Using Geographic Information Systems (GIS) to Understand a Community's Primary Care Needs
Upload
khangminh22Category
view
1download
0
CONTENTS
Appendices .................................................................................................................................................. 3
Commonly Used Abbreviations or Terms ................................................................................................ 4
Executive Summary .................................................................................................................................... 5
Objectives ................................................................................................................................................ 5
Recommendations .................................................................................................................................. 5
Findings │Statewide Outcome Indicators ............................................................................................. 7
Findings │Quartile Ranking of Counties .............................................................................................. 13
State Overview ......................................................................................................................................... 15
Tribal Populations ................................................................................................................................. 16
South Dakota Medicaid Access to Care ............................................................................................... 17
Telehealth .............................................................................................................................................. 18
South Dakota Health Indicator Analysis ................................................................................................. 19
Method of Analysis ............................................................................................................................... 19
Findings .................................................................................................................................................20
South Dakota Shortage Designations ..................................................................................................... 22
Health Professional Shortage Area Designations (HPSA) .................................................................. 22
Primary Care Delivery Systems ............................................................................................................... 27
Community Health Centers ..................................................................................................................28
Rural Health Clinics ............................................................................................................................... 31
Critical Access Hospitals ....................................................................................................................... 31
Behavioral Health and Substance Abuse ................................................................................................34
Screening, Brief Intervention, and Referral to Treatment .................................................................34
Primary Care Programs and Resources .................................................................................................. 35
Primary Care Workforce ......................................................................................................................... 39
Educational Opportunities .................................................................................................................. 39
Sources ..................................................................................................................................................... 48

South Dakota Department of Health, Office of Rural Health 2020 Primary Care Needs Assessment Page 3 of 48
APPENDICES
APPENDIX A │SUPPLEMENTAL TABLES FOR HEALTH STATUS INDICATORS A1 – A40
APPENDIX B │SUPPLEMENTAL TABLES FOR HEALTH ACCESS INDICATORS B1 – B22
APPENDIX C │SUPPLEMENTAL TABLES FOR HEALTH RISK BEHAVIOR INDICATORS C1 – C11
APPENDIX D │HEALTH INDICATORS RANKING BY COUNTY, FULL LIST D1 – D5
APPENDIX E │QUARTILE RANKINGS, ALL COUNTIES E1 – E2
APPENDIX F │SOUTH DAKOTA POPULATION DEMOGRAPHICS F1 – F31
APPENDIX G │SOUTH DAKOTA MEDICAID DATA G1 – G4
APPENDIX H │PRIMARY HEALTH INDICATORS AND ANNOTATED REFERENCES H1 – H15
APPENDIX I │FEDERALLY QUALIFIED HEALTH CENTERS DIRECTORY I1 – I3
APPENDIX J │HRSA HEALTH WORKFORCE SITES DIRECTORY J1 – J11
APPENDIX K │RURAL HEALTH CLINICS DIRECTORY K1 – K2
APPENDIX L │SOUTH DAKOTA CRITICAL ACCESS HOSPITAL DIRECTORY L1
APPENDIX M │SCREENING BRIEF INTERVENTION AND REFERRAL TO TREATMENT M1 – M2
APPENDIX N │NURSING EDUCATION PROGRAMS IN SOUTH DAKOTA N1 – N5
APPENDIX O │RECOMMENDATIONS O1 – O8

South Dakota Department of Health, Office of Rural Health 2020 Primary Care Needs Assessment Page 4 of 48
COMMONLY USED ABBREVIATIONS OR TERMS
BRFSS Behavioral Risk Factor Surveillance System
CAH Critical Access Hospital
CHC Community Health Center
DOH Department of Health
FORHP Federal Office of Rural Health Policy
FQHC Federally Qualified Health Center
HLC Higher Learning Commission
HPSA Health Professional Shortage Area
HRSA Health Resources & Services Administration
LNE Low Number of Events
MUA Medically Underserved Area
MUP Medically Underserved Population
n.d. no data
NHSC National Health Service Corps
ORH Office of Rural Health
PCO Primary Care Office
pop. population
RHC Rural Health Clinic
The enclosed report reflects the findings of a comprehensive secondary analysis and needs assessment of South Dakota counties and their potential areas of need in primary health care. The assessment was conducted by external evaluators of Sage Project Consultants, LLC, a Vermillion-based consulting firm, in cooperation with the Office of Rural Health, South Dakota Department of Health.
Funding to support the development of this publication was provided by the Health Resources and Services Administration (HRSA) of the U.S. Department of Health and Human Services (HHS) as part of an award totaling $155,916 with 0% financed with non-governmental sources. The contents are those of the author(s) and do not necessarily represent the official views of, nor an endorsement, by HRSA, HHS, or the U.S. Government. For more information, please visit HRSA.gov.

South Dakota Department of Health, Office of Rural Health
2020 Primary Care Needs Assessment Page 5 of 48
EXECUTIVE SUMMARY
The South Dakota Primary Care Office (PCO) is housed within the South Dakota Department of Health (DOH), Office of Rural Health (ORH). The mission of the ORH is to improve the delivery of health services to rural and medically underserved communities, emphasizing access. The ORH’s efforts are largely aimed at the local level within South Dakota’s communities, most of which are rural and/or frontier.
OBJECTIVES
The objective of the South Dakota Primary Care Needs Assessment (PCNA), sponsored and managed by the PCO, is to identify areas for priority attention in the coming years in the PCO’s efforts to promote access to care. In addition, the completion of this needs assessment is being done in compliance with the Cooperative Agreements to States/Territories for the Coordination and Development of Primary Care Offices awarded to the PCO by the Health Resources and Services Administration (HRSA).
Despite South Dakota’s broad geography and sparse population, making prevalence or incidence data often too few to report, this needs assessment has been conducted at a county level when possible. Each county was ordinally ranked and scored on a series of three health indicators – Health Status, Health Access, and Health Risk Behaviors. The results of this ranking were used as one approach to highlighting potential areas for priority focus by the PCO, but in no means is meant to suggest that counties with a lower score are not in need of enhanced primary care delivery or physician placement. The scope was developed to provide sufficient breadth of factors relating to aspects of primary care delivery across the State, but also enough depth of content to provide reasonable estimates for the county rankings and subsequent priority areas of focus.
Figure 1 lists the data comprised of the three health indicators including Health Status, Health Access, and Health Risk Behaviors.
RECOMMENDATIONS
South Dakota has established several goals, objectives, and strategies to address the metrics discussed in this report. Appendix O outlines strategic plans by the Department of Health, Department of Social Services, and Department of Public Safety. In addition to state-wide plans, health care systems, non-profits, and several other organizations have active plans to address primary care, behavioral health, and access to care at a community level.
The PCNA report was reviewed with the Department of Social Services – Division of Behavioral Health, Great Plains Tribal Chairmen’s Health Board, and South Dakota Association of Healthcare Organizations (SDAHO). Based on the analysis, the following recommendations were suggested:
• The counties that scored lower in health outcomes and health indicators overlap with South Dakota’s tribal nations. There is an ongoing need to continue efforts to close the health equity gaps with Native American citizens living in South Dakota.
• The Medicaid data indicates there is significant room for improvement in child measures, particularly well child checkups for those served by the Children’s Health Insurance Program (CHIP) system.
• The addition of the following components to the next PCNA report in 2025: o Examine all levels of healthcare workforce due to critical shortages on all levels. o Partner with South Dakota Health Link to conduct population health analytics. o Partner with the Department of Social Services – Division of Behavioral Health to outline
more behavioral health metrics including workforce.

South Dakota Department of Health, Office of Rural Health
2020 Primary Care Needs Assessment Page 6 of 48
FIGURE 1: HEALTH STATUS, HEALTH ACCESS, AND HEALTH RISK BEHAVIORS INDICATORS
Hea
lth
Sta
tus •Health Outcomes
•Health Factors
•Poor or Fair Health
•Life Expectancy (Male)
•Life Expectancy
(Female)
•Total Mortality Rate
• Infant Mortality Rate
•Top 10 Causes of
Death in SD
•Adult Obesity
•Diabetes Prevalence
•Cancer Prevalence
•Anxiety Disorder
Diagnosis
•Depression Diagnosis
•STD Incidence Rates
Hea
lth
Ac
ce
ss
•Poverty Level
•Free & reduced school
lunch
•Have a personal
doctor/provider
•Have a usual place to
go for medical care
•Live births
•Low birth weight
•Dentist ratio to
population
•Prenatal care in first
trimester
•Colorectal cancer
screening
•Breast cancer
screening
• Influenza vaccination
•Could not see a doctor
due to cost
•Uninsured adults aged
18 to 64
•Uninsured children,
under 18
•EMS, average
dispatch to enroute
Hea
lth
Ris
k B
eh
avio
rs
•Access to healthy
foods
•Physical inactivity
•Adult smoking
•Mother's tobacco use
during pregnancy
•Mother's breastfeeding
at discharge
•Excessive drinking
South Dakota Department of Health, Office of Rural Health
2020 Primary Care Needs Assessment Page 7 of 48
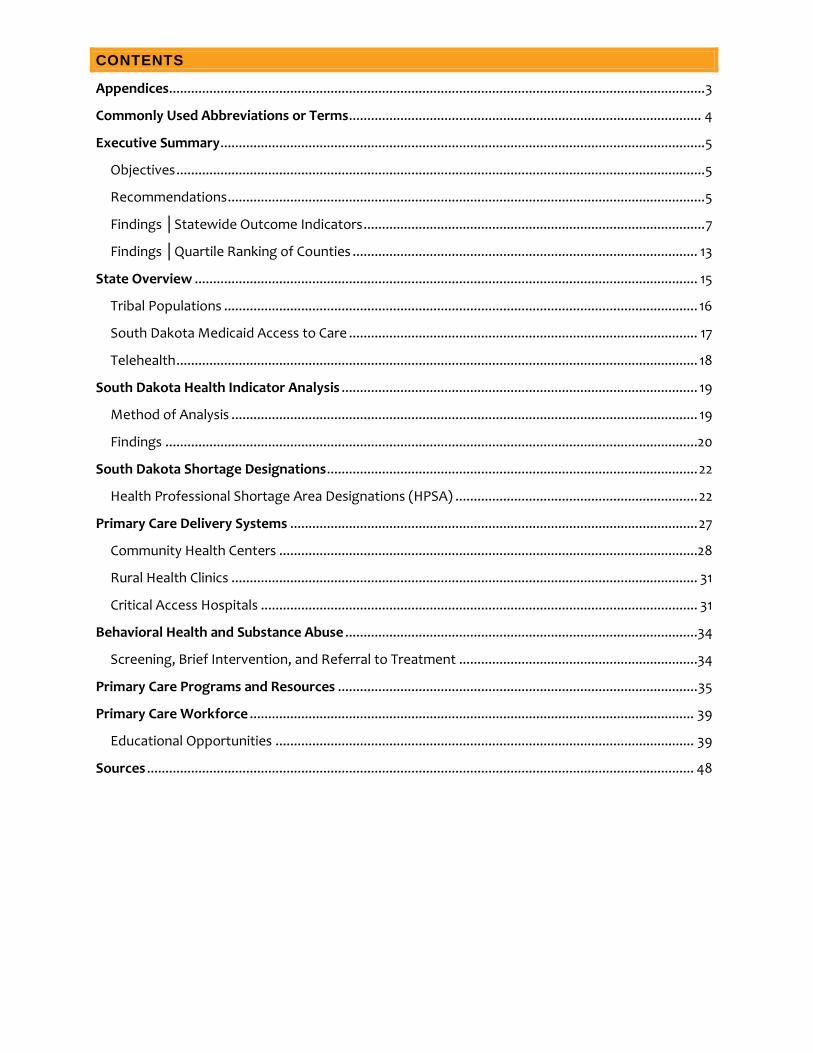
In addition to the chosen health indicators, several datasets limited to statewide data only were leveraged to provide insight into whether those key indicators were showing improvement over time. Baseline rates were collected for 2011, and current rates (for comparison) were collected for 2017 in nearly all instances except where noted. This exercise provides a high-level view of movement towards positive or negative change in the various health indicators and provides an additional longitudinal monitoring tool for use to manage resources and efforts over the coming years.
Finally, an assessment of ongoing efforts in the State to enhance the delivery of primary care is featured in this report. The study encompasses the full continuum of a care delivery model, ranging from a summary and assessment of educational offerings for medical professionals (e.g., nurses, advanced practice providers, and physicians) all the way to designated shortage areas of known priority.
FINDINGS │STATEWIDE OUTCOME INDICATORS
Health Status Indicators
Supplemental tables for the health status indicators can be found in Appendix A.
TABLE 1: HEALTH STATUS INDICATORS
Health Status Indicators Baseline Rate
(2011 unless noted)
(2014 unless noted)
Current Rate
(2017 unless noted)
Direction of Change1
Poor or Fair Health
(County Health Rankings)
n.d. 11.1% 13% Not Improved
Life Expectancy (Male)
Institute for Health Metrics & Evaluation (IHME)
77.1 years 77.1 years (2013)
77.2 years (2014)
Improved
Life Expectancy (Female)
IHME
82.0 years 81.9 years (2013)
82 years (2014)
Improved
Mortality Rate (Total)2
(SD DOH Vital Statistics, age-adjusted)
704.9 deaths3
704.1 deaths4 711.5 deaths5
Not Improved
Infant
(SD DOH Vital Statistics)
7.0 deaths3 6.9 deaths4 6.5 deaths5
Improved
Heart Disease
(SD DOH Vital Statistics, age-adjusted)
159.6 deaths3
152.7 deaths4 151.4 deaths5
Improved
Cancer
(SD DOH Vital Statistics, age-adjusted)
166.1 deaths3
163.2 deaths4 156.6 deaths5
Improved

South Dakota Department of Health, Office of Rural Health
2020 Primary Care Needs Assessment Page 8 of 48
Health Status Indicators Baseline Rate
(2011 unless noted)
(2014 unless noted)
Current Rate
(2017 unless noted)
Direction of Change1
Chronic Lower Respiratory Disease
(SD DOH Vital Statistics, age-adjusted)
46.6 deaths3 43.6 deaths4 41.8 deaths5
Improved
Alzheimer’s
(SD DOH Vital Statistics, age-adjusted)
34.9 deaths3 36.7 deaths4 36.0 deaths5
Improved
Cerebrovascular Disease/Stroke
(SD DOH Vital Statistics, age-adjusted)
39.3 deaths3 39.0 deaths4 36.3 deaths5
Improved
Accident
(SD DOH Vital Statistics, age-adjusted)
42.4 deaths3 46.3 deaths4 50.9 deaths5
Not Improved
Diabetes
(SD DOH Vital Statistics, age-adjusted)
23.8 deaths3 23.4 deaths4 23.8 deaths5
Not Improved
Suicide
(SD DOH Vital Statistics, age-adjusted)
15.3 deaths3 16.7 deaths4 19.7 deaths5
Not Improved
Influenza/Pneumonia
(SD DOH Vital Statistics, age-adjusted)
15.9 deaths3 16.2 deaths4 17.3 deaths5
Not Improved
Chronic Liver Disease
(SD DOH Vital Statistics, age-adjusted)
10.5 deaths3 12.7 deaths4 15.7
deaths5
Not Improved
Obesity Prevalence
(CDC’s BRFSS)
28.1% of South
Dakotans
29.9% of South
Dakotans
32% of South
Dakotans
Not Improved
School-Aged Children BMI, Percent Obese or Overweight (School Height & Weight Report)
15.2% 15.8% 16.6% Not Improved
Diabetes Prevalence
(CDC’s BRFSS)
9.5% of South
Dakotans
9.1% of South Dakotans
(2013)
10% (2016) of South Dakotans
Not Improved

South Dakota Department of Health, Office of Rural Health
2020 Primary Care Needs Assessment Page 9 of 48
Health Status Indicators Baseline Rate
(2011 unless noted)
(2014 unless noted)
Current Rate
(2017 unless noted)
Direction of Change1
Cancer Prevalence Rates, all sites, age-adjusted6
(SD Cancer Registry)
455.4 (2011) 395.9 (2013) 449.6 Not Improved
Anxiety Disorder Diagnosis
(Helmsley Foundation, A Picture of Health)
n.d. 7.5% surveyed
n.d. No comparison
Depression Diagnosis
(Helmsley Foundation, A Picture of Health)
n.d. 5.5% surveyed
n.d. No comparison
STD Incidence Rates7
(SD DOH, Disease Prevention)
4,014 avg. incidences
5,009 avg.
incidences
5,600 avg. incidences
(2016)
Not Improved

South Dakota Department of Health, Office of Rural Health
2020 Primary Care Needs Assessment Page 10 of 48
Health Access Indicators
Supplemental tables for the health access indicators can be found in Appendix B.
TABLE 2: HEALTH ACCESS INDICATORS
Health Access Indicator Baseline Rate
(2011 unless noted)
(2014 unless noted)
Current Rate
(2017 unless noted)
Direction of Change
Poverty level
(US Census)
14.1% (2009 – 2013)
14.8% persons in
poverty
13.1% (2019)
Improved
Free & reduced school lunch
(KIDS COUNT Data Center)
41% of K-12 students
46% of K-12 students
38% (2019) Improved
Have a personal doctor/provider
(Helmsley Foundation, A Picture of Health)
n.d. 77.4% surveyed
n.d. No comparison
Have a place to go for medical care
(Helmsley Foundation, A Picture of Health)
n.d.
94.2% surveyed
n.d.
No comparison
Could not see a doctor due to cost (Percent, County Health Rankings
n.d. n.d. 8.7% (2015) No comparison
Dentists ratio to population
(County Health Rankings, 2015)
n.d. 1 dentist to every 1,813
residents
1 dentist to every 1,680 residents
(2018)
Improved
Live births
(SD DOH & KIDS COUNT data)
11,834 live births
12,281 live births
11,890 (2018)
Not Applicable
Low birth weight
(SD DOH Vital Statistics, age-adjusted)
6.5% of infants3
6.4% of infants4
6.5% Not Improved
Prenatal care in first trimester
(SD DOH, Health Statistics)
69.4% of mothers3
71.1% of mothers4
72.4% Improved
Colorectal cancer screening
(BRFSS8)
62.5%
(2012)
66.7% 72.5% Improved

South Dakota Department of Health, Office of Rural Health
2020 Primary Care Needs Assessment Page 11 of 48
Health Access Indicator Baseline Rate
(2011 unless noted)
(2014 unless noted)
Current Rate
(2017 unless noted)
Direction of Change
Mammography screening
(County Health Rankings, 2015)
77%
(2012)
n.d. 49% of female
Medicare enrollees age 65-74
Not Improved
Mammography screening, age 50+
(State Cancer Profiles)
77.1%
(2012)
n.d. 82.0% Improved
Mammography screening, age 40+
(State Cancer Profiles)
73.0%
(2012)
n.d. 76.0% Improved
Blood stool test
(State Cancer Profiles)
13.5%
(2012)
n.d. 8.3% Not Improved
PAP screening in past 3 years
(State Cancer Profiles)
79.1%
(2012)
n.d. 67.1% Not Improved
Influenza vaccination, aged 65+
(cdc.gov/flu/fluvaxview/)
n.d. 40% (2015) 47% (2017) Improved
Pneumonia vaccination, aged 65+
(BRFSS)
67.1% 65.4% (2013) 77% (2018) Improved
Uninsured adults, aged 18 to 64
(US Census, SAHIE)
17.1% 15.7% (2013) 13% Improved
Uninsured children, under 18
(US Census, SAHIE)
6% 6% (2013) 6% No change
EMS Dispatch to Enroute Time n.d. n.d. 5.62 minutes (2015)
No comparison

South Dakota Department of Health, Office of Rural Health
2020 Primary Care Needs Assessment Page 12 of 48
Health Risk Behavior Indicators
Supplemental tables for the health risk behavior indicators can be found in Appendix C.
TABLE 3: HEALTH RISK BEHAVIORS
Health Risk Behavior
Indicators
Baseline Rate
(2011 unless
noted)
(2014 unless
noted)
Current
Rate
(2017 unless
noted)
Direction of
Change
Access to healthy foods
(County Health Rankings, 2020)
n.d. 11% of residents
(2015)
11% No change
Physical inactivity (less than 150
min. of aerobic physical
activity/week)
(CDC, Diabetes Risk Factors)
53.9% of South
Dakotans
46.3% (2013) of
South Dakotans
21% of
South
Dakotans
Not Improved
Adult smoking9
(County Health Rankings, 2020)
23.0% of South
Dakotans
18.6% of South
Dakotans
19% Not Improved
Mother’s tobacco use during
pregnancy
(SD DOH Vital Statistics)
18.1% of
mothers3
16.1% of
mothers4
14% of
mothers5
Improved
Mothers breastfeeding at
discharge
(SD DOH Vital Statistics)
73.1% of
mothers3
75.4% of
mothers4
79.4% of
mothers5
Improved
Excessive drinking10
(County Health Rankings, 2015)
n.d. 19% of South
Dakotans
19% of
South
Dakotans
No change
n.d. = no data

South Dakota Department of Health, Office of Rural Health
2020 Primary Care Needs Assessment Page 13 of 48
FINDINGS │QUARTILE RANKING OF COUNTIES
To rank all South Dakota counties in an objective manner, the methodology used by Idaho and Maryland in their Primary Care Needs Assessments was leveraged. This is the same methodology used in the 2015 South Dakota Primary Care Needs Assessment report. To examine the 66 counties across a total of 44 different indicators, county-level data was queried – when available – and data for each county informed the ranking. The rankings were applied for each indicator by assigning a numerical value (1-66) based upon actual data results (e.g., diabetes prevalence by county). A lower numerical value for a county represents a better health outcome for that county in comparison to other counties in the state, and a higher numerical value represents a poorer health outcome. A large grid was created to capture the rankings (see Appendix D) and the sum of each county’s rankings across the indicators was totaled.
The totals for each county were then transposed to a new grid and ordered from smallest to largest. The group of 66 counties was then assigned a quartile in that same order (see Appendix E). The result of this method is a series of three maps, color-coded in increased darkness and intensity for counties with higher indicator totals. The darker the color, the higher the sum of the rankings, and ultimately the poorer health outcomes. In contrast, the lighter the color, the lower the sum of rankings, and ultimately better health outcomes.
FIGURE 2: HEALTH STATUS BY COUNTY

South Dakota Department of Health, Office of Rural Health
2020 Primary Care Needs Assessment Page 14 of 48
FIGURE 3: HEALTH ACCESS BY COUNTY
FIGURE 4: HEALTH RISK BEHAVIOR BY COUNTY

South Dakota Department of Health, Office of Rural Health
2020 Primary Care Needs Assessment Page 15 of 48
While the quartile ranking was conducted by analyzing each indicator area (Health Status, Health Access, and Health Risk Behaviors) separately, it is interesting to note that several counties repeated in each indicator area across the same quartile.
A TOTAL OF 11 COUNTIES WERE CONSISTENTLY IN ALL FOURTH QUARTILE RANKINGS (BOTTOM 25%).
• Bennett
• Dewey
• Mellette
• Todd
• Buffalo
• Jackson
• Oglala Lakota
• Ziebach
• Corson
• Lyman
• Roberts
6 COUNTIES WERE CONSISTENTLY REPRESENTED IN THE TOP QUARTILE (TOP 25%).
• Brookings
• Hand
• Campbell
• Lincoln
• Deuel
• Union
STATE OVERVIEW
South Dakota is the 16th largest state in terms of land area within the US with more than 75,000 square miles (US Census, 2010) in its territory. It lies in the Upper Midwest and is divided into east and west by the Missouri River. South Dakota is home to nine federally recognized Indian tribes, and more than 8.6% 11of the State’s total population is Native American. The State is comprised of 66 counties, ranging in population from 90312 residents in Jones County in central SD to 193,134 residents11 in Minnehaha in eastern SD, with nearly 278,000 residents in the surrounding Sioux Falls Metropolitan Area. Only nine of the 66 South Dakota counties have more than 20,000 residents. The remaining counties are either rural (26 counties) or frontier (31 counties); 9.8% of the State’s population lives in a frontier county11. South Dakota population demographics can be found in Appendix F.
Much like some of its surrounding states, South Dakota is experiencing ‘rural flight’, where despite falling populations in rural counties the overall population of the State is increasing. Percent change in population estimates within the State has increased 8.7% from 2010 to 2019 (U.S. Census Bureau-Quick Facts).
Despite its vast geographic expanse, the State has a total population of 884,659 (2019 U.S. Census population estimate) and ranks 46th in the nation in terms of overall population and 47th for overall population density. There are on average 10.7 persons per square mile (2010 US Census).
According to the 2019 US Census population estimates, South Dakota is predominantly white (85.7%), followed by American Indian (8.6%).
There are 58 hospitals in South Dakota consisting of 38 Critical Access Hospitals (25 beds or less), 11 Hospitals (26 beds or more) and nine (9) Specialized Hospitals.
South Dakota Department of Health, Office of Rural Health
2020 Primary Care Needs Assessment Page 16 of 48
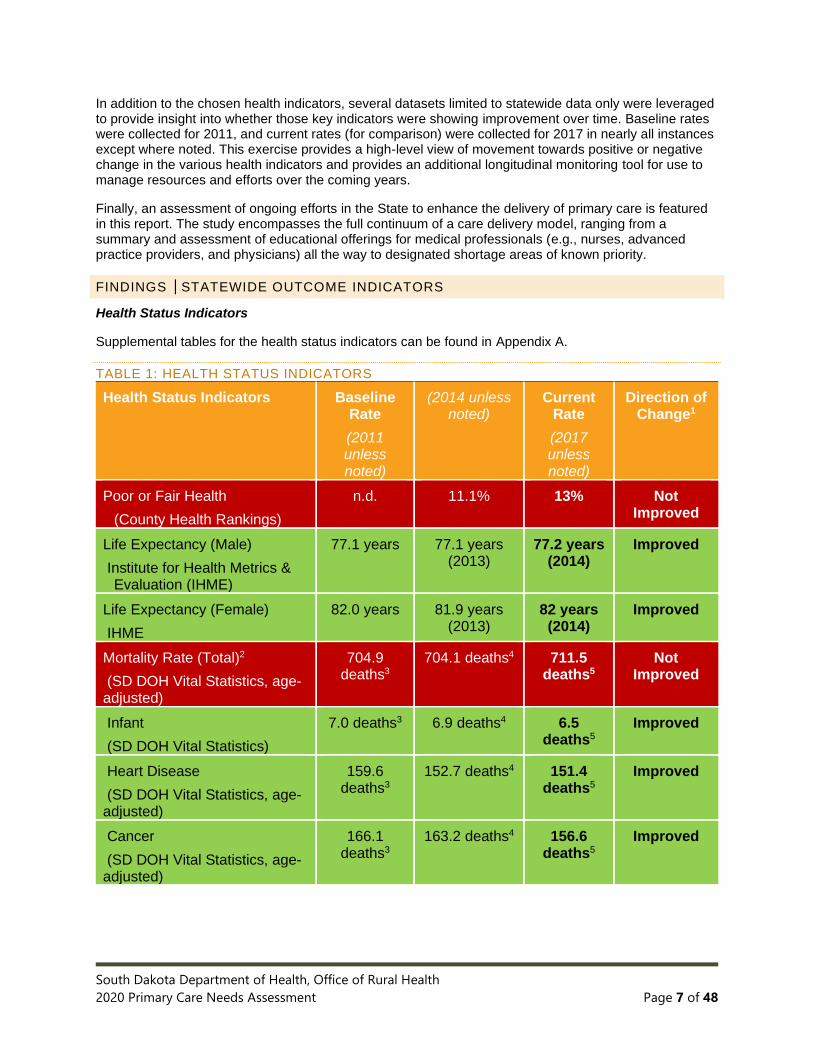
TRIBAL POPULATIONS
Native Americans have treaty rights to federal healthcare services through a series of acts that resulted in the formation of the federal agency known today as the Indian Health Service. Healthcare services are provided to federally recognized tribes. South Dakota has nine federally recognized tribes.
TRIBAL HEALTHCARE FACILITIES
The Great Plains Area Indian Health Service (IHS) provides health services to approximately 122,000 American Indians who reside within nineteen service units. There are sixteen reservations: eight in South Dakota, four in North Dakota, three in Nebraska, and one in Iowa. There are also three non-reservation service units: Rapid City, South Dakota, Trenton Service Unit; North Dakota; and Northern Ponca Service Unit, Nebraska. The Great Plains Area IHS also provides health services to approximately 6,000 Native Americans who are not counted in the user population of the Area. This population does not reside within any service unit; however, they meet the IHS eligibility criteria for health services provided at IHS or Tribally operated direct care facilities. The largest concentrations of the non-service unit eligible are found in Aberdeen and Sioux Falls, South Dakota and Bismarck and Grand Forks, North Dakota13.
Indian Health Service Facilities located in South Dakota:
• Cheyenne River Service Unit
• Fort Thompson Service Unit
• Great Plains Youth Regional Treatment Center
• Flandreau Service Unit
• Lower Brule Service Unit
• Pine Ridge Service Unit
• Rapid City Service Unit
• Rosebud Service Unit
• Standing Rock Service Unit
• Yankton Service Unit
The eleven counties consistently in the bottom 25% of the rankings (see page 15) for Health Status, Health Access and Health Risk Behavior encompass all or part of seven of the nine Tribes in South Dakota.
Within the reservation boundaries, there are many facilities that qualify as automatic Health Professional Shortage Area site (See pages 23-24). In addition, most counties encompassing Tribal Lands show:
• Primary Medical Care - Geographic or Low-income shortage area
• Dental Healthcare - Geographic or Low-income shortage area
• Mental Healthcare - Geographic or Low-income shortage area
• Medically Underserved Areas – Medically Underserved Areas, Medically Underserved Population (low-income), Medically Underserved Communities
Figure 5 shows the tribal lands of each of the nine (9) tribes as overlapped with South Dakota Counties.

South Dakota Department of Health, Office of Rural Health
2020 Primary Care Needs Assessment Page 17 of 48
FIGURE 5: AMERICAN INDIAN TRIBAL RESERVATIONS
SOUTH DAKOTA MEDICAID ACCESS TO CARE
South Dakota’s Medicaid program plays a vital role in the health care of many South Dakotans. South Dakota Medicaid provides healthcare coverage for low-income individuals, including children, pregnant women, and individuals with disabilities, elderly, low-income parents of young children, and other adults. Medicaid is one of the largest healthcare insurers in South Dakota. South Dakota’s program has high rates of provider participation and engages key stakeholders regularly relative to program development and implementation. At the end of State Fiscal Year 2019, South Dakota Medicaid had over 16,500 providers enrolled and an average of 7,000 providing services each month.
South Dakota Medicaid’s high rates of provider participation support access to needed healthcare services. In State Fiscal Year 2019, South Dakota Medicaid had participation from approximately14:
• 100% of all acute care hospitals
• 98% of all Rural Health Clinics
• 93% of all Federally Qualified Health Centers
• 99% of retail pharmacies
• 99% of all nursing homes
• 100% of all community mental health centers
• 79% of all home health agencies
• 71% of all dentists
• 63% of all physicians
See Appendix G for more information.

South Dakota Department of Health, Office of Rural Health
2020 Primary Care Needs Assessment Page 18 of 48
TELEHEALTH
Telehealth is one of South Dakota’s strengths; a strong telehealth presence exists as a way for individuals in rural areas to access high quality health care in South Dakota. Several platforms for telehealth exist and each offers a unique way to connect individuals in remote locations to high quality health care. South Dakota Medicaid has expanded access to telehealth services at IHS facilities that support specialty and primary care and emergency department care through partnerships with non-IHS providers. These services were enacted through a gradual roll out and utilization of the services via telehealth is increasing.
Although telehealth is a strength for our state, there is still room for growth. Roughly 135,000 South Dakotans still do not have access to reliable broadband. During the last two years, the state has invested $10 million and $6.6 million respectively in CARES Act funding to improve broadband in South Dakota.15 This $16.6 million has leveraged substantial federal and private investment, bringing the total investment in broadband in the state to $88.2 million.
TRIBAL TELEHEALTH
Tribal telehealth is offered at the following locations for the following services16:
Standing Rock Service Unit, Fort Yates, ND Telehealth services offered (* indicates Avera Health Telehealth Services):
• *Rheumatology
• *Endocrinology
• *Psychiatry
• *Infectious Disease
• *Behavioral Health
Cheyenne River Health Center, Eagle Butte, SD Telehealth services offered:
• E-care
• Cardiology
• Dermatology
• Endocrinology
• Nephrology
• Rheumatology
Fort Thompson IHS Health Center, Fort Thompson, SD Telehealth services offered (* indicates Avera Health Telehealth Services):
• Internal Medicine
• Rheumatology*
• Endocrinology*
• Psychiatry*
• Infectious Disease*
• Behavioral Health*
Flandreau Santee Sioux Tribal Health Center, Flandreau, SD Telehealth services offered (* indicates Avera Health Telehealth Services):
• Rheumatology*
• Endocrinology*
• Psychiatry*
• Infectious Disease*
• Behavioral Health*
South Dakota Department of Health, Office of Rural Health
2020 Primary Care Needs Assessment Page 19 of 48
Lower Brule Service Unit, Lower Brule, SD Telehealth services offered (* indicates Avera Health Telehealth Services):
• Rheumatology*
• Endocrinology*
• Psychiatry*
• Infectious Disease*
• Behavioral Health*
Pine Ridge Service Unit: Pine Ridge Hospital, Pine Ridge, SD Telehealth services offered:
• Telemedicine Clinic
• Counseling
• Dentistry
• Outpatient Pediatric
• Outpatient Adult
• Behavioral Health
Oyate Health Center, Rapid City, SD Telehealth services offered:
• Telemedicine Clinic
Rosebud Service Unit, Rosebud, SD Telehealth services offered (* indicates Avera Health Telehealth Services):
• Rheumatology*
• Endocrinology*
• Psychiatry*
• Infectious Disease*
• Behavioral Health*
Woodrow Wilson Keeble Memorial Health Care Center, Sisseton, SD Telehealth services offered (* indicates contracted services with Great Plains Area):
• Behavioral Health*
• Pain management*
• RA*
Yankton Service Unit, Wagner, SD Telehealth services pending
SOUTH DAKOTA HEALTH INDICATOR ANALYSIS
METHOD OF ANALYSIS
A total of 44 indicators were selected by the PCO that reflect three areas of primary care: health status, health access, and health risk behavior. These indicators were ranked by county to demonstrate areas of greater unmet needs in primary care delivery or access. This methodology was based largely off the Idaho Primary Care Needs Assessment completed in 2014 and adapted for use in South Dakota’s Primary Care Needs Assessment in 2020.
Of the 44 indicators, 23 represent health status, 15 represent health access, and 6 represent health risk behaviors. Final selection of these indicators was based on known issues impacting primary care delivery or access in the State, the goals of the South Dakota State Department of Health Strategic Plan 2015-2020, and availability of datasets at the county-level. While there may have been other categories that

South Dakota Department of Health, Office of Rural Health
2020 Primary Care Needs Assessment Page 20 of 48
would have been appropriate to include in this analysis, lack of county-level data prevented their inclusion in this analysis.
Several mortality rate indicators are included in the health status category; the top ten causes of resident deaths were considered. A complete listing of indicators is available in Appendix H, along with an annotated description of the indicator’s data source and any assumptions/interpretations made in the analysis and assignment of quartile rankings.
As previously noted, the methodology for ranking the indicators was adapted from the Idaho Primary Care Needs Assessment. Idaho noted in its Primary Care Needs Assessment, “counties are ordinally ranked for each indicator by assigning a numerical value based upon indicator results. A lower numerical value for a county represents a better health outcome for that county in comparison to other counties, whereas a higher numerical value for a given county represents a poorer health outcome in comparison to counties with lower values.” Following the ranking assignment, counties were color-coded and separated into quartiles for easier viewing.
This methodology does not imply any level of statistical significance. This is due to several factors, largely because not every indicator had data available at the county level; in these instances, statewide data was used. Similar to what Idaho did, counties in which insufficient data or only statewide results were available were assigned the median rank separating the upper half of the quartiles from the bottom half.
FINDINGS
The following tables reflect a listing of each quartile ranking, categorized by indicator type. Counties within each quartile are listed in alphabetical order.
TABLE 4: FIRST QUARTILE
Top Quartile (top 25%)
Health Status Health Care Access Health Risk Behaviors
Bon Homme Brookings Campbell Deuel Douglas Edmunds Hand Harding Hutchinson Jerauld Jones Lawrence Lincoln Stanley Sully Union
Bon Homme Brookings Campbell Clay Codington Davison Deuel Hand Hughes Kingsbury Lincoln McCook Miner Stanley Union Yankton
Brookings Campbell Custer Deuel Douglas Faulk Grant Hand Hanson Hutchinson Kingsbury Lincoln Miner Perkins Turner Union

South Dakota Department of Health, Office of Rural Health
2020 Primary Care Needs Assessment Page 21 of 48
TABLE 5: SECOND QUARTILE
Second
Health Status Health Care Access Health Risk Behaviors
Aurora Brown Brule Codington Custer Davison Faulk Haakon Hamlin Hanson Hyde Lake Miner Moody Perkins Potter Sanborn
Brown Edmunds Grant Haakon Hamlin Harding Hutchinson Hyde Jerauld Lake Lawrence Meade Minnehaha Potter Spink Sully Turner
Aurora Beadle Brown Butte Clark Edmunds Hamlin Hyde Jones Lake Lawrence McCook McPherson Minnehaha Potter Stanley Sully
TABLE 6: THIRD QUARTILE
Third
Health Status Health Care Access Health Risk Behaviors
Butte Clark Clay Day Grant Gregory Hughes Kingsbury Marshall McCook McPherson Meade Minnehaha Pennington Spink Tripp Turner Yankton
Aurora Beadle Brule Butte Clark Custer Day Douglas Fall River Faulk Gregory Hanson Jones Moody Pennington Sanborn Walworth
Bon Homme Charles Mix Clay Davison Fall River Gregory Haakon Harding Hughes Jerauld Marshall Meade Pennington Spink Tripp Walworth Yankton

South Dakota Department of Health, Office of Rural Health
2020 Primary Care Needs Assessment Page 22 of 48
TABLE 7: FOURTH QUARTILE
Bottom Quartile (bottom 25%)
Health Status Health Care Access Health Risk Behaviors
Beadle Bennett Buffalo Charles Mix Corson Dewey Fall River Jackson Lyman Mellette Oglala Lakota Roberts Todd Walworth Ziebach
Bennett Buffalo Charles Mix Corson Dewey Jackson Lyman Marshall McPherson Mellette Oglala Lakota Perkins Roberts Todd Tripp Ziebach
Bennett Brule Buffalo Codington Corson Day Dewey Jackson Lyman Mellette Moody Oglala Lakota Roberts Sanborn Todd Ziebach
SOUTH DAKOTA SHORTAGE DESIGNATIONS
HEALTH PROFESSIONAL SHORTAGE AREA DESIGNATIONS (HPSA)
PRIMARY MEDICAL CARE SHORTAGE AREAS
Primary medical care is assessed by HRSA to determine shortages and categorized into one of three designation types: geographic area, population groups, and facilities. Each category has its own criteria:
TABLE 8: HPSA CRITERIA Criteria Impact on South Dakota
Geographic Area
▪ Be a rational area for the delivery of primary medical care services.
▪ Meet certain conditions around population to full-time-equivalent primary care physician ratios of a minimum of 3,500:1. Geographic High Needs is 3,000:1.
▪ Demonstrative that other primary care providers in contiguous areas are over utilized, too far away, or inaccessible.
▪ 38 counties are fully or partially designated as Primary Care Geographic (3,500:1) HPSAs in South Dakota.
▪ 8 of the 38, areas are designated as Geographic High Need (3,000 to 1): Bennett County, Harding County, Jackson County, Mellette County, Roberts County Oglala Lakota County, Todd County, Ziebach County.
Population Groups
▪ Reside in an area that is rational for the delivery of primary care medical services.
▪ Have access barriers to providers. ▪ Have a ratio of persons in the
population group to number of primary care physicians of a minimum of 3,000:1.
▪ Have a shortage of providers for a specific group of people within a defined geographic area.
▪ 19 counties are designated for this category, notably for low income: Beadle, Bon Homme, Brule, Buffalo, Charles Mix, Day, Fall River, Faulk, Gregory, Haakon, Hand, Hutchinson, Jerauld, Lawrence, McPherson, Sanborn, Spink, Tripp, Walworth.

South Dakota Department of Health, Office of Rural Health
2020 Primary Care Needs Assessment Page 23 of 48
Criteria Impact on South Dakota
Facilities
▪ Be a public and/or non-profit medical facility, with specific requirements.
▪ Be either a federal and/or state maximum or medium correctional institution.
▪ Be a state or county hospital with a shortage of mental health provides.
▪ Be a facility that is automatically designated based on statute or through regulation.
▪ 26 Indian Health Service Facilities. ▪ 10 Rural Health Clinics. ▪ 4 FQHCs, which have a total of 45 clinic
sites. ▪ 3 Correctional Facilities. ▪ 2 Mental Hospitals.
As defined by HRSA, HPSA Scores “are developed for use by the National Health Service Corps (NHSC) in determining priorities for assignment of clinicians” and range from 1 to 25 for primary care and mental health, and 1 to 26 for dental health. The higher the score, the greater the priority. The HRSA Health Workforce Site Directory can be found in Appendix J.
There are 93 primary care shortage area designations of various types (geographic areas, population groups, and facilities) across South Dakota; of those, 81 have a HPSA Score of 10 or higher. Six of the 81 scored designated areas have a HPSA Score greater than 20.
FIGURE 6: HPSA – PRIMARY MEDICAL CARE

South Dakota Department of Health, Office of Rural Health
2020 Primary Care Needs Assessment Page 24 of 48
DENTAL HEALTH PROFESSIONAL SHORTAGE AREAS
A Dental HPSA Designation is like Primary Care in its criteria; all areas are designated as either a geographic area, a population group, or a facility. The requirements are largely the same, the primary exception being that the area must meet a population to full-time-equivalent dentist ratio of at least 5,000:1 for geographic, and 4,000:1 for geographic high needs and population. Slightly improved from shortage designations in primary care, there are 38 of 66 counties that do not represent a full or partial dental shortage area. However, more than one-third of all counties in the state represent designated shortage areas based on geography or low-income.
FIGURE 7: HPSA – DENTAL HEALTHCARE

South Dakota Department of Health, Office of Rural Health
2020 Primary Care Needs Assessment Page 25 of 48
MENTAL HEALTH PROFESSIONAL SHORTAGE AREAS
Mental Health HPSA designations must meet a population to full-time-equivalent psychiatrist ratio of at least 30,000:1. Geographic high needs is 20,000:1 and population is 20,000:1. All areas are designated as either a geographic area, a population group, or a facility. Only 5 of the 66 counties do not represent a mental health shortage area.
FIGURE 8: HPSA – MENTAL HEALTHCARE

South Dakota Department of Health, Office of Rural Health
2020 Primary Care Needs Assessment Page 26 of 48
MEDICALLY UNDERSERVED AREAS AND POPULATIONS (MUA/MUP)
Medically Underserved Areas/Populations are “areas or populations designated by HRSA as having too few primary care providers, high infant mortality, high poverty or high elderly population.” Most counties in South Dakota are designated or have areas/communities that are designated within their jurisdictions as medically underserved; only 6 of 66 total counties are not designated as such.
FIGURE 9: MEDICALLY UNDERSERVED AREAS

South Dakota Department of Health, Office of Rural Health
2020 Primary Care Needs Assessment Page 27 of 48
PRIMARY CARE DELIVERY SYSTEMS
One of the recommendations from the Governor’s Primary Care Task Force (2018) was directed towards innovative primary care models. The Task Force noted, “Strengthening the primary care infrastructure and maintaining access to quality primary healthcare services will require a cooperative effort between both public and private entities”. Inter-professional collaborative practice, telehealth, and the use of hospitalists as well as PAs and NPs in the hospital setting to support rural healthcare providers were key areas identified by the Task Force.
FIGURE 10: PRIMARY CARE PHYSICIANS BY FIELD IN SOUTH DAKOTA
From the same source (Kaiser Family Foundation) there are 494 physician assistants and 605 nurse practitioners in South Dakota at the time of this writing.
FIGURE 11: ADVANCED PRACTICE PROVIDERS IN SOUTH DAKOTA
2
81
123
340
560
0 100 200 300 400 500 600
Geriatrics
Obstetrics & Gynecology
Pediatrics
Internal Medicine
Family Medicine/General Practice
There are over 1,100 Primary Care PhysiciansData provided by Kaiser Family Foundation, March 2020.
524
63
18
605
326
153
15
494
0 100 200 300 400 500 600 700
Female
Male
Unspecified
Total
There are over 1,000 Advanced Practice Providers
Physician Assistants
Nurse Practioners
Data provided by Kaiser Family Foundation, March 2020.

South Dakota Department of Health, Office of Rural Health
2020 Primary Care Needs Assessment Page 28 of 48
A vital link in providing primary care is through professional nursing staff at the various clinics and hospitals across the State. According to the Kaiser Family Foundation there are 21,114 professionally active (licensed) nurses in the State, of which the vast majority (88%) are registered nurses.
FIGURE 12: ESTIMATED RATIO OF 42 PERSONS TO EVERY NURSE
Primary care is delivered through an extensive network of large medical systems (e.g., Avera Health and Sanford Health, each based out of Sioux Falls, SD; and Monument Health based out of Rapid City, SD) and independent hospitals, but also through an even more extensive network of community health centers and rural clinics. Across the State there are 38 Critical Access Hospitals (25 beds or less), 11 Hospitals (26 beds or more) and nine (9) Specialized Hospitals.
COMMUNITY HEALTH CENTERS
Community Health Centers (CHCs) are “non-profit community-driven clinics” that provide primary and preventative care to all individuals regardless of ability to pay. Each CHC provides both medical and behavioral/mental health services, and some include dental and/or substance abuse services as well. There are four CHC organizations in South Dakota; each CHC organization is comprised of the sites as listed below17:
• Community Health Center of the Black Hills, Inc., with four locations in Rapid City providing medical, behavioral/mental, dental, and oral care, diabetes case management, homeless healthcare outreach, and school-based care.
• Falls Community Health, which provides medical, behavioral/mental, dental and eye care (in partnership with the Lion’s Eye Clinic) at its downtown Sioux Falls location in addition to three school-based sites.
• Horizon Health Care, Inc., represents the largest network of CHCs in South Dakota in terms of service area with 29 clinics across 22 communities, eight of which have dental services as well as medical and behavioral/mental, services. These communities include Aberdeen, Alcester, Bison, Bryant, De Smet, Eagle Butte, Elk Point, Faith, Fort Thompson, Howard, Huron, Isabel, Lake Preston, LaPlant, Martin, McIntosh, Mission, Plankinton, Wessington Springs, White River, Woonsocket, and Yankton.
• Rural Health Care, Inc., provides primary care and behavioral/mental, delivery at eight communities in South Dakota including Chamberlain, Fort Pierre, Highmore, Kennebec, Murdo, Onida, Mitchell and Presho.
18,479
2,635
21,114
RN
LPN
Total
Over 21,000 professionally active nurses practice in South Dakota
South Dakota Center for Nursing Workforce (April 10, 2019). South Dakota Nursing Workforce: 2019 Supply and Employment Characteristics.
https://doh.sd.gov/boards/nursing/sdcenter.aspx Accessed September 30, 2020. Ratio calculated using 2019 US Census population estimates.

South Dakota Department of Health, Office of Rural Health
2020 Primary Care Needs Assessment Page 29 of 48
According to the Community Healthcare Association of the Dakotas (CHAD), there are five main ways a CHC is different from other primary care providers:
• CHCs are only located in communities with a high need for health care.
• Medical and behavioral/mental health services are offered at every site.
• Medicaid, Medicare, private insurance, and uninsured patients are accepted.
• Health care patients must be the majority on the governing Board of Directors.
• CHCs must report on and meet numerous requirements for need, service, governance, finance, and management.
CHCs in rural America play a critical role in access as they are designed to provide medical and dental care to all individuals, regardless of their ability to pay, and they serve as a more-local solution to health care.
Federally Qualified Health Centers. As defined by HRSA18, an FQHC is a Medicare/Medicaid designation administered by Centers for Medicare and Medicaid Services (CMS). Eligible organizations include organizations receiving grants under section 330 of the PHS Act, look-alikes, and certain tribal organizations. (Section 1861(aa)(4)(B) and section 1905(l)(2)(B) of the SSA).
A total of 51 sites for Federally Qualified Health Centers19 (FQHCs) deliver primary care. These health centers, medical clinics and dental clinics are in most cases free-standing. Some FQHCs in South Dakota are unique in that they are co-located with either a community center or a K-12 school. A listing of FQHCs can be found in Appendix I.
Community Health Centers (CHC) in South Dakota make up a majority of the FQHCs. In 2020, the National Association of Community Health Centers20 recorded a total of 79,460 patients seen at 46 CHC delivery sites in South Dakota. There were 19% of patients uninsured and 24% were covered by Medicaid. There has been a 30% growth in patients since 2010. 21

South Dakota Department of Health, Office of Rural Health
2020 Primary Care Needs Assessment Page 30 of 48
FIGURE 13: FEDERALLY QUALIFIED HEALTH CENTERS
Six School-Based Health Centers Statewide. Of the 51 total FQHCs in the State, six are school based: Rapid City (Community Health Center of the Black Hills, General Beadle School Based Center), Pierre (Eastside Neighborhood Center), Ridgeview (Horizon Health Care, Tiospaye Topa School) and Sioux Falls (Falls Community Health at Hawthorne, Hayward, and Terry Redlin Elementary Schools). School based health centers serve as an important health care delivery model by providing school-aged youth with comprehensive physical, mental, and preventative health care services delivered by medical professionals in a school setting. These centers offer care to students in a way that eliminates barriers due to lack of insurance or difficulty in accessing traditional venues of health care.
The City of Sioux Falls (Falls Community Health) and Sioux Falls School District have partnered and have medical clinics at Hayward, Hawthorne, and Terry Redlin Elementary.
Falls Community Health (FCH) School Based Clinics are designed to:
• Serve all students.
• Help students stay in school to receive needed care rather than leaving campus.
• Remove barriers such as lack of transportation or insurance.
• Be accessible with a convenient location in a familiar setting.
• Provide high-quality primary care with a strong emphasis on prevention.
• Provide Chronic Disease Management with an effort to decrease student absences.
• Connect students with community providers when diagnosis is beyond the scope of FCH.
• Address student success by collaborating with school nurses, teachers, parent’s, counselors, principals, and other school staff to reduce health related barriers and promote healthy childhood development.22

South Dakota Department of Health, Office of Rural Health
2020 Primary Care Needs Assessment Page 31 of 48
RURAL HEALTH CLINICS
There is a total of 57 Rural Health Clinics across South Dakota. These clinics are located across 35 counties in 55 cities in South Dakota. A listing of rural health clinics in South Dakota can be found in Appendix K.
FIGURE 14: RURAL HEALTH CLINICS
According to CMS23, the Rural Health Clinic Services Act of 1977 was “enacted to address an inadequate supply of physicians serving Medicare patients in rural areas and to increase the use of non-physician practitioners in those same areas”. Approximately 4,000 Rural Health Clinics exist nationwide; there are a total of 57 Rural Health Clinics across South Dakota.
CMS defines a Rural Health Clinic as meeting several requirements, notably those listed below:
• Must be located in a non-urbanized area as defined by the US Census Bureau.
• Must be located in an area currently designated or certified by HRSA as a shortage area.
• Must employ a nurse practitioner or physician assistant, and have that provider working at the clinic at least 50 percent of the time it is open under the supervision of a physician (MD or DO).
• Must directly provide diagnostic and laboratory services.
• Must have arrangements with one or more hospitals to furnish medically necessary services that are not available at the clinic.
• Must have available drugs and biologicals necessary for the treatment of emergencies.
CRITICAL ACCESS HOSPITALS
Efforts to sustain and improve medical services in rural America have been supported through the Medicare Rural Hospital Flexibility Grant Program (Flex Program) since 1997, authorized originally through the Balanced Budget Act of 1997 and later reauthorized through Section 405 of the Medicare Prescription Drug, Improvement, and Modernization Act of 2003. The program is administered by HRSA’s Federal Office of Rural Health Policy (FORHP). In South Dakota, the state program is administered by the SD DOH ORH. The State Rural Health Plan (SRHP) was developed to guide the state’s efforts in critical access care delivery in its vast rural and frontier landscape. The most recent edition of the Plan was

South Dakota Department of Health, Office of Rural Health
2020 Primary Care Needs Assessment Page 32 of 48
published in 2008 and remains in use to date. The summary information provided in this section is largely adapted from that 2008 plan.
Designation of Critical Access Hospitals. If certified as a Critical Access Hospital (CAH) the hospital can receive 101 percent reimbursement for acute inpatient and outpatient services, it provides to all Medicare beneficiaries. To be designated as a CAH a hospital must meet the following:
• Be located in a state that has an established Flex Program, which South Dakota has maintained since 1999.
• Be located in a rural area.
• Furnish 24-hour emergency care services, using either on-site or on-call staff.
• Provide no more than 25 inpatient acute care beds, and no more than 15 of those can be classified as a swing bed.
• Have an average annual length of stay of 96 hours or less.
• Be located either more than 35 miles from the nearest hospital or other CAH, or more than 15 miles from areas of mountainous terrain or access via secondary roads only, or be State certified as of December 31, 2005, as a “necessary provider” of health care services to residents in the area.
There are 38 certified CAHs (August 1, 2020) in South Dakota. A listing of critical access hospitals in South Dakota can be found in Appendix L.

South Dakota Department of Health, Office of Rural Health
2020 Primary Care Needs Assessment Page 33 of 48
FIGURE 15: CERTIFIED CRITICAL ACCESS HOSPITALS
Of note, the distribution and presence of CAHs across South Dakota varies greatly from east to west of the Missouri River. Of the 38 CAHs in the state, 29 (76% of total) are located east of the Missouri River. It should be noted that approximately 70% of the State’s total population lives east river.
The presence of CAHs west river is much more broadly distributed. Even though people are more sparsely settled in that area of the state, the distances one must travel to access a CAH are great in some circumstances. Several communities in the northwestern corner of the state each have more than an 80-mile drive one way to access a CAH for care. For example, Buffalo to Sturgis is 89 miles one-way; Bison east to Mobridge is 120 miles one-way; and Faith south to Philip is 81 miles one-way. If traveling 55 mph on a clear roadway, it can take 90 minutes to get from these remote communities to one that has a CAH. Roads available for travel in this area are typically limited to one or two, at most, state, or county paved highways from town to town. In winter months, weather can make travel very difficult, especially in rural areas. These factors all heavily impact the ability for residents in South Dakota, particularly in western rural and frontier counties, to access emergency or even acute health care.
To mitigate these barriers, in part, the state’s CAHs all have referral, transfer, transportation and communication agreements with larger acute care hospitals. The state’s CAHs also have credentialing and quality assurance agreements with the state’s quality innovation network. Additionally, the South Dakota Flex Program also works to develop rural health networks in all areas of the program by, for example, funding projects at the local level that create new or enhanced networks of care delivery.
State Flex Program funds are also used to implement and/or support collaborative projects with key partners, including but not limited to the CAHs, SDAHO, the Great Plains Quality Innovation Network (QIN), the major health systems (Avera Health, Sanford Health, and Monument Health), Emergency Medical Services (EMS), and other state and federal agencies. Several examples of this work include:

South Dakota Department of Health, Office of Rural Health
2020 Primary Care Needs Assessment Page 34 of 48
• Improving quality of care through the Medicare Beneficiary Quality Improvement Project (MBQIP), managed by the SD DOH ORH;
• Improving and integrating EMS services through the establishment of a statewide trauma system; and
• Improving revenue cycle management and implementing activities designed to increase profitability within a hospital or a group of hospitals.
BEHAVIORAL HEALTH AND SUBSTANCE ABUSE
To provide care for patients in the primary care setting, it is important for providers to understand the basics of behavioral health and substance abuse. Screenings are often used to assist healthcare providers in understanding their patient’s use and abuse of substances, as well as possible behavioral health needs.
SCREENING, BRIEF INTERVENTION, AND REFERRAL TO TREATMENT
Screening, Brief Intervention, and Referral to Treatment, (SBIRT) is a comprehensive, integrated, public health approach to the delivery of early intervention and treatment services for persons with substance use disorders, as well as those who are at risk of developing these disorders. Primary care centers, hospital emergency rooms, trauma centers, and other community settings provide opportunities for early intervention with at-risk substance users before more severe consequences occur.
SBIRT focuses on:
• Screening to quickly assess the severity of substance use and identify the appropriate level of treatment.
• Brief intervention services that focus on increasing insight and awareness of an individual’s substance use and motivation toward behavioral change.
• Referral to treatment to provide those identified as needing more extensive treatment with access to specialty care.
To better understand the level to which SBIRT components were implemented in state, the South Dakota Department of Social Services, Division of Behavioral Health (DBH) surveyed primary care clinics and emergency departments in 2019. A total of 28 emergency departments and 44 primary care clinics in South Dakota responded.
See more information in Appendix M.
EMERGENCY DEPARTMENT SCREENINGS
Of the 28 responding emergency departments, the majority of responses indicated that both large and small emergency departments already utilize some sort of screening for patients. Large emergency departments were defined as departments with five (5) or more physicians, while small emergency departments were those with four (4) or less physicians. All large emergency departments responding (100%) indicated having screening processes in place for alcohol use, drug use, and emotional or mental health symptoms. Additionally, 3 out of 4 (76%) of small emergency departments indicated having similar screenings in place for alcohol use, drug use, and emotional or mental health symptoms. The larger emergency departments reported having more experience with validated screening instruments as did the smaller emergency departments.

South Dakota Department of Health, Office of Rural Health
2020 Primary Care Needs Assessment Page 35 of 48
PRIMARY CARE SCREENINGS
The majority of the 44 responding primary care clinics indicated having a screening protocol in place. Of those responding, 80% indicated that they were currently screening for alcohol use issues, and 73% indicated that they were currently screening for drug use. Nearly all clinics (91%) indicated that they currently screen patients for emotional or mental health symptoms.
PRIMARY CARE PROGRAMS AND RESOURCES
The Governor, Legislature and other key stakeholders have worked to increase educational program capacity and remove barriers to practice. In addition to the incentives and capacity building efforts for medical students, physician assistant students, and nurse practitioner students, support has been provided to recruitment programs and reduced licensure barriers. Beginning in 2013, a law was passed to establish a medical resident license which not only provides additional practice opportunities for medical residents during their training but allows South Dakota communities to develop relationships with those training residents as part of their recruiting process to support efforts to have residents remain in those communities as practicing physicians. Further, the Recruitment Assistance Program and the Rural Healthcare Facility Recruitment Assistance Program were developed to help small, rural communities (defined as less than 10,000 in population) to fill healthcare professional vacancies.
The mission of the Department of Health, Office of Rural Health is to improve the delivery of health services to rural and medically underserved communities, emphasizing access and work primarily at the local level. To do so, the state has several incentive programs aimed at reducing the financial barrier for providers to attain their education and incentivize them to practice in rural, underserved communities in the State.
RECRUITMENT ASSISTANCE PROGRAM
Since this program began 56 physicians, 17 dentists and 37 physician assistants, nurse practitioners and nurse midwives have completed or are currently participating in the Recruitment Assistance Program.
The program provides qualifying physicians, dentists, physician assistants, nurse practitioners and nurse midwives an incentive payment in return for three continuous years of practice in an eligible rural community. Requests for participation in this recruitment program are reviewed on a first come first-served basis. A community or facility representative must contact the Office of Rural Health to request an assessment to determine eligibility. The amount of the incentive payment beginning July 1, 2020 for a qualifying physician or dentist is $243,634. The amount of the incentive payment beginning July 1, 2020 for a qualifying physician assistant, nurse practitioner or nurse midwife is $69,108. This payment is evaluated and updated annually on July 1st.
To be eligible a physician must:
• Be licensed as a physician in South Dakota.
• Have completed an accredited residency program in family practice, pediatrics, internal medicine, or obstetrics/gynecology.
• Be a United States citizen.
• Agree to practice full time as a physician in an eligible community for at least three consecutive years.
• Agree to be a participating South Dakota medical assistance provider and to serve any individual eligible under SDCL 28-6 and may not refuse treatment to any such individual while participating in the program.
• Provide services to Medicaid, Medicare, and State Children's Health Insurance Program patients.

South Dakota Department of Health, Office of Rural Health
2020 Primary Care Needs Assessment Page 36 of 48
• Not have previously participated in such a program, or any other state or federal scholarship, loan repayment or tuition reimbursement program which obligates the person to provide medical services within an underserved area.
• Be recruited to a community and be on-site and practicing for less than four months.
To be eligible a dentist must:
• Be licensed as a dentist in South Dakota.
• Be a United States citizen.
• Agree to practice full time as a general or pediatric dentist in an eligible community for at least three consecutive years.
• Agree to be a participating South Dakota medical assistance provider and to serve any individual eligible under SDCL 28-6 and may not refuse treatment to any such individual while participating in the program.
• Provide services to Medicaid, Medicare, and State Children's Health Insurance Program patients.
• Not have previously participated in such a program, or any other state or federal scholarship, loan repayment or tuition reimbursement program which obligates the person to provide medical services within an underserved area.
• Be recruited to a community and be on-site and practicing for less than four months.
To be eligible a physician assistant, nurse practitioner or nurse midwife must:
• Be licensed in South Dakota as a physician assistant, nurse practitioner, or nurse midwife.
• Be a United States citizen.
• Agree to practice full-time in an eligible community for at least three consecutive years.
• Agree to be a participating South Dakota medical assistance provider and to serve any individual eligible under SDCL 28-6 and may not refuse treatment to any such individual while participating in the program.
• Provide services to Medicaid, Medicare, and State Children's Health Insurance Program patients.
• Not have previously participated in such a program, or any other state or federal scholarship, loan repayment or tuition reimbursement program which obligates the person to provide medical services within an underserved area.
• Be recruited to a community and be on-site and practicing for less than four months.
To be eligible a community must:
• Have a population of 10,000 or less and must not be located within a 20-mile radius extending from the city center of a city of 50,000 people or more.
• Have an unmet provider need > 0.25 FTE.
• Agree to pay a pro-rated portion of the total amount of the incentive payment. Payment to provider must be made during the contract time frame.

South Dakota Department of Health, Office of Rural Health
2020 Primary Care Needs Assessment Page 37 of 48
TABLE 9: PROVIDERS - RECRUITMENT ASSISTANCE PROGRAM
PHYSICIAN OR DENTIST
Population Percentage Community Payment State Payment
0 – 2,500 25% $60,908.50 $182,725.50
2,501 – 4,999 50% $121,817.00 $121,817.00
5,000 – 10,000 75% $182,725.50 $60,908.50
PHYSICIAN ASSISTANT, NURSE PRACTITIONER OR NURSE MIDWIFE
Population Percentage Community Payment State Payment
0 – 2,500 25% $17,277.10 $51,831.30
2,501 – 4,999 50% $34,554.20 $34,554.20
5,000 – 10,000 75% $51,831.30 $17,277.10
Source: South Dakota Department of Health, Rural Health, Recruitment Assistance. https://doh.sd.gov/providers/ruralhealth/Recruitment/RAP.aspx
• Be assessed by the Department of Health to evaluate the community's need for eligible providers and its ability to sustain and support additional providers and be found eligible for participation. In determining eligibility, the DOH office reviews information such as:
o Number of provider full-time equivalent (FTE) in the community. o Population of the community and surrounding area. o Ratio of 1 provider FTE per 1,500 people to determine need for an additional
physician, physician assistant, nurse practitioner, or nurse midwife. o Ratio of 1 provider FTE per 3,000 people to determine need for an additional dentist.
RURAL HEALTHCARE FACILITY RECRUITMENT ASSISTANCE PROGRAM
The Rural Healthcare Facility Recruitment Assistance Program provides a $10,000 payment to eligible health professionals who complete a three-year, full-time service commitment. The health professional must enter a three-way contract between the employing facility and the state. Eligible facilities must be in a community with a population of 10,000 or less. Applications must be submitted by employing facility with a limit of 3 participants per employing facility.
Eligible occupations Eligible facilities Dietitian or Nutritionist South Dakota licensed: Nurse (LPN or RN) Hospitals Occupational therapist Nursing homes Respiratory therapist Federally certified home health agencies Laboratory technologist Chemical dependency treatment facilities Pharmacist Intermediate care facilities for individuals with intellectual disabilities Physical therapist Community support providers Paramedic Community mental health centers Medical technologist ESRD facilities Radiologic technologist Community health centers (FQHCs) Speech therapist Ambulance services Healthcare social worker
As of December 2020, a total of 598 individuals have participated in this program since its inception. Of those individuals, 455 have completed their three-year service commitment. The remaining individuals are still working under their service commitment or have defaulted on their service commitment.
NATIONAL HEALTH SERVICE CORPS 24
The National Health Service Corps (NHSC) provides underserved communities with healthcare professionals necessary to provide adequate health and mental health services though their three-loan
South Dakota Department of Health, Office of Rural Health
2020 Primary Care Needs Assessment Page 38 of 48
repayment programs; Loan Repayment Program, Substance Use Disorder Workforce Loan Repayment Program (SUD Workforce LRP), and Rural Community Loan Repayment Program (LRP).
Through the Loan Repayment Program, NHSC provides primary care, dental health, and mental health clinicians up to $50,000 to repay their student loans in exchange for a two-year commitment of work at an approved NHSC site in high-need, underserved areas across the United States. After completing the initial service commitment, participants can apply to extend their service and in turn receive additional loan repayment assistance.
To combat the nation’s opioid crisis, HRSA launched the NHSC Substance Use Disorder Workforce Loan Repayment Program (SUD Workforce LRP). The program supports the recruitment and retention of health professionals needed in underserved areas to expand access to SUD treatment and prevent overdose deaths. This program provides up to $75,000 to repay eligible providers student loans in exchange for a three-year commitment of work at an approved NHSC site.
The Rural Community Loan Repayment Program (LRP) is for providers working to combat the opioid epidemic in the nation’s rural communities. This program provides up to $100,000 to repay eligible providers student loans in exchange for a three-year commitment of work at an approved NHSC site.
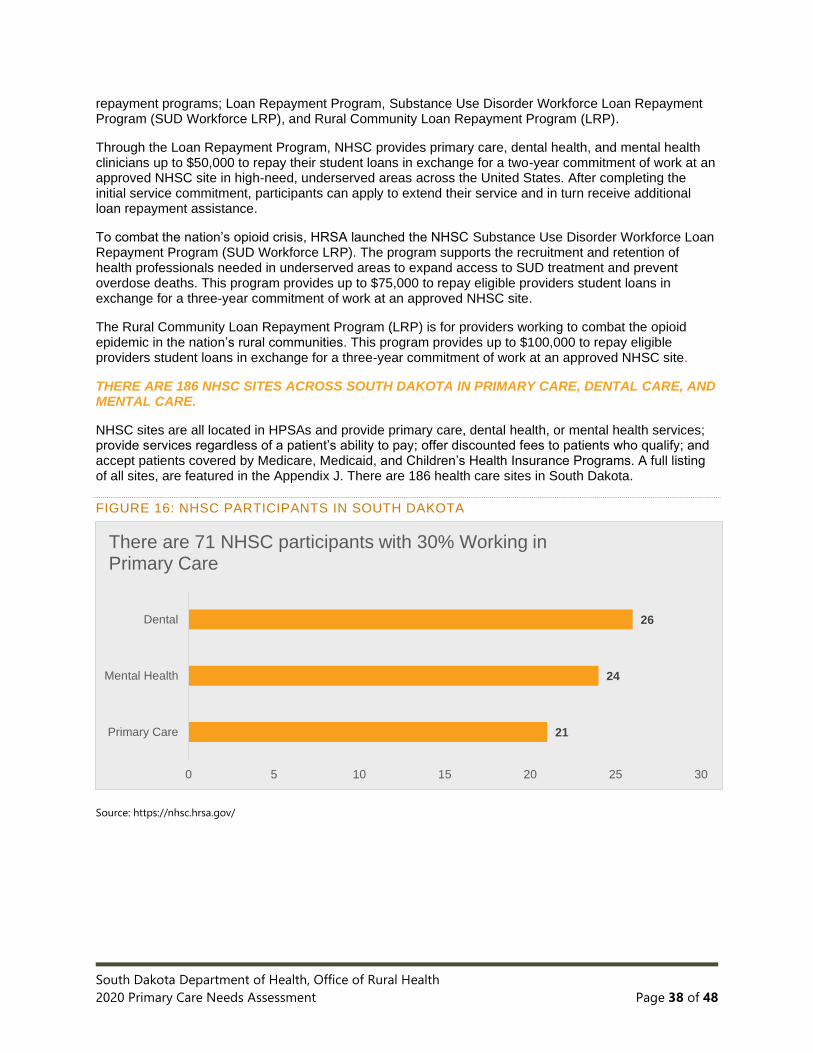
THERE ARE 186 NHSC SITES ACROSS SOUTH DAKOTA IN PRIMARY CARE, DENTAL CARE, AND MENTAL CARE.
NHSC sites are all located in HPSAs and provide primary care, dental health, or mental health services; provide services regardless of a patient’s ability to pay; offer discounted fees to patients who qualify; and accept patients covered by Medicare, Medicaid, and Children’s Health Insurance Programs. A full listing of all sites, are featured in the Appendix J. There are 186 health care sites in South Dakota.
FIGURE 16: NHSC PARTICIPANTS IN SOUTH DAKOTA
Source: https://nhsc.hrsa.gov/
21
24
26
0 5 10 15 20 25 30
Primary Care
Mental Health
Dental
There are 71 NHSC participants with 30% Working in Primary Care

South Dakota Department of Health, Office of Rural Health
2020 Primary Care Needs Assessment Page 39 of 48
SOUTH DAKOTA J-1 VISA WAIVER PROGRAM
The South Dakota Department of Health is committed to assuring that all South Dakotans have access to quality, affordable health care. The state has established the J-1 Visa Waiver Program to help rural communities recruit foreign or international medical graduate physicians. The Office of Rural Health supports and facilitates waiver requests.
Applications for a waiver request must be submitted by the employing facility on behalf of a J-1 physician seeking waiver, not by the J-1 physician or the physician's representative. The employing facility must be in or serving residents of a shortage area as determined by the Department of Health and designated by the federal government. The facility must have made a bona fide employment offer to a J-1 physician and have submitted a J-1 visa waiver request in the form of an application to the Department of Health.
The J-1 Physician is a physician in possession of a temporary Exchange Visitor (J-1) Visa to pursue a graduate medical education in the United States and seeking waiver of their J-1 visa home country residency requirement through the practice of medicine full-time within a shortage area. A shortage area is a geographic area that is designated by the federal government as a Medically Underserved Area or Health Professional Shortage Area. Such designation must be in effect at the time of the application.
The J-1 physician must work "full time" (an average of 40 hours of medical practice per week, meaning a four-week minimum of 128 hours seeing patients on an ambulatory or in-patient basis and 32 hours administrative work for at least 48 weeks per year).
To date, the ORH has facilitated 183 completed or continuing J-1 Visa Waivers, placing physicians through this program in 29 counties25 throughout South Dakota.
PRIMARY CARE WORKFORCE
Improving health care access across South Dakota must include efforts to expand the workforce that supports quality health care delivery, with focus given towards rural communities that remain a high if not critical need area among the 51%26 of South Dakotans that call a rural community, farm, ranch, or acreage home.
EDUCATIONAL OPPORTUNITIES
According to its most recent healthcare workforce report, the State of South Dakota has seen proof of substantial and steady growth in its healthcare industry for at least the last four decades. Trends indicate that growth in healthcare both in terms of jobs and services will be one of South Dakota’s largest growth industries over the next decade. This growth is driven in part by several factors, including an aging patient population, an expanding general population, technological advances in the workplace requiring additional staff, a growing emphasis on disease management, and an aging healthcare workforce who must be replaced as they retire.
Healthcare occupations that provide direct health care services are among the fastest growing professions in South Dakota and are projected to make up approximately 10% of the state’s projected new jobs between 2016 and 2026; these include registered nurses (1,718 more registered nurses needed), nursing assistants (472 more assistants needed), and medical assistants (194 more medical assistants needed) at the top of the list. As a result, it is helpful to note that several nursing education programs are available throughout the state with existing capacity to teach/train more nursing professionals to fill this gap.

South Dakota Department of Health, Office of Rural Health
2020 Primary Care Needs Assessment Page 40 of 48
NURSING EDUCATION PROGRAMS
Note: Nursing acronyms - LPN-Licensed Practical Nurse; RN-Registered Nurse; AD – Associate Degree RN; BSN – Baccalaureate of Science Degree- Nursing (Registered Nurse); RN-BSN – Registered Nurse Bachelor Degree-Nursing; MSN - Master of Science-Nursing.
As advocated by HRSA, understanding the supply and distribution of nurses is “key to ensuring access to care and an effective health care system.” According to its 2013 national report27 on nursing workforce trends, there were 2.8 million Registered Nurses (RNs) (including advanced practice RNs) and nearly 700,000 Licensed Practical Nurses (LPNs) in the nursing workforce. However, only 16 percent of the RN workforce and 24 percent of the LPN workforce live in a rural area, which presents an element of concern for a State such as South Dakota with such a vast rural and frontier population.
• Number of practicing nurses is growing nationally. The workforce has grown substantially since 2000, with growth rates of 24.1 and 15.5 percent for RNs and LPNs respectively, a rate that outpaces the growth in US population. Per capita rates have also increased, 14 and 6 percent for RNs and LPNs, respectively.
• Aging cohort of nurses causes some concern as their retirement approaches. Despite growth in new entrants, about one-third of the nursing workforce today is older than 50, with the largest age cohort being 41 to 50 years of age as of 2000.
• Nurses are pursuing more advanced training. Just over half of the RN workforce on a national scale holds a bachelor’s or higher degree, with the associate degree being the first nursing degree for many of these nurses. The number of nurses with bachelor’s level training has also increased slightly (50 to 55 percent) over recent years. Notably, nearly 28,000 RNs were awarded a post-licensure bachelor’s degree in nursing (RN-BSN) in 2011 alone, contributing to an estimated 86.3 percent increase in the annual number of RN-BSN graduates over the preceding four years (2008-2011).
South Dakota is no exception to the national averages highlighted above. According to the South Dakota Board of Nursing Annual Report of Nursing Education Programs, 201928, the following trends have been observed.
• In 2019 there were 193 LPNs enrolled in AD RN or baccalaureate (Baccalaureate of Science Degree- Nursing [Registered Nurse]) upward mobility programs, 59 fewer or a change of -23.4% from 2018. In 2019 there were 111 RNs enrolled in baccalaureate upward mobility nursing programs, 23 fewer or a change of -17.2% from 2018.
• A total of 811 students graduated from the pre-licensure AD RN and BSN programs. This was 115 more than in 2018. South Dakota’s pass rate for both baccalaureate and associate degree nursing programs in 2019 was 93% compared to a national rate of 88%.

South Dakota Department of Health, Office of Rural Health
2020 Primary Care Needs Assessment Page 41 of 48
FIGURE 17: NURSING PROGRAMS
The majority, 65%, of graduates produced by SD’s RN programs were licensed in SD in 2019, compared to 72.3% in 2018.
The map above highlights the location of nursing education programs in South Dakota, including practical nursing, associate degree programs, bachelor’s degree, and master’s degree programs.
Nursing education programs in South Dakota can be found in Appendix N.
PRACTICAL NURSING PROGRAMS
There are six fully accredited Practical Nursing Programs in South Dakota, located in Mitchell, Mission, Rapid City, Sioux Falls, Sisseton, and Watertown. Fully accredited is defined as having both commission or professional organization accreditation (e.g., HLC) and having full approval through the South Dakota Board of Nursing.

South Dakota Department of Health, Office of Rural Health
2020 Primary Care Needs Assessment Page 42 of 48
FIGURE 18: NURSING ENROLLMENT TRENDS
Data obtained from the SD Board of Nursing Annual Report of Education Program, 2019; chart was re-created for this report only.
ASSOCIATE DEGREE PROGRAMS
There are a total of three associate degree RN programs approved by the SD Board of Nursing: Dakota Oglala Lakota College (Pine Ridge, SD), Southeast Technical Institute (Sioux Falls, SD), and Lake Area Technical Institute (Watertown, SD). One program, Western Dakota Technical Institute (Rapid City) is currently at an interim approval.
BACHELOR ’S DEGREE PROGRAMS
There are seven South Dakota Board of Nursing approved RN programs in South Dakota that offer traditional baccalaureate degree program options, RN-to-BSN options, or accelerated degree options.
• Augustana University offers Generic RN and Accelerated RN programs
• Dakota Wesleyan Offers Generic RN, LPN to BSN and RN to BSN
• Mount Marty College Offers Generic RN, LPN to BSN and RN to BSN
• Presentation College Offers Generic RN, LPN to BSN and RN to BSN
• South Dakota State University Offers Generic RN, Accelerated RN, and RN to BSN
• University of South Dakota (USD) Offers Generic RN, LPN to BSN and RN to BSN
• University of Sioux Falls Offers Generic RN, Accelerated RN, and RN to BSN
MASTER’S DEGREE PROGRAMS
There are three South Dakota Board of Nursing approved Master of Science in Nursing (MSN) programs in South Dakota that are state approved and have national accreditation.
• Mount Marty College o Family Nurse Practitioner o Psychiatric Mental Health Nurse Practitioner o Postgraduate Certification (Family Nurse Practitioner, Psychiatric Mental Health Nurse
Practitioner) o Certified Registered Nurse Anesthetist (CRNA) o Doctor of Nurse Anesthesia Practice (DNAP)
• Presentation College o Family Nurse Practitioner
• South Dakota State University o Nurse Administrator o Clinical Nurse Leader
92
216
306
149103
134125
68111
0
100
200
300
400
LPN to AD RN LPN to BSN RN to BSN
Enrollment in RN Upward Mobility Programs
2017 2018 2019

South Dakota Department of Health, Office of Rural Health
2020 Primary Care Needs Assessment Page 43 of 48
o Nurse Educator o Family Nurse Practitioner o Postgraduate Certification (Family Nurse Practitioner, Clinical Nurse leader, Nurse
Educator) o DNP (Family Nurse Practitioner) o PhD
DOCTORAL DEGREE PROGRAMS
There are two South Dakota Board of Nursing approved Doctoral Degree programs in South Dakota that have national accreditation. Both programs are offered by South Dakota State University.
ADVANCED DEGREE PROGRAMS
South Dakota fortunately is home to several professional programs for advanced training of nurses and ultimately physicians. In addition to the State’s flagship medical school at USD, and a Physician Assistant (PA) program also at USD, there are opportunities for advanced training in nursing.
ADVANCED DEGREE PROGRAMS ARE OFFERED ACROSS 13 COMMUNITIES IN THE STATE OF SOUTH DAKOTA, RANGING FROM APPLIED RURAL MEDICINE TRAINING FOR PHYSICIANS TO ADVANCED PRACTITIONER PROGRAMS.
FIGURE 19: ADVANCED DEGREE PROGRAMS

South Dakota Department of Health, Office of Rural Health
2020 Primary Care Needs Assessment Page 44 of 48
STATE EFFORTS ARE BEING DIRECTED AT INCREASING THE NUMBER OF MEDICAL SCHOOL GRADUATES THAT PRACTICE IN SOUTH DAKOTA POST-RESIDENCY.
The Sanford School of Medicine (SSOM) at USD is primarily housed out of its flagship location in Vermillion but offers a network of campus locations in Sioux Falls, Yankton, Vermillion, and Rapid City.
Further, SSOM has, with support from state government, implemented several experiences aimed at providing its students with quality rural health experiences aimed to motivate those students to practice in those communities after they complete their training. SSOM has a Frontier and Rural Medicine Program (FARM) that allows its students to experience rural medicine while living and learning across the State, with sites including Milbank, Mobridge, Parkston, Platte, Pierre, Winner, Spearfish and Vermillion. This program has been nationally recognized, as has SSOM, for its continued focus on training physicians that have direct clinical experience in and familiarity with rural communities, making them more apt to settle and practice there as licensed professionals. Two-degree paths are available: M.D. Program (Sanford School of Medicine) and Physician Scientist (M.D./Ph.D.) Program (Sanford School of Medicine).
University of South Dakota offers a Physician Assistant (Master of Science) program. USD’s Physician Assistant program is the only one of its kind in South Dakota. USD offers pre-physician assistant training at the undergraduate level, and a MS in Physician Assistant Studies at the graduate level. Physician Assistants are ranked by U.S. News and World Report as #2 in best health care jobs, #3 in top 100 jobs in all fields, and #3 in Best STEM Jobs making the program placement in South Dakota vital to supporting its educational priorities in training medical professionals in all continuums of care.
RESIDENCY AND FELLOWSHIP PROGRAMS
A total of nine residency programs and four fellowship programs are housed in South Dakota, most of which are headquartered and have residents’ practice in one of the two major medical hubs – Rapid City and Sioux Falls. The first program to be established and still in operation is the Sioux Falls Family Medicine Residency, touting nearly 350 graduates of its 3-year program to date.

South Dakota Department of Health, Office of Rural Health
2020 Primary Care Needs Assessment Page 45 of 48
TABLE 10: RESIDENCY PROGRAMS
Residencies Affiliation Est. Features Family Medicine Sioux Falls
Sioux Falls Family Medicine Residency, affiliated with the Sanford School of Medicine
1973 ▪ 3-year program. ▪ Graduated nearly 350 residents to date. ▪ The Sioux Falls Family Medicine
Residency is devoted to providing an excellent education that prepares physicians for practice in South Dakota and other areas of the mostly rural upper Midwest.
Family Medicine Rapid City
Rapid City Regional Hospital Family Medicine Residency Program, affiliated with the Sanford School of Medicine. Jointly sponsored by Avera McKennan and Sanford Health Hospitals.
1995 ▪ 3-year program. ▪ Only residency program in Rapid City. ▪ 6-6-6 community-based program. ▪ Includes obstetrics, with most residents
delivering more than 100 babies during their residency.
▪ Nearly 100 residents have graduated to date.
Pierre Rural Family Medicine
Center for Family Medicine and Sanford School of Medicine
2017 ▪ 3-year program. ▪ Year 1 completed in Sioux Falls. ▪ Year 2 and 3 completed in Pierre.
▪ 2 residents per year. ▪ Joint project of Avera St. Mary’s and
Sanford Clinic Pierre. ▪ The mission is to train and prepare family
physicians for practice in the rural communities of South Dakota and the upper Midwest.
Internal Medicine
Internist training provided by Sanford School of Medicine
1975 ▪ 3-year program. ▪ 8 new categorical and 2 preliminary
residents accepted each year. ▪ 24 total categorical residents in three-year
program. ▪ Over half of the graduates enter general
internal medicine careers.
General Surgery
Residents spend 52 months of their training, including the majority of subspecialty rotations, at Sanford USD Medical Center in Sioux Falls. In addition, residents rotate through Avera Sacred Heart Hospital in Yankton for their rural experience for four months; the Sioux Falls Veterans Affairs Health Care System for two months; and an optional elective at John H. Stroger Jr. Hospital of Cook County in Chicago for two months for management of penetrative and operative traumas.
2014 ▪ Accreditation for 15 residents in five-year program (three per year).
▪ Emphasis on compassion, integrity, responsiveness, accountability, and respect for diversity.
▪ Faculty consists of general surgeons with extensive experience and expert specialists in an array of surgical fields.
▪ Wide range of hands-on experience and training, with rotations in general surgery (including rural surgery and trauma) at community-based, federal, and urban teaching hospital systems.
▪ During the five-year program, residents do clinical and/or outcome-based research and present at regional or national conferences.

South Dakota Department of Health, Office of Rural Health
2020 Primary Care Needs Assessment Page 46 of 48
Pathology Pathology Residency at Sanford School of Medicine; residents’ practice at Sanford Health in Sioux Falls
2008 ▪ 4-year program. ▪ Two residents accepted each year. ▪ Extensive interaction with teaching
staff. ▪ Teaching opportunities with medical
technologists, medical students, and residents from other specialties.
▪ Hands-on experience in diagnostic pathology.
▪ Clinical and basic science research encouraged.
▪ Excellent placement rate in competitive fellowship programs across the nation.
▪ Faculty consists of experts in hematopathology, cytopathology, blood banking, dermatopathology, breast pathology and forensic pathology.
Pediatrics
Pediatrics Residency Program at Sanford Children’s Hospital
2011 ▪ 3-year program.
Psychiatry
University Psychiatry Associates: Residents train primarily at the Avera Behavioral Health Center
2008 ▪ 4-year program. ▪ Psychiatry residents offer
comprehensive mental health services at three university clinic outpatient facilities in Sioux Falls and at numerous outreach sites throughout the region.
▪ Clinical training sites have been established in the following diverse settings: ▪ Non-profit and VA hospitals. ▪ Private and public residential
treatment programs. ▪ University clinics and community
mental health centers. ▪ Forensic settings. ▪ Chemical dependency programs.
Transitional Year
Sanford School of Medicine 2011 ▪ Up to seven elective blocks with a schedule designed specifically for each resident.
▪ Flexible scheduling allows each resident to pursue his or her interests.
▪ Great faculty-to-resident ratio in both a traditional medical education setting and a one-on-one model.

South Dakota Department of Health, Office of Rural Health
2020 Primary Care Needs Assessment Page 47 of 48
TABLE 11: FELLOWSHIP PROGRAMS
Fellowships Affiliation Est. Features
Cardiovascular Disease
Sanford School of Medicine, with practice at the Sanford Heart Hospital
2012 ▪ 3-year program. ▪ Accredited for 2 fellows per year, for a
total of six fellows. ▪ Education delivered at a newly
constructed, state-of-the-art Sanford Heart Hospital. ▪ Research at the Sanford
Cardiovascular Health Resource Center.
Child & Adolescent Psychiatry
Avera Behavioral Health Center, Sanford School of Medicine
1992 ▪ Fellows trained for careers in private, academic, or institutional-based practices.
▪ Fellows generally enter the program after completion of the general psychiatry program but may be considered after PGY1.
▪ Applicants may be accepted into both general and child and adolescent. psychiatry if they desire to become child psychiatrists.
Geriatrics Avera McKennan Hospital & University Health Center, Sanford USD Medical Center, and the Sioux Falls VA Medical Center.
2011 ▪ 1-year program ▪ Training at
▪ Avera McKennan Hospital and University Health Center.
▪ Sanford USD Medical Center. ▪ Sioux Falls VA Medical Center. ▪ Variety of Local Nursing Homes.
Interventional Cardiology
USD Sanford School of Medicine
▪ The program trains one fellow per year at the six-floor Sanford Heart Hospital, a state-of-the-art facility located in Sioux Falls, South Dakota.
▪ Fellows have access to all Food and Drug Administration-approved devices in the cath labs, many of which are bi-plane, and are expected to participate in and perform more than 1,000 procedures, including angioplasty and structural heart disease procedures, during the year of training.
▪ Program faculty consists of high-volume operators with experience and motivation to teach, develop and publish interventional techniques. This institution is the regional leader in innovation and education in the field of cardiovascular disease.

South Dakota Department of Health, Office of Rural Health
2020 Primary Care Needs Assessment Page 48 of 48
SOURCES
1 No comparison: data not available for baseline or current rate. No change: difference between baseline and current rate is less than 1.0. 2 All mortality rates are age-adjusted and per 100,000 pop. 3 2011 represents 2007-2011 data. 4 2014 represents 2010-2014 data. 5 2017 represents 2013-2017 data. 6 Age-adjusted rate per 100,000 pop. obtained from South Dakota Cancer Registry, Cancer in South Dakota Reports (2011, 2013, and 2017) 7 Average annual incidence (cases per 100,000 pop. per year) totals reflect chlamydia and gonorrhea only; syphilis is reported as a cumulative incidence rate from 2007-2016 and thus is not included in the performance metrics. 8 Rates adhere to US Preventative Task Force (USPSTF) recommendations for colorectal screening amongst persons aged 50-75. 9 Percentage of adults reporting that they smoke cigarettes on BRFSS. 10 Percentage of adults reporting binge or heavy drinking on BRFSS. 11 U.S. Census Bureau (2019) Table: DP05 2019 American Community Survey 1-Year Estimates. Retrieved from https://data.census.gov/cedsci/profile?g=0400000US46. 12 U.S. Census Bureau, Population Division (2020) Annual Estimates of the Resident Population for Counties in South Dakota: April 1, 2010 to July 1, 2019 (CO-EST2019-ANNRES-46). Release Date: March 2020. Retrieved from https://www.census.gov/data/tables/time-series/demo/popest/2010s-counties-total.html. 13 Indian Health Service website, https://www.ihs.gov/greatplains/healthcarefacilities/ accessed 19 February 2021. 14 South Dakota Department of Social Services, Division of Medical Services. South Dakota Access Monitoring Review Plan 2020. Accessed at https://dss.sd.gov/docs/medicaid/reports/Access_Monitoring_Review_Plan_2020.pdf on February 22, 2021 15 Steve Westra. Op-Ed to the Rapid City Journal. February 1, 2021. Accessed at https://rapidcityjournal.com/opinion/westra-broadband-for-the-next-generation/article_d285e9fb-0064-5c4d-8d64-ce96d5795edd.html?utm_campaign=snd-autopilot on February 22, 2021 16 Great Plains Area Health Care Sites/Telehealth. Great Plains Tribal Chairmen’s Health Board. Document from email dated February 22, 2021. 17 “Where are Community Health Centers Located” document from email dated December 1, 2020. 18 Information accessed from. https://bphc.hrsa.gov/programrequirements/compliancemanual/glossary.html#volunteer-health-professional on October 7, 2020. 19
Data from NPI accessed at https://npidb.org/organizations/ambulatory_health_care/federally-qualified-health-center-fqhc_261qf0400x/sd/ on December 7, 2020.
20 National Association of Community Health Centers, https://www.nachc.org/wp-content/uploads/2019/03/South-Dakota_21.pdf 21
What is a Community Health Center? Accessed from CHAD on October 6, 2020 at http://www.communityhealthcare.net/health-centers 22
City of Sioux Falls, Community Health Clinic, Accessed at https://www.siouxfalls.org/health/falls-community-health/school-based/about on October 8, 2020. 23 Rural Health Fact Sheet Series, Rural Health Clinic. Accessed January 17, 2016 from https://www.cms.gov/Outreach-and-Education/Medicare-Learning-Network-MLN/MLNProducts/downloads/RuralHlthClinfctsht.pdf 24 National Health Service Corps Repayment Programs. Website: https://nhsc.hrsa.gov/loan-repayment/nhsc-all-loan-repayment-programs-comparison Accessed December 18, 2020. 25
Counties include Bon Homme, Brookings, Brown, Charles Mix, Clay, Codington, Davison, Day, Deuel, Edmunds, Faulk, Hand, Hughes, Jerauld, Jones, Kingsbury, Lincoln, Lyman, McCook, McPherson, Minnehaha, Potter, Roberts, Spink, Sully, Tripp, Turner, Union, and Yankton. 26
South Dakota Health Care Workforce Needs Assessment 2018, p3. 27 U.S. Department of Health and Human Services, Health Resources and Services Administration. 2013. The U.S. Nursing Workforce: Trends in Supply and Education. Pages vii-ix. 28 South Dakota Board of Nursing. 2019. South Dakota Annual Report of Nursing Education Programs: 2020.

2020 Primary Care Needs Assessment SD Department of Health, Office of Rural Health A-1
APPENDIX A │SUPPLEMENTAL TABLES FOR HEALTH STATUS INDICATORS
Table 1: Health Outcomes Ranking by County, South Dakota, 2016-2018
Table 2: Health Factors Ranking by County, South Dakota, 2016-2018
Table 3: Percent of South Dakotans with Fair or Poor Health by County, 2017
Table 4: Life Expectancy at Birth by County of Residence, 2017
Table 5: Infant Mortality by County, 2011, 2014, and 2017
Table 6: Resident Deaths (Mortality), All Causes by County, 2011, 2014, and 2017
Table 7: Heart Disease Mortality by County, 2011, 2014, and 2017
Table 8: Cancer Mortality by County, 2011, 2014, and 2017
Table 9: Chronic Lower Respiratory Disease Mortality by County, 2011, 2014, and 2017
Table 10: Alzheimer’s Disease Mortality by County, 2011, 2014, and 2017
Table 11: Cerebrovascular Disease Mortality by County, 2011, 2014, and 2017
Table 12: Accidents Mortality by County, 2011, 2014, and 2017
Table 13: Diabetes Mortality by County, 2011, 2014, and 2017
Table 14: Suicide by County, 2011, 2014, and 2017
Table 15: Influenza and Pneumonia Mortality by County, 2011, 2014, and 2017
Table 16: Chronic Liver Disease and Cirrhosis Mortality, 2011, 2014, and 2017
Table 17: Diabetes Prevalence by County, 2016
Table 18: South Dakota K-12 School BMI for Academic Years 2010-11 and 2013-18
Table 19: Adult Obesity by County, 2016
Table 20: Age-Adjusted Cancer Incidence and Death Rates in South Dakota, 2015-2017
Table 21: Cancer Prevalence by County, 2017
Table 22: Cases of HIV and AIDS, 2005-2017
Table 23: South Dakotans Who Self-Identified as having Depression, 2014
Table 24: South Dakotans Who Self-Identified as having Anxiety, 2014
Table 25: Reported Sexually Transmitted Diseases, 2012-2016

2020 Primary Care Needs Assessment SD Department of Health, Office of Rural Health A-2
Table 1: Health Outcomes Ranking by County, South Dakota, 2016-2018
Methodology: Health outcome ranking is based off an equal weighting of length and quality of life. All data
used in the measures was obtained for years 2016-2018.
County Rank
Hamlin 1
Grant 2
Lincoln 3
Brookings 4
Lake 5
Bon Homme 6
Union 7
Deuel 8
Moody 9
Turner 10
McCook 11
Hutchinson 12
Brown 13
Clay 14
Brule 15
Spink 16
Hughes 17
Sanborn 18
Hanson 19
Codington 20
Davison 21
Minnehaha 22
Stanley 23
Gregory 24
Aurora 25
Hand 26
Miner 27
Walworth 28
Edmunds 29
Campbell 30
Kingsbury 31
Meade 32
Jerauld 33
County Rank
Marshall 34
Yankton 35
Clark 36
Custer 37
Butte 38
Potter 39
Pennington 40
Day 41
Beadle 42
Perkins 43
Roberts 44
Haakon 45
Faulk 46
Lawrence 47
Fall River 48
Tripp 49
Charles Mix 50
McPherson 51
Lyman 52
Bennett 53
Jackson 54
Ziebach 55
Dewey 56
Mellette 57
Todd 58
Corson 59
Oglala Lakota 60
Buffalo 61
Douglas NR
Harding NR
Hyde NR
Jones NR
Sully NR
NR: Not Ranked Source: University of Wisconsin Population Health Institute. County Health Rankings South
Dakota. (2020). Retrieved August 2020, from https://www.countyhealthrankings.org/app/south-
dakota/2020/overview
Measure Data Source
Length of Life
Premature death National Center for Health Statistics - Mortality files 2016-2018
Quality of Life
Poor or fair health Behavioral Risk Factor Surveillance System 2017
Poor physical health days Behavioral Risk Factor Surveillance System 2017
Poor mental health days Behavioral Risk Factor Surveillance System 2017
Low birthweight National Center for Health Statistics - Natality files 2012-2018

2020 Primary Care Needs Assessment SD Department of Health, Office of Rural Health A-3
Table 2: Health Factors Ranking by County, South Dakota, 2016-2018
Methodology: Health factors are based on weighted scores for health behaviors, clinical care, social and
economic factors, and the physical environment.
County Rank
Lincoln 1
Hand 2
Brookings 3
Stanley 4
Jerauld 5
Lawrence 6
Davison 7
Grant 8
Kingsbury 9
Miner 10
Union 11
Brown 12
Hughes 13
Perkins 14
Lake 15
Hanson 16
Hutchinson 17
Edmunds 18
Codington 19
Hamlin 20
Minnehaha 21
Potter 22
Haakon 23
Aurora 24
Yankton 25
Turner 26
Meade 27
Campbell 28
Clay 29
Brule 30
Custer 31
McCook 32
Clark 33
McPherson 34
County Rank
Bon Homme 35
Deuel 36
Butte 37
Pennington 38
Marshall 39
Walworth 40
Fall River 41
Sanborn 42
Faulk 43
Day 44
Gregory 45
Beadle 46
Spink 47
Tripp 48
Moody 49
Robert 50
Charles Mix 51
Lyman 52
Jackson 53
Ziebach 54
Bennett 55
Mellette 56
Dewey 57
Corson 58
Buffalo 59
Oglala Lakota 60
Todd 61
Douglas NR
Harding NR
Hyde NR
Jones NR
Sully NR
NR: Not Ranked

2020 Primary Care Needs Assessment SD Department of Health, Office of Rural Health A-4
Continued, Table 2: Health Factors Ranking by County, South Dakota
Health Behaviors
Measure Data Source
Tobacco Use Adult smoking The Behavioral Risk Factor Surveillance System (BRFSS)
Diet/Exercise Adult obesity United States Diabetes Surveillance System
Food environment index USDA Food Environment Atlas, Map the Meal Gap from Feeding America
Physical inactivity United States Diabetes Surveillance System
Access to exercise opportunities Business Analyst, Delorme map data, ESRI, & US Census Tigerline Files
Alcohol and Drug Use
Excessive drinking The Behavioral Risk Factor Surveillance System (BRFSS)
Alcohol-impaired driving deaths Fatality Analysis Reporting System
Sexual Activity Sexually transmitted infections National Center for HIV/AIDS, Viral Hepatitis, STD, and TB Prevention
Teen births National Center for Health Statistics - Natality files
Clinical Care Measure Data Source
Access to Care Uninsured Small Area Health Insurance Estimates, 2017
Primary care physicians Area Health Resource File/American Medical Association, 2017
Dentists Area Health Resource File/National Provider Identification File, 2018
Mental health providers CMS, National Provider Identification File, 2019
Quality of Care Preventable hospital stays Mapping Medicare Disparities Tool 2017
Flu vaccinations Mapping Medicare Disparities Tool 2017
Mammography screening Mapping Medicare Disparities Tool 2017
Social & Economic
Measure Data Source
Education High school graduation South Dakota Department of Education 2017-2018
Some college American Community Survey, 2014-2018
Employment Unemployment Bureau of Labor Statistics, 2018
Children in poverty Small Area Income and Poverty Estimates, 2018
Income inequality American Community Survey, 2014-2018
Family & Social Support
Children in single-parent household American Community Survey, 2014-2018
Social associations County Business Patterns, 2017
Community Safety
Violent crime Uniform Drive Reporting – FBI, 2014 & 2016
Injury deaths National Center for Health Statistics - Mortality Files 2014-2018
Physical Environment
Measure Data Source
Air and water quality
Air pollution – particulate Environmental Public Health Tracking Network 2014
Drinking water violations Safe Drinking Water Information System, 2018
Source: University of Wisconsin Population Health Institute. County Health Rankings South Dakota. (2020). Retrieved August 2020, from
https://www.countyhealthrankings.org/app/south-dakota/2020/overview

2020 Primary Care Needs Assessment SD Department of Health, Office of Rural Health A-5
Table 3: Percent of South Dakotans with Fair or Poor Health by County, 2017
State of South Dakota
% Fair/Poor % Range (Min-Max)
13% 9-32%
County % Fair/Poor % Error Margin
Aurora 10% 9-10%
Beadle 13% 12-13%
Bennett 21% 20-21%
Bon Homme 12% 11-12%
Brookings 11% 10-11%
Brown 12% 11-12%
Brule 12% 11-13%
Buffalo 30% 29-31%
Butte 13% 12-13%
Campbell 13% 9-10%
Charles Mix 17% 17-18%
Clark 12% 11-12%
Clay 13% 13-14%
Codington 12% 12-13%
Corson 27% 26-28%
Custer 11% 11-12%
Davison 12% 11-13%
Day 13% 13-14%
Deuel 11% 10-11%
Dewey 24% 24-25%
Douglas 10% 10-11%
Edmunds 10% 9-10%
Fall River 13% 12-13%
Faulk 11% 10-11%
Grant 11% 10-11%
Gregory 13% 13-14%
Haakon 13% 13-14%
Hamlin 10% 9-10%
Hand 10% 9-10%
Hanson 10% 10-11%
Harding 11% 11-12%
Hughes 12% 11-12%
Hutchinson 11% 11-12%
County % Fair/Poor % Error Margin
Hyde 12% 11-12%
Jackson 23% 23-24%
Jerauld 10% 10-11%
Jones 11% 10-11%
Kingsbury 11% 10-11%
Lake 11% 11-12%
Lawrence 10% 10-11%
Lincoln 9% 9-10%
Lyman 17% 17-18%
Marshall 11% 11-12%
McCook 11% 10-11%
McPherson 12% 11-13%
Meade 12% 12-13%
Mellette 26% 26-27%
Miner 11% 10-11%
Minnehaha 12% 11-12%
Moody 13% 12-13%
Oglala Lakota 23% 31-32%
Pennington 14% 13-14%
Perkins 12% 11-12%
Potter 10% 9-10%
Roberts 17% 16-17%
Sanborn 10% 10-11%
Spink 11% 10-11%
Stanley 10% 9-10%
Sully 10% 9-10%
Todd 29% 28-30%
Tripp 14% 14-15%
Turner 11% 10-11%
Union 10% 9-10%
Walworth 11% 11-12%
Yankton 12% 11-12%
Ziebach 29% 28-30%
Source: University of Wisconsin Population Health Institute. County Health Rankings. (2020). Retrieved August
2020, from https://www.countyhealthrankings.org/app/south-dakota/2020/overview

2020 Primary Care Needs Assessment SD Department of Health, Office of Rural Health A-6
Table 4: Life Expectancy at Birth by County of Residence, 2017
State of South Dakota
Life Expectancy at Birth
Male (in years) 77.2
Female (in years) 82.0
County FEMALE (in years)
MALE (in years)
Aurora 82.2 78.0
Beadle 82.3 76.7
Bennett 78.4 71.2
Bon Homme 84.0 79.1
Brookings 83.2 79.3
Brown 82.5 77.7
Brule 82.4 77.6
Buffalo 73.1 65.3
Butte 80.8 76.0
Campbell 86.1 78.5
Charles Mix 81.6 75.6
Clark 83.2 77.1
Clay 82.7 77.7
Codington 82.1 78.0
Corson 77.3 68.0
Custer 82.4 77.7
Davison 82.4 77.4
Day 81.8 76.4
Deuel 83.3 78.0
Dewey 74.5 67.7
Douglas 83.5 78.7
Edmunds 83.3 78.4
Fall River 80.9 72.5
Faulk 83.4 79.0
Grant 82.0 77.2
Gregory 81.4 77.0
Haakon 81.8 77.5
Hamlin 81.9 76.8
Hand 83.9 79.4
Hanson 84.1 78.9
Harding 83.6 77.0
Hughes 81.3 78.6
Hutchinson 83.3 78.3
County FEMALE (in years)
MALE (in years)
Hyde 81.7 77.7
Jackson 78.1 72.3
Jerauld 84.3 78.1
Jones 82.9 77.5
Kingsbury 81.9 76.8
Lake 83.4 78.5
Lawrence 82.4 79.0
Lincoln 84.6 81.3
Lyman 79.8 75.5
Marshall 82.6 78.0
McCook 82.2 76.3
McPherson 83.9 78.6
Meade 82.2 76.5
Mellette 77.5 71.1
Miner 83.1 77.7
Minnehaha 82.1 77.2
Moody 84.0 77.0
Oglala Lakota 71.0 62.8
Pennington 82.5 78.3
Perkins 81.7 77.0
Potter 82.4 77.2
Roberts 80.0 75.0
Sanborn 83.2 77.6
Spink 82.3 77.4
Stanley 82.3 77.0
Sully 84.9 78.8
Todd 72.5 64.7
Tripp 82.2 76.2
Turner 82.9 77.7
Union 83.1 78.5
Walworth 80.9 75.5
Yankton 82.7 78.4
Ziebach 79.2 74.0
Source: Institute for Health Metrics and Evaluation (IHME), US County Profile: Counties, South Dakota, Life
Expectancy. Retrieved July 13, 2020, from http://www.healthdata.org/us-county-profiles

2020 Primary Care Needs Assessment SD Department of Health, Office of Rural Health A-7
Table 5: Infant Mortality by County, 2011, 2014, and 2017
State of South Dakota
Infant Mortality Number of infant (less than one year) deaths per 1,000 live births
2011 7.0
2014 6.9
2017 6.47
Number of infant (less than one year) deaths per 1,000 live births
Change
County 2011 2014 2017 2011-2014 2014-2017
Aurora LNE LNE LNE → →
Beadle 8.7 11.9 7.41 ↑ ↓
Bennett 15.0 25.3 23.67 ↑ ↓
Bon Homme LNE 9.4 9.35 ↑ →
Brookings 6.8 7.5 6.45 → ↓
Brown 4.9 5.8 3.92 → ↓
Brule 13.5 16.0 8.22 ↑ ↓
Buffalo 14.9 18.9 11.90 ↑ ↓
Butte 10.2 9.3 7.80 → ↓
Campbell LNE LNE LNE → →
Charles Mix 7.6 5.0 3.69 ↓ ↓
Clark LNE LNE 9.68 → ↑
Clay LNE 8.0 LNE ↑ ↓
Codington 5.1 5.3 2.68 → ↓
Corson 11.8 7.0 8.51 ↓ ↑
Custer LNE LNE LNE → →
Davison 5.8 5.3 6.35 → ↑
Day LNE LNE LNE → →
Deuel LNE LNE LNE → →
Dewey LNE 11.2 10.44 ↑ →
Douglas LNE LNE LNE → →
Edmunds LNE LNE LNE → →
Fall River 11.6 LNE LNE ↓ →
Faulk LNE LNE LNE → →
Grant LNE LNE LNE → →
Gregory LNE 16.5 11.24 ↑ ↓
Haakon LNE LNE LNE → →
Hamlin LNE LNE 5.14 → ↑
Hand LNE LNE LNE → →
Hanson LNE 23.5 22.52 ↑ →
Harding LNE LNE LNE → →
Hughes 6.8 6.8 9.27 → ↑
Hutchinson LNE LNE LNE → →
Hyde LNE LNE LNE → →
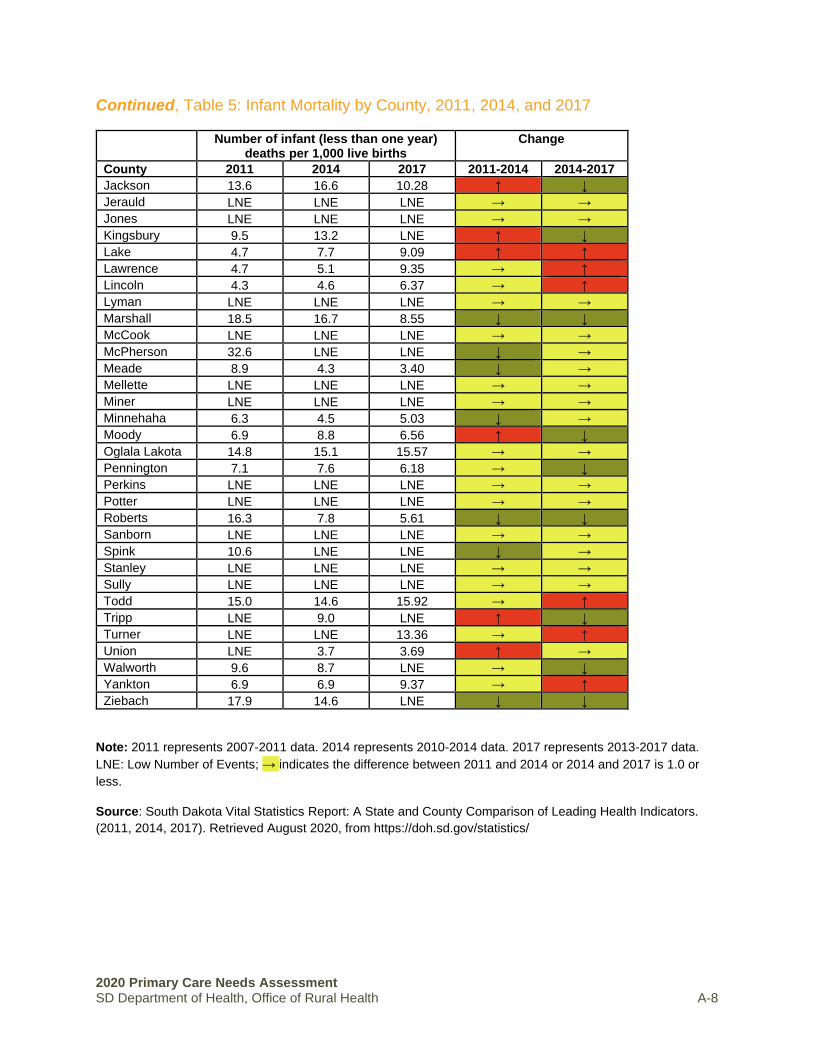
2020 Primary Care Needs Assessment SD Department of Health, Office of Rural Health A-8
Continued, Table 5: Infant Mortality by County, 2011, 2014, and 2017
Number of infant (less than one year) deaths per 1,000 live births
Change
County 2011 2014 2017 2011-2014 2014-2017
Jackson 13.6 16.6 10.28 ↑ ↓
Jerauld LNE LNE LNE → →
Jones LNE LNE LNE → →
Kingsbury 9.5 13.2 LNE ↑ ↓
Lake 4.7 7.7 9.09 ↑ ↑
Lawrence 4.7 5.1 9.35 → ↑
Lincoln 4.3 4.6 6.37 → ↑
Lyman LNE LNE LNE → →
Marshall 18.5 16.7 8.55 ↓ ↓
McCook LNE LNE LNE → →
McPherson 32.6 LNE LNE ↓ →
Meade 8.9 4.3 3.40 ↓ →
Mellette LNE LNE LNE → →
Miner LNE LNE LNE → →
Minnehaha 6.3 4.5 5.03 ↓ →
Moody 6.9 8.8 6.56 ↑ ↓
Oglala Lakota 14.8 15.1 15.57 → →
Pennington 7.1 7.6 6.18 → ↓
Perkins LNE LNE LNE → →
Potter LNE LNE LNE → →
Roberts 16.3 7.8 5.61 ↓ ↓
Sanborn LNE LNE LNE → →
Spink 10.6 LNE LNE ↓ →
Stanley LNE LNE LNE → →
Sully LNE LNE LNE → →
Todd 15.0 14.6 15.92 → ↑
Tripp LNE 9.0 LNE ↑ ↓
Turner LNE LNE 13.36 → ↑
Union LNE 3.7 3.69 ↑ →
Walworth 9.6 8.7 LNE → ↓
Yankton 6.9 6.9 9.37 → ↑
Ziebach 17.9 14.6 LNE ↓ ↓
Note: 2011 represents 2007-2011 data. 2014 represents 2010-2014 data. 2017 represents 2013-2017 data.
LNE: Low Number of Events; → indicates the difference between 2011 and 2014 or 2014 and 2017 is 1.0 or
less.
Source: South Dakota Vital Statistics Report: A State and County Comparison of Leading Health Indicators.
(2011, 2014, 2017). Retrieved August 2020, from https://doh.sd.gov/statistics/

2020 Primary Care Needs Assessment SD Department of Health, Office of Rural Health A-9
Table 6: Resident Deaths (Mortality), All Causes by County, 2011, 2014, and 2017
State of South Dakota
Mortality Rates, All Causes Mortality rates, age-adjusted per 100,000 population
2011 704.9
2014 704.1
2017 711.5
Mortality rate, age-adjusted per 100,000 population
Change
County 2011 2014 2017 2011-2014 2014-2017
Aurora 589.4 648.1 600.7 ↑ ↓
Beadle 741.3 716.4 727.0 ↓ ↑
Bennett 971.0 939.7 1,072.6 ↓ ↑
Bon Homme 635.8 580.4 613.1 ↓ ↑
Brookings 634.9 660.4 622.6 ↑ ↓
Brown 685.8 718.3 695.2 ↑ ↓
Brule 652.8 685.0 675.9 ↑ ↓
Buffalo 1,329.1 1,243.7 1,552.9 ↓ ↑
Butte 853.9 768.2 735.5 ↓ ↓
Campbell 485.6 595.3 601.1 ↑ ↑
Charles Mix 764.4 709.5 857.9 ↓ ↑
Clark 716.9 743.1 697.7 ↑ ↓
Clay 701.6 769.1 785.7 ↑ ↑
Codington 703.4 667.9 649.8 ↓ ↓
Corson 1,213.7 1,213.8 1,292.0 → ↑
Custer 662.7 627.0 644.9 ↓ ↑
Davison 687.1 685.1 708.1 ↓ ↑
Day 729.1 656.6 702.1 ↓ ↑
Deuel 704.3 566.3 620.1 ↓ ↑
Dewey 1,176.0 1,331.7 1,353.3 ↑ ↑
Douglas 691.9 716.4 627.8 ↑ ↓
Edmunds 661.7 614.1 598.8 ↓ ↓
Fall River 828.2 909.5 974.4 ↑ ↑
Faulk 574.2 555.8 697.8 ↓ ↑
Grant 663.7 666.0 767.5 ↑ ↑
Gregory 773.6 821.6 800.1 ↑ ↓
Haakon 648.4 742.0 727.0 ↑ ↓
Hamlin 814.6 760.5 732.4 ↓ ↓
Hand 555.0 568.9 645.3 ↑ ↑
Hanson 672.9 683.7 920.3 ↑ ↑
Harding 611.0 612.4 448.2 ↑ ↓
Hughes 685.3 649.2 660.7 ↓ ↑
Hutchinson 652.9 665.8 698.7 ↑ ↑
Hyde 790.8 657.8 747.3 ↓ ↑
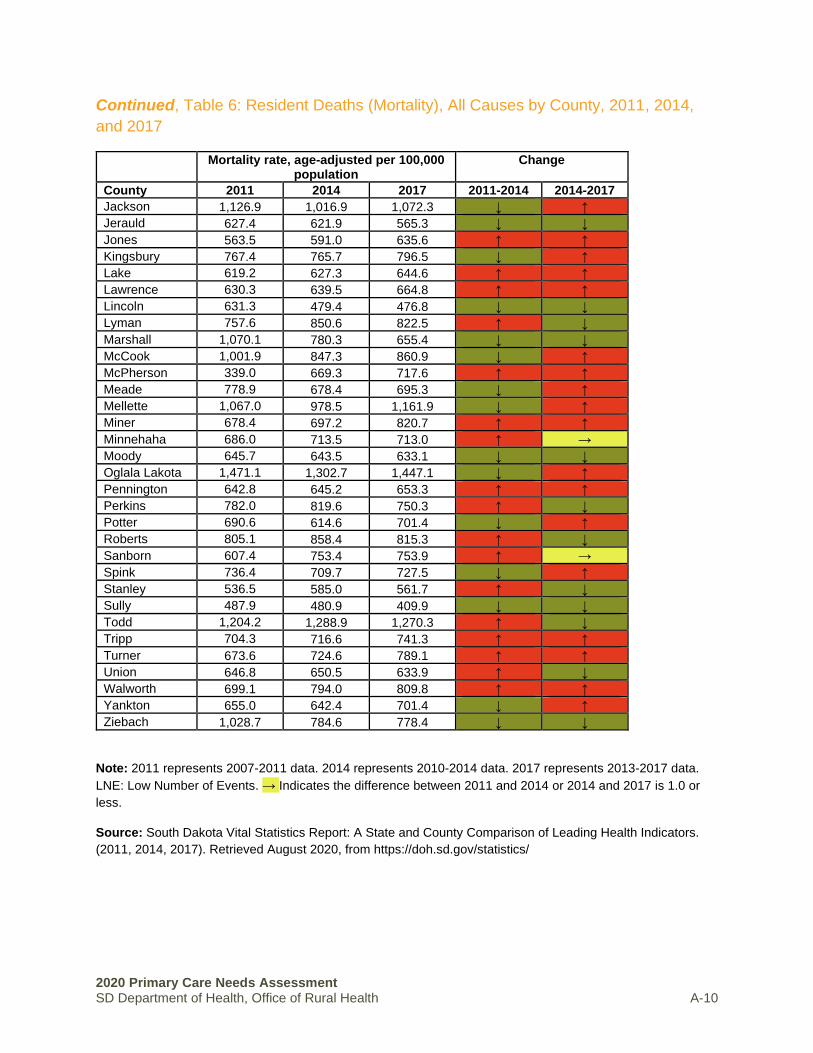
2020 Primary Care Needs Assessment SD Department of Health, Office of Rural Health A-10
Continued, Table 6: Resident Deaths (Mortality), All Causes by County, 2011, 2014,
and 2017
Mortality rate, age-adjusted per 100,000 population
Change
County 2011 2014 2017 2011-2014 2014-2017
Jackson 1,126.9 1,016.9 1,072.3 ↓ ↑
Jerauld 627.4 621.9 565.3 ↓ ↓
Jones 563.5 591.0 635.6 ↑ ↑
Kingsbury 767.4 765.7 796.5 ↓ ↑
Lake 619.2 627.3 644.6 ↑ ↑
Lawrence 630.3 639.5 664.8 ↑ ↑
Lincoln 631.3 479.4 476.8 ↓ ↓
Lyman 757.6 850.6 822.5 ↑ ↓
Marshall 1,070.1 780.3 655.4 ↓ ↓
McCook 1,001.9 847.3 860.9 ↓ ↑
McPherson 339.0 669.3 717.6 ↑ ↑
Meade 778.9 678.4 695.3 ↓ ↑
Mellette 1,067.0 978.5 1,161.9 ↓ ↑
Miner 678.4 697.2 820.7 ↑ ↑
Minnehaha 686.0 713.5 713.0 ↑ →
Moody 645.7 643.5 633.1 ↓ ↓
Oglala Lakota 1,471.1 1,302.7 1,447.1 ↓ ↑
Pennington 642.8 645.2 653.3 ↑ ↑
Perkins 782.0 819.6 750.3 ↑ ↓
Potter 690.6 614.6 701.4 ↓ ↑
Roberts 805.1 858.4 815.3 ↑ ↓
Sanborn 607.4 753.4 753.9 ↑ →
Spink 736.4 709.7 727.5 ↓ ↑
Stanley 536.5 585.0 561.7 ↑ ↓
Sully 487.9 480.9 409.9 ↓ ↓
Todd 1,204.2 1,288.9 1,270.3 ↑ ↓
Tripp 704.3 716.6 741.3 ↑ ↑
Turner 673.6 724.6 789.1 ↑ ↑
Union 646.8 650.5 633.9 ↑ ↓
Walworth 699.1 794.0 809.8 ↑ ↑
Yankton 655.0 642.4 701.4 ↓ ↑
Ziebach 1,028.7 784.6 778.4 ↓ ↓
Note: 2011 represents 2007-2011 data. 2014 represents 2010-2014 data. 2017 represents 2013-2017 data.
LNE: Low Number of Events. → Indicates the difference between 2011 and 2014 or 2014 and 2017 is 1.0 or
less.
Source: South Dakota Vital Statistics Report: A State and County Comparison of Leading Health Indicators.
(2011, 2014, 2017). Retrieved August 2020, from https://doh.sd.gov/statistics/

2020 Primary Care Needs Assessment SD Department of Health, Office of Rural Health A-11
Table 7: Heart Disease Mortality by County, 2011, 2014, and 2017
State of South Dakota
Heart Disease Mortality Mortality rates, age-adjusted per 100,000 population
2011 159.6
2014 152.7
2017 151.4
Heart Disease Mortality Rate, age-adjusted per 100,000 population
Change
County 2011 2014 2017 2011-2014 2014-2017
Aurora 164.1 163.5 150.6 → ↓
Beadle 167.8 154.4 134.0 ↓ ↓
Bennett 171.5 197.9 199.0 ↑ ↑
Bon Homme 168.8 115.5 111.1 ↓ ↓
Brookings 136.3 138.4 145.5 ↑ ↑
Brown 170.9 160.4 139.8 ↓ ↓
Brule 150.8 150.7 163.2 → ↑
Buffalo 347.7 146.5 208.8 ↓ ↑
Butte 173.9 199.4 185.6 ↑ ↓
Campbell 156.0 179.0 119.2 ↑ ↓
Charles Mix 186.8 181.1 183.1 ↓ ↑
Clark 187.7 159.2 128.0 ↓ ↓
Clay 188.2 236.8 240.6 ↑ ↑
Codington 166.9 143.1 149.9 ↓ ↑
Corson 279.6 244.4 315.3 ↓ ↑
Custer 134.7 119.1 134.2 ↓ ↑
Davison 177.2 186.1 174.0 ↑ ↓
Day 197.2 162.8 155.2 ↓ ↓
Deuel 141.4 141.2 123.8 → ↓
Dewey 261.3 252.5 206.6 ↓ ↓
Douglas 144.0 147.5 102.0 ↑ ↓
Edmunds 166.0 127.3 126.7 ↓ →
Fall River 213.6 205.0 216.9 ↓ ↑
Faulk 84.3 110.3 128.3 ↑ ↑
Grant 151.1 143.5 176.3 ↓ ↑
Gregory 207.2 207.5 165.9 → ↓
Haakon 117.4 183.6 140.6 ↑ ↓
Hamlin 170.9 147.4 118.5 ↓ ↓
Hand 115.8 103.9 115.6 ↓ ↑
Hanson 178.9 188.3 207.0 ↑ ↑
Harding 192.4 132.0 99.0 ↓ ↓
Hughes 158.6 134.5 139.2 ↓ ↑
Hutchinson 150.6 149.9 158.6 → ↑
Hyde 310.0 257.9 220.0 ↓ ↓

2020 Primary Care Needs Assessment SD Department of Health, Office of Rural Health A-12
Continued, Table 7: Heart Disease Mortality by County, 2011, 2014, and 2017
Heart Disease Mortality Rate, age-adjusted per 100,000 population
Change
County 2011 2014 2017 2011-2014 2014-2017
Jackson 205.6 171.1 229.5 ↓ ↑
Jerauld 101.1 117.1 97.8 ↑ ↓
Jones 84.9 81.0 94.4 ↓ ↑
Kingsbury 180.6 180.9 172.1 → ↓
Lake 154.9 135.9 152.0 ↓ ↑
Lawrence 138.5 132.5 126.5 ↓ ↓
Lincoln 140.4 100.5 101.0 ↓ →
Lyman 173.9 201.8 159.1 ↑ ↓
Marshall 201.0 161.4 134.6 ↓ ↓
McCook 258.0 213.8 197.1 ↓ ↓
McPherson 108.9 214.3 232.8 ↑ ↑
Meade 169.9 143.8 142.7 ↓ ↓
Mellette 172.5 117.5 203.8 ↓ ↑
Miner 174.2 178.0 183.8 ↑ ↑
Minnehaha 146.4 143.3 150.5 ↓ ↑
Moody 177.0 152.7 154.1 ↓ ↑
Oglala Lakota 222.1 154.1 187.1 ↓ ↑
Pennington 143.7 147.2 149.9 ↑ ↑
Perkins 151.2 132.9 144.1 ↓ ↑
Potter 119.2 124.5 116.5 ↑ ↓
Roberts 198.3 179.1 144.3 ↓ ↓
Sanborn 122.5 116.5 125.2 ↓ ↑
Spink 167.8 136.0 153.5 ↓ ↑
Stanley 81.5 89.6 86.6 ↑ ↓
Sully 124.1 117.7 66.0 ↓ ↓
Todd 182.9 206.4 202.5 ↑ ↓
Tripp 176.3 149.8 187.1 ↓ ↑
Turner 176.4 161.1 168.3 ↓ ↑
Union 144.1 167.8 138.5 ↑ ↓
Walworth 119.6 151.9 150.1 ↑ ↓
Yankton 155.0 155.4 166.5 → ↑
Ziebach 211.1 228.4 171.8 ↑ ↓
Note: 2011 represents 2007-2011 data. 2014 represents 2010-2014 data. 2017 represents 2013-2017 data.
LNE: Low Number of Events. → Indicates the difference between 2011 and 2014 is 1.0 or less.
Source: South Dakota Vital Statistics Report: A State and County Comparison of Leading Health Indicators.
(2011, 2014, 2017). Retrieved August 2020, from https://doh.sd.gov/statistics/

2020 Primary Care Needs Assessment SD Department of Health, Office of Rural Health A-13
Table 8: Cancer Mortality by County, 2011, 2014, and 2017
State of South Dakota
Cancer Mortality Mortality rates, age-adjusted per 100,000 population
2011 166.1
2014 163.2
2017 156.6
Cancer Mortality Rate, age-adjusted per 100,000 population
Change
County 2011 2014 2017 2011-2014 2014-2017
Aurora 134.5 162.7 126.8 ↑ ↓
Beadle 178.8 164.9 173.3 ↓ ↑
Bennett 199.2 179.6 204.8 ↓ ↑
Bon Homme 158.4 135.4 143.1 ↓ ↑
Brookings 152.4 169.1 147.7 ↑ ↓
Brown 165.5 167.1 165.3 ↑ ↓
Brule 147.8 154.7 141.5 ↑ ↓
Buffalo 277.2 271.8 281.2 ↓ ↑
Butte 224.6 174.7 170.6 ↓ ↓
Campbell 107.9 104.3 110.7 ↓ ↑
Charles Mix 180.8 161.0 172.9 ↓ ↑
Clark 148.2 170.6 153.7 ↑ ↓
Clay 150.5 175.0 178.0 ↑ ↑
Codington 175.7 175.1 176.0 → →
Corson 215.7 210.0 209.3 ↓ →
Custer 184.0 147.9 120.6 ↓ ↓
Davison 164.9 172.8 163.0 ↑ ↓
Day 170.2 124.4 131.1 ↓ ↑
Deuel 129.6 106.5 156.1 ↓ ↑
Dewey 207.1 230.3 191.2 ↑ ↓
Douglas 183.7 185.5 150.5 ↑ ↓
Edmunds 143.5 142.1 128.0 ↓ ↓
Fall River 200.2 188.6 185.9 ↓ ↓
Faulk 122.0 161.1 159.4 ↑ ↓
Grant 145.8 129.4 141.4 ↓ ↑
Gregory 182.1 170.6 176.6 ↓ ↑
Haakon 160.4 174.2 166.4 ↑ ↓
Hamlin 158.5 138.9 149.9 ↓ ↑
Hand 125.9 132.7 147.3 ↑ ↑
Hanson 172.0 179.3 279.2 ↑ ↑
Harding 94.7 66.8 91.1 ↓ ↑
Hughes 160.3 155.6 144.7 ↓ ↓
Hutchinson 164.1 127.6 126.2 ↓ ↓
Hyde 149.2 118.8 117.6 ↓ ↓

2020 Primary Care Needs Assessment SD Department of Health, Office of Rural Health A-14
Continued, Table 8: Cancer Mortality by County, 2011, 2014, and 2017
Jackson 178.2 178.5 200.3 → ↑
Jerauld 229.3 173.9 165.9 ↓ ↓
Jones 165.5 128.6 149.7 ↓ ↑
Kingsbury 177.7 167.7 202.0 ↓ ↑
Lake 151.9 151.2 121.6 → ↓
Lawrence 165.0 162.6 140.6 ↓ ↓
Lincoln 148.6 122.4 114.9 ↓ ↓
Lyman 133.6 139.6 160.9 ↑ ↑
Marshall 242.8 174.6 135.4 ↓ ↓
McCook 252.2 206.7 230.9 ↓ ↑
McPherson 44.5 114.8 146.2 ↑ ↑
Meade 178.7 152.2 161.1 ↓ ↑
Mellette 222.8 228.0 148.8 ↑ ↓
Miner 194.6 147.7 197.9 ↓ ↑
Minnehaha 170.6 179.5 165.9 ↑ ↓
Moody 160.9 171.5 136.8 ↑ ↓
Oglala Lakota 221.3 216.8 213.2 ↓ ↓
Pennington 162.9 160.6 152.3 ↓ ↓
Perkins 192.3 212.1 154.3 ↑ ↓
Potter 198.5 124.3 118.1 ↓ ↓
Roberts 197.2 199.1 172.5 ↑ ↓
Sanborn 115.4 183.9 167.5 ↑ ↓
Spink 138.3 148.5 167.1 ↑ ↑
Stanley 172.3 158.7 179.4 ↓ ↑
Sully 125.7 167.3 133.1 ↑ ↓
Todd 208.8 206.9 211.9 ↓ ↑
Tripp 135.7 149.6 144.9 ↑ ↓
Turner 146.8 166.3 161.6 ↑ ↓
Union 183.8 159.3 154.3 ↓ ↓
Walworth 134.8 175.3 147.6 ↑ ↓
Yankton 145.1 145.0 137.3 → ↓
Ziebach 178.9 57.1 64.9 ↓ ↑
Note: 2011 represents 2007-2011 data. 2014 represents 2010-2014 data. 2017 represents 2013-2017 data.
LNE: Low Number of Events. → Indicates the difference between 2011 and 2014 or 2014 and 2017 is 1.0 or
less.
Source: South Dakota Vital Statistics Report: A State and County Comparison of Leading Health Indicators.
(2011, 2014, 2017). Retrieved August 2020, from https://doh.sd.gov/statistics/
Cancer Mortality Rate, age-adjusted per 100,000 population
Change
County 2011 2014 2017 2011-2014 2014-2017

2020 Primary Care Needs Assessment SD Department of Health, Office of Rural Health A-15
Table 9: Chronic Lower Respiratory Disease Mortality by County, 2011, 2014, and 2017
State of South Dakota
Chronic Lower Respiratory Mortality Mortality rates, age-adjusted per 100,000 population
2011 46.6
2014 43.6
2017 41.8
Chronic Lower Respiratory Mortality Rate, age-adjusted per 100,000
population
Change
County 2011 2014 2017 2011-2014 2014-2017
Aurora 54.9 21.5 21.5 ↓ →
Beadle 41.0 37.3 32.1 ↓ ↓
Bennett 47.4 39.3 63.9 ↓ ↑
Bon Homme 38.5 37.9 44.0 → ↑
Brookings 36.1 30.9 27.8 ↓ ↓
Brown 40.4 42.8 36.3 ↑ ↓
Brule 40.5 28.1 34.6 ↓ ↑
Buffalo 55.0 LNE 49.4 ↓ ↑
Butte 53.3 43.4 62.9 ↓ ↑
Campbell LNE LNE 25.0 → ↑
Charles Mix 49.0 29.9 39.7 ↓ ↑
Clark 46.1 39.7 33.6 ↓ ↓
Clay 53.0 37.8 45.9 ↓ ↑
Codington 40.6 45.7 39.7 ↑ ↓
Corson 61.6 46.5 38.8 ↓ ↓
Custer 23.4 41.1 27.4 ↑ ↓
Davison 45.3 31.5 35.6 ↓ ↑
Day 44.1 48.0 30.8 ↑ ↓
Deuel 71.0 45.3 41.2 ↓ ↓
Dewey 50.8 42.6 44.8 ↓ ↑
Douglas 42.3 57.1 54.2 ↑ ↓
Edmunds 62.4 47.0 31.5 ↓ ↓
Fall River 62.8 93.6 84.5 ↑ ↓
Faulk 41.8 49.0 49.5 ↑ →
Grant 43.2 48.7 56.0 ↑ ↑
Gregory 58.6 60.5 54.4 ↑ ↓
Haakon 26.5 54.1 76.0 ↑ ↑
Hamlin 54.4 46.7 31.2 ↓ ↓
Hand 34.4 50.8 55.5 ↑ ↑
Hanson 17.7 12.6 LNE ↓ ↓
Harding 53.6 42.3 LNE ↓ ↓
Hughes 54.2 45.8 49.5 ↓ ↑
Hutchinson 38.6 39.0 32.2 → ↓

2020 Primary Care Needs Assessment SD Department of Health, Office of Rural Health A-16
Continued, Table 9: Chronic Lower Respiratory Disease Mortality by County, 2011,
2014, and 2017
Chronic Lower Respiratory Mortality Rate, age-adjusted per
100,000 population
Change
County 2011 2014 2017 2011-2014 2014-2017
Hyde 19.2 LNE 28.3 ↓ ↑
Jackson 78.7 84.2 54.3 ↑ ↓
Jerauld 48.8 42.0 14.5 ↓ ↓
Jones 56.4 45.2 57.5 ↓ ↑
Kingsbury 33.3 29.9 36.3 ↓ ↑
Lake 48.2 41.6 45.3 ↓ ↑
Lawrence 51.4 62.1 54.8 ↑ ↓
Lincoln 40.8 28.1 25.8 ↓ ↓
Lyman 52.4 55.1 40.2 ↑ ↓
Marshall 69.1 52.8 50.5 ↓ ↓
McCook 76.1 26.9 13.9 ↓ ↓
McPherson 9.9 29.0 22.7 ↑ ↓
Meade 57.1 52.9 64.5 ↓ ↑
Mellette 92.4 58.3 98.9 ↓ ↑
Miner 49.8 46.3 34.0 ↓ ↓
Minnehaha 50.7 47.1 43.8 ↓ ↓
Moody 26.0 21.9 21.4 ↓ →
Oglala Lakota 91.4 57.2 49.1 ↓ ↓
Pennington 44.1 35.2 31.4 ↓ ↓
Perkins 56.4 28.6 59.4 ↓ ↑
Potter 37.8 34.8 41.8 ↓ ↑
Roberts 30.0 38.3 47.5 ↑ ↑
Sanborn 20.6 41.0 34.1 ↑ ↓
Spink 60.4 62.4 39.2 ↑ ↓
Stanley 53.0 109.3 84.9 ↑ ↓
Sully LNE LNE 34.7 → ↑
Todd 74.7 83.1 66.9 ↑ ↓
Tripp 46.5 37.9 44.2 ↓ ↑
Turner 41.6 64.8 61.1 ↑ ↓
Union 50.4 46.8 52.9 ↓ ↑
Walworth 49.5 43.0 59.4 ↓ ↑
Yankton 48.1 48.9 53.3 → ↑
Ziebach 63.4 68.5 69.2 ↑ ↑
Note: 2011 represents 2007-2011 data. 2014 represents 2010-2014 data. 2017 represents 2013-2017 data.
LNE: Low Number of Events. → Indicates the difference between 2011 and 2014 or 2014 and 2017 is 1.0 or
less.
Source: South Dakota Vital Statistics Report: A State and County Comparison of Leading Health Indicators.
(2011, 2014, 2017). Retrieved August 2020, from https://doh.sd.gov/statistics/

2020 Primary Care Needs Assessment SD Department of Health, Office of Rural Health A-17
Table 10: Alzheimer’s Disease Mortality by County, 2011, 2014, and 2017
State of South Dakota
Alzheimer’s Disease Mortality Mortality rates, age-adjusted per 100,000 population
2011 34.9
2014 36.7
2017 36.0
Alzheimer’s Mortality Rate, age-adjusted per 100,000 population
Change
County 2011 2014 2017 2011-2014 2014-2017
Aurora 24.5 26.0 42.5 ↑ ↑
Beadle 29.3 39.9 44.6 ↑ ↑
Bennett LNE LNE 17.7 → ↑
Bon Homme 24.0 30.5 22.1 ↑ ↓
Brookings 36.8 38.8 25.8 ↑ ↓
Brown 37.2 48.5 37.7 ↑ ↓
Brule 32.4 30.4 31.3 ↓ →
Buffalo LNE 63.1 LNE ↑ ↓
Butte 28.6 33.1 29.2 ↑ ↓
Campbell 19.1 19.2 18.5 → →
Charles Mix 27.3 51.5 49.9 ↑ ↓
Clark 27.8 35.1 32.8 ↑ ↓
Clay 25.5 19.6 24.2 ↓ ↑
Codington 34.8 37.1 30.5 ↑ ↓
Corson 35.6 40.2 LNE ↑ ↓
Custer 29.3 24.6 23.5 ↓ ↓
Davison 29.6 23.5 25.1 ↓ ↑
Day 42.5 27.0 37.8 ↓ ↑
Deuel 42.7 23.4 27.8 ↓ ↑
Dewey 42.4 22.6 14.6 ↓ ↓
Douglas 38.1 47.0 47.5 ↑ →
Edmunds 33.9 24.6 27.3 ↓ ↑
Fall River 21.8 25.1 36.8 ↑ ↑
Faulk 62.6 39.1 40.1 ↓ →
Grant 41.3 41.9 50.3 → ↑
Gregory 22.0 22.6 27.1 → ↑
Haakon LNE LNE LNE → →
Hamlin 101.6 105.8 72.3 ↑ ↓
Hand 10.3 9.8 18.8 → ↑
Hanson LNE 24.7 41.7 ↑ ↑
Harding LNE LNE LNE → →
Hughes 37.9 32.8 24.6 ↓ ↓
Hutchinson 27.4 31.0 48.2 ↑ ↑
Hyde 20.2 22.1 26.0 ↑ ↑

2020 Primary Care Needs Assessment SD Department of Health, Office of Rural Health A-18
Continued, Table 10: Alzheimer’s Disease Mortality by County, 2011, 2014, and 2017
Alzheimer’s Mortality Rate, age-adjusted per 100,000 population
Change
County 2011 2014 2017 2011-2014 2014-2017
Jackson 30.5 19.1 LNE ↓ ↓
Jerauld 69.5 77.1 85.6 ↑ ↑
Jones LNE 26.6 LNE ↑ ↓
Kingsbury 37.5 32.8 28.9 ↓ ↓
Lake 49.3 49.5 36.9 → ↓
Lawrence 24.3 25.6 29.0 ↑ ↑
Lincoln 39.4 32.9 40.7 ↓ ↑
Lyman 43.5 55.8 42.3 ↑ ↓
Marshall 48.5 29.2 26.7 ↓ ↓
McCook 52.2 67.2 63.9 ↑ ↓
McPherson 13.0 21.4 29.2 ↑ ↑
Meade 26.2 20.2 20.7 ↓ →
Mellette 23.8 23.7 47.4 → ↑
Miner 70.8 70.3 38.9 → ↓
Minnehaha 39.8 43.7 44.7 ↑ →
Moody 64.0 63.6 46.2 → ↓
Oglala Lakota LNE 15.3 14.7 ↑ →
Pennington 30.2 27.7 27.8 ↓ →
Perkins 33.8 36.9 40.4 ↑ ↑
Potter 28.5 31.1 42.3 ↑ ↑
Roberts 19.6 27.2 27.6 ↑ →
Sanborn 50.6 98.5 114.0 ↑ ↑
Spink 44.8 47.8 39.7 ↑ ↓
Stanley LNE LNE LNE → →
Sully LNE LNE LNE → →
Todd 18.5 13.1 23.9 ↓ ↑
Tripp 38.2 53.1 62.9 ↑ ↑
Turner 51.0 64.3 68.9 ↑ ↑
Union 28.0 31.3 25.4 ↑ ↓
Walworth 58.7 66.3 68.9 ↑ ↑
Yankton 35.8 32.7 33.1 ↓ →
Ziebach LNE LNE LNE → →
Note: 2011 represents 2007-2011 data. 2014 represents 2010-2014 data. 2017 represents 2013-2017 data.
LNE: Low Number of Events. → Indicates the difference between 2011 and 2014 or 2014 and 2017 is 1.0 or
less.
Source: South Dakota Vital Statistics Report: A State and County Comparison of Leading Health Indicators.
(2011, 2014, 2017). Retrieved August 2020, from https://doh.sd.gov/statistics/

2020 Primary Care Needs Assessment SD Department of Health, Office of Rural Health A-19
Table 11: Cerebrovascular Disease Mortality by County, 2011, 2014, and 2017
State of South Dakota
Cerebrovascular Disease Mortality Mortality rates, age-adjusted per 100,000 population
2011 39.3
2014 39.0
2017 36.3
Cerebrovascular Disease Mortality Rate, age-adjusted per
100,000 population
Change
County 2011 2014 2017 2011-2014 2014-2017
Aurora 26.4 61.4 62.1 ↑ →
Beadle 45.7 43.5 46.5 ↓ ↑
Bennett 43.2 44.9 22.8 ↑ ↓
Bon Homme 47.1 37.5 41.1 ↓ ↑
Brookings 39.9 48.5 45.7 ↑ ↓
Brown 38.4 39.7 39.6 ↑ →
Brule 22.1 27.9 15.8 ↑ ↓
Buffalo 45.6 LNE 44.2 ↓ ↑
Butte 36.5 31.1 34.1 ↓ ↑
Campbell 44.6 52.4 31.0 ↑ ↓
Charles Mix 23.7 26.3 41.3 ↑ ↑
Clark 43.4 56.7 51.1 ↑ ↓
Clay 54.3 42.7 42.5 ↓ →
Codington 38.6 33.2 32.5 ↓ →
Corson 32.8 32.2 26.3 → ↓
Custer 45.8 40.4 36.8 ↓ ↓
Davison 46.7 41.1 38.8 ↓ ↓
Day 66.9 55.7 49.6 ↓ ↓
Deuel 35.1 36.7 48.2 ↑ ↑
Dewey 26.3 36.3 32.3 ↑ ↓
Douglas 43.6 38.6 20.8 ↓ ↓
Edmunds 29.0 17.5 26.5 ↓ ↑
Fall River 29.9 31.3 42.5 ↑ ↑
Faulk 35.3 23.6 33.2 ↓ ↑
Grant 48.2 48.8 59.5 → ↑
Gregory 28.1 40.6 39.0 ↑ ↓
Haakon 36.8 43.2 36.2 ↑ ↓
Hamlin 67.0 47.1 46.7 ↓ →
Hand 31.4 38.4 53.3 ↑ ↑
Hanson 62.6 28.3 32.7 ↓ ↑
Harding 57.3 67.4 51.3 ↑ ↓
Hughes 48.0 53.6 44.9 ↑ ↓
Hutchinson 32.6 47.8 57.1 ↑ ↑

2020 Primary Care Needs Assessment SD Department of Health, Office of Rural Health A-20
Continued, Table 11: Cerebrovascular Disease Mortality by County, 2011, 2014, and
2017
Cerebrovascular Disease Mortality Rate, age-adjusted per
100,000 population
Change
County 2011 2014 2017 Change Change
Hyde 25.2 69.0 49.8 ↑ ↓
Jackson LNE LNE 26.3 → ↑
Jerauld 50.8 64.5 34.6 ↑ ↓
Jones LNE LNE LNE → →
Kingsbury 62.8 41.2 41.0 ↓ →
Lake 43.0 54.5 54.2 ↑ →
Lawrence 35.4 33.1 27.8 ↓ ↓
Lincoln 37.2 31.3 26.7 ↓ ↓
Lyman 28.6 44.4 42.5 ↑ ↓
Marshall 75.3 72.6 68.9 ↓ ↓
McCook 74.8 55.1 51.7 ↓ ↓
McPherson 40.7 60.6 38.4 ↑ ↓
Meade 47.0 43.0 32.1 ↓ ↓
Mellette 58.7 62.3 31.6 ↑ ↓
Miner 39.8 48.3 44.0 ↑ ↓
Minnehaha 40.7 42.1 37.2 ↑ ↓
Moody 37.5 41.4 31.8 ↑ ↓
Oglala Lakota 74.7 53.6 44.0 ↓ ↓
Pennington 27.7 29.5 26.4 ↑ ↓
Perkins 33.4 33.2 32.9 → →
Potter 28.8 21.0 14.0 ↓ ↓
Roberts 44.5 49.9 43.5 ↑ ↓
Sanborn 33.0 34.9 22.2 ↑ ↓
Spink 39.4 31.3 26.7 ↓ ↓
Stanley 42.5 30.8 14.5 ↓ ↓
Sully 28.4 LNE LNE ↓ →
Todd 59.3 75.4 36.9 ↑ ↓
Tripp 42.3 28.9 27.5 ↓ ↓
Turner 35.2 20.7 23.6 ↓ ↑
Union 30.3 22.4 25.1 ↓ ↑
Walworth 40.4 55.5 36.5 ↑ ↓
Yankton 34.4 26.9 34.9 ↓ ↑
Ziebach 35.7 44.6 LNE ↑ ↓
Note: 2011 represents 2007-2011 data. 2014 represents 2010-2014 data. 2017 represents 2013-2017 data.
LNE: Low Number of Events. → Indicates the difference between 2011 and 2014 or 2014 and 2017 is 1.0 or
less.
Source: South Dakota Vital Statistics Report: A State and County Comparison of Leading Health Indicators.
(2011, 2014, 2017). Retrieved August 2020, from https://doh.sd.gov/statistics/

2020 Primary Care Needs Assessment SD Department of Health, Office of Rural Health A-21
Table 12: Accidents Mortality by County, 2011, 2014, and 2017
State of South Dakota
Accidents Mortality Mortality rates, age-adjusted per 100,000 population
2011 42.4
2014 46.3
2017 50.9
Accidents Mortality Rate, age-adjusted per 100,000 population
Change
County 2011 2014 2017 2011-2014 2014-2017
Aurora 28.0 49.5 51.4 ↑ ↑
Beadle 37.6 42.1 47.7 ↑ ↑
Bennett 70.0 78.1 115.1 ↑ ↑
Bon Homme 34.7 31.1 43.2 ↓ ↑
Brookings 32.0 31.8 36.6 → ↑
Brown 29.3 35.6 40.2 ↑ ↑
Brule 46.9 57.2 41.2 ↑ ↓
Buffalo 119.1 88.6 141.5 ↓ ↑
Butte 44.7 47.7 50.2 ↑ ↑
Campbell 33.9 103.9 123.0 ↑ ↑
Charles Mix 58.8 52.1 79.7 ↓ ↑
Clark 46.8 78.9 64.2 ↑ ↓
Clay 39.2 33.7 29.2 ↓ ↓
Codington 39.8 39.4 40.2 → →
Corson 138.6 131.0 132.3 ↓ ↑
Custer 52.1 52.3 66.6 → ↑
Davison 24.3 36.4 43.6 ↑ ↑
Day 48.4 51.5 76.9 ↑ ↑
Deuel 54.6 42.6 25.8 ↓ ↓
Dewey 115.2 155.3 175.8 ↑ ↑
Douglas 37.9 42.1 55.6 ↑ ↑
Edmunds 29.2 40.2 55.7 ↑ ↑
Fall River 60.0 55.0 72.3 ↓ ↑
Faulk 28.3 8.7 42.4 ↓ ↑
Grant 47.1 33.0 45.7 ↓ ↑
Gregory 64.9 91.8 85.5 ↑ ↓
Haakon 66.3 29.7 23.7 ↓ ↓
Hamlin 42.9 47.2 45.6 ↑ ↓
Hand 45.2 33.0 48.3 ↓ ↑
Hanson 46.5 47.2 53.6 → ↑
Harding 86.4 108.9 43.3 ↑ ↓
Hughes 25.4 38.5 43.0 ↑ ↑
Hutchinson 46.1 52.1 69.8 ↑ ↑
Hyde 121.8 LNE 71.3 ↓ ↑

2020 Primary Care Needs Assessment SD Department of Health, Office of Rural Health A-22
Continued, Table 12: Accidents Mortality by County, 2011, 2014, and 2017
Accidents Mortality Rate, age-adjusted per 100,000 population
Change
County 2011 2014 2017 2011-2014 2014-2017
Jackson 164.2 106.5 151.3 ↓ ↑
Jerauld 30.5 38.9 59.5 ↑ ↑
Jones LNE LNE LNE → →
Kingsbury 58.4 65.5 73.3 ↑ ↑
Lake 21.5 31.9 33.0 ↑ ↑
Lawrence 32.0 34.0 53.2 ↑ ↑
Lincoln 33.0 24.4 23.2 ↓ ↓
Lyman 138.4 129.5 83.6 ↓ ↓
Marshall 86.3 63.6 55.3 ↓ ↓
McCook 25.0 54.2 47.0 ↑ ↓
McPherson 21.9 56.3 46.7 ↑ ↓
Meade 56.0 36.7 39.9 ↓ ↑
Mellette 133.6 65.7 101.0 ↓ ↑
Miner 28.4 62.0 73.5 ↑ ↑
Minnehaha 31.5 40.4 44.9 ↑ ↑
Moody 36.4 40.5 36.9 ↑ ↓
Oglala Lakota 153.3 144.4 169.6 ↓ ↑
Pennington 40.6 44.0 46.1 ↑ ↑
Perkins 72.0 70.3 36.8 ↓ ↓
Potter 42.2 58.5 82.8 ↑ ↑
Roberts 56.6 78.5 76.5 ↑ ↓
Sanborn 82.7 61.2 38.1 ↓ ↓
Spink 70.6 90.5 78.0 ↑ ↓
Stanley 31.9 18.8 17.2 ↓ ↓
Sully 54.2 28.1 LNE ↓ ↓
Todd 137.3 135.0 146.0 ↓ ↑
Tripp 47.5 55.8 40.7 ↑ ↓
Turner 40.1 48.1 54.7 ↑ ↑
Union 40.7 32.6 28.5 ↓ ↓
Walworth 43.7 39.9 84.0 ↓ ↑
Yankton 39.4 43.4 53.0 ↑ ↑
Ziebach 124.6 105.8 120.8 ↓ ↑
Note: 2011 represents 2007-2011 data. 2014 represents 2010-2014 data. 2017 represents 2013-2017 data.
LNE: Low Number of Events. → Indicates the difference between 2011 and 2014 is 1.0 or less.
Source: South Dakota Vital Statistics Report: A State and County Comparison of Leading Health Indicators.
(2011, 2014, 2017). Retrieved August 2020, from https://doh.sd.gov/statistics/

2020 Primary Care Needs Assessment SD Department of Health, Office of Rural Health A-23
Table 13: Diabetes Mortality by County, 2011, 2014, and 2017
State of South Dakota
Diabetes Mortality Mortality rates, age-adjusted per 100,000 population
2011 23.8
2014 23.4
2017 23.8
Diabetes Mortality Rate, age-adjusted per 100,000 population
Change
County 2011 2014 2017 2011-2014 2014-2017
Aurora 28.7 31.9 20.1 ↑ ↓
Beadle 40.4 37.4 34.6 ↓ ↓
Bennett 47.8 47.0 93.1 → ↑
Bon Homme 23.4 20.3 22.9 ↓ ↑
Brookings 13.3 15.4 22.7 ↑ ↑
Brown 20.3 29.2 26.6 ↑ ↓
Brule 48.9 34.6 27.7 ↓ ↓
Buffalo 60.6 66.3 124.6 ↑ ↑
Butte 25.2 29.6 15.0 ↑ ↓
Campbell 19.9 29.8 37.1 ↑ ↑
Charles Mix 43.7 33.2 45.2 ↓ ↑
Clark 22.2 21.4 35.7 → ↑
Clay 30.1 31.2 20.2 ↑ ↓
Codington 21.5 24.7 23.7 ↑ →
Corson 97.6 65.4 64.6 ↓ →
Custer 13.4 11.3 16.1 ↓ ↑
Davison 12.2 18.3 26.2 ↑ ↑
Day 14.6 23.5 26.5 ↑ ↑
Deuel 21.8 12.1 13.8 ↓ ↑
Dewey 82.7 99.9 101.5 ↑ ↑
Douglas 26.7 15.5 25.3 ↓ ↑
Edmunds 50.5 52.8 25.7 ↑ ↓
Fall River 41.0 47.6 37.1 ↑ ↓
Faulk 15.7 34.8 26.5 ↑ ↓
Grant 27.6 35.2 28.9 ↑ ↓
Gregory 44.9 41.4 27.3 ↓ ↓
Haakon 17.3 LNE LNE ↓ →
Hamlin 30.0 22.1 22.2 ↓ →
Hand 17.9 33.3 27.2 ↑ ↓
Hanson LNE LNE 29.8 → ↑
Harding LNE 51.4 65.1 ↑ ↑
Hughes 25.5 20.5 34.0 ↓ ↑
Hutchinson 19.6 19.4 15.2 → ↓
Hyde 23.8 LNE 22.3 ↓ ↑

2020 Primary Care Needs Assessment SD Department of Health, Office of Rural Health A-24
Continued, Table 13: Diabetes Mortality by County, 2011, 2014, and 2017
Diabetes Mortality Rate, age-adjusted per 100,000 population
Change
County 2011 2014 2017 2011-2014 2014-2017
Jackson 45.0 44.3 49.0 → ↑
Jerauld LNE LNE LNE → →
Jones LNE LNE LNE → →
Kingsbury 17.9 23.8 19.7 ↑ ↓
Lake 14.3 17.5 30.4 ↑ ↑
Lawrence 22.9 25.0 22.2 ↑ ↓
Lincoln 26.4 9.4 10.1 ↓ →
Lyman 13.2 22.5 39.3 ↑ ↑
Marshall 51.4 34.8 14.1 ↓ ↓
McCook 22.8 25.4 35.0 ↑ ↑
McPherson 16.0 25.3 32.7 ↑ ↑
Meade 27.1 20.2 15.3 ↓ ↓
Mellette 34.8 79.2 66.5 ↑ ↓
Miner LNE 11.0 46.9 ↑ ↑
Minnehaha 15.9 17.2 15.5 ↑ ↓
Moody 30.5 32.8 27.1 ↑ ↓
Oglala Lakota 124.2 91.2 139.3 ↓ ↑
Pennington 11.7 10.5 13.4 ↓ ↑
Perkins 20.8 16.7 22.9 ↓ ↑
Potter 40.3 34.9 39.6 ↓ ↑
Roberts 29.8 37.9 26.4 ↑ ↓
Sanborn 26.9 19.0 18.1 ↓ →
Spink 26.8 27.6 30.9 → ↑
Stanley 25.5 20.2 26.5 ↓ ↑
Sully 28.4 LNE LNE ↓ →
Todd 101.9 100.1 103.7 ↓ ↑
Tripp 32.0 16.9 17.1 ↓ →
Turner 21.9 21.0 13.2 → ↓
Union 22.7 11.4 14.0 ↓ ↑
Walworth 28.6 31.7 27.9 ↑ ↓
Yankton 34.6 25.1 27.9 ↓ ↑
Ziebach 88.0 54.6 40.0 ↓ ↓
Note: 2011 represents 2007-2011 data. 2014 represents 2010-2014 data. 2017 represents 2013-2017 data.
LNE: Low Number of Events. → Indicates the difference between 2011 and 2014 or 2014 and 2017 is 1.0 or
less.
Source: South Dakota Vital Statistics Report: A State and County Comparison of Leading Health Indicators.
(2011, 2014, 2017). Retrieved August 2020, from https://doh.sd.gov/statistics/

2020 Primary Care Needs Assessment SD Department of Health, Office of Rural Health A-25
Table 14: Suicide by County, 2011, 2014, and 2017
State of South Dakota
Suicides Mortality rates, age-adjusted per 100,000 population
2011 15.3
2014 16.7
2017 19.7
Suicides, age-adjusted per 100,000 population
Change
County 2011 2014 2017 2011-2014 2014-2017
Aurora LNE LNE LNE → →
Beadle 8.4 7.9 18.5 → ↑
Bennett 22.2 22.0 30.7 → ↑
Bon Homme 13.0 12.7 11.6 → ↓
Brookings 6.8 8.6 14.0 ↑ ↑
Brown 10.3 11.6 15.2 ↑ ↑
Brule LNE 17.0 18.1 ↑ ↑
Buffalo 63.5 36.6 110.9 ↓ ↑
Butte 20.3 23.8 6.6 ↑ ↓
Campbell LNE LNE LNE → →
Charles Mix 15.4 19.5 44.4 ↑ ↑
Clark LNE LNE LNE → →
Clay 8.9 16.5 7.7 ↑ ↓
Codington 19.4 14.8 9.7 ↓ ↓
Corson 63.4 64.0 58.5 → ↓
Custer 9.6 11.5 22.3 ↑ ↑
Davison 16.2 18.6 13.2 ↑ ↓
Day LNE 10.7 13.0 ↑ ↑
Deuel 21.9 19.8 LNE ↓ ↓
Dewey 60.2 41.8 46.6 ↓ ↑
Douglas 18.5 LNE LNE ↓ →
Edmunds 16.0 LNE LNE ↓ →
Fall River 12.9 17.0 23.3 ↑ ↑
Faulk LNE LNE 26.3 → ↑
Grant 14.0 9.4 24.7 ↓ ↑
Gregory 21.5 LNE 13.0 ↓ ↑
Haakon LNE LNE 33.4 → ↑
Hamlin LNE 13.1 14.1 ↑ →
Hand LNE LNE 23.8 → ↑
Hanson LNE LNE 18.9 → ↑
Harding LNE LNE LNE → →
Hughes 18.6 16.6 15.6 ↓ →
Hutchinson LNE LNE LNE → →
Hyde LNE LNE LNE → →

2020 Primary Care Needs Assessment SD Department of Health, Office of Rural Health A-26
Continued, Table 14: Suicide by County, 2011, 2014, and 2017
Suicides, age-adjusted per 100,000 population
Change
County 2011 2014 2017 2011-2014 2014-2017
Jackson 45.0 31.9 42.2 ↓ ↑
Jerauld LNE LNE LNE → →
Jones LNE LNE LNE → →
Kingsbury 17.6 27.8 34.8 ↑ ↑
Lake 12.9 16.0 24.0 ↑ ↑
Lawrence 16.0 17.1 21.2 ↑ ↑
Lincoln 7.6 8.9 8.4 ↑ →
Lyman LNE LNE 68.0 → ↑
Marshall LNE 18.4 21.7 ↑ ↑
McCook 13.0 13.3 15.5 → ↑
McPherson LNE LNE 52.1 → ↑
Meade 20.9 29.8 24.5 ↑ ↓
Mellette LNE 31.2 34.4 ↑ ↑
Miner LNE LNE LNE → →
Minnehaha 13.5 16.7 18.9 ↑ ↑
Moody 14.3 22.2 22.5 ↑ →
Oglala Lakota 28.2 37.7 49.1 ↑ ↑
Pennington 17.8 16.7 20.4 ↓ ↑
Perkins LNE 24.1 LNE ↑ ↓
Potter 13.9 LNE 31.6 ↓ ↑
Roberts 22.5 23.4 42.6 → ↑
Sanborn LNE LNE LNE → →
Spink 9.5 LNE LNE ↓ →
Stanley LNE 41.3 50.2 ↑ ↑
Sully LNE LNE LNE → →
Todd 76.4 52.7 60.4 ↓ ↑
Tripp 11.5 LNE LNE ↓ →
Turner 8.3 18.3 21.1 ↑ ↑
Union 6.9 8.8 11.2 ↑ ↑
Walworth LNE 13.1 31.9 ↑ ↑
Yankton 15.3 18.4 15.5 ↑ ↓
Ziebach LNE LNE 34.2 → ↑
Note: 2011 represents 2007-2011 data. 2014 represents 2010-2014 data. 2017 represents 2013-2017 data.
LNE: Low Number of Events. → Indicates the difference between 2011 and 2014 or 2014 and 2017 is 1.0 or
less.
Source: South Dakota Vital Statistics Report: A State and County Comparison of Leading Health Indicators.
(2011, 2014, 2017). Retrieved August 2020, from https://doh.sd.gov/statistics/

2020 Primary Care Needs Assessment SD Department of Health, Office of Rural Health A-27
Table 15: Influenza & Pneumonia Mortality by County, 2011, 2014, and 2017
State of South Dakota
Influenza & Pneumonia Mortality Mortality rates, age-adjusted per 100,000 population
2011 15.9
2014 16.2
2017 17.3
Influenza & Pneumonia Mortality Rate, age-adjusted
per 100,000 population
Change
County 2011 2014 2017 2011-2014 2014-2017
Aurora 13.6 21.3 21.2 ↑ →
Beadle 18.9 23.8 35.5 ↑ ↑
Bennett 60.4 48.6 26.5 ↓ ↓
Bon Homme 7.9 11.1 22.1 ↑ ↑
Brookings 16.1 13.6 10.7 ↓ ↓
Brown 20.2 17.4 18.9 ↓ ↑
Brule 12.7 20.7 18.7 ↑ ↓
Buffalo 33.1 LNE 56.4 ↓ ↑
Butte 34.2 22.0 7.2 ↓ ↓
Campbell LNE LNE LNE → →
Charles Mix 18.7 19.3 21.6 → ↑
Clark 21.4 22.9 16.6 ↑ ↓
Clay 15.2 19.3 28.8 ↑ ↑
Codington 18.4 14.7 11.4 ↓ ↓
Corson 18.1 26.3 33.6 ↑ ↑
Custer 15.3 14.7 28.8 → ↑
Davison 19.9 24.0 21.5 ↑ ↓
Day 15.0 11.7 13.6 ↓ ↑
Deuel 10.1 18.4 17.1 ↑ ↓
Dewey 40.3 54.2 65.7 ↑ ↑
Douglas 27.8 14.4 12.8 ↓ ↓
Edmunds 8.2 18.7 19.8 ↑ ↑
Fall River 13.1 21.3 21.9 ↑ →
Faulk 41.1 11.5 10.2 ↓ ↓
Grant 8.2 17.0 24.5 ↑ ↑
Gregory 4.4 7.4 5.8 ↑ ↓
Haakon 49.7 46.7 31.2 ↓ ↓
Hamlin 24.2 20.3 19.7 ↓ →
Hand LNE 7.9 18.9 ↑ ↑
Hanson LNE 16.8 23.7 ↑ ↑
Harding LNE LNE LNE → →
Hughes 8.4 14.6 29.7 ↑ ↑
Hutchinson 16.5 20.5 17.8 ↑ ↓

2020 Primary Care Needs Assessment SD Department of Health, Office of Rural Health A-28
Continued, Table 15: Influenza & Pneumonia Mortality by County, 2011, 2014, and
2017
Influenza & Pneumonia Mortality Rate, age-adjusted
per 100,000 population
Change
County 2011 2014 2017 2011-2014 2014-2017
Hyde LNE LNE 28.5 → ↑
Hyde LNE LNE 28.5 → ↑
Jerauld 8.4 LNE 19.6 ↓ ↑
Jones 26.0 LNE LNE ↓ →
Kingsbury 23.7 26.5 25.2 ↑ ↓
Lake 6.4 7.2 10.6 → ↑
Lawrence 7.6 9.6 17.3 ↑ ↑
Lincoln 8.8 10.3 10.0 ↑ →
Lyman 18.0 17.5 17.8 → →
Marshall 14.0 22.8 10.0 ↑ ↓
McCook 32.3 17.0 12.2 ↓ ↓
McPherson 8.0 8.6 LNE ↑ ↓
Meade 20.1 13.7 17.8 ↓ ↑
Mellette LNE LNE 22.5 → ↑
Miner 9.8 17.1 LNE ↑ ↓
Minnehaha 12.7 12.4 13.2 → →
Moody LNE LNE LNE → →
Oglala Lakota 52.8 49.2 36.0 ↓ ↓
Pennington 16.3 15.9 12.1 → ↓
Perkins LNE 22.1 18.5 ↑ ↓
Potter 30.8 18.7 20.7 ↓ ↑
Roberts 7.8 14.0 19.5 ↑ ↑
Sanborn 18.4 19.7 17.0 ↑ ↓
Spink 17.5 24.9 30.9 ↑ ↑
Stanley LNE LNE LNE → →
Sully LNE LNE LNE → →
Todd 17.5 29.7 51.3 ↑ ↑
Tripp 22.3 23.5 19.7 ↑ ↓
Turner 16.5 9.8 10.7 ↓ →
Union 11.1 16.1 21.1 ↑ ↑
Walworth 30.6 14.7 30.8 ↓ ↑
Yankton 13.9 15.3 19.9 ↑ ↑
Ziebach LNE LNE 23.0 → ↑
Note: 2011 represents 2007-2011 data. 2014 represents 2010-2014 data. 2017 represents 2013-2017 data.
LNE: Low Number of Events. → Indicates the difference between 2011 and 2014 or 2014 and 2017 is 1.0 or
less.
Source: South Dakota Vital Statistics Report: A State and County Comparison of Leading Health Indicators.
(2011, 2014, 2017). Retrieved August 2020, from https://doh.sd.gov/statistics/

2020 Primary Care Needs Assessment SD Department of Health, Office of Rural Health A-29
Table 16: Chronic Liver Disease and Cirrhosis Mortality, 2011, 2014, and 2017
State of South Dakota
Chronic Liver Disease/Cirrhosis Mortality rates, age-adjusted per 100,000 population
2011 10.5
2014 12.7
2017 15.7
Chronic Liver Disease and Cirrhosis Mortality Rate, age-adjusted per 100,000
population
Change
County 2011 2014 2017 2011-2014 2014-2017
Aurora LNE LNE LNE → →
Beadle 6.8 10.0 15.4 ↑ ↑
Bennett 36.7 44.4 43.2 ↑ ↓
Bon Homme LNE LNE LNE → →
Brookings 2.9 4.1 8.6 ↑ ↑
Brown 9.6 7.5 8.8 ↓ ↑
Brule 10.3 LNE 8.2 ↓ ↑
Buffalo 85.5 96.3 113.6 ↑ ↑
Butte 7.4 11.9 17.3 ↑ ↑
Campbell LNE LNE LNE → →
Charles Mix 22.3 8.9 31.1 ↓ ↑
Clark 17.0 LNE LNE ↓ →
Clay 10.1 7.4 9.9 ↓ ↑
Codington 6.6 5.1 5.5 ↓ →
Corson 19.1 58.8 64.9 ↑ ↑
Custer 8.5 10.0 18.6 ↑ ↑
Davison 9.4 5.3 10.4 ↓ ↑
Day 9.1 7.8 18.8 ↓ ↑
Deuel LNE LNE LNE → →
Dewey 60.4 98.0 95.0 ↑ ↓
Douglas LNE 24.3 29.1 ↑ ↑
Edmunds 11.9 LNE LNE ↓ →
Fall River 20.1 12.9 19.5 ↓ ↑
Faulk LNE LNE 28.6 → ↑
Grant LNE LNE 5.0 → ↑
Gregory LNE 24.7 31.3 ↑ ↑
Haakon LNE LNE LNE → →
Hamlin LNE LNE 13.5 → ↑
Hand 16.6 12.7 12.3 ↓ →
Hanson LNE LNE LNE → →
Harding LNE LNE LNE → →
Hughes 8.9 11.8 8.0 ↑ ↓
Hutchinson LNE LNE LNE → →

2020 Primary Care Needs Assessment SD Department of Health, Office of Rural Health A-30
Continued, Table 16: Chronic Liver Disease and Cirrhosis Mortality, 2011, 2014, and
2017
Chronic Liver Disease and Cirrhosis Mortality Rate, age-adjusted per 100,000
population
Change
County 2011 2014 2017 2011-2014 2014-2017
Hyde LNE LNE LNE → →
Jackson 64.2 66.2 58.2 ↑ ↓
Jerauld LNE LNE LNE → →
Jones LNE LNE LNE → →
Kingsbury LNE 12.3 20.1 ↑ ↑
Lake 7.9 11.8 10.7 ↑ ↓
Lawrence 8.3 9.7 11.5 ↑ ↑
Lincoln 2.9 2.4 2.9 → →
Lyman 18.0 19.0 30.5 → ↑
Marshall LNE 10.2 7.3 ↑ ↓
McCook LNE LNE LNE → →
McPherson LNE LNE 19.1 → ↑
Meade 10.2 11.6 11.1 ↑ →
Mellette 79.8 79.0 146.3 → ↑
Miner 13.9 LNE LNE ↓ →
Minnehaha 9.8 10.4 10.7 → →
Moody 10.7 LNE 8.1 ↓ ↑
Oglala Lakota 93.5 120.4 164.2 ↑ ↑
Pennington 6.0 12.0 15.8 ↑ ↑
Perkins LNE LNE 15.2 → ↑
Potter LNE LNE LNE → →
Roberts 22.7 28.9 24.1 ↑ ↓
Sanborn LNE LNE 22.0 → ↑
Spink 15.8 15.7 7.3 → ↓
Stanley LNE LNE 28.1 → ↑
Sully LNE LNE LNE → →
Todd 50.2 70.8 75.1 ↑ ↑
Tripp 11.7 33.7 21.9 ↑ ↓
Turner LNE LNE 19.6 → ↑
Union 6.4 9.3 13.9 ↑ ↑
Walworth 18.0 26.0 18.2 ↑ ↓
Yankton 7.2 4.8 7.0 ↓ ↑
Ziebach LNE 49.6 44.5 ↑ ↓
Note: 2011 represents 2007-2011 data. 2014 represents 2010-2014 data. 2017 represents 2013-2017 data.
LNE: Low Number of Events. → Indicates the difference between 2011 and 2014 or 2014 and 2017 is 1.0 or
less.
Source: South Dakota Vital Statistics Report: A State and County Comparison of Leading Health Indicators.
(2011, 2014, 2017). Retrieved August 2020, from https://doh.sd.gov/statistics/

2020 Primary Care Needs Assessment SD Department of Health, Office of Rural Health A-31
Table 17: Diabetes Prevalence: The percentage of adults aged 20 and above with
diagnosed diabetes in a given County, 2016
Methodology: The Method for Calculating Diabetes Prevalence - Data for Diabetes Prevalence are provided by
the CDC Interactive Diabetes Atlas which uses BRFSS data to provide county-level estimates. Diabetes
Prevalence survey estimates include both landline and cell phone users. Previously, only landline users were
included in the data. This change was implemented in order to provide users with the most accurate estimates
of health in their community as possible.
State of South Dakota 2016
% diabetes prevalence 10% of South Dakotans
County %
Aurora 26%
Beadle 9%
Bennett 14%
Bon Homme 13%
Brookings 6%
Brown 10%
Brule 5%
Buffalo 16%
Butte 11%
Campbell 4%
Charles Mix 10%
Clark 10%
Clay 8%
Codington 10%
Corson 17%
Custer 16%
Davison 8%
Day 11%
Deuel 11%
Dewey 18%
Douglas 13%
Edmunds 10%
Fall River 11%
Faulk 8%
Grant 8%
Gregory 9%
Haakon 11%
Hamlin 9%
Hand 7%
Hanson 12%
Harding 8%
Hughes 9%
Hutchinson 10%
County %
Hyde 6%
Jackson 13%
Jerauld 18%
Jones 11%
Kingsbury 9%
Lake 9%
Lawrence 9%
Lincoln 8%
Lyman 12%
Marshall 11%
McCook 9%
McPherson 12%
Meade 9%
Mellette 14%
Miner 13%
Minnehaha 9%
Moody 13%
Oglala Lakota 19%
Pennington 10%
Perkins 10%
Potter 10%
Roberts 17%
Sanborn 13%
Spink 14%
Stanley 11%
Sully 6%
Todd 14%
Tripp 11%
Turner 10%
Union 13%
Walworth 14%
Yankton 9%
Ziebach 18%
Source: University of Wisconsin Population Health Institute. County Health Rankings South Dakota. (2020).
Retrieved August 2020, from https://www.countyhealthrankings.org/app/south-dakota/2020/overview

2020 Primary Care Needs Assessment SD Department of Health, Office of Rural Health A-32
Table 18: South Dakota K-12 School Body Mass Index (BMI) for Academic Years 2010-
11 and 2013-2018
BMI: Obese - All Age Groups
2010-2011 2013-2014 2014-2015 2015-2016 2016-2017 2017-2018
All age groups
15.2% 15.8% 16.0% 16.1% 16.0% 16.6%
BMI: Below 5th Percentile
Age Group 2010-2011 2013-2014 2014-2015 2015-2016 2016-2017 2017-2018
5-8 years 3.8% 3.4% 14.9% 15.0% 14.8% 15.3%
9-11 years 3.5% 3.1% 16.6% 15.6% 15.7% 16.0%
12-14 years 3.2% 2.6% 17.7% 17.4% 17.3% 17.4%
15-19 years 2.0% 2.3% 17.0% 17.8% 15.3% 17.3%
BMI: Obese
Age Group 2010-2011 2013-2014 2014-2015 2015-2016 2016-2017 2017-2018
5-8 years 13.0% 13.1% 12.9% 12.9% 12.8% 13.2%
9-11 years 16.3% 17.9% 17.9% 17.9% 17.4% 18.7%
12-14 years 17.0% 17.4% 18.3% 17.6% 17.9% 18.7%
15-19 years 16.3% 18.2% 18.4% 19.2% 19.8% 19.8%
Sources:
School Height and Weight Report; South Dakota Students 2013 – 2014 School Year (Figure 2, Page 6 for
Below 5th Percentile data; Figures 3-6, Page 8 for Obese data); South Dakota Department of Health; February
2015.
School Height and Weight Report; South Dakota Students 2014 – 2015 School Year (Figure 2, Page 6 for
Below 5th Percentile data; Figures 3-6, Page 8 for Obese data); South Dakota Department of Health;
November 2015.
School Height and Weight Report; South Dakota Students 2015 – 2016 School Year (Figure 2, Page 6 for
Below 5th Percentile data; Figures 3-6, Page 8 for Obese data); South Dakota Department of Health;
November 2016.
School Height and Weight Report; South Dakota Students 2016 – 2017 School Year (Figure 2, Page 6 for
Below 5th Percentile data; Figures 3-6, Page 8 for Obese data); South Dakota Department of Health;
December 2017.
School Height and Weight Report; South Dakota Students 2017 – 2018 School Year (Figure 2, Page 6 for
Below 5th Percentile data; Figures 3-6, Page 8 for Obese data); South Dakota Department of Health;
December 2018.
Note: The data reported here was obtained from the afore-mentioned source. Note that the reported values in
the original 2010-2011 School Year Report from the South Dakota Department of Health included slightly
different values.
Citation: South Dakota Department of Health (various years). School Height and Weight Report South Dakota
Students. Retrieved August 2020, from https://doh.sd.gov/statistics/school-height-weight.aspx?

2020 Primary Care Needs Assessment SD Department of Health, Office of Rural Health A-33
Table 19: Adult Obesity by County, 2016
Methodology: Adult Obesity is based on responses to the Behavioral Risk Factor Surveillance Survey (BRFSS) and
is the percentage of the adult population (age 20 and older) that reports a body mass index (BMI) greater than or
equal to 30 kg/m2. Participants are asked to self-report their height and weight. From these reported values, BMIs for
the participants are calculated.
Data for Adult Obesity are provided by the CDC Interactive Diabetes Atlas which uses BRFSS data to provide county-
level estimates. Beginning with the 2015 County Health Rankings, Adult Obesity estimates include both landline and
cell phone users. Previously, only landline users were included in the data. This change was implemented in order to
provide users with the most accurate estimates of health in their community as possible.
State of South Dakota 2016
% obese (BMI 30.0 or higher) 32%
County %
Aurora 37%
Beadle 36%
Bennett 42%
Bon Homme 40%
Brookings 28%
Brown 32%
Brule 29%
Buffalo 48%
Butte 32%
Campbell 31%
Charles Mix 42%
Clark 31%
Clay 30%
Codington 32%
Corson 39%
Custer 31%
Davison 27%
Day 36%
Deuel 36%
Dewey 39%
Douglas 29%
Edmunds 31%
Fall River 33%
Faulk 37%
Grant 27%
Gregory 30%
Haakon 26%
Hamlin 29%
Hand 31%
Hanson 28%
Harding 40%
Hughes 33%
Hutchinson 33%
County %
Hyde 25%
Jackson 35%
Jerauld 23%
Jones 27%
Kingsbury 30%
Lake 32%
Lawrence 26%
Lincoln 30%
Lyman 38%
Marshall 30%
McCook 36%
McPherson 31%
Meade 29%
Mellette 36%
Miner 24%
Minnehaha 32%
Moody 37%
Oglala Lakota 40%
Pennington 29%
Perkins 30%
Potter 28%
Roberts 37%
Sanborn 39%
Spink 40%
Stanley 28%
Sully 28%
Todd 39%
Tripp 36%
Turner 38%
Union 30%
Walworth 32%
Yankton 38%
Ziebach 52%
Source: University of Wisconsin Population Health Institute. County Health Rankings South Dakota. (2020).
Retrieved August 2020, from https://www.countyhealthrankings.org/app/south-dakota/2020/overview
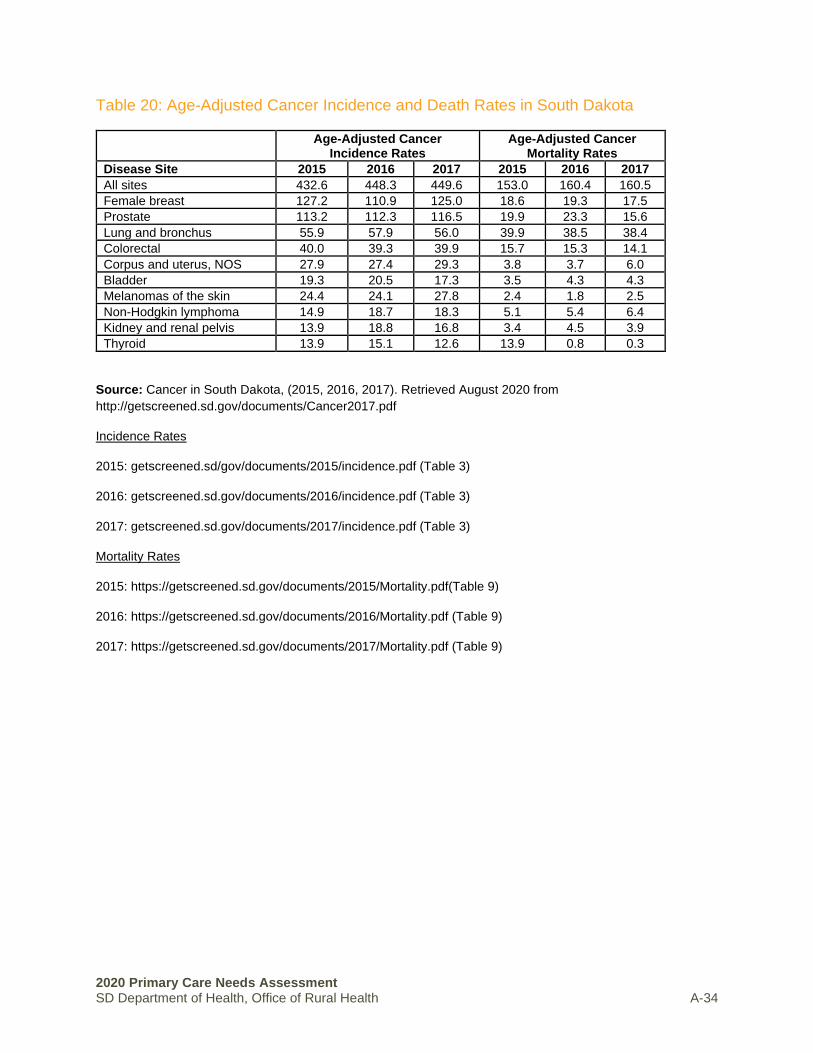
2020 Primary Care Needs Assessment SD Department of Health, Office of Rural Health A-34
Table 20: Age-Adjusted Cancer Incidence and Death Rates in South Dakota
Age-Adjusted Cancer Incidence Rates
Age-Adjusted Cancer Mortality Rates
Disease Site 2015 2016 2017 2015 2016 2017
All sites 432.6 448.3 449.6 153.0 160.4 160.5
Female breast 127.2 110.9 125.0 18.6 19.3 17.5
Prostate 113.2 112.3 116.5 19.9 23.3 15.6
Lung and bronchus 55.9 57.9 56.0 39.9 38.5 38.4
Colorectal 40.0 39.3 39.9 15.7 15.3 14.1
Corpus and uterus, NOS 27.9 27.4 29.3 3.8 3.7 6.0
Bladder 19.3 20.5 17.3 3.5 4.3 4.3
Melanomas of the skin 24.4 24.1 27.8 2.4 1.8 2.5
Non-Hodgkin lymphoma 14.9 18.7 18.3 5.1 5.4 6.4
Kidney and renal pelvis 13.9 18.8 16.8 3.4 4.5 3.9
Thyroid 13.9 15.1 12.6 13.9 0.8 0.3
Source: Cancer in South Dakota, (2015, 2016, 2017). Retrieved August 2020 from
http://getscreened.sd.gov/documents/Cancer2017.pdf
Incidence Rates
2015: getscreened.sd/gov/documents/2015/incidence.pdf (Table 3)
2016: getscreened.sd.gov/documents/2016/incidence.pdf (Table 3)
2017: getscreened.sd.gov/documents/2017/incidence.pdf (Table 3)
Mortality Rates
2015: https://getscreened.sd.gov/documents/2015/Mortality.pdf(Table 9)
2016: https://getscreened.sd.gov/documents/2016/Mortality.pdf (Table 9)
2017: https://getscreened.sd.gov/documents/2017/Mortality.pdf (Table 9)

2020 Primary Care Needs Assessment SD Department of Health, Office of Rural Health A-35
Table 21: Cancer Prevalence by County
State of South Dakota
Year 2013 2014 2015 2016 2017
Age-adjusted incidence rate
450.0 451.5 432.6 448.3 449.6
County 2017 Cancer Prevalence Age
Adjusted Incidence Rate
Aurora 477.9
Beadle 436.1
Bennett 271.8
Bon Homme 484.7
Brookings 432.2
Brown 385.9
Brule 644.9
Buffalo 441.6
Butte 412.1
Campbell 311.3
Charles Mix 458.8
Clark 626.8
Clay 535.6
Codington 457.4
Corson 376.7
Custer 285.4
Davison 517.6
Day 474.9
Deuel 479.0
Dewey 504.0
Douglas 639.3
Edmunds 568.8
Fall River 337.1
Faulk 464.4
Grant 501.2
Gregory 377.8
Haakon 328.1
Hamlin 552.2
Hand 516.7
Hanson 286.6
Harding 111.9
Hughes 471.3
Hutchinson 563.5
County 2017 Cancer Prevalence Age
Adjusted Incidence Rate
Hyde 565.5
Jackson 412.6
Jerauld 381.1
Jones 288.0
Kingsbury 545.9
Lake 477.2
Lawrence 449.8
Lincoln 453.6
Lyman 362.2
Marshall 180.7
McCook 502.5
McPherson 730.0
Meade 365.8
Mellette 148.3
Miner 442.1
Minnehaha 508.7
Moody 309.2
Oglala Lakota 464.6
Pennington 426.6
Perkins 278.4
Potter 576.7
Roberts 416.4
Sanborn 581.1
Spink 471.0
Stanley 363.5
Sully 107.6
Todd 575.4
Tripp 503.1
Turner 500.7
Union 464.5
Walworth 442.8
Yankton 406.0
Ziebach 115.0
Source: Cancer in South Dakota, (various years). Retrieved August 2020 from
http://getscreened.sd.gov/documents/Cancer2017.pdf

2020 Primary Care Needs Assessment SD Department of Health, Office of Rural Health A-36
Table 22: Cases of HIV and AIDS, 2005-2017
Methodology: Cases of HIV/AIDS by year.
Year 2005 2006 2007 2008 2009 2010 2011 2012 2013 2014 2015 2016 2017
HIV/AIDS, Average Annual
Incidence
33 34 25 34 21 35 21 29 36 31 25 47 41
Source: South Dakota Vital Statistics Report: A State and County Comparison of Leading Health Indicators.
(2014, 2017). Retrieved August 2020, from https://doh.sd.gov/statistics/

2020 Primary Care Needs Assessment SD Department of Health, Office of Rural Health A-37
Table 23: South Dakotans Who Self-Identified as having Depression, 2014
Methodology: Multiple modes of data collection were used including mail, telephone and in-person surveys. A
representative sample of US Postal addresses were selected, clustered by geography. Randomly selected
households first received a postcard to raise awareness of the study and test addresses, which was followed by
two waves of survey mailings and automated reminder calls to prompt respondents to complete the survey on
paper or online.
State of South Dakota
% of residents reporting being screened positive with depression 5.5%
County % “yes”
Aurora 7.3%
Beadle 4.8%
Bennett n.d.
Bon Homme 4.1%
Brookings 2.4%
Brown 6.1%
Brule 4.7%
Buffalo 16.7%
Butte 1.3%
Campbell 1.0%
Charles Mix 6.6%
Clark 4.0%
Clay 2.8%
Codington 6.6%
Corson n.d.
Custer 6.4%
Davison 2.6%
Day 5.2%
Deuel 2.2%
Dewey n.d.
Douglas 4.9%
Edmunds 4.2%
Fall River 3.0%
Faulk 4.3%
Grant 9.1%
Gregory 2.9%
Haakon 4.3%
Hamlin 3.2%
Hand 4.9%
Hanson 2.6%
Harding 7.0%
Hughes 5.8%
Hutchinson 3.6%
County % “yes”
Hyde 4.0%
Jackson n.d.
Jerauld 1.7%
Jones 1.9%
Kingsbury 5.6%
Lake 0.0%
Lawrence 3.0%
Lincoln 4.2%
Lyman 3.0%
Marshall 8.2%
McCook 8.3%
McPherson 4.4%
Meade 6.4%
Mellette n.d.
Miner 4.7%
Minnehaha 5.3%
Moody 8.1%
Oglala Lakota n.d.
Pennington 9.1%
Perkins 4.4%
Potter 8.4%
Roberts 10.4%
Sanborn 1.8%
Spink 7.2%
Stanley 8.6%
Sully 4.7%
Todd n.d.
Tripp n.d.
Turner 8.7%
Union 4.6%
Walworth 3.9%
Yankton 1.6%
Ziebach n.d.
n.d.: no data
Source: Spurlock M., Davis M.M., Dulacki K., Meath T., Li H.F., McCarty D., Knight-Richardson N., Wright B.,
Warne D., McConnell K.J. Focus on South Dakota: A Picture of Health. Report Findings from the South
Dakota Health Survey. May 2015.

2020 Primary Care Needs Assessment SD Department of Health, Office of Rural Health A-38
Table 24: South Dakotans Who Self-Identified as having Anxiety, 2014
Methodology: Multiple modes of data collection were used including mail, telephone and in-person surveys. A
representative sample of US Postal addresses were selected, clustered by geography. Randomly selected
households first received a postcard to raise awareness of the study and test addresses, which was followed by
two waves of survey mailings and automated reminder calls to prompt respondents to complete the survey on
paper or online.
State of South Dakota
% of residents reporting being screened positive with anxiety 7.5%
County % “yes”
Aurora 3.5%
Beadle 4.8%
Bennett n.d.
Bon Homme 3.6%
Brookings 19.3%
Brown 6.3%
Brule 5.5%
Buffalo 16.9%
Butte 6.1%
Campbell 2.3%
Charles Mix 8.4%
Clark 4.1%
Clay 3.4%
Codington 11.7%
Corson n.d.
Custer 5.3%
Davison 3.0%
Day 5.3%
Deuel 2.2%
Dewey n.d.
Douglas 1.8%
Edmunds 3.4%
Fall River 7.8%
Faulk 4.3%
Grant 8.5%
Gregory 2.9%
Haakon 3.4%
Hamlin 3.4%
Hand 7.4%
Hanson 4.6%
Harding 7.0%
Hughes 2.2%
Hutchinson 3.8%
County % “yes”
Hyde 4.0%
Jackson n.d.
Jerauld 6.8%
Jones 1.9%
Kingsbury 4.6%
Lake 6.7%
Lawrence 10.5%
Lincoln 2.2%
Lyman 2.4%
Marshall 9.1%
McCook 17.2%
McPherson 5.2%
Meade 4.8%
Mellette n.d.
Miner 3.3%
Minnehaha 8.9%
Moody 4.0%
Oglala Lakota n.d.
Pennington 8.9%
Perkins 8.5%
Potter 8.0%
Roberts 3.7%
Sanborn 0.0%
Spink 4.4%
Stanley 13.6%
Sully 4.7%
Todd n.d.
Tripp n.d.
Turner 5.5%
Union 7.9%
Walworth 4.5%
Yankton 3.1%
Ziebach n.d.
n.d.: no data
Source: Spurlock M., Davis M.M., Dulacki K., Meath T., Li H.F., McCarty D., Knight-Richardson N., Wright B.,
Warne D., McConnell K.J. Focus on South Dakota: A Picture of Health. Report Findings from the South
Dakota Health Survey. May 2015.

2020 Primary Care Needs Assessment SD Department of Health, Office of Rural Health A-39
Table 25: Reported Sexually Transmitted Diseases, 2012-2016
Methodology: Number of reported sexually transmitted cases. Individual counties events of 1 or 2 in a single
year are published as ≤2.
STD cases and average annual rates* by county, South Dakota 2012-2016
*Rate = cases per 100,000 population per year. Counties with 1 or 2 cases are shown as ≤ 2. Gonorrhea Chlamydia Syphilis
County Cases Rate* Cases Rate* Cases Rate*
Aurora 4 29.1 19 138.4 0 0
Beadle 20 22 344 378.7 0 0
Bennett 59 344 164 956.3 0 0
Bon Homme 3 8.5 59 168 0 0
Brookings 26 15.6 568 341 3 1.8
Brown 58 30.2 639 332.7 ≤2 1
Brule 13 49 59 222.3 ≤2 3.8
Buffalo 38 365.9 161 1,550.30 0 0
Butte 13 25.2 150 291.3 0 0
Campbell 0 0 5 72.2 0 0
Charles Mix 126 271.3 408 878.6 4 8.6
Clark ≤2 11 34 186.6 0 0
Clay 32 45.9 276 396.2 4 5.7
Codington 38 27.2 467 334.3 4 2.9
Corson 140 669.5 415 1,984.70 74 353.9
Custer 11 26.1 128 303.1 0 0
Davison 66 66.4 357 359.1 5 5
Day 10 35.8 62 221.9 0 0
Deuel 0 0 26 120.6 0 0
Dewey 295 1,042.00 682 2,409.00 16 56.5
Douglas ≤2 13.5 7 47.1 3 20.2
Edmunds ≤2 5 15 75.3 0 0
Fall River 15 43.8 82 239.6 0 0
Faulk ≤2 17 7 59.4 0 0
Grant 8 22.1 51 140.9 ≤2 2.8
Gregory ≤2 9.5 32 151.8 0 0
Haakon 5 54.1 11 119.1 0 0
Hamlin 3 10 37 123.6 0 0
Hand 0 0 16 95.7 0 0
Hanson 0 0 13 76 0 0
Harding 0 0 6 96 0 0
Hughes 74 83.9 373 422.9 ≤2 1.1
Hutchinson 5 13.9 43 119.4 0 0
Hyde 0 0 9 128.9 0 0
Jackson 33 201.6 131 800.2 0 0
Jerauld ≤2 10 11 109.6 0 0
Jones 3 61.5 15 307.7 0 0
Sexually transmitted disease cases reported in South Dakota, 2007-2016
South Dakota 2012 2013 2014 2015 2016 Total
Gonorrhea 707 789 880 1,055 1,269 6,750
Chlamydia 3,925 3,947 4,129 3,877 4,331 35,354
Syphilis* 21 49 79 48 40 258
*Early syphilis (primary, secondary, and early latent) and congenital syphilis

2020 Primary Care Needs Assessment SD Department of Health, Office of Rural Health A-40
Continued, Table 25: Reported Sexually Transmitted Diseases, 2012-2016
STD cases and average annual rates* by county, South Dakota 2012-2016
*Rate = cases per 100,000 population per year. Counties with 1 or 2 cases are shown as ≤ 2.
Gonorrhea Chlamydia Syphilis
County Cases Rate* Cases County Cases Rate*
Kingsbury 7 27.6 43 169.5 0 0
Lake 3 4.9 108 174.6 ≤2 1.6
Lawrence 28 22.7 503 408 0 0
Lincoln 64 24.8 477 185.1 5 1.9
Lyman 60 309.5 149 768.6 ≤2 5.2
Marshall 6 25.6 37 158 3 12.8
McCook 12 42.5 39 138.1 0 0
McPherson 0 0 6 49.4 0 0
Meade 44 32.7 450 333.9 ≤2 1.5
Mellette 24 228.6 72 685.7 0 0
Miner ≤2 17.3 13 112.3 0 0
Minnehaha 1,248 136.5 5,046 551.8 118 12.9
Moody 17 53.4 95 298.4 0 0
Oglala Lakota 520 731.5 1,647 2,316.80 8 11.3
Pennington 913 168.7 3,021 558.2 6 1.1
Perkins 0 0 10 65.9 0 0
Potter 1 8.5 15 128.2 0 0
Roberts 39 75.2 529 1,019.90 3 5.8
Sanborn ≤2 8.6 22 188.4 0 0
Spink 4 12.1 53 160.7 0 0
Stanley 5 33.5 55 368.8 0 0
Sully ≤2 13.9 6 83.4 0 0
Todd 350 708.4 985 1,993.50 ≤2 4
Tripp 7 25.4 74 268.5 0 0
Turner 5 12.1 51 123.3 ≤2 4.8
Union 30 39.9 119 158.4 ≤2 2.7
Walworth 25 90.7 130 471.8 8 29
Yankton 42 37 349 307.7 ≤2 0.9
Ziebach 57 403.4 117 828 0 0
South Dakota 4,623 108.1 20,103 470.1 280 6.5
Source: Sexually Transmitted Disease Surveillance in South Dakota. (2017). Retrieved August 2020, from
https://doh.sd.gov/diseases/infectious/std/Reports.aspx
* Syphilis is a sexually transmitted disease. Syphilis manifests as primary, secondary, latent and tertiary stages
in adults or children. Congenital syphilis may cause stillbirth or developmental anomalies in infected infants.
The primary, secondary and early latent stages are infectious to others.

2020 Primary Care Needs Assessment
SD Department of Health, Office of Rural Health B-1
APPENDIX B │SUPPLEMENTAL TABLES FOR HEALTH ACCESS INDICATORS
Table 26: Ratio of Population to Dentists in South Dakota, 2018
Table 27: South Dakotans in Poverty by County, 2019
Table 28: Percent of South Dakota Students (K-12) Eligible to Receive Free or Reduced-Price School Lunch, 2011, 2014, and 2019
Table 29: South Dakotans who Self-Identified as having a Usual Place to go for Care by County, 2014
Table 30: South Dakotans who Self-Identified as having a Personal Doctor or Provider by County, 2014
Table 31: Percent of South Dakotans who could not see a doctor due to cost by County, 2014
Table 32: Live Births by County, 2010-2018
Table 33: Percent of Infants with Low Birth Weight by County, 2011, 2014, and 2017
Table 34: Percent of Mothers Receiving Prenatal Care in their First Trimester by County, 2011, 2014, and 2017
Table 35: Rates of Cancer Screening Tests for Age-Eligible Populations in South Dakota, 2012
Table 36: Model-Based Percent of South Dakotans who have ever had a Colorectal Endoscopy (Sigmoidoscopy or Colonoscopy) and are 50+ by County, 2008-2010
Table 37: Percent of Female Medicare Enrollees (Aged 67-69) in South Dakota who have had a Mammography Screening by County, 2018
Table 38: Flu Vaccinations of Medicare Beneficiaries in South Dakota as of 2017, By County
Table 39: Uninsured Adults, Aged 18 to 64 by County
Table 40: Uninsured Children, Under 19 by County
Table 41: Average EMS Dispatch to Enroute Time (in minutes) by County
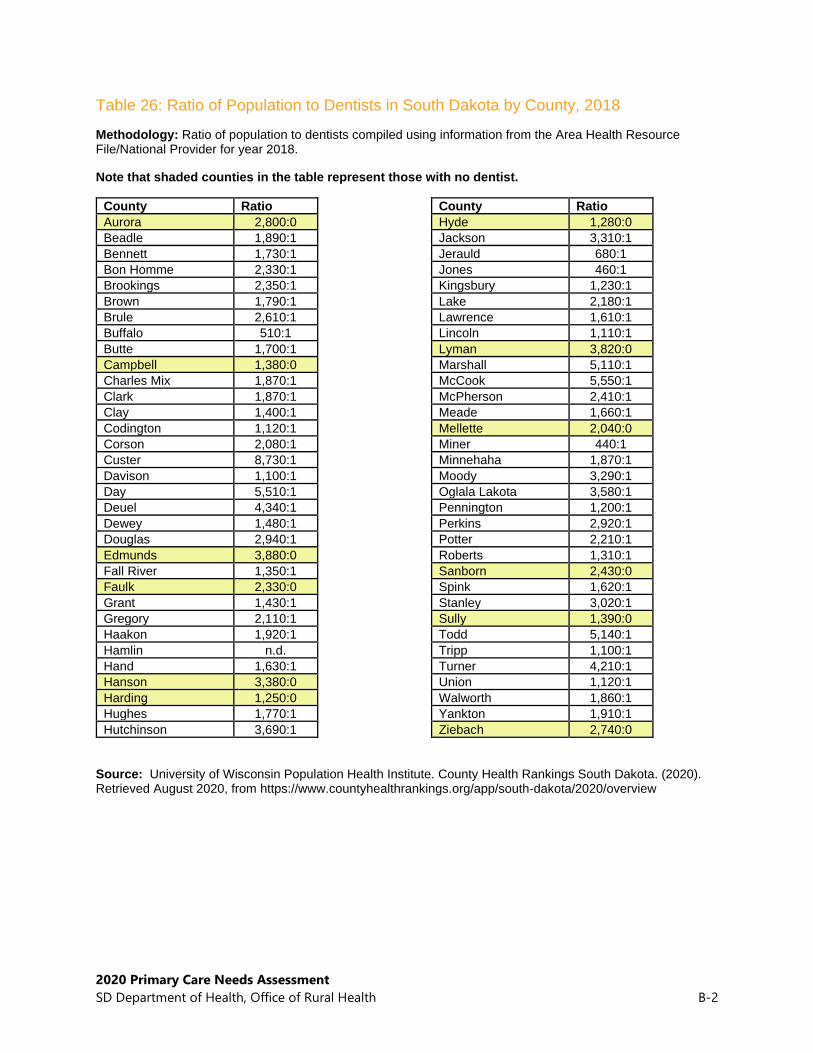
2020 Primary Care Needs Assessment
SD Department of Health, Office of Rural Health B-2
Table 26: Ratio of Population to Dentists in South Dakota by County, 2018
Methodology: Ratio of population to dentists compiled using information from the Area Health Resource File/National Provider for year 2018.
Note that shaded counties in the table represent those with no dentist.
County Ratio
Aurora 2,800:0
Beadle 1,890:1
Bennett 1,730:1
Bon Homme 2,330:1
Brookings 2,350:1
Brown 1,790:1
Brule 2,610:1
Buffalo 510:1
Butte 1,700:1
Campbell 1,380:0
Charles Mix 1,870:1
Clark 1,870:1
Clay 1,400:1
Codington 1,120:1
Corson 2,080:1
Custer 8,730:1
Davison 1,100:1
Day 5,510:1
Deuel 4,340:1
Dewey 1,480:1
Douglas 2,940:1
Edmunds 3,880:0
Fall River 1,350:1
Faulk 2,330:0
Grant 1,430:1
Gregory 2,110:1
Haakon 1,920:1
Hamlin n.d.
Hand 1,630:1
Hanson 3,380:0
Harding 1,250:0
Hughes 1,770:1
Hutchinson 3,690:1
County Ratio
Hyde 1,280:0
Jackson 3,310:1
Jerauld 680:1
Jones 460:1
Kingsbury 1,230:1
Lake 2,180:1
Lawrence 1,610:1
Lincoln 1,110:1
Lyman 3,820:0
Marshall 5,110:1
McCook 5,550:1
McPherson 2,410:1
Meade 1,660:1
Mellette 2,040:0
Miner 440:1
Minnehaha 1,870:1
Moody 3,290:1
Oglala Lakota 3,580:1
Pennington 1,200:1
Perkins 2,920:1
Potter 2,210:1
Roberts 1,310:1
Sanborn 2,430:0
Spink 1,620:1
Stanley 3,020:1
Sully 1,390:0
Todd 5,140:1
Tripp 1,100:1
Turner 4,210:1
Union 1,120:1
Walworth 1,860:1
Yankton 1,910:1
Ziebach 2,740:0
Source: University of Wisconsin Population Health Institute. County Health Rankings South Dakota. (2020). Retrieved August 2020, from https://www.countyhealthrankings.org/app/south-dakota/2020/overview

2020 Primary Care Needs Assessment SD Department of Health, Office of Rural Health B-3
Table 27: South Dakotans in Poverty by County, 2019
State of South Dakota 20111 2014 2019
Persons in poverty, % 14.1% 14.8% 13.1%
County Persons in poverty (%)
Aurora 10.2%
Beadle 12.9%
Bennett 32.5%
Bon Homme 15.7%
Brookings 11.8%
Brown 11.0%
Brule 15.8%
Buffalo 45.7%
Butte 14.3%
Campbell 10.9%
Charles Mix 20.9%
Clark 12.6%
Clay 19.5%
Codington 11.3%
Corson 33.6%
Custer 10.1%
Davison 12.0%
Day 15.3%
Deuel 9.1%
Dewey 25.8%
Douglas 12.1%
Edmunds 11.5%
Fall River 13.0%
Faulk 15.6%
Grant 9.9%
Gregory 16.5%
Haakon 11.0%
Hamlin 9.3%
Hand 9.8%
Hanson 8.8%
Harding 10.7%
Hughes 9.4%
Hutchinson 11.5%
County Persons in poverty (%)
Hyde 10.3%
Jackson 32.7%
Jerauld 14.5%
Jones 13.2%
Kingsbury 9.0%
Lake 10.2%
Lawrence 12.7%
Lincoln 4.4%
Lyman 21.1%
Marshall 12.0%
McCook 9.6%
McPherson 17.1%
Meade 8.4%
Mellette 35.2%
Miner 11.5%
Minnehaha 9.6%
Moody 9.9%
Oglala Lakota 54.0%
Pennington 13.3%
Perkins 13.7%
Potter 10.2%
Roberts 21.3%
Sanborn 12.9%
Spink 12.6%
Stanley 7.8%
Sully 8.8%
Todd 48.4%
Tripp 19.9%
Turner 9.4%
Union 5.9%
Walworth 15.0%
Yankton 11.0%
Ziebach 43.9%
Source: U. S. Census Bureau (2020). QuickFacts: United States. Retrieved August 2020, from https://www.census.gov/quickfacts/fact/table/US/PST045219
1 Reported 2009-2013

2020 Primary Care Needs Assessment SD Department of Health, Office of Rural Health B-4
Table 28: Percent of South Dakota Students (K-12) eligible to receive Free or Reduced-Price School Lunch, 2011, 2014, and 2019
State of South Dakota
Year Percent of K-12 Students Eligible to Receive Free or Reduced-Price School Lunch
2011 41% of students
2014 46% of students
2019 38% of students
Percent of K-12 Students Eligible to Receive Free or Reduced-Price School
Lunch
Change
County 2011 2014 2019 2011-2014 2014-2019
Aurora 39% 47% 44% ↑ ↓
Beadle 52% 55% 46% ↑ ↓
Bennett 80% 84% n.d. ↑ n.d.
Bon Homme 41% 38% 31% ↓ ↓
Brookings 27% 26% 25% ↓ ↓
Brown 30% 34% 25% ↑ ↓
Brule 55% 58% 51% ↑ ↓
Buffalo 10% 83% n.d. ↑ n.d.
Butte 46% 45% 47% ↓ ↑
Campbell 29% 25% 26% ↓ ↑
Charles Mix 64% 80% 66% ↑ ↓
Clark 49% 42% 43% ↓ ↑
Clay 39% 38% 31% ↓ ↓
Codington 31% 35% 37% ↑ ↑
Corson 88% 86% n.d. ↓ n.d.
Custer 37% 36% 44% ↓ ↑
Davison 37% 40% 35% ↑ ↓
Day 48% 48% 43% → ↓
Deuel 29% 33% 31% ↑ ↓
Dewey 78% 81% 43% ↑ ↓
Douglas 35% 27% 32% ↓ ↑
Edmunds 41% 35% 35% ↓ →
Fall River 49% 45% 60% ↓ ↑
Faulk 35% 32% 22% ↓ ↓
Grant 34% 40% 42% ↑ ↑
Gregory 61% 57% 53% ↓ ↓
Haakon 38% 41% 26% ↑ ↓
Hamlin 43% 38% 34% ↓ ↓
Hand 30% 19% 17% ↓ ↓
Hanson 25% 25% 23% → ↓
Harding 37% 30% 26% ↓ ↓
Hughes 32% 30% 30% ↓ →
Hutchinson 37% 35% 41% ↓ ↑

2020 Primary Care Needs Assessment SD Department of Health, Office of Rural Health B-5
Continued, Table 28: Percent of South Dakota Students (K-12) Eligible to Receive Free or Reduced-Price School Lunch, 2011, 2014, and 2019
Percent of K-12 Students Eligible to Receive Free or Reduced-Price School
Lunch
Change
County 2011 2014 2019 2011-2014 2014-2019
Hyde 31% 32% 28% ↑ ↓
Jackson 80% 72% 56% ↓ ↓
Jerauld 41% 41% 28% → ↓
Jones 46% 46% 43% → ↓
Kingsbury 29% 24% 27% ↓ ↑
Lake 34% 29% 33% ↓ ↑
Lawrence 39% 36% 36% ↓ →
Lincoln 21% 18% 19% ↓ ↑
Lyman 72% 76% 50% ↑ ↓
Marshall 46% 42% 42% ↓ →
McCook 36% 26% 25% ↓ ↓
McPherson 59% 56% 53% ↓ ↓
Meade 39% 39% 38% → ↓
Mellette 69% 71% n.d. ↑ n.d.
Miner 31% 26% 26% ↓ →
Minnehaha 36% 37% 23% ↑ ↓
Moody 54% 48% 38% ↓ ↓
Oglala Lakota 79% n.d. n.d. n.d. n.d.
Pennington 41% 44% 37% ↑ ↓
Perkins 50% 44% 36% ↓ ↓
Potter 30% 28% 34% ↓ ↑
Roberts 56% 61% 54% ↑ ↓
Sanborn 47% 42% 38% ↓ ↓
Spink 36% 33% 31% ↓ ↓
Stanley 48% 46% 27% ↓ ↓
Sully 34% 25% 25% ↓ →
Todd 84% n.d. n.d. n.d. n.d.
Tripp 52% 52% 54% → ↑
Turner 33% 33% 29% → ↓
Union 28% 24% 23% ↓ ↓
Walworth 42% 40% 34% ↓ ↓
Yankton 37% 36% 39% ↓ ↑
Ziebach 75% 75% 68% → ↓
→ indicates the difference between 2011 and 2014 or 2014 and 2019 is less than 1%.
n.d. - data is not available or data is suppressed if 20 or fewer children are enrolled in the district or county.
Source: KIDS COUNT Data Center, Accessed July 20, 2020 at https://datacenter.kidscount.org/data/tables/10643-eligible-recipients-of-free-or-reduced-price-lunch?loc=43&loct=2#detailed/2/any/false/1965,1750,1686/any/20417

2020 Primary Care Needs Assessment SD Department of Health, Office of Rural Health B-6
Table 29: South Dakotans who Self-Identified as having a Usual Place to go for Care by County, 2014
Methodology: Multiple modes of data collection were used including mail, telephone and in-person surveys. A representative sample of US Postal addresses were selected, clustered by geography. Randomly selected households first received a postcard to raise awareness of the study and test addresses, which was followed by survey mailings and automated reminder calls.
State of South Dakota 2014
Percent of residents who have a usual place to go for care 94.2%
County
Percent of residents who have a usual
place to go for care
Aurora 95.4%
Beadle 95.7%
Bennett n.d.
Bon Homme 94.3%
Brookings 86.7%
Brown 98.6%
Brule 98.5%
Buffalo 98.4%
Butte 92.3%
Campbell 96.6%
Charles Mix 98.1%
Clark 94.8%
Clay 87.9%
Codington 93.5%
Corson n.d.
Custer 91.8%
Davison 99.3%
Day 98.7%
Deuel 91.4%
Dewey n.d.
Douglas 93.9%
Edmunds 94.4%
Fall River 96.9%
Faulk 99.2%
Grant 99.0%
Gregory 97.2%
Haakon 93.7%
Hamlin 94.6%
Hand 95.9%
Hanson 96.0%
Harding 93.6%
Hughes 98.1%
Hutchinson 91.4%
n.d. = no data
n.d.: no data County
Percent of residents who have a usual
place to go for care
Hyde 91.3%
Jackson n.d.
Jerauld 96.7%
Jones 85.7%
Kingsbury 91.4%
Lake 99.2%
Lawrence 87.7%
Lincoln 97.6%
Lyman 97.1%
Marshall 94.6%
McCook 92.2%
McPherson 99.1%
Meade 89.8%
Mellette n.d.
Miner 92.0%
Minnehaha 94.1%
Moody 99.4%
Oglala Lakota n.d.
Pennington 92.2%
Perkins 94.8%
Potter 92.2%
Roberts 99.4%
Sanborn 95.5%
Spink 98.2%
Stanley 89.9%
Sully 91.5%
Todd n.d.
Tripp n.d.
Turner 92.6%
Union 95.0%
Walworth 94.1%
Yankton 97.0%
Ziebach n.d.
Source: Spurlock M., Davis M.M., Dulacki K., Meath T., Li H.F., McCarty D., Knight-Richardson N., Wright B., Warne D., McConnell K.J. Focus on South Dakota: A Picture of Health. Report Findings from the South Dakota Health Survey. May 2015.
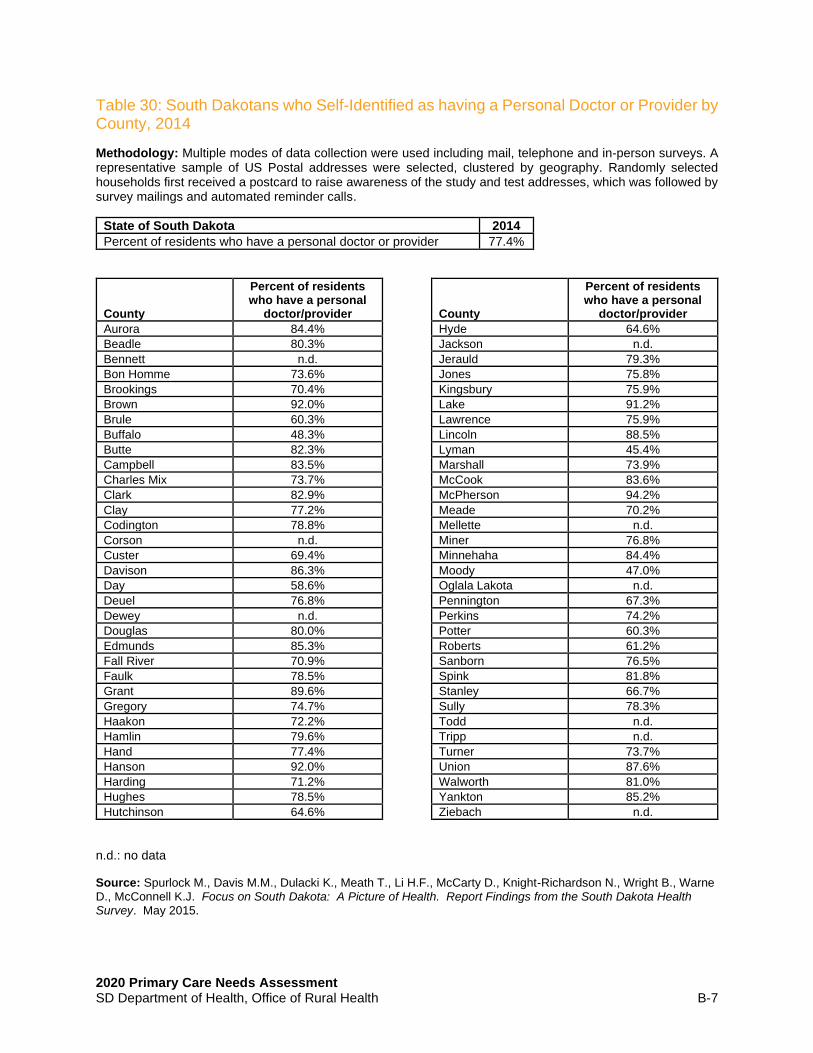
2020 Primary Care Needs Assessment SD Department of Health, Office of Rural Health B-7
Table 30: South Dakotans who Self-Identified as having a Personal Doctor or Provider by County, 2014
Methodology: Multiple modes of data collection were used including mail, telephone and in-person surveys. A representative sample of US Postal addresses were selected, clustered by geography. Randomly selected households first received a postcard to raise awareness of the study and test addresses, which was followed by survey mailings and automated reminder calls.
State of South Dakota 2014
Percent of residents who have a personal doctor or provider 77.4%
County
Percent of residents who have a personal
doctor/provider
Aurora 84.4%
Beadle 80.3%
Bennett n.d.
Bon Homme 73.6%
Brookings 70.4%
Brown 92.0%
Brule 60.3%
Buffalo 48.3%
Butte 82.3%
Campbell 83.5%
Charles Mix 73.7%
Clark 82.9%
Clay 77.2%
Codington 78.8%
Corson n.d.
Custer 69.4%
Davison 86.3%
Day 58.6%
Deuel 76.8%
Dewey n.d.
Douglas 80.0%
Edmunds 85.3%
Fall River 70.9%
Faulk 78.5%
Grant 89.6%
Gregory 74.7%
Haakon 72.2%
Hamlin 79.6%
Hand 77.4%
Hanson 92.0%
Harding 71.2%
Hughes 78.5%
Hutchinson 64.6%
County
Percent of residents who have a personal
doctor/provider
Hyde 64.6%
Jackson n.d.
Jerauld 79.3%
Jones 75.8%
Kingsbury 75.9%
Lake 91.2%
Lawrence 75.9%
Lincoln 88.5%
Lyman 45.4%
Marshall 73.9%
McCook 83.6%
McPherson 94.2%
Meade 70.2%
Mellette n.d.
Miner 76.8%
Minnehaha 84.4%
Moody 47.0%
Oglala Lakota n.d.
Pennington 67.3%
Perkins 74.2%
Potter 60.3%
Roberts 61.2%
Sanborn 76.5%
Spink 81.8%
Stanley 66.7%
Sully 78.3%
Todd n.d.
Tripp n.d.
Turner 73.7%
Union 87.6%
Walworth 81.0%
Yankton 85.2%
Ziebach n.d.
n.d.: no data
Source: Spurlock M., Davis M.M., Dulacki K., Meath T., Li H.F., McCarty D., Knight-Richardson N., Wright B., Warne D., McConnell K.J. Focus on South Dakota: A Picture of Health. Report Findings from the South Dakota Health Survey. May 2015.

2020 Primary Care Needs Assessment SD Department of Health, Office of Rural Health B-8
Table 31: Percent of South Dakotans who could not see a doctor due to cost by County, 2014
Methodology: “Could not see a doctor due to cost” was measured using data from the Behavioral Risk Factor Surveillance System, program years 2006-2012.
State of South Dakota 2014
Percent of population who could not see a doctor due to cost 8.7%
County
Percent of population who could not see a doctor due to cost
Aurora n.d.
Beadle 5.2%
Bennett 9.3%
Bon Homme 6.9%
Brookings 7.3%
Brown 7.1%
Brule 7.6%
Buffalo 14.9%
Butte 11.3%
Campbell n.d.
Charles Mix 8.3%
Clark n.d.
Clay 9.3%
Codington 7.8%
Corson 18.5%
Custer 9.6%
Davison 6.5%
Day 6.0%
Deuel 15.8%
Dewey 8.1%
Douglas 8.0%
Edmunds n.d.
Fall River 14.2%
Faulk n.d.
Grant n.d.
Gregory n.d.
Haakon 5.4%
Hamlin n.d.
Hand 4.6%
Hanson n.d.
Harding n.d.
Hughes 6.6%
Hutchinson n.d.
County
Percent of population who could not see a doctor due to cost
Hyde n.d.
Jackson 14.6%
Jerauld n.d.
Jones n.d.
Kingsbury 4.4%
Lake 9.1%
Lawrence 11.6%
Lincoln 5.5%
Lyman 4.9%
Marshall 8.2%
McCook n.d.
McPherson n.d.
Meade 9.8%
Mellette n.d.
Miner n.d.
Minnehaha 8.6%
Moody n.d.
Oglala Lakota 13.2%
Pennington 11.7%
Perkins n.d.
Potter n.d.
Roberts 7.2%
Sanborn 14.0%
Spink n.d.
Stanley 6.1%
Sully n.d.
Todd 14.0%
Tripp 7.5%
Turner n.d.
Union 4.3%
Walworth 7.7%
Yankton 7.3%
Ziebach 17.4%
n.d.: no data
Source: University of Wisconsin Population Health Institute. County Health Rankings 2015.

2020 Primary Care Needs Assessment SD Department of Health, Office of Rural Health B-9
Table 32: Live Births by County, 2010-2018
State of South Dakota
Year 2010 2011 2012 2013 2014
Births 11,795 11,834 12,092 12,243 12,281
State of South Dakota
Year 2015 2016 2017 2018
Births 12,323 12,270 12,128 11,890
County 2010 2011 2012 2013 2014
Aurora 29 39 30 40 42
Beadle 274 294 327 337 366
Bennett 70 76 69 69 72
Bon Homme 67 62 77 57 56
Brookings 379 385 404 430 406
Brown 467 485 476 512 482
Brule 74 69 84 70 77
Buffalo 49 57 47 58 53
Butte 114 136 120 133 142
Campbell 16 8 9 12 15
Charles Mix 156 157 161 151 174
Clark 48 52 43 51 67
Clay 138 152 151 166 143
Codington 375 372 376 410 372
Corson 78 84 87 93 86
Custer 85 77 66 71 65
Davison 258 262 264 263 271
Day 68 59 76 52 56
Deuel 51 48 46 46 47
Dewey 118 144 151 148 153
Douglas 30 36 37 33 40
Edmunds 34 47 46 46 53
Fall River 55 49 61 63 55
Faulk 24 28 28 23 38
Grant 81 69 83 80 97
Gregory 50 42 44 45 62
Haakon 23 23 18 20 17
Hamlin 102 107 127 124 118
Hand 46 36 28 38 42
Hanson 55 44 51 56 49
Harding 15 9 14 17 20
Hughes 225 237 230 255 229
Hutchinson 81 72 86 107 102
Hyde 12 15 9 19 14
Jackson 75 68 69 78 71
Jerauld 29 24 23 24 32
Jones 10 11 10 10 9

2020 Primary Care Needs Assessment SD Department of Health, Office of Rural Health B-10
Continued, Table 32: Live Births by County, 2010-2018
County 2010 2011 2012 2013 2014
Kingsbury 51 71 54 61 66
Lake 128 133 128 140 122
Lawrence 252 213 240 230 245
Lincoln 808 781 852 753 766
Lyman 72 76 60 69 71
Marshall 50 60 56 62 72
McCook 80 66 74 75 81
McPherson 18 24 25 24 30
Meade 334 314 327 320 318
Mellette 38 27 27 37 35
Miner 19 24 20 28 22
Minnehaha 2749 2779 2811 2863 2947
Moody 89 86 93 93 93
Oglala Lakota 370 344 350 352 312
Pennington 1549 1502 1532 1596 1540
Perkins 32 29 30 40 35
Potter 24 27 25 20 24
Roberts 159 187 176 201 177
Sanborn 24 28 34 35 37
Spink 78 72 91 80 69
Stanley 41 43 36 35 39
Sully 18 18 13 17 15
Todd 242 313 288 250 279
Tripp 61 70 66 65 71
Turner 101 89 89 86 81
Union 179 169 178 150 140
Walworth 56 69 66 70 85
Yankton 258 246 275 253 281
Ziebach 54 38 48 31 35
County 2015 2016 2017 2018
Aurora 33 49 36 41
Beadle 297 347 273 284
Bennett 71 65 61 55
Bon Homme 76 68 64 77
Brookings 471 414 451 435
Brown 492 557 510 508
Brule 69 71 78 62
Buffalo 42 52 47 22
Butte 100 135 131 146
Campbell 13 8 14 14
Charles Mix 156 164 168 156
Clark 61 65 66 66
Clay 145 147 155 114
Codington 381 370 336 326
Corson 89 101 101 91
Custer 86 69 78 63
Davison 242 257 227 263
Day 73 50 62 72

2020 Primary Care Needs Assessment SD Department of Health, Office of Rural Health B-11
Continued, Table 32: Live Births by County, 2010-2018
County 2015 2016 2017 2018
Deuel 44 64 53 53
Dewey 148 163 154 138
Douglas 43 46 44 41
Edmunds 48 46 43 34
Fall River 76 60 51 44
Faulk 32 31 38 32
Grant 74 84 87 80
Gregory 50 58 52 50
Haakon 26 19 26 14
Hamlin 121 111 110 125
Hand 24 39 44 35
Hanson 36 39 42 38
Harding 21 16 15 19
Hughes 249 233 221 246
Hutchinson 120 120 117 115
Hyde 15 20 18 14
Jackson 67 81 92 73
Jerauld 16 20 18 24
Jones 11 13 9 17
Kingsbury 64 67 67 71
Lake 134 133 131 128
Lawrence 220 241 241 202
Lincoln 751 810 846 829
Lyman 74 82 63 74
Marshall 80 68 90 85
McCook 22 27 18 24
McPherson 70 74 73 66
Meade 304 269 258 261
Mellette 40 44 45 33
Miner 32 21 27 29
Minnehaha 3,046 2,936 2,908 2,890
Moody 93 91 87 81
Oglala Lakota 337 284 321 261
Pennington 1,536 1,470 1,466 1,541
Perkins 33 40 37 33
Potter 24 28 15 24
Roberts 181 168 164 167
Sanborn 39 39 33 32
Spink 67 85 82 84
Stanley 45 42 29 44
Sully 11 16 24 16
Todd 274 260 256 230
Tripp 71 79 84 88
Turner 104 75 103 101
Union 169 163 191 166
Walworth 86 61 88 66
Yankton 299 318 269 253
Ziebach 32 27 19 24
Source: SD DOH, Vital Statistics accessed July 20, 2020 at https://doh.sd.gov/statistics/ county data: The Annie E. Casey Foundation, KIDS COUNT Data Center, datacenter.kidscount.org

2020 Primary Care Needs Assessment SD Department of Health, Office of Rural Health B-12
Table 33: Percent of Infants with Low Birth Weight by County, 2011, 2014, and 2017
State of South Dakota
Year Percent of Infants with Low Birth Weight
2011 6.5%
2014 6.4%
2017 6.5%
Percent of Infants with Low Birth Weight Change
County 2011 2014 2017 2011-2014 2014-2017
Aurora 8.9% 5.6% 8.0% ↓ ↑
Beadle 7.7% 7.5% 6.8% ↓ ↓
Bennett 7.2% 3.9% 5.6% ↓ ↑
Bon Homme 6.2% 6.6% 5.0% ↑ ↓
Brookings 4.7% 4.9% 5.5% ↑ ↑
Brown 5.9% 5.7% 6.5% ↓ ↑
Brule 6.2% 6.4% 5.8% ↑ ↓
Buffalo 6.3% 7.2% 8.4% ↑ ↑
Butte 4.4% 5.9% 7.2% ↑ ↑
Campbell 4.4% LNE LNE ↓ →
Charles Mix 5.0% 6.3% 5.9% ↑ ↓
Clark 4.1% 5.0% 6.5% ↑ ↑
Clay 6.3% 5.5% 5.4% ↓ ↓
Codington 5.5% 6.2% 7.2% ↑ ↑
Corson 6.4% 6.8% 9.4% ↑ ↑
Custer 6.6% 8.2% 8.1% ↑ ↓
Davison 6.4% 5.0% 6.6% ↓ ↑
Day 4.9% 6.8% 5.1% ↑ ↓
Deuel 6.4% 2.9% 4.3% ↓ ↑
Dewey 6.7% 6.6% 9.4% ↓ ↑
Douglas 3.8% 6.3% 5.8% ↑ ↓
Edmunds 4.6% 2.7% 3.8% ↓ ↑
Fall River 7.7% 8.1% 7.5% ↑ ↓
Faulk 2.5% 5.0% 8.0% ↑ ↑
Grant 4.1% 4.9% 5.0% ↑ ↑
Gregory 5.4% 3.7% 3.4% ↓ ↓
Haakon LNE 3.0% 2.8% ↑ ↓
Hamlin 4.2% 4.5% 4.1% ↑ ↓
Hand 8.6% 8.9% 7.0% ↑ ↓
Hanson 9.0% 7.5% 7.2% ↓ ↓
Harding LNE LNE 3.4% → ↑
Hughes 4.5% 4.8% 6.0% ↑ ↑
Hutchinson 3.4% 4.3% 5.3% ↑ ↑
Hyde LNE LNE 7.0% → ↑
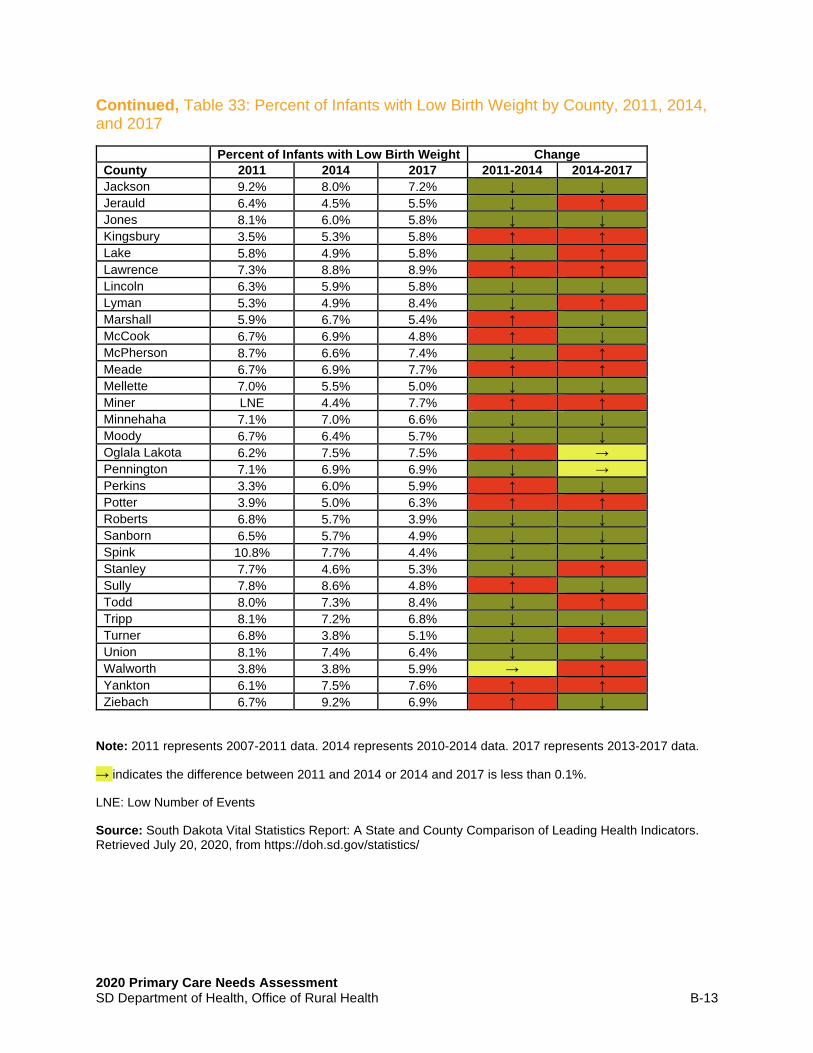
2020 Primary Care Needs Assessment SD Department of Health, Office of Rural Health B-13
Continued, Table 33: Percent of Infants with Low Birth Weight by County, 2011, 2014, and 2017
Percent of Infants with Low Birth Weight Change
County 2011 2014 2017 2011-2014 2014-2017
Jackson 9.2% 8.0% 7.2% ↓ ↓
Jerauld 6.4% 4.5% 5.5% ↓ ↑
Jones 8.1% 6.0% 5.8% ↓ ↓
Kingsbury 3.5% 5.3% 5.8% ↑ ↑
Lake 5.8% 4.9% 5.8% ↓ ↑
Lawrence 7.3% 8.8% 8.9% ↑ ↑
Lincoln 6.3% 5.9% 5.8% ↓ ↓
Lyman 5.3% 4.9% 8.4% ↓ ↑
Marshall 5.9% 6.7% 5.4% ↑ ↓
McCook 6.7% 6.9% 4.8% ↑ ↓
McPherson 8.7% 6.6% 7.4% ↓ ↑
Meade 6.7% 6.9% 7.7% ↑ ↑
Mellette 7.0% 5.5% 5.0% ↓ ↓
Miner LNE 4.4% 7.7% ↑ ↑
Minnehaha 7.1% 7.0% 6.6% ↓ ↓
Moody 6.7% 6.4% 5.7% ↓ ↓
Oglala Lakota 6.2% 7.5% 7.5% ↑ →
Pennington 7.1% 6.9% 6.9% ↓ →
Perkins 3.3% 6.0% 5.9% ↑ ↓
Potter 3.9% 5.0% 6.3% ↑ ↑
Roberts 6.8% 5.7% 3.9% ↓ ↓
Sanborn 6.5% 5.7% 4.9% ↓ ↓
Spink 10.8% 7.7% 4.4% ↓ ↓
Stanley 7.7% 4.6% 5.3% ↓ ↑
Sully 7.8% 8.6% 4.8% ↑ ↓
Todd 8.0% 7.3% 8.4% ↓ ↑
Tripp 8.1% 7.2% 6.8% ↓ ↓
Turner 6.8% 3.8% 5.1% ↓ ↑
Union 8.1% 7.4% 6.4% ↓ ↓
Walworth 3.8% 3.8% 5.9% → ↑
Yankton 6.1% 7.5% 7.6% ↑ ↑
Ziebach 6.7% 9.2% 6.9% ↑ ↓
Note: 2011 represents 2007-2011 data. 2014 represents 2010-2014 data. 2017 represents 2013-2017 data.
→ indicates the difference between 2011 and 2014 or 2014 and 2017 is less than 0.1%.
LNE: Low Number of Events
Source: South Dakota Vital Statistics Report: A State and County Comparison of Leading Health Indicators. Retrieved July 20, 2020, from https://doh.sd.gov/statistics/

2020 Primary Care Needs Assessment SD Department of Health, Office of Rural Health B-14
Table 34: Percent of Mothers Receiving Prenatal Care in their First Trimester by County, 2011, 2014, and 2017
State of South Dakota
Year Percent of women who reported receiving prenatal care in the first trimester
2011 69.4%
2014 71.1%
2017 72.4%
Percent of women who reported
receiving prenatal care in the first trimester
Change
County 2011 2014 2017 2011-2014 2014-2017
Aurora 73.8% 68.0% 72.0% ↓ ↑
Beadle 58.5% 55.0% 56.8% ↓ ↑
Bennett 41.8% 43.2% 56.1% ↑ ↑
Bon Homme 79.4% 79.5% 78.3% → ↓
Brookings 75.7% 77.4% 80.6% ↑ ↑
Brown 77.2% 75.5% 69.8% ↓ ↓
Brule 66.4% 67.8% 64.6% ↑ ↓
Buffalo 46.2% 36.3% 29.5% ↓ ↓
Butte 77.2% 78.6% 77.9% ↑ →
Campbell 73.5% 78.3% 79.0% ↑ →
Charles Mix 62.3% 65.1% 64.6% ↑ →
Clark 57.3% 59.9% 65.9% ↑ ↑
Clay 77.7% 79.1% 80.7% ↑ ↑
Codington 77.1% 79.4% 79.9% ↑ →
Corson 48.7% 46.0% 42.9% ↓ ↓
Custer 70.6% 72.1% 72.1% ↑ →
Davison 76.8% 78.0% 80.3% ↑ ↑
Day 69.1% 65.3% 72.6% ↓ ↑
Deuel 84.4% 81.0% 80.7% ↓ →
Dewey 53.4% 49.3% 50.6% ↓ ↑
Douglas 70.1% 71.6% 76.1% ↑ ↑
Edmunds 71.2% 69.6% 64.3% ↓ ↓
Fall River 55.7% 64.3% 68.2% ↑ ↑
Faulk 56.3% 57.9% 56.8% ↑ ↓
Grant 74.0% 78.1% 78.7% ↑ →
Gregory 63.8% 60.5% 65.3% ↓ ↑
Haakon 68.7% 68.3% 73.8% → ↑
Hamlin 68.5% 71.9% 73.5% ↑ ↑
Hand 71.9% 61.0% 54.3% ↓ ↓
Hanson 66.5% 62.2% 69.2% ↓ ↑
Harding 77.4% 74.3% 79.5% ↓ ↑
Hughes 70.7% 60.9% 50.1% ↓ ↓
Hutchinson 62.4% 67.0% 68.6% ↑ ↑

2020 Primary Care Needs Assessment SD Department of Health, Office of Rural Health B-15
Continued, Table 34: Percent of Mothers Receiving Prenatal Care in their First Trimester by County, 2011, 2014, and 2017
Percent of women who reported receiving prenatal care in the first
trimester
Change
County 2011 2014 2017 2011-2014 2014-2017
Hyde 75.9% 68.1% 61.2% ↓ ↓
Jackson 47.9% 49.4% 54.3% ↑ ↑
Jerauld 66.4% 68.2% 77.1% ↑ ↑
Jones 80.6% 74.0% 55.8% ↓ ↓
Kingsbury 71.1% 72.9% 80.1% ↑ ↑
Lake 73.4% 73.1% 73.8% → →
Lawrence 79.7% 81.1% 79.5% ↑ ↓
Lincoln 78.3% 83.7% 85.5% ↑ ↑
Lyman 52.0% 48.1% 45.9% ↓ ↓
Marshall 61.8% 60.5% 56.4% ↓ ↓
McCook 69.1% 73.0% 75.0% ↑ ↑
McPherson 65.2% 61.9% 53.3% ↓ ↓
Meade 77.7% 77.9% 78.4% → ↓
Mellette 44.4% 50.3% 48.2% ↑ ↓
Miner 71.4% 69.6% 65.6% ↓ ↓
Minnehaha 68.5% 74.4% 77.0% ↑ ↑
Moody 60.6% 65.1% 73.8% ↑ ↑
Oglala Lakota 51.6% 53.9% 59.3% ↑ ↑
Pennington 72.2% 72.3% 73.6% → ↑
Perkins 66.4% 65.9% 72.4% → ↑
Potter 74.2% 61.7% 56.8% ↓ ↓
Roberts 52.7% 54.5% 59.1% ↑ ↑
Sanborn 72.6% 69.4% 73.6% ↓ ↑
Spink 68.5% 69.7% 68.2% ↑ ↓
Stanley 72.3% 62.8% 56.7% ↓ ↓
Sully 73.0% 53.8% 49.4% ↓ ↓
Todd 39.1% 40.1% 39.5% → →
Tripp 65.1% 66.8% 71.4% ↑ ↑
Turner 73.1% 78.4% 81.6% ↑ ↑
Union 83.7% 86.7% 86.4% ↑ →
Walworth 64.4% 62.6% 65.2% ↓ ↑
Yankton 83.4% 83.4% 84.8% → ↑
Ziebach 46.0% 48.5% 53.2% ↑ ↑
Note: 2011 represents 2007-2011 data. 2014 represents 2010-2014 data. 2017 represents 2013-2017 data.
→ indicates the difference between 2011 and 2014 or 2014 and 2017 is less than 1%.
Source: South Dakota Vital Statistics Report: A State and County Comparison of Leading Health Indicators. Retrieved July 20, 2020, from https://doh.sd.gov/statistics/

2020 Primary Care Needs Assessment SD Department of Health, Office of Rural Health B-16
Table 35: Rates of Cancer Screening Tests for Age-Eligible Populations in South Dakota, 2012 and 2018
Screening Tests 2012 2018
Sigmoidoscopy or Colonoscopy 65.6% 72.4%
Blood stool test 13.5% 8.3%
PAP screening in past 3 years 79.1% 67.1%
Mammogram, age 50+ 77.1% 82.0%
Mammogram, age 40+ 73.0% 76.0%
Source: State Cancer Profiles. (2020). Retrieved August 2020, from https://statecancerprofiles.cancer.gov/risk/

2020 Primary Care Needs Assessment SD Department of Health, Office of Rural Health B-17
Table 36: Screening and Risk Factors Report for South Dakota by County. Ever Had Colorectal Endoscopy (Sigmoidoscopy or Colonoscopy) All Races (includes Hispanic), Both Sexes, Ages 50+
Methodology: 2008-2010 County Level Modeled Estimate combining BRFSS and NHIS. Data reflects individuals who self-reported if they had ever had a colorectal endoscopy (sigmoidoscopy or colonoscopy). Data is reported for all races, both sexes, ages 50+. These county estimates were updated May 16, 2017, using a new methodology. See https://sae.cancer.gov for more details.
State of South Dakota 2017
Screening and Risk Factors Report for South Dakota (Directly Estimated 2018 BRFSS Data)
72.4%
County
2008-2010 County Level Modeled Estimate Combining
BRFSS & NHIS
Aurora 65.2%
Beadle 58.2%
Bennett 49.7%
Bon Homme 63.7%
Brookings 61.2%
Brown 64.1%
Brule 70.6%
Buffalo 30.8%
Butte 60.5%
Campbell 61.4%
Charles Mix 55.6%
Clark 66.7%
Clay 57.1%
Codington 60.2%
Corson 45.7%
Custer 59.0%
Davison 63.3%
Day 55.1%
Deuel 44.7%
Dewey 36.5%
Douglas 50.9%
Edmunds 53.9%
Fall River 62.0%
Faulk 39.1%
Grant 59.8%
Gregory 54.9%
Haakon 61.3%
Hamlin 54.8%
Hand 61.1%
Hanson 41.5%
Harding 52.0%
Hughes 67.2%
Hutchinson 57.8%
County
2008-2010 County Level Modeled Estimate Combining
BRFSS & NHIS
Hyde 72.5%
Jackson 47.4%
Jerauld 42.9%
Jones 60.2%
Kingsbury 59.4%
Lake 56.6%
Lawrence 56.1%
Lincoln 61.4%
Lyman 49.0%
Marshall 53.6%
McCook 65.6%
McPherson 42.1%
Meade 56.2%
Mellette 48.5%
Miner 71.6%
Minnehaha 64.1%
Moody 56.1%
Oglala Lakota 38.3%
Pennington 55.2%
Perkins 52.2%
Potter 66.9%
Roberts 52.4%
Sanborn 57.3%
Spink 58.3%
Stanley 54.3%
Sully 51.8%
Todd 33.5%
Tripp 58.3%
Turner 56.4%
Union 68.9%
Walworth 59.5%
Yankton 63.6%
Ziebach 39.8%
Source: State Cancer Profiles. (2020). Retrieved September 10, 2020, from statecancerprofiles.cancer.gov/risk/

2020 Primary Care Needs Assessment SD Department of Health, Office of Rural Health B-18
Table 37: Percent of Female Medicare Enrollees (Aged 65-74) in South Dakota who have had a Mammography Screening by County, 2018
Methodology: Mammography Screening is the percentage of female fee-for-service (FFS) Medicare enrollees, ages 65-74, that receive an annual mammogram.
State of South Dakota 2012 2017
Percentage of female Medicare enrollees in SD aged 65-74 who received mammography screening
77% 49%
County
Percentage of female Medicare enrollees aged
67-69
Aurora 51%
Beadle 50%
Bennett 29%
Bon Homme 59%
Brookings 52%
Brown 61%
Brule 54%
Buffalo 26%
Butte 40%
Campbell 58%
Charles Mix 47%
Clark 52%
Clay 46%
Codington 59%
Corson 18%
Custer 40%
Davison 55%
Day 54%
Deuel 51%
Dewey 19%
Douglas 50%
Edmunds 52%
Fall River 32%
Faulk 57%
Grant 51%
Gregory 48%
Haakon 38%
Hamlin 55%
Hand 53%
Hanson 48%
Harding 31%
Hughes 53%
Hutchinson 48%
County
Percentage of female Medicare enrollees aged
67-69
Hyde 57%
Jackson 39%
Jerauld 47%
Jones 43%
Kingsbury 53%
Lake 50%
Lawrence 47%
Lincoln 55%
Lyman 52%
Marshall 55%
McCook 48%
McPherson 51%
Meade 46%
Mellette 31%
Miner 56%
Minnehaha 54%
Moody 48%
Oglala Lakota 19%
Pennington 46%
Perkins 40%
Potter 45%
Roberts 52%
Sanborn 49%
Spink 56%
Stanley 48%
Sully 48%
Todd 15%
Tripp 45%
Turner 44%
Union 56%
Walworth 47%
Yankton 51%
Ziebach 13%
Source: University of Wisconsin Population Health Institute. County Health Rankings South Dakota. (2020). Retrieved August 2020, from https://www.countyhealthrankings.org/app/south-dakota/2020/overview

2020 Primary Care Needs Assessment SD Department of Health, Office of Rural Health B-19
Table 38: Flu Vaccinations of Medicare Beneficiaries in South Dakota as of 2017, By County
Methodology: Flu Vaccinations is the percentage of fee-for-service Medicare enrollees that had a reimbursed flu vaccination during the year. Age is a non-modifiable risk factor, and as age increases, poor health outcomes are more likely. An age-adjusted rate is reported in order to fairly compare counties with differing age structures.
State of South Dakota 2016 2017
Percent of South Dakotan Medicare Beneficiaries who have received a flu vaccination
45% 47%
County
Percentage of Medicare beneficiaries that have had
the flu vaccine in 2017
Aurora 39%
Beadle 53%
Bennett 7%
Bon Homme 33%
Brookings 59%
Brown 52%
Brule 42%
Buffalo 37%
Butte 32%
Campbell 33%
Charles Mix 27%
Clark 33%
Clay 60%
Codington 58%
Corson 8%
Custer 41%
Davison 61%
Day 21%
Deuel 48%
Dewey 26%
Douglas 42%
Edmunds 42%
Fall River 20%
Faulk 22%
Grant 35%
Gregory 32%
Haakon 19%
Hamlin 41%
Hand 57%
Hanson 49%
Harding 33%
Hughes 56%
Hutchinson 29%
County
Percentage of Medicare beneficiaries that have had
the flu vaccine in 2017
Hyde 23%
Jackson 11%
Jerauld 22%
Jones 16%
Kingsbury 42%
Lake 55%
Lawrence 50%
Lincoln 54%
Lyman 27%
Marshall 20%
McCook 45%
McPherson 49%
Meade 43%
Mellette 20%
Miner 26%
Minnehaha 59%
Moody 35%
Oglala Lakota 15%
Pennington 48%
Perkins 14%
Potter 28%
Roberts 25%
Sanborn 45%
Spink 27%
Stanley 52%
Sully 33%
Todd 20%
Tripp 20%
Turner 39%
Union 50%
Walworth 17%
Yankton 58%
Ziebach 19%
Source: University of Wisconsin Population Health Institute. County Health Rankings South Dakota. (2020). Retrieved August 2020, from https://www.countyhealthrankings.org/app/south-dakota/2020/overview

2020 Primary Care Needs Assessment SD Department of Health, Office of Rural Health B-20
Table 39: Uninsured Adults, Aged 18 to 64 by County
State of South Dakota 2011 2013 2017
Percentage of uninsured adults aged 18 to 64 17% 16% 13%
Percentage Uninsured
County 2011 2013 2017
Aurora 20% 17% 17%
Beadle 19% 19% 17%
Bennett 29% 26% 28%
Bon Homme 16% 17% 12%
Brookings 17% 15% 10%
Brown 13% 12% 13%
Brule 19% 20% 20%
Buffalo 31 % 28% 27%
Butte 22% 20% 14%
Campbell 15% 15% 12%
Charles Mix 23% 24% 21%
Clark 19% 16% 16%
Clay 20% 17% 12%
Codington 16% 14% 10%
Corson 27% 28% 28%
Custer 15% 16% 13%
Davison 16% 14% 10%
Day 21% 19% 16%
Deuel 17% 15% 11%
Dewey 34% 29% 27%
Douglas 19% 18% 14%
Edmunds 16% 13% 12%
Fall River 19% 17% 12%
Faulk 18% 14% 11%
Grant 17% 16% 12%
Gregory 23% 20% 17%
Haakon 20% 17% 13%
Hamlin 18% 17% 13%
Hand 16% 14% 11%
Hanson 18% 17% 13%
Harding 22% 18% 14%
Hughes 15% 13% 11%
Hutchinson 16% 16% 13%
Percentage Uninsured
County 2011 2013 2017
Hyde 18% 19% 13%
Jackson 29% 29% 31%
Jerauld 15% 17% 12%
Jones 24% 22% 17%
Kingsbury 15% 14% 11%
Lake 14% 13% 9%
Lawrence 19% 15% 11%
Lincoln 11% 9% 7%
Lyman 27% 27% 23%
Marshall 16% 13% 19%
McCook 20% 18% 12%
McPherson 20% 20% 15%
Meade 19% 17% 12%
Mellette 28% 27% 29%
Miner 16% 13% 11%
Minnehaha 16% 15% 10%
Moody 18% 17% 17%
Oglala Lakota 25% 25% 24%
Pennington 18% 16% 14%
Perkins 24% 22% 17%
Potter 15% 15% 12%
Roberts 23% 22% 23%
Sanborn 19% 18% 14%
Spink 16% 14% 12%
Stanley 18% 18% 12%
Sully 15% 17% 13%
Todd 23% 23% 25%
Tripp 22% 22% 20%
Turner 15% 15% 11%
Union 9% 10% 9%
Walworth 19% 17% 16%
Yankton 17% 14% 11%
Ziebach 29% 28% 28%
Source: U. S. Census Bureau. (2020). Small Area Health Insurance Estimates (SAHIE) Program. Retrieved August 2020, from https://www.census.gov/programs-surveys/sahie.html

2020 Primary Care Needs Assessment SD Department of Health, Office of Rural Health B-21
Table 40: Uninsured Children, Under 18 by County
State of South Dakota 2011 2013 2017
Percentage of uninsured children under age 18 6% 6% 6%
Percentage Uninsured
County 2011 2013 2017
Aurora 11% 9% 12%
Beadle 7% 8% 7%
Bennett 8% 8% 10%
Bon Homme 8% 9% 9%
Brookings 6% 6% 5%
Brown 5% 5% 6%
Brule 9% 10% 14%
Buffalo 9% 7% 7%
Butte 8% 7% 6%
Campbell 8% 9% 11%
Charles Mix 10% 11% 10%
Clark 9% 9% 11%
Clay 6% 7% 6%
Codington 5% 5% 5%
Corson 9% 9% 11%
Custer 8% 9% 8%
Davison 5% 5% 5%
Day 10% 9% 12%
Deuel 9% 8% 7%
Dewey 12% 8% 9%
Douglas 9% 9% 12%
Edmunds 7% 7% 11%
Fall River 7% 8% 6%
Faulk 8% 8% 8%
Grant 7% 7% 7%
Gregory 11% 10% 11%
Haakon 12% 11% 13%
Hamlin 8% 9% 8%
Hand 9% 8% 11%
Hanson 8% 8% 8%
Harding 11% 11% 10%
Hughes 6% 6% 6%
Hutchinson 7% 8% 10%
Percentage Uninsured
County 2011 2013 2017
Hyde 9% 11% 10%
Jackson 11% 10% 14%
Jerauld 7% 10% 12%
Jones 12% 12% 14%
Kingsbury 8% 8% 8%
Lake 5% 6% 5%
Lawrence 6% 6% 5%
Lincoln 4% 4% 4%
Lyman 11% 11% 11%
Marshall 7% 8% 15%
McCook 9% 9% 7%
McPherson 11% 11% 13%
Meade 6% 7% 6%
Mellette 10% 10% 12%
Miner 7% 8% 8%
Minnehaha 5% 5% 5%
Moody 10% 9% 12%
Oglala Lakota 7% 6% 6%
Pennington 6% 6% 6%
Perkins 13% 13% 15%
Potter 8% 9% 9%
Roberts 10% 10% 13%
Sanborn 9% 10% 10%
Spink 7% 7% 8%
Stanley 8% 8% 7%
Sully 8% 11% 11%
Todd 6% 6% 7%
Tripp 9% 10% 12%
Turner 7% 7% 7%
Union 4% 5% 6%
Walworth 7% 7% 8%
Yankton 6% 6% 5%
Ziebach 9% 8% 12%
Source: U. S. Census Bureau. (2020). Small Area Health Insurance Estimates (SAHIE) Program. Retrieved August 2020, from https://www.census.gov/programs-surveys/sahie.html

2020 Primary Care Needs Assessment SD Department of Health, Office of Rural Health B-22
Table 41: Average EMS Dispatch to Enroute Time (in minutes) by County
Methodology: Data was queried through the South Dakota Department of Health Med-Media WebCUR System. Emergency Medical Services reported data from 2013 – 2015. Calculations are based on the difference between time of dispatch and time of enroute of EMS. County average times were calculated by averaging EMS reported data for each county.
State of South Dakota 2015
State average EMS dispatch to enroute time in minutes 5.62
County Average Time (in minutes)
Aurora n.d.
Beadle 6.29
Bennett 9.33
Bon Homme 4.47
Brookings 2.43
Brown 3.62
Brule 5.89
Buffalo 1.24
Butte 6.42
Campbell 4.22
Charles Mix 5.73
Clark 4.60
Clay 6.08
Codington 0.71
Corson n.d.
Custer 6.03
Davison 1.75
Day 7.00
Deuel 4.87
Dewey 7.84
Douglas 5.75
Edmunds 4.99
Fall River 5.02
Faulk 5.24
Grant 4.49
Gregory 12.43
Haakon 10.19
Hamlin 7.72
Hand 6.55
Hanson n.d.
Harding 5.04
Hughes 0.56
Hutchinson 5.63
County Average Time (in minutes)
Hyde 4.42
Jackson 4.99
Jerauld 3.51
Jones 4.15
Kingsbury 6.31
Lake 11.21
Lawrence 2.99
Lincoln 5.81
Lyman 2.47
Marshall 7.10
McCook 3.94
McPherson 4.32
Meade 3.08
Mellette 7.49
Miner 10.65
Minnehaha 12.59
Moody 6.23
Oglala Lakota 3.46
Pennington 6.08
Perkins 6.58
Potter 15.37
Roberts 6.37
Sanborn 7.26
Spink 3.68
Stanley n.d.
Sully 2.44
Todd 4.60
Tripp 20.73
Turner 8.58
Union 6.81
Walworth 4.81
Yankton 2.82
Ziebach n.d.
n.d.: no data
Source: South Dakota Department of Health, Med-Media WebCUR System.

2020 Primary Care Needs Assessment SD Department of Health, Office of Rural Health C-1
APPENDIX C │SUPPLEMENTAL TABLES FOR HEALTH RISK BEHAVIOR INDICATORS
Table 42: Percent of South Dakotans who Lack Adequate Access to Food by County, 2017 Table 43: Percent of South Dakotans that are Physically Inactive by County, 2016 Table 44: Percent of Adults in South Dakota that Smoke by County, 2017 Table 45: Percent of Mothers Who Used Tobacco while Pregnant, 2011, 2014, 2017 Table 46: Percent of Mothers who were Breastfeeding at Discharge, 2011, 2014, 2017 Table 47: Percent of South Dakotans who Report to be Excessive Drinkers, 2014, 2017

2020 Primary Care Needs Assessment SD Department of Health, Office of Rural Health C-2
Table 42: Percent of South Dakotans who Lack Adequate Access to Food by County, 2017 Methodology Food Insecurity estimates the percentage of the population who did not have access to a reliable source of food during the past year. The numerator is the population with a lack of access, at times, to enough food for an active, healthy life or with uncertain availability of nutritionally adequate foods. The denominator is the total county population.
State of South Dakota 2017
Percent who lack adequate access to food 11%
County
Percent who lack adequate access
to food
Aurora 8%
Beadle 13%
Bennett 18%
Bon Homme 10%
Brookings 13%
Brown 11%
Brule 12%
Buffalo 23%
Butte 11%
Campbell 8%
Charles Mix 14%
Clark 11%
Clay 16%
Codington 12%
Corson 22%
Custer 11%
Davison 12%
Day 12%
Deuel 10%
Dewey 21%
Douglas 10%
Edmunds 8%
Fall River 12%
Faulk 10%
Grant 9%
Gregory 12%
Haakon 12%
Hamlin 8%
Hand 10%
Hanson 9%
Harding 11%
Hughes 11%
Hutchinson 11%
County
Percent who lack adequate access
to food
Hyde 11%
Jackson 21%
Jerauld 10%
Jones 11%
Kingsbury 9%
Lake 12%
Lawrence 12%
Lincoln 7%
Lyman 14%
Marshall 10%
McCook 9%
McPherson 12%
Meade 10%
Mellette 20%
Miner 10%
Minnehaha 11%
Moody 11%
Oglala Lakota 27%
Pennington 12%
Perkins 11%
Potter 9%
Roberts 14%
Sanborn 10%
Spink 10%
Stanley 9%
Sully 8%
Todd 25%
Tripp 13%
Turner 10%
Union 9%
Walworth 12%
Yankton 12%
Ziebach 22%
Source: University of Wisconsin Population Health Institute. County Health Rankings South Dakota. (2020). Retrieved August 2020, from https://www.countyhealthrankings.org/app/south-dakota/2020/overview

2020 Primary Care Needs Assessment SD Department of Health, Office of Rural Health C-3
Table 43: Percent of South Dakotans that are Physically Inactive by County, 2016 Methodology: Physical Inactivity is based on responses to the Behavioral Risk Factor Surveillance Survey and is the percentage of adults ages 20 and over reporting no leisure-time physical activity in the past month. Data for Physical Inactivity are provided by the CDC Interactive Diabetes Atlas which uses BRFSS data to provide county-level estimates. Beginning with the 2015 County Health Rankings, Physical Inactivity estimates include both landline and cell phone users. Previously, only landline users were included in the data. This change was implemented in order to provide users with the most accurate estimates of health in their community as possible.
County
Percent of population that are physically
inactive
Aurora 19%
Beadle 19%
Bennett 23%
Bon Homme 27%
Brookings 15%
Brown 21%
Brule 25%
Buffalo 24%
Butte 22%
Campbell 22%
Charles Mix 23%
Clark 28%
Clay 20%
Codington 21%
Corson 26%
Custer 24%
Davison 22%
Day 30%
Deuel 27%
Dewey 27%
Douglas 23%
Edmunds 31%
Fall River 20%
Faulk 37%
Grant 25%
Gregory 36%
Haakon 30%
Hamlin 21%
Hand 21%
Hanson 22%
Harding 29%
Hughes 20%
Hutchinson 20%
County
Percent of population that are physically
inactive
Hyde 19%
Jackson 26%
Jerauld 26%
Jones 22%
Kingsbury 24%
Lake 23%
Lawrence 18%
Lincoln 20%
Lyman 32%
Marshall 19%
McCook 27%
McPherson 26%
Meade 21%
Mellette 28%
Miner 24%
Minnehaha 19%
Moody 30%
Oglala Lakota 27%
Pennington 19%
Perkins 21%
Potter 30%
Roberts 33%
Sanborn 29%
Spink 30%
Stanley 23%
Sully 23%
Todd 28%
Tripp 28%
Turner 22%
Union 24%
Walworth 25%
Yankton 19%
Ziebach 27%
Source: University of Wisconsin Population Health Institute. County Health Rankings South Dakota. (2020). Retrieved August 2020, from https://www.countyhealthrankings.org/app/south-dakota/2020/overview

2020 Primary Care Needs Assessment SD Department of Health, Office of Rural Health C-4
Table 44: Percent of Adults in South Dakota that Smoke by County, 2017 Methodology: Adult Smoking is the percentage of the adult population in a county who both report that they currently smoke every day or most days and have smoked at least 100 cigarettes in their lifetime.
State of South Dakota 2017
Percent of adult population that are current smokers 19%
County Percent of adult
population that smoke
Aurora 12%
Beadle 16%
Bennett 27%
Bon Homme 15%
Brookings 13%
Brown 14%
Brule 16%
Buffalo 36%
Butte 16%
Campbell 12%
Charles Mix 20%
Clark 14%
Clay 16%
Codington 16%
Corson 32%
Custer 14%
Davison 15%
Day 15%
Deuel 13%
Dewey 31%
Douglas 13%
Edmunds 13%
Fall River 16%
Faulk 13%
Grant 13%
Gregory 16%
Haakon 15%
Hamlin 13%
Hand 13%
Hanson 14%
Harding 15%
Hughes 15%
Hutchinson 13%
County Percent of adult
population that smoke
Hyde 14%
Jackson 28%
Jerauld 12%
Jones 14%
Kingsbury 13%
Lake 14%
Lawrence 15%
Lincoln 13%
Lyman 21%
Marshall 14%
McCook 14%
McPherson 14%
Meade 16%
Mellette 29%
Miner 14%
Minnehaha 15%
Moody 17%
Oglala Lakota 38%
Pennington 16%
Perkins 14%
Potter 12%
Roberts 21%
Sanborn 14%
Spink 14%
Stanley 13%
Sully 13%
Todd 41%
Tripp 17%
Turner 14%
Union 13%
Walworth 15%
Yankton 15%
Ziebach 32%
Source: University of Wisconsin Population Health Institute. County Health Rankings South Dakota. (2020). Retrieved August 2020, from https://www.countyhealthrankings.org/app/south-dakota/2020/overview

2020 Primary Care Needs Assessment SD Department of Health, Office of Rural Health C-5
Table 45: Percent of Mothers Who Used Tobacco while Pregnant, 2011, 2014, 2017
State of South Dakota
Year Percent of mothers who used tobacco while pregnant
2011 18.1%
2014 16.1%
2017 14.0%
Percent of mothers who used tobacco while
pregnant Change
County 2011 2014 2017 2011-2014 2014-2017
Aurora 14.8% 13.3% 10.6% ↓ ↓
Beadle 19.9% 15.5% 12.8% ↓ ↓
Bennett 21.9% 22.9% 25.5% ↑ ↑
Bon Homme 16.1% 10.3% 10.9% ↓ →
Brookings 12.2% 11.5% 9.1% → ↓
Brown 16.2% 18.3% 16.0% ↑ ↓
Brule 18.7% 17.3% 15.2% ↓ ↓
Buffalo 35.7% 33.5% 29.8% ↓ ↓
Butte 23.8% 26.0% 20.7% ↑ ↓
Campbell LNE LNE 4.8% → ↑
Charles Mix 25.6% 23.4% 21.6% ↓ ↓
Clark 15.0% 10.4% 9.4% ↓ ↓
Clay 11.0% 10.0% 9.9% ↓ →
Codington 24.7% 23.2% 20.5% ↓ ↓
Corson 24.8% 20.9% 25.2% ↓ ↑
Custer 18.2% 19.2% 18.8% → →
Davison 22.3% 19.1% 19.3% ↓ →
Day 28.5% 29.6% 24.0% ↑ ↓
Deuel 17.8% 15.7% 9.5% ↓ ↓
Dewey 28.9% 26.9% 20.5% ↓ ↓
Douglas 15.0% 9.1% 9.8% ↓ →
Edmunds 10.8% 10.6% 7.7% → ↓
Fall River 28.7% 20.6% 17.5% ↓ ↓
Faulk 7.4% 2.9% 2.5% ↓ →
Grant 16.4% 12.3% 12.8% ↓ →
Gregory 19.7% 16.5% 11.3% ↓ ↓
Haakon 10.5% 11.0% 15.7% → ↑
Hamlin 15.6% 14.9% 13.2% → ↓
Hand 8.2% 8.4% 8.6% → →
Hanson 7.8% 7.1% 6.8% → →
Harding 8.2% 5.3% 6.7% ↓ ↑
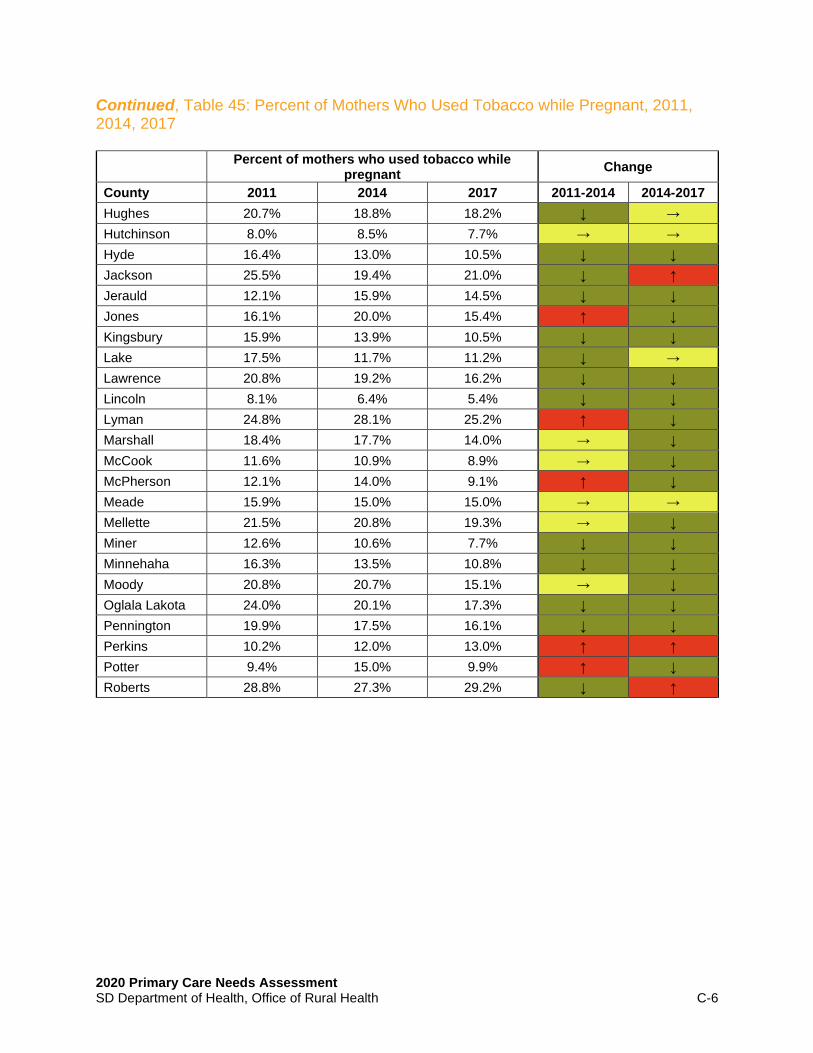
2020 Primary Care Needs Assessment SD Department of Health, Office of Rural Health C-6
Continued, Table 45: Percent of Mothers Who Used Tobacco while Pregnant, 2011, 2014, 2017
Percent of mothers who used tobacco while
pregnant Change
County 2011 2014 2017 2011-2014 2014-2017
Hughes 20.7% 18.8% 18.2% ↓ →
Hutchinson 8.0% 8.5% 7.7% → →
Hyde 16.4% 13.0% 10.5% ↓ ↓
Jackson 25.5% 19.4% 21.0% ↓ ↑
Jerauld 12.1% 15.9% 14.5% ↓ ↓
Jones 16.1% 20.0% 15.4% ↑ ↓
Kingsbury 15.9% 13.9% 10.5% ↓ ↓
Lake 17.5% 11.7% 11.2% ↓ →
Lawrence 20.8% 19.2% 16.2% ↓ ↓
Lincoln 8.1% 6.4% 5.4% ↓ ↓
Lyman 24.8% 28.1% 25.2% ↑ ↓
Marshall 18.4% 17.7% 14.0% → ↓
McCook 11.6% 10.9% 8.9% → ↓
McPherson 12.1% 14.0% 9.1% ↑ ↓
Meade 15.9% 15.0% 15.0% → →
Mellette 21.5% 20.8% 19.3% → ↓
Miner 12.6% 10.6% 7.7% ↓ ↓
Minnehaha 16.3% 13.5% 10.8% ↓ ↓
Moody 20.8% 20.7% 15.1% → ↓
Oglala Lakota 24.0% 20.1% 17.3% ↓ ↓
Pennington 19.9% 17.5% 16.1% ↓ ↓
Perkins 10.2% 12.0% 13.0% ↑ ↑
Potter 9.4% 15.0% 9.9% ↑ ↓
Roberts 28.8% 27.3% 29.2% ↓ ↑

2020 Primary Care Needs Assessment SD Department of Health, Office of Rural Health C-7
Continued, Table 45: Percent of Mothers Who Used Tobacco while Pregnant, 2011, 2014, 2017
Percent of mothers who used tobacco while
pregnant Change
County 2011 2014 2017 2011-2014 2014-2017
Sanborn 13.9% 15.2% 16.9% ↑ ↑
Spink 16.1% 16.5% 13.6% → ↓
Stanley 26.0% 17.5% 10.0% ↓ ↓
Sully 11.2% 8.6% 10.8% ↓ ↑
Todd 26.4% 25.3% 21.1% ↓ ↓
Tripp 25.6% 21.7% 14.7% ↓ ↓
Turner 13.0% 10.8% 8.9% ↓ ↓
Union 13.8% 11.2% 7.6% ↓ ↓
Walworth 23.2% 20.3% 17.0% ↓ ↓
Yankton 22.2% 21.0% 19.8% ↓ ↓
Ziebach 22.3% 22.1% 20.1% → ↓
Note 1: 2011 represents 2007-2011 data. 2014 represents 2010-2014 data. 2017 represents 2013-2017 Note 2: Data for mothers who used tobacco are self-reported.
→ indicates the difference between 2011 and 2014 or between 2017 and 2017 is less than 1%. Source: South Dakota Vital Statistics Report: A State and County Comparison of Leading Health Indicators. Retrieved July 20, 2020, from https://doh.sd.gov/statistics/
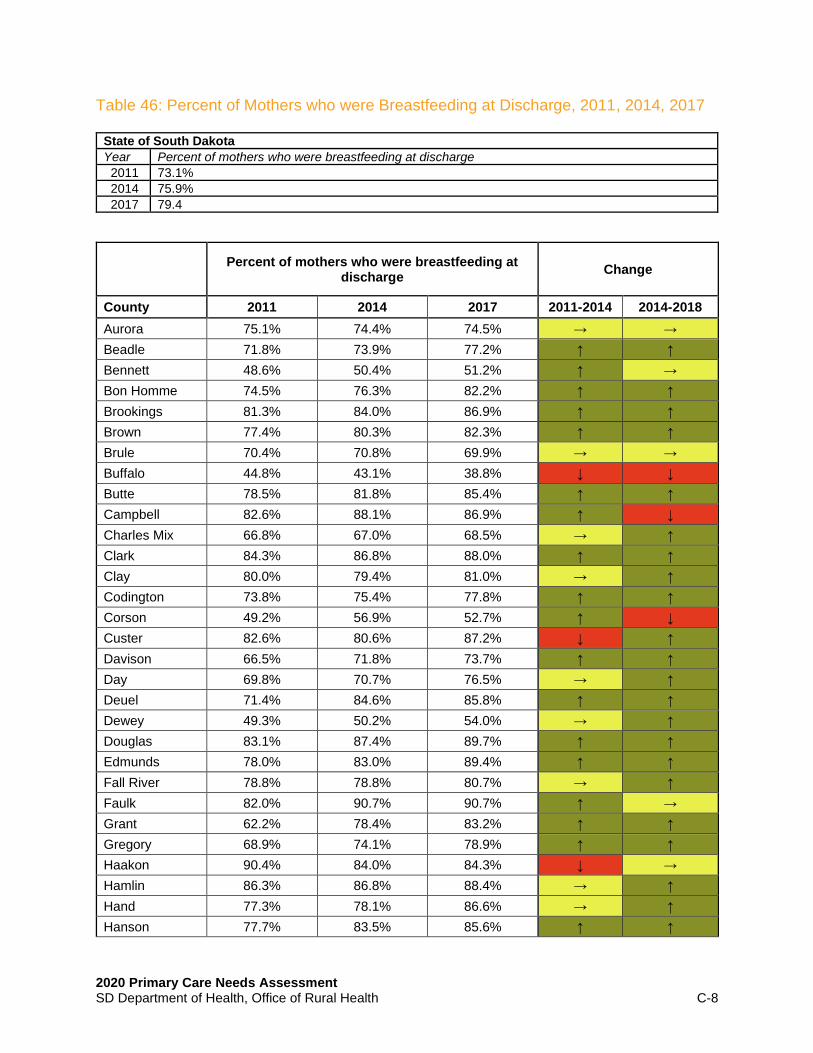
2020 Primary Care Needs Assessment SD Department of Health, Office of Rural Health C-8
Table 46: Percent of Mothers who were Breastfeeding at Discharge, 2011, 2014, 2017
State of South Dakota
Year Percent of mothers who were breastfeeding at discharge
2011 73.1%
2014 75.9%
2017 79.4
Percent of mothers who were breastfeeding at
discharge Change
County 2011 2014 2017 2011-2014 2014-2018
Aurora 75.1% 74.4% 74.5% → →
Beadle 71.8% 73.9% 77.2% ↑ ↑
Bennett 48.6% 50.4% 51.2% ↑ →
Bon Homme 74.5% 76.3% 82.2% ↑ ↑
Brookings 81.3% 84.0% 86.9% ↑ ↑
Brown 77.4% 80.3% 82.3% ↑ ↑
Brule 70.4% 70.8% 69.9% → →
Buffalo 44.8% 43.1% 38.8% ↓ ↓
Butte 78.5% 81.8% 85.4% ↑ ↑
Campbell 82.6% 88.1% 86.9% ↑ ↓
Charles Mix 66.8% 67.0% 68.5% → ↑
Clark 84.3% 86.8% 88.0% ↑ ↑
Clay 80.0% 79.4% 81.0% → ↑
Codington 73.8% 75.4% 77.8% ↑ ↑
Corson 49.2% 56.9% 52.7% ↑ ↓
Custer 82.6% 80.6% 87.2% ↓ ↑
Davison 66.5% 71.8% 73.7% ↑ ↑
Day 69.8% 70.7% 76.5% → ↑
Deuel 71.4% 84.6% 85.8% ↑ ↑
Dewey 49.3% 50.2% 54.0% → ↑
Douglas 83.1% 87.4% 89.7% ↑ ↑
Edmunds 78.0% 83.0% 89.4% ↑ ↑
Fall River 78.8% 78.8% 80.7% → ↑
Faulk 82.0% 90.7% 90.7% ↑ →
Grant 62.2% 78.4% 83.2% ↑ ↑
Gregory 68.9% 74.1% 78.9% ↑ ↑
Haakon 90.4% 84.0% 84.3% ↓ →
Hamlin 86.3% 86.8% 88.4% → ↑
Hand 77.3% 78.1% 86.6% → ↑
Hanson 77.7% 83.5% 85.6% ↑ ↑

2020 Primary Care Needs Assessment SD Department of Health, Office of Rural Health C-9
Continued, Table 46: Percent of Mothers who were Breastfeeding at Discharge, 2011, 2014, 2017
Percent of mothers who were breastfeeding at
discharge Change
County 2011 2014 2017 2011-2014 2014-2018
Harding 87.3% 89.2% 94.2% ↑ ↑
Hughes 71.7% 75.3% 77.2% ↑ ↑
Hutchinson 79.1% 81.5% 83.5% ↑ ↑
Hyde 72.7% 73.1% 80.2% → ↑
Jackson 49.1% 56.5% 61.9% ↑ ↑
Jerauld 83.2% 83.3% 79.1% → ↓
Jones 79.0% 88.0% 88.5% ↑ →
Kingsbury 78.5% 82.7% 88.0% ↑ ↑
Lake 78.4% 79.7% 82.5% → ↑
Lawrence 80.0% 82.0% 85.0% ↑ ↑
Lincoln 78.6% 80.6% 85.1% ↑ ↑
Lyman 62.5% 59.4% 62.5% ↓ ↑
Marshall 73.3% 76.3% 81.0% ↑ ↑
McCook 76.7% 75.9% 83.5% → ↑
McPherson 80.4% 84.2% 84.3% ↑ →
Meade 82.5% 85.1% 87.8% ↑ ↑
Mellette 69.4% 74.4% 67.8% ↑ ↓
Miner 75.8% 82.1% 83.1% ↑ ↑
Minnehaha 73.6% 76.3% 80.9% ↑ ↑
Moody 70.8% 75.1% 78.9% ↑ ↑
Oglala Lakota 49.9% 51.4% 56.8% ↑ ↑
Pennington 78.2% 80.8% 84.2% ↑ ↑
Perkins 79.7% 80.6% 86.2% → ↑
Potter 66.7% 80.7% 87.4% ↑ ↑
Roberts 62.0% 68.1% 68.9% ↑ →

2020 Primary Care Needs Assessment SD Department of Health, Office of Rural Health C-10
Continued, Table 46: Percent of Mothers who were Breastfeeding at Discharge, 2011, 2014, 2017
Percent of mothers who were breastfeeding at
discharge Change
County 2011 2014 2017 2011-2014 2014-2018
Sanborn 78.3% 81.6% 83.0% ↑ ↑
Spink 74.9% 80.8% 84.0% ↑ ↑
Stanley 75.0% 76.3% 85.2% ↑ ↑
Sully 75.6% 77.8% 77.1% ↑ →
Todd 55.6% 60.6% 60.8% ↑ →
Tripp 65.9% 67.5% 74.9% ↑ ↑
Turner 76.3% 78.4% 81.0% ↑ ↑
Union 77.2% 80.9% 83.1% ↑ ↑
Walworth 63.4% 71.8% 72.6% ↑ →
Yankton 68.7% 69.7% 76.1% → ↑
Ziebach 52.5% 55.7% 66.9% ↑ ↑
Note 1: 2011 represents 2007-2011 data. 2014 represents 2010-2014 data. 2017 data represent 2013-2017. Note 2: Data for mothers who breastfed are self-supported.
→ indicates the difference between 2011 and 2014 and between 2014 and 2017 is less than 1%. Source: South Dakota Vital Statistics Report: A State and County Comparison of Leading Health Indicators. Retrieved July 20, 2020, from https://doh.sd.gov/statistics/

2020 Primary Care Needs Assessment SD Department of Health, Office of Rural Health C-11
Table 47: Percent of South Dakotans who Report to be Excessive Drinkers, 2017 Methodology: Excessive Drinking measures the percentage of a county’s adult population that reports binge or heavy drinking in the past 30 days.
State of South Dakota 2017
Percent of adult population that excessively drinks 19%
County Percent of population who
drink excessively
Aurora 19%
Beadle 17%
Bennett 16%
Bon Homme 20%
Brookings 20%
Brown 18%
Brule 17%
Buffalo 17%
Butte 16%
Campbell 18%
Charles Mix 16%
Clark 19%
Clay 23%
Codington 19%
Corson 15%
Custer 16%
Davison 18%
Day 16%
Deuel 19%
Dewey 19%
Douglas 18%
Edmunds 18%
Fall River 16%
Faulk 17%
Grant 18%
Gregory 16%
Haakon 16%
Hamlin 19%
Hand 18%
Hanson 20%
Harding 19%
Hughes 19%
Hutchinson 17%
County Percent of population who drink excessively
Hyde 17%
Jackson 16%
Jerauld 17%
Jones 17%
Kingsbury 18%
Lake 18%
Lawrence 20%
Lincoln 21%
Lyman 17%
Marshall 19%
McCook 19%
McPherson 16%
Meade 20%
Mellette 14%
Miner 18%
Minnehaha 19%
Moody 18%
Oglala Lakota 16%
Pennington 18%
Perkins 17%
Potter 17%
Roberts 18%
Sanborn 20%
Spink 19%
Stanley 20%
Sully 19%
Todd 18%
Tripp 16%
Turner 17%
Union 20%
Walworth 18%
Yankton 20%
Ziebach 15%
Source: University of Wisconsin Population Health Institute. County Health Rankings South Dakota. (2020). Retrieved August 2020, from https://www.countyhealthrankings.org/app/south-dakota/2020/overview

APPENDIX D │HEALTH INDICATORS RANKING BY COUNTY, FULL LIST
2020 Primary Care Needs Assessment SD Department of Health, Office of Rural Health D-1
HEA
LT
H S
TA
TU
S
Healt
h O
utc
om
es
Healt
h F
acto
rs
Poor
or
Fair
Healt
h
Lif
e E
xp
ecta
ncy (
Male
)
Lif
e E
xp
en
tan
cy (
Fem
ale
)
Tota
l M
ort
ali
ty R
ate
Infa
nt
Mort
ali
ty R
ate
Heart
Dis
ease M
ort
ali
ty R
ate
Can
cer
Mort
ali
ty R
ate
Ch
ron
ic L
ow
er
Resp
irato
ry D
isease M
ort
ali
ty R
ate
Alz
heim
er'
s M
ort
ali
ty R
ate
Str
oke M
ort
ali
ty R
ate
Accid
en
t M
ort
ali
ty R
ate
Dia
bete
s M
ort
ali
ty R
ate
Su
icid
e
Infl
uen
za/Pn
eu
mon
ia M
ort
ali
ty R
ate
Ch
ron
ic L
iver
Dis
ease M
ort
ali
ty R
ate
Ad
ult
Obesit
y
Dia
bete
s P
revale
nce
Can
cer
Pre
vale
nce
An
xie
ty D
isord
er
Dia
gn
osis
Dep
ressio
n D
iagn
osis
ST
D I
ncid
en
ce R
ate
s
TO
TA
L
Aurora 25 24 2 20 37 7 1 34 10 6 51 65 33 19 1 43 1 48 66 43 17 47 19 619
Beadle 42 46 44 47 34 36 47 19 50 17 52 53 30 48 34 62 39 42 13 28 30 33 25 871
Bennett 53 55 58 60 59 60 66 55 60 59 12 9 58 62 49 53 58 63 53 6 33 33 40 1114
Bon Homme 6 35 31 4 6 9 54 8 20 35 16 42 21 25 23 47 1 59 46 45 18 22 13 586
Brookings 4 3 15 3 17 11 45 29 26 11 23 52 10 24 27 15 27 9 3 27 57 9 38 485
Brown 13 12 31 24 27 25 38 24 41 25 41 40 15 35 29 33 28 32 24 21 38 40 40 676
Brule 15 30 31 30 29 24 49 41 19 22 36 6 18 39 33 32 26 14 2 65 35 30 44 670
Buffalo 61 59 66 64 64 66 61 60 66 42 1 50 62 65 66 65 64 65 58 29 55 57 41 1287
Butte 38 37 44 52 55 40 48 51 47 58 33 29 32 11 18 10 41 32 34 23 37 3 23 796
Campbell 30 28 44 12 1 8 1 12 3 8 13 20 60 51 1 1 1 26 1 12 7 2 2 344
Charles Mix 50 51 55 53 50 55 36 49 49 29 58 43 52 56 58 45 56 63 24 35 46 43 59 1115
Clark 36 33 31 39 17 27 57 17 32 19 37 58 42 50 1 24 1 26 24 63 23 20 16 693
Clay 14 29 44 24 24 47 1 65 53 39 19 44 8 20 19 55 29 19 7 54 13 12 50 689
Codington 20 19 31 20 41 19 34 30 51 29 35 25 15 27 21 17 20 32 24 34 53 44 43 684
Corson 59 58 63 62 62 63 50 66 61 27 1 12 61 59 63 61 61 55 60 18 33 33 64 1152
Custer 37 31 15 24 29 17 1 20 7 10 17 34 43 15 41 55 43 26 58 8 33 41 24 629
Davison 21 7 31 34 29 33 43 47 40 24 21 38 23 30 26 44 30 6 7 53 10 10 50 657
Day 41 44 44 49 46 32 1 38 12 13 42 56 50 32 24 22 44 42 34 41 34 36 25 802
Deuel 8 36 15 20 14 10 1 13 35 32 29 55 6 8 1 26 1 42 34 44 4 8 6 448
Dewey 56 57 61 63 63 64 59 58 56 37 10 24 66 63 59 66 63 55 62 50 33 33 66 1224
Douglas 33 33 2 9 11 12 1 7 30 48 56 7 39 28 1 20 54 14 46 64 2 34 28 579
Edmunds 29 18 2 15 14 6 1 16 11 16 27 15 40 29 1 39 1 26 24 59 14 23 6 432
Fall River 48 41 44 58 53 58 1 61 55 64 39 44 46 51 43 46 46 38 34 14 43 14 27 968
Faulk 46 43 15 5 12 28 1 18 36 43 45 28 19 32 48 13 53 48 7 36 24 25 9 634
Grant 2 8 15 36 43 45 1 48 18 53 59 64 26 42 47 51 19 6 7 47 47 54 33 771
Gregory 24 45 44 40 51 50 60 42 52 50 26 39 56 38 24 9 57 19 13 19 9 13 13 793
Haakon 45 23 44 32 46 36 1 25 44 63 1 32 5 1 52 60 1 4 34 13 15 26 21 624
Hamlin 1 20 2 45 44 39 40 11 29 14 64 54 25 21 28 37 36 14 13 56 16 17 11 637
Hand 26 2 2 2 8 18 1 9 24 52 14 61 31 37 44 33 35 26 6 52 42 35 4 564
Hanson 19 16 2 7 5 57 65 59 65 1 48 26 36 43 35 50 1 9 43 9 27 11 3 637
Harding 33 33 15 40 10 2 1 5 2 1 1 59 22 60 1 1 1 59 7 2 41 45 4 445
Hughes 17 13 31 10 52 22 53 23 21 43 20 51 20 47 32 57 24 38 13 40 5 39 49 720
Hutchinson 12 17 15 17 14 29 1 39 9 18 57 63 44 12 1 28 1 38 24 57 20 18 12 546
Hyde 33 33 31 24 48 42 1 62 5 12 24 57 45 23 1 54 1 3 3 58 21 21 7 609
Jackson 54 53 59 59 60 59 58 63 58 49 1 12 64 58 56 23 60 41 46 24 33 33 38 1061
Jerauld 33 5 2 19 4 5 1 4 42 4 65 30 41 1 1 36 1 1 62 20 40 5 9 431
Jones 33 33 15 32 22 15 1 3 28 54 1 1 1 1 1 1 1 6 34 10 3 7 30 333
Kingsbury 31 9 15 45 44 49 1 46 59 25 31 41 47 18 55 52 48 19 13 55 28 38 21 790
Lake 5 15 15 12 12 16 52 35 8 38 40 62 9 44 45 14 31 32 13 42 39 1 28 608
Lawrence 47 6 2 5 29 23 54 15 17 51 32 19 35 21 39 27 34 4 13 32 52 15 26 598
Lincoln 3 1 1 1 3 3 44 6 4 9 47 16 4 5 20 11 18 19 7 33 6 24 36 321
Lyman 52 52 55 54 57 54 1 40 37 31 49 44 54 53 65 28 55 52 43 15 8 16 57 972
Marshall 34 39 15 20 26 21 51 21 14 45 25 66 38 10 40 11 22 19 34 5 51 49 39 695
McCook 11 32 15 50 37 56 1 54 64 3 61 60 29 49 30 19 1 42 13 48 56 50 21 802
McPherson 51 34 31 10 8 35 1 64 23 7 33 37 28 46 62 1 45 26 43 66 32 27 1 711

APPENDIX D │HEALTH INDICATORS RANKING BY COUNTY, FULL LIST
2020 Primary Care Needs Assessment SD Department of Health, Office of Rural Health D-2
HEA
LT
H S
TA
TU
S
Healt
h O
utc
om
es
Healt
h F
acto
rs
Poor
or
Fair
Healt
h
Lif
e E
xp
ecta
ncy (
Male
)
Lif
e E
xp
en
tan
cy (
Fem
ale
)
Tota
l M
ort
ali
ty R
ate
Infa
nt
Mort
ali
ty R
ate
Heart
Dis
ease M
ort
ali
ty R
ate
Can
cer
Mort
ali
ty R
ate
Ch
ron
ic L
ow
er
Resp
irato
ry D
isease M
ort
ali
ty R
ate
Alz
heim
er'
s M
ort
ali
ty R
ate
Str
oke M
ort
ali
ty R
ate
Accid
en
t M
ort
ali
ty R
ate
Dia
bete
s M
ort
ali
ty R
ate
Su
icid
e
Infl
uen
za/Pn
eu
mon
ia M
ort
ali
ty R
ate
Ch
ron
ic L
iver
Dis
ease M
ort
ali
ty R
ate
Ad
ult
Obesit
y
Dia
bete
s P
revale
nce
Can
cer
Pre
vale
nce
An
xie
ty D
isord
er
Dia
gn
osis
Dep
ressio
n D
iagn
osis
ST
D I
ncid
en
ce R
ate
s
TO
TA
L
Meade 32 27 31 48 37 26 35 26 38 60 15 23 14 13 46 28 33 14 13 17 31 42 42 691
Mellette 57 56 62 61 61 61 1 57 27 66 55 21 57 61 54 48 65 42 53 4 33 33 38 1073
Miner 27 10 15 24 20 53 1 50 57 20 43 48 48 57 1 1 1 2 46 30 12 31 13 610
Minnehaha 22 21 31 36 41 34 39 33 42 34 53 36 24 14 35 21 31 32 13 51 49 37 56 785
Moody 9 49 44 40 6 13 46 37 15 5 54 22 12 36 42 1 25 48 46 11 22 48 29 660
Oglala Lakota 60 60 59 66 66 65 63 52 63 41 11 48 65 66 60 63 66 59 65 38 33 33 63 1265
Pennington 40 38 53 17 27 20 42 30 31 15 29 14 27 7 37 18 40 14 24 26 50 55 51 705
Perkins 43 14 31 40 48 43 1 27 33 55 46 27 11 25 1 31 38 19 24 7 48 28 2 642
Potter 39 22 2 36 29 30 1 10 6 33 49 4 53 54 50 41 1 9 24 61 45 51 10 660
Roberts 44 50 55 56 56 52 41 28 48 40 28 47 49 31 57 35 51 48 60 25 19 56 57 1033
Sanborn 18 42 2 30 17 44 1 14 46 21 66 8 13 17 1 25 50 55 46 62 1 6 15 600
Spink 16 47 15 34 34 38 1 36 45 28 44 16 51 45 1 59 22 59 53 39 25 46 15 769
Stanley 23 4 2 40 34 4 1 2 54 65 1 5 3 32 61 1 52 9 34 16 54 52 29 578
Sully 33 33 2 8 2 1 1 1 13 23 1 1 1 1 1 1 1 9 3 1 29 32 10 208
Todd 58 61 64 65 65 62 64 56 62 61 18 35 63 64 64 64 62 55 53 60 33 33 60 1282
Tripp 49 48 53 51 37 41 1 52 22 36 60 18 17 16 1 37 49 42 34 49 33 33 23 802
Turner 10 26 15 24 22 48 62 44 39 57 62 10 37 6 38 15 47 52 24 46 36 53 29 802
Union 7 11 2 12 20 14 36 22 33 46 22 11 7 9 22 42 37 19 46 37 44 29 39 567
Walworth 28 40 15 54 53 51 1 32 25 55 62 33 55 40 51 58 42 32 53 31 26 19 56 912
Yankton 35 25 31 15 24 30 56 43 16 47 38 31 34 40 30 40 21 52 13 22 11 4 41 699
Ziebach 55 54 64 57 58 46 1 45 1 62 1 1 59 55 53 49 59 66 62 3 33 33 40 957

APPENDIX D │HEALTH INDICATORS RANKING BY COUNTY, FULL LIST
2020 Primary Care Needs Assessment SD Department of Health, Office of Rural Health D-3
HEA
LT
H A
CC
ESS
Den
tists
rati
o t
o p
op
ula
tion
Povert
y L
evel
Fre
e &
red
uced
sch
ool
lun
ch
Have a
pers
on
al
docto
r/p
rovid
er
Have a
usu
al
pla
ce t
o g
o f
or
med
ical
care
Cou
ld n
ot
see a
docto
r d
ue t
o c
ost
Liv
e b
irth
rate
Low
bir
th w
eig
ht
Pre
nata
l care
in
fir
st
trim
este
r
Colo
recta
l can
cer
scre
en
ing
Bre
ast
can
cer
scre
en
ing
Infu
len
za v
accin
ati
on
Un
insu
red
ad
ult
s, aged
18 t
o 6
4
Un
insu
red
ch
ild
ren
, u
nd
er
18
EM
S, avera
ge d
isp
atc
h t
o e
nro
ute
TO
TA
L
Aurora 55 18 47 46 32 33 20 58 31 9 25 29 46 51 33 533
Beadle 29 38 49 39 34 5 60 42 48 30 30 11 46 18 40 519
Bennett 22 59 33 33 33 26 26 24 53 51 60 66 62 37 54 639
Bon Homme 37 49 21 18 25 12 36 13 16 10 2 34 17 34 20 344
Brookings 38 31 7 14 2 15 62 22 7 19 20 3 4 2 5 251
Brown 24 24 7 55 49 13 63 38 33 13 1 12 29 9 13 383
Brule 40 50 52 5 48 18 27 26 42 3 14 23 53 62 35 498
Buffalo 3 64 33 3 47 38 7 61 66 65 61 31 60 18 3 560
Butte 21 44 50 42 17 30 49 48 17 20 52 39 37 9 43 518
Campbell 55 23 11 44 37 33 1 1 13 14 4 34 17 43 17 347
Charles Mix 26 55 59 19 44 23 50 32 42 36 41 43 55 37 32 594
Clark 26 35 43 43 29 33 29 38 38 6 20 34 43 43 22 482
Clay 14 53 21 30 4 26 44 20 5 31 45 2 17 9 37 358
Codington 8 27 34 35 19 20 61 48 10 22 2 5 4 2 2 299
Corson 32 61 33 33 33 41 42 65 64 55 64 65 62 43 33 726
Custer 54 17 47 12 12 28 28 60 30 26 52 27 29 26 36 484
Davison 5 32 30 50 55 10 59 40 8 12 10 1 4 2 4 322
Day 52 47 43 4 50 8 33 16 28 40 14 52 43 51 47 528
Deuel 49 8 21 28 8 39 25 8 5 56 25 18 8 18 25 341
Dewey 16 58 43 33 33 22 48 65 59 63 62 46 60 34 52 694
Douglas 42 34 25 38 22 21 20 26 20 49 30 23 37 51 33 471
Edmunds 55 28 30 49 26 33 17 5 44 43 20 23 17 43 26 459
Fall River 13 40 58 15 39 36 22 53 36 16 57 53 17 9 28 492
Faulk 55 48 3 33 53 33 13 58 49 61 5 50 8 26 30 525
Grant 15 15 41 53 51 33 37 13 14 21 25 32 17 18 21 406
Gregory 33 51 53 23 42 33 24 3 40 37 34 39 46 43 58 559
Haakon 31 24 11 17 21 6 1 2 22 15 56 58 29 59 55 407
Hamlin 33 9 27 37 27 33 46 7 27 41 10 27 29 26 51 430
Hand 19 14 1 31 35 3 18 46 55 17 17 7 8 43 44 358
Hanson 55 5 4 55 36 33 19 48 34 59 34 16 29 26 33 486
Harding 55 22 11 16 20 33 6 3 11 45 58 34 37 37 29 417
Hughes 23 10 20 33 44 11 55 35 60 7 17 8 8 9 1 341
Hutchinson 47 28 40 8 8 33 45 18 35 31 34 41 29 37 31 465
Hyde 55 21 17 9 7 33 1 46 45 1 5 49 29 37 19 374
Jackson 45 60 57 33 33 37 34 48 55 54 55 64 66 62 26 729
Jerauld 4 45 17 36 38 33 8 22 18 57 41 50 17 51 12 449
Jones 2 41 43 24 1 33 5 26 54 18 51 61 46 62 16 483
Kingsbury 11 7 15 25 8 2 32 26 9 25 17 23 8 26 41 275
Lake 35 18 26 54 53 25 47 26 22 32 30 9 2 2 57 438
Lawrence 17 37 32 25 3 31 53 64 11 38 41 14 8 2 9 385
Lincoln 7 1 2 52 43 7 64 26 2 23 10 10 1 1 34 283
Lyman 55 56 51 1 41 4 35 61 63 52 20 43 56 43 7 588
Marshall 50 32 41 21 27 42 40 20 52 44 10 53 52 65 48 597
McCook 53 12 7 45 14 33 8 10 21 8 34 20 17 18 15 315
McPherson 39 52 53 57 52 33 29 52 55 58 25 16 42 59 18 640

APPENDIX D │HEALTH INDICATORS RANKING BY COUNTY, FULL LIST
2020 Primary Care Needs Assessment SD Department of Health, Office of Rural Health D-4
HEA
LT
H A
CC
ESS
Den
tists
rati
o t
o p
op
ula
tion
Povert
y L
evel
Fre
e &
red
uced
sch
ool
lun
ch
Have a
pers
on
al
docto
r/p
rovid
er
Have a
usu
al
pla
ce t
o g
o f
or
med
ical
care
Cou
ld n
ot
see a
docto
r d
ue t
o c
ost
Liv
e b
irth
rate
Low
bir
th w
eig
ht
Pre
nata
l care
in
fir
st
trim
este
r
Colo
recta
l can
cer
scre
en
ing
Bre
ast
can
cer
scre
en
ing
Infu
len
za v
accin
ati
on
Un
insu
red
ad
ult
s, aged
18 t
o 6
4
Un
insu
red
ch
ild
ren
, u
nd
er
18
EM
S, avera
ge d
isp
atc
h t
o e
nro
ute
TO
TA
L
Meade 20 4 36 13 5 29 57 56 15 39 45 22 17 9 10 377
Mellette 55 62 33 33 33 33 15 13 62 53 58 53 65 51 50 669
Miner 1 28 11 28 13 33 12 56 39 2 7 46 8 26 56 366
Minnehaha 26 12 4 46 23 24 66 40 19 33 14 3 4 2 59 375
Moody 44 15 36 2 56 33 38 25 22 34 34 32 46 51 39 507
Oglala Lakota 46 66 33 33 33 33 57 53 46 62 62 62 58 9 11 664
Pennington 10 42 34 11 14 32 65 44 25 50 45 18 37 9 37 473
Perkins 41 43 32 22 29 33 15 32 29 46 52 63 46 65 45 593
Potter 36 18 27 5 14 33 8 36 49 5 48 42 17 34 60 432
Roberts 12 57 55 7 56 14 52 6 47 48 20 48 56 59 42 579
Sanborn 55 39 36 27 33 34 13 12 25 29 33 20 37 37 49 479
Spink 18 35 21 41 46 33 39 9 36 27 7 43 17 26 14 412
Stanley 43 3 15 10 6 9 22 18 51 42 34 12 17 18 33 333
Sully 55 5 7 32 11 33 4 10 61 47 34 34 29 43 6 411
Todd 51 65 33 33 33 34 54 61 65 64 65 53 59 18 22 710
Tripp 5 54 55 33 33 17 41 42 32 28 48 53 53 51 61 606
Turner 48 10 19 19 18 33 43 16 4 35 50 29 8 18 53 403
Union 8 2 4 51 31 1 51 37 1 4 7 14 2 9 46 268
Walworth 25 46 27 40 23 19 29 32 41 24 41 60 43 26 24 500
Yankton 30 24 39 48 40 15 56 55 3 11 25 5 8 2 8 369
Ziebach 55 63 60 33 33 40 8 44 58 60 66 58 62 51 33 724

APPENDIX D │HEALTH INDICATORS RANKING BY COUNTY, FULL LIST
2020 Primary Care Needs Assessment SD Department of Health, Office of Rural Health D-5
HEA
LT
H R
ISK
BEH
AV
IOR
S
Access t
o h
ealt
hy f
ood
s
Ph
ysic
al
inacti
vit
y
Ad
ult
Sm
okin
g
Moth
er'
s t
obacco u
se d
uri
ng p
regn
an
cy
Moth
er'
s b
reatf
eed
ing a
t d
isch
arg
e
Excessiv
e d
rin
kin
g
TO
TA
L
Aurora 47 13 1 23 51 43 178
Beadle 15 8 44 29 45 16 157
Bennett 64 44 58 64 65 4 299
Bon Homme 6 38 34 26 34 56 194
Brookings 37 3 5 13 12 56 126
Brown 15 29 19 42 33 28 166
Brule 30 45 44 39 54 16 228
Buffalo 66 57 64 66 66 16 335
Butte 19 21 44 57 18 4 163
Campbell 55 9 1 2 12 28 107
Charles Mix 6 2 55 60 56 4 183
Clark 36 51 19 15 7 43 171
Clay 28 28 44 18 35 66 219
Codington 23 35 44 55 44 43 244
Corson 63 56 62 62 64 2 309
Custer 15 43 19 50 11 4 142
Davison 11 39 34 51 52 28 215
Day 39 48 34 61 48 4 234
Deuel 48 15 5 16 16 43 143
Dewey 45 64 61 55 63 43 331
Douglas 51 29 5 17 3 28 133
Edmunds 39 63 5 7 4 28 146
Fall River 30 23 44 48 39 4 188
Faulk 46 46 5 1 2 16 116
Grant 8 11 5 29 28 28 109
Gregory 30 59 44 28 42 4 207
Haakon 38 48 34 41 22 4 187
Hamlin 56 21 5 32 6 43 163
Hand 30 31 5 10 14 28 118
Hanson 11 5 19 5 17 56 113
Harding 56 41 34 4 1 43 179
Hughes 8 32 34 49 45 43 211
Hutchinson 5 6 5 7 26 16 65
Hyde 43 12 19 21 40 16 151
Jackson 61 60 59 58 60 4 302
Jerauld 53 40 1 35 41 16 186
Jones 56 32 19 40 5 16 168
Kingsbury 34 50 5 21 7 28 145
Lake 3 37 19 27 32 28 146
Lawrence 11 4 34 44 21 56 170
Lincoln 1 14 5 3 20 65 108
Lyman 60 61 56 63 59 16 315
Marshall 43 26 19 34 35 43 200
McCook 23 26 19 11 26 43 148
McPherson 48 47 19 13 22 4 153
HEA
LT
H R
ISK
BEH
AV
IOR
S
Access t
o h
ealt
hy f
ood
s
Ph
ysic
al
inacti
vit
y
Ad
ult
Sm
okin
g
Moth
er'
s t
obacco u
se d
uri
ng p
regn
an
cy
Moth
er'
s b
reatf
eed
ing a
t d
isch
arg
e
Excessiv
e d
rin
kin
g
TO
TA
L
Meade 19 16 44 37 9 56 181
Mellette 62 62 60 51 57 1 293
Miner 23 7 19 7 29 28 113
Minnehaha 8 23 34 24 38 43 170
Moody 53 54 53 38 42 28 268
Oglala Lakota 65 53 65 47 62 4 296
Pennington 15 25 44 43 24 28 179
Perkins 39 18 19 31 15 16 138
Potter 56 58 1 18 10 16 159
Roberts 23 66 56 65 55 28 293
Sanborn 51 65 19 45 31 56 267
Spink 29 34 19 33 25 43 183
Stanley 11 42 5 20 19 56 153
Sully 39 18 5 24 47 43 176
Todd 34 52 66 59 61 28 300
Tripp 19 36 53 36 50 4 198
Turner 1 20 19 11 35 16 102
Union 3 1 5 6 29 56 100
Walworth 19 16 34 46 53 28 196
Yankton 23 9 34 53 49 56 224
Ziebach 48 55 63 54 58 2 280

2020 Primary Care Needs Assessment
SD Department of Health, Office of Rural Health E-1
APPENDIX E │QUARTILE RANKINGS, ALL COUNTIES
HEALTH
STATUS
(Sum)
HEALTH
ACCESS
(Sum)
HEALTH RISK
BEHAVIORS
(Sum)
Sully 208 Brookings 251 Hutchinson 65
Lincoln 321 Union 268 Union 100
Jones 333 Kingsbury 275 Turner 102
Campbell 344 Lincoln 283 Campbell 107
Jerauld 431 Codington 299 Lincoln 108
Edmunds 432 McCook 315 Grant 109
Harding 445 Davison 322 Hanson 113
Deuel 448 Stanley 333 Miner 113
Brookings 485 Deuel 341 Faulk 116
Hutchinson 546 Hughes 341 Hand 118
Hand 564 Bon Homme 344 Brookings 126
Union 567 Campbell 347 Douglas 133
Stanley 578 Clay 358 Perkins 138
Douglas 579 Hand 358 Custer 142
Bon Homme 586 Miner 366 Deuel 143
Lawrence 598 Yankton 369 Kingsbury 145
Sanborn 600 Hyde 374 Edmunds 146
Lake 608 Minnehaha 375 Lake 146
Hyde 609 Meade 377 McCook 148
Miner 610 Brown 383 Hyde 151
Aurora 619 Lawrence 385 McPherson 153
Haakon 624 Turner 403 Stanley 153
Custer 629 Grant 406 Beadle 157
Faulk 634 Haakon 407 Potter 159
Hamlin 637 Sully 411 Butte 163
Hanson 637 Spink 412 Hamlin 163
Perkins 642 Harding 417 Brown 166
Davison 657 Hamlin 430 Jones 168
Moody 660 Potter 432 Lawrence 170
Potter 660 Lake 438 Minnehaha 170
Brule 670 Jerauld 449 Clark 171
Brown 676 Edmunds 459 Sully 176
Codington 684 Hutchinson 465 Aurora 178
FIR
ST
QU
AR
TIL
ESEC
ON
D Q
UA
RT
ILE

2020 Primary Care Needs Assessment
SD Department of Health, Office of Rural Health E-2
*Turner County is in the Third Quartile with a sum of 802.
HEALTH
STATUS
(Sum)
HEALTH
ACCESS
(Sum)
HEALTH RISK
BEHAVIORS
(Sum)
Clay 689 Douglas 471 Harding 179
Meade 691 Pennington 473 Pennington 179
Clark 693 Sanborn 479 Meade 181
Marshall 695 Clark 482 Charles Mix 183
Yankton 699 Jones 483 Spink 183
Pennington 705 Custer 484 Jerauld 186
McPherson 711 Hanson 486 Haakon 187
Hughes 720 Fall River 492 Fall River 188
Spink 769 Brule 498 Bon Homme 194
Grant 771 Walworth 500 Walworth 196
Minnehaha 785 Moody 507 Tripp 198
Kingsbury 790 Butte 518 Marshall 200
Gregory 793 Beadle 519 Gregory 207
Butte 796 Faulk 525 Hughes 211
Day 802 Day 528 Davison 215
Tripp 802 Aurora 533 Clay 219
McCook 802 Gregory 559 Yankton 224
Turner* 802 Buffalo 560 Brule 228
Beadle 871 Roberts 579 Day 234
Walworth 912 Lyman 588 Codington 244
Ziebach 957 Perkins 593 Sanborn 267
Fall River 968 Charles Mix 594 Moody 268
Lyman 972 Marshall 597 Ziebach 280
Roberts 1033 Tripp 606 Mellette 293
Jackson 1061 Bennett 639 Roberts 293
Mellette 1073 McPherson 640 Oglala Lakota 296
Bennett 1114 Oglala Lakota 664 Bennett 299
Charles Mix 1115 Mellette 669 Todd 300
Corson 1152 Dewey 694 Jackson 302
Dewey 1224 Todd 710 Corson 309
Oglala Lakota 1265 Ziebach 724 Lyman 315
Todd 1282 Corson 726 Dewey 331
Buffalo 1287 Jackson 729 Buffalo 335
TH
IRD
QU
AR
TIL
EFO
UR
TH
QU
AR
TIL
E

2020 Primary Care Needs Assessment SD Department of Health, Office of Rural Health F-1
APPENDIX F │SOUTH DAKOTA POPULATION DEMOGRAPHICS
Table 48: Total Population by County, 2011, 2014, and 2017
Table 49: White Population by County, 2011, 2014, and 2017
Table 50: Non-White Population by County, 2011, 2014, and 2017
Table 51: Population by Age, by County, 2011, 2014, and 2017
Table 52: Unintentional Drug Overdose – Fatal per 100,000
Table 53: Unintentional Drug Overdose - Non-Fatal per 100,000
Table 54: Opioid Prescriptions per 100
Table 55: Naloxone Administration per 10,000
Table 56: Drug Related Hospital Discharges per 100,000
Table 57: Substance Use Treatment Admissions per 10,000
Table 58: High Intensity Drug Trafficking Area
Table 59: Poverty
Table 60: No High School Diploma
Table 61: Unemployed
Table 62: Single Parent Households
Table 63: Persons 65 and Older
Table 64: Persons 17 or Younger
Table 65: Minority
Table 66: Housing Unit with More People than Rooms
Table 67: Household with No Vehicle
Table 68: Uninsured
Table 69: Mobile Homes
Table 70: People with Disability
Table 71: Speak Limited English
Table 72: Per Capita Income

2020 Primary Care Needs Assessment SD Department of Health, Office of Rural Health F-2
Table 48: Total Population by County, 2011, 2014, and 2017
State of South Dakota 2011 2014 2017
Total population 824,082 853,175 869,666
Total population
County 2011 2014 2017
Aurora 2,694 2,745 2,738
Beadle 17,550 18,169 18,157
Bennett 3,441 3,430 3,454
Bon Homme 6,983 7,023 6,984
Brookings 32,226 33,314 34,255
Brown 36,822 38,408 39,178
Brule 5,283 5,309 5,312
Buffalo 1,988 2,077 1,999
Butte 10,259 10,298 10,107
Campbell 1,427 1,386 1,379
Charles Mix 9,208 9,287 9,428
Clark 3,628 3,645 3,668
Clay 14,051 13,932 13,990
Codington 27,442 27,938 28,099
Corson 4,022 4,182 4,203
Custer 8,338 8,445 8,691
Davison 19,651 19,885 19,704
Day 5,741 5,588 5,521
Deuel 4,359 4,312 4,281
Dewey 5,421 5,662 5,835
Douglas 2,972 2,973 2,931
Edmunds 4,056 3,983 3,919
Fall River 6,981 6,845 6,687
Faulk 2,367 2,357 2,329
Grant 7,250 7,241 7,061
Gregory 4,216 4,217 4,226
Haakon 1,907 1,847 1,943
Hamlin 5,978 5,989 5,948
Hand 3,423 3,345 3,277
Hanson 3,376 3,419 3,423
Harding 1,269 1,250 1,242
Hughes 17,292 17,642 17,666
Hutchinson 7,257 7,200 7,358
Total population
County 2011 2014 2017
Hyde 1,394 1,396 1,318
Jackson 3,169 3,274 3,289
Jerauld 2,085 2,007 2,028
Jones 1,003 975 936
Kingsbury 5,179 5,075 4,952
Lake 11,567 12,368 12,809
Lawrence 24,312 24,657 25,429
Lincoln 46,793 51,548 56,664
Lyman 3,806 3,877 3,904
Marshall 4,597 4,683 4,804
McCook 5,556 5,649 5,499
McPherson 2,452 2,429 2,426
Meade 25,546 26,951 28,018
Mellette 2,067 2,100 2,088
Miner 2,359 2,316 2,228
Minnehaha 171,752 182,882 188,616
Moody 6,475 6,367 6,579
Oglala Lakota 13,928 14,218 14,354
Pennington 102,815 108,242 110,141
Perkins 3,001 3,033 2,974
Potter 2,364 2,340 2,231
Roberts 10,286 10,374 10,278
Sanborn 2,392 2,336 2,450
Spink 6,470 6,598 6,410
Stanley 3,002 2,983 3,011
Sully 1,375 1,438 1,407
Todd 9,822 9,882 10,065
Tripp 5,615 5,512 5,460
Turner 8,332 8,272 8,315
Union 14,651 15,029 15,029
Walworth 5,575 5,511 5,543
Yankton 22,612 22,684 22,662
Ziebach 2,852 2,826 2,756
Source: South Dakota Vital Statistics Report: A State and County Comparison of Leading Health Indicators.
https://doh.sd.gov/statistics/
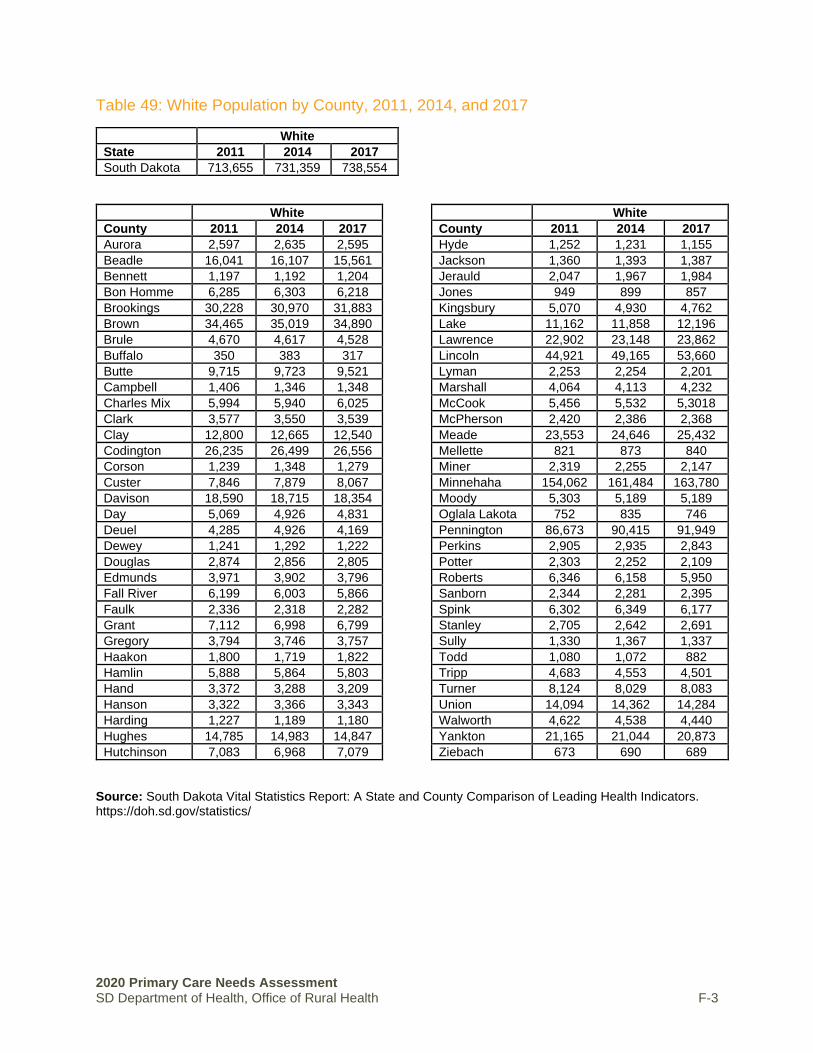
2020 Primary Care Needs Assessment SD Department of Health, Office of Rural Health F-3
Table 49: White Population by County, 2011, 2014, and 2017
White
State 2011 2014 2017
South Dakota 713,655 731,359 738,554
White
County 2011 2014 2017
Aurora 2,597 2,635 2,595
Beadle 16,041 16,107 15,561
Bennett 1,197 1,192 1,204
Bon Homme 6,285 6,303 6,218
Brookings 30,228 30,970 31,883
Brown 34,465 35,019 34,890
Brule 4,670 4,617 4,528
Buffalo 350 383 317
Butte 9,715 9,723 9,521
Campbell 1,406 1,346 1,348
Charles Mix 5,994 5,940 6,025
Clark 3,577 3,550 3,539
Clay 12,800 12,665 12,540
Codington 26,235 26,499 26,556
Corson 1,239 1,348 1,279
Custer 7,846 7,879 8,067
Davison 18,590 18,715 18,354
Day 5,069 4,926 4,831
Deuel 4,285 4,926 4,169
Dewey 1,241 1,292 1,222
Douglas 2,874 2,856 2,805
Edmunds 3,971 3,902 3,796
Fall River 6,199 6,003 5,866
Faulk 2,336 2,318 2,282
Grant 7,112 6,998 6,799
Gregory 3,794 3,746 3,757
Haakon 1,800 1,719 1,822
Hamlin 5,888 5,864 5,803
Hand 3,372 3,288 3,209
Hanson 3,322 3,366 3,343
Harding 1,227 1,189 1,180
Hughes 14,785 14,983 14,847
Hutchinson 7,083 6,968 7,079
White
County 2011 2014 2017
Hyde 1,252 1,231 1,155
Jackson 1,360 1,393 1,387
Jerauld 2,047 1,967 1,984
Jones 949 899 857
Kingsbury 5,070 4,930 4,762
Lake 11,162 11,858 12,196
Lawrence 22,902 23,148 23,862
Lincoln 44,921 49,165 53,660
Lyman 2,253 2,254 2,201
Marshall 4,064 4,113 4,232
McCook 5,456 5,532 5,3018
McPherson 2,420 2,386 2,368
Meade 23,553 24,646 25,432
Mellette 821 873 840
Miner 2,319 2,255 2,147
Minnehaha 154,062 161,484 163,780
Moody 5,303 5,189 5,189
Oglala Lakota 752 835 746
Pennington 86,673 90,415 91,949
Perkins 2,905 2,935 2,843
Potter 2,303 2,252 2,109
Roberts 6,346 6,158 5,950
Sanborn 2,344 2,281 2,395
Spink 6,302 6,349 6,177
Stanley 2,705 2,642 2,691
Sully 1,330 1,367 1,337
Todd 1,080 1,072 882
Tripp 4,683 4,553 4,501
Turner 8,124 8,029 8,083
Union 14,094 14,362 14,284
Walworth 4,622 4,538 4,440
Yankton 21,165 21,044 20,873
Ziebach 673 690 689
Source: South Dakota Vital Statistics Report: A State and County Comparison of Leading Health Indicators. https://doh.sd.gov/statistics/
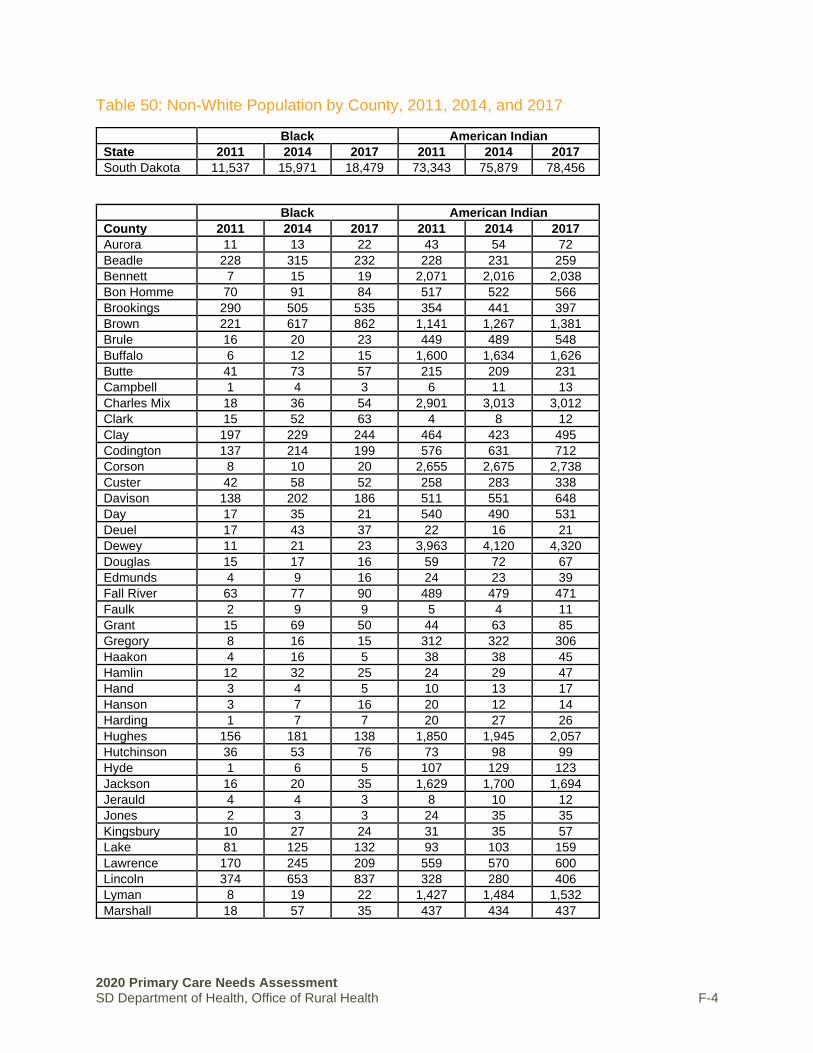
2020 Primary Care Needs Assessment SD Department of Health, Office of Rural Health F-4
Table 50: Non-White Population by County, 2011, 2014, and 2017
Black American Indian
State 2011 2014 2017 2011 2014 2017
South Dakota 11,537 15,971 18,479 73,343 75,879 78,456
Black American Indian
County 2011 2014 2017 2011 2014 2017
Aurora 11 13 22 43 54 72
Beadle 228 315 232 228 231 259
Bennett 7 15 19 2,071 2,016 2,038
Bon Homme 70 91 84 517 522 566
Brookings 290 505 535 354 441 397
Brown 221 617 862 1,141 1,267 1,381
Brule 16 20 23 449 489 548
Buffalo 6 12 15 1,600 1,634 1,626
Butte 41 73 57 215 209 231
Campbell 1 4 3 6 11 13
Charles Mix 18 36 54 2,901 3,013 3,012
Clark 15 52 63 4 8 12
Clay 197 229 244 464 423 495
Codington 137 214 199 576 631 712
Corson 8 10 20 2,655 2,675 2,738
Custer 42 58 52 258 283 338
Davison 138 202 186 511 551 648
Day 17 35 21 540 490 531
Deuel 17 43 37 22 16 21
Dewey 11 21 23 3,963 4,120 4,320
Douglas 15 17 16 59 72 67
Edmunds 4 9 16 24 23 39
Fall River 63 77 90 489 479 471
Faulk 2 9 9 5 4 11
Grant 15 69 50 44 63 85
Gregory 8 16 15 312 322 306
Haakon 4 16 5 38 38 45
Hamlin 12 32 25 24 29 47
Hand 3 4 5 10 13 17
Hanson 3 7 16 20 12 14
Harding 1 7 7 20 27 26
Hughes 156 181 138 1,850 1,945 2,057
Hutchinson 36 53 76 73 98 99
Hyde 1 6 5 107 129 123
Jackson 16 20 35 1,629 1,700 1,694
Jerauld 4 4 3 8 10 12
Jones 2 3 3 24 35 35
Kingsbury 10 27 24 31 35 57
Lake 81 125 132 93 103 159
Lawrence 170 245 209 559 570 600
Lincoln 374 653 837 328 280 406
Lyman 8 19 22 1,427 1,484 1,532
Marshall 18 57 35 437 434 437

2020 Primary Care Needs Assessment SD Department of Health, Office of Rural Health F-5
Continued, Table 50: Non-White Population by County, 2011, 2014, and 2017
Black American Indian
County 2011 2014 2017 2011 2014 2017
McCook 17 25 32 33 37 65
McPherson - 10 15 2 9 6
Meade 434 519 583 639 744 781
Mellette 4 7 6 1,110 1,100 1,123
Miner 2 15 22 5 12 15
Minnehaha 6,527 8,482 10,644 4,809 4,988 5,256
Moody 39 57 131 900 856 890
Oglala Lakota 42 32 52 12,869 13,109 13,291
Pennington 1,337 1,704 1,477 9,973 10,812 11,105
Perkins 9 10 15 45 51 65
Potter 5 10 10 21 42 49
Roberts 31 63 76 3,559 3,798 3,888
Sanborn - 3 5 12 9 10
Spink 19 47 43 91 127 112
Stanley 9 27 23 198 230 212
Sully 3 12 6 17 28 33
Todd 29 28 50 8,506 8,523 8,855
Tripp 11 22 32 780 774 776
Turner 25 42 42 92 86 84
Union 117 160 164 103 108 133
Walworth 11 29 29 775 747 791
Yankton 384 437 485 633 689 686
Ziebach 9 9 13 2,085 2,011 1,933
Asian 2 or More Races
State 2011 2014 2017 2011 2014 2017
South Dakota 8,241 10,739 12,901 16,482 18,602 20,557
Asian 2 or More Races
County 2011 2014 2017 2011 2014 2017
Aurora 19 17 20 24 26 29
Beadle 772 1,153 1,702 281 329 355
Bennett 17 22 15 145 184 177
Bon Homme 14 13 12 98 94 103
Brookings 902 941 884 451 430 528
Brown 368 735 1,148 552 702 817
Brule 11 16 21 137 166 190
Buffalo 4 2 1 30 46 40
Butte 31 33 44 256 251 245
Campbell 7 7 6 7 18 9
Charles Mix 18 22 25 276 275 311
Clark 4 3 18 29 32 36
Clay 267 299 361 309 308 340
Codington 137 221 193 357 371 436
Corson 16 15 21 101 130 143

2020 Primary Care Needs Assessment SD Department of Health, Office of Rural Health F-6
Continued, Table 50: Non-White Population by County, 2011, 2014, and 2017
Asian 2 or More Races
County 2011 2014 2017 2011 2014 2017
Custer 33 42 50 158 179 182
Davison 98 109 127 295 287 372
Day 11 34 39 103 103 99
Deuel 4 6 8 31 42 46
Dewey 11 10 14 201 219 255
Douglas 3 7 3 21 21 40
Edmunds 4 7 28 49 42 40
Fall River 28 60 42 195 222 216
Faulk 2 5 10 21 21 17
Grant 22 28 28 51 80 94
Gregory 13 18 19 80 101 125
Haakon 11 13 5 53 60 64
Hamlin 18 19 23 36 44 49
Hand 10 12 12 27 26 33
Hanson 14 12 12 17 21 37
Harding 1 3 3 20 24 26
Hughes 104 115 136 398 415 482
Hutchinson 15 15 19 58 65 82
Hyde 3 4 3 28 25 30
Jackson 3 2 6 162 155 166
Jerauld 4 5 4 17 18 23
Jones 1 8 1 25 26 33
Kingsbury 16 21 33 52 62 75
Lake 81 120 137 150 160 178
Lawrence 170 178 238 486 499 504
Lincoln 515 684 765 655 752 965
Lyman 11 11 12 107 108 135
Marshall 14 12 11 60 67 89
McCook 11 10 13 39 43 67
McPherson 5 4 12 20 17 23
Meade 204 252 348 715 771 840
Mellette 6 6 5 126 114 114
Miner 9 9 10 24 25 34
Minnehaha 2,576 3,495 4,142 3,607 4,234 4,564
Moody 71 81 151 162 184 218
Oglala Lakota 56 16 19 195 23 238
Pennington 1,131 1,314 1,299 3,599 3,882 4,203
Perkins 6 8 8 36 29 41
Potter 9 11 23 26 25 39
Roberts 31 33 24 319 322 339
Sanborn 7 5 7 31 37 32
Spink 6 7 7 45 68 70
Stanley 3 8 10 84 76 75
Sully - 1 2 26 30 29
Todd 29 25 20 187 234 258
Tripp 11 28 18 129 134 133
Turner 17 20 22 75 91 79
Union 147 159 193 176 227 245

2020 Primary Care Needs Assessment SD Department of Health, Office of Rural Health F-7
Continued, Table 50: Non-White Population by County, 2011, 2014, and 2017
Source: South Dakota Vital Statistics Report: A State and County Comparison of Leading Health Indicators. https://doh.sd.gov/statistics/
Walworth 17 20 104 151 177 178
Yankton 136 157 195 294 348 412
Ziebach 9 10 10 77 105 110

2020 Primary Care Needs Assessment SD Department of Health, Office of Rural Health F-8
Table 51: Population by Age, by County, 2011, 2014, and 2017
Under 5 Years Under 18 Years
State 2011 2014 2017 2011 2014 2017
South Dakota 59,334 60,610 61,759 203,548 210,407 214,856
Under 5 Years Under 18 Years
County 2011 2014 2017 2011 2014 2017
Aurora 183 178 168 714 722 690
Beadle 1,351 1,521 1,666 4,300 4,690 4,990
Bennett 358 328 328 1,180 1,151 1,151
Bon Homme 328 319 374 1,355 1,364 1,367
Brookings 1,901 2,023 2,226 6,026 6,551 7,013
Brown 2,541 2,609 2,635 8,506 9,113 9,469
Brule 365 373 335 1,337 1,351 1,410
Buffalo 249 276 226 805 842 767
Butte 728 647 612 2,544 2,488 2,441
Campbell 56 52 56 247 230 211
Charles Mix 792 800 829 2,735 2,739 2,782
Clark 268 304 372 856 871 938
Clay 759 794 756 2,431 2,518 2,479
Codington 2,058 1,966 1,833 6,751 6,805 6,808
Corson 370 392 439 1,392 1,445 1,532
Custer 375 331 350 1,601 1,428 1,369
Davison 1,376 1,243 1,238 4,539 4,569 4,586
Day 344 319 306 1,246 1,230 1,237
Deuel 270 239 266 1,011 993 996
Dewey 526 665 726 1,838 1,988 2,154
Douglas 158 186 214 669 679 729
Edmunds 227 219 279 965 904 909
Fall River 265 226 304 1,201 1,225 1,171
Faulk 142 143 182 552 528 566
Grant 428 412 440 1,639 1,624 1,598
Gregory 249 240 269 944 959 981
Haakon 128 117 118 441 413 462
Hamlin 538 568 545 1,793 1,874 1,892
Hand 181 173 182 705 701 698

2020 Primary Care Needs Assessment SD Department of Health, Office of Rural Health F-9
Continued, Table 51: Population by Age, by County, 2011, 2014, and 2017
Under 5 Years Under 18 Years
County 2011 2011 2014 2011 2011 2014
Hanson 297 332 273 1,080 1,129 1,057
Harding 71 97 85 291 280 284
Hughes 1,193 1,229 1,226 4,115 4,191 4,249
Hutchinson 435 490 611 1,720 1,697 1,821
Hyde 82 70 75 309 299 279
Jackson 292 358 349 1,033 1,118 1,064
Jerauld 148 135 125 450 465 474
Jones 63 50 53 226 206 205
Kingsbury 321 320 324 1,145 1,121 1,120
Lake 636 682 688 2,394 2,441 2,557
Lawrence 1,337 1,151 1,159 4,644 4,517 4,614
Lincoln 4,399 4,275 4,206 13,664 15,035 16,009
Lyman 263 323 348 1,085 1,113 1,148
Marshall 285 290 361 1,011 1,002 1,111
McCook 406 394 425 1,422 1,480 1,516
McPherson 130 139 172 535 539 587
Meade 1,865 1,701 1,599 6,208 6,479 6,509
Mellette 192 197 197 666 646 631
Miner 151 130 143 552 550 547
Minnehaha 12,881 14,060 14,635 42,766 45,888 47,882
Moody 473 478 499 1,671 1,622 1,722
Oglala Lakota 1,588 1,664 1,519 5,446 5,420 5,391
Pennington 7,505 7,547 7,355 24,984 25,953 25,591
Perkins 159 159 182 636 652 637
Potter 132 127 113 478 483 475
Roberts 854 906 906 2,942 2,953 2,896
Sanborn 134 149 219 500 518 638
Spink 382 390 382 1,598 1,583 1,503
Stanley 183 176 194 693 713 734
Sully 87 71 84 298 311 295
Todd 1,306 1,285 1,309 4,027 3,991 4,151
Tripp 331 341 375 1,297 1,237 1,254
Turner 508 495 514 1,966 1,923 1,989
Union 952 912 860 3,736 3,817 3,608
Walworth 351 330 384 1,232 1,244 1,298
Yankton 1,289 1,317 1,368 4,862 4,786 4,784
Ziebach 317 177 166 1,104 1,010 830
Source: South Dakota Vital Statistics Report: A State and County Comparison of Leading Health Indicators. https://doh.sd.gov/statistics/

2020 Primary Care Needs Assessment SD Department of Health, Office of Rural Health F-10
Continued, Table 51: Population by Age, by County, 2011, 2014, and 2017
65 Years and Over
State 2011 2014 2017
South Dakota 118,668 130,223 141,624
65 Years and Over
County 2011 2014 2017
Aurora 525 541 581
Beadle 2,948 3,034 3,155
Bennett 379 422 431
Bon Homme 1,327 1,403 1,432
Brookings 3,255 3,482 4,000
Brown 5,855 6,151 6,522
Brule 888 916 956
Buffalo 137 149 145
Butte 1,621 1,902 1,974
Campbell 375 343 379
Charles Mix 1,602 1,667 1,713
Clark 798 745 778
Clay 1,419 1,557 1,645
Codington 4,061 4,339 4,787
Corson 418 439 455
Custer 1,843 2,162 2,487
Davison 3,341 3,455 3,341
Day 1,320 1,363 1,320
Deuel 850 904 850
Dewey 515 565 515
Douglas 713 736 707
Edmunds 868 852 840
Fall River 1,668 1,786 1,896
Faulk 554 551 540
Grant 1,370 1,445 1,480
Gregory 1,003 1,018 1,046
Haakon 406 429 460
Hamlin 1,046 1,048 935
Hand 849 820 824
Hanson 469 466 523
Harding 183 196 209
Hughes 2,317 2,657 2,954
Hutchinson 1,800 1,708 1,672
Hyde 308 334 332
Jackson 421 437 446
Jerauld 517 499 542
Jones 203 211 220
Kingsbury 1,113 1,092 1,126
Lake 1,978 2,445 2,705
Source: South Dakota Vital Statistics Report: A State and County Comparison of Leading Health Indicators. https://doh.sd.gov/statistics/
65 Years and Over
County 2011 2014 2017
Lawrence 4,060 4,571 5,293
Lincoln 4,305 5,347 7,025
Lyman 563 589 610
Marshall 878 929 997
McCook 1,056 1,104 1,019
McPherson 733 684 679
Meade 3,168 3,698 4,107
Mellette 539 328 328
Miner 526 505 452
Minnehaha 19,408 22,271 24,161
Moody 991 1,086 1,208
Oglala Lakota 864 965 1,007
Pennington 14,291 16,684 19,101
Perkins 672 697 716
Potter 610 664 639
Roberts 1,759 1,881 1,976
Sanborn 500 442 452
Spink 1,275 1,291 1,299
Stanley 498 511 607
Sully 254 270 332
Todd 599 717 727
Tripp 1,179 1,189 1,223
Turner 1,566 1,698 1,733
Union 2,110 2,330 2,714
Walworth 1,310 1,337 1,311
Yankton 3,708 3,977 4,212
Ziebach 197 189 261

2020 Primary Care Needs Assessment SD Department of Health, Office of Rural Health F-11
Table 52: Unintentional Drug Overdose - Fatal per 100,000
Unintentional Drug Overdose – Fatal per 100,000
State 2016-2018
South Dakota 5.6
Unintentional Drug Overdose – Fatal per 100,000
County 2016-2018
Aurora 0
Beadle 9.2
Bennett 0
Bon Homme 0
Brookings 3.9
Brown 4.3
Brule 6.3
Buffalo 33.4
Butte 6.6
Campbell 24.2
Charles Mix 3.5
Clark 0
Clay 4.8
Codington 2.4
Corson 23.8
Custer 15.3
Davison 6.8
Day 0
Deuel 0
Dewey 0
Douglas 11.4
Edmunds 0
Fall River 5.0
Faulk 0
Grant 4.7
Gregory 7.9
Haakon 17.2
Hamlin 0
Hand 0
Hanson 0
Harding 0
Hughes 5.7
Hutchinson 0
Unintentional Drug Overdose – Fatal per 100,000
County 2016-2018
Hyde 0
Jackson 0
Jerauld 0
Jones 0
Kingsbury 0
Lake 2.6
Lawrence 6.6
Lincoln 4.7
Lyman 0
Marshall 0
McCook 0
McPherson 0
Meade 1.2
Mellette 0
Miner 15.0
Minnehaha 8.5
Moody 0
Oglala Lakota 7.0
Pennington 6.7
Perkins 0
Potter 14.9
Roberts 3.2
Sanborn 0
Spink 5.2
Stanley 0
Sully 0
Todd 6.6
Tripp 0
Turner 4.0
Union 2.2
Walworth 6.0
Yankton 7.4
Ziebach 0
Source: SD DOH, Hospital Discharge, 2016-2018.

2020 Primary Care Needs Assessment SD Department of Health, Office of Rural Health F-12
Table 53: Unintentional Drug Overdose - Non-Fatal per 100,000
Unintentional Drug Overdose – Non-Fatal per 100,000
State 2016-2018
South Dakota 9.2
Unintentional Drug Overdose – Non-Fatal per 100,000
County 2016-2018
Aurora 18.3
Beadle 0
Bennett 14.5
Bon Homme 7.2
Brookings 11.7
Brown 2.6
Brule 0
Buffalo 50.0
Butte 14.8
Campbell 0
Charles Mix 15.9
Clark 0
Clay 28.6
Codington 10.7
Corson 11.9
Custer 28.8
Davison 5.1
Day 0
Deuel 0
Dewey 0
Douglas 0
Edmunds 0
Fall River 15.0
Faulk 0
Grant 7.1
Gregory 0
Haakon 0
Hamlin 0
Hand 0
Hanson 0
Harding 40.3
Hughes 2.8
Hutchinson 6.8
Unintentional Drug Overdose – Non-Fatal per 100,000
County 2016-2018
Hyde 0
Jackson 0
Jerauld 0
Jones 0
Kingsbury 30.3
Lake 11.7
Lawrence 15.7
Lincoln 2.6
Lyman 12.8
Marshall 0
McCook 0
McPherson 0
Meade 7.1
Mellette 23.9
Miner 0
Minnehaha 10.6
Moody 15.2
Oglala Lakota 3.5
Pennington 11.3
Perkins 0
Potter 0
Roberts 34.1
Sanborn 20.4
Spink 7.8
Stanley 0
Sully 0
Todd 9.9
Tripp 9.2
Turner 6.0
Union 0
Walworth 9.0
Yankton 13.2
Ziebach 0
Source: SD DOH, Hospital Discharge, 2016-2018.

2020 Primary Care Needs Assessment SD Department of Health, Office of Rural Health F-13
Table 54: Opioid Prescriptions per 100
Opioid Prescriptions per 100
State 2016-2018
South Dakota 59.3
Opioid Prescriptions per 100
County 2016-2018
Aurora 64.5
Beadle 57.8
Bennett 58.3
Bon Homme 60.4
Brookings 42
Brown 60.2
Brule 70.1
Buffalo 99.3
Butte 68.1
Campbell 33.4
Charles Mix 80.9
Clark 44.4
Clay 40.9
Codington 52.2
Corson 39.8
Custer 89.6
Davison 58.3
Day 71.7
Deuel 60.9
Dewey 80
Douglas 64.9
Edmunds 67.6
Fall River 109.4
Faulk 52.4
Grant 60.2
Gregory 62.1
Haakon 71.1
Hamlin 43.2
Hand 35.4
Hanson 28.6
Harding 29
Hughes 65.3
Hutchinson 71.8
Hyde 49.3
Opioid Prescriptions per 100
County 2016-2018
Jackson 67.5
Jerauld 104.3
Jones 69
Kingsbury 70.9
Lake 41.6
Lawrence 57.3
Lincoln 38.9
Lyman 70.6
Marshall 43.6
McCook 67.6
McPherson 52.2
Meade 57.3
Mellette 65
Miner 58
Minnehaha 56.2
Moody 67.8
Oglala Lakota 117.2
Pennington 60.2
Perkins 59.6
Potter 77.9
Roberts 76.4
Sanborn 56.8
Spink 74.4
Stanley 63.7
Sully 40.4
Todd 95.8
Tripp 65.4
Turner 66.5
Union 45.5
Walworth 71.4
Yankton 76
Ziebach 36.1
Source: SD DOH, South Dakota Prescription Drug Monitoring Program, 2016-2018.

2020 Primary Care Needs Assessment SD Department of Health, Office of Rural Health F-14
Table 55: Naloxone Administration per 10,000
Naloxone Administration per 10,000
State 2018
South Dakota 3.8
Naloxone Administration per 10,000
County 2018
Aurora 3.7
Beadle 0
Bennett 0
Bon Homme 1.4
Brookings 1.5
Brown 1.8
Brule 7.5
Buffalo 5.0
Butte 3.0
Campbell 0
Charles Mix 0
Clark 0
Clay 2.1
Codington 1.4
Corson 0
Custer 1.2
Davison 1.0
Day 1.8
Deuel 0
Dewey 3.4
Douglas 3.4
Edmunds 2.6
Fall River 4.5
Faulk 0
Grant 0
Gregory 2.4
Haakon 0
Hamlin 0
Hand 0
Hanson 0
Harding 0
Hughes 10.2
Hutchinson 0
Hyde 0
Naloxone Administration per 10,000
County 2018
Jackson 9.1
Jerauld 0
Jones 10.7
Kingsbury 0
Lake 0
Lawrence 3.9
Lincoln 3.0
Lyman 12.8
Marshall 0
McCook 2.1
McPherson 1.8
Meade 3.6
Mellette 4.8
Miner 0
Minnehaha 7
Moody 4.6
Oglala Lakota 11.1
Pennington 4.8
Perkins 0
Potter 4.5
Roberts 1.9
Sanborn 0
Spink 1.6
Stanley 0
Sully 0
Todd 7.0
Tripp 1.8
Turner 1.2
Union 0.7
Walworth 5.4
Yankton 0.4
Ziebach 3.6
Source: SD DOH, Emergency Medical Services, 2018.

2020 Primary Care Needs Assessment SD Department of Health, Office of Rural Health F-15
Table 56: Drug Related Hospital Discharges per 100,000
Drug Related Hospital Discharges per 100,000
State 2017-2018
South Dakota 31.0
Drug Related Hospital Discharges per 100,000
County 2017-2018
Aurora 0
Beadle 55.1
Bennett 0
Bon Homme 14.3
Brookings 116.8
Brown 38.3
Brule 18.8
Buffalo 0
Butte 9.9
Campbell 0
Charles Mix 42.4
Clark 27.3
Clay 14.3
Codington 24.9
Corson 47.6
Custer 23.0
Davison 40.6
Day 54.3
Deuel 0
Dewey 17.1
Douglas 102.4
Edmunds 0
Fall River 29.9
Faulk 0
Grant 0
Gregory 23.7
Haakon 0
Hamlin 16.8
Hand 61.0
Hanson 29.2
Harding 0
Hughes 79.2
Hutchinson 13.6
Drug Related Hospital Discharges per 100,000
County 2017-2018
Hyde 0
Jackson 0
Jerauld 0
Jones 0
Kingsbury 60.6
Lake 0
Lawrence 11.8
Lincoln 26.5
Lyman 0
Marshall 41.6
McCook 18.2
McPherson 41.2
Meade 21.4
Mellette 0
Miner 0
Minnehaha 38.2
Moody 76.0
Oglala Lakota 7.0
Pennington 13.6
Perkins 0
Potter 0
Roberts 19.5
Sanborn 0
Spink 62.4
Stanley 0
Sully 71.1
Todd 19.9
Tripp 0
Turner 24.1
Union 6.7
Walworth 54.1
Yankton 35.3
Ziebach 0
Source: SD DOH, Syndromic Surveillance, July 2017-December 2018.

2020 Primary Care Needs Assessment SD Department of Health, Office of Rural Health F-16
Table 57: Substance Use Treatment Admissions per 10,000
Substance Use Treatment Admissions per 10,000
State 2016-2018
South Dakota 119.5
Substance Use Treatment Admissions per 10,000
County 2016-2018
Aurora 49.9
Beadle 89.4
Bennett 148.6
Bon Homme 36.3
Brookings 51.8
Brown 152.4
Brule 110.4
Buffalo 190.1
Butte 110.2
Campbell 19.3
Charles Mix 180.7
Clark 52.7
Clay 77.9
Codington 139.4
Corson 46.8
Custer 57.5
Davison 203.2
Day 89.4
Deuel 28.0
Dewey 71.4
Douglas 35.3
Edmunds 23.8
Fall River 137.6
Faulk 32.9
Grant 59.5
Gregory 60.7
Haakon 32.6
Hamlin 41.5
Hand 32.6
Hanson 36.0
Harding 13.4
Hughes 222.3
Hutchinson 24.9
Substance Use Treatment Admissions per 10,000
County 2016-2018
Hyde 22.8
Jackson 37.5
Jerauld 18.1
Jones 46.3
Kingsbury 38.4
Lake 65.1
Lawrence 114
Lincoln 25.5
Lyman 130.6
Marshall 64.5
McCook 44.3
McPherson 44
Meade 91.8
Mellette 71.8
Miner 47.9
Minnehaha 183.6
Moody 84.6
Oglala Lakota 61.5
Pennington 162.9
Perkins 26.9
Potter 71.7
Roberts 145
Sanborn 44.9
Spink 64.5
Stanley 135.1
Sully 56.9
Todd 33.4
Tripp 107.4
Turner 39.7
Union 38.8
Walworth 55.9
Yankton 166.9
Ziebach 30.2
Source: South Dakota Department of Social Services, Treatment Episode Data, 2016-2018.

2020 Primary Care Needs Assessment SD Department of Health, Office of Rural Health F-17
Table 58: High Intensity Drug Trafficking Area
High Intensity Drug Trafficking Area
State 2018
South Dakota N/A
High Intensity Drug Trafficking Area
County 2018
Aurora No
Beadle Yes
Bennett No
Bon Homme No
Brookings Yes
Brown Yes
Brule No
Buffalo No
Butte No
Campbell No
Charles Mix No
Clark No
Clay Yes
Codington Yes
Corson No
Custer Yes
Davison No
Day No
Deuel No
Dewey No
Douglas No
Edmunds No
Fall River No
Faulk No
Grant No
Gregory No
Haakon No
Hamlin No
Hand No
Hanson No
Harding No
Hughes No
Hutchinson No
High Intensity Drug Trafficking Area
County County
Hyde No
Jackson No
Jerauld No
Jones No
Kingsbury No
Lake No
Lawrence Yes
Lincoln Yes
Lyman No
Marshall No
McCook No
McPherson No
Meade Yes
Mellette No
Miner No
Minnehaha Yes
Moody No
Oglala Lakota No
Pennington Yes
Perkins No
Potter No
Roberts No
Sanborn No
Spink No
Stanley No
Sully No
Todd No
Tripp No
Turner No
Union Yes
Walworth No
Yankton Yes
Ziebach No
Source: U.S. Drug Enforcement Administration, High Intensity Drug Trafficking Area (HITDA) Programs County Data, May 2018.

2020 Primary Care Needs Assessment SD Department of Health, Office of Rural Health F-18
Table 59: Poverty
Poverty
State 2012-2016
South Dakota 13.9%
Poverty
County 2012-2016
Aurora 6.2%
Beadle 23.7%
Bennett 38.1%
Bon Homme 10.3%
Brookings 15.9%
Brown 11%
Brule 14.6%
Buffalo 40.5%
Butte 11.1%
Campbell 4.7%
Charles Mix 21.4%
Clark 13.3%
Clay 24.7%
Codington 11.7%
Corson 47.9%
Custer 13.2%
Davison 12.6%
Day 16.5%
Deuel 10%
Dewey 31.4%
Douglas 8.2%
Edmunds 5.9%
Fall River 15%
Faulk 10.9%
Grant 7.6%
Gregory 15.3%
Haakon 17.2%
Hamlin 5.6%
Hand 8.2%
Hanson 6.5%
Harding 12.9%
Hughes 11.3%
Hutchinson 13%
Poverty
County 2012-2016
Hyde 14.2%
Jackson 44.8%
Jerauld 8.9%
Jones 10.8%
Kingsbury 9.5%
Lake 15.5%
Lawrence 12.4%
Lincoln 3%
Lyman 21.7%
Marshall 8.3%
McCook 9.3%
McPherson 17%
Meade 8.8%
Mellette 42.6%
Miner 11.6%
Minnehaha 11%
Moody 15.9%
Oglala Lakota 51.9%
Pennington 14%
Perkins 12%
Potter 6.5%
Roberts 18.8%
Sanborn 9.7%
Spink 9.9%
Stanley 5.8%
Sully 3.3%
Todd 52%
Tripp 19.7%
Turner 10.6%
Union 7.3%
Walworth 10.2%
Yankton 13.1%
Ziebach 43.1%
Source: Census, American Community Survey (ACS), 2012-2016, Table B19301.

2020 Primary Care Needs Assessment SD Department of Health, Office of Rural Health F-19
Table 60: No High School Diploma
No High School Diploma
State 2012-2016
South Dakota 8.6%
No High School Diploma
County 2012-2016
Aurora 12.4%
Beadle 16.8%
Bennett 20.5%
Bon Homme 11.2%
Brookings 3.9%
Brown 7.9%
Brule 13.4%
Buffalo 21.6%
Butte 9.7%
Campbell 9.2%
Charles Mix 12.7%
Clark 9.4%
Clay 5%
Codington 8.3%
Corson 18.1%
Custer 6.2%
Davison 9.1%
Day 9.2%
Deuel 9.7%
Dewey 15.4%
Douglas 13.3%
Edmunds 9.3%
Fall River 6.5%
Faulk 7.9%
Grant 9.6%
Gregory 12.5%
Haakon 9.6%
Hamlin 7.4%
Hand 7.6%
Hanson 7.6%
Harding 6.1%
Hughes 9.2%
Hutchinson 12.9%
No High School Diploma
County 2012-2016
Hyde 7.3%
Jackson 15.3%
Jerauld 10.3%
Jones 7.7%
Kingsbury 9.3%
Lake 6.8%
Lawrence 6.2%
Lincoln 5%
Lyman 10.4%
Marshall 8.7%
McCook 11.7%
McPherson 18.4%
Meade 5.3%
Mellette 18.3%
Miner 10.5%
Minnehaha 8.1%
Moody 10.1%
Oglala Lakota 24.4%
Pennington 6.5%
Perkins 8.3%
Potter 7.6%
Roberts 11.8%
Sanborn 9%
Spink 8%
Stanley 6.9%
Sully 5%
Todd 22%
Tripp 10.6%
Turner 7.1%
Union 8.6%
Walworth 11.4%
Yankton 8.9%
Ziebach 16.6%
Source: Census, American Community Survey (ACS), 2012-2016, Table B19301.

2020 Primary Care Needs Assessment SD Department of Health, Office of Rural Health F-20
Table 61: Unemployed
Unemployed
State 2012-2016
South Dakota 2.6%
Unemployed
County 2012-2016
Aurora 1%
Beadle 1.4%
Bennett 8%
Bon Homme 0.6%
Brookings 2.4%
Brown 1.2%
Brule 1.3%
Buffalo 9.1%
Butte 1.8%
Campbell 0.7%
Charles Mix 3%
Clark 2.6%
Clay 4.5%
Codington 1.8%
Corson 17.9%
Custer 2.3%
Davison 2.7%
Day 0.9%
Deuel 1.3%
Dewey 17.7%
Douglas 0.6%
Edmunds 1%
Fall River 1.5%
Faulk 0.2%
Grant 2.2%
Gregory 0.5%
Haakon 1.3%
Hamlin 1.2%
Hand 1%
Hanson 0.3%
Harding 1%
Hughes 1.4%
Hutchinson 3.5%
Unemployed
County 2012-2016
Hyde 1.8%
Jackson 6.3%
Jerauld 0.1%
Jones 2%
Kingsbury 1.2%
Lake 2.7%
Lawrence 2%
Lincoln 1.6%
Lyman 4.1%
Marshall 1.1%
McCook 1.8%
McPherson 3.8%
Meade 0.9%
Mellette 3.3%
Miner 1.3%
Minnehaha 2.5%
Moody 3.4%
Oglala Lakota 9.9%
Pennington 2.8%
Perkins 2.5%
Potter 0.5%
Roberts 4.5%
Sanborn 2.1%
Spink 1.2%
Stanley 0.8%
Sully 0.4%
Todd 7.8%
Tripp 1.2%
Turner 1.5%
Union 1.4%
Walworth 2.4%
Yankton 1.8%
Ziebach 18%
Source: Census, American Community Survey (ACS), 2012-2016, Table B19301.
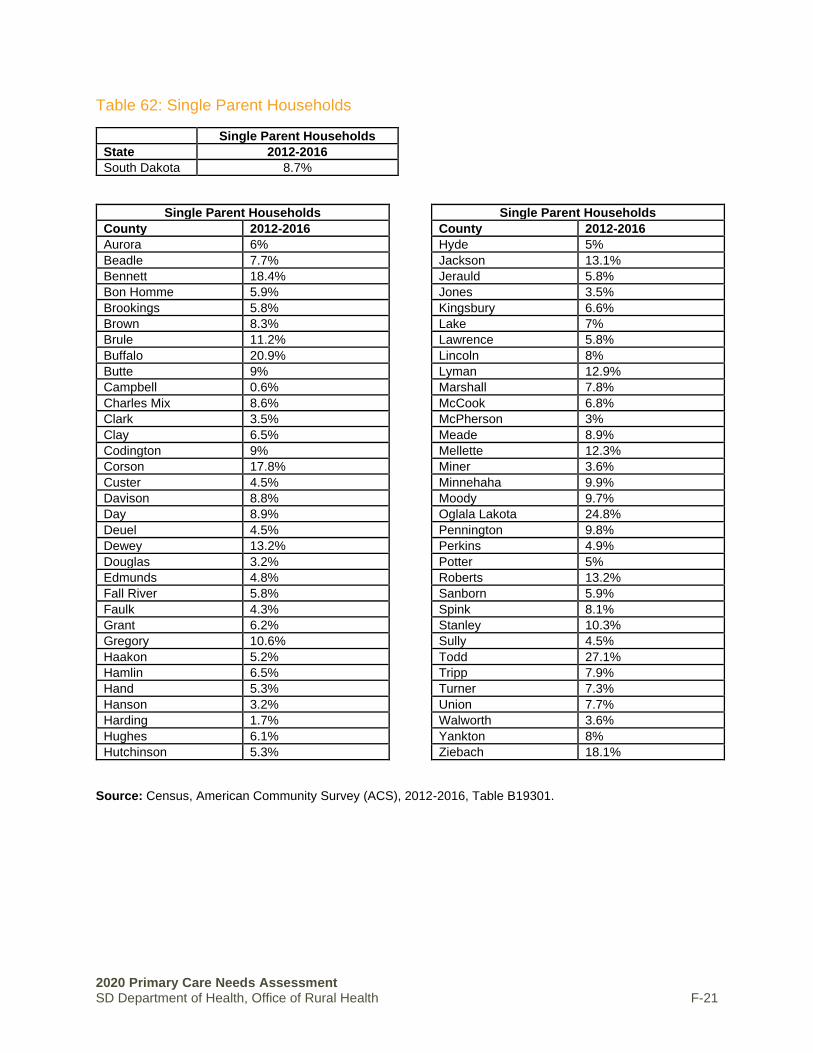
2020 Primary Care Needs Assessment SD Department of Health, Office of Rural Health F-21
Table 62: Single Parent Households
Single Parent Households
State 2012-2016
South Dakota 8.7%
Single Parent Households
County 2012-2016
Aurora 6%
Beadle 7.7%
Bennett 18.4%
Bon Homme 5.9%
Brookings 5.8%
Brown 8.3%
Brule 11.2%
Buffalo 20.9%
Butte 9%
Campbell 0.6%
Charles Mix 8.6%
Clark 3.5%
Clay 6.5%
Codington 9%
Corson 17.8%
Custer 4.5%
Davison 8.8%
Day 8.9%
Deuel 4.5%
Dewey 13.2%
Douglas 3.2%
Edmunds 4.8%
Fall River 5.8%
Faulk 4.3%
Grant 6.2%
Gregory 10.6%
Haakon 5.2%
Hamlin 6.5%
Hand 5.3%
Hanson 3.2%
Harding 1.7%
Hughes 6.1%
Hutchinson 5.3%
Single Parent Households
County 2012-2016
Hyde 5%
Jackson 13.1%
Jerauld 5.8%
Jones 3.5%
Kingsbury 6.6%
Lake 7%
Lawrence 5.8%
Lincoln 8%
Lyman 12.9%
Marshall 7.8%
McCook 6.8%
McPherson 3%
Meade 8.9%
Mellette 12.3%
Miner 3.6%
Minnehaha 9.9%
Moody 9.7%
Oglala Lakota 24.8%
Pennington 9.8%
Perkins 4.9%
Potter 5%
Roberts 13.2%
Sanborn 5.9%
Spink 8.1%
Stanley 10.3%
Sully 4.5%
Todd 27.1%
Tripp 7.9%
Turner 7.3%
Union 7.7%
Walworth 3.6%
Yankton 8%
Ziebach 18.1%
Source: Census, American Community Survey (ACS), 2012-2016, Table B19301.

2020 Primary Care Needs Assessment SD Department of Health, Office of Rural Health F-22
Table 63: Persons 65 and Older
Persons 65 and Older
State 2012-2016
South Dakota 15.5%
Persons 65 and Older
County 2012-2016
Aurora 20.1%
Beadle 16.5%
Bennett 11.8%
Bon Homme 20.7%
Brookings 10.8%
Brown 16.2%
Brule 17%
Buffalo 7.8%
Butte 18.6%
Campbell 22.9%
Charles Mix 18.1%
Clark 20.5%
Clay 11.1%
Codington 16%
Corson 10.5%
Custer 26.9%
Davison 17.5%
Day 24.9%
Deuel 21.1%
Dewey 9.6%
Douglas 24%
Edmunds 20.5%
Fall River 25.6%
Faulk 24.2%
Grant 20%
Gregory 24.1%
Haakon 23%
Hamlin 16.3%
Hand 25%
Hanson 14.5%
Harding 18.7%
Hughes 15.6%
Hutchinson 23.2%
Persons 65 and Older
County 2012-2016
Hyde 24%
Jackson 14.2%
Jerauld 25.9%
Jones 22.8%
Kingsbury 22.2%
Lake 19.3%
Lawrence 19%
Lincoln 11.1%
Lyman 15.1%
Marshall 20%
McCook 18.5%
McPherson 30.5%
Meade 13.9%
Mellette 15.2%
Miner 20.2%
Minnehaha 12.1%
Moody 17.5%
Oglala Lakota 6.3%
Pennington 16%
Perkins 21.6%
Potter 28.6%
Roberts 18.7%
Sanborn 19.6%
Spink 20.4%
Stanley 18.7%
Sully 19.8%
Todd 6.9%
Tripp 21.4%
Turner 20.1%
Union 16.6%
Walworth 23.3%
Yankton 17.6%
Ziebach 8.7%
Source: Census, American Community Survey (ACS), 2012-2016, Table B19301.

2020 Primary Care Needs Assessment SD Department of Health, Office of Rural Health F-23
Table 64: Persons 17 or Younger
Persons 17 or Younger
State 2012-2016
South Dakota 24.7%
Persons 17 or Younger
County 2012-2016
Aurora 26.1%
Beadle 26.6%
Bennett 35.4%
Bon Homme 18%
Brookings 20.2%
Brown 23.8%
Brule 25.6%
Buffalo 38.5%
Butte 24.2%
Campbell 21.5%
Charles Mix 29.5%
Clark 24.5%
Clay 17.2%
Codington 24.3%
Corson 35.3%
Custer 16.6%
Davison 22.7%
Day 21.4%
Deuel 23.1%
Dewey 35.7%
Douglas 23.8%
Edmunds 23.8%
Fall River 18%
Faulk 21%
Grant 22.6%
Gregory 23.6%
Haakon 25.4%
Hamlin 31.7%
Hand 21.2%
Hanson 31.9%
Harding 23.8%
Hughes 23.9%
Hutchinson 23.7%
Persons 17 or Younger
County 2012-2016
Hyde 21%
Jackson 30.7%
Jerauld 22.9%
Jones 15.8%
Kingsbury 21.3%
Lake 21.9%
Lawrence 18.2%
Lincoln 28.8%
Lyman 28.3%
Marshall 24.3%
McCook 27.2%
McPherson 19.5%
Meade 23.9%
Mellette 30.6%
Miner 25.9%
Minnehaha 25.2%
Moody 25.1%
Oglala Lakota 37.3%
Pennington 23.6%
Perkins 21.2%
Potter 20.4%
Roberts 28.2%
Sanborn 20.7%
Spink 23.7%
Stanley 23%
Sully 23.8%
Todd 40.1%
Tripp 22.6%
Turner 23.6%
Union 24.6%
Walworth 23%
Yankton 21.3%
Ziebach 33.7%
Source: Census, American Community Survey (ACS), 2012-2016, Table B19301.

2020 Primary Care Needs Assessment SD Department of Health, Office of Rural Health F-24
Table 65: Minority
Minority
State 2012-2016
South Dakota 17.3%
Minority
County 2012-2016
Aurora 11.2%
Beadle 20.5%
Bennett 69%
Bon Homme 12.6%
Brookings 9%
Brown 11.4%
Brule 15.2%
Buffalo 88.2%
Butte 8.2%
Campbell 2.8%
Charles Mix 36.7%
Clark 5.2%
Clay 11.8%
Codington 6.8%
Corson 70.7%
Custer 9.4%
Davison 8.3%
Day 13.7%
Deuel 3.2%
Dewey 79.6%
Douglas 5.1%
Edmunds 2.6%
Fall River 14.8%
Faulk 5.3%
Grant 6.1%
Gregory 11.6%
Haakon 11.3%
Hamlin 5.5%
Hand 2.1%
Hanson 6.1%
Harding 6.2%
Hughes 16.9%
Hutchinson 4.9%
Minority
County 2012-2016
Hyde 14.4%
Jackson 57.1%
Jerauld 3.7%
Jones 0%
Kingsbury 4.9%
Lake 6.2%
Lawrence 8.6%
Lincoln 6.4%
Lyman 43.6%
Marshall 16.2%
McCook 5.4%
McPherson 10.2%
Meade 12%
Mellette 58.9%
Miner 4.8%
Minnehaha 16.4%
Moody 22.4%
Oglala Lakota 95.9%
Pennington 19.5%
Perkins 5.3%
Potter 6.9%
Roberts 42.3%
Sanborn 4.8%
Spink 5%
Stanley 12.2%
Sully 4.5%
Todd 91.5%
Tripp 17.9%
Turner 4.3%
Union 7.2%
Walworth 20.2%
Yankton 10.6%
Ziebach 76.6%
Source: Census, American Community Survey (ACS), 2012-2016, Table B19301.
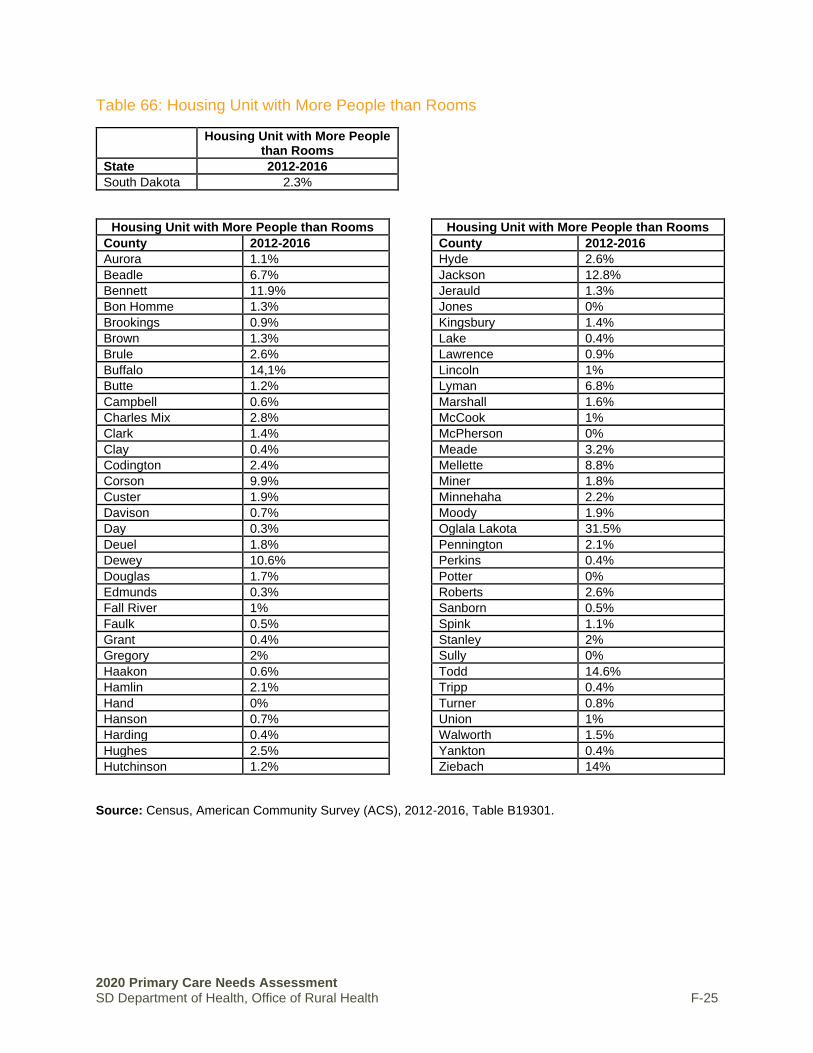
2020 Primary Care Needs Assessment SD Department of Health, Office of Rural Health F-25
Table 66: Housing Unit with More People than Rooms
Housing Unit with More People than Rooms
State 2012-2016
South Dakota 2.3%
Housing Unit with More People than Rooms
County 2012-2016
Aurora 1.1%
Beadle 6.7%
Bennett 11.9%
Bon Homme 1.3%
Brookings 0.9%
Brown 1.3%
Brule 2.6%
Buffalo 14,1%
Butte 1.2%
Campbell 0.6%
Charles Mix 2.8%
Clark 1.4%
Clay 0.4%
Codington 2.4%
Corson 9.9%
Custer 1.9%
Davison 0.7%
Day 0.3%
Deuel 1.8%
Dewey 10.6%
Douglas 1.7%
Edmunds 0.3%
Fall River 1%
Faulk 0.5%
Grant 0.4%
Gregory 2%
Haakon 0.6%
Hamlin 2.1%
Hand 0%
Hanson 0.7%
Harding 0.4%
Hughes 2.5%
Hutchinson 1.2%
Housing Unit with More People than Rooms
County 2012-2016
Hyde 2.6%
Jackson 12.8%
Jerauld 1.3%
Jones 0%
Kingsbury 1.4%
Lake 0.4%
Lawrence 0.9%
Lincoln 1%
Lyman 6.8%
Marshall 1.6%
McCook 1%
McPherson 0%
Meade 3.2%
Mellette 8.8%
Miner 1.8%
Minnehaha 2.2%
Moody 1.9%
Oglala Lakota 31.5%
Pennington 2.1%
Perkins 0.4%
Potter 0%
Roberts 2.6%
Sanborn 0.5%
Spink 1.1%
Stanley 2%
Sully 0%
Todd 14.6%
Tripp 0.4%
Turner 0.8%
Union 1%
Walworth 1.5%
Yankton 0.4%
Ziebach 14%
Source: Census, American Community Survey (ACS), 2012-2016, Table B19301.

2020 Primary Care Needs Assessment SD Department of Health, Office of Rural Health F-26
Table 67: Household with No Vehicle
Household with No Vehicle
State 2012-2016
South Dakota 5.2%
Household with No Vehicle
County 2012-2016
Aurora 1.3%
Beadle 6.5%
Bennett 4.3%
Bon Homme 4.6%
Brookings 4.3%
Brown 7.3%
Brule 7.5%
Buffalo 10.2%
Butte 4.9%
Campbell 0.9%
Charles Mix 6.3%
Clark 5.4%
Clay 4.3%
Codington 5.4%
Corson 13.4%
Custer 3%
Davison 4.5%
Day 3.5%
Deuel 1.7%
Dewey 10%
Douglas 3.9%
Edmunds 4.9%
Fall River 7.7%
Faulk 3.7%
Grant 2.9%
Gregory 5.5%
Haakon 2.5%
Hamlin 3%
Hand 3.8%
Hanson 0.8%
Harding 0.9%
Hughes 7%
Hutchinson 4.8%
Household with No Vehicle
County 2012-2016
Hyde 3.3%
Jackson 9%
Jerauld 2.9%
Jones 2.2%
Kingsbury 3.5%
Lake 4.7%
Lawrence 8.6%
Lincoln 1.8%
Lyman 6.4%
Marshall 3.8%
McCook 2.8%
McPherson 3.7%
Meade 2%
Mellette 12%
Miner 1.5%
Minnehaha 5.5%
Moody 4.4%
Oglala Lakota 14.4%
Pennington 5.1%
Perkins 5.6%
Potter 0.8%
Roberts 4.4%
Sanborn 0.7%
Spink 2.8%
Stanley 1.5%
Sully 2.2%
Todd 20.7%
Tripp 4.9%
Turner 3.7%
Union 3.2%
Walworth 3.7%
Yankton 5.6%
Ziebach 13.7%
Source: Census, American Community Survey (ACS), 2012-2016, Table B19301.

2020 Primary Care Needs Assessment SD Department of Health, Office of Rural Health F-27
Table 68: Uninsured
Uninsured
State 2012-2016
South Dakota 9.7%
Uninsured
County 2012-2016
Aurora 5%
Beadle 7.1%
Bennett 20.6%
Bon Homme 5.7%
Brookings 6.4%
Brown 7.8%
Brule 9.7%
Buffalo 47.1%
Butte 14%
Campbell 4.4%
Charles Mix 20.7%
Clark 7.5%
Clay 9%
Codington 6.3%
Corson 23.9%
Custer 10.4%
Davison 7.1%
Day 10.8%
Deuel 6.1%
Dewey 29.9%
Douglas 12.7%
Edmunds 5.8%
Fall River 9.3%
Faulk 10.6%
Grant 3.7%
Gregory 10.9%
Haakon 8.1%
Hamlin 5.9%
Hand 4.6%
Hanson 5.3%
Harding 7.6%
Hughes 7.7%
Hutchinson 7.1%
Uninsured
County 2012-2016
Hyde 6.6%
Jackson 24.7%
Jerauld 7.2%
Jones 15%
Kingsbury 4.5%
Lake 6.4%
Lawrence 10.3%
Lincoln 4.6%
Lyman 18.9%
Marshall 8.1%
McCook 7.1%
McPherson 11.7%
Meade 10.8%
Mellette 33%
Miner 9.1%
Minnehaha 7.9%
Moody 10.6%
Oglala Lakota 34.4%
Pennington 11.3%
Perkins 10%
Potter 5.9%
Roberts 20.8%
Sanborn 6.2%
Spink 7.5%
Stanley 6.4%
Sully 9%
Todd 30.1%
Tripp 9.8%
Turner 6.7%
Union 7.3%
Walworth 10%
Yankton 6.3%
Ziebach 23%
Source: Census, American Community Survey (ACS), 2012-2016, Table B19301.
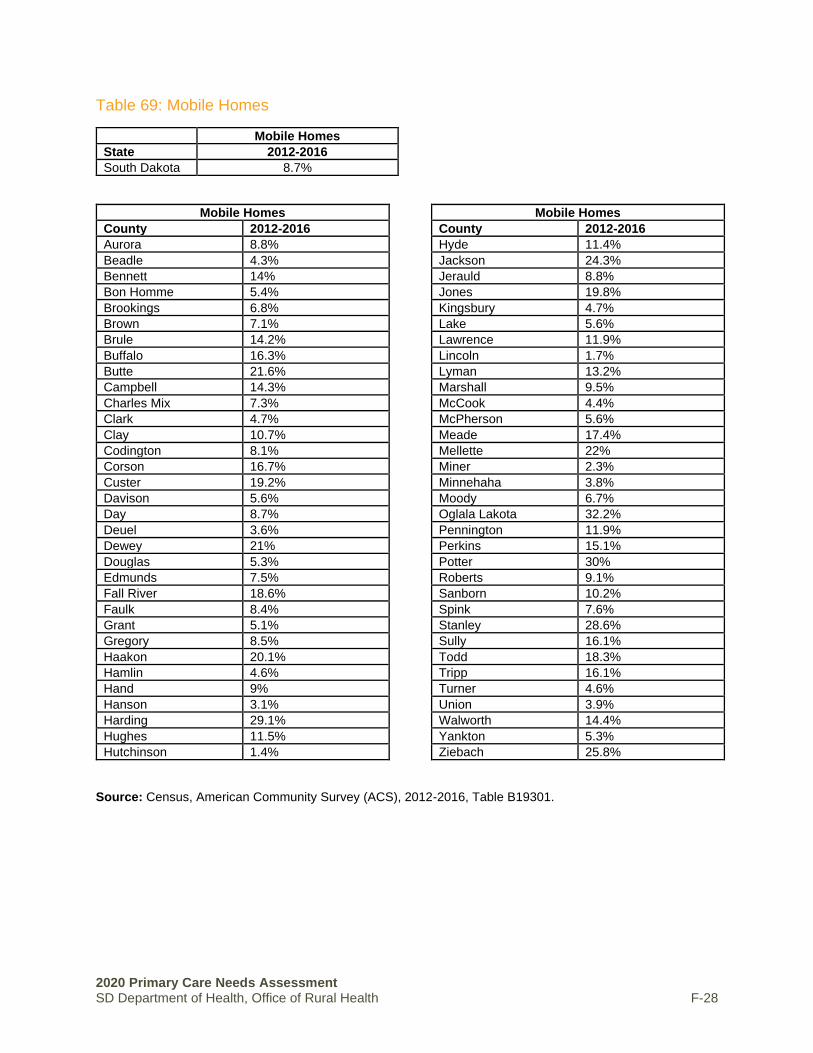
2020 Primary Care Needs Assessment SD Department of Health, Office of Rural Health F-28
Table 69: Mobile Homes
Mobile Homes
State 2012-2016
South Dakota 8.7%
Mobile Homes
County 2012-2016
Aurora 8.8%
Beadle 4.3%
Bennett 14%
Bon Homme 5.4%
Brookings 6.8%
Brown 7.1%
Brule 14.2%
Buffalo 16.3%
Butte 21.6%
Campbell 14.3%
Charles Mix 7.3%
Clark 4.7%
Clay 10.7%
Codington 8.1%
Corson 16.7%
Custer 19.2%
Davison 5.6%
Day 8.7%
Deuel 3.6%
Dewey 21%
Douglas 5.3%
Edmunds 7.5%
Fall River 18.6%
Faulk 8.4%
Grant 5.1%
Gregory 8.5%
Haakon 20.1%
Hamlin 4.6%
Hand 9%
Hanson 3.1%
Harding 29.1%
Hughes 11.5%
Hutchinson 1.4%
Mobile Homes
County 2012-2016
Hyde 11.4%
Jackson 24.3%
Jerauld 8.8%
Jones 19.8%
Kingsbury 4.7%
Lake 5.6%
Lawrence 11.9%
Lincoln 1.7%
Lyman 13.2%
Marshall 9.5%
McCook 4.4%
McPherson 5.6%
Meade 17.4%
Mellette 22%
Miner 2.3%
Minnehaha 3.8%
Moody 6.7%
Oglala Lakota 32.2%
Pennington 11.9%
Perkins 15.1%
Potter 30%
Roberts 9.1%
Sanborn 10.2%
Spink 7.6%
Stanley 28.6%
Sully 16.1%
Todd 18.3%
Tripp 16.1%
Turner 4.6%
Union 3.9%
Walworth 14.4%
Yankton 5.3%
Ziebach 25.8%
Source: Census, American Community Survey (ACS), 2012-2016, Table B19301.

2020 Primary Care Needs Assessment SD Department of Health, Office of Rural Health F-29
Table 70: People with Disability
People with Disability
State 2012-2016
South Dakota 12.1%
People with Disability
County 2012-2016
Aurora 12.8%
Beadle 11.4%
Bennett 12.6%
Bon Homme 13%
Brookings 9%
Brown 10.6%
Brule 16.2%
Buffalo 18.4%
Butte 14.8%
Campbell 12.5%
Charles Mix 15.5%
Clark 15.4%
Clay 10.1%
Codington 13.4%
Corson 13.6%
Custer 15.5%
Davison 15.8%
Day 12.1%
Deuel 13.3%
Dewey 10.5%
Douglas 13%
Edmunds 11.9%
Fall River 21.5%
Faulk 11.6%
Grant 14.6%
Gregory 14%
Haakon 13.3%
Hamlin 10.3%
Hand 12.6%
Hanson 12.4%
Harding 9%
Hughes 11.6%
Hutchinson 15.1%
People with Disability
County 2012-2016
Hyde 10.9%
Jackson 14.9%
Jerauld 12.5%
Jones 12.8%
Kingsbury 12.7%
Lake 12.8%
Lawrence 15.5%
Lincoln 7.3%
Lyman 10.2%
Marshall 10%
McCook 11.9%
McPherson 18.6%
Meade 13.2%
Mellette 12.4%
Miner 13%
Minnehaha 10.4%
Moody 11.3%
Oglala Lakota 15.9%
Pennington 13.8%
Perkins 16.5%
Potter 14.4%
Roberts 11.8%
Sanborn 12.3%
Spink 13.8%
Stanley 8.6%
Sully 8.8%
Todd 11.9%
Tripp 10%
Turner 14%
Union 11.2%
Walworth 15.6%
Yankton 14.5%
Ziebach 11.9%
Source: Census, American Community Survey (ACS), 2012-2016, Table B19301.

2020 Primary Care Needs Assessment SD Department of Health, Office of Rural Health F-30
Table 71: Speak Limited English
Speak Limited English
State 2012-2016
South Dakota 1.0%
Speak Limited English
County 2012-2016
Aurora 2.2%
Beadle 7.7%
Bennett 0.5%
Bon Homme 0.3%
Brookings 0.8%
Brown 1.4%
Brule 0.1%
Buffalo 0%
Butte 0.1%
Campbell 0%
Charles Mix 0.1%
Clark 0.4%
Clay 0.7%
Codington 0.3%
Corson 0%
Custer 1.2%
Davison 1%
Day 0%
Deuel 0.8%
Dewey 0.1%
Douglas 0%
Edmunds 0.2%
Fall River 0.9%
Faulk 0%
Grant 0%
Gregory 0%
Haakon 0%
Hamlin 0.8%
Hand 0%
Hanson 0.1%
Harding 0.4%
Hughes 0.9%
Hutchinson 0.3%
Hyde 0.9%
Speak Limited English
County 2012-2016
Jackson 0%
Jerauld 0.4%
Jones 0%
Kingsbury 0.2%
Lake 0.4%
Lawrence 0.5%
Lincoln 0.6%
Lyman 0%
Marshall 2.8%
McCook 1%
McPherson 0.3%
Meade 0.1%
Mellette 0.2%
Miner 0.2%
Minnehaha 1.8%
Moody 1%
Oglala Lakota 1.3%
Pennington 0.4%
Perkins 0.1%
Potter 0%
Roberts 0.2%
Sanborn 0.8%
Spink 0.4%
Stanley 0%
Sully 0%
Todd 0.4%
Tripp 0%
Turner 0.6%
Union 0.5%
Walworth 0.5%
Yankton 0.6%
Ziebach 0.7%
Source: Census, American Community Survey (ACS), 2012-2016, Table B19301.
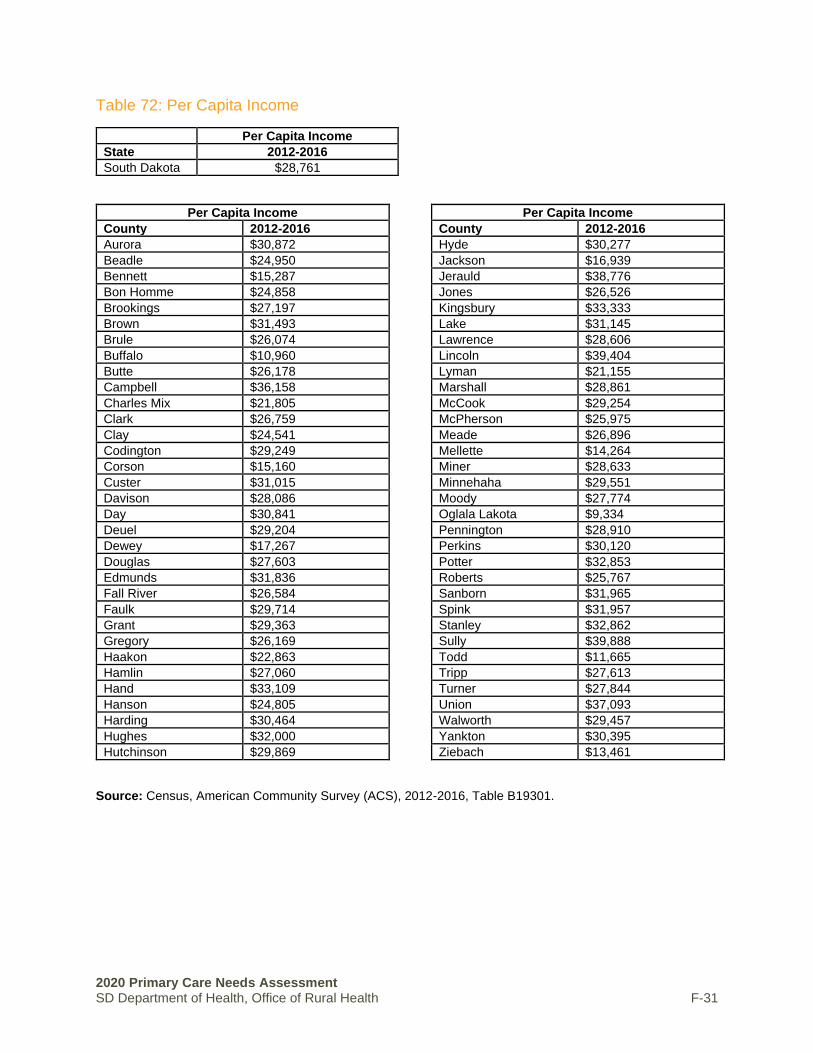
2020 Primary Care Needs Assessment SD Department of Health, Office of Rural Health F-31
Table 72: Per Capita Income
Per Capita Income
State 2012-2016
South Dakota $28,761
Per Capita Income
County 2012-2016
Aurora $30,872
Beadle $24,950
Bennett $15,287
Bon Homme $24,858
Brookings $27,197
Brown $31,493
Brule $26,074
Buffalo $10,960
Butte $26,178
Campbell $36,158
Charles Mix $21,805
Clark $26,759
Clay $24,541
Codington $29,249
Corson $15,160
Custer $31,015
Davison $28,086
Day $30,841
Deuel $29,204
Dewey $17,267
Douglas $27,603
Edmunds $31,836
Fall River $26,584
Faulk $29,714
Grant $29,363
Gregory $26,169
Haakon $22,863
Hamlin $27,060
Hand $33,109
Hanson $24,805
Harding $30,464
Hughes $32,000
Hutchinson $29,869
Per Capita Income
County 2012-2016
Hyde $30,277
Jackson $16,939
Jerauld $38,776
Jones $26,526
Kingsbury $33,333
Lake $31,145
Lawrence $28,606
Lincoln $39,404
Lyman $21,155
Marshall $28,861
McCook $29,254
McPherson $25,975
Meade $26,896
Mellette $14,264
Miner $28,633
Minnehaha $29,551
Moody $27,774
Oglala Lakota $9,334
Pennington $28,910
Perkins $30,120
Potter $32,853
Roberts $25,767
Sanborn $31,965
Spink $31,957
Stanley $32,862
Sully $39,888
Todd $11,665
Tripp $27,613
Turner $27,844
Union $37,093
Walworth $29,457
Yankton $30,395
Ziebach $13,461
Source: Census, American Community Survey (ACS), 2012-2016, Table B19301.

2020 Primary Care Needs Assessment SD Department of Health, Office of Rural Health G-1
APPENDIX G │SOUTH DAKOTA MEDICAID DATA
ENROLLMENT
South Dakota Medicaid & CHIP Enrollment as of September 2020 Total Medicaid & CHIP Enrollment (Preliminary) 118,950 Net Change in Enrollment July-September 2013 3,449 % Change in Enrollment July-September 2013 2.99%
Source: https://www.medicaid.gov/state-overviews/stateprofile.html?state=south-dakota
CHILD QUALITY MEASURE DATA
CHILDREN: PRIMARY CARE ACCESS AND PREVENTIVE CARE Adolescent Well-Care Visits Ages 12 – 21 (FY 2019)
• Percentage with at Least 1 Well-Care Visit with a Primary Care Practitioner or Obstetrician/Gynecologist: Ages 12 to 21
32.0% - South Dakota 41.7% - Bottom Quartile of 49 states reporting this measure 50.6% - Median of 49 States Reporting this measure 56.7% - Top quartile of 49 states reporting this measure
IMMUNIZATIONS FOR ADOLESCENTS: AGE 13 (FFY 2019)
• HPV Rate: Percentage completing the human papillomavirus (HPV) vaccine series by their 13th birthday
• Combination 1 rate: percentage receiving meningococcal conjugate and Tdap vaccines (combination 1) by their 13th birthday
37.6% - South Dakota 30.5% - Bottom Quartile of 45 states reporting this measure 34.4% - Median of 45 States Reporting this measure 39.5% - Top quartile of 45 states reporting this measure
WELL-CHILD VISITS IN THE FIRST 15 MONTHS OF LIFE (FFY 2019)
• Percentage who had 6 or More Well-Child Visits with a Primary Care Practitioner during the First 15 Months of Life
44.9% - South Dakota 57.3% - Bottom Quartile of 48 states reporting this measure 64.0% - Median of 48 States Reporting this measure 69.7% - Top quartile of 48 states reporting this measure
WELL-CHILD VISITS IN THE THIRD, FOURTH, FIFTH, AND SIXTH YEARS OF LIFE (FFY 2019)
• Percentage who had 1 or More Well-Child Visits with a Primary Care Practitioner: Ages 3 to 6 42.6% - South Dakota 61.8% - Bottom Quartile of 49 states reporting this measure 69.0% - Median of 49 States Reporting this measure 74.3% - Top quartile of 49 states reporting this measure

2020 Primary Care Needs Assessment SD Department of Health, Office of Rural Health G-2
CHILDREN: MATERNAL AND PERINATAL HEALTH Contraceptive Care: Postpartum Women Ages 15 to 20 (FFY 2019)
• Percentage of postpartum women provided a most effective or moderately effective method of contraception within 3 days of delivery: Ages 15 – 20.
• Percentage of postpartum women provided a most effective or moderately effective method of contraception within 60 days of delivery: Ages 15 – 20
• Percentage of postpartum women provided a long-acting reversible method of contraception within 3 days of delivery: Ages 15 – 20
• Percentage of postpartum women provided a long-acting reversible method of contraception within 60 days of delivery: Ages 15 – 20
1.9% - South Dakota 0.8% - Bottom Quartile of 32 states reporting this measure 2.0% - Median of 32 States Reporting this measure 4.0% - Top quartile of 32 states reporting this measure
LIVE BIRTHS WEIGHING LESS THAN 2,500 GRAMS (FFY 2019)
• Percentage of Live Births that Weighed Less Than 2,500 Grams Note: Lower rates are better for this measure 8.3% - South Dakota 10.7% - Bottom Quartile of 51 states reporting this measure 9.5% - Median of 51 States Reporting this measure 8.0% - Top quartile of 51 states reporting this measure
PRENATAL AND POSTPARTUM CARE: TIMELINESS OF PRENATAL CARE (FFY 2019)
• Percentage of Women Delivering a Live Birth with a Prenatal Care Visit in the First Trimester or within 42 Days of Enrollment in Medicaid or CHIP
43.4% - South Dakota 68.1% - Bottom Quartile of 42 states reporting this measure 80.7% - Median of 42 States Reporting this measure 85.7% - Top quartile of 42 states reporting this measure
CHILDREN: BEHAVIORAL HEALTH CARE Follow-Up After Hospitalization for Mental Illness: Ages 6 to 17 (FFY 2019)
• 7 day follow-up rate: percentage of hospitalizations for mental illness or intentional self-harm with a follow-up visit within 7 days after discharge: Ages 6 – 17
• 30 day follow-up rate: percentage of hospitalizations for mental illness or intentional self-harm with a follow-up visit within 7 days after discharge: Ages 6 – 17
19.1% - South Dakota 35.0% - Bottom Quartile of 44 states reporting this measure 41.9% - Median of 44 States Reporting this measure 58.8% - Top quartile of 44 states reporting this measure
USE OF MULTIPLE CONCURRENT ANTIPSYCHOTICS IN CHILDREN AND ADOLESCENTS: AGES 1 TO 17(FFY 2019)
• Percentage on Two or More Concurrent Antipsychotic Medications: Ages 1 to 17 Note: Lower rates are better for this measure 3.3% - South Dakota 3.5% - Bottom Quartile of 42 states reporting this measure 2.6% - Median of 42 States Reporting this measure 1.7% - Top quartile of 42 states reporting this measure

2020 Primary Care Needs Assessment SD Department of Health, Office of Rural Health G-3
CHILDREN: DENTAL AND ORAL HEALTH SERVICES Dental Sealants for 6-9 Year-Old Children at Elevated Caries Risk(FFY 2019)
• Percentage at Elevated Risk of Dental Caries (Moderate or High Risk) who Received a Sealant on a Permanent First Molar Tooth: Ages 6 to 9
28.6% - South Dakota 19.1% - Bottom Quartile of 35 states reporting this measure 22.7% - Median of 35 States Reporting this measure 25.3% - Top quartile of 35 states reporting this measure
PERCENTAGE OF ELIGIBLES WHO RECEIVED PREVENTIVE DENTAL SERVICES: AGES 1 TO 20(FFY 2019)
• Percentage Enrolled in Medicaid or Medicaid Expansion CHIP Programs for at least 90 Continuous Days with at Least 1 Preventive Dental Service: Ages 1 to 20
45.0% - South Dakota 44.1% - Bottom Quartile of 51 states reporting this measure 49.1% - Median of 51 States Reporting this measure 52.1% - Top quartile of 51 states reporting this measure Source: https://www.medicaid.gov/state-overviews/stateprofile.html?state=south-dakota
ADULT MEASURES
ADULT: MATERNAL AND PERINATAL HEALTH Contraceptive Care: Postpartum Women Ages 21 to 44(FFY 2019)
• Percentage of postpartum women provided a most effective or moderately effective method of contraception within 3 days of delivery: Ages 21 - 44.
• Percentage of postpartum women provided a most effective or moderately effective method of contraception within 60 days of delivery: Ages 21 - 44.
• Percentage of postpartum women provided a long-acting reversible method of contraception within 3 days of delivery: Ages 21 - 44.
• Percentage of postpartum women provided a long-acting reversible method of contraception within 60 days of delivery: Ages 21 - 44.
12.3% - South Dakota 9.1% - Bottom Quartile of 29 states reporting this measure 11.3% - Median of 29 States Reporting this measure 14.4% - Top quartile of 29 states reporting this measure
ADULT: BEHAVIORAL HEALTH CARE Follow-Up After Hospitalization for Mental Illness: Age 18 and Older(FFY 2019)
• 7 day follow-up rate: percentage of hospitalizations for mental illness or intentional self-harm with a follow-up visit within 7 days after discharge: Ages 18 - 64
• 30 day follow-up rate: percentage of hospitalizations for mental illness or intentional self-harm with a follow-up visit within 7 days after discharge: Ages 18 - 64
34.2% - South Dakota 24.3% - Bottom Quartile of 42 states reporting this measure 32.3% - Median of 42 States Reporting this measure 46.7% - Top quartile of 42 states reporting this measure

2020 Primary Care Needs Assessment SD Department of Health, Office of Rural Health G-4
USE OF OPIOIDS AT HIGH DOSAGE IN PERSONS WITHOUT CANCER: AGE 18 AND OLDER (FFY 2019)
• Percentage of Adults Without Cancer with Two or More Opioid Prescription Claims with an Average Daily Dosage Greater than or Equal to 90 Morphine Milligram Equivalents Over 90 Consecutive Days or More: Ages 18 to 64
Note: Lower rates are better for this measure 8.8% - South Dakota 3.4% - Bottom Quartile of 26 states reporting this measure 6.4% - Median of 26 States Reporting this measure 10.7% - Top quartile of 26 states reporting this measure Source: https://www.medicaid.gov/state-overviews/stateprofile.html?state=south-dakota
ADULTS: ADDITIONAL MEASURES
NUMBER OF HOSPITALIZATIONS PER 1,000 LONG-STAY NURSING HOME RESIDENT DAYS (CY 2019) If a nursing home sends many residents to the hospital, it may indicate that the nursing home is not properly assessing or taking care of its residents. This measure reports the number of unplanned hospitalizations, including observation stays, per 1,000 long-stay nursing home resident days in calendar year 2019. Long-stay resident days are all days after the 100th cumulative day in a nursing home. 1.4% - South Dakota 1.4% - Bottom Quartile of 51 states reporting this measure 1.5% - Median of 51 States Reporting this measure 1.8% - Top quartile of 51 states reporting this measure
PERCENTAGE OF LONG-STAY NURSING HOME RESIDENTS WHO GOT AN ANTIPSYCHOTIC MEDICATION (CY 2019) Antipsychotic drugs are an important treatment for patients with certain mental health conditions, but they are associated with an increased risk of death when used in elderly patients with dementia. The medications also have side effects. If possible, nursing homes should try to address a resident's expressions of distress by first implementing person-centered approaches that do not involve medications. Addressing each resident's needs through approaches other than medications— like higher staffing ratios, non-pharmacological interventions, and regular assignment of nursing staff—may lower the use of medications in many cases. This measure reports the percentage of long-stay nursing home residents who received antipsychotic drugs in calendar year 2019. Note: Lower rates are better for this measure. 16.6% - South Dakota 12.5% - Bottom Quartile of 53 states reporting this measure 14.4% - Median of 53 States Reporting this measure 16.5% - Top quartile of 53 states reporting this measure

2020 Primary Care Needs Assessment SD Department of Health, Office of Rural Health H-1
APPENDIX H │PRIMARY HEALTH INDICATORS AND ANNOTATED REFERENCES
Indicators Annotated References and Noted Assumptions
Health Outcomes
Health Status Indicators
Health Outcomes
University of Wisconsin Population Health Institute. County Health Rankings South Dakota. (2020). Retrieved August 2020, from https://www.countyhealthrankings.org/app/south-dakota/2020/overview
The County Health Rankings are based on a model of community health that emphasizes the many factors that influence how long and how well we live. The Rankings use more than 30 measures that help communities understand how healthy their residents are today (health outcomes) and what will impact their health in the future (health factors).
Counties were ranked using the same ranking applied by County Health Rankings (University of Wisconsin). Counties were ranked 1-61; a total of 5 counties were not ranked by CHR. For the purpose of this assessment, those counties were assigned the median rank for the category (median rank = 31).
Health Factors
University of Wisconsin Population Health Institute. County Health Rankings South Dakota. (2020). Retrieved August 2020, from https://www.countyhealthrankings.org/app/south-dakota/2020/overview
The Health Factor ranking is based on weighted scores for health behaviors, clinical care, social and economic factors, and the physical environment. Sources for original data include: BRFSS, Centers for Disease Control Interactive Atlas, USDA Food Environment Atlas, US Census, Fatality Analysis Reporting System, National Center for HIV/AIDS, National Center for Health Statistics, Small Area Health Insurance Estimates, Dartmouth Atlas of Health Care, Bureau of Labor Statistics, Small Area Income and Poverty Estimates, American Community Survey.
Counties were ranked using the same ranking applied by CHR. Counties were ranked 1-61; a total of 5 counties were not ranked by CHR. For the purpose of this assessment, those counties were assigned the median rank for the category (median rank = 31).
Poor or Fair Health
University of Wisconsin Population Health Institute. County Health Rankings South Dakota. (2020). Retrieved August 2020, from https://www.countyhealthrankings.org/app/south-dakota/2020/overview
Poor or Fair Health measures the percentage of adults in a county who consider themselves to be in poor or fair health (age-adjusted) via BRFSS. Years of Data Used, 2017.
Counties were ranked from 1-66 (the lower the ranking, the lower the percent of residents indicating poor or fair health).

2020 Primary Care Needs Assessment SD Department of Health, Office of Rural Health H-2
Life Expectancy
Institute for Health Metrics and Evaluation (IHME), US County Profile: Counties, South Dakota, Life Expectancy. Retrieved 13 June 2020, from http://www.healthdata.org/us-county-profiles
The Global Burden of Disease Study 2017 (GBD 2017), coordinated by the Institute for Health Metrics and Evaluation (IHME), analyzed the performance of all 3,142 US counties or county-equivalents in terms of life expectancy at birth, mortality rates for select causes, alcohol use, smoking prevalence, obesity prevalence, and recommended physical activity, using novel small area estimation techniques and the most up-to-date county-level information.
Life expectancy is the number of years that the average member of a group can expect to live. Many things can affect a group’s life expectancy, including things like death rates in children, income, access to health care, diet, and environment. Life expectancy in a group even changes over time as new life-saving technologies emerge, a civil war occurs, or other things happen. Since 1990 life expectancy at birth has increased in most places around the world.
Counties were ranked from 1-66 (the lower the ranking, the higher the life expectancy in years). Rankings were adjusted for counties that had the same reported life expectancy; in these cases, all counties with the same reported value were given the same rank score (e.g. Aurora, McCook, Meade, and Tripp Counties each reported 82.2 years of age for female life expectancy; all were given a ranking score of 37, instead of individual rankings of 37, 38, 39, and 40). Ranking continued at 41 for subsequent counties with lower life expectancy reported values.
Mortality Rates (includes Infant,
Resident, Heart Disease, Cancer, Chronic Lower
Respiratory, Alzheimer’s,
Cerebrovascular, Accidents, Diabetes, Suicide, Influenza & Pneumonia, Chronic
Liver Disease & Cirrhosis)
South Dakota Vital Statistics Report: A State and County Comparison of Leading Health Indicators. (2011, 2014, 2017). Retrieved August 2020, from https://doh.sd.gov/statistics/
Mortality rates are age-adjusted death rates per 100,000 population.
Infant mortality is the number of infant deaths (less than one year of age) per 1,000 live births. The 2011 infant mortality represents 2007 - 2011 data. The 2014 infant mortality represents 2010 - 2014 data. The 2017 infant mortality represents 2013-2017 data.
Counties were ranked 1-66 according to 2017 reported values for mortality, all causes. Counties that reported LNE (low number of events) were given a score of 1.
Infant mortality rate data had 33 counties with LNE or a low number of events; these counties were given a score of 1.
Diabetes Prevalence University of Wisconsin Population Health Institute. County Health Rankings South Dakota. (2020). Retrieved August 2020, from https://www.countyhealthrankings.org/app/south-dakota/2020/overview

2020 Primary Care Needs Assessment SD Department of Health, Office of Rural Health H-3
The Method for Calculating Diabetes Prevalence - Data for Diabetes Prevalence are provided by the CDC Interactive Diabetes Atlas which uses BRFSS data to provide county-level estimates. Diabetes Prevalence survey estimates include both landline and cell phone users. Previously, only landline users were included in the data. This change was implemented in order to provide users with the most accurate estimates of health in their community as possible.
The calculation of Diabetes Prevalence uses three years of survey data to create a single-year estimate using a complex statistical model. The estimate represents the middle year of the three years of data used.
Modeling generates more stable estimates for places with small numbers of residents or survey responses. There are also drawbacks to using modeled data. The smaller the population or sample size of a county, the more the estimates are derived from the model itself and the less they are based on survey responses. Models make statistical assumptions about relationships that may not hold in all cases. Finally, there is no perfect model and each model generally has limitations specific to their methods.
Counties were ranked 1-66 according to 2012 reported values. Rankings were adjusted for counties that had the same reported value, giving the lowest possible ranking associated with that value (see detailed description of ranking methodology in life expectancy description above).
South Dakota K-12 School BMI for
Academic Years 2010-11 through 2017-18
South Dakota Department of Health (various years). School Height and Weight Report South Dakota Students. Retrieved August 2020, from https://doh.sd.gov/statistics/school-height-weight.aspx?
(Figure 2, Page 6 for Below 5th Percentile data; Figures 3-6, Page 8 for Obese data)
Note: Note that the reported values in the original 2010-2011 School Year Report from the South Dakota Department of Health included slightly different values.
Data are analyzed for short stature, underweight, overweight and obesity using the current national standards. This document focuses on excess weight, as South Dakota students, as a whole, are neither short nor underweight. The DOH began using the definitions of overweight and obesity beginning with the 2006-2007 report to describe elevated body mass index (BMI)-for-age for children and adolescents. BMI-forage is the preferred term to describe the weight status of children and adolescents. Children with a BMI-for-age between the 85th and 94th percentile are described as “overweight”. If a child is at or above the 95th percentile, the term to describe the child is “obese”.
Adult Obesity
University of Wisconsin Population Health Institute. County Health Rankings South Dakota. (2020). Retrieved August 2020, from https://www.countyhealthrankings.org/app/south-dakota/2020/overview
Data are for 2016
Adult Obesity is based on responses to the Behavioral Risk Factor Surveillance Survey (BRFSS) and is the percentage of the adult population (age 20 and older) that reports a body mass index (BMI) greater than or

2020 Primary Care Needs Assessment SD Department of Health, Office of Rural Health H-4
equal to 30 kg/m2. Participants are asked to self-report their height and weight. From these reported values, BMIs for the participants are calculated.
Data for Adult Obesity are provided by the CDC Interactive Diabetes Atlas which uses BRFSS data to provide county-level estimates. Beginning with the 2015 County Health Rankings, Adult Obesity estimates include both landline and cell phone users. Previously, only landline users were included in the data. This change was implemented in order to provide users with the most accurate estimates of health in their community as possible.
Adult Obesity estimates are produced from three years of survey data and created using a complex statistical model. Modeling generates more stable estimates for places with small numbers of residents or survey responses. There are also drawbacks to using modeled data. The smaller the population or sample size of a county, the more the estimates are derived from the model itself and the less they are based on survey responses. Models make statistical assumptions about relationships that may not hold in all cases. Finally, there is no perfect model and each model generally has limitations specific to their methods.
Counties were ranked 1-66 according to 2016 reported values. Rankings were adjusted for counties that had the same reported value, giving the lowest possible ranking associated with that value (see detailed description of ranking methodology in life expectancy description above).
Age adjusted Cancer Incidence and Death Rates in South Dakota
Cancer in South Dakota, (2015, 2016, 2017). Retrieved August 2020 from http://getscreened.sd.gov/documents/Cancer2017.pdf
Incidence rates - Table 3; Mortality rates - Table 9.
Cancer Prevalence
Cancer in South Dakota, (various years). Retrieved August 2020 from http://getscreened.sd.gov/documents/Cancer2017.pdf
Age-adjusted incidence rates are calculated using the direct method and standardized to the age distribution of the 2000 US standard population. Age adjustment allows rates for one geographic area to be compared with rates from other geographic areas that may have differences in age distributions. Any observed differences in age-adjusted incidence rates between populations are not due to different age structures. Reports prior to 1999 used the 1970 US standard population. In conformity with the National Cancer Institute’s (NCI) Surveillance, Epidemiology, and End Results (SEER) Program guidelines, the incidence rates for cancer sites exclude the following: In situ cases, except bladder; Basal and squamous cell skin cancers; Cases with unknown age; Cases with unknown gender.
Cancer prevalence data for all counties in South Dakota, all ages, all genders, all races, all stages, and all primary and subsites of disease. The counties were ordered from lowest to highest value, rankings of 1-66 applied.
Cases of HIV and AIDS, 2005-2017
South Dakota Vital Statistics Report: A State and County Comparison of Leading Health Indicators. (2014, 2017). Retrieved August 2020, from https://doh.sd.gov/statistics/

2020 Primary Care Needs Assessment SD Department of Health, Office of Rural Health H-5
Depression Diagnosis
Spurlock M., Davis M.M., Dulacki K., Meath T., Li H.F., McCarty D., Knight-Richardson N., Wright B., Warne D., McConnell K.J. Focus on South Dakota: A picture of Health. Report Findings from the South Dakota Health Survey. May 2015. https://helmsleytrust.org/publication/focus-south-dakota-picture-health
Multiple modes of data collection, including mail, telephone, and in-person surveys were used to achieve high response rates and to engage underrepresented populations in the study. Using a list of addresses from the U.S. Postal Service, a representative random sample of households was selected in South Dakota, clustered by geography. Randomly selected households first received a postcard to raise awareness of the study and to test addresses. This was followed by two waves of survey mailings and automated reminder calls. Respondents could complete the survey on paper and return by prepaid mail or on a web-based survey. Households that did not respond to the mail survey received a series of telephone follow-up calls over a several week period. After the mail and telephone data collection, households in reservation areas that had not responded were advanced to an in-person follow-up. This approach was based on input from regional stakeholders, who indicated that in-person contacts would be more successful than mail and telephone attempts. Local research assistants were hired and trained to approach households in reservation communities and Rapid City with the survey. As research assistants completed the in-person follow-up, they also collected surveys from “housing insecure” respondents if the primary respondent indicated there were multiple families or additional adults outside of the primary household living in the residence. All respondents received a modest cash stipend for their time.
Counties were ranked 1-57 in this assessment; a total of 10 counties did not report data. These counties were given the median score for all rankings (median score = 29).
Anxiety Disorder Diagnosis
Spurlock M., Davis M.M., Dulacki K., Meath T., Li H.F., McCarty D., Knight-Richardson N., Wright B., Warne D., McConnell K.J. Focus on South Dakota: A picture of Health. Report Findings from the South Dakota Health Survey. May 2015.
https://helmsleytrust.org/publication/focus-south-dakota-picture-health
Multiple modes of data collection, including mail, telephone, and in-person surveys were used to achieve high response rates and to engage underrepresented populations in the study. Using a list of addresses from the U.S. Postal Service, a representative random sample of households was selected in South Dakota, clustered by geography. Randomly selected households first received a postcard to raise awareness of the study and to test addresses. This was followed by two waves of survey mailings and automated reminder calls. Respondents could complete the survey on paper and return by prepaid mail or on a web-based survey. Households that did not respond to the mail survey received a series of telephone follow-up calls over a several week period. After the mail and telephone data collection, households in reservation areas that had not responded were advanced to an in-person follow-up. This approach was based on input from regional stakeholders, who indicated that in-person contacts would be more successful than mail and telephone attempts. Local research assistants were hired and trained to approach households in reservation communities and Rapid City with the survey. As research

2020 Primary Care Needs Assessment SD Department of Health, Office of Rural Health H-6
assistants completed the in-person follow-up, they also collected surveys from “housing insecure” respondents if the primary respondent indicated there were multiple families or additional adults outside of the primary household living in the residence. All respondents received a modest cash stipend for their time.
Counties were ranked 1-57 in this assessment; a total of 10 counties did not report data. These counties were given the median score for all rankings (median score = 33).
Sexually Transmitted Diseases
Sexually Transmitted Disease Surveillance in South Dakota. (2017). Retrieved August 2020, from https://doh.sd.gov/diseases/infectious/std/Reports.aspx
Number (reported sexually transmitted cases) and Rate (cases per 100,000
population per year). Counties with 1-2 cases are published as ≤2.
Counties were ranked based on their rate for each of reported STDs (Chlamydia, Gonorrhea, and Syphilis) in order from lowest (ranking of 1) to highest (ranking of 66) in disease prevalence. Counties having a rate of 0 (zero) were given a ranking of 1. The three disease-specific county rankings were than averaged, and the average rank is what is included in the quartile ranking exercise.

2020 Primary Care Needs Assessment SD Department of Health, Office of Rural Health H-7
Health Access Indicators
Dentists in South Dakota
University of Wisconsin Population Health Institute. County Health Rankings South Dakota. (2020). Retrieved August 2020, from https://www.countyhealthrankings.org/app/south-dakota/2020/overview
Data are from 2018.
Dentists is the ratio of the population to dentists. The ratio represents the population served by one dentist if the entire population of a county was distributed equally across all practicing dentists. For example, if a county has a population of 50,000 and has 20 dentists, their ratio would be: 2,500:1. The value on the right side of the ratio is always 1 or 0; 1 indicates that there is at least one dentist in the county, and zero indicates there are no registered dentists in the county.
The left side of the ratio is the total county population. The right side of the ratio is the number of dentists in a county. Registered dentists with a National Provider Identification are counted.
Poverty
U. S. Census Bureau (2020). QuickFacts: United States. Retrieved August 2020, from https://www.census.gov/quickfacts/fact/table/US/PST045219
QuickFacts provides statistics for all states and counties, and for cities and towns with a population of 5,000 or more.
Data at a county level - Small Area Income and Poverty Estimates (SAIPE) The U.S. Census Bureau's SAIPE program provides annual estimates of income and poverty statistics for all school districts, counties, and states. The main objective of this program is to provide estimates of income and poverty for the administration of federal programs and the allocation of federal funds to local jurisdictions. In addition to these federal programs, state and local programs use the income and poverty estimates for distributing funds and managing programs. These estimates combine data from administrative records, postcensal population estimates, and the decennial census with direct estimates from the American Community Survey to provide consistent and reliable single-year estimates. Small Area Income and Poverty Estimates main page.
Person in poverty (percent) was collected for each county and ordered from lowest rate of poverty to highest rate of poverty, then ranked 1-66.
Free or Reduced-Price School Lunch
KIDS COUNT Data Center, Accessed July 20, 2020 at https://datacenter.kidscount.org/data/tables/10643-eligible-recipients-of-free-or-reduced-price-lunch?loc=43&loct=2#detailed/2/any/false/1965,1750,1686/any/20417
The number of children eligible to receive free or reduced-price lunch in public schools. Children may also be eligible to receive free or reduced-price breakfast and/or milk. To receive a free or reduced-price meal, households must meet income eligibility requirements. Children in food stamp or TANF families are automatically eligible for free school meals. Families who receive commodity assistance through food distribution programs in American Indian tribal areas are also automatically eligible for free meals. In the 2014/15 school year, a new lunch option was made

2020 Primary Care Needs Assessment SD Department of Health, Office of Rural Health H-8
available to South Dakota schools participating in the National School Lunch and School Breakfast Programs called the Community Eligibility Provision (CEP). The CEP was enacted as part of the Healthy, Hunger-Free Kids Act 2010 and provides universal meal service to students enrolled in schools with at least 40 percent of students who are directly certified for free meals. The denominator for the percentage is total public school enrollment in respective geographic areas. Data Source: State and District data: South Dakota Department of Education, Statistical Digest, https://doe.sd.gov/ofm/statdigest.aspx County data: Child and Adult Nutrition Services, South Dakota Department of Education. https://doe.sd.gov/
Counties were ordered from lowest percentage participation in free and reduced school lunch program to highest percentage participation and ranked 1-66. Six counties did not report data for 2014-2019 and were given the median rank score (33).
Usual place to go for Care
Source: Spurlock M., Davis M.M., Dulacki K., Meath T., Li H.F., McCarty D., Knight-Richardson N., Wright B., Warne D., McConnell K.J. Focus on South Dakota: A Picture of Health. Report Findings from the South Dakota Health Survey. May 2015. https://helmsleytrust.org/publication/focus-south-dakota-picture-health
Multiple modes of data collection were used including mail, telephone and in-person surveys. A representative sample of US Postal addresses were selected, clustered by geography. Randomly selected households first received a postcard to raise awareness of the study and test addresses, which was followed by survey mailings and automated reminder calls.
Rankings were adjusted for counties that had the same reported value, giving the lowest possible ranking associated with that value (see detailed description of ranking methodology in life expectancy description above).
Have a personal doctor/provider
Source: Spurlock M., Davis M.M., Dulacki K., Meath T., Li H.F., McCarty D., Knight-Richardson N., Wright B., Warne D., McConnell K.J. Focus on South Dakota: A Picture of Health. Report Findings from the South Dakota Health Survey. May 2015. https://helmsleytrust.org/publication/focus-south-dakota-picture-health
Multiple modes of data collection were used including mail, telephone and in-person surveys. A representative sample of US Postal addresses were selected, clustered by geography. Randomly selected households first received a postcard to raise awareness of the study and test addresses, which was followed by survey mailings and automated reminder calls.
Table 31: Percent of South Dakotans who
could not see a doctor due to cost by County,
2014
University of Wisconsin Population Health Institute. County Health Rankings South Dakota. (2014). Retrieved August 2020, from https://www.countyhealthrankings.org/app/south-dakota/
The Behavioral Risk Factor Surveillance System (BRFSS) is a national random digit dial (RDD) telephone survey. Data obtained from the BRFSS are representative of the total non-institutionalized population over 18 years of age living in households with a land line telephone. For the County Health Rankings, data from the BRFSS are used to measure various health behaviors and health-related quality of life (HRQoL) indicators. All

2020 Primary Care Needs Assessment SD Department of Health, Office of Rural Health H-9
data from the BRFSS are weighted by population and the HRQoL measures are age-adjusted. We obtained county-level measures, in almost all instances aggregated over seven years, from the National Center for Health Statistics (NCHS)/Centers for Disease Control and Prevention (CDC).
The 2014 County Health Rankings used data from 2006-2012 for this measure.
Live Births
South Dakota Vital Statistics Report: A State and County Comparison of Leading Health Indicators. Retrieved July 20, 2020, from https://doh.sd.gov/statistics/
County data: The Annie E. Casey Foundation, KIDS COUNT Data Center, datacenter.kidscount.org
Rankings were adjusted for counties that had the same reported value, giving the lowest possible ranking associated with that value (see detailed description of ranking methodology in life expectancy description above).
Low birth weight
South Dakota Vital Statistics Report: A State and County Comparison of Leading Health Indicators. Retrieved July 20, 2020, from https://doh.sd.gov/statistics/
Rankings were adjusted for counties that had the same reported value, giving the lowest possible ranking associated with that value (see detailed description of ranking methodology in life expectancy description above).
Prenatal care in first trimester
South Dakota Vital Statistics Report: A State and County Comparison of Leading Health Indicators. Retrieved July 20, 2020, from https://doh.sd.gov/statistics/
Counties were ranked according to the 2014 percent of mothers that received prenatal care in their first trimester as reported by the SD DOH and scored 1-66, lower scores indicating a lower percent of mothers receiving prenatal care in their first trimester and higher scores indicating a higher percent of mothers receiving prenatal care in their first trimester. The 2014 prenatal care in first trimester is Health Status Indicators 2010-2014.
Rankings were adjusted for counties that had the same reported value, giving the lowest possible ranking associated with that value (see detailed description of ranking methodology in life expectancy description above).
Cancer screening tests
State Cancer Profiles. (2020). Retrieved August 2020, from https://statecancerprofiles.cancer.gov/risk/
Estimates are based on a statistical model which combines information from the Behavioral Risk Factor Surveillance System and the National Health Interview Survey to correct for nonresponse and under-coverage bias and are enhanced in small areas by borrowing information from similar areas across the nation. For more information, visit https://sae.cancer.gov/.

2020 Primary Care Needs Assessment SD Department of Health, Office of Rural Health H-10
Counties were ranked 1-66 based on the model-based percent derived from the combined BRFSS and NHIS data.
Screening and Risk Factors Report for South Dakota by County. Ever Had
Colorectal Endoscopy (Sigmoidoscopy or
Colonoscopy) All Races (includes Hispanic),
Both Sexes, Ages 50+
State Cancer Profiles. (2020). Retrieved September 10, 2020, from https://statecancerprofiles.cancer.gov/risk/
Methodology: 2008-2010 County Level Modeled Estimate combining BRFSS and NHIS. Data reflects individuals who self-reported if they had ever had a colorectal endoscopy (sigmoidoscopy or colonoscopy). Data is reported for all races, both sexes, ages 50+. These county estimates were updated May 16, 2017, using a new methodology. See https://sae.cancer.gov for more details.
State data: Screening and Risk Factors Report for South Dakota (Directly Estimated 2018 BRFSS Data)
Breast cancer screening
University of Wisconsin Population Health Institute. County Health Rankings South Dakota. (2020). Retrieved August 2020, from https://www.countyhealthrankings.org/app/south-dakota/2020/overview
Data are from 2018.
Mammography Screening is the percentage of female fee-for-service (FFS) Medicare enrollees, ages 65-74, that receive an annual mammogram. In the 2019 County Health Rankings, the source for this measure switched from Dartmouth Atlas of Health Care to Mapping Medicare Disparities. The current measure now includes mammography screening for women between the ages of 65 and 74; the Dartmouth Atlas of Health Care measures only women ages 67 to 69.
Counties were ranked 1-66 based on the percent who have been screened for breast cancer.
Influenza vaccination
University of Wisconsin Population Health Institute. County Health Rankings South Dakota. (2020). Retrieved August 2020, from https://www.countyhealthrankings.org/app/south-dakota/2020/overview
This measure includes only the percentage of Medicare fee-for-service enrollees who have received a flu vaccine and may potentially miss trends and disparities among younger age groups or people not enrolled in Medicare.
The numerator is the number of Medicare beneficiaries enrolled in fee-for-service Medicare Part B for at least one month of the selected year and who have received a covered influenza vaccine in the last year (Current Procedural Terminology/Healthcare Common Procedure Coding System codes: 90630, 90653-90657, 90660-90662, 90672-90674, 90685-90688, Q2035-Q2039, G0008).
The denominator includes Medicare beneficiaries enrolled in fee-for-service Medicare Part B for at least one month of the selected year.
Rankings were adjusted for counties that had the same reported value, giving the lowest possible ranking associated with that value (see detailed description of ranking methodology in life expectancy description above).

2020 Primary Care Needs Assessment SD Department of Health, Office of Rural Health H-11
Uninsured adults, aged 18 to 64
U. S. Census Bureau. (2020). Small Area Health Insurance Estimates (SAHIE) Program. Retrieved August 2020, from https://www.census.gov/programs-surveys/sahie.html
Rankings were adjusted for counties that had the same reported value, giving the lowest possible ranking associated with that value (see detailed description of ranking methodology in life expectancy description above).
Uninsured children, under 18
U. S. Census Bureau. (2020). Small Area Health Insurance Estimates (SAHIE) Program. Retrieved August 2020, from https://www.census.gov/programs-surveys/sahie.html
Rankings were adjusted for counties that had the same reported value, giving the lowest possible ranking associated with that value (see detailed description of ranking methodology in life expectancy description above).
EMS, Average Dispatch to Enroute Time in Minutes
South Dakota Department of Health, Med-Media WebCUR System.
Rankings were adjusted for counties that had the same reported value, giving the lowest possible ranking associated with that value (see detailed description of ranking methodology in life expectancy description above). Five counties did not report data. These counties were given the median score for all rankings (median score = 33).

2020 Primary Care Needs Assessment SD Department of Health, Office of Rural Health H-12
Health Risk Behavior Indicators
Food Insecurity
University of Wisconsin Population Health Institute. County Health Rankings South Dakota. (2020). Retrieved August 2020, from https://www.countyhealthrankings.org/app/south-dakota/2020/overview
Data are from 2017.
Food Insecurity estimates the percentage of the population who did not have access to a reliable source of food during the past year. The numerator is the population with a lack of access, at times, to enough food for an active, healthy life or with uncertain availability of nutritionally adequate foods. The denominator is the total county population.
Counties were ranked 1-66 based on the percent limited access reported by CHR. Rankings were adjusted for counties that had the same reported value, giving the lowest possible ranking associated with that value (see detailed description of ranking methodology in life expectancy description above).
Physical Inactivity
University of Wisconsin Population Health Institute. County Health Rankings South Dakota. (2020). Retrieved August 2020, from https://www.countyhealthrankings.org/app/south-dakota/2020/overview
Physical Inactivity is based on responses to the Behavioral Risk Factor Surveillance Survey and is the percentage of adults ages 20 and over reporting no leisure-time physical activity in the past month.
Data for Physical Inactivity are provided by the CDC Interactive Diabetes Atlas which uses BRFSS data to provide county-level estimates. Beginning with the 2015 County Health Rankings, Physical Inactivity estimates include both landline and cell phone users. Previously, only landline users were included in the data. This change was implemented in order to provide users with the most accurate estimates of health in their community as possible.
Physical inactivity estimates are produced from three years of survey data and created using a complex statistical model. Modeling generates more stable estimates for places with small numbers of residents or survey responses. There are also drawbacks to using modeled data. The smaller the population or sample size of a county, the more the estimates are derived from the model itself and the less they are based on survey responses. Models make statistical assumptions about relationships that may not hold in all cases. Finally, there is no perfect model and each model generally has limitations specific to their methods.
Counties were ranked 1-66 according to 2017 reported values. Rankings were adjusted for counties that had the same reported value, giving the lowest possible ranking associated with that value (see detailed description of ranking methodology in life expectancy description above).
Adult smoking University of Wisconsin Population Health Institute. County Health Rankings South Dakota. (2020). Retrieved August 2020, from https://www.countyhealthrankings.org/app/south-dakota/2020/overview

2020 Primary Care Needs Assessment SD Department of Health, Office of Rural Health H-13
Data are from 2017.
Adult Smoking is the percentage of the adult population in a county who both report that they currently smoke every day or most days and have smoked at least 100 cigarettes in their lifetime. Beginning with the 2016 Rankings, the CDC provided single-year modeled county-level estimates that included both landline and cell phone users. These changes were implemented in order to provide users with the most accurate estimates of health in their community as possible.
Counties were ranked 1-66 based on the percent of reported adult smokers reported by CHR. Rankings were adjusted for counties that had the same reported value, giving the lowest possible ranking associated with that value (see detailed description of ranking methodology in life expectancy description above).
Mother’s tobacco use during pregnancy
South Dakota Vital Statistics Report: A State and County Comparison of Leading Health Indicators. Retrieved July 20, 2020, from https://doh.sd.gov/statistics/
Data for mothers who used tobacco are self-reported.
Counties were ranked 1-66 based on the percent of mothers who used tobacco while pregnant as reported in 2011, 2014, 2017. Rankings were adjusted for counties that had the same reported value, giving the lowest possible ranking associated with that value (see detailed description of ranking methodology in life expectancy description above). The 2017 mother’s tobacco use during pregnancy are Health Status Indicators 2014-2017.
Mother’s breastfeeding at discharge
South Dakota Vital Statistics Report: A State and County Comparison of Leading Health Indicators. Retrieved July 20, 2020, from https://doh.sd.gov/statistics/
Counties were ranked 1-66 based on the percent of mothers who were breastfeeding their newborn(s) at discharge as reported in 2014. Rankings were adjusted for counties that had the same reported value, giving the lowest possible ranking associated with that value (see detailed description of ranking methodology in life expectancy description above). The 2017 mother’s breastfeeding at discharge is Health Status Indicators 2014-2017.
Excessive drinking
University of Wisconsin Population Health Institute. County Health Rankings South Dakota. (2020). Retrieved August 2020, from https://www.countyhealthrankings.org/app/south-dakota/2020/overview
Data are from 2017.
Excessive Drinking measures the percentage of a county’s adult population that reports binge or heavy drinking in the past 30 days. Beginning with the 2016 Rankings, the CDC provided single-year modeled county-level estimates that included both landline and cell phone users. These changes were implemented in order to provide users with the most accurate estimates of health in their community as possible.

2020 Primary Care Needs Assessment SD Department of Health, Office of Rural Health H-14
Counties were ranked 1-66 based on the percent of excessive drinkers per county reported by CHR. Rankings were adjusted for counties that had the same reported value, giving the lowest possible ranking associated with that value (see detailed description of ranking methodology in life expectancy description above).

2020 Primary Care Needs Assessment SD Department of Health, Office of Rural Health H-15
Total Population by County, 2011, 2014, and 2017
Source: South Dakota Vital Statistics Report: A State and County Comparison of Leading Health Indicators. https://doh.sd.gov/statistics/
Table 49: White Population by County, 2011, 2014, and 2017
Source: South Dakota Vital Statistics Report: A State and County Comparison of Leading Health Indicators. https://doh.sd.gov/statistics/
Table 50: Non-White Population by County, 2011, 2014, and 2017
Source: South Dakota Vital Statistics Report: A State and County Comparison of Leading Health Indicators. https://doh.sd.gov/statistics/
Table 51: Population by Age, by County, 2011, 2014, and 2017
Source: South Dakota Vital Statistics Report: A State and County Comparison of Leading Health Indicators. https://doh.sd.gov/statistics/
South Dakota Critical Access Hospital Directory
Source: Flex Monitoring Team, Critical Access Hospital Locations, (2020) Retrieved on July 9, 2020 from https://www.flexmonitoring.org/data/critical-access-hospital-locations/ Data in the list updated April 28, 2020.
Federally Qualified Health Centers Directory
Source: National Database Look-up, (2020). Retrieved July 9, 2020, from https://npidb.org/organizations/ambulatory_health_care/federally-qualified-health-center-fqhc_261qf0400x/sd/ Source: Health Resources & Services Administration (HRSA) Data Explorer, (2020) Retrieved on December 7, 2020 from https://data.hrsa.gov/tools/data-explorer Addresses obtained from: Horizon Health Care (2020) Retrieved July 9, 2020, from https://www.horizonhealthcare.org/our-locations/ Rural Health Care, Inc. (2020) Retrieved July 9, 2020, from https://www.ruralhc.net/
Primary Care NHSC Sites Directory
Source: Health Resources & Services Administration (HRSA) Data Explorer, (2020) Retrieved on July 14, 2020 from https://data.hrsa.gov/tools/data-explorer
Dental Care NHSC Sites Directory
Source: Health Resources & Services Administration (HRSA) Data Explorer, (2020) Retrieved on July 14, 2020 from https://data.hrsa.gov/tools/data-explorer
Mental Health NHSC Sites Directory
Source: Health Resources & Services Administration (HRSA) Data Explorer, (2020) Retrieved on July 14, 2020 from https://data.hrsa.gov/tools/data-explorer
Rural Health Clinics Directory
Source: Centers for Medicare & Medicaid Services Health Center Facilities Report, (2020) Retrieved on July 14, 2020 from https://data.hrsa.gov/data/reports
Supplemental Figures for Shortage Areas and Designations
Source: South Dakota Department of Health, Office of Rural Health. Federally designated health professional shortage areas and medically underserved areas. (2020) Retrieved September 10, 2020, from https://doh.sd.gov/providers/ruralhealth/shortage.aspx
Nursing Education Programs in South Dakota
Source: South Dakota Department of Health, Licensing Boards, South Dakota Board of Nursing (2020) Retrieved on July 7, 2020 from https://doh.sd.gov/boards/nursing/education.aspx

2020 Primary Care Needs Assessment SD Department of Health, Office of Rural Health I-1
APPENDIX I │FEDERALLY QUALIFIED HEALTH CENTERS DIRECTORY
Name Address City County
Horizon Health Care | Aberdeen Community Health Center
506 S. Wilson St. Aberdeen Brown
Horizon Health Care | Alcester Community Health Center
104 West 2nd Street Alcester Union
Horizon Health Care | Alcester Dental Clinic
111 Iowa Street Alcester Union
Horizon Health Care | Bison Community Clinic
105 West Main Street Bison Perkins
Rural Health Care, Inc. | Access Health-Brookings
400 22nd Ave Ste. 1 Brookings Brookings
Horizon Health Care | Bryant Community Health Center
110 West Main Street Bryant Hamlin
Rural Health Care, Inc. | Dakota Family Medical Center
101 South Front Street Chamberlain Brule
Horizon Health Care | DeSmet Community Health Center
401 Prairie Avenue SW DeSmet Kingsbury
Horizon Health Care | De Smet Dental Services
401 Prairie Avenue SW DeSmet Kingsbury
Horizon Health Care | Family Health Center of Eagle Butte
24337 U.S. Hwy 212 Eagle Butte Dewey
Horizon Health Care | Elk Point Community Health Center
204 East Main Street Elk Point Union
Horizon Health Care | Union County Correctional Facility
300 East Main St Elk Point Union
Horizon Health Care | Faith Community Health Center
112 North 2nd Avenue West
Faith Meade
Horizon Health Care | Faith Dental Clinic
112 North 2nd Avenue West
Faith Meade
Rural Health Care, Inc. | Oahe Valley Health Center
202 Island Drive; Suite 1 Fort Pierre Stanley
Horizon Health Care | Fort Thompson Community Health Center
125 SD Hwy 249 Fort Thompson Buffalo
Rural Health Care, Inc. | Community Care Clinic
608 E. Garfield Gettysburg Potter
Rural Health Care, Inc. | Highmore Clinic
200 Commercial Avenue SE
Highmore Hyde
Horizon Health Care | Prairie Winds Dental
112 N Main St. Howard Miner
Horizon Health Care | Howard Community Health Center
208 South Main Street Howard Miner
Horizon Health Care | James Valley Community Health Center
1000 18th Street SW; Suite 27
Huron Beadle
Horizon Health Care | Isabel Community Clinic
118 North Main Street Isabel Dewey

2020 Primary Care Needs Assessment SD Department of Health, Office of Rural Health I-2
Rural Health Care, Inc. | Kennebec Clinic
120 South Main Kennebec Lyman
Horizon Health Care | Martin Community Health Center
109 Pugh Street Martin Bennett
Horizon Health Care | Lake Preston Community Health Center
709 4th Street SE Lake Preston Kingsbury
Horizon Health Care | McIntosh Community Clinic
208 Main Street McIntosh Corson
Horizon Health Care | Mission Community Health Center
161 South Main Street Mission Todd
Rural Health Care, Inc. | Access Health-Mitchell
1900 Grassland Drive Mitchell Davison
Rural Health Care, Inc. | Jones County Clinic
609 Garfield Avenue Murdo Jones
Rural Health Care, Inc. | Onida Clinic
303 South Main Street Onida Sully
Eastside Neighborhood Center 2400 E Capitol Ave Pierre Hughes
South Dakota Urban Indian Health, Inc.
1714 Abbey Rd Pierre Hughes
Horizon Health Care | Aurora County Community Health Center
106 South Main St Plankinton Aurora
Horizon Health Care | Aurora County Dental Clinic
106 South Main St Plankinton Aurora
Rural Health Care, Inc. | Stanley-Jones Memorial Clinic
116 North Main Street Presho Lyman
Community Health Center of the Black Hills | Consolidated Community Health Center
350 Pine St Rapid City Pennington
Community Health Center of the Black Hills | General Beadle School Based
10 Van Buren St Rapid City Pennington
Community Health Center of the Black Hills | Cornerstone Rescue Mission-Men's Shelter
30 Main St Rapid City Pennington
Horizon Health Care | Tiospaye Topa School
PO Box 300 Ridgeview Dewey
Falls Community Health Clinic 521 North Main Avenue Sioux Falls Minnehaha
Falls Community Health | Hawthorne Elementary School
601 North Spring Avenue Sioux Falls Minnehaha
Falls Community Health | Hayward Elementary School
410 North Valley View Road
Sioux Falls Minnehaha
Falls Community Health | Terry Redlin Elementary School
1721 E Austin St Sioux Falls Minnehaha
South Dakota Urban Indian Health, Inc.
1200 N West Ave Sioux Falls Minnehaha
Horizon Health Care | Jerauld County Community Health Center
602 1st Street NE; Suite 1 Wessington Springs
Jerauld

2020 Primary Care Needs Assessment SD Department of Health, Office of Rural Health I-3
Horizon Health Care | Jerauld County Dental Clinic
602 1st Street NE; Suite 2 Wessington Springs
Jerauld
Horizon Health Care | Mellette County Community Health Center
309 East 4th Street White River Mellette
Horizon Health Care | Woonsocket Community Health Center
302 S. Dumont Ave. Woonsocket Sanborn
Horizon Health Care | Yankton Community Health Center
920 Broadway Ave Suite 2
Yankton Yankton
Horizon Health Care | Yankton Community Dental Services
920 Broadway Ave Suite 2
Yankton Yankton
Source: National Database Look-up, (2020). Retrieved December 7, 2020, from https://npidb.org/organizations/ambulatory_health_care/federally-qualified-health-center-fqhc_261qf0400x/sd/ and Health Resources & Services Administration (HRSA) Data Explorer, (2020) Retrieved on December 7, 2020 from https://data.hrsa.gov/tools/data-explorer
Addresses obtained from:
Horizon Health Care (2020) Retrieved December 7, 2020, from https://www.horizonhealthcare.org/our-locations/
Rural Health Care, Inc. (2020) Retrieved December 7, 2020, from https://www.ruralhc.net/

2020 Primary Care Needs Assessment SD Department of Health, Office of Rural Health J-1
APPENDIX J │HRSA HEALTH WORKFORCE SITES DIRECTORY
Source: Health Resources & Services Administration (HRSA) Health Workforce Connector, (2020) Retrieved on December 18, 2020 from https://connector.hrsa.gov/connector/search
Site NameOpen
PositionsSite Type
Primary Care
HPSA Score
Mental Health
HPSA Score
Dental Health
HPSA Score
NHSC Site
Status
Nurse Corps
Site Status
Address Line
1
Address Line
2City State Zip Code Phone Number
Rural Health Care, Inc - Stanley
Jones Memorial Clinic0
NHSC/Nurse Corps: Federally
Qualified Health Centers
(FQHC)
17 21 19 Active Active116 N. Main
St.Presho SD 57568 (605) 895-2589
Delta Dental South Dakota -
Rural Community Health/Dakota
Smiles Mobile Dental Program
0NHSC: Mobile Unit / Nurse
Corps: Urgent Care Center17 18 19 Active Active
116 N. Main
StreetPresho SD 57568 (605) 224-7345
Lower Brule Sioux Tribe -
Behavioral Health Clinic0
NHSC/Nurse Corps: American
Indian Health Fac ility17 18 19 Active Active
187 Oyate
CirlceLower Brule SD 57548 (605) 473-5561
Lower Brule Service Unit - Lower
Brule Indian Health Center1
NHSC/Nurse Corps: American
Indian Health Fac ility19 18 19 Active Active
601 Gall
StreetPO Box 248 Lower Brule SD 57548 (605) 473-8224
Horizon Health Care, Inc . - Fort
Thompson Community Health
Center
0
NHSC/Nurse Corps: Federally
Qualified Health Centers
(FQHC)
18 20 26 Active Active125 SD Hwy
249PO Box 378 Fort Thompson SD 57339 (605) 245-2700
Fort Thompson Service Unit -
Fort Thompson Indian Health
Center
1NHSC/Nurse Corps: American
Indian Health Fac ility19 17 24 Active Active
1323 BIA
Route 4Fort Thompson SD 57339 (605) 245-1500
Rural Health Care, Inc - Dakota
Family Medical Center0
NHSC/Nurse Corps: Federally
Qualified Health Centers
(FQHC)
15 21 10 Active Active101 S Front
StreetChamberlain SD 57325 (605) 234-6584
Dakota Mental Health Center -
Chamberlain Clinic0
NHSC: Community Mental
Health Center (CMHC) / Nurse
Corps: Certified Community
Behavioral Health Clinics
14 19 0 Active Active200 Paul Gust
Rd.Suite 102 Chamberlain SD 57325 (605) 734-6535
Dehon Health and Family
Services Center0
NHSC: School Based Clinic /
Nurse Corps: Nurse Managed
Health Clinic/Center
14 19 0 Active Active PO Box 891301 N. Main
StreetChamberlain SD 57325 (605) 234-3321
Sanford Chamberlain Medical
Center (CAH)0
Nurse Corps: Critical Access
Hospital (CAH)14 19 0 Inactive Active
300 S Bryon
Blvd.Chamberlain SD 57325 (605) 234-5511
Sanford Chamberlain Clinic 0
NHSC: Community Outpatient
Fac ility / Nurse Corps: Critical
Access Hospital (CAH)
14 19 0 Inactive Active300 South
Byron Blvd.
Primary Care
ClinicChamberlain SD 57325 (605) 234-6551
South Dakota Department of
Corrections - South Dakota
Women's Prison
0 NHSC: Correctional Fac ility 3 21 0 Active Terminated3200 East
Highway 34Pierre SD 57501 (605) 773-6636
Rural Health Care, Inc -
Buchanan Elementary School
SBHC (Part-Time)
0
NHSC/Nurse Corps: Federally
Qualified Health Centers
(FQHC)
15 21 10 Active Active
100 N
Buchanan
Ave.
Pierre SD 57501-3004 (605) 773-7226
Missouri River Counseling 0 NHSC: Private Practice 0 18 0 Active Inactive1309 E. Wells
AvePierre SD 57501 (605) 222-9130
St Mary's Healthcare Center 0Nurse Corps: Residential
Nursing Home0 18 0 Inactive Active
800 East
Dakota
Avenue
Pierre SD 57501
South Dakota Department of
Corrections - Administration0 NHSC: Correctional Fac ility 0 21 0 Active Terminated
3200 East
Highway 34
c/o 500 East
Capitol
Avenue
Pierre SD 57501 (605) 773-3478
South Dakota Urban Indian
Health - Pierre0
NHSC/Nurse Corps: American
Indian Health Fac ility4 18 9 Active Active
1714 Abbey
RoadPierre SD 57501 (605) 339-0420

2020 Primary Care Needs Assessment SD Department of Health, Office of Rural Health J-2
Site NameOpen
PositionsSite Type
Primary Care
HPSA Score
Mental Health
HPSA Score
Dental Health
HPSA Score
NHSC Site
Status
Nurse Corps
Site Status
Address Line
1
Address Line
2City State Zip Code Phone Number
Capital Area Counseling Service 0
NHSC: Community Mental
Health Center (CMHC) / Nurse
Corps: Certified Community
Behavioral Health Clinics
0 18 0 Active Active2001 Eastgate
AvenuePierre SD 57501 (605) 224-5811
Oahe, Incorporated 0Nurse Corps: State or Local
Health Department0 18 0 Inactive Active
125 West
Pleasant DrivePierre SD 57501 (605) 224-4501
Capital Area Counseling Service -
Main Site0
NHSC: Community Mental
Health Center (CMHC) / Nurse
Corps: Certified Community
Behavioral Health Clinics
0 18 0Terminate
dActive
803 E. Dakota
AvenuePO Box 148 Pierre SD 57501 (605) 224-5811
Rural Health Care, Inc - Oahe
Valley Health Center0
NHSC/Nurse Corps: Federally
Qualified Health Centers
(FQHC)
15 21 10 Active Active 202 Island Dr. Ste. 1 Fort Pierre SD 57532-7303 (605) 223-2200
Rural Health Care, Inc - Jones
County Clinic0
NHSC/Nurse Corps: Federally
Qualified Health Centers
(FQHC)
15 21 10 Active Active609 Garfield
Ave.Murdo SD 57559-4100 (605) 669-2121
WINNER REGIONAL HEALTHCARE
CENTER (DUPLICATE)0
NHSC: Community Outpatient
Fac ility / Nurse Corps: Critical
Access Hospital (CAH)
15 20 15Terminate
dActive
745 East 8th
StreetWinner SD 57580
Winner Regional Healthcare
Center (CAH)0
NHSC/Nurse Corps: Critical
Access Hospital (CAH)15 20 15 Active Active
745 East 8th
StreetWinner SD 57580 (605) 842-2626
Winner Regional Healthcare -
Winner Regional Clinic0
NHSC: Certified Rural Health
Clinic (RHC) / Nurse Corps:
Critical Access Hospital (CAH)
15 20 15 Inactive Active825 E. 8th
StreetWinner SD 57580 (605) 842-2626
Southern Plains Behavioral
Health Services - Winner Clinic
and Administration
0
NHSC: Community Mental
Health Center (CMHC) / Nurse
Corps: Certified Community
Behavioral Health Clinics
15 20 0 Active Active500 East 9th
StreetWinner SD 57580 (605) 842-1465
Rural Health Care, Inc - Highmore
Clinic0
NHSC/Nurse Corps: Federally
Qualified Health Centers
(FQHC)
15 21 10 Active Active
200 S.
Commercial
St.
Highmore SD 57345 (605) 852-2238
Horizon Health Care, Inc . -
Mellette County Community
Health Center
0
NHSC/Nurse Corps: Federally
Qualified Health Centers
(FQHC)
18 20 26 Active Active309 East 4th
StreetPO Box 281 White River SD 57579 (605) 259-3121
Rural Health Care, Inc - Onida
Clinic0
NHSC/Nurse Corps: Federally
Qualified Health Centers
(FQHC)
15 21 10 Active Active 303 S. Main St. Onida SD 57564-2160 (605) 258-2635
Avera Medical Group Gregory 0
NHSC: Community Outpatient
Fac ility / Nurse Corps: Critical
Access Hospital (CAH)
14 20 11 Inactive Active 405 Whittecar Gregory SD 57533 (605) 835-9611
Avera Hand County Memorial
Hospital (CAH)0
NHSC/Nurse Corps: Critical
Access Hospital (CAH)14 17 11 Inactive Active
300 West 5th
StreetMiller SD 57362 (605) 853-2421
Horizon Health Care, Inc . -
Mission Community Health
Center
0
NHSC/Nurse Corps: Federally
Qualified Health Centers
(FQHC)
21 20 26 Active Active 161 S Main St PO Box 49 Mission SD 57555 (605) 856-4703
Prairie Good Samaritan Center 0Nurse Corps: Residential
Nursing Home14 17 11 Inactive Active
421 East
Fourth StreetMiller SD 57362
Community Memorial Hospital -
Burke Clinic0
NHSC: Certified Rural Health
Clinic (RHC) / Nurse Corps:
Rural Health Clinic
14 20 11 Inactive Active814 Jackson
StreetPO Box 358 Burke SD 57523 (605) 775-2631
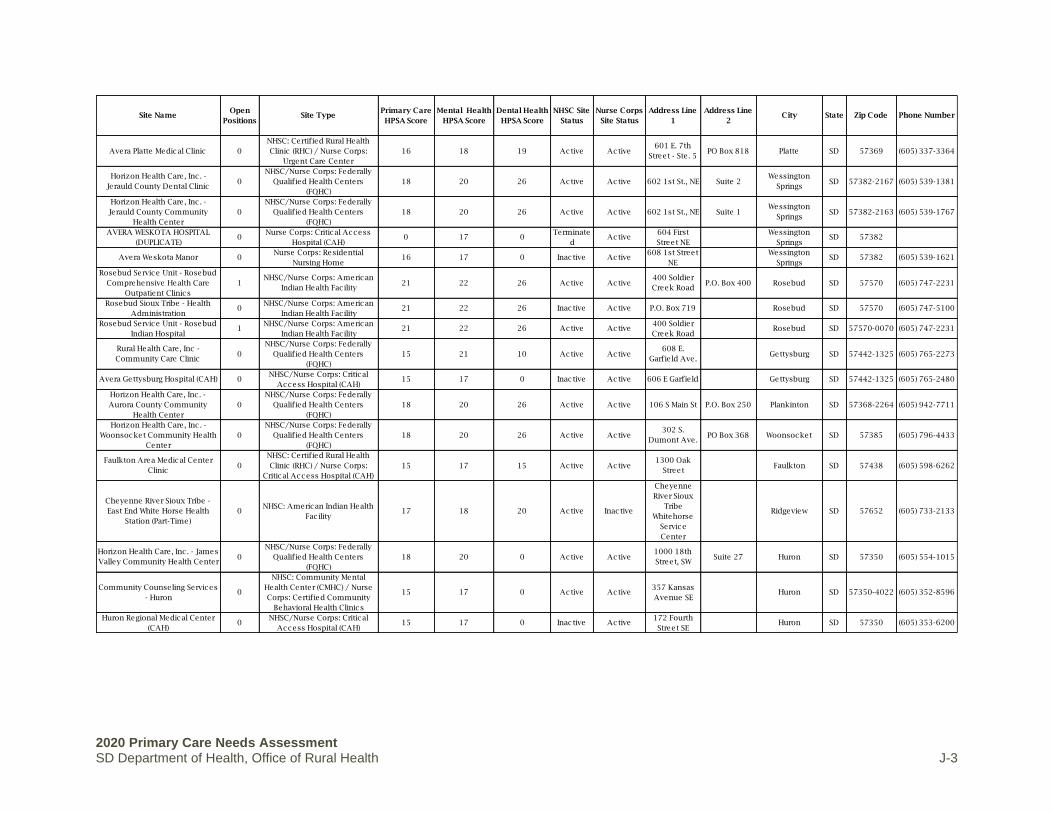
2020 Primary Care Needs Assessment SD Department of Health, Office of Rural Health J-3
Site NameOpen
PositionsSite Type
Primary Care
HPSA Score
Mental Health
HPSA Score
Dental Health
HPSA Score
NHSC Site
Status
Nurse Corps
Site Status
Address Line
1
Address Line
2City State Zip Code Phone Number
Avera Platte Medical Clinic 0
NHSC: Certified Rural Health
Clinic (RHC) / Nurse Corps:
Urgent Care Center
16 18 19 Active Active601 E. 7th
Street - Ste. 5PO Box 818 Platte SD 57369 (605) 337-3364
Horizon Health Care, Inc . -
Jerauld County Dental Clinic0
NHSC/Nurse Corps: Federally
Qualified Health Centers
(FQHC)
18 20 26 Active Active 602 1st St., NE Suite 2Wessington
SpringsSD 57382-2167 (605) 539-1381
Horizon Health Care, Inc . -
Jerauld County Community
Health Center
0
NHSC/Nurse Corps: Federally
Qualified Health Centers
(FQHC)
18 20 26 Active Active 602 1st St., NE Suite 1Wessington
SpringsSD 57382-2163 (605) 539-1767
AVERA WESKOTA HOSPITAL
(DUPLICATE)0
Nurse Corps: Critical Access
Hospital (CAH)0 17 0
Terminate
dActive
604 First
Street NE
Wessington
SpringsSD 57382
Avera Weskota Manor 0Nurse Corps: Residential
Nursing Home16 17 0 Inactive Active
608 1st Street
NE
Wessington
SpringsSD 57382 (605) 539-1621
Rosebud Service Unit - Rosebud
Comprehensive Health Care
Outpatient Clinics
1NHSC/Nurse Corps: American
Indian Health Fac ility21 22 26 Active Active
400 Soldier
Creek RoadP.O. Box 400 Rosebud SD 57570 (605) 747-2231
Rosebud Sioux Tribe - Health
Administration0
NHSC/Nurse Corps: American
Indian Health Fac ility21 22 26 Inactive Active P.O. Box 719 Rosebud SD 57570 (605) 747-5100
Rosebud Service Unit - Rosebud
Indian Hospital1
NHSC/Nurse Corps: American
Indian Health Fac ility21 22 26 Active Active
400 Soldier
Creek RoadRosebud SD 57570-0070 (605) 747-2231
Rural Health Care, Inc -
Community Care Clinic0
NHSC/Nurse Corps: Federally
Qualified Health Centers
(FQHC)
15 21 10 Active Active608 E.
Garfield Ave.Gettysburg SD 57442-1325 (605) 765-2273
Avera Gettysburg Hospital (CAH) 0NHSC/Nurse Corps: Critical
Access Hospital (CAH)15 17 0 Inactive Active 606 E Garfield Gettysburg SD 57442-1325 (605) 765-2480
Horizon Health Care, Inc . -
Aurora County Community
Health Center
0
NHSC/Nurse Corps: Federally
Qualified Health Centers
(FQHC)
18 20 26 Active Active 106 S Main St P.O. Box 250 Plankinton SD 57368-2264 (605) 942-7711
Horizon Health Care, Inc . -
Woonsocket Community Health
Center
0
NHSC/Nurse Corps: Federally
Qualified Health Centers
(FQHC)
18 20 26 Active Active302 S.
Dumont Ave.PO Box 368 Woonsocket SD 57385 (605) 796-4433
Faulkton Area Medical Center
Clinic0
NHSC: Certified Rural Health
Clinic (RHC) / Nurse Corps:
Critical Access Hospital (CAH)
15 17 15 Active Active1300 Oak
StreetFaulkton SD 57438 (605) 598-6262
Cheyenne River Sioux Tribe -
East End White Horse Health
Station (Part-Time)
0NHSC: American Indian Health
Fac ility17 18 20 Active Inactive
Cheyenne
River Sioux
Tribe
Whitehorse
Service
Center
Ridgeview SD 57652 (605) 733-2133
Horizon Health Care, Inc . - James
Valley Community Health Center0
NHSC/Nurse Corps: Federally
Qualified Health Centers
(FQHC)
18 20 0 Active Active1000 18th
Street, SWSuite 27 Huron SD 57350 (605) 554-1015
Community Counseling Services
- Huron0
NHSC: Community Mental
Health Center (CMHC) / Nurse
Corps: Certified Community
Behavioral Health Clinics
15 17 0 Active Active357 Kansas
Avenue SEHuron SD 57350-4022 (605) 352-8596
Huron Regional Medical Center
(CAH)0
NHSC/Nurse Corps: Critical
Access Hospital (CAH)15 17 0 Inactive Active
172 Fourth
Street SEHuron SD 57350 (605) 353-6200

2020 Primary Care Needs Assessment SD Department of Health, Office of Rural Health J-4
Site NameOpen
PositionsSite Type
Primary Care
HPSA Score
Mental Health
HPSA Score
Dental Health
HPSA Score
NHSC Site
Status
Nurse Corps
Site Status
Address Line
1
Address Line
2City State Zip Code Phone Number
Philip Health Services (CAH) 0NHSC/Nurse Corps: Critical
Access Hospital (CAH)8 18 0 Inactive Active
503 W. Pine
StreetPhilp SD 57567 (605) 859-2511
Avera St. Benedict CRH Clinic
Lake Andes0
NHSC: Certified Rural Health
Clinic (RHC) / Nurse Corps:
Rural Health Clinic
13 18 19 Inactive Active756 E. Lake
StreetPO Box 279 Lake Andes SD 57356 (605) 487-7878
Douglas County Memorial
Hospital (CAH)0
NHSC/Nurse Corps: Critical
Access Hospital (CAH)7 18 0 Inactive Active 708 8th Street Armour SD 57313 (605) 724-2159
South Dakota Development
Center0 Nurse Corps: Public Hospital 0 20 0 Inactive Active
17267 W 3rd
StRedfield SD 57469
Community Memorial Hospital
(CAH)0
NHSC/Nurse Corps: Critical
Access Hospital (CAH)15 17 0 Inactive Active
111 West
10th AvenueRedfield SD 57469 (605) 472-1110
Mitchell and Avera Medical
Group Family Health Center0
Nurse Corps: Federally
Qualified Health Centers
(FQHC)
15 19 0 Inactive Active
1900
Grassland
Drive
Mitchell SD 57301
Dakota Mental Health Center -
Administration and Mitchell
Clinic
0
NHSC: Community Mental
Health Center (CMHC) / Nurse
Corps: Certified Community
Behavioral Health Clinics
0 19 0 Active Active910 West
Havens StreetMitchell SD 57301-3831 (605) 996-9686
SD Health Dept - Davison 0Nurse Corps: State or Local
Health Department0 19 0 Inactive Active
115 W. 12th
Ave.Mitchell SD 57301
Dakota Wesleyan University 0Nurse Corps: Accredited
School of Nursing0 19 0 Inactive Active
1200 W
University
Avenue
Mitchell SD 57301 (800) 333-8506
Avera@Home -Hospice and
Home Health0 Nurse Corps: Hospice Program 0 19 0 Inactive Active
525 North
Foster StreetMitchell SD 57301
Avera Queen of Peace Hospital 0Nurse Corps: Disproportionate
Share Hospital (DSH)0 19 0 Inactive Active 525 N. Foster Mitchell SD 57301
Pine Ridge Service Unit -
Wanblee Health Center1
NHSC/Nurse Corps: American
Indian Health Fac ility20 23 26 Active Active
100 Clinic
DriveWanblee SD 57577 (605) 462-6155
Cheyenne River Service Unit -
Eagle Butte IHS Outpatient Clinic1
NHSC/Nurse Corps: American
Indian Health Fac ility19 18 23 Active Active
24276 166th
St.Box 1012 Eagle Butte SD 57625 (605) 964-7724
Horizon Health Care, Inc . -
Family Health Center of Eagle
Butte
0
NHSC/Nurse Corps: Federally
Qualified Health Centers
(FQHC)
18 20 26 Active Active24337 US
Highway 212PO Box 860 Eagle Butte SD 57625 (605) 964-8000
Cheyenne River Service Unit -
Eagle Butte Indian Hospital 1
NHSC/Nurse Corps: American
Indian Health Fac ility19 19 21 Active Active
24276 166th
St.Box 1012 Eagle Butte SD 57625 (605) 964-3004
Cheyenne River Sioux Tribe -
Tribal Dental Clinic0
NHSC/Nurse Corps: American
Indian Health Fac ility21 19 23 Active Active
24276 166th
St. Airport
Road
Dental Clinic Eagle Butte SD 57625 (605) 964-7830
Wagner Good Samaritan Center 0Nurse Corps: Residential
Nursing Home13 18 19 Inactive Active
515 West
Highway 46Wagner SD 57380

2020 Primary Care Needs Assessment SD Department of Health, Office of Rural Health J-5
Site NameOpen
PositionsSite Type
Primary Care
HPSA Score
Mental Health
HPSA Score
Dental Health
HPSA Score
NHSC Site
Status
Nurse Corps
Site Status
Address Line
1
Address Line
2City State Zip Code Phone Number
Wagner Family Dental 0 NHSC: Private Practice 13 18 19 Active Inactive412 West SD
Hwy 46Wagner SD 57380 (605) 384-3400
Avera Wagner Community Clinic 0
NHSC: Community Outpatient
Fac ility / Nurse Corps: Critical
Access Hospital (CAH)
13 18 19 Active Active513 3rd Street
SWWagner SD 57380 (605) 384-3418
Yankton Service Unit - Wagner
Indian Health Center1
NHSC/Nurse Corps: American
Indian Health Fac ility17 18 23 Active Active
111
Washington
St., NW
Wagner SD 57380 (605) 384-3621
Avera Wagner Community
Memorial Hospital (CAH)0
NHSC/Nurse Corps: Critical
Access Hospital (CAH)13 18 19 Active Active
513 3rd Street
SWPO Box 280 Wagner SD 57380 (605) 384-3611
Bowdle Healthcare Center -
Bowdle Healthcare Clinic0
NHSC: Certified Rural Health
Clinic (RHC) / Nurse Corps:
Rural Health Clinic
15 17 11 Active Active8001 W. 5th
StreetBowdle SD 57428 (605) 285-6146
Bowdle Healthcare Center (CAH) 0NHSC/Nurse Corps: Critical
Access Hospital (CAH)15 17 0 Active Active
8001 5th
StreetBowdle SD 57428 (605) 285-6146
Avera St. Benedict Health Center
(CAH)0
NHSC/Nurse Corps: Critical
Access Hospital (CAH)15 18 0 Inactive Active
401 West
Glynn DriveParkston SD 57366 (605) 928-3311
Avera St. Benedict Certified
Rural Health Clinic Parkston0
NHSC: Certified Rural Health
Clinic (RHC)15 18 15 Active Inactive
401 West
Glynn DriveParkston SD 57366 (605) 928-3311
Horizon Health Care, Inc . - Martin
Community Health Center0
NHSC/Nurse Corps: Federally
Qualified Health Centers
(FQHC)
18 22 17 Active Active109 Pugh
StreetPO Box 550 Martin SD 57551 (605) 685-6868
Horizon Health Care, Inc . - Martin
Dental Clinic1
NHSC/Nurse Corps: Federally
Qualified Health Centers
(FQHC)
18 22 26 Active Active103 East
BennettMartin SD 57551 (605) 685-1046
Pine Ridge Service Unit - Lacreek
District Clinic0
NHSC: American Indian Health
Fac ility21 24 25 Active Inactive
119 South 1st
AvenueMartin SD 57551 (605) 685-2880
Bennett County Hospital -
Bennett County Rural Health
Clinic
0
NHSC: Certified Rural Health
Clinic (RHC) / Nurse Corps:
Rural Health Clinic
19 23 24 Active Active 302 S 1st Ave Martin SD 57551 (605) 685-1660
Bennett County Hospital and
Nursing Home (CAH)0
NHSC/Nurse Corps: Critical
Access Hospital (CAH)18 22 17 Active Active
102 Major
Allen RoadMartin SD 57751 (605) 685-6622
Standing Rock Service Unit -
Wakpala Health Station (Part-
Time)
0NHSC: American Indian Health
Fac ility20 20 20 Active Inactive
House #1
Prairie
Avenue
PO Box 879 Wakpala SD 57658 (605) 823-4458
Mobridge Regional Hospital
(CAH)0
NHSC/Nurse Corps: Critical
Access Hospital (CAH)7 17 0 Active Active
1401 10th
Avenue WestPO Box 580 Mobridge SD 57601 (605) 845-3692
Horizon Health Care, Inc . -
Dupree School Clinic (Part-Time)0
NHSC/Nurse Corps: Federally
Qualified Health Centers
(FQHC)
21 0 0 Inactive Active 223 A Street Dupree SD 57623
Mobridge Regional Hospital -
Mobridge Medical Clinic0
NHSC: Certified Rural Health
Clinic (RHC) / Nurse Corps:
Rural Health Clinic
18 17 17 Active Active1309 10th
Avenue West
Rural Health
ClinicMobridge SD 57601 (605) 845-8105

2020 Primary Care Needs Assessment SD Department of Health, Office of Rural Health J-6
Site NameOpen
PositionsSite Type
Primary Care
HPSA Score
Mental Health
HPSA Score
Dental Health
HPSA Score
NHSC Site
Status
Nurse Corps
Site Status
Address Line
1
Address Line
2City State Zip Code Phone Number
Ogala Lakota College 0Nurse Corps: Accredited
School of Nursing18 22 19 Inactive Active
3 Mile creek
RoadKyle SD 57752 (605) 455-6000
Mobridge Regional Hospital -
West Dakota Health Center0
NHSC: Certified Rural Health
Clinic (RHC) / Nurse Corps:
Rural Health Clinic
19 0 21 Active Active906 Main
StreetTimber Lake SD 57656 (605) 865-3258
Cheyenne River Sioux Tribe -
Cherry Creek Health Station (Part-
Time)
0NHSC: American Indian Health
Fac ility19 18 14 Active Inactive
Cheyenne
River Sioux
Tribe Offices
Dupree SD 57623 (605) 538-4251
Cheyenne River Sioux Tribe -
West End Red Scaffold Health
Station (Part-Time)
0NHSC: American Indian Health
Fac ility18 18 21 Active Inactive
Cheyenne
River Sioux
Tribe Red
Scaffold
Health Station
Dupree SD 57623 (605) 538-4241
Horizon Health Care, Inc . -
Howard Community Health
Center
0
NHSC/Nurse Corps: Federally
Qualified Health Centers
(FQHC)
18 20 12 Active Active 208 S. Main St. Howard SD 57349 (605) 772-4574
Horizon Health Care, Inc . - Prairie
Winds Dental Clinic0
NHSC/Nurse Corps: Federally
Qualified Health Centers
(FQHC)
18 20 26 Active Active112 N. Main
St.Howard SD 57349-9055 (605) 772-4703
Pine Ridge Service Unit - Kyle
Health Center1
NHSC/Nurse Corps: American
Indian Health Fac ility20 22 25 Active Active
1000 Health
Center RoadKyle SD 57752 (605) 455-2451
Horizon Health Care, Inc . - De
Smet Community Health and
Dental Center
0
NHSC/Nurse Corps: Federally
Qualified Health Centers
(FQHC)
18 20 26 Active Active401 Prairie
Ave SWPO Box 49 De Smet SD 57231-2224 (605) 854-3455
De Smet Good Samaritan Center 0Nurse Corps: Residential
Nursing Home15 17 0 Inactive Active
411 Calumet
Avenue NWRR1 Box 15A De Smet SD 57231
Good Samaritan Soc iety Center-
Tyndall0
Nurse Corps: Residential
Nursing Home15 18 0 Inactive Active
2304 Laurel
StreetTyndall SD 57066
Avera St. Michael's Hospital
(CAH)0
NHSC/Nurse Corps: Critical
Access Hospital (CAH)15 18 0 Active Active
410 West
16th AvenueTyndall SD 57066 (605) 589-2100
Avera Bon Homme Family
Practice Clinic0
NHSC: Certified Rural Health
Clinic (RHC) / Nurse Corps:
Urgent Care Center
15 18 13 Active Active410 W 16th
AvenueTyndall SD 57066 (605) 589-2190
AVERA LANGMANN JUNGMAN
MEMORIAL HOSPITAL
(DUPLICATE)
0Nurse Corps: Critical Access
Hospital (CAH)15 18 0
Terminate
dActive 600 Billars St Scotland SD 29169
Avera Landmann Jungman
Memorial Hospital (CAH)0
NHSC/Nurse Corps: Critical
Access Hospital (CAH)15 18 0 Inactive Active 600 Billars St Scotland SD 57059 (605) 583-2226
Horizon Health Care, Inc . - Isabel
Community Clinic0
NHSC/Nurse Corps: Federally
Qualified Health Centers
(FQHC)
18 20 26 Active Active 118 N Main St Isabel SD 57633 (605) 466-2120
Sanford Health Clark Clinic 0Nurse Corps: Urgent Care
Center14 17 15 Inactive Active
211 N.
Commercial
St.
Clark SD 57225
South Dakota Department Of
Health - Brown County0
NHSC/Nurse Corps: State or
Local Health Department0 17 0 Inactive Active 402 S. Main St. Aberdeen SD 57401

2020 Primary Care Needs Assessment SD Department of Health, Office of Rural Health J-7
Site NameOpen
PositionsSite Type
Primary Care
HPSA Score
Mental Health
HPSA Score
Dental Health
HPSA Score
NHSC Site
Status
Nurse Corps
Site Status
Address Line
1
Address Line
2City State Zip Code Phone Number
Horizon Health Care, Inc . -
Aberdeen Community Health
Center
0
NHSC/Nurse Corps: Federally
Qualified Health Centers
(FQHC)
18 20 26 Active Active422 5th Ave.
SESuite 209 Aberdeen SD 57401 (605) 725-3900
Northeastern Mental Health
Center0
NHSC: Community Mental
Health Center (CMHC) / Nurse
Corps: Certified Community
Behavioral Health Clinics
0 17 0 Active Active
14 S Main
Street Suite
1E
Aberdeen SD 57401-2615 (605) 225-1010
Avera St. luke's 0 Nurse Corps: Private Hospital 0 17 0 Inactive Active305 South
State St.Aberdeen SD 57401
Aberdeen Medical Group 0Nurse Corps: Urgent Care
Center0 17 0 Inactive Active
105 S. State
St.Aberdeen SD 57401
HCR Manorcare 0 Nurse Corps: Nursing Home 0 17 0 Inactive Active400 NW 8th
Ave.Aberdeen SD 57401
Aberdeen Health and Rehab 0Nurse Corps: Residential
Nursing Home0 17 0 Inactive Active
1700 N
Highway 281Aberdeen SD 57401
Eureka Medical Clinic Avera 0
NHSC: Certified Rural Health
Clinic (RHC) / Nurse Corps:
Urgent Care Center
17 17 15 Active Active 200 J Ave Suite A Eureka SD 57437 (605) 284-2621
Avera Health - Mother Joseph
Manor Retirement Community0 Nurse Corps: Nursing Home 0 17 0 Inactive Active 1002 N Jay St. Aberdeen SD 57401
Presentation College 0Nurse Corps: Accredited
School of Nursing0 17 0 Inactive Active
1500 N Main
StreetAberdeen SD 57401
Sanford Aberdeen Medical
Center0 Nurse Corps: Private Hospital 0 17 0 Inactive Active
2905 3rd
Avenue SEAberdeen SD 57402
Avera Eureka Community Health
Services (CAH)0
NHSC/Nurse Corps: Critical
Access Hospital (CAH)17 17 0 Active Active 200 J Ave PO Box 517 Eureka SD 57437 (605) 284-2661
South Dakota Department of
Corrections - Mike Durfee State
Prison
0 NHSC: Correctional Fac ility 6 21 0 Active Terminated1412 Wood
StreetSpringfield SD 57062 (605) 369-2201
Menno-Olivet Care Center 0Nurse Corps: Residential
Nursing Home15 18 0 Inactive Active
402 S. PINE
POB 487MENNO SD 57045
Horizon Health Care, Inc . - Lake
Preston Community Health
Center
0
NHSC/Nurse Corps: Federally
Qualified Health Centers
(FQHC)
18 20 26 Active Active 709 4th St., SE Lake Preston SD 57249-2116 (605) 847-4484
Horizon Health Care, Inc . - Bryant
Community Health Center0
NHSC/Nurse Corps: Federally
Qualified Health Centers
(FQHC)
18 20 26 Active Active 110 W Main St PO Box 176 Bryant SD 57221 (605) 628-2318
Freeman Regional Health
Services (CAH)0
NHSC/Nurse Corps: Critical
Access Hospital (CAH)15 18 0 Inactive Active
510 East 8th
StreetFreeman SD 57029 (605) 925-4000
Standing Rock Service Unit -
McLaughlin Indian Health Clinic2
NHSC/Nurse Corps: American
Indian Health Fac ility20 21 23 Active Active
701 East 6th
St - Bldg 001PO Box 879 McLaughlin SD 57642 (605) 823-4458

2020 Primary Care Needs Assessment SD Department of Health, Office of Rural Health J-8
Site NameOpen
PositionsSite Type
Primary Care
HPSA Score
Mental Health
HPSA Score
Dental Health
HPSA Score
NHSC Site
Status
Nurse Corps
Site Status
Address Line
1
Address Line
2City State Zip Code Phone Number
Horizon Health Care, Inc . - Faith
Community Health Center &
Dental Clinic
1
NHSC/Nurse Corps: Federally
Qualified Health Centers
(FQHC)
18 20 26 Active Active112 N 2nd
Ave. WestPO Box 577 Faith SD 57626 (605) 967-2644
Mobridge Regional Hospital -
West River Health Clinic0
NHSC: Certified Rural Health
Clinic (RHC) / Nurse Corps:
Rural Health Clinic
21 18 22 Active Active103 1st Ave
EastMcLaughlin SD 57642 (605) 823-4253
Standing Rock Service Unit -
Bullhead Health Station (Part-
Time)
0NHSC: American Indian Health
Fac ility21 19 26 Active Inactive
102 Tasunka
StreetBullhead SD 57621 (701) 854-8211
Tieszen Memorial Home 0Nurse Corps: Residential
Nursing Home11 0 0 Inactive Active 312 E State St, Marion SD 57043
Madison Regional Health (CAH) 0NHSC/Nurse Corps: Critical
Access Hospital (CAH)0 17 0 Inactive Active
323 10th
Street SWMadison SD 57042 (605) 256-6551
Community Counseling Services
- Madison0
NHSC: Community Mental
Health Center (CMHC) / Nurse
Corps: Certified Community
Behavioral Health Clinics
0 17 0 Active Active 914 N.E. Third Madison SD 57042 (605) 256-9656
Brookings Health - Arlington
Medical Center0
NHSC: Certified Rural Health
Clinic (RHC) / Nurse Corps:
Rural Health Clinic
15 17 0 Inactive Active104 West
Birch StreetArlington SD 57212 (605) 983-3283
Avera Sister James Care Center 0Nurse Corps: Residential
Nursing Home0 18 9 Inactive Active
2111 W 11th
StYankton SD 57078
South Dakota Human Services
Center (State Mental Hospital)0
NHSC: Correctional Fac ility /
Nurse Corps: Public Hospital0 16 0 Inactive Active
3515 N.
BroadwayPO Box 7600 Yankton SD 57078 (605) 668-3100
Mount Marty College 0Nurse Corps: Accredited
School of Nursing0 18 9 Inactive Active
1105 West
8th StreetSD 57078-3724
Avera Sacred Heart Hospital 0 Nurse Corps: Private Hospital 0 18 9 Inactive Active 501 Summit Yankton SD 57078 (605) 668-8000
Horizon Health Care, Inc . -
Yankton Community Health
Center and Dental Services
0
NHSC/Nurse Corps: Federally
Qualified Health Centers
(FQHC)
18 20 26 Active Active409 W
Summit StreetSuite 3400 Yankton SD 57078-3735 (605) 260-0310
Lewis and Clark Behavioral
Health Center0
NHSC: Community Mental
Health Center (CMHC) / Nurse
Corps: Rural Health Clinic
0 18 9 Active Active1028 Walnut
StreetYankton SD 57078-2910 (605) 665-4606
Family Education & Counseling
Center Inc . (Part-Time)0
NHSC: Private Practice / Nurse
Corps: Urgent Care Center0 18 9 Inactive Active
1700 Burleigh
StreetYankton SD 57078 (605) 260-9284
Oglala Lakota College of Nursing 0Nurse Corps: Accredited
School of Nursing0 22 0 Inactive Active
#1 Nursing
WayPine Ridge SD 57770 (605) 867-5856
Pioneer Memorial Hospital &
Health Services (CAH)0
NHSC: Critical Access Hospital
(CAH) / Nurse Corps: Rural
Health Clinic
11 0 0 Inactive Active
315 North
Washington
Street
PO Box 368 Viborg SD 57070 (605) 330-6582
Sanford Hospital Webster (CAH) 0NHSC/Nurse Corps: Critical
Access Hospital (CAH)17 17 15 Inactive Active
1401 West 1st
StreetWebster SD 57274 (605) 345-3336

2020 Primary Care Needs Assessment SD Department of Health, Office of Rural Health J-9
Site NameOpen
PositionsSite Type
Primary Care
HPSA Score
Mental Health
HPSA Score
Dental Health
HPSA Score
NHSC Site
Status
Nurse Corps
Site Status
Address Line
1
Address Line
2City State Zip Code Phone Number
Sunset Manor Avera 0Nurse Corps: Residential
Nursing Home0 18 0 Inactive Active 129 E Clay St. Irene SD 57037 (605) 263-3318
Sanford Health Watertown Clinic 0
NHSC: Community Outpatient
Fac ility / Nurse Corps: Private
Hospital
0 17 0 Inactive Active901 Fourth St.
NW.Watertown SD 57201 (605) 886-1565
Prairie Lakes Healthcare System 0Nurse Corps: Disproportionate
Share Hospital (DSH)0 17 0 Inactive Active
401 9th Ave
NWWatertown SD 57201
Bridgeway Counseling Center,
Inc .0 NHSC: Private Practice 0 17 0 Active Inactive
Medical Arts
Building600 4th St. NE Watertown SD 57201 (605) 886-5262
Horizon Health Care, Inc . -
McIntosh Community Clinic0
NHSC/Nurse Corps: Federally
Qualified Health Centers
(FQHC)
20 20 26 Active Active 208 Main St McIntosh SD 57641 (605) 273-4335
Human Service Agency - Main 0
NHSC: Community Mental
Health Center (CMHC) / Nurse
Corps: Certified Community
Behavioral Health Clinics
0 17 0 Active Active123 19th
Street NEWatertown SD 57201 (605) 886-0123
Estelline Nursing and Care
Center0
Nurse Corps: Residential
Nursing Home15 17 0 Inactive Active
205 Fjerestad
AvenueEstelline SD 57234
Pine Ridge Service Unit - Pine
Ridge Indian Hospital1
NHSC/Nurse Corps: American
Indian Health Fac ility20 24 26 Active Active East Hwy 18 P.O. Box 1201 Pine Ridge SD 57770 (605) 867-3389
Sanford Health Lennox Clinic 0
NHSC: Certified Rural Health
Clinic (RHC) / Nurse Corps:
Urgent Care Center
8 0 0 Inactive Active 108 S. Main St. Lennox SD 57039 (605) 647-2988
South Dakota State University -
College of Nursing0
Nurse Corps: Accredited
School of Nursing0 16 0 Inactive Active
255 Rotunda
Lane, South
Wagner Hall
(SWG)Brookings SD 57007 (605) 688-5178
City of Sioux Falls- Falls
Community Health Hayward
Elementary SBHC (Part- Time)
0
NHSC/Nurse Corps: Federally
Qualified Health Centers
(FQHC)
18 18 21 Active Active410 N. Valley
View Rd.Sioux Falls SD 57107 (605) 367-8793
Brookings Health System 0 Nurse Corps: Public Hospital 0 16 0 Inactive Active 300 22nd Ave Brookings SD 57006 (605) 696-9000
Pine Ridge Service Unit - Pine
Ridge IHS Outpatient Clinic1
NHSC/Nurse Corps: American
Indian Health Fac ility20 24 26 Active Active
East Highway
18PO Box 1201 Pine Ridge SD 57770 (605) 867-5131
South Dakota Urban Indian
Health - Sioux Falls0
NHSC/Nurse Corps: American
Indian Health Fac ility4 16 14 Active Active
1200 N West
Ave
SDUIH Sioux
Falls ClinicSioux Falls SD 57104 (605) 339-0420
City of Sioux Falls - Falls
Community Health Hawthorne
Elementary SBHC (Part-Time)
0
NHSC/Nurse Corps: Federally
Qualified Health Centers
(FQHC)
18 18 21 Active Active601 N. Spring
AvenueSioux Falls SD 57104-2721 (605) 367-8793
South Dakota Department of
Corrections - South Dakota State
Penitentiary & Jameson Annex
0 NHSC: Correctional Fac ility 6 12 6 Active Terminated 1600 North Dr P O Box 5911 Sioux Falls SD 57117 (605) 367-5192
City of Sioux Falls - Falls
Community Health0
NHSC/Nurse Corps: Federally
Qualified Health Centers
(FQHC)
18 18 21 Active Active521 N. Main
AvenueSioux Falls SD 57104-5963 (605) 367-8793

2020 Primary Care Needs Assessment SD Department of Health, Office of Rural Health J-10
Site NameOpen
PositionsSite Type
Primary Care
HPSA Score
Mental Health
HPSA Score
Dental Health
HPSA Score
NHSC Site
Status
Nurse Corps
Site Status
Address Line
1
Address Line
2City State Zip Code Phone Number
Avera McKennan Hospital and
University Health Center0
Nurse Corps: Disproportionate
Share Hospital (DSH)0 0 14 Inactive Active
1325 S. Cliff
AvenueSioux Falls SD 57105-5045 (605) 322-8000
City of Sioux Falls - Falls
Community Health Terry Redlin
SBHC (Part-Time)
0
NHSC/Nurse Corps: Federally
Qualified Health Centers
(FQHC)
18 18 14 Active Active1722 E 8th
StreetSioux Falls SD 57103 (605) 367-8793
Horizon Health Care, Inc . - Bison
Community Clinic0
NHSC/Nurse Corps: Federally
Qualified Health Centers
(FQHC)
18 20 26 Active Active 105 W Main St. PO Box 427 Bison SD 57620 (605) 244-5206
Flandreau Santee Sioux Tribe -
Counseling Center0
NHSC/Nurse Corps: American
Indian Health Fac ility13 17 11 Active Active
1301 South
Veterans
Street
Old Bingo Hall Flandreau SD 57028 (605) 997-3891
Flandreau Santee Sioux Tribe -
Tribal Health Clinic0
NHSC/Nurse Corps: American
Indian Health Fac ility13 17 11 Active Active
701 West
Broad AvenueFlandreau SD 57028 (605) 573-4126
Community Health Center of the
Black Hills0
NHSC/Nurse Corps: Federally
Qualified Health Centers
(FQHC)
16 17 15 Active Active350 Pine
StreetRapid City SD 57701-1669 (605) 721-8939
Community Health Center of the
Black Hills Pediatrics0
NHSC/Nurse Corps: Federally
Qualified Health Centers
(FQHC)
16 0 15 Active Active350 Pine
StreetRapid City SD 57701 (605) 721-8813
Community Health Center of the
Black Hills Oral Health Center0
NHSC/Nurse Corps: Federally
Qualified Health Centers
(FQHC)
0 0 15 Active Active350 Pine
StreetRapid City SD 57701 (605) 721-8853
Avera Flandreau Hospital (CAH) 0NHSC/Nurse Corps: Critical
Access Hospital (CAH)13 17 0 Inactive Active
214 N. Prairie
StreetFlandreau SD 57028 (605) 997-2433
Avera Medical Group Flandreau 0
NHSC: Certified Rural Health
Clinic (RHC) / Nurse Corps:
Critical Access Hospital (CAH)
13 17 11 Inactive Active212 N. Prairie
StreetFlandreau SD 57028 (605) 997-2471
Community Health Center of the
Black Hills - General Beadle
SBHC (Part-Time)
0
NHSC/Nurse Corps: Federally
Qualified Health Centers
(FQHC)
16 17 15 Active Active10 Van Buren
StreetRapid City SD 57701 (605) 721-8939
Community Health Center of the
Black Hills - Flormann Health
Center
0
NHSC/Nurse Corps: Federally
Qualified Health Centers
(FQHC)
16 0 15 Active Active640 Flormann
St.Rapid City SD 57701-4600 (605) 394-5213
Rapid City Service Unit - Sioux
San PHS Outpatient Clinic1
NHSC/Nurse Corps: American
Indian Health Fac ility17 10 9 Active Active
3200 Canyon
Lake Drive
Rapid City
Service UnitRapid City SD 57702 (605) 355-2500
Oglala Native Women's Health
Care0
NHSC/Nurse Corps: American
Indian Health Fac ility17 10 9 Active Active
3200 Canyon
Lake Dr.
Native
Women's
Health Care
Bldg.
Rapid City SD 57702 (605) 342-7400
Deuel County Good Samaritan
Nursing Home0
Nurse Corps: Residential
Nursing Home11 17 0 Inactive Active
913 Colonel
Pete St.Clear Lake SD 57226
Sanford Clear Lake Medical
Center (CAH)0
NHSC/Nurse Corps: Critical
Access Hospital (CAH)11 17 0 Inactive Active
701 3rd
Avenue SouthClear Lake SD 57226 (605) 874-2141
Oyate Health Center 0NHSC/Nurse Corps: American
Indian Health Fac ility19 8 8 Active Active
3200 Canyon
Lake DriveRapid City SD 57702 (605) 721-1922

2020 Primary Care Needs Assessment SD Department of Health, Office of Rural Health J-11
Site NameOpen
PositionsSite Type
Primary Care
HPSA Score
Mental Health
HPSA Score
Dental Health
HPSA Score
NHSC Site
Status
Nurse Corps
Site Status
Address Line
1
Address Line
2City State Zip Code Phone Number
University Of South Dakota -
School of Health Sc iences0
Nurse Corps: Accredited
School of Nursing0 18 0 Inactive Active 414 East Clark Vermillion SD 57069 (877) 269-6837
Sanford Health Vermillion Clinic 0
NHSC: Community Outpatient
Fac ility / Nurse Corps: Critical
Access Hospital (CAH)
0 18 0 Inactive Active20 S. Plum
StreetVermillion SD 57069 (605) 677-3500
Sanford Vermillion Medical
Center (CAH)0
NHSC/Nurse Corps: Critical
Access Hospital (CAH)0 18 0 Inactive Active
20 S. Plum
StreetVermillion SD 57069 (605) 677-3500
Sanford Vermillian Care Center 0Nurse Corps: Residential
Nursing Home0 18 0 Inactive Active
125 Walker
StreetVermillion SD 57069 (605) 677-3500
Sanford Canton-Inwood Medical
Center (CAH)0
NHSC/Nurse Corps: Critical
Access Hospital (CAH)8 0 0 Inactive Active
440 North
Hiawatha
Drive
Canton SD 57013 (605) 764-1400
Five Counties Nursing Home 0Nurse Corps: Residential
Nursing Home15 19 0 Inactive Active
405 6th
Avenue WestLemmon SD 57638
Horizon Health Care, Inc . -
Alcester Community Health
Center
0
NHSC/Nurse Corps: Federally
Qualified Health Centers
(FQHC)
18 20 26 Active Active 104 W 2nd St. PO Box 468 Alcester SD 57001-2281 (605) 934-2122
Horizon Health Care, Inc . -
Alcester Dental Clinic0
NHSC/Nurse Corps: Federally
Qualified Health Centers
(FQHC)
18 20 26 Active Active111 Iowa
StreetAlcester SD 57001 (605) 772-4525
VA Black Hills Health Care
System - Fort Meade Campus0
NHSC: Community Outpatient
Fac ility / Nurse Corps: Public
Hospital
9 15 0 Inactive Active
113
Comanche
Road
Ft. Meade SD 57741 (605) 347-2511
Massa Berry Regional Medical
Clinic0
NHSC: Private Practice / Nurse
Corps: Urgent Care Center9 15 0 Inactive Active
890 Lazelle
StreetSturgis SD 57785
Regional Health - Sturgis Hospital
(CAH)0
NHSC/Nurse Corps: Critical
Access Hospital (CAH)9 15 0 Inactive Active
2140 Junction
AvenueSturgis SD 57785 (605) 720-2400
Coteau Health Care System -
CDP Clinic Sisseton0
NHSC: Certified Rural Health
Clinic (RHC) / Nurse Corps:
Rural Health Clinic
17 17 15 Inactive Active205 Orchard
DriveSisseton SD 57262 (605) 698-7647
Human Service Agency -
Sisseton0
NHSC: Community Mental
Health Center (CMHC) / Nurse
Corps: Certified Community
Behavioral Health Clinics
17 17 15 Active Active301 Veterans
AvenueSisseton SD 57262 (605) 698-7688
Sisseton Wahpeton Oyate of The
Lake Traverse Reservation -
Dakotah Pride Center
0NHSC/Nurse Corps: American
Indian Health Fac ility0 17 0 Active Active
420 Dakota
AvenueAgency Village SD 57262 (605) 698-3917
Fall River Health Services - Fall
River Rural Health Clinic0
NHSC: Certified Rural Health
Clinic (RHC) / Nurse Corps:
Rural Health Clinic
15 12 0 Inactive Active1201 Highway
71 South
Rural Health
ClinicHot Springs SD 57747 (605) 745-8928
Avera Milbank Area Hospital
(CAH)0
Nurse Corps: Critical Access
Hospital (CAH)0 17 0 Inactive Active
301 Flynn
DriveMilbank SD 57252 (605) 432-4538
Sisseton Service Unit - Woodrow
Wilson Keeble Memorial Health
Care Center
1NHSC/Nurse Corps: American
Indian Health Fac ility18 17 15 Active Active
100 Lake
Traverse
Drive
Sisseton SD 57262 (605) 698-7606
Horizon Health Care, Inc . - Elk
Point Community Health Center0
NHSC/Nurse Corps: Federally
Qualified Health Centers
(FQHC)
18 20 26 Active Active 204 E Main St Elk Point SD 57025-2334 (605) 356-3317
Union County Health Foundation -
Union County Correctional
Fac ility
0
NHSC/Nurse Corps: Federally
Qualified Health Centers
(FQHC)
0 18 0 Inactive Active 300 E. Main St. Elk Point SD 57025-2160 (605) 356-3317
Monument Health - Lead
Deadwood Regional Hospital
(CAH)
0NHSC/Nurse Corps: Critical
Access Hospital (CAH)16 15 0 Inactive Active
61 Charles
StreetDeadwood SD 57732 (605) 717-6000
Spearfish Regional Hospital 0
NHSC: Other Health Fac ility /
Nurse Corps: Disproportionate
Share Hospital (DSH)
16 15 0 Inactive Active1440 North
Main StSpearfish SD 57783 (605) 644-4000

2020 Primary Care Needs Assessment SD Department of Health, Office of Rural Health K-1
APPENDIX K │RURAL HEALTH CLINICS DIRECTORY
Name Physical Address City County
White Lake Medical Clinic Avera 306 S Johnston St White Lake Aurora
Bennett County Rural Health Clinic 102 Major Allen Martin Bennett
Bon Homme Family Practice-Avon 130 N Main Street Avon Bon Homme
Bon Homme Family Practice-Tyndall 410 West 16th Ave Tyndall Bon Homme
Avera Medical Group Volga 210 Kasan Ave Volga Brookings
Brookings Health System White Medical Clinic 302 East 5th Street White Brookings
Kadoka Clinic 601 Chestnut Street Kadoka Buffalo
Prairie Health Clinic - Stickney 301 Main Street Stickney Buffalo
Monument Health Belle Fourche Clinic 2200 13th Ave Belle Fourche
Butte
Campbell County Clinic-Herreid 208 Main St. N. Herreid Campbell
Avera St. Benedict CRHC - Lake Andes 756 E Lake Lake Andes Charles Mix
Geddes Medical Clinic 308 Main Geddes Charles Mix
Platte Medical Clinic 601 E 7th St Suite 5 Platte Charles Mix
Sanford Clinic Clark 117 W 1st Ave Clark Clark
West River Health Clinic 103 1st Ave East McLaughlin Corson
Avera Medical Group Waubay 542 Main Street Waubay Day
Sanford Clinic Webster 101 Peabody Drive Webster Day
Sanford Clear Lake Clinic 701 3rd Ave S Clear Lake Deuel
West Dakota Health Center 906 Main Street Timber Lake Dewey
Prairie Health Clinic 708 8th St Armour Douglas
Prairie Health Clinic - Corsica 265 Main Street Corsica Douglas
Bowdle Clinic 8001 W 5th St Bowdle Edmunds
Sanford Clinic Ipswich 110 5th Ave Ipswich Edmunds
Fall River Clinic 1201 Highway 71 South
Hot Springs Fall River
Monument Health Medical Clinic 1100 Hwy 71 S, Suite 101
Hot Springs Fall River
Faulkton Area Medical Center 1300 Oak Street Faulkton Faulk
Avera Medical Group Milbank 301 Flynn Dr Milbank Grant
Avera Medical Group Revillo 103 E 3rd St Revillo Grant
Bonesteel Medical Clinic 314 Mellette Bonesteel Gregory
Burke Medical Clinic 814 Jackson Street Burke Gregory
Philip Clinic 503 West Pine Philip Haakon
Sanford Clinic Estelline 305 Hospital Dr Estelline Hamlin

2020 Primary Care Needs Assessment SD Department of Health, Office of Rural Health K-2
Name Physical Address City County
Sanford Clinic Lake Norden Main Street Lake Norden
Hamlin
Avera St. Benedict Cert Rh Clinic 401 W Glynn Dr Parkston Hutchinson
Avera St. Benedict CRHC - Tripp 306 S Main St Tripp Hutchinson
Rural Medical Clinics 301 S High St Menno Hutchinson
Brookings Health System Arlington Medical Center
104 W Birch Arlington Kingsbury
Sanford Beresford Clinic 600 W Cedar St Beresford Lincoln
Sanford Clinic Lennox 108 S Main Lennox Lincoln
Marshall County Medical Clinic 415 9th St Britton Marshall
Rural Medical Clinics 208 N Main Bridgewater McCook
Eureka Medical Clinic Avera 200 J Ave Ste A Eureka McPherson
Flandreau Medical Clinic Avera 212 N Prairie Ave Flandreau Moody
Monument Health Hill City Clinic 228 Elm St PO Box 639
Hill City Pennington
Monument Health Wall Clinic 112 7th Ave Wall Pennington
West River Health Services 411 Main Ave Lemmon Perkins
Avera Medical Group Wilmot 409 4th St Wilmot Roberts
Coteau Des Prairies Health Care System-Rosholt Clinic
1116 W Main St Rosholt Roberts
Coteau Des Prairies Hospital-Sisseton Clinic 203 Orchard Drive Sisseton Roberts
Redfield Clinic 1010 W 1st St Redfield Spink
Avera Medical Group Winner 660 W 2nd St Winner Tripp
Winner Regional Clinic 745 East 8th Street Winner Tripp
Centerville Medical Clinic 512 Broadway St Centerville Turner
Parker Medical Clinic 100 East Sanborn St Parker Turner
Rural Medical Clinics 370 State St Marion Turner
Viborg Medical Clinic 103 W Pioneer Viborg Turner
Mobridge Medical Clinic 1309 10th Avenue West
Mobridge Walworth
Source: Centers for Medicare & Medicaid Services Health Center Facilities Report, (2020) Retrieved on July
14, 2020 from https://data.hrsa.gov/data/reports

2020 Primary Care Needs Assessment SD Department of Health, Office of Rural Health L-1
APPENDIX L │SOUTH DAKOTA CRITICAL ACCESS HOSPITAL DIRECTORY
Name City County Total Beds
Douglas County Memorial Hospital Armour Douglas 11
Bowdle Hospital Bowdle Edmunds 12
Marshall County Healthcare Center Britton Marshall 20
Community Memorial Hospital Burke Gregory 16
Sanford Clear Lake Medical Center Clear Lake Deuel 10
Monument Health Lead-Deadwood Hospital Deadwood Lawrence 18
Eureka Community Health Services Eureka McPherson 4
Faulkton Area Medical Center Faulkton Faulk 12
Avera Flandreau Hospital Flandreau Moody 18
Freeman Medical Center Freeman Hutchinson 25
Avera Gettysburg Hospital Gettysburg Potter 10
Bennett County Hospital and Nursing Home Martin Bennett 14
Hans P. Peterson Memorial Hospital Philip Haakon 18
Platte Health Center Platte Charles Mix 17
Redfield Community Memorial Hospital Redfield Spink 25
Landmann-Jungman Memorial Hospital Scotland Bon Homme 25
Sturgis Regional Hospital Sturgis Meade 25
Wagner Community Memorial Hospital Wagner Charles Mix 20
Sanford Webster Medical Center Webster Day 25
Fall River Hospital Hot Springs Fall River 25
Custer Regional Hospital Custer Custer 11
Avera Weskota Memorial Medical Center Wessington Springs Jerauld 16
Mobridge Regional Hospital Mobridge Walworth 25
Milbank Area Hospital/Avera Health Milbank Grant 25
Pioneer Memorial Hospital Viborg Turner 12
St. Michael’s Hospital - Avera Tyndall Bon Homme 25
Madison Regional Health Services Madison Lake 22
Sanford Chamberlain Medical Center Chamberlain Brule 25
Avera De Smet Memorial Hospital De Smet Kingsbury 6
Avera St. Benedict Health Center Parkson Hutchinson 25
Avera Dells Area Hospital Dell Rapids Minnehaha 23
Sanford Canton-Inwood Medical Center Canton Lincoln 11
Winner Regional Healthcare Center Winner Tripp 25
Huron Regional Medical Center Huron Beadle 25
Sanford Vermillion Hospital Vermillion Clay 25
Avera Hand County Memorial Hospital & Clinic Miller Hand 11
Avera Gregory Hospital Gregory Gregory 25
Coteau des Prairies Health Care System Sisseton Roberts 25
Source: Flex Monitoring Team, Critical Access Hospital Locations, (2020) Retrieved on July 9, 2020 from
https://www.flexmonitoring.org/data/critical-access-hospital-locations/
Data in the list updated April 28, 2020.

2020 Primary Care Needs Assessment SD Department of Health, Office of Rural Health M-1
APPENDIX M │SCREENING BRIEF INTERVENTION AND REFERRAL TO TREATMENT

2020 Primary Care Needs Assessment SD Department of Health, Office of Rural Health M-2
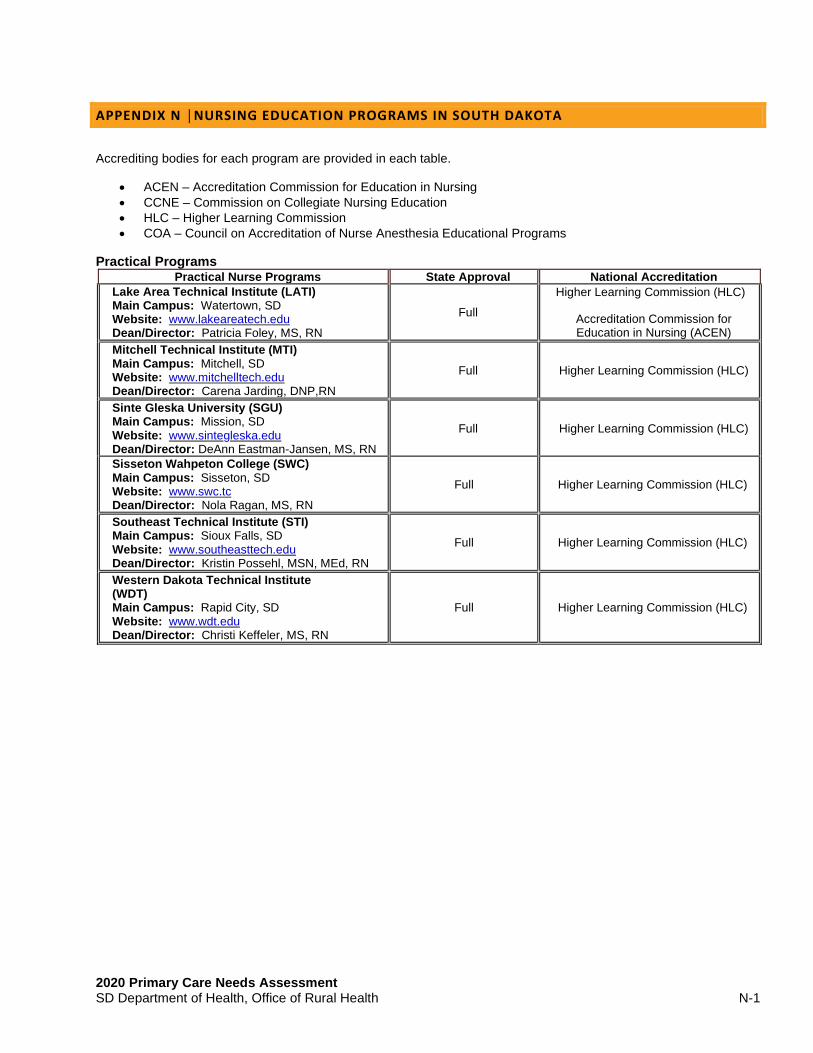
2020 Primary Care Needs Assessment SD Department of Health, Office of Rural Health N-1
APPENDIX N │NURSING EDUCATION PROGRAMS IN SOUTH DAKOTA
Accrediting bodies for each program are provided in each table.
• ACEN – Accreditation Commission for Education in Nursing
• CCNE – Commission on Collegiate Nursing Education
• HLC – Higher Learning Commission
• COA – Council on Accreditation of Nurse Anesthesia Educational Programs
Practical Programs Practical Nurse Programs State Approval National Accreditation
Lake Area Technical Institute (LATI) Main Campus: Watertown, SD Website: www.lakeareatech.edu Dean/Director: Patricia Foley, MS, RN
Full
Higher Learning Commission (HLC)
Accreditation Commission for Education in Nursing (ACEN)
Mitchell Technical Institute (MTI) Main Campus: Mitchell, SD Website: www.mitchelltech.edu Dean/Director: Carena Jarding, DNP,RN
Full Higher Learning Commission (HLC)
Sinte Gleska University (SGU) Main Campus: Mission, SD Website: www.sintegleska.edu Dean/Director: DeAnn Eastman-Jansen, MS, RN
Full Higher Learning Commission (HLC)
Sisseton Wahpeton College (SWC) Main Campus: Sisseton, SD Website: www.swc.tc Dean/Director: Nola Ragan, MS, RN
Full Higher Learning Commission (HLC)
Southeast Technical Institute (STI) Main Campus: Sioux Falls, SD Website: www.southeasttech.edu Dean/Director: Kristin Possehl, MSN, MEd, RN
Full Higher Learning Commission (HLC)
Western Dakota Technical Institute (WDT) Main Campus: Rapid City, SD Website: www.wdt.edu Dean/Director: Christi Keffeler, MS, RN
Full Higher Learning Commission (HLC)

2020 Primary Care Needs Assessment SD Department of Health, Office of Rural Health N-2
Associate Degree Programs Associate Degree RN Programs State Approval National Accreditation
Lake Area Technical Institute (LATI) Main Campus: Watertown, SD Website: www.lakeareatech.edu Dean/Director: Patricia Foley, MS, RN
• LPN to Associate Degree RN
Full Higher Learning Commission (HLC)
Oglala Lakota College (OLC) Main Campus: Pine Ridge, SD Website: www.olc.edu Interim Dean/Director: Michelle Bruns, MSN, RN
• Generic Associate Degree RN
Full Higher Learning Commission (HLC)
Southeast Technical Institute (STI) Main Campus: Sioux Falls, SD Website: www.southeasttech.edu Dean/Director: Kristin Possehl, MSN, MEd, RN
• LPN to Associate Degree RN
Full
Higher Learning Commission (HLC)
Accreditation Commission for Education in Nursing (ACEN)
Western Dakota Technical Institute (WDT) Main Campus: Rapid City, SD Website: www.wdt.edu Dean/Director: Christi Keffeler, MS, RN
• LPN to Associate Degree RN
Interim Higher Learning Commission (HLC)

2020 Primary Care Needs Assessment SD Department of Health, Office of Rural Health N-3
Baccalaureate Degree Programs Baccalaureate Degree RN Programs State Approval National Accreditation
Augustana University (AU) Main Campus: Sioux Falls, SD Website: www.augie.edu Dean/Director: Lynn White PhD, RN, ACNS-BC
• Generic RN
• Accelerated RN
Full
Higher Learning Commission (HLC)
Commission on Collegiate Nursing Education (CCNE)
Dakota Wesleyan University (DWU) Main Campus: Mitchell, SD Website: www.dwu.edu Dean/Director: Stacy Eden, DNP, APRN, FNP-C
• Generic RN
• LPN to BSN
• RN to BSN
Full
Higher Learning Commission (HLC)
Commission on Collegiate Nursing Education (CCNE)
Mount Marty College (MMC) Main Campus: Yankton, SD Website: www.mtmc.edu Dean/Director: Kathy Magorian, EdD, MSN, RN
• Generic RN
• LPN to BSN
• RN to BSN
Full
Higher Learning Commission (HLC)
Commission on Collegiate Nursing Education (CCNE)
Presentation College (PC) Main Campus: Aberdeen, SD Website: www.presentation.edu Dean/Director: Sandra Sexton Welling, PhD, RN, CCM
• Generic RN
• LPN to BSN
• RN to BSN
Full
Higher Learning Commission (HLC)
Commission on Collegiate Nursing Education (CCNE)
South Dakota State University (SDSU) Main Campus: Brookings, SD Website: www.sdstate.edu Dean/Director: Mary Anne Krogh, PhD, APRN, CRNA, FAAN
• Generic RN
• Accelerated RN
• RN to BSN
Full
Higher Learning Commission (HLC)
Commission on Collegiate Nursing Education (CCNE)
University of Sioux Falls (USF) Main Campus: Sioux Falls, SD Website: www.usiouxfalls.edu Dean/Director: Jessica Cherenegar, DNP, RN
• Generic RN
• Accelerated RN
• RN to BSN
Full
Higher Learning Commission (HLC)
Commission on Collegiate Nursing Education (CCNE)
University of South Dakota (USD) Main Campus: Vermillion, SD Website: www.usd.edu Interim Dean/Director: Anne Pithan, DNP, RN, CMSRN, CNE
• Generic RN
• LPN to RN
• RN to BSN
Full
Higher Learning Commission (HLC)
Commission on Collegiate Nursing Education (CCNE)

2020 Primary Care Needs Assessment SD Department of Health, Office of Rural Health N-4
Master’s Degree Programs
Master's Degree Programs State Approval National Accreditation Mount Marty College (MMC) Main Campus: Yankton, SD Website: www.mtmc.edu Dean/Director: Kathy Magorian, EdD, MSN, RN
• Family Nurse Practitioner
• Psychiatric Mental Health Nurse Practitioner
• Postgraduate Certification (Family Nurse Practitioner, Psychiatric Mental Health Nurse Practitioner)
Accept National
Accreditation
Higher Learning Commission (HLC)
Commission on Collegiate Nursing Education (CCNE)
Mount Marty College (MMC) Nurse Anesthesia Program Main Campus: Sioux Falls, SD Website: www.mtmc.edu Dean/Director: Larry Dahlen, PhD, CRNA
• CRNA
Accept National
Accreditation
Higher Learning Commission (HLC)
Council on Accreditation of Nurse Anesthesia Educational Programs
(COA)
Presentation College (PC) Main Campus: Aberdeen, SD Website: www.presentation.edu Dean/Director: Sandra Sexton Welling, PhD, RN, CCM
• Family Nurse Practitioner
Accept National
Accreditation
Higher Learning Commission (HLC)
Commission on Collegiate Nursing Education (CCNE)
South Dakota State University (SDSU) Main Campus: Brookings, SD Website: www.sdstate.edu Dean/Director: Mary Anne Krogh, PhD, APRN, CRNA, FAAN
• Nurse Administrator
• Clinical Nurse Leader
• Nurse Educator
• Family Nurse Practitioner • Postgraduate Certification (Family
Nurse Practitioner, Clinical Nurse leader, Nurse Educator)
Accept National
Accreditation
Higher Learning Commission (HLC)
Commission on Collegiate Nursing Education (CCNE)

2020 Primary Care Needs Assessment SD Department of Health, Office of Rural Health N-5
Doctoral Degree Programs
Doctoral Degree Programs
State Approval
National Accreditation
Mount Marty College (MMC) Nurse Anesthesia Program Main Campus: Sioux Falls, SD Website: www.mtmc.eud Dean/Director: Larry Dahlen, PhD, CRNA
• DNAP
Accept National
Accreditation
Higher Learning Commission (HLC)
Council on Accreditation of Nurse Anesthesia Educational Programs
(COA)
South Dakota State University (SDSU) Main Campus: Brookings, SD Website: www.sdstate.edu Dean/Director: Mary Anne Krogh, PhD, APRN, CRNA, FAAN
• DNP (Family Nurse Practitioner)
• PhD
Accept National
Accreditation
Higher Learning Commission (HLC)
Commission on Collegiate Nursing Education (CCNE)
Source: South Dakota Department of Health, Licensing Boards, South Dakota Board of Nursing (2020) Retrieved on July 7, 2020 from https://doh.sd.gov/boards/nursing/education.aspx

2020 Primary Care Needs Assessment SD Department of Health, Office of Rural Health O-1
APPENDIX O │RECOMMENDATIONS
The strategic plans developed by the South Dakota Department of Health, Department of Social Services, and Department of Public Safety along with their strategic partners and stakeholders address goals, objectives, and strategies to improve health outcomes for citizens of our state. Below is a list of state plans and high-level goals that address the health outcomes and equity in South Dakota.
SOUTH DAKOTA DEPARTMENT OF HEALTH STRATEGIC PLAN 2020 – 2025
https://doh.sd.gov/StrategicPlan/default.aspx Goal 1: Enhance the accessibility, quality, and effective use of health resources. Goal 2: Provide services to improve public health. Goal 3: Plan, prepare, and respond to public health threats. Goal 4: Maximize partnerships to address underlying factors that determine overall health. Goal 5: Strengthen and support a qualified workforce.
SOUTH DAKOTA DEPARTMENT OF HEALTH | STRATEGIES FOR HEALTH EQUITY
https://doh.sd.gov/healthequity/ Goal 1: Build organizational capacity. Organizations can engage in practices that influence their impact
on health equity. Practices such as staff training, resource distribution, and staffing decisions impact public health.
Goal 2: Community engagement. Involve community members in health initiatives to foster relationships, improve assessment efforts, build capacity to positively affect the community, and enhance sustainability.
Goal 3: Establish and foster partnerships. Engage a diverse sector of partners to collectively achieve equitable outcomes by leveraging diverse skills and expertise.
Goal 4: Understand health equity. Understand inequities that exist to establish baselines, monitor trends over time, inform partners where to focus resources, and ensure strategies address the needs of populations experiencing health inequities.
Goal 5: Health equity focused evidence-based strategies. Ensure strategies have a deliberate focus on health equity and include supportive activities to address barriers or unintended outcomes underserved populations may face.
Goal 6: Evaluation. Focus on health equity in evaluation efforts and use culturally appropriate tools and methodologies. Health equity-oriented evaluation can reveal trends in health inequities.
SOUTH DAKOTA STATE PLAN ON AGING 2017 -2021
https://dhs.sd.gov/LTSS/docs/FINAL%20Signed%20South%20Dakota%202017-2021%20State%20Plan%20on%20Aging.pdf
Goal 1: Promote existing services. Goal 2: Improve Access to services. Goal 3: Enhance Quality of services. Goal 4: Empower workforce and local community supports.

2020 Primary Care Needs Assessment SD Department of Health, Office of Rural Health O-2
STRATEGIC FRAMEWORK FOR THE CHRONIC DISEASE PREVENTION AND HEALTH PROMOTION 2020
https://doh.sd.gov/diseases/assets/OHP2020StrategicPlan.pdf
Goal A. Prevention and Health Promotion: Increase emphasis on promoting health and preventing risk factors, thereby reducing the onset of chronic health conditions.
Goal B. Health Equity: Leverage program and policy activities, build partner capacities, and establish tailored interventions to help eliminate health disparities.
Goal C. Policy/Systems/Environment Change: Transforming Communities by promoting social, environmental, policy, and systems approaches that support healthy living for individuals, families, and communities where they live work and play.
Strategies: 1. Reduce the burden of obesity. 2. Increase physical activity. 3. Increase consumption of fruits and vegetables. 4. Reduce the burden of commercial tobacco. 5. Reduce the burden of cardiovascular disease. 6. Reduce the burden of diabetes. 7. Reduce the burden or oral disease. 8. Reduce the burden of cancer.
GOOD AND HEALTHY RECOMMENDATIONS 2014
https://goodandhealthysd.org/wp-content/uploads/2014/01/FinalCostSavingsWhitePaper.pdf
Goal 1: Preventing dental caries through school-based dental sealant delivery programs and Delta
Dental's Dakota Smiles Mobile Dental Program. Goal 2: Reducing tobacco use and secondhand smoke exposure. Goal 3: Increasing appropriate vaccination through the South Dakota Immunization Program. Goal 4: Facilitating Flu-FIT Programs to screen for colorectal cancer. Goal 5: Offering Chronic Disease Self-Management Programs such as Better Choices, Better Health®
South Dakota. Goal 6: Executing Diabetes Prevention and Control programing such as combined diet and physical
activity promotion programs to prevent Type 2 diabetes among people at increased risk.
SOUTH DAKOTA STATE PLAN FOR NUTRITION AND PHYSICAL ACTIVITY TO PREVENT OBESITY AND OTHER CHRONIC DISEASES 2015 - 2020
https://healthysd.gov/wp-content/uploads/2015/05/NPAStatePlan.pdf Goal 1: Promote, support, and implement the adoption of food service guidelines/nutrition standards in
priority settings Early Care and Education (ECE), Local Education Agencies (LEA), worksites, communities.
Goal 2: Promote the adoption of physical education/physical activity policies in local education agencies. Goal 3: Promote and implement the adoption of physical activity in worksites. Goal 4: Increase access to healthy foods and beverages. Goal 5: Increase adoption of healthy community design principles and access to places and spaces to be
physically active in communities. Goal 6: Implement high quality physical education and physical activity in K-12 schools. Goal 7: Improve physical activity and screen time policies and practices in Early Care and Education
settings (ECEs). Goal 8: Improve nutrition quality of foods and beverages served or available in local education agencies. Goal 9: Increase access to breastfeeding friendly environments.

2020 Primary Care Needs Assessment SD Department of Health, Office of Rural Health O-3
Goal 10: Increase use of community health workers supporting self-management of chronic diseases. Goal 11: Promote adoption of healthcare provider behaviors that lead to quality care improvement
changes within health systems. Goal 12: Gather, analyze, and disseminate data and information.
SOUTH DAKOTA CANCER PLAN 2021 - 2025
https://www.cancersd.com/about-us/2021-2025-sd-cancer-plan/
Goal 1: Prevent cancer among South Dakotans. Goal 2: Detect cancer in the earliest stages for all South Dakotans. Goal 3: Ensure timely and appropriate access and treatment for all cancer patients in South Dakota. Goal 4: Optimize quality of life for South Dakota cancer patients, survivors, and caregivers. Goal 5: Promote health equity as it relates to cancer control in South Dakota. Goal 6: Support collaboration among stakeholders in South Dakota to reduce duplication and maximize
impact.
STATEWIDE CAPACITY FOR COLORECTAL CANCER SCREENING
https://getscreened.sd.gov/documents/SummaryCapacityReport.pdf Goal 1: Educate healthcare providers in the state of South Dakota about current clinical practice
guidelines for CRC.
• Screening tests for CRC that follow the guidelines.
• Screening tests that do not follow the current CRC screening guidelines.
• Available resources to assist with CRC screening cost barriers. Goal 2: Develop CRC screening protocols and educational resources for healthcare facilities and
providers. Disseminate these resources as part of a CRC screening tool kit. Goal 3: Educate the people of SD on the importance of CRC screening and screening options using
population-based media and other innovative approaches that reach large numbers of age eligible community members.
Goal 4: Educate healthcare providers and systems about colonoscopy quality measures in an effort to increase participation in these initiatives.
SOUTH DAKOTA CARDIOVASCULAR COLLABORATIVE STRATEGIC PLAN 2017 - 2021
https://doh.sd.gov/documents/diseases/chronic/CardiovascularCollaborativeStrategicPlan_Overview.pdf Goal 1: Improve Data Collection. Explore a process to collect, analyze and benchmark cardiovascular
indicators available from the HIE and other data sources. Goal 2: Priority Populations. Promote the different models of team-based, patient-centered care in South
Dakota (health cooperative clinic, health homes, PCMH). Goal 3: Continuum of Care. Develop pilot program for cardiac ready communities. Goal 4: Prevention and Management. Encourage the implementation quality improvement processes in
health systems.
SOUTH DAKOTA DIABETES STATE PLAN 2018 – 2020
https://doh.sd.gov/prevention/assets/DiabetesStatePlan2018.pdf Goal A: Prevent the onset of diabetes through evidence-based public health strategies. Goal B: Provide appropriate prediabetes interventions in order or slow down the disease progression. Goal C: Empower South Dakotans with diabetes to successfully manage their disease. Goal D: Advocate on behalf of South Dakota citizens with diabetes and their caregivers.

2020 Primary Care Needs Assessment SD Department of Health, Office of Rural Health O-4
SOUTH DAKOTA TOBACCO CONTROL STATE PLAN 2020-2025
https://doh.sd.gov/prevention/assets/TobaccoControlStatePlan.pdf Goal 1: Prevent tobacco use among youth and young adults. Goal 2: Promote quitting of all tobacco products. Goal 3: Eliminate all types of exposure to tobacco use. Goal 4: Strive to achieve health equity in tobacco control.
ORAL HEALTH SURVEY OF SOUTH DAKOTA CHILDREN 2014
https://doh.sd.gov/prevention/assets/OralHealthSurvey2014.pdf Goal 1: Develop an ongoing campaign to promote oral health as part of general health and well-being. Goal 2: Build capacity in dental public health. Goal 3: Increase private and public sector participation in mobilizing resources and developing policy to
pursue and sustain these strategies. Goal 4: Expand comprehensive decay prevention to include pregnant women, infants and toddlers,
through the lifespan. Goal 5: Provide anticipatory guidance to prevent dental disease to parents in health and social service
settings. Goal 6: Teach parents how to use the dental health care system and advocate for oral health for
themselves and their children. Goal 7: Promote annual dental exams as a minimum standard of dental care, particularly for high-risk
children by one year of age. Goal 8: Increase the number of dental providers in underserved areas and the number that participate in
public insurance programs. Goal 9: Educate medical care providers about the relationship between oral health and general health. Goal 10: Increase the provision of dental sealants in schools, safety nets and private dental practices.
INTEGRATED HIV PREVENTION AND CARE PLAN / STATEWIDE COORDINATED
STATEMENT OF NEED
https://doh.sd.gov/documents/diseases/infectious/Integrated-Prevention-care-plan.pdf Goal 1: By the end of 2021, lower the number of newly diagnosed infections by 2% Goal 2: By the end of 2021, increase viral load suppression rate by 25%. Goal 3: By the end of 2021, increase the number of PLWH retained in care by 25%
SOUTH DAKOTA WIC (WOMEN, INFANTS, AND CHILDREN) PROGRAM 2017
https://sdwic.org/wp-content/uploads/WIC_GoalsObjectives2017_Final.pdf
Goal 1: To ensure program benefits are provided to eligible persons. Goal 2: To expand and improve the quality of nutrition education to meet the specific nutritional needs of
individual participants. Goal 3: To expand and improve the quality of nutrition education to meet the specific nutritional needs of
individual participants and special populations. Goal 4: Electronic Benefit Transfer Implementation (eWIC): Move toward a more confidential and efficient
means for the delivery of supplemental foods. Goal 5: Ensure appropriate management information systems are in place for collection and reporting of
data and program operations to satisfy federal reporting requirements, to increase the operational efficiency of the program.

2020 Primary Care Needs Assessment SD Department of Health, Office of Rural Health O-5
SOUTH DAKOTA DEPARTMENT OF HEALTH GOALS AND MATERNAL CHILD HEALTH
MEASURES
https://doh.sd.gov/documents/family/MaternalChildHealthPlan.pdf Goal 1: Improve the quality, accessibility, and effective use of health care.
• National Performance Measure 1: Percent of women ages 18-44 with a past year preventive medical visit.
• National Performance Measure 10: Percent of adolescents, ages 12 through 17, with a preventive medical visit in the past year.
• National Performance Measure 11: Percent of children with and without special health care needs having a medical home.
Goal 2: Support life-long health for all South Dakotans.
• National Performance Measure 5: Percent of infants placed to sleep on their backs.
• National Performance Measure 6: Percent of children, ages 10 through 71 months, receiving a developmental screening using a parent-completed screening tool.
• National Performance Measure 7: Rate of hospitalization for non-fatal injury per 100,000 children ages 0 through 9 and adolescents 10 through 19.
• National Performance Measure 13: (A) Percent of women who had a dental visit during pregnancy and (B) Percent of children, ages 1 through 17 who had a preventive dental visit in the past year.
• National Performance Measure 14: (A) Percent of women who smoke during pregnancy and (B) Percent of children who live in households where someone smokes.
• State Performance Measure 2: Percentage of children, ages 2 to 5 years, receiving WIC services with a BMI at or above the 85th percentile (overweight or obese).
• State Performance Measure 3: The percent of women (15 through 44) with a live birth during the reporting year whose observed to expected prenatal visits are greater than or equal to 80 percent.
Goal 3: Prepare for, respond to, and prevent public health threats.
• Utilize Department of Health communications and social media platforms to enhance education and awareness.
Goal 4: Develop and strengthen strategic partnerships to improve public health.
• State Performance Measure 1: Reduce suicide attempts by adolescents ages 14 through 18. Goal 5: Maximize the effectiveness and strengthen infrastructure of the Department of Health.
• State Performance Measure 4: MCH data is analyzed and disseminated.
SOUTH DAKOTA DEPARTMENT OF HEALTH GOALS AND BRIGHT START HOME
VISITING PROGRAM GOALS
https://doh.sd.gov/documents/family/BrightStartPlan.pdf Goal 1: Improve the quality, accessibility, and effective use of health care.
• HOME VISITING GOAL 1: Improve pregnancy related outcomes for first-time pregnant women served by the program in identified at-risk communities.
Goal 2: Support life-long health for all South Dakotans.
• HOME VISITING GOAL 1: Improve pregnancy related outcomes for first-time pregnant women served by the program in identified at-risk communities.
• HOME VISITING GOAL 2: Improve the health and development of infants and children enrolled in the program in identified at-risk communities.
Goal 3: Prepare for, respond to, and prevent public health threats.
• HOME VISITING GOAL 2: Improve the health and development of infants and children enrolled in the program in identified at-risk communities.

2020 Primary Care Needs Assessment SD Department of Health, Office of Rural Health O-6
Goal 4: Develop and strengthen strategic partnerships to improve public health.
• HOME VISITING GOAL 3: Improve early childhood comprehensive system development. Goal 5: Maximize the effectiveness and strengthen infrastructure of the Department of Health.
• The Bright Start Home Visiting Program is committed to providing high-quality services, with specially trained nurses who implement the evidence-based program with fidelity to the model.
• The Bright Start Home Visiting Program is also committed to improving program quality by using Continuous Quality Improvement.
EMS WORKFORCE SUMMIT RECOMMENDATIONS 2010
https://doh.sd.gov/documents/EMS/2010Summit.pdf Goal 1: Develop a statewide promotion and marketing campaign. Goal 2: Organize meetings with ambulance services and EMTs. Goal 3: Increase number of test sites. Goal 4: Host educational session for medical directors. Goal 5: Provide ambulance service director training. Goal 6: Provide networking opportunities.
SOUTH DAKOTA RAPE PREVENTION EDUCATION STATE ACTION PLAN 2019 - 2024
https://doh.sd.gov/documents/Prevention/RPE_SD_StateActionPlan.pdf Goal 1: Addressing health disparities and disproportion. Goal 2: Coordination with partners. Goal 3: Leveraging partnerships and resources to increase primary prevention efforts. Goal 4: Tracking and use of data. Goal 5: Implement action plans. Goal 6: Implement programs: Youth VIP, ACE Interface, The Hook-Up, Safe Bars, Network Programs
SOUTH DAKOTA DEPARTMENT OF HEALTH | SUICIDE PREVENTION
https://doh.sd.gov/documents/DashboardSuicide.pdf Reduce the suicide crude death rate for South Dakota from 17.8 per 100,000 in 2012-2016 to 16.0 per 100,000 by 2016-2020
SOUTH DAKOTA SUICIDE PREVENTIONS STATE PLAN
https://sdsuicideprevention.org/wp-content/uploads/2021/01/SD_SuicidePreventionPlan_2020-2025.pdf Goal 1: Prevention. Implement evidence-based interventions throughout multiple sectors to prevent
suicides, suicide attempts, and other risky behavior. Goal 2: Intervention. Increase awareness and access to services to intervene in time of crisis. Goal 3: Postvention. Provide support for recovery services for survivors, their families, and the
community to eliminate future suicides.
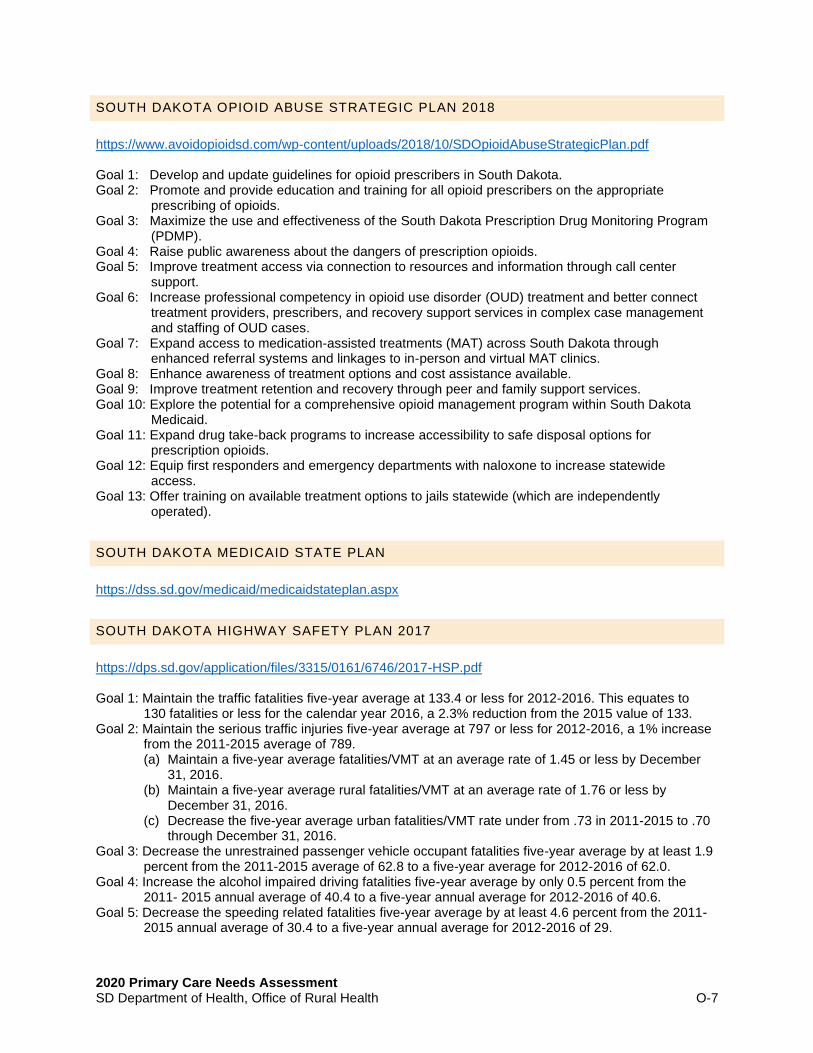
2020 Primary Care Needs Assessment SD Department of Health, Office of Rural Health O-7
SOUTH DAKOTA OPIOID ABUSE STRATEGIC PLAN 2018
https://www.avoidopioidsd.com/wp-content/uploads/2018/10/SDOpioidAbuseStrategicPlan.pdf Goal 1: Develop and update guidelines for opioid prescribers in South Dakota. Goal 2: Promote and provide education and training for all opioid prescribers on the appropriate
prescribing of opioids. Goal 3: Maximize the use and effectiveness of the South Dakota Prescription Drug Monitoring Program
(PDMP). Goal 4: Raise public awareness about the dangers of prescription opioids. Goal 5: Improve treatment access via connection to resources and information through call center
support. Goal 6: Increase professional competency in opioid use disorder (OUD) treatment and better connect
treatment providers, prescribers, and recovery support services in complex case management and staffing of OUD cases.
Goal 7: Expand access to medication-assisted treatments (MAT) across South Dakota through enhanced referral systems and linkages to in-person and virtual MAT clinics.
Goal 8: Enhance awareness of treatment options and cost assistance available. Goal 9: Improve treatment retention and recovery through peer and family support services. Goal 10: Explore the potential for a comprehensive opioid management program within South Dakota
Medicaid. Goal 11: Expand drug take-back programs to increase accessibility to safe disposal options for
prescription opioids. Goal 12: Equip first responders and emergency departments with naloxone to increase statewide
access. Goal 13: Offer training on available treatment options to jails statewide (which are independently
operated).
SOUTH DAKOTA MEDICAID STATE PLAN
https://dss.sd.gov/medicaid/medicaidstateplan.aspx
SOUTH DAKOTA HIGHWAY SAFETY PLAN 2017
https://dps.sd.gov/application/files/3315/0161/6746/2017-HSP.pdf Goal 1: Maintain the traffic fatalities five-year average at 133.4 or less for 2012-2016. This equates to
130 fatalities or less for the calendar year 2016, a 2.3% reduction from the 2015 value of 133. Goal 2: Maintain the serious traffic injuries five-year average at 797 or less for 2012-2016, a 1% increase
from the 2011-2015 average of 789. (a) Maintain a five-year average fatalities/VMT at an average rate of 1.45 or less by December
31, 2016. (b) Maintain a five-year average rural fatalities/VMT at an average rate of 1.76 or less by
December 31, 2016. (c) Decrease the five-year average urban fatalities/VMT rate under from .73 in 2011-2015 to .70
through December 31, 2016. Goal 3: Decrease the unrestrained passenger vehicle occupant fatalities five-year average by at least 1.9
percent from the 2011-2015 average of 62.8 to a five-year average for 2012-2016 of 62.0. Goal 4: Increase the alcohol impaired driving fatalities five-year average by only 0.5 percent from the
2011- 2015 annual average of 40.4 to a five-year annual average for 2012-2016 of 40.6. Goal 5: Decrease the speeding related fatalities five-year average by at least 4.6 percent from the 2011-
2015 annual average of 30.4 to a five-year annual average for 2012-2016 of 29.

2020 Primary Care Needs Assessment SD Department of Health, Office of Rural Health O-8
Goal 6: Maintain and increase in the five-year average of no more than 10 percent from the 2011-2015 annual average of 21 to a five-year annual average for 2012-2016 of 23.2.
Goal 7: Maintain the unhelmeted motorcyclist fatalities five-year average at 17.4 fatalities or less for 2012- 2016.
Goal 8: Decrease the drivers age 20 or younger involved in fatal crashes five-year average by at least 1.2 percent from the 2011-2015 annual average of 17 to a five-year annual average for 2012- 2016 of 16.8.
Goal 9: Maintain a pedestrian fatalities five-year average of 7 fatalities or less for 2012-2016, despite expected increases in population.
Goal 10: Maintain a bicyclist fatalities five-year average of 1 fatality or less for 2012-2016, despite expected increases in population.
Goal 11: Increase statewide observed seat belt use of front seat outboard occupants in passenger vehicles .4 percentage points from the 2015 calendar year base year average usage rate of 73.6 percent to 74% percent by December 31, 2016. 13 COR
Copyright © 2022 FDOKUMEN