The Energy & Biodiversity Initiative Online Biodiversity Information Sources
Biodiversity Informatics, 8, 2013, pp 59 - 93
ASSESSMENT OF USER NEEDS OF PRIMARY BIODIVERSITY DATA:
ANALYSIS, CONCERNS, AND CHALLENGES
ARTURO H. ARIÑO (1)*, VISHWAS CHAVAN (2), DANIEL P. FAITH (3)
(1) Department of Zoology and Ecology, University of Navarra, Pamplona, Spain.
(2) Global Biodiversity Information Facility Secretariat, Universitetsparken 15, DK 2100,
Copenhagen, Denmark
(3) Australian Museum, 6 College Street, Sydney, NSW, Australia. *corresponding author
Abstract — A Content Needs Assessment (CNA) survey has been conducted in order to determine what
GBIF-mediated data users may be using, what they would be using if available, and what they need in terms
of primary biodiversity data records. The survey was launched in 2009 in six languages, and collected more
than 700 individual responses. Analysis of the responses showed some lack of awareness about the
availability of accessible primary data, and pointed out some types of data in high demand for linking to
distribution and taxonomic data now derived from the GBIF cache. A notable example was linkages to
molecular data. Also, the CNA survey uncovered some biases in the design of user needs surveys, by
showing demographic and linguistic effects that may have influenced the distribution of responses received
in analogous surveys conducted at the global scale.
INTRODUCTION
Biodiversity research is becoming a data-
intensive science (Kelling et al., 2009). The more
than 267 million primary biodiversity records that
hundreds of data publishers were making openly
available through GBIF by the end of 2010
International Biodiversity Year (GBIF 2010) is a
significant asset, and a valuable form of scientific
capital (Borgman, 2003, 2007).
Scientific data are expensive to produce but
can be of tremendous future value (Borgman,
2007), although quantifying such future value is
difficult without some indication about future data
uses. Nevertheless, the value for natural history
collections (NHCs) has been demonstrated, in
accord with long-standing predictions (Grinnell,
1910). Such values are seen as extending to
various kinds of data derived from biodiversity
research which need to be held in perpetuity as
well. Of course, not all available data are fit for all
uses (Hill et al., 2010). The expense of producing
data, and maintaining the cyberinfrastructure
needed for their open access, delivery, and data-
intensive collaborative research (Borgman et al.,
2006), justifies increased efforts to assess what
types of biodiversity data are most needed by
researchers. This may help optimize resource
allocation and research output. In 2009, GBIF set
up a Content Needs Assessment Task Group
(CNA TG) to address this assessment (GBIF
2009a).
The objective of CNA is to get a first-hand
idea about the user needs of biodiversity data
(Chavan et al., 2010). Two main tools are
available for CNA: information mining (including
literature review), and surveys. While the former
may be thought of as retrospective research,
collating documented uses in response to specific
needs, the latter can proceed both ways: describing
researchers’ past, present and possible future
requirements.
In 2009, CNA TG conducted a survey with the
purpose of collecting information on the
demography of use of biodiversity data, and
understanding the myriad of broad ‘primary
biodiversity data’ needs across user communities
(GBIF, 2009). The survey also sought input to
determine the unique scientific and policy
contributions of uses made of data mobilized and
accessible through the GBIF community.

ASSESSMENT OF USER NEEDS – ARIÑO ET AL.
60
DESIGN
The survey contained 21 questions spread over
6 sections (Table 1): (a) respondent profile, (b)
uses of primary biodiversity data, (c) access to
primary biodiversity data, (d) data quality and
quantity requirements, (e) species level data
requirements, and (f) usefulness of GBIF
mobilised data. The survey included an introduct-
ion succinctly describing GBIF and the objective
of CNA (Table 1). Most questions were multiple-
choice, although estimates were required for some
quantity data. Also, most questions included an
option for a free-text answer not covered by
available choices.
Table 1: List of questions and options
Overhead: GBIF Content Needs Assessment (CNA)
Survey: Introduction [Objective of CNA Survey, Description of GBIF,
estimated time to completion (21 questions, 18 minutes),
Anonymity assurance].
Section (a): GBIF Content Needs Assessment (CNA)
Survey: User Profile
User profile question Q1. Details of the Person undertaking this survey.
Options/Suboptions: Name; Organisation/institution affiliated with; Street/PO box; City; State; Country; ZIP CODE; Phone/Mobile; Email; Web/URL. (Free-text answers)
User profile question Q2. Describe your organization (please tick one or several options)
Options/Suboptions: Academic / educational institution; Research institution; National agency; Non Governmental Organisation (NGO); Intergovernmental Organisation (IGO) or Multilateral Convention; Private company; Individual researcher or Naturalists (e.g. citizen scientists); Others (please specify). (Exclusive multiple choice)
User profile question Q3. Main interest/business of your organization (please tick one or several options)
Options/Suboptions: Conservation Science (including taxonomic research); Bioproductivity / Bioprospecting (agriculture; fisheries; forestry; etc.); Biodiversity; Biomedical and/or Public health; Biotechnology; Biosecurity; Natural Resources Management; Industrial / Commercial use of natural resources; Exhibition / Educational / Academic; Others (please specify). (Non-exclusive multiple choice)
Section (b): GBIF CNA Survey: Uses of Primary
Biodiversity Data.
This section of the survey is designed to understand the
purpose for which ‘primary biodiversity data’ is used by
various stakeholders. DEFINITION: Primary biodiversity
data is defined as the digital text or multimedia data record
detailing the instance of an organism – or the what, where,
when, how and by whom of the organisms occurrence and
recording. The uses of primary biodiversity data are wide
and varied, and encompass virtually every aspect of human
endeavor – food, shelter, health, recreation, art and history,
society, science & politics, etc. Furthermore, such data is
essential for predicting the sustainable future of our planet,
and therefore of all living beings.
Question (Q) 01. List the ways in which you use Primary Biodiversity Data (please choose one or several options)
Options/Suboptions: Taxonomy; Biogeographic studies; Species diversity & populations; Life histories & phonologies; Endangered, migratory and invasive species; Impact of climate change; Ecology, evolution & genetics; Environmental regionalization; Conservation planning; Sustainable Use; Natural Resources Management; Agriculture, fisheries, forestry and mining; Nursery & pet industry; Health & public safety; Bioprospecting; Forensics; Border control and wildlife trade; Education & public outreach; Ecotourism; Art & History; Society and politics; Recreation; Human infrastructure planning; Industrial use; Environmental impact management; Others (please specify). (Non-exclusive multiple choice)
Q02. Provide example documentation (reports/papers/presentations) where Primary Biodiversity Data has been used by you/your group?
NOTE: Please provide literature references, URLs of web sites, news items. Please also email us a copy of the
report/paper etc. at [email protected].
Options/Suboptions: Separate fields for multiple examples. (Free-text answers)
Section (c): GBIF CNA Survey: Access to Primary
Biodiversity Data.
In this section, GBIF seeks to learn how users access
primary biodiversity data (please choose one or several
options). The objective is to understand the mechanisms
employed and the frequency for accessing primary
biodiversity data.
Q03. How do you access primary biodiversity data?
Options/Suboptions: Through your own field works/surveys; Through hardcopy, literature survey (non-digital form); Through primary publications (e.g. taxonomic monographs, maps of species observations); Through access to offline digital data sets (CDROM/DVD/tapes etc.); Through the GBIF Data Portal (http://data.gbif.org); Through other web based data
ASSESSMENT OF USER NEEDS – ARIÑO ET AL.
61
portals (please specify); Through FTP sites (please specify); Through institutional agreements; Through payment basis; Through free and open datasests within and outside of your institution; Through reciprocal agreements with other groups/individuals; Through others (please specify). (Non-exclusive multiple choice)
Q04. Frequency of access
Options/Suboptions: Daily basis; Once a month; Once a quarter; Bi-annual; Can not determine (on Need basis); Others (please specify). (Exclusive multiple choice)
Q05. Some of the datasets mobilised through GBIF have multiple access points (e.g. OBIS mobilised data set can typically have three access points – GBIF data portal, OBIS portal, and data sets own portal). How do you access such data sets?
Options/Suboptions: Only through GBIF Portal; Only through thematic/regional aggregator portal(s); Directly through datasets own portal(s); All of the above. (Exclusive multiple choice)
Q06. If you are accessing datasets through access points other than the GBIF data portal, why?
Options/Suboptions: Lack of awareness about accessibility through the GBIF portal; Have been using these access points for a long time; Ease of use; More specific search features; Workflow integration; Others (please specify). (Non-exclusive multiple choice)
Q07. Select the data formats which you often choose to access the primary biodiversity data.
Options/Suboptions: MySql (dump); Excel; Tab delimited; Comma separated values; XML; Maps as images; Kml; Others (please specify). (Non-exclusive multiple choice)
Q08. GBIF serve data in all the formats listed in the previous question. If GBIF were to serve data in other formats, which would be your preference(s)? (Free-text answers)
Q09. List the other types of data you use together with primary biodiversity data? (e.g. satellite imagery, environmental data layers such as salinity, temperature etc., land use data, infrastructure development such as housing, roads, dams, etc.) (Free-text answers)
Section (d): GBIF CNA Survey: Quality and
Quantity Requirements
Q10. Types or Nature of Primary Biodiversity Data Required?
Options/Suboptions: Taxonomic names/checklists; Occurrence records (presence only); Occurrence records (including absence records); Population density/dynamics; Species interaction data; Species information (descriptive data); Others (please specify). (Non-exclusive multiple choice)
Q11. Quantity of data required for each data type?
Options/Suboptions: Taxonomic names/checklists; Occurrence records; Population density/dynamics; Multimedia resources; Others (please specify). (Choice matrix. Exclusive column options for each option row: 1-100 records; 101-1000 records; 1001-10000 records; 10000+ records)
Q12. For which type of environments do you use/need more primary biodiversity data?
Options/Suboptions: Marine: Coasts; Marine: Oceans; Marine: Deep Seas; Marine: Islands; Marine: Estuarine; Inland: Wetlands; Inland: River basin; Terrestrial: Tropical forests; Terrestrial: Temperate forests; Terrestrial: Deserts; Terrestrial: Grasslands; Terrestrial: Agro-ecosystem; Terrestrial: Mountains; Others (please specify). (Choice matrix. Exclusive column options for each option row: Frequent Use; Less Frequent Use; Occasionally required; Not required)
Q13. Which data at the ecosystem level are the most required by you and at what scale?
Options/Suboptions: Ecoregions; Vegetation coverage; Protected areas; Temperature; Precipitation; Soil; Watersheds; Basins; Others (please specify). (Choice matrix. Non-exclusive column options for each option row: Global; Regional; National; Provincial; Local)
Section (e): GBIF CNA Survey: Species-level data
requirements.
The objective of this section is to understand data on which
taxa’s is most often required.
Q14. Which data at the plant species level are most required by you and at what scale? Please specify child taxa or common names in the box below.
Options/Suboptions: Plants: Monocots; Plants: Dicots; Plants: Bryophytes; Plants: Pteridophytes; Plants: Gymnosperms; Plants: Algae; Plants: Others (please specify). (Choice matrix. Non-exclusive column options for each option row: Global; Regional; National; Provincial; Local)
Q15. Which data at the animal species level are the most required by you and at what scale? Please specify child taxa or common names in the box below.
Options/Suboptions: Phylum: Acanthocephala; Phylum: Annelida; Phylum: Arthropoda; Phylum: Brachiopoda; Phylum: Cephalorhyncha; Phylum: Chaetognatha; Phylum: Chordata; Phylum: Cnidaria; Phylum: Ctenophora; Phylum: Echinodermata; Phylum: Echiura; Phylum: Ectoprocta; Phylum: Entoprocta; Phylum: Gastrotricha; Phylum: Gnathostomulida; Phylum: Hemichordata; Phylum: Mesozoa; Phylum: Mollusca; Phylum: Myxozoa; Phylum: Nematoda; Phylum: Nemertea; Phylum: Onychopora; Phylum: Phoronida; Phylum: Placozoa; Phylum: Platyhelminthes; Phylum: Porifera; Phylum: Rotifera; Phylum: Sipuncula; Phylum: Tardigrada; Others (please specify). (Choice matrix. Non-
ASSESSMENT OF USER NEEDS – ARIÑO ET AL.
62
exclusive column options for each option row: Global; Regional; National; Provincial; Local)
Q16. Which data at the fungi, virus and microbial species level are most required by you and at what scale? Please specify child taxa or common names in the box below.
Options/Suboptions: Microbes; Fungi; Virus; Others (please specify). (Choice matrix. Non-exclusive column options for each option row: Global; Regional; National; Provincial; Local)
Q17. What are the most important characteristics that you generally want for species occurrence data?
Options/Suboptions: Precise/accurate geo-referenced data; Metadata on uncertainty about geographical/georeferenced data; Pre-1990 data; Post-1990 data; Type specimens in scientific collections; Source of information; Images; Synonyms of species name; Common name of species; Species habitat descriptions; Others (please specify). (Non-exclusive multiple choice)
Section (f): GBIF CNA Survey: Usefulness of GBIF
mobilised data
Q18. Does GBIF mobilised data satisfy your needs?
Options/Suboptions: No, I have not at all used GBIF mobilised data; No, not at all useful for my applications; Maybe, partially useful for my applications; Yes, completely useful for my applications; Please specify for
what applications you use GBIF data: (Exclusive multiple choice)
Q19. If GBIF mobilised data is partially or absolutely not useful for your applications, we would like to know which needs are not satisfied by the GBIF mobilised data?
Options/Suboptions: Type of data; Data volume/quantity; Spatial extent; Taxonomic coverage; Georeference quality; Age of data; Sequence based associated occurrence data; Others (please specify): (Non-exclusive multiple choice)
Q20. What type of data would you like to see becoming increasingly discoverable and accessible through GBIF?
Options/Suboptions: Taxonomic Names/Checklist data; Specimen based occurrence data; Observation based occurrence data; Multimedia resources based occurrence data; Other types of observations/occurrences data (e.g. agro-forestry, fish landing, migration etc.); Names and occurrences extracted from publications; Sequence based associated occurrence data; Any other (please specify): (Non-exclusive multiple choice)
Q21. If you have any comments not covered by the survey, feel free to enter them here. [Free-text answers]
SurveyMonkey (http://www.surveymonkey.com)
was used to design and host the survey. On May7th,
2009, the survey was launched in English, French
and Spanish. Chinese (traditional and simplified)
and Russian versions of the survey were launched
a week later on May 14th, 2009 (GBIF 2009b,
GBIF 2009c, GBIF 2009d). While English, French
and Spanish survey versions were closed on June
12th, 2009, Chinese and Russian versions were
drawn to a close on June 19th, 2009.
Survey announcements were widely circulated
using, (a) GBIF communications portal, (b) GBIF
mailing lists, (c) TAXACOM, (d) International
Commission on Zoological Nomenclature, (e)
Taxonomic Database Working Group, and (f)
Expert Centre for Taxonomic Identification
mailing list. The GBIF Secretariat made a request
to the Convention on Biological Diversity (CBD)
Secretariat to disseminate the launch of the survey,
and this request was implemented by the CBD
Secretariat. Task Group members also forwarded
requests to other national, professional or subject-
specific lists and networks.
ANALYTICAL METHODS
SurveyMonkey output was supplied as a set of
Excel tables for each version, recording individual
respondents in rows and each single possible
option for each question as a column. Cells were
filled with the selected, verbatim options (see Fig.
1). As the number of options exceeded Excel’s
maximum column capacity, additional Excel books
were produced by the site holding additional
columns. In all, twelve sheets (two for each distinct
survey) were downloaded.
ASSESSMENT OF USER NEEDS – ARIÑO ET AL.
63
Figure 1: A small section of one of the raw files as produced by the survey software, arranged in an Excel
spreadsheet. Each row corresponds to one respondent (personal data obscured).
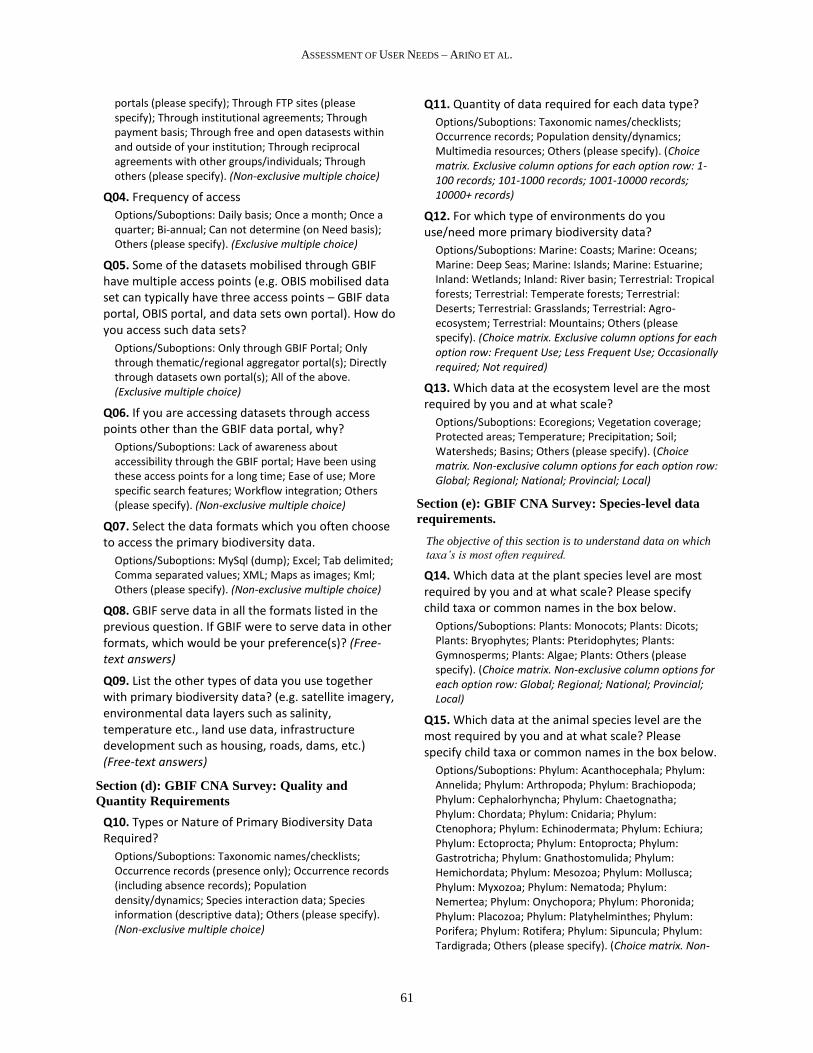
As this layout was not amenable to direct
analysis (Chavan et al., 2010), a 48,767-record
database was constructed where each record was
an individual option or response supplied by each
respondent to each question (see Fig. 2). In order
to nullify language differences between surveys,
free-text answers coming from fixed options were
then recoded homogeneously across all six
surveys, and merged together into a single file.
The original language was however retained as a
field, allowing for grouping when the language
factor was needed later in the analysis. Also,
verbatim responses (in their original language,
before recoding) were retained for reference as
fields.
Figure 2: Data arranged as a database. Each row is an individually selected option in the survey, with
fields for language (SurveyLang), question and option number (VNAME), verbatim answer
(VCONTENT), and recoded (language-free) answer (VNAME-C).
ASSESSMENT OF USER NEEDS – ARIÑO ET AL.
64
This recoding also allowed for the original
number of variables in the survey output (one for
each possible answer in multiple-choice questions)
to be greatly reduced to one variable for each
question. In the case of multiple-choice range
questions, variables were created where a weighted
index substituted several individual options within
a range by the centroid of the chosen options.
Thus, a final, unified Excel datasheet1 was built
from the database for subsequent analyses
containing numerical data.
In addition, 3,883 verbatim, free-text answers
and comments2 were compiled together after
translating into English some 1,873 from the
original Traditional Chinese (CN-T), Simplified
Chinese (CN-S), Spanish (ES), French (FR), and
Russian (RU) languages. Where appropriate, some
of these answers were in turn coded to gather
frequency data, in order to address emergent
questions not included within the surveys at the
outset.
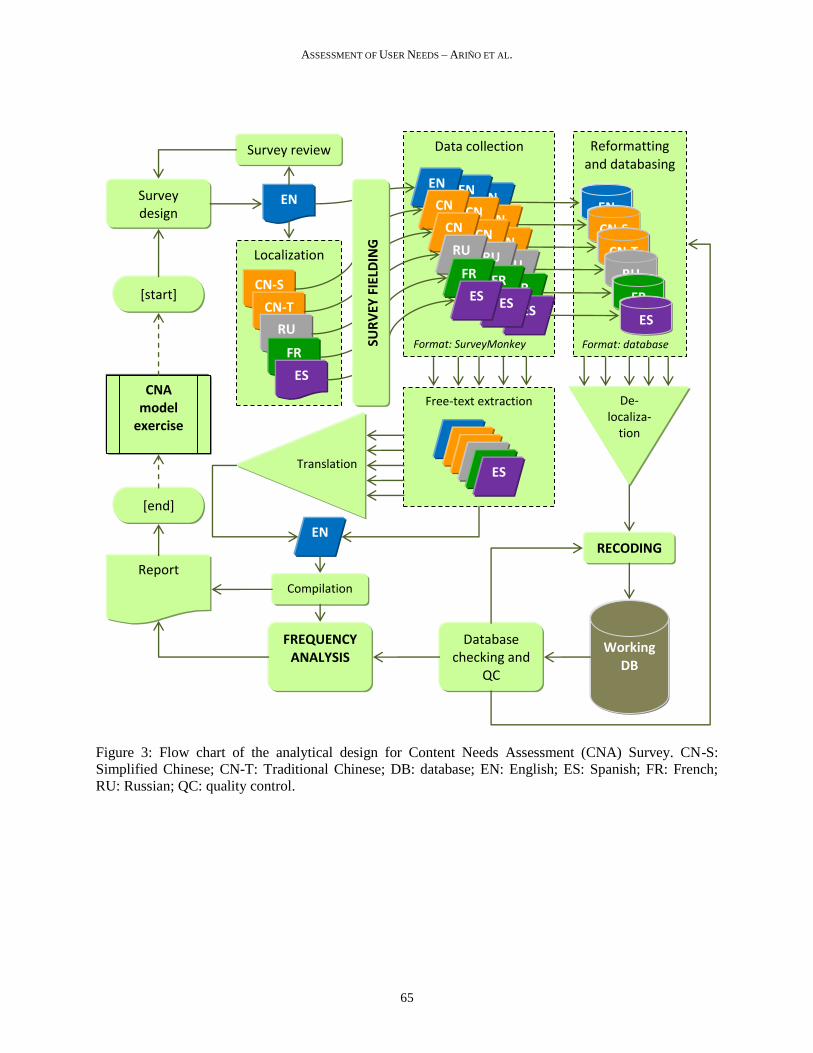
The unified datasheet was checked for
duplicates, errors and mismanagement, and
summary statistics and frequency data were
compiled (Fig. 3). A number of additional data
were collected from other sources for further
analysis, e.g. the respondent’s city’s coordinates
were taken from geo-location facilities.
For the majority of the questions, we analysed
responses by frequency analyses, either directly on
the data variables, or on cross-tabulations among
variables. Frequencies were plotted or mapped as
appropriate in order to address trends from
questions either originally designed in the survey’s
goals, or emerging from the analytical process.
RESULTS AND DISCUSSION
We will present the main results here along
with a short discussion relevant to each result.
More detailed discussion of the survey results, in
the context of biodiversity conservation challenges,
can be found in Faith et al., this volume.
1 The unified Excel datasheet has been archived and is available for
further analysis on request. 2 The full set of 3,883 verbatim, free-text answers and comments has
been archived and is available for further analysis on request.
Survey Characteristics
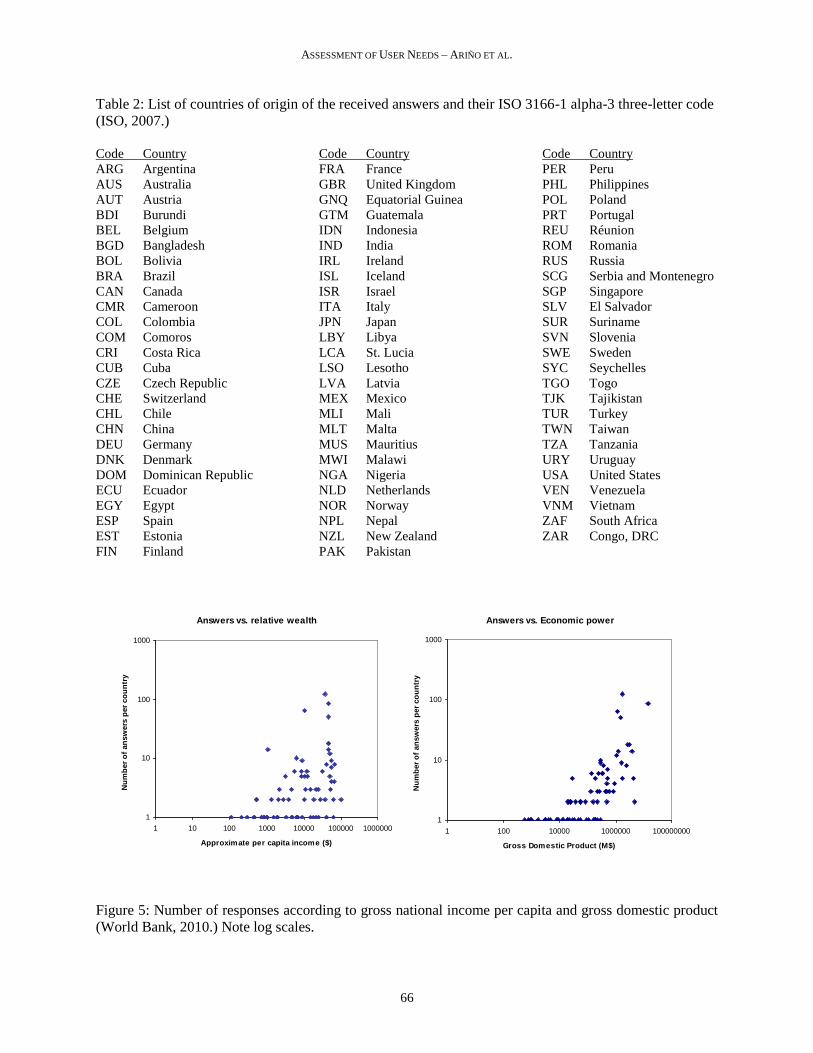
The survey received 750 distinct responses
from 77 countries (Table 2). However, most
respondents were from Taiwan (157), Spain (124),
USA (85), Mexico (64), and Canada (50). Thirty-
one countries (40%) provided a single response
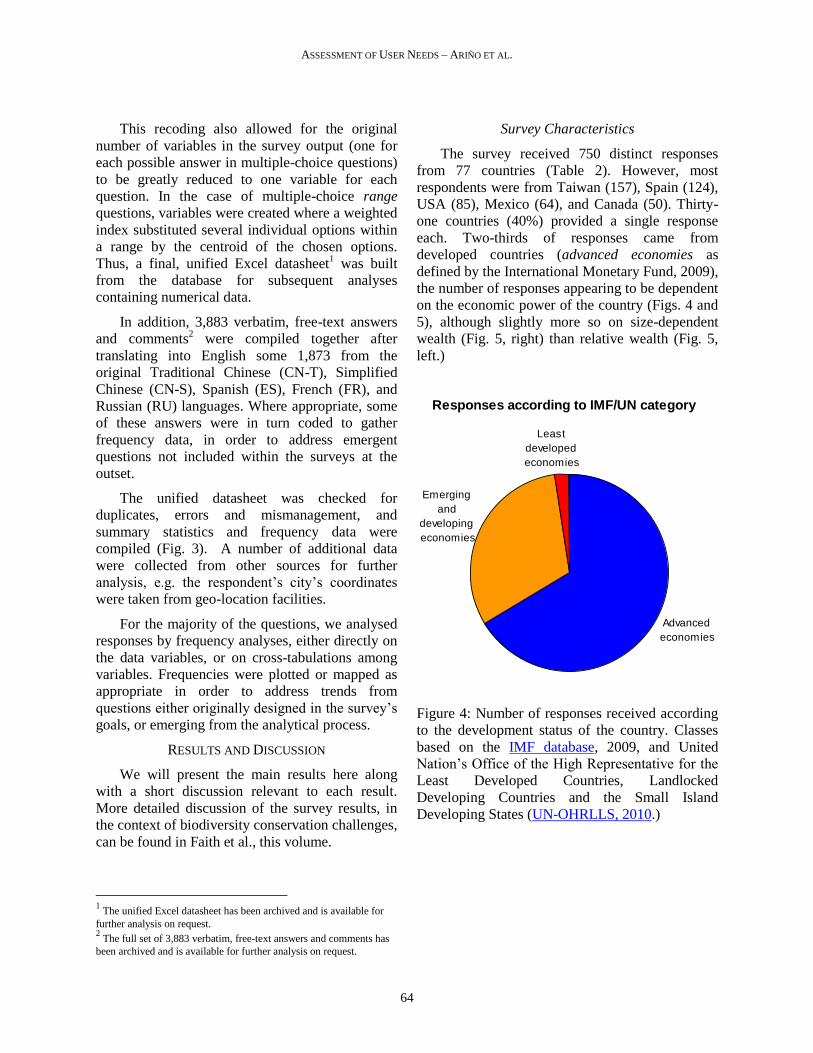
each. Two-thirds of responses came from
developed countries (advanced economies as
defined by the International Monetary Fund, 2009),
the number of responses appearing to be dependent
on the economic power of the country (Figs. 4 and
5), although slightly more so on size-dependent
wealth (Fig. 5, right) than relative wealth (Fig. 5,
left.)
Responses according to IMF/UN category
Advanced
economies
Emerging
and
developing
economies
Least
developed
economies
Figure 4: Number of responses received according
to the development status of the country. Classes
based on the IMF database, 2009, and United
Nation’s Office of the High Representative for the
Least Developed Countries, Landlocked
Developing Countries and the Small Island
Developing States (UN-OHRLLS, 2010.)
ASSESSMENT OF USER NEEDS – ARIÑO ET AL.
65
Figure 3: Flow chart of the analytical design for Content Needs Assessment (CNA) Survey. CN-S:
Simplified Chinese; CN-T: Traditional Chinese; DB: database; EN: English; ES: Spanish; FR: French;
RU: Russian; QC: quality control.
Survey design
Localization
CN-S
CN-T
RU
FR
ES
EN
Survey review
De-localiza-
tion
Working DB
Database checking and
QC
FREQUENCY ANALYSIS
Report
RECODING
Data collection
EN
CN-S CN
-T RU
FR
ES
EN
CN-S CN
-T RU
FR
ES
EN
CN-S CN
-T RU
FR
ES
Format: SurveyMonkey
Reformatting and databasing
EN
CN-S
CN-T
RU
FR
ES
Format: database
Translation
Compilation
SUR
VEY
FIE
LDIN
G
CNA model
exercise
[start]
[end]
Free-text extraction
EN CN
-S CN-T RU FR
ES
EN
ASSESSMENT OF USER NEEDS – ARIÑO ET AL.
66
Table 2: List of countries of origin of the received answers and their ISO 3166-1 alpha-3 three-letter code
(ISO, 2007.)
Code Country
ARG Argentina
AUS Australia
AUT Austria
BDI Burundi
BEL Belgium
BGD Bangladesh
BOL Bolivia
BRA Brazil
CAN Canada
CMR Cameroon
COL Colombia
COM Comoros
CRI Costa Rica
CUB Cuba
CZE Czech Republic
CHE Switzerland
CHL Chile
CHN China
DEU Germany
DNK Denmark
DOM Dominican Republic
ECU Ecuador
EGY Egypt
ESP Spain
EST Estonia
FIN Finland
Code Country
FRA France
GBR United Kingdom
GNQ Equatorial Guinea
GTM Guatemala
IDN Indonesia
IND India
IRL Ireland
ISL Iceland
ISR Israel
ITA Italy
JPN Japan
LBY Libya
LCA St. Lucia
LSO Lesotho
LVA Latvia
MEX Mexico
MLI Mali
MLT Malta
MUS Mauritius
MWI Malawi
NGA Nigeria
NLD Netherlands
NOR Norway
NPL Nepal
NZL New Zealand
PAK Pakistan
Code Country
PER Peru
PHL Philippines
POL Poland
PRT Portugal
REU Réunion
ROM Romania
RUS Russia
SCG Serbia and Montenegro
SGP Singapore
SLV El Salvador
SUR Suriname
SVN Slovenia
SWE Sweden
SYC Seychelles
TGO Togo
TJK Tajikistan
TUR Turkey
TWN Taiwan
TZA Tanzania
URY Uruguay
USA United States
VEN Venezuela
VNM Vietnam
ZAF South Africa
ZAR Congo, DRC
Figure 5: Number of responses according to gross national income per capita and gross domestic product
(World Bank, 2010.) Note log scales.
Answers vs. relative wealth
1
10
100
1000
1 10 100 1000 10000 100000 1000000
Approximate per capita income ($)
Nu
mb
er
of
an
sw
ers
per
co
un
try
Answers vs. Economic power
1
10
100
1000
1 100 10000 1000000 100000000
Gross Domestic Product (M$)
Nu
mb
er
of
an
sw
ers
per
co
un
try

ASSESSMENT OF USER NEEDS – ARIÑO ET AL.
67
The geographical spread of the respondents is
depicted in Figure 6. There is a high concentration
of respondents from the northern hemisphere
(developed countries), and there are also apparent
geographical gaps, such as Russia and China.
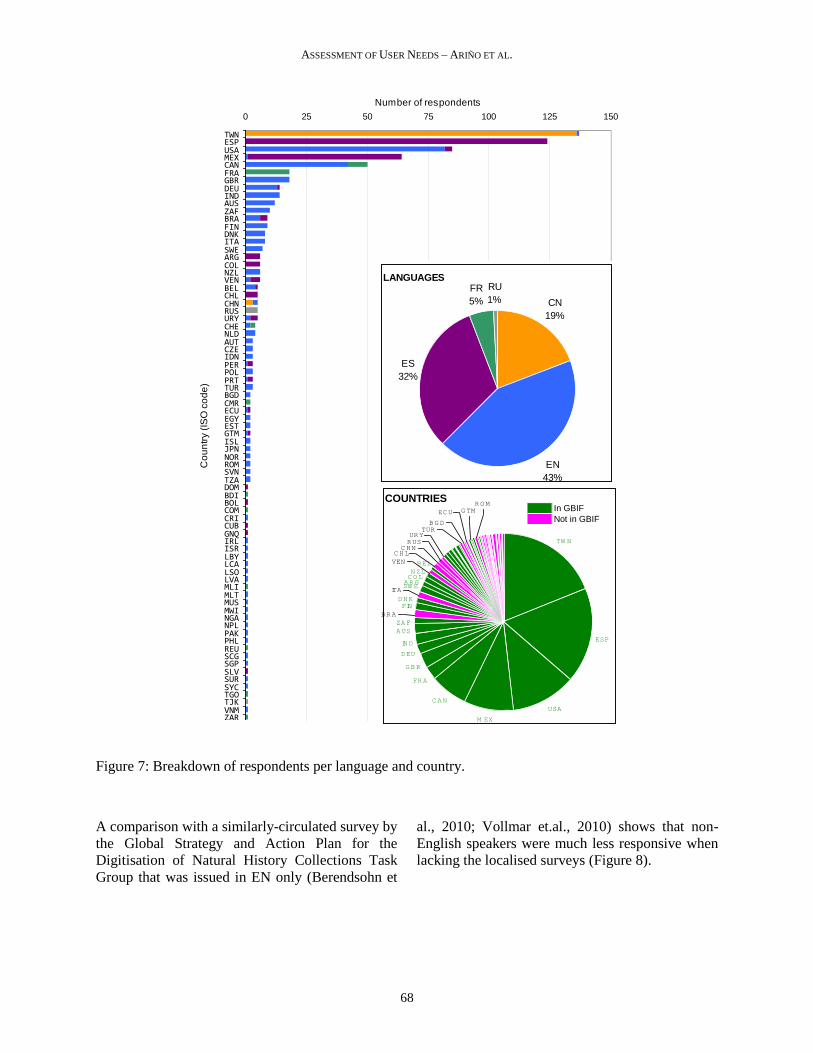
Most respondents used the English version
(43%), followed by Spanish (32%), Chinese
(19%), French (5%), and Russian (1%). Among
GBIF participant countries, 38 responded and
provided most responses (89%), representing 50%
of all responding countries, although about half of
the participants provided very few responses, less
than five each: CHE, NLD, AUT, CZE, IDN, PER,
POL, PRT, CMR, EGY, EST, ISL, JPN, NOR,
SVN, TZA, CRI, IRL, PAK, PHL. Furthermore,
eleven GBIF participant countries did not respond:
BEN, BGR, GHA, GIN, KOR, MDG, MAR, NIC,
PNG and SVK (Fig. 7).
In general, respondents appear to have used
their own language to respond the survey (table 3),
although some did select the EN version even
though a localised version was available. In fact,
the most common assumed (vernacular, official, or
widely used in the country of origin) language
among all respondents was Spanish (242
respondents, vs. 197 English speakers). It seems
therefore apparent that the translation effort
resulted in a higher turnout for the survey than if it
had been in EN only.
-90
-60
-30
0
30
60
90
-180 -150 -120 -90 -60 -30 0 30 60 90 120 150 180
Figure 6: Geographical location of respondents. Each dot represents one or more respondents.
ASSESSMENT OF USER NEEDS – ARIÑO ET AL.
68
0 25 50 75 100 125 150
TWNESPUSAMEXCANFRAGBRDEUINDAUSZAFBRAFINDNKITASWEARGCOLNZLVENBELCHLCHNRUSURYCHENLDAUTCZEIDNPERPOLPRTTURBGDCMRECUEGYESTGTMISLJPNNORROMSVNTZADOMBDIBOLCOMCRICUBGNQIRLISRLBYLCALSOLVAMLIMLTMUSMWINGANPLPAKPHLREUSCGSGPSLVSURSYCTGOTJKVNMZAR
Co
un
try (
ISO
co
de
)
Number of respondents
CN
EN
ES
FR
RU
Figure 7: Breakdown of respondents per language and country.
A comparison with a similarly-circulated survey by
the Global Strategy and Action Plan for the
Digitisation of Natural History Collections Task
Group that was issued in EN only (Berendsohn et
al., 2010; Vollmar et.al., 2010) shows that non-
English speakers were much less responsive when
lacking the localised surveys (Figure 8).
COUNTRIESROM
GTMECU
BGDTUR
ITA
BRA
SW EARG
FINDNK
ZAF
AUS
IND
DEU
GBR
FRA
CAN
M EX
USA
ESP
TW N
COLNZL
VEN
CHLCHNRUSURY
BEL
In GBIF
Not in GBIF
LANGUAGES
CN
19%
EN
43%
ES
32%
FR
5%
RU
1%
ASSESSMENT OF USER NEEDS – ARIÑO ET AL.
69
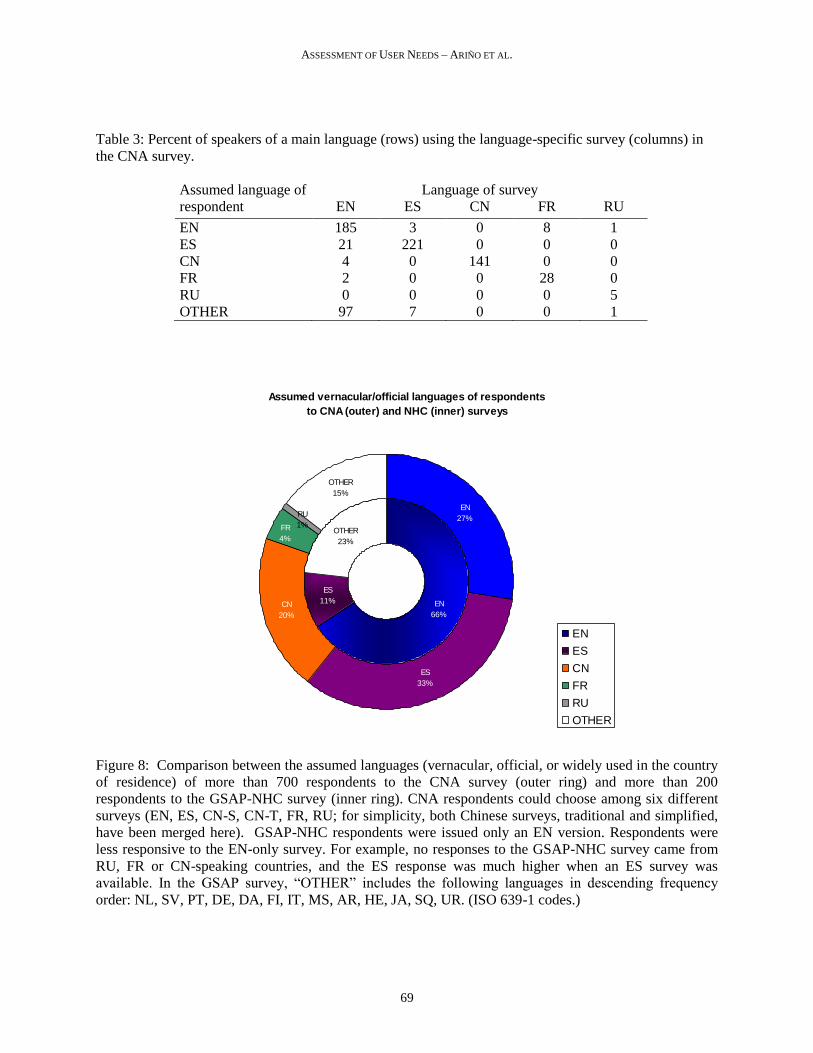
Table 3: Percent of speakers of a main language (rows) using the language-specific survey (columns) in
the CNA survey.
Assumed language of
respondent
Language of survey
EN ES CN FR RU
EN 185 3 0 8 1
ES 21 221 0 0 0
CN 4 0 141 0 0
FR 2 0 0 28 0
RU 0 0 0 0 5
OTHER 97 7 0 0 1
Assumed vernacular/official languages of respondents
to CNA (outer) and NHC (inner) surveys
OTHER
23%
RU
1%
OTHER
15%
ES
11% EN
66%
CN
20%
ES
33%
EN
27%
FR
4%
EN
ES
CN
FR
RU
OTHER
Figure 8: Comparison between the assumed languages (vernacular, official, or widely used in the country
of residence) of more than 700 respondents to the CNA survey (outer ring) and more than 200
respondents to the GSAP-NHC survey (inner ring). CNA respondents could choose among six different
surveys (EN, ES, CN-S, CN-T, FR, RU; for simplicity, both Chinese surveys, traditional and simplified,
have been merged here). GSAP-NHC respondents were issued only an EN version. Respondents were
less responsive to the EN-only survey. For example, no responses to the GSAP-NHC survey came from
RU, FR or CN-speaking countries, and the ES response was much higher when an ES survey was
available. In the GSAP survey, “OTHER” includes the following languages in descending frequency
order: NL, SV, PT, DE, DA, FI, IT, MS, AR, HE, JA, SQ, UR. (ISO 639-1 codes.)

ASSESSMENT OF USER NEEDS – ARIÑO ET AL.
70
Although countries mobilizing more data were also
providing more responses, some countries had a
very low turnout, with three or less responses each:
CRI, ISL, JPN, NOR, SVN, AUT, PER, POL, PRT
(Figure 9). One of the GBIF participant countries
(South Korea) did mobilize data but did not
provide any responses, but 49 non-participant
countries did provide responses (Fig. 10): BDI,
BGD, BOL, BRA, CHL, CHN, CMR, COL, COM,
CUB, CZE, DOM, ECU, EGY, EST, GNQ, GTM,
IDN, IND, IRL, ISR, ITA, LBY, LCA, LSO, LVA,
MLI, MLT, MUS, MWI, NGA, NPL, PHL, REU,
ROM, RUS, SGP, SLV, SUR, SYC, TGO, TJK,
TUR, TZA, URY, VEN, VNM, ZAF, ZAR.
Responses vs. Amount of mobilised records
1
10
100
1000
1 100 10000 1000000 100000000
Mobilised records
Nu
mb
er
of
an
sw
ers
per
co
un
try
Figure 9: Responses from GBIF participant countries vs. volume of data mobilization (GBIF, 2009.)
The above results, especially the low turnout
from a number of GBIF participant countries,
suggest a need for improved coordination by the
GBIF participant nodes in conducting similar
surveys. This highlights the gains for GBIF as a
community to be made from improved outreach
and public relations.
Most of the survey respondents were academic
(45%) or research (26%) (Figure 11), but
surprisingly, NGOs were poorly represented (5%).
This suggests that either NGOs were not sampled
adequately, or the NGOs do not actually use the
type of data mobilised by GBIF.
68 respondents (9%) specified other types or
made clarifications, although most could actually
be included within the predefined types. The most
common “other” types listed were those related
with the administration or national, state, or county
government (27) and museums, herbaria or
botanical gardens (15), although many also
included this institution within Academic or
Research institution. A number of respondents
made clarifications because it was not possible to
tick more than one predefined answer.
The majority of the respondents were active
within biodiversity research (69%) or conservation
science (59%), including taxonomic research
(because the survey here posed a multiple-choice
question, respondents could select more than one
area). A second group of interest included
management and education, chosen each by one-
third of the respondents (Figure 12).
.

ASSESSMENT OF USER NEEDS – ARIÑO ET AL.
71
Figure 10: Countries mobilising data through GBIF network (GBIF, 2009) vs. countries providing
responses. Green: Mobilising and responding; yellow: mobilising but not responding (KR); saffron:
responding but not mobilising; blank: neither mobilising nor responding.
0 150 300 450 600 750
Academic / Educational institution
Research Institution
National Agency
Non Governmental Organisation (NGO)
Individual Researcher or Naturalist (e.g. citizen scientists)
Private Company
Intergovernmental Organisation (IGO) OR Multilateral Convention
Others (please specify)
Number of responses
RU FR EN ES CN
Figure 11: Organisations that responded to survey (Table 1: User Profile –Q2.)

ASSESSMENT OF USER NEEDS – ARIÑO ET AL.
72
0 150 300 450 600 750
Biodiversity
Conservation Science (including Taxonomic Research)
Natural Resources Management
Exhibition / Educational / Academic
Bioproductivity / Bioprospecting (Agriculture, Fisheries, Forestry, etc.)
Biotechnology
Biosecurity
Industrial / Commercial Use of Natural Resources
Biomedical and/or Public Health
Others (please specify)
Number of responses
RU FR EN ES CN
Figure 12: Main interest/business of respondent organisations. More than one option was available to
each respondent.
Bio
div
ers
ity
Conserv
ation S
cie
nce (
inclu
din
g
Taxonom
ic R
esearc
h)
Natu
ral R
esourc
es M
anagem
ent
Exhib
itio
n /
Educational /
Academ
ic
Bio
pro
ductivity /
Bio
pro
specting
(Agriculture
, F
isheries,
Fore
str
y,
etc
.)
Bio
technolo
gy
Oth
ers
Bio
security
Industr
ial /
Com
merc
ial U
se o
f
Natu
ral R
esourc
es
Bio
medic
al and/o
r P
ublic
Health
Academic / Educational institution 240 223 84 136 57 34 18 8 15 17
Research Institution 150 125 67 57 32 23 14 12 13 9
National Agency 37 24 35 9 16 5 10 14 5 1
Others 24 18 16 12 3 12 4 3
Non Governmental Organisation (NGO) 27 21 9 7 4 3 6 3 2 1
Individual Researcher or Naturalist (e.g.
citizen scientists)17 16 3 5 3 2 1 2
Private Company 9 7 10 1 2 1 1 2 3
Intergovernmental Organisation (IGO) OR
Multilateral Convention6 4 5 1 6 1 1 1 1
Main interest/business of your organization
Describe y
our
org
aniz
atio
n
respondents 34% 31% 27% 24% 20% 17% 14% 10% 7% 3% none
Figure 13: Correspondences between type of institution and their main interests (Table 1: User Profile –
Q2 & Q3.)

ASSESSMENT OF USER NEEDS – ARIÑO ET AL.
73
A few respondents (3%) chose not to select
any predefined answer but supplied an alternate
definition. However, most of these answers could
fit within the predefined categories (see Annex).
Some exclusive answers that appeared very
focused and could not be readily fit in other
categories were: “application of environmental
regulations”; “environmental policy and
legislation”; “software development”; “sustainable
design and construction”; “to promote
environmental care and sustainable development”.
Educational/academic institutions seem
proportionally more related to biodiversity and
conservation science than their administration
counterparts. NGOs, in turn, seem more committed
to this research or activity. Management also lies
within the administration, but not so much
bioproductivity. (Figure 13).
USES OF PRIMARY BIODIVERSITY DATA:
Using primary biodiversity data (Q01)
Results of the survey (Figure 14) show that
there are three broad categories of uses for
biodiversity data:
1. Basic science, as represented by Taxonomy,
Diversity, Population Dynamics,
Biogeography, Ecology, Evolution. These
represent the majority of the uses.
2. More applied science, such as genetics,
endangered species, studies dealing with
migrations and invasions, conservation
planning, natural resources management,
environmental impact management or climate
change impact.
List the ways in which you use Primary Biodiversity Data
0 100 200 300 400 500 600 700
Taxonomy
Species diversity and populations
Biogeographic studies
Endangered, migratory and invasive Species
Ecology, Evolution and Genetics
Conservation Planning
Natural Resources Management
Life histories and phenologies
Education and Public Outreach
Impact of Climate Change
Environmental Impact Management
Sustainable Use
Agriculture, Fisheries, Forestry and Mining
Environmental regionalisation
Ecotourism
Bioprospecting
Forensics
Recreation
Border Control and Wildlife Trade
Health and Public Safety
Human Infrastructure Planning
Society and Politics
Art and History
Nursery and Pet Industry
Industrial Use
Others (please specify)
RU FR EN ES CN
Figure 14: Uses of Primary biodiversity data. Frequency of responses to Q01: “List the ways in which
you use primary biodiversity data” (Table 1.)
ASSESSMENT OF USER NEEDS – ARIÑO ET AL.
74
Unspecified Museum
Collections Databases
Cited 17-32 times
Cited 9-16 times
cited 5-8 times
cited 3-4 timescited twice
rest (cited once)
ITIS
; 9
GBIF; 10
ANTHOS; 10
CO
NA
BIO
; 1
7
TROPIC
OS; 1
7
IPNI; 14
MaN
IS; 7
Na
ture
Serv
e; 6
Gen
Ba
nk;
5
CS
IC in
dexe
s; 5K
ew; 5
Fis
hB
ase
; 5
USDA Pla
nts; 4HerpNET; 4
OBIS; 4
Google; 4
MOBOT; 4
NYBG SciWeb; 4
Paleo Portal; 4
SP2K; 3
CatBDB; 3
Remib; 3
Aluka; 3
OR
NIS; 2
BHL; 2
BioO
NE; 2
EU
RIS
CO
; 2E
RM
S; 2
TE
LA
Bota
nic
a; 2
Faun
a E
uro
pa
ea; 2
SY
ST
AX
; 2C
oL; 2
Index F
ungoru
m; 2
WoR
MS
; 2
How do you access primary biodiversity data?
0 100 200 300 400 500 600 700
Through your own field works/surveys:
Through hardcopy, literature survey (non-digital form):
Through Primary Publications (e.g. taxonomic monographs, maps of
species observations):
Through other web based data portals (please specify)
Through the GBIF Data Portal (http://data.gbif.org)
Through access to offline digital data sets (CDROM/DVD/Tapes etc.)
Through free and open datasets within and outside of your institution:
Through Reciprocal agreements with other groups/individuals
Through institutional agreements
Through Payment basis
Through FTP sites (please specify)
Through others (please specify)
RU FR EN ES CN
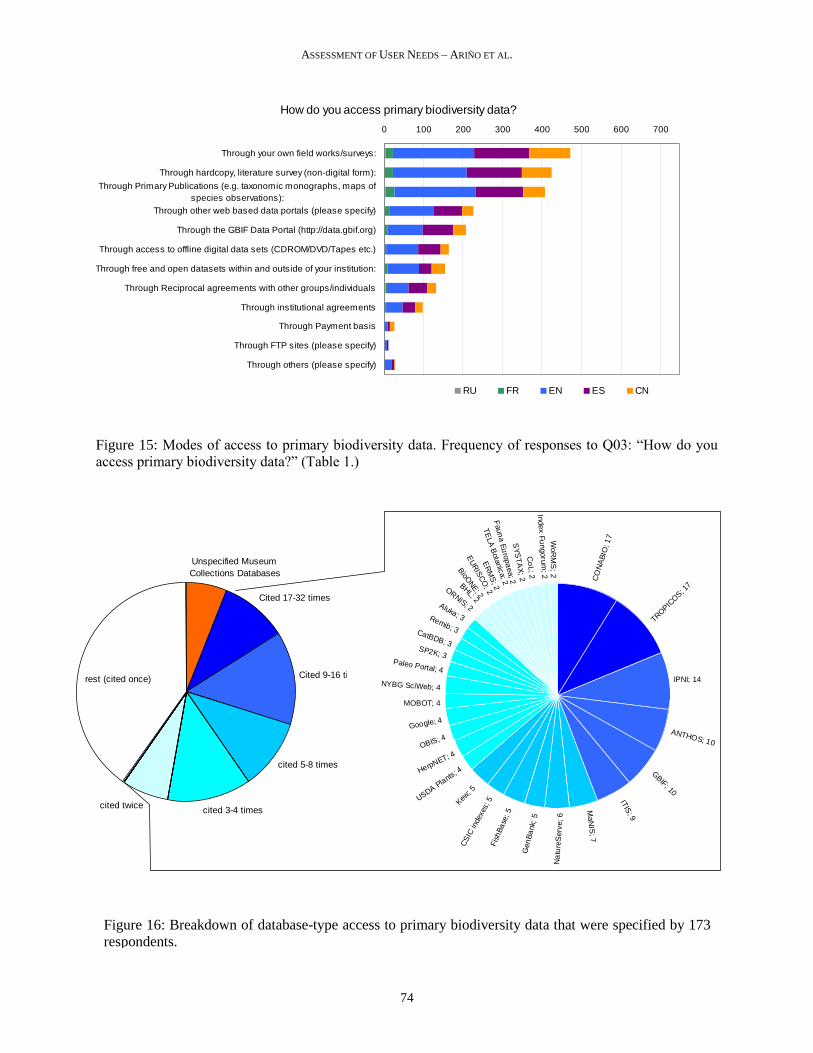
Figure 15: Modes of access to primary biodiversity data. Frequency of responses to Q03: “How do you
access primary biodiversity data?” (Table 1.)
Figure 16: Breakdown of database-type access to primary biodiversity data that were specified by 173
respondents.
ASSESSMENT OF USER NEEDS – ARIÑO ET AL.
75
3. Societal issues, such as ecotourism, recreation,
public health, infrastructure planning, etc.
These have a low representation overall.
These results must be viewed in the light of the
types of respondents, which were heavily biased
towards research/academic institutions. This
accounts for numerous respondents’ links to basic
science.
(a) Accessing data (Q03)
Two main categories can be distinguished here
(Figure 15). First, data that are deemed
trustworthy: one’s own data collected from field
work, or surveys, and peer-reviewed data collected
from literature. Second, data sources assumed to be
“less reliable” (because of potential lack of quality
checks such as in a peer review, or because of
intrinsic lack of confidence in other’s data), such
as web portals (including GBIF data portal) and
other digital data sources.
One-third of the respondents used GBIF data,
either directly from the GBIF data portal, or
similar access points. Therefore, the remaining
two-thirds of the respondents who use other
resources define a group of potential future
contributors to GBIF (although many of them
might be actually using GBIF data as many of
these portals are indeed associated with GBIF).
The fact that the majority of respondents were
using portals other than GBIF data portal may
suggest that national, regional or thematic data
portals should be encouraged as part of the GBIF
community.
Respondents answering the previous question
were asked to provide detailed data. More than two
hundred (209) respondents provided sources3 of
which 173 supplied 316 databased/electronic
sources. Figure 16 summarises these sources. This
breakdown allows us to see both the relative
importance of online sources, and what sources
could eventually be most ‘profitably’ targeted by
GBIF for integration
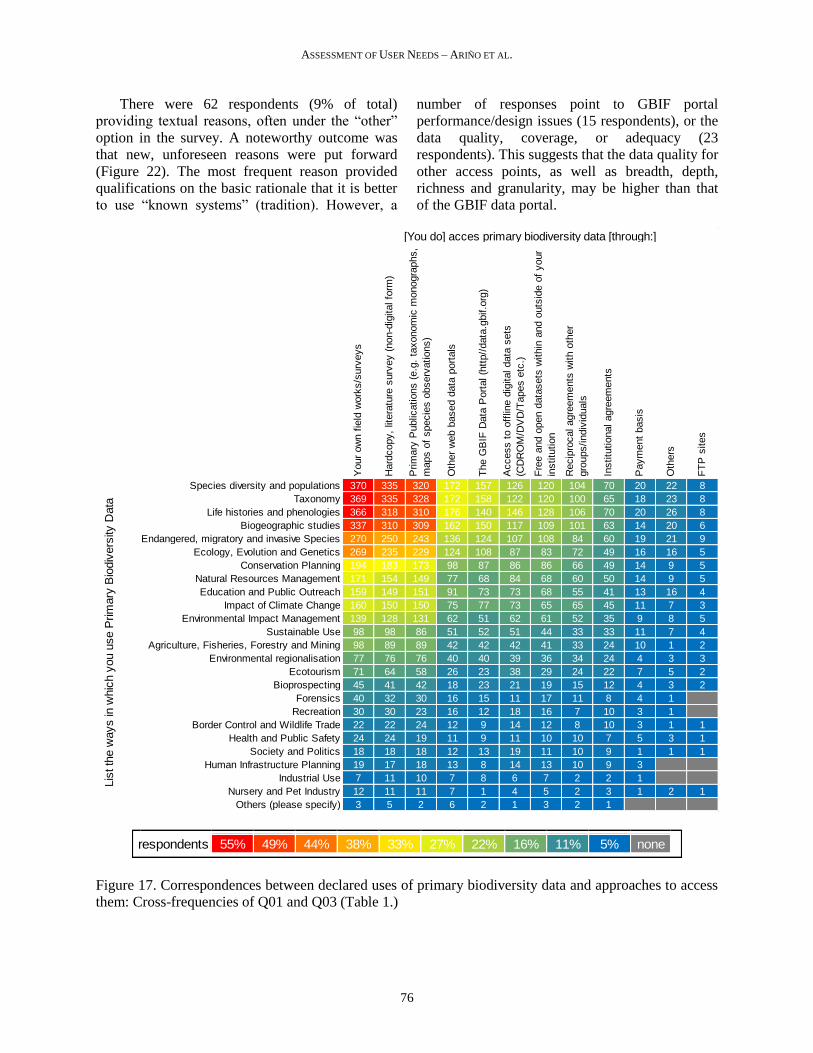
Different types of users tend to use different
access mechanisms (Figure 17). For example,
systematists tend to use data originating through
their own work program. Access through GBIF
3 At the time of publishing of this report, these will be archived and
made available for further analysis on request.
(green in Fig. 17) follows, in general, the same
pattern as for other on-line data sources. Most
access of GBIF data appears to be related to
“hard”-science, i.e. taxonomy, biogeography,
biodiversity, etc. However, the percentage oriented
in this way is not as great as that for traditional
access means (own/field work, hardcopy literature,
etc.)
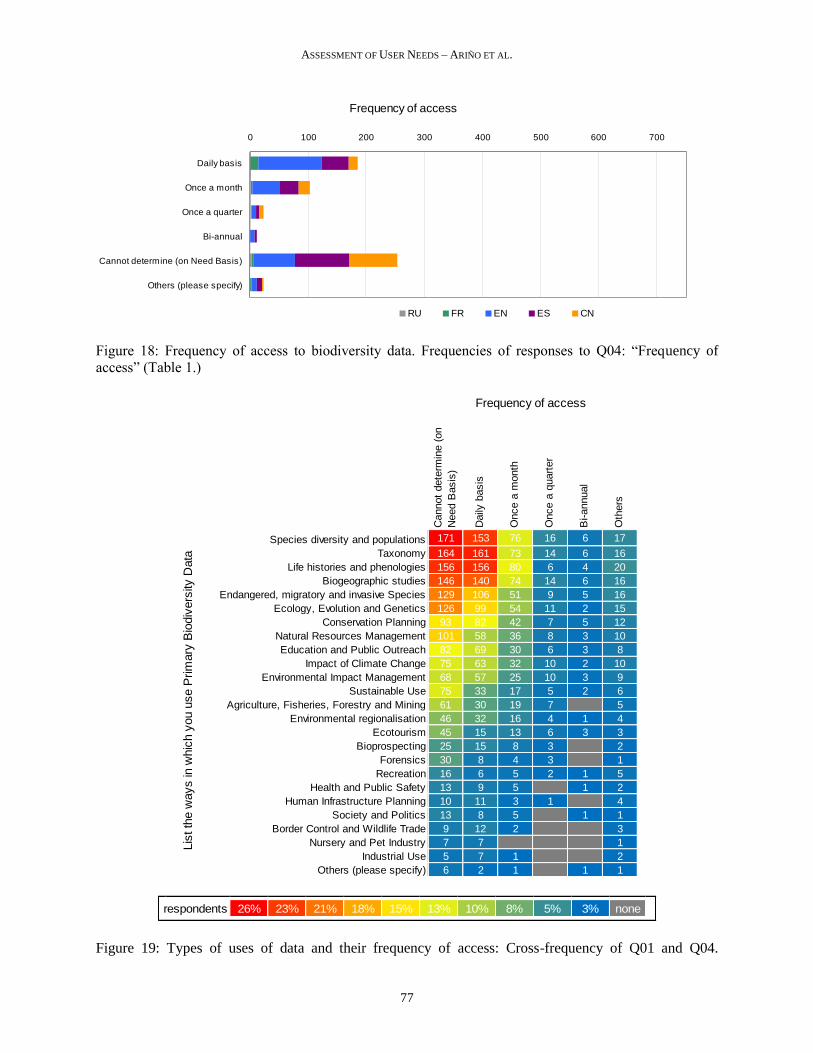
Frequency of access (Q04)
The majority of the respondent users were not
able to determine the frequency of access (Figure
18). However, nearly two hundred respondents
indicated that they access data on a daily basis.
Further, another one hundred did so on a monthly
basis.
The breakdown of the frequency of access
according to different uses of data (Figure 19)
shows that basic science data require access more
frequently, along with outreach and environmental
impact management needs.
Together, these findings may indicate what
fraction of users appear to be depending on data
availability.
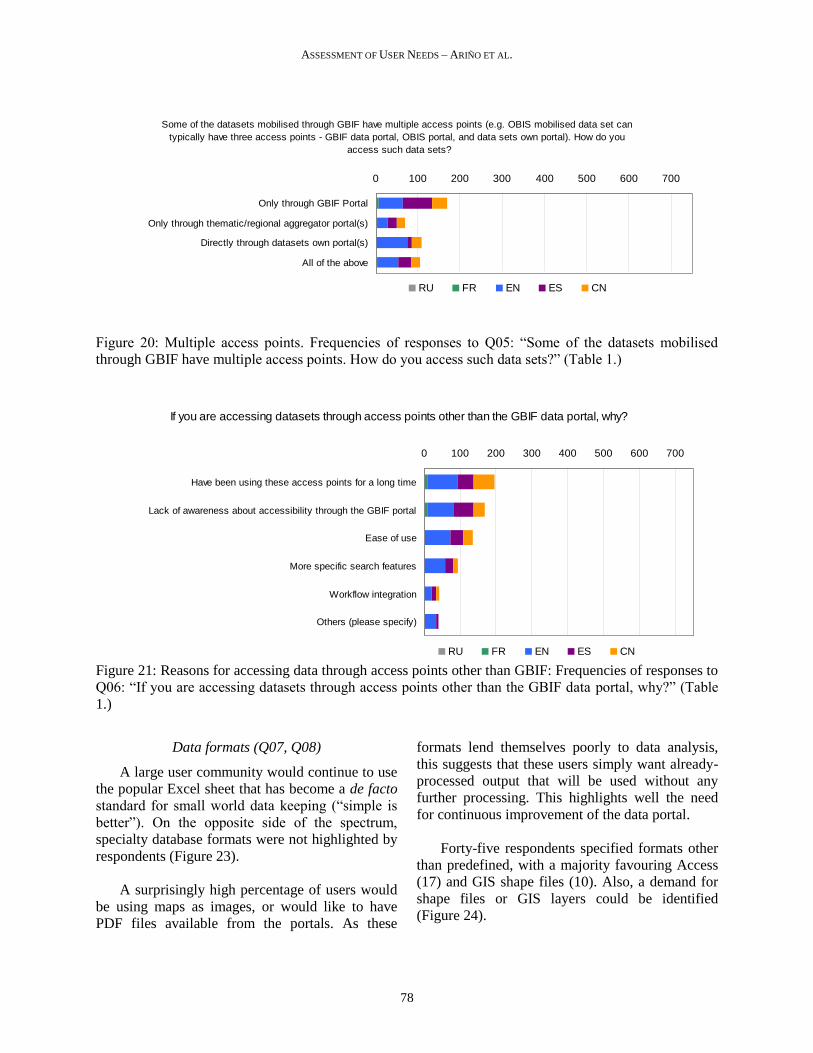
Multiple access points (Q05)
Although about one fourth of users like to use
more than one data portal (Figure 20), the survey
results indicate that most users have their own
preferred data portal. Among these, the majority of
the preferred, sole-use, portals is the GBIF data
portal.
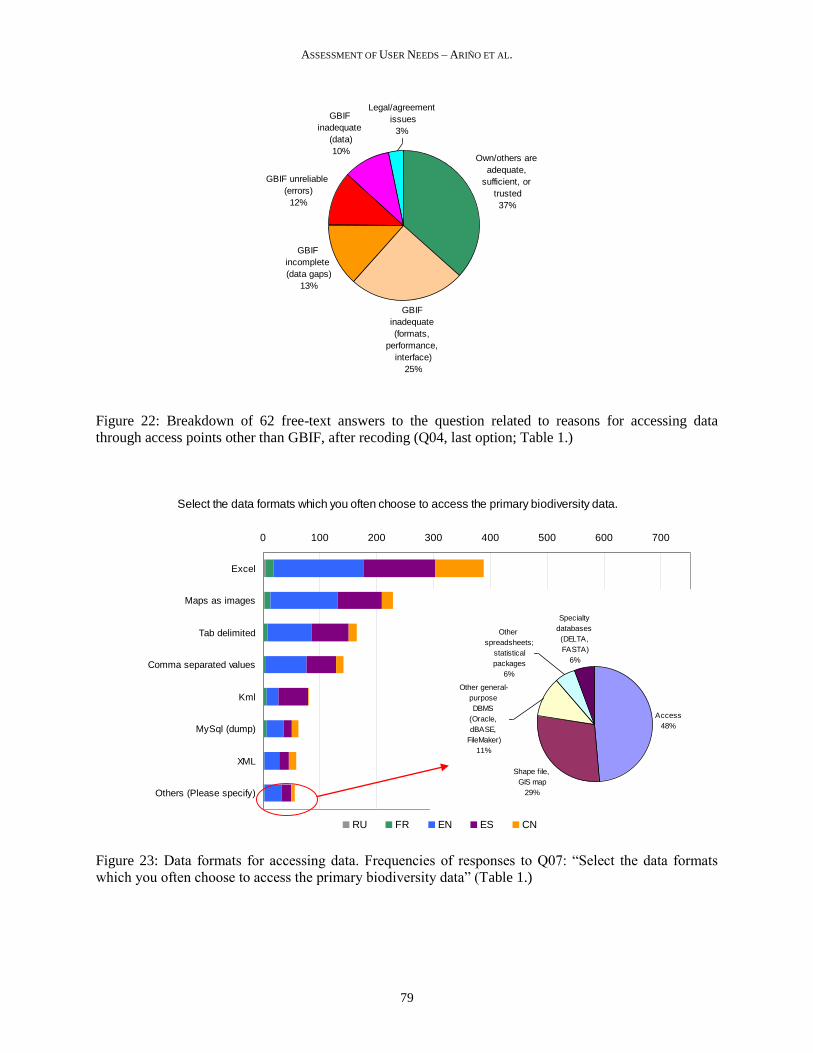
Using other data access points (Q06)
Among the reasons that respondents put
forward for accessing data portals other than GBIF,
“tradition” was the most frequently cited (Figure
21). It should be noted in this context that many
data portals existed even before GBIF data portal
was put in place. Thus, “tradition” reflects the
“head start” gained by some data portals (“why
should I go somewhere else?”). It is noteworthy
that a widespread lack of awareness of the GBIF
data portal is revealed by the survey results.
Further, the survey reveals that some users are
choosing other data portals because of “ease of
use”.
ASSESSMENT OF USER NEEDS – ARIÑO ET AL.
76
There were 62 respondents (9% of total)
providing textual reasons, often under the “other”
option in the survey. A noteworthy outcome was
that new, unforeseen reasons were put forward
(Figure 22). The most frequent reason provided
qualifications on the basic rationale that it is better
to use “known systems” (tradition). However, a
number of responses point to GBIF portal
performance/design issues (15 respondents), or the
data quality, coverage, or adequacy (23
respondents). This suggests that the data quality for
other access points, as well as breadth, depth,
richness and granularity, may be higher than that
of the GBIF data portal.
Your
ow
n f
ield
work
s/s
urv
eys
Hard
copy,
litera
ture
surv
ey (
non-d
igital fo
rm)
Prim
ary
Public
ations (
e.g
. ta
xonom
ic m
onogra
phs,
maps o
f specie
s o
bserv
ations)
Oth
er
web b
ased d
ata
port
als
The G
BIF
Data
Port
al (h
ttp//
data
.gbif.o
rg)
Access t
o o
fflin
e d
igital data
sets
(CD
RO
M/D
VD
/Tapes e
tc.)
Fre
e a
nd o
pen d
ata
sets
within
and o
uts
ide o
f your
institu
tion
Recip
rocal agre
em
ents
with o
ther
gro
ups/indiv
iduals
Institu
tional agre
em
ents
Paym
ent
basis
Oth
ers
FT
P s
ites
Species diversity and populations 370 335 320 172 157 126 120 104 70 20 22 8
Taxonomy 369 335 328 172 158 122 120 100 65 18 23 8
Life histories and phenologies 366 318 310 176 140 146 128 106 70 20 26 8
Biogeographic studies 337 310 309 162 150 117 109 101 63 14 20 6
Endangered, migratory and invasive Species 270 250 243 136 124 107 108 84 60 19 21 9
Ecology, Evolution and Genetics 269 235 229 124 108 87 83 72 49 16 16 5
Conservation Planning 194 183 173 98 87 86 86 66 49 14 9 5
Natural Resources Management 171 154 149 77 68 84 68 60 50 14 9 5
Education and Public Outreach 159 149 151 91 73 73 68 55 41 13 16 4
Impact of Climate Change 160 150 150 75 77 73 65 65 45 11 7 3
Environmental Impact Management 139 128 131 62 51 62 61 52 35 9 8 5
Sustainable Use 98 98 86 51 52 51 44 33 33 11 7 4
Agriculture, Fisheries, Forestry and Mining 98 89 89 42 42 42 41 33 24 10 1 2
Environmental regionalisation 77 76 76 40 40 39 36 34 24 4 3 3
Ecotourism 71 64 58 26 23 38 29 24 22 7 5 2
Bioprospecting 45 41 42 18 23 21 19 15 12 4 3 2
Forensics 40 32 30 16 15 11 17 11 8 4 1
Recreation 30 30 23 16 12 18 16 7 10 3 1
Border Control and Wildlife Trade 22 22 24 12 9 14 12 8 10 3 1 1
Health and Public Safety 24 24 19 11 9 11 10 10 7 5 3 1
Society and Politics 18 18 18 12 13 19 11 10 9 1 1 1
Human Infrastructure Planning 19 17 18 13 8 14 13 10 9 3
Industrial Use 7 11 10 7 8 6 7 2 2 1
Nursery and Pet Industry 12 11 11 7 1 4 5 2 3 1 2 1
Others (please specify) 3 5 2 6 2 1 3 2 1
[You do] acces primary biodiversity data [through:]
Lis
t th
e w
ays in
whic
h y
ou u
se P
rim
ary
Bio
div
ers
ity D
ata
respondents 55% 49% 44% 38% 33% 27% 22% 16% 11% 5% none
Figure 17. Correspondences between declared uses of primary biodiversity data and approaches to access
them: Cross-frequencies of Q01 and Q03 (Table 1.)
ASSESSMENT OF USER NEEDS – ARIÑO ET AL.
77
Frequency of access
0 100 200 300 400 500 600 700
Daily basis
Once a month
Once a quarter
Bi-annual
Cannot determine (on Need Basis)
Others (please specify)
RU FR EN ES CN
Figure 18: Frequency of access to biodiversity data. Frequencies of responses to Q04: “Frequency of
access” (Table 1.)
Cannot
dete
rmin
e (
on
Need B
asis
)
Daily
basis
Once a
month
Once a
quart
er
Bi-annual
Oth
ers
Species diversity and populations 171 153 76 16 6 17
Taxonomy 164 161 73 14 6 16
Life histories and phenologies 156 156 80 6 4 20
Biogeographic studies 146 140 74 14 6 16
Endangered, migratory and invasive Species 129 106 51 9 5 16
Ecology, Evolution and Genetics 126 99 54 11 2 15
Conservation Planning 93 82 42 7 5 12
Natural Resources Management 101 58 36 8 3 10
Education and Public Outreach 82 69 30 6 3 8
Impact of Climate Change 75 63 32 10 2 10
Environmental Impact Management 68 57 25 10 3 9
Sustainable Use 75 33 17 5 2 6
Agriculture, Fisheries, Forestry and Mining 61 30 19 7 5
Environmental regionalisation 46 32 16 4 1 4
Ecotourism 45 15 13 6 3 3
Bioprospecting 25 15 8 3 2
Forensics 30 8 4 3 1
Recreation 16 6 5 2 1 5
Health and Public Safety 13 9 5 1 2
Human Infrastructure Planning 10 11 3 1 4
Society and Politics 13 8 5 1 1
Border Control and Wildlife Trade 9 12 2 3
Nursery and Pet Industry 7 7 1
Industrial Use 5 7 1 2
Others (please specify) 6 2 1 1 1
Frequency of access
Lis
t th
e w
ays in
whic
h y
ou u
se P
rim
ary
Bio
div
ers
ity D
ata
respondents 26% 23% 21% 18% 15% 13% 10% 8% 5% 3% none
Figure 19: Types of uses of data and their frequency of access: Cross-frequency of Q01 and Q04.
ASSESSMENT OF USER NEEDS – ARIÑO ET AL.
78
Some of the datasets mobilised through GBIF have multiple access points (e.g. OBIS mobilised data set can
typically have three access points - GBIF data portal, OBIS portal, and data sets own portal). How do you
access such data sets?
0 100 200 300 400 500 600 700
Only through GBIF Portal
Only through thematic/regional aggregator portal(s)
Directly through datasets own portal(s)
All of the above
RU FR EN ES CN
Figure 20: Multiple access points. Frequencies of responses to Q05: “Some of the datasets mobilised
through GBIF have multiple access points. How do you access such data sets?” (Table 1.)
If you are accessing datasets through access points other than the GBIF data portal, why?
0 100 200 300 400 500 600 700
Have been using these access points for a long time
Lack of awareness about accessibility through the GBIF portal
Ease of use
More specific search features
Workflow integration
Others (please specify)
RU FR EN ES CN
Figure 21: Reasons for accessing data through access points other than GBIF: Frequencies of responses to
Q06: “If you are accessing datasets through access points other than the GBIF data portal, why?” (Table
1.)
Data formats (Q07, Q08)
A large user community would continue to use
the popular Excel sheet that has become a de facto
standard for small world data keeping (“simple is
better”). On the opposite side of the spectrum,
specialty database formats were not highlighted by
respondents (Figure 23).
A surprisingly high percentage of users would
be using maps as images, or would like to have
PDF files available from the portals. As these
formats lend themselves poorly to data analysis,
this suggests that these users simply want already-
processed output that will be used without any
further processing. This highlights well the need
for continuous improvement of the data portal.
Forty-five respondents specified formats other
than predefined, with a majority favouring Access
(17) and GIS shape files (10). Also, a demand for
shape files or GIS layers could be identified
(Figure 24).
ASSESSMENT OF USER NEEDS – ARIÑO ET AL.
79
Own/others are
adequate,
sufficient, or
trusted
37%
GBIF
inadequate
(formats,
performance,
interface)
25%
GBIF
incomplete
(data gaps)
13%
GBIF unreliable
(errors)
12%
GBIF
inadequate
(data)
10%
Legal/agreement
issues
3%
Figure 22: Breakdown of 62 free-text answers to the question related to reasons for accessing data
through access points other than GBIF, after recoding (Q04, last option; Table 1.)
Select the data formats which you often choose to access the primary biodiversity data.
0 100 200 300 400 500 600 700
Excel
Maps as images
Tab delimited
Comma separated values
Kml
MySql (dump)
XML
Others (Please specify)
RU FR EN ES CN
Figure 23: Data formats for accessing data. Frequencies of responses to Q07: “Select the data formats
which you often choose to access the primary biodiversity data” (Table 1.)
Access
48%
Shape file,
GIS map
29%
Specialty
databases
(DELTA,
FASTA)
6%
Other
spreadsheets;
statistical
packages
6%
Other general-
purpose
DBMS
(Oracle,
dBASE,
FileMaker)
11%

ASSESSMENT OF USER NEEDS – ARIÑO ET AL.
80
If GBIF were to serve data in other formats, which would be your
preference(s)?
0 5 10 15 20 25 30 35 40
Shape file, GIS mapdata
Excel
Access
text, csv, prn, matrix file
Image maps (JPG, GIF)
dBASE
Other Office/OO files
SQL dumps
kml
XML
FileMaker
Postgres
Matlab
Formats not available in GBIF
Formats already available in GBIF
Figure 24: Other data formats potentially required from GBIF. Frequencies of responses to Q08: “If GBIF
were to serve data in other formats, which would be your preference?” (Table 1.)
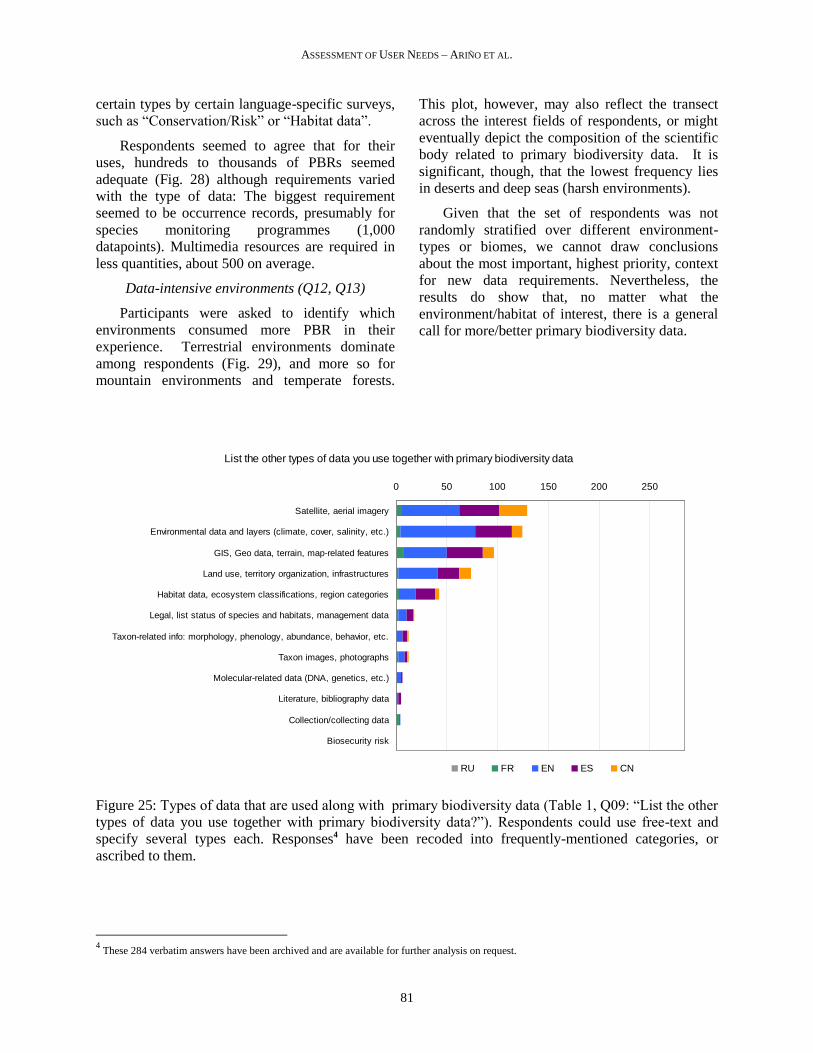
Other types of data (Q09)
When asked to list what other types of data are
used along with primary biodiversity data, three
broad groups are evident (Figure 25): (i)
Geographically-explicit data, including satellite
and aerial imagery and related data, environmental
data, and land use/infrastructures data (the most
sought after); (ii) Species- or habitat-related
ecological and taxonomical data; (iii) other
specialty data (molecular, genetics, collection and
methods, historical, etc.)
QUALITY AND QUANTITY REQUIREMENTS
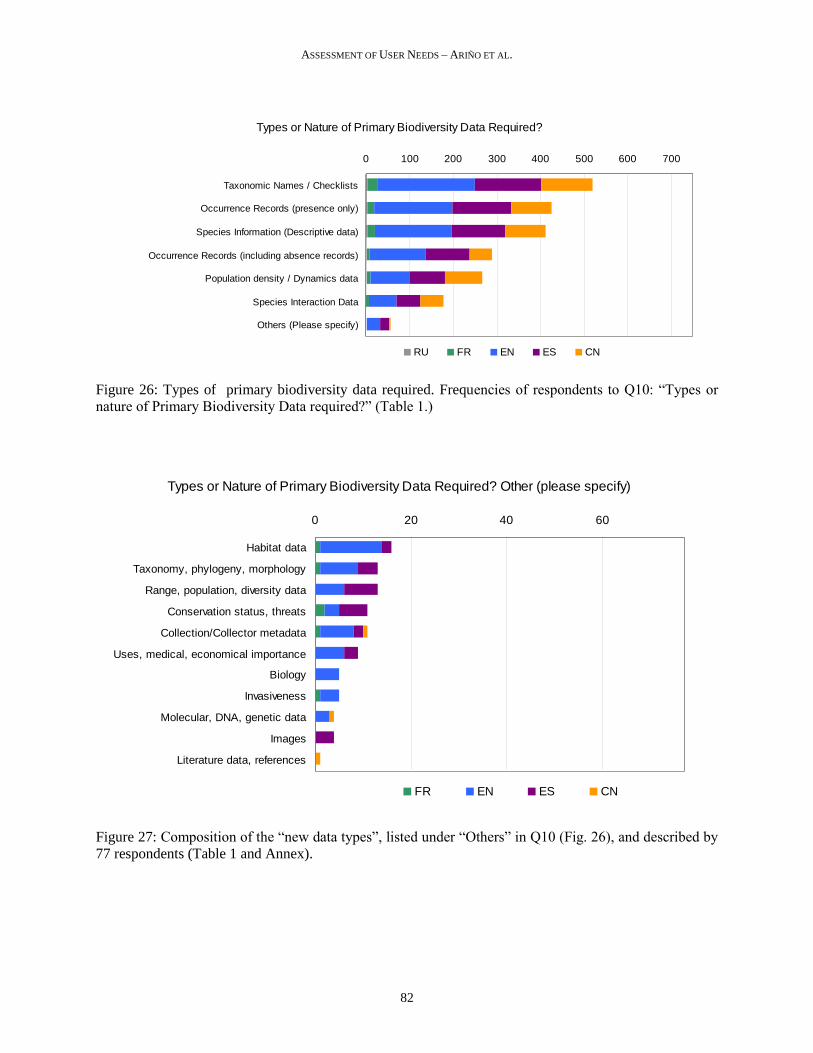
Primary biodiversity data required (Q10, Q11)
More than two thirds of respondents required
taxon names to be included among the retrieved
data (Figure 26), either because of the
respondents’ disciplinary biases (a majority of
biodiversity-related scientists) or because data
meaning or usefulness would require some type of
taxonomic ascription. This result is not surprising
given that it has been recognized worldwide that
the reliance on a correct name is absolute.
Occurrence data, and descriptive data about
the species, both naturally linked to the taxon
identifier, are the second group of required data.
Together, these two types of data appear to form
the core of “biodiversity data”.
A more specific type of data appears as a third
requirement: distribution data that may be used for
modelling, such as occurrence data (including
absence data), and population and population
interaction data.
Respondents free-texting “Others” offered a
wide range of options, although most could
actually be included within the pre-defined types
(Fig. 27). Among the particular types (but always
with low frequency) were some that might not be
properly considered primary biodiversity data,
such as “risk status”, “invasiveness” or
“interactive keys” (see Annex for a full list). It is
illustrative to observe the importance given to
ASSESSMENT OF USER NEEDS – ARIÑO ET AL.
81
certain types by certain language-specific surveys,
such as “Conservation/Risk” or “Habitat data”.
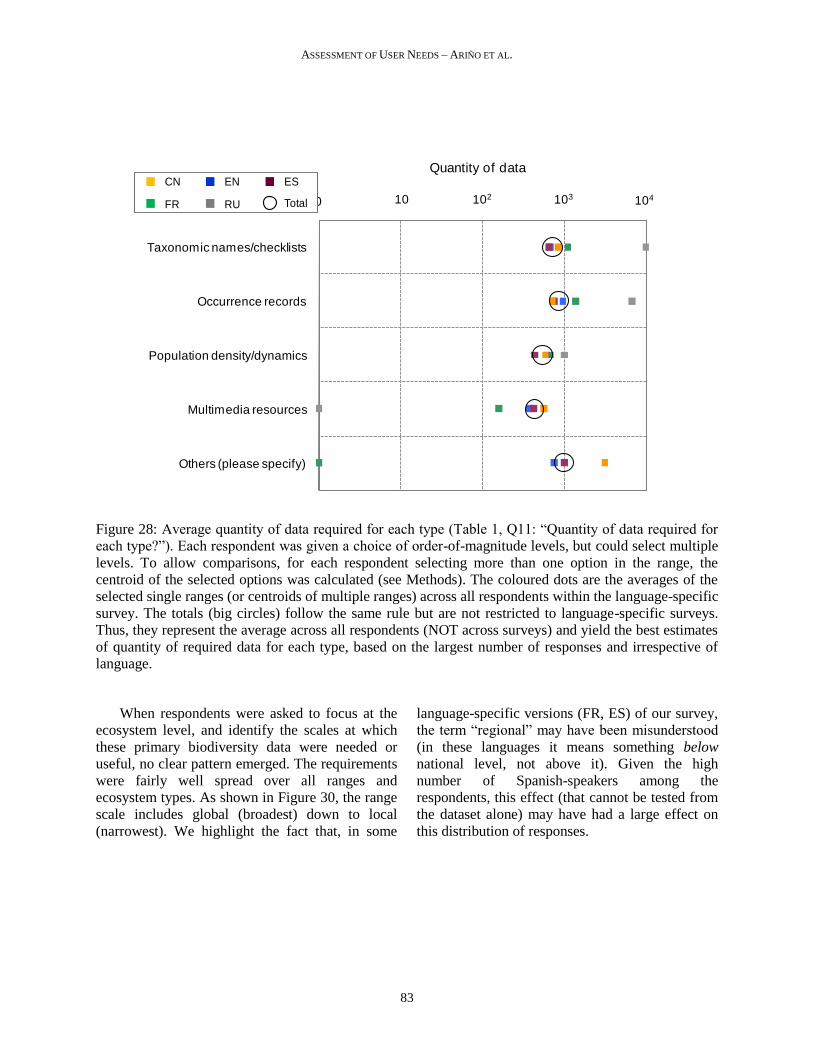
Respondents seemed to agree that for their
uses, hundreds to thousands of PBRs seemed
adequate (Fig. 28) although requirements varied
with the type of data: The biggest requirement
seemed to be occurrence records, presumably for
species monitoring programmes (1,000
datapoints). Multimedia resources are required in
less quantities, about 500 on average.
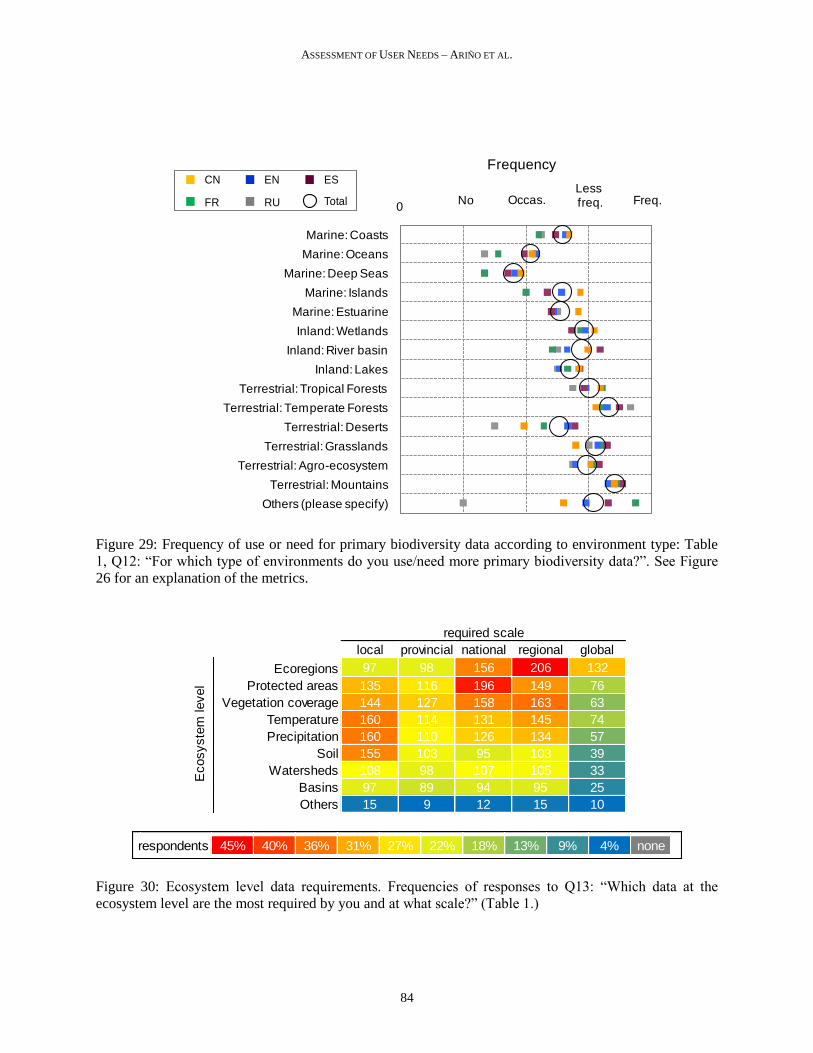
Data-intensive environments (Q12, Q13)
Participants were asked to identify which
environments consumed more PBR in their
experience. Terrestrial environments dominate
among respondents (Fig. 29), and more so for
mountain environments and temperate forests.
This plot, however, may also reflect the transect
across the interest fields of respondents, or might
eventually depict the composition of the scientific
body related to primary biodiversity data. It is
significant, though, that the lowest frequency lies
in deserts and deep seas (harsh environments).
Given that the set of respondents was not
randomly stratified over different environment-
types or biomes, we cannot draw conclusions
about the most important, highest priority, context
for new data requirements. Nevertheless, the
results do show that, no matter what the
environment/habitat of interest, there is a general
call for more/better primary biodiversity data.
List the other types of data you use together with primary biodiversity data
0 50 100 150 200 250
Satellite, aerial imagery
Environmental data and layers (climate, cover, salinity, etc.)
GIS, Geo data, terrain, map-related features
Land use, territory organization, infrastructures
Habitat data, ecosystem classifications, region categories
Legal, list status of species and habitats, management data
Taxon-related info: morphology, phenology, abundance, behavior, etc.
Taxon images, photographs
Molecular-related data (DNA, genetics, etc.)
Literature, bibliography data
Collection/collecting data
Biosecurity risk
RU FR EN ES CN
Figure 25: Types of data that are used along with primary biodiversity data (Table 1, Q09: “List the other
types of data you use together with primary biodiversity data?”). Respondents could use free-text and
specify several types each. Responses4 have been recoded into frequently-mentioned categories, or
ascribed to them.
4 These 284 verbatim answers have been archived and are available for further analysis on request.
ASSESSMENT OF USER NEEDS – ARIÑO ET AL.
82
Types or Nature of Primary Biodiversity Data Required?
0 100 200 300 400 500 600 700
Taxonomic Names / Checklists
Occurrence Records (presence only)
Species Information (Descriptive data)
Occurrence Records (including absence records)
Population density / Dynamics data
Species Interaction Data
Others (Please specify)
RU FR EN ES CN
Figure 26: Types of primary biodiversity data required. Frequencies of respondents to Q10: “Types or
nature of Primary Biodiversity Data required?” (Table 1.)
Types or Nature of Primary Biodiversity Data Required? Other (please specify)
0 20 40 60
Habitat data
Taxonomy, phylogeny, morphology
Range, population, diversity data
Conservation status, threats
Collection/Collector metadata
Uses, medical, economical importance
Biology
Invasiveness
Molecular, DNA, genetic data
Images
Literature data, references
FR EN ES CN
Figure 27: Composition of the “new data types”, listed under “Others” in Q10 (Fig. 26), and described by
77 respondents (Table 1 and Annex).
ASSESSMENT OF USER NEEDS – ARIÑO ET AL.
83
Figure 28: Average quantity of data required for each type (Table 1, Q11: “Quantity of data required for
each type?”). Each respondent was given a choice of order-of-magnitude levels, but could select multiple
levels. To allow comparisons, for each respondent selecting more than one option in the range, the
centroid of the selected options was calculated (see Methods). The coloured dots are the averages of the
selected single ranges (or centroids of multiple ranges) across all respondents within the language-specific
survey. The totals (big circles) follow the same rule but are not restricted to language-specific surveys.
Thus, they represent the average across all respondents (NOT across surveys) and yield the best estimates
of quantity of required data for each type, based on the largest number of responses and irrespective of
language.
When respondents were asked to focus at the
ecosystem level, and identify the scales at which
these primary biodiversity data were needed or
useful, no clear pattern emerged. The requirements
were fairly well spread over all ranges and
ecosystem types. As shown in Figure 30, the range
scale includes global (broadest) down to local
(narrowest). We highlight the fact that, in some
language-specific versions (FR, ES) of our survey,
the term “regional” may have been misunderstood
(in these languages it means something below
national level, not above it). Given the high
number of Spanish-speakers among the
respondents, this effect (that cannot be tested from
the dataset alone) may have had a large effect on
this distribution of responses.
0 1 2 3 4
Taxonomic names/checklists
Occurrence records
Population density/dynamics
Multimedia resources
Others (please specify)
Quantity of data
10 102 103 104
CN
FR
EN
RU
ES
Total
ASSESSMENT OF USER NEEDS – ARIÑO ET AL.
84
Figure 29: Frequency of use or need for primary biodiversity data according to environment type: Table
1, Q12: “For which type of environments do you use/need more primary biodiversity data?”. See Figure
26 for an explanation of the metrics.
local provincial national regional global
Ecoregions 97 98 156 206 132
Protected areas 135 116 196 149 76
Vegetation coverage 144 127 158 163 63
Temperature 160 114 131 145 74
Precipitation 160 110 126 134 57
Soil 155 103 95 103 39
Watersheds 108 98 107 105 33
Basins 97 89 94 95 25
Others 15 9 12 15 10
required scale
Ecosyste
m level
respondents 45% 40% 36% 31% 27% 22% 18% 13% 9% 4% none
Figure 30: Ecosystem level data requirements. Frequencies of responses to Q13: “Which data at the
ecosystem level are the most required by you and at what scale?” (Table 1.)
0 1 2 3 4
Marine: Coasts
Marine: Oceans
Marine: Deep Seas
Marine: Islands
Marine: Estuarine
Inland: Wetlands
Inland: River basin
Inland: Lakes
Terrestrial: Tropical Forests
Terrestrial: Temperate Forests
Terrestrial: Deserts
Terrestrial: Grasslands
Terrestrial: Agro-ecosystem
Terrestrial: Mountains
Others (please specify)
Frequency
No Occas.Lessfreq. Freq.
CN
FR
EN
RU
ES
Total
ASSESSMENT OF USER NEEDS – ARIÑO ET AL.
85
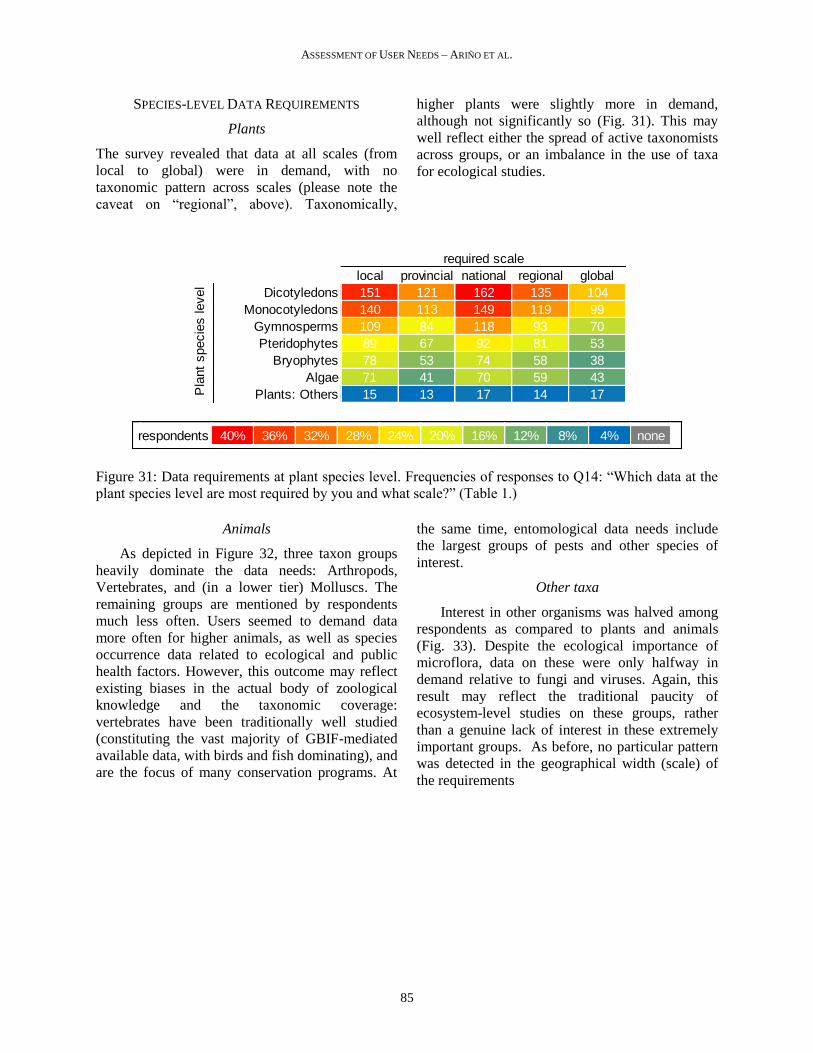
SPECIES-LEVEL DATA REQUIREMENTS
Plants
The survey revealed that data at all scales (from
local to global) were in demand, with no
taxonomic pattern across scales (please note the
caveat on “regional”, above). Taxonomically,
higher plants were slightly more in demand,
although not significantly so (Fig. 31). This may
well reflect either the spread of active taxonomists
across groups, or an imbalance in the use of taxa
for ecological studies.
local provincial national regional global
Dicotyledons 151 121 162 135 104
Monocotyledons 140 113 149 119 99
Gymnosperms 109 84 118 93 70
Pteridophytes 89 67 92 81 53
Bryophytes 78 53 74 58 38
Algae 71 41 70 59 43
Plants: Others 15 13 17 14 17
required scale
Pla
nt
specie
s level
respondents 40% 36% 32% 28% 24% 20% 16% 12% 8% 4% none
Figure 31: Data requirements at plant species level. Frequencies of responses to Q14: “Which data at the
plant species level are most required by you and what scale?” (Table 1.)
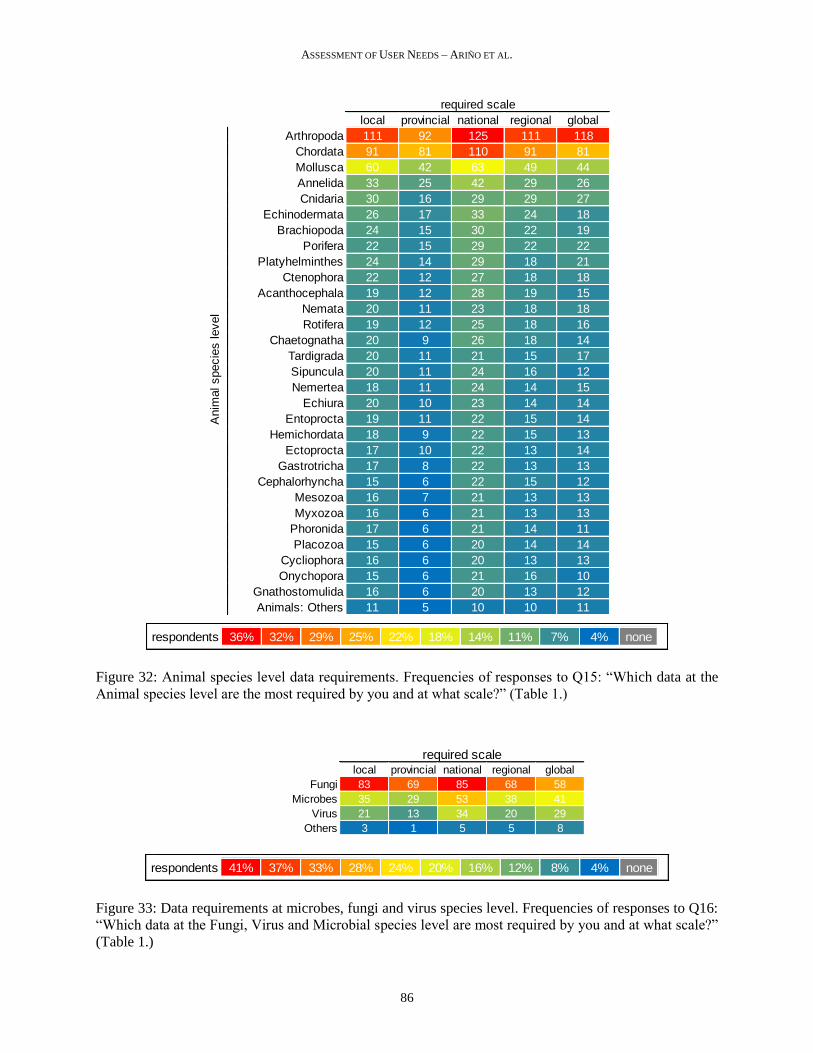
Animals
As depicted in Figure 32, three taxon groups
heavily dominate the data needs: Arthropods,
Vertebrates, and (in a lower tier) Molluscs. The
remaining groups are mentioned by respondents
much less often. Users seemed to demand data
more often for higher animals, as well as species
occurrence data related to ecological and public
health factors. However, this outcome may reflect
existing biases in the actual body of zoological
knowledge and the taxonomic coverage:
vertebrates have been traditionally well studied
(constituting the vast majority of GBIF-mediated
available data, with birds and fish dominating), and
are the focus of many conservation programs. At
the same time, entomological data needs include
the largest groups of pests and other species of
interest.
Other taxa
Interest in other organisms was halved among
respondents as compared to plants and animals
(Fig. 33). Despite the ecological importance of
microflora, data on these were only halfway in
demand relative to fungi and viruses. Again, this
result may reflect the traditional paucity of
ecosystem-level studies on these groups, rather
than a genuine lack of interest in these extremely
important groups. As before, no particular pattern
was detected in the geographical width (scale) of
the requirements
ASSESSMENT OF USER NEEDS – ARIÑO ET AL.
86
local provincial national regional global
Arthropoda 111 92 125 111 118
Chordata 91 81 110 91 81
Mollusca 60 42 63 49 44
Annelida 33 25 42 29 26
Cnidaria 30 16 29 29 27
Echinodermata 26 17 33 24 18
Brachiopoda 24 15 30 22 19
Porifera 22 15 29 22 22
Platyhelminthes 24 14 29 18 21
Ctenophora 22 12 27 18 18
Acanthocephala 19 12 28 19 15
Nemata 20 11 23 18 18
Rotifera 19 12 25 18 16
Chaetognatha 20 9 26 18 14
Tardigrada 20 11 21 15 17
Sipuncula 20 11 24 16 12
Nemertea 18 11 24 14 15
Echiura 20 10 23 14 14
Entoprocta 19 11 22 15 14
Hemichordata 18 9 22 15 13
Ectoprocta 17 10 22 13 14
Gastrotricha 17 8 22 13 13
Cephalorhyncha 15 6 22 15 12
Mesozoa 16 7 21 13 13
Myxozoa 16 6 21 13 13
Phoronida 17 6 21 14 11
Placozoa 15 6 20 14 14
Cycliophora 16 6 20 13 13
Onychopora 15 6 21 16 10
Gnathostomulida 16 6 20 13 12
Animals: Others 11 5 10 10 11
required scale
Anim
al specie
s level
respondents 36% 32% 29% 25% 22% 18% 14% 11% 7% 4% none
Figure 32: Animal species level data requirements. Frequencies of responses to Q15: “Which data at the
Animal species level are the most required by you and at what scale?” (Table 1.)
local provincial national regional global
Fungi 83 69 85 68 58
Microbes 35 29 53 38 41
Virus 21 13 34 20 29
Others 3 1 5 5 8
required scale
respondents 41% 37% 33% 28% 24% 20% 16% 12% 8% 4% none
Figure 33: Data requirements at microbes, fungi and virus species level. Frequencies of responses to Q16:
“Which data at the Fungi, Virus and Microbial species level are most required by you and at what scale?”
(Table 1.)
ASSESSMENT OF USER NEEDS – ARIÑO ET AL.
87
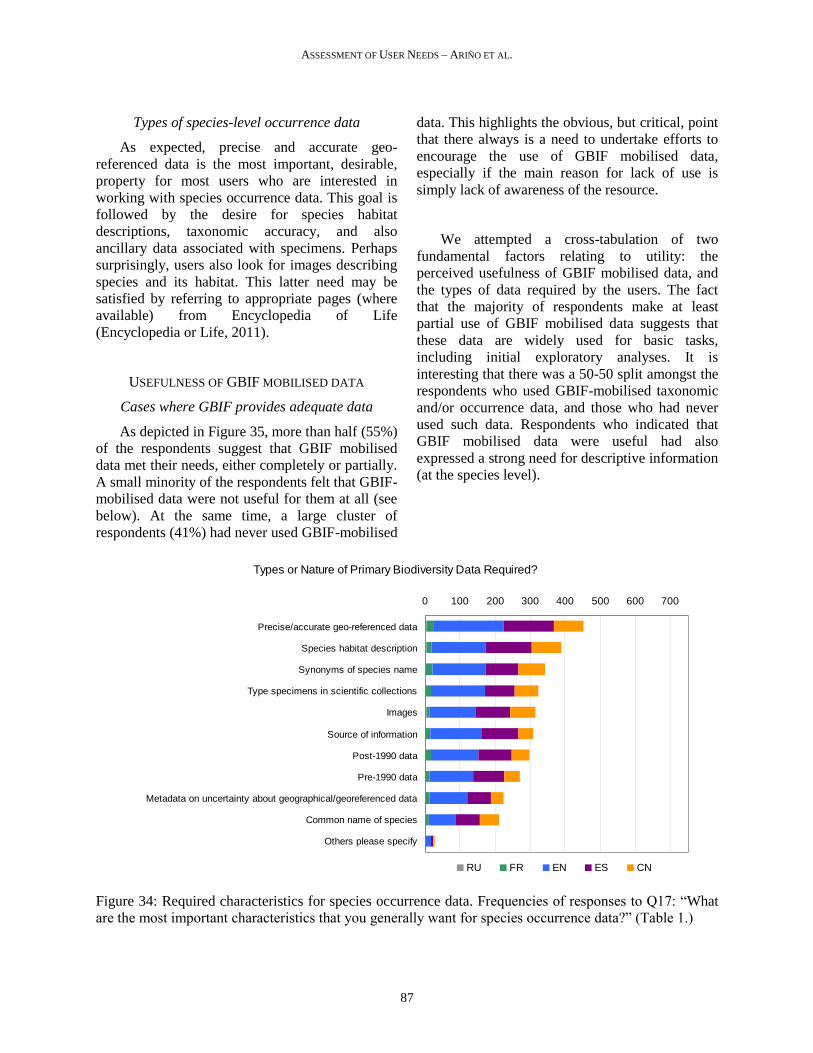
Types of species-level occurrence data
As expected, precise and accurate geo-
referenced data is the most important, desirable,
property for most users who are interested in
working with species occurrence data. This goal is
followed by the desire for species habitat
descriptions, taxonomic accuracy, and also
ancillary data associated with specimens. Perhaps
surprisingly, users also look for images describing
species and its habitat. This latter need may be
satisfied by referring to appropriate pages (where
available) from Encyclopedia of Life
(Encyclopedia or Life, 2011).
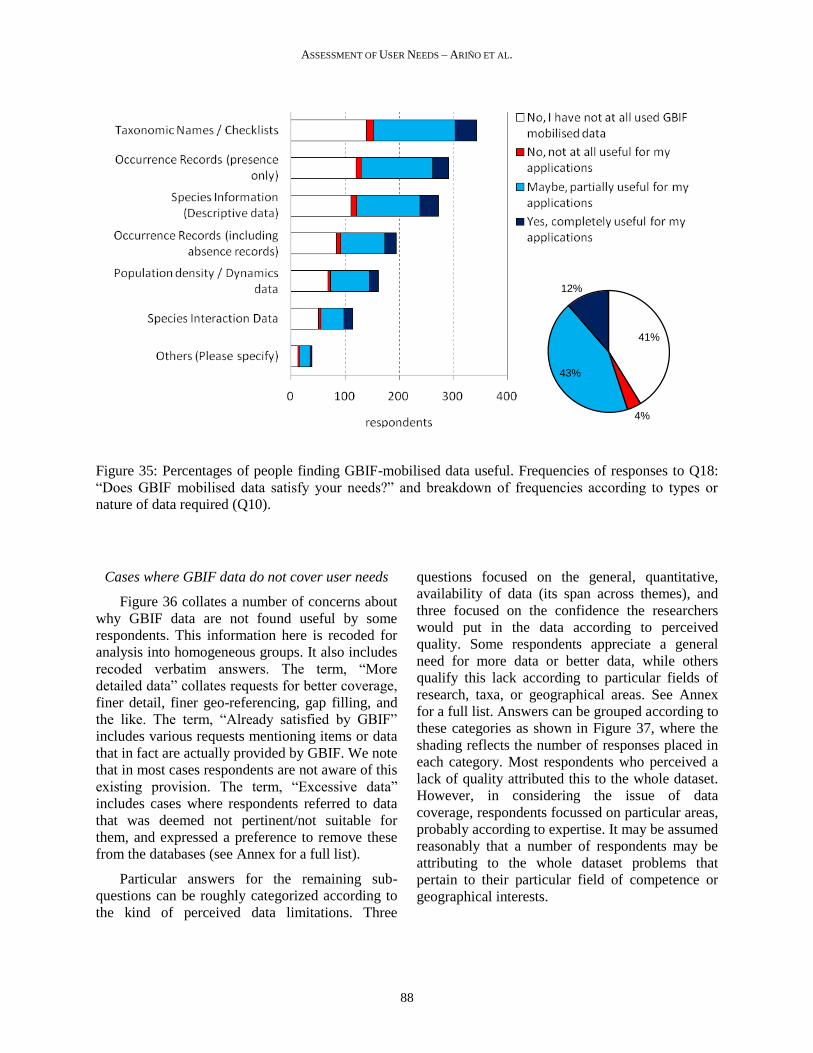
USEFULNESS OF GBIF MOBILISED DATA
Cases where GBIF provides adequate data
As depicted in Figure 35, more than half (55%)
of the respondents suggest that GBIF mobilised
data met their needs, either completely or partially.
A small minority of the respondents felt that GBIF-
mobilised data were not useful for them at all (see
below). At the same time, a large cluster of
respondents (41%) had never used GBIF-mobilised
data. This highlights the obvious, but critical, point
that there always is a need to undertake efforts to
encourage the use of GBIF mobilised data,
especially if the main reason for lack of use is
simply lack of awareness of the resource.
We attempted a cross-tabulation of two
fundamental factors relating to utility: the
perceived usefulness of GBIF mobilised data, and
the types of data required by the users. The fact
that the majority of respondents make at least
partial use of GBIF mobilised data suggests that
these data are widely used for basic tasks,
including initial exploratory analyses. It is
interesting that there was a 50-50 split amongst the
respondents who used GBIF-mobilised taxonomic
and/or occurrence data, and those who had never
used such data. Respondents who indicated that
GBIF mobilised data were useful had also
expressed a strong need for descriptive information
(at the species level).
Types or Nature of Primary Biodiversity Data Required?
0 100 200 300 400 500 600 700
Precise/accurate geo-referenced data
Species habitat description
Synonyms of species name
Type specimens in scientific collections
Images
Source of information
Post-1990 data
Pre-1990 data
Metadata on uncertainty about geographical/georeferenced data
Common name of species
Others please specify
RU FR EN ES CN
Figure 34: Required characteristics for species occurrence data. Frequencies of responses to Q17: “What
are the most important characteristics that you generally want for species occurrence data?” (Table 1.)
ASSESSMENT OF USER NEEDS – ARIÑO ET AL.
88
Figure 35: Percentages of people finding GBIF-mobilised data useful. Frequencies of responses to Q18:
“Does GBIF mobilised data satisfy your needs?” and breakdown of frequencies according to types or
nature of data required (Q10).
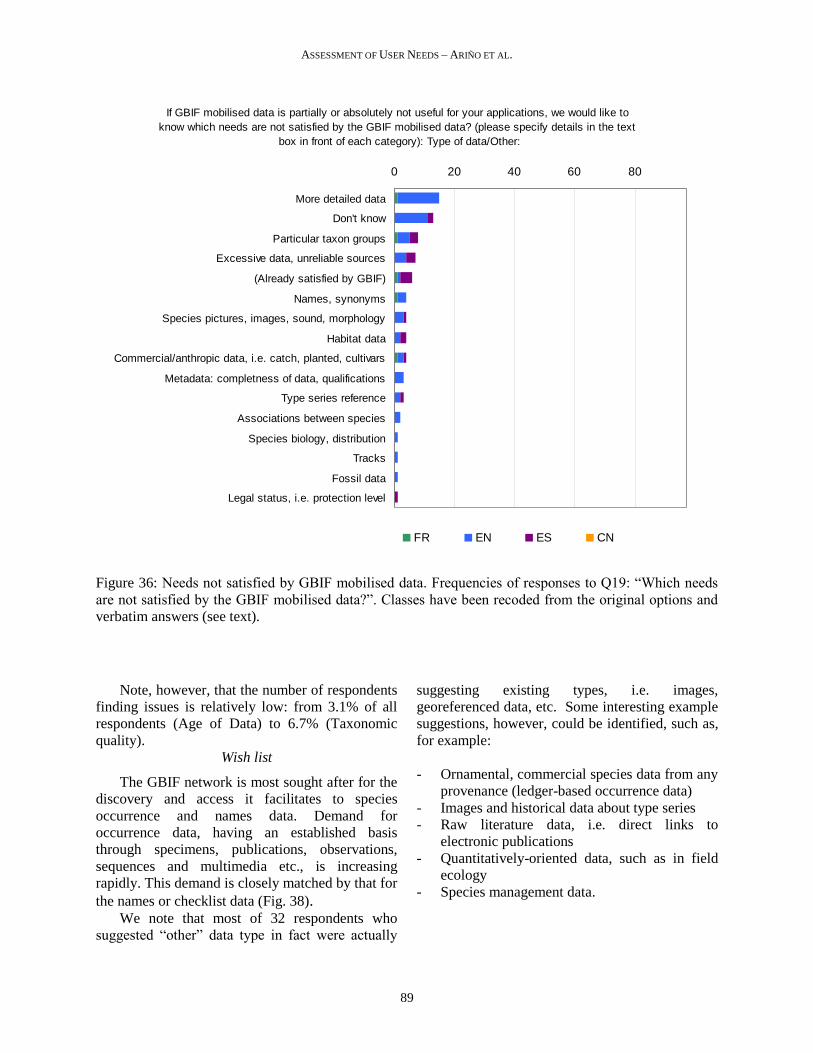
Cases where GBIF data do not cover user needs
Figure 36 collates a number of concerns about
why GBIF data are not found useful by some
respondents. This information here is recoded for
analysis into homogeneous groups. It also includes
recoded verbatim answers. The term, “More
detailed data” collates requests for better coverage,
finer detail, finer geo-referencing, gap filling, and
the like. The term, “Already satisfied by GBIF”
includes various requests mentioning items or data
that in fact are actually provided by GBIF. We note
that in most cases respondents are not aware of this
existing provision. The term, “Excessive data”
includes cases where respondents referred to data
that was deemed not pertinent/not suitable for
them, and expressed a preference to remove these
from the databases (see Annex for a full list).
Particular answers for the remaining sub-
questions can be roughly categorized according to
the kind of perceived data limitations. Three
questions focused on the general, quantitative,
availability of data (its span across themes), and
three focused on the confidence the researchers
would put in the data according to perceived
quality. Some respondents appreciate a general
need for more data or better data, while others
qualify this lack according to particular fields of
research, taxa, or geographical areas. See Annex
for a full list. Answers can be grouped according to
these categories as shown in Figure 37, where the
shading reflects the number of responses placed in
each category. Most respondents who perceived a
lack of quality attributed this to the whole dataset.
However, in considering the issue of data
coverage, respondents focussed on particular areas,
probably according to expertise. It may be assumed
reasonably that a number of respondents may be
attributing to the whole dataset problems that
pertain to their particular field of competence or
geographical interests.
41%
4%
43%
12%
ASSESSMENT OF USER NEEDS – ARIÑO ET AL.
89
If GBIF mobilised data is partially or absolutely not useful for your applications, we would like to
know which needs are not satisfied by the GBIF mobilised data? (please specify details in the text
box in front of each category): Type of data/Other:
0 20 40 60 80
More detailed data
Don't know
Particular taxon groups
Excessive data, unreliable sources
(Already satisfied by GBIF)
Names, synonyms
Species pictures, images, sound, morphology
Habitat data
Commercial/anthropic data, i.e. catch, planted, cultivars
Metadata: completness of data, qualifications
Type series reference
Associations between species
Species biology, distribution
Tracks
Fossil data
Legal status, i.e. protection level
FR EN ES CN
Figure 36: Needs not satisfied by GBIF mobilised data. Frequencies of responses to Q19: “Which needs
are not satisfied by the GBIF mobilised data?”. Classes have been recoded from the original options and
verbatim answers (see text).
Note, however, that the number of respondents
finding issues is relatively low: from 3.1% of all
respondents (Age of Data) to 6.7% (Taxonomic
quality).
Wish list
The GBIF network is most sought after for the
discovery and access it facilitates to species
occurrence and names data. Demand for
occurrence data, having an established basis
through specimens, publications, observations,
sequences and multimedia etc., is increasing
rapidly. This demand is closely matched by that for
the names or checklist data (Fig. 38). We note that most of 32 respondents who
suggested “other” data type in fact were actually
suggesting existing types, i.e. images,
georeferenced data, etc. Some interesting example
suggestions, however, could be identified, such as,
for example:
- Ornamental, commercial species data from any
provenance (ledger-based occurrence data)
- Images and historical data about type series
- Raw literature data, i.e. direct links to
electronic publications
- Quantitatively-oriented data, such as in field
ecology
- Species management data.
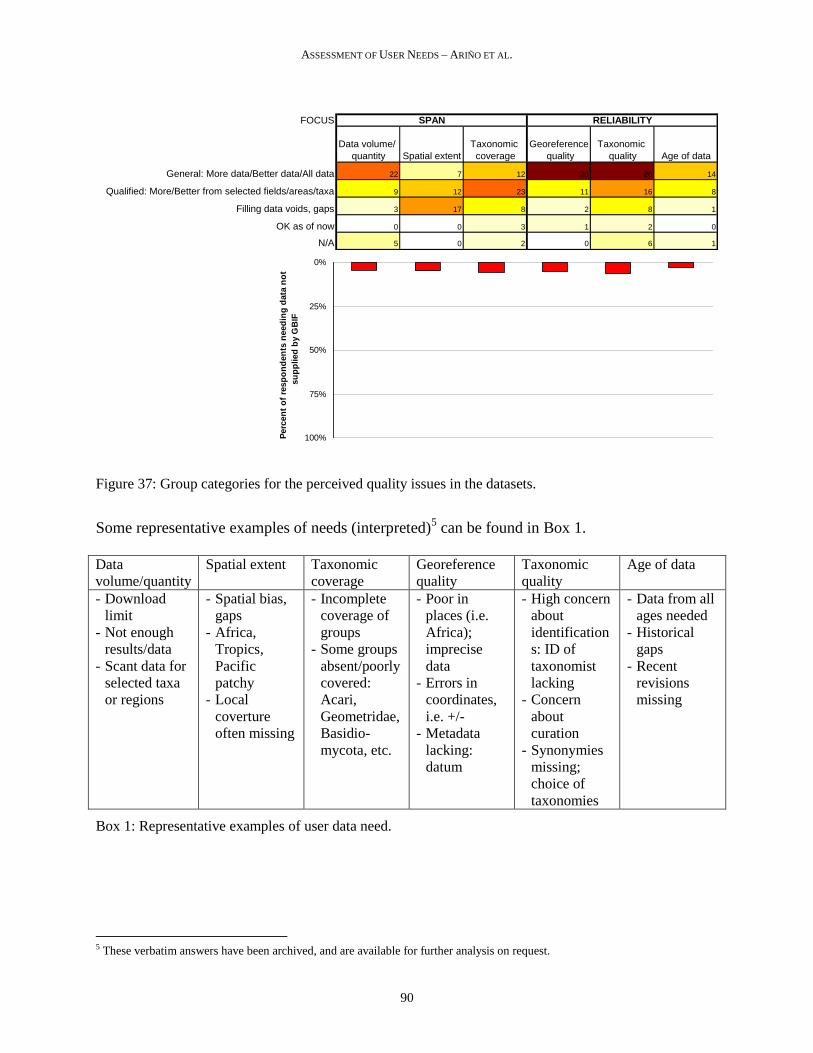
ASSESSMENT OF USER NEEDS – ARIÑO ET AL.
90
FOCUS
Data volume/
quantity Spatial extent
Taxonomic
coverage
Georeference
quality
Taxonomic
quality Age of data
General: More data/Better data/All data 22 7 12 28 26 14
Qualified: More/Better from selected fields/areas/taxa 9 12 23 11 16 8
Filling data voids, gaps 3 17 8 2 8 1
OK as of now 0 0 3 1 2 0
N/A 5 0 2 0 6 1
SPAN RELIABILITY
0%
25%
50%
75%
100%Perc
en
t o
f re
sp
on
den
ts n
eed
ing
data
no
t
su
pp
lied
by G
BIF
Figure 37: Group categories for the perceived quality issues in the datasets.
Some representative examples of needs (interpreted)5 can be found in Box 1.
Data
volume/quantity
Spatial extent Taxonomic
coverage
Georeference
quality
Taxonomic
quality
Age of data
- Download
limit
- Not enough
results/data
- Scant data for
selected taxa
or regions
- Spatial bias,
gaps
- Africa,
Tropics,
Pacific
patchy
- Local
coverture
often missing
- Incomplete
coverage of
groups
- Some groups
absent/poorly
covered:
Acari,
Geometridae,
Basidio-
mycota, etc.
- Poor in
places (i.e.
Africa);
imprecise
data
- Errors in
coordinates,
i.e. +/-
- Metadata
lacking:
datum
- High concern
about
identification
s: ID of
taxonomist
lacking
- Concern
about
curation
- Synonymies
missing;
choice of
taxonomies
- Data from all
ages needed
- Historical
gaps
- Recent
revisions
missing
Box 1: Representative examples of user data need.
5 These verbatim answers have been archived, and are available for further analysis on request.
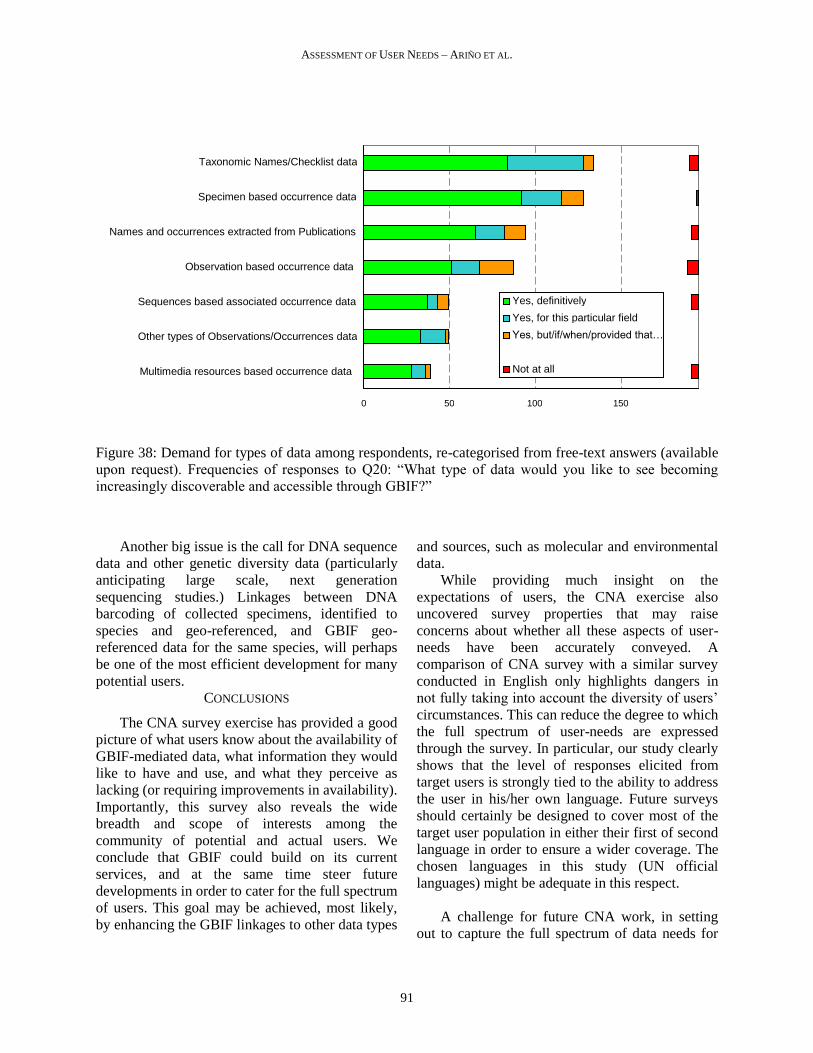
ASSESSMENT OF USER NEEDS – ARIÑO ET AL.
91
Figure 38: Demand for types of data among respondents, re-categorised from free-text answers (available
upon request). Frequencies of responses to Q20: “What type of data would you like to see becoming
increasingly discoverable and accessible through GBIF?”
Another big issue is the call for DNA sequence
data and other genetic diversity data (particularly
anticipating large scale, next generation
sequencing studies.) Linkages between DNA
barcoding of collected specimens, identified to
species and geo-referenced, and GBIF geo-
referenced data for the same species, will perhaps
be one of the most efficient development for many
potential users.
CONCLUSIONS
The CNA survey exercise has provided a good
picture of what users know about the availability of
GBIF-mediated data, what information they would
like to have and use, and what they perceive as
lacking (or requiring improvements in availability).
Importantly, this survey also reveals the wide
breadth and scope of interests among the
community of potential and actual users. We
conclude that GBIF could build on its current
services, and at the same time steer future
developments in order to cater for the full spectrum
of users. This goal may be achieved, most likely,
by enhancing the GBIF linkages to other data types
and sources, such as molecular and environmental
data.
While providing much insight on the
expectations of users, the CNA exercise also
uncovered survey properties that may raise
concerns about whether all these aspects of user-
needs have been accurately conveyed. A
comparison of CNA survey with a similar survey
conducted in English only highlights dangers in
not fully taking into account the diversity of users’
circumstances. This can reduce the degree to which
the full spectrum of user-needs are expressed
through the survey. In particular, our study clearly
shows that the level of responses elicited from
target users is strongly tied to the ability to address
the user in his/her own language. Future surveys
should certainly be designed to cover most of the
target user population in either their first of second
language in order to ensure a wider coverage. The
chosen languages in this study (UN official
languages) might be adequate in this respect.
A challenge for future CNA work, in setting
out to capture the full spectrum of data needs for
0 50 100 150
Multimedia resources based occurrence data
Other types of Observations/Occurrences data
Sequences based associated occurrence data
Observation based occurrence data
Names and occurrences extracted from Publications
Specimen based occurrence data
Taxonomic Names/Checklist data
Yes, definitively
Yes, for this particular field
Yes, but/if/when/provided that…
Not at all
ASSESSMENT OF USER NEEDS – ARIÑO ET AL.
92
biodiversity research, will be to ensure reaching
that maximum breadth of researchers, in a
representative, homogeneous, manner. New
data/information challenges are emerging through
national and international programs and activities,
including those related to the new post-2010
targets of the Convention on Biological Diversity,
the global Biodiversity Observation Network
(GEO BON) (Andrefouet et al., 2008), and the new
intergovernmental science-policy platform on
biodiversity and ecosystem services (IPBES,
2011). These challenges particularly involve needs
to integrate biodiversity with ecosystem services
and other needs of society, for research,
observations, assessments, and policy
development. We touch on some of these issues in
the companion paper on CNA recommendations
(Faith et al., this volume).
ACKNOWLEDGEMENTS
We are grateful to the Global Biodiversity
Information Facility for supporting and funding
this survey through the Content Needs Assessment
Task Group. AHA is grateful to the University of
Navarra for support and infrastructure.
REFERENCES
Andrefouet S., Costello M.J., Faith D.P., Ferrier S.,
Geller G.N., Höft R., Jürgens N., Lane M.A.,
Larigauderie A., Mace G., Miazza S., Muchoney
D., Parr T., Pereira H.M., Sayre R., Scholes R.J.,
Stiassny M.L.J., Turner W., Walther B.A., Yahara
T., 2008. The GEO Biodiversity Observation
Network Concept Document. GEO - Group on
Earth Observations, Geneva, Switzerland. 45 pp.
Berendsohn W., Chavan V., Macklin J., 2010. Summary
of Recommendations of the GBIF Task Group on
the Global Strategy and Action Plan for the
Digitisation of Natural History Collections.
Biodiversity Informatics, 7(2): 67-71.
Borgman C.L., 2003. From Gutenberg to the Global
Information Infrastructure : Access to Information
in the Networked World. Cambridge, MA, USA:
MIT Press. 345 pp.
Borgman C.L., 2007. Scholarship in the Digital Age:
Information, Infrastructure, and the Internet. The
MIT Press. 336 pp.
Borgman C.L., Wallis J.C., Enyedy N., 2006. Little
science confronts the data deluge: habitat ecology,
embedded sensor networks, and digital libraries.
International Journal on Digital Libraries, 7 (1-2):
17-30.
Chavan V., Sood R., Ariño A.H., 2010. Best practice
guide for ‘Data Discovery and Publishing
Strategy and Action Plans’. GBIF, Copenhagen.
Encyclopedia of Life, 2011. Available from
http://www.eol.org. Last accessed 24 Jan 2011.
Faith D.P., Collen B., Ariño A.H., Koleff P.O., Kerr J.,
Guinotte J., Chavan V., 2013. Bridging the data
gaps: Recommendations of the GBIF Content
Needs Assessment Task Group. Biodiversity
Informatics, 8.
Global Biodiversity Information Facility (GBIF), 2009a.
Content Needs Assessment Task Group. Accessible
at http://www.gbif.org/informatics/primary-
data/task-groups/cna-tg/. Last accessed 2010.12.26
Global Biodiversity Information Facility (GBIF) 2009b.
GBIF Content Needs Assessment Survey 2009.
Accessible at
http://www.gbif.org/communications/news-and-
events/showsingle/article/gbif-content-needs-
assessment-survey-2009/. Last accessed
2010.12.26.
Global Biodiversity Information Facility (GBIF) 2009c.
GBIF Content Needs Assessment Survey 2009
available in Chinese.
http://www.gbif.org/communications/news-and-
events/showsingle/article/gbif-content-needs-
assessment-survey-2009-available-in-chinese/. Last
accessed 2010.12.26.
Global Biodiversity Information Facility (GBIF) 2009d.
GBIF Content Needs Assessment Survey 2009
available in Russian.
http://www.gbif.org/communications/news-and-
events/showsingle/article/russkaja-versija-
voprosnika-po-vyjasneniju-potrebnostei-v/. Last
accessed 2010.12.26.
Global Biodiversity Information Facility (GBIF), 2010.
Data portal. Countries, Territories and Islands.
http://data.gbif.org/countries/Last accessed
2010.12.21
Grinnell J., 1910. The Methods and Uses of a Research
Museum. Popular Science Monthly, 77: 163-169.
Hill A.W, Otegui J., Ariño A.H., Guralnick R.P., 2010.
GBIF Position Paper on Future Directions and
Recommendations for Enhancing Fitness-for-Use
Across the GBIF Network, version 1.0.
Copenhagen: Global Biodiversity Information
Facility, 25 pp.
ASSESSMENT OF USER NEEDS – ARIÑO ET AL.
93
International Monetary Fund (IMF), 2009. World
Economic Outlook Database—WEO Groups and
Aggregates Information.
http://www.imf.org/external/pubs/ft/weo/2009/01/w
eodata/groups.htm. Last accessed 2010.12.21
International Standards Organisation (ISO), 2007. ISO
3166 Maintenance agency
(ISO 3166/MA) - ISO's focal point for country
codes. http://www.iso.org/iso/country_codes.htm.
Last accessed 2010.12.21
IPBES, 2011. Intergovernmental Science-Policy
Platform on Biodiversity and Ecosystem Services.
Available online: http://www.ipbes.net/. Last
accessed on 13 January 2011).
Kelling, S., W.M. Hochachka, D. Fink, M. Riedewald,
R. Caruana, G. Ballard, G. Hooker. 2009. Data
Intensive Science: A New Paradigm for
Biodiversity Studies. Bioscience 59:613-620.
United Nation’s Office of the High Representative for
the Least Developed Countries, Landlocked
Developing Countries and the Small Island
Developing States (UN-OHRLLS), 2010. List of
countries.
http://www.unohrlls.org/en/ldc/related/62/.Last
accessed 2010.12.21
World Bank, 2010. World Development Indicators. GNI
per capita, Atlas method (current US$). World
Bank national accounts data and OECD national
account data files.
http://data.worldbank.org/indicator/NY.GNP.PCAP
.CD. Last accessed 2010.12.21
Vollmar A., Macklin J., Ford L., 2010. Natural History
Specimen Digitization: Challenges and Concerns.
Biodiversity Informatics, 7(2): 93-112.
Copyright © 2022 FDOKUMEN