2015 Level II mindmaps (04. FRA)
36
CFA LEVEL II FINANCIAL REPORTING ANALYSIS Copyright (2014), CFA Institute. Reproduced and republished with permission from CFA Institute. All rights reserved
Transcript of 2015 Level II mindmaps (04. FRA)

CFA LEVEL II
FINANCIAL REPORTING ANALYSIS
Copyright (2014), CFA Institute.
Reproduced and republished with permission from CFA Institute. All rights reserved

15.Inventories:Implications
For FS &Ratios


LEASE n=2 years PMT= i= 13%
1. Ordinary annuity PV= 100
Operating lease Financial lease Operating lease Financial leaseYr1 Yr2 Yr1 Yr2 Yr1 Yr2 Yr1 Yr2
Asset 0 0 Asset Asset Lease receivable
Beg. 100 50 Beg. 100 50 Beg. 100 53
(‐)Depr 50 50 (‐)Depr 50 50 (+)Int. rev 13 7
End 50 0 End 50 0 (‐)Receipt 60 60
End 53 0
Liability 0 0 Liability Liability 0 0 Liability 0 0
Beg. 100 53
(+)Int.exp 13 7
(‐)Pmt 60 60
End 53 0
Lease exp 60 60 Depr exp 50 50 Lease rev. 60 60 Int. rev. 13 7
Int. exp 13 7 Depr exp 50 50
63 57 10 10
CF? ‐60 ‐60 CF? ‐13 ‐7 CF? 60 60 CF? 13 7
CF? ‐47 ‐53 CF? 47 53
‐60 ‐60 60 60
Note: if sales‐type lease‐‐>
just add gross profit
2. Annuity due PV= 113
Financial lease Financial leaseYr1 Yr2 Yr1 Yr2
Asset Lease receivable
Beg. 113 56.5 113 60
(‐)Depr 56.5 56.5 (‐)Receipt 60 60
End 56.5 0 Beg 53 0
(+)Int. 7 0
End 60 0
Liability Liability 0 0
113 60
(‐)Pmt 60 60
Beg 53 0
(+)Int. 7 0
End 60 0
Depr exp 56.5 56.5
Int. exp 7 0
63.4 56.5 Int. rev. 7 0
CF? ‐7 0 CF? 7 0
CF? ‐53 ‐60 CF? 53 60
‐60 ‐60 60 60
60
LESSEE LESSOR
LESSEE LESSOR

17.1IntercorporateInvestments
Joint ventures (shared control)
1.Investmentsin financialassets(minoritypassive)
Examples


4. Jointventures
What is a joint venture Shared by 2 investors or moreInvest in foreign markets, special projects, risky ventures
Under IFRS & US GAAP Equity methodin rare cases: Proportionate consolidation
5. SPEand VIE
SPE
Special Purpose Vehiclea legal structure (corporation, partnership, joint venture, trust)
securitizeassets (such assponsor'sreceivables)
remove from sponsor's BSCF in = CFObut if with recourse --> similar tocollaterallized borrowingsFinancial analysts mustadjust CFO & leverage
to isolate assets & liabilities to reduce risk --> reducefinancial cost (previously an OBS --> improve ratios)
VIE
Variable Interest Entity
=SPE+conditions
At risk equity is insufficient tofinance the entity's activities withoutadditional financial support
equityinvestorslacks
decision making rightsobligation to absorb lossesright to receive residualinterest in the SPE
--> must consolidate
QSPE
Qualifying SPE
only hold financial assets(usually receivables)QSPE had totalcontrol of the assetsnot have to consolidate
In the pastUSGAAP permittedIFRS not permit
Now: both USGAAP & IFRS not permit
c. Effects onfinancial ratios
Items
Net income
Equity
Assets & Liabilities
Sales
Ratios
LeverageNet profit marginROEROA

30% 3 Note: PP=BV
TABLE 1: (1/1/2011)
Parent SubsidiaryEquity
methodExplanation
Proportionate consolidation
methodExplanation
Acquisition method (purchase method/
consolidation method)Explanation
Cash 20 9 17 19.7 26A/R+Inventory 28 7 28 30.1 35
Investment in S 3Fixed assets 32 8 32 34.4 40
Total assets 80 24 80 84.2 101
Total liabilities 40 14 40 44.2 54
Common stock 28 6 28 28 28Retained earnings 12 4 12 12 12
Total Equity 40 10 40 40 407 Minority interest
Total liab.&equity 80 24 80 84.2 101
TABLE 2: (31/12/2011)
Parent only
SubsidiaryEquity
methodExplanation
Proportionate consolidation
methodExplanation
Acquisition method (purchase method/
consolidation method)Explanation
Revenues 60 20 60 66 80Expenses -40 -16 -40 -44.8 -56Equity in income of S 1.2
-2.8 Minority interestNet income 20 4 21.2 21.2 21.2Dividend 0 1Retained earnings 20 3
Cash increased due to div from S 0.3 0.3 0.3Investment in S 3.9Accum. Retained Earnings 33.2 33.2 33.2Minority Interest 9.1
Some BS items of Parent for the year ending 31/12/2011
% Purchased of Subsidiary Purchased price
BS before acquisition as at 1/1/2011 BS of Parent after acquisition as at 1/1/2011
IS for the year ending 31/12/2011 IS of Parent for the year ending 31/12/2011

30% Purchased price 4.5 Note: PP=FV>BV
TABLE 3: (1/1/2011) Fixed assets are depreciated SL over: 3 years
Parent SubsidiaryFair Value of Subsi.
Equity method
ExplanationProportionate consolidation
methodExplanation
Acquisition method (purchase method/
consolidation method)Explanation
Cash 20 9 9 15.50 18.20 24.5A/R+Inventory 28 7 7 28 30.1 35
4.5 Investment in SFixed assets 32 8 13 32 35.9 45
Total assets 80 24 29 80 84.2 104.5
Total liabilities 40 14 14 40 44.2 54
Common stock 28 6 28 28 28Retained earnings 12 4 12 12 12
Total Equity 40 10 15 40 40 4010.5 Minority interest
Total liab.&equity 80 24 80 84.2 104.5
TABLE 4: (31/12/2011)
Parent only
SubsidiaryEquity
methodExplanation
Proportionate consolidation
methodExplanation
Acquisition method (purchase method/
consolidation method)Explanation
Revenues 60 20 60 66 80Expenses -40 -16 -40 -44.8 -56
1.2 Equity in income of SAdditional depreciation -0.5 -0.5 -0.5
-2.8 Minority interestNet income 20 4 20.7 20.7 20.7Dividend 0 1Retained earnings 20 3
Investment in S 4.9
% Purchased of Subsidiary
BS before acquisition as at 1/1/2011 BS of Parent after acquisition as at 1/1/2011
IS for the year ending 31/12/2011 IS of Parent for the year ending 31/12/2011
Some BS items of Parent for the year ending 31/12/2011

a. Types ofpost-employmentbenefit plans
Example 1
b. Measuresof a DBpension plan'sliability/asset
c. DBpensioncosts

c. DBpensioncosts(CONT.)
d. Impactof a DBP'sassumptions
e. Adjustmentsfor analyticalpurpose
f. Cash flowinformation
Share-basedcompensation
g. Accountingissues
h.
Stockgrant
Stockoptions

Pension example 1:
Employee: 22 years old, working till 60 years old, lives till 80 years old End of this year --> annual salary 60m Salary growth 5.2611%/year --> last salary before retiring: 400m DB plan: for each year of retirement, pension= 1% (=f) of last salary for number of working years First pension: 61 years old. Last pension: 80 years old Discount rate 10%

PENSION1. PBO (Projected Benefit Obligation) is a Liability; CSC (Current Service Cost) is an expense
22 23 24 60 61 80
Salary: g= 5.2611%
1st yr (23) Discount rate r=10%
2nd yr (24)
22 23 24 60 61 80
60m 400m=last salary f= 1% per working year
CSC=1m 4m 4mPBO=1m
CSC=1.1m 4m 4m2nd yr (24)
2. Plan asset (money contribution to trust + investment return) Long term expected return: 15%1st yr (23) Contribute
CSC=1.1m 4m 4mPBO=2xCSC=2.2m=Previous PBO+CSC+Int costInt cost=Discount rate x Previous PBO=0.1m
1mPlan assetCFO
2nd yr (24) (assuming Contribution = 0)Plan asset=1.12m
1m R= 12% (actual return)‐1m
Pension exp=1.00m
= Plan asset ‐ PBO
=CSC + Int cost ‐ E(R)
in IS: E(R)=0.15min OCI: Actuarial loss:‐0.03m
Funded status=‐1.08m
In IS: Pension exp=1.05m
Reporting In BS:USGAAP: Net pension liab: 1.08m; OCI: ‐0.03mIFRS: Net pension liab: 1.05m (no OCI)
3. Plan amendment Year 2: increase f to 2%2 d (24) CSC 2 2 882nd yr (24)
=CSC + Int cost ‐ E(R) +Prior service cost (optional: 10% corridor)
CSC=2.2m 8mPBO=2xCSC=4.4m=Previous PBO+CSC+Int cost+???Int cost=0.1mPrior service cost= 1.1mIn IS: Pension exp=3.25m
8m
4. ABO & VBO Year 2: employee quits2nd yr (24) Last salary 63m
CSC=0.158m 0.632m 0.632mPBO=2xCSC=0.316m=ABOf d /If vested 5 years ‐‐> VBO=1/5xABO=0.063m

Pension example 2:
Expected return on plan assets is 80
Amortization of actuarial loss is 30
Amortization of prior service cost is 10
Calculate
Net periodic benefit expense Economic pension expense

Pension example 3:
Calculate Pension expense and make adjustments for analytical purposes.

Pension example 4:
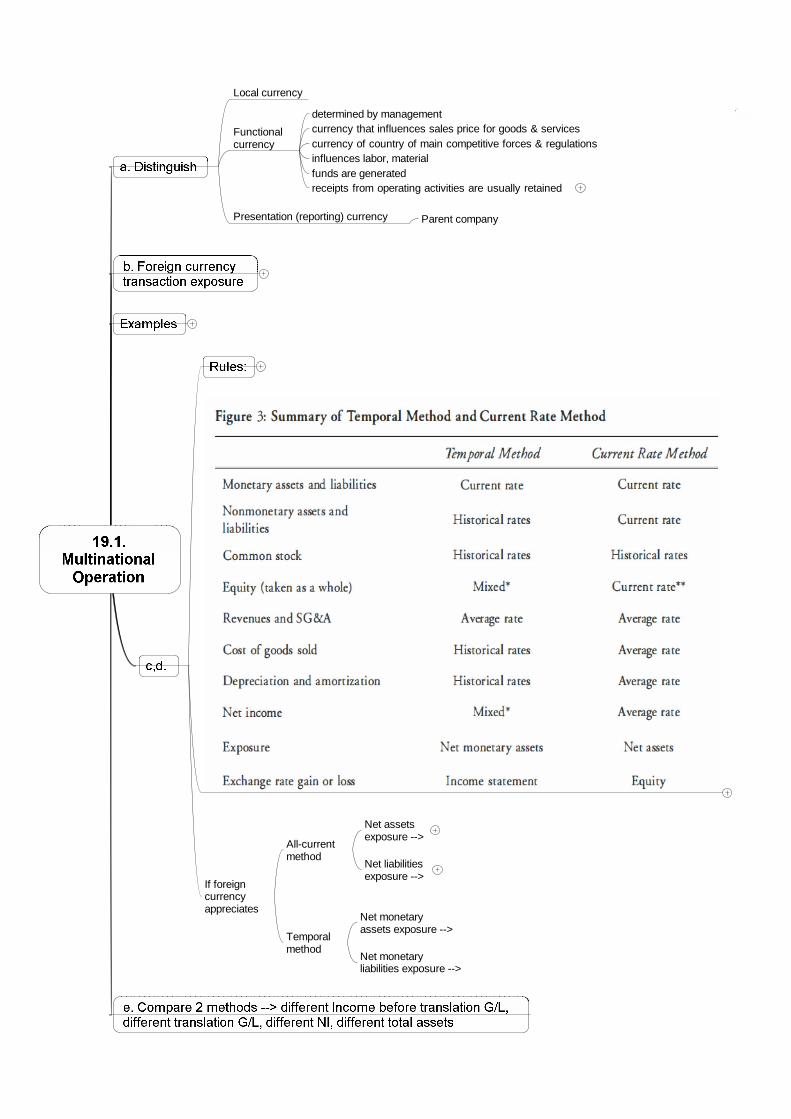
Local currency
Functionalcurrency
determined by managementcurrency that influences sales price for goods & servicescurrency of country of main competitive forces & regulationsinfluences labor, materialfunds are generatedreceipts from operating activities are usually retained
Presentation (reporting) currency Parent company
If foreigncurrencyappreciates
All-currentmethod
Net assetsexposure -->
Net liabilitiesexposure -->
Temporalmethod
Net monetaryassets exposure -->
Net monetaryliabilities exposure -->

19.2.Multinational
Operation
f. Affecting theparent company'sfinancial ratios
g. Subsidiariesoperating inhyperinflationaryeconomies
Analyzing foreign currency disclosure
h. Impact oneffective tax rate
i. Componentsof saleschanges andSustainability
j. Countries of operationaffect financial results

Exchange rate throughout 2010 1.00 Exchange rate at 31‐12‐2011 1.10 Average exchange rate for 2011 0.90
USD VND USD e/r at time ofpurchase/deal
VND All CURRENT VND TEMPORAL
Cash 1,100 1,100 500 550 550A/R ‐ ‐ 400 440 440Inventory ‐ ‐ 600 0.80 660 480
Fixed assets ‐ ‐ 500 1.30 550 650
TOTAL ASSETS 1,100 1,100 2,000 2,200 2,120 ‐
A/P ‐ ‐ 100 110 110Unearned Rev. ‐ ‐ 200 1.25 220 250 Long‐term Liab. ‐ ‐ 400 440 440
Common Equity 1,000 1,000 1,000 1,000 1,000 Retained Earnings 100 100 300 340
TOTAL LIAB.&EQUI 1,100 1,100 2,000
Revenue ‐ ‐ 3,000 2,700 COGS ‐ ‐ (2,000) 0.85 1,700 Depreciation exp. ‐ ‐ (100) 1.30 130 Other exp. ‐ ‐ (700) 630
Net income ‐ ‐ 200 240 INCO
ME STAT
EMEN
TBA
LANCE
SHEET
Year 2011Year 2010

Schweser example (Multinational Operations)
U$/LC 31/12/2008 31/12/2009INCOME STATEMENT 2009
All current method
Current ex/ rate 0.5000 0.4545 LC $ $ ExplanationAverage ex/ rate 0.4762 Revenues 5,000 2,381.00 2,381.00 AverageHistorical ex/ rate COGS 3,300 1,571.46 1,595.22 Historical
For COGS 0.4834 Gross margin 1,700 809.54 785.78 For Depr. Exp. 0.4878 Other expenses ‐400 (190.48) (190.48) AverageFor Fixed assets 0.4881 Depr. Expenses ‐600 (285.72) (292.68) HistoricalFor accum. Depr. 0.4896 302.62 Inc bf remeasureG/LFor end. inventory 0.4762 48.01 Remeasurement G/L
For equity 0.5000 Net Income 700 333.34 350.63
BALANCE SHEETAll current method
BALANCE SHEETAll current method
LC $ LC $ $ E l i
Temporal method
31/12/2008 31/12/2009Temporal method
LC $ LC $ $ ExplanationCash 100 50.00 Cash 100 45.45 45.45 CurrentA/R 500 250.00 A/R 650 295.43 295.43 CurrentInventory 1,000 500.00 Inventory 1,200 545.40 571.44 Historical
Current Assets 1,600 800.00 Current Assets 1,950 886.28 912.32
Fixed Assets 800 400.00 Fixed Assets 1,600 727.20 780.96 HistoricalAccum. Depr. ‐100 (50.00) Accum. Depr. ‐700 (318.15) (342.72) Historical
Net fixed assets 700 350.00 Net fixed assets 900 409.05 438.24
Total assets 2,300 1,150.00 Total assets 2,850 1,295.33 1,350.56
Accounts payable 400 200.00 Accounts payable 500 227.25 227.25 CurrentCurrent debt 100 50.00 Current debt 200 90.90 90.90 CurrentLong term debt 1,300 650.00 Long term debt 950 431.78 431.78 CurrentTotal liabilities 1,800 900.00 Total liabilities 1,650 749.93 749.93
Common stock 400 200.00 Common stock 400 181.80 200.00 HistoricalRetained earnings 100 50.00 Retained earnings 800 363.60 400.63 Plug number
???Total equity 500 250.00 Total equity 1,200 545.40 600.63

FRA2‐ Multinational operations‐ Eg.3
1234567
891011
12
13
141516171819202122
A B C D E
Adjustments for inflation under IFRS
Price indicesDec. 31. 2006 100Dec. 31. 2007 150Average for 2007 125
INCOME STATEMENT2007
Adjustment factor
Inflation adjusted
Revenues 15,000 1.20 18,000Expenses ‐12,000 1.20 ‐14,400Net purchasing power G/L 6,900
Net Income 3,000 10,500
BALANCE SHEET 2006 2007Adjustment
factorInflation adjusted
Cash 5,000 8,000 8,000Supplies 25,000 25,000 1.50 37,500
Total assets 30,000 33,000 45,500
Accounts payable 20,000 20,000 20,000Common stock 10,000 10,000 1.50 15,000Retained earnings 0 3,000 10,500
Total liab.& equity 30,000 33,000 45,500

20.1.EvaluatingFinancialReporting
Quality
FR qualityReportingquality
= info is
f. Earningsquality
3 conditions
Conceptualframework
Answer 2questions
is FR GAAP compliant& Decision-useful
High quality earnings?
ContinuumFrom highest tolowest FR quality
Arisefrom
Measurement& Timing
aggressive vs. conservativeaffecting multiple FS elements
ClassificationExamplesaffecting one FS element only
Biasedaccounting
Misstateprofitability
Mechanism
RevenueChannel stuffingBill & holdOutright fake sales
Lessor use of finance lease_____ operating revenue, _____ non operating expense_____ IS gain, ______ OCI loss
Warning signs
high revenue growthA/R growth > Sales growthHigh customer returnsCFO < EBITFinal quarter surprisesInconsistency in operating classificationAggressive accounting assumptionsExecutive compensation tied to financial results
Misstateassets/liabilities
Mechanism
Inappropriate models (useful life...)Reclassification from current to non-currentOver/Understate allowances and reservesUnderstate identifiable assets(overstate GW) in acquisition
Warning signs
Inconsistency in model inputs forvaluation of assets vs liabilitiesAllowances & reserves differfrom peers & fluctuateHigh GW / Total assetsUse of SPELarge fluctuations in DTA, DTLLarge OBS liabilities
OverstateCFO
MechanismManage activitiesto affect CFO
e.g.: Stretching payables
Misclassify CFI as CFO
Warning signs
A/P increases while Inventory & A/R decreaseCapitalized expenditures (deduct CFI)Sale and leaseback of assetsBank overdraft increases
Business combinations-acquisition method
buy target with high CFO --> increase CFO (pay by stocks or CFI)
reason foracquiring may be
hiding accountingirregularities
buy targets with dissimilar operations orwith less publicly available information
Both acquiring and target firms have incentives topursue aggressive accounting to inflate stock priceOverstate GW (understate value of identifiable net assets
GAAP accounting butnot economic reality e.g..: Enron was able to avoid consolidation of SPEs
Restructuring provisions & Impairment losses

7 steps
Understand company, industry, accounting principlesUnderstate mgmt (compensation & independence)Areas of accounting vulnerable to subjectivityCompare cross-sectional & time series FS & ratiosCheck for warning signsCheck for shifting of profits or rev. among multiple business linesUse quantitative tools to evaluate the likelihood of misreporting
Quantitativetools
TheBeneishmodel
M-score
8 variables
DSRI =
GMI =
AQI =
SGI =
DEPI =
SGAI =
Accruals =
LEVI =
Cut-off value
Limitationsrely on accounting datacompanies aware --> game the measures--> reducing predictive power
Altmanmodel
Z-score
Discriminant analysis
5 variables
Net WC/ Total assets
Retained earnings / total assets
EBIT/ Total assets
Pshare / BV liab
Sales / Total assets
Limitationsrely on accounting datasingle period static
consider life cycleindustry norms
CFObe high --> cover CAPEX, debt repmt, divsustainable sourceslow volatility
Checkunusual itemsrevenue qualitystrategic provisioning

Companies may include proformaincome (excl non recurring)
check reconciliation from proformaincome to reported income
Formula:to gauge earnings persistence
Accruals
Non discretionary occur as part of normal business
Discretionary
from non-normal transactionsor accounting choicessometimes used to manipulate earningsindicator:residualsfromregressionmodel with:
total accruals as Y variablefactors that give rise tonormal accruals as Xvariables, e.g:
Red flag when: Net income > 0 but CFO <0
Otherindicators
Repeatedly meet or barely beat consensus estimates
Externalindicators
Enforcement actions by regulatory authorities (SEC)Restatements
Extreme earnings --> not continue forever but revert back to normal level
Accruals increase --> mean reversion faster
Revenuerecognitionissues
Concern both Quantity & Quality
6 steps
Understand the basicsEvaluate & question ageing A/RCash vs accrualsCompare financial with physical dataEvaluate rev. trend and compare with peersCheck for related party transactions
Expensecapitalization
3 stepsUnderstand the basicsTrend and comparative analysisCheck for related party transactions
Completeness check for OBSTake-or-pay contracts --> shouldrecord obligations (penalty pmt)Operating lease --> should capitalize
concern when equity methods for subsidiaries with close to 50% ownership
Unbiasedmeasurement Subjectivity in
measuring(pension, investment, GW, inventory, PP&E impairments)
Clearpresentation
discretion in choosing to present as a single-line item or groupedclear presentation (FS+footnotes+supplementarydisclosures) --> allow comparison
FS, Auditor's report, footnotes, MD&A, financial pressSEC form "NT" (unable to file required reports timely)

BENEISH MODEL – M SCORE
Days Sales Receivable Index (DSRI) is: DSRI = (Net Receivablest / Salest) / Net Receivablest-1 / Salest-1) Gross Margin Index (GMI) is: GMI = [(Salest-1 - COGSt-1) / Salest-1] / [(Salest - COGSt) / Salest] Asset Quality Index (AQI) is: AQI = [1 - (Current Assetst + PP&Et + Securitiest) / Total Assetst] / [1 - ((Current Assetst-1 + PP&Et-
1 + Securitiest-1) / Total Assetst-1)] Sales Growth Index (SGI) is: SGI = Salest / Salest-1 Depreciation Index (DEPI) is: DEPI = (Depreciationt-1/ (PP&Et-1 + Depreciationt-1)) / (Depreciationt / (PP&Et + Depreciationt)) SG&A Expense Index (SGAI) is: SGAI = (SG&A Expenset / Salest) / (SG&A Expenset-1 / Salest-1) Leverage index (LVGI) is: LVGI = [(Current Liabilitiest + Total Long Term Debtt) / Total Assetst] / [(Current Liabilitiest-1 + Total Long Term Debtt-1) / Total Assetst-1] Total Accruals to Total Assets (TATA) is: TATA = (Income from Continuing Operationst - Cash Flows from Operationst) / Total Assetst

Beneish M-Score
1
234567891011121314151617181920212223242526272829303132333435363738
A B C D E F G H I J
Beneish M-Scorehttp://investexcel.net
Parameters GlossaryYear 2008 2009 SGA Selling, General and Administrative ExpensesNet Sales 93823 93685 CA Current AssetsCost of Goods 52155 49193 DSRI Days Sales in Receivables IndexNet Receivables 1174 1373 GMI Gross Margin IndexCurrent Assets 73717 67991 AQI Asset Quality IndexProperty, Plant and Equipment 2532 2058 SGI Sales Growth IndexDepreciation 1696 1716 DEPI Depreciation IndexTotal Assets 86291 84832 SGAI Sales, General and Administrative Expenses IndexSGA Expense 32426 33013 LVGI Leverage IndexNet Income 5741 9888 TATA Total Accruals to Total AssetsCash Flow from Operations 8416 2877Current Liabilities 26297 26275Long-term Debt 1232 1470
Derived VariablesOther L/T Assets [TA-(CA+PPE)] 10042 14783DSRI 0.854 =(C8/C6)/(D8/D6)GMI 1.069 =((D6-D7)/D6)/((C6-C7)/C6)AQI 0.668 =(C20/C12)/(D20/D12)SGI 1.001 =C6/D6DEPI 1.134 =(D11/(D11+D10))/(C11/(C11+C10))SGAI 0.981 =(C13/C6)/(D13/D6)TATA -0.031 =(C14-C15)/C12LVGI 0.975 =((C17+C16)/C12)/((D17+D16)/D12)
M-score5 variable model -3.16 if M > -2.22, firm is likely to be a manipulator8 variable model -2.83
Notes5 variable equation M = -6.065+ .823 DSRI + .906 GMI + .593 AQI + .717 SGI + .107 DEPI8 variable equation M = -4.84 + .920 DSRI + .528 GMI + .404 AQI + .892 SGI + .115 DEPI -.172 SGAI + 4.679 Accrual to TA - .327 Leverage

Altman Z-Scorehttp://investexcel.net
PARAMETERSIncome statementNet sales 200Operating income 10Balance sheetCurrent assets 95Total assets 150Current liabilities 80Total liabilities 125Retained earnings 25Public companiesMarket value of equity 300Private companiesBook value of equity 200
CALCUATIONS Z Z1 Z2Factor Public Private General
Mfg Mfg UseWorking capital/Total assets X1 0.1 1.2 0.717 6.56Retained earning /Total assets X2 0.16667 1.4 0.847 3.26EBIT/Total assets X3 0.06667 3.3 3.107 6.72Market value of equity/Total liabilities X4 2.4 0.6
Book value of equity/Total liabilities X4A 1.6 0.42 1.05Net sales/Total assets X5 1.33333 1 0.998
Z-Score 3.35 2.42 3.33
LEGENDFinancially sound if greater than 2.99 2.9 2.6Caution required if between 2.77 - 2.99Likely to go bankrupt within 2 years if between 1.8 - 2.7Likelihood of bankruptcy is high if below 1.88 1.23 1.1Average for nonbankrupt companies 5.02 4.14 7.7Average for bankrupt companies -0.29 0.15 4.06

Primary purpose: identify potential outcomes, good or bad, that could affect an investment decision
Dupont Formula:
As reported Figure 3
Stand-alone basis: -->remove equity income Figure 4
Common size BS Figure 5
Divide by total LT capital Figure 6
Working capital ratios Figure 7
By Business segmentsGeographic segments
Figure 8,9,10
Accrual ratios & CF/Operating income
Figure 11-15
standalone value ofparent, P/E multiple
Figure 16
Eliminate operating lease
Eliminate QSPE
Figure 17

1 | P a g e
FRA LEVEL II INTEGRATION OF FS ANALYSIS TECHNIQUES Focus 1: Sources of earnings & ROE

2 | P a g e
Focus 2: Asset base
Focus 3: Capital structure

3 | P a g e
Focus 4: Capital allocation decisions

4 | P a g e

5 | P a g e
Focus 5: Earnings quality & CF analysis

6 | P a g e

7 | P a g e
Focus 6: Market value decomposition
Eg.: Market cap of parent = $137b, Market cap of associate = EUR 60b, Average e/r = $1.4/EUR. Ownership = 30%. Implied (stand-alone) value of parent (without associates) =?
Implied (stand-alone) P/E = ?

8 | P a g e
Focus 7: OBS financing Operating lease pmt = $2.4m/ year, n=5 years, r=10% => PV of lease pmts = Make adjustments:
Focus 8: Anticipating changes in accounting standards Eliminate operating lease treatment (USGAAP) USGAAP & IFRS convergence Prohibit QSPE: