Grasping Weber's illusion: The effect of receptor density differences on grasping and matching

Behavioral/Cognitive
Differences in Neural Activation for Object-DirectedGrasping in Chimpanzees and Humans
Erin E. Hecht,1,2,3 Lauren E. Murphy,3,4,5 David A. Gutman,6,7 John R. Votaw,3,8 David M. Schuster,8 Todd M. Preuss,2,3
Guy A. Orban,9 Dietrich Stout,1 and Lisa A. Parr2,3,7
1Department of Anthropology, 5Department of Psychology, 6Department of Biomedical Informatics, 7Department of Psychiatry and Behavioral Science, and8Department of Radiology and Imaging Sciences, School of Medicine, Emory University, Atlanta, Georgia 30322, 2Center for Translational SocialNeuroscience and 3Yerkes National Primate Research Center, Emory University, Atlanta, Georgia 30329, 4Department of Biology, Georgia State University,Atlanta, Georgia 30302, and 9Department of Neuroscience, University of Parma, Italy
The human faculty for object-mediated action, including tool use and imitation, exceeds that of even our closest primate relatives and isa key foundation of human cognitive and cultural uniqueness. In humans and macaques, observing object-directed grasping actionsactivates a network of frontal, parietal, and occipitotemporal brain regions, but differences in human and macaque activation suggestthat this system has been a focus of selection in the primate lineage. To study the evolution of this system, we performed functionalneuroimaging in humans’ closest living relatives, chimpanzees. We compare activations during performance of an object-directedmanual grasping action, observation of the same action, and observation of a mimed version of the action that consisted of onlymovements without results. Performance and observation of the same action activated a distributed frontoparietal network similar tothat reported in macaques and humans. Like humans and unlike macaques, these regions were also activated by observing movementswithout results. However, in a direct chimpanzee/human comparison, we also identified unique aspects of human neural responses toobserved grasping. Chimpanzee activation showed a prefrontal bias, including significantly more activity in ventrolateral prefrontalcortex, whereas human activation was more evenly distributed across more posterior regions, including significantly more activation inventral premotor cortex, inferior parietal cortex, and inferotemporal cortex. This indicates a more “bottom-up” representation ofobserved action in the human brain and suggests that the evolution of tool use, social learning, and cumulative culture may have involvedmodifications of frontoparietal interactions.
IntroductionHumans’ manual interactions with objects are part of what sets usapart from the rest of the animal kingdom. We manipulate andalter objects individually and cooperatively; create and use tools;and understand, learn from, and copy each other’s object-relatedactions in ways that other species do not. This faculty for object-mediated action creates a new medium for the elaboration ofhuman culture and cognition and may provide a foundation for
key aspects of human uniqueness (Schiffer, 1999; Clark, 2008;Iriki and Sakura, 2008).
Human neuroimaging studies have identified a distributedfrontoparieto– occipitotemporal network involved in the ob-servation of object-directed grasping actions (Iacoboni et al.,1999; Buccino et al., 2001; Caspers et al., 2010; Jastorff et al.,2010; Molenberghs et al., 2012). Studies in macaques reveal asimilar network, but with relatively greater frontal activationand less parietal activation during grasping observation (Ne-lissen et al., 2005) and relatively greater prefrontal activationwhen viewing objects (Denys et al., 2004). In particular, fMRIstudies have found evidence of 3D-structure-from-motionprocessing in human but not macaque intraparietal sulcus(Vanduffel et al., 2002) and sensitivity to the observation oftool use in human but not macaque anterior inferior parietalcortex (Peeters et al., 2009). It has also been shown that ma-caque mirror neurons only respond to actions that have phys-ical results on objects (transitive actions such as grasping anobject) and not to actions that consist of movements withoutresults (intransitive actions such as miming a grasping move-ment; Rizzolatti et al., 1996), whereas homologous humanregions are activated by intransitive actions (Buccino et al.,2001; Binkofski and Buccino, 2006; Filimon et al., 2007; Lui etal., 2008). Therefore, evidence indicates that the human brainresponds to observed object-related actions differently from
Received May 22, 2013; revised July 12, 2013; accepted July 16, 2013.Author contributions: E.E.H., J.R.V., D.M.S., G.A.O., D.S., and L.A.P. designed research; E.E.H., L.E.M., and D.S.
performed research; T.M.P. contributed unpublished reagents/analytic tools; E.E.H., L.E.M., D.A.G., T.M.P., D.S., andL.A.P. analyzed data; E.E.H. wrote the paper.
This work was supported by the National Institutes of Health (Grant #RR-00165 to the Yerkes National PrimateResearch Center superceded by Office of Research Infrastructure Programs/OD P51OD11132; Grants #MH58922 and#F31MH086179-01 to E.E.H.; and Grants #5P01 AG026423-03 and RO1 MH068791 to L.A.P.), the Wenner-GrenFoundation (Dissertation Fieldwork Grant and Osmundsen Initiative Award 7699 Reference #3681 to E.E.H.), and theEmory Center for Systems Imaging (Pilot Grants #PET.HRRT.PS.001.12 and #MRI.3T.PS.001.12 to D.S.). We thank thestaffs of the Yerkes Imaging Center, Biomedical Imaging Technology Center, Wesley Woods Imaging Center,animal care facility, machine shop, and veterinary facility and James Rilling for sharing no-task chimpanzeecontrol PET scans.
The authors declare no competing financial interests.Correspondence should be addressed to Erin E. Hecht, Department of Anthropology, Emory University, 1557
Dickey Drive, 114 Anthropology Building, Atlanta, GA 30322. E-mail: [email protected]:10.1523/JNEUROSCI.2172-13.2013
Copyright © 2013 the authors 0270-6474/13/3314117-18$15.00/0
The Journal of Neuroscience, August 28, 2013 • 33(35):14117–14134 • 14117

other primates, which has broad relevance for the evolution ofhuman behavior.
To pinpoint any uniquely human features of these neural sys-tems, it is crucial to perform direct comparisons with our closestliving relatives, chimpanzees. Rhesus macaques, the most com-mon neuroscience model species, are separated from humans byapproximately 25 million years of divergent evolution (Good-man et al., 1998) and rarely or never produce many of the com-plex object-related behaviors that are characteristic of humans,such as tool use and imitation (Visalberghi and Fragazy, 2002). Incontrast, chimpanzees do use tools (Goodall, 1964; Whiten et al.,1999), do imitate in some circumstances (Whiten et al., 2009),and are humans’ closest living relatives, separated by approxi-mately 6 million years (Goodman et al., 1998). Chimpanzee neu-roscience research is extremely rare and difficult given thatethical and safety considerations preclude most of the neurosci-ence methods used in humans and monkeys. However, the Ye-rkes National Primate Research Center has developed the use of afunctional neuroimaging method, FDG-PET, to map chimpan-zee regional cerebral glucose metabolism during awake behavior(Rilling et al., 2007; Taglialatela et al., 2008; Parr et al., 2009;
Taglialatela et al., 2011). Building on these achievements, we per-formed a parallel PET imaging study in humans and chimpan-zees. We characterize here the response properties of thechimpanzee grasping execution/observation network and alsoreport a direct, quantitative chimpanzee/human comparison forgrasping observation.
Materials and MethodsSubjects. Chimpanzee subjects included four individuals (two male, twofemale) housed at the Yerkes National Primate Research Center. All hadprevious experience working on cognitive behavioral tasks. Chimpanzeeprocedures were approved by the institutional animal care and use com-mittee at Emory University. Human subjects included six individuals(three male, three female) recruited from the graduate and undergradu-ate student population at Emory University. All human subjects wereneurologically and psychiatrically normal and were right-handed by self-report. Human subjects gave written consent and procedures were ap-proved by the institutional review board of Emory University.
Chimpanzee behavioral tasks. Chimpanzees underwent three func-tional neuroimaging conditions (Fig. 1): (1) performance of a manual,transitive (object-directed) grasping action; (2) observation of a humanexperimenter demonstrating the same action; and (3) observation of an
Figure 1. Chimpanzee behavioral tasks. A, Reach-to-grasp action used in tasks. The ball is fed into a downward-slanting chute. The chimpanzee reaches toward and grasps the ball, navigatesaround the internal divider, and places the ball into another chute, where it rolls back to the experimenter. B, Action execution condition. The chimpanzee performed the reach-to-grasp action whilean experimenter passed the ball through the chutes. This experimenter was hidden behind an opaque screen, but a second, inactive experimenter was visible. This controlled for the presence of avisible human in the observation condition and also allowed the chimpanzee’s behavior to be monitored. All sides of the box were opaque, so the chimpanzee could not see his own hand movements.C, Transitive and intransitive observation conditions. The top and 1 side of the box were replaced with clear Plexiglas. The experimenter performing the actions was visible, but the secondexperimenter was hidden. In the transitive observation condition, the experimenter performed the actions as in A. In the intransitive observation condition, the experimenter mimed these sameactions without touching any object. D, Control for the perception of object movement in the intransitive observation condition. The ball was slid in and out of the box along a transparent thread,interspersed with the experimenter’s mimed grasping actions. The chimpanzee was unable to see the experimenter’s hand moving the thread.
14118 • J. Neurosci., August 28, 2013 • 33(35):14117–14134 Hecht et al. • Object-Directed Grasping in Chimpanzees and Humans

intransitive version of this action in which the demonstrated graspingmovement was mimed without touching any object. This intransitivecondition also included the observation of object movement so that anydifferences in activation between the transitive and intransitive observa-tion conditions could be attributed specifically to the presence or absenceof an object-directed grasp. Chimpanzees performed grasping actions inthe execution condition with the right hand; these actions were per-formed inside a metal box so that subjects were unable to view their ownmovements. The human demonstrator performed the actions in the ob-servation conditions with the right hand in the same box. Chimpanzeeswere trained on the motor task for the execution condition using behav-ioral chaining. They were similarly trained to watch the demonstratedactions while sitting and not moving for the observation conditions.Subjects were considered fully trained when they could perform the in-tended behaviors (grasping or sitting still and watching) for 30 min with�3 min of off-target behavior. Therefore, by the time scans were ac-quired, subjects were very well practiced at the tasks. Subjects were of-fered small sips of sugar-free Kool-Aid when necessary to maintainmotivation at the task. No subject received more than approximately 150ml and the experimenter’s hand motions when lifting the bottle werehidden. Scans from a previously published study were also available, inwhich chimpanzee subjects were freely resting in their enclosures with-out any specific motor task, perceptual stimulus, or behavioral instruc-tions (Fig. 2 in Rilling et al., 2007). However, it is important to note that,in contrast to standard fMRI control tasks, which are highly controlled,this rest condition did include a low level of motor activity and the abilityto observe normal environmental surroundings, because neither move-ment nor vision can be practically or ethically restrained in chimpanzees.
Human task. Human subjects underwent a transitive action observa-tion condition analogous to the second chimpanzee condition. Humanstimuli consisted of 12 separate videos, each �2 s in length, depictingobject-directed, reach-to-grasp actions by a human hand (Peeters et al.,2009). The depicted actions included both precision and whole-handgrips of a ball and a block (both approximately golf ball sized) as well as asmaller pebble (approximately dime sized). Screenshots of these videos,as well as a photograph of the comparable chimpanzee stimulus, areshown in Figure 2. Videos were looped end-to-end in a quasirandomorder with no repeats to produce a continuous 45 min stream. Humansubjects were instructed to sit quietly without moving and observe thevideos.
FDG dosage. FDG-PET uses FDG, a glucose analog radiolabeled with18F. FDG is taken up by cells in the same manner as glucose but becomestemporarily trapped inside the cell; photons that result from decay aredetected by the scanner and metabolism then completes normally (Reiv-ich et al., 1979). Chimpanzee subjects drank a 15 mCi dose of FDG mixedin sugar-free Kool-Aid, performed the behavioral task for each condi-tion, and then were anesthetized and scanned. Human subjects receiveda 10 mCi intravenous dose of FDG, observed the perceptual stimuli, andthen were scanned. The human dose was lower due to the direct, intra-venous dosage method. Therefore, in scan images, brighter regions indi-cate areas of increased metabolism during the task. This method wasdeveloped at the Yerkes National Primate Research Center and is the onlymethodology available for functional neuroimaging in awake, behavingchimpanzees (Rilling et al., 2007; Taglialatela et al., 2008, 2011; Parr et al.,2009; ). FDG gray matter absorption after oral dosage rises slowly forapproximately 10 min and then rises sharply (Parr et al., 2009). Duringinitial chimpanzee behavioral training, it became apparent that it wasdifficult for our tasks to hold the chimpanzees’ attention for sustainedperiods, and we wanted to ensure maximally focused behavior during theperiod of greatest FDG uptake. Therefore, in the 10 min after dosage,chimpanzees rested quietly in their cage. During this period, behaviorwas videotaped and monitored remotely via live feed to ensure that noactions took place that could confound image interpretation. Humans,other chimpanzees, and manipulatable objects were all removed from thesubject’s vicinity. Ten minutes after dosage, the behavioral task began.
Because each FDG-PET scan averages brain activity over the entire 45min uptake period, the homogeneity of the subject’s behavior during thatperiod is crucial for linking brain activation to the task. Although thechimpanzees’ behavior was not physically constrained, we were able to
ensure behavioral homogeneity across conditions by only scanning sub-jects when their behavior conformed to predefined criteria. If the totaltime of non-task-related hand or mouth activity exceeded predefinedthresholds, the scan was cancelled and reattempted at a later date. Be-tween one and five chimpanzee scans were aborted for every one success-fully obtained. The thresholds for cancellation were as follows: �3 minperforming mouth movements or reaching/grasping actions with thehand or arm; �3 min in any other activity not involving the hands, arms,or mouth; �10 min being inactive but not engaged in the task. Behaviorof both chimpanzee and human subjects between FDG dosage and scanacquisition is listed in Table 1. During the entire 45 min uptake period,chimpanzee subjects spent an average of 2:32 in non-task-related activity(5.62% of total uptake time); humans spent an average of 2:22 (5.26% oftotal uptake time).
Figure 2. Transitive grasping stimuli observed by chimpanzees and humans. A, Screenshotsfrom human video stimuli (Peeters et al., 2009). B, Photograph of chimpanzee live-actiondemonstration.
Hecht et al. • Object-Directed Grasping in Chimpanzees and Humans J. Neurosci., August 28, 2013 • 33(35):14117–14134 • 14119

Image acquisition. Human subjects were scanned 45 min after dosage.At this same time point, chimpanzee subjects were sedated with Telazol(4 –5 mg/kg, i.m.), anesthetized with propofol (10 mg/kg/h), and thenscanned. Both human and chimpanzee subjects were scanned using pre-viously described procedures (Rilling et al., 2007; Parret al., 2009) withthe same Siemens high-resolution research tomograph, which acquires207 slices (1.2 mm slice separation) with a reconstructed image resolu-tion of �3 mm. Images were reconstructed with corrections for motion,attenuation, scatter, randoms, and dead time. PET image pixel size was1.22 mm isotropic. Chimpanzee T1-weighted MRI scans were acquiredas described previously (Rilling et al., 2007; Parr et al., 2009) with a3.0-Tesla Trio scanner (Siemens) at a resolution of 0.63 � 0.63 � 0.60mm. Human T1-weighted MRI scans were also acquired with a 3.0-TeslaTrio scanner (Siemens) at a resolution of 1.0 � 1.0 � 1.0 mm.
Image analysis. Chimpanzee and human images were analyzed in ex-actly the same way. PET images were coregistered to and masked withskull-stripped MRI images so that only voxels relating to the brain wouldbe analyzed. Each image was normalized by dividing it by its own meanvoxel value so that images could be compared across subjects and condi-tions. Each image was smoothed using a 4 mm kernel. In the chimpanzeedataset, group statistical analyses were performed using SPM to identifydifferences in activation between conditions. Scans were analyzed using afull factorial model in SPM5 with one factor (condition) with four levels(execution, transitive observation, intransitive observation, rest). Forthese group-level SPM analyses, the threshold was set at p � 0.05, uncor-rected. This liberal threshold was chosen due to the relative similaritybetween the experimental and control conditions (i.e., the no-task con-trol scans included a low but non-zero level of motor actions and werenot free from visual stimulation because the subjects could see theirnormal surroundings). In both the chimpanzee and human datasets, wealso performed within-subjects analyses. In these individual analyses,each image was thresholded to include only the top 1% of the robustmean of the histogram of voxel values in that condition. This thresholdwas chosen in the interest of providing a relatively conservative map ofthe wider distributed network involved in the tasks (Rilling et al., 2007used 5%). The number of activated voxels in each ROI, in each condition,in each subject was calculated. 3D images of brain activations were cre-ated using MRIcron with an 8 mm search depth. PET activations wereoverlaid on our nonlinearly averaged, 36-subject chimpanzee brain tem-plate (Li et al., 2010) or the MNI 1 mm nonlinear human template for thegroup analyses and on each subject’s own T1 MRI scan for the within-subjects analyses.
ROI definition. A map of chimpanzee cortical anatomy drawn on ourchimpanzee brain template is included so that readers can orient themselvesto the location of our ROIs and surrounding brain regions (Fig. 3A). For the
chimpanzee analyses, ROIs were drawn by hand in each subject’s T1 MRIimage (Fig. 3B). Human Brodmann area (BA) 44 is homologous to chim-panzee FCBm, which occupies the pars opercularis of the inferior frontalgyrus (Bailey et al., 1950). Human BA 40 is homologous to chimpanzee areasPFD/PF, which occupy the anterior part of the supramarginal gyrus in infe-rior parietal cortex (Bailey et al., 1950). For the comparative chimpanzee/human analyses, we used a larger set of ROIs covering most of frontal,parietal, and occipitotemporal cortex. These ROIs were drawn on the chim-panzee and human templates and were defined by an experienced compar-ative chimpanzee/human neuroanatomist (T.M.P.) on the basis of clearlyidentifiable landmarks and homologies in cytoarchitectonics, as described bypreviously published atlases and studies (Brodmannn, 1909; Economo andParker, 1929; Bailey, 1948; Von Bonin, 1948; Bailey et al., 1950; Schenker etal., 2010). These ROIs are illustrated in Figure 11A and are anatomicallydefined in Table 2.
ResultsCharacterization of chimpanzee grasping networks: actionexecution, transitive observation, and intransitiveobservationWhole-brain group-level analyses using SPMInitial whole-brain group-level comparisons revealed that themajor differences between the experimental conditions andrest occurred in cerebellum and brainstem. Therefore, for fur-ther group-level statistical analyses, we masked the cerebellumand brainstem to investigate more directly activation differ-ences in the cerebrum.
SPM comparisons between conditions are rendered on the 3Dchimpanzee template brain in Figure 4; coronal slices are shown inFigure 5; coordinates for activation peaks are given in Table 3. TheExecution � Rest contrast revealed left-lateralized clusters of activa-tion in primary motor cortex (in the vicinity of the hand and armrepresentations), ventral premotor cortex, inferior frontal gyrus, in-ferior parietal cortex, and lateral temporal cortex (Fig. 4A, 3D ren-derings; Fig. 5A, coronal slices). Similar frontal and temporal regionswere active in the Transitive Observation � Rest and IntransitiveObservation � Rest contrasts (Fig. 4B,C, 3D renderings; Fig.5B,C, coronal slices).
The SPM contrasts for Execution � Transitive Observationand Execution � Intransitive Observation produced clustersin inferior parietal cortex (Fig. 4 D, E, 3D renderings; Fig.5 D, E, coronal slices). The anterior aspect of this cluster is
Table 1. Measurements and descriptions of non-task-related behavior for each chimpanzee and human subject during FDG uptake
Condition Subject Time Description of non-task-related behavior
Action execution Chimp1 3:08 Chew on ball, scratch/groom self, return ball through cage mesh, raspberry, aggression displayChimp 2 1:59 Chew on ball, bite fingernails, scratch/groom selfChimp 3 1:20 Swing, climb, move barrel, manipulate cage lockChimp 4 5:00 Food beg, spit water at experimenters
Transitive observation Chimp1 1:00 Groom selfChimp 2 2:15 Swing, climb, manipulate own feet, bite fingernails, food beg, aggression display, throw feces
at experimenters, scratch/groom self, pat own head, manipulate cage locksChimp 3 1:18 Scratch/groom self, aggression displayChimp 4 1:36 Suck thumb, poke finger through cage mesh, scratch/groom self
Intransitive observation Chimp1 3:55 Scratch/groom self, spit water at experimentersChimp 2 3:34 Pick up hairs from floor, bite/lick cage mesh, scratch/groom self, climbChimp 3 0:37 ClimbChimp 4 4:42 Spit water at experimenters, scratch/groom self, manipulate own feet, gurgle juice, food beg
Transitive observation Human 1 0:48 Manipulate wristwatch, scratch face, yawn, adjust shirtHuman 2 No video due to equipment errorHuman 3 04:46 Head nod, fall asleepHuman 4 04:29 Yawn, manipulate blanketHuman 5 01:38 Rearrange blanket, yawnHuman 6 00:07 Yawn, stretch, scratch face
14120 • J. Neurosci., August 28, 2013 • 33(35):14117–14134 Hecht et al. • Object-Directed Grasping in Chimpanzees and Humans

most likely in area AIP. Small clusters also occurred aroundthe border of the precentral gyrus (area FBA, homologous toBA 6) and pars opercularis of the inferior frontal gyrus (areaFCBm, homologous to BA 44).
The SPM contrasts for Transitive Observation � Executionand Intransitive Observation � Execution produced clusters inlateral temporal cortex, especially on the right side (Fig. 4F,G, 3D
renderings; Fig. 5F,G, coronal slices). These contrasts also pro-duced clusters in anterior inferior frontal gyrus, probably areaFCBm (homologous to BA 44), as well as scattered small clustersin dorsal premotor and dorsolateral prefrontal cortex, probablyincluding the frontal eye fields (area FD�).
The SPM contrast for Transitive Observation � Intransi-tive Observation produced clusters at the border between the
Figure 3. Chimpanzee cortical anatomy and ROIs. Left hemispheres appear on the left. A, Chimpanzee cortical anatomy. Architectonic areas (top) and surface morphology of cerebralcortex (bottom). The nomenclature for sulci and gyri is based on Bailey et al. (1950), although our abbreviations follow more modern conventions. Cortical areas are denoted accordingto the system of Bailey et al. (1950) and Bailey (1948) based on Economo’s system in humans (Economo and Parker, 1929). For most areas, there is a fairly straightforward correspondencebetween the Bailey et al. (1950) areas and their counterparts in Brodmannn’s human map (Brodmannn, 1909; Von Bonin, 1948), and we have added Brodmannn numbers in parenthesesbelow the Bailey et al. (1950) symbols. Areas thought to be homologous to BA 44 and BA 45 of humans occupy the posterior inferior frontal gyrus and adjacent part of the inferior frontalsulcus in chimpanzees, as discussed by Schenker et al. (2010). B, ROIs in FCBm and PFD/PF in each subject. CS, central sulcus; FOS, frontoorbital sulcus; IFG, inferior frontal gyrus; IFS,inferior frontal sulcus; IPL, inferior parietal lobule; IPS, intraparietal sulcus; LCaS, lateral calcarine sulcus; LOTS, lateral occipitotemporal sulcus; LS, lateral sulcus; LuS, lunate sulcus; MFG,middle frontal gyrus; MTG, middle temporal gyrus; MTS, middle temporal sulcus; PoCG, postcentral gyrus; PoCS, postcentral sulcus; PrCG, precentral gyrus; PrCS, precentral sulcus; SFG,superior frontal gyrus; SFS, superior frontal sulcus; SPL, superior parietal lobule.
Hecht et al. • Object-Directed Grasping in Chimpanzees and Humans J. Neurosci., August 28, 2013 • 33(35):14117–14134 • 14121

Table 2. Anatomical definitions of homologous human and chimpanzee ROIs
ROI
Chimpanzees Humans
Anatomical description Cyto-architectonic region(s) Anatomical description Cyto-architectonic region(s)
Lateral occipital cortex (LOC) Its anterior border is a line drawn straight upfrom the occipital notch following theinferior extension of the STS. Its posteriorborder includes both the banks and thefundus of the lunate sulcus. It includes bothbanks of the medial parietooccipital fissure.
OA (BA 19) Same, except its posterior border is acurved line placed half way to thepole.
BA 19
Inferotemporal cortex (IT) Lateral temporal cortex inferior to the superiorcentral sulcus extending ventrally to theborder with the hippocampal formation. Itsanterior border is the temporal pole and itsposterior border is an imaginary verticalline drawn up from the occipital notch.
TE1 (BA 21), TE2 (BA 20),PH (BA 37)
Same. BA 21, BA 20, BA 37
Superior temporal sulcus (STS) Includes both banks and fundus. Its posteriorborder is the imaginary extension of theinferior terminus of the STS parallel to butanterior to the lunate sulcus.
Same, except its posterior termina-tion is vertical line from occipitalnotch.
Inferior parietal cortex (IPL) Its anterior border is the posterior bank ofpostcentral sulcus. Its posterior border is avertical line drawn up from the terminationof the inferior sulcus that extends off theposterior end of the STS.
PFD, PF (BA 40/7b), PG (BA 39/7a) Its anterior border is the fundus ofthe postcentral sulcus. Its poste-rior border is vertical line drawnup from the occipital notch.
BA 40, BA 39
Superior parietal cortex (SPL) Its anterior border is the posterior bank ofpostcentral sulcus. Its posterior border is avertical line drawn up from the terminationof the inferior sulcus that extends off theposterior end of the STS.
PEm (BA 5), PEp (BA 5) Its anterior border is the fundus ofthe postcentral sulcus. Its poste-rior border is a vertical line drawnup from the occipital notch.
BA 5, BA 7
Primary and secondary somatosensorycortex (S1-S2)
Its anterior border is the fundus of the centralsulcus. Its posterior border is the fundus ofpostcentral sulcus.
PB (BA 3, BA 1), PC (BA 2) Same. BA 3, BA 1, BA 2
Primary motor cortex (M1) Its posterior border is the fundus of the centralsulcus. Its anterior border is an imaginaryline drawn straight up from the intersec-tion of the inferior frontal sulcus and thecentral sulcus. At its inferior aspect, the ROIexists entirely inside the central sulcus. Atits superior aspect, the ROI extends past thedorsal precentral sulcus.
FA (BA 4) Its posterior border is the fundus ofthe central sulcus. Its anteriorborder is a vertical line from thelateral sulcus to the superior tip ofsuperior precentral sulcus.
BA 4
Dorsal premotor cortex (PMd) At its dorsal aspect, it extends anteriorly to animaginary line drawn from the tip of theinferior precentral sulcus at a 90 degreeangle with the lateral sulcus. The inferiorpart of the ROI is bordered anteriorly at theinferior frontal sulcus, curving down andback to meet the PMv ROI. The borderbetween PMd and PMv is an imaginary linedrawn parallel to the lateral sulcus at thedorsal tip of the frontooccipital sulcus sothat the superior borders of PMv andBroca’s area are continuous.
FB (BA 6), FC (BA 8) Its posterior border is a vertical linefrom the lateral sulcus to thesuperior tip of the superior pre-central sulcus. Its anterior borderis a 45 degree line from the an-terosuperior edge of the PMv ROI.The border between PMd andPMv is the gyrus that splits thesuperior and inferior precentralsulci.
BA 6, BA 8
Ventral premotor cortex (PMv) Bordered posteriorly by the M1/S1 ROI, superi-orly as described above, and anteriorly bythe inferior precentral sulcus.
FBA (BA 6) Its anterior border is the inferiorprecentral sulcus. Its posteriorborder is a vertical line from thelateral sulcus to the superior tip ofsuperior precentral sulcus (M1).Its superior border is the gyrusthat splits the inferior and supe-rior precentral gyri.
BA 6
(Table continues.)
14122 • J. Neurosci., August 28, 2013 • 33(35):14117–14134 Hecht et al. • Object-Directed Grasping in Chimpanzees and Humans

left precentral and inferior frontal gyri, left inferior parietalcortex, left dorsal premotor cortex, right dorsal premotor orprimary motor cortex, right orbitofrontal cortex, and bilaterallateral temporal cortex (Fig. 4H, 3D renderings; Fig. 5H, cor-onal slices). Again, the anterior inferior parietal activations aremost likely in area AIP. The opposite contrast, Intransitive
Observation � Transitive Observation, produced small clus-ters at the border of the left precentral and inferior frontal gyri(located more ventrally than the Transitive � Intransitivecluster), left anterior superior temporal sulcus and middletemporal gyrus, and right inferior parietal cortex (Fig. 4I, 3Drenderings; Fig. 5I, coronal slices).
Table 2. Continued
ROI
Chimpanzees Humans
Anatomical description Cyto-architectonic region(s) Anatomical description Cyto-architectonic region(s)
Dorsolateral prefrontal cortex (DLPFC) Bordered dorsally by the interhemisphericfissure, posteriorly by the PMd ROI, inferi-orly by the Broca’s area ROI, and anteriorlyby an imaginary line that is an extension ofthe orbital sulcus drawn past the tip of themiddle frontal sulcus.
FDm (BA 9), FD� (BA 46) Its inferior border is the inferiorfrontal sulcus. Its anterior borderis a 45 degree line drawn from tipof anterior horizontal ramus (thesulcus that borders the anterioredge of Broca’s area).
BA 9, BA 46
Ventrolateral prefrontal cortex (VLPFC) Includes the pars opercularis and pars triangu-laris of the inferior frontal gyrus. Borderedposteriorly by the inferior precentral sulcus,anteriorly by the small sulcus that extendsanteriorly from the frontoorbital sulcus,and superiorly by the inferior frontal sulcus.
FCBm (BA 44), FDp (BA 45) Same. BA 44, BA 45
Figure 4. 3D surface renderings of group-level SPM statistical comparisons between conditions. Left hemispheres appear on the left. SPM5 analysis thresholded at p � 0.05. A, Execution� Rest.B, Transitive Observation � Rest. C, Intransitive Observation � Rest. D, Execution � Transitive Observation. E, Execution � Intransitive Observation. F, Transitive Observation � Execution. G,Intransitive Observation � Execution. H, Transitive Observation � Intransitive Observation. I, Intransitive Observation � Transitive Observation.
Hecht et al. • Object-Directed Grasping in Chimpanzees and Humans J. Neurosci., August 28, 2013 • 33(35):14117–14134 • 14123

Whole-brain individual subject-level analyses using a1% thresholdFigure 6 shows the top 1% of activity in each subject’s scan in eachcondition. All action conditions activated similar frontoparietalregions, including central sulcus, precentral and postcentral gyri,dorsal and ventral premotor cortex, ventrolateral prefrontal cor-
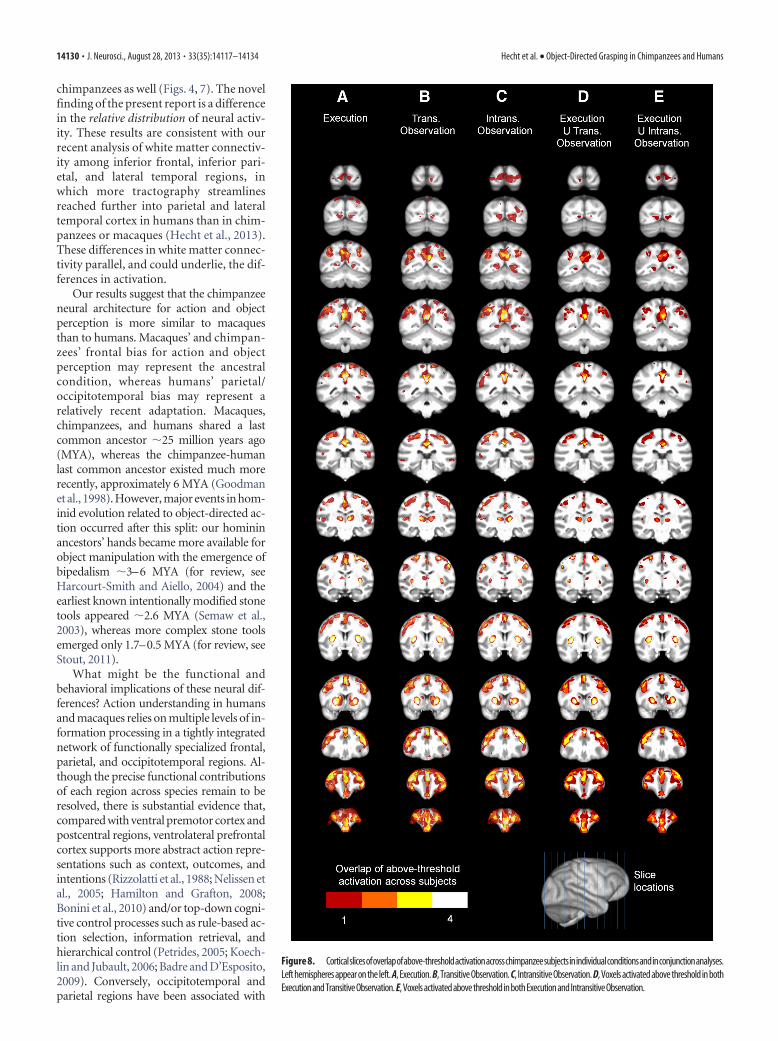
tex, dorsolateral prefrontal cortex (probably including the frontaleye fields), and inferior and superior parietal cortex. Individualsubjects’ activations are overlaid in a group composite map (Fig.7A–C, 3D renderings; Fig. 8A–C, coronal slices), which shows thenumber of subjects with above-threshold activation at a givenvoxel in each condition. The transitive and intransitive observa-
Figure 5. Coronal slices of group-level SPM statistical comparisons between conditions. Left hemispheres appear on the left. SPM5 analysis thresholded at p � 0.05.
14124 • J. Neurosci., August 28, 2013 • 33(35):14117–14134 Hecht et al. • Object-Directed Grasping in Chimpanzees and Humans

Table 3. Cluster sizes; T, Z, and p values; and coordinates of activation peak(s) foreach cluster from the nine SPM analyses shown in Figures 4 and 5
Cluster size T Z p x,y,z (mm) of peak(s)
Execution � Rest1851 7.65 3.65 0 �7, �24, 1
5.13 3.07 0.001 4, �4, 53.85 2.64 0.004 0, �18, 2
1222 6.39 3.39 0 �28, �49, �126.09 3.32 0 �33, �33, �125.11 3.06 0.001 �20, �44,, �11
1130 9.47 3.95 0 22, �41, �125.36 3.13 0.001 15, �45, �93.66 2.56 0.005 25, �48, �14
897 8.04 3.72 0 �37, 2, 108.03 3.72 0 �30, 5, 42.59 2.05 0.02 �36, 0, 19
465 10.73 4.11 0 24, 10, 22.38 1.93 0.027 22, 2, �3
337 7.65 3.65 0 6, 10, �62.89 2.2 0.014 14, 3, �1
306 4.34 2.82 0.002 �10, 10, �63.54 2.51 0.006 �6, 22, �2
289 11.53 4.21 0 �29, �16, 322.28 1.87 0.031 �24, �10, 35
271 6.26 3.36 0 �33, �22, 242.26 1.86 0.032 �33, �14, 17
247 6.78 3.48 0 �37, �14, �6247 2.47 1.98 0.024 �18, 12, 0197 3.21 2.36 0.009 32, 3, 6124 2.92 2.22 0.013 �19, 2, �2105 3.52 2.5 0.006 5, 15, 2100 2.59 2.05 0.02 �8, 15, 784 3.57 2.52 0.006 �25, �16, 874 2.51 2 0.023 �30, 0, �1966 3.01 2.27 0.012 37, 3, 1066 2.86 2.19 0.014 �24, �10, 2665 2.7 2.1 0.018 �11, �44, �762 3.63 2.54 0.005 �29, �34, 2359 2.64 2.07 0.019 15, �47, 356 2.99 2.26 0.012 �10, �54, �1055 2.72 2.11 0.017 �18, �47, 254 5.08 3.05 0.001 �34, �14, 646 8.11 3.73 0 18, �25, �338 3.52 2.5 0.006 35, �9, �238 2.72 2.12 0.017 �3, �35, �130 3.41 2.45 0.007 �24, �30, 2830 2.52 2.01 0.022 �15, �5, 129 3.12 2.32 0.01 6, �41, �223 2.87 2.2 0.014 �25, 13, 123 2.3 1.88 0.03 �26, �2, 122 2.65 2.08 0.019 34, 10, 1321 2.97 2.25 0.012 �26, 1, �621 2.15 1.79 0.037 12, �53, �715 2.03 1.71 0.043 4, 19, �411 3.17 2.34 0.01 25, �33, �1411 2.72 2.12 0.017 �38, �22, 10
Transitive Observation � Rest2398 14.83 4.53 0 21, �35, �7
8.4 3.78 0 22, �41, �137.87 3.69 0 19, �26, �6
1560 8.56 3.81 0 �7, �24, 15.27 3.11 0.001 �9, �39, �45.25 3.1 0.001 �23, �24, �13
830 5.94 3.29 0.001 �34, 2, 103.83 2.62 0.004 �34, 9, 143.79 2.61 0.005 �37, �5, 16
(Table continues.)
Table 3. Continued
Cluster size T Z p x,y,z (mm) of peak(s)
546 3.11 2.31 0.01 �15, 3, 12.6 2.05 0.02 �18, 12, 2
455 5.5 3.17 0.001 �35, �14, �63.31 2.41 0.008 �36, �16, �14
267 3.55 2.51 0.006 �22, �49, �63.17 2.34 0.01 �21, �43, �122.41 1.95 0.026 �28, �49, �14
239 3.21 2.36 0.009 �3, �9, 10133 3.05 2.28 0.011 �29, �5, �21108 4.52 2.88 0.002 �12, �59, �1498 2.79 2.15 0.016 �7, 15, 894 3.42 2.45 0.007 34, �1, 370 3.59 2.53 0.006 37, �26, �163 2.34 1.9 0.028 4, �6, 660 2.56 2.03 0.021 25, �10, �1856 2.95 2.23 0.013 11, �53, �655 2.74 2.12 0.017 �26, �14, 3452 4.36 2.82 0.002 �33, �18, �745 3.39 2.44 0.007 22, �57, �1445 3.26 2.38 0.009 �32, 15, 1038 3.56 2.51 0.006 13, �30, �738 3.13 2.32 0.01 �27, 3, 534 2.95 2.23 0.013 6, �41, �233 3.36 2.43 0.008 �26, �2, 230 3.14 2.33 0.01 �38, �22, �229 2.31 1.89 0.03 �7, 5, 1525 2.25 1.85 0.032 32, �9, �1822 2.87 2.19 0.014 �26, 2, 2721 3.31 2.41 0.008 �7, 22, �221 2.39 1.93 0.027 �18, �46, 219 2.58 2.04 0.021 �38, �26, �1216 3.22 2.37 0.009 �21, �34, �414 2.6 2.05 0.02 �26, 13, 113 2.16 1.8 0.036 6, 17, �512 3.12 2.32 0.01 37, �22, �1012 2.44 1.96 0.025 32, �37, �1411 2.16 1.79 0.036 �26, �6, 910 2.49 1.99 0.023 �30, �53, �14
Intransitive Observation � Rest979 9.46 3.95 0 21, �35, �7
3.01 2.26 0.012 19, �48, �92.53 2.01 0.022 11, �42, �7
529 8.65 3.82 0 �38, �16, �113.9 2.66 0.004 �37, �8, �6
399 3.46 2.47 0.007 4, �7, 92.74 2.12 0.017 �5, �5, 6
311 6.05 3.31 0 �31, �33, �133.24 2.37 0.009 �23, �22, �14
302 3.62 2.54 0.006 0, 13, �62.93 2.22 0.013 �4, 22, �42.27 1.86 0.031 �2, 11, 2
273 3.52 2.5 0.006 �12, �31, �83.3 2.4 0.008 �10, �31, 0
215 3.38 2.44 0.007 �33, 3, 14204 3.11 2.31 0.01 �17, 1, �2180 3.22 2.37 0.009 �3, �25, �2
2.1 1.76 0.039 2, �18, 0177 4.24 2.78 0.003 15, �2, 0161 2.55 2.02 0.021 �6, �16, 0159 3 2.26 0.012 27, �11, �19
2.93 2.22 0.013 29, 1, �14136 3.11 2.31 0.01 22, 14, 2136 2.27 1.86 0.032 �9, 14, �1
2.9 2.21 0.014 23, 7, �2(Table continues.)
Hecht et al. • Object-Directed Grasping in Chimpanzees and Humans J. Neurosci., August 28, 2013 • 33(35):14117–14134 • 14125

Table 3. Continued
Cluster size T Z p x,y,z (mm) of peak(s)
111 3.91 2.66 0.004 �26, 11, 9108 5.24 3.1 0.001 20, �26, �7107 3.39 2.44 0.007 �28, 6, 3100 4.13 2.74 0.003 �26, 12, 192 2.67 2.09 0.018 �20, 11, �148 2.51 2 0.023 �26, 0, �635 2.67 2.09 0.018 �29, �13, 131 3.71 2.58 0.005 27, 5, 231 2.85 2.19 0.014 �29, �48, �1428 2.07 1.74 0.041 0, �16, 625 2.09 1.75 0.04 37, �4, 1524 3.04 2.28 0.011 �29, �11, 3023 2.83 2.18 0.015 �26, �2, 120 2.34 1.9 0.029 28, 20, 1019 3.35 2.42 0.008 �32, �41, �1419 2.59 2.05 0.02 �37, �22, 117 2.52 2.01 0.022 6, �39, 112 2.1 1.76 0.039 �25, �11, 2611 2.54 2.02 0.022 �14, �50, 2411 2.32 1.89 0.029 �27, �6, �21
Execution � Transitive Observation469 5.77 3.24 0.001 �27, �35, 23
3.71 2.58 0.005 �31, �25, 26444 10.28 4.06 0 6, 18, 3
2.84 2.18 0.015 10, 10, �2225 5.07 3.05 0.001 �26, �18, 10207 4 2.69 0.004 37, �14, 18140 3.22 2.37 0.009 36, �26, 16127 6.37 3.39 0 6, �37, 3484 3.16 2.34 0.01 �5, �11, 2777 3.9 2.65 0.004 10, �22, 2269 3.92 2.66 0.004 12, �40, 2668 4.55 2.89 0.002 29, �5, 864 4.97 3.02 0.001 �6, �12, 1049 4.73 2.95 0.002 �28, 10, 749 2.45 1.97 0.025 �23, �44, �1047 3.03 2.28 0.011 �24, 6, 242 4.93 3.01 0.001 �5, �40, 3342 2.89 2.21 0.014 14, 11, 241 2.46 1.97 0.024 �38, �22, 1140 6.04 3.31 0 �28, �8, 135 3.05 2.28 0.011 6, �54, 121 4.83 2.98 0.001 �30, 5, 517 2.65 2.08 0.019 6, �28, 3017 2.26 1.86 0.032 39, �6, 414 2.4 1.94 0.026 26, 10, 413 2.77 2.14 0.016 �33, �14, �613 2.36 1.92 0.028 �33, �34, 2011 2.32 1.89 0.029 �35, �20, 1710 2.53 2.01 0.022 �26, �25, 1910 2.24 1.84 0.033 �25, �49, �13
Execution � Intransitive Observation930 4.45 2.85 0.002 �2, �18, 34
2.75 2.13 0.016 3, �11, 24508 5.36 3.13 0.001 �34, �23, 21271 8.04 3.72 0 7, 14, 3260 6.87 3.5 0 30, 10, 14234 7.22 3.57 0 9, �37, 34212 5.51 3.18 0.001 10, 6, �5
3.97 2.68 0.004 14, 10, 2174 3.82 2.62 0.004 2, 12, 21132 3.52 2.5 0.006 �26, �17, 10129 3.21 2.36 0.009 �2, �29, 2892 5.99 3.3 0 6, �2, 6
(Table continues.)
Table 3. Continued
Cluster size T Z p x,y,z (mm) of peak(s)
79 7.13 3.55 0 26, �6, �375 5.91 3.28 0.001 �13, �43, 1375 2.83 2.17 0.015 5, �27, 3063 2.58 2.04 0.021 �19, �9, 554 3.37 2.43 0.008 15, �47, 2453 4.07 2.72 0.003 7, �26, 2443 3.12 2.32 0.01 �6, �25, 2643 2.47 1.98 0.024 29, �2, 842 3.61 2.53 0.006 6, �10, 1031 2.87 2.2 0.014 �2, 10, 2628 3.87 2.64 0.004 �36, �29, 1828 2.79 2.15 0.016 21, 10, 127 3.02 2.27 0.012 �2, 15, 3127 2.65 2.08 0.019 5, 3, 2521 2.91 2.22 0.013 �14, �25, �121 2.44 1.96 0.025 29, 13, 219 2.5 2 0.023 2, �23, 3818 3.55 2.51 0.006 �37, �26, 1518 3.5 2.49 0.006 �29, 17, 318 2.41 1.94 0.026 �31, �8, 1217 5.46 3.16 0.001 �10, 18, 617 3.35 2.42 0.008 �2, 4, 2215 3.64 2.55 0.005 14, �3, 3415 2.88 2.2 0.014 �32, 13, 1414 2.63 2.07 0.019 14, 31, 1713 3.29 2.4 0.008 �12, 20, 2911 2.22 1.83 0.034 �23, �32, 2810 2.17 1.8 0.036 9, 23, 2610 2.17 1.8 0.036 �23, �13, 35
Transitive Observation � Execution1221 7.62 3.65 0 36, �20, 0
7.08 3.54 0 35, �30, �34.14 2.74 0.003 29, �32, 5
342 3.39 2.44 0.007 �2, �44, 14329 9.74 3.99 0 31, �49, �8176 4.92 3.01 0.001 �24, 22, 9168 4.89 2.99 0.001 �37, �22, �1159 7.96 3.71 0 �7, �24, 0
2.55 2.02 0.022 �10, �31, �6129 4.58 2.9 0.002 2, �33, 18125 4.36 2.82 0.002 20, �35, �769 4.5 2.87 0.002 �4, �36, 262 2.81 2.16 0.015 36, �41, �356 2.83 2.17 0.015 �26, 2, 2743 2.65 2.08 0.019 30, 4, 2439 3.55 2.51 0.006 18, �26, �632 2.45 1.96 0.025 �15, 18, 228 3.21 2.36 0.009 �2, �22, �926 3.21 2.36 0.009 �37, �6, 1525 5.79 3.25 0.001 �18, 5, 3625 2.2 1.82 0.035 22, �22, �1021 3.56 2.51 0.006 �34, �26, �1320 2.48 1.98 0.024 �39, �28, �418 3.45 2.47 0.007 28, �39, 1417 2.26 1.86 0.032 �24, �56, 816 2.73 2.12 0.017 �9, 7, 1616 2.59 2.04 0.02 �6, 17, 3015 2.4 1.94 0.026 �37, �16, �1414 2.2 1.82 0.034 30, �13, �1813 2.55 2.02 0.022 22, �58, �1413 2.2 1.82 0.035 27, �20, �1412 2.28 1.87 0.031 �34, 10, 1411 2.17 1.8 0.036 �36, �32, 410 2.96 2.24 0.013 �23, �23, �13
(Table continues.)
14126 • J. Neurosci., August 28, 2013 • 33(35):14117–14134 Hecht et al. • Object-Directed Grasping in Chimpanzees and Humans

tion conditions activated visibly similar regions, both whenconsidering group-level activations compared with a low-action-execution, low-action-perception rest condition (Figs. 4B,C,5B,C) and when considering conservatively thresholded individ-ual subject-level activations without a comparison condition(Fig. 6, Transitive and Intransitive Observation panels for eachsubject).
To identify brain regions that mapped observed actions ontothe same substrates used to perform them, we performed a con-junction analysis, selecting voxels that were active in both theexecution and transitive or intransitive observation conditions.The final two panels for each chimpanzee in Figure 6 shows theseoverlaps in individual subjects; Figure 7D, E show 3D renderingsof a group composite map; Figure 8D, E show coronal slices ofthis group composite map. Regions of overlap between executionand transitive action observation included central sulcus, precen-tral and postcentral gyri, dorsal and ventral premotor cortex,ventrolateral prefrontal cortex, dorsolateral prefrontal cortex,and inferior and superior parietal cortex. Regions of overlap be-tween execution and intransitive action observation are visiblyvery similar, both at the individual subjects level (Fig. 6, Execu-tion U Transitive/Instransitive Observation panels for each sub-ject) and at the group level (Figs. 7D,E, 8D,E).
ROI analysesFinally, we compared the ratio of the frontal and parietal ROI’svolumes that contained above-threshold activation, both in theindividual conditions and in the Execution U Transitive/Intran-sitive Observation conjunction analyses. Activity in both thefrontal and parietal ROIs was significantly greater in each of theexperimental conditions than in the rest condition, but there wasno significant difference between the Transitive and the Intran-sitive Observation conditions (Fig. 9A). Similarly, activity in theROIs was not significantly different between the Execution UTransitive Observation and Execution U Intransitive Observa-tion conjunction analyses (Fig. 9B).
Comparison of chimpanzee and human graspingobservation networksWhole-brain analysesFigure 10 shows the top 1% of activation in the transitive obser-vation condition for each of six human subjects, as well as com-posite group image of these activations rendered on the MNItemplate. The individual thresholded images in Figure 10A arecomparable to the chimpanzee Transitive Observation panels in
Table 3. Continued
Cluster size T Z p x,y,z (mm) of peak(s)
10 2.38 1.92 0.027 �32, �36, 610 2.28 1.87 0.031 �37, �20, �13
Intransitive Observation � Execution364 4.99 3.03 0.001 �2, 14, �3355 4.74 2.95 0.002 �3, �43, 10
2.25 1.85 0.032 2, �33, 18204 3.76 2.6 0.005 31, �31, 4
3.52 2.5 0.006 33, �26, �4143 4.28 2.79 0.003 30, �45, �10101 3.8 2.61 0.004 �20, 27, 10
2.32 1.89 0.029 �17, 18, 488 4.16 2.75 0.003 �7, 17, 2984 3.59 2.53 0.006 �9, 34, 1653 2.59 2.05 0.02 27, �11, �1946 3.65 2.55 0.005 �6, 16, 145 4.62 2.91 0.002 �5, �38, 243 3.13 2.32 0.01 20, �35, �742 2.53 2.01 0.022 37, �3, 1240 2.5 2 0.023 10, �18, 3837 2.5 2 0.023 �29, 5, �1535 2.77 2.14 0.016 �9, �18, �130 2.92 2.22 0.013 �12, �29, �227 3.14 2.33 0.01 27, �4, 2625 2.95 2.23 0.013 �38, �22, 023 2.79 2.16 0.016 �22, 14, 3020 2.97 2.24 0.012 6, 5, 4119 2.59 2.05 0.02 24, �35, 2714 2.7 2.11 0.018 �6, 30, 912 2.79 2.15 0.016 23, 21, 2612 2.7 2.11 0.018 26, 6, 2710 4.94 3.01 0.001 27, �11, 1810 3.14 2.33 0.01 25, �17, 2
Transitive � Intransitive Observation179 4.29 2.8 0.003 �14, 4, 1170 5.13 3.07 0.001 �34, 10, 13
3.59 2.53 0.006 �29, 8, 22155 6.25 3.36 0 35, �30, �3
2.55 2.02 0.022 34, �22, �2127 4.69 2.93 0.002 18, �6, 38122 4.47 2.86 0.002 �33, �24, �13
3.15 2.33 0.01 �36, �15, �14113 4.97 3.02 0.001 �33, �24, 21109 2.91 2.22 0.013 22, �31, �1054 2.34 1.9 0.029 7, 29, 449 3.66 2.56 0.005 �36, �30, 1742 5.54 3.18 0.001 13, 9, �242 3.36 2.43 0.008 �14, 18, 236 3.3 2.4 0.008 33, �38, �229 4.5 2.87 0.002 6, 14, 229 2.86 2.19 0.014 23, �22, �1127 2.76 2.14 0.016 �34, �9, �1826 2.88 2.2 0.014 �2, �44, 1422 2.98 2.25 0.012 �25, �5, �1921 4.7 2.94 0.002 �20, 5, 3420 2.49 1.99 0.023 �21, �24, �618 3.23 2.37 0.009 �11, 18, 618 2.8 2.16 0.016 26, �42, �1315 2.91 2.21 0.013 10, �40, 3315 2.5 2 0.023 33, �26, 113 2.58 2.04 0.021 5, �29, 2512 2.64 2.07 0.019 26, �6, 112 2.59 2.05 0.02 �16, �25, �212 2.5 2 0.023 34, �31, �1212 2.5 1.99 0.023 6, 17, 25
(Table continues.)
Table 3. Continued
Cluster size T Z p x,y,z (mm) of peak(s)
12 2.23 1.84 0.033 20, 22, 711 2.43 1.96 0.025 �31, �19, �910 2.16 1.8 0.036 �1, 16, 30
Intransitive � Transitive Observation51 2.62 2.06 0.02 �27, �7, �649 5.59 3.2 0.001 28, �8, 1745 3.83 2.63 0.004 27, �7, 738 3.15 2.33 0.01 �6, �47, 1833 2.52 2.01 0.022 �7, �4, 732 6.62 3.44 0 �31, �14, �529 2.33 1.9 0.029 13, �2, 424 4.14 2.74 0.003 �29, 10, 816 2.67 2.09 0.018 �24, �37, 2515 3.41 2.45 0.007 25, �34, 2814 2.68 2.1 0.018 �35, �10, �1112 2.26 1.85 0.032 �2, �39, 31
Hecht et al. • Object-Directed Grasping in Chimpanzees and Humans J. Neurosci., August 28, 2013 • 33(35):14117–14134 • 14127

Figure 6; the composite group image iscomparable to the chimpanzee image inFigure 7B. Differences between chimpan-zee and human activations are grossly ev-ident. Chimpanzee activation is focusedmainly in frontal cortex, including espe-cially prefrontal cortex, with relatively lessactivation in occipitotemporal and pari-etal cortex. In contrast, human activationis more evenly distributed between fron-tal, parietal, and occipitotemporal cortex.
ROI analysesTo assess these qualitative differencesquantitatively, we measured the propor-tion of the total volume of above-threshold activation that fell into each of aset of ROIs drawn in homologous regionsof human and chimpanzee frontal, pari-etal, and occipitotemporal cortex. TheseROIs are illustrated in Figure 11A and areanatomically defined in Table 2. Thiscomparison revealed significantly greateractivation in ventrolateral prefrontal cor-tex in chimpanzees and greater activationin ventral premotor cortex, inferior pari-etal lobule, and inferotemporal cortex inhumans (Fig. 11B).
DiscussionThis research characterized the responsesof the chimpanzee action execution/ob-servation system. We identified chimpan-zee regions that were activated duringperformance of object-directed grasping,observation of the same action, and obser-vation of similar movements performedwithout grasping any object. Group-levelstatistical comparisons between each ofthese conditions and rest highlighted small,focused activations in the hemisphere con-tralateral to the hand carrying out the task(Figs. 4, 6); conservatively thresholded scansin individual subjects revealed a distributedbilateral network (Figs. 6, 7, 8). Chimpanzeeregions that are more activated by produc-ing than observing grasping include por-tions of inferior parietal cortex, includinganterior intraparietal sulcus and probablythe chimpanzee homolog of area AIP,somatosensory cortex, cerebellum, andpremotor cortex (Figs. 4D,E, 5D,E).Chimpanzee regions that are more activatedby observing than producing grasping in-clude portions of superior temporal sulcus,inferotemporal cortex, occipitotemporalcortex, and inferior frontal gyrus (Figs.4F,G, 5F,G). These results are, unsurpris-ingly, similar to activations reported in ma-caques and humans (for review, see (Orbanand Jastorff, 2013).
An important result of these analyseswas that chimpanzee brain activations for
Figure 6. 3D surface renderings of top 1% of activity in chimpanzee subjects during each individual condition and in conjunc-tion analyses. Left hemispheres appear on the left.
14128 • J. Neurosci., August 28, 2013 • 33(35):14117–14134 Hecht et al. • Object-Directed Grasping in Chimpanzees and Humans

observing transitive and intransitive actions are very similar (Fig.5). There are a few small, constrained portions of chimpanzeefrontoparietal cortex that are activated more by transitive thanintransitive observation (Figs. 4H, 5H), but the regions of overlapbetween execution and transitive observation are nearly identicalto the regions of overlap between execution and intransitive ob-servation (Figs. 7D,E, 8D,E). Furthermore, in ROIs homologousto macaque regions that contain mirror neurons, there is no sig-nificant difference in activation for transitive and intransitiveobservation (Fig. 9). This suggests that when a chimpanzee ob-serves another individual performing hand movements, these aremapped onto almost the same brain regions that the chimpwould use to produce those movements himself regardless ofwhether the movements lead to a physical result. This is similar tohumans, who also map observed intransitive actions onto one’sown motor system with somatotopic specificity (Buccino et al.,2001; Binkofski and Buccino, 2006; Filimon et al., 2007; Lui et al.,2008). This result is in notable contrast to macaques, in whichmirror neurons are strongly goal oriented (Umilta et al., 2001)and do not respond to intransitive action (Rizzolatti et al., 1996).
What might be the behavioral significance of chimpanzees’similar neural responses for transitive and intransitive action?Lyons et al. (2006) proposed that the macaque brain performs“intentional compression,” boiling observed actions down totheir environmental results. Our results suggest that the chim-panzee brain does not “compress” observed actions in this way.Chimpanzees map not only the results but also the movements ofobserved actions to the same brain regions that produce thoseactions. This may be a correlate of, and a prerequisite to, theability to copy specific movements. Perhaps for an individual tocopy the specific movements of an action, the brain must becapable of mapping those movements onto the same neural cir-cuitry used to produce them. Therefore, perhaps macaques em-ulate results but do not imitate movements because their brains“mirror” interactions between hands and objects, but not manual
movements apart from objects. Perhapschimpanzees are capable of some limitedimitation of movements because theirbrains, like ours, do “mirror” movements.This hypothesis could be investigated inother species that copy the specific move-ments of observed actions.
We also found that chimpanzeeFCBm, the homolog to human BA 44, ismore responsive to grasping actions thanPFD/PF, which is homologous to humanBA 40 (Fig. 9A,B). This is similar to ma-caque 2-deoxyglucose studies in whichobserving grasping action caused signalincreases between 7% and 19% in F5 andbetween 2% and 11% in PF/PFG (Raos etal., 2004; 2007). This is also similar to ma-caque fMRI studies finding greater frontalactivation and reduced parietal activationcompared with humans during the per-ception of actions and objects (Vanduffelet al., 2002; Denys et al., 2004; Raos et al.,2004; 2007; Peeters et al., 2009). In con-trast, meta-analyses of �100 human fMRIand O 15 PET studies have reported com-paratively more balanced frontal and pa-rietal activations (Caspers et al., 2010;Molenberghs et al., 2012).
Our human FDG-PET study enabled a direct comparisonwith our chimpanzee activations. Differences in activation weregrossly evident. Chimpanzee activation was focused mainly infrontal cortex, including especially prefrontal cortex, with rela-tively less activation in occipitotemporal and parietal cortex. Incontrast, human activation was more evenly distributed amongfrontal, parietal, and occipitotemporal cortex (compare Transi-tive Observation panels in Figs. 6, 10). Quantitatively, chimpan-zees had significantly more activation in ventrolateral prefrontalcortex, whereas humans had significantly more activation in in-ferior parietal cortex, inferotemporal cortex, and ventral premo-tor cortex (Fig. 11).
A limitation of the present study was that behavioral condi-tions and scan acquisition methods were not identical for chim-panzees and humans. This was because the human data wereacquired as pilot data for a separate study. Due to the rarity ofchimpanzee data and the even greater rarity of comparable hu-man data, we performed opportunistic post hoc comparisons.Our analyses carefully controlled for methodological differencesand, importantly, expectations for possible methodology-relateddifferences in regional brain activation are opposite to what weobserved, suggesting that observed differences in brain activationwere not due to these methodological differences (Table 4). Fur-ther research is warranted to more precisely delineate chimpan-zee/human differences, particularly during the observation ofintransitive action.
Our results indicate that the neural response of chimpanzeesto the observation of object-directed grasping is biased towardprefrontal cortex in a way that the response of humans is not.Conversely, the neural response of humans is biased toward pa-rietal and occipitotemporal regions in a way that the response ofchimpanzees is not. To be clear, there is abundant evidence ofoccipitotemporal and parietal response to transitive action obser-vation in macaques and humans (for review, see Orban and Jas-torff, 2013), and our data do indicate such responses in
Figure 7. 3D surface renderings of overlap of above-threshold activation across chimpanzee subjects in individual conditionsand in conjunction analyses. Left hemispheres appear on the left. A, Execution. B, Transitive Observation. C, Intransitive Observa-tion. D, Voxels activated above threshold in both Execution and Transitive Observation. E, Voxels activated above threshold in bothExecution and Intransitive Observation.
Hecht et al. • Object-Directed Grasping in Chimpanzees and Humans J. Neurosci., August 28, 2013 • 33(35):14117–14134 • 14129
chimpanzees as well (Figs. 4, 7). The novelfinding of the present report is a differencein the relative distribution of neural activ-ity. These results are consistent with ourrecent analysis of white matter connectiv-ity among inferior frontal, inferior pari-etal, and lateral temporal regions, inwhich more tractography streamlinesreached further into parietal and lateraltemporal cortex in humans than in chim-panzees or macaques (Hecht et al., 2013).These differences in white matter connec-tivity parallel, and could underlie, the dif-ferences in activation.
Our results suggest that the chimpanzeeneural architecture for action and objectperception is more similar to macaquesthan to humans. Macaques’ and chimpan-zees’ frontal bias for action and objectperception may represent the ancestralcondition, whereas humans’ parietal/occipitotemporal bias may represent arelatively recent adaptation. Macaques,chimpanzees, and humans shared a lastcommon ancestor �25 million years ago(MYA), whereas the chimpanzee-humanlast common ancestor existed much morerecently, approximately 6 MYA (Goodmanet al., 1998). However, major events in hom-inid evolution related to object-directed ac-tion occurred after this split: our homininancestors’ hands became more available forobject manipulation with the emergence ofbipedalism �3–6 MYA (for review, seeHarcourt-Smith and Aiello, 2004) and theearliest known intentionally modified stonetools appeared �2.6 MYA (Semaw et al.,2003), whereas more complex stone toolsemerged only 1.7–0.5 MYA (for review, seeStout, 2011).
What might be the functional andbehavioral implications of these neural dif-ferences? Action understanding in humansand macaques relies on multiple levels of in-formation processing in a tightly integratednetwork of functionally specialized frontal,parietal, and occipitotemporal regions. Al-though the precise functional contributionsof each region across species remain to beresolved, there is substantial evidence that,compared with ventral premotor cortex andpostcentral regions, ventrolateral prefrontalcortex supports more abstract action repre-sentations such as context, outcomes, andintentions (Rizzolatti et al., 1988; Nelissen etal., 2005; Hamilton and Grafton, 2008;Bonini et al., 2010) and/or top-down cogni-tive control processes such as rule-based ac-tion selection, information retrieval, andhierarchical control (Petrides, 2005; Koech-lin and Jubault, 2006; Badre and D’Esposito,2009). Conversely, occipitotemporal andparietal regions have been associated with
Figure 8. Corticalslicesofoverlapofabove-thresholdactivationacrosschimpanzeesubjectsinindividualconditionsandinconjunctionanalyses.Left hemispheres appear on the left. A, Execution. B, Transitive Observation. C, Intransitive Observation. D, Voxels activated above threshold in bothExecutionandTransitiveObservation. E,VoxelsactivatedabovethresholdinbothExecutionandIntransitiveObservation.
14130 • J. Neurosci., August 28, 2013 • 33(35):14117–14134 Hecht et al. • Object-Directed Grasping in Chimpanzees and Humans

more specific representations, such as kinematics or proximate goals(Rozzi et al., 2008; Bonini et al., 2010) and/or bottom-up perceptual-motor processes such as recognition, categorization, and sequencing(Jubault et al., 2007; Jastorff et al., 2010), including the integration ofsemantic and motor information for complex tool use (Frey, 2007).The observed prefrontal bias in chimpanzee brain responseduring transitive action observation thus suggests greaterfunctional investment in high-level representations and top-down control processes, compared with a human conditiondisplaying relatively greater reliance on specific representa-tions and bottom-up perceptual recognition. This functionaldifference parallels behavioral evidence. When copying oth-ers’ behavior, humans have a greater propensity for copyingaction details (imitating), whereas chimpanzees have a greaterpropensity for copying action outcomes (emulating) (Whitenet al., 2009). Similarly, when monitoring their own behavior,
Figure 10. Human activation during transitive grasping observation. Left hemispheres ap-pear on the left. A, Top 1% of activity in individual subjects. B, Overlap of above-thresholdactivation across subjects.
Figure 9. Quantification of activity in chimpanzee regions homologous to those that containmirror neurons in macaques. A, ROI activation in individual conditions. Percentage of ROIs activein each condition were averaged across subjects. An initial repeated-measures ANOVA showedno effect of hemisphere, so data were averaged bilaterally for each ROI. Activation was greaterin execution, transitive observation, and intransitive observation relative to rest, as measuredwith a repeated-measures ANOVA (main effect of task condition, F(3,9) � 14.185, p � 0.001;individual comparisons, p � 0.004, 0.007, and 0.026, respectively). In addition, the FCBm wasmore active than PFD/PF (main effect of region, F(1,3) � 17.386, p � 0.014). B, ROI activationin conjunction analyses. Percentage of voxels in top 1% of execution condition which were alsoin top 1% of transitive observation or intransitive observation conditions in FCMb and PF,averaged across subjects. A repeated-measures ANOVA revealed no effect of condition, but amain effect of region (F(1,3) � 16.076, p � 0.028); the frontal ROI was more active than theparietal ROI.
Hecht et al. • Object-Directed Grasping in Chimpanzees and Humans J. Neurosci., August 28, 2013 • 33(35):14117–14134 • 14131

humans have a bias toward monitoring kinematics, whereaschimpanzees have a bias toward monitoring goals (Kanekoand Tomonaga, 2012). Humans’ increased attention to theirown and others’ action details has been identified as a keyfactor in the emergence of imitation, cumulative culture, andthe complex object-related behaviors they enable (Tennie etal., 2009; Dean et al., 2012); the results reported here offer awindow into the neural and cognitive bases of theseadaptations.
ReferencesBadre D, D’Esposito M (2009) Is the rostro-caudal axis of the frontal lobe
hierarchical? Nat Rev Neurosci 10:659 – 669. CrossRef MedlineBailey P (1948) Concerning cytoarchitecture of the frontal lobe of chimpan-
zee (Pan satyrus) and man (Homo sapiens). In: The frontal lobes (FultonJF, ed), pp 84 –94 Baltimore: Williams and Wilkins.
Bailey P, Von Bonin G, McCulloch W (1950) The isocortex of the chimpan-zee. Urbana, Illinois: The University of Illinois.
Binkofski F, Buccino G (2006) The role of ventral premotor cortex in actionexecution and action understanding. J Physiol Paris 99:396 – 405.CrossRef Medline
Bonini L, Rozzi S, Serventi FU, Simone L, Ferrari PF, Fogassi L (2010)Ventral premotor and inferior parietal cortices make distinct contri-bution to action organization and intention understanding. CerebCortex 20:1372–1385. CrossRef Medline
Brodmannn K (1909) Vergleichende Lokalisationslehre der Grosshirn-rhinde. Leipzig: Barth (reprinted as Brodmannn’s Localisation in theCereb Cortex, translated and edited by L. J. Garey, London: Smith-Gordon, 1994).
Buccino G, Binkofski F, Fink GR, Fadiga L, Fo-gassi L, Gallese V, Seitz RJ, Zilles K, Rizzo-latti G, Freund HJ (2001) Actionobservation activates premotor and parietalareas in a somatotopic manner: an fMRIstudy. Eur J Neurosci 13:400 – 404. CrossRefMedline
Caggiano V, Fogassi L, Rizzolatti G, Pomper JK,Thier P, Giese MA, Casile A (2011) View-based encoding of actions in mirror neuronsof area f5 in macaque premotor cortex. CurrBiol 21:144 –148. CrossRef Medline
Caspers S, Zilles K, Laird AR, Eickhoff SB (2010)ALE meta-analysis of action observation andimitation in the human brain. Neuroimage50:1148 –1167. CrossRef Medline
Clark A (2008) Supersizing the mind: embodi-ment, action, and cognitive extension. NewYork: Oxford UP.
Dean LG, Kendal RL, Schapiro SJ, Thierry B, La-land KN (2012) Identification of the socialand cognitive processes underlying humancumulative culture. Science 335:1114 –1118.CrossRef Medline
Denys K, Vanduffel W, Fize D, Nelissen K, Sawa-mura H, Georgieva S, Vogels R, Van Essen D,Orban GA (2004) Visual activation in pre-frontal cortex is stronger in monkeys than inhumans. J Cogn Neurosci 16:1505–1516.CrossRef Medline
Economo C, Parker S (1929) The cytoarchitec-tonics of the human cerebral cortex. London:Humphrey Milford; Oxford UP.
Filimon F, Nelson JD, Hagler DJ, Sereno MI (2007)Human cortical representations for reaching:mirror neurons for execution, observation, andimagery. Neuroimage 37:1315–1328. CrossRefMedline
Frey SH (2007) What puts the how in where?Tool use and the divided visual streams hy-pothesis. Cortex 43:368 –375. CrossRefMedline
Georgieva S, Peeters R, Kolster H, Todd JT, Or-ban GA (2009) The processing of three-dimensional shape from dispar-ity in the human brain. J Neurosci 29:727–742. CrossRef Medline
Goodall J (1964) Tool-using and aimed throwing in a community of free-living chimpanzees. Nature 201:1264 –1266. CrossRef Medline
Goodman M, Porter CA, Czelusniak J, Page SL, Schneider H, Shoshani J,Gunnell G, Groves CP (1998) Toward a phylogenetic classification ofprimates based on DNA evidence complemented by fossil evidence. MolPhylogenet Evol 9:585–598. CrossRef Medline
Hamilton AF, Grafton ST (2008) Action outcomes are represented in hu-man inferior frontoparietal cortex. Cereb Cortex 18:1160 –1168. Medline
Harcourt-Smith WE, Aiello LC (2004) Fossils, feet and the evolution of hu-man bipedal locomotion. J Anat 204:403– 416. CrossRef Medline
Hecht EE, Gutman DA, Preuss TM, Sanchez MM, Parr LA, Rilling JK(2013) Process versus product in social learning: comparative diffu-sion tensor imaging of neural systems for action execution-observation matching in macaques, chimpanzees, and humans. CerebCortex 23:1014 –1024. CrossRef Medline
Iacoboni M, Woods RP, Brass M, Bekkering H, Mazziotta JC, Rizzolatti G(1999) Cortical mechanisms of human imitation. Science 286:2526 –2528. CrossRef Medline
Iriki A, Sakura O (2008) The neuroscience of primate intellectual evolution:natural selection and passive and intentional niche construction. PhilosTrans R Soc Lond B Biol Sci 363:2229 –2241. CrossRef Medline
Jastorff J, Begliomini C, Fabbri-Destro M, Rizzolatti G, Orban GA (2010)Coding observed motor acts: different organizational principles inthe parietal and premotor cortex of humans. J Neurophysiol 104:128 –140. CrossRef Medline
Joly O, Vanduffel W, Orban GA (2009) The monkey ventral premotor
Figure 11. Quantitative comparison of chimpanzee and human activation during transitive grasping observation. A,ROIs. B, Percentage of total above-threshold activation that fell into each ROI. Inferior parietal lobule (IPL), inferotemporalcortex (IT), and PMv accounted for a significantly greater proportion of overall activation in humans than in chimpanzees( p � 0.036, p � 0.001, and p � 0.001, respectively; independent samples t test). Ventrolateral prefrontal cortex (VLPFC)accounted for a significantly greater proportion of overall activation in chimpanzees than in humans ( p � 0.033, inde-pendent samples t test). Error bars, �1 SEM. DLPFC, dorsolateral prefrontal cortex; PMd, dorsal premotor cortex; PMv,ventral premotor cortex; M1, primary motor cortex; S1–S2, primary and secondary somatosensory cortex; LOC, lateraloccipital cortex; STS, superior temporal sulcus.
14132 • J. Neurosci., August 28, 2013 • 33(35):14117–14134 Hecht et al. • Object-Directed Grasping in Chimpanzees and Humans

cortex processes 3D shape from disparity. Neuroimage 47:262–272. CrossRef Medline
Jubault T, Ody C, Koechlin E (2007) Serial organization of human behaviorin the inferior parietal cortex. J Neurosci 27:11028 –11036. CrossRefMedline
Kaneko T, Tomonaga M (2012) Relative contributions of goal representa-tion and kinematic information to self-monitoring by chimpanzees andhumans. Cognition 125:168 –178. CrossRef Medline
Koechlin E, Jubault T (2006) Broca’s area and the hierarchical organizationof human behavior. Neuron 50:963–974. CrossRef Medline
Li L, Preuss TM, Rilling JK, Hopkins WD, Glasser MF, Kumar B, Nana R,Zhang X, Hu X (2010) Chimpanzee (Pan troglodytes) precentral corti-cospinal system asymmetry and handedness: a diffusion magnetic reso-nance imaging study. PloS One 5:e12886. CrossRef Medline
Lui F, Buccino G, Duzzi D, Benuzzi F, Crisi G, Baraldi P, Nichelli P, Porro CA,Rizzolatti G (2008) Neural substrates for observing and imagining non-object-directed actions. Soc Neurosci 3:261–275. CrossRef Medline
Lyons DE, Santos LR, Keil FC (2006) Reflections of other minds: how pri-mate social cognition can inform the function of mirror neurons. CurrOpin Neurobiol 16:230 –234. CrossRef Medline
Molenberghs P, Cunnington R, Mattingley JB (2012) Brain regions withmirror properties: a meta-analysis of 125 human fMRI studies. NeurosciBiobehav Rev 36:341–349. CrossRef Medline
Nelissen K, Luppino G, Vanduffel W, Rizzolatti G, Orban GA (2005) Ob-serving others: multiple action representation in the frontal lobe. Science310:332–336. CrossRef Medline
Orban G, Jastorff J (2013) Functional mapping of motion regions in hu-mans and non-human primates. In: The new visual neurosciences (Wer-ner J, Chalupa L, eds). Boston: MIT.
Parr LA, Hecht E, Barks SK, Preuss TM, Votaw JR (2009) Face processing inthe chimpanzee brain. Curr Biol 19:50 –53. CrossRef Medline
Peeters R, Simone L, Nelissen K, Fabbri-Destro M, Vanduffel W, Rizzo-latti G, Orban GA (2009) The representation of tool use in humansand monkeys: common and uniquely human features. J Neurosci 29:11523–11539. CrossRef Medline
Petrides M (2005) Lateral prefrontal cortex: architectonic and functionalorganization. Philos Trans R Soc Lond B Biol Sci 360:781–795. CrossRefMedline
Raos V, Evangeliou MN, Savaki HE (2004) Observation of action: graspingwith the mind’s hand. Neuroimage 23:193–201. CrossRef Medline
Raos V, Evangeliou MN, Savaki HE (2007) Mental simulation of action inthe service of action perception. J Neurosci 27:12675–12683. CrossRefMedline
Reivich M, Kuhl D, Wolf A, Greenberg J, Phelps M, Ido T, Casella V, FowlerJ, Hoffman E, Alavi A, Som P, Sokoloff L (1979) The [18F]fluorodeoxy-glucose method for the measurement of local cerebral glucose utilizationin man. Circ Res 44:127–137. CrossRef Medline
Rilling JK, Barks SK, Parr LA, Preuss TM, Faber TL, Pagnoni G, BremnerJD, Votaw JR (2007) A comparison of resting-state brain activity inhumans and chimpanzees. Proc Natl Acad Sci U S A 104:17146 –17151. CrossRef Medline
Rizzolatti G, Camarda R, Fogassi L, Gentilucci M, Luppino G, Matelli M(1988) Functional organization of inferior area 6 in the macaque mon-key. II. Area F5 and the control of distal movements. Exp Brain Res71:491–507. CrossRef Medline
Rizzolatti G, Fadiga L, Gallese V, Fogassi L (1996) Premotor cortex and therecognition of motor actions. Brain Res Cogn Brain Res 3:131–141.CrossRef Medline
Rozzi S, Ferrari PF, Bonini L, Rizzolatti G, Fogassi L (2008) Functional or-ganization of inferior parietal lobule convexity in the macaque monkey:electrophysiological characterization of motor, sensory and mirror re-
Table 4. Evaluation of the potential effects of differences in methodology in human versus chimpanzee experiments
Difference between human and chimpanzee experimentsExpected result if this difference is great enough tosignificantly affect the pattern of brain activation Evaluation of data
Humans received intravenous, 10 mCi doses of fluorode-oxyglucose, whereas chimpanzees received oral, 15mCi doses.
This might cause differences in the overall level of activityacross the brain (i.e., human scans might have greaterabsolute brightness).
Each scan was normalized to its own mean intensityvalue, so the average intensity of each image isexactly equal to 1. Identical thresholding meth-ods were applied to both species. Above-thresh-old voxels in each ROI were normalized as apercentage of the total above-threshold voxels inthe entire brain. These steps control for possibledifferences in the overall level of brain activity.
Human stimuli were 2D videos, whereas chimpanzeestimuli were 3D live demonstrations.
PMv is involved in processing 3D shape from visual dis-parity (stereopsis) (Georgieva et al., 2009; Joly et al.,2009). This might cause greater PMv activation inchimpanzees than humans. In addition, a lower per-centage of macaque mirror neurons are activated byvideos than by live demonstrations (Caggiano et al.,2011). This might cause greater chimpanzee activationin regions homologous to those that contain mirrorneurons in macaques.
Humans had greater activation than chimpanzees inboth ventral premotor cortex and inferior pari-etal cortex. This suggests that species differencesin the pattern of brain activation are not due todifferences in the dimensionality of the stimuli.
Human stimuli consisted only of a hand, the lower por-tion of the arm, the tabletop, and graspable object,whereas chimpanzee stimuli included an entire hu-man demonstrator as well as the testing box in whichthe grasping actions were performed.
In monkeys, observation of only a hand grasping anobject activates more rostral regions of VLPFC and PMv(areas 46, 45A, 45B, and rostral F5), whereas observa-tion of an entire demonstrator grasping an object alsoactivates caudal F5 (Nelissen et al., 2005). This mightcause frontal activations to extend more caudally thanin chimpanzees than humans.
Frontal activations extended more caudally in hu-mans than chimpanzees; PMv contained a signif-icantly greater proportion of total brainactivation in humans than chimpanzees (Figure11). This suggests that species differences in thepattern of brain activation are not due to differ-ences in scene complexity.
Chimpanzee stimuli included a more prominent reachingaction than human stimuli.
Observed reaching activates more dorsal regions of pre-motor cortex than observed grasping (Filimon et al.,2007). This might cause greater PMd activation inhumans than chimpanzees.
PMd activation was not significantly different be-tween humans and chimpanzees (Figure 11).This suggests that species differences in thepattern of brain activation are not due to differ-ences in the prominence of the observed reach-ing action.
Possible methodology-related differences in regional brain activation were either controlled for using normalization procedures or are opposite to what we observed; therefore, these differences are not likely to have contributed todifferences in observed activation.
PMv, ventral premotor cortex; PMd, dorsal premotor cortex; VLPFC, ventrolateral prefrontal cortex; IPL, inferior parietal lobule.
Hecht et al. • Object-Directed Grasping in Chimpanzees and Humans J. Neurosci., August 28, 2013 • 33(35):14117–14134 • 14133

sponses and their correlation with cytoarchitectonic areas. Eur J Neurosci28:1569 –1588. CrossRef Medline
Schenker NM, Hopkins WD, Spocter MA, Garrison AR, Stimpson CD, ErwinJM, Hof PR, Sherwood CC (2010) Broca’s area homologue in chimpan-zees (Pan troglodytes): probabilistic mapping, asymmetry, and compari-son to humans. Cereb Cortex 20:730 –742. CrossRef Medline
Schiffer MB (1999) The material life of human beings: artifacts, behaviorand communication. New York: Routledge.
Semaw S, Rogers MJ, Quade J, Renne PR, Butler RF, Dominguez-Rodrigo M,Stout D, Hart WS, Pickering T, Simpson SW (2003) 2.6-Million-year-old stone tools and associated bones from OGS-6 and OGS-7, Gona, Afar,Ethiopia. J Hum Evol 45:169 –177. CrossRef Medline
Stout D (2011) Stone toolmaking and the evolution of human culture andcognition. Philos Trans R Soc Lond B Biol Sci 366:1050 –1059. CrossRefMedline
Taglialatela JP, Russell JL, Schaeffer JA, Hopkins WD (2008) Communica-tive signaling activates ‘Broca’s’ homolog in chimpanzees. Curr Biol 18:343–348. CrossRef Medline
Taglialatela JP, Russell JL, Schaeffer JA, Hopkins WD (2011) Chimpanzeevocal signaling points to a multimodal origin of human language. PloSOne 6:e18852. CrossRef Medline
TennieC,Call J,TomaselloM (2009) Ratchetinguptheratchet:ontheevolutionofcumulative culture. Philos Trans R Soc Lond B Biol Sci 364:2405–2415. CrossRefMedline
UmiltaMA,KohlerE,GalleseV,FogassiL,FadigaL,KeysersC,RizzolattiG (2001) Iknow what you are doing. A neurophysiological study. Neuron 31:155–165.CrossRef Medline
Vanduffel W, Fize D, Peuskens H, Denys K, Sunaert S, Todd JT, Orban GA(2002) Extracting 3D from motion: differences in human and monkeyintraparietal cortex. Science 298:413– 415. CrossRef Medline
Visalberghi E, Fragazy D (2002) “Do monkeys ape?” Ten years after. In:Imitation in animals and artefacts (Dautenhahn CN, ed), pp 471– 499.Cambridge, MA: MIT.
Von Bonin G (1948) The frontal lobe of primates; cytoarchitectural studies.Res Publ Assoc Res Nerv Ment Dis 27:67– 83. Medline
Whiten A, Goodall J, McGrew WC, Nishida T, Reynolds V, Sugiyama Y, TutinCE, Wrangham RW, Boesch C (1999) Cultures in chimpanzees. Nature399:682– 685. CrossRef Medline
Whiten A, McGuigan N, Marshall-Pescini S, Hopper LM (2009) Emulation,imitation, overimitation and the scope of culture for child and chimpan-zee. Philos Trans R Soc Lond B Biol Sci 364:2417–2428. CrossRef Medline
14134 • J. Neurosci., August 28, 2013 • 33(35):14117–14134 Hecht et al. • Object-Directed Grasping in Chimpanzees and Humans
Copyright © 2022 FDOKUMEN