Social comparison mediates chimpanzees' responses to loss, not frustration
Bonobos Fall within the Genomic Variation ofChimpanzeesAnne Fischer1*¤a, Kay Prufer1, Jeffrey M. Good1¤b, Michel Halbwax1¤c, Victor Wiebe1, Claudine Andre2,
Rebeca Atencia3, Lawrence Mugisha4, Susan E. Ptak1, Svante Paabo1
1 Max Plank Institute for Evolutionary Anthropology, Leipzig, Germany, 2 Lola Ya Bonobo Bonobo Sanctuary, ‘‘Petites Chutes de la Lukaya’’, Kinshasa, Democratic Republic
of Congo, 3 Reserve Naturelle Sanctuaire a Chimpanzes de Tchimpounga, Jane Goodall Institute, Pointe-Noire, Republic of Congo, 4 Chimpanzee Sanctuary and Wildlife
Conservation Trust (CSWCT), Entebbe, Uganda
Abstract
To gain insight into the patterns of genetic variation and evolutionary relationships within and between bonobos andchimpanzees, we sequenced 150,000 base pairs of nuclear DNA divided among 15 autosomal regions as well as thecomplete mitochondrial genomes from 20 bonobos and 58 chimpanzees. Except for western chimpanzees, we found poorgenetic separation of chimpanzees based on sample locality. In contrast, bonobos consistently cluster together but fall as agroup within the variation of chimpanzees for many of the regions. Thus, while chimpanzees retain genomic variation thatpredates bonobo-chimpanzee speciation, extensive lineage sorting has occurred within bonobos such that much of theirgenome traces its ancestry back to a single common ancestor that postdates their origin as a group separate fromchimpanzees.
Citation: Fischer A, Prufer K, Good JM, Halbwax M, Wiebe V, et al. (2011) Bonobos Fall within the Genomic Variation of Chimpanzees. PLoS ONE 6(6): e21605.doi:10.1371/journal.pone.0021605
Editor: Etienne Joly, Universite de Toulouse, France
Received November 24, 2010; Accepted June 6, 2011; Published June 29, 2011
Copyright: � 2011 Fischer et al. This is an open-access article distributed under the terms of the Creative Commons Attribution License, which permitsunrestricted use, distribution, and reproduction in any medium, provided the original author and source are credited.
Funding: This work was financially supported by the Max-Planck Gesellschaft and the ERC grant 233297, TWOPAN. JMG was supported by an NSF internationalpostdoctoral fellowship (OISE-0754461) during a portion of this research. The funders had no role in study design, data collection and analysis, decision to publish,or preparation of the manuscript.
Competing Interests: The authors have declared that no competing interests exist.
* E-mail: [email protected]
¤a Current address: International Center for Insect Physiology and Ecology, Nairobi, Kenya¤b Current address: Division of Biological Sciences, The University of Montana, Missoula, Montana, United States of America¤c Current address: Fernan Vaz Gorilla Project, Port-Gentil, Gabon
Introduction
In humans, extensive data has been collected for large numbers
of individuals (e.g. [1]; HapMap project, www.hapmap.org;
NIEHS SNP project, http://egp.gs.washington.edu/; the 1000
genomes project). By contrast, data on DNA sequence variation in
the closest non-extinct relatives of humans, chimpanzees (Pan
troglodytes) and bonobos (Pan paniscus), are limited to a handful of
studies that have collected genetic data across a handful of
genomic regions to discern basic population and demographic
parameters [2,3,4,5,6,7]. While these studies provide an important
first step, their geographic sampling was limited, so they are likely
to have captured only a fraction of the species-wide variation that
may exist within natural populations. In particular, variation in
bonobos and some populations of chimpanzees has been examined
in only a few studies of mostly captive-born individuals [6,8]. In
chimpanzees, four ‘‘subspecies’’ are commonly recognized which
correspond to the geographic ranges where these groups are found
(Figure 1): western chimpanzees (Pan troglodytes verus); Nigerian-
Cameroonian chimpanzees (P.t. ellioti or formerly P.t. vellerosus);
central chimpanzees (P.t. troglodytes); and eastern chimpanzees (P.t.
schweinfurthii). Little or no morphological and behavioral differ-
ences distinguish the four groups from each other [9,10,11]. In
contrast, bonobos (Pan paniscus) have no recognized subspecies but
clearly differ from chimpanzees in morphology and behavior
[11,12,13,14]. Genetic variation in bonobos has been examined in
only a few, usually captive-born individuals [2,3,4,5,6,15,16]. We
have collected DNA from 20 wild-born bonobos and 44 wild-born
and 14 captive-born chimpanzees representing all four chimpan-
zee groups (see Materials and Methods) and sequenced 15 non-
coding autosomal regions each encompassing about 10,000
basepairs (bp), as well as the complete mitochondrial (mt) DNAs
from these individuals.
Results and Discussion
Genetic diversityTo characterize the patterns of genetic diversity within groups,
we computed various summary statistics (Table 1). As previously
shown [6,8,17,18,19], nucleotide diversity and hence effective
population sizes are highest in central and eastern chimpanzees
and lowest in western chimpanzees, while bonobos have diversity
levels similar to western chimpanzees, in agreement with previous
studies of zoo [2,6] and wild-caught individuals [20]. Diversity
levels in Nigerian-Cameroonian chimpanzees are intermediate to
those of central and eastern chimpanzees on the one hand and
western chimpanzees and bonobos on the other.
We assessed how well a null model of constant population size
and random mating fit each population [21]. Only the central
chimpanzee samples deviate from this null model (p,1/10000)
due to an excess of rare alleles (Table 1 and Table S1) that suggests
population growth as has been previously reported [3,4,22].
PLoS ONE | www.plosone.org 1 June 2011 | Volume 6 | Issue 6 | e21605

Genetic relationship between populationsChimpanzee populations. Figure 2 shows the phylogeny
estimated for each genomic region. While central, eastern and
Nigerian-Cameroonian chimpanzees are highly interspersed in
these phylogenies and never form monophyletic groups, western
chimpanzees are monophyletic in 6 of the 16 trees (Figure 2;
Table 2). As expected from its lower effective population size and
as has previously been reported based on smaller numbers of
individuals and regions [20], mtDNA shows more clustering than
the autosomal DNA sequences. We note that four individuals
designated as central chimpanzees fall within the eastern
chimpanzee cluster for mtDNA. Three of these individuals were
confiscated in the Democratic Republic of Congo, where both
central and eastern chimpanzees can be found. Below, we report
the results with all individuals included but have checked that the
results are not significantly changed when these four individuals
are excluded from the analyses wherever necessary.
When we combine all autosomal SNPs, the level of genetic
differentiation between pairs of chimpanzee populations (as
assessed by Fst) was highest for comparisons involving western
chimpanzees (Table 3). When the program Structure was applied to
the whole dataset, the highest likelihood was obtained for the
model with four populations (Figure 3), the four populations being
bonobos, western, central, and eastern chimpanzees. While the
picture is clear for western chimpanzees, it is more complex for
central and eastern chimpanzees: six eastern chimpanzees are
inferred to have more than 20% ancestry from central
chimpanzees and among the 16 central chimpanzees that
according to the mtDNA are of central African origin, seven
have more than 20% ancestry from eastern chimpanzees. In a
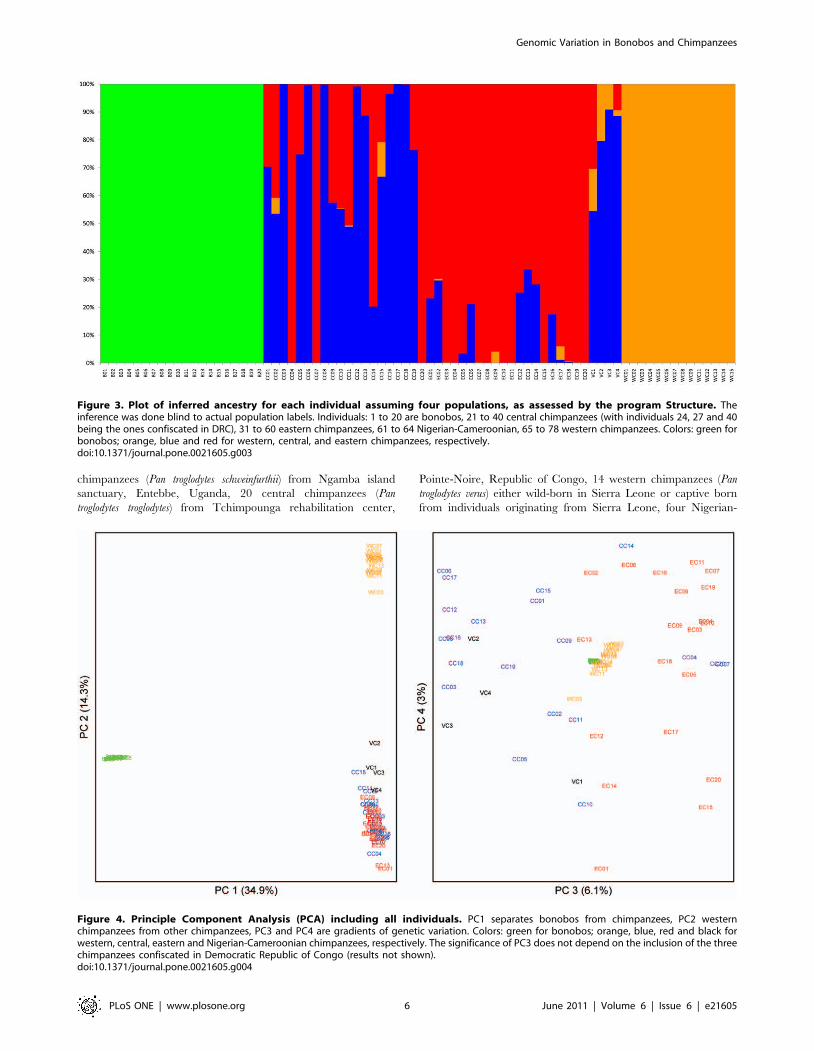
principal component analysis (PCA) using all individuals (Figure 4),
the first PC separates bonobos from chimpanzees while the second
PC, that explains 14.3% of the variation, separates western
chimpanzees from the other chimpanzees (p,1028) (Figure 4).
Figure 1. Map of population ranges.doi:10.1371/journal.pone.0021605.g001
Genomic Variation in Bonobos and Chimpanzees
PLoS ONE | www.plosone.org 2 June 2011 | Volume 6 | Issue 6 | e21605
The third PC, explaining 6.1% of the variation, tend to separate
eastern and central chimpanzees. Note that the four central
chimpanzees falling with eastern chimpanzees on the right of the
graph are the same individuals that group with eastern
chimpanzees in the mtDNA phylogeny.
Of particular interest is that none of the autosomal phylogenies
support the monophyly of the Nigerian-Cameroonian chimpanzees
(Figure 2; Table 2). In fact, Nigerian-Cameroonian individuals
group with individuals from all other three populations (Figure 2).
The Fst based on the autosomal sequences show that Nigerian-
Cameroonian chimpanzees are more differentiated from western
chimpanzees (Fst = 0.37) than from central and eastern chimpan-
zees (Fst = 0.16 and 0.21, respectively) (Table 3) and the Structure
analysis fails to suggest that the Nigerian-Cameroonian chimpan-
zees are a separate population (Figure 3), and instead suggests that
they have more than 50% ancestry shared with central chimpan-
zees. Likewise, in the PCA, the four Nigerian-Cameroonian
individuals fall within central and eastern chimpanzee variation,
while being separated from western chimpanzees (Figure 4).
An earlier study of one wild-caught Nigerian-Cameroonian
individual showed it to be related to both western and central
chimpanzees based on nuclear microsatellites [2]. However, in a
recent study [7] of 94 chimpanzees, including 32 designated as
Nigerian-Cameroonian, the weight of evidence is supporting three
major groups, which are western chimpanzees, Nigerian-Camer-
oonian chimpanzees and central/eastern chimpanzees. One
possible reason for this apparent discrepancy may be the limited
number of Nigerian-Cameroonian individuals in our study.
However the nuclear DNA sequences studied here are expected
to reflect historic events over a much greater time depth than
microsatellites. Thus, our data suggest that any genetic differen-
tiation of Nigerian-Cameroonian populations is likely to have
occurred relatively recently in the evolution of chimpanzees.
Regardless, it is important to note that both nuclear data sets fail to
support the close relationship of Nigerian-Cameroonian chimpan-
zees and western chimpanzees observed for mitochondrial DNA
(Figure 2) [23,24,25].
Chimpanzees and BonobosWhen all SNPs in the nuclear data are combined, more than
50% of the variation is between bonobos and chimpanzees
(0.54#Fst#0.74; Table 3) and the Structure (Figure 3) as well as the
PCA analyses (Figure 4) support a separation between bonobos
and common chimpanzees as does a concatenated phylogenetic
analysis of all of autosomal region (Figure S1). However, the
individual autosomal phylogenies reveal contrasting patterns
between bonobos and chimpanzees. Bonobos are strongly
monophyletic (i.e., all bonobos are more closely related to each
other than to any chimpanzee) for all but one genomic region
(Figure 2; Table 2). The one possible exception (Figure 2 h) also
shows a high posterior probability for the bonobo clade
(P = 0.913). Thus, much of the bonobo genome coalesces to a
common ancestor since the population split from chimpanzees. In
contrast, monophyly of all chimpanzees is only observed in a small
subset of the phylogenies (4 out of 16) and for 5 of the 16 regions
bonobos unambiguously fall within the diversity of chimpanzees
(i.e., some chimpanzees are more closely related to bonobos than
to other chimpanzees) (Figure 2). This is also reflected in the
patterns of allele sharing (Table S2) where there are more sites that
unite bonobos to the exclusion of chimpanzees (than vice versa)
and more sites for which bonobos fall within the diversity of
chimpanzees (than vice versa).
Phylogenetic lineage sorting subsequent to the separation of two
species necessarily proceeds through three distinct phases:
complete lack of sorting (polyphyly), sorting within one species
(paraphyly), and complete sorting (reciprocal monophyly)
[26,27,28,29]. Incomplete lineage sorting has been seen for many
other closely related organisms (e.g. [30,31,32,33]). In the human
genome, about 32% of regions share a more recent ancestry with
gorilla than with chimpanzees or fall outside chimpanzees and
gorillas [34,35], and for ,1% of the genome, humans may share a
more recent ancestry with either chimpanzees or bonobos rather
than these with each other [3]. We show that chimpanzees retain
ancestral polymorphisms to a much greater degree than bonobos.
This is presumably a result of a larger effective population size of
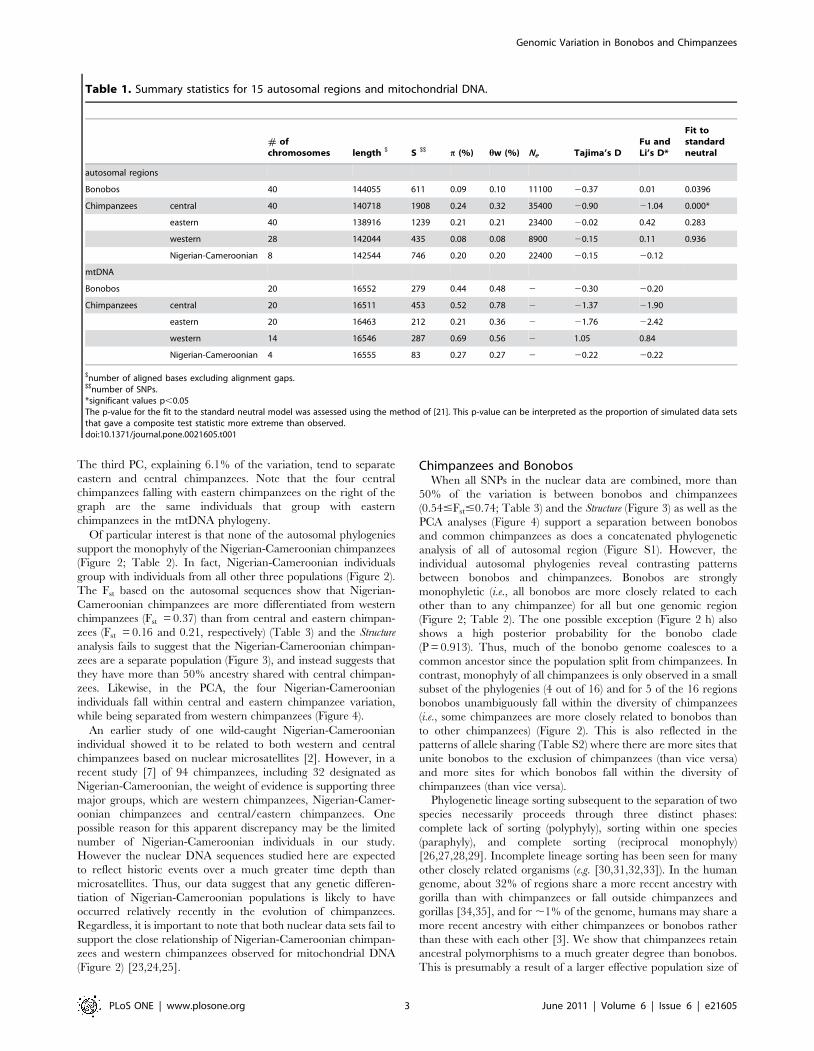
Table 1. Summary statistics for 15 autosomal regions and mitochondrial DNA.
# ofchromosomes length $ S $$ p (%) hw (%) Ne Tajima’s D
Fu andLi’s D*
Fit tostandardneutral
autosomal regions
Bonobos 40 144055 611 0.09 0.10 11100 20.37 0.01 0.0396
Chimpanzees central 40 140718 1908 0.24 0.32 35400 20.90 21.04 0.000*
eastern 40 138916 1239 0.21 0.21 23400 20.02 0.42 0.283
western 28 142044 435 0.08 0.08 8900 20.15 0.11 0.936
Nigerian-Cameroonian 8 142544 746 0.20 0.20 22400 20.15 20.12
mtDNA
Bonobos 20 16552 279 0.44 0.48 2 20.30 20.20
Chimpanzees central 20 16511 453 0.52 0.78 2 21.37 21.90
eastern 20 16463 212 0.21 0.36 2 21.76 22.42
western 14 16546 287 0.69 0.56 2 1.05 0.84
Nigerian-Cameroonian 4 16555 83 0.27 0.27 2 20.22 20.22
$number of aligned bases excluding alignment gaps.$$number of SNPs.*significant values p,0.05The p-value for the fit to the standard neutral model was assessed using the method of [21]. This p-value can be interpreted as the proportion of simulated data setsthat gave a composite test statistic more extreme than observed.doi:10.1371/journal.pone.0021605.t001
Genomic Variation in Bonobos and Chimpanzees
PLoS ONE | www.plosone.org 3 June 2011 | Volume 6 | Issue 6 | e21605

Figure 2. 50% majority consensus tree for mtDNA (mt) and each of the fifteen nuclear regions (a to o). Colors: red for bonobos, green,grey, blue, and yellow for western, central, eastern and vellerosus chimpanzees, respectively.doi:10.1371/journal.pone.0021605.g002
Genomic Variation in Bonobos and Chimpanzees
PLoS ONE | www.plosone.org 4 June 2011 | Volume 6 | Issue 6 | e21605
the chimpanzees, as reflected in the estimates of diversity, which
for central chimpanzees (the most diverse population) suggest an
effective size of ,35,000 and an average coalescent time of DNA
sequences of 2.8 million years ago (i.e. ,4Ne generations ago). In
contrast, the effective population size of bonobos is ,11,000 which
results in an average coalescent time of 880,000 years ago.
Materials and Methods
Collection of sequence dataEthics statement. All animal work was conducted according
to relevant national, EU and international guidelines. In all cases,
the animals were not subjected to any experimental procedures,
and the blood samples used were left-over aliquots collected by
veterinarians carrying out routine medical examination.
Authorization for use of the samples was obtained from the
respective Ministries of Environment as well as by the Ministere de
la Recherche Scientifique (DRC) to ‘‘Les Amis des Bonobos du
Congo’’, the Uganda Wildlife Authority and the Uganda National
Council for Science and Technology, and the Ministere de
l’Enseignement Superieur et de la Recherche Scientifique from
Republic of Congo. The international transport of samples was
approved (CITES numbers: Uganda E-3520/05, Kenya E-1259/
05, DRC E-0908/07, Republic of Congo E-1274/07). The
proposal that in part cover this research (233297, TWOPAN)
was reviewed and approved by the European Commission.
SamplesA total of 58 unrelated common chimpanzees and 20 unrelated
bonobos were used for this study. Most of these apes were
confiscated by various officials from individuals selling these
animals for trade or who kept them as pets, and then were brought
to the sanctuaries. Where an animal is confiscated is thought to be
an imperfect, but probable indication of where the chimpanzee
was originally living and the population identity of the chimpan-
zees are mostly based on this. We thus have a sample of 20 eastern
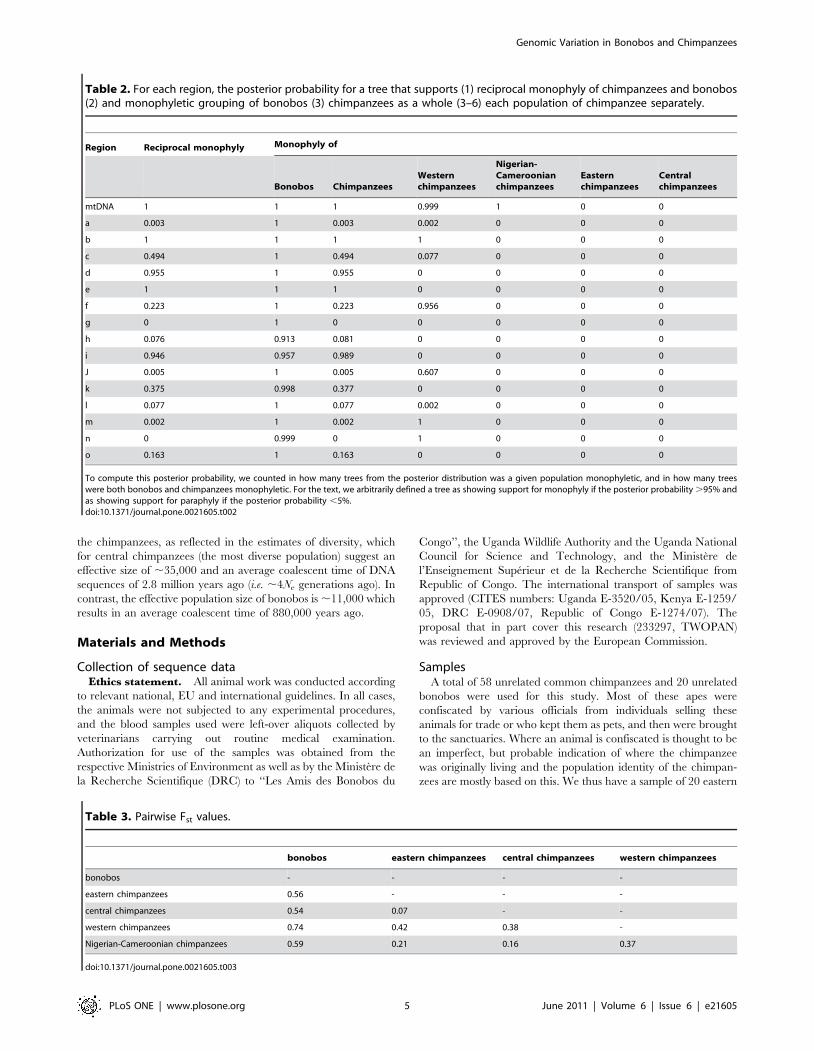
Table 2. For each region, the posterior probability for a tree that supports (1) reciprocal monophyly of chimpanzees and bonobos(2) and monophyletic grouping of bonobos (3) chimpanzees as a whole (3–6) each population of chimpanzee separately.
Region Reciprocal monophyly Monophyly of
Bonobos ChimpanzeesWesternchimpanzees
Nigerian-Cameroonianchimpanzees
Easternchimpanzees
Centralchimpanzees
mtDNA 1 1 1 0.999 1 0 0
a 0.003 1 0.003 0.002 0 0 0
b 1 1 1 1 0 0 0
c 0.494 1 0.494 0.077 0 0 0
d 0.955 1 0.955 0 0 0 0
e 1 1 1 0 0 0 0
f 0.223 1 0.223 0.956 0 0 0
g 0 1 0 0 0 0 0
h 0.076 0.913 0.081 0 0 0 0
i 0.946 0.957 0.989 0 0 0 0
J 0.005 1 0.005 0.607 0 0 0
k 0.375 0.998 0.377 0 0 0 0
l 0.077 1 0.077 0.002 0 0 0
m 0.002 1 0.002 1 0 0 0
n 0 0.999 0 1 0 0 0
o 0.163 1 0.163 0 0 0 0
To compute this posterior probability, we counted in how many trees from the posterior distribution was a given population monophyletic, and in how many treeswere both bonobos and chimpanzees monophyletic. For the text, we arbitrarily defined a tree as showing support for monophyly if the posterior probability .95% andas showing support for paraphyly if the posterior probability ,5%.doi:10.1371/journal.pone.0021605.t002
Table 3. Pairwise Fst values.
bonobos eastern chimpanzees central chimpanzees western chimpanzees
bonobos - - - -
eastern chimpanzees 0.56 - - -
central chimpanzees 0.54 0.07 - -
western chimpanzees 0.74 0.42 0.38 -
Nigerian-Cameroonian chimpanzees 0.59 0.21 0.16 0.37
doi:10.1371/journal.pone.0021605.t003
Genomic Variation in Bonobos and Chimpanzees
PLoS ONE | www.plosone.org 5 June 2011 | Volume 6 | Issue 6 | e21605
chimpanzees (Pan troglodytes schweinfurthii) from Ngamba island
sanctuary, Entebbe, Uganda, 20 central chimpanzees (Pan
troglodytes troglodytes) from Tchimpounga rehabilitation center,
Pointe-Noire, Republic of Congo, 14 western chimpanzees (Pan
troglodytes verus) either wild-born in Sierra Leone or captive born
from individuals originating from Sierra Leone, four Nigerian-
Figure 4. Principle Component Analysis (PCA) including all individuals. PC1 separates bonobos from chimpanzees, PC2 westernchimpanzees from other chimpanzees, PC3 and PC4 are gradients of genetic variation. Colors: green for bonobos; orange, blue, red and black forwestern, central, eastern and Nigerian-Cameroonian chimpanzees, respectively. The significance of PC3 does not depend on the inclusion of the threechimpanzees confiscated in Democratic Republic of Congo (results not shown).doi:10.1371/journal.pone.0021605.g004
Figure 3. Plot of inferred ancestry for each individual assuming four populations, as assessed by the program Structure. Theinference was done blind to actual population labels. Individuals: 1 to 20 are bonobos, 21 to 40 central chimpanzees (with individuals 24, 27 and 40being the ones confiscated in DRC), 31 to 60 eastern chimpanzees, 61 to 64 Nigerian-Cameroonian, 65 to 78 western chimpanzees. Colors: green forbonobos; orange, blue and red for western, central, and eastern chimpanzees, respectively.doi:10.1371/journal.pone.0021605.g003
Genomic Variation in Bonobos and Chimpanzees
PLoS ONE | www.plosone.org 6 June 2011 | Volume 6 | Issue 6 | e21605
Cameroonian chimpanzees (Pan troglodytes ellioti or formerly P.t.
vellerosus) from Sweetwaters chimpanzee sanctuary, Kenya and 20
bonobos (Pan paniscus) from Lola ya bonobo sanctuary, Kinshasa,
Democratic Republic of Congo. Nigerian-Cameroonian chim-
panzees were confiscated in Cairo, Egypt, and originated from
Nigeria. An analysis of mtDNA confirmed their designation as
Nigerian-Cameroonian chimpanzees. Since the sampling scheme
follows the broad population framework established based on
geography and analysis of mtDNA, our analysis does also [23,36].
The blood samples from central and eastern chimpanzees and
bonobos were collected by Michel Halbwax and Anne Fischer in
2007 and 2008 during regular health checks. The lymphocytes were
extracted from blood samples using a Ficoll gradient and frozen.
Genomic regions chosenFor each individual, we targeted the complete mitochondrial
genome and 15 regions of approximately 10 kilobases (kb). The 15
nuclear regions are all non-coding, distant from known genes (at
least 72 kb) and were chosen to have average recombination rate
and GC content in the human genome. Based on these criteria, we
used eleven of the 15 nuclear regions that overlapped with locus-
pairs previously sequenced in humans [21]. Four additional
regions were picked at random in the genome, based on the same
criteria. The chromosomal location and coordinates are given in
Table S3. Based on human recombination estimates, the average
recombination rate for all regions was 1.63 cM/Mb, slightly
higher than the human genome-wide average of 1.19 cM/Mb.
The average GC content for these regions was 37.94%, a bit lower
compared to the genome average in humans of 42%. Human was
used as an outgroup (genome sequence built hg18).
DNA extraction, amplification and sequencingDNA was extracted from 50 ml cell cultures (5–506106 cells)
obtained from lymphocytes transformed with Epstein-Barr virus
using the Gentra-puregene kit from QIAGEN and following
manufacturer’s instructions. The DNA was aliquoted to a
concentration of 100 ng/ml for further use.
For the mitochondrial genome, two sets of primers previously
designed to amplify mtDNA from a large number of primates were
used [37]. Each of the 15 regions was amplified in a single
polymerase chain reaction (PCR) using primers that were designed
from the reference human and chimpanzee genome sequences. All
loci were amplified in 50 ml reactions and PCR was run with an
annealing temperature of 64uC according to the manufacturer’s
instructions. PCR products were cleaned with PEG purification,
washed twice with 70% ethanol, and eluted in TE.
All sequencing was performed using the 454 FLX sequencing
platform. We used a parallel tagged sequencing protocol [37] to
enable multiplexing of regions and individuals.
AssemblyWe used an iterative mapping assembler, (MIA, R. E. Green,
http://sourceforge.net/projects/mia-assembler/) to assemble all
reads. The first round of MIA performs a mapping assembly based
on a reference genome, which for the 15 autosomal regions was
the human genome sequence and for the mitochondrial genome
the published sequences for bonobo and chimpanzee, respectively.
MIA then uses the consensus-call of the previous round of
alignments as reference for further rounds of alignment until the
called consensus sequence is not changed in two consecutive
rounds. MIA was run separately for each individual and for each
region. However, initially all reads from a given individual were
included during the assembly of each region. If a read was aligned
to more than one region, the best alignment score was used to
assign the read to only one region. All regions were then assembled
again using MIA, but using only those reads that matched each
region best. To be considered for the assemblies, at least 12
consecutive base-pairs of a read had to match the reference
sequence. An average of six percent of the reads did not map to
any reference sequence and likely represents unspecific PCR
products. To minimize the effect of homopolymer over- and
under-calls in 454 data, we used a gap penalty that decreased
according to the function 1/L, where L is the homopolymer
length. To test whether using the human reference sequence as the
initial mapping sequence influences the outcome of the iterative
procedure, all autosomal regions from one bonobo were assembled
using both the human and chimpanzee sequences as reference.
The final consensus sequences were identical except for the length
of nine different homopolymers (all of length .6), six cases where
simple repeat regions differed in length and lead to misaligned
reads, and two cases where there was an insertion in the
chimpanzee (114 and 214 base pairs, respectively) not present in
the human genome. We therefore masked simple repeat regions
from further analyses. Our analyses were not affected by
homopolymer over- or undercalls or by insertion-deletions, as
these were ignored.
Calling of SNPsWe used perl scripts to identify potential heterozygous sites
within a given individual from the MIA output file. Below, we list
the filtering steps that were applied to get a set of high-quality
SNPs.
1. In order to remove multiple sequences that may be generated
from single molecules being amplified in an emulsion droplet
with more than one bead (i.e. emulsion PCR duplicates) [38],
we retained only the read with the highest quality score for
each group of reads with identical strand and start position in
the alignment.
2. Following [39], we filtered all reads whose alignment to the
consensus sequence contained gaps within 5 base-pairs on each
side of the potential SNP position.
3. We allowed at most one mismatch in 5 neighboring bases
around the potential SNP.
4. We did not call SNPs if there exists a homopolymer of length
longer or equal to 6 within a 20 base pair window around the
site, since we observed high rates of sequencing error and
misalignments in these regions.
5. Following [39], we also used the quality scores produced by the
454 base calling software (Version 2.0) to apply the Neighbor-
Quality Score (NQS) with a cutoff of at least 15 for 5
neighboring positions on each side of the potential SNP
position and 20 for the middle base on all reads.
If, after removal of reads due to filters 1 and 2, the potential
SNP position was covered by less than 8 reads, or if the potential
SNP position failed due to filters 3, 4 and 5 then we were unable to
call a SNP in this position. If we were able to call a SNP, then we
considered the potential position to be a SNP (i.e. to be
heterozygous) if the minor allele frequency was above 0.15 and
at least one read from each allele passes the NQS criteria outlined
in filter 5. Otherwise the potential position was considered to not
contain a SNP (i.e. to be homozygous).
False positive rates in homozygous PCR productsWe used data from ten 5 kb X chromosomal regions
(Thalmann et al., in preparation) collected in a similar fashion
Genomic Variation in Bonobos and Chimpanzees
PLoS ONE | www.plosone.org 7 June 2011 | Volume 6 | Issue 6 | e21605

to our data in two male humans to test the false positive rate of our
SNP calling protocol. No SNPs were called.
False negative rates by comparing 454 data to previouslysequenced data
In order to further test how many heterozygous positions were
missed or gained, we compared the newly generated 454 data with
data previously generated by Sanger sequencing [6]. Seven
samples from western chimpanzees and 9 regions were overlap-
ping between this study and the one from [6], representing a total
of ,9 kb of data. This 9 kb contained 62 SNPs previously
identified with Sanger sequencing. We found all of them when
applying our filtering criteria. We also found one more SNP,
which we did not call with Sanger sequencing.
Effect of changing SNP calling algorithmWe varied the filtering criteria and looked at how the number of
inferred SNPs changed for the above two situations. The filtering
criteria chosen were the ones that gave the least number of false
positives and false negatives. Using more permissive values
resulted in finding SNPs when there were none (or were not
present under Sanger sequencing), while more restrictive values
made us lose SNPs which were present under Sanger sequencing.
Furthermore, our nucleotide diversity estimates and the excess
of rare alleles in central chimpanzees (see Table 1) all confirm
previous findings (e.g. [4,6]). This suggests that we are not
excessively missing rare alleles or overcalling SNPs, at least
compared to Sanger sequencing.
Homozygous regions/allelic dropoutWhen analyzing the data from the 20 bonobos, 85 of the 300
products (15 loci * 20 individuals = 300 products) were homozygous
across the entire 10 kb of sequence. This raised the concern of allelic
dropout in our data. To exclude allelic dropout, we repeated the
entire experiment for bonobos with nested primers. One region
turned out to be affected by allelic dropout. For all other samples, we
thus repeated all the regions that were completely homozygous in one
individual with a second pair of primers. We note, however, that we
did observe individuals in both bonobos and chimpanzees that seem
to be truly homozygous across some 10 kb stretches of DNA.
In the case of no allelic dropout and equal amplification of both
alleles in the PCR, we expected both alleles at a frequency close to
50% and the distribution of the minor allele frequency to look like
half a normal distribution. A closer look at the data revealed that
for some heterozygous individuals the minor allele frequency was
skewed. This can be explained by unequal amplification of both
alleles, which could be due to a mismatch to one allele in the 39
end of one primer. We therefore plotted the minor allele frequency
for all regions for each individual separately and also repeated
each region showing a skew in the minor allele frequency with a
second pair of primers. A skew was defined as the minor allele
frequencies of each SNP in one region are all below 30%. Figure
S2 shows the shift in minor allele frequencies before and after
using a new set of primers for one population.
We note that 6 products still showed a skew in minor allele
frequency after using different primers and repeating the PCR. We
kept them as is in the analysis.
Sequence analysesThe consensus sequences for each region were aligned with
Muscle using default parameters [40,41].
Sequences are available under accession numbers JF725992 -
JF727238.
Population genetic analysesSummary statistics were calculated using DNAsp v5 [42],
including nucleotide diversity (p and hw), Tajima’s D, Fu and Li’s
D*. Effective population sizes (Ne) were estimated as Ne = hw /4 m[43], where m = (d/2t)g [44], d is a sequence divergence of 1.35% as
estimated from the data, t the time since divergence between
humans and chimpanzees (6 million years), and g the generation
time assumed to be 20 years [4].
Testing the fit of each population to standard neutralmodel
We tested the fit of each population to a standard neutral model
based upon the observed allele frequency spectra using the method
of [21]. Briefly, we used the program ms [45] to simulate 1,000 15
locus datasets, where for each locus we matched the total number
of chromosomes and the average length (,10,000 bp) in a given
population. h and r for each locus were chosen from a
distribution. Values for h followed a gamma distribution
parameterized using the average and variance in the mutation
rate across all 15 loci. Mutation rates were estimated based on
divergence to human, assuming a generation time of 20 years
(Fischer et al. 2004) and a divergence time of 6 million years.
Values for r followed a log-normal distribution parameterized
using the average human recombination rate and variance in the
human recombination rates for all 15 loci [46].
The observed and simulated data were compared using the
variance across loci of Tajima’s D plus four additional summary
statistics whose average value across all loci were computed: the
number of segregating sites (S), the mean pairwise difference (p),
Fu and Li’s D*, and Tajima’s D. For the simulated data, these
summary statistics were computed using sumstats [47]. Following
[21], we computed the probability of observing each summary
statistic across the ,1,000 simulated datasets and then calculated
the sum, C, of the natural log of the p-values for each of the
summary statistics.
We evaluated the fit of a given demographic model by
calculating the probability of observing C in the simulated data.
Note that our approach differs from [21] in that we do not include
the population recombination rate, r, in our list of summary
statistics. Independent estimates of local recombination rates,
which are often not well conserved between humans and
chimpanzees [48,49], are not yet available in chimpanzees and
bonobos and our data generally provided a poor fit across
populations to recombination estimates derived from human
populations (data not shown).
Population structureTo explore genetic structure among populations, we used two
approaches. The Structure software [50] was run using the
admixture model, so that individuals were allowed to have ancestry
from multiple populations. Three independent runs were performed
with a model of correlated allele frequencies, a ‘‘burn-in’’ of 100,000
Markov Chain Monte Carlo (MCMC) iterations, and 1,000,000
additional MCMC iterations. The number of populations assumed,
K, varied from 2 to 7. We averaged the results of the three
independent runs for each K value to determine the most likely
model, i.e. the one with the highest likelihood.
In addition, the Eigensoft software package [51] was used to
perform a principal component analysis (PCA). For pairs of SNPs
in high linkage disequilibrium (r2.0.5), one position was randomly
excluded. Likewise, we removed all positions with a minor allele
frequency lower than 5%. The statistical significance of any given
principle component (PC) is obtained by a bonferroni-corrected
Genomic Variation in Bonobos and Chimpanzees
PLoS ONE | www.plosone.org 8 June 2011 | Volume 6 | Issue 6 | e21605
Tracy Widom test [51]. A significant PC was considered indicative
of significant population structure, which can be in the form of
clusters or gradients along an axis of genetic variation.
Population divergence timesWe attempted to use MIMAR [17], a Markov Chain Monte
Carlo approach which allows for some recombination to estimate
divergence times and migration rates between closely-related
populations, on each pair of populations. However, we found that
the reasonably high recombination rates within our 10 kb regions
proved too computationally demanding and we failed to reach
convergence of the Markov chains even after four months.
Phylogenetic analysisWe reconstructed the phylogeny of each region, using Bayesian
inference as implemented in MrBayes v3 [52]. Each region was
collapsed to unique reconstructed haplotypes and a best-fit model of
sequence evolution was selected using decision theory with the
program DT-ModSel [53] and PAUP* v4.0d105 [54]. However,
only a few models are available in MrBayes. Thus, we chose the
closest best fit model that is actually implemented in MrBayes. For
mtDNA, the 14 nuclear regions and all regions concatenated the
closest best-fit model was the Hasegawa-Kishino-Yano substitution
matrix [55] with invariant sites and a gamma distributed correction
for rate heterogeneity (HKY+I+G) [55]. For one region the general-
time reversible (GTR+I+G) model was the best model. (No
qualitative differences were seen if we used the (HKY+I+G) model
for all regions). For each region, we ran four independent runs, each
for ten million generations and sampled every 1,000 generations. For
each run, we used one cold and three heated Markov Chains. We
excluded the first 10% of each run, resulting in a posterior
distribution of 36.000 distinct tree topologies. We used the program
Tracer v1.4.1 (http://tree.bio.ed.ac.uk/software/tracer/) to verify
that convergence was reached by the chosen burn-in. A single
human sequence was used as an outgroup for all phylogenetic
analyses. We calculated the posterior probability of monophyly by
determining the proportion of phylogenies for a given locus that were
consistent with monophyly for each population group and/or
species. To do this, we used PAUP* to constrain the posterior
distribution of phylogenies from the four independent runs of
MrBayes (minus the 10% burn-in for each run) to conform to each of
the following hypotheses: monophyly of bonobos, western chimpan-
zees, eastern chimpanzees, central chimpanzees, Nigerian-Camer-
oonian chimpanzees, all chimpanzees, and reciprocal monophyly
between chimpanzees and bonobos. The proportion of phylogenies
retained under each constrained model was taken as the posterior
support for each hypothesis. We arbitrarily defined a tree as showing
support for monophyly if the posterior probability .95% and as
showing support for paraphyly if the posterior probability ,5%.
We also estimated a single phylogeny for a concatenated
alignment of the 15 nuclear regions. We had difficulty reaching
convergence of the Markov Chains in our initial analyses using a
Bayesian framework. Therefore, we estimated a single phylogeny
with Maximum Likelihood (ML) using the program RAxML (v.
7.2.8; [56]). We used the fast bootstrapping algorithm under the
GTR+G model of sequence evolution. Two thousand bootstrap
replicates were performed with simultaneous optimization of the
ML topology.
Supporting Information
Figure S1 Maximum Likelihood consensus tree basedon the concatenated sequences of all 15 regions, withbootstrap values for 2000 replicates.
(TIF)
Figure S2 Minor allele frequency distribution foreastern chimpanzees before (a) and after (b) ream-plification with a new set of primers.
(TIF)
Table S1 Simulated values of various summary statis-tics under the standard neutral model matched for S andthe number of chromosomes. Also listed is the observed value
for each summary statistic.
(DOC)
Table S2 For each region, the number of sites for which(1) chimpanzees are polymorphic and bonobos are fixedfor the derived state; (2) bonobos are polymorphic andchimpanzees are fixed for the derived state; (3) bothbonobos and chimpanzees are polymorphic; (4) chim-panzees are fixed for the derived state and bonobos arefixed for the ancestral state; and (5) bonobos are fixedfor the derived state and chimpanzees are fixed for theancestral state.
(DOC)
Table S3 Location of the selected regions in the humangenome.
(DOC)
Acknowledgments
We thank Annie Olivecrona for the Nigerian-Cameroonian samples, the
staff of the sanctuaries for invaluable help and support, Kathrin Kohler for
preparing cell-lines and DNA, the sequencing group at the MPI-EVA
(especially Barbara Hoffner and Ayinuer Aximu), Jonas Eriksson for
creating Figure 1, Dan Vanderpool for assistance with phylogenetic
analyses, Jack Sullivan, Christoph Teunert, Marc Bauchet, Celine Bequet
and Knut Finstermeier for input on data analysis, and David Hughes, Olaf
Thalmann and Linda Vigilant for comments on the manuscript.
Author Contributions
Conceived and designed the experiments: AF SP. Performed the
experiments: AF VW. Analyzed the data: AF KP SEP JMG. Contributed
reagents/materials/analysis tools: AF KP MH CA RA LM SP. Wrote the
paper: AF SEP SP KP JMG. Obtained CITES permits for chimpanzee
and bonobo samples:: CA RA LM.
References
1. Hinds DA, Stuve LL, Nilsen GB, Halperin E, Eskin E, et al. (2005) Whole-
genome patterns of common DNA variation in three human populations.
Science 307: 1072–1079.
2. Becquet C, Patterson N, Stone AC, Przeworski M, Reich D (2007) Genetic
structure of chimpanzee populations. PLoS Genet 3: e66.
3. Caswell JL, Mallick S, Richter DJ, Neubauer J, Schirmer C, et al. (2008)
Analysis of chimpanzee history based on genome sequence alignments. PLoS
Genet 4: e1000057.
4. Fischer A, Wiebe V, Paabo S, Przeworski M (2004) Evidence for a complex
demographic history of chimpanzees. Mol Biol Evol 21: 799–808.
5. Yu N, Jensen-Seaman MI, Chemnick L, Kidd JR, Deinard AS, et al. (2003) Low
nucleotide diversity in chimpanzees and bonobos. Genetics 164: 1511–1518.
6. Fischer A, Pollack J, Thalmann O, Nickel B, Paabo S (2006) Demographic
history and genetic differentiation in apes. Curr Biol 16: 1133–1138.
7. Gonder MK, Locatelli S, Ghobrial L, Mitchell MW, Kujawski JT, et al. (2011)
Evidence from Cameroon reveals differences in the genetic structure and
histories of chimpanzee populations. Proc Natl Acad Sci U S A 108: 4766–
4771.
8. Kaessmann H, Wiebe V, Paabo S (1999) Extensive nuclear DNA sequence
diversity among chimpanzees. Science 286: 1159–1162.
Genomic Variation in Bonobos and Chimpanzees
PLoS ONE | www.plosone.org 9 June 2011 | Volume 6 | Issue 6 | e21605
9. Braga J (1995) Skeletal variation and measure of divergence among
chimpanzees. Contribution of the study of discrete traits. Academie des sciences.pp 1025–1030.
10. Shea BT, Leigh SR, Groves CP (1993) Multivariate craniometric variation in
chimpanzees: implications for species identification; Kimbel WH, Martin LB,
eds. New York: Plenum Press. 580 p.
11. Uchida A (1996) What we don’t know about great ape variation. Trends inEcology and Evolution 11: 163–168.
12. Kano T (1992) The Last Ape: Pygmy Chimpanzee Behavior and Ecology.
StanfordCA, , USA: Stanford University Press. 248 p.
13. Wrangham R, Pilbeam D (2001) African Apes as time machines. In:Galdikas BMF, Briggs N, Sheeran LK, Shapiro GL, Goodall J, eds. All Apes
Great and Small Vol 1: Chimpanzees, Bonobos and Gorillas. New York, NewYork, USA: Plenum/Kluwer Publication. 316 p.
14. Zihlman A (1996) Reconstruction reconsidered chimpanzee models and human
evolution. In: McGrew WC, Marchant LF, Nishida T, eds. Great Ape Societies.
Cambridge, UK: Cambridge University Press. 352 p.
15. Eriksson J, Hohmann G, Boesch C, Vigilant L (2004) Rivers influence thepopulation genetic structure of bonobos (Pan paniscus). Mol Ecol 13: 3425–3435.
16. Stone AC, Griffiths RC, Zegura SL, Hammer MF (2002) High levels of Y-
chromosome nucleotide diversity in the genus Pan. Proc Natl Acad Sci U S A99: 43–48.
17. Becquet C, Przeworski M (2007) A new approach to estimate parameters of
speciation models with application to apes. Genome Res 17: 1505–1519.
18. Jensen-Seaman MI, Deinard AS, Kidd KK (2001) Modern African apepopulations as genetic and demographic models of the last common ancestor of
humans, chimpanzees, and gorillas. J Hered 92: 475–480.
19. Won YJ, Hey J (2005) Divergence population genetics of chimpanzees. Mol Biol
Evol 22: 297–307.
20. Deinard AS, Kidd K (2000) Identifying conservation units within captivechimpanzee populations. Am J Phys Anthropol 111: 25–44.
21. Voight BF, Adams AM, Frisse LA, Qian Y, Hudson RR, et al. (2005)
Interrogating multiple aspects of variation in a full resequencing data set to inferhuman population size changes. Proc Natl Acad Sci U S A 102: 18508–18513.
22. Wegmann D, Excoffier L (2010) Bayesian Inference of the Demographic History
of Chimpanzees.
23. Gonder MK, Oates JF, Disotell TR, Forstner MR, Morales JC, et al. (1997) Anew west African chimpanzee subspecies? Nature 388: 337.
24. Gagneux P, Wills C, Gerloff U, Tautz D, Morin PA, et al. (1999) Mitochondrial
sequences show diverse evolutionary histories of African hominoids. Proc NatlAcad Sci U S A 96: 5077–5082.
25. Bjork A, Liu W, Wertheim JO, Hahn BH, Worobey M (2010) Evolutionary
history of chimpanzees inferred from complete mitochondrial genomes. Mol Biol
Evol.
26. Hudson RR (1992) Gene trees, species trees and the segregation of ancestralalleles. Genetics 131: 509–512.
27. Pamilo P, Nei M (1988) Relationships between gene trees and species trees.
Molecular Biology and Evolution 5: 568–583.
28. Takahata N (1993) Allelic genealogy and human evolution. Mol Biol Evol 10:2–22.
29. Wu CI (1991) Inferences of species phylogeny in relation to segregation of
ancient polymorphisms. Genetics 127: 429–435.
30. Geraldes A, Basset P, Gibson B, Smith KL, Harr B, et al. (2008) Inferring thehistory of speciation in house mice from autosomal, X-linked, Y-linked and
mitochondrial genes. Molecular Ecology 17: 5349–5363.
31. Xu X, Walters C, Antolin MF, Alexander ML, Lutz S, et al. (2009) Phylogeny
and biogeography of the eastern Asian-North American disjunct wild-rice genus(Zizania L., Poaceae). Molecular Phylogenetics and Evolution 55: 1008–1017.
32. McGuire JA, Linkem CW, Koo MS, Hutchinson DW, Lappin AK, et al. (2007)
Mitochondrial introgression and incomplete lineage sorting through space andtime: phylogenetics of crotaphytid lizards. Evolution 61: 2879–2897.
33. Heckman KL, Mariani CL, Rosoloarison R, Yoder AD (2007) Multiple nuclear
loci reveal patterns of incomplete lineage sorting and complex species historywithin western mouse lemurs (Microcebus). Molecular Phylogenetics and
Evolution 43: 353–367.34. Hobolth A, Christensen OF, Mailund T, Schierup MH (2007) Genomic
relationships and speciation times of human, chimpanzee, and gorilla inferred
from a coalescent hidden Markov model. PLoS Genet 3: e7.35. Patterson N, Richter DJ, Gnerre S, Lander ES, Reich D (2006) Genetic
evidence for complex speciation of humans and chimpanzees. Nature.36. Napier JR, Napier PH (1967) A handbook of living primates. New York:
Academic Press. 456 p.37. Meyer M, Stenzel U, Hofreiter M (2008) Parallel tagged sequencing on the 454
platform. Nat Protoc 3: 267–278.
38. Green RE, Krause J, Ptak SE, Briggs AW, Ronan MT, et al. (2006) Analysis ofone million base pairs of Neanderthal DNA. Nature 444: 330–336.
39. Brockman W, Alvarez P, Young S, Garber M, Giannoukos G, et al. (2008)Quality scores and SNP detection in sequencing-by-synthesis systems. Genome
Res 18: 763–770.
40. Edgar RC (2004) MUSCLE: a multiple sequence alignment method withreduced time and space complexity. BMC Bioinformatics 5: 113.
41. Edgar RC (2004) MUSCLE: multiple sequence alignment with high accuracyand high throughput. Nucleic Acids Res 32: 1792–1797.
42. Librado P, Rozas J (2009) DnaSP v5: a software for comprehensive analysis ofDNA polymorphism data. Bioinformatics 25: 1451–1452.
43. Tajima F (1989) Statistical method for testing the neutral mutation hypothesis by
DNA polymorphism. Genetics 123: 585–595.44. Kimura M (1983) The neutral theory of evolution. Cambridge, UK: Cambridge
University Press. pp 384.45. Hudson RR (2002) Generating samples under a Wright-Fisher neutral model of
genetic variation. Bioinformatics 18: 337–338.
46. Kong A, Gudbjartsson DF, Sainz J, Jonsdottir GM, Gudjonsson SA, et al. (2002)A high-resolution recombination map of the human genome. Nat Genet 31:
241–247.47. Thornton K (2003) Libsequence: a C++ class library for evolutionary genetic
analysis. Bioinformatics 19: 2325–2327.48. Ptak SE, Hinds DA, Koehler K, Nickel B, Patil N, et al. (2005) Fine-scale
recombination patterns differ between chimpanzees and humans. Nat Genet 37:
429–434.49. Winckler W, Myers SR, Richter DJ, Onofrio RC, McDonald GJ, et al. (2005)
Comparison of fine-scale recombination rates in humans and chimpanzees.Science 308: 107–111.
50. Pritchard JK, Stephens M, Donnelly P (2000) Inference of population structure
using multilocus genotype data. Genetics 155: 945–959.51. Patterson N, Price AL, Reich D (2006) Population structure and eigenanalysis.
PLoS Genet 2: e190.52. Ronquist F, Huelsenbeck JP (2003) MrBayes 3: Bayesian phylogenetic inference
under mixed models. Bioinformatics 19: 1572–1574.53. Minin V, Abdo Z, Joyce P, Sullivan J (2003) Performance-based selection of
likelihood models for phylogeny estimation. Syst Biol 52: 674–683.
54. Swofford DL (2002) PAUP*.Phylogenetic Analysis Using Parsimony (*and OtherMethods). Version 4. Sunderland, MA, USA: Sinauer Associates.
55. Hasegawa M, Kishino H, Yano T (1985) Dating of the human-ape splitting by amolecular clock of mitochondrial DNA. J Mol Evol 22: 160–174.
56. Stamatakis A (2006) RAxML-VI-HPC: maximum likelihood-based phylogenetic
analyses with thousands of taxa and mixed models. Bioinformatics 22:2688–2690.
Genomic Variation in Bonobos and Chimpanzees
PLoS ONE | www.plosone.org 10 June 2011 | Volume 6 | Issue 6 | e21605
Copyright © 2022 FDOKUMEN