2010 Clive James - ISAAA
292
I S A A A INTERNATIONAL SERVICE FOR THE ACQUISITION OF AGRI-BIOTECH APPLICATIONS ISAAA Briefs BRIEF 42 Global Status of Commercialized Biotech/GM Crops: 2010 by Clive James Founder and Chair, ISAAA Board of Directors No. 42 - 2010 Dedicated by the Author to the Twentieth Anniversary of ISAAA, 1991 to 2010 GLOBAL AREA OF BIOTECH CROPS Million Hectares (1996-2010) Source: Clive James, 2010. 1996 1997 1998 1999 2000 2001 2002 2003 2004 2005 2006 2007 2008 2009 2010 20 40 60 80 100 140 160 120 0 29 Biotech Crop Countries Total Hectares Industrial Developing A record 15.4 million farmers, in 29 countries, planted 148 million hectares (365 million acres) in 2010, a sustained increase of 10% or 14 million hectares (35 million acres) over 2009.
-
Upload
khangminh22 -
Category
Documents
-
view
0 -
download
0
Transcript of 2010 Clive James - ISAAA

i s a a aInternatIonal ServIcefor the acquISItIon
of agrI-bIotechapplIcatIonS
ISAAA Briefsbrief 42
Global status of Commercialized biotech/GM Crops: 2010
by
Clive James Founder and Chair, ISAAA Board of Directors
No. 42 - 2010
Dedicated by the Author to the Twentieth Anniversary of ISAAA, 1991 to 2010
Global area of bioteCh CropsMillion hectares (1996-2010)
Source: Clive James, 2010.
1996 1997 1998 1999 2000 2001 2002 2003 2004 2005 2006 2007 2008 2009 2010
20
40
60
80
100
140
160
120
0
29 Biotech Crop CountriesTotal HectaresIndustrialDeveloping
A record 15.4 million farmers, in 29 countries, planted 148 million hectares (365 million acres)
in 2010, a sustained increase of 10% or 14 million hectares (35 million acres) over 2009.

author’s note:
Global totals of millions of hectares planted with biotech crops have been rounded off to the nearest million and similarly, subtotals to the nearest 100,000 hectares, using both < and > characters; hence in some cases this leads to insignificant approximations, and there may be minor variances in some figures, totals, and percentage estimates that do not always add up exactly to 100% because of rounding off. It is also important to note that countries in the Southern Hemisphere plant their crops in the last quarter of the calendar year. The biotech crop areas reported in this publication are planted, not necessarily harvested hectarage in the year stated. Thus, for example, the 2010 information for Argentina, Brazil, Australia, South Africa, and Uruguay is hectares usually planted in the last quarter of 2010 and harvested in the first quarter of 2011 with some countries like the Philippines having more than one season per year. Thus, for countries of the Southern hemisphere, such as Brazil, Argentina and South Africa the estimates are projections, and thus are always subject to change due to weather, which may increase or decrease actual planted hectares before the end of the planting season when this Brief has to go to press. For Brazil, the winter maize crop (safrinha) planted in the last week of December 2010 and more intensively through January and February 2011 is classified as a 2010 crop in this Brief consistent with a policy which uses the first date of planting to determine the crop year. Details of the references listed in the Executive Summary are found in the full Brief 42.

brief 42
Global status of Commercialized biotech/GM Crops: 2010
by
Clive James Founder and Chair, ISAAA Board of Directors
No. 42 - 2010
Dedicated by the Author to the Twentieth Anniversary of ISAAA, 1991 to 2010

Co-sponsors:
published by:
Copyright:
Citation:
isbN:
publication ordersand price:
info on isaaa:
electronically:
Fondazione Bussolera-Branca, Italy Ibercaja, SpainISAAA
ISAAA gratefully acknowledges grants from Fondazione Bussolera-Branca and Ibercaja to support the preparation of this Brief and its free distribution to developing countries. The objective is to provide information and knowledge to the scientific community and society on biotech/GM crops to facilitate a more informed and transparent discussion regarding their potential role in contributing to global food, feed, fiber and fuel security, and a more sustainable agriculture. The author, not the co-sponsors, takes full responsibility for the views expressed in this publication and for any errors of omission or misinterpretation.
The International Service for the Acquisition of Agri-biotech Applications (ISAAA).
ISAAA 2010. All rights reserved. Whereas ISAAA encourages the global sharing of information in Brief 42, no part of this publication maybe reproduced in any form or by any means, electronically, mechanically, by photocopying, recording or otherwise without the permission of the copyright owners. Reproduction of this publication, or parts thereof, for educational and non-commercial purposes is encouraged with due acknowledgment, subsequent to permission being granted by ISAAA.
James, Clive. 2010. Global Status of Commercialized Biotech/GM Crops: 2010. ISAAA Brief No. 42. ISAAA: Ithaca, NY.
978-1-892456-49-4
Please contact the ISAAA SEAsiaCenter to purchase a hard copy of the full version of Brief 42, including the Executive Summary and the Highlights at http://www.isaaa.org. The publication is available free of charge to eligible nationals of developing countries.
ISAAA SEAsiaCenter c/o IRRIDAPO Box 7777Metro Manila, Philippines
For information about ISAAA, please contact the Center nearest you:
ISAAA AmeriCenter ISAAA AfriCenter ISAAA SEAsiaCenter417 Bradfield Hall PO Box 70, ILRI Campus c/o IRRICornell University Old Naivasha Road DAPO Box 7777Ithaca NY 14853, U.S.A. Uthiru, Nairobi 90665 Metro Manila Kenya Philippines
or email to [email protected]
For Executive Summaries of all ISAAA Briefs, please visit http://www.isaaa.org

i
CoNteNts
List of Tables and Figures ................................................................................................................ Highlights ....................................................................................................................................... Executive Summary: A separate supplement to this Brief and accessible at http://www.isaaa.org Introduction .................................................................................................................................... Global Area of Biotech Crops in 2010 ............................................................................................ Distribution of Biotech Crops in Industrial and Developing Countries ............................................ Distribution of Biotech Crops by Country ....................................................................................... USA .................................................................................................................................... Brazil ................................................................................................................................. Argentina ........................................................................................................................... India ................................................................................................................................... Canada ............................................................................................................................... China ................................................................................................................................. Paraguay ............................................................................................................................ Pakistan ............................................................................................................................. South Africa ....................................................................................................................... Uruguay ............................................................................................................................. Bolivia ................................................................................................................................ Australia ............................................................................................................................. Philippines ......................................................................................................................... Myanmar ........................................................................................................................... Burkina Faso ........................................................................................................................ Spain .................................................................................................................................. Mexico ............................................................................................................................... Colombia ........................................................................................................................... Chile .................................................................................................................................. Honduras ........................................................................................................................... Portugal .............................................................................................................................. Czech Republic .................................................................................................................. Poland ................................................................................................................................ Egypt .................................................................................................................................. Slovakia ............................................................................................................................. Costa Rica ........................................................................................................................... Romania ............................................................................................................................. Sweden ............................................................................................................................... Germany ............................................................................................................................ European Union ................................................................................................................. Africa .................................................................................................................................. Cuba .................................................................................................................................. Distribution of Biotech Crops, by Crop ........................................................................................... Biotech Soybean ................................................................................................................ Biotech Maize ....................................................................................................................
iii vi
1 5 9
11 16 27 40 45 90 94
116 118 134 138 140 142 148 154 160 170 174 177 179 181 181 184 185 186 188 189 190 193 194 195 203 209 210 212 212

ii
CoNteNts
Biotech Cotton ................................................................................................................... Biotech Canola ................................................................................................................. Biotech Alfalfa ................................................................................................................. Other Biotech Crops ..........................................................................................................Distribution of Biotech Crops, by Trait ...........................................................................................Dominant Biotech Crops in 2010 ..................................................................................................Global Adoption of Biotech Soybean, Maize, Cotton, Canola ..................................................The Global Value of the Biotech Crop Market ................................................................................Global Status of Regulatory Approvals ............................................................................................Acknowledgments ..........................................................................................................................References ......................................................................................................................................Appendices Appendix 1: Global Status of Regulatory Approvals ........................................................... Appendix 2: Global Crop Protection Market ...................................................................... Appendix 3: Useful Tables and Charts on the International Seed Trade ............................... Appendix 4: Listing of Events, Bt Cotton Variety and Hybrids in India, 2009 ...................... Appendix 5: Updates of On-going Biotech/GM Crops Research Activities in Uganda, 2010 ...
213214214215215218220220223225226
243268270272278

iii
list of tables aNd fiGures
TablesTable 1 Global Area of Biotech Crops, the First 14 Years, 1996 to 2010Table 2 Global Area of Biotech Crops, 2009 and 2010: Industrial and Developing Countries
(Million Hectares)Table 3 Global Area of Biotech Crops in 2009 and 2010: by Country (Million Hectares)Table 4 Biotech Crops Approved for Commercial Planting in Brazil, 1998 to 1 December 2010Table 5 Commercial Approvals for Planting, Food and Feed in Argentina, 1996 to 2010Table 6 Beneficiaries of Direct Benefits of Biotech Soybeans in Argentina, 1996 to 2005Table 7 Status of Oilseeds Production in India, 2003 to 2009Table 8 Status of Edible Oil Production, Import and Consumption in India, 2003 to 2010 Table 9 Break-down of Cotton By-products from 2002-03, 2009-10 and 2010-11Table 10 Value of Seed Cotton By-products, 2009-10 Table 11 Land Holdings Distribution and Production of Cotton in India, 2009-2010Table 12 The Technological Changes Introduced in Cotton in India, 1950 to 2010Table 13 Adoption of Bt Cotton in India, by Major States, from 2002 to 2010 (000’ ha)Table 14 Adoption of Single and Multiple Gene Bt Cotton Hybrids in India, 2006 to 2010 (In
Millions of Hectares and Percentage)Table 15a Commercial Release of Different Bt Cotton Events in India, 2002 to 2010Table 15b Bt and Bt/HT Events Field-tested and Pending Approval for Commercialization in India,
2011-2015Table 16 Deployment of Approved Bt Cotton Events/Hybrids/Variety by Region in India in 2010Table 17 Deployment of Approved Bt Cotton Events/Hybrids/Variety by Companies/Institutions in
India, 2002 to 2010Table 18 Twelve Studies Conducted by Public Institutes on the Benefits of Bt Cotton in India for
the Years, 1998 to 2010Table 19 DBT’s Institutional Capacity and Infrastructure for R&D of Crop Biotech in India, 2009Table 20 Status of Field Trials of Biotech/GM Crops in India, 2010Table 21 Direct and Spill-over Benefits of HT Canola (Ca$M)Table 22 Approval of Biotech Crops in ChinaTable 23 Distribution of Cotton in Pakistan, 2008-09Table 24 Commercial Release of Different Bt Cotton Varieties and Hybrid in Pakistan, 2010Table 25 Adoption of Bt Cotton in Pakistan, 2010Table 26 Status of Advanced Field Trials of Biotech Crops in Pakistan, 2010Table 27 Adoption of Biotech Crops in South Africa, 2001 to 2010 (Thousand Hectares)Table 28 Partial Budget for Production of RR®soybean and its Conventional Equivalent in BoliviaTable 29 Hectares of Canola, Conventional and RR Biotech, Planted in Australia, by State, 2009
and 2010Table 30 Approval of Biotech Maize Events in the Philippines, 2002 to 2010Table 31 Adoption of Bt Cotton in Myanmar, 2006 to 2010

iv
list of tables aNd fiGures
Table 32 Hectares of Biotech Bt Maize in the Autonomous Communities of Spain, 1998 to 2010Table 33 Hectares of Maize in Spain by Province, 2010Table 34 GM Technologies Featured in the Field TrialsTable 35 Hectares of Major Biotech Seed Crops Grown for Export in Chile, 2002/03 to 2010/11Table 36 Cultivation of Bt Maize in Portugal in 2010Table 37 Hectares of Bt Maize Planted in 2006 to 2010 in EU Countries and Hectares of Amflora
Potato Grown in the EU countries in 2010Table 38 GMO Crop Approvals for Import by the European Union, 2004 to 2010Table 39 Imports of Maize Grain into Cuba, 2006-2009Table 40 Global Area of Biotech Crops, 2009 and 2010: by Crop (Million Hectares)Table 41 Global Area of Biotech Crops, 2009 and 2010: by Trait (Million Hectares)Table 42 Dominant Biotech Crops in 2010 (Million Hectares)Table 43 Biotech Crop Area as Percent of Global Area of Principal Crops, 2010 (Million Hectares)Table 44 The Global Value of the Biotech Crop Market, 1996 to 2010
Figures
Figure 1 International Prices of Crop Commodities and a Barrel of Crude Oil, 2006 to December 2010 Figure 2 Global Area of Biotech Crops, 1996 to 2010 (Million Hectares)Figure 3 Global Area of Biotech Crops, 1996 to 2010: Industrial and Developing Countries
(Million Hectares)Figure 4 Global Area (Million Hectares) of Biotech Crops, 1996 to 2010, by Country, and Mega-
Countries, and for the Top Ten CountriesFigure 5 Brazilian Grain Production, 1990 to 2010Figure 6 Soybean Production Cost in Brazil, 2007/08 to 2010/11Figure 7 Estimates of Brazilian Soybean Export Revenue (US$ Billion), 1999 to 2010 Figure 8 Soybean Cultivars Registered in Brazil, 2000 to 2010Figure 9 Cotton Varieties Registered in Brazil, 1998 to 2010Figure 10 Maize Hybrids and Lines Registered in Brazil, 1999 to 2010Figure 11 Economic Benefits from the Adoption of Biotech Crops in Brazil, 1996/97 to 2008/09,
by Crop, and by BenefitFigure 12 Water Savings/Benefits from the Adoption of Biotech Crops in Brazil, 1996/97 to 2008/09,
– 287,000 People Benefited from Water Savings of 12.6 Billion LitersFigure 13 Diesel Savings/Benefits from the Adoption of Biotech Crops in Brazil, 1996/97 to 2008/09;
– Diesel Savings of 104.8 Million Liters Enough to Supply a Fleet of 44,000 Vehicles for 13 Years
Figure 14 Savings of 270,000 Tons of CO2 Emissions for Biotech Crops in Brazil Equivalent to Conserving 2 Million Trees During the Period 1996/97 to 2008/09

v
list of tables aNd fiGures
Figure 15 Savings of 6,870 Tons of Pesticides (active ingredient) from Planting Biotech Crops in Brazil during the Period 1996/97 to 2008/09
Figure 16 A Schematic Diagram of the Multipurpose Utility of Cotton CropFigure 17 Crop-wise Composition of the Availability of Meal (oilcake) in India, 2007-08Figure 18 Technological Leapfrogging and Cotton Productivity in India, 1950 to 2010Figure 19 Adoption of Single and Multiple Gene Bt Cotton Hybrids from 2002 to 2010Figure 20 Percent Adoption of Bt Cotton in India and in Different States Expressed as Percent
Adoption Within States and Nationally in India, 2002 to 2010Figure 21 Adoption of Single and Multiple Gene Bt Cotton Hybrids from 2002 to 2010Figure 22 Number of Small Farmers Adopting Bt Cotton Hybrids in India, 2002 to 2010Figure 23 Cotton Hectarage, Production and Yield in India, 2001 to 201Figure 24 Export and Import of Cotton in India, 2001 to 2010Figure 25 Bt Cotton Hybrids Market in India (in Rupee Crore), 2002 to 2009Figure 26 Approval of Events and Bt Cotton Variety & Hybrids in India, 2010Figure 27 Release of Bt Cotton Hybrids in India, 2002 to 2010Figure 28 Returns to Labor from Bt Cotton and Conventional Cotton in Rural India, 2010Figure 29 Percentage of Conventional, Biotech and Mutation-based Herbicide Tolerant (HT) Canola
Planted in Canada, 1995 to 2010 (Million Hectares)Figure 30 Adoption of Bt Cotton in Each Province of Northern China, as Percentage, 1997 to 2006Figure 31 Declining Trend in the Growth of Agriculture in Pakistan, 1960s to 2000sFigure 32 Composition of Value of Major Crops, 2009-10Figure 33 Comparison of Total Exports Versus Textile and Clothing Exports from Pakistan, 2001 to 2010Figure 34 Trend in Annual Cotton Yields in Pakistan, 1990 to 2010Figure 35 Cotton Production, Consumption, Export and Import in Pakistan, 1990 to 2010Figure 36 Flow Chart of Biosafety Regulation in PakistanFigure 37 Increase in Hectarage Traits of Biotech Maize in the Philippines and Proportion of
Commercialized Traits, 2003 to 2010Figure 38 Cotton Research & Development Farms in MyanmarFigure 39 Cotton Area, Production and Yield in Myanmar, 2000 to 2009Figure 40 Comparing Yield of Long Staple Bt Cotton, Short Staple Cotton and National Average,
2000 to 2009Figure 41 Map of Cotton-Growing Areas in Burkina FasoFigure 42 Summary of Three Countries Commercializing Biotech CropsFigure 43 Global Area of Biotech Crops, 1996 to 2010: by Crop (Million Hectares)Figure 44 Global Area of Biotech Crops, 1996 to 2010: by Trait (Million Hectares)Figure 45 Global Total and Trait Hectares of Biotech Crops, 1996 to 2010 (Million Hectares)Figure 46 Global Adoption Rates (%) for Principal Biotech Crops, 2010 (Million Hectares)Figure 47 US Revenues from Major GM Crops

vi
2010 was the 15th anniversary of the commercialization of biotech crops, 1996-2010.
Accumulated hectarage from 1996 to 2010 exceeded 1 billion hectares (equivalent to the total vast area of USA or China), clearly signifying that biotech crops are here to stay.
A record 87-fold increase in hectarage between 1996 and 2010, which makes biotech crops the fastest adopted crop technology in the history of modern agriculture. Strong double digit-growth of 10% in 2010 reaching 148 million hectares – notably, the 14 million hectare increase is the second largest increase in 15 years. “Trait hectares” grew from 180 million hectares in 2009, to 205 million hectares in 2010; an increase of 14%, or 25 million ”trait hectares”.
Number of countries planting biotech crops soared to a record 29, up from 25 in 2009 – for the first time, the top 10 countries each grew >1 million hectares. More than half the world’s population, 59% or ~4 billion people, live in the 29 countries planting biotech crops.
Three new countries, Pakistan, Myanmar and Sweden, reported planting biotech crops officially for the first time in 2010, and Germany also resumed planting.
Of the 29 biotech crop countries in 2010, 19 were developing and only 10 were industrial countries; in addition, another 30 imported biotech crop products for a total of 59 countries approving use of biotech crops, either for planting or importing; 75% of the world’s population live in the 59 countries.
In 2010, a record 15.4 million farmers grew biotech crops – notably over 90%, or 14.4 million, were small resource-poor farmers in developing countries; number of beneficiary farmers is conservative due to spill-over of benefits from biotech crops to conventional crops. Remarkably, since 1996, farmers worldwide elected to make ~100 million independent decisions to plant and replant more biotech crops every single year, because of the significant benefits they offer.
Developing countries grew 48% of global biotech crops in 2010 and will exceed industrial countries hectarage before 2015. Biotech growth rate was much faster in developing countries, 17% or 10.2 million hectares, versus 5% or 3.8 million hectares in industrial countries. The five lead developing countries in biotech crops are China and India in Asia, Brazil and Argentina in Latin America, and South Africa on the continent of Africa. Brazil, the engine of growth in Latin America, increased its hectarage of biotech crops, more than any other country worldwide – a record 4 million hectare increase.
highlights of “Global status of Commercialized biotech/GM Crops: 2010”
by Clive James, founder and Chair of isaaa
Biotech Crops Surge over 1 Billion Hectares

vii
highlights of the Global status of Commercialized biotech/GM Crops: 2010
In Australia, biotech crops recovered after a multi-year drought with the largest proportional year-on-year increase of 184% to reach 653,000 hectares.
Burkina Faso had the second largest proportional increase of biotech hectarage at 126%, with 80,000 farmers planting a record 260,000 hectares equivalent to a 65% adoption rate.
In Myanmar, 375,000 small farmers successfully planted 270,000 hectares of Bt cotton, equivalent to a 75% biotech adoption for all cotton grown in the country.
In India, stellar growth continued for the ninth year, with 6.3 million farmers growing 9.4 million hectares of Bt cotton, equivalent to an 86% adoption rate.
Mexico successfully conducted the first series of field trials with biotech maize.
A record eight EU countries grew either Bt maize or the “Amflora” starch potato, newly approved by the EU – the first approval for planting in 13 years in the EU.
For the first time, biotech crops occupied a substantial 10% of the ~1.5 billion hectares of global cropland; >50% of global cropland is in the 29 countries planting biotech crops in 2010.
Stacked traits are an important feature of biotech crops – 11 countries planted biotech crops with two or more traits in 2010, and 8 were developing countries – 32.2 million hectares or 22% of the 148 million hectares were stacked in 2010.
From 1996 to 2009, biotech crops contributed to Sustainability and Climate Change by: increasing crop production and value by US$65 billion; providing a better environment, by saving 393 million kgs a.i. of pesticides; in 2009 alone reducing CO2 emissions by 18 billion kgs., equivalent to taking ~8 million cars off the road; conserving biodiversity by saving 75 million hectares of land; and helped alleviate poverty by helping 14.4 million small farmers who are some of the poorest people in the world.
There is an urgent need for appropriate cost/time-effective regulatory systems that are responsible, rigorous but not onerous, for small and poor developing countries.
Global value of biotech seed alone was valued at US$11.2 billion in 2010, with commercial biotech maize, soybean grain and cotton valued at ~US$150 billion per year.
Future Prospects look encouraging for the next five years: drought tolerant maize in 2012; Golden Rice in 2013; and Bt rice before the MDG of 2015, to potentially benefit 1 billion poor people in rice households, in Asia alone. Biotech crops can make an enormous contribution to the 2015 MDG goal of cutting poverty in half, by optimizing crop productivity in a proposed global initiative to honor the legacy of ISAAA’s founding patron, and Nobel Peace Laureate, Norman Borlaug, who saved 1 billion people from hunger.

viii

Global status of Commercialized biotech/GM Crops: 2010
1
Global status of Commercialized biotech/GM Crops: 2010
by
Clive JamesChair, isaaa board of directors
introduction
This Brief focuses on the global biotech crop highlights in 2010, and is dedicated to the 20th anniversary of ISAAA, 1991 to 2010.
2010 marks the 15th anniversary of the commercialization, 1996-2010, of biotech crops, also known as genetically modified (GM) or transgenic crops, now more often called “biotech crops” as referred to in this Brief. The experience of the first 14 years of commercialization, 1996 to 2009, has confirmed that the early promise of crop biotechnology has been fulfilled. Biotech crops have delivered substantial agronomic, environmental, economic, health and social benefits to farmers and, increasingly, to society at large. The rapid adoption of biotech crops, during the initial 14 years of commercialization, 1996 to 2009, reflects the substantial multiple benefits realized by both large and small farmers in industrial and developing countries, which have grown biotech crops commercially. Between 1996 and 2009, developing and industrial countries contributed to a record 80-fold increase in the global area of biotech crops from 1.7 million hectares in 1996 to 134 million hectares in 2009. Adoption rates for biotech crops during the period 1996 to 2009 are unprecedented and, by recent agricultural industry standards, they represent the highest adoption rates for improved crops, for example, higher than the adoption of hybrid maize in its heyday in the mid-west of the USA. High adoption rates reflect farmer satisfaction with the products that offer substantial benefits ranging from more convenient and flexible crop management, lower cost of production, higher productivity and/or net returns per hectare, health and social benefits, and a cleaner environment through decreased use of conventional pesticides, which collectively contribute to a more sustainable agriculture. There is a growing body of consistent evidence across years, countries, crops and traits generated by public sector institutions that clearly demonstrate the benefits from biotech crops. These benefits include improved weed and insect pest control with biotech herbicide tolerant and insect resistant Bt crops, that also benefit from lower input and production costs; biotech crops also offer substantial economic advantages to farmers compared with corresponding conventional crops. The severity of weeds, insect pests and diseases varies from year-to-year and country to country, and hence will directly impact pest control costs and the economic advantages of biotech crops in any given time or place.

Global status of Commercialized biotech/GM Crops: 2010
2
Despite the continuing debate on biotech crops, particularly in countries of the European Union (EU), millions of large and small farmers in both industrial and developing countries have continued to increase their plantings of biotech crops by double-digit adoption growth rates almost every year since 1996, because of the significant multiple benefits that biotech crops offer. This high rate of adoption is a strong vote of confidence in biotech crops, reflecting farmer satisfaction in both industrial and developing countries. About 14 million farmers in 25 countries grew biotech crops in 2009 and derived multiple benefits that included significant agronomic, environmental, health, social and economic advantages. ISAAA’s 2009 Global Review (James, 2009b) predicted that the number of farmers planting biotech crops, as well as the global area of biotech crops, would continue to grow in 2010. Global population was approximately 6.5 billion in 2006 and is expected to reach approximately 9.2 billion by 2050, when around 90% of the global population will reside in Asia, Africa, and Latin America. In 2009, for the first time ever, over 1 billion people in the developing countries suffered from hunger and malnutrition and more than 1 billion were afflicted by poverty. Biotech crops represent promising technologies that can make a vital contribution, but are not a panacea, to global food, feed and fiber security. Biotech crops can also make a critically important contribution to the alleviation of poverty, the most formidable challenge facing global society which has made the commitment to the Millennium Development Goals (MDG) to cut poverty, hunger and malnutrition by half by 2015; this is also the year that marks the completion of the second decade of commercialization of biotech crops, 2006-2015.
The most compelling case for biotechnology, and more specifically biotech crops, is their capability to contribute to:
increasing crop productivity, and thus contribute to global food, feed, and fiber security, with benefits for producers, consumers and society at large alike; contribute to more affordable food as a result of coincidentally increasing productivity significantly and reducing production costs substantially;
self-sufficiency which is optimizing productivity and production on a nations own arable land, whereas food security is “food for all” without specific reference to source – self-sufficiency and food security are not mutually exclusive, currently there is an increased emphasis on self-sufficiency by both national programs and donors;
conserving biodiversity – as a land-saving technology capable of higher productivity on the current ~1.5 billion hectares of arable land, biotech crops can help preclude deforestation and protect biodiversity in forests and in other in-situ biodiversity sanctuaries;
reducing the environmental footprint of agriculture by contributing to more efficient use of external inputs, thereby contributing to a safer environment and more sustainable agriculture

Global status of Commercialized biotech/GM Crops: 2010
3
systems; special attention to more efficient use of water in crop production and development of drought tolerant biotech crops;
mitigating some of the challenges associated with climate change (increased frequency and severity of droughts, floods, changes in temperature, rising sea levels exacerbating salinity and changes in temperature) and reducing greenhouse gases by using biotech applications for “speeding the breeding” in crop improvement programs to expedite the development of well adapted germplasm for rapidly changing climatic conditions and optimize the sequestration of CO2;
increasing stability of productivity and production to lessen suffering during famines due to biotic and abiotic stresses, particularly drought, which is the major constraint to increased productivity on the ~1.5 billion hectares of arable land in the world;
the improvement of economic, health and social benefits, food, feed, and fiber security, and the alleviation of abject poverty, hunger and malnutrition for the rural population dependent on agriculture in developing countries who represent 70% of the world’s poor; thus, provide significant and important multiple and mutual benefits to producers, consumers and global society.
the most promising technological option for increasing global food, feed and fiber production is to combine the best of the old and the best of the new by integrating the best of conventional technology (adapted germplasm) and the best of biotechnology applications, including molecular breeding and the incorporation of transgenic novel traits. The improved crop products, resulting from the synergy of combining the best of the old with the best of the new must then be incorporated as the innovative technology component in a global food, feed and fiber security strategy that must also address other critical issues, including population control and improved food, feed and fiber distribution. Adoption of such a holistic strategy will allow society to continue to benefit from the vital contribution that both conventional and modern innovative plant breeding offers global society.
The author has published global reviews of biotech crops annually since 1996 as ISAAA Briefs, James, 2009b; James, 2008; James, 2007; James, 2006; James, 2005; James, 2004; James, 2003; James, 2002; James, 2001; James, 2000; James, 1999; James, 1998; James, 1997; James and Krattiger, 1996). This publication provides the latest information on the global status of commercialized biotech crops. A detailed global data set on the adoption of commercialized biotech crops is presented for the year 2010 and the changes that have occurred between 2009 and 2010 are highlighted. The global adoption trends during the last 15 years from 1996 to 2010 are also illustrated as well as the contribution of biotech crops to the world’s 1 billion poor people, of which resource-poor farmers are a significant proportion.

Global status of Commercialized biotech/GM Crops: 2010
4
This ISAAA Annual Global Review of biotech crops (Brief 42, 2010) is the fifteenth in an annual series. It documents the global database on the adoption and distribution of biotech crops in 2010, and in the Appendix there are five sections: 1) a comprehensive inventory of biotech crop products that have received regulatory approvals for import for food, feed use and for release into the environment, including planting, in specific countries; 2) a table with global status of crop protection in 2009, courtesy of Cropnosis; 3) useful tables and charts on the international seed trade – these have been reproduced with permission of the International Seed Federation (ISF); 4) a table detailing the deployment of Bt cotton hybrids and varieties in India in 2009; and 5) a table summarizing biotech crop activities in Uganda.
Note that the words rapeseed, canola, and Argentine canola are used synonymously, as well as transgenic, genetically modified crops, GM crops, and biotech crops, reflecting the usage of these words in different regions of the world, with biotech crops being used exclusively in this text because of its growing usage worldwide. Similarly, the words corn, used in North America, and maize, used more commonly elsewhere in the world, are synonymous, with maize being used consistently in this Brief, except for common names like corn rootworm where global usage dictates the use of the word corn. All $ dollar values in this Brief are to US dollars unless otherwise noted. Some of the listed references may not be cited in the text – for convenience they have been included because they were considered useful reading material and were used as preparatory documents for this Brief. Global totals of millions of hectares planted with biotech crops have been rounded off to the nearest million and similarly subtotals to the nearest 100,000 hectares, using both < and > characters; hence in some cases this leads to insignificant approximations, and there may be minor variances in some figures, totals, and percentage estimates that do not always add up exactly to 100% because of rounding off. Similarly, global totals of millions of hectares of biotech crops are rounded off to the nearest 1 million. It is also important to note that countries in the Southern Hemisphere plant their crops in the last quarter of the calendar year. The biotech crop areas reported in this publication are planted, not necessarily harvested hectarage, in the year stated. Thus, for example, the 2010 information for Argentina, Brazil, Australia, South Africa, and Uruguay is hectares usually planted in the last quarter of 2010 and harvested in the first quarter of 2011, or later, with some countries like the Philippines planting crops in more than one season per year. Thus, for countries of the Southern hemisphere, such as Brazil and Argentina the estimates are projections, and thus are always subject to change due to weather, which may increase or decrease actual planted area before the end of the planting season when this Brief went to press. For Brazil, the winter maize crop (safrinha) planted at the end of December 2010 and more intensively through January and February 2011, is classified as a 2010 crop in this Brief, consistent with a policy which uses the first date of planting to determine the crop year. Country figures were sourced from The Economist, supplemented by data from World Bank, FAO and UNCTAD, when necessary.
Global status of Commercialized biotech/GM Crops: 2010
5
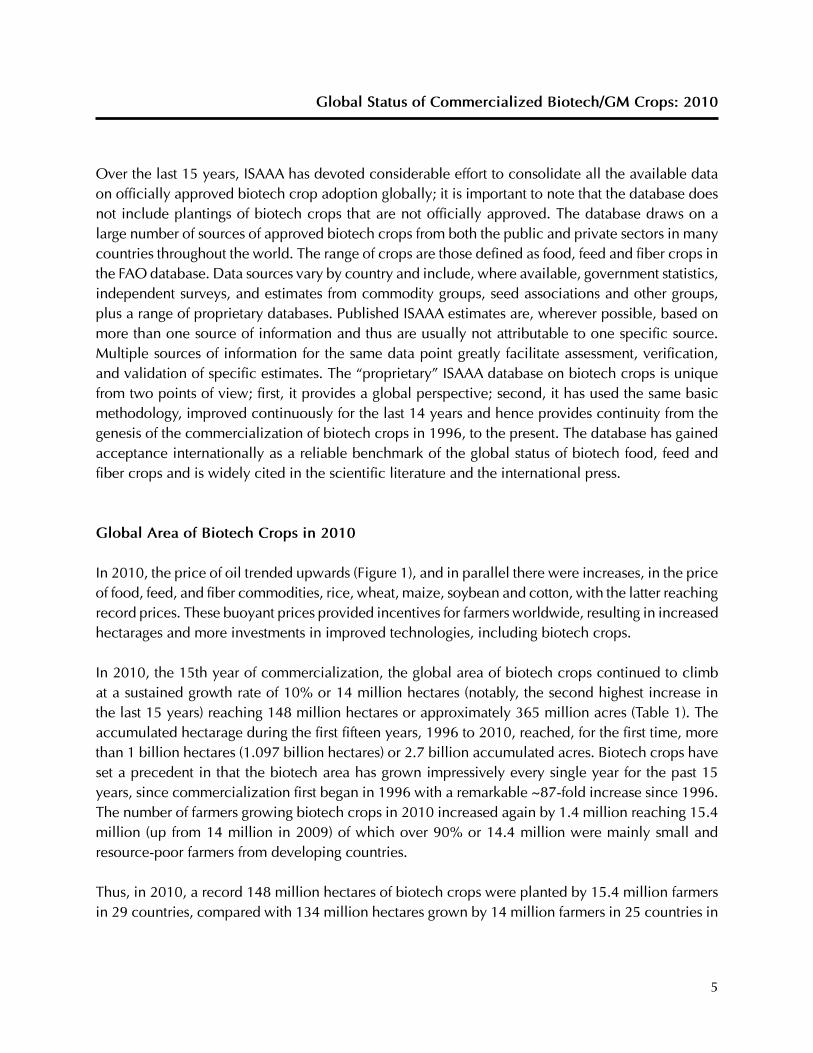
Over the last 15 years, ISAAA has devoted considerable effort to consolidate all the available data on officially approved biotech crop adoption globally; it is important to note that the database does not include plantings of biotech crops that are not officially approved. The database draws on a large number of sources of approved biotech crops from both the public and private sectors in many countries throughout the world. The range of crops are those defined as food, feed and fiber crops in the FAO database. Data sources vary by country and include, where available, government statistics, independent surveys, and estimates from commodity groups, seed associations and other groups, plus a range of proprietary databases. Published ISAAA estimates are, wherever possible, based on more than one source of information and thus are usually not attributable to one specific source. Multiple sources of information for the same data point greatly facilitate assessment, verification, and validation of specific estimates. The “proprietary” ISAAA database on biotech crops is unique from two points of view; first, it provides a global perspective; second, it has used the same basic methodology, improved continuously for the last 14 years and hence provides continuity from the genesis of the commercialization of biotech crops in 1996, to the present. The database has gained acceptance internationally as a reliable benchmark of the global status of biotech food, feed and fiber crops and is widely cited in the scientific literature and the international press.
Global area of biotech Crops in 2010
In 2010, the price of oil trended upwards (Figure 1), and in parallel there were increases, in the price of food, feed, and fiber commodities, rice, wheat, maize, soybean and cotton, with the latter reaching record prices. These buoyant prices provided incentives for farmers worldwide, resulting in increased hectarages and more investments in improved technologies, including biotech crops.
In 2010, the 15th year of commercialization, the global area of biotech crops continued to climb at a sustained growth rate of 10% or 14 million hectares (notably, the second highest increase in the last 15 years) reaching 148 million hectares or approximately 365 million acres (Table 1). The accumulated hectarage during the first fifteen years, 1996 to 2010, reached, for the first time, more than 1 billion hectares (1.097 billion hectares) or 2.7 billion accumulated acres. Biotech crops have set a precedent in that the biotech area has grown impressively every single year for the past 15 years, since commercialization first began in 1996 with a remarkable ~87-fold increase since 1996. The number of farmers growing biotech crops in 2010 increased again by 1.4 million reaching 15.4 million (up from 14 million in 2009) of which over 90% or 14.4 million were mainly small and resource-poor farmers from developing countries.
Thus, in 2010, a record 148 million hectares of biotech crops were planted by 15.4 million farmers in 29 countries, compared with 134 million hectares grown by 14 million farmers in 25 countries in

Global status of Commercialized biotech/GM Crops: 2010
6
2009. Three new biotech countries, Pakistan, Myanmar and Sweden (the first of the Scandinavian countries to grow biotech crops) joined, whilst Germany resumed planting biotech crops. This brings the total number of countries planting biotech crops in 2010 to 29 of which 19 were developing countries and 10 industrial countries. It is notable that 14 million hectares more were planted in 2010 by 15.4 million farmers in the 15th year of commercialization at a growth rate of 10% equivalent to 148 million hectares. The highest increase in any country, in absolute hectarage growth, was Brazil with 4.0 million hectares and the highest proportional increase was Australia with a 184% increase from 230,000 hectares in 2009 to 653,000 hectares in 2010. The total number of EU countries which grew biotech crops in 2010 was eight, up from six in 2009.
To put the 2010 global area of biotech crops into context, 148 million hectares of biotech crops is equivalent to approximately 15% of the total land area of China (956 million hectares) or the USA (937 million hectares) and more than six times the land area of the United Kingdom (24.4 million hectares). The increase in area between 2009 and 2010 of 10% is equivalent to 14 million hectares or ~35 million acres.
figure 1. international prices of Crop Commodities and a barrel of Crude oil, 2006 to december 2010
Source: International Monetary Fund, 2010.
0
200
400
600
800
1000
1200
Jan
uar
y F M A MJ
2006
J A S O N DJa
nu
ary F M A MJ
2007
J A S O N DJa
nu
ary F M A MJ
2008
J A S O N D
Jan
uar
y F M A MJ
200
9 J A S O N D
Jan
uar
y F M A MJ
2010
J A S O N D
Ric
e, W
hea
t, M
aize
, So
ybea
n in
US$
/mil
ton
,
Co
tto
n in
US$
cen
ts/p
ou
nd
0
20
40
60
80
100
120
140
Cru
de
Oil
Pri
ce in
US$
/Bar
rel
Rice Soybean Wheat Maize Cotton Crude Oil Price
c

Global status of Commercialized biotech/GM Crops: 2010
7
table 1. Global area of biotech Crops, the first 14 Years, 1996 to 2010
Year hectares (million) acres (million)
1996 1.7 4.3
1997 11.0 27.5
1998 27.8 69.5
1999 39.9 98.6
2000 44.2 109.2
2001 52.6 130.0
2002 58.7 145.0
2003 67.7 167.2
2004 81.0 200.0
2005 90.0 222.0
2006 102.0 252.0
2007 114.3 282.0
2008 125.0 308.8
2009 134.0 335.0
2010 148.0 365.0
total 1,097.9 2,716.0
increase of 10%, 14 million hectares (35 million acres) between 2009 and 2010.Source: Clive James, 2010.
During the fifteen years of commercialization 1996 to 2010, the global area of biotech crops increased ~87-fold, from 1.7 million hectares in 1996 to 148 million hectares in 2010 (Figure 2). This rate of adoption is the highest rate of crop technology adoption for any crop technology and reflects the continuing and growing acceptance of biotech crops by farmers in both large as well as small and resource-poor farmers in industrial and developing countries. In the same period, the number of countries growing biotech crops more than quadrupled, increasing from 6 in 1996 to 12 countries in 1999, 17 in 2004, 21 countries in 2005, 25 in 2009, and 29 in 2010. A new wave of adoption of biotech crops is fueled by several factors which are contributing to a broad-based global growth in biotech crops. These factors include: 29 countries (19 developing and 10 industrial) already planting biotech crops in 2010, with a strong indication that new countries like Vietnam will join in 2011 and beyond; notable and significant continuing progress in Africa in 2010 with all three African countries (South Africa, Burkina Faso and Egypt) increasing their hectarage of biotech crops significantly– Africa is the continent with the greatest challenge; significant increases in area of “new” biotech crops such

Global status of Commercialized biotech/GM Crops: 2010
8
figure 2. Global area of biotech Crops, 1996 to 2010 (Million hectares)
Source: Compiled by Clive James, 2010.
Mill
ion
Hec
tare
s
1996 1997 1998 1999 2000 2001 2002 2003 2004 2005 2006 2007 2008 2009 2010
20
40
60
80
100
120
160
140
0
as Bt maize in Brazil which opens up significant additional potential hectarage globally for biotech crops; two of the three new countries reported significant hectarage – Pakistan with 600,000 farmers planting 2.4 million hectares of Bt cotton and Myanmar with 375,000 farmers planting 270,000 hectares of Bt cotton; continuing growth in stacked traits in cotton and maize, increasingly deployed by 11 countries worldwide; and new second generation events being deployed that further enhance the benefits of first generation events. This new wave of adoption is providing a seamless interface with the first wave of adoption, resulting in continued and broad-based strong and stable growth in global hectarage of biotech crops. Notably in 2010, the accumulated hectarage (planted since 1996) surged and broke through the 1billionth hectare barrier for the first time to register an important milestone in the adoption of biotech crops globally. In 2010, developing countries continued to out-number industrial countries by 19 to 10, and closed the gap with industrial countries to only 4%, from 8% last year. This trend is expected to continue in the future with 40 countries, or more, expected to adopt biotech crops by 2015, the end of the second decade of commercialization. By coincidence, 2015 also happens to be the Millennium Development Goals year, when global society has pledged to cut poverty and hunger in half – a vital humanitarian goal that biotech crops can contribute to, in

Global status of Commercialized biotech/GM Crops: 2010
9
an appropriate and significant way in developing countries. The MDG provides global society and the scientific community with a one-time opportunity to urgently set explicit humanitarian goals, more specifically the imperative priority of food security and reducing hunger and poverty by 50% by 2015, to which biotech crops can make a significant contribution.
Brazil, reported, by far, the largest absolute increase in biotech crops in 2010 at 4 million hectares, followed by the USA at 2.8 million hectares. The two largest proportional increases in 2010 were Australia at 184% increase and Burkina Faso at 126%. The broad increases across countries in 2010 are robust and provide a solid foundation for future growth.
In summary, during the first fifteen years of commercialization 1996 to 2010, for the first time ever, an accumulated total of more than 1 billion hectares, equivalent to over 2.7 billion acres of biotech crops, have been successfully grown as a result of approximately 100 million repeat independent decisions by farmers to plant biotech crops (Table 1 and Figure 2). Farmers have signaled their strong vote of confidence in crop biotechnology by consistently increasing their plantings of biotech crops by high growth rates every single year since biotech crops were first commercialized in 1996, with the number of biotech countries more than quadrupling from 6 to 29 in the same 15-year period. However, even the significant hectarage of 148 million hectares does not fully capture the biotech crop hectarage planted with stacked traits, which are masked when biotech crop hectarage is expressed simply as biotech hectares rather than biotech “trait hectares”. Taking into account that approximately 22% of the 148 million hectares had two or three traits (planted primarily in the USA, but also increasingly in ten other countries, Argentina, Canada, South Africa, Australia, the Philippines, Brazil, Mexico, Colombia, Honduras, and Chile), the global area of biotech crops in 2010 expressed as “trait hectares” was 205 million compared with 180 million “trait hectares” in 2009. Thus, the real growth rate measured in “trait hectares” between 2009 (180 million) and 2010 (205 million) was 14% or 25 million hectares compared with the apparent growth rate of 10% or 14 million hectares when measured conservatively in hectares between 2009 (134 million hectares) and 2010 (148 million hectares).
distribution of biotech Crops in industrial and developing Countries
Figure 3 shows the relative hectarage of biotech crops in industrial and developing countries during the period 1996 to 2010. It clearly illustrates that whereas the substantial but consistently declining share (52% in 2010 compared with 54% in 2009, 56% in 2008, 57% in 2007 and 60% in 2006) of biotech crops continued to be grown in industrial countries in 2010, the proportion of biotech crops grown in developing countries has increased consistently every single year from 14% in 1997, to 16% in 1998, to 18% in 1999, 24% in 2000, 26% in 2001, 27% in 2002, 30% in 2003, 34%

Global status of Commercialized biotech/GM Crops: 2010
10
table 2. Global area of biotech Crops, 2009 and 2010: industrial and developing Countries (Million hectares)
2009 % 2010 % +/- %
Industrial countries 72.5 54 76.3 52 3.8 +5
Developing countries 61.5 46 71.7 48 10.2 +17
total 134.0 100 148.0 100 14.0 +10
Source: Clive James, 2010.
figure 3. Global area of biotech Crops, 1996 to 2010: industrial and developing Countries (Million hectares)
Source: Clive James, 2010.
1996 1997 1998 1999 2000 2001 2002 2003 2004 2005 20082006 20092007 2010
20
40
60
80
100
160
120
140
0
Total
Industrial
Developing
Mill
ion
Hec
tare
s

Global status of Commercialized biotech/GM Crops: 2010
11
in 2004, 38% in 2005, 40% in 2006, 43% in 2007, 44% in 2008, 46% in 2009 and 48% in 2010. Thus, in 2010, almost half of the global biotech crop area of 148 million hectares, equivalent to 71.7 million hectares, was grown in 19 developing countries where growth continued to be strong, compared with the 10 industrial countries growing biotech crops (Table 2). It is noteworthy that in 2010, with the exception of Australia (184% growth) all the countries that exhibited proportional growth of 10% or more in biotech crop area were developing countries; they were in descending order of percentage growth: Burkina Faso (126% increase), Brazil (19%), Paraguay (18%), India (12%), Bolivia (12%), and Philippines (10%) (Table 3). As in the past, in 2010, percent growth in biotech crop area continued to be significantly stronger in the developing countries (17% and 10.2 million hectares) than industrial countries (5% and 3.8 million hectares). Thus, generally, year-on-year growth whether measured in absolute hectares or by percent, was significantly higher in developing countries than industrial countries between 2009 and 2010. The strong trend for higher growth in developing countries versus industrial countries is highly likely to continue in the near, mid and long-term, as more countries from the South adopt biotech crops and crops like rice, 90% of which is grown in developing countries, are deployed as new biotech crops.
Of the US$64.6 billion additional gain in farmer income generated by biotech crops in the first 14 years of commercialization (1996 to 2009), it is noteworthy that slightly more than half, US$32.9 billion, was generated in industrial countries and the balance of just less than half, US$31.7 billion, in developing countries. However, in 2009, developing countries had a slightly larger share, 53% equivalent to US$5.7 billion of the total US$10.7 billion gain, with industrial countries slightly less at 47% or US$5.0 billion (Brookes and Barfoot, 2011, forthcoming). The slightly larger share for developing countries in 2009 reflects the higher growth rates in developing countries in more recent years which is expected to continue in the future.
distribution of biotech Crops, by Country
There was an increase of two, Pakistan and Uruguay in the number of countries which grew biotech crops on 1 million hectares, or more, in 2010 bringing the total to a historical milestone of 10 for the first time. Pakistan, Myanmar and Sweden grew biotech crops for the first time and Germany resumed planting. The top ten countries each of which grew over 1 million hectares in 2010 are listed by hectarage in Table 3 and Figure 4, led by the USA which grew 66.8 million hectares (45% of global total), Brazil with 25.4 million hectares (17%), Argentina with 22.9 million hectares (16%), India with 9.4 million hectares (6%), Canada with 8.8 million hectares (6%), China with 3.5 million hectares (2%), Paraguay with 2.6 million hectares (2%), Pakistan 2.4 (2%), South Africa 2.2 million hectares (2%) and Uruguay with 1.1 million hectares or 1% of global biotech hectarage. An additional 19 countries grew a total of approximately 3.0 million hectares in 2010 (Table 3

Global status of Commercialized biotech/GM Crops: 2010
12
table 3. Global area of biotech Crops in 2009 and 2010: by Country (Million hectares)
Country 2009 % 2010 % +/- %
1 USA* 64.0 48 66.8 45 +2.8 +4
2 Brazil* 21.4 16 25.4 17 +4.0 +19
3 Argentina* 21.3 16 22.9 16 +1.6 +8
4 India* 8.4 6 9.4 6 +1.0 +12
5 Canada* 8.2 6 8.8 6 +0.6 +7
6 China* 3.7 3 3.5 2 -0.2 -5
7 Paraguay* 2.2 2 2.6 2 +0.4 +18
8 Pakistan * – – – – 2.4 2 +2.4 – –
9 South Africa* 2.1 2 2.2 2 +0.1 +5
10 Uruguay* 0.8 <1 1.1 1 +0.3 +38
11 Bolivia* 0.8 <1 0.9 1 +0.1 +12
12 Australia* 0.2 <1 0.7 <1 +0.5 +184**
13 Philippines* 0.5 <1 0.5 <1 +0.0 +10**
14 Myanmar* – – 0.3 <1 +0.3 – –
15 Burkina Faso* 0.1 <1 0.3 <1 +0.2 +126**
16 Spain* 0.1 <1 0.1 <1 <0.1 – –
17 Mexico* 0.1 <1 0.1 <1 <0.1 – –
18 Colombia <0.1 <1 <0.1 <1 <0.1 – –
19 Chile <0.1 <1 <0.1 <1 <0.1 – –
20 Honduras <0.1 <1 <0.1 <1 <0.1 – –
21 Portugal <0.1 <1 <0.1 <1 <0.1 – –
22 Czech Republic <0.1 <1 <0.1 <1 <0.1
23 Poland <0.1 <1 <0.1 <1 <0.1 – –
24 Egypt <0.1 <1 <0.1 <1 <0.1 – –
25 Slovakia <0.1 <1 <0.1 <1 <0.1 – –
26 Costa Rica <0.1 <1 <0.1 <1 <0.1 – –
27 Romania <0.1 <1 <0.1 <1 <0.1
28 Sweden – – – – <0.1 <1 <0.1 – –
29 Germany – – – – <0.1 <1 <0.1 – –
total 134.0 100 148.0 100 14.0 +10
*biotech mega-countries growing 50,000 hectares, or more.
Source: Clive James, 2010.**Based on actual hectarage increases.

Global status of Commercialized biotech/GM Crops: 2010
13
biotech Mega-Countries
50,000 hectares, or more
USABrazil*Argentina*India*CanadaChina*Paraguay*Pakistan*South Africa*Uruguay*Bolivia*AustraliaPhilippines*Myanmar*Burkina Faso*SpainMexico*
66.8 million25.4 million22.9 million
9.4 million8.8 million3.5 million2.6 million2.4 million2.2 million1.1 million0.9 million0.7 million0.5 million0.3 million0.3 million0.1 million0.1 million
less than 50,000 hectaresColombia*Chile*Honduras*PortugalCzech RepublicPoland
Egypt*SlovakiaCosta Rica*RomaniaSwedenGermany
* Developing countries
source: Clive James, 2010.
Million hectares
top 10 countriesgrowing 1 millionhectares, or more in 2010
figure 4. Global area (Million hectares) of biotech Crops, 1996 to 2010, by Country, and Mega-Countries, and for the top ten Countries
10%
Increase over 2009 29 countries which have adopted biotech crops
in 2010, global area of biotech crops was 148 million hectares, representing an increase of 10% over 2009, equivalent to14 million hectares.
source: Clive James, 2010.

Global status of Commercialized biotech/GM Crops: 2010
14
and Figure 4). It should be noted that of the top ten countries, each growing 1.0 million hectares or more of biotech crops, the majority (8 out of 10) are developing countries, Brazil, Argentina, India, China, Paraguay, Pakistan, South Africa, and Uruguay compared with only two industrial countries, USA and Canada. The number of biotech mega-countries (countries which grew 50,000 hectares, or more, of biotech crops) increased to 17 compared with 15 in 2009 with Pakistan and Uruguay being added to the list of mega-countries; two of the three African countries (South Africa and Burkina Faso) are already mega-countries, with Burkina Faso qualifying in only the second year of commercialization. Notably, 13 of the 17 mega-countries are developing countries from Latin America, Asia and Africa. The high proportion of biotech mega-countries in 2010, 17 out of 29, equivalent to almost 60%, reflects the significant broadening, deepening and stabilizing in biotech crop adoption that has occurred within the group of more progressive mega-countries adopting more than 50,000 hectares of biotech crops, on all six continents in the last 15 years.
It is noteworthy that in 2010, Australia had the highest growth rate (184%) followed by Burkina Faso (126%) between 2009 and 2010 and that Brazil had the highest absolute growth of biotech crops (4.0 million hectares) followed by the USA (2.8 million hectares).
In the first twelve years of commercialization of biotech crops, 1996 to 2007, South Africa was the only country on the continent of Africa to commercialize biotech crops, and Africa is recognized as the continent that represents by far the biggest challenge in terms of adoption and acceptance. Accordingly, the decision in 2008 of Burkina Faso to grow Bt cotton and for Egypt to commercialize Bt maize for the first time was of strategic importance for the African continent. For the first time in 2008, there was a lead country commercializing biotech crops in each of the three major regions of the continent – South Africa in southern and eastern Africa, Burkina Faso in West Africa and Egypt in North Africa. This broader geographical coverage in Africa is of strategic importance because it allows more Africans to become practitioners of biotech crops and be able to benefit directly from “learning by doing”, which has proven to be very important in China and India. Growth was reported in all three African countries in 2010 with Burkina Faso recording the second highest percentage growth (+126%) of any country in the world. South Africa also recorded a significant increase of 5% in 2010, as well as Egypt increasing its hectarage from a modest 1,000 hectares to 2,000 hectares. China was the only country to report a significant decrease in biotech crop area in 2010. The lower plantings of Bt cotton in China was entirely the result of decreased total plantings of cotton, with percentage adoption increasing marginally by 1%. The decrease in total cotton hectarage in China is probably due to a higher priority being assigned to the more strategic hectarage of domestic food and feed crops, a trend that is likely to continue.
It is noteworthy that there are now 10 countries in Latin America which benefit from the extensive adoption of biotech crops; they are, listed in descending order of hectarage: Brazil, Argentina,

Global status of Commercialized biotech/GM Crops: 2010
15
Paraguay, Uruguay, Bolivia, Mexico, Colombia, Chile, Honduras and Costa Rica. It is also noteworthy that Japan grew, for the second year, a commercial biotech flower, the “blue rose” in 2010. The rose was grown under partially covered conditions and not in “open field” conditions like the other food, feed and fiber biotech crops grown in other countries listed in this Brief. Australia and Colombia also grow biotech carnations.
In 2010, a record eight EU countries, Spain, Portugal, Czech Republic, Poland, Slovakia, Romania Sweden and Germany grew either Bt maize or the “Amflora” potato, newly approved by the EU. Spain, the EU country that grew more than 80% of all the Bt maize in the EU (which was ~91,000 hectares), marginally increased its absolute and percent adoption of Bt maize in 2010.
Seven countries reported significant increases in absolute area of biotech crops of 0.5 million hectares or more, between 2009 and 2010: they were Brazil with 4.0 million hectares, USA with a 2.8 million hectare increase, Pakistan 2.4 million, Argentina 1.6 million, India 1.0 million, Canada 0.6 million and Australia with 0.5 million hectares.
Based on proportional year-to-year annual growth in biotech crop area, two countries merit mention Australia with 184% increase and Burkina Faso with 126% increase.
The six principal countries that have gained the most economically (over US$1 billion) from biotech crops, during the first 14 years of commercialization of biotech crops, 1996 to 2009 are, in descending order of magnitude, the USA (US$29.8 billion), Argentina (US$10.3 billion), China (US$9.3 billion), India (US$7.0 billion), Brazil (US$3.5 billion), Canada (US$2.6 billion), and others (US$2.1 billion) for a total of US$64.6 billion; US$31.7 billion for developing countries and US$32.9 billion for industrial countries (Brookes and Barfoot, 2011, forthcoming).
In 2009 alone, economic benefits globally were US$10.7 billion of which US$5.7 billion was for developing and US$5.0 billion was for industrial countries. The six countries that gained the most economically from biotech crops in 2009 were , in descending order of magnitude, the USA (US$4.5 billion), India (US$1.9 billion), China (US$1.7 billion), Argentina US$1.1 billion, Brazil (US$0.7 billion), and Canada (US$0.4 billion), and others (US$0.4 billion) for a total of US$10.7 billion in 2009.
The 29 countries that grew biotech crops in 2010 are listed in descending order of their biotech crop areas in Table 3. There were 19 developing countries, and 10 industrial countries. In 2010, biotech crops were grown commercially in all six continents of the world – North America, Latin America, Asia, Oceania, Europe (Eastern and Western), and Africa. The top ten countries, each growing 1.0 million hectares, or more, of biotech crops in 2010, are listed in order of crop biotech hectarage in

Global status of Commercialized biotech/GM Crops: 2010
16
Table 3. These top 10 biotech countries accounted for approximately 98% of the global biotech crop hectarage with the balance of 2% growing in the other 19 countries listed in decreasing order of biotech crop hectarage – Bolivia, Australia, Philippines, Myanmar, Burkina Faso, Mexico, Spain, Mexico, Colombia, Chile, Honduras, Portugal, Czech Republic, Poland, Egypt, Slovakia, Costa Rica, Romania, Sweden and Germany. The individual country reports in the body of the Brief provide a more detailed analysis of the biotech crop situation in each of the 29 biotech crop countries, with more detail provided for the 17 mega-biotech countries growing 50,000 hectares, or more, of biotech crops.
USA
in 2010, the usa continued to be the largest producer of biotech crops in the world with a global market share of 45% and gained us$4.5 billion in farm income. in 2010, the usa planted a record hectarage of 66.8 million hectares of biotech maize, soybean, cotton, canola, sugarbeets, alfalfa, papaya and squash, up from the 64.0 million hectares in 2009, and equivalent to a year-on-year growth rate of 4.4%. the increase in biotech crop hectarage of 2.8 million hectares between 2009 and 2010 was the second largest, after brazil, for any country in the world. the usa also leads the way in the deployment of stacked traits in maize and cotton which offer farmers multiple and significant benefits. in 2010, the usa benefited from a third season of commercializing biotech rr®sugarbeets which again occupied ~450,000 hectares equivalent to a 95% adoption, in only its fourth year of commercialization; this makes rr®sugarbeets the fastest ever adopted biotech crop. When this brief went to press, the legal situation regarding the production of seed for 2012 was still uncertain. the adoption rates for the principal biotech crops in the usa for soybean, maize, cotton, canola and sugarbeets are close to optimal and further significant increases will be achieved only through stacking of multiple traits in the same crop or the introduction of new biotech crops and/or traits. a us study on the economic benefits of bt maize reported that area-wide suppression of the european Corn borer pest in both bt maize and non-bt maize crops resulted in a gain for farmers of us$6.9 billion over the 14 year period 1996 to 2009. importantly, the indirect benefit associated with non-bt maize (us$4.3 billion) was 62 percent, greater than the direct benefit of us$2.6 billion from planting bt maize.
The USA is one of the six “founder biotech crop countries”, having commercialized biotech maize, soybean, cotton and potato in 1996, the first year of global commercialization of biotech crops. The USA continued to be the lead biotech country in 2010 with continued growth particularly

Global status of Commercialized biotech/GM Crops: 2010
17
in terms of biotech maize in which stacked traits continued to be an important feature. USDA estimates (USDA NASS, 2010) indicate that the three principal biotech crops all continued to increase – soybean was 93% biotech, up from 91% in 2009, upland cotton 93%, up from 88% in 2009, and maize 86%, up from 85% in 2009. The total hectarage planted to biotech maize, soybean, cotton, canola, sugarbeets, alfalfa, papaya and squash was 66.8 million hectares, up 2.8 million hectares or 4.4% from the 64.0 million hectares planted in 2009. With the exception of Brazil, the 2.8 million hectare increase in the USA in 2010 was the largest increase in absolute terms, for any country, despite the fact that percent adoption of all biotech crops in the USA are now close to optimal levels in the three principal major biotech crops of soybean, maize and cotton but also in other biotech crops – 96% for biotech sugarbeets and 88% for canola.
Total plantings of maize in the USA in 2010 were 35.6 million hectares, up slightly from 2009 (NASS USDA Crop, 2010) but down significantly from the 37.9 million hectares in 2007. Biotech maize continued to be attractive in the USA in 2010 because of continued demand for feed, ethanol and strong export sales. Total plantings of soybean at 31.6 million hectares in 2010, up from 31.4 million hectares in 2009, was the highest ever.
Total plantings of upland cotton at 4.3 million hectares in 2010, compared with only 3.5 million hectares for 2009, were up significantly and associated with historically record high prices of cotton. Thus, after consecutive annual decreases for several years, upland cotton in 2010 was at a high.
usa
Population: 308.8 million
GDP: US$14,093 billion
GDP per Capita: US$46,350
Agriculture as % GDP: 1%
Agricultural GDP: US$140.9 billion
% employed in agriculture: 2%
Arable Land (AL): 178 million hectares
Ratio of AL/Population*: 2.4
Major crops: • Maize • Soybean • Cotton • Sugarcane • Sugarbeet • Alfalfa • Wheat • Canola
Commercialized Biotech Crops:• HT/Bt/HT-Bt Maize • HT Soybean • HT Canola • Bt/HT/Bt-HT Cotton •VR Squash • VR Papaya • Bt/HT Potato • Sugarbeet • HT Alfalfa
Total area under biotech crops and (%) increase in 2010: 66.8 Million Hectares (+4%)
Farm income gain from biotech, 1996-2009: $29.8 billion
*Ratio: % global arable land / % global population
Source: The Economist, supplemented with Data from the World Bank, FAO and UNCTAD when necessary.

Global status of Commercialized biotech/GM Crops: 2010
18
Canola hectarage in the USA was 616,000 hectares, up significantly from 335,000 hectares in 2009, and up over 80% from 2009. The major canola state of North Dakota planted 460,000 hectares in 2010, up 84% from 2009, when hectarage was only 295,000. Total hectarage of sugarbeets in 2010 was similar at 473,684 hectares. Estimates of alfalfa seedings for 2010, will not be available from USDA until the first quarter of 2011, but they are not likely to be very different from 2009 seedings at approximately 1.3 million hectares – this includes alfalfa harvested as hay and alfalfa haylage and green chop. Alfalfa is planted as a forage crop and grazed or harvested and fed to animals.
In 2010, the USA continued to grow more biotech crops (66.8 million hectares) than any other country in the world, equivalent to 45% of global biotech crop hectarage. In 2010, the gain was 2.8 million hectares of biotech crops, equivalent to a ~4% growth rate. This is consistent with steady increases in the percentage adoption for the major crops which is now close to optimal with biotech soybean and cotton at 93% adoption, maize at 86% adoption, canola at 88% and sugarbeet at 95%.
Adoption of biotech maize continued to climb with strong growth in the stacked traits, particularly in the triple stacks. However, the growth of 2.8 million hectares for all biotech crops in 2010 does not fully measure the “real” as opposed to “apparent” increase in biotech crop hectarage planted. The double stacked traits in maize and cotton and the triple stacked traits in maize, are masked when biotech crop hectarage is expressed simply as biotech “hectares” rather than biotech “trait hectares” – the same concept as expressing air travel as “passenger miles” rather than “miles.” Thus, of the 66.8 million hectares of biotech crops planted in the USA in 2010, approximately 27 million hectares, (26.7 million in 2010) equivalent to 41%, slightly more than 2009, had either two or three stacked traits.
The two-trait stacked products include biotech maize and cotton crops with two different insect resistant genes (for European corn borer and corn root worm control in maize) or two stacked traits for insect resistance and herbicide tolerance in the same variety in both maize and cotton. The maize stacked products with three traits feature two traits for insect control and one for herbicide tolerance. Accordingly, the adjusted “trait hectares” total for the USA in 2010 was approximately 119 million hectares (up from 108 million hectares in 2009) compared with only 66.8 million “hectares” of biotech crops. Thus, the apparent year-to-year growth for biotech crops in the USA in 2010, based on hectares is 4.4%, an increase from 64.0 million hectares to 66.8 million hectares. However, the “real” growth rate for biotech crops in the USA in 2010 is 10%, more than twice the hectare growth rate of 4.4%; this difference is due to the number of “trait hectares” increasing from 108 million hectares in 2009 by 11 million hectares (as opposed to 2.8 million in hectare growth), to approximately 119 million “trait hectares” in 2010. Furthermore, within the stacked traits category in maize, there are both double and triple stacks, and in 2010, the highest growth in the USA in 2010 was in the triple stacks.

Global status of Commercialized biotech/GM Crops: 2010
19
Given that the USA has proportionally much more stacked traits than any other country, the masking effect leading to apparent lower adoption affects the USA more than other countries. It is noteworthy that 11 countries (equivalent to 41% of all 29 biotech countries) deployed stacked traits in either maize or cotton in 2010 with 8 out of the 11 being developing countries. In addition to the USA, the other ten countries which deployed stacked traits in 2010 were in descending order of hectarage: Argentina, Canada, South Africa, Australia, the Philippines, Brazil, Mexico, Chile, Honduras, and Colombia, albeit at much lower proportions than the USA, but this is a trend that will increasingly affect other countries. In 2010, the total stacked trait hectarage in the other ten countries was approximately 5 million hectares. In 2010, the global “trait hectares” was 205 million hectares compared with only approximately 180 million hectares in 2009, equivalent to a growth rate of 14%. Thus, the apparent growth of +10%, or 14 million hectares, based on an increase from 134 million hectares in 2009 to 148 million hectares in 2010, underestimates the real growth of 14% or 25 million hectares based on the growth in “trait hectares” from 180 million “trait hectares” in 2009 to 205 million “trait hectares” in 2010. Thus, in summary on a global basis “apparent growth” in biotech crops between 2009 and 2010, measured in hectares, was 10% or 14 million hectares, whereas the real growth measure in “trait hectares” was approximately 14% or 25 million trait hectares.
The big increases in US biotech crops were approximately the same for maize, soybean and cotton at over three-quarters of 1 million for each of the three crops. In 2010, the area of biotech soybean and cotton, 31.4 million hectares and 3.9 million hectares respectively, had similar and the highest adoptions rate at 93%, the highest ever; this compared with an increased adoption rates of 86% in maize in 2010. Of the 3.9 million hectares of upland biotech cotton in the USA in 2010, 2.1 million or 67% was occupied by the stacked traits of Bt and herbicide tolerance, 30% were herbicide tolerance, and 3% with a single Bt trait. Total canola plantings in the USA were over 616,000 hectares with 88% and 95% planted to herbicide tolerant biotech canola and sugarbeet, respectively.
Sugarbeets growers have always faced significant challenges in weed management. In 2006, a small hectarage of a ‘new’ and important biotech crop was planted for the first time in the USA. Roundup Ready [RR®] herbicide tolerant sugarbeets was first planted in 2006 to evaluate the new technology and to sell the sugar, pulp and molasses into the market place. In 2007, another small hectarage was planted but because of very limited biotech seed availability, only one sugarbeets company was able to transition to Roundup Ready (RR®). With greater amounts of seed production, it was estimated that in 2008, 59% of the 437,246 hectares of sugarbeets planted in the USA, equivalent to 257,975 hectares were RR®sugarbeets. Farmers welcomed the commercialization of sugarbeets and were very pleased with the biotech product, which provided superior weed control, and was more cost-effective and easier to cultivate than conventional sugarbeets. Farmers cited many advantages of RR®sugarbeets over conventional including: the number of required cultivations cut by half, with

Global status of Commercialized biotech/GM Crops: 2010
20
30% savings in fuel; significant labor savings including elimination of supplementary hand weeding and labor time; less soil compaction; provides an incentive and facilitates adoption of minimum or no till; number of herbicide applications decreased as well as the convenience of reliance on fewer types of herbicides; less crop damage from herbicide applications; and generally more profitable and convenient to cultivate than conventional sugarbeets. In 2008, growers became convinced of the value of RR®sugarbeets and were keen to support the development of other traits, which they know to be important including disease, insect and nematode resistance, and drought and cold tolerance. Herbicide tolerant RR®sugarbeets were quickly and widely adopted by growers in the USA and Canada in 2009. For the first time in 2009, adequate supplies of many seed varieties were finally available for farmers. An estimated 95% of ~485,000 hectares of sugarbeets planted in the USA in 2009 were devoted to varieties improved through biotechnology. Canadian growers planted approximately 15,000 hectares of biotech varieties in 2009, representing nearly 96% of their nation’s sugarbeets crop. This was the second year of commercial planting in Eastern Canada and the first year of commercial production in Western Canada. This very high adoption rate of 95% in four years makes RR®sugarbeets the fastest ever adopted biotech crop since biotech crops were first commercialized in 1996, fourteen years ago. Given the unqualified success of RR®sugarbeets, the estimated hectares of RR®sugarbeets in the US and Canada in 2010 was the same as for 2009 viz; in 2010, the USA had a 95% adoption for RR®sugarbeets equivalent to 485,000 hectares and similarly, Canada had a 95% adoption equivalent to 15,000 hectares.
Independent scientific analysis shows that the sugar derived from RR®sugarbeets is identical at the molecular level to sugar from other comparably grown sugarbeets, and to the sugar from sugarcane. It is important to note that the sugar from RR®sugarbeets does not contain any DNA from the biotech transformation process, so the sugar is the same as the sugar produced from conventional sugarbeets and accordingly does not require labeling in the USA and in foreign markets like Japan. Since the USA is one of the largest importers of sugar in the world, most of the sugar and by-products from sugarbeets production are consumed domestically. However, the sugar, pulp and molasses derived from the RR®sugarbeets have been approved in all the major export markets including Japan, Canada, Mexico and the European Union, as well as South Korea, Australia, New Zealand, Colombia, Russia, China, Singapore and the Philippines.
Adoption of RR®sugarbeets by processors, and the consumers understanding and acceptance that the “sugar is the same” pure and natural sweetener as it has always been, has important implications regarding acceptance of biotech sugarbeets in other countries including the EU, and more generally by developing countries which grow sugarcane for food and ethanol production, such as Brazil.

Global status of Commercialized biotech/GM Crops: 2010
21
In September 2009, a California court ruled that the U.S. Department of Agriculture (USDA) did not adequately study RR®sugarbeets’ environmental risks when it allowed the commercialization of RR®sugarbeets in the US and ordered the USDA to conduct a more intensive study which was pending when this Brief went to Press. It should be noted that the court’s decision did not question the safety or efficacy of RR®sugarbeets.
On August 13, 2010, the same court once again regulated RR®sugarbeets, however, the 2010 crop could be harvested processed and sold. The U.S. Department of Agriculture is in the process of reviewing options for a partial or conditional deregulation for planting in 2011. A decision by USDA was not expected to come until year-end 2010 at the earliest. When this Brief went to press the legal situation regarding the production of seed for 2012 was still being contested and hence uncertain.
The very high level of satisfaction and demand by US and Canadian farmers for RR®sugarbeets launch probably has implications for sugarcane, (80% of global sugar production is from cane) for which biotech traits are under development in several countries and approval for field trials was granted in Australia in October 2009. Sugarcane crops, improved through biotechnology, have not yet been commercialized. However, significant research is actively under way in Australia, Brazil, Colombia, Mauritius and South Africa, as well as the United States. Traits under study in cane include herbicide tolerance, pest resistance, disease resistance, and drought, cold and salt tolerance.
Luther Markwart, executive vice president of the American Sugarbeets Association, said “Biotech sugarbeets seeds arrived just in time to save a struggling industry that is essential to our nation’s food security. Sugar from sugarbeets currently provides about half of the nation’s sugar consumption. Our industry leaders have spent over 10 years to develop, approve, adopt and transition our U.S. production to this important technology. Growers simply said if our industry is going to survive, we’ve got to have these kinds of tools. Roundup Ready beet seeds are saving producers money and making the crop much easier to manage. Weeds are our biggest problem. Typically, with conventional beets you have to use four to five applications of a combination of various herbicides. Now farmers are using fewer chemicals and less fuel, and Roundup Ready doesn’t stress the beets” (Murphy, 2008; Porter, 2009).
There was no reported change in the RR®alfalfa hectarage of ~100,000 hectares between 2009 and 2010 pending final resolution of a San Francisco federal judge suspension which was ostensibly lifted on 21 June 2010 by the US Supreme Court. The complex background is as follows: Herbicide tolerant RR®alfalfa was approved for commercialization in the USA in June 2005. The first pre-commercial plantings (20,000 hectares) were sown in the fall of 2005, followed by larger commercial plantings (40,000 hectares) in the spring of 2006. Another planting of 20,000 hectares in the fall of 2006 resulted in a total of 80,000 hectares seeded in the 2006 launch of RR®alfalfa in the USA.

Global status of Commercialized biotech/GM Crops: 2010
22
Whereas there is approximately 11 million hectares of the perennial alfalfa crop in the USA, only 1.3 million hectares were probably seeded in 2006. Thus, the 60,000 to 80,000 hectares of RR®alfalfa represent approximately 5% of all the alfalfa seeded in 2006.
RR®alfalfa was very well received by farmers in the USA with all available seed sold in 2006 and demand was expected to grow over time. Benefits include improved and more convenient weed control resulting in significant increases in quantity and quality of forage alfalfa as well as the crop and feed safety advantages that the product offers. Gene flow has been studied and 300 meters provide adequate isolation between conventional and biotech alfalfa and 500 meters for seed crops. RR®alfalfa plants were first produced in 1997 and field trials were initiated in 1999, followed with multiple location trials to determine the best performing varieties. Import approvals have already been secured for RR®alfalfa in major US export markets for alfalfa hay including Mexico, Canada, Japan, the Philippines and Australia, and pending in South Korea – these countries represent greater than 90% of the US alfalfa hay export market. Japan is the major market for alfalfa hay exports, mainly from California and the west coast states. The USA is a major producer of alfalfa hay which occupies approximately 9 million hectares with an average yield of 7.59 metric tons per hectare of dry hay valued at US$105 per ton, worth US$7 billion per year. In addition, there is approximately 2 million hectares of alfalfa used for haylage/green chop with a yield of approximately 14.19 metric tons per hectare. The crop is sown in both the spring and the fall, with 1 to 4 cuttings per season, depending on location. Over 90% of the alfalfa in the USA is used for animal feed with about 7% used as sprouts for human consumption. Monsanto developed the biotech alfalfa in partnership with Forage Genetics International. RR®alfalfa is likely to be more of a niche biotech crop product than the other large-scale applications to the current major row crops of soybean, maize and cotton.
A Council for Agricultural Science and Technology (CAST, UC Davis News and Information, 2008) report in the USA concluded that, “We now have enough scientific data to design strategies for preventing gene flow from genetically engineered to conventional or organic alfalfa hay and seed operations.” This important finding from CAST provided factual evidence for USDA to complete its environmental impact study for submission to lift the court order on planting of RR®alfalfa, however a court judgment still upheld the original decision to halt planting.
In 2009, Monsanto filed a petition requesting the U.S. Supreme Court to review a federal appeals court’s decision to block the cultivation of the company’s RR®alfalfa until the USDA completes its environmental assessment (Tomich, 2009). Monsanto said that, “We have asked the U.S. Supreme Court to review the case because we believe the lower courts were wrong to impose a ban on planting Roundup Ready alfalfa while the U.S. Department of Agriculture conducts additional environmental reviews.” Monsanto added that the law is clear that courts should only take this drastic action when it is likely that irreparable harm will result. “Yet, there is no evidence

Global status of Commercialized biotech/GM Crops: 2010
23
of any harm resulting from Roundup Ready alfalfa, and the trial court failed to consider relevant scientific evidence in reaching its decision to ban planting. Roundup Ready alfalfa meets the needs of farmers for dependable, cost-effective control of weeds in alfalfa and reduces herbicide applications with a system that has a 30-year history of safe use.” Monsanto said that “The appellate court upheld the lower court’s injunction even after a 2008 Supreme Court decision that reinforced the importance of considering relevant scientific evidence and, they looked forward to successful completion of the additional environmental review ordered by the court, but hoped the Supreme Court would agree that it was wrong to make farmers wait for years to get the benefit of a safe and effective product.”
On 2 June 2010, the U.S. Supreme Court overturned the earlier federal judge’s ban on the planting of alfalfa seeds tolerant to glyphosate (Stohr, 2010). The 7-1 ruling shifted the onus to APHIS/USDA which under the Supreme Court ruling can allow limited planting; this was a temporary measure that would allow USDA to complete the environmental impact statement that ultimately would allow unrestricted planting. The Supreme Court ruled that the federal judge in San Francisco overreacted in placing nationwide ban on glyphosate tolerant alfalfa because of the possibility of gene flow to conventional alfalfa crops. In December 2010, USDA announced that EPA will post a final Environmental Impact Study (EIS) on Roundup Ready alfalfa for public review in the Federal Register on December 23, 2010. A copy of the EIS provided to EPA can be reviewed at http://www.aphis.usda.gov/biotechnology/downloads/alfalfa/gt_alfalfa%20_feis.pdf. There is some speculation and concern in the farming community that USDA in its quest to find a compromise between the opposing parties, might over-regulate isolation distances which would place impractical limitations on the production of RR®alfalfa seed and hay in the major alfalfa producing states of California, Idaho, Washington and Nevada. The demand for RR®alfalfa from the farming community is expected to be high, provided that regulations on isolation distances, as currently applies to isolation distances for foundation and certified seed production, are reasonable and based on practical experience and not ideology (Western Farm Press, 17 December, 2010).
In addition to the four major biotech crops, soybean, maize, cotton and canola, and the RR®alfalfa and RR®sugarbeets, small hectarages of virus resistant squash (2,000 hectares) and virus resistant papaya (2,000 hectares) continued to be grown successfully in the USA in 2010.
benefits from biotech Crops in the usa
In the most recent global study on the benefits from biotech crops, Brookes and Barfoot (2011, forthcoming) estimate that USA has enhanced farm income from biotech crops by US$29.8 billion in the first fourteen years of commercialization of biotech crops 1996 to 2009. This represents 46%

Global status of Commercialized biotech/GM Crops: 2010
24
of global benefits for the same period, and the benefits for 2009 alone are estimated at US$4.5 billion (representing 42% of global benefits in 2009). These are the largest gains for any biotech crop country.
A 2010 University of Minnesota study (Hutchinson et al, 2010) on biotech maize, resistant to European corn borer (ECB) reported that “area-wide suppression dramatically reduced the estimated US$1 billion in annual losses caused by the European Corn Borer (ECB).” Importantly, the study reported that biotech Bt maize has even benefited conventional maize. Widespread planting of biotech Bt maize throughout the Upper Midwest of the USA since the 1996 has suppressed populations of the ECB, historically one of maize’s primary pests causing losses estimated at approximately US$1 billion per year. Corn borer moths cannot discern between Bt and non-Bt maize, so the pest lays eggs in both Bt and non Bt maize fields. As soon as the eggs hatch in Bt maize, borer larvae feed and die within 24 to 48 hours. As a result, corn borer numbers have also declined in neighboring non-Bt fields by 28 percent to 73 percent in Minnesota, Illinois and Wisconsin. The study also reports similar declines of the pest in Iowa and Nebraska. The results of the study are consistent with findings of Wu et al. (2008) who also demonstrated a dramatic up to 90%, area-wide reduction of cotton bollworm in China in other host crops such as maize, soybeans and vegetables.
in the us study, the economic benefits of this area-wide pest suppression was estimated at us$6.9 billion over the 14 year period 1996 to 2009 for the 5-state region, comprising Minnesota, illinois and Wisconsin, iowa and Nebraska. of the us$6.9 billion, it is noteworthy that non-bt corn hectares accounted for us$4.3 billion (62 percent, or almost two-thirds, of the total benefit). The principal benefit of Bt maize is due to reduced yield losses, resulting from the deployment of Bt maize for which farmers have paid Bt maize technology fees. However, what is noteworthy is that as a result of area-wide pest suppression, farmers planting non-Bt hectares also experienced yield increases without the cost of Bt technology fees; in fact non-Bt hectares benefited from more than half (62%) of the total benefits of growing Bt maize in the 5 contiguous states.
Importantly, the study, noted that “previous cost-benefit analyses focused directly on Bt maize hectares but that this study was the first in the USA to include the value of area-wide pest suppression and the subsequent indirect benefits to farmers planting conventional non-Bt maize.” The study did not consider benefits for other important Midwestern crops affected by European corn borer, such as sweet corn, potatoes and green beans, which the Wu study in China did. The authors noted “that additional environmental benefits from corn borer suppression are probably being realized, such as less insecticide use, but that these benefits have yet to be documented.”

Global status of Commercialized biotech/GM Crops: 2010
25
It is noteworthy that the suppression of European corn borer was only demonstrable in Minnesota, Illinois and Wisconsin because state entomologists have monitored pest populations for more than 45 years. Pest suppression and related yield benefits may well be occurring to both adopters and non-adopters of Bt maize in other parts of the United States and the rest of the world, but those benefits cannot be documented due to lack of historical benchmark data on pest levels. In conclusion the authors noted “that sustaining the economic and environmental benefits of Bt maize and other transgenic crops for adopters and non-adopters alike depends on the continued stewardship of these technologies. Thus, farmers, industry, and regulators need to remain committed to planting appropriate non-Bt maize refugia to minimize the risk that corn borers will develop resistance to Bt maize which has now been successfully planted on millions of hectares globally since 1996.” In summary, this important study confirms that Bt maize delivers more benefits to society than originally realized and is consistent with similar indirect benefits in China from the deployment of Bt cotton.
An independent study published by the US National Research Council (an organization related to the National US Academy of Sciences) in April 2010 (http://www.nap.edu) is entitled “The impact of genetically engineered (GE) crops on farm sustainability in the United States.” The study concluded that “many US farmers are realizing substantial economic and environmental benefits, such as lower production cost benefits, fewer pest problems, reduced use of pesticides and better yields compared with conventional crops.” Whereas the study documents the decreased use of pesticides, and that GE farmers are more likely to practice conservation tillage, it opines that the improvement in water quality might prove to be the largest single benefit associated with biotech crops. The study concluded that farmers have not been adversely affected by the proprietary terms involved in patent protected GE seed. The study also noted that biotech crops “tolerant to glyphosate could develop more weed problems as weeds evolve their own resistance to glyphosate and that herbicide crops could loose their effectiveness unless farmers also use other proven weed and insect management practices.” The study claims to be “the first comprehensive assessment of how GE crops are affecting all US farmers including those who grow conventional or organic crops.”
A study by Piggott and Marra (2007) of 2005 data in North Carolina, USA assessed the additional per hectare benefits to a farmer and to the state of North Carolina resulting from a change in policy for Bollgard®II cotton that would eliminate the required refuge. The annual benefit at the farm level was US$56.37 per hectare and US$32,202, 907 at the state level for North Carolina, when non-pecuniary benefits are not considered. When non-pecuniary benefits are considered, the farmer benefits per hectare was US$66.44 per hectare and US$37,986,449, which is an increase of US$10.07 per hectare and US$5,783,542 at the State level. The increase in value to the technology developer was US$2,427,620.

Global status of Commercialized biotech/GM Crops: 2010
26
A study by the University of Arizona (Frisvold et al. 2006) examined the impact of Bt cotton in the USA and China in 2001. The two countries increased total world cotton production by 0.7% and reduced world cotton price by US$0.31 per kg. Net global economic effects were US$838 million worldwide with consumers benefiting US$63 million. Chinese cotton farmers gained US$428 million and US farmers gained US$179 million whereas cotton farmers in the rest of the world lost US$69 million because of the reduced price of cotton.
political Will and support
senator richard lugar, one of the sponsors of the Global Security Act by the Senate, said that “the bill directs US assistance in developing local technological solutions to advance agricultural productivity in countries suffering from chronic hunger - it does not require that these solutions be genetically modified technology, but it does not preclude it where appropriate.” He also added that the bill “would mandate that US assistance be used to promote genetically modified agricultural technologies, and that US food aid would be conditioned on recipient countries approving the use of GM products” (Lugar, 2010).
In a panel of featured notable leaders and CEOs at the World Economic Forum in Davos-Klosters, Switzerland in January 29, 2010 called “Rethinking How to Feed the World,” Bill Gates was asked if he was for or against genetically modified food. Mr. Gates confirmed his support for the transgenic approach saying that, “What our foundation is doing is we’re working with partners, for example, Du Pont Pioneer on some new maize things, with Archer Daniels Midland (ADM) on some cocoa growing things. Some of these are traditional breeding and some of them are transgenic. In parallel, we are also funding scientific expertise in Africa so when, three or four years from now, there are some crops with big benefits, drought resistance, that the transgenic approach probably can do better than any other approach, each country can decide what are the benefits to them and what are the risks, what’s known about its safety, IP licensing and things that would make them hesitant, and then, you know, they’ll on their own, be able to make that decision” (Gates, 2010).
Farmer Experience
laura foell, a United Soybean Board director and a farmer from Iowa, said, “As a parent and a farmer, I chose biotechnology because I wanted my kids eating safe, nutritious foods. After all, our vegetable garden for the family’s meals is right next to our soybean fields, so it was important to reduce my farm’s pesticide use. Biotechnology cut it by half” (Foell, 2010).

Global status of Commercialized biotech/GM Crops: 2010
27
Illinois Soybean Association Chairman and Roseville Farmer ron Moore in his speech at a biotechnology conference in Chicago in 2010 said that, “the advancements in biotechnology have drastically changed the agricultural industry in the past decade, especially the seed trade. Corn and soybeans can now be genetically engineered to be herbicide resistant, insect resistant and drought resistant. Drought tolerant is big,” he said. “You can grow in more arid areas. It allows us to bring new traits to market quicker” (Moore, 2010).
BRAzIl
in 2010, brazil retained and strengthened its position as the second largest grower of biotech crops in the world. biotech crops in brazil in 2010 were estimated to occupy 25.4 million hectares; this is an increase of 4.0 million hectares, the largest absolute increase in any country in the world, for the second year running, and equivalent to a 19% increase over 2009; brazil now plants 17% of all the biotech crops in the world. the economic gains at the farm level for brazil for the seven year period 2003 to 2009 was us$3.5 billion and us$0.7 billion for 2009 alone.of the 25.4 million hectares of biotech crops grown in brazil in 2010, 17.8 million hectares were planted for the eighth consecutive year to rr®soybean, up from 16.2 million hectares in 2009 and representing a record 75% adoption rate, versus 71%
brazil
Population: 194.2 million
GDP: US$1,575 billion
GDP per Capita: US$8,210
Agriculture as % GDP: 7%
Agricultural GDP: US$110 billion
% employed in agriculture: 21%
Arable Land (AL): 59.6 million hectares
Ratio of AL/Population*: 1.3
Major crops: • Sugarcane • Soybean • Maize • Cassava • Oranges Commercialized Biotech Crops: • HT Soybean • Bt Cotton • Bt Maize
Total area under biotech crops and (%) increase in 2010: 25.4 Million Hectares (+19%)
Farm income gain from biotech, 2003-2009: US$3.5 billion
*Ratio: % global arable land / % global population

Global status of Commercialized biotech/GM Crops: 2010
28
in 2009. in addition, in 2010 brazil planted 7.3 million hectares of biotech maize for the third time in both the summer and winter seasons. the hectarage of biotech maize increased by 2.3 million hectares or almost a 50% increase over 2009, with an adoption rate of 56%; the adoption rates for summer maize were 43%, and 76% for the winter maize which also included, for the first time, stacked traits (bt/ht) in the winter maize. finally, 250,000 hectares of biotech cotton were planted for the fifth time at an adoption rate of approximately 25%. stacked gene products for herbicide tolerance and insect resistance have already been approved for all three biotech crops – cotton, maize and soybean. The future of biotech crops in brazil looks very promising with a “home-grown” virus resistant bean developed by eMbrapa, in the final stages of field testing, and a herbicide tolerant soybean developed jointly by embrapa and basf ready for commercialization in 2011. to-date, brazil has approved 27 crop events, with 8 events (4 maize, 3 soybeans and 1 cotton) expeditiously approved in 2010 alone.
The most impressive feature of Brazil’s grain production over the last 20 years, is the doubling of production to approximately 149 million tons of grain or 156% growth since 1990 while the total planted area just expanded 27% (Figure 5). This increase in productivity is the result of improved technology, better agronomic practices as well as deployment of higher yielding improved varieties and hybrids. Thus, the comparative advantage of the new, more cost-effective and highly productive
figure 5. brazilian Grain production, 1990 to 2010
Source: CONAB/Céleres, 2010. Elaboration and projections: Céleres.

Global status of Commercialized biotech/GM Crops: 2010
29
biotech crops, is very important for Brazil even though it is the only country in the world with up to 100 million hectares of new land, with water, that it can bring into production to meet its own increasing domestic need for grain as well as that of increasing export markets, particularly Asia and more specifically China. Biotech crops are especially important for Brazil because they offer an enormous new untapped potential in the remaining years of the second decade of commercialization of biotech crops, 2006 to 2015, and beyond. Failure to take full advantage of crop biotechnology would place Brazil at a significant disadvantage compared with other lead countries, such as the USA which is already aggressively expediting the deployment of second generation technology including advanced stacked traits.
From a historical perspective it is noteworthy that following two Presidential decrees in 2003 and 2004 to approve the planting of farmer-saved biotech soybean seed for the 2003/04 and 2004/05 seasons, the most important event, by far was when the Brazilian Congress passed a Biosafety Bill (Law no. 11,105) in March 2005. This Bill provided, for the first time, a legal framework to facilitate the approval and adoption of biotech crops in Brazil. The Bill allowed, for the first time, sale of commercial certified RR®soybean seed and the approved use of Bt cotton (event BC 531) as the first registered variety DP90B. The first approval of biotech maize was in 2007 but could not be deployed until 2008 because of regulatory constraints related to environmental impact assessments.
Projecting the adoption rate for biotech crops in the southern hemisphere country of Brazil has always been a challenge because crops are not planted until the last quarter of the year when the Brief is being prepared and the projections involve many factors that are unrelated to biotech crops per se. At the beginning of 2010 it seemed that Brazilian soybean farmers were going to reduce their plantings but the rebounding of prices after July 2010 resulted in them increasing their plantings compared to 2009/10. For maize, after a year of low domestic prices which led to an increase in price support, farmers decided to reduce summer maize plantings. The decrease in hectarage of summer maize was offset by a significant increase in winter maize (safrinha), the sixth consecutive year for increases in winter maize. Farmers plant winter maize in conjunction with soybean to increase their profitability. Given that cotton is planted later than both soybean and maize, cotton farmers have more flexibility to change planting intentions. One of the advantages is that they have been able to capture the benefits from the current high cotton prices in the international markets by locking into profitable multi-year future contracts. In 20004/05 cotton farmers in Brazil planted 1.2 million hectares but reduced their cotton hectarage in 2008 to 845,000 hectares due to lower international prices. For 2010/11, cotton hectarage in Brazil is projected to probably exceed one million hectares for the first time since 2004/05, and large cotton growers have been able to take advantage of high prices guaranteed in three year future contracts.
Whereas crop prices increased substantially in 2010 and are likely to reach even higher levels in 2011, production costs remained low, compared with 2009. For the third consecutive year,

Global status of Commercialized biotech/GM Crops: 2010
30
the 2010/11 crop year featured lower costs of production as the main inputs, especially fertilizer which registered a significant decrease in costs. It is noteworthy that in 2010 like 2009, the costs of production for RR®soybean was about 5% cheaper than the conventional soybean in the key selected states of Brazil (Figure 6). This scenario of significantly lower production costs, especially for biotech soybean compared with conventional, looks encouraging for 2011 and 2012, when plantings of crops in Brazil are expected to expand and adoption rates of biotech crops to increase.
According to the Brazilian External Trade Secretariat (SECEX) in 2009, China bought 15.9 million metric tons of soybeans from Brazil; exports of soybean to China represent more than 50% of total soybean exports from Brazil. The total soybean export market for Brazil in 2010 was worth US$17.6 billion, (compared with US$17.3 billion in 2009) and comprised of US$11.3 billion for soybean grain and the balance in meal and oil (Figure 7).
Brazil has several factors in its favor that will likely stimulate strong growth in the agricultural sector in the next decade. These include an enormous area of new land (up to 100 million hectares) with an adequate water supply which is critical; strong domestic and export markets for grain and oil seeds for feed, poultry and pork production; large productivity gaps in crops such as maize, cotton, and rice with entrepreneur farmers who will quickly adopt innovative technology like biotech crops, to close those gaps. The challenges are the lack of infrastructure in transportation and marketing, and the increasing dependency on Asian markets.
figure 6. soybean production Cost in brazil, 2007/08 to 2010/11
Source: Céleres, 2010. Values in BRL/hectare Estimated in October, 2010
direct production Cost - rr®soybean Direct Production Cost – Conventional Soybean

Global status of Commercialized biotech/GM Crops: 2010
31
biotech Crops approval and plantings in 2010
Compared with 2009, in 2010, more hectares of RR®soybean were planted in virtually all of the states in Brazil, with the largest plantings in Mato Grosso (4.13 million hectares) exceeding those in Rio Grande do Sul (4.12 million hectares) for the first time since the introduction of biotech soybean in Brazil. Parana and Goias ranked third and fourth, planting 3.39 and 1.74 million hectares, respectively. Given farmer options and profitability of alternate crops, total planting of soybean in Brazil in 2010/11 is projected at 23.6 million hectares in 2010. The impressive list of approved biotech crops in Brazil, as of 15 December 2010, is listed, by year in Table 4. It includes stacked traits for cotton, maize and soybean – the latter is a first for Brazil where insect resistance and herbicide tolerance are high value traits for soybeans with stacks expected to be launched in 2011. In summary, to-date Brazil has approved 27 crop events, with 8 events (4 maize, 3 soybeans and 1 cotton) expedited in 2010 alone.
It is provisionally projected that RR®soybean will occupy approximately 17.8 million hectares of the 23.6 million hectare crop in Brazil in the 2010/11 season, equivalent to an adoption rate of 75% which represents a significant growth when compared to a 71% adoption rate in 2009/10 equivalent to 16.5 million hectares, an increase of 1.3 million hectares over 2009. A total of 95 varieties were registered for sale in 2009 of which 71, equivalent to 75% were RR®soybean with the remaining 24 varieties (25%) conventional (Figure 8). In 2010, from January to November, another 53 soybean
figure 7. estimates of brazilian soybean export revenue (us$ billion), 1999 to 2010
Source: SECEX. Elaboration (e) and Projection (p): Céleres, 2010.

Global status of Commercialized biotech/GM Crops: 2010
32
table 4. biotech Crops approved for Commercial planting in brazil, 1998 to 1 december 2010
Crop trait event approval
Soybean Herbicide tolerance GTS 40-3-2 1998
Cotton Insect resistance MON531 2005
Maize Insect resistance MON810 (YieldGard) 2007
Maize Herbicide tolerance T25 2007
Cotton Herbicide tolerance LLCotton25 2008
Cotton Herbicide tolerance MON 1445 2008
Maize Insect resistance and herbicide tolerance Bt11 2008
Maize Herbicide tolerance NK603 2008
Maize Herbicide tolerance GA21 2008
Maize Insect resistance and herbicide tolerance TC 1507 (Herculex) 2008
Cotton Insect resistance and herbicide tolerance WideStrike 2009
Cotton Insect resistance Bollgard II 2009
Maize Insect resistance MIR 162 2009
Maize Insect resistance and herbicide tolerance MON810 × NK603 2009
Maize Insect resistance and herbicide tolerance Bt11 × GA21 2009
Maize Insect resistance MON 89034 2009
Maize Insect resistance and herbicide tolerance TC 1507 × NK603 2009
Cotton Insect resistance and herbicide tolerance MON531 × MON 1445 2009
Soybean Herbicide tolerance CV127 (Cultivance) 2009
Maize Insect resistance and herbicide tolerance Bt11×MIR162×GA21 2009
Maize Insect resistance and herbicide tolerance MON89034 ×NK603 2009
Soybean Herbicide tolerance A5547-127 2010
Soybean Herbicide tolerance Liberty Link 2010
Soybean Insect resistance and herbicide tolerance MON 87701 × MON 89788 (BtRR2Y)
2010
Cotton Herbicide tolerance GHB614 (Glytol) 2010
Maize Insect resistance and herbicide tolerance MON 880187 2010
Maize Insect resistance and herbicide tolerance MON 89034 ×TC1507 ×NK603
2010
Source: CTN Bio Website 1 December 2010.

Global status of Commercialized biotech/GM Crops: 2010
33
varieties were approved in Brazil of which 44 were RR®soybean or 83% of the total. Since RR®
soybean was first approved and commercialized in 2003 (approved in 1998, but commercialized only in 2003) a total of 467 new varieties have been approved of which 290 or 62% were biotech and 177 or 38% were conventional. The data for the registration of both conventional and biotech soybean varieties for the period 2000 to 2010 are detailed in Figure 8 showing more RR®soybean varieties than conventional, and this trend is expected to continue. As the number of RR®soybean varieties adapted to the Central West region of Brazil increases year by year, the adoption rate in the region is expected to increase in parallel. Notably, the first stacked soybean with insect resistance and herbicide tolerance was approved in Brazil in August, 2010 and expected to be commercialized in 2011.
Biotech cotton was first approved in Brazil in 2005 with event BCE 531 in the variety DP90B which allowed cotton growers in Brazil to legally plant Bt cotton for the first time in the 2006/07 season. This variety had undergone field-testing in Brazil prior to the events that delayed registration due to legal considerations. In 2006, another Bt cotton variety NuOpal was registered, thus two varieties of Bt cotton were available for planting in 2007. In 2008, one variety of herbicide tolerant cotton was approved in Brazil. In 2009, the first two stacked IR/HT cotton products were registered (Table 4). Brazil is expected to grow approximately 970,000 hectares or more of cotton in 2010/11, up from 820,000 hectares of cotton in 2009/10, making Brazil the sixth largest grower of cotton, by area, in the world after India, China, USA, Pakistan, and Uzbekistan.
figure 8. soybean Cultivars registered in brazil, 2000 to 2010
* As November/2010Source: Brazilian Ag Minister/SNRC, 2010. Elaboration: Céleres

Global status of Commercialized biotech/GM Crops: 2010
34
The adoption of approved biotech cottons in Brazil in 2010/11 is projected at 250,000 hectares at an adoption rate of 26%. The number of registered conventional and biotech varieties of cotton are shown in Figure 9. Given that deployment of biotech varieties of cotton is more difficult to monitor than biotech maize hybrids, the estimate of 250,000 hectares of biotech cotton in Brazil in 2010 is likely to be conservative. The challenge of estimating biotech cotton hectarage is exacerbated by the fact that farmer-saved Bt cotton varietal seeds are common.
The biotech maize hybrids approved in Brazil from 2007 to 2010 are summarized in Table 4 and Figure 10 confirm that there were 123 maize hybrids registered of which, by far, the majority, 80%, were biotech hybrids. They include the single Bt and HT products as well as seven stacked Bt/HT hybrids. The biotech hybrids are sown in two seasons: the first is the summer maize harvested in September and the second is the winter season with planting starting in December 2010 but with most of the plantings in hybrids January 2011 and beyond. It is important to note that given that the second winter maize planting starts in December the last month of the calendar year of 2010 (and onwards to January and February 2010), it is classified as a 2010 crop (not 2011) for the purposes of this Brief.
Of the projected 7.6 million hectares of the total maize plantings in the 2010/11 summer crop, planted after September 2010, about 3.3 million hectares are estimated to be biotech maize equivalent to an adoption rate of 43%. For the second planting of winter maize starting in December 2010/ January
figure 9. Cotton Varieties registered in brazil, 1998 to 2010
* As of November/2010Source: Brazilian Ag Minister/SNRC, 2010. Elaboration: Céleres

Global status of Commercialized biotech/GM Crops: 2010
35
2011 of 5.3 million hectares, a projected 4.0 million hectares is estimated to be biotech maize equivalent to a record adoption rate of 75%. Consolidating these two separate maize plantings in Brazil for 2010, brings the total maize hectarage to 12.9 million hectares for both summer and winter crops of which a record 7.3 million hectares, or 56% is biotech maize. Farmer experience with biotech maize in Brazil has been positive because it has improved the competitiveness of maize production and helped sustain an adequate supply of maize used as animal feed in the national market as well as generating an exportable surplus.
In 2010, Brazil consolidated and strengthened its position as the second largest grower of biotech crops in the world. For 2010, biotech crops in Brazil were estimated to occupy 25.4 million hectares, a substantial increase of 4.0 million hectares from 2009, a substantial year-over-year growth of 19%. Of the 25.4 million hectares of biotech crops grown in Brazil in 2010, 17.8 million hectares were planted to RR®soybean, 7.3 million hectares of biotech maize in its fourth year of commercial planting and 250,000 hectares planted with biotech cotton, grown officially for the sixth time in 2010.
In summary, Brazil, in a relatively short time of six years has already become a world leader in the adoption of biotech crops. In the near-term there are opportunities for significant growth in HT and Bt/HT soybean hectarage, substantial expansion in biotech maize on the 13 million hectares of
figure 10. Maize hybrids and lines registered in brazil, 1999 to 2010
* As of November/2010Source: Brazilian Ag Minister/SNRC, 2010. Elaboration: Céleres

Global status of Commercialized biotech/GM Crops: 2010
36
maize – the third largest hectarage in the world; expansion in biotech cotton – sixth largest hectarage in the world; probably will be the first country in the world to commercialize biotech sugarcane on the 8.1 million hectares of sugarcane, the largest in any country in the world; Brazil also has 2.8 million hectares of rice (10th largest hectarage in the world) that can benefit from biotechnology being developed in Asia which produces and consumes 90% of the world’s rice.
benefits from biotech Crops in brazil
One way of characterizing the distribution of benefits is by crop as shown in Figure11. In thirteen years (1996/97 to 2008/09), the economic benefits captured by Brazilian farmers and the developers of the technology (industry) is estimated at US$3.6 billion. Of this total, soybeans, the first biotech crop to be deployed had the largest share of the total benefits, at 78% (US$2.8 billion). Biotech maize first adopted in 2008 already accounts for 18% (US$648,000) of the economic benefits, while biotech cotton, was first deployed in 2004/05, on a much smaller hectarage accounted for 4% of the total benefits valued at US$144,000 (Figure 11).
Another way of characterizing the distribution of benefits is shown “by benefits” in Figure 11. Of the total US$3.6 million in benefits, lower cost of production resulted in savings of 63% (US$2.7
By benefit
figure 11. economic benefits from the adoption of biotech Crops in brazil, 1996/97 to 2008/09, by Crop, and by benefit
By crop
Data: Soybeans: 1996/97 to 2008/09; Cotton: 2004/05 to 2008/09; Corn: 2008/09Source: CÉLERES® based on proprietary research studies

Global status of Commercialized biotech/GM Crops: 2010
37
billion), yield gains were equivalent to 18% or US$648,000, and the developers of biotech crops were rewarded with a return on their investment of 19%, equivalent to US$684,000. Thus, the major beneficiaries, by far, were farmers who benefited from both reduced production costs and increased yields for a total of 81% of all benefits equivalent to US$2.9 billion compared with only 19% or US$684,000 for the developers of the technology in industry.
Considering the socio-environmental benefits derived from biotech crops in Brazil, for the period 1996/97 to 2008/09, the benefits in terms of savings in water, pesticides, diesel, and CO2 emissions were analyzed. For water usage, biotech crops in Brazil contributed savings of 12.6 billion liters, enough water to supply 287,000 people during the 13 year period 1996/97 to 2008/09. Of this total of 12.6 billion liters of water saved, 95% was due to planting biotech soybean, 3% to biotech maize and 2% to biotech cotton (Figure 12). The dominance of water savings from biotech soybeans versus other crops is due to the fact that it was the first biotech product to be introduced and soybean is grown on a much larger hectarage than biotech cotton and maize, which were introduced later than soybean.
Benefits to Brazil from biotech crops, in terms of savings on diesel (hence decrease in CO2 emissions) for the 13 year period 1996/97 to 2008/09 were 104.8 million liters of saved diesel, enough diesel to supply a fleet of 44,000 thousand light vehicles for the period 1996/97 to 2008/09 (Figure 13).
figure 12. Water savings/benefits from the adoption of biotech Crops in brazil, 1996/97 to 2008/09, – 287,000 People Benefited from Water Savings of 12.6 Billion liters
Data: Soybeans: 1996/97 to 2008/09; Cotton: 2004/05 to 2008/09; Corn: 2008/09* Based on the daily consumption of 120 liters per person, as per UN’s recommendationSource: CÉLERES AMBIENTAL® based on proprietary research studies

Global status of Commercialized biotech/GM Crops: 2010
38
The decrease in CO2 emissions from burning 104.8 million liters less diesel is equivalent to savings of 270,000 tons of CO2, which in turn is equivalent to conserving 2 million trees in the Riparian forest (Figure 14). Again the major savings are related to biotech soybean (95%) with maize at 3% and cotton at 2%.
Savings in pesticides (expressed as active ingredient, a.i.) due to the use of biotech crops for the 13 year period 1996/97 to 2008/09, were 6,800 tons of active ingredients. Again, biotech soybean was responsible for the major saving, 84% of the total, cotton 10%, and maize 6% (Figure 15).
An annual global study of benefits from biotech crops concluded that Brazil is estimated to have enhanced farm income from biotech crops by US$3.5 billion in the seven-year period 2003 to 2009 and the benefits for 2010 alone is estimated at US$0.7 billion (Brookes and Barfoot, 2011, forthcoming).
Farmer Testimonies
flavio augusto pilau, a Brazilian corn farmer in Matto Grosso gives farming and restoration of the natural biodiversity in his area a full time effort. Erosion that led to soil degradation and poor productivity in the area was a big problem which was effectively controlled by the use of
figure 13. diesel savings/benefits from the adoption of biotech Crops in brazil, 1996/97 to 2008/09; – Diesel Savings of 104.8 Million Liters Enough to Supply a Fleet of 44,000 Vehicles for 13 Years
Data : Soybeans: 1996/97 to 2008/09; Cotton: 2004/05 to 2008/09; Corn: 2008/09* Based on a light vehicle, running on diesel, having an annual mileage of 24,000 km and an average consumption of 10 km/l, totaling an annual consumption of 2,400 liters/vehicleSource: CÉLERES AMBIENTAL® based on proprietary research studies

Global status of Commercialized biotech/GM Crops: 2010
39
figure 14. savings of 270,000 tons of Co2 emissions for biotech Crops in brazil equivalent to Conserving 2 Million trees during the period 1996/97 to 2008/09
Data : Soybeans: 1996/97 to 2008/09; Cotton: 2004/05 to 2008/09; Corn: 2008/09* Based on the Riparian Forest as referenceSource: CÉLERES AMBIENTAL® based on proprietary research studies
figure 15. savings of 6,870 tons of pesticides (active ingredient) from planting biotech Crops in brazil during the period 1996/97 to 2008/09
Data: Soybeans: 1996/97 to 2008/09; Cotton: 2004/05 to 2008/09; Corn: 2008/09Source: CÉLERES AMBIENTAL® based on proprietary research studies

Global status of Commercialized biotech/GM Crops: 2010
40
less aggressive crop protection products as well as the use of biotech corn seeds. The prevalence of fauna has also increased due to the restoration of their food supply. “With the difficulty in controlling weed pressures in this area, the use of biotech varieties makes the process much easier.” He now plants 70% of his fields with biotech maize hybrids. “The adoption of biotech varieties in this country has pulled Brazil into a new age of excellent productivity potential, especially where corn is concerned” (Pilau, 2010).
adilmar sartori has managed an 8,500 hectare crop land in Primavera de Leste, Mato Grosso, Brazil for the last two years. Since then, he has improved the standard of living of his family and his Mato Grosso community. He has realized early-on that technology plays an important role in the success of his farm. “Right away we saw the difference and since then we’ve been testing, analyzing and evaluating the results of successive crops,” says Sartori, referring to seeds produced through biotechnology. The entire farm has always been planted with biotech seeds. “We need these improved genetics to protect the crop through to harvest,” he says. “Without them we would not have any success.” The use of these biotech seed varieties gives Sartori confidence of a good harvest year after year because of the protection they provide against insect pests and weed pressures. “Without [these products] yield per crop would be about one-third of what it is now. There would be no economic advantage of producing without these technologies,” he concludes (Sartori, 2009).
ARGENTINA
argentina maintained its ranking as the third largest producer of biotech crops in the world in 2010 occupying 15% of global hectarage. in 2010, argentina was expected to plant a total hectarage of 22.9 million hectares of biotech soybean, maize and cotton, up from 21.3 million hectares in 2009. benefits from rr®soybean alone for the first decade, 1996 to 2005, was estimated at close to us$20 billion.
Argentina is also one of the six “founder biotech crop countries”, having commercialized RR®soybean and Bt cotton in 1996, the first year of global commercialization of biotech crops. After retaining the second ranking position in the world for biotech crops area for 13 years, Argentina was narrowly displaced from being the second largest producer of biotech crops in the world in 2009, by Brazil. The 17 biotech crop products approved for commercial planting in Argentina and for import as food and feed products are listed in Table 5 including the designation of the event and the year of approval.
In 2010, the year-over-year increase, compared with 2009, was 1.6 million hectares, and the annual growth rate in 2010 was 8% over 2009. Of the 22.9 million hectares of biotech crops in Argentina

Global status of Commercialized biotech/GM Crops: 2010
41
in 2010, 19.5 million hectares were expected to be planted to biotech soybean, up 0.7 million hectares over 2009. The 19.5 million hectares of biotech soybean is equivalent to 100% of the record planting of 19.5 million hectares of the national soybean crop in Argentina in 2010.
The hectarage of biotech maize hybrid plantings in 2010 was approximately 3.0 million hectares. Of the 3.0 million hectares of biotech hybrid maize, about 1.8 million hectares were planted to the stacked product Bt/HT maize, 900,000 hectares to the Bt product, and 300,000 hectares to herbicide tolerant maize. The stacked gene Bt /HT maize product, occupied more area than the other two products, Bt and HT, and is expected to retain its premier position in the future. Thus, the adoption rate in the 3.0 million hectares of hybrid maize was approximately 86% of the total maize hectarage with the stacked Bt/HT product representing 60%, Bt 30% and HT at 10%.
Argentina reported a total planted area of 400,000 hectares of cotton for 2010, up from 350,000 hectares in 2009. Of the 400,000 hectares of total cotton plantings in 2010, 375,000 hectares were biotech, of which 275,000 hectares were the Bt/HT stacked product, about 60,000 hectares were herbicide tolerant (HT) cotton and 40,000 hectares were Bt and the balance of 25,000 hectares were conventional. The general increase in biotech cotton during the last four years is related to various factors including the availability of better adapted biotech varieties, improved returns and more awareness by farmers of the benefits associated with the technology, and improved reporting. It is noteworthy that farmer-saved seed, which is prevalent in Argentina, can lead to problems with Bt cotton if the purity drops to a point where larvae can establish on non-Bt cotton plants and start an infestation which can compromise insect resistant management strategies.
arGeNtiNa
Population: 39.9 million
GDP: US$328 billion
GDP per Capita: US$8,240
Agriculture as % GDP: 10%
Agricultural GDP: US$32.8 billion
% employed in agriculture: 1%
Arable Land (AL): 33.2 million hectares
Ratio of AL/Population*: 3.3
Major crops: • Soybean • Sugarcane • Wheat • Maize • Sunflower seed
Commercialized Biotech Crops:• HT Soybean • Bt/HT Cotton • Bt/HT/Bt-HT Maize
Total area under biotech crops and (%) increase in 2010: 22.9 Million Hectares (+8%)
Farm income gain from biotech, 1996-2009: US$10.3 billion
*Ratio: % global arable land / % global population

Global status of Commercialized biotech/GM Crops: 2010
42
benefits from biotech Crops in argentina
A detailed analysis by Eduardo Trigo from the FORGES Foundation and Eugenio Cap of the Institute of Economics and Sociology of the National Institute of Agricultural Technology (INTA, Trigo and Cap, 2006), estimated that the total global direct and indirect benefits from RR®soybean in Argentina for the first 10 years of commercialization, 1996 to 2005 was US$46 billion. This was generated from increased farmer incomes, a million new jobs and more affordable soybean for consumers and significant environmental benefits, particularly the practice of no till for conserving soil and moisture and double cropping. Of the global US$46 billion indirect and direct benefits, Argentina gained approximately US$20 billion in direct benefits from RR®soybean in the decade 1996 to 2005 (Table 6). The study estimated benefits on the basis of production increases which could be identified as resulting from the adoption of the new technologies, including the impact of increased productivity in animal production related to RR®soybean.
table 5. Commercial approvals for planting, food and feed in argentina, 1996 to 2010
Crop trait event Year
Soybean Herbicide tolerance 40-3-2 1996
Maize Insect resistance 176 1998
Maize Herbicide tolerance T25 1998
Cotton Insect resistance MON531 1998
Maize Insect resistance MON810 1998
Cotton Herbicide tolerance MON 1445 2001
Maize Insect resistance Bt11 2001
Maize Herbicide tolerance NK603 2004
Maize Herbicide tolerance and Insect resistance TC1507 2005
Maize Herbicide tolerance GA21 2005
Maize Herbicide tolerance × Insect resistance NK603 ×MON810 2007
Maize Herbicide tolerance × Insect resistance NK603 ×TC 1507 2008
Cotton Herbicide tolerance × Insect resistance MON1445 × MON531 2009
Maize Herbicide tolerance × Insect resistance Bt11 × GA21 2009
Maize Insect resistance MON89034 2010
Maize Insect resistance and Herbicide tolerance MON88017 2010
Maize Insect resistance and Herbicide tolerance MON89034 × MON88017 2010
Source: ArgenBio, 2010 (Personal Communication).
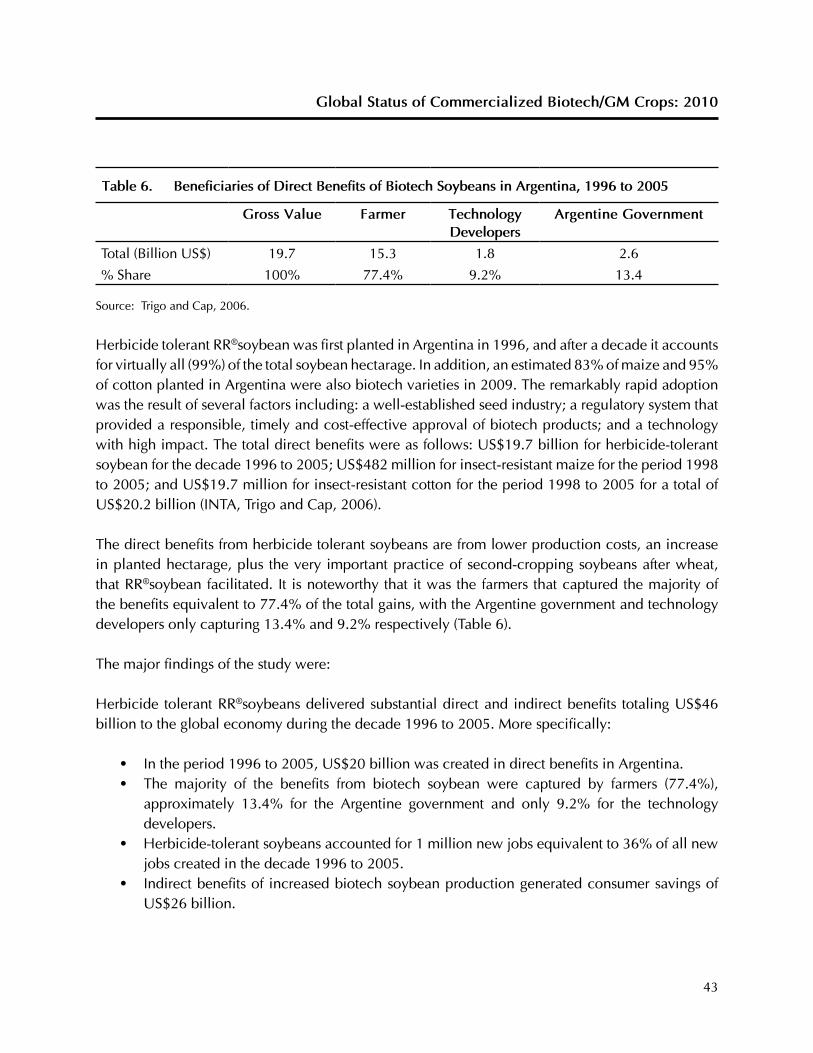
Global status of Commercialized biotech/GM Crops: 2010
43
table 6. beneficiaries of direct benefits of biotech soybeans in argentina, 1996 to 2005
Gross Value farmer technology developers
argentine Government
Total (Billion US$) 19.7 15.3 1.8 2.6
% Share 100% 77.4% 9.2% 13.4
Source: Trigo and Cap, 2006.
Herbicide tolerant RR®soybean was first planted in Argentina in 1996, and after a decade it accounts for virtually all (99%) of the total soybean hectarage. In addition, an estimated 83% of maize and 95% of cotton planted in Argentina were also biotech varieties in 2009. The remarkably rapid adoption was the result of several factors including: a well-established seed industry; a regulatory system that provided a responsible, timely and cost-effective approval of biotech products; and a technology with high impact. The total direct benefits were as follows: US$19.7 billion for herbicide-tolerant soybean for the decade 1996 to 2005; US$482 million for insect-resistant maize for the period 1998 to 2005; and US$19.7 million for insect-resistant cotton for the period 1998 to 2005 for a total of US$20.2 billion (INTA, Trigo and Cap, 2006).
The direct benefits from herbicide tolerant soybeans are from lower production costs, an increase in planted hectarage, plus the very important practice of second-cropping soybeans after wheat, that RR®soybean facilitated. It is noteworthy that it was the farmers that captured the majority of the benefits equivalent to 77.4% of the total gains, with the Argentine government and technology developers only capturing 13.4% and 9.2% respectively (Table 6).
The major findings of the study were:
Herbicide tolerant RR®soybeans delivered substantial direct and indirect benefits totaling US$46 billion to the global economy during the decade 1996 to 2005. More specifically:
• In the period 1996 to 2005, US$20 billion was created in direct benefits in Argentina.• The majority of the benefits from biotech soybean were captured by farmers (77.4%),
approximately 13.4% for the Argentine government and only 9.2% for the technology developers.
• Herbicide-tolerant soybeans accounted for 1 million new jobs equivalent to 36% of all new jobs created in the decade 1996 to 2005.
• Indirect benefits of increased biotech soybean production generated consumer savings of US$26 billion.

Global status of Commercialized biotech/GM Crops: 2010
44
Biotech soybeans greatly facilitated fast adoption of low/no-till systems which conserved both soil and water.
• No/low-till hectarage increased from 120,000 hectares in 1991 to over 7.5 million hectares in 2005.
• Herbicide-tolerant soybeans were a principal factor in the adoption of no/low-till practices.• No/low-till practices mitigated the serious problems with soil erosion and conservation
of moisture in the Pampas in the 1980s resulting from intensification of conventional agriculture.
In the most recent global study on the benefits from biotech crops (Brookes and Barfoot, 2011, forthcoming) estimates that Argentina has enhanced farm income from biotech crops by us$10.3 billion in the first fourteen years of commercialization of biotech crops 1996 to 2009, and the benefits for 2009 alone were estimated at us$1.1 billion.
Farmer Experience
Martin arechavaleta is a soybean grower and a third generation farmer in Victoria, Province of Entre Rios, Argentina. He told of his old farm practices when products were expensive and difficult to apply. “We had to live with many problems. Production was half of what we have now,” he says.
He first incorporated biotechnology into his farm more than 10 years ago when he started planting glyphosate-resistant soybean. “We have seen many advantages over the years with the new products. Before, it was a lot of mechanical work to get rid of weeds. Now, the producer is more free, there is more production and less cost” (Arechavaleta, 2010).
Mario alberto sanchez, started his family farm enterprise of around 30 hectares with soybeans, corn, sorghum, and sunflowers. This increased to 3,300 hectares over the past 22 years due to his sustainable cropping practices as well as his adoption of biotech seed and crop protection practices. He has grown glyphosate-tolerant corn and soybeans which led to increased profits and reduced costs. “We started using the product because of the quality of the seeds. We began testing and realized that besides the quality improvement, there was an increase in performance,” he says, adding that fewer crop protection applications and working in a preventative way is a real plus. “With this product we’re more relaxed. The leftover time can be devoted to family, or in our case, we can rent or buy more land and then we can advance” (Sanchez, 2010).

Global status of Commercialized biotech/GM Crops: 2010
45
INDIA
in 2010, the adoption of bt cotton in india soared to a record 9.4 million hectares, equivalent to 86% of the record 11 million hectare cotton crop planted in the country. the 1 million hectare gain in bt cotton in 2010 resulted from an increase of 8.4 million hectares in 2009 to 9.4 million hectares in 2010 farmed by 6.3 million farmers growing on average 1.5 hectares of cotton; the 8.4 million hectares of bt cotton in 2009 occupied 81% of the 10.3 million hectare of cotton farmed by 5.6 million farmers. thus, in 2010, an additional 0.7 million farmers preferred to grow bt cotton, rather than conventional cotton – a significant increase from the 5.6 million cotton farmers in 2009. overall, the increase from 50,000 hectares of bt cotton in 2002, (when bt cotton was first commercialized) to 9.4 million hectares in 2010 represents an unprecedented 188-fold increase in nine years. the annual global study of benefits generated by biotech crops, conducted by brookes and barfoot, estimated that india enhanced farm income from bt cotton by us$7.0 billion in the period 2002 to 2009 and us$1.9 billion in 2009 alone. typically, yield gains are approximately 31%, a significant 39% reduction in the number of insecticide sprays, leading to an 88% increase in profitability, equivalent to a substantial increase of approximately us$250 per hectare. thus, bt cotton has transformed cotton production in india by increasing yield, decreasing insecticide applications and through welfare benefits contributed to the alleviation of poverty for over 6 million small resource-poor farmers in 2010 alone; the potential of biotech cotton in india for the future is enormous. a total of 780 bt cotton introductions (779 hybrids and one variety) were approved for planting in 2010 compared with 522 bt cotton hybrids in 2009. the increase in total hectares of cotton planted in india is, to a large extent, a reflection of the growing acceptance of bt cotton hybrids by cotton farmers throughout the country. Notably, india has achieved unparalleled progress in cotton on three fronts in 2010; the highest ever area of cotton, 11 million hectares under cultivation; the largest ever cotton production equivalent to 32.5 million bales; a sustained high cotton yield of more than 500 kg per hectare despite significant increases in cotton hectarage. Next year, 2011, india will celebrate a decade of bt cotton growing which has been a great boon to cotton, indian agriculture and the country.
to meet the growing demand of the burgeoning population of india, bt cotton, has been successfully used as a multiple purpose crop in three ways: in the form of edible oil as food for human consumption; de-oiled cake as an animal feed; and kapas for fiber. the production of cotton seed, and its by-products as oil and meal, has increased manifold from 0.46 million tons in 2002-03 to 1.20 million tons in 2010-11. as a

Global status of Commercialized biotech/GM Crops: 2010
46
result, bt cotton meal (de-oiled cake) contributes one third of the country’s total demand for animal feed, whereas cotton oil contributes 13.7% of total edible oil production for human consumption in the country – a significant contribution which offsets more than half of the import bill for edible oil valued at us$6.5 billion annually. increased production of bt cotton oil could be one of the important strategies to substitute for edible oil imports which constitute more than 50% of the total edible oil consumption in the country. in 2009-10 india, for the first time ever, imported more edible oil, 8.80 million tons, than the 7.88 million tons it produced domestically. due to the high nutritional content of cotton oil, bt cotton oil is marketed after blending it with different edible oils. in this brief, the major focus of attention is on vegetable oil from bt cotton seeds, which has been an unqualified success over the last nine years since it was first commercialized in india in 2002. india is becoming increasingly dependent on expensive imports of vegetable oil, which is a valid strategic concern, and biotech bt cotton and its second generation of stacked products, as a multipurpose crop for oil, fiber and feed, can play a critical role in indian agriculture in the near, mid and long term future. there are also important opportunities with biotech soybean, mustard and pulses which would be appropriate to explore in 2011 which marks the 10th anniversary of the successful adoption of biotech cotton in india. it is noteworthy that the by-products of bt cotton, have been safely consumed as food and feed in india for nine years, without incident. Given this unblemished record,
iNdia
Population: 1,186.2 million
GDP: US$1,159 billion
GDP per Capita: US$ 1,020
Agriculture as % GDP: 17%
Agricultural GDP: US$197 billion
% employed in agriculture: 64%
Arable Land (AL): 177.5 million hectares
Ratio of AL/Population*: 0.60
Major crops: • Sugarcane • Rice • Wheat • Vegetables, fresh • Potato • Cotton
Commercialized Biotech Crop: Bt Cotton
Total area under biotech crops and (%) increase in 2010: 9.4 Million Hectares (+12%))
Farm income gain from biotech, 2002-2009: US$7.0 billion
*Ratio: % global arable land / % global population

Global status of Commercialized biotech/GM Crops: 2010
47
which is consistent with experience of more than 10 other countries world-wide, now maybe is the time for india to benefit from the application of the well-tested bt technology in other crops.
Indian Agriculture – A Brief Profile India, the largest democracy in the world, is highly dependent on agriculture. The performance of the agriculture sector continues to influence the growth of the economy – a major factor in driving India’s national economy. In recent years, there has been a decline in the share of agriculture in the national economy from almost a quarter to 17% of its Gross Domestic Product (GDP). In contrast, there has been a very small decline in the workforce engaged in agriculture which still provides a means of survival to 52% of the population – more than half of India’s population (Ministry of Finance, 2009). India is a nation of small resource-poor farmers, most of whom do not make enough income to cover their meager basic needs and expenditures. The latest National Sample Survey conducted in 2003, reported that 60.4% of rural households were engaged in farming indicating that there were 89.4 million farmer households in India (National Sample Survey, 2003). Sixty percent of the farming households own less than 1 hectare of land, and only 5% own more than 4 hectares. Only 5 million farming households (5% of 90 million) have an income that is greater than their expenditures. The average income of farm households in India (based on 40 Rupees per US dollar) was US$50 per month and the average consumption expenditures was US$70. Thus, of the 90 million farmer households in India, approximately 85 million, which represent about 95% of all farmers, are small and resource-poor farmers who do not make enough money from the land to make ends meet – in the past, these included the vast majority of over 6.86 million Indian cotton farmers.
In this Brief, the major focus of attention will be on vegetable oil seeds, as represented by Bt cotton, which has been an unqualified success over the last nine years since it was first commercialized in India in 2002. India is becoming increasingly dependent on expensive imports of vegetable oil, which is a strategic concern, and biotech Bt cotton, and its second generation of stacked products, as a multipurpose crop for oil, fiber and feed, can play a critical role in Indian agriculture in the near, mid and long term future. There are also important opportunities with biotech soybean, mustard and pulses which could be explored in 2011 to mark the 10th anniversary of the successful adoption of biotech cotton in India.
bt Cotton: a Multipurpose Crop
Cotton is recognized as a fiber crop with varied applications from making tiny threads to fashionable clothing in the textile sector. A significant unknown fact is that roughly 67% of the cotton produced

Global status of Commercialized biotech/GM Crops: 2010
48
is consumed directly as food or feed with the remaining 33% used as fiber in the textile sector in India. The cotton crop, like maize and rice, has been gaining popularity as a multipurpose crop in India.
Cotton lint and cottonseeds are the principal products of the cotton plant. Cotton lint is the fiber part of the cotton plant whereas the cottonseeds yield three important by-products including linters, hulls and kernels (Figure 16). Linters are specially used for manufacturing of various products including production of propellants used for gun ammunition and also for missiles in the defense sector. Along with the de-oiled meal, the decorticated cottonseeds cake or commonly known as hulls are also directly fed to livestock such as cattle and buffaloes for producing milk and meat. A significant portion of the crushed kernel are consumed either as edible oil or mixed with other edible oils for direct human consumption in the country.
figure 16. a schematic diagram of the Multipurpose utility of Cotton Crop
short description of cottonseed byproducts Linters: Short fibres still clinging to the seed after ginningHulls: A tough protective covering of the kernelOil: Extracted from kernel and used for human consumption Meal: Residue after extraction of oil
Source: Compiled by ISAAA, 2010, Significant portion adopted from Mayee & Chakraborty, 2010; OTA, 2009.

Global status of Commercialized biotech/GM Crops: 2010
49
Over the years, cotton fiber has been used as a principal raw material for textile industry, whereas the use of cottonseed oil and meal (de-oiled cake) has been gaining popularity in the country. Notably, for every 1 kg of fiber, the cotton plant produces around 1.65 to 1.85 kg of cottonseed – a rich source of oil and high quality protein. This attribute makes cotton the second largest field crop in India in terms of edible oilseed tonnage (Sunikumar et al. 2006; AICOSCA, 2010). Amongst all the sources of edible oil seeds, cottonseeds production registered the most significant increase from 2003 to 2009 – cottonseeds almost doubled production from 5.5 million tons in 2003 to 8.7 million tons in 2009 and is likely to cross the 10 million tons level in 2010 (Table 7). Bt cotton contributes more than 86% of the total cottonseeds and its by-products, oil and meal, in 2009.
In addition, cotton meal (de-oiled cake) constitutes the largest share in terms of total availability of meal, followed by soy cake, rapeseed and rice bran in the country. It is important to note that cotton meal contributes one third of the total meal consumed, and is the preferred feed for cattle and buffaloes in the country (Figure 17). Cottonseed is also a major source of protein, as its by-product oil cake contains a high quality protein (23%) – a necessary ingredient for animal feed. De-oiled cotton cake assumes a special significance as an important component of animal diet given that traditional cattle feeds have been replaced by the nutritionally balanced compound cattle feed in India. The All India Cottonseed Crushers’ Association (AICOSCA) estimates that the availability and access to large quantities of de-oiled cake as a proteinaceous cottonseed extraction would significantly boost the manufacturing prospects of compound cattle feed, fish feed and also poultry feed in India (AICOSCA, 2010).
table 7. status of oilseeds production in india, 2003 to 2009
Year Major Nine edible oilseeds production* (M tons)
Cottonseed production(M tons)
2003-04 25.2 5.5
2004-05 24.4 6.8
2005-06 27.9 8.5
2006-07 24.3 9.0
2007-08 29.8 9.9
2008-09 25.9 8.7
* Nine major oilseeds crop including groundnut, soybean, rape/mustard/toria, sunflower, sesame, castor, niger, safflower and linseed.
Source: Compiled by ISAAA, 2010; COOIT, 2010.

Global status of Commercialized biotech/GM Crops: 2010
50
bt Cotton oil: a domestic substitute for imported edible oil
India is a major importer of edible oil in the world. Notably, India imported around 8.8 million tons of edible oil in 2009-10 to meet the burgeoning demand for edible oil in the country – imports have doubled in the last five years from 4.39 million tons in 2003-04 to 8.8 million tons in 2009-10. In 2009-10, imports of edible oil constituted more than 50% of the total edible oil consumption in the country (Table 8). There has been a widening gap between the production and consumption of edible oil in the country and it is estimated that the import of edible oil costs US$6.5 billion every year to India’s exchequer (COOIT, 2010). The fact that imports exceeded domestic production for the first time is mainly due to the fact that, with the exception of cotton, the productivity of major oilseed crops are either stagnant or decelerating – a near stagnant oilseeds production in the last decade due to non growth in hectarage (Economic Times, 2010).
Amidst the oilseed crisis, cotton is the only oilseeds crop that has shown a remarkable progress after the introduction of Bt cotton hybrids in 2002. In the last nine years, cottonseed has become an important source of oilseeds in the country. The production of cotton oil registered a three-fold increase from 0.46 million tons in 2002-03 to 1.20 million tons in 2010-11 (Table 9). Due to the high nutritional content of cotton oil, it is marketed after blending with different vegetable oils in the country.
figure 17. Crop-wise Composition of the availability of Meal (oilcake) in india, 2007-08
Source: COOIT, 2010.

Global status of Commercialized biotech/GM Crops: 2010
51
table 8. status of edible oil production, import and Consumption in india, 2003 to 2010
Year domestic production including Cotton oil
(Million tons)
import(Million tons)
Consumption(Million tons)
2003-04 7.14 4.39 11.53
2004-05 7.24 5.04 12.28
2005-06 8.31 4.41 12.72
2006-07 7.37 4.71 12.08
2007-08 8.65 5.60 14.25
2008-09 8.21 8.17 16.98
2009-10 7.88 8.80 16.68
Source: Ministry of Agriculture, 2010.
table 9. break-down of Cotton by-products from 2002-03, 2009-10 and 2010-11
item 2002-03 2009-10 2010-11
Cotton production (million bales) 13.6 29.5 32.5
Cottonseed production @ 310kg/bale (million tons) 4.21 9.15 10.07
Retained for sowing & direct consumption (million tons)* 0.50 0.50 0.50
Marketable Surplus (million tons) 3.71 8.65 9.57
Production of washed cottonseed oil (12.5%) (million tons) 0.46 1.08 1.20
* very few farmers retain cotton seed for sowing over the last nine years as cotton hybrid seed planting increased to 90% of cotton area. Cotton hybrid seeds production is undertaken separately by specialised cottonseed growers and marketed by private seed sector in the country.
Source: Compiled by ISAAA, 2010; COOIT, 2010; AICOSCA, 2010.
In 2009-10, cotton oil contributed 1.08 million tons to the total production of 7.88 million tons of edible oil from all domestic sources, including cotton oil which is equivalent to 13.7% of total edible oil production in the country. It is estimated that cotton oil has the potential to offset a significant amount of edible oil import demand provided that effective measures are undertaken to improve cottonseed storage, implement scientific processing by delinting/dehulling prior to ginning & pressing, reduce direct consumption of oil-content meal, promote decorticated meal as feed, enhance percent oil recovery, and use modern methods in processing other by-products

Global status of Commercialized biotech/GM Crops: 2010
52
table 10. Value of seed Cotton by-products, 2009-10
by-product Value (rupee per ton)
Fiber 30,000
Cottonseed 11,000
Oil (20% recovery) 9,400
Cake (40% recovery) 4,000
Hull (35% recovery) 2,450
Linter (5% recovery) 1,250
total 47,100
Source: Compiled by ISAAA, 2010; OTA, 2009.
(Bajoria, 2010; AICOSCA, 2010). More importantly, full utilization of seed cotton to the value chain of various cotton by-products generates a significant value of Rs. 47,000 per ton to farmers and processors (Table 10).
Cotton Cultivation in india: a paradigm shift
India has a larger hectarage of cotton than any country in the world. Year 2010 set a new record of 11 million hectares of cotton cultivation in India – an attribute to the ever growing acceptance of Bt cotton hybrids by Indian cotton farmers. Notably, India achieved unparalleled progress on three fronts: highest ever hectarage under cotton cultivation – 11 million hectares; largest ever production of cotton at 32.5 million bales: and a sustained cotton yield of more than 500 kg per hectare despite significant increases in cotton hectarage. Based on the latest estimate (Table 11), the Directorate of Cotton Development, Ministry of Agriculture reports that the total hectarage of cotton in India was 11 million hectares in 2010 approximately 6.8% higher than the 10.3 million hectares in 2009, and farmed by more than 7 million farmers in 2010 as compared to 6.86 million farmers in 2009.
In the past fifty years or so, there have been several notable advancements in the Indian cotton sector. It is evident from history that technological changes in the cotton sector have contributed significantly to yield improvement and growth in cotton production. As a result, there has been a considerable increase in farm income at the national level that benefited cotton farmers, millers, textile manufacturers and consumers as well. The most noticeable technological change in the cotton sector was the improvement of desi cotton varieties in 1950s-60s followed by the introduction Gossypium hirsutum varieties of cotton in 1960s-70s. This was followed by development of cotton hybrids from intra-species and interspecies combinations in 1970s-80s and the introduction of pyrethroid-based pesticides in the 1980s-90s. The commercialization of Bt technology in cotton hybrids in 2002

Global status of Commercialized biotech/GM Crops: 2010
53
and the rapid adoption of Bt cotton hybrids by cotton farmers in subsequent years has completely transformed the face of cotton production in India. Technological change through Bt cotton in India is a classic example of how it contributed to a doubling of cotton yield, is highlighted in Table 12 and Figure 18. It is expected that the infusion of second generation biotech traits in improved cotton hybrids, including efficient weed management technology (herbicide tolerant cotton), improved fiber quality, and development of drought tolerant cotton will also significantly contribute to the cotton sector in the near future. The next flux in doubling cotton yield between 2015 to 2020 is expected to emanate from the readjustment of cotton agronomic practices including developing cotton genotypes suitable for maximizing plant density (population per unit area) coupled with the stacking of biotech traits (Choudhary & Gaur, 2009a; Mayee, 2010).
With the commercialization of hybrid cottons in the 1970s, a major change took place in cotton that impacted on both quality and quantity (Basu & Paroda, 1995). Hybrid H-4 released in 1970 became the first successful commercial cotton hybrid in the country, which led to development and release of
table 11. land holdings distribution and production of Cotton in india, 2009-2010
No. state average Cotton
holding per farm (hectare)
area of Cotton (Million hectare)
production (Million bale)
average Yield (Kg/ha)
No. of Cotton farmers (Million)
1 Punjab 2.64 0.536 1.425 564 0.199
2 Haryana 1.72 0.507 1.475 522 0.265
3 Rajasthan 0.98 0.444 1.1 422 0.308
4 Gujarat 1.80 2.625 9.8 650 1.307
5 Maharashtra 1.46 3.503 6.3 3357 2.152
6 Madhya Pradesh 1.38 0.604 1.5 489 0.452
7 Andhra Pradesh 1.45 1.483 5.2 648 0.964
8 Karnataka 1.56 0.427 0.90 375 0.261
9 Tamil Nadu 0.52 0.114 0.50 780 0.209
10 Orissa 0.76 0.054 0.15 510 0.076
11 Others 0.30 0.032 0.85 – 0.086
(Weighted Average) or Total
(1.50) 10.3 29.5 486 6.86
Source: Ministry of Agriculture, 2009 and Cotton Advisory Board, 2010.

Global status of Commercialized biotech/GM Crops: 2010
54
table 12. the technological Changes introduced in Cotton in india, 1950 to 2010
Year technology introductions
1950s-60s Improvement of desi cotton.
1960s-70s Introduction of Gossypium hirsutum varieties of cotton.
1970s-80s Deployment of cotton hybrids developed from intra-species and interspecies combinations.
1980s-90s Introduction of pyrethroid-based insect control mechanisms
2002-2010 Commercialization of Bt technology (with single as well as combination of genes) in cotton hybrids.
2010-2015 A milestone period marking the introduction of stacked Bt/HT technology in cotton; improvement of fiber quality and development of Marker Aided Selection (MAS) based high-yielding cotton genotype. A major innovation in breeding and cotton agronomy by introducing high-density cotton genotypes and agronomic practices to boost cotton yield per unit area.State-of-the-art techniques/mechanization for cotton picking, ginning and processing.
2015 Onwards Deployment of triple gene Bt technology, sucking pest resistant and drought tolerant cotton. Stacking of insect resistant, sucking pest resistant and drought tolerant cotton traits.
Source: Adopted from Choudhary & Gaur, 2009a.
Source: Adopted from Choudhary & Gaur, 2009a.
figure 18. Technological Leapfrogging and Cotton Productivity in India, 1950 to 2010

Global status of Commercialized biotech/GM Crops: 2010
55
many inter-specific and intra-specific cotton hybrids in 1970s, 80s and 90s, resulting in a significant increase in cotton yield in the country. The advent of the hybrid era in cotton stimulated involvement of the private sector in breeding, seed production and commercialization of cotton hybrids in the country. Some of the popular cotton hybrids released by the private sector, which became very popular in central and southern cotton growing zones, included cotton hybrid MECH 1, MECH 4, Somnath, Jaganath and Ankur. As a result of the high performing cotton hybrids, hectarage under cotton hybrids reached an unprecedented 36% in 1995 and 48% in 2002 (Basu & Paroda, 1995; Mayee, 2010). In 2009, of the national total of 10.3 million hectares of cotton, hybrids occupied 90% (9.2 million hectares) of the cotton area, and only 10% (1.1 million hectares) were occupied by varieties. The percentage planted to hybrids increased significantly from 48% in 2002 to 90% in 2009, a trend that has been accentuated by the introduction in 2002 of high performance Bt cotton hybrids, which have out-performed conventional hybrids and open pollinated cotton varieties.
Comparing the distribution of cotton hectarage by state, in India in 2009 (Table 11), it is evident that the major states growing cotton are located in Central and Southern zones which occupy more than 85% of total cotton area in the country. The majority of the cotton in India is grown in ten states, which are grouped into three different zones namely, Northern zone (Punjab, Haryana and Rajasthan), Central zone (Maharashtra, Madhya Pradesh, Gujarat and Orissa) and Southern zone (Andhra Pradesh, Karnataka and Tamil Nadu). Approximately 65% of India’s cotton is produced on dry land and 35% on irrigated lands. Except for the Northern Zone, which is 100% irrigated, both Central and Southern cotton growing zones are predominantly rainfed. Cotton is the major cash crop of India and accounts for 75% of the fiber used in the textile industry, which has 1,063 spinning mills, and accounts for 4% of GDP. Cotton impacts the lives of an estimated 60 million people in India, including farmers who cultivate the crop, and a legion of workers involved in the cotton industry from processing to trading. India is the only country to grow all four species of cultivated cotton Gossypium arboreum and G. herbaceum (Asian cottons), G. barbadense (Egyptian cotton) and G. hirsutum (American upland cotton). Gossypium hirsutum represents more than 90% of the hybrid cotton production in India and all the current Bt cotton hybrids are G. hirsutum. There were 6.86 million cotton farmers planting cotton over 10.3 million hectare in 2009 (Table 11). Maharashtra, the largest cotton-growing State, had 2.15 million farmers growing cotton, which occupied approximately 34% of India’s total cotton area; this was mostly cultivated on dry land. Gujarat had 1.30 million farmers, followed by 0.96 million in Andhra Pradesh, 0.45 million in Madhya Pradesh, 0.30 million in Rajasthan, 0.26 million in Haryana, 0.20 million farmers each in Punjab, Karnataka and Tamil Nadu and the balance in other states of India.
adoption of bt Cotton hybrids in india, 2002 to 2010 Bt cotton, which confers resistance to important insect pests of cotton, was first adopted in India as hybrids in 2002. There were 54,000 farmers which grew approximately 50,000 hectares of officially

Global status of Commercialized biotech/GM Crops: 2010
56
approved Bt cotton hybrids for the first time in 2002 which doubled to approximately 100,000 hectares in 2003 (Figure 19). The Bt cotton area increased again four-fold in 2004 to reach half a million hectares. In 2005, the area planted to Bt cotton in India continued to climb reaching 1.3 million hectares, an increase of 160% over 2004. In 2006, the adoption record increases which continued with almost a tripling of the area of Bt cotton to 3.8 million hectares. This tripling in area was the highest percentage year-on-year growth for any country planting biotech crops in the world in 2006. Notably in 2006, India’s Bt cotton area (3.8 million hectares) exceeded for the first time, that of China’s 3.5 million hectares. In 2007, the Indian cotton sector continued to grow with a record increase of 63% in Bt cotton area from 3.8 to 6.2 million hectares, to become the largest hectarage of Bt cotton in any country in the world. In 2008, the Bt cotton area increased yet again to a record 7.6 million hectares from 6.2 million hectares in 2007. Maintaining double digit growth, the Bt cotton area increased to 8.4 million hectares in 2009, over 7.6 million hectares in the previous year. The high adoption of 81% in 2009 provided a solid platform to further support an increase in Bt cotton hybrid hectarage in 2010, which grew by over 10% to 9.4 million hectares which is equivalent to 86% of the total cotton area of 11 million hectares in 2010. Despite a very high level of adoption in previous years, 2010 was the seventh consecutive year for India to have a significant year-on-year percentage growth; a 160% increase in 2005, followed by a 192% increase
figure 19. adoption of single and Multiple Gene bt Cotton hybrids from 2002 to 2010
Source: Compiled by ISAAA, 2010.

Global status of Commercialized biotech/GM Crops: 2010
57
in 2006, a 63% increase in 2007, 23% increase in 2008, 11% increase in 2009 and another 11% increase in 2010 (Figure 20). In 2006-07, ISAAA reported that India overtook the USA to become the second largest cotton producing country in the world, after China (USDA/FAS, 2007).
Of the estimated 11 million hectares of cotton in India in 2010, 86% or 9.4 million hectares were Bt cotton hybrids – a remarkably high proportion of Bt cotton in a fairly short period of nine years equivalent to an unprecedented 188-fold increase from 2002 to 2010. Of the 9.4 million hectares, 35% was under irrigation and 65% rainfed. A total of 780 introductions (779 Bt cotton hybrids and one Bt cotton variety) were approved for planting in 2010 compared with 522 Bt cotton hybrids in 2009, 274 in 2008, 131 in 2007, 62 in 2006, 20 in 2005 and only 4 Bt cotton hybrids in 2004. Over the last nine years, India has greatly diversified deployment of Bt genes and genotypes, which are well-adapted to the different agro-ecological zones to ensure equitable distribution to small and resource-poor cotton farmers. The distribution of Bt cotton in the major growing states from 2002 to 2010 is shown in Table 13. The major states growing Bt cotton in 2010, listed in order of hectarage, were Maharashtra (3.71 million hectares) representing 40% of all Bt cotton in India in 2010, followed by Gujarat (1.78 million hectares or 19%), Andhra Pradesh (1.65 million hectares
figure 20. percent adoption of bt Cotton in india and in different states expressed as percent adoption Within states and Nationally in india, 2002 to 2010
Source: Compiled by ISAAA, 2010.

Global status of Commercialized biotech/GM Crops: 2010
58
or 18%), Northern Zone (1.16 million hectares or 12%), Madhya Pradesh (610,000 hectares or 7%), and the balance in Karnataka, Tamil Nadu and other states.
In recent years, there has been an increasing trend to adopt multiple gene (mostly two genes) Bt cotton hybrids by cotton farmers in India (Table 14 and Figure 21). The first two-gene event MON15985, commonly known as Bollgard®II (BG®II) was developed by Mahyco and sourced from Monsanto, featured the two genes cry1Ac and cry2Ab, and was approved for sale for the first time in 2006 – four years after the approval of the single gene event MON531 Bt cotton hybrids in 2002-03. In the first year 2006-07, the multiple gene Bt cotton hybrids were planted on 0.15 million hectares whilst single gene Bt cotton hybrids occupied 3.65 million hectares equivalent to 96% of all the Bt cotton planted.
The area under single gene Bt cotton hybrids increased to 5.74 million hectares in 2007 and then registered a decline of 5.56 million hectares in 2008 and 3.58 million hectares in 2009 and 2.8 million hectares in 2010 coinciding with the release and preference of farmers to adopt multiple gene Bt cotton hybrids. During this time, multiple gene Bt cotton area grew rapidly to 0.46 million hectares in 2007 to 2.04 million hectare in 2008. In 2009, the multiple gene Bt cotton hybrids were planted for the first time on more area (57%) than single gene Bt cotton hybrids occupying 4.82 million hectares as compared to 3.58 million (43%) occupied by single gene Bt cotton hybrids. Since its commercial release, farmers continued to prefer multiple gene Bt cotton hybrids over single gene Bt cotton hybrids. In 2010, 6.6 million hectares were planted with multiple gene Bt cotton hybrids as compared to 2.8 million hectares of single gene Bt cotton hybrids. In essence, multiple gene Bt
table 13. adoption of bt Cotton in india, by Major states, from 2002 to 2010 (000’ ha)
state 2002 2003 2004 2005 2006 2007 2008 2009 2010Maharashtra 25 30 200 607 1,840 2,800 3,130 3,396 3,710
Andhra Pradesh 8 10 75 280 830 1,090 1,320 1,049 1,650
Gujarat 10 36 122 150 470 908 1,360 1,682 1,780
Madhya Pradesh 2 13 80 146 310 500 620 621 610
Northern Region* - - - 60 215 682 840 1,243 1,162
Karnataka 3 4 18 30 85 145 240 273 370
Tamil Nadu 2 7 5 27 45 70 90 109 110
Other - - - - 5 5 5 8 8
total 50 100 500 1,300 3,800 6,200 7,605 8,381 9,400
Source: Compiled by ISAAA, 2010.

Global status of Commercialized biotech/GM Crops: 2010
59
table 14. adoption of single and Multiple Gene bt Cotton hybrids in india, 2006 to 2010 (in Millions of hectares and percentage)
Number of Genes
2005 2006 2007 2008 2009 2010
Multiple - 0.15 (4%) 0.46 (8%) 2.04 (27%) 4.82 (57% ) 6.60 (70%)
Single 1.3 (100%) 3.65 (96%) 5.74 (92%) 5.56 (73%) 3.58 (43%) 2.80 (30%)
total 1.3 (100%) 3.80 (100%) 6.20 (100%) 7.60 (100%) 8.40 (100%) 9.40 (100%)
figure 21. adoption of single and Multiple Gene bt Cotton hybrids from 2002 to 2010
Source: Compiled by ISAAA, 2010.

Global status of Commercialized biotech/GM Crops: 2010
60
cotton hybrids occupied 70% of the total Bt cotton area whereas remaining 30% planted with single gene Bt cotton hybrids. It is estimated that the multiple gene Bt cotton hybrids will occupy more than 90% of total Bt cotton area in 2011-12.
Farmers prefer multiple genes over a single gene Bt cotton hybrids because multiple gene Bt cotton hybrids provide additional protection to Spodopetra (a leaf eating tobacco caterpillar) while it also increases efficacy of protection to both American bollworm, Pink bollworm and Spotted bollworm. It is reported that multiple gene Bt cotton farmers earn higher profit through cost savings associated with fewer sprays for Spodopetra control as well as increasing yield by 8-10% over single gene Bt cotton hybrids
Number of farmers Growing bt Cotton hybrids in india, 2002 to 2010
Based on the latest official data, the average cotton holding per farm in India is 1.5 hectares (Table 11) and thus it is estimated that approximately 6.3 million small and resource-poor farmers planted Bt cotton hybrids in 2010, up from 5.6 million in 2009, 5.0 million in 2008 and 3.8 million farmers in 2007 (Figure 22). Thus, remarkably, the number of farmers growing Bt cotton hybrids in India has increased from 50,000 in 2002 to 100,000 in 2003, 300,000 small farmers in 2004, to 1 million in 2005, with over a two-fold increase of 2.3 million farmers in 2006, 3.8 million farmers in 2007, 5 million in 2008, 5.6 million in 2009 and 6.3 million farmers in 2010. This is the largest increase in number of farmers planting biotech crops in any country in 2010. The 6.3 million small and resource-poor farmers who planted and benefited significantly from Bt cotton hybrids in 2010 represented approximately 85% of the total number of 7.3 million farmers who grew cotton in India in 2010. The adoption of Bt cotton hybrids by 6.3 million farmers is approximately the same high level of adoption for biotech cotton in the mature biotech cotton markets of the USA and Australia. It is notable that the first indigenous, publicly-bred Bt variety Bikaneri Nerma (BN) and hybrid NHH-44Bt (expressing event BNLA-601) were commercialized for the first time in 2009. They were unique because they were the first Bt cotton hybrid and variety to be bred by a group of Indian public sector institutes which include the Central Institute for Cotton Research (CICR), Nagpur and National Research Centre for Plant Biotechnology (NRCPB), New Delhi of the Indian Council of Agricultural Research (ICAR) in partnership with the University of Agricultural Sciences (UAS), Dharwad. NHH-44Bt was planted on approximately 1,000 hectares in three different states including Maharashtra and Gujarat in Central cotton zone and Andhra Pradesh in Southern cotton growing zone, whilst the variety BN Bt was planted on approximately 9,000 hectares in 2009 (Kranthi, 2009).
Some of the critics opposed to Bt cotton in India have, without presenting supporting evidence, alleged that Bt cotton has contributed to farmer suicides in India. An important paper (IFPRI, 2008) published by the International Food Policy Research Institute, based in the USA, could not find

Global status of Commercialized biotech/GM Crops: 2010
61
evidence to support the views of the critics. On the contrary, the paper concludes that:
“In this paper, we provide a comprehensive review of evidence on Bt cotton and farmer suicides, taking into account information from published official and unofficial reports, peer-reviewed journal articles, published studies, media news clips, magazine articles, and radio broadcasts from India, Asia, and international sources from 2002 to 2007. The review is used to evaluate a set of hypotheses on whether or not there has been a resurgence of farmer suicides, and the potential relationship suicide may have with the use of Bt cotton.
We first show that there is no evidence in available data of a “resurgence” of farmer suicides in India in the last five years. Second, we find that Bt cotton technology has been very effective overall in India. However, the context in which Bt cotton was introduced has generated disappointing results in some particular districts and seasons. Third, our analysis clearly shows that Bt cotton is neither a necessary nor a sufficient condition for the occurrence of farmer suicides. In contrast, many other factors have likely played a prominent role” (IFPRI, 2008).
figure 22. Number of small farmers adopting bt Cotton hybrids in india, 2002 to 2010
Source: Compiled by ISAAA, 2010.

Global status of Commercialized biotech/GM Crops: 2010
62
Cotton production, Yield and imports/exports, 2002 to 2010 Coincidental with the steep increase in adoption of Bt cotton between 2002 and 2010, the average yield of cotton in India, which used to have one of the lowest yields in the world, increased from 308 kg per hectare in 2001-02, to 526 kg per hectare in 2008-09 and continue to sustain above 500 kg per hectare in the 2010-11 season, with 50% or more of the increase in yield, attributed to Bt cotton (Figure 23). Thus, at a national level, Bt cotton is a major factor contributing to higher cotton production which increased from 15.8 million bales in 2001-02, to 24.4 million bales in 2005-06, 28 million bales in 2006-07, and 31.5 million bales in 2007-08, which was a record cotton crop for India (Cotton Advisory Board, 2008). Subsequently, cotton production declined to 29 million bales in 2008-09 before again showing upward trends to 29.5 million bales in 2009-10 seasons due to prevailing unfavorable climatic condition in 2008 and despite the fact that there was a delayed monsoon with erratic rainfall and flooding at the time of boll maturity and cotton picking in the Central and Southern cotton growing zones in 2009. The Cotton Advisory Board projects the largest
figure 23. Cotton hectarage, production and Yield in india, 2001 to 2010
1 bale = 170 kgSource: Cotton Advisory Board, 2010.

Global status of Commercialized biotech/GM Crops: 2010
63
ever cotton production of 32.5 million bales in India in 2010-11 – this is a significant increase in overall cotton production over 2009 and the previous years. Other cotton industry sources also estimate cotton production between 33 to 34.5 million bales in 2010-11 (Cotton Advisory Board, 2010). This quantum leap in cotton production since 2002-03 has been triggered by improved seeds and particularly the ever-increasing hectarage of improved Bt cotton in the ten cotton-growing states (Cotton Advisory Board, 2009). While the public sector continues to play a dominant role in production and distribution of low-value high volume seeds like cereals, pulses and oilseeds, the private seed sector is focusing on high hectarage cash crops like cotton and high-value, low volume segments such as vegetables and horticultural crops. The private seed industry’s role in promoting genetically modified (Bt) cotton has been particularly significant. India is now a mega cotton producing country in the world as noted in the Economic Survey of 2006-07. In the past, the Annual Economic Survey 2007-08 of the Ministry of Finance also reports an increase in production and productivity of cotton during the Tenth Five Year Plan (2002-2007), which coincides with the introduction of Bt cotton in India in 2002 (Ministry of Finance, 2008). Recognizing the remarkable progress achieved in cotton production in the last nine years, the Ministry of Agriculture engaged the Biotech Consortium of India Limited (BCIL) – an expert agency, to undertake public awareness programmes in nine Bt cotton growing States at State capital, district and tehsil levels (Ministry of Finance, 2010).
With the boom in cotton production in the last nine years, India has become transformed from a net importer to a net exporter of cotton. Exports of cotton have registered a sharp increase from a meager 0.05 million bales in 2001-02 to 5.8 million bales in 2006-07 before touching a high of 8.8 million bales in 2007-08 (PIB, 2007). In 2008-09, raw cotton export recorded a modest 3.5 million bales. In 2009-10, cotton export rebounded to 8.3 million bales fetching the best international price for cotton farmers and traders (Figure 24). However, the high international cotton price put pressure on domestic cotton prices making it expensive for India’s growing textile sector. In order to address concerns on high price of domestic cotton by the textile sector and to address the important issue of steep increases in prices of cotton in domestic market much higher than the minimum support price (MSP) given by the State run cotton procurement agencies, the Government of India initiated several policy interventions in early 2010. These included an export duty on raw cotton, banning export of cotton for a certain period in mid-2010, and placing exports of raw cotton in the licensed category (DGFT, 2010a & 2010b; PIB, 2010a). In September 2010, the Government of India increased the export cap on cotton to 5.5 million bales, based on the availability of surplus cotton in the 2010 cotton season (PIB, 2010b). In order to exercise implementation of the exportable cotton limit to 5.5 million bales, the government made it mandatory for all the contracts for export of cotton yarn to be registered with the Textile Commissioner prior to shipment (Textile Commissioner, 2010). It is expected that the government would further increase export limit and eventually allow free exports of cotton without any control due to the expected high production and availability of cotton in the domestic market (Roy, 2010; Reuters, 2010).

Global status of Commercialized biotech/GM Crops: 2010
64
hybrid Cotton seeds and biotech industry in india, 2002 to 2009
Concurrent with the boom in cotton production, the Indian cotton hybrid seeds and biotech industry has also been growing at an unprecedented rate with high year-on-year growth because of the high adoption of Bt cotton by Indian farmers. In 2009-10, the overall Indian biotechnology industry registered a 17% growth in Rupee terms, with record revenue of Rs. 14,199 crore (US$3 billion) from 12,137 crore (US$2.7) billion (based on Rupees 45 per US$) in 2008-09. It is the first time in the history of Indian biotech sector to reach the benchmark of US$3 billion in 2008-09. According to the survey conducted by BioSpectrum-ABLE (BioSpectrum, 2010) in 2009-10 (Figure 25), the crop biotech sector grew by 37% to 1936 crore in 2009-10 from Rs. 1,494 crore (US$332 million) in 2008-09 – crop biotech sector registered the largest growth among various segments of biotech sector in India. Notably, Bt cotton is the only biotech crop product that continues to grow with increasing adoption of Bt cotton hybrids by farmers in India. During the last eight years (2002-2009), Bt cotton sustained growth of the biotech crop segment in the Indian biotech industry. In 2009-10, the share of the crop biotech segment increased to 13.63% compared to 12.31% in 2008-09 of
figure 24. export and import of Cotton in india, 2001 to 2010
1 bale = 170 kgSource: Cotton Advisory Board, 2010; Press Information Bureau; 2010a.

Global status of Commercialized biotech/GM Crops: 2010
65
the Indian biotech sector revenue – a trend that has continued since the introduction of Bt cotton hybrids in 2002. More specifically, the biotech crop revenues grew continuously at a double digit rate of 37% in 2009-10, 24% in 2008-09, 30% in 2007-08, 54.9% in 2006-07, 95% in 2005-06; it increased eighteen-fold from Rs.110 crore (US$25 million) in 2002-2003 to Rs. 1,936 crore in 2009-10. In 2009, the share of crop biotech segment increased from 12.31% in 2008-09 to 13.63% in 2009-10. The biopharma segment continued to account for the largest share, 61.71%, of the biotech industry revenues followed by 18.78% for bioservices, 13.63% for biotech crop, 3.95% for bioindustrial and the remaining 1.63% for the bioinformatics sector (BioSpectrum, 2010).
approval of events and bt Cotton hybrids in india
The number of events, as well as the number of Bt cotton hybrids and companies marketing approved hybrids have all increased significantly from 2002, the first year of commercialization of Bt cotton in India. In 2010, the number of Bt cotton hybrids increased substantially to 780 introductions (779 hybrids and one variety) from 522 in 2009, 274 hybrids in 2008, 131 hybrids in 2007, 62 hybrids in 2006, 20 hybrids in 2005, 4 hybrids in 2004 and 3 hybrids in 2003 and 2002, respectively. Importantly, this increase in number of hybrids has provided much more choice year after year to
figure 25. bt Cotton hybrids Market in india (in rupee Crore), 2002 to 2009
(1 Crore = 10 Million Rupees)Source: BioSpectrum, 2010.

Global status of Commercialized biotech/GM Crops: 2010
66
farmers in the North, Central and Southern regions, where specific hybrids have been approved for cultivation in specific regions (Appendix 4 and Figure 26). In 2010, a total of six events were approved for incorporation in a total of 780 hybrids with a publically developed Bt cotton event BN Bt incorporated in both cotton variety, Bikaneri Nerma (BN), approved in 2008 and the publicly-bred Bt cotton hybrid NHH-44 which was approved for commercial cultivation in 2009. The sixth event MLS-9124 was approved for the first time in 2009 (Table 15a).
In 2010, four new cotton events expressing insect resistance and herbicide tolerance in the cotton plant were field-tested in different cotton growing locations in the country. Two out of the four events were developed by stacking two biotech traits including insect resistance (IR) with single/multiple genes and herbicide tolerance (HT) to effectively control both the bollworm complex and control of weeds. The Indian Council of Agricultural Research (ICAR, 2009), reported that weeds account for a major loss in cotton crops – as much as 47.5% reduction in cotton yield due to weeds. Traditionally, cotton farmers have used various methods including mechanical, physical, cultural and chemical methods to control weeds on cotton productivity. An age-old physical method of weed control by hand that employs farm laborers, especially women laborers, is now considered a farm drudgery by many farm laborers, and is in gradual decline. Growing use of herbicides is being witnessed as an important new component of integrated weed management (IWM) in today’s agricultural systems. Both selective and non-selective herbicides including diuron, paraquet, fluchloralin and pendimethalin are used to control weeds so, caution has to be exercised in their application because they will also damage the cotton crop if not applied properly. Thus, the present day use of herbicides requires extreme care which in some cases deter farmers from applying herbicides. Herbicide tolerant (HT) cotton plants including Bollgard II® Roundup Ready Flex (BG-II®RRF) cotton which is at an advanced stage of regulatory review and, subject to approval, be commercially released in 2011-12 could provide effective control of weeds without damaging the cotton crop. These new events are undergoing field testing and pending approval have the potential to be commercialized sometime between 2011 and 2015 (Table 15a and b).
The first event, MON531, Bollgard®I (BG®I), featuring the cry1Ac gene was developed by Maharashtra Hybrid Seeds Company Ltd. (Mahyco), sourced from Monsanto, and approved for sale in 2010, for the ninth consecutive year, in a total of 210 hybrids for use in the North, Central and South zones – this compares with 180 BG®I hybrids in 2009, 141 BG®I hybrids in 2008, 96 BG®I hybrids in 2007 and 48 BG®I hybrids in 2006.
The second event, MON15985, Bollgard®II (BG®II) was also developed by Mahyco and sourced from Monsanto, featured the two genes cry1Ac and cry2Ab, and was approved for sale for the first time in 2006 in a total of seven hybrids for use in the Central and South zones. This event was approved for commercial cultivation for the first time in the Northern zone in 2007 and the number

Global status of Commercialized biotech/GM Crops: 2010
67
figure 26. approval of events and bt Cotton Variety & hybrids in india, 2010
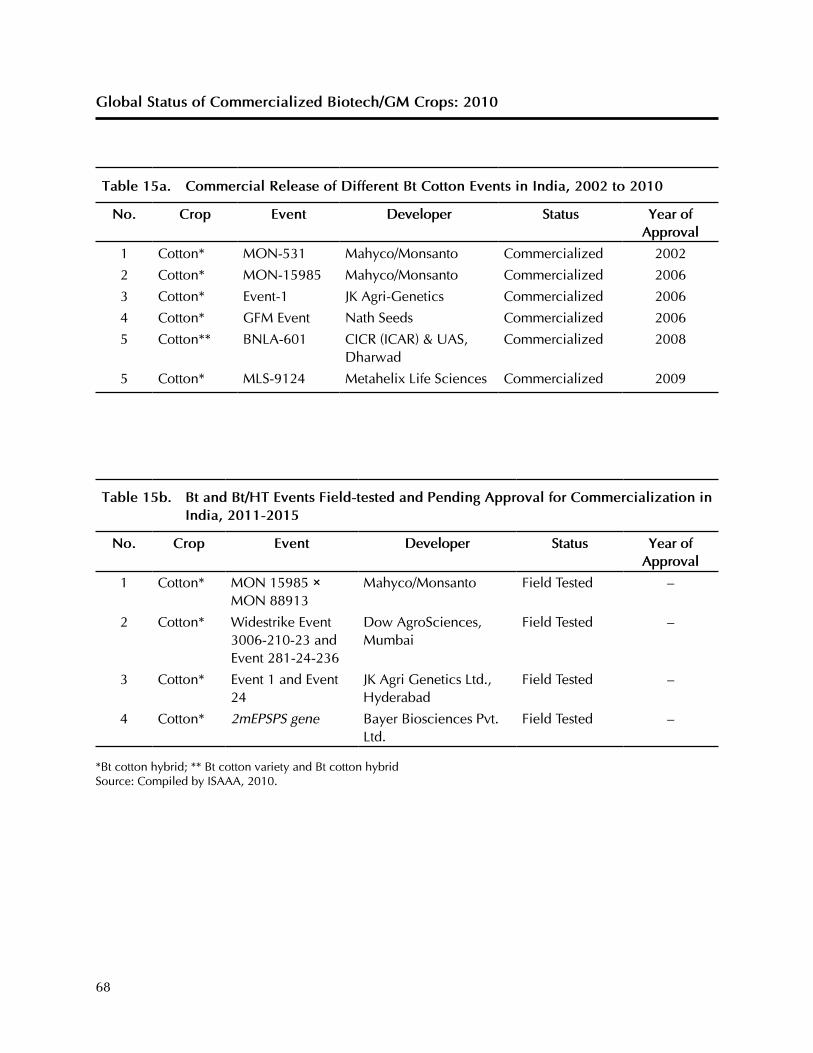
Global status of Commercialized biotech/GM Crops: 2010
68
table 15b. bt and bt/ht events field-tested and pending approval for Commercialization in india, 2011-2015
No. Crop event developer status Year of approval
1 Cotton* MON 15985×MON 88913
Mahyco/Monsanto Field Tested –
2 Cotton* Widestrike Event 3006-210-23 and Event 281-24-236
Dow AgroSciences, Mumbai
Field Tested –
3 Cotton* Event 1 and Event 24
JK Agri Genetics Ltd., Hyderabad
Field Tested –
4 Cotton* 2mEPSPS gene Bayer Biosciences Pvt. Ltd.
Field Tested –
*Bt cotton hybrid; ** Bt cotton variety and Bt cotton hybrid Source: Compiled by ISAAA, 2010.
table 15a. Commercial release of different bt Cotton events in india, 2002 to 2010
No. Crop event developer status Year of approval
1 Cotton* MON-531 Mahyco/Monsanto Commercialized 2002
2 Cotton* MON-15985 Mahyco/Monsanto Commercialized 2006
3 Cotton* Event-1 JK Agri-Genetics Commercialized 2006
4 Cotton* GFM Event Nath Seeds Commercialized 2006
5 Cotton** BNLA-601 CICR (ICAR) & UAS, Dharwad
Commercialized 2008
5 Cotton* MLS-9124 Metahelix Life Sciences Commercialized 2009

Global status of Commercialized biotech/GM Crops: 2010
69
of hybrids for sale increased from 7 in 2006, 21 in 2007, 94 in 2008, 248 in 2009 and further increased significantly to 438 BG®II cotton hybrids in 2010 in the North, Central and South zones.
The third event, known as Event-1 was developed by JK Seeds featuring the cry1Ac gene, sourced from IIT Kharagpur, India. The event was approved for sale for the first time in 2006 in a total of four hybrids for use in the North, Central and South zones. Whereas this event was approved in only four hybrids in 2006, in 2008 it quadrupled to 15 hybrids, 27 in 2009 and 41 Bt cotton hybrids in 2010.
The fourth event is the GFM event which was developed by Nath Seeds, sourced from China, and features the fused genes cry1Ab and cry1Ac. It was approved for sale for the first time in a total of three hybrids in 2006, one in each of the three regions of India. In 2010, the number of hybrids for sale increased three-fold from 24 in 2008 to 63 in 2009 and 87 Bt cotton hybrids in 2010 in 3 zones.
In contrast to the above four events, which were all incorporated in cotton hybrids, notably the fifth event known as BNLA-601 was approved for commercial sale in an indigenous publicly-bred cotton variety named Bikaneri Nerma (BN) expressing the cry1Ac gene. It was approved for commercial release in the North, Central and South cotton growing zones in India during Kharif, 2008. The approval of the Bt cotton variety BN will help farmers in varietal growing areas which were previously disadvantaged because they were unable to benefit from the insect resistant Bt cotton hybrids cultivated widely across all three cotton growing zones. In 2009, a publicly-bred Bt cotton hybrid BNLA-601 expressing the cry1Ac gene is the first indigenous Bt cotton event developed by the Central Institute of Cotton Research (CICR) – one of the premier public sector institutes of the Indian Council of Agricultural Research (ICAR) – along with University of Agricultural Sciences, Dharwad, Karnataka.
The sixth new event, MLS-9124, was developed indigenously by Metahelix Life Sciences and features a synthetic cry1C gene. In 2009, two Bt cotton hybrids namely MH-5125 and MH-5174 expressing the synthetic cry1C gene (MLS-9124) were approved for commercial sale for Central and Southern zones.
The seventh event, Bollgard®II (BG®II) Roundup Ready Flex (BGIIRRF®) is being developed by Mahyco and sourced from Monsanto, first time features stacking of two events in India including insect resistance and herbicide tolerance in cotton. Bollgard®II (BG®II) Roundup Ready Flex (BG®II RRF) expresses three genes; cry1Ac and cry2Ab to confer insect resistance and CP4EPSPS genes to impart herbicide tolerance. In 2010, four BG®II RRF cotton hybrids including two hybrids for North zone and two for Central and South zones were approved for seed production in an area of 25 acres per hybrid and is likely to be approved for commercial release in 2011-12.

Global status of Commercialized biotech/GM Crops: 2010
70
The eighth event, WidestrikeTM is being developed by Dow AgroSciences, expressing multiple genes including cry1F gene and cry1Ac (Event 3006-210-23 and Event 281-24-236) and has two genes for insect protection.
The ninth event, known as a combination of Event-1 x Event-24 is being developed by JK Seeds featuring two genes cry1Ac and cry1Ec, sourced from IIT Kharagpur and NBRI Lucknow, India. Hybrids expressing Event-1 x Event-24 event have been field tested in the North, Central and South zones in 2010.
The tenth event named, Glytol cotton, expresses herbicide tolerance in cotton and is undergoing elite event selection in field trials in 2010. Glytol cotton event was developed by Bayer Biosciences and contains the 2mEPSPS gene conferring tolerance to cotton hybrids sprayed with the herbicide Glyphosate.
The commercial deployment of the first five events in hybrids and sixth event in both variety and hybrids in India is summarized in Table 16, and their regional distribution is detailed in Table 17. The variety Bikaneri Nerma was approved in 2008 and commercialized by CICR, Nagpur and the University of Agricultural Sciences (UAS), Dharwad in the three zones of North, Central and South India. In addition, NHH-44 Bt cotton hybrids was commercialized by CICR, Nagpur and University of Agricultural Sciences (UAS), Dharwad, and approved for planting in Central and South cotton growing zones in 2009. In 2010, it is estimated that farm saved seeds of BN Bt variety would be
table 16. deployment of approved bt Cotton events/hybrids/Variety by region in india in 2010
event North (N)
Central (C)
south (s)
North/Central (N/C)
North/south (N/s)
Central/south (C/s)
N/C/s total hybrids
BG-I1 42 45 42 14 1 53 13* 210
BG-II2 104 55 74 6 6 140 53* 438
Event-I3 9 8 6 0 0 17 1* 41
GFM Event4 20 28 14 4 0 20 1* 87
BNLA-6015 0 0 0 0 0 1 1* 2
MLS-91246 0 0 0 0 0 2 0* 2
Total 175 136 136 24 7 233 69* 780
*Bt cotton variety 1,2 Mahyco 3 JK Seeds 4 Nath Seeds 5CICR (ICAR) and 6MetahelixSource: Compiled by ISAAA, 2010.

Global status of Commercialized biotech/GM Crops: 2010
71
tabl
e 17
. d
eplo
ymen
t of a
ppro
ved
bt C
otto
n ev
ents
/hyb
rids/
Var
iety
by
Com
pani
es/in
stitu
tions
in in
dia,
200
2 to
201
0
even
t20
0220
0320
0420
0520
0620
0720
0820
0920
10N
or
th z
oN
eH
arya
naPu
njab
R
ajas
than
6 H
ybrid
s 1
Even
t3
Com
pani
es
14 H
ybrid
s3
Even
ts6
Com
pani
es
32 H
ybrid
s4
Even
ts14
Com
pani
es
62 H
ybrid
s4
Even
ts 1
5 C
ompa
nies
164
Hyb
rids
5 Ev
ents
26
Com
pani
es
271
Hyb
rids
5 Ev
ents
31
Com
pani
es
CeN
tra
l zo
Ne
Guj
arat
Mad
hya
Prad
esh
Mah
aras
htra
3H
ybrid
s3
Hyb
rids
4H
ybrid
s12
hyb
rids
1 Ev
ent
4 C
ompa
nies
36 H
ybrid
s4
Even
ts15
Com
pani
es
84 H
ybrid
s4
Even
ts23
Com
pani
es
148
Hyb
rids
4 Ev
ents
27
Com
pani
es
296
Hyb
rids
6 Ev
ents
35 C
ompa
nies
459
Hyb
rids
6 Ev
ents
35
Com
pani
es
sou
th z
oN
eA
ndhr
a Pr
ades
hK
arna
taka
Tam
il N
adu
3H
ybrid
s3
Hyb
rids
4H
ybrid
s9
Hyb
rids
1 Ev
ent
3 C
ompa
nies
31 h
ybrid
s4
Even
ts13
Com
pani
es
70 H
ybrid
s4
Even
ts22
Com
pani
es
149
Hyb
rids
4 Ev
ents
27
Com
pani
es
294
Hyb
rids
6 Ev
ents
35 C
ompa
nies
444
Hyb
rids
6 Ev
ents
35
Com
pani
es
sum
mar
yTo
tal n
o. o
f hyb
rids
Tota
l no.
of e
vent
sTo
tal n
o. o
f co
mpa
nies
3 1 1
3 1 1
4 1 1
20 1 3
62 4 15
131 4 24
274 4 30
522* 6 35
780* 6 35
* So
me
of th
e 78
0 hy
brid
s in
clud
ing
a va
riety
are
bei
ng g
row
n in
mul
tiple
regi
ons
(see
Fig
ure
25)
Sour
ce: C
ompi
led
by IS
AA
A, 2
010.

Global status of Commercialized biotech/GM Crops: 2010
72
grown by those farmers who either can’t afford to buy Bt cotton hybrid seeds or prefer to grow BN Bt varieties in their field.
The number of Bt cotton hybrids as well as the number of companies offering Bt cotton hybrids in India has increased dramatically over the last 9 years since the first commercialization in 2002. In 2010, the number of Bt cotton hybrids increased to 780 (including one variety) from 522 (including one variety) in 2009, 274 in 2008 and 131 in 2007 with 34 companies and one public sector institution undertaking the marketing of those hybrids and one variety in three cotton-growing zones in 2010. The following 34 indigenous seed companies and one public sector institution from India, listed alphabetically, offered the 780 hybrids and one variety for sale in 2010; Ajeet Seeds Ltd., Amar Biotech Ltd., Ankur Seeds Pvt., Bayer Biosciences Ltd., Bioseeds Research India Pvt. Ltd., Ganga Kaveri Seeds Pvt. Ltd., Green Gold Pvt. Ltd., J. K. Agri Genetics Ltd., Kaveri Seeds Pvt. Ltd., Krishidhan Seeds Ltd., Mahyco, Metahelix Life Sciences, Monsanto Holdings Pvt. Ltd., Namdhari Seeds Pvt. Ltd., Nandi Seeds Pvt. Ltd., Nath Seeds Ltd., Navkar Hybrid Seeds Pvt. Ltd., Nuziveedu Seeds Ltd., Palamoor Seeds Pvt. Ltd., Prabhat Agri Biotech Ltd., Pravardhan Seeds Ltd., Rasi Seeds Ltd, RJ Biotech Pvt. Ltd., Safal Seeds and Biotech Ltd., Seed Works India Pvt. Ltd., Solar Agrotech Pvt. Ltd., Super Seeds Pvt. Ltd., Tulasi Seeds Pvt. Ltd., Uniphos Enterprises Ltd., Vibha Agrotech Ltd., Vikki Agrotech, Vikram Seeds Ltd., Yashoda Hybrid Seeds Pvt. Ltd., Zuari Seeds Ltd., CICR (Nagpur) and UAS Dharwad.
The deployment of the six events in 780 hybrids in 2010 is summarized in Table 16 and Table 17, as well as the corresponding distribution of hybrids in 2002, 2003, 2004, 2005, 2006, 2007, 2008 and 2009. In 2010, the Genetic Engineering Appraisal Committee (GEAC) approved 258 new Bt cotton hybrids for commercial cultivation in the 2010 season, in addition to the 522 Bt cotton hybrids approved for sale in 2009, for a total of 780 hybrids. This provided farmers in India’s three cotton-growing zones significantly more choice of hybrids for cultivation in 2010. Of the 780 Bt cotton hybrids approved for commercial cultivation, 271 hybrids featuring five events were sold by 31 companies in the Northern zone, 459 hybrids featuring six events were sold by 35 companies in the Central zone, and 444 hybrids featuring six events were sold by 35 companies in the Southern zone (Table 17 and Figure 27).
As described in earlier in this chapter on India, there has been a substantial increase in the area and number of hybrids with two genes for pest resistance, the BG®II event, in 2010. The BG®II cotton hybrids more than doubled to 438 in 2010 from 248 in 2009, 94 in 2008 and only 21 hybrids in 2007. This trend is due to the multiple benefits that double genes offer in terms of more effective control of more than one insect pest. For this reason, the BG®II hybrids are preferred by farmers across all three different cotton-growing zones. The BG®II hybrids protect cotton crops from both Helicoverpa armigera and Spodoptera insects and offer an effective tool in insect resistance management to Indian cotton farmers.

Global status of Commercialized biotech/GM Crops: 2010
73
Similarly, the distribution of the 780 hybrids approved for 2010 is summarized in Table 17 as well as 522 hybrids approved for 2009, 274 hybrids approved for 2008, 131 hybrids approved for 2007, the 62 hybrids approved for 2006, the 20 hybrids approved for 2005, the four hybrids offered for sale in 2004 and the three hybrids approved for both 2003 and 2002. In 2002, Mahyco was the first to receive approval for three Bt cotton hybrids, i.e. MECH 12, MECH 162 and MECH 184, for commercial cultivation in the Central and Southern cotton growing zones in India. The rapid deployment of hybrids during the period 2002 to 2009 reaching 780 Bt cotton hybrids in 2010 as well as their respective events in the three regions is summarized in Appendix 4 and illustrated in the map in Figure 26.
The approval and adoption of Bt cotton by the two most populous countries in the world, India (1.1 billion people) and China (1.3 billion people), can greatly influence the approval, adoption and acceptance of biotech crops in other countries throughout the world, particularly in developing countries. It is noteworthy that both India and China elected to pursue a similar strategy by first exploring the potential benefits of crop biotechnology with a commercial crop, Bt cotton, which has already generated significant and consistent benefits in China, with the same pattern evident
figure 27. release of bt Cotton hybrids in india, 2002 to 2010
Source: Compiled by ISAAA, 2010.

Global status of Commercialized biotech/GM Crops: 2010
74
in India, the largest grower of cotton in the world. In 2010, India had more than twice the biotech cotton area (9.4 million hectares) than China (3.8 million hectares), whereas the number of farmers benefiting from Bt cotton was higher in China (6.5 million) than India (6.3 million) because the average cotton holding per farm in China is smaller (0.6 hectare) than in India (1.5 hectare).
impact and benefits from bt Cotton in india
In 2010, researchers at the University of Warwick published a research paper entitled “GM crops and gender issues” and another new report “The Impact of Bt Cotton on Poor Households in Rural India” taking into account the use of a microeconomic modelling approach and comprehensive survey data from India to analyse welfare and distribution effects in a typical village economy – this study places much more emphasis on the welfare benefits than the previous eleven socio-economic studies conducted from 1998 to 2009, (detailed later) which place more emphasis on direct benefits related to productivity of Bt cotton. The Warwick study noted that the use of Bt cotton in India has produced massive gains in women’s employment and income in the country. “Planting of insect-resistant Bacillus thuringiensis toxin cotton generated not only higher income for rural workers but also more employment, especially for hired female labor,” reports the study (Subramanian, 2010). The report concluded that, Bt cotton generates additional employment, raising the total wage income by US$40 per hectare, as compared with conventional cotton (Figure 28). The study also reported that since Bt cotton was introduced in India in 2002, higher yields compared with conventional cotton have led to additional labor employed to pick the increased production. The study reported that employment for cotton picking increased significantly for hired females who benefited 55% more than male laborers, which translates to about 424 million additional employment opportunities for female earners for the total Bt cotton area in India (Subramanian, 2010). The study noted that Bt cotton also improved female working conditions since less family male labor was needed for scouting and spraying for pests, making that labor available for other household economic activities traditionally done by female family members. Finally, the study concluded that the “overall, Bt cotton enhanced the quality of life of women through increasing income and reducing ‘femanual’ work” (University of Warwick, 2010; Subramanian, 2010).
In addition to the 2010 Warwick Study referred to above, a collection of twelve other economic studies on the impact of Bt cotton, all conducted by public sector institutes over the period 1998 to 2010, covering both pre and post-commercialization of Bt cotton are referenced chronologically in Table 18. The first three studies were based on two sets of data to estimate the overall economic advantage of cotton including a field trial data set for 1998/99 to 2000/01 from the Department of Biotechnology analyzed by Naik (2001) and the second set was an ICAR field trial data set for 2001-2002 analyzed and published by ICAR (2002) and Qaim (2006). The other eight studies/surveys were conducted on large numbers of Bt cotton farmers’ fields between 2002 to 2007, by different

Global status of Commercialized biotech/GM Crops: 2010
75
public sector institutions listed in Table 18. The studies have consistently confirmed 50 to 110% increase in profits from Bt cotton (compared with conventional), equivalent to a range of US$76 to US$250 per hectare. These profits have accrued to small and resource-poor cotton farmers in the various cotton growing states of India. The yield increases ranged usually from 30 to 60% and the reduction in number of insecticide sprays averaged around 50%. It is noteworthy that the benefits recorded in pre-commercialization field trials are consistent with the actual experience of farmers commercializing Bt cotton during the eight year period 2002 to 2009.
Pre-commercialization Bt cotton data analyzed by Naik (2001) indicated that the overall economic advantage of Bt cotton in 1998/99 ranged from US$76 to US$236 per hectare, equivalent to an average 77% gain, compared with conventional cotton. Naik reported a 38% yield increase and 75% reduction in numbers of insecticides spray on Bt cotton over non-Bt counterparts.
The ICAR (2002) data set from large scale field trials in 2001 reported that the economic advantages for three Bt cotton hybrids (MECH-12, MECH-162 and MECH-184) tested under the All India Coordinated Cotton Improvement Project (AICCIP) from 1998/99 to 2000/01 was relatively high due
figure 28. returns to labor from bt Cotton and Conventional Cotton in rural india, 2010
Source: Adopted from Subramanian, 2010.

Global status of Commercialized biotech/GM Crops: 2010
76
tabl
e 18
. tw
elve
stu
dies
Con
duct
ed b
y pu
blic
inst
itute
s on
the
ben
efits
of b
t Cot
ton
in in
dia
for t
he Y
ears
, 199
8 to
201
0
publ
icat
ion
1 Nai
k 20
01
2 iC
ar
fiel
dtr
ials
20
02
3 Qai
m20
06
4 ben
net
2006
5 iiM
a
2006
6 iC
ar
fld
2006
7 and
hra
uni
ver-
sity
200
6
8 Ces
s20
07
9 sub
ra-
man
ian
& Q
aim
20
09
10sa
-da
shiv
ap-
pa&
Qai
m20
09
11Q
aim
et. al
12su
bram
a-ni
an&
Qai
m
2010
Perio
d st
udie
d19
98-9
9 &
00-
0120
0120
01-
2002
2002
&
2003
2004
2005
2006
2004
-05
2004
-05
2006
-07
1998
-06
2006
-07
Yiel
d in
crea
se38
%60
-90%
34%
45-6
3%31
%30
.9%
46%
32%
30-4
0%43
%37
%43
%
Red
uctio
n in
no
. of s
pray
4 to
1
(75%
)5-
6 to
1
spra
y (7
0%)
6.8
to 4
.2
(50%
)3
to 1
39%
–55
%25
%50
%21
%41
%21
%
Incr
ease
d pr
ofit
77%
68%
69%
50%
or
mor
e gr
oss
mar
gins
88%
–11
0%83
%–
70%
89%
134%
Ave
rage
in
crea
se in
pr
ofit/
hect
are
$76
to
$236
/he
ctar
e
$96
to
$210
/he
ctar
e
$118
/he
ctar
e–
$250
/he
ctar
e–
$223
/he
ctar
e$2
25/
hect
are
$156
/he
ctar
e or
mor
e
$148
/he
ctar
e or
m
ore
$131
/he
ctar
e or
mor
e
$161
/he
ctar
e or
m
ore
Sour
ces:
1.
N
aik
G. 2
001.
“A
n an
alys
is o
f soc
io-e
cono
mic
impa
ct o
f Bt t
echn
olog
y on
Indi
an c
otto
n fa
rmer
s,”
Cen
tre fo
r Man
agem
ent i
n A
gric
ultu
re, I
IMA
, Ind
ia.
2.
Indi
an C
ounc
il fo
r Agr
icul
tura
l Res
earc
h (IC
AR
), 20
02. “
Rep
ort o
n 20
01 IP
M tr
ial c
ost b
enef
it an
alys
is,”
ICA
R, N
ew D
elhi
, Ind
ia.
3.
Qai
m M
. 20
06. “
Ado
ptio
n of
Bt c
otto
n an
d im
pact
var
iabi
lity:
Insi
ghts
from
Indi
a”, R
evie
w o
f Agr
icul
tura
l Eco
nom
ics.
28:
48-
58.
4.
Ben
nett
R. e
t al.
2006
. “Fa
rm-le
vel e
cono
mic
per
form
ance
of g
enet
ical
ly m
odifi
ed c
otto
n in
Mah
aras
tra, I
ndia
,” R
evie
w o
f Agr
icul
tura
l Eco
nom
ics,
28:
59-
71.
5.
Gan
dhi,
V a
nd N
ambo
odiri
, NV.
200
6. “
The
adop
tion
and
econ
omic
s of
Bt c
otto
n in
Indi
a: P
relim
inar
y re
sults
from
a s
tudy
”, II
M A
hmed
abad
wor
king
pa
per n
o. 2
006-
09-0
4, p
p 1-
27. S
ept 2
006.
6.
Fron
t lin
e de
mon
stra
tions
on
cotto
n 20
05-0
6. M
ini M
issi
on II
, Tec
hnol
ogy
Mis
sion
on
Cot
ton,
Indi
an C
ounc
il fo
r Agr
icul
tura
l Res
earc
h (IC
AR
), N
ew D
elhi
, In
dia.
7.
Ram
gopa
l, N
. 200
6. E
cono
mic
s of
Bt c
otto
n vi
s-à-
vis
Trad
ition
al c
otto
n va
rietie
s (S
tudy
in A
ndhr
a Pr
ades
h),”
Agr
o-Ec
onom
ic R
esea
rch
Cen
ter,
And
hra
Uni
vers
ity, A
.P.
8.
Dev
SM
and
NC
Rao
. 200
7. “
Soci
o-ec
onom
ic im
pact
of B
t cot
ton”
, CES
S M
onog
raph
s, C
entre
for E
cono
mic
and
Soc
ial S
tudi
es (C
ESS)
, Hyd
erab
ad, A
.P.
9.
Subr
aman
ian
A a
nd M
Qai
m. 2
009.
Vill
age-
wid
e Ef
fect
s of
Agr
icul
tura
l Bio
tech
nolo
gy: T
he C
ase
of B
t Cot
ton
in In
dia,
Wor
ld D
evel
opm
ent.
37 (1
): 25
6–26
7.10
. Sa
dash
ivap
pa P
and
M Q
aim
. 200
9. B
t Cot
ton
in In
dia:
Dev
elop
men
t of B
enef
its a
nd th
e R
ole
of G
over
nmen
t See
d Pr
ice
Inte
rven
tions
, AgB
ioFo
rum
. 12(
2):
1-12
.11
. Q
aim
M, A
Sub
ram
ania
n an
d P
Sada
shiv
appa
. 200
9. C
omm
erci
aliz
ed G
M c
rops
and
yie
ld, C
orre
spon
denc
e, N
atur
e B
iote
chno
logy
. 27
(9) (
Sept
200
9).
12.
Subr
aman
ian
A a
nd M
Qai
m. 2
010.
The
impa
ct o
f Bt c
otto
n on
poo
r hou
seho
lds
in ru
ral I
ndia
. Jou
rnal
of D
evel
opm
ent S
tudi
es, V
ol.4
6 (N
o.2)
. pp.
295
-31
1. 2
010.

Global status of Commercialized biotech/GM Crops: 2010
77
to severe pest infestations confirming efficacy of Bt technology for targeted insect pests. The overall economic advantages of the three Bt hybrids ranged from US$96 to US$210 per hectare – a 29% to 86% increase compared to conventional cotton. Qaim (2006) analyzed multi-location field trials data generated by Mahyco and showed similar economic benefits – a 50% reduction in the number of sprays, a 34% yield increase resulting in a net profit of US$118 per hectare. The magnitude of the economic advantages reported by Qaim (2006) was of the same order of magnitude as the 1998/99 data set analyzed by Naik (2001), and ICAR field trials data (2002). These pre-commercialization studies confirmed that Bt cotton resulted in a major economic advantage to cotton farmers by substantially increasing yield, reducing insecticide sprays and reduction in labor costs.
The first on-farm study by Bennett et al. (2006) confirmed that the principal gain from Bt cotton in India was the significant yield gains estimated at 45% in 2002, and 63% in 2001, for an average of 54% over the two years. Taking into account the decrease in application of insecticides for bollworm control, which translates into a saving of 2.5 sprays, and the increased cost of Bt cotton seed, Brookes and Barfoot (2008) estimated that the net economic benefits for Bt cotton farmers in India were US$139 per hectare in 2002, US$324 per hectare in 2003, US$171 per hectare in 2004, and US$260 per hectare in 2005, for a four year average of approximately US$225 per hectare. The benefits at the farm level translated to a national gain of US$2.0 billion in 2007 and accumulatively US$3.2 billion for the period 2002 to 2007. Other studies reported a similar range of benefits, acknowledging that benefits will vary from year to year due to varying levels of bollworm infestations. The study by Gandhi and Namboodiri (2006), reported a yield gain of 31%, a significant reduction in the number of pesticide sprays by 39%, and an 88% increase in profit or an increase of US$250 per hectare for the 2004 cotton growing season.
A Front Line Demonstration (FLD) study on cotton for 2005-06 released by the Indian Council of Agricultural Research (ICAR, 2006) reconfirms a net 30.9% increase in seed yield of Bt cotton hybrids over non-Bt hybrids and a 66.3% increase over open-pollinated cotton varieties (OPV). Data in the study covered 1,200 demonstration and farmers’ plots in 11 cotton-growing states in India. In the demonstration plots, the Bt cotton hybrids proved to be highly productive with an average yield of 2,329 kg/ha of seed cotton compared to the non-Bt cotton hybrids (1,742 kg/ha) and varieties (1,340 kg/ha). Similarly, the average yield of Bt cotton hybrids was higher in farmers’ plots at 1,783 kg/ha compared to non-Bt cotton hybrids (1,362 kg/ha) and OPV in farmers’ field (1,072 kg/ha).
A study in 2005 by University of Andhra (2006) concluded that Bt cotton farmers earned three times more than non-Bt cotton farmers in Guntur district and eight times more in Warangal district of Andhra Pradesh, India. The Government of Andhra Pradesh commissioned the study three years ago to examine the advantages, disadvantages, cost of cultivation and net return to Bt cotton as compared to other cotton varieties in selected districts. The study confirmed that the average Bt

Global status of Commercialized biotech/GM Crops: 2010
78
farmer had a 46% higher yield and applied 55% less pesticides than the non-Bt cotton farmer in Guntur district. Bt cotton farmers in Warangal district applied 16% less pesticides and reaped 47% more cotton as compared to non-Bt farmers. Farmers noted that Bt cotton allowed earlier picking due to less pest susceptibility, and the boll color was superior.
A 2007 study “Socioeconomic impact of Bt cotton”, conducted by the Centre for Economic and Social Studies (CESS), Hyderabad concluded that the Bt cotton technology was superior to the conventional cotton hybrids in terms of yield and net returns. The study was carried out in four districts; Warangal, Nalgonda, Guntur and Kurnool in Andhra Pradesh representing the four agro-climatic zones in 2004-2005, 2005-2006, and sponsored by the Andhra Pradesh Netherlands Biotechnology Program (APNBP) now known as Agri Biotechnology Foundation – a part of Seventh Framework Program of the European Union. Whereas the absolute cost of production for Bt cotton was 17% higher, the study reported that the expenditures on insecticides decreased by 18% (from 12 sprays on non-Bt cotton to 9 sprays) yield increased by 32% resulting in the overall cost of cotton per quintal decreasing by 11%. Thus, as a result of higher yield and reduced pesticide sprays, Bt cotton farmers improved their net income by 83% over non-Bt cotton. The study confirmed that Bt cotton generated 21% higher labor employment than non-Bt cotton of which female laborers were the major beneficiaries among casual laborers. The study concluded that small farmers elected to plant Bt cotton, rather than conventional because it was more profitable and allowed them and their families to enjoy improved living standards.
A recent paper “Village-wide effects of agricultural biotechnology: The case of Bt cotton in India”, featured a case study by Subramanian et al. (2009). The study analyzed the economy-wide effects of Bt cotton for rural households in semi-arid India. The study showed that Bt cotton technology increased yield between 30-40% and reduced insecticide quantities by about 50% on average, thus generating an additional income of US$156 per hectare or more. More specifically, Bt cotton was associated with a substantial overall generation of rural employment with important gender implications. They concluded by noting that Bt technology generated more employment for females than males, “The aggregation of total wage income showed that females earned much more from Bt cotton than males. This was due to the fact that cotton harvesting is largely carried out by hired female laborers, whose employment opportunities and returns to labor improve remarkably. Pest control, on the other hand, is often the responsibility of male family members, so that Bt technology reduced their employment in cotton production. On average, the saved family labor could be reemployed efficiently in alternative agricultural and non-agricultural activities, so that the overall returns to labor increased, including for males.” Similarly, studies published by Sadashivappa et al. (2009) (which analyzed Bt technology performance over the first five years of adoption, using panel data with three rounds of observations) concluded that on average, Bt adopting farmers realized pesticide reductions of roughly 40%, and

Global status of Commercialized biotech/GM Crops: 2010
79
yield advantages of 30-40% resulting in a higher net profit of 70% or US$148 per hectare, or more.
Moreover, the recent studies by Qaim et al. (2009) analyzed the socio-economic effects of Bt cotton in India and demonstrated spillover effects of Bt cotton benefits for rural households in semi-arid states – Maharashtra, Andhra Pradesh, Karnataka and Tamil Nadu. The pre and post commercialization farm surveys conducted by Qaim et al. (2009) revealed that farmers adopting Bt cotton used 41% less pesticides and obtained 37% higher yields, resulting in an 89% or US$135 per hectare gain in cotton profits. In spite of seasonal and regional variation, these advantages have been sustainable over time. These direct benefits of Bt cotton technology have also been reported by other farm surveys conducted by public sector institutions during the period 1998 to 2006. For the first time in a systematic survey, Qaim et al. (2009), demonstrated the indirect benefits of Bt technology in India. For instance, higher cotton yields provided more employment opportunities for agricultural laborers and a boost to rural transport and trading businesses. Income gains among farmers and farm workers resulted in more demand for food and non-food items, inducing growth and household income increases in other sectors locally. Their research noted that each dollar of direct benefits was associated with over US$0.80 of additional indirect benefits in the local economy. In terms of income distribution, all types of households benefited, including those below the poverty line. Sixty percent of the gains accrued to the extremely and moderately poor. Bt cotton also generated increased net employment, with important gender implications. Compared to conventional cotton, Bt increased aggregated returns to labor by 42%, whereas the returns for hired female agricultural workers increased by 55%. This is largely due to additional labor employed for picking cotton, which is primarily a female activity in India. As is known, women’s income has a particularly positive effect for child nutrition and welfare. These studies concluded that “In this case, at least, there is strong evidence that the trait in this crop is already contributing to poverty reduction in the subcontinent.”
In 2010, the University of Warwick researchers published a study referred to earlier “The Impact of Bt Cotton on Poor Households in Rural India” in the Journal of Development Studies analysing the direct and spill-over effects of Bt cotton on poor households in rural India. The study shows that the main beneficiaries are vulnerable farmers, whose household income gains are 134 percent higher under Bt than under conventional cotton. Concluding that Bt cotton produces important benefits in large parts of rural India, the study also demonstrate that technology adoption entails important positive socioeconomic effects in the small farm sector as generated income gains for all types of households, including those below the poverty line. Underscoring the UN Millennium Development Goals (MDG) of halving poverty by 2015, the study concludes that GM crop applications can help reduce poverty, as such has wider implications and might further the debate about the role of agricultural biotechnology for sustainable development (Subramanian & Qaim, 2010).

Global status of Commercialized biotech/GM Crops: 2010
80
The only published impact studies of Bt cotton in 2008/09 was conducted by IMRB International (IMRB, 2009) which focused on the agronomic and economic benefits. The only published study specifically on the social impact of Bt cotton was conducted by Indicus Analytics in 2007 (Indicus, 2007).
The IMRB study “Samiksha-09” sampled 4,863 farmers selected from 400 villages from 27 districts in six States and interviewed 4,860 farmers representing both BG-I®, BG-II® and non-Bt cotton farmers based on 2008 cotton cultivation. The IMRB study compared the economic benefits of BG-I® and BG-II® cotton hybrids versus non-Bt cotton hybrids. The study reported a 38% incremental yield for BG-I® hybrids and 46% incremental yield with BG-II® cotton hybrids over conventional cotton hybrids in 2008. Similarly, the study reported higher saving on the cost of pesticide sprays of Rs. 1,635 per hectare (US$36) for BG-II® hybrids and Rs. 909 (US$20) for BG-I® cotton hybrids over conventional cotton. As a result, BG-II® cotton farmers earned Rs. 23,374 per hectare (US$520) and Rs. 17,082 (US$378) for BG-I® cotton farmers over conventional cotton farmers. It is noteworthy that on average BG-II® cotton farmers earned an additional net income of Rs. 6,292 (US$140) over BG-I® cotton farmers. This is consistent with the trend for farmers to increasingly adopt BG-II® cotton hybrids over BG-I® cotton hybrids in 2008 and 2009, and it is expected that BG-II® cotton hybrids will replace BG-I® cotton hybrids in the near term. On a cost benefit analysis, the study showed that BG-II® cotton hybrids offered 194% return on investment compared with 158% for BG-I® cotton hybrids and only 93% for non-Bt cotton hybrids. The study also revealed that 90% and 91% of BG-I® and BG-II® cotton farmers, respectively, were satisfied with the performance of Bt cotton technology irrespective of whether they were large, medium, or small and marginal farmers. The IMRB estimates for the 2008 season were higher than estimates for the previous years (2002 to 2007) due to higher prices of cotton, and the higher value of the Indian Rupee versus the US dollar. The IMRB study estimated that in 2008 Bt cotton technology helped farmers to increase cotton production nationally by 72 million quintals of seed cotton (42 million bales of lint), reduced pesticide usage by Rs. 1,813 crore (US$403 million) and earned an additional income of Rs. 16,215 crore (US$3.6 billion).
The latest parallel study to the IMRB studies, conducted by Indicus Analytics (Indicus, 2007) focused on Bt cotton in India in 2006 – it was the first study to focus entirely on the social impact as opposed to the economic impact. The study involved 9,300 households growing Bt cotton and non-Bt cotton in 465 villages. The study reported that villages growing Bt cotton had more social benefits than villages growing non-Bt cotton. More specifically, compared with non-Bt cotton villages, Bt cotton villages had more access to permanent markets (44% versus 35%), and banking facilities (34% versus 28%). Bt cotton farmers also benefited more from visits of government and private sector extension workers and were more likely to adopt recommended practices such as improved rotation, and change in the use of the first generation Bt cotton hybrids for improved second generation Bt cotton hybrids. Notably, there was also a consistent difference between Bt cotton households and non-Bt cotton households in terms of access and utilization of various services. More specifically

Global status of Commercialized biotech/GM Crops: 2010
81
compared with non-Bt cotton household, women in Bt cotton households had a higher usage of antenatal check ups, and more use of professionals to assist with births at home. Similarly, children from Bt cotton households had higher proportion of children benefiting from vaccination (67% versus 62%) and they were more likely to be enrolled/registered in school. It is noteworthy that the socio-economic advantages enjoyed by Bt cotton households were already evident in 2006 despite the fact that the first Bt cotton was only adopted in 2002. Thus, the economic benefits associated with Bt cotton was already starting to have a welfare impact in 2006 that provides a better quality of life for Bt cotton farmers and their families in India.
The 2008 ISAAA Report (James, 2008) projected that the adoption rate of Bt cotton in India in 2009 would reach more than 80%, whereas the actual level in 2009 was 81% (James, 2009b) which further increased to 86% in 2010. Given the significant and multiple agronomic, economic and welfare benefits that farmers derive from Bt cotton in India, the adoption of approved Bt cotton hybrids and varieties in India is expected to continue to increase only modestly in 2011 since the current level of adoption at 86% is close to optimal, however should total plantings of cotton increase significantly, then a greater gain in Bt cotton hectares would follow. Despite the unprecedented high adoption rate of 86% of Bt cotton by 6.3 million farmers, the majority of whom have first-hand experience of up to nine years of the significant benefits it offers, and the consistent high performance of Bt cotton compared with conventional, anti-biotech groups still continue to vigorously campaign against biotech in India, using all means to try and discredit the technology, including filing public interest writ petitions and pursuing litigation in the Supreme Court contesting the biosafety of biotech products.
bt brinjal: an important biotech Vegetable Crop
India’s Genetic Engineering Appraisal Committee (GEAC), the country’s biotech regulator, in its 97th meeting held on 14th Oct 2009 recommended the commercial release of Bt Brinjal Event EE-1 developed indigenously by M/s Maharashtra Hybrid Seeds Company Ltd. (Mahyco) in collaboration with the University of Agricultural Sciences (UAS), Dharwad, the Tamil Nadu Agricultural University (TNAU), Coimbatore and the Indian Institute of Vegetable Research (IIVR), Varanasi (GEAC, 2009a; MoEF, 2009). The recommendation came seven years after the approval of Bt cotton, the country’s first biotech crop which was already planted by 5.6 million farmers on 81% of total cotton area that time in 2009. Bt brinjal, which is resistant to the dreaded Fruit and Shoot Borer (FSB), has been under research and development and a stringent regulatory approval process in India since 2000. However, on 9th Feb 2010, the Ministry of Environment and Forest (MoEF) decided to temporarily halt the commercial release of Bt brinjal until such time independent scientific studies established, to the satisfaction of both the public and professionals, the safety of the product from the point of view of its long-term impact on human health and environment, including the rich genetic wealth existing in brinjal in India (MoEF, 2010).

Global status of Commercialized biotech/GM Crops: 2010
82
In response to the moratorium on Bt brinjal in Feb 2010, efforts were made to address the concerns and raise awareness about the potential benefits of Bt brinjal to farmers and consumers in the country. Accordingly, the six top science academies of India reviewed and ultimately endorsed the safety of Bt brinjal and recommended limited release of Bt brinjal in the “Inter-Academy Report on GM Crops” released in Sept 2010 and further updated in Dec 2010. Vindicating the doubt raised by opponents of the technology the Academy Report states that “the overwhelming view is that the available evidence has shown, adequately and beyond reasonable doubt, that Bt brinjal is safe for human consumption and that its environmental effects are negligible. It is appropriate now to release Bt brinjal for cultivation in specific farmers’ fields in identified states” (INSA, 2010a; INSA, 2010b; INSA, 2010c). Critics contested the findings of the Academy Report and the decision to approve Bt brinjal was pending as this Brief went to press. Readers are referred to ISAAA Brief 38 (Choudhary and Gaur, 2009) for a detailed account of the development and regulation of Bt Brinjal in India.
Given that biotech crops are not a technology in which society is normally not well informed, ISAAA Brief 38 (Choudhary and Gaur, 2009b) “The Development and Regulation of Bt Brinjal in India (Eggplant/Aubergine)” was released in early 2009, prior to the moratorium on Bt brinjal in Feb 2010. It was designed as a primer for all interest groups with a desire to: firstly, learn about the cultivation of brinjal in India; secondly, to learn about the approval status and attributes of Bt brinjal which provides an option for significantly decreasing the use of insecticides on this important vegetable crop. The subjects covered in ISAAA Brief 38 range from the cultivation of brinjal as a vegetable used in diverse dishes in India and internationally, to the development and approval status of Bt brinjal in India including: regulation, biosafety and food safety assessment, the future prospects for Bt brinjal, and implications for other biotech food crops. ISAAA Brief 38 concludes that the commercialization of Bt brinjal has the potential to benefit up to a total of 1.7 million small farmers in the three countries of India (550,000 hectares farmed by 1.4 million small farmers), Bangladesh (57,747 hectares farmed by approximately 300,000 farmers) and the Philippines (21,000 hectares farmed by 30,000 farmers). The collective area of 630,000 hectares of brinjal represents a quarter of the total vegetable area in these three countries and therefore the potential impact of this project is significant. Brinjal is grown all-year round and supplies 25 calories per serving, and its “meaty” texture makes brinjal a perfect staple for vegetarians. ISAAA Brief 38 was designed to facilitate a more informed and transparent discussion regarding the potential role of biotech food crops, such as Bt brinjal, in contributing to global food security and a more sustainable agriculture.
investments in Crop biotechnology in india
India is a country with first-hand experience of the life-saving benefits of the Green Revolution in wheat and rice. Yields in both wheat and rice are now plateauing and the conventional technology

Global status of Commercialized biotech/GM Crops: 2010
83
currently used in wheat and rice and other crops will need to be supplemented to feed a growing population that will increase by 50% to 1.5 billion people by 2050. Accordingly, the Government of India, through the Department of Biotechnology (DBT) in the Ministry of Science and Technology, established six centers of plant biotechnology in 1990, in addition to the existing research institutions of the Indian Council of Agricultural Research (ICAR), Council of Scientific and Industrial Research (CSIR) and different centers/departments of the State Agricultural Universities engaged in R&D of crop biotechnology sector in India. In recent years, the Department of Biotechnology (DBT) has either announced establishment or proposals to establish a series of new institutions, resource centers, biotech parks and incubators and biotech clusters across India to strengthen plant biotechnology research in the country. Table 19 lists DBT’s institutional capacity and infrastructure for education, R&D and applied research of crop biotechnology sector in India as of 2009. The increased public sector investments in crop biotechnology in India are complemented by private sector investments from a large number of indigenous Indian seed companies and subsidiaries of multinationals involved in biotech crops.
Although there are no published estimates of the research and development (R&D) expenditures on crop biotechnology in India, the high level of activity in both the public and the private sector indicates that the fast-growing investments are substantial with India ranking third after China and Brazil in developing countries. Crop biotech investments from both the public and private sectors in India have increased significantly in recent years. Public sector investments alone in crop biotechnology were estimated to be about US$1.5 billion over the last five years, or US$300 million per year. Private sector investments are judged to be somewhat less than the public sector at up to US$200 million making the current total of public and private sector investments in crop biotechnology in India at the order of US$500 million per year. Current R&D in crop biotechnology in India is focused on the development of biotech food, feed and fiber crops that can contribute to higher and more stable yields and also enhanced nutrition. Given that rice production in India is vital for food security, much emphasis has been assigned to genomics in rice and the development of improved varieties tolerant to abiotic stresses such as salinity and drought, and biotic stresses such as pests and diseases. Field trials with biotech Bt rice are already underway. Reduction of post-harvest losses, particularly in fruits and vegetables, through delayed ripening genes, is also a major thrust. Reflecting the emphasis on improved crop nutrition, two international collaborative projects involve Golden Rice, and mustard with enhanced levels of beta-carotene plus an initiative to enhance the nutritional value of potatoes with the ama1 gene. Research in Germany (Stein et al, 2006) predicts a positive impact of Golden Rice 2 in India. Under an optimistic scenario, the burden of disability adjusted life years (DALYs) would be reduced by a significant 59% and by 9% under a pessimistic scenario.

Global status of Commercialized biotech/GM Crops: 2010
84
tabl
e 19
. d
bt’
s in
stitu
tiona
l Cap
acity
and
inf
rast
ruct
ure
for r
&d
of C
rop
bio
tech
in in
dia,
200
9
Nat
iona
l in
stit
utio
ns
New
Nat
iona
l in
stit
utio
ns
bio
tech
par
ks a
nd
incu
bato
rs
r
esou
rce
Cen
ters
bio
tech
nolo
gy
Clu
ster
sR
ajiv
Gan
dhi C
entre
fo
r Bio
tech
nolo
gy,
Thiru
vana
ntha
pura
mEs
tabl
ishe
d in
199
0
UN
ESC
O R
egio
nal
Cen
tre fo
r Bio
tech
nolo
gy
Trai
ning
and
Edu
catio
n,
Farid
abad
*
Tech
nolo
gy B
usin
ess
Incu
bato
rs
(DST
)*Pl
atfo
rm fo
r Tra
nsla
tiona
l R
esea
rch
on T
rans
geni
c C
rops
(P
TTC
) at I
CR
ISAT
, Hyd
erab
ad*
Agr
i-foo
d B
iote
ch
Clu
ster
, Pun
jab
Kno
wle
dge
City
, M
ohal
i*
Nat
iona
l Cen
tre fo
r Cel
l Sc
ienc
es (N
CC
S), P
une
Esta
blis
hed
in 1
996
Nat
iona
l Agr
i-foo
d B
iote
chno
logy
Inst
itute
(N
AB
I), M
ohal
i*
ICIC
I Kno
wle
dge
Park
, H
yder
abad
*G
enom
ics
and
prot
eom
ics
tech
nolo
gy p
latfo
rms
at D
elhi
U
nive
rsity
and
IAR
I*
Nat
iona
l Cap
ital
Reg
ion
Bio
tech
nolo
gy
Clu
ster
, Far
idab
ad**
Nat
iona
l Ins
titut
e of
Pla
nt
Gen
ome
Res
earc
h (N
IPG
R),
New
Del
hiEs
tabl
ishe
d in
199
7
Food
Bio
proc
essi
ng U
nit,
Moh
ali*
S&T
Park
, Ban
galo
re*
Det
ectio
n fa
cilit
ies
of g
enet
ical
ly
mod
ified
food
and
food
pro
duct
s (C
DFD
, Hyd
erab
ad);
(NB
PGR
, N
ew D
elhi
); (IT
RC
, Luc
know
); (N
IN, H
yder
abad
); an
d (C
FTR
I, M
ysor
e)*
Bio
tech
nolo
gy
Clu
ster
, Uni
vers
ity o
f A
gric
ultu
ral S
cien
ces,
B
anga
lore
**
Cen
tre fo
r DN
A
Fing
erpr
intin
g an
d D
iagn
ostic
s (C
DFD
), H
yder
abad
Esta
blis
hed
in 1
998
Nat
iona
l Ins
titut
e of
Abi
otic
Stre
ss
Man
agem
ent,
Bar
amat
i*(A
new
inst
itute
of I
CA
R)
TIC
EL P
ark,
Che
nnai
*N
atio
nal C
onta
inm
ent-
cum
-Qua
rant
ine
Faci
lity
for
Tran
sgen
ic P
lant
ing
Mat
eria
l, N
BPG
R, N
ew D
elhi
(DB
T)*
Bio
tech
nolo
gy
Clu
ster
, Uni
vers
ity
of H
yder
abad
, H
yder
abad
**
Inst
itute
of B
iore
sour
ces
and
Sust
aina
ble
Dev
elop
men
t (IB
SD),
Imph
alEs
tabl
ishe
d in
200
1
Nat
iona
l Ins
titut
e of
Agr
icul
tura
l B
iote
chno
logy
**(A
new
inst
itute
of I
CA
R)
Agr
i-foo
d B
iote
ch P
ark,
Moh
ali*
Nat
iona
l Cer
tific
atio
n Fa
cilit
y fo
r Ti
ssue
Cul
ture
Pla
nts
(at s
ever
al
exis
ting
inst
itutio
ns)*
Inst
itute
of L
ife S
cien
ces
(ILS)
, Bhu
vane
shw
arEs
tabl
ishe
d in
200
2
Nat
iona
l Bio
tic S
tress
In
stitu
te**
(A n
ew in
stitu
te o
f IC
AR
)
Bio
tech
nolo
gy In
cuba
tion
Cen
tre, G
enom
e Va
lley,
H
yder
abad
*
Bio
mol
ecul
ar C
hara
cter
izat
ion
Cen
tre, B
anga
lore
**
Cen
tre o
f Bio
info
rmat
ics
in A
gric
ultu
re**
(A n
ew in
stitu
te o
f IC
AR
)
Agr
i-Inc
ubat
or, U
nive
rsity
of
Agr
icul
tura
l Sci
ence
s, D
harw
ad
and
Tam
il N
adu
Agr
icul
tura
l U
nive
rsity
, Coi
mba
tore
*
Agr
i Bus
ines
s In
cuba
tor,
(ICR
ISAT
), H
yder
abad
(An
initi
ativ
e of
DST
)*
*New
initi
ativ
e, *
*Pro
pose
d
Sour
ce: D
BT,
200
9; N
ates
h &
Bha
n, 2
009.

Global status of Commercialized biotech/GM Crops: 2010
85
biotech Crops under development in india
Biotech crops being developed by the public sector include the following 11 crops: brinjal, cotton, groundnut, mustard, papaya, potato, rice, sorghum, sugarcane, tomato and watermelon. In addition, the private sector in India has the following eight biotech crops under development: brinjal, cabbage, cauliflower, cotton, maize, okra, rice and tomato. There are now 16 biotech crops in field trials in India and these are listed alphabetically in Table 20. In India, an estimated 13 million farmers grow over 7.5 million hectares of maize – India is the fifth largest maize country in the world after the USA, China, Brazil and Mexico. Clearance was given recently by the Indian Government for field trials of Bt maize, HT maize and Bt/HT maize which, subject to regulatory approval could be deployed commercially within 2 to 3 years.
It is clear that India will be in a position to commercialize several biotech food crops in the near term, thus an awareness initiative to inform the public of the attributes of biotech crops is both timely and important. A survey by the Indian Institute of Management (IIM, 2007) addressed the issues of consumer awareness, opinion, acceptance and willingness to pay for GM foods in the Indian market place. The survey, conducted by (IIM) Ahmadabad in collaboration with Ohio State University, revealed that 70% of India’s middle class is prepared to consume genetically modified food. The study also revealed that on average, consumers were willing to pay 19.5% and 16.1% premiums for Golden Rice and GM edible oil, respectively. The study suggested that consumer education societies, government ministries, and food companies create awareness about GM foods amongst Indian consumers. In summary, India’s increased public and private sector investments including government support for crop biotechnology is progressive. It is expected that Bt brinjal which is put on temporarily halt for commercialization would drive the interest of public researchers and private investors in the future prospects of biotech crops in the country.
economic benefits of bt cotton in india
The annual global study of benefits generated by biotech crops, conducted by Brookes and Barfoot (2011, forthcoming), estimates that India enhanced farm income from Bt cotton by US$7.0 billion in the period 2002 to 2009 and US$1.9 billion in 2009 alone. Typically, yield gains are approximately 31%, a significant 39% reduction in the number of insecticide sprays, leading to an 88% increase in profitability, equivalent to a substantial increase of approximately US$250 per hectare (Gandhi and Namboodiri, 2006). The earlier section in this Chapter on “Impact and Benefits of Bt cotton in India” documents a legion of referenced and compelling independent studies that confirm that Bt cotton has transformed cotton production in India by increasing yield, decreasing insecticide applications and through welfare benefits contributed to the alleviation of poverty for 6.3 million small and resource-poor farmers in 2010 alone; the potential of biotech cotton in India for the future is enormous.

Global status of Commercialized biotech/GM Crops: 2010
86
table 20. status of field trials of biotech/GM Crops in india, 2010
Crop organization transgene/trait eventBrinjal IARI, New Delhi
Sungro Seeds, New DelhiMahyco, JalnaTNAU, CoimbatoreUAS, DharwadIIVR, VaranasiBejo Sheetal, Jalna
cry1Aabc/IRcry1Ac/IRcry1Ac/IRcry1Ac/IRcry1Ac/IRcry1Ac/IRcry1Fa1/IR
- EE-1EE-1EE-1EE-1EE-1Event-142
Cabbage Nunhems, GurgaonSungro Seeds, New Delhi
cry1Ba and cry1Ca/IR cry1Ac/IR
--
Cauliflower Sungro Seeds, New DelhiNunhems, Gurgaon
cry1Ac/IRcry1Ba and cry1Ca/IR
CFE-4-
Chickpea NRCPB, New Delhi cry2Aa gene/IR Event Selection
Cotton Mahyco, JalnaDow Agro Sciences, Mumbai
JK Agri-Genetics, HyderabadMetahelix, BangaloreCICR, Nagpur and UAS, DharwadBayer BioScience Pvt. Ltd.
cry1Ac and cry2Ab/IR & HTcry1Ac and cry1F/IR
cry1Ac and cry1Ec/IRcry1C/IRcry1Ac/IR2mEPSPS/HT
MON 15985 and MON 88913Event 3006-210-23 and Event 281-24-236Event 1 and Event 24Event 9124BN Bt event (BNLA-601)Event Glytol
Groundnut ICRISAT, HyderabadUAS, GKVK, Bangalore
Rice chit and DREB/FR, DSTDREB 1A and DREB 1B Drought Resistance (DR)
-
Maize Monsanto, Mumbai
Pioneer/Dupont, HyderabadDow Agro Sciences, MumbaiSyngenta Biosciences Pvt. Ltd.Syngenta Biosciences Pvt. Ltd.
cry2Ab2 & cryA.105 and CP4EPSPS/IR&HTcry1F and CP4EPSPS/IR&HTcry1F/IRcry1Ab gene/IRcry1Ab × mepsps/IR&HT
Mon89034 and NK603
TC1507, NK603TC1507Event Bt11Event Bt11×GA21
Mustard Delhi University, New DelhiIARI, New Delhi
bar, barnase,barstar/APosmotin gene/Drought Tolerance
-Event Omb5-B
Okra Mahyco, MumbaiSungro Seeds, DelhiBejo Sheetal, JalnaArya Seeds, Gurgaon
cry1Ac/IRcry1Ac/IRcry1Ac/IRCP-AV1/IR
-
Papaya IIHR, Bangalore PRSV cp-gene/Virus Resistance (VR)
Event Selection
Potato CPRI, ShimlaNIPGR, DelhiIARI, New Delhi
RB, GA20 Oxidase 1 gene/DRama1/NEVirus Resistance (VR)
-
Event Selection

Global status of Commercialized biotech/GM Crops: 2010
87
table 20. status of field trials of biotech/GM Crops in india, 2010
Crop organization transgene/trait eventRice IARI, New Delhi
TNAU, CoimbatoreMSSRF, ChennaiDRR, HyderabadMahyco, MumbaiBayer CropScience, HyderabadAvesthagen
E.I. Dupont India Pvt. Ltd., HyderabadMetahelix, Bangalore
cry1Aabc, DREB, GR-1 & GR-2 (Golden Rice)/NEchi11/FR
MnSOD/DSTcry1Ac/IRcry1Ac, cry2Ab/IRcry1Ab, cry1Ac, and bar/IRNAD9/NEOs-Msca1 genecry1Ac and cry1Ab
-
Sorghum DSR, HyderabadCRIDA, Hyderabad
cry 1B/IRmtID gene (DST)
Event 4 and Event 19Event Selection
Tomato IARI, New DelhiMahyco, MumbaiAvesthagen
IIHR, Bangalore
antisense replicase, ACCSynthase gene, osmotin,DREB/IR, DR, FR, NE, DSTcry1Ac/IRNAD9/NEVR (Virus Resistance)
-
--Event selection
Watermelon IIHR, Bangalore VR (Virus Resistance) Event selection
Legend: AP: Agronomic Performance, BR: Bacterial Resistance, DR: Disease Resistance, DST: Drought and Salinity Tolerance, FR: Fungal resistance, IR: Insect Resistance, HT: Herbicide Tolerance, NE: Nutritional Enhancement.
Abbreviation: TNAU- Tamil Nadu Agricultural University; IIVR- Indian Institute of Vegetable Research; UAS-University of Agricultural Sciences; CICR-Central Institute of Cotton Research; ICRISAT-International Crop Research Institute for Semi-Arid Tropics; CPRI-Central Potato Research Institute; NIPGR-National Institute of Plant Genome Research; IARI-Indian Agricultural Research Institute; MSSRF-MS Swaminathan Research Foundation; DRR-Directorate of Rice Research; NRCS-National Research Center on Sorghum.
Source: Indian GMO Research Information System (IGMORIS), 2010, Compiled by ISAAA, 2010.
political Will and support
the prime Minister of india dr. Manmohan singh. While inaugurating the 97th Indian Science Congress in Thiruvanthapuran, Kerala on 3 January, 2010, dr. Manmohan singh, the prime Minister of india lauded the resounding success of Bt cotton in India and emphasized the need for developments in biotechnology for greatly improving the yield of major crops in India. His speech was of particular significance because the congress is the apex body for science and technology in India and has focused on “Science and Technology Challenges of 21st Century-National Perspective”.

Global status of Commercialized biotech/GM Crops: 2010
88
He said “Developments in biotechnology present us the prospect of greatly improving yields in our major crops by increasing resistance to pests and also to moisture stress. Bt Cotton has been well accepted in the country and has made a great difference to the production of cotton. The technology of genetic modification is also being extended to food crops though this raises legitimate questions of safety. These must be given full weightage, with appropriate regulatory control based on strictly scientific criteria. Subject to these caveats, we should pursue all possible leads that biotechnology provides that might increase our food security as we go through climate related stress.”
prof. M. s. swaminathan, Member of parliament, rajya sabha (upper house), the parliament of india and Chairman, Mssrf. Prof. M. S. Swaminathan in his article “GM: Food for Thought” published in the Asian Age, Delhi, 26th August 2009:
“The world population has crossed six billion and is predicted to double in the next 50 years. Ensuring an adequate food supply for this booming population is a major challenge in the years to come. GM foods promise to meet this need in a number of ways….. GM foods have the potential to solve many of the world’s hunger and malnutrition problems, and to help protect and preserve the environment by increasing yield and reducing reliance upon chemical pesticides.”
Mr. sharad pawar, the Minister of agriculture and Consumer affairs. Presentation at the National Seminar on “Seed and Crop Technologies for Doubling Agricultural Production”, organized by the National Seed Association of India (NSAI) from 8-9 August, 2008, New Delhi:
“With limited natural resources available to improve agricultural production, genetically engineered crops developed by applying biotechnological tools, are being looked upon as a promising alternative which can benefit farmers, manufacturers as well as consumers.”
In 2010, a record 6.3 million farmers planted Bt cotton over 9.4 million hectares in India. Majority of these farmers are small, marginal and resource poor. Their livelihood depends on success and failure of cotton crop. In the past, ISAAA highlighted the testimonials of randomly selected small farmers both men and women from all nine cotton growing states of India. Testimonials included details of farmers, their family, and their experience with growing both single gene and multiple gene Bt cotton hybrids. Two new farmers from Rajasthan and Haryana who grow commercial Bt cotton on their own land and on leased land share their experiences as follow:
Mr. Rammurthy grows Bt cotton on 3 keela (equivalent of 3acres) leased land and lives happily in his Village Dhanna Kalla, District Hanshi of Haryana.

Global status of Commercialized biotech/GM Crops: 2010
89
“My name is Rammurthy resident of Dhanna Kalla. My village is located 2 kms from the land where I cultivate Bt cotton. I have five members in my family including 2 boys and a girl. My boys studied 10th standard like me and left school to work with me in my farm. I am a farmer with 3 acres of land since I left school many years ago. I cultivate Bt cotton on a leased land and pay approximately Rs. 10,000 per season to the owner of the land. In addition, I also grow Bt cotton on my own farm which is located close to my village. Since the introduction of Bt cotton, I grow cotton on leased land as I find it comfortable and profitable to grow cotton now. I take two crops in a year, cotton in Kharif and wheat in Rabi season. I also grow some vegetables as well. Bt cotton yields around 30 to 40 mann (12 to 16 quintal per acre) with negligible cost on spraying, which has come down to 2 to 3 sprays from 15 sprays in the past. With Rasi Bt cotton hybrids, I earned approximately Rs. 20,000 per acre after paying Rs. 10,000 to land owner. I will be getting my daughter married soon.”
Mr. Mal Singh Jalla is a Bt cotton farmer from Tamariya village, Banswara district of Rajasthan.
“I am a born farmer in this irrigated belt of Banswara district of Rajasthan. I own 10 bigga (approximately 2.5 acre) of land inherited from my family. Fortunately my farm is located on the main highway which gives me early exposure to various new technologies as many experts visit my farm regularly. I have two boys who are in private job in Vadodara district of Gujarat. I myself cultivate land to grow various crops including corn, cotton, wheat and vegetables like chilli and brinjal. I started growing Bt cotton after it was formerly introduced in Rajasthan in 2005. This year, I am undertaking Bt cotton seed production program on my 2.5 acre of land. This is the new way of doing farming in my life. I am very excited to continue Bt cotton hybrid seed production program where I earn more money than growing commercial Bt cotton hybrids on my farm in the past. I believe farmers should be allowed to choose various options where they can make more money from their limited land. last year, I reaped around 10-12 quintals per acre of cotton by planting Bt cotton hybrids and earned significantly more than growing other crops like traditional maize on my land. In the past, I used to grow cotton hybrids including Shankar 4 and Shankar 6 cotton hybrid. I have also undertaken seed production program of castor on a leased land this year. I am very optimistic of my new venture of Bt cotton hybrid seed production.”

Global status of Commercialized biotech/GM Crops: 2010
90
CANADA
in 2010, Canada retained its fifth place in world ranking. Growth in biotech crop area continued in Canada in 2010 to reach 8.8 million hectares with a net gain of approximately 550,000 hectares, equivalent to a 7% year-over-year growth for the four biotech crops of canola, maize, soybean and sugarbeets. of the four biotech crops the largest increase was 300,000 hectares for canola, with a 94% adoption and approximately a 100,000 hectares each for maize and soybean. the average economic benefit from herbicide tolerant canola in western Canada during the three year period 2005 to 2007 was approximately Ca $400 million per year.
Canada is a member of the group of six “founder biotech crop countries”, having commercialized herbicide tolerant canola in 1996, the first year of commercialization of biotech crops. In 2010, Canada retained its fifth place in world ranking. Growth in biotech crop area continued in Canada in 2010 with a net gain of approximately 550,000 hectares, equivalent to a 7% year-over-year growth, with a total biotech crop area of 8.8 million hectares for the four biotech crops of canola, maize, soybean and sugarbeets. The largest biotech crop area by far, is herbicide tolerant canola, most of which is grown in the west where adoption rates are very high. The total land area planted to canola in Canada in 2010 was 6.7 million hectares, up from 6.4 million hectares in 2009. In fact, the intended planting of canola in 2010 was a record 7.2 million hectares, a 10% increase over 2009 but severe floods precluded this target from being realized. In 2010, the national adoption rate for biotech canola was
CaNada
Population: 33.2 million
GDP: US$1,501 billion
GDP per Capita: US$45,070
Agriculture as % GDP: 3%
Agricultural GDP: US$45 billion
% employed in agriculture: 3%
Arable Land (AL): 49.9 million hectares
Ratio of AL/Population*: 6.0
Major crops: • Wheat • Maize • Potato • Barley • Rapeseed
Commercialized Biotech Crops: • HT Canola • HT/Bt/HT-Bt Maize • HT Soybean • HT Sugarbeet
Total area under biotech crops and (%) increase in 2010: 8.8 Million Hectares (+7%)
Farm income gain from biotech, 1996-2009: US$2.6 billion
*Ratio: % global arable land / % global population

Global status of Commercialized biotech/GM Crops: 2010
91
94%, compared with 93% in 2009, 86% in both 2008 and 2007, 84% in 2006 and 82% in 2005 (Figure 29). In 2010, biotech herbicide tolerant canola was grown on approximately 6.3 million hectares, 5% more than the 6.0 million hectares of biotech canola grown in 2009, 5.5 million hectares in 2008, 5.1 million hectares in 2007 and 4.5 million hectares of biotech canola in 2006. Thus, in Canada there has been an impressive, steady and significant increase both in the total land area planted to canola and in the percentage planted to herbicide tolerant biotech canola, which has now reached a high national adoption rate of 94%, with only 1% devoted to conventional canola; the balance of 5% canola hectarage was planted to mutation-derived herbicide tolerant canola. In Ontario and Quebec, the major provinces for maize and soybean hectarage, the total plantings of maize for all purposes in 2010 were 1.44 million hectares. The total plantings of soybean were up by 7% at 1.5 million hectares compared with only 1.4 million hectares in 2009. The 2010 total plantings of sugarbeets were the same as 2009 at approximately 18,000 hectares of which 96% was herbicide tolerant. In 2010, the area of biotech maize, 1.3 million hectares was up slightly from the 1.2 million hectares in 2009. Canada is one of only seven countries (the others are the USA, Argentina, the Philippines, South Africa, Honduras and Chile) which grow maize with double stacked traits for herbicide tolerance and Bt for insect resistance. Similarly except for the USA,
figure 29. percentage of Conventional, biotech and Mutation-based herbicide tolerant (ht) Canola planted in Canada, 1995 to 2010 (Million hectares)
Source: Based on Canola Council of Canada data, Personal Communication, 2010.

Global status of Commercialized biotech/GM Crops: 2010
92
Canada is the only country to grow a triple stack with one gene for European corn borer, a second for root worm control and a third for herbicide tolerance. Of the biotech maize in Canada in 2010, only 29% contained a single gene, compared with 46% in 2009, 68% in 2008. In 2010, 70% contained 2 or 3 stacked genes compared with 54% in 2009. This growth in double and triple stacked genes versus single genes is typical of the shift in favor of stacked genes compared with single genes that has occurred in all seven countries that deploy stacked genes in maize. In 2009, the biotech soybean hectarage was 1.1 million hectares, a significant 15% higher than the 995,000 hectares in 2008.
Biotech RR®sugarbeets was planted in Canada in 2010, for the third time after being launched in 2008. It is estimated that in 2010, 95% (same as 2009) of the sugarbeets in Canada, equivalent to approximately 15,000 hectares were RR®sugarbeets. This was the third year of planting in Ontario in Eastern Canada, (with the beets transported and processed in the USA) and the second year of production in Western Canada where they were also processed.
It is estimated that approximately 2% of the Canada canola production will be used for biofuel by 2012. Canada is a major producer of wheat and several of the current principal wheat varieties have been developed through mutagenesis – there is increased interest in biotech wheat. Maize with higher levels of lysine is undergoing field tests. The RR®alfalfa from the USA has also been approved for import to Canada.
benefits from biotech Crops in Canada
Canada is estimated to have enhanced farm income from biotech canola, maize and soybean by US$2.6 billion in the period 1996 to 2009 and the benefits for 2009 alone is estimated at US$0.4 billion (Brookes and Barfoot, 2011, forthcoming).
The detailed benefit study of biotech canola, conducted by the Canola Council of Canada in 2007 is summarized below. Biotech canola was by far the largest hectarage of biotech crops in Canada in 2007 representing approximately 75% of the total biotech crop area of 7 million hectares. The detailed study (Canola Council of Canada, 2007) involved 650 growers; 325 growing conventional and 325 growing herbicide tolerant biotech canola. The study covered the period 1997 to 2000 and the major benefits were the following:
• More cost effective weed management was the most important advantage attributed by farmers to herbicide tolerant canola with herbicide cost 40% lower for biotech canola (saving of 1,500 MT of herbicide in 2000) compared with conventional canola.

Global status of Commercialized biotech/GM Crops: 2010
93
• A 10% yield advantage for biotech canola over conventional and the dockage was only 3.87% for biotech canola compared with 5.14% for conventional.
• Less tillage and summer fallow required for biotech canola which required less labor and tractor fuel (saving of 31.2 million liters in 2000 alone) and facilitated conservation of soil structure and moisture and easy “over the top” spraying for weeds after crop establishment.
• Increased grower revenue of US$14.36 per hectare and a profit of US$26.23 per hectare for biotech canola over conventional.
• At a national level the direct value to growers from 1997 to 2000 was in the range of US$144 to US$249 million.
• The indirect value to industry of biotech canola was up to US$215 million for the same period 1997 to 2000.
• The total direct and indirect value to industry and growers for the period 1997 to 2000 was US$464 million.
• Extrapolating from the period 1997 to 2000 when 8,090,000 hectares of biotech canola were grown for a gain of US$464 million and the additional 19,809,000 hectares grown during the period 2001 to 2007, the total direct and indirect value to industry and growers for the period 1997 to 2007 is of the order of US$1.6 billion.
A more recent analysis reported in 2010, on 2005 to 2007, data by Smyth et al. (2010) concluded that herbicide tolerant canola in western Canada had generated between Ca$1.063 billion and Ca$1.192 billion in direct and indirect/spill-over benefits for producers during the three year period 2005 to 2007 with an average annual economic benefit of almost Ca$400 million (Ca$397) (Table 21). The authors concluded that the economic benefits were partly attributed to lower production costs and to improved weed control. The findings of the survey were similar to earlier studies (Canola Council of Canada, 2007). The 2010 Report (Smyth et al. 2001) “refutes the claims and accusations made by critics of agricultural biotechnology that genetically modified crops do not benefit farmers and are harmful to the environment” – on the contrary it reports that the economic and environmental benefits are numerous and substantial.
Farmer Experience
brian Chorney operates the family-owned John Chorney Farms in East Selkirk, Manitoba, Canada. The farm which was established by his grandfather was used to having a summer fallow to control weeds. Today, Chorney has access to a wide range of tools to improve crop productivity and enable sustainable farming including biotech products such as herbicide-tolerant soybeans and canola to control difficult weeds. “Biotechnology adds tools to our toolbox as farmers. We can look at different methods of controlling weeds,” says Chorney, “Prior to crop protection products

Global status of Commercialized biotech/GM Crops: 2010
94
and biotechnology, the only method of controlling weeds was cultivation. Now I don’t have planned summer fallow and I can clean up fields by growing different crops.” With the wide variety of crops to choose from Chorney said, “Biotech crops have given us the opportunity to look at our crop rotation on a holistic approach. If you look at a canola, winter wheat, soybean, spring wheat type rotation, it is a diverse approach that is sustainable long-term for our farm viability” (Chorney, 2010).
Jim and denise timmings operate a 4,000 acre Timstar Farms in Rockwood, Southern Ontario, Canada. The 40-year family farm business was made profitable and sustainable in the last decade due to the family’s hard work and their adoption of agricultural innovations such as plant biotechnology and crop protection products. “Growing the crops we grow is difficult, if not impossible, without crop protection products,” says Timmings. “We have to control the weeds, we have to maintain the yields in order to be profitable and biotech crops have allowed us to do some different things to be sustainable ” (Timmings, 2010).
CHINA
by far, the most important biotech crop developments in China in recent times were the approvals on 27 November 2009 of biotech bt rice and biotech phytase maize. the developments have momentous implications for China, asia and the world, because rice is the most important food crop in the world and maize is the most important feed crop in the world. in China alone, bt rice can benefit 110 million rice households totaling 440 million beneficiaries, assuming four per family. With
table 21. direct and spill-over benefits of ht Canola (Ca$M)
Year Million acres
direct spill-over reduced tillage
Cost of volunteer control
total benefits
low high low high
2005 12.6 141 63 103 153 14 343 383
2006 12.8 143 64 105 153 14 346 387
2007 14.8 165 73 121 153 17 374 422
Average 13.4 150 67 110 153 15 354 397
total $1,063 $1,192
Source: Smyth et al. 2010.

Global status of Commercialized biotech/GM Crops: 2010
95
250 million rice households in asia, the number of potential beneficiaries is a momentous 1 billion people. China needs to increase its rice yield to 7.85 tonnes per hectare by 2030 when its population will be 1.6 billion. in 2030, China will need approximately 235 million tonnes of paddy annually, equivalent to one third of global production of approximately 750 million tonnes. Whereas rice is the most important food crop in China, maize is the most important feed crop. Maize is grown by 100 million maize households (400 million potential beneficiaries) in China alone. phytase maize can increase the efficiency of meat production, an important new and growing need, as China becomes more prosperous and consumes more meat. China has 500 million pigs (50% of the global swine herd) and 13 billion chickens, ducks and other poultry which need feed. in 2010, China grew significantly less cotton, down from 5.4 million hectares to 5.0 million hectares. however, the adoption rate of bt cotton in China increased marginally from 68% in 2009 to 69% in 2010 when an estimated 3.45 million hectares of bt cotton were planted. the decrease in hectarage of bt cotton from 3.7 million hectares in 2009 to 3.45 million hectares in 2010 is entirely due to the decrease in total hectarage of cotton planted in 2010, with the adoption rate actually increasing marginally from 68% in 2009 to 69% in 2010. economic gains at the farmer level from bt cotton for the period 1997 to 2009 was us$9.3 billion and us$1.7 billion for 2009 alone. in 2010, 6.5 million small and resource-poor farmers in China continued to benefit from planting 3.45 million hectares of bt cotton. research in northern
ChiNa
Population: 1,336.3 million
GDP: US$4,327 billion
GDP per Capita: US$3,270
Agriculture as % GDP: 11%
Agricultural GDP: US$476 billion
% employed in agriculture: 41%
Arable Land (AL): 143.5 million hectares
Ratio of AL/Population*: 0.45
Major crops: • Rice, paddy • Sugarcane • Sweet potato • Maize • Vegetables, fresh • Cotton Commercialized Biotech Crops: • Bt Cotton • Bt Poplar • PRSV Papaya • VR Sweet Pepper • DR, VR Tomato
Total area under biotech crops and (%) increase in 2010: 3.5 Million Hectares (-5%)
Increased farm income for 1997-2009: US$9.3 billion
*Ratio: % global arable land / % global population
Global status of Commercialized biotech/GM Crops: 2010
96
China indicates that there maybe up to an additional 10 million beneficiary farmers cultivating 22 million hectares of crops other than cotton, which also host cotton bollworm, but where infestations have decreased up to ten-fold. thus, the number of beneficiary farmers in China alone may exceed 15 million. China has also approved and successfully grown biotech papaya, a fruit food crop for four years, since 2007. in Guangdong province, the principal province in China for papaya, virtually all (99%) of the papaya planted in 2010 was biotech papaya resistant to the lethal papaya ring spot virus (prsV) disease. the adoption of virus-resistant biotech papaya in China has increased in both absolute hectarage and proportion every single year to a high of 4,625 hectares or 99% in 2010 from 90% in 2009, 88% in 2008, and 70% adoption, equivalent to 3,550 hectares in 2007 when it was first commercialized in China. in addition, plantations of bt poplar, with improved insect resistance, continued to be successfully grown on approximately 453 hectares. the Chinese Government’s assignment of high priority to agriculture, and more specifically crop biotechnology, championed by premier Wen Jiabao, is resulting in handsome returns for China both in terms of strategically important new crops like biotech rice and maize and reflects China’s increasing academic excellence in crop biotechnology. agricultural science is China’s fastest-growing research field, with China’s share of global publications in agricultural science growing from 1.5% in 1999 to 5% in 2008. in 1999, China spent only 0.23% of its agricultural Gdp on agricultural r&d, but this increased to 0.8% in 2008 and is now close to the 1% recommended by the World bank for developing countries. the new target for the Chinese Government is to increase total grain production to 540 million tons by 2020 and to double Chinese farmers’ 2008 income by 2020, with biotech crops expected to make an important contribution.
China approves biotech rice and maize in landmark decision on 27 November 2009.
In November 2009, China completed its approval of a troika of key biotech crops – fiber (Bt cotton already approved in 1997), feed (phytase maize) and food (Bt rice). The ISAAA 2008 Brief, predicted “a new wave of adoption of biotech crops…providing a seamless interface with the first wave of adoption, resulting in continued and broad-based strong growth in global hectarage.” This prediction became reality on 27 November 2009, when China’s Ministry of Agriculture (MOA) granted no less than three biosafety certificates on the same day. Two certificates were issued for biotech rice, one for a rice variety (Huahui-1) a restorer line, and the other for a hybrid rice line (Bt Shanyou-63), both of which expressed cry1Ab/cry1Ac and developed at Huazhong Agricultural University (James, 2009a). The approval of Bt rice is extremely important because rice is the most important food crop in the world that feeds 3 billion people or almost half of humanity; furthermore

Global status of Commercialized biotech/GM Crops: 2010
97
and importantly, rice is also the most important food crop of the poor. The third certificate was for biotech phytase maize; this is also very important because maize is the most important animal feed crop in the world. The phytase maize was developed by the Chinese Academy of Agricultural Sciences (CAAS) and licensed to Origin Agritech Limited after 7 years of study at CAAS. the three certificates of approval have momentous positive implications for biotech crops in China, asia and the whole world. It is important to note that the MOA conducted a very careful due diligence study, prior to issuing the three certificates for full commercialization in about 3 years, pending completion of the standard registration field trials which applies to all new conventional and biotech crops. It is noteworthy that China has now completed approval of a troika of the key biotech crops in an appropriate chronology – first was FIBER (cotton), followed by FEED (maize) and FOOD (rice). The potential benefits of these 3 crops for China are enormous and summarized below.
• bt cotton. China has successfully planted Bt cotton since 1997 and in 2010, 6.5 million small farmers in China are already increasing their income by approximately US$220 per hectare (equivalent to approximately US$1 billion nationally) due, on average, to a 10% increase in yield, and a 60% reduction in insecticides, both of which contribute to a more sustainable agriculture and the prosperity of small poor farmers. China is the largest producer of cotton in the world, with 69% of its 5.0 million hectares successfully planted with Bt cotton in 2010.
• bt rice offers the potential to generate benefits of US$4 billion annually from an average yield increase of up to 8%, and an 80% decrease in insecticides, equivalent to 17 kg per hectare on China’s major staple food crop, rice, which occupies 30 million hectares (Huang et al. 2005). It is estimated that 75% of all rice in China is infested with the rice-borer pest, which Bt rice controls. China is the biggest producer of rice in the world (178 million tons of paddy) with 110 million rice households (a total of 440 million people based on 4 per family) who could benefit directly as farmers from this technology, as well as China’s 1.3 billion rice consumers. Bt rice will increase productivity of more affordable rice at the very time when China needs new technology to maintain self-sufficiency and increase food production to overcome drought, salinity, pests and other yield constraints associated with climate change and dropping water tables. Crops that use water efficiently and the development of drought tolerant crops is top priority for China. China needs to increase its rice yield to 7.85 tons per hectare by 2030 when its population will be 1.6 billion (Chen et al. 2010). thus, in 2030, China will need approximately 235 million tonnes of paddy annually, equivalent to one third of global production of approximately 750 million tones.
• phytase maize. China, after the USA, is the second largest grower of maize in the world (30

Global status of Commercialized biotech/GM Crops: 2010
98
million hectares grown by 100 million households); it is principally used for animal feed. Achieving self-sufficiency in maize and meeting the increased demand for more meat in a more prosperous China is an enormous challenge. For example, China’s swine herd, the biggest in the world, increased 100-fold from 5 million in 1968 to over 500 million today. Phytase maize will allow pigs to digest more phosphorus, resulting in faster growth/more efficient meat production, and coincidentally result in a reduction of phosphate pollution from animal waste into soil and extensive bodies of water and aquifers. Maize is also used as feed for China’s huge number of domesticated avian species – 13 billion chickens, ducks and other poultry, up from 12.3 million in 1968. Phytase maize will allow animal feed producers to eliminate the need to purchase phytase with savings in equipment, labor and added convenience. The significance of this maize approval is that China is the second largest grower of maize in the world with 30 million hectares (USA is the largest at 35 million hectares). As wealth is rapidly being created in China, more meat is being consumed which in turn requires significantly more animal feed of which maize is a principal source. China imports 5 million tons annually at a foreign exchange cost of US$1 billion. It is noteworthy that phytase maize is China’s first approved feed crop. The only country in Asia that has approved and already growing biotech maize is the Philippines where it was first deployed in 2003; Bt maize, herbicide tolerant (HT) maize and the stacked Bt/HT product were grown on approximately 0.411 million hectares in the Philippines in 2010.
In China, it is very important to note that all three approved biotech crops, Bt cotton, Bt rice and phytase maize, were all developed with public resources by Chinese public sector institutions. The significant advantages that these products offer China also apply to other developing countries, particularly in Asia (but also elsewhere in the world), which have similar crop production constraints. Other Asian countries, which could benefit from biotech maize, include India (8 million hectares), Indonesia (3 million hectares), Thailand, Vietnam and Pakistan, all with approximately 1 million hectares each of maize. Asia grows and consumes 90% of the production from the world’s 150 million hectares of rice, and Bt rice will have enormous impact in Asia. Not only can Bt rice contribute to an increase in productivity and self-sufficiency but it can also make a substantive contribution to the alleviation of poverty of poor small farmers who represent 50% of the world’s poor. Similarly, there are up to 50 million hectares of maize in Asia that could benefit from biotech maize. China’s exertion of global leadership in approving biotech rice and maize in 2009 will likely result in a positive influence on acceptance and speed of adoption of biotech food and feed crops in Asia, and more generally globally, particularly in developing countries. This approval is exemplary for other countries in pursuit of “self-sufficiency” (optimizing productivity and production of home-grown food) as opposed to “food security”, (enough food for all) – the distinction is important and the two goals are not mutually exclusive. China can serve as a model for other developing countries, particularly in Asia, which could have substantive implications for:

Global status of Commercialized biotech/GM Crops: 2010
99
• a more timely and efficient approval process for biotech crops in developing countries;• new modes of South-South technology transfer and sharing, including public/public and
public/private sector partnerships; • more orderly international trade in rice and reduction in probability of recurrence of 2008-
type price hikes, which were devastating for the poor; and• shift of more authority and responsibility to developing countries to optimize “self-
sufficiency” and provide more incentive for their involvement to deliver their share of the 2015 Millennium Development Goals.
From a long term perspective, Bt rice and phytase maize should be seen as only the first of many agronomic and quality biotech traits to be integrated into improved biotech crops, with significant enhanced yield and quality, which can contribute to the doubling of food, feed and fiber production on less resources, particularly water and nitrogen, by 2050. The approval by China of the first major biotech food crop, Bt rice, can be the unique global catalyst for both the public and private sectors from developing and industrial countries to work together in a global initiative towards the noble goal of “food for all and self-sufficiency” in a more just society. The issuance of three biosafety certificates for rice and maize reflects China’s clear intent to practice what it preaches and to approve for commercialization its home-grown biotech fiber, feed and food crops (biotech papaya – a fruit/food crop that has been successfully cultivated commercially since 2006/07) that offer significant economic and environmental benefits, and perhaps more importantly, allows China to be least dependent on others for food, feed and fiber – a strategic issue for China.
The biosafety approval of Bt rice and phytase maize on 27 November 2009 triggered a great deal of interest globally, and resulted in a flood of reports in the international media, a sample of which is represented in the following list of selected articles:
bt rice: China-Ministry of agriculture-office of biosafety Management of Genetically Modified organismsChinese Ministry of Agriculture, October 22, 2009http://www.stee.agri.gov.cn/biosafety/spxx/t20091022_819217.htm
top rice producer China approves GMo strainReuters, November 27, 2009http://www.reuters.com/article/latestCrisis/idUSSP364484
beijing Gives Nod to Modified rice Wall Street Journal, December 1, 2009http://online.wsj.com/article/SB125959909959569901.html

Global status of Commercialized biotech/GM Crops: 2010
100
China Ministry Gives security oK to GM rice, GM CornDow Jones, December 1, 2009h t t p : / / w w w. a g r i c u l t u r e . c o m / a g / f u t u r e s o u rc e / F u t u r e S o u rc e S t o r y I n d e x .jhtml?storyId=174501159
China’s Crop-technology shift May Narrow Yield Gap (update1) Bloomberg, December 2, 2009http://www.bloomberg.com/apps/news?pid=email_en&sid=ahxyeoOwTKNc#
China approves biotech rice and maize in landmark decision ISAAA CBU, December 4, 2009http://www.isaaa.org/kc/cropbiotechupdate/online/default.asp?Date=12/4/2009#5112
China approves biotech rice and maize in landmark decisionBiotech Research institute (BRI), December 7, 2009http://bri.caas.net.cn/news/in_01.aspx?id=508
China’s ratification of transgenic rice and maizeChina Biotechnology Center (CBC), December 8, 2009http://www.biotech.org.cn/news/news/show.php?id=74548
China’s ratification of transgenic rice and maizeXinhau, December 12, 2009http://news.xinhuanet.com/fortune/2009-12/11/content_12632062.htm
China approves biotech rice and maize in landmark decisionChinese People Website, December 15, 2009 http://nc.people.com.cn/GB/10581464.html
China makes ‘landmark’ GM food crop approvalSciDev Net, December 17, 2009http://www.scidev.net/en/news/china-makes-landmark-gm-food-crop-approval.html
Gene rice on its way in China New Scientist, January 4, 2010 http://www.newscientist.com/article/dn18328?opattr=Gene_rice_on_its_way_in_China
Genetically Modified rice and Corn to Grow in China, then the WorldAaron Saenz, January 26, 2010

Global status of Commercialized biotech/GM Crops: 2010
101
http://singularityhub.com/2010/01/26/genetically-modified-rice-and-corn-to-grow-in-china-then-the-world/
Controversial GM rice gets green lights in ChinaTimes of India, February 6, 2010http://timesofindia.indiatimes.com/world/china/Controversial-GM-rice-gets-green-lights-in-China/articleshow/5543143.cms
Chinese experts: No evidence yet to show GM food unsafeXinhau, February 6, 2010http://news.xinhuanet.com/english2010/sci/201002/06/c_13165914.htm
China signals major shift into GM cropsSciDev Net, February 8, 2010http://www.scidev.net/en/news/china-signals-major-shift-into-gm-crops.html
Like the USA, Argentina and Canada, China is a member of the group of six “founder biotech crop countries”, having first commercialized biotech crops in 1996, the first year of global commercialization. The national area planted to cotton in China in 2010, at 5.0 million hectares was significantly lower than that planted in 2009 at 5.41 million hectares, and thus a parallel decrease has been triggered in the area of Bt cotton. The area planted to Bt cotton in 2010, 3.45 million hectares was lower in absolute terms, but the percentage adoption was marginally higher at 69% compared with 68% for 2009. The size of farms in China is very small. In a recent survey of cotton farms, the average size of farm, as determined by the area of cultivable land, was 0.8 hectare and the average size of a cotton holding was 0.6 hectare. Currently, 64 varieties of Bt cotton are grown in China. An estimated 6.5 million small and resource-poor farmers grew Bt cotton in China in 2010. An important paper in Science (Wu et al. 2008) suggested that the potential number of small farmers actually benefiting indirectly from Bt cotton in China might be as high as 10 million more. It is noteworthy that a recent paper, (Hutchinson et al. 2010) based on studies in the USA draws similar conclusions to Wu et al. (2008) – indeed it reports that the indirect benefits for conventional crops grown in the same area where biotech crops are deployed, are actually greater than the direct benefits from biotech crops. For more details see the Chapter on the USA in this Brief.
Following the extensive planting of Bt cotton in six northern provinces of Hebei, Shandong, Jiangsu, Shanxi, Henan and Anhui in China, during the period 1997 to 2006, Wu et al. (2008) reported that cotton bollworm populations decreased markedly by up to 10-fold (approximately 90% from around 3,000 in 1997 to 300 in 2006) in other crops that also host the cotton bollworm – these include maize, peanut, sesame, legumes, wheat, sorghum, vegetables and melons. Whereas cotton occupies

Global status of Commercialized biotech/GM Crops: 2010
102
only about 3 million hectares and farmed by an estimated 5 million farmers in the six northern provinces in China, host crops of cotton bollworm occupy 7 times the area at 22 million hectares and are farmed by more than 10 million farmers receiving indirect benefits from Bt cotton – i.e. farmers deriving indirect benefits from Bt cotton number twice the number of Bt cotton farmers (5 million) that derive direct benefits from Bt cotton. Thus importantly, his study concludes that Bt cotton not only provides control for the damaging cotton bollworm on cotton but results in the suppression of cotton bollworm on several other important host crops that occupy more than seven times the area of Bt cotton. The dramatic reduction by 90% in the level of cotton bollworm in host crops other than cotton has implications for insecticide savings, which may translate to a significant decrease in the need for insecticide sprays on these host crops, other than cotton, cultivated by approximately 10 million farmers. This important finding may mean that the number of farmers that could benefit directly and indirectly from Bt cotton in northern China, may number an additional 10 million, compared with the 5 million that benefit from Bt cotton directly in the six northern provinces of China. Thus, past estimates of the benefits associated with Bt cotton in China in terms of the number of beneficiary farmers, and economic, agronomic and environmental benefits may have been grossly underestimated because the benefits to farmers cultivating crops other than cotton that host cotton bollworm were not known and have not been considered.
Coincidentally, as a result of the decrease in use of broad spectrum sprays for the control of cotton bollworm in cotton in northern China, mirids, which were previously a secondary insect pest of relatively low economic importance have not surprisingly become relatively more important. This demonstrates the need and importance for a broad integrated pest management strategy for the control of insect pets featuring both biotechnology and other means of control.
Entomologists A. M. Shelton Ph.D., Mao Chen Ph.D. and Jianzhou Zhao, Ph.D., all affiliated with Cornell (Personal Communication, 2010) offered the following important commentary on the success of Bt cotton in China and a proposed strategy for controlling the increasingly important mirids, and other pests, not controlled by Bt cotton.
“The cotton bollworm (Helicoverpa armigera) and pink bollworm (Pectinophora gossypiella) are the most devastating pests on cotton in China and are the key pests that Chinese cotton farmers have traditionally had difficulty in controlling, even with frequent insecticide spray programs. Bt cotton has changed this situation. The high adoption rate of Bt cotton in China has resulted in effective suppression of both species on cotton and also regional suppression of the polyphagous H. armigera on a number of other crops (e.g. peanuts, soybean and vegetables). This situation has resulted in dramatic reductions in the use of traditional, broad-spectrum insecticides which, in turn, has led to decreased environmental harm and fewer farmer poisonings. However, since Bt cotton only controls the caterpillar pests, in some cases other

Global status of Commercialized biotech/GM Crops: 2010
103
arthropod populations have increased. This includes cotton aphids (Aphis gossypii, A. atrata, A. medicaginis, and Acyrthosiphon gossypii), mirids (Adelphocoris suturalis, A. lineolatus, A. fasciaticollis, Lygus lucorum, and L. pratensis), spider mites (Tetranychus cinnabarinus, T. truncates, T. turkestani, and T. dunhuangensis), thrips (Frankliniella intonsa, Thrips tabaci, and T. flavus), and whiteflies (Bemisia argentifolii and B. tabaci).
Management programs for the insect complex not affected by Bt proteins need to be put into place and these include the use of some systemic insecticides which are far safer on the environment and natural enemies. From the pest management standpoint, conservation of such natural enemies, through the use of Bt plants and selective insecticides is key for managing the entire pest complex of cotton and is part of an overall integrated pest management (IPM) approach needed for sustainable cotton production. Such comprehensive IPM programs have proven effective for key and secondary arthropod pests in the US where Bt cotton adoption continues to climb and reached 73% of all cotton production in the US in 2010. Chinese scientists are exploring strategies so that they can also obtain similar comprehensive IPM programs.”
The field data from China’s Ministry of Agriculture used in the same study by Wu et al. (2008) also clearly demonstrated the unusually high and rapid adoption of Bt cotton in each of the six provinces of northern China during the period 1997 to 2006 (Figure 30). It is noteworthy that adoption of Bt cotton was fastest in the two provinces of Hebei and Shangdong reaching over 95% in the short span of 5 years and 100% in 8 years. The adoption rates in the provinces of Jiangsu, Shanxi, Henan and Anhui were almost as fast, reaching 80 to 90% in 8 years or less (Figure 29). In northern China, as a region, more than 66% adoption of Bt cotton was reached in only 5 years. These adoption rates are remarkably high by any standard and reflect the vote of confidence and trust of farmers in Bt cotton, which has delivered multiple and significant economic, agronomic and socio-economic benefits consistently from 1997, the first year of commercialization, to the present.
One of the important indicators that reflect farmers’ confidence in any new technology, including Bt cotton, is the extent to which farmers repeat the planting of Bt cotton in the following season. In 2006 and 2007, of 240 cotton growing households surveyed in 12 villages in three provinces – Hebei, Henan and Shandong, by the Center for Chinese Agricultural Policy (CCAP) of the Chinese Academy of Sciences (CAS), it is notable that every single family that reported growing Bt cotton in 2006 also elected to grow Bt cotton in 2007. Thus, the repeat index for farmers growing Bt cotton in 2006 and 2007 in three provinces in China was 100%. Interestingly, of the 240 farmers surveyed, a few farmers in one village also grew one variety of non-Bt cotton in 2006 that they also grew in 2007. This reflects the fact that farmers invariably want to compare the performance of old and improved technologies side-by-side in their own fields. The same happened during the introduction of hybrid

Global status of Commercialized biotech/GM Crops: 2010
104
maize in the corn belt in the USA – farmers planted the best performing varieties next to the new hybrids until they were satisfied that hybrids consistently out-performed their old varieties, and it took several years before hybrid maize was fully adopted.
The level of Bt cotton adoption in China seems to have plateaued at around 70% (69%). This plateauing is partly due to the fact that the large cotton areas in the province of Xing Xang are subject to much less pest pressure than provinces such as Hebei where pest pressure is high and where adoption rates are 100% and well above the national average of around 70%. In the absence of a sample survey to specifically determine the presence or absence of Bt genes in cotton in Xing Xang, it is estimated that about 10 to 15% of the cotton area in Xing Xang is planted with Bt cotton, with some observers estimating that the adoption rate could be significantly higher in Xing Xang.
No additional information was available in 2010 regarding a preliminary earlier report from the Chinese Academy of Agricultural Sciences (CAAS) that new Bt cotton hybrids could yield up to 25%
figure 30. adoption of bt Cotton in each province of Northern China, as percentage, 1997 to 2006
Source: Wu et al. 2008, Data in Annex from China’s Ministry of Agriculture.

Global status of Commercialized biotech/GM Crops: 2010
105
more than the current Bt cotton varieties. If confirmed, this could spur a renewed wave of increased adoption that would significantly exceed current adoption rates of around two-thirds of national cotton hectarage. New Bt cotton hybrids could boost farmer income making China the second country after India to profit from Bt cotton hybrids which, unlike varieties, offer an incentive for developers of the hybrids which have a built-in value-capture system not found in varieties. Use of non-conventional hybrids is already widespread (70% adoption) in the Yangtze River Valley but less prevalent in the Yellow River Valley. These non-conventional Bt hybrids are bred by crossing two varieties, rather than the normal inbred lines, which optimize hybrid vigor. The use of these non-conventional Bt hybrids provides slightly higher yields and can pave the way for new hybrids with higher yield potential. China, with its track record of having already developed successful Bt cotton varieties that compete with products developed by the private sector, has gained a rich experience in crop biotechnology, which has served China well in the development of biotech crops like Bt rice and Phytase maize, and for other biotech crops in the future.
In September 2006, China’s National Biosafety Committee recommended for commercialization a locally developed biotech papaya resistant to papaya ring spot virus (PRSV) (Table 22). The technology features the viral replicase gene and was developed by South China Agricultural University; the papaya biotech variety is highly resistant to all the local strains of PRSV. This approval and eventual commercialization in China was a significant development in that papaya is a fruit/food crop, which is widely consumed throughout the country. The main province for papaya production in China is the province of Guangdong. In 2010, the total papaya hectarage in Guangdong province was approximately 4,625 hectares (95 or 10% less than 2009) because of low papaya prices in 2010. However the percentage adoption of biotech PRSV papaya increased from 90% in 2009 to 99% in
table 22. approval of biotech Crops in China
Crop Year of approval
Cotton 1997
Petunia 1997
Tomato 1998
Sweet Pepper 1998
Poplar Trees 2003
Papaya 2006
Rice (Bt) 2009 (27 November, biosafety approval)
Maize (Phytase) 2009 (27 November, biosafety approval)
Source: Compiled by Clive James, 2010.

Global status of Commercialized biotech/GM Crops: 2010
106
2010. In a 2010 sample survey, out of 267 growers, 266 reported growing virus-resistant biotech papaya, whilst only one reported growing non-biotech papaya (Hu, Personal Communication, 2010). Thus, the adoption of virus- resistant biotech papaya in China has increased in both absolute hectarage and proportion every single year to a high of 4,625 hectares or 99% in 2010 from 90% in 2009, 88% in 2008, and 70% adoption, equivalent to 3,550 hectares in 2007, when it was first commercialized in China.
Biotechnology has also been applied to trees in China and Bt poplars (Populus nigra) have been approved for commercialization. The first Bt poplars were developed and commercialized in 2003 by the Research Institute of Forestry in Beijing, which is part of the Chinese Academy of Forestry. It is estimated that by the year 2015, China will need 330-340 million cubic meters of timber, of which approximately half, or 140-150 million cubic meters, will have to be produced in China, with the balance imported. In order to meet this challenging goal, the development of improved tree plantations in China was accelerated. Some fast-growing trees, such as poplar, eucalyptus, larch, and Chinese fir, were carefully selected and widely planted in China. During the past 20 years, a total of 7.04 million hectares of selected poplar clones were planted in China for commercial production; this represents a significant 19% of total tree plantations in China. However, it was observed that these mono-clonal plantations were susceptible to insect pests which caused severe infestations resulting in significant damage, estimated at millions of US dollars annually.
In order to develop poplars that were more tolerant to insect attack, GM/biotech poplars were developed in China. More specifically, Populus nigra clones (12, 172 and 153) were developed with cry1Aa and a hybrid white poplar, clone 741, was transformed with a fusion of cry1Aa and API (coding for a proteinase inhibitor from Sagittaria sagittifolia). Under rigorous testing, the Bt poplar clones have exhibited a high level of resistance to leaf pests, resulting in a substantial 90% reduction in leaf damage. The two clones were first commercialized in 2003 in Northern China, and by 2010 they occupied 453 hectares, up slightly from 447 hectares in 2009 and 400 hectares in 2008. The transgenic poplar plantations have effectively inhibited the fast-spread of target insect pests and have significantly reduced the number of insecticide applications required. The performance of the Bt black poplar plantations are significantly better than the clones deployed locally. The availability of commercial Bt poplar plantations has made it possible to empirically assess gene flow via pollen and seeds, and also for assessing the impact of Bt poplar on the insect community when intercropping with Bt cotton. The transgenic Populus nigra has also been used for hybridizing with non-transgenic P. deltoides to generate an insect resistant source in a breeding program designed to generate new hybrid clones. There are now 3 transgenic poplar lines approved for environmental release in China, and another 5 have been deployed in small-scale field trials. Transformation of poplar with diverse traits such as tolerance to freezing, control of flowering and modification of wood specifications with improved pulping qualities and more efficient saccharification (conversion of lignocellulose to sugar) are in progress.

Global status of Commercialized biotech/GM Crops: 2010
107
About 90% of the 453 hectares in 2010 were Bt Populus nigra clones, and the balance of 10% was clone 741 featuring cry1Aa and API. A new clone under development, a hybrid white poplar clone 84K transformed with the Bt886Cry3Aa resistance gene, has already undergone testing in nurseries and the preliminary results are promising. Clone 84K with Bt886Cry3Aa is tolerant to the economically important Asian longhorn beetle, which attacks the trunks of poplars and can cause significant damage (Lu M-Z, 2010, Personal Communication).
One of the noteworthy features of crop biotechnology in China is the emergence of private seed companies, which conduct R&D in crop biotechnology and develop and distribute both conventional and biotech hybrid seed. One such company is Origin Agritech Limited, which is based in Beijing, and trades on the NASDAQ in the US as SEED – it is China’s lead vertically integrated biotech seed company. It was founded in 1997 and conducts R&D to produce conventional and biotech hybrid seed, of which conventional maize is currently the principal commercial crop. Origin operates in China and South East Asia and has a large network of 3,800 primary distributors and 65,000 secondary distributors. Origin prepares financial statements according to the US GAAP accounting procedures. For the third quarter, 1April to 30 June 2010, revenues were approximately US$68 million with a gross profit of US$28 million (Business Wire, 30 August 2010).
On 22 September 2010, Origin announced that it had reached an agreement with the Institute of Plant Protection of the Chinese Academy of Agricultural Sciences (CAAS) for the worldwide exclusive rights of the Bt gene developed by the Academy; Origin already had the rights to use the Bt gene in China. Under the new agreement Origin has the right to sublicense the Bt gene and/or to improve its performance (Business Wire, 22 September 2010).
Earlier, Origin had also acquired the rights to phytase maize from CAAS and this product was approved for biosafety by China on 27 November 2009 (Origin Agritech, 2009). The potential phytase maize market worldwide is estimated at US$500 million per year, of which US$200 million is in China alone. To put this into context, the current conventional maize seed market in China is estimated to be worth over US$1 billion per year. Phytase maize is expected to be the first biotech maize to be commercialized in China by Origin followed by glyphosate tolerant maize, which is currently in Phase 3 of environmental field tests, and then Bt maize. Origin has already submitted Bt maize for phase 3 field trials and stacking all three genes coding for phytase, glyphosate tolerance and Bt, is a future option. Many maize growing countries have already successfully implemented the option of stacking genes with herbicide tolerance and Bt insect resistance but China is likely to be the first to deploy phytase maize; this is a very important product for China given the importance of pork as a meat, in the country which has over 500 million swine, equivalent to approximately half of the global swine herd. Phytase maize will also be beneficial to the Chinese US$13 billion poultry industry, the largest in the world, and will coincidentally result in less ecological pollution by phosphates of ecological zones and waterways.

Global status of Commercialized biotech/GM Crops: 2010
108
There is a growing number of collaborative initiatives between Chinese institutions and foreign companies and institutions. For example, the China National Seed Group (China Seed) and Monsanto have agreed to extend their respective investments in their joint venture company, CNSGC-DEKALB Seed Company Ltd. (CNDK) – the agreement is pending approval by the Chinese Government. CNDK was formed in 2001 to market maize hybrids in China, the second largest market for maize hybrids in the world, after the USA. In November 2009, Monsanto announced the establishment of its Biotechnology Research Center in Zhongguancun, Bejing that will allow the company to strengthen its links with Chinese Research Institutions in plant biotechnology and genomics. In November 2008, Bayer Crop Science signed an MOU with the Chinese Academy of Agricultural Sciences (CAAS) for joint development and global marketing of new agricultural products which will strengthen and expand the seed and traits business of both parties in China.
The decision by China on 5 September 2008 to approve for import the RR2Yield™ soybean was a major development with significant implications (McWilliams, 2008). China, the most populous country in the world is also the largest consumer of edible soybean in the world. China spent US$4 billion importing US soybean in 2007 which accounted for 38% of all US soybean exports. Prior to the Chinese approval, RR2Yield™ soybean had already been approved as safe for food, feed in the USA, Canada, Mexico, Taiwan, Japan, the Philippines, Australia and New Zealand which collectively import 30% of all US soy exports. The new approval from China means that over two thirds (68%) of the US soybean export markets have already been cleared with China representing more than half (38% out of 68%).
support for biotech Crops in China
It is evident that after the 27 November 2009 biosafety approvals of both biotech rice and maize, that Chinese policymakers view agricultural biotechnology as a strategic element for increasing productivity and self-sufficiency, improving national food security and ensuring competitiveness in the international market place. There is no doubt that China is now becoming one of the world leaders in crop biotechnology since Chinese policymakers have concluded that there are unacceptable risks of being dependent on imported technologies for food security. In addition to cotton which is already deployed and the approved Bt rice and phytase maize, China has an impressive portfolio of a dozen other biotech crops being field-tested, including wheat, potato, tomato, soybean, cabbage, peanut, melon, papaya, sweet pepper, chili, rapeseed, and tobacco.
It is instructive to trace the increasing political will, support and confidence in biotech crops prior to the 27 November 2009 approval of Bt rice and phytase maize. In June 2008, Chinese premier Wen Jiabao addressed the Chinese Academy of Science and stated that, “To solve the food problem, we have to rely on big science and technology measures, rely on biotechnology, rely on GM.”

Global status of Commercialized biotech/GM Crops: 2010
109
This was a remarkably strong statement of support for biotech crops from China’s cabinet and Premier Wen Jiabao, who urged authorities to “waste no time to implement the program and understand the urgency and importance of the program.” In July 2008, Premier Wen Jiabao, in his capacity as Chairman of the State Council, announced that the cabinet had approved a significant increase in budget for GM crops of 4 to 5 billion Yuan, equivalent to US$584 million to US$730 million in the coming years. As of 2006, China had approved 211 field trials for a total of 20 crops. In September 2008, Xue dayuan, chief scientist on biodiversity, noted that the new US$3.5 billion R&D initiative announced by Premier Wen Jiabao “will spur the commercialization of GM varieties” (Stone, 2008). It is noteworthy that funding for the program is resourced in a novel way from local governments and indigenous agbiotech companies. A significant component in the new initiative is a public awareness program to educate the public about biotech crops, consistent with the mission of ISAAA. The aim of the program is to “obtain genes with great potential commercial value whose intellectual property rights belong to China, and to develop high quality, high yield, and pest resistant genetically modified new species” (Shuping, 2008; Stone, 2008). Thus, biotech crops in China are assigned the highest level of political support. Premier Wen’s and the cabinet’s very supportive comments on biotech crops had direct implications for biotech rice in China and is viewed in a very positive light by Dr. Dafang Huang, former director of the Biotechnology Research Institute (BRI) in the Chinese Academy for Agricultural Sciences and by Dr. Jikun Huang, senior economist at the Chinese Academy of Science. Dr. Jikun Huang commented that, “The plan’s approval is a very positive signal to the future of research and commercialization of more GMO crops.” Dr. Jikun Huang has been involved in the development of biotech crops in China, since the genesis of biotech crops in China and has projected benefits of US$4 billion per year from Bt rice – this projection is based on extensive pre-production field trials conducted to determine the benefits of biotech rice. The biosafety approval of biotech rice by China on 27 November 2009 has enormous implications for all the rice growing countries of Asia which represent 90% of global production, with more than 110 million households growing rice in China alone, and more than a quarter billion (250 million) rice households in Asia, the majority of which represent the poorest people in the world. In the context of decreasing agricultural land, rapidly dropping water tables and increased demand for food grains, China has set challenging targets to produce 500 million tons of grains by 2010 and 540 million by 2020 whereas demand in 2008 is already at 518 million tons (Shuping, 2008).
Indications that China was considering commercialization of biotech rice in the near term were attributed to comments made by the Vice Minister of Agriculture Niu Dun, and reported by the China Daily on 25 August 2009. More specifically Nui Dun said “China has worked on research of transgenic rice and is strongly considering its commercialization.” Government officials observed that the GM/biotech rice being considered for approval was more resistant to pests and tastier and indicated that final approval to sell GM rice was close. Observers in China opined that a change in attitude regarding the approval of biotech rice began last year when the State Council approved a

Global status of Commercialized biotech/GM Crops: 2010
110
major R&D project on GM crops, meats and other products worth 20 billion yuan (US$3 billion at 6.8 yuan per US$). Government officials said that “By 2020, China could be a leader in GM foods, cloning, large-scale transgenic technology and new breed promotion. Rice and corn are the items nearest commercialization.” Given that rice is a crucial staple in Asia and throughout the Pacific area, officials said “Increased production would make a massive difference.”
Over the last 30 years, China’s national rice production has almost doubled from 304 million tons in 1978 to 528 million tons in 2008. China’s population is expected to grow to 1.6 billion by 2020, when it is estimated that 630 million tons of rice will be needed. China has embraced biotechnology and more specifically highlighted biotech crops in a well planned innovative scientific strategy that offers the best promise for doubling food, feed and fiber production sustainably in China by 2050. Dr. Cao Mengliang, a researcher on molecular rice at China’s National Hybrid Rice R&D Centre, said that “In China, the safety of transgenic food is not only a scientific issue, but one with economic and political importance. Studies of the safety of the technology have been completed. Discussions about whether to open it up to the market are now in the final stages. Now, the safety certificate is the last thing needed before commercialized production. The technology will mainly focus on insect resistance, pesticide implications and disease control and upon improvements to quality and taste” (China Daily, 2009).
Observers monitoring the situation in biotech/GM rice in China predict that following the 27 November 2009 approval, biotech rice will be welcomed by farmers because of its potential to increase yield, reduced need for pesticides and labor, and thus its potential to generate increased return which can contribute to a better quality of life for the 110 million rice households in China who are some of the poorest people in the world. Thus biotech crops are entirely consistent with the policy of the Chinese Government which has assigned the highest priority to poverty alleviation and increased prosperity for the rural population of China which represents approximately two-thirds of China’s 1.3 billion people.
The Chinese Government’s assignment of high priority to agriculture, and more specifically crop biotechnology, championed by Premier Wen Jiabao, is resulting in handsome returns for China both in terms of strategically important new crops like biotech rice and maize and reflects the growing academic excellence of China at a global level in biotech crops. A November 2009 Report (Adams, 2009) noted that agricultural science is China’s fastest-growing research field. From 1999 to 2008, growth in agricultural science papers outpaced growth in all other topics. From 2004 to 2008, agricultural researchers published four times more scientific papers compared with the period 1999 to 2003. China’s share of global publications in agricultural science grew from 1.5% in 1999 to 5% in 2008. Professor Lin Min, Director of the Chinese Academy of Agricultural Sciences’ Biotechnology Research Center, opined that China’s agricultural ascent in agricultural science is due to “rich research resources, constant governmental investment and support, and an expanding pool of world-

Global status of Commercialized biotech/GM Crops: 2010
111
class talents.” In 1999, China spent only 0.23% of its agricultural GDP on agricultural R & D but this increased to 0.8% in 2008 and is now close to the 1% recommended by the World Bank for developing countries (Lin, 2009). Allocation by the Chinese Government of substantial agricultural research resources, have been the key to driving the rapid growth especially in biotechnology: “Otherwise you could only conduct model research rather than application research. The return of an increasing number of overseas-trained and world-class Chinese agricultural scientists is also helping and they are lured back by China’s rapid economic development and attractive job offers and at the same time, China’s home-grown agricultural researchers are also catching up quickly,” said Lin (2009).
The US$19.2 billion Initial Public Offering (IPO) of China’s Agriculture Bank in July 2010 was not only one of the largest ever IPOs in world stock market listings, but it was also a landmark transformation of China’s gigantic financial institutions to support agriculture that competes or surpasses other listed financial institutions in the western industrial western world (The Economist, 8 July 2010). The emergence of China’s state banks has been spectacular by any standards. The size of China’s agricultural bank is enormous with 441,000 staff and “more branches than Wall street has desks” – China, sometimes referred to as the “Middle Kingdom” is once more becoming a dominant player on the world scene, having injected US$420 billion into its five biggest banks since 1998 alone. In 2009, the Agricultural bank’s credit grew by an enormous 41%, fuelled by a one-third increase in credit to its customers.
Elsewhere in Asia, outside China, there are also significant R&D investments on biotech rice featuring agronomic and quality traits. For example, a team at the University of Tokyo, Japan has developed biotech rice that can tolerate iron deficiency, which is a very prevalent constraint in the rice growing countries of Asia (Takanori et al. 2008). Deployment of a rice tolerant to iron deficiency is one of many biotechnology applications, including pest and disease resistance and pro-Vitamin A enhanced Golden Rice (expected to be available in Asia in 2013) that could contribute to higher productivity and improved nutritional quality of rice. Rice is not only the most important food crop in the world but is also the most important food crop of the poor in the world. This is particularly true in Asia where 90% of the world’s rice is produced and consumed and where rice has a very important cultural role. In Asia, rice is the staple of 600 million extremely poor rural people, mostly subsistence farmers and the rural landless who are completely dependent on agriculture for their livelihood. Hence, biotech rice with improved attributes can make an enormous contribution to the alleviation of poverty and hunger in Asia but also in Latin America and Africa where rice is important, particularly for the poorer in rural communities. China is very much cognizant of the essential need for biosafety management in order to ensure protection of the environment and consumers, and this was the major consideration in the biosafety approval of Bt rice in November 2009. Given the paramount importance of rice as the principal food

Global status of Commercialized biotech/GM Crops: 2010
112
crop in China, approximately 20% of the government’s investment in crop biotechnology has been devoted to rice. This was equivalent to an annual investment of US$24 million at official exchange rates, or US$120 million per year at a purchasing power parity rate of five, which undoubtedly makes China’s investment in rice biotechnology, by far, the largest in the world. Three insect resistant hybrid rice varieties, two featuring the Bt gene and the other with the CpTi trypsin gene, entered pre-production field trials in 2001, plus a rice variety carrying the Xa21 gene that confers resistance to the important bacterial blight disease of rice. Annual and extensive large-scale pre-production trials of these new biotech hybrids of rice, starting in 2001, confirmed yield increases of approximately 2 to 6%, plus a saving of 17 kg per hectare in pesticides, with positive health implications, along with a labor saving of 8 days per hectare, resulting in an overall increase in net income per hectare of US$80 to US$100. It is projected that with full adoption, the new biotech rice hybrids could result in a national benefit to China of US$4 billion; insect borers, which can be controlled by Bt, are prevalent on up to 75% of approximately 30 million hectares of rice in China (Jikun Huang, 2009. Personal Communication).
Whereas ISAAA has no knowledge of biotech rice being approved in any other country except China, the previous administration in Iran did temporarily officially release a Bt rice in 2004 to coincide with the celebration of the International Rice Year. The biotech rice, a high quality rice named “Tarom molaii”, was estimated to have been cultivated on 2,000 hectares in 2004 and was grown successfully on 4,000 hectares by more than 500 farmers in 2005, because it yielded significantly more than its conventional counterpart. The National Biosafety Council of Iran is now apparently reviewing the dossier on biotech rice as part of the process of approving and commercialization of rice in Iran.
Even though the global price of rice has modulated to approximately US$500 per ton in recent months, the unprecedented increase in the price of rice to US$1,000 a ton in April 2008 (a significant 2.5-fold increase over the 2006 price of US$300 a ton), spurred unparalleled political support for biotech crops and provided an important incentive for the expedited adoption of biotech rice because of its potential to significantly increase productivity per hectare leading to increase in supply and in turn to modulate rice prices.
With the approval of biotech rice in November 2009, this leaves wheat, as the only one of the three major world staples: maize, rice and wheat, to be denied the significant advantages offered by biotechnology. The adoption of biotech rice and maize in Asia will, in due course, greatly facilitate and expedite the approval and adoption of biotech wheat. The first biotech wheat to be approved in China in about 7 years may be virus resistant (yellow mosaic virus), which is being field tested. A “sprout tolerant” wheat is also being developed in China. Wheat with improved resistance to Fusarium and thus lower levels of mycotoxin is also under development as well as quality traits, and for the longer term, the more challenging task of improved drought resistance.

Global status of Commercialized biotech/GM Crops: 2010
113
The near-term food and feed needs of China, and more broadly Asia, are not limited to the major crop rice, but also apply to maize for feed, and also, more and better quality wheat for food. China’s priority-trait needs include disease and insect resistance, herbicide tolerance as well as quality traits. China has an impressive stable of its own home-grown biotech crops with various traits which can be complemented with products developed by the public and private sectors from the global crop biotech market. China has estimated the potential benefits from both biotech cotton and rice at US$5 billion per year and can complement these gains by applying biotechnology to the other staples of maize and wheat, and up to a dozen other crops in the near, medium and long term. At the opening ceremony of the International High-level Forum on Biotechnology held in Beijing in September 2005, the Minister of Science and Technology Xu Guanhua commented that, “Biotechnology could become the fastest growing industry in China in the next 15 years” and that, “Biotechnology will be put high on the country’s mid- and long-term scientific and technological development strategy.” He further predicted that eventually the advancement in R&D would lead to a bio-economy boom (China Daily, 15 September 2005). China currently has 200 government funded biotechnology laboratories and 500 companies active in biotechnology.
In summary, there is little doubt, now that China has approved both biotech rice and maize, the country will seek to further enhance its role as a world leader in crop biotechnology. The 2008 statements of Premier Wen Jiabao backed by a substantial commitment of an additional US$3.5 billion over the next 15 years to crop biotechnology is evidence of very strong political will at the cabinet level for crop biotechnology in China. In October 2008, Wen Jiabao (2008) reinforced his support for biotech crops when he stated that, “I strongly advocate making great efforts to pursue transgenic engineering. The recent food shortages around the world have further strengthened my belief.” The substantial economic, environmental, and social benefits from Bt cotton have provided China with its first-hand experience of biotech crops. It is almost certain that the rich experience with Bt cotton served China well in its consideration and approval of biotech rice and maize in November 2009.
China considers food safety and self-sufficiency top priorities and importantly, as basic human rights. China is committed to transform agriculture from a traditional to a modern agriculture with high priority assigned to crop biotechnology. China has consistently maintained a grain self-sufficiency of 95% or more in recent years, and has made a significant contribution to the alleviation of poverty (People’s Daily, 2009). In 2008, total grain production in China reached 525 million tons, compared with only 113 million tons in 1949. In 2007, per capita rural income was 4,140 Yuan (US$608), five times what it was in 1978. The number of rural poor has declined from 250 million in 1978 to 15 million today. China, with the exception of India, is one of very few developing countries which has increased investments in agriculture significantly and as a result reaped handsome benefits. The Chinese Government increased its investments in agriculture by 30% in 2007, by 38% in 2008 and

Global status of Commercialized biotech/GM Crops: 2010
114
by another 20% in 2009. Maize yield increased from 1.18 tons in 1961 to 5.61 tons per hectare in 2007, rice from 2.0 to 6.3 tons and wheat from 0.6 tons to 4.6 tons per hectare, in the same period. The new target for the Chinese Government is to increase total grain production to 540 million tons by 2020 and to double Chinese farmers’ 2008 income by 2020 (Xinhua, 2009). These are challenging and formidable targets but past experience and perseverance in successfully attaining equally formidable goals would indicate that for China, they are feasible. The major challenge is to increase crop productivity significantly in the face of water scarcity, loss of fertile land and slowing agricultural productivity constrained by the law of diminishing returns, slowing gains from successful past technologies. Despite all these formidable challenges, China is also boldly investing in more collaborative programs designed to assist other developing countries in agriculture with a more pragmatic “do as i do” philosophy and not the “do as i say” philosophy practiced by most other development donors. China is currently setting up 20 agricultural technology demonstration centers in the developing world and plans to double the number of Chinese agricultural experts assigned to agricultural development projects in Asia, Africa and Latin America.
benefits from biotech Crops in China
Bt cotton – In 2010, Bt cotton was planted by 6.5 million small and resource-poor farmers on 3.45 million hectares, which is 69% of the 5 million hectares of all cotton planted in China in 2010. Based on studies conducted by the Center for Chinese Agricultural Policy (CCAP), it was concluded that, on average at the farm level, Bt cotton increases yield by 9.6%, reduces insecticide use by 60%, with positive implications for both the environment and the farmers’ health, and generates a substantial US$220 per hectare increase in income which makes a significant contribution to their livelihood as the income of many cotton farmers can be as low as around US$1 per day (Jikun Huang, 2008, Personal Communication). At the national level, it is estimated that increased income from Bt cotton will be approximately US$1 billion per year in 2010. it is estimated that China has enhanced its farm income from biotech cotton by us$9.3 billion in the period 1997 to 2009 and by us$1.7 billion in 2009 alone (brookes and barfoot, forthcoming 2011).
Biotech rice – The biotech hybrid rice is resistant to specific pests (insect borers). The product, based on CCAP’s study, increased yield by up to 8%, reduced insecticide application by nearly 80% or 17 kg per hectare. At a national level, it is projected that biotech rice could deliver benefits of the order of US$4 billion per year in the future, plus environmental benefits that will contribute to a more sustainable agriculture and the alleviation of poverty for small and resource-poor farmers (Jikun Huang, Personal Communication).

Global status of Commercialized biotech/GM Crops: 2010
115
political support for biotech crops in China
the president of China hu Jintao emphasized that “Science and technology are the basis of building an innovative country, speeding up the transformation of economic development. China should vigorously develop modern science and technology by developing high quality, efficient, and safe agriculture and related bio-industries; and ensuring security of food and major agricultural products.” These thoughts were shared by the Chinese President Hu Jintao during the 15th Academician Conference of the Chinese Academy of Sciences. At the 10th Academician Conference of the Chinese Academy of Engineering on June 7, 2010 in Beijing, the President also stressed that “China will fully develop advanced breeding techniques to improve the quality, yield and disease resistance of agricultural products. He said that this will assure sustainable development and competitiveness of the nation’s agricultural sector” (Hu, 2010).
Chinese Vice Minister for agriculture zhang taolin called for the need to promote the development of the seed industry in China. Zhang, speaking at the first China Agricultural Scientific and Technological Innovation Forum, emphasized the need to speed up technological innovations in the seed industry. Zhang also called authorities to “scale up management of seed industry, revise and improve relevant regulations and rules, improve examination criteria of varieties and threshold of market access, and standardize the examination, production and operation of genetically modified organisms (GMOs)” (Zhang, 2010).
dr. dafang huang, former Director of the Biotechnology Research Institute under the Chinese Academy of Agricultural Sciences (CAAS), in an interview by the Xinhua News Agency said that, “We are technically advantageous in hybrid rice planting. The genetically modified technology could ensure China’s superiority in food production.” Supporting Dr. Huang’s statement was dr. Wu Yongning, a scientist at the Chinese Center for Disease Control and Prevention, “I am not ruling out all possible risks, but those risks of genetically-modified food are no greater than that of traditional ones, given the heavy use of pesticide in growing traditional food” (Huang, 2010).
At the 43rd Shanghai Academician Salon held in the Hall of Science, Shanghai, China on April 13, 2010, prof. lin hongxuan, academician of Chinese academy of sciences, Chinese academy of engineering, discussed biotechnology applications for breeding of new crop varieties with desirable traits and its role in modern agriculture production and said that “This reform in bio-breeding is irreversible, and we should face it actively,” said Prof. Lin. “The bio-breeding (biotechnology) industry should be promoted on the basis of scientific evaluation through multi-channel and multi-level public education” (Lin, 2010).

Global status of Commercialized biotech/GM Crops: 2010
116
Farmer Experience
Niu Qingjun is a typical Chinese cotton farmer in Shandong province in China, one of the largest cotton growing provinces in the country. Niu is 42 years old, is married with two children and 80% of the family income comes from cotton, which represents the livelihood of the whole family. Niu has been growing Bt cotton since 1998. The total size of his farm is 0.61 hectare and cotton is the only crop that he grows on his farm. Niu’s experience with Bt cotton is captured in the following comments. “We could not even plant cotton if there is no insect resistant cotton (Bt cotton). We could not control bollworm infestation before planting insect resistant cotton, even if spraying 40 times insecticide in 1997.” Niu harvested 2,680 kg of seed cotton in 2007; given that the price of seed cotton is 6.8 RMB/kg, he would approximately make a profit of 14,000 RMB or US$1,886 (not including labor inputs). Niu only sprayed insecticide 12 times in 2007, approximately half the number of sprays he used on conventional cotton prior to the introduction of Bt cotton (Qingjun, 2007).
Before 1997, zu Maotang was one of the cotton farmers across China who were having problems with bollworms. He was using 13 to 15 pesticide sprays per mu (1 mu =1/15 hectare) and worms were already becoming resistant to the insecticide. He learned about experiments on Bt cotton from Dr. Guo Sandui at the Chinese Academy of Sciences, and a partnership between the farmer and scientist took place. Mr. Zu had a chance to save his livelihood, while Dr. Guo had Mr. Zu’s farm for crop testing. Mr. Zu became the first biotech cotton farmer in China, and since then he has enjoyed more than a 10-fold increase in yield (180-190 kg per ha). He has improved the financial status of the family and proudly purchased a family flat in a nearby city. He now shares his expertise through an agricultural association he set up to help farmers in his community. As he says, “Deng Xiaoping gave us policies for prosperity – and ag-scientists gave us the tools to achieve it” (Maotang, 2010).
PARAGUAY
paraguay has successfully grown rr® soybean for seven years since 2004. in 2010, paraguay grew a total of 2.7 million hectares of soybean, of which 2.6 million hectares (approximately 95% adoption) were biotech herbicide tolerant soybean; this compares with 2.2 million hectares of biotech soybean in 2009 out of a total of 2.6 million hectares. the increase in 2010 was due to more total plantings of

Global status of Commercialized biotech/GM Crops: 2010
117
soybean, and a higher adoption rate. economic gains over the period 2004 to 2009 is estimated at us$572 million and the benefits for 2009 alone at us$69 million.
Paraguay is the world’s number four exporter of soybeans and grew biotech soybean unofficially for several years until it approved four herbicide tolerant soybean varieties in 2004. In 2010, Paraguay was expected to grow a total of 2.7 million hectares of soybean of which 2.6 million hectares (approximately 95% adoption) was biotech herbicide tolerant soybean; this compares with 2.2 million hectares of biotech soybean in 2009 out of a total of 2.6 million hectares. The increase in 2009 was mainly due to more total plantings of soybean, and a higher adoption rate. Paraguay is one of the 11 countries that have successfully grown biotech soybeans; the eleven countries, listed in order of biotech soybean hectarage are the USA, Argentina, Brazil, Paraguay, Canada, Bolivia, Uruguay, South Africa, Mexico, Chile and Costa Rica.
Biotech maize and cotton have not been officially approved to-date in Paraguay but its neighboring countries Argentina and Brazil are growing both biotech crops successfully. Paraguay was expected to grow approximately 600,000 hectares of maize in 2010, the same as 2009 and 2008, and up from 450,000 hectares in 2007. There is almost certainly a potential for utilizing biotech maize for economic, environmental and social benefits because its neighbor Argentina is already benefiting from Bt and herbicide tolerant maize, as well as the stacked product. Paraguay was also expected to grow 50,000 hectares of cotton in 2010, which could also benefit significantly from the biotech traits used in cotton in the neighboring countries of Argentina and Brazil.
paraGuaY
Population: 6.3 million
GDP: US$14 billion
GDP per Capita: US$2,130
Agriculture as % GDP: 19%
Agricultural GDP: US$2.7 billion
% employed in agriculture: 26.8%
Arable Land (AL): 4.3 million hectares
Ratio of AL/Population*: 3.0
Major crops: • Cassava • Soybean • Sugarcane • Maize • Wheat
Commercialized Biotech Crop: HT Soybean
Total area under biotech crops and (%) increase in 2010: 2.6 Million Hectares (+18%)
Farm income gain from biotech, 2004-2009: US$572 million
*Ratio: % global arable land / % global population

Global status of Commercialized biotech/GM Crops: 2010
118
benefits from biotech Crop in paraguay
Paraguay is estimated to have enhanced farm income from biotech soybean by US$572 million in the period 2004 to 2009 and the benefits for 2009 alone is estimated at US$69 million (Brookes and Barfoot, 2011, forthcoming).
political support to GM Crops in latin america
The Consejo Agropecuario del Sur (CAS) – Southern Agricultural Council met in Santiago, Chile last October 21-22, 2010 and issued an important statement to endorse agricultural biotechnology development in their countries. CAS is a regional government network of the Ministers of Agriculture of the Southern Cone countries of Latin America, which include Argentina, Brazil, Chile, Uruguay and Paraguay, all important GM crop producers (Crop Biotech Update, 29 October 2010a).
The statement said, there is a need to incorporate scientific and technological innovation to meet the challenge of global food production, and achieve competitive and sustainable development of agriculture. Specifically, the members agreed to:
• Deepen and strengthen the regulatory frameworks and instruments to ensure the use of genetically modified organisms.
• Request international organizations to provide technical and financial cooperation in a coordinated manner for the development of GMOs in accordance with the specific demands of the countries of the region.
• Instruct CAS to continue its coordination, harmonization and promotional efforts on activities related to GMOs.
PAKISTAN
reminiscent of the green revolution era, that made pakistan self sufficient in food production in the 1960s, the Government of pakistan made the historic decision in 2010 to approve the commercial release of 8 insect resistant bt cotton varieties and 1 hybrid. the bt cotton was planted by approximately 600,000 farmers in the kharif season of 2010 (Monsoon season) on 2.4 million hectares, occupying a substantial 75% of the total 3.2 million hectares of cotton area planted nationally in pakistan. as a result, a record cotton production of 14 million bales was expected in 2010, however, 2 to 2.5 million bales of cotton were lost due to severe floods, which destroyed 0.7

Global status of Commercialized biotech/GM Crops: 2010
119
million hectares of cotton in the major cotton growing provinces of punjab and sindh, resulting in a significantly lowered cotton production of only 12 million bales. based on field experiments in pakistan, it is estimated that biotech cotton with both bt and herbicide tolerance has the potential to increase yield, result in significant savings of insecticides, and deliver substantial net economic benefits of up to us$280 per hectare, which could contribute an additional us$800 million annually to the farm economy of pakistan. thus, the second generation biotech crops, conferring both insect resistance and herbicide tolerance in cotton and maize, which have been field tested in 2010, offer pakistan new opportunities for boosting crop yields which have been almost stagnant for the last two decades. Compared with other countries, like india, that have derived significant yield benefits from bt cotton, pakistan has to contend with the possibility that the significant yield gains from bt cotton can be eroded by cotton leaf curl virus (ClCV). the importance of food, feed and fiber crops are major contributors to pakistan’s Gdp, and biotech crops could make a significant contribution at this critical time, when pakistan is trying to desperately recover from the worst floods in its history.
Pakistan is predominantly an agrarian country. It is located in Central South Asia and is surrounded by India in the East, Afghanistan in the North-West and Iran in the West with a coastal exposure to the Arabian Sea. Pakistan is the sixth most populous country in the world and home to a rapidly growing population of 167 million. The recent Pakistan Economic Survey indicates that the country would probably become the fourth largest populated nation by 2050 (Economic Survey, 2010). Pakistan has to feed a burgeoning population with limited arable land of 22.5 million hectares,
paKistaN
Population: 167 million
GDP: US$165 billion
GDP per Capita: US$990
Agriculture as % GDP: 20%
Agricultural GDP: US$33 billion
% employed in agriculture: 44%
Arable Land (AL): 22.5 million hectares
Ratio of AL/Population*: 0.5
Major crops: • Cotton • Sugarcane • Maize • Wheat • Rice
Commercialized Biotech Crop: Bt Cotton
Total area under biotech crops in 2010: 2.4 Million Hectares
*Ratio: % global arable land / % global population

Global status of Commercialized biotech/GM Crops: 2010
120
equivalent to roughly a quarter of total land area of 80 million hectares. Agriculture continues to play an important role to sustain employment, economic growth, export earnings, and produce sufficient food to feed the growing population.
Agriculture remains the most crucial sector in Pakistan’s economy and accounts for over 20% of the national Gross Domestic Product (GDP). Agriculture employs 44% of the country’s labor force and two-thirds of the export earnings are derived from raw cotton, garments and cotton textiles. Crop cultivation and animal rearing are the principal sources of rural livelihoods with 62% of the population residing in rural areas. In the last two decades, crop production has been declining with direct negative impact on growth prospects for agriculture and in turn the national economy (Figure 31). The survey also noted that agriculture, particularly crop production, has been suffering heavily from stagnation in yield and a widening gap developing between actual yields and those required for ensuring food security and rural prosperity. Pakistan was at the forefront in introducing semi-dwarf high yielding wheat varieties in the late 1960s and early 1970s which helped the country to double its wheat production in the short span of 5 years. However, the impressive gains of the green revolution technologies of the 1970s and 1980s in wheat are a distant past. In 2007, a “Vision 2030” report by the Planning Commission of Pakistan concluded that the emergence of post-green revolution problems, especially constraints due to pests and diseases, declining water resources and
figure 31. declining trend in the Growth of agriculture in pakistan, 1960s to 2000s
Source: Economic Survey, 2010.

Global status of Commercialized biotech/GM Crops: 2010
121
land degradation, coupled with high population growth are posing serious threats to food security and environmental sustainability (Planning Commission, 2007).
In the past two decades, the country has been suffering from the lack of investment in new seeds, farming technologies and techniques, water infrastructure and declining availability of water for irrigation. A cursory glance at the agriculture sector shows that the gains made in the last decades have been primarily due to the performance of the livestock sector which contributes 53% to agricultural value-added products, as compared to 47% from crop production. Five major crops, wheat (40%), cotton (23%), rice (18%), sugarcane (10%) and maize (5%) account for 95% of the total crop production in the country (Figure 32). It is noteworthy that these major crops are the foundation for ensuring food security, and urgently require an infusion of new technologies to overcome the productivity barrier.
Agriculture production in Pakistan is heavily dependent on the supply of irrigation water, and rainfall in the monsoon and winter seasons. In addition to canal irrigation system, which irrigates around 20% of the arable land, it receives an average of 138 mm rainfall in the monsoon season from July to September, and 71 mm in winter. Farmers in Pakistan cultivate crops in two principal crops seasons, Kharif (monsoon season, planted in May and harvested in the fall) and Rabi (winter crops, harvested
figure 32. Composition of Value of Major Crops, 2009-10
Source: Economic Survey, 2010.

Global status of Commercialized biotech/GM Crops: 2010
122
in the spring). Four of the five principal crops including cotton, rice, sugarcane and maize are grown in the Kharif season whilst wheat and other minor crops are Rabi season crops.
In 2009-10, cotton remained the second major contributor and accounts for 9 percent of the value-added in agriculture and combined with textile industry, it makes up about 9% of the country’s GDP (All Pakistan Textile Mills Association, 2007). At the national level, the performance of cotton crop is a significant influence on the national GDP growth with a +/- 10% change in production of cotton crop exerting a substantially disproportionate effect of 2% to 8% on the growth of GDP. Cotton is a multipurpose crop (fiber, oil and animal feed) and the single largest source of raw material for the textile industry in Pakistan which has been the main driver of the national economy for the last 50 years, in terms of foreign currency earnings and job creation. Figure 33 illustrates that the textile and clothing industry has consistently contributed more than 50% to total exports from Pakistan during the period 2001 to 2010.
During the last ten years, the textile industry in Pakistan has made an investment of about US$7.5 billion. As of 2009, there are hundreds of processing & ginning factories and textile mills with an installed capacity of 10.5 million spindles and 9,000 looms producing 2.2 billion kg of yarn and 1.1 billion square meter of cloth, for domestic and export requirements (Textile Commissioner’s
figure 33. Comparison of total exports Versus textile and Clothing exports from pakistan, 2001 to 2010
Source: Economic Survey, 2010.

Global status of Commercialized biotech/GM Crops: 2010
123
Organisation, 2010b). In view of new emerging opportunities, the Government of Pakistan unveiled a new Textiles Policy 2009-2014 to boost textile export to US$25 billion with the help of a newly launched Textiles Investment Support Fund (TISF) and Technology Up-gradation Fund (TUF) (Ministry of Textile Industry, 2009). Pakistan has a goal to increase its world textile trade share from 1.8% in 2009 to 3% by 2014 (Economic Survey, 2009). In spite of these initiatives, investment in the textile sector has shown a rapid decline, adversely impacting on the future prospects of the textile sector. This regression has been mainly due to the declining production of raw cotton domestically, and record high international cotton prices.
Pakistan is the fourth largest cotton producer in the world after China, India and USA. Cotton is the most important cash crop of a legion of farmers who grow cotton, mainly in Punjab and Sindh provinces which are divided into zones on the basis of rainfall and temperature (Soomro, 1996). Farmers plant cotton on 2.8 to 3.2 million hectares with an average farm holding of approximately 4 hectares (Rao, 2010 Personal Communication and Table 23). Thus there are around 750,000 cotton farmers in the country. Both Punjab and Sindh farmers mainly grow open pollinated varieties (OPVs) of cotton with almost 100% assured irrigation facility throughout the cotton season. A small area of cotton is also grown in the province of Balochistan and the North West Frontier Province (NWFP). Kharif is the major season for cotton cultivation which begins in April-June and harvested during October-December. An overview of cotton cultivation and its distribution in Pakistan in 2008-09 is detailed in Table 23.
It is important to note that the area under cotton has not increased substantially over the last two decades – 2.7 million hectares in 1990-91 to 3.1 million hectares in 2009-10. During the same period, cotton yields remained almost stagnant at 550 kg to 750 kg of lint per hectare which is a major cause of concern for the growing textile industry (Figure 34). As a result, the annual cotton production has stalled at between 10 to 12 million bales whilst demand for cotton doubled from 6.6 million bales in 1990-91 to 14.8 million bales in 2009-10 (Figure 35). Pakistan was a net cotton exporter in the early 1990s but is now a major importer of cotton to meet the growing demand of Pakistan’s domestic cotton based industry. Over the last five years, Pakistan has been importing 3 to 5 million bales of cotton per year which costs the national exchequer between US$3 to 5 million per year, which further widens the trade deficit to record levels. In contrast to the situation in Pakistan, the top three cotton producers in the world, China, India and USA have substantially increased cotton yield over the same period outcompeting others including Pakistan in the world cotton market. For instance, India has doubled its cotton production from 13 million bales in 2001 to 30 million bales in 2009-10. It is noteworthy that all three lead cotton countries have successfully deployed biotech cotton varieties and hybrids which confer resistance to major insect pests and tolerance to herbicides thus benefiting from cost effective and efficient management of insect pest and weed control. Consequently, farmers in these countries have generated substantial additional income by

Global status of Commercialized biotech/GM Crops: 2010
124
reducing losses caused by insect pests and weeds, significantly reduced insecticide applications and reaped bumper harvests of competitively priced cotton for the international market.
Insect pests and diseases of cotton cause substantial losses in Pakistan. There are mainly two types of insect pests; chewing and sucking pests which significantly damage the standing crop in the major cotton growing provinces of Punjab and Sindh. The major pests are the chewing insects – the bollworm complex including the American bollworm (Helicoverpa armigera), spotted bollworm (Erias vitella), pink bollworm (Pectinophora gosspiella) and army worms (Spodoptera sps). The second group are the sucking pests which comprise of the whitefly, cotton jassids, thrips, mites and aphids (Table 23). A timely and sufficient number of insecticide sprays can effectively control sucking pests
table 23. distribution of Cotton in pakistan, 2008-09
province punjab sindh balochistan/NWfp (North West frontier
province)Area 2.224 M ha 0.562 M ha <50,000 ha
Production 8.751 M Bales 2.978 M Bales <50,000 Bales
Productivity 669 Kg/ha 902 kg/ha –
Condition Irrigated Irrigated Irrigated
Nature of Genotype Varieties Varieties Varieties
Popular Varieties/Hybrids popular non-bt varieties: BH-160, CIM-473, CIM-496, CIM-506, CIM-534, MNH-786, NIAB-111bt Varieties: IR-3701, Ali Akbar-703, MG-6, Sitara-008, IR-1524, FH-113, Ali Akbar-802, Neelum-121 and GM-2085
popular non-bt varieties: NIAB-78, CRIS-134, FH-1000, FH-901bt Varieties: IR-3701, Ali Akbar-703, MG-6, Sitara-008, IR-1524, FH-113, Ali Akbar-802, Neelum-121 and GM-2085
Bt-121, CRIS-134, MN-496, MN-506
Species G. hirsutum (>99%)G. arboreum (<1%)
G. hirsutum (>99%)G. arboreum (<1%)
G. hirsutum
Insect/Pests Bollworm complex, Mealy Bug, Thrips, Jassids, Mites
Bollworm complex, Mealy Bug, Thrips, Jassids, Mites
Bollworm complex, Mealy Bug, Thrips, Jassids, Mites
Diseases Leaf Curl Virus Leaf Curl Virus in upper Sindh only
Nil
Time of Sowing (Month) March to May March to May May
Time of Harvest (Month) Start after 130 days of sowing
Start after 130 days of sowing
Start after 130 days of sowing
Source: Personal Communication with Mr. Ijaz Ahmad Rao and compiled by ISAAA, 2010.

Global status of Commercialized biotech/GM Crops: 2010
125
figure 34. trend in annual Cotton Yields in pakistan, 1990 to 2010
Source: Ministry of Food, Agriculture and Livestock, 2010.
figure 35. Cotton production, Consumption, export and import in pakistan, 1990 to 2010
Source: Ministry of Food, Agriculture and Livestock, 2010.

Global status of Commercialized biotech/GM Crops: 2010
126
however bollworms continue to devastate the cotton crop resulting in significant losses and lower production of cotton as well as deteriorating cotton quality. In recent years, cotton leaf diseases particularly cotton leaf curl virus (CLCV) has become a major threat to cotton production, and it has rapidly spread in the Punjab and Sindh provinces. The epidemic of cotton leaf curl virus (CLCV) has significantly decreased cotton production in 1994-95 and again in 2003-04 with moderate damage to cotton in other years. Cotton farmers have to resort to frequent insecticide applications to control insect pests and diseases. On average, 5-8 insecticide applications are required to control the bollworm complex, depending on the infestation levels. At the national level, cotton farmers spend approximately US$250 million annually on insecticides, of which US$190 million of insecticides are for bollworm control alone (Pakistan Industry Estimates, 2010). Research studies by the National Institute of Biotechnology and Genetic Engineering (NIBGE) suggest that the constant increase in application of pesticides has escalated production costs and contributed to environmental and public health problems as well as the development of resistance in insect pests to frequently used insecticides (Zafar, 2007).
The All Pakistan Textile Mills Association (APTMA) estimated that the textile industry’s raw cotton requirements would be 20.1 million bales by 2015 comprising 66% of medium staple, 26% long staple and 8% extra long staple cotton. To meet these needs “Cotton Vision 2015” concluded that this increased demand would require an increase of 5% in cotton hectarage in Balochistan and in the North West Frontier Province (NWFP), an annual average of 5% increase in yield, introduction of CLCV resistant Bt cotton varieties and hybrids, and a strengthening of R&D and infrastructure of cotton institutes in Pakistan. In 2005-06, Pakistan’s federal government launched an ambitious plan to enhance cotton production to 20.7 million bales by 2015 – a 60% increase over 2005-06 production, however actual production has dropped from 14 million bales in 2005/6 to a low of 12 million bales in 2009-10 (Figure 35).
Commercial approval of bt Cotton in pakistan
In concurrence with the federal government national biosafety framework, the Punjab Seed Council (PSC) under the Ministry of Agriculture of the Punjab province decided to officially approve the commercial cultivation of 8 insect resistant Bt cotton varieties and one Bt cotton hybrid at their 39th meeting held on 31st March 2010. This decision of the Punjab Seed Council was considered very important particularly because a decision had not been declared at that time by the National Biosafety Committee (NBC) of the federal Ministry of Environment.
Punjab is the largest cotton growing region occupying almost 80% of total cotton in Pakistan with the balance of cotton hectarage in the Sindh with less in Balochistan and North West NWFP (Table 23). The federal Ministry of Food and Agriculture (MinFA) endorsed the PSC’s decision for commercial

Global status of Commercialized biotech/GM Crops: 2010
127
release of Bt cotton in the meeting held on 15th April 2010. Accordingly, the Punjab Seed Council (PSC) approved the release of two events of Bt cotton namely MON531 (cry1Ac gene) and the GFM event expressing the fusion gene cry1Ac and cry1Ab. A total of 8 cotton varieties expressing MON531 and one hybrid expressing the fusion gene cry1Ac and cry1Ab received approval for commercial cultivation in 2010 (Punjab Seed Council, 2010; NBC, 2010).
Consistent with past experience in many other countries there was speculation that cotton farmers in Punjab and Sindh had been planting unofficial and unauthorized Bt cotton varieties on a large scale for sometime prior to the official release in 2010; this posed a potential serious threat that insects would develop resistance against these varieties and lead to destruction of cotton crops and socio-economic and financial loss to a cotton economy that was already fragile (Rao, 2006; NBC, 2010). The Planning Commission of Pakistan in its annual plan 2010-11 reported that unauthorized cultivation of Bt cotton was on a significant scale and exacerbated pest infestation problems which could have negatively affected productivity in 2008 and 2009 (Planning Commission, 2010). Accordingly, the decision of the Punjab Seed Council (PSC) to officially approve cultivation of the 8 Bt cotton varieties and 1 hybrid in 2010 assumes great significance for Pakistan and could pave the way for improved and sustained cotton production in the country.
It is important to note that all approved Bt cotton varieties and hybrid have undergone more than 5 to 6 years of field trials complying with the field trial procedures laid down by the Pakistan Central Cotton Committee (PCCC). All eight Bt cotton varieties expressing cry1Ac gene (MON531 event) namely IR-3701, Ali Akbar-703, MG-6, Sitara-008, IR-1524, FH-113, Ali Akbar-802 and Neelum-121 have been developed by public and private sector institutes whereas one Bt cotton hybrid GM-2085 expressing fusion gene cry1Ac and cry1Ab has been developed by an indigenous private seed company. Out of the eight Bt cotton varieties, four Bt cotton varieties received unconditional approval, four varieties received one year approval with the condition that developers must submit fiber characteristics duly certified by the designated laboratory. In addition, Bt cotton hybrid GM-2085 received approval for two years with the condition that hybrid would be reconsidered by the PSC after fulfilling the requirement of the Federal Seed Certification and Registration Department (FSC&RD) in the Distinctness, Uniformity and Stability (DUS) trials. The details of each Bt cotton variety/hybrid, gene and event and its developer and date of approval are given in Table 24.
In 2010, Pakistan became the twelfth country to officially plant Bt cotton. Thus, the Bt cotton farmers of Pakistan, for the first time, joined the exclusive club of biotech cotton growing farmers from the USA, China, India, Australia, South Africa, Brazil, Argentina, Columbia, Mexico, Costa Rica and Burkina Faso which control a very large proportion of global cotton production and trade. In 2010, these countries including Pakistan planted 2.4 million hectares of biotech cotton which is 14% of total biotech cotton area of the world (Table 25).

Global status of Commercialized biotech/GM Crops: 2010
128
table 24. Commercial release of different bt Cotton Varieties and hybrid in pakistan, 2010
Crop event Variety (*hybrid)
developer status date of approval
Cotton cry1Ac gene (MON531 event)
IR-3701 Nuclear Institute for Biotechnology and Genetic Engineering (NIBGE), Faisalabad
Approved Punjab Seed Council (PSC) approved it on 31 March 2010
Federal Ministry for Food and Agriculture approval on 15 April 2010
Cotton cry1Ac gene (MON531 event)
Ali Akbar-703
M/s Ali Akbar Seeds, Multan
Approved As Above
Cotton cry1Ac gene (MON531 event)
MG-6 M/s Nawab Gurmani Foundation
Approved As Above
Cotton cry1Ac gene (MON531 event)
Sitara-008 M/s Nawab Gurmani Foundation
Approved As Above
Cotton cry1Ac gene (MON531 event)
IR-1524 NIBGE, Faisalabad
One year Approval (Approved for one year with the condition to reconsider after improving fibre characteristics)
As Above
Cotton cry1Ac gene (MON531 event)
FH-113 Cotton Research Institute, AARI, Faisalabad
One year Approval (Approved for one year with the condition to reconsider after improving fibre characteristics)
As Above
Cotton cry1Ac gene (MON531 event)
Ali Akbar-802
M/s. Ali Akbar Seeds, Multan
One year Approval (Approved for one year with the condition to reconsider after improving fibre characteristics)
As Above
Cotton cry1Ac gene (MON531 event)
Neelum-121 M/s. Neelum Seeds, Multan
One year Approval (Approved for one year with the condition to reconsider after improving fibre characteristics)
As Above
Cotton fusion gene (cry1Ac and cry1Ab)/GFM event
GM-2085(*hybrid)
M/s. Guard Agricultural Research Services, Lahore
Approved(two year approval, DUS trial data to be submitted to FSC&RD)
As Above
Source: Punjab Seed Council (PSC), 2010.

Global status of Commercialized biotech/GM Crops: 2010
129
table 25. adoption of bt Cotton in pakistan, 2010
Year adoption of bt Cotton (ha) total Cotton (ha) % adoption
2010 2.4 million hectare 3.2 million hectare 75%
Source: Compiled by ISAAA, 2010.
2010 was a record year for cotton farmers in Pakistan when approximately 600,000 farmers in Pakistan planted 2.4 million hectares of Bt cotton equivalent to 75% of the 3.2 million hectares of cotton (up 3% on the 3.1 million planted in 2009) cultivated nationally in Pakistan.
After the establishment of the Bt cotton crop, the country expected to harvest a record 14 million bales of cotton as compared to 12.7 million bales in 2009-10. However, an estimated 2 to 2.5 million bales of cotton were destroyed when an estimated 0.7 million hectares was devastated by the worst floods in the history of Pakistan. Floods destroyed 0.52 million hectares of cotton in Punjab and 0.13 million hectares in Sindh province. As a result, projected production was lowered from an estimated 14 million bales to 12 million bales (PCGA, 2010; Daily Times, 2010).
Monitoring of Bt cotton fields prior to the floods indicated that the approved 8 Bt cotton varieties and 1 hybrid performed well and seemed relatively tolerant to cotton leaf curl virus (CLCV) and out-yielded their non-Bt counterparts and required 3-5 fewer insecticide sprays. Based on preliminary field trials, assuming deployment of biotech cotton at 90% with both insect and herbicide tolerance, there is a potential to substantially increase farmer income by approximately up to US$280 per hectare (Pakistan Textile Journal, 2010; Kakakhel, 2010). In order to optimize the benefits from the new technologies in 2010, Punjab has planned a vigorous country wide campaign for 2010 to implement insect resistant management and effectively control whitefly which is the vector of the deadly cotton leaf curl virus (CLCV). Guidelines for marketing of Bt cotton seeds were issued by the Directorate General of Agriculture Extension of Punjab to ensure genetic purity, germination, refuge and product labelling of Bt cotton packets for optimizing the full potential of Bt cotton seeds in farmers field (Directorate General of Agriculture, 2010).
biosafety regulation in pakistan
In 2005, the Federal Ministry of Environment of Pakistan notified the Pakistan Biosafety Rules 2005 on 21 April 2005 of section 31 of the Pakistan Environmental Protection Act 1997. The Rules 2005 apply to manufacture, import, export, storage, sale & purchase of microorganisms, gene technological products, living modified organisms, substances or cells and products thereof for

Global status of Commercialized biotech/GM Crops: 2010
130
research, experimentation, field trials and commercial release of biotech products by institutes of public and private sectors in Pakistan. Rules 2005 not only legislates to underpin the growing local demand for biotechnological interventions for crop improvement but also meeting the obligation of international environmental agreements such as the Cartagena Protocol on Biosafety. Prior to notifying the National Biosafety Rules 2005, the experimentation, field trials and risk assessment of GMOs were regulated under the “Voluntary Code of Conduct for release of GMO into the environment” (Pak EPA, 2005a; Zafar, 2007; NBC, 2010).
Complying with the provisions of Rules 2005, the Pakistan Environmental Protection Agency (Pak EPA) of the Ministry of Environment developed the National Biosafety Guidelines 2005 and Proformas for the Movement of Regulated Materials which establishes comprehensive procedures and forms to carry out risk assessment and devise risk management plans for protecting crops and biological diversity. The National Biosafety Rules and Guidelines 2005 envisage a three layer regulatory mechanism to implement and monitor provisions of the Rules 2005 as illustrated in Figure 36.
The National Biosafety Committee (NBC) is the apex committee to approve and/or reject proposals related to import, export, field trials and commercial release of genetically modified crops in Pakistan. The NBC is headed by Secretary of Ministry of Environment and housed at the National Biosafety Centre (NBC) which provides required facilities for the implementation of the Rules and Guidelines 2005. The NBC consists of members officiating from various federal and provincial ministries including agriculture, environment, health and S&T, and scientific agencies such as the Pakistan Agricultural Research Council (PARC), Pakistan Atomic Energy Commission (PAEC), Department of Plant Quarantine, Federal Seed Certification and Registration Department and the Pakistan Central Cotton Committee (PCCC). The National Biosafety Committee (NBC) considers the applications for import, export and commercial release of genetically modified crops based on the recommendations of the Technical Advisory Committee (TAC), independently reviews the risk assessment and ensures compliance with biosafety provisions prescribed in the National Biosafety Rules 2005 and the National Biosafety Guidelines 2005. The Technical Advisory Committee (TAC) serves as a chief technical committee that is empowered to examine application, review and control safety measures, develop safety protocols, guide product development, monitor field performance and submit its recommendations on the products under testing to the NBC. The members of TAC consist of scientists working in the premier biotech, agriculture, health and environmental sciences related institutes in Pakistan and served by the National Biosafety Centre (NBC) of the Pakistan Environmental Protection Agency. At the ground level, The Institutional Biosafety Committee (IBS) serves as a first tier committee to oversee and supervise R&D of genetically modified crops at the institute level and assist TAC and NBC in the decision making process (Pak EPA, 2005b).
As shown in the flow chart in Figure 36, the National Biosafety Guidelines 2005 classify microorganisms into two broad categories; exempt category of microorganisms which pose no risk

Global status of Commercialized biotech/GM Crops: 2010
131
and have been successfully used in other countries and those with low/high risks that fall under regulated category. Both categories of micro-organisms have to strictly comply with the biosafety provisions prescribed in Rules 2005 and the Guidelines 2005 and are regulated by a three-tier monitoring and implementing committee as described above. In case of the exempt category microorganisms, the NBC may consider the application for commercial release of GMOs on a priority basis, based on the recommendation of IBC and TAC granting exempt status to GMOs having no risk and sufficient prior history of usage in Pakistan and abroad. Under this category of GMOs, the applicant can leverage the global biosafety data and seek early commercialization of GMOs reducing the 2-3 years of time to market. However, in both cases, the GMOs have to undergo two years of the Pakistan Central Cotton Committee’s (PCCC) adaptability trials to ensure agronomic benefits, trait efficacy and environmental impact assessment and one year of large field trials prior to commercialization (Pak EPA, 2005a, b).
figure 36. flow Chart of biosafety regulation in pakistan
Source: Compiled by ISAAA, 2010.

Global status of Commercialized biotech/GM Crops: 2010
132
advanced field trials of biotech Crops in pakistan
In the early 1970s, Pakistan was the first country to adopt and popularize the semi-dwarf high yielding wheat varieties that subsequently facilitated the implementation of the Green Revolution in Pakistan. In recent years, Pakistan’s leadership have reiterated that technology, especially “biotechnology can play the critical role in meeting agricultural targets during this century, leading to higher production, better resistance, and lower costs of production. Major investments in public sector have been made over the years in agricultural biotechnology, and a few research centres have attained international recognition. There is a need to establish more such centres especially on agro-genomics to act as the supplier of all basic information for developing desirable transgenic crops and animals. Investments in this area will have high rates of return” (Planning Commission, 2007).
Over the years, Pakistan has developed a well established infrastructure and R&D programs for crop improvement particularly in major crops like wheat, cotton, rice, maize and sugarcane, both at the federal and provincial levels. In recent years, the Pakistan Atomic Energy Centre (PAEC) and the Pakistan Agricultural Research Council (PARC) have invested US$17 million by establishing four biotech institutes namely: National Institute for Biotechnology and Genetic Engineering (NIBGE), Faisalabad: Centre of Excellence in Molecular Biology (CEMB), Lahore: National Institute of Genomics and Advanced Biotechnology (NIGAB), Islamabad; and Agricultural Biotechnology Research Institute (ABRI), Faisalabad. In addition, 26 centres at various agricultural crop institutes and universities have been modernized to undertake tissue culture related activities, crop improvement using marker-assisted selection techniques, DNA testing and GMO detection in Pakistan (Khalid, 2009).
With the official release of eight Bt cotton varieties and one Bt cotton hybrid in 2010, there has been a definitive thrust at both public and private sector institutes to advance applications of biotechnology for crop improvement. Various biotech crops, including cotton, maize, sugarcane, potato and tomato are under development and are at the laboratory and field trial stages of the regulatory approval system in Pakistan. In 2010, the National Biosafety Committee (NBC) approved the large scale field trials of various events of cotton including stacked traits of insect resistance and herbicide tolerance which, subject to regulatory approval could be released in 2011. Notably, the other important development in 2010 was the approval of second year large scale fields of Bt & HT maize. Maize is a major feed crop in Pakistan grown on over 1 million hectares, and it is possible that Pakistan may approve the commercial cultivation of biotech maize in 2011-12 to help maize farmers to substantially improve their maize yield and its competitiveness in the international maize market (Table 26).

Global status of Commercialized biotech/GM Crops: 2010
133
table 26. status of advanced field trials of biotech Crops in pakistan, 2010
Crop organization transgene/biotech trait eventCotton NIBGE, Pakistan
Monsanto PakistanAli Akbar SeedsCEMB, Pakistan
cry1Ac/IRcry1Ac and cry2Ab/IR cry1Ac/IRcry1Ac and cry2A/IR
–MON 15985 Event-1–
Maize Monsanto, Pakistan
Pioneer, Pakistan
cry2Ab2 & cryA.105 and CP4EPSPS/IR&HTcry1F, cry1Ab and CP4EPSPS/IR&HT
Mon89034 and NK603
HX1 × MON810 × K603
Source: National Biosafety Committee Pakistan, 2010; compiled by ISAAA, 2010.
It is estimated that with the official release of first generation insect resistant cotton varieties and hybrids in 2010, along with expected release of stacked traits of biotech cotton in 2011, Pakistan could accrue significant benefits of approximately US$800 million per year to its farm economy, assuming a 90% adoption of biotech cotton (Industry Estimates, 2010). Additionally, it is expected that a widespread adoption of biotech cotton would substantially reduce insecticides sprays, less exposure of farmers and farm labourers to insecticides, higher quality of cotton and higher return to cotton farmers and overall gains to the farm economy at national level. Compared with other countries, like India, that have derived significant yield benefits from Bt cotton, Pakistan has to contend with the possibility that the significant yield gains from Bt cotton can be eroded by cotton leaf curl virus.
Farmer Testimonials
Mr. Niaz Nizamani is a learned progressive farmer from Tando Allahyar (near Hyderabad, Sindh). He is growing sugar cane, banana, cotton, rice, and wheat on his farms. He has experienced planting Bt cotton and said, “Bt cotton is a total revolution in the field of agriculture. We get very good yields per hectare along with a good quality.” He added that “ClCV virus is the major problem faced by the cotton farmers of Pakistan, and currently available Bt seed varieties are not able to solve the problem. Still, we are in need of some better quality seeds to overcome the ClCV problem which is affecting our crops and reducing the productivity to half.”
Mr. hadi bukhsh leghari is working as the technical manager of a Sindh farm in Tando Allahyar. He told the Pakistan Biotechnology Information Center (PABIC) that, “in the coastal areas of Sindh no cotton has been grown but after the introduction of different Bt cotton varieties many farmers are growing this because of high yield and good quality.” According to him, the major

Global status of Commercialized biotech/GM Crops: 2010
134
problem is the lack of a protocol to be followed by the growers for the sowing of Bt seeds. He said, “Although Pakistan has approved eight cotton varieties, still, we are waiting for the proper permission and the sustainable supply of the seeds. This situation actually confounds our agriculture sector re. the illegal and unknown varieties which results in other complications, like ClCV.”
SOUTH AFRICA
the planting of biotech crops for the 2010/11 season started late due to delayed spring rains but was underway when this brief went to press. the hectarage occupied by biotech crops in 2010 continued to increase for the 13th consecutive season. the estimated total biotech crop area in 2010 was 2.2 million hectares, compared with 2.1 million hectares in 2009-10. the total maize area decreased by 10% mainly due to carry-over of grain stocks and lower grain prices, while soybean plantings increased. approximately 10 million hectares of biotech maize (white and yellow) were planted in the 10 year period 2001 to 2010. the total area planted to soybeans increased from 270,000 hectares in 2009 to 390,000 hectares in 2010 due to higher demand, while the adoption rate of herbicide tolerant soybeans remained at 85% (332,000 hectares). Consistent with global trends, the total cotton area is expected to double to 15,000 hectares, due to the high cotton prices, with the biotech adoption rate reaching 100%, 95% of which are stacked. herbicide tolerant cotton is used as a mandatory refuge for biotech cotton fields. a new offering of biotech traits are being field trialed for maize, soybean and cotton, and new biotech crops are also being tested.
From a regulation viewpoint, the GMO Act of 1997, amended in 2006 to meet requirements under the Cartagena Protocol on Biosafety (CPB), was amended again recently and approved in April 2010. The decision-making process remains the same and is based on applications for permits. The standards and other regulatory changes for managing import of commodity grain containing events not yet approved in South Africa, and the Consumer Protection Act of 2008 that contains a contentious clause for mandatory labeling of GM goods, are still being drafted and reviewed. The Executive Council has commenced a study into guidelines for biosafety assessment of stacked traits.
It is estimated that 2.47 million commercial hectares of all maize will be planted in 2010, down 10% from 2009, in the ratio of 62% white (11.8% down) or 1.522 million hectares and 38% yellow

Global status of Commercialized biotech/GM Crops: 2010
135
grain (down 7.5%) or 0.946 million hectares. Of the total maize area, 76.9% or 1.9 million hectares will be biotech, slightly down from 78% in 2009/10. Of the 1.9 million hectares of biotech maize 45.6% or 865,589 hectares were the single Bt gene, 13.4% or 254,211 hectares herbicide tolerant, and 41% or 777,820 hectares stacked Bt and herbicide tolerant (HT) traits. Approximately 10 million hectares of biotech maize (white and yellow) have been planted in the 10 year period 2001 to 2010, producing a grain crop of over 38 million MT up to 2010 harvest without a single report of adverse effects on humans, animals or the environment. The yield benefit to farmers from the Bt trait over this period amounted to US$376 million (Van der Walt, Personal Communication, 2009).
The white maize sector of 1.52 million hectares comprises 74.8% biotech or 1.14 million hectares with the single Bt gene accounting for 571,280 hectares (50.2%), herbicide tolerance 97,040 hectares (8.5%) and Bt-herbicide tolerance stacks at 470,430 hectares (41.3%). Stacked traits increased 3.8-fold due to more availability of seed. The yellow maize planting of 946,000 hectares comprised 80.2% or 758,870 hectares of biotech, up from the 77.1% of the previous season (Table 27). The biotech breakdown by trait for yellow maize is 38.8% or 294,309 hectares for the single Bt trait, 20.7% or 157,171 hectares for herbicide tolerance, and 40.5% (up from 28% in 2009/10) or 307,390 hectares for the stacked Bt and herbicide tolerant product. Smallholder and peasant farmers planted some 19,000 hectares of biotech maize in 2009; 52% were Bt, 23% herbicide tolerant, and 25% Bt/HT stacked. Similar data on small farmer usage for 2010 were not available when this Brief went to press.
south afriCa
Population: 48.8 million
GDP: US$276 billion
GDP per Capita: US$5,680
Agriculture as % GDP: 3.0%
Agricultural GDP: US$8.3 billion
% employed in agriculture: 8%
Arable Land (AL): 14.7 million hectares
Ratio of AL/Population*: 1.3
Major crops: • Sugarcane • Maize • Wheat • Grapes • Potato
Commercialized Biotech Crops:• HT/Bt/HT-Bt Cotton • HT/Bt/HT-Bt Maize • HT Soybean
Total area under biotech crops and (%) increase in 2010: 2.2 Million Hectares (+5%)
Farm income gain from biotech, 1998-2009: US$676 million
*Ratio: % global arable land / % global population

Global status of Commercialized biotech/GM Crops: 2010
136
Total soybean plantings are estimated to grow by 25% in 2010, compared with 2009, to reach a record 390,000 hectares. HT soybean is estimated at 331,500 hectares or 85% of the total area planted. Of the 66 soybean varieties listed for 2010, 18 or 27% were biotech. Roundup Ready (RR) herbicide tolerance is being replaced with RRFlex herbicide tolerance trait.
Cotton production has continued to decline in recent years due to a movement away from dry land to irrigation. Dry land cotton proved not to be competitive with maize yields of 12 to 15 tons per ha. Government support for smallholder cotton farmers has also declined. However, rising global prices are now encouraging increased interest in cotton and 15,000 hectares is expected to be planted in 2010. All of the cotton is expected to be biotech with 95% stacked (Bt/HT) and 5% RR used in refugia. The stacked BtRR (Bollgard®II RR) will be entirely replaced with BtRRFlex by 2011. There was no conventional cotton grown in 2010.
There were 360 GMO permits granted in 2009, 294 or 82% being for maize grain exports and seed imports and exports (LMOs in terms of the Protocol). Biotech seed imports amounted to 598 tons while 7,760 metric tons (MT) were exported; the balance of permits were small samples for multiplication, breeding, trials and contained use. The other 16% dealt with other crop species, as well as microbes and GM vaccines for clinical trials. It is also noteworthy that South Africa remains an active exporter
table 27. adoption of biotech Crops in south africa, 2001 to 2010 (thousand hectares)
Year total area of biotech crops (maize, soybean,
cotton)
total area ofbiotech maize
total area of biotech white maize(% of total white maize area)
2001 197 166 6 (<1%)
2002 273 236 60 (3%)
2003 404 341 144 (8%)
2004 573 410 147 (8%)
2005 610 456 281 (29%)
2006 1,412 1,232 704 (44%)
2007 1,800 1,607 1,040 (62%)
2008 1,813 1,617 891 (56%)
2009 2,116 1,878 1,212 (79%)
2010 2,229 1,898 1,139 (75%)
Total 11,427 9,841 5,624
Source: Compiled by ISAAA, 2010.

Global status of Commercialized biotech/GM Crops: 2010
137
of conventional (not indicated in permits) and of GM cotton seed. In 2009/10, 215 MT of GM cotton seeds were exported (74 MT in 2008/09) and only 3 MT imported. Up to end of October 2010, 261 maize permits were granted, or 84% of the total 312 permits issued. Some 60 permits covered GM or commingled GM maize grain with a total quantity of 1.7 million tons exported, while only one commodity consignment of 30,000 tons was imported. GM maize seed exports amounted to 8,783 tons (10 permits), excluding seed for trials, multiplication or contained use. GM maize seed imports were 1,707 tons. GM cotton seed involved 293 tons or 10 permits, excluding seed for trials, multiplication or breeding. Only small samples of cotton seed were imported.
Analysis of permits by event and application are detailed below:
The field trials approved for 2009/10 are characterized by unique event identifiers:• Maize: MON8740, MON8934, MON8934 × NK603, MON810 × MIR162, Bt11 × GA21,
GA21, TC1507, TC1507 × MON810, TC1507 × MON810 × NK603, TC1507 × MIR162 × NK603, TC1507 × MIR162, TC1507 × MON810 × MIR162, Pioneer 59122, Pioneer98140, Pioneer98140 × MON810, Pioneer98140 × TC1507 × Mon810.
• Cotton: BG®II × GlyTol × LLC25, Twinlink (IR-HT), LLGlytol × LL 25, Twinlink × Glytol, BG®II × LL25, GHB914.
• Sorghum: African Biofortified Sorghum (in greenhouse)• Table grapes: Fungal resistance to test gene expression (grapes do not set berries in
greenhouse)• Sugarcane: Alternative sugars variety NCo310; three growth rate/yield/altered sucrose traits
(pASNI, SVPPase, pAUGdf510).• Cassava: Altered starch (in green house)
Commercial general release approved in 2010:• Maize: MON89034; and MON89034 × NK603
Field trials approved for January to October 2010:• Maize: Nine of the above events in 2009/2010 were approved for trials in 2010/2011. • Cotton: Four of the events trialed in 2009 were approved for 2010 in repeat trials• Table grape: 2009 trial continued.• Sugarcane trials still in field• Cassava: Enhanced starch approved for field trial.
Greenhouse trial:• Ornithogalum (indigenous bulb flower): virus resistance.

Global status of Commercialized biotech/GM Crops: 2010
138
Clinical trials:• Several GM vaccines for treatment of tuberculosis and measles were approved for trials, as
well as permits to import and export similar vaccines.
Economic Benefits
it estimated that the economic gains from biotech crops for south africa for the period 1998 to 2009 was us$676 million and us$142 million for 2009 alone (brookes and barfoot, 2011 forthcoming)
Farmer Testimonies
samuel Moloi grows 156 acres of corn on land that he rents in the Free State province, a vast region of prairies in South Africa’s interior. He uses GM seeds that are both insect-resistant and tolerant to Roundup herbicide. He says he spends less on diesel by using his tractor, and less and less on labor, because he doesn’t have to hire workers to cut the weeds, a common practice in Africa. “The GM seed is a little bit higher (in cost), but it does a fantastic, a wonderful job for me,” he said. ”The benefits at the end of the day outweigh the cost of the seed itself” (Moloi, 2010).
evan enslyn of Klipfontein Farm near Witbank, South Africa acknowledges that new technologies sometimes cost more upfront but he says, “Making use of the new technology lowers the total costs and results in better profits that can be ploughed back into the farm to buy new technologies or improve business and marketing skills.” New biotech seed varieties, such as Bt maize with built-in pest protection, are a great example of new technologies that are helping Klipfontein Farm to expand. “It definitely pays to buy new seed technologies,” says Enslyn. Although buying new seed is more expensive, the added benefits help him save money in the long run because he uses less crop protection products to control unwanted pests (Enslyn, 2009).
URUGUAY
uruguay increased its biotech plantings of soybean and maize to 1.1 million hectares in 2010, a significant increase of about 300,000 hectares from 2009. the largest gain was recorded for herbicide tolerant soybean which now occupies 100% of the national soybean hectarage of 1 million hectares. biotech maize increased marginally from 90,000 hectares to100,000 hectares. uruguay has enhanced farm income from

Global status of Commercialized biotech/GM Crops: 2010
139
biotech soybean and maize of us$68 million in the period 2000 to 2009 and for 2009 alone at us$17 million.
Uruguay, which introduced biotech soybean in 2000, followed by Bt maize in 2003 increased its total biotech crop area once again in 2010 to reach over 1 million hectares (1.1million) for the first time; most of the gain came from biotech soybean. A significant increase was recorded in the hectarage of herbicide tolerant soybean which now occupies 100% of the national soybean hectarage of 1 million hectares, compared with 700,000 hectares in 2009.
Bt maize, which Uruguay first approved in 2003, occupied 100,000 hectares, up from 90,000 hectares in 2009, and occupied 83% of the total maize plantings of 120,000 hectares in 2010. Farmers have switched from maize to RR®soybean because it is more profitable than maize and the cost of production is also lower.
Importantly, the moratorium for consideration of new events, in place since 2005, was lifted in 2009 and a government Commission was established to consider approval of new events.
benefits from biotech Crops in uruguay
Uruguay is estimated to have enhanced farm income from biotech soybean and maize of US$68 million in the period 2000 to 2009 and the benefits for 2009 alone is estimated at US$17 million (Brookes and Barfoot, 2011, forthcoming).
uruGuaY
Population: 3.3 million
GDP: US$31.5 billion
GDP per Capita: US$ 9,010
Agriculture as % GDP: 10%
Agricultural GDP: US$3.2 billion
% employed in agriculture: 11.1%
Arable Land (AL): 1.35 million hectares
Ratio of AL/Population*: 1.6
Major crops: • Rice • Maize • Soybean • Wheat • Barley
Commercialized Biotech Crops: • HT Soybean • Bt Maize
Total area under biotech crops and (%) increase in 2010: 1.1 Million Hectares (+38%)
Farm income gain from biotech, 2000 to 2009: US$68 million
*Ratio: % global arable land / % global population

Global status of Commercialized biotech/GM Crops: 2010
140
BOlIVIA
rr®soybean was grown on an estimated 850,000 (~0.9) hectares in bolivia in 2010, which is equivalent to 85% of the total national hectarage of soybean estimated at almost 1 million hectares. in 2008, bolivia became the tenth country to officially grow rr®soybean with 600,000 hectares in 2008 – thus the growth rate between 2008 and 2010 has been significant.
Bolivia is a small country in the Andean region of Latin America with a population of 10 million and a GDP of approximately US$20 billion. Agriculture contributes approximately 14% to GDP and employs just over 43% of the total labor force. Agriculture in the eastern Amazon region of Bolivia benefits from rich soils and modern agriculture which is in contrast to the traditional subsistence farming in the mountainous west of the country. There are approximately 2 million hectares of cropland, and soybean is a major crop in the eastern region. In 2007, Bolivia grew approximately 1 million hectares of soybean (960,000 hectares) with an average yield of 1.97 tons per hectare to generate an annual production of 2 million tons. Bolivia is a major exporter of soybeans (approximately 5% of total exports) in the form of beans, oil, and cake.
Certified seed in bolivia It is not a well recognized fact that the seed industry business in Bolivia is exemplary in the organization and use of certified seeds. In 2008, the percentage of certified soybeans in Bolivia reached a high of 75% despite the fact that in Bolivia there is a tradition, which is constantly changing, for smaller farmers to save their own soybean seed. However, smaller farmers are
boliVia
Population: 10.1 million
GDP: US$17.4 billion
GDP per Capita: US$1,630
Agriculture as % GDP: 14%
Agricultural GDP: US$2.4 billion
% employed in agriculture: 43%
Arable Land (AL): 3.6 million hectares
Ratio of AL/Population*: 2.0
Major crops: • Soybean • Maize • Coffee • Cocoa • Sugarcane • Cotton • Potato
Commercialized Biotech Crop: HT Soybean
Total area under biotech crops and (%) increase in 2010: 850,000 Hectares (+12%)
Farm income gain from biotech, 2008-2010: US$165 million
*Ratio: % global arable land / % global population

Global status of Commercialized biotech/GM Crops: 2010
141
becoming increasingly aware of the benefits associated with certified seed and are adopting it within their traditional farming systems, resulting in a high level of adoption of 75% in 2008. At the national level and at the Santa Cruz State level, Bolivia has well organized extension programs that provide technical assistance to seed producers regarding the value of high quality certified seed with a focus on the significant benefits it offers smaller low-income farmers. The presence of an effective and efficient certified seed industry in Bolivia greatly facilitates access and adoption of certified RR®soybean seed which is used not only by the larger farmers but increasingly by smaller subsistence farmers.
IFPRI reports that 97% of the soybeans are grown in Santa Cruz where most of the producers are relatively small farmers (classified as less than 50 hectares), although the majority of the production is by larger farms. RR®soybean was grown on 850,000 hectares or 85% of the estimated total hectarage of approximately 1 million hectares of soybean planted in Bolivia in 2010.
According to the most recent estimates of global hectarage of soybean (FAO, 2009 data), Bolivia ranks eighth in the world with 979,678 hectares, after the USA (30.9 million hectares), Brazil (21.8), Argentina (16.8), India (9.6), China (8.8), Paraguay (2.6), and Canada (1.4). Of the top eight soybean countries, five (USA, Argentina, Brazil, Paraguay and Canada) grow RR®soybean.
In 2008, Bolivia became the tenth soybean country to officially grow RR®soybean. In 2008, 600,000 hectares of RR®soybean were planted in Bolivia, equivalent to 63% of the total national hectarage of 960,000 hectares. RR®soybean has been adopted on extensive hectarages in Bolivia’s two neighboring countries of Brazil (over 17 million hectares) and Paraguay (over 2 million hectares) for many years.
benefits from rr®soybean in bolivia
Paz et al. (2008) noted that Bolivia is one of the few countries in Latin America where there is a significant number of small farmers producing soybeans. In Bolivia, soybeans are important, contributing 4.6% of GDP and 10% of total exports. Paz et al. (2008) noted that despite the lack of government incentive, RR®soybeans continue to expand because cost-benefit analysis favors RR®soybean over conventional. More specifically, the partial budget analysis (Table 28) indicates that the net benefits favor RR®soybean over conventional, which is approximately US$200 (US$196) per hectare (Table 28). The principal benefits, include a 30% increase in yield, a 22% savings on herbicides and more modest savings in labor and other variable costs; in some cases, cost of RR® seed was lower than conventional seed. Based on a net return of US$196 per hectare with 850,000 hectares of RR®soybeans, the 2010 benefits at the national level were of the order of approximately US$165 million, which is a significant benefit for a small poor country such as Bolivia.

Global status of Commercialized biotech/GM Crops: 2010
142
table 28. partial budget for production of rr®soybean and its Conventional equivalent in bolivia
Variable Non-rr rr
Yield (t/ha)* 1.47 1.91
Price (US$/t)* 409.32 398.59
Gross Benefit (US$/ha)* 600.26 780.83
Costs (US$/ha)
Seed 23.46 26.78
Herbicides 41.53 32.25
Insecticides 21.34 24.12
Fungicides 37.93 37.86
Labor cost for chemical input application
4.98 5.03
Machinery 55.02 52.13
All other labor costs* 3.50 2.25
Other variable costs 161.74 146.67
Net Benefits (US$/ha)* 436.53 632.54
Difference RR – non RR (US$/ha) 196.01
Source: IPFRI Annual Report, Paz et al, 2008.
AUSTRAlIA
in 2010, australia grew 653,000 hectares of biotech crops, comprising 520,000 hectares of biotech cotton, (up from 190,000 hectares in 2009), and 133,000 hectares of biotech canola (up more than three- fold from the 41,200 hectares in 2009). the increase between 2009 and 2010 was 184% making it the biggest proportional increase in any country in the world in 2010. a remarkable 98.5% of all the cotton grown in australia in 2010 was biotech and over 91% of it featured the stacked genes for insect resistance and herbicide tolerance. the total biotech crop hectarage in 2010 represents almost a 14-fold increase over the 48,000 hectares of biotech crops in 2007 during which australia suffered a very severe drought which continued in 2008 and to a lesser degree in 2009 when the country was still recovering from the multi-year drought which is the worse on record in australia. enhanced farm income from biotech crops

Global status of Commercialized biotech/GM Crops: 2010
143
is estimated at us$262 million for the period 1996 to 2009 and the benefits for 2009 alone at us$38 million.
Australia is the fifth member of the six “founder biotech crop countries”, having commercialized Bt cotton in 1996, the first year of global commercialization of biotech crops. Australia was expected to plant 653,000 hectares of biotech crops in 2010, 184% more than 2009 and 14-fold more than the 48,000 hectares in 2007. The unusually low plantings of biotech crops in 2007 were due to the effects of the severe droughts in 2006 and 2007 which continued to have an impact in 2008 – this was the worst drought that Australia has experienced. Assuming 520,000 hectares of biotech cotton in 2010, the overall percentage adoption of biotech cotton in 2010 was expected to be 98.5%. In 2010, 91% of all cotton in Australia featured the stacked genes for herbicide tolerance and insect resistance (RR®Flex and Bollgard®II); 1% with the Bollgard®II dual Bt genes; 7% with a single gene for herbicide tolerance including RR®Flex, and the remaining 1.5% in conventional cotton.
The Australian biotech cotton program is extremely well managed and it is to the credit of Australia that it achieved complete substitution of the single Bt gene product (Bollgard®I) with the dual Bt gene varieties (Bollgard®II) in only two years, 2002-03. This greatly accelerated and enhanced the stability of Bt resistance management, which simultaneously benefited from better and more reliable protection against the major insect pests. In 2002-03, there was a limitation in place on the percentage of Bt cotton allowed to be planted in Australia. In 2003-04, the single Bt gene product was restricted to 15% on any farm in Australia and the combined area of the single and dual
australia
Population: 21.0 million
GDP: US$1,015 billion
GDP per Capita: US$47,370
Agriculture as % GDP: 3%
Agricultural GDP: US$30.6 billion
% employed in agriculture: 3%
Arable Land (AL): 46.1 million hectares
Ratio of AL/Population*: 10.0
Major crops: • Wheat • Sugarcane • Cotton • Barley • Fruits
Commercialized Biotech Crops: • Bt/Bt-HT Cotton • HT/F/HT-F Canola • FC Carnation
Total area under biotech crops and (%) increase in 2010: 653,000 Hectares (+184%)
Farm income gain from biotech, 1996-2009: US$262 million
*Ratio: % global arable land / % global population

Global status of Commercialized biotech/GM Crops: 2010
144
gene Bt products was restricted to a maximum of 40%. With the introduction of the dual Bt gene product (Bollgard®II), these deployment limitations that applied to the single gene product because of concern related to the deployment of resistance to the single Bt gene, were lifted.
In 2010, Australia, for the third year, grew herbicide tolerant RR®canola in three states: New South Wales (NSW), Victoria and with Western Australia joining for the first time. According to the Australian Oilseeds Federation, an estimated 1.61 million hectares of canola were grown in Australia in 2010 of which 1.42 million hectares equivalent to 88% of the national total were grown in the three states of Western Australia, NSW and Victoria (Table 29). Western Australia grew an estimated 860,000 hectares of canola in 2010 of which 72,790 or 9% were RR®canola. Victoria grew an estimated 260,000 hectares of canola in 2010 of which 36,500 hectares or 14% were RR®canola – this is a 26.5% increase over the 28,840 hectares grown in 2009 which represented 13% adoption. In NSW, 300,000 hectares of canola were grown in 2010, of which 24,040 hectares were RR®canola – this is a doubling of the 12,360 hectares planted in 2009. At the national level RR®canola adoption in Australia has increased more than three fold from the 41,200 hectares in 2009 (3% adoption) to 133,330 hectares in 2010 representing an 8% adoption at the national level (Table 29) compared with 3% in 2009. Thus, there has been almost a tripling of percentage adoption rates (3% to 8%) and in absolute hectarage an increase from (41,200 hectares to 133,330 hectares), in only the third year of commercialization in 2010. The lifting of the ban by Western Australia in 2010 was of key significance because it grows approximately half (860,000 hectares) of the total hectarage of canola in Australia (1.6 million hectares). Thus, the three states of WA, NSW and Victoria which currently grow herbicide tolerant canola are dominant with over 80% of the canola hectarage in Australia; this is a significant potential for future growth for biotech canola (FAS-GAIN Report on Biotechnology in Australia, 2010).
table 29. hectares of Canola, Conventional and rr biotech, planted in australia, by state, 2009 and 2010.
state total Canola (ha) biotech Canola (ha) biotech Canola %
2009 2010 2009 2010 2009 2010
NSW 240,090 300,000 12,360 24,040 5 8
Victoria 219,000 260,000 28,840 36,500 13 14
South Australia 180,000 190,000 - - - -
Western Australia
610,000 860,000 - 72,790 - 9
Total 1,249,000 1,610,000 41,200 133,330 3 8
Source: Compiled by Clive James, 2010 from Industry sources.

Global status of Commercialized biotech/GM Crops: 2010
145
Drought tolerant wheat The Victorian Department of Primary Industries has field tested biotech wheat expressing candidate genes for drought tolerance over the 2007-09 period. The trials were planted in Northern Victoria in a drought prone area that suffered significant crop losses due to severe drought in recent years. Lines of biotech wheat were identified in the field trials that yielded over 20% more than the controls under water stress. The stated goal of this important research effort is to develop and commercialize the world’s first biotech wheat within the next 5 to 10 years. Given that water constraints is by far the most important constraint globally to increased productivity, the encouraging results from this research effort is extremely important (German Spangenberg, 2009. Personal Communication).
Panama disease of bananasThe Panama disease of bananas called “verticillium wilt” caused by the fungus Fusarium is an extremely important disease of bananas in the South East, which threatens the northern territories of Australia, and Queensland is also at risk. A team of scientists from Queensland, led by Dr. Jim Dale has developed a transgenic biotech banana which has proven resistance to the disease when challenged with severe epidemics of the disease under greenhouse conditions. The resistance is conferred by a single gene in both Cavendish and lady finger bananas; field tests were executed to study the resistance under field conditions. Coincidentally, efforts are underway to increase the nutrition of bananas as well as resistance to Panama disease which is an endemic and important disease of bananas worldwide and is particularly important in developing countries where bananas are a staple food (ABC News, 2007).
GM perennial pasture grasses, rye grass and fescuesThe first field trials of biotech/GM perennial pasture grasses, rye grass and fescues, were approved by the Federal Gene Regulator in October 2008. The trials featured biotech varieties which are more nutritious, have a reduced non-digestible content, could reduce the amount of feed required and could also help farmers survive drought (The Age, 2008).
Improving crop yieldAt the University of Newcastle, Australia, Yong Ling Ruan discovered that deleting a gene from tomatoes allows the plant to produce sweeter and longer-lasting leaves, which can boost crop yield and shelf life (University of Newcastle, Australia, 2009). Scientists found genes that can feed millions. It is estimated that at least five more years are required to verify the value of the technology at the field level. The research is at a preliminary stage and further work needs to be completed to explore whether the technique could be applied to important commercial food, feed and fiber crops. The research is a collaborative effort between the University of Newcastle and the Zhejiang Academy of Sciences in Hangzhou, China.

Global status of Commercialized biotech/GM Crops: 2010
146
Biotech SugarcaneIn November 2009, The Bureau of Sugar Experiment Stations (BSES) announced a A$25 million partnership with DuPont to field test biotech sugarcane over the next 5 years on approximately 2 hectares of land in Queensland; preliminary approval was granted by the Office of the Gene Regulator for these trials. The trials will feature unspecified new biotechnology applications which can contribute to increased productivity and efficiency of sugarcane production which is used for both food and biofuel. Commercial biotech sugarcane is not expected to be available until about 7 years from now, around 2017. Australia produces about 33 million tons of sugar annually of which about 85% is exported, making it the second most important crop export after wheat. In 2009, Australian farmers reaped about A$1.5 billion from sugarcane (Australian Financial Review, 2009).
benefits from biotech Crops in australia
biotech Cotton in australia Australia is estimated to have enhanced farm income from biotech cotton by US$262 million in the period 1996 to 2009 and the benefits for 2009 alone is estimated at US$38 million (Brookes and Barfoot 2011, forthcoming). The results of a federal study released in September 2005 by the Australian Bureau of Agricultural and Resource Economics (ABARE), Apted et al. (2005) is consistent with the views of some farmers, and estimates that a ban on biotech canola in Australia over 10 years could have cost Australian farmers US$3 billion.
biotech Canola in australiaBiotech canola offers Australia a way to increase yield in a sustainable manner and generating higher profits for farmers and a more affordable product for consumers who are not prepared to pay a premium for conventional canola. In the past 10 years, Canada has successfully produced and marketed the equivalent of 50 years of conventional canola in Australia which has missed out on significant domestic and export opportunities with biotech canola (Australian Ministry of Agriculture, Fisheries and Forestry Press Release, 2007). The guidance for Australia, which operates the best managed biotech cotton program in the world, is to take the experience with biotech cotton, apply it to correct the mistakes of late commercialization of biotech canola and apply the learnings from both crops to prepare in advance for the successful, and timely introduction of biotech wheat, which is judged to be inevitable – wheat is Australia’s most important crop and significant export.
scientists and farmers support biotech Crops in australia
Delegates at the 2008 ABARE conference learned that the introduction of GM crops in Australia were creating both opportunities and challenges for farmers:

Global status of Commercialized biotech/GM Crops: 2010
147
australia’s Chief scientist, dr. Jim peacock, said biotechnology will play an important role in addressing global issues of food security. “We lose 12 percent of yields around the world to disease pathogens, and GM technologies offer a means to increase global food supply,” Dr. Peacock said.
ABARE Principal research economist Max foster said that evidence of separate markets for GM and non-GM grains is already present in world markets. “World trade in soybeans, corn, canola and cotton is dominated by GM varieties, but non-GM crop varieties coexist as niche markets,” Mr. Foster said.
Victorian canola grower andrew broad told the conference that biotechnology will play a significant role in the Australian grain industry remaining competitive, with declining yields and profitability from canola becoming significant issues. “Without biotechnology, the Australian canola industry will not remain viable,” Mr. Broad said.
GM canola grower reuben Cheesman from St. Arnaud in Victoria grew 56 hectares of Roundup Ready canola last year and is increasing this to 180 hectares this year. “lower herbicide costs and the ease of use of the system were true benefits. Together with higher yields, oil content and superior weed control in comparison to Clearfield® varieties, Roundup Ready has a distinct advantage over other systems,” he said.
Views on Biotech Crops in Australia
The motion to disallow GM Crops by the Green Parties in Western Australia (WA) was voted down by the Nationals and Liberals in the State Parliament in May 2010. On this, Mike Norton, the Wa president was not surprised that this move was defeated in the upper house of the Parliament. He said that the use of GM technology is well and truly warranted. “I think the bulk of farmers would certainly hope that GM technology is well and truly here to stay. It’s certainly another tool that Western Australian farmers need to manage their operations without increasing costs” (Norton, 2010).
Mr. roy hamilton is a founding member of the Riverine Plains Grower Group, and a regular participant in Grain Research and Development Corporation (GRDC) Southern Grower Updates. Mr. Hamilton also sits on the SE Regional Advisory Committee and enjoys reflecting local farmer issues and priorities through to the GRDC Southern Panel. “I like looking at new ways of doing things. I was in Canada in 2001 and did some research and talked to a lot of farmers and became quite comfortable with the science and technology, and the rigour involved in the safety of the GM system,” Mr. Hamilton said (Hamilton, 2010).

Global status of Commercialized biotech/GM Crops: 2010
148
dr. Jason Clay, senior vice president at the World Wildlife Fund (WWF) said of the increase in world’s population, “we need to address this because the ‘impacts’ to people and food production/consumption have on the land and water that are acceptable today with 6.8 billion people will not be acceptable with 9.1 billion people. We will have to get better at producing more food with fewer resources.” Agriculture/food producers need to become increasingly more efficient and producers must adopt advanced genetics, management practices and technology and emphasized that “we cannot abandon modern genetics and technology,” he added (Clay, 2010).
PHIlIPPINES
in 2010, the area planted to biotech maize in the philippines is projected to increase to 541,000 hectares, up by 10% from the estimated 490,000 hectares of biotech maize in 2009. Notably, the area occupied in 2010 by the stacked traits of bt/ht maize is 411,000 hectares, compared with only 338,000 hectares in 2009, with the stacked trait maize occupying 76% of total biotech maize hectares in 2010, reflecting the preference of farmers for stacked traits and the superior benefits they offer over a single trait. farm level economic gains from biotech maize in the philippines in the period 2003 to 2009 is estimated at us$108 million and for 2009 alone at us$35 million.
The adoption of biotech maize in the Philippines has increased consistently every year since it was first commercialized in 2003. The area planted to biotech maize was projected to significantly increase in the wet and dry seasons in 2010 to reach 541,000 hectares, up by 10% from the 490,000 hectares of biotech maize in 2009 (Figure 37). Notably, the area occupied by the stacked traits of Bt/HT maize has continuously increased every year reaching 411,000 hectares in 2010, compared with only 338,000 hectares in 2009, up by a substantial 22% reflecting the preference of farmers for stacked traits and the superior benefits they offer over single trait. This shift in farmers’ preference from single trait maize to those with combined traits has been observed since the introduction of stacked-traits in 2006. The total hectarage planted to the single trait Bt maize, after experiencing a 32% decline between 2008 to 2009, further decreased by 12% in 2010, equivalent to 47,500 hectares compared to last year’s 54,000 hectares. Herbicide tolerant (HT) maize was planted on 82,600 hectares in 2010, a decrease of 16% from 98,000 hectares in 2009. On a percentage basis, biotech yellow maize has consistently increased by about 5% of the total yellow maize hectarage every single year from the first year of commercialization in 2003, reaching the highest ever level of 42% in 2010 (up from 38% in 2009). Consistent with the experience of other biotech maize growing

Global status of Commercialized biotech/GM Crops: 2010
149
countries the year-by-year steady increase in adoption of biotech maize reflects the significant and consistent benefits generated by biotech maize to farmers in the Philippines.
The number of small resource-poor farmers, growing on average 2 hectares of biotech maize in the Philippines in 2010, was estimated at 270,000, up significantly by 20,000 from 250,000 in 2009. A total of seven events of biotech maize are approved for commercial planting in the Philippines: MON810 for insect resistance (first approved in 2002 and the approval was renewed in 2007), NK603 for herbicide tolerance (first approved in 2005 and renewed in 2010), Bt11 for insect resistance (first approved in 2005 and renewed in 2010), GA21 for herbicide tolerance approved in 2009, the stacked gene product of MON810/NK603 (first approved in 2005 and renewed in 2010), the stacked trait Bt11/GA21 for insect resistance and herbicide tolerance approved in 2010 and the newly approved MON89034 which contains two Bt genes for resistance to fall armyworm, black cutworm, the ECB and the corn worm (Table 30). In addition, a total of 25 stacked trait maize and cotton products have been approved for importation for direct use as food, feed and for processing, from among a total of 61 biotech crops and products currently approved for direct use as food, feed and for processing. The future acceptance prospects for biotech crops in the Philippines look very promising with products also being developed by national and international institutes. These are Golden Rice, and biofortified rice that are being developed by the Philippine Rice Research Institute (PhilRice) and the International Rice Research Institute (IRRI). The first generation Golden Rice was first tested in advanced field trials in the Philippines in 2008. It is expected that field trials of the Golden Rice GR2 being developed by IRRI and PhilRice will be planted soon. In addition to the trait for pro-Vitamin A, the biotech rice of PhilRice, also dubbed as
philippiNes
Population: 89.7 million
GDP: US$167 billion
GDP per Capita: US$1,850
Agriculture as % GDP: 15%
Agricultural GDP: US$25 billion
% employed in agriculture: 37%
Arable Land (AL): 5.1 million hectares
Ratio of AL/Population*: 0.3
Major crops: • Sugarcane • Maize • Pineapple • Coconut • Banana • Mango • Rice • Cassava
Commercialized Biotech Crop: Bt/HT/Bt-HT Maize
Total area under biotech crops and (%) increase in 2010: 541,000 Hectares (10%)
Increased farm income for 2003-2009: US$108 million
*Ratio: % global arable land / % global population

Global status of Commercialized biotech/GM Crops: 2010
150
table 30. approval of biotech Maize events in the philippines, 2002 to 2010
Crop event trait Year of approval/renewal
Maize MON810 IR 2002/2007
Maize NK603 HT 2005/2010
Maize Bt11 IR 2005/2010
Maize MON810/NK603 IR/HT 2005/2010
Maize GA21 HT 2009
Maize Bt11/GA21 IR/HT 2010
Maize MON89034 IR/HT 2010
IR: Insect resistance, HT: Herbicide Tolerance Source: Compiled by ISAAA, 2010.
figure 37. increase in hectarage traits of biotech Maize in the philippines and proportion of Commercialized traits, 2003 to 2010
Source: Compiled by ISAAA, 2010.

Global status of Commercialized biotech/GM Crops: 2010
151
a ‘3-in-1’ rice, incorporates resistance to tungro virus and to bacterial blight diseases (Pablico, 2008; Icamina, 2008).
The fruit and shoot borer resistant eggplant being developed by the Institute of Plant Breeding (IPB), University of the Philippines Los Baños (IPB-UPLB) already completed the first season of multi-location field trials in the first semester of 2010 and started the second season multi-location trials in late 2010. Biotech papaya with delayed ripening and papaya ring spot virus (PRSV) resistance also being developed by IPB-UPLB has already been tested in confined field trials. Bt cotton for the first time was tested in a confined field trial in 2010. Initiatives in other crops include the development of a virus resistant sweet potato through collaborative activities between the Visayas State University (VSU) and IPB-UPLB and the initial efforts to generate transgenic lines of virus resistant abaca (Musa textilis) by the Fiber Industry Development Authority (FIDA) in collaboration with the University of the Philippines. The Philippine Department of Science and Technology and the Department of Agriculture Biotechnology Program Office have been very supportive of research and development activities on biotech crops and have been eager to support the products that will emerge from the R&D pipeline for commercialization in the near term.
It is important to note that the Philippines is the first country in the ASEAN region to implement a regulatory system for transgenic crops; the system has also served as a model for other countries in the region. The Philippine biotechnology regulatory system was formalized with the issuance of Executive Order No. 430 in 1990 establishing the National Biosafety Committee of the Philippines (NCBP). In 2002, the Department of Agriculture (DA) issued Administrative Order No. 8, which provided the basis for commercial release of biotech crops. Subsequently, in 2006 Executive Order 514 was issued further strengthening the NCBP and establishing the National Biosafety Framework. In 2008, the country launched its national biosafety clearinghouse, BCH Pilipinas, to serve as the Philippine node of the Biosafety Clearing House (BCH) mechanism established under the Cartagena Protocol on Biosafety (CPB). The Philippines, which grows approximately 2.7 million hectares of maize is the only country in Asia to approve and grow a major biotech feed crop; moreover, the Philippines achieved a biotech mega-country status with biotech maize in 2004, i.e. 50,000 hectares or more. Asia grows 32% of the global 158 million hectares of maize with China itself growing 29 million hectares, plus significant production in India (7.8 million hectares), Indonesia (3.6 million hectares), Philippines (2.7 million hectares), and Vietnam, Pakistan and Thailand (each with about 1 million hectares) (FAO, 2009).

Global status of Commercialized biotech/GM Crops: 2010
152
benefits from biotech Crops in the philippines
The benefits of biotech maize to Filipino farmers’ livelihood, income, the environment and health have been well studied and documented. Farms planting Bt maize in the Northern Philippine provinces have significantly higher populations of beneficial insects such as flower bugs, beetles, and spiders than those planted with conventional hybrid maize (Javier et al. 2004).
the farm level economic benefit of planting biotech maize in the philippines in the period 2003 to 2009 is estimated to have reached us$108 million. for 2009 alone, the net national impact of biotech maize on farm income was estimated at us$35 million (brookes and barfoot, forthcoming 2011).
Other studies report that gain in profit at the farmer level was computed at 10,132 pesos (about US$180) per hectare for farmers planting Bt maize with a corresponding savings of 168 pesos (about US$3) per hectare in insecticide costs (Yorobe and Quicoy, 2006). In another socio-economic impact study (Gonzales, 2005), it was reported that the additional farm income from Bt maize was 7,482 pesos (about US$135) per hectare during the dry season and 7,080 pesos (about US$125) per hectare during the wet season of the 2003-2004 crop year. Using data from the 2004-2005 crop year, it was determined that Bt maize could provide an overall income advantage that ranged from 5 to 14% during the wet season and 20 to 48% during the dry season (Gonzales, 2007). In a more recent study covering crop year 2007-2008, biotech maize increased average net profitability in 9 provinces by between 4 to 7% during the wet season and between 3 to 9% during the dry season (Gonzales, 2009). Overall, the four studies which examined net farm income, as well as other indicators, consistently confirmed the positive impact of Bt maize on small and resource-poor farmers and maize producers generally in the Philippines.
The projected benefits from other biotech crops nearing commercialization, such as the Golden Rice could be higher than maize at US$88 million per year (Zimmermann and Qaim, 2004), while benefits from Bt eggplant are projected at almost nine million pesos (about US$200,000) (Francisco, 2007). The benefits from Golden Rice are derived from gains due to reduced mortality and reduced disability. Benefits from Bt eggplant include higher income from higher marketable yields, reduction in insecticide use by as much as 48%, and environmental benefits associated with less insecticide residue in soil and water and the protection of beneficial insects and avian species. Bt eggplant adoption could result to savings of about 2.5 million pesos (about US$44,414) in human health costs, and 6.8 million pesos (about US$120,805) in aggregated projected benefits for farm animals, beneficial insects, and avian species (Francisco, 2009). For the virus resistant papaya, a substantial increase in the farmer’s net income is projected, with expected returns of up to 275% more than conventional papaya (Yorobe, 2006).

Global status of Commercialized biotech/GM Crops: 2010
153
Other recently completed ex-ante studies in Bt cotton and abaca (Musa textilis) indicate significant potential social and economic benefits. These studies were conducted to assist Philippine policy makers decide whether the development and commercialization of these biotech crops in the country is a sound investment. Chupungco et al. (2008) has concluded that Bt cotton commercialization in the Philippines will improve yield by about 20% with a return on investment (ROI) of between 60-80%, compared to 7-21% when using conventional varieties. The biotech abaca resistant to abaca bunchy top virus (ABTV), abaca mosaic virus (AbaMV) and bract mosaic virus (BrMV), were estimated to be able to provide an additional increase in yield of 2.5 tons per hectare and 49.36% ROI after 10 years (Dumayas et al. 2008). In summary, the Philippines has already gained US$108 million from biotech maize in a short span of seven years, 2003 to 2009, and is advancing the adoption of the maize stacked traits, IR/HT. In 2010, stacked traits in maize represented more than 75% of the total biotech maize area in the Philippines. Future prospects look encouraging, with “home grown” biotech products likely to be commercialized in the next 3 years including Bt eggplant in 2012 and with a reasonable possibility that the Philippines might also be the first country to commercialize Golden Rice around 2012-13 (IRRI, 2010).
Stakeholder Experiences
emil Q. Javier, President of the National Academy of Science and Technology (NAST), former President of the University of the Philippines, and Minister of Science, says “Much of this was made possible through collective leadership, a strong group of scientists who believed in transgenics for modern agriculture, and government support,” referring to the several Philippine biotech products in the pipeline such as Bt eggplant, virus-resistant and delayed ripening papaya, Golden Rice, blight resistant rice, and virus resistant abaca (Navarro, 2009).
dr. Candida b. adalla, the Director of the Department of Agriculture Biotechnology Program Office stressed in a farmers’ forum that, “We are investing on the safe use of biotech and are committed for the safe and responsible use of biotech. Biotech products would benefit everyone, particularly the Filipino people.”
dr. emiliana bernardo, an entomologist and retired professor of the University of the Philippines Los Baños, answering a query on “interfering with the act of God” in a researchers’ workshop said, “I believe that nothing will succeed without the permission of God. The fact that God gave us the wisdom to develop the technology and transfer the gene there, then that means God gave us the permission to transfer. And so I am not afraid.”

Global status of Commercialized biotech/GM Crops: 2010
154
isidro acosta, a maize farmer and Region 2 RAFC Chairman from Naguilian Isabela said, “You get savings from labor and spraying with biotech corn. It is also safe to the environment. When you spray an ordinary hybrid corn, you cannot immediately go in your farm within 24 hours – you have to let the chemicals pass. When we sprayed back then, many friendly insects disappeared. Now, with biotech corn, they are gradually coming back to the farm, because spraying has significantly lessened.”
“With biotech corn, you don’t have to weed, you don’t have to spray pesticides, you have no problem with borer. You are not tired,” said a lady farmer Lydia Lapastora of Benito Soliven, Isabela.
MYANMAR
in 2010, Myanmar became the fifth country in south and south east asia, and the 29th country in the world to commercialize biotech crops. a long staple insect resistant bt cotton variety named “silver sixth” or “Ngwe chi 6” was estimated to have been planted by 375,000 farmers on about 270,000 hectares (0.7 hectare per farm), equivalent to 75% of all the cotton grown in Myanmar.
Myanmar is the largest country in mainland South East Asia and has borders with five nations, India, Bangladesh, China, Thailand and Laos and a coast line on the Andaman Sea. With a population of 50 million, Myanmar is mainly an agricultural based economy which contributes more than half (50.3%) of the national Gross Domestic Product (GDP) of US$26.5 billion equivalent to US$635 per capita; an estimated 25% are below the poverty line. Agriculture employs 70% of total population of the country which has two distinct agro-eco climates – the temperate North and tropical South. This allows the country to cultivate different crops throughout the year. The different agro-climatic zones embrace the extensive deltatic region, the long coastal strips, the central zone and the hilly regions with a broad range of crops including rice, oil seed crops, pulses, and industrial crops including cotton, vegetables, fruits and flowers under their respective cropping systems (MCSE, 2001; UNEP GEF, 2006).
Approximately 4.5 million farm families cultivate various crops on an estimated arable land of 10.6 million hectares, with an average 2.35 hectare per farm family. It is estimated that around 3 million farms (two-thirds of all farms) cultivate less than an average 2 hectares. There are four principal crops – rice, pulses, cotton and sugarcane that ensure food self sufficiency and earn significant foreign exchange. Rice occupies 47% or 5.5 million hectares of the cultivated area and cotton occupies

Global status of Commercialized biotech/GM Crops: 2010
155
about 350,000 hectares. Most of the crops are rainfed with a noticeable increase in area under irrigation in recent years. Intensive multiple cropping system allows farmers to reap significant returns throughout the year. India relies heavily on the supply of beans and pulses from Myanmar and imports more than one billion dollars worth of agricultural produce annually. In 2009-10, Myanmar-India bilateral trade reached US$1.2 billion with India being Myanmar’s fourth largest trading partner after Thailand, China and Singapore. Myanmar’s export to India amounted to US$1 billion whereas import from India is US$194 million (CSO, 2010).
Cotton in Myanmar
Cotton is a traditional crop grown in Myanmar and is the principal fiber crop of the country. It occupies about 350,000 hectares, primarily in the central zone of the country which receives 600 mm to 1000 mm rainfall. Approximately half a million farmers (an estimated 503,566 farming 368,000 hectares in 2007) cultivate an average 0.7 hectares of cotton per farm in the regions of Western Bago, Mandalay, Magwe and Sagaing (ICAC, 2008). Traditionally, cotton farmers grew indigenously developed varieties of Gossypium arboreum until the large scale commercial adoption of upland cotton varieties of Gossypium hirsutum in the 1960s. The Ministry of Agriculture and Irrigation (MOAI) conducts all activities related to research, development and seed multiplication on their own research farms, located in the central part of the country. In addition, there is a cotton fiber and miniature spinning laboratory, established in the 1980s designed to ensure compliance with quality parameters (Tun Win, 2008). Most of the cotton produced in the country is used by the textile industry with 0.3 million spindles and a large number of spinning units to meet the growing demand for quality yarn and fabric in the country. The Cotton and Sericulture Department (CSD) of the Ministry of Agriculture and Irrigation conducts all the R&D and extension activities on cotton in seed farms, in all the major cotton producing zones that are also
MYaNMar
Population: 50.5 million
GDP: US$26.5 billion
GDP per Capita: US$635
Agriculture as % GDP: 50.3%
Agricultural GDP: US$13.3 billion
% employed in agriculture: 70%
Arable Land (AL): 10.6 million hectares
Ratio of AL/Population*: 0.7
Major crops: • Rice • Sesame • Cotton • Pulses • Groundnuts • Beans • Sugarcane
Commercialized Biotech Crop: Bt Cotton
Total area under biotech crops in 2010: 270,000 hectares
*Ratio: % global arable land / % global population

Global status of Commercialized biotech/GM Crops: 2010
156
responsible for seed multiplication of improved varieties (Figure 38). Yezin Agricultural University (YAU) and the Department of Agricultural Research (DAR) also conduct research on cotton.
bt Cotton
In 2010, for the first time, it was reported that Bt cotton was being widely grown in Myanmar (Gain Report BM0025 USDA/FAS 3 Nov 2010; Myanmar Times, 2010). The reports confirmed that a long staple variety named ‘Silver Sixth’ popularly known as “Ngwe chi 6” Bt cotton variety was developed in Myanmar in 2001. Following field trials at Mandalay’s research facilities the first release was in 2006-07. In the interim, cotton farmers have quickly switched to Ngwe chi 6 Bt cotton variety with adoption increasing significantly from 8,300 hectares in 2007-08 to 140,000 ha in 2008-09. In 2009-10, the adoption of Ngwe chi 6 Bt cotton variety doubled with an estimated 270,000 hectares farmed by 375,000 farmers or 75% of the cotton area planted in all major cotton growing regions including Western Bago, Mandalay, Magwe and Sagaing in Myanmar. In 2010, it is estimated that the Ngwe chi 6 Bt cotton variety was grown by 375,000 farmers (based on an estimated 503,566 farmers growing all cotton in Myanmar in 2007) (ICAC, 2010 Personal Communication), on approximately the same area of 270,000 hectares (an average of 0.7 hectares of Bt cotton per farm). Bt cotton now occupies the entire long staple hectarage in the country (Table 31).
In 2010-11, the only cotton area that was planted with conventional non-Bt cotton variety was the area with short staple cotton variety, for which Bt cotton varieties are not available; “ Ngwe chi 6” is the only long staple Bt cotton variety released to date in Myanmar. According to the Ministry of Agriculture’s Extension Department approximately 75% of the cotton grown in Myanmar is long staple cotton whilst the balance of 25% is short staple. In 2009, Myanmar grew 360,000 hectares of cotton of which 270,000 hectares were long staple cotton producing 524,000 MT or 93 percent of total cotton production, whilst 68,000 hectares were short staple cotton producing only 38,000 MT or 7 percent of total cotton production. The yield of short staple cotton has grown at only 2.5% per year whilst the yield of long staple cotton has doubled since the introduction of Ngwe chi 6 in 2006-07 (Figure 39).
r&d in Cotton research
The cotton and sericulture department of the Ministry of Agriculture and Irrigation focuses exclusively on R&D programs to develop long staple cotton varieties and hybrids especially for better fibre quality and improved ginning percentage. In addition to the five commercially grown varieties (Ngwe chi 1, Ngwe chi 2, Ngwe chi 3, Ngwe chi 4 and Ngwe chi 5), four promising new cotton varieties namely SDG 1, SDG 4, SDG 6 and SDG 8, which posses greater ginning percentage, have been developed through conventional breeding. The introduction of Ngwe chi 6 – the long staple

Global status of Commercialized biotech/GM Crops: 2010
157
figure 38. Cotton research & development farms in Myanmar
Caption: L= Lungyaw farm; S= Shwedaung farm; A= Aunglan farm; H= Hlaing det farm; C= Chaung Magyi farm; M= Padawzet farm; M= Fibre quality lab; P= Pyaw bwe farm.
Source: Adopted from Tun Win, 2008.
CENTRAL ZONE FOR COTTON PRODUCTION

Global status of Commercialized biotech/GM Crops: 2010
158
table 31. adoption of bt Cotton in Myanmar, 2006 to 2010
Year adoption of bt Cotton (ha)
total Cotton (ha)
% adoption
2006-07 <500 300,000 <1%
2007-08 8,300 368,000 2%
2008-09 140,000 360,000 39%
2009-10 270,000 360,000 75%
2010-11 270,000 360,000 75%
Source: Compiled by ISAAA, 2010.
figure 39. Cotton area, production and Yield in Myanmar, 2000 to 2009
Source: Adopted from GAIN, USDA FAS, 2010.

Global status of Commercialized biotech/GM Crops: 2010
159
insect resistant Bt cotton variety developed using genetic modification technology was a landmark achievement of the Cotton and Sericulture department (CSD) of the Ministry of Agriculture and Irrigation in 2006 (USDA FAS, 2010; Myanmar Times, 2010). In 2010, Myanmar became the 13th cotton growing country in the world to commercially deploy biotech cotton and now joins the group of 29 biotech crop growing countries in the world in 2010.
Myanmar was involved in a project in the mid 2000s to establish a National Development Policy with the assistance of the United Nations; the project was supported by the Global Environment Facility (GEF) in 2004 and terminated in 2005. Current laws that may facilitate the introduction of regulatory biotech and biosafety laws include the Essential Supplies and Services Act, the Pesticide Law, the Plant Pest Quarantine Law, the Seed Law, the National Food Law, and the Animal Health and Development Law. The National Biosafety Framework (NBF) was developed in accordance with the Cartagena Protocol on Biosafety (CPB) that was signed by Myanmar on 11 May 2001. Under the National Biosafety Framework (NBF), the Ministry of Agriculture and Irrigation drafted the Law of Biosafety with the help of UNEP GEF and this is pending approval by the legislature of the Union of Myanmar (UNEP GEF, 2006).
It is noteworthy that as long ago as in 2005, Myanmar had already completed four years (2001 to 2005) of field trials of Bt cotton in the Mandalay division of Myanmar (GAIN Report BM5018, 2005). These field trials were reported to have shown that the Bt cotton was well adapted to Myanmar’s soil and climate. At the same time, efforts were made to strengthen the human resources and trained manpower in biotechnology areas including agriculture, pharmaceuticals, fermentation and industrial biotechnology in the country. In this regard, the Department of Biotechnology which was newly established in Yangon Technological University (YTU) under the Ministry of Science & Technology (MoST) has been conducting some programs in biotechnology since 1998. In 2001 a national Biotechnology Development Center was established at Pathein University, Irrawaddy Division in collaboration with the National Institute of Technology and Evaluation of Japan.
benefits of bt Cotton
It is estimated that more than 90% of long staple cotton producers in Myanmar have adopted Bt cotton. Compared to conventional long staple cotton, the best Bt cotton growers are estimated to have doubled or tripled yield using Ngwe chi 6 which requires one third less insecticides, resulting in a net significant increase in income (GAIN, USDA/FAS, 2010). The increase in income can be up to three times the income of competing crops such as beans, pulse and sesame, and can even be higher than the income from rice. Yield of long staple cotton has risen steeply from 2007 (coincides with introduction of Bt cotton Ngwe chi 6) to 2009 whilst the yield of the short staple cotton has remained stagnant (Figure 40).

Global status of Commercialized biotech/GM Crops: 2010
160
BURKINA FASO
2010 was the third year for farmers in burkina faso to benefit significantly from bt cotton. in 2010, out of a total of 400,000 hectares planted to cotton, remarkably 260,000 hectares or 65%, (two-thirds), were planted to bt cotton. thus, the increase from 2009 (115,000 hectares) to 2010 (260,000 hectares) is a dramatic jump of 126% making burkina faso, for the second year running, the country with one of the highest proportional increases in biotech hectarage in the world. indeed, had it not been for the unusually late rains, the adoption rate would have exceeded 75% or 300,000 hectares in 2010. this unprecedented high adoption rate speaks for itself in terms of the success of bt cotton in burkina faso, the benefits it offers and the trust of about 80,000 bt cotton farmers, the majority of whom (80%) are very small resource poor-farmers with less than 3 hectares of land. benefits from bt cotton included an average yield increase of almost 20%, plus labor and insecticide savings (2 rather than 6 sprays), which resulted in a net gain of about us$66 per hectare compared with conventional cotton. it is estimated that bt cotton has the potential to generate
figure 40. Comparing Yield of long staple bt Cotton, short staple Cotton and National average, 2000 to 2009
Source: Adopted from GAIN, USDA FAS, 2010.

Global status of Commercialized biotech/GM Crops: 2010
161
an economic benefit of up to us$100 million per year for burkina faso. National benefits to bt cotton farmers in 2009 were estimated at us$35 million representing 53% of total benefits with the balance accruing to the developers of the technology. extrapolating for 2010, when the adoption rate was 65%, compared with 29% in 2009, the national benefit from bt cotton in 2010 maybe of the order of us$80 million. in 2008, for the first time ever, approximately 4,500 burkina faso farmers successfully produced 1,600 tonnes of bt cotton seed on a total of 6,800 farmer fields; the first 8,500 hectares of commercial bt cotton was planted in the country in 2008. in 2009, approximately 115,000 hectares of bt cotton were planted for commercialization in burkina faso. Compared with 2008, when 8,500 hectares were planted, this was an unprecedented year-to-year increase of approximately 14-fold (1,353% increase), to 115,000 hectares, the fastest proportional increase in hectarage of any biotech crop in any country in 2009. thus, the adoption rate of bt cotton in burkina faso has increased from 2% of 475,000 hectares in 2008 to 29% of 400,000 hectares in 2009 and a record 65% or 260,000 hectares in 2010.
Located in the Sahel, Burkina Faso is rated as one of the poorest countries in the world with per capita GDP of US$510 per year. Annual average rainfall is 100 centimeters in the South to 25 centimeters in the North. The terrain is a savannah plateau at an altitude of 300 to 400 meters. Almost 30 percent of the country’s GDP of US$8.1 billion is derived from agriculture which also provides up to 90% of national employment, making it the most important sector. The major crops
burKiNa faso
Population: 15.8 million
GDP: US$8.1 billion
GDP per Capita: US$510
Agriculture as % GDP: 28%
Agricultural GDP: US$2.3 billion
% employed in agriculture: 93%
Arable Land (AL): 5.2 million hectares
Ratio of AL/Population*: 1.5
Major crops: • Cotton • Millet • Peanuts • Maize • Sorghum • Rice • Shea nuts
Commercialized Biotech Crops: Bt Maize
Total area under biotech crops and (%) increase in 2010: 260,000 Hectares (+126%)
Farm income gain from biotech, 2009-2010: US$80 million
*Ratio: % global arable land / % global population

Global status of Commercialized biotech/GM Crops: 2010
162
are cotton planted on up to 600,000 to 700,000 hectares in 2006 and 2007, respectively, as a cash crop, and the food crops include sorghum, millet, rice, peanuts, shea nuts and maize. Drought, poor soil, insect pests and lack of infrastructure and financial resources pose significant challenges to socio-economic development, which revolves around agriculture.
Cotton remains Burkina Faso’s principal cash crop generating over US$300 million in annual revenues. This represents over 60% of the country’s export earnings (ICAC, 2006). Exports of cotton have ranged from 775,000 bales per year to 1.4 million bales. Some 2.2 million people depend directly or indirectly on cotton, often referred to locally as “white gold” (Vognan et al. 2002) “the king” (CARITAS, 2004; Elbehri and MacDonald, 2004) and “the foundation” of rural economies. Increasing productivity in cotton would therefore directly translate into a significant boost in GDP. Other commercial crops for exportation include fruits, vegetables, French beans and tomatoes.
2010 was the third year for Burkina Faso to benefit significantly from Bt cotton. In 2010, out of a total of 400,000 hectares planted to cotton, remarkably 260,000 hectares or 65%, (two-thirds), were planted to Bt cotton by 80,000 farmers. Thus, the increase from 2009 (115,000 hectares) to 2010 is a dramatic jump of 126%, making it, for the second year running the highest proportional increase in biotech hectares of any country in the world. Indeed, had it not been for the unusually late rains, the adoption rate would have exceeded 75% or 300,000 hectares in 2010. This unprecedented high adoption rate speaks for itself in terms of the success of Bt cotton in Burkina Faso, the benefits it offers and the trust of up to 100,000 resource-poor farmers in the new technology. In 2008, for the first time ever, approximately 4,500 Burkina Faso farmers successfully produced 1,600 tons of Bt cotton seed on a total of 6,800 farmer fields; the first 8,500 hectares of commercial Bt cotton was planted in the country in 2008. In 2009, approximately 115,000 hectares of Bt cotton were planted for commercialization in Burkina Faso. Compared with 2008, when 8,500 hectares were planted, this was an unprecedented year-to-year increase of approximately 14-fold (1,353% increase), to 115,000 hectares, the fastest proportional increase in hectarage of any biotech crop in any country in 2009. Thus, the adoption rate of Bt cotton in Burkina Faso has increased from 2% of 475,000 hectares in 2008 to a substantial 29% of 400,000 hectares in 2009 and a record 65% adoption or 260,000 hectares in 2010. It is estimated that Bt cotton has the potential to generate an economic benefit of up to US$100 million per year for Burkina Faso, based on yield increases of up to 30%, plus a two-thirds reduction in insecticides sprays, from a total of 6 sprays required for conventional cotton, to only 2 for Bt cotton.
The potential economic impacts of Bollgard®II introduction in Burkina Faso are expected to be significant. Even with the application of recommended insecticides, crop losses of 30% or more due to insect pests of cotton have been recorded (Goze et al. 2003; Vaissayre and Cauquil, 2000). On average, at the national level, the annual cost for insecticides for the control of cotton bollworms and

Global status of Commercialized biotech/GM Crops: 2010
163
related pests is US$60 million per year (Toe, 2003). However, insecticides are proving ineffective with losses due to bollworm as high as 40% even with the full treatment of insecticides (Traoré et al. 2006). Moreover, Bt cotton may prove to be the only option in areas where pest infestations are so high that growing conventional cotton with insecticides is unprofitable. Adoption of Bt cotton is thus inspired by the need to improve productivity, raise farmers’ incomes and reduce pesticide use. In 2009 alone, 650,000 tonnes were harvested depending on climatic conditions.
Insect pests and drought are the two significant constraints to increased productivity in the country. All the cotton is produced by small resource-poor subsistence farmers, similar to the situation in countries like China and India. Yield is however low at approximately 367 kg per hectare, compared with 985 kg per hectare in the USA (Korves, 2008). Burkina Faso’s cotton production in 2006/07 was 1.3 million bales but this decreased to 0.68 million bales in 2007/08. Preliminary projections by USDA has estimated production for 2008-09 at 0.95 million bales. In 2008-2009 production increased to 457,000 tonnes of cotton seed. It is expected that the production will soar to approximately 650,000 tonnes of cotton seed for the 2009-2010 season (USDA, 2009).
In an effort to address the challenge posed by insect pests, the national research institute, Institut de l’Environnement et de Recherches Agricoles (INERA), field tested Bt cotton over a four-year period (2003 to 2007) with excellent results. INERA scientists in collaboration with Monsanto incorporated the Bt gene (Bollgard®II) into selected popular cotton varieties that are well adapted to the local environment. After rigorous risk assessment and stakeholder consultations, the National Bio-Security Agency approved two varieties of Bt cotton for seed production and commercialization. The approved Bt cotton varieties have the following advantages:
A well-conducted survey in 2009 (Vitale et al. 2010), has provided a detailed analysis of the impact of Bollgard®ll in Burkina Faso, and is summarized below:
• The yield advantage of Bollgard®ll over conventional was 18.9%.• Yield increase plus labor and insecticide savings (2 rather than 6 sprays) resulted in a gain
of US$65.57 per hectare compared with conventional cotton; this translated to a 206% increase in cotton income.
• For the average cotton farm with 3.16 hectares of cotton, Bollgard®II increased farm income by US$207.20; INRA surveys indicated that the average cotton farm income of US$657.11 increased by 31% with the use of Bollgard®II.
• The main benefit of Bollgard®II derives from the increase in yield whereas the reduction of production costs associated with four less insecticide sprays is offset by the higher cost of the seed.
• National benefits to farmers in 2009 were estimated at US$35 million representing 53% of total benefits with the balance accruing to the developers of the technology. Extrapolating

Global status of Commercialized biotech/GM Crops: 2010
164
for 2010 when the adoption rate was 65%, compared with 29% in 2009 the national benefit from Bt cotton in 2010 maybe of the order of up to US$80 million.
Extrapolating from the above for 2010, and based on an estimated total of 400,000 hectares of all cotton planted with a 65% adoption of Bt cotton and with an average cotton holding of 3.16 hectare per farm there were approximately a total of 125,000 cotton farmers in Burkina Faso. Farmers were divided into three categories; manual farmers with <1 hectare and no draught animals – equivalent to 5% of farmers numbering about 5,000 farmers nationally; small farms with 1 to 3 hectares with 1 draught animal numbering about 100,000 nationally; larger farms with >3 to 25 hectares with 2 or more draught animals numbering about 20,000 nationally. Thus, with an adoption rate of 65% for Bt cotton in 2010 there were approximately 80,000 Bt cotton farmers who benefited from the technology of which 4,000 would be manual, 65,000 would be small farmers and about 13,000 farmers would be larger farmers for a total of about 80,000 (82,000). The higher yield of Bt cotton compared with conventional cotton results in a more competitive product for the international cotton market and higher profits for small resource-poor subsistence farmers, thus making a contribution to the alleviation of their poverty. According to the Director of INERA Dr. Gnissa Konate, the scientific work to evaluate performance and selection of the two approved varieties was done by local scientists under authority of Burkina Faso’s National Bio-Security Agency (Personal Communication, 2009). The capability of local researchers to produce Bt cotton seed locally counters the long-held perception of dependency on foreign firms for seed. The State is co-owner of the genetically modified varieties with Monsanto. The price of the seed and the distribution of value added were determined by mutual agreement. Royalties have been negotiated in such a way that the technology fee accruing to Monsanto will be dependent on the farmer’s income. The general formula is that the value of increased yield plus savings in insecticide sprays will be considered as gross income which will be divided into three parts. Two-thirds will remain at the farm gate, thus, most of the gain goes to the farmers with the remaining one-third to be shared between Monsanto and the seed companies that provide planting seed. The cotton sector is well organized into village associations and cotton companies that have exclusive rights to buy seed cotton from producers and provide them with inputs, including seed. The main cotton producing regions are in the west which is covered by the Textile Fiber Company of Burkina Faso SOFITEX. The regions as indicated in the map below are: (1) N’dorola, Kenedogou, (2) Banfora, Comoe, (3) Bobo-Dioulasso, Houet, (4) Diebougou, Bougouriba, (5) Hounde, Tuy, (6) Dedougou, Mouhoun, (7) Koudougou, Boulkiemde (Figure 41).
Another company, the Cotton Society of Gourma (SOCOMA) takes care of production in six provinces in the East namely: Gnagna, Gourma, Komandjari, Kompienga, Tapoa and Koulpelogo (SOCOMA,

Global status of Commercialized biotech/GM Crops: 2010
165
2007). FASO COTTON situated in central Burkina Faso is the smallest company. It covers 11 provinces grouped into 5 regions: Zorgho (Oubritenga, Kourwéogo, Ganzourgou, Kouritenga, and Namentenga), Tenkodogo (Boulgou), Manga (Zoundweogo), Pô (Nahouri) and Kombissiri (Bazega, Kadiogo et Bam).
Burkina Faso serves as an example within the Economic Community of West African States (ECOWAS) for its development capabilities in biotechnology with Bt cotton in a legal context. In 2010, the third year of commercialization, approximately 260,000 hectares of Bt cotton were planted compared with 2009 when 115,000 hectares were planted. This is an unprecedented 14-fold increase, a substantial 29% of 400,000 hectares of cotton planted in 2009. This was a significant milestone by any standard, and compares favorably with the earlier impressive Bt cotton adoption trends in
figure 41. Map of Cotton-Growing areas in burkina faso*
*Main cotton growing regions in Burkina Faso: (1) N’dorola, Kenedogou, (2) Banfora, Comoe, (3) Bobo-Dioulasso, Houet, (4) Diebougou, Bougouriba, (5) Hounde, Tuy, (6) Dedougou, Mouhoun, (7) Koudougou, Boulkiemde.
Source: Compiled by ISAAA, 2010.

Global status of Commercialized biotech/GM Crops: 2010
166
China, India and South Africa. Thus, the adoption rate in Burkina Faso has increased from 2% of 475,000 hectares in 2008 to a substantial 29% of the estimated 400,000 hectares in 2009 and 65% of the 400,000 hectares of cotton in 2010.
Burkina Faso’s Bt cotton program, initiated and expedited by the Government can serve as a model for many other developing countries growing cotton. It is also consistent with the recommendation of the 2008 G8 Hokkaido meeting which recommended the utilization of biotech crops acknowledging the significant and multiple benefits they offer. Burkina Faso, as the leader of the group of four cotton growing countries in West Africa (Burkina Faso, Benin, Chad and Mali) is now in a position to share its important knowledge and experience on Bt cotton with its neighboring countries, so that they, if they so wish, can expedite the commercialization of Bt cotton in their respective countries. This would ultimately expedite the commercialization process in those countries for the benefit of their cotton farmers. It is noteworthy that these countries are beginning to put regulatory mechanisms in place as a first step towards preparing themselves for the safe and responsible uptake of the technology. The National Assemblies of Mali and Togo for example, passed national biosafety laws in 2008 (James, 2008).
In an effort to generate evidence on the real and potential benefits of Bt cotton in Burkina Faso and indeed the western African region, several ex-ante socio-economic studies have been conducted. Vitale et al. (2008) estimated that Bt cotton would generate US$106 million per year for Burkina Faso based on yield increases of 20% and a decreased need for insecticides. Falck-Zepeda et al. (2008) studied potential payoffs and economic risks of adopting biotech cotton in 5 countries in West Africa namely; Benin, Burkina Faso, Mali, Senegal and Togo. The study concluded that Bt technology needs to be adopted, in order to ‘catch up’ with major cotton-producing countries in the rest of the world. Under the assumptions of the model, all of the studied countries would be worse off economically by not adopting Bt cotton. Referencing the cotton initiative in the WTO’s Doha Round of discussions, a paper from the World Bank (WPS3197, Anderson et al. 2006) concluded that cotton-growing developing countries in Africa and elsewhere do not have to wait until the Doha Round is completed before benefiting from increased income from cotton.
summary of bt Cotton seed production in the first season: 2008-2009
The three cotton producing companies in Burkina Faso, SOFITEX, FASO COTTON and SOCOMA, together with the INERA Cotton Program were collectively responsible for the first year of Bt cotton seed production in the country. To ensure seed multiplication of highest quality, a stringent appraisal process was followed with regard to selection of production areas and seed producers. While there was a slight delay in arrival of the seed, the results were impressive. About 4,500 farmers were involved with a total of 6,800 fields. An estimated 1,600 tons of delinted Bt cotton seeds were

Global status of Commercialized biotech/GM Crops: 2010
167
produced from the 8,500 hectares planted. Farmers were impressed with the efficiency of BG®II gene in controlling target pests and the reduction in use of insecticides during the growing season – a first sign of satisfaction with the technology. Farmers reported, on average, a reduction of the number of sprays from 8 to 2 to 4, plus a yield increase of 28%.
benefits from bt cotton
Yield increase of approximately 20%, plus labor and insecticide savings (2 rather than 6 sprays) resulted in a gain of US$65.57 per hectare compared with conventional cotton. National benefits to Bt cotton farmers in 2009 were estimated at US$35 million representing 53% of total benefits, with the balance accruing to the developers of the technology (Vitale et al. 2010). Extrapolating for 2010 when the adoption rate was 65%, compared with 29% in 2009 the national benefit from Bt cotton in 2010 maybe up to the order of US$80 million.
political Will and support
president of burkina faso, honorable blaise Compaore’s statement on GMOs during the National Peasants Day 2010 “In a continent that is hungry, the GM debate should be very different. The technology provides one of the best ways to substantially increase agricultural productivity and thus ensure food security to the people. In the cotton sector, for example, Burkina Faso has succeeded in increasing its production under current conditions, but it will be difficult to exceed one million tonnes. But with falling prices, we have no choice but to produce in quantity. And biotechnology may allow us to reach 2 to 3 million tons.” Farmer Testimonials
an interview with Madame bodounou Konate: Cotton producer and Women Group leader in 2010;
Mrs. Bodounou Konate is the departmental coordinator of Balavé women group in the western region of Burkina Faso. Her farm is 25 km from the city of Balavé, which is the provincial capital of Banwa Solenzo. She has wide experience with both organic and modern farming techniques, and initially worked with the Departmental Union of Cotton Producers Balavé.
A Bt cotton role model and trainer, Madame Konate shares her motivation to farming. “I decided to become a farmer because I did not want to leave the whole burden of feeding the family to my husband. I used to grow groundnuts, sorghum and beans, but after reflection, I realized

Global status of Commercialized biotech/GM Crops: 2010
168
the yields were going down and also fetching very little in the local market. I received some training in organic farming but applying this in the farm required a lot of family labour and time.
One day while in a group meeting, an extension officer spoke to us about the advantages of Bt cotton and its ease of maintenance. I was convinced because I had already seen how content my husband was about his Bt cotton field. He no longer needed to spray so many times and was also spending less energy and family labour to manage the crop. This was unlike in the past when he and those of my group members made us draw hundreds of liters of water to spray conventional cotton eight times in every season. We found this idea interesting and since then my group members decided to join in the growing of Bt cotton. One factor that was very compelling was the reduction in the number of spraying very poisonous chemicals from eight to three.
last year, I grew a half-hectare of Bt cotton but this year, I doubled it to one hectare because I earned good money from the first year crop which I sprayed only two times. I also grew sorghum in the half-acre I used last year for Bt cotton and the yield was much better because Bt cotton enriched the soil. I therefore harvested more food crops and made some more money than before from the same field which went into the family welfare.
I have now become a Bt cotton farmer advocate and have been encouraging my women group members to grow the crop. I received training from the technical officer of Agriculture who is now involved in training my group members on good stewardship – spacing of the Bt cotton plants, the number of times to spray and maintenance, even for other crops.
Our only plea is for the Bt cotton seed to be lowered or get assistance from well-wishers to purchase the seeds. We also need more information on cultivation and care of Bt cotton and we would prefer the radio for this purpose since most of us can now afford our own small radios. I am grateful to the people who developed the Bt cotton seeds and I think biotechnology has a big role in contributing towards reducing poverty and good health.”
an interview with Mr. harouna Nébié, bt cotton farmer from dabiou-sissili in 2010;
Harouna Nébié is the president of the provincial cotton producers in Sissili, in the mid-south of the country. He is 46 years old and has a family with 6 children. He works with eight of his brothers in his farm. He is a model farmer by all standards and was named the best producer in the season 2004-2005 by Burkinabe Textile Fibre Company (SOFITEX).

Global status of Commercialized biotech/GM Crops: 2010
169
Harouna is a firm believer in good agricultural practices. “Without agriculture, no country would be stable. This sector is primarily our livelihood. We cannot afford to remain traditional in our thinking of the agricultural sector otherwise the country may not be able to meet the challenge of achieving food self-sufficiency,” he says.
According to Harouna, the cultivation of Bt cotton in Burkina Faso has demonstrated what the technology can do to alleviate farmers problems in agriculture. “For almost fifteen years, cotton pests have been creating havoc to cotton and we were almost abandoning its cultivation. Today, with the genetically modified cotton, which has coincided with improved international market, the atmosphere is good.”
“I started growing GM cotton in 2007. For this year’s campaign, I have planted 8 hectares of GM cotton and 5 ha for conventional cotton. This is a double increase from last year’s 4 hectares of GM cotton and 10 ha of conventional cotton. I increased the area because the instruction given was to plant more transgenic cotton. But if we had not been given percentages in respect of each type of cotton, I could have planted my entire farm with Bt cotton. This is precisely because of the benefits my family and I have experienced. Besides the excellent performance as you can see, there is a drastic reduction in labour inputs from reduced number of sprays from 6 to 2. My wife, children and my brothers do not have to waste so much time fetching the water for spraying. Besides, less pesticide sprays have reduced contact with dangerous chemicals, improving our health. During the past year, I received 5 tons of Bt cotton for sowing in four hectares, which gave me a sum of 750,000 CFA francs (US$1,600) after sales, which I consider very profitable.
In my capacity as president of the province’s producers, I am encouraging more farmers to plant Bt cotton so that they too can enjoy the many benefits of Bt cotton. Today, I am proud to have been among pioneer recipients of Bt cotton seed.”
His final words: “I’ll repeat myself – agricultural biotechnology is the best thing that has happened and will serve many generations of farmers. As with cotton, you can already see our satisfaction. We hope our experience, being from a poor country, will help other African countries to understand better that African farmers appreciate new technologies and deserve to farm with dignity. We also want to be given the opportunity to choose, not other people who have never worked in a farm choosing for us.”

Global status of Commercialized biotech/GM Crops: 2010
170
SPAIN
spain is the lead biotech crop country in europe, with 84% of all the bt maize hectares planted in europe in 2010. spain has successfully grown bt maize for thirteen years and grew 76,575 hectares of bt maize approved in spain and the eu in 2010, compared with 76,057 hectares in 2009. however, total plantings of maize were 4% less in 2010 at 320,289 compared with 349,902 hectares in 2009, leading to an adoption rate in 2010 of 24% compared with 22% in 2009. enhanced farm income from biotech bt maize is estimated at us$94 million for the period 1998 to 2009 and for 2009 alone at us$16 million.
Spain is the only country in the European Union to grow a substantial area of a biotech crop. In 2010, Spain grew 84% of all the 91,193 hectares of biotech maize in the EU. Note that the 2010 estimates by the Government of Spain include, for the first time, Bt maize hybrids approved in other EU countries. Spain has successfully grown Bt maize for thirteen years since 1998 when it first planted approximately 22,000 hectares out of a national maize hectarage of 500,000 hectares. Since 1998, the area of Bt maize has grown consistently reaching a peak of over 50,000 in the last four years, qualifying Spain as one of the 15 biotech mega-countries globally growing 50,000 hectares or more of biotech crops. In 2010, the Bt maize area in Spain reached 76,575 hectares compared with 76,057 hectares in 2009 and the adoption rate in 2010 was 24%. In 2010, total maize plantings at 320,289 hectares were 4% less than 2009 when the adoption rate was 22% and total maize plantings were 349,042 hectares. Thus, both absolute Bt maize hectares increased in 2010 as well as the adoption rate of 24%. The principal areas of Bt maize in Spain in 2010 were in the provinces of Aragon (28,652 hectares) where the adoption rate for Bt maize was 51.3% compared with 45% in 2009, followed by Cataluña (28,258 hectares) with the highest adoption rate of 84%, same as last year’s, with significantly less
spaiN
Population: 44.6 million
GDP: US$1,604 billion
GDP per Capita: US$35,220
Agriculture as % GDP: 3%
Agricultural GDP: US$48.12 billion
% employed in agriculture: 4%
Arable Land (AL): 12.6 million hectares
Ratio of AL/Population*: 1.1
Major crops: • Grape • Maize • Wheat • Sugarbeet • Potato
Commercialized Biotech Crops: Bt maize
Total area under biotech crops and (%) increase in 2010: 76,575 Hectares (+0.68%)
Farm income gain from biotech, 1996-2009: US$94 million
*Ratio: % global arable land / % global population

Global status of Commercialized biotech/GM Crops: 2010
171
area of Bt maize in Extremadura (7,770 hectares), with an adoption rate of 19%, with the balance of Bt maize grown in seven other provinces in Spain in 2010 (Tables 32 and 33).
Currently, varieties of nine seed companies, including event MON810 biotech maize have been approved for commercial planting. Up until 2002, only the variety COMPA CB was grown with Bt-176 for insect resistance, and this variety was grown until the 2005 season. MON810 varieties for insect resistance were approved in 2003 and now there are 46 varieties registered with MON810. In November 2004, herbicide tolerant NK603 maize was approved for import, but the approval for planting in the European Union is still pending. When approved, biotech maize varieties with NK603 are likely to be deployed throughout Spain.
Spain is a feedstock deficit country and therefore, there is an incentive for Spanish farmers to increase productivity and be competitive, by employing innovative and cost effective technologies. The future growth of biotech maize in Spain will be dependent on the continued growth in the area planted to Bt maize, the approval of NK603, and particularly a progressive and tolerant government policy especially in relation to coexistence.
Spain is the leader in biotech crops in the EU and conducts 42% of all the biotech field trials planted in the EU. In Spain, field trials of biotech crops are very carefully controlled and must be reviewed and recommended for approval by the National Biosafety Committee and are then subject to final approval by the Federal Government.
benefits from biotech Crops in spain
spain is estimated to have enhanced farm income from biotech bt maize by us$94 million in the period 1998 to 2009 and the benefits for 2009 alone is estimated at us$16 million (Brookes and Barfoot, 2011, forthcoming).
The benefits to Spanish farmers from Bt maize has been reported by PG Economics and indicates that the average increase in yield was 6%, and the net impact on gross margin is US$112 per hectare. Data from the Institute of Agro-Food Research and Technology (IRTA, 2008), a public research institute in Spain indicates that for an area where the corn borer is prevalent, Bt-varieties have a yield advantage of 7.5% with an 83% reduction in levels of fumonisins. There is potential for increasing Bt maize hectarage in Spain, up to one-third of the total maize area, and the national gain is estimated at US$13 to US$18 million per year. The grain harvested from Bt maize in Spain is sold through the normal channels as animal feed or fed to animals on the farm.

Global status of Commercialized biotech/GM Crops: 2010
172
tabl
e 32
. h
ecta
res
of b
iote
ch b
t Mai
ze in
the
aut
onom
ous
Com
mun
ities
of s
pain
, 199
8 to
201
0
prov
ince
s19
9819
9920
0020
0120
0220
0320
0420
0520
0620
0720
0820
0920
10
Ara
gon
11,5
007,
300
9,00
04,
250
9,20
012
,592
25,5
4721
,259
23,7
3435
,860
31,8
5729
,540
28,
652
Cat
aluñ
a1,
700
3,00
04,
500
3,25
05,
300
5,43
015
,699
16,8
3020
,365
23,0
1325
,298
28,2
60 2
8,25
8
Extre
ma-
dura
1,00
02,
500
2,50
060
01,
500
1,89
92,
026
1,17
12,
071
6,46
010
,416
8,30
8 7
,770
Nav
arra
1,76
030
022
080
500
1,38
72,
446
2,60
42,
821
5,32
75,
150
4,39
7 4
,477
Cas
tilla
-La
Man
cha
4,50
06,
800
5,65
087
04,
150
7,68
28,
197
7,95
74,
176
3,65
94,
739
3,12
8 3
,187
And
aluc
ia78
02,
800
1,50
045
01,
800
2,06
72,
770
2,87
529
859
21,
372
2,17
5 3
,773
Mad
rid66
01,
560
1,97
01,
940
780
1,03
41,
385
155
8019
338
113
0 3
40
Isla
s B
alea
res
22
260
306
2929
03
392
75
Cas
tilla
Y
Leon
200
360
270
00
740
120
1328
19 0
La R
ioja
2530
300
00
3541
122
411
8 5
Mur
cia
00
00
00
120
024
00
0
Ast
uria
s0
00
00
00
00
00
0 0
Vale
ncia
190
300
150
100
2072
7329
30
014
0 2
3
Can
tabr
ia0
00
00
00
00
00
015
tota
l22
,317
24,9
5225
,816
11,5
4023
,280
32,2
4358
,219
53,2
2653
,667
75,1
4879
,269
76,0
5776
,575
Sour
ce: M
inis
try o
f Agr
icul
ture
, Spa
in, 2
010.

Global status of Commercialized biotech/GM Crops: 2010
173
Farmers’ Views on Biotech Crops
Farmers from Spain, Romania and Portugal presented to the members of the parliament (MPs) and representatives of the European Commission in Brussels a manifesto stating that “Biotechnology, a tool for agro-food cannot be ignored. The text in the rejection of positions and decisions against GMOs are not based in science. The safety of GM crops is guaranteed by the strictest and independent scientific assessment.” The farmers stressed the inequality of the European Union in making decisions re. agricultural production and called for scientifically-based decisions so as not to discriminate against farmers who want to grow GM crops. Spanish farmers have also attested their experiences in planting GM crops saying that the cultivation of transgenic maize leads to higher yields in a more cost-effective way with higher quality grain and using less resource. The farmers noted that biotech crops which
table 33. hectares of Maize in spain by province, 2010
province hectaresCastilla Y León 96,003
Aragon 55,902
Extremadura 40,100
Castilla-Mancha 28,866
Cataluña 33,591
Galicia 23,700
Andalucia 20,866
Navarra 12,290
Madrid 5,450
Canarias 645
C. Valenciana 525
Baleres 525
La Rioja 500
Pais Vasco 454
Cantbaria 322
Pais de Asturias 300
R de Murcia 250
spain total 320,289
Source: Ministry of Environment Rural Development and Fisheries, Spain, 2010. Avances Suopefices y Producciones Agricolas, July 2010.

Global status of Commercialized biotech/GM Crops: 2010
174
are available in other parts of the world, should also be enjoyed by farmers in the EU (Crop Biotech Update, 16 July 2010).
MEXICO
in 2010, Mexico planted 58,000 hectares of biotech cotton, equivalent to 73% of the 80,000 hectares of the national cotton hectarage and 13,000 hectares of biotech rr®soybean for a country total of 71,000 hectares of biotech crops, compared to 73,000 hectares in 2009. the most significant development in Mexico in 2009/10 was the planting of the first biotech maize trials in the country. after an 11 year moratorium, the Mexican government approved 21 experimental field trials of GM maize; Mexico grows just over 7 million hectares of maize annually. Mexico is estimated to have enhanced farm income from biotech cotton and soybean by us$102 million in the period 1996 to 2009 and the benefits for 2009 alone is us$11 million.
Mexico is the last of the six “founder biotech crop countries” having grown biotech Bt cotton in 1996, the first year of the global commercialization of biotech crops. In 2010, the total cotton plantings in Mexico were approximately 80,000 hectares. Approximately 73% or 58,000 hectares were biotech products. A high percentage (93%) was planted with the stacked trait of Bt/HT with the marginal balance as Bt or HT. In addition to biotech cotton, 13,000 hectares of RR®soybean were planted in 2010 compared with 17,000 hectares in 2009. Thus, the total hectarage of biotech crops in Mexico in 2010 was 71,000 hectares similar to 2009 at 73,000 hectares.
Mexico has no trade constraints related to biotech crops and is a major importer of food, feed and fiber from the USA. In 2005, Mexico imported US$9.9 billion worth of agricultural products from the USA. These included 5.7 million tons of maize, 3.7 million tons of soybeans and 387,000 tons of cotton. While Mexico has no trade constraints related to biotech crops, generally, it is the center of diversity for maize and the conservation of biodiversity in Mexican landraces that has fuelled a long standing debate vis-à-vis the potential for gene flow from biotech maize imported from the USA. Following years of debate, the Mexican Congress and Senate approved a Biosafety Law on 15 February 2005 that facilitated the introduction of biotech crops despite the fear of some regarding gene flow in maize. Under the new law, authorization for the sale, planting and utilization of biotech crops and products is on a case-by-case basis, under the control of Comision Intersecretarial de Bioseguridad y Organismos Geneticamento Modificados (CIBIOGEM), an inter-ministerial body. Increasing trade in biotech crops made the new law necessary, and Mexican policy makers believe

Global status of Commercialized biotech/GM Crops: 2010
175
it is a major step forward in dealing with an issue that required urgent attention.
The most significant biotech crop development for Mexico in 2009/10 was the ending of an 11 year moratorium on field trials of biotech maize. In 2009/10, experimental, open field trials of biotech maize were approved and planted in the northern region of Mexico. The trials were approved following the passage of the GMO Biosafety Law (2005), its By Laws (2008) and the Mexican regulatory framework for GM maize was concluded in March 2009. This was accompanied with the enactment of the Special Protection Regime for Maize, which provides for the protection of the Mexican maize landraces – Mexico is the center of origin and diversity for maize. The biosafety requirements demand that the seed and all other harvestable products from these trials not be commercialized.
Given that Mexico is the center of origin of maize, the Mexican Biosafety Law for GMOs, which was passed in March 2005, requires a special regime to protect maize in its center of origin. After an eleven year moratorium, which precluded field trials of biotech maize in Mexico, the first experimental field trials were succesfully conducted in 2009/10, which demonstrated the effectiveness of biotech crops for the control of insect pests and weeds. The Mexican government approved 20 permits for field trials in 2010 in the northern states of Mexico in Sonora, Sinaloa, Tamaulipas, Chihuahua and La Laguna. All the trials were conducted by independent scientists from recognized local Universities and Public Research Institutions. The evaluation was focused on three fundamental aspects: the agronomic equivalence of biotech maize versus its conventional counterpart; the biological effectiveness of insect resistant maize and the impact on non-targeted
MeXiCo
Population: 107.8 million
GDP: US$1,088 billion
GDP per Capita: US$10,230
Agriculture as % GDP: 4%
Agricultural GDP: US$43.5 billion
% employed in agriculture: 14%
Arable Land (AL): 25.6 million hectares
Ratio of AL/Population*: 1.0
Major crops: • Maize • Soybeans • Cotton • Wheat • Rice • Coffee
Commercialized Biotech Crops: • Bt Cotton • HT Soybean
Total area under biotech crops and (%) increase in 2010: 71,000 Hectares (-2.7%)
Farm income gain from biotech, 1996-2009: US$102 million
*Ratio: % global arable land / % global population

Global status of Commercialized biotech/GM Crops: 2010
176
organisms; and the biological effectiveness of herbicide tolerance maize. The field trials of biotech maize featured the following technologies in Table 34.
table 34. GM technologies featured in the field trials
Characteristic event
Insect Resistance (IR) DAS 01507-1
Herbicide Tolerance (IR) MON 00603-6
Insect Resistance + Herbicide Tolerance (IR/HT)
MON 89034-3 × MON 00603-6DAS 01507-1 × MON 00603-6MON 89034-3 × MON88017-3
More than 75 biosafety measures and conditions were required by the permits that would allow the planting of the first biotech maize field trials using Government issued permits. All measures were succesfully implemented, and integrated in a strict regulatory framework for conducting the open field trials with biotech maize, consistent with the international biosafety standards. Some of these measures required: an isolation distance of 600 meters as well as a 30 day difference between the planting dates of conventional varieties and biotech crops; location of the field trials was limited to the northern region of the country – far from centers of origin and diversity of wild relatives of maize.
The 2010 field trials with biotech maize, featuring insect resistance confirmed the efficiency of the Bt technology for controlling pests, including fall army worm, ear worm, corn borer and root worm. The conventional varieties required an average of five applications of insecticides for effective pest control, compared with no sprays for the biotech crops, which yielded on average 7% more than the conventional counterparts.
The major findings of the first biotech maize in Mexico in 2010 were:1. It is possible to conduct research and field trials with biotech maize in Mexico in a safe,
reliable manner, in compliance with strict biosafety measures, consistent with international standards.
2. Biotech maize behaves and responds to the environment in the same way as the range of conventional maize currently used by Mexican farmers.
3. The insect resistant biotech maize was effective for the control of the major maize insect pests.
4. Biotech maize does not pose any risk whatsoever to other fauna, since there were no changes in the populations of the non-target organisms in biotech maize (insects, wasps, ladybugs, leafhoppers, spiders, crickets, and others).

Global status of Commercialized biotech/GM Crops: 2010
177
5. Biotech maize tolerant to glyphosate, treated with a few applications of glyphosate, allowed effective control of weeds.
Plans for 2011
The field trials of biotech maize in Mexico in 2010 demonstrated that biotech maize is safe and effective; this is consistent with international experience with commercializing biotech maize in more than 10 countries around the world for about 15 years. Further trials, planned for 2011 will evaluate biotech maize semi-commercially; these trials will generate valuable information regarding the use of adequate biosafety measures that will allow coexistence of biotech and conventional maize to be practiced on a realistic and pragmatic basis, as well as to provide accurate cost-benefit data regarding economic benefits for farmers. The first permits for biotech maize trials to be conducted semi-commercially in 2011 were requested in the last quarter of 2010, for planting in 2011.
benefits from biotech Crops in Mexico
Mexico is estimated to have enhanced farm income from biotech cotton and soybean by US$102 million in the period 1996 to 2009 and the benefits for 2009 alone is estimated at US$11 million (Brookes and Barfoot, 2011, forthcoming).
COlOMBIA
Colombia grew 37,000 hectares of biotech cotton in 2010, compared with 24,000 hectares in 2009, a 50% year-to-year increase. over 90% of the biotech cotton was the stacked product bt/ht. about 35,000 hectares of biotech maize was also grown in a “controlled program” but this hectarage is not included in the global data base. Colombia is estimated to have enhanced farm income from biotech cotton by us$21 million in the period 2002 to 2009 and the benefits for 2009 alone is estimated at us$1 million.
In 2010, Colombia grew approximately 37,000 hectares of biotech cotton, compared with 24,000 hectares in 2009. Of the 37,000 hectares, over 90%, equivalent to about 34,000 hectares were the stacked traits Bt and herbicide tolerance (HT), and about 3,000 hectares were herbicide tolerant. The cotton is planted in two seasons. Colombia first introduced Bt cotton in 2002 on approximately 2,000 hectares and in the interim, this has increased to 37,000 hectares.

Global status of Commercialized biotech/GM Crops: 2010
178
Biotech maize is not approved for commercialization in Colombia. However in 2010, Colombia, for the fourth year, planted biotech maize in two seasons in a “controlled planting program” in two regions, one on the Coast and Llanos region and the other in the interior of the country. Biotech maize was planted in 2010 on a total of 35,000 hectares, same as last year. The 2010 hectarage of biotech maize comprised 20,000 hectares of Bt maize, 1,000 hectares of herbicide tolerant and 13,000 hectares of the stacked Bt/HT product. The biotech maize hectarage grown in Colombia is not included in the global biotech data for 2010 because it has not been approved for commercialization, and is only grown in a “controlled planting program.”
Colombia has approximately 600,000 hectares of maize which could be an important new potential application for biotech maize. Colombia has been growing blue biotech carnation for export only since 2002, and in 2010 planted 4 hectares in greenhouses near Bogota which, although commercial, are not included in the global biotech hectarage.
benefits from biotech Crops in Colombia
Colombia is estimated to have enhanced farm income from biotech cotton by US$21 million in the period 2002 to 2009 and the benefits for 2009 alone is estimated at US$1 million (Brookes and Barfoot, 2011, forthcoming).
Farmer Testimonies
sergio Valencia, has farmed corn, soybeans, coffee, citrus, tomatoes, passion fruit, banana, and African palm in Llanos Orienta les (Eastern Plains), Colombia for 20 years. He heard about the benefits of planting biotech maize in 2009 and has since then planted a 60 hectare field of biotech maize. Valencia believes that although the biotech maize seeds are slightly more expensive than conventional seeds, the extra expense translates into overall savings because planting biotech maize reduces the application of inputs. He explains that, “In a conventional maize crops, he would spend about 500 thousand pesos (approximately US$250) per hectare during a farming season. However, by planting biotech seeds, he has been able to reduce that amount to just 70 thousand pesos (approximately, US$35) per hectare. The use of biotech seeds has enabled him to save 86 percent in costs per hectare.” He added that, “which means I get to enjoy more free time! I can focus in other activities in my farm or …just rest!”
For all these benefits, he said, today “I do prefer biotechnology!” From now on he will continue to grow biotech crops in this region of Colombia, which has been catalogued as one of the most promising territories on agricultural development and production (Valencia, 2010).

Global status of Commercialized biotech/GM Crops: 2010
179
CHIlE
Chile grew a total of 16,678 hectares of biotech maize, soybean and canola, exclusively for seed exports in 2010 and has legislation under consideration for also allowing domestic commercialization.
In 2010-11, Chile was projected to plant 9,378 hectares of biotech maize, 3,800 hectares of biotech soybean and 3,500 hectares of biotech canola for a total of 16,678 hectares for seed export; this is significantly less than the 32,000 hectares planted in 2009-10, as other countries compete vigorously for the seed market. There is legislation in Parliament to allow consumption of domestically grown biotech crops in Chile.
Chile has a population of 16.8 million and a GDP of US$169 billion, 4% of which is generated from agriculture, and forestry is a strong sector in the country. Fruits are major exports worth US$2 billion per year and it has a thriving global export market in wines. A significant 13% of the population is involved in agriculture and the export market requires that the products are of top quality to compete in the global market.
From a biotech crop standpoint, it is important to recognize that Chile is the fifth largest producer of export seed in the world, with a value of US$370 million (Table 1 in Appendix 3). Chile has been producing biotech seed for export since commercialization began in 1996 and this activity is fully covered by the current law. Chile has clearly demonstrated over the last fourteen years that like the other 28 countries that commercialized biotech crops, it has all the necessary management know-how and skills to responsibly handle all the aspects related to the growing of biotech crops. The only difference between Chile and the other countries planting biotech crops is that the current law only allows commercialization of biotech crops for export. However, there is a new law in passage in the Chilean Parliament that would also allow commercialization and consumption of biotech crops produced in Chile. This is a logical development given that Chile already imports significant quantities of biotech crops, such as biotech maize, for consumption from its neighboring country, Argentina, which is the third largest producer of biotech crops in the world. Chile has 120,000 hectares of maize which could benefit significantly from biotechnology and substitute for some of the imports of biotech maize from Argentina. The most recent REDBIO regional meeting on biotechnology recognized this opportunity for Chile to grow biotech maize for domestic consumption.
The area of biotech crops grown for seed export in Chile has shown a growth trend and plateauing over the last seven years, increasing from 10,725 hectares in 2002/03 to a high of 36,000 hectares in 2008 and consolidating to 32,200 hectares in 2009 and to 16,678 hectares in 2010/11 (Table 35). Multiplication of biotech seed for export is a significant business activity valued at approximately

Global status of Commercialized biotech/GM Crops: 2010
180
US$400 million in 2009, of which the value of biotech seed alone was at least US$200 million. Maize has always been the most important biotech seed crop grown in Chile at 9,378 hectares in 2010/11 followed by 3,000 hectares of soybean and 1,200 hectares of canola. The number of biotech seed crops multiplied in Chile is now approximately 10 crop/trait combinations. The country has broad and diversified experience in successfully managing all aspects related to the growing of biotech crops for over 10 years.
table 35. hectares of Major biotech seed Crops Grown for export in Chile, 2002/03 to 2010/11
Crop 2002/03 2003/04 2004/05 2005/06 2006/07 2007/08 2008/09 2009/10 2010/11*
Maize 10,400 8,450 7,614 12,120 17,981 25,000 30,000 28,000 9,378
Canola 110 140 746 628 444 2,500 4,200 1,200 3,500
Soybean 215 128 273 166 250 500 1,800 3,000 3,800
total 10,725 8,718 8,633 12,914 18,675 28,000 36,000 32,200 16,678
Source: Government of Chile statistics, SAG, 2010. *industry estimates
Several organizations in Chile have been pursuing the development of biotech crop products for several years, including the following: The Catholic University of Santiago is developing citrus species that are resistant to drought and tolerant to nitrogen deficiency, virus resistant potatoes, and Pinus radiata species that are resistant to shoot moth and also tolerant to glyphosate. The National Institute for Agricultural Research (INIA) is developing grapes that are resistant to Botrytis, and in a joint program with the University of Santo Tomas they are developing stone fruits (nectarines and peaches) with improved quality and shelf life. Fundacion Chile provides technical and financial support for some of these projects.
Biotech activities in Chile are not restricted to crops but also include forestry products. Recently, some Chilean Research Institutes have joined forces to develop drought-tolerant Eucalyptus. Chile’s Institute for Agricultural Research (INIA) and Chile’s Forest Research Institute (INFOR) have announced a joint program to develop varieties of eucalypts, Eucalyptus globulus, with increased tolerance to drought. The project aims to provide farmers and forestry industry with plants and trees better adapted to the conditions of the arid interior regions of Chile. It is estimated that currently 1.8 million hectares of land are not realizing their production potential due to the low availability of water. More information can be obtained from INIA Chile (2007).

Global status of Commercialized biotech/GM Crops: 2010
181
HONDURAS
honduras grew 15,000 hectares of biotech maize in 2010, the same as 2009,comprising 11,000 hectares of bt/ht maize and 4,000 hectares of ht maize.
Honduras is a poor country in Central America with a GDP per capita of US$1,966 – one of the poorest in the region. Both large and small farmers cultivate maize which is the major staple in the country. The average yield is 1.6 tons per hectare which is one of the lowest in the region; this low yield is due to several factors, including lepidopteran pests which can cause significant losses, particularly on smallholdings.
Honduras was the first country to adopt biotech maize in Central America and introduced herbicide tolerant maize in 2002 with a pre-commercial introductory area of approximately 500 hectares. In the interim, the biotech maize area has increased to 15,000 hectares in 2009, up approximately 67% from 9,000 hectares in 2008 and was at the same level in 2010. In 2010, the 15,000 hectares comprised 11,000 hectares of the stacked Bt/HT maize and 4,000 hectares of HT maize. The national maize crop of Honduras is approximately 362,000 hectares.
benefits from biotech Maize in honduras
Assuming a modest gain of US$75 per hectare from stacked biotech maize the national benefit from 15,000 hectares would be about US$1 million per year. Preliminary results from IFPRI studies, suggest that, not surprisingly, the larger farmers (over 2 hectares) have been the initial beneficiaries of biotech maize in Honduras and studies are underway to assess the impact of biotech maize in the country. The experience of Honduras, as a small country with very limited resources, in implementing a successful biosafety program can serve as a useful model and learning experience for other small countries particularly those in the Central American region. Zamorano University in Honduras has activities in biotech crops, including a knowledge sharing initiative which should contribute to a better understanding of biotech crops and facilitate more informed decisions about biotech crops, their attributes and potential benefits.
PORTUGAl
in 2010, portugal planted 4,868 hectares of bt maize, compared with 5,094 hectares in 2009, a 4% decrease. however in 2010, the total hectarage planted to maize also decreased from 135,000 hectares to 132,000 hectares, a 2% drop. adjusting for

Global status of Commercialized biotech/GM Crops: 2010
182
the decrease in total maize hectares between 2010 and 2009, the adoption rate of bt maize remains the same at approximately 4% for both years. in 2010, a total of 4,868 hectares of bt maize, were grown in 4 regions by 191 farmers with an average bt maize planting of 25 hectares per farm. portuguese farmers, who first grew bt maize in 1999, resumed successful planting in 2005, since then, they have elected to continue to plant bt maize for six years because of the benefits they offer. average bt maize area per farm in 2010 was a modest 25 hectares.
Portugal resumed the planting of Bt maize in 2005 after a five-year gap having planted an introductory area of approximately 1,000 hectares in 1999 for one year. In 2010, Portugal planted 4,868 hectares of Bt maize, compared with 5,094 hectares in 2009. However in 2010, the total hectarage planted to maize also decreased from 135,000 hectares to 132,000 hectares, a 2% drop. Adjusting for the decrease in total maize hectares between 2010 and 2009, the adoption rate remains the same at approximately 4% for both years. The major regions for planting Bt maize in Portugal are listed in Table 36 in descending order of hectarage and percent contribution to the total national hectarage of 4,868 hectares in 2010, as well as the number of notifications by farmers intending to plant Bt maize (191), with an average hectarage of 25 hectares Bt maize per farm. The region of Alentejo has the largest hectarage of Bt maize at 2,344 hectares or 48% of the national hectarage with 65 farmers submitting notifications of their intent to plant Bt maize. Alentejo was followed by the Lisbon and Tejo Valley regions with 1,511 hectares of Bt maize or 31% of the national hectarage with 31 farmers submitting notifications. The central region was the third region with 765 hectares of Bt maize or 16% of the national hectarage with 51 farmers submitting notifications. Finally, the Northern area was the fourth region with 248 hectares of Bt maize or 5% of the national hectarage with 44 farmers submitting notifications. At the national level in Portugal in 2010, a total of 4,868 hectares of Bt
table 36. Cultivation of bt Maize in portugal in 2010
region hectares (has.) percentageNational has.
average has./maize/farm
Number of farmers (Notifications)
Alentejo 2,344 48 36 65
Lisbon/de Tejo 1,511 31 49 31
Central 765 16 15 51
North 248 5 6 44
NatioNal 4,868 100 25 191
Source: Ministry of Agriculture, Rural Development, and Fisheries, Lisbon, Portugal, www.dgadr.pt, 11 October, 2010.

Global status of Commercialized biotech/GM Crops: 2010
183
maize were grown in 4 regions by 191 farmers with an average of 25 hectares Bt maize area per farm. Thus, the percentage adoption of Bt maize in Portugal in 2010 was the same as for 2009 at 4%. All the Bt maize in Portugal is MON 810, resistant to European corn borer. As a member country of the EU, Portugal’s continued cultivation of Bt maize is an important development, acknowledging that the national maize area is modest at 132,000 hectares (Portuguese Ministry of Agriculture, 2010).
The Government of Portugal passed a Decree, which requires a minimum distance of 200 meters between biotech and conventional maize and 300 meters between biotech maize and organic maize; buffer zones can substitute for these distances. Implementation of coexistence laws results in biotech maize being grown in the central and southern regions of Portugal where the farms are bigger, and where coexistence distances can be accommodated and also where producers are more responsive to the introduction of new and more cost effective technologies. The Ministry of Agriculture also passed legislation to establish biotech free areas where all the farmers in one town, or 3,000 hectare area, can elect not to grow biotech varieties. All biotech varieties approved in the EC catalogue can be grown in Portugal.
benefits from biotech Crop in portugal
The area infested by the European corn borer (ECB) in Portugal are in the Alentejo and Ribatejo regions and the estimated infested area that would benefit significantly from Bt maize is estimated at approximately 15,000 hectares, which is equivalent to approximately 10% of the total maize area. The yield increase from Bt maize is of the order of 8 to 17% with an average of 12% equivalent to an increase of 1.2 MT per hectare. Assuming an average increase of US$150 per hectare the gain at the national level for Portugal for Bt maize would be in the order of increase of US$2.25 million per year.
Farmer Experience Jose Maria telles rasquilla is a Portuguese farmer who has planted Bt maize since 1999. He says that, “Growing biotech maize offers environmental advantages and economic benefits such as better yields and less spraying, which means reduced costs, larger margins per hectare and good quality products. Developing new technologies and agricultural products can help the environment and have a positive impact on rural development.”

Global status of Commercialized biotech/GM Crops: 2010
184
CzECH REPUBlIC (CzECHIA)
in 2010, the Czech republic grew 4,680 hectares of biotech bt maize, and for the first time, 150 hectares of amflora, the biotech potato newly approved for cultivation in the eu in March 2010. thus, the total hectarage of the two biotech crops was 4,830 hectares. the Czech republic grew 4,680 hectares of bt maize in 2010, compared with 6,480 hectares in 2009, a 1,800 hectare decrease; the decrease was associated with various factors including less total maize hectarage, and the onerous disincentive for farmers who were required to report intended biotech plantings to government authorities very early. of the three countries which grew “amflora” in 2010 the Czech republic grew the most at 150 hectares, compared to 80 hectares in sweden and 15 hectares in Germany.
The Czech Republic, more familiarly known as Czechia, approved the commercial production of a biotech crop for the first time in 2005 and grew 150 hectares of Bt maize. In 2006, Czechia grew 1,290 hectares of Bt maize, which increased to 5,000 hectares in 2007. In 2008, Czechia increased its Bt maize area for the third consecutive year by more than 68% to 8,380 hectares and this decreased to 6,480 hectares grown by about 125 farmers in 2009 and 4,680 hectares in 2010. The decrease in Bt maize plantings was associated with many factors, including the onerous disincentive for farmers who had to report intended biotech plantings as early as January 2009.
In 2010, in addition to the 4,680 hectares of biotech Bt maize the Czech Republic grew, for the first time 150 hectares of Amflora, the biotech potato newly approved in the EU in March 2010 for planting and use as industrial starch and feed. Thus, in 2010 the total hectarage of the two biotech crops was 4,830 hectares in 2010. Of the three countries which grew “Amflora” for the first time in 2010 the Czech Republic grew the most at 150 hectares, compared with 80 hectares in Sweden and 15 hectares in Germany.
The latest information shows that Czechia grew up to 400,000 hectares of maize in 2009 of which the majority was for silage. It was estimated that up to 30,000 to 50,000 hectares of maize were affected by the corn borer to a degree that would warrant the deployment of Bt maize planting, thus the potential for biotech maize expansion is significant. Coexistence rules apply with 70 meters between Bt maize and conventional maize (or alternatively 1 row of buffer replaces 2 meters of isolation) and 200 meters between Bt maize and organic maize (or alternatively 100 meters of isolation and 50 buffer rows).

Global status of Commercialized biotech/GM Crops: 2010
185
benefits from biotech Crops in Czechia
The Phytosanitary Service of the Government estimated that up to 90,000 hectares were infested with European corn borer (ECB), and that up to 30,000 hectares were being sprayed with insecticide to control ECB. In trials with Bt maize, yield increases of 5 to 20% were being realized, which is equivalent to an increase of about US$100 per hectare. Based on 30,000 hectares of Bt deployed, the income gain at the national level could be of the order of US$3 million per year. It is too early to expect assessments of benefits from Amflora at this time.
POlAND
the hectarage planted to bt maize in poland in 2010 was the same as in 2009, and estimated at 3,000 hectares.
Poland has a population of approximately 38.12 million and a GDP (nominal) of US$528 billion, 5% of which is generated from agriculture equivalent to US$26.4 billion per year. Agricultural products and food stuffs represent about 8% of total exports which is US$6 billion per year. Agriculture provides employment for 15% of the population, the highest percentage in the EU of which Poland is a member.
The hectarage planted to Bt maize in Poland in 2010 was the same as in 2009, and estimated at approximately 3,000 hectares. The latest information indicates that there was an estimated total of 670,000 hectares of maize grown in Poland in 2009, of which 260,000 hectares, or 39%, was used for grain, and 61% or 410,000 hectares, used for silage. European corn borer (ECB) used to be limited to only a few regions in the South and South East, but it is now endemic in all regions of Poland and causes significant damage. Economic thresholds which merit the use of Bt maize as a control measure are at a 15% level of infestation for grain crops and 30% to 40% infestation for silage crops. Insecticide application to control ECB is infrequent due to lack of tradition, equipment, awareness of the significant damage the pest is causing and the small size of holdings and fields. Trichogramma is sometimes used as a biological control agent at a cost of US$90 to US$105 per hectare. Insecticide control, which is rarely used, cost about US$35 per hectare.
Some pre-commercial Bt maize was planted in Poland in 2006 on approximately 100 hectares. In 2007, Poland commercialized Bt maize for the first time when 327 hectares were planted. Based on the positive experience of farmers who planted the 327 hectares of Bt maize in 2007, the hectarage planted to Bt maize in 2008 increased more than 8-fold to 3,000 hectares and the hectarage remained

Global status of Commercialized biotech/GM Crops: 2010
186
the same in 2009 and 2010. In 2007, Poland had the distinction of becoming the eighth EU country to plant Bt maize, which meant that over one quarter of the 27 EU countries were commercially planting biotech maize. Bt yellow maize is being used in Poland for animal feed and/or for ethanol production.
benefits from bt Maize in poland
In 2007, a report entitled “The benefits of adopting genetically modified maize in the European Union; first results from 1998 to 2006 plantings,” Graham Brookes (Personal Communication, 2008) reported that gross margins from Bt maize, over conventional, based on trials conducted in 2006 were on average approximately 25% higher, and associated with an increase of 2.15 tons/ha. A significant advantage of Bt maize, not captured in the benefits associated with yield increase, is the substantial decrease in mycotoxin level with multi-fold decreases in the levels of all the various toxins. For example, Fumonisin B1 decreased from a range of 121 to 409 ppm in conventional maize to 0 to 25 ppm in Bt maize. Similarly, Fumonisin B2 decreased from a range of 44 to 103 ppm in conventional maize to a range of 0 to 8 ppm in Bt maize.
EGYPT
in 2010, egypt planted 2,000 hectares of bt yellow maize (MoN 810) known in egypt as ajeeb YG®), with a year-over-year increase of 100%, compared with the 1,000 hectares in 2009. egypt was the first to adopt biotech crops in the arab countries when it planted bt maize in 2008 on 700 hectares, which climbed to 1,000 hectares in 2009, and 2,000 hectares in 2010.
Egypt with a population of 80 million lies in the northeastern corner of Africa with a total land area of approximately 100 million hectares. It is bounded by the Mediterranean Sea to the North and the Red Sea to the East and Sudan to the South. The topography of Egypt is dominated by the river Nile, the longest river in the world, which provides the critical water supply to this arid country. Only 3% of the land, equivalent to approximately 2.5 million hectares is devoted to agriculture, making it one of the world’s lowest levels of cultivable land per capita. However, agriculture is considered a principal sector in the economy contributing about 13% to GDP and providing close to 30% of employment. About 90% of the agricultural land is in the Nile Delta and the balance is within a narrow strip along the Nile between Aswan and Cairo. The rich cultivated land, irrigated by the Nile, is very fertile and allows double cropping. Nevertheless, the meager area of cultivable land as well as problems related to salinity and water, results in Egypt being dependent on imports

Global status of Commercialized biotech/GM Crops: 2010
187
for about half of its food supply. The principal crops are rice, wheat, sugarcane and maize. The government policy is to enhance agriculture as a major contributor to the national economy, by promoting privatization and decreasing government controls and subsidies. The major challenges for agricultural development in Egypt are the limited arable land base, erosion of land resources, loss of soil fertility and salinity and the high rate of population growth of 1.9%.
In 2010, Egypt continued to plant approximately 2,000 hectares of Bt maize (MON 810: Ajeeb YG®). Egypt first planted Bt yellow maize in 2008, with 700 hectares which increased to 1,000 hectares in 2009 and to 2,000 hectares in 2010. Egypt was the first country in the Arab world to commercialize biotech crops, by planting a hybrid Bt yellow maize, Ajeeb YG®. The planned increase in hectarage of Bt maize to over 5,000 hectares in 2009 was not realized, because import licenses for 150 tons of Ajeeb YG®, sufficient for planting 5,200 hectares, was not issued. Thus, the developers of Ajeeb YG® had to rely on approximately 28 tons of locally produced seeds to plant 1,000 hectares in 2009. Egypt grew approximately 660,000 hectares of maize in 2010, and imports annually 4.5 million tons of yellow maize valued at US$1.3 billion. Of the 660,000 hectares of maize, 160,000 hectares (25%) are yellow maize and the balance of 500.000 hectares is white maize. The biotech maize hybrid is resistant to three maize insect pest borers (Massoud, 2005). Field trials were conducted in Egypt from 2002 and these have indicated that the yield of Bt yellow maize can be increased by up to a significant 30% over conventional yellow hybrid maize.
Egypt has a well established biotechnology institute, the Agricultural Genetic Engineering Research Institute (AGERI), which is the lead crop biotech institute in the Arab world, and the centre of excellence in biotechnology, molecular biology, and genetic engineering research focusing on product development. AGERI is within the Agricultural Research Centre (ARC) of the Egyptian Ministry of Agriculture and Land Reclamation. It is dedicated to the production of biotech crops and biotechnology-based products. AGERI’s objective is to maximize production efficiencies with scarce water resources and arable land, reduce environmental degradation and minimize production risks for farmers. AGERI has a broad range of biotech crop activities, including the development of resistance to biotic stresses caused by viruses, insect, fungal pests and nematodes, and tolerance to the abiotic stresses of drought and salinity. Some basic research is also conducted on genome mapping, and protein and bio-molecular engineering. AGERI has several collaborative research programs with universities and institutions internationally. Several biotech crops are under development including wheat, barley and cotton tolerant to drought and salinity. There is a suite of projects incorporating resistance to various viruses in potato, squash and melons (zucchini yellow mosaic), tomato (tomato yellow leaf curl), and banana (bunchy top and cucumber mosaic). Similarly, there is also another suite of projects incorporating resistance to insect pests, mainly featuring Bt genes, including projects on the Gossypium barbadense species of cotton (bollworm and other lepidopteran pests), potato (tuber moth), and maize (Sesamia stem borer).

Global status of Commercialized biotech/GM Crops: 2010
188
benefits from bt Maize in egypt
Developers of Ajeeb YG® have reported the following economic benefits in 2009. Increase in yield per hectare resulted in a gain of US$267, plus an insecticide saving equivalent to US$89 per hectare for a total gain of US$356 per hectare, minus the additional cost of seed per hectare at US$75 for a net benefit per hectare of US$281. Extrapolating from these data, the benefits from planting 2,000 hectares in 2010 is of the order of US$550,000. On a national basis the estimated annual opportunity cost to Egypt of not deploying Bt maize, based on a 33% and 66% adoption on the 160,000 hectares of yellow maize is US$15 million and US$30 million annually, respectively. Additionally, the use of Bt maize in Egypt would have an import substitution value, from increased self-sufficiency of maize plus savings of foreign exchange.
SlOVAKIA
in 2010, the hectarage of bt maize in slovakia was 1,248 hectares compared with 875 hectares in 2009. the increase of 43% was as a result of several factors including, in particular, the continued satisfaction of farmers with bt maize.
Slovakia grew its first commercial biotech crop, Bt maize in 2006 when 30 hectares of Bt maize were grown for commercial production by several farmers. In 2007, the area increased 30-fold to 900 hectares and in 2008 it again increased by over 111% to 1,931 hectares. As a result of several factors associated with the economic recession and decreased plantings of hybrid maize, the Bt maize hectarage in 2009 decreased to 875 hectares but increased again in 2010 to 1,248 hectares equivalent to a significant year-over-year increase of 43%.
As an EU member state, Slovakia can grow maize with the MON810 event which has been approved by the EU for all of its 27 member countries. Slovakia is estimated to have grown 236,000 hectares of maize in 2008 comprising 157,000 for grain and 79,000 for silage.
benefits from biotech Crops in slovakia
It is estimated that from a third to a half of the 240,000 hectares of maize in Slovakia is infested with European corn borer with the most severe infestations in the south of the country where most of the maize is grown. Yield gains conferred by Bt maize have been measured at 10 to 15%. The average

Global status of Commercialized biotech/GM Crops: 2010
189
gain per hectare from Bt maize is estimated at US$45 to US$100 per hectare. Thus, at the national level, the income gain for farmers, assuming 100,000 hectares of Bt maize, would be in the range of US$4.5 million to US$10 million annually in Slovakia.
COSTA RICA
Costa rica grew biotech cotton and soybean for seed export for the first time in 2009, and continued to grow them in 2010. like Chile, Costa rica plants commercial biotech crops exclusively for the seed export trade. in 2010, it planted approximately 750 hectares of biotech cotton, compared with 1,500 hectares in 2009, as well as about 100 hectares of biotech soybean for a total of 850 hectares of biotech crops.
Costa Rica is a Spanish speaking country with a population of approximately 4.5 million situated in Central America. Costa Rica is bounded by Nicaragua to the north, Panama to the east and south, the Pacific Ocean to the south and east, and the Caribbean to the East. The major cash crops for domestic consumption and exports are coffee, bananas and pineapples. About a quarter of Costa Rica is designated as national parks and the country was one of the first in the world to develop ecotourism. Whereas Costa Rica has only about 0.1% of the world’s landmass, it contains 5% of the world’s biodiversity. Expressed as a percentage of its land area, Costa Rica has the largest area of land devoted to national parks and protected areas than any other country in the world.
Costa Rica was included for the first time in 2009 in the global list of countries officially planting biotech crops, because like Chile, it plants commercial biotech crops exclusively for the export seed trade. The only difference between Chile and Costa Rica, and the other twenty seven countries planting biotech crops in 2010, is that the current laws in Costa Rica and Chile allow only commercialization of biotech crops designated for seed export. The biosafety law was promulgated in Costa Rica in 1998 (www.cr.biosafetyclearinghouse.net). The volume of biotech seed production in Costa Rica is small compared with Chile but has potential for growth. In 2010, approximately 750 hectares of biotech cotton (all three types of biotech cotton – Bt, herbicide tolerant (HT), and the stacked gene product for Bt/herbicide tolerance) were planted commercially, compared with 1,500 hectares in 2009, as well as about 100 hectares of biotech soybean, the same as 2009. The decrease in biotech cotton seed production in 2010 was due to market uncertainty related to the recession, and hectarage is expected to increase next year.
Apart from the commercial production of biotech crops for seed export, Costa Rica is also continuing to field test biotech pineapples, featuring a nutritional quality trait and a disease resistant banana.

Global status of Commercialized biotech/GM Crops: 2010
190
These field tests were approved under the biosafety regulations of Costa Rica which conform to international standards.
ROMANIA
romania grew its first 350 hectares of bt maize in 2007 which increased to 7,146 hectares in 2008. following the severe economic recession, (particularly the restricted access to credit), the biotech maize area in 2009 receded to 3,243 hectares and to a further 822 hectares in 2010; onerous reporting requirements for farmers regarding intended planting details, and decreased total plantings of hybrid maize are partly responsible for the lower hectarge in 2010. up until 2006, romania successfully grew over 100,000 hectares of rr®soybean, but on entry to the eu in January 2007, was forced to discontinue the use of an extremely cost-effective technology because rr®soybean is not approved for commercialized planting in the eu. this has been a great loss to both producers and consumers alike. it is noteworthy that because conventional soybeans yield substantially less than rr®soybean, the hectarage of soybeans has dropped precipitously in romania from 177,000 hectares in 2006 to 46,000 hectares in 2008. despite the need for romania to discontinue the cultivation of rr®soybean, it has been able to take advantage of the fact that bt maize is registered for commercialized planting in the eu. romania is estimated to have enhanced farm income from rr®soybean of us$45 million in the period 2001 to 2008 after which it had to discontinue planting when romania became an eu member state.
Romania grew its first 350 hectares of Bt maize in 2007 which increased to 7,146 hectares in 2008. Following the severe economic recession, (particularly restricted access to credit), the biotech maize area in 2009 receded to 3,243 hectares and to a further 822 hectares in 2010; onerous reporting requirements for farmers regarding intended planting details, and decreased total plantings of hybrid maize is partly responsible for the lower hectarage in 2010. Up until 2006, Romania successfully grew over 100,000 hectares of RR®soybean, but on entry to the EU in January 2007 had to discontinue the use of an extremely cost-effective technology because RR®soybean is not approved for commercialized planting in the EU. This has been a great loss to both producers and consumers alike. It is noteworthy that because conventional soybeans yield substantially less than RR®soybean, the hectarage of soybeans has dropped precipitously in Romania from 177,000 hectares in 2006 to only 46,000 hectares in 2008. As a result of cessation of cultivation of RR®soybean and the commensurate decrease in soybean production, Romania has to import soybean, it is almost certain to be RR®soybean, the very same product which the Government has banned from domestic

Global status of Commercialized biotech/GM Crops: 2010
191
production – an example of a negative impact from a flawed logic arising from a bureaucratic requirement. However, despite the need for Romania to discontinue the cultivation of RR®soybean, it has been able to take advantage of the fact that Bt maize is registered for commercialized planting in the EU. Romania grew its first 350 hectares of Bt maize in 2007, and this increased more than 20-fold in 2008, to 7,146 hectares; this was the highest percent increase for any country in 2008, acknowledging that the base hectarage of 350 hectares in 2007 was very low. Following the severe economic recession in 2009, (particularly restricted access to credit), and decreased planting of hybrid maize, the biotech maize area in 2009 receded to 3,243 hectares. It is noteworthy that there are 4.5 million small farms in Romania, which remarkably represent almost a third of all farms in the EU (The Economist, 2007).
Even though Romania has ceased to grow RR®soybean, it is anticipated that Romania will resume growing RR®soybean if and when it is eventually approved for planting in the EU, thus it is appropriate to discuss the history of Romania and RR®soybean. Romania ranked equally with France as the third largest producers of soybean in Europe, after Italy and Serbia Montenegro, with approximately 150,000 hectares of soybean planted in 2007. Romania first grew herbicide tolerant soybean in 2001 when it planted 14,250 hectares of RR®soybean of its national soybean hectarage of approximately 100,000 hectares – a 15% adoption rate. In 2006, of its national soybean hectarage of 145,000 hectares, 115,000 hectares were planted with RR®soybean, equivalent to a 79% adoption rate. The very high adoption rate of 79% reflects the confidence of farmers in RR®soybean, which has delivered unprecedented benefits compared with RR®soybean in other countries, particularly in terms of yield gains. A study by PG Economics in 2003 estimated that the average yield gain was over 31%, equivalent to an increase in gross margins, ranging from 127 to 185%, or an average gain of US$239 per hectare that translates to an annual economic gain at the national level of between US$10 and US$20 million. Given that RR®soybean technology is usually yield-neutral in other countries such as the USA and Argentina which have embraced the technology at high adoption rates, the yield increases in Romania are quite unprecedented. The high yield increases that ranged from 15 to 50% with an average of 31% reflect past low usage of herbicides and ineffective weed management, particularly of Johnson grass, which is very difficult to control.
Despite the above significant and unique advantages, a decision was taken by the Romanian Government, required by the European Union, to discontinue cultivation of biotech soybean as of January 2007 to qualify for membership in the EU, where RR®soybean has not been approved for planting. Many independent observers support the very strong views of Romanian farmers who are very much opposed to the decision to discontinue RR®soybean cultivation and believe that there were several compelling reasons for Romania to continue to grow RR®soybean after joining the EU, through a derogation. First, if farmers are denied the right to plant RR®soybean they will not be able to achieve as cost-effective weed-control program, even with more expensive alternates, resulting in

Global status of Commercialized biotech/GM Crops: 2010
192
significant financial losses for farmers growing conventional soybeans, and less affordable soybeans for consumers. Second, given that use of RR®soybean also results in better weed control in the crops following it in the rotation, elimination of RR®soybean leads to higher cost of weed control and more use of herbicides for all other crops following it in the rotation. This will result in negative implications for the environment because of more applications of alternative herbicides, which will also erode profitability. Thirdly, preclusion of RR®soybean legal plantings in Romania has reduced national production of soybean by up to one third which illogically can only be compensated with imports of exactly the same product – RR®soybean that has been banned, which will have to be purchased with scarce foreign exchange. Experience in other countries indicates that denying the legal use of RR®soybean to Romanian farmers will lead to illegal plantings of a significant magnitude with all its negative implications for all parties concerned.
As a 2007 accession country to the EU, Romania’s positive experience over the last eight years with biotech soybeans has important policy implications vis-à-vis cultivation of biotech crops in all other EU accession countries like Bulgaria, and other neighboring countries in the Black Sea region. Romania’s role model as a successful grower of biotech crops in Eastern Europe is clearly important, particularly since it was a 2007 accession country to the EU. Furthermore, Romania’s success with biotech crops started with RR®soybean in 2001, followed by Bt maize in 2007, 2008 and 2009. Romania was the largest grower of maize in Europe – 2.5 million hectares in 2008, compared with 1.6 million hectares in France, 1.2 million hectares in Hungary, 1 million hectares in Italy and 0.4 million hectares in Germany. In this context, it is noteworthy that in 2007, in addition to Romania, seven other EU countries, Spain, France, Czech Republic, Slovakia, Portugal, Germany, and Poland successfully grew an increasing hectarage of Bt maize on approximately 110,000 hectares. Contrary to the findings of the European Food Safety Agency (EFSA) which declared that the event MON810 in Bt maize was safe to cultivate in Europe, France decided to discontinue Bt maize in 2008 and Germany in 2009. In both cases, the evidence submitted by the two countries to support their rejection was not considered valid by EFSA – thus the decisions by both France and Germany to discontinue cultivation of Bt maize are in the view of EFSA, as an EU independent scientific organization, cannot be supported by scientific evidence.
benefits from biotech Crop in romania
There has been active debate on the use of biotech crops in Romania. The Romanian Minister of Agriculture strongly supports the resumption of growing biotech soybean, stating that the Ministry of Agriculture will support biotech soybean in the EU. The Romanian Senate has also supported biotech crops with an almost unanimous vote on an Emergency Ordinance to embrace biotech products as food, whereas the Ministry of the Environment has been ambivalent on the subject.

Global status of Commercialized biotech/GM Crops: 2010
193
For RR®soybean, cultivated since 2001 and occupying 145,000 hectares in 2006, the yield benefits of 30% was unique – in all other countries, RR®soybean is a yield neutral technology. The high yield increases in Romania of 15 to 50% with an average of 31% reflect past low usage of herbicides and ineffective of weed management, particularly of Johnson grass, which is very difficult to control. A 2003 study by PG Economics estimated an average yield gain of 31% or more, equivalent to gross margin gains of 127 to 185% or an average gain of US$239 per hectare – equivalent to a national economic gain of US$10 and US$20 million, respectively.
Romania is estimated to have enhanced farm income from RR®soybean of US$45 million in the period 2001 to 2008. (Brookes and Barfoot, 2011, forthcoming). Romania had to stop growing RR®soybean when it became an EU member country in January 2007, and since then, the hectarage of soybean in Romania has plummeted from 177,000 hectares in 2006 to only 46,000 hectares in 2008.
Farmer Experience The experience of farmers, who are the practitioners of biotech crops are important because they are masters of risk aversion and have no compunction in rejecting any technology that does not deliver benefits. Romanian farmers embraced biotech soybean and, Romanian soybean farmer lucian Buzdugan accurately predicted the fate of Romanian farmers – on entry to the EU, Romanian farmers would have to pay the high price of banning the technology.
“I can tell you that soybean farmers in Romania are very interested in biotech seeds. If one day our government says no more GMOs (genetically modified organisms), it’s a disaster. Before, yields were just 1,300 to 1,500 pounds per acre with conventional soybeans and are now averaging 2,500 to 3,000 pounds per acre with biotech varieties.”
SWEDEN
it is noteworthy that in 2010, sweden became the first scandinavian country to grow biotech crops. sweden officially grew 80 hectares of the biotech potato “amflora” for seed multiplication and commercial production.
Notably in 2010, Sweden became the first Scandinavian country to grow biotech crops. In 2010, Sweden was one of three countries in the EU (the others were the Czech Republic and Germany) to grow the biotech potato “Amflora” approved for planting in the EU in March 2010. Amflora was

Global status of Commercialized biotech/GM Crops: 2010
194
approved for planting in the EU as a source of pure amylopectin for producing high quality glazed paper, adhesive and value added products for textile industry. Amflora reduces production costs and optimizes processing, using less water energy and chemicals. Amflora was also approved for feed use by farmers. The product Amflora was developed by BASF from Germany which has a similar second generation product under development.
In addition to Sweden, the other three Scandinavian countries are Denmark, Norway and Finland. The Ministry of Agriculture from Denmark has already declared an interest in a biotech potato that is currently under development, which is resistant to the devastating “late blight” disease, the cause of the devastating Irish famine in 1845. Around 250 Danish farmers have already been trained in the practical implementation of coexistence practices so that they are prepared for planting the first commercial biotech crop, such as “late blight” resistant potato determined to be appropriate, safe and beneficial to Denmark. the danish Minister of agriculture, eva Kjer hansen has published a welcomed report entitled “lets get rid of the myths of GMOs” (Ministry of Agriculture and Fisheries, Denmark 2009) and called for an evidence-based open-debate on genetically modified organisms and argues that there is nothing new in modifying plant genetic material. Late blight-resistant potatoes offer Denmark significant advantages, including substantial reduction in pesticides with positive implications for the environment (potatoes are sprayed up to 7 times a season for late-blight in Denmark) and biodiversity. Denmark’s forward-looking policy on biotech crops has anticipated that the country will plant biotech crops that offer Danish farmers advantages and the hope is that these could become available soon.
GERMANY
in 2010, Germany resumed planting biotech crops commercially when it approved the commercial production of the newly eu- approved biotech potato “amflora” on 15 hectares in 2010. Germany discontinued the deployment of bt maize after 2008 when it planted 3,173 hectares, up 18% from the 2,685 hectares planted in 2007.
In 2010, Germany resumed planting biotech crops when it allowed the commercial planting and production of the newly EU-approved biotech potato “Amflora” on approximately 15 hectares. “Amflora” was developed by BASF and produces a high quality amylopectin starch suitable for high grade glazed paper production, adhesives and value added products in the textile industry. Amflora was the first biotech product to be approved for planting in the EU in thirteen years. The only other product that is approved for planting in the EU is Bt maize. The EU approval of “Amflora” is for both industrial and feed use.

Global status of Commercialized biotech/GM Crops: 2010
195
Germany has officially grown a small hectarage, from 300 to 500 hectares of Bt maize commercially for eight years, starting in 2000 to 2008; Bt176 was used until 2003 when MON810 was introduced. The area of officially approved commercial Bt maize in Germany in 2008 was 3,173 hectares, up 18% from the 2,685 hectares planted in 2007. The regulation governing the planting of this token area of biotech maize is as follows. Given that Germany does not allow the sale of biotech seeds for unlimited planting, seed companies can apply for special permits annually to supply a limited amount of biotech seed. For maize, the limit is 0.1% of any registered variety. To preclude any liability related to the cultivation of this small area of Bt maize in Germany, the milling company Maerka Kraftfutter has voluntarily agreed to purchase, at market prices, all the maize grain from any field within 500 meters of a biotech maize field. In 2004, detailed monitoring of biotech maize fields in Germany confirmed that maize samples taken more than 20 meters from biotech maize had less than the 0.9% threshold for biotech content. In early 2005, Germany introduced the first elements of a Genetech Law, which covers coexistence and liability; the Law has been heavily criticized because it is so restrictive leaving no incentive, but significant disincentive for farmers to adopt Bt maize in Germany. After 2008, Germany discontinued the deployment of Bt maize
benefits from biotech Crop in Germany
Benefits accrued to German farmers when they successfully planted Bt maize during the eight year period 2000 to 2008 when they were allowed to grow Bt maize officially. The areas infested by European corn borer (ECB) in Germany are in the North Rhine, Westphalia, Saxony and Brandenburg regions. It is estimated that the infested area in these regions would benefit significantly from Bt maize, whereas most of the Northern states do not suffer from ECB. An estimated 18% of the 300,000 hectare maize crop could benefit from Bt maize. Given that measured yield gains due to Bt maize were of the order of 12 to 14%, the average gain per hectare from Bt maize is US$150 per hectare, the gain on 55,000 hectares at the national level for Germany would be of the order of US$8.25 million per year.
THE EUROPEAN UNION (EU 27)
a record eight eu countries planted 91,438 hectares including 91,193 hectares of biotech bt maize and 245 hectares of a new biotech potato named “amflora” in 2010. five countries, spain, portugal, poland, slovakia and romania continued to plant only bt maize; two countries, sweden and Germany planted only amflora potato, and one country Czechia planted both bt maize and amflora. the total bt

Global status of Commercialized biotech/GM Crops: 2010
196
maize hectares in 2010 was 91,193 compared with 94,750 hectares in 2009, a 4% decrease which coincided with a decrease in total maize hectares in 2010. for the newly eu approved amflora potato, the first approval for planting in 13 years, Czechia grew an initial 150 hectares for commercial production, sweden grew 80 hectares, and Germany 15 hectares for seed multiplication and commercial production; it is noteworthy that sweden is the first eu scandinavian country to grow biotech crops. spain was by far the largest eu bt maize grower with over 80% of the total in the eu with a record adoption rate of 24% in 2010, compared with 22% in 2009. bt maize hectarage increased in spain and slovakia, remained the same in poland, and decreased in romania, portugal and Czechia. the marginal decrease of 4% in bt maize in the eu was associated with several factors, including decreased total plantings of hybrid maize in countries like spain and portugal and disincentives for some farmers due to onerous reporting of intended plantings of bt maize.
The European Union comprises 27 states, a population of almost 500 million (7% of global) with a GDP in 2008 of US$18.39 trillion, equivalent to over 22% of global GDP. Less than 6% of the EU’s workforce is employed in agriculture and the principal major crops occupy just over 90 million hectares (versus 1.5 billion hectares globally) of which maize is 13 million hectares, about 10% of global hectarage. There are approximately 15 million farms in the EU; Romania has the largest number of farms (almost a third of the EU total, followed by Poland, Italy and Spain). Table 37 summarizes the planting of Bt maize in the countries of the European Union from 2006 to 2010. A record eight EU countries planted 91,438 hectares of biotech Bt maize and a new biotech crop “Amflora” potato in 2010. Five countries, Spain, Portugal, Poland, Slovakia and Romania continued to plant only Bt maize; two countries, Sweden and Germany planted only Amflora potato, and one country Czechia planted both Bt maize and Amflora. The total Bt maize hectares in 2010 was 91,193 compared with 94,750 hectares in 2009, a 4% decrease of 3,557 hectares which coincided with the decrease in total maize hectares in 2010. For the newly EU approved Amflora potato, the first approval for planting in 13 years, Czechia grew an initial 150 hectares for commercial production, Sweden grew 80 hectares, and Germany 15 hectares for seed multiplication and commercial production; it is noteworthy that Sweden is the first EU Scandinavian country to grow biotech crops. Spain was by far the largest EU Bt maize grower with over 80% of the total in the EU with a record adoption rate of 24%. Bt maize hectarage increased in Spain and Slovakia, remained the same in Poland and decreased in Romania, Portugal and Czechia. The marginal decrease of 4% in Bt maize in the EU was associated with several factors, including decreased total plantings of hybrid maize in countries like Spain and Portugal and disincentives for some farmers due to onerous reporting of intended plantings of Bt maize.

Global status of Commercialized biotech/GM Crops: 2010
197
table 37. hectares of bt Maize planted in 2006 to 2010 in eu Countries and hectares of amflora potato Grown in the eu Countries in 2010
Country 2006 bt
maize
2007 bt maize
2008bt maize
2009bt maize
2010bt maize
Change 2009/10 bt maize
amflora 2010
bt maize +amflora
1 Spain 53,667 75,148 79,269 76,057 76,575 +518 – – 76,575
2 Czechia 1,290 5,000 8,380 6,480 4,680 -1,800 150 4,830
3 Portugal 1,250 4,263 4,851 5,094 4,868 -226 – – 4,868
4 Romania* – – 350 7,146 3,244 822 -2,422 – – 822
5 Germany 950 2,685 3,173 – – – – – – 15 15
6 Poland 100 327 3,000 3,000 3,000 – – – – 3,000
7 Slovakia 30 900 1,900 875 1,248 +373 1,248
8 Sweden – – – – – – 80 80
total 57,287 88,673 107,719 94,750 91,193 -3,557 245 91,438
* Germany, discontinued planting Bt maize at the end of 2008 and grew 15 hectares of Amflora potato in 2010. Czech Republic and Sweden grew 150 hectares and 80 hectares of Amflora in 2010 respectively in 2010. Romania grew 145,000 hectares of RR®soybean in 2006 but had to cease growing it after becoming an EU member in January 2007.Source: Compiled by Clive James, 2010.
All six EU countries which grew Bt maize commercially in 2010 provided benefits to farmers, to the environment and a more affordable feed source for animals, which in turn benefited consumers who eat meat.
Contrary to the findings of France and Germany, EFSA has clearly stated, that “No specific scientific evidence, in terms of risk to human and animal health and the environment, was provided that would justify the invocation of a safeguard clause” (EFSA, 2008). A report in September 2008 by the EU’s Joint Research Council (EU-JRC, 2008) concluded that, “No demonstration of any health effects of GM food products submitted to the regulatory process that has been reported so far.” This finding of the JRC endorsing the safety of biotech crops is consistent with many independent studies conducted over the last several years including the Nuffield Bioethics Council, the Royal Society and the EU’s EFSA. The latest report (EU-JRC, 2008) suggested that, “Europe must ‘move forward’ and clear biotech crops amid increasing food prices.”
The events approved in the EU for imports (not planting) in 2004 to 2009 are summarized in Table 38.

Global status of Commercialized biotech/GM Crops: 2010
198
table 38. GMo Crop approvals for import by the european union, 2004 to 2010
Crop trait event Company approval for date approved
Carnation Mod Flower Color
FLO-40644-4Moonlite
Florigene Ltd Import and Processing
May 30, 2007
Cotton HT LL Cotton 25 Bayer Company Food/Feed Import and Processing
September 29, 2008
Maize IR Bt 11 Monsanto Food and Feed May 19, 2004
Maize HT NK603 Monsanto Food and Feed October 26, 2004
Maize IR MON863 Monsanto Food and Feed January 13, 2006
Maize IR/HT DAS1507 Pioneer/Dow Agro Science
Food and Feed March 3, 2006
Maize IR/HT DAS 59122-7
Dow AgroSciences/Pioneer Hi-bred
Food/Feed Import and Processing
October 24, 2007
Maize IR/HT DAS1507 × NK603
Pioneer Hi-bred/Mycogen Seeds
Food/Feed Import and Processing
October 24, 2007
Maize IR/HT MON603 × MON810
Monsanto Co. Food/Feed October 24, 2007
Maize HT GA 21 Syngenta Food/Feed Import and Processing
March 28, 2008
Maize IR/HT DAS 59122 × NK603
Pioneer Hi-Bred Food/Feed Import and Processing
October 30, 2009
Maize IR/HT MON88017 Monsanto Food/Feed Import and Processing
October 30, 2009
Maize IR MON89034 Monsanto Food/Feed Import and Processing
October 30, 2009
Maize IR MIR604 Syngenta Seeds Food/Feed Import and Processing
November 30, 2009
Maize IR/HT MON863 × MON810 × NK603
Monsanto Food/Feed Import and Processing
March 2, 2010
Maize IR/HT MON863 × NK603
Monsanto Food/Feed Import and Processing
March 2, 2010
Maize IR MON863 × MON810
Monsanto Food/Feed Import and Processing
March 2, 2010

Global status of Commercialized biotech/GM Crops: 2010
199
table 38. GMo Crop approvals for import by the european union, 2004 to 2010
Crop trait event Company approval for date approved
Maize IR/HT 1507 × 59122
Dow AgroSciences/Pioneer Hi-Bred
Food/Feed Import and Processing
July 10, 2010
Maize HT 59122 × 1507 × NK603
Pioneer Hi-Bred Food/Feed Import and Processing
July 10, 2010
Maize IR/HT MON88017 × MON810
Monsanto Food/Feed Import and Processing
July 10, 2010
Maize IR/HT MON89034 × NK603
Monsanto Food/Feed Import and Processing
July 10, 2010
Maize IR/HT Bt 11 × GA21
Syngenta Food/Feed Import and Processing
July 10, 2010
Potato Altered Comp
EH92-527-1 Amylogen HB Cultivation March 2, 2010
Potato Altered Comp
EH92-527-1 BASF Plant Science
Food/Feed March 2, 2010
Rapeseed HT GT 73 Monsanto Import and Processing
August 31, 2005
Rapeseed Male Ster/HT
MS8 × RF3 Bayer Crop Science
Import and Processing
March 26, 2007
Rapeseed HT T45 Bayer Crop Science
Food/Feed Import and Processing
March 10, 2009
Soybean HT A2704-12 Bayer Crop Science
Food/Feed Import and Processing
September. 8, 2008
Soybean HT Mon 89788-1
Monsanto Food/Feed Import and Processing
December 4, 2008
Sugarbeet HT H7-1 KWS SAAT AG/ Monsanto
Food/Feed October 24, 2007
Source: GMO Compass Database, 2010; European Commission, 2010a.

Global status of Commercialized biotech/GM Crops: 2010
200
Political Support to Biotech Crops in the EU.
Whereas there is a great deal of ideological and political opposition to biotech crops in the EU, there is also some more progressive thinking.
In a very substantive report, published in October 2009, entitled “Reaping the Benefits – Science and the sustainable intensification of agriculture,” the royal society, the UK’s most prestigious scientific academy, has recommended publicly funded research of GM crop technologies. The report concludes that the application of both conventional and biotech technologies would allow northern Europe to become one of the ‘major bread baskets of the world’. The UK Government’s Chief Scientist, dr. John beddington has endorsed biotech crops for the UK. In addition, the food standards agency (fsa) is due to initiate a dialogue to explore the GM crops with consumers (Crop Biotech Update, 29 October, 2010).
The UK Government’s Food 2030 study, published in early January 2010, concluded that Britain must embrace GM crops or face serious food shortages in the future. The Report has had unusually strong support from Government, ministers, leading scientists and is consistent with the recommendations of the recent substantive report from the UK’s prestigious Royal Society, referenced in the following paragraph (Crop Biotech Update, 8 January, 2010).
Speaking at the Oxford Farming Conference, after the publication of the Food 2030 Report, Professor John Beddington, the UK’s Chief Scientist said, “GM and nanotechnology should be part of modern agriculture. We need a greener revolution, improving production and efficiency through the food chain within environmental and other constraints. Techniques and technologies from many disciplines ranging from biotechnology and engineering to newer fields such as nanotechnology will be needed” (Gray, 2009). Sir David King, the UK Government’s former Chief Scientific Adviser is a strong advocate of biotech crops and cautioned that, “The world would need all the food it could get to feed over 9 billion people by 2050. We will only do this with the assistance of a third green revolution and GM technologies will be crucial in delivery of this” (Cookson, 2008).
A study by a group from the University of Leuven, Belgium (Demont et al. 2007) concluded that the potential annual value of biotech crops for an average EU country can be up to US$60 million per year and that biotech sugarbeet alone could generate annual gains in the order of US$1 billion per year for the EU.
the debate about zero tolerance of unauthorized biotech crop events in imported feed has continued. The European Compound Feed Manufacturers’ Federation (FEAC) has been seeking for some easing of zero tolerance in the EU to GM/biotech in the feeds, but their request was sidelined by

Global status of Commercialized biotech/GM Crops: 2010
201
the EU commission. This negative outcome bitterly disappointed FEAC, which understandably claim that GM crops are now so widespread globally that traces are inevitable, irrespective of the measure taken to prevent trace amounts. FEAC was seeking a sensible concession similar to that granted to banned veterinary antibiotics, which are now allowed in the EU at trace levels. The sidelining by the EU of the proposal is judged to be very serious by FEAC given that soybean meal is the “lifeline” of Europe’s livestock industry, and without it there would be “no” compound feed. The impractical zero tolerance policy has high risks because the EU is dependent for more than 80% on imports of vegetable proteins for which there are no substitution possibilities in the short term. On 29 October 2010, The EU Commission presented its long-awaited proposal for tolerance levels for unapproved GMOs in agricultural imports: The proposal is that unintentional impurities should be permitted up to 0.1 per cent – but only for feed but not food products. As of the time when this Brief went to press Member States had yet to agree to the 0.1 % proposal (Crop Biotech Update, 5 November, 2010).
The danish Minister of agriculture, eva Kjer hansen has published a welcomed report entitled “lets get rid of the myths of GMOs” (Ministry of Agriculture and Fisheries, Denmark 2009). She calls for an evidence-based open-debate on genetically modified organisms and argues that there is nothing new in modifying plant genetic material. She points out that recombinant insulin is accepted and used daily around the world and that there are biotech crops such as blight-resistant potatoes that offer Denmark significant advantages, including substantial reduction in pesticides with positive implications for the environment (potatoes are sprayed up to 7 times a season for late-blight in Denmark) and biodiversity. She also cites benefits related to reductions in greenhouse gases. Denmark’s forward-looking policy on biotech crops has anticipated that the country will plant biotech crops that offer Danish farmers advantages and that these could become available soon. Around 250 Danish farmers have already undertaken training in the practical implementation of coexistence practices so that they are prepared for planting the first commercial biotech crops determined to be safe and beneficial to Denmark.
An international group of scientists including some from the Scottish Crop Research Institute (2009) have sequenced the potato genome. This is an important achievement, given that potato is the third most important food crop in the world after rice and wheat, and will allow the development of biotech potatoes to be expedited in the EU in “speeding the breeding” initiatives. It is noteworthy that Bt biotech potato was one of the first successfully commercialized biotech crops in the USA and Canada in the 1990s. The approval of Amflora potato, developed in Europe, could well prove to be a very important development for the future of biotech crops in the EU. Both public and private institutions in the EU are now developing several new biotech potatoes with traits ranging from improved starch production, late blight disease resistance, bacterial disease resistance and nematode resistance. Russia is also involved in the development of Bt potatoes resistant to the devastating Colorado beetle pest. In summary, in the next five years biotech potatoes could present an attractive

Global status of Commercialized biotech/GM Crops: 2010
202
and appropriate biotech product for consideration by the EU, which produces one-third of global production in intensive cropping systems requiring heavy and expensive pesticide applications for diseases such as the devastating late blight fungal disease which was the cause of the Irish famine in 1845. Biotech potatoes could substantially reduce the need for pesticides on crops which is entirely consistent with EU policy.
One of the first actions that the current eu Commissioner for health and Consumer affairs, Mr. John dalli, took in 2010 was to approve the planting of the biotech potato “Amflora” developed by BASF from Germany; this was the first in 13 years following the approval of Bt maize MON 810 in 1998. Commissioner Dalli proceeded to present a proposal that would allow EU states to independently reject or approve products. His objective was to make EU approvals for biotech crops more efficient, more equitable, less bureaucratic and more transparent. However, there have been many objections from member states including questioning the legality of the proposal, despite it having been cleared at the outset by Mr. Dalli’s lawyers. There are more than ten biotech crops waiting for EU approval to plant, including two varieties of biotech potato, one from BASF, another by Avebe from Holland, and a sugarbeet developed jointly by KWS from Germany and Monsanto. The EU member states of Austria, Greece and Italy have consistently denied approvals for planting or importing of biotech crops in the EU. Several of the countries exporting biotech crops, including the USA, Canada and Argentina won a 2006 WTO lawsuit that required the EU to ease approvals of biotech crops; under this WTO ruling these countries could require duties to be paid by the EU if the EU continues to block trade in biotech crops (New York Times, 11 Nov 2010).
Most recently, the European Commission (EC) published a compendium “A Decade of EU-funded GMO Research (2001-2010)” in December 2010 which summarizes the results of 50 research projects addressing primarily the safety of GMOs for the environment and for animal and human health. The compendium reported that the European Union (EU) has funded a significant number of projects on GMOs worth €200 million or US$ 250 million between 2001 and 2010 and invested over €300 million on research on the bio-safety of GMOs since 1982. Launching the compendium, the european Commissioner for research, innovation and science Máire Geoghegan-Quinn said “The aim of this book is to contribute to a fully transparent debate on GMOs, based on balanced, science–based information. According to the findings of these projects GMOs potentially provide opportunities to reduce malnutrition, especially in lesser developed countries, as well as to increase yields and assist towards the adaptation of agriculture to climate change. But we clearly need strong safeguards to control any potential risks” (European Commission, 2010b).
This new publication aims to contribute to the debate on GMOs by disseminating the outcomes of research projects to scientists, regulatory bodies and to the public. It is a follow-up to previous

Global status of Commercialized biotech/GM Crops: 2010
203
publications on EU-funded research on GMO safety. Over the last 25 years, more than 500 independent research groups have been involved in such research. According to the projects’ results, there is, as of today, no scientific evidence associating GMOs with higher risks for the environment or for food and feed safety than conventional plants and organisms (European Commission, 2010b).
Farmer Testimonies and Views
Jim McCarthy, who has an extensive farming business in Ireland, the US, Eastern Europe and Argentina, said “GM crops would allow EU farmers to use less agrochemicals and help them lower production costs. GM was the biggest development in agriculture since the tractor” (McCarthy, 2010).
A global poll run of six leading farming magazines gave farmers an opportunity to air their opinion on the technologies which they think would feed the world. Votes were expressed in the UK Farmers Weekly and the Dutch Boerderij, and farmer views from south africa, New zealand, australia, usa and Canada also joined in. Results showed that 37.1% of the farmers are amenable to new technologies, and genetic modification was by far the most popular of the five presented key factors. Farmers voted for education and training at 20.3%, investment in research and development (18%), removal of trade barriers (14.7%), and government intervention in food production (10%) (Crop Biotech Update, 5 February, 2010).
progress with biotech Crops in africa
The map of Africa (Figure 42) provides a self explanatory summary of the three countries which are commercializing biotech crops (South Africa, Burkina Faso and Egypt) and the three countries that are conducting field trials with biotech crops (Kenya, Uganda and Nigeria). More details of the biotech crop activities in Uganda are provided in Table 5 in the Appendix.
In 2010, a number of African countries also recorded significant progress at policy, research and regulatory levels. The passing of the Kenya Biosafety Bill into Law on February 12, 2009 has led to the activation and operation of the National Biosafety Authority, a statutory body for handling all matters related to biosafety. The Authority has already developed five sets of implementing regulations to guide research, commercialization and trade with biotech crops. They include regulations on contained use experiments, environmental release, import/export and transit of biotech produce. When gazetted, the regulations will provide the necessary legal framework to enforce the Biosafety Act.

Country Crop Trait Institutions involved Stage
Burkina Faso1st commercialized in 2008
Cotton, Gossypium hirsutum L. Insect resistance INERA, Monsanto, Approved for commercializa-tion
Egypt 1st commercialized 2008
Maize, Zea mays L. Insect resistance Monsanto Approved for commercializa-tion
Cotton, Gossypium barbadense Insect resistant ARC Field Trials
Wheat, Triticum durum L. Drought tolerant AGERI Field trials
Fungal resistance AGERI Field Trials
Salt tolerant AGERI Field Trials
Potato, Solanum tuberosum L. Viral resistance AGERI Field trials
Tomato, Lycopersicon esculentum Viral resistance AGERI CGH
Nigeria Cowpea, Vigna unguiculata Insect resistance AATF, NGICA IITA, Monsan-to, CSIRO Australia. IAR
CFT approved in Nigeria
Cassava Manihot esculenta BioCassava Plus Donald Danforth Center, NRCRI, IITA, CIAT, Washing-ton State University
CFT
KenyaBiosafety Act approved in 2009
Maize, Zea mays L. Insect resistance KARI, CIMMYT, Monsanto, University of Ottawa, Synge-nta Foundation for Sustain-able Development
Confined field trials (CFT)
Insect resistance
Insect resistance
Drought Tolerance (WEMA) AATF, CIMMYT, KARI, Monsanto
CFT approved by NBA
Cotton, Gossypium hirsutum L. Insect resistance KARI/Monsanto CFT
Cassava, Manihot esculenta Cassava mosaic disease KARI, Danforth Plant Science Center
CFT
BioCassava Plus Vitamin A enriched
Donald Danforth Center, KARI, IITA, CIAT, Washington State University
Approval for CFT by NBA
Sweet potato, Ipomoea batatas Viral disease KARI/Monsanto CFT
Sorghum, Sorghum bicolor (ABS) Biofortified A consortium of 9 institutions led by Africa Harvest
Contained Greenhouse Trials (CGH)
Uganda Cotton, Gossypium barbadense Insect resistance/ herbicide tolerance
NARO/Monsanto, ABSPII, USAID & Cornell University
CFT approved
Banana, Musa sp. Black sigatoka NARO-Ug, University of Leuven IITA,USAID
CFT
Banana bacterial wilt AATF, NARO-Ug, IITA,Academia Sinica
CFT approved
Maize, Zea mays L. Drought tolerance AATF, CIMMYT, KARI, Monsanto
CFT approved
South Africa1st Commercialized 1998
Maize, Zea mays L. Drought tolerance Monsanto CFT
Herbicide toleranceSyngenta
Field trial release
Insect resistance
Insect/herbicide tolerance Pioneer Trial release
Cassava, Manihot esculenta Starch enhanced ARC-IIC CGH
Cotton, Gossypium hirsutum L. Insect/herbicide toleranceBayer Trial release
Herbicide tolerance
Potato, Solanum tuberosum L. Insect resistance ARC-OVI Field trials
Sorghum, Sorghum bicolor Biofortified High lysine A consortium of 9 institutions led by Africa Harvest
Contained Greenhouse Trials (CGH)
Table 42. Summary of Three Countries Commercializing Biotech Crops
1, 2 and 3: Countries with commercialized GM crops and on going trials
4, 5 and 6: Countries with on goings trials
Global Status of Commercialized Biotech/GM Crops: 2010
204

Global status of Commercialized biotech/GM Crops: 2010
205
Another important development in 2010 for Kenya was the formation of an all-inclusive task force to fast track commercialization of Bt cotton, following completion of essential research by Kenyan researchers. A roadmap has been developed outlining the key activities and players at each stage of the commercialization process from determination of suitable varieties in the different agro-ecological zones to establishment of systems for seed multiplication and distribution, training for stewardship of the transgenic Bt cotton crop, development of business structures for efficient and equitable technology delivery, farmers’ training and development of an elaborate outreach and communication program. Members of the task force have been carefully selected to include all players in the cotton sub-sector value chain from researchers to ginners, regulators, service providers in extension, inputs supply, marketing and communications. This is an appropriate public-private sector partnership that is poised to deliver to Kenyan farmers, the long-awaited Bt cotton seeds by 2014. The National Biosafety Authority, itself a member of the task force, has pledged to promptly provide regulatory guidance on the commercialization process and ensure adherence to international practice for safety and responsible deployment of the technology.
While investments have been low, particularly in public-sector R&D, several other innovative public–private partnerships (PPP) have been adopted to improve the pace of research on and delivery of biotech crops relevant to Africa’s needs. In Uganda, for example, research is being undertaken on various crops directly addressing the country’s food security needs such as cassava, banana and drought-tolerant maize. The country is also in its second year of trials with a stacked trait for insect control (Bollgard®) and herbicide tolerance (Roundup Ready®) cotton with promising results. Uganda’s National Agricultural Research Organization (NARO) estimates cotton yield losses in the country due to insect pests to be about 40% and losses due to weeds at about 30%. This suggests that the choice of the stacked or both traits combined could double yields without expansion of cultivated area. The country’s favorable agro-climatic conditions provide for production of a high quality, long staple cotton, which guarantees a stable demand in international markets. It is therefore expected that Uganda would realize substantial benefits from increased productivity and subsequent export revenue. Like its neighboring country Kenya, commercialization of transgenic cotton in Uganda is projected to commence by 2014, thus providing an opportunity for farmers in Eastern Africa to join millions of farmers all over the world and more notably in African countries like South Africa and Burkina Faso, who are already benefiting from commercial planting of Bt cotton.
Tanzania is a key member of the Water Efficient Maize for Africa (WEMA) project, is also following closely, developments in Kenya and Uganda and has been working towards revising its regulations to allow for the conduct of confined field trials of drought tolerant maize and cotton. In April 2010, the country’s Prime Minister, Mizengo Pinda, challenged national researchers to move fast and “rid themselves of ill-informed fears” of the technology. While presiding over a meeting of the country’s top researchers, scientists and policy makers to review the country’s agricultural blueprint, Kilimo

Global status of Commercialized biotech/GM Crops: 2010
206
Kwanza (Swahili for “Farming First”), he had personally convened the brain-storming meeting between the scientists and government bureaucracy in order to give an added push to the embracement of modern agriculture. “It is foolish to imagine that we would be the only clever ones around, as our neighbors all around us push ahead with the promises of biotechnology in agriculture,” he said, adding that “next-door Kenya and India were already way ahead of Tanzania in this field.”
Other key indications of positive developments in crop biotechnology in Eastern Africa in 2010 included the inauguration of a national agricultural research laboratory at Holetta Research Center (HRC) in Ethiopia. The state-of-the-art laboratory, is designated to enhance agricultural research efficiency through application of biotechnology tools; improve production, productivity and quality of plants, animals, microbes and their products. The physical building of this laboratory was completed in 2009 with financial support from the World Bank, through the Rural Capacity Building Project (RCBP). In his opening speech, the Minister of Agriculture and Rural Development, His Excellency .E, Ato Tefera Deribew, acknowledged the role that biotechnology would play in furtherance of meeting the development goals of the Millennium Summit. The Minister said, “We cannot afford to ignore biotechnology and hope to succeed in this highly competitive globalized situation.”
Further south in Africa, Malawi plans to start up field trials on Bt cotton soon. An application which has been reviewed by the relevant authorities is currently awaiting refinement and approval. In Botswana, the process of operationalizing its biosafety framework was initiated and draft biosafety regulations developed. Both of these draft documents were circulated for consideration by the Ministries involved with biotech crops, and are expected to be endorsed by Parliament before year-end 2010. Speaking at a consultative meeting in Gaborone on the socio-economic concerns re. the introduction of GMOs, biosafety officer Motlalepula Pholo from the Department of Agricultural Research opined that regulations will minimize risks. ”GMO is like a candle. The way you light it and where you put it must not cause problems,” said Pholo emphasizing that proper use of GMOs will bring valuable results to end users.
In addition to advancements in research, several regional initiatives on harmonization of policies and regulatory frameworks have made substantive progress. After more than nine years, talks between member states of the Common Market for Eastern and Southern Africa (COMESA) have produced draft policies and biosafety guidelines on GM technology, aimed at a regional approach to handling issues of commercial planting and trade in GM crops. Implementation of national consultations on the draft regional biosafety guidelines among member states has been initiated. The consultations were prompted by a decision from the Third Meeting of the Joint COMESA Ministers of Agriculture, Environment and Natural Resources during their annual meeting in July 2010, in Lusaka, Zambia to ensure inclusiveness and wide ownership of the policy documents. The regional harmonization

Global status of Commercialized biotech/GM Crops: 2010
207
process aims at sharing information, resources and expertise for cost-effectiveness in capacity building and drawing synergies to avoid redundancies. Under the proposals, a country which desires to grow a GM crop commercially would inform COMESA, which would then conduct a science-based risk assessment audit. The body would judge whether the crop is safe for the environment and human consumption. If the assessment proved positive, broader regional approval would be given for the crop to be grown commercially in all COMESA countries. National governments would retain the power to decide whether or not to proceed, (Nature, 1 October 2010).
COMESA is the largest economic trading bloc in Africa. It has 19 member states, a collective population of 390 million people, an annual import trade of around US$32 billion, and an export trade of US$82 billion. Agriculture plays a big role in the economies of COMESA countries in terms of livelihood, employment and international trade. Agricultural commodities are therefore major drivers for growth in intra-COMESA trade. COMESA trade statistics indicate that total intra-COMESA trade during 2008 amounted to some US$6.3 billion. Of this, food and agricultural raw materials constituted US$2.1 billion. However, cyclical droughts and abiotic stresses in the region predispose these countries to food insecurity, while biotic challenges such as disease pathogens and pests affect productivity of most staple crops. Adoption of biotech crops would thus make a significant contribution in raising productivity, incomes and environmental conservation as well as contributing to alleviation of poverty.
In West Africa, as Burkina Faso’s hectarage of Bt cotton expanded, its neighboring country Mali made major policy decisions that are likely to spur developments in the country’s biotech sector in the near term. The Cabinet adopted a draft decree specifying detailed procedures for testing of genetically modified organisms. The decree provides research institutes and laboratories in the country with the regulatory framework necessary for starting experiments, trials and the environmental release of genetically modified organisms in a safe and responsible way. A draft decree establishing the duties, composition and working procedures of the National Biosafety Committee (NBC) was also adopted. The National Biosafety Committee was established by Law No.°08-42 of 1 December 2008 to provide guidance and make recommendations to the national competent authority responsible for biosafety and biotechnology matters in the country. The Committee could however not operate without legal endorsement. This is a welcome move for Malian farmers who have watched in earnest as their counterparts in Burkina Faso reaped substantive benefits from adoption of Bt cotton, especially the benefits associated with reduced insecticide use.
In a recent (November 2010) study tour in Burkina Faso, Bourama Dembele, a Malian farmer had this to say “I have seen for myself and learnt a lot about the many benefits that Burkinabe farmers are reaping from Bt cotton. The evidence is very clear that Bt cotton can truly contribute to increased ‘white gold’ production in our country.” Another farmer Modibo Doumbia said “I am now convinced that Bt cotton is beneficial to small scale farmers like those in my

Global status of Commercialized biotech/GM Crops: 2010
208
Association. I will share the experiences and urge our members to push for adoption of Bt cotton here in Mali.” He said he was personally ready to invest in Bt cotton in light of what he had seen in Burkina Faso fields.
Anglophone West Africa countries are also taking their cue from developments within their region, especially Burkina Faso, and are making efforts to catch up. In Nigeria, honorable (barr) Makanjoulo the chairman of the Agricultural Parliamentary Committee in the lower house Abuja, sponsored a Biosafety Bill that was successfully debated by Parliament in 2010. The Bill, aimed at providing a regulatory regime and guidance for the sustainable development of the science of modern technology, its application, safe use of GMOs and their products in Nigeria was passed by the House of Representatives and is currently with Senate to seek its concurrence. According to Prince Chibundu, Head of Communications, expectations are high that the Bill will receive an expedited action and accelerated hearing in the Senate. Nigerian scientists are currently conducting confined field trials with Bt cowpea and Biocassava plus, and will require the Law to move to the next level of commercialization of the products, once they complete the required research.
In Ghana, the Cabinet approved a draft Biosafety Bill which has since been forwarded to Parliament for review and enactment. Citing threats posed by climate change, stagnant cereal crop yields and the need for more environmentally stable agricultural practices as catalysts for embracing modern biotechnology and genetic engineering, the Ghanian Science and Environment, Minister hon. sherry ayittey in November 2010 expressed optimism that the Bill would be speedily approved. She is convinced that biotechnology offers farmers new benefits such as crops with long-shelf life, delayed ripening, improved nutrition and quality, and has tasked the National Biosafety Committee and regulators to build capacity to face the challenges associated with the introduction and adoption of biotech crops.
It is noteworthy that with more knowledge of developments on biotech crops in other countries around the world, African farmers are now starting to demand biotech crops. At the second consultative meeting on biotechnology and biosafety in October 2010 at Lusaka in Zambia, (organized by the Alliance for Commodity Trade in Eastern and Southern Africa (ACTESA), which is a specialized agency of COMESA), Zambian farmers expressed their frustration at the slow pace at which the technology is advancing in their own country and challenged researchers to hasten the process. On behalf of the more than 600 farmers in attendance, Jennifer Handoondo, a woman farmer had this to say, “I have attended several workshops on biotechnology and biosafety and I keep hearing the same stories that zambia has no capacity to introduce GM crops such as Bt cotton. We zambian farmers are the most vulnerable and in need of technologies that can help us increase productivity and fight poverty. I am a single parent who fully depends on agriculture to feed and educate my children. Scientists should stop denying us access to GM crops when farmers in countries such as South Africa and Burkina Faso are enjoying the benefits.”

Global status of Commercialized biotech/GM Crops: 2010
209
Cuba Cuba, a country of 11 million people, imports around 60% of its food and feed, including large tonnages of maize, soy and wheat. The President of Cuba has called for increased agricultural output to contribute to “national security” following the unprecedented food price crisis in 2008. Food and feed imports were valued at US$1.5 billion of foreign exchange in Cuba in 2009. During the food crisis of 2008, the situation was exacerbated due to three hurricanes battering Cuba causing losses estimated at US$10 billion in damages and destroyed 30% of the country’s crops, resulting in brief food shortages. In a determined and carefully planned research effort to significantly increase productivity of maize, Cuba, is developing biotech Bt maize to control losses from the insect pest fall armyworm (Spodoptera frugiperda). Like many other tropical countries, armyworm is the most serious threat to maize production in Cuba, where it causes significant yield losses. The Bt maize is being developed and field-tested in a rigorously designed biosafety program, which meets the demanding standards of international protocols, by the country’s internationally recognized Institute for Genetic Engineering and Biotechnology (CIGB). To-date, field tests in Cuba have indicated that the significant and multiple benefits associated with Bt maize are similar to those reported by other countries which have already commercialized Bt maize. These benefits include, reduction in insecticides for the control of fall armyworm, less exposure of farmers and the environment to pesticides, protection of the enhanced diversity of more prevalent beneficial insects, and sustainable increases in productivity of up to 30%, or more, depending on the severity of the armyworm infestation, which varies significantly with climatic and ecological conditions. The multiple location field trials involving biotech maize hybrids are at an advanced phase, and occupied more than 3,000 hectares in 2010 in several provinces. The field trials featured biotech maize hybrids, and mycorrhizal additives (with no insecticides, in a sustainable management system) and generated excellent results with the biotech maize yielding up to 40% more than the conventional maize in the same experiments. The rigorously executed program of regulated field trials is designed to address the issues of producers, consumers and society by comprehensively evaluating all aspects of the technology, prior to the final submission of an extensive dossier to the regulatory authorities in Cuba, for commercial approval consideration in the near term.
table 39. imports of Maize Grain into Cuba, 2006 -2009
Maíze grain 2006 2007 2008 2009
Quantity MT* 599,917 708,389 716,984 682,526
Value $ million 86.600 146.863 207.542 147.402
Source: Annuario Estadistico de Cuba, 2009 * metric tonnes

Global status of Commercialized biotech/GM Crops: 2010
210
The Bt maize being developed by Cuba is similar to that grown on over 45 million hectares in over 15 countries in 2010 alone. Thus, Cuba has the advantage of benefiting from the extensive and long term commercial experience over almost 15 years of a large number of countries in all continents of the world, including six EU countries which have been successfully growing and benefiting from Bt maize for more than a decade, and which also import large tonnages of biotech crops. The potential benefits of commercializing Bt maize in Cuba are significant. The latest published import information indicated that Cuba imported significant tonnages of maize ranging from 599,917 tonnes in 2006 valued at approximately US$86 million to approximately 700,000 tons in 2007 to 2009 valued at up to US$200 million (Table 39, Annuario Estadistico de Cuba, 2009). Some of these imports could be substituted by domestic production, if the yield losses due to armyworm alone, which are up to 30%, are controlled, thus making the country substantially more self-sufficient in maize production. This is a very important benefit to Cuba because the alternative is to keep relying on imports, which are likely to become more expensive as prices of staples trend upwards in the future. Work is also underway in Cuba to develop biotech soybean, potatoes and tomato, but unlike Bt maize, these biotech crops are at the R&D stage.
distribution of biotech Crops, by Crop
The distribution of the global biotech crop area for the four major crops is illustrated in Figure 43 and Table 40 for the period 1996 to 2010. It clearly shows the continuing dominance of biotech soybean occupying 50% of the global area of biotech crops in 2010; the entire biotech soybean hectarage is herbicide tolerant. Biotech soybean retained its position in 2010 as the biotech crop occupying the largest area globally, occupying 73.3 million hectares in 2010, 6% higher than 2009 and biotech maize had the second highest area at 46.0 million hectares and also had the second highest year-to-year growth rate for any biotech crop at 10%. Biotech cotton reached 21.0 million hectares in 2010 and grew at the fastest of all biotech crops at a rate of 30% between 2009 and 2010. Canola reached 7.0 million hectares in 2010 with a 9% global growth rate and planted in Australia for the third time in 2010. Sugarbeet is a relatively new biotech crop first commercialized in the USA and Canada in 2007, and plateaued at 95% in 2010 the same adoption rate as 2009. RR®alfalfa, first grown in 2006, occupied the same area of approximately 100,000 hectares, equivalent to approximately 5% of the 1.3 million hectare seeded in the USA in 2010, with no further planting taking place in 2010, pending resolution of the guidelines after completion of the environmental impact study by USDA. Small hectarages of biotech virus-resistant squash and papaya continue to be grown in the USA, and China also grows about 5,000 hectares of PRSV resistant papaya and 453 hectares of Bt poplar.

Global status of Commercialized biotech/GM Crops: 2010
211
Source: Clive James, 2010.
figure 43. Global area of biotech Crops, 1996 to 2010: by Crop (Million hectares)
table 40. Global area of biotech Crops, 2009 and 2010: by Crop (Million hectares)
Crop 2009 % 2010 % +/- %
Soybean 69.2 52 73.3 50 4.1 +6
Maize 41.7 31 46.0 31 4.3 +10
Cotton 16.1 12 21.0 14 4.9 +30
Canola 6.4 5 7.0 5 0.6 +9
Sugar beet 0.5 <1 0.5 <1 <0.1 – –
Alfalfa 0.1 <1 0.1 <1 <0.1 – –
Papaya <0.1 <1 <0.1 <1 <0.1 – –
Others <0.1 <1 <0.1 <1 <0.1 – –
total 134 100 148 100 14.0 +10
Source: Clive James, 2010.
1996
Mill
ion
Hec
tare
s
1997 1998 1999 2000 2001 2002 2003 2004 2005 2006 2007 2008 2009 2010
10
20
30
40
50
80
60
70
0
SoybeanMaizeCottonCanola

Global status of Commercialized biotech/GM Crops: 2010
212
Biotech soybeanIn 2010, biotech soybean accounted for 50% of all the biotech crop hectarage in the world. The global hectarage of herbicide tolerant soybean in 2010 was 73.3 million hectares, up by 4.1 million hectares, or 6% from 2009 at 69.2 million hectares. The increase resulted from the following significant changes at the country level. The largest increase in RR®soybean, was in Brazil with an increase of 10%, equivalent to 1.6 million hectares followed by the USA with an increase of 0.9 million hectares and Argentina at 0.8 million; more modest increases were recorded in Uruguay, Canada, South Africa, and Bolivia. There were 11 countries which reported growing RR®soybean in 2010. The top three countries, growing by far the largest hectarage of herbicide tolerant soybean, were the USA (30.0 million hectares), Argentina (19.5 million hectares) and Brazil (17.8 million hectares). The other eight countries growing RR®soybean in decreasing order of hectarage included Paraguay, Canada, Uruguay, Bolivia, South Africa, Mexico, Chile and Costa Rica. Of the global hectarage of 90 million hectares of soybean grown in 2010, an impressive 81% or 73.3 million hectares were RR®soybean.
The increase in income benefits for farmers growing biotech soybean during the 14 year period 1996 to 2009 was US$25.0 billion and for 2009 alone, US$2.0 billion (Brookes and Barfoot, 2011, forthcoming).
Biotech maizeIn 2010, biotech maize increased by 10%, equivalent to 4.3 million hectares, the second highest increase after biotech cotton. In 2010, biotech maize was grown on 46.0 million hectares, up from 41.7 million hectares in 2009 – an increase of 4.3 million hectares, or a year-over-year growth rate of 10%. It is noteworthy that 16 countries grew biotech maize in 2010. There were five countries which grew more than 1 million hectares of biotech maize in 2010; in decreasing order of hectarage they were: USA 31.7 million hectares, Brazil 7.3 million, Argentina 3.0 million, South Africa 1.9 million and Canada 1.3 million hectares. The largest increase in any country in 2010 was in Brazil, which was expected to plant 7.3 million hectares up 2.3 million from the 5 million planted in 2009; this compares with a 0.9 million hectare increase in the USA. Modest increases were reported by several countries and small decreases in others, particularly in the EU where with the exception of Spain, Bt maize hectares in all countries is under 10,000 hectares. An important feature of biotech maize is stacking, which is discussed in the sections on countries and traits.
Of the global hectarage of 158 million hectares of maize grown in 16 countries in 2010, over a quarter, 29% or 46.0 million hectares, were biotech maize; this compares with 26% or 41.7 million hectares grown in 16 out of 25 biotech crop countries worldwide in 2009. Preliminary projections of yield gains from biotech drought tolerant maize in the USA, expected to be available about 2012, or earlier, are 8 to 10% in the non-irrigated areas from North Dakota to Texas. By 2015, current

Global status of Commercialized biotech/GM Crops: 2010
213
yields of 5.5 metric tons in the dry regions of the USA are projected to increase by up to 7.5 metric tons per hectare.
As the economies of the more advanced developing countries in Asia and Latin America grow at much higher rates (8% +) than North America and Europe, this will significantly increase demand for feed maize to meet higher meat consumption in diets, as people become wealthier and more prosperous with more surplus income to spend. Coincidentally, maize continued to be used for ethanol production, particularly in the USA.
The increase in income benefits for farmers growing biotech maize during the 14 years (1996 to 2009) was US$16.7 billion and US$4.2 billion for 2009 alone (Brookes and Barfoot, 2011, forthcoming).
Biotech cottonThe area planted to biotech cotton globally in 2010 was 21.0 million hectares up by 4.9 million hectares or an impressive 30% over 2009. This is by far the largest increase for any biotech crop in 2010. A major reason for this is on the one hand, the inclusion for the first time of Pakistan with 2.4 million hectares and Myanmar with 270,000 hectares. The other major reason for the very high increase is that after several years of declining cotton prices, which drove down hectarage, the unprecedented high prices in 2010 provided strong incentives for farmers to plant more cotton including more biotech cotton. A total of 13 countries grew biotech cotton in 2010 and five grew more than 0.5 million hectares – they are listed here in descending order of hectarage: India 9.4 million hectares, up from 8.4 million in 2009, USA with 4.0 million hectares, China 3.5 million, Pakistan 2.4 million and Australia with 0.5 million. The other eight countries in descending order of biotech hectarage were Argentina, Myanmar, Burkina Faso, Brazil, Mexico, Colombia, South Africa and Costa Rica.
RR®Flex cotton was introduced in the USA and Australia for the first time in 2006 and continued to enjoy strong growth in 2010. It is marketed as a single gene and also as a stacked product with insect resistance in Bollgard®II. The simultaneous marketing of biotech cotton from the public and private sectors in India at this time is likely to also become more prevalent as biotech crops are developed by government supported public sector institutions in developing countries. It is notable that in 2010, the biotech cotton area in India again exceeded the Bt cotton in China. In 2010, biotech hybrid cotton in India, the largest cotton growing country in the world, occupied 9.4 million hectares of approved Bt cotton increasing by an impressive 12% gain between 2009 and 2010, despite almost optimal levels of adoption which reached 86% in 2010. The advantages of Bt cotton hybrid in India are significant and the substantial increase in 2010 was due to the significant gains in production, economic, environmental, health and social benefits, which has revolutionized cotton production in India. Finally, it is notable that, Burkina Faso which grew 8,500 hectares of Bt cotton (Bollgard®II)

Global status of Commercialized biotech/GM Crops: 2010
214
for the first time in 2008, increased this hectarage to 115,000 hectares in 2009 and impressively to 260,000 hectares in 2010. This represents a 126% increase over 2009 making it the second highest year-to-year increase for any country in the world in 2010 after Australia.
Of the global hectarage of 33 million hectares of cotton grown in 2010, almost two thirds, 64% or 21.0 million hectares, were biotech cotton and grown in 13 of the 29 biotech crop countries worldwide.
The increase in income benefits for farmers growing biotech cotton during the 14 year period 1996 to 2009 was US$20.5 billion and US$4.0 billion for 2009 alone (Brookes and Barfoot, 2011, forthcoming).
Biotech canola The global area of biotech canola in 2010 is estimated to have increased by a modest 0.6 million hectares, from 6.4 million hectares in 2009 to an estimated 7.0 million hectares in 2010, an increase of 9% from 2009. This increase may be attributed to a significant expansion of 300,000 hectares in Canada. Notably, Australia grew 133,000 hectares herbicide tolerant biotech canola in three states, up from two states in 2009. After a protracted debate at the national level in Australia the sentiment is shifting in favor of biotech canola (Table 33). In Canada, by far the largest grower of canola globally, the adoption of herbicide tolerant canola has consistently increased reaching a record 94% in 2010 compared with 93% in 2009, with only 1% of the crop now conventional. Only four countries currently grow biotech canola: Canada, the USA, Australia and Chile but the global hectarage and prevalence could increase significantly in the near term in response to growing adoption in Australia, and more generally, the likely increased use of canola for vegetable oil and biodiesel. Less than 1% of the canola crop in Canada was used for biodiesel in 2008 and this is expected to remain low at around 2% in 2012 when new biodiesel plants come on stream.
Of the global hectarage of 31 million hectares of canola grown in 2010, 23%, or 7.0 million hectares (up from 21% and 6.4 million hectares in 2009) were biotech canola grown in Canada, the USA, Australia and Chile.
The increase in income benefits for farmers growing biotech canola during the 14 year period 1996 to 2009 was US$2.2 billion and US$0.4 billion for 2009 alone (Brookes and Barfoot, 2011, forthcoming).
Biotech alfalfa Herbicide tolerant RR®alfalfa was approved for commercialization in the USA in 2005. The first pre-commercial plantings (20,000 hectares) were sown in the fall of 2005, followed by larger commercial plantings of 60,000 in 2006. The 60,000 hectares of RR®alfalfa represent approximately 5% of the

Global status of Commercialized biotech/GM Crops: 2010
215
1.3 million hectares alfalfa seeded in 2006. Herbicide tolerance is expected to be the first of several traits to be incorporated into this important forage crop. A court injunction in 2007 suspended further plantings of RR®alfalfa until a new dossier of information was submitted to the regulators for consideration. Before the injunction came into force, another 22,000 hectares were planted bringing the total of RR®alfalfa in the USA in 2007 to 102,000 hectares. There are approximately 9 million hectares of alfalfa grown for dry hay in the USA, annually worth US$7 billion. Unlike the large biotech row crops of soybean and maize, biotech alfalfa is likely to be more of a niche market. After several court hearings which blocked further planting, a successful appeal resulted in a U.S. Supreme Court ruling in 2010 that overturned the earlier block on planting RR®alfalfa whilst USDA has completed its environmental assessment. In December 2010, USDA announced that EPA will post a final Environmental Impact Study (EIS) on Roundup Ready alfalfa for public review in the Federal Register on December 23, 2010. A copy of the EIS provided to EPA can be reviewed at http://www.aphis.usda.gov/biotechnology/downloads/alfalfa/gt_alfalfa%20_feis.pdf.
Other biotech cropsSmall areas of biotech virus resistant squash (2,000 hectares) and PRSV resistant papaya in Hawaii (2,000 hectares with a 60% adoption) continued to be grown in the USA in 2010; the papaya industry in Hawaii was destroyed by PRSV and saved by the biotech papaya which is resistant to PRSV. In China, in 2010 there were approximately 5,000 hectares of PRSV resistant papaya (99% adoption rate) and 453 hectares of Bt poplars.
distribution of biotech Crops, by trait
During the 15 year period 1996 to 2010, herbicide tolerance has consistently been the dominant trait (Figure 44). In 2010, herbicide tolerance, deployed in soybean, maize, canola, cotton, sugarbeet and alfalfa occupied 89.3 million hectares or 61% of the 148 million hectares of biotech crops planted globally (Table 41); this compares with 83.6 million hectares equivalent to 62% in 2009. In contrast to the 89.3 million hectares of herbicide tolerant crops in 2010, there was much less Bt cotton and Bt maize, at 16.1 million hectares and 10.2 million hectares, respectively for a total of 26.3 million hectares. In 2010, the stacked traits in both maize and cotton reached 32.3 million hectares, up from 28.7 million hectares in 2009. Biotech crops with Bt genes alone occupied 17% of the global biotech area in 2010, compared with 22% of stacked traits for herbicide tolerance and insect resistance deployed in both cotton (Bt/HT) and maize (Bt/Bt/IR, Bt/HT, and Bt/Bt/HT) (Table 41); the Bt/Bt/IR stack refers to different Bt or other IR genes that code for different traits for example above ground pests and below ground pests in maize. In terms of year-over-year increases the highest growth was for insect resistance at 21%, followed by stacked genes at 13% with herbicide tolerance trailing at 7%, but with a much higher absolute hectarage of 89.3 million

Global status of Commercialized biotech/GM Crops: 2010
216
figure 44. Global area of biotech Crops, 1996 to 2010: by trait (Million hectares)
1996 1997 1998 1999 2000 2001 2002 2003 2004 2005 2006 2007 2008 2009 2010
10
20
30
40
50
60
80
90
100
0
Herbicide Tolerance
Insect Resistance
Herbicide Tolerance/Insect Resistance70
Mill
ion
Hec
tare
s
Source: Clive James, 2010.
hectares devoted to herbicide tolerance (61%). The high growth rate for Bt at 21% reflects the interaction of several significant changes but is primarily driven by the introduction in 2010 of large additional hectarages of Bt cotton in Pakistan (2.4 million hectares), India (1 million), about one-quarter of a million hectares each in Myanmar and Burkina Faso, and an increase of about 2 million hectares of Bt maize in Brazil. These additions in insect resistance crops would be offset by decreases in mature markets such as the USA, Canada and Argentina, where the stacked trait (Bt/HT) is replacing the single Bt. The stacked traits in maize and cotton increased by 3.6 million hectares or 13% between 2009 and 2010. For the longer term, stacked traits in both maize and cotton are expected to continue to increase because they reflect the needs of farmers who have to simultaneously address the multiple yield constraints associated with both biotic and abiotic stresses. This stacking trend will continue and intensify as more traits become available to farmers, and is a very important feature of the technology with SmartStaxTM comprising 8 genes coding for three traits, launched in the USA and Canada in 2010.
The deployment of stacked traits of different Bt genes and herbicide tolerance is becoming increasingly important and is most prevalent in the USA which had approximately 85% of the 32.2 million (27.3

Global status of Commercialized biotech/GM Crops: 2010
217
million hectares) as “stacked traits” in 2010. The other six principal countries, of a total of 11, which deployed stacked traits in 2010 were: Argentina (2.1 million hectares), Canada (0.9 million hectares), South Africa (0.8 million hectares), Australia (0.5 million hectares) and Philippines (0.4 million hectares). Mexico, Honduras, Chile, and Colombia, planted less than 0.1 million hectares each. These countries will derive significant benefits from deploying stacked products because productivity constraints at the farmer level are related to multiple biotic stresses, and not to single biotic stress. Given that the USA has proportionally much more stacked traits than any other country, the masking effect leading to apparent lower adoption affects the USA more than other countries. It is noteworthy that 11 countries (equivalent to 41% of all 29 biotech countries) deployed stacked traits in either maize or cotton in 2010 with 8 out of the 11 being developing countries. In addition to the USA, the other ten countries which deployed stacked traits in 2010 were in order of hectarage: Argentina, Canada, South Africa, Australia, the Philippines, Brazil, Mexico, Chile, Honduras, Colombia, while albeit at much lower proportions than the USA, but this is a trend that will increasingly affect other countries. In 2010, the total stacked trait hectarage in the other ten countries was approximately 5 million hectares. In 2010, the global “trait hectares” was 205 million hectares compared with only approximately 180 million hectares in 2009, equivalent to a growth rate of 14%. Thus, the apparent growth of 10%, or 14 million hectares based on an increase from 134 million hectares in 2009 to 148 million hectares in 2010 underestimates the real growth of 25 million hectares based on the growth in “trait hectares” from 180 million “trait hectares” in 2009 to 205 million “trait hectares” in 2010. Thus, in summary on a global basis “apparent growth” in biotech crops between 2009 and 2010, measured in hectares, was 10% or 14 million hectares, whereas the real growth measure in “trait hectares” was approximately 14% or 25 million trait hectares.
On a global basis, the 143.7 million “trait hectares” planted in 2007 increased by 15% to 166 million hectares in 2008 with a modest growth of 8% to 180 million in 2009 and by a further 14% growth to 205 million ‘trait’ hectares in 2010 (Figure 45).
table 41. Global area of biotech Crops, 2009 and 2010: by trait (Million hectares)
trait 2009 % 2010 % +/- %
Herbicide tolerance 83.6 62 89.3 61 +5.7 +7
Stacked traits 28.7 21 32.3 22 +3.6 +13
Insect resistance (Bt) 21.7 16 26.3 17 +4.6 +21
Virus resistance/Other <0.1 <1 <0.1 <1 <0.1 <1
total 134.0 100 148.0 100 14.0 +10
Source: Clive James, 2010.

Global status of Commercialized biotech/GM Crops: 2010
218
Distribution of economic benefits at the farm level by trait, for the first thirteen years of commercialization of biotech crops 1996 to 2009 was as follows: all herbicide tolerant crops at US$30.2 billion and all insect resistant crops at US$34.2 billion, with the balance of US$0.2 billion for other minor biotech crops. For 2009 alone, the benefits were: all herbicide tolerant crops US$2.7 billion, and all insect resistant crops US$7.8 billion plus a balance of US$0.2 billion for the minor biotech crops for a total of ~US$10.7 billion (Brookes and Barfoot, 2011, forthcoming).
dominant biotech Crops in 2010
Herbicide tolerant soybean continued to be the dominant biotech crop grown commercially in 11 countries in 2010; listed in order of hectarage, the 11 countries were: USA, Argentina, Brazil, Paraguay, Canada, Uruguay, Bolivia, South Africa, Mexico, Chile and Costa Rica. Globally, herbicide tolerant soybean occupied 73.3 million hectares, (up 4.1 million hectares, or 6% from 2009, which was the largest absolute increase for any crop in 2010) representing 50% of the global biotech crop area of 148 million hectares for all crops (Table 42). The second most dominant biotech crop was maize with stacked traits, which occupied 28.8 million hectares, (up 2.7 million hectares, or 10%) and occupied 19% of the global biotech area and planted in eight countries, the USA, Canada, South Africa, the Philippines, Brazil, Honduras, Argentina and Chile. The stacked maize category includes three combinations of traits: a double stack with insect resistance (Bt)
figure 45. Global total and trait hectares of biotech Crops, 1996 to 2010 (Million hectares)
1996 1997 1998 1999 2000 2001 2002 2003 2004 2005 2006 2007 2008 2009 2010
50
400
150
250
0
Trait Hectares
Total Hectares200
Mill
ion
Hec
tare
s
Source: Clive James, 2010.

Global status of Commercialized biotech/GM Crops: 2010
219
and herbicide tolerance (HT), Bt/HT; a double stack with two traits for insect resistance, Bt/Bt; and a triple stack with two types of insect resistance, plus herbicide tolerance, Bt/Bt/HT. Maize with stacked traits occupied a total of 28.8 million hectares in 2010 compared with 26.1 million hectares in 2009 a 10% year-to-year increase, and occupying 19% of global biotech crop hectarage. The third most dominant crop was Bt cotton, which occupied 16.1 million hectares, equivalent to 11% of the global biotech area, up 3.7 million hectares, or 30%, since 2009 (the second largest percentage increase and the second largest absolute increase for any biotech crop in 2010) and planted in eleven countries, listed in order of descending hectarage: India, China, Pakistan, Myanmar, Burkina Faso, Brazil, USA, Argentina, Australia, Mexico, and Costa Rica. The fourth most dominant crop was Bt maize which occupied 10.2 million hectares, equivalent to 7% of global biotech area and was planted in 15 countries in descending order of hectarage – Brazil, USA, Argentina, South Africa, Uruguay, Canada, Spain, the Philippines, Portugal, Czech Republic, Poland, Egypt, Slovakia, Chile, and Romania. The fifth most dominant crop was herbicide tolerant maize occupying 7.0 million hectares, equivalent to 5% of global biotech crop area and planted in eight countries – the USA, Canada, Argentina, South Africa, Brazil, the Philippines, Honduras and Chile. The sixth most dominant crop was herbicide tolerant canola, occupying 7.0 million hectares, equivalent to 5% and planted in four countries, Canada, USA, Australia and Chile. The seventh most dominant crop was stacked cotton, occupying 3.5 million hectares, up 0.9 million hectares or 35% from 2009 (the largest percent increase of any crop in 2010) and occupying 2% of global biotech area, and planted in six countries: USA, Australia, Argentina, Mexico, Colombia
table 42. dominant biotech Crops in 2010 (Million hectares)
Crop 2009 2010 Change2010-2009
% Change % Global
Herbicide tolerant Soybean 69.2 73.3 4.1 6 50
Stacked traits Maize 26.1 28.8 2.7 10 19
Bt Cotton 12.4 16.1 3.7 30 11
Bt Maize 9.2 10.2 1.0 11 7
Herbicide tolerant Maize 6.4 7.0 0.6 9 5
Herbicide tolerant Canola 6.4 7.0 0.6 9 5
Stacked traits Cotton 2.6 3.5 0.9 35 2
Herbicide tolerant Cotton 1.1 1.4 0.3 --- 1
Herbicide tolerant Sugarbeet 0.5 0.5 0 --- <1
Herbicide tolerant Alfalfa 0.1 0.1 0 --- <1
Others <0.1 0.1 0 --- <1
total 134.0 148.0 14.0 10% 100%
Source: Compiled by ISAAA, 2010.

Global status of Commercialized biotech/GM Crops: 2010
220
and South Africa. The eighth most dominant trait was herbicide tolerant cotton occupying 1.4 million hectares or 1% of all biotech crops globally and planted in seven countries. The balance of other crops listed in Table 42 occupied less than 1% of global biotech crop area and include, in descending order of area: herbicide tolerant sugarbeet grown on 0.5 million hectares in the USA and Canada in 2010 and herbicide tolerant alfalfa grown on 0.1 million hectares in the USA in 2010. The “Others” category, with a total of less than 1,000 hectares, includes virus resistant papaya and squash in the USA, Bt poplars and biotech papaya, sweet pepper and tomato in China.
Global adoption of biotech soybean, Maize, Cotton and Canola
Another way to provide a global perspective of the status of biotech crops is to characterize the global adoption rates as a percentage of the respective global areas of the four principal crops – soybean, cotton, maize and canola – in which biotechnology is utilized (Table 43 and Figure 46). The data indicate that in 2010, 81% of the 90 million hectares of soybean planted globally were biotech – an increase over 2009, when 77% of 90 million hectares of soybean were biotech. Of the 33 million hectares of global cotton, almost two–thirds (64%) or 21.0 million hectares were biotech in 2010 compared with 49% or 16.1 million hectares planted to biotech cotton in 2009 – this largely reflects the new plantings of Bt cotton in Pakistan (2.4 million hectares and Myanmar and significant increases in biotech cotton in India (1 million hectares) USA and Brazil. Of the 158 million hectares of global maize planted in 2010, more than one-quarter (29%) or 46.0 million were biotech maize. Finally, of the 31 million hectares of canola grown globally in 2010, almost one quarter (23%) were herbicide tolerant biotech canola, equivalent to 7.0 million hectares, compared with 6.4 million hectares or 21% in 2009. If the global areas (conventional plus biotech) of these four crops are aggregated, the total area is 312 million hectares, of which close to half, 47%, or 148 million hectares, were biotech in 2010 – up from 43% and 134 million hectares in 2009.
Whereas critics of biotech crops often contend that the current focus on biotech soybean, maize, cotton and canola reflects only the needs of large commercial farmers in the richer industrial countries, it is important to note that two-thirds of these 312 million hectares are in the developing countries, farmed mainly by millions of small, resource-poor farmers, where yields are lower, constraints are greater, and where the need for improved production of food, feed, and fiber crops is the greatest.
the Global Value of the biotech Crop Market
Global value of the biotech seed market alone was valued at us$11.2 billion in 2010 with commercial biotech maize, soybean grain and cotton valued at approximately us$150 billion for 2010.

Global status of Commercialized biotech/GM Crops: 2010
221
table 43. biotech Crop area as percent of Global area of principal Crops, 2010 (Million hectares)
Crop Global area* biotech Crop area biotech area as % of Global area
Soybean 90 73.3 81
Cotton 33 21.0 64
Maize 158 46.0 29
Canola 31 7.0 23
Others - - 0.7 - -
total 312 148.0 47
Source: Compiled by ISAAA, 2010. *Latest FAO 2007 hectarage
figure 46. Global adoption rates (%) for principal biotech Crops, 2010 (Million hectares)
FAO Global hectarages for 2007.Source: Compiled by Clive James, 2010.
81%Soybean
64%Cotton
29%Maize
23%Canola
Mill
ion
Hec
tare
s
20
40
60
80
100
120
0
140
160
180
90
33
158
31
Transgenic
Non-transgenic

Global status of Commercialized biotech/GM Crops: 2010
222
In 2010, the global market value of biotech crops, estimated by Cropnosis, was US$11.2 billion, (up from US$10.6 billion in 2009); this represents 22% of the US$51.8 billion global crop protection market in 2010, and 33% of the ~US$34 billion commercial seed market (Table 44). The US$11.2 billion biotech crop market comprised US$5.4 billion for biotech maize (equivalent to 48% of global biotech crop market, down from 50% in 2009), US$4.3 billion for biotech soybean (38%, up from 37% in 2009), US$1.2 billion for biotech cotton (11%), and US$0.3 billion for biotech canola (3%). Of the US$11.2 billion biotech crop market, US$8.9 billion (80%) was in the industrial countries and US$2.3 billion (20%) was in the developing countries. The market value of the global biotech crop market is based on the sale price of biotech seed plus any technology fees that apply. The accumulated global value for the 15 year period, since biotech crops were first commercialized in 1996, is estimated at US$73.5 billion. The global value of the biotech crop seed market is projected at ~US$12 billion for 2011.
A holistic estimate of the value of biotech crops globally and in the USA was recently documented by Carlson (2009) who noted that the annual ISAAA estimates (James, 2008) detailed above, are only “for seeds and licensing revenues rather than from ‘crops’, which have much greater market value.” He also indicated that “Worldwide farm-scale revenues from GM crops are difficult to assess directly, but that good data are available for the United States.” The USDA Economic Research Service reports that 80-90% of all corn, soy, and cotton grown in the United States is biotech (Figure 47).
Published reports by Carlson (2009) enabled him to estimate revenues from the major GM crops at about US$65 billion in 2008 in the USA alone. Given that the USA has approximately 50% of global biotech crop plantings, Carlson estimated that “global farm-scale revenues from GM corn, soy and cotton in 2008 were about double the US gains of US$65 billion, equivalent to US$130 billion.” For the US alone, taking into account the biotech crop revenue figure of US$65 billion plus contributions from GM drugs (‘biologics’) and GM industrial products (fuels, materials, enzymes), which Carlson had previously estimated (Carlson, 2007) – he estimated that US revenues alone in 2007 from all GM products (biotech crops, biologics and industrial products) was approximately US$240 billion and growing at 15-20% annually. Given the US GDP, of about US$14.3 trillion in 2008, Carlson estimated that revenues from all GM products in the USA could amount to the equivalent of about 2% of US GDP in 2009.
The estimated global farm-scale revenues for the harvested commercial “end products”, (the biotech grain and other harvested products) is obviously many-fold greater than the value of the biotech seed alone (US$11.2 billion). Extrapolating from the 2008 data of Carlson, 2009, detailed above, the value of the biotech harvested grain from biotech seed would be worth ~US$150 billion globally in 2010, and projected to increase at up to 10 - 15% annually.
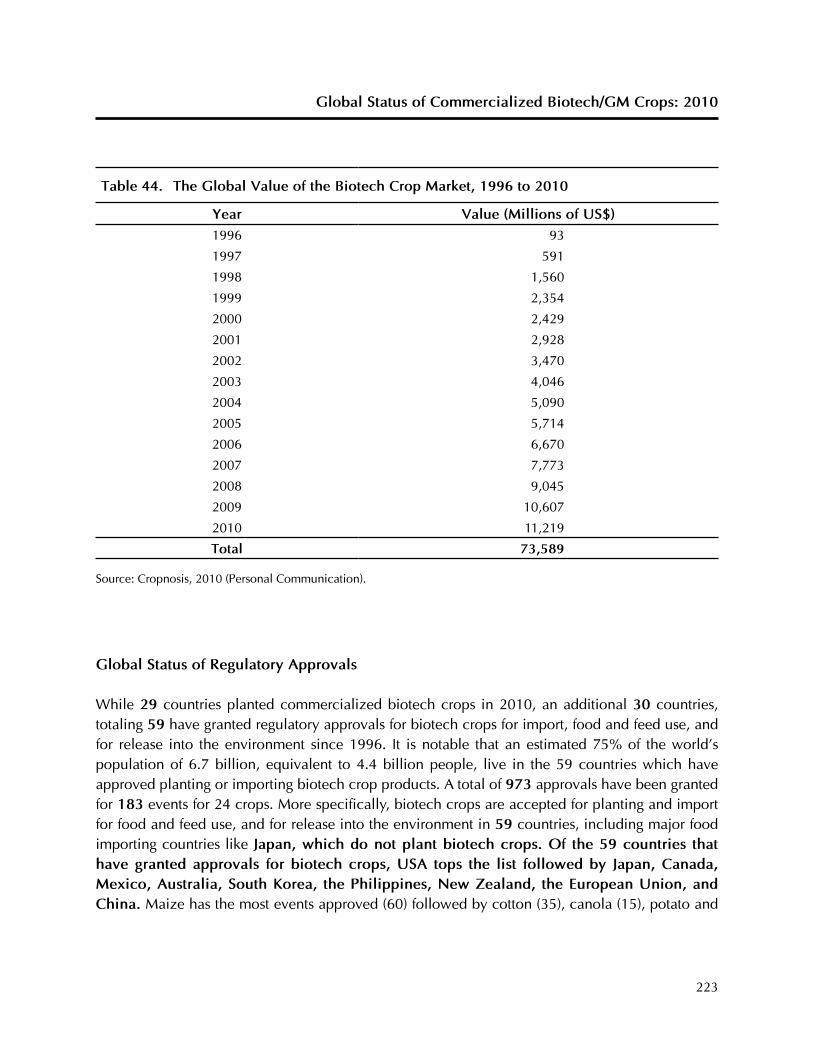
Global status of Commercialized biotech/GM Crops: 2010
223
table 44. the Global Value of the biotech Crop Market, 1996 to 2010
Year Value (Millions of us$)1996 93
1997 591
1998 1,560
1999 2,354
2000 2,429
2001 2,928
2002 3,470
2003 4,046
2004 5,090
2005 5,714
2006 6,670
2007 7,773
2008 9,045
2009 10,607
2010 11,219
total 73,589
Source: Cropnosis, 2010 (Personal Communication).
Global status of regulatory approvals
While 29 countries planted commercialized biotech crops in 2010, an additional 30 countries, totaling 59 have granted regulatory approvals for biotech crops for import, food and feed use, and for release into the environment since 1996. It is notable that an estimated 75% of the world’s population of 6.7 billion, equivalent to 4.4 billion people, live in the 59 countries which have approved planting or importing biotech crop products. A total of 973 approvals have been granted for 183 events for 24 crops. More specifically, biotech crops are accepted for planting and import for food and feed use, and for release into the environment in 59 countries, including major food importing countries like Japan, which do not plant biotech crops. of the 59 countries that have granted approvals for biotech crops, usa tops the list followed by Japan, Canada, Mexico, australia, south Korea, the philippines, New zealand, the european union, and China. Maize has the most events approved (60) followed by cotton (35), canola (15), potato and

Global status of Commercialized biotech/GM Crops: 2010
224
soybean (14 each). The event that has received regulatory approval in most countries is herbicide tolerant soybean event GTS-40-3-2 with 24 approvals (EU=27 counted as 1 approval only), followed by herbicide tolerant maize (NK603) and insect resistant maize (MON810) with 21 approvals each, and insect resistant cotton (MON531/757/1076) with 16 approvals worldwide.
USD
Bill
ions
Year2000 2001 2002 2003 2004 2005 2006 2007 2008
0
10
20
30
40
50
60
70
80
GM Corn RevenuesGM Cotton RevenuesGM Soy RevenuesTotal GM Crop Revenues
us revenues from Major GM Crops
figure 47. us revenues from Major GM Crops
Source: Carlson, 2009

The provision of data on global adoption of commercialized biotech crops by a legion of colleagues, too numerous to name, from the public and private sectors in industrial and developing countries is much appreciated. Without their collaboration, this publication would not be possible. A very special thanks to my wife Glenys James who, as always, gave of her time freely to ISAAA, and diligently persevered to input the entire manuscript, and gave me encouragement and support. It is a pleasure to thank Dr. Randy A. Hautea, Global Coordinator and Director of the ISAAA SEAsiaCenter and his staff, for always providing excellent and expeditious services for formatting and proofreading the manuscript. Particular thanks to Dr. Rhodora R. Aldemita for coordinating and verifying the entire document compiling Appendix 1; to Mr. Bhagirath Choudhary for preparing three country chapters; and Dr. Anderson Gomes for preparing one country chapter. Thanks also to Dr. Mariechel J. Navarro, Clement Dionglay, Jenny A. Panopio, Panfilo G. De Guzman, Eric John F. Azucena, Fely H. Almasan, Kristine L. Natividad, Teresita F. Victoria and Donna N. Malayang for overseeing and expediting the preparation of the manuscript for publication including formatting all the text, tables and figures. Whereas the assistance of everyone is acknowledged and greatly appreciated, the author takes full responsibility for the views expressed in this publication and for any errors of omission or misinterpretation.
acknowledgments
225

references
226
ABC News. 2008. WA lifts ban on GM cotton crops. Australian Broadcasting Corporation, November 14, 2008. http://www.abc.net.au/news/stories/2008/11/14/2420142.htm?section=justin
ABC News. 2007. GM bananas could solve Panama plight. December 20, 2007. http://www.abc.net.au/news/stories/2007/12/20/2124584.htm?section=justin
AICOSCA. 2010. 50th Annual Report & Accounts 2009-10, All India Cottonseed Crushers’ Association (AICOSCA), Mumbai, 2010.
Adam, D. 2008. GM will not solve current food crisis says industry. Guardian, June 27, 2008, United Kingdom. http://www.guardian.co.uk/environment/2008/jun/27/gmcrops.food
All Pakistan Textile Mills Association. 2007. Textile Industry Economic Contribution 2006-07, Production Report, All Pakistan Textile Mills Association (APTMA), 2007, available at: http://www.aptma.org.pk/Pak_Textile_Statistics/tec.ASP
Anderson, K., E. Valenzuela, and L.A. Jackson. 2006. Recent and Prospective Adoption of Genetically Modified Cotton: A Global CGE Analysis of Economic Impacts. World Bank Policy Research Working Paper 3917. pp. 1-27.
Anonymous. 2010. Why farms maybe the new forests. The Economist, 2 January 2010. page 44.
Arechavaleta M. 2010. Family evolves with the farm. http://www.croplife.org/files/documentspublished/1/en-us/CS/5181_CS_2009_06_16_Farmer_Profile_-_Argentina_-_Arechavaleta_-_Family_evolves_with_the_farm.pdf
ArgenBio.2010 http://www.argenbio.org/
Australian Financial Review. 2009. http://www.afr.com. 13 Nov 2009.
Bajoria S. 2010. Speech of Sandeep Bajoria, Golden Jubilee Celebration, 50th Annual General Meeting, All India Cottonseed Crushers’ Association (AICOSCA), Mumbai, 3 Sept 2010.
Basu AK and RS Paroda. 1995. Hybrid cotton in India –a success story, APAARI publication 1995/1. Asia Pacific Association of Agricultural Research Institutions (APAARI), Bangkok, 1995.
Biospectrum-ABLE Survey. 2010. India Biotech Recovers- Crosses $3 Billion, Vol.1, Biospectrum Magazine, Bangalore, India. June 2010. http://www.ableindia.org/html/resources/eighth_biospectrum_June_10.pdf
Brazilian Agriculture Ministry. (Menisterio de Agricultura, Pecuaria e Abastecimento)
Brazilian Central Bank. 2010. http://www.bcb.gov.br/?english
Brazilian External Trade Secretariat (SECEX). 2007. http://www.datamark.com.br/administrator/secex/pesquisa/pesquisapais.asp?BT
Brookes G and P Barfoot. 2011. GM Crops: Global Socio-economic and Environmental Impacts 1996-2009. P.G. Economics Ltd, Dorchester, UK. (forthcoming).

references
227
Brookes G and P Barfoot. 2010. GM Crops: Global Socio-economic and Environmental Impacts 1996-2008. P.G. Economics Ltd, Dorchester, UK. www.pgeconomics.co.uk/.../2010-global-gm-crop-impact-study-final-April-2010.pdf
Business Wire, 30 August 2010. Origin Agritech Limited Reports Third Quarter Financial Results for Three Months Ended June 30, 2010 http://www.originseed.com.cn/en/news/view.php?pid=22&id=677
Business Wire, 22 September 2010. Origin Agritech reaches worldwide agreement for Bt gene. http://www.marketwatch.com/story/origin-agritech-limited-reaches-worldwide-agreement-for-bt-gene-2010-09-22
Carlson R. 2009. The Market Value of GM Products. Nature Biotechnology 27, 984 (2009) http://www.nature.com/nbt/journal/v27/n11/pdf/nbt1109-984a.pdf and http://www.agbioworld.org/newsletter_wm/index.php?caseid=archive&newsid=2926.
Canola Council of Canada. 2010. http://www.canola-council.org
CARITAS. 2004. Unfair Trade and Cotton: Global Challenges, Local Challenges.
CELERES AMBIENTAL. 2010. http://www.celeresambiental.com.br/
Central Organization for Oil Industry and Trade (COOIT). 2010. Crop Estimate Information Sheet, 31st All India Seminar on Rabi Oilseeds crops, COOIT, Delhi, 12 March 2010.
Chen M, S Shelton, and Y Gong-yin. 2010/11. Modified Rice in China: From Research to Commercialization. Annual Review of Entomol. 2011. 56:81 101. http://www.ento.annualreviews.org.
Chile’s INIA (Instituto de Investigaciones Agropecuarias). http://www.inia.cl/link.cgi/
Chile’s Forest Research Institute (INFOR). http://www.infor.cl/
China Daily, 25 August 2009. GM Rice may join the Menu. http://www.china.org.cn/business/2009-08/25/content_18394775.htm
China Daily, 15 September 2005. Biotech prepares for rapid expansion. http://www.edu.cn/20050915/3151906.shtml.
Chorney B. 2010. A Holistic Approach to Farming. http://www.croplife.org/files/documentspublished/1/en-us/CS/5252_CS_2010_01_21_Farmer_Profile_-_Canada_-_Chorney_-_A_holistic_approach_to_farming.pdf
Choudhary B and K Gaur. 2009a. India poised to become number cotton producer in the world, Textile Times, Vol. 1 no 5, January-February 2009.
Choudhary B and K Gaur. 2009b. The Development and Regulation of Bt Brinjal in India (Eggplant/Aubergine). ISAAA Brief No.38. ISAAA: Ithaca, NY. http://www.isaaa.org/Resources/publications/briefs/38/download/isaaa-brief-38-2009.pdf.
Chupungco AR, AC Rola and DD Elazegui (eds.) 2008. Consequences of Bt Cotton Technology Importation in the Philippines. ISPPS-CPAF-UPLB, UPLB-FI, College, Laguna; DA Biotechnology Program, Quezon City; and PhilRice, Muñoz, Nueva Ecija.

references
228
Clay J. 2010. Earth needs more from less. http://sl.farmonline.com.au/news/nationalrural/agribusiness-and-general/general/earth-needs-more-from-less/1913852.aspx?storypage=0
Commisāo Tèchnica Nacional de Biossegurança (CTNBIO). 2009. Menisterio de Ciencia e Tecnologia. http://www.cib.org.br/ctnbio/eventoseprovadosnov10.pdf
Cookson C. 2008. Time to sow? GM food could curb cost of staples. Financial Times. 10 July 2008. http://www.truthabouttrade.org/content/view/12053/54/ http://www.ft.com/cms/s/0/f8b45556-4e97-11dd-ba7c-000077b07658.html?nclick_check=1
Costa Rica Biosafety Clearing House. http://www.cr.biosafetyclearinghouse.net
Cotton Advisory Board. 2010. Finalization of area and production of cotton for 2008-08 cotton season, further revision of area under cotton cultivation and production of cotton for cotton season 2009-10 and to project the state-wise area and cotton production for the forthcoming cotton season 2010-11, Cotton Advisory Board (CAB), Office of the Textile Commissioner, Ministry of Textile, Sept 2010.
Cotton Advisory Board (CAB). 2009. Minutes of the second meeting of the Cotton Advisory Board for the cotton season 2009-10, Office of the Textile Commissioner, Ministry of Textile, Government of India, 29 August 2009. http://www.txcindia.com/html/CAB_tables_for_website[1]%2001092009.pdf
Cotton Advisory Board (CAB). 2008. Minutes of the meeting for the cotton year 2007-08 and cotton projection for 2008-09, Office of the Textile Commissioner, Ministry of Textile, Government of India. http://www.txcindia.com/html/production,%20yield%202007089%20cabmeeting%2020102008.pdf
Cotton and Sericulture Department (CSD), Ministry of Agriculture and Irrigation (MOAI), Myanmar
CSO. 2010. Selected monthly economic indicators –foreign trade, Central Statistical Organisation (CSO), Ministry of National Planning and Economic Development, Myanmar, August 2010.
Crop Biotech Update, 5 November, 2010. EU Commission for 0.1 Percent Tolerance in Feed Imports. http://www.isaaa.org. http://www.gmo-compass.org/eng/news/544.docu.html
Crop Biotech Update, 29 October 2010a. Ministers of Agriculture in Southern Latin American Countries Issue Statement on Biotech. http://www.isaaa.org.The Spanish version of the CAS Statement can be downloaded from http://www.consejocas.org/data/cas_documentos/343692.PDF.
Crop Biotech Update, 29 October, 2010b. Britain Must Launch GM Food Revolution, says Chief Scientist. http://www.isaaa.org. Original article can be found at http://www.guardian.co.uk/environment/2010/jan/06/gm-food-revolution-government-scientist
Crop Biotech Update, 16 July 2010. Consumers, Scientists, Farmers, and Spanish Companies Demand GM Crop and Technology Access. Full Report in Spanish at: http://fundacion-antama.org/consumidores-cientificos-agricultores-y-empresas-espanolas-piden-en-bruselas-un-acceso-mas-justo-a-los-cultivos-transgenicos-y-tecnologicos/
Crop Biotech Update, 5 February 2010. Europe’s Farmers Call for Access to GM Crops. http://www.europabio.org/pressreleases/green/pr_09022010farmers.pdf

references
229
Crop Biotech Update, 8 January, 210. Increasing Agricultural Production In The Uk: Constraints And Proposed Solutions. http://www.isaaa.org. Read http://www.ofc.org.uk/images/stories/File/Beddington%202010_Key%20issues%20Ag%20science.pdf and http://www.bbsrc.ac.uk/media/releases/2010/100106-only-greater-agricultural-science-co-operation-will-deliver-gains.html for more information.
Daily Times. 2010. Cotton Crisis Looming, Daily Times, 14 Sept 2010, available at: http://www.dailytimes.com.pk/default.asp?page=2010\09\14\story_14-9-2010_pg5_11
Demont M, K Dillens, E. Mathijs and E Tollens. 2007. GM crops in Europe: How much value and for whom? EuroChoices. 6(3): 46-53. http://www.agr.kuleuven.ac.be/aee/clo/euwab.htm
Department of Biotechnology (DBT). 2009. News update, Department of Biotechnology, Ministry of Science and Technology. Government of India. http://dbtindia.nic.in/
Directorate General of Agriculture. 2010. Guidelines for marketing of Bt cotton seeds, Directorate General of Agriculture (Ext. & A.R), Ministry of Agriculture, Punjab, Pakistan.
DGFT. 2010a. Compulsory registration of cotton yarn export contracts – regarding, Notification No. 38/2009-14, Directorate General of Foreign Trade (DGFT), Ministry of Commerce and Industry, 9th April 2010.
DGFT. 2010b. Compulsory registration of cotton yarn export contracts – regarding, Notification No. 38/2009-14, Directorate General of Foreign Trade (DGFT), Ministry of Commerce and Industry, 21st May 2010.
Dumayas EE, AC Rola and DD Elazegui (eds). 2008. Returns to Research and Development Investments for Genetically Modified (GM) Abaca. ISPPS-CPAf-UPLB, UPLB-FI, College, Laguna; DA Biotechnology Program, Quezon City; and PhilRice, Muñoz, Nueva Ecija.
Ecologist, 15 November, 2010. Exclusive interview Mark Lynas: ‘More than half of greens agree with me on GM & nuclear’ http://www.theecologist.org/Interviews/682581/mark_lynas_more_than_half_the_green_movement_agrees_with_me_on_gm_and_nuclear.html
Economic Survey. 2009. Pakistan Economic Survey 2008-09, Ministry of Finance, Government of Pakistan, available at: http://www.finance.gov.pk/survey_0809.html
Economic Survey. 2010. Pakistan Economic Survey, 2009-10, Ministry of Finance, Government of Pakistan, available at: http://www.finance.gov.pk/survey_0910.html
Economic Times. 2010. Edible oil imports doubled in four years to over 88 LT, 18 Oct 2010
Elbehri A and S MacDonald. 2004. ‘Estimating the impact of transgenic Bt cotton on West and Central Africa: a general equilibrium approach’, World Development, 32 (12): 2049-2064.
Enslyn E. 2009. Improving productivity through technology. http://www.croplife.org/files/documentspublished/1/en-us/CS/5186_CS_2009_06_24_Farmer_Profile_-_South_Africa_-_Enslyn_-_Improving_Productivity_through_Technology.pdf
EU-Joint Research Council Report. 2008. Scientific and technical contribution to the development of an overall health strategy in the area of GMOs. September 2008. http://ec.europa.eu/dgs/jrc/downloads/jrc_20080910_gmo_study_en.pdf

references
230
European Commission. 2010a. EU register of genetically modified food and feed, Food and Feed Safety, DG Health and Consumer Protection, European Commission (EC), 2010. Available at: http://ec.europa.eu/food/dyna/gm_register/index_en.cfm
European Commission. 2010b. A Decade of EU-funded GMO Research (2001-2010), European Commission (EC), 9 December 2010. Available at: http://ec.europa.eu/research/biosociety/library/brochures_reports_en.htm
Falck-Zepeda J, D Horna and M Smale. 2008. Betting on cotton: Potential payoffs and economic risks of adopting transgenic cotton in West Africa. http://www.aaae-africa.org/afjare/docs/AfJAREFalck-ZepedaFINAL.pdf
FAS-GAIN Report Biotechnology in Australia. 14 July 2010. http://gain.fas.usda.gov/Recent%20GAIN%20Publications/Biotechnology%20-%20GE%20Plants%20and%20Animals_Canberra_Australia_07-14-2010.pdf
FAO-OECD. 2010. Food and Agriculture Outlook 2010-2019. http://www.oecd.org/document/29/0,3746,en_21571361_44315115_45430045_1_1_1_1,00.html
Feedstuffs, March 6, 2006 and Sept. 29, 2008 as cited in Feedstuffs, June 29, 2009. Court Upholds Biotech Alfalfa Injunction. NewsWatch. http://fdsmagissues.feedstuffs.com/fds/PastIssues/FDS8126/fds02_8126.pdf
Financial Times, 7 August 2010. Drought devastated Russian wheat production in 2010. page 15.
Food and Agriculture Statistics, 2009. http://faostat.fao.org/site/567/DesktopDefault.aspx?PageID=567#ancor
Foell L. 2010. http://www.monsanto.co.uk/news/ukshowlib.phtml?uid=14450
Francisco S. 2009. Cost and Benefits of Bt Eggplant with Resistance to Fruit and Shoot Borer in the Philippines. In. GW Norton and DM Hautea (eds). 2009. Projected Impacts of Agricultural Biotechnologies for Fruits and Vegetables in the Philippines and Indonesia. International Service for the Acquisition of Agri-biotech Applications (ISAAA) and SEAMEO Southeast Asian Regional Center for Graduate Study and Research in Agriculture (SEARCA), Los Banos, Laguna. Pp35-54.
Francisco S. 2007. Ex-ante economic impact assessment of Bt eggplant crop production in the Philippines. Philippine Journal of Crop Science. 32(2): 3-14.
Frisvold GB, JM Reeves and R Tronstad. 2006. Bt cotton adoption in the United States and China: International trade and welfare effects. AgBioForum, 9(2): 69-78.
GAIN, USDA FAS. 2010. New technologies aiding Burmese cotton farmers by Tun Winn, GAIN report no. BM0025, USDA FAS, 3 Nov 2010 available at: http://gain.fas.usda.gov/Recent%20GAIN%20Publications/New%20Technologies%20Aiding%20Burmese%20Cotton%20Farmers_Rangoon_Burma%20-%20Union%20of_11-3-2010.pdf
GMO Compass Database. http://www.gmo-compass.org/eng/gmo/db/
Gates W. 2010. Rethinking how to feed the world – Bill Gates Backs Genetically Modified Food Research. http://fora.tv/2010/01/29/rethinking_how_to_feed_the_world#bill_gates_backs_genetically_modified_food_research (video)

references
231
Genetic Engineering Appraisal Committee (GEAC). 2009a. Minutes of 97th Meeting, 14th Oct, 2009, Ministry of Environment and Forest (MoEF), http://www.envfor.nic.in/divisions/csurv/geac/decision-oct-97.pdf
Golden Rice website. http://www.goldenrice.org
Gonzales LA. 2005. Harnessing the Benefits of Biotechnology: The Case of Bt Corn in the Philippines. SIKAP/STRIVE Foundation, Los Baños, Laguna, Philippines.
Gonzales LA. 2007. Four Seasons of Post-Commercialization: Monitoring and Evaluating the Socio-Economic Impact of Bt Corn in the Philippines. SIKAP/STRIVE Foundation, Los Baños, Laguna, Philippines.
Gonzales LA. 2009. SocioEconomic Impact of Biotech Maize Adoption in the Philippines. In. Modern Biotechnology and Agriculture: A History of the Commercialization of Biotech Maize in the Philippines. SIKAP/STRIVE Foundation. Los Baños, Laguna, Philippines. Pages 144-212
Government of Chile Statistics. SAG. 2010. http://www.sag.gob.cl
Goze E, S Nibouche and J Deguine. 2003. Spatial and probability distribution of Helicoverpa armigera (Lepidoptera: Noctuidae) in cotton: systematic sampling, exact confidence intervals and sequential test. Environmental Entomology. 32 (5): 203–1210.
Gray L. 2009. Chief scientist says GM and nanotechnology should be part of modern agriculture. http://www.telegraph.co.uk/earth/earthnews/6943231/Chief-scientist-says-GM-and-nanotechnology-should-be-part-of-modern-agriculture.html
Hamilton R. 2010. GM canola, a useful tool at Albury. http://theland.farmonline.com.au/news/state/grains-and-cropping/general/gm-canola-a-useful-tool-at-albury/1871329.aspx?storypage=0
Huang D. 2010. Chinese Experts Assure Safety of GM Foods. Crop Biotech Update 5 February, 2010. http://www.isaaa.org. The original story is available at http://english.cas.cn/Ne/CN/201002/t20100208_50788.shtml
Hutchinson WD. 2010. Areawide Suppression of European Corn Borer with Bt Maize Reaps Savings for Non-Bt maize. http://www.sciencemag.org/content/330/6001/222.full See news article at: http://cropwatch.unl.edu/web/cropwatch/archive?articleID=4351804
Hu J. 2010. China Will Strengthen Modern S&T Development. Crop Biotech Update. 11 June 2010. http://www.isaaa.org. Details of the news are available at http://zqb.cyol.com/content/2010-06/08/content_3267816.htm
ICAC (International Cotton Advisory Committee). 2008. Cotton Production Practices, Tech Info Center Section, ICAC Washington DC. http://www.crdc.com.au/uploaded/file/E-Library/E-JOINT/ICAC%20Recorder%20June%202008.pdf
ICAR. 2009. Weed management. Handbbook of Agriculture, Indian Council of Agricultural Research (ICAR), New Delhi. 2009
IIM. 2007. Emerging Markets for GM Foods: An Indian Perspective on Consumer Understanding and Willingness to Pay. An e-copy of the report is available at: http://www.iimahd.ernet.in/publications/data/2007-06-08Deodhar.pdf

references
232
Icamina PM. 2008. 3-in-1 rice helps prevent Vitamin A deficiency. The Manila Times. November 3, 2008 issue.
Indian National Science Academy (INSA). 2010a. Inter Academy Report of GM Crops, Indian National Science Academy (INSA), Sept 2010.
Indian National Science Academy (INSA). 2010b. Preparation of the report on GM crops under the auspices of academies –Preliminaries, Indian National Science Academy (INSA), Oct 2010, available at: http://insaindia.org/pdf/gmcrops.pdf
INSA. 2010c, Inter-Academy Report on GM Crops –Updated, Indian National Science Academy (INSA), New
Delhi, Dec 2010.
Indian GMO Research Information System (IGMORIS). 2010. Department of Biotechnology (DBT), Government of India. http://www.igmoris.nic.in/
Indicus Analytics, 2007. Socio-economic appraisal of Bt cotton cultivation in India. Indicus Analytics Study.
International Rice Research Institute (IRRI). 2010. Golden Rice - fighting vitamin A deficiency. http://irri.org/goldenrice.
International Cotton Advisory Committee (ICAC). 2006. Cotton: Review of the World Situation, Vol. 58, pp.2
International Food Policy Institute (IFPRI). 2008. Bt cotton and farmer Suicides in India, IFPRI Discussion Paper 00808. Reviewing the Evidence, by Guillaume P Gruere, Purvi Mehta-Bhatt and Debdatta Sengupta, October 2008. An e-copy of the report is available at: http://www.ifpri.org/publication/bt-cotton-andfarmer-suicides-india
James C. 2009a. China Approves Biotech Rice and Maize in Landmark Decision. Crop Biotech Update. 4 December, 2009.
James C. 2009b. Global Status of Commercialized Biotech/GM Crops: 2008. ISAAA Brief No. 41. ISAAA: Ithaca, NY.
James C. 2008. Global Status of Commercialized Biotech/GM Crops: 2008. ISAAA Brief No. 39. ISAAA: Ithaca, NY.
James C. 2007. Global Status of Commercialized Biotech/GM Crops: 2007. ISAAA Brief No. 37. ISAAA: Ithaca, NY.
James C. 2006. Global Status of Commercialized Biotech/GM Crops: 2006. ISAAA Brief No. 35. ISAAA: Ithaca, NY.
James C. 2005. Global Status of Commercialized Biotech/GM Crops: 2006. ISAAA Brief No. 34. ISAAA: Ithaca, NY.
James C. 2004. Global Status of Commercialized Biotech/GM Crops: 2004 ISAAA Brief No. 32. ISAAA: Ithaca, NY.

references
233
James C. 2003. Global Status of Commercialized Biotech/GM Crops: 2003. ISAAA Brief No. 30. ISAAA: Ithaca, NY.
James C. 2002. Global Review of Commercialized Transgenic Crops: 2001 Feature Bt cotton. ISAAA Brief No. 29. ISAAA: Ithaca, NY.
James C. 2001. Global Review of Commercialized Transgenic Crops: 2001. ISAAA Brief No. 24. ISAAA: Ithaca, NY.
James C. 2000. Global Review of Commercialized Transgenic Crops: 2000. ISAAA Brief No. 21. ISAAA: Ithaca, NY.
James C. 1999. Global Review of Commercialized Transgenic Crops: 1999. ISAAA Brief No. 17. ISAAA: Ithaca, NY.
James C. 1998. Global Review of Commercialized Transgenic Crops: 1998. ISAAA Brief No. 8. ISAAA: Ithaca, NY.
James C. 1997. Global Review of Commercialized Transgenic Crops: 1997. ISAAA Brief No. 5. ISAAA: Ithaca, NY.
James C and AF Krattiger. 1996. Global Review of the Field Testing and Commercialization of Transgenic Plants 1986 to 2005. The First Decade of Crop Biotechnology, 1986 to 1995. ISAAA Brief No. 1. ISAAA: Ithaca, NY.
Javier PA, MV Agsaoay and JL dela Cruz. 2004. Influence of YieldGard on the effectiveness of Trichogramma evanescens (Hymenoptera:Trichogrammatidae), an egg parasitoid of Asian corn borer, Ostrinia furnacalis (Guenee). Project Terminal Report. National Crop Protection Center, University of the Philippines Los Baños. 40 pp.
Jiabo W. 2008. Chinese premier says he supports developing transgenic engineering. http://china-wire.org/?p=1187
Kakakhel I. 2010. Government misses cotton sowing targets. Daily Times, 16 July 2010, available at http://www.dailytimes.com.pk/default.asp?page=2010%5C07%5C16%5Cstory_16-7-2010_pg5_8
Khalid ZM. 2009. Status of Biotechnology and Biosafety of GM Crops in Pakistan, presentation during the Regional Biosafety Workshop, Asian Bio-Net, Department of Agriculture, Thailand, 30 November to 4 December 2009, available at: http://it.doa.go.th/asianbionet/activities/thailandNov2009/doc/Pakistan/Pakistan.pdf
Khan AD. 2010. Cotton history and future prospects report, Ministry of Food and Agriculture, CMP-II, Khyber Pukhtoonkhwa, Peshawar, 2010. http://www.npfs-minfa.gov.pk/PageFiles/226_Cotton-History-and-Future.pdf
Korves R. 2008. Burkina Faso plants Bt cotton. Truth about Trade and Technology, 22 August 200, India.
Kranthi KR. 2009. Personal Communication, Central Institute of Cotton Research (CICR), Nagpur, India, 30 July 2009.

references
234
Lacombe S, A Rougon-Cardoso, E Sherwood, N Peeters, D Dahlbeck, HP van Esse, M Smoker, G Rallapli, BPHJ Thomma, B Staskawicz, JDG Jones and C Zipfel. 2010. Interfamily transfer of a plant pattern-recognition receptor confers broad-spectrum bacterial resistance. Nature Biotechnology. 28 (4). April 2010. pp.365-369. http://www.nature.com/nbt/journal/v28/n4/pdf/nbt.1613.pdf.
Lin G. 2009. Agriculture fastest-growing research in China. 12 November 2009 http://www.scidev.net/en/news/agriculture-fastest-growing-research-in-china.html
Lin H. 2010. CAS Academician Discusses Potential for Bio-breeding. Crop Biotech Update 13 May 2010. http://www.isaaa.org. For more information on biotechnology in China, contact Prof. Zhang Hongxiang at Chinese Biotechnology Information Cente at [email protected]
Lugar R. 2010. US Global Security Act to Battle Hunger Worldwide. Crop Biotech Update. For more details, visit http://www.irinnews.org/Report.aspx?ReportId=89467.
Mahyco. 2010. Personal communication with officials of Mahyco, 26 Nov 2010
MCSE. 2001. Rural population and farm families-land holding, statistics, Myanma Cotton and Sericulture Enterprise (MCSE), Ministry of Agriculture, 2001
Maotang Z. 2010. Zu Maotang - The First Biotech Farmer in China. http://www.croplife.org/files/documentspublished/1/enus/CS/4760_CS_2009_05_13_Farmer_Profile_-_China_-_Zu_Maotang_-_the_first_biotech_farmer_in_China.pdf
Massoud MA. 2005. The influence of encoding BT corn hybrids (MON 810 event) on the infestation of the corn borers in Egypt. The 3rd International Conference of Plant Protection Research Institute, 26-29 November, 2005, 83 (2): 469-496.
Mayee CD 2010. Chairman, Agricultural Scientists Recruitment Board (ASRB), Ministry of Agriculture, Personal Communication.
Mayee CD and Chakraborthy, M. 2010, The significance of cotton seed oil in edible oilseed – An overview, Article for Souvenier 2009-10 of IOPEPEC, ministry of Commerce and Industry, Govt of India, 2010.
McCarthy J. 2010. http://www.pressandjournal.co.uk/Article.aspx/1592911?UserKey&UserKey&UserKey=#ixzz161LKUrBq
McWilliams J. 2008. China import approval bolters New Monsanto soybean seed. St. Louis Post – Dispatch, USA. Retrieved 8 September, 2008. http://www.soyatech.com/news_story.php?id=10146
Ministry of Agriculture. 2009. Cotton Statistics at a Glance. 2009. Directorate of Cotton Development, Department of Agriculture and Cooperation, Ministry of Agriculture, Government of India.
Ministry of Agriculture and Fisheries, Denmark. 2009. Denmark: GMO crops can help climate and environment, according to a new report from the Danish Food Ministry. Sept. 18, 2009. http://bites.ksu.edu/news/135342/09/09/18/denmark-gmo-crops-can-help-climate-and-environment-according-new-report-danish-
Ministry of Agriculture, Rural Development, and Fisheries, Lisbon, Portugal, 11 October, 2010. http://www.dgadr.pt.

references
235
Ministry of Agriculture. 2010. Edible Oil Scenario. Directorate of Vanaspati, Vegetable Oils & Fats, Ministry of Agriculture, Food and Consumer Affairs, Govt of India.
Ministry of Agriculture, Spain. 2010. http://www.mapa.es/en/agricultura/agricultura.htm
Ministry of Food, Agriculture and Livestock. 2010. Cotton area, production and yield.
Ministry of Environment and Forest (MoEF). 2010. Decision on commercialization of Bt brinjal, Minister’s report, Minister of State for Environment and Forest (MOEF), Government of India dated 9th Feb 2010 available at: http://moef.nic.in/downloads/public-information/minister_REPORT.pdf
Ministry of Environment and Forest (MoEF). 2009. Press Statement by Mr. Jairam Ramesh, Minister of State for Environment and Forest, Government of India dated 15th Oct 2009 available at: http://moef.nic.in/downloads/public-information/Press_Bt%20Brinjal.pdf
Ministry of Environment, Rural Development and Fisheries, Spain. 2010. Avances Suopefices y Producciones Agricolas, July 2010. http://www.mapa.es/en/ministerio/pags/hechoscifras/cifras.htm
Ministry of Finance, India. 2009. The Economic Survey, 2008-09. Ministry of Finance, Govt of India, available at: http://indiabudget.nic.in/es2008-09/esmain.htm
Ministry of Finance, India. 2008. The Economic Survey, 2007-08, Ministry of Finance, Govt of India.
Ministry of Finance, 2010. Economic Survey, 2009-10. Agriculture and food management, Economic Survey, 2009-10, Ministry of Finance, Govt of India.
Ministry of Textile Industry. 2009. Textiles Policy 2009-2014, Ministry of Textile Industry, Oct 2009, available at: http://202.83.164.26/wps/portal/Moti
Moore R. 2010. Biotechnology is future of farming. http://www.reviewatlas.com/news/x968905986/Biotechnology-is-future-of-farming
Moloi S. 2010. In Biotech in Africa: In South Africa, the welcome mat is out http://www.desmoinesregister.com/article/20100510/BUSINESS01/5100313/1029/BUSINESS/Biotech-in-
Africa-In-South-Africa-the-welcome-mat-is-out
Murphy D. 2008. Dan Murphy: Five Minutes With Luther Markwart, American Sugarbeet Growers. http://www.cattlenetwork.com/Dan-Murphy--Five-Minutes-With-Luther-Markwart--American-Sugarbeet-Growers/2008-03-03/Article.aspx?oid=624062
Myanmar Times, 2010. New cotton strain could yield exports by Soe Sandar Oo, Myanmar Times, October 11 - 17, 2010, Myanmar, available at: http://www.mmtimes.com/2010/business/544/54402biz.html
NASS USDA Crop, 2010. http://www.nass.usda.gov/Newsroom/2010/01_12_2010.asp
Navarro M. 2009. Trail blazing biotech in the philippines: an interview with academician Emil Q. Javier. In. Mariechel J. Navarro (ed) Brief 40. Communicating Crop Biotechnology: Stories from Stakeholders. International Service for the Acquisition of Agribiotechnology Applications (ISAAA). Los Baños, Laguna. Pp. 81-83.

references
236
Natesh S and MK Bhan. 2009. Biotechnology sector in India: strengths, limitations, remedies and outlook,Current Science, Vol. 97, No. 2, PP. 157-169, 25 July 2009. http://www.ias.ac.in/currsci/jul252009/157.pdf
National Biosafety Centre (NBC). 2010. Biosafety and Genetically Modified Organisms, Pakistan Environmental Protection Agency, Ministry of Environment, Pakistan.
National Biosafety Committee. 2010. Minutes of the 8th meeting of National Biosafety Committee (NBC) held on 25th March, 2010, Ministry of Environment, Islamabad, Pakistan.
Nature, 1 October 2010. Uganda prepares to plant transgenic papayas. http://www.nature.com/news/2010/101001/full/news.2010.509.html
New Biotechnology. 2010. Summary of the contents of the Study Week in Vatican City May 15-19, 2009. http://www.ask force.org/web/Vatican-PAS-Studyweek-Elsevier-publ-20101130/Press-Release-PAS-Studyweek-20101127.pdf; Participants:http://www.ask-force.org/web/Vatican-Studyweek-Elsevier/Participants-List-english-email.pdf
New York Times, 11 Nov 2010. EU Approves First Modified Crop for Planting in 12 Years. http://www.nytimes.com/2010/11/11/business/global/11biotech.html?src=busln
New York Times, 16 November 2010. Mutation advances set to flip biotech crio debate. http://www.nytimes.com/gwire/2010/11/16/16greenwire-mutation-advances-set-to-flip-biotech-crop-deb-78201.html
Norton M. 2010. http://www.abc.net.au/news/stories/2010/05/19/2903920.htm
Oerke EC. 2006. Crop losses to pests. Journal of Agricultural Science. 2006 (144): 31-43. Cambridge University Press).
Oil Technologists Association of India (OTA). 2009. OTA News letter, Western Zone, vol. XI, no. 4, Oct-Dec 2009, Mumbai.
Origin Agritech. 2009. Origin Agritech Announces Final Approval of World’s First Genetically Modified Phytase Corn. http://www.originseed.com.cn/en/news/view.php?pid=22&id=437
Pablico SM. 2008. PhilRice Develops 3-in-1 Rice. The Philippine STAR. August 31, 2008 issue.
Pakistan Industry Estimates, 2010
Pakistan Cotton Ginner Association (PCGA). 2010. Estimate of Cotton Crop Loss, Pakistan Cotton Ginner Association (PCGA), 2010, available at: www.pcga.org
Pakistan Environmental Protection Agency (Pak EPA). 2005a. Pakistan Biosafety Rules 2005, Gazette notification no. S.R.O. (I) 336 (I)/2005, Ministry of Environment, Islamabad, 21 April 2005.
Pakistan Environmental Protection Agency (Pak EPA). 2005b. National Biosafety Guidelines 2005, Notification no. F. 2(7)95 Bio, Ministry of Environment, Islamabad, May 2005.
Pakistan Textile Journal. 2010. Textile Briefs National, May 2010, available at: http://www.ptj.com.pk/Web-2010/05-10/Textile-Briefs-National.htm

references
237
Pakistan Times. 2006. Cotton production in Pakistan to be raised to 20.7 m bales by 2015, Pakistan Times, 22 May 2006, available at: http://pakistantimes.net/2006/05/22/business2.htm
Paz R, W Fernandez, O Zambrano and J Falck Zepeda. 2008. Socio-Economic considerations of genetically-modified soybean Adoptio: The Case of Bolivia. http://www.cbd.int/doc/external/mop-04/ifpri-cs-bolivia-en.pdf
People’s Daily Online. 2009. From self-sufficiency to grain contribution, China’s agriculture passes 60 memorable years, 26 August, 2009. http://english.people.com.cn/90001/90776/90882/6739421.html
Piggott NE and MC Marra. 2007. The Net Gain to Farmers of a Natural Refuge Plan for Biollgard III®Cotton. AgBioForum 10 (1): 1-10. http://www.agbioforum.org/v10n1/v10n1a01-piggott.htm
Pilau FA. 2009. Farming, an enriching life. http://www.croplife.org/files/documentspublished/1/en-us/CS/5189_CS_2009_06_24_Farmer_Profile_-_Brazil_-_Pilau_-_Farming,_an_Enriching_Life.pdf
Planning Commission. 2007. Pakistan in the 21st Century Vision 2030, Planning Commission, Government of Pakistan, August 2007.
Planning Commission. 2010. Agriculture development, Annual Plan 2010-2011, Planning Commission, Government of Pakistan, Available at: http://www.planningcommission.gov.pk/annual%20plans/2010-11/Agriculture%20Development.pdf.
Porter S. 2009. GM Sugar beet hit by California Court Ruling. Northern Colorado Business Report. Oct. 23, 2009. http://www.ncbr.com/article.asp?id=102674
Potrykus I. 2010. Regulation must be revolutionized. Nature 466. 29 July 29 2010. http://www.nature.com/nature/journal/v466/n7306/full/466561a.html
Potrykus I. and K Ammann (eds), 2010. Transgenic Plants for Food Security in the Context of Development. New Biotechnology. In Press.
Press Information Bureau (PIB). 2007. Export of cotton continues to increase, Press Information Bureau, Govt of India, 20 March 2007 available at: http://pib.nic.in/release/release.asp?relid=26236
Press Information Bureau (PIB). 2010a. Ban of cotton exports, Press Information Bureau, Govt of India, 4 August 2010 available at: http://pib.nic.in/release/release.asp?relid=64126&kwd=
Press Information Bureau (PIB), 2010b. Government allows cotton exports up to 55 lakh bales in 2010-11 to review the cotton export scenario on 15th November 2010, Press Information Bureau, Govt of India, 4 Sept 2010 available at: http://pib.nic.in/release/release.asp?relid=65557
Punjab Seed Council. 2010. Minutes of 39th meeting of Punjab Seed Council (PSC) held on 31st March 2010, Ministry of Agriculture, Punjab, Pakistan.
Rao IA. 2006. First Bt cotton grown in Pakistan, Advisory Biotechnology, Pak Kissan, 17 March 2006, available at: http://www.pakissan.com/english/advisory/biotechnology/first.bt.cotton.grown.in.pakistan.shtml
Rao IA. 2010. Personal communication with Mr Ijaz Ahmad Rao on 16 July 2010.

references
238
Roy D. 2010. India May Raise Cotton-Export Limit as Output Surges-Group Says, Businesweek, 21 Sept 2010 available at: http://www.businessweek.com/news/2010-09-21/india-may-raise-cotton-export-limit-as-output-surges-group-says.html
Reuters. 2010. India may allow export of cotton from October – report, Reuters, 11 August 2010 available at: http://in.reuters.com/article/idINIndia-50767420100811
Sanchez MA. 2010. Sustainable practices lead to farm growth, family security. http://www.croplife.org/files/documentspublished/1/en-us/CS/5183_CS_2009_06_16_Farmer_Profile_-_Argentina_-_Sanchez_-_Sustainable_Practices.pdf
Sartori A. 2009. The Call of the Land. http://www.croplife.org/files/documentspublished/1/en-us/CS/5190_CS_2009_06_24_Farmer_Profile_-_Brazil_-_Sartori_-_The_Call_of_the_Land.pdf
Scientific Alliance, 1 October, 2010. Doing the right thing for the wrong reasons. Can also be viewed at http://gmopundit.blogspot.com/2010/10/doing-right-thing-for-wrong-reasons.html
Scottish Crop Research Institute. 2009. Potato Genome Sequencing. http://www.scri.ac.uk/research/genetics/GenomeBiology/potatosequencing
Shuping N. 2008. China Approves big budget for GMO amid food worries. 10 July 2008. Reuters.http://www.reuters.com/article/environmentNews/idUSPEK11727520080710?feedType=RSS&feedName=environmentNews&sp=true
Smyth S. G Michael, P Peter and C David. 2010. Assessing the Economic and Ecological Impacts of Herbicide Tolerant Canola in Western Canada. Report commissioned by the Canola Council of Canada. http://www.mcgacanola.org/documents/AssessingtheEconomicandEcologicalImpactsofHerbicideTolerantCanolainWesternCanada.pdf
Soomro B. and P Khaliq. 1996. Cotton production in Pakistan- a success story, APAARI publication 1996/2, Asia Pacific Association of Agricultural Research Institutions (APAARI), Bangkok, Thailand.
Stein AJ, HPS Sachdev and M Qaim. 2006. Potential impact and cost-effectiveness of Golden Rice. Nature Biotechnology. 24:1200-01.
Stohr G. 2010. Monsanto Wins as US Supreme Court Backs Alfalfa Seed Planting. http://www.bloomberg.com/news/2010-06-21/monsanto-wins-supreme-court-ruling-on-lifting-modified-alfalfa-seed-ban.html. 21 June 2010.
Stone R. 2008. China plans $3.5 billion GM Crops Initiative. Science 321:1279. Retrieved on Sept. 5, 2008. http://science-mag.aaas.org/cgi/content/summary/321/5894/1279
Subramanian A, K Kjrwan, D Pink and M Matin. 2010. GM crops and gender issues. Nature Biotechnology, Vol.28 (No.5). pp. 404-406. May 2010. http://www.nature.com/nbt/journal/v28/n5/full/nbt0510-404.html
Summer A. 2010. Global Poverty and the new bottom billion: What if three quarters of the world’s poor live in middle-income countries. Institute of Development Studies. UK. http://www.ids.ac.uk/go/idspublication/global-poverty-and-the-new-bottom-billion-three-quarters-of-the-world-s-poor-live-in-middle-income-countries.

references
239
Sunikumar G. LM Campbell, L Puckhaber, RD Stipanovic, and KS Rathore. 2006. Engineering cottonseed for use in human nutrition by tissue-specific reduction of toxic gossypol, Proceedings of National Academy of Sciences (PNAS). 103(48) 18054-18059. http://www.pnas.org/content/103/48/18054.
Surman, W. 2010. OFC 2011: GM key to future of CAP - Lyon. http://www.farmersguardian.com/home/latest-news/ofc-2011-gm-key-to-future-of-cap-lyon/36394.article
Takanori K, H Nakanishi, M Takahashi, S Mori and N K Nishizawa. 2008. Generation and Field Trials of Transgenic Rice Tolerant to Iron Deficiency. Retrieved 1 August, 2008. http://www.springerlink.com/content/m412wx750257h33l/fulltext.pdf
Textile Commissioner. 2010. Memorandum-I, Procedural requirement for obtaining Export Authorisation Registration of raw cotton, No.1/162/2010/Cotton/Vol.VIII/14, Office of the Textile Commissioner, Ministry of Textile, 07 Sept, 2010.
Textile Commissioner’s Organisation. 2010a. Export Report for Ten Years, Ministry of Textile Industry, 2010, available at: http://www.tco.gov.pk/
Textile Commissioner’s Organisation. 2010b. Ten years of cotton textile production report, Textile Commissioner’s Organisation, Ministry of Textile Industry, 2010, available at: http://www.tco.gov.pk/
The Age. 2008. Australian First GM grass trial to start. The Age, Melbourne, 28 October 2008. http://www.theage.com.au/national/australianfirst-gm-grass-trials-to-start-in-victoria-20081028-5aai.html
The Economist, 30 September 2010. Measuring global poverty. Whose problem now. http://www.economist.com/node/17155748?story_id=17155748
The Economist, 25 September 2010. Global targets, local ingenuity. http://www.economist.com/node/17090934
The Economist, 8 July 2010. Great Wall Street. http://www.economist.com/node/16541609?story_id=16541609
The Economist, 22 May 2010. The Economist, for want of a drink. Page 3-20. http://www.economist.com/node/16136302
The Economist, 15 April 2010. A special report on innovation in emerging markets. First break all the rules. The charms of frugal innovation. http://www.economist.com/node/15879359
The Economist, 30 December 2009. Why farms maybe the new forests. http://www.economist.com/node/15179766
The Economist, 2007. Biotech Crop Plantings in Romania. November 17-23 edition. p. 63
Timmings J. 2010. Stewards of the soil. http://www.croplife.org/files/documentspublished/1/en-us/CS/5255_CS_2010_01_21_Farmer_Profile_-_Canada_-_Timmings_-_Stewards_of_the_soil.pdf
Toe A. 2003. Limites maximales de résidus de pesticides dans les produits agricoles d’exportation dans trois pays du CILSS-Etude du Burkina Faso’, FAO/CILLS, Rapports Techniques, Projet Gestion des pesticides au Sahel, Bamako, Mali.

references
240
Tomich J. 2009. Monsanto Asks Supreme Court to Review Alfalfa Ban. SoyaTech. November 2, 2009. http://www.soyatech.com/news_story.php?id=16057.
Traoré O, D Sanfo, K Traoré and B Koulibaly. 2006. ‘The effect of Bt gene on cotton productivity, ginning rate and fiber characteristics under Burkina Faso cropping conditions’, A Working Document Written by INERA Staff Members, Bobo Dialasso, Burkina Faso.
Trigo EJ and EJ Cap. 2006. Ten Years of Genetically Modified Crops in Argentine Agriculture. Argentine Council for Information and Development of Biotechnology (ArgenBio), Buenos Aires, Argentina. December 2006.
UC Davis News and Information. 2008. National report outlines strategies for mitigating alfalfa gene flow. November 3, 2008. http://www.news.ucdavis.edu/search/news_detail.lasso?id=8856.
United Nations. 1987. Global Issues – Environment. Excerpts from the Brundland Report “Our Common Future” http://www.un.org/en/globalissues/environment/
University of New Castle Australia. 2009 Gene breakthrough secures crops’ future. July 21, 2009.
United States Department of Agriculture, National Agricultural Statistics Service (USDA)/FAS. 2007. Cotton: World Markets and Trade Monthly Circular, 1 September 2007. FAS, USDA. http://www.fas.usda.gov/cotton/circular/Current.asp
University of Warwick. 2010. GM Crops produces massive gains for women’s employment in India, press release, University of Warwick, 28 July 2010, available at: http://www2.warwick.ac.uk/newsandevents/pressreleases/gm_crop_produces
USDA National Agriculture Statistics Service (NASS). 2009. Adoption of Genetically Engineered Crops in the. 2009. National Agriculture Statistics http://www.ers.usda.gov/Data/BiotechCrops/
USDA National Agricultural Statistics Service (NASS). 2010. Adoption of Genetically Engineered Crops in 2010. National Statistics. http://www.ers.usda.gov/Data/BiotechCrops/
US National Research Council. April 2010. “The impact of genetically engineered (GE) crops on farm sustainability in the United States” http://www.nap.edu.
Vaissayre M and J Cauquil. 2000. ‘Principaux ravageurs et maladies du cotonnier en Afrique au Sud du Sahara’, A Report Published by CIRAD.
Valencia S. 2010. I do prefer biotechnology. http://www.croplife.org/files/documentspublished/1/en-us/CS/5288_CS_2010_01_28_Farmer_Profile_-_Colombia_-_Valencia_-_I_do_prefer_biotechnology.pdf
Vitale J, M Ouattara, G Vognan, and O Traore, 2010, Proceedings of ICABR Conference at Ravello Italy.
Vitale J, H Glick, J Greenplate, M Abdennadher and O Traoré. 2008. The economic impacts of second generation Bt cotton in West Africa: Empirical evidence from Burkina Faso International Journal of Biotechnology. l10 (2/3).

references
241
Vognan G, M Ouédraogo and S Ouédraogo. 2002. Description de la filière cotonnière au Burkina Faso, Rapport intermédiaire, INERA, p.34.
Western Farm Press, 17 December 2010. USDA’s biotech ag alliance efforts likely to end in futility or worse. http://westernfarmpress.com/government/usdas-biotech-ag-alliance-efforts-likely-end-futility-or-worse.
World Bank. 2008. The World Development Report, Agriculture for Development. World Bank, Washington DC.
Wu K-M, Y-H Lu, H-Q Feng, Y Jiang and Z Z Jian. 2008. Suppression of cotton bollworm in multiple crops in China in areas with Bt toxin-containing cotton. Science. 321: 1676-1678.
Xinhua. 2009. China to raise grain output to 540 mln tonnes by 2020. 8 April 2009. http://id2.mofcom.gov.cn/aarticle/chinanews/200904/20090406159327.html
Yorobe JM, Jr and CB Quicoy. 2006. Economic impact of Bt corn in the Philippines. The Philippine Agricultural Scientist, 89(3): 258-67.
Zafar Y, et al. 2007. Current status and prospects of biotech cotton in Pakistan, Proceedings of the Regional Consultation on Genetically Modified Cotton for Risk Assessment and Opportunities for Small-Scale Cotton Growers, National Institute for Biotechnology and Genetic Engineering, Faisalabad, Pakistan, March 6-8, 2007, Technical paper No. 63, Common Fund for Commodity (CFC).
Zhang T. 2010. Promote The Development Of The Seed Industry, Says China’s Vice Minister Of Agriculture, Crop Biotech Update. 22 January 2010. http://www.isaaa.org; http://english.agri.gov.cn/ga/np/201001/t20100121_1614.htm for more information.
Zimmermann R and M Qaim. 2004. Potential health benefits of Golden Rice: A Philippine case study. Food
Policy. 29: 147-168.


appendix 1
Global status of regulatory approvals*
* This is an overview of the global status of regulatory approvals for import for food and feed use and for release into the environment through December 2010. Regulatory approval processes for biotech products vary from country to country and therefore, countries should be consulted for specific details.

245
Appendix 1. Global Status of Regulatory ApprovalsCompiled by M. Escaler, ISAAA 2006; RR Aldemita, ISAAA 2007, 2008, 2009, 2010
Sources: http://www.agbios.com http://www.fas.usda.gov/itp/biotech/countries.html http://www.ogtr.gov.au http://www.mhlw.go.jp/english/topics/food/pdf/sec01-2.pdf http://www.bch.biodic.go.jp http://www.gmo-compass.org http://www.bpi.da.gov.ph http://bch.biodiv.org
ARGentinA
Crop Latin name trait event Developer Food Feed Direct Use PlantingCotton Gossypium hirsutum L. HT MON1445 Monsanto Company 2001 2001 2001Cotton Gossypium hirsutum L. IR MON531 Monsanto Company 1998 1998 1998Cotton Gossypium hirsutum L. IR + HT MON531 × MON1445 Monsanto Company 2009 2009 2009 2009Cotton Gossypium hirsutum L. IR MON531/757/1076 Monsanto Company 1998 1998 1998Maize Zea mays L. HT + IR BT 11 (X4334CBR, X4734CBR) Syngenta Seeds 2001 2001 2001Maize Zea mays L. IR BT 176 Syngenta Seeds 1998 1998 1998Maize Zea mays L. HT + IR BT11 × GA21 Syngenta Seeds 2010 2010 2010Maize Zea mays L. HT + IR DBT418 DeKalb Genetics Corporation 1998Maize Zea mays L. HT GA21 Monsanto Company 2005 2005 2005Maize Zea mays L. IR MON810 Monsanto Company 1998 1998 1998Maize Zea mays L. HT + IR MON88017 Monsanto Company 2010 2010 2010 2010Maize Zea mays L. IR MON89034 Monsanto Company 2010 2010 2010 2010Maize Zea mays L. IR + HT MON89034 × MON88017 Monsanto Company 2010 2010 2010 2010Maize Zea mays L. HT NK603 Monsanto Company 2004 2004 2004Maize Zea mays L. HT + IR NK603 × MON810 Monsanto Company 2005 2005 2005Maize Zea mays L. HT T14 Bayer CropScience 1998 1998 1998Maize Zea mays L. HT T25 Bayer CropScience (Aventis CropScience (AgrEvo)) 1998 1998 1998Maize Zea mays L. HT + IR TC1507 Mycogen (Dow AgroSciences) - Pioneer (DuPont) 2005 2005 2005Maize Zea mays L. HT + IR TC1507 × NK603 Dow AgroSciences LLC and Pioneer Hi-Bred International Inc. 2006 2006 2008 2006Soybean Glycine max L. HT GTS 40-3-2 (40-3-2) Monsanto Company 1996 1996 1996
AUStRALiA
Crop Latin name trait event Developer Food Feed Direct Use PlantingAlfalfa Medicago sativa HT J101 Monsanto Company 2007 2007Alfalfa Medicago sativa HT J163 Monsanto Company 2007 2007Argentine Canola Brassica napus HT GT200 (RT200) Monsanto Company 2010 2010 2010Argentine Canola Brassica napus HT + F MS8 × RF3 Bayer CropScience (Aventis CropScience(AgrEvo)) 2002 2002 2003Argentine Canola Brassica napus HT OXY-235 Aventis CropScience 2002Argentine Canola Brassica napus HT + F PGS1 (MS1(B91-4) × RF1(B93-101)) Bayer CropScience (Aventis CropScience(AgrEvo)) 2002 2002 2003Argentine Canola Brassica napus HT + F PGS2 (MS1 x RF2) (B91-4 x B94-2) Aventis CropScience 2002 2002 2003Argentine Canola Brassica napus HT RT73 (GT73) Monsanto Company 2000 2003Argentine Canola Brassica napus HT T45 (HCN28) Bayer CropScience 2002 2002 2003Argentine Canola Brassica napus HT Topas 19/2, HCN92 Bayer CropScience (Aventis CropScience(AgrEvo)) 2002 2003Carnation Dianthus caryophyllus FC + HT 123.2.2 (40619) Florigene Pty Ltd. 2007Carnation Dianthus caryophyllus FC + HT 123.2.38 (40644) Florigene Pty Ltd. 2007Carnation Dianthus caryophyllus FC + HT 123.8.8 (40685) Florigene Pty Ltd. 2007Carnation Dianthus caryophyllus FC 4, 11, 15, 16 Florigene Pty Ltd. 1995Carnation Dianthus caryophyllus DS 66 Florigene Pty Ltd. 1995Carnation Dianthus caryophyllus FC + HT 959A, 988A, 1226A, 1351A, 1363A, 1400A Florigene Pty Ltd. 2007Cotton Gossypium hirsutum L. IR 281-24-236 × 3006-210-23 Dow AgroSciences LLC 2005 2009 2009
LeGenDCPP Cedar Pollen PeptideDR Delayed Ripening/Altered Shelf-LifeDS Delayed SenescenceDT Drought ToleranceF Fertility RestoredFC Modified Flower ColorFC + HT Modified Flower Color and Herbicide ToleranceFlav Path Flavonoid Biosynthetic Pathway
HC High CelluloseHPhy High PhytaseHT Herbicide ToleranceHT + F Herbicide Tolerance and Ferticility Restored HT + HT Stacked Herbicide Tolerant TraitsHT + IR Herbicide Tolerance and Insect ResistanceIR Insect ResistanceIR + HT Insect Resistance and Herbicide ToleranceIR + VR Insect Resistance and Virus Resistance
Lys Enhanced Lysine ContentLys + IR Enhanced Lysine Content and Insect ResistanceMS Male SterilityMS + HT Male Sterility and Herbicide ToleranceNIC Nicotine ReductionOC Modified Oil ContentOC + HT Modified Oil Content and Herbicide TolerancePlt Quality Mod AmylaseVR Virus ResistanceVR+IR+HT Virus Resistance + Insect Resistance + Herbicide Tolerance * The product has been approved for planting/cultivation but it is not
necessarily in commercial production at present

246
AUStRALiA
Crop Latin name trait event Developer Food Feed Direct Use PlantingCotton Gossypium hirsutum L. HT BCS-GHØØ2-5 (GHB614) Bayer CropScience 2009Cotton Gossypium hirsutum L. HT BXN Calgene Inc. 2002 2002Cotton Gossypium hirsutum L. IR COT102 Syngenta Seeds 2005Cotton Gossypium hirsutum L. IR COT67B Syngenta Seeds 2009Cotton Gossypium hirsutum L. HT LLCotton25 Bayer CropScience 2006 2006Cotton Gossypium hirsutum L. HT MON1445 Monsanto Company 2000 2006Cotton Gossypium hirsutum L. IR MON15985 Monsanto Company 2002 2006Cotton Gossypium hirsutum L. IR + HT MON15985 × MON1445 Monsanto Company 2006Cotton Gossypium hirsutum L. IR MON531 Monsanto Company 1996 1996 2003Cotton Gossypium hirsutum L. IR + HT MON531 × MON1445 Monsanto Company 2003Cotton Gossypium hirsutum L. IR MON531/757/1076 Monsanto Company 1996 1996 1996Cotton Gossypium hirsutum L. HT MON88913 Monsanto Company 2006 2006Cotton Gossypium hirsutum L. HT + IR MON88913 × MON15985 Monsanto Company 2006Cotton Gossypium hirsutum L. IR T304-40 Bayer CropScience 2010 2010 2010Maize Zea mays L. Plt Quality 3272 Syngenta Seeds 2008 2008Maize Zea mays L. HT + IR 59122 Dow AgroSciences LLC and Pioneer Hi-Bred International Inc. 2005Maize Zea mays L. HT + IR BT 11 (X4334CBR, X4734CBR) Syngenta Seeds 2001 2001Maize Zea mays L. IR BT 176 Syngenta Seeds 2001 2001Maize Zea mays L. HT + IR DAS 59122 × TC1507 × NK603 Pioneer Hi-Bred International Inc. 2007 2007 2007Maize Zea mays L. HT + IR DAS-59122-7 × NK603 Dow AgroSciences LLC and Pioneer Hi-Bred International Inc. 2006 2006 2006Maize Zea mays L. HT + IR DBT418 DeKalb Genetics Corporation 2002Maize Zea mays L. HT + HT Event 98140 Pioneer Hi-Bred International Inc. 2010 2010Maize Zea mays L. HT GA21 Monsanto Company 2000Maize Zea mays L. Lys LY038 Monsanto Company 2007 2007Maize Zea mays L. IR MIR 604 Syngenta Seeds 2006Maize Zea mays L. IR MIR162 Syngenta Seeds 2009Maize Zea mays L. DT MON 87460 Monsanto Company 2010 2010 2010Maize Zea mays L. IR MON810 Monsanto Company 2000Maize Zea mays L. IR MON863 Monsanto Company 2003Maize Zea mays L. HT + IR MON88017 Monsanto Company 2006Maize Zea mays L. IR MON89034 Monsanto Company 2008 2008Maize Zea mays L. HT NK603 Monsanto Company 2002Maize Zea mays L. HT T25 Bayer CropScience (Aventis CropScience(AgrEvo)) 2002 2002Maize Zea mays L. HT + IR TC1507 Mycogen (Dow AgroSciences) - Pioneer (DuPont) 2003Maize Zea mays L. HT + IR TC1507 × DAS 59122-7 Dow AgroSciences LLC and Pioneer Hi-Bred International Inc. 2007 2007 2007Potato Solanum tuberosum L. IR ATBT04-6, ATBT04-27, ATBT04-30 Monsanto Company 2001 2001Potato Solanum tuberosum L. IR BT6, BT10, BT12, BT16, BT17, BT18, BT23 Monsanto Company 2001 2001Potato Solanum tuberosum L. IR + VR RBMT15-101 Monsanto Company 2001 2001Potato Solanum tuberosum L. IR + VR RBMT21-129 Monsanto Company 2001 2001Potato Solanum tuberosum L. IR + VR RBMT21-350 Monsanto Company 2001 2001Potato Solanum tuberosum L. IR + VR RBMT22-82 Monsanto Company 2001 2001Potato Solanum tuberosum L. IR + VR SEMT15-02 Monsanto Company 2001 2001Potato Solanum tuberosum L. IR + VR SEMT15-15 Monsanto Company 2001 2001Potato Solanum tuberosum L. IR SPBT02-5 Monsanto Company 2001 2001Rice Oryza sativa L. HT LLRICE06, LLRICE62 Aventis CropScience 2010 2010Rose Rosa hybrida Flav Path IFD-524Ø1-4 Suntory Limited 2009Soybean Glycine max L. OC 260-05 (G94-1, G94-19, G168) DuPont Canada Agricultural Products 2000Soybean Glycine max L. HT A2704-12 Bayer CropScience (Aventis CropScience(AgrEvo)) 2004Soybean Glycine max L. HT A5547-127 Bayer CropScience 2004 2004Soybean Glycine max L. OC + HT DP-305423 DuPont Canada Agricultural Products 2010 2010

247
AUStRALiA
Crop Latin name trait event Developer Food Feed Direct Use PlantingSoybean Glycine max L. HT DP356043 Pioneer Hi-Bred International Inc. 2010 2010 2010Soybean Glycine max L. HT GTS 40-3-2 (40-3-2) Monsanto Company 2000Soybean Glycine max L. IR MON87701 Monsanto Company 2010 2010 2010Soybean Glycine max L. HT MON89788 Monsanto Company 2008 2008Sugarbeet Beta vulgaris HT GTS B77 Monsanto Company 2002 2002Sugarbeet Beta vulgaris HT H7-1 Monsanto Company 2005
BOLiViA
Crop Latin name trait event Developer Food Feed Direct Use PlantingSoybean Glycine max L. HT GTS 40-3-2 (40-3-2) Monsanto Company 2008 2008 2008 2008
BRAziL
Crop Latin name trait event Developer Food Feed Direct Use PlantingCotton Gossypium hirsutum L. IR 281-24-236 x 3006-210-23 Dow AgroSciences LLC 2009 2009 2009Cotton Gossypium hirsutum L. HT BCS-GHØØ2-5 (GHB614) Bayer CropScience 2010 2010 2010Cotton Gossypium hirsutum L. HT LLCotton25 Bayer CropScience 2008 2008 2008 2008Cotton Gossypium hirsutum L. HT MON1445 Monsanto Company 2008 2008 2008 2008Cotton Gossypium hirsutum L. IR MON15985 Monsanto Company 2009 2009 2009 2009Cotton Gossypium hirsutum L. IR + HT MON531 × MON1445 Monsanto Company 2009 2009 2009Cotton Gossypium hirsutum L. IR MON531/757/1076 Monsanto Company 2005 2005 2005Maize Zea mays L. HT + IR BT 11 (X4334CBR, X4734CBR) Syngenta Seeds 2008 2008 2008 2008Maize Zea mays L. HT + IR BT11 × GA21 Syngenta Seeds 2009 2009 2009Maize Zea mays L. HT + IR BT11 × MIR 162 × GA21 Syngenta Seeds 2009 2009 2009 2009Maize Zea mays L. HT GA21 Monsanto Company 2008 2008 2008 2008Maize Zea mays L. IR MIR162 Syngenta Seeds 2009 2009 2009Maize Zea mays L. IR + HT MON 89034 × NK603 Monsanto Company 2009 2009 2009 2009Maize Zea mays L. IR MON810 Monsanto Company 2008 2008 2007 2008Maize Zea mays L. HT + IR MON88017 Monsanto Company 2010 2010 2010 2010Maize Zea mays L. IR MON89034 Monsanto Company 2009 2009 2009Maize Zea mays L. IR + HT MON89034 × TC1507 × MON88017 × DAS-59122-7 Dow AgroSciences LLC 2010 2010 2010 2010Maize Zea mays L. HT NK603 Monsanto Company 2008 2008 2008 2008Maize Zea mays L. HT + IR NK603 x MON810 Monsanto Company 2009 2009 2009Maize Zea mays L. HT T14 Bayer CropScience 2008 2008 2008Maize Zea mays L. HT T25 Bayer CropScience (Aventis CropScience(AgrEvo)) 2008 2008 2008Maize Zea mays L. HT + IR TC1507 Mycogen (Dow AgroSciences) - Pioneer (DuPont) 2008 2008 2008 2008Maize Zea mays L. HT + IR TC1507 × NK603 Dow AgroSciences LLC and Pioneer Hi-Bred International Inc. 2009 2009 2009Soybean Glycine max L. HT A2704-12 Bayer CropScience (Aventis CropScience(AgrEvo)) 2010 2010 2010 2010Soybean Glycine max L. HT A5547-127 Bayer CropScience 2010 2010 2010 2010Soybean Glycine max L. HT CRV 127 BASF and EMBRAPA 2010 2010 2010Soybean Glycine max L. HT GTS 40-3-2 (40-3-2) Monsanto Company 1998 1998 1998Soybean Glycine max L. IR + HT MON 87701 × MON 89778 Monsanto Company 2010 2010 2010 2010
BURkinA FASO
Crop Latin name trait event Developer Food Feed Direct Use PlantingCotton Gossypium hirsutum L. IR MON15985 Monsanto Company 2008 2008 2008 2008
CAnADA
Crop Latin name trait event Developer Food Feed Direct Use PlantingAlfalfa Medicago sativa HT J101 Monsanto Company 2005 2005 2005

248
CAnADA
Crop Latin name trait event Developer Food Feed Direct Use PlantingAlfalfa Medicago sativa HT J163 Monsanto Company 2005 2005 2005Argentine Canola Brassica napus OC 23-18-17, 23-198 Calgene Inc. 1996 1996 1996Argentine Canola Brassica napus HT GT200 (RT200) Monsanto Company 1997 1997 1996Argentine Canola Brassica napus HT HCN10 Aventis CropScience 1995 1995 1995Argentine Canola Brassica napus HT + F MS8 × RF3 Bayer CropScience (Aventis CropScience(AgrEvo)) 1997 1996 1996Argentine Canola Brassica napus HT OXY-235 Aventis CropScience 1997 1997 1997Argentine Canola Brassica napus HT + F PGS1 (MS1(B91-4) × RF1(B93-101)) Bayer CropScience (Aventis CropScience(AgrEvo)) 1995 1995 1995Argentine Canola Brassica napus HT + F PGS2 (MS1 x RF2) (B91-4 x B94-2) Aventis CropScience 1995 1995 1995Argentine Canola Brassica napus HT RT73 (GT73) Monsanto Company 1994 1995 1995Argentine Canola Brassica napus HT T45 (HCN28) Bayer CropScience 1997 1996 1996Argentine Canola Brassica napus HT Topas 19/2, HCN92 Bayer CropScience (Aventis CropScience(AgrEvo)) 1995 1995 1995Cotton Gossypium hirsutum L. IR 281-24-236 Dow AgroSciences LLC 2005 2005Cotton Gossypium hirsutum L. IR 3006-210-23 Dow AgroSciences LLC 2005 2005Cotton Gossypium hirsutum L. HT + IR 31807/31808 Calgene Inc. 1998Cotton Gossypium hirsutum L. HT BCS-GHØØ2-5 (GHB614) Bayer CropScience 2008 2008Cotton Gossypium hirsutum L. HT BXN Calgene Inc. 1996Cotton Gossypium hirsutum L. HT LLCotton25 Bayer CropScience 2004 2004Cotton Gossypium hirsutum L. HT MON1445 Monsanto Company 1996 1997Cotton Gossypium hirsutum L. IR MON15985 Monsanto Company 2003 2003Cotton Gossypium hirsutum L. IR + HT MON15985 × MON1445 Monsanto Company 2004 2004 2004Cotton Gossypium hirsutum L. IR MON531/757/1076 Monsanto Company 1996 1996Cotton Gossypium hirsutum L. HT MON88913 Monsanto Company 2005 2005Flax, Linseed Linum usitatissumum L. HT FP967 University of Saskatchewan 1998 1996 1996Maize Zea mays L. Plt Quality 3272 Syngenta Seeds 2008 2008 2008Maize Zea mays L. HT + IR 59122 Dow AgroSciences LLC and Pioneer Hi-Bred International Inc. 2005 2005 2005Maize Zea mays L. HT + IR BT 11 (X4334CBR, X4734CBR) Syngenta Seeds 1996 1996 1996Maize Zea mays L. IR BT 176 Syngenta Seeds 1995 1996 1996Maize Zea mays L. HT + IR BT11 × GA21 Syngenta Seeds 2005 2005 2005Maize Zea mays L. HT + IR BT11 × MIR 162 × GA21 Syngenta Seeds 2010 2010Maize Zea mays L. HT + IR BT11 × MIR604 Syngenta Seeds 2007 2007 2007Maize Zea mays L. IR + HT BT11 × MIR604 × GA21 Syngenta Seeds 2007 2007 2007Maize Zea mays L. HT + IR DAS 59122 × TC1507 × NK603 Pioneer Hi-Bred International Inc. 2006 2006 2006Maize Zea mays L. HT + IR DAS-59122-7 × NK603 Dow AgroSciences LLC and Pioneer Hi-Bred International Inc. 2005 2005 2005Maize Zea mays L. HT + IR DBT418 DeKalb Genetics Corporation 1997 1997 1997Maize Zea mays L. HT DLL25 (B16) DeKalb Genetics Corporation 1996 1996 1996Maize Zea mays L. VR+IR+HT Event 3272 × BT11 × MIR 604 × GA21 Syngenta Seeds 2010 2010 2010Maize Zea mays L. HT + HT Event 98140 Pioneer Hi-Bred International Inc. 2009 2009 2009Maize Zea mays L. HT GA21 Monsanto Company 1998 1998 1998Maize Zea mays L. HT + IR GA21 x MON810 Monsanto Company 2003 2003 2003Maize Zea mays L. Lys LY038 Monsanto Company 2006 2006 2006Maize Zea mays L. IR MIR 604 Syngenta Seeds 2007 2007 2007Maize Zea mays L. IR MIR162 Syngenta Seeds 2010 2010 2010Maize Zea mays L. IR + HT MON 89034 x NK603 Monsanto Company 2009 2009 2009Maize Zea mays L. IR + HT MON802 Monsanto Company 1997 1997 1997Maize Zea mays L. IR + HT MON809 Pioneer Hi-Bred International Inc. 1996 1996 1996Maize Zea mays L. IR MON810 Monsanto Company 1997 1997 1997Maize Zea mays L. HT + IR MON810 × MON88017 Monsanto Company 2006 2006 2006Maize Zea mays L. HT MON832 Monsanto Company 1997Maize Zea mays L. IR MON863 Monsanto Company 2003 2003 2003Maize Zea mays L. IR MON863 × MON810 Monsanto Company 2004 2004 2004
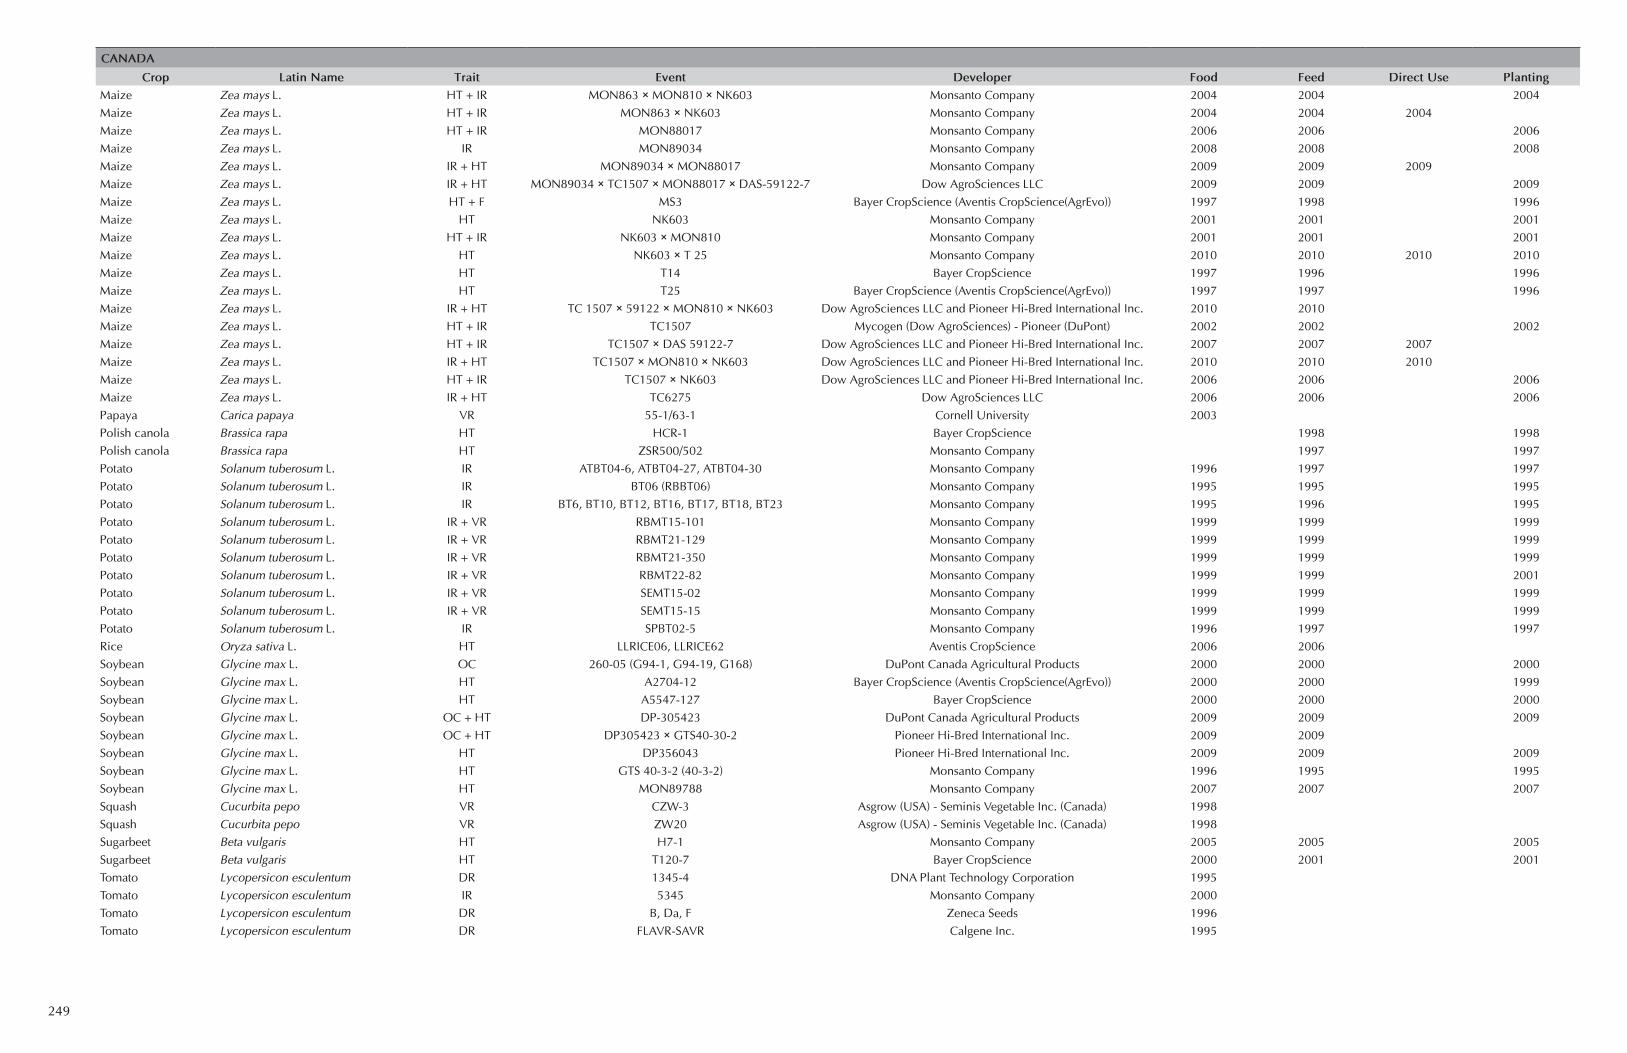
249
CAnADA
Crop Latin name trait event Developer Food Feed Direct Use PlantingMaize Zea mays L. HT + IR MON863 × MON810 × NK603 Monsanto Company 2004 2004 2004Maize Zea mays L. HT + IR MON863 × NK603 Monsanto Company 2004 2004 2004Maize Zea mays L. HT + IR MON88017 Monsanto Company 2006 2006 2006Maize Zea mays L. IR MON89034 Monsanto Company 2008 2008 2008Maize Zea mays L. IR + HT MON89034 × MON88017 Monsanto Company 2009 2009 2009Maize Zea mays L. IR + HT MON89034 × TC1507 × MON88017 × DAS-59122-7 Dow AgroSciences LLC 2009 2009 2009Maize Zea mays L. HT + F MS3 Bayer CropScience (Aventis CropScience(AgrEvo)) 1997 1998 1996Maize Zea mays L. HT NK603 Monsanto Company 2001 2001 2001Maize Zea mays L. HT + IR NK603 × MON810 Monsanto Company 2001 2001 2001Maize Zea mays L. HT NK603 × T 25 Monsanto Company 2010 2010 2010 2010Maize Zea mays L. HT T14 Bayer CropScience 1997 1996 1996Maize Zea mays L. HT T25 Bayer CropScience (Aventis CropScience(AgrEvo)) 1997 1997 1996Maize Zea mays L. IR + HT TC 1507 × 59122 × MON810 × NK603 Dow AgroSciences LLC and Pioneer Hi-Bred International Inc. 2010 2010Maize Zea mays L. HT + IR TC1507 Mycogen (Dow AgroSciences) - Pioneer (DuPont) 2002 2002 2002Maize Zea mays L. HT + IR TC1507 × DAS 59122-7 Dow AgroSciences LLC and Pioneer Hi-Bred International Inc. 2007 2007 2007Maize Zea mays L. IR + HT TC1507 × MON810 × NK603 Dow AgroSciences LLC and Pioneer Hi-Bred International Inc. 2010 2010 2010Maize Zea mays L. HT + IR TC1507 × NK603 Dow AgroSciences LLC and Pioneer Hi-Bred International Inc. 2006 2006 2006Maize Zea mays L. IR + HT TC6275 Dow AgroSciences LLC 2006 2006 2006Papaya Carica papaya VR 55-1/63-1 Cornell University 2003Polish canola Brassica rapa HT HCR-1 Bayer CropScience 1998 1998Polish canola Brassica rapa HT ZSR500/502 Monsanto Company 1997 1997Potato Solanum tuberosum L. IR ATBT04-6, ATBT04-27, ATBT04-30 Monsanto Company 1996 1997 1997Potato Solanum tuberosum L. IR BT06 (RBBT06) Monsanto Company 1995 1995 1995Potato Solanum tuberosum L. IR BT6, BT10, BT12, BT16, BT17, BT18, BT23 Monsanto Company 1995 1996 1995Potato Solanum tuberosum L. IR + VR RBMT15-101 Monsanto Company 1999 1999 1999Potato Solanum tuberosum L. IR + VR RBMT21-129 Monsanto Company 1999 1999 1999Potato Solanum tuberosum L. IR + VR RBMT21-350 Monsanto Company 1999 1999 1999Potato Solanum tuberosum L. IR + VR RBMT22-82 Monsanto Company 1999 1999 2001Potato Solanum tuberosum L. IR + VR SEMT15-02 Monsanto Company 1999 1999 1999Potato Solanum tuberosum L. IR + VR SEMT15-15 Monsanto Company 1999 1999 1999Potato Solanum tuberosum L. IR SPBT02-5 Monsanto Company 1996 1997 1997Rice Oryza sativa L. HT LLRICE06, LLRICE62 Aventis CropScience 2006 2006Soybean Glycine max L. OC 260-05 (G94-1, G94-19, G168) DuPont Canada Agricultural Products 2000 2000 2000Soybean Glycine max L. HT A2704-12 Bayer CropScience (Aventis CropScience(AgrEvo)) 2000 2000 1999Soybean Glycine max L. HT A5547-127 Bayer CropScience 2000 2000 2000Soybean Glycine max L. OC + HT DP-305423 DuPont Canada Agricultural Products 2009 2009 2009Soybean Glycine max L. OC + HT DP305423 × GTS40-30-2 Pioneer Hi-Bred International Inc. 2009 2009Soybean Glycine max L. HT DP356043 Pioneer Hi-Bred International Inc. 2009 2009 2009Soybean Glycine max L. HT GTS 40-3-2 (40-3-2) Monsanto Company 1996 1995 1995Soybean Glycine max L. HT MON89788 Monsanto Company 2007 2007 2007Squash Cucurbita pepo VR CZW-3 Asgrow (USA) - Seminis Vegetable Inc. (Canada) 1998Squash Cucurbita pepo VR ZW20 Asgrow (USA) - Seminis Vegetable Inc. (Canada) 1998Sugarbeet Beta vulgaris HT H7-1 Monsanto Company 2005 2005 2005Sugarbeet Beta vulgaris HT T120-7 Bayer CropScience 2000 2001 2001Tomato Lycopersicon esculentum DR 1345-4 DNA Plant Technology Corporation 1995Tomato Lycopersicon esculentum IR 5345 Monsanto Company 2000Tomato Lycopersicon esculentum DR B, Da, F Zeneca Seeds 1996Tomato Lycopersicon esculentum DR FLAVR-SAVR Calgene Inc. 1995

250
ChiLe
Crop Latin name trait event Developer Food Feed Direct Use PlantingArgentine Canola Brassica napus HT GT200 (RT200) Monsanto Company 2007Maize Zea mays L. IR MON810 Monsanto Company 2007Soybean Glycine max L. HT GTS 40-3-2 (40-3-2) Monsanto Company 2007
ChinA
Crop Latin name trait event Developer Food Feed Direct Use PlantingArgentine Canola Brassica napus HT + F MS8 × RF3 Bayer CropScience (Aventis CropScience(AgrEvo)) 2004 2004Argentine Canola Brassica napus HT OXY-235 Aventis CropScience 2004 2004Argentine Canola Brassica napus HT + F PGS1 (MS1(B91-4) x RF1(B93-101)) Bayer CropScience (Aventis CropScience(AgrEvo)) 2004 2004Argentine Canola Brassica napus HT + F PGS2 (MS1 x RF2) (B91-4 x B94-2) Aventis CropScience 2004 2004Argentine Canola Brassica napus HT RT73 (GT73) Monsanto Company 2004 2004Argentine Canola Brassica napus HT T45 (HCN28) Bayer CropScience 2004 2004Argentine Canola Brassica napus HT Topas 19/2, HCN92 Bayer CropScience (Aventis CropScience(AgrEvo)) 2004 2004Cotton Gossypium hirsutum L. IR Cry1A + CpT1 Chinese Academy of Agricultural Sciences 1999Cotton Gossypium hirsutum L. IR GK12 Chinese Academy of Agricultural Sciences 1997Cotton Gossypium hirsutum L. HT LLCotton25 Bayer CropScience 2006 2006Cotton Gossypium hirsutum L. HT MON1445 Monsanto Company 2004 2004Cotton Gossypium hirsutum L. IR MON15985 Monsanto Company 2006 2006Cotton Gossypium hirsutum L. IR MON531/757/1076 Monsanto Company 2004 2004Maize Zea mays L. HT + IR 59122 Dow AgroSciences LLC and Pioneer Hi-Bred International Inc. 2006 2006Maize Zea mays L. HT + IR BT 11 (X4334CBR, X4734CBR) Syngenta Seeds 2004 2004Maize Zea mays L. IR BT 176 Syngenta Seeds 2004 2004Maize Zea mays L. HT GA21 Monsanto Company 2004 2004Maize Zea mays L. HT High Phytase Origin Agritech 2009Maize Zea mays L. IR MON810 Monsanto Company 2004Maize Zea mays L. IR MON863 Monsanto Company 2004 2004Maize Zea mays L. HT NK603 Monsanto Company 2005 2005Maize Zea mays L. HT T25 Bayer CropScience (Aventis CropScience(AgrEvo)) 2004 2004Maize Zea mays L. HT + IR TC1507 Mycogen (Dow AgroSciences) - Pioneer (DuPont) 2004 2004Papaya Carica papaya VR Huanong No. 1 South China Agricultural University 2006Petunia Petunia FC CHS gene Beijing University 1998Poplar Populus nigra IR Bt Poplar Research Institute of Forestry, Beijing, China 2003 2008Rice Oryza sativa L. IR cry1Ac Event Huazhong Agricultural University 2009 2009 2009Soybean Glycine max L. HT A2704-12 Bayer CropScience (Aventis CropScience(AgrEvo)) 2007 2007Soybean Glycine max L. HT GTS 40-3-2 (40-3-2) Monsanto Company 2004 2004Soybean Glycine max L. HT MON89788 Monsanto Company 2008 2008Sweet pepper Capsicum annuum VR PK-SP01 Beijing University 1998 1998Tomato Lycopersicon esculentum DR Da Dong No. 9 Institute of Microbiology, CAS 2000 2000 2000Tomato Lycopersicon esculentum DR Huafan No. 1 Huazhong Agricultural University 1997 1997 1997Tomato Lycopersicon esculentum DR PK-TM8805R Beijing University 1998
COLOmBiA
Crop Latin name trait event Developer Food Feed Direct Use PlantingCarnation Dianthus caryophyllus FC + HT 959A, 988A, 1226A, 1351A, 1363A, 1400A Florigene Pty Ltd. 2000Cotton Gossypium hirsutum L. HT LLCotton25 Bayer CropScience 2010Cotton Gossypium hirsutum L. HT MON1445 Monsanto Company 2004 2004 2004Cotton Gossypium hirsutum L. IR MON15985 Monsanto Company 2009Cotton Gossypium hirsutum L. IR + HT MON15985 x MON1445 Monsanto Company 2006 2008Cotton Gossypium hirsutum L. IR MON531 Monsanto Company 2003 2003 2003

251
COLOmBiA
Crop Latin name trait event Developer Food Feed Direct Use PlantingCotton Gossypium hirsutum L. IR + HT MON531 × MON1445 Monsanto Company 2007Cotton Gossypium hirsutum L. IR MON531/757/1076 Monsanto Company 2004 2004Cotton Gossypium hirsutum L. HT MON88913 Monsanto Company 2007 2007 2010Cotton Gossypium hirsutum L. HT + IR MON88913 × MON15985 Monsanto Company 2010 2007 2007Maize Zea mays L. HT + IR BT 11 (X4334CBR, X4734CBR) Syngenta Seeds 2008 2008 2008Maize Zea mays L. HT + IR BT11 × MIR 162 × GA21 Syngenta Seeds 2010 2010 2010Maize Zea mays L. HT + IR BT11 x MIR604 Syngenta SeedsMaize Zea mays L. HT GA21 Monsanto Company 2010 2010 2008Maize Zea mays L. Lys LY038 Monsanto Company 2010 2010 2010Maize Zea mays L. IR + HT MON 89034 × NK603 Monsanto Company 2010Maize Zea mays L. IR MON810 Monsanto Company 2003 2006Maize Zea mays L. IR MON863 Monsanto CompanyMaize Zea mays L. HT + IR MON88017 Monsanto Company 2010Maize Zea mays L. IR MON89034 Monsanto Company 2008Maize Zea mays L. IR + HT MON89034 × TC1507 × MON88017 × DAS-59122-7 Dow AgroSciences LLC 2010Maize Zea mays L. HT NK603 Monsanto Company 2004 2004 2008Maize Zea mays L. HT + IR NK603 × MON810 Monsanto Company 2008 2008 2008Maize Zea mays L. HT + IR TC1507 Mycogen (Dow AgroSciences) - Pioneer (DuPont) 2006 2006 2006Maize Zea mays L. HT + IR TC1507 × NK603 Dow AgroSciences LLC and Pioneer Hi-Bred International Inc. 2008Rice Oryza sativa L. HT LLRICE601 Bayer CropScience 2008 2008Rose Rosa hybrida FC Blue Rose pSPB130 International Flower Developments - PTY (Colombia) 2010Soybean Glycine max L. HT DP356043 Pioneer Hi-Bred International Inc. 2010 2010Soybean Glycine max L. HT GTS 40-3-2 (40-3-2) Monsanto Company 2005 2005 2010Soybean Glycine max L. HT MON89788 Monsanto Company 2010 2010Sugarbeet Beta vulgaris HT H7-1 Monsanto Company 2010Wheat Triticum aestivum HT MON-71800 Monsanto Company 2004 2004
COStA RiCA
Crop Latin name trait event Developer Food Feed Direct Use PlantingCotton Gossypium hirsutum L. IR 281-24-236 x 3006-210-23 Dow AgroSciences LLC 2009Cotton Gossypium hirsutum L. HT + IR 3006-210-23 x 281-24-236 x MON88913 Dow AgroSciences LLC and Pioneer Hi-Bred International Inc. 2009Cotton Gossypium hirsutum L. HT BCS-GHØØ2-5 (GHB614) Bayer CropScience 2009Cotton Gossypium hirsutum L. IR COT 102 x COT 67B Syngenta Seeds 2009Cotton Gossypium hirsutum L. IR COT102 Syngenta Seeds 2009Cotton Gossypium hirsutum L. IR + HT COT102 x COT67B x MON88913 Syngenta Seeds 2009Cotton Gossypium hirsutum L. IR COT67B Syngenta Seeds 2009Cotton Gossypium hirsutum L. HT Dicamba and Gluphosinate Monsanto Company 2009Cotton Gossypium hirsutum L. IR GEM1 Bayer SA, Costa Rica 2009Cotton Gossypium hirsutum L. HT MON1445 Monsanto Company 2008Cotton Gossypium hirsutum L. IR MON15985 Monsanto Company 2008Cotton Gossypium hirsutum L. IR + HT MON15985 x MON1445 Monsanto Company 2008Cotton Gossypium hirsutum L. IR MON531 Monsanto Company 2008Cotton Gossypium hirsutum L. IR + HT MON531 X MON1445 Monsanto Company 2008Cotton Gossypium hirsutum L. HT MON88913 Monsanto Company 2008Cotton Gossypium hirsutum L. HT + IR MON88913 x MON15985 Monsanto Company 2008Soybean Glycine max L. HT GTS 40-3-2 (40-3-2) Monsanto Company 2008Soybean Glycine max L. HT MON89788 Monsanto Company 2009

252
CzeCh RePUBLiC
Crop Latin name trait event Developer Food Feed Direct Use PlantingMaize Zea mays L. IR MON810 Monsanto Company 2005 2005 2005Potato Solanum tuberosum L. Plt Quality EH92-527-1 Bayer CropScience 2010 2010 2010Soybean Glycine max L. HT GTS 40-3-2 (40-3-2) Monsanto Company 2001 2001 2001
eGyPt, ARAB ReP.
Crop Latin name trait event Developer Food Feed Direct Use PlantingMaize Zea mays L. IR MON810 Monsanto Company 2008
eL SALVADOR
Crop Latin name trait event Developer Food Feed Direct Use PlantingMaize Zea mays L. HT NK603 Monsanto Company 2009 2009Maize Zea mays L. HT + IR NK603 × MON810 Monsanto Company 2009 2009Maize Zea mays L. HT + IR TC1507 Mycogen (Dow AgroSciences) - Pioneer (DuPont) 2009 2009
eUROPeAn UniOn
Crop Latin name trait event Developer Food Feed Direct Use PlantingArgentine Canola Brassica napus HT + F MS8 × RF3 Bayer CropScience (Aventis CropScience(AgrEvo)) 1999 2000 2007Argentine Canola Brassica napus HT RT73 (GT73) Monsanto Company 2007 2007Argentine Canola Brassica napus HT T45 (HCN28) Bayer CropScience 2007 2007 2007Argentine Canola Brassica napus HT Topas 19/2, HCN92 Bayer CropScience (Aventis CropScience(AgrEvo)) 1997 1998Carnation Dianthus caryophyllus FC + HT 123.2.38 (40644) Florigene Pty Ltd. 2007 2007Carnation Dianthus caryophyllus FC 4, 11, 15, 16 Florigene Pty Ltd. 1997Carnation Dianthus caryophyllus DS 66 Florigene Pty Ltd. 1998 1998Carnation Dianthus caryophyllus FC + HT 959A, 988A, 1226A, 1351A, 1363A, 1400A Florigene Pty Ltd. 1998 1998Chicory Cichorium intybus HT + F RM3-3, RM3-4, RM3-6 Bejo Zaden BV 1996Cotton Gossypium hirsutum L. HT LLCotton25 Bayer CropScience 2008 2008 2008Cotton Gossypium hirsutum L. HT MON1445 Monsanto Company 2002 1997Cotton Gossypium hirsutum L. IR MON15985 Monsanto Company 2005 2005Cotton Gossypium hirsutum L. IR + HT MON15985 × MON1445 Monsanto Company 2005 2005Cotton Gossypium hirsutum L. IR MON531 Monsanto Company 2002 1997Cotton Gossypium hirsutum L. IR + HT MON531 × MON1445 Monsanto Company 2005 2005Maize Zea mays L. HT + IR 59122 Dow AgroSciences LLC and Pioneer Hi-Bred International Inc. 2007 2007 2007Maize Zea mays L. HT + IR BT 11 (X4334CBR, X4734CBR) Syngenta Seeds 1998 1998Maize Zea mays L. IR BT 176 Syngenta Seeds 1997 1997 1997Maize Zea mays L. HT + IR BT11 x GA21 Syngenta Seeds 2010 2010 2010Maize Zea mays L. HT + IR DAS-59122-7 × NK603 Dow AgroSciences LLC and Pioneer Hi-Bred International Inc. 2009 2009 2009Maize Zea mays L. HT GA21 Monsanto Company 2006 2006 2008Maize Zea mays L. HT + IR GA21 x MON810 Monsanto Company 2005 2007Maize Zea mays L. IR MIR 604 Syngenta Seeds 2009 2009 2009Maize Zea mays L. IR + HT MON 89034 × NK603 Monsanto Company 2010 2010 2010Maize Zea mays L. IR MON810 Monsanto Company 1998 1998 2004Maize Zea mays L. HT + IR MON810 × MON88017 Monsanto Company 2010 2010 2010Maize Zea mays L. IR MON863 Monsanto Company 2006 2005Maize Zea mays L. IR MON863 × MON810 Monsanto Company 2010 2010Maize Zea mays L. HT + IR MON863 x MON810 x NK603 Monsanto Company 2010 2010 2010Maize Zea mays L. HT + IR MON863 × NK603 Monsanto Company 2007 2005 2007Maize Zea mays L. HT + IR MON88017 Monsanto Company 2009 2009Maize Zea mays L. IR MON89034 Monsanto Company 2009 2009 2009Maize Zea mays L. HT NK603 Monsanto Company 2004 2004
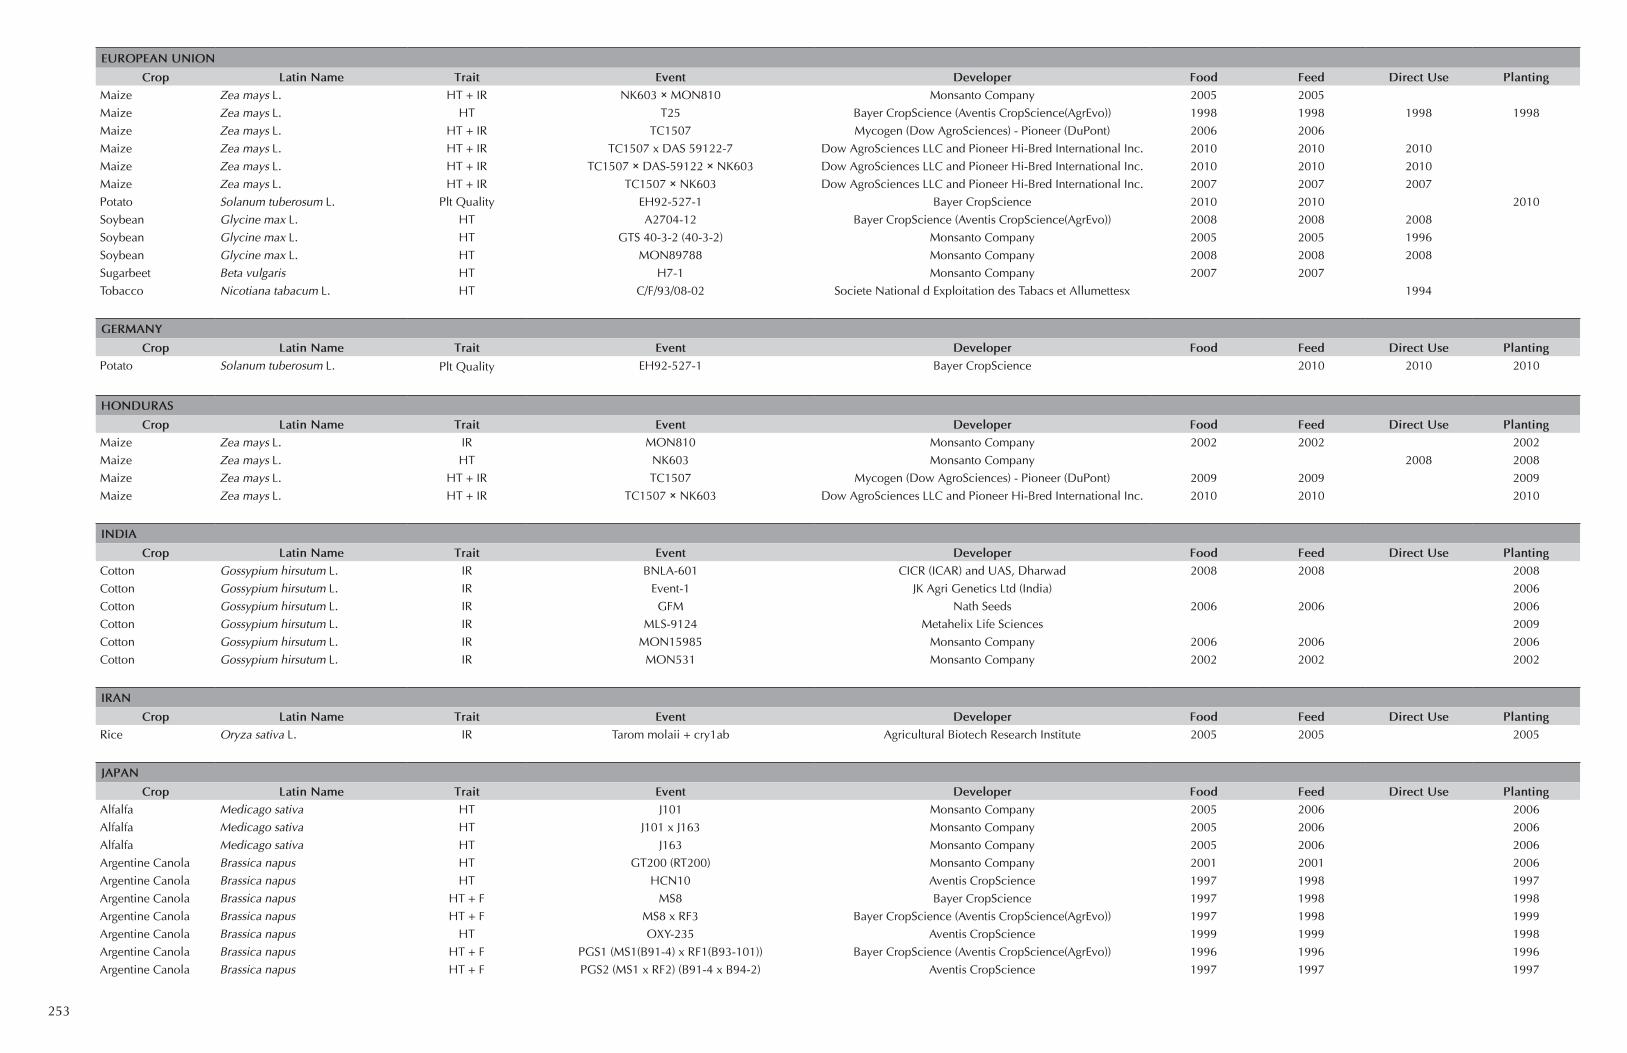
253
eUROPeAn UniOn
Crop Latin name trait event Developer Food Feed Direct Use PlantingMaize Zea mays L. HT + IR NK603 × MON810 Monsanto Company 2005 2005Maize Zea mays L. HT T25 Bayer CropScience (Aventis CropScience(AgrEvo)) 1998 1998 1998 1998Maize Zea mays L. HT + IR TC1507 Mycogen (Dow AgroSciences) - Pioneer (DuPont) 2006 2006Maize Zea mays L. HT + IR TC1507 x DAS 59122-7 Dow AgroSciences LLC and Pioneer Hi-Bred International Inc. 2010 2010 2010Maize Zea mays L. HT + IR TC1507 × DAS-59122 × NK603 Dow AgroSciences LLC and Pioneer Hi-Bred International Inc. 2010 2010 2010Maize Zea mays L. HT + IR TC1507 × NK603 Dow AgroSciences LLC and Pioneer Hi-Bred International Inc. 2007 2007 2007Potato Solanum tuberosum L. Plt Quality EH92-527-1 Bayer CropScience 2010 2010 2010Soybean Glycine max L. HT A2704-12 Bayer CropScience (Aventis CropScience(AgrEvo)) 2008 2008 2008Soybean Glycine max L. HT GTS 40-3-2 (40-3-2) Monsanto Company 2005 2005 1996Soybean Glycine max L. HT MON89788 Monsanto Company 2008 2008 2008Sugarbeet Beta vulgaris HT H7-1 Monsanto Company 2007 2007Tobacco Nicotiana tabacum L. HT C/F/93/08-02 Societe National d Exploitation des Tabacs et Allumettesx 1994
GeRmAny
Crop Latin name trait event Developer Food Feed Direct Use PlantingPotato Solanum tuberosum L. Plt Quality EH92-527-1 Bayer CropScience 2010 2010 2010
hOnDURAS
Crop Latin name trait event Developer Food Feed Direct Use PlantingMaize Zea mays L. IR MON810 Monsanto Company 2002 2002 2002Maize Zea mays L. HT NK603 Monsanto Company 2008 2008Maize Zea mays L. HT + IR TC1507 Mycogen (Dow AgroSciences) - Pioneer (DuPont) 2009 2009 2009Maize Zea mays L. HT + IR TC1507 × NK603 Dow AgroSciences LLC and Pioneer Hi-Bred International Inc. 2010 2010 2010
inDiA
Crop Latin name trait event Developer Food Feed Direct Use PlantingCotton Gossypium hirsutum L. IR BNLA-601 CICR (ICAR) and UAS, Dharwad 2008 2008 2008Cotton Gossypium hirsutum L. IR Event-1 JK Agri Genetics Ltd (India) 2006Cotton Gossypium hirsutum L. IR GFM Nath Seeds 2006 2006 2006Cotton Gossypium hirsutum L. IR MLS-9124 Metahelix Life Sciences 2009Cotton Gossypium hirsutum L. IR MON15985 Monsanto Company 2006 2006 2006Cotton Gossypium hirsutum L. IR MON531 Monsanto Company 2002 2002 2002
iRAn
Crop Latin name trait event Developer Food Feed Direct Use PlantingRice Oryza sativa L. IR Tarom molaii + cry1ab Agricultural Biotech Research Institute 2005 2005 2005
jAPAn
Crop Latin name trait event Developer Food Feed Direct Use PlantingAlfalfa Medicago sativa HT J101 Monsanto Company 2005 2006 2006Alfalfa Medicago sativa HT J101 x J163 Monsanto Company 2005 2006 2006Alfalfa Medicago sativa HT J163 Monsanto Company 2005 2006 2006Argentine Canola Brassica napus HT GT200 (RT200) Monsanto Company 2001 2001 2006Argentine Canola Brassica napus HT HCN10 Aventis CropScience 1997 1998 1997Argentine Canola Brassica napus HT + F MS8 Bayer CropScience 1997 1998 1998Argentine Canola Brassica napus HT + F MS8 x RF3 Bayer CropScience (Aventis CropScience(AgrEvo)) 1997 1998 1999Argentine Canola Brassica napus HT OXY-235 Aventis CropScience 1999 1999 1998Argentine Canola Brassica napus HT + F PGS1 (MS1(B91-4) x RF1(B93-101)) Bayer CropScience (Aventis CropScience(AgrEvo)) 1996 1996 1996Argentine Canola Brassica napus HT + F PGS2 (MS1 x RF2) (B91-4 x B94-2) Aventis CropScience 1997 1997 1997

254
jAPAn
Crop Latin name trait event Developer Food Feed Direct Use PlantingArgentine Canola Brassica napus HT PHY14 Bayer CropScience 2001 1998 1997Argentine Canola Brassica napus HT + F PHY35 Bayer CropScience 2001 1998 1997Argentine Canola Brassica napus HT + F PHY36 Bayer CropScience 1997 1997 1997Argentine Canola Brassica napus HT + F RF3 Bayer CropScience 1997 1998 1998Argentine Canola Brassica napus HT RT73 (GT73) Monsanto Company 1996 1996 1996Argentine Canola Brassica napus HT T45 (HCN28) Bayer CropScience 1997 1997 1997Argentine Canola Brassica napus HT Topas 19/2, HCN92 Bayer CropScience (Aventis CropScience(AgrEvo)) 2007 2007Carnation Dianthus caryophyllus FC + HT 123.2.2 (40619) Florigene Pty Ltd. 2004Carnation Dianthus caryophyllus FC + HT 123.2.38 (40644) Florigene Pty Ltd. 2004Carnation Dianthus caryophyllus FC + HT 123.8.8 (40685) Florigene Pty Ltd. 2004Carnation Dianthus caryophyllus FC + HT 959A, 988A, 1226A, 1351A, 1363A, 1400A Florigene Pty Ltd. 2004Carnation Dianthus caryophyllus HT FLO-4Ø689-6 Suntory Limited 2007 2007Cotton Gossypium hirsutum L. IR 281-24-236 Dow AgroSciences LLC 2005Cotton Gossypium hirsutum L. IR 281-24-236 x 3006-210-23 Dow AgroSciences LLC 2004 2004Cotton Gossypium hirsutum L. IR 3006-210-23 Dow AgroSciences LLC 2005Cotton Gossypium hirsutum L. HT + IR 3006-210-23 x 281-24-236 x MON1445 Dow AgroSciences LLC 2006 2006Cotton Gossypium hirsutum L. HT + IR 3006-210-23 x 281-24-236 x MON88913 Dow AgroSciences LLC and Pioneer Hi-Bred International Inc. 2006Cotton Gossypium hirsutum L. HT + IR 31807/31808 Calgene Inc. 1999 1999 1998Cotton Gossypium hirsutum L. HT + HT ACS-GH00103-3 x BCS-GH002-5 Syngenta Seeds 2010 2010 2010Cotton Gossypium hirsutum L. HT BCS-GHØØ2-5 (GHB614) Bayer CropScience 2010 2010 2010Cotton Gossypium hirsutum L. HT BXN Calgene Inc. 1997 1998 1997Cotton Gossypium hirsutum L. IR COT102 Syngenta Seeds 2007Cotton Gossypium hirsutum L. IR COT67B Syngenta Seeds 2007Cotton Gossypium hirsutum L. HT LLCotton25 Bayer CropScience 2004 2006Cotton Gossypium hirsutum L. HT + IR LLCotton25 × MON15985 Bayer CropScience 2006 2007 2007Cotton Gossypium hirsutum L. HT MON1445 Monsanto Company 1997 1998 1997Cotton Gossypium hirsutum L. IR MON15985 Monsanto Company 2002 2003Cotton Gossypium hirsutum L. IR + HT MON15985 × MON1445 Monsanto Company 2005 2005Cotton Gossypium hirsutum L. IR + HT MON531 × MON1445 Monsanto Company 2004 2003 2004Cotton Gossypium hirsutum L. IR MON531/757/1076 Monsanto Company 1997 1997 1997Cotton Gossypium hirsutum L. HT MON88913 Monsanto Company 2005 2006Cotton Gossypium hirsutum L. HT + IR MON88913 × MON15985 Monsanto Company 2005 2006Maize Zea mays L. Plt Quality 3272 Syngenta Seeds 2010 2010 2010 2010Maize Zea mays L. HT + IR 59122 Dow AgroSciences LLC and Pioneer Hi-Bred International Inc. 2006 2006 2006Maize Zea mays L. HT + IR ACS-ZMØØ3-2 (T25) x MON-ØØ81Ø-6 Bayer CropScience 2003 2003Maize Zea mays L. HT + IR BT 11 (X4334CBR, X4734CBR) Syngenta Seeds 1996Maize Zea mays L. IR BT 176 Syngenta Seeds 1996 1996 1996Maize Zea mays L. HT + IR BT11 × GA21 Syngenta Seeds 2007 2007Maize Zea mays L. HT + IR BT11 × MIR 162 × GA21 Syngenta Seeds 2010 2010 2010 2010Maize Zea mays L. IR + HT BT11 × MIR162 × MIR 604 × GA21 Syngenta Seeds 2010 2010 2010 2010Maize Zea mays L. HT + IR BT11 x MIR604 Syngenta Seeds 2007Maize Zea mays L. IR + HT BT11 × MIR604 × GA21 Syngenta Seeds 2007 2010 2010 2010Maize Zea mays L. HT + IR DAS 59122 x TC1507 x NK603 Pioneer Hi-Bred International Inc. 2005 2006 2007Maize Zea mays L. HT + IR DAS-59122-7 × NK603 Dow AgroSciences LLC and Pioneer Hi-Bred International Inc. 2005 2006 2006Maize Zea mays L. HT + IR DBT418 DeKalb Genetics Corporation 1999 1999Maize Zea mays L. HT DLL25 (B16) DeKalb Genetics Corporation 1999 2000 1999Maize Zea mays L. VR+IR+HT Event 3272 x BT11 x MIR 604 x GA21 Syngenta Seeds 2010Maize Zea mays L. HT + HT Event 98140 Pioneer Hi-Bred International Inc. 2007Maize Zea mays L. HT + IR GA21 × MON810 Monsanto Company 2003 2003Maize Zea mays L. Lys LY038 Monsanto Company 2007 2007
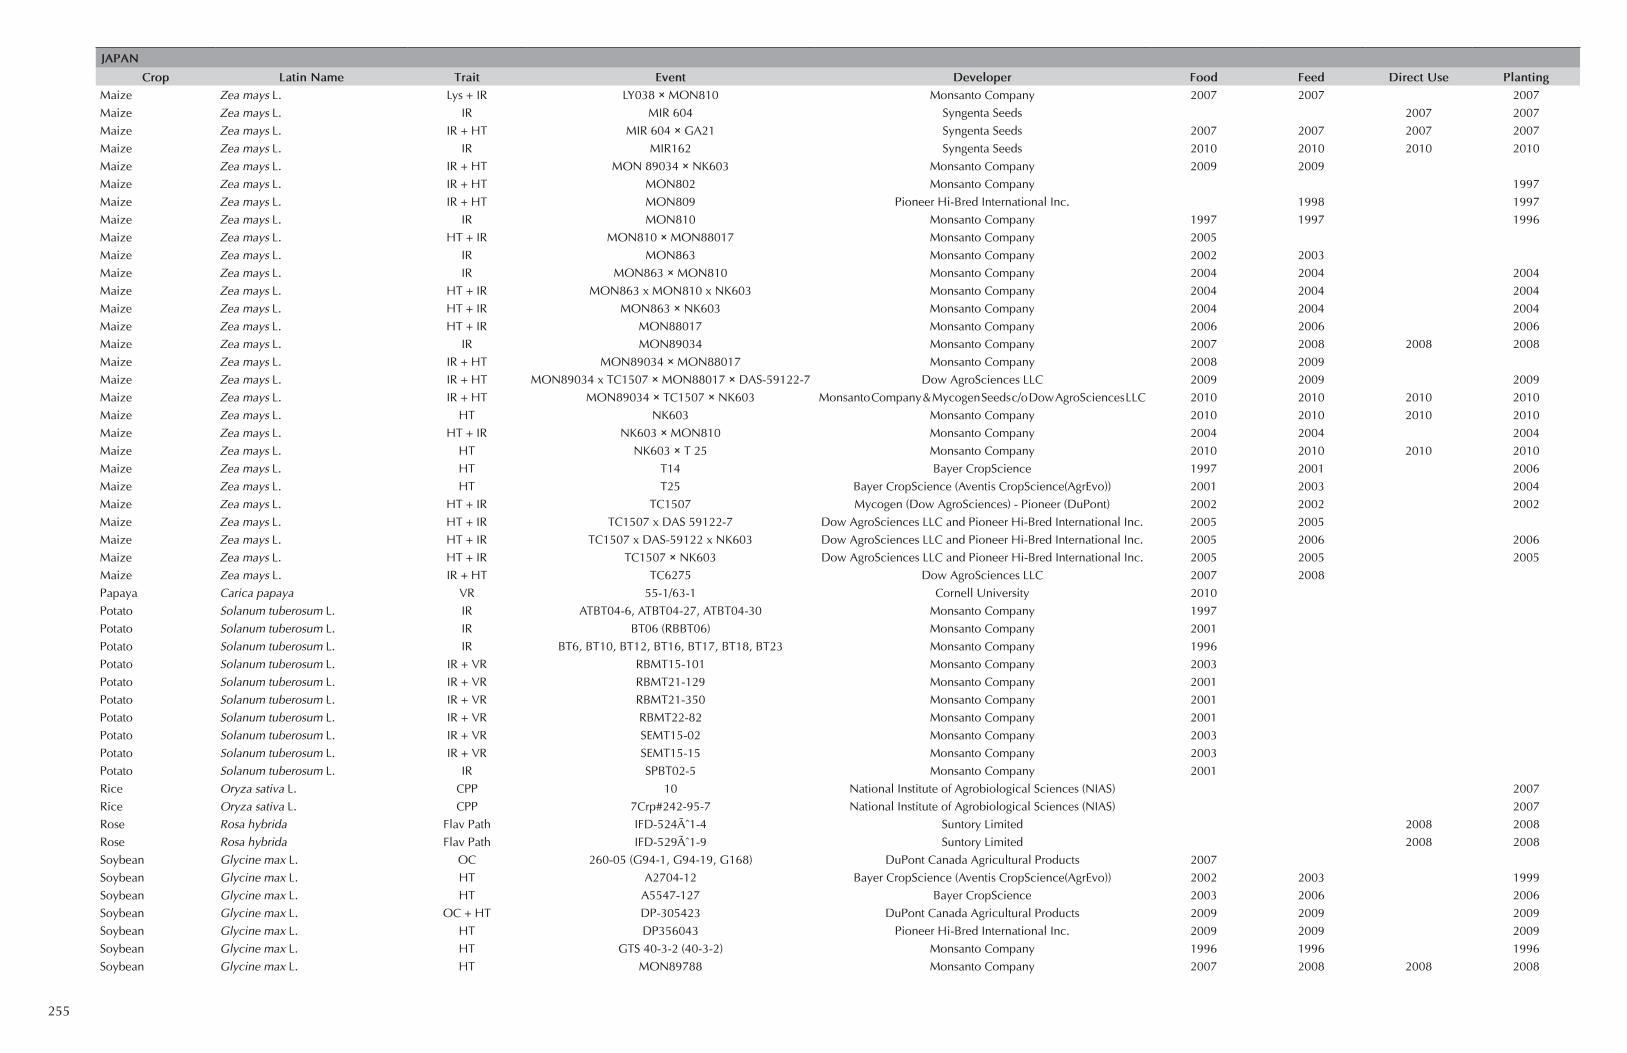
255
jAPAn
Crop Latin name trait event Developer Food Feed Direct Use PlantingMaize Zea mays L. Lys + IR LY038 × MON810 Monsanto Company 2007 2007 2007Maize Zea mays L. IR MIR 604 Syngenta Seeds 2007 2007Maize Zea mays L. IR + HT MIR 604 × GA21 Syngenta Seeds 2007 2007 2007 2007Maize Zea mays L. IR MIR162 Syngenta Seeds 2010 2010 2010 2010Maize Zea mays L. IR + HT MON 89034 × NK603 Monsanto Company 2009 2009Maize Zea mays L. IR + HT MON802 Monsanto Company 1997Maize Zea mays L. IR + HT MON809 Pioneer Hi-Bred International Inc. 1998 1997Maize Zea mays L. IR MON810 Monsanto Company 1997 1997 1996Maize Zea mays L. HT + IR MON810 × MON88017 Monsanto Company 2005Maize Zea mays L. IR MON863 Monsanto Company 2002 2003Maize Zea mays L. IR MON863 × MON810 Monsanto Company 2004 2004 2004Maize Zea mays L. HT + IR MON863 x MON810 x NK603 Monsanto Company 2004 2004 2004Maize Zea mays L. HT + IR MON863 × NK603 Monsanto Company 2004 2004 2004Maize Zea mays L. HT + IR MON88017 Monsanto Company 2006 2006 2006Maize Zea mays L. IR MON89034 Monsanto Company 2007 2008 2008 2008Maize Zea mays L. IR + HT MON89034 × MON88017 Monsanto Company 2008 2009Maize Zea mays L. IR + HT MON89034 x TC1507 × MON88017 × DAS-59122-7 Dow AgroSciences LLC 2009 2009 2009Maize Zea mays L. IR + HT MON89034 × TC1507 × NK603 Monsanto Company & Mycogen Seeds c/o Dow AgroSciences LLC 2010 2010 2010 2010Maize Zea mays L. HT NK603 Monsanto Company 2010 2010 2010 2010Maize Zea mays L. HT + IR NK603 × MON810 Monsanto Company 2004 2004 2004Maize Zea mays L. HT NK603 × T 25 Monsanto Company 2010 2010 2010 2010Maize Zea mays L. HT T14 Bayer CropScience 1997 2001 2006Maize Zea mays L. HT T25 Bayer CropScience (Aventis CropScience(AgrEvo)) 2001 2003 2004Maize Zea mays L. HT + IR TC1507 Mycogen (Dow AgroSciences) - Pioneer (DuPont) 2002 2002 2002Maize Zea mays L. HT + IR TC1507 x DAS 59122-7 Dow AgroSciences LLC and Pioneer Hi-Bred International Inc. 2005 2005Maize Zea mays L. HT + IR TC1507 x DAS-59122 x NK603 Dow AgroSciences LLC and Pioneer Hi-Bred International Inc. 2005 2006 2006Maize Zea mays L. HT + IR TC1507 × NK603 Dow AgroSciences LLC and Pioneer Hi-Bred International Inc. 2005 2005 2005Maize Zea mays L. IR + HT TC6275 Dow AgroSciences LLC 2007 2008Papaya Carica papaya VR 55-1/63-1 Cornell University 2010Potato Solanum tuberosum L. IR ATBT04-6, ATBT04-27, ATBT04-30 Monsanto Company 1997Potato Solanum tuberosum L. IR BT06 (RBBT06) Monsanto Company 2001Potato Solanum tuberosum L. IR BT6, BT10, BT12, BT16, BT17, BT18, BT23 Monsanto Company 1996Potato Solanum tuberosum L. IR + VR RBMT15-101 Monsanto Company 2003Potato Solanum tuberosum L. IR + VR RBMT21-129 Monsanto Company 2001Potato Solanum tuberosum L. IR + VR RBMT21-350 Monsanto Company 2001Potato Solanum tuberosum L. IR + VR RBMT22-82 Monsanto Company 2001Potato Solanum tuberosum L. IR + VR SEMT15-02 Monsanto Company 2003Potato Solanum tuberosum L. IR + VR SEMT15-15 Monsanto Company 2003Potato Solanum tuberosum L. IR SPBT02-5 Monsanto Company 2001Rice Oryza sativa L. CPP 10 National Institute of Agrobiological Sciences (NIAS) 2007Rice Oryza sativa L. CPP 7Crp#242-95-7 National Institute of Agrobiological Sciences (NIAS) 2007Rose Rosa hybrida Flav Path IFD-524Ø1-4 Suntory Limited 2008 2008Rose Rosa hybrida Flav Path IFD-529Ø1-9 Suntory Limited 2008 2008Soybean Glycine max L. OC 260-05 (G94-1, G94-19, G168) DuPont Canada Agricultural Products 2007Soybean Glycine max L. HT A2704-12 Bayer CropScience (Aventis CropScience(AgrEvo)) 2002 2003 1999Soybean Glycine max L. HT A5547-127 Bayer CropScience 2003 2006 2006Soybean Glycine max L. OC + HT DP-305423 DuPont Canada Agricultural Products 2009 2009 2009Soybean Glycine max L. HT DP356043 Pioneer Hi-Bred International Inc. 2009 2009 2009Soybean Glycine max L. HT GTS 40-3-2 (40-3-2) Monsanto Company 1996 1996 1996Soybean Glycine max L. HT MON89788 Monsanto Company 2007 2008 2008 2008

256
jAPAn
Crop Latin name trait event Developer Food Feed Direct Use PlantingSugarbeet Beta vulgaris HT GTS B77 Monsanto Company 2003Sugarbeet Beta vulgaris HT H7-1 Monsanto Company 2003 2007 2007Sugarbeet Beta vulgaris HT T120-7 Bayer CropScience 2001 2003Tomato Lycopersicon esculentum DR FLAVR-SAVR Calgene Inc. 1997
kOReA, ReP.
Crop Latin name trait event Developer Food Feed Direct Use PlantingArgentine Canola Brassica napus HT + F MS8 × RF3 Bayer CropScience (Aventis CropScience(AgrEvo)) 2005 2005Argentine Canola Brassica napus HT + F PGS1 (MS1(B91-4) × RF1(B93-101)) Bayer CropScience (Aventis CropScience(AgrEvo)) 2005Argentine Canola Brassica napus HT + F PGS2 (MS1 × RF2) (B91-4 × B94-2) Aventis CropScience 2005Argentine Canola Brassica napus HT RT73 (GT73) Monsanto Company 2003 2005Argentine Canola Brassica napus HT T45 (HCN28) Bayer CropScience 2005 2005Argentine Canola Brassica napus HT Topas 19/2, HCN92 Bayer CropScience (Aventis CropScience(AgrEvo)) 2005Cotton Gossypium hirsutum L. IR 281-24-236 × 3006-210-23 Dow AgroSciences LLC 2005 2008Cotton Gossypium hirsutum L. HT + IR 3006-210-23 × 281-24-236 × MON1445 Dow AgroSciences LLC 2006Cotton Gossypium hirsutum L. HT + IR 3006-210-23 × 281-24-236 × MON88913 Dow AgroSciences LLC and Pioneer Hi-Bred International Inc. 2006 2008Cotton Gossypium hirsutum L. IR 757 Monsanto Company 2003 2004Cotton Gossypium hirsutum L. HT BCS-GHØØ2-5 (GHB614) Bayer CropScience 2010 2010Cotton Gossypium hirsutum L. HT LLCotton25 Bayer CropScience 2005 2006Cotton Gossypium hirsutum L. HT + IR LLCotton25 × MON15985 Bayer CropScience 2007 2008Cotton Gossypium hirsutum L. HT MON1445 Monsanto Company 2003 2004Cotton Gossypium hirsutum L. IR MON15985 Monsanto Company 2003 2004Cotton Gossypium hirsutum L. IR + HT MON15985 × MON1445 Monsanto Company 2004 2008Cotton Gossypium hirsutum L. IR MON531 Monsanto Company 2003Cotton Gossypium hirsutum L. IR + HT MON531 × MON1445 Monsanto Company 2008 2008Cotton Gossypium hirsutum L. IR MON531/757/1076 Monsanto Company 2003 2004Cotton Gossypium hirsutum L. HT MON88913 Monsanto Company 2006Cotton Gossypium hirsutum L. HT + IR MON88913 × MON15985 Monsanto Company 2006 2008Maize Zea mays L. HT + IR 59122 Dow AgroSciences LLC and Pioneer Hi-Bred International Inc. 2005 2005Maize Zea mays L. HT + IR BT 11 (X4334CBR, X4734CBR) Syngenta Seeds 2003 2006Maize Zea mays L. IR BT 176 Syngenta Seeds 2003 2006Maize Zea mays L. HT + IR BT11 × GA21 Syngenta Seeds 2006 2008Maize Zea mays L. HT + IR BT11 × MIR604 Syngenta Seeds 2007 2007Maize Zea mays L. IR + HT BT11 × MIR604 × GA21 Syngenta Seeds 2008 2008Maize Zea mays L. HT + IR DAS 59122 × TC1507 × NK603 Pioneer Hi-Bred International Inc. 2008 2008Maize Zea mays L. HT + IR DAS-59122-7 × NK603 Dow AgroSciences LLC and Pioneer Hi-Bred International Inc. 2006Maize Zea mays L. HT + IR DBT418 DeKalb Genetics Corporation 2004Maize Zea mays L. HT DLL25 (B16) DeKalb Genetics Corporation 2004Maize Zea mays L. HT + HT Event 98140 Pioneer Hi-Bred International Inc. 2010 2010Maize Zea mays L. HT GA21 Monsanto Company 2010 2005Maize Zea mays L. HT + IR GA21 × MON810 Monsanto Company 2004Maize Zea mays L. IR MIR 604 Syngenta Seeds 2007 2008Maize Zea mays L. IR + HT MIR 604 × GA21 Syngenta Seeds 2007 2008Maize Zea mays L. IR MIR162 Syngenta Seeds 2008 2010Maize Zea mays L. IR + HT MON 89034 × NK603 Monsanto Company 2010 2009Maize Zea mays L. IR MON810 Monsanto Company 2002Maize Zea mays L. HT + IR MON810 × MON88017 Monsanto Company 2006Maize Zea mays L. IR MON863 Monsanto Company 2003 2004Maize Zea mays L. IR MON863 × MON810 Monsanto Company 2004Maize Zea mays L. HT + IR MON863 × MON810 × NK603 Monsanto Company 2004

257
kOReA, ReP.
Crop Latin name trait event Developer Food Feed Direct Use PlantingMaize Zea mays L. HT + IR MON863 × NK603 Monsanto Company 2004Maize Zea mays L. HT + IR MON88017 Monsanto Company 2006Maize Zea mays L. IR MON89034 Monsanto Company 2009 2009Maize Zea mays L. IR + HT MON89034 × MON88017 Monsanto Company 2009 2009Maize Zea mays L. IR + HT MON89034 × TC1507 × MON88017 × DAS-59122-7 Dow AgroSciences LLC 2009 2009Maize Zea mays L. IR + HT MON89034 × TC1507 × NK603 Monsanto Company & Mycogen Seeds c/o Dow AgroSciences LLC 2010 2010Maize Zea mays L. HT NK603 Monsanto Company 2002 2004Maize Zea mays L. HT + IR NK603 × MON810 Monsanto Company 2004Maize Zea mays L. HT NK603 × T 25 Monsanto Company 2010 2010 2010Maize Zea mays L. HT T25 Bayer CropScience (Aventis CropScience(AgrEvo)) 2003 2004Maize Zea mays L. IR + HT TC 1507 × 59122 × MON810 × NK603 Dow AgroSciences LLC and Pioneer Hi-Bred International Inc. 2010 2010Maize Zea mays L. HT + IR TC1507 Mycogen (Dow AgroSciences) - Pioneer (DuPont) 2002 2004Maize Zea mays L. HT + IR TC1507 × DAS 59122-7 Dow AgroSciences LLC and Pioneer Hi-Bred International Inc. 2007 2007 2007Maize Zea mays L. IR + HT TC1507 × MON810 × NK603 Dow AgroSciences LLC and Pioneer Hi-Bred International Inc. 2010 2010Maize Zea mays L. HT + IR TC1507 × NK603 Dow AgroSciences LLC and Pioneer Hi-Bred International Inc. 2004Potato Solanum tuberosum L. IR ATBT04-6, ATBT04-27, ATBT04-30 Monsanto Company 2004Potato Solanum tuberosum L. IR BT06 (RBBT06) Monsanto Company 2004Potato Solanum tuberosum L. IR BT6, BT10, BT12, BT16, BT17, BT18, BT23 Monsanto Company 2004Potato Solanum tuberosum L. IR + VR RBMT15-101 Monsanto Company 2004Potato Solanum tuberosum L. IR + VR RBMT21-129 Monsanto Company 2004Potato Solanum tuberosum L. IR + VR RBMT21-350 Monsanto Company 2004Potato Solanum tuberosum L. IR + VR RBMT22-82 Monsanto Company 2004Potato Solanum tuberosum L. IR + VR SEMT15-02 Monsanto Company 2004Potato Solanum tuberosum L. IR + VR SEMT15-15 Monsanto Company 2004Soybean Glycine max L. HT A2704-12 Bayer CropScience (Aventis CropScience(AgrEvo)) 2009 2009Soybean Glycine max L. HT DP356043 Pioneer Hi-Bred International Inc. 2010 2009Soybean Glycine max L. HT GTS 40-3-2 (40-3-2) Monsanto Company 2004 2004Soybean Glycine max L. HT MON89788 Monsanto Company 2008 2008Sugarbeet Beta vulgaris HT H7-1 Monsanto Company 2006
mALAySiA
Crop Latin name trait event Developer Food Feed Direct Use PlantingMaize Zea mays L. IR MON810 Monsanto Company 1998 1998 1998Maize Zea mays L. IR MON863 Monsanto Company 1998 1998 1998Maize Zea mays L. HT NK603 Monsanto Company 1998 1998 1998Soybean Glycine max L. HT GTS 40-3-2 (40-3-2) Monsanto Company 1997 1997 1997
mexiCO
Crop Latin name trait event Developer Food Feed Direct Use PlantingAlfalfa Medicago sativa HT J101 Monsanto Company 2005Alfalfa Medicago sativa HT J101 x J163 Monsanto Company 2010 2010Alfalfa Medicago sativa HT J163 Monsanto Company 2005 2005Argentine Canola Brassica napus HT + F MS8 x RF3 Bayer CropScience (Aventis CropScience(AgrEvo)) 2004 2004Argentine Canola Brassica napus HT RT73 (GT73) Monsanto Company 1996 1996Argentine Canola Brassica napus HT T45 (HCN28) Bayer CropScience 2001Argentine Canola Brassica napus HT Topas 19/2, HCN92 Bayer CropScience (Aventis CropScience(AgrEvo)) 1999Cotton Gossypium hirsutum L. IR 281-24-236 Dow AgroSciences LLC 2004 2004Cotton Gossypium hirsutum L. IR 281-24-236 x 3006-210-23 Dow AgroSciences LLC 2004 2004Cotton Gossypium hirsutum L. IR 3006-210-23 Dow AgroSciences LLC 2004 2004

258
mexiCO
Crop Latin name trait event Developer Food Feed Direct Use PlantingCotton Gossypium hirsutum L. HT + IR 3006-210-23 × 281-24-236 × MON1445 Dow AgroSciences LLC 2005 2005Cotton Gossypium hirsutum L. HT + IR 3006-210-23 × 281-24-236 × MON88913 Dow AgroSciences LLC and Pioneer Hi-Bred International Inc. 2006 2006Cotton Gossypium hirsutum L. HT + HT ACS-GH00103-3 x BCS-GH002-5 Syngenta Seeds 2010 2010Cotton Gossypium hirsutum L. HT BCS-GHØØ2-5 (GHB614) Bayer CropScience 2009 2009Cotton Gossypium hirsutum L. HT BXN Calgene Inc. 1996 1996Cotton Gossypium hirsutum L. IR COT102 Syngenta Seeds 2010 2010Cotton Gossypium hirsutum L. HT LLCotton25 Bayer CropScience 2006 2006Cotton Gossypium hirsutum L. HT + IR LLCotton25 × MON15985 Bayer CropScience 2008 2008Cotton Gossypium hirsutum L. IR MON15985 Monsanto Company 2003 2003Cotton Gossypium hirsutum L. IR + HT MON15985 × MON1445 Monsanto Company 2006 2006Cotton Gossypium hirsutum L. IR MON531 Monsanto Company 1996 1996Cotton Gossypium hirsutum L. IR + HT MON531 × MON1445 Monsanto Company 2002 2002Cotton Gossypium hirsutum L. IR MON531/757/1076 Monsanto Company 1997 1997 1997Cotton Gossypium hirsutum L. HT MON88913 Monsanto Company 2008 2008Cotton Gossypium hirsutum L. HT + IR MON88913 × MON15985 Monsanto Company 2008 2008Maize Zea mays L. Plt Quality 3272 Syngenta Seeds 2008 2008Maize Zea mays L. HT + IR 59122 Dow AgroSciences LLC and Pioneer Hi-Bred International Inc. 2004 2004Maize Zea mays L. HT + IR BT 11 (X4334CBR, X4734CBR) Syngenta Seeds 2007 2007Maize Zea mays L. HT + IR BT11 × GA21 Syngenta Seeds 2007 2007Maize Zea mays L. HT + IR BT11 × MIR 162 × GA21 Syngenta Seeds 2010 2010 2010Maize Zea mays L. HT + IR BT11 × MIR604 Syngenta Seeds 2007 2007Maize Zea mays L. IR + HT BT11 × MIR604 × GA21 Syngenta Seeds 2008 2008Maize Zea mays L. HT + IR DAS 59122 × TC1507 × NK603 Pioneer Hi-Bred International Inc. 2006 2006Maize Zea mays L. HT + IR DAS-59122-7 × NK603 Dow AgroSciences LLC and Pioneer Hi-Bred International Inc. 2006 2006Maize Zea mays L. HT + HT Event 98140 Pioneer Hi-Bred International Inc. 2009 2009Maize Zea mays L. HT GA21 Monsanto Company 2002 2002Maize Zea mays L. Lys LY038 Monsanto Company 2007Maize Zea mays L. Lys + IR LY038 × MON810 Monsanto Company 2008 2008Maize Zea mays L. IR MIR 604 Syngenta Seeds 2007 2007Maize Zea mays L. IR + HT MIR 604 × GA21 Syngenta Seeds 2007 2007Maize Zea mays L. IR MIR162 Syngenta Seeds 2010 2010Maize Zea mays L. IR + HT MON 89034 × NK603 Monsanto Company 2010 2010Maize Zea mays L. IR MON810 Monsanto Company 2002Maize Zea mays L. HT + IR MON810 × MON88017 Monsanto Company 2006 2006Maize Zea mays L. IR MON863 Monsanto Company 2003Maize Zea mays L. IR MON863 × MON810 Monsanto Company 2006 2006Maize Zea mays L. HT + IR MON863 × MON810 × NK603 Monsanto Company 2004 2006Maize Zea mays L. HT + IR MON863 × NK603 Monsanto Company 2004Maize Zea mays L. HT + IR MON88017 Monsanto Company 2006 2006Maize Zea mays L. IR MON89034 Monsanto Company 2008 2008Maize Zea mays L. IR + HT MON89034 × MON88017 Monsanto Company 2010 2010Maize Zea mays L. IR + HT MON89034 × TC1507 × MON88017 × DAS-59122-7 Dow AgroSciences LLC 2010 2010Maize Zea mays L. HT NK603 Monsanto Company 2002Maize Zea mays L. HT + IR NK603 × MON810 Monsanto Company 2004Maize Zea mays L. HT T14 Bayer CropScience 2007 2007Maize Zea mays L. HT T25 Bayer CropScience (Aventis CropScience(AgrEvo)) 2007 2007Maize Zea mays L. IR + HT TC 1507 × 59122 × MON810 × NK603 Dow AgroSciences LLC and Pioneer Hi-Bred International Inc. 2010 2010Maize Zea mays L. HT + IR TC1507 Mycogen (Dow AgroSciences) - Pioneer (DuPont) 2003Maize Zea mays L. HT + IR TC1507 × DAS 59122-7 Dow AgroSciences LLC and Pioneer Hi-Bred International Inc. 2006Maize Zea mays L. IR + HT TC1507 × MON 810 Dow AgroSciences LLC and Pioneer Hi-Bred International Inc. 2010 2010

259
mexiCO
Crop Latin name trait event Developer Food Feed Direct Use PlantingMaize Zea mays L. IR + HT TC1507 × MON810 × NK603 Dow AgroSciences LLC and Pioneer Hi-Bred International Inc. 2010 2010Maize Zea mays L. HT + IR TC1507 × NK603 Dow AgroSciences LLC and Pioneer Hi-Bred International Inc. 2004 2004Potato Solanum tuberosum L. IR BT6, BT10, BT12, BT16, BT17, BT18, BT23 Monsanto Company 1996 1996Potato Solanum tuberosum L. IR + VR RBMT15-101 Monsanto Company 2001 2001Potato Solanum tuberosum L. IR + VR RBMT21-129 Monsanto Company 2001 2001Potato Solanum tuberosum L. IR + VR RBMT21-350 Monsanto Company 2001 2001Potato Solanum tuberosum L. IR + VR RBMT22-82 Monsanto Company 2001 2001Potato Solanum tuberosum L. IR + VR SEMT15-02 Monsanto Company 2001 2001Potato Solanum tuberosum L. IR + VR SEMT15-15 Monsanto Company 2001 2001Rice Oryza sativa L. HT LLRICE06, LLRICE62 Aventis CropScience 2007 2007Soybean Glycine max L. HT A2704-12 Bayer CropScience (Aventis CropScience(AgrEvo)) 2003 2003Soybean Glycine max L. HT A5547-127 Bayer CropScience 2003 2003Soybean Glycine max L. OC + HT DP-305423 DuPont Canada Agricultural Products 2009 2009Soybean Glycine max L. OC + HT DP305423 x GTS40-30-2 Pioneer Hi-Bred International Inc. 2010 2010Soybean Glycine max L. HT DP356043 Pioneer Hi-Bred International Inc. 2008 2008Soybean Glycine max L. HT GTS 40-3-2 (40-3-2) Monsanto Company 1998 1998 1998Soybean Glycine max L. HT MON89788 Monsanto Company 2008 2008Sugarbeet Beta vulgaris HT H7-1 Monsanto Company 2006 2006Tomato Lycopersicon esculentum DR 1345-4 DNA Plant Technology Corporation 1998 1998Tomato Lycopersicon esculentum DR B, Da, F Zeneca Seeds 1996 1996Tomato Lycopersicon esculentum DR FLAVR-SAVR Calgene Inc. 1995 1995 1995
myAnmAR
Crop Latin name trait event Developer Food Feed Direct Use PlantingCotton Gossypium hirsutum L. IR Silver Six Cotton and Sericulture Department 2006 2006 2006
netheRLAnDS
Crop Latin name trait event Developer Food Feed Direct Use PlantingMaize Zea mays L. IR BT 176 Syngenta Seeds 1997 1997
new zeALAnD
Crop Latin name trait event Developer Food Feed Direct Use PlantingAlfalfa Medicago sativa HT J101 × J163 Monsanto Company 2007Argentine Canola Brassica napus HT + F MS8 × RF3 Bayer CropScience (Aventis CropScience(AgrEvo)) 2002Argentine Canola Brassica napus HT OXY-235 Aventis CropScience 2002Argentine Canola Brassica napus HT + F PGS1 (MS1(B91-4) × RF1(B93-101)) Bayer CropScience (Aventis CropScience(AgrEvo)) 2002Argentine Canola Brassica napus HT + F PGS2 (MS1 x RF2) (B91-4 × B94-2) Aventis CropScience 2002Argentine Canola Brassica napus HT RT73 (GT73) Monsanto Company 2002Argentine Canola Brassica napus HT T45 (HCN28) Bayer CropScience 2002Argentine Canola Brassica napus HT Topas 19/2, HCN92 Bayer CropScience (Aventis CropScience(AgrEvo)) 2002Cotton Gossypium hirsutum L. HT BXN Calgene Inc. 2002Cotton Gossypium hirsutum L. IR COT102 Syngenta Seeds 2005Cotton Gossypium hirsutum L. HT LLCotton25 Bayer CropScience 2006Cotton Gossypium hirsutum L. HT MON1445 Monsanto Company 2000Cotton Gossypium hirsutum L. IR MON15985 Monsanto Company 2002Cotton Gossypium hirsutum L. IR MON531/757/1076 Monsanto Company 2000Cotton Gossypium hirsutum L. HT MON88913 Monsanto Company 2006Cotton Gossypium hirsutum L. IR T304-40 Bayer CropScience 2010 2010 2010Maize Zea mays L. Plt Quality 3272 Syngenta Seeds 2008 2008 2008

260
new zeALAnD
Crop Latin name trait event Developer Food Feed Direct Use PlantingMaize Zea mays L. HT + IR 59122 Dow AgroSciences LLC and Pioneer Hi-Bred International Inc. 2005Maize Zea mays L. HT + IR BT 11 (X4334CBR, X4734CBR) Syngenta Seeds 2001Maize Zea mays L. IR BT 176 Syngenta Seeds 2001Maize Zea mays L. HT + IR DAS 59122 × TC1507 × NK603 Pioneer Hi-Bred International Inc. 2007 2007 2007Maize Zea mays L. HT + IR DAS-59122-7 × NK603 Dow AgroSciences LLC and Pioneer Hi-Bred International Inc. 2006 2006 2006Maize Zea mays L. HT + IR DBT418 DeKalb Genetics Corporation 2002Maize Zea mays L. HT + HT Event 98140 Pioneer Hi-Bred International Inc. 2010 2010Maize Zea mays L. HT GA21 Monsanto Company 2000Maize Zea mays L. Lys LY038 Monsanto Company 2008 2008Maize Zea mays L. IR MIR 604 Syngenta Seeds 2006Maize Zea mays L. DT MON 87460 Monsanto Company 2010 2010 2010Maize Zea mays L. IR MON810 Monsanto Company 2000Maize Zea mays L. IR MON863 Monsanto Company 2003Maize Zea mays L. HT + IR MON88017 Monsanto Company 2006Maize Zea mays L. IR MON89034 Monsanto Company 2008 2008Maize Zea mays L. HT NK603 Monsanto Company 2002Maize Zea mays L. HT T25 Bayer CropScience (Aventis CropScience(AgrEvo)) 2002Maize Zea mays L. HT + IR TC1507 Mycogen (Dow AgroSciences) - Pioneer (DuPont) 2003Maize Zea mays L. HT + IR TC1507 × DAS 59122-7 Dow AgroSciences LLC and Pioneer Hi-Bred International Inc. 2007 2007 2007Potato Solanum tuberosum L. IR + VR RBMT15-101 Monsanto Company 2001Potato Solanum tuberosum L. IR + VR RBMT21-129 Monsanto Company 2001Potato Solanum tuberosum L. IR + VR RBMT21-350 Monsanto Company 2001Potato Solanum tuberosum L. IR + VR RBMT22-82 Monsanto Company 2001Potato Solanum tuberosum L. IR + VR SEMT15-02 Monsanto Company 2001Potato Solanum tuberosum L. IR + VR SEMT15-15 Monsanto Company 2001Potato Solanum tuberosum L. IR SPBT02-5 Monsanto Company 2001Rice Oryza sativa L. HT LLRICE06, LLRICE62 Aventis CropScience 2010 2010Soybean Glycine max L. OC 260-05 (G94-1, G94-19, G168) DuPont Canada Agricultural Products 2000Soybean Glycine max L. HT A2704-12 Bayer CropScience (Aventis CropScience(AgrEvo)) 2004Soybean Glycine max L. OC + HT DP-305423 DuPont Canada Agricultural Products 2010 2010Soybean Glycine max L. HT DP356043 Pioneer Hi-Bred International Inc. 2010 2010 2010Soybean Glycine max L. HT GTS 40-3-2 (40-3-2) Monsanto Company 2000Soybean Glycine max L. IR MON87701 Monsanto Company 2010 2010 2010Sugarbeet Beta vulgaris HT GTS B77 Monsanto Company 2002Sugarbeet Beta vulgaris HT H7-1 Monsanto Company 2005
PAkiStAn
Crop Latin name trait event Developer Food Feed Direct Use PlantingCotton Gossypium hirsutum L. IR MON531 Monsanto Company 2010 2010 2010 2010
PARAGUAy
Crop Latin name trait event Developer Food Feed Direct Use PlantingSoybean Glycine max L. HT GTS 40-3-2 (40-3-2) Monsanto Company 2004 2004 2004
PhiLiPPineS
Crop Latin name trait event Developer Food Feed Direct Use PlantingAlfalfa Medicago sativa HT J101 Monsanto Company 2006 2006Alfalfa Medicago sativa HT J163 Monsanto Company 2006 2006Argentine Canola Brassica napus HT RT73 (GT73) Monsanto Company 2003 2003

261
PhiLiPPineS
Crop Latin name trait event Developer Food Feed Direct Use PlantingCotton Gossypium hirsutum L. HT MON1445 Monsanto Company 2003 2003Cotton Gossypium hirsutum L. IR MON15985 Monsanto Company 2003 2003Cotton Gossypium hirsutum L. IR + HT MON15985 × MON1445 Monsanto Company 2004 2004Cotton Gossypium hirsutum L. IR MON531 Monsanto Company 2004 2004Cotton Gossypium hirsutum L. IR + HT MON531 × MON1445 Monsanto Company 2004 2004Cotton Gossypium hirsutum L. IR MON531/757/1076 Monsanto Company 2004 2004Cotton Gossypium hirsutum L. HT MON88913 Monsanto Company 2005 2005Cotton Gossypium hirsutum L. HT + IR MON88913 × MON15985 Monsanto Company 2006 2006Maize Zea mays L. Plt Quality 3272 Syngenta Seeds 2008 2008Maize Zea mays L. HT + IR 59122 Dow AgroSciences LLC and Pioneer Hi-Bred International Inc. 2006 2006Maize Zea mays L. HT + IR BT 11 (X4334CBR, X4734CBR) Syngenta Seeds 2003 2003 2005Maize Zea mays L. IR BT 176 Syngenta Seeds 2003 2003Maize Zea mays L. HT + IR BT11 × GA21 Syngenta Seeds 2007 2007 2010Maize Zea mays L. HT + IR BT11 × MIR 162 × GA21 Syngenta Seeds 2010 2010 2010Maize Zea mays L. IR + HT BT11 × MIR162 × MIR 604 × GA21 Syngenta Seeds 2010 2010 2010Maize Zea mays L. HT + IR BT11 × MIR604 Syngenta Seeds 2007 2007Maize Zea mays L. IR + HT BT11 × MIR604 × GA21 Syngenta Seeds 2008 2008Maize Zea mays L. HT + IR DAS 59122 × TC1507 × NK603 Pioneer Hi-Bred International Inc. 2007 2007Maize Zea mays L. HT + IR DAS-59122-7 × NK603 Dow AgroSciences LLC and Pioneer Hi-Bred International Inc. 2006 2006Maize Zea mays L. HT + IR DBT418 DeKalb Genetics Corporation 2003 2003Maize Zea mays L. HT DLL25 (B16) DeKalb Genetics Corporation 2003 2003Maize Zea mays L. VR+IR+HT Event 3272 × BT11 × MIR 604 x GA21 Syngenta Seeds 2010 2010 2010Maize Zea mays L. HT GA21 Monsanto Company 2009 2009 2009Maize Zea mays L. HT + IR GA21 × MON810 Monsanto Company 2004 2004Maize Zea mays L. Lys LY038 Monsanto Company 2006 2006Maize Zea mays L. Lys + IR LY038 × MON810 Monsanto Company 2006 2006Maize Zea mays L. IR MIR 604 Syngenta Seeds 2007 2007Maize Zea mays L. IR + HT MIR 604 × GA21 Syngenta Seeds 2007 2007Maize Zea mays L. IR MIR162 Syngenta Seeds 2010 2010Maize Zea mays L. IR + HT MON 89034 × NK603 Monsanto Company 2009 2009Maize Zea mays L. IR MON810 Monsanto Company 2002 2002 2002Maize Zea mays L. HT + IR MON810 × MON88017 Monsanto Company 2006 2006Maize Zea mays L. IR MON863 Monsanto Company 2003 2003Maize Zea mays L. IR MON863 × MON810 Monsanto Company 2004 2004Maize Zea mays L. HT + IR MON863 × MON810 × NK603 Monsanto Company 2005 2004Maize Zea mays L. HT + IR MON863 × NK603 Monsanto Company 2004Maize Zea mays L. HT + IR MON88017 Monsanto Company 2006 2006Maize Zea mays L. IR MON89034 Monsanto Company 2009 2009 2010Maize Zea mays L. IR + HT MON89034 × MON88017 Monsanto Company 2009 2009Maize Zea mays L. IR + HT MON89034 × TC1507 × MON88017 × DAS-59122-7 Dow AgroSciences LLC 2010 2010 2010Maize Zea mays L. HT NK603 Monsanto Company 2003 2003 2005Maize Zea mays L. HT + IR NK603 × MON810 Monsanto Company 2010 2010 2010 2010Maize Zea mays L. HT NK603 × T 25 Monsanto Company 2010 2010 2010Maize Zea mays L. HT T25 Bayer CropScience (Aventis CropScience(AgrEvo)) 2003 2003Maize Zea mays L. HT + IR TC1507 × DAS 59122-7 Dow AgroSciences LLC and Pioneer Hi-Bred International Inc. 2006 2006Maize Zea mays L. HT + IR TC1507 x NK603 Dow AgroSciences LLC and Pioneer Hi-Bred International Inc. 2006 2006Potato Solanum tuberosum L. IR ATBT04-6, ATBT04-27, ATBT04-30 Monsanto Company 2003 2003Potato Solanum tuberosum L. IR BT06 (RBBT06) Monsanto Company 2003 2003Potato Solanum tuberosum L. IR BT6, BT10, BT12, BT16, BT17, BT18, BT23 Monsanto Company 2003 2003Potato Solanum tuberosum L. IR + VR RBMT15-101 Monsanto Company 2003 2003

262
PhiLiPPineS
Crop Latin name trait event Developer Food Feed Direct Use PlantingPotato Solanum tuberosum L. IR + VR RBMT21-129 Monsanto Company 2004 2004Potato Solanum tuberosum L. IR + VR RBMT21-350 Monsanto Company 2004 2004Potato Solanum tuberosum L. IR + VR RBMT22-82 Monsanto Company 2004 2004Potato Solanum tuberosum L. IR + VR SEMT15-02 Monsanto Company 2003 2003Potato Solanum tuberosum L. IR + VR SEMT15-15 Monsanto Company 2003 2003Potato Solanum tuberosum L. IR SPBT02-5 Monsanto Company 2003 2003Soybean Glycine max L. HT A2704-12 Bayer CropScience (Aventis CropScience(AgrEvo)) 2009 2009Soybean Glycine max L. HT DP356043 Pioneer Hi-Bred International Inc. 2009 2009 2010Soybean Glycine max L. HT GTS 40-3-2 (40-3-2) Monsanto Company 2003 2003Soybean Glycine max L. HT MON89788 Monsanto Company 2007 2007Sugarbeet Beta vulgaris HT GTS B77 Monsanto Company 2004 2004Sugarbeet Beta vulgaris HT H7-1 Monsanto Company 2005 2005
ROmAniA
Crop Latin name trait event Developer Food Feed Direct Use PlantingMaize Zea mays L. IR MON810 Monsanto Company 2007
RUSSiAn FeDeRAtiOn
Crop Latin name trait event Developer Food Feed Direct Use PlantingMaize Zea mays L. Plt Quality 3272 Syngenta Seeds 2010Maize Zea mays L. HT + IR BT 11 (X4334CBR, X4734CBR) Syngenta Seeds 2003Maize Zea mays L. HT GA21 Monsanto Company 2000 2003Maize Zea mays L. IR MIR 604 Syngenta Seeds 2007 2008Maize Zea mays L. IR MON810 Monsanto Company 2000 2003Maize Zea mays L. IR MON863 Monsanto Company 2003 2003Maize Zea mays L. HT + IR MON88017 Monsanto Company 2007 2008Maize Zea mays L. HT NK603 Monsanto Company 2002 2003Maize Zea mays L. HT T25 Bayer CropScience (Aventis CropScience(AgrEvo)) 2001Potato Solanum tuberosum L. IR 1210 amk Centre Bioengineering RAS, Russia 2006Potato Solanum tuberosum L. IR 2904/1 kgs Centre Bioengineering RAS, Russia 2005Potato Solanum tuberosum L. IR BT06 (RBBT06) Monsanto Company 2000Potato Solanum tuberosum L. IR SPBT02-5 Monsanto Company 2000Rice Oryza sativa L. HT LLRICE06, LLRICE62 Aventis CropScience 2003Soybean Glycine max L. HT A2704-12 Bayer CropScience (Aventis CropScience(AgrEvo)) 2002Soybean Glycine max L. HT A5547-127 Bayer CropScience 2002Soybean Glycine max L. HT GTS 40-3-2 (40-3-2) Monsanto Company 1999Soybean Glycine max L. HT MON89788 Monsanto Company 2010Sugarbeet Beta vulgaris HT GTS B77 Monsanto Company 2001Sugarbeet Beta vulgaris HT H7-1 Monsanto Company 2006
SinGAPORe
Crop Latin name trait event Developer Food Feed Direct Use PlantingCotton Gossypium hirsutum L. HT MON88913 Monsanto Company 2007Maize Zea mays L. IR MON863 Monsanto Company 2006 2006Maize Zea mays L. HT NK603 Monsanto Company 2006 2006Sugarbeet Beta vulgaris HT H7-1 Monsanto Company 2007 2007

263
SOUth AFRiCA
Crop Latin name trait event Developer Food Feed Direct Use PlantingArgentine Canola Brassica napus HT + F MS8 × RF3 Bayer CropScience (Aventis CropScience(AgrEvo)) 2001 2001Argentine Canola Brassica napus HT + F PGS1 (MS1(B91-4) × RF1(B93-101)) Bayer CropScience (Aventis CropScience(AgrEvo)) 2001Argentine Canola Brassica napus HT + F PGS2 (MS1 × RF2) (B91-4 × B94-2) Aventis CropScience 2001 2001Argentine Canola Brassica napus HT Topas 19/2, HCN92 Bayer CropScience (Aventis CropScience(AgrEvo)) 2001 2001Cotton Gossypium hirsutum L. HT MON1445 Monsanto Company 2000 2000 2000Cotton Gossypium hirsutum L. IR MON15985 Monsanto Company 2003 2003 2003Cotton Gossypium hirsutum L. IR MON531 Monsanto Company 2007 2007 2007Cotton Gossypium hirsutum L. IR + HT MON531 × MON1445 Monsanto Company 2004 2004 2004Cotton Gossypium hirsutum L. IR MON531/757/1076 Monsanto Company 1997 1997 1997Cotton Gossypium hirsutum L. HT MON88913 Monsanto Company 2007 2007 2007Cotton Gossypium hirsutum L. HT + IR MON88913 × MON15985 Monsanto Company 2007 2007 2007Maize Zea mays L. HT + IR BT 11 (X4334CBR, X4734CBR) Syngenta Seeds 2002 2002 2003Maize Zea mays L. IR BT 176 Syngenta Seeds 2001 2001Maize Zea mays L. HT + IR GA21 × MON810 Monsanto Company 2003 2003Maize Zea mays L. IR + HT MON 89034 × NK603 Monsanto Company 2010 2010 2010 2010Maize Zea mays L. IR MON810 Monsanto Company 1997 1997 1997Maize Zea mays L. IR MON89034 Monsanto Company 2010 2010 2010 2010Maize Zea mays L. HT NK603 Monsanto Company 2002 2002 2002Maize Zea mays L. HT + IR NK603 x MON810 Monsanto Company 2004 2004 2007Maize Zea mays L. HT + IR TC1507 Mycogen (Dow AgroSciences) - Pioneer (DuPont) 2002 2002Soybean Glycine max L. HT A2704-12 Bayer CropScience (Aventis CropScience(AgrEvo)) 2001 2001Soybean Glycine max L. HT GTS 40-3-2 (40-3-2) Monsanto Company 2001 2001 2001
SweDen
Crop Latin name trait event Developer Food Feed Direct Use PlantingPotato Solanum tuberosum L. Plt Quality EH92-527-1 Bayer CropScience 2010 2010 2007
SwitzeRLAnD
Crop Latin name trait event Developer Food Feed Direct Use PlantingMaize Zea mays L. HT + IR BT 11 (X4334CBR, X4734CBR) Syngenta Seeds 1998 1998Maize Zea mays L. IR BT 176 Syngenta Seeds 1997 1997Maize Zea mays L. IR MON810 Monsanto Company 2000 2000Soybean Glycine max L. HT GTS 40-3-2 (40-3-2) Monsanto Company 1996 1996
tAiwAn
Crop Latin name trait event Developer Food Feed Direct Use PlantingMaize Zea mays L. Plt Quality 3272 Syngenta Seeds 2010 2010 2010Maize Zea mays L. HT + IR 59122 Dow AgroSciences LLC and Pioneer Hi-Bred International Inc. 2005Maize Zea mays L. HT + IR BT 11 (X4334CBR, X4734CBR) Syngenta Seeds 2004Maize Zea mays L. IR BT 176 Syngenta Seeds 2004Maize Zea mays L. IR + HT Bt11 × MIR162 × MIR604 Syngenta Seeds 2009Maize Zea mays L. HT + IR DBT418 DeKalb Genetics Corporation 2003Maize Zea mays L. HT DLL25 (B16) DeKalb Genetics Corporation 2003Maize Zea mays L. HT GA21 Monsanto Company 2003 2003 2003Maize Zea mays L. Lys LY038 Monsanto Company 2006 2006 2006Maize Zea mays L. IR MIR 604 Syngenta Seeds 2007 2007 2007Maize Zea mays L. IR MIR162 Syngenta Seeds 2009Maize Zea mays L. IR + HT MON 89034 × NK603 Monsanto Company 2009Maize Zea mays L. IR MON810 Monsanto Company 2002 2002

264
tAiwAn
Crop Latin name trait event Developer Food Feed Direct Use PlantingMaize Zea mays L. HT + IR MON810 × MON88017 Monsanto Company 2009Maize Zea mays L. IR MON863 Monsanto Company 2003 2003Maize Zea mays L. HT + IR MON863 × MON810 × NK603 Monsanto Company 2009 2009 2009Maize Zea mays L. HT + IR MON863 × NK603 Monsanto Company 2009Maize Zea mays L. HT + IR MON88017 Monsanto Company 2006 2006Maize Zea mays L. IR MON89034 Monsanto Company 2008Maize Zea mays L. IR + HT MON89034 × MON88017 Monsanto Company 2009Maize Zea mays L. IR + HT MON89034 × TC1507 × MON88017 × DAS-59122-7 Dow AgroSciences LLC 2009 2009Maize Zea mays L. HT NK603 Monsanto Company 2003 2003Maize Zea mays L. HT + IR NK603 × MON810 Monsanto Company 2009 2009 2009Maize Zea mays L. HT T25 Bayer CropScience (Aventis CropScience(AgrEvo)) 2002 2002Maize Zea mays L. HT + IR TC1507 Mycogen (Dow AgroSciences) - Pioneer (DuPont) 2003 2003Maize Zea mays L. HT + IR TC1507 × DAS 59122-7 Dow AgroSciences LLC and Pioneer Hi-Bred International Inc. 2010 2010Maize Zea mays L. HT + IR TC1507 × DAS-59122 × NK603 Dow AgroSciences LLC and Pioneer Hi-Bred International Inc. 2010 2010Maize Zea mays L. HT + IR TC1507 × NK603 Dow AgroSciences LLC and Pioneer Hi-Bred International Inc. 2010 2010Soybean Glycine max L. HT A2704-12 Bayer CropScience (Aventis CropScience(AgrEvo)) 2007Soybean Glycine max L. OC + HT DP-305423 DuPont Canada Agricultural Products 2010 2010Soybean Glycine max L. HT DP356043 Pioneer Hi-Bred International Inc. 2009 2009 2009Soybean Glycine max L. HT GTS 40-3-2 (40-3-2) Monsanto Company 2002Soybean Glycine max L. HT MON89788 Monsanto Company 2008 2008 2008
thAiLAnD
Crop Latin name trait event Developer Food Feed Direct Use PlantingMaize Zea mays L. HT NK603 Monsanto Company 2000 2000Soybean Glycine max L. HT GTS 40-3-2 (40-3-2) Monsanto Company 2000 2000
UniteD kinGDOm
Crop Latin name trait event Developer Food Feed Direct Use PlantingMaize Zea mays L. HT + IR BT 11 (X4334CBR, X4734CBR) Syngenta Seeds 1998 1998Maize Zea mays L. IR BT 176 Syngenta Seeds 1997Soybean Glycine max L. HT GTS 40-3-2 (40-3-2) Monsanto Company 1996 1996
UniteD StAteS OF AmeRiCA
Crop Latin name trait event Developer Food Feed Direct Use PlantingAlfalfa Medicago sativa HT J101 Monsanto Company 2004 2004 2005Alfalfa Medicago sativa HT J163 Monsanto Company 2004 2004 2005Argentine Canola Brassica napus OC 23-18-17, 23-198 Calgene Inc. 1994 1994 1994Argentine Canola Brassica napus HT GT200 (RT200) Monsanto Company 2002 2002 2003Argentine Canola Brassica napus HT HCN10 Aventis CropScience 1995 1995 1995Argentine Canola Brassica napus HT + F MS8 × RF3 Bayer CropScience (Aventis CropScience(AgrEvo)) 1994 1994 1994Argentine Canola Brassica napus HT OXY-235 Aventis CropScience 1999Argentine Canola Brassica napus HT + F PGS1 (MS1(B91-4) × RF1(B93-101)) Bayer CropScience (Aventis CropScience(AgrEvo)) 1996 1996 2002Argentine Canola Brassica napus HT + F PGS2 (MS1 × RF2) (B91-4 × B94-2) Aventis CropScience 1996 1996 2002Argentine Canola Brassica napus HT RT73 (GT73) Monsanto Company 1995 1995 1999Argentine Canola Brassica napus HT T45 (HCN28) Bayer CropScience 1998 1998 1998Argentine Canola Brassica napus HT Topas 19/2, HCN92 Bayer CropScience (Aventis CropScience(AgrEvo)) 1995 2002Chicory Cichorium intybus HT + F RM3-3, RM3-4, RM3-6 Bejo Zaden BV 1997 1997 1997Cotton Gossypium hirsutum L. HT 19-51A DuPont Canada Agricultural Products 1996 1996 1996Cotton Gossypium hirsutum L. IR 281-24-236 Dow AgroSciences LLC 2004 2004 2004

265
UniteD StAteS OF AmeRiCA
Crop Latin name trait event Developer Food Feed Direct Use PlantingCotton Gossypium hirsutum L. IR 281-24-236 × 3006-210-23 Dow AgroSciences LLC 2004 2004 2004Cotton Gossypium hirsutum L. IR 3006-210-23 Dow AgroSciences LLC 2004 2004 2004Cotton Gossypium hirsutum L. HT + IR 31807/31808 Calgene Inc. 1998 1998 1997Cotton Gossypium hirsutum L. HT BCS-GHØØ2-5 (GHB614) Bayer CropScience 2009 2009 2009Cotton Gossypium hirsutum L. HT BXN Calgene Inc. 1994 1994 1994Cotton Gossypium hirsutum L. IR COT102 Syngenta Seeds 2005 2005Cotton Gossypium hirsutum L. IR COT67B Syngenta Seeds 2009Cotton Gossypium hirsutum L. HT LLCotton25 Bayer CropScience 2003 2003 2003Cotton Gossypium hirsutum L. HT MON1445 Monsanto Company 1995 1995 1995Cotton Gossypium hirsutum L. IR MON15985 Monsanto Company 2002 2002Cotton Gossypium hirsutum L. IR + HT MON15985 × MON1445 Monsanto Company 2004 2004 2004Cotton Gossypium hirsutum L. IR MON531/757/1076 Monsanto Company 1995 1995 1995Cotton Gossypium hirsutum L. HT MON88913 Monsanto Company 2005 2005 2004Creeping Bentgrass Agrostis stolonifera HT ASR368 Scotts Seeds 2003Flax, Linseed Linum usitatissumum L. HT FP967 University of Saskatchewan 1998 1998 1999Maize Zea mays L. Plt Quality 3272 Syngenta Seeds 2007 2007Maize Zea mays L. HT + IR 59122 Dow AgroSciences LLC and Pioneer Hi-Bred International Inc. 2004 2004 2005Maize Zea mays L. MS+HT 676, 678, 680 Pioneer Hi-Bred International Inc. 1998 1998 1998Maize Zea mays L. HT + IR BT 11 (X4334CBR, X4734CBR) Syngenta Seeds 1996 1996 1996Maize Zea mays L. IR BT 176 Syngenta Seeds 1995 1995 1995Maize Zea mays L. HT + IR BT11 × GA21 Syngenta Seeds 2007 2007 2007 2007Maize Zea mays L. HT + IR BT11 × MIR 162 × GA21 Syngenta Seeds 2010 2010Maize Zea mays L. IR + HT BT11 × MIR162 × MIR 604 × GA21 Syngenta Seeds 2010 2010Maize Zea mays L. IR + HT Bt11 × MIR162 × MIR604 Syngenta Seeds 2009 2009 2009Maize Zea mays L. HT + IR BT11 × MIR604 Syngenta Seeds 2007 2007 2007Maize Zea mays L. IR + HT CBH-351 Aventis CropScience 1998 1998Maize Zea mays L. HT + IR DAS 59122 × TC1507 × NK603 Pioneer Hi-Bred International Inc. 2007 2007 2007Maize Zea mays L. HT + IR DAS-59122-7 × NK603 Dow AgroSciences LLC and Pioneer Hi-Bred International Inc. 2006 2006 2006Maize Zea mays L. HT + IR DBT418 DeKalb Genetics Corporation 1997 1997 1997Maize Zea mays L. HT DLL25 (B16) DeKalb Genetics Corporation 1996 1996 1995Maize Zea mays L. VR+IR+HT Event 3272 × BT11 × MIR 604 × GA21 Syngenta Seeds 2010 2010Maize Zea mays L. HT + HT Event 98140 Pioneer Hi-Bred International Inc. 2008 2008Maize Zea mays L. HT GA21 Monsanto Company 1996 1997Maize Zea mays L. HT + IR GA21 × MON810 Monsanto Company 2003 2003 2003Maize Zea mays L. Lys LY038 Monsanto Company 2005 2005 2006Maize Zea mays L. Lys + IR LY038 × MON810 Monsanto Company 2006 2006 2006Maize Zea mays L. IR MIR 604 Syngenta Seeds 2007 2007Maize Zea mays L. IR MIR162 Syngenta Seeds 2008 2008Maize Zea mays L. IR + HT MON 89034 × DAS1507-1 × DAS 59122-7 Monsanto Company 2009 2009 2009Maize Zea mays L. IR + HT MON 89034 × NK603 Monsanto Company 2009 2009 2009Maize Zea mays L. IR MON80100 Monsanto Company 1996 1996 1995Maize Zea mays L. IR + HT MON802 Monsanto Company 1996 1996 1997Maize Zea mays L. IR + HT MON809 Pioneer Hi-Bred International Inc. 1996 1996 1996Maize Zea mays L. IR MON810 Monsanto Company 1996 1996 1995Maize Zea mays L. HT + IR MON810 × MON88017 Monsanto Company 2006 2006 2006Maize Zea mays L. HT MON832 Monsanto Company 1996Maize Zea mays L. IR MON863 Monsanto Company 2001 2001Maize Zea mays L. IR MON863 × MON810 Monsanto Company 2004 2004 2004 2004Maize Zea mays L. HT + IR MON863 × MON810 × NK603 Monsanto Company 2004 2004 2004Maize Zea mays L. HT + IR MON863 × NK603 Monsanto Company 2004 2004 2004

266
UniteD StAteS OF AmeRiCA
Crop Latin name trait event Developer Food Feed Direct Use PlantingMaize Zea mays L. HT + IR MON88017 Monsanto Company 1996 1996 1995Maize Zea mays L. IR MON89034 Monsanto Company 2007 2008 2008 2008Maize Zea mays L. IR + HT MON89034 × MON88017 Monsanto Company 2009 2009 2009Maize Zea mays L. IR + HT MON89034 × TC1507 × MON88017 × DAS-59122-7 Dow AgroSciences LLC 2009 2009 2009Maize Zea mays L. HT + F MS3 Bayer CropScience (Aventis CropScience(AgrEvo)) 1996 1996 1996Maize Zea mays L. HT + F MS6 Bayer CropScience (Aventis CropScience(AgrEvo)) 2000 2000 1999Maize Zea mays L. HT NK603 Monsanto Company 2000 2000 2000Maize Zea mays L. HT + IR NK603 × MON810 Monsanto Company 2001 2001 2001 2001Maize Zea mays L. HT NK603 × T 25 Monsanto Company 2010 2010 2010 2010Maize Zea mays L. HT T14 Bayer CropScience 1995 1995 1995Maize Zea mays L. HT T25 Bayer CropScience (Aventis CropScience(AgrEvo)) 1995 1995 1995Maize Zea mays L. IR + HT TC 1507 × 59122 × MON810 × NK603 Dow AgroSciences LLC and Pioneer Hi-Bred International Inc. 2010 2010 2010Maize Zea mays L. HT + IR TC1507 Mycogen (Dow AgroSciences) - Pioneer (DuPont) 2001 2001 2001Maize Zea mays L. HT + IR TC1507 × DAS 59122-7 Dow AgroSciences LLC and Pioneer Hi-Bred International Inc. 2007 2007 2007Maize Zea mays L. IR + HT TC1507 × MON 810 Dow AgroSciences LLC and Pioneer Hi-Bred International Inc. 2010 2010Maize Zea mays L. IR + HT TC1507 × MON810 × NK603 Dow AgroSciences LLC and Pioneer Hi-Bred International Inc. 2010 2010 2010Maize Zea mays L. HT + IR TC1507 × NK603 Dow AgroSciences LLC and Pioneer Hi-Bred International Inc. 2006 2006 2006Maize Zea mays L. IR + HT TC6275 Dow AgroSciences LLC 2004 2004 2004Melon Cucumis melo DR A, B Agritope Inc. 1999Papaya Carica papaya VR 55-1/63-1 Cornell University 1997 1997 1996Papaya Carica papaya VR UFL-X17CP-6 (X17-2) University of Florida 2008 2008 2009Plum Prunus domestica VR ARS-PLMC5-6 United States Department of Agriculture -
Agricultural Research Service2009 2009 2007 2007
Potato Solanum tuberosum L. IR ATBT04-6, ATBT04-27, ATBT04-30 Monsanto Company 1996 1996 1996Potato Solanum tuberosum L. IR BT06 (RBBT06) Monsanto Company 1994 1995Potato Solanum tuberosum L. IR BT6, BT10, BT12, BT16, BT17, BT18, BT23 Monsanto Company 1994 1994 1995Potato Solanum tuberosum L. IR + VR RBMT15-101 Monsanto Company 1998 1998 1999Potato Solanum tuberosum L. IR + VR RBMT21-129 Monsanto Company 1998 1998 1998Potato Solanum tuberosum L. IR + VR RBMT21-350 Monsanto Company 1998 1998 1998Potato Solanum tuberosum L. IR + VR RBMT22-82 Monsanto Company 1998 1998 1998Potato Solanum tuberosum L. IR + VR SEMT15-02 Monsanto Company 1998 1998 1999Potato Solanum tuberosum L. IR + VR SEMT15-07 Monsanto Company 2000 2000Potato Solanum tuberosum L. IR + VR SEMT15-15 Monsanto Company 1998 1998 1999Potato Solanum tuberosum L. IR SPBT02-5 Monsanto Company 1996 1996 1996Rice Oryza sativa L. HT LLRICE06, LLRICE62 Aventis CropScience 2000 2000 1999Rice Oryza sativa L. HT LLRICE601 Bayer CropScience 2006Soybean Glycine max L. OC 260-05 (G94-1, G94-19, G168) DuPont Canada Agricultural Products 1997 1997 1997Soybean Glycine max L. HT A2704-12 Bayer CropScience (Aventis CropScience(AgrEvo)) 1998 1998 1996Soybean Glycine max L. HT A5547-127 Bayer CropScience 1998 1998 1998Soybean Glycine max L. OC + HT DP-305423 DuPont Canada Agricultural Products 2009 2009 2010Soybean Glycine max L. HT DP356043 Pioneer Hi-Bred International Inc. 2007 2007 2008 2008Soybean Glycine max L. HT GTS 40-3-2 (40-3-2) Monsanto Company 1994 1994 1994Soybean Glycine max L. HT GU262 Bayer CropScience 1998 1998 1998Soybean Glycine max L. IR MON87701 Monsanto Company 2010 2010 2010Soybean Glycine max L. HT MON89788 Monsanto Company 2007 2007 2007 2007Soybean Glycine max L. HT W62, W98 Bayer CropScience 1998 1998 1996Squash Cucurbita pepo VR CZW-3 Asgrow (USA) - Seminis Vegetable Inc. (Canada) 1994 1994 1996Squash Cucurbita pepo VR ZW20 Asgrow (USA) - Seminis Vegetable Inc. (Canada) 1997 1997 1994Sugarbeet Beta vulgaris HT GTS B77 Monsanto Company 1998 1998 1998Sugarbeet Beta vulgaris HT H7-1 Monsanto Company 2004 2004 2005

267
UniteD StAteS OF AmeRiCA
Crop Latin name trait event Developer Food Feed Direct Use PlantingSugarbeet Beta vulgaris HT T120-7 Bayer CropScience 1998 1998 1998Tobacco Nicotiana tabacum L. NIC Vector 21-41 Vector Tobacco Inc. 2002Tomato Lycopersicon esculentum DR 1345-4 DNA Plant Technology Corporation 1994 1994 1995Tomato Lycopersicon esculentum DR 35-1-N Agritope Inc. 1996 1996 1996Tomato Lycopersicon esculentum IR 5345 Monsanto Company 1998 1998 1998Tomato Lycopersicon esculentum DR 8338 Monsanto Company 1994 1994 1995Tomato Lycopersicon esculentum DR B, Da, F Zeneca Seeds 1994 1994 1995Wheat Triticum aestivum HT MON-71800 Monsanto Company 2004 2004
URUGUAy
Crop Latin name trait event Developer Food Feed Direct Use PlantingCotton Gossypium hirsutum L. IR COT67B Syngenta Seeds 2009Maize Zea mays L. HT + IR BT 11 (X4334CBR, X4734CBR) Syngenta Seeds 2004 2004 2004Maize Zea mays L. IR MON810 Monsanto Company 2003 2003 2003Soybean Glycine max L. HT GTS 40-3-2 (40-3-2) Monsanto Company 1997 1997 1997


appendix 2
Global Crop protection Market

269
appendix 2 Global status of Commercialized biotech/GM Crops: 2010
table 1. Global Crop protection Market, 2009
herbicides biotech totalothersinsecticides fungicides
North AmericaWest EuropeEast EuropeJapan
6,3493,428
6691,248
1,7031,218
3811,265
1,2153,170
3591,000
434644
86122
8,35716
20
18,0588,4761,4973,635
Industrial Countries 11,694 4,567 5,744 1,286 8,375 31,666
Developing Countries 6,175 5,628 4,500 568 2,232 19,103
Latin AmericaRest of Far EastRest of World
3,5991,940
636
2,3181,9151,395
2,5211,477
502
337143
88
1,377371484
10,1525,8463,105
$M
total 17,869 10,195 10,244 1,854 10,607 50,769
Source: Cropnosis Agrochemical Service, 2010

appendix 3
useful tables and Charts on the international seed trade
Reproduced with the Permission of the International Seed Federation (ISF)

271
table 1. seed exports (fob) of selected Countries, 2009 (with over 100 Million $ Market)*
field CropsNetherlands USAFranceGermany ChileCanadaMexicoHungaryDenmarkItalyArgentinaBelgiumChinaAustriaJapanSpainOthers
241746884458261273244221168123163160
721153062
699
Vegetable Crops1,058
432278
48109
8211145594
94
683
8747
351
total1,2991,1781,162
506370355255235223217172164140118117109
1,050
Country
total 4,920 2,750 7,670
appendix 3 Global status of Commercialized biotech/GM Crops: 2010
table 2. seed imports (fob) of selected Countries, 2009 (with over 100 Million $ Market)**
field CropsUSAFranceNetherlandsGermanyMexicoSpainItalyCanadaRussian FederationUkraineUnited KingdomBelgiumJapan ChinaRomaniaTurkeyPolandAustriaHungaryOthers
447590282457270198186223210182126160
9276
12453789184
1,096
Vegetable Crops300107310
72173198162
594524733178731472441417
742
total747697592529443396348282255206199191170149138125122105101
1,838
Country
total 5,025 2,608 7,633Source: International Seed Federation, 2010*http://www.worldseed.org/cms/medias/file/ResourceCenter/SeedStatistics/SeedExports/Seed_Exports_2009.pdf**http://www.worldseed.org/cms/medias/file/ResourceCenter/SeedStatistics/SeedImports/Seed_Imports_2009.pdf

appendix 4
listing of events, bt Cotton Variety and hybrids in india

273
app
endi
x 4
Glo
bal
stat
us o
f C
omm
erci
aliz
ed b
iote
ch/G
M C
rops
: 20
10
tabl
e 1.
lis
ting
of e
vent
s, b
t cot
ton
varie
ty a
nd h
ybrid
s in
indi
a, 2
010
zon
eb
G-i
hyb
rids
bG
-ii
hyb
rids
GfM
/eve
nt-i
/Mls
-912
4/b
Nla
-601
Nor
th z
one
(271
Hyb
rids
5 Ev
ents
, 31
Com
pani
es)
AB
CH
223
Bt,
AB
CH
224
Bt,
AB
CH
225
Bt,
AB
CH
226
Bt,
AB
CH
227
Bt,
AB
CH
228
Bt,
AB
CH
229
Bt,
AB
CH
230
Bt,
AB
CH
231
Bt,
AB
CH
-232
Bt,
AB
CH
-235
Bt,
AB
CH
-308
3 B
t, A
BC
H-3
483
Bt,
AB
CH
-185
7 B
t, A
BC
H-1
72
Bt,
AB
CH
-173
Bt,
AB
CH
-174
Bt,
AB
CH
-177
B
t, A
BC
H-1
78 B
t, A
nkur
302
8 B
t, A
nkur
812
0 B
t, A
nkur
-651
, Ank
ur-2
226,
Ank
ur-2
534,
GK
-20
6, IT
-905
, Jai
Bt,
KD
CH
H-5
53 B
GI,
KSC
H-
201
Bt,
KSC
H-2
04 B
t, K
DC
HH
-507
BG
-I,
KD
CH
H-9
810,
MR
C-6
025,
MR
C-6
029,
MR
C-
6301
, MR
C-6
304,
NA
MC
OT-
402,
NC
S-13
8,
NC
S-91
3, N
CS-
950,
NC
S-90
1 B
t, N
CS-
902
Bt,
NC
S-90
3 B
t, N
CS-
904
Bt,
NC
S-90
5 B
t, O
le,
SP50
4B1
BG
I, N
CS
1915
Bt ,
NC
S 19
16
Bt,
PCH
-141
4 B
t, PR
CH
-721
Bt,
PRC
H-7
22 B
t, PC
H 4
01 B
t, PC
H 4
02 B
t, PC
H 4
03 B
t, PC
H-
406
Bt,
RC
H-1
34, R
CH
-308
, RC
H-3
14, R
CH
-31
7, S
DS-
9, S
DS-
1368
, Sha
kti-9
Bt,
Sigm
a, S
P 70
07 B
1, V
BC
H-1
006
BG
, VB
CH
-100
8 B
G,
VIC
H-1
1 B
G, 6
317
Bt,
6488
Bt
AB
CH
243
Bt,
AB
CH
244
Bt,
AB
CH
245
Bt,
AB
CH
246
Bt,
AB
CH
24
7Bt,
AB
CH
248
Bt,
AB
CH
251
Bt,
AB
CH
252
Bt,
AB
CH
254
Bt,
AB
CH
-256
Bt,
AB
CH
-129
9 B
t (B
G-II
), A
BC
H-2
099
Bt (
BG
-II),
A
BC
H-4
899
Bt (
BG
-II),
AB
CH
-739
9 B
t (B
G-II
), A
BC
H-1
43 B
t (B
G-
II),
AB
CH
-146
Bt (
BG
-II),
AB
CH
-181
Bt (
BG
-II),
AB
CH
-182
Bt
(BG
-II),
AB
CH
-191
Bt (
BG
-II),
AB
CH
-192
Bt (
BG
-II),
AC
H-1
55-2
, A
CH
177-
2, A
CH
133-
2, A
CH
33-
2, A
NK
UR
322
4 B
GII,
AN
KU
R
3244
BG
II, A
NK
UR
322
8 B
GII,
Ank
ur 3
028
BG
-II, A
NK
UR
-564
2,
AN
KU
R-8
120,
GK
-228
BG
II,G
K-2
39 B
GII,
GK
-212
, Ja
i BG
-II,
Jass
i, K
CH
-36
BG
-II, K
CH
999
BG
-II, K
CH
-14K
59 B
GII,
KC
H-
15K
39 B
GII,
KC
H-1
00 B
G-II
, KC
H-1
72 B
G-II
, KC
H-1
89 B
G-II
, K
CH
-311
BG
-II,
KC
H-7
07 B
t, K
DC
HH
-541
BG
II, K
DC
HH
-441
, K
CH
-100
BG
II, K
CH
-172
BG
II, K
CH
-189
BG
II,K
CH
-311
BG
II,
KD
CH
H-5
16 B
GII,
KD
CH
H-6
21 B
GII
, KD
CH
H-6
41 B
GII,
K
DC
HH
-981
0 B
GII,
KSC
H-2
07 B
t, M
RC
-730
1 B
GII,
MR
C-7
347
BG
II, M
RC
-735
1 B
GII,
MR
C-7
361
BG
II, M
RC
-736
5 B
G-II
, M
RC
-70
17, M
RC
-703
1, M
RC
-704
1, M
RC
-704
5, N
CS
9002
Bt2
, N
CS
9011
Bt2
, NA
MC
OT-
616
BG
II, N
AM
CO
T-61
7 B
GII,
NC
S 90
12 B
t2,
NC
S 90
13 B
t2 ,
NC
S 90
24 B
t2, N
CS-
855
Bt2
, N
CS-
856
Bt2
, NC
S-85
7 B
t2, N
CS-
858
Bt2
, N
CS-
145
(Bun
ny),
NSP
L 25
2 B
G II
, NSP
L 53
1 B
G II
, NSP
L 22
23B
GII,
PC
H-9
602
Bt2
, PC
H-9
604
Bt2
, PC
H-
9605
Bt2
, PC
H- 9
609
Bt2
, PC
H-9
611
Bt2
, PC
H-8
76 B
t2, P
CH
-877
B
t2, P
CH
-878
Bt2
, PC
H-8
79 B
t2, R
CH
650
BG
II , R
CH
653
BG
II,
RC
H-6
02 B
GII,
RC
H-6
05 B
GII,
RC
H-3
14 B
GII,
RC
H-1
34,
PRC
H-
708
Bt2
, PR
CH
-302
, PR
CH
-333
, SD
S-27
BG
II, S
DS-
6003
BG
II,
SDS-
234
BG
II, S
DS-
9, S
DS-
36, S
OLA
R-5
6 B
G-II
, SO
LAR
-64
BG
-II,
SOLA
R-6
5 B
G-II
, SO
LAR
-72
BG
II, S
OLA
R-7
5 B
G-II
, SO
LAR
-76
BG
-II, S
OLA
R-7
7 B
G-II
, Sha
kthi
9 B
GII,
SP7
007B
2, S
P711
4B2
BG
II, S
P504
B2
BG
II, S
O7H
878
BG
II, S
P116
9B2,
SP
7010
B2,
SW
CH
-473
5 B
GII,
SW
CH
-474
4 B
GII,
SW
CH
-474
8 B
GII,
SW
CH
-47
50 B
GII,
SW
CH
-475
5 B
GII,
SW
CH
- 475
7 B
GII,
SW
CH
-476
8 B
GII,
SW
CH
-477
0 B
GII,
SW
CH
-470
7 B
G-II
, SW
CH
-471
1 B
G-II
, SW
CH
-2 B
G-II
, SW
CH
-470
4 B
G-II
, SW
CH
-471
3 B
G-II
, Sup
er-
721B
GII,
Sup
er-9
31B
GII,
Sup
er -9
65B
GII,
Supe
r-971
BG
II,Su
per-
5BG
II, S
uper
-511
BG
II, S
uper
-544
BG
II, T
ULA
SI-9
BG
II, T
ULA
SI
118
BG
II,TU
LASI
252
BG
II,TU
LASI
135
BG
II, T
ULA
SI 1
71B
GII,
Tu
lasi
-162
BG
II, T
ulas
i-225
BG
-II,
Tula
si-4
, Tul
asi-4
5, V
BC
H-1
532
BG
II, V
BC
H-1
533B
GII,
VB
CH
-153
4BG
II,V
BC
H-1
544B
GII,
VB
CH
15
15 B
GII,
VB
CH
151
6 B
GII,
VB
CH
151
7 B
GII,
VB
CH
151
8 B
GII,
V
BC
H-1
501,
VB
CH
-150
4, V
ICH
-307
BG
-II,
VIC
H-3
08 B
G-II
, V
ICH
-309
BG
-II, V
ICH
-310
BG
-II,
VIC
H-9
, VIC
H-1
1, 5
69, 6
488-
2,
251
0-2,
211
3-2,
841
2(B
GII)
, 846
-2(B
GII)
, 311
-2 (B
GII)
Nav
kar-5
Bt,
NC
EH-6
R, N
CEH
-26
Bt,
NC
EH-3
1 B
t, N
CH
-100
5 B
t, N
CH
-108
5 B
t, N
CH
-116
3 B
t, N
CH
-117
7 B
t, N
CEH
-51,
NC
EH-1
45,
SBC
H-2
78 B
t, SB
CH
-290
Bt,Y
RC
H-1
8Bt,
UPL
HH
- 12
Bt,
UPL
HH
- 271
Bt,
UPL
HH
- 342
B
t, U
PLH
H- 3
50 B
t, Z
CH
-193
Bt,
UPL
HH
-1,
YR
CH
-22B
t,YR
CH
-36B
t,YR
CH
-40B
t, JK
CH
-10
9 B
t, JK
CH
-104
Bt,
JK
CH
-195
0 B
t, JK
CH
-99
Bt,
JKC
H-1
145
Bt,
JKC
H-1
923
Bt,
JKC
H-1
945
Bt,
JKC
H-1
947,
JK-1
050,
JKC
H-2
26 B
t, b
Nb
t (V
arie
ty)
274
app
endi
x 4
Glo
bal
stat
us o
f C
omm
erci
aliz
ed b
iote
ch/G
M C
rops
: 20
10
tabl
e 1.
lis
ting
of e
vent
s, b
t cot
ton
varie
ty a
nd h
ybrid
s in
indi
a, 2
010
zon
eb
G-i
hyb
rids
bG
-ii
hyb
rids
GfM
/eve
nt-i
/Mls
-912
4/b
Nla
-601
Cen
tral
zon
e (4
59 H
ybrid
s 6
Even
ts, 3
5 C
ompa
nies
)
AB
CH
223
Bt,
AB
CH
224
Bt,
AB
CH
225
Bt,
AB
CH
226
Bt,
AB
CH
227
Bt,
AB
CH
228
Bt,
AB
CH
229
Bt,
AB
CH
230
Bt,
AB
CH
231
Bt,
AB
CH
236
Bt,
AB
CH
237
Bt,
AB
CH
-308
3Bt,
AB
CH
-348
3 B
t, A
BC
H-1
857
Bt,
AB
CH
-172
Bt,
AB
CH
-173
Bt,
AB
CH
-174
Bt,
AB
CH
-177
Bt,
AB
CH
-178
Bt,
AB
CH
-116
5, A
BC
H-1
220,
AC
H
33-1
, AC
H 1
55-1
, AC
H-1
77-1
, Akk
a, A
nkur
30
42 B
t, A
nkur
-9, A
nkur
-651
, Ank
ur-3
032
Bt,
Ank
ur H
xB-1
950
Bt,
Bra
hma,
Dyn
a, G
K-2
04,
GK
-205
, Jai
Bt,
KC
H-1
35, K
CH
-707
, KD
CH
B-
407
BG
-I, K
DC
HH
-507
BG
-I, K
DC
HH
-786
, K
DC
HH
-963
2, K
DC
HH
-981
0, K
DC
HH
-982
1,
KD
CH
H-5
53 B
GI,
KSC
H 2
01 B
GI,
KSC
H 2
04
BG
I, M
ahas
angr
am B
G, M
ECH
-12,
MEC
H-
162,
MEC
H-1
84, M
RC
-630
1, N
CS-
906
Bt,
NC
S-90
7 B
t, N
CS-
908
Bt,
NC
S-90
9 B
t, N
CS-
910
Bt,
NC
S-13
8, N
CS-
145
(Bun
ny),
NC
S-20
7 (M
allik
a), N
CS-
913,
NC
S-92
9, N
CS-
950
, N
CS-
954,
NC
S-95
5, N
CH
B-9
91, N
CH
B-9
92,
NPH
-217
1, N
SPL-
36, N
SPL-
405,
NSP
L-99
9,
PCH
-404
Bt,
PCH
-405
Bt,
PCH
-407
Bt,
PCH
-40
8 B
t, PC
H-4
09 B
t, PC
H-1
15, P
CH
-207
(P
CH
-205
), PC
H-9
23, P
CH
-930
, PR
CH
-724
Bt,
PRC
H-7
25 B
t, PR
CH
B-4
05 B
G-I,
PR
CH
-10
2, P
RC
H-3
1, R
udra
, RC
H-1
34 B
t, R
CH
-2,
RC
H-1
18, R
CH
-138
, RC
H-1
44, R
CH
-377
, R
CH
-386
, RC
H-3
95 B
t, S
arju
-BG
, Sig
ma,
SP
1136
B1,
SP-
499,
SP-
503,
SP-
504
(Dha
nno)
, SP
-904
, SP-
923,
SW
CH
-442
8 B
t, SW
CH
-45
31 B
t, SW
CH
-431
4 B
t, Tu
lasi
-4, T
ulas
i-5
Bt,
Tula
si-9
, Tul
asi-1
17, V
BC
HB
-120
1BG
, V
BC
HB
-120
2BG
, VB
CH
B-1
203B
G, V
BC
H-
101,
VB
CH
-100
6,V
BC
H-1
009,
VB
CH
-101
0,
VB
CH
-101
6, V
BC
H-1
017,
VC
H-1
11, V
ICH
-5,
VIC
H-9
, VIC
H-1
5, 3
22 B
t, 11
0 B
t, 61
88 B
t, 56
3 B
t, 31
1 B
t
AB
CH
-129
9 B
t (B
G-II
), A
BC
H-2
099
Bt (
BG
-II),
AB
CH
-489
9 B
t (B
G-
II), A
BC
H-7
399
Bt (
BG
-II),
AB
CH
-102
0 B
t (B
G-II
), A
BC
H-1
43 B
t (B
G-II
), A
BC
H-1
46 B
t (B
G-II
), A
BC
H-1
81 B
t (B
G-II
), A
BC
H-1
82 B
t (B
G-II
), A
BC
H-1
91 B
t (B
G-II
), A
BC
H-1
92 B
t (B
G-II
), A
BC
H 2
43B
t, A
BC
H 2
44B
t, A
BC
H 2
45B
t, A
BC
H 2
46B
t, A
BC
H 2
47B
t, A
BC
H
248B
t, A
BC
H 2
52B
t, A
BC
H 2
54B
t, A
BC
H 2
56B
t, A
BC
H 2
40B
t, A
BC
H 2
41B
t, A
CH
-5 B
GII,
AC
H-6
BG
II, P
aram
veer
(AC
H-1
2-2
BG
II), A
CH
-52-
2 B
GII,
AC
H-1
11-2
, AC
H-1
77-2
, Aje
et-1
1-2,
Aje
et-
155-
2, A
kka,
Am
ar-1
065
Bt,
AN
KU
R 3
224
BG
II, A
NK
UR
324
4 B
GII,
AN
KU
R 3
228
BG
II, A
NK
UR
564
2 B
GII,
AN
KU
R 3
066
BG
II,
Ank
ur-3
028
BG
-II, A
nkur
-303
4 B
G II
, Ank
ur- 2
16 B
G II
, Ank
ur-2
57
BG
II, A
nkur
-307
0 B
G II
, Ank
ur H
B 2
104
BG
-II, A
tal,
Bra
hma
BG
II,
GK
-228
BG
II, G
K-2
38 B
GII,
GK
-244
BG
II, G
K-2
18 B
GII,
GK
-221
B
GII,
GK
-224
BG
II, G
K-2
31 B
GII
, GK
-235
BG
II, G
K-2
05, J
ai
BG
-II,
JKC
H 9
9 D
OU
BLE
Bt (
JKC
H99
BG
II),
JKC
H 2
245
DO
UB
LE
Bt (
JKC
H 2
245
BG
II), J
K D
UR
GA
DO
UB
LE B
t (JK
DU
RG
AB
GII)
, IN
DR
A V
AJR
A D
OU
BLE
Bt (
IND
RA
VA
JRA
BG
II), K
CH
100
BG
II,
KC
H-1
72B
GII,
KC
H-1
89B
GII,
KC
H 3
11B
GII,
KC
H-1
4K59
BG
-II,
KC
H-1
5K39
BG
-II, K
CH
-36
BG
-II, K
CH
-999
BG
II, K
CH
-707
, K
CH
-135
, KD
CH
H-9
810
BG
II, K
DC
HH
-641
BG
II, K
DC
HH
-541
B
GII,
KD
CH
B-4
07 B
G-II
, KD
CH
H-4
41, K
DC
HH
-621
, KD
CH
H-
9632
, KSC
H 2
07 B
G II
, Kris
hna
BG
II, M
LBC
H6
BG
II, M
LCH
-317
, M
RC
-737
3 B
G II
, MR
C-7
383
BG
II, M
RC
-730
1, M
RC
-732
6, M
RC
-73
47, M
RC
-735
1, M
RC
- 791
8, M
RC
-736
1 B
GII,
MR
C-7
375
BG
II,
MR
C-7
377
BG
II, M
RC
-738
5BG
II, M
RC
-738
7 B
GII,
Mah
asan
gram
B
GII,
NA
MC
OT
621
BG
II, N
AM
CO
T 62
7 B
GII,
NC
S 90
14B
t2 ,
NA
MC
OT
614
BG
II, N
AM
CO
T 61
5 B
GII,
NA
MC
OT
603
BG
II,
NA
MC
OT
605
BG
II, N
CS
9015
Bt2
, NC
S 90
25 B
t2, N
CS
9028
B
t2, N
CS
9030
Bt2
, NC
S 95
0Bt2
, NC
S 95
4 B
t2, N
CS
955
Bt2
, N
CS
929
Bt2
, NC
S 13
8 B
t2, N
CS
856B
t2, N
CS
858B
t2, N
CS
865
Bt2
, NC
S 86
6Bt2
, NC
S-85
9 B
t2, N
CS-
860
Bt2
, NC
S-86
1 B
t2,
NC
S-86
2Bt2
, NC
S-85
3Bt2
, NC
S-14
5 B
t 2, N
CS-
207
(Mal
lika)
, N
CS-
854
Bt2
, NC
HB
-990
1 B
t2, N
CH
B-9
902
Bt2
, NC
HB
-990
3 B
t2, N
CH
B-9
904
Bt2
, NC
HB
-990
5 B
t2, N
SPL
252
BG
II, N
SPL
531
BG
II, N
SPL
2223
BG
II, N
CH
B-9
45 B
t, N
SPL-
333
BG
II, N
SPL-
432
BG
II, N
SPL-
666
BG
II, N
SPL-
36, N
SPL-
405,
NSP
L-99
9, P
CH
B-9
969
Bt2
, PC
H-9
613
Bt2
, PC
H-9
614
Bt2
, PC
H-9
616
Bt2
, PC
H-9
619
Bt2
, PC
H-9
620
Bt2
, Par
as L
aksh
mi,
PCH
-115
Bt2
, PC
H-8
81 B
t2, P
CH
-88
2 B
t2, P
CH
-217
1 B
t 2, P
CH
-205
Bt2
, PR
CH
-331
Bt I
I,
AC
H-1
575
Bt,
AC
H 1
050
Bt,
AC
H 1
151
Bt,
AC
H 1
171
Bt,
AC
H-1
019,
Dhr
uv B
t, K
ashi
nath
, G
BC
H-0
7 B
t, G
BC
H-0
9 B
t, G
BC
H-0
1,
Mon
soon
Bt,
Nav
kar-5
, NC
EH-2
9, N
CEH
-24,
N
CEH
-210
, NC
EH-2
R, N
CEH
-3R
, NC
EH-2
1,
NC
EH-2
3, N
CEH
-14,
NC
EH-3
4 B
t, SB
CH
-31
0Bt(G
azab
Bt),
SB
CH
-286
Bt (
Rak
a B
t),
SBC
H- 3
11B
t, SS
B-7
1Bt,
SSB
-72B
t, TP
HC
N07
-01
5 B
t, TP
HC
N07
-005
Bt,
TPH
CN
07-0
09 B
t, U
PLH
H-2
71 B
t, U
PLH
H-1
7 B
t, U
PLH
H-1
2 B
t,
UPL
HH
-189
Bt,
UPL
HH
-352
Bt,
UPL
HH
-13
Bt,U
PLH
H-1
Bt,
UPL
HH
-10
Bt,
UPL
HH
-2B
t, Y
RC
H-1
8Bt,Y
RC
H-2
2Bt,Y
RC
H-3
6Bt,Y
RC
H-
40B
t, Y
RC
H-4
Bt,
YR
CH
-9 B
t, Y
RC
H-1
3 B
t, Y
RC
H-3
1 B
t, Y
RC
H-4
5 B
t, Y
RC
H-5
4 B
t, Z
CH
-50
005,
ZC
H-5
0072
Bt,
JK IN
DR
A V
AJR
A B
t, JK
SU
PER
VA
RU
N B
t, JK
SH
IKH
AR
Bt (
JKC
H-
1305
Bt),
JK A
GN
I Bt(J
KC
H-2
022
Bt),
JK R
UB
Y B
t(JK
CH
-224
6 B
t), JK
-Cha
mun
di B
t, JK
-Gow
ri B
t, JK
CH
-224
5 B
t, JK
CH
B-2
29 B
t, JK
-Ishw
ar
(JKC
H-6
34 B
t), JK
CH
-99,
JKC
H-2
26, J
KC
H-6
66,
JK-D
urga
Bt,
JK-In
dra
Bt,
JK-V
arun
a, P
CH
-66B
t, PC
H-5
5Bt,
PCH
- 44B
t, PC
H-2
2Bt,
PCH
-99
Bt,
PCH
-77
Bt,
PRC
H-7
12 B
t, PR
CH
-713
Bt,
PRC
H-7
14 B
t, PR
CH
-715
Bt,
Mh
-512
5bt,
M
h-5
174b
t, b
N b
t (V
arie
ty)

275
app
endi
x 4
Glo
bal
stat
us o
f C
omm
erci
aliz
ed b
iote
ch/G
M C
rops
: 20
10
tabl
e 1.
lis
ting
of e
vent
s, b
t cot
ton
varie
ty a
nd h
ybrid
s in
indi
a, 2
010
zon
eb
G-i
hyb
rids
bG
-ii
hyb
rids
GfM
/eve
nt-i
/Mls
-912
4/b
Nla
-601
PRC
H-3
33 B
t II,
PRC
H-5
04, P
RC
H-5
05, P
RC
H-7
01B
t2, P
RC
H-7
03
Bt2
, PR
CH
-704
Bt2
, PR
CH
-709
Bt2
, PR
CH
B-6
01B
t2, P
RC
HB
-602
B
t2, R
CH
386
BG
II, R
CH
656
BG
II, R
CH
659
BG
II, R
CH
-608
BG
II,
RC
H-3
77 B
GII,
RC
H-5
30 B
G-II
, RC
H-2
, RC
H-5
15, R
CH
-578
, R
CH
-584
, Sar
ju B
G II
, Sen
apat
i BG
II, S
olar
66
BG
II, S
olar
60
BG
II,
Sol
ar 7
6 B
GII,
Sol
ar 7
5 B
GII,
SP7
147B
2, S
P715
7B2,
SP71
96B
2 B
GII,
SP1
171B
2, S
P904
B2,
SP1
016
B2,
SP1
170
B2,
SP5
04 B
2,
Supe
r -72
1BG
II, S
uper
-931
BG
II, S
uper
-965
BG
II, S
uper
-971
BG
II ,
Supe
r-511
BG
II, S
uper
-544
BG
II, S
uper
5 B
GII,
SW
CH
-482
3 B
GII,
SW
CH
-474
6 B
GII,
SW
CH
-475
3 B
GII,
SW
CH
- 476
5 B
GII,
SW
CH
-47
90 B
GII,
SW
CH
-480
0 B
GII,
SW
CH
-477
6 B
GII,
SW
CH
-474
9 B
GII,
SW
CH
- 473
1BG
II, S
WC
H-4
751
BG
II, S
WC
H-4
754
BG
II,
SWC
H-4
769
BG
II, S
WC
H-2
BG
-II, S
WC
H-4
708
BG
-II, S
WC
H-
4715
BG
-II, S
WC
H-1
BG
-II, S
WC
H-5
017,
SW
CH
-501
1, S
udar
shan
B
G II
, TU
LASI
-252
BG
II, T
ULA
SI 1
71 B
GII,
TU
LASI
45B
GII,
TULA
SI
333
BG
II, T
ulas
i-135
BG
-II, T
ulas
i-144
BG
-II, T
ulas
i-162
BG
-II,
Tula
si- 1
17 B
G-II
, Tul
asi-4
, Tul
asi-9
, Tul
asi-1
18,V
BC
H-1
533B
GII,
V
BC
H-1
537B
GII,
VB
CH
-153
9BG
II, V
BC
H-1
542B
GII,
VB
CH
-15
43B
GII,
VB
CH
-154
4BG
II, 8
41-2
(BG
II), V
BC
H- 1
511,
VB
CH
-15
16, V
BC
H-1
519,
VB
CH
- 152
0, V
BC
H- 1
521,
VB
CH
B-1
525,
V
BC
HB
-152
6, V
ICH
-311
BG
-II, V
BC
H-1
501,
VB
CH
-150
3, V
BC
H-
1505
, V
ICH
-312
BG
-II, V
ICH
-313
BG
-II, V
ICH
-314
BG
-II, V
ICH
-5
Bt,
VIC
H-1
5, 8
46-2
(BG
II), 8
44-2
(BG
II), 5
63-2
(BG
II), 8
42-2
(BG
II),
847-
2 (B
GII)
, 721
3-2
(BG
II), 7
215-
2 (B
GII)
, 311
-2, 5
57-2
, 11
0-2,
11
1-2,
195
-2
sout
h z
one
(444
Hyb
rids,
6 Ev
ents
, 35
Com
pani
es)
AB
CH
231
Bt,
AB
CH
-172
Bt,
AB
CH
-173
Bt,
AB
CH
-174
Bt,
AB
CH
-177
Bt,
AB
CH
-178
Bt,
AB
CH
-308
3 B
t, A
BC
H-3
483
Bt,
AB
CH
-116
5,
AB
CH
-122
0, A
CH
B-9
01-1
Bt,
AC
H-1
Bt,
AC
H
21-1
, AC
H 3
3-1,
AC
H 1
55-1
, Akk
a, A
nkur
-23
8 B
t, A
nkur
-308
2 B
t, A
nkur
HB
102
4 B
t,
Ank
ur-3
042
Bt,
Ank
ur H
B-1
902
Bt,
Ank
ur H
B-
1976
Bt,
Bra
hma,
Dyn
a, G
K-2
07, G
K-2
09,
Jai B
t, K
CH
-135
, KC
H-7
07, M
ahas
angr
am
BG
, KD
CH
H 5
53 B
GI ,
KD
CH
H-5
07 B
G-I,
K
DC
HB
-407
, KD
CH
H-9
632,
KD
CH
H-9
810,
AB
CH
224
Bt,
AB
CH
225
Bt,
AB
CH
227
Bt,
AB
CH
229
Bt,
AB
CH
23
0 B
t, A
BC
H 2
40 B
t, A
BC
H 2
41 B
t, A
BC
H 2
43 B
t, A
BC
H 2
44
Bt,
AB
CH
245
Bt,
AB
CH
246
Bt,
AB
CH
247
Bt,
AB
CH
248
Bt,
AB
CH
252
Bt,
AB
CH
254
Bt,
AB
CH
256
Bt ,
AB
CH
-143
Bt B
G-II
, A
BC
H-1
46 B
t BG
-II,
AB
CH
-147
Bt B
G-II
, AB
CH
-148
Bt B
G-II
, A
BC
H-1
299
Bt B
G-II
, AB
CH
-739
9 B
t BG
-II, A
BC
H-1
81 B
t BG
-II,
AB
CH
-182
Bt B
G-II
, AB
CH
-191
Bt B
G-II
, AB
CH
-192
Bt B
G-II
, A
BC
H-1
065
Bt,
AB
CH
-102
0 B
t, A
CH
-5 (A
jeet
5) B
GII,
AC
H-6
(A
jeet
6) B
GII,
Par
amve
er (A
CH
-12-
2 B
GII)
, AC
H-3
3-2,
AC
H-
177-
2, A
CH
-155
-2,
AN
KU
R 3
224
BG
II, A
NK
UR
324
4 B
GII,
A
NK
UR
322
8 B
GII,
Akk
a, A
nkur
-302
8 B
G-II
, Ank
ur-3
034
BG
-II,
Dhr
uv B
t, G
BC
H-0
4Bt,
GB
CH
-07
Bt,
Kas
hina
th,
Mon
soon
Bt,
NC
EH-2
R, N
CEH
-3R
, NC
EH-1
3 B
t, N
CEH
-34
Bt,
SSB
-71B
t, SS
B-7
2Bt,
SBC
H-
311B
t, SB
CH
-310
Bt,
SBC
H-2
92 B
t, TP
HC
N07
-01
5 B
t, TP
HC
N07
-005
Bt,
TPH
CN
07-0
09 B
t, U
PLH
H-1
89 B
t, U
PLH
H-7
Bt,
UPL
HH
-295
Bt,
UPL
HH
-355
Bt,
UPL
HH
-358
Bt,
UPL
HH
-360
B
t, U
PLH
H-3
47 B
t, U
PLH
H-2
65 B
t, U
PLH
H-
271
Bt,
UPL
HH
-10
Bt,
YR
CH
- 4 B
t, Y
RC
H-9
Bt,
YR
CH
-13
Bt,
YR
CH
-31
Bt,
YR
CH
-45
Bt,
YR
CH
-54
Bt,
UPL
HH
-12
Bt,
UPL
HH
-5 B
t,

276
app
endi
x 4
Glo
bal
stat
us o
f C
omm
erci
aliz
ed b
iote
ch/G
M C
rops
: 20
10
tabl
e 1.
lis
ting
of e
vent
s, b
t cot
ton
varie
ty a
nd h
ybrid
s in
indi
a, 2
010
zon
eb
G-i
hyb
rids
bG
-ii
hyb
rids
GfM
/eve
nt-i
/Mls
-912
4/b
Nla
-601
KSC
H 2
01, K
SCH
204
, MEC
H-1
62*,
MEC
H-
184*
, MR
C-6
322,
MR
C-6
918,
NC
S-19
11
Bt,
NC
S-19
12 B
t, N
CS-
1913
, NC
S-19
14 B
t, N
CS-
145
(Bun
ny),
NC
S-20
7 (M
allik
a), N
CS-
913,
NC
S-92
9, N
CS-
950,
NC
S-95
4, N
CS-
906
Bt,
NC
S-90
7 B
t, N
CS-
908
Bt,
NC
S-90
9 B
t,
NC
S-91
0 B
t, N
CH
B-9
40 B
t, N
CH
B-9
45 B
t, N
CH
B-9
90, N
CH
B-9
92, N
PH-2
171,
NSP
L-9,
N
SPL-
36, N
SPL-
603,
NSP
L-66
6, N
SPL-
405,
N
SPL-
999,
Ole
, PC
H-1
410
Bt,
PCH
141
1 B
t, PC
H 1
412
Bt,
PCH
-141
3 B
t, P
CH
-115
, PC
H-
207
(PC
H 2
05),
PCH
-409
Bt,
PCH
-930
, PC
H-
2270
, PR
CH
B-4
05,
PRC
H-3
1 B
t, PR
CH
724
B
t, PR
CH
725
Bt,
RC
H-2
, RC
H-2
0, S
P113
6 B
I (B
GI),
RC
H-1
11, R
CH
-371
, RC
H-3
68, R
CH
B-
708,
Rud
ra, S
igm
a, S
P 11
70 B
1, S
P101
6 B
1,
SP91
1B1,
SP-
503,
SP-
504
(Dha
nno)
, SP-
700,
SW
CH
-442
8 B
t, SW
CH
-453
1 B
t, SW
CH
-43
14 B
t, Tu
lasi
-9 B
t, Tu
lasi
-4, T
ulas
i-45
Bt,T
ulas
i-117
, Tul
asi-1
18 B
t, V
BC
HB
-101
0 B
G, V
BC
H-1
016
Bt,V
BC
H-1
018
Bt,
VB
CH
B-
1203
,VIC
H-5
, VIC
H-9
, VC
H-1
11, 1
18 B
t, 34
0 B
t, 61
88 B
t
Ank
ur-2
57 B
G-II
, Ank
ur-3
56 B
G-II
, Ank
ur-3
066
BG
-II, A
nkur
HB
21
10 B
G-II
, Ank
ur-5
642,
Ank
ur-1
0122
, Ata
l BG
II, B
rahm
a, G
K
228
BG
II, G
K 2
38 B
GII,
GK
239
BG
II, G
K 2
41 B
GII,
GK
-218
BG
II,
GK
-221
BG
II, G
K-2
23 B
GII,
GK
-224
BG
II, G
K-2
31 B
GII,
GK
-235
B
GII,
GK
-217
, Jai
BG
-II, J
KC
H 9
9 D
OU
BLE
Bt (
JKC
H 9
9 B
G II
), JK
CH
224
5 D
OU
BLE
Bt (
JKC
H 2
245
BG
II),
JK D
UR
GA
DO
UB
LE
Bt (
JK D
urga
BG
II),
IND
RA
VA
JRA
DO
UB
LE B
t (In
dra
Vajra
BG
II)
, KC
H-1
08 B
GII,
KC
H-1
11 B
GII,
KC
H-1
44 B
GII,
KC
H-7
11 B
GII,
K
CH
- 100
BG
II, K
CH
-172
BG
II, K
CH
-189
BG
II, K
CH
-311
BG
II,
KC
H-7
07 B
GII,
KC
H-1
4K59
BG
II, K
CH
-15K
39 B
GII,
KC
H-3
6 B
GII,
K
CH
-999
BG
II, K
CH
-135
Bt,
KD
CH
H-5
41 B
GII,
KD
CH
B-4
07
BG
-II, K
DC
HH
-441
, KD
CH
H-6
21, K
DC
HH
-963
2, K
DC
HH
641
B
G II
, KD
CH
H 9
810
BG
II, K
SCH
207
, Mah
asan
gram
BG
II, M
RC
-73
61 B
GII,
MR
C-7
375
BG
II, M
RC
-737
7 B
GII,
MR
C-7
385B
GII,
M
RC
-738
7 B
GII
, MLB
CH
6 B
GII,
MLC
H-3
18, M
RC
-737
3 B
GII,
M
RC
-738
3 B
GII,
MR
C-7
160,
MR
C-7
918,
MR
C-7
201,
MR
C-7
347,
M
RC
-735
1, M
RC
-792
9, N
AM
CO
T 61
0 B
GII,
NA
MC
OT
622
BG
II, N
AM
CO
T 80
3 (H
B) B
G II
, NA
MC
OT-
612,
NA
MC
OT-
607,
N
AM
CO
T-60
4 B
G-II
, N
AM
CO
T-60
5 B
G-II
, NA
MC
OT-
614
BG
-II,
NA
MC
OT-
615
BG
-II, N
CS
9014
Bt 2
, NC
S 90
15 B
t 2, N
CS
9025
B
t2, N
CS
9028
Bt2
, NC
S 90
30 B
t2, N
CS
950
Bt2
, NC
S 95
4 B
t2,
NC
S 95
5 B
t2, N
CS
929
Bt2
, NC
S 13
8 B
t2, N
CS
856
Bt2
, NC
S 85
8 B
t2, N
CS-
854,
NC
S-20
7, N
CS-
145
(Bun
ny),
NC
HB
990
1 B
t 2,
NC
HB
990
2 B
t2, N
CH
B 9
903
Bt2
, NC
HB
990
4 B
t2, N
CH
B 9
905
Bt 2
, NC
HB
990
Bt 2
, NC
HB
991
Bt 2
, NSP
L 25
2 B
G II
, NSP
L 53
1 B
G II
, NSP
L 22
23B
GII
, NSP
L-43
2 B
GII,
NSP
L-33
3 B
GII,
NSP
L-40
5, N
SPL-
999,
PC
H 9
613
Bt 2
, PC
H 9
614
Bt2
, PC
H 9
616,
PC
H
9619
Bt 2
, PC
H 9
620
Bt2
, PC
H-8
84 B
t2, P
CH
-887
Bt2
, PC
H-8
88
Bt2
, PC
H-1
15 B
t2, P
CH
-881
Bt2
, PC
H-8
82 B
t2, P
CH
-885
Bt2
, PC
H-8
86 B
t2, P
CH
-205
Bt2
, PC
H-2
171
Bt2
, PC
H-2
270,
PC
H-
105,
PC
HB
996
9 B
t2 ,
PRC
H 7
01 B
t2, P
RC
H 7
03 B
t2, P
RC
H 7
04
Bt2
, PR
CH
709
Bt2
, PR
CH
710
Bt2
, PR
CH
B 6
01 B
t2, P
RC
HB
602
B
t2, P
RC
H-3
31 B
G-II
, PR
CH
-333
BG
-II,
PRC
H-5
04, P
RC
H-5
05,
RC
H-2
0 B
G-II
, R
CH
-656
BG
II, R
CH
-659
BG
II, R
CH
B- 6
25 B
GII,
R
CH
-111
BG
II, R
CH
-2, R
CH
-530
, RC
H-5
33, R
CH
-596
, SA
RJU
BG
-II,
, SP
-117
1 B
2, S
P 50
4 B
2 (D
hann
o) B
G II
, SP9
11B
2, S
P904
B2,
SP
-103
7, S
P117
0 B
2,
ZC
H-5
0072
Bt,
JK C
OM
MA
ND
ER B
t (JK
CH
-22
53 B
t), JK
KA
NA
KA
DU
RG
A B
t (JK
CH
-200
4 B
t), JK
SU
PER
STA
R B
t (JK
CH
-224
7 B
t), IN
DR
A
VA
JRA
, JK
SU
PER
VA
RU
N B
t, JK
CH
-130
5 B
t, JK
CH
B-2
29 B
t, JK
-Dur
ga,
JKC
H-9
9, JK
CH
-634
(JK
-Isw
ar),
JKC
H-2
245
Bt,
JK C
ham
undi
Bt,
JK-I
ndra
Bt,
JK-
Gow
ri B
t, PC
H-6
6Bt,
PCH
-55B
t, PC
H-4
4Bt,
PCH
- 22
Bt,
PCH
-99
Bt,
PCH
-77
Bt,
PRC
H-7
12 B
t, PR
CH
-713
Bt,
PR
CH
-714
Bt,
PRC
H-7
15 B
t, M
h-5
125b
t, M
h-
5174
bt,
bN
b
t (V
arie
ty)
Sour
ce: C
ompi
led
by IS
AA
A, 2
010


appendix 5
updates of on-going biotech/GM Crops research activities in uganda, 2010

table 1. updates of on-going biotech/GM Crops research activities in uganda, 2010
Crop trait event institutions involved
stage
Cotton, Gossypium barbadense
Insect resistance/herbicide tolerance
Bollgard IR/HT NARO/Monsanto, ABSPII, USAID & Cornell University
CFT ongoing
Banana, Musa sp. Black sigatoka resistance
Banana bacterial wilt resistance Biofortified Banana
Chitinase gene
Pflp and hrap genes
NARO, KatholiekeUniversity of Leuven, IITA,USAID
NARO, IITA, AATF
CFT concluded
CFT ongoing
Cassava, Manihot esculenta
CMD resistance
Cassava brown streak disease (CBSD) resistance
siRNA and G5 protein strategy
Gene silencing induced by the virus coat protein
NARO/NaCRRI, IITA, Donald Danforth Plant Science Center, USAID
CFT ongoing
Maize, Zea mays L. Drought tolerance MON 87460 NARO, AATF, CIMMYT, Monsanto
CFT
Sweetpotato, Ipomea batatas
Virus resistance
Sweetpotato weevils resistance
siRNA and RNase-Ala37, 44 protein
Cry 7Aa1, Cry3Ca1 & ET 33-34
NARO, CIP Awaiting CFT approval
Approved for contained screen house trials (weevils)
appendix 5 Global status of Commercialized biotech/GM Crops: 2010
279

978-1-892456-49-4