2010 AN N U AL R E P ORT - AnnualReports.com
92
TOM BRADY I NFL MVP CAM NEWTON I HEISMAN TROPHY WINNER LINDSEY VONN I OLYMPIC GOLD MEDALIST 2010 ANNUAL REPORT
-
Upload
khangminh22 -
Category
Documents
-
view
2 -
download
0
Transcript of 2010 AN N U AL R E P ORT - AnnualReports.com

TOM BRADY I NFL MVP CAM NEWTON I HEISMAN TROPHY WINNER LINDSEY VONN I OLYMPIC GOLD MEDALIST
2010
AN
NU
AL
RE
PO
RT

OFFICIAL PERFORMANCE FOOTWEAR SUPPLIER OF MLBIn 2010, Under Armour became theOFFICIAL PERFORMANCE FOOTWEARSUPPLIER OF MLB. And it also addedseveral key stars to the line up,including Buster Posey, 2010 National League Rookie of the Year and World Series Champion.
NFL CONTRACT RENEWALUnder Armour signed a new 5-year
deal with the NFL for on-fi eld glove
and footwear rights and to remain
the exclusive title sponsor of the NFL
Scouting Combine.
SOUTH CAROLINA BASEBALL
Decked out head-to-toe in Under Armour
footwear, uniforms, and accessories, the
University of South Carolina Gamecocks
won the College World Series in
Omaha, NE.
AUBURN FOOTBALL
Led by Heisman Trophy-winning QB Cam
Newton, the Auburn University Tigers
fi nished their historic undefeated season
with a National Championship victory
over Oregon, 22-19.
NATIONALCHAMPIONS
AUBURN TIGERS
2010
da
DfoUw
PROTECT THIS HOUSE.® I WILL.
The Brand’s original Rally Cry came back full
force in 2010 with “PROTECT THIS HOUSE.
I WILL.” It was a global marketing campaign
featuring some of the world’s most exciting
young athletes, including Olympic Gold
Medalists Lindsey Vonn and Michael
Phelps, MMA champion Georges St-Pierre,
and NBA star Brandon Jennings.
AULe
$1 BILLION AND COUNTINGIn 2010, Under Armour met and then blew away its goal of $1 Billion. It is an important milestone on the road to becoming the World’s #1 Performance Athletic Brand. GREAT PRODUCT, GREAT STORY, GREAT SERVICE, and most importantly, GREAT TEAM!
d fhe ex
Scouti
thSc
INTRODUCING UNDER ARMOUR ®
CHARGED COTTONIt’s fi nally here: Under Armour Charged
Cotton, the world’s fi rst true performance
cotton, which dries up to 5 times faster
than ordinary cotton. Mother Nature
Made It. We Made It Better.™

WE ARE 14 YEARS INTO THIS THING...and it feels like we are just getting started. I say that with pride at the results we posted in 2010 and with confi dence that we are laying the right foundation for our long-term continued growth.
We believe we are still in the early stage of the Under Armour story for three primary reasons: fi rst, we have built an incredibly powerful and authentic Brand in a relatively short time; second, our product line remains narrow relative to the opportunities in apparel, footwear and other categories where our Brand can play; and third, we have yet to truly establish our Brand outside of North America.
So while the opportunities for our Brand seem boundless, we remain focused on execution and 2010 was a great example of what the Under Armour Brand can achieve.
We crossed an important threshold in 2010, surpassing the $1 billion net revenue mark, with net revenues growing 24% to $1.064 billion. Apparel net revenues increased 31% to $853.5 million driven by strength across the Men’s, Women’s, and Youth apparel products. Direct-to-Consumer net revenues grew 57% over the prior year. And as evidence that our execution is focused on returning value to our shareholders, earnings per share increased 46% to $1.34.
While passing the $1 billion revenue mark is an important milestone for us, it really underscores the tremendous opportunities that are still available to our Brand. We accomplished that $1 billion in revenues largely on the strength of our North American apparel business, much of which is still compression and base layer product. The opportunities that exist within our fi ve Growth Drivers – Men’s and Women’s Apparel, Footwear, Direct-to-Consumer and International – each represent expansive opportunities for our Brand to grow, and we continue to invest for long-term growth.
In Apparel, we have built a strong foundation of trust with athletes and we continue to build on that equity through continued innovation on the fi eld of play. Our apparel growth will be driven largely by maintaining and growing our core UA consumer while bringing the Brand to new athletes through our expanding breadth of product. In 2010, our core of female athletes continued to expand as our growth rate in Women’s Apparel outpaced our strong growth rate in Men’s Apparel.
When we fi rst brought the idea of moisture-wicking compression apparel to the market in 1996, our goal was to make athletes rethink expectations for their apparel. And with the launch of Charged Cotton™ in March 2011 – the next chapter in Under Armour’s innovation platform – we will raise expectations once again. Charged Cotton dries up to fi ve times faster than regular cotton and will bring a new level of performance to a category where expectations have been low.
We recognize the value of our continued product leadership in apparel and are working to bring that same level of innovation to our expanding line of footwear. Our initial entry in basketball footwear was made stronger by our ability to test our basketball footwear on players for several years before we brought this product to market at the end of 2010.
What drives our team is being held to the demanding expectations of the world’s top athletes. In the case of New England Patriots QB and NFL MVP Tom Brady, we have invested in our footwear business to make a football cleat that could be worn with confi dence by the league’s best player. The same logic rings true with our relationship with the Tigers of Auburn University, college football national champions. In both cases, we were able to reinforce our reputation for making all athletes better because they trust that the Under Armour Brand will perform on the fi eld of play.
Further, we are still in the early stages of our footwear business. Having our baseball cleats on national champions University of South Carolina in just our fourth year in that business and our football cleats on Auburn in year fi ve tells us we have the capacity to be a great footwear company. With running launchingin 2009 and basketball late in 2010, we anticipate those critical categories todeliver great results for us over time as well.
Our fourth growth driver, Direct-to-Consumer, continued to excel in 2010 and was an important component of our improvement in full-year gross
CH
AIR
MA
N’S
2010 LETTE
R TO
SH
AR
EH
OLD
ER
S
GEORGES ST-PIERREI
MM
A CHAMPION
go
10ss
margins which expanded to 49.9% compared to 47.9% in the prior year. Expanding our presence in our Direct-to-Consumersales channel is a key element of our strategy to reach newconsumers, be it online or in our specialty or Factory Houseoutlet stores.
In addition, the knowledge we gain by operating our own retailstores makes us better partners with our strong wholesaleaccount base. The continued strength of both our Direct-to-Consumer sales channel and our wholesale U.S. Apparelaffords us the opportunity to be patient in areas such asFootwear and International where we continue to invest for sustainable growth.
Since the very early days of Under Armour, we haveunderstood the magnitude of being the next great athletic Brand and have invested to build a sound foundation from which to grow upon. We have been investors with an eye on the long term, whether those investments were in systems, innovation, new categories, or building our team.
In our International business, we bring a performance Brand that speaks to athletes of all types, be it on thesoccer pitch or the ski slopes. Creating the infrastructure to bring that product to the global market is a tremendous challenge to a company growing at the pace that we are in North America.
The success of our licensing partner in Japan, whose sales surpassed the $100 million U.S. dollar mark in 2010, is evidence that our Brand can play well outside of the U.S. In addition to these strong results in Japan, we continue to make progress in key markets in Europe and are taking prudent steps to build the foundation for our long-term presence in critical growth markets suchas China.
In summary, we took many important steps in 2010toward our goal of becoming THE Athletic Brand of this Generation. It is humbling to think about passingthe $1 billion revenue mark while at the same time being confi dent that our Brand is still in its early stages. But at the simplest level, our formula hasn’t truly changed. Our appetite to make all athletesbetter remains strong, whether it’s on the fi eld of the BCS National Championship Game, a ski mountain in Utah where the next Lindsey Vonn is training, or a batting cage in Tokyo where a teenager is gettingin his last few swings before they turn out the lights. Our trip is still just getting started and we remain humble and hungry as this next part of the journey begins.
Humble & Hungry,
Kevin A. Plank
President, Chief Executive Offi cer and
Chairman of the Board of Directors,
Under Armour, Inc.
NET REVENUES GROWING 24% TO $1.064 BILLION
EARNINGS PER SHARE INCREASED 46% TO $1.34
AND WITH THE LAUNCH OF CHARGED COTTONIN MARCH 2011– THE NEXT CHAPTER IN UNDER ARMOUR’S INNOVATION PLATFORM – WE WILL RAISE EXPECTATIONS ONCE AGAIN.

*5-Year Compound Annual Growth Rate based on fi scal year 2005 net revenues of $281,053
5-YEAR COMPOUND ANNUAL GROWTH RATE - 30.5%
NET REVENUESIN THOUSANDS; YEAR 2006-2010
MONICA HARGROVEI
WORLD-CLASS SPRINTER
2006 2007 2008 2009 2010
$430,689
$606,561
$725,244
$856,411
$1,063,927

*5-Year Compound Annual Growth Rate based on fi scal year 2005 income from operations of $35,810 5-YEAR COMPOUND ANNUAL GROWTH RATE- 25.7%
INCOME FROM OPERATIONSIN THOUSANDS; YEAR 2006-2010
CASH, NET OF DEBTIN THOUSANDS; YEAR END 2006-2010
CASH,NET OF DEBT
CASH DEBT
$64,398 $26,256 $56,451 $167,074 $187,9282006 2007 2008 2009 2010
2006 2007 2008 2009 2010
$56,918
$86,265
$76,925
$85,273
$112,355
$70,655
$40,588
$102,042
$187,297
$203,870
$6,257$14,332
$45,591
$20,223 $15,942

MILES AUSTIN I PRO BOWL WIDE RECEIVER

UNITED STATESSECURITIES AND EXCHANGE COMMISSION
Washington, D.C. 20549
Form 10-K(Mark One)
Í ANNUAL REPORT PURSUANT TO SECTION 13 OR 15(d) OF THE SECURITIESEXCHANGE ACT OF 1934For the fiscal year ended December 31, 2010
or
‘ TRANSITION REPORT PURSUANT TO SECTION 13 OR 15(d) OF THE SECURITIESEXCHANGE ACT OF 1934For the transition period from to
Commission File No. 001-33202
UNDER ARMOUR, INC.(Exact name of registrant as specified in its charter)
Maryland 52-1990078(State or other jurisdiction ofincorporation or organization)
(I.R.S. EmployerIdentification No.)
1020 Hull StreetBaltimore, Maryland 21230 (410) 454-6428
(Address of principal executive offices) (Zip Code) (Registrant’s Telephone Number, Including Area Code)Securities registered pursuant to Section 12(b) of the Act:
Class A Common Stock New York Stock Exchange(Title of each class) (Name of each exchange on which registered)
Securities registered pursuant to Section 12(g) of the Act:None
Indicate by check mark if the registrant is a well-known seasoned issuer, as defined in Rule 405 of the SecuritiesAct. Yes Í No ‘
Indicate by check mark if the registrant is not required to file reports pursuant to Section 13 or Section 15(d) of theAct. Yes ‘ No Í
Indicate by check mark whether the registrant (1) has filed all reports required to be filed by Section 13 or 15(d) of theSecurities Exchange Act of 1934 during the preceding 12 months (or for such shorter period that the registrant was required to filesuch reports), and (2) has been subject to such filing requirements for the past 90 days. Yes Í No ‘
Indicate by check mark whether the registrant has submitted electronically and posted on its corporate Web site, if any, everyInteractive Data File required to be submitted and posted pursuant to Rule 405 of Regulation S-T (§229.405 of this chapter) duringthe preceding 12 months (or for such shorter period that the registrant was required to submit and post such files. Yes Í No ‘
Indicate by check mark if the disclosure of delinquent filers pursuant to Item 405 or Regulation S-K (§229.405 of this chapter)is not contained herein, and will not be contained, to the best of registrant’s knowledge, in definitive proxy or information statementsincorporated by reference in Part III of this Form 10-K or any amendment to this Form 10-K. Í
Indicate by check mark whether the registrant is a large accelerated filer, an accelerated filer, a non-accelerated filer, or asmaller reporting company. See definitions of “large accelerated filer,” “accelerated filer,” and “smaller reporting company” in Rule12b-2 of the Exchange Act.
Large accelerated filer Í Accelerated filer ‘Non-accelerated filer ‘ (Do not check if a smaller reporting company) Smaller reporting company ‘Indicate by check mark whether the registrant is a shell company (as defined in Rule 12b-2 of the Act). Yes ‘ No ÍAs of June 30, 2010, the last business day of our most recently completed second fiscal quarter, the aggregate market value of
the registrant’s Class A Common Stock held by non-affiliates was $1,165,676,590.As of January 31, 2011, there were 38,672,858 shares of Class A Common Stock and 12,500,000 shares of Class B Convertible
Common Stock outstanding.DOCUMENTS INCORPORATED BY REFERENCE
Portions of Under Armour, Inc.’s Proxy Statement for the Annual Meeting of Stockholders to be held on May 3, 2011 areincorporated by reference in Part III of this Form 10-K.

UNDER ARMOUR, INC.
ANNUAL REPORT ON FORM 10-KTABLE OF CONTENTS
PART I.Item 1. Business
General . . . . . . . . . . . . . . . . . . . . . . . . . . . . . . . . . . . . . . . . . . . . . . . . . . . . . . . . . . . . . . . . . 1Products . . . . . . . . . . . . . . . . . . . . . . . . . . . . . . . . . . . . . . . . . . . . . . . . . . . . . . . . . . . . . . . . 1Marketing and Promotion . . . . . . . . . . . . . . . . . . . . . . . . . . . . . . . . . . . . . . . . . . . . . . . . . . 2Customers . . . . . . . . . . . . . . . . . . . . . . . . . . . . . . . . . . . . . . . . . . . . . . . . . . . . . . . . . . . . . . 4Product Licensing . . . . . . . . . . . . . . . . . . . . . . . . . . . . . . . . . . . . . . . . . . . . . . . . . . . . . . . . 5Net Revenues in Other Foreign Countries . . . . . . . . . . . . . . . . . . . . . . . . . . . . . . . . . . . . . . 5Seasonality . . . . . . . . . . . . . . . . . . . . . . . . . . . . . . . . . . . . . . . . . . . . . . . . . . . . . . . . . . . . . . 6Product Design and Development . . . . . . . . . . . . . . . . . . . . . . . . . . . . . . . . . . . . . . . . . . . . 6Sourcing, Manufacturing and Quality Assurance . . . . . . . . . . . . . . . . . . . . . . . . . . . . . . . . 6Distribution and Inventory Management . . . . . . . . . . . . . . . . . . . . . . . . . . . . . . . . . . . . . . . 7Intellectual Property . . . . . . . . . . . . . . . . . . . . . . . . . . . . . . . . . . . . . . . . . . . . . . . . . . . . . . . 8Competition . . . . . . . . . . . . . . . . . . . . . . . . . . . . . . . . . . . . . . . . . . . . . . . . . . . . . . . . . . . . . 8Employees . . . . . . . . . . . . . . . . . . . . . . . . . . . . . . . . . . . . . . . . . . . . . . . . . . . . . . . . . . . . . . 9Available Information . . . . . . . . . . . . . . . . . . . . . . . . . . . . . . . . . . . . . . . . . . . . . . . . . . . . . 9
Item 1A. Risk Factors . . . . . . . . . . . . . . . . . . . . . . . . . . . . . . . . . . . . . . . . . . . . . . . . . . . . . . . . . . . . . . . . . 10Item 1B. Unresolved Staff Comments . . . . . . . . . . . . . . . . . . . . . . . . . . . . . . . . . . . . . . . . . . . . . . . . . . . . 19Item 2. Properties . . . . . . . . . . . . . . . . . . . . . . . . . . . . . . . . . . . . . . . . . . . . . . . . . . . . . . . . . . . . . . . . . . . 20Item 3. Legal Proceedings . . . . . . . . . . . . . . . . . . . . . . . . . . . . . . . . . . . . . . . . . . . . . . . . . . . . . . . . . . . . 20
Executive Officers of the Registrant . . . . . . . . . . . . . . . . . . . . . . . . . . . . . . . . . . . . . . . . . . . . . . 21PART II.
Item 5. Market for Registrant’s Common Equity, Related Stockholder Matters and Issuer Purchasesof Equity Securities . . . . . . . . . . . . . . . . . . . . . . . . . . . . . . . . . . . . . . . . . . . . . . . . . . . . . . . . . 23
Item 6. Selected Financial Data . . . . . . . . . . . . . . . . . . . . . . . . . . . . . . . . . . . . . . . . . . . . . . . . . . . . . . . . 26Item 7. Management’s Discussion and Analysis of Financial Condition and Results of Operations . . . 26Item 7A. Quantitative and Qualitative Disclosures About Market Risk . . . . . . . . . . . . . . . . . . . . . . . . . . 41Item 8. Financial Statements and Supplementary Data . . . . . . . . . . . . . . . . . . . . . . . . . . . . . . . . . . . . . . 43Item 9. Changes in and Disagreements With Accountants on Accounting and Financial Disclosure . . 70Item 9A. Controls and Procedures . . . . . . . . . . . . . . . . . . . . . . . . . . . . . . . . . . . . . . . . . . . . . . . . . . . . . . . 70Item 9B. Other Information . . . . . . . . . . . . . . . . . . . . . . . . . . . . . . . . . . . . . . . . . . . . . . . . . . . . . . . . . . . . 70
PART III.Item 10. Directors, Executive Officers and Corporate Governance . . . . . . . . . . . . . . . . . . . . . . . . . . . . . 71Item 11. Executive Compensation . . . . . . . . . . . . . . . . . . . . . . . . . . . . . . . . . . . . . . . . . . . . . . . . . . . . . . . 71Item 12. Security Ownership of Certain Beneficial Owners and Management and Related Stockholder
Matters . . . . . . . . . . . . . . . . . . . . . . . . . . . . . . . . . . . . . . . . . . . . . . . . . . . . . . . . . . . . . . . . . . . 71Item 13. Certain Relationships and Related Transactions, and Director Independence . . . . . . . . . . . . . . 71Item 14. Principal Accountant Fees and Services . . . . . . . . . . . . . . . . . . . . . . . . . . . . . . . . . . . . . . . . . . . 71
PART IV.Item 15. Exhibits and Financial Statement Schedules . . . . . . . . . . . . . . . . . . . . . . . . . . . . . . . . . . . . . . . 72
SIGNATURES . . . . . . . . . . . . . . . . . . . . . . . . . . . . . . . . . . . . . . . . . . . . . . . . . . . . . . . . . . . . . . . . . . . . . . . . . . 76

PART I
ITEM 1. BUSINESS
General
Our principal business activities are the development, marketing and distribution of branded performanceapparel, footwear and accessories for men, women and youth. The brand’s moisture-wicking fabrications areengineered in many designs and styles for wear in nearly every climate to provide a performance alternative totraditional products. Our products are sold worldwide and are worn by athletes at all levels, from youth toprofessional, on playing fields around the globe, as well as consumers with active lifestyles.
Our net revenues are generated primarily from the wholesale distribution of our products to national,regional, independent and specialty retailers. We also generate net revenue from product licensing and from thesale of our products through our direct to consumer sales channel, which includes sales through our factory houseand specialty stores, website and catalogs. Our products are offered in over twenty three thousand retail storesworldwide. A large majority of our products are sold in North America; however we believe that our productsappeal to athletes and consumers with active lifestyles around the globe. Internationally, we sell our products incertain countries in Europe, a third party licensee sells our products in Japan, and distributors sell our products inother foreign countries. We plan to continue to grow our business over the long term through increased sales ofour apparel, footwear and accessories, expansion of our wholesale distribution, growth in our direct to consumersales channel and expansion in international markets. Virtually all of our products are manufactured byunaffiliated manufacturers operating in 22 countries outside of the United States.
We were incorporated as a Maryland corporation in 1996. As used in this report, the terms “we,” “our,”“us,” “Under Armour” and the “Company” refer to Under Armour, Inc. and its subsidiaries unless the contextindicates otherwise. We have registered trademarks around the globe, including UNDER ARMOUR®,HEATGEAR®, COLDGEAR®, ALLSEASONGEAR® and the Under Armour UA Logo, and we have applied toregister many other trademarks. This Annual Report on Form 10-K also contains additional trademarks andtradenames of our Company and other companies. All trademarks and tradenames appearing in this AnnualReport on Form 10-K are the property of their respective holders.
Products
Our product offerings consist of apparel, footwear and accessories for men, women and youth. We marketour products at multiple price levels and provide consumers with what we believe to be a superior alternative totraditional athletic products. In 2010, sales of apparel, footwear and accessories represented 80%, 12% and 4% ofnet revenues, respectively. Licensing arrangements for the sale of our products represented the remaining 4% ofnet revenues. Refer to Note 16 to the Consolidated Financial Statements for net revenues by product.
Apparel
Our apparel is offered in a variety of styles and fits intended to enhance comfort and mobility, regulate bodytemperature and improve performance regardless of weather conditions. Our apparel is engineered to replacetraditional non-performance fabrics in the world of athletics and fitness with performance alternatives designedand merchandised along gearlines. Our three gearlines are marketed to tell a very simple story about our highlytechnical products and extend across the sporting goods, outdoor and active lifestyle markets. We market ourapparel for consumers to choose HEATGEAR® when it is hot, COLDGEAR® when it is cold andALLSEASONGEAR® between the extremes. Within each gearline our apparel comes in three fit types:compression (tight fit), fitted (athletic fit) and loose (relaxed).
1

HEATGEAR® is designed to be worn in warm to hot temperatures under equipment or as a single layer. Ourfirst compression T-shirt was the original HEATGEAR® product and remains one of our signature styles. Whilea sweat-soaked traditional non-performance T-shirt can weigh two to three pounds, HEATGEAR® is engineeredwith a microfiber blend designed to wick moisture from the body which helps the body stay cool, dry and light.We offer HEATGEAR® in a variety of tops and bottoms in a broad array of colors and styles for wear in the gymor outside in warm weather.
Because athletes sweat in cold weather as well as in the heat, COLDGEAR® is designed to wick moisturefrom the body while circulating body heat from hot spots to help maintain core body temperature. OurCOLDGEAR® apparel provides both dryness and warmth in a single light layer that can be worn beneath ajersey, uniform, protective gear or ski-vest and our COLDGEAR® outerwear products protect the athlete, as wellas the coach and the fan from the outside in. Our COLDGEAR® product offerings generally sell at higher pricesthan our other gearlines.
ALLSEASONGEAR® is designed to be worn in changing temperatures and uses technical fabrics to keepthe wearer cool and dry in warmer temperatures while preventing a chill in cooler temperatures.
Footwear
We began offering footwear for men, women and youth in 2006, and each year we have expanded ourfootwear offerings. Our footwear offerings include football, baseball, lacrosse, softball and soccer cleats, slides,performance training footwear, running footwear and basketball footwear. Our footwear is light, breathable andbuilt with performance attributes for athletes. Our footwear is designed with innovative technologies whichprovide stabilization, directional cushioning and moisture management engineered to maximize the athlete’scomfort and control. During 2010, we introduced basketball footwear, which had a limited introduction in theUnited States and Canada.
Accessories
Our baseball batting, football, golf and running gloves include HEATGEAR® and COLDGEAR®
technologies and are designed with advanced fabrications to provide the same level of performance as our otherproducts. Net revenues generated from the sale of baseball batting, football, golf and running gloves are includedin our accessories category.
We also have agreements with our licensees to develop Under Armour accessories. Our product, marketingand sales teams are actively involved in all steps of the design process in order to maintain brand standards andconsistency. During 2010, our licensees offered bags, socks, headwear, custom-molded mouth guards andeyewear designed to be used and worn before, during and after competition, and feature performance advantagesand functionality similar to our other product offerings. License revenues generated from the sale of theseaccessories are included in our net revenues. We have developed our own headwear and bags, and beginning in2011, these products are being sold by us rather than by one of our licensees.
Marketing and Promotion
We currently focus on marketing and selling our products to consumers for use in athletics, fitness, trainingand outdoor activities. We maintain control over our brand image with an in-house marketing and promotionsdepartment that designs and produces most of our advertising campaigns. We seek to drive consumer demand forour products by building brand equity and awareness as a leading performance athletic brand.
Sports Marketing
Our marketing and promotion strategy begins with selling our products to high-performing athletes andteams on the high school, collegiate and professional levels. We execute this strategy through outfitting
2

agreements, professional and collegiate sponsorships, individual athlete agreements and by selling our productsdirectly to team equipment managers and to individual athletes. As a result, our products are seen on the field,giving them exposure to various consumer audiences through the internet, television, magazines and live atsporting events. This exposure to consumers helps us establish on-field authenticity as consumers can see ourproducts being worn by high-performing athletes. We are the official outfitter of the athletic teams at AuburnUniversity (the 2011 BCS National Champions), Boston College, Texas Tech University, the University ofMaryland, the University of South Carolina and the University of South Florida. We are the official outfitter ofnumerous other teams, including the football teams at the University of Hawaii and the University of Utah. Wesupply uniforms, sideline apparel and fan gear for these teams. In addition, we sell our products domestically toprofessional football teams and Division I men’s and women’s collegiate athletic teams. Since 2006 we havebeen an official supplier of footwear to the National Football League (“NFL”), a step we took to complete thecircle of authenticity from the Friday night lights of high school to Saturday afternoon college game day to themarquee Sunday match-ups of the NFL. In 2010 we signed an agreement to become an official supplier of glovesto the NFL beginning in 2011 and combine training apparel beginning in 2012. This relationship enables NFLplayers to wear Under Armour products on the field and at the combine and enables Under Armour to reach fansat the highest level of competitive football.
Internationally, we are selling our products to European soccer and rugby teams. We are the official supplierof performance apparel to the Hannover 96 football club and the Welsh Rugby Union, among others. In addition,we are an official supplier of performance apparel to Hockey Canada and have advertising rights throughout theAir Canada Center during the Toronto Maple Leafs’ home games. We have also been designated as the OfficialPerformance Product Sponsor of the Toronto Maple Leafs.
We also have sponsorship agreements with individual athletes. Our strategy is to find the next generation ofstars, like Milwaukee Bucks point guard Brandon Jennings, U.S. professional skier and Olympic gold medalwinner Lindsey Vonn, professional lacrosse player Paul Rabil, Baltimore Orioles catcher Matthew Wieters,National League Rookie of the Year and World Series Champion Buster Posey, UFC Welterweight ChampionGeorges St-Pierre and the number one pick in the 2010 Major League Baseball Draft, Bryce Harper of theWashington Nationals. In addition, our roster of athletes includes established stars such as professional footballplayers Tom Brady, Brandon Jacobs, Miles Austin, Vernon Davis and Anquan Boldin, triathlon champion Chris“Macca” McCormack, professional baseball players Ryan Zimmerman and Jose Reyes, U.S. Women’s NationalSoccer Team players Heather Mitts and Lauren Cheney, U.S. Olympic and professional volleyball player NicoleBranagh, U.S. Olympic swimmer Michael Phelps, and professional golfer Hunter Mahan.
We seek to sponsor events to drive awareness and brand authenticity from a grassroots level. For example,we entered into an agreement with IMG Academies for the development of a unique, comprehensive athletictraining platform that we believe will establish a global measurement standard for sports performance, health andfitness. In 2010, we hosted over 50 combines, camps and clinics for many sports at regional sites across thecountry for male and female athletes.
We reach young football athletes at all levels by sponsoring American Youth Football, a footballorganization that promotes the development of youth; the Under Armour All-America Football Game, which isan annual competition between the top seniors in high school football; and the Under Armour Senior Bowl,which is an annual competition between the top seniors in college football. In addition, we are the presentingsponsor for the 2010 NFL Scouting Combine.
We partner with Ripken Baseball to outfit Ripken Baseball participants and to be the title sponsor for all 25Ripken youth baseball tournaments, reaching 35,000 young athletes. In addition, we partner with the BaseballFactory to outfit the nation’s top high school baseball athletes from head-to-toe and serve as the title sponsor fornationally recognized baseball tournaments and teams. In addition, beginning with the upcoming 2011 season,we are the Official Footwear Supplier of Major League Baseball.
3
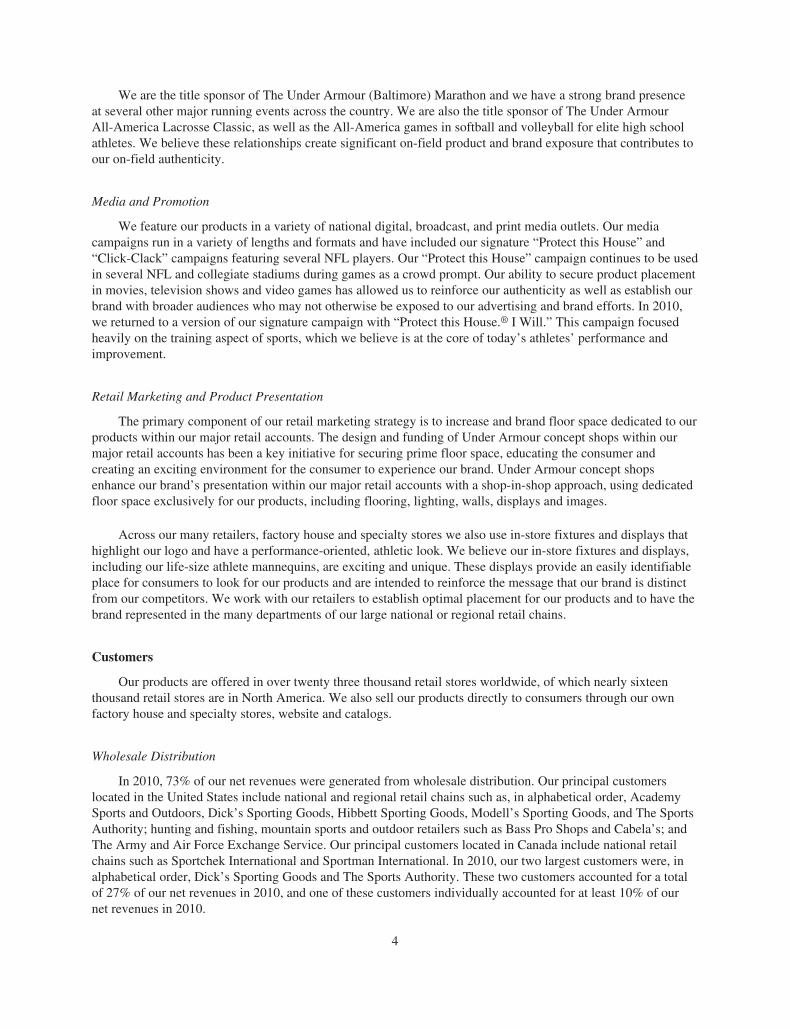
We are the title sponsor of The Under Armour (Baltimore) Marathon and we have a strong brand presenceat several other major running events across the country. We are also the title sponsor of The Under ArmourAll-America Lacrosse Classic, as well as the All-America games in softball and volleyball for elite high schoolathletes. We believe these relationships create significant on-field product and brand exposure that contributes toour on-field authenticity.
Media and Promotion
We feature our products in a variety of national digital, broadcast, and print media outlets. Our mediacampaigns run in a variety of lengths and formats and have included our signature “Protect this House” and“Click-Clack” campaigns featuring several NFL players. Our “Protect this House” campaign continues to be usedin several NFL and collegiate stadiums during games as a crowd prompt. Our ability to secure product placementin movies, television shows and video games has allowed us to reinforce our authenticity as well as establish ourbrand with broader audiences who may not otherwise be exposed to our advertising and brand efforts. In 2010,we returned to a version of our signature campaign with “Protect this House.® I Will.” This campaign focusedheavily on the training aspect of sports, which we believe is at the core of today’s athletes’ performance andimprovement.
Retail Marketing and Product Presentation
The primary component of our retail marketing strategy is to increase and brand floor space dedicated to ourproducts within our major retail accounts. The design and funding of Under Armour concept shops within ourmajor retail accounts has been a key initiative for securing prime floor space, educating the consumer andcreating an exciting environment for the consumer to experience our brand. Under Armour concept shopsenhance our brand’s presentation within our major retail accounts with a shop-in-shop approach, using dedicatedfloor space exclusively for our products, including flooring, lighting, walls, displays and images.
Across our many retailers, factory house and specialty stores we also use in-store fixtures and displays thathighlight our logo and have a performance-oriented, athletic look. We believe our in-store fixtures and displays,including our life-size athlete mannequins, are exciting and unique. These displays provide an easily identifiableplace for consumers to look for our products and are intended to reinforce the message that our brand is distinctfrom our competitors. We work with our retailers to establish optimal placement for our products and to have thebrand represented in the many departments of our large national or regional retail chains.
Customers
Our products are offered in over twenty three thousand retail stores worldwide, of which nearly sixteenthousand retail stores are in North America. We also sell our products directly to consumers through our ownfactory house and specialty stores, website and catalogs.
Wholesale Distribution
In 2010, 73% of our net revenues were generated from wholesale distribution. Our principal customerslocated in the United States include national and regional retail chains such as, in alphabetical order, AcademySports and Outdoors, Dick’s Sporting Goods, Hibbett Sporting Goods, Modell’s Sporting Goods, and The SportsAuthority; hunting and fishing, mountain sports and outdoor retailers such as Bass Pro Shops and Cabela’s; andThe Army and Air Force Exchange Service. Our principal customers located in Canada include national retailchains such as Sportchek International and Sportman International. In 2010, our two largest customers were, inalphabetical order, Dick’s Sporting Goods and The Sports Authority. These two customers accounted for a totalof 27% of our net revenues in 2010, and one of these customers individually accounted for at least 10% of ournet revenues in 2010.
4

In 2010, approximately 75% of our wholesale distribution was derived from large format national andregional retail chains. Additional wholesale distribution in 2010 was derived from independent and specialtyretailers, institutional athletic departments, leagues and teams. The independent and specialty retailers areserviced by a combination of in-house sales personnel and third-party commissioned manufacturer’srepresentatives and continue to represent an important part of our product distribution strategy and help build onthe authenticity of our products. Our independent sales include sales to military specialists, fitness specialists,outdoor retailers and other specialty channels. With the launch of our footwear, we expanded our distribution atthe mall through national footwear retailers including Finish Line and Foot Locker.
Direct to Consumer Sales
In 2010, 23% of our net revenues were generated through direct to consumer sales. Direct to consumer salesinclude discounted sales through our own factory house stores and sales through our specialty stores, globalwebsite and catalog. As of December 31, 2010, we had 54 factory house stores, of which the majority are locatedat outlet centers on the East Coast of the United States. Through our specialty stores, consumers experience ourbrand first-hand and have broader access to our performance products. These specialty stores are located nearAnnapolis, Maryland, Chicago, Illinois, Boston, Massachusetts, and Washington, D.C.
Product Licensing
In addition to generating net revenues through wholesale distribution and direct to consumer sales, wegenerate net revenues from licensing arrangements to manufacture and distribute Under Armour brandedproducts. In order to maintain consistent quality and performance, we pre-approve all products manufactured andsold by our licensees, and our quality assurance team strives to ensure that the products meet the same qualityand compliance standards as the products that we sell directly. We have relationships with several licensees forsocks, team uniforms, eyewear and custom-molded mouth guards, as well as the distribution of our products tocollege bookstores and golf pro shops. In addition, we have a relationship with a Japanese licensee that has theexclusive rights to distribute our products in Japan. In 2010, license revenues accounted for 4% of our netrevenues. We have developed our own headwear and bags, and beginning in 2011, these products are being soldby us rather than by one of our licensees.
Net Revenues in Other Foreign Countries
Our net revenues in other foreign countries include net revenues generated in Western Europe, primarily inAustria, France, Germany, Ireland and the United Kingdom. In addition, net revenues in other foreign countriesinclude net revenues generated through third-party distributors primarily in Australia, Italy, Greece, NewZealand, Panama, Scandinavia and Spain, along with license revenues from our licensee in Japan. We believethat the trend toward performance products is global, and we will continue to introduce our products and simplemerchandising story to athletes throughout the world. In international markets, we are introducing ourperformance apparel, footwear and accessories in a manner consistent with our past brand-building strategy,including selling our products directly to teams and individual athletes in these markets, thereby providing uswith product exposure to broad audiences of potential consumers.
Since 2002, we have had a license agreement with Dome Corporation, which produces, markets and sellsour branded products in Japan. We work closely with this licensee to develop variations of our products for thedifferent sizes, sports interests and preferences of the Japanese consumer. Our branded products are now sold inJapan to professional sports teams, including Omiya Ardija, a professional soccer club in Saitama, Japan, as wellas baseball and other soccer teams, and to over two thousand independent specialty stores and large sportinggoods retailers, such as Alpen, Himaraya, The Sports Authority and Xebio. We made a minority equityinvestment in Dome Corporation effective January 2011.
In 2006, we opened our European headquarters in Amsterdam, The Netherlands from which our Europeansales, marketing and logistics functions are conducted. We sell our branded products to Premier League Football
5

clubs and multiple running, golf and cricket clubs in the United Kingdom, soccer teams in France, Germany,Greece, Ireland, Italy, Spain and Sweden, as well as First Division Rugby clubs in France, Ireland, Italy and theUnited Kingdom. Refer to Note 16 to the Consolidated Financial Statements for consolidated net revenues foreach of the last three years attributed to the United States and to other foreign countries.
We operate in the following geographic segments: North America, Europe, the Middle East and Africa(“EMEA”) and Asia. Refer to Note 16 to the Consolidated Financial Statements for financial information onthese segments.
Seasonality
Historically, we have recognized a significant portion of our income from operations in the last two quartersof the year, driven primarily by increased sales volume of our products during the fall selling season, reflectingour historical strength in fall sports, and the seasonality of our higher priced COLDGEAR® line. Historically, alarger portion of our income from operations has been in the last two quarters of the year partially due to the shiftin the timing of marketing investments to the first two quarters of the year. The majority of our net revenues weregenerated during the last two quarters in each of 2010, 2009 and 2008. The level of our working capital generallyreflects the seasonality and growth in our business. We generally expect inventory, accounts payable and certainaccrued expenses to be higher in the second and third quarters in preparation for the fall selling season.
Product Design and Development
Our products are manufactured with technical fabrications produced by third parties and developed incollaboration with our product development team. This approach enables us to select and create superior,technically advanced fabrics, produced to our specifications, while focusing our product development efforts ondesign, fit, climate and product end use.
We seek to regularly upgrade and improve our products with the latest in innovative technology whilebroadening our product offerings. Our goal, to deliver superior performance in all our products, provides ourdevelopers and licensees with a clear, overarching direction for the brand and helps them identify newopportunities to create performance products that meet the changing needs of athletes. We design products with“visible technology,” utilizing color, texture and fabrication to enhance our customers’ perception andunderstanding of product use and benefits.
Our product development team has significant prior industry experience at leading fabric and other rawmaterial suppliers and branded athletic apparel and footwear companies throughout the world. This team worksclosely with our sports marketing and sales teams as well as professional and collegiate athletes to identifyproduct trends and determine market needs. For example, these teams worked closely to identify the opportunityand market for our Catalyst products, which are the cornerstone of the Under Armour Green Collection. Thefabrics of the Catalyst products are made from recycled plastic bottles and, like many of our products, aredesigned to keep an athlete cool and dry and protected from the sun’s harmful rays.
Sourcing, Manufacturing and Quality Assurance
Many of the specialty fabrics and other raw materials used in our products are technically advancedproducts developed by third parties and may be available, in the short term, from a limited number of sources.The fabric and other raw materials used to manufacture our products are sourced by our manufacturers from alimited number of suppliers pre-approved by us. In 2010, approximately 70% to 75% of the fabric used in ourproducts came from eight suppliers. These fabric suppliers have locations in El Salvador, Mexico, Peru, Taiwanand the United States. We continue to seek new suppliers and believe, although there can be no assurance, thatthis concentration will decrease over time. The fabrics used by our suppliers and manufacturers are primarilysynthetic fabrics and involve raw materials, including petroleum based products, that may be subject to price
6

fluctuations and shortages. Beginning in 2011 we are offering CHARGED COTTON™ products using primarilycotton fabrics that also may be subject to price fluctuations and shortages.
Substantially all of our products are manufactured by unaffiliated manufacturers and, in 2010, sixmanufacturers produced approximately 45% of our products. In 2010, our products were manufactured by 26primary manufacturers, operating in 22 countries. During 2010, approximately 55% of our products weremanufactured in Asia, 25% in Central and South America, 10% in Mexico and 5% in the Middle East. Allmanufacturers are evaluated for quality systems, social compliance and financial strength by our qualityassurance team prior to being selected and on an ongoing basis. Where appropriate, we strive to qualify multiplemanufacturers for particular product types and fabrications. We also seek out vendors that can perform multiplemanufacturing stages, such as procuring raw materials and providing finished products, which helps us to controlour cost of goods sold. We enter into a variety of agreements with our manufacturers, including non-disclosureand confidentiality agreements, and we require that all of our manufacturers adhere to a code of conductregarding quality of manufacturing and working conditions and other social concerns. We do not, however, haveany long term agreements requiring us to utilize any manufacturer, and no manufacturer is required to produceour products in the long term. We have an office in Hong Kong to support our manufacturing, quality assuranceand sourcing efforts for apparel and offices in Guangzhou, China to support our manufacturing, quality assuranceand sourcing efforts for footwear.
We also manufacture a limited number of apparel products on-premises in our quick turn, Special Make-UpShop located at one of our distribution facilities in Maryland. Through this 17,000 square-foot shop, we are ableto build and ship apparel products on tight deadlines for high-profile athletes, leagues and teams. While theapparel products manufactured in the quick turn, Special Make-Up Shop represent an immaterial portion of ourtotal net revenues, we believe the facility helps us to provide superior service to select customers.
Distribution and Inventory Management
We package and distribute the majority of our products through two distribution facilities locatedapproximately 15 miles from our Baltimore, Maryland headquarters. One facility is a high-bay facility built in2000, in which we currently lease and occupy approximately 359,000 square feet. The lease term expires inSeptember 2011, with two options to extend the lease term for up to four years in total. The other facility is ahigh-bay facility built in 2003, in which we lease and occupy approximately 308,000 square feet. The lease termexpires in April 2013, with one option to extend the lease term for an additional five years. In addition, wedistribute our products in North America through a third-party logistics provider with primary locations inCalifornia and in Florida. The agreement with this provider continues until December 2012. In 2010, we began todistribute some of our international products through a third-party logistics provider in Hong Kong. We alsodistribute our products in Europe through a third-party logistics provider based out of Venlo, The Netherlands.This agreement continues until April 2013. We believe our distribution facilities and space available at our third-party logistics providers will be adequate to meet our short term needs. We expect to expand to additionalfacilities in the future.
Inventory management is important to the financial condition and operating results of our business. Wemanage our inventory levels based on any existing orders, anticipated sales and the rapid-delivery requirementsof our customers. Our inventory strategy is focused on continuing to meet consumer demand while improvingour inventory efficiency over the long term by putting systems and procedures in place to improve our inventorymanagement. We expect to achieve this by being in stock in core product offerings, which includes products thatwe plan to have available for sale over the next twelve months and beyond at full price. In addition, we expect toachieve our inventory strategy by ordering our seasonal products based on current bookings, shipping seasonalproduct at the start of the shipping window in order to maximize the productivity of floor space at our retailersand earmarking any seasonal excess for sales through our factory house stores and liquidation sales to thirdparties.
7
Our practice, and the general practice in the apparel and footwear industries, is to offer retail customers theright to return defective or improperly shipped merchandise. Because of long lead-times for design andproduction of our products, from time to time we commence production of new products before receiving ordersfor those products. This affects our inventory levels for new products.
Intellectual Property
We believe we own the internally developed material trademarks used in connection with the marketing,distribution and sale of all our products, both domestically and internationally, where our products are currentlysold or manufactured. Our major trademarks include the UA Logo and UNDER ARMOUR®, both of which areregistered in the United States, Canada, the European Union, Japan and several other foreign countries in whichwe sell or plan to sell our products. We also own trademark registrations for UA®, ARMOUR®, HEATGEAR®,COLDGEAR®, ALLSEASONGEAR®, PROTECT THIS HOUSE®, THE ADVANTAGE IS UNDENIABLE ®,DUPLICITY®, MPZ®, BOXERJOCK®, RECHARGE®, ARMOURBITE®, ATHLETES RUN®, and for other ofour trademarks. In addition, we have applied to register numerous other trademarks including: CHARGEDCOTTON™, GAMEDAY ARMOUR™, and MICRO G™. We also own internally developed domain names forour primary trademarks and hold copyright registrations for several commercials, as well as for certain artwork.We intend to continue to strategically register, both domestically and internationally, trademarks and copyrightswe utilize today and those we develop in the future. We will continue to aggressively police our trademarks andpursue those who infringe, both domestically and internationally.
We believe the distinctive trademarks we use in connection with our products are important in building ourbrand image and distinguishing our products from those of others. These trademarks are among our mostvaluable assets. In addition to our distinctive trademarks, we also place significant value on our trade dress,which is the overall image and appearance of our products, and we believe our trade dress helps to distinguishour products in the marketplace.
The intellectual property rights in much of the technology, materials and processes used to manufacture ourproducts are often owned or controlled by our suppliers. However, we seek to protect certain innovative productsand features that we believe to be new, strategic and important to our business. In 2010, we filed several patentapplications in connection with certain of our products and designs that we believe offer a unique utility orfunction. We will continue to file patent applications where we deem appropriate to protect our inventions anddesigns, and we expect the number of applications to grow as our business grows and as we continue to innovatein a range of product categories.
Competition
The market for performance athletic apparel and footwear is highly competitive and includes many newcompetitors as well as increased competition from established companies expanding their production andmarketing of performance products. The fabrics and technology used in manufacturing our products are generallynot unique to us, and we do not currently own any fabric or process patents. Many of our competitors are largeapparel, footwear and sporting goods companies with strong worldwide brand recognition and significantlygreater resources than us, such as Nike and adidas. We also compete with other manufacturers, including thosespecializing in outdoor apparel, and private label offerings of certain retailers, including some of our customers.
In addition, we must compete with others for purchasing decisions, as well as limited floor space at retailers.We believe we have been successful in this area because of the relationships we have developed and as a result ofthe strong sales of our products. However, if retailers earn greater margins from our competitors’ products, theymay favor the display and sale of those products.
We believe we have been able to compete successfully because of our brand image and recognition, theperformance and quality of our products and our selective distribution policies. We also believe our focused
8

gearline merchandising story differentiates us from our competition. In the future we expect to compete forconsumer preferences and expect that we may face greater competition on pricing. This may favor largercompetitors with lower costs per unit of product produced that can spread the effect of price discounts across alarger array of products and across a larger customer base than ours. The purchasing decisions of consumers forour products often reflect highly subjective preferences that can be influenced by many factors, includingadvertising, media, product sponsorships, product improvements and changing styles.
Employees
As of December 31, 2010, we had approximately thirty nine hundred employees, including approximatelytwenty two hundred in our factory house and specialty stores and six hundred at our distribution facilities.Approximately two thousand of our employees were full-time. Most of our employees are located in the UnitedStates and none of our employees are currently covered by a collective bargaining agreement. We have had nolabor-related work stoppages, and we believe our relations with our employees are good.
AVAILABLE INFORMATION
We will make available free of charge on or through our website at www.underarmour.com our annualreports on Form 10-K, quarterly reports on Form 10-Q, current reports on Form 8-K and amendments to thesereports filed or furnished pursuant to Section 13(a) or 15(d) of the Exchange Act as soon as reasonablypracticable after we file these materials with the Securities and Exchange Commission. We also post on thiswebsite our key corporate governance documents, including our board committee charters, our corporategovernance guidelines and our ethics policy.
9

ITEM 1A. RISK FACTORS
Forward-Looking Statements
Some of the statements contained in this Form 10-K and the documents incorporated herein by referenceconstitute forward-looking statements. Forward-looking statements relate to expectations, beliefs, projections,future plans and strategies, anticipated events or trends and similar expressions concerning matters that are nothistorical facts, such as statements regarding our future financial condition or results of operations, our prospectsand strategies for future growth, the development and introduction of new products, and the implementation ofour marketing and branding strategies. In many cases, you can identify forward-looking statements by terms suchas “may,” “will,” “should,” “expects,” “plans,” “anticipates,” “believes,” “estimates,” “predicts,” “outlook,”“potential” or the negative of these terms or other comparable terminology.
The forward-looking statements contained in this Form 10-K and the documents incorporated herein byreference reflect our current views about future events and are subject to risks, uncertainties, assumptions andchanges in circumstances that may cause events or our actual activities or results to differ significantly fromthose expressed in any forward-looking statement. Although we believe that the expectations reflected in theforward-looking statements are reasonable, we cannot guarantee future events, results, actions, levels of activity,performance or achievements. Readers are cautioned not to place undue reliance on these forward-lookingstatements. A number of important factors could cause actual results to differ materially from those indicated bythese forward-looking statements, including, but not limited to, those factors described in “Risk Factors” and“Management’s Discussion and Analysis of Financial Condition and Results of Operations.” These factorsinclude without limitation:
• changes in general economic or market conditions that could affect consumer spending and thefinancial health of our retail customers;
• our ability to effectively manage our growth and a more complex business;
• our ability to effectively develop and launch new, innovative and updated products;
• our ability to accurately forecast consumer demand for our products and manage our inventory inresponse to changing demands;
• increased competition causing us to reduce the prices of our products or to increase significantly ourmarketing efforts in order to avoid losing market share;
• fluctuations in the costs of our products;
• loss of key suppliers or manufacturers or failure of our suppliers or manufacturers to produce or deliverour products in a timely or cost-effective manner;
• changes in consumer preferences or the reduction in demand for performance apparel, footwear andother products;
• our ability to accurately anticipate and respond to seasonal or quarterly fluctuations in our operatingresults;
• our ability to effectively market and maintain a positive brand image;
• the availability, integration and effective operation of management information systems and othertechnology; and
• our ability to attract and maintain the services of our senior management and key employees.
The forward-looking statements contained in this Form 10-K reflect our views and assumptions only as ofthe date of this Form 10-K. We undertake no obligation to update any forward-looking statement to reflect eventsor circumstances after the date on which the statement is made or to reflect the occurrence of unanticipatedevents.
10

Our results of operations and financial condition could be adversely affected by numerous risks. Youshould carefully consider the risk factors detailed below in conjunction with the other information containedin this Form 10-K. Should any of these risks actually materialize, our business, financial condition and futureprospects could be negatively impacted.
During a downturn in the economy, consumer purchases of discretionary items are affected, which couldmaterially harm our sales, profitability and financial condition.
Many of our products may be considered discretionary items for consumers. Factors affecting the level ofconsumer spending for such discretionary items include general economic conditions, the availability ofconsumer credit and consumer confidence in future economic conditions. Consumer purchases of discretionaryitems tend to decline during recessionary periods when disposable income is lower. We have limited experienceoperating a business during a recessionary period and can therefore not predict the full impact of a downturn inthe economy on our sales and profitability, including how our business responds when the economy is recoveringfrom a recession. A downturn in the economy in markets in which we sell our products may materially harm oursales, profitability and financial condition.
If the financial condition of our retail customers declines, our financial condition and results of operationscould be adversely impacted.
We extend credit to our customers based on an assessment of a customer’s financial condition, generallywithout requiring collateral. We face increased risk of order reduction or cancellation when dealing withfinancially ailing customers or customers struggling with economic uncertainty. A slowing economy in our keymarkets or a continued decline in consumer purchases of sporting goods generally could have an adverse effecton the financial health of our retail customers, which could in turn have an adverse effect on our sales, our abilityto collect on receivables and our financial condition.
A decline in sales to, or the loss of, one or more of our key customers could result in a material loss of netrevenues and negatively impact our prospects for growth.
In 2010, approximately 27% of our net revenues were generated from sales to our two largest customers inalphabetical order, Dick’s Sporting Goods and The Sports Authority. We currently do not enter into long termsales contracts with these or our other key customers, relying instead on our relationships with these customersand on our position in the marketplace. As a result, we face the risk that one or more of these key customers maynot increase their business with us as we expect, or may significantly decrease their business with us or terminatetheir relationship with us. The failure to increase our sales to these customers as we anticipate would have anegative impact on our growth prospects and any decrease or loss of these key customers’ business could resultin a material decrease in our net revenues and net income.
If we continue to grow at a rapid pace, we may not be able to effectively manage our growth and theincreased complexity of our business and as a result our brand image, net revenues and profitability maydecline.
We have expanded our operations rapidly since our inception and our net revenues have increased to$1,063.9 million in 2010 from $430.7 million in 2006. If our operations continue to grow at a rapid pace, we mayexperience difficulties in obtaining sufficient raw materials and manufacturing capacity to produce our products,as well as delays in production and shipments, as our products are subject to risks associated with overseassourcing and manufacturing. We could be required to continue to expand our sales and marketing, productdevelopment and distribution functions, to upgrade our management information systems and other processesand technology, and to obtain more space to support our expanding workforce. This expansion could increase thestrain on these and other resources, and we could experience serious operating difficulties, including difficulties
11

in hiring, training and managing an increasing number of employees. In addition, as our business becomes morecomplex through the introduction of more new products, such as new footwear, and the expansion of ourdistribution channels, including additional specialty and factory house stores, and expanded internationaldistribution, these operational strains and other difficulties could increase. These difficulties could result in theerosion of our brand image and a decrease in net revenues and net income.
If we are unable to anticipate consumer preferences and successfully develop and introduce new,innovative and updated products, we may not be able to maintain or increase our net revenues andprofitability.
Our success depends on our ability to identify and originate product trends as well as to anticipate and reactto changing consumer demands in a timely manner. All of our products are subject to changing consumerpreferences that cannot be predicted with certainty. Our new products may not receive consumer acceptance asconsumer preferences could shift rapidly to different types of performance or other sports products or away fromthese types of products altogether, and our future success depends in part on our ability to anticipate and respondto these changes. Failure to anticipate and respond in a timely manner to changing consumer preferences couldlead to, among other things, lower sales and excess inventory levels.
Even if we are successful in anticipating consumer preferences, our ability to adequately react to andaddress those preferences will in part depend upon our continued ability to develop and introduce innovative,high-quality products. The failure to effectively introduce new products and enter into new product categoriesthat are accepted by consumers could result in a decrease in net revenues and excess inventory levels, whichcould have a material adverse effect on our financial condition.
Our results of operations could be materially harmed if we are unable to accurately forecast demand forour products.
To ensure adequate inventory supply, we must forecast inventory needs and place orders with ourmanufacturers before firm orders are placed by our customers. In addition, a significant portion of our netrevenues are generated by at-once orders for immediate delivery to customers, particularly during our historicalpeak season from August through November. If we fail to accurately forecast customer demand we mayexperience excess inventory levels or a shortage of product to deliver to our customers.
Factors that could affect our ability to accurately forecast demand for our products include:
• an increase or decrease in consumer demand for our products;
• our failure to accurately forecast consumer acceptance for our new products;
• product introductions by competitors;
• unanticipated changes in general market conditions or other factors, which may result in cancellationsof advance orders or a reduction or increase in the rate of reorders placed by retailers;
• weakening of economic conditions or consumer confidence in future economic conditions, which couldreduce demand for discretionary items, such as our products; and
• terrorism or acts of war, or the threat thereof, or political instability or unrest which could adverselyaffect consumer confidence and spending or interrupt production and distribution of product and rawmaterials.
Inventory levels in excess of customer demand may result in inventory write-downs or write-offs and thesale of excess inventory at discounted prices, which would have an adverse effect on gross margin. In addition, ifwe underestimate the demand for our products, our manufacturers may not be able to produce products to meetour customer requirements, and this could result in delays in the shipment of our products and our ability torecognize revenue, as well as damage to our reputation and customer relationships.
12

The difficulty in forecasting demand also makes it difficult to estimate our future results of operations andfinancial condition from period to period. A failure to accurately predict the level of demand for our productscould adversely impact our profitability.
Our revolving credit facility provides our lenders with a first-priority lien against substantially all of ourassets and contains financial covenants and other restrictions on our actions, and it could therefore limitour operational flexibility or otherwise adversely affect our financial condition.
We have, from time to time, financed our liquidity needs in part from borrowings made under a revolvingcredit facility. Our revolving credit facility provides for a committed revolving credit line of up to $200.0 million(based on the value of our qualified domestic accounts receivable and inventory).
The agreement for our revolving credit facility contains a number of restrictions that limit our ability,among other things, to:
• use our accounts receivable, inventory, trademarks and most of our other assets as security in otherborrowings or transactions;
• incur additional indebtedness;
• sell certain assets;
• make certain investments;
• guarantee certain obligations of third parties;
• undergo a merger or consolidation; and
• materially change our line of business.
Our revolving credit facility also provides the lenders with the ability to reduce the borrowing base, even ifwe are in compliance with all conditions of the revolving credit facility, upon a material adverse change to ourbusiness, properties, assets, financial condition or results of operations. In addition, we must maintain a certainleverage ratio and fixed charge coverage ratio as defined in the credit agreement. Failure to comply with theseoperating or financial covenants could result from, among other things, changes in our results of operations orgeneral economic conditions. These covenants may restrict our ability to engage in transactions that wouldotherwise be in our best interests. Failure to comply with any of the covenants under the credit agreement couldresult in a default. This could cause the lenders to accelerate the timing of payments and exercise their lien onessentially all of our assets, which would have a material adverse effect on our business, operations, financialcondition and liquidity. In addition, because borrowings under the revolving credit facility bear interest atvariable interest rates, which we do not anticipate hedging against, increases in interest rates would increase ourcost of borrowing, resulting in a decline in our net income and cash flow. There were no amounts outstandingunder our revolving credit facility as of December 31, 2010.
We may need to raise additional capital required to grow our business, and we may not be able to raisecapital on terms acceptable to us or at all.
Growing and operating our business will require significant cash outlays and capital expenditures andcommitments. If cash on hand and cash generated from operations are not sufficient to meet our cashrequirements, we will need to seek additional capital, potentially through debt or equity financings, to fund ourgrowth. We may not be able to raise needed cash on terms acceptable to us or at all. Financings may be on termsthat are dilutive or potentially dilutive to our stockholders, and the prices at which new investors would bewilling to purchase our securities may be lower than the current price per share of our common stock. Theholders of new securities may also have rights, preferences or privileges which are senior to those of existingholders of common stock. If new sources of financing are required, but are insufficient or unavailable, we will be
13

required to modify our growth and operating plans based on available funding, if any, which would harm ourability to grow our business.
We operate in a highly competitive market and the size and resources of some of our competitors mayallow them to compete more effectively than we can, resulting in a loss of our market share and a decreasein our net revenues and gross profit.
The market for performance athletic apparel and footwear is highly competitive and includes many newcompetitors as well as increased competition from established companies expanding their production andmarketing of performance products. Because we currently do not own any fabric or process patents, our currentand future competitors are able to manufacture and sell products with performance characteristics andfabrications similar to our products. Many of our competitors are large apparel and footwear companies withstrong worldwide brand recognition. Because of the fragmented nature of the industry, we also compete withother manufacturers, including those specializing in outdoor apparel and private label offerings of certainretailers, including some of our retail customers. Many of our competitors have significant competitiveadvantages, including greater financial, distribution, marketing and other resources, longer operating histories,better brand recognition among consumers, and greater economies of scale. In addition, our competitors havelong term relationships with our key retail customers that are potentially more important to those customersbecause of the significantly larger volume and product mix that our competitors sell to them. As a result, thesecompetitors may be better equipped than we are to influence consumer preferences or otherwise increase theirmarket share by:
• quickly adapting to changes in customer requirements;
• readily taking advantage of acquisition and other opportunities;
• discounting excess inventory that has been written down or written off;
• devoting resources to the marketing and sale of their products, including significant advertising, mediaplacement and product endorsement;
• adopting aggressive pricing policies; and
• engaging in lengthy and costly intellectual property and other disputes.
In addition, while one of our growth strategies is to increase floor space for our products in retail stores,retailers have limited resources and floor space and we must compete with others to develop relationships withthem. Increased competition by existing and future competitors could result in reductions in floor space in retaillocations, reductions in sales or reductions in the prices of our products, and if retailers earn greater margins fromour competitors’ products, they may favor the display and sale of those products. Our inability to competesuccessfully against our competitors and maintain our gross margin could have a material adverse effect on ourbusiness, financial condition and results of operations.
Our profitability may decline as a result of increasing pressure on margins.
Our industry is subject to significant pricing pressure caused by many factors, including intensecompetition, consolidation in the retail industry, pressure from retailers to reduce the costs of products andchanges in consumer demand. These factors may cause us to reduce our prices to retailers and consumers, whichcould cause our profitability to decline if we are unable to offset price reductions with comparable reductions inour operating costs. This could have a material adverse effect on our results of operations and financial condition.
Fluctuations in the cost of products could negatively affect our operating results.
The fabrics used by our suppliers and manufacturers are made of raw materials including petroleum-basedproducts and, beginning in 2011, cotton. Significant price fluctuations or shortages in petroleum or other rawmaterials can materially adversely affect our cost of goods sold, results of operations and financial condition.
14

We rely on third-party suppliers and manufacturers to provide fabrics for and to produce our products,and we have limited control over these suppliers and manufacturers and may not be able to obtain qualityproducts on a timely basis or in sufficient quantity.
Many of the specialty fabrics used in our products are technically advanced textile products developed bythird parties and may be available, in the short-term, from a very limited number of sources. Substantially all ofour products are manufactured by unaffiliated manufacturers, and, in 2010, six manufacturers producedapproximately 45% of our products. We have no long term contracts with our suppliers or manufacturingsources, and we compete with other companies for fabrics, raw materials, production and import quota capacity.
We may experience a significant disruption in the supply of fabrics or raw materials from current sources or,in the event of a disruption, we may be unable to locate alternative materials suppliers of comparable quality atan acceptable price, or at all. In addition, our unaffiliated manufacturers may not be able to fill our orders in atimely manner. If we experience significant increased demand, or we lose or need to replace an existingmanufacturer or supplier as a result of adverse economic conditions or other reasons, additional supplies offabrics or raw materials or additional manufacturing capacity may not be available when required on terms thatare acceptable to us, or at all, or suppliers or manufacturers may not be able to allocate sufficient capacity to us inorder to meet our requirements. In addition, even if we are able to expand existing or find new manufacturing orfabric sources, we may encounter delays in production and added costs as a result of the time it takes to train oursuppliers and manufacturers in our methods, products and quality control standards. Any delays, interruption orincreased costs in the supply of fabric or manufacture of our products could have an adverse effect on our abilityto meet retail customer and consumer demand for our products and result in lower net revenues and net incomeboth in the short and long term.
We have occasionally received, and may in the future continue to receive, shipments of product that fail toconform to our quality control standards. In that event, unless we are able to obtain replacement products in atimely manner, we risk the loss of net revenues resulting from the inability to sell those products and relatedincreased administrative and shipping costs. In addition, because we do not control our manufacturers, productsthat fail to meet our standards or other unauthorized products could end up in the marketplace without ourknowledge, which could harm our brand and our reputation in the marketplace.
Labor disruptions at ports or our suppliers or manufacturers may adversely affect our business.
Our business depends on our ability to source and distribute products in a timely manner. As a result, werely on the free flow of goods through open and operational ports worldwide and on a consistent basis from oursuppliers and manufacturers. Labor disputes at various ports, such as those experienced at western U.S. ports in2002, or at our suppliers or manufacturers, create significant risks for our business, particularly if these disputesresult in work slowdowns, lockouts, strikes or other disruptions during our peak importing or manufacturingseasons, and could have an adverse effect on our business, potentially resulting in cancelled orders by customers,unanticipated inventory accumulation or shortages and reduced net revenues and net income.
Our international operations and the operations of many of our manufacturers are subject to additionalrisks that are beyond our control and that could harm our business.
In 2010, our apparel and footwear were manufactured by 26 primary manufacturers, operating in 22countries. Of these, six manufactured approximately 45% of our products, at locations in Honduras, Jordan,Malaysia, Mexico, Nicaragua, Philippines, Taiwan and Vietnam. In 2010, approximately 55% of our productswere manufactured in Asia, 25% in Central and South America, 10% in Mexico and 5% in the Middle East. Inaddition, approximately 6% of our 2010 net revenues were generated through sales and licensing fees in otherforeign countries. As a result of our international manufacturing and sales, we are subject to risks associated withdoing business abroad, including:
• political unrest, terrorism and economic instability resulting in the disruption of trade from foreigncountries in which our products are manufactured;
15

• currency exchange fluctuations;
• the imposition of new laws and regulations, including those relating to labor conditions, quality andsafety standards, imports, duties, taxes and other charges on imports, trade restrictions and restrictionson the transfer of funds, as well as rules and regulations regarding climate change;
• reduced protection for intellectual property rights in some countries;
• understanding foreign consumer tastes and preferences that may differ from those in the United States;
• complying with foreign laws and regulations that differ from country to country;
• disruptions or delays in shipments; and
• changes in local economic conditions in countries where our manufacturers, suppliers or customers arelocated.
Sales of performance athletic products may not continue to grow and this could adversely impact ourability to grow our business.
We believe continued growth in industry-wide sales of performance athletic products will be largelydependent on consumers continuing to transition from traditional alternatives to performance athletic products. Ifconsumers are not convinced these athletic products are a better choice than traditional alternatives, growth in theindustry and our business could be adversely affected. In addition, because performance athletic products areoften more expensive than traditional alternatives, consumers who are convinced these athletic products providea better alternative may still not be convinced they are worth the extra cost. If industry-wide sales of performanceathletic products do not grow, our ability to continue to grow our business and our financial condition and resultsof operations could be materially adversely impacted.
Our operating results are subject to seasonal and quarterly variations in our net revenues and net income,which could adversely affect the price of our Class A Common Stock.
We have experienced, and expect to continue to experience, seasonal and quarterly variations in our netrevenues and net income. These variations are primarily related to increased sales of our products during the fallseason, reflecting our historical strength in fall sports, and the seasonality of sales of our higher pricedCOLDGEAR® line. The majority of our net revenues were generated during the last two quarters in each of2010, 2009 and 2008, respectively.
Our quarterly results of operations may also fluctuate significantly as a result of a variety of other factors,including, among other things, the timing and introduction of advertising for new products and changes in ourproduct mix. Variations in weather conditions may also have an adverse effect on our quarterly results ofoperations. For example, warmer than normal weather conditions throughout the fall or winter may reduce salesof our COLDGEAR® line, leaving us with excess inventory and operating results below our expectations.
As a result of these seasonal and quarterly fluctuations, we believe that comparisons of our operating resultsbetween different quarters within a single year are not necessarily meaningful and that these comparisons cannotbe relied upon as indicators of our future performance. Any seasonal or quarterly fluctuations that we report inthe future may not match the expectations of market analysts and investors. This could cause the price of ourClass A Common Stock to fluctuate significantly.
The value of our brand and sales of our products could be diminished if we are associated with negativepublicity.
We require our suppliers, independent manufacturers and licensees of our products to operate theirbusinesses in compliance with the laws and regulations that apply to them as well as the social and other
16

standards and policies we impose on them. We do not control these suppliers, manufacturers or licensees or theirlabor practices. A violation of our policies, labor laws or other laws by our suppliers, manufacturers or licenseescould interrupt or otherwise disrupt our sourcing or damage our brand image. Negative publicity regarding theproduction methods of any of our suppliers, manufacturers or licensees could adversely affect our reputation andsales and force us to locate alternative suppliers, manufacturing sources or licensees.
In addition, we have sponsorship contracts with a variety of athletes and feature those athletes in ouradvertising and marketing efforts, and many athletes and teams use our products, including those teams orleagues for which we are an official supplier. Actions taken by athletes, teams or leagues associated with ourproducts could harm the reputations of those athletes, teams or leagues. As a result, our brand image, netrevenues and profitability could be adversely affected.
Sponsorships and designations as an official supplier may become more expensive and this could impactthe value of our brand image.
A key element of our marketing strategy has been to create a link in the consumer market between ourproducts and professional and collegiate athletes. We previously gained significant publicity and brand namerecognition from the perceived sponsorships associated with professional and collegiate athletes and sportsprograms using our products. The use of our products by athletes and teams was frequently without our payingcompensation or in exchange for our furnishing product at a reduced cost or without charge and without formalarrangements. We also have licensing agreements to be the official supplier of performance apparel and footwearto a variety of sports teams and leagues at the collegiate and professional level as well as Olympic teams.However, as competition in the performance apparel and footwear industry has increased, the costs associatedwith athlete sponsorships and official supplier licensing agreements have increased, including the costsassociated with obtaining and retaining these sponsorships and agreements. If we are unable to maintain ourcurrent association with professional and collegiate athletes, teams and leagues, or to do so at a reasonable cost,we could lose the on-field authenticity associated with our products, and we may be required to modify andsubstantially increase our marketing investments. As a result, our brand image, net revenues, expenses andprofitability could be materially adversely affected.
If we encounter problems with our distribution system, our ability to deliver our products to the marketcould be adversely affected.
We rely on our two distribution facilities in Glen Burnie, Maryland for the majority of our productdistribution. Our distribution facilities utilize computer controlled and automated equipment, which means theoperations are complicated and may be subject to a number of risks related to security or computer viruses, theproper operation of software and hardware, power interruptions or other system failures. In addition, because themajority of our products are distributed from two nearby locations, our operations could also be interrupted byfloods, fires or other natural disasters near our distribution facilities, as well as labor difficulties. We maintainbusiness interruption insurance, but it may not adequately protect us from the adverse effects that could becaused by significant disruptions in our distribution facilities, such as the long term loss of customers or anerosion of our brand image. In addition, our distribution capacity is dependent on the timely performance ofservices by third parties, including the shipping of product to and from our distribution facilities. If we encounterproblems with our distribution facilities, our ability to meet customer expectations, manage inventory, completesales and achieve objectives for operating efficiencies could be materially adversely affected.
We rely significantly on information technology and any failure, inadequacy, interruption or security lapseof that technology could harm our ability to effectively operate our business.
Our ability to effectively manage and maintain our inventory and internal reports, and to ship products tocustomers and invoice them on a timely basis depends significantly on our enterprise resource planning,warehouse management, and other information systems. The failure of these systems to operate effectively or to
17

integrate with other systems, or a breach in security of these systems could cause delays in product fulfillmentand reduced efficiency of our operations, and it could require significant capital investments to remediate anysuch failure, problem or breach.
Our future success is substantially dependent on the continued service of our senior management andother key employees.
Our future success is substantially dependent on the continued service of our senior management and otherkey employees, particularly Kevin A. Plank, our founder, President and Chief Executive Officer. The loss of theservices of our senior management or other key employees could make it more difficult to successfully operateour business and achieve our business goals.
We also may be unable to retain existing management, product creation, sales, marketing, operational andother support personnel that are critical to our success, which could result in harm to key customer relationships,loss of key information, expertise or know-how and unanticipated recruitment and training costs.
If we are unable to attract and retain new team members, including senior management, we may not beable to achieve our business objectives.
Our growth has largely been the result of significant contributions by our current senior management,product design teams and other key employees. However, to be successful in continuing to grow our business, wewill need to continue to attract, retain and motivate highly talented management and other employees with arange of skills and experience. Competition for employees in our industry is intense and we have experienceddifficulty from time to time in attracting the personnel necessary to support the growth of our business, and wemay experience similar difficulties in the future. If we are unable to attract, assimilate and retain managementand other employees with the necessary skills, we may not be able to grow or successfully operate our business.
Our failure to comply with trade and other regulations could lead to investigations or actions bygovernment regulators and negative publicity.
The labeling, distribution, importation, marketing and sale of our products are subject to extensiveregulation by various federal agencies, including the Federal Trade Commission, Consumer Product SafetyCommission and state attorneys general in the U.S., as well as by various other federal, state, provincial, localand international regulatory authorities in the locations in which our products are distributed or sold. If we fail tocomply with those regulations, we could become subject to significant penalties or claims, which could harm ourresults of operations or our ability to conduct our business. In addition, the adoption of new regulations orchanges in the interpretation of existing regulations may result in significant compliance costs or discontinuationof product sales and may impair the marketing of our products, resulting in significant loss of net revenues.
Our President and Chief Executive Officer controls the majority of the voting power of our common stock.
Our Class A Common Stock has one vote per share and our Class B Convertible Common Stock has 10votes per share. Our President and Chief Executive Officer, Kevin A. Plank, beneficially owns all outstandingshares of Class B Convertible Common Stock. As a result, Mr. Plank has the majority voting control and is ableto direct the election of all of the members of our Board of Directors and other matters we submit to a vote of ourstockholders. This concentration of ownership may have various effects including, but not limited to, delaying orpreventing a change of control.
Our fabrics and manufacturing technology are not patented and can be imitated by our competitors.
The intellectual property rights in the technology, fabrics and processes used to manufacture our productsare generally owned or controlled by our suppliers and are generally not unique to us. Our ability to obtain patent
18

protection for our products is limited and we currently own no fabric or process patents. As a result, our currentand future competitors are able to manufacture and sell products with performance characteristics andfabrications similar to our products. Because many of our competitors have significantly greater financial,distribution, marketing and other resources than we do, they may be able to manufacture and sell products basedon our fabrics and manufacturing technology at lower prices than we can. If our competitors do sell similarproducts to ours at lower prices, our net revenues and profitability could be materially adversely affected.
Our trademark and other proprietary rights could potentially conflict with the rights of others and wemay be prevented from selling some of our products.
Our success depends in large part on our brand image. We believe our registered and common lawtrademarks have significant value and are important to identifying and differentiating our products from those ofour competitors and creating and sustaining demand for our products. There may be obstacles that arise as weexpand our product line and geographic scope of our marketing. From time to time, we have received claimsrelating to intellectual property rights of others, and we expect third parties will continue to assert intellectualproperty claims against us, particularly as we expand our business and the number of products we offer. Anyclaim, regardless of its merit, could be expensive and time consuming to defend. Successful infringement claimsagainst us could result in significant monetary liability or prevent us from selling some of our products. Inaddition, resolution of claims may require us to redesign our products, license rights belonging to third parties orcease using those rights altogether. Any of these events could harm our business and have a material adverseeffect on our results of operations and financial condition.
Our failure to protect our intellectual property rights could diminish the value of our brand, weaken ourcompetitive position and reduce our net revenues.
We currently rely on a combination of copyright, trademark and trade dress laws, patent laws, unfaircompetition laws, confidentiality procedures and licensing arrangements to establish and protect our intellectualproperty rights. The steps taken by us to protect our proprietary rights may not be adequate to preventinfringement of our trademarks and proprietary rights by others, including imitation of our products andmisappropriation of our brand. In addition, intellectual property protection may be unavailable or limited in someforeign countries where laws or law enforcement practices may not protect our proprietary rights as fully as inthe United States, and it may be more difficult for us to successfully challenge the use of our proprietary rightsby other parties in these countries. If we fail to protect and maintain our intellectual property rights, the value ofour brand could be diminished and our competitive position may suffer.
From time to time, we discover unauthorized products in the marketplace that are either counterfeitreproductions of our products or unauthorized irregulars that do not meet our quality control standards. If we areunsuccessful in challenging a third party’s products on the basis of trademark infringement, continued sales oftheir products could adversely impact our brand, result in the shift of consumer preferences away from ourproducts and adversely affect our business.
We have licensed in the past, and expect to license in the future, certain of our proprietary rights, such astrademarks or copyrighted material, to third parties. These licensees may take actions that diminish the value ofour proprietary rights or harm our reputation.
ITEM 1B. UNRESOLVED STAFF COMMENTS
Not applicable.
19

ITEM 2. PROPERTIES
Our principal executive and administrative offices are located at an office complex in Baltimore, Maryland.We believe that our current location will be sufficient for the operation of our business over the next twelvemonths. We have two primary distribution facilities in Glen Burnie, Maryland. We believe our distributionfacilities and space available through our third-party logistics providers will be adequate to meet our short termneeds. We expect to expand to additional distribution facilities in the future.
The location, general use, approximate size and lease term of our properties as of December 31, 2010, noneof which is currently owned by us, are set forth below:
Location UseApproximateSquare Feet
LeaseEnd Date
Baltimore, MD . . . . . Corporate headquarters 267,000 (1)Amsterdam, TheNetherlands . . . . . . European headquarters 6,300 December 2011
Glen Burnie, MD . . . Distribution facilities, 17,000 square foot quick-turn,Special Make-Up Shop manufacturing facility and6,000 square foot factory house store 667,000 (2)
Denver, CO . . . . . . . . Sales office 4,000 August 2011Ontario, Canada . . . . Sales office 10,000 October 2011Guangzhou, China . . . Quality assurance & sourcing for footwear 4,600 December 2012Hong Kong . . . . . . . . Quality assurance & sourcing for apparel 10,700 September 2014Various . . . . . . . . . . . Retail store space 269,000 (3)
(1) Includes various lease obligations with options to renew beginning February 2012 through October 2015.
(2) Includes a 359,000 square foot facility with an option to renew in September 2011 and a 308,000 squarefoot facility with an option to renew in May 2013.
(3) Includes fifty seven factory house and specialty stores located in the United States with lease end dates ofApril 2011 through July 2020. We also have an additional factory house store which is included in the GlenBurnie, Maryland location in the table above. Excluded in the table above are executed lease agreements forfactory house stores that we did not yet occupy as of December 31, 2010. We anticipate that we will be ableto extend these leases that expire in the near future on satisfactory terms or relocate to other locations.
In November 2010 we entered into an agreement to purchase 400,000 square feet of office space at ourcurrent office complex. Subject to certain conditions, we expect the transaction to close in early 2011. As ofFebruary 2011, we lease approximately 170,000 square feet of the available space in this part of the complex, andwe anticipate taking additional space over time.
ITEM 3. LEGAL PROCEEDINGS
From time to time, we have been involved in various legal proceedings. We believe all such litigation isroutine in nature and incidental to the conduct of our business, and we believe no such litigation will have amaterial adverse effect on our financial condition, cash flows or results of operations.
20
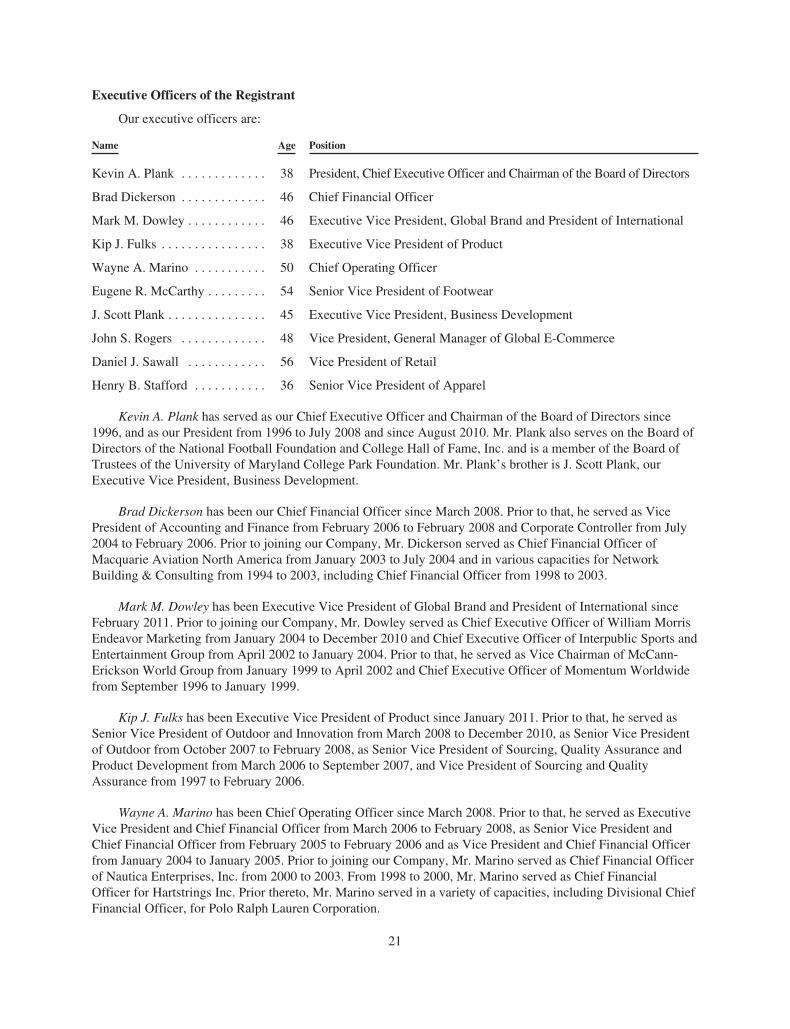
Executive Officers of the Registrant
Our executive officers are:
Name Age Position
Kevin A. Plank . . . . . . . . . . . . . 38 President, Chief Executive Officer and Chairman of the Board of Directors
Brad Dickerson . . . . . . . . . . . . . 46 Chief Financial Officer
Mark M. Dowley . . . . . . . . . . . . 46 Executive Vice President, Global Brand and President of International
Kip J. Fulks . . . . . . . . . . . . . . . . 38 Executive Vice President of Product
Wayne A. Marino . . . . . . . . . . . 50 Chief Operating Officer
Eugene R. McCarthy . . . . . . . . . 54 Senior Vice President of Footwear
J. Scott Plank . . . . . . . . . . . . . . . 45 Executive Vice President, Business Development
John S. Rogers . . . . . . . . . . . . . 48 Vice President, General Manager of Global E-Commerce
Daniel J. Sawall . . . . . . . . . . . . 56 Vice President of Retail
Henry B. Stafford . . . . . . . . . . . 36 Senior Vice President of Apparel
Kevin A. Plank has served as our Chief Executive Officer and Chairman of the Board of Directors since1996, and as our President from 1996 to July 2008 and since August 2010. Mr. Plank also serves on the Board ofDirectors of the National Football Foundation and College Hall of Fame, Inc. and is a member of the Board ofTrustees of the University of Maryland College Park Foundation. Mr. Plank’s brother is J. Scott Plank, ourExecutive Vice President, Business Development.
Brad Dickerson has been our Chief Financial Officer since March 2008. Prior to that, he served as VicePresident of Accounting and Finance from February 2006 to February 2008 and Corporate Controller from July2004 to February 2006. Prior to joining our Company, Mr. Dickerson served as Chief Financial Officer ofMacquarie Aviation North America from January 2003 to July 2004 and in various capacities for NetworkBuilding & Consulting from 1994 to 2003, including Chief Financial Officer from 1998 to 2003.
Mark M. Dowley has been Executive Vice President of Global Brand and President of International sinceFebruary 2011. Prior to joining our Company, Mr. Dowley served as Chief Executive Officer of William MorrisEndeavor Marketing from January 2004 to December 2010 and Chief Executive Officer of Interpublic Sports andEntertainment Group from April 2002 to January 2004. Prior to that, he served as Vice Chairman of McCann-Erickson World Group from January 1999 to April 2002 and Chief Executive Officer of Momentum Worldwidefrom September 1996 to January 1999.
Kip J. Fulks has been Executive Vice President of Product since January 2011. Prior to that, he served asSenior Vice President of Outdoor and Innovation from March 2008 to December 2010, as Senior Vice Presidentof Outdoor from October 2007 to February 2008, as Senior Vice President of Sourcing, Quality Assurance andProduct Development from March 2006 to September 2007, and Vice President of Sourcing and QualityAssurance from 1997 to February 2006.
Wayne A. Marino has been Chief Operating Officer since March 2008. Prior to that, he served as ExecutiveVice President and Chief Financial Officer from March 2006 to February 2008, as Senior Vice President andChief Financial Officer from February 2005 to February 2006 and as Vice President and Chief Financial Officerfrom January 2004 to January 2005. Prior to joining our Company, Mr. Marino served as Chief Financial Officerof Nautica Enterprises, Inc. from 2000 to 2003. From 1998 to 2000, Mr. Marino served as Chief FinancialOfficer for Hartstrings Inc. Prior thereto, Mr. Marino served in a variety of capacities, including Divisional ChiefFinancial Officer, for Polo Ralph Lauren Corporation.
21

Eugene R. McCarthy has been our Senior Vice President of Footwear since August 2009. Prior to joiningour Company, he served as Co-President of The Timberland brand from December 2007 to July 2009, Presidentof its Authentic Youth Division from February 2007 to November 2007 and Group Vice President of Product andDesign from April 2006 to January 2007. Prior thereto, Mr. McCarthy served as Senior Vice President of Productand Design for Reebok International from July 2003 to November 2005 and in a variety of capacities for Nikefrom 1982 to 2003, including Global Director of Sales and Retail Marketing for Brand Jordan, from 1999 to2003.
J. Scott Plank has been our Executive Vice President of Business Development since August 2009 focusingon domestic and international business development opportunities. Prior to that, he served as Senior VicePresident of Retail from March 2006 to July 2009 with responsibility for factory house and specialty stores ande-commerce, as Chief Administrative Officer from January 2004 to February 2006 and Vice President of Financefrom 2000 to 2003 with operational and strategic responsibilities. Mr. Plank was a director of Under Armour, Inc.from 2001 until July 2005. Mr. Plank is the brother of Kevin A. Plank, our President, Chief Executive Officerand Chairman of the Board of Directors.
John S. Rogers has been Vice President/General Manager of Global E-commerce since May 2010. Prior tojoining our Company, he served in a variety of capacities for The Orvis Company, Inc., including Vice Presidentof Multi-Channel Marketing and General Manager of the UK Division from 2006 to April 2010, Director ofMulti-Channel Marketing from 2004 to 2006 and Director of E-commerce Marketing from 2000 to 2004. Priorthereto, Mr. Rogers served as Director of Branding for Toysmart.com, a Walt Disney company, from 1999 to2000 and Director of Global Brands for Hasbro, from 1994 to 1999.
Daniel J. Sawall has been Vice President of Retail since February 2010. Prior to joining our Company, heserved as Senior Vice President and General Merchandise Manager of Golfsmith from August 2009 to January2010. Prior thereto, Mr. Sawall served as General Manager for US Nike Factory Stores from February 2007 toApril 2009, an independent marketing and business consultant from January 2003 to January 2007, VicePresident and General Merchandise Manager for the d.e.m.o. division of Pacific Sunwear from July 2000 to May2002 and General Merchandise Manager, Retail Stores for Guess? from 1998 to 2000. He began his career as abuyer for Federated Department Stores and then worked as a buyer and in various management capacities for 15years for Dillard’s Department Stores.
Henry B. Stafford has been Senior Vice President of Apparel since June 2010. Prior to joining our company,he worked with American Eagle Outfitters as Senior Vice President and Chief Merchandising Officer of The AEBrand from April 2007 to May 2010, General Merchandise Manager and Senior Vice President of Men’s and AECanadian Division from April 2005 to March 2007 and General Merchandise Manager and Vice President ofMen’s from September 2003 to March 2005. Prior thereto, Mr. Stafford served in a variety of capacities for OldNavy from 1998 to 2003, including Divisional Merchandising Manager for Men’s Tops from 2001 to 2003, andserved as a buyer for Abercrombie and Fitch from 1996 to 1998.
22

PART II
ITEM 5. MARKET FOR REGISTRANT’S COMMON EQUITY, RELATED STOCKHOLDERMATTERS AND ISSUER PURCHASES OF EQUITY SECURITIES
Under Armour’s Class A Common Stock is traded on the New York Stock Exchange (“NYSE”) under thesymbol “UA”. As of January 31, 2011, there were 1,106 record holders of our Class A Common Stock and 5record holders of Class B Convertible Common Stock which are beneficially owned by our President and ChiefExecutive Officer Kevin A. Plank. The following table sets forth by quarter the high and low sale prices of ourClass A Common Stock on the NYSE during 2010 and 2009.
High Low
2010
First Quarter (January 1 – March 31) $31.16 $23.72Second Quarter (April 1 – June 30) $38.87 $29.12Third Quarter (July 1 – September 30) $46.10 $31.63Fourth Quarter (October 1 – December 31) $60.14 $44.07
2009
First Quarter (January 1 – March 31) $26.48 $11.94Second Quarter (April 1 – June 30) $26.48 $15.78Third Quarter (July 1 – September 30) $31.24 $19.49Fourth Quarter (October 1 – December 31) $33.31 $25.26
Dividends
No cash dividends were declared or paid during 2010 or 2009 on any class of our common stock. Wecurrently anticipate we will retain any future earnings for use in our business. As a result, we do not anticipatepaying any cash dividends in the foreseeable future. In addition, under our credit facility, we must comply with afixed charge coverage ratio that could limit our ability to pay dividends to our stockholders. Refer to “FinancialPosition, Capital Resources and Liquidity” within Management’s Discussion and Analysis and Note 6 to theConsolidated Financial Statements for further discussion of our credit facility.
Stock Compensation Plans
The following table contains certain information regarding our equity compensation plans.
Plan Category
Number ofsecurities to be
issued upon exercise ofoutstanding options,warrants and rights
(a)
Weighted-averageexercise price of
outstanding options,warrants and rights
(b)
Number of securitiesremaining
available for futureissuance under equitycompensation plans(excluding securities
reflected in column (a))(c)
Equity Compensation plans approved by securityholders 3,069,880 $25.31 6,710,370
Equity Compensation plans not approved bysecurity holders 480,000 $36.99 —
The number of securities to be issued upon exercise of outstanding options, warrants and rights issued underequity compensation plans approved by security holders includes 95.6 thousand restricted stock units anddeferred stock units issued to employees, non-employees and directors of Under Armour; these restricted stockunits and deferred stock units are not included in the weighted average exercise price calculation above. Thenumber of securities remaining available for future issuance includes 5.9 million shares of our Class A Common
23

Stock under our Amended and Restated 2005 Omnibus Long-Term Incentive Plan (“2005 Stock Plan”) and0.8 million shares of our Class A Common Stock under our Employee Stock Purchase Plan. In addition tosecurities issued upon the exercise of stock options, warrants and rights, the 2005 Stock Plan authorizes theissuance of restricted and unrestricted shares of our Class A Common Stock and other equity awards. Refer toNote 12 to the Consolidated Financial Statements for information required by this Item regarding the materialfeatures of each plan.
The number of securities issued under equity compensation plans not approved by security holders includes480.0 thousand fully vested and non-forfeitable warrants granted in 2006 to NFL Properties LLC as partialconsideration for footwear promotional rights. Refer to Note 12 to the Consolidated Financial Statements for afurther discussion on the warrants.
Recent Sales of Unregistered Equity Securities
From September 15, 2010 through January 31, 2011, we issued 78.0 thousand shares of Class A CommonStock upon the exercise of previously granted stock options to employees at a weighted average exercise price of$3.23 per share, for an aggregate amount of consideration of $251.9 thousand.
The issuances of securities described above were made in reliance upon Section 4(2) under the SecuritiesAct in that any issuance did not involve a public offering or under Rule 701 promulgated under the SecuritiesAct, in that they were offered and sold either pursuant to written compensatory plans or pursuant to a writtencontract relating to compensation, as provided by Rule 701.
24

Stock Performance Graph
The stock performance graph below compares cumulative total return on Under Armour, Inc. Class ACommon Stock to the cumulative total return of the NYSE Market Index, the Hemscott Group Textile-ApparelClothing Index and S&P 500 Apparel, Accessories and Luxury Goods Index from December 31, 2005 throughDecember 31, 2010. The graph assumes an initial investment of $100 in Under Armour and each index as ofDecember 31, 2005 and reinvestment of any dividends. The graph showing the Hemscott Group Textile-ApparelClothing Index (“Hemscott Group Index”) was compiled and prepared by Morningstar, Inc. The Hemscott GroupIndex presented below consists of 67 specialty retailers †. We have added the S&P 500 Apparel, Accessories andLuxury Goods Index because we believe this is a more commonly used index for our industry.
The performance shown on the graph below is not intended to forecast or be indicative of possible futureperformance of our common stock.
50.00
70.00
90.00
110.00
130.00
150.00
12/31/200912/31/200812/31/200712/31/200612/31/2005 12/31/2010
DO
LLA
RS
UNDER ARMOUR, INC.NYSE MARKET INDEXHEMSCOTT GROUP INDEX †S&P 500 APPAREL, ACCESSORIES & LUXURY GOODS
12/31/2005 12/31/2006 12/31/2007 12/31/2008 12/31/2009 12/31/2010
Under Armour, Inc. $100.00 $131.69 $113.99 $62.23 $ 71.18 $143.15NYSE Market Index $100.00 $120.47 $131.15 $79.67 $102.20 $115.88Hemscott Group Index † $100.00 $127.88 $108.03 $62.09 $109.33 $137.75S&P 500 Apparel, Accessories & LuxuryGoods $100.00 $129.75 $ 90.24 $59.77 $ 97.26 $137.32
† The other registrants included in the Hemscott Group Index are as follows: American Apparel Inc., Belluna Co Ltd., Benetton SPA,Bernard Chaus, Inc., Blue Holdings, Inc., Brownie’s Marine Group, Inc., Burberry Group PLC, Carlyle Golf, Carter’s, Inc., Cherokee Inc.,China Xiniya Fashion Limited AM, Columbia Sportswear Company, Crown Crafts, Inc., Cygne Designs, Inc., Delta Apparel, Inc.,Donnkenny, Inc., Dussault Apparel, Inc., Ever-Glory International Group, Inc., Execute Sports, Incorporated, Frederick’s of HollywoodGroup, Inc., G-III Apparel Group, Ltd., Gildan Activewear, Inc., Gildan Activewear Inc. A, Hanesbrands, Inc., Hartmarx Corporation, IncaDesigns, Inc., Jalate, Ltd., Jin En International Group Holding Company, JLM Couture, Inc., Joe’s Jeans, Inc., Kuhlman Company, Inc.,Liz Claiborne, Inc., Lululemon Athletica, Inc., Maidenform Brands, Inc., Naturally Advanced Tech, Nitches, Inc., No Show, Inc., ObsceneJeans Corp., Oneita Industries, Inc., Oxford Industries, Inc., Panglobal Brands, Inc., People’s Liberation, Inc., Perry Ellis International,Inc., Phillips-Van Heusen Corporation, Puma, Inc., Polo Ralph Lauren Corporation, Quiksilver, Inc., Retrospettiva, Inc., Sew Cal LogoInc., Simon Worldwide, Inc., Sirena Apparel Group, Sport Haley, Sunset Suit Holdings, Inc., Superior Uniform Group, Talon International,Inc., Tefron, Ltd., The Swatch Group Ltd., Total Apparel Group, Inc., TriMedia Entertainment Group, Inc., True Religion Apparel, Inc.,VF Corporation, Vital State, Inc., VLOV, Inc., Wacoal Holdings Corporation, Warnaco Group, Inc. and Wolford AG.
25

ITEM 6. SELECTED FINANCIAL DATA
The following selected financial data is qualified by reference to, and should be read in conjunction with,the Consolidated Financial Statements, including the notes thereto, and “Management’s Discussion and Analysisof Financial Condition and Results of Operations” included elsewhere in this Form 10-K.
Year Ended December 31,
2010 2009 2008 2007 2006
(In thousands, except per share amounts)
Net revenues $1,063,927 $856,411 $725,244 $606,561 $430,689Cost of goods sold 533,420 446,286 372,203 302,083 216,753
Gross profit 530,507 410,125 353,041 304,478 213,936Selling, general and administrative expenses 418,152 324,852 276,116 218,213 157,018
Income from operations 112,355 85,273 76,925 86,265 56,918Interest expense, net (2,258) (2,344) (850) 749 1,457Other expense, net (1,178) (511) (6,175) 2,029 712
Income before income taxes 108,919 82,418 69,900 89,043 59,087Provision for income taxes 40,442 35,633 31,671 36,485 20,108
Net income $ 68,477 $ 46,785 $ 38,229 $ 52,558 $ 38,979
Net income available per common shareBasic $ 1.35 $ 0.94 $ 0.78 $ 1.09 $ 0.82Diluted $ 1.34 $ 0.92 $ 0.76 $ 1.05 $ 0.78
Weighted average common shares outstandingBasic 50,798 49,848 49,086 48,345 47,291Diluted 51,282 50,650 50,342 50,141 49,676
Dividends declared $ — $ — $ — $ — $ —
At December 31,
2010 2009 2008 2007 2006
(In thousands)
Cash and cash equivalents $ 203,870 $187,297 $102,042 $ 40,588 $ 70,655Working capital (1) 406,703 327,838 263,313 226,546 173,389Inventories 215,355 148,488 182,232 166,082 81,031Total assets 675,378 545,588 487,555 390,613 289,368Total debt and capital lease obligations, includingcurrent maturities 15,942 20,223 45,591 14,332 6,257
Total stockholders’ equity $ 496,966 $399,997 $331,097 $280,485 $214,388
(1) Working capital is defined as current assets minus current liabilities.
ITEM 7. MANAGEMENT’S DISCUSSION AND ANALYSIS OF FINANCIAL CONDITION ANDRESULTS OF OPERATIONS
The information contained in this section should be read in conjunction with our Consolidated FinancialStatements and related notes and the information contained elsewhere in this Form 10-K under the captions“Risk Factors,” “Selected Financial Data,” and “Business.”
Overview
We are a leading developer, marketer and distributor of branded performance apparel, footwear andaccessories. The brand’s moisture-wicking fabrications are engineered in many different designs and styles forwear in nearly every climate to provide a performance alternative to traditional products. Our products are sold
26
worldwide and worn by athletes at all levels, from youth to professional, on playing fields around the globe, aswell as by consumers with active lifestyles.
Our net revenues grew to $1,063.9 million in 2010 from $430.7 million in 2006. We believe that our growthin net revenues has been driven by a growing interest in performance products and the strength of the UnderArmour brand in the marketplace relative to our competitors, as evidenced by the increases in our sales of ourproducts. We plan to continue to increase our net revenues over the long term by increased sales of our apparel,footwear and accessories, expansion of our wholesale distribution, growth in our direct to consumer sales channeland expansion in international markets. Our direct to consumer sales channel includes sales through our factoryhouse and specialty stores, website, and catalog. New product offerings for 2010 included basketball footwearwhich had a limited introduction in the United States and Canada.
Our products are currently offered in over twenty three thousand retail stores worldwide. A large majority ofour products are sold in North America; however we believe our products appeal to athletes and consumers withactive lifestyles around the globe. Internationally, our products are offered primarily in Austria, France,Germany, Ireland and the United Kingdom, as well as in Japan through a third-party licensee, and throughdistributors located in other foreign countries.
We believe there is an increasing recognition of the health benefits of an active lifestyle. We believe thistrend provides us with an expanding consumer base for our products. We also believe there is a continuing shiftin consumer demand from traditional non-performance products to our performance products, which are intendedto provide better performance by wicking perspiration away from the skin, helping to regulate body temperatureand enhancing comfort. We believe that these shifts in consumer preferences and lifestyles are not unique to theUnited States, but are occurring in a number of markets globally, thereby increasing our opportunities tointroduce our performance products to new consumers.
Although we believe these trends will facilitate our growth, we also face potential challenges that couldlimit our ability to take advantage of these opportunities, including, among others, the risk of general economicor market conditions that could affect consumer spending and the financial health of our retail customers. Inaddition, we may not be able to effectively manage our growth and a more complex business. We may notconsistently be able to anticipate consumer preferences and develop new and innovative products in a timelymanner that meets changing preferences. Furthermore, our industry is very competitive, and competitionpressures could cause us to reduce the prices of our products or otherwise affect our profitability. We also rely onthird-party suppliers and manufacturers outside the U.S. to provide fabrics and to produce our products, anddisruptions to our supply chain could harm our business. For a more complete discussion of the risks facing ourbusiness, refer to “Risk Factors.”
General
Net revenues comprise both net sales and license revenues. Net sales comprise sales from our primaryproduct categories, which are apparel, footwear and accessories. Our license revenues consist of fees paid to usby our licensees in exchange for the use of our trademarks on core products of socks, headwear, bags, eyewear,custom-molded mouth guards, other accessories and team uniforms, as well as the distribution of our products inJapan. We have developed our own headwear and bags, and beginning in 2011, these products are being sold byus rather than by one of our licensees. We expect our net revenues to increase by approximately $60 million from2010 to 2011 as a result of this change, which includes an increase in accessories revenues and a decrease in ourlicense revenues in 2011. In addition we expect the related cost of goods sold to increase.
Cost of goods sold consists primarily of product costs, inbound freight and duty costs, outbound freightcosts, handling costs to make products floor-ready to customer specifications, royalty payments to endorsersbased on a predetermined percentage of sales of selected products and write downs for inventory obsolescence.The fabrics in many of our products are made of petroleum-based synthetic materials. Therefore our product
27

costs, as well as our inbound and outbound freight costs, could be affected by long term pricing trends of oil. Ingeneral, as a percentage of net revenues, we expect cost of goods sold associated with our footwear to be higherthan the cost of goods sold associated with our apparel. No cost of goods sold is associated with license revenues.
We include outbound freight costs associated with shipping goods to customers as cost of goods sold;however, we include the majority of outbound handling costs as a component of selling, general andadministrative expenses. As a result, our gross profit may not be comparable to that of other companies thatinclude outbound handling costs in their cost of goods sold. Outbound handling costs include costs associatedwith preparing goods to ship to customers and certain costs to operate our distribution facilities. These costs were$14.7 million, $12.2 million and $10.2 million for the years ended December 31, 2010, 2009 and 2008,respectively.
Our selling, general and administrative expenses consist of costs related to marketing, selling, productinnovation and supply chain and corporate services. Personnel costs are included in these categories based on theemployees’ function. Personnel costs include salaries, benefits and incentive and stock-based compensationexpense related to the employee. Our marketing costs are an important driver of our growth. Marketing costsconsist primarily of commercials, print ads, league, team, player and event sponsorships, amortization offootwear promotional rights and depreciation expense specific to our in-store fixture program. In addition,marketing costs include costs associated with our Special Make-Up Shop (“SMU Shop”) located at one of ourdistribution facilities where we manufacture a limited number of products primarily for our league, team, playerand event sponsorships. Selling costs consist primarily of costs relating to sales through our wholesale channel,the majority of our direct to consumer sales channel costs, along with commissions paid to third parties. Productinnovation and supply chain costs include our apparel, footwear and accessories product innovation, sourcing anddevelopment costs, distribution facility operating costs, and costs relating to our Hong Kong and Guangzhou,China offices which help support manufacturing, quality assurance and sourcing efforts. Corporate servicesprimarily consist of corporate facility operating costs and company-wide administrative expenses.
Other expense, net consists of unrealized and realized gains and losses on our derivative financialinstruments and unrealized and realized gains and losses on adjustments that arise from fluctuations in foreigncurrency exchange rates relating to transactions generated by our international subsidiaries.
Reclassifications
Outbound freight costs associated with shipping goods of $9.2 million and $7.0 million included in selling,general and administrative expenses for the years ended December 31, 2009 and 2008, respectively, werereclassified to cost of goods sold to conform to the presentation for the year ended December 31, 2010. Inaddition, costs of $6.3 million and $5.1 million associated with our sourcing offices and SMU Shop included incost of goods sold for the years ended December 31, 2009 and 2008, respectively, were reclassified to selling,general and administrative expenses to conform to the presentation for the year ended December 31, 2010. Webelieve these changes were appropriate given our view that cost of goods sold should primarily include productcosts which are variable in nature. In addition, these reclassifications more closely align with the way we manageour business.
28

Results of Operations
The following table sets forth key components of our results of operations for the periods indicated, both indollars and as a percentage of net revenues:
Year Ended December 31,
(In thousands) 2010 2009 2008
Net revenues $1,063,927 $856,411 $725,244Cost of goods sold 533,420 446,286 372,203
Gross profit 530,507 410,125 353,041Selling, general and administrative expenses 418,152 324,852 276,116
Income from operations 112,355 85,273 76,925Interest expense, net (2,258) (2,344) (850)Other expense, net (1,178) (511) (6,175)
Income before income taxes 108,919 82,418 69,900Provision for income taxes 40,442 35,633 31,671
Net income $ 68,477 $ 46,785 $ 38,229
Year Ended December 31,
(As a percentage of net revenues) 2010 2009 2008
Net revenues 100.0% 100.0% 100.0%Cost of goods sold 50.1 52.1 51.3
Gross profit 49.9 47.9 48.7Selling, general and administrative expenses 39.3 37.9 38.1
Income from operations 10.6 10.0 10.6Interest expense, net (0.3) (0.3) (0.1)Other expense, net (0.1) (0.1) (0.9)
Income before income taxes 10.2 9.6 9.6Provision for income taxes 3.8 4.1 4.3
Net income 6.4% 5.5% 5.3%
Year Ended December 31, 2010 Compared to Year Ended December 31, 2009
Net revenues increased $207.5 million, or 24.2%, to $1,063.9 million in 2010 from $856.4 million in 2009.
Net revenues by geographic region are summarized below:
Year Ended December 31,
2010 2009 $ Change % Change
(In thousands)
North America $ 997,816 $808,020 $189,796 23.5%Other foreign countries 66,111 48,391 17,720 36.6
Total net revenues $1,063,927 $856,411 $207,516 24.2%
Net revenues in North America increased $189.8 million to $997.8 million in 2010 from $808.0 million in2009 primarily due to increased net sales in apparel as discussed below. Net revenues in other foreign countriesincreased by $17.7 million to $66.1 million in 2010 from $48.4 million in 2009 primarily due to increasedapparel sales in our Europe, Middle East and Africa (“EMEA”) operating segment and increased productdistribution by our licensee in Japan.
29

Net revenues by product category are summarized below:
Year Ended December 31,
2010 2009 $ Change % Change
(In thousands)
Apparel $ 853,493 $651,779 $201,714 30.9%Footwear 127,175 136,224 (9,049) (6.6)Accessories 43,882 35,077 8,805 25.1
Total net sales 1,024,550 823,080 201,470 24.5License revenues 39,377 33,331 6,046 18.1
Total net revenues $1,063,927 $856,411 $207,516 24.2%
Net sales increased $201.5 million, or 24.5%, to $1,024.6 million in 2010 from $823.1 million in 2009 asnoted in the table above. The increase in net sales primarily reflects:
• $88.9 million, or 56.8%, increase in direct to consumer sales, which includes 19 additional stores in2010; and
• unit growth driven by increased distribution and new offerings in multiple product categories, mostsignificantly in our training, base layer, mountain, golf and underwear categories; partially offset by
• $9.0 million decrease in footwear sales driven primarily by a decline in running and training footwearsales.
License revenues increased $6.1 million, or 18.1%, to $39.4 million in 2010 from $33.3 million in 2009.This increase in license revenues was primarily a result of increased sales by our licensees due to increaseddistribution and continued unit volume growth. We have developed our own headwear and bags, and beginningin 2011, these products are being sold by us rather than by one of our licensees.
Gross profit increased $120.4 million to $530.5 million in 2010 from $410.1 million in 2009. Gross profit asa percentage of net revenues, or gross margin, increased 200 basis points to 49.9% in 2010 compared to 47.9% in2009. The increase in gross margin percentage was primarily driven by the following:
• increased direct to consumer higher margin sales, accounting for an approximate 100 basis pointincrease;
• decreased sales markdowns and returns, primarily due to improved sell-through rates at retail,accounting for an approximate 50 basis point increase; and
• decreased inventory reserves, partially offset by increased lower margin third party liquidation sales,accounting for an approximate 50 basis point increase.
Selling, general and administrative expenses increased $93.3 million to $418.2 million in 2010 from $324.9million in 2009. As a percentage of net revenues, selling, general and administrative expenses increased to 39.3%in 2010 from 37.9% in 2009. These changes were primarily attributable to the following:
• Marketing costs increased $19.3 million to $128.2 million in 2010 from $108.9 million in 2009primarily due to an increase in sponsorship of events and collegiate and professional teams andathletes, increased television and digital campaign costs, including media campaigns for specificcustomers and additional personnel costs. In addition, we incurred increased expenses for ourperformance incentive plan as compared to the prior year. As a percentage of net revenues, marketingcosts decreased to 12.0% in 2010 from 12.7% in 2009 primarily due to decreased marketing costs forspecific customers.
• Selling costs increased $25.0 million to $94.6 million in 2010 from $69.6 million in 2009. Thisincrease was primarily due to higher personnel and other costs incurred for the continued expansion of
30

our direct to consumer distribution channel and higher selling personnel costs, including increasedexpenses for our performance incentive plan as compared to the prior year. As a percentage of netrevenues, selling costs increased to 8.9% in 2010 from 8.1% in 2009 primarily due to higher personneland other costs incurred for the continued expansion of our factory house stores.
• Product innovation and supply chain costs increased $25.0 million to $96.8 million in 2010 from $71.8million in 2009 primarily due to higher personnel costs for the design and sourcing of our expandingapparel, footwear and accessories lines and higher distribution facilities operating and personnel costsas compared to the prior year to support our growth in net revenues. In addition, we incurred higherexpenses for our performance incentive plan as compared to the prior year. As a percentage of netrevenues, product innovation and supply chain costs increased to 9.1% in 2010 from 8.4% in 2009primarily due to the items noted above.
• Corporate services costs increased $24.0 million to $98.6 million in 2010 from $74.6 million in 2009.This increase was attributable primarily to higher corporate facility costs, information technologyinitiatives and corporate personnel costs, including increased expenses for our performance incentiveplan as compared to the prior year. As a percentage of net revenues, corporate services costs increasedto 9.3% in 2010 from 8.7% in 2009 primarily due to the items noted above.
Income from operations increased $27.1 million, or 31.8%, to $112.4 million in 2010 from $85.3 million in2009. Income from operations as a percentage of net revenues increased to 10.6% in 2010 from 10.0% in 2009.This increase was a result of the items discussed above.
Interest expense, net remained unchanged at $2.3 million in 2010 and 2009.
Other expense, net increased $0.7 million to $1.2 million in 2010 from $0.5 million in 2009. The increase in2010 was due to higher net losses on the combined foreign currency exchange rate changes on transactionsdenominated in the Euro and Canadian dollar and our derivative financial instruments as compared to 2009.
Provision for income taxes increased $4.8 million to $40.4 million in 2010 from $35.6 million in 2009. Oureffective tax rate was 37.1% in 2010 compared to 43.2% in 2009, primarily due to tax planning strategies andfederal and state tax credits reducing the effective tax rate, partially offset by a valuation allowance recordedagainst our foreign net operating loss carryforward.
Year Ended December 31, 2009 Compared to Year Ended December 31, 2008
Net revenues increased $131.2 million, or 18.1%, to $856.4 million in 2009 from $725.2 million in 2008.
Net revenues by geographic region are summarized below:
Year Ended December 31,
2009 2008 $ Change % Change
(In thousands)
North America $808,020 $692,388 $115,632 16.7%Other foreign countries 48,391 32,856 15,535 47.3
Total net revenues $856,411 $725,244 $131,167 18.1%
Net revenues in North America increased $115.6 million to $808.0 million in 2009 from $692.4 million in2008 primarily due to increased net sales in apparel and footwear as discussed below. Net revenues in otherforeign countries increased by $15.5 million to $48.4 million in 2009 from $32.9 million in 2008 primarily due toincreased apparel sales in our EMEA operating segment.
31

Net revenues by product category are summarized below:
Year Ended December 31,
2009 2008 $ Change % Change
(In thousands)
Apparel $651,779 $578,887 $ 72,892 12.6%Footwear 136,224 84,848 51,376 60.6Accessories 35,077 31,547 3,530 11.2
Total net sales 823,080 695,282 127,798 18.4License revenues 33,331 29,962 3,369 11.2
Total net revenues $856,411 $725,244 $131,167 18.1%
Net sales increased $127.8 million, or 18.4%, to $823.1 million in 2009 from $695.3 million in 2008 asnoted in the table above. The increase in net sales primarily reflects:
• $51.4 million increase in footwear sales driven primarily by our running footwear launch during thefirst quarter of 2009;
• $51.8 million increase in direct to consumer sales growth, including the impact of footwear; and
• apparel unit growth driven by increased distribution and new offerings in multiple product categories,most significantly in our training, fitness, running and underwear categories.
License revenues increased $3.3 million, or 11.2%, to $33.3 million in 2009 from $30.0 million in 2008.This increase in license revenues was a result of increased sales by our licensees due to increased distribution andcontinued unit volume growth, along with new license agreements for team uniforms and custom-molded mouthguards.
Gross profit increased $57.1 million to $410.1 million in 2009 from $353.0 million in 2008. Gross profit asa percentage of net revenues, or gross margin, decreased 80 basis points to 47.9% in 2009 compared to 48.7% in2008. The decrease in gross margin percentage was primarily driven by the following:
• increased footwear and apparel liquidations to third parties, accounting for an approximate 40 basispoint decrease;
• less favorable footwear and apparel product mix relative to margins, accounting for an approximate 40basis point decrease; and
• increased footwear and accessory inventory reserves, accounting for an approximate 20 basis pointdecrease; partially offset by
• increased direct to consumer higher margin sales, accounting for an approximate 30 basis pointincrease.
Selling, general and administrative expenses increased $48.8 million, or 17.7%, to $324.9 million in 2009from $276.1 million in 2008. As a percentage of net revenues, selling, general and administrative expensesdecreased slightly to 37.9% in 2009 from 38.1% in 2008. These changes were primarily attributable to thefollowing:
• Marketing costs increased $12.8 million to $108.9 million in 2009 from $96.1 million in 2008primarily due to increased sponsorships of collegiate and professional teams and new events, includingthe National Football League Scouting Combine, and increased marketing costs for specific customers,including our in-store brand campaign supporting the introduction of our performance runningfootwear. These increases were partially offset by lower media and print expenditures in 2009. As a
32

percentage of net revenues, marketing costs decreased to 12.7% in 2009 from 13.3% in 2008 primarilydue to lower media and print expenditures costs in 2009, partially offset by the other items notedabove.
• Selling costs increased $13.5 million to $69.6 million in 2009 from $56.1 million in 2008. Thisincrease was primarily due to costs incurred for the continued expansion of our direct to consumersales channel and higher personnel costs, including increased expenses for our performance incentiveplan as compared to the prior year. As a percentage of net revenues, selling costs increased to 8.1% in2009 from 7.7% in 2008 due to increased costs incurred for the continued expansion of our factoryhouse stores, partially offset by decreased apparel selling personnel costs as a percentage of netrevenues.
• Product innovation and supply chain costs increased $13.4 million to $71.8 million in 2009 from $58.4million in 2008 primarily due to higher personnel costs for the design and sourcing of our expandingapparel and footwear lines, including increased expenses for our performance incentive plan ascompared to the prior year. In addition, this increase was due to higher distribution facilities operatingand personnel costs to support our growth. As a percentage of net revenues, product innovation andsupply chain costs increased to 8.4% in 2009 from 8.1% in 2008 due to the items noted above.
• Corporate services costs increased $9.1 million to $74.6 million in 2009 from $65.5 million in 2008.This increase was attributable primarily to higher personnel costs for additional corporate personnelnecessary to support our growth, including increased expenses for our performance incentive plan ascompared to the prior year. In addition, this increase was due to higher company-wide stock-basedcompensation and increased investments in consumer insight research. These increases were partiallyoffset by decreased allowances for bad debts during 2009. As a percentage of net revenues, corporateservices costs increased to 8.7% in 2009 from 9.0% in 2008 due to the items noted above.
Income from operations increased $8.4 million, or 10.9%, to $85.3 million in 2009 from $76.9 million in2008. Income from operations as a percentage of net revenues decreased to 10.0% in 2009 from 10.6% in 2008.This decrease was a result of a decrease in gross profit as a percentage of net revenues as discussed above.
Interest expense, net increased $1.4 million to $2.3 million in 2009 from $0.9 million in 2008. This increasewas primarily due to the write-off of deferred financing costs related to our prior revolving credit facility andincreased costs for our revolving credit facility during 2009.
Other expense, net decreased $5.7 million to $0.5 million in 2009 from $6.2 million in 2008. This changewas primarily due to our expanded foreign currency exchange hedging strategy in 2009 that reduced ourexposure associated with foreign currency exchange rate fluctuations primarily on intercompany transactions forour European subsidiary in 2009 as compared to the prior year.
Provision for income taxes increased $3.9 million to $35.6 million in 2009 from $31.7 million in 2008. Oureffective tax rate was 43.2% in 2009 compared to 45.3% in 2008. The effective tax rate in 2009 was lower thanthe effective tax rate in 2008 primarily due to decreased losses in our foreign subsidiaries and certain taxplanning strategies implemented during 2009.
Seasonality
Historically, we have recognized a significant portion of our income from operations in the last two quartersof the year, driven primarily by increased sales volume of our products during the fall selling season, reflectingour historical strength in fall sports, and the seasonality of our higher priced COLDGEAR® line. Historically, alarger portion of our income from operations has been in the last two quarters of the year partially due to the shiftin the timing of marketing investments to the first two quarters of the year. The majority of our net revenues weregenerated during the last two quarters in each of 2010, 2009 and 2008. The level of our working capital generallyreflects the seasonality and growth in our business. We generally expect inventory, accounts payable and certainaccrued expenses to be higher in the second and third quarters in preparation for the fall selling season.
33

The following table sets forth certain financial information for the periods indicated. The data is prepared onthe same basis as the audited consolidated financial statements included elsewhere in this Form 10-K. Allrecurring, necessary adjustments are reflected in the data below.
Quarter Ended
Mar 31,2010
Jun 30,2010
Sep 30,2010
Dec 31,2010
Mar 31,2009
Jun 30,2009
Sep 30,2009
Dec 31,2009
(In thousands)
Net revenues $229,407 $204,786 $328,568 $301,166 $200,000 $164,648 $269,546 $222,217Gross profit 107,631 99,926 167,372 155,578 89,224 73,729 133,320 113,852Marketing SG&A expenses 31,198 27,438 36,015 33,539 33,707 21,814 28,246 25,128Other SG&A expenses 62,849 65,596 74,668 86,849 47,621 48,534 58,011 61,791Income from operations 13,584 6,892 56,689 35,190 7,896 3,381 47,063 26,933
(As a percentage of annual totals)
Net revenues 21.6% 19.2% 30.9% 28.3% 23.4% 19.2% 31.5% 25.9%Gross profit 20.3% 18.8% 31.6% 29.3% 21.7% 18.0% 32.5% 27.8%Marketing SG&A expenses 24.3% 21.4% 28.1% 26.2% 31.0% 20.0% 25.9% 23.1%Other SG&A expenses 21.7% 22.6% 25.8% 29.9% 22.0% 22.5% 26.9% 28.6%Income from operations 12.1% 6.1% 50.5% 31.3% 9.2% 4.0% 55.2% 31.6%
Financial Position, Capital Resources and Liquidity
Our cash requirements have principally been for working capital and capital expenditures. Working capitalis primarily funded from cash flows provided by operating activities and cash and cash equivalents on hand. Ourworking capital requirements generally reflect the seasonality and growth in our business as we recognize themajority of our net revenues in the back half of the year. We fund our working capital, primarily inventory, andcapital investments from cash flows provided by operating activities, cash and cash equivalents on hand andborrowings primarily available under our long term debt facilities. Our capital investments have includedexpanding our in-store fixture and branded concept shop program, improvements and expansion of ourdistribution and corporate facilities to support our growth, leasehold improvements to our new factory house andspecialty stores, and investment and improvements in information technology systems. In 2011, our capitalexpenditures are expected to include the purchase, subject to certain closing conditions, of part of our corporateoffice complex for $60.5 million. We intend to fund this purchase through additional debt.
Our focus remains on inventory management including improving our planning capabilities, managing ourinventory purchases, reducing our production lead times and selling excess inventory through our factory housestores and other liquidation channels. However, we do expect several factors to contribute to inventory growth inexcess of sales growth in the first half of 2011. We are increasing our safety stock in core product offerings andseasonal products to better meet consumer demand. Core product offerings are products that we generally plan tohave available for sale for at least the next twelve months at full price. In addition, beginning in 2011, headwearand bags are being sold by us rather than by one of our licensees, which will also contribute to our expected yearover year inventory growth.
We believe our cash and cash equivalents on hand, cash from operations and borrowings available to usunder our revolving credit and long term debt facilities will be adequate to meet our liquidity needs and capitalexpenditure requirements for at least the next twelve months. We may require additional capital to meet ourlonger term liquidity and future growth needs. Although we believe we have adequate sources of liquidity overthe long term, a prolonged economic recession or a slow recovery could adversely affect our business andliquidity (refer to the “Risk Factors” section included in Item 1A). In addition, instability in or tightening of thecapital markets could adversely affect our ability to obtain additional capital to grow our business and will affectthe cost and terms of such capital.
34

Cash Flows
The following table presents the major components of net cash flows used in and provided by operating,investing and financing activities for the periods presented:
Year Ended December 31,
(In thousands) 2010 2009 2008
Net cash provided by (used in):Operating activities $ 50,114 $119,041 $ 69,516Investing activities (41,785) (19,880) (42,066)Financing activities 7,243 (16,467) 35,381Effect of exchange rate changes on cash and cashequivalents 1,001 2,561 (1,377)
Net increase in cash and cash equivalents $ 16,573 $ 85,255 $ 61,454
Operating Activities
Operating activities consist primarily of net income adjusted for certain non-cash items. Adjustments to netincome for non-cash items include depreciation and amortization, unrealized foreign currency exchange rategains and losses, losses on disposals of property and equipment, stock-based compensation, deferred incometaxes and changes in reserves and allowances. In addition, operating cash flows include the effect of changes inoperating assets and liabilities, principally inventories, accounts receivable, income taxes payable and receivable,prepaid expenses and other assets, accounts payable and accrued expenses.
Cash provided by operating activities decreased $68.9 million to $50.1 million in 2010 from $119.0 millionin 2009. The decrease in cash provided by operating activities was due to decreased net cash flows fromoperating assets and liabilities of $99.1 million, partially offset by an increase in net income of $21.7 million andadjustments to net income for non-cash items which increased $8.5 million year over year. The decrease in netcash flows related to changes in operating assets and liabilities period over period was primarily driven by thefollowing:
• an increase in net inventory investments of $98.2 million, partially offset by an increase in accountspayable of $20.5 million. In line with our prior guidance, inventory grew in the fourth quarter of 2010at a rate higher than net sales growth due to increased safety stock, primarily ColdGear, to better meetanticipated consumer demand, investments around new products in 2011 including headwear, bags andCharged Cotton, and continued increases in our made-for strategy across our factory house store base.In 2009, operational initiatives were put in place to improve our inventory management which assistedin the decrease of inventory for that period; and
• an increase in accounts receivable during 2010 primarily due to a 36.9% increase in net sales during thefourth quarter of 2010; partially offset by
• higher income taxes payable in 2010 as compared to 2009.
Adjustments to net income for non-cash items increased in 2010 as compared to 2009 primarily due tounrealized foreign currency exchange rate losses in 2010 as compared to unrealized foreign currency exchangerate gains in 2009.
Cash provided by operating activities increased $49.5 million to $119.0 million in 2009 from cash providedby operating activities of $69.5 million in 2008. The increase in cash provided by operating activities was due toincreased net cash inflows from operating assets and liabilities of $49.7 million and an increase in net income of$8.6 million, partially offset by lower adjustments to net income for non-cash items which decreased $8.8 million
35

year over year. The increase in net cash inflows related to changes in operating assets and liabilities period overperiod was primarily driven by the following:
• a decrease in inventory of $52.5 million, primarily driven by the operational initiatives put in place toimprove our inventory management, increased liquidation sales to third parties and a larger percentageof products shipped directly from our suppliers to our customers, partially offset by a decrease inaccounts payable of $21.3 million; and
• an increase in accrued expenses and other liabilities of $17.0 million in 2009 as compared to 2008primarily due to lower performance incentive plan payouts in 2009 as compared to 2008, as well ashigher accruals to account for increased expenses for our performance incentive plan as ofDecember 31, 2009 as compared to December 31, 2008.
Adjustments to net income for non-cash items decreased in 2009 as compared to 2008 primarily due tounrealized foreign currency exchange rate gains in 2009 as compared to unrealized foreign currency exchangerate losses in 2008.
Investing Activities
Cash used in investing activities increased $21.9 million to $41.8 million in 2010 from $19.9 million in2009. This increase in cash used in investing activities was primarily due to increased investments in new factoryhouse stores and corporate and distribution facilities, partially offset by lower investments in our in-store fixtureprogram and branded concept shops. In addition, cash used in investing activities increased due to a deposit madein late December 2010 for a minority equity investment completed in early 2011 in Dome Corporation, ourJapanese licensee.
Cash used in investing activities decreased $22.2 million to $19.9 million in 2009 from $42.1 million in2008. This decrease in cash used in investing activities was primarily due to lower investments in our direct toconsumer sales channel, our in-store fixture program and branded concept shops, our distribution facilities andour information technology initiatives. In addition, cash used in investing activities decreased due to the lowerpurchase of trust owned life insurance policies.
Total capital expenditures were $33.1 million, $24.6 million and $41.1 million in 2010, 2009 and 2008,respectively. Total capital expenditures in 2010, 2009 and 2008 included non-cash transactions of $2.9 million,$4.8 million and $2.5 million, respectively (refer to non-cash investing activities included on the ConsolidatedStatements of Cash Flows). Because we receive certain capital expenditures prior to transmitting payment forthese capital investments, total capital expenditures exceed capital investments included in our consolidatedstatements of cash flows. Capital expenditures for 2011 are expected to be in the range of $40 million to $45million, in addition to $60.5 million relating to the purchase of part of our corporate office complex.
Financing Activities
Cash provided by financing activities increased $23.7 million to $7.2 million in 2010 from cash used infinancing activities of $16.5 million in 2009. This increase was primarily due to the final payment made on ourprior revolving credit facility that was terminated during 2009.
Cash used in financing activities increased $51.9 million to $16.5 million in 2009 from cash provided byfinancing activities of $35.4 million in 2008. This increase was primarily due to additional net payments made onour revolving credit and long term debt facilities in 2009 as compared to 2008.
Revolving Credit Facility
We have a revolving credit facility with certain lending institutions. The revolving credit facility has a termof three years, expiring in January 2012, and provides for a committed revolving credit line of up to $200.0million based on our qualified domestic inventory and accounts receivable balances. The commitment amount
36

under the revolving credit facility may be increased by an additional $50.0 million, subject to certain conditionsand approvals under the credit agreement.
The revolving credit facility may be used for working capital and general corporate purposes. It iscollateralized by substantially all of our assets and the assets of our domestic subsidiaries (other than ourtrademarks), and by a pledge of 65% of the equity interests of certain of our foreign subsidiaries. Up to $5.0million of the revolving credit facility may be used to support letters of credit, of which no amounts wereoutstanding as of December 31, 2010. We must maintain a certain leverage ratio and fixed charge coverage ratioas defined in the credit agreement. As of December 31, 2010, we were in compliance with these financialcovenants. The revolving credit facility also provides our lenders with the ability to reduce the borrowing base,even if we are in compliance with all conditions of the revolving credit facility, upon a material adverse changeto our business, properties, assets, financial condition or results of operations. The revolving credit facilitycontains a number of restrictions that limit our ability, among other things, and subject to certain limitedexceptions, to incur additional indebtedness, pledge our assets as security, guaranty obligations of third parties,make investments, undergo a merger or consolidation, dispose of assets, or materially change our line ofbusiness. In addition, the revolving credit facility includes a cross default provision whereby an event of defaultunder other debt obligations, as defined in the credit agreement, will be considered an event of default under thiscredit agreement.
Borrowings under the revolving credit facility bear interest based on the daily balance outstanding at aLIBOR rate option (with LIBOR subject to a rate floor of 1.25%) plus an applicable margin (varying from 2.0%to 2.5%) or, in certain cases at our discretion, a base rate option (based on the prime rate or as otherwise specifiedin the credit agreement, with the base rate subject to a rate floor of 2.25%) plus an applicable margin (varyingfrom 1.0% to 1.5%). The revolving credit facility also carries a commitment fee varying from 0.38% to 0.5% ofthe committed line amount less outstanding borrowings and letters of credit. The applicable margins arecalculated quarterly and vary based on our leverage ratio as set forth in the credit agreement.
Prior to entering the revolving credit facility in January 2009, we terminated our prior $100.0 millionrevolving credit facility. In conjunction with the termination of the prior revolving credit facility, we repaid thethen outstanding balance of $25.0 million. The prior revolving credit facility was also collateralized bysubstantially all of our assets, other than our trademarks, and included covenants, conditions and other termssimilar to our current revolving credit facility.
As of December 31, 2010, borrowings under our $200 million revolving credit facility were limited toapproximately $151.5 million based on our eligible domestic inventory and accounts receivable balances. Theweighted average interest rate on the balances outstanding under the prior revolving credit facility was 1.4% and3.7% during the years ended December 31, 2009 and 2008. No balances were outstanding under the currentrevolving credit facility during the years ended December 31, 2010 and 2009, respectively.
Long Term Debt
We have long term debt agreements with various lenders to finance the acquisition of or lease of qualifyingcapital investments. Loans under these agreements are collateralized by a first lien on the related assets acquired.As these agreements are not committed facilities, each advance is subject to approval by the lenders.Additionally, these agreements include a cross default provision whereby an event of default under other debtobligations, including our revolving credit facility, will be considered an event of default under these agreements.In addition, these agreements require a prepayment fee if we pay outstanding amounts ahead of the scheduledterms. The terms of our revolving credit facility limit the total amount of additional financing under theseagreements to $35.0 million, of which $22.1 million was remaining as of December 31, 2010. At December 31,2010 and 2009, the outstanding principal balance under these agreements was $15.9 million and $20.1 million,respectively. Currently, advances under these agreements bear interest rates which are fixed at the time of eachadvance. The weighted average interest rate on outstanding borrowings was 5.3%, 5.9% and 6.1% for the yearsended December 31, 2010, 2009 and 2008, respectively.
37

We monitor the financial health and stability of our lenders under the revolving credit and long term debtfacilities, however continuing significant instability in the credit markets could negatively impact lenders andtheir ability to perform under their facilities.
Contractual Commitments and Contingencies
We lease warehouse space, office facilities, space for our factory house and specialty stores and certainequipment under non-cancelable operating and capital leases. The leases expire at various dates through 2021,excluding extensions at our option, and contain various provisions for rental adjustments. In addition, this tableincludes executed lease agreements for factory house stores that we did not yet occupy as of December 31, 2010.The operating leases generally contain renewal provisions for varying periods of time. Our significant contractualobligations and commitments as of December 31, 2010 are summarized in the following table:
Payments Due by Period
(in thousands) TotalLess Than1 Year 1 to 3 Years 3 to 5 Years
More Than5 Years
Contractual obligationsLong term debt obligations (1) $ 15,942 $ 6,865 $ 6,821 $ 2,256 $ —Operating lease obligations (2) 95,704 19,528 31,400 24,677 20,099Product purchase obligations (3) 356,943 356,943 — — —Sponsorships and other (4) 167,629 43,506 72,015 48,625 3,483
Total $636,218 $426,842 $110,236 $75,558 $23,582
(1) Excludes a total of $1.1 million in interest payments on long term debt obligations.
(2) Includes the minimum payments for operating lease obligations. The operating lease obligations do notinclude any contingent rent expense we may incur at our factory house stores based on future sales above aspecified minimum or payments made for maintenance, insurance and real estate taxes.
(3) We generally place orders with our manufacturers at least three to four months in advance of expectedfuture sales. The amounts listed for product purchase obligations primarily represent our open productionpurchase orders for our apparel, footwear and accessories, including expected inbound freight, duties andother costs. These open purchase orders specify fixed or minimum quantities of products at determinableprices. The reported amounts exclude product purchase liabilities included in accounts payable as ofDecember 31, 2010.
(4) Includes footwear promotional rights fees, sponsorships of individual athletes, sports teams and athleticevents and other marketing commitments in order to promote our brand. Some of these sponsorshipagreements provide for additional performance incentives and product supply obligations. It is not possibleto determine how much we will spend on product supply obligations on an annual basis as contractsgenerally do not stipulate specific cash amounts to be spent on products. The amount of product provided tothese sponsorships depends on many factors including general playing conditions, the number of sportingevents in which they participate and our decisions regarding product and marketing initiatives. In addition,the costs to design, develop, source and purchase the products furnished to the endorsers are incurred over aperiod of time and are not necessarily tracked separately from similar costs incurred for products sold tocustomers. In addition, it is not possible to determine the amounts we may be required to pay under theseagreements as they are primarily subject to certain performance based variables. The amounts listed aboveare the fixed minimum amounts required to be paid under these agreements.
The table above excludes a $6.4 million liability for uncertain tax positions, including the related interestand penalties, recorded in accordance with applicable accounting guidance, as we are unable to reasonablyestimate the timing of settlement. Refer to Note 10 to the Consolidated Financial Statements for a furtherdiscussion of our uncertain tax positions.
38

In addition, the table above excludes the expected purchase of part of our corporate office complex of $60.5million. The purchase is subject to certain closing conditions. We expect the transaction to close in early 2011.We expect this transaction to have minimal impact on cash flows both from a purchase perspective and on ago-forward operational basis, as we intend to fund this purchase through additional debt.
Off-Balance Sheet Arrangements
In connection with various contracts and agreements, we have agreed to indemnify counterparties againstcertain third party claims relating to the infringement of intellectual property rights and other items. Generally,such indemnification obligations do not apply in situations in which our counterparties are grossly negligent,engage in willful misconduct, or act in bad faith. Based on our historical experience and the estimated probabilityof future loss, we have determined the fair value of such indemnifications is not material to our financial positionor results of operations.
Critical Accounting Policies and Estimates
Our consolidated financial statements have been prepared in accordance with accounting principlesgenerally accepted in the United States of America. To prepare these financial statements, we must makeestimates and assumptions that affect the reported amounts of assets, liabilities, revenues and expenses, as well asthe disclosures of contingent assets and liabilities. Actual results could be significantly different from theseestimates. We believe the following discussion addresses the critical accounting policies that are necessary tounderstand and evaluate our reported financial results.
Revenue Recognition
Net revenues consist of both net sales and license revenues. Net sales are recognized upon transfer ofownership, including passage of title to the customer and transfer of risk of loss related to those goods. Transferof title and risk of loss are based upon shipment under free on board shipping point for most goods or uponreceipt by the customer depending on the country of the sale and the agreement with the customer. In someinstances, transfer of title and risk of loss take place at the point of sale, for example at our factory house andspecialty stores. We may also ship product directly from our supplier to the customer and recognize revenuewhen the product is delivered to and accepted by the customer. License revenues are recognized based uponshipment of licensed products sold by our licensees.
Sales Returns, Allowances, Markdowns and Discounts
We record reductions to revenue for estimated customer returns, allowances, markdowns and discounts. Webase our estimates on historical rates of customer returns and allowances as well as the specific identification ofoutstanding returns, markdowns and allowances that have not yet been received by us. The actual amount ofcustomer returns and allowances, which is inherently uncertain, may differ from our estimates. If we determinethat actual or expected returns or allowances are significantly higher or lower than the reserves we established,we would record a reduction or increase, as appropriate, to net sales in the period in which we make such adetermination. Provisions for customer specific discounts are based on contractual obligations with certain majorcustomers.
Reserves for returns, allowances, markdowns and discounts are recorded as an offset to accounts receivableas settlements are made through offsets to outstanding customer invoices. Prior to 2010, the majority of reservesfor customer markdowns and discounts were recorded as accrued expenses as settlements were made throughcash disbursements. As of December 31, 2010, there were $8.3 million in customer markdowns and discountsrecorded as offsets to accounts receivable, and no amounts were recorded as accrued expenses. As of
39

December 31, 2009, there were no significant customer markdowns or discounts recorded as offsets to accountsreceivable, and $6.9 million was recorded as accrued expenses.
Allowance for Doubtful Accounts
We make ongoing estimates relating to the collectability of our accounts receivable and maintain a reservefor estimated losses resulting from the inability of our customers to make required payments. In determining theamount of the reserve, we consider our historical levels of credit losses and significant economic developmentswithin the retail environment that could impact the ability of our customers to pay outstanding balances andmake judgments about the creditworthiness of significant customers based on ongoing credit evaluations.Because we cannot predict future changes in the financial stability of our customers, future losses fromuncollectible accounts may differ from our estimates. If the financial condition of our customers were todeteriorate, resulting in their inability to make payments, a larger reserve might be required. In the event wedetermine that a smaller or larger reserve was appropriate, we would record a benefit or charge to selling, generaland administrative expenses in the period in which we made such a determination.
Inventory Valuation and Reserves
We value our inventory at standard cost which approximates our landed cost, using the first-in, first-outmethod of cost determination. Market value is estimated based upon assumptions made about future demand andretail market conditions. If we determine that the estimated market value of our inventory is less than thecarrying value of such inventory, we provide a charge to cost of goods sold to reflect the lower of cost or market.If actual market conditions are less favorable than those projected by us, further adjustments may be required thatwould increase our cost of goods sold in the period in which we make such a determination.
Impairment of Long-Lived Assets
We continually evaluate whether events and circumstances have occurred that indicate the remainingestimated useful life of long-lived assets may warrant revision or that the remaining balance may not berecoverable. These factors may include a significant deterioration of operating results, changes in business plans,or changes in anticipated cash flows. When factors indicate that an asset should be evaluated for possibleimpairment, we review long-lived assets to assess recoverability from future operations using undiscounted cashflows. Impairments are recognized in earnings to the extent that the carrying value exceeds fair value. Nomaterial impairments were recorded in the years ended December 31, 2010, 2009 and 2008.
Income Taxes
Income taxes are accounted for under the asset and liability method. Deferred income tax assets andliabilities are established for temporary differences between the financial reporting basis and the tax basis of ourassets and liabilities at tax rates expected to be in effect when such assets or liabilities are realized or settled.Deferred income tax assets are reduced by valuation allowances when necessary.
Assessing whether deferred tax assets are realizable requires significant judgment. We consider all availablepositive and negative evidence, including historical operating performance and expectations of future operatingperformance. The ultimate realization of deferred tax assets is often dependent upon future taxable income andtherefore can be uncertain. To the extent we believe it is more likely than not that all or some portion of the assetwill not be realized, valuation allowances are established against our deferred tax assets, which increase incometax expense in the period when such a determination is made.
Income taxes include the largest amount of tax benefit for an uncertain tax position that is more likely thannot to be sustained upon audit based on the technical merits of the tax position. Settlements with tax authorities,the expiration of statutes of limitations for particular tax positions, or obtaining new information on particular taxpositions may cause a change to the effective tax rate. We recognize accrued interest and penalties related tounrecognized tax benefits in the provision for income taxes on the consolidated statements of income.
40

Stock-Based Compensation
We account for stock-based compensation in accordance with accounting guidance that requires all stock-based compensation awards granted to employees and directors to be measured at fair value and recognized as anexpense in the financial statements. Historically, we recognized expense for stock-based compensation awardsgranted prior to our initial filing of our S-1 Registration Statement in accordance with accounting guidance thatallows the intrinsic value method. Under the intrinsic value method, stock-based compensation expense of fixedstock options is based on the difference, if any, between the fair value of our stock on the grant date and theexercise price of the option. The stock-based compensation expense for these awards was fully amortized in2010. As of December 31, 2010, we had $19.0 million of unrecognized compensation expense, excludingperformance-based stock options, expected to be recognized over a weighted average period of 2.0 years. Inaddition, we had $16.0 million of unrecognized compensation expense related to performance-based stockoptions, expected to be recognized over a weighted average period of 2.5 years if all combined operating incometargets would be reached.
Determining the appropriate fair value model and calculating the fair value of stock-based compensationawards require the input of highly subjective assumptions, including the expected life of the stock-basedcompensation awards, stock price volatility and estimated forfeiture rates. We use the Black-Scholes option-pricing model to determine the fair value of stock-based compensation awards. The assumptions used incalculating the fair value of stock-based compensation awards represent management’s best estimates, but theestimates involve inherent uncertainties and the application of management judgment. In addition, compensationexpense for performance-based awards is recorded over the related service period when achievement of theperformance target is deemed probable, which requires management judgment. As a result, if factors change andwe use different assumptions, our stock-based compensation expense could be materially different in the future.Refer to Note 2 and Note 12 to the Consolidated Financial Statements for a further discussion on stock-basedcompensation.
Recently Adopted Accounting Standards
In June 2009, the Financial Accounting Standards Board (“FASB”) issued an amendment to the accountingand disclosure requirements for the consolidation of variable interest entities (“VIEs”). This amendment requiresan enterprise to perform a qualitative analysis when determining whether or not it must consolidate a VIE. Theamendment also requires an enterprise to continuously reassess whether it must consolidate a VIE. Finally, anenterprise will be required to disclose significant judgments and assumptions used to determine whether or not toconsolidate a VIE. This amendment is effective for financial statements issued for annual periods beginning afterNovember 15, 2009, and for interim periods within the first annual period. The adoption of this amendment didnot have any impact on our consolidated financial statements.
ITEM 7A. QUANTITATIVE AND QUALITATIVE DISCLOSURE ABOUTMARKET RISK
Foreign Currency Exchange and Foreign Currency Risk Management and Derivatives
We currently generate a small amount of our consolidated net revenues in Canada and Europe. Thereporting currency for our consolidated financial statements is the U.S. dollar. To date, net revenues generatedoutside of the United States have not been significant. However, as our net revenues generated outside of theUnited States increase, our results of operations could be adversely impacted by changes in foreign currencyexchange rates. For example, if we recognize foreign revenues in local foreign currencies (as we currently do inCanada and Europe) and if the U.S. dollar strengthens, it could have a negative impact on our foreign revenuesupon translation of those results into the U.S. dollar upon consolidation of our financial statements. In addition,we are exposed to gains and losses resulting from fluctuations in foreign currency exchange rates on transactionsgenerated by our foreign subsidiaries in currencies other than their local currencies. These gains and losses areprimarily driven by inter-company transactions. These exposures are included in other expense, net on theconsolidated statements of income.
41

When deemed necessary, we have used foreign currency forward contracts to reduce the risk from exchangerate fluctuations on inter-company transactions and projected inventory purchases for our European andCanadian subsidiaries. We do not enter into derivative financial instruments for speculative or trading purposes.
Based on the foreign currency forward contracts outstanding as of December 31, 2010, we receive USDollars in exchange for Canadian Dollars at a weighted average contractual forward foreign currency exchangerate of 1.00 CAD per $1.00 and US Dollars in exchange for Euros at a weighted average contractual foreigncurrency exchange rate of 0.76 EUR per $1.00. As of December 31, 2010, the notional value of our outstandingforeign currency forward contracts for our Canadian subsidiary was $17.6 million with contract maturities of 1month, and the notional value of our outstanding foreign currency forward contracts for our European subsidiarywas $34.8 million with contract maturities of 1 month. The foreign currency forward contracts are not designatedas cash flow hedges, and accordingly, changes in their fair value are recorded in other expense, net on theconsolidated statements of income. The fair values of our foreign currency forward contracts were liabilities of$0.6 million as of December 31, 2010, and were included in accrued expenses on the consolidated balance sheet.The fair values of our foreign currency forward contracts were assets of $0.3 million as of December 31, 2009,and were included in prepaid expenses and other current assets on the consolidated balance sheet. Refer to Note 9for a discussion of the fair value measurements. Included in other expense, net were the following amountsrelated to changes in foreign currency exchange rates and derivative foreign currency forward contracts:
Year Ended December 31,
(In thousands) 2010 2009 2008
Unrealized foreign currency exchange rate gains (losses) $(1,280) $ 5,222 $(5,459)Realized foreign currency exchange rate losses (2,638) (261) (2,166)Unrealized derivative gains (losses) (809) (1,060) 1,650Realized derivative gains (losses) 3,549 (4,412) (204)
Although we have entered into foreign currency forward contracts to minimize some of the impact offoreign currency exchange rate fluctuations on future cash flows, we cannot be assured that foreign currencyexchange rate fluctuations will not have a material adverse impact on our financial condition and results ofoperations.
Inflation
Inflationary factors such as increases in the cost of our product and overhead costs may adversely affect ouroperating results. Although we do not believe that inflation has had a material impact on our financial position orresults of operations to date, a high rate of inflation in the future may have an adverse effect on our ability tomaintain current levels of gross margin and selling, general and administrative expenses as a percentage of netrevenues if the selling prices of our products do not increase with these increased costs.
42

ITEM 8. FINANCIAL STATEMENTS AND SUPPLEMENTARY DATA
Report of Management on Internal Control Over Financial Reporting
Management is responsible for establishing and maintaining adequate internal control over financialreporting for the Company. We conducted an evaluation of the effectiveness of our internal control over financialreporting based on the framework in Internal Control—Integrated Framework issued by the Committee ofSponsoring Organizations of the Treadway Commission (COSO). This evaluation included review of thedocumentation of controls, evaluation of the design effectiveness of controls, testing of the operatingeffectiveness of controls and a conclusion on this evaluation. Based on our evaluation, we have concluded thatour internal control over financial reporting was effective as of December 31, 2010.
The effectiveness of our internal control over financial reporting as of December 31, 2010, has been auditedby PricewaterhouseCoopers LLP, an independent registered public accounting firm, as stated in their reportwhich appears herein.
/s/ KEVIN A. PLANKKevin A. Plank
President, Chief Executive Officer and Chairman of theBoard of Directors
/s/ BRAD DICKERSON
Brad Dickerson
Chief Financial Officer
Dated: February 24, 2011
43

Report of Independent Registered Public Accounting Firm
To the Board of Directors and Stockholders of Under Armour, Inc.:
In our opinion, the consolidated financial statements listed in the index appearing under Item 15(a)(1)present fairly, in all material respects, the financial position of Under Armour, Inc. and its subsidiaries (theCompany) at December 31, 2010 and 2009, and the results of their operations and their cash flows for each of thethree years in the period ended December 31, 2010 in conformity with accounting principles generally acceptedin the United States of America. In addition, in our opinion, the financial statement schedule listed in the indexappearing under Item 15(a)(2) presents fairly, in all material respects, the information set forth therein when readin conjunction with the related consolidated financial statements. Also in our opinion, the Company maintained,in all material respects, effective internal control over financial reporting as of December 31, 2010, based oncriteria established in Internal Control—Integrated Framework issued by the Committee of SponsoringOrganizations of the Treadway Commission (COSO). The Company’s management is responsible for thesefinancial statements and financial statement schedule, for maintaining effective internal control over financialreporting and for its assessment of the effectiveness of internal control over financial reporting, included in theaccompanying Report of Management on Internal Control over Financial Reporting. Our responsibility is toexpress opinions on these financial statements, on the financial statement schedule, and on the Company’sinternal control over financial reporting based on our integrated audits. We conducted our audits in accordancewith the standards of the Public Company Accounting Oversight Board (United States). Those standards requirethat we plan and perform the audits to obtain reasonable assurance about whether the financial statements arefree of material misstatement and whether effective internal control over financial reporting was maintained in allmaterial respects. Our audits of the financial statements included examining, on a test basis, evidence supportingthe amounts and disclosures in the financial statements, assessing the accounting principles used and significantestimates made by management, and evaluating the overall financial statement presentation. Our audit of internalcontrol over financial reporting included obtaining an understanding of internal control over financial reporting,assessing the risk that a material weakness exists, and testing and evaluating the design and operatingeffectiveness of internal control based on the assessed risk. Our audits also included performing such otherprocedures as we considered necessary in the circumstances. We believe that our audits provide a reasonablebasis for our opinions.
A company’s internal control over financial reporting is a process designed to provide reasonable assuranceregarding the reliability of financial reporting and the preparation of financial statements for external purposes inaccordance with generally accepted accounting principles. A company’s internal control over financial reportingincludes those policies and procedures that (i) pertain to the maintenance of records that, in reasonable detail,accurately and fairly reflect the transactions and dispositions of the assets of the company; (ii) provide reasonableassurance that transactions are recorded as necessary to permit preparation of financial statements in accordancewith generally accepted accounting principles, and that receipts and expenditures of the company are being madeonly in accordance with authorizations of management and directors of the company; and (iii) provide reasonableassurance regarding prevention or timely detection of unauthorized acquisition, use, or disposition of thecompany’s assets that could have a material effect on the financial statements.
Because of its inherent limitations, internal control over financial reporting may not prevent or detectmisstatements. Also, projections of any evaluation of effectiveness to future periods are subject to the risk thatcontrols may become inadequate because of changes in conditions, or that the degree of compliance with thepolicies or procedures may deteriorate.
/s/ PricewaterhouseCoopers LLP
Baltimore, MarylandFebruary 24, 2011
44

Under Armour, Inc. and Subsidiaries
Consolidated Balance Sheets(In thousands, except share data)
December 31,2010
December 31,2009
AssetsCurrent assets
Cash and cash equivalents $203,870 $187,297Accounts receivable, net 102,034 79,356Inventories 215,355 148,488Prepaid expenses and other current assets 19,326 19,989Deferred income taxes 15,265 12,870
Total current assets 555,850 448,000Property and equipment, net 76,127 72,926Intangible assets, net 3,914 5,681Deferred income taxes 21,275 13,908Other long term assets 18,212 5,073
Total assets $675,378 $545,588
Liabilities and Stockholders’ EquityCurrent liabilities
Accounts payable $ 84,679 $ 68,710Accrued expenses 55,138 40,885Current maturities of long term debt 6,865 9,178Current maturities of capital lease obligations — 97Other current liabilities 2,465 1,292
Total current liabilities 149,147 120,162Long term debt, net of current maturities 9,077 10,948Other long term liabilities 20,188 14,481
Total liabilities 178,412 145,591
Commitments and contingencies (see Note 7)
Stockholders’ equityClass A Common Stock, $.0003 1/3 par value; 100,000,000 shares authorized asof December 31, 2010 and 2009; 38,660,355 shares issued and outstanding asof December 31, 2010 and 37,747,647 shares issued and outstanding as ofDecember 31, 2009 13 13
Class B Convertible Common Stock, $.0003 1/3 par value; 12,500,000 sharesauthorized, issued and outstanding as of December 31, 2010 and 2009 4 4
Additional paid-in capital 224,887 197,342Retained earnings 270,021 202,188Unearned compensation — (14)Accumulated other comprehensive income 2,041 464
Total stockholders’ equity 496,966 399,997
Total liabilities and stockholders’ equity $675,378 $545,588
See accompanying notes.
45

Under Armour, Inc. and Subsidiaries
Consolidated Statements of Income(In thousands, except per share amounts)
Year Ended December 31,
2010 2009 2008
Net revenues $1,063,927 $856,411 $725,244Cost of goods sold 533,420 446,286 372,203
Gross profit 530,507 410,125 353,041Selling, general and administrative expenses 418,152 324,852 276,116
Income from operations 112,355 85,273 76,925Interest expense, net (2,258) (2,344) (850)Other expense, net (1,178) (511) (6,175)
Income before income taxes 108,919 82,418 69,900Provision for income taxes 40,442 35,633 31,671
Net income $ 68,477 $ 46,785 $ 38,229
Net income available per common shareBasic $ 1.35 $ 0.94 $ 0.78Diluted $ 1.34 $ 0.92 $ 0.76
Weighted average common shares outstandingBasic 50,798 49,848 49,086Diluted 51,282 50,650 50,342
See accompanying notes.
46

Under Armour, Inc. and Subsidiaries
Consolidated Statements of Stockholders’ Equity and Comprehensive Income(In thousands)
Class ACommon Stock
Class BConvertible
Common Stock AdditionalPaid-InCapital
RetainedEarnings
UnearnedCompen-sation
Accum-ulatedOtherCompre-hensiveIncome(Loss)
Compre-hensiveIncome
TotalStockholders’
EquityShares Amount Shares Amount
Balance as of December 31, 2007 36,190 $ 12 12,500 $ 4 $162,362 $117,782 $(182) $ 507 $280,485Exercise of stock options 225 — — — 785 — — — 785Issuance of Class A CommonStock, net of forfeitures 394 — — — 1,205 — — — 1,205
Stock-based compensation expense — — — — 8,340 — 122 — 8,462Net excess tax benefits from stock-based compensationarrangements — — — — 2,033 — — — 2,033
Comprehensive income :Net income — — — — — 38,229 — — $38,229 38,229Foreign currency translationadjustment, net of tax of$100 — — — — — — — (102) (102) (102)
Comprehensive income 38,127
Balance as of December 31, 2008 36,809 12 12,500 4 174,725 156,011 (60) 405 331,097Exercise of stock options 853 1 — — 4,000 — — — 4,001Shares withheld in consideration ofemployee tax obligations relativeto stock-based compensationarrangements (26) — — — — (608) — — (608)
Issuance of Class A CommonStock, net of forfeitures 112 — — — 1,509 — — — 1,509
Stock-based compensation expense — — — — 12,864 — 46 — 12,910Net excess tax benefits from stock-based compensationarrangements — — — — 4,244 — — — 4,244
Comprehensive income :Net income — — — — — 46,785 — — 46,785 46,785Foreign currency translationadjustment, net of tax of$101 — — — — — — — 59 59 59
Comprehensive income 46,844
Balance as of December 31, 2009 37,748 13 12,500 4 197,342 202,188 (14) 464 399,997Exercise of stock options 799 — — — 6,104 — — — 6,104Shares withheld in consideration ofemployee tax obligations relativeto stock-based compensationarrangements (19) — — — — (644) — — (644)
Issuance of Class A CommonStock, net of forfeitures 132 — — — 1,788 — — — 1,788
Stock-based compensation expense — — — — 16,170 — 14 — 16,184Net excess tax benefits from stock-based compensationarrangements — — — — 3,483 — — — 3,483
Comprehensive income :Net income — — — — — 68,477 — — $68,477 68,477Foreign currency translationadjustment — — — — — — — 1,577 1,577 1,577
Comprehensive income $70,054
Balance as of December 31, 2010 38,660 $ 13 12,500 $ 4 $224,887 $270,021 $ — $2,041 $496,966
See accompanying notes.
47

Under Armour, Inc. and Subsidiaries
Consolidated Statements of Cash Flows(In thousands)
Year Ended December 31,
2010 2009 2008
Cash flows from operating activitiesNet income $ 68,477 $ 46,785 $ 38,229Adjustments to reconcile net income to net cash provided by (used in) operating activities
Depreciation and amortization 31,321 28,249 21,347Unrealized foreign currency exchange rate (gains) losses 1,280 (5,222) 5,459Loss on disposal of property and equipment 44 37 15Stock-based compensation 16,227 12,910 8,466Deferred income taxes (10,337) (5,212) (2,818)Changes in reserves and allowances 2,322 1,623 8,711Changes in operating assets and liabilities:
Accounts receivable (32,320) 3,792 2,634Inventories (65,239) 32,998 (19,497)Prepaid expenses and other assets (4,099) 1,870 (7,187)Accounts payable 16,158 (4,386) 16,957Accrued expenses and other liabilities 21,330 11,656 (5,316)Income taxes payable and receivable 4,950 (6,059) 2,516
Net cash provided by operating activities 50,114 119,041 69,516
Cash flows from investing activitiesPurchase of property and equipment (30,182) (19,845) (38,594)Purchase of intangible assets — — (600)Purchase of trust owned life insurance policies (478) (35) (2,893)Deposit for purchase of long term investment (11,125) — —Proceeds from sales of property and equipment — — 21
Net cash used in investing activities (41,785) (19,880) (42,066)
Cash flows from financing activitiesProceeds from revolving credit facility — — 40,000Payments on revolving credit facility — (25,000) (15,000)Proceeds from long term debt 5,262 7,649 13,214Payments on long term debt (9,446) (7,656) (6,490)Payments on capital lease obligations (97) (361) (464)Excess tax benefits from stock-based compensation arrangements 4,189 5,127 2,131Proceeds from exercise of stock options and other stock issuances 7,335 5,128 1,990Payments of debt financing costs — (1,354) —
Net cash provided by (used in) financing activities 7,243 (16,467) 35,381Effect of exchange rate changes on cash and cash equivalents 1,001 2,561 (1,377)
Net increase in cash and cash equivalents 16,573 85,255 61,454Cash and cash equivalentsBeginning of year 187,297 102,042 40,588
End of year $203,870 $187,297 $102,042
Non-cash financing and investing activitiesPurchase of property and equipment through certain obligations $ 2,922 $ 4,784 $ 2,486Purchase of intangible asset through certain obligations — 2,105 —
Other supplemental informationCash paid for income taxes 38,773 40,834 29,561Cash paid for interest 992 1,273 1,444
See accompanying notes.
48

Under Armour, Inc. and Subsidiaries
Notes to the Audited Consolidated Financial Statements
1. Description of the Business
Under Armour, Inc. is a developer, marketer and distributor of branded performance apparel, footwear andaccessories. These products are sold worldwide and worn by athletes at all levels, from youth to professional onplaying fields around the globe, as well as by consumers with active lifestyles.
2. Summary of Significant Accounting Policies
Basis of Presentation
The accompanying consolidated financial statements include the accounts of Under Armour, Inc. and itswholly owned subsidiaries (the “Company”). All intercompany balances and transactions have been eliminated.The accompanying consolidated financial statements were prepared in accordance with accounting principlesgenerally accepted in the United States of America.
Cash and Cash Equivalents
The Company considers all highly liquid investments with an original maturity of three months or less atdate of inception to be cash and cash equivalents. Included in interest expense, net for the years endedDecember 31, 2010, 2009 and 2008 was interest income of $48.7 thousand, $102.8 thousand and $636.5thousand, respectively, related to cash and cash equivalents.
Concentration of Credit Risk
Financial instruments that subject the Company to significant concentration of credit risk consist primarilyof accounts receivable. The majority of the Company’s accounts receivable are due from large sporting goodsretailers. Credit is extended based on an evaluation of the customer’s financial condition and collateral is notrequired. The most significant customers that accounted for a large portion of net revenues and accountsreceivable are as follows:
CustomerA
CustomerB
CustomerC
Net revenues2010 18.5% 8.7% 5.0%2009 19.4% 9.4% 4.6%2008 18.6% 12.2% 4.7%
Accounts receivable2010 23.3% 11.0% 5.4%2009 17.6% 10.7% 6.0%2008 25.0% 15.8% 7.9%
Allowance for Doubtful Accounts
The Company makes ongoing estimates relating to the collectability of accounts receivable and maintains anallowance for estimated losses resulting from the inability of its customers to make required payments. Indetermining the amount of the reserve, the Company considers historical levels of credit losses and significanteconomic developments within the retail environment that could impact the ability of its customers to payoutstanding balances and makes judgments about the creditworthiness of significant customers based on ongoingcredit evaluations. Because the Company cannot predict future changes in the financial stability of its customers,
49

actual future losses from uncollectible accounts may differ from estimates. If the financial condition of customerswere to deteriorate, resulting in their inability to make payments, a larger reserve might be required. In the eventthe Company determines a smaller or larger reserve is appropriate, it would record a benefit or charge to selling,general and administrative expense in the period in which such a determination was made. As of December 31,2010 and 2009, the allowance for doubtful accounts was $4.9 million and $5.2 million, respectively.
Inventories
Inventories consist of finished goods, raw materials and work-in-process. Costs of finished goodsinventories include all costs incurred to bring inventory to its current condition, including inbound freight, dutiesand other costs. The Company values its inventory at standard cost which approximates landed cost, using thefirst-in, first-out method of cost determination. Market value is estimated based upon assumptions made aboutfuture demand and retail market conditions. If the Company determines that the estimated market value of itsinventory is less than the carrying value of such inventory, it provides a charge to cost of goods sold to reflect thelower of cost or market. If actual market conditions are less favorable than those projected by the Company,further adjustments may be required that would increase the cost of goods sold in the period in which such adetermination was made.
Income Taxes
Income taxes are accounted for under the asset and liability method. Deferred income tax assets andliabilities are established for temporary differences between the financial reporting basis and the tax basis of theCompany’s assets and liabilities at tax rates expected to be in effect when such assets or liabilities are realized orsettled. Deferred income tax assets are reduced by valuation allowances when necessary.
Assessing whether deferred tax assets are realizable requires significant judgment. The Company considersall available positive and negative evidence, including historical operating performance and expectations offuture operating performance. The ultimate realization of deferred tax assets is often dependent upon futuretaxable income and therefore can be uncertain. To the extent the Company believes it is more likely than not thatall or some portion of the asset will not be realized, valuation allowances are established against the Company’sdeferred tax assets, which increase income tax expense in the period when such a determination is made.
Income taxes include the largest amount of tax benefit for an uncertain tax position that is more likely thannot to be sustained upon audit based on the technical merits of the tax position. Settlements with tax authorities,the expiration of statutes of limitations for particular tax positions, or obtaining new information on particular taxpositions may cause a change to the effective tax rate. The Company recognizes accrued interest and penaltiesrelated to unrecognized tax benefits in the provision for income taxes on the consolidated statements of income.
Property and Equipment
Property and equipment are stated at cost, including the cost of internal labor for software customized forinternal use, less accumulated depreciation and amortization. Property and equipment is depreciated using thestraight-line method over the estimated useful lives of the assets: 3 to 7 years for furniture, office equipment,software and plant equipment. Leasehold improvements are amortized over the shorter of the lease term or theestimated useful lives of the assets. The cost of in-store apparel and footwear fixtures and displays arecapitalized, included in furniture, fixtures and displays, and depreciated over 3 to 5 years.
The Company capitalizes the cost of interest for long term property and equipment projects based on theCompany’s weighted average borrowing rates in place while the projects are in progress. Capitalized interest was$0.7 million and $0.4 million as of December 31, 2010 and 2009, respectively.
50

Upon retirement or disposition of property and equipment, the cost and accumulated depreciation areremoved from the accounts and any resulting gain or loss is reflected in selling, general and administrativeexpenses for that period. Major additions and betterments are capitalized to the asset accounts while maintenanceand repairs, which do not improve or extend the lives of assets, are expensed as incurred.
Impairment of Long-Lived Assets
The Company continually evaluates whether events and circumstances have occurred that indicate theremaining estimated useful life of long-lived assets may warrant revision or that the remaining balance may notbe recoverable. These factors may include a significant deterioration of operating results, changes in businessplans, or changes in anticipated cash flows. When factors indicate that an asset should be evaluated for possibleimpairment, the Company reviews long-lived assets to assess recoverability from future operations usingundiscounted cash flows. If future undiscounted cash flows are less than the carrying value, an impairment isrecognized in earnings to the extent that the carrying value exceeds fair value. No material impairments wererecorded in the years ended December 31, 2010, 2009 and 2008.
Accrued Expenses
At December 31, 2010, accrued expenses primarily included $31.0 million and $7.8 million of accruedcompensation and benefits and marketing expenses, respectively. At December 31, 2009, accrued expensesprimarily included $14.5 million, $6.9 million and $5.2 million of accrued compensation and benefits, certaincustomer markdowns and discounts and marketing expenses, respectively.
Foreign Currency Translation and Transactions
The functional currency for each of the Company’s wholly owned foreign subsidiaries is generally theapplicable local currency. The translation of foreign currencies into U.S. dollars is performed for assets andliabilities using current foreign currency exchange rates in effect at the balance sheet date and for revenue andexpense accounts using average foreign currency exchange rates during the period. Capital accounts aretranslated at historical foreign currency exchange rates. Translation gains and losses are included in stockholders’equity as a component of accumulated other comprehensive income. Adjustments that arise from foreigncurrency exchange rate changes on transactions, primarily driven by intercompany transactions, denominated in acurrency other than the local currency are included in other expense, net on the consolidated statements ofincome.
Derivatives
The Company uses derivative financial instruments in the form of foreign currency forward contracts tominimize the risk associated with foreign currency exchange rate fluctuations. The Company accounts forderivative financial instruments pursuant to applicable accounting guidance. This guidance establishesaccounting and reporting standards for derivative financial instruments and requires all derivatives to berecognized as either assets or liabilities on the balance sheet and to be measured at fair value. Unrealizedderivative gain positions are recorded as other current assets or other non-current assets, and unrealizedderivative loss positions are recorded as accrued expenses or other long term liabilities, depending on thederivative financial instrument’s maturity date.
Currently, the Company’s foreign currency forward contracts are not designated as cash flow hedges, andaccordingly, changes in their fair value are recorded to other expense, net on the consolidated statements ofincome. The Company does not enter into derivative financial instruments for speculative or trading purposes.
51

Revenue Recognition
The Company recognizes revenue pursuant to applicable accounting standards. Net revenues consist of bothnet sales and license revenues. Net sales are recognized upon transfer of ownership, including passage of title tothe customer and transfer of risk of loss related to those goods. Transfer of title and risk of loss is based uponshipment under free on board shipping point for most goods or upon receipt by the customer depending on thecountry of the sale and the agreement with the customer. In some instances, transfer of title and risk of loss takesplace at the point of sale, for example, at the Company’s retail stores. The Company may also ship productdirectly from its supplier to the customer and recognize revenue when the product is delivered to and accepted bythe customer. License revenues are recognized based upon shipment of licensed products sold by the Company’slicensees. Sales taxes imposed on the Company’s revenues from product sales are presented on a net basis on theconsolidated statements of income and therefore do not impact net revenues or costs of goods sold.
Sales Returns, Allowances, Markdowns and Discounts
The Company records reductions to revenue for estimated customer returns, allowances, markdowns anddiscounts. The Company bases its estimates on historical rates of customer returns and allowances as well as thespecific identification of outstanding returns, markdowns and allowances that have not yet been received by theCompany. The actual amount of customer returns and allowances, which is inherently uncertain, may differ fromthe Company’s estimates. If the Company determines that actual or expected returns or allowances aresignificantly higher or lower than the reserves it established, it would record a reduction or increase, asappropriate, to net sales in the period in which it makes such a determination. Provisions for customer specificdiscounts are based on contractual obligations with certain major customers.
Reserves for returns, allowances, markdowns and discounts are recorded as an offset to accounts receivableas settlements are made through offsets to outstanding customer invoices. Prior to 2010, the majority of reservesfor customer markdowns and discounts were recorded as accrued expenses as settlements were made throughcash disbursements. As of December 31, 2010, there were $8.3 million in customer markdowns and discountsrecorded as offsets to accounts receivable, and no amounts were recorded as accrued expenses. As ofDecember 31, 2009, there were no significant customer markdowns or discounts recorded as offsets to accountsreceivable, and $6.9 million was recorded as accrued expenses.
Advertising Costs
Advertising costs are charged to selling, general and administrative expenses. Advertising production costsare expensed the first time an advertisement related to such production costs is run. Media (television, print andradio) placement costs are expensed in the month during which the advertisement appears. In addition,advertising costs include sponsorship expenses. Accounting for sponsorship payments is based upon specificcontract provisions and the payments are generally expensed uniformly over the term of the contract after givingrecognition to periodic performance compliance provisions of the contracts. Advertising expense, includingamortization of in-store marketing fixtures and displays, was $128.2 million, $108.9 million and $96.1 millionfor the years ended December 31, 2010, 2009 and 2008, respectively. At December 31, 2010 and 2009, prepaidadvertising costs were $3.2 million and $1.4 million, respectively.
Shipping and Handling Costs
The Company charges certain customers shipping and handling fees. These fees are recorded in netrevenues. The Company includes outbound freight costs associated with shipping goods to customers as acomponent of cost of goods sold. The Company includes the majority of outbound handling costs as a componentof selling, general and administrative expenses. Outbound handling costs include costs associated with preparinggoods to ship to customers and certain costs to operate the Company’s distribution facilities. These costs,included within selling, general and administrative expenses, were $14.7 million, $12.2 million and $10.2 millionfor the years ended December 31, 2010, 2009 and 2008, respectively.
52

Earnings per Share
Basic earnings per common share is computed by dividing net income available to common stockholders for theperiod by the weighted average number of common shares outstanding during the period. Any stock-based compensationawards that are determined to be participating securities are included in the calculation of basic earnings per share usingthe two class method. Diluted earnings per common share is computed by dividing net income available to commonstockholders for the period by the diluted weighted average common shares outstanding during the period. Dilutedearnings per share reflects the potential dilution from common shares issuable through stock options, warrants, restrictedstock units and other equity awards. Refer to Note 11 for further discussion of earnings per share.
Stock-Based Compensation
The Company accounts for stock-based compensation in accordance with accounting guidance that requiresall stock-based compensation awards granted to employees and directors to be measured at fair value andrecognized as an expense in the financial statements. In addition, this guidance requires that excess tax benefitsrelated to stock-based compensation awards be reflected as financing cash flows.
The Company uses the Black-Scholes option-pricing model to estimate the fair market value of stock-basedcompensation awards. As the Company does not have sufficient historical exercise data to provide a reasonable basisupon which to estimate the expected life due to the limited period of time its shares of Class A Common Stock havebeen publicly traded, it uses the “simplified method” as permitted by accounting guidance. The “simplified method”calculates the expected life of a stock option equal to the time from grant to the midpoint between the vesting dateand contractual term, taking into account all vesting tranches. The risk free interest rate is based on the yield for theU.S. Treasury bill with a maturity equal to the expected life of the stock option. Expected volatility is based on anaverage for a peer group of companies similar in terms of type of business, industry, stage of life cycle and size.Compensation expense is recognized net of forfeitures on a straight-line basis over the total vesting period, which isthe implied requisite service period. Compensation expense for performance-based awards is recorded over theimplied requisite service period when achievement of the performance target is deemed probable. The forfeiture rateis estimated at the date of grant based on historical rates.
In addition, the Company recognized expense for stock-based compensation awards granted prior to theCompany’s initial filing of its S-1 Registration Statement in accordance with accounting guidance that allows theintrinsic value method. Under the intrinsic value method, stock-based compensation expense of fixed stock options isbased on the difference, if any, between the fair value of the company’s stock on the grant date and the exercise priceof the option. The stock-based compensation expense for these awards was fully amortized in 2010. Had theCompany elected to account for all stock-based compensation awards at fair value, net income and earnings per sharefor the years ended December 31, 2010, 2009 and 2008 would have been reported as set forth in the following table:
Year Ended December 31,
(In thousands, except per share amounts) 2010 2009 2008
Net income $ 68,477 $46,785 $38,229Add: stock-based compensation expense included inreported net income, net of taxes 10,202 7,329 4,633
Deduct: stock-based compensation expense determinedunder fair value based methods for all awards, net oftaxes (10,233) (7,360) (4,796)
Pro forma net income $ 68,446 $46,754 $38,066
Earnings per share including stock-based compensationexpense
Basic, pro forma $ 1.35 $ 0.94 $ 0.78Diluted, pro forma $ 1.33 $ 0.92 $ 0.76Basic, as reported $ 1.35 $ 0.94 $ 0.78Diluted, as reported $ 1.34 $ 0.92 $ 0.76
53

The Company issues new shares of Class A Common Stock upon exercise of stock options, grant ofrestricted stock or share unit conversion. Refer to Note 12 for further details on stock-based compensation.
Management Estimates
The preparation of financial statements in conformity with accounting principles generally accepted in theUnited States of America requires management to make estimates, including estimates relating to assumptionsthat affect the reported amounts of assets and liabilities, and disclosure of contingent assets and liabilities at thedate of the consolidated financial statements and the reported amounts of revenues and expenses during thereporting period. Actual results could differ from these estimates.
Fair Value of Financial Instruments
The carrying amounts shown for the Company’s cash and cash equivalents, accounts receivable andaccounts payable approximate fair value because of the short term maturity of those instruments. The fair valueof the long term debt approximates its carrying value based on the variable nature of interest rates and currentmarket rates available to the Company.
Recently Adopted Accounting Standards
In June 2009, the Financial Accounting Standards Board (“FASB”) issued an amendment to the accountingand disclosure requirements for the consolidation of variable interest entities (“VIEs”). This amendment requiresan enterprise to perform a qualitative analysis when determining whether or not it must consolidate a VIE. Theamendment also requires an enterprise to continuously reassess whether it must consolidate a VIE. Finally, anenterprise will be required to disclose significant judgments and assumptions used to determine whether or not toconsolidate a VIE. This amendment was effective for financial statements issued for annual periods beginningafter November 15, 2009, and for interim periods within the first annual period. The adoption of this amendmentdid not have any impact on the Company’s consolidated financial statements.
Reclassifications
Outbound freight costs associated with shipping goods of $9.2 million and $7.0 million included in selling,general and administrative expenses for the years ended December 31, 2009 and 2008, respectively, werereclassified to cost of goods sold to conform to the presentation for the year ended December 31, 2010. Inaddition, costs of $6.3 million and $5.1 million associated with the Company’s sourcing offices and SpecialMake-Up Shop included in cost of goods sold for the years ended December 31, 2009 and 2008, respectively,were reclassified to selling, general and administrative expenses to conform to the presentation for the yearsended December 31, 2010. The Company believes these changes were appropriate given its view that cost ofgoods sold should primarily include product costs which are variable in nature. In addition, these reclassificationsmore closely align with the way the Company manages its business.
54

3. Inventories
Inventories consisted of the following:
December 31,
(In thousands) 2010 2009
Finished goods $214,524 $147,632Raw materials 831 785Work-in-process — 71
Total inventories $215,355 $148,488
4. Property and Equipment, Net
Property and equipment consisted of the following:
December 31,
(In thousands) 2010 2009
Furniture, fixtures and displays $ 41,907 $ 43,538Software 30,579 25,548Leasehold improvements 38,739 24,347Plant equipment 21,653 18,153Office equipment 21,271 16,298Construction in progress 7,223 12,532Other 1,534 2,166
Subtotal property and equipment 162,906 142,582Accumulated depreciation and amortization (86,779) (69,656)
Property and equipment, net $ 76,127 $ 72,926
Construction in progress primarily includes costs incurred for software systems, leasehold improvementsand in-store fixtures and displays not yet placed in use.
Depreciation and amortization expense related to property and equipment was $28.7 million, $25.3 millionand $19.6 million for the years ended December 31, 2010, 2009 and 2008, respectively.
5. Intangible Assets, Net
The following table summarizes the Company’s intangible assets as of the periods indicated:
December 31, 2010 December 31, 2009
(In thousands)
GrossCarryingAmount
AccumulatedAmortization
Net CarryingAmount
GrossCarryingAmount
AccumulatedAmortization
Net CarryingAmount
Intangible assets subject toamortization:Footwear promotional rights $ 8,500 $(6,625) $1,875 $ 8,500 $(5,125) $3,375Other 2,982 (943) 2,039 2,830 (524) 2,306
Total $11,482 $(7,568) $3,914 $11,330 $(5,649) $5,681
Intangible assets are amortized using estimated useful lives of 55 months to 89 months with no residualvalue. Amortization expense, which is included in selling, general and administrative expenses, was $2.0 million,$1.9 million and $1.6 million for the years ended December 31, 2010, 2009 and 2008, respectively. Theestimated amortization expense of the Company’s intangible assets is $2.1 million, $1.0 million and $0.6 millionfor the years ending December 31, 2011, 2012 and 2013, respectively, and $0.1 million for each of the yearsending December 31, 2014 and 2015.
55

6. Revolving Credit Facility and Long Term Debt
Revolving Credit Facility
The Company has a revolving credit facility with certain lending institutions. The revolving credit facilityhas a term of three years, expiring in January 2012, and provides for a committed revolving credit line of up to$200.0 million based on the Company’s qualified domestic inventory and accounts receivable balances. Thecommitment amount under the revolving credit facility may be increased by an additional $50.0 million, subjectto certain conditions and approvals under the credit agreement.
The revolving credit facility may be used for working capital and general corporate purposes. It iscollateralized by substantially all of the assets of the Company and its domestic subsidiaries (other than theCompany’s trademarks), and by a pledge of 65% of the equity interests of certain of the Company’s foreignsubsidiaries. Up to $5.0 million of the revolving credit facility may be used to support letters of credit, of whichno amounts were outstanding as of December 31, 2010. The Company must maintain a certain leverage ratio andfixed charge coverage ratio as defined in the credit agreement. As of December 31, 2010, the Company was incompliance with these financial covenants. The revolving credit facility also provides the lenders with the abilityto reduce the borrowing base, even if the Company is in compliance with all conditions of the revolving creditfacility, upon a material adverse change to the business, properties, assets, financial condition or results ofoperations of the Company. The revolving credit facility contains a number of restrictions that limit theCompany’s ability, among other things, and subject to certain limited exceptions, to incur additionalindebtedness, pledge its assets as security, guaranty obligations of third parties, make investments, undergo amerger or consolidation, dispose of assets, or materially change its line of business. In addition, the revolvingcredit facility includes a cross default provision whereby an event of default under other debt obligations, asdefined in the credit agreement, will be considered an event of default under this credit agreement.
Borrowings under the revolving credit facility bear interest based on the daily balance outstanding at aLIBOR rate option (with LIBOR subject to a rate floor of 1.25%) plus an applicable margin (varying from 2.0%to 2.5%) or, in certain cases at the Company’s discretion, a base rate option (based on the prime rate or asotherwise specified in the credit agreement, with the base rate subject to a rate floor of 2.25%) plus an applicablemargin (varying from 1.0% to 1.5%). The revolving credit facility also carries a commitment fee varying from0.38% to 0.5% of the committed line amount less outstanding borrowings and letters of credit. The applicablemargins are calculated quarterly and vary based on the Company’s leverage ratio as defined in the creditagreement.
Prior to entering into the revolving credit facility in January 2009, the Company terminated its prior $100.0million revolving credit facility. In conjunction with the termination of the prior revolving credit facility, theCompany repaid the then outstanding balance of $25.0 million. The prior revolving credit facility was alsocollateralized by substantially all of the Company’s assets, other than its trademarks, and included covenants,conditions and other terms similar to the Company’s current revolving credit facility.
As of December 31, 2010, borrowings under the $200 million revolving credit facility were limited toapproximately $151.5 million based on the Company’s eligible domestic inventory and accounts receivablebalances. The weighted average interest rates on the balances outstanding under the prior revolving credit facilitywere 1.4% and 3.7% during the years ended December 31, 2009 and 2008, respectively. No balances wereoutstanding under the current revolving credit facility during the years ended December 31, 2010 and 2009.
Long Term Debt
The Company has long term debt agreements with various lenders to finance the acquisition or lease ofqualifying capital investments. Loans under these agreements are collateralized by a first lien on the relatedassets acquired. As these agreements are not committed facilities, each advance is subject to approval by thelenders. Additionally, these agreements include a cross default provision whereby an event of default under other
56

debt obligations, including the Company’s revolving credit facility, will be considered an event of default underthese agreements. These agreements require a prepayment fee if the Company pays outstanding amounts aheadof the scheduled terms. The terms of the revolving credit facility limit the total amount of additional financingunder these agreements to $35.0 million, of which $22.1 million was remaining as of December 31, 2010. AtDecember 31, 2010 and 2009, the outstanding principal balance under these agreements was $15.9 million and$20.1 million, respectively. Currently, advances under these agreements bear interest rates which are fixed at thetime of each advance. The weighted average interest rate on outstanding borrowings was 5.3%, 5.9% and 6.1%for the years ended December 31, 2010, 2009 and 2008, respectively.
The following is a schedule of future principal payments on long term debt as of December 31, 2010:
(In thousands)
2011 $ 6,8652012 4,7572013 2,0642014 1,5322015 724
Total future principal payments on long term debt 15,942Less current maturities of long term debt (6,865)
Long term debt obligations $ 9,077
The Company monitors the financial health and stability of its lenders under the revolving credit and longterm debt facilities, however continued significant instability in the credit markets could negatively impactlenders and their ability to perform under their facilities.
Interest expense, net includes interest expense and amortization of deferred financing costs of $2.3 million,$2.4 million and $1.5 million for the years ended December 31, 2010, 2009 and 2008, respectively.
7. Commitments and Contingencies
Obligations Under Operating and Capital Leases
The Company leases warehouse space, office facilities, space for its retail stores and certain equipmentunder non-cancelable operating and capital leases. The leases expire at various dates through 2021, excludingextensions at the Company’s option, and include provisions for rental adjustments. The table below includesexecuted lease agreements for factory house stores that the Company did not yet occupy as of December 31,2010. The following is a schedule of future minimum lease payments for non-cancelable operating leases as ofDecember 31, 2010:
(In thousands) Operating
2011 $19,5282012 16,5592013 14,8412014 13,3702015 11,3072016 and thereafter 20,099
Total future minimum lease payments $95,704
Rent expense for the years ended December 31, 2010, 2009 and 2008 was $19.3 million, $14.1 million and$12.9 million, respectively, under non-cancelable operating lease agreements. Included in these amounts wascontingent rent expense of $2.0 million, $0.6 million and $0.4 million for the years ended December 31, 2010,2009 and 2008, respectively.
57

The Company had no outstanding capital lease agreements as of December 31, 2010 and no significantoutstanding capital lease agreements as of December 31, 2009.
Sponsorships and Other Marketing Commitments
Within the normal course of business, the Company enters into contractual commitments in order topromote the Company’s brand and products. These commitments include sponsorship agreements with teams andathletes on the collegiate and professional levels, official supplier agreements, athletic event sponsorships andother marketing commitments. The following is a schedule of the Company’s future minimum payments underits sponsorship and other marketing agreements as of December 31, 2010:
(In thousands)
2011 $ 43,5062012 39,2512013 32,7642014 29,7312015 18,8942016 and thereafter 3,483
Total future minimum sponsorship and other marketing payments $167,629
The amounts listed above are the minimum obligations required to be paid under the Company’ssponsorship and other marketing agreements. The amounts listed above do not include additional performanceincentives and product supply obligations provided under certain agreements. It is not possible to determine howmuch the Company will spend on product supply obligations on an annual basis as contracts generally do notstipulate specific cash amounts to be spent on products. The amount of product provided to the sponsorshipsdepends on many factors including general playing conditions, the number of sporting events in which theyparticipate and the Company’s decisions regarding product and marketing initiatives. In addition, the costs todesign, develop, source and purchase the products furnished to the endorsers are incurred over a period of timeand are not necessarily tracked separately from similar costs incurred for products sold to customers.
Other
The Company is, from time to time, involved in routine legal matters incidental to its business. TheCompany believes that the ultimate resolution of any such current proceedings and claims will not have amaterial adverse effect on its consolidated financial position, results of operations or cash flows.
In connection with various contracts and agreements, the Company has agreed to indemnify counterpartiesagainst certain third party claims relating to the infringement of intellectual property rights and other items.Generally, such indemnification obligations do not apply in situations in which the counterparties are grosslynegligent, engage in willful misconduct, or act in bad faith. Based on the Company’s historical experience andthe estimated probability of future loss, the Company has determined that the fair value of such indemnificationsis not material to its consolidated financial position or results of operations.
8. Stockholders’ Equity
The Company’s Class A Common Stock and Class B Convertible Common Stock have an authorizednumber of shares of 100.0 million shares and 12.5 million shares, respectively, and each have a par value of$0.0003 1/3 per share. Holders of Class A Common Stock and Class B Convertible Common Stock haveidentical rights, except that the holders of Class A Common Stock are entitled to one vote per share and holdersof Class B Convertible Common Stock are entitled to 10 votes per share on all matters submitted to a stockholdervote. Class B Convertible Common Stock may only be held by the Company’s Chief Executive Officer (“CEO”),or a related party of the CEO, as defined in the Company’s charter. As a result, the Company’s CEO has amajority voting control over the Company. Upon the transfer of shares of Class B Convertible Stock to a person
58

other than the Company’s CEO or a related party of the CEO, the shares automatically convert into shares ofClass A Common Stock on a one-for-one basis. In addition, all of the outstanding shares of Class B ConvertibleCommon Stock will automatically convert into shares of Class A Common Stock on a one-for-one basis on thedate upon which the shares of Class A Common Stock and Class B Convertible Common Stock beneficiallyowned by the Company’s CEO is less than 15% of the total shares of Class A Common Stock and Class BConvertible Common Stock outstanding. Holders of the Company’s common stock are entitled to receivedividends when and if authorized and declared out of assets legally available for the payment of dividends.
9. Fair Value Measurements
Fair value is defined as the price that would be received to sell an asset or paid to transfer a liability in anorderly transaction between market participants at the measurement date (an exit price). The fair valueaccounting guidance outlines a valuation framework, creates a fair value hierarchy in order to increase theconsistency and comparability of fair value measurements and the related disclosures and prioritizes the inputsused in measuring fair value as follows:
Level 1: Observable inputs such as quoted prices in active markets;
Level 2: Inputs, other than quoted prices in active markets, that are observable either directly orindirectly; and
Level 3: Unobservable inputs in which there is little or no market data, which require the reportingentity to develop its own assumptions.
Financial assets and (liabilities) measured at fair value as of December 31, 2010 are set forth in the tablebelow:
(In thousands) Level 1 Level 2 Level 3
Derivative foreign currency forward contracts (see Note 14) $— $ (551) $—TOLI held by the Rabbi Trust (see Note 13) — 3,593 —Deferred Compensation Plan obligations (see Note 13) — (3,591) —
Fair values of the financial assets and liabilities listed above are determined using inputs that use as theirbasis readily observable market data that are actively quoted and are validated through external sources,including third-party pricing services and brokers. The foreign currency forward contracts represent gains andlosses on derivative contracts, which is the net difference between the U.S. dollars to be received or paid at thecontracts’ settlement date and the U.S. dollar value of the foreign currency to be sold or purchased at the currentforward exchange rate. The fair value of the TOLI held by the Rabbi Trust is based on the cash-surrender valueof the life insurance policies, which are invested primarily in mutual funds and a separately managed fixedincome fund. These investments are in the same funds and purchased in substantially the same amounts as theselected investments of participants in the Deferred Compensation Plan, which represent the underlying liabilitiesto participants in the Deferred Compensation Plan. Liabilities under the Deferred Compensation Plan arerecorded at amounts due to participants, based on the fair value of participants’ selected investments.
10. Provision for Income Taxes
Income (loss) before income taxes is as follows:
Year Ended December 31,
(In thousands) 2010 2009 2008
Income (loss) before income taxes:United States $ 96,179 $86,752 $ 85,204Foreign 12,740 (4,334) (15,304)
Total $108,919 $82,418 $ 69,900
59

The components of the provision for income taxes consisted of the following:
Year Ended December 31,
(In thousands) 2010 2009 2008
CurrentFederal $ 39,139 $32,215 $28,225State 8,020 7,285 5,022Other foreign countries 3,620 1,345 1,242
50,779 40,845 34,489
DeferredFederal (6,617) (2,421) 226State (3,487) 244 1,699Other foreign countries (233) (3,035) (4,743)
(10,337) (5,212) (2,818)
Provision for income taxes $ 40,442 $35,633 $31,671
A reconciliation from the U.S. statutory federal income tax rate to the effective income tax rate is asfollows:
Year Ended December 31,
2010 2009 2008
U.S. federal statutory income tax rate 35.0% 35.0% 35.0%State taxes, net of federal tax impact 1.2 5.7 6.5Nondeductible expenses 1.4 2.2 1.7Foreign rate differential (1.6) (0.7) 2.2Unrecognized tax benefits 2.3 1.1 —Other (1.2) (0.1) (0.1)
Effective income tax rate 37.1% 43.2% 45.3%
The decrease in the 2010 full year effective income tax rate, as compared to 2009, is primarily attributableto certain tax planning strategies and federal and state tax credits reducing the effective tax rate for the period.This reduction was partially offset by the establishment of a valuation allowance recorded against a portion of theCompany’s deferred tax assets and additional unrecognized tax benefits.
60

Deferred tax assets and liabilities consisted of the following:
December 31,
(In thousands) 2010 2009
Deferred tax assetState tax credits, net of federal tax impact $ 1,750 $ —Tax basis inventory adjustment 3,052 1,874Inventory obsolescence reserves 2,264 2,800Allowance for doubtful accounts and other reserves 8,996 7,042Foreign net operating loss carryforward 10,917 9,476Stock-based compensation 8,790 5,450Intangible asset 372 1,068Deferred rent 2,975 1,728Deferred compensation 1,449 1,105Other 2,709 3,151
Total deferred tax assets 43,274 33,694Less: valuation allowance (1,765) —
Total net deferred tax assets 41,509 33,694
Deferred tax liabilityPrepaid expenses (1,865) (1,133)Property, plant and equipment (3,104) (5,783)
Total deferred tax liabilities (4,969) (6,916)
Total deferred tax assets, net $36,540 $26,778
As of December 31, 2010, the Company had $10.9 million in deferred tax assets associated with foreign netoperating loss carryforwards which will begin to expire in 5 to 9 years. As of December 31, 2010, the Companybelieved certain deferred tax assets associated with foreign net operating loss carryforwards would expire unusedbased on updated forward-looking financial information. Therefore, a valuation allowance of $1.5 million and$1.8 million was recorded against the Company’s net deferred tax assets as of September 30, 2010 andDecember 31, 2010, respectively. The valuation allowance resulted in an increase to income tax expense of $1.8million for the year ended December 31, 2010. Although realization of the remaining foreign net operating losscarryforwards is not assured, the Company believes it is more likely than not that the remaining $9.1 million willbe realized. This realizable amount could be increased or decreased if future taxable income during thecarryforward periods is increased or reduced.
As of December 31, 2010, withholding and U.S. taxes have not been provided on approximately $37.3million of cumulative undistributed earnings of the Company’s non-U.S. subsidiaries because the Companyintends to indefinitely reinvest these earnings in its non-U.S. subsidiaries.
61

As of December 31, 2010 and 2009, the total liability for unrecognized tax benefits, including relatedinterest and penalties, was approximately $6.4 million and $3.5 million, respectively. The following tablerepresents a reconciliation of the Company’s total unrecognized tax benefits balances, excluding interest andpenalties, for the years ended December 31, 2010, 2009 and 2008:
Year Ended December 31,
(In thousands) 2010 2009 2008
Beginning of year $2,598 $1,675 $1,781Increases as a result of tax positions taken in a prior period — — —Decreases as a result of tax positions taken in a prior period — — —Increases as a result of tax positions taken during the currentperiod 2,632 1,163 281
Decreases as a result of tax positions taken during the currentperiod — — —
Decreases as a result of settlements during the current period — (43) —Reductions as a result of a lapse of statute of limitationsduring the current period (65) (197) (387)
End of year $5,165 $2,598 $1,675
As of December 31, 2010, $4.3 million of unrecognized tax benefits, excluding interest and penalties, wouldimpact the Company’s effective tax rate if recognized.
As of December 31, 2010, 2009 and 2008, the liability for unrecognized tax benefits included $1.3 million,$0.9 million and $0.8 million for the accrual of interest and penalties, respectively. For each of the years endedDecember 31, 2010, 2009 and 2008, the Company recorded $0.3 million, $0.2 million and $0.2 million for theaccrual of interest and penalties in its consolidated statement of income.
The Company files income tax returns in the U.S. federal jurisdiction and various state and foreignjurisdictions. The majority of the Company’s returns for years before 2006 are no longer subject to U.S. federal,state and local or foreign income tax examinations by tax authorities. The Company may incur a decrease in thetotal unrecognized tax benefits within the next twelve months as a result of the possible expiration of certainstatutes of limitations for particular tax positions.
62

11. Earnings per Share
The Company adopted accounting guidance during 2009 requiring any stock-based compensation awardsthat entitle their holders to receive dividends prior to vesting to be considered participating securities and to beincluded in the calculation of basic earnings per share using the two class method. Historically, these stock-basedcompensation awards were included in the calculation of diluted earnings per share using the treasury stockmethod. The Company determined that all outstanding restricted stock awards meet the definition of participatingsecurities and should be included in basic earnings per share using the two class method. The Company includedoutstanding restricted stock awards in the calculation of basic earnings per share for the years endedDecember 31, 2010 and 2009 and adjusted prior period earnings per share calculations. The application of thisaccounting guidance decreased basic and diluted earnings per share presented for the year ended December 31,2008 by $0.01. The calculation of earnings per share for common stock shown below excludes the incomeattributable to outstanding restricted stock awards from the numerator and excludes the impact of these awardsfrom the denominator. The following is a reconciliation of basic earnings per share to diluted earnings per share:
Year Ended December 31,
(In thousands, except per share amounts) 2010 2009 2008
NumeratorNet income $68,477 $46,785 $38,229Net income attributable to participating securities (548) (468) (421)
Net income available to common shareholders (1) $67,929 $46,317 $37,808
DenominatorWeighted average common shares outstanding 50,379 49,341 48,569Effect of dilutive securities 484 803 1,257
Weighted average common shares and dilutive securitiesoutstanding 50,863 50,144 49,826
Earnings per share—basic $ 1.35 $ 0.94 $ 0.78Earnings per share—diluted $ 1.34 $ 0.92 $ 0.76
(1) Basic weighted average common shares outstanding 50,379 49,341 48,569Basic weighted average common shares outstandingand participating securities 50,798 49,848 49,086
Percentage allocated to common stockholders 99.2% 99.0% 98.9%
Effects of potentially dilutive securities are presented only in periods in which they are dilutive. Stockoptions, restricted stock units and warrants representing 0.9 million, 1.1 million and 1.0 million shares ofcommon stock were outstanding for each of the years ended December 31, 2010, 2009 and 2008, respectively,but were excluded from the computation of diluted earnings per share because their effect would be anti-dilutive.
12. Stock-Based Compensation
Stock Compensation Plans
The Under Armour, Inc. Amended and Restated 2005 Omnibus Long-Term Incentive Plan (the “2005Plan”) provides for the issuance of stock options, restricted stock, restricted stock units and other equity awardsto officers, directors, key employees and other persons. In 2009, stockholders approved amendments to the 2005Plan, including an increase in the maximum number of shares available for issuance under the 2005 Plan from2.7 million shares to 10.0 million shares, as well as limiting the number of stock options awarded in any calendaryear to 1.0 million for any one participant. Stock options and restricted stock awards under the 2005 Plangenerally vest ratably over a four to five year period. The exercise period for stock options is generally ten yearsfrom the date of grant. The Company generally receives a tax deduction for any ordinary income recognized by aparticipant in respect to an award under the 2005 Plan. The 2005 Plan terminates in 2015. As of December 31,2010, 5.9 million shares are available for future grants of awards under the 2005 Plan.
63

The Company’s 2000 Stock Option Plan (the “2000 Plan”) provided for the issuance of stock options,restricted stock and other equity awards to officers, directors, key employees and other persons. The 2000 Planwas terminated and superseded by the 2005 Plan upon the Company’s initial public offering in November 2005.No further awards may be granted under the 2000 Plan. Stock options and restricted stock awards under the 2000Plan generally vest ratably over a four to five year period. The exercise period for stock options generally doesnot exceed five years from the date of grant. The Company generally receives a tax deduction for any ordinaryincome recognized by a participant in respect to an award under the 2000 Plan.
Total stock-based compensation expense for the years ended December 31, 2010, 2009 and 2008 was $16.2million, $12.9 million and $8.5 million, respectively. As of December 31, 2010, the Company had $19.0million of unrecognized compensation expense, excluding performance-based stock options, expected to berecognized over a weighted average period of 2.0 years.
Employee Stock Purchase Plan
The Company’s Employee Stock Purchase Plan (the “ESPP”) allows for the purchase of Class A CommonStock by all eligible employees at a 15% discount from fair market value subject to certain limits as defined inthe ESPP. The maximum number of shares available under the ESPP is 1.0 million shares. During the yearsended December 31, 2010, 2009 and 2008, 39.6 thousand, 59.8 thousand and 46.6 thousand shares werepurchased under the ESPP, respectively.
2006 Non-Employee Director Compensation Plan and Deferred Stock Unit Plan
The Company’s Non-Employee Director Compensation Plan (the “Director Compensation Plan”) providesfor cash compensation and equity awards to non-employee directors of the Company under the 2005 Plan.Non-employee directors have the option to defer the value of their annual cash retainers as deferred stock units inaccordance with the Under Armour, Inc. 2006 Non-Employee Deferred Stock Unit Plan (the “DSU Plan”). Eachnew non-employee director receives an award of restricted stock units upon the initial election to the Board ofDirectors, with the units covering stock valued at $0.1 million on the grant date and vesting in three equal annualinstallments. In addition, each non-employee director receives, following each annual stockholders’ meeting, agrant under the 2005 Plan of restricted stock units covering stock valued at $75.0 thousand on the grant date.Each award vests 100% on the date of the next annual stockholders’ meeting following the grant date.
The receipt of the shares otherwise deliverable upon vesting of the restricted stock units automaticallydefers into deferred stock units under the DSU Plan. Under the DSU Plan each deferred stock unit represents theCompany’s obligation to issue one share of the Company’s Class A Common Stock with the shares delivered sixmonths following the termination of the director’s service.
Stock Options
The weighted average fair value of a stock option granted for the years ended December 31, 2010, 2009 and2008 was $16.71, $7.79 and $19.48, respectively. The fair value of each stock option granted is estimated on thedate of grant using the Black-Scholes option-pricing model with the following weighted average assumptions:
Year Ended December 31,
2010 2009 2008
Risk-free interest rate 1.6% - 3.1% 2.0% - 3.2% 2.9% - 4.4%Average expected life in years 6.25 - 7.0 5.0 - 6.5 5.4 - 8.3Expected volatility 55.2% - 55.8% 53.4% - 56.2% 44.0% - 47.7%Expected dividend yield 0% 0% 0%
64

A summary of the Company’s stock options as of December 31, 2010, 2009 and 2008, and changes duringthe years then ended is presented below:
(In thousands, except per share amounts)
Year Ended December 31,
2010 2009 2008
Numberof StockOptions
WeightedAverageExercisePrice
Numberof StockOptions
WeightedAverageExercisePrice
Numberof StockOptions
WeightedAverageExercisePrice
Outstanding, beginning of year 2,831 $18.02 2,456 $15.92 2,126 $ 8.23Granted, at fair market value 1,435 29.32 1,364 14.53 609 37.96Exercised (799) 7.64 (853) 4.69 (225) 3.49Expired (7) 41.26 (34) 33.87 — —Forfeited (486) 23.52 (102) 27.04 (54) 13.67
Outstanding, end of year 2,974 $25.31 2,831 $18.02 2,456 $15.92
Options exercisable, end of year 304 $33.04 908 $11.58 1,044 $ 7.22
The intrinsic value of stock options exercised during the years ended December 31, 2010, 2009 and 2008was $7.6 million, $14.8 million and $6.7 million, respectively.
The following table summarizes information about stock options outstanding and exercisable as ofDecember 31, 2010:
(In thousands, except per share amounts)
Options Outstanding Options Exercisable
Number ofUnderlyingShares
WeightedAverageExercisePrice PerShare
WeightedAverage
RemainingContractualLife (Years)
TotalIntrinsicValue
Number ofUnderlyingShares
WeightedAverageExercisePrice PerShare
WeightedAverage
RemainingContractualLife (Years)
TotalIntrinsicValue
2,974 $25.31 8.4 $87,834 304 $33.04 6.1 $6,632
Included in the tables above are 1.1 million and 1.3 million performance-based stock options granted toofficers and key employees under the 2005 Plan during the years ended December 31, 2010 and 2009,respectively. These performance-based stock options have a weighted average exercise price of $20.75, and aterm of ten years. These performance-based options have vestings that are tied to the achievement of certaincombined annual operating income targets. Upon the achievement of each of the combined operating incometargets, 50% of the options will vest and the remaining 50% will vest one year later. If certain lower levels ofcombined operating income are achieved, fewer or no options will vest at that time and one year later, and theremaining stock options will be forfeited. At this time, the combined operating income targets related to the1.3 million performance-based stock options granted during the year ended December 31, 2009 have been met,and the options will vest 50% on February 15, 2011 and the remaining 50% will vest on February 15, 2012,subject to continued employment.
The weighted average fair value of these performance-based stock options is $11.66, and was estimatedusing the Black-Scholes option-pricing model consistent with the weighted average assumptions included in thetable above. During the years ended December 31, 2010 and 2009, the Company recorded $6.2 million and $2.9million, respectively, in stock-based compensation expense for these performance-based stock options. As ofDecember 31, 2010, the Company had $16.0 million of unrecognized compensation expense expected to berecognized over a weighted average period of 2.5 years if all combined operating income targets would bereached.
65

Restricted Stock and Restricted Stock Units
A summary of the Company’s restricted stock and restricted stock units as of December 31, 2010, 2009 and2008, and changes during the years then ended is presented below:
Year Ended December 31,
(In thousands, except per share amounts) 2010 2009 2008
Numberof
RestrictedShares
WeightedAverageValue
Numberof
RestrictedShares
WeightedAverageValue
Numberof
RestrictedShares
WeightedAverageValue
Outstanding, beginning of year 488 $37.40 639 $38.27 362 $42.06Granted 195 33.46 63 24.36 404 36.55Forfeited (102) 39.68 (19) 44.96 (45) 51.74Vested (169) 34.81 (195) 35.32 (82) 39.63
Outstanding, end of year 412 $36.04 488 $37.40 639 $38.27
Warrants
On August 3, 2006, the Company issued fully vested and non-forfeitable warrants to purchase480.0 thousand shares of the Company’s Class A Common Stock to NFL Properties as partial consideration forfootwear promotional rights which were recorded as an intangible asset (refer to Note 5). With the assistance ofan independent third party valuation firm, the Company assessed the fair value of the warrants using various fairvalue models. Using these measures, the Company concluded that the fair value of the warrants was $8.5 million.The warrants have a term of 12 years from the date of issuance and an exercise price of $36.99 per share, whichwas the closing price of the Company’s Class A Common Stock on August 2, 2006. As of December 31, 2010,all outstanding warrants were exercisable, and no warrants have been exercised.
13. Other Employee Benefits
The Company offers a 401(k) Deferred Compensation Plan for the benefit of eligible employees. Employeecontributions are voluntary and subject to Internal Revenue Service limitations. The Company matches a portionof the participant’s contribution and recorded expense of $1.2 million, $1.3 million and $1.1 million for the yearsended December 31, 2010, 2009 and 2008, respectively. Shares of the Company’s Class A Common Stock arenot an investment option in this plan.
In addition, the Company offers the Under Armour, Inc. Deferred Compensation Plan (the “DeferredCompensation Plan”) which allows a select group of management or highly compensated employees, asapproved by the Compensation Committee, to make an annual base salary and/or bonus deferral for each year. Asof December 31, 2010 and 2009, the Deferred Compensation Plan obligations were $3.6 million and $2.7million, respectively, and were included in other long term liabilities on the consolidated balance sheets.
The Company established a rabbi trust (the “Rabbi Trust”) to fund obligations to participants in the DeferredCompensation Plan. As of December 31, 2010 and 2009, the assets held in the Rabbi Trust were trust owned lifeinsurance policies (“TOLI”) with cash-surrender values of $3.6 million and $2.8 million, respectively. Theseassets are consolidated as allowed by accounting guidance, and are included in other non-current assets on theconsolidated balance sheet. Refer to Note 9 for a discussion of the fair value measurements of the assets held inthe Rabbi Trust and the Deferred Compensation Plan obligations.
14. Foreign Currency Risk Management and Derivatives
The Company is exposed to gains and losses resulting from fluctuations in foreign currency exchange ratesrelating to transactions generated by its international subsidiaries in currencies other than their local currencies.These gains and losses are primarily driven by intercompany transactions. When deemed necessary, the
66
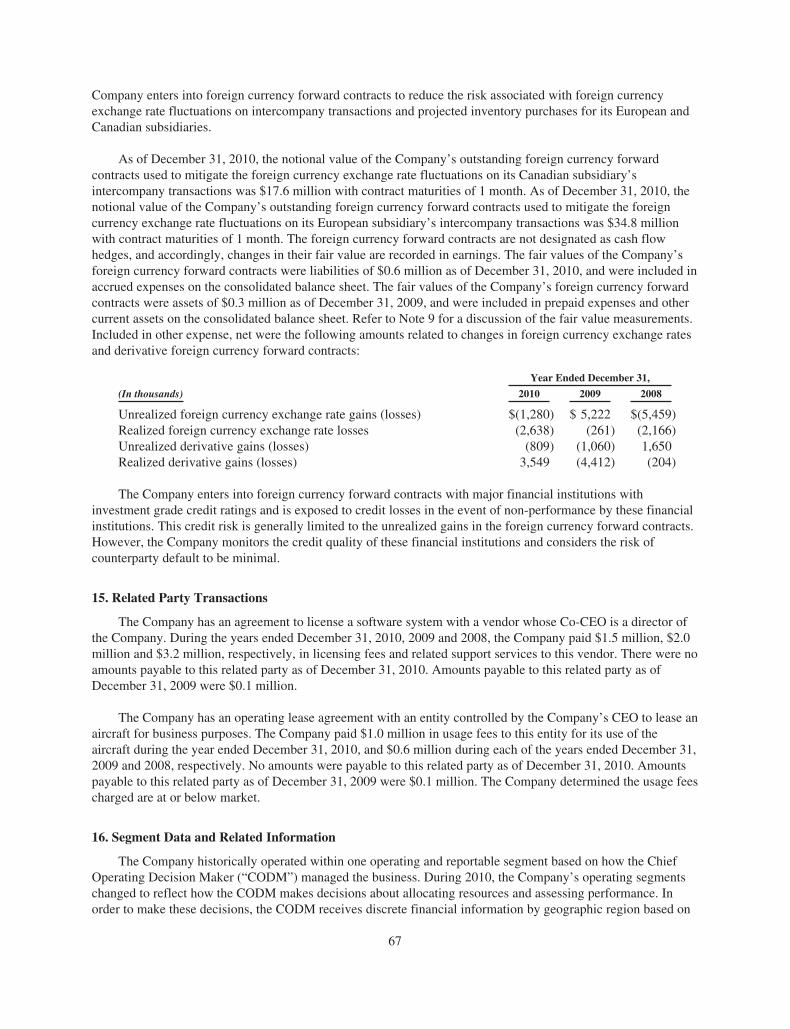
Company enters into foreign currency forward contracts to reduce the risk associated with foreign currencyexchange rate fluctuations on intercompany transactions and projected inventory purchases for its European andCanadian subsidiaries.
As of December 31, 2010, the notional value of the Company’s outstanding foreign currency forwardcontracts used to mitigate the foreign currency exchange rate fluctuations on its Canadian subsidiary’sintercompany transactions was $17.6 million with contract maturities of 1 month. As of December 31, 2010, thenotional value of the Company’s outstanding foreign currency forward contracts used to mitigate the foreigncurrency exchange rate fluctuations on its European subsidiary’s intercompany transactions was $34.8 millionwith contract maturities of 1 month. The foreign currency forward contracts are not designated as cash flowhedges, and accordingly, changes in their fair value are recorded in earnings. The fair values of the Company’sforeign currency forward contracts were liabilities of $0.6 million as of December 31, 2010, and were included inaccrued expenses on the consolidated balance sheet. The fair values of the Company’s foreign currency forwardcontracts were assets of $0.3 million as of December 31, 2009, and were included in prepaid expenses and othercurrent assets on the consolidated balance sheet. Refer to Note 9 for a discussion of the fair value measurements.Included in other expense, net were the following amounts related to changes in foreign currency exchange ratesand derivative foreign currency forward contracts:
(In thousands)
Year Ended December 31,
2010 2009 2008
Unrealized foreign currency exchange rate gains (losses) $(1,280) $ 5,222 $(5,459)Realized foreign currency exchange rate losses (2,638) (261) (2,166)Unrealized derivative gains (losses) (809) (1,060) 1,650Realized derivative gains (losses) 3,549 (4,412) (204)
The Company enters into foreign currency forward contracts with major financial institutions withinvestment grade credit ratings and is exposed to credit losses in the event of non-performance by these financialinstitutions. This credit risk is generally limited to the unrealized gains in the foreign currency forward contracts.However, the Company monitors the credit quality of these financial institutions and considers the risk ofcounterparty default to be minimal.
15. Related Party Transactions
The Company has an agreement to license a software system with a vendor whose Co-CEO is a director ofthe Company. During the years ended December 31, 2010, 2009 and 2008, the Company paid $1.5 million, $2.0million and $3.2 million, respectively, in licensing fees and related support services to this vendor. There were noamounts payable to this related party as of December 31, 2010. Amounts payable to this related party as ofDecember 31, 2009 were $0.1 million.
The Company has an operating lease agreement with an entity controlled by the Company’s CEO to lease anaircraft for business purposes. The Company paid $1.0 million in usage fees to this entity for its use of theaircraft during the year ended December 31, 2010, and $0.6 million during each of the years ended December 31,2009 and 2008, respectively. No amounts were payable to this related party as of December 31, 2010. Amountspayable to this related party as of December 31, 2009 were $0.1 million. The Company determined the usage feescharged are at or below market.
16. Segment Data and Related Information
The Company historically operated within one operating and reportable segment based on how the ChiefOperating Decision Maker (“CODM”) managed the business. During 2010, the Company’s operating segmentschanged to reflect how the CODM makes decisions about allocating resources and assessing performance. Inorder to make these decisions, the CODM receives discrete financial information by geographic region based on
67

the Company’s strategy to become a global brand. These geographic regions include North America; LatinAmerica; Europe, the Middle East and Africa (“EMEA”); and Asia. The Company’s new operating segments arebased on these geographic regions. Each geographic segment operates exclusively in one industry: thedevelopment, marketing and distribution of branded performance apparel, footwear and accessories. As the LatinAmerica, EMEA and Asia operating segments did not meet the quantitative thresholds for individual disclosureas reportable segments, they were combined into other foreign countries.
The geographic distribution of the Company’s net revenues, operating income and total assets aresummarized in the following tables based on the location of its customers and operations. Net revenues representsales to external customers for each segment. In addition to net revenues, operating income is a primary financialmeasure used by the Company to evaluate performance of each segment. Intercompany balances were eliminatedfor separate disclosure and corporate expenses have not been allocated to other foreign countries. Prior perioddata included below was reclassified to conform to the current period presentation.
(In thousands)
Year Ended December 31,
2010 2009 2008
Net revenuesNorth America $ 997,816 $808,020 $692,388Other foreign countries 66,111 48,391 32,856
Total net revenues $1,063,927 $856,411 $725,244
(In thousands)
Year Ended December 31,
2010 2009 2008
Operating incomeNorth America $ 102,806 $ 83,239 $ 76,326Other foreign countries 9,549 2,034 599
Total operating income 112,355 85,273 76,925Interest expense, net (2,258) (2,344) (850)Other expense, net (1,178) (511) (6,175)
Income before income taxes $ 108,919 $ 82,418 $ 69,900
(In thousands)
December 31,
2010 2009
Total assetsNorth America $613,515 $493,726Other foreign countries 61,863 51,862
Total assets $675,378 $545,588
Net revenues by product category are as follows:
(In thousands)
Year Ended December 31,
2010 2009 2008
Apparel $ 853,493 $651,779 $578,887Footwear 127,175 136,224 84,848Accessories 43,882 35,077 31,547
Total net sales 1,024,550 823,080 695,282License revenues 39,377 33,331 29,962
Total net revenues $1,063,927 $856,411 $725,244
68

During the years ended December 31, 2010 and 2009, substantially all of the Company’s long-lived assetswere located in the United States. Net revenues in the United States were $952.9 million, $771.2 million and$660.8 million for the years ended December 31, 2010, 2009 and 2008, respectively.
17. Unaudited Quarterly Financial Data
(In thousands)
Quarter Ended (unaudited) Year EndedDecember 31,March 31, June 30, September 30, December 31,
2010
Net revenues $229,407 $204,786 $328,568 $301,166 $1,063,927Gross profit 107,631 99,926 167,372 155,578 530,507Income from operations 13,584 6,892 56,689 35,190 112,355Net income 7,170 3,502 34,857 22,948 68,477Earnings per share-basic $ 0.14 $ 0.07 $ 0.68 $ 0.45 $ 1.35Earnings per share-diluted $ 0.14 $ 0.07 $ 0.68 $ 0.44 $ 1.34
2009
Net revenues $200,000 $164,648 $269,546 $222,217 $ 856,411Gross profit 89,224 73,729 133,320 113,852 410,125Income from operations 7,896 3,381 47,063 26,933 85,273Net income 3,962 1,439 26,182 15,202 46,785Earnings per share-basic $ 0.08 $ 0.03 $ 0.52 $ 0.30 $ 0.94Earnings per share-diluted $ 0.08 $ 0.03 $ 0.52 $ 0.30 $ 0.92
18. Subsequent Events
Long Term Investment
In December 2010, the Company advanced $11.1 million to Dome Corporation (“Dome”), its Japaneselicensee, in order to make a minority equity investment in Dome which closed in January 2011. In February2011, the Company purchased an additional $3.7 million of equity from existing Dome shareholders.
Stockholders’ Equity
In February 2011, 312.5 thousand shares of Class B Convertible Common Stock were converted into sharesof Class A Common Stock on a one-for-one basis in connection with a stock sale.
Stock-Based Compensation
In February 2011, 0.3 million performance-based restricted stock units were awarded to certain officers andkey employees under the 2005 Plan. The performance-based restricted stock units have vesting that is tied to theachievement of a certain combined annual operating income target for 2012 and 2013. Upon the achievement ofthe combined operating income target, 50% of the restricted stock units will vest on February 15, 2014 and theremaining 50% will vest on February 15, 2015. If certain lower levels of combined operating income for 2012and 2013 are achieved, fewer or no restricted stock units will vest at that time and one year later, and theremaining restricted stock units will be forfeited.
In addition, 0.2 million shares of restricted stock were awarded to a certain executive in February 2011.These shares of restricted stock have a vesting term of ten years.
69

ITEM 9. CHANGES IN AND DISAGREEMENTSWITH ACCOUNTANTS ON ACCOUNTING ANDFINANCIAL DISCLOSURE
None
ITEM 9A.CONTROLS AND PROCEDURES
Our management has evaluated, under the supervision and with the participation of our Chief ExecutiveOfficer and Chief Financial Officer, the effectiveness of our disclosure controls and procedures as ofDecember 31, 2010 pursuant to Rule 13a-15(b) under the Securities Exchange Act of 1934 (the “Exchange Act”).Based on that evaluation, our Chief Executive Officer and Chief Financial Officer have concluded that, as ofDecember 31, 2010, our disclosure controls and procedures are effective in ensuring that information required tobe disclosed in our Exchange Act reports is (1) recorded, processed, summarized and reported in a timely mannerand (2) accumulated and communicated to our management, including our Chief Executive Officer and ChiefFinancial Officer, as appropriate to allow timely decisions regarding required disclosure. Refer to Item 8 of thisreport for the “Report of Management on Internal Control over Financial Reporting.”
There has been no change in our internal control over financial reporting during the most recent fiscalquarter that has materially affected, or that is reasonably likely to materially affect our internal control overfinancial reporting.
ITEM 9B.OTHER INFORMATION
None
70

PART III
ITEM 10. DIRECTORS, EXECUTIVE OFFICERS AND CORPORATE GOVERNANCE
The information required by this Item regarding directors is incorporated herein by reference from the 2011Proxy Statement, under the headings “NOMINEES FOR ELECTION AT THE ANNUAL MEETING,”“CORPORATE GOVERNANCE AND RELATED MATTERS: Audit Committee” and “SECTION 16(a)BENEFICIAL OWNERSHIP REPORTING COMPLIANCE.” Information required by this Item regardingexecutive officers is included under “Executive Officers of the Registrant” in Part 1 of this Form 10-K.
Code of Ethics
We have a written code of ethics in place that applies to all our employees, including our principal executiveofficer, principal financial officer, and principal accounting officer and controller. A copy of our ethics policy isavailable on our website: www.underarmour.com. We are required to disclose any change to, or waiver from, ourcode of ethics for our senior financial officers. We intend to use our website as a method of disseminating thisdisclosure as permitted by applicable SEC rules.
ITEM 11. EXECUTIVE COMPENSATION
The information required by this Item is incorporated by reference herein from the 2011 Proxy Statementunder the headings “CORPORATE GOVERNANCE AND RELATED MATTERS: Compensation of Directors”and “EXECUTIVE COMPENSATION.”
ITEM 12. SECURITY OWNERSHIP OF CERTAIN BENEFICIAL OWNERS ANDMANAGEMENTAND RELATED STOCKHOLDERMATTERS
The information required by this Item is incorporated by reference herein from the 2011 Proxy Statementunder the heading “SECURITY OWNERSHIP OF MANAGEMENT AND CERTAIN BENEFICIAL OWNERSOF SHARES.” Also refer to Item 5 “Market for Registrant’s Common Equity, Related Stockholder Matters andIssuer Purchases of Equity Securities.”
ITEM 13. CERTAIN RELATIONSHIPS AND RELATED TRANSACTIONS, AND DIRECTORINDEPENDENCE
The information required by this Item is incorporated by reference herein from the 2011 Proxy Statementunder the heading “TRANSACTIONS WITH RELATED PERSONS” and “CORPORATE GOVERNANCEAND RELATED MATTERS—Independence of Directors.”
ITEM 14. PRINCIPAL ACCOUNTANT FEES AND SERVICES
The information required by this Item is incorporated by reference herein from the 2011 Proxy Statementunder the heading “INDEPENDENT AUDITORS.”
71
PART IV
ITEM 15. EXHIBITS AND FINANCIAL STATEMENT SCHEDULES
a. The following documents are filed as part of this Form 10-K:
1. Financial Statements:
Report of Independent Registered Public Accounting Firm 44
Consolidated Balance Sheets as of December 31, 2010 and 2009 45
Consolidated Statements of Income for the Years Ended December 31, 2010, 2009 and 2008 46
Consolidated Statements of Stockholders’ Equity and Comprehensive Income for the Years EndedDecember 31, 2010, 2009 and 2008 47
Consolidated Statements of Cash Flows for the Years Ended December 31, 2010, 2009 and 2008 48
Notes to the Audited Consolidated Financial Statements 49
2. Financial Statement Schedule
Schedule II—Valuation and Qualifying Accounts 77
All other schedules are omitted because they are not applicable or the required information is shown in theconsolidated financial statements or notes thereto.
3. Exhibits
The following exhibits are incorporated by reference or filed herewith. References to Amendment No. 3 toForm S-1 are to Amendment No. 3 to the Registrant’s Registration Statement on Form S-1 (FileNo. 333-127856), filed with the Securities and Exchange Commission (SEC) on November 15, 2005. Referencesto the Company’s 2005 Form 10-K are to the Registrant’s Annual Report on Form 10-K for the year endedDecember 31, 2005. References to the Company’s 2006 Form 10-K are to the Registrant’s Annual Report onForm 10-K for the year ended December 31, 2006. References to the Company’s 2007 Form 10-K are to theRegistrant’s Annual Report on Form 10-K for the year ended December 31, 2007. References to the Company’s2008 Form 10-K are to the Registrant’s Annual Report on Form 10-K for the year ended December 31, 2008.References to the Company’s 2009 Form 10-K are to the Registrant’s Annual Report on Form 10-K for the yearended December 31, 2009.
Exhibit No.
3.01 Amended and Restated Articles of Incorporation (incorporated by reference to Exhibit 3.01 of theCompany’s 2005 Form 10-K).
3.02 Amended and Restated By-Laws (incorporated by reference to Exhibit 3.02 of the Company’s2005 Form 10-K).
4.01 Warrant Agreement between the Company and NFL Properties LLC dated as of August 3, 2006(incorporated by reference to Exhibit 4.1 of the Current Report on Form 8-K filed August 7,2006).
4.02 Registration Rights Agreement between the Company and NFL Properties LLC dated as ofAugust 3, 2006 (incorporated by reference to Exhibit 4.2 of the Current Report on Form 8-K filedAugust 7, 2006).
10.01 Under Armour, Inc. Executive Incentive Plan (incorporated by reference to Exhibit 10.01 of theCompany’s Form 10-Q for the quarterly period ended March 31, 2008).*
10.02 Employee Confidentiality, Non-Competition and Non-Solicitation Agreement by and betweenSuzanne J. Karkus and the Company (incorporated by reference to Exhibit 10.04 of theCompany’s 2007 Form 10-K).*
72
Exhibit No.
10.03 Agreement and General Release by and between the Company and Suzanne J. Karkus datedFebruary 3, 2010 (incorporated by reference to Exhibit 10.04 of the Company’s 2009Form 10-K).*
10.04 Employee Confidentiality, Non-Competition and Non-Solicitation Agreement by and betweenDavid McCreight and the Company (incorporated by reference to Exhibit 10.01 of the Company’sForm 10-Q for the quarterly period ended June 30, 2008).*
10.05 Agreement and General Release by and between the Company and David McCreight datedJuly 12, 2010 (incorporated by reference to Exhibit 10.02 of the Company’s Form 10-Q for thequarterly period ended June 30, 2010).*
10.06 Form of Employee Confidentiality, Non-Competition and Non-Solicitation Agreement by andbetween certain executives and the Company (incorporated by reference to Exhibit 10.05 of theCompany’s 2007 Form 10-K).*
10.07 Standard Industrial Lease between the Company and The Realty Associates Fund V, L.P. datedDecember 22, 2003 (portions of this exhibit have been omitted pursuant to a request forconfidential treatment) (incorporated by reference to Exhibit 10.15 of Amendment No. 3 toForm S-1), as amended by the First Amendment dated February 23, 2006 (portions of this exhibithave been omitted pursuant to a request for confidential treatment) (incorporated by reference toExhibit 10.08 of the Company’s 2006 Form 10-K).
10.08 Office lease by and between Hull Point LLC and the Company dated March 29, 2002 (portions ofthis exhibit have been omitted pursuant to a request for confidential treatment) (incorporated byreference to Exhibit 10.16 of Amendment No. 3 to Form S-1), as amended by the FirstAmendment dated September 10, 2002 (portions of this exhibit have been omitted pursuant to arequest for confidential treatment) (incorporated by reference to Exhibit 10.17 of AmendmentNo. 3 to Form S-1), the Second Amendment dated March 6, 2003 (portions of this exhibit havebeen omitted pursuant to a request for confidential treatment) (incorporated by reference toExhibit 10.18 of Amendment No. 3 to Form S-1), the Third Amendment dated June 23, 2004(portions of this exhibit have been omitted pursuant to a request for confidential treatment)(incorporated by reference to Exhibit 10.19 of Amendment No. 3 to Form S-1), the FourthAmendment dated October 12, 2006 (portions of this exhibit have been omitted pursuant to arequest for confidential treatment) (incorporated by reference to Exhibit 10.09A of the Company’s2006 Form 10-K), the Fifth Amendment dated December 1, 2006 (portions of this exhibit havebeen omitted pursuant to a request for confidential treatment) (incorporated by reference toExhibit 10.09B of the Company’s 2006 Form 10-K), the Sixth Amendment dated May 1, 2007(portions of this exhibit have been omitted pursuant to a request for confidential treatment)(incorporated by reference to Exhibit 10.1 of the Current Report on Form 8-K filed on May 22,2007), the Seventh Amendment dated November 20, 2007 (incorporated by reference toExhibit 10.07 of the Company’s 2007 Form 10-K), and the Eighth Amendment dated January 1,2011 (portions of this exhibit have been omitted pursuant to a request for confidential treatment).
10.09 Office lease by and between Beason Properties LLLP (as successor to 1450 Beason Street LLC)and the Company dated December 14, 2007 (portions of this exhibit have been omitted pursuant toa request for confidential treatment) (incorporated by reference to Exhibit 10.1 of the CurrentReport on Form 8-K filed on December 20, 2007), as amended by the First Amendment datedJune 4, 2008 (incorporated by reference to Exhibit 10.04 of the Company’s Form 10-Q for thequarterly period ended June 30, 2008) and the Second Amendment to Office Lease datedOctober 1, 2009 (portions of this exhibit have been omitted pursuant to a request for confidentialtreatment) (incorporated by reference to Exhibit 10.01 of the Company’s Form 10-Q for thequarterly period ended September 30, 2009).
73
Exhibit No.
10.10 Agreement of Sublease by and between Corporate Healthcare Financing, Inc. and the Companydated June 1, 2004 (portions of this exhibit have been omitted pursuant to a request forconfidential treatment) (incorporated by reference to Exhibit 10.20 of Amendment No. 3 toForm S-1).
10.11 Industrial Lease Agreement between the Company and Marley Neck 3R, LLC dated October 19,2006 (portions of this exhibit have been omitted pursuant to a request for confidential treatment)(incorporated by reference to Exhibit 10.1 of the Company’s Form 10-Q for the quarterly periodended September 30, 2006).
10.12 Credit Agreement among PNC Bank, National Association, as Administrative Agent, SunTrustBank, as Syndication Agent, Compass Bank, as Documentation Agent, and the Lenders that areparty thereto and the Company dated January 28, 2009 (incorporated by reference to Exhibit 10.12of the Company’s 2008 Form 10-K), as amended by First Amendment to Credit Agreement datedMay 13, 2009 (incorporated by reference to Exhibit 10.01 of the Company’s Form 10-Q for thequarterly period ended June 30, 2009), Second Amendment to the Credit Agreement datedJune 29, 2009 (incorporated by reference to Exhibit 10.02 of the Company’s Form 10-Q for thequarterly period ended June 30, 2009), Third Amendment to the Credit Agreement dated July 19,2010 (incorporated by reference to Exhibit 10.01 of the Company’s Form 10-Q for the quarterlyperiod ended June 30, 2010) and Fourth Amendment to Credit Agreement dated November 30,2010.
10.13 Lender Joinder and Assumption Agreement by Manufacturers and Traders Trust Company datedFebruary 13, 2009 (incorporated by reference to Exhibit 10.13 of the Company’s 2008 Form10-K).
10.14 Under Armour, Inc. Deferred Compensation Plan, as amended (incorporated by reference toExhibit 10.15 of the Company’s 2007 Form 10-K) and Amendment One to this plan.*
10.15 Form of Change in Control Severance Agreement (incorporated by reference to Exhibit 10.15 ofthe Company’s 2009 Form 10-K) and First Amendment to this agreement.*
10.16 Under Armour, Inc. Amended and Restated 2005 Omnibus Long-Term Incentive Plan(incorporated by reference to Exhibit 10.01 of the Company’s Form 10-Q for the quarterly periodending March 31, 2009).*
10.17 Forms of Restricted Stock Grant Agreement under the Amended and Restated 2005 OmnibusLong-Term Incentive Plan (incorporated by reference to Exhibits 10.22 a-b of the Company’s2007 Form 10-K and Exhibit 10.21 of the Company’s 2009 Form 10-K).*
10.18 Form of Non-Qualified Stock Option Grant Agreement under the Amended and Restated 2005Omnibus Long-Term Incentive Plan (other forms of Non-Qualified Stock Option GrantAgreement under the 2005 Amended and Restated Omnibus Long-Term Incentive Planincorporated by reference to Exhibits 10.23 b-c of the Company’s 2007 Form 10-K andExhibit 10.22 of the Company’s 2009 Form 10-K).*
10.19 Form of Restricted Stock Unit Grant Agreement under the Amended and Restated 2005 OmnibusLong-Term Incentive Plan.*
10.20 Forms of Performance-Based Stock Option Grant Agreement under the Amended and Restated2005 Omnibus Long-Term Incentive Plan (incorporated by reference to Exhibits 10.02-10.03 ofthe Company’s Form 10-Q for the quarterly period ended March 31, 2009 and Exhibit 10.03 of theCompany’s Form 10-Q for the quarterly period ended March 31, 2010).*
10.21 Restricted Stock Agreement under the Amended and Restated 2005 Omnibus Long-TermIncentive Plan by and between David McCreight and the Company (incorporated by reference toExhibit 10.03 of the Company’s Form 10-Q for the quarterly period ended June 30, 2008).*
74

Exhibit No.
10.22 Under Armour, Inc. 2006 Non-Employee Director Compensation Plan (incorporated by referenceto Exhibit 10.1 of the Current Report on Form 8-K filed April 13, 2006) and Forms of GrantAward Agreement and Notice- Non-Employee Director Initial Restricted Stock Unit Grant,Annual Restricted Stock Unit Grant and Annual Stock Option Award (incorporated by reference toExhibits 10.1-10.3 of the Current Report on Form 8-K filed June 6, 2006).*
10.23 Under Armour, Inc. 2006 Non-Employee Director Deferred Stock Unit Plan (incorporated byreference to Exhibit 10.02 of the Company’s Form 10-Q for the quarterly period ended March 31,2010) and Amendment One to this plan.*
10.24 Under Armour, Inc. 2010 Non-Employee Director Compensation Plan (incorporated by referenceto Exhibit 10.01 of the Company’s Form 10-Q for the quarterly period ended March 31, 2010) andAmendment One to this plan and Form of Annual Restricted Stock Unit Grant.*
21.01 List of Subsidiaries.
23.01 Consent of PricewaterhouseCoopers LLP.
31.01 Section 302 Chief Executive Officer Certification.
31.02 Section 302 Chief Financial Officer Certification.
32.01 Section 906 Chief Executive Officer Certification.
32.02 Section 906 Chief Financial Officer Certification.
101.INS XBRL Instance Document
101.SCH XBRL Taxonomy Extension Schema Document
101.CAL XBRL Taxonomy Extension Calculation Linkbase Document
101.DEF XBRL Taxonomy Extension Definition Linkbase Document
101.LAB XBRL Taxonomy Extension Label Linkbase Document
101.PRE XBRL Taxonomy Extension Presentation Linkbase Document
* Management contract or a compensatory plan or arrangement required to be filed as an Exhibit pursuant toItem 15(b) of Form 10-K.
75

SIGNATURES
Pursuant to the requirements of Section 13 or 15(d) of the Securities Exchange Act of 1934, the registranthas duly caused this report to be signed on its behalf by the undersigned, thereunto duly authorized.
UNDER ARMOUR, INC.
By: /s/ KEVIN A. PLANK
Kevin A. PlankPresident, Chief Executive Officer and Chairmanof the Board of Directors
Dated: February 24, 2011
Pursuant to the requirements of the Securities Act of 1934, this report has been signed below by thefollowing persons on behalf of the registrant and in the capacities and on the date indicated.
/s/ KEVIN A. PLANK
Kevin A. Plank
President, Chief Executive Officer and Chairman of theBoard of Directors (principal executive officer)
/s/ BRAD DICKERSON
Brad Dickerson
Chief Financial Officer (principal accounting andfinancial officer)
/s/ BYRON K. ADAMS, JR.
Byron K. Adams, Jr.
Director
/s/ DOUGLAS E. COLTHARP
Douglas E. Coltharp
Director
/s/ ANTHONY W. DEERING
Anthony W. Deering
Director
/s/ A.B. KRONGARD
A.B. Krongard
Director
/s/ WILLIAM R. MCDERMOTT
William R. McDermott
Director
/s/ HARVEY L. SANDERS
Harvey L. Sanders
Director
/s/ THOMAS J. SIPPEL
Thomas J. Sippel
Director
Dated: February 24, 2011
76
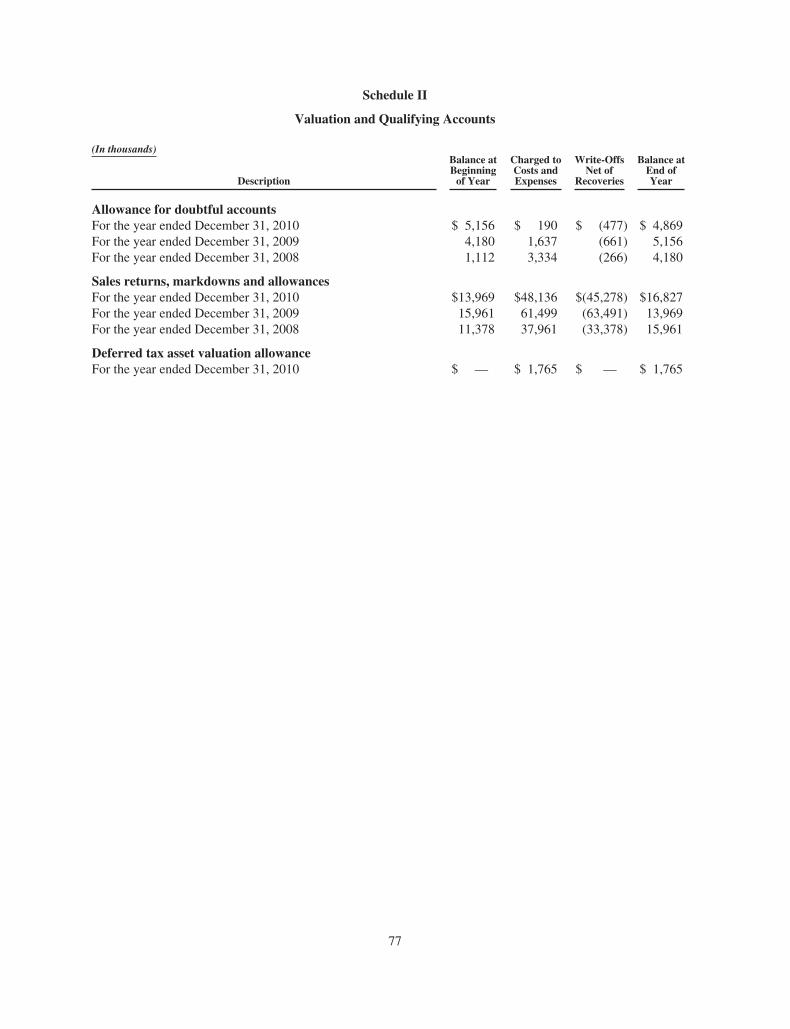
Schedule II
Valuation and Qualifying Accounts
(In thousands)
Description
Balance atBeginningof Year
Charged toCosts andExpenses
Write-OffsNet of
Recoveries
Balance atEnd ofYear
Allowance for doubtful accountsFor the year ended December 31, 2010 $ 5,156 $ 190 $ (477) $ 4,869For the year ended December 31, 2009 4,180 1,637 (661) 5,156For the year ended December 31, 2008 1,112 3,334 (266) 4,180
Sales returns, markdowns and allowancesFor the year ended December 31, 2010 $13,969 $48,136 $(45,278) $16,827For the year ended December 31, 2009 15,961 61,499 (63,491) 13,969For the year ended December 31, 2008 11,378 37,961 (33,378) 15,961
Deferred tax asset valuation allowanceFor the year ended December 31, 2010 $ — $ 1,765 $ — $ 1,765
77

[THIS PAGE INTENTIONALLY LEFT BLANK]

HEAT
HER M
ITTS
IDE
FEND
ER /
US SO
CCER
LA
UREN
CHEN
EYI
FORW
ARD
/ US S
OCCE
R

BUSTER POSEYI
NATIONAL LEAGUE ROOKIE OF THE YEAR

BRYCE HARPERI FIRST OVERALL P
ICK IN THE 2010 MLB DRAFT
OFFICIAL PERFORMANCE FOOTWEAR SUPPLIER OF MLB

BRANDON JENNINGSI
GUARD

BRAD J. DICKERSONCHIEF FINANCIAL OFFICER
MARK M. DOWLEYEXECUTIVE VICE PRESIDENT, GLOBAL BRAND
AND PRESIDENT OF INTERNATIONAL
KIP J. FULKSEXECUTIVE VICE PRESIDENT, PRODUCT
WAYNE A. MARINOCHIEF OPERATING OFFICER
J. SCOTT PLANKEXECUTIVE VICE PRESIDENT,BUSINESS DEVELOPMENT
EXECUTIVE TEAM
KEVIN A. PLANKPRESIDENT, CHIEF EXECUTIVE OFFICER AND CHAIRMAN OF THE BOARD OF DIRECTORS
BOARD OF DIRECTORS
KEVIN A. PLANKPRESIDENT, CHIEF EXECUTIVE OFFICER AND
CHAIRMAN OF THE BOARD OF DIRECTORS
BYRON K. ADAMS, JR.
MANAGING DIRECTOR, ROSEWOOD CAPITAL, LLC
DOUGLAS E. COLTHARPEXECUTIVE VICE PRESIDENT AND
CHIEF FINANCIAL OFFICER, HEALTHSOUTH CORPORATION
ANTHONY W. DEERINGFORMER CHIEF EXECUTIVE OFFICER AND
CHAIRMAN OF THE BOARD OF DIRECTORS, THE ROUSE COMPANY
A.B. KRONGARDFORMER CHIEF EXECUTIVE OFFICER AND
CHAIRMAN OF THE BOARD OF DIRECTORS, ALEX.BROWN, INCORPORATED
WILLIAM R. MCDERMOTTCO-CHIEF EXECUTIVE OFFICER AND
EXECUTIVE BOARD MEMBER, SAP AG
HARVEY L. SANDERSFORMER CHIEF EXECUTIVE OFFICER AND
CHAIRMAN OF THE BOARD OF DIRECTORS, NAUTICA ENTERPRISES, INC.
THOMAS J. SIPPEL PARTNER, GILL SIPPEL & GALLAGHER

UNDER ARMOUR, INC.
1020 HULL STREET BALTIMORE, MARYLAND 21230
WWW.UNDERARMOUR.COM 1.888.4ARMOUR
BOBBY BROWN I X GAMES MEDALISTBOBBY ZAMORA I FULHAM FOOTBALL CLUB
JAMIE ROBERTS I WRU RUGBY
underarmour.com facebook.com/underarmour twitter.com/under_armour