1\r~ rrC EsKI - World Bank Documents
70
RESTRICTED 1\r~ rrC EsKI LI In CfplY Report No. EA- 147a I W'HiN 1IIIA JU I I WjITHIN ONE WEEK | This report was prepared for use within the Bank and its offiliated organizations. They do not accept responsibility for its accuracy or completeness. The report may not be published nor may it be quoted as representing their views. INTERNAT:IONAL BANK FOR RECONSTRUCTION AND DEVELOPMENT INTERNATIONAL DEVELOPMENT ASSOCIATION OF FINLAND June 29, 1964 Department of Operations F___ r nn A Public Disclosure Authorized Public Disclosure Authorized Public Disclosure Authorized Public Disclosure Authorized
-
Upload
khangminh22 -
Category
Documents
-
view
3 -
download
0
Transcript of 1\r~ rrC EsKI - World Bank Documents

RESTRICTED
1\r~ rrC EsKI LI In CfplY Report No. EA- 147a
I W'HiN 1IIIA JU I IWjITHIN
ONE WEEK |
This report was prepared for use within the Bank and its offiliated organizations.They do not accept responsibility for its accuracy or completeness. The report maynot be published nor may it be quoted as representing their views.
INTERNAT:IONAL BANK FOR RECONSTRUCTION AND DEVELOPMENT
INTERNATIONAL DEVELOPMENT ASSOCIATION
OF
FINLAND
June 29, 1964
Department of OperationsF___ r nn A
Pub
lic D
iscl
osur
e A
utho
rized
Pub
lic D
iscl
osur
e A
utho
rized
Pub
lic D
iscl
osur
e A
utho
rized
Pub
lic D
iscl
osur
e A
utho
rized

CURRENCY EQUiVI AL E N S
Before September 15, 1957:U.S. $1 = 230 markkas
After September 15, 1957:UT. S. $1 = 322nmarkka
Since January 1, 1963:U.S. $1 3.22 markkas1 markka = 31 U. S. cents1 million markkas = U.S. $310,000

THE ECO;IOOIIY OF FINLAID
Table of Contents
Paze
BASIC DATA 1 2
SUi4HUARY A1iD CONCLUSIONS
I. GENERAL 1
II. THE EMCNOMY AND ITS PROSPECTS 4Agriculture )Forestry 6TIndu stry 7
WToodworkirig Industries 7Other Industries 9Power 11T rans po rt+ aton .12
Railroads 12V'aterways Road Transport 13Ati.r TLransportu 14Shipping and Ports 1i
Th e Publlc Sector 15The Banking System and Credit Policy 17Prices and Wages 1yInvestment and Saving 19Foreign Trade 22Balance of Payments 24
III. CONCLUSIONS - NEED FuR FOREIGN BOUFOVING -Ms,DIlwO,tleINtSS 27
rV. AiTNEE5SArnnex I - Historical BackgroundAnnex II - Political BackgroundAnrnex III - Social Background
STATISTICAL A.'PENDIX Tables 1 to 22, inc.

F IN,LA ND
BASIC DATA
Area: 337,000 square kilometers (130,000 square miles)
Population (1963): h.4 millionAnnual rate of grow;th: 1%
Gross National Product (1962): ;v5,300 millionPer capita: ,;11,200Increase 1957-1962: 4 1/2% per annum
Net Domestic Product by Sectors 1962:Pcr cent of total)
Agriculture 10.7Forestry 9.6Industry 31.0Transport 7.7Governrment 11.9Other 29.1
Total 100.0
Utilization of Gross National Product (1962):(.9er cent of total)
Priv3te consumption 57.3Government consumption 1L.2Gross investment 30.0Exports 25.0Imports
Total 100.0
Foreign Trade (1962):Geographic Distribution
(Per cent of total)Exports imports
EFTA 31.9of ihich UK 20.3 15.2
E.G ~~28.7 3146 United States 5.3 5.1Soviet Union 17..R 13.7Other 16.3 11.4
Total 100.0 100.0

- 2 -
Comxnodit'y Com positi^n(?er cent of total)
Lxports ImVL UoTimber and products 27.1 Food 10.1rulp andu paper 15.0 Fuel 97
Metal goods 18.7 Consumer manufactures 16.7nJ lL- UU11r%I1 - IiiUU I~ AU)0 1Othier 9.2 Oter ri!anuf'actuures 28U.3-
Other 35.2
Total 100.0 Total 100.0
1958 1959 1960 1961 1962 1966_,;nholesaie Drices 100 99 103 104 106 109Cost of livirtg 100 102 105 107 111 117
Gold and Foreign Illillion $Exchange As,sets of End of YearBan'k of Fi-land 259.2 330.0 339.6 358.0 316.9 3h46.9
Fxternal Public DebtOutstandinE; December 31, 196? - '367.6 millionService 1963 - 34 million

Summary and Conclusions
1. Finland is still a country in the process of economic development.Although per capita income is high in relation to income in underdevelopedcountries in other parts of the world, living standards are considerablybelow the Western European average. Finland has the human and materialresources that would enable it to catch up with its WIestern neighbors. ItsLess advanced stage of development is due mainly to the fact that economicdevelopment caime later to it than to other 1-estern European countries.
2. The forests, Finland's principal resource, did not become economi-callv valuable until sea transnort costs were halved in the 1870's and untiltechnological advances in pulp and paper making at about the same timecreated a large new demand for wood. PoliticAl independence was not achieveduntil 1917. As late as 1920 over half of the Finnish population was earningits livelihood in agricuIltur- -uhinhh in a nountrv wit)h thp noor soil.s ,ndhard climate of Finland, could not provide an adequate income for thosermrr,s7P.r in it;-
J. Paroress was v.crl rapi duri t , v .'ne J InIV.ar + ,.TM but was i,"iinrru ar
by the war. The tremendous task of liquidating the effects of war and defeaturas comntl-d in -les th3n ten yea and -ince l-en F-;l3nd ha - ri Is been dAcoringall its energies to economic development.
. The paEt five years have been a period of rapid growth, with a per4.~4~ capita increase in rsL L iLELcor .e U ,5 a year, im cLULjJVLivens and
greater financial strength. However, serious problems remain which cannotbe sol-ved without a further major national and individual efforL.
The low yields per man in agriculture and the res3ulting need forlarge transfers of income to the farm population will continue to strainthe country's financial position until the movement of labor out of agri-culture and into industry accelerates. M4embership in EFTA offers newopportunities but aiso requires a far-reacning rationali3ation, modernizationand expansion of Finnish industries other than woodworking. The woodworkingindustry can no longer be relied upon to act as the prime mover in economicgrowth. Other industries, in which Finland's cornpetitive advantages are less,will have to be developed to play this role. Finland seems equal to the newchallenge but will have to continue devoting some 30% of its gross nationalproduct to investment. During the last four years net external borrowinghas averaged 4D57 million a year and has made an important contribution to themaintenance of a high volume of investment, together with considerablefinancial stabiLity. During the 1950's exchange controls and import restric-tions had provided a shelter under which all new investment as well as therebuilding of external reserves could be financed from domestic resources. The cos-

- ii -
however, to the economy during this period, in terms of financial instabilityand competitive weakness, was great. The financing of the large investmentneeds of the coming years exclusively out of dome.stic resources would bewholly incomp.tible with the preservation of convertibility and of freedom inexternal transactions. Even with net foreign borrowing of $i;55 million ayear during the past four years, the task of safeguarding the value of thecurrency has been hard and some loss of competitive strength has recentlytaken place.
6. The e-xternal public debt in W-Testern currencies, at $327 million onIDecember 31, 1962, is relatively small and its service corresponds to only3% of current foreign exchange earnings. Thus, Finland has a substartialborrowing capacity. liew official borrowing of some $60 to $,70 million ayear (corresponding to a net increase in the public external debt of some$hO million a year) during the next five years would increase the burden ofservicing the debt to slightlv over h5 of current foreign exch2nge earnings.
7. Finlanrd t s record ns a bhrromer i4 unmatcr.hedL Tts irnah14iy to raisefunds in foreign capital markets has been due in part to the limited oppor-tuinitiesq fo-r fo-re~ign hnorrownt.T in rerl d!r~ing thea posw^artrirl andr inpart to the apparent vulnerability of its international position. Duringthe past ¶ra-l Inowever, the outlook has A1e^. e brigh te, probl-yc d tthe relaxation of cold war tensions. During the current year three issuesha0ve been made in Europe and in thAe UTTJ1*elV Q+a+eS, to4allS $35 - .il'o.
If this trend continues Finland should be able to meet a substantial part-r -;+s ca 4ta1 ne -I thr ug u o1-4 -A -4-1_ - .4' 4-v X uclJ | LAti 0U t J V dlIU V .WI1 ' L _ 111 L 'J± UW1 1 vVe1'JL1 .11
private capital markets. Financial circles in New York believe that onpresenu indicuad tions FiLLand mady be eu±u tu rals sor, ,C) 2 U Ito$3 r"l'LLn ayear in the UJnited States and Europe during the coming years. This wouldstil.lJ leave part of the needUs fVo oUfregL1 capital ucUUvt:eu. Ihus, U1nuinueU
Bank lending to Finland, until access to foreign capital markets has further,-iproved., appears justified.

THE ECONO0'IY OF FINTAND
I. GENERAL
1. Finland is a northern, sparsely populated, relatively flat countrywhose 130,000 square miles (337,000 sq. kin.) are covered up to 70 oer centby forests and up to 9 ner cent by lakes and rivers. Iz area Finland islarger than Italy and considerably larger than WATestern Germany, but itspopulation is only L.5 million, less than one tenth of t;he population ineither of these two countries. The over-all density, 34 inhabitants persauare mile, is the third lowest in Furope (Iceland C, Norlay 29) but thisaverage conceaLs wide regional diffe-ences. In the Southwest, wiliclh includesthe capital. Helsinki. and accounts for only 20W of the total land area andfor 55% of the total population, the density is 110 inhabitants per squaremile (ahout haLf the average for rtrancej. In T_qn1,qndj *rMlh arccunt_s for30% of the total area but for only 5% of the population, the density is 5
2. in'land i t ed4c betnvw n t Qh n9ndr 70C pa 1les i
about the same latitude as Alaska and Greenland, but its climate is lessextreme, bDeing r. o d er a ted in -the, west -n - ottfs by the 4 ulf Str-m The.--- fra f ~II~, J~~15 £ItJ~C1 Uti~U.Lf U.IIJ WVK- U C.~AU O'Jt. U4*ItVZCO U usa 'J~; U_Li LJ U.k K--11IL. i sac
winters are, however, long and severe and tl.e summers last only two to twoand a half months. Ice cond iions a-long thJe oast last t- to six iI4io ,
depending on the location. Normally only the south-western ports are keptopen in winter., with the use of icebrUdealer.
* me ex LI~±VC 1res ~ts corjsti 'luu ile Fim±nland Is -in±ipal :iaturia' resouirca. sil~ex Lenseflive 'ieu -1.ll ,b liaiUr!. i^J .au:WIruee
On a per capita basis the annual growth of timber in Finland, at 10 cubicmeters, is the iargest in the LVorld, foillowed by Sweden at 6 cubic metersand 5 cubic neters for Canada. Thae corresponding figures for countrieslike the United States, the Soviet Union and France are i.5, 1.8 and 0.9cubic meters, respectively. Over 50 per cent of forests consist of pine,about 30 per cent of spruce and 17 per cent of birch.
4. The interconnected waterways and abundant water supply in thle countryls60,000 lakes are the second most imoortant natural asset, providing avaluable source of power and a network of transportation which forms an inte-gral part of thie forest-based activities.
On the other hand, the Fiinnish soil is relatively unproductive andlimited deposits of iron and copper are so far the only mineral resources ofsome economic significance. Host of Finland's agricultural land, corres-ponding to 9% of the total land area, has been wrested from sw^^amps and peatbogs. Finland consists of an ancient mass of hard, impermeable rock, itssoils having developed almost exclusively, from glacial, as opposed to alluv-ialdeposits. Extensive liming and drainage and years of cultivation and ferti-lization have therefore been necessary before reasonable yields could beobtained. Only about 30% of the area under cultivation. mainly in thesouthwest, where clay soils predominate, is considered relatively fertile.

- 2 -
The oreponderance of inferior coils, combined with the insufficiencv ofproductive heat and the vagaries of the weather, make natural conditionsfor farming unfavorable.
6. Thp lnn di n over qnqrP1'r nonilOntpfi qrpnr_ nnd thp sqvorpand prolonged winters, olace F'nland at a considerable disadvantage vis-a-visother WJfestern fR.uroeanr countries wTi th regard to the cost; and ease of internaltransoortation. Access to world markets is also less favorable than for
other5Tster oun+tr4s noue1 to gfreater di;stannc_es andr the fez ng f rooastalW1~X ~ LA '~M ~ --- --- .- 6 . ~ C L ~ . -~S' th - 01 -- S _
waters during the winter which requires expensive icebreaking operations.
7. The forests were of little econoinic value until the maiddle of the14l-,t centur, -.;nd V4nn reaie ari4- unerevelpe coutr unti theenOJ.7 UL U.I !U iu X _tLnLad JU . 111±i'U i UILU',l 1_4'~V U-LU/LA UI J UlL UJL_ U41K, UAJU W
the century. In spite of naturally unfavorable conditions 80% of the popu-.lat-uion were enae ink)Ul 1 a1I1JUCIi ia-l enug .o re uiice..Famines were frequent and severe. In the poorest districts, pine-bar'{ wasuseu re-ularly in bread.
8. TIwo uevelopmrlents during the second part of the l9th century, the sharpreduction in transport costs and a technological revolution in oulp and paper.making, completely transformed Finiana's economic opportunities. The demar!afor timber in W,estern Europe grew rapidly, and r'innish exports of sawn timberincreased from 85,000 standards a year in 1861-1871 to 770,000 standards in1913. Pulp and paper mills were built with the aid of British, Swedish andGerman capit.al, domestic purchasing power increased, creating a market forhome manufacturing, and the country's inadequate transportation was vastlyimproved. 'This rapid economic transform'ation was facilitated byr favorablegeneral conditions. Literacy had been virtually un-versal since the 17thcentury, and there was a long tradition of good administration and a higillydevelooed legal system. The irriprovenient in health conditions caused a rapidincrease in population in spite of large emigration to the United States (atotal of about 35C,000). Between- 1850 and 1920 the population increased from1.6 million to 3.1 million. The new economic activities, however, which wereimostly highly capital-intensive, did not provide sufficient employniento)portunities for a substantial shift awav from farming. As late as 192065% of the popu:lat.ion were still engaged in agriculture.
9. The inte-war period saw a further rapid advance in industry and foreignbrade, but war and defeat left a daunting legacy. Reparations estimated at3500 million in current dollars had to be paid to the Soviet Union over aperiod of seven years and entirely new industries had to be set up to supply theraoods demanded as reparations. The population of the provinces ceded to3,oviet Russia (l477,000) left the area and had to be resettled in Finland.,'bout 200,000 of these were farmers with their families. The industrial anduther facilities of the ceded territories had to be replaced to provideemolviiient for the remaining refugees. 'Reconstruction of the devastated northinvolved the making good of losses estimated at $300 million. Unlike otherEuropean countries, Finland was not able to count Gn substantial foreign aid-or the easing of its burdens.

- 3 -
10. Through tremendous efforts and sacrifices. the most urgent tasks ofreconstruction had been completed by 1953. However, important investmentsreouired for economic development, which in other countries had been underway since the end of the war, had had to be deferred. Private consumptionexorted a grpat.er nressure on resoureas after rationing and other controlshad been removed. Political conditions added to the difficulties of maintainingfinanciAl qt.ahi1itv in a seri ounl1 vtrnirined enonomy. The lack of a cl e rmajority in Parliament resulted in coalition governments which were not strongennugh to resist the dema.nrds for improved social servi e nra hdbneft. s andi forother public expenditures. Severe quantitative restrictions on imports keptthe external accounts inreasonable balance urivn c most of this period, bu ttheresulting pent-up demand and limited competition caused sharp increases inprice/s. ll OtC.h nA Warnd costs whic eceee by a n;+ ;mn,-n~n th - + lrplace in the rest of the world. When the overvaluation of the currency began
to~ UL Ifc t.h cm ive po .Lsion of-C± -the *major sector of' th UJ 1eco , tUhe
woodworking industry, it was widely realized that drastic action was needed. P4
Fieandt, was formed in 1957 and out into effect a stabilization program whichivincuded L±1 -ghI'er taxation, cuts in public expend itUu re-S, tigh1.t creditU CU1iL,.xo.US,
relaxation of import restrictions and a 30% devaluation of the Finnish markc.Tnese measures of retrenchlnent, coinciding with the i95O recession in worldtrade, caused an actual decline in production during 1958 and the emergence ofserious unemployment, but succeeded in their immediate aim of restoring pricestability, freeing the economy of restrictions and controls and strengtheningthe external position.
11. Rising world demand for pulp and paper and a large increase in Finnishproductive capacity started a new phase of expansion in 1959, whichn lasted neLr]four years. This period has been characterized not only by striking increasesin production and exports and an increase in foreign exchange reserves, butalso by considerable price stability and improved competitiveness. TheFinnish mark was made externally convertible in 1960.
12. The ecconomic situation began to look less favorable in the course of1962 and deteriorated seriously in 1963. Over-expansion in world pulp and papercapacity and a slackening in the growth of world demand slowed down the e-pansionin Finnish exports and caused considerable price weakness in the export sector.'The fiscal discipline of the post-stabilization years was gradually relaxedafter 1960, and rising public expenditures, combined with some reduction intaxation, caused a growing deterioration in Dublic finances. The large recourseof the Government to the capital market and the decline in foreign exchangereserves caused by a sharp increase in imports during 1962 reduced the liquidityof the banking system and at the same time the Bank of Finland had to tightenuo credit. This in turn seriously affected both industrial investment and theoverall level of economic activity. Prospects for 196[ are more favorable,dueto the improved export outlook and the probability of easier credit conditions.but the development of prices and costs is a major cause of concern. Priceincreases in 1963 were greater than in other Western European countries, and afurther substantial increase is expected in 1964. This is a problem related tothe countrv' s politiAal. economic and sonial structnre which is I ike1r to n-ersist

- 4 -
for many vears to come. It will probably continue to create difficulties forthe economy, but is unlikely to impede seriously the country's development.
II. THF ECONOIffiI AND ITS PROSPECTS
Agriculture
13. The 1960 census showed that on December 31 of that year, 29.2% of thelabor Pforc ,,. -- - 4 .;_ , f; - a+4 A na ;n +, , ++;n& c- + -
on the other hand, agriculture has accounted for only 10.6% of the net domesticproductuu ur ing 1960-1963 J, adUL U is prob H abl'Le taUli L Ut rL conti U toL to
total production was even less, since food prices are deliberately set at ahigh lievel, which serves redistributive purposes. F;inland is by no means un..quein the lower productivity of its agriculture, relatively te other economicactivities, but the fact thlat agriculture in Finland contirnues to account LO;such a large proportion of total employment makes the resulting problems moredifficult than, in most other liTestern European countries.
14. The poor returns yielded by agriculture are not due to lack of effort.Finnish farmers are hardwrking, efficient and progressive. In the postwarperiod large investments have been maue in mechanization, drainage and otherimprovements, and productivity per person employed has been increasing by some4% a year. The rewards from farming rerlain, liowever, meager, and this is d&ito the unfavorable natural conditions and the small size of farm holdings. TnDenmark the average crop yield per hectare has corresponded to 4,500 foddorunits and in Sweden to 2,500 fodder units. WEith a comparaVie level of ef:icienc:,Finland has obtained only 1,500 fodder units per hectare.±/ The aveic-e size ofFinnish farms was already small before the War, reflecting the disprc portionbetween the availability of arable land and the numbers dependent on agriculturefor their livelihood. In the postwar period the situation was made worse by thnresettlement of the refugees from 2 he territories ceded to the Soviet Union.In 1959, 71% of all Finnish farms2 were less than 10 hectares (25 acres). InDenmark, where yields pe- acre are s) much higher, only 40%6 of total holdingsare of this size.
:15. 'Without the additional income from his forest holdings and the wagesearned in logging, floating and road construction (mainly winter relief work),the typical Finnish farmer would not have been able to make a reasonable li-vingon the land, in spite of subsidies a&d price supports. Over 60` of the totalforest area is o>med by the farmers. This corresponds to an average of 38hectares per farm. It is estimated That during 1954-1959 farmers with lessthan 10 hectares of agricultural land obtained from their forest holdings
CL/ A fodder unit is the enuivalent. of 1 kg. of barley in termts of starchcontent (0.7 kg. of starch).
2/ This calcu'Lation excludes farms of less than two hectares. If such farmsare jncdi ir1z- +ho n ronor+tion roP farmrs iuncdr 10 hectares increases to78.6, of the tctal.

an additional income equivalent to 26% of the income derived from agriculture.Paid work outside the farm was an even greater source of additional earnings(46% of income from agriculture). To the extent that farming is a joint activitywith forestry, the picture is somewhat less unfavorable than the comparisonbetween agricultural employment and agricultural output suggests. This quali-fication, however, does not alter the conclusion that mianpower on the land isexcessive. Objective Finnish agricultural experts believe that about 20% ofthis manpower could be transferred to other occupations without affecting theoutput of farm and forest products.
:L6. The problem of excessive manpower in agriculture is to a considerableextent a regional problem which, however, has wider national imolications. itis on the poorer soils and harsher climate of the northern areas that farmingis particularly unrewarding and the need for subsidization greatest. These,however, are also the areas least capable of attracting industry. A movementout of agriculture is, therefore, associated with a shirt of population to thesouth. This is a develooment which may lead to the dencipulation of the northand, as in Nonmay, it is viewed with considerable concern and expl.ains thelarge public P-nen'clitures made in these areqs. inclldinp the setting uD ofgovernment-owned industries, through which both countries hope to prevent suchdenonnn1nt.i on.
17. TDuring the prewar years t.he objeitlv.ie of agricu al policy in Finlandas elsewhere, was to achieve national self-sufficiency in foodstuffs, includinagcereals, In the postwar period the emnhasis was shifted to dairy farming, forwhich conditions are relatively more favorable, and self-sufficiency in breadgrains4 woo red;ced,U fromm /J0< nL 1 k38 to U% ar~ing the -9f0' O _.s il
surpluses, which can be disposed of only through a costly subsidization ofbutter ex-yorU'Js, foruced a- rueversal Uo UI.Lo L UUL.LlIy LuriB be l ltAW Jrso
Prices were readjusted to make the growing of bread grains more profitabletllan that of ccarse grains and, as a result, self-sufficlency- rose to 36% i.n1960 and is estimated at 806 for 1963. It is estimated that during July 196n-June 1961 26% oi gross returns per hectare were derlved from crops anld U66from livestock.
13. Between 1950 and 1960 emoloyment in agriculture decreased by 166,000or by 245, an average oI aboutG 2%7 per annum. iJ51st of the decline, however,took place during the earlier years, and more recently the movement out ofagriculture appears to have slowed down. The extent to which this is theresult of increased subsidization is difficult to deternine, but the improve-ment in incomes must undoubtedly have been a factor. No cnange in presentagricultural policies appears likely during the next five years, and it isprobable that the movement out of agriculture will continue to be slow. Therecan be no doubt that the high food prices and large transfers of income fromthe urban to the rural population which are involved in present agriculturalpolicies constitute a serious threat to price stability. This is so becauset-ade unions are seeking a level of real income for their me.mbers which isnot attainable so long as part of money wages have to be transferred to thelarge numbers engaged in agriculture in the form of high food prices and high

- 6 -
taxes. A slow movement out of agriculture will mean that financial stabilitywill continue to be precarious and that the development of the economy wil:Lbe held back. A more rapid movement, on the other hand, will be possibleonly if the tempo of industrialization is stepped up, which in turn will:increase the already heavy investment needs for industrial installations,housing and other urban facilities. Thus, whether it stays on the farms orrmoves out, the excessive manpower which at present characterizes Finnish agri-culture is likely to pose serious problems for some time to come. In thelonger run, however, the existence of a large reserve of well-trained,hardworking and reliable manpower may prove an advantage in relation to otherWestern European countries, where a shortage of labor is expected to develop,and may itself provide a stimulus to further industrialization.
Forestry
19. The natural conditions which are unfavorable to agriculture are idealfor foresty and have largely determined the character of Finnish economicdevelopnent. Forestry accounts directly for 10% of the net domestic product,hbu t- r ovide As thhe#Ina -i; r, 4-m 4 an+ enr n-rnr 70l't r'fi +h rornnn+ Orlo v.+ a0th Li 0r v LAOO Lii vw10 LJ .J.L0 '.._0i U *'. ±, 'Li V 0± X 0 U £s a LIt 00L Ss J .J 0f 1 e ..
December 31, 1960, the number of persons employed predoiniiantly in forestryrepresented ff C%. ofP 4 -e total "a-or fPorce. thAe "a'-or Jniut of farmers, w-h-ichmay be estimated at another 5%, raises the share of forestry in total employ-.nentIU LA.' toLI some 10 or l e., lto the samne proportion a.s it c oLnt u u .LUU o n 4A.'
the national income. This suggests that the productivity of labor is more thantwice as high 1n forestry as in agriculture. The exact orooortion of totalemployment provided by forestry is not, however, easy to estimate. Althoughsmall farms account for the bulk of the annual cut and ownership is scatteredamong 250,000 owners, efficient manageraent is the rule, and the degree ofcompliance with government regulations and scientific advice is high.
20. The Finnish forests regenerate themselves naturally and, with goodmanagement and some artificial regeneration, their yield has been rising overthe years. £'loreover, techr.ological advances, the opening up of newi forestdistricts, and a shift to more valuable uses have made possible a more intensireexploitation of available resources. Thus, with very little new investment inthe forests and in spite of the loss of 13% of the forest area at the end ofthe war, the raw materials have been available for an increase of 75% in theproduction of wood pulp and of 28% in the production of sawn timber between1937 and 1960. The situation, however, has been changing in recent years.Since 1960 annual cuttings have exceeded the allowable level, estimated at47 million cubic meters a year, by a substantial margin. They were 53.2 million cTmeters in 1960 and 55.2 million cubic meters in 1961, but somewhat smaller in1962. It is currently estimated that, unless action is taken, the allowablelevel of cuttings will decline to 42 million cubic meters in about 40 years.lTorestry officials have prepared an intensive program of drainage and reforesta-tion which would gradually increase the allowable level of cuttings to 56million cubic meters by the year 2000. The program would mean a doubling ofthe present volume of investment in drainage and reforestation during 1965-19692nd would require additional expenditures of some .20 million a year.

21. In considering, however, the extent to which Finland's forest resourcesset a limit to the further expansion of the woodworking industry, the scopefor a further shift to more intensive economic exploitation of availablesupolies shiould not be disregarded. At present nearly half of total cuttilngsare still not subjected to any kind of processing.
Industry
22. On December 31, 1960, the numoers engaged in industry, includingmining and electricity, represented 20.7% of the labor force. During 1960-1962 industry has accounted for 31% of the net domestic product. The followingtable shows the relative inilportance of the principal rnanufacturing industriesfrom the point of view of emoloyment and output in 1962:
Emnloyment Value Value added peradded onerson employed
(Per cent of total) $
Pulp and paper 11 lh.4 4,700nther w.Toodworking 9 6.6 24 0PEngineering and machinery 9.5 10.0 3,500ID- _hlb l r1ng n v.A -+h - tn s-.rnc
portation equipment 9.5 7.3 2,600Electrical equi.p.ent *Q L.3 3,5f00i4etals 2.5 2.7 3,900-Uutzl pVdWUUlU 5. 4t v1A
Chemicals 3.5 5.7 °,000I extiles .- 0I L574\J,
Clothing and footwear 8.5 6.0 4,000
'Printing 6.o 6.0 3,800Other 12.5 L.0
Total 100.0 100.0 3,400
2:3. Woodworking Industries - The natural advantages enjoyed by Finlandin this sector, in combination with enterprising and efficient businessleadership, have given the country a strong competitive position in the worLdmarket for sawn timber, pulp and paper. Progress has been especially rapidin the postwar period. Finland lost 25% of its chemical pulp capacity, 1iL/ ofits mechanical pulp capacity and 5% of its paper capacity at the end of thewar through the cession of territory to the Soviet Union. During the firstpostwar years reparations and the resettlement of refugees were the overridingpriorities and investments in pulp and paper, the most important sectors ofthe woodworking industry, had to await their turn. Thus, it was only in 1951tiiat prewar levesls of production were reachied in piulp and newsprint, while i:nother paper the prewar levels had already been considerably exceeded. Inthe same period oroduction of pulp and newsorint had doubled in Canada and

had increased by 10 and 27% respectively in Sweden. In 1952 the Finnishwoodworking industry embarked on a large program of expansion and by 1958Finland had regained the ground lost. A new program of expansion and modern-ization was aclopted in 1958 and was further enlarged at the end of 1960. Theprogram is reported to be virtually completed by now. The following tableillustrates the increase in production since the war:
1938 1951 1962 1963
MIechanical pulp ('000 tons) 639 807 1,385 n.a.Chemical pulp " 1,471 1,386 2,925 3,193Newsorint "400 410 925 955Printing and writing paper " ) 322 373Kraft paper ) 160 336 312 354Other oaner " ) 180 190Paper board "1h9 205 780 n.a,Fiber hoard - 117 220 237Plrood (T000 cubic meters) 244 314 )438 na.Saiwn gods (t000 standards) ljO31 1 L1;35 n.a.
21. In ter-s of val-me, the relaltiv-e importance ot f the principal ryrndwas as follows in 1960:
million $
4echanical pulp 50
Paper and products 200n-y Wuuu vSawmill products 230Obhi'er 150~
Total 940
Virtuallv the wrhole of the imechlanical pulp, used mainly in the productionof newsprint, is processed domestically (in 1939 over 40/6 was ex2orted). ]nrecent years half of the chemical pulp, two-thirds of sawn goods and about90% of paper products have been exported.
25. WJorld consumotion of paper, which was already expanding vigorouslyduring the interwar period, has grown even more rapidly since the war. Theaverage rate of growth, which was about 4.5% a year during 1922-1938, increasedto 6.5% a year between 1947-49 and 1954-56. Until 1957 the existing capacityhad barely been able to meet the demand, with the result that both pricesand profitability were high. As is usually the case, especially when largeunits of production are involved, these favorable market conditions led to alarge expansion in capacity, which, towards the end of 1961, was proving

greater than the increase in demand and produced a substantial weakenilg ofprices. The reserve capacity required for smooth operation is estimated at5% but in 1962 the rate of utilization of pulp capacity in the threeScandinavian countries had declined as follows:
Per cent of Total Capacity
Sweden 81Finlanid 81Norway 76.6
26. It is expected that between 1960 and 1965 world capacity (excludingPthe Communist l3loc and China) iAll have increased by 26d, or by an average ofabout 5% a year:
Increase1960 1965 1960-1965
(million toiis)
PaDer PulpNn"+th Arnc^i-in 350 1 -0 60WIestern Europe 16.4 22.2 6.0Other 6. n 10. n 1
Total 57- 7324 16.0
Niorth imerica 41.0 50.0 9.01.7 4. - -- 'LI, , 0Ti AI ') A '7 li.ester E;irope 21.0 28.0 7.0
Other 10.0 14 .0 o4. 0
Total 72.0 92.0 20.0
According to a recent FAO publication, Hesrtern European exuari5ioii will exceXeuthe prospective growth in demand, especially for newsprint, and this meansthat the industry must -prepare itself to accept surplus manufacturingcapacity as a normal state of affairs for the next four to five years, to1966-67".
27. The leaders of the Finnish industry view their own prospects witnconsiderable confidence but it is obvious that no further large expansionwill be undertaken in the coming years, although modernization and theinstallation of' additional processing facilities will continue.
28. Other Industries. The fact that the Finnish woodworking industry,which has been the prime mover of expansion during the past decade, is nowdue to take a back seat, has raised the question of how the growth of theecernomy will be maintained in the coming years. It is widely felt that theanswer lies in de-teloping new products for export, and it is believed that

- 10 -
the metalworking industries, the chemical industries and some consumer goodsindustries could, through specialization and modernization, become importantexoort industries.
29. Finland had to set up completely new metalworking and engineer,ingindustries in order to meet its reparations payments to the U.S.S.R.1/ Becauseof the wide range of products they covered and the conditions under whichthey were brought into being, these industries could not be expected to provecompetitive in world markets, and they have been able to continue in productionmainly because trade agreements with the U.S.S.R., subsequent to the comple-tion of reparations payments, have provided an outlet for their products.
30. Some branches of the Finnish metal industry, and especially thoseproducing machinery for pulp and paper, are, however, highly competitive, andthe industry as a whole does meet nearly half of domestic requirements withonly moderate protection. It is felt that by concentrating on a smallernumber of products. in which Finnish skills and technical abilitv would giveit a competitive advantage, this industry could gradually develop into animportant exnorter of specialized nroducts.
31. Finlanni has a relativelr small c.hemical industrv which nrovi.ies somneexports, mainly sulphuric acid and tall oil, and meets a large part ofdomestic requirements for oil products, irtiizqs naints: and dyes andpharmaceuticals. It is felt that this industry, too, could develop into an
vr~c,rnnv J nt~nQ+-'r i f i + n'vrcnv.+~~in n .zrnnl 1 mimhc~r' rvf ~ r-e-u'.' ~,irv'inr_xp_rt industry lf it cnetae nasalnme fpout eurnhigh technical standards.
32. As in other countries, increased protection during the 1930's madeFinland largely seLO-±supoortin" in n an consume g. Th Iuie
on most manufactured goods have ranged between 15o' and 50%, being nearer theupper limit lor finished Uproducs and nearer the lower limit for semi-manufactures and equipment. In addition to this protection, the importres trictions of the post-war period, together -sith inflationary demiand, pro-vided great scope for expansion in these industries, and some diPficulties w-ereexperienced when imports were liberalized and internal demand brought uiiuercontrol. The fact, however, that these industries have shared in the expansionof itIe last ,i-vyears indicats U th Uat they ha-Ve Ubeen aeUL to dUJU UU the
more competitive conditions that have prevailed since 1958. At the same timeimports of consumer manufactures have increased considerably, demonstrating;that the high degree of self-sufficiency of the 1950's was largely artifici&l.
33. The agreement between the European Free Trade Association and Finla!ndsigned in March, 1961 recognized that the Finnish home market industrieswould require a somewhat longer period to adjust to increased foreign competi-tion than the comparable industries in EFTA countries and granted Finland
1/ The reparations deliveries have included 623 vessels, 30 complete factoryplants with power stations, 1,000 transportable powe- stations, 701 stearand diesel locomotives, 80 turbo-generators, 52,000 electric and gasolinemotors.

- 11 -
more favorable treatment in respect of a number of nroducts than is providedfor EFTA members. While some concern was expressed at the time about theability of a numhbe of these inriu.strie n survive withont. prtection, it isgenerally believed in Finland that the period of transition is long enough tonarmi t the wonressii c mand ustrent to b mrlad w.it+hout. unduei ha"rdshipy orl di-
location. The view of most Finnish industrial producers seems to be not onlythant th wr.Ti'll b ab ton meet thel increase foeign ompe4tiionl Iut also th3t
the EFTA agreement will open up new and wider opportunities for Finnish skillsanidd enterprise. The o-. problem .4-4 aJ O the ne condiJt4i onsA .ls f.
to be the problem of financing of the new investments required for modernization,specialization, andIU expansionLV11. LRuLsU Ut dute e ncouragngU bt Ino yUe
conclusive. Protective duties on industrial products have already been loweredDJy OU/o W ± IJI±UU ; ut:±ullg dily SteLIUUS U1111CUIL'1Eb.S
34. In view of the present uncertainty about the future of trade relationsin Europe an attempt to assess Finnish prospects within a wider Europeancontext would be too speculative to have any practical value. Looking beyondthe next five years, however, it seems reasonable to expect that Finland willprove as successful as Sweden and Denmark in developing specialized industrialproducts, in which ingenuity and quality rather than scale of production arethe decisive factors. The basic requirement for such industries is the existencc,of a well-trained labor force and of ample technical and managerial talent.Finland is as well endowed in such resources as the other Scandinavian countriesand should, therefore, eventually catch up with them in its industrial develop-ment. The recent performance of Finnish manufactured goods other than paperseemas to suggest that the process of industrial diversification may alreadynave begun. Exports of this group of products, which account for 6% of totalexports, increased by 26% in 1963, from $55 million to about $70 million. Thegroup includes such diverse products as textiles ($13 million), clothing,gLass, ceramics, furniture, plastic products and special equipment. The largeand growing Western European market should offer considerable scope for theexpansion of sales of specialized products of this type in the coming years.
Power
35. Finland has an abundant supply of water but relatively low elevationsC100 to 200 meters) limit its value as a source of power. The total econoiu-cally exploitable power potential is estimated at some 18 billion kwh, ofwhich about half' has already been harnessed. Construction costs are highand, with the decline in world fuel orices and freights since 1958, thermalpower has become a more economic alternative.
36. The bulk of the present hydro-electric capacity has been built in thepostwar oeriod. The tbJo maior schemes have been the develoDment of the OulURiver in Northiern Finland (430 TIV) and the development of the Kemi River inLapland (8900 1W), the latter due to be completed in 19(7 or 19i8= The locationof these plants in the northern part of the country (300 to 500 miles from thema,or consumption centers) has required the building of costly trans.misaon*acilities. In recent years, the emphasis in the plarmizig of power expansionhas,. beern shitin toA v trher+rnnl r,l nnts.

37. A cnaracteristic feature of Finland's power economy is the high pro-p,--or+ ton of prVate`Y &Erat e pJMer in tllh e ) Utal suppJLy k"U/0 IO Uith Ut odtL
during 1958-61). This reflects the predominant position of the pulp and papermills, which generate a large part of their own requirem-ents, as power con2suumer-.In 1960, 75%, of total power generation was utilized by industry, with pulp aildpaper mills accounting for 57% of industrial consumotioni. The hign degree Oiself-sufficiency of the pulp and paper mills is due both to the fact that theindustry owns a substantiai hydro-electric capacity and to the fact that itn.akes extensive use of back pressure, an extremely economic source of energyfor power generation.
28. As elsew,There, the expansion of production and incomes during the post-war period led to a rapid increase in the demand for electricity. During tileseven-year period L955-1961 consuiaption of publicly-generated power increasiedby 58%, or by an average of nearly 7,' a year, .nd consumption of privetelygenierated power increased by 120C,, or by over 10>6 a year. Per capita consump-tion, at 2,300 lwh in 1961, is comparable to thie levels of other VTesternEuropean countries, but of course much lower than in countries with largehydroelectric re.sources like Norway and Sweden.
39, The principal hydroelectric facilities supplying the general publicare government-owned, while most thermal installations supplying the generalpublic are owned bySr municipalities and private power companies.
TransDortation
ho. Like industry and for the same reasons, modern transportation camelater in Finland than in the other bfestern Luropean countries. Until the middleof the 19th century Finland had had virtually no internal transportation srstemand had hardly needed one.
Railroads
bl. In 1862 the first 66 miles of railroad (Helsinki-HEimeenlinna) werecompleted and hy 1917, - urb-n Fi nlndr dlared its independnrcen,r 2 O Tnilps hadbeen built by the State, accounting for virtually the whole of the country'srail facilities. The systpm was furthe_r expanded and improved during the inter-war period and by 1939 the network had increased to 3,565 miles. Serious lossesand deterio ration were suffered during the war but, due tn the other urgenttasks of reconstruction, rehabilitation and improvement of the railroads couldnot begin until the early fifties. The major needs- have trof roadbe6s, the relaying of several lines with heavier rails and the re-placemen
4n-fr .rn,v..n=+ 11 - ng sc+nc. T-na investments wi Icnntinue to he
required during the coming years to bring the efficiency of the rail systemuoA to +h re- _-arl _A+hm+hs_ l .An+_Te _A A1
uv U. J& s tOanCI of +< hesw ote 1,;s "s+eU-, EurVopeans counU -J
t. Th vol.,.eof freigh carri4 e by t'ne ra-ilroads (in teri,.s of ton-L4~. 1110 VO.±LUjI00.±10.1 UU iU LJ Uj 1 ',I 0L± 0000Q k-L±1 ULI~ 0±U1
kiloineters) doub:led between 1938 and 19'51, but iiicreased by only 7,6 during17''-196'7v-., r-et~' U±in, Uas elewhere, the i1nJCdU of tiJL,11WCA Utrasprtaio..
ln 1962, the share of the railroads in freight transport was 42%, compared w. th
- 13 -
I),I in 1953. Ahont Tan P of' t-hp frpeigh+. at. nresent. carried byr the railro
consists of timber and pulp and paper products and another 20% of minerals.
43. Developments in railroad passenger traffic have followed the samepAt- te n The. vo um o1 4. -. P 4 - x J n t. m A- -; - - - - - - - -I _X ome _- N vo b -A _
UJ< U . 11. ±s1I; V'-Lvi4L v. U. dxICa LJL.A., 11 U:L1'1D U.J LJd Ha A.i.LUI U-Id / UUUU | ru
between 1938 and 1951 but increased by only 12% during 1951-1961. In 1962 th;eral>lroaJds~ accourt.ed .,Lu oinly ±u/O ofU L.L passenge trfic, comr1LdU Wi 3 _V/0%
in 1953.
V;a terways
44. Finland's inland waterwnJays began to be developed at about tl-he same timeas the railroads. The important caimaa canal in Eastern Finland, with a totallength of 37 miles, was completed in 1856. In a relatively short time threelarge lake and river systems were created through the construction of canals,locks, channels and fairways, providing 2,700 miles of continuous throughwaysnavigable for steamers and barges. The chief function of the system, hiowever,has been the transportation of wood over 26,500 miles of floatable chanmels.The system has proved highly profitable and has retained its importance forlog floating but other traffic is no longer significant. In 1961 the volumne oftirber floated on the system was 2.8 million tons, compared with 5.9 milliontons transoorted by the railroads. Log floating through the system had doubledbetween 1950 arid 1961. With the cession of the Eastern territories to theSoviet Union, only the upper part (14 miles) of the former canal were left inFinnish territory and, as a result, the econonic importance of the Saimaa lakesystem was considerably reduced. In 1962 the Soviet Union o,fered to grant 350-year lease on the remaining part of the canal. Finland accepted the offerand intends to carry out the necessary repairs and extensions. It is recognizedthat these will be costly but it is felt that there would be sufficient bene-fits to transoortation to warrant the expense.
Road Transport
h5. RoRds came last in Finland. Until 1921 road construction and rmin-tenance had been chiefly the responsibility of local landowners and industrialconcerns. The countrv's road network consisted of foot and horse trails androads for horse-drawfn vehicles. in 1923 there were less than 2,000 roadvehlicles of all tvoes. A law came into effect in 1921 w,rhich transferred theresponsibility for all m-ain roads to the Goverrment and an intensive effo:t wasm.ie cinrinc the intprv'ar npriodr to nrovir1e the Country with an adeqnuate roadsystem. Expenditures on road construction and maintenance absorbed some 5%of hn - reve-nue in this pe-riori. Tn rirvonnng thp stam a serionu effort
was made to ensure that the new facilities would complement the railroadsrather than compete with them. Tn spite of this effort, ?Pi land was still fnrfrom having acquired a modern road system. The best of the trunk lines were
g-,e.s1,D onl, _--n -n of' -te. re-rand to1tuou s, while the
r3maining mileage consisted mainly or' unsurfaced roads. In 1938 there weree -i I I ). r , f Qlrd) -n-4--- -_, s7h1 pq A-f1 1 1 +- -rA¢ t'.A - vAlen -i ttne vel'^ F; P1l A
Li VJ.l l V1UJ I-i v VV ii 'JV . V inlhaLbi tan-iso O J UJ U*r J. V CdA r L i V VAs V r ±L-4.O
Der 830 inhabitants.

46. Tin the earlier postwar period the improvement of road transportationwas he"ld back by other, even more urgent, tasks. Severe restrictions onthe importation of vehicles checked the growth of road transport and the needfor provision of better road facilities. Road construction was largely anactivity for the relief of winter unemployment, mainly in the northern areas.In 1953 there were still only 108,300 road vehicles. corresponding to onevehicle per 40 inhabitants. The corresponding figures in the other Scandinaviancountries were 20 for Norwav, 18 for Denm-ark and 1l for Sweden. The relaxationof import restrictions after 1958, as was to be expected, led to a sharp increasein road transoort. but also revealed the inadequacv of the ePcistAna roadfacilities. On December 31, 1962, there were 346,800 road vehicles corres-pondiing to one vehicr1e npr 13 irnhhi-n.nts. T'he npresent. s e of c]elopmentn .
of the road system is as follows:
IMliles
Paved highways 1,8000) 11 gravel=surfaced
highways 5,200ull u~il .II L i 0l.a Qo_ I , _,IWW
Local and private roads 21,000
Total 45,500
47. lajor expenditures on road corstruction and mainteniance were only$20 rillion inr 1950 and had increased to $55 million in 155, wihile curing1959-1961 they have averaged over $100 million per annum, corresponding toaDout 97' of all State expenditures.
Air Transport
h8. Adequate and efficient air transportation on both domestic and foreigr.routes is provided by Aero Cy (Finnair), a companiy w.ith a 73% governmentownership. Reguiar service is maintained to 16 Finni sh cities and 14 foreigncities. As elsewhere, the increase in air travel has been rapid, havingdoubled during 1955-1961.
Shipping and Ports
49- Unlike Norwiegian and Swedish shipping, which carries on a large inter-national business, Finnish shipping is engaged principally in trade betweenFinland and foreign countries (only 20% of gross freights were earned in tradebstween foreign ports in 1961). Its share in Finnish foreign trade is, however,substantial (49% of total tonnage in 1961) and its foreign exchange earningscorrespond to 10% of exports. The Finnish merchant fleet suffered severelosses as a resu:Lt of the w^rar but had been reconstructed by 1953 and since thenthe tonnage has increased by 40%, to 945,000 gross tons, in reslponse to thegrowth of foreign trade. Coastwise shipping is relatively unimportant.

- 15 -
50V. Xleeae2 rnipal sea por's around h os,ofwihtreI±1ere ae 23~ prn ~.±i~LJJ F9IU dJU1I UIie cot~ U, 'JJ. WII.LL;1 ULA
Helsinki, Kotka and Turku, handle about half of the total tonnage loaded andunloaded in the country. Facilities are well-developed but the growth ofpulp and paper exports has created the need for additional capacity.
51. Viewing the Finnish transportation system as a whole, it may be saidtnat in soite of the large resources devoted to its development it still fallsshort of the requirements of a modem economy. This is due both to the factthat massive facilities had to be created in a relatively short period oftime and to the fact that in a large, sparsely populated country, with a hardclimate and difficult terrain, the cost of such facilities is bound to be highand to impose a heavy burden on available resources. During 1960-62 investnLentin transportation absorbed 77% of the resources devoted to public investmentby the CentraL Government.
Public Finance
52. As elsewhere, Government intervention in the economy has increasecdin the postwar period, in response to the electorate's demands for improvedsocial services and public facilities and for better provision for theneedier sections of the population. The burden of taxation, which corres-ponded to about 15% of gross national product before the war, more thandoubled in the immediate postwar years, to provide the large resources neededfor reparatiorns resettlemlent of refugees, compensation of war victims, etc.The completion of these tasks did not, however, result in a sharp decline inthe claims on public resources, as otlher important needs, which had been post-poned, had to be met. Thus, while the burden of taxation decreased somewhatafter 1953. it has remnined at. around 30Ut of gross national oroduct duringthe past decade. These calculations refer to the total tax burden, whichi nclndes the taxes nnl 1 cPtep hv the GPntral GInvernmPnt and the municipal i ties;as well as the contributions to social security. In 1961-62 the taxescollected by the Central Government , together with social security contribu-tions, accounted for some 75% of the total and the taxes collected by thelocalI authl-orities for ~some 001 ofP 4the +otal.
53. The prevailing feeling in Firnlish business circles is that the levelof public expenditures has been excessive and that the resulting heavytaxation has been ar. 4ei.n vo son ecnoicdeelpr4-. axs,hoeleabsorb a smaller proportion of the gross national product than in Norway or,J-LV:U:1CI dIlU U ._L CUU UdAd ±'JVII L L J DVIILEVIJd fU -L t : lid V)( Ullal .I Ull el U lU-LiL ,WV
Scandinavian countries:
1961
Finland Sweden Norway
Direct taxes on (Per cent of GNP)corpora-tions 3.0 2.5 ) 17.9
Other direct taxes 13.5 18.3 )Indirect taxes 13.5 11.7 l4.7
TotaL 30.0 32.32

- 16 -
54. in fact, the financial problem is not so much that taxes are highbut that the expectations for improved public services and benefits are evenhigher. The manner in which this pressure for increased expenditures hasbeen met has tended not only to make the total demand in the economy excessivefrom time to time, often at the wrong time, but also to disrupt the financingof investment. Budgetary developments during 1960-1963 illustrate this.
55. The fiscal discipline enforced by the stabilization program ofSeptember 1957 was maintained until 1960, when, with the aid of buoyant revenue,the Government achieved a cash surplus equivalent to ,'28 million in its over-all transactions. Encouraged by t'hese favorable developments Parliamentproceeded to increase expenditures and also make some reductions in taxatiol,with the result that an overall deficit (after deducting net foreign borroinrg)of $9517 million emerged in 1961, which increased to $54 million in 1962 andreached $95 million in 1963.
56. The Government of F'inland has had no access to short-term accommodationfrom the banks, while advances from the Bank of Finland have been obtained onlyin exceptional circumstances and for strictly limited periods. Thus, theGovernment has to meet its financing requiremnents through borrowing from thepublic, wlhich means that no directly inflationary financing is possible as arule. However, increased Government borrowing causes a corresponding decreasein the liquidity of the banks and an increase in their rediscounts at the Bankof Finland. hence a total increase in monetarv demand. This happened in 1961and 1962, when rediscounting increased by the equivalent of t27 and '$33 millionresnrectivelv; aloTwing a conti nipi t snhstnntia l ex4ansion il baLk lending (b-nar,
lending increased by 20% in 1960, 17% in 1961 and 10% in 1962). The resultingir.rease~i in ronnnn+anx rndemnd in an econom-r ope_ratng at near full ranrcir-nrn-vrd
excessive and caused both a deterioration in the balance of pa<yments andincreased pressure on prices and costs. The furt,her large increase in Covcr.r.entborrowing in 1963 and the need to protect the foreign excha.nge reserve forcedthe Bnank of Tilin- 4-t 4--- nrnrnre-A;+ 4it resrlcton in the course of J°AJ
u.~ ~a..a V~ ~ '& V CI C ''± C4± U ± CO UI LC V-- -1JO L U-IC U I C1
which corrected the external unbalance but also, coming at a time when the bouomin tIe econor,.y was over, affected adUverseUly thie leve ot-Lo'I ac ULVILUJ dlii Uith vtl±iriie
of investment.
57. The 1964 budget provides for higher taxes, including a supplementary4
3A on i-r-,-c -d,-t -iche ..-. 11be deductible in 1J57 and 1i6nA,-. A-L4--. -. &OAQ - inCP. 'T'i-..,
together with greater restraint in the growth of expenditures, could, combinedvXu_4 ., 5 v_ _ ____.. WiLth a revival of ue0iCuiij aCtivlity, Eimprov UI1ziUtlderUaly t,1he fical pLcture In
the current year. The problem, however, of Dreventing such a sequence fromrepeating itself rem-ains. in essence, this is a problem created by the existenceof a relatively strong Parliament and a relatively weak executive, whichcharacterizes the Fin.nish political scenUe, and which is in sharp contrast withconditions in Norway and Sweden. At the initiative of the Bank of Finland, aproposai. was submitted to Parliament in the summer of ±963 providing in substnncefor the building up of cash balances by the Government during periods of higheconomic activity and drawing thenl down in periods of slack. This is an er.inuntlypractical solution which would make Finnish fiscal policy more responsive to thecverall needs of the economy without requiring any basic changes in the Finnish

- 17 -
processes of budget-making. The bill is still under consideration but theprospects of adoption are uncertain. Even if such a bill were passed, it wouldtake several years before a sufficient reserve were built up to make thepolicy effective.
The Banking Systern and Credit Policy
58. Finland acquired a Central Bank before the development of commercialbanking, a rather unusual process, due to historical reasons. The Bank ofFinland was established by decree of Czar Alexander I in 1811 and it was notuntil 1862 that the first conmercial bank was set up. The Bank of Finland isan autonomous public agency operating under the supervision of the Diet andor}mini.qt.PrP- hv n ninP_in-mmhPr siinnrvi sorv nouinnil P1ln.t.cd hv thp T)i tnd bhv Board of M4anagement consisting of the Governor of the Bank and another fourmembers, w^ho are appointed by the~ President.
~ 0 ~ ~s1 1-~~~1A i- c I 1,i c4lil -tr el PYI+ v.I q -nr T1~~' n ~ n~ n+ rv,
59. Comu.eria bnkig s ighy enralze. here -r a+ present olfive commercial banks, with 630 branches all over the country. The largesttvn_s of thle .lbanks aco nt for _ Ov.r A)I"' Of 1 t taldeosits. T8he r.th__ 4wr-+-o+Ivg y±± mjo ua o sw vssu uv Ufl Uv v~ V uv ± o U|J uF V 3| . IJIt1us.± a C)L J1 U/
financial institutions are the Cooperativre Credit Societies (527) and theirC,entral B'a n'k- ulthe sacvingsO banz-k4s ) /l2, Cand Wtheir Cetrl BIL1-1ank, s)L&illx mortga6tbanks and the Postal Savings Bank. Lending by the insurance companiescorrespondus to about 1U0% of tlhe combined lending ofj adl financial tituicns.
The National F'ensions Fund has invested most of its assets in loans to powerplants and to industry. Its to-tal lending is of thle same order of. magnitudeas lending by the insurance companies.
60. Credit conditions in Finland have been characterized by three featureswhich are seldom found in combination elsewhere: (a) the tendency of 'bDUget
nmaking to proceed with insufficient regard for the requirements of financialstability has placed the principal responsibility for the containment ofinflaticnary pressures on the Bank of Finland; (b) the means at the disposalof the Bank of' Finland for tthe carrying out of this responsibility have beeninadequate; (c) in spite of these limitations, the Bank of Finland has beer,able to carry out its responsibility of containing inflationaryr pressures ritha considerable degree of success.
61. The Bank of Finland has no authority to require the financial insti-tutions to deposit with it a proportion of their funds nor can it regulatecredit through open market operations, since there is virtually no capitalriarket in Finland, the bonds generally remaining in the hands of the buyeruntil maturity. The principal instrument at the disposal of the Bank ofFinland is the fixing of the rediscount rate, which determiines other rates inthe banking system, and especially the system of penalty rates on rediscountedbills, under which rediscounting banks may be required *to pay a progressivelyrising charge, up to a maximum of 4%, in addition to the basic rediscount rate,wheni their lending exceeds certain limits prescribed by the Bank of Finland.

- 18 -
62. The effectiveness of the interest rate instrument has been limitedin several ways: (i) a change of the rediscount rate must be approved by the]3oard of Supervisors, which is an elected body and is therefore sensitive topolitical considerations. On Mlarch 30, 1962, the Bank of Finland raised therediscount rate from 6.75% to 85o but on April 28 the Board of Supervisorsreduced the rate to 7%; (ii) wihile the level of interest rates has beenrelatively high. it has tended to be rigid and. in view of the orevailingscarcity of capital, it has not been high enough to equate supply and demand,w,iith the reosult that the hbnks have heen onperting a form of rationing ofcredit, which is not conducive to the best allocation of resources; (iii) inperiods of increased Tgover.nm.ent borrowi^ng the higher interest rates offeredion Government bonds, not being matched by higher deposit rates, have reducedthe resources of the banking syste nm and cseriouly .r disruptedr trhe financingr, rof
the private sector; (iv) the penalty system is effective only in connectionwlth theL L- 4banks4 * h -have i .- rodsIut.4-g 4facili s at te Bc n f Fina nd P I. o
These banks, however, account for less than half of total lending by financialins titu.tions; (v) th peat 4sys,,,ter~ . take~s- tir.,e to, bezome'4. ef-ctve, 3S the-- CMf.,47-J Le. W I.) -m4S$V +1L ±,. 14-44
banks usually prefer to pay the penalty for a while tharn curtail promisedc , A- ; 4- r ac; n; 4: 4A -_|; e_ 4- 4- 1, -4 4A'..' .L U4 .U ±.4L.LJ.. U' U1D±.L UU 0 ULIILUI 0 0
63. Th~~e success of the P,anlc of Finland in con'ann crdi e.Lnsonhabeen due mainlr to the influential position it occuoies in the financial 'ifeof the country, which gives it considerable powe-s )i mTloral persuasion.During 1961-62 the Bank was able to reach agreement with the fina zial insli-1;utions 'or the deposit of special cash reserves. In September ly62 ceilingson rediscounts were imposed on the banking institutions and during 1963 theseceilings were Lowered and the livit fixed individually ior each bank;. As aresult of these efforts, credit expansion, which assumed excessive proportionsdlring 1960-61, slowed down in 1962 and 1963, and this has been a major factorin the improverient of the external position during 1963. Taking into accountthe rise in prices, the 6% increase in outstanding loans during i.6^3 inciccttesa very small increase in the volume of lending. Cne aditional factor in t;hecdecline in crediit expansion during 19b3 has been the cessation of shlort-termforeign borrowing by the commercial bancs, at the request of the Bank of Frniandi'ollowing a sharp inc'ease in 1962.
64. It should be kept in mind that an excessive credit expansion is, toat considerable degree, self-correcting, since, by causing a decline in foreignexchange reserves, it reduces the liquidity of the banking syste'm and ihenceits ability to satisfy the existing demand for credit. The problem is not somuch how to prevent an excessive credit expansion to continue forever but howto ensure that credit expansion will not become excessive in the first place.The Bank of 1'inland itself points out that its powTers of persuasi-on becomeeffective only after the situation has deteriorated and that the degrea ofrestriction it can enforce through voluntary agreements is less vhaii is reouiredduring periods of rapid expansion. For many years the Bank has been reques.tingstatutory authority to impose varIable reserve requirements but the necessarylegislation failed to receive parliamnentary approval. A new proposal wassubmitted to Parliament last summer, at the initiative of the Baznk of Finland,

- 19 -
which provides that all banking institutions (not merely the commercial banks)could hp required bv the Bank of Finland to denosit funds in a soecial accountwith the Bank, whenever their lending resources, both domestic and foreign5had increased ecessively in relation to the requirements of financial stabilit;v
Together wiith the bill for the building up of cash reserves by the State andwith a third bill, also pendincg in Parliament,iSor an evpansion of the sy.temof special investment fund accounts for private industry in operation since1955 thi ppsa LI- +he s+engthenlng of+epow_rs of the Bank of Fi.andwould, if adopted, go a long way towards smoothing out fluctuations in economic
demand during periods of expansion.
Prices and Wagres
65. Duringr 1959-1961 increases in productivity largely offset the rise inwages 0!ich >tloolh p' ac il tL1 pJ.UU er dIi dV'd VL U/ Q JL dinUiUllJ au
prices rose only moderately (wholesale prices by an average of a little over1% a year anud the cost of living b-y an average of 2% a year). As -Ihe econoiayTcame closer to full utilization of labor and productive capacity increases inoutput per man became smaller, and the margin ior absorbing wage increases wascorrespondingly reduced. In 1962, wholesale prices rose by 1.5` and the costof living Dy 3.7%-0, in spite of the fact tnat wage increases were no larger tnanin the previous years. These price increases were still in line with pricedevelopments elsewhere and Finland's competitive position was not thereforeadver3ely affected. The fact, howzever, that wage rates are linked to the costof living and agricultural prices to industrial wages means that, once pricesbegin to rise, a cumulative process is set in motion which is very hard to stop.Ln 1963, wholesale prices increased by 3% and the cost of living by 5.4h%. Itis generally recognized in Finland that these increases exceed price develop-ments elsewhere and that the country's comnetitive nosition has been weakenedby them. Moreover, prospects for 1964 are for a further deterioration. Ilvo-year wage agreements, recently concluded by most trade unions on the basis ofproposals by the official arbitrator, orovide for a 6% increase in 1964 and a3.8% increase in 1965, as well as for adjustments for cost-of-living incrcas-s.An adjustment in agricultural prices was due in February and another one inAugust-September. It is feared that as a result of these various factors wragesin 1964 may rise by 12 to 14% and the cost of living by as much as 10%. Drasticaction is clearly needed if the currency is not to become again overvalued.
Investment and Saving
66. Finland has devoted to gross fixed investment about 25% of the gro snatiorial product during the 1950's and 30% during the three vears 1960-63.This is one of the highest rates of investment in Europe. Finland's largeinvestment needs are due to the high cost of nublic facilities, as well as ofhousing, in a northern, sparsely populated country, to the high standards ofsocial services eommon to nll Scandinvria. to the cahital-intensie eharacteof industry and to the heavy investments required to mrintain a reasonable
/roTis bivitv a in arncrur t beenrp-
1/ This bill has lsut baen rassed bv Parlipment.

- 20 -
67. Gross investment at the rate of 25 to 30% of gross nationa:L productand. net ivestlet at t h e rat of I ov e r 2 0-i o fL IC t- e u 1t Unu11 r uc ar I e
far in excess of what the public is willing to save voluntarily, even in theUIII Li.U.L~ U J :I2 U11 IJ2U j~ i UUL ULL Ij JL I n4UJ.-L 1~ - or'J U -viI.thr4 lefties oPL T`estern luropean countries. DuriLng L1960.-t1 net prate sav-ing,
in Finland corresponded to 12' of the net national product at market prices,w hLich was exactly thie saile dZ ±11 as in LT.sE1 UtrIL-1y, aiiu [Uis rate was maintainedin 1962. In this period net fixed investment averaged 23.3% of net nationaloroduct. The additional financing requirea over what was voluntarily savecdwas provided largely through taxation but also through net capital imports.The following table summarizes the situation during iy60-62 and illustratesthe principal differences with 1955-59:
1955-59 1960-62
(Annual Averages)
Gross investment as % of GNP 26.0 30.7(fixed investment)
Depreciation % of GNP 5 8Net investrment as %
of net national productat market prices 21.0 24.5
of which:Fixed investment 21.0 23.3Increase in inventories n.a. 1.2
Net investment financedas follov:s (in % of netdomestic product):Nqet private saving:
Corporations 2 2Other 9 10.3
Tax revenue 11.3 10.7Net capital imports -0.7 l.L
68. This table shIows that the increase in the rate of net fixed invest-ment during 1960-62 was made possible by the shift from a net capital outflowduring 195•-59 (representing the rebuilding of foreign exchange reserves) toa net capital inflow during 1960-62. Net capital imports during 1960-62, whichcorresoonded to 6% of net fixed investment, contributed both to the increase ininvestment over the previous period and to an easing of the pressure of invUst-ment on resources. which had been a maior cause of financial instability inthie earlier years.
59. Although both voluntary saving and saving through taxation have beenhligh, investment. reiui rrnpn7t. have been evren higher, the resulting shortageof capital being felt most acutely bv the industrial sector, and especially thesr llaer, home market industries. Tax revenrue and netf oreign borrcw.Ting by theGovernment have financed all thie investments made in the pubhic sectoi- anid inaddition have provided resources for Gove.mret lendingJ t+o oth-er sectors.
luring the last three years, when Gove-nment finances deteriorated sharply,

- 21 -
nec domestic borrowing by the Government has been less than lending by theGovernment to public enterprises and to agriculture, housing, etc. A largepart of personal saving has been invested in the purchase of dwellings and mostof the remaining personal saving has taken the form of deposits with financialinstitutions,, which have naturally given first priority to the short-termneeds of comqmerce and industry and, in granting their longer-term credits, havetended to favor the larger industries, especially woodworking. Thus, it is thesmaller industries, producing mainly for the home market, which have experiencedthe greatest difficulties in modernizing and expanding their facilities. These,however, are the industries on which the future growth of the economy and itsability to meet increased foreign competition largely depend. The financingneeds of these industries are urgent,not only because they have been inadeauatelymet in the past, but also because these industries must achieve a high degreeof specialization and rationalization in o;-der to become competitive, both athome and in foreign markets. Due in large part to the proximity of Sweden,the country withl the highest wage rates in Europe, and to the freedom of move-ment between the two countries. wages in Finland are higher than the level ofprodactivity in the more protected industries warrants. This means that inorder to SUrviveo wthoit nrotection T'inniqh induistries must become as t.'hrvq-lc'gically advanced and as highly modernized as the industries of the mostde,elonpd colintries.
70. The shortage of capital experienced by Finnish industry has rmne sbeen ascribed to the underdeveloped character of the Finnish capital market.Th'e f.act that t.he of perS-sonl S-avirn-s are enf trus,ed t+ o the-n fin3 fi na cnc i1institutions is attributed not only to habit, but also to the tax ex-emptionsg. arL 4u. ed to .nterest4 o n depossits and on G.overnLent 'bon5ds. The 1hea*11y1 conccn=tration of private savings in the financial institutions is felt to operate
4-ans the srale 1'industrial--4 concerns and the- develo,pment4o a or ztL i i CUPI O -4( iJ Ul LLU OLi4d 4Jl, .L11 j U-IC LA7U~V1.5LJAIIK-IIU -4± C2 1115J.- 14 d U -LV 14;
capital market in industria' bonds and shares is advocated as a means of over-com,ing the f.LnarILicin UI.Lg.LL Udifiul ie Lof thdeLeLer LIIUUs tsL. L Vi-Lsuch a
devrelopment is undoubtedly desirable, it seems doubtful that smaller concernswould haave been rrmore successful in tapp-ing pri-vate savlngs in the capitalmarket thlan in borrowing from financial institutions, especially in view ofhthe lacX of jL..-d-.L, VI,irt of l the iI.nnls pub-lic -with'uL' s u ch investIme:1tst wt is
more probable that the underdeveloped character of the Fimnish capital marketreflects th e stabe of developUL[Leb OI L LIe eUUUnly as a wIIle: aniU tIatu a moresophisticated organization can only gradually emerge as the economy develops.
71. Another criticism of Finnish conditions is the familiar one voiced ina1l Scandinavian countries, that the Government diverts too high a proportionoZ total resources to its own needs and thereby deorives the private sector oftile funds required to finance industrial modernization and expansion. wnat-ever the validity of this criticism, the fact remains that the electorateanproves of this allocation of resources and gives no indication of wanting lesspublic spending in the future. An investigation of the development of publicfinances during 1963-67 carried out by the Ministry of Finance has concludedthat, while the gross national product at current prices will probably increaseby 31, during 1963-67 and total State expenditures by 28% public capital

- 22 -
exoenditures are likely to increase by 3h.6V during this Deriods Thus, nosignificant change in the situation which has obtainecd diAring the pastten years appears in prospect.
7Z; Sim-i lnr-:Ir +the fact+ +that +there is slll 3 large unsatis d r1ennnd
for housing indicates that the proportion of resources devoted to this sectoris also unlikelyr +o decline in the coming years ar.d might eren increase. The
woodworking industry has by now completed the large expansion program begunin 1058, -wh4lch -as fiane in par -hvg -oeg borwig -- t -ts 4capital+
needs will continue to be substantial and the smaller claims it will make onLJIi) L .I E . LL.L .Ld_. L £t 1i u ' v ± u _ ' UIL_AA ..LI .4U U,. L+
U-'. IuO DlU c n c VU1 u s i o n I erdgt s aL s U X11d U Ui( IU -U v I L V I i . u IIe
requirementsof industries other than woodworking calls botlh for greater emphlasison these industries on the part of' rinnish credit institutions and for increasedexternal financing. The reorganization and expanlsion of the IndustrializationF unu w) tn IO/B.ank assistance represents an important step toward both udirec:-tions, but further action will be needed in the coming years.
Foreign Trade
74. The exceptional difficulties which Finland had to overcome in theearlier postwar years are reflected in the development of its foreign trade.Unlike most other countries, which were able to expand their exports consider-ably above prewar levels within a few years after the end of hostilities,Finland did not reach its prewar export volume until 195:3-5:, end the growthin its foreign trade remained relatively slow until 1958. This was due botlhto the heavy tasks of interrnal reconstruction (including the payment of re-parations) and to the unfavorable competitive position in which internalinflation had placed Finnish proJucts. High prices for wood products in thisperiod offset to some extent the relativelv slow increase in volume. Therestoration of financial stability and the large investments made in the wood-working sector since 1958 brought about a complete transformation in Finland'sexport performance. The volume of exports, wiii.ch had increased by 33% duringthe five years 195h-58:, increased by 48Jo during 1959-63, this being the majorfactor in the 32% growth in the gross national product during this period.During the past five years exports of goods and services have corresponded to25:/o of the gross national product.
75. While export prices declined from the high levels of the 1950's, ijipoltprices declined even more, so that the favorable terms of trade, compared withprewar, which Finland had enjoyed in the earlier period were Pmaintained andeven improved during the past five years. This has been one of the mostimportant factors in Finland's ability to maintain external balance throughoutthe postwar period.
76. The predominance of wood products in Finnish foreign trade has changedvery little over the years, but within the group of wood oroducts there hasbeen a very marked shift to more highly processed goods:

Per cent of total
1913 1929 1938 1959 1962
Wood productsTimber and sarinill products 55.2 54.1 30.1 29.9 25.2Woodpulp 4.5 17.6 25.9 18.1 17.8Paper and proclucts 13.5 11.9 15.2 25.7 29.8
Total 73.2 83.6 71.2 73.7 72.8
Agricultural productsButter, cheese, etc. 9.3 10.0 8.9 5.6 h45
Other productsShips and boats ) 0.4 6.9 6.2Other metal goods ) 7.5 6.4 2.9 9.6 10.5Textiles ) 0.9 ) )Other ) 15.9 ) .2 ) 6,0
Total 100.0 100.0 100.0 100.0 100.0
7'. The improvement in the termas of trade enabled Finland to increase thevoLume of its imDorts more than the volume of exports compared withl prewar,out the strong inflationary demand prevailing until 1958 required the maintenanceor severe import restrictions to keep the external accounts in reasonablebolance and permit the rebuilding of foreign exchange reser-es. '.Tith the removalof import restrictions in ] 958 the volume of imports increased sharply, and in1.963 it was 05 ahove the 195-5,8 nvernae. Together ith the expansinn involume there was a change in the composition of imoorts. The share of finishednmrzf'actures, .^.rhiGh had represented ln0 of total irpnnr.+, before the war andnad declined to 33% of the total during the 1954-58 period, increased againaft;er 1958 and in 1962 reached b n of t.he total.
783. The rdirecPtion of Pinnish FPreig7n trade has ref'lectedfo to some e-xter.t.
the country's political fortunes. In 1913 28% of total exports went to Russia,LT)i-ih uT.TnQ an mnr+Mnt+ mr.3ket+ for' r Frvni sh manufatred goods an rrle f rl-T in l
market for Finnish paper. Russia also provided 28.3% of total Fimnish imaports.T1. ; xr ing tl+aeTt +;4 -+AATT +h .- A1; AA +1, 11 k> -' 4.. -;-
IJUX 1XE WS | 1J Xllacl tJiX| U ; |elw W u- -Uo ~ u- <:D00 ul.al _ ts S O XS /O' Vuu ,,the postwar period it increased again and during 1959-63 it has corresponded to''%/ of th Utoa. ±liUs Urade is UasedU on bi ateraUl exchi arnges, -Ii th FI n a n inlndU
provi.ding mainly engineering products and the Soviet Union mainly feedingstuffs,crud'e m2terlials and oiLL. Anoth L 5SIII o)/O Fl c.Mish tIradeI Ls auccunteIUL'Ui U.Lf-
lateral exchanges with other Eastern European countries. Western Europe remains,howe-ver, the prinicipal Market for FiIInish products and the principal supplier ofFinnish imports. Participation in EFTA has not so far resulted in aly signi-ficant change in the pattern of trade.

- 24 -
79. Prospects for a continued growth of Finnish foreign trade during thenext five years appear favorable. Although the large expansion in the wood-working industry has now been completed, the existence of excess capacity inLboth 1962 and 1963 and the new investments which will continue to be madeshould ensure an increase in the value of exports of some 5% per annum duringthe next five years. World demand for pulp and paper appears likely toc3ntinue expanding at this rate. The increase in exports of miscellaneousmanufactures, whlich accounted for only 6% of total exports in 1963, and inexports of engineering and metal products to 1,w.estern markets, will have to bevery sharp if it is to contribute significantly to the growth of the Finnisheconomy and of Finnish trade. Such a sharp increase is possible exactlybecause these exoorts are at present quite small. The experience of Denmark,w'hich has been f'aced with a siniilar problem and was ab'le to increase itsexports of industrial products by ovrer 10% a year during 1057-1962, is indicativeof what can be achieved in a period of expanding world trade by a country withthe necessarv technical skills and mwnagerial talent. DeveloDments inEuropean trade, and especially in the relations between EFTA and EEC, couldgreatlv facilitate Finland's task if they are in the direction of freer trans-actions or hinder it, if they lead to the fonaation of exclusive tradinggreups= The decisive factor; however; will hp Fiinland's onm bhilitv to hec.omean efficient producer in new lines of manufactures in which its relati-eadlvantages are not as great as in woodworking. A competitve cost structurewill be an essential requirement for the success of this effort. The rise inprices in 1963 has already weakened Fi.nan's compeLiti ew pstion, but thedamage should not prove lasting if sufficient restraint is exercised in thene:t few yesrs, since pric incre3ses are tac'ing place elsewITere aS wea.l.
8r. Thus, 4t seers reasonable to assu,e that th,e value Of F;- ish eorts,which increased by 8% a year during 195°-63, may increase by 5% to 6% in thecmLig uecalde, and Itis shou I lu pe,4t a contnLued growth and diversificatoof the Finnish economy.
Balance of Payments
81. During the late 1930's Finland maintained a surpluis in its currenttransactions which it used to retire its external debt. This required veryanistere financi2aL conditions domesticallv. including a high rate of unemolcvnnenz.and was a policy dictated by the feeling that the alaount of foreign borrowingundertaken in the 199O0t had been eyeessive (A 8T millior hcad been horrowed inNew York alone in that period).
8?. For entirely different reasons, i.e. the need to rebuild the depletedfjreign exchannre rsre +aivd.nngh ctre+Ajv.&ir d -iffr n+ rnens i.e. fi

restrictions and controls, Finland maintained a surplus in its current accountnlo during the decade l950-59, wicbiih nirprary 23 inillinnn pr nnu,r and rmdepossible an increase of ';239 million in the gold and foreign exchange holdingsof the Bank of Finland, fxim $76.7 million l t the eInd nF 1Q9),t + 3 W7 mnilrln
at the end of l959. The need for this effort is shown by the fact that in190 +the recn-rves correspondd to only t--r +-on impo -rts. Ry U6 thyr hka--/. 7' IA - .l -',L - -,J t%JL. -fJ ¼A-AjA '. V.- ,A *U13 .I~J. 1 VQ* -j _Lj_J' -±t'j .S
increased to nearly four months' imports. This result was not, however,achieved rt thOutJ-4 cost to 4 U - - --- the - - 1.2- 1-__4 the dore '.estlc -ecn-o -, -
lated fromi external influences, the policy of import restrictions and exchangeconturo'ls graldual'ly weak1en edl the country's compeUL tltlve positlion aidiU checUkedeconomic development. It took a drastic, and painful, program of stabilizationto restore equL,t'r±um in ±1 econom.y ad k posil a return to externalconvertibility and freer international transactions. During 1960-63 Finlandexperienced a current account deficit of a million per arnum, which is norein line with the countryis stage of development and exceptionallyr high invs+t-mnent requirements. There can be no doubt that in the absence of this deficitthe degree of financial stability and the rate of economic growth maintained:Ln this period would not have been possible. The 55 million annual averageconceals large year-to-year fluctuations ($90 million in 1962 and $30 millionin 1963) which reflect in part the inadeouacies of fiscal and credit policies,and especially the inability to control the booms before a financial crisisdevelops. The sharp correction of the large 1962 deficit in 1963 was possibleonly through a very restrictive credit policy which, together with a slackeningof exports, dampened investment and economic activity beyond what would havebeen necessary if monetary demand had been kept under better control in 1961,and especially in 1962.
83. While in 1961 and 1962 the financing of the external deficit haddepended excessively on short-term borrowing, the situation was corrected in1963 and in retrospect the deficit of the past four years has proved wellwithin Finlanid's capacity to finance. Debt amortization, public and private,has required another $L2 million per annum so that total new borrowing require-ments have averaged ^;97 million per annum in this period. In 1960-62 short-term borrowing had corresponded to 23%O of total new borrowing but in 1963the situation was reversed and long-term borrowing was suf`icient, not only tomeet the external deficit and make good the loss in reserves during 1962, butalso to nermit a large repayment of short-terrm debt. The increased availabilityof long-term financing reflects an improvement in the opportunities forbo.rowing during the past year, which continues in 1964. Bank loans were tlheprincipal source of official long-term borrowing in 1960-62.

- 26 -
84. 1he follo-ring table summarizes these developments:
Balance of Payments
1960 1961 1962 1963- (preliminaq )
T1"irc-handise tradeBxports 990 10,5 1105 ii,0Imports 1n067 1155 1230 n1291
Net,=+ -77 -10 C0
Other curruntRecei p ts- -18 209 23c1)'7 I37
Payments 148 173 202 207
,Jet 35 36 35 30
Errors and omissions 10 -5 - -.LLurrent account balance- -69 -YU -30Amortization of ?ublic and
private uebt-/ -6 -39-Financed as fa)llows:
IB-iD loans 17.2 1G.4 17, 12Other off:Lcial long-term 7 342' 153i )Private long-terrm 11 19 18 ) 150SuoDlier's credits (net) 8 h 14 )Net borrowTing by cormerc10barRs-il 30 49Other short-term 30 11 -31 -23Other (re,idual) 1>.8 1'.6 Ih.9 -15
Tctal 78 126 91 111
Chanme in gold and foreign exchangeassets of Bank of Finland 10 18 -41 30
1/ Of which repayment of 3ank loans has been as follows:(Million 42)
1960 1961 1962 19633.-7 -l.0 5. T.
2,1 Includes ';19 million drawn from a 1959 Soviet credit of -124 million.It should, hawever, be pointed out that in 1961 Finland!S holdings ofSoviet bloc currencies increased by $23 million.
3,/ Includes `;12.5 million drawn from the Soviet credit. It is reportedthat the -Soviet credit is being increasingly utilized for the purchase,of irilitary equipment.

- 27 -
III. C!JC5LUSIONS
NEED FOR FOREIGN BORRUFrITNG - CURDIW(9RTHINTESS
85. The major conclusion from the preceding analysis is that Finland isstill- - c iment f3cng -i----l- strutual
adjustments in the coming years. By the standards of underdeveloped countries_n other parts of the world the per capi+a inco C at obout e1,0 n 1962, is
high but by the standards of Western Europe, to which Finland geographicallyand cultluraULy belongs, t, his is well below average. I-U±trovA1) livn sLtadluarUd
are comparatively lower than this figure indicates since Finland has to devotea higher proportion of its resources to invesltment than Irost other Europeancountries. Private consumption in Finland in 1962 corresponded to 5755 perI '5n. d' nr' r. D _ _ _ _n n. ',-- _ _ _liedu, cUiIIpare'u With @LU ,05U U i)u uiuriaI-K anu j'L.UUG ur rrailUe.
&6. Finland has the material and hurmian resources needed for attaining thieliving standards reached in other 1estern European countries. The irain reasonwhy it is still behind is that economic development came to the country laterthan in the rest of 7,Testern Europe and was interrupted by the serious lossesaned disruption caused by war and defeat. while tne progress made during thepast ten years has enabled Finland to recover nost of the! ground lost, seriousproblems remain which will require as sustained an effort, in the next decade ashas been needed to liquidate the effects of war and defeat.
87. Agriculture still provides the livelihood for a quarter of the popu-.iation, but climaate and soil conditions are too unfavTorable to enable theotherwise efficient Finnish farmers to earn incomes comparable to thlose of therest of the population. The heavy subsidization needed to reduce this dis-crepancy in incomes exerts a strong and continuing pressure on Finnish resourcesand is undoubtedly one of the most serious problems facing the Finnish economy.While it is easy to ascribe this situation to political pressures, the rmorelundamental factor is the low returnsfrom farming. The answer lies in a morerapid movement of labor out of agriculture. This will necessarily take timeand can be speeded up only through a large expansion in industry, which willcall for large new investments in plant and equipment as well as in urbanfacilities.
88. Membership in EFITA has opened up new opportunities for Finland, buthas also created new problems of adjustment. The Finnish home market industries.which have traditionally enjoyed a considerable degree of protection, aregr,adually loosing their sheltered position and will, in the next few years,have to become fully competitive with the much larger and stronger industriesc,f countries like Britain and Sweden. Expansion in the woodworking industryis likcely to mark time for a while, following the completion of the largeprogram begun in 1958. The growth in world pulp and paper capacitv hasanticipated the expected increase in demand during the next few years and atoresent this canacritv is not fully utilized. Tn Finland a limit is also setby raw material supplies. It is generally believed that any substantial uicrease

- 28 -
in deanand for industrial wood woulA lead to hir,her timbher prices and over-cutting. Thus, if the pace of econorric advance is to be maintained andexcess manpowIer in agriculture reduced, rew export products will have tobe developed.. Finland seems to possess the technical skills, advancedorcgan.iz nt n-- n e-n and mangle ~r i na ta V 1e.nt needed for s iaizAe, + .eti.V.
industries and prospects appear particularly promising in the fields ofengireerlb an che.,.icals. S"uch- industuries -vill have 4o be moenan-el
equipped ar.d their development will make large demands on available capital.Transportatlion !Laclities are stULil lra de4at for a .UUId UL;UI1L)Iy, -Ul
large investments will be needed for improvement and expansion.
89. Thus, during the next five years the investment requirements of theFinnlsh econormy will not be smnaller than in the past and may even be larger.The experience of the last four years suggests that, if such investmentneeds are to be met without endangering the precariously maintained finan-cial stability, a net inflow of capital of at least 50 million per anmlmwill be required. It might be argued that such an inflow has correspondedto less than. 6% of net investment and that the resources it made availablecould have been provided by an increase in domestic savings. This argnient,however, would ignore the fact that the domestic savings effort was alreadyft the limit of what could be diverted from consumption without seriousstrains on the financial structure. Moreover, foreign borrowing has beenof decisive importance to the countryis foreign exchange position. Thenet capital inflow of $.200 million during 1960-63 compares with foreignexchange reserves of about G350 million. The alternative to foreign financ-ing or to a return to exchange controls and import restrictions would havebeen a tightening up of domestic moretary and fiscal policy whicil, in orderto produce the required results, should have caused a contraction in domes-tic investrent much greater than the reduction in the external deficit.
90. Finlard can easily undertake additional foreign debt obligationsof the order of magnitude of recent years both because prospects for conti-nued growth in foreign e:change earninfrs are good and because the burdenof the present debti is relatively small. Finland retired the bulk of itsexternal ptublic debt during the late 1930's and has had only limited recourseto foreign borrowing in the postwar period. The public external debt out-standing on December 31, i962, consisted principally of '.166 million ofSwedish and UJS Government credits granted in the earlyr postwar period ardof :'123 million of Bank loans. A^t that time a Soviet credit of 0.125 milliongranted in 1.959 had been utilized ornly to the extent of "ll million. Theimpression when the credit was granted, that it would. be of little economicvalue to Finland-has proved correct. It is reported that in 1963 substantialdrawings oni the credit were made for purchases of military equipment. Onthe other hand the servicing of this credit will be easy, stnce Finland tendsto nave a large surplus in its trade with the Soviet lJnion. Excluding theSoviet credit. the Finnish external debt of A327 million on December il. 1962.was no higher than it had been ten years earlier and its service requiredonlv .t30 mil-lion in 1963. i.e. thhe same amount as ir 19q3. Mearwhile. 'ow-ever, the country's foreign exchange earning capacity has doubled and tne:ervie-s o' t1hP dbht in 19 t;A eorreflrondPd to s ign 0'+ly l h ,- o -.. ,+
ioreign exchange earnings in Western currencles.

- 29 -
91. Net foreign borrowing, public and private, at the rate of the pastfour years, i.e. $55 million per annum, would require new borrowings of theorder of $100 million a year of which some t60 to 470 mTillion would probablyhave to be official borrowing. Repayments on the debt outstandirng on June 1,1963, will average about 025 million a year during 196i-70. A rate of officialborrowing of J,60 to $70 million a year would add about 4)200 million to out-standing debt in five years. Assuming that the cost for interest and amorti-zation would be 12%, this would increase the service of the debt at the end ofthe period from $30 million in 1964 to $60 millioni by :1969. Even if foreignexchange earnings in W!estern currencies -ncrease by on:Ly 4h a year (from about"1,100 million in 1963 to $1,h00 million by 1969) the service of the debtwould be absorbing only 4.3% of current foreign exchange earnings by 1969-70.
92. In addition to its good econorlic prospects and relatively small debt,Finland has an unmatched record as a borrower. ILs inability to raise moneyin capital markets has been due in part to the liaited possibilities for allforeign borrowing which, for a variety of reasons, have existed in the post-war period and in part to the apparent vulnerability of its internationalposition. A market improvement has, however, taken place recently. A ten-yearissuie for ,12.5 milliorn at 6% and at a Drice of issue of 98-3/Ai was made inNew York in March 1963 and proved quite successful. In July 1963 Finland alsoobtained a loan of DM 25 million from the 'prman (rovPrrimPnt.-ownPd KrP8it,anstalt._The real improvement, however, has taken place during the last few months. Inibiarrh an issuei was nadre by the PP-ubhlir of Finland in rTPermanv for 1M )10million at 6-11/4% and a orice of issue of 98. In May the Republic of Finlandraised rt1l mIi:lon in lNiew York. Tlle bonds, at 6, have a maturity of 12 ye9rs,and were issued at 98. In addition, a Government guarantee was provided foran issue of -niq 40 million by the prisvrtelr o Irvrnutia+ l ;otgage Bnnr of
Finland. It is reported that arrangements are being completed for furtherbhr% raingryu~n h o.n6rots
°3. It istoeal4- ases-esinXcr Ce fteeicesdvpr
tunities for borrowing, but there can be no doubt that the relaxation of coldwar -tensions- 44_J and th1e1±_3 gUowin5 r n osi_..ta-nig
its independence have been important factors. If this trend continues Finlandsho uld5 ve abl.e to obtza in a subs'ani.,a.L a.r oi U Vfns .L." t rJ 'eed in tLLecoming years in private capital markets. Financial circles in New York bel evcthia. on present, ind-ications between $ an' g3, ,,iillo el ye-ar cou.ul be: [ra,bed
in this way in the United States and Europe. Tfhis would be a great improvementover conditions during the past uecade but would still meet only half of
?inland's probable capital requirements. Additional funds will no doubt beavailable through other sources (banks, Governments, etc.), but the total islikely to fall slort of needs for some time to comne.
9h. Foreign direct investment may also increase and, although Finlandprovides no special incentives to attract such investment and some o: tne

earlier suspicions against foreign capital still linger, the good opportunitiesand fair treatment wnich may be expected in Finiand, together with the improve-ment in the international climate, may attract foreign enterprise in certainfields, especially industry. This, however, is unlikely to reduce to anysignificant extent the financing requirements estimated above.
95. Thus, although the recent imorovement in borrowing prospects isenicouraging, the dependence on the Bank for supplementing the resources F.nlandneeds for its development and for the strengthening of its economy continuesand justifies further recourse to the Bank.
Department of Operations, EuropeJune ; - n,' '96'

A.NNEX I
HISTO0RICAL BACIT,'1ROUMD
1. Scattered settlements were made in pre-historic times in the westand south-west of Finland by Scandinavians from neighboring Sweden. Themajor settlements, however, occurred in the first centuries of the Christianera. Tribes belonging to the Finno-Ugric linguistic family, and probablyoriginating from the area between the Urals and the Volga, which had settledfor centuries along the Baltic' and mixed with other racial group!s, eventuallymoved north and established themselves over a large part of the territoryof present-day Finland, During the 12th century the three main tribes inwhich the settlers giouped themselves gradually came under Swedish domination,the original rnotive for the spread of Swedish power having been Christianiza-tion,
2. Finland remained a Swedish orovince for six centuries but duringthe last two centuries it enjoyed considerable local autonomy as a GrandDuchy of S-weden. In 1809 Russia, an ally of Napoleon at that time, invacdedFinland and Sweden was forced to cede the territory to Russia. Russiatsacquisition of Finland was not affected by Napoleon's subsequent defeatas Russia herself had meanwhile joined the coalition against Napoleon.
3. For a variety of motives, Alexander I of Russia continued thestatus of Finland as a Grand Duchy and granted to it even more sclf-govern-ment than it had enjoyed under Swedish rule, proclaiming that Finland was"lhencefortlh raised to the circle of nations." The objuct of the strongFinnish nationalist movement, which developed during tlhe 19th centary wasnot a change in the status of Finland as a Russian Grand Duchv but thereplacement of Swedish, which had remained the officiaL language, byFinnish.
4Rplt_ions with Rnssip- how.ever, deeriorated sharply at the end aF'the century when the new czar, Nicholas II, yielding to imperialisticnressursrs Tithin Russin. Pmharked on a nolicv of russ fi cati on of t,ho GfrandDuchy, which met with determined, and successful,resistance.
5. Finland declared itself an independent state in December 1917 andadopted a constitution making the country a republic in 919. (SovietRussia recognized Finnish independence in the Treaty of Tartu of October1920.) This, however, was also aperiod of serious internal -issensionbetween extreme right and extreme left which culminated in a bitter civilwar during 1917-1918.
AD The internal political l . .uio n- a ed sri.n-e v,nA ougho,-- m osWtof the interwar period due to the continued conflict between extreme rightand extreme left but conditions improved dur-ng t-e last Icur prcwar yearunder a coalition of Agrarians, Progressives (Liberals) and Social Democrats.

- 2 -
7. SinGe it. hcrnme in.ienpndtnt F-inland tried to maintAin 2 pol-ev ofneutrality in foreign affairs, but there was considerable suspicion of Russianlnte.pntlons aid rel1antions with Soviet. Russ liahi remainend ncnol-
8. Rejection by FinIad of' a Soiet reaond for a base in t (G. iilf of
Finland led to the Russian attack on Finland in November 1939 which endedin1 F~_innis A-ePat and territor"ia los-e in M-rch 10 T-O I ln the -hope o
.1. 1 41 .U~i - - U01 LI OIW~ --- Vi .1. -. _L. 1. 1.4. --V 0 - -J -1 -OL '.1± 4 -.-'4' . ..1± LII £..' J - '4
recouping these losses Finland joined Germany as a co-belligerent (as dis-ti--ngu i she d IC,o= an ally) -41-- -! the later- wa ag-s a)usl duin 11-9
± I~4, ~A Q~ J -LI IAA W O I LI U WC, 0 ±VOCL 062 U1k _LUOOXOC UUIU 4.XA6 J./4 . /L~4 .
Finland signed a separate armistice with Russia i.n September 194L1 and a peacetreatUy i 1 9i7 UL. UCL-, L,. UndUl Uer tuh I'e te'ms of thi'e a LILLJiI±Lce Finland was forced
to cede about 12% of its territory to Russia, as in 1940, to agree to thepaymeuii ue ' leavy repara una anu 'o accept a Sovi e n a va uase a trlL-kal.,12 miles south-west of Hlelsinki. The country, however, was never occupiedby Russia.
9. In 1948, the Soviet Union asked FinLand to sign a treaty of friend-ship and mutual assistance, under which Finland had to undertake the obli-gation to fight in defense of the Soviet Union if the latter wvere attackedthrough Finland by Germany or any state allied with Germany. The treatyalso provided for mutual consultations in case of a threat of attack onFinland and for Soviet assistance in case of an actual attackc. 'he Finnsstress, first, that the obligation does not extend to the case when anattack is made on the Soviet Union outside Finnish territory and, second,that the treaty specifically recognizes "Finland's endeavor to hold herselfoutside the conflicts of interest between the Great Powerat, i.e., Finlancl'spolicy of neutrality. In 1955 tne treaty was extended for amother twentyyears and the Soviet Union, as a gesture of good will, gave up the Porkkalanaval base and agreed to Finnish membership in the UJnited Nations.
10. A policy of neutrality, which at the same time ma-intains the confi-dence of the Soviet Union in Finnish intentions, was strongly urged on thenation at the end of the war by Jmbo Paasifcivi, w,sJho served as Presidentduring 1946-1956. There is general apreement in Finland that such a policy,widely known as the "Faasikivi line", is in the nationail interest. It isfelt that the fact that the policy is a necessity imposed on Finland by therealities oL geography and of arrld power relationships makes it no less amatter of national interest to Dursue this course.

A TTNM'V TT
POLITICAL BACKGRQONfl
1. The constitution of 1919 provides for a single legislative cham~ber(the Diet) of' 200 members, elected for a four-year term by prorortionalrepresentation and for a president elected for a six-year term by indirectpopular vote. Sovereign power is embodied in the chlamber but in practicethe ioresident's influence on political developments has been considerable.Tne pavers of the president are exercised through the ministers who arepolitically and legally responsible and who must enjoy the confidence ofthe chamber.
2. Before the war the Social Democrats were the single largest party,followed by the Agrarians. In 1939 the Social Democrats held 437, of theseats in the Diet and the Agrarians another 25%. The Communist Party wasbanned. Since the end of the War the political situation has been compli-cated by the ernergence of a stronig left-wing movement dominated by theComminunists (The Finnish People's Democratic League or SKDL), which hasobtained over 200 of the total votes and seats in the Diet. One of thereasons for the substantial popular sunport obtained by this extremist grouphas been the continued hostility towards communism and the Soviet Urionof the Social Democratic leaders VAin6 Tanner and VIJinI5 Leskinen, as wellas the Social Democrats? relative conservatism in economic and social policy.Thus the share of the Social Democrats declined to 27% of the total voteduring 1948-1254 and has been further reduced since 19'8, follo-wing thesecession of its more radical members. The fact that the two parties,which account for half the seats in the Diet. have been both bitterlyonposed to each other and distrusted by large sections of the population,hnas given a preponderant role in Finnish nolitics to the Agrarians, thethird largest party, whi-ch has continued to account for about 26% of theseats in the 'Diet. The ahility of the Agrarians, a basicallv cons_rvativenarty, to insoire confidence to the Soviet Union, has been another importantfactor in their noliticra strenath. During the nast ten years Urho Kekko;enmthe leader of the Agrarians, who was elected President in February 1956hy a 2nnjoritv of one vote anci re-elected in Febhr-aIr 1962 hy a largemajority, has been the arbiter of Finnish politics. Following the parlia'-mentaryz elections of Februarv 1 Q2, a maniritfv eoa1-tion of Agrariarns,conservatives and three Trade union representatives, under the AgrarianAhti Karjalainen, was laboriously nut together in Anril 1962 but did nctsurvive a crisis over food subsidies in the summer of 1963. A non-oartisancare+.anker 7orernrnpnt. under- Reino Tphto.n +the Cbh if rf' Adrlminis+.rn+aio o thefMinistrr of Trade and Industry, was formed in December 1963. Thnis is adevice frequerntlpy resorted to in the past, wthich secures continuity ingovernment while a political solution is being sought. The election int.he siurer nf 1O,A of' n ew lSocial- Pnrfnr+a p c '-ai Rafael a ha
removed one of the obstacles to the particioation of the Soci.al Democratsicn a nes, coalition .but the m distrust letffeen them and thecontlinues.

- 9 -
3. The average life of Finnish Cabinets since independence has beenless than a year. The political instability implied is, however, moreannarent than real since the relative strength of parties has changedremarkably little and this has made the possible political combinationsand Dcrmutations rather limited. As in other countries unable to produceclear majorities, the Trincipal result of the political cor.ditions pre-vailing in Finland has been a relatively weak executive and a relativelystrong parliament, with the inevitable corollazy that needed measures havetended to be postooned until a crisis had developed. This has beenparticularly the case in economic matters and has been a major Finnishdifficulty compared wvith conditions in Sweden and Norway.
The Swedish-sneaking population
h. The S,edish-speaking group is a minority only from the point ofview of language. InaLl other respects, including race, it is an integralpart of the Finnish nation.
5. The Swedish-speaking population has been less than 151 of the tot;alsince 1800 but has held a predominant nosition in the life of the countrydue mainly to historical factors. With the spread of democracy the politlical,social and economic influence of this group has been declining.
6. The Swedish-speaking population has remained remarkably stable innulmbers during the 20th century, at around 330,000 and as a result theproportion it has represented in the total population has decreased from11.6% in 1910 to 7J15 in 1960.
?= The Const-ititinn of 1919 n-rovi r3s that bnoth Finni-h -nn $wlpeiiqlhshould rank as national languages and the Language Act of 1922 contains moredetailed I rovisions, based On the general o r,tI 1+e tha+ th`e extent of 1+heuse of either language for administrative and judicial purposes in any"i-tyan dsrct should dependie on the relntivenuerca strength ofP speake-of the two languages in the district concerned. It is, however, indicativeouf t.he rot.ring ascendncyv of t.he Finnish lnalngage t.hat in 1950) onrly I% ofsthe Swedish-soeaking population did not speak Finnish 'ihile only a minorityOrfn t Fi ih-speaqidn populatio. spoke Svedish.

ANNEX III
SOCIAL BACrGROUND
Social Con.ditions and Policies
l. ITe existence of a "large rural population and the inaDiiity oIlarge numbers, especially in the north, to earn a reasonable living on theland dominate Finnish social conditions and policies.
2. High levels of economic activity in industry and related activitieshave virtually solved the problem of urban unemployment which existed beforethe war but -the problem of rural unemployment, especially during the wint;ermonths in the north, persists. In rural areasover 15% of the male populationof working age is sometimes unemployed for three months or more.
3. In the post-war period full employrent became a national policy andmeasures to relieve unemployment have been greatly expanded. They takethe form mainly of public works, principally road and railway constructionplanned and financed by the Central Government, and of loans to privateindustry to stimulate econor,mic activity in areas of substantial unemploy-ment. In l959, when winter unemployment reached a post-war peak of 90,000,a total of 30,000 were given employment in public works. During 1960-63expenditures on public works to relieve unemployment averaged 0156 milliona year, nearly 5% of total current Government revenue. This method ofdealing with unemployment is considered by many excessively costly but itseems to fit the special character of Finnish unemployment as a. predomina.nwlwyrural phenomenon.
.Uremploy_nent insuirance ha.s been only voluntary and has been confinedto small numbers among trade union members but a more comprehensive schemewas adopted in recent years.
5. Social welfare services, which include child and family allowances.old a.ge pensions, public assistance and health services, have expandedgreatly since the early post-war years and are at present at about the sainplevel in relation to the national product as in the other Scandinaviancountries:
Soeial WeLf~are RYrenrditflrP
as per cent ofnet nationnl inMomA
1957
Finland 12.3Denmark 13.3Norway 10.5*S-uedei 'n 12.8

6. Tn addition, housing subsidies are granted for low income groupsand a full scale health insurance program hias been recewntly adopteda
7. Industrial relations, which were strained before the war, iavegreatly improved in the post-war period fol.lowing an agreement of mutualrecognition signed in 1940 (and amiended in 19i4i and 1946) by the Confedera-tion of Finnish Employers and the Central Federation of' Trade Unions, onthe pattern of similar agreements in Sweden and Denmark.
8. lMembership in trade unions is less than in the other Scandinaviancountries (only 4500 of all industrial ermployees), but there has been arapid expansion during the postwar period.,
9. Since 1958 the trade union movement has been solit in t",io organiza-tions, the Central Federation of Finnish rrade Unions (SAK) to tlhe leftand the Finnish Trade Union Organization (SAJ) to the right. Their member-ship is 200,000 and 80,000 respec-tively. In addition there are a numberof trade unions with a total membershio of about 220,000, which are independentof these two organizations. These conditions inevitablyn make the trade unionmovement less effective than. in the other three Scandinavian countries.
The Cooperative Movement
10. Due probably to the harsher environment and resuilting greater needfor mutual help, cooperation is more developed in Scand4navia than elsewherein the world and, within Scandinavia, F-inland is the countiy where 'themove.nent has achieved its. greatest advance.
11 1IPmhershin in the. coonprativp.s hns doublRd sincf the wnr. recAnhinq1.8 million in 1961 in a total population of 4.5 million0 The largest-vru.m.e on business was done by neoopertive qtores! the c-redit I cietiei
and the dairies. The Central Bank of the Cooperative Cr-edit Societies (OKO)is on.e of the country' s la Pi Iai3 lns*itui Tn 1961 Q he +tives accounted for 6/% of the rnet doimestic product and were important irhthe following sectors:
Pel- cenrt cfincome in each sector
Manufacturing otherthan wood-working1.
Retail trade and other
THotels 2640

-3-
Government L3nterprise
12. Government ownership of prodrcti. e assets is more eytensive inFinlard than in the other Scandinavian countries. This is due to a varietyof historical and other reasons and not to any hostility to private enter-prise.
13. Ir J961 State enterprises and Goverrnment-owned companies accountedfor 1L. of the net domestic product and were predominant in the folloT.Iingsectors:
Per cent of net.uroduct in sector
Forestrv 17Mining 70Metal Industrios 20!'oodworking Industries 17Gt.her mnanafnct.uri nL 5F ovTer 51Transportation 4Construc-tion 25
14. The ain . consideration in the setting up of goverrm-nt-ownedenterprises in recent yes has been the development f the north4. Theseare enterprises for which sufficient private capital and initiative have
_A~~~~~~~~~~~~~M - -- 4 - I n - - - - - - __ - - 4-Ar .44 w - 4 1 - r I- 41 -n l e n a a lJ: L V .L Lv I Pi .L113 .LPJd.L -L5t. L CLH' -. Li . LJ¢.Ly k UL±L
State ard their financial position in 1962 were as fcllovs:
1962t ori,.-'-----u-
Receipts LTDnditures deficitvIjIL ' fi U1. rLii
State Railways 456h 460.0 - 3.6Post and Telegraph System 2-0.8 2h40.7 0.1State Forestry 136.8 117.1 19.7Other 104.5 100.5 4.0
15. Government-owned companies are onerated on strictly business prin-ciples and are completely independent of political influence. They arei'naged as efficiently as privately-owned companies ard tnis is one reasonwhy there is no serious opposition in Finlarnd to the role played by theGoverrnment in the economic life of the country.

STATTSTTCA.T, APPrf.NnhTX
List of Tables
Number
National Accounts .................. 1................... Gro-e+" ln Na+ional 'Product- 19816 ................... Industrial Production. 3 ..................I-ndus ctria Productl'on ]991> ................................. 3a ,U fC- ClkAU, J 1i 6-'D OA,--- - 1 Cfn -1 CVI)
Forestry . .......................... 5±i±A__: A..) . i_ 1±_UUU . .± L ..
Electric Power ......................................... 7Odcc-upat: Lo-na-l DI;5UlUU-011 of KPf-ulaio ........................... 8
Fixed Investment . ..................................... 9rrices and Wages ...................................... 10Hloney Supply ....................................... 11Central Goverrfnent Budget . .............................. 12Composition of Public Expenditures ...... .............. 13Financial Institutions . .........................,.. 14Interest Rates ..................................... 15Direction of Foreign Trade ......................... 16Commodilty Composition of Imports ... ................... 17Exports of Main Product of Forestry and .loodworking ... 18Foreign Trade VoltLme and Prices ..... .................. 19Foreign Exchange P.eserves .. ........................... 20External Public Debt .................................. 21Estimated Service Payments on External Public Debt .... 22

Table 1
National Accounts
( in mi.Lli.on 1 FmI Ik. )
1960 1961 1962 1963(prelirminary)
Gross national oroduct atmarket prices
Privaate consuniption 8,2h0 9,006 9,760 10,39'0Government consumption 1,915 2,1h2 2,b09 2,7h0rrross nrivnt'? invYstment 31.56 )L.201 hi.329 L;350Gross public invesbment 695 749 776 900Rynorts of gooid and snrvi es 3,69)4 3,995 ),j25i8 )i;20Imports of goods and services-3,837 -4,191 -4,:09 -4,520
T'otal 14,293 15,902 17,025 18 280
Plus net factor incomefrom abroad -18 2? 14 70
C-oss domesti,c p,-oduc+ III -II O!,9 17,()70 1I ,350~
Indirect taxes minussubsid:ies "0'1 I Pon -1 (Y75 1 9000
5ross do m es t1lc productw atfactor cost 12,610 14,099 15,095) 16,450
Depreciat-ioUI -. ,LUI'4 --L,27f0 -.L,30 14LJ
18I U IUiIiUa Lic JVru[IUC; U a
factor cost =ictorla Iica 1,516 12v2 ,15 1n1
Pcr cent annual increase at0 _ _ _ rr I rJ.coU1ibaisai piXIces Y. V/0 (*)/b i.y/O y/,

Table 1 (continued)
National Accounts
Gross National Product at Mar-ket Prices
Per cent or total
1_5 1959 1960 1961 196? 19M(preliminary)
ConsumntionPrivate 60 58.9 57.7 56.6 57.3 56.8Bublic 12 1)L.l l3.h� 13.5 l14.2 1,.0
Puivate 26 20.7 25.1 26.4 25.- 23.8P5.6 4.0 4.7 4.6 4.
Exports of goodsand services 24 25.0 25.8 25.1 25.0 24.2
Imports of goodsand services -22 -24.3 -26.8 -26.3 -26.5 -2h.7
Total 100 100.0 100.0 100.0 100.0 100.0
Net Domestic Product at Factor Costby Sectors
1926 1938 1955 1962 1963(prei.minary)
Agriculture and fishirig 22 19 11 10.7 11.1Forestry 15 16 12 9 8.3Manufacturing ) 28.9Miniing ) 2 26 32 31.0 0.4Power ) 2.8Construction 5 5 9 9.3 9.6Trarnsnortation 5 6 7 7.7 7.8Commerce, banking, etc. ) 12 12.3 13.0General Government ) 29 28 9 11.5 11.7Cther Services ) ° 6.2 6.4
Total 100 100 100 100.0 1;.0

Table 2
Groiwthn in Nqational Product 193O-1963
Jet Domt PrnAiii q. at Coq-.nnt. Prlesi
193= 100
Total Per capita
1950 124 113
1952 134 1201953 1 1371o
19g o150 131
1956 162 138
1955 163 136'I 4.17. 1i4.
1960 190 156
1962 209 1691963 F2i 1735
iPreliminari
Economic Review 1964h I
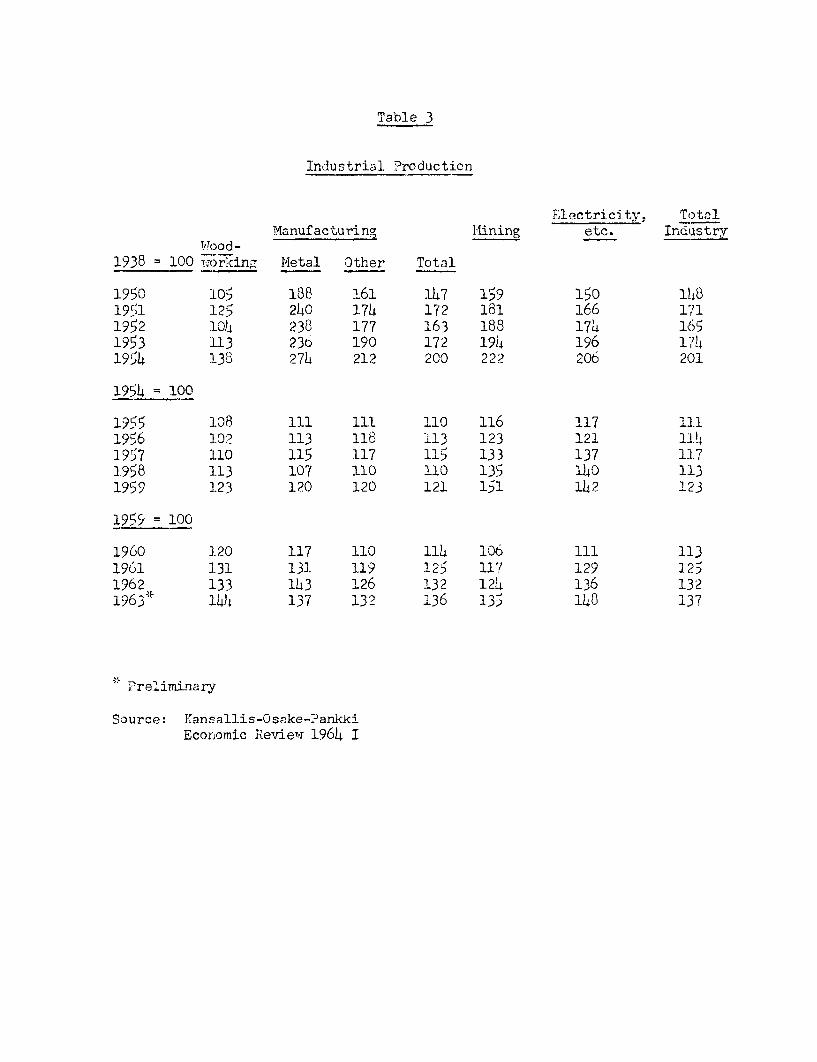
Table 3
Industrial Producticn
Electricitv. Tot21
Manufacturing Mlining etc. IndiastryWood -
1938 100 working Metal Other Total
1950 :lO5 188 1 61 14;7 159 150 } tt319I :25 2hi0 174 172 181 166 17 11952 -Lo4 238 177 163 188 174 1651953 L1 3 236 190 172 194 *196 17)!
195h 133 27L 212 2C0 222 206 201
1549 100
1955 il 111 111 110 116 117 11.11956 102 113 11 113 123 121 11. 1957 1.10 115 117 115 133 137 1171 Off '.1 I107 110 r) 10 13c 140 1) II
1959 1.23 120 120 121 151 142 123
1959 = 100
1960 ].20 117 110 114 106 111 1131G 13 , 1 13 119, -2 11 1 jYI ±)L 1.)I . ±17 .2 ! -L7
1962 133 113 126 132 12L4 136 132903) 14 137I 13? 135 13 14U 137
Preliminary
Source: Kansallis-Osake-?ankkiEconomic Revieew 1964 I

Table L
Manufacturing Pr'eduction 1959-19631959 = 100
1 960 1961 1 9g; 1 9S)3
S.^w,.i:lIs 126 122 1JL 112Pulo and paper 117 136 103 157
Metdl ~~~~117 13i1 a?3 3
cf whicht'4aoh;irL'.tey 12C1 L3 .1JVElactric,il equipment 122 129 140T ra:n sport equipment 112 121 13LOthier 119 135 12Th
Outher 110 1 12
cf whichFood 111 117 2.22Beverages 108 123 1 26Textiles 103 ill 113Clothirg &. footwear 108 111 126Chemiicals 110 123 133"r:iLting 112 121 127
Consurner goods 109 120 128 133Investment goods 11L 132 lTh4 133
Source: Bulletin of St3tisticsBank of Finland Mlonthly Bulletin, April 1964

Table 5
A1. lor,.uercial Lellir V J -(1000 cubic meters piled measure)
1950 1955 1959 1960 1961 1962 1963
PulpwoodSpruce 6,800 i2,45i i2,007 Ji2,77 ±5,i5c l3 i,209
Pine 1,900 5,213 6,904 6,943 7,263 6,959 6,943Birch - - - ,169 i1.913 2,480 3,519
Large-size tAXr.L3,400 14,417 12,396 16,863 15,791Y. 15,268 16,494
Fuel wood 3,ooo 473 9 4,307 ,,164 06,5F)4 0,5084 7,9&0
Other 900 1,800 2,lb88 1,679 2,030 1,853 1,639
Total 26,000 38,600 38,100 44,593 49,00o 47,499 47,784
Source: Statistical Yearboolk of Finland Bulletin of Statiscics
B. Utilization
1955-57 1960(million cubic meters)
Industrial use:Sawn timber 10.4 17.7Pulp wood 10.5 17.0
Other domestic uses:Home use b.7r rural population 10.3 )Other 5.0 °
Exports of round wood 4.5 4.7
Total utilization 41.2 48,1
Loueing and floating lossesand natural waste 4.3 5.1
Tota'l cuttings 45.5 53.2
Source: For 1955-57 Bank of Finland Monthly Bulletin, June 1961For 190 n data siipplied to Bank Ivission oy Government Officials.

Table 6
Agricultur&l Production
Crops lviilk delivered(million fodder units) to ciairies
( '000 tons)
1938 4,134 n. a.
1951 3,3L4L i,4h71 952 3; 609 1 v 501953 3,867 1,657195h 3,607 1 7031955 3,2`3 1,709
1957 3,685 2,Ob51958~~~ 3, 81 2,0
1959 3,1~h 2 2,317'
1961 4, 5oo 2,616
1963* 2, 746
Dreliminery
Source: Statistical Yearbook of Tin1cndBulletin of StatisticsEconomic Survey 1963
1/ Slightly different series.

Table 7
Electric Power
A. Production
19a l9 f8 1959 1960 1961 1962 1963(million kh 7
Publ-cIlydro 3,710 4,950 3,820 3,710 5,550
Ihealmc 110 100 680 1,100Total 3,120 5,050 4,500 4,1310 6,003
Privaterydro 1,66 '2,nri I 71, 1 , o0 2,1fi
The mal 708 898 1,669 2,526 2 01I- -ta' 77T 2 06 TT- - T57i
!TOzal r,O7[4 -29, 3412 3C
Public and PrivateHydro 4,876 6,960 5,563 5,119 7,739 9,)!2 8,292
Thermal 818 998 2,3149 3 ,626 _2I4 1,670 3 07Total 5,674 7,59Y 7,912 10,207 1,094 11 ,I599
Source: UN S-tatistical Yearbook, 1962 for 1954-1961Central Statistical Office of Finland, U.-ulletin of Otatistics
larch 1964 for 1962 and 1963 (figures are stated to be pre-
liminary).
B. Const.nrption
Co0marison wlt4! ot.her cowrt.rles
kWrn Der head of population in 2.963.
Puflicly generated Totalpower generation
Finland 1,350 2,270France 1,200 1,670Germany 1,400 2,300IJ.K. 2,400 2,700Dermark 1,000 1,130 (1960)Sweden 5,800 (1957) 5,000Norway 6,ooo 9,300
Source: UN Statiscal Yearbook, 1962

Table 8
Occupational Distribution of PoplilationCensus December 3~1,7196-
Total Population Economically active
Number Per cent Number Per cent.'000 of total '000 of total
Agriculture 1.119 2-.2 922Fcrestry 257 5.8 112 5.5Tnidustrv 870 1, 21=9Construction 16 10.3 176 8.7lectricity, water=-f- O7 1.1 19 0.9
Commerce 393 8.8 236 11.6Transpo-Qt 299 A.7 129 6.3Services 4t82 10.8 30: lL. 8
Economically inactive i-7R 10.8Unknown 13 _03 6 0.3
Total 4h446 100.0 2,033 100.0
Source: Statistical Yearbook of Firland 1962

Table 9
A f--4+4 o4 L2'4-_A I.e.+nA. A 4 V__ tjfT; 4 U a *t. _Cc L, ttAa,n -
(Million FM)
1 9 6 0 1 9 6 1 1 9 6 2Gross Net Gross Net
Agriculture 332 204 382 235 375 221Forestry 56 46 94 93 86 79Industry 1,209 681 1,452 775 1,374 696Transport 503 426 501 418 546 44.3
n ____ __ _ ^ -S ZH- ., . a AVanivU1.Vrc tc; ODI 3V 00 .L2L 320 209Government 734 658 794 708 822 722Housr -4-- - otI.-- L',^ 920i ',Ic 98t Na7 LL' I-'I'
.&. "WWM&L JVaZL 7&'J tLj4-1 f 7-ZUj iA'
Tntal 4,1 60An 3nn 6-AAA 1.27 .oAA 'A A4O'
Source: Bulletin of Statistics, September 1963.
B. Comparison with other countries
Per cent of Total
1960-61
Finland. Sweden Denrark Norway France
Agricultureforestry and fishing 10 3.5 12 8 7
Mantfacturing, mining,construction andelectricity 29 35 20 30 36
Transportation 11 20 19 26 15HouiLng 22 23 15 14 22vtwr r 2 18.5 34 22 20
Total lfV li lfV lfV
Government 16 17 11 12 12Government enterprises 8 13 6 (88 (88Private sector (84 70 83 ( (
Total 100 100 100 100 100
Per Capita Gross Fixed Investment in 1961(US dollars)
Agriculture 30 16 30 30 16.LIZuaL1ry 100 ) 150 5LIJ1
Transportation 35 80 48 115 30Housing 80 100 LA An 60Government 55 70 28 50 28
Total 320 400 250 400 240
% of GNP 30 22 20 29 18
Souree: UN Yearbook of National Accomta Statistics, 1962.

T able 10
Priccs and .lIages
uhoiesal e ShareCost or living :?rices Wges prices
1937 100 100 100 100195° 930 1,030 :1,380 340
1950 100 100 100 1001958 164 167 200 263
1958 100 100 100 1001959 102 99 106 1141960 105 103 111 1391961 107 104 120 1381962 111 1C6 128 1361963 117 109 136 1431964 128 (April) 117 (i-arch) 148 (April)
Source: International Financial Statistics

Table 11
M4oney Supply(Million FM)
Currency and Time and Gross NationlEnd of Year Demaand Deposits Savings Deposits Product
1937 36 152 n.a.
19b9 612 951 3,932
1957 1,171 3,223 11,0921958 1,302 3,706 11,8251959 1,h49 4,358 12,5581960 1,49' 5,151 14,2911961 1,646 5,986 15,901.1962 1,722 6,h16 17,0211963 1,983 6,685
Source: International Financial Statistics

Table 12
Central Government Budget(Million Fril)
19_9 1960 1961 1962 1963_
CurrentRevenue 3,121 3,51 3,763 4L145 4,323Expenditures 2,295 2,501 2,859 3,24h 3,613
Surplus 829 1,047 904 901 '110
Capital expendituresInvestment ) 697 773 81, 930Lending ) 866 279 237 270 ) 97Other (net) j -18 -17 - )__r
Total 866 950 993 1,085 1,127
Overall balance -37 89 -89 -184 -417
Foreign horrowingNew~ loans - 1' 75 ht7 150
PRepayments -68 -36 -31 _37 -38
Balance -68 -22 34 1 112
financing: -605 7 -55 -172 -305
New loans 207 197 175 367 420'pj,,jXen'l -100 -15L -12 *Q -8
'ter - (increase/-7r i7 170e P. t I .- D0 n.1
5A.'I.. >A -
decrease in cash balances,:I1U~l'- Utlii IJUI ngJW 11, eUt.) - -7V I4C -! 14
Estinates made by Bank of Finland for Bank Mission in November 1963.
Source: Data supplied by Bank of Finland to Bank Mission.

Composition of Public Expenditures
Per cet4 o-f Totl),[
kCurren-t, consur,,ptiorul 41 ° 4Subsidies 8 13 7
±L1UULW~~ II~~i±l~L~ (~n I 7Linco.me tranlsfers 21 19 23Investment 13 13 15Lending to public enter-
pri5es and the privatesector 17 15 13
Total puolic expenditures 100 1(O 100
Per cent of GITP
Current consumption 12.5 13.0 13.8Subsidiies 2.' h.0 2.4Income transfers 6.3 6.0 7.4Investment 4.0 4.6 4.7Lending to public enter-
prises and the privatesector 5.0 .0 4 .4
Total public expenditures 30.3 32.6 :32.7
Source: UIJ' Yearbool; of National Accoants Statistics 1962

Table 14
Finaneial Tnstitutinns
1961 1962 1963
Per cent of total
CnmmnrniiAl bankq 37 43 38Savings banks 32 26 21
and their Central Bank 21 16 21P- b.t Off-ic - r n n-L I kif 2
Too t100I 100) Ir
Loans granted to
CIoloU-,ercial banks 40 33 33Savings banks 25 26 21
and their Central Bank 26 18 30lf.. nLr-' - - n I -1 II-1Prob VIffle rBanK 4 i1 0Mortgage Banks 5 13 10
Total 10u 100 100
Lending by banks, iThsurance companies &the National Pensions Fund
Loans cutstanding Increase duringDec. 31, 1961 1961(T of total) (% uf tctal)
Agriculture and forestry 11.7 14Industry 24.3 31Porer 10.5 4Commerce 14.0 9Transport 3.6 5Mortgages 13.0 12Local authorit1es 4.7 -Other 18.2 25
Total 100.0 100
Source: Statistical Yearbook of Finland 1962. Kansallis-OsakePankki Economic Review 1964, I.

Table 15
Interest Rates
On DeDosits Non-index-tied Index-tied
6-month -1/2% 3% to 3-1/2.12-month 6%
Partly and wholly index-tied deposits have been rising during thepnst vyer= On lTr-hber 31, 1963 thev repnresented,C )j1 nof all deposits.
T'he. Ynont oro nly v anpnli ratno.Pn crmmPrrT r 1 h:inP 1 nnnq TwTas 7-1 /2%'toward the end of 1963. Last March the Bank of Finland took the unusualstep of requesting the v -reddit insti +utions +to annil ar Iofl{ * -l Ji +w the
wholesale price index on new loans of more than one year and on outstandingcredits.
T-+. --4- raTes on Go 1re nl - n.;
1i T' 4 y J -r06. "
on recent issues have been as follows:
November 1963
8% - 30 million RI 5-year bonds soldtlo banXXing inst uti0[15.
97 - 4u million FM tax bonds sold To
public, redeemable April 1965.
January 1964
Variable interest rate - 50 million FM 5-year bonds sold(3-11a2/4 above general to the public.deposit rate of conmercialbanks).
Bonds 50% index-tied, in- - 30 million FM 10-year bonds toterest 6-1/24fi. be sold to the public.
April 1964
- 60 million FM tax bonds to besold to the public, redeemableMay 1965.
Interest on non-index-tied deposits and Government bonds has beentax free but the tax treatment of index-tied deposits arnd bonds has varied.Recently exemDtion from tax has been extended to most index-tied depositsand Government bonds.
Source: Bank of Finland Monthly Bulletin

Table 16
Direction of' Foreiqi Trade
Per cent of total
19i3 1938 1960 1961 1962 1963
Exports
EFTA 34.2 54.0 34.9 34.3 31.9 32.6U1 26ti 44.7 24.5 22.2 20.3 21.5Sweden 4.1 5.0 4.8 5.7 5.7 5.7Other 3,3 4.3 5.6 6.9 5.9 5.tL
EEC 32.3 25.6 23.1 31.0 28.7 29.8Gernlany 12.9 14. 7 1. 12.9 11.9 12.0Other 19.4 10.9 16.5 18.1 16.8 17.8
United States - 9.2 5.0 4. 5.3 5.2
Eastern Europe 19.5 17.14 22.1 20.9Rtussia 28.0 3.2 1.1 .I 17.8 L16.0Other 5.4 5.3 4.3 4.9
Other 5.5 8.0 12.5 12.4 12.0 11.5
Total 100.0 100.0 100.0 100.0 100.0 100.0
Imports
EFTA 23.B 41.1 33.5 34.5 35,3 35.9K T 177 P7 -7 =43 17i5
Sweden 5.5 12.9 10.4 11.4 12.1 11.8Other 6=0 6.5 7.3 7R8 8.0 A.8
FEC> 46.1 31.~7 34.5 34.Fq 3q5 31.°
Cermany T°.T 20.0 19. 21.3 20T7 1.1Otheir I 3 11 7 15 1 13 .f - 1.1 1 31
1Tnited St,aties - '9°0 5. -7 5 7 5.1
Eastern Eur op 200. 1. 0 21 .7
Russia 28.3 1.2 14.7 13.6 13.7 16.9nther k 9 e. C) r'7 , I C
0. he 1.8 170 57 5. 4.1 o.
nw -;Q 'A l r I v .% r. _ .
ToU L 'l IUU.U 100.u.O 100U. O iO. O 100. 0
Source: For- 1913 and 1938 R.R. Platt Finland and its Geography 1955,,For 1960-1963 Bank of Finland Monthly Bulletin,

.LCLJ.Le 17
Commodity Composition of Imports
Per cent of totally>y~ lyo-, iyo iyr 7O1959 i6 1960 192 96
rood 13o'6 10.3 9.7 10.1 13.2A'els 10.7 10.1 9.3 9.7 10.0Crude materials 7.8 8.1 6.9 7.3 8.0Other materials 28.9 30.5 29.6 27.9 25.8
Finished manufactures:Consumer goods i4.0 14.0 1605 16.7 17_/Investment goods 25.0 27.0 28.0 28.3 26
Total 100.0 100.0 10090 100.0 100.0
M i 1 1 i n $Finished Manufactures
Consumer Investment Other Totalgoods goods Total Imports Impc)rts
1954 85 124 209 446 6551955 115 145 260 510 7701956 124 186 310 515 8651957 115 16r7 275 625 9001958 100 153 253 [477 7301959 119 212 331 5°4 8351960 149 292 441 622 1,0631961 192 323 515 635 1,1501962 203 359 562 668 1,2301963 520 690 1,210
f First 9 months.
Source: Central Statistical Office, Bulletins of Statistics.

Table 18
Exports of Main Products of Forestry and Woodworlcing*7'-+,ua-Im+J os u vssohervI4se ind1icated)
1954 1955 1956 1957 1958 1959 1960 1961 1962 1963
Roundwood, mi.llionSolid cu.f. 3.6 5.0 4.4 41 3.9 38 e 6 .0 3.7 2.1
Sawn timber,1,000 stds. 733 786 648 719 762 950 1,1371,106 1,010 977
Plywood andveneers 298 321 230 260 239 296 358 329 357 384
iMechanicalwoodpulp 193 183 156 165 1)43 139 176 160 150 1.73
Sulphite pulp 580 682 679 697 725 770 919 872 828 861
Su'Lphate pulp 375 447 L52 L.74 476 549 500 569 731 893
Fiberboard 59 61 49 60 83 110 128 146 152 16]
Board 101 110 106 134 1L.5 1L2 1L50 154 153 171
Newsorint 392 470 537 551 585 576 0°1 846 870 882
All other paper 359 L35 )460 557 562 668 '769 960 1,110 l,244
Source: Bank of Finland Monthily Bulletin, April 1964

Table 10
Foreigni Tride
Volume and Prices
Volume Prices Terms oftracie
Exports Imports Exports Imports
1950 100 100 1935 100 100 1001951 1.26 129 1950 1,420 1,366 1041952 1.12 154 1951 2,955 1,878 1571953 124 118 1952 2.10 1.o8l 13h1954 145 156 1953 1,944 1,590 122
195h 2,07L 1,550 13h
195L 100 100 195h 100 100 lOG1955 109 116 19`5 106 100 1061956 107 127 19,6 106 105l 1021957 117 123 1957 116 122 959<f, 11 ll ]n I 9hP, Iq V! n 99
1959 131 132 1959 130 133 981960 159 165 1960 133 136 9P19612 160 177 1961 135 137 99196'2 168 186 1962 13L' 139 96'
1963"- 170 183
Prelimnina ry
Source: Kansallis-Osake-PankkiEconomic Review 1964 I

Table 20
Foreign Exchange Reserves(Million ,)
Bank of Finland Commeroial Banks RateEnd__CI of exch.ange
Yehr Assets Liabilities Assets Liabilities FM per US.3- which
gold1937 73.9 28.08 1.8 8.1 6.o 45.6
1949 76.7 6.o 50.1 l1h.0 4.0 2311950 82.7 12.0 6h.1 25.0 5.7 23119%I 208.5 26.14 51.8 47.4 10.5 2311952 132.4 26.4 59.4 26.4 30.0 2311953 i144.8 26.l 61.5 29.9 12.6 231195)4 209.8 31.2 65.5 28.1 1C.1 23119'55 218.1 35.3 59.8 32.0" 6.9 2311956 173.4 35.3 79.1 27.7 9.6 231'9:7 l70.6 35.3 70.3 2l.3 6.1 321.01953 ) 5:?9.6 35.3 50.1 27. 7 6.9 320.Ji1958 ) 259.2 1/1959 330.0 - 38.1 50.1 2e.2 12.0 32C.21960 339.6 4l.1 51.5 lS.5 16.2 320.53.961 :358.0 46.9 38.E 53.0 555.8 321.9)1962 3160.9 60.9 36.1 5L.1 99,5 32?.3i963 46.9 60.6 32.8 1!9. 7 86.I ?.1964 (Fob.) ?!65.8 65.6 32.8 50.0 98.6 3.?2
vSourc: Intrnatlonal'W Fn nc,i l3 a stcs
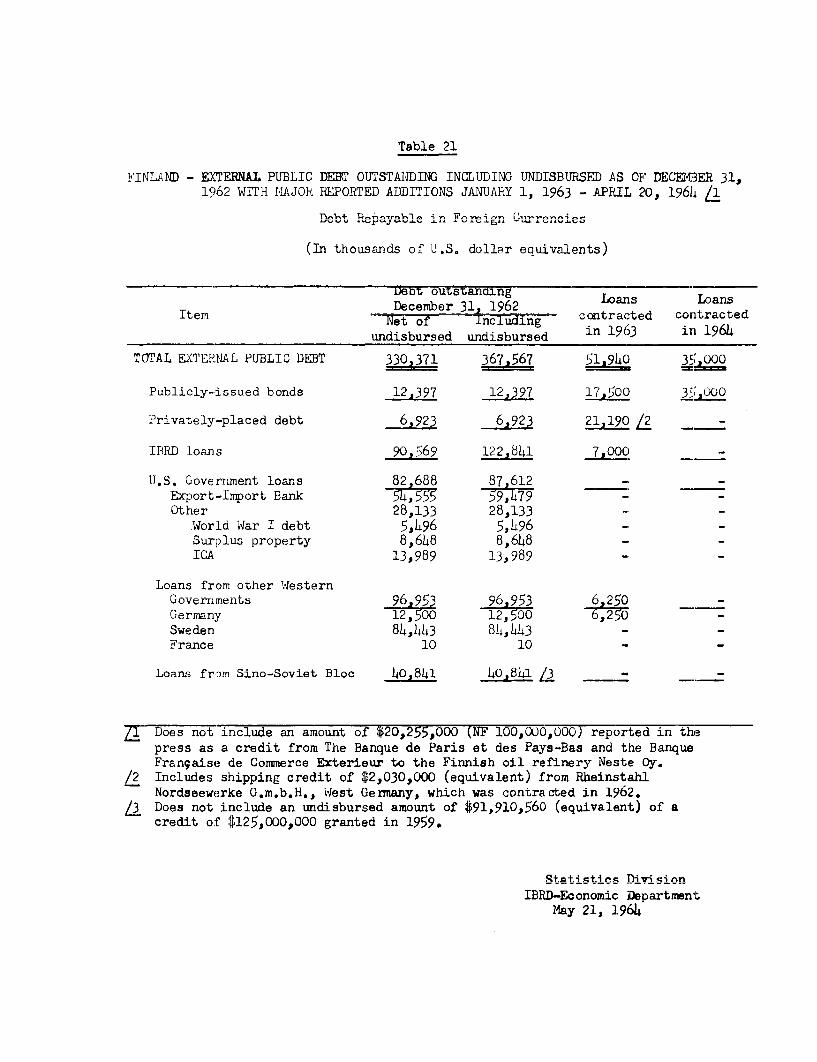
Table 21
FINLAND - EXTERNAL PUBLIC DEBT OUTSTANDING INCLUDING UNDISBURSED AS OF DECEMUBER 31,1962 WIFH MAJORt REPOECIED ADDIlTIONS JANUjAKY 1, 1963 - APRIL 20, 196h4 A
Dobtv 1P_pa_yable i-n Fo-4gn G,_rrenc4es
(Tn +ho\c1:nriq rof' Tl R rif1l1rv aniiirnlon+1.c
-Det outstanctng LoansiTe. December 31, 1962 --- Loans tL kem Net of including at; u ed contracted
undisbursed undisbursed in 1963 in 1964
TOTAL EXTFENAL PUBLIC DEBT 330,371 367.567 51 940 3',,ooo
Publicly-issued bonds 12,397 12,397 17,500 35,000
Privately-placed debt 6,923 6,923 21,190 /2 _ -
IPRD loans 90,569 122,841 7,000
IJ.S. Goverrment loans 82 688 87 612 - -Export-Import Bank 59; _Other 28,133 28,133 _
World War I debt 5,496 5,496 -Surplus property 8,648 8,648 -ICA 13,989 13,989 -
Loans from other Westernr _ _ I ^/ t H / t H . if m H~~~~~~~/ l~~uovernrmeits >O,Y))
Gerrmny 12,500 1 250'Y .1~~~~~~I ..
Sweduen 81w, 1 1.3 8 1. l -. -.-LJ~j uL4pL4L4) U4i4, 4L&) -
France 10 10 -
Loans frorn Sino-Soviet Bloc 4o,841 40,8141 L _ _
Ll Does not include an amount of $20,255,000 (NF 100,000WO,00) reported in thepress as a credit from The Banque de Paris et des Pays-Bas and the BanqueFrangaise de Commerce Exterieur to the Finnish oil refinery Neste Oy.
/2 Includes shipping credit of $2,030,000 (equivalent) from RheinstahlNordseewerke G.m.b.H., West Germany, which was contracted in 1962.
13 Does not include an undisbursed amount of $91,910,560 (equivalent) of acredit of 125,uuu,u000 granted in 1959.
IBRD-Economic DepartmentMay 21. 196h

Table 2;2: FINLAND - ESTIMATEI) CONTRACTUAL SERVICE PAYKMNTS ON EXTERNAL ]PUBLIC DEBT OUTSTANDING INCLUDING 'UNDIIS9BUHS' ASOF DECEMBER 31, 1962 WII'H MAJOR REPORTED ADDITIONS JANUARY 1 - JUNE 1, 1963 /1
(In thousands of U.S. dollar equivalents)
Debt out~~~~~~~~~~~~~~~~~~~~~~~~~~~~~~~~~~~~~~~~~~~~~~~~~~~~~~~~~~~~~~~~~~~~~~~~~~~~~~~~~~~~~~~~ib -Mstanding Payments during year standing Payments during yearDeb ou-.…… Ladn -___
ear pdisbursec; Amorti- Yn- Tear plus un- Amorti- In-
Janursed zation terest otal disbursed zation testTotal debt Publicly-issued bonds
1963 367.557 21.048 1295070 34,01l8 1963 12,397 872 887 1,7591964 3659259 19,847 13,786 3,3,633 1964 24*025 728 1,234 1,962
1965 3459412' 359785 13,9955 4-9, 740 1965 23.297 672 1,204 1,87I 619616 309,627' 25.461 12.1156 388,317 1966 22.625 1,543 1,181 297241967 284,166 26.869 1 1.r37 38,606 1967 219082 2.431 1,074 3,5051968 2579297' 279423 109575 3,7,998 1968 18s651 2*405 946 3,35i1
1969 229.874 28,114 9.*171 37,4135 1969 16.246 2,383 814 3.1 97
1970 201.760, 269947 8.1L36 3,5,0113 1970 13.863 2.(086 685 2,?7711971 174.8131 25,808 6,9997 32,805 1971 11,777 19905 569 2.4741972 1499005 26.463 591173 32,336 1972 99872 1.8l90 464 2.3541973 1229542 219632 4 r38 26,37TF0 1973 7.982 1.036 356 1,3 921974 100.910, 15.162 3.8l62 19.024 1974 69946 - 330 33101975 85.748 109945 3.191 14.136 1975 6.946 - 337 33719716 749803, 17.07W 2.o732 19.802 1976 69946 69 946 343 7.2891977 57733, 69337 2.009 8,346
Privately-pLaced debt - _ IBRD loinS
1963 6.92Z1 19403 358 19761 1963 L22,841 6,553 4.774 11.3271964 i25. Q 669 3u7 976 1964 116P288 6.881 5.305 12.1I861965 4.851 39874 282 4,156 1965 109*407 7.'386 5,566 12,9521966 977r 453 46 4'99 1966 102.021 8,679 5,480 14,1591967 524 288 28 316 1967 93,342 9,1419 5,020 144-1691968 236 65 13 78 1968 84,193 9.637 49539 14,17'61969 171 40 10 50 1969 749556 10.156 49020 14,1761970 131 40 6 446 1970 64,400 89 563 3*474 12,43171971 9]1 40 4 44 1971 559437 7.679 3,021 1097001972 51I 47 2 49 1972 479758 8.118 2.582 10s7CIO1973 4 4 4 1973 39v640 8.9583 2,121 10,704
1974 3;iu57 9,075 1.629 1UP7041975 21.982 5.338 1.172 6,5101976 16,644 59000 874 5,8741977 119644 1.,675 646 2,321
e fTEotnoea at encl of t abe.

Table 22: FINLAND - ESTIMATE]D CONTRACTUAL SERVICE PAYMENTS ON EIXTERNAL PUBLIC DIET OUTSTANDING INCLUJDING UNDISBURSED ASOF DECEMBEIR 31, 1962 WITH MAJOR REPORTED ADDITIONS JANUARY' 1 - JUNE 1, 1963 Li (CONT.)
(In thousands of U.S. dollar equivalents)-… _ _ ____]?age 2
Debt Out.. Payme3nts during ye8r Debt out- PayimBnts during yearI. . ............I_ st3ariing - -
Year plus Un- Amorti- In- Year plus un- Amorti- In-disbursed zation terest Total cisbursecd zation terest rotaLJan 1 o Januay o]L
u.5r. uverrment aIsn-"o_t_a…_ tu.; o_v.loans - Expoit-bpor 3snk
1963 879612 59907 2 o718 8915Z5 1963 59.479 5 .U55 1,904 6,9F591964 81,705 5,174 2#666 7,8340 1964 549424 4,3b00 1,873 16,1731965 76.5311 5.969 2iP589 8,558 .1965 50v124 5, 116 1,819 66,93519,66 70,562 6.189 2i,371 8,'560 1966 459008 5.316 1,623 6,93191967 6&.313 6 9314i Z.146 8,9460 1967 39.692 5.416 1.4,21 6 8371968 58 3059 6.537 10917 8.U454 ;1968 349276 5.6,16 19216 65,83 21969 51.522 6,66:1 1 682 8, 343 1969 289660 5i71b6 1,01D7 6>,7231970 44.986,1 6,886i 1ip440 8,;326 197U 229944 5,916 7'90 6,97061971 379 913 7.11 110190 8.301 1971 17.028 6.116 567 r.,6d31972 30.864 7.234 935 8,169 1972 10.912 6,212 338 i6.550
1973 Z316 3D 5.749 684 6,433 1973 4.700 4.700 115 4,8151974 17.881I 1.071 539 1615161975 16C804 1.1081 509 1,6171976 15,6916 1133 479 1.65121977 149563 550 448 998
U.S.Govt. loans Other Loans from other Western Governments
1963 28.133 852 814 1v666 1963 96.943 3,305 3,230 6,5351964 27.2811 874 793 1,667 1964 99.888 33987 3.3,47 6.7341965 269407 853 770 1,623 1965 96.501 49877 3,462 8,333919,66 25.554 87:3 748 1,621 1966 91,624 5,5589 3,2!51 8,8401967 24.6111 8915 725 1,623 1967 86,035 5.679 3,0;18 8,96971968 23 9743 921 701 1,622 1968 80.356 5.771 2T71 i 1855419,69 22.9862 945 675 1,620 1969 74,585 5,866 2,544 18.41019,70 21.917 970 650 1,620 1970 68.719 5,964 2,3105 1I,26919,71 20.*947 995 623 1,618 :1971 629755 6,065 2,062 438,1271972 19,952 1.022 597 1,619 1972 56.690 69171 1.815 7,9861Y73 18t930 i 9049 569 1,618 1973 50.519 5?493 1-565 T;058
1974 17,881 1,077 539 1,616 1974 45,026 5.01Q 1.9364 6 93741975 16.804 1, 1 08 509 1,617 1975 40,016 49499 1,173 5 ,6721976 15,696 1 ,133 479 1.612 1976 35,517 3,991 1,036 5,0271977 14,563 550 448 998 ]L977 31.526 4,112 91L5 5,027
;ee e…oo e aT…e_ri e
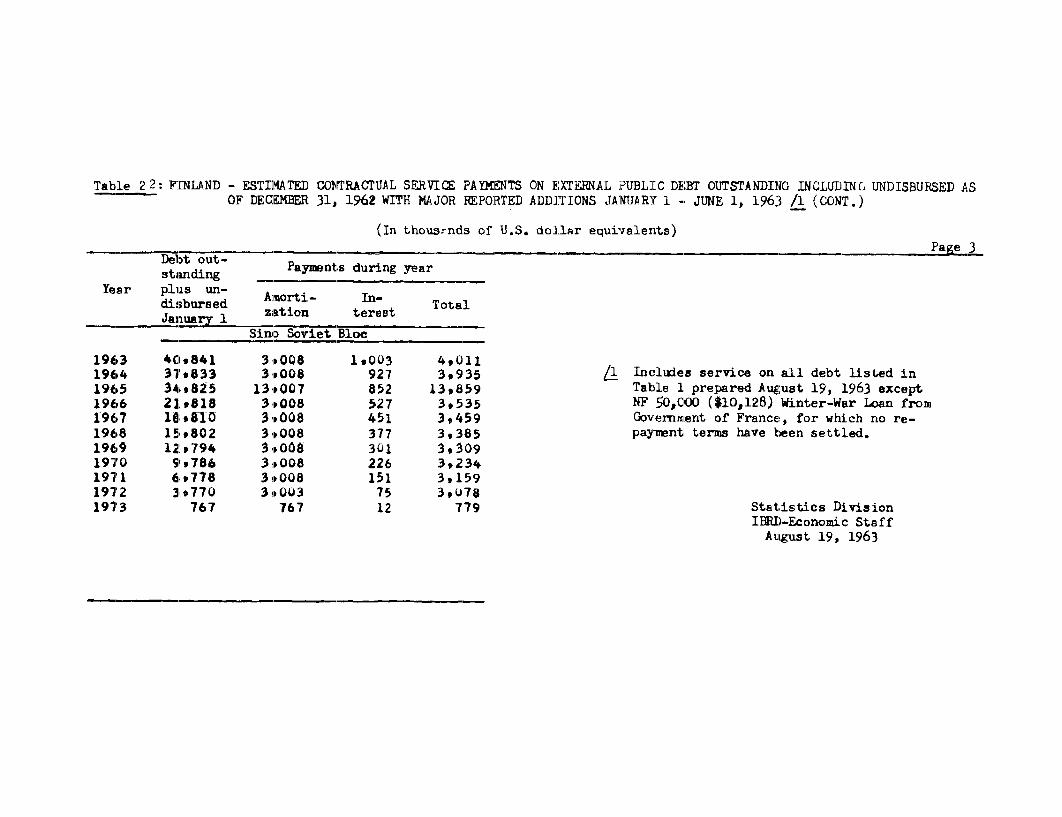
Table 2 2: FINLAND - ESTIMATED CONTRACTUAL SERVICE PAYMENTS ON EXTERNAL ?UBL:[C DEBT OUTSTANDING INCLUDIING UNDISBURSED ASOF' DECEMBEt 31, 1962 WITH MAJOR REPO:RTED ADDITIONS JA]NUARYI 1 - JUNE 1, 1963 /1 (CONT.)
(In thousrnds of U.S. dollr equivalents)__ _ _ Page 3
stikndirig Pap3nts during yearYear plus 'm Aimorti- In-
disbursed zation terest TotalJaurr1 zsin trt
Sino Soviet Bloc
1963 4C0,841 3,.008 1,003 4,0111964 317,833 3 008 927 3,935 L Incluies service on all debt listed in1965 34 ,825 13ii007 852 1L3,859 Table 1 prepared August 19, 1963 except1966 21,.818 3#008 527 3.535 NF 50,000 ($1oJ,L28) Winter-War Loan from1967 1,8iga0 3. 008 451 39459 GoNrernmlent of France, for which no re-1968 15,,80,2 31,008 377 3,385 payaent termsu hive been settled.1969 12 ,7944 3,00a 301 3.309197'0 9 .786 3o,008 226 3,2341971 6,97713 3 *008 151 3,159197'2 3i.770) 3 O003 75 3*U781973 767 767 12 779 Statistics Division
IBRD-Economic StaffAugust 19, 196:3