Upper Albian OAE 1d event in the Chihuahua Trough, New Mexico, U.S.A
Indo. J. Chem., 2008, 8 (3), 411 – 417 411
Mohammed Hadi Al–Douh et al.
1D AND 2D NMR STUDIES OF BENZYL O–VANILLIN
Mohammed Hadi Al–Douh, Shafida Abd Hamid* and Hasnah Osman
School of Chemical Sciences, Universiti Sains Malaysia (USM), Minden 11800, Pinang, Malaysia.
Received 14 July 2008; Accepted 9 September 2008
ABSTRACT
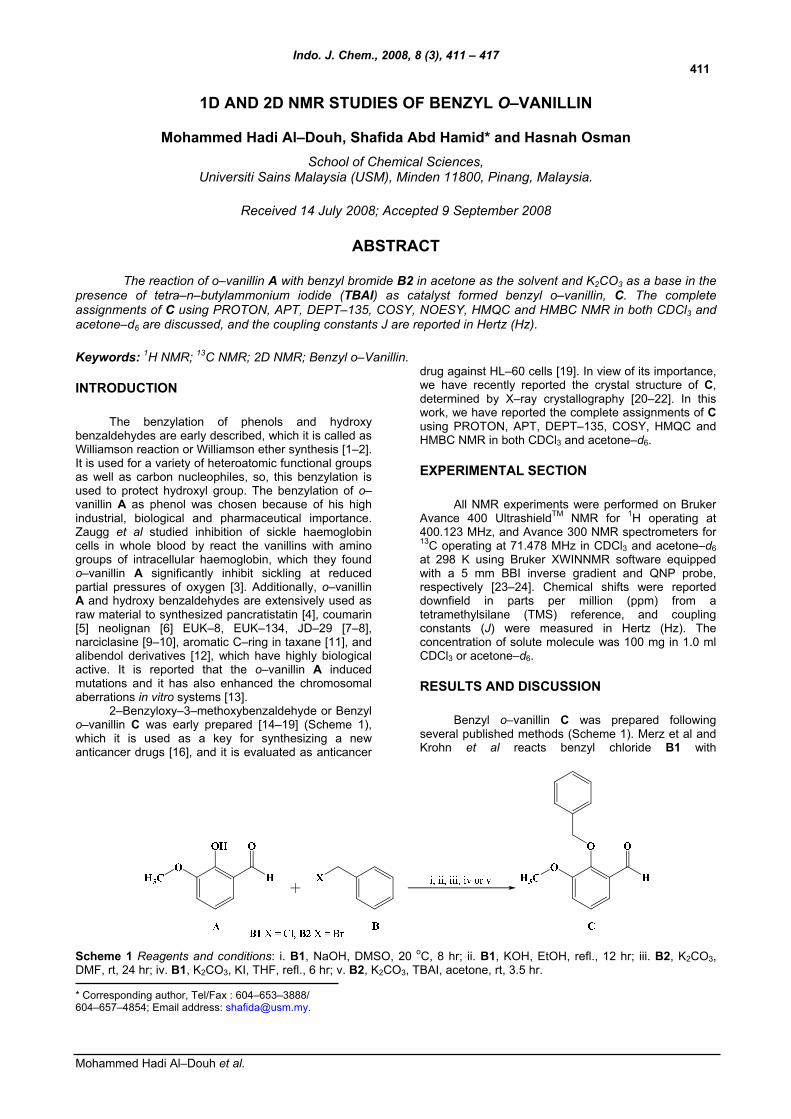
The reaction of o–vanillin A with benzyl bromide B2 in acetone as the solvent and K2CO3 as a base in the
presence of tetra–n–butylammonium iodide (TBAI) as catalyst formed benzyl o–vanillin, C. The complete assignments of C using PROTON, APT, DEPT–135, COSY, NOESY, HMQC and HMBC NMR in both CDCl3 and acetone–d6 are discussed, and the coupling constants J are reported in Hertz (Hz). Keywords: 1H NMR; 13C NMR; 2D NMR; Benzyl o–Vanillin.
INTRODUCTION
The benzylation of phenols and hydroxy benzaldehydes are early described, which it is called as Williamson reaction or Williamson ether synthesis [1–2]. It is used for a variety of heteroatomic functional groups as well as carbon nucleophiles, so, this benzylation is used to protect hydroxyl group. The benzylation of o–vanillin A as phenol was chosen because of his high industrial, biological and pharmaceutical importance. Zaugg et al studied inhibition of sickle haemoglobin cells in whole blood by react the vanillins with amino groups of intracellular haemoglobin, which they found o–vanillin A significantly inhibit sickling at reduced partial pressures of oxygen [3]. Additionally, o–vanillin A and hydroxy benzaldehydes are extensively used as raw material to synthesized pancratistatin [4], coumarin [5] neolignan [6] EUK–8, EUK–134, JD–29 [7–8], narciclasine [9–10], aromatic C–ring in taxane [11], and alibendol derivatives [12], which have highly biological active. It is reported that the o–vanillin A induced mutations and it has also enhanced the chromosomal aberrations in vitro systems [13].
2–Benzyloxy–3–methoxybenzaldehyde or Benzyl o–vanillin C was early prepared [14–19] (Scheme 1), which it is used as a key for synthesizing a new anticancer drugs [16], and it is evaluated as anticancer
drug against HL–60 cells [19]. In view of its importance, we have recently reported the crystal structure of C, determined by X–ray crystallography [20–22]. In this work, we have reported the complete assignments of C using PROTON, APT, DEPT–135, COSY, HMQC and HMBC NMR in both CDCl3 and acetone–d6.
EXPERIMENTAL SECTION
All NMR experiments were performed on Bruker Avance 400 UltrashieldTM NMR for 1H operating at 400.123 MHz, and Avance 300 NMR spectrometers for 13C operating at 71.478 MHz in CDCl3 and acetone–d6 at 298 K using Bruker XWINNMR software equipped with a 5 mm BBI inverse gradient and QNP probe, respectively [23–24]. Chemical shifts were reported downfield in parts per million (ppm) from a tetramethylsilane (TMS) reference, and coupling constants (J) were measured in Hertz (Hz). The concentration of solute molecule was 100 mg in 1.0 ml CDCl3 or acetone–d6.
RESULTS AND DISCUSSION
Benzyl o–vanillin C was prepared following several published methods (Scheme 1). Merz et al and Krohn et al reacts benzyl chloride B1 with
Scheme 1 Reagents and conditions: i. B1, NaOH, DMSO, 20 oC, 8 hr; ii. B1, KOH, EtOH, refl., 12 hr; iii. B2, K2CO3, DMF, rt, 24 hr; iv. B1, K2CO3, KI, THF, refl., 6 hr; v. B2, K2CO3, TBAI, acetone, rt, 3.5 hr. * Corresponding author, Tel/Fax : 604–653–3888/ 604–657–4854; Email address: [email protected].

Indo. J. Chem., 2008, 8 (3), 411 – 417 412
Mohammed Hadi Al–Douh et al.
Table 1 1H and 13C NMR chemical shifts and coupling constants of C in CDCl3 and acetone–d6: 1H NMR (ppm) 13C NMR (ppm) Atom
No. CDCl3 J (Hz) acetone–d6 J (Hz) CDCl3 acetone–d6 CHO 10.22, d 0.72 10.24, d 0.77 190.80 190.17 CH3 3.82, s – 3.98, s – 56.52 56.52 CH2 5.12, s – 5.23, s – 76.76 76.49
1 – – – – 130.74 131.10 2 – – – – 151.48 151.76 3 – – – – 153.47 154.23 4 7.10–7.08, dd 8.09, 1.88 7.30–7.28, dd 7.87, 1.66 118.43 119.12 5 7.06–7.02, td 7.78, 0.64 7.20–7.15, td 7.91, 0.76 124.67 125.09 6 7.29–7.26, dd 7.83, 1.96 7.38–7.35, dd 7.87, 1.86 119.47 119.19 1` – – – – 136.77 137.82 2` 7.35–7.33, dd 7.49, 1.93 7.47–7.45, dd 7.78, 1.76 129.01 129.23 3` 7.31–7.28, t 6.33 7.39–7.34, t 7.41 129.08 129.59 4` 7.32–7.28, t 8.01 7.42–7.39, t 4.67 128.94 129.10
Figure 1 The molecular structure of Benzyl o–vanillin C, showing 50% probability displacement ellipsoids and atomic number. The dashed lines indicate intrarmolcular hydrogen bonds. o–vanillin A in DMSO at 20°C using NaOH as a base for 4–8 hours [14,17], while Profft and Cotterill et al
used KOH as a base and refluxing the mixture in EtOH for 12 hours, the melting point of C 45°C [15–16]. Both reactions produce 95% yield in powder form with melting points of 45–47°C. Recently, Berger performed similar reaction using benzyl bromide B2 in DMF and K2CO3 as the base [18]. Although the reaction can be done at room temperature, it took 24 hours to complete with 96% yield. However, the product was obtained as an oily liquid. Lin et al yielded C as 89% by using B1 and A in THF under reflux for 6 hours, they used K2CO3 as a base and KI as catalyst, the melting points of 58–59°C [19].
On the other hand, we prepared C by reacting benzyl bromide B2 with A in acetone as the solvent and K2CO3 as a base [20, 25]. As previous methods needed considerable time to achieve a good yield, therefore, TBAI was added in an attempt to accelerate the reaction. TBAI seemed to do the trick and proved to be an excellent catalyst for the reaction, whereby the reaction conducted at room temperature took only 3.5 hours with 99.6% yield [22, 25]. Furthermore, C was obtained as single crystals with melting point of 35–35.5 °C [20–22], Figure 1.
The title compound C was used and conformed in the solution state, the conventional 1D 1H NMR, 13C NMR, APT, DEPT–135 along with 2D COSY, HMQC and HMBC to assign all proton and carbon chemical shifts. The splitting patterns for the aromatic protons of C were obtained from spectra acquired using 400 MHz 1H NMR. The 1H and 13C NMR chemical shift and coupling constants data in CDCl3 and acetone–d6 are
Table 2 1H–1H COSY and 1H–13C HMQC NMR of C in CDCl3 and acetone–d6:
COSY 1J HMQC (ppm) Atom CDCl3 acetone–d6 CDCl3 acetone–d6
CHO CH2, H5 H5, H6, H2` 190.80 190.17 CH3 H4 H4 56.52 56.52 CH2 H2`, CHO H2` 76.76 76.49 H4
CH3 CH3, H5 118.43 119.12 H5
CHO CHO, H4, H6 124.67 125.09 H6
x H5, CHO 119.47 119.19 H2`
CH2 CH2, CHO 128.94 129.10 H3`
– – 129.08 129.59 H4`
– – 129.01 129.23 x: not clear observation.

Indo. J. Chem., 2008, 8 (3), 411 – 417 413
Mohammed Hadi Al–Douh et al.
Figure 2 The chemical structure and the NMR numbering scheme of Benzyl o–vanillin C.
listed in Table 1, while Table 2 shows the COSY signals and Table 3 shows the HMQC and HMBC signals of C. The structure was further substantiated by complete 1H and 13C NMR assignments in both solvents, which have not been previously reported for C, using 2D NMR COSY, HMQC and HMBC experiments. Figure 2 shows the chemical structure and the NMR numbering scheme of C. 1D NMR spectra
1H NMR spectra
The 1H NMR spectra in CDCl3 and acetone–d6 of C were obtained and shown in Figure 3. The 1H NMR spectrum in acetone–d6 shows similar splitting patterns
Figure 3 1H NMR spectrum of C in a) CDCl3 and b) in acetone–d6.

Indo. J. Chem., 2008, 8 (3), 411 – 417 414
Mohammed Hadi Al–Douh et al.
as those in CDCl3 except that all the peaks shifted to more downfield. However, in acetone–d6 clearer splitting patterns are observed. In CDCl3 the 1H NMR spectrum shows the chemical shift of the aldehydic proton at δ = 10.22 ppm as a doublet, (J = 0.72 Hz). The doublet may be due to coupling of aldehydic proton with H5, which it is in a long-range couplings or zigzag configuration [26]. On the benzyl ring, two H2` protons exhibited a signal at δ = 7.35–7.33 ppm as doublet of a doublet, (J = 7.49 and 1.93 Hz). The signal for H4` (δ = 7.42–7.39 ppm) was overlapped with that of H3` and is not clearly shown, although in acetone–d6, it appears as a triplet (J = 4.67 Hz). H3` exhibited a signal at δ = 7.39–7.34 ppm (J = 7.41 Hz) as a triplet which was shown clearly in acetone–d6.
Meanwhile, H6 appears as doublet of a doublet due to coupling with H5 and H4 (δ = 7.38–7.35 ppm, J = 7.87 and 1.86 Hz). On the trisubstituted ring, H4
exhibited doublet of a doublet at δ = 7.10–7.08 ppm, (J = 8.09 and 1.88 Hz) due to coupling of the proton to H5 and H6. Finally, H5 exhibited a signal at δ = 7.06–7.02 ppm as triplet of a doublet, (J = 7.78 and 0.64 Hz) in CDCl3, and at δ = 7.20–7.15 ppm as triplet of a doublet, (J = 7.91 and 0.76 Hz) in acetone–d6 which is more clearly observed in Figure 3(b). The protons on methylene group of benzyl ring and the methyl protons exhibited signals at δ = 5.12 and 3.82 ppm, respectively.
13C NMR spectra
The 13C NMR spectrum of C was obtained and shown in Figure 4. In CDCl3, the peak appears at δ = 190.80 ppm in the 13C NMR spectrum of C was assigned to the C=O group, while the quaternary
Figure 4 13C NMR spectrum of C in a) CDCl3 and b) in acetone–d6.

Indo. J. Chem., 2008, 8 (3), 411 – 417 415
Mohammed Hadi Al–Douh et al.
Figure 5 1H–1H connectivities in the COSY a) in CDCl3, b) in acetone–d6 and c) the most important correlations observed in COSY spectrum of C.
carbon signals were observed at δ = 153.47, 151.48, 136.77 and 130.74 ppm for C3, C2, C1` and C1, respectively. Other aromatic carbon signals of benzyl ring were observed at δ = 129.08, 129.01 and 128.94 ppm for C3`, C2` and C4`, respectively, while C5, C6 and C4 at the trisubstituted aromatic carbon showed signals at δ = 124.67, 119.47 and 118.43 ppm, respectively.
The 13C NMR spectrum also shows CH2 signal at δ = 76.76 ppm and 56.52 ppm for OMe. Similar to 1H NMR spectra, 13C NMR spectrum in acetone–d6 shows the values of carbons being shifted to about 0.16–1.05 ppm downfield with the exception of C6. Attached proton test (APT) and DEPT–135 NMR experiments in both solvents were also performed to confirm our postulation. Further confirmation was done by HMQC experiments. Table 1 summarises the 1H and 13C NMR in both solvents. 2D NMR spectra
1H–1H COSY NMR
The signals of C are assigned with an aid by the Correlation spectroscopy or COSY experiment which is a homonuclear 2D technique that explains which pairs of 1H nuclei in a molecule are coupled to one another. Figure 5 shows the 1H–1H COSY NMR spectrum of C. The COSY spectrum confirmed the correlation assignments in both solvents CDCl3 and acetone–d6 of H4 with methoxy group OMe at δ = 3.82 and 3.98 ppm, respectively. While the homonuclear connectivities observed between CH2 with H2` in the benzyl ring and the aldehydic proton. From both spectra it can be seen that the one of the methylene protons is correlated with H2`, probably because the proton is H–bonded to the O atom in OMe. However, the 1H NMR for methylene protons only show a singlet at δ = 5.12 ppm, indicating the both protons are equivalent. We propose that the rapid movement at the methylene carbon cause this phenomena providing the interchange between the two protons. 1H–13C HMQC NMR
Heteronuclear multiple quantum coherence or the 2D HMQC NMR spectrum was conducted to determine which hydrogens are connected to which carbons. The HMQC NMR spectrum for C was shown in Figure 6, and it confirms the attachments between the aromatic hydrogens and their corresponding carbons. The signals owing to C4, C6, C5, C2`, C4` and C3` atoms are observed at δ = 118.43, 119.47, 124.67 and 128–130 ppm in CDCl3, and at δ = 119.12, 119.19, 125.09, 129.10, 129.23 and 129.59 ppm in acetone–d6, respectively. The one bond 13C–1H connectivities are also well observed for OMe and CH2 atoms whereby the cross peaks appear at the respective δ = 56.52 and 76.76 ppm in CDCl3, and at δ = 56.52 and 76.49 ppm in acetone–d6.
Table 2 summarises the values of COSY and HMQC experiments in both CDCl3 and acetone–d6.

Indo. J. Chem., 2008, 8 (3), 411 – 417 416
Mohammed Hadi Al–Douh et al.
Figure 6 1H–13C connectivities of C in the HMQC a) in CDCl3 and b) in acetone–d6. CONCLUSION
We have reported the complete assignments of Benzyl o–van C using 1H, 13C, COSY and HMQC NMR in both CDCl3 and acetone–d6. Attached proton test (APT) and DEPT–135 NMR experiments in both solvents were also performed to confirm our postulation although the results were not discussed here. Further reactions using the compound to synthesise biologically important compounds are in progress. ACKNOWLEDGEMENTS
We thank the Malaysian Government and Universiti Sains Malaysia (USM) for IRPA short term grant [203/PKIMIA/671046] to conduct this work. M. H. Al–Douh thanks the Yemen Government and Hadhramout University of Science and Technology (HUST) for financial scholarship support.
REFERENCES
1. McOmie, J.F.W., 1963, "Protective Groups" in Advance in Org. Chem. Method and Results. Eds. Raphael, R.A., Taylor E.C., and Wynberg, H., John Wiley and Sons, Inc., New York, Vol. 3, Ch. 4, 191–294.
2. Feuer, H., and Hooz, J., 1967, "Methods of Formation of The Ether Linkage" in The Chemistry of the Ether Linkage. Ed. Patai, S., John Wiley and Sons, Inc., New York, Ch. 10, 446–498.
3. Zaugg, R.H., Walder, J.A. and Klotz, I.M., 1977, J. Biol. Chem., 252, 23, 8542–8548.
4. Magnus, P. and Sebhat, I.K., 1998, Tetrahedron, 54, 15509–15524.
5. Scott, J.L. and Raston, C.L., 2000, Green Chem., 2, 245–247.
6. Juhasz, L., Dinya, Z., Antus, S. and Gunda, T.E., 2000, Tetrahedron Lett., 41, 2491–2494.
7. Baker, K., Marcus, C.B., Huffman, K., Kruk, H., Malfroy, B. and Doctrow, S.R., 1998, J. Pharm. Exp. Therap., 284, 215–221.
8. Dessolin, J., Schuler, M., Quinart, A., Giorgi, F.D., Ghosez, L. and Ichas, F., 2002, Eur. J. Pharma., 447, 155–161.
9. Hudlicky, T., Rinner, U., Gonzalez, D., Akgun, H., Schilling, S., Siengalewicz, P., Martinot, T.A. and Pettit, G.R., 2002, J. Org. Chem., 67, 8726–8743.
10. Gonzalez, D., Martinot, T. and Hudlicky, T., 1999, Tetrahedron Lett., 40, 3077–3080.
11. Smil, D.V., Laurent, A., Spassova, N.S. and Fallis, A.G., 2003, Tetrahedron Lett., 44, 5129–5132.
12. Kim, E., Kim, J.Y. and Rhee, H., 2004, Bull. Korean Chem. Soc., 25, 1720–1722.
13. Barik, A., Priyadarsini, K.I. and Mohan, H., 2004, Rad. Phy. Chem., 70, 687–696.
14. Merz, K.W. and Fink, J., 1956, Arch. Pharm. Ber. dtsch. Pharm. Ges., 289, 347–358.
15. Profft, E., 1957, J. Praks. Chem., 5, 175–181. 16. Cotterill, A.S., Hartopp, P., Jones, G.B., Moody,
C.J., Norton, C.L., O'Sullivan, N. and Swann, E., 1994, Tetrahedron, 50, 7857–7874.
17. Krohn, K., Loock, U., Paavilainen, K., Hausen, B.M., Schmalle, H.W. and Kiesele, H., 2001, ARKIVOC, i, 88–130.
18. Berger, J.M., 2001, "Isolation, Characterization, and Synthesis of Bioactive Natural Products from Rainforest Flora", Ph. D. Thesis, Virginia Polytechnic Institute and State University, Pennsylvania, USA.
19. Lin, C.F., Yang, J.S., Chang, C.Y., Kuo, S.C., Lee, M.R. and Huang, L.J., 2005, Bioorg. Med. Chem., 13, 1537–1544.
20. Al–Douh, M.H., Hamid, S.A., Osman, H., Ng, S.L. and Fun, H.K., 2006, Acta Cryst. E, 62, 10, o4767–o4770.
21. Crystal data for C: C15H14O3, M = 242.26, monoclinic, space group P21/c, a = 13.7203(3), b = 4.6599(10), c = 19.1552(5) Ǻ, β = 97.736(1)°, V = 1213.55(5) Ǻ3, Z = 4, Dc = 1.326 g cm–3, μ(Mo–Kα) = 0.092 mm–1, F(000) = 512, T = 297 K, 3905 independent reflections. Data were collected on Bruker SMART APEX2 CCD areadetector using ω–scans [27], and the non–hydrogen atoms were refined anisotropically using full matrix least squares based on F2 to give R1 = 0.0514, wR2 = 0.1878 for 2949 independent observed reflections
Indo. J. Chem., 2008, 8 (3), 411 – 417 417
Mohammed Hadi Al–Douh et al.
[F2 > 2σ (F2), 2θ = 31.2°] and 164 parameters. The structure was solved and refined by SHELXTL against F2 [28]. The software was used SHELXTL [28] and PLATON [29]. These data can be obtained free of charge from International Union of Crystallography IUCr ci2177 or The Cambridge Crystallographic Data Centre CCDC 627450. (Reference: doi:10.1107/S1600536806039250).
22. Al–Douh, M.H., Hamid, S.A. and Osman, H., 2008, Univ. Aden J. Nat. Appl. Sci., 12, 1, 79–92.
23. Bruker program 1D WIN–NMR (release 6. 0) and 2D WIN–NMR (release 6.1).
24. Berger, S. and Braun, S., 2004, 200 and More NMR Experiments, A Practical Course, Wiley–VCH, Weinheim.
25. Al–Douh, M.H., Hamid, S.A. and Osman, H., 2008, Univ. Aden J. Nat. Appl. Sci., 12, 3, xxx–xxx.
26. Balci, M., 2005, "Basic 1H– and 13C–NMR Spectroscopy", Elsevier, Ch. 4, 129–130.
27. APEX2 (Version 1.27), SAINT (Version 7.12A), and SADABS (Version 2004/1), 2005, Bruker AXS Inc., Madison, Wisconsin, USA.
28. Sheldrick, G.M., SHELXTL. (Version 5.1), 1998, Program for the Solution of Crystal Structures, Bruker AXS Inc., Madison, Wisconsin, USA.
29. Spek, A.L., 2003, J. Appl. Crystallogr., 36, 7–13.
Copyright © 2022 FDOKUMEN