Proses Dekarburisasi Nickel Pig Iron / DECARBURISATION PROCESS OF NICKEL PIG IRON
Upload
khangminh22Category
view
1download
0
N80- 16095
SEALED-CELL NICKEL-CADIUM BATTERY APPLICATIONS MANUAL
GODDARD SPACE FLIGHT CENTER
GREENBELT, MD
DEC 79
https://ntrs.nasa.gov/search.jsp?R=19800007835 2020-03-21T19:11:10+00:00Z


N80-16095
NASA Reference Publication 1052
Sealed-Cell Nickel-Cadmium Battery
Applications Manual
Willard R. Scott and Douglas W. Rusta
Written Under Contract NAS5-23514 for NASA/GSFC
by TRW Systems, Redondo Beach, California
Floyd E. Ford, GSFC Technical Representative
DECEMBER 1979
AS/X
REPROOUCEO BY
NATIONAL TECHNICAL
,INFORMATION SERVICEU.S. OEPARTMEN1 I_ COUMEI_E
SPRINGFIELO. Yk. 22161

BIBLIOGRAPHIC DATA SHEET
1. Report No.
NASA RP-1052
2. Government Accession No.
4. Title and Subtitle
Sealed-Cell Nickel-Cadmium Battery
Applications Manual
7. Author(s)
Willard R. Scott and Douglas W. Rustag. Performing Organization Name and Address
Goddard Space Flight Center
Greenbelt, Maryland 20771
12. SponsoringAgency Name and Address
National Aeronautics and Space Administration
Washington, D.C. 20546
3. Recipient's Catalog No.
5. Report Date
December 1979
6. Performing Organization Code
?ll8. Performing Organization Report No.
G-7824
10. Work Unit No.
506-23-2211. Contract or Grant No.
13. Type of Report and Period Covered
Reference Publication
14. Sponsoring Agency Code
15, Supplementary Notes
Written under contract for NASA/GSFC by TRW Systems. Redondo Beach, California
(Floyd E. Ford, GSFC Technical Representative)
16. Abstract
This manual covers the design, procurement, testing, and application of aerospace-qualits.'
hermetically sealed nickel-cadmium cells and batteries. Its focus is on cell technolo_, cell
and battery development, and spacecraft applications. Written for spacecraft batter3.' and
electric power-system engineers, it summarizes and interprets applicable NASA. militar3", and
o_eneral technical literatur, for the period from 1967 to 1977. It discusses long-term
performance in terms of the effect of initial design, process, and application variables and
presents design guidelines and practices when applicable.
17. Key Words (Selected by Author(s))
Nickel-cadmium batter3.. Spacecraft batteD',
Secondary batter3", Ener_' storage (spacecraft),
Electrochemical batteD', Hermetically sealed
cell
19. Security Classif. (of this report) 20. SecuriW Classif. (of this page)
Unclassified Unclassified I
*For sale by the National Technical Information Service, Springfield, Virginia 22151.
18. Distribution Statement
STAR CategoD" 20
Unclassified-Unlimited
21. No. of Pan_ J 99


NOTICE
THIS DOCUMENT HAS BEEN REPRODUCED
FROM THE BEST COPY FURNISHED US BY
THE SPONSORING AGENCY. ALTHOUGH IT
IS RECOGNIZED THAT CERTAIN PORTIONS
ARE ILLEGIBLE, IT IS BEING RELEASED
IN THE INTEREST OF MAKING AVAILABLE
AS MUCH INFORMATION AS POSSIBLE.


NASA Reference Publication 1052
N80-16095
•_i¸
Sealed-Cell Nickel-Cadmium Battery
Applications Manual
Willard R. Scott and Douglas W. Rusta
TRW Systems, Redondo Beach, California
NASANational Aeronautics
and Space Administration
Scientific and Technical
Information Branch
1979

All measurement values are expressed in the International System of
Units (SI) in accordance with NASA Policy Directive 2220.4, para-
graph 4, except for the following: the ampere-hour is used rather thanthe coulomb because it is traditional within the battery community.

PREFACE
Since 1967, Government agencies have sponsored numerous contracts and
technical meetings for improving the design, performance, and service life-
time capability of sealed-cell nickel-cadmium batteries. Much of the work
has been focused on improving manufacturing controls, documentation, and
the overall quality-assurance aspects of cell procurement and battery pro-
duction. For the most part, data and information generated by these con-
tractual efforts have been dispersed but in a form unsuitable for direct ap-
plication to other design efforts. In 1975, the National Aeronautics and
Space Administration/Goddard Space Flight Center (NASA/GSFC) began
to develop a battery applications manual that would: (a) present an inte-
grated view of the state of the art, and (b) present data, information, design
guidelines, and design practices of direct use and benefit to battery and
electric power-system designers. Accordingly, in May 1976, NASA awarded
Contract NAS5-23514 for preparing this manual with the objective that
its subsequent use would save battery-system designers time and effort that
would otherwise be spent in searching the recent voluminous battery litera-
ture and in separating fact from conjecture. This manual, which covers the
available nickel-cadmium literature through September 1977, is the product
of this project. As principal investigator and coauthor, Dr. Willard R. Scott
was responsible for all aspects of cell and battery technology and applica-
tions: Douglas Rusta, as project manager and coauthor, was concerned with
overall manual development and with preparing technical material on bat-
tery and battery-system development, defining interfaces between the bat-
tery and other spacecraft equipment, and describing aerospace and terres-
trial applications.
Several sources of data and information were used in developing this man-
ual, particularly NASA and unclassified military reports and publications.
These listings were obtained from the following sources:
• A machine search of the National Technical Information Service
(NTIS) data base
• A machine search of the NASA/GSFC Library data base
iii
,.CII¸ •
D.D. Abbott and I.S. Mehdi, "Batteries: A Literature Review and
State of the Art in 1975," five volumes, Contract JPL-953984, Boeing
Report D180-18849-2
• "Battery Information Index," Battelle Memorial Institute, June 1972
• "Nickel-Cadmium Batteries - A Bibliography with Abstracts," Report
NTIS/PS-76/0466, June 1976
• G. Halpert and W. Webster, Jr., "Secondary Aerospace Batteries andBattery Materials - A B_liography," NASA SP-7027, August 1969
P. McDermott, G. Halpert, S. Ekpanyaskun, and P. Nche, "Secon-
dary Aerospace Batteries and Battery Materials - A Bibliography,"NASA SP-7044, July 1976
E. Brooman, "An Annotated Bibliography of the Thermal Properties
of Primary and Secondary Cells," Report AFAPL-TR-70-34, June
1970
The NASA/GSFC Battery Workshop Proceedings (1968 through 1977)and
the Power SourcesSymposium Proceedings(through 1976) were additional
sourcesof bibliographiclistings.Other sourcesincluded the resultsof a
questionnairesurveyof 17 privateand Government organizationsconcerned
with aerospace-batteryapplicationsand of separatevisitsto GSFC and to
the Naval Weapons Supply Center at Crane, Indianafor the purpose of
identifyingand collectingunpublished data and information.
iv
CONTENTS
SECTION 1-INTRODUCTION ........................
1.1 History and Background ..................... 15
1.2 Organization .............................
SECTION 2-CELL DESCRIPTION ......................
Page
9
2.1 Introduction ............................. 992.2 Electrode Reactions ........................
2.3 Cell Design and Construction .................. 12472.4 Cell Manufacturing .........................
2.5 Reference Cell Design Data .................... 58
2.6 Lightweight Cells .......................... 62
SECTION 3-CELL PROPERTIES AND PERFORMANCE ...... 65
653. l Introduction .............................663.2 Static Properties of Cells .....................
3.3 Initial Performance Characteristics ............... 78
3.4 Long-Term Performance Characteristics ........... 134
SECTION 4-CELL FAILURE ANALYSIS AND
MECHANISMS ................................... 179
1794.1 Introduction .............................
4.2 Systematic Approach to Degradation/Failure179
Analysis ................................4.3 Degradation and Failure.Analysis Terminology
Applicable to Cells and Batteries ................ 1804.4 Observed Degradation and Failure Modes .......... 186
4.5 Underlying Causes of Degradation and Failure ....... 1914.6 Effect of Cell Design on Degradation Processes ....... 209
4.7 Effect of Operating Conditions on DegradationProcesses ................................ 216
v
CONTENTS (Continued)
SECTION
Page
5-CELL AND BATTERY PROCUREMENT .......... 221
2215.1 Introduction ..............................5.2 Cell Procurement Process ...................... 222
5.3 Cell Specification Document .................... 225
5.4 Request for Proposal ......................... 231
5.5 Manufacturing Control Document ................ 234
5.6 Battery Engineering Support to Quality.Assurance Activities ......................... 237
5.7 Cell Acceptance ............................ 239
5.8 Battery Procurement ......................... 239
SECTION 6-CELL AND BATTERY TESTING ............... 245
6.1 Introduction .............................. 245
6.2 Acceptance Testing .......................... 2456.3 Qualification Testing ......................... 262
6.4 Life Testing ............................... 262
6.5 Special Accelerated Testing .................... 2696.6 Miscellaneous Tests ......... • ................ 272
SECTION 7-BATTERY SYSTEM DEFINITION .............. 275
7.1 Introduction .......... • ................... 275
7.2 Electric Power System Design Considerations ......... 275
7.3 Types of Electric Power Systems ................. 289
7.4 Methods of Temperature Control ................. 302
SECTION 8-BATTERY SYSTEM DESIGN ................. 3 25
8.1 Introduction .............................. 325
8.2 Requirements and Constraints ................... 3258.3 Methods of Charge Control ..................... 329
8.4 Methods of Cell and Battery Protection ............ 352
8.5 Methods of Discharge Control ................... 370
8.6 Synthesis of Battery-System Configurations .......... 379
8.7 Analysis of Battery-System Cortfigutations .......... 388
vi
CONTENTS (Continued)
Page
SECTION 9-BATTERY DESIGN AND DEVELOPMENT ........ 409
9.1 Introduction .............................. 409
9.2 Definition of the Battery Configuration ............ 410
9.3 Battery Manufacturing ........................ 426
9.4 Battery Acceptance Testing ................ • .... 429
9.5 Battery Qualification Testing ................... 434
9.6 Battery Storage, Maintenance, and Installation ........ 437
SECTION 10-APPLICATIONS ......................... 445
10.1 Introduction .............................. 445
10.2 Battery-System Hardware Descriptions ............. 445
10.3 Advanced Battery Systems ..................... 454
10.4 Terrestrial Applications ....................... 457
REFERENCES ..................................... 459
APPENDIX A-DEFINITIONS .......................... 491
APPENDIX B-AUTHOR INDEX ......................... 497
APPENDIX C-ORGANIZATION INDEX ................... 503
APPENDIX D-SUBJECT INDEX ........................ .q05
vii

SECTION1INTRODUCTION
1.1 HISTORY AND BACKGROUND
The majority of spacecraft flown in the two decades of the space era havecontained energy storage systems composed of nickel-cadmium batteries.
This fact is due to the high cycle-life capability, good specific energy, andrelatively simple charge-control requirements of the nickel-cadmium
system. Because the reliability of the system has been quite good, nickel-cadmium batteries have been used for extended manned missions, as well
as for unmanned applications. In unmanned applications mission lengthhas increased up to ten-fold in 20 years.
A large part of this success is attributable to the availability (for the first
time in the 1950's) of significant quantities of hermetically sealed cells.
Originally developed for commercial purposes, the earliest sealed nickel-
cadmium cells were not suitable for aerospace application. They were
small in capacity and often exhibited the effects of seal unreliability, poorthermal design, nonoptimum electrochemical design, and lack of control
of materials and processes. As time progressed, sponsoring government
agencies, cell buyers, and cell suppliers identified and addressed many
problems. By the late 1960's, cells were available in capacities up to 50 Ah,
seal problems were less frequent, and several domestic suppliers were
offering designs that emphasized light weight. Depths of discharge had
risen from about 5 percent to 15 to 20 percent in low-altitude orbit appli-
cations and up to 40 percent for the batteries of geosynchronous orbit
spacecraft.
As more demands were made of the nickel-cadmium system, more develop-
,nent efforts were initiated to obtain better performance and reliability.
Government space agencies provided the impetus and direction for this
work with leadership provided by skill groups at the Goddard Space Flight
Center (GSFC), the Jet Propulsion Laboratory (JPL), and the U.S. Air
Force Aero Propulsion Laboratory. The primary goal was to obtain a cell
that would meet standards of aerospace quality through what was nec-
essarily an evolutionary process in the environment produced by a young
2 Ni-Cd BATTERY APPLICATIONS MANUAL
and dynamic space program. Among many important issues that were
addressed during these years were:
• the determination and solution of the causes of common cell
failures
the establishment of the relationship between operating tem-
perature and cycle-life performance
the development of improved methods of charge monitoringand control
the investigation of the effect of changes in ceil design on long-
term performance
the solution of design problems associated with larger cells andbatteries
• the development of failure-analysis techniques
the establishment of controlled cell manufacturing and test
procedures
Aerospace contractors, independent research organizations, and batterycell suppliers contributed to these studies by participating under govern-ment-sponsored development projects and by sharing experiences otherwiseobtained from work performed for commercial space activities.
The National Aeronautics and Space Administration (NASA) understoodthe importance of disseminating the information obtained from theseactivities and of encouraging the sharing of experiences as a means of
ensuring the development of good application practices and uniform prod-uct characteristics. This understanding was demonstrated in three impor-
tant ways. First, a long-term cell evaluation project was established at theNaval Weapons Supply Center, Crane, Indiana (NWSC/Crane), which con-
tinues today. The NWSC/Crane test programs represent the most importantsingle source of comparative real-time and accelerated life-cycling testdata for the aerospace battery community. NWSC/Crane testing effortshave been summarized with regularity with raw data always available to
organizations with legitimate need. Second, NASA has sponsored the
publication of a series of periodic monographs (of which this document isone) that summarize the state of the art and provide a valuable source of
INTRODUCTION 3
reference material (References 1 and 2). Finally, NASA has sponsored and
hosted annual battery workshops at the Goddard Space Flight Centersince 1968.
These workshops provide an opportunity for representatives from all
organizations concerned with the design, manufacture, test, and applica-
tion of sealed aerospace-quality cells and batteries to exchange problems
and solutions, development status reports, experiences, and views regardingperceived trends in technology. The maintenance of peer contact has
proved to be important in keeping channels of communication open
throughout the industry, and the published transcripts of the meetLngshave become an important source of battery design information.
Throughout the 1970's, interest intensified in several areas. Perhaps the
most important of these has involved studies of ways to further improve
cell reliability. Work has proceeded along several lines: (1) definition and
better understanding of cell.design variables; (2) definition and control of
cell manufacturing processes; and (3) definition of correct application
procedures. The results of these efforts have been a general upgrading of
cell procurement specifications and the agreement of the cell suppliers to
work under a predetermined set of manufacturing controls.
Another area of interest, which is closely related to efforts made in im-
proving cell reliability, concerns the question of extending the service life
of the nickel-cadmium system. It is generally understood that early cells
were usually designed for obtaining high values of specific energy with
less attention paid to design aspects that are now known to strongly
influence long-term operation. Continued study indicated that proper
specification of certain cell-design variables is essential if the full cycle-life
capability of the nickel-cadmium system is to be realized. Cooperation
between users and suppliers has resulted in cell specifications that are now
somewhat more self-consistent in terms of expected performance and
actual weight. Many controlled tests and experiments have demonstrated
the influence of depth of discharge and temperature on cycling perfor-
mance. It is now clear that maintenance of controlled low operatingtemperatures is very. important in achieving long life. Data obtained from
accelerated tests indicate that proper in-orbit reconditioning of batteries-
particularly in geosynchronous orbit applications-may also provide ex-tensions of service life. Future work wiU undoubtedly focus on the benefit
of these approaches. Other. more fundamental work will address the
relationship between cell-design and manufacturing variables and cycle-life performance.
4 Ni-Cd BATI'ERY APPLICATIONS MANUAL
Battery system weight continues to be a major area of interest. Much
progress has been made in the art of packaging nickel-cadmium cells into
batteries. In early configurations, 20 to 30 percent of the total batterymass was devoted to structure, thermal-control auxiliaries, and wire and
connectors. Today, advanced designs require only 5 to 15 percent of the
total mass for the same functions. Lightweight, long-life cells that weigh
about 25 percent less than conventional cells are under development.About half of the reduction is obtained through the use of smaller elec-
trodes of high specific energy; the remaining half results from the scaling
of other cell components and the use of thin-wall cell containers.
The economic realities of the 1970's, coupled with the future availability
of the Space Transportation System in the 1980's, have provided motiva-
tion for searching for ways to standardize spacecraft hardware. For some
years, work within NASA has been directed at the system, component,
and device levels. Two results of these efforts will be the development of
a Standard 20.Ah cell and a Standard 22-cell battery that contains this cell
(Reference 3). The effort at the cell level has provided an opportunity for
developing specifications and manufacturing controls that reflect the ex-
perience gained over many projects and many years.
Most of the developments outlined in the previous four paragraphs have
occurred since the last general NASA publication on batteries (Reference
2) was published in 1968. At that time, relatively little performance data
were available from the literature, and what there was often representedcell configurations that are now considered to be either obsolete or non-
representative of those manufactured today. Significant investigations that
were then under way were not reported until several years later.
This document updates the record and provides both an overview
and an interpretation of the progress made in the last decade. Although
titled as an applications manual, the approach taken is less toward
that of a "cookbook" and more toward that of a summary. This is
justified because the state of the an in nickel-cadmium cell and battery
design is still in considerable flux, with much work to be done before
precise rules can be defined for battery-system synthesis and hardware
implementation.
A review of the literature has revealed many areas in which data are
either missing, incomplete, or so specific to an application that it requires
first-hand evaluation by the prospective user. Relatively few controlled
experiments have been documented in detail. This is not surprising because
much development work has been perfomled in the context of either
INTRODUCTION 5
specific projects or organization-funded research and development activ-
ities. General publication of results is difficult to accomplish in the former
case and often prohibited for proprietary reasons in the latter case. A
questionnaire survey of private and government organizations was con-
ducted to identify present concerns and future needs. The results of the
survey guided the selection and organization of material in this manual.
Material is presented at three levels-cell, battery, and system. To fulfill
the objective of showing how nickel-cadmium cells can best be used in
spacecraft application, this manual has been written for both battery and
power system engineers because their efforts are closely interrelated during
the conceptual and preliminary phases of design. It has therefore been
necessary to include collateral material, not found elsewhere in concise
form, for providing information necessary to understanding past applica-tions and current trends in design. The importance of a thorough definition
of design requirements and constraints to the success of a battery system
development effort has been emphasized. The viewpoint expressed is not
parochial. Many requirements are determined at the spacecraft system and
subsystem levels and may often not be translated in sufficiently clear terms
to the battery-component level. The avoidance of such a situation is ulti-
mately the responsibility of the battery designer.
Therefore, the following sections encompass a dual approach to battery
system design. The battery is viewed as a system component with definite
requirements, constraints, and interfaces. Full understanding of the mean-
ing of each of these enables specification of the correct cell for a particular
application. The cell, in turn, is examined as a device whose initial and final
performance is dependent on many variables-some directly associated
with the intended application and others associated with fundamental
design and manufacturing considerations. Any practical cell design or mis-
sion application involves a series of compromises regarding these aspects.If the user is helped in developing an understanding of how the signifi-
cant parameters that affect performance and reliability may be balancedand how mission objectives can be satisfied, this manual will have served
its intended purpose.
1.2 ORGANIZATION
The manual is organized into 10 sections. This section provides an overviewof the book. Sections 2 through 6 describe the design and performance of
the sealed nickel-cadmium cell. Sections 7 through 10 deal with the appli-
cation of the cell to batteries and battery, systems. Although data and

6 Ni-Cd BATTERY APPLICATIONS MANUAL
information useful for battery system design appear throughout the
manual, cell-level design data are presented mainly in Section 3.
Section 2 contains a general description of the modem aerospace-quality
sealed nickel-cadmium cell. The treatment contains only as much theory
as required to demonstrate the operation of the cell as a secondary (re-
chargeable) energy-storage device. Each cell component is discussed and
the variables critical to its design and manufacture are identified. Quan-
titative measures of electrochemical and mechanical properties are pro-
vided for typical cells and, in particular, for cells identified throughout this
manual as reference designs.
Three reference cell designs are identified. Each represents a particular
group of cell configurations and has been applied during the last 5 years.
They are used only as a well-defined baseline configuration against which
cells within the groups can be compared. Therefore, the description anddiscussion of the reference cells is not meant as a recommendation for
their use in new applications.
Section 2 and subsequent chapters introduce definitions of terminology
that may or may not be familiar to the reader. Some workers in the field
may disagree with certain proposed definitions. It is believed that clear,
precise language is necessary for good technical communications, and an
attempt has been made to be consistent in meeting this standard.
Section 3 contains a summary of data on the physical and electrical prop-
erties of a variety of cells. The material is arranged in three groups: static
properties, initial performance characteristics, and long-term performancecharacteristics. The first two groups describe so-called "new" cells-those
that have experienced only a small number of discharge/charge cycles for
stabilizing their characteristics. The last group contains examples and
estimates of changes to the characteristics that may be expected with con-tinued service. These results may be used to perform sizing calculations
based on end-of-mission requirements.
Section 4 considers the causes of change in cell performance character-
istics throughout the service period. The discussion is focused on the rela-
tionship of cell design and manufacturing variables on degradation and
failure phenomena. The treatment requires careful definition of what is
meant by degradation and failure and requires the introduction of termin-
ology from the disciplines of failure physics and analysis.
INTRODUCTION 7
Section 5 addresses the general subject of cell and battery procurement
methodology and practice. The total procurement cycle is discussed, from
the preparation of specifications to the disposition of hardware after it
has been received and accepted, but before it is integrated into the nexthardware level.
Section 6 is concerned with all aspects of cell and battery testing and, in
certain areas, serves as an adjunct to Sections 4 and 5. Alternativ_ testing
philosophies are described and evaluated with special reference to the
impact on project time and cost.
Sections 2 through 6 deal with topics at the cell and battery levels without
direct discussion of application beyond the categorization of performance
variations and other considerations in terms of general mission specifica-
tions (orbit characteristics, design life, etc.). Throughout the discussions,
there is a presumption that the cells and batteries will be operated properly
in orbit to maintain energy balance and temperature control. The entire
question of what constitutes proper application at the battery and power
system levels is the subject of Sections 7 through 10.
Section 7 presents a general review of electric power subsystem designmethodology. The role of the battery system is emphasized to show how
it affects, and is affected by, the operation of the power subsystem. This
section also contains a review of thermal design principles and techniques
as they are used in providing thermal control of ceUs, batteries, and bat-
tery auxiliaries.
Section 8 examines aspects of battery system design, including the selec-
tion and application of electronic controls and protection functions. The
treatment is based on a loosely connected series of cases or examples, each
considered in detail, that identify problem areas in application and offer
alternative methods of solution. Design guidelines are introduced when
appropriate.
Section 9 continues the progression from the general (the electric power
system') to the specific (in this case, the battery as a component). It dis-
cusses battery development and provides an outline of a general develop-
ment plan from the conceptual design phase, through manufacture and
component-level testing, to subsequent prelaunch storage and logisticactivities.
Section 10 concludes the manual with illustrations of battery system hard-
ware representative of the recent, present, and expected conditions of the
Ni-Cd BATTERY APPLICATIONS MANUAL
state of the art. Terrestrial applications of sealed nickel.cadmium cells are
briefly discussed.
The following terminology has been used throughout this manual: cell
battery, battery system, and electric power system. It is appropriate hereto define these and other related terms. A battery is defined as an assembly
of cells, connected electrically in series, together with whatever auxiliaries
may be integrally mounted, such as cell protection or charge/dischargecontrol circuitry, telemetry and command interface circuitry, recondiUon-
ing networks and controls, heaters and heater controls, other thermalcontrol devices, and radiation shields. The battery assembly is identified
by both a configured-item identification number and an assembly drawing
with associated parts list.*
A battery system is a complete energy-storage system and includes all bat-
teries and other components or functions that are related to the batteries
and that are required for their operation and maintenance. By this defini-
tion, charge controllers or discharge regulators that may be contained in
another component, such as a power-control unit, are part of the battery
system. If dedicated to the batteries, active thermal-control equipment,
such as heat pipes or thermal louvers, form a battery thermal-control sys-
tem that is part of the battery system.
The spacecraft electric power subsystem is referred to as an electric power
system. It contains the battery system, other power sources such as thesolar-cen array, and regulation, conversion, and distribution equipment.
By this terminology, a spacecraft also contains a thermal-control system,
a structural system, a command and telemetry system, an attitude-control
system, a propulsion system, and one or more payloads.
*Some batteries are composed of physically separate subas_ernblies or modules thatmay or may not be identical in electrical and mechanical configuration. For the pur-poses of this manual, it is assumed that the battery consists of all subassembli_ sodefined that are connected electrically in series and are necessary to its thnction.
SECTION 2
CELL DESCRIFrION
2.1 INTRODUCTION
This section presents an overall description of the sealed nickel-cadmiumcell and includes sections on the electrochemistry of the cell system, the
design and construction of present-day cells, and the manufacturing proc-ess used to produce commercially available cells. Much of the informationpresented on cell design and manufacturing has not been published andwas obtained by reviewing cell.design data supplied during the process of
cell procurement and from private communications with vendors andUSers.
The discussion of electrochemistry is nontheoretical and covers only the
material required to understand and deal with cell design and performance.The description of the state of the art of cell design covers the design ofcell components and presents typical properties data. Electrical character-istics of components are given, but electrical performance at the cell level
is not included here because it is the subject of Section 3. References 4, 5,and 6 contain more general information on cell design. Additional detailsbeyond those in this manual may be found in the references cited in the
following sections.
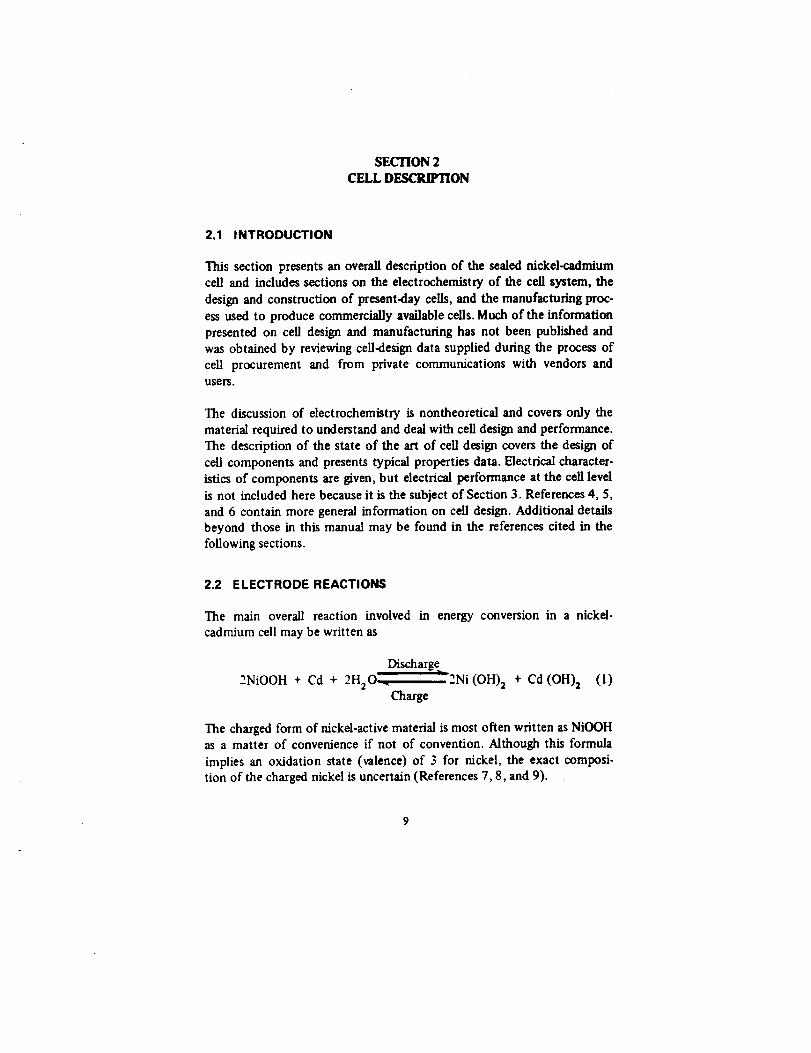
2.2 ELECTRODE REACTIONS
The main overall reaction involved in energy conversion in a nickel-
cadmium cell may be written as
Discharge2NiOOH + Cd + 2H20 _ 2Ni(OH) 2 + Cd (OH)2
Charge(l)
The charged form of nickel-active material is most often written as NiOOHas a matter of convenience if not of convention. Although this formula
implies an oxidation state (valence) of 3 for nickel, the exact composi-tion of the charged nickel is uncertain (References 7, 8, and 9).
10 Ni-Cd BATTERY APPLICATIONS MANUAL
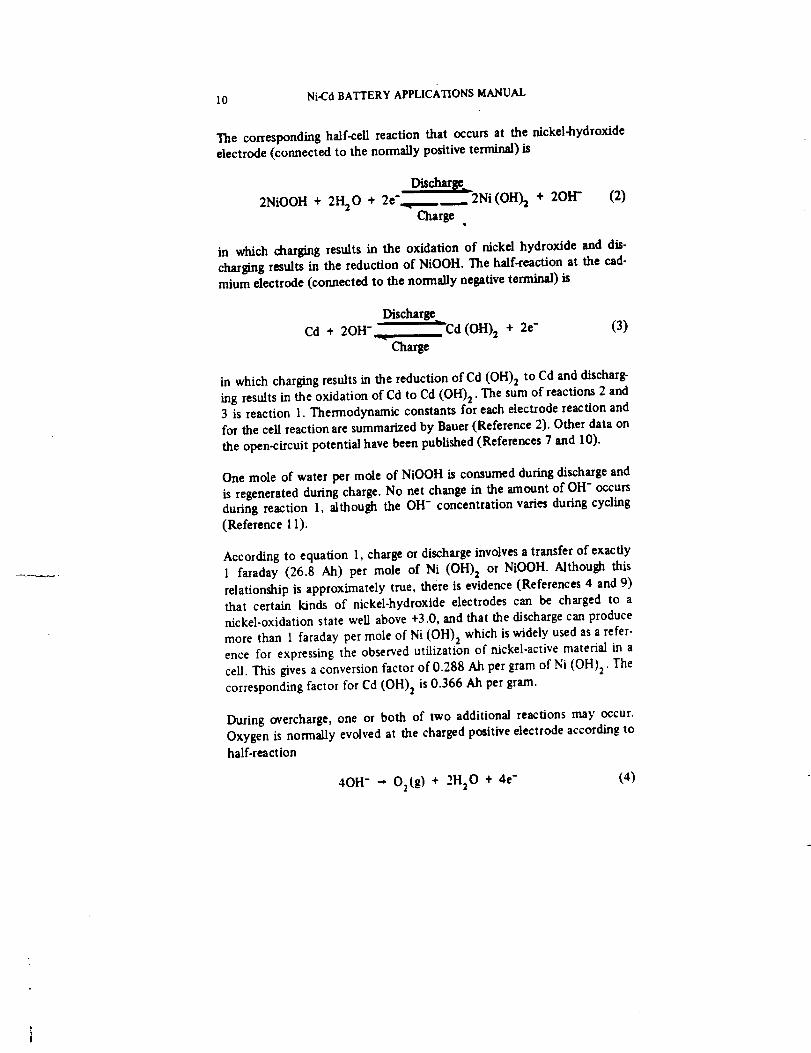
The corresponding half-cell reaction that occurs at the nickel-hydroxide
electrode (connected to the normally positive terminal) is
Discharge
2NiOOH + 2H20 + 2e-,._.._,,_._ 2Ni (OH) 2Charge
+ 2OH- (2)
in which charging results in the oxidation of nickel hydroxide and dis-
charging results in the reduction of NiOOH. The half-reaction at the cad-mium electrode (connected to the normally negative terminal) is
Cd + 2OH- Discharge Cd (OH) 2 + 2e-
Charge
(3)
in which charging results in the reduction of Cd (OH) 2 to Cd and discharg-
ing results in the oxidation of Cd to Cd (OH) 2 . The sum of reactions 2 and3 is reaction 1. Thermodynamic constants for each electrode reaction and
for the cell reaction are summarized by Bauer (Reference 2). Other data on
the open-circuit potential have been published (References 7 and 10).
One mole of water per mole of NiOOH is consumed during discharge and
is regenerated during charge. No net change in the amount of OH- occursduring reaction 1, although the OH- concentration varies during cycling
(Reference 11).
According to equation 1, charge or discharge involves a transfer of exactly
1 faraday (26.8 Ah) per mole of Ni (OH) 2 or NiOOH. Although this
relationship is approximately true, there is evidence (References 4 and 9)that certain kinds of nickel-hydroxide electrodes can be charged to a
nickel-oxidation state well above +3.0, and that the discharge can produce
more than 1 faraday per mole of Ni (OH) 2 which is widely used as a refer-
ence for expressing the observed utilization of nickel-active material in a
cell. This gives a conversion factor of 0.288 Ah per gram of Ni (OH) 2. The
corresponding factor for Cd (OH) 2 is 0.366 Ah per gram.
During overcharge, one or both of two additional reactions may occur.
Oxygen is normally evolved at the charged positive electrode according to
half.reaction
4OH- _ 02(g) + 2H20 + 4e-(4)
CELL DESCRIPTION 11
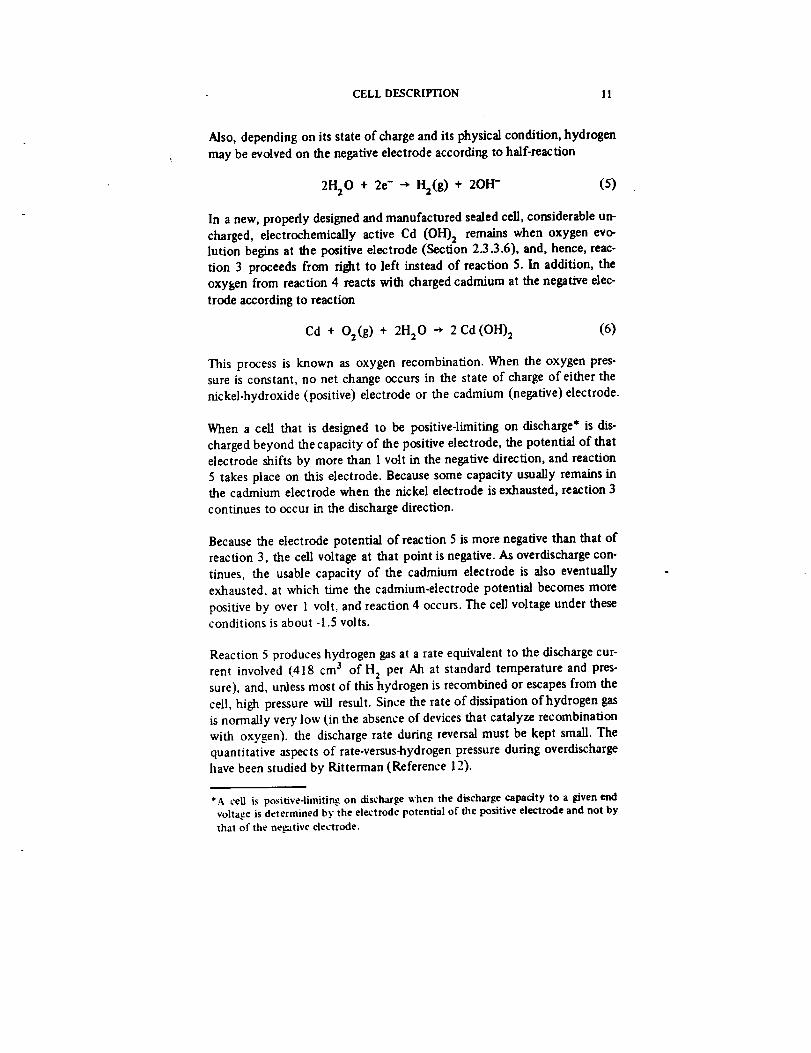
Also, depending on its state of charge and its physical condition, hydrogen
may be evolved on the negative electrode according to half-reaction
2H20 + 2e- -+ H2(g) + 2OH- (5)
In a new, properly designed and manufactured sealed cell, considerable un-
charged, electrochemically active Cd (OH) 2 remains when oxygen evo-lution begins at the positive electrode (Section 2.33.6), and, hence, reac-
tion 3 proceeds from fight to left instead of reaction 5. In addition, the
oxygen from reaction 4 reacts with charged cadmium at the negative elec-
trode according to reaction
Cd + O2(g) + 2H20 -* 2 Cd(OH) 2 (6)
This process is known as oxygen recombination. When the oxygen pres-sure is constant, no net change occurs in the state of charge of either the
nickel-hydroxide (positive) electrode or the cadmium (negative) electrode.
When a cell that is designed to be positive-limiting on discharge* is dis-
charged beyond the capacity of the positive electrode, the potential of thatelectrode shifts by more than 1 volt in the negative direction, and reaction
5 takes place on this electrode. Because some capacity usually remains inthe cadmium electrode when the nickel electrode is exhausted, reaction 3
continues to occur in the discharge direction.
Because the electrode potential of reaction 5 is more negative than that of
reaction 3, the cell voltage at that point is negative. As overdischarge con-
tinues, the usable capacity of the cadmium electrode is also eventually
exhausted, at which time the cadmium-electrode potential becomes more
positive by over 1 volt, and reaction 4 occurs. The cell voltage under theseconditions is about -1.5 volts.
Reaction 5 produces hydrogen gas at a rate equivalent to the discharge cur-
rent involved (418 cm 3 of H 2 per All at standard temperature and pres-
sure), and, unless most of this hydrogen is recombined or escapes from the
cell, high pressure will result. Since the rate of dissipation of hydrogen gas
is normally very low (,in the absence of devices that catalyze recombination
with oxygen), the discharge rate during reversal must be kept small. The
quantitative aspects of rate-versus-hydrogen pressure during overdischarge
have been studied by Ritterman (Reference 12).
*A ceil is positiveqimiting on discharge when the discharge capacity to a given end
voltage is determined by the electrode potential of the positive electrode and not by
that of the ne_tive electrode.
12 Ni..CdBATTERY APPLICATIONS MANUAL
2.3 CELL DESIGN AND CONSTRUCTION
This section presents and correlates certain details of design and construc-
tion of modem hermetically sealed, sintered-plate nickel-cadmium battery
cells. The material is presented as background information and is intended
to serve as the basis for discussing the effect of design variations in Sections
3 and4.
2.3.1 General Design Requirements for Space Applicatiom
By fax, the largest use of nickel-cadmium batteries in space applications is
for orbiting spacecraft, whether for Earth orbiters, lunar orbiters, Mars
orbiters, or others. Such applications take advantage of the inherently long
cycle life of the nickel-cadmium cell as compared to other types of sealedcells.
The cell and battery design requirements for orbital applications are:
• Capability to withstand launch vibrations and shock environ-ments
• Integrity of the hermetic seal mainh_i_ed throqghout thou s_,nds
of electrical cycles involving pressure _d thermal ?h_ges
• Low _ermal resistance from pla_e stack to spacecraft he_t sink
• Long cycle life under a wid¢ raage of corlg!jtions
• Stable long-term voltage regula.tion
• Mapdmum coulombic efficiency
• Maximum useable energy per u.mt wei_t
e Stable long-term overcharge char_¢teristic_
This section describes how the design and ¢oostructi.ola of the cell ¢ontrib,
utes to the achievement of these requiremolats. S¢c.tion 2.3._ discussos tile
design of irldividqal cell components, and Sect!oft 2.3.3 discu.sses the design
of the cell as a whole, including fl_e interrelat!onship of ¢cmlponents.
CELL DESCRIFFION 13
2.3.2 Cell Components
The cell components of greatest potential impact on cell performance and
life are the plates,* separators, container and seals, and electrolyte. For a
summary of additional information, see Reference 5. Two excellent bibli-
ographies on cell materials have been published (References 13 and 14).
2.3.2. 1 Plate Design
A sintered plate consists of a porous metal substrate, called a plaque,
whose pores are partially f_led with an electrochemically active material.
The plaque consists of a matrix of sintered-nickel particles attached to a
supporting base, usually referred to as the grid. Many design variables can
affect plate behavior and, hence, cell performance and life. Some of these
are discussed in the following paragraphs.
Plaque Design-The variables involved in plaque design include grid type,
material, and thickness, plaque thickness, porosity (void fraction), and
pore size.
Two types of grids are generally used: perforated sheet metal and metal
screen. Each is made as either solid nickel or nickel-plated steel. The sheet
is usuagy 0.08 to 0.1 millimeter (0.003 to 0.004 inch) thick and is about
40 percent perforated. Typically, screen grids are made from wire about
0.3 millimeter (0.01 inch) in diameter and have up to eight wires per
centimeter (20 per inch). Currendy. only a wet slurry coating is used with
perforated sheet grids, and only a dry powder coating is used with screen
grids. (See the following description of the plaque-making process.)
Although the screen can be slur13,'-coated, perforated sheet is usually un-suitable for dry-coating because it does not retain dry nickel powder
properly.
From a reliability standpoint, the perforated sheet-grid/slurry-coated
plaque design appears to be superior to the screen-grid/dry-coated type
for spacecraft applications. Several deficiencies of the latter may be cited.
For example, the individual _vires at the edges of the screen grids are dif-
ficult to control, even when the plaque is coined, and tend to become
*The term "plate" is used in this manual to desfm_.atethe physical entity consistingofa flat structure made up of an electrical conductor and the active material. A num-ber of plates welded together become a "'plate _oup.'" The term "electrode" is re-served for a plate or plate _oup that operates electrochemically in an electrolyte.
14 Ni-Cd BATTERY APPLICATIONS MANUAL
bent toward the adjacent plate, thereby shorting the ceil. The tabs must bewelded to the remainder of the plaque, and this weld is often a point of
relatively high resistance, which causes hot spots that can soften or melt
the separator that leads to plate-to-plate shorting in the tab area. High
voltage or charge and low voltage or discharge can also result. Finally, dry-
sintered plates undergo considerably more swelling and buciding with
cycling because the sintered matrix is relatively weak and is largely on oneside of the screen grid. Therefore, any swelling of the sinter (normal for
chemically impregnated positive plates)* tends to distort the plate.
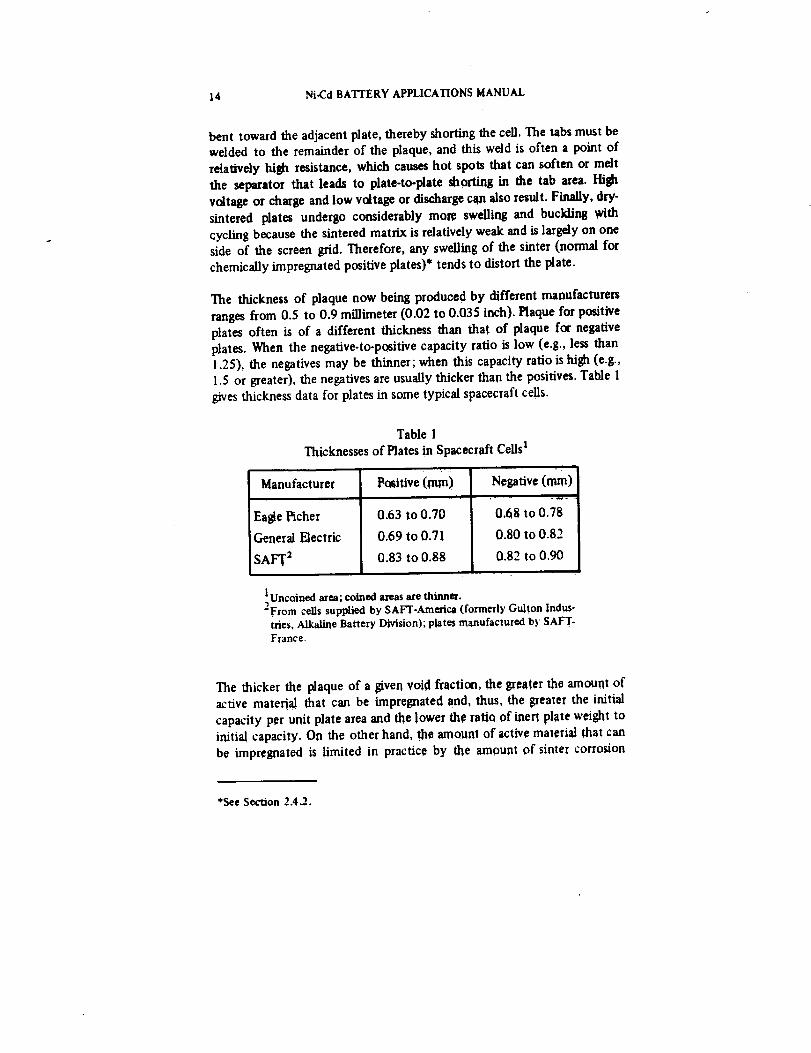
The thickness of plaque now being produced by different manufacturers
ranges from 0.5 to 0.9 millimeter (0.02 to 0.035 inch). Plaque for positive
plates often is of a different thickness than that of plaque for negative
plates. When the negative-to-p0sitive capacity ratio is low (e.g., less than
1.25), the negatives may be thinner; when this capacity ratio is high (e.g.,
1.5 or greater), the negatives are usually thicker than the positives. Table 1
gives thickness data for plates in some typical spacecraft ceils.
Table 1
Thicknesses of plates in Spacecraft Cells I
Manufacturer
Eagle Picher
General Electric
SAF'[ 2
P itive( )
0.63 to 0.70
0.69 to 0.71
0.83 to 0.88
N,gative
0.68 to 0.78
0.80 to 0.82
0.82 to 0,90
1Uncoined area; coined areas are thinner.2From cells supplied by SAF"r-America (formerly Gulton Indus-
tries, Alkaline Battery Division); plates manufactured by SAFT-France.
The thicker the plaque of a given void fraction, the greater the amount ofactive mater_a! that can be impregnated and, thus, the greater the initial
capacity per unit plate area and the lower the ratio of inert plate weight to
initial capacity. On the other hand, the amount of active material that can
be impregnated is limited in practice by the amount of sinter corrosion
*See Section 2.4.2.
CELLDESCRIPTION 15
thatispermittedby the blockage of pores and by accumulation of surface
buildup. (See Section 2A.) Thin plates are better for high-rate operation
(i.e., charge and discharge rates well above the IC rate), _ however, space-
craft batteries are rarely designed for true high-rate operation, since cycle
life may be shortened under these conditions. Plaque (and plate) thickness
is thus not easily optimized, and the choice is often dictated by the capa-
bilities of the cell manufacturers' equipment and processes.
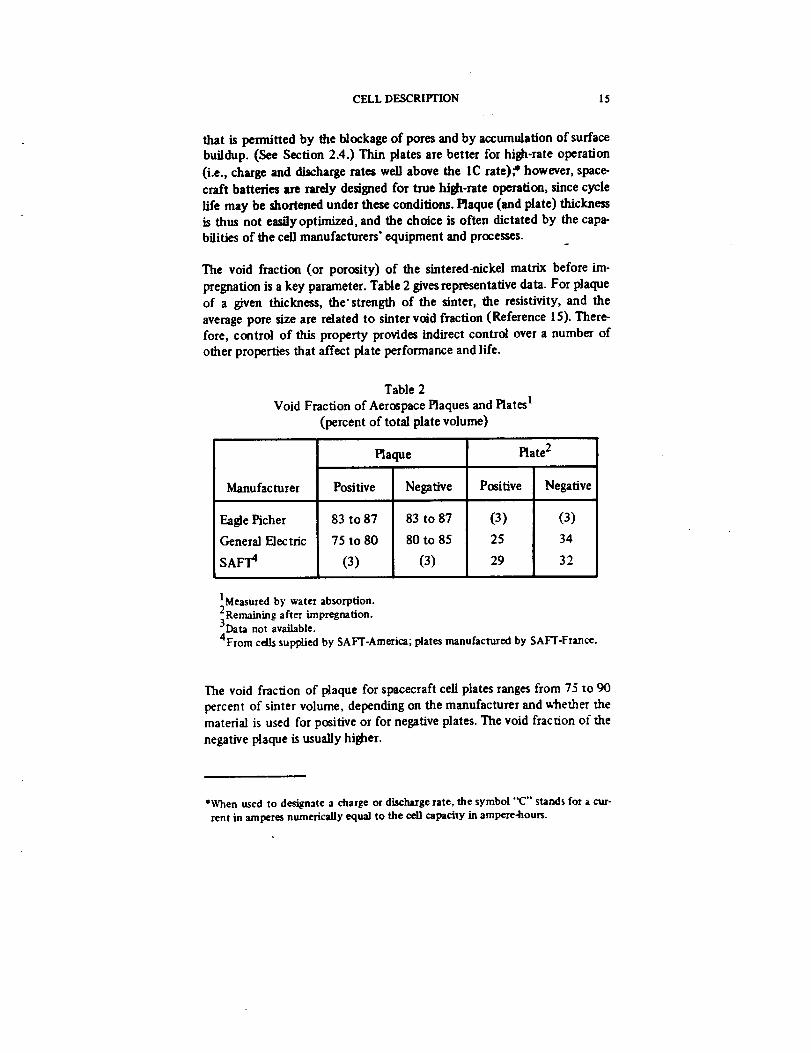
The void fraction (or porosity) of the sintered-nickel matrix before im-
pregnation is a key parameter. Table 2 gives representative data. For plaque
of a given thickness, the'strength of the sinter, the resistivity, and the
average pore size are related to sinter void fraction (Reference 15). There
fore, control of this property provides indirect control over a number of
other properties that affect plate performance and life.
Table 2
Void Fraction of Aerospace Plaques and Plates 1
(percent of total plate volume)
Manufacturer
Eagle Picher
General Electric
SAFT 4
Plaque
Positive Negative
83 to 87 83 to 87
75 to 80 80 to 85
(3) (3)
Positive
(3)
25
29
Plate 2
Negative
(3)
34
32
1Measured by water absorption._2Remainingafter impregnation._Data not available.
4From ceils supplied by SAFT-America; plates manufactmed by SAFT-France.
The void fraction of plaque for spacecraft cell plates ranges from 75 to 90
percent of sinter volume, depending on the manufacturer and v,_ether thematerial is used for positive or for negative plates. The void fraction of the
negative plaque is usually higher.
*When used to designate a charge or discharge rate, the symbol "'C" stands for a cur-rent in amperes numerically equal to the cell capacity in ampere-hours.
16 Ni-Cd BATTERY APPLICATIONS MANUAL
The void fraction for positive plaque has been optimized with respect toinitial capacity and handling during manufacturing. However, heavilyloaded plates made from such plaque by the chemical impregnation methodundergo considerable thickening with cycling (References 16 and 17).Also, after several hundred cycles, positive-plate capacity and utilization*of active material decrease relative to their initial values when plaque void
fraction is above 75 to 80 percent, (Reference 18), whereas the oppositetrend is observed below 75 percent. Because, for a given plate thickness,
plate weight per unit area increases as void fraction decreases, however,design tradeoffs at the plaque design level are possible.
Relatively few data are available on pore size and pore-size distribution insintered-nickel plaque. One reason for this is the difficulty and expense of
making the measurements. It has been reported that the mercury intrusionmethod that is often used for measuring pore size in other applications isnot valid for sintered nickel (Reference 15). Available data show a rangefrom 1 to over 100 microns calculated pore diameter, with averages in the
range of 10 to 20 microns (References 19 and 20). Figure 1 shows the sur-face of a sintered-nickel plaque as seen under the scanning electron micro-
scope.
Reference 18 shows that the average pore size increases as void fractionincreases and that utilization in positive plates decreases as pore size in-
creases. Thus, optimization of a cell design for specific energy should in-clude consideration of plaque pore size as well as void fraction.
The edges of plates used in most aerospace cells are "'coined." Coining is
the process of stamping the sinter to densffy it and thereby to strengthenthe edges. Because coining is normally done before impregnation, theamount of active material absorbed by the edges is less than that in theuncoined area; hence, the weakening effect of cycling on the sinter struc-ture is less at the edges. Different manufacturers use different degrees ofthickness reduction, ranging from 15 to 50 percent of the uncompressedthickness. Tests have shown (Reference 17) that the beneficial effect on
positive plates is insignificant unless the thickness reduction is greater than30 percent. Figure 2 shows the appearance of properly coined edges.
The average width of the coined border is usually constant for a givenmanufacturer and independent of the size of the plate. Thus, the per-centage of total plate area affected by coining increases as cell size (and
plate size) decreases. For an average coined width of 1.5 millimeters,
*In this manual, utilization = (capacity obtained on disch_e - theoretical capacitycalculated from the amount of active material present).
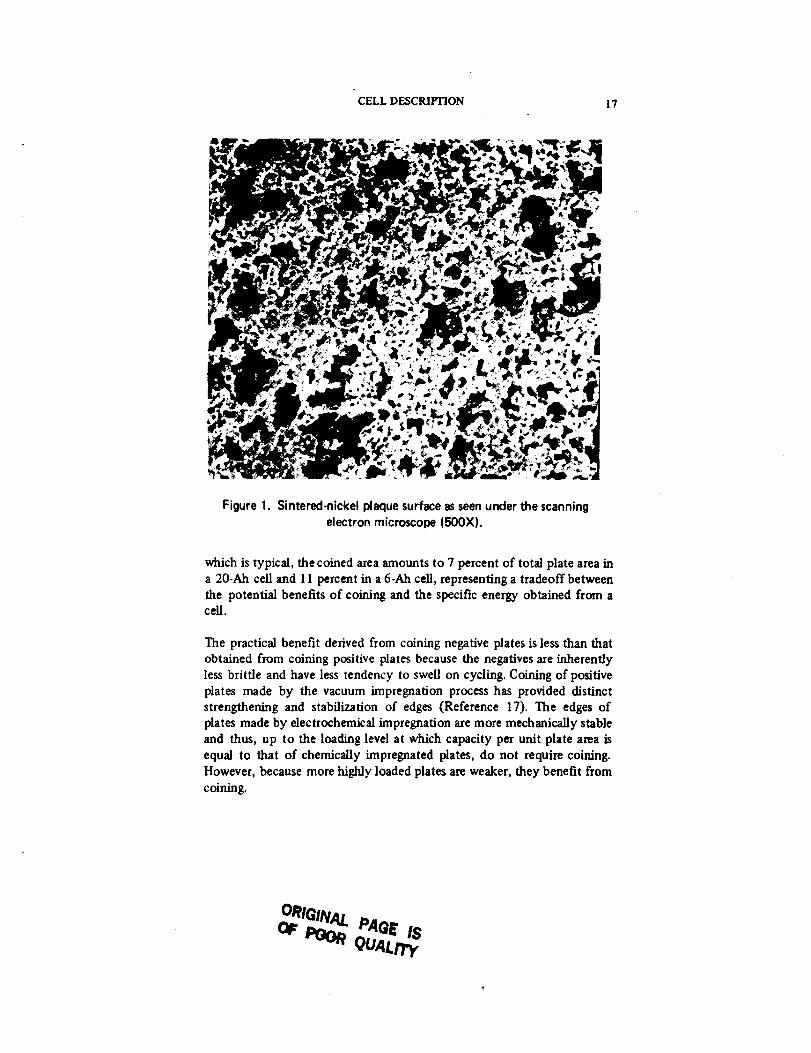
CELL DESCRIFFION I7
Figure 1. Sintered-nickel plaque surface asseen under the scanning
electron microscope (500X).
which is typical, the coined area amounts to 7 percent of total plate area in
a 20-Ah cell and 11 percent in a 6-Ah cell, representing a tradeoff between
the potential benefits of coining and the specific energy obtained from acell.
The practical benefit derived from coining negative plates is less than that
obtained from coining positive plates because the negatives are inherently
less brittle and have less tendency to swell on cycling. Coining of positive
plates made by the vacuum impregnation process has provided distinct
strengthening and stabilization of edges (Reference 17). The edges of
plates made by electrochemical impregnation are more mechanically stable
and thus, up to the loading level at which capacity per unit plate area is
equal to that of chemically impregnated plates, do not require coining.
However, because more highly loaded plates are weaker, they benefit from
coining.
ORIGINAl.
QUALn.y
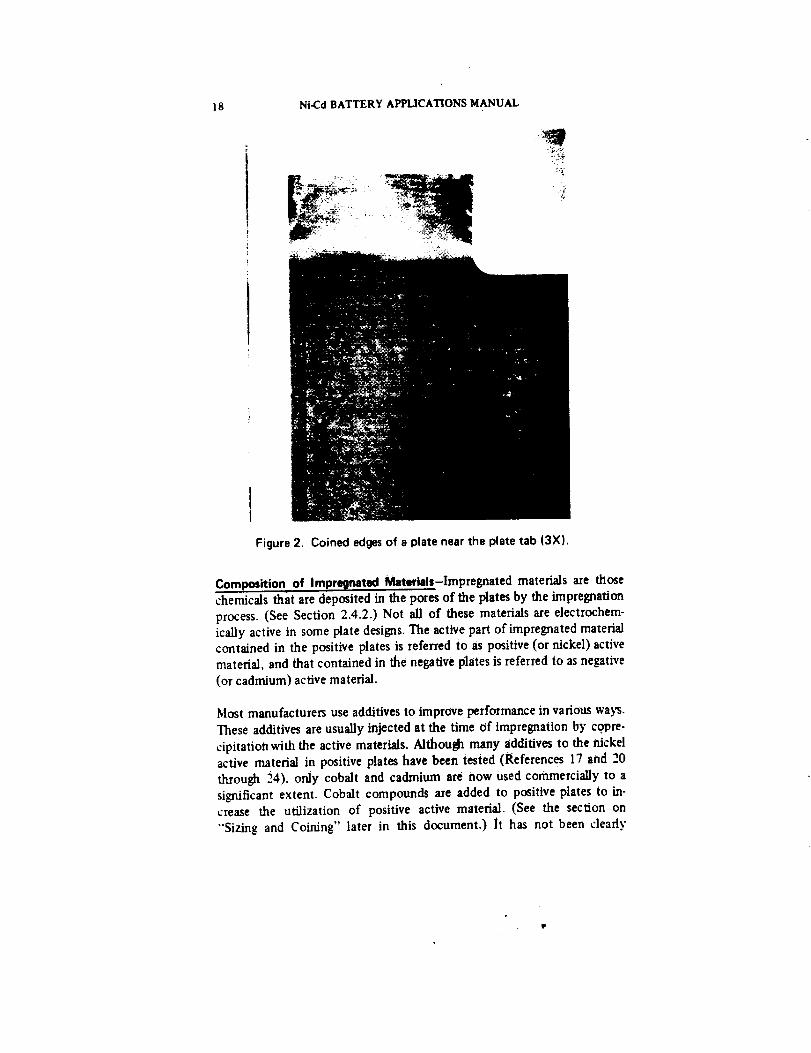
18 Ni-Cd BATTERY APPLICATIONS MANUAL
Figure 2. Coined edges of a plate near the plate tab (3X).
Composition of impre_Inated Materials-Impregnated materials are those
chemicals that are deposited in the pores of the plates by the impregnation
process. (See Section 2.4.2.) Not all of these materials are electrochem-
icaJ]y active in some plate designs. The active part of impregnated material
contained in the positive plates is referred to as positive (or nickel) active
material, and that contained in the negative plates is referred to as negative
(or cadmium) active material.
Most manufacturers use additives to improve performance in various ways.
These additives are usually injected at the time of impregnation by co pre-
dpitation with the active materials. Although many additives to the nickel
active material in positive plates have been tested (References l ? and 20
through 24). only cobalt and cadmium are now used commercially to a
significant extent. Cobalt compounds are added to positive plates to in-
crease the utilization of positive active material. (See the section on
"'Sizing and Coining" later in this document.) it has not been clearly
<
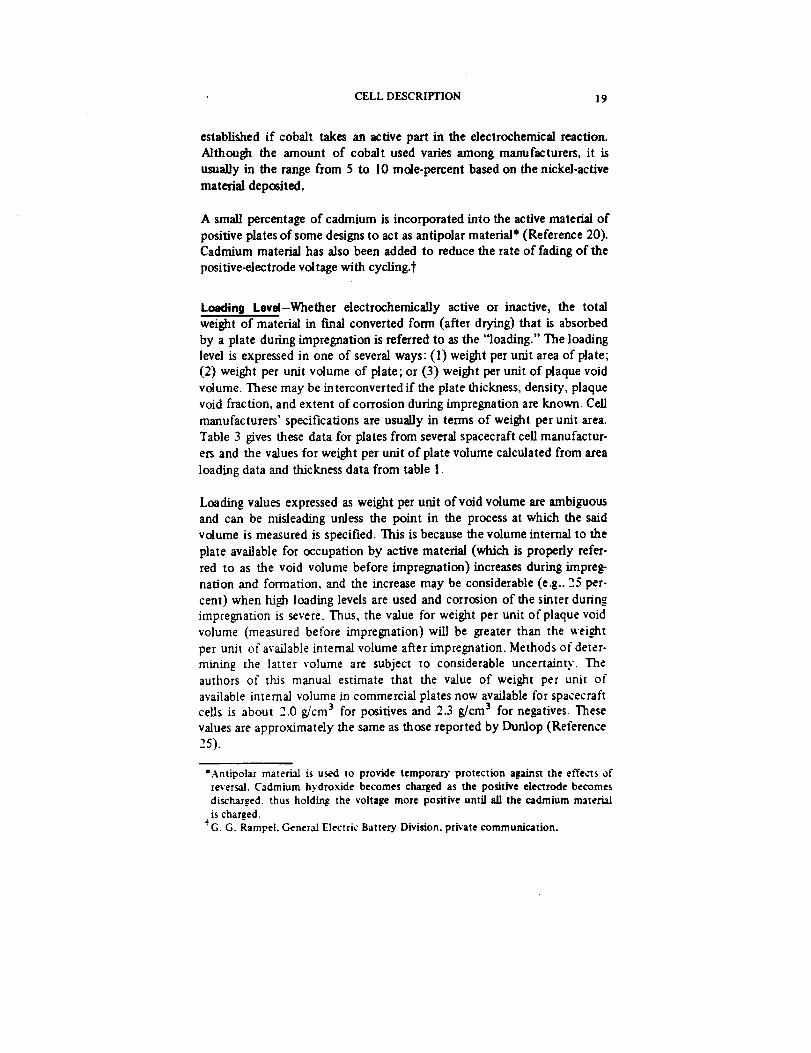
CELL DESCRIPTION 19
established if cobalt takes an active part in the electrochemical reaction.
Although the amount of cobalt used varies among manufacturers, it is
usually in the range from 5 to l0 male-percent based on the nickel-active
material deposited,
A small percentage of cadmium is incorporated into the active material of
positive plates of some designs to act as antipolar material* (Reference 20).Cadmium material has also been added to reduce the rate of fading of the
positive-electrode voltage with cycling._"
Loading Level-Whether electrochemically active or inactive, the total
weight of material in final converted form (after drying) that is absorbed
by a plate during impregnation is referred to as the "loading." The loading
level is expressed in one of several ways: (1) weight per unit area of plate;
(2) weight per unit volume of plate; or (3) weight per unit of plaque void
volume. These may be interconverted if the plate thickness, density, plaque
void fraction, and extent of corrosion during impregnation are known. Cell
manufacturers' specifications are usually in terms of weight per unit area.
Table 3 gives these data for plates from several spacecraft cell manufactur-
ers and the values for weight per unit of plate volume calculated from area
loading data and thickness data from table 1.
Loading values expressed as weight per unit of void volume are ambiguousand can be misleading unless the point in the process at which the said
volume is measured is specified. This is because the volume internal to the
plate available for occupation by active material (which is properly refer-
red to as the void volume before impregnation) increases during impreg-
nation and formation, and the increase may be considerable (e.g.. 25 per.
cent) when high loading levels are used and corrosion of the sinter during
impregnation is severe. Thus, the value for weight per unit of plaque void
volume (measured before impregnation) will be greater than the weight
per unit of available internal volume after impregnation. Methods of deter-
mining the latter volume are subject to considerable uncertaint.v. The
authors of this manual estimate that the value of weight per unit of
available internal volume in commercial plates now available for spacecraftceils is about 2.0 g/cm 3 for positives and 2.3 g/cm a for negatives. These
values are approximately the same as those reported by Dunlop (Reference
25).
*Antipolar material is used to provide temporary protection against the effects ofreversal. Cadmium hydroxide becomes charged as the positive electrode becomesdischarged, thus holding the voltage more positive until all the cadmium material
• is charged._'G. G. Rampel. Gener_ Electric Battery Division. private communication.
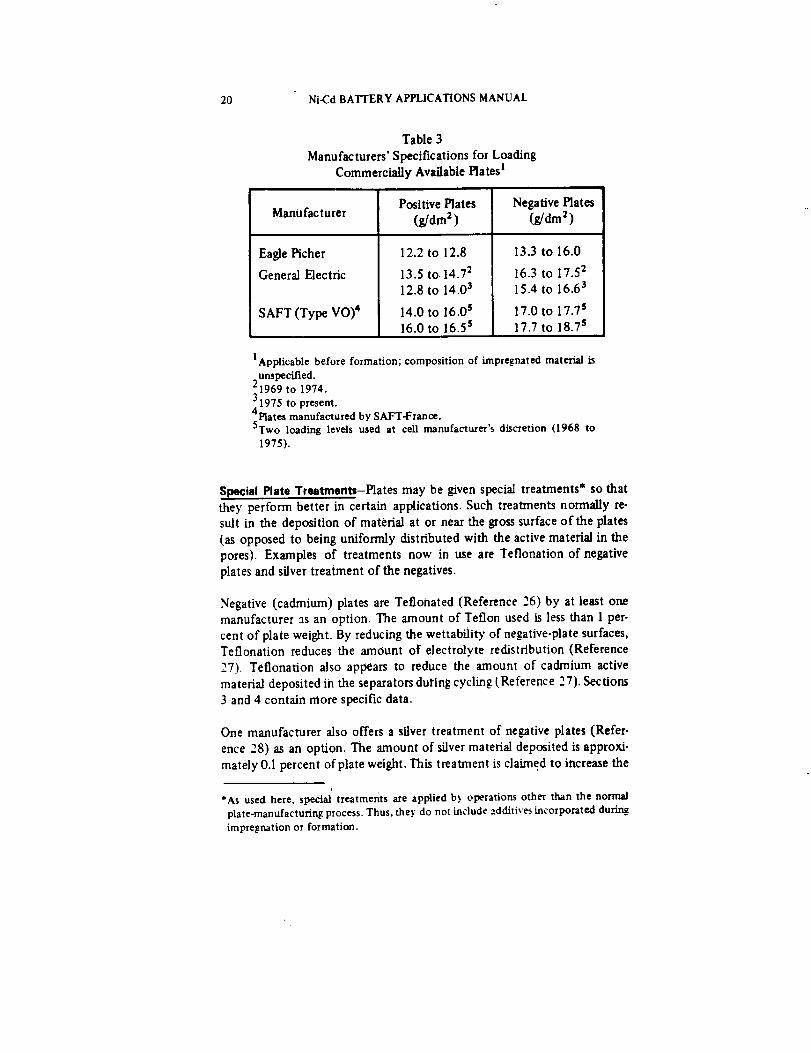
20 Ni-CdBATTERYAPPLICATIONSMANUAL
Table 3
Manufacturers' Specifications for Loading
Commercially Available Plates I
Manufacturer
Eagle Picher
General Electric
SAFT (Type VO) 4
Positive Hates
(g,/dm 2)
12.2 to 12.8
13.5 to. 14.7 2
12.8 to 14.0 3
14.0 to 16.0 s
16.0 to 16.5 s
Negative Plates
(g/_2)
13.3 to 16.0
16.3 to 17.5 215.4 to 16.6 3
17.0 to 17.7 s
17.7 to 18.7 s
IApplicable before formation; composition of impregnated material isunspecified.1969 to 1974.
31975 to present.4plates manufactured by SAFT-France.5Two loading levels used at cell manufacturer's discretion (1968 to
1975).
Special Plata Treatments-Plates may be given special treatments* so that
they perform better in certain applications. Such treatments normally re-
sult in the deposition of material at or near the gross surface of the plates
(as opposed to being uniformly distributed with the active material in the
pores). Examples of treatments now in use are Teflonation of negative
plates and silver treatment of the negatives.
Negative (cadmium) plates are Tetlonated (Reference 26) by at least one
manufacturer as an option. The amount of Teflon used is less than 1 per-
cent of plate weight. By reducing the wettability of negative-plate surfaces,Teflonation reduces the amount of electrolyte redistribution (Reference
27). Teflonation also appears to reduce the amount of cadmium active
material deposited in the separators during cycling/Reference 27). Sections
3 and 4 contain more specific data.
One manufacturer also offers a silver treatment of negative plates (Refer-
ence 28) as an option. The amount of silver material deposited is approxi-
mately 0.1 percent of plate weight. This treata'nent is claimed to increase the
*As used here, special treatments are apptied by operations other than the normalplate-manufacturing process. Thus, they do not include additives incorporated during.impregnation or formation.

CELL DESCRIPTION 21
oxygen-recombination rate capability of the negative-plate surfaces, partic-
ularly at low temperatures. No comparative test data demonstrating suchan effect has been published.
2.3.2.2 Separator Design
Separator materials for sealed aerospace cells should exhibit the followingcharacteristics:
Physical strength as a mechanical spacer between positive and
negative plates
Minimum electrolytic resistance (good conductivity in elec-trolyte)
• Protection against plate-to-plate shorts
Resistance to chemical degradation by electrolyte or activematerials
• Dimensional stability over the operating temperature range
Effectiveness in preventing migration of particles and colloidal
or soluble substances between plates of opposite polarity
• Cushioning of plates against mechanical shock
Retention of sufficient electrolyte to perform the batter).,reactions under operational acceleration fields
• Sufficient physical strength to provide easy handling
• Permeability to gasses
In general, only highly porous, so-called "absorber-type" separators (as
opposed to the barrier type used in silver-electrode ceils) are used in sealed
cells. These absorbers are usually nonwoven, felt-like products that permit
maximum transfer of oxygen between the positive and negative plates to
facilitate oxygen recombination and to control overcharge pressure. Figure
3 shows the open structure of this type of separator.
_-,, ,'l ._.
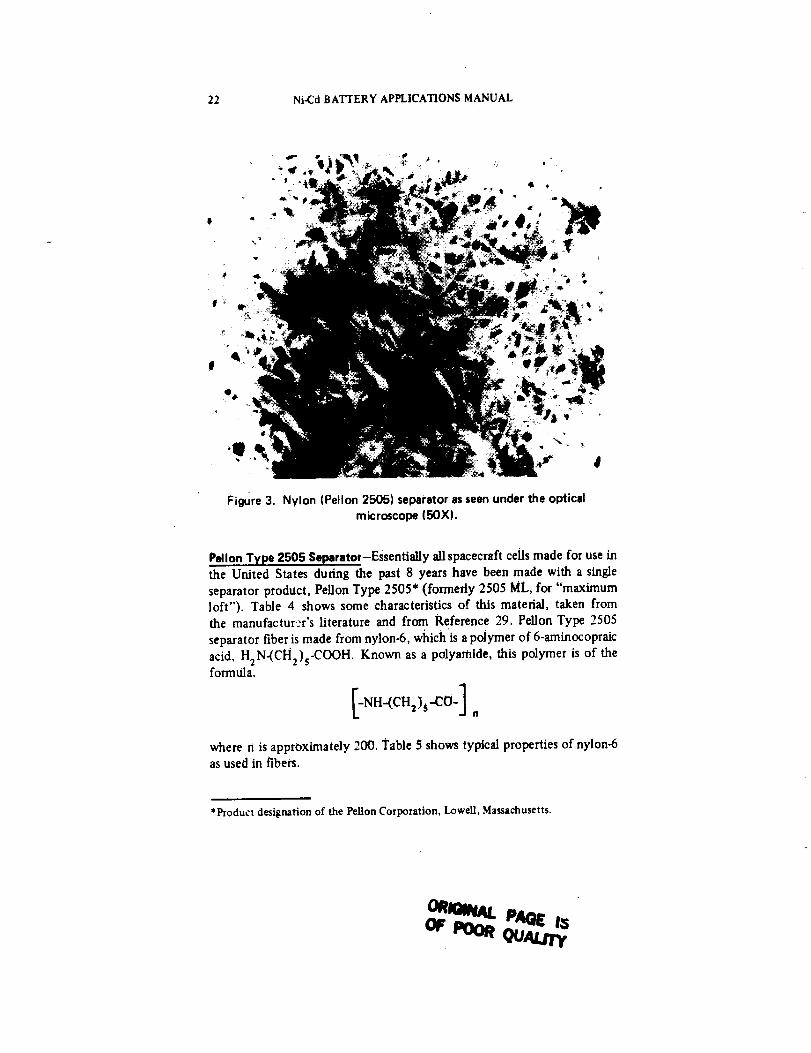
22 Ni-Cd BATTERY APPLICATIONS MANUAL
|
Figure3. Nylon (Pelion2505) separatorasseen underthe opticalmicroscope(50X).
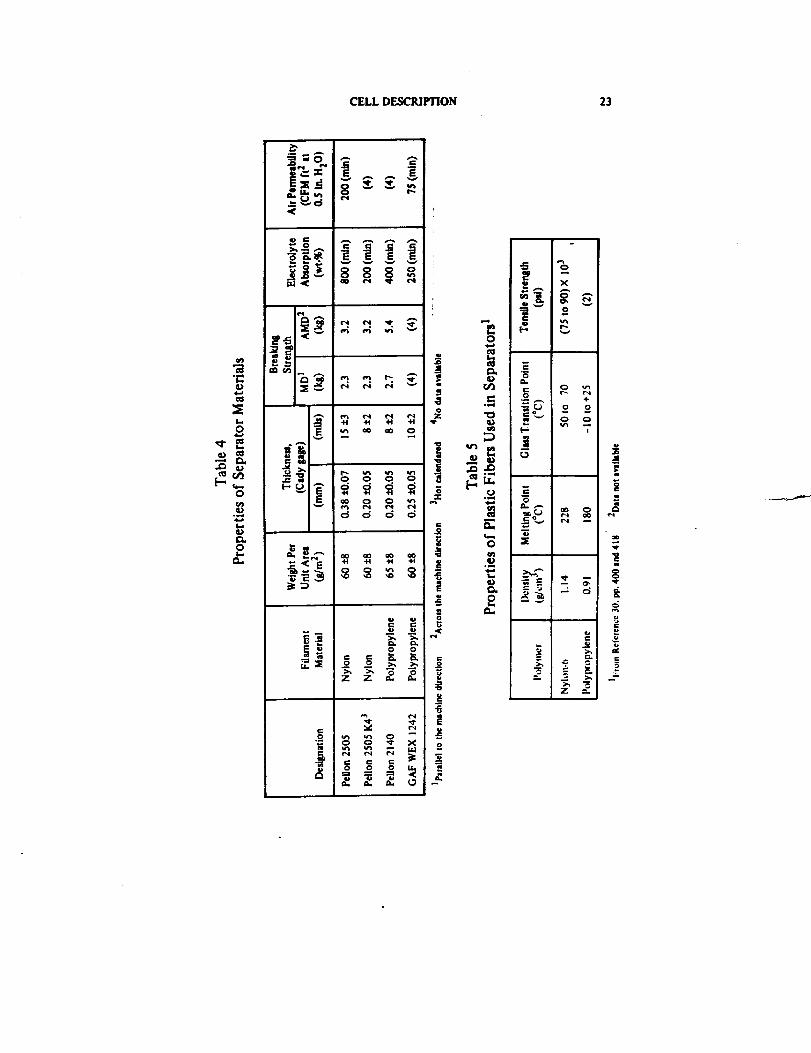
PelionType 2505 Separator-Essentiagyall spacecraft cells made for use inthe United States during the past 8 years have been made with a single
separator product, PeUon Type 2505* (formerly 2505 ML, for "maximumloft"). Table 4 shows some characteristics of this material, taken fromthe manufactur':r's literature and from Reference 29. Pelion Type 2505
separator fiber is made from nylon-6, which is a polymer of 6-aminocopraic
acid, H2N-(CH2)s-COOH. Known as a polyamlde, this polymer is of theformula,
[-NH"(CH2}s-CO-] a
where rt is approximately 200. Table 5 shows typical properties of nylon-6as used in fibers.
*Product designation of the Pelion Corporation, LoweR, Massachusetts.
CELL DESCRIFrlON 23
o_
_ N
om
_ o d d
Ji0 0
Z Z _.
_o_
• -_or_ 0 0
:_ _
o
>,
!
2
24 Ni-Cd BATrERY APPLICATIONS MANUAL
The amide groups (-CO-NH-), which link the hydrocarbon groups of the
polymer together, react slowly with the hydroxide ions (OH-) in the elec-
trolyte so that the wettability of the fdament surfaces increases for a timeafter the cell is first filled. This same reaction can eventually lead to decom-
position of the polymer and, hence, to degradation of the properties of the
separator (Reference 30). (See Chapter 4.)
Other Separator Materials-The only other material for absorber separatorsused in a significant number of sealed ceils is polypropylene. This material
has been used by the Canadian Defence Research Establishment in a
number of Canada-sponsored satellite programs and by the United States
when high temperatures are unavoidable.
Polypropylene is a hydrocarbon of the formula,
CH 3
Because of its structure and the fact that it contains no nitrogen or oxygen
as does nylon-6, polypropylene is chemically quite different from nylon-6;it is less wettable and more resistant to the action of the electrolyte and
oxygen in the cell. Consequently, the f'tlament surfaces are less wetted by
electrolyte, and the separator offers more chemical resistance to the cell
environment than does nylon.
Many types of polypropylene absorber separators from different sources
have been tested (References 31 through 35). Two products for whichthe most data are available are listed with their properties in table 4. The
properties of the polypropylene polymer material are shown in table 5.
Manufacturers have offered a few specialized nonwoven products that con-
tain both nylon and polypropylene fibers. Also, fibers made of Teflon and
other unusual materials and variations having different fiber diameters
(deniers) have been available in limited quantities for testing. Wettability
and electrolyte retention of these materials are different from those of the
more standardized products. However, no long-term comparative test data
appear to be available to indicate their relative merits.
CELL DESCRIPTION 25
Structure and Pretreatment-Nonwoven separators are made from what is
known as "staple fiber," which is highly contorted asspun, as opposed to
the straight-type fiber used for weaving. To produce a coherent product
that retains a certain thickness and shape, the fibers are compressed and
bonded at contact points. Nylon filaments are usually bonded chemically,
whereas polypropylene filaments are bonded with heat. Bonding methods
vary widely from one material to another, and the bonding materials and
processes are generally proprietary.
Because nonwoven materials are highly porous and compressible, they can
be made thinner and denser by usingheat and compression either during or
after the bonding operation. This process is known as "calendaring." For
example, Pelion Type 2505-K4 is a calendared version of Type 2505 and,
hence, has the same fiber content and weight per unit area as that of the
thicker product. Although nonwoven nylon products with less and more
weight per unit area than that of Pelion 2505 are available (e.g., Pelion
2506 and Pelion FT 2117), they have been little used for spacecraft
applications.
Nonwoven polypropylene products have been made inherently more wet-
table by radiation grafting of hydrophilic side-chains onto the polymer or
by incorporating a surfactant in the fiber during manufacture (Reference
35). The long-term effectiveness of these materials has yet to be demon-strated.
Form of Separators-In completed calls, separators are deployed in one of
several genera] forms: (1) the so-caged "accordion fold" configuration.(2) "U-folds," and (3) "'bags." In the accordion-fold style, a continuous
length of separator is used to interleave between all plate surfaces, with a
sharp fold between each layer. In the U-fold style, a separate piece of
separator is folded around each plate with the sides open. In the bag form.
separate pieces of separator product are cut for each positive plate, foldedover, and heat-sealed along two edges to form a flat bag that is open at the
top. Because cell manufacturers tend to make separators for all of their
cells in the same form. only one form is normally available from any one
manufacturer. No comparative data appear to be available on which tobase a choice between these forms.
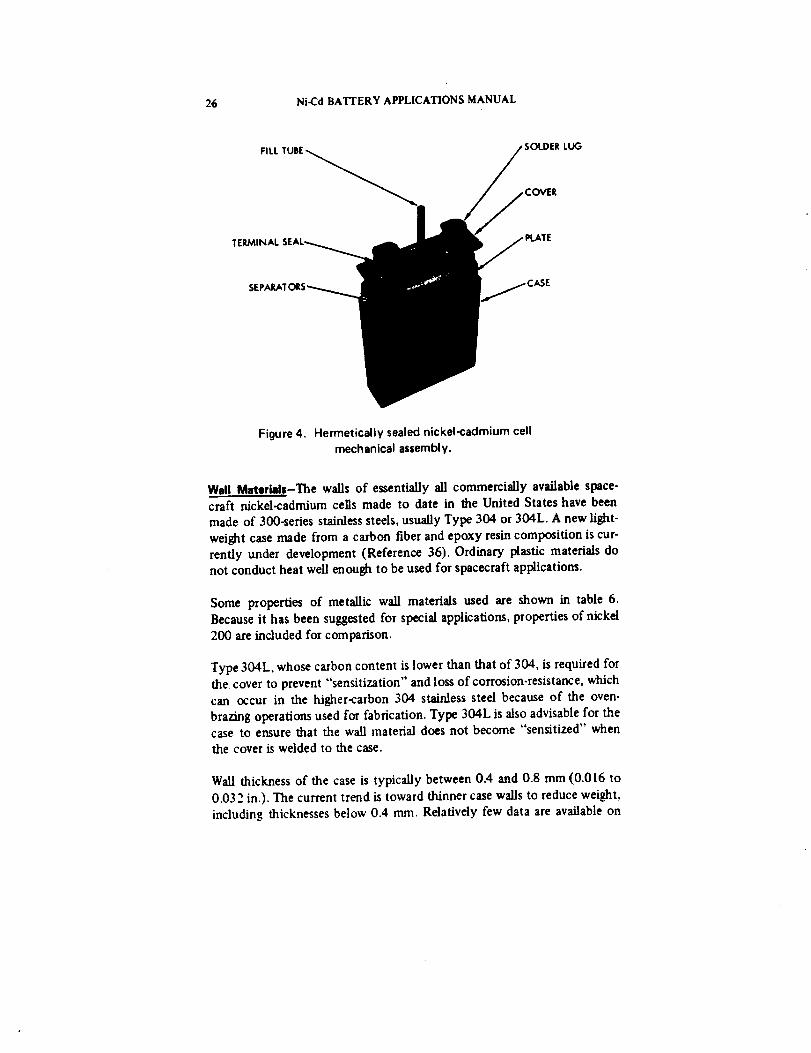
2.3.2.3 Case and Cover Design
The 'lower" part of the cell enclosure surrounding the plates is referred to
as the case (or sometimes the "'can"), whereas the "top" part, usually bear-
ing the terminals, is referred to as the cover or cover assembly (figure 4).
26 Ni-Cd BATFERY APPLICATIONS MANUAL
FILL
TERMII
Figure 4. Hermetically sealed nickel-cadmium cell
mechanical assembly.
Wall Materials-The walls of essentially all commercially available space-
craft nickd-cadmium cells made to date in the United States have been
made of 300-series stainless steels, usually Type 304 or 304L. A new light.
weight case made from a carbon fiber and epoxy resin composition is cur-
rently under development (Reference 36). Ordinary plastic materials do
not conduct heat well enough to be used for spacecraft applications.
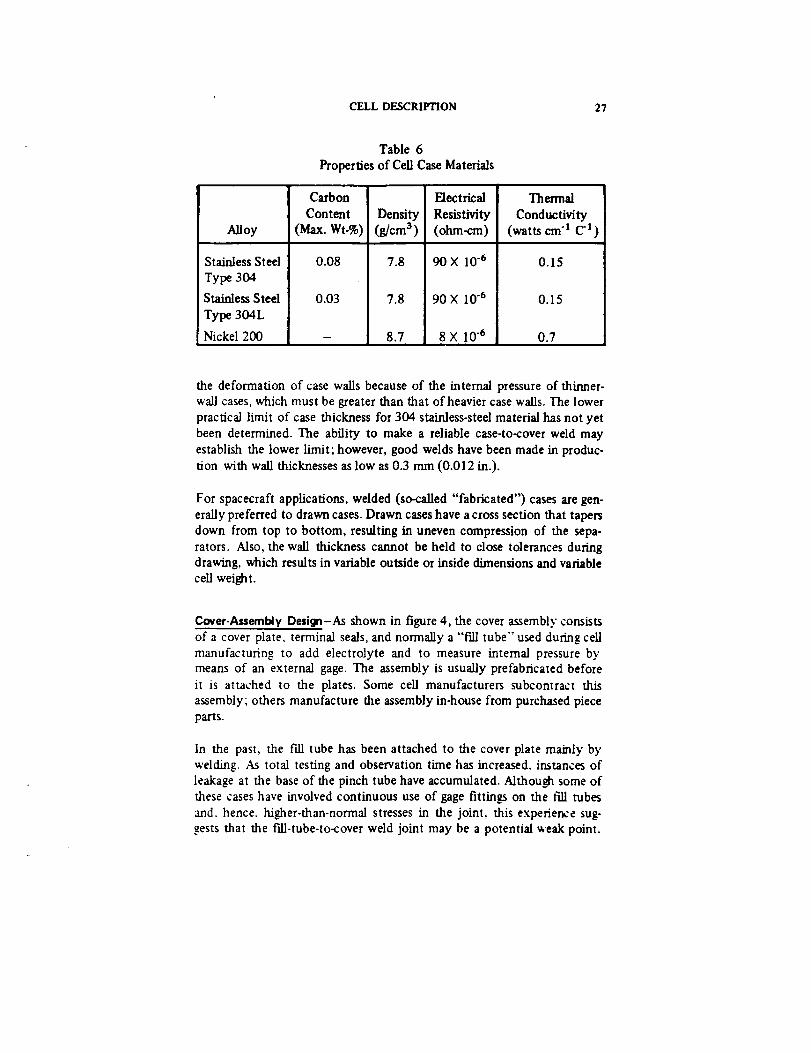
Some properties of metallic wall materials used are shown in table 6.
Because it has been suggested for special applications, properties of nickel
200 are included for comparison.
Type 304L, whose carbon content is lower than that of 304, is required for
the. cover to prevent "'sensitization" and loss of corrosion-resistance, whichcan occur in the higher-carbon 304 stalaless steel because of the oven-
brazing operations used for fabrication. Type 304L is also advisable for thecase to ensure that the wall material does not become "sensitized" whenthe cover is welded to the case.
Wall thickness of the case is typically between 0.4 and 0.8 mm (0.016 to
0.03 2 in.). The current trend is toward thinner case walls to reduce weight,
including thicknesses below 0.4 ram. Relatively few data are available on
CELL DESCRIPTION 27
Table 6
Properties of Cell Case Materials
Alloy
Stainless Steel
Type 304
Stainless Steel
Type 304L
Nickel 200
Carbon
Content
(Max. Wt-%)
0.08
Density(g/cm3)
Electrical
Resistivity
(oh_-cm)
0.03
7.8
7.8
8.7
90X 10 "6
90 X 10 .6
8X 10⁶
Thermal
Conductivity
(watts em "l C l)
0.15
0.15
0.7
the deformation of case walls because of the internal pressure of thinner-
wall cases, which must be greater than that of heavier case walls. The lower
practical limit of case thickness for 304 stainless-steel material has not yet
been determined. The ability to make a reliable case-to-cover weld may
establish the lower limit; however, good welds have been made in produc-
tion with wall thicknesses as low as 0.3 mm (0.012 in.).
For spacecraft applications, welded (so-called "fabricated") cases axe gen-
eraUy preferred to drawn cases. Drawn cases have a cross section that tapers
down from top to bottom, resulting in uneven compression of the sepa-
rators. Also, the wall thickness cannot be held to close tolerances during
drawing, which results in variable outside or inside dimensions and variablecell weight.
Cover-Assemldy Design-As shown in figure 4, the cover assembly consists
of a cover plate, terminal seals, and normally a "'fill tube" used during cell
manufacturing to add electrolyte and to measure internal pressure bymeans of an external gage. The assembly is usually prefabricated before
it is attached to the plates. Some cell manufacturers subcontract this
assembly; others manufacture the assembly in-house from purchased piece
parts.
In the past, the fill tube has been attached to the cover plate mainly by
welding. As total testing and observation time has increased, instances of
leakage at the base of the pinch tube have accumulated. Although some of
these cases have involved continuous use of gage fittings on the t'tU tubes
and. hence, higher-than-normal stresses in the joint, this experience sug-
gests that the fill-tube-to-cover weld joint may be a potential weak point.

28 Ni-Cd BATTERY APPLICATIONS MANUAL
Several users have evaluated brazing this joint, and brazing appears to
provide a stronger, more reliable joint than welding.
As the cover dimensions are increased (as is usually the case for cells of
50-Ah capacity and above), more attention must be paid to flexing of thecover plate. Such flexing can place great stress concentrations on theterminal seals and, hence, lead to a higher probability of seal failure.
Heavier gage material can be used in larger covers, or reinforcement can be
added only where needed when weight is critical.
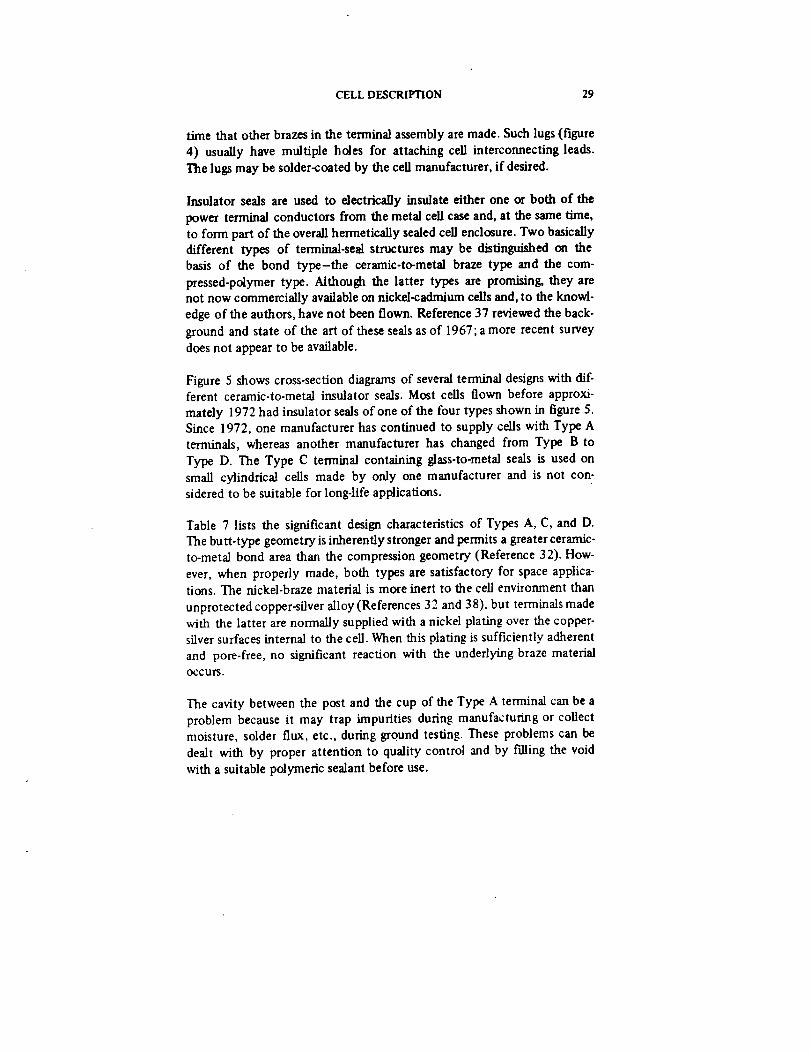
Terminal Seal Design-The main power terminals (so designated to distin-guish them from auxiliary terminals that may be present in ceUs containingauxiliary electrodes) consist basically of the terminal conductors and, forinsulated terminals, the insulator seals. This section discusses these two
parts separately.
The main terminal conductor (sometimes called a post or stud) may bemade of either nickel or stainless steel. Nickel conductors are appre-
ciably lighter for a given current-carrying capacity because nickel has ahigher electrical conductivity than stainless steel. However, unless all theother metal parts (flanges, etc.) that are brazed to the post have compatiblebrazing characteristics, it may not be practical to use nickel for the postmaterial. Thus, the entire terminal must be designed as a whole for manu-facturability, optimum conductiviW-to-weight ratio, and reliability.
Because the caps, flanges, and collars used in some insulated terminaldesigns are relatively thin, they must be protected from corrosion by theatmosphere while on the Earth's surface. This is especiaLly true vAaen these
parts are made of Kovar or of nickel-iron alloys with no chromium content.Protective coatin_ may be required when these materials are exposed toother than a dehumidified environment.
The "'combs" (the lower ends of the posts that mate with the plate tabs)
are part of the terminal conductors. The choice of materials for the combsis more restricted than for the posts. Mechanical strength and weldabiliw
with the plate-tab material are important requirements. Stainless steel isgenerally used because it has the best combination of desired properties.
Copper or nickel solder lugs on the tops of the terminal posts are nowavailable from all cell manufacturers, with nickel being the preferredmaterial. These lugs are usually brazed onto the terminal posts at the same
CELL DESCRIPTION 29
time that other brazes in the terminal assembly are made. Such lugs (figure
4) usually have multiple holes for attaching cell interconnecting leads.
The lugs may be solder-coated by the cell manufacturer, if desired.
Insulator seals are used to electrically insulate either one or both of the
power terminal conductors from the metal cell case and, at the same time,
to form part of the overall hermetically sealed cell enclosure. Two basically
different types of terminal-seal structures may he distinguished on the
basis of the bond type-the ceramic-to-metal braze type and the com-
pressed-polymer type. Although the latter types are promising, they arenot now commercially available on nickel-cadmium cells and, to the knowl-
edge of the authors, have not been flown. Reference 37 reviewed the back-
ground and state of the art of these seals as of 1967; a more recent survey
does not appear to be available.
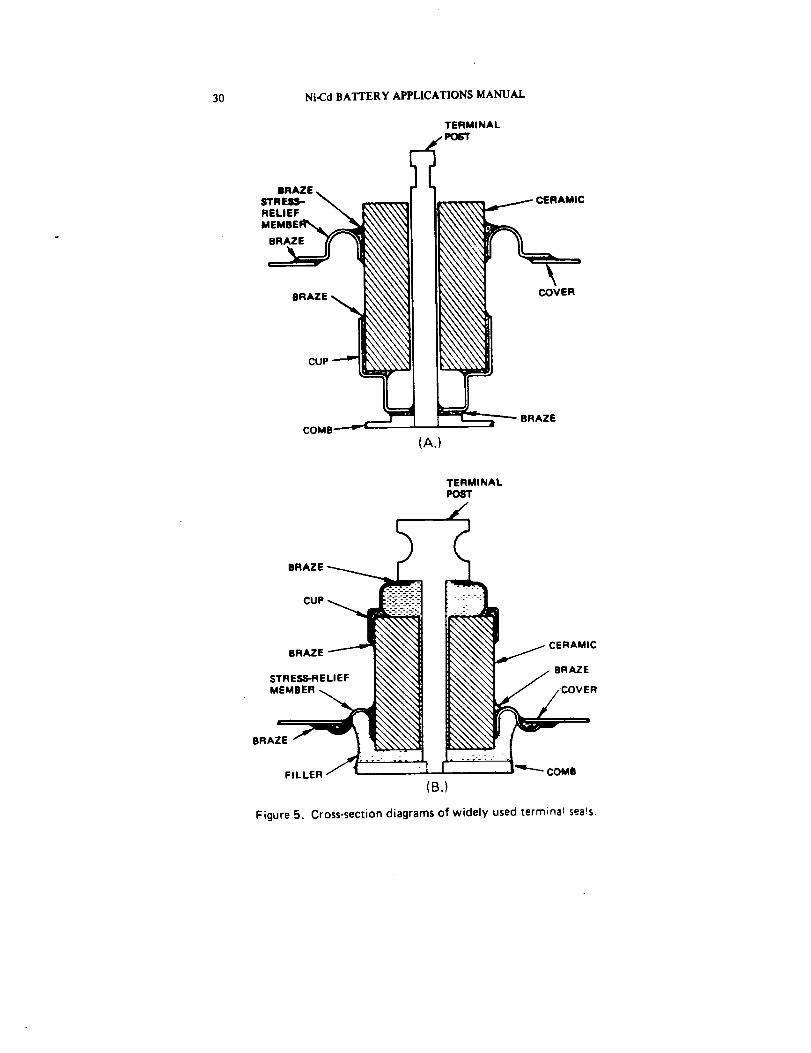
Figure 5 shows cross-section diagrams of several terminal designs with dif-ferent ceramic-to-metal insulator seals. Most cells flown before approxi-
mately 1972 had insulator seals of one of the four types shown in figure 5.
Since 1972, one manufacturer has continued to supply cells with Type A
terminals, whereas another manufacturer has changed from Type B to
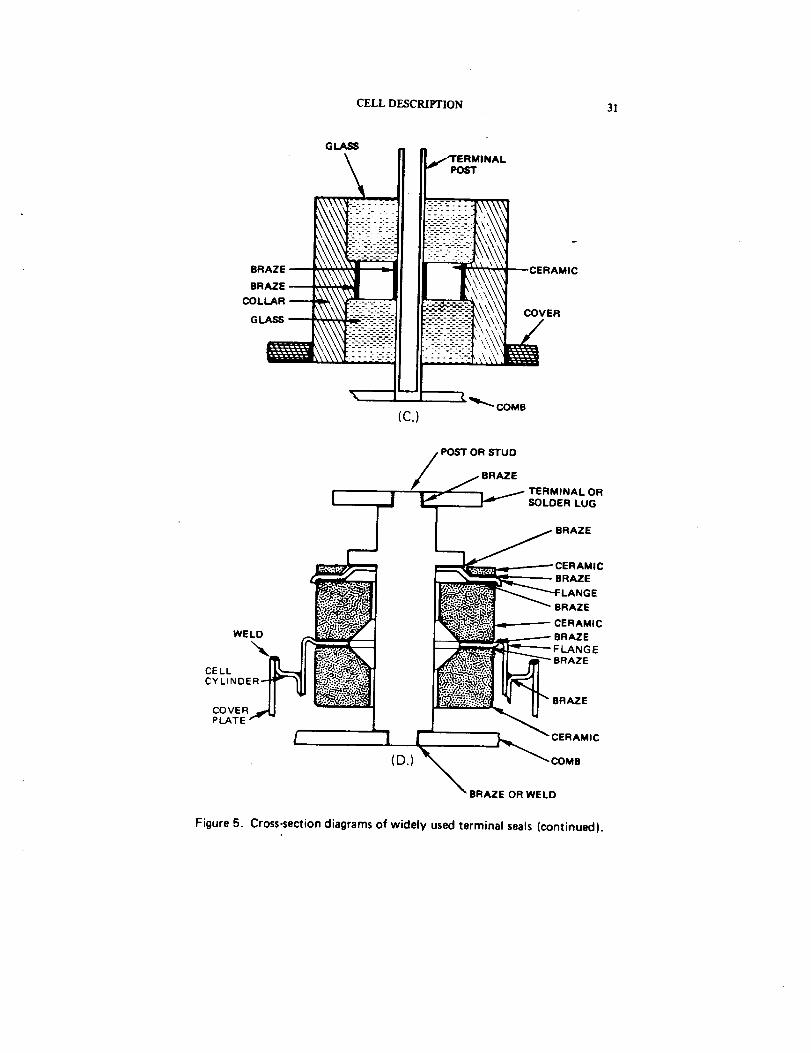
Type D. The Type C terminal containing glass-to-metal seals is used on
small cylindrical cells made by only one manufacturer and is not con-
sidered to be suitable for long-life applications.
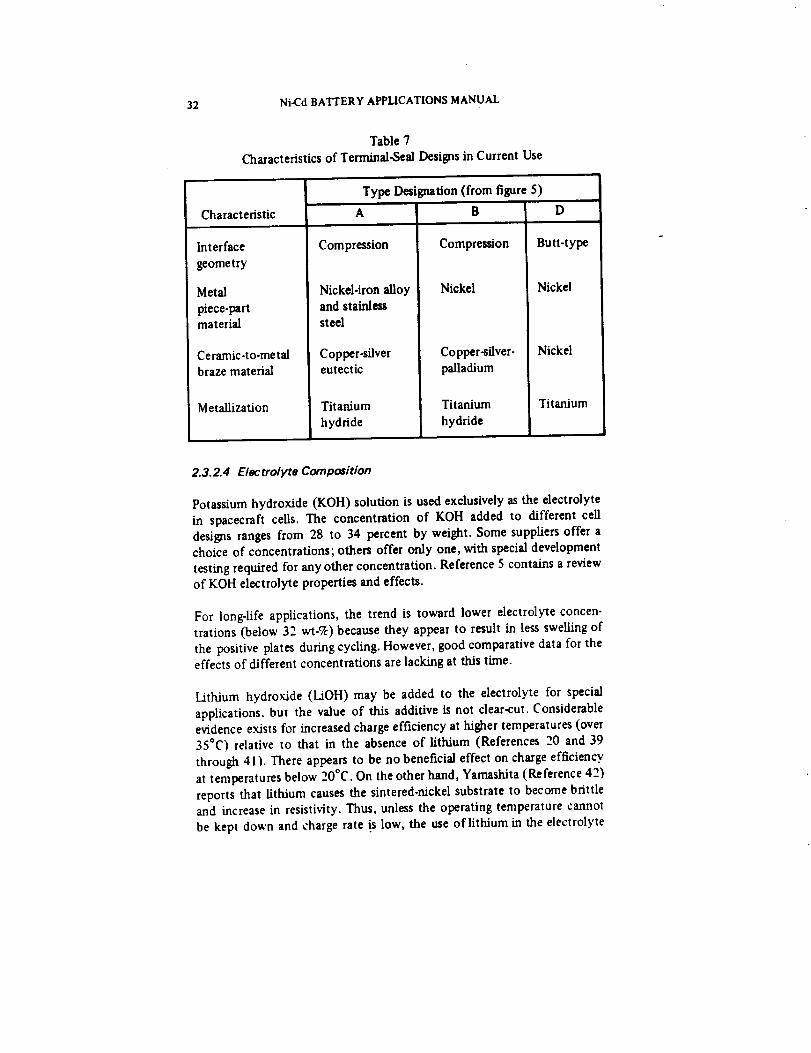
Table 7 lists the significant design characteristics of Types A, C, and D.
The butt-type geometry is inherently stronger and permits a greater ceramic-
to-metal bond area than the compression geometry (Reference 32). How-
ever, when properly made, both types are satisfactory for space applica-tions. The nickel-braze material is more inert to the cell environment than
unprotected copper-silver alloy (References 32 and 38). but terminals madewith the latter are normally supplied with a nickel plating over the copper-
silver surfaces internal to the cell. When this plating is sufficiently adherent
and pore-free, no significant reaction with the underlying braze material
occurs.
/'he cavity between the post and the cup of the Type A terminal can be a
problem because it may trap impurities during manufacturing or collectmoisture, solder flux, etc., during ground testing. These problems can be
dealt with by proper attention to quality control and by filling the void
svith a suitable polymeric sealant before use.
30 Ni-Cd BATTERY APPLICATIONS MANUAL
TERMINAL
r't.t
.EL,SF _ _\\\\_!1 '
(A.)
CERAMIC
COVER
BRAZE
J
BRAZE_
BRAZE .... \
STRESS-RELIEF
MEMBER
.... \
TERMI NAL
POST
..-.- -
."._._\\\" j CERAMIC
. ._ \ / BRAZE
I I----- COMeB.)
Figure 5. Cross-section diagrams of widely used terminal seals.
CELL DESCRIPTION 31
BRAZE
BRAZE --
COLLAR
GLASS
GLASS
\_\\\w : -T:
i:i--i-i!\\\ :--_ :-_--. -...... [
_\\\ - .-...
b_
\ \ \ - • - "-- .--_--b, • • :-: :..-:--.,
m-_
_,,"I"ERMINALPOST
"-:.:-::-_-:-_:::::::_--':--:--: ,\
_CERAMIC
COVER
_ COMe(C.
BRAZE OR WELD
Figure 5. Cross-section diagrams of widely used terminal seals (continued).
32 Ni-Cd BA'I_ERY APPLICATIONS MANUAL
Table 7
Characteristics of Terminal-Seal Designs in Current Use
Characteristic
Interface
geometry
Metal
piece-partmaterial
Ceramic-to-metal
braze material
MetaUization
Type Designation (from figure 5)
A B
Compression
Nickel-iron alloy
and stainless
steel
Copper-silvereutectic
Titanium
hydride
Compression
Nickel
Copper-silver-
palladium
Titanium
hydride
D
Butt-type
Nickel
Nickel
Titanium
2.3.2.4 Electrolyte Composition
Potassium hydroxide (KOH) solution is used exclusively as the electrolyte
in spacecraft cells. The concentration of KOH added to different cell
designs ranges from 28 to 34 percent by weight. Some suppliers offer achoice of concentrations; others offer only one, with special development
testing required for any other concentration. Reference 5 contains a review
of KOH electrolyte properties and effects.
For long-life applications, the trend is toward lower electrolyte concen-
trations (below 32 wt.%) because they appear to result in less swelling of
the positive plates during cycling. However, good comparative data for theeffects of different concentrations are lacking at this time.
Lithium hydroxide (LiOH) may be added to the electrolyte for special
applications, but the value of this additive is not clear-cut. Considerableevidence exists for increased charge efficiency at higher temperatures (over
35°C) relative to that in the absence of lithium (References 20 and 39
through 41"t. There appears to be no beneficial effect on charge efficiency
at temperatures below 20°C. On the other hand, Yamashita (Reference 42)
reports that lithium causes the sintered-nickel substrate to become brittle
and increase in resistivity. Thus, unless the operating temperature cannot
be kept down and charge rate is low, the use of lithium in the electrolyte
CELL DESCRIPTION 33
cannot be recommended for spacecraft applications, particularly not forlong-term missions. (See the section on "Oxygen Evolution and Pressureon Overcharge" later in this document.)
Although carbonate is almost always present to some extent in potassiumhydroxide solution, cell manufacturers can limit this impurity to 3 wt-%
(as K2CO3) in the solution as it is first added to the cell. Concentrationsup to 3 wt-% in new electrolyte may be insignificant because when electro-lyte enters the cell, the concentration of carbonate usually increases
rapidly with cycling to a level over I0 wt.% as carbonate is extracted fromthe plates into solution. (This occurs even with plates that have been "de-carbonated"* because this operation does not normally remove all thecarbonate that is initially present.) Section 3 describes the effect of car-
bonate in the electrolyte on ceil performance.
2.3.3 The Cell as an Entity
This section describes the design and structure of the hermetically sealednickel-cadmium cell as a completed entity ready to operate. The topicscovered include geometric considerations, capacity ratios, electrolyte quan-
tity, and precharge. The range of these variables available in commercial
spacecraft cells is shown in relation to cell capacity, and practical limitsare indicated. The implications of these variables for cell size and mass arediscussed qualitatively. A more quantitative assessment of their impact on
electrical performance and on specific energy is contained in Section 3.
2.3.3. I Plate Area and Number of Plates
By the proper choice of plaque thickness, plaque porosity, and quantity ofactive material impregnated per unit pore volume, the total area of positive
plates necessary for dehvermg a specified initial capacity may be variedover a considerable range. Positive plate area per unit of measured capacityis also a function of the impregnation and formation processes and the
electrolyte level, among other variables. Chemically impregnated positiveplates produced commercially, which are loaded to approximately 2g/cm 3of pore volume, initially exhibit ratios ranging from 3 to 4 Ah/dm 2,r and a
utilization of 80 to 90 percent. Electrochemically impregnated platesexhibit about 25 percent higher initial utilizations and therefore requirecorrespondin#y less plate area per unit capacity delivered.
*Subjected to an operation designed to remove carbonate from the plates before cell
construction.+Plate areas by convention are expressed in square decimeters (din-) and are areas of
plate material (i.e.. only one of the two faces is counted). The total gross surface
area (counting both faces) of 1 dm 2 of plate would be 2 din2.
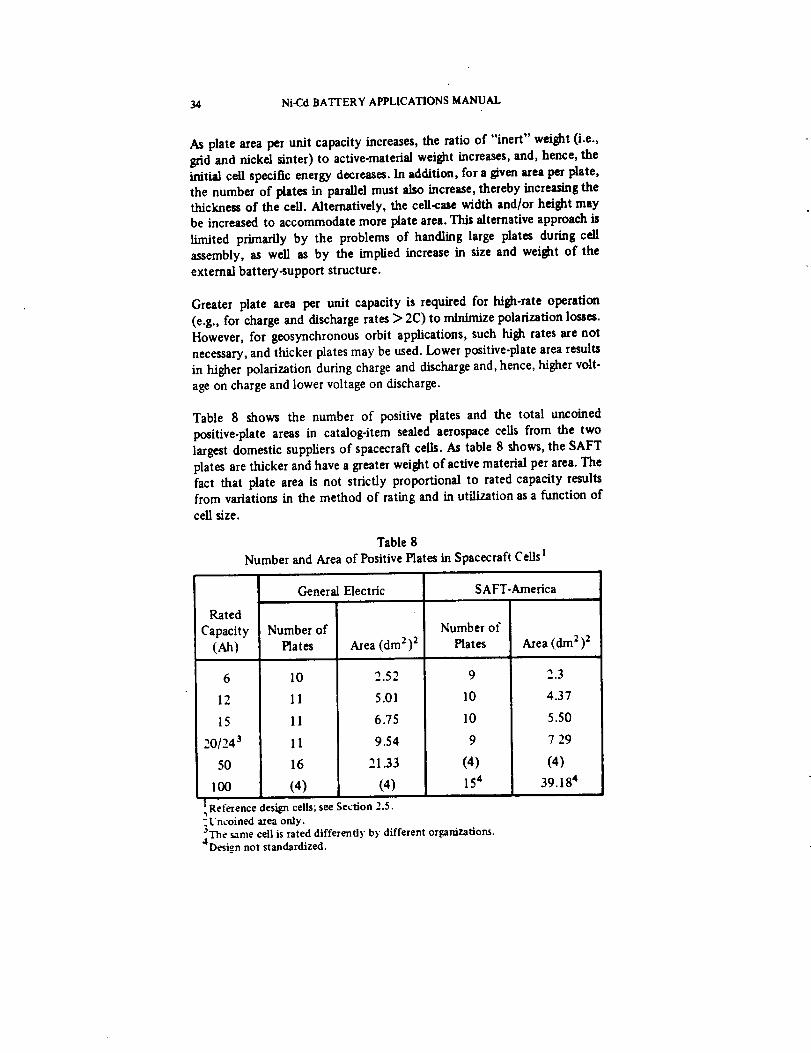
34 Ni-Cd BATI'ERY APPLICATIONS MANUAL
As plate area per unit capacity increases, the ratio of "'inert" weight (i.e.,
grid and nickel s_nter) to active-material weight increases, and, hence, theinitial cell specific energy decreases. In addition, for a given area per plate,
the number of plates in parallel must also increase, thereby increasing thethickness of the cell. Alternatively, the cell-cue width and/or height maybe increased to accommodate more plate area. This alternative approach is
limited primarily by the problems of handling large plates during cell
assembly, as well as by the implied increase in size and weight of the
external battery-support structure.
Greater plate area per unit capacity is required for high-rate operation
(e.g., for charge and discharge rates > 2C) to minimize polarization losses.
However, for geosynchronous orbit applications, such high rates are not
necessary, and thicker plates may be used. Lower positive-plate area results
in higher polarization during charge and discharge and, hence, higher volt-
age on charge and lower voltage on discharge.
Table 8 shows the number of positive plates and the total uncoined
positive-plate areas in catalog-item sealed aerospace cells from the two
largest domestic suppliers of spacecraft cells. As table 8 shows, the SAFT
plates are thicker and have a greater weight of active material per area. The
fact that plate area is not strictly proportional to rated capacity resultsfrom variations in the method of rating and in utilization as a function of
cell size.
Table 8
Number and Area of Positive Plates in Spacecraft Cells i
Rated
Capacity
(Ah)
6
12
15
20/24 a
50
100
General Electric
Number of
Plates
10
11
11
11
16
(4)
Area (dm 2)2
2.52
5.01
6.75
9.54
21.33
(4)
SAFT-America
Number of
Plates
9
10
10
9
(4)
154
Area (din 2)2
2.3
4.37
5.50
7 29
(4)
39.184
_Reference design ceils; see Section 2.5.: Uncoined area oniy."The same cell is rated differently by different organizations.4Design not standardized.
CELL DESCRIPTION 35
The usual cell contains one more negative plate than positive plate. Cells
have been made with more or less negative plates than is normal for achiev-
ing variations in the ratio of negative-to-positive capacity. (See Section
2.3.3.5 .)
2.3.3.2 Plate_eparation Distance
The distance between adjacent plate surfaces in the cell affects other design
parameters and properties:
The separator pore volume, the amount of electrolyte the
separator can absorb, and the ability of the separator to com-
pete with the plates for electrolyte increases as the separation
increases.
The probability of a plate-to-plate short caused by plate
buckling or bent corners or edges decreases as the as-built
separation distance increases.
The percentage reduction in thickness of the separators (caused
by thickening of positive plates) is reduced by greater initial
separation.
The ease with which the plate stack may be inserted into the
case during cell assembly is greater with less initial compression
of the separators (assuming a particular separator material
thickness and weight per unit area).
The internal resistance of the cell is slightly greater at greater
separation distance for the same volume of electrolyte added.
Cell thickness and, to a small degree, cell weight must increase
as plate separation increases (assuming that the plate thick-
ness and the number of plates remain constant).
Therefore, many opportunities exist for tradeoffs involving plate-separationdistance.
The separation distance in commercially available cells of current design
using Pelion Type 2505 separator material averages about 0.018 cm
(0.007 in.), vahich is about 50 percent of the thickness of the separator as
36 Ni-Cd BA'FI"ERYAPPLICATIONS MANUAL
measured by a Cady gage.* At this compressed thickness, the dry porosity
of the separator is calculated to be about 75 percent. Therefore, with
approximately 0.7 cm 3 of electrolyte per dm 2 of separator (typical of a
newly made cell in the discharged state), the remaining porosity (with
electrolyte in place) of the separator is about 40 percent. This porosity
decreases during overcharge when some electrolyte is forced out of the
positive plates. These figures show how separation, separator material,
and electrolyte volume interact to affect the oxygen permeability andultimately the overcharge pressure behavior Of the cell.
Some minimum amount of compression of the porous separators is
desirable for minimizing the interelectrode resistance, maximizing the rate
of passage of oxygen during overcharge, and maximizing the ease of trans-fer of electrolyte between the plates and separators during cycling, t There-
fore, because an increase in separation distance results in decreased com-
pression, greater than normal separation may require a different separator
material (thicker in the uncompressed state and possessing more weight
per unit area) or the use of two layers of lighter material. Two layers of
separator appear to work as well as one (under equal compression).
2.3.3.3 Electrolyte Quantity
The quantity of electrolyte that may be used in a sealed nickel-cadre/urn
cell of a given size may vary considerably. The optimum amount depends
on the life requirement, operating conditions, and maximum allowablepressure. Quantities as low as 2 cm 3 per Ah of rated cell capacity permit
the cell to operate for some period of time before excessive redistribution
and drying of the separator occur. On the other hand, amounts up to and
beyond 4 cm 3 per All are feasible if cell temperature and overcharge are
rigidly controlled. Generally, the higher the electrolyte fill level, the longer
the useful cycle life. Optimum quantities for different applications have
not yet been established.
Different methods are used by different cell manufacturers to arrive at
their design point. Some add electrolyte to a given fraction (e.g., 85 per-
cent) of the residual void volume of the dry plate stack, including the
separators: others add electrolyte based on the weight of the plates (e.g.,
30 percent). The level found in most spacecraft calls is in the range from 4
to 5.2 g (3 to 4 cm 3) per Ah of rated capacity.
*Used for measuring thickness under light compression.!G. G. Rampel. General Electric Battery Division, private communication.
CELL DESCRIPTION 37
The maximum amount of electrolyte that can be tolerated without high
overcharge pressure is a function of a number of component design vat.
iables, such as separator-fiber material (nylon or polypropylene), separation
distance, residual porosity of the plates, and whether or not the plates have
been Teflon-coated. Quantitative data relating proper electrolyte volumes
to these variables are not available, and, hence, the amount for any partic-
ular combination of design features is determined by test. Because of this,
the quantity that may be used is strongly dependent on the allowable
overcharge pressure.
The amount of electrolyte in a cell when it is finally dosed ("pinched off")
is not necessarily the amount initially added to the dry cell. Some manu-
facturers remove or add some electrolyte during electrical processing. Thus,
to properly identify the electrolyte content, the point in the manufactur-
ing sequence must also be specified.
Clearly, the cell weight is a direct function of electrolyte weight. Thus, the
emphasis placed on reducing cell weight has a tendency to cause mini-mization of electrolyte quantity. Because the length of useful cell service
life can depend on the amount of electrolyte present, the cell design proc-ess must resolve this conflict.
2.3.3.4 Internal Void Volume
The internal void volume is the gas space within the cell enclosure that is
not occupied by a solid or a liquid. When the cell is overcharged (or over-
discharged) at a given current, any oxygen or hydrogen produced in excess
of that which can be recombined builds up a pressure equal to
nRTP = _ (7)
VV
where n is the number of moles of gas present in the cell, R is the universal
gas constant, T is the absolute temperature, and V v is the void volume.
Thus, for a given set of overcharge conditions, the end-of-charge pressure
wig be inversely proportional to V v.
For a fixed cell-case volume and plate volume, the void volume decreases as
electrolyte volume increases. Thus, without independent adjustment of
void volume along with electrolyte volume, the end-of_:harge pressure can
be very sensitive to electrolyte volume.
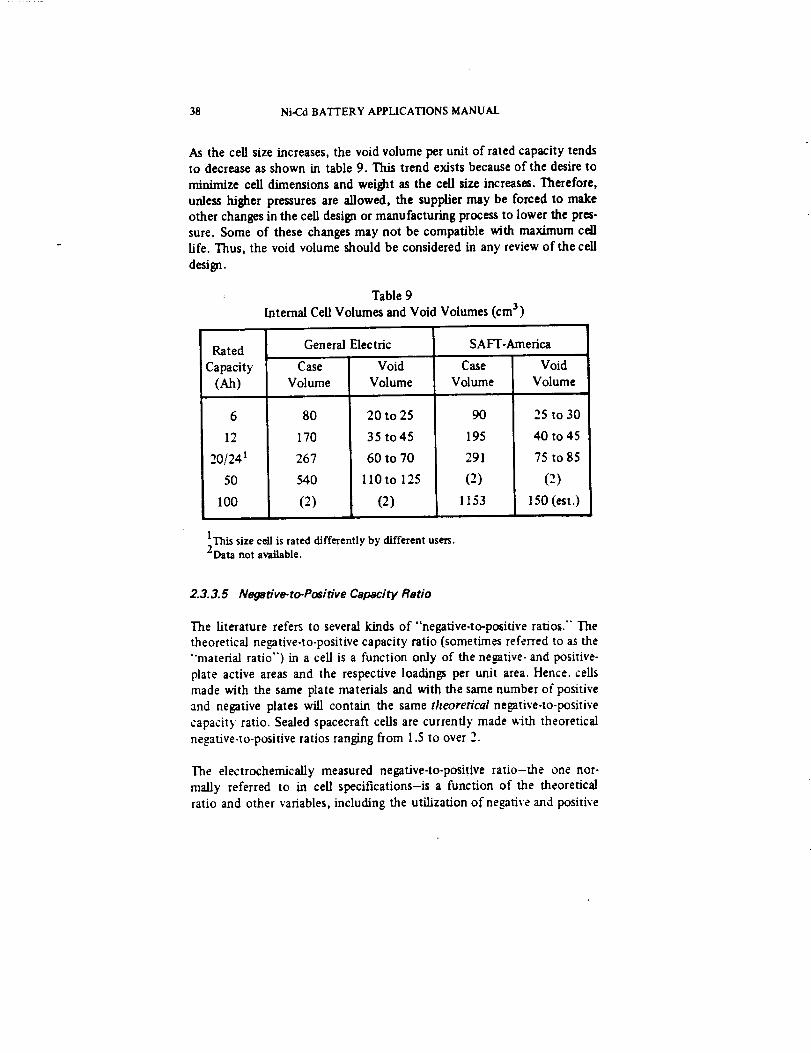
38 Ni-Cd BATTERY APPLICATIONS MANUAL
As the cell size increases, the void volume per unit of rated capacity tendsto decrease as shown in table 9. This trend exists because of the desire to
minimize cell dimensions and weight as the cell size increases. Therefore,
unless higher pressures are allowed, the supplier may be forced to makeother changes in the cell design or manufacturing process to lower the pres-
sure. Some of these changes may not be compatible with maximum cell
life. Thus, the void volume should be considered in any review of the cell
design.
Table 9
Internal Cell Volumes and Void Volumes (cm 3)
Rated
i Capacity
(Ah)
6
12
20/241
50
I00
General Electric SAFT-America
Case
Volume
80
170
267
540
(2)
Void
Volume
20 to 25
35 to45
60 to 70
llOto 125
(2)
IThis size cell is rated differently by different users.2Data not available.
Case
Volume
90
195
291
(2)
I153
Void
Volume
25 to 30
40 to 45
75 to 85
(2)
150 (est.)
2.3.3.5 Negative_tc_Positive Capacity Ratio
The Literature refers to several kinds of "negative.to-positive ratios." The
theoretical negative-to-positive capacity ratio (sometimes referred to as the
"'material ratio") in a cell is a function only of the negative- and positive-
plate active areas and the respective Ioadings per unit area. Hence. cells
made with the same plate materials and with the same number of positive
and negative plates will contain the same theoretical negative-to-positive
capacity ratio. Sealed spacecraft cells are currently made g-ith theoretical
negative-to-positive ratios ranging from 1.5 to over 2.
The electrochemically measured negative-to-positive ratio-the one nor-
mally referred to in cell specifications-is a function of the theoretical
ratio and other variables, including the utilization of negative and positive
CELL DESCRIPTION 39
active materials, the test temperature, and the charge and discharge rates.
In turn,utilization of the negative materials is often sensitive to the number
of cycles experienced since reconditioning.
A wide range of negative-to-positive ratios for design have been reported
and have been summarized by Gross (Reference 43). It appears that someo f these values are theoretical capacity ratios and others are measured ratios.
The measurement has not been standardized, and the results can lead to con-
fusion. In a new cell, the measured ratio is always less than the theoretical
ratio because the utilization of the negative is less than that of the positive.
In general, optimum negative-to-positive ratios for different applications
have not yet been established. This ratio must be coordinated with the
selected values of charged and discharged excess negative required. (See
following paragraphs.) A conservative minimum value, which has given
acceptable performance in many cells in the temperature range from 0 ° to
25°C, is 1.5 to l as measured electrochemically. Gross (Reference 43)
discusses guidelines for departure from this ratio.
2.3.3.6 Precharge and Uncharged Excess Negative
It was noted previously that, in positive-limited sealed cells, the negative
capacity is designed to be considerably greater than the positive capacity.Thus, by suitable adjustment, the positive electrode can be made to
operate at states of charge that are different relative to that of the negativeelectrode.
The diagrams in figure 6 illustrate three different situations. When the cellhas been sealed and remains sealed so that no oxygen or hydrogen can
escape and when the internal pressure of oxygen and/or hydrogen remainslow, the relative position of the capacity blocks in figure 6 remains fixed
(in the vertical direction) by the chemistry of the system. On the other
hand, if at any time the enclosure is vented so that oxygen gas escapes
during overcharge or hydrogen escapes during overdischarge, the relativestate of charge will shift. This change may be shown by a relative vertical
movement of the positive capacity block in figure 6. If the cell is again
sealed after such venting, the new relative state of charge will then be fixed.
Venting oxygen during overcharge increases the relative state of charge
of the negative electrode because no change in the state of charge of the

40 Ni-Cd BATrERY APPLICATIONSMANUAL
NEG.
PO$.
A. DISCHARGED PIU(_I TO
PRECHARC_ ADJL_TMENT
N_'O°
"OVBCHARGIE [
PROTECTION" J
POS. [
?i
I
I. C_ItGED (SF.ALED),
AFTER tlRECHAIC__ ADJUSTMENT
SEALED
CELL
CAPACITY
NEG.
PRECHARGE {
C, DI$CHAIIGED TO 1 VOLT
Figure 6. Relative state_of_:harge diagrams.
positive electrode takes place (only oxygen evolution according toreaction 4) while the negative electrode is being "charged" according to
2Cd(OH)2 --* 2Cd + 2H 20 + 02 (8)
Most cell manufacturers install the plates with both positive and negativematerials nearly discharged as in figure 6A. Soon after adding electrolyte,
the cells are charged, overcharged, and oxygen-vented to increase therelative state of charge of the negative electrode. The ampere-hours ofcharged-negative capacity change produced by these means is the "pre-
charge." The relative state of charge in a charged ceil after venting is thenrepresented qualitatively by figure 6B.
The term "precharge'" is sometimes used to refer to the total charged-negative capacity in the sealed cell when the positive electrode is com-pletely discharged (figure 6C). This use of the term can lead to confusion.
Because the true state of charge of the negative electrode at the beginning
of the adjustment previously described is uncertain, the total charged-negative capacity (measurable by chemical analysis) after the adjustment
is usually not the same as the change in charge level produced by the pre-charge operation. Also, only a part of the charged-negative material may be
CELL DESCRIPTION 41
electrochemically active (so that it may be discharged at a normal poten-tial). Thus, to avoid confusion, different terms should be used to dis-
tinguish between: (a) the total amount of charged-negative material after
adjusting precharge, and Co) the amount that is measurable by electro-
chemical means. The modifying terms "total" and "active" are used in this
manual to indicate concepts (a) and (b), respectively.
Some charged excess negative capacity helps to stabilize initial capacity and
minimizes capacity-fading during cycling (References 32, 33, and 44).
Also, in one report (Reference 45), overcharge pressure decreased as the
amount of electrochemically measurable charged excess increased (SAFT
cells). However, just how much charged excess is necessary is uncertain, as
is the question of how much of the excess must be active. The answers to
these questions appear to differ with different applications. A thoroughreview of this area has recently been published (Reference 43), and someof the results are summarized in Section 3.3.1.2 of this manual.
The amount of negative capacity that remains uncharged when the positive
electrode reaches full overcharge (sealed-cell condition) is the unchargedexcess negative. That portion of this excess that is electrochemically active
is sometimes called the "overcharge protection" because it prevents the
evolution of hydrogen gas during overcharge (figure 6B). Because the sum
of the charged excess negative capacity, the operating cell capacity, and
the uncharged excess negative capacity is roughJy a constant equal to the
total usable negative capacity under a given set of operating conditions,
increased precharge means decreased overcharge protection and vice versa.
However, for long-term missions, it is becoming clear that adequate over-
charge protection is more important than excess charged negative (Refer-
ences 16, 17, and 46). (See Section 3.3.1.2.) As a minimum, the active
uncharged excess should amount to 20 percent of total negative capacity ina new cell.
2.3.3. 7 Number of Insulated Terminals
Cells may be designed with either the positive terminal insulated and the
negative terminal common with the case or both terminals insulated from
the case. Each configuration has relative merits.
The single-insulated design has only one insulator-seal assembly (rather
than two) to provide a potential source of leakage and is slightly less
expensive. Also, the two outermost (negative) plates need not (and oftenare not) be insulated from the case walls: therefore, the thermal resistance
42 Ni-Cd BATTERY APPLICATIONS MANUAL
between the outer plates and the cell wall is somewhat lower than when an
insulating layer is interposed. This difference is not large, however, and
usually does not impact the battery thermal design.
On the other hand, the single-insulated cell can be seriously damaged ffthe
positive terminal is accidently shorted to the case (as with a tool duringtest setup or battery assembly) because the current can rapidly burn a hole
in the case wall. Furthermore, the cases of such cells must always be well-
insulated from each other and from grounds to prevent high-current short-
ing.
The double-insulated design is generally safer to handle because a tem-
porary external short between a terminal and the case will have no appre-ciable effect. Although the cases must still be insulated from one another
in any series-cell arrangement to prevent current from flowing between the
bases of the higher and the lower voltage cells in the string, double-insulated terminal cases are more tolerant of variations in insulation resis-
tance (produced by variations in relative humidity while the battery is onthe Earth's surface).
Although the statistical probability of cell leakage is twice as great withtwo insulated seals as with one, the failure rate by leakage of individual
terminal seals, involving ceramic-to-metal joints as made by today's tech-
nology, is low enough that the factor of two does not significantly affect
cell reliability.
2.3.3.8 Cylindrical Versus Pn'smatic Cell Configura_on
Sealed spacecraft-quality nickel-cadmium ceils are commercially available
in only two proven configurations: cylindrical with a "jeily-roll" plate
stack, and prismatic or rectangular with flat, parallel plates. The cylindri-cal cases have the advantage that, if the ends are heavy enough, no external
support is needed to contain cell pressure, thus saving packaging weight.
Because a good heat path must be provided, however, the saving is not as
great as it might be. Also, only the smaller size cells (10 Ah or less) can be
made self.supporting without excessive cell-case weight.
Cylindrical cells normally have a single insulated terminal, with the other
terminal being common with the case. Because only a small number of tabsare used to make electrical contact with the plates and because of the dif-
ficuhy in making strong, low-resistance contacts between the tabs and the
CELLDESCRIPTION 43
plates, insulated terminal, and case wall, cylindrical cells from some
manufacturers are much more subject to high internal ohmic resistance
and internal open-circuit failures than prismatic cells.
Nevertheless, when properly made and operated at a low utilization level
(i.e., low depth of discharge and discharge rate), cylindrical cells are
capable of long useful life. For example, the International Satellite for
Ionosphere Studies (ISIS) spacecraft battery and certain others* using
cylindrical cells at 10-percent maximum depth of discharge in synchronous
orbit have operated successfully for over 10 years in orbit. The use of
higher rates and higher depths of discharge produces more rapid degrada-
tion of plates in cylindrical cells than in prismatic cells. Most manufacturers
do not offer hermetically sealed cylindrical cells in sizes over 6 Ah, and
some do not offer this type in designs suitable for space applications.
2.3.3.9 Auxi/iary Electrodes
One or more of several types of auxiliary electrodes may be incorporated
within the cell. These include: (1)the oxygen-signal, control, or adsorbed-hydrogen (Adhydrode) t electrode: (2) the recombination or "full-cell"
electrode; and (3) the reference electrode.
Oxygen-Signal Electrode-The oxygen-signal electrode is usually a porous
metal surface fabricated on a nickel or noble metal screen or expanded
metal suhstrate. Most signal electrodes have a thin film of Teflon on one
side to act as an oxygen-diffusion barrier, and, hence, the response is
roughly proportional to oxygen partial pressure in the low pressure range(0 to 25 psia) (References 44, 47, and 48). $ Currently, there are no
standards for electrode area, and different cell manufacturers make elec-
trodes that range from 10 to 70 cm:.
Oxygen-signal electrodes have been physically located: (1)between the
outer surface of the outermost ne@tive plate and the adjacent wall of thecell (Reference 49); $ (2) in the space between the edges of the plates and
the narrow sides (Reference 50) of the case: $ or (3) between plates within
the plate stack (Reference 51) _ Table l0 summarizes the relative merits
*Designed by the Canadian Defence Research E.qablishment, Ottawa, Canada.=Trademark of SAFT-America. Incorporated._tH. N. Seiger, "The Active Adhydrode: A Sensor for Monitoring End of Charge inSealed Nickel-Cadmium Batteries." unnumbered and undated report, GultonIndustries, Inc., Metuchea. New Jetse3. (no_a S.-%.FT;-ILmeri_L
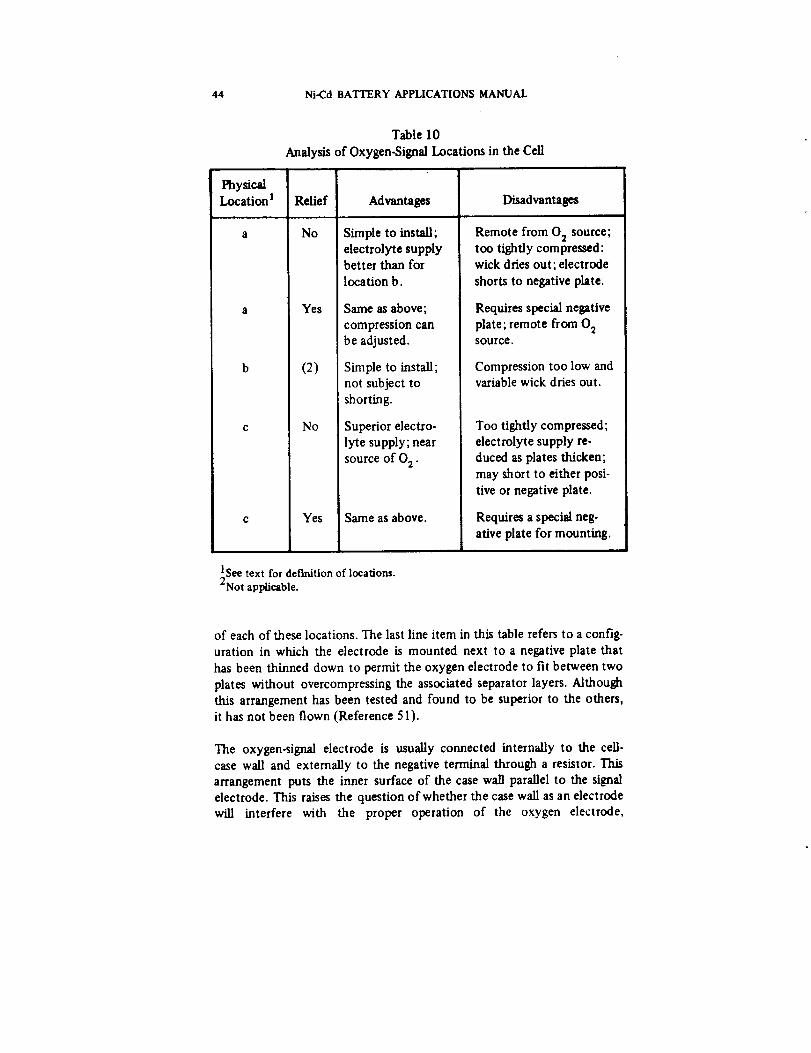
44 Ni-CdBATTERYAPPLICATIONSMANUAL
PhysicalLocationt
Table 10
AnalysisofOxygen-SignalLocationsin the Cell
Relief
No
a Yes
b (2)
c No
Advantages
Simple to install;
electrolyte supplybetter than for
location b.
Same as above;
compression can
be adjusted.
Simple to install;
not subject to
shorting.
Superior electro-
lyte supply; near
source of 0 2 .
c Yes Same as above.
Disadvantages
Remote from 0 2 source;too tightly compressed:
wick dries out; electrode
shorts to negative plate:
Requires special negative
plate; remote from O2source.
Compression too low andvariable wick dries out.
Too tightly compressed;
electrolyte supply re-
duced as plates thicken;
may short to either posi-
tive or negative plate.
Requires a special neg-
ative plate for mounting.
ISee text for definition of locations.2Not applicable.
of each of these locations. The last line item in this table refers to a config-
uration in which the electrode is mounted next to a negative plate that
has been thinned down to permit the oxygen electrode to fit between two
plates without overcompressing the associated separator layers. Although
this arrangement has been tested and found to be superior to the others,
it has not been flown (Reference 51).
The oxygen-signal electrode is usually connected internally to the cell.case wall and externally to the negative terminal through a resistor. This
arrangement puts the inner surface of the case wall parallel to the signal
electrode. This raises the question of whether the case wall as an electrode
will interfere with the proper operation of the oxygen electrode,
CELLDESCRIPTION 45
particularly in large cells in which the ratio of cell-wall area to signal-
electrode area may be much greater than that of small cells. Recent con-
trolled tests (Reference 5 l) have shown that no significant difference exists
between the signal characteristics whether the signal electrode is connected
to, or insulated from, the cell case in 50-Ah cells operating with signalelectrodes with areas as small as 10 cm 2 .
The value of the external resistance is not critical within a certain rather
wide range, usually extending over more than an order of magnitude be-tween 10 and 200 ohms. Ford (Reference 52) has shown that, within the
useful range, there is a resistance value that results in a maximum power
dissipation in the load and that overall signal performance is best when
ufing a resistor equal to or close to this maximum power value.
Details of location and method of placement of oxygen-signal electrodes
within the cell and the control of the gas and electrolyte environment in
the vicinity of the electrode have not received sufficient attention in the
past. As a result, the reliability of the oxygen signal has generally been low
for long-life applications. It has been shown that careful design can greatly
improve oxygen-signal performance (Reference 51). However, the useful
life of the signal electrode remains strongly dependent on proper electro-
lyte distribution in the cell so that separator material surrounding the
electrode does not dry out (Reference 51).
Recombination Auxiliary Electrode-The recombination electrode is
designed to recombine oxygen and/or hydrogen at high rates and low pres-
sures (References 44, 47, and 48). To do this effectively, such electrodes
usually contain a platinum catalyst. The electrodes are connected elec-
trically to the negative terminal through a small resistance. This connection
may be made within the cell when access to the resistance for measuring
current or voltage is not needed. When the cell is equipped with two insu-lated power terminals, the connection may be made externally, using the
metal container as part of the electrical lead from the enclosed auxiliary
electrode.
Recombination electrodes are usually located in the space between the
edges of the plates and the narrow sides (and bottom) of the case. Toobtain the maximum electrode area, the electrode is often cut as a long,
narrow strip and is run around three sides of the plate stack. This strip is
surrounded by" a wick made of separator material. The Apollo Telescope
Mount batteries aboard the Skylab spacecraft were equipped with this type
of electrode, as well as with a signal electrode (Reference 49).
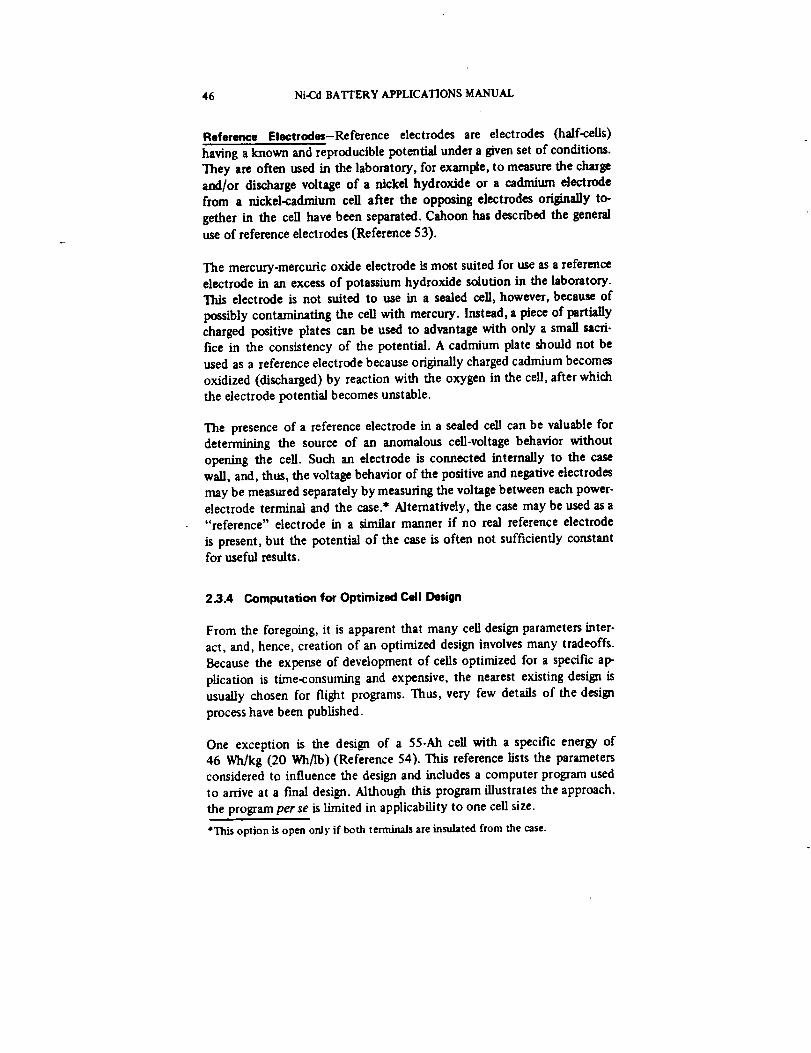
46 Ni-Cd BATTERY APPLICATIONS MANUAL
Reference Electrodes-Reference electrodes are electrodes (half-ceils)
having a known and reproducible potential under a given set of conditions.
They are often used in the laboratory, for example, to measure the charge
and/or discharge voltage of a nickel hydroxide or a cadmium electrode
from a nickel-cadmium cell after the opposing electrodes originally to-
gether in the cell have been separated. Cahoon has descffoed the general
use of reference electrodes (Reference 53).
The mercury-mercuric oxide electrode is most suited for use as a reference
electrode in an excess of potassium hydroxide solution in the laboratory.This electrode is not suited to use in a sealed cell, however, because of
possibly contaminating the cell with mercury. Instead, a piece of partially
charged positive plates can be used to advantage with only a small sacri-
fice in the consistency of the potential. A cadmium plate should not be
used as a reference electrode because originally charged cadmium becomes
oxidized (discharged) by reaction with the oxygen in the cell, after which
the electrode potential becomes unstable.
The presence of a reference electrode in a sealed cell can be valuable fordetermining the source of an anomalous cell.voltage behavior without
opening the cell. Such an electrode is connected internally to the casewall, and, thus, the voltage behavior of the positive and negative electrodes
may be measured separately by measuring the voltage between each power-electrode terminal and the case.* Alternatively, the case may be used as a
"reference" electrode in a similar manner if no real reference electrode
is present, but the potential of the case is often not sufficiently constantfor useful results.
2.3.4 Computation for Optimized Cell Design
From the foregoing, it is apparent that many cell design parameters inter-
act, and, hence, creation of an optimized design involves many tradeoffs.
Because the expense of development of cells optimized for a specific ap-
plication is time-consuming and expensive, the nearest existing design is
usually chosen for flight programs. Thus, very few details of the design
process have been published.
One exception is the design of a 55.Ah cell with a specific energy of
46 Wh/kg (20 Wh/lb) (Reference 54). This reference lists the parameters
considered to influence the design and includes a computer program used
to arrive at a final design. Although this program illustrates the approach,
the program per se is limited in applicability to one cell size.
*This option is open only if both terminals are insulated from the case.

CELL DESCRIPTION 47
2.4 CELL MANUFACTURING
The information in this section was selected for the general interest of the
battery engineer and serves as a basis for the discumion of the effects of
manufacturing process variables contained in Sections 3 and 4.
It is recognized that the overall process differs somewhat betwee_l eachcell manufacturer in that certain materials and/or process steps may be
used by one and not by the others. This presentation attempts to identify
both the common aspects and the significant differences as practiced by the
three major manufacturers of hermetically sealed spacecraft cells in the
United States today.
2.4.1 Plate Manufacturing
The manufacture of sealed nickel-cadmium cells may be considered to
start with the manufacture of plates. Two of the three major suppliers* of
spacecraft ceils (i.e., General Electric and SAFT-America) use plates made
by similar processes that are closely related to a process originally devel-
oped by SAFT in France. The third supplier (Eagle Picher) uses plates
made by a considerably different process.
2.4.1.1 The SA FT- Type Plate-Manufacturing Process
Figure 7 shows the plate-manufacturing process used by General Electric
Battery Products Department and by SAFT-America and referred to here
as the SAFT-type process. No published studies of this process as it is
implemented in production (i.e., using full-scale production equipment)could be found. However, several studies of similar processes carried out
on a pilot scale have been performed (References 8, 15, 55, and 56).
In the SAFT-type process, the grid (or substrate) is made from mild steel.
Nickel substrate would be preferable from a chemical standpoint, butnickel is too soft to withstand the action of the machinery involved. The
grid is prepared by perforating, cleaning, and nickel-plating the steel strip.The strip is about 0.1 mm thick and is processed in strips about 20 cm
wide.
*.Marathon Battery Corporation (formerly Sonotone) manufactures small (less than6 All), hermetically sealed cylindrical cells. However, because few of these ceils areused for spacecraft applications. Marathon is not classified here as a major supplier..Marathon'splate process is similar to that used by Eagle Picher. (See Section 2.4.1.2.)
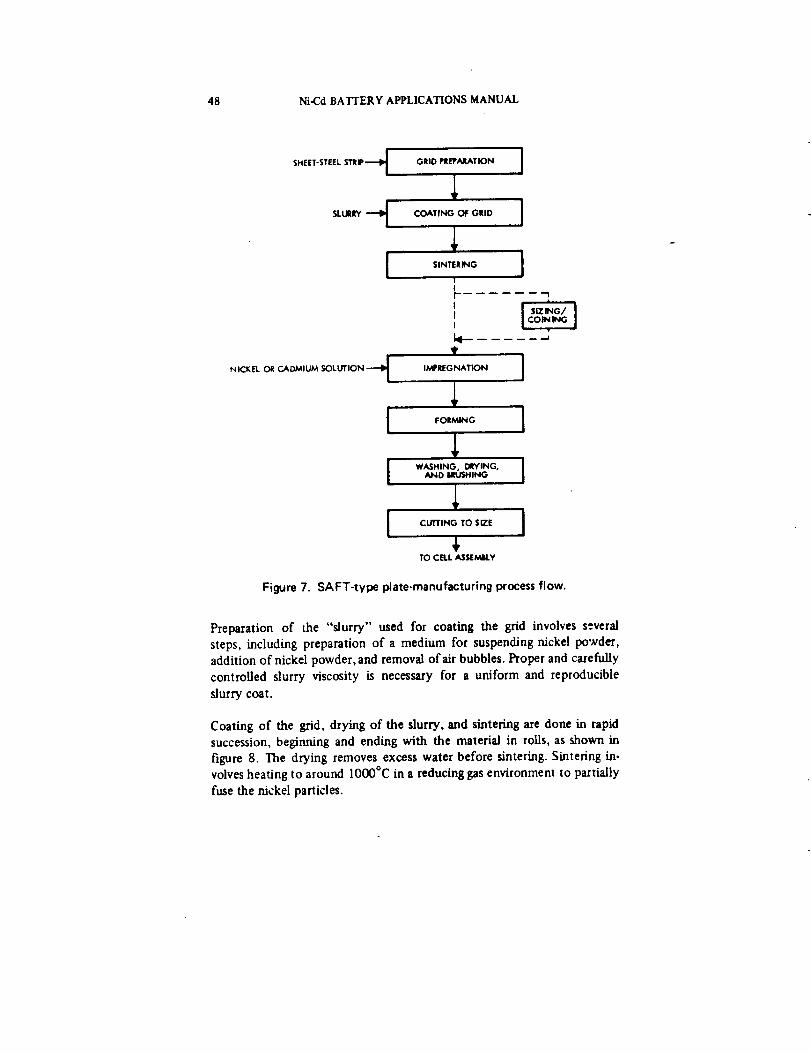
48 Ni-Cd BATI'ERY APPLICATIONS MANUAL
SHEET-STEEL STRIP---_ GRID PREPARATION
SLURRY_ COATING OF GRID
I SINTERING
rItI
T
NICKEL OR CADMIUM SOLUTION -_ I/_REGNATION
J FORMING
WASHING, 0RYING,AND IRU_HING
CUTTING TO SIZE
TO CELLASSEMII.Y
I
I
IIt
! S=_G/ I
_...J
!
i
I
i
Figure 7. SAFT-type plate-manufacturing process flow,
Preparation of _he "slurry" used for coating the grid involves several
steps, including preparation of a medium for suspending nickel powder,addition of nickel powder, and removal of air bubbles. Proper and carefully
controlled slurry viscosity is necessary for a uniform and reproducible
slurry coat.
Coating of the grid, drying of the slurry, and sintering are done in rapid
succession, beginning and ending with the material in rolls, as shown in
figure 8. The drying removes excess water before sintering. Sintering in-volves heating to around 1000°C in a reducing gas environment to partially
fuse the nickel particles.
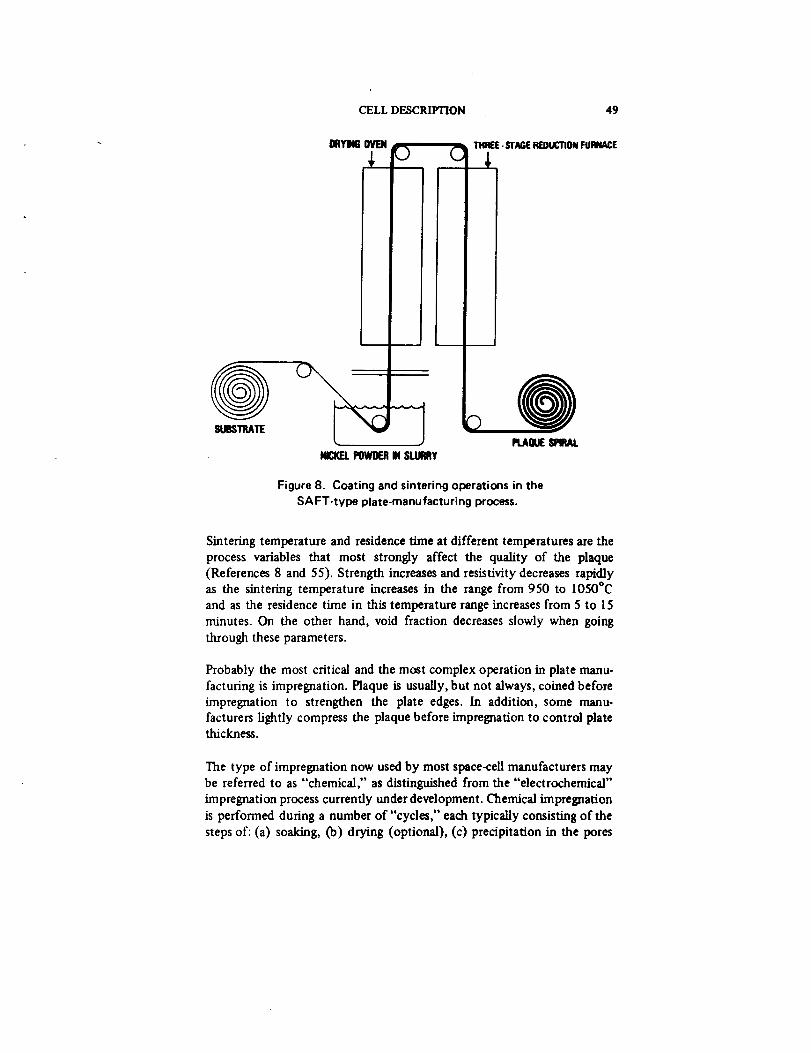
CELLDESCRIPTION 49
DRYINGOVEN
NICKELPOWDERINSLURRY
THREE-STAGEREDUCTIONFURNACE
I
Figure 8. Coating and sintering operations in the
SAFT-type plate-manufacturing process.
Sintering temperature and residence time at different temperatures are the
process variables that most strongly affect the quality of the plaque
(References 8 and 55). Strength increases and resistivity decreases rapidlyas the sintering temperature increases in the range from 950 to 1050°C
and as the residence time in this temperature range increases from 5 to 15
minutes. On the other hand, void fraction decreases slowly when going
through these parameters.
Probably the most critical and the most complex operation in plate manu-
facturing is impregnation. Plaque is usually, but not always, coined before
impregnation to strengthen the plate edges. In addition, some manu-
facturers lightly compress the plaque before impregnation to control platethickness.
The type of impregnation now used by most space-cell manufacturers may
be referred to as "chemical," as distinguished from the "electrochemical"
impregnation process currently under development. Chemical impregnation
is performed during a number of "cycles," each typically consisting of the
steps of: (a) soaking, (b) drying (optional), (c) precipitation in the pores
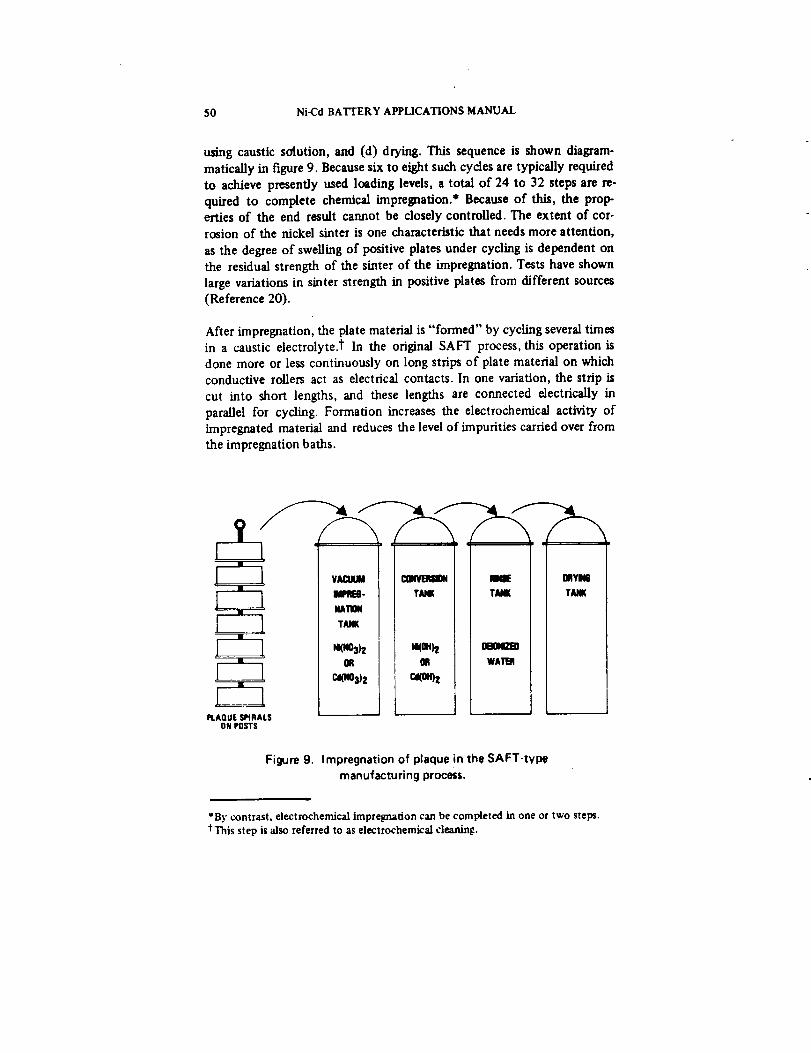
50 Ni-Cd BATTERY APPLICATIONS MANUAL
using caustic solution, and (d) drying. This sequence is shown diagram-
matically in figure 9. Because six to eight such cycles are typically required
to achieve presently used loading levels, a total of 24 to 32 steps are re-
quired to complete chemical impregnation.* Because of this, the prop-erties of the end result cannot be closely controlled. The extent of cor-
rosion of the nickel sinter is one characteristic that needs more attention,
as the degree of swelling of positive plates under cycling is dependent onthe residual strength of the sinter of the impregnation. Tests have shown
large variations in sinter strength in positive plates from different sources
(Reference 20).
After impregnation, the plate material is "formed" by cycling several times
in a caustic electrolyte.t In the original SAFT process, this operation is
done more or less continuously on long strips of plate material on which
conductive rollers act as electrical contacts. In one variation, the strip is
cut into short lengths, and these lengths are connected electrically in
parallel for cycling. Formation increases the electrochemical activity of
impregnated material and reduces the level of impurities carried over from
the impregnation baths.
TANK
PLAGUESPIRALSON POSTS
Nn0S)2OR
Cd(NO_t
m(0H)2OR
_0H) t
Figure 9. Impregnation of plaque in the SAFT-tvI_
manufacturing process.
*By contrast, electrochemical impregnation can be completed in one or two steps.
_"This step is also referred to as electrochemical cleaning.
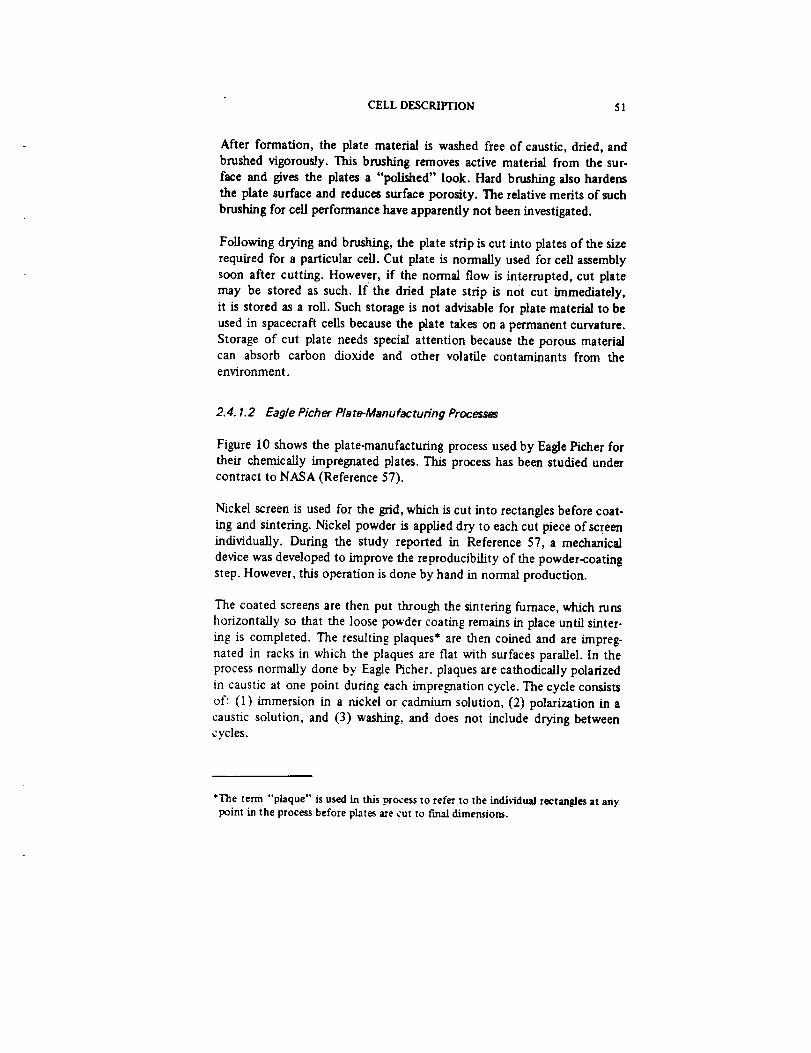
CELL DESCRIPTION 51
After formation, the plate material is washed free of caustic, dried, and
brushed vigorously. This brushing removes active material from the sur-
face and gives the plates a "polished" look. Hard brushing also hardens
the plate surface and reduces surface porosity. The relative merits of such
brushing for cell performance have apparently not been investigated.
Following drying and brushing, the plate strip is cut into plates of the size
required for a particular cell. Cut plate is normally used for cell assembly
soon after cutting. However, if the normal flow is interrupted, cut platemay be stored as such. If the dried plate strip is not cut immediately,
it is stored as a roll. Such storage is not advisable for plate material to be
used in spacecraft cells because the plate takes on a permanent curvature.
Storage of cut plate needs special attention because the porous materialcan absorb carbon dioxide and other volatile contaminants from theenvironment.
2.4. 1.2 Eagle Picher P/are-Manufacturing Processes
Figure 10 shows the plate-manufacturing process used by Eagle Picher for
their chemically impregnated plates. This process has been studied undercontract to NASA (Reference 57).
Nickel screen is used for the grid, which is cut into rectangles before coat-
ing and sintenng. Nickel powder is applied dry to each cut piece of screen
individually. During the study reported in Reference 57, a mechanical
device was developed to improve the reproducibility of the powder-coating
step. However, this operation is done by hand in normal production.
The coated screens are then put through the sintering furnace, which runs
horizontally so that the loose powder coating remains in place until sinter-
ing is completed. The resulting plaques* are then coined and are impreg-
nated in racks in which the plaques are flat with surfaces parallel. In the
process normally done by Eagle Picher. plaques are cathodically polarized
in caustic at one point during each impregnation cycle. The cycle consists
of: (1) immersion in a nickel or cadmium solution, (2) polarization in a
caustic solution, and (3) washing, and does not include drying betweencycles.
*The term "plaque" is used in this process to refer to the individual rectangles at anypoint in the process before plates a.recut to final dimensions.
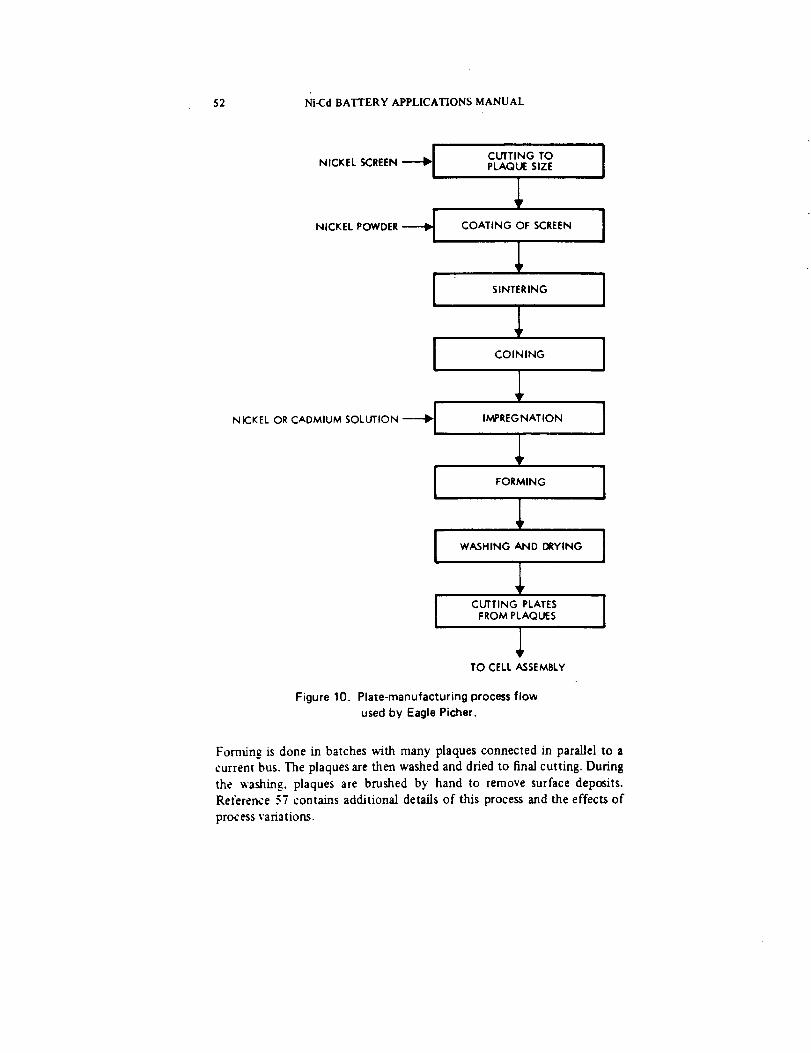
52 Ni-Cd BATTERY APPLICATIONS MANUAL
NICKEL SCREEN ------_[
NICKEL POWDER -_
NICKEL OR CADMIUM SOLUTION _J
CUTTING TO JPLAQUE SIZE
|
COATING OF SCREEN JI
SINTERING
COINING
IMPREGNATION
FORMING
WASHING AND DRYING
CUTTING PLATESFROM PLAQUES
TO CELL ASSEMBLY
Figure 10. Plate-manufacturing process flow
used by Eagle Picher.
Forming is done in batches with many plaques connected in parallel to a
current bus. The plaques are then washed and dried to final cutting. During
the washing, plaques are brushed by hand to remove surface deposits.
Reference 57 contains additional details of this process and the effects of
process variations.
CELL DESCRIFI'ION 53
2. 4. 1.3 Electrochemical Impregnation Process
Another plate-manufacturing process being considered for spacecraft cells
involves electrochemical impregnation (El) rather than chemical impreg-nation (Reference 58). This type of process has been under development
for some time, but is not yet in fuU-scale production (References 32
through 34, 54, and 59 through 61). At least one company is now offering
cells with EI plates made on pilot-scale equipment.
The electrochemical method of impregnation involves immersing the
plaque in an acidic solution of either nickel (for positive plates) or
cadmium (for negative plates) nitrate and passing current cathodic to the
plaque (plaque negative in the external circuit). Because material is pre-
cipitated in the pores of the sinter as hydroxides practically free of nitrate,
separate caustic treatment is not needed as in the SAFT and Eagle Picher
processes described previously. The cathodic polarization performed differs
from that in the Eagle Picher process in that the former is done in an acid
solution and the latter is done in caustic. The remainder of the plate-manufacturing process for El plates is similar to that described in Section2.4.1.2.
2.4.2 Spacecraft Cell Assembly and Tesdng
When the plates have been manufactured, cell assembly can begin. Figure11 shows the overall manufacturing flow. Figure 12 shows a more detailed
sequence of major steps typical of current manufacturing of high-quality
spacecraft cells. All manufacturers do not perform all these steps, and the
order differs somewhat from one manufacturer to another (References 62
and 63). Some comment on certain steps is in order.
Weight.sorting involves screening the plates to retain those within a speci-
fied tolerance around the average weight. Halpen (Reference 64) has
shown that such screening reduces the scatter of plate and cell capacities
because plate capacity is correlated with plate weight. This correlation is
better for plates made by SAFT-France than those made by General
Electric Company, however, probably because of a difference in the
amount of corrosion in the sinter in plates from these two sources.
Electrochemical testing involves cycling temporary ceUs in an excess of
electrolyte. General Electric Company and S.MrT-America subject all
chemicaUy impregnated plates for spacecraft cells to this testing. Eagle
Picher does not electrochemically test plates after the formation cycling
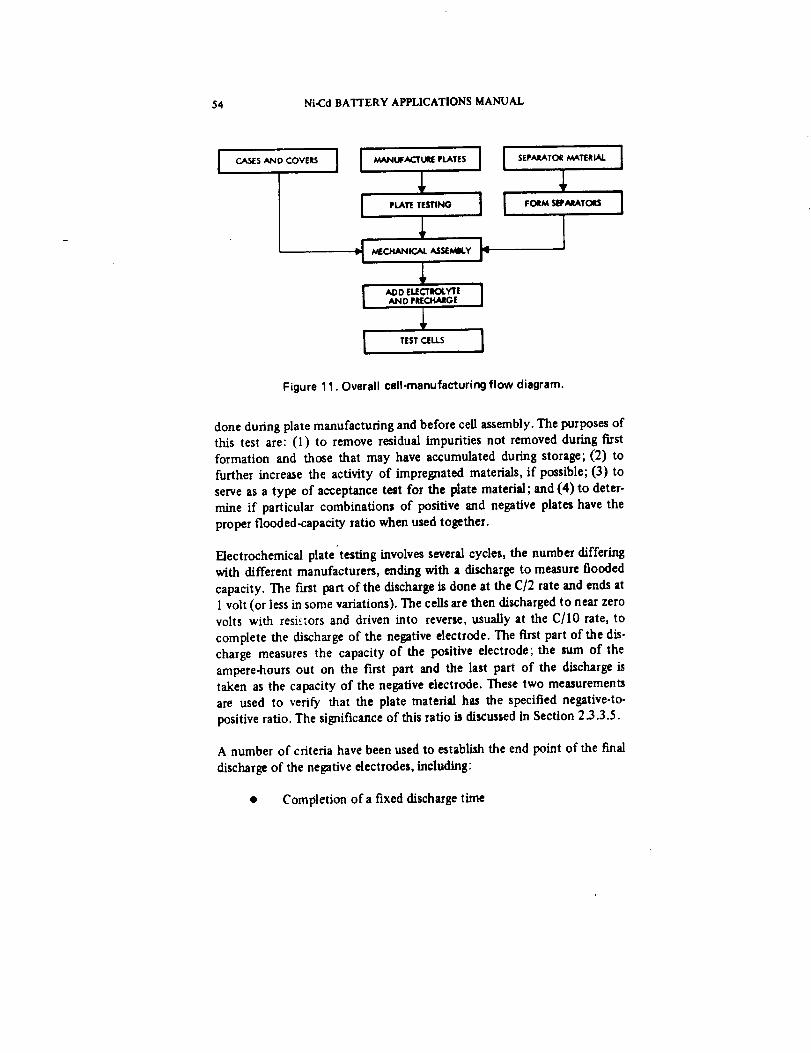
54 Ni-Cd BATTERY APPLICATIONS MANUAL
J CASES AND COVERS ]
I
I
!
MANUFACTURE PLATES
J,PLATE TESTING -]
k_CHA_IICAL A$$1EMELY p
1 [ SEPAJtATOR MATERIAL ]
[ FOaMS_._TOeS J
i
ADD ELECTROLYTE ' ']AND PRECHARGE
TEST CELLS I
Figure 1I. Overall cell-manufacturing flow diagram.
done during plate manufacturing and before cell assembly. The purposes ofthis test aTe: (1) to remove residual impurities not removed during first
formation and those that may have accumulated during storage; (2) to
further increase the activity of impregnated materials, if possible; (3) to
serve as a type of acceptance test for the plate material; and (4) to deter-
mine if particular combinations of positive and negative plates have the
proper flooded.capacity ratio when used together.
Electrochemical platetesting involves several cycles, the number differing
with different manufacturers, ending with a discharge to measure flooded
capacity. The first part of the discharge is done at the C/2 rate and ends at
1 volt (or less in some variations). The cells are then discharged to near zerovolts with resistors and driven into reverse, usually at the C/lO rate, to
complete the discharge of the negative electrode. The first part of the dis-
charge measures the capacity of the positive electrode; the sum of the
ampere-hours out on the first part and the last part of the discharge is
taken as the capacity of the negative electrode. These two measurements
are used to verify that the plate material has the specified negative,to-
positive ratio. The significance of this ratio is discussed in Section 2.3.3.5.
A number of criteria have been used to establish the end point of the final
discharge of the negative electrodes, including:
• Completion of a fixed discharge time
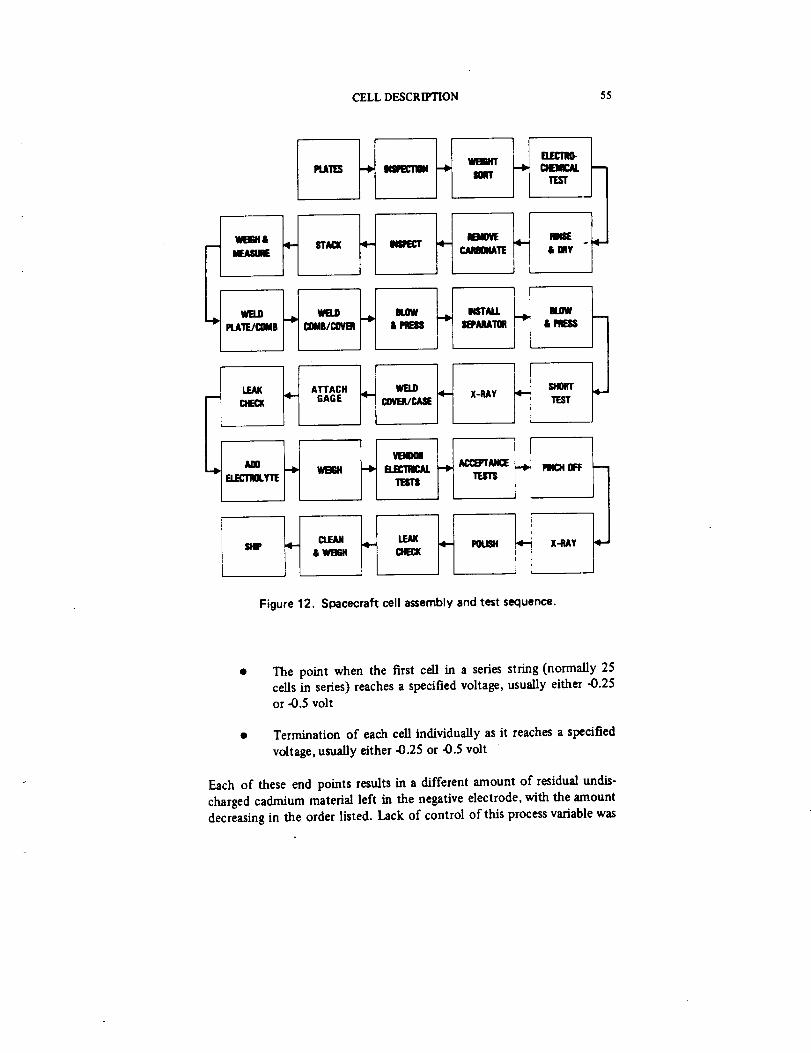
CELL DESCRIFFION 55
4"-H.,- m'- -I"H H-B'PUI_/COMII I_IIICOVBI &_ I_MA'I_I &
GAGE COVER/CA_
H H--EL_nlIx.Y'nE _
X-RAY TIEST
PINCHOFF
SHIP
Figure 12. Spacecraft cell assembly and test sequence.
f
The point when the first cell in a series string (normally 25
cells in series) reaches a specified voltage, usually either -0.25
or -0.5 volt
Termination of each cell individually as it reaches a specified
voltage, usually either -0.25 or .0.5 volt
Each of these end points results in a different amount of residual undis-
charged cadmium material left in the negative electrode, with the amountdecreasing in the order listed. Lack of control of this process variable was
56 Ni-CdBATI'ERY APPLICATIONS MANUAL
probably a major contributor to the variability of precharge and charge
voltage and pressure behavior observed in these sealed cells before 1968,
when an intensive investigation of the effects of such variables began
(Reference 47).
The platesfrom cellsthatpasscapacityrequirementsforboth positiveand
negativeelectrodesare washed, dried,and inspectedfor visibledamage.
The cellsthatdo not passeitherthe positiveor the negativecapacitycri-
teriaare rejected.Retestingmay be allowed.Users'specificationsdo not
appeartoimpose plate-lotrejectionon the basisofthesetests.
Plates that pass inspection are put into packs of the proper number of each
polarity, and the plate tabs are welded to the combs. At this point, one
manufacturer subjects the plates to a procedure intended to extractsoluble carbonate. Because this step involves immersion in caustic solution,
the plates must again be washed and dried. Because both the caustic treat-
ment and the subsequent washing may result in loss of cadmium-active
material, good control is required to prevent undue reduction in excess
negative capacity.
After separators are added, the plate stack is put into a press and is
strongly compressed to test for plate-to-plate shorts before inserting the
plates into the case. This overcompression facilitates insertion because the
separators recover their original thickness slowly, but may damage sep-
arator material if compression is not limited.
Radiographic inspection (X-ray) after plate insertion and before welding
the cover to the case is advisable for detecting any foreign or loose material
and for determining that the plates are properly situated and that the
plate tabs are not unduly distorted. The forces involved in inserting the
plates often cause the plates to slide or skew, and radiographic viewing is
the only available method of detecting these effects. After the cover iswelded to the case, radiographic inspection is not as useful but is
performed on critical items to determine if the welding operation has
introduced any metal particles.
Some manufacturers add only the amount of electrolyte at the start that
they wish to remain in the cell at closure. Others may add more initially
than they plan to leave in the f'mal cell, and remove some later in the
sequence. The latter procedure appears to be necessary in cells with Tef-
lonated negatives when precharge is set by venting at pressures above 1
atmosphere.

CELL DESCRIPTION 57
Some manufacturers add electrolyte with the cell under atmospheric pres-
sure; others use vacuum in various ways during this step. Each method re-suits in a different degree of filling the pores of the plates with dectrolyteand in a different amount of nitrogen gas (from trapped air) left in the cellat closure. No agreement on the best method is apparent from the pub-lished literature. Filling under vacuum appears likely to give the leastamount of electrolyte distribution during cycling.
Some manufacturers install the plates discharged and must therefore
charge the cell and vent oxygen to increase the state of charge of the neg-ative relative to the positive electrode to set the precharge level. One manu-facturer installs the negative plates charged and sets the precharge level by
discharging the negative electrode, using the case wall as a counterelectrode.
Oxygen is vented in two ways: (1) permitting a certain pressure to build upand releasing the pressure to atmospheric, repeating the number of timesnecessary (by calculation) to vent oxygen equal to the ampere-hours ofprecharge desired; and (2) venting the cell at slightly above atmospheric
pressure and collecting the gas over water. The latter method is easier tocontrol and permits the gas to be easily sampled for analysis to ensure thatit is essentially all oxygen as expected.
After setting the precharge level, the cells are subjected to a number oftests that determine if the ceils meet the manufacturer's standards of per-formance. The details of these tests differ with each manufacturer. They
usually consist of less than 20 cycles of charge/discharge during whichvoltage, pressure, and capacity are observed under a set of conditions themanufacturer uses for all cells of that general type. From the manufac-
turer's viewpoint, conformance to the norm within certain limits indicates
a good cell.
During these initial tests, the cells are equipped with removable pressuregages that facilitate examination of an important aspect of initial testing--
the determination of overcharge pressure characteristics. Because of thevariation in void volume and surface area from cell to cell and from lot to
lot, ceil manufacturers reserve the right to "rework" ceils that have over-
charge pressures either above or below a certain range. Such rework maytake the form of removing or adding electrolyte, readjusting the amount ofexcess charged-negative capacity, or perfomlance of additional cycling.
58 Ni-Cd BATTERY APPLICATIONS MANUAL
After the manufacturer's standard electrical tests, cells undergo acceptance
testing to the buyer's specifications. (See Section 6.) Cells that successfully
complete acceptance testing are cleaned and packaged for shipment as the
fmal operation in the production sequence.
2.5 REFERENCE CELL DESIGN DATA
An attempt has been made in this manual to provide performance data
keyed as closely as possible to cell design and manufacturing processdetails. (See Section 3.) When only limited information on these details
was available, the approach taken was to identify the manufacturers of the
cells for which data are presented and to point out any significant dif-
ferences in cell behavior that may be correlated with known differences
in the design or process.
To implement this approach, the design characteristics occurring most
frequently in cells supplied by each of the major cell suppliers in recent
years were tabulated and defined as "reference design data" (table 11).
Cells whose designs fall within the ranges indicated are referred to as
"reference design cells." The authors believe that most of the test and
flight data obtained over the past 8 years has come from these reference
design cells. Table 11 includes data for the SAFT-France VO23S cell be-cause a considerable volume of test data has been generated in the
European space community on this cell, some of which has been included
in Section 3. Hence, the VO23S cell represents a useful reference design.
Table 12 lists the outside case dimensions of those spacecraft cells most
commonly used in the United States. Figure 13 is a photograph of four of
these cells. The exact width and depth depend on the case-wall thickness,
which the user may usually specify within limits. The case height is subject
to greater variation than any other dimension because it can be adjusted to
fit specific space requirements without impacting the plate-stack config-
uration or the case "footprint." The corresponding dimensions of theSAFT-France VO23S cell are: width 76.2 ram;thickness 29 ram; and case
height 160 mm.
Table 13 lists the case volumes and cell masses of those cells listed in
table 12. The cells have been selected for comparing those from different
manufacturers with similar actual capacities at the various size levels. The
masses of specific designs vary as the case-wall thickness, case heights, and
electrolyte volume are varied. For comparison, the case volume and mass ofthe SAFT-France VO23S cell are 354 cm 3 (21.5 in 3) and 1.015 kg
(2.24 lb), respectively.
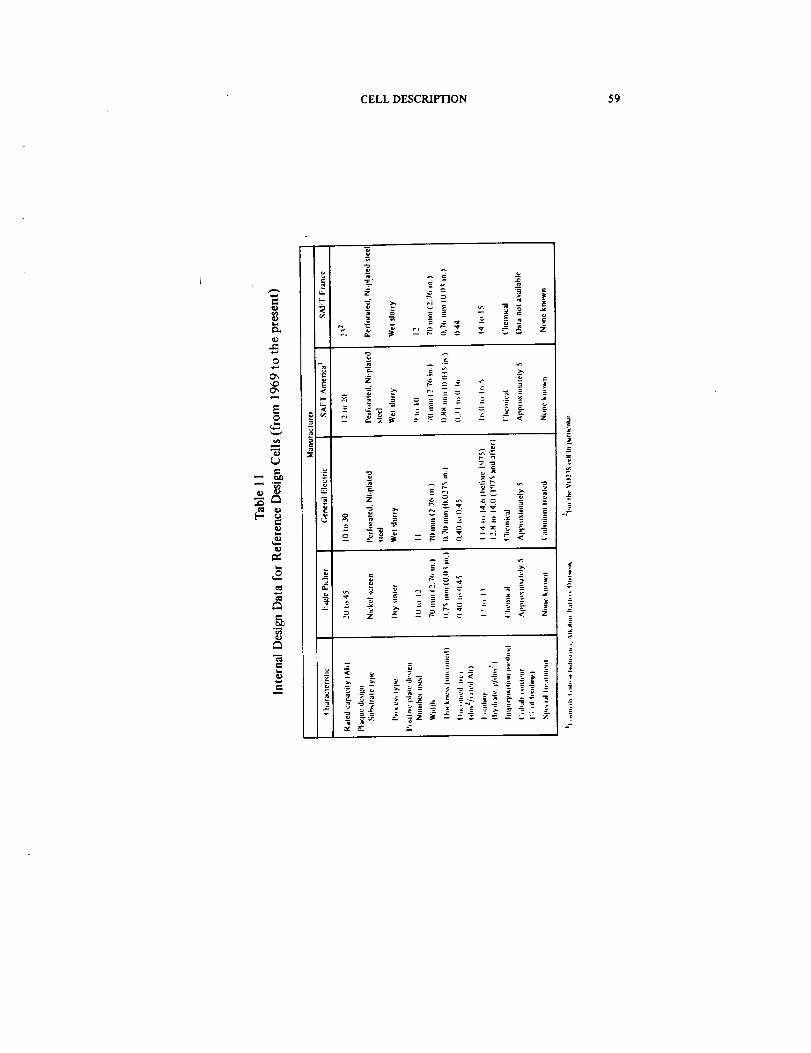
CELL DESCKIPTION 59
c_
O
EO
F_
e-
=
-- =
= _ . ,_
< _ _ = _=
:o
"2
z _=_ .__- _ _
. _-:_: _ _ -_ _ --__ _:_: ._ _
_ >"
_£ -.:
v>
:

60 Ni-Cd BATTERY APPLICATIONS MANUAL
e,o
,u
[-
!
_=
=
_E
r,
o • o E
c_ -_ _- -_ oz z _ _ - -'
v_. c
c
8_
|,
=
"= =
Z
=
-- Z
!
:=
#
i
=
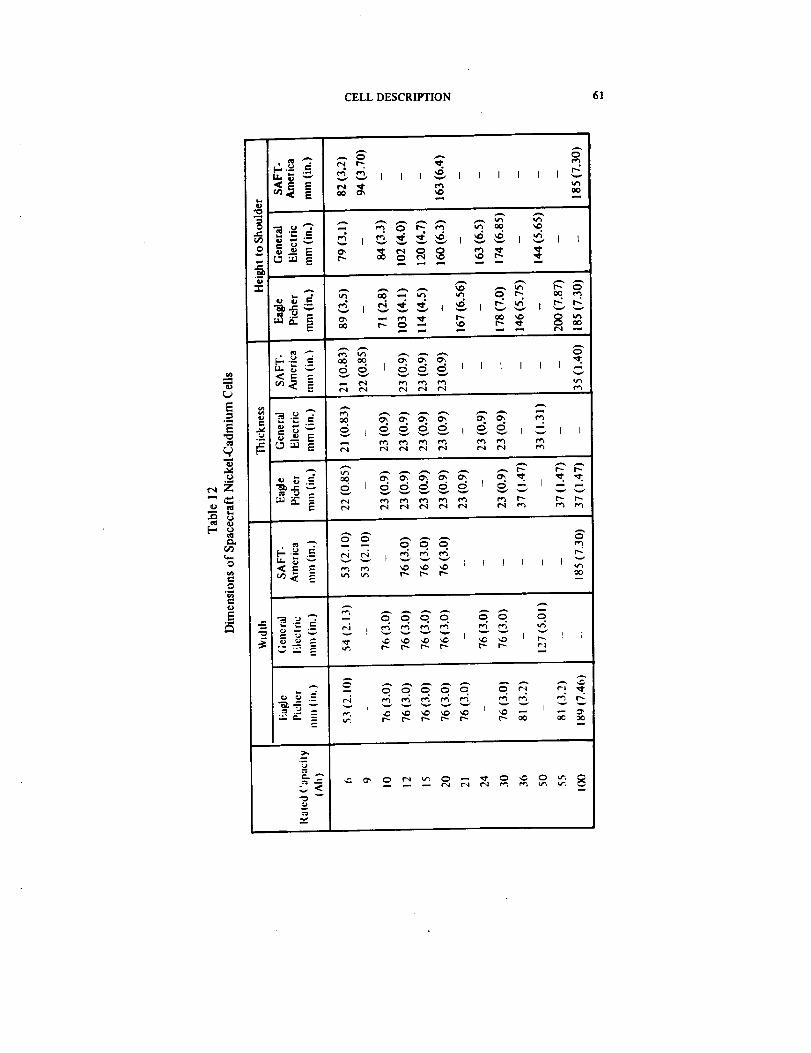
CELL DESCRIPTION 61
E..=E
_4
e_Z
[" _ex.
o
E
•_ = t _
..m
--
L@__._. e.,
_. o_ _ _ __. . . o_. _. _- _-
o(_1 _ _ e_ r_ e_ r_ t"_ _
- - o.o. _
o • ° °
_ _ t_ _._ _.- _ _!
A
m
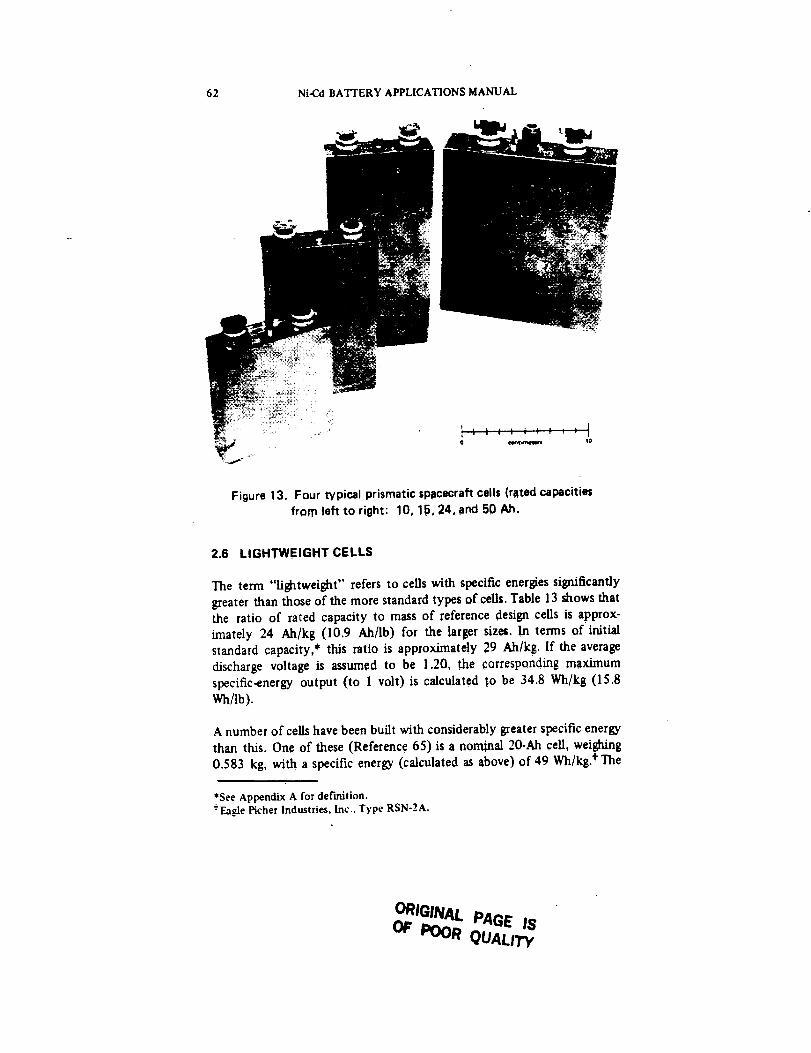
62 Ni-Cd BATTERY APPLICATIONS MANUAL
Ilu
!
Figure 13. Four typical prismatic spacecraft cells (rated capacities
from left to right'. 10, 15, 24, and 50 Ah.
2.6 LIGHTWEIGHT CELLS
The term "lightweight" refers to cells with specific energies significantly
greater than those of the more standard types of ceils. Table 13 shows thatthe ratio of rated capacity to mass of reference design ceils is approx-
imately 24 Ah/kg (10.9 Ah/lb) for the larger size=. In terms of initial
standard capacity,* tlus ratio is approximately 29 Ah/kg. If the average
discharge voltage is assumed to be 1.20, the corresponding maximum
specific-energy output (to 1 volt) is calculated to be 34.8 Wh/kg (15.8
Wh/lb).
A number of cells have been built with considerably greater specific energy
than this. One of these (Reference 65) is a nora|hal 20-Ah cell, weighing
0.583 kg, with a specific energy (calculated as above) of 49 Wh/kg. "t"The
*See Appendix A for de('mition,
-EaSe Picher Industries, Inc.. Type RSN-2A.
ORIGINAl. PAGE IS
OF POOR QUALITY,
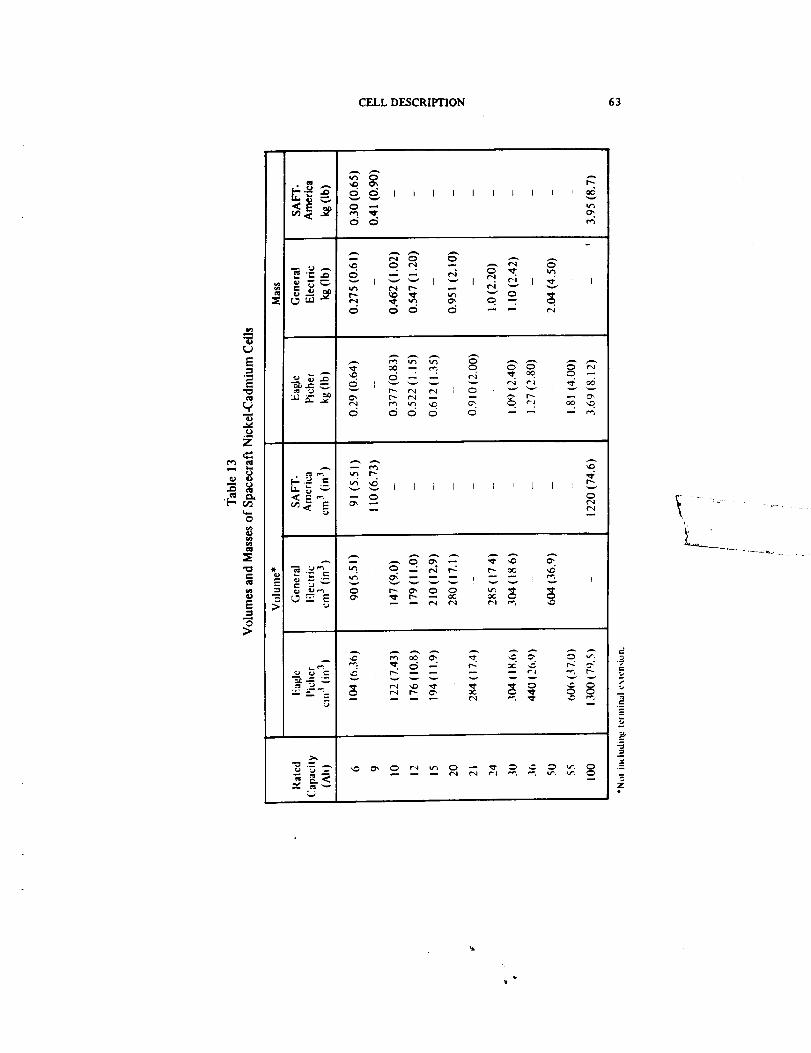
CELL DESCRIPTION 63
E
E
_4
Z
o
_'_ _ _ _ I j I I I I I I L I _
d d ,.4
¢_ _ _ _ .
d d d d - -
_"_ _ _ _ -o c_ o o
OO
O ¢'_
o
v
o
_._ _ _ ¢_ _ O _ _" _ _ _ _, O
F.
Z
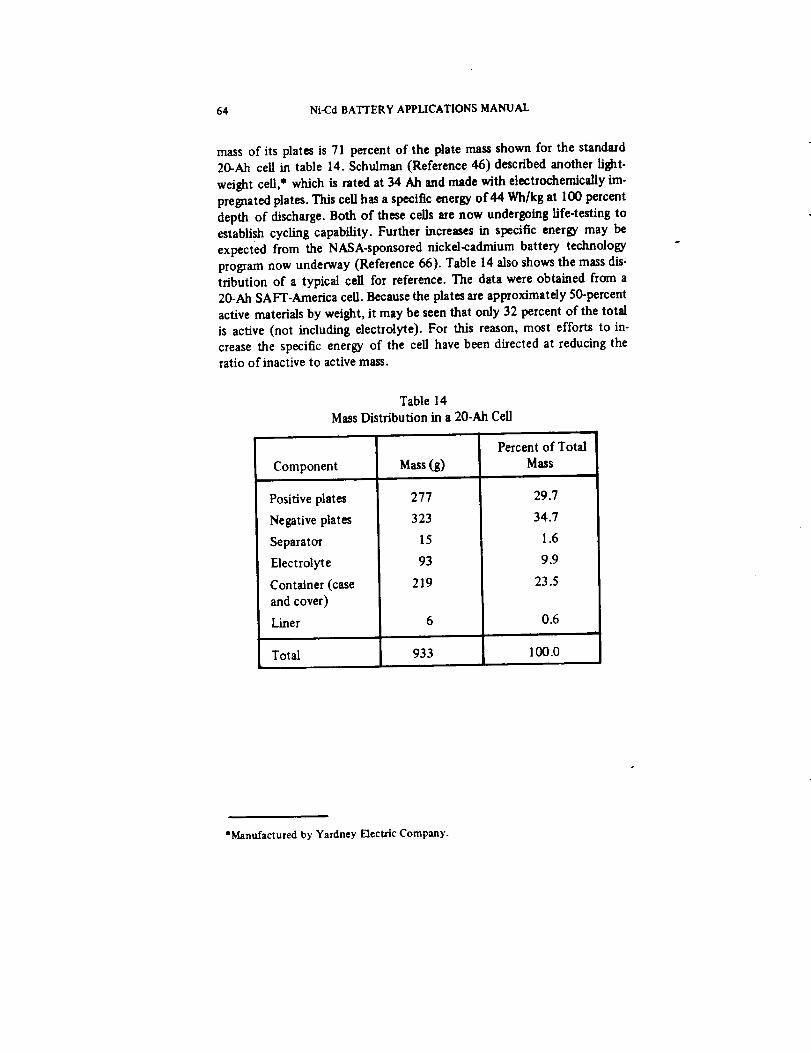
64 Ni-Cd BA'I'rERY APPLICATIONS MANUAL
mass of its plates is 71 percent of the plate mass shown for the standard20-Ah cell in table 14. Schulman (Reference 46) described another light-
weight cell,* which is rated at 34 Ah and made with electrochemically im-
pregnated plates. This cell has a specific energy of 44 Wh/kg at I00 percent
depth of discharge. Both of these cells are now undergoing life.testing toestablish cycling capability. Further increases in specific energy may be
expected from the NASA-sponsored nickel-cadmium battery technology
program now underway (Reference 66). Table 14 also shows the mass dis-
tribution of a typical cell for reference. The data were obtained from a20-Ah SAFT-America cell. Because the plates are approximately 50-percent
active materials by weight, it may be seen that only 32 percent of the total
is active (not including electrolyte). For this reason, most efforts to in-
crease the specific energy of the cell have been directed at reducing theratio of inactive to active mass.
Table 14
Mass Distribution in a 2O-Ah Cell
Component
Positive plates
Negative plates
Separator
Electrolyte
Container (case
and cover)
Liner
Total
Mass(g)
277
323
15
93
219
933
Percent of Total
Mass
29.7
34.7
1.6
9.9
23.5
0.6
100.0
*Manufactured by Yardney Flectric Company.
SECTION 3
CELL PROPERTIES AND PERFORMANCE
3.1 INTRODUCTION
This section presents typical properties and performance character-
istics of sealed nickel-cadmium ceils. Static properties are those that do notinvolve net-energy conversion; performance characteristics are those that
are involved with energy conversion and mass transfer within the ceil.
Performance information is presented in two parts: that for initial charac-
teristics, and that for long-term performance. Initial characteristics are
considered to be those observed during the first 20 to 50 cycles of opera- ,
tion, and during the frrst cycles after reconditioning. Long-term character-
istics are those observed after several hundred or more cycles and/or
several years of service without reconditioning or with ineffective recon-
ditioning. Failure to distinguish between initial and long-term cell behavior
in the design of the system can lead to battery-limited power-system
operation within the system design life.
Performance data given are primarily for cells designed as described in
Section 2.5 (i.e., for so-called "reference design ceils"). The effects of
departures from these reference designs are indicated in terms of depar-tures from the performance of reference cells taken as the norm. The same
treatment is given to variations in processes.
Initial characteristics are similar among cells that are similar in design butmade by different types of processes. Thus, initial characteristics are rela-
.tively insensitive to process details over a broad range.., The user shouldunderstand the design aspects that have a direct impact on initial character-istics so that they may be controlled by specification.
Long-term performance or, more specifically, the changes in characteristicsresulting from long-tern1 operation are generally more sensitive to both
design and process details than initial characteristics. However, because
long-term effects cannot be measured during acceptance testing and be-
cause the state of the art of performance analysis does not permit reliable
predictions from a theoretical standpoint, long.term performance predic-
tions must be based mainly on prior flight and test data and the potentialimpact of critical design and process aspects. Section 3.4 summarizes avail.
able information on these relationships.
65

66 Ni-Cd BATTERY APPLICATIONS MANUAL
Both initial characteristics and long-term performance may be affected
by conditions of use. Because use conditions interact adversely with the
results of certain designs and pr_, some design and use combinationsmust be avoided. The effect of operating conditions and their limits is
discussed under both initial and long-term performance.
The terms used to descn'oe most of the so-caUed "static" properties of
cells, such as mass, length, temperature, impedance, thermal capacity, and
thermal conductivity, are relatively straightforward. Other concepts des-
cribing dynamic performance, such as those of state of charge, capacity,
energy, and heat generation, are functions of many variables and therefore
require careful definition if they are to be used with confidence in engi-
neering practice. This section defines these latter concepts in terms of
directly measurable variables-cell terminal voltage, cell current, cell-wall
temperature, and cell internal pressure-and of various functions derivedfrom them. Ceil-wall temperature is considered as directly measurable;
internal cell temperature is access_le only with difficulty. Although inter-
nal temperature is a more fundamental variable than cell-wall temperature,it can be estimated from external temperature only ff the cell heat-
generation rate and internal thermal resistances are known.
The electrical power input to, or output from, a cell is an instantaneous
performance characteristic that is not normally measurable directly, but it
may be determined at any point by multiplying the ceil voltage by the cur-
rent. Note that because it is a photovohalc cell, a galvanic cell is an energy
storage and delivery device and not a power generator, although the
sintered-plate nickel-cadmium cell is capable of delivering high power
within the bounds of its dischargeable energy content.
3.2 STATIC PROPERTIES OF CELLS
The properties described in this section are mainly inherent in the physical
and chemical structure of sealed, sintered-plate nickel-cadmium cells (i.e.,properties that do not involve net dc current flow or energy conversion).
The following paragraphs describe the static properties of reference designs
and the effects of design variations.
CELLPROPERTIES AND PERFORMANCE 67
3.2.1 Properties of Reference Design Ceils
3.2.1.1 Internal Impedance
A knowledge of the effective internal impedance of cells is useful in the
design and performance analysis of electric power systems for evaluating
the response of the battery to ripple, noise, charging and discharging
transients, and other phenomena. In this manual, the term "impedance" is
used to refer to the ratio of the observed cell-voltage change to the corres-
ponding change in the alternating current through the cell. Some people
refer to this measured value as "internal resistance." This designation is
misleading, however, because the impedance of a nickel-cadmium cell at all
frequencies outside a narrow band contains a relatively large reactive com-ponent (in addition to ohmic resistance), as follows.
Internal Impedance at Low Frequencies-Most impedance measurements
for which data are available have been made at frequencies of from 40 to
60 Hz. Figure 14 summarizes the results for prismatic cells made with non-
woven nylon separators and shows a plot of impedance versus the fraction
100 Ah + (rated capacity). This quotient is used to linearize the plot,
recognizing: (1) that impedance should vary linearly with the reciprocal
of the plate area, and (2) plate area is roughly proportional to ratedcapacity.
The solid line corresponds to the smoothed data in References 2 and 67.
The dotted lines show the limits of the more reliable data and indicate that
the spread is about e25 percent over the range of cell sizes and designs
included. Although temperature and state of charge are mainly unspecifiedfor these data, it may be assumed that most measurements were made at
room ambient. The closeness of the fit of the smoothed data points (cir-
cles) to a straight line verifies that the impedance is inversely proportionalto plate area.
In a detailed study of impedance of one size of prismatic cell (rated at 23
ampere-hours), impedance was measured as a function of temperature, re-
charge ratio, and test frequency (Reference 67). Impedance varied within
a range of -+25 percent from the mean with temperature over the rangefrom 0 to +40°C as measured at I00 to l0 s Hz. However, at 1 and 10 Hz
at 0°C, impedance was a factor of 2 greater than at these frequencies at 20or 40°C.
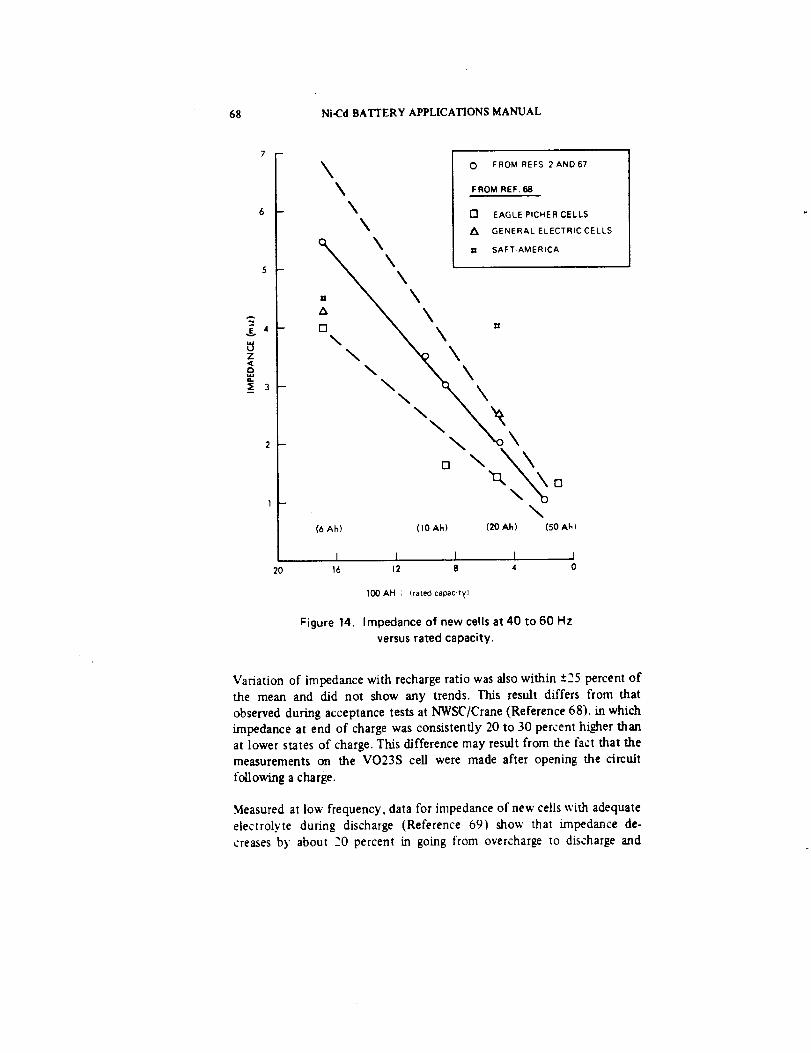
68 Ni-Cd BATTERY APPLICATIONS MANUAL
&4
Z<
3
2
1
2O
O FROM REFS 2 AND67
FROM REF. 68
[] EAGLE PICHER CELLS
_ GENERAL ELECTRIC CELLS
_ 13 SAFT.AMERICA
\\ - __
\
\\\ "_\\
"\ \o\
[] \,q,_ _
\(6 Ah) (10 Ah) (20 Ak) (50 Ah)
I I I 1 I16 12 8 4 0
100AH ÷ (ratedcapac_t¥1
Figure 14. Impedance of new cells at 40 to 60 Hz
versus rated capacity.
Variation of impedance with recharge ratio was also within £25 percent of
the mean and did not show any trends. This result differs from that
observed during acceptance tests at NWSC/Crane (Reference 68). in which
impedance at end of charge was consistently 20 to 30 percent higher than
at lower states of charge. This difference may result from the fact that the
measurements on the VO23S cell were made after opening the circuit
t'otlowi.ng a charge.
Measured at lot' frequency, data for impedance of new cells with adequate
electrolyte during discharge (Reference 69) shot' that impedance de-
creases by about 20 percent in going from overcharge to discharge and

CELL PROPERTIES AND PERFORMANCE 69
remains nearly constant at the level shown in figure 15 during discharge(at the 0.5C rate) at least to 100 percent of rated capacity. If inadequateelectrolyte is present in the cell as a whole, or if the electrolyte content of
the separator is much less than normal, the impedance at depths of dis-charge approaching 1O0 percent can be much higher. (See figure 20.)
50-
4O
30
20-
10 -
5
4-
3-
2 -
I
i0-I
SAFT V023S CELLS
AT 120% CHARGETHROUGHPUT
0°C
D 20°C
0 _C
REFERENCE67
0
] I
I 10
/l
l/
ll
?
TEST FREQUENCY
//
/
//
1
,o3(Sz)
I
104
I
_os
Figure 15. Cell impedanceversusfrequency.

70 Ni-Cd BATTERY APPLICATIONS MANUAL
Impedance Versus Frequency-.Figure 15 (from Reference 67) shows impe-dance data for SAFT VO23S cells, measured at frequencies from l to lO 5
Hz after a charge throughput of 120 percent of rated capacity.* (Note that
both impedance and frequency scales are logarithmic.) Impedance is
relatively constant up to about lO0 Hz; it then increases rapidly at higher
frequencies.
Reactive Component of Cell Impedance-The foregoing data are for the
absolute or scalar value of cell impedance (i.e., without regard to the nature
of the impedance). For some applications, the angle between the current
and voltage vectors (phase angle) and the relative magnitude of resistive
and reactive components is needed.
Figure 16 shows a curve of sine 0 (0 = measured phase angle) versus test
frequency for SAFT VO23S cells, taken from Reference 67 and corres-
ponding to the impedance data in figure 15. Positive and negative values of
sine 0 are associated with net inductive and capacitive reactance, respec-
tively, as shown in figure 17. Similar phase-angle versus frequency datawere reported for a 15-Ah cell, measured at 12, 60, and 400 Hz (Refer-
ence 69), in which the phase angle at any one frequency changed by only
a few degrees in going from the charged to the discharged state.
The behavior shown in figure 16 suggests a simplified equivalent circuit
such as the one shown in figure 18. This circuit is similar to that shown by
Bauer (Reference 2). Between 30 and lO0 Hz, the effects ofC i and Li on
impedance roughly cancel one another, leaving R i as the measured com-
ponent. At low- and high-frequency extremes, shunting resistances R¢ and
R L , respectively, limit the impedance.
In the region between 30 and 100 Hz, if the effect of Rc and R L in figure
18 is neglected, the apparent resistance, R i, and the apparent inductive and
capacitive reactances may be calculaeed using the formula:
X = IZI sine 0
Therefore, at sine 0 = 0, X = 0, and the impedance is purely resistive
(ohmic). At 150 I-[z, at which sine 0 = +0.5, reactance is inductive and
numerically equal to one-half the impedance. At this point, the impedance
(9)
*The ceLlswere charged at the 0.1C rate, beginning after a discharge to 1 volt.
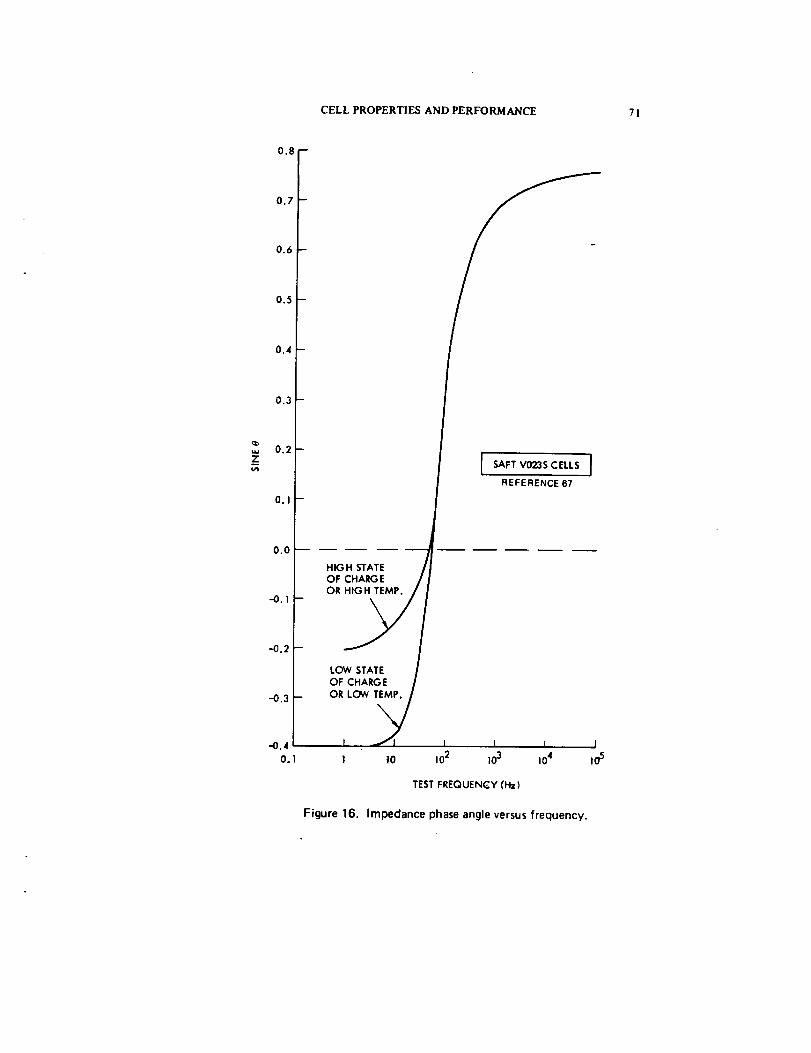
CELL PROPERTIES AND PERFORMANCE 71
0.1
J SAFT V023S CELLS
REFERENCE67
HIG H STATE
OF CHARGEOR HIGH TEMP.
LOW STATE
OF CHARGE
OR LOW TEMP.
Figure 16.
|0 102 103 104
TEST FREQUENCY (Hz)
Impedance phase angle versus frequency.
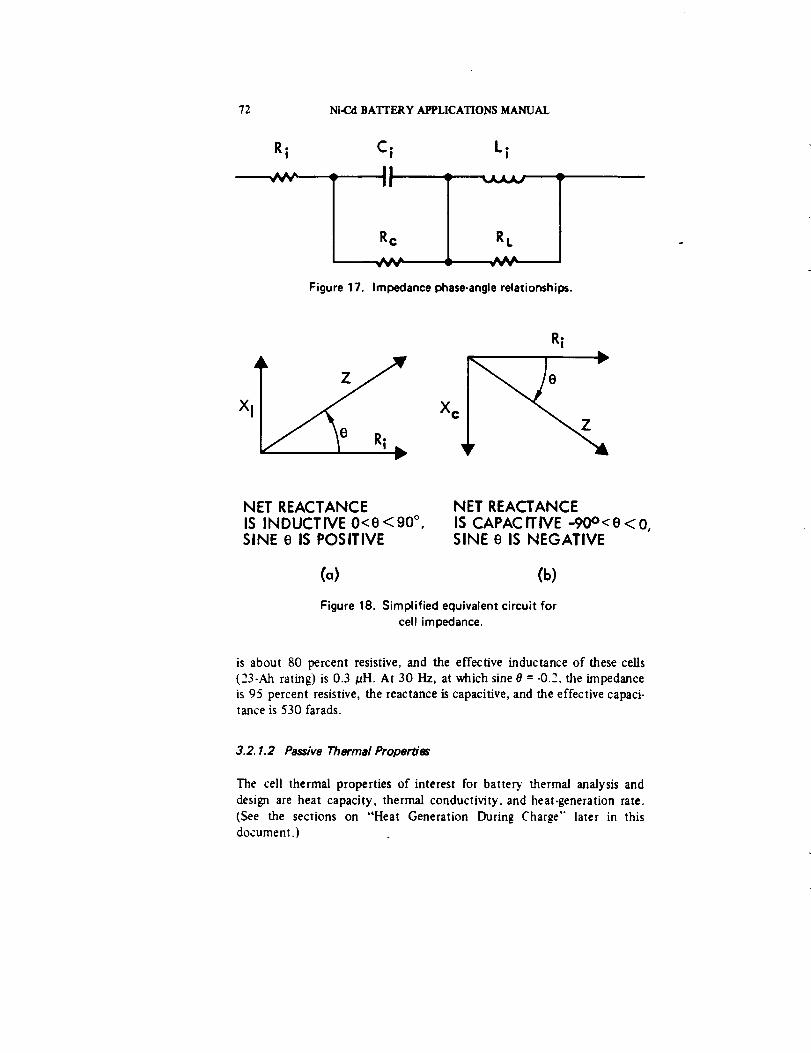
72
R|
Ni.Cd BATTERY APPLICATIONS MANUAL
Ci L i
Rc R L
Figure 17. Impedance phase-angle relationships.
X¢
R|
NET REACTANCEIS INDUCTIVE 0<e <90 °,SINE e IS POSITIVE
NET REACTANCE
IS CAPACITIVE -90o<e <0,SINE e IS NEGATIVE
(o) (b)
Figure 18. Simplified equivalent circuit for
cell impedance.
is about 80 percent resistive, and the effective inductance of these cells
(23-Ah rating) is 0.3 pH. At 30 Hz, at which sine 0 = -0.2, the impedance
is 95 percent resistive, the reactance is capacitive, and the effective capaci-tance is 530 farads.
3.2. 1.2 Passive Thermal Properties
The cell thermal properties of interest for battery thermal analysis and
desi_ are heat capacity, thermal conductivity, and heat-generation rate.
(See the sections on "Heat Generation During Charge" later in thisdocument.)
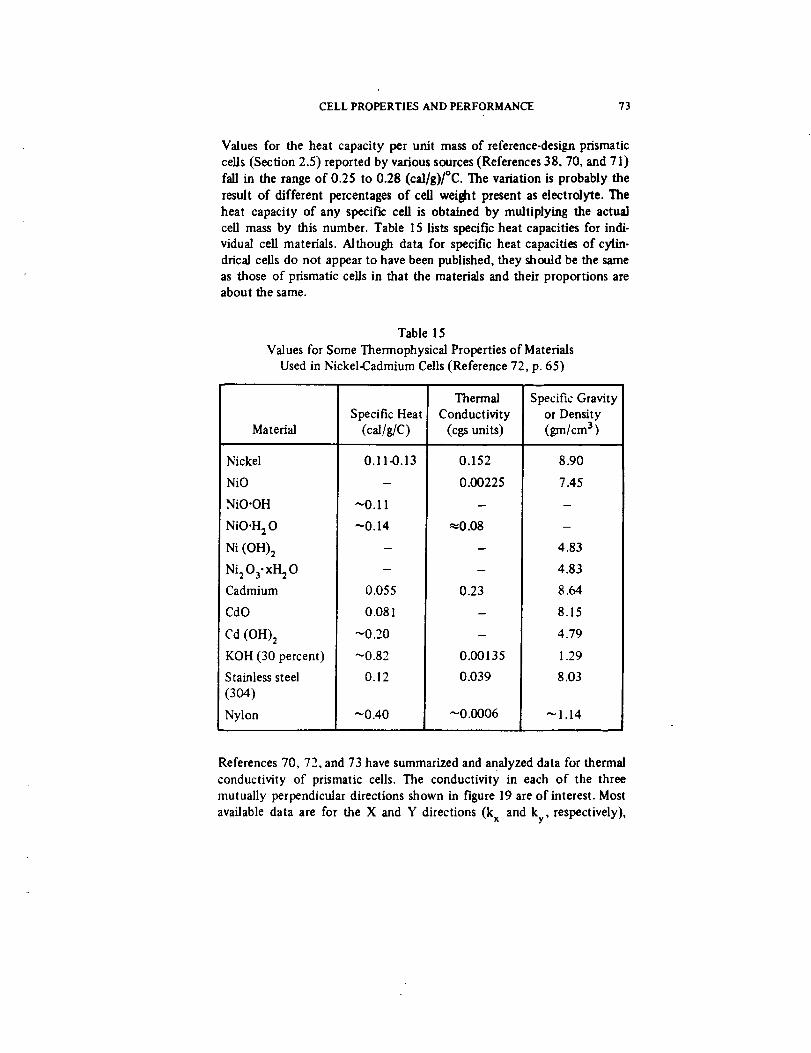
CELL PROPERTIES AND PERFORMANCE 73
Values for the heat capacity per unit mass of reference-design prismatic
cells (Section 2.5) reported by various sources (References 38, 70, and 71)
fall in the range of 0.25 to 0.28 (cal/g)/°C. The variation is probably the
result of different percentages of cell weight present as electrolyte. The
heat capacity of any specific cell is obtained by multiplying the actual
cell mass by this number. Table 15 lists specific heat capacities for indi-
vidual cell materials. Although data for specific heat capacities of cylin-
drical cells do not appear to have been published, they should be the same
as those of prismatic ceils in that the materials and their proportions areabout the same.
Table 15
Values for Some Thermophysical Properties of Materials
Used in Nickel-Cadmium Cells (Reference 72, p. 65)
Material
Nickel
NiO
NiO-OH
NiO-H 20
Ni (OH)2
Ni 203. xH 20
Cadmium
CdO
Cd (OH)2
KOH (30 percent)
Stainless steel
(304)
Nylon
Specific Heat
(cal/g/C)
0.11-0.13
~0.11
"0.14
0.055
0.081
~0.20
~0.82
0.12
t0.40
Thermal
Conductivity
(cgs units)
Specific Gravity
or Density(gm/cm a)
8.90
7.45
0.152
0.00225
_0.08
0.23
0.00135
0.039
_0.0006
4.83
4.83
8.64
8.15
4.79
1.29
8.03
_1.14
References 70, 72, and 73 have summarized and analyzed data for thermal
conductivity of prismatic cells. The conductivity in each of the three
mutually perpendicular directions shown in figure 19 are of interest. Most
available data are for the X and Y directions (k x and ky, respectively),

74 Ni-Cd BATI'ERY APPLICATIONS MANUAL
Z DIRECI_ON
_rilml to p*4_ o! pk.it
$
X OIRECTION
me'ne_.¢u_ar to pkme
'r OIAECTIO_
Figure 19. Major directions for heat flow
in a prismatic cell.
where kz is calculated from ky. The units of thermal conductivity are[cal/cm:/sec]/(°C/cm) in cgs umts and [Btu/ft2)/hr]/(°F/ft) in English
units.
Table 16 is a summary of thermal conductivity values for some refer-
ence design nickel-cadmium cells from the literature. These data show con-
siderable scatter and large discrepancies between some calculated and
measured values, reflecting difficulties in modeling and/or in making accu-
rate measurements. A slight trend toward lower values of k x for largercapacity cells is apparent.
A detailed study of thermal conductivity of 20-Ah spacecraft cells (Refer-
ence 72) yielded the measured values shown in table 17. These data apply
to cells in the fully discharged state. The values for kx increased linearlywith state of charge to a maximum of 12 to 14 percent greater than in thedischarged state. Because the cells from which these data were obtained
were manufactured before 1969. their designs may differ in some details
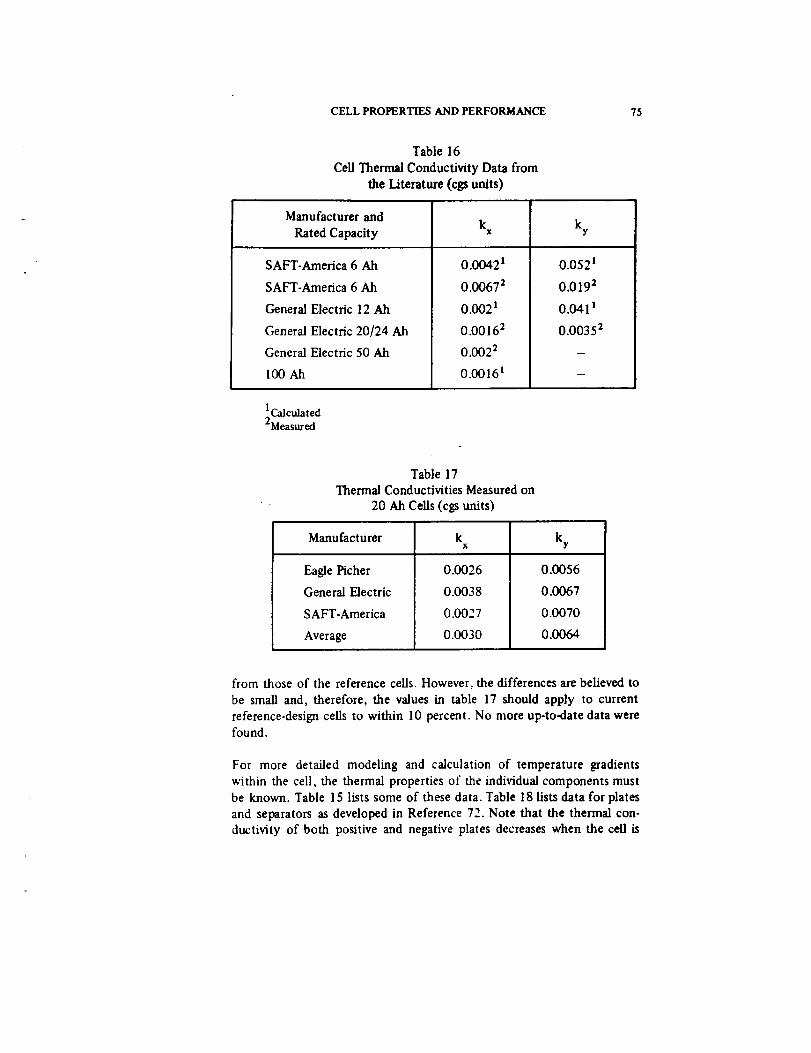
CELL PROPERTIES AND PERFORMANCE 75
Table 16
Cell Thermal Conductivity Data from
the Literature (cgs units)
Manufacturer and
Rated Capacity
SAFT-America 6 Ah
SAFT-America 6 Ah
General Electric 12 Ah
General Electric 20/24 Ah
General Electric 50 Ah
lOOAh
kX
0.00421
0.00672
0.002 l
0.00162
0.0022
0.00161
kY
0.052 l
0.0192
0.0411
0.00352
2CalculatedMeasured
Table 17
Thermal Conductivities Measured on
20 Ah Cells (cgs units)
Manufacturer k kx y
Eagle Picher
General Electric
SAFT-America
Average
0.0026
0.0038
0.0027
0.0030
0.0056
0.0067
0.0070
0.0064
from those of the reference cells. However, the differences are believed to
be small and, therefore, the values in table 17 should apply to current
reference-design cells to within 10 percent. No more up-to-date data werefound.
For more detailed modeling and calculation of temperature gradients
within the cell, the thermal properties of the individual components must
be known. Table 15 lists some of these data. Table 18 lists data for plates
and separators as developed in Reference 72. Note that the thermal con-
ductivity of both positive and negative plates decreases when the cell is
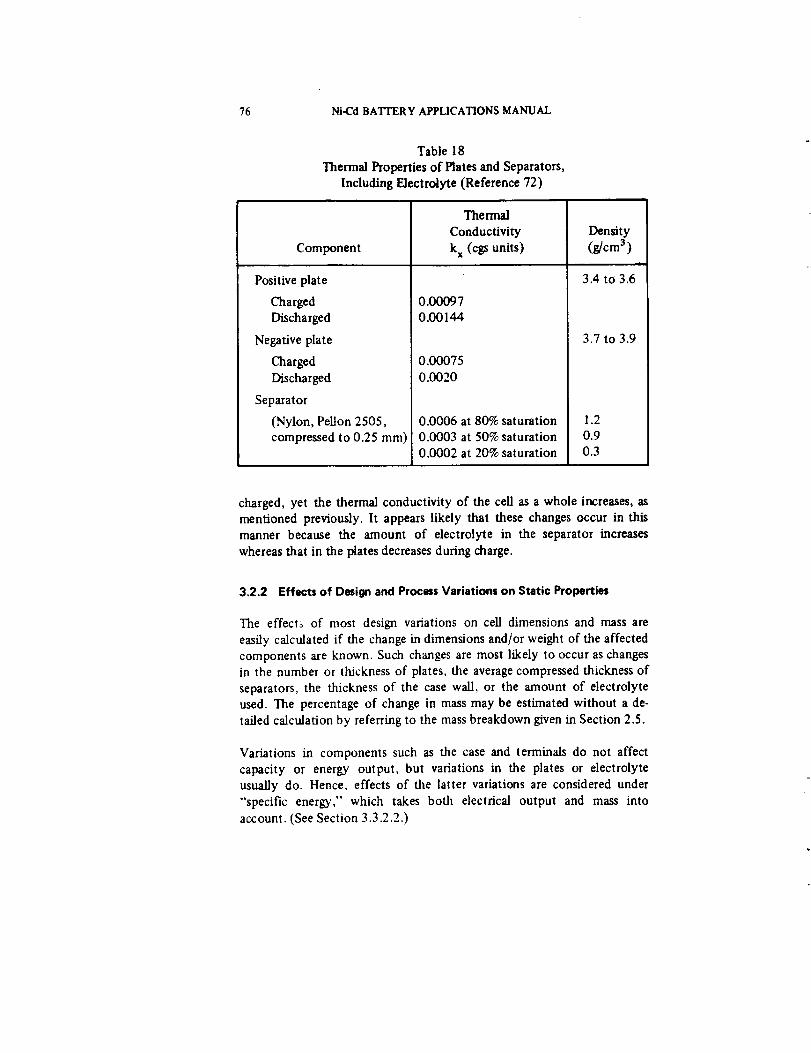
76 Ni-Cd BATI'ERY APPLICATIONS MANUAL
Table 18
Thermal Properties of Plates and Separators,
Including Electrolyte (Reference 72)
Component
Positive plate
Charged
Discharged
Negative plate
Charged
Discharged
Separator
(Nylon, Pellon 2505,compressed to 0.25 mm)
Thermal
Conductivity
k x (cgs units)
0.00O97
0.00144
0.00075
0.0020
0.0006 at 80% saturation
0.0003 at 50% saturation
0.0002 at 20% saturation
Density
(g/cm3)
3.4to3.6
3.7 to 3.9
1.2
0.9
0.3
charged, yet the therma_ conductivity of the cell as a whole increases, as
mentioned previously. It appears likely that these changes occur in thismanner because the amount of electrolyte in the separator increases
whereas that in the plates decreases during charge.
3.2.2 Effects of Design and ProcessVariations on Static Properties
The effect_ of most design variations on cell dimensions and mass are
easily calculated if the change in dimensions and/or weight of the affected
components are known. Such changes are most likely to occur as changesin the number or thickness of plates, the average compressed thickness of
separators, the thickness of the case wall, or the amount of electrolyte
used. The percentage of change in mass may be estimated without a de-
tailed calculation by referring to the mass breakdown given in Section 2.5.
Variations in components such as the case and terminals do not affect
capacity or energy output, but variations in the plates or electrolyte
usually do. Hence, effects of the latter variations are considered under
"'specific energy," which takes both electrical output and mass into
account. (See Section 3.3.2.2.)
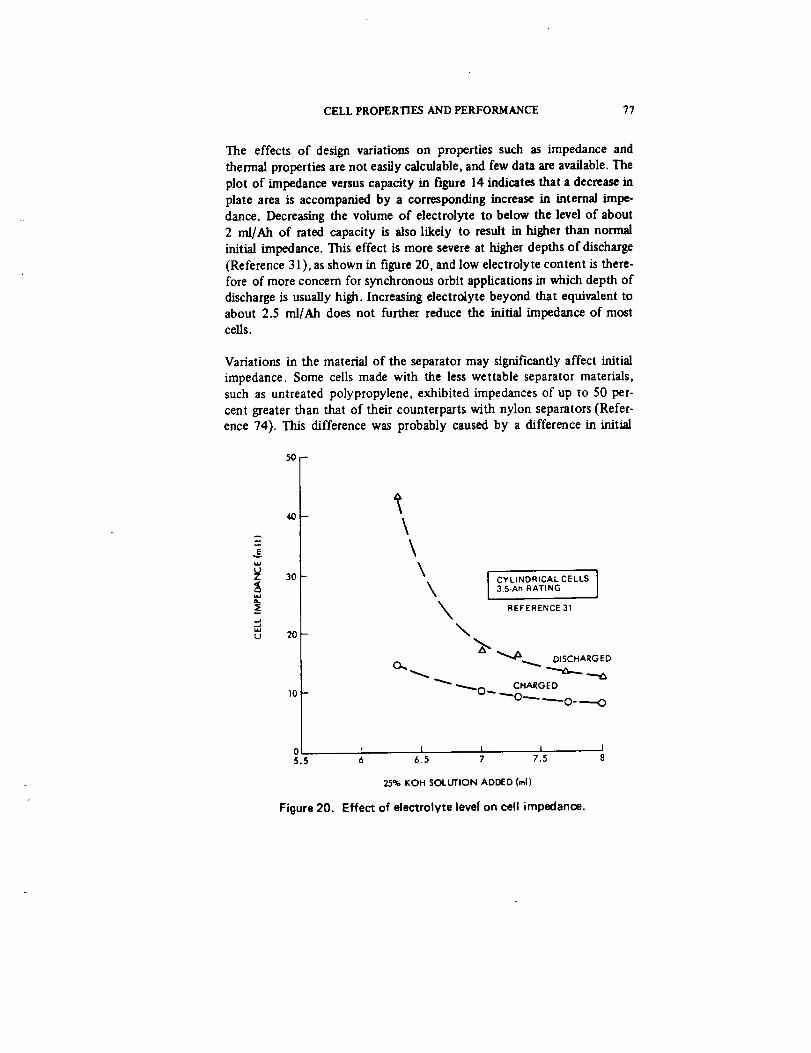
CELL PROPERTIES AND PERFORMANCE 77
The effects of design variations on properties such as impedance and
thermal properties are not easily calculable, and few data axe available. The
plot of impedance versus capacity in figure 14 indicates that a decrease in
plate area is accompanied by a corresponding increase in internal impe-
dance. Decreasing the volume of electrolyte to below the level of about
2 ml/Ah of rated capacity is also likely to result in higher than normal
initial impedance. This effect is more severe at higher depths of discharge
(Reference 31), as shown in figure 20, and low electrolyte content is there-
fore of more concern for synchronous orbit applications in which depth of
discharge is usually high. Increasing electrolyte beyond that equivalent to
about 2.5 rnl/Ah does not further reduce the initial impedance of most
cells.
Variations in the material of the separator may significantly affect initial
impedance. Some cells made with the less wettable separator materials,
such as untreated polypropylene, exhibited impedances of up to 50 per-
cent greater than that of their counterparts with nylon separators (Refer-
ence 74). This difference was probably caused by a difference in initial
50-
U
40
30 _-
2O
10
\\\
O_
\\
CYLINDRICALCELLS I3.5-Ah RATING
REFERENCE 31
\
_ "_¢l_ DISCHARGED
_O'-- ..CHARGED
O---. ----O- "---O
0 I I 1 I
5.5 6 6.5 7 7.5
25% KOH SOLUTION ADDED (ml)
Figure 20. Effect of electrolyte level on cell impedance.
78 Ni-Cd BATrERY APPLICATIONS MANUAL
electrolyte distn_oution between the two types of cells in question. Poly-
propylene separators may also make impedance more sensitive to electro-
lyre level because a difference of 50 percent in impedance was seen be-
tween pore fills of 70 and 80 percent (Reference 74).
Because the specific heat of a nickel-cadmium cell as a whole appears to be
independent of design variations for reference-type cells (Reference 72),
heat capacity will be simply proportional to cell mass. On the other hand,thermal conductivity increases as the number of plates per unit cell thick-
ness increases, as separator thickness decreases, and as volume of electro-
lyte per unit of plate stack volume (percent of pore fill) increases. The
amount of electrolyte in the separators has the largest single effect when
the level is low. (See table 18.) This relationship suggests that, although
cells may have adequate thermal conductivity when new and, hence, when
electrolyte distribution is normal, the thermal conductivity can decrease
significantly with electrolyte redistribution, causing an increased internalthermal resistance.
3.3 INITIAL PERFORMANCE CHARACTERISTICS
This section describes the dynamic performance characteristics of herme-
tically sealed, sintered-plate, nickel-cadmium cells that are most useful for
design and performance analysis of working spacecraft electric power sys-
tems. Initial characteristics have been defmed as those to be expected with-
in the first 50 or so repetitive cycles of cell life or soon after effectivereconditioning. Thus, no appreciable voltage degradation is included. These
data provide a frame of reference for comparing subsequent performance.
Separate data is given for short cycle (90- to 180-minute cycle length, as
for low Earth-orbit applications) and for long cycle (12- to 24-hour cycle
length, as for Earth-synchronous and other medium- to hi_-altitude appli-
cations). This division reco_izes the significant differences in operating
conditions between these two major application areas. The long-cycle data
also applies to interplanetary probes and orbiters.
Charge data for one-at-a-time cycles* is given separately from that for con-
tinuous cycling. Discharge data is given separately.
*A one-at-a-time cycle is one of a set of only a few cycles, usualJ.vperformed under agiven set of standard conditions, before and after which the conditions are different(e.g., the ceils may be cycling continuouslyL Before each charge of a one-shot cycle,ceils are either discharged to 1 volt or are discharged on a resistor to zero or near-zero volt (as specifiedL Charging is usually prolonged and taken to a higher state ofcharge than for regular cycling.
CELL PROPERTIES AND PERFORMANCE 79
Composite data typical of the cells of all manufacturers are presented when
available, but data for cells with widely differing behavior are not com-
bined. Significant performance differences exist among ceils from different
sources, resulting from certain design or process differences, that the bat-
tery engineer must consider.
A few words about the method used to express variables is in order. Charge
and discharge currents are expressed as far as possible in so-called "norma-
lized" form (i.e., the current in amperes divided by cell capacity in ampere-
hours). The manufacturer's rating (C R) is used as the divisor in this manual.Other methods of normalization used include: (1) dividing by the capacity
actually measured under a specified set of conditions; (2) dividing by the
area of the positive plates in the cell: or (3) dividing by the weight of
positive active material in the cell. These divisors for current often providemore accurate or internally consistent relationships between ceils of one
specific design. However, when specific design details are lacking, the rated
capacity is considered to be the most practical common denominator for
use as a scaling factor for different ceils. With a knowledge of factors such
as the foregoing, the designer can convert to other scales if desired.
The scales for charge throughput and discharge output are normalized by
dividing ampere-hours by the rated capacity (CR). When appropriate,
"true" state of charge, as defined in the Appendix A. is used as the depen-
dent variable rather than charge throughput. Although true state of charge
is more difficult to determine than charge throughput, certain character-
istics (such as instantaneous charge efficiency and heat rate) are much more
closely related to true state of charge, and. hence, this type of plot is more
broadly useful.
Voltage data are presented as voltage per ceil. Such data are usually the
average of 5 to 30 ceils operating in series. Data on the spread between the
highest and lowest cell voltages are given when significant and when data
are available. Unless otherwise noted, the temperatures given are cell-wall
temperatures. When ceil-wail temperatures are not available, ambient tem-
perature is indicated.
3.3.1 Initial Charge Characteristics
This section describes initial charge characteristics, including data for active
charge (that portion of charge in which the charge efficiency is high),overcharge (when charge efficiency is low or zero), and trickle charge
(when charge rates are usually less than 0.03C following a charge at a
higher rate).
80 Ni-Cd BATTERY APPLICATIONS MANUAL
3.3. 1.1 Charge Data for Reference-Design Cells
Charlte Voltage and Corrant-The voltage of a nickel-cadmium cell oncharge is a function of a number of operating variables, including tempera-
lure, charge rate, initial state of charge, state of charge at the point of inter-
est, and immediate prior history. In addition, charge-voltage character-
istics, although generally similar in shape for different designs, vary in
shape as a function of design details, such as plate area per ampere-hour,
plate loading, pore size, and electrolyte level. Because of the variables
involved, no satisfactory general approach to predicting charge voltage has
been developed. Also, charge voltage is not controlled directly by the cell.
manufacturing process in the present state of the art. Hence, initial voltage
characteristics are not single-valued but are distributed over a range, even
for cells from the same lot. System design must consider this range.
Transient Charge Characteris_'cs-Figures 21 through 25 show typicalvoltage curves for charge during one-at-a-time cycles using continuous,constant current in the absence of vo]tage-]imiling for reference-design cells
from several sources. The rate of voltage increase per unit of charge in-
creases after a throughput equal to the prior discharge. At higher rates
and/or lower temperatures, the voltage subsequently either rises to a new
nearly constant level or passes through a maximum and then decreases
somewhat. The former voltage behavior occurs when the cell-wall tempera-
ture is rigidiy held at the test temperature; the latter behavior, which is
much more commonly observed, occurs as the cell-wal] and internal cell
temperatures rise considerably above the test temperature because of over-
charge heating. Rigid control of cell-wall temperature requires complete
immersion of cells in a well-stirred liquid bath; operation of cells in cir-culating air results in significant rise of wall temperature.
Figure 26 shows charge-voltage data at charge throughputs of l O0 and 120
percent as a function of cell temperature and charge rate. cross-plotted
from the voltage data in figure 25. The charge rates are those that are
appropriate for long-cycle applications. However, not all types of cells have
voltage characteristics that are straight lines over the entire range. Because
the overcharge characteristics of specific cells may vary from one design
to another, they can be measured under operating conditions if voltage is
to be used to terminate charge.
These data are not used as such for designing charge control for short orbit
operation, as the battery under these conditions reaches the voltage limit
before recharge is complete and is then typically permitted to taper-charge
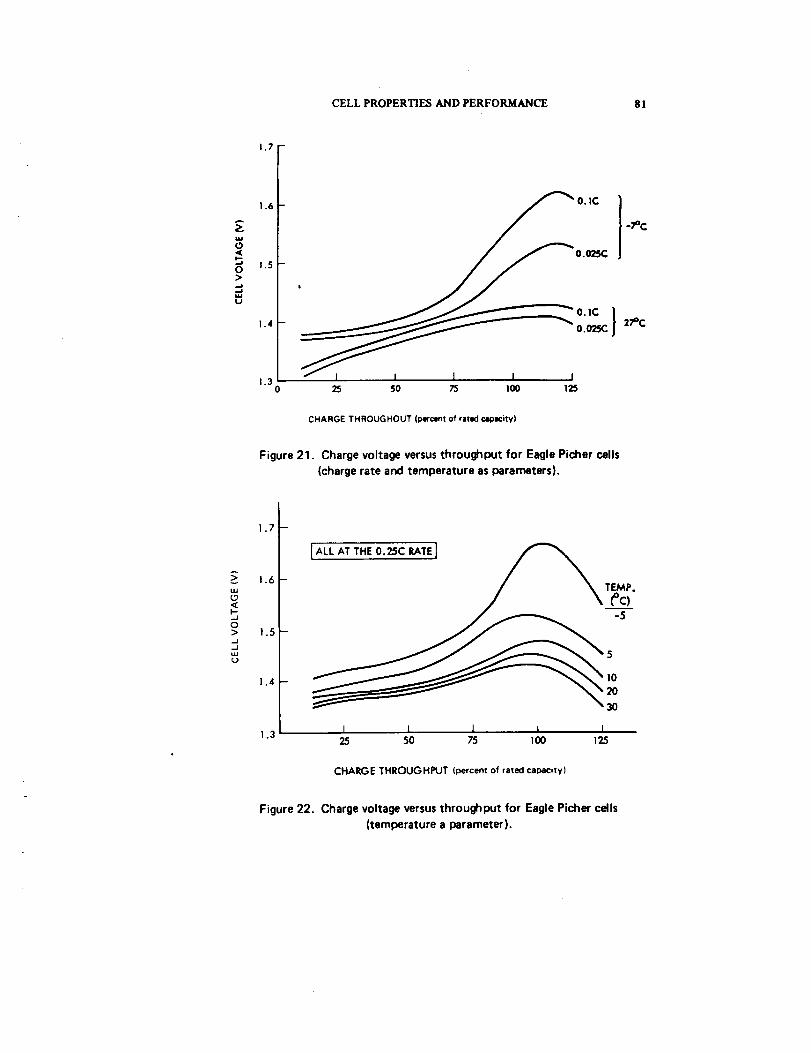
CELL PROPERTIES AND PERFORMANCE 81
1.7
1.6 _ O. IC
/ -7°C
0.025C
1.4 _ _ 0.025C 2;#C
1.3 _ I I
0 25 50 73 I00 125
CHARGE THROUGHOUT (percent of rated capacity)
Figure 21. Charge voltage versus throughput for Eagle Picher cells
(charge rate and temperature as parameters),
v--J
o:>
1,7 B
1.6-
1.5--
1.4--
JALL AT THE 0.25C RATE J
1.3 I I I t25 50 75 100
CHARGE THROUGHPUT (percent of rated capacity)
10
3O
I
125
Figure 22. Charge voltage versus throughput for Eagle Picher cells
(temperature a parameter).
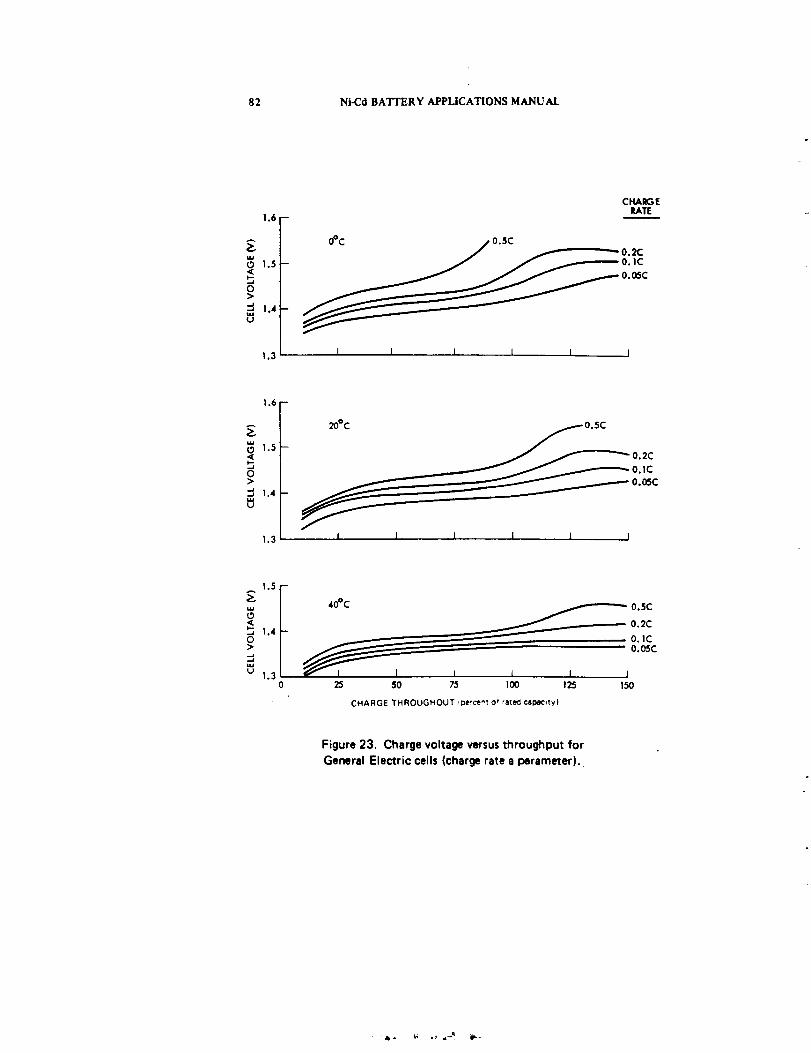
82 Ni-Cd BA'I'I'ERY APPLICATIONS MANUAl.
CHARGE
1.6 - RATE
I (Pc j o.5c
/ _o.2c_lS_- _ / _o.,c
o
•H, i. 4
.3
20°C 0.5C
1.5 0.2C
0.1C
0.05C1.4
1.3 t I [ l I I I
1"5 I ,oo_ _o_c_ 0.2C_"t- _-_---_:_ o,_
oo, u 1.31 _ I I _ I I I
0 25 50 75 100 125 150
CHARGE THROUGHOUT _De-ce^_of tate_ ¢81;_1¢ity)
Figure 23. Charge voltage versus throughput for
General Electric cells (charge rate a parameter).
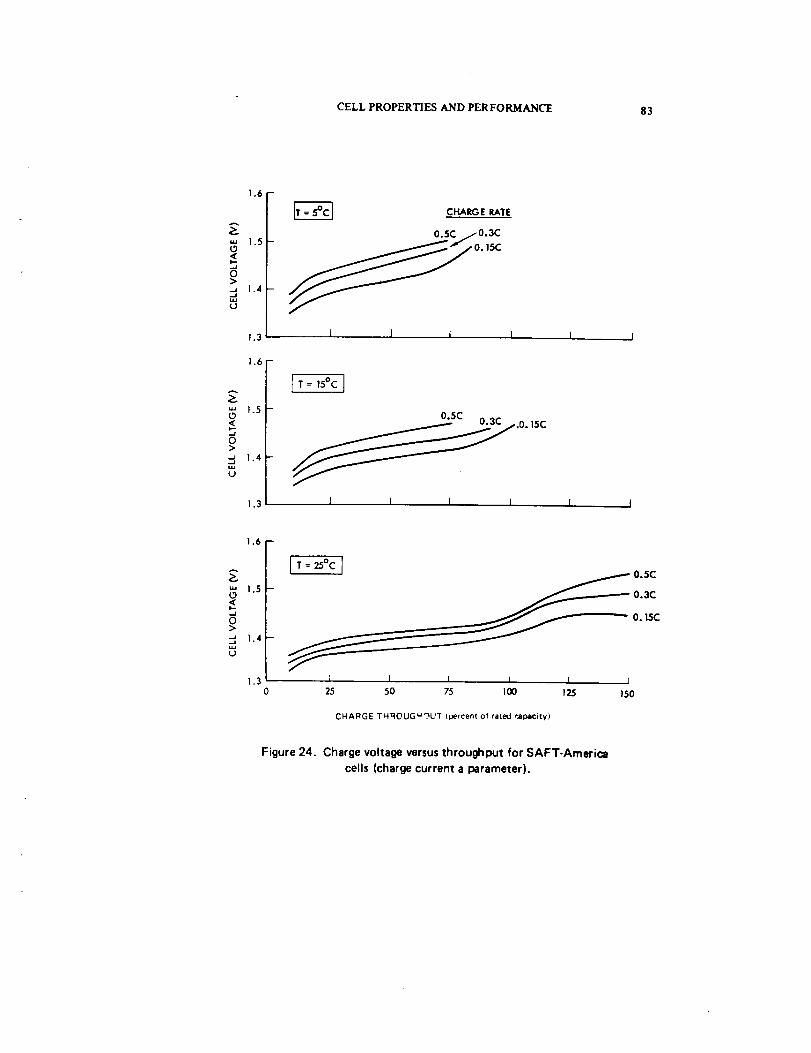
CELL PROPERTIES AND PERFORMANCE 83
A
>
tJ
>
1,6
1.5-
1.4--
1.3
1.6-
1.5
1.4
CHARGE RATE
0.5C /0.3C
0.15C
l J I
T = 15°C J
0.5C
_0 15C
• , .
1.3 [ I L I I I
1.6 -
1.5
].4
1.30
J T = 25°C J
_ _ 0.5C
0.3C
0.15C
I 1 i I I J
25 50 75 100 125 150
CHARGE TH_IOUGUOUT (percent of rated r,apacity)
Figure 24. Charge voltage versus throughput for SAFT-America
cells (charge current a parameter).
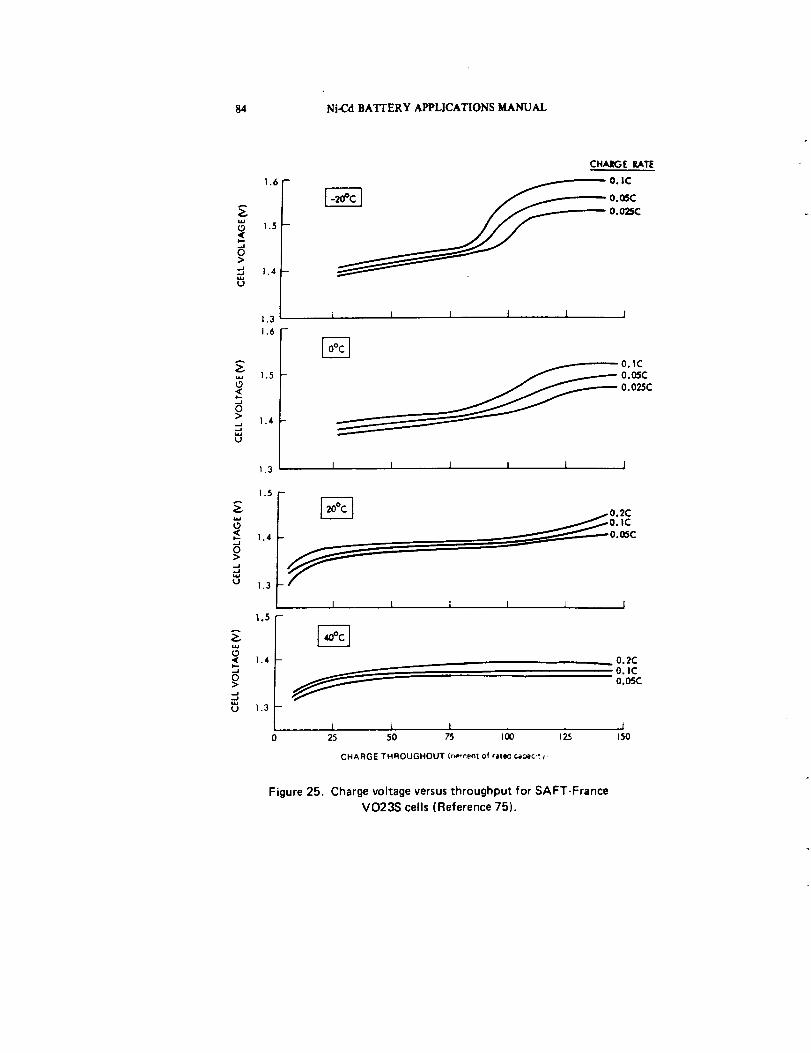
84 Ni.Cd BATTERY APPLICATIONS MANUAL
>
u
wtD
u
1.6
1.5
1.4
CHARGE RATE
0. IC
1.3 1 I I 1 J I
1.6
1.5
1.4
1.3
O. IC
0.05C
0.025C
i I I I i I
i.5
>
U
1.4
1.3
0.2C
O. IC0.05C
i 1 i 10 25 50 75 I0_ 125 150
CHARGE THROUGHOUT (r_-cent of rateK_c_:ec.__.,
Figure 25. Charge voltage versus throughput for SAFT-France
VO23S cells (Reference 75).

CELL PROPERTIES AND PERFORMANCE 85
1.60 D
1.55
1.50
I.-
>
U
I. 45
1.40
I.35
0.1C RR= 1.2
RR= 1.2
TOLERANCE = +0.01 VOLTRR = RECHARGE RATIO
• 1C RR = 1.0
0.05C RR = 1.0
\
REFERENCE76
I I-20 0 2O
CELL TEMPERATURE l:C_
Figure 26. Charge voltage versus temperature and charge rate
(recharge ratio a parameter).
I4O
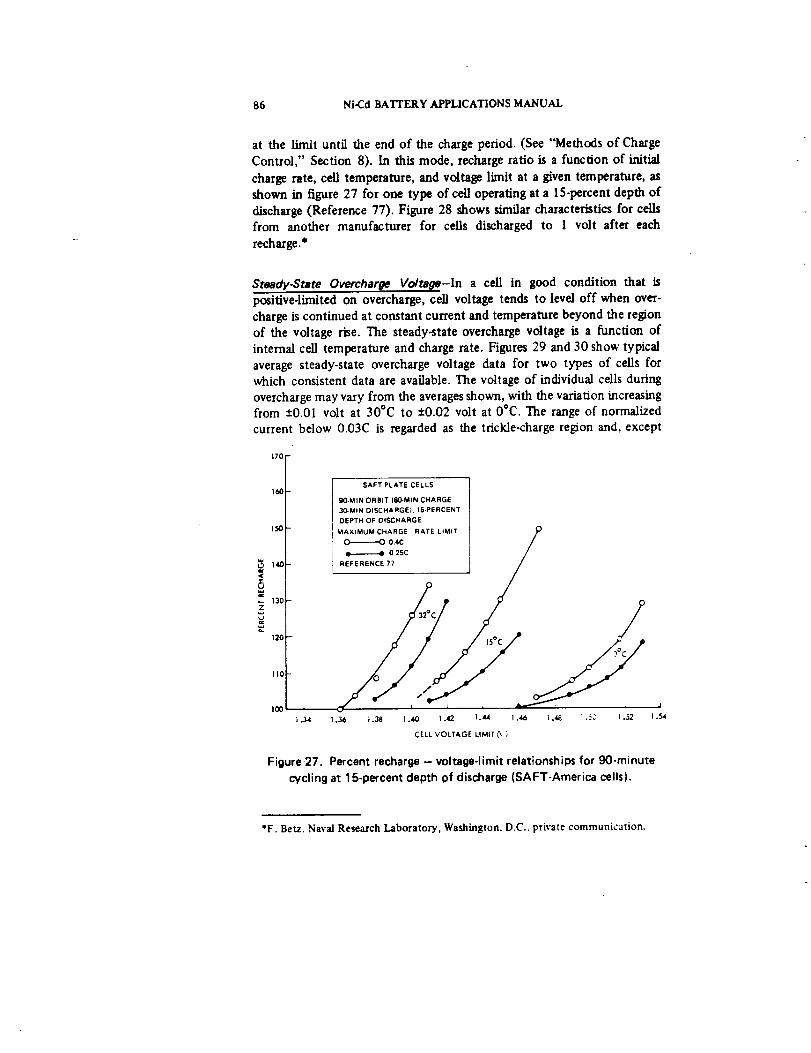
86 Ni-Cd BATFERY APPLICATIONS MANUAL
at the limit unt_ the end of the charge period. (See "Methods of Charge
Control," Section 8). In this mode, recharge ratio is a function of initial
charge rate, cell temperature, and voltage limit at a given temperature, asshown in figure 27 for one type of cell operating at a 15-percent depth of
discharge (Reference 77). Figure 28 shows similar characteristics for ceilsfrom another manufacturer for cells discharged to 1 volt after each
recharge.*
Sroody-Srore Overcharge Vo/to(To-ln a cell in good condition that b
positive-limited on overcharge, cell voltage tends to level off when over-
charge is continued at constant current and temperature beyond the region
of the voltage rise. The steady-state overcharge voltage is a function of
internal cell temperature and charge rate. Figures 29 and 30 show typical
average steady-state overcharge voltage data for two types of cells forwhich consistent data are available. The voltage of individual cells during
overcharge may vary from the averages shown, with the variation increasingfrom ±0.01 volt at 30°C to ±0.02 volt at 0°C. The range of normalized
current below 0.03C is regarded as the trickle-charge region and, except
150
u
.-- 130Z
120
IlC
I(X)
| °34
SAFT PLATE CELLS
90-MIN ORBIT 160-MIN CHARGE,
30-MIN DISCHARGEL 15.PERCENT
DEPTH OF DISCHARGE
MAXIMUM CHARGE RATE LIMIT /O/
0.4C //
--2/. /15°C///Y .//
1.36 1.38 1.40 1 .42 1.44 1 .46 1.4E ; .5C I ._?
CELL VOLTAGE LIMIT _. )
I
).54
Figure27. Percent recharge -- voltage-limit relationships for 90-minute
cycling at 15-percent depth of discharge (SAFT-America cells),
*F. Beta. Naval Research Laboratory, Washington. D.C.. private communication.
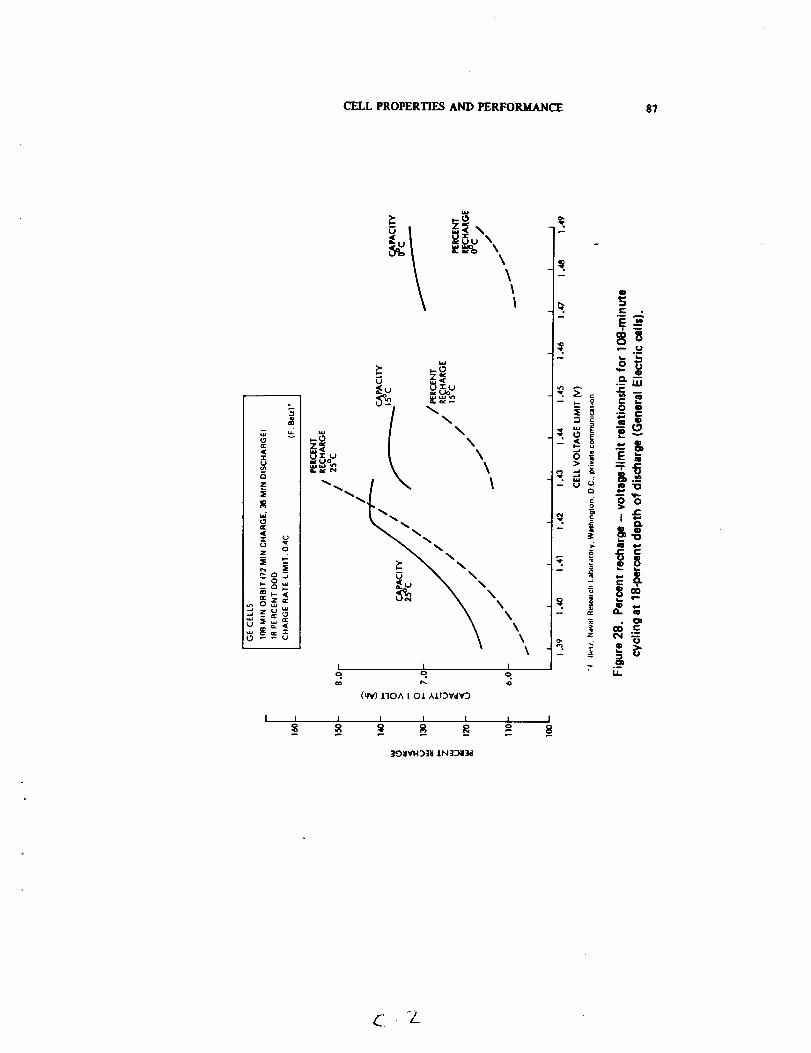
CELLPROPERTIES AND PERFORMANCE 87
*....
,<
cI
z
u Oz
0 i.u
_z_
I I
Z.<
_t,,)
I
w
0 z<_u u_u
\
_ x_v_' ,
o . o
(_) l'lOA l Ol _LI.I::3VdV3
\\
I I I 1 1 |
-- B B -- 8
E .-_
o
i °'
_'_d_'o
iiB
-_ . O:
',, OO r-Z t"q "--
r,,)
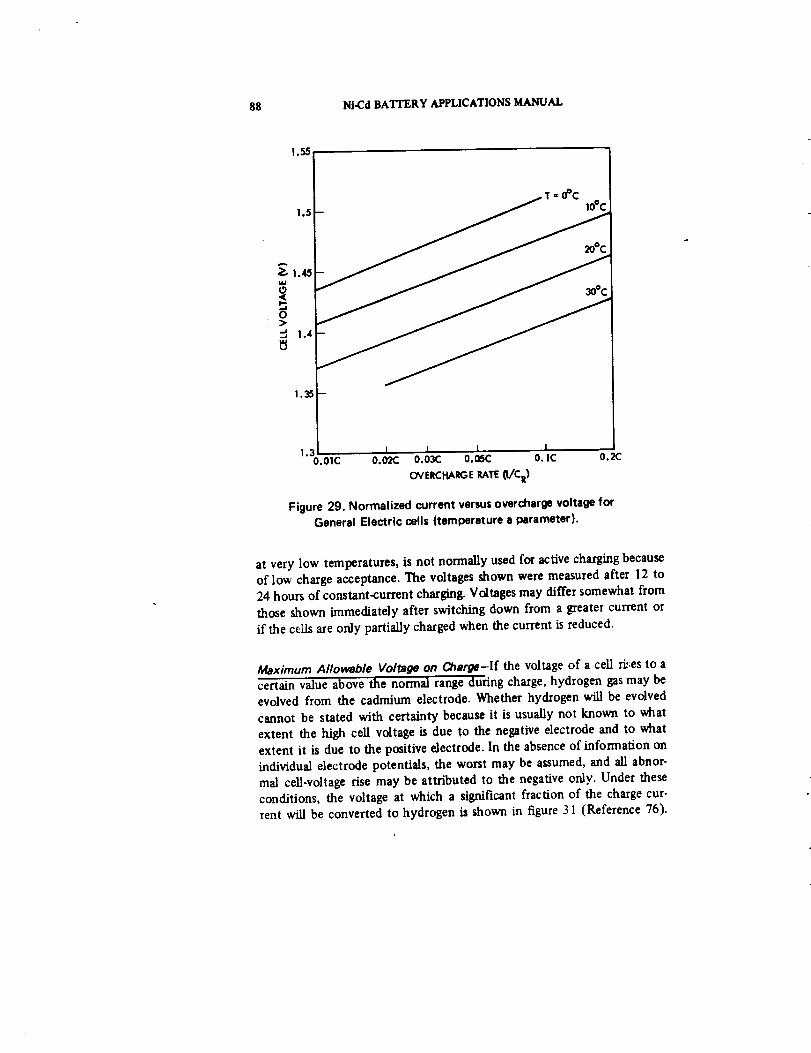
88 Ni-Cd BATTERY APPLICATIONS MANUAL
!.55
= 0Ocio°c
Figure 29. Normalized current versus overcharge voltage for
General Electric cells (temperature a parameter).
at very low temperatures, is not normally used for active charging because
of low charge acceptance. The voltages shown were measured after 12 to
24 hours of constant-current charging. Voltages may differ somewhat from
those shown immediately after switching down from a greater current or
if the cells are only parti_y charged when the current is reduced.
Maximum Allowable Voltage on OSarge-If the voltage of a cell rL_.esto a
certain value above the normal range during charge, hydrogen gas may be
evolved from the cadmium electrode. Whether hydrogen wig be evolved
cannot be stated with certainty because it is usually not known to what
extent the high cell voltage is due to the negative electrode and to what
extent it is due to the positive electrode. In the absence of information on
individual electrode potentials, the worst may be assumed, and all abnor-
mal cell-voltage rise may be attributed to the negative only. Under these
con_tions, the voltage at which a significant fraction of the charge cur-
rent will be converted to hydrogen is shown in figure 31 (Reference 76).

CELL PROPERTIES AND PERFORMANCE 89
1.6
1.55
1.5
1.45
o
!.4
1.30.01C
" "2°°c@c
I_SAFT'AMERICAV023S1973 lGULTON V020 1964
I I l I0.02C 0.03C 0.05C O.1C 0.2(;
OVERCHARGERATE(VCR)
Figure 30. Overcharge voltage versus overcharge rate for
SAFT-America cells (temperature a parameter).
As shown, maximum safe voltage is a function of cell temperature and
charge rate. The rate effect shown is only for cells with an internal im-
pedance of 50/C R miUiohms, which is typical of new cellswith adequate
electrolyte (figure 14). If the impedance is much greater than this,the
maximum voltage levels are higher accordingly, and the difference be.
tween high and low rates becomes larger.Adso, if the potential of the
positive electrode is abnormally high, the cellvoltage for hydrogen evo-
lution will be correspondingly higher. It is because the hydrogen.
evolution voltage of the cellis a function of allthese variablesthat the
condition of the ceil must be completely defined to specify a voltage;
in older cells, the negative electrode potential must be known to predict
the probability of hydrogen evolution.
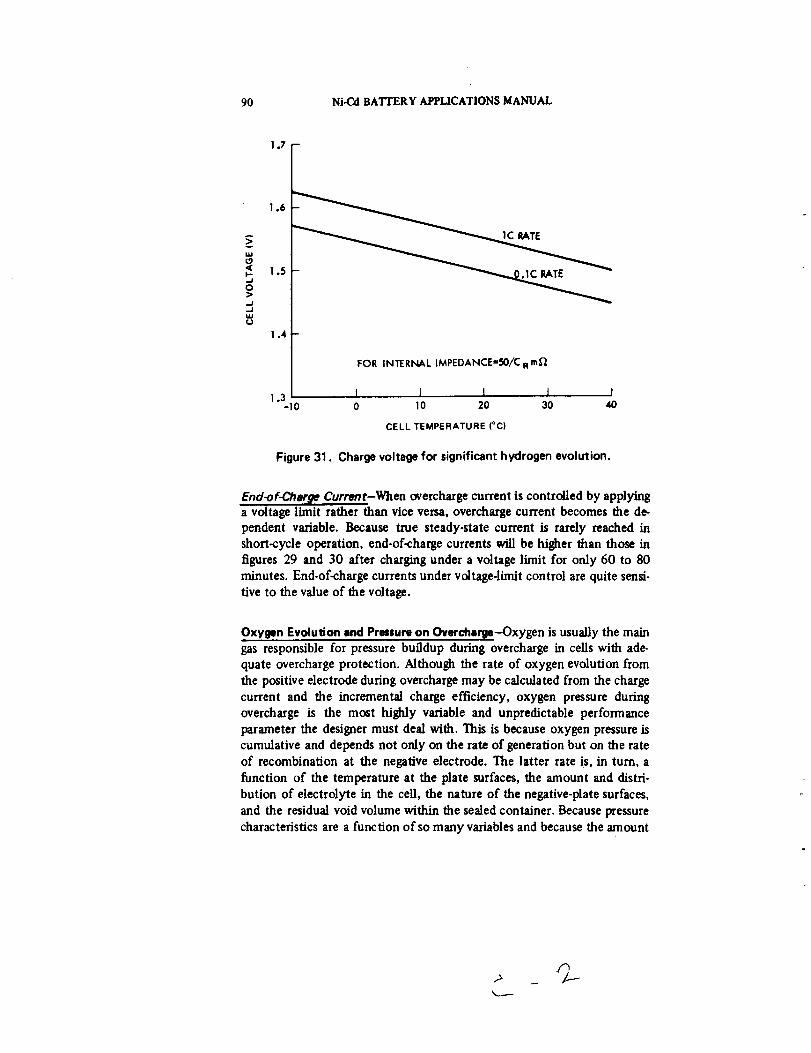
90 Ni-Cd BATTERY APPLICATIONS MANUAL
13 -
1.6
A
i 1.5
.,,J
..I
wU
1.4-
i.3
FOR INTERNALIMPEDANCE=50/CAm_
I I I J I-10 0 I0 20 30 40
CELLTEMPERATURE(°C|
Figure 31. Charge voltage for significant hydrogen evolution.
End_f-Chorpe Current-When overcharge current is controlled by applyinga voltage limit rather than vice versa, overcharge current becomes the de-pendent variable. Because true steady-state current is rarely reached in
short-cycle operation, end-of-charge currents will be higher than those in
figures 29 and 30 after charging under a voltage limit for only 60 to 80
minutes. End-of-charge currents under vdtage-limit control are quite sensi-
tive to the value of the voltage.
Oxygen Evolution and Pressure on Overcharile-Oxygen is usually the maingas responsible for pressure buildup during overcharge in cells with ade-
quate overcharge protection. Although the rate of oxygen evolution from
the positive electrode during overcharge may be calculated from the charge
current and the incremental charge efficiency, oxygen pressure during
overcharge is the most highly variable and unpredictable performance
parameter the designer must deal with. This is because oxygen pressure is
cumulative and depends not only on the rate of generation but on the rate
of recombination at the negative electrode. The latter rate is, in turn, a
function of the temperature at the plate surfaces, the amount and distri-
bution of electrolyte in the cell, the nature of the negative-pla¢e surfaces,
and the residual void volume within the sealed container. Because pressure
characteristics are a function of so many variables and because the amount

CELL PROPERTIES AND PERFORMANCE 91
of electrolyte added can be varied to adjust overcharge pressure, pressure
behavior can vary significantly from cell to cell and from lot to lot. A
maximum overcharge pressure is usually listed in the cell specification,
ranging from 50 to 80 pounds per square inch gage (psig). Limits cn the
low pressure side and on electrolyte quantity are also needed for mini-
mizing problems from electrolyte redistribution. (See Section 4.5.3.3.)
Figure 32 shows the general effects of temperature and charge rate on
oxygen pressure after extended overcharge in new SAFT cells containing
about 3 nd of electrolyte per ampere-hour (Reference 76). The corres-
ponding overcharge-voltage data appear in the previous section.
0.05
"HIGH" PRESSURE
( > 65 psia )
"LOW" PRESSURE(<30 psia)
I I I10 20 30
CELL TEMPERATURE(°C)
I4O
Figure 32. Overcharge pressure diagram for SAFT VO23S cell.
Charge Efficiency and Charge Acceptance-Some charge efficiency infor-
mation in the literature is misleading because it is not labeled as either
coulombic or energy efficiency.* Furthermore, average efficiency data are
*See Appendix A for def'mitions.

92 Ni-Cd BATTERY APPLICATIONS MANUAL
often not distinguished from incremental efficiency* data. This section
describes both overall and incremental coulombic (ampere-hour) efficiencydata, which may be combined with charge-voltage data to calculate energyefficiencies if desired.
Overall Charge Efficioncy--Overall ampere-hour charge efficiency, asmeasured by the ratio of ampere-hours discharged to total ampere-hourscharged, is a function of cell temperature, charge rate, recharge ratio, anddischarge conditions. Figure 33 shows data for charging at 23 to 25°Cambient under conditions in which the recharge ratio was limited to unity.
Some data have been published for cells made before 1969 that indicatemuch lower charge efficiencies than those in figure 33, particularly at lowercharge rates. These older data may have been obtained on cells that con-tained impurities and may not represent cells made in recent years.
100
90>.
so
| 70E
o 60
_4o
3o
-r
10-
L0.01
• GE CELL _Reference 78)
IZ SAFT-FRANCE CELL (Reference 75}
I l IO.CR 0.05 0.1 0.20
CHARGE RATE (I/C)
Figure 33. Charge acceptance at 23 to 25°C for
100 percent of rated ampere-hour throughput.
|o.5o
I1.0
*See Appendix A for tier'tuitions.
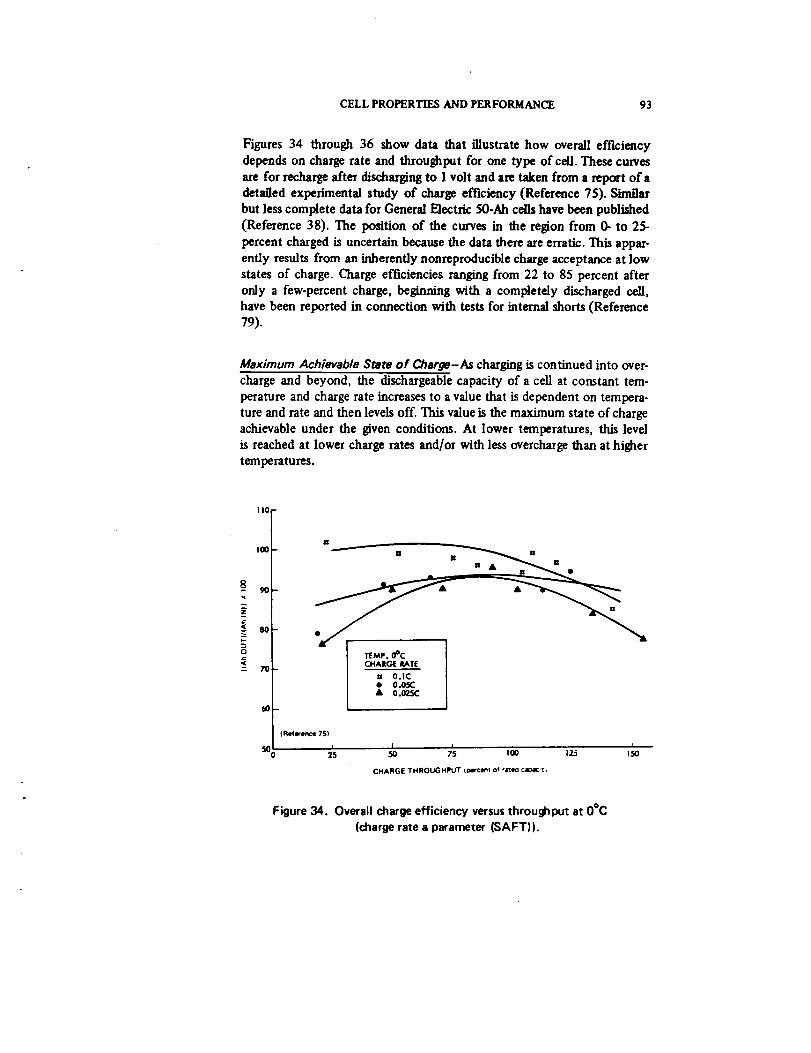
CELL PROPERTIES AND PERFORMANCE 93
Figures 34 through 36 show data that illustrate how overall efficiency
depends on charge rate and throughput for one type of cell. These curves
are for recharge after discharging to 1 volt and are taken from a report of a
detailed experimental study of charge efficiency (Reference 75). Similar
but less complete data for General Electric 50-Ah cells have been published
(Reference 38). The position of the curves in the region from 0- to 25-
percent charged is uncertain because the data there are erratic. This appar-
ently results from an inherently nonreproducible charge acceptance at low
states of charge. Charge efficiencies ranging from 22 to 85 percent after
only a few-percent charge, beginning with a completely discharged cell,
have been reported in connection with tests for internal shorts (Reference
79).
Maximum Achievable State of Charge-As charging iscontinued into over-
charge and beyond, the dischargeable capacity of a cell at constant tem-
perature and charge rate increases to a value that is dependent on tempera-
ture and rate and then levels off. This value is the maximum state of charge
achievable under the given conditions. At lower temperatures, this level
is reached at lower charge rates and/or with less overcharge than at higher
temperatures.
110
IO0
9O
z
_- eo
$o
n -- m __M II H Ill •
I TEMP. 0°C
CHARGE RATE
l= 0.1C• 0.05C• 0.025C
I l I50 75 100 125 150
CHARGE THROUGHPUT tmr_e_T o_ ri_eacaoac,..
Figure 34. Overall charge efficiency versus throughput at 0°C
(charge rate a parameter (SAFT)).
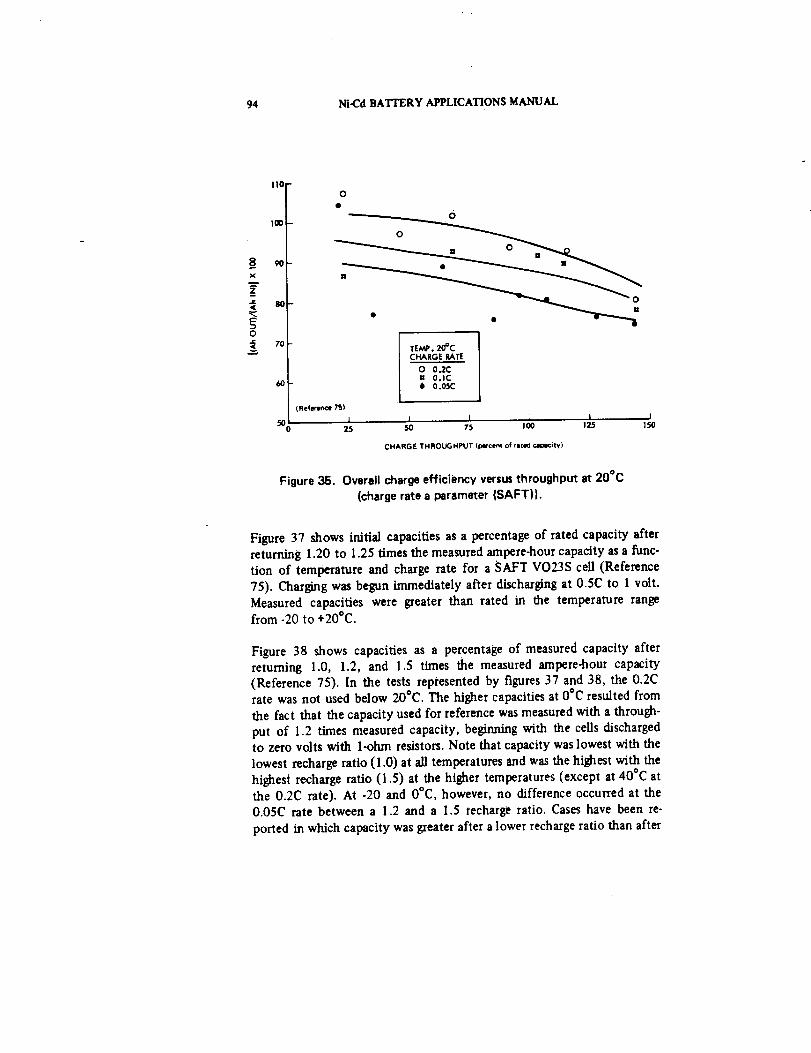
94 Ni-Cd BATYERY APPLICATIONS MANUAL
I10
ioo
x
so
o
_ 7o
5o
L o 6
TEMP. 20°CCHARGE RATE
O 0.2Cu 0.1C@ 0.05C
(Reterw,ce 7E)
I J25 50 75 I_ 1_ 1_
CHARGE THROUGHPUT (percent of feted camlcity)
Figure 35. Overallchargeefficiency versusthroughput at 20°C(chargerate a parameter (SAFT)).
Figure 37 shows initial capacities as a percentage of rated capacity afterreturning 1.20 to 1.25 times the measured ampere-hour capacity as a func-tion of temperature and charge rate for a SAFT VO23S cell (Reference75). Charging was begun immed/ately after discharging at 0.5C to l volt.Measured capacities were greater than rated in the temperature rangefrom -20 to +20°C.
Figure 38 shows capacities as a percentage of measured capacity afterreturning 1.0, 1.2, and 1.5 times the measured ampere-hour capacity
(Reference 75). In the tests represented by figures 37 and 38, the 0.2Crate was not used below 20°C. The higher capacities at O°Cresulted from
the fact that the capacity used for reference was measured with a through-
put of 1.2 times measured capacity, beginning with the cells dischargedto zero volts with I-ohm resistors. Note that capacity was lowest with the
lowest recharge ratio (1.0) at all temperatures and was the highest with thehighest recharge ratio (1.5) at the higher temperatures (except at 40°C atthe 0.2C rate). At -20 and O°C, however, no difference occurred at the0.05C rate between a 1.2 and a 1.5 recharge ratio. Cases have been re-
ported in which capacity was greater after a lower recharge ratio than after
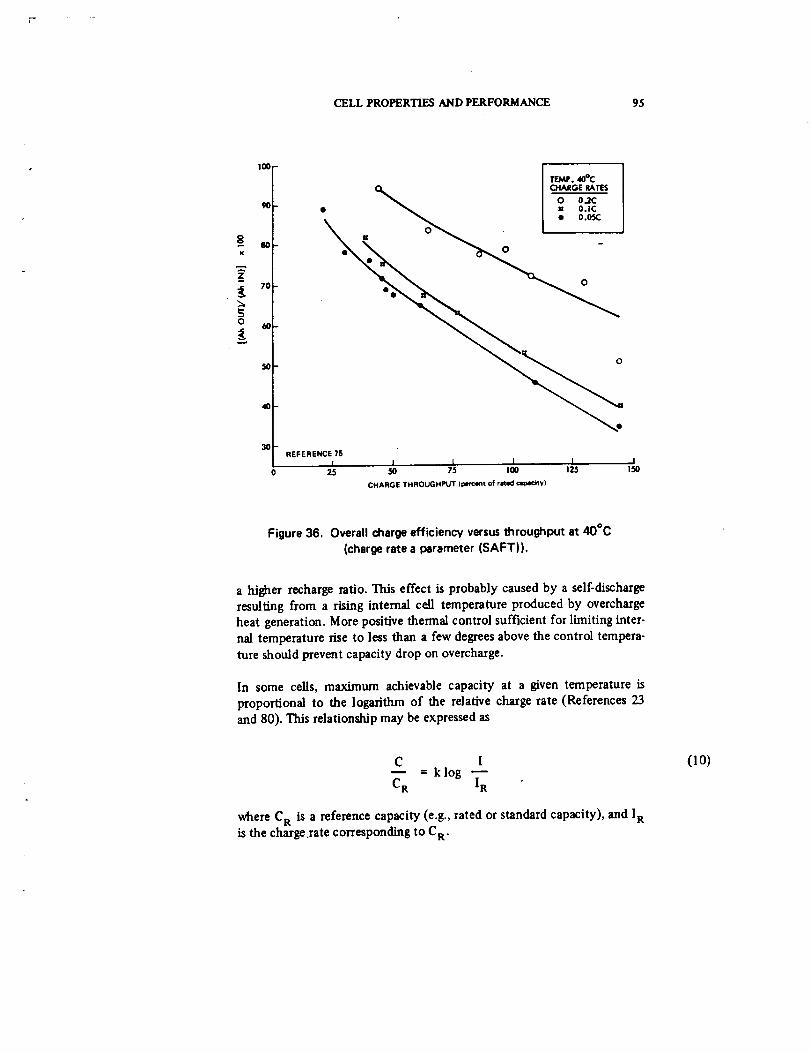
7-
CELL PROPERTIES AND PERFORMANCE 95
8K
z
o
io0
9o
eo
70
5o
4o
3o
rF.MP.40°C
• _ m O.)C
REFERENCE 75
I25
I I I I I
50 75 100 125 150
CHARGE THROUGHPUT Ii:_rcoll of riled c11_ci_¥)
Figure 36. Overall charge efficiency versus throughput at 40°C
(charge rate a parameter (SAFT)).
a higher recharge ratio. This effect is probably caused by a self-discharge
resulting from a rising internal cell temperature produced by overcharge
heat generation. More positive thermal control sufficient for limiting inter-
nal temperature rise to less than a few degrees above the control tempera-
ture should prevent capacity drop on overcharge.
In some cells, maximum achievable capacity at a given temperature is
proportional to the logarithm of the relative charge rate (References 23
and 80). This relationship may be expressed as
C I= k log
C R IR
where CR is a reference capacity (e.g., rated or standard capacity), and IR
is the charge.rate corresponding to C R.
(IO)
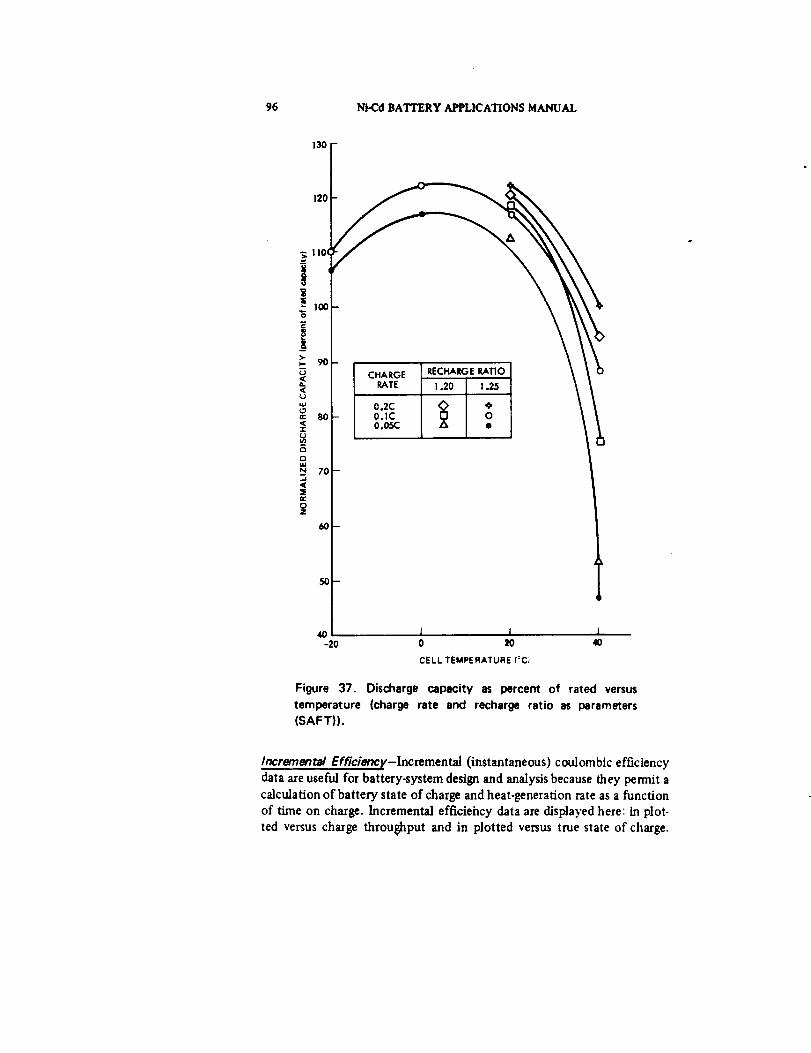
96 Ni-Cd BATTERY APPLICATIONS MANUAL
130
120
==o
c8
>-1-
(3
re"
"t"
a0
.J
n-OZ
9OCHARGE
RATE
0.2C80 0.1C
0.05C
70
60 -
50-
40
RECHARGERATIO
1.20 1.25
o
1 1 l-20 0 _0 40
CELL TEMPERATUREI:Ci
Figure 37. Discharge capacity as percem of rated versus
temperature (charge rate and recharge ratio as parameters
(SAFT)).
Incremental Efficiency-lncremental (instantaneous) cou]ombic efficiency
data are useful for battery-system design and analysis because they permit a
calculation of battery state of charge and heat-generation rate as a function
of time on charge. IncrementaL] efficiehcy data are displayed here: in plot-
ted versus charge throu_put and in plotted versus true state of charge.

CELL PROPERTIES AND PERFORMANCE 97
"O
o"
==
e_v
>-I--
O.
¢,3
E3Ill
l.MIt.
..I
er
oZ
120
110
100
90
80
70
CHARGE RECHG RATIORATE 1.0 i.2 1.5
0.2C • • •
0.1C O O Z_
0.05C = O V
6OI I I
-2O 0 20
CELL TEMPERATURE (°C)
4O
Figure 38. Discharge capacity as a percent of measured versus
temperature (charge rate and discharge ratio as parameters (SAFT)).
Figure 39 shows plots of incremental efficiency versus charge throughputfor SAFT cells (Reference 75), where the charge began after a discharge
to 1 volt and capacity was measured at the 0.5C discharge rate.
Data for charge efficiency based on actual (true) state of charge is morefundamental and more useful for battery-performance analysis computa-
tions than data based on charge throughput. Bauer showed sets of curves
for incremental charge efficiency plotted versus true (calculated) state of
charge as a function of charge rate for several temperatures (Reference 2).
These curves represent a synthesis of data from a number of sources. Nonew curves of this kind appear to have been published since that time.
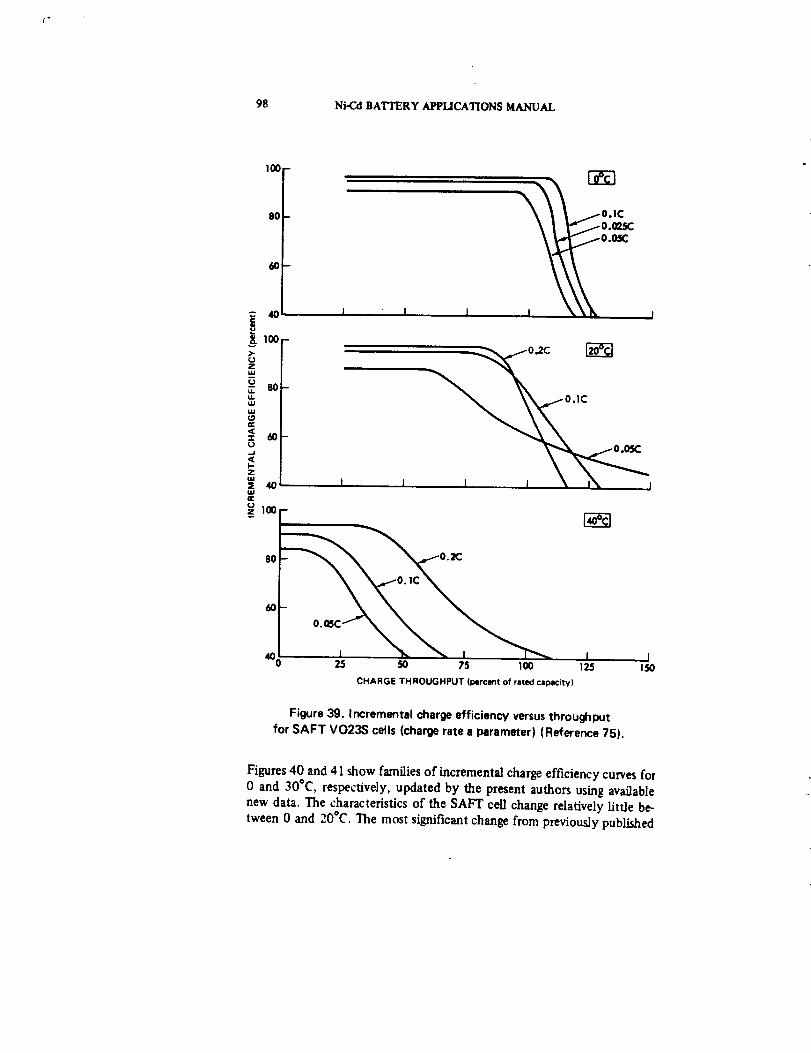
98 Ni-Cd BATTERY APPLICATIONS MANUAL
I00
8O O.iC
- 40 I I I
= 0.1C
8
4o I I I I \ I\ J
loo-
80 u_,,_ _f,,_ O.2C
°-o.=- \\400 1 _ _ I _ I I
25 50 7S !00 12S 150
CHARGE THROUGHPUT (oercemof ratedcapacity)
Figure 39. Incremental charge efficiency versus throughput
for SAFT VO23S cells (charge rate e parameter) (Reference 75).
Figures 40 and 41 show families of incremental charge efficiency curves/or
0 and 30°C, respectively, updated by the present authors using avagab]e
new data. The characteristics of the SAFT cell change relatively little be-
tween 0 and 20°C. The most significant change from previously published
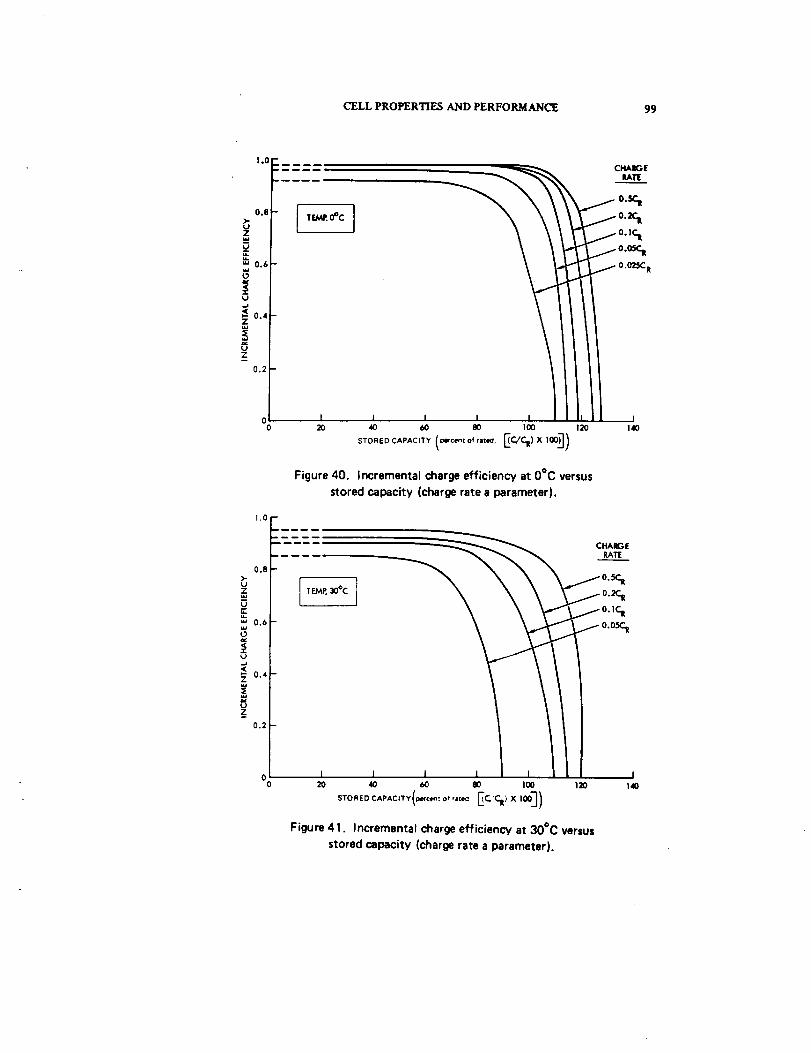
CELL PROPERTIES AND PERFORMANCE 99
|.0 --
0.8
uZ
u
0.6
3U
_0.4Z
Uz
0.2
oo
TE_" a°c ]
I2o
o.sct
o.z_
\ \ \ _/o.,_\ \ _/o._,
t ih 0,025C R
I I I j_
40 60 80 100 120 140
STORED CAPACITY (_centofra,ed, EC/CII()X 100)7)
Figure 40. Incremental charge efficiency at 0°C versus
stored capacity (charge rate a parameter).
1.0
0.8
.J_ 0.6
0.4
uJ
o
0.2
0
_'_ CHARGE
- 0.05C_
- 1 I I
40 60 GIO 1_ 120 140
STO R ED CAPAC|T Y (_3e¢....... |_ _'r_ X J'] )
Figure 41. Incremental charge efficiency at 30°C versus
stored capacity (charge rate a parameter).
10o Ni.C.d BATFERY APPLICATIONS MANUAL
data (Reference 2) is an increase in the achievable state of charge for
many of the curves, as indicated by the data in figure 37, cell manufac-turer's test data, and acceptance test data from the NASA evaluation pro-
gram at NWSC/Crane.
As shown, these curves are believed to apply most accurately under the
following conditions:
a. Charging begins after a discharge to 1 volt/cert.
b. Charging is at a constant current, except as noted in c.
C. Cell voltage does not exceed limits shown in figure 27. If the
appropriate limit is reached, charging continues at the voltage
limit.
d. Cell design and thermal control are such as to keep the internal
cell temperature within 5°C of the given temperature.
e. The following discharge, which is the measure of the state of
charge reached, is begun within 1 hour after the main charge
ends (i.e., open circuit or trickle charging after the main chargedoes not last more than 1 hour). Also, the discharge is per-
formed at the given temperature, at the 0.54: R rate, and to
1 volt per cell.
Note that, because true state of charge cannot be measured directly when
discharge is incomplete, the validity of these efficiency data for cycling to
normal depths of discharge (e.g., 25 to 75 percent) cannot be determined
directly. However, oxygen-evolution data (Reference 81), and the fact that
the shapes of the charge voltage curves are similar for different initial
states of charge, indicate that the data in figures 40 and 41 can be used toestimate efficiencies for charging from a nonzero state of charge by com-
pressing the curves toward the right to fit the curve into the range of state
of charge being used.
Charge Retention on Open Circuit-Nickel-cadmium ceils gradually lose
charge when standing on open circuit because of thermal decomposition of
the charge material in the positive electrode. The rate of such loss is a func-
tion of temperature and state of charge and is usually determined by
fully charging a group of cells and then discharging samples after different
times on open-circuit stand.
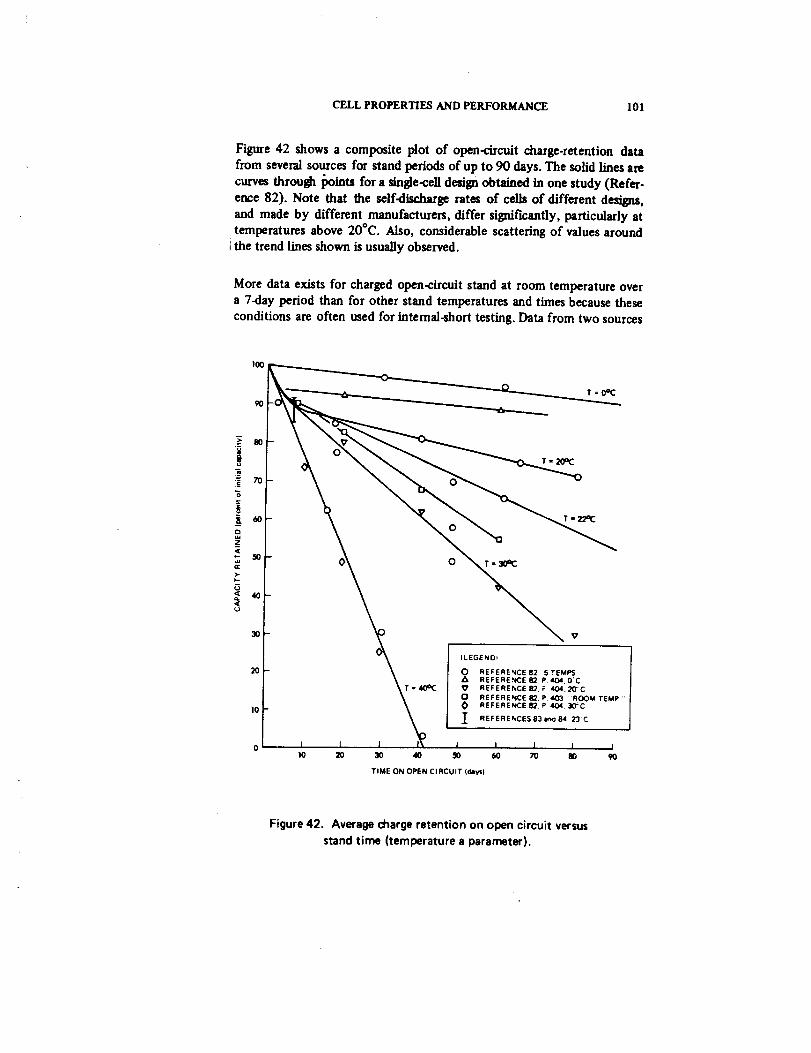
CELL PROPERTIES AND PERFORMANCE 101
Figure 42 shows a composite plot of open-circuit charge-retention data
from several sources for stand periods of up to 90 days. The solid lines are
curves through points for a single-cell design obtained in one study (Refer-
ence 82). Note that the self-discharge rates of cells of different designs,
and made by different manufacturers, differ significantly, particularly attemperatures above 20°C. Also, considerable scattering of values around
;the trend lines shown is usually observed.
More data exists for charged open.circuit stand at room temperature over
a 7-day period than for other stand temperatures and times because these
conditions are often used for internal-short testing. Data from two sources
50 T. 30e_
40-
3O V
ILEGEND_
20 O REFERENCE B2 5 TEMPSA REFERE,"_CE 82 P 404.0:C
_7 REFERENCE 82. F 404 20-C
n REFERENCE 82 P 403 "ROO_ TEMP "
10 0 REFERENCE82 P 404 313_C
I REFERENCES 83 w'm 84 23C
0 _ I J I I I10 50 60 70 80 '90
0
30
TIME ON OPEN CIRCUIT (dale;I
Figure 42. Average charge retention on open circuit versus
stand time (temperature a parameter).
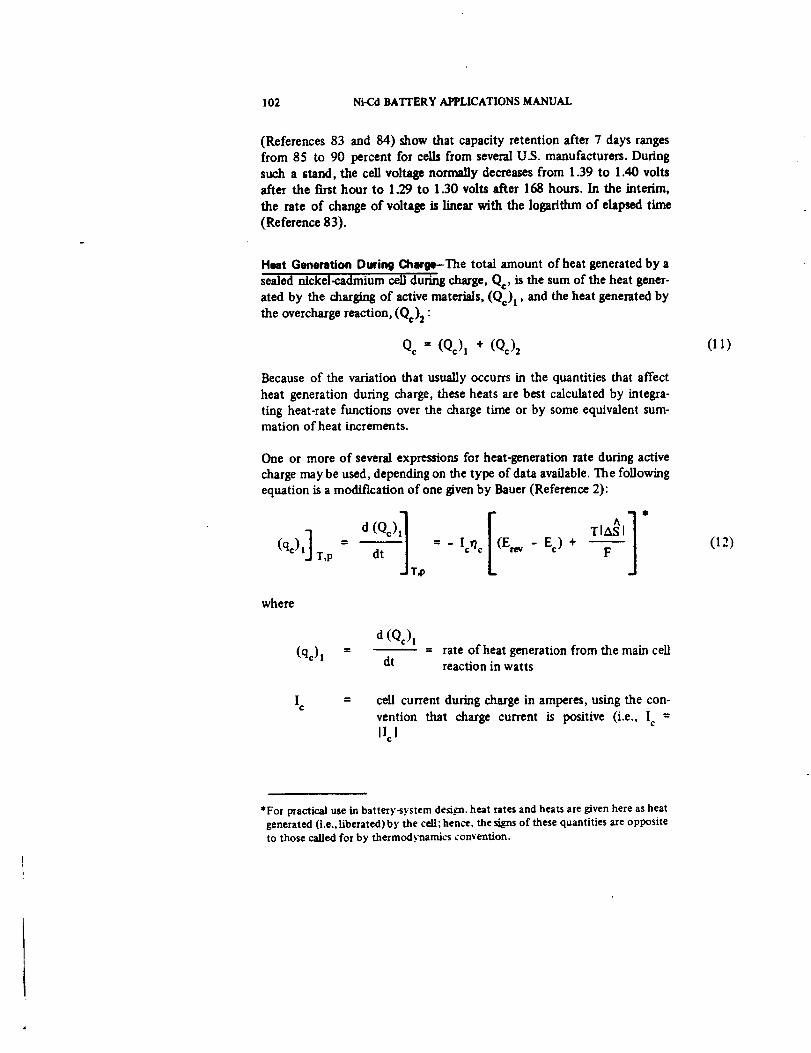
I02 Ni-Cd BATTERY APPLICATIONS MANUAL
(References 83 and 84) show that capacity retention after 7 days ranges
from 85 to 90 percent for cells from several U.S. manufacturers. During
such a stand, the cell voltage normally decreases from 1.39 to 1.40 voltsafter the fLrst hour to 1.29 to 1.30 volts after 168 hours. In the interim,
the rate of change of voltage is linear with the logarithm of elapsed time
(Reference 83).
Heat Generation During Charge-The total amount of heat generated by a
sealed nickel-cadmium cell during charge, Qc' is the sum of the heat gener-
ated by the charging of active materials, (Q©)l' and the heat generated by
the overcharge reaction, (Qc)2 :
Qc = (Qc)l + (Qc)2
Because of the variation that usually occurrs in the quantities that affect
heat generation during charge, these heats are best calculated by integra-
ting heat-rate functions over the charge time or by some equivalent sum-mation of heat increments.
One or more of several expressions for heat-generation rate during active
charge may be used, depending on the type of data available. The following
equation is a modification of one given by Bauer (Reference 2):
(qc) "lj d (Q¢) TIA_I= = _ Ic_ c (Ere_ - Ec) +
T,p TJ T,p
where
d (Q¢)!
(qc)] = dtrate of heat generation from the main cell
reaction in watts
iC
cell current during charge in amperes, using the con-
vention that charge current is positive (i.e., Ic =
Ilcl
(11)
(]2)
*For practical use in battery-system design, heat rates and heats are given here as heatgenerated (i.e., liberated)by the cell; hen_, the sis_s of these quantities are oppositeto those called for by thermodynamics convention.

CELL PROPERTIES AND PERFORMANCE 103
incremental (instantaneous) coulombic charge effic-iency
E reversible EMF of the cell (volts)
E¢ measured cell terminal voltage on charge
^AS =
absolute temperature, deg K
the entropy change per equivalent (joules K"1)
F Faraday constant = 9.65 × 10⁴ coulombs per equiva-lent
p = internal cell pressure
Equation 12 is strictly accurate only if temperature and pressure are con-
stant. However, negligt_ole error is introduced if the temperature varies asmuch as 20°C during charge or if pressure changes as much as l0 atmos-
pheres. Therefore, in subsequent equations of this kind, the subscriptsindicating constants p and T are dropped.
In equation 12, efficiency, r/c, and cell voltage, Ec, are functions of tem-perature, charge rate, and state of charge. As noted earlier, state of charge
is a function of initial state of charge, charge temperature, and charge rate•
Thus, evaluation of (qc)l undel actual operating conditions can be quite
complex and is best done by computer. On the other hand, if Ic, _c' Erev'and Ec are assumed to be constant or if average values are estimated, cor-
responding constant average values of (qc)t can be calculated for limitedperiods of time during charge.
^The value of AS for use in equation 12 is somewhat in doubt: reported
values (Reference 2), range from -40 to -50 joules K "1 (-lO to-12 cal K'X).
This degree of uncertainty can effect the relative accuracy of the calculated
heat rate that varies from small to large depending on the value of (Erev -
Ec). Note that on charge E _ Erev; therefore, (Er_- Ec) is negative. Thus,(Qc) l will be zero when_(Ere v - Ec)l = T _I/F. At normal battery
operating temperatures, the latter term _- 0.15 volt.
The main source of uncertainty in using equation 12 is the term, E
According to the derivation of equation 12 (see, e.g., Reference 2, p. 12),
E. v is the thermodynamic reversible potential of reaction 1. h is known
that E is a function of cell temperature. Values ranging from 1.25 to

104 Ni-Cd BATTERY APPLICATIONS MANUAL
1.30 are quoted in reviews of data for this quantity (References 2 and 85).
It is uncertain if, at a given temperature, Erev is a fixed value or a functionof the state of charge of the cell.
A somewhat different expression for (qc)t that does not contain the term,
Erev, and that is adapted from an equation for discharge derived byBrooman (Reference 73) is shown in the following equation:
(%)I = Ic_c (Eo - Ec) - \aT/p (13)
where E° = measured open-circuit cell voltage, and the other quantities areas defined for equation 12. Subscript p indicates constant pressure. Broo-
man does not give values for E° or indicate how Eo might be measured. The
only self-consistent set of data found for Eo is that published by SAFT
(Reference 7 5) and plotted in figure 43. As may be seen, values for Eo werefunctions of temperature and recharge ratio (i.e., state of charge). Compari-
son of figure 43 with figure 27, which contain data from the same charges,
gives values for (E_- E ) ranging from 43.03 to 43.05 volt in the temperaturerange of 0 to 20_C. Tl_e slopes of the curves in figure 43 at 10°C, which
give an estimate of (aEo/_)T),,, range from -8 to -11 X 10 .4 volt K"1.Bauer gives a value of -2_ × f0 "4 volt K"s for dE/dT, where E refers to
the reversible potential (Reference 2). It is apparent that the E° values
shown are not truly reversible potentials, but quasi-stable open-circuit
values associated with the charging process.
A third expression for heat rate during active charge, also derived from one
presented by Brooman (Reference 73), which contains no equilibrium or
open-circuit voltage terms, is shown in the following equation:
^
^
where, as before, (qc)t is the rate of heat generation in watts, H is the
enthalpy or heat-content change in joules per equivaJent, and Ic, _c' F, and
Ec are as def'med for equation 12. The value of A_ at 25°C is well estab-lished at -140 X 103 joules (equivalent) "! , thus making the first term in
the^parentheses in equation 14 equal to 1.45 volts at 25°C. The value of[AHI should increase as temperature decreases, but no low-temperature
values were found. Even so, equation 13 appears to be simpler and may be
more reliable than either equation 12 or 13.
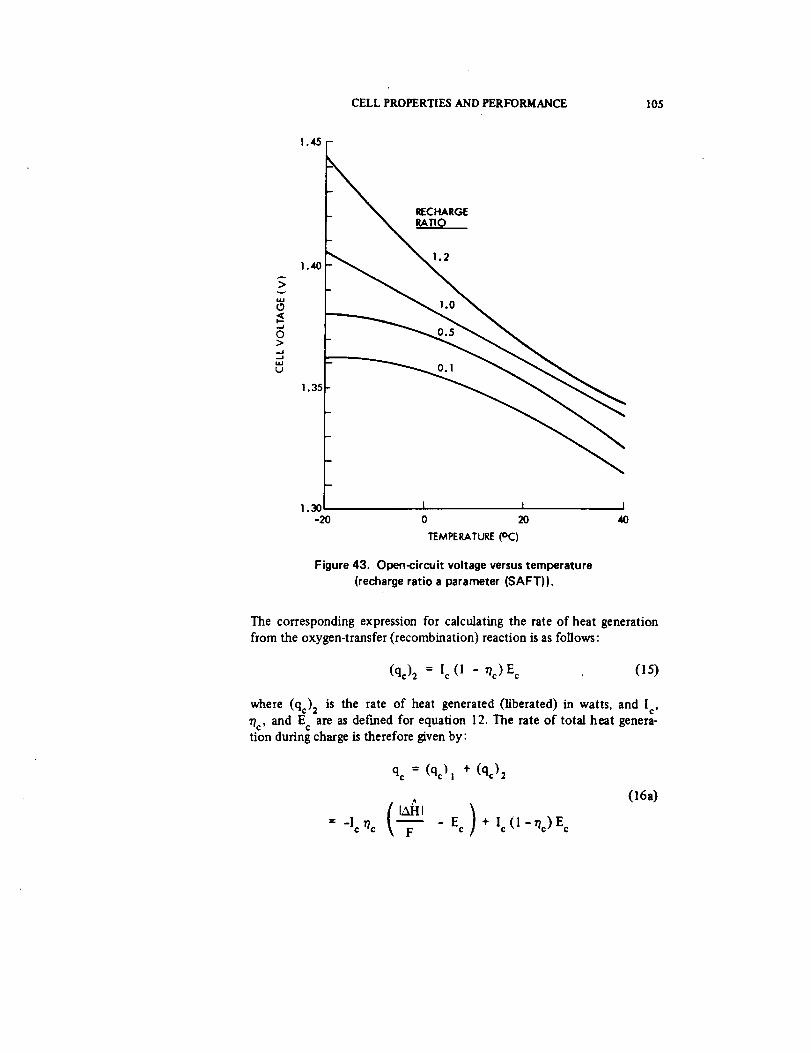
CELL PROPERTIES AND PERFORMANCE 105
! .45
>
>
LtJ
t..j
RECHARGERATIO
1.35
1.30 I I I-20 0 20 40
TEMPERATURE(oC)
Figure 43. Open_ircuit voltage versus temperature
(recharge ratio a parameter (SAFT)).
The corresponding expression for calculating the rate of heat generationfrom the oxygen-transfer (recombination) reaction is as follows:
(q¢)2 = I¢ (I - r/c) E c (]5)
where (qc)2 is the rate of heat generated (liberated) in watts, and Ic,
_c' and Ec are as defined for equation 12. The rate of total heat genera-
tion during charge is therefore given by:
= -I c 1/c
qc = (qc_l + (q¢)2
I,._ll -E )+ Ic(1-rte) E cF c
(16a)

106 Ni-CdBATTERYAPPLICATIONSMANUAL
( _c LM_I E /= -lc F c(16b)
To calculate the total heat generated during charge or during any part ofcharge, equation 16 may be integrated with respect to time, and the result
may be evaluated between the desired time limits. Thus,
I t2 ftl z2Qc = qc dt
t I(17)
2 Ic ( _c [AI_I= - F Ec/) dt*
t I
equation 17 shows that, if Ic, _c' and Ec may be assumed constant for anypart of the charge, the integral is evaluated as
r/c IA_I )c - E • (t 2 - t 1) (18)Qc] I,n,E = - I F c
3.3. 1.2 Effectsof Cell DesignVariationson Initial ChargeCharacteristics
Table 19 lists the qualitative effects of a number of cell design variationson key charge characteristics. These variables have the largest expectedeffects and are those over which the user has some degree of control by
specification or approval of the manufacturing control document.
The higher the loading in positive plates, in terms of active material perunit gross area, the higher the overcharge voltage will be at a given chargerate, I/C, because the higher current density results in a more positivenickel-hydroxide electrode potential. Thicker plates with the same volu-metric loading as thinner plates will have higher area loading than thethinner plates. This also implies that, at end of charge, the electrode reaches
the oxygen-evolution potential at a lower state of charge and overall chargeacceptance is therefore lower.
*Like q_, Qf is defined here as heat generated by the cell (not heat absorbed), and,hence,_ts s_gn is opposite to that of the thermodynamic heat change.
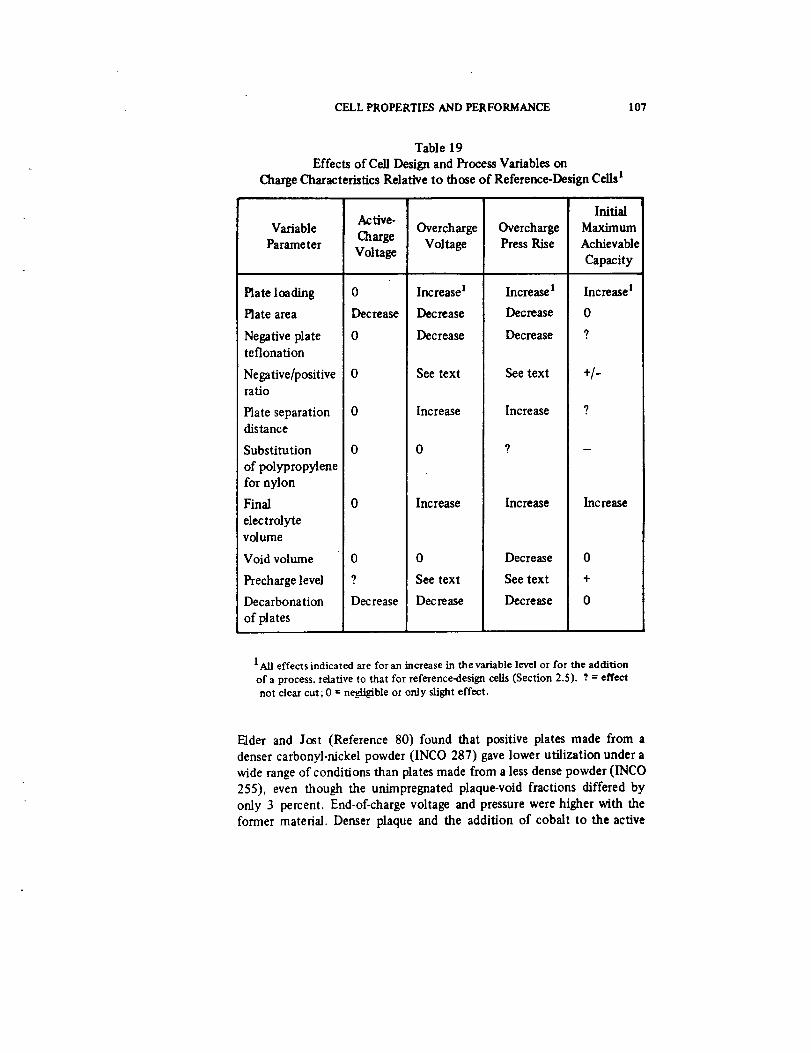
CELL PROPERTIES AND PERFORMANCE 107
Table 19
Effects of Cell Design and Process Variables onCharge Characteristics Relative to those of Reference-Design Cells I
Variable
Parameter
Plate loading
Plate area
Negative plateteflonation
Negative/positiveratio
Plate separationdistance
Substitution
of polypropylene
for nylon
Final
electrolytevolume
Void volume
Precharge level
Decarbonation
of plates
A_tive-
Charge
Voltage
0
Decrease
0
0
0
0
0
0
9
Decrease
Overcharge
Voltage
Increase !
Decrease
Decrease
See text
Increase
Increase
0
See text
Decrease
OverchargePress Rise
Increase 1
Decrease
Decrease
See text
Increase
Increase
Decre_e
Seetext
Decre_e
Initial
Maximum
Achievable
Capacity
Increase I
0
9
+/-
?
_cre_e
0
+
0
IAIIeffects indicated are for an increase in the variable level or for the addition
of a process, relative to that for reference-design cells (Section 2.5). ? = effectnot clear cut; 0 = nedigible or only slight effect.
Elder and Jost (Reference 80) found that positive plates made from a
denser carbonyl-nickel powder (INCO 287) gave lower utilization under a
wide range of conditions than plates made from a less dense powder (INCO
255), even though the unimpregnated plaque-void fractions differed by
only 3 percent. End-of-charge voltage and pressure were higher with the
former material. Denser plaque and the addition of cobalt to the active

108 Ni-Cd BATTERY APPLICATIONS MANUAL
material made charge voltage more sensitive to charge rate. Elder and Jost
expressed their results in the form of the equation:
Parameter = ko + k 1 (charge level*) + k 2 (charge rate) (19)
where the parameter may be end-of-charge voltage, discharge capacity, etc.The calculated values for the constants are given in Reference 80 for
various combinations of design factors.
High-loading of the negative plates also increases charge voltage (References
86 and 87), but to alesser extent than with positive plates because the large
excess of cadmium-active material present results in a lower initial negative
electrode-current density. Lower loading facilitates charging at high rates
and/or at low temperatures by keeping the negative overvoltage low and,
hence, minimizing hydrogen evolution. Data for hydrogen-evolution elec-
trode potentials are summarized by Gross and Glockling (Reference 88).
Within certain limits, negative-plate loading strongly affects overcharge
pressure (due to oxygen evolution from the positive electrode), because the
recombination rate decreases as loading increases and, hence, residual
porosity and exposed nickel-sinter surface area decreases. Maurer (Refer-ence 32) showed that a difference of 10 percent (from 30 to 40) in pore
volume filled can result in a 10-fold difference in pressure. Because this
effect is sensitive to the amount of electrolyte in the cell, these two design
aspects must be coordinated.
Cell manufacturers claim that teflonated negative plates (Section 2.3.2.1.4)
result in lower overcharge pressure at a given temperature, charge rate, and
electrolyte level than nonteflonated plates with the same loading level.
However, the independent effect of the teflonation treatment is obscured
because more electrolyte is usually added to these cells to bring their pres-
sure level up to that observed for nonteflonated negatives.
The ratio of negative-to-positive capacity in a cell (Section 2.3.3.5) does
not in itself affect initial charge characteristics. It does affect the total
excess negative capacity available and, hence, affects the total amount of
charged excess negative and uncharged excess negative capacity that can be
provided. A certain fraction of the total charged excess negative is referred
to as "'precharge" (Section 2.3.3.6). The exact effects of precharge and
uncharged excess cadmium on initial charge behavior has been debated at
*The term "charge level" as used here is equal to (charge throughput)/(theoreticalcapacity).

CELL PROPERTIES AND PERFORMANCE 109
length (References 32, 33, and 45), but still remains uncertain. An excel-
lent review of this and related factors has recently been published (Refer-
ence 43), from which tables 20 and 21 are taken. Ford (Reference 45) and
Turner (Reference 89) have reported that overcharge _ygen pressure
decreases sharply as the precharge level is increased over a range of a factor
of 5 in new cells. Font (Reference 90) found only a small decrease in pres-
sure over a similar range of precharge. However, such an effect appears todiminish as cells are cycled. There is general agreement (References 32 and
45) that precharge should not be increased solely to reduce oxygen pres-
sure in an attempt to compensate for other design defects.
Table 20
Qualitative Effects of Precharge I Level
(Reference 43)
Oxygen pressure
Capacity
Cell beginning-of-charge
voltage
End-of-charge voltage 2
Voltage recovery
following short
Little
Precharge
HighLow
High
Much
Precharge
Low
HighLow
High
Low
_Precharge obtained at the of cadmium.expense uncharged excess
High end-of-charge voltage is caused by the reduced amount of
uncharged exce_s cadmium that can occur at high precharge levels.
Maurer (Reference 45) has attributed the effect of increasing precharge on
initial oxygen pressure to an increase in porosity and surface area for re-
combination. Thus, any such effect would be expected to also be a function
of negative loading level and electrolyte distribution, neither of which are
directly controllable. Maurer has recommended that 10 percent of the
negative be precharged (with a negative-to-positive ratio of 1.7) to avoid
generating bursts of hydrogen when cells are charged from the completely
discharged state.

110 Ni-Cd BATTERY APPLICATIONS MANUAL
Table 21
Qualitative Effects ofUnchargedExcess-CadmiumLevel*
Cell end-of-charge
voltage
Cell end-of-dischargevoltage
Tolerance to highcharge rate
Tolerance to low
temperature overcharge
Tolerance to effects of
separator degradation
Tolerance to increase
of positive capacity
Low
High
Low
Low
Low
Low
Low
High
Low
High
High
High
_gh
High
*Uncharged excess cadmium obtained at ex-pense of chtrged excess.
Most cells made by existing commercial processes contain approximately10 percent of the negative capacity as elemental cadmium (charged)
material before any precharge adjustment is made. Although this materialis initially electrochemically inactive, it may be measured by chemicalanalysis. This material may become partially activated after relatively fewcycles, causing charge behavior to change accordingly. For this reason,charge behavior should not be finally judged until at least 20 to 30 cycleshave been performed. This general approach may present the need for
a smaller amount of added precharge, permitting a larger amount of un-charged excess negative material to remain.
A minimum of precharge is required for low-pressure operation in thetemperature range from 0 to 20°C; greater precharge is required at both
lower and higher temperatures, however, with the difference increasing astemperature extremes increase. Also, less precharge is needed at lower
charge rates (<0.1 C) than at higher rates.
CELL PROPERTIES AND PERFORMANCE 111
Finally, because various reactions within the ceil tend to increase the
amount of charged excess negative (Section 4), it is wise to err on the low
side for initial precharge. However, precise data on quantitative relation-
ships are lacking.
The amount of uncharged excess-negative material initially in the cell is at
least as important for controlling charge behavior as the amount of pre-charge, particularly for applications such as synchronous orbit in which
cells spend relatively long periods on charge. Dunlop (Reference 91) has
shown that, in synchronous orbit tests, high end-of-charge voltage and
hydrogen pressure correlated with a low level of electrochemically active
uncharged excess-negative capacity. Ford (Reference 45) descn_oed how
high voltage and pressure on overcharge may develop during prelaunch
testing if insufficient uncharged excess negative is present. Maurer (Refer-ence 32) points out that the utilization of the negative and, hence, the
activity of the uncharged excess-negative capacity decreases as operating
temperature decreases and charge rate increases. These relationships are
largely responsible for the high end-of-charge voltage and the increase in
hydrogen in the cell when operating at very low temperature (Reference92). At spacecraft battery operating temperatures from 0 to 25°C, the
extreme temperature effect can be ignored.
The minimum amount of electrochemically active uncharged excess
negative should be 30 percent of the positive capacity for spacecraft opera-
tions (20 percent of the total active negative for a negative-to-positive ratio
of 1.5), as measured on a new cell. However, the maximum possible
amount of uncharged excess negative should be installed for any applica-
tion that involves many cycles (_10,000) or long mission life (>3 years).
This can be achieved by using the largest possible negative-to-positive ratio,
achieving the highest possible utilization of negative material and mini-
mizing added precharge. Increasing the negative-to-positive ratio should be
done without increasing the negative plate loading over conunercially
available levels and may therefore reduce the initial specific energy levels.
This is one of the more important tradeoffs, involved in optimizing cell
design for a given application.
There appears to be little direct effect on charge characteristics of varying
the separation (distance)between plates over the practical range of 0.1 mm
to 0.3 mm (0.004 to 0.012 inch). Greater separation with no change of
electrolyte volume will result in greater porosity of compressed separatormaterial and, hence, lower overcharge pressures. Greater separation re-
quires a larger and therefore heavier container. Other advantages of
greater separation are discussed under long-term effects and failure deter-
minants. Vasiations in charge behavior sometimes attributed to different
112 Ni-Cd BATFERY APPLICATIONS MANUAL
separator fiber material (e.g., polypropylene versus nylon) are more likelyattributable to differences in the amount of electrolyte present and the
distribution of electrolyte.
With a given design of the plates, plate separation, separator material, and
dry void volume, the maximum amount of electrolyte that may be added
before observing high and variable overcharge pressure is limited, as illus-
trated in figure 44. The weight of electrolyte per unit capacity that may be
added without pressure problems is a function of many cell-design param-
eters. For example, teflonation of negative-plate material resulted in lower
peak voltage and lower pressure (Reference 93) and permitted higher
steady-state charging rates over a wide range of temperature with more
electrolyte than poss_le with standard-type negative plates.
The residual void (gas) volume in a cell will affect the overcharge pressure
considerably. The smaller the void volume, the higher the pressure will be
under a given set of temperature, charge rate, and overcharge conditions.
Any change in case dimensions or electrolyte volume without a change of
plate-pack dimensions can change the void volume. A trend toward lower
void volumes per unit cell capacity as capacity increases was noted inSection 2.3.3.4.
A final aspect of charge characteristics is oxygen-signal (or adhydrode)
electrode voltage in cells equipped with these auxiliary electrodes. In
general, two methods and locations of installation are used. One method
places the auxiliary "electrode with its plane perpendicular to the plane of
the cen plates and locates it along one edge of the plate stack in the space
between the edges of the plates and a narrow side of the case. The other
method places the auxiliary electrode with its plane parallel to that of the
plates and locates it either between an outside plate and a broad face of the
case or m the plate stack between a positive and a negative plate. If ade-
quate electrolyte is added and the electrolyte is well-distributed, initial
signal-voltage behavior is usually normal and essentially the same for both
configurations when nylon separator material is used (Reference 51).When the auxiliary electrode is located at the edge of the plate stack,
signal voltage can be marginal and erratic with polypropylene separator
material, presumably because of the lesser wicking capability of this
material. Initial oxygen signal electrode performance was good with poly-
propylene separators when the auxiliary electrode was placed fiat between
two plates in the plate stack (Reference 51).
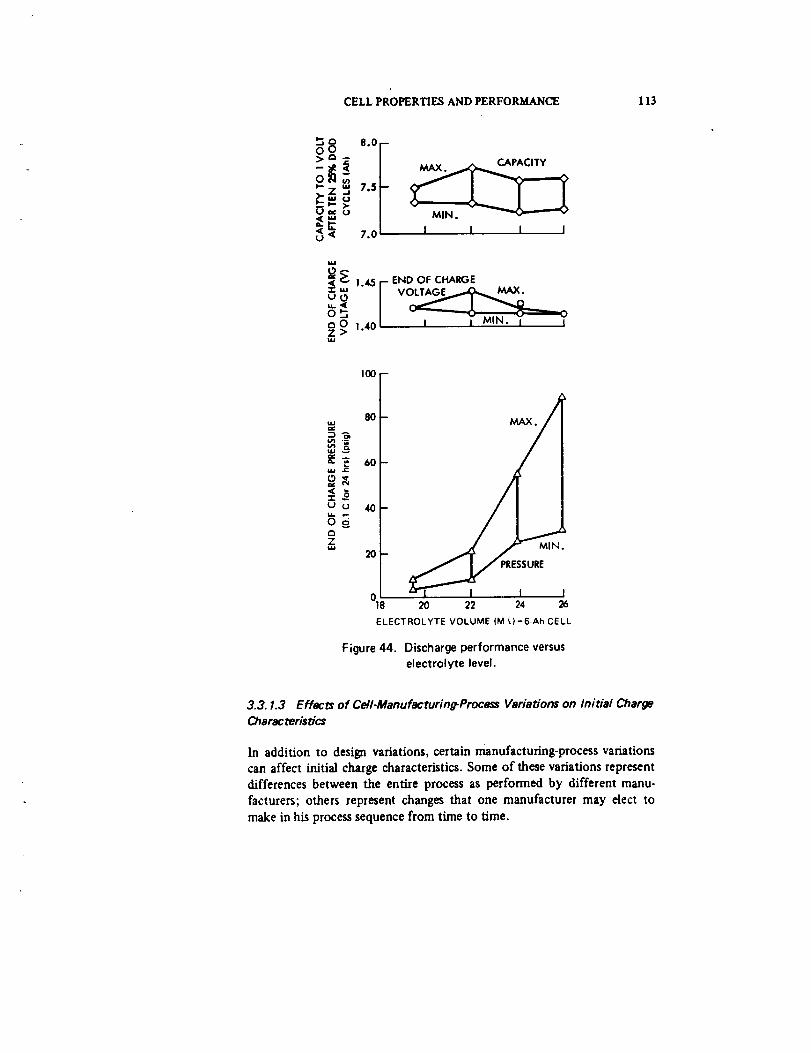
CELL PROPERTIES AND PERFORMANCE 113
8.0
7.o
_ 1.45 r- END OF CHARGE
oO I 40l I I _,r,,. I IZM.I
MJ
U
O
z
100-
8O
6O
4O
2O
MAX,
MIN.
,___/ PRESSURE
"-_1 I I I018 20 22 24 26
ELECTROLYTE VOLUME (M _,)-6-Ah CELL
Figure 44. Discharge performance versus
electrolyte level.
3.3. 1.3 Effects of Cell.Manufacturing-Process Variations on Initial Charge
Characteristics
In addition to design variations, certain manufacturing-process variations
can affect initial charge characteristics. Some of these variations represent
differences between the entire process as performed by different manu-
facturers; others represent changes that one manufacturer may elect to
make in his process sequence from time to time.
114 Ni-Cd BATTERY APPLICATIONS MANUAL
Only a few organized studies of the effects of process variables have been
published, and these dealt with only a few particular plate materials, some
of which have not been produced commercially (References 8, 15, and 57).Very little such information is available for the processes used by the two
largest suppliers of spacecraft nickel-cadmium cells in the United States.
One study (Reference 15) included both dry-sinter (loose powder) and
slurry-coated sinter substrates, together with three types of impregnation,
among other variables. Although some charge data are shown, the data
were not analyzed to show the effect of those variables on initial chargecharacteristics.
Another study of process variables that involve only a dry-sintered plate
process (Reference 57) found that the use of ten-flooded-formation cycles
during platemaking gave significantly lower overcharge voltages and pres-
sures in test cells than either one- or three-formation cycles. Note, how-
ever, that the cell assembly and test process used to make the test cells did
not include any open-cell-formation cycling other than that done during
platemaking.
Hooded-formation cycling (electrochemical testing) can remove a sig-
nificant quantity of cadmium-active material from negative plates, and in-deed this procedure is intended to remove loosely adherent material before
the plates are installed in sealed containers.* The last discharge of the proc-
edure is designed to determine if the resulting group of plates has retained
the minimum required capacity of both positive and negative plates.
Because the part of this discharge below zero volts is usually run at a low
rate (e.g., 0.1C), it indicates the presence, but not necessarily the high-rate
activity, of the excess cadmium material in the negative plates.
Anot_ler variable of the open-cell-formation procedure that apparently
affects subsequent cell-charge behavior is the voltage to which the flooded
cells are taken on the last discharge before the plates are washed and dried.
Among other things, this discharge is used to establish that the minimum
required electrochemical negative-to-positive ratio is present.* This involves
discharging the cells into reverse, usually at the O.1C rate. Different manu-
facturers have used cutoff voltages ranging from -0.25 to -1.0 volt. Some
workers associate abnormally high end-of-charge voltage with cutoff
voltages that are more than -0.5 volt negative, although no cause-and-
effect relationship has been established. The difference is attributed to a
difference in the amount of undischarged cadmium left in the negative
*G. G. Rampel, General Electric Battery I_'ision, private communication.
CELLPROPERTIES AND PERFORMANCE 115
plates with different end voltages. There appears to be sufficient weight of
empirical evidence to support recommending a cutoff voltage no lower
than -0.5 volt at the 0.IC rate. At the 0.5C rate often used for testing for
excess negative capacity during acceptance testing, an end voltage of -1.0volt is more appropriate.
A process step that affects initial cell-charge performance through its effect
on negative plates is decarbonation. Certain manufacturers use this proc-edure to reduce the amount of carbonates in the plates before the cell is
sealed.* Different procedures have been used, including "flushing" the
cell with electrolyte either with or without cycling, overcharging, andthen replacing the electrolyte and soaking the plates in electrolyte before
assembling the final cell. All such procedures increase the porosity of the
negative plates by removing solid material from the pores, thus increasing
the effective void volume of the cell. Without compensation with added
electrolyte, end-of-charge voltage and pressure are often lower with decar-bonation than without. Decarbonation also removes active material from
the plates along with the carbonate and may discharge part of the charged-cadmium content of the negative plates.
3.3.2 Initial Discharge Characteristics
The initial discharge characteristics (those observed before significant
degradation has occurred) are less sensitive to cell design than charge char-
acteristics. However, as in previous sections, discharge data for cells of
known design are presented before an attempt is made to generalize.
3.3.2. 1 Discharge Characteristics of Reference-Design Cells
Discharge Voltage-Discharge voltage is most often shown as a function of
normalized output. Falk and Salkind present a comprehensive summary of
such discharge curves for both vented (flooded) and sealed (starved) cells
(Reference 5, pp. 325-334 and 384-389. respectively). However, these data
are mainly for discharge rates in the range from IC to IOC, which is used
for terrestrial applications but not for spacecraft for which long cycle lifeis required.
Figure 45 shows average discharge-voltage curves that are typical of re-
c¢ntly made reference-design spacecraft cells in the size range from 10- to50-Ah capacity operating at an average temperature of IO°C. These cells
*G. G. Rampel, General Electric Battery. Db_ion. private communication.

116 Ni-Cd BATTERY APPLICATIONS MANUAL
1.4
1.2
1.0
0.8
_ 0.6
_ o.4
0.2
TEMr IOeC
I [ I I l0 0.2 0.4 0.6 0.9 1.0
DEPTH OF DISCHARGE (AhD/C R)
1.2 1.4
Figure 45. Discharge voltage versus depth of discharge for
new cells at 10°C (discharge rate a parameter) (General Electric).
have an actual initial standard capacity that averages 120 percent of the
manufacturer's rating (CR). For ceils with other ratios of actual-to-ratedcapacity, the scale of figure 45 can be adjusted accordingly.
Figure 45 shows, within 0.005 volt, the same discharge voltage at mid-
discharge for operation at temperatures other than IO°C in the range from
0 to 20°C that is recommended for high.reliability designs at any given dis-
charge rate. Lower temperatures increase the slope (negative) of the plateau,
increasing the beginning of discharge voltage and decreasing the end of dis-
charge voltage. Higher temperatures have the opposite effect on the plateau
slope. These statements assume that charge control is properly adjusted to
compensate for effects of temperature on charging characteristics.
The most important part of these curves is the "plateau" at which the
voltage changes only slowly with ampere4tours out. At a given state of
charge, this plateau voltage is approximately a linear function of discharge
current over a wide range of current. This behavior lends itself to another
kind of data display-current-voltage (l-V) curves-in which I-V relation-
ships are shown as straight lines. This format may facilitate computer
processing of the data. Bauer showed diagrams of this type for discharge
at several temperatures (Reference 2). Section 3.3.3 contains I.V diagramsfor currently manufactured cells.
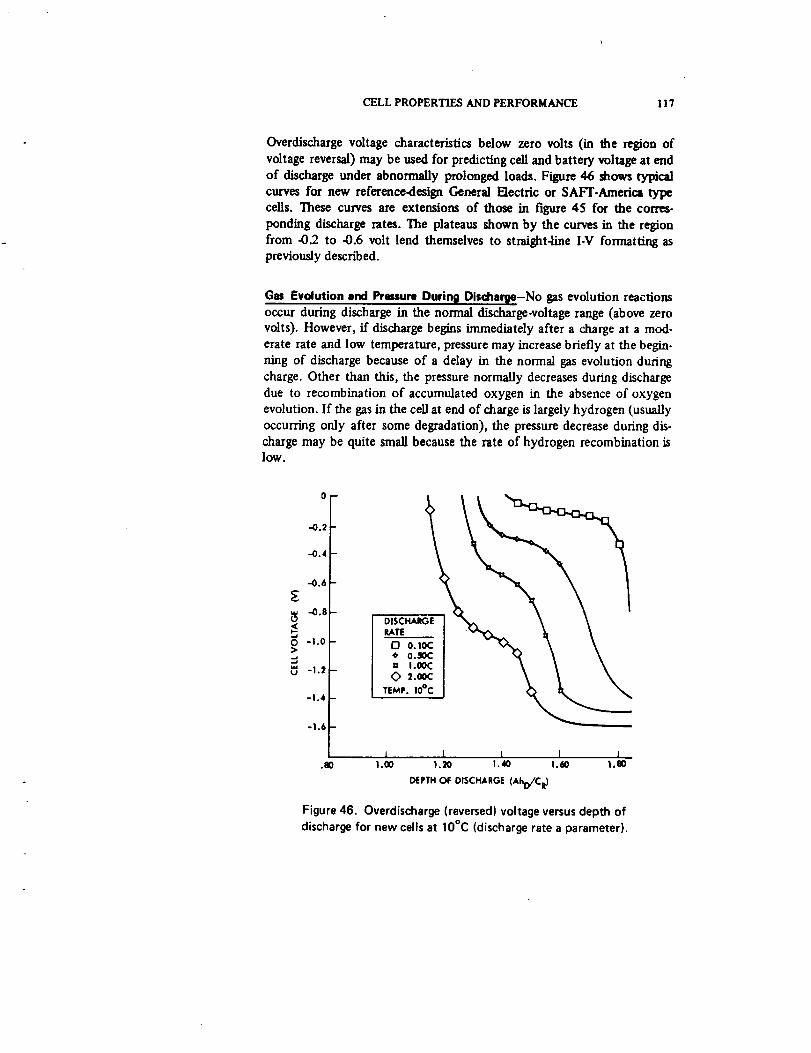
CELL PROPERTIES AND PERFORMANCE 117
Overdischarge voltage characteristics below zero volts (in the region ofvoltage reversal) may be used for predicting cell and battery voltage at endof discharge under abnormally prolonged loads. Figure 46 shows typicalcurves for new reference-design General FJectric or SAFT-America typeceils. These curves are extensions of those in figure 45 for the corres-
ponding discharge rates. The plateaus shown by the curves in the regionfrom -0.2 to -0.6 volt lend themselves to straight-line I-V forrnatl_lg aspreviously described.
Gas Evolution and Pressure Durinil Discharite-No gas evolution reactionsoccur during discharge in the normal discharge-voltage range (above zerovolts). However, if discharge begins immediately after a charge at a mod-erate rate and low temperature, pressure may increase briefly at the begin-ning of discharge because of a delay in the normal gas evolution duringcharge. Other than this, the pressure normally decreases during discharge
due to recombination of accumulated oxygen in the absence of oxygenevolution. If the gas in the cell at end of charge is largely hydrogen (usuallyoccurring only after some degradation), the pressure decrease during dis.charge may be quite small because the rate of hydrogen recombination islow.
>
0
-0.2
.-0.4
.-0.6
-o.e
-! .0
-I.2
-I .4
-I.6
1 I I I t.ao i.oo 1.2o i.,m 1.6o 1.8o
_rTMOFOISCHAR_¢Ah_CO
Figure46. Overdischarge(reversed)voltageversusdepth ofdischargefor new cellsat 10°C (dischargerate a parameter).
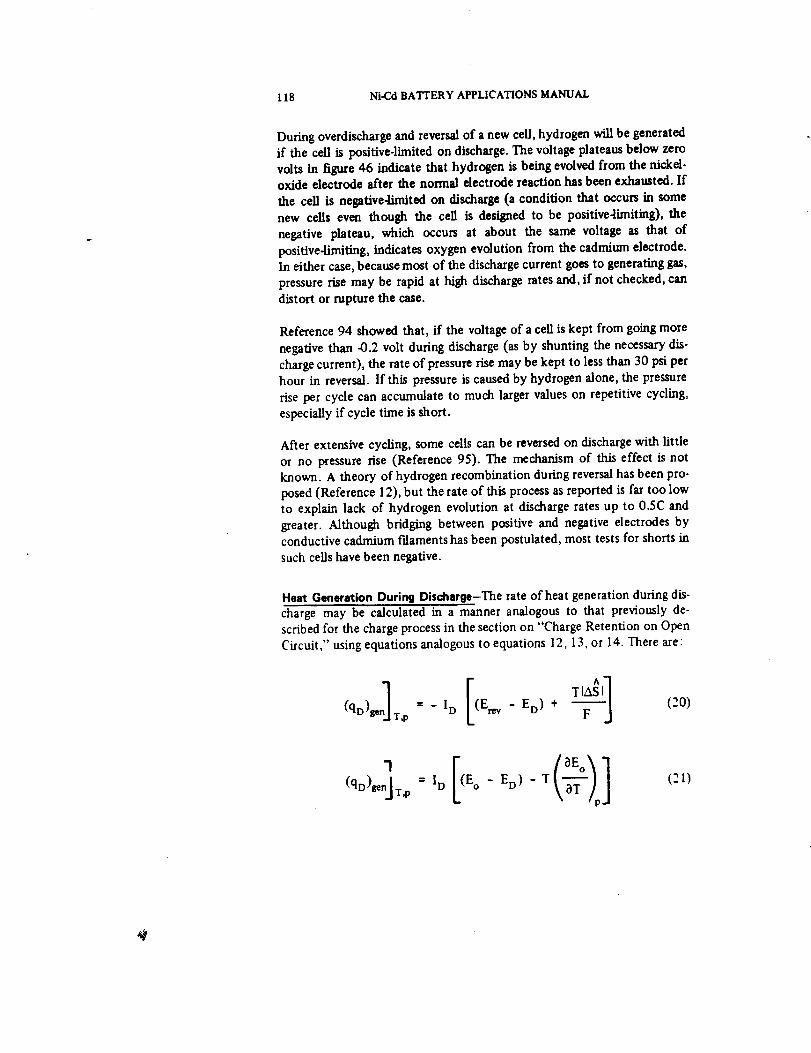
118 Ni-Cd BATTERY APPLICATIONS MANUAL
During overdischarge and reversal of a new cell, hydrogen will be generatedif the cell is positive-limited on discharge. The voltage plateaus below zerovolts in figure 46 indicate that hydrogen is being evolved from the nickel-oxide electrode after the normal electrode reaction has been exhausted. If
the cell is negat/ve-limited on discharge (a condition that occurs in somenew cells even though the cell is designed to be positive-limiting), the
negative plateau, which occurs at about the same voltage as that of
positive-limiting, indicates oxygen evolution from the cadmium electrode.In either case, because most of the discharge current goes to generating gas,
pressure rise may be rapid at high discharge rates and, if not checked, candistort or rapture the case.
Reference 94 showed that, if the voltage of a cell is kept from going more
negative than .0.2 volt during discharge (as by shunting the necessary dis-charge current), the rate of pressure rise may be kept to less than 30 psi perhour in reversal. If this pressure is caused by hydrogen alone, the pressure
rise per cycle can accumulate to much larger values on repetitive cycling,especially if cycle time is short.
After extensive cycling, some cells can be reversed on discharge with little
or no pressure rise (Reference 95). The mechanism of this effect is notknown. A theory of hydrogen recombination during reversalhas been pro-
posed (Reference 12), but the rate of this process as reported is far too lowto explain lack of hydrogen evolution at discharge rates up to 0.5C andgreater. Although bridging between positive and negative electrodes byconductive cadmium fdaments has been postulated, most tests for shorts in
such cells have been negative.
Heat Generation During Disohar_-The rate of heat generation during dis-charge may be calculated in a manner analogous to that previously de-scribed for the charge process in the section on "Charge Retention on OpenCircuit," using equations analogous to equations 12, 13, or 14. There are:
_- _ I D (E_.v E D) + -- .(qD)ge T,p
(20)
(qD)genJT,p = l D E o(21)
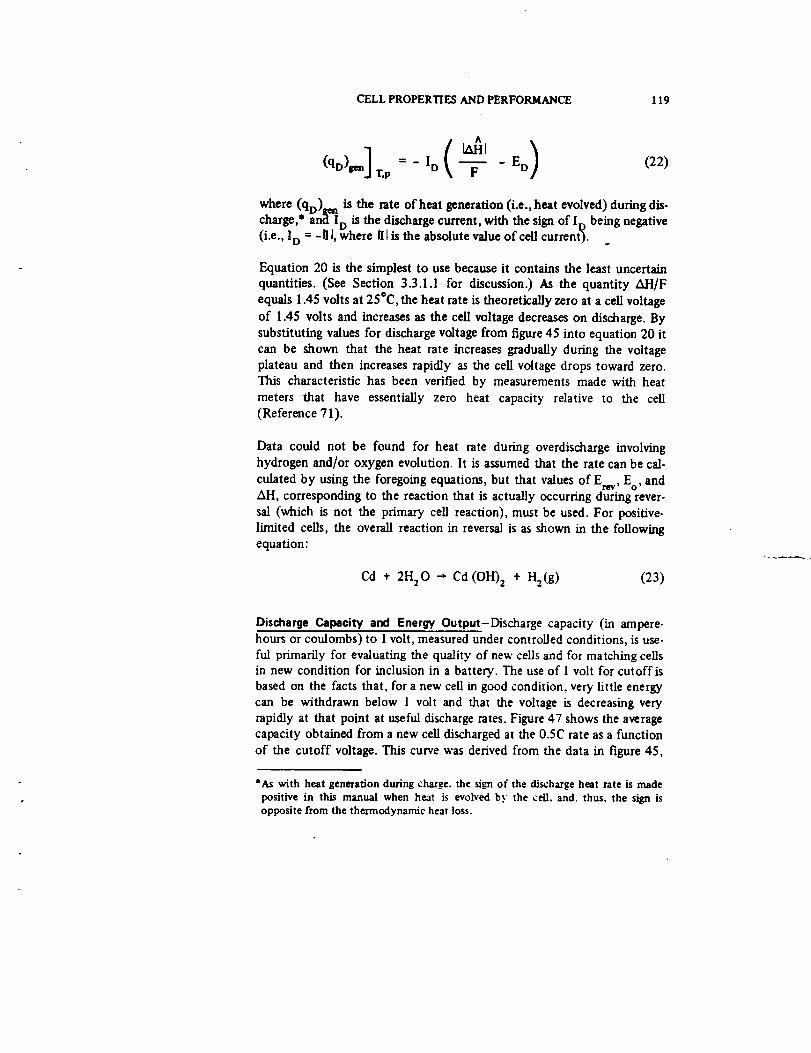
CELL PROPERTIES AND PERFORMANCE 119
__ _ I D -- _ ED(qD)t_a T,p F(22)
where (qD) is the rate of heat generation (i.e., heat evolved) during dis-charge,* an_ D is the discharge current, with the sign of In being negative
(i.e., I0 = - [II,where IIIis the absolute value of cell current_. _
Equation 20 is the simplest to use because it contains the least uncertain
quantities. (See Section 3.3.1.1 for discussion.) As the quantity AH/F
equals 1.45 volts at 25°C, the heat rate is theoretically zero at a cell voltage
of 1.45 volts and increases as the cell voltage decreases on discharge. By
substituting values for discharge voltage from figure 45 into equation 20 it
can be shown that the heat rate increases gradually during the voltage
plateau and then increases rapidly as the cell voltage drops toward zero."Ibis characteristic has been verified by measurements made with heat
meters that have essentially zero heat capacity relative to the cell
(Reference 71).
Data could not be found for heat rate during overdischarge involving
hydrogen and/or oxygen evolution. It is assumed that the rate can be cal-
culated by using the foregoing equations, but that values of Erev, E o, andAid, corresponding to the reaction that is actually occurring during rever-
sal (which is not the primary cell reaction), must be used. For positive-
limited cells, the overall reaction in reversal is as shown in the following
equation:
Cd + 2H20 _ Cd (OH)2 + H2(g ) (23)
Discharge Capacity and Energy Output-Discharge capacity (in ampere-hours or coulombs) to 1 volt, measured under controlled conditions, is use-
ful primarily for evaluating the quality of new cells and for matching cells
in new condition for inclusion in a battery. The use of 1 volt for cutoffis
based on the facts that, for a new ceil in good condition, very little energy
can be withdrawn below 1 volt and that the voltage is decreasing very
rapidly at that point at useful discharge rates. Figure 47 shows the average
capacity obtained from a new cell discharged at the 0.5C rate as a function
of the cutoff voltage. This curve was derived from the data in figure 45,
*As with heat generation during charge, the sism of the discharge heat rate is madepositive in this manual when heat is evob'ed by the cell, and. thus, the sign isopposite from the thermodynamic heat loss.
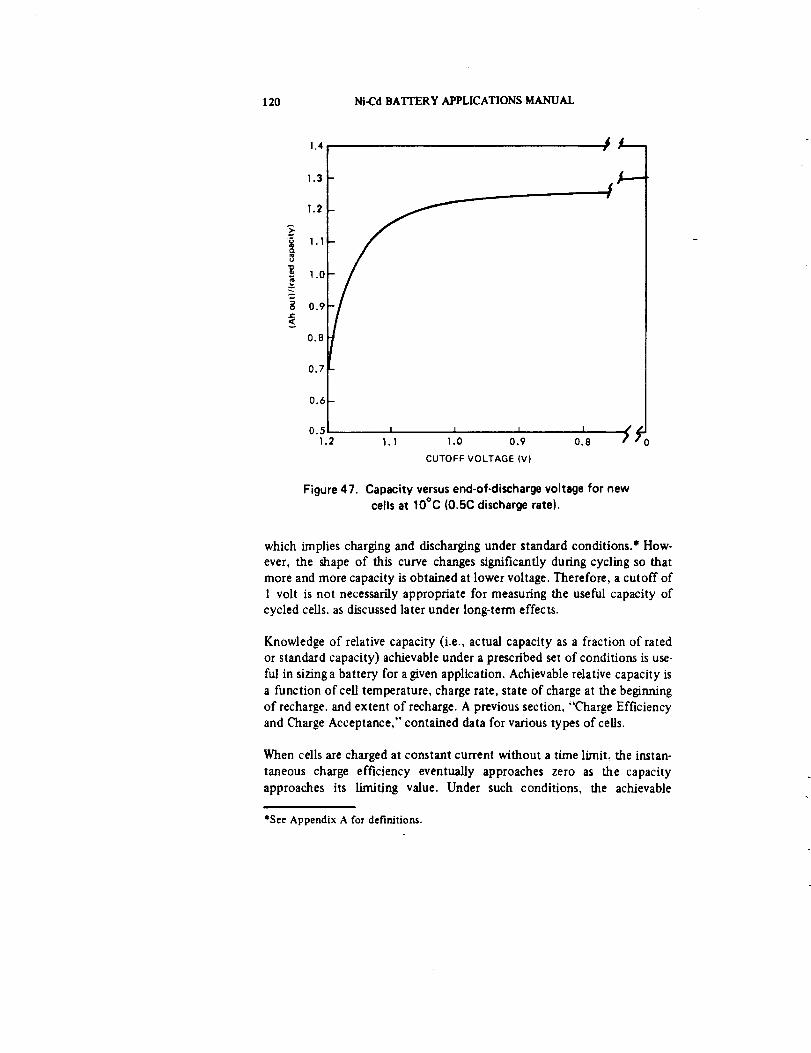
120 Ni-Cd BATI'ERY APPLICATIONS MANUAL
1.4
1.3
1.2
i 1.11.0
"_ 0.9
v
0.8
0.7
0.6-
0.'_1.2 1.1 !.0 0.9 0.8 //0
CUTOFF VOLTAGE (V)
Figure 47. Capacity versus end-of-discharge voltage for new
cells at 10°C (0.5C discharge rate).
which implies charging and discharging under standard conditions.* How-
ever, the shape of this curve changes significantly during cycling so that
more and more capacity is obtained at lower voltage. Therefore, a cutoff of
1 volt is not necessarily appropriate for measuring the useful capacity of
cycled cells, as discussed later under long-term effects.
Knowledge of relative capacity (i.e., actual capacity as a fraction of rated
or standard capacity) achievable under a prescribed set of conditions is use-
ful in sizing a battery for a given application. Achievable relative capacity is
a function ofceU temperature, charge rate, state of charge at the beginrdng
of recharge, and extent of recharge. A previous section, "Charge Efficiency
and Charge Acceptance," contained data for various types of cells.
When cells are charged at constant current without a time limit, the instan-
taneous charge efficiency eventually approaches zero as the capacity
approaches its limiting value. Under such conditions, the achievable
*See Appendix A for definitions.

CELL PROPERTIES AND PERFORMANCE 121
capacity may be estimated from efficiency versus state-of-charge diagrams
(e.g., figures 40 and 41) by noting the capacity at which the incremental
efficiency becomes zero.
For ceils of a given design and mass, standard capacity is a measure of
quality. For comparing cells of different designs and weights, specific
capacity, or capacity per unit mass, gives a useful figure of merit. Although
specific energy is often used for this purpose, it implies that the discharge
voltage curve, or at least the average voltage on the plateau, either is known
or can be assumed. Specific capacity is a design-related parameter that is
relatively independent of the voltage of the plateau and therefore indepen-dent of specific use conditions.
Discharge energy is the time-integral of the product of voltage and current
(power output). Thus, energy discharged above some cutoff voltage indi-
cates how long the cell will support a constant power load above that
voltage. The ampere-hour capacity indicates how long the cell will support
a constant current load above a given lower voltage limit. Inasmuch as
most spacecraft loads require constant power rather than constant current,
discharge energy is a better measure of the ability of a cell to perform in a
spacecraft power system than ampere-hour capacity.
Relatively little energy data are available because of the added cost of the
equipment and time required for acquiring the needed intermediate voltage
data and for making the computations. Modem automatic data-acquisition
systems can easily obtain the input data, and a low-cost computer can
make the necessary calculations either on-line or off-line. Because cell
manufacturers have not yet availed themselves of this type of equipment,
however, cells cannot now be cost-effectively tested for energy content at
the manufacturer's plant. However, requirements for minimum dischargeenergy can and should be applied when selecting cells for batteries.
Most energy output values are obtained from constant-current discharge
data. If the cell voltage remains relatively constant (on the plateau)
throughout the discharge, constant-current discharge is adequate. If thevoltage at the end of discharge begins to drop, a constant-current load
will result in higher capacity and energy output than that of a constant-
power load. Hence, the latter produces the more realistic data for cells in.
tended for spacecraft usage.
When battery mass is of prime concern, specific energy* (i.e., energy perunit of cell mass) is a useful figure of merit ff it is used in a definitive
*Specific energy is also referred to as "energy density."
122 Ni-CdBATTERYAPPLICATIONSMANUAL
manner.A rough approximation to output energy can be obtained by
multiplying the ampere-hour capacity by the average discharge voltage
(VD)' if known, or by the mid-point voltage on the plateau. For new ceilsdischarged to 1 volt at the 0.5C rate, this voltage is close to 1.2 volts;hence,
much published specific-energy data have been calculated simply by mul-
tiplying specific capacity by 1.2. At higher discharge rates and after
multiple cycles, average discharge voltage and capacity are less than they
were initially; therefore, in-service specific energy is quite sensitive to themethod and extent of use. Data in table 13 show the initial standard
specific energy* (for V D = 1.2 volts) of commercially available reference-design ceils to be 35 to 37 watt-hours per kg (16 to 17 Wh/lb) to 1 volt.
Utilization-Utilization describes the fraction of active material in an
electrode or cell that is converted to electrical output on discharge. It may
be expressed as the number of coulombs or ampere-hours per unit mass of
active material present or as ampere-hours divided by the ampere-hours
calculated as theoretically equal to the mass of active material. Expressed
as a percentage, the latter fraction is often referred to as the "electro-
chemical efficiency." This concept should not be confused with charge
efficiency.
The theoretical coulombic equivalent of nickel-hydroxide [Ni (OH) 2 ] fora 1-electron per mol change according to equation 1 is 0.288 ampere-hour
per gram: for cadmium-hydroxide [Cd (OH):] for a 2-electron per molchange is 0.366 ampere-hour per gram. Because the actual electron change
per mol of Ni (OH) 2 taking place on a nickel-hydroxide electrode is un-certain (Reference 9), the expression of utilization as a function of mass is
preferred. Inasmuch as the active materials constitute approximately 25
percent of the cell mass in current designs, maximum utilization is a key
to maximum specific energy.
3.3.2.2 Effects of Cell Design Variations on Initial Discharge
Characteristics
This section considers the effects of cell-design (including component
design) variations on the initial discharge characteristics of sealed nickel-
cadmium cells. The characteristics discussed are voltage, utilization, specific
capacity, and specific energy as observed during the first few cycles of
operation under new-cell conditions. Section 3.4 covers the effects of such
variations on long-term cell performance.
*Corresponds to the standard capacity; see Appendix A for definitions.

CELL PROPERTIES AND PERFORMANCE 123
Most published data on effects of cell-design variables are for initial capa-
city because it is the most quickly and easily measured. In some cases, data
are also given on utilization, energy, or specific energy. Because much of
the data were obtained on electrodes operating under flooded conditions,
they must be interpreted before they can be applied to complete, starved
electrolyte cells.
Many variables affect utilization and specific energy, and many of them
interact. A summary of the effects of some of the more important vari-ables follows. References 5 and 96 contain additional information.
Plate (Plaque) "l'hicknas-Within the range of discharge rates (up to 1C)
used for most spacecraft applications, corresponding to current densities
up to about 2 ampere/dm 2, little effect on voltage and capacity per unit
area is observed because the thickness of the positive plates is varied by
---50 percent about the 0.8- to 0.9-mm (0.028- to 0.032-inch) range now
offered by manufacturers if other variables such as plaque void fraction
and area loading* are constant (Reference 5). At much higher discharge
rates, utilization in thinner plates is distinctly greater than in thicker
plates. Thickness of plates should not be confused with thickness of activematerial.
With a given impregnation procedure, loading and therefore capacity (to a
first approximation) increases linearly with plaque thickness in the range
from 0.7 to 1 mm (0.025 to 0.04 inch) (Reference 54). Thus, plaque
thickness must be controlled if capacity per unit of plate area is to beuniform.
If the area loading is to be increased over levels now used (table 11), plate
thickness may be increased to keep the volumetric loading (grams per unit
volume of void) nearly constant. However, such thicker plates are subject
to lower cycle life, as described in Section 3.4. With the area loading levels
shown in table 11, plate thickness cannot be decreased significantly with-
out causing the volumetric loading to become too high, thus reducingutilization.
Void Fraction and Pore Size-Void fraction (also referred to as porosity)
and average pore size are discussed together because, with a given type of
nickel powder and sintering procedure, average pore size increases as void
*Loading of active material per unit of apparent plate area.
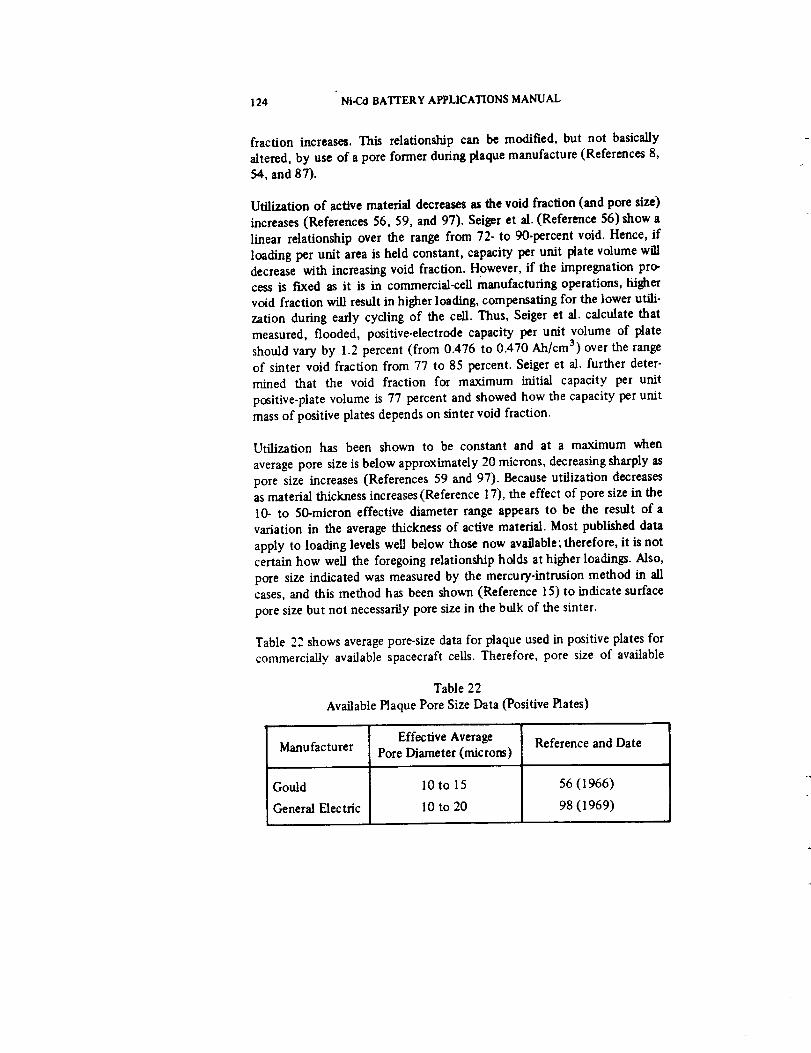
124 Ni-Cd BATFERY APPLICATIONS MANUAL
fraction increases. This relationship can be modified, but not basically
altered, by use of a pore former during plaque manufacture (References 8,
54, and 87).
Utilization of active material decreases as the void fraction (and pore size)
increases (References 56, 59, and 97). Seiger et al. (Reference 56) show a
linear relationship over the range from 72- to 90-percent void. Hence, if
loading per unit area is held constant, capacity per unit plate volume willdecrease with increasing void fraction. However, if the impregnation pro-
cess is fixed as it is in commercial-cen manufacturing operations, higher
void fraction will result in higher loading, compensating for the lower utili-
zation during early cycling of the cell. Thus, Seiger et al. calculate that
measured, flooded, positive-electrode capacity per unit volume of plate
should vary by 1.2 percent (from 0.476 to 0.470 Ah/cm 3) over the range
of sinter void fraction from 77 to 85 percent. Seiger et al. further deter-
mined that the void fraction for maximum initial capacity per unit
positive-plate volume is 77 percent and showed how the capacity per unit
mass of positive plates depends on sinter void fraction.
Utilization has been shown to be constant and at a maximum when
average pore size is below approximately 20 microns, decreasing sharply as
pore size increases (References 59 and 97). Because utilization decreasesas material thickness increases (Reference 17), the effect of pore size in the
10- to 50-micron effective diameter range appears to be the result of a
variation in the average thickness of active material. Most published data
apply to loading levels well below those now available; therefore, it is notcertain how well the foregoing relationship holds at higher loadings. Also,
pore size indicated was measured by the mercury-intrnsion method in allcases, and this method has been shown (Reference 15) to indicate surface
pore size but not necessarily pore size in the bulk of the sinter.
Table 22 shows average pore-size data for plaque used in positive plates for
commercially available spacecraft cells. Therefore, pore size of available
Table 22
Available Plaque Pore Size Data (Positive Plates)
Manufacturer
Gould
General Electric
Effective AveragePore Diameter (microns)
10to 15
10 to 20
Reference and Date
56 (1966)
98 (1969)
CELL PROPERTIES AND PERFORMANCE 125
plate material appears to be optimum for maximum initial capacity perunit area. However, pore size is not directly controlled by cell manu-
facturers during platemaking; it is the net result of the type of nickel
powder used, the density and viscosity of slurry used, and the sintering
conditions. Being a function of so many variables, pore size is a poten-
tial source of trouble if it increases significantly from the normal range.
Note that reports of a study of cell-manufacturing variables (Reference 57)
did not mention plaque pore size.
Sizing and Coining-Sizing, or compaction of the plaque to control or
reduce thickness before impregnation, reduces utilization at a fixed pore-
fill fraction* (Reference 59). This effect may cause a manufacturer to load
the plates excessively to compensate for the resulting reduction in capacity
per unit plate area. Sizing is therefore usually undesirable. However, ifthickness variations are excessive, they can lead to cell-behavior variations,
making sizing a practical necessity. Closer control over unsized plaque
thickness is preferable.
Coining reduces capacity per unit overall plate area (and, hence, per unit
plate weight) in proportion to the fraction of area coined and to the thick-ness reduction used. Plate material that is compressed to less than 70 per-
cent of its uncoined thickness is essentially inert. If present in a border
approximately 2 mm wide, such coining corresponds to about 5 percent
of the total plate area and associated capacity in a 20-Ah cell. Coined areas
of positive plates having a thickness greater than 80 percent of the un-
coined thickness provide little protection against physical damage during
handling and against decomposition because of cycling in the cell (Refer-
ence 20).
Loading-Few data published during the last decade were found that relate
capacity to loading level with other variables held constant. In one studyinvolving plate material not currently available (Reference 54), flooded
capacity of positive plates was proportional to loading over a range from3.2 to 7 Ah/dm 2 (0.48 to 0.61 Ah/cm 3 of total plate volume) for plates
0.7 to 1.2 mm (0.0264 to 0.048 inch) thick, respectively. The initial
porosity of all plaque was about 80 percent (by mercury, intrusion). The
volumetric loading increased with plaque thickness because corrosion ofthe sinter increased with thickness. U_lization averaged 95 percent at the
0.5C discharge rate for these tests. Utilization of positive electrodes in
*The fraction of the original pore volume (after compaction) filled with solid activematerial.

126 Ni-Cd BATTERY APPLICATIONS MANUAL
starved cells made from the thicker plates and using an 80-percent electro-
lyte pore fall was 75 percent. This is the utilization level seen initially in
General Electric and SAFT ceils made with chemically impregnated plates.
This large difference between flooded and starved utilization of positive-
active material makes the use of flooded-capacity data to predict the
starved capacity versus loading relationship rather uncertain.
A study of process variables (Reference 57) found that, at 230C, capacity
in electrolyte-starved cells was relatively constant with positive-electrode
loading in the range from 11 to 15 g/dm 2 and was more than propor-
tionately lower at a loading level of 8 to I0 g/drn 2 . The lower utilization at
the lower loading levels was probably due to insufficient electrolyte rather
than lower loading per se because 5 percent less electrolyte was used inthese cells.
The sensitivity of utilization to electrolyte level noted here is discussed
in more detail later. In starved cells, more electrolyte can be added to com-
pensate for the effect on capacity of reduced loading over a range of 10
percent (Reference 93). This fact will tend to obscure any clear elucidation
of the effect of loading alone on capacity.
The positive-active material in reference-design cells amounts to approxi-
mately 15 percent of the cell mass. Therefore, a 10-percent increase in
positive loading would result in a 1.5-percent increase in cell mass. Thus,
the capacity and energy output must increase by more than 1.6 percent to
produce an increase in specific energy. In addition, an increase in loading
of positive plates can affect the long-term performance of the cell in ways
that may be more serious than the impact on cell mass for a given applica-
tion. (See Section 4.)
Effect of Cobalt in Positive-Active Material-The effect of cobalt (as an
additive to positive-active material) on initial charge acceptance and capac-
ity has been a subject of a number of studies. One of these (Reference 23)
showed that 20-percent* Co (OH) 2 was optimum within the range of 5 to40 percent tested. This study emphasized higher-temperature (e.g., 65°C)
performance, in which charge acceptance (at the 0.1C charge rate used)
without additives proved to be poor. At 250C, utilization with 10- to 15-
percent cobalt was nearly the same as that for 20-percent cobalt-10 to 20
percent greater at the 1C discharge rate than without cobalt.
*Because the molecular weight of Co (OH) 2 is almost identical to that of Ni (OI4)2, ag_ven weight percent is numerically the same mole percent. Hence, it is not necessaryto designate which type of percentage is meant.
CELLPROPERTIES AND PERFORMANCE 127
The increase in discharge capacity (to 1 volt) produced by introducing
cobalt is accompanied by a decrease in the plateau voltage (Reference 20).
Thus, although added cobalt increases initial specif'_ capacity, it may not
increase specific energy deliverable to a constant power load.
Another study involving electrochemical impregnation (Reference 20)
found that 10 percent cobalt was optimum for capacity at the I-C discharge
rate when high-temperature performance was not required. This study
showed that, based on Ni (OH)2 content, utilization of active material in-
creased faster than the increase in total weight of Ni (OH)2 plus Co (OH) 2as the percent of cobalt in the mixture was increased in the range from 0 to
10 percent, then decreased at higher cobalt percentages. These results were
obtained at loading levels well below those of currently available spacecraftcells, however, and information on the effect of cobalt use at higher plate-
loading levels is not available.
A third study (Reference 80) included a wider range of conditions than
that of the preceding work. This study showed that the results from cobaltaddition at 4.4 percent (the only leve] tested) is dependent on many vari-
ables. At high charge rates and recharge ratios of less than l, the cobalt in-
creased charge acceptance, whereas, at low charge rates and considerable
overcharge, little benefit occurred (at 4.4 percent) at 23°C. The foregoingresults indicate that the level of cobalt tested here was too low for
optimum effect. Many interactions with other design variables and operat-
ing conditions w_re observed, and the resuhs are presented in the form of
coefficients of general equations for capacity as a function of charge rate,
charge coefficient,* and discharge rate.
No data were found for comparative testing of cobalt additive at tempera-tures below 23°C. Because of the inherently better charge acceptance of
Ni (OH) 2 at lower temperatures, considerably less benefit would be fromcobalt at 0°C than at 25°C. However, there appears to be no disadvantage
to carrying cobalt in the range of 5 to 10 percent of the positive-active
material in cells used at low temperature.
In general, cobalt levels above 10 percent (as Co (OH) 2) should be neces-sary only if the cell must operate at high temperatures and maximum
capacity is required. Cycle life will still be short under these conditions,
however, and testing of the particular plate material to be used for high
temperature performance is advisable.
*Chargecoefficient = (ampere hours chatged)/(ampere hours of measured capacity).
128 Ni-CdBATTERYAPPLICATIONSMANUAL
Effects of Negative-Electr-n'J-a-Designon Initial DischargeCharacteristics-As with positive electrodes, two aspects of electrode design are distin-
guished: (1) intrinsic aspects, such as plaque structure and loading level;and (2) overaU aspects, such as total negative-plate area, negative-to-
positive ratio, and precharge level.
The degree of impact of negative-electrode design variations on initial celldischarge voltage and capacity is small for cells designed to be positive-limited (as are all sealed cells in commercial use today), but it is large for
cells designed to be negative-limited, such as those studied under recentcontract efforts (References 99 through 101). However, any design aspectthat affects negative-material utilization w_l affect the amount (mass) of
material required for achieving a given negative-to-positive ratio and willtherefore affect the mass and initial specific capacity of a positive limited
cell.
Gross (Reference 88) summarized published information on sintered nickel-cadmium-plate design, including the points that maximum initial utilizationat normal discharge rates occurs at low active-material loading levels andwith sinter pore size in the range from l0 to 20 microns. Because low load-
ing and small pore size both imply low cadmium-plate capacity per unitplate mass, tradeoffs are involved in reaching an optimum. Such tradeoffsmust also consider the expected changes in cadmium-electrode activity
with cycling, which are much greater than those for the nickel-hydroxideelectrode. Section 3.4. l describes cycling effects.
In one study, including indium compounds as part of the active material insintered cadmium plates improved utilization, particularly at high rates
and/or low temperatures (Reference 90). Indium has not been used com-mercialJy because, for most applications, the degree of effect does not
justify the high cost of this material.
Evidence for a beneficial effect of added nickel hydroxide on initial capac-
ity is contradictory. Because aU tests show that nickel additions result ina second, lower cell-voltage plateau on discharge after cycling, this additive
does not appear to be beneficial in the long run (Reference 88).
"Teflonated" cadmium plates have a somewhat lower initial utilization
than nonteflonated plates(Reference 54); therefore, a given electrode mass
provides a smaller initial excess over the positive capacity. However,because life-test data to date indicate that teflonated negatives exhibit lessfading with cycling (Section 3.4.1.6), no additional mass may be needed for
an adequate negative excess at end of life.
CELL PROPERTIES AND PERFORMANCE 129
Nonsintered cadmium-plate designs, such as the so-called "sponge" type
and various pressed composition types have been proposed for spacecraft
nickel-cadmium cells. These materials have significantly lower mass for a
given negative capacity than sintered plates but suffer from much more
rapid fading with cycling. Nonsintered cadmium plates have been flown insilver-cadmium cells but not in sealed nickel-cadmium cells.
When adequate excess negative capacity is installed, the only overall aspect
of negative-electrode design known to affect initial capacity is the pre-
charge level. Seiger reports that an amount of precharge (by venting
oxygen) equal to 20 percent of the positive capacity is required to obtain
the maximum cell capacity from a new cell (Reference 8). However, one
study showed that this effect of initially added precharge disappeared after
10 cycles, after which capacity with no added precharge equaled that in
cells with large amounts of precharge (Reference 102). This result, obtained
by using a 130-percent recharge ratio, is consistent with the effect of cyc-
ling and overcharge described by Maurer (References 32 and 45), whereby
inactive excess charged negative is converted to active charged excess and
therefore has the same effect as that of precharge added by adjustment.
The effect of separator design on initial capacity is not well-defined.
Occasional comments appear in the literature to the effect that lower
capacity was observed with a polypropylene separator than with a nylon
separator (i.e., Pelion 2505). No such difference has been observed under
controlled test conditions in programs in which special attention was given
to obtaining adequate electrolyte in the cells (References 51 and 103).
The authors believe that the lower initial capacities that some observed
with polypropylene were due, not to the separator material per se, but to
the fact that the electrolyte present in the cell or in the separator was insuf-
ficient to provide full capacity.
When the cell is finally seaJed, the amount of electrolyte, if too small, can
result in low discharge voltage and/or capacity. The optimum amount for a
particular cell design is a function of plate and separator design and, more
specifically, of the residual dry void volume of the plate stack. For cells
made with chemically impregnated plates such as those now commerciallyavailable, initial capacity is affected when the level of electrolyte is less
than about 2.5 ml/Ah of capacity. With electrochemically impregnated
plates, this effect occurs at about 3 ml/Ah per ampere-hour, presumably
because of the higher plate void volume per ampere-hour.

130 Ni-Cd BATTERY APPLICATIONS MANUAL
3.3.2.3 Effects of Manufectuting-Process Variations on Capacity
Initial specific capacity and specific energy of cells are probably affected
by many process variables. Discussion of all such variables is beyond the
scope of this manual. Those having the greatest effect per unit of cell massare considered here. Although they were produced by different processes,
products (plates and cells) with the same physical properties are compared.
Whether the plaque used for impregnation is made by the dry 0oose) or
by the slurry-coated sinter process does not appear to affect initial flooded
capacity of positive plates having a given thickness, plaque void fraction,and loading level. On the other hand, whether the plaque is impregnated
by the chemical or by the electrochemical precipitation process has a
sizeable effect. Generally, utilization of active material in chemically
impregnated (CI) plates during flooded formation cycling is about 0.26
ampere-hour per gram (from manufacturing test data) or 90 percent of
theoretical. Utilization of electrochemically impregnated (EI) plate is re-
ported (Reference 17) to be 0.31 to 0.33 ampere-hour per gram (110 to
115 percent of theoretical) under similar conditions: Because the ratio of
starved-cell capacity to flooded capacity is about 0.85 for both types of
plates, less active material and less plate material (and mass) are needed for
a given capacity for El plates, and initial specific capacity and specific
energy will be correspondingly greater.
In one study, increasing the number of electrical cycles first used on newly
impregnated positive-plate material (referred to variously as fwst formationor electrochemical cleaning) increased the initial capacity of positive
plates (Reference 57). Thus, variations in details of initial formation appear
to be responsible for some observed low and/or variable capacity in com-
pleted ceils. Most manufacturers perform additional formation cycling of
plates in the form of open cells before assembling the spacecraft cell. Thistends to minimize the effect of variations attributable to earlier formation
processing. The cell user is normally not in a position to influence the
procedure for either of these formation steps, but should attempt to deter-mine if they are properly controlled.
3.3.3 Initial Cyclic Charge and Discharge
Previous sections described charge and discharge behavior immediately
following the reconstituting effect of complete discharge as obtained on aresistive short-down (i.e., before significant change in the cell physics and
CELL PROPERTIES AND PERFORMANCE 131
chemistry has occurred). This section reviews differences from the initial
behavior observed to the result from limited continuous cycling* (such as
that used for acceptance testing). This information applies to about the
fwst 50 cycles at the beginning of cell life, during which it is assumed thatthe cells are shorted down several times.
During continuous cycling, the cell is charged and discharged differently
than for a one-shot cycle. The cell is charged for a shorter period of _ne
and often with an imposed voltage limit, and discharge is not carried to
completion, but usually is limited to a value considerably less than the
rated capacity. Under such conditions, the cell usually does not have 0_ne
to become as fully charged or as fully discharged on any one cycle as on the
longer one-shot type cycle, and cell behavior is modified accordingly.
The cell voltage and internal-pressure profiles during continuous cycling
are functions of cycle length, operating temperature, depth of discharge,
charge rate, and charge-control method used. During acceptance testing and
capacity measurement of ceils, as well as during eclipse seasons in a syn-chronous equatorial orbit, cycle length is on the order of 24 hours, tem-
perature is usually 5 to 250C, and charge rates are 0.05C to 0.1C. Under
such conditions, the behavior shown in figure 48 is typical of a system
operating at 0 to 15°C, in which charge control involves switching from a
constant 0.1C rate to a constant 0.01C rate for overcharge. Auxiliary
(oxygen signal) electrode voltage and cell temperature are also shown for
reference. As may be seen, cell voltage, pressure, temperature, and auxiliary
electrode voltage rise together as the cell approaches full charge. The
dashed-line extensions indicate the behavior to be expected if charging
were continued beyond the point at which switching to the lower level
occurred. The degree of increase in cell voltage (and pressure) is less at
higher temperatures, as shown by figures 21 through 25. The extent of
temperature rise is a function of the thermal design of the cell, the batter),"
structure, and the heat sink. (See Section 8.)
Figure 49 shows a typical initial performance profile of a cell operating in
a 100-minute cycle without voltage-limiting on charge. Higher charge rates
are involved than those normally used for longer cycles, and, consequently.
*Continuous cycling as used here means that more than one cycle is performedconsecutively and that each discharge or charge follows the previous opposite half-cycle either immediately or with an intervening period of trickle charge or open cir-cuit that lasts for only a fraction of the normal cycle period.
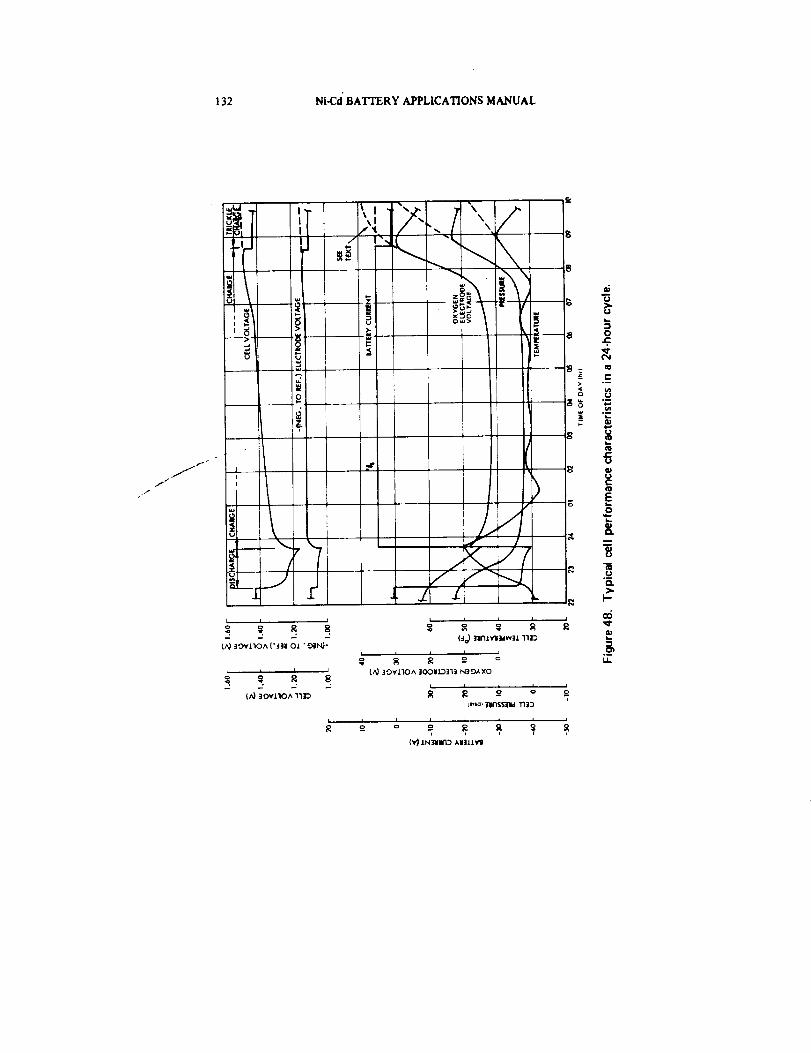
132 Ni-Cd" BATTERY APPLICATIONS MANUAL
/

CELL PROPERTIES AND PERFORMANCE 133
1.6
1.5
_" 1.40
-4
1.3
1.2
CELL VOLTAG
I I I l
.|
20
LUa:IL
0 1 I I I I
lo
A
5
I-
RE
j HEAT - SINK TEMP. 5°C I
1 I I I I
0 0 20 40 60 80 100
TIME ON CYCLE IminuteS)
Figure 49. Typical cell performance characteristics
during 100-minute repetitive cyding without voltage-
limiting.
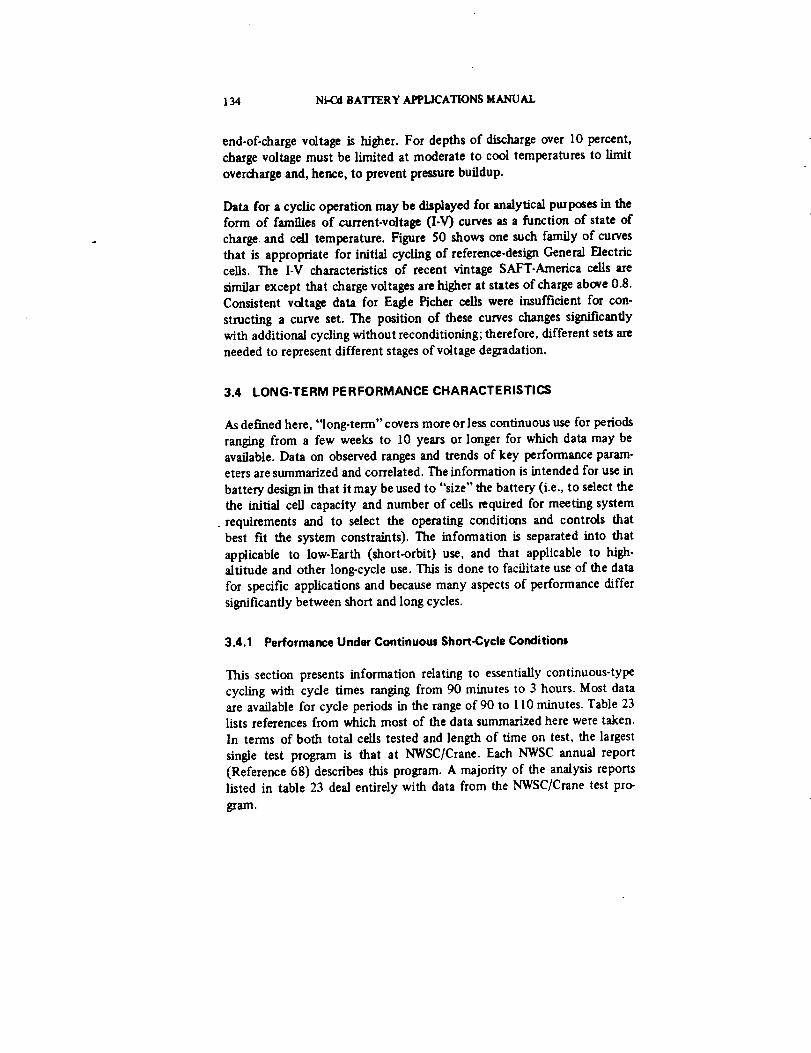
134 Ni-C__ BATTERY APPLICATIONS MANUAL
end-of-charge voltage is higher. For depths of discharge over 10 percent,
charge voltage must be limited at moderate to cool temperatures to limitovercharge and, hence, to prevent pressure buildup.
Data for a cyclic operation may be displayed for analytical purposes in theform of families of current-voltage (I-V) curves as a function of state of
charge and cell temperature. Figure 50 shows one such family of curvesthat is appropriate for initial cycling of reference-design General Electricceils. The I-V characteristics of recent vintage SAFT-America cells are
similar except that charge voltages are higher at states of charge above 0.8.Consistent voltage data for Eagle Picher cells were insufficient for con-structing a curve set. The position of these curves changes significantlywith additional cycling without reconditioning; therefore, different sets are
needed to represent different stages of voltage degradation.
3.4 LONG-TERM PERFORMANCE CHARACTERISTICS
As defined here, "long-term" covers more or less continuous use for periods
ranging from a few weeks to 10 years or longer for which data may beav_able. Data on observed ranges and trends of key performance param-eters are summarized and correlated. The information is intended for use in
battery design in that it may be used to "size" the battery (i.e., to select thethe initial cell capacity and number of cells required for meeting system
requirements and to select the operating conditions and controls thatbest fit the system constraints). The information is separated into thatapplicable to low-Earth (short-orbit) use, and that applicable to high-altitude and other long-cycle use. This is done to facilitate use of the datafor specific applications and because many aspects of performance differ
significantly between short and long cycles.
3.4.1 PerformanceUnder ContinuousShort-CycleConditions
This section presents information relating to essentially continuous-typecycling with cycle times ranging from 90 minutes to 3 hours. Most dataare available for cycle periods in the range of 90 to 1l0 minutes. Table 23lists references from which most of the data summarized here were taken.In terms of both total cells tested and length of time on test, the largest
single test program is that at NWSC/Crane. Each NWSC annual report
(Reference 68) describes this program. A majority of the analysis reportslisted in table 23 deal entirely with data from the NWSC/Crane test pro-
gram.
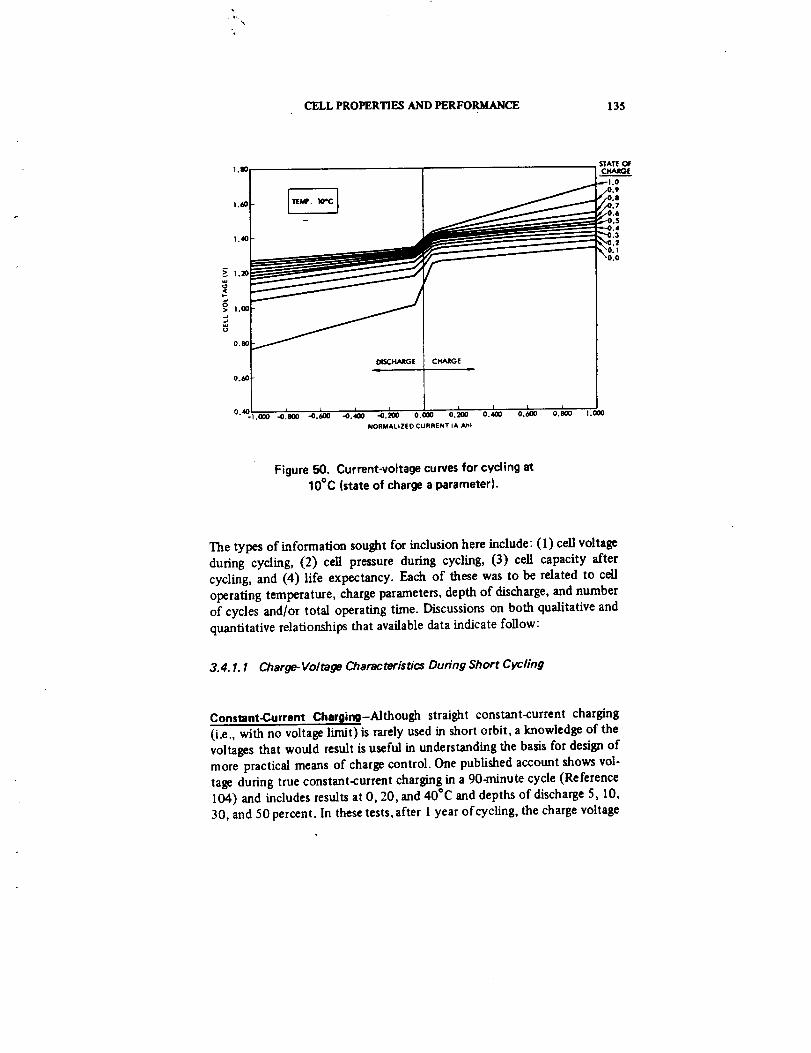
CELL PROPERTIES AND PERFORMANCE 135
> 1._
0.60
0.40 m
CHARGE
.OOO _.NO -0.-'_-_A_----_--_.O00-0.400 -0.200 0._00 0.40O 0.600 O.SO0 1.000
NORMALtZEO CURRENT IA A_,)
Figure 50. Current-voltage curves for cycling at
10°C (state of charge a parameter).
The types of information sought for inclusion here include: (1) cell voltage
during cycling, (2) cell pressure during cycling, (3) cell capacity after
cycling, and (4) life expectancy. Each of these was to be related to cell
operating temperature, charge parameters, depth of discharge, and number
of cycles and/or total operating time. Discussions on both qualitative and
quantitative relationships that available data indicate follow:
3.4. 1.1 Charge- Voltage Characteristics During Short Cycling
Constant-Current Charging-Although straight constant-current charging
(i.e., with no voltage limit) is rarely used in short orbit, a knowledge of the
voltages that would result is useful in understanding the basis for design of
more practical means of charge control. One published account shows vol-
tage during true constant-current charging in a 90-minute cycle (Reference
104) and includes results at 0, 20, and 40°C and depths of discharge 5, 10,
30, and 50 percent. In these tests, after 1 year of cycling, the charge voltage

136 Ni-Cd BATI'ERY APPLICATIONS MANUAL
[-.
<
t--t_
e.
O
O
&= o
A
_ _ "_, - _" =, _
]=
.. x x x x
_8 ......
,o
|!_Eo c
cz
_=_!-

CELL PROPERTIES AND PERFORMANCE 137
exhibited a short plateau at 1.35 to 1.45 volts. This plateau voltage in.
creased with decreasing temperature but was independent of depth of dis,
charge. The end-of-charge voltage, on the other hand, increased sharply as
temperature decreased and as depth of discharge increased, as shown intable 24.
Table 24
End-of-Charge Voltages on Constant-Current Charge
in 90-minute Cycles After 5000 Cycles (Reference 104)
Temperature CC)
0
20
40
Depth-of-Discharge (percent)
5
1.57
1.43
1.45
I0
1.61
1.47
1.45
30
1.63
i.55
i .45
50
1.67
1.55
Although the reference does not state the recharge ratio for these tests, it is
estimated from the shapes of the voltage curves to be 1.25 or greater. The
increasing voltages at higher depths of discharge result from the fact that
charge current must increase as depth of discharge increases in order to
adequately recharge the cells in the 60.minute charge period.
Because most of the voltages in table 24 may result in rapid gas evolution
(figure 3 l), they tend to cause a net pressure increase from cycle to cycle,
leading to excessive pressure and internal temperatures after many cycles.
To prevent this occurrence, a voltage limit is usually applied. Most low-Earth-orbit related testing and applications over the last 10 years have
involved such a voltage limit.
Charge Current-Voltage Performance Using Voltage-Limited Charging-
Figure 51 shows voltage and current characteristics typical of l O0-rninute
cycling with a charge-voltage limit. If curves 1A and IB represent thebehavior of a cell that has not been previously subjected to extended
continuous cycling, then curves 2A and 2B and 3A and 3B represent two
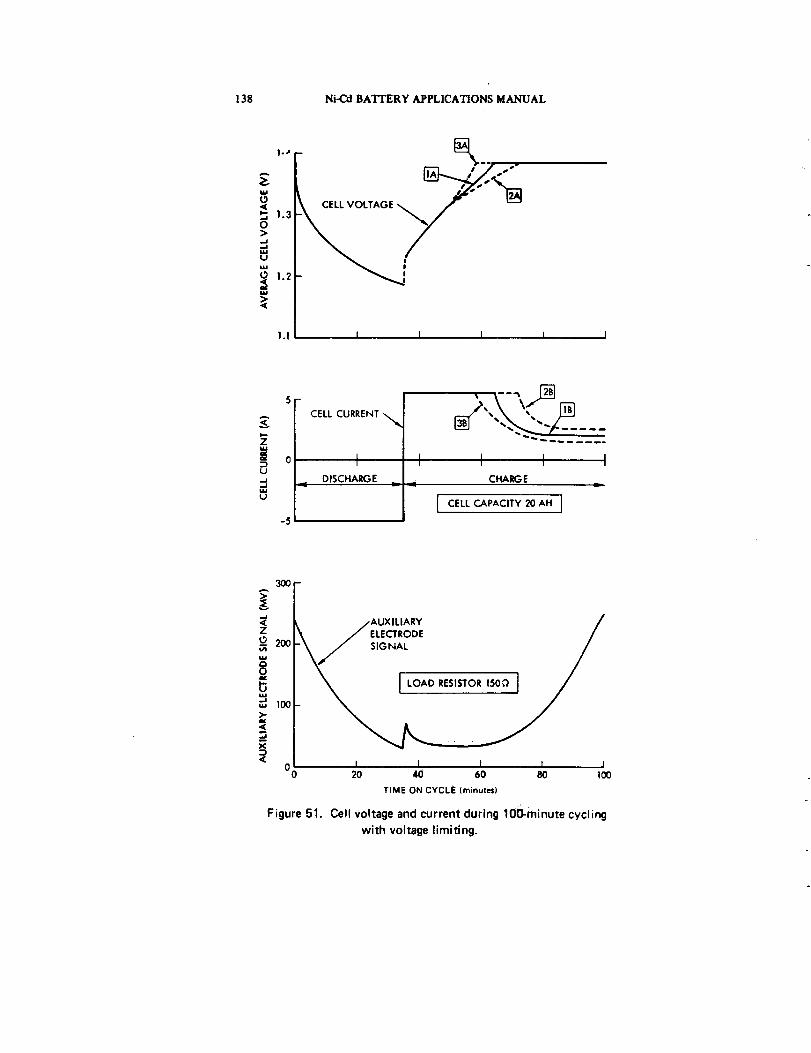
138 Ni-Cd BATTERY APPLICATIONS MANUAL
A
O>
|°,,i
1.3
1.2
1.1 I I I I I
A
=3U
-5
CELL CURRENT ,,_
IDISCHARGE
".._':_ -I t I
CHARGE
CELL CAPACITY 20 AH ]
Z
g
X
300
200
100
0 o
/AUXILIARY /
/ELECTRODE /
\/ /
J I I 1 l20 40 60 80 100
TIME ON CYCLE (minutes)
Figure 51. Cell voltage and current during lO0-minute cycling
with voltage limiting.
CELL PROPERTIES AND PERFORMANCE 139
ways that the voltage-current characteristics have been observed to charge
with cycling. On curve 2A, charge voltage venus time is below that for
curve 1A, the voltage limit is reached later, and, as for curve 2B, the cur-
rent remains higher than that for curve lB. The opposite is true for curves
3A and 3B.
Most cells progress from curve 1 in the direction of curve 2 during the first
several hundred cycles on life test (References 68, 115, and 116). After
that, the characteristics of better performing cells tend to remain in the
region between curves 1 and 2, whereas those of cells that experience un-
usually rapid fading or that have inadequate active uncharged excess neg-
ative capacity tend to move toward curve 3. Furthermore, life-cycle test
data (Reference 68) indicate that lower charge-voltage limits (at a given
temperature) tend to keep charge-voltage characteristics low and suppressthe development of high charge-voltage behavior. The lower voltage limit
causes the current to cut back at a lower state of charge, making charge
voltage less sensitive to variations in the condition of the negative electrode.
When using voltage limits that have been found best for long cycle life, the
end-of-charge current at the beginning of cycle is about 25 percent of the
maximum available charge current (before voltage limiting), the exact frac-
tion depending on cell temperature. As cycling continues under a f'Lxed-
voltage limit (which is usually adjusted to give a recharge ratio of less than
1.10 at moderate temperatures at the beginning of cycling), the end-of-
charge current and recharge ratio gradually increase. Without adjustment of
the voltage limit, end-of-charge current can increase by as much as 50 per-cent before it stabilizes. When end-of-charge current increases in this way,
the voltage limit must be decreased if the recharge ratio is to be kept closeto its initial value. This adjustment was made during many of the low-
Earth-orbit life tests performed at NWSC/Crane (Reference 68). The degree
of this change appears to be greater for General Electric cells of more re-
cent vintage than it is for older cells and SAFT-America cells.
The foregoing analysis applies strictly ordy when each cell is controlled
with an individual voltage limit, when many cells are operated in series in a
battery with a voltage limit applied at the battery terminals, as is usually
the case, all the cells are charged at the maximum current for the same
period of time, all cells experience the same current taper, and cell-voltage
divergence around the average per-cell limit voltage occurs. This divergenceincreases with recharge ratios greater than 1.0 and with the number of
cycles (Reference 49). Selection of ceils that were more closely matched
for capacity decreased the observed cell divergence.
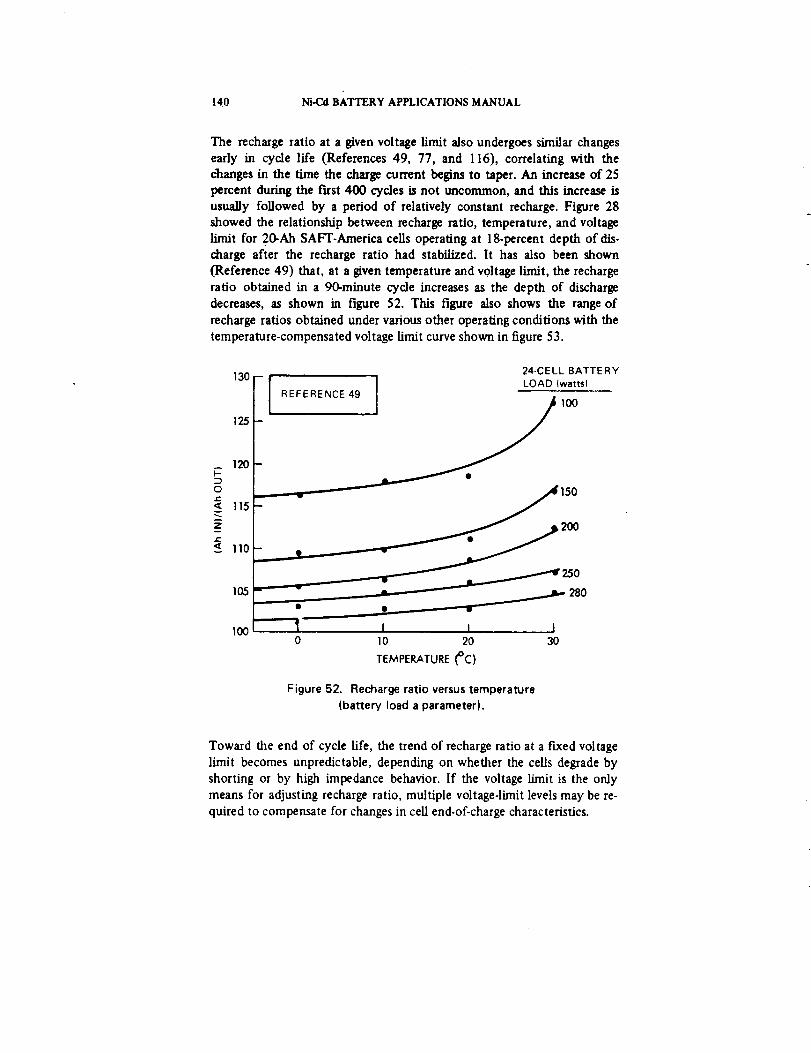
140 Ni-Cd BATTERY APPLICATIONS MANUAL
The recharge ratio at a given voltage limit also undergoes similar changes
early in cycle life (References 49, 77, and 116), correlating with the
changes in the time the charge current begins to taper. An increase of 25
percent during the first 400 cycles is not uncommon, and this increase is
usually followed by a period of relatively constant recharge. Figure 28
showed the relationship between recharge ratio, temperature, and voltage
limit for 20-Ah SAFT-America cells operating at 18-percent depth of dis-
charge after the recharge ratio had stabilized. It has also been shown
(Reference 49) that, at a given temperature and voltage limit, the recharge
raUo obtained in a 90-minute cycle increases as the depth of discharge
decreases, as shown in figure 52. This figure also shows the range of
recharge ratios obtained under various other operating conditions with the
temperature-compensated voltage limit curve shown in figure 53.
130
125
120
oe-
',_ 115
ze-
<_ 110
105
IO0
24-CELL BATTERYLOAD (watts)
REFERENCE 49
. / 150
• ____ 280
I I 110 20 30
TEMPERATURE_C)
0
Figure 52. Recharge ratio versus temperature
(battery load a parameter).
Toward the end of cycle life, the trend of recharge ratio at a fixed voltage
limit becomes unpredictable, depending on whether the cells degrade by
shorting or by high impedance behavior. If the voltage limit is the only
means for adjusting recharge ratio, multiple voltage-limit levels may be re-
quired to compensate for changes in ceLl end-of-charge characteristics.
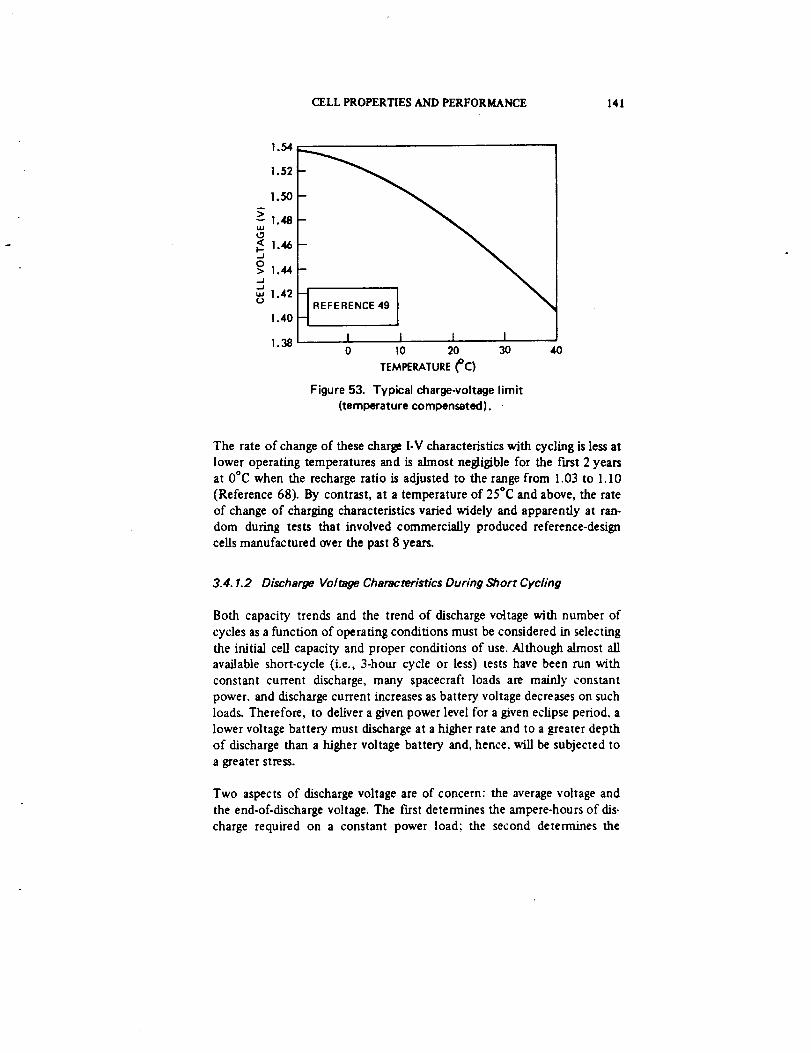
CELLPROPERTIESANDPERFORMANCE 141
1.54
1.52
!.50
i.48
_1,44
g 1.42
1.40
1.38 I I I I0 10 20 30
TEMPERATURE(°C)
Figure 53. Typical eharge-volt_e limit(temperature compensated)..
4O
The rate of change of these charge I-V characteristics with cycling is less at
lower operating temperatures and is almost negligible for the first 2 years
at O°C when the recharge ratio is adjusted to the range from 1.03 to 1.10
(Reference 68). By contrast, at a temperature of 25°C and above, the rate
of change of charging characteristics varied widely and apparently at ran-
dom during tests that involved commercially produced reference-design
cells manufactured over the past 8 years.
3.4. 1.2 Discharge Voltage Characteristics During ShortCycling
Both capacity trends and the trend of discharge voltage with number of
cycles as a function of operating conditions must be considered in selecting
the initial cell capacity and proper conditions of use. Although almost all
available short-cycle (i.e., 3-hour cycle or less) tests have been run with
constant current discharge, many spacecraft loads are mainly constant
power, and discharge current increases as battery voltage decreases on suchloads. Therefore, to deliver a given power level for a given eclipse period, a
lower voltage battery must discharge at a higher rate and to a greater depth
of discharge than a higher voltage battery and, hence, will be subjected to
a greater stress.
Two aspects of discharge voltage are of concern: the average voltage and
the end-of-discharge voltage. The first determines the ampere-hours of dis-
charge required on a constant power load: the second determines the
142 Ni-Cd BATTERY APPLICATIONS MANUAL
maximum discharge rate and whether the battery voltage will remain with-
in the range required for proper operation of the system. Average discharge
voltage may be defined as equal to (watt-hours discharged)/(ampere-hours
discharged). The denominator of this fraction is easily calculated but the
numerator must be evaluated by integrating volt-amperes over the discharge
time interval. For constant-power discharge, the ease of calculating numer-
ator and denominator is reversed. No average voltage data were found for
either kind of testing.
When the discharge voltage versus ampere-hours curve is nearly a straight
line, the mid-discharge voltage is a good approximation to the average dis-
charge voltage. This is the case early in cycle life for low depths of dis-
charge and for low-temperature operation (References 68 and 104). Under
less favorable operating conditions, the mid-discharge voltage may decline
only slightly, whereas the end.of-discharge voltage drops sharply, indicating
a rapid decline in voltage during the last half of discharge. Therefore,
knowledge of both mid-discharge and end-of-discharge voltages permits a
visualization of the shape of the discharge voltage curve and, hence, some
estimate of the degree of voltage regulation that is obtainable. The annual
reports of the NWSC/Crane test program (Reference 68) contain consider-
able data on mid-discharge voltage.
Table 25 shows data from 35 representative packs of cells on low Earth-
orbit life tests at NWSC/Crane. The table includes only cells made by
General Electric and SAFT.America because insufficient long-term testdata were available for cells from other manufacturers. No cell failures had
occurred in any of the packs shown within the number of cycles shown foreach.
In table 25, cell packs are listed in order of increasing operating tempera-ture and increasing depth of discharge. Test items 1 through 10 involved
cells made prior to 1968 before more stringent controls were applied to all
manufacturing. Furthermore, spacecraft cells made by General Electric
contained plates of significantly different thickness and loading before
1968 than they did after 1968. As shown in a recent report by NWSC/
Crane (Reference 117), before 1968 positive plate thickness was 0.86 mm
(0.034 inch) and negative plate thickness was 0.74 mm (0.029 inch)in
uncycled General Electric cells (i.e., the positive plates were thicker than
the negative plates, as were SAFT-America cells at that time). After 1968,
plate thicknesses provided by General Electric were as shown for reference-
design cells in table 11 (i.e., the positive plates were thinner than the
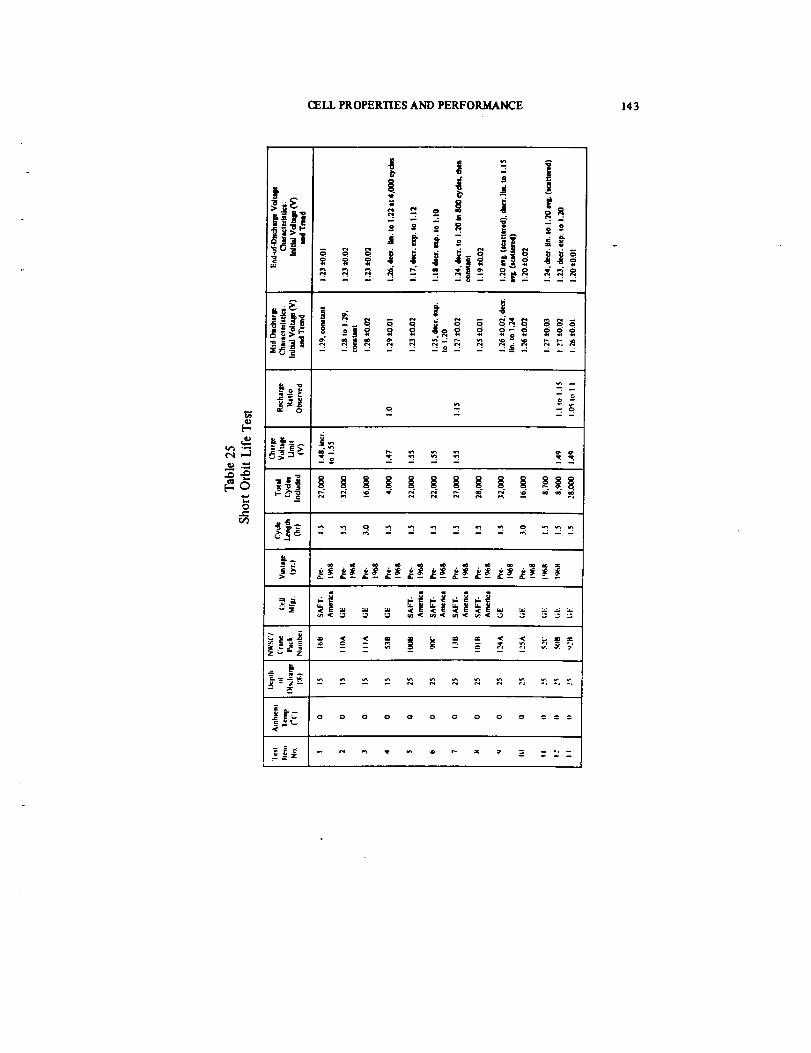
CELL PROPERTIES AND PERFORMANCE 143
,f
! : |o _
" o R• - ": .f _ ._
g g
A
-,'_ _ _ _ . _-:_ _ _. _"-__e
o
z:_--z
t_o

144 Ni-Cd BATTERY APPLICATIONS MANUAL
., o .i l_
i i'i _
" - J i_ : "
". ": - ° " :.'; ;t
i i "" t!-_ 4
_o_ - = -_ -_ ._
,,_ ..... . . . .
@
t",i
,,_, "_ A i,G ,i_
_...I_ _ _ " _
li, A.. _v- _ _
n
_'_'_i " -
It
I: .
l'c °
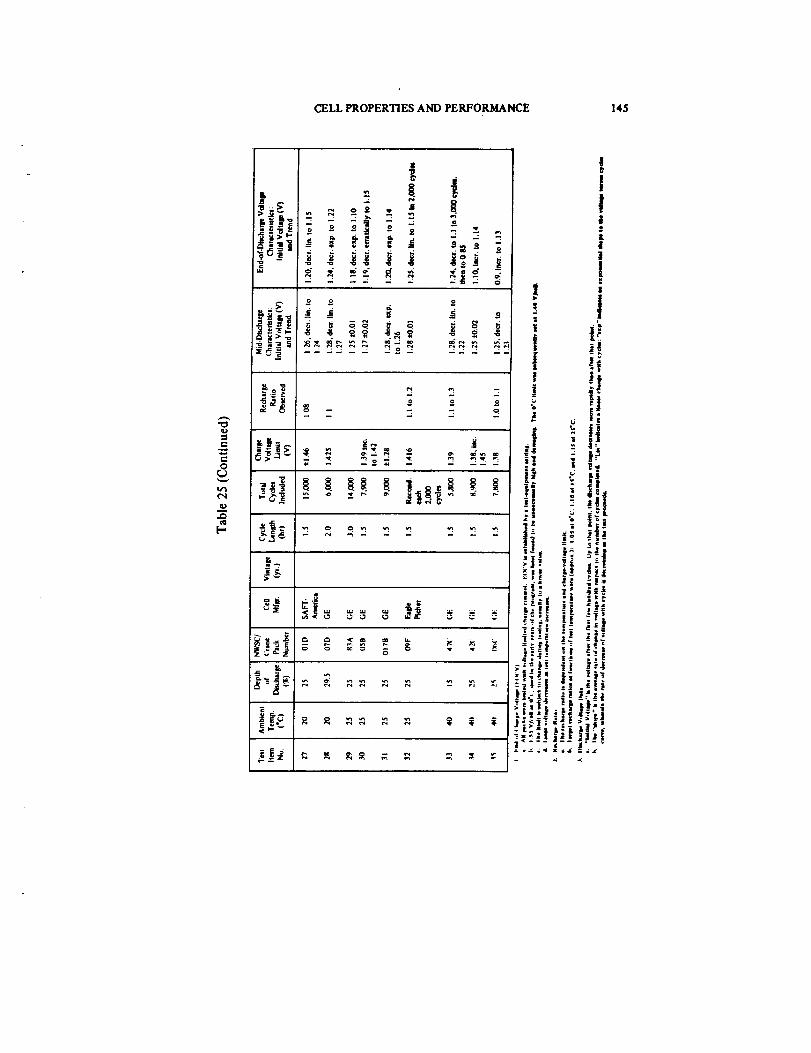
CELL PROPERTIES AND PERFORMANCE 145
@
q.)
,JD
[-
°
_. i_..__ _

146_ Ni-Cd BATTERY APPLICATIONS MANUAL
negative plates). The thickness of the plates supplied by SAFT-America
in their standard spacecraft cell has remained unchanged; however, some
variation on thickness and loading is available on special order from this
company.
In table 25, note that different tests have progressed to different numbers
of cycles and that the final discharge-voltage data apply at the end of the
number of cycles completed. Analysis of the discharge data in table 25reveals that:
• For mid-discharge voltage behavior:
Initial mid-discharge voltages ranged mainly from 1.25 to 1.29volts with extremes at 1.23 and 1.30 volts. No correlation of
this voltage with either test temperature or charge-voltage limit
is apparent. Midvoltages were slightly lower at higher depths of
discharge.
The trend of the mid-discharge voltage was either constant
(+0.02 volt) or decreasing linearly with cycles at a rate of 1 to
2 mV per 1000 cycles in the test temperature range from 0 to
25°C. The rates of charge increased with temperature and depth
of discharge.
• For end-of-discharge voltage behavior:
Initial end-of.discharge voltages ranged mainly from 1.20 to
1.24 volts with extremes at 1.18 and 1.25 volts. Higher values
are associated with lower test temperatures and lower depths
of discharge.
With some exceptions, final end-of-discharge voltages ranged
from 1.20 to 1.23 volts at lower temperatures and depths of
discharge, and between 1.15 and 1.20 volts at higher tempera-
tures and depths of discharge. Generally, the higher the
voltage at any point in the test, the more rapidly the voltage
decreased with cycling. Although rates of charge varied widely
between packs, they tended to be greater at higher tempera-
ture. The rate of decay between the initial and the final
voltage levels ranges from 5 to 20 mV per 1000 cycles when
linear and from 20 to 40 mV per cycle-decade when exponen-
tial. At a given combination of temperature and depth of
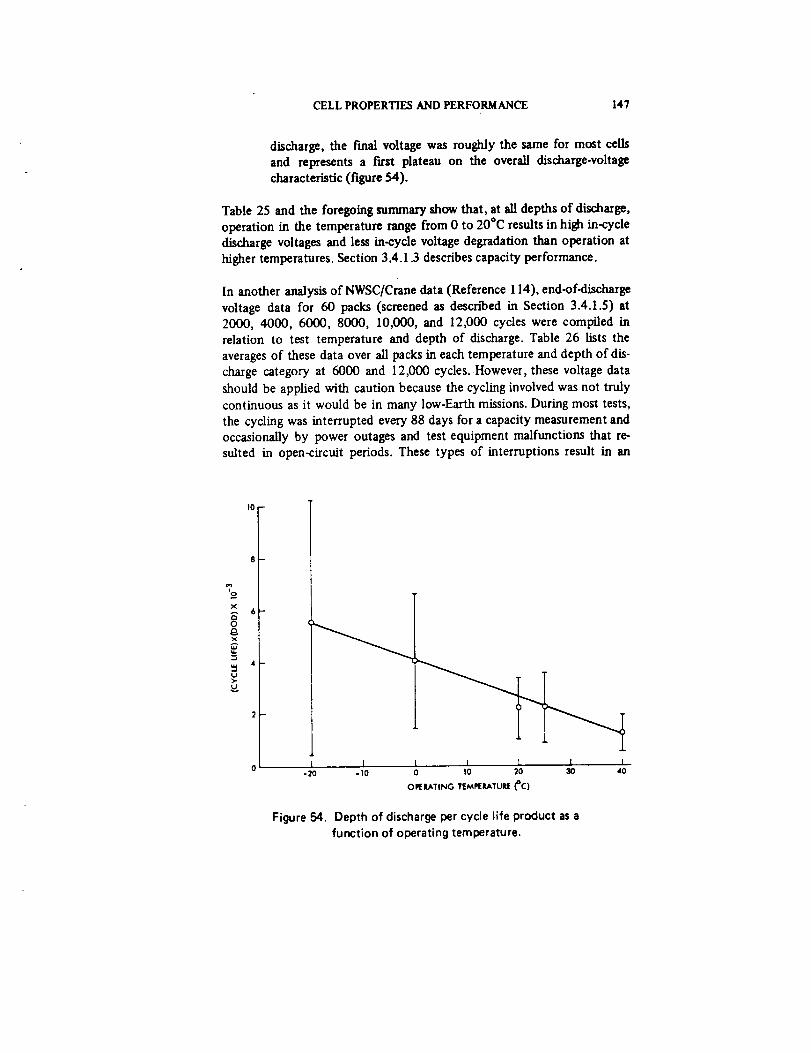
CELL PROPERTIES AND PERFORMANCE 147
discharge, the final voltage was roughly the same for most cells
and represents a first plateau on the overall discharge-voltage
characteristic (figure 54).
Table 25 and the foregoing summary show that, at all depths of discharge,
operation in the temperature range from 0 to 20°C results in high in-cycle
discharge voltages and less in-cycle voltage degradation than operation at
higher temperatures. Section 3.4.1.3 describes capacity performance.
In another analysis of NWSC/Crane data (Reference 114), end-of-discharge
voltage data for 60 packs (screened as described in Section 3.4.1.5) at2000, 4000, 6000, 8000, 10,000, and 12,000 cycles were compiled in
relation to test temperature and depth of discharge. Table 26 lists the
averages of these data over all packs in each temperature and depth of dis-
charge category at 6000 and 12,000 cycles. However, these voltage data
should be applied with caution because the cycling involved was not truly
continuous as it would be in many low-Earth missions. During most tests,
the cycling was interrupted every 88 days for a capacity measurement and
occasionally by power outages and test equipment malfunctions that re-
sulted in open-circuit periods. These types of interruptions result in an
o
r_O
U>.
-20 oi0
I i 1 I io lO 20 30 40
OIEIL&TINGTEMPERATURE_C)
Figure 54. Depth of discharge per cycle life product as a
function of operating temperature.
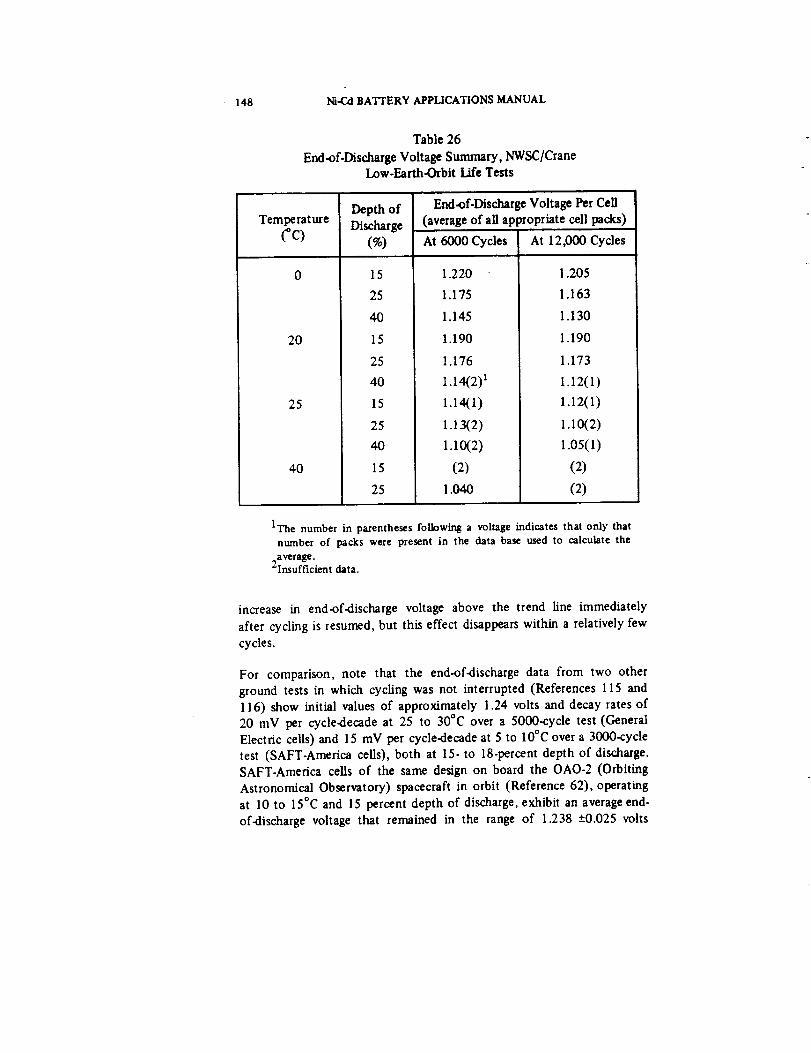
148 Ni-C_,dBATTERY APPLICATIONS MANUAL
Table 26
End-of.DischargeVoltageSummary, NWSC/Crane
Low-Earth-Orbit Life Tests
TemperatureCc)
20
25
40
Depth of
Discharge
(%)
15
25
40
15
25
40
15
25
40
15
25
End-of-Discharge Voltage Per Cell
(average of all appropriate cell packs)
At 6000 Cycles
1.220
1.175
1.145
1.190
1.176
1.14(2) 1
1.14(1)
1.13(2)
1.10(2)
(2)
1.040
At 12,000 Cycles
1.205
1.163
1.130
1.190
1.173
1.12(1)
1.12(1)
1.10(2)
1.05(l)
(2)
(2)
1The number in parentheses following a voltage indicates that only thatnumber of packs were present in the data base used to calculate the
2average.Insufficient data.
increase in end-of-discharge voltage above the trend line immediately
after cycling is resumed, but this effect disappears within a relatively few
cycles.
For comparison, note that the end-of-discharge data from two other
ground tests in which cycling was not interrupted (References 115 and
116) show initial values of approximately 1.24 volts and decay rates of
20 mV per cycle-decade at 25 to 30°C over a 5000-cycle test (General
Electric cells) and 15 mV per cycle.decade at 5 to IO°C over a 3000-cycle
test (SAFT-America cells), both at 15- to 18-percent depth of discharge.SAFT-America cells of the same design on board the OAO-2 (Orbiting
Astronomical Observatory) spacecraft in orbit (Reference 62), operating
at 10 to 15°C and 15 percent depth of discharge, exhibit an average end-
of-discharge voltage that remained in the range of 1.238 ±0.025 volts
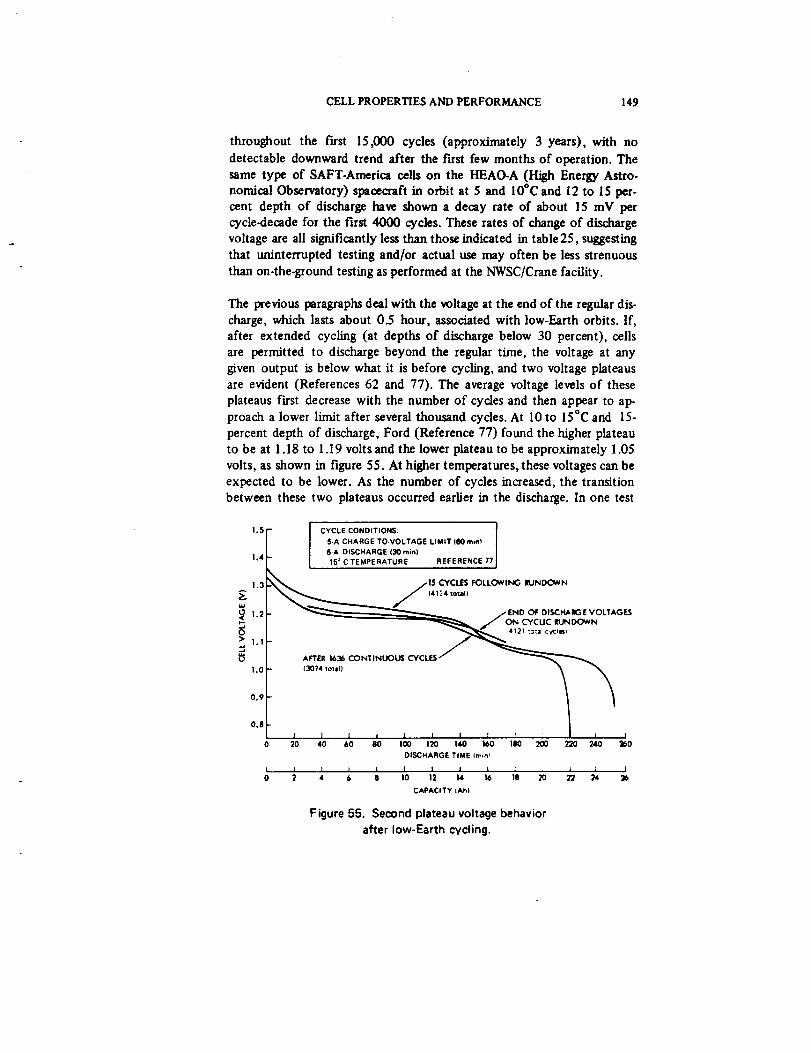
CELL PROPERTIES AND PERFORMANCE 149
throughout the first 15,000 cycles (approximately 3 years), with no
detectable downward trend after the first few months of operation. The
same type of SAFT-America cells on the HEAO-A (High Energy Astro-nomical Observatory) spacecraft in orbit at 5 and 10°C and 12 to 15 per-
cent depth of discharge have shown a decay rate of about 15 mV per
cycle-decade for the first 4000 cycles. These rates of change of discharge
voltage are all significantly less than those indicated in table 25, suggesting
that uninterrupted testing and/or actual use may often be less strenuous
than on-the-ground testing as performed at the NWSC/Crane facility.
The previous paragraphs deal with the voltage at the end of the regular dis-
charge, which lasts about 0.5 hour, assocbted with low-Earth orbits. If,
after extended cycling (at depths of discharge below 30 percent), cells
are permitted to discharge beyond the regular time, the voltage at any
given output is below what it is before cycling, and two voltage plateaus
are evident (References 62 and 77). The average voltage levels of these
plateaus first decrease with the number of cycles and then appear to ap-
proach a lower limit after several thousand cycles. At 10 to 15°C and 15-
percent depth of discharge, Ford (Reference 77) found the higher plateau
to be at 1.18 to 1.19 volts and the lower plateau to be approximately 1.05
volts, as shown in figure 55. At higher temperatures, these voltages can be
expected to be lower. As the number of cycles increased, the transition
between these two plateaus occurred earlier in the discharge. In one test
1.5
1.4
1.3
1.2p-
> 1.l
1.0
0.9
0.8
0
i
0
CYCLE CONDITIONS: [
5-A CHARGE-TO-VOLTAGE LIMIT |@0 mint
@-A OISCHARGE (30 rain)
15 + C TEMPERATURE REFERENCE 77
/15 CYCLES FOLLOWING III'UND(_._IN14114 total)
].E,,,0 o_0,so.,,m,VOW,AGES
AFTEIt 1636 CONTINUOUS CYCLES / __
I I I I I I I l I I
20 40 60 80 100 120 140 160 lIK} 200 220 240 360
DISCHARGE TIME Iminl
I Z I I I I I l i i I
2 4 6 6 10 12 14 16 18 20 22 24 _6
CAPACITY lAb)
Figure 55. Second plateau voltage behavior
after low-Earth cycling.
150 Ni-Cd BATTERY APPLICATIONS MANUAL
(Reference 77), the upper plateau had disappeared after 11,697 consec-
utive cycles without a complete discharge. Similar experience from other,less well.documented sources indicates that this voltage behavior is typical
of low-Earth cycling and must be considered during design.
3.4. 1.3 Capacity Trends During Short-Cycle Operation
The main impact of the declining voltage characteristic described pre-
viously is its effect on cell and battery capacity to a given end voltage. If
the lower voltage limit of the power-system bus is too high and, more
specifically, if it corresponds to an average cell voltage greater than that of
the lower plateau, then loss of some usable capacity will occur earlier in
cycle life than if the lower voltage limit is set at 1.0 volt per cell. This
effect is illustrated graphically by two capacity versus cycle versus end-
voltage plots in the "13th Annual Report of the Cycle Life Test" by
NWSC/Crane (Reference 118). For example, the capacity down to 1.1 volt
per cell was consistently less than 75 percent of that to 1.0 volt per cell at
0°C and 25 percent depth of discharge.
These data also show that the capacity to a given end voltage decreases
more rapidly at higher temperature and at higher in-cycle depth of dis-
charge. At the same time, operation at lower temperature (0°C compared
to 25 or 40°C) compensated for the severe rate of loss of capacity that
would be expected from operation at both high depth of discharge and
high temperature. During testing, similar effects of operating temperature
on capacity were found (Reference 49) for a much smaller population of
cells from one supplier in the form of 24-cell batteries.
The 6th annual report of the NWSC/Crane test program (Reference 119)contains much data for trends of capacity to 1 volt per cell. More recent
NWSC/Crane annual reports show some additional plots. These data show
that, although the general trend of capacity is downward in the long run,
the capacity of some cells and cell packs increases during the fkst several
thousand cycles of regular testing. These increases occur mainly at low
temperatures and probably result from either incomplete formation of the
positive plates during cell manufacturing or inadequate active excess
charged.negative capacity at the beginning of cycling.
The decline in capacity normally observed at O°C is roughly linear with
cycles and occurs at a rate of about 5 percent per year for most types of
cells at depths of discharge up to 25 percent. This slope remains nearly
constant for 4 to 5 years on test. At 25°C, the rate ofloss is more unpre-
dictable, ranging from 25 to 50 percent per year during the first year and
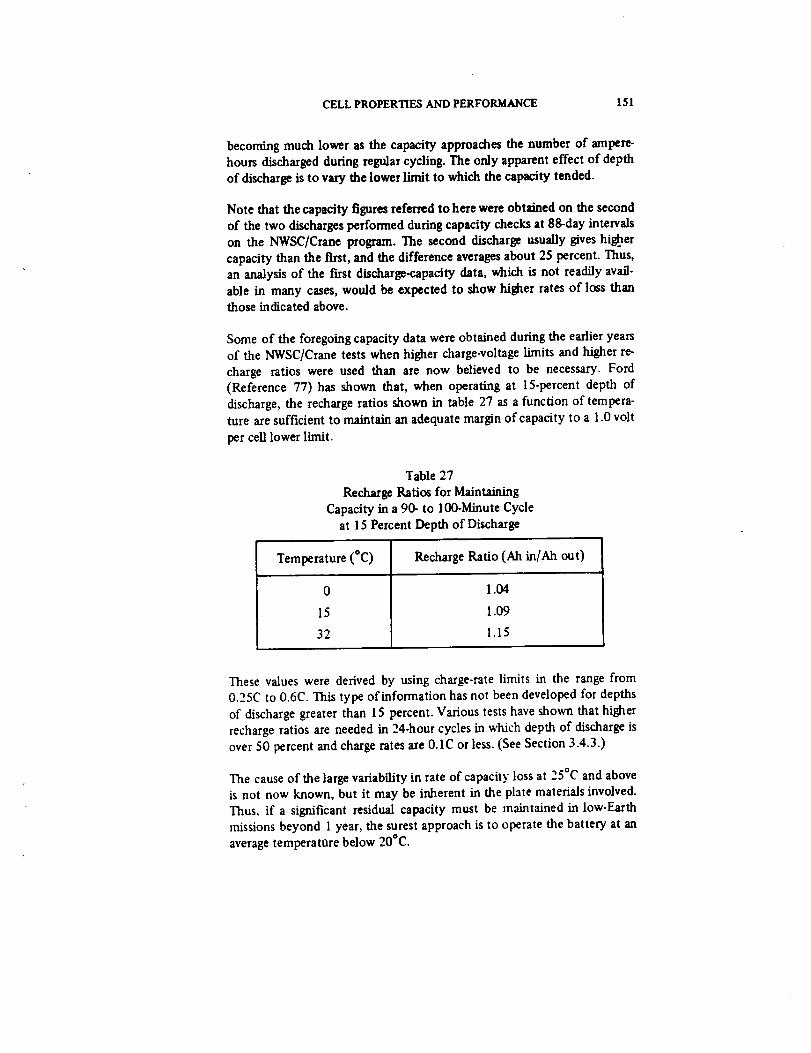
CELL PROPERTIES AND PERFORMANCE 151
becoming much lower as the capacity approaches the number of ampere-
hours discharged during regular cycling. The only apparent effect of depth
of discharge is to vary the lower limit to which the capacity tended.
Note that the capacity figures referred to here were obtained on the second
of the two discharges performed during capacity checks at 88-day intervals
on the NWSC/Crane program. The second discharge usually gives hi_er
capacity than the first, and the difference averages about 25 percent. Thus,an analysis of the first discharge-capacity data, which is not readily avail-
able in many cases, would be expected to show higher rates of loss thanthose indicated above.
Some of the foregoing capacity data were obtained during the earlier years
of the NWSC]Crane tests when higher charge-voltage limits and higher re-
charge ratios were used than are now believed to be necessary. Ford
(Reference 77) has shown that, when operating at 15-percent depth of
discharge, the recharge ratios shown in table 27 as a function of tempera-
tare are sufficient to maintain an adequate margin of capacity to a 1.0 volt
per cell lower limit.
Table 27
Recharge Ratios for Maintaining
Capacity in a 90- to 100-Minute Cycle
at 15 Percent Depth of Discharge
Temperature (°C) Recharge Ratio (All in/Ah out)
0
15
32
1.04
1.09
1.15
These values were derived by using charge-rate limits in the range from
0.25C to 0.6C. This type of information has not been developed for depths
of discharge greater than 15 percent. Various tests have shown that higher
recharge ratios are needed in 24-hour cycles in which depth of discharge is
over 50 percent and charge rates are O.1C or less. (See Section 3.4.3.)
The cause of the large variability in rate of capacity loss at 25°C and above
is not now known, but it may be inherent in the plate materials involved.
Thus. if a significant residual capacity must be maintained in low-Earth
missions beyond 1 year, the surest approach is to operate the battery at an
average temperattlre below 20°C.
152 Ni-Cd BATTERY APPLICATIONS MANUAL
3.4.1.4 Auxiliary Electrode Performance During Short-Orbit Cycling
At a given operating temperature, the output of the oxygen-signal auxiliary
electrode with a given load resistance is a function of the partial pressure of
oxygen (at a given state of charge) in the cell (References 44, 47, and 48)and the distribution of electrolyte in the vicinity of the oxygen electrode
(Reference 48), neither of which are directly measurable. As ceils are
firmly constrained while being cycled, considerable pressure can accum-
ulate before being detected if no pressure transducer is attached. Even
when total pressure is measured and found to be constant, the partial pres-
sure of oxygen at a given point in the cycle may vary from time to time.Thus, variations in auxiliary electrode signal output during life testing are
to be expected.
The trend of signal voltage under actual low-Earth-orbit test conditions hasbeen toward lower values with prolonged cycling (References 49, 68, and
120), although some increase in signal may be observed in the meantime.
Ford (Reference 120) reports that, in a low-Earth-orbit application, oxygen
electrodes performed well in SAFT-America cells over a number of years.
Output voltages at end of charge were sensitive to recharge ratio, as
expected from the relationship of oxygen pressure to recharge ratio. A loss
of signal sensitivity occurred in some cells after cycling, which was attri-
buted to an effect of hydrogen generated because the cells had become
negative-limited on charge. No direct experimental proof that hydrogenwas the cause was reported. Tests showed that normal signal behavior
could be restored by decreasing the recharge ratio at which the initial
(relative high) charge rate was reduced. Thus, stable operation of the
oxygen-signal auxiliary electrode for multiyear missions appears to be
dependent on the degree to which loss of overcharge protection and
electrolyte redistribution within the cell can be controlled. In the absenceof such controls, it is advisable to provide several selectable levels of trip
voltage for charge control, in a manner similar to that often implemented
for the battery charge-voltage limit, to accommodate up to a two-to-one
range of variation.
3.4. 1.5 Ce/I Failure Rate and Cycle Life in Short-Cycle Operation
To perform battery reliability assessments as usually required during space-
craft system design, cell failure-rate or life-expectancy data are necessary.
Failure rate is defined as the average of the hazard function and is devel-
oped mathematically in Section 8.7.4.1. The life expectancy of a cell is
the mean operating time or the mean number of cycles to failure. In an
CELL PROPERTIES AND PERFORMANCE 153
application or test in which cycling is regular and continuous, operating
time and number of cycles are directly interconvertible and either meas-
ure of life can be used without ambiguity. However, when cycling is inter-
mittent, as in eccentric and geosynchronous equatmial orbits, mean timeto failure and mean cycles to failure cannot be interconverted without a
definition of the mission profde. Therefore, there may be anywhere from
a few to several hundred charge-discharge cycles per year in different inter-
mediate and high-altitude Earth orbits. For low-Earth-orbit (short-cycle)
testing as performed at NWSC/Crane and for most other low-Earth-oriented
ground tests, cycling is done more or less continuously (except as notedearlier), and about 5500 cycles per year are completed for 90- to 100.
minute cycling. It has therefore become customary to express life expec-
tancy in this operating mode in terms of mean cycles to failure or, as the
term is often abbreviated, mean cycle life.
A number of reports published during the past 8 years present cell failure-
rate and/or cycle-life data, mostly from analysis of the NWSC/Crane testresults. Reference 112 describes an extensive computerized analysis of data
from several ground-test programs as of 1971. A complex cell-reliability
model is generated with submodels for failure rate as a function of aging,
quality-related failures, and dormancy (when applicable), and the constants
calculated for each submodel are given as a function of test temperature,
depth of discharge, and a third variable depending on the submodel. The
data analysis showed that, in terms of instantaneous failure rate* versus
cycles:
• There was no significant difference between the results from
1.5-hour cycles and 3-hour cycles.
• There was no significant difference between the results from
cylindrical and prismatic cells.
• After the first 2000 cycles, larger cells had slightly higher failurerates than smaller cells.
• Cells manufactured by General Electric had the highest overall
long-term reliability.
In the range from 5000 to 15,000 cycles, the failure rate at 40°C
was an order of magnitude greater /10 4 hr "l versus 10 s hr "l)than at 0°C.
*Instantaneous failure rate is the same as the hazard rate, and may be used to cal-culate cell reliabRity as descn'bed in Section 8.
154 Ni-CdBATrERYAPPLICATIONSMANUAL
• Afterthefirst2000cycles,thefailurerateincreasedwithcyclesat25and40°Cbutdecreasedat0°C.
Afterthefirst 2000cycles,thefailureratefor 40-percentdepthof dischargewasaboutfivetimes that at 25-percent depth of dis.
charge at 25°C. No similar analysis was shown for 15-percent
depth of discharge at 0°C.
• A minimum failure rate was found at a recharge ratio of 1.15 at20 to 25°C over a range of depths of discharge and charge rates.
Cell failure rates from the aggregate of ground-test data available
at the time of the study (1971) were an order of magnitude
greater than those estimated from orbital operations, whichranged from 10 .4 hr "1 to 10 .6 hr". Reference to sources of
these figures was given in the report.
Reference 111 contains another thorough analysis of NWSC/Crane test
data. This report shows a useful tabulation of most cell packs tested,
categorized by cell manufacturer, special cell features, test temperature,
and depth of discharge, as well as total cycles completed, number of ceUs
starting each test category, and number of individual cell failures to the
date of the study (1972). A particular objective of this study was to deter-
mine the relative merits of pooling failure data from cells of different
manufacturers versus keeping such data segregated. The conclusion on this
point was that cell-failure distributions for cells from different manufac-
turers were distinctly different. Therefore, such differences should be con-
sidered when selecting a source of cells for a specific mission. An extensive
set of curves for probability of celt failures as a function of cycles at each
combination of temperature and depth of discharge used in the NWSC/
Crane program are shown with separate curves for cells from different
manufacturers. Figure 56 is an example of one of these graphs.
A third report (Reference 112) contains information similar to that in
Reference 111 updated to 1974. A tabulation shows pack start and
completion dates but not individual cell.failure data. Plots of calculated
mean cell cycle life wrsus depth of discharge for five test temperatures are
shown. An approximate linear relationship between the product [(meancycle life) X (depth of discharge)] and test temperature was found, as
shown in figure 54. The diagonal line in this figure _rresponds to theequation:
F (T) = fi.DOD = - (70.7) T + 4015 (24)

CELLPROPERTIES AND PERFORMANCE 155
16
O. I 1 I0 50 90 9-$ 99 99.9
PROBABILITY Of CELL FAILURE _;wcenD
Figure 56. Probability of cell failure versus number of
short cycles for cells from four manufacturers.
99.99
where fi is the mean cycle life, and DOD is expressed as a fraction of 1.
This reference contains no data on failure rates per se.
A more recent study of this type (Reference 114), published in 1975, con-
rains tabulations of results of 90-minute cycle tests at NWSC/Cranewhere certain factors were out, such as cylindrical ceils, cells made with
other than nylon separators, failures caused by leakage through defective
or broken seals, failures attributable to shorting as a result of silver
migration from the terminal braze alloy, and failures caused by mal-function of test equipment. These tabulations show individual cell failures
and removals by cycle number-information published in the first few
annual reports of the NWSC/Crane program, but not since that time.
The analysis approach used leads directly to cell reliabilities rather than to
failure rates. Reliability was calculated for different sets of temperature
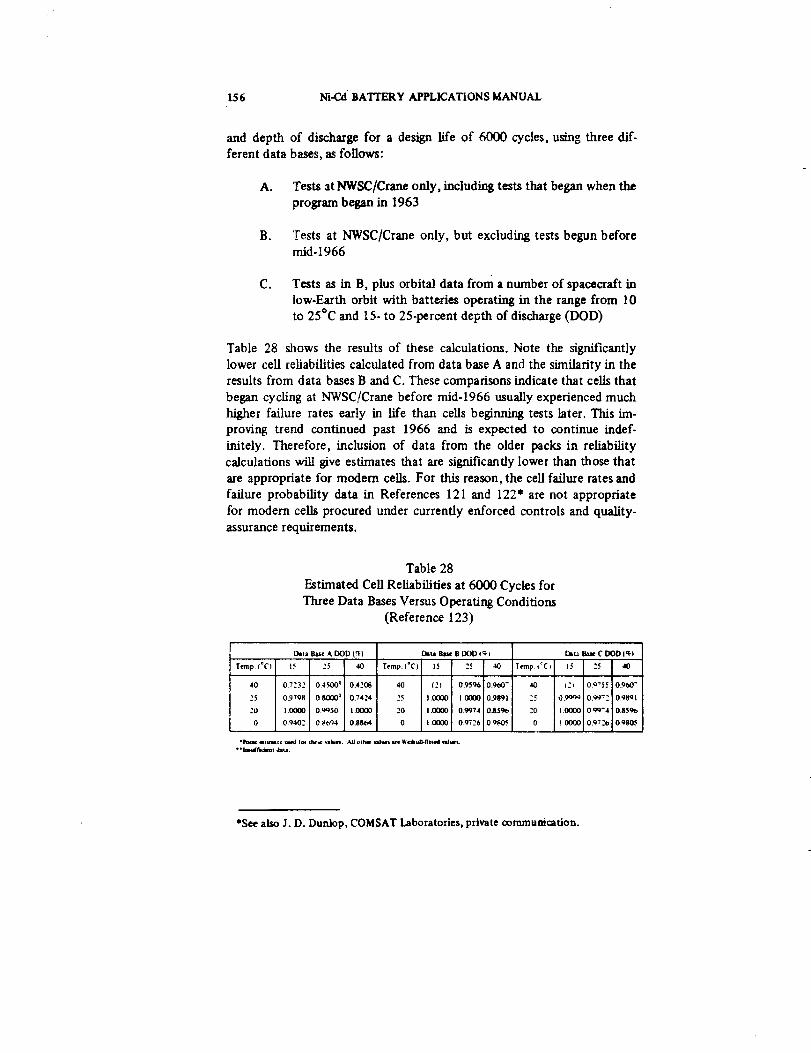
156 NI-CA"BATTERY APPLICATIONS MANUAL
and depth of discharge for a design life of 6000 cycles, umng three dif-
ferent data bases, as follows:
A. Tests at NWSC/Crane only, including tests that began when the
program began in 1963
B. Tests at NWSC/Crane only, but excluding tests begun beforemid-1966
C° Tests as in B, plus orbital data from a number of spacecraft in
low-Earth orbit with batteries operating in the range from l0
to 25°C and 15- to 25-percent depth of discharge (DOD)
Table 28 shows the results of these calculations. Note the significantly
lower cell reliabilities calculated from data base A and the similarity in the
results from data bases B and C. These comparisons indicate that cells that
began cycling at NWSC/Crane before mid-1966 usually experienced much
higher failure rates early in life than cells beginning tests later. This im-
proving trend continued past 1966 and is expected to continue indef-
initely. Therefore, inclusion of data from the older packs in reliability
calculations will give estimates that are significantly lower than those that
are appropriate for modern cells. For this reason, the cell failure rates and
failure probability data in References 121 and 122" are not appropriate
for modem cells procured under currently enforced controls and quality-
assurance requirements.
Table 28
Estimated Cell Reliabilities at 6000 Cycles for
Three Data Bases Versus Operating Conditions
(Reference 123)
Temp (eC_
25
"0
0
Data Ba_e A DOD t_) Data Base B DOD*gt
i5 25 40 Terap <eC)_ 15 25 40 letup *:Ci
0723: 0.4500 t 0.4208 40 (2_ 09596 0.960- 40
0.9798 08000 t 0.7424 25 1.0_00 1.01300 0.989] -'5
1.0000 0oq50 1.QO00 20 1.0000 0.9974 0Jt59_ 20
0 q402 0 80q4 0.8864 0 [ +O(g}0 09726 0 9f.(Yf 0
"Itelal mtUalte used 1o4 tlwse +lltiet+ All elhll ¢lhlet II+ ttelbltl_flllld lllul.t.• "lalm'fldmat data.
15 25 40
l"_ 0.c'+$5 0+<_,0 °
05 _. 0.¢9":-" O._8ql
1.0000 000"4 0.85_'b
!O00D 0.9%_o 0o_80_
*See also J. D. Dunlop, COMSAT Laboratories, private communication.
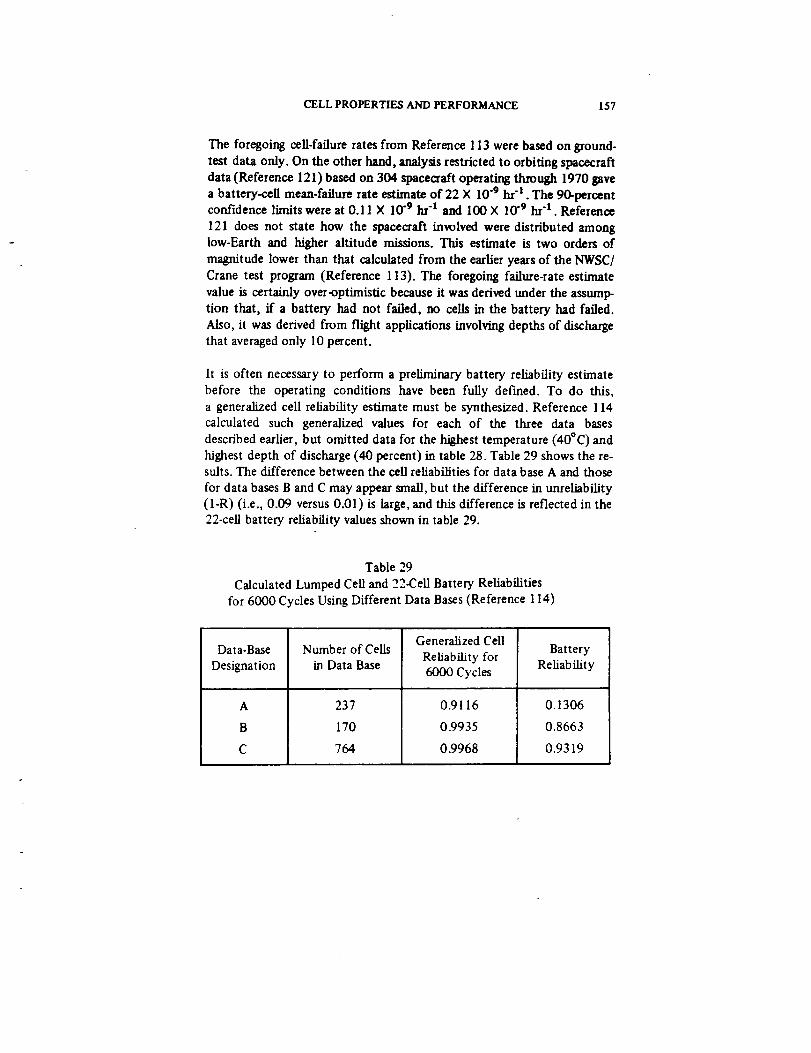
CELLPROPERTIES AND PERFORMANCE 157
The foregoing cell-failure rates from Reference 113 were based on ground-
test data only. On the other hand, analysis restricted to orbiting spacecraft
data(Reference 121) based on 304 spaceoraft operating through 1970 gave
a battery-cell mean-failure rate estimate of 22 × 10 .9 hi -1 . The 90-percentconfidence limits were at 0.11 × 10 .9 hr-1 and 100 X 10 -9 hr "1. Reference
121 does not state how the spacecraft involved were distributed amonglow-Earth and higher altitude missions. This estimate is two orders of
magnitude lower than that calculated from the earlier years of the NWSC/
Crane test program (Reference 113). The foregoing failure-rate estimate
value is certainly over-optimistic because it was derived under the assump-
tion that, if a battery had not failed, no cells in the battery had failed.
Also, it was derived from flight applications involving depths of discharge
that averaged only 10 percent.
It is often necessary to perform a preliminary battery reliability estimate
before the operating conditions have been fully defined. To do this,
a generalized cell reliability estimate must be synthesized. Reference 114
calculated such generalized values for each of the three data bases
described earlier, but omitted data for the highest temperature (40°C) and
highest depth of discharge (40 percent) in table 28. Table 29 shows the re-suits. The difference between the ceil reliabilities for data base A and those
for data bases B and C may appear small, but the difference in unreliability(I-R) (i.e., 0.09 versus 0.01) is large, and this difference is reflected in the
22-cell battery reliability values shown in table 29.
Table 29
Calculated Lumped Cell and _._.Cell BatteD' Reliabilities
for 6000 Cycles Using Different Data Bases (Reference 114)
Data-Base
Designation
A
B
C
Number of Cells
in Data Base
237
170
764
Generalized Cell
Reliability for6000 Cycles
0.9116
0.9935
0.9968
BatteryReliability
0.1306
0.8663
0.9319

I58 Ni-Cd BATTERY APPLICATIONS MANUAL
Data base C was further used in an effort to produce a generalized cell and
battery reliability model to fit the available NWSC/Crane test data (Refer-
ence 122). The result was a temperature and depth.of.discharge dependentmodel of broad usefulness. This model was used to generate figure 57,
which shows mean cell cycle life as a function of depth of discharge with
temperature as a parameter, and figures 58 and 59, which show cell
reliability as a function of depth of discharge at 6000 and 12,000 90-
minute cycles. This study also showed that newer cells (past 1968) have a
considerably higher reliability estimate under all operating conditions over
the cycle life indicated than older ceils. This improvement is due in part to
improvements in test methods and controls, but in particular to the signif-
icant improvements in cell quality produced by the NASA-sponsored high-
reliability program begun in 1968.
35
REFERENCE 122
o
_J
u
z
,,J
20
15
I0
T=_ _
T=40
T
1
0
Figure 57.
10 20 30 40
DEPTH OF DISCHARGE (p_rcent}
Estimated mean cell cycle life diagram.
50
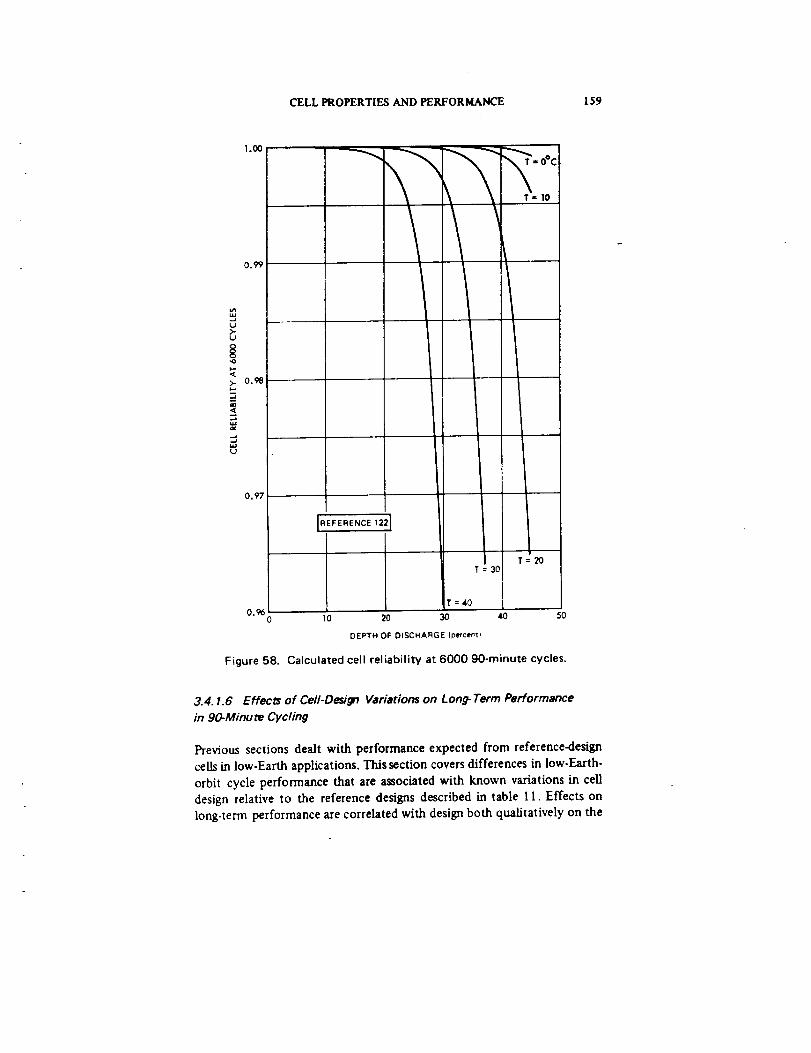
CELL PROPERTIES AND PERFORMANCE 159
t.)
>-tj
>-
..JJ
t_t.)
1.00
0.99
0.98
0.97
OC_
T= 10
REFERENCE122
IT = 30
T=20
T =40
0.960 10 20 30 40 DO
DEPTH OF DISCHARGE Ipeece_!
Figure 58. Calculated cell reliability at 6000 90-minute cycles.
3.4. 1.6 Effects of Cell-Design Variations on Long-Term Performance
in 9(_Minu te Cycling
Previous sections dealt with performance expected from reference-design
cells in low-Earth applications. This section covers differences in low-Earth-
orbit cycle performance that are associated with known variations in celldesign relative to the reference designs described in table 11. Effects onlong-term performance are correlated with design both qualitatively on the
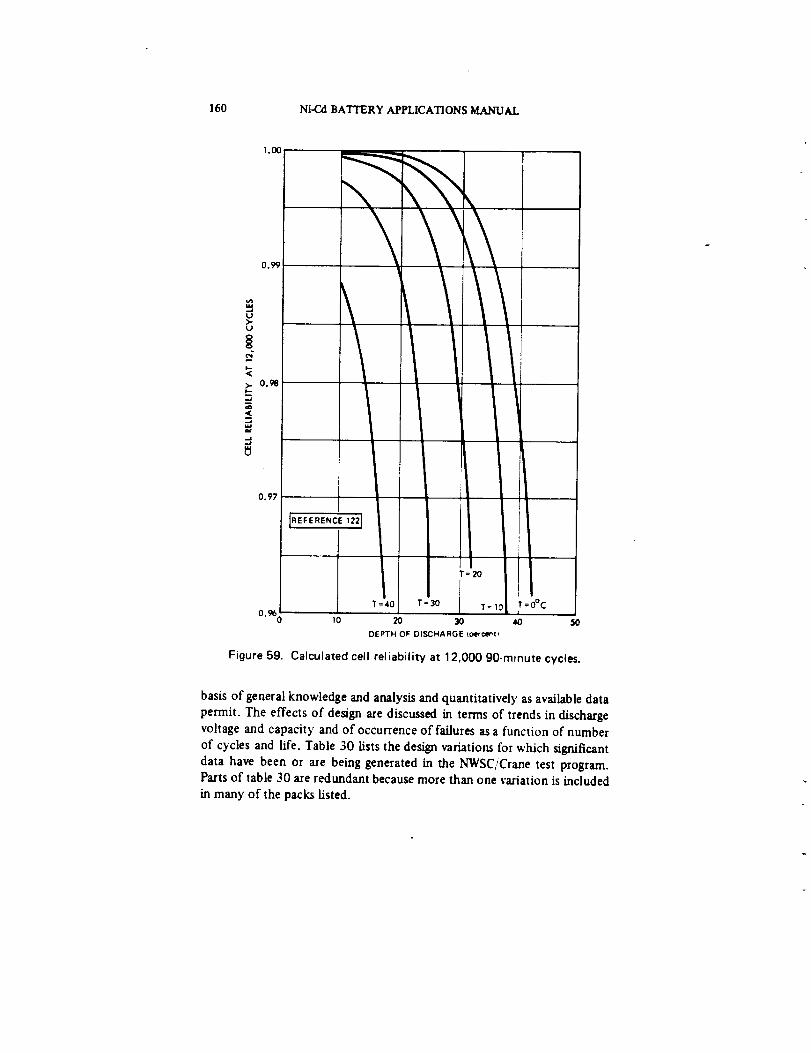
160 Ni-Cd BATTERY APPLICATIONS MANUAL
1.00
0.99
..tU3,-U
d
>. 0._
0.97
\
0.96(_ 10
/ / II
Figure 59.
I IT=°,iT:40 T=3o T:101_=0°C
20 30 40 50DEPTH OF DISCHARGE t_,e_tp
Calculated cell reliability at 12,000 90-minute cycles.
basis of general knowledge and analysis and quantitatively as available data
permit. The effects of design are discussed in terms of trends in discharge
voltage and capacity and of occurrence of failures as a function of number
of cycles and life. Table 30 fists the design variations for which significant
data have been or are being generated in the NWSC/Crane test program.
Parts of table 30 axe redundant because more than one variation is included
in many of the packs listed.
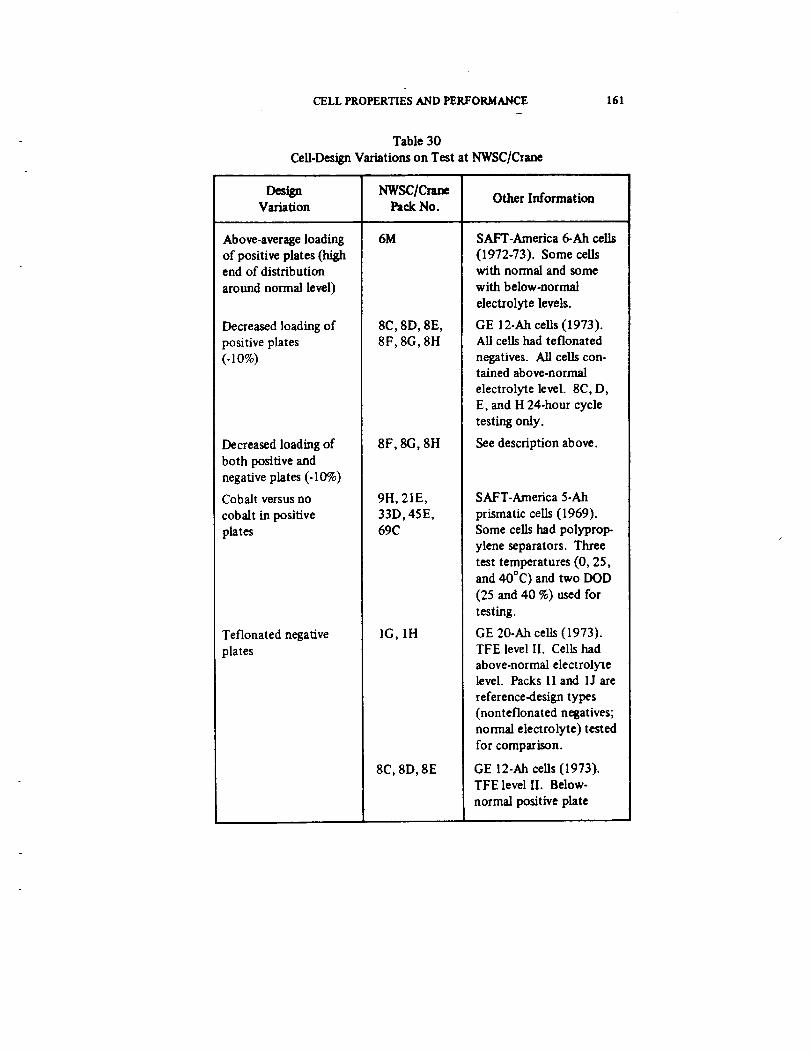
CELL PROPERTIES AND PERFORMANCE 161
Table 30
Cell-Design Variations on Test at NWSC/Crane
Des_nVariation
NWSC/CranePack No.
6MAbove-average loading
of positive plates (highend of distribution
around normal level)
Decreased loading of
positive plates
(-lO%)
Decreased loading of
both positive and
negative plates (-10%)
Cobalt versus no
cobalt in positive
plates
Teflonated negative
plates
8C, 8D, 8E,
8F, 8G, 8H
8F, 8G, 8H
9H, 21E,
33D, 45E,69C
IG, IH
8C, 8D, 8E
Other Information
SAFT-America 6-Ah cells
(1972-73). Some cellswith normal and some
with below-normal
electrolyte levels.
GE 12-Ah cells (1973).All cells had teflonated
negatives. All cells con-tained above-normal
electrolyte level. 8C, D,
E, and H 24-hour cycle
testing only.
See description above.
SAFT-America 5-Ah
prismatic ceils (1969).
Some cells had polyprop-
ylene separators. Three
test temperatures (0, 25,
and 40°C) and two DOD
(25 and 40 %) used for
testing.
GE 20-Ah ceils (1973).TFE level II. Cells had
above-normal electrolytelevel. Packs 11 and 1J are
reference-design types
(nonteflonated negatives;
normal electrolyte) tested
for comparison.
GE 12-Ah cells (1973).
TFE level If. Below-
normal positive plate

162 Ni-Cd BATI'ERY APPLICATIONS MANUAL
Table 30 (Continued)
Design
Variation
Teflonated negative
plates (continued)
Silver-treated
negative plates
Separator material
and/or type
Separator material
and/or type
Electrolyte levelabove normal
Negative prechargelevel
NWSCICrane
Pack No.
8C, 8D, 8E
(continued)
18F
7C
9H, 33D,45E
2D, 2E, 14E,
22C, 25D,
26D, 31C,
38F, 46C,49B
9J to 9M,90 to 9T
1E, 1F
1G, 1H, 8C,
8D, 8E, 8F,
8G, 8H, 18F
48C
48D
4C, 4E
Other Information
loading. Above-normal
electrolyte level. 24-hour
testing only.
GE 8-Ah (1973). Pack18E is nonteflonatedcontrol.
GE 12-Ah cells (1973).
SAFT-America cells
(1969). Electrolytelevels unknown.
Eagle Picher 6-Ah cells
(1970). Electrolytelevels unknown.
Eagle Picher 6-Ah cells
(1974). Electrolytelevels unknown.
SAFT-America 20-Ah
cells (1973). 20 and 40%above normal.
See above for identifi-
cation.
SAFT-America 20-Ah
cells (pre-1968). Three
levels of added precharge:0,4, and 8 Ah.
SAFT-America 20-Ah
cells (pre-1968). Three
levels of added precharge:normal, normal -3 Ah,
and normal +3 All.
CELLPROPERTIESANDPERFORMANCE 163
The effect of higher-than-normal loading of positive plates on the trends of
electrical output with cycling is not clear from existing data. In one small
sample (pack 6M), no significant differences were evident in average end-of-
discharge voltage and capacity trends between cells with above-normal
loading and those with normal loading over a 5000.cycle test at 20°C and
25 percent depth of discharge. The difference in loading level between thetest cells and the norm was 5 to 10 percent. Data for individual cells were
perturbated by the presence of different amounts of electrolyte in each
cell,* and all ceils analyzed had very high percentages of carbonate in the
electrolyte at the end of the test. Because cells with lower-than-normal
loading of positive plates (packs 8C through 8H) also contain other design
variations, the results from these cells (described below under the heading
of teflonated negative plates) cannot be simply interpreted to show the
effect of variation of positive loading per se.
A number of tests (table 30)have been conducted with two levels of cobalt
in the positive plates (normal level and none). Because of the number of
variables (two kinds of separator material and a range of operating con-
ditions), the smallness of the sample, and the scatter of the data, the re-suits are not clear-cut. On the average, the cells with more cobalt had some-
what longer cycle lives at 25 and 40°C than those with less cobalt, butthere was no difference at 0°C. All cells analyzed had a high percentage of
carbonate in the electrolyte at the end of the test, and the amount of car-
bonate was independent of whether the cells contained nylon or polyprop-
lylene separators.
Long-term testing of the effects of negative-plate (cadmium) design vari-ables has been limited to life testing of cells that contain negative plates
having either a teflonation or a silver treatment, as manufactured by theGeneral Electric Battery Division. In one set of tests involving teflonated
versus nonteflonated negative plates (packs 1G, 1H, II, and I J) at 0 and
20°C, no failures occurred in either design over a 2-year period. End-of-
discharge voltages of the teflonated design have consistently been slightlybelow those of the nonteflonated (standard) design throughout the test.
Out-of-cycle capacities have declined less than lO percent to date.
Packs 8C, 8D, and 8E (table 30) with teflonated negative plates are being
tested in a 24-hour rather than a 15-hour cycle. In about 600 cycles, end-
of-discharge voltage (for a 1-hour discharge-at the 0.5C rate)has declinedto about 1.17 volts for packs 8C and 8D (0 and IO°C test temperatures)
*Resulting inadvertently from a cell production problem.
164 Nt-Cd BATTERY APPLICATIONS MANUAL
and is varying between 1.05 and 1.16 volts for pack 8E (at 20°C).
Capacity has declined from an average of 14.5 to 14.2 Ah for pack 8C and
11A Ah for pack 8E. Comparison of these data with data from packs 123B
(at 0°C) and 109B (at 20°C), which were without teflonated negative plates
but tested in a 24-hour cycle, shows that the end-of-discharge voltage and
capacity behavior are similar at the 600-cycle point. Thus, more cycle
time will be required before the results from packs 8C, 8D, and 8E become
significant.
Low-Earth-orbit testing began recently on another group of cells with
teflonated negative plates and lower-than-normal loading of both positiveand negative plates (packs 8F, 8G, and 8H, table 30). Because these cells
also have an above-normal electrolyte level, the effect of teflonation on
voltage and capacity may be difficult to detect. Other variables may need
to be better controlled because test results to date are not consistent. For
example, the average end-of-discharge voltage of the pack 8F cells at 20°C
and 25 percent depth of discharge had decreased to 1.15 volts after 3000
cycles, compared to a value of 1.20 volts at the 3000-cycle point for a
group of 20-Ah cells of a similar design (pack 1G) under the same test con-
ditions. After 6 months of cycling, the capacity checks were higher than
precycling values for both of these packs. This initial capacity increase
occurs in many cells with teflonated negatives, particularly when operatedat 0°C.
Another comparative test involving teflonated negative plates is under way
at NWSC/Crane: that of packs lgE (nonteflonated)and 18F (teflonated).
Performance of these packs at 20°C and 25 percent depth of discharge
was almost identical for the first 2 years on test. As in the previouslydescribed tests that had been in progress for 2 years at the time of this
writing, no cell failures had occurred, and no cell teardown analysis datahave been obtained on the cells involved.
The second negative plate design variation being tested at N'_VSC/Crane is
the silver treatment. Pack 7C, which has negative plates of this type, hasbeen on test at 10°C and 16 percent depth of discharge for over 4 years
with no cell failures. End-of-discharge voltage is stable at approximately
1.24 volts, and capacity decline is normal for these operating conditions.No teardown analysis has been performed on these cells to date. Because
the cells are not equipped with pressure gages, the cell manufacturer's
claim that the treatment reduced overcharge pressure could not be verifiedin this pack.
CELLPROPERTIESAND PERFORMANCE 165
Many cells with the silver treatment have been operating in orbit for up to
an equal amount of time with no known problems atm_outable to the
_ver. Dunlop* has observed in ground tests that cells with silver.treated
negatives appear to be associated with more migration of negative materialthan those without silver, but no cause-and-effect relationship has been
established between these variables. Some users have observed that,
although there is a beneficial effect of the silver when the cells are new, theeffect diminishes as the cells are cycled.
Many varieties of nonwoven nylon and polypropylene separator materials
have been tested in cell cycle fife tests since 1968. One series of tests per-
formed early in this period involved Eagle Picher ceils (References 32 and
34). Performance of cells with polypropylene separators was comparable
to that of nylon separators for the In,st several thousand cycles in the
temperature range from 5 to 25°C. Mid-discharge voltages were the same,and end-of-discharge voltages were 50 to I00 mV lower for polypropylene.
In the range from 5000 to 15,000 cycles (I to 3 years on test), the end-of-
discharge voltage decreased further, and end-of-charge voltage increased inthe cells with polypropylene separators relative to performance of the ceils
with nylon separators. These results appear to be consistent with datafrom the NWSC/Crane tests (table 30), which have been summarized by
Hermigan (Reference 34). The electrolyte content of polypropylene separ-
ators of the type tested earlier decreased by a factor of three or more
during the first 4000 to 6000 cycles of testing. During the same cycling,
the electrolyte content of Pelion 2505 type nylon separators decreased
only by 10 to 20 percent. In a group of newer polypropylene separator
products, two showed rates of loss of electrolyte similar to that of nylon
(Reference 124), but last-cycle capacities to 0.75 did not correlate well
with electrolyte retention in these cases. One polypropylene product,modified to increase wettability by radiation-grafting of polar side chains,
exhibited no better electrolyte retention and last-cycle capacity than most
nonmodified polypropylene materials. No useful cell voltage data wereobtained during the latter tests because the discharge voltage of the cells
fell rapidly with cycling and, hence, was not representative of normalnickel-cadmium cell behavior (Reference 118).
Polypropylene should be superior to nylon as a separator material at
temperatures well above 25°C, at which the rate of hydrolysis of nylon in-
creases rapidly (Reference 124). Polypropylene separators have been used
successfully in cells that must be subjected to heat sterilization before
*J. D. Dunlop, COMSAT Laboratories, private communication.
166 Ni-CdBATTERYAPPHCATIONSMANUAL
launch(References 103 and 124). These cells are required to undergorelatively few cycles (usually less than 500)in the 15 to 25°C temperature
range during their service lffe-a requirement that they meet. One pack ofcells tested at NWSC/Crane had polypropylene separators (pack 9H, table
' 30).When cycled at 40°C and 25 percent depth of discharge, they suffered
arapid loss of'capacity (50 percent'by the first capacity check), but con-tinued at that level for over 16,000 cycles without failing. This amounts to
twice the average number of cycles to failure observed in packs with nylon
separators that were tested at 40°C. Teardown analysis showed severe
migration of negative material through the separator but no deteriorationof the separator material itself. Thus, causes of failure other than separa-
tor deterioration are predominant in cells with polypropylene separators
operated at high temperatures.
Another design variable of considerable potential impact is electrolytelevel. The level in reference-design cells is about 3 ml per ampere-hour of
rated capacity. A number of cell packs now on test at h'WSC/Crane con-
tain cells with higher-than-normal levels. In one set of three packs (1 D, 1E,and IF), the electrolyte level was the only known variable. After 24
months of cycling at 20°C, the end-of-discharge voltages and capacities ofthe cells with above-normal electrolyte levels were sign/ficantly lower than
those for the standard design, A _umber of other packs contained cells
with_ above-normal electrolyte ,levels. (See bottom of table 30.) However,
these cells also contained one or more other design variations (as described
. in other sections of table'30) so that the effectofelectrol_e le_l alone is
'_ not apparent. Therefore, the,value ofadding electrolyte abot¢ the level in
reference-design cells has not been clearly demonstrated in low-Earth-orbit
,_ cycle tests to date. Continuation of tests in progress, w'ith the possible
addition.of more control sample cells, should provide the desired demon-SH'at.ion. _ _ '
me final design variable to be discussed hereis the precharge level. It isdifficult topredict the ultimate effect of variations in the precharge level
because, with cells having a fixed negative.to-positiveratio tas they do g_th
fixed negative and positive plate material designs), increasing the ,prechargedecreases the excess uncharged excess negative(overcharge protection) and
_ice versa. Which of these excess negative capacities 'eventually controls
cell behavior probably depends on :the use,conditions. In NWSC/Ccane
•:tests of two packs of ceils (48C and 48D) with a wide range of precharge
levels (from -3 to +8 Ah id 20-Ah cells), only one _!1 behaved abnormally '
(one of two cells with 8 Ah of precharge added); it generated excessive
pressure after 500 cycles. Little difference was seen between the electrical
behavior of the other cells. Eventual shorting failures appeared to be
CELL PROPERTIES AND PERFORMANCE 167
distn'butedrandomly among the ceilswith differentprechargelevels.In
pack 4C at N'WSC/Crane after500 days on testat 10°C and 15 percent
depth of discharge, the cell with the highest precharge setting has thehighest end-of.charge voltage; otherwise, there is no correlation between
precharge level and performance to date. The range of added precharge
was quite small, however (4.5 to 6.45 Ah in a 20-Ah cell), and may nothave been large enough to make a good test. In pack 4E, tested at 10°C
and 14 percent depth-of-discharge, the ceils with the largest added amount
of precharge had the lowest capacity for the first 18 months on test;after that, the cell with the lowest Ixecharge had the lowest end-of-
discharge voltage and capacity. The differences were small (0.02 volt and 1Ah) for the range of 4 to 1 in the amount of precharging used. These results
indicate that, under these operating conditions, variables other than
added precharge (over a wide range of precharge level) may limit cell per-formance more than the precharge level.
3.4.2 Long-Term Performance Under Noncontinuous Short-CycleConditions
This section describes the effects on ceil performance of interrupting the
regular cycling in various ways during 90- to 100-cycle operation. Such
interruptions may either occur inadvertently or be performed for variousreasons.
3.4.2. 1 Effect of Rest, Change of Cycle, or Prolonged Charge
Section 3.4.1 noted that cycling in the NWSC/Crane test program is not
continuous, but is interrupted both randomly by equipment problems and,for many tests, regularly for capacity checks. Both of these events result in
an increase in discharge voltage in a number of ensuing cycles. This effect
usually lasts only for a relatively few cycles, but may show an increaseabove the overall trend line for several hundred cycles.
Kitsch and Shikoh (Reference 49) report that some capacity lost whilecycling at 20°C was recovered by lowering the temperature to 0°C for a
number of cycles. This effect was probably gradual and was probably due
more to the higher charge efficiency at the lower temperature than to anyspecial effect of the temperature change.
It has been reported that any change of charge rate or discharge rate from
that used for regular cycling without a change in cycle timing increases
168 Ni-CdBAI"TERYAPPLICATIONSMANUAL
dischargevoltageand/orcapacity.Hereagain,it is likelythat this effect
results from an increase in the average state of charge of the cell caused by
the change in operating parameters.
Prolonged charging at a lower rate than that used for regular cyclingshould increase voltage and capacity, and tome refer to it as one form of re-
conditioning. Kirsch and Shikoh (Reference 49) show that overcharges of
50 and 100 percent at the 0.1C rate had very little effect after 50 percent
of the original capacity had been lost during short cycling at 10 to 20°C.
Such charging usually restores capacity only if the capacity loss is tem-
porary and attributable to insufficient charging in regular cycle.
3.4.2.2 Reconditioning During Short-Cycle Operation
As used here, the term "reconditioning" refers to an effect, not to any
specific procedure. Many different procedures may be used, and different
procedures are needed to be effective, depending on the operating con-ditions and the underlying cause of performance degradation.
Ford (Reference 77) has shown that, if ceils are permitted to dischargedown to about 1 volt at the normal in-cycle discharge rate after an ex-
tended period of cycling that involves only a 30.minute discharge per
cycle, the discharge voltage on subsequent cycles is increased, althoughthe total watt-hour capacity to 1 volt is not increased, and the capacity is
not restored to the precycling level. Therefore, this method of "recon-
ditioning" is apparently not optimum under these conditions.
It has been shown that, when observed voltage degradation is not caused
by inadequate charging, the greatest actual reconditioning effect, in terms
of discharge voltage and watt-hour recovery, is achieved by discharging at amuch lower rate than that used for normal cycling (References 123 and
125). During ground testing in which cell terminals are accessible, this can
be done by placing a suitable-sized resistor across each cetl. Kitsch and
Shikoh (Reference 49) showed that this method, applied for 72 hours, re-
stored a battery to essentially full precycling capacity after low-Earth-cycle
testing. This procedure is usually not practical in an orbiting spacecraft,
however, even if batteries could be taken off the line for the necessary
time (usually a minimum of 48 hours) because equipment is not providedfor remote connection of cells.
Lanier (Reference 126) recently descn'oed a compact, automatic device
for implementing full discharge at the battery terminals while preventing
any cell from going below zero volts. Repeated use of this device during a
CELLPROPERTIES AND PERFORMANCE 169
test of over 24,000 cycles resulted in restoring nearly new capacity each
time. In addition, charge-voltage divergence was reduced significantly. To
use such methods during minions in which there is no natural interruption
in cycling, the total battery complement can be divided electrkally into
two or more series strings of cells, so that one string at a time may be takenoff the line for reconditioning.
3.4.3 Long-Term Performance Under Continuous 24-Hour CyclingConditions
Observed long-term trends in the performance of reference-design cells,used for most high-altitude applications to date, are described first. A dis-
cussion of expected effects of certain cell-design and process variations onlong-cycle performance follows.
Charge/discharge cycles in a synchronous equatorial orbit occur in groupsof about 45 each, often referred to as eclipse seasons, between which no
cycling normally occurs. During eclipse season, the cycles last 24 hours;
therefore, eclipse seasons last for 45 days. The discharges last for periodsthat vary from 5 to 20 minutes on the first day and increase to about 72
minutes on the 23rd day. They then decrease again to 5 to 20 minutes on
the last day. Because two of these 45-day seasons occur each year, the inter-
vening noncycling periods last for 134 days. Of concern are the behavior
patterns: (1) on charge during the eclipse season cycling, (2)on discharge
during eclipse seasons, and (3) during the noncyclic periods.
Much less testing has been done for synchronous orbit than for low-Earth
orbit, and the amount of published data for the former is correspondinglysmaller. The most broadly based known test program in the United States
is that at NWSC/Crane (Reference 117). References 29, 38,125, and 127
through 131 describe more specific _'nchronous-orbit life tests. Refer-
ences 132 and 133 describe extensive European test programs. These
tests cover the temperature range from -10 to +40°C, maximum depths of
discharge from 30 to 85 percent of rated capacity, and charge rates from0.03C to 0.3C.
Orbiting spacecraft provide the other basic source of performance and life
data. However, because existing systems provide only battery-level data and
the relat ionship between battery-level data and cell performance is obscure,few useful cell characteristic data have been derived from orbit data.

170 Ni-CdBATTERYAPPLICATIONSMANUAL
About half of all synchronous-orbit ground tests have been real-time tests,and the remainder have been various time-accelerated tests. As far as is
known, the latter do not involve increased stress levels, but rather involve
omitting a large fraction of the noncycling time associated with a real-
time orbit. Correlation of voltage performance between real-time tests and
time-accelerated tests, in which noncycle time is spent on trickle charge
for the few tests that can be directly compared (References 51 and 133),
is good for up to the equivalent of 4 years of real time. No comparative
data were found for longer missions.
3.4.3. 1 Charge- Voltage Current Trends During Eclipse Seasons in
Synchronous-Orbit Operation
In each case for which data are available, the voltage trend at the end of
charge during eclipse.season cycling has been as if there were a gradual in-crease in internal impedance on entering overcharge. SAFT-America cells
have generally experienced a larger change with time than have General
Electric cells. Where charging has been by constant current with no voltagelimit or none below 1.55 volts, end-of-charge voltage at a given recharge
ratio and temperature has increased gradually but continuously. The rate
of increase with time is generally greater at lower temperatures and higher
charge rates. At charge rates below 0.05C and at moderate temperatures,
the rate of this voltage increase has been typically about 0.005 volt per
cell per year (Reference 132). At higher rates and at about 0°C, the charge
voltage of pre-1968 General Electric cells increased by 0.05 volt per cell
in the first year or two on real-time synchronous-orbit tests, after which
it leveled out in the range from 1.54 to 1.58 volts (Reference 117).
Although this high a voltage is not desirable, note that a number of these
cells have operated for several years at 0°C in this mode without being dis-
torted by high internal pressure while restrained on the large faces. Thus,
end-of-charge voltages above 1.5 volts per cell at about 0°C are to be
expected on constant-current charging unless an appropriate voltage limit
is used.
When a fixed charge-voltage limit has been used, the increasing impedance
effect causes the charge voltage to reach the limit sooner as time goes on,
causing premature current tapering or current reduction, which can lead to
insufficient charge return to support the maximum depths of discharge
used in synchronous-orbit applications. Thus, end.of.charge current may
decrease by a factor of 2 to 4 over several years. Such a change may cause
the operating temperature range of the battery to decrease significantly.
Provision of multiple selectable voltage limits almost eliminates this
CELL PROPERTIES AND PERFORMANCE 171
problem. However, if the increase in this end.of-charge impedance effect
becomes too severe, raising the voltage limit will only raise the end-of-
charge cell voltages further without appreciably increasing the charge
throughput.
The cause of this increasing impedance effect is not fully understood at
this time. One possible cause is a reduction in the amount of uncharged
excess-negative capacity in the cells. (See Section 4.) However, high voltage
on constant current has been seen in cells that appear to have adequateuncharged excess negative. A better understanding of this effect is therefore
needed for supporting future long-term communications satellite missions.
3.4.3.2 Discharge Voltage Trends During Cycling in Synchronous-
Orbit Operation
The voltage characteristic in synchronous cycling that is of most concern
for battery design is the minimum voltage that occurs at the end of one or
more of the longest discharges in the middle of each eclipse season. The
season-minimum end-of-discharge voltage is not a well-defined function of
mission time* based on existing data, except at low temperature (-10 to
+10°C) and low maximum depths of discharge (30 percent and below).
Under the latter conditions, the minimum voltage of good quaLity cells can
be expected to decrease linearly with time, beginning above 1.2 volts per
cell and remaining above 1.15 volts for at least 4 years (eight eclipse sea-
sons) (References 132 and 133). As the cell temperature and/or maximum
depth of discharge increases, the trend of minimum eclipse.season voltage
during continuous operation without reconditioning becomes less pre-
dictable from existing data. This appears to be due partly to the wide range
of charge rates and charge-control methods used in different tests and
partly to inherent differences in cell design and response.
Table 31 is a compilation of minimum end-of-discharge voltage data from
many ground tests. These data are plotted in figures 60 and 61, together
with data from 24- and 50-Ah battery life tests (References 51 and 125)
and from certain orbiting geosynchronous communications satellites. Data
for depths of discharge ranging from 60 to 65 percent are grouped in
figure 60, and data for the range from 75 to 85 percent are grouped in
figure 61. No flight data are included. In all these tests, the batteries were
trickle-charged during noncycling periods at rates ranging from 0.01C to0.03C.
*Because cycling in synchronous and dmilar orbits is not often continuous, it isgenerally more useful to relate trends to total mission dine than to use the numberof cycles completed.
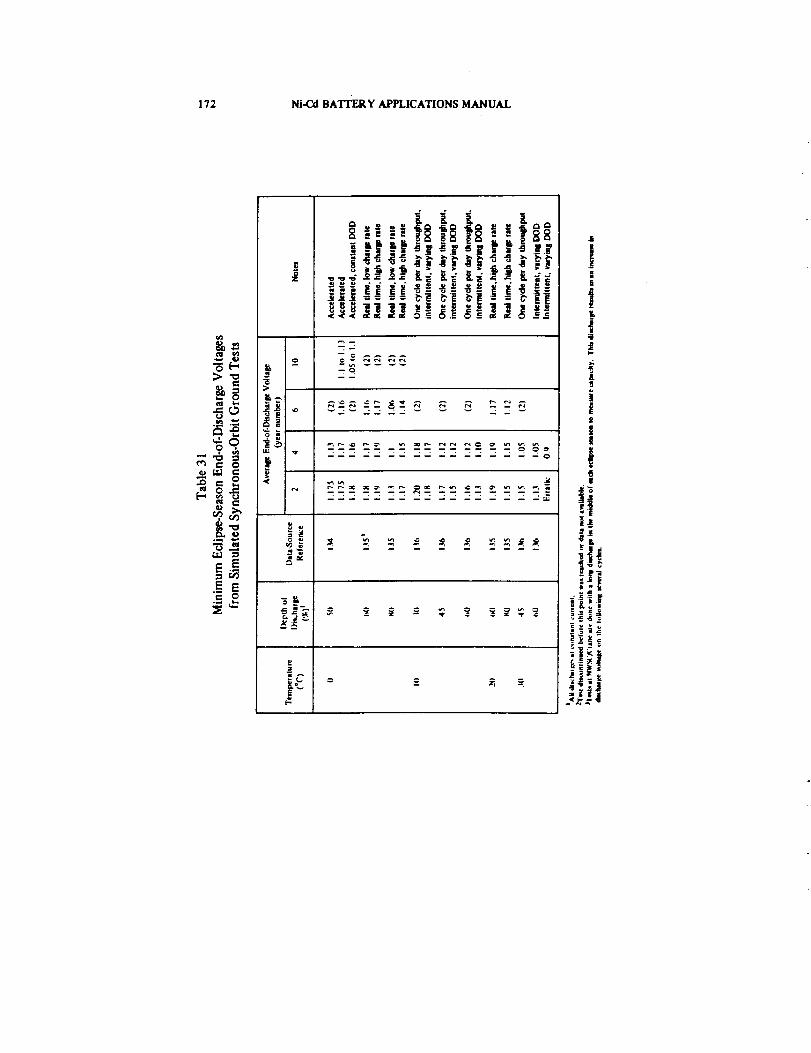
172 Ni-Cd BATI_Y APPLICATIONS MANUAL
• _._ __._ _ _ff _._ ._-"
.!
II
[Ji
|
&
i£
|il
!Ii
_E
a
___|
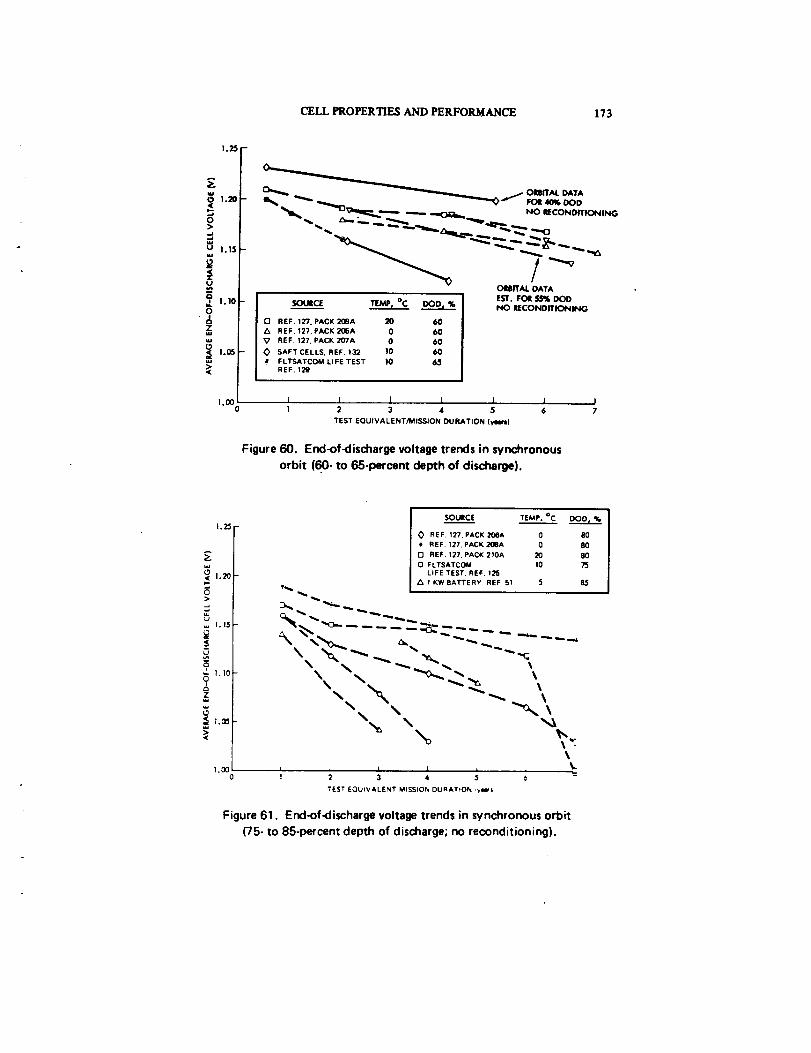
CELL PROPERTIF_._ AND PERFORMANCE 173
_ !.20i
<
o>
,.15
1.10
0
z
I.(_
1.00
_/ORBITAL DATA
_,,,J_ _ _ NO IIECONDrFIONING
ORBITAL DATA
ESr. FOR 55_ DOD
TE/v_, °C NO RECONDITIONINGsout_13 REF. 127. PACK 20gA 20 60
Z_ REF. 127. PACK 296A 0 60
V REF. 127, PACK 207A 0 60
SAFT CELLS. REF. 132 10 60
__ FLTSATCOM LIFE TEST 10 6_
REF. 129
l l I t I I I
I 2 3 4 5 6 7
TEST EQUIVALENT/MISSION DURATION (yNril
Figure 60. End_f_lischarge voltage trends in synchronous
orbit (60- to 65-percent depth of discharge).
1.25
1.20
>
1.15
1.10
?_3
z
I.(10
SOURCE TEMP. °C
REF. 127. PACK 206A 0 80
di REF. 127, PACK 2OIBA 0 80
r-1 REF. '127, PACK 210A 20 80
O F LTSATCOM 10
LiFE TEST, REF. 125
A I KW BATTERY, REF 51 $ 85
\ '_-"_ ". ,_, "_._
\
%
I 2 3 4
%I
5 _ "
TEST EQUIVALENT MISSIOh DURATION ,_Is
Figure 61. End<)f-discharge voltage trends in synchronous orbit
(75- to 85-percent depth of discharge; no reconditioning).
174 Ni-_l BATTERY APPLICATIONS MANUAL
Figure 60 shows that the voltage trends from different tests (real-t_ne,accelerated-time, variable discharge, and constant discharge) at any one
depth of discharge and temperature fall roughly together over the first 6
"years" of operation,* with some scatter as expected. The voltage levels
are appropriate for batteries in good condition at the beginning of the first
eclipse season of the mission. Otherwise, the voltage levels may be as much
as 0.03 volt lower than that shown.
One aspect the figures do not show is an increasing spread between the
highest and lowest voltage cells at end of discharge as the average of amulticell battery falls below 1.1 volts per cell. The voltages of the lowest
voltage cells appear to be reaching a second plateau. Tiffs plateau is lesswell-clef'reed than the one that results from cycling at low depth of dis-
charge (Reference 77) and, for some cells, may be located below I volt.
Much less end-of-discharge voltage spread is observed when a battery is
subjected to regular, effective reconditioning during life tests (Reference
125). (See Section 3.4.4.)
3.4.3.3 Capacity Trends During Continuous Long-Cycle Tests
Capacity to any given end voltage decreases gradually with the number of
eclipse seasons or total cycles completed in a synchronous-orbit regime.The rate of decline increases as operating temperature increases. The
NWSC/Crane tests (Reference 117) provide the only source of in-test
capacity data. In these tests, each cell pack was discharged down at thenormal test rate in the middle of each simulated eclipse season. Only five
cells have been subjected to any one set of conditions, however, and this
number of samples is too small to provide clear-cut capacity degradation
guidelines at this time.
Capacity trend data are available from another type of long-cycle testingat NWSC/Crane in which the cells undergo an unchanging 24-hour cycle,
with a 1-hour discharge each day. Here again, the test packs are periodi-
cally discharged down to 1 volt per ceil at the test discharge rate. Figure
62 is a plot of the decline of capacity that occurs during one 24-hour cycletest as a function of the lower voltage limit. Note that, in this case, the dif-
terence between an end voltage of 1.0 volt per cell and 1. I volts per cell
corresponded to a difference of 18 months of operation at 60 percent
depth of discharge.
*In this context, a '_.'eax" _-or_es_nds to the completion of t_'o _mulated eclipse_sons, ptus any associated nou_',,-c_ operation between seasom.
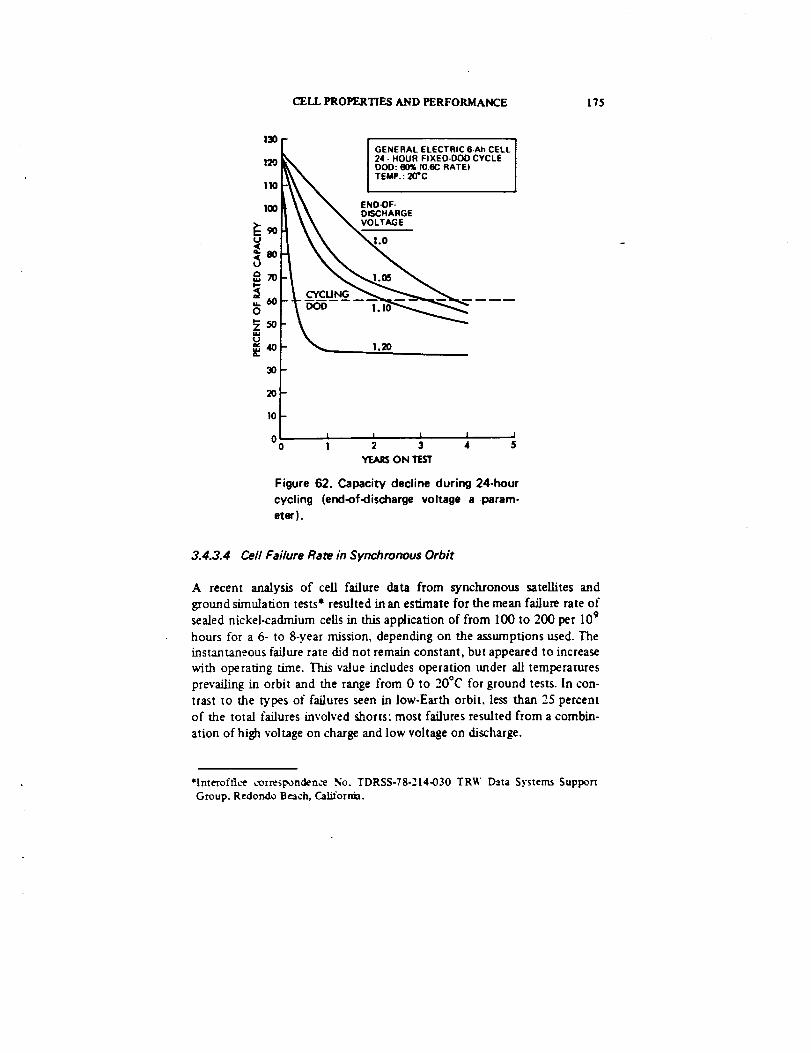
CELL PROPERTIES AND PERFORMANCE 175
O
U
130
120
II0
tO0
90
aoi
70
60
50
40
:f10
00
J GENERAL ELECTRIC6-Ah CELL24- HOUR FIXED-DOD CYCLE [
% | DOD: BOY.(0.6C RATE) J
END-OF-II, _, _ DISCHARGE
_ _OLTAGE1.0
1.05
_._ 1.20
I I i l I1 2 3 4 $
YEARS ON TEST
Figure 62. Capacity decline during 24-hour
cycling (end-of-discharge voltage a param-
eter).
3.4.3.4 Cell Failure Rate in Synchronous Orbit
A recent analysis of cell failure data from synchronous satellites and
ground simulation tests* resulted in an estimate for the mean failure rate ofsealed nickel-cadmium cells in this application of from 100 to 200 per 109
hours for a 6- to 8-year mission, depending on the assumptions used. The
instantaneous failure rate did not remain constant, but appeared to increase
with operating time. This value includes operation under all temperatures
prevailing in orbit and the range from 0 to 20°C for ground tests. In con-
trast to the types of failures seen in low-Earth orbit, less than 25 percentof the total failures involved shorts: most failures resulted from a combin-
ation of high voltage on charge and low voltage on discharge.
*Interoffi_-e ,-or_sponden:e No. TDRSS-78-214-030 TRY," Data Systems Support
Group. Redondo Beach, Cal_'ornia.
176 Ni-Cd BATTERY APPLICATIONS MANUAL
3.4.3.5 Effects of Cell-Design and Process Variations on Performance
in Long-Cycle Applications
No specific cell-design variation tests have been conducted under short-orbit cycle conditions for comparison with those done at NWSC/Crane.(See Section 3.4.1.5.) Krause reports that ceils with teflonated negativesare showingresults that are superior to those of normal cells in an accel-erated synchronous-cycle test at 100-percent maximum depth of discharge
(Reference 135). No voltage or capaciW data were given.
Nickel-cadmium cells with electrochemically impregnated positive plateshave been subjected to various time-accelerated tests for geosynchronous,
orbit applications (References 25 and 137). The general result is that dis-charge voltage is more stable than that of chemically impregnated plates.Little, if any, thickening of the positive plates occurred during these tests.
One synchronous-orbit test with cells that incorporate both positive andnegative plates made by the electrochemical impregnation process has beenreported (Reference 136). The results of testing electrochemically impreg-nated plates to date must be considered preliminary, however, and muchremains to be done to evaluate this development and a number of other
potential design and process improvements now being offered by cellmanufacturers for synchronous and interplanetary-probe applications.
3.4:4 Effect of Reconditioningon Performancein Synchronous-Omit
Operation
The data and projections discussed in Section 3.4.3 are applicable when noeffective reconditioning procedures are used during a test or flight. An
"'effective" procedure is defined as a procedure that produces a large andlong-lasting increase in usable energy per cycle and. ultimately, in useful
cycle life. Some procedures referred to as "reconditioning" have littleactual beneficial effect and are therefore reconditioning in name only.
To be effective, a reconditioning procedure must consider the degree andnature of degradation in the cells-the greater the degradation and thelonger the time since the batter)" was previously effectively reconditioned.the more difficult it is to achieve true reconditioning. On the other hand, if
a weft-devised procedure is applied regularly throughout a mission, startingat the beginning, a minimum of difficuhy should be encountered in main-taming a battery in condition. Regular reconditioning, by discharge to 1volt per cell average, has been performed over several years in a number of
orbiting satellites with good results tReferen_s ",8. 125. and 134).
CELL PROPERTIES AND PERFORMANCE 177
Although a significant increase in discharge voltage is usually obtained by
discharging down to 1.0 volt per cell at the 0.3C to 0.6C rate. followed by
a full recharge, a much greater and longer lasting increase in discharge
energy is usually obtained when the discharge is performed at the 0.05Cto 0.01C rate. One fife-test has been described (Reference 123) in which,
by discharging a battery regularly through a resistor at the O.OIC rate orless down to a low battery terminal voltage (of the order of 1 to 2 volts),
near-furl capacity was restored in a previously degraded battery and hasbeen maintained throughout more than 30 simulated eclipse seasons (equiv-
alent in cycles to 15 years in orbit). Some cells were reversed near the end
of the low-rate discharge, but no ill effects on these ceils have been
detected. The pressure in one cell that was equipped with a pressure trans-
ducer has never exceeded 30 psia during reversal.

SECTION4CEILFAILUREANALYSISANDMECHANISMS
4.1 INTRODUCTION
This section presents an approach to the analysis of degradation and fail-
ure, including a system for classifying these phenomena. The methodology
of cell teardown analysis as it pertains to the sealed nickel-cadmium cell is
presented briefly, and the significant findings in this area are evaluated. The
forms and causes of failure that occur most frequently are then analyzedand classified.
4.2 SYSTEMATIC APPROACH TO DEGRADATION/FAILURE
ANALYSIS
Cell degradation or failure analysis has been defined as the process of deter-
mining the nature and underlying causes of observed anomalous behavior
(References 138 and 139). This information may serve as the basis for cor-
rective action. Defined in this way, failure analysis is considerably broader
than teardown analysis per se. A complete degradation/failure analysis of a
battery cell should involve the following steps:
• Gathering and analyzing available data
• Postulating one or more theories as to the cause of the failure
Performing electrical testing and teardown analysis of the cell
in question to verify the theory
Correlating electrical behavior with the physical/chemical con-
ditions inside the cell and developing a description of the proc-
ess of degradation
These steps were first described in detail with respect to nickel-cadmium
cells by McCallum et al. (References 138 and 140 through 143). These
reports also contain additional references in this field. Progress in the
area of failure analysis has been impeded by the lack of a widely accepted
frame of reference and method of describing cell-degradation/failure
phenomena. McCallum et al. (References 138 through 143) developed one
179

180 Ni-Cd BATTERY APPLICATIONS MANUAL
method that consists of a system of concepts, terms, and definitions
designed for organizing information describing failure, its characteristics,
and its underlying causes. This conceptual framework is summarized here
because it is widely applicable and because many of the details are necessary
to the discussion of relationships between degradation and cell-design and
process variables that follow. On the basis of the author's experience,
certain modifications to the system as originally published have beenincluded.
4.3 DEGRADATION AND FAILURE-ANALYSIS TERMINOLOGY
APPLICABLE TO CELLS AND BATTERIES
4.3.1 Degradation end Failure
The term "degradation" may be defined as a significant and persistent
change in performance or in some characteristic, relative to that observed
when the cell or battery was new, in a direction that reduces usefulness or
manageability. The term "failure" is more specific, being defined as the
inability of a cell or battery to deliver on discharge or accept on charge a
prescribed quantity of electrical energy within a prescribed set of limits
(Reference 138). The limits referred to are the "failure criteria."
Because theconceptofdegradationincludesfailureasa specialcase,degra-
dationmay be describedwithout any judgment regardingfailure,but fail-
ure impliesdegradation beyond prescribedlimits.Users establishthe
criteriaof failuretofittheirapplications.
Although most clearly defined when applied to whole cells or batteries, the
term "degradation" may also be applied to cell components and to their
particular characteristics. For clarity, additional modifying terms should be
used when referring to a specific case. These modifiers should specify the
device level (i.e., battery, cell, or cell component, if known) and the dete-
riorated characteristics. For example, one might have "battery. charge-
voltage degradation." "cell-capacity degradation," or "separator wettabilitydegradation."
As previously defined, failure can be either reversible or irreversible. For
example, the inability of a cell to meet performance requirements is
usually irreversible if it results from an irreversible open circuit, a high
impedance, or a shorted condition. If the inability exists only under a
particular set of operating conditions, a change in these operating con-
ditions or the application of an appropriate reconditioning procedure may
!
CELL FAILURE ANALYSIS AND MECHANISMS 181
eliminate the "failure." This type of failure is usually exhibited as a gradualdecline of end-of-discharge voltage to a point less than a tolerable limit.
Often, however, operating conditions cannot be changed or reconditioning
cannot be performed in a given application, so that an otherwise revem"olefailure may become permanent.
4.3.2 Degradation/Failure Modes Defined
The term "failure mode" is widely used to refer to all aspects of cell degra-
dation or failure. McCallum et al. (References 138 and 140) proposed that
the term "mode" be used in a more restricted sense-to identify only the
directly measurable parameter or combination of such parameters that
exhibited deterioration or exceeded prescribed limits. Use of this definition
confines a degradation/failure mode to a description in terms of electrical
quantities, such as voltage, current, ampere-hours, and watt-hours. Restric-
ting these definitions to electrical quantities was based on the fact that
cell-level electrical (i.e., current/voltage) degradation can impact battery
electrical performance and on the assumption that characteristics such as
internal ceil pressure and temperature cannot have a direct impact. It was
also recognized that pressure and temperature data often are not available
for individual cells; therefore, mode definitions should not require thatthese parameters be specified. However valid these points may be, it has
become evident that information other than electrical can help consid-
erably in understanding the cause of failure, and pressure and temperature
data should therefore be included in the description of the failure mode
when they are available. This broader definition will therefore be used inthis manual.
Table 32 is a matrix of the various categories of data and the choices with-
in each category that are useful to describe a degradation/failure mode. The
term "electrical degradation/failure mode" refers to mode descriptions
that include only electrical quantities.
An example of a degradation mode would be "abnormally low cell voltage,
high pressure, and high temperature at end of discharge." The correspond.
ing electrical degradation mode would be "low cell voltage at end of dis-
charge." A related electrical failure mode would be "cell voltage below 0.5
volt on discharge before rated capacity output (temperature and rate
specified)." Failure modes are discussed further in Section 4.4.
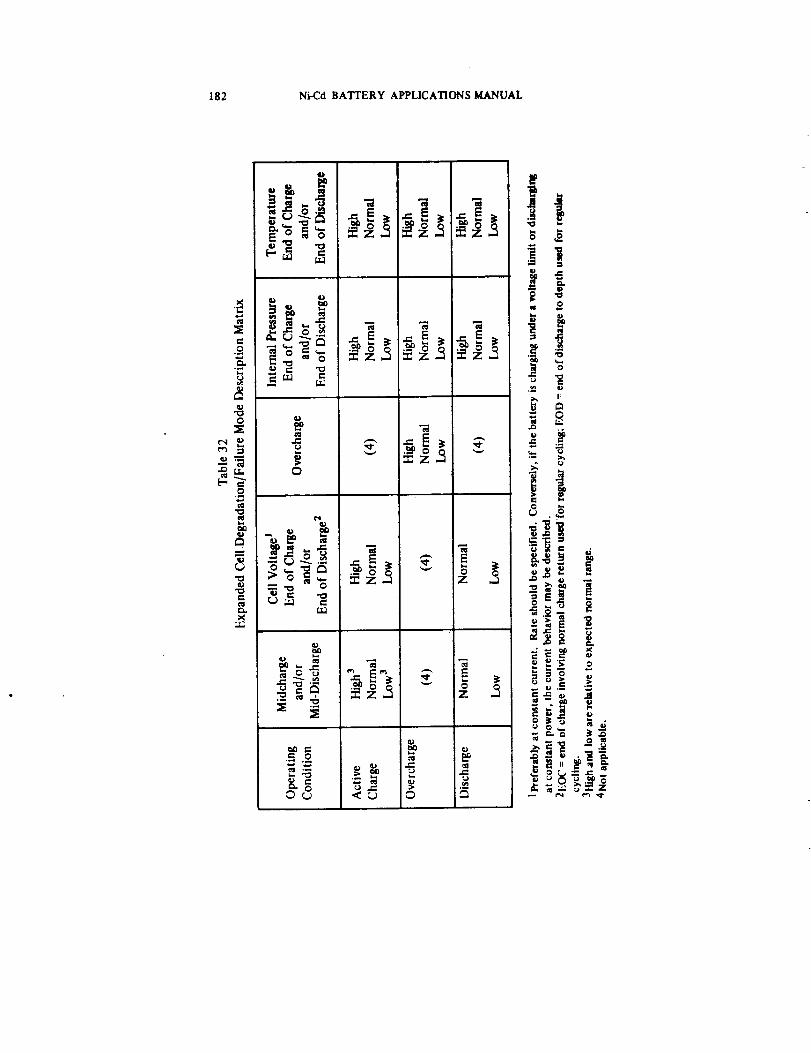
182 Ni-Cd BATI'ERY APPLICATIONS MANUAL
G
_t q)
O _ O m
0
0
X
0
_ m
_Z Z ,_
°!o
I=
-i
_-8 "
CELL FAILURE ANALYSIS AND MECHANISMS 183
4.3.3 Degradation/Failure Determinants Defined
McCallum and Miller distinguished two levels of causes of degradation/
failure modes (Reference 138). The most immediate and predo_tcause was called the "determinant." The determinant was defined as that
single cell component, together with the electrical condition and/or behav-
ior of that component, that directly produced the degradation/failure
mode of interest (References 138 and 140). It is advisable to broaden the
definition to include more than one component because two or all three
of the components that may often be determinants (i_e., positive electrode,
negative electrode, and separator) may share the respons_/lity for abnor-
mai cell behavior, and one should not be rejected over the others. For
example, the cell terminal voltage (VT) may be modeled as
V T = Ep - E_ + I (25)
where
Ep = the electrode potential of the positive electrode at current I
EIq = the electrode potential of the negative electrode at current I
I = cell current (positive on charge; negative on discharge)
R i = interelectrode ohmic resistance, where Ri is largely a functionof the resistance across the separator
Thus, each term on the fight-hand side of equation 25 corresponds to one
determinant of V T.
Therefore, in the analysis scheme used in this manual, a failure mode may
have several determinants but each determinant is concerned with only one
component.
Examples of possible determinants of the degradation mode ';low _altage
at end of discharge" might be "excessive polarization* of the negative
*polarization of either electrode is the difference between the observed elect.rodepotential with current flowing and that on open circuit. Thus, ff (Eo) p and qEo_ N_e the open-cixcuit potentials, the respective polarizations are Ep -(Eo} P and EN -(EO)N, where Ep and EN are as defined for equation 25. With the s_gnol I def'medas for equation 25 Ep - (Eo) P is positive on charge and negative on discharge, andE N - (Eo) N is the opposite.
184 Ni-Cd BATYERY APPLICATIONS MANUAL
electrode at end of discharge" and "excessive IR-drop across the sepa-
rators." Note that these descriptions state the existing electrical response
of components, but do not state the cause for the response or how the
observed condition may be developed. These latter aspects are the subject
of the failure mechanisms, as described in the following section. Deter-
minants are discussed further in Section 4.5.2.
4.3.4 Degradation/Failure Mechanisms Defined
The term "'failure mechanism" is often used interchangeably with the term
"failure mode" to refer to all aspects of the failure process. It is also used
loosely to refer to the behavior of a cell component (e.g., the "plate-
swelling mechanism" or the "separator dry-out mechanism"). The term
"mechanism" may also be used in failure analysis to refer to or describe
the sequence of steps or reactions leading from the original condition of a
component to the condition described by a determinant. In this manual,
the term "mechanism" will be used only in the sense last defined. Further-
more, the term "specific mechanism" will be used to describe the detailed
physical or chemical changes involved in any single step in a sequence.
Examples of physical or chemical processes involved in specific mech-anisms include:
• Solution of an ionic solid in the electrolyte
• Precipitation of a dissolved substance
• Corrosion of a metal
• Diffusion of protons or charged ions through a solid phase
• Diffusion of dissolved substances through the electrolyte
Expansion and contractione
Chemical reactions such as hydrolysis, oxidation, and reduction
Mechanisms of degradation are more difficult and costly to determine
than determinants and are therefore often neglected. Yet a knowledge of
mechanisms is essential in designing meaningful accelerated tests and.
ultimately, in elhninating a failure determinant. Section 4.5.3 contains
examples of degradation mechanisms.
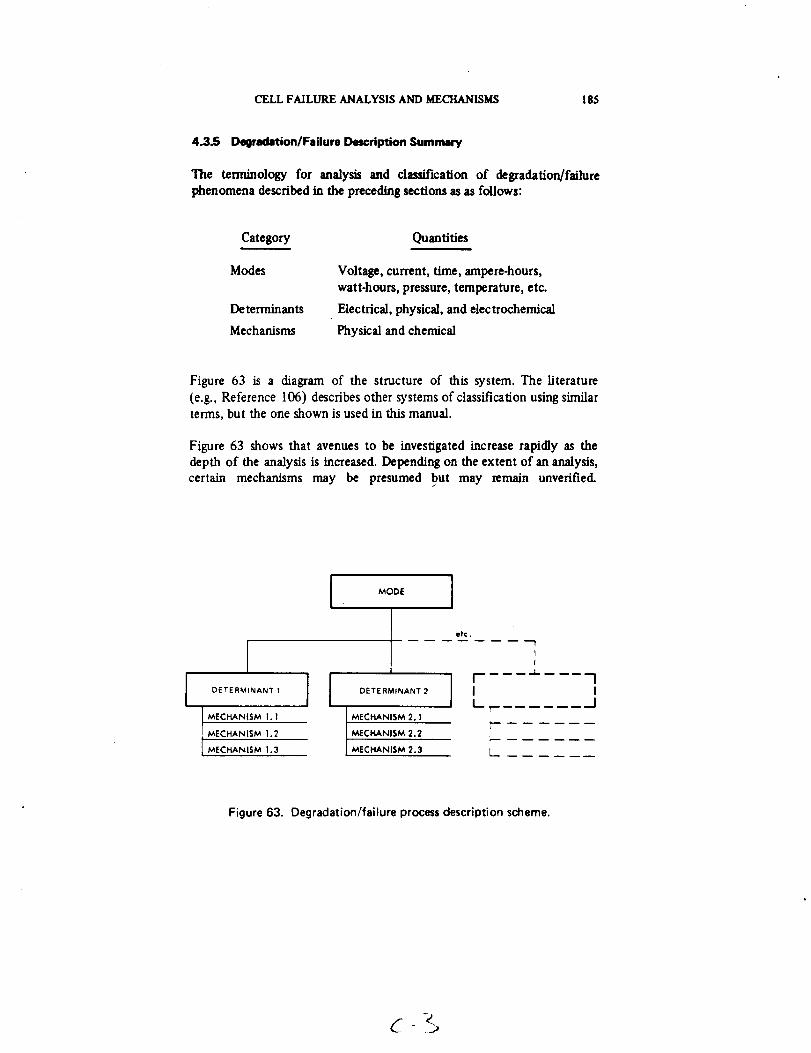
CELL FAILUREANALYSISANDMECHANISMS 185
4.3.5 Degradation/FailureDescriptionSummary
The terminology for analysis and classification of degradation/failurephenomena described in the preceding sections as as follows:
Category
Modes
Determinants
Mechanisms
Quantities
Voltage, current, time, ampereohours,
watt-hours, pressure, temperature, etc.
Electrical, physical, and electrochemical
Physical and chemical
Figure 63 is a diagram of the structure of this system. The literature
(e.g., Reference 106) describes other systems of classification using similarterms, but the one shown is used in this manual.
Figure 63 shows that avenues to be investigated increase rapidly as thedepth of the analysis is increased. Depending on the extent of an analysis,certain mechanisms may be presumed but may remain unverified.
E 1
II
f .... "_"-- -----7
L. l
MECHANISM 1. I MECHANISM 2. I ,_--
MECHANISM 1.2 MECHANISM 2.2
MECHANISM 1.3 MECHANISM 2.3 L-
Figure63. Degradation/failure processdescriptionscheme.
186 Ni-Cd BATTERY APPLICATIONS MANUAL
Judgment and experience may be used to establish "most probable" mech-
anisms in the absence of physical evidence. The distinction between pre-sumed and demonstrated mechanisms is often not clear in literature refer-
en_.
Although this overall method of description is most applicable at the cell
level, it is also applicable to batteries with appropriate modifications. The
degradation mode of a battery would describe characteristics measurable
at the battery (ceLl string) power terminals, as well as average battery
temperature and, possibly, average cell pressure if it can be determined.
Battery-degradation determinants would include individual cells as a whole
because the cells are the main active "component" of a battery. High.
resistance connector contacts and solder joints are other possible battery-
degradation determinants.
4.4 OBSERVED DEGRADATION AND FAILURE MODES
This section discusses and classifies observed degradation/failure behavior
according to the system described in Section 4.3. These discussions provide
a basis for examining the underlying causes presented in subsequent sec-
tions. See Section 3 for data on frequency of failure as a function of
number of cycles or operating time.
4A.1 Low Voltage at End of Discharge
The degradation mode "low voltage at end of discharge" is the most fre-
quent observed cell degradation characteristic (References 68 and 106),
and it impacts battery voltage performance most directly. Low end-of-
discharge voltage is classified as either a degradation mode or a failure
mode, depending on the severity of the voltage discrepancy, the shape of
the voltage-discharge time curve, and the minimum allowable voltage.
In most common uses, the voltage behavior referred to is that observed
during continuous cycling under use conditions (i.e.. the "in-cycle" behav-
ior). The end-of-discharge versus output behavior out-of-cycle or undernoncyclic conditions is often quite different from m-cycle behavior. (See
Section 4.4.2.)
Because the phrase "low voltage at end of discharge"describes only a singlepoint in the charge/discharge cycle, it provides little information on which
to base a failure analysis. To improve the description, cell voltage at several
points in the operating electrical cycle could be included in the mode
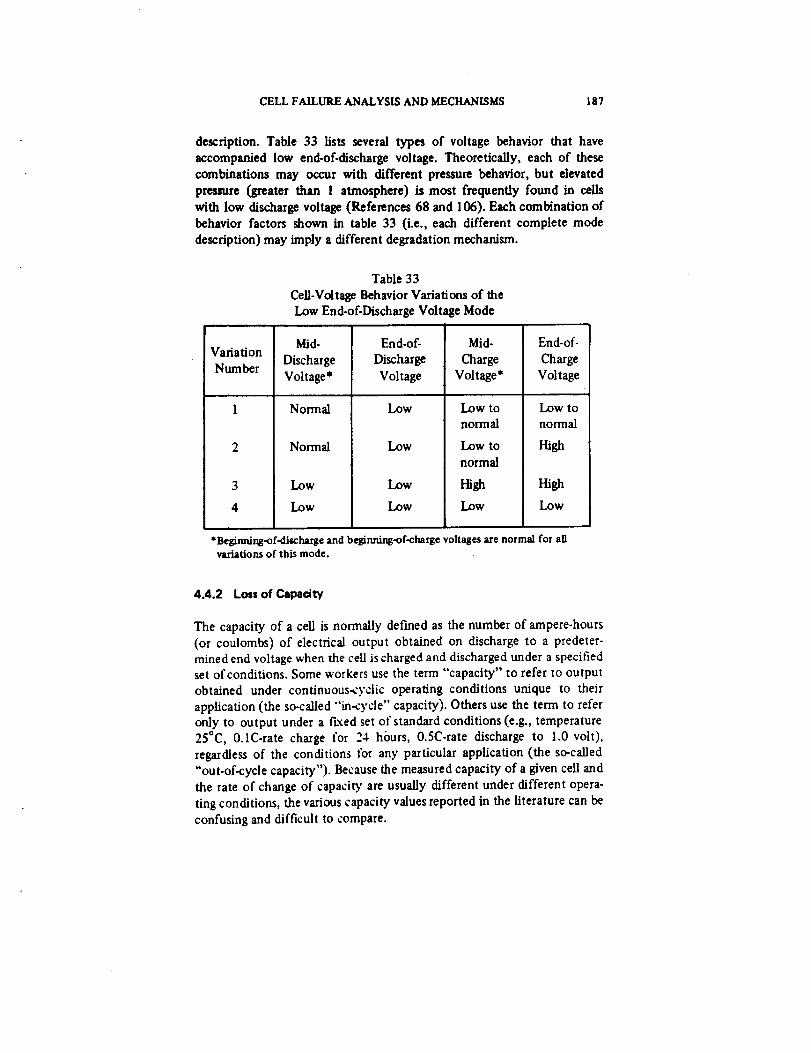
CELL FAILURE ANALYSIS AND MECHANISMS 187
description. Table 33 lists several types of voltage behavior that have
accompanied low end-of-discharge voltage. Theoretically, each of these
combinations may occur with different pressure behavior, but elevated
pressure (greater than I atmosphere) is most frequently found in cells
with low discharge voltage (References 68 and 106). Each combination of
behavior factors shown in table 33 (i.e., each different complete mode
description) may imply a different degradation mechanism.
Table 33
Cell-Voltage Behavior Variations of the
Low End-of-Discharge Voltage Mode
Variation
Number
3
4
Mid-
Discharge
Voltage*
Normal
Normal
Low
Low
End-of-
Discharge
Voltage
Low
Low
Low
Low
Mid-
Charge
Voltage*
Low to
normal
Low to
normal
High
Low
End-of-
Charge
Voltage
Low to
normal
_gh
High
Low
*Beginning-of-discharge and beginning-of-charge voltages are normal for allvariations of this mode.
4.4.2 Loss of Capacity
The capacity of a cell is normally defined as the number of ampere-hours
(or coulombs) of electrical output obtained on discharge to a predeter-mined end voltage when the cell is charged and discharged under a specified
set of conditions. Some workers use the term "capacity" to refer to output
obtained under continuous-cyclic operating conditions unique to their
application (the so-called "'in-cycle" capacity). Others use the term to referonly to output under a FLxed set of standard conditions (e.g., temperature
25"C, O.1C-rate charge for 24 hours, 0.SC-rate discharge to 1.0 volt),
regardless of the conditions for any particular application (the so-called
"out-of-cycle capacity"). Because the measured capacity of a given cell and
the rate of change of capacit3' are usually different under different opera-
ting conditions, the various capacity values reported in the literature can be
confusing and difficult to compare.
188 Ni-Cd BATI'ERY APFLICATIONS MANUAL
When in-cycle capacity is referred to, the foregoing definition of capacity
indicates that "loss of capacity" is another name for "discharge voltage
reaching some lower limit after a decreased ampere-hour output" during
cycling; therefore, the loss of capacity results automatically from the low
end-of-discharge voltage-dagradation mode. When out-of-cycle capacity is
referred to, loss of such capacity may or may not correlate with decreasing
in-cycle end-of, discharge voltage. During short-cycle operation and at lower
depths-of-discharge, the in-cycle end-of-discharge voltage may decLine
considerably over the first several thousand cycles (e.g., from 1.2 volts to
between 1.0 and 1.1 volts), yet the out-of-cycle capacity to 1.0 volt may
decrease only slightly. This situation is most likely when the charge and/or
discharged rates used for capacity measurement are much different from
those used for normal cycling. On the other hand, during 24-hour-cycle
operation using a high depth-of-discharge, out-of-cycle capacity may de-
cline considerably while in-cycle end-of-discharge voltage changes tittle.
Figure 64 shows these distinctions graphically. Discharge.voltage curve 1
represents that of a new cell, with C 1 capacity to 1.0 volt. After several
thousand cycles involving discharge to the point at which D I/C I is thedepth of discharge, the total discharge-voltage curve may resemble curve 2,
in which the end of discharge voltage at D l is below l .l volts, but capacity
at the 0.5C rate to l volt is still C x (Reference 77). On the other hand,
cycling to D 2 (e.g., for a geosynchronous-orbit application, in which D 2 'C1may be 0.6 to 0.8) may result in voltage curve 3 with only a small voltage
loss at D 2 but a 20 percent loss of capacity from C x to C 2 (Reference 17).as measured at the 0.5C rate. Thus, in the absence of a more universal and
precise definition of the term "'capacity," decrease of end-of-discharge
voltage and loss of capacity may occur independendy, and. hence, both are
classified as degradation/failure modes.
4.4.3 Low Voltage on Charge
The phrase "low voltage on charge" is used here to refer to beha_ior in
which charge voltage may be as much as, but not more than. about 0.05
volt below the normal expected value and discharge voltage is normal.
Behavior in which both end-of-charge and end.of.discharge volt_es are
somewhat low. but not indicative of a short, is classified as a log end-of-
discharge voltage mode. _See variation 4 in table 33.) Very low voltage is
discussed in Section 4.4.4.
Table 34 Lists the variations of low-charge-voltage behavior. Such beha_-ior
is usually clearly e_Sdent only during constant-current char_ng. If charge
voltage is limited, the behavior shows instead as an abnommlly hi_ current
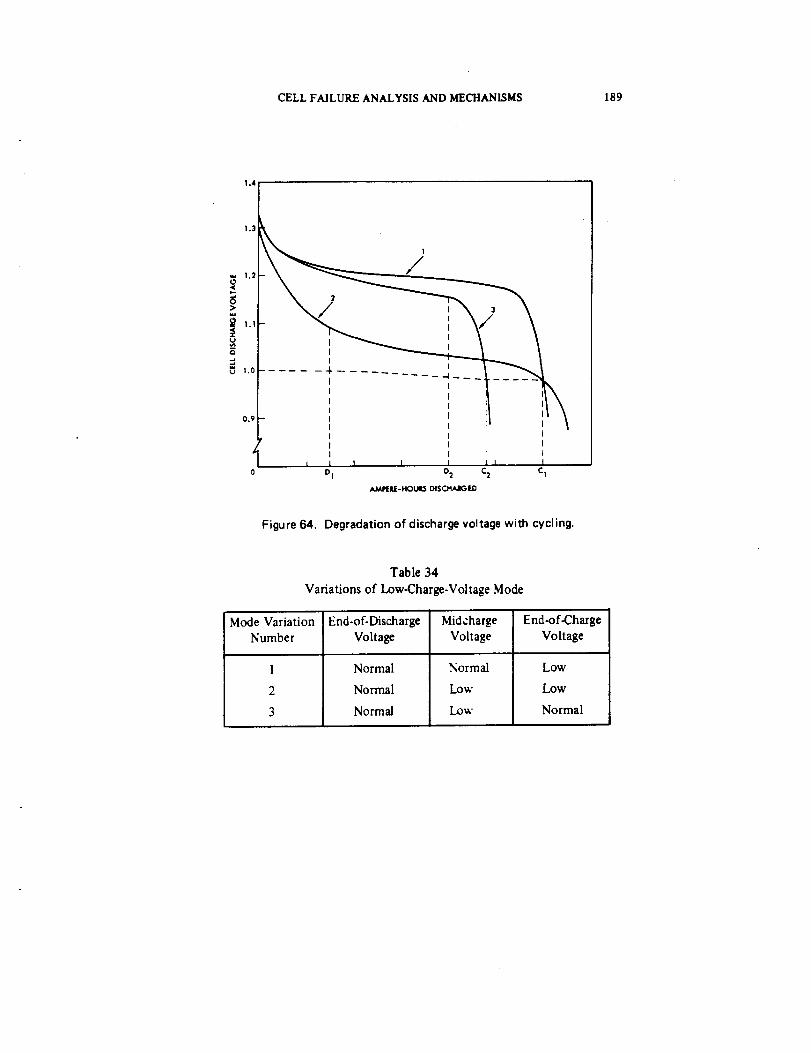
CELL FAILURE ANALYSIS AND MECHANISMS 189
1.4
1.3
w 1.2
>
1.1
u
I.o
0.9
2 I 3
I
I
t i i iD D2 C2 C1
AMPERE- HOUIL_ DISCHARGED
Figure 64. Degradation of discharge voltage with cycling.
Table 34
Variations of Low-Charge-Voltage Mode
Mode Variation
Number
End.of-Discharge
Voltage
Normal
Normal
Normal
Midcharge
Voltage
Normal
Low
Low
End-of-Charge
Voltage
Low
Low
Normal
190 Ni-CdBATTERY APPLICATIONS MANUAL
after the voltage limit is reached. When tested in a low-Earth-orbit cycle,
General Electric cells exhibit this behavior more than cells of other man-
ufacturers, and the effect is greater the lower the voltage limit value. This
type of low-charge-voltage behavior is not classified as a failure modebecause it does not signify cell failure ff that discharge voltage is normal. It
is considered a degradation mode, however, because it represents a per.
sistent and undesirable departure from the original behavior.
4.4.4 Shorted-Failure Mode
The term "shorted" is commonly used to describe an observed behavior in
which the cell voltage is significantly less than normal throughout the
charge/discharge cycle. Actual voltages may range from only a few mil-livolts to over 1 volt and may vary considerably during a cycle. Terms such as
"hard," "soft," "high resistance," etc., may be added to the term "short,"
depending on the observed voltage. Ordinarily a cell in the shorted con-
dition cannot be fully or adequately charged under the conditions of use,
even though the short may be of the high-resistance type (Reference 68).
4.4.5 High Voltage on Charge
"High voltage on charge" usually means "higher than normal voltage at end
of charge," and "end of charge" most often means a recharge ratio of 1.0
or greater. This behavior may be observed when a cell is charged at constantcurrent without a voltage limit or as part of a number of cells in a series
battery on which a voltage limit is applied at the battery terminals. When a
voltage limit is applied to an individual cell or to the terminals of a small
group of cells, or when a large fraction of the cells in a battery with _vltage-
limiting show similar "high-voltage" behavior, the tendency toward high
end.of-charge voltage is seen as low end-of-charge current (Reference 68).The cell therefore behaves as if there were an abnormally large increase in
internal Lmpedance at end of charge. No clear dividing Line exists between
the range of charge voltage referred to as "high charge voltage" and that
indicative of a high internal impedance.
Charge voltage alone is not a criteria of failure because failure is judged
only on discharge. High charge voltage can contribute to a failure by pre-
venting adequate recharge during cycling when the maximum charge vol-
tage across the battery is fixed. Even in this case, however, a single high-
voltage cell in a 20- to 24-cell battery will have a negligible effect on re-
charge, unless that cell is essentially an open circuit. Batteries have operated
satisfactorily as a source of energy on discharge with one (or more) cells
CELL FAILURE ANALYSIS AND MECHANISMS 191
going to abnormally high voltage at end of charge. Therefore, the type ofhigh charge voltage usually observed, in itself, is not classified as a failuremode. Such behavior may be associated with a true failure mode, as shown
in table 33 for low-discharge-voltage mode variations 2 and 3. High chargevoltage can be considered a degradation mode, however, because the termdescribes a persistent and undesirable departure from normal behavior.
4.4.6 Open-Circuit Failure Mode
An unusual type of cell-voltage behavior is characterized by a relatively
high voltage at an times during charge (equal to the voltage applied at thebattery terminals) and a very large negative voltage at all times during dis-charge with no current flow. This behavior is commonly referred to as an"open circuit." However, whether or not the cell is truly an open circuitinternally can be determined ordy by teardown analysis. The term "opencircuit" is classified as a failure mode even though it does not specify volt-
age or current because it stands for a well-recognized set of current/voltage
symptoms.
4.4.7 Other DegradationCharacteristics
Many characteristics other than those described in the previous sectionsare referred to in literature as degradation or failure modes. These include
cadmium migration, separator deterioration, separator dryout, plate de-terioration, and high pressure (Reference 68). According to the classifica-tion system described in Section 4.3, these are degradation/failure deter-minants, not modes, because they refer to conditions within the cell that
are not apparent until the cell is opened and, hence, destroyed as ahermetically sealed device. Degradation/failure determinants are discussed
in the following sections.
4.5 UNDERLYING CAUSES OF DEGRADATION AND FAILURE
In general, degradation and failure of cells are produced by the effects ofcertain incompletely reversible responses of internal cell components toimposed operating conditions. As the operating conditions become more"severe." such as by increasing the temperature and/or charge and dischargerates, the rates of degradation processes usually increase. This section
identifies the component or components and conditions of same that areresponsible for various externally observed degradation/failure modes (i.e.,the determinants of each mode), describes the methods and results of tear.do_n analysis, and reviews available information on degradation/failuredeterminants.
192 Ni-CdBATTERY APPLICATIONS MANUAL
4.5.1 Teardown Analysis
4.5.1. 1 Definition and History*
Teardown analysis is the process of opening and disassembling a cell and
inspecting, testing, and analyzing the internal components. When done inconnection with a failure analysis, the purpose of these tests and analyses
is to establish the determinants of the degradation or failure and, if possible,
to obtain information that may lead to a postulation of the mechanism
of the degradation process involved. However, teardown analysis per sedoes not include an actual determination of the mechanism.
Observations from teardown analysis appeared in the literature well before
the experimental procedures were published. The early annual reports from
the evaluation program at NWSC/Crane contained some of the first pub-
lished observations from relatively large numbers of failed cells (Reference
68). Kent (Reference 106) summarized much of this information. Infor-
mation on teardown analysis procedures began to be published around
1968; since that time, development effort on procedures and the practice
of cell.teardown analysis have grown rapidly. One of the first published
accounts of a complete cell failure-analysis system and cell-teardown
analysis procedure was that of McCallum and Faust (References 140 and
144). These methods and concepts were developed further by Reed and
McCallum (Reference 142), McCallum and Miller (Reference 138),
Halpert (Reference 19), Dunlop (Reference 45), Parry (Reference 145),
Kr_er (Reference 146), and others. References t42 and 147 contain com-
plete procedures for teardown analysis of sealed nickel-cadmium cells.
Stofel describes a similar procedure in less detail (Reference 148).
4.5. 1.2 Cell- Teardown Procedures
As described in Reference 147, cell-teardown analysis may consist of the
follo_-ing steps:
• Gas sampling and gas analysis
• Extraction of electrolyte
• Electrolyte analysis (for KOH, carbonate, nitrate, etc.)
*The term "failure analysis" is sometimes used in the literature to refer to teardownanalysis as defined here. Itowever, as defined in Section 4.2. failure analysis has amuch broader scope, and tcardown analysis can be performed in the absence of afailure.

CELL FAILURE ANALYSIS AND MECHANISMS 193
• Inspection of components
• Chemical analysis of positive plates for:
- Charged and discharged nickel-active material
- Carbonate
- Nitrate
- Additives
• Chemical analysis of negative plates for:
- Charged and discharged cadmium-active material
- Carbonate
- Nitrate
- Additives
• Electrochemical capacity measurements of positive and neg-
ative plates
• Physical property measurements on positive and negative
plates, including:
- Weight
- Thickness
- Void fraction (porosity)
- Mechanical strength
- Surface area
- Crystal structure
Reference 147 also contains procedural details, calculations, and da_a
sheets. The procedure may be varied to disassemble the plate stack before
extracting the electrolyte so that the electrolyte content of individual
194 Ni-CdBATTERYAPPLICATIONSMANUAL
plates and separators may be measured to determine electrolyte distribu-
tion. Also, testing and analysis of separators can be added, if desired, using
tests and data given in References 29 and 149.
The most difficult part of cell-teardown analysis is the chemical analyses
of plates, particularly of positive plates. After some cycling by direct
extraction with ammonium hydroxide/chloride solution* as described by
Reed and McCallum (Reference 142) and Parry (Reference 145),
positive-plate analysis has not been satisfactory because of interference by
residual charged nickel-active material. The procedure originally descn_oed
by Kr6ger (Reference 146) and detailed in Reference 147 is more gener.
ally useful.
Although older methods of analyzing negative plates (References 142 and
145) worked better than those for positive plates, the method given in
Reference 147 is recommended. Some question remains as to whether the
extraction step cleanly separates discharged cadmium material (Cd +) from
charged material (Cd°). Another method that is free from this uncertainty
involves treating the sample with a dilute nonoxidizing acid wherebyhydrogen gas is generated by any Cd ° that is present.+ The details of this
method have not been published. Some organizations use atomic-
absorption (AA) spectroscopy to determine nickel and cadmium in solutionrather than the wet-chemical methods described in Reference 45. When an
AA instrument is available, it can save time because physical separation of
constituents is usually not necessary. Also, AA can be used to advantage to
analyze for cobalt, iron, silver, and other metallic elements that may be
present in small concentrations in the sinter.
4.5. 1.3 Results of Teardown Analyse_ of Nickel-Cadmium Cells
The results of teardown analyses performed on failed+ ceils from the test
program at NWSC/Crane through the year 1967 (Reference 68) were sum-
marized and statistically analyzed in Reference 106. During this period,
the analysis was limited to visual inspection and recording of conditionsobserved in failed cells.
*Sometimes referred to as "Muspratt solution."+D. Maurer, Bell Telephone Laboratories, private commurtk-ation.$For the tier-tuition of failure used in the NWSC/Crane propam at that time, see thereports listed in Reference 68.
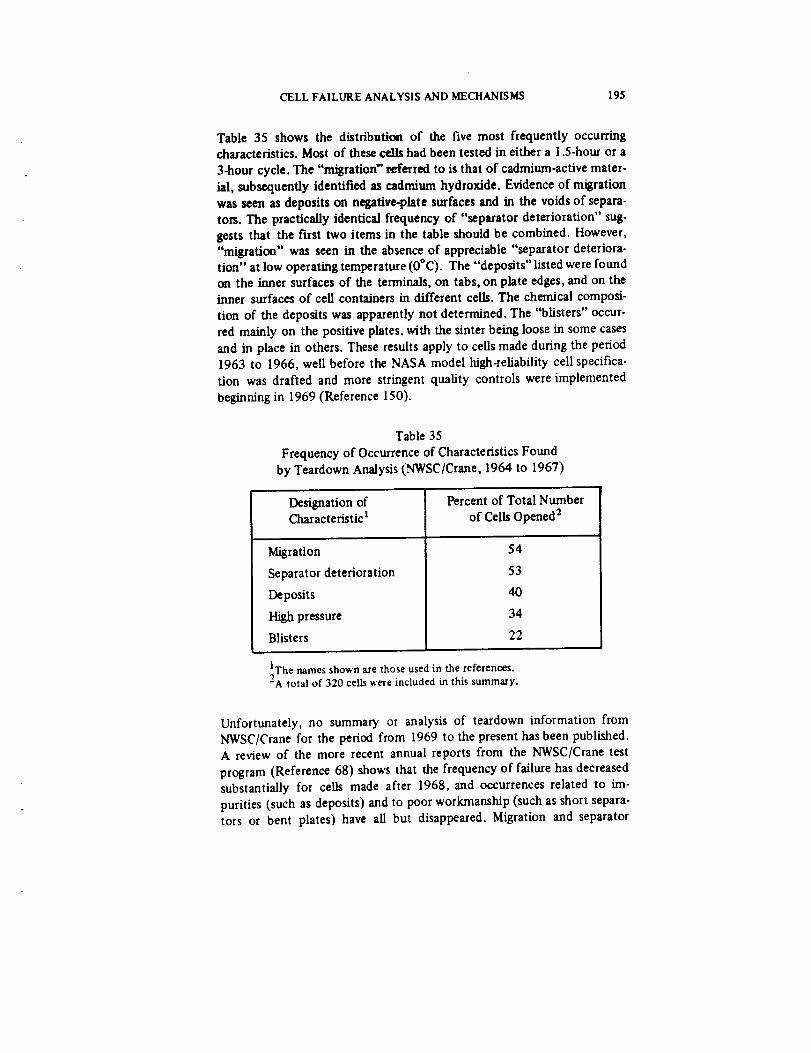
CELL FAILURE ANALYSIS AND MECHANISMS 195
Table 35 shows the distribution of the five most frequently occurring
characteristics. Most of these cells had been tested in either a 1.5-hour or a
3-hour cycle. The "migration" _eferred to is that of cadmium-active mater-
ial, subsequently identified as cadmium hydroxide. Evidence of migration
was seen as deposits on negative-plate surfaces and in the voids of separa-
tols. The practically identical frequency of "separator deterioration" sug-
gests that the first two items in the table should be combined. However,
"migration" was seen in the absence of appreciable "separator deteriora-
tion" at low operating temperature (0°C). The "deposits" listed were foundon the inner surfaces of the terminals, on tabs, on plate edges, and on the
inner surfaces of cell containers in different cells. The chemical composi-
tion of the deposits was apparently not determined. The "blisters" occur-
red mainly on the positive plates, with the sinter being loose in some cases
and in place in others. These results apply to cells made during the period1963 to 1966, well before the NASA model high.reliability cell specifica-
tion was drafted and more stringent quality controls were implemented
beginning in 1969 (Reference 150).
Table 35
Frequency of Occurrence of Characteristics Found
by Teardown Analysis (NWSC/Crane, 1964 to 1967)
Designation ofCharacteristic I
Migration
Separator deterioration
Deposits
High pressure
Blisters
Percent of Total Number
of Cells Opened 2
54
53
40
34
22
IThe shown are those used in the references.names"A total of 320 cells were included in this summary.
Unfortunately, no summary or analysis of teardown information from
NWSC/Crane for the period from 1969 to the present has been published.
A review of the more recent annual reports from the NWSC/Crane test
program (Reference 68) shows that the frequency of failure has decreasedsubstantially for cells made after 1968, and occurrences related to im-
purities (such as deposits) and to poor workmanship (such as short separa-
tors or bent plates) have all but disappeared. Migration and separator
196 Ni-Cd BATTERY APPLICATIONS MANUAL
degradation continue to be the most frequently observed effects in cells
undergoing low-Earth-orbit testing, and the percentage of these effects has
increased as the percentage of other effects has decreased.
References 19, 38, 117, and 151 also contain accounts of migration and/or
separator deterioration obtained from teardown analysis. These results
apply to cells tested under normal operating conditions of temperature,
charge rate, and discharge rate. Although some teardown results from
accelerated testing (involving elevated temperatures or rates) at NWSC/
Crane have been published, data on migration or separator degradation
were not included (References 152 and 153).
Other frequently observed effects associated with degradation and failure
include thickening of positive plates (References 17, 25, and 154), and
redistribution of porosity and active material in positive plates (References
17, 25, and 154), weakening and crumbling of positive-plate sinter (Refer-
ences 17 and 117), migration of electrolyte out of the separators into the
plates (References 155 through 158), flooding of the pores in negative
plates (References 91,155,156, and 159), and a buildup of carbonate con-centration in the electrolyte (References 19, 68, 91, 152,153, 156, 157.
and 158). All of these phenomena often occur together in the same cell.
making the overall degradation process quite complex.
4.5.2 Degradation/Failure Determinants
This section describes the determinants of the more important degradation/
failure modes that were reviewed in Section 4.4, including both demon-
strated and nondemonstrated but probable determinants. Much of the
information presented was obtained from teardown analysis. In some cases.
experimental proof of a determinant was obtained in the course of failure
analysis: in most cases, however, it is known only that certain internal con-
ditions were found in cells that had failed, and the determinants can only
be presumed.
4.5.2. 1 Determinants of Low End-of.Di=charge Voltage Modes
Table 36 lists all possible determinants of the four most frequently occur-
ring low end-of-discharge voltage degradation modes as def'med in table 33.
These determinants also apply to the loss-of-capacity failure mode. In table
36, any or all of the items shown in one of the four numbered rows for a
particular point in the electrical cycle (i.e., mid-discharge, end-of.discharge.
midcharge, and end of charge) may contribute at that point.
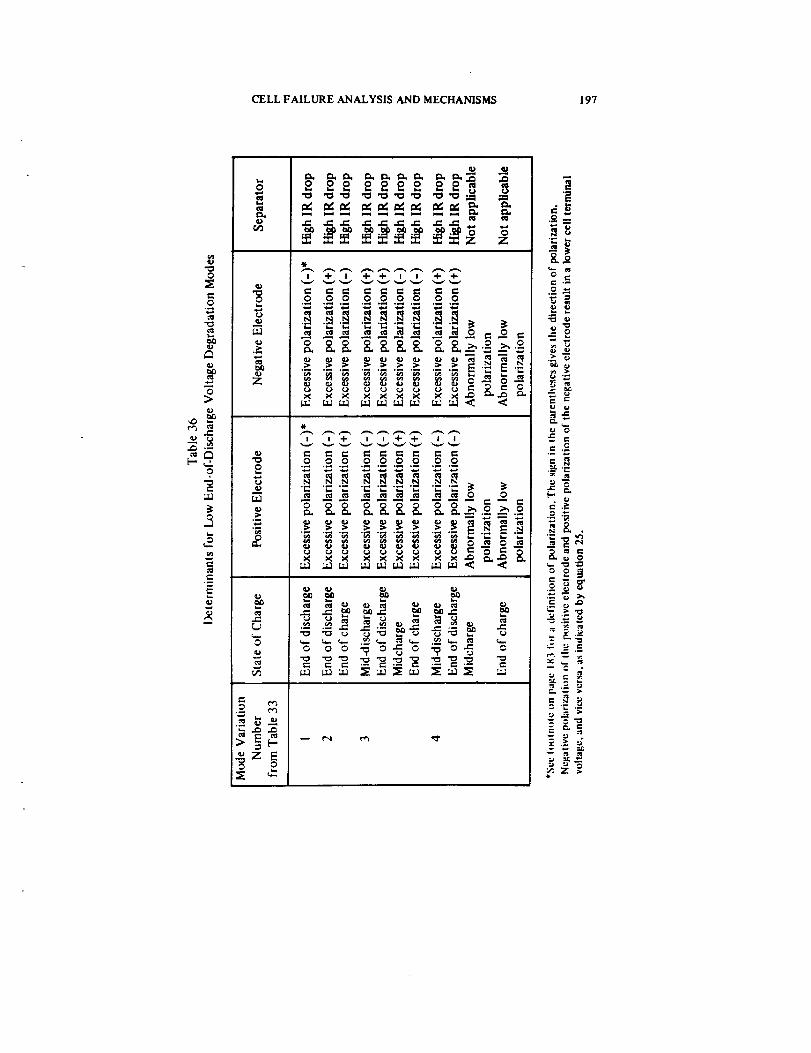
CELL FAILURE ANALYSIS AND MECHANISMS 197
o
c-
O
qb
o
e-
e-
e-t.
O
O
O
Z
fib
o
o
o
z Eo
O
_222_2
ooooooooo
...... _•_._-_._ • .
N NNNNXN_
o=__=
_._e- 0
, + _ + _ _
000000000
o _ __ _o _o
•_ ._._ ._._._._ ._._-
0 _b q_
_ °
0
o 0
.__._
198 Ni-Cd BATTERY APPLICATIONS MANUAL
In all cases in which the results of cell-failure analysis were reported by
McCallum and coworkers for low end-of-discharge voltage failures (Refer-
ences 140 through 143), "loss of capacity" from both positive and neg-
ative electrodes was observed,but significant increases in internal resistancewere measured in some but not all of the failed cells. The term "temporary
loss of capacity" was used in the references to indicate that the capacitymeasured in the flooded state after removal from the original cell was
significantly greater than that observed in the original cell. Although elec-
trode discharge-voltage curves were not reported, it is surmised that exces-
sive polarization at end of discharge, as indicated in table 36, was observed.
In most cells, the degradation in the voltage of the positive electrode was
sufficient to impact the cell voltage under the test conditions, but that of
the negative electrode had not progressed to that extent.
Published data from the use of reference electrodes in starved cells under-
going short-cycle testing (References 15, 20. and 59) show that both elec-
trodes usually develop excess polarization (often referred to as "fading")
as cycling continues, with the positive electrode exhibiting excess polari-zation relatively early in cycle life and the negative electrode following by
several hundred to several thousand cycles. Because of this difference in
rate of response between the positive and negative electrodes, tests of short
duration and certain types of accelerated tests can lead to the conclusion
that only the positive electrode can be responsible for long-term cell voltage
changes (Reference 19).
In contrast to the foregoing behavior, only the negative electrode became
strongly polarized in a synchronous-orbit test involving a deep maximum
depth-of-discharge (84 percent of rated capacity) and a temperature of 0 to
15°C during discharge (Reference 51). This is one example of how oper-
ating conditions can determine the relative importance of the determinants.
Data available for internal impedance before and after cycle testing and for
failed cells (References 51, 87, 141, and 160) show a wide range of
impedance behavior. With nylon separators and/or at test temperatures of25°C or below, impedance changes are small and do not correlate with low
end-of-discharge voltage (Reference 141). With polypropylene separators
and at elevated temperatures, impedance often increases sharply during
cycling, and the lfigher impedances correspond with the lower cell end-of-
discharge voltages (References 51 and 160). However, it is believed that, in
most cases in which impedance increased considerably in cells with poly-
propylene separators, insufficient electroly_e had been added when the cellwas made.
CELL FAILURE ANALYSIS AND MECHANISMS 199
4.5.2.2 DeterTninants of Low-C_arge-VoRage Modes
The possible determinants of the low-charge-voltage modes described in
Section 4.4.3 are the same as those shown in the last two lines of table 33.
The separator cannot be a determinant here because any increase in
separator IR drop from the normal new-cell value (which is of the order of
a few milliohms as shown in figure 14) would only increase charge voltage,not decrease it.
4.5.2.3 Determinants of the Shorted Failure Mode
The possible determinants of the shorted failure mode described in Section
4.4.4 include two types of shorting paths within the cell-electronic (metal-
to-metal) and electrochemical. Electronic shorting is the process whereby
electric current flows from one electrode to the other through the cell
entirely as electron flow (i.e., without taking part in any electrode reac-
tions). Before 1968, many cases of this type of shorting were caused by the
bridging of silver across the insulator of a terminal seal in cells in which
high-silver alloys were used as seal braze materials (Reference 68. First
through Fourth Annual Reports). Since then, after the use of high-silver
alloys was discontinued and/or protective coatings were applied to braze
materials, only shorts of the type that occur between plates of opposite
polarity or between positive plates and the case have been significant.
Table 37 lists the different forms of plate-to-plate (metal-to-metal) shorting.
together with the apparent contributing causes of each. Although items 1.
3a, and 3b result primarily from poor workmanship during cell assembly,
they sometimes do not manifest themseh,es for a great many cycles.
Items 2 and 3c result from the response of cell materials to electrical
cycling and enxaronmental conditions.
An electrochemical short occurs when an electrochemical reaction, other
than the main cell reaction and having a charge and/or discharge voltage
much lower than that of the main cell reaction, begins to take place at an
appreciable rate in the cell. The one most likely to occur in a nickel-cadmium cell is the cadmium.cadmium cell, which could occur after a cer-
tain amount of cadmium had accumulated on the positive plates. Because
the voltage necessa_ for driving this reaction is about 0.2 voh, the occur-
rence offl_is reaction may explain why some cells cannot be overdlscharged
to cell voltage that is more negative than -0.2 volt regardless of how lono
the discharge is continued (Ret'erence 95).
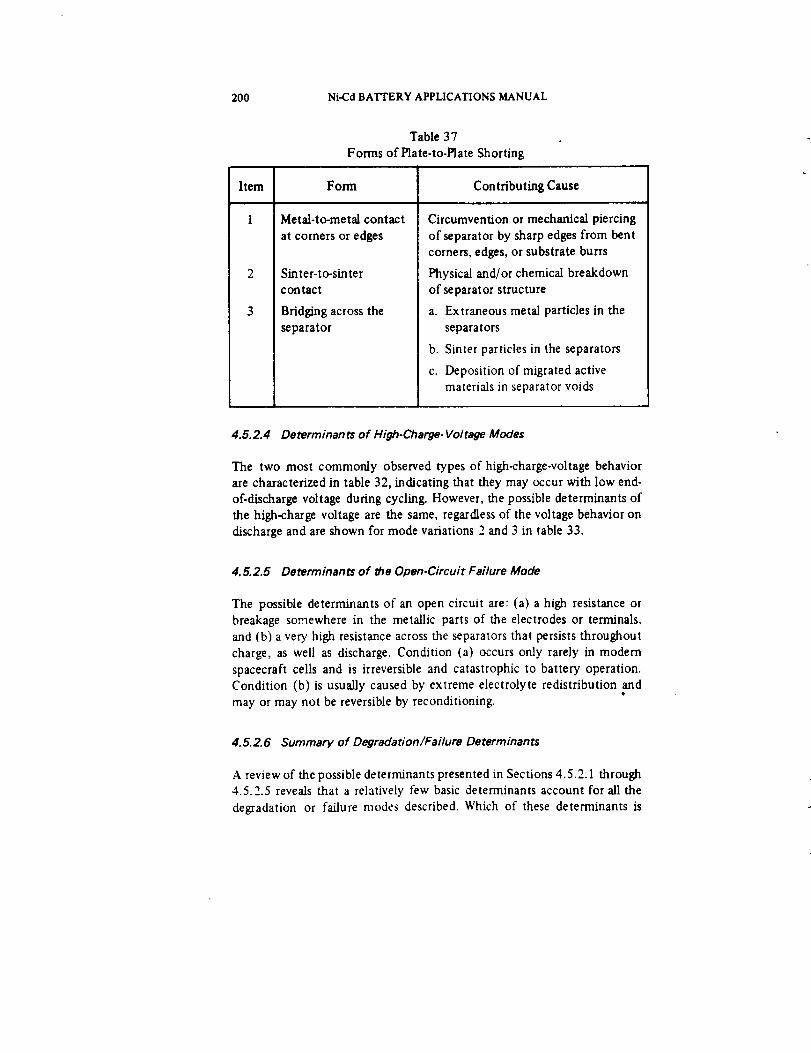
200 Ni-Cd BATTERY APPLICATIONS MANUAL
Table 37
Forms of Plate-to-Plate Shorting
Item
1
Form Contributing Cause
Metal-to-metal contact
at comers or edges
2 Sinter-to-sinter
contact
3 Bridging across the
separator
Circumvention or mechanical piercing
of separator by sharp edges from bent
corners, edges, or substrate burrs
Physical and/or chemical breakdown
of separator structure
a. Extraneous metal particles in the
separators
b. Sinter particles in the separators
c. Deposition of migrated active
materials in separator voids
4.5.2.4 Determinants of High-Charge-Voltage Modes
The two most commonly observed types of high-charge-voltage behavior
are characterized in table 32, indicating that they may occur with low end-
of-discharge voltage during cycling. However, the possible determinants of
the high-charge voltage are the same, regardless of the voltage behavior on
discharge and are shown for mode variations 2 and 3 in table 33.
4.5.2.5 Determinants of the Open-Circuit Fai/ure Mode
The possible determinants of an open circuit are: (a) a high resistance or
breakage somewhere in the metallic parts of the electrodes or terminals,
and (b) a very high resistance across the separators that persists throughout
charge, as well as discharge. Condition (a) occurs only rarely in modern
spacecraft cells and is irreversible and catastrophic to battery operation.
Condition (b) is usually caused by extreme electrolyte redistribution and
may or may not be reversible by reconditioning.
4.5.2.6 Summary of Degradation�Failure Determinants
A review of the possible determinants presented in Sections 4.5.2.1 through
4.5.2.5 reveals that a relatively few basic determinants account for all the
degradation or failure modes described. Which of these determinants is
CELLFAILURE ANALYSIS AND MECHANISMS 201
operative must be established by fagure analysis before a study of the
mechanism can begin. Those determinants are:
• Excessive polarization _fthe positive electrode
• Excessive polarization of the negative electrode
• A relatively high IR drop across the separator
• A shorting path between the positive and negative electrodes
• An open circuit within the cell case
4.5.3 Cell Degradation/Failure Mechanisms
Gross published a comprehensive, qualitative review of degradation/failuredeterminants and mechanisms in sealed nickel-cadmium cells in which
many factors are mentioned as potential sources of trouble (Reference
161). Although this article is a good introduction to cell failure, it does
not indicate interrelationships between factors or relative importance of
the factors reviewed.
McCaUum and coworkers published many reports bearing the term "Failure
Mechanisms" in the rifle, including References 138, 140 through 144, 160.
and 162. Although these reports contain considerable information on fail-ure determinants, failure mechanisms are discussed only briefly in the
form of theories and are not supported by experimental evidence. The re-suits of this work are discussed further in Section 4.7.
More recently, information relative to failure mechanisms has come from a
variety of sources. Certain degradative processes have received spe_al
attention, mainly because their effects are easily seen with the unaided eye
during teardown analysis or because relevant data are obtained by simple
measurements or tests. The following paragraphs discuss these processes.
together with others that are considered important but which are no_
accompanied by visible evidence.
4.5.3. 1 Expansion of Positive Plates
Sintered-nickel-hydroxide positive plates tend to expand during cycling.
particularly when the cell is overcharged excessively. The expansion occursw'ithin the sintered-nickel structure because of forces within the pores that
202 Ni-Cd BATTERY APPLICATIONS MANUAL
result from the considerably different volumes per unit weight of the
charged and discharged forms of nickel-active material (Reference 100) and
oxygen gas generated on overcha_ge_nd trapped within the pore structure
(References 163 and 164).
As a consequence of this expansion, the rate and degree of expansion of
positive plates increases as the loading level increases and as sinter tensile
strength decreases. The controlling sinter strength is in the completed plate
after impregnation and formation. In turn, this residual strength is depen-
dent on the strength in the plaque before impregnation and on the extent
of corrosion experienced during impregnation. Because the chemical-
impregnation process results in less than 5-percent corrosion to get the
same capacity per unit area, it results in a stronger sinter and less expansion
(Reference 154). Over the long term, expansion of the positive plates
must be minimized to ensure high reliability for long cycle life; therefore,
cells for long-life applications should be made with positive plates having
the greatest possible strength and/or the lowest possible loading level.
4.5.3.2 Electrolyte Redistribution and Separator Drying
Although it has long been recognized (e.g., see Reference 19) that dry
separators are a major contributing cause of low-discharge-voltage behavior,
only recently has the mechanism by which electrolyte is lost from the
separator become clear. Dunlop (Reference 25) has shown that, as the
positive plates thicken with cycling, positive active material moves toward
the plate surface and, in so doing, greatly reduces the pore size at the sur-
face where contact is made with the separators. The capillary action of the
exposed pores is thus increased, causing electrolyte to be drawn out of the
separator more strongly than when the cell was new. At the same time, the
expansion of the positive-plate sinter provides more void volume inside the
plates, where the absorbed electrolyte is trapped so that it cannot be recir-
culated.
An additional driving force for electrolyte redistribution is described by
Seiger (Reference 34). who finds that a certain volume of air is included
in the pores of plates when cells are assembled, and, unless special proce-
dures are used (other than those used for normal spacecraft-cell produc-
tion) during the initial addition of electrolyte, the volume occupied by the
nitrogen in this air WIU eventually become occupied with electrolyte. Some
fraction of this electrolyte is likely to come from the separator.
CELL FMLURE ANALYSIS AND MECHANISMS 203
Separator materials that are onlyaveakly wetted by electrolyte further
promote electrolyte redistribution because they release their initial electro-
lyte content more easily and completely than more strongly wetted mater-
ials. Thus, the theory predicts and experience confirms (Reference 158)
that unmodified polypropylene separators (weakly wetted) should have a
greater tendency to dry out in service than nylon separators. On the other
hand, life-cycletest results indicate that cells made with teflonated negative
plates are less subject to electrolyte redistribution, apparently because theTeflon film makes the plates less wettable and thus inhibits movement of
electrolyte into the negative plates.
The effect of temperature on the rate and extent of electrolyte redistri-
bution is not dear-cut. The rate of positive-plate expansion increases and
the viscosity of the electrolyte decreases with increasing temperature, andboth of these changes are in the direction of increasing the rate of electro-
lyre distribution. However, because the wettability of separators by electro-
lyte increases with temperature, the expected net effect is not obvious. The
temperature coefficient of wettability for polypropylene fiber is greater
than that for nylon, and low-temperature inactive storage of certain cells
with polypropylene separators results in some dewetting.*
It is therefore dear that maintenance of proper electrolyte distribution in a
sealed cell requires a balance between a number of design factors and
process steps. Plates must be strong and must resist expansion; the separator
must have some minimum permanent wettability with electrolyte; and
special care must be taken to remove all inert gasses from the pores of the
plates before completing the addition of electrolyte and to ensure that
sufficient electrolyte has been added.
4.5.3.3 Migration of Negative-Acdve Material
The phrase "migration of negative-active material," or simply "cadmium
migration," is used to refer to the condition seen in many cells on teardown
after cycling in which dark-colored, solid material is deposited on the outer
surfaces of the cadmium plates (outside of the pores in which the cadmium-
active material was initially confined) and/or in the separators. This con-
dition is found to a differing extent in all cycled cells, whether or not theyhave degraded or failed (Reference oS). McDermott (Reference 165) and
Gross (Reference 88) summarized the history, effects, and mechanism of
migration of negative material in spacecraft nickel-cadmium cells.
*G. G. Rampel, General Electric Battery DMsion, private communication.
204 Ni-CdBATFERYAPPLICATIONSMANUAL
The migrated material was analyzed and found to be almost entirely
cadmium hydroxide (i.e., the discharged form of cadmium).* The generally
accepted mechanism of migration inmlves the generation of soluble com-
plex ions containing cadmium, such at Cd (OH) i, in the pores of the neg-
ative plates during discharge, the diffusion of these ions toward the positive
plates under the influence of the potential field between the positive and
negative,and the precipitation of Cd (OH) 2 by decomposition of Cd (OH)]as the concentration of KOH in the electrolyte decreases or as the tempera-
ture decreases. The solid Cd (OH) 2 may precipitate in the mouth of the
pores of the negative plates, on the outer surface of the negative plates, orin voids between the separator fdaments. Mayer (Reference 166) hasshown that carbonate ions in the electrolyte can accelerate the movement
of soluble cadmium species from the negative plates in the direction of the
positive plates, and this effect has been observed by others (Reference 167).
A relatively high concentration of migrated negative material is often found
when the separator is particularly dry. Whether the migration or the drycondition occurs first has not been determined. In such cases, the separa-
tors are usually stuck to the negative-plate surfaces to the extent that theycannot be removed for examination without destroying the original
structure.
Because the amount of negative-active material that migrates is only a
small fraction of the total quantity in the negative plates, the direct
negative capacity loss represented is not the main concern. Instead, prob-lems from migrated material arise from other effects; namely, that migrated
material can: (a) partially or completely block some of the negative-plate
surface pores, reducing access to most of the active material deeper in the
pores (References 88 and 167): (b) fill some of the pores in the separator.forcing out the electrolyte and contributing to high resistance across the
separators; and (c) lead to internal shorting of the cell. This last point re-
quires more comment.
Pure cadmium hydroxide is a poor conductor of electric current: hence,
the question: how does fltis material lead to a plate-to-plate short? The
answer has been speculated upon. and some circumstantial evidence has
been published, + but no direct proof has been forthcoming. One theoryholds that. within the mass of cadmium hydroxide, metallic cadmium is
gradually formed and. under the right conditions, can eventually form a
*Occasionally, nickel-active material is also found in the separators.eD. Mattrer, Bell Telephone Laboratories, private communication.
CELLFAILURE ANALYSIS AND MECHANISMS 205
continuous, electronically conductive path between adjacent negative- and
positive.plate surfaces. Although migration may be severe, not all ceils
develop shorts due to cadmim,a migration, apparently because the con-
ditions required for development of a short are not present in all cells.
Because these conditions are not understood at this time, the occurrence
of shorting from cadmium cannot be predicted with any certainty.
4.5.3.4 Separator Deterioration
Physical deterioration of nylon separator material has been observed in a
high percentage of ceils that have failed during low.Earth-orbit cycle testing
at NWSC/Crane (Reference 68). The literature often states that migration
of negative-active material is the cause of the separator deterioration when
these occur together, but such cause and effect have not been demon-strated.
Although the literature often mentions "oxidation of (nylon) separator
material" as a presumed mechanism leading to separator degradation,
recent work (Reference 30) has shown that direct oxidation is not a sig-
nificant reaction path relative to chemical hydrolysis of the nylon polymer
by the alkaline electrolyte solution. The rate of hydrolysis in 31-percent
potassium hydroxide solution increased by a factor of 3 for each IO°C in-
crease in temperature. A lO-percent weight loss caused by hydrolysis pro-
duces a marked weakening of the structure of the separator, so that it be-
comes less able to prevent the plates from coming in contact.
4.5.3,5 Loss of OverchargeProtection
The basis of overcharge protection in a sealed nickel-cadmium cell was dis-
cussed in Section 2.3.3.6. Such protection may be decreased or lost in
several ways: (a) the pores in the negative plates may become blocked with
mi_ated material as mentioned previously (Reference 88); (b) the active-surface area may decrease because of agglomeration and crystal growth
{References 88, 168, and 169); and (c) the negative electrode may become
more highly charged relative to the positive electrode. The first two itemsare difficult to detect and have received little attention to date. The last
item. which has been studied by Dunlop and Earl (References 91 and 170
through 172), Font (Reference 90), and others, is considered to be one of
the primary degradation mechanisms for synchronous-orbit operation.
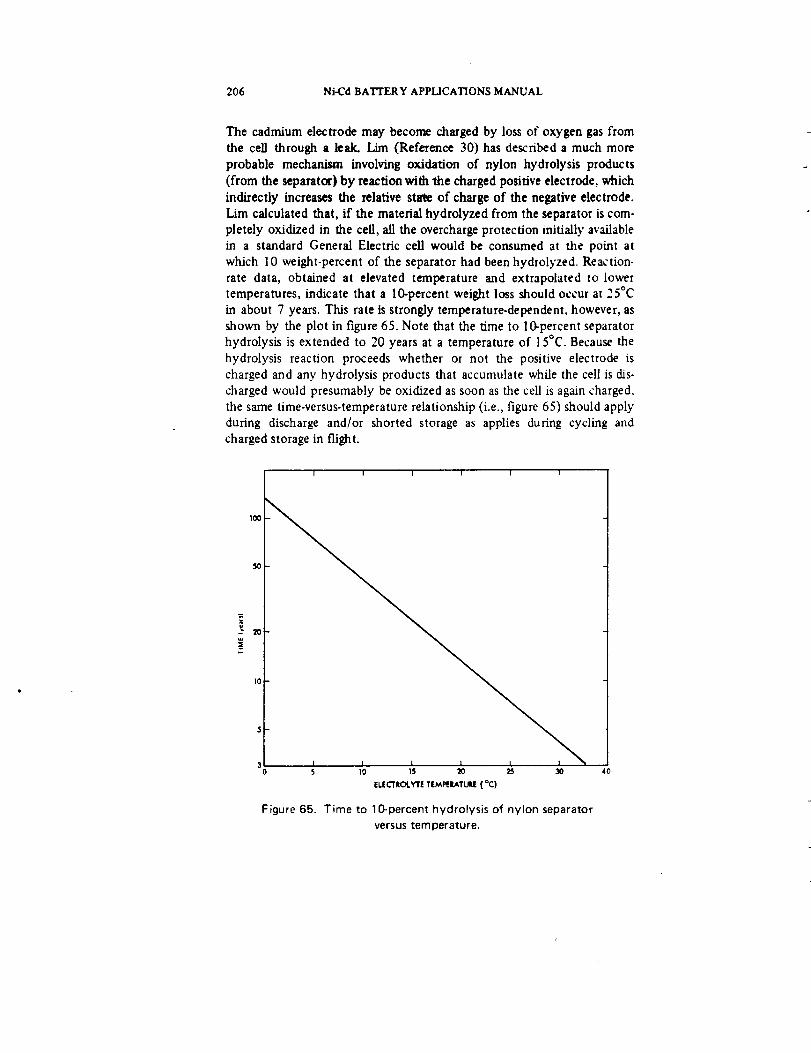
206 Ni-Cd BATTERY APPLICATIONS MANUAL
The cadmium elec_ode may become charged by loss of oxygen gas from
the cell through a leak. Lira (Reference 30) has described a much more
probable mechanism involving oxidation of nylon hydrolysis products
(from the separator} by reaction with Be charged positive electrode, which
indirectly increases the relative state of charge of the negative electrode.
Lira calculated that, if the material hydrolyzed from the separator is com-
pletely oxidized in the cell, all the overcharge protection initially available
in a standard Generad Electric cell would be consumed at the point at
which 10 weight-percent of the separator had been hydrolyzed. Reaction-
rate data, obtained at elevated temperature and extrapolated to lowertemperatures, indicate that a 10-percent weight loss should occur at 25°C
in about 7 years. This rate is strongly temperature-dependent, however, as
shown by the plot in figure 65. Note that the time to 10-percent separator
hydrolysis is extended to 20 years at a temperature of 15°C. Because the
hydrolysis reaction proceeds whether or not the positive electrode is
charged and any hydrolysis products that accumulate while the cell is dis-
charged would presumably be oxidized as soon as the cell is again charged,
the same time-versus-temperature relationship (i.e., figure 65) should apply
during discharge and/or shorted storage as applies during cycling and
charged storage in flight.
100
5O
-_ 20
10
I I I I f l
S 10 I$ _0 9di 30
ELECTROLYTE TEMi_I_TUIE (°C)
4O
Figure 65. Time to 10-percent hydrolysis of nylon separator
versus temperature.
CELL FAILURE ANALYSIS AND MECHANISMS 207
4.5.3.6 Accumulation of Undischargeable Charged Material and
Unchargeable Discharged/Via terial
Kr6ger (References 20 and 59) and Scott (Reference 17) have shown that
the percent of active material in the positive electrode that can be effec-
tively discharged at practical discharge rates (usually in the range of 0.3 to
1C) decreases significantly during the first 100 cycles of operation and
more gradually after that. Similarly, undischargeable charged cadmium
builds up in negative electrodes during cycling (Reference 88) as does
unchargeable (discharged) cadmium hydroxide. These accumulations de-crease the active areas available for electrochemical reaction and. hence,
result in excessive polarization and capacity loss.
One theory proposed for the effect of reconditioning by low-rate discharge
is that such operation is able to discharge accumulated charged material
that is not discharged during normal cycling. The extra material so dis-
charged is then charged on the following recharge, resulting in the presence
of a step increase in the amount of utilizable material for discharge. How-
ever, low-rate discharge cannot retrieve accumulated unchargeable mater-
ial. Such material has been at least partially rejuvenated by prolonged
overcharge (Reference 45, p. 99) and by pulse charging (References 173
and 174).
4.5.3.7 Degradation Mechanisms Related to Specific Determinants
The preceding sections described degradation mechanisms in general terms.
Interpretation of actual failure-analysis data is facilitated if observationsand information on mechanisms can be assigned to specific determinants
(as defined in Section 4.3.3 and outlined in Section 4.5.2). To assist in this
process, the author has assigned by analysis the most probable immediatelyunderlying causes of each of the most probable determinants (.table 38).The mechanisms shown are referred to as "first level'" to indicate that
additional levels of cause and effect may underlie the phenomena described.
Note that different mechanisms may be implied by a single cell component,
depending on the nature of the abnormal behavior and where it occurs
in the charge'discharge cycle.
4.5.3.8 Interaction Between Degradation Mechanisms
As indicated in Sections 4.5.3.1 through 4.5.3.6 and elsewhere, degradation
mechanisms in a sealed nickel-cadmium cell are rarely independent, and
many are hi_Lly interactive. Figures 66 through 70 show the nature and

208 Ni-Cd BATTERY APPLICATIONS MANUAL
Table 38
First-Level Degradation Mechanisms
Determinant
Component Electrical Behavior
Positive
electrode
Negativeelectrode
Excessive polarization
during active charge
Excessive polarization
during overcharge
Excessive polarization
during discharge
Increased polarization
during active charge
Excessive polarization
during overcharge
Related First-Level Mechanisms
Increased current density due todecreased electroactive surface area
Increased plate-surface resistance
Decreased electrochemically active
area for overcharge
Increased oxygen-evolution
potential
Increased plate-surface resistance
Insufficient reserve of electro-
chemically active-charged-positive
material at end of discharge
!Decreased utilization of charged
material
Increased plate-surface resistance
Increased current density due todecreased electroactive surface
area
Increased plate-surface resistance
Decreased amount of excess
negative material (overcharge
protection)
Decreased electrochemical
activity of excess uncharged
negative material
Decreased electrochemical
activity of overall negative
electrode (fading)
Decreased oxygen-recombination
rate capability (increased oxygen-
recombination overvoltage)
Increased plate-surface resistance
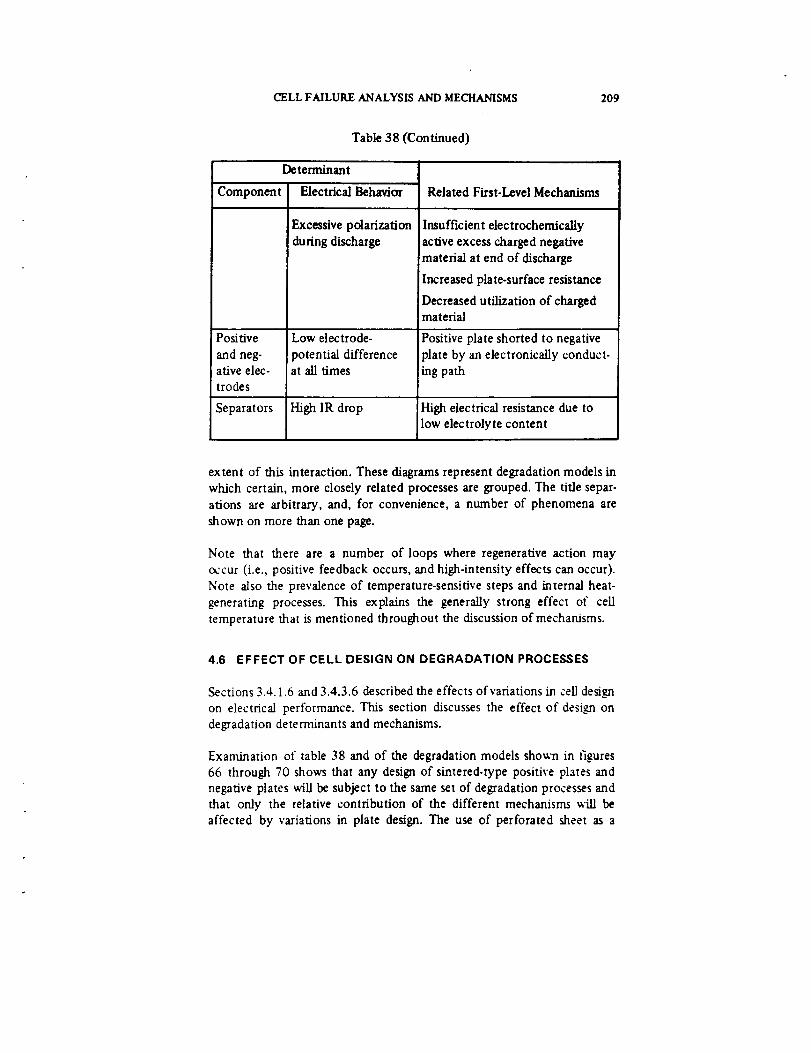
CELL FAILURE ANALYSIS AND MECHANISMS 209
Table 38 (Continued)
Component
Positive
and neg-ative elec-
trodes
Determinant
Electrical Behavityt
Excessive polarization
[during discharge
Low electrode-
potential differenceat all times
Related First-Level Mechanisms
Insufficient electrochemically
active excess charged negative
material at end of discharge
Increased plate-surface resistance
Decreased utilization of chargedmaterial
Positive plate shorted to negative
plate by an electronically conduct-
ing path
Separators High IR drop High electrical resistance due tolow electrolyte content
extent of this interaction. These diagrams represent degradation models inwhich certain, more closely related processes are grouped. The title separ-
ations are arbitrary, and, for convenience, a number of phenomena are
shown on more than one page.
Note that there are a number of loops where regenerative action may
occur (i.e., positive feedback occurs, and high-intensity effects can occur).
Note also the prevalence of temperature-sensitive steps and internal heat-
generating processes. This explains the generally strong effect of cell
temperature that is mentioned throughout the discussion of mechanisms.
4.6 EFFECT OF CELL DESIGN ON DEGRADATION PROCESSES
Sections 3.4.1.6 and 3.4.3.6 described the effects of variations in cell design
on electrical performance. This section discusses the effect of design on
degradation detemfinants and mechanisms.
Examination of table 38 and of the degradation models shown in fi_res
66 through 70 shows that any design of sintered-type positive plates and
negative plates will be subject to the same set of degradation processes and
that only the relative contribution of the different mechanisms will be
affected by variations in plate design. The use of perforated sheet as a
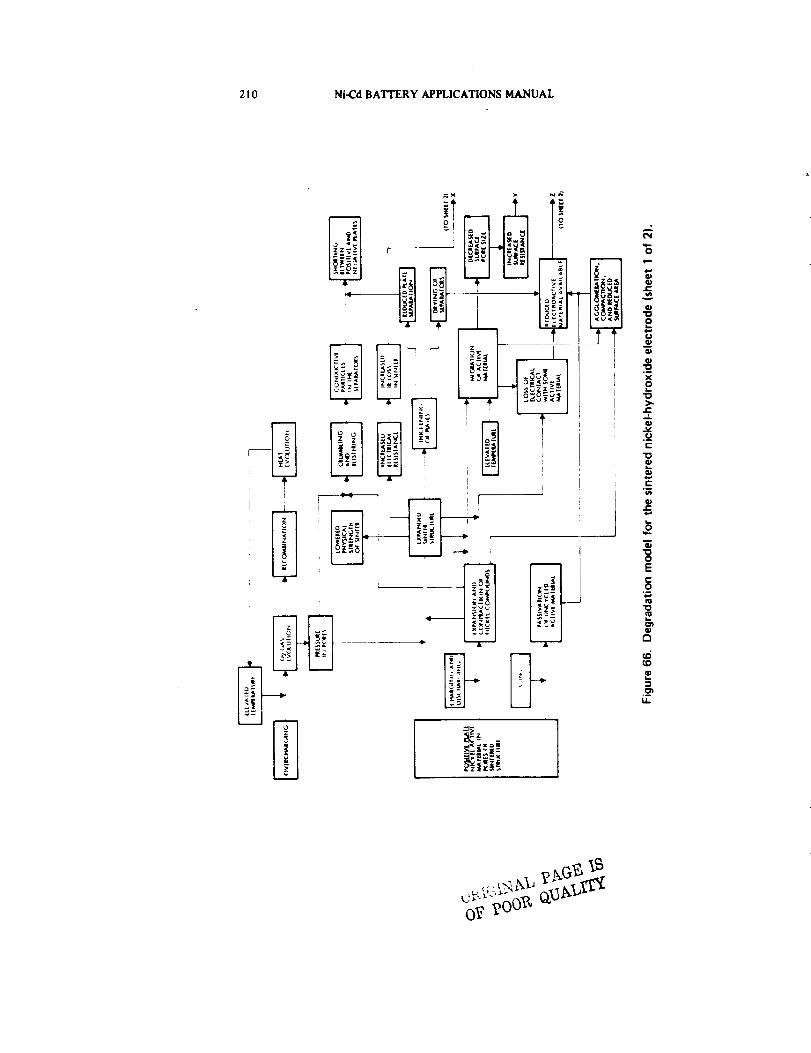
210 Ni-Cd BA'I_I'ERY APPLICATIONS MANUAL
I1
lID
e
X0
ID
e-
"D
e-°w
Q,)
EC0
o--
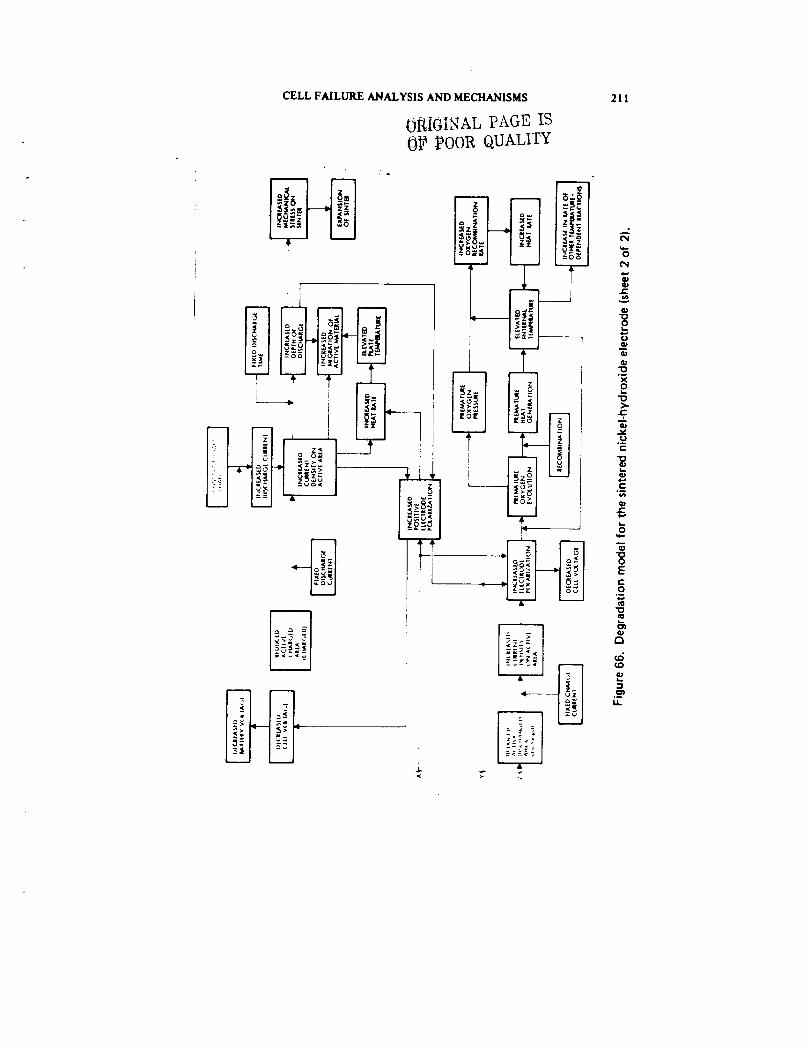
CELL FAILURE ANALYSIS AND MECHANISMS
01_IGINAL PAGE IS
0_ _OOR QUALITY
211
]
li:l--_l_H _z: / r
i
o
.....:
"O
X
>.
m
¢..
e.-.Q
G)
Ee.-o
.m
¢6
-1
I,l.
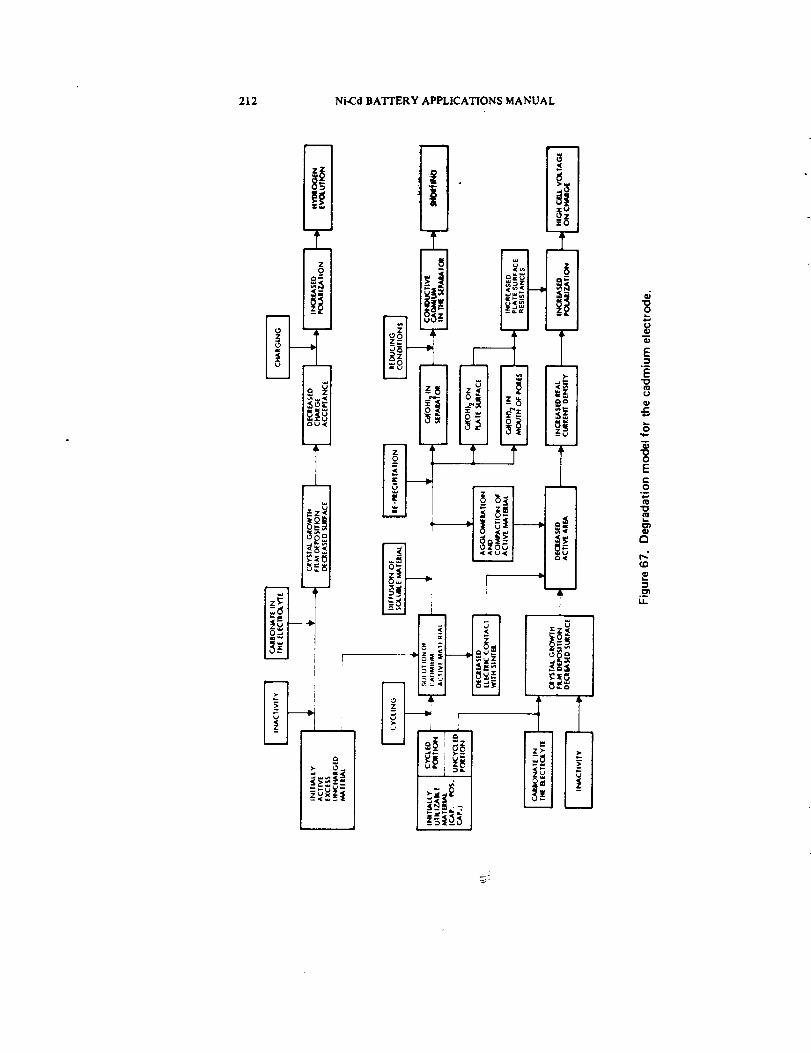
212 Ni-Cd BATTERY APPLICATIONS MANUAL
i
i!il_51
E
E
ID
0
Ec-o
.o
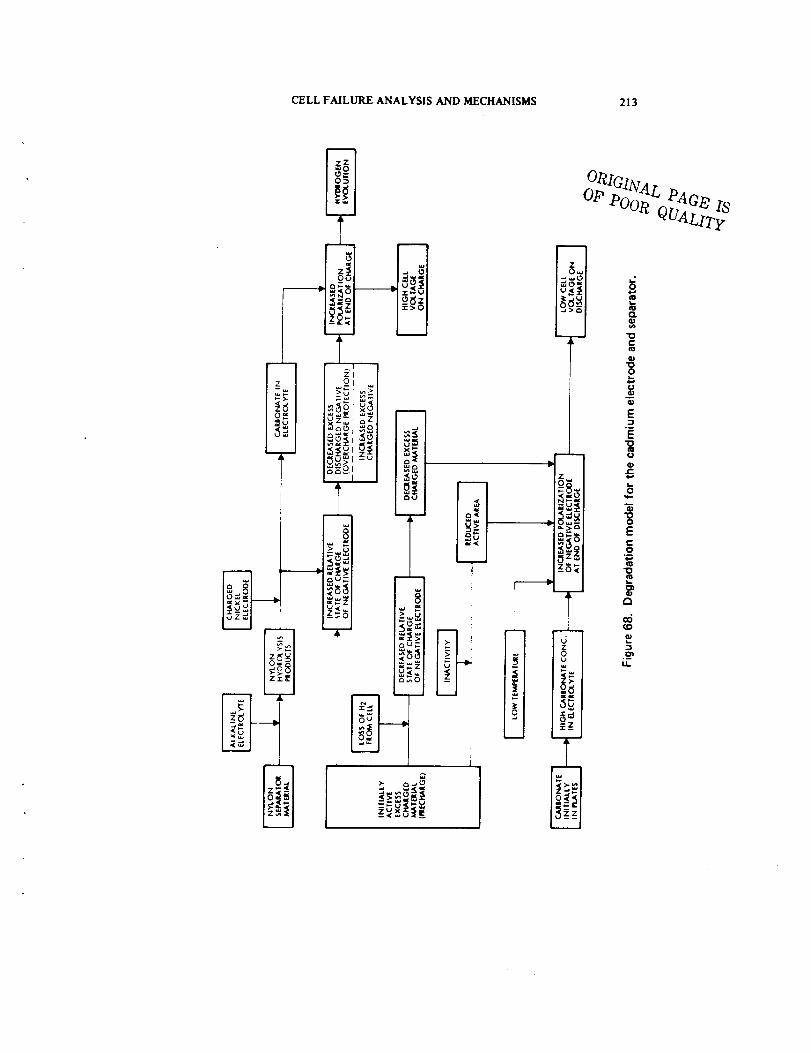
CELL FAILURE ANALYSIS AND MECHANISMS 213
h
_z_-I
_r-. _0
_uZ_l az I
iilttJ_
I
gfZ_l > _,..,
-_ _-_1_1
I=_d --_
I_G ____
, 1f
>- .._0
I
ZO_
,2
._z
r _
I_1_°_1
O_(GI_VA Lo_, _.4
W_LITF
t,,.
f_
"o
E
"ot_
Et-O
"o
r_
t.D
I1
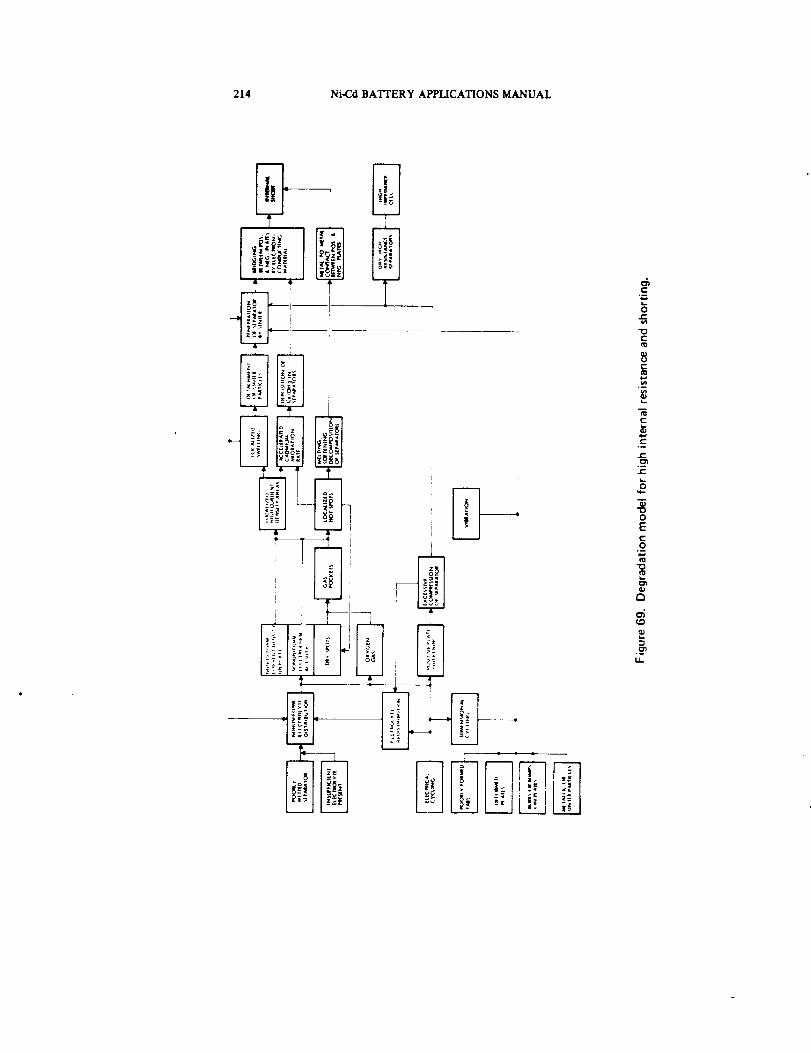
214 Ni-C,d BATI'ERY APPLICATIONS MANUAL
I
i-
"5
_0
me-
C._
¢-
t-
0
Ec-o
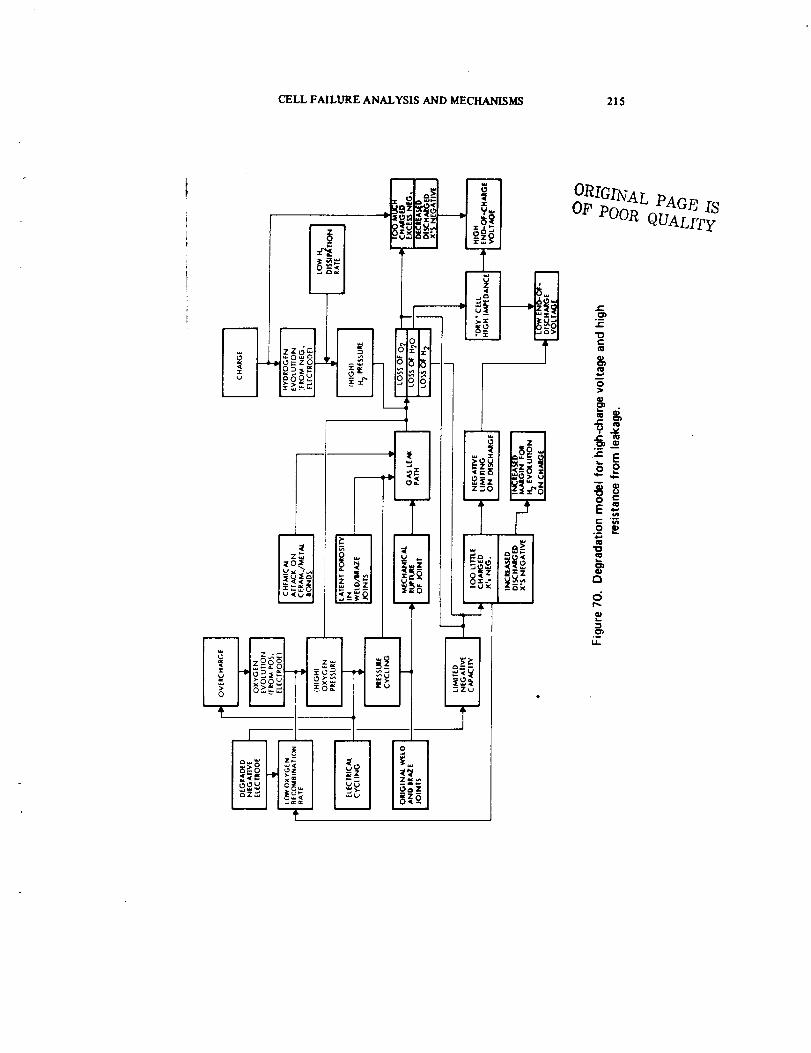
CELL FAILURE ANALYSIS AND MECHANISMS 215
ORIGINAL PAGE IS
OF' POOR QUALITy
t-
e-
"ur-
&10
O"J
.6
r- E
C
E_='_,
o
216 Ni-Cd BATrERY APPLICATIONS MANUAL
substrate in plates results in less expansion of the grid than the use of wire
screen, especially in the direction parallel to the plane of the plates. Heavy
loading results in more migration of active material, more pore blockage,
and more buildup of material in the separators. Most of these effects are
minimized in plates made by the electrochemical impregnation process inwhich the sintered structure is stronger and the active material is more
evenly distributed in the pores than is the case for chemically impregnated
plates.
Increasing the ratio of negative-to-positive capacity over a value of about
1.5 to l will improve performance only in those cases in which excessive
electrode polarization is known to be the controlling determinant. Accom-
plishment of such an increase by increasing the negative-plate loading or by
adding negative-plate area without making other adjustments is likely to
result in more migrated negative material and possibly a net loss in mean
time to failure. Use of teflonated negative-plate material appears to de-
crease the amount of negative-material migration substantially, but it de-
mands more attention to proper adjustments of electrolyte during cell
manufacturing.
Substitution of polypropylene (or other nonreactive polymer) for nylon in
the separators will eliminate the nylon-hydrolysis mechanism and associ-
ated decreasing overcharge protection, but it is likely to cause more severe
electrolyte redistribution and high internal resistance after cycling. Addition
of more electrolyte to the cell tends to offset the effect of redistribution
to some degree, but it does not eliminate it, and it may result in high
internal pressures early in cycle life.
4.7 EFFECT OF OPERATING CONDITIONS ON DEGRADATION
PROCESSES
This section summarizes the effects of operating temperature and depth of
discharge on degradation processes.
4.7.1 Effect of Operating Temperature on Degradation Determinants
and Mechanisms
The visible evidence of degradation is qualitatively the same in all cells,
regardless of the operating temperature, as observed from teardown analysis
after tests covering the temperature range from -20 to 40°C (References
19, 68, 106, 152, and 153k These results were reviewed in Section 4.5.1.3.
CELL FAILURE ANALYSIS AND MECHANISMS 217
The relative amount of these effects appears to change with temperature,
however, but quantitative data on this point are lacking.
The main effect of temperature on degradation is on the rate of the various
processes. The rate of all chemical reactions increases rapdily with in.
creasing temperature (usually by a factor of between 1.5 and 3 per 10°C
rise in temperature). Because each reaction (specific mechanism) has its
own temperature effect, the distribution of the various processes shown
in figures 66 through 70 may be expected to change as temperature changes.
In one of the earliest tests in which temperature was the only applied
variable and covered a wide range (-20 to +40°C) (Reference 175), all cell
failures occurred by end-of-discharge voltage going below 1.1 volts (pre-
selected failure criterion). The main failure determinant-loss of capacity
of the positive electrode-was_the same at all test temperatures. The authors
state that the mechanism of failure was also the same at all temperatures.
No investigation of the mechanism was reported, however, although it was
speculated that the presence of unusually high concentrations of nitrate
and carbonate in the cells was somehow responsible. End-of-discharge
voltage data did not fit any of several models tried. Acceleration factors
calculated from highly smoothed end-of-discharge voltage data showed no
accelerating effect of temperature when there was no temperature gradient
across the cells.* It appears that the failure criterion of 1.1 volts at end of
discharge was too high for these tests: hence, the results are of little value
in predicting the expected long-term effects of temperature.
An accelerated test program involving temperatures ranging from 20 to
60°C is now in progress at NWSC/Crane (References 152, 153, and 176),
in which the temperature variable is matrixed with a number of other
variables. Most of the electrical testing has been completed, but, because
failure analysis and analysis of the data are not complete, the effect of
temperature on the mechanism has not yet been determined.
The most obvious visible qualitative effect of increasing operating tempera-
ture is an increase in the amount of migrated negative-active material and
in the degree of separator degradation, mainly from low-Earth-orbit tests.
Although it is not clear in the Nrwsc/Crane reports (Reference 68), both
cadmium migration and separator deterioration are generally minor in cellstested at 0°C.
*Cells with temperature _adients tproduced by installing electrical heating elementsinside the cells) showed significant effect of the magnitude of this gradient on chargein end-of-discharge _x_ltagewi_h cycling.

218 Ni-CdBATTERYAPPLICATIONSMANUAL
4.7.2 Effect of Depth of Dischargeand DischargeRm onDegradationProcesses
A great deal of information in the literature suggests that cell cycle life isrelated to the depth of discharge used for cycling. Most such informationcomes from low.Earth-orbit cycling, in which failure is most often attn_o-utable to internal shorting associated with migrated cadmium material,
although the actual failure mode is not clear in many cases.
In one special test at 25°C in which discharge rate was held constant (at1C) and depth of discharge was varied over the range from 10 to 80 percent
(Reference 177), little effect of differing depth of discharge on the capacityof the negative electrodes was seen at any single point in the test. How-
ever, a gradual loss of electrode capacity occurred at all depths of dischargeover the 1600 cycles performed and at a rate per cycle that increased onlyslightly with depth of discharge. Reference 172 contains a limited study
of the specific mechanism of the observed negative capacity loss butno information on the performance of the positive electrodes in thesetest cells.
In another special test at 25°C (Reference 85), all the test cells were cycled
to 50-percent depth of discharge, and the discharge rate was varied overthe range from 0.5 to 8(? by varying the discharge time. Poor correlationwas seen between the average number of cycles to failure and the different
discharge rates, probably because of the high end-of.discharge failurecriterion used (1.1 volts corrected for discharge rate by adding the productof internal impedance and discharge current). Both positive and negativeelectrodes suffered capacity loss, but the severity of the losses did notcorrelate well with discharge rate. Internal impedance increased by as much
as 75 percent in some cells, but remained in the normal range for all cellsduring the test. No investigation of mechanisms was reported.
From a sophisticated analysis of test data from one of the accelerated tests
conducted during the studies described in References 85 and 177, Roegerand McCallum (Reference 162) found that, over the fLrst 3000 4-hour
csdes, end-of-discharge voltage decreased linearly with the logarithm ofthe number of cycles completed. From this, they concluded that, whenthis was the case, the accessible area of the active material was decreasingby the same ratio during each cycle, where the rate of charge per cycle wasa function of discharge rate (depth of discharge constant at 50 percent).On the other hand, loss of capacity from the positive electrodes was foundto be more a function of the number of cycles completed than of the
charge or discharge rates applied.
CELL FAILURE ANALYSIS AND MECHANISMS 219
Discharge rate is also included as a variable in the current NASA acceleratedtest at NWSC/Crane, combined with many other variables (References 152,
153, and 176). The data are being analyzed to show the effect of the
operating variables, but results are_ot yet available.
Therefore, at this time, the relationships between degradation determinants
and mechanisms on the one hand and depth of discharge and discharge rate
on the other are unclear. For a particular application, the user does not
have an independent choice of both depth of discharge and discharge
rate because, for a given discharge time, these increase and decrease
together as the cell capacity is varied (in design). If depth of discharge and
discharge rate actually have separate effects on the degradation mecha-nism, these effects will always be confounded in service. This may explain
why much of the available data relating performance to depth of discharge
appear to be inconsistent.

SECTION $
CELL AND BATTERY PROCUREMENT
5.1 INTRODUCTION
The procurement process for sealed nickel-cadmium battery cells, or for
complete batteries made with such cells, results in some considerationsthat are not normally part of similar procurement processes for items such
as resistors, capacitors, or solid-state devices. This is because cell manu-
facturing-at the current state of the art and with the market conditions of
the mid-1970's-involves a large number of hand operations and variables,
is difficult to maintain under tight control, and is subject to frequent and
often unexplained upsets.These factors may combine to produce unexpect-
ed quality deviations and delays in deliveries.
A cell is made by first manufacturing many component parts and then
assembling the parts into a completed cell, as explained in Section 2.4.
Because each of these components is subject to its own variability, for pro-
curement purposes, whole cells should be treated more as "critical assem-
blies" than as "parts." Because they are delivered sealed, however, most
procurement systems usually treat them simply as parts.
Although parts application specialists are normally available within larger
companies to write specifications for, and to assist in the procurement of.most electrical, electronic, and mechanical items, no such battery cell pro-
curement specialists normally exist outside the battery engineering group
itself. The battery engineer should therefore be prepared to participate in a
wide range of cell and/or battery procurement activities to ensure that the
items are delivered to specification and on schedule. This section is designed
to assist the battery engineer in performing this important function.
The procurement of batteries (i.e., completed mechanical and electrical as-
semblies of multiple cells) involves many of the same activities and prob-
lems as procurement of cells per se and, hence,can be considered as an ex-
tension of cell procurement. This section deals first and most extensively
with cell procurement; Section 5.8 describes activities that are unique to the
procurement of batteries.
221 ,---PrecedinEpal[eblank
/r
r'
222 Ni-CdBATTERY APPLICATIONS MANUAL
5.2 CELL PROCUREMENT PROCESS
In general, cells are procured for new hardware programs under a subcon-
tract arrangement rather than by a simple purchase order. The process of
procuring cells by subcontract is similar to that used by government agen-
cies in placing a contract. Figure 71 shows a typical flow of activities and
events preceding a procurement, and figure 72 shows the procurement se-
quence. The sequence applies not only to new procurements, but also to
cases in which significant new requirements are introduced that may entail
a new or redesigned cell. The sequence may be somewhat abbreviated for
procuring a predetermined cell design.
All the activities in figures 71 and 72 are shown in table 39 with primary
functional responsibilities and supporting roles identified. Note that battery
engineering has primary responsibility for determining the battery and ceil
design and for creating performance specifications, although other groups
are involved with the remaining phases of cell procurement. Throughout the
entire process, the battery engineer provides support to all activities. The
following paragraphs briefly describe the activities and the role of the bat-
tery engineer in each.
Battery specifications precede cell specifications and are derived from electric
power-system requirements. When the batteries are to be built in-house andcells therefore procured individually, the battery specification remains an in.
house document. When batteries are procured outside, both the battery and
cell specifications are used for procurement, as discussed in Section 5.3. The
battery engineer is usually responsible for preparing the battery specifica-
tion, often with assistance from the power-systems engineer and the quality
engineer.
The ceil procurement specification is normally prepared before issuance of
a Request for Proposal (RFP) if it is not already available, and it is the key
engineering document on which the procurement is based. The battery en-
gineer has primary responsibility for this specification but draws support
from the quali_' engineer. Cell specifications are treated at length in Sec-tion 5.3.
In any action that involves the solicitation of bids, the more complete anddefinitive the RFP. the more cost-effective the overall procurement. One of
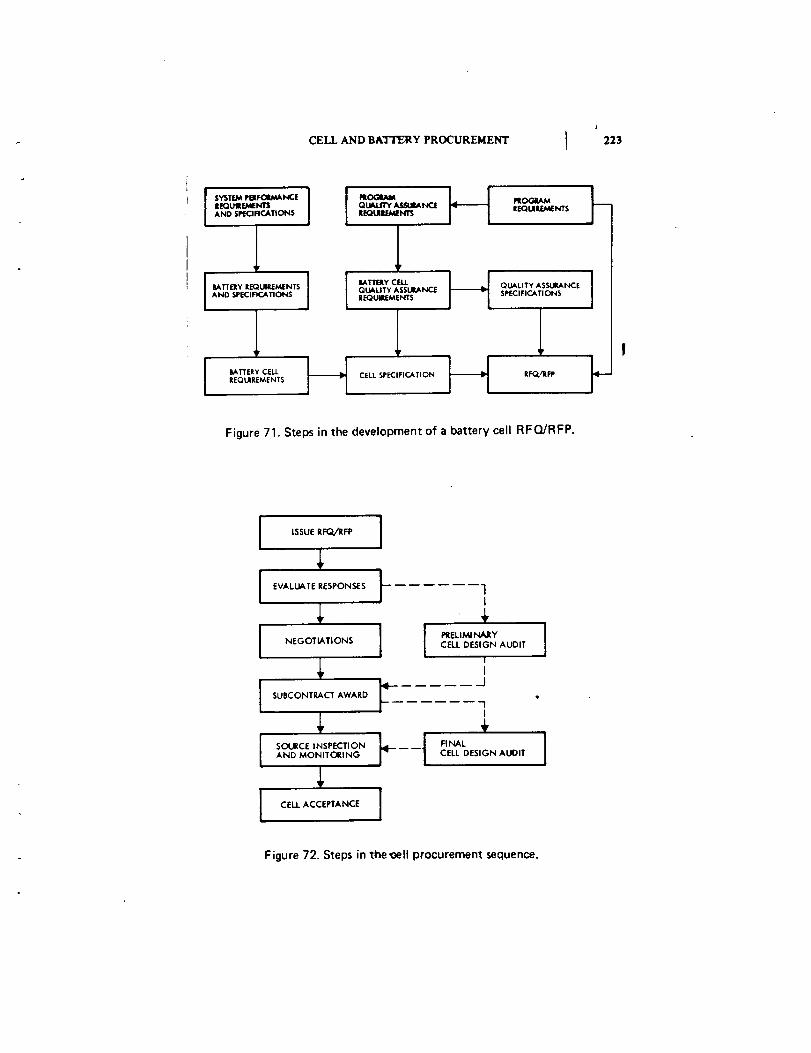
CELL AND BATTERY PROCUREMENT
i
223
REQUIRE;_NTS QU_JITY ASSUI_NCE REQ_RF./e_ NTSAND SI_VClFICATIO IqS REQUIREMENTS
1 1BATTERYREQUIREMENTS QUALITY ASSURANCE SPECIFICATIONSAND SPECIFICATIONS REQUIREMENTS
i l l
Figure 71. Steps in the development of a battery cell RFQJRFP.
I SSUE RFQ/RFP I
J EVALUATE RESPONSES J
I NEGOTIATIONS l
I SUBCONTRACT AWARD ']4"-
AND MONITORING
J CELL ACCEPTANCE ]
1I
PRELIMI NAItY ICELL DESIGN AUDIT
I
I/
Q-1
I
÷
FINAL JCELL DESIGN AUDIT
Figure 72. Steps in the_ell procurement sequence.
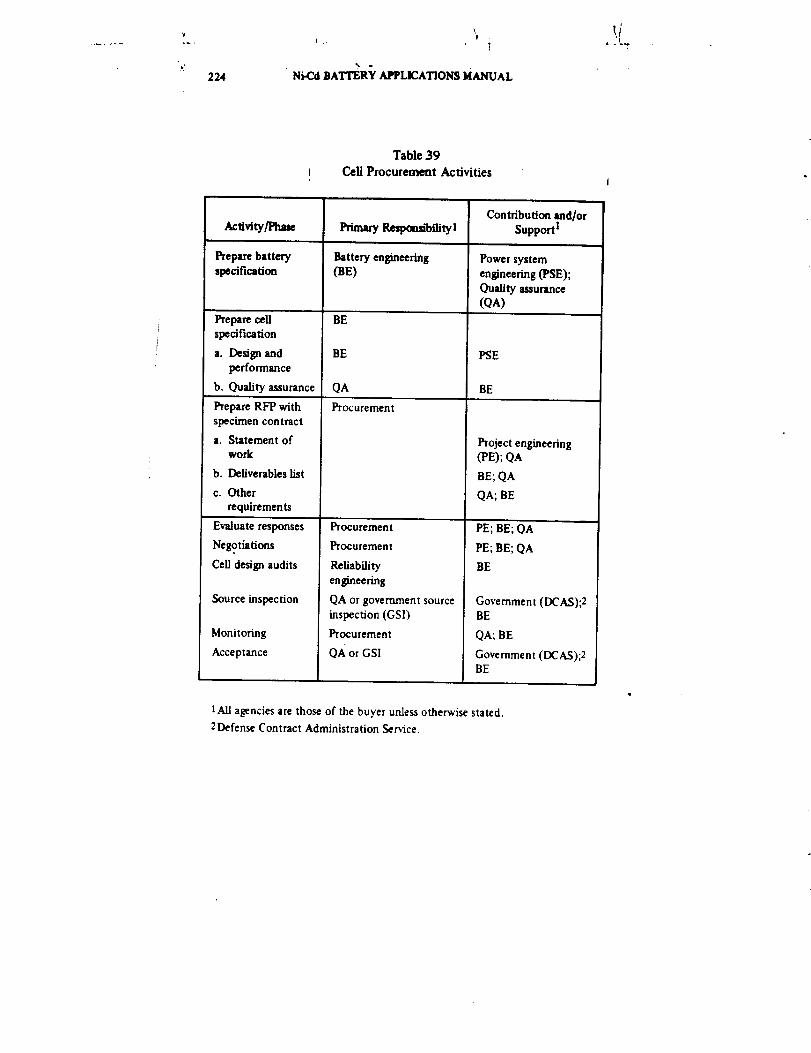
224 ' Ni-Cd BATTERY APPLICATIONS MANUAL
Table 39
i Cell Procurement Activities
Act/vity/l_se
Prepare battery
specification
Prepare cellspecification
a. Design and
performance
b. Quality assurance
Prepare RFP with
specimen contract
a. Statement of
work
b. Deliverables list
c. Other
requirements
Evaluate responses
Negotiations
Cell designaudits
Source inspection
Monitoring
Acceptance
Primary Respo_m'bility I
Battery engineering
(hE)
BE
BE
QA
Procurement
Procurement
Procurement
Reliability
engineering
QA or government source
inspection(GSI)
Procurement
QA or GSI
Contribution and/or
Support 1
Power system
engineering (PSE);Quality assurance
(QA)
PSE
BE
Project engineering(PE); QA
BE; QA
QA; BE
PE; BE; QA
PE; BE; QA
BE
Government (DCAS);2BE
QA; BE
Government (DCAS);2BE
IAII agenciesare those of the buyer unless otherwise stated.
2Defense Contract Administration Service.

I
iL'_LL AND BATTERY PROCUgEId_ 225
the best approaches is to provide bidders with a specimen contract complete
with a definitive statement of work, a list of deliverables, and any and all
specifications, instructions, and guidelines thjat constrain the potential sup-
plier. The battery engineer should be familiar with the procurement system
of his company/agency and should contribute to the RFP package as early
as possible.
Procurement personnel evaluate the responses to an RFP, and any subse-
quent negotiations, with the assistance of cognizant project, battery-
engineering, and quality-assurance representatives. During negotiations, any
significant differences in position between the buyer and proposer on the
cell specification and, if possible, on the Manufacturing Control Document
(MCD) should be resolved. Section 5.4 discusses these activities.
After contract award, a source inspection program is implemented, and
monitoring activities are initiated-first at the user's plant and later at the
supplier's facility. These activities are outgrowths of a quality-assurance
plan prepared by the user and coordinated with an MCD prepared by the
supplier. Sections 5.5 through 5.7 present guidelines for the engineering
support of this phase of procurement and acceptance activities.
This general review of the ceil procurement process has identified a number
of key documents and activities that require special attention by the battery
engineer. These include the cell specification, the RFP or purchase order
package and consequent negotiations, and the monitoring of production and
quality-assurance operations.
5.3 CELL SPECIFICATION DOCUMENT
This section is intended as an engineering guide to the preparation of an
effective cell specification rather than a general treatise on the preparation
of specifications. Individual company procurement manuals and federal
publications (Reference 178) contain complete information for preparingspecifications.
5.3.1 Types of Specification Documents
Several types of specification documents, identified in terms of the arrange-
ment of certain material and the degree of generality, are used: (a) the detail
I _ Ni-Cd BATI'ERY APPLICATION$ MANUAL
specification, (b) the general specification, and (c) the standard specifica-
tion. They are descn'bed in the following paragraphs with reference to their
use for cell procurement.
5.3.1. I Detail Specificaffon
A detail specification contains all the details pertaining to a specific cell in
the main body (basic content) of the text. This type of specification usually
covers only one cell size.
5.3. 1.2 Genera/Specificaffon and Specification Sheets
In a "general specification," only those requirements applicable to a broadclass of cells are included in the main body of the text. Particular require-
ments defining dimensions, capacity, weight, configuration, and test details
appear on separate pages that are usually referred to as "specificationsheets." Therefore, a general specification, with one or more specification
sheets attached, forms a complete specification.
This approach permits changing of cell particulars when necessary without
revising and reissuing an entire specification. General specifications can also
aid the procurement process because they can be made available for review
by the cell manufacturer well in advance of a particular procurement,
thereby permitting plenty of time for accommodation. A single general
specification can be used for many procurements, eliminating the need to
negotiate common requirements each time. This can help to reduce costs
and to provide a rational basis for developing a general MCD.
A variation on the standard specification consists of the preparation of only
the general quality-assurance requirements as a general specification docu-
ment. All design • nd performance requirements are then issued for particu-
lar cells as required.
5.3. 1.3 Standard Specifications
The use of general specifications as previously defined above, with the ac-
companying benefits obtained by simplified documentation, still permits
each company to impose separate and different requirements. As developed
by NASA, the standard cell-specification concept goes a step beyond and
provides for both a general specification that would be standardized
throughout the industry and standardized detail specifications for selected
• CELL AND BATYERY PROCUREMENT
!
cell sizes. By this means, the cost of procurement could be reduced, and the
overall uniformity of cells made to these specifications could be increased
significantly.
5.3.2 Specifical_on Foem and Contm/
Specifications that conform to the requirements of Reference 178 areconstructed around a six-section outline with the headings: (1) Scope,
(2) Applicable Documents, (3) Requirements, (4) Quality Assurance Provi-
sions, (5) Preparation for Delivery, and (6) Notes. Only Sections 3 and 4
are discussed here.
5.3.2. 1 Requirements
Because the long-term performance of the cell is component- and process-
sensitive, it is necessary to specify certain aspects of components and pro-
tess steps in order to have better control over performance of the finished
cell. It is advisable to separate requirements for components and processes
from those for the whole cell and to place these under separate headings.
Alternatively, this may be done by putting all requirements for components
under the heading of "Design Requirements" or under a heading such as
"Details of Components." Such separation will ensure that both in.process
and end-item requirements will receive the individual attention desired.
Of the many topics that may be included under "Requirements," design
(and construction) and performance require the greatest care in preparation.
To simplify the design requirements section, it is advisable to put all visually
observable and directly measurable aspects, such as external ,dimensions,
cell weight, overall configuration, and external Finish, etc., under separate
headings. Design requirements would then include only the less obvious
aspects, such as materials of construction, details of terminal-seal design,
number and thickness of plates, separation distance, quantity of electrolyte,
and precharge level.
Requirements for design should not conflict with requirements for perfor-mance. The information in Sections 2, 3, and 4 should prove helpful in
making these assessments, and the cell manufacturers should be consulted.
In a cell specification, performance requirements normally deal only with
the behavior and output of the cell as a whole. They are expressed in terms
of the voltage, current, and pressure relationships during the passage of
electricity and of quantifies such as capacity and energy derived from
I
i _ i Ni-Cd BATrERY APPLICATIONS MANUAL
voltage/current/time data. These may be subdivided into requirementsunder "normal environment" conditions (e.g., moderate temperature,
ambient pressure, etc.) and requirements under various normormal environ-
mental conditions, such as at temperature extremes, during and after
vibration or shock, and under constant acce]eratiom.
The different types of performance characteristics presented in Section 3
are candidates for inclusion in a specification. Other characteristics may be
needed for specific applications, yet others may sometimes be includedfor reference and for comparing data with that of cells previously pur-
chased.
5.12.2 Verification of Requirements
In a properly constructed specification, each specific requirement statement
(in the "Requirements" section) is accompanied by a corresponding method
for verification (usually located in the "Quality Assurance" section). The
method specified may be a test, a physical measurement, a chemical analy-
sis, or a documented calculation. Practical considerations dictate that
requirements that must be verified on all individual cells during acceptance
testing must be capable of such verification in a relatively short period
of time (usually a few weeks) to expedite completion of the procurement
cycle. Verifications that require longer periods fall into the category of
qualification tests.
Design requirements are verifiable if they are sufficiently specific. Thus,
requirements for items such as the material of the case, the concentra-tion of the electrolyte, and the excess charged-negative capacity may be
verified in a short time by known methods, although a given contract may
require that verification of any of these aspects be performed only infre-
quently.
On the other hand, requirements such as "the cell shall be designed for a
useful life of 5 years" or "the cell shall be designed for a minimum of
10,000 cycles" can be verified only by theoretical analysis within the time
constraints for cell acceptance. Furthermore, at the present state of the
art, no manufacturer can design a cell specifically for a given cycle life or
guarantee that a given design will last for many years. Therefore, suchbroad statements should not be included in design requirements but should
be placed under a separate heading such as "Life and Reliability" or"Intended Use." The overall design may be made subject to analysis by the
design-audit process. (See Section 5.4.)
CELL AND BATTERY PROCUREMENT 229
By the same argument, performance requirements placed in the "Require-
ments" section should specify only initial characteristics (as defined and
used in Sections 2 and 3). Because long-term or end-of-life performance and
reliability cannot be verified for procurement purposes, statements as to
desired limits, if included, should be placed under a heading such as "Life
and Reliability." As such, they may be consideredas performance goals and
may serve as guidelines for cell, design. Until the cell becomes qualified by
life-testing, the probability that the cell will achieve the goals may be
assessed by analysis in lieu of test. The results of this analysis then may
be made one subject of a cell-design audit. (See Section 5.4.)
If a given cell design has been qualified and the ability of that design to
meet the performance requirements has been officially demonstrated, the
procurement problem then becomes one of ensuring that the same design is
accurately reproduced. This effort is a matter of quality assurance and is
discussed in the following section.
5.3.2.3 QualiW-Assurance Provisions
The quality-assurance portion of the specification is the result of a joint
effort by the battery engineer and the quality engineer to reflect the unique
aspects of the cell-production process. This activity is greatly facilitatedif the MCD to be used is in hand so that the manufacturing steps and the
supplier's proposed quality plan are known.
The quality requirements should cover both materials that are processed
and the final product. Particular attention should be given to the more criti-
cal components, such as plates, terminal seals, and separator material.
Generally, these items should receive more rigorous inspection, screening,
and testing than is normally performed by cell supplier in the manufactureof commercial ceils.
Requirements for the qualification of cells are always included in the
"Quality Assurance" section. Complete and specific descriptions of all
qualification tests and associated pass/fail criteria should be provided,
especially for those tests that are not part of the acceptance-test sequence.By this means, the cell supplier can determine what testing the cell must
pass to be qualified and may be guided in his design accordingly. He may
also be able to point out possible conflicts between the design requirements
and these test requirements.
Qualification testing usually consists of a series of tests, some of which are
the same as those used for acceptance, plus others performed under more
i 230 Ni-Cd BATYERY APPLICATIONS MANUAL
extreme operating conditions and/or environmental stress levels. Although
long-term life testing on the pound may be involved, more often, the final
qualification status results from actual spaceflight application. Different
approaches to the qualification testing of cels are discussed further in
Section 6.
The requirements for the acceptance of cells form another major part of
the Quality Assurance provisions. They usually include two main items:
• Delivery by the seller of a certificate of conformance stating that the
cells in question: (1) conform with the requirements of the specifi-
cation, and (2) were made to the same design, using the same mate-
rials and processes, as the cells already qualified or otherwise approved
• Satisfactory completion of acceptance testing
Before the order is closed out, the battery engineer, together with his pur-
chasing agent, should verify that all data, samples, and other nonhardware
items required by the contract were received in good order. He should also
attempt to validate foregoing items (1) and (2) of the certificate of con-formance.
In a specification, requirements for cell acceptance normally follow those
for qualification. According to standard format, subsections on responsibil-
ity for testing, sampling instructions, special test conditions, and a list of
the test sequence are given here. Details of the test methods are described
later in the cell specification under "Test Methods." The substance of thesetests is discussed in Section 6 of this manual.
The buyer may elect to have the manufacturer perform only part of the
acceptance testing, and the buyer perform the remainder. It is never advis-
able to permit the supplier to do no acceptance testing, however. If he
performs no tests and if the cells fail to pass some part of the testing at the
buyer's facility, the supplier has a right to question the proper conduct ofthe test, and the cells may have to be returned to the supplier for resolx'ing
the problem. For this and for other reasons, some suppliers choose to per-
form certain acceptance tests even when the)' are not required by contractto do so.
Perfomlance of some. if not all, acceptance testing by the supplier offers
certain other advantages. It expedites the availability of acceptable ceils;
it is usually less costly than when the tests are done at the buyer's facility:
and it permits testing to be done with accompanying pressure measurements
CELL AND BATTERY PROCUREMENT i 231
(before pinch-off) if desired. The main disadvantage of acceptance testing
by the supplier is that his test equipment and controls are usually not as
refined as those available at the buyer's plant, particularly for thermal
control. The supplier usually uses only air as the cooling fluid, with the
result that cells are operated near the upper limit of the test tolerance.
This results in lower charge voltage and higher discharge voltage than if
the ceils were operated near the lower end of the temperature tolerance,
where they tend to be when the heat path is through metal clamps to a
liquid-cooled heat sink. If the acceptable performance limits are too narrow,
this type of temperature control difference can be sufficient to result in
passing a test at the supplier but failing to pass after receipt at the destina-tion.
Another type of acceptance test that should be considered for obtaining
greater control of internal design and processing is teardown analyses.
Randomly selected ceils can be opened, the internal parts visually inspected,
and certain measurements and tests made quickly and inexpensively con-
current with the main electrical testing activities. Advance suitable accep-
tance criteria must be negotiated with the cell manufacturer.
5.4 REQUEST FOR PROPOSAL
The RFP defines the content of the proposal, as well as the scope of the
work to be done after contract award. The battery engineer should assist in
formulating both sets of requirements and should participate in subsequent
proposal evaluations.
The supplier should be required to defend his proposed design when: (a) a
qualified cell cannot satisfy battery performance and life requirements;(b) the f'me details of cell design are left to the supplier; and (c) when the
supplier proposes to use a different design from one already qualified tomeet an old set of performance requirements. This is best done by requir-
ing that a description of the cell design, detailed down to the level of all
proposed changes, be included in the proposal response, together with a
discussion of why the proposed design is expected to meet the perfor-mance and life specifications. The discussion of cell-desigr_ parameters
contained in Section 3 may be used as a guide for the type of design in-
formation to be requested. A discussion of the design and the rationale for
its selection may be a part of negotiations; if so, the request for proposalshould so state.
_132 _Ni-Cd BATTERY API'LICATIONS MANUAL
Generally, all future significant spacecraft cell production is expected to be
performed with reference to some vorsion of an MCD.* Because the contentof the MCD can affect cost and schedule, it is advisable to attempt to
resolve any significant differences between the buyer and supplier regarding
the MCD. Therefore, if the MCD to be used has not already been estab-
lished at the time the procurement action is initiated, one or more copies,
updated to reflect specification and contract requirements, should be re-
quired as part of the proposal. The document may then become the subject
of subsequent negotiations.
Also of interest to the battery engineer are requirements for tasks that
follow the award of a contract. Postaward requirements should be identified
by a "specimen contract" that later becomes the final contract after modifi-
cations that result from negotiations.
The primary contract requirement is for the delivery of cell hardware.
Formulation of this requirement is greatly simplified by reference to the cell
specification, which def'mes individual cell characteristics in detail. The only
other information that the RFP must def'me is how many cells are required
and when they are to be delivered.
Because most cell procurements call for delivery of items in addition to
cells, however, the request for proposal must also det'me these nonhardware
items and their delivery schedules. These items may be conveniently sum-
marized in a list or table that identifies how many of each must be pro-
duced, when, and to whom each is to be delivered. Such a table is similar to
the Contract Data Requirements List, DD Form 1423. associated with
many government contracts. This list should include, as applicable, the fol-
lowing items:
• Cell-design package
• Ceil-design audit
• Manufacturing Control Document
• Master production schedule
• Material and production records
• Quality control reports
• Samples
• Acceptance test data sheets• Certificate of Conformance for cells
"See Section 5.5 for a definition and discussion of the MCD.
CELL AND BATTERY PROCUREMENT 233
A cell-design audit should be conducted if a new design is to be built or if
new drawings or revisions to existing drawings or procedures are necessary
for updating a design that was previously reviewed and approved. Thisreview should be held after the supplier has completed the drawing/design
package to be used for production. The battery engineer should submit a
copy of the design package to the buyer for his review well before the
review meeting is scheduled.
The master production schedule, a key item needed for properly monitoringthe work flow, should include:
• Shipping dates with quantities of deliverable cells
• Production milestones for each production group of cells, includingat least:
- Availability of plate material
- Completion of aerospace formation
- Filling with electrolyte
- Completion of acceptance testing
• Due dates of any production reports, samples, data packages, and
other required software
The material and production records required should include as a minimum
copies of:
• Evidence of acceptability of the plate material used
• Evidence of acceptability of the separator material used
• Data sheets from the aerospace formation (open ceil) test operation
• Selected data sheets on which other data are recorded during
production
• All manufacturing travel cards
The evidence of acceptability of plates and separator material, which maybe in the form of certificates of conformance, should show both as-
determined and required values and the applicable drawing reference with
revision number and date of revision. The formation data permit the engi-
neer to review the manufacturer's decision to either use or reject groups or

234 Ni-Cd BATTERY APPLICATIONS MANUAL
lots of plate material. The travel cards and other in-process data sheets are
of value in tracking the effectivity of events or changes to the process when
other sources of schedule information are incomplete.
Specifications for these items have not usually been invoked in the past.Yet, to ensure that what is wanted is obtained, it is advisable to include
minimum specifications for content, format, and type and quality of
reproduction of software as attachments to the contract. Blank forms
and/or completed examples of acceptable material should also be attached,
if possible.
A key item on the foregoing list of deliverables is the MCD. As noted, it
is recommended that arrangements be made to deliver this document with
the proposals to ensure adequate time for review. Because this document is
of central importance to the control and documentation of cell design and
processing, it is discussed in detail in the following section.
5.5 MANUFACTURING CONTROL DOCUMENT
The MCD, sometimes referred to as a Process Identification Document
(PID), is a document package prepared by the manufacturer to define the
details of cell design and the process steps tO be used. Whereas the specifi-
cation defines what is to be made and how it (the cell) should work, the
MCD defines how it will be made and how the intent of the specification is
to be carried out. The use of this type of documentation has increased
rapidly during the last 5 years, and many prime contracts now require itsuse for cell procurement.
5.5.1 MCD Format and Content
In general, an MCD contains the following items and sections:
• Revision record
• Table of contents
• Engineering drawings
• General engineering documents
• General quality-control procedures• Process flow chart
• Process step to document cross-reference table
• Material control procedures and forms
• Step-by-step manufacturing and test instructions
• Step-by-step quality-control instructions
CELL AND BATTERY PROCUREMENT _$
• Travel card forms
• Data sheet forms
• Customer acceptance test procedure
Except for special items that individual customers may add, the main body
of the MCD tends to be the same for all sizes of spacecraft cells made by
one supplier. Only certain drawings (e.g., of the plates and of the completedcell assembly) and specific values of charge and discharge current defined
for the purpose of test need to be different. The customer-required accep-
tance test procedure, which is a part of the MCD, usually exhibits the mostvariations of any section of the document.
The format, and to a lesser degree the content, of the MCD varies consider-
ably from one supplier to another at the present time. These differences
make comparative evaluation difficult for the cell user. It is hoped that in
the future the standard cell program sponsored by NASA will result in amore standardized format.
A number of pertinent drawings, procedures, and operating instructions
may not be distributed with the MCD because they may be considered
proprietary by the manufacturer. However, all pertinent documents should
be included at least by reference to the document number. All such docu-
ment callouts should include a current revision number/letter and corre-
sponding date.
5.5.2 Engineering Review of MCD
In the first submittal of the MCD, the buyer is responsible for determining
if the design and process are adequately defined for his application. The cell
design is defined in an engineering sense by the applicable drawing "tree."
Usually only a small part of this tree, consisting of a number of top-leveldrawings, is included in distributed copies of the MCD. Experience has
shown that they do not provide adequate visibility for verifying design con-trol to the level required to obtain long-life spacecraft cells. One approach
to improving this situation is to include a complete tree diagram in terms of
all the drawing/document numbers. Because plate design is basic to cell
design, this tree should identify the positive and negative plates to be used
in the cell. The battery engineer should review all parts of these documents
that impact cell design before f'mal approval of the MCD. If some drawings
cannot be permitted outside the factory, they should be reviewed on the
premises. Once a given drawing revision has been reviewed, any subsequentrevision should be considered to constitute an official revision to the MCD
and should be so handled. The contract provisions that cover the use of theMCD should make this point clear.
236 Ni-C.dBATTERY APPLICATIONS MANUAL
The same approach should be followed throughout review of the process
steps described in a first-submittal MCD. Documents referenced but not
supplied should be reviewed at the supplier's facili_. Options exercised
for repair or rework of material failing to pass an inspection or test stepshould be identified, and the applicable rework/retestpmcedures should be
documented. Adequate record keeping and data gathering should be ensured
through the use of appropriate manufacturing travel cards and data sheets.
Although the manufacturer's travel cards are not normally designed to fol-
low rework, rework can sometimes be the cause of subsequent abnormalcell behavior.
Although users may not be able to directly influence the way certain manu-facturing operations are performed, they can often exert strong influence on
the manufacturer's quality-control program. Thus, the battery engineer
should review the quality plan presented in the MCD from his point of viewand should make recommendations to his qual/ty.assurance engineer dur-
ing the review process. For example, possible improvements might take the
form of additional inspection steps, greater depth of coverage for key steps,
or additional inspection data to be taken.
5.5.3 Standardized Manufacturing Control Documents
The creation of new MCD's and their review are time-consuming activities.
Furthermore, the continual introduction of new and unfamiliar instructions
into the production sequence is often counterproductive because of the
time needed to accommodate each change.
These problems can be minimized by the use of a standardized MCD orstandardized control document modules. Because a high percentage of cell
assembly and initial test operations perfomled by a _ven manufacturer
are essentially the same for all spacecraft cells made regardless of the buyer's
specification, a large portion of the complete document could be preparedin advance in standardized form. Only those portions unique to the parti-
cular cell ordered would have to be prepared in original form.
This approach is facilitated by the use of general specifications, particularly
those for quality assurance. Quality requirements tend to be the major
source of differences from program to program and from campany to com-
pany. Formatting the MCD so that the Quality Control Plan is a separable
module, with inspections and tests keyed to the process flow diagram.
would expedite the review and approval process. Use of standard specifica-
tions when applicable would also simplify this process.
CELL AND BATTERY PROCUREMENT ! 237
5.6 BATTERY ENGINEERING SUPPORT TO QUALITY-
ASSURANCE ACTIVITIES
The role of the user's quality-assurance function in cell procurement is not
only verifying that the delivered items meet the specification requirements,
but also ensuring that manufacturing is performed in accordance with the
approved MCD. The latter task is essential because of the strong dependence
of long-term cell performance on certain process details as discussed in Sec-
tion 3. This task is best performed by verifying that the manufacturer's
quality-assurance organization is performing in accordance with the quality
plan in the MCD.
Verification of conformance to the MCD is sometimes difficult because the
written instructions are often incomplete and/or unclear, and are therefore
subject to differing interpretations by different personnel. In such cases,
the buyer's quality representative may be required to judge if a deviation is
m the spirit of, or only in the letter of. the instruction. It is here that the
battery engineer should contribute by analyzing the degree of potential
impact of the deviation on ultimate cell perfom_ance.
Before cell production begins, the buyer's quality engineer prepares a
quality-assurance plan covering source inspection (inspection at the manu-
facturer's plant by a representative of the buyer) and production monitoring
(tracking manufacturing activities at the supplier's facility). The details of
this plan are based mainly on the process sequence and on the manufac-
turer's quality plan as described in the MCD.
In developing the plan, it is important to assign priorities to the operations
so that key steps are given proper attention. The batteD' engineer is in the
best position to assign these priorities because of his knowledge of the pro-
cess. When many cells are to be manufactured in a relatively short time,
several production lots may be in process at one time. Under these condi-
tions, proper quality-assurance coverage of only the high-priority steps can
be a full-thne job for one man. At such times, direct support by the battery
en_neer at the manufacturer's plant may be advisable.
To be effective, the source inspection plan should address the following
activities at the manufacturer's plant:
• Reinspection of materials or hardware (after the manufacturer's
inspection), usually on a random sample basis
238 NI-CdBATTERY APPLICATIONS MANUAL
• Verification that various approvals have been accomplished and
associated paperwork has been properly completed
• Review of data sheets and quality-control record forms for confor-
mance with manufacturers' standards and contractual requirements
Verification that equipment setups are proper, that equipment is in
calibration, and that operations are being performed according to the
MCD
• Verification that the latest revisions of operating instructions are
being used on the floor
• Verification of conformance of cells to preshipment acceptance
requirements and of the completeness of the data package
• Communications of events that may impact schedule and of ques-
tions of interpretation by either telephone or teletype to the buyer
• Preparation of periodic reports to the buyer's quality engineer or
quality management
Monitoring normally consists of following these activities, tracking the
status of cells, and responding to communications from the supplier and
from the source inspector as production proceeds. These activities permit
the user to anticipate receipt of cells and. if necessary, to assist the sup-
plier in a timely manner to avoid delay in deliveries. Such monitoring is
made necessary by the limited spacecraft-cell production capacity and staff
maintained by the cell manufacturers.
To best support procurement as production proceeds, the battery engineershould know the status of each batch of cells as production continues. If
possible, production schedule information should be obtained at weeklyintervals down to the level of the number of cells at each operation. In this
way. the effectivity of any process change that is made during a productionrun can be established with minimum risk to the entire production run. This
problem is difficult at best. however, because cells are not individually seri-
alized until near the end of the process, and manufacturing sublots are not
separately identified. It is evident that only more rigorous accountability
than has been customary will improve traceability to process details.

CELL AND BATTERY PROCUREMENT 239
5.7 CELL ACCEPTANCE
Acceptance of cells is the last step in the cell-procurement cycle in which
the battery engineer is involved. Acceptance is usually accomplished in two
stages: (a) a provisional acceptance at the supplier's location, and (b) a final
acceptance at the buyer's plant. The second stage is necessary because of
the possibility that adverse sl_pping conditions may permanently degrade
cell performance beyond specification limits.
The source inspector normally receives notice from the buyer's quality-
assurance in-house personnel that a group of cells have completed accep-
tance, that other cells have not passed all requirements and are being held
for retest, or that the supplier requests a waiver on one or more cells. As
much information on the nature and distribution of the data in question
should be transmitted at this time so that the battery engineer can make
the required judgments. Similarly, to expedite the decision on final accep-
tance, data obtained from any final acceptance testing at the user's plant
should be made available immediately to the battery engineer.
5.8 BATTERY PROCUREMENT
Any company charged with designing or building a spacecraft electric power
system must make a "make-or-buy" decision regarding the batteries (i.e.,
whether to make the batteries in-house using purchased cells or to buy the
batteries from an outside source). If the company has the facilities, equip-
ment, and experienced personnel to assemble and test batteries, economics
usually dictate a "make" decision. If these capabilities are not available,
battery assembhes must be procured.
Two types of qualified outside sources are available: (a)another spacecraft
contractor with power systems and battery assembly capability, and (b) cell
manufacturers who also make batteries. Most prime contractors for space-
craft systems can now make and test batteries in-house. Of the major eel]
manufacturers. Ea£.le Picher Industries, Incorporated, and SAFT-Arnerica
make batteries, but General Electric Company (Battery Business Depart-
ment) does not. ]'he suppher does not have to perform all of the activities.
required t'or delivering flight-ready units to a spacecraft. The buyer may
retain the desi_ activity as well as qualification testing; the latter may be
done in-house after receipt of the hardware. The supplier normally performs
acceptance testing. Thus, many practical combinations of tasks and per-
tbrming organizations are possible.
I 240 Ni-Cd BATTERY APPLICATIONS MANUAL
For a final procurement decision, a number of technical and cost trade-
offs must be evaluated. Table 40 summarizes the considerations associated
with selecting either type of outside source or of performing the entire
job in-house. The table shows that, for new and critical designs for which a
high degree of optimization is necessary for meeting weight or perfor-mance requirements, the design work is best performed in-house. However,
if the design is not critical, especially if a standardized design can be uti-
lized, outside sources for batteries may prove most cost-effective.
5.8.1 Specifications for Battery Procurement
A cell specification and a battery specification are both normally used as
separate documents for battery procurement. This practice reflects thefact that the cells used to make the batteries should be manufactured.
tested, and accepted in the same manner as if they were to be delivered as
individual cells. Therefore, the cell specification need be no different from
that described in Section 5.3. Obviously, for mutual compatibility, certain
requirements must be coordinated with those in the battery specification.
The battery specification used for outside procurement may be nearly the
same as that prepared during a battery design program, but it should also
contain certain requirements that may not be included in a specification
written for internal use only. For example, a battery procurement specifi-
cation should contain procedures and criteria for selecting cells to be used
for battery assembly out of the many available cells (all of which are
individually acceptable) and for assigning cells to individual battery assern-blies. Section 6 discusses such criteria.
A related set of requirements concerns the range and limits of individual
cell voltages at end of charge and end of discharge during battery accep-
tance testing. Such requirements recognize the fact that occasionally the
process of constraining the cells in a battery case or the performance of
battery-level testing at levels beyond those experienced during cell accep-
tance testing will cause some cells to behave poorly. When cells of this
kind are present, a batter should not be considered acceptable even
though the batter3' terminal voltage falls within prescribed limits.
Formulating definitive and adequate battery acceptance and qualifica-
tion test requirements and associated pass/fail criteria demands more carethan that for individual cells, because a completed battery represents much
more time and cost. The specification of these requirements should not be
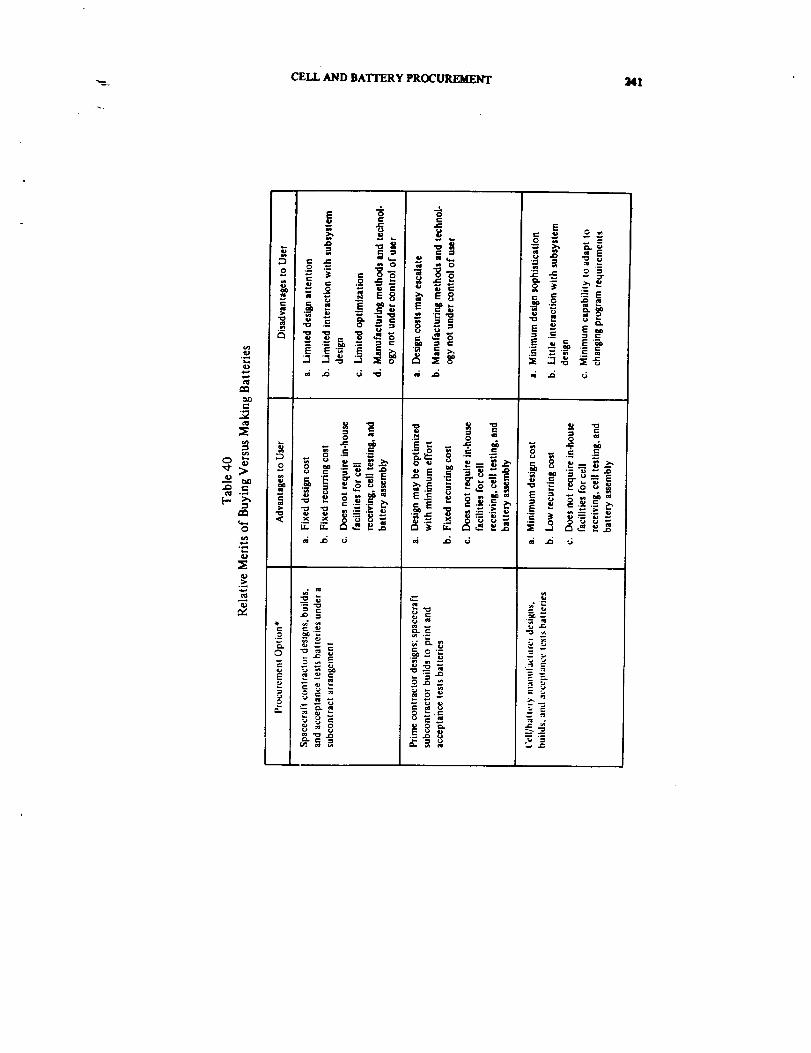
CELL AND BATTERY PROCUREMENT
e'-
O
I-,
.>_
=E o om
.,D
" "= _ E8 _ E8
;.3 o o
_ =. ,,sm e. _'0 .-- '=
_ os
_ m
--- o
_ _- ____ _.._-=
E0
"_ . ,,..
,_ ,4 d
0 _m e., e-,
.- ._0_ _ -
.:_
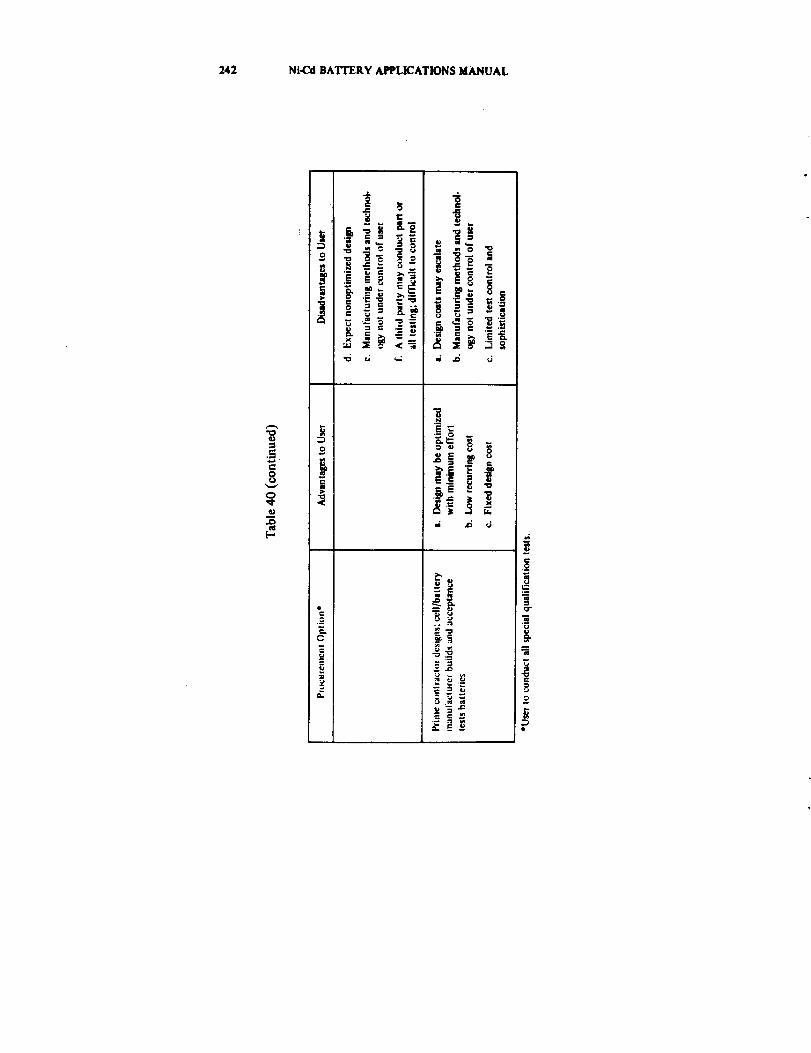
242 Ni-CM BATFERY APPLICATIONS MANUAL
q,J
_r8
[-,
_ ___--
r_
o
o
8_
,_ .6 6
E_
gq _
3
CELL AND BATTERY PROCUREMENT 243
merely an extension of cell testing, although the data must relate to cell
test data. Section 6 describes cell and battery testing and interpretation of
the results.
5.8.2 Monitoring of Batlmry Production
The procedure for monitoring the procurement of a battery assembly is, atthe outset, similar to that for cell production as described in Section 5.6.
An MCD should be implemented for the battery assembly and acceptance
test phases as a separate document from the one for controlling cell
assembly.

SECTION6CELL AND BA2'TERY TESTING
6.1 INTRODUCTION
From the time they are manufactured until they are launched aboard a
spacecraft, sealed nickel-cadmium cells and batteries undergo many tests
designed for verifying their quality and for ensuring their suitability for
flight. Tests may be performed: (a) before the cells are sealed; (b) after the
cells are sealed but before they are assembled into batteries; or (c) at the
battery level. Some tests provide a basis for formal acceptance or qualifica.
tion of ceLl or battery hardware, others provide for monitoring of the manu-facturing process. This section reviews these tests in terms of the various
test methods used, the success criteria applied, and the degree to which they
accomplish their intended purpose, and identifies controversial areas and
potential problems.
6.2 ACCEPTANCE TESTING
When cells or batteries are procured to a specification or batteries are
assembled to a specification, a number of activities are performed to verify
that all requirements are met. These activities are part of the process of veri-
fication described in Section 5 and include a set of tests and inspections that
are universally referred to as acceptance tests. The acceptance testing of
cells or batteries may be performed entirely by the manufacturer or may be
divided between the manufacturer and the buyer, with some degree ofplanned duplication. In either case, the buyer seeks the maximum amount
of information useful to his particular application from the tests. However,
it is desirable to avoid unique, application-oriented tests during the normal
acceptance sequence, particularly during the part of the sequence that isperformed by the cell or battery manufacturer. The buyer should perform
such special tests after the items have been formally accepted. Otherwise, if
negative results from the special tests are obtained or if the cell characteris-
tics are temporarily affected by the special tests, the main purpose of accep-tance testing may be compromised. If, on the other hand, maximum use is
made of test methods and conditions that are normally used by the manu-
facturer, it will be possible to take full advantage of the data obtained from
prior tests of other similar items. Anomalous results may therefore be
245 , PrecedingpageblankL
246 Ni-Cd BATTERY APPLICATIONS MANUAL
referenced to a large established test data base. During negotiations of the
procurement specificatatm and the related MCD, the manufacturer should betold of any special _ that must be included in the acceptance test se-
quence.
The procurement specification should contain specific instructions as to
what tests will be done, what criteria will apply, and which of the tests will
be done by the cell manufacturer. Some of the tests, such as those involving
cell-pressure measurements, can be done only by the manufacturer.
Because some of the cell manufacturer's acceptance tests are similar or iden-
tical to tests in his preacceptance manufacturing test sequence, the dividing
line between these two types of tests is often indistinct. This can sometimes
lead to confusion as to the responsibilities and options of the manufac-
turer in the event of failure to meet agreed-upon criteria before and during
formal acceptance tests. Therefore, the contract should clearly def'me the
boundaries of the buyer-invoked acceptance tests at the manufacturer's
plant and the procedures for disposition of material within those boundar-
ies. Acceptance testing of ceils at the cell level differs considerably from
acceptance testing of batteries as a whole.
6.2.1 Cell Acceptance Testing
The current approach to acceptance testing of sealed nickel-cadmium cells
within the aerospace industry is the result of an evolutionary process that
began in the late 1950's. At the outset of the space program, this testing
reflected the minimal requirements that were then placed on cell perform-
ance and the commercial origins of the device. As the need for improved
performance and reliability developed, more attention was given to estab-
lishing bette, methods of screening by cell buyers in both industry and the
government. These efforts remained only loosely coordinated until the late
1960's when NASA and the Armed Services began a joint effort to develop
manufacturing and test standards at the cell level. This work, which was
performed in conjunction with cell suppliers and industrial users, culmi-
nated in NASA's "Specification for the Manufacturing of Aerospace Nickel-
Cadmium Storage Cells," NASA/GSFC Specification 74-15000 (Reference
179).
The payoff of these efforts, particularly those that concerned the develop-
ment of standardized cell acceptance-test methods, has been a general im-
provement in the yield of cells that have successfully passed such testing.
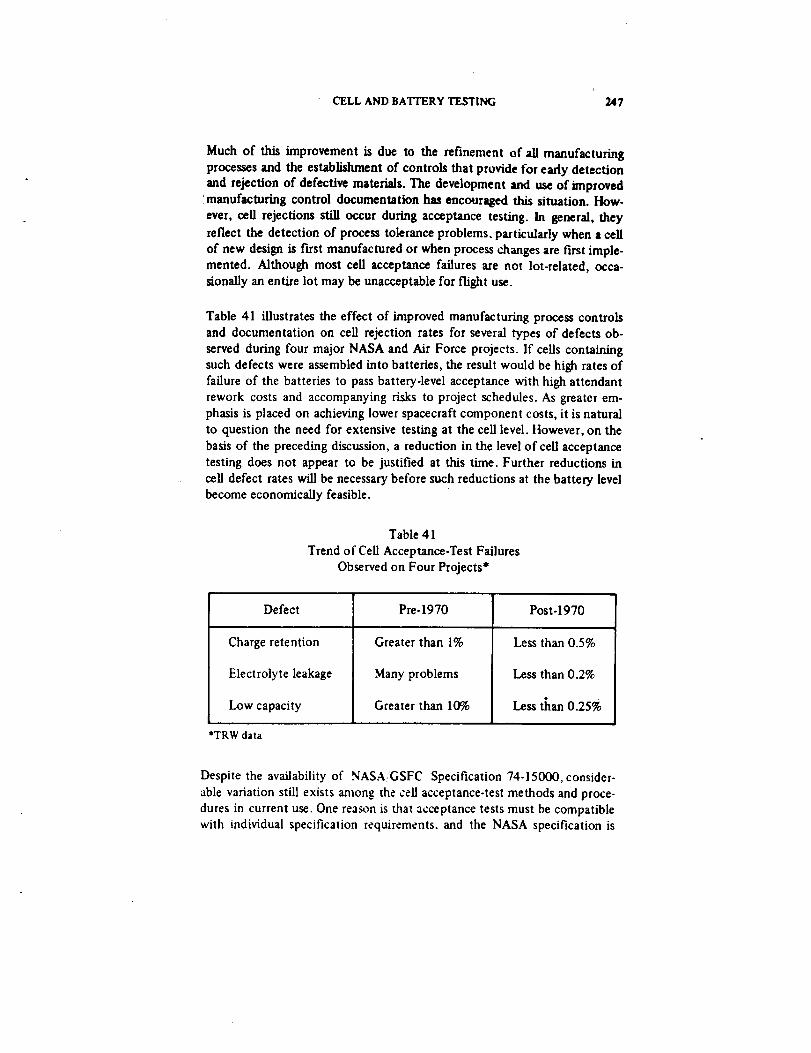
CELL AND BATTERY TESTING 247
Much of this improvement is due to the refinement of all manufacturing
processes and the establishment of controls that provide for early detection
and rejection of defective materials. The development and use of improvedmanufacturing control documentation has encouraged this situation. How-
ever, cell rejections still occur during acceptance testing, in general, they
reflect the detection of process tolerance problems, particularly when a cell
of new design is first manufactured or when process "changes are first imple-
mented. Although most cell acceptance failures are not lot-related, occa-sionally an entire lot may be unacceptable for flight use.
Table 41 illustrates the effect of improved manufacturing process controls
and documentation on cell rejection rates for several types of defects ob-
served during four major NASA and Air Force projects. If cells containingsuch defects were assembled into batteries, the result would be high rates of
failure of the batteries to pass battery-level acceptance with high attendant
rework costs and accompanying risks to project schedules. As greater em-
phasis is placed on achieving lower spacecraft component costs, it is natural
to question the need for extensive testing at the cell level. However, on the
basis of the preceding discussion, a reduction in the level of cell acceptance
testing does not appear to be justified at this time. Further reductions in
cell defect rates will be necessary before such reductions at the battery level
become economically feasible.
Table 41
Trend of Cell Acceptance-Test Failures
Observed on Four Projects*
Defect Pre-1970 Post-1970
Charge retention
Electrolyte leakage
Low capacity
*TRW data
Greater than 1%
Many problems
Greater than 10%
Less than 0.5%
Less than 0.2%
Less than 0.25%
Despite the availability of NASA/GSFC Specification 74-15000, consider-
able variation still exists anlong the cell acceptance-test methods and proce-
dures in current use. One reason is that acceptance tests must be compatible
with individual specification requirements, and the NASA specification is
' _s _-N_,d B^TI_RVAI_LXCATIO_SMANUAL
not currently in general use. Another reason is that many projects are on-
going, and it is not practical to change existing practices. Also, some in-dividual organizations have invested considerable effort in developing their
methods and procedures, and they rely on the data thus obtained to supportcurrent cell and battery design and procurement activities. A final reason
is that, for certain mission applications, additional tests and procedures
tailored to those applications may be required even though it is desirablenot to do them.
6.2. I. 1 Cell Acceptance-Test Sequence
The cell acceptance-test sequence may vary from one organization to
another primarily in two respects: (a) in the def'mition of the dividing linebetween the manufacturer's in-process tests and the buyer's tests, and (b)
in the division of formal acceptance tests between the manufacturer's and
the buyer's facilities.
Figures 73 and 74 show the entire cell test sequence as defined by NASA]
GSFC Specification 74-15000.* Figure 73 shows the f'mal tests in the manu-
facturing sequence and those tests designated as acceptance tests to be per-
formed by the manufacturer. Figure 74 shows a sequence, referred to in
Specification 74-15000 as performance tests, to be performed by the buyer.
Figure 74 includes two additional tests that, although they are not alwaysconsidered to be acceptance tests, have proved to be of general value: a
30.cycle burn-in type test and destructive testing. The latter tests are dis-cussed in Section 6.2.2.
The order of the tests shown in figures 73 and 74 is based on considerable
experience and results in a minimum amount of interaction between tests.
Therefore, the order should not be changed without careful consideration
of all implications.
6.2. 1.2 Review of Cell Acceptance-Test Methods
This section describes cell acceptance-test methods. The tests reviewed are
those that appear in NASA/GSFC Specification 74-15000.
*This specification is used as both a source and a reference because it has been widelycoordinated with, and distributed within, the aerospace industry and the government.
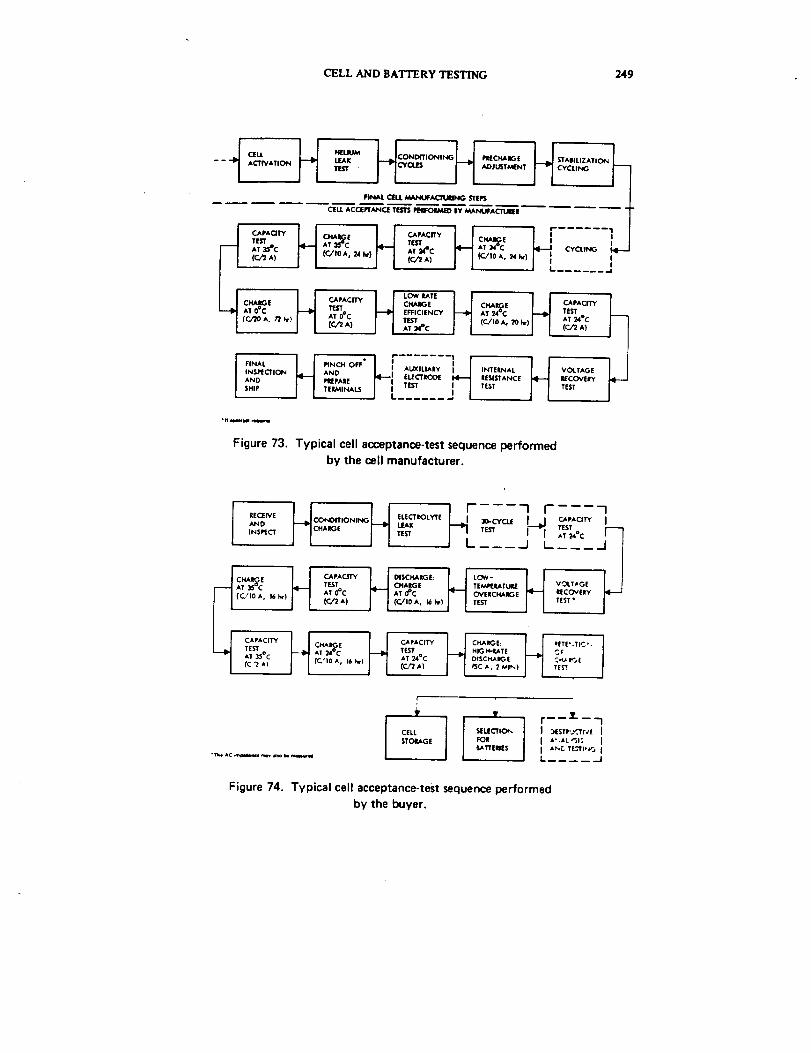
CELL AND BATTERY TESTING 249
- - ACTIVATION
I C_PAaTY
TEST
AT_¢(r../_A)
CHAIGEAT 0PC
H H kLEAK IONING PllECHAIG E $TA|ILIZATIOt_.
TEST ADJU%T_NT CYCLING _
CE II ACCEPTANCE TESTS REIIFOIMI_ I_ WL_NUFACIIJlEE
H H H ,CHA E TESTAT _/ CA ImACn'Y CNAI_ E l i
(c/to A,_ Iv) AT_C AT_-c CYCUNG(c.J_A) (C'/"0A,24k') I ! 1
H _'Ac"_H _°"" uTEST CNAIGE CIg_l_E J I CAPACITY
AT 0°C EFFICIENCY AT 24"C _ TESTTEST (C/10 A, 20 Iv) J J A! 24°C
(CJW2A) AT )i°C ] [ (C/2 A)
H .l I 1 I H
FINAL RNCH OFF It AUXILIARy i l INTERNAL VOLTAGE
INSflalON AND J4---I ELECTRODE
ANO "*_ I-[ Tm i-I EE"sTANcE mECOV.'rs,,, TE_,_,.sIt. ...... J I TEST TEST
1.llwm
Figure 73. Typical cell acceptance-test sequence performed
by the cell manufacturer.
IIECEIVE _ H ELECTEOLYTE
AND CONOITIONING
INSliIECT J -I CHAIIGE TESTLEAK
H.,.o..H.,c_,AT 35-C TEST CHAllGEAT0°C AT0°C
I I (C/to A, 16 kr) (_ A)
--H HI _ I TEST CHA_E
JST 35°C AT 24°C TEST
AT 24°C(c '2 A_ (c'1o A, t6 h,) (_ A)
I _o-CYc-, _PAOn" I
TEST __
TEST AT 24°C
.... _J |....
LO_'- I ITEMfllATUIIE VOLTAGE
OVERCHARGE IECOVEIV
(C./IO A, 16 iv) TEST tE_l ° l
/
H CHARGE: H _ETE'.T;_ % I
HIG H-_tTE CF
DISCH_II_E CH/. J_ E
f_iC _l, 2 MIN) TE_'T
(
ll ICELL SlEUECTIO_ I _strJcrr#E I
L
Figure 74. Typical cell acceptance-test sequence performed
by the buyer.
250 Ni-Cd BATTERY APPLICATIONS MANUAL
Table 42 lists the tests shown in figure 73, together with a brief description
of the method specified, suggested alternatives, and authors' comments.
Two aspects of the various methods are considered: (1) the test procedureper se, and (2) the criteria used for judging the results of the tests. This
recognizes the possibility that, although a test procedure may be valid, the
pass/fall criteria associated with it may be poorly chosen. Such criteria areoften determined by specification performance requirements that may be
inappropriate.
Not all of the procedures in table 42 are completely understood, and there
is lack of agreement on some of the methods and criteria shown. Several of
these points are:
The actual effect of "stabilization cycling" (item 1 of table 42) on
the internal makeup of the cells is not clear. Although the charge
and discharge voltages may be stabilized in 10 cycles, indications are
that the active capacity of the negative electrode and the activity of
the charged excess negative capacity may continue to change for 50
to 100 cycles. Also, there is reason to believe that most positive-plate
swelling and electrolyte redistribution takes place after the first 10 to
20 cycles. Furthermore, there appears to be no information available
on the effect of the particular depth of discharge used on the sub-
sequent cell performance during acceptance tests. Some users have
suggested that the depth of discharge used for stabilization should be
the same as that for the intended application. However, no infor-
mation has yet been made available to demonstrate the advantage of
this approach.
@ Overcharge tests conducted at O*C (item 7, table 42) for verifying
overcharge protection have occasionally produced results that have
not yet been fully explained. Sometimes high cell voltage is observed
with low cell pressure; sometimes (but less often) the opposite is seen.Good correlation between low-temperature overcharge voltage and
pressure behavior and the amount of overcharge protection provided
in the form of excess uncharged negative capacity has not been
demonstrated, although it is usually true that little or no overcharge
protection results in a high voltage. The presently used upper limit
criterion of 1.52 volts may be too harsh and, if interpreted literally,
could result in the rejection of good cells. Some cells may peak at
slightly above 1.52 volts and then settle down to a much lower volt-
age. These cells would be rejected by the present criterion. Thus, itis recommended that the basis of judgment in this test be expanded

CELL AND BATTERY TESTING i 251
.O
h
g
m
ih |_5 ei_L]-- :gr
-- c u,
- ll"E
. U_t_:
_I_A -
_,_
0
_L||
JI_ =_
it ,, .o.
|
l,!
= _-_ _ o- _.
-_. _ _-z,
z
i
ORIGilNAL ±'_'"_'_._ IS
OF POOR _UALITY
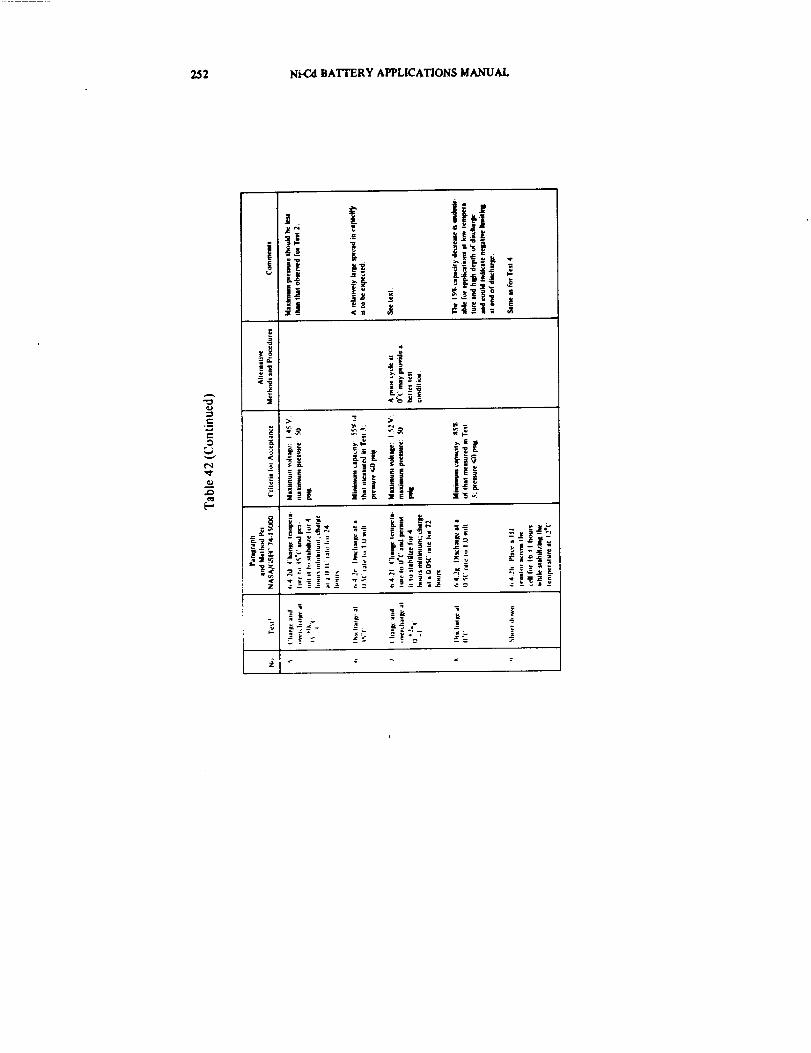
252 Ni-Cd BATYERY APPLICATIONS MANUAL
-ie-
e-
,.o
[.,.,
_ t
;E_e _;[
=.." _ie
_ _
_ ._ = -

CELL AND BATTERY TESTING i 253
"O
O
.=C
3 ;
: : .. _. _: o 2
_ .,_, c- = ,0 _a = = q,_.6 =- _. ", 32 E
u u _m.=
z
_ _,_ .=,._
,_ _ -_
< _(_
=__
ORiOINAL
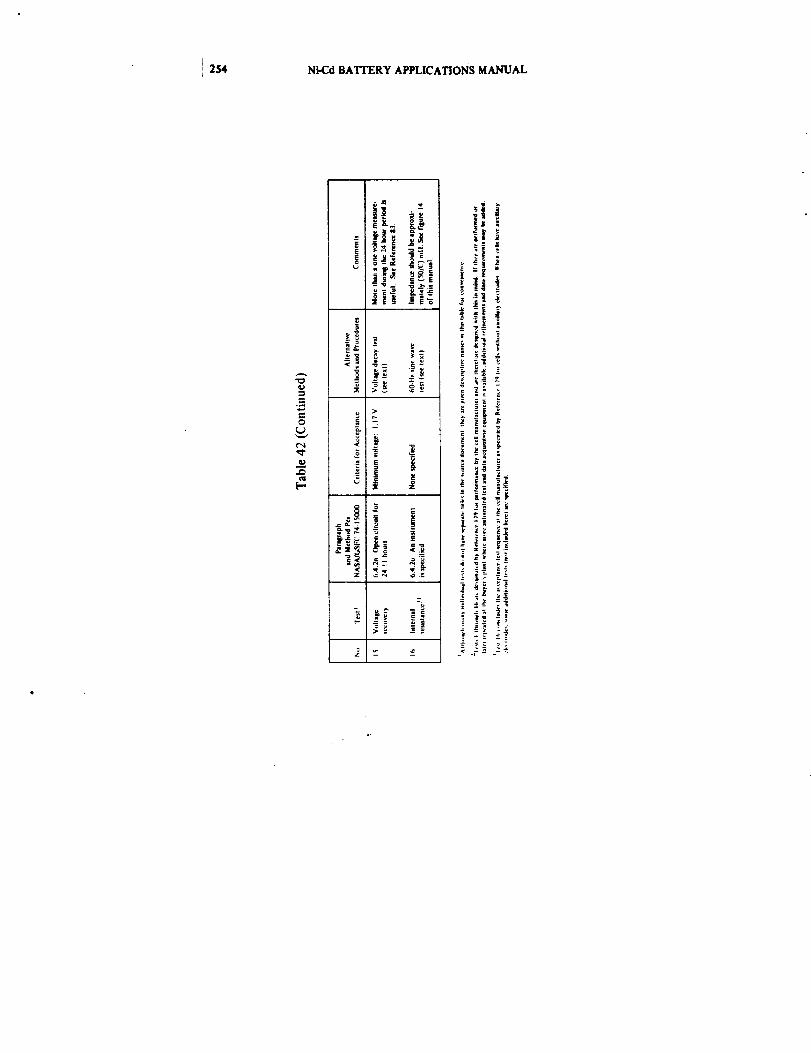
! 254 Ni-Cd BATYERY APPLICATIONS MANUAL
...s
e-
G.)
[..,
i _'_ _
z _- _ 25 _e

' - CELL AND BATTERY TESTING J 255
to separately specify the maximum voltage during the peak, the dura-
tion of the peak, and the voltage and rate of change of voltage at the
end of the overcharge period. Any pressure measurements that can be
made during this test will greatly facilitate interpretation of the data.
The voltage recovery test (item 15, table 42) is done to detect internal
shorts. It has been shown (Reference 83) that this test method, in
which a single voltage measurement is taken at the end of a 24-hour
open-circuit stand period, gives results that are relatively sensitive to
pretest cell conditioning. Three test methods in general use wereevaluated and compared in Reference 83: (1) open-circuit voltage
decay after a brief charge; (2) open-circuit voltage recovery after
shorting; and (3) open-circuit voltage decay and capacity loss after a
full charge. Although all methods were considered to have merit,the first method was recommended for general use. Method 2 showed
a sensitivity under ideal conditions that is comparable to that of
method 1, but was more affected by the cell's immediate prior history
and by conditioning procedures than the other methods. Method 3was less sensitive than the others but more immune than the others
to prior history effects. The results of methods 1 and 2 are adversely
affected if the cells are tested in a negative-limited condition. Method
3 is also used to test for charge retention and, as such, may be per-
formed at different temperatures to determine the effect of tempera-
ture. Method 1 is sometimes referred to as a charge-retention test.
This title is considered to be inappropriate because the method is not
suited for that purpose (Reference 83).
Several methods for measuring internal resistance/impedance (see
item 16, table 4"..) are in use, including: (I) sine-wave ac current and
(2) square-wave ac current, both at various frequencies, and (3)
high-rate dc discharge current. No data are available to show whether
the methods each give the same value for the measured variable. The
data in figure 15 show that, without separating the measured voltage
into its resistive and reactive components, ac measurements will give
erroneously high values for resistance at frequencies above about
300 Hz. Thus, the use of commercially available direct-reading milli-
ohmmeters that apply square-wave current for measuring cell resis-
tance can give significant errors if much high-frequency content existsin the excitation current waveform and the instrument does not
discriminate between in-phase and out-of-phase responses.
I256 Ni-CdBA'I'FERYAPPLICATIONS MANUAL
As greater demands for longer service life and higher reliability are placed on
the nickel-cadmium system, tests of greater sensitivity may be required that,
in turn, may increase cell rejection rates. Accordingly, as the battery engi-
neer develops new criteria or uses the tnesent criteria, he should not be
overzealous in setting tolerances and limits but should allow for the applica-
tion of engineering judgment to resolve slight variations or inconsistencies
in the data.
6.2.1.3 Cell-Lot and Plate-Lot Acceptance
Cell specifications normally do not contain provisions for judging the
acceptability of cell lots* as a whole; instead, each cell is considered accept-able or not on its individual merits. However, it is possible for a relatively
high percentage of cells in a lot to exhibit the same defect or defects, and
the buyer should have the prerogative to reject the entire lot until a review
can be conducted. The power to take such action must be established con-
tractually in advance, along with the criteria for lot acceptance.
Occasionally, a cell lot will be defective because the plate lot from which it
was made was inherently defective. Cell manufacturers rarely reject plate
lots as a whole, even though large percentages of the plates may be defective
on inspection or test, because no written procedures and criteria for
plate-lot acceptance are normally in effect. The authors consider this to be
a potentially serious weakness of current quality-assurance practices and
something for all spacecraft cell users to consider.
6.2.2 Other Tests and Analysis
The sequence of tests shown in figure 74 may or may not be used for con-
tractual acceptance of cells. Table 43 lists, the tests enclosed in solid lines
in this sequence, together with a brief description of the test method
def'med in Section 8 of NASA/GSFC Specification 74-15000 (Reference
179) and comments by the authors.
The tests enclosed in dashed lines were added to the buyer's sequence by
some organizations, particularly for cells that are to be used in long-life
geosynchronous spacecraft. The 30-cycle test, which involves high depths
*The term "cell lot" refers to a manufacturing lot, which is normally defined as allceils made from a single plate lot and manufactured in a _oup over a relatively shorttime.

CELL AND BAT_'ERY TESTING 257
c_
r_
0
m
g.2
g., -- O
C---S_ g - i <__-_ _-_ _
w.=>.
g =
> _, _._
- ._ i_ii^' "5 _ .IF
•-_ ___ ,,.. . E=;_
_= =.,
._ _._
.S
_s_; _ _._
-_-_ ___
_ -
ORIGINAL pAGE_ _

'I 2.$8 Ni-Cd BAITERY APPLICATIONS MANUAL
of discharge and low temperatures, can be useful for detecting an exces-
dvely high rate of fading but, more specifically, an excessively high rate of
decrease of negative capacity or precharge. The cycling is usually terminated
with a complete discharge at the cycle temperature and may be followed by
a capacity measurement at the standard temperature of 24°C, as shown in
the flow diagram. This test may be expanded to include a capacity measure-
ment before and after reconditioning before testing for internal shorts.
The other optional item shown in figure 74 is destructive testing and analy-
sis. Since 1970, spacecraft life requirements have been increasing. Recent
specifications for geosynchronous-orbit applications require prelaunch
storage lifetimes of 4 to 7 years (Reference 180) and service lifetimes of
5 to 10 years; therefore, up to 12 years of total life capability may be
required. These lifetime extensions are causing battery users to look for
better ways of detecting latent manufacturing cell defects that are not
detected by any known nondestructive acceptance tests. These tests may
consist of the accelerated cycling of cells to failure and/or of teardown
analyses. In the latter case, sample cells are opened, and the components
are tested and analyzed for mechanical, electrochemical, and chemical
properties. Additional information on teardown analysis appears in Sec-tion 4."
[ntelsat/Comsat now requires that two cells from each cell (plate) lot be
subjected to teardown analysis (Reference 62). Several Air Force projects
have incorporated similar requirements into cell and battery specifications.
Most companies are now using this form of testing only for engineeringevaluation. It is to be hoped that the result of these tests wig achieve the
status of acceptance requirements in the near future.
6.2.3 Selecting and Matching Cells for Batteries
The process of selecting and matching cells for batteries is not standardized
and is hardly discussed in the literature. The process involves the applica-
tion of engineering judgment on the basis of a detailed review of manu-
facturing process data, acceptance test data, and data obtained from any
other special tests. The objective of cell selection is to ensure uniformity of
cell characteristics within the battery and the battery system; cells with
performance characteristics that are not similar to the main group of cells
are discarded. It is good practice to select the number of cells needed for a
battery, plus at least one spare cell for compatible replacement if it becomes
necessary.
/CELL AND BATrERY TESTING | 259
!
One or more of four methods are used for selecting and matching ceils for
batteries: (1) capacity matching, (2) discharge-voltage characteristic match-
ing, (3) charge-voltage characteristic matching, and (4) charge efficiency
screening. The method or combination of methods depends on the type of
orbit, the maximum depth of discharge, the operating temperature range,
and the characteristics of the battery charge controls. The following para-
graphs descn'be these methods and the factors that influence their selection.
Capacity matching is the most common method used to assign cells to indi-
vidual batteries. In general, the cell of lowest capacity in a series circuit (or
string) will establish the capacity of the battery because the discharge must
be stopped before that cell is reversed. Capacity matching is therefore
more important for geosynchronous applications that require deep depths
of discharge than it is for low-Earth-orbit applications. Typical geosynchro-
nous-orbit capacity-matching criteria are ±1.5 percent for cells within any
single battery and ±2.5 percent for batteries within a spacecraft. By com-
parison, NASA low-Earth spacecraft projects (Orbiting Astronomical Obser-
vatory and High Energy Astronomical Observatory) have required that cell
capacities within a battery be matched to within ±2.5 percent and that bat-
tery capacities within a spacecraft be matched to within +5 percent.
The capacity data used for matching may be taken from any number of
capacity measurements, including those performed during acceptance and
performance testing (as outlined in figures 73 and 74) and/or additional
tests. The spread in capacities for any group of cells is dependent on the
immediate prior history in the test sequence. If the capacity measurement
cycle is preceded by a short-down period, the range of values for the test
group will usually be quite narrow. If two or three cycles are run without
pause after a short-down period, the measured values after the first cyclewill be closely grouped, but, after the second or third cycle, the spread of
values will become greater. The latter is particularly true at the end of a 30-
cycle test if the capacity is measured before reconditioning or short-down.
Capacity is usually measured by using a constant-current discharge. How-
ever, for the most part, spacecraft electrical loads are a combination of con-
stant resistance and constant power, predominantly the latter, and the cur-
rent drawn from the battery is anything but constant as the battery voltage
decreases. Thus, if matching were to be performed rigorously, it would be
based on energy output rather than on capacity at constant current. This
approach has not been used generally because of the added requirements
260 Ni-CdBATTERY APPLICATIONS MANUAL
that it would place on cell test and data.acquisition equipment. However,most modem automatic data-acquisition systems can easily acquire the
periodic voltage and current data required and, with the assistance of an
on-line computer, calcu_te the energy data on an essentially continuous
basis, if desired.
In the absence of this type of equipment, matching may be improved by
including in the criteria, in addition to capacity data, voltages at one or two
points on the discharge-voltage curve. These points are best chosen atmid-discharge, where the voltage is between 1.2 and 1.25 volts, and near
the end, where the average is about I .I volts. The product of these voltages
and the corresponding ampere-hour outputs may be used as a substitute for
a true discharge-energy calculation.
Matching discharge voRage at the battery level in paralleled multiple-battery
systems is usually not required. All the batteries will discharge at approxi-
mately the same voltage, and differences among the individual dischargecurrents win reflect differences in battery current-voltage characteristics.
As discussed later in Section 8.5.1, there is a strong tendency toward
balanced discharging in the absence of cell failures because of the interac-
tion of conditions of temperature and state of charge. Furthermore, the
effect of differences in the resistance of individual battery harnesses usually
masks the differences among the discharge-voltage characteristics.
Matching charge-voltage characteristics of ceils within a battery can be
important if voltage-limited charge controls are used. For example, in low-
altitude orbit applications, if the limit is set high so that relatively high
recharge ratios are obtained, the range of cell voltages at the end of charge
will tend to be wide, suggesting a need for voltage matching. This is one
argument for designing such charge-control systems to limit in a manner
that provides recharge ratios as low as possible, as was done for the Orbit-
hag Astronomical Satellite (References 62 and 77). With early limiting, theindividual cell voltages will tend to be tightly clustered.
From the viewpoint of operating temperature, the need for charge-voltage
matching increases as the temperature during charge decreases. Operation ator near 0°C, and particularly with higher charge rates, means that a rela-
tively wide range of cell voltages will be obtained during overcharge in the
absence of a voltage limit. More work needs to be done in developing low-
temperature tests and associated matching criteria that reflect battery-
operating temperature regimes anticipated for longlife missions.

CELLANDBATI'ERYTESTING 261
In summary, it is apparent that cell charge-voltage matching is advisable inall situations that depend on charge voltage as a signal or control parameterand in all situations in which charging is performed in the vicinity of 0°C.In lieu of such matching, a reasonable criterion for General Electric and
SAFT-America cells is selection within +7 millivolts of the group mean volt-age following 4 hours of overcharge at 23°C at a C/10 charge rate. Eagle
Picher cells may require a wider range. No criterion is needed for matchingthe charge voltages of multiple batteries if they are charged separately;batteries charged in parallel from a single charge controller may requirecharge-voltage matching, although the effect of temperature differencesbetween the batteries could mask the effect of differences in the chargecharacteristics.
Charge.efficiency characteristics of cells become important in applicationsthat involve extremely low or high charge rates. In the former case, it isimportant to eliminate from consideration the cells that are unable to attaina full state of charge when charged at the low current rates that could occur
in certain geosynchronous-orbit applications. For the latter case, it maysometimes be desirable to screen out the cells that contribute excess dissipa-tion and, therefore, exhibit higher operating temperatures than other cells
in the battery. Although neither case can be considered a significantproblem for most battery applications, of the two, the low-rate charge-acceptance case is encountered most often because of the need for minimiz-
ing the area and weight of the solar-cell array.
These different data do not usually result in the selection of a single group
of cells. For example, the best match by capacity may not correspond to
the best match by overcharge voltage. It is therefore necessary to apply
weighting factors to the different types of data. No general rules are
obvious. From the foregoing discussion, such weighting must depend on the
type of orbit involved, the design of the charge-control method, and the
operating temperature range.
6.2.4 Battery-AcceptanceTesting
After a battery assembly has been completed mechanically, it is usuallygiven some simple nonoperating bench tests and then subjected to battery-level acceptance testing to specification. Battery-acceptance testing is some-times done separately and as a prerequisite to qualification testing or as apart of qualification testing. Section 9 describes the sequence and details ofsuch testing.
26| Ni=CdBATTERY APPLICATIONS MANUAL
One aspect of battery-acceptance testing that is usually underemphasized
is cell-voltage behavior during battery operation. Individual cell voltages
are carefully monitored during cell-acceptance and matching tests for good
reason, and they should not be ignored after battery assembly. It shouldnot be assumed that-the same voltage distribution observed during cell-
level testing will be necessarily observed after the ceils are assembled into a
battery.
6.3 QUALIFICATION TESTING
The objectives of qualification testing are: (a) to verify that all electrical.
mechanical, and thermal aspects of the unit meet specification require-
ments, and Co) to ensure interface compatibility (insofar as possible) with
the spacecraft, the launch vehicle, and ground-handling and electrical sup-
port equipment.
Because most cell designs are scaled from previously qualified designs.
qualification of battery cells is usually accomplished by analysis. If a cell
design is completely new or otherwise unique, qualification testing may be
t_erformed. However, such qualification can only be general in nature.because it is essentially impossible to simulate with any degree of accuracy
the vibration, shock, acceleration, and thermal environment that cells will
experience in an actual battery assembly. For this reason and because most
ceils used are already qualified as cells and, hence, do not require requalifi-cation at the ceil level, almost all qualification testing is performed at the
battery level.
NASA/GSFC Specification S-711-17 (Reference 181) defines a complete
battery-qualification test program for the standard nickel-cadmium bat-
teD' specified in NASA/GSFC Specification S-711-16 (Reference 182).Table 44 summarizer the battery-level qualification tests identified by the
NASA specification and certain other tests that are sometimes performed.
Therefore, table 44 is a checklist for both cell. and batteD'qualificationtests. Section 9.5 describes battery-qualification testing in greater detail.
6.4 LIFE TESTING
As defined previously, acceptance and qualification tests establish compli-
ance with specification design requirements but do not provide verification
that a battery will meet the service life and reliability goals for the mission.
The term "goal" is used rather than "requirement" because battery service

CELL AND BATrERY TESTING 265
Table 44
Cell- and Battery-Qualification Test Matrix
Test
Physical inspection
Physical measurements
Magnetic measurements (optional)
Functional tests
Insulation resistance
Electrical continuity
Capacity
Electrolyte leakage
Voltage recovery (optional)
Charge retention (optional)
Sensor operation
Heater operation
Internal resistance
Humidity
Vibration
Shock
Acceleration
Thermal vacuum
Special tests
High-rate discharge
Thermal cycling
Cell Level
,/
(1)
_/(2)_/(2)
,/
Battery Level
(1)
_/(2)_/(2)
Iverified by materials analyses rather than by specific test. The shipping container
should protect the battery and its cells from humidity exposure.
2Usuadly most realistically performed at the spacecraft level
'264 . _. . ..Ni-Cd BATrERY APPLICATIONS MANUAL
life and reliability are not verifiable quantities in the usual sense. Although
cell.procurement and battery-equipment specifications sometimes include
specific design requirements for these items, it is neither practical nor possi-ble for a cell manufacturer or a battery supplier to provide direct verifica-
tion by test that the requirements are met. Mimons are measured in years,
and it may take years for a properly designed and operated nickel-cadmium
battery to exhibit serious degradation or cell failure. Cell and battery
reliability can be estimated only on the basis of failure distribution
developed for quantities of cells of similar design operated in a similar man-ner. These circumstances are resolved by reliance on the data collected from
the types of life tests discussed in this section.
The usual objectives of cell and battery life testing are:
• To verify that the cell or battery design can meet service life require-ments before wearout failure in a simulated space environment
• To obtain degradation and failure data for battery-system reliability
assessment
• To obtain beginning-of-life and end-of-life performance data for
power-system design analyses, charge-control design analyses, and
orbital-operations planning
Two kinds of battery life tests may be distinguished: (a) real-time and (b)accelerated. From a technical viewpoint, real-time tests are preferred
because they provide the closest possible simulation of actual flight condi-
tions. Real-time life tests are readily performed for low-altitude orbit mis-
sions, which are relatively shorter in duration, but present problems of time
and money that increase as the mission length increases. For geosynchro-
nous applications of 5 years or more, real-time tests are usually prohibitive
for particular spacecraft projects and are usually performed only in support
of long-range development efforts. In lieu of true real-time tests, therefore,
certain forms of time-accelerated life tests have been performed.
6.4.1 Real-Time Life Testing
All life tests that have been performed for low-altitude applications have
been real-time tests. Certain orbits in this class may exhibit short periods of
constant sunlight during which the batteries are not cycled, but such effects
q . CELL AND BA'IWERYTESTING ] 265
are usually ignored in life testing and cycling continues uninterrupted. With
notable exceptions, real-time tests performed for specific low-altitude space-
craft projects are not performed for the full required mission life. No guide-
lines are known that define the number of cycles that must be accumulatedas a minimum for verification of service life.
Real-time life tests that simulated low-altitude orbit discharge/charge pro-
tiles have been successfully performed for a number of NASA spacecraft
projects (References 62, 77, 116, and 183 through 185). The tests were
accomplished by using the charge-control methods planned for the respec-
tive projects. Temperatures were selected to bound the predicted operating
temperature range (i.e., tests were usually performed in parallel at two or
three operating temperatures).* Because of these differences, it is difficult
to quantitatively compare the results. Another important source of low-
orbit life-cycle data is the series of tests performed under NASA auspices
at NWSC/Crane (Reference 68, 12th Annual Report). These tests, which
may be referred to as life cycle tests rather than as mission simulation life
tests, are a major source of failure data.
As mentioned earlier, real-time life testing for geosynchronous applications
is usually impractical for direct support of specific spacecraft projects.Mission-life goals have now reached 10 years, and there are economic pres-
sures for further life extensions. However, certain ongoing tests have been
useful in providing design guidelines. For example, the NWSC/Crane real-
time geosynchronous life testing of cell packs began in 1967 and continues
to the present (Reference 186). COMSAT Laboratories also performed
mission-simulation real-time tests (Reference 91), which began 1 to 2
years before the first launch of a particular spacecraft series. Some of these
tests have been continued for over 6 years. Finally, a real-time geosynchro-
nous test, which lasted only 18 months but included four simulated eclipse
seasons (one at the beginning), has been reported (Reference 51). This
test was conducted with a prototype 50-Ah battery whose cells were equip-
ped with active solid.state bypass circuits for controlling overcharge and
overdischarge. For detailed descriptions of the test articles, the test equip-
ment, and the test methods, see the referenced reports.
*An alternate method makes use of a variable average battery heat-sink temperatureprof'de throughout the mission.
266 Ni-Cd BATrERY APPLICATIONS MANUAL
6.4.2 Accelerated Life Testing
The objective of any accelerated life test is to verify life 'capability ins
shorter period than would otherwise'be roqUl_d if _ea]-time testing were r,
performed. An accelerated test should only hasten normal degradation'pro"cesses and should not introcluce new forms of degradaUon. Furthermore,
if the test is performed in connection with a specific spacecraft project, the
test method and conditions should be related as closely as possible to the
service conditions to facilitiate the interpretation of results.
Two approaches to the fife-test acceleration are possible. In one, the overall
test time required is shortened without knowingly increasing the stress
levels by raising temperature, charge rate, or depth of discharge above their
anticipated values. This approach is usually feasible for polar-orbit applica-tions or for higher-altitude applications which experience some extended
noncycling periods each year. The other approach involves increasing the
operating temperature and/or the stress levels in the cells and, hence, the
degradation rates during cycling. Only the latter approach is feasible whenthe mission involves essentially continuous cycling. This section discusses
the former approach; Section 6.5 describes acceleration by increasing stress
levels.
Two methods have been used most often to shorten test time without in-
creasing stress. The first, most often used for geosynchronous applications,involves eliminating or reducing intervals of low operational stress such as
the continuous noncycling periods corresponding to periods of continuous
sunlight in orbit. However, disagreement exists as to whether the resultsobtained truly account for all of the degradation that would be realized in
an actual mission. Because certain degradation processes within the ceils are
believed to be time-dependent rather than cyCle-dependent, their effect
would not necessarily become manifest during this type of accelerated life
test. Results from this form of accelerated testing were in good agreement
with real-time testing under otherwise nearly identical conditions over an
18-month test period (Reference 51). as illustrated in figure 75. Reasonable
agreement between the voltage trend from an accelerated test and that from
flight data from two spacecraft of the Defense Satellite Communications
System (DSCS-II) series is shown in figure 76 over a mission time of almost
5 years.
The second method used for accelerating synchronous tests involves per-
forming a discharge to the same depth of discharge ever)" day of the test,
with the depth of discharge made equal to the average of the variable depths
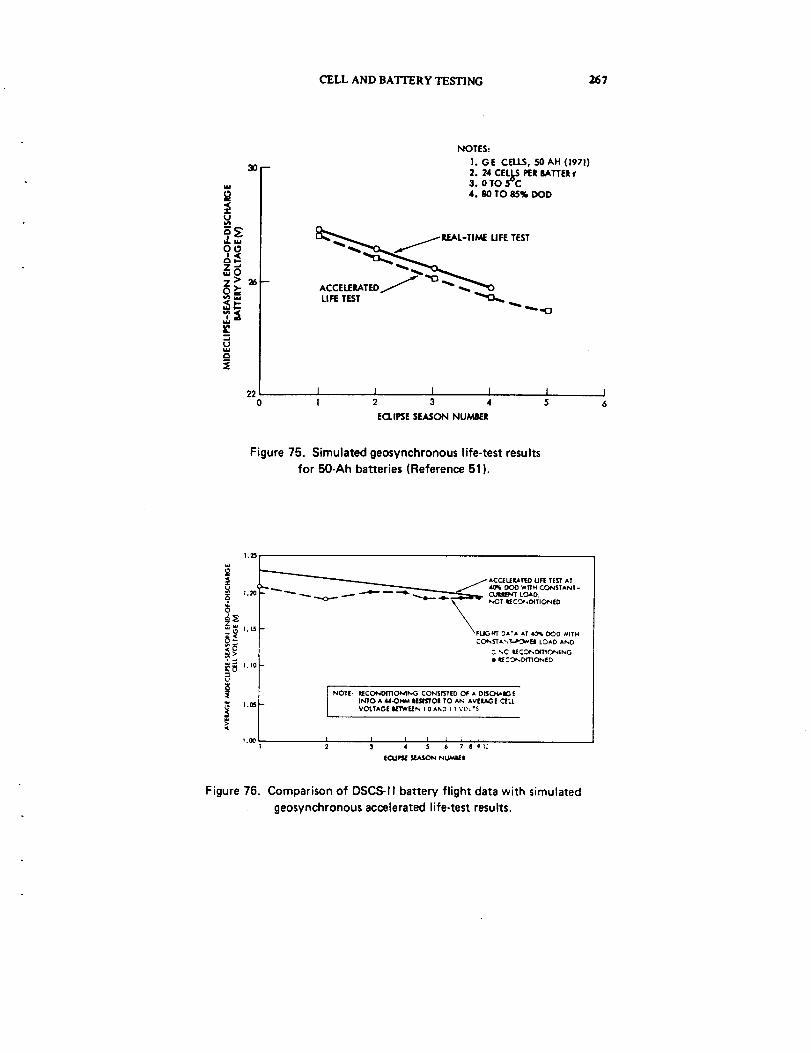
CELL AND BATTERY TESTING 267
OOe_
z6
m..J
B
26--
220
NOTES:
I. GE CELLS,50 AH (1971)2. 24 CELJr5PERLATTERf3.0 TO 5_C4.80 TO 85% DOD
ME UFETEST
ACCELERATEDJ '_C__ _%OLIFETEST
I I I I I1 2 3 4 5
ECLIPSESEASONNUMBER
Figure 75. Simulated geosynchronous life-test results
for 50-Ah batteries (Reference 51).
1.25
1.20 q
,.°
t.05
Figure 76.
/ ACCELEILATEO UFE tE_'t AtDO0 WlT_ CONSTANt-
--_'_"" _'" ",_.._0.......- - ''4_- _ _ _.,_______ C'vqUILq_hrC:TIU_CC_t *Dt TIONEDLOAD;
T_FLIIGffT DA A AT 4_ DC)D #ITH
COt_S'rJ.%_*'_WEi LOAD AND
._ _,C ILEC0_DITIONING
• _ CO_.DtT1ONED
[ NOTE_ IIECON0tTIONING CONSISTED OF A DI$C.HAIGEINTO A 44-OHM IE_IqZI'OI TO An AVEILAGE C_LL
VOLTAGE IEl%VEEN I 0AhD 1 _ _.C,L"_.
I I I i i i , h,2 3 4 .5 6 7 8 el_,
ECUFSE SF.ASON NUMIEI
Comparison of DSCS-II battery flight data with simulated
geosynchronous accelerated life-test results.
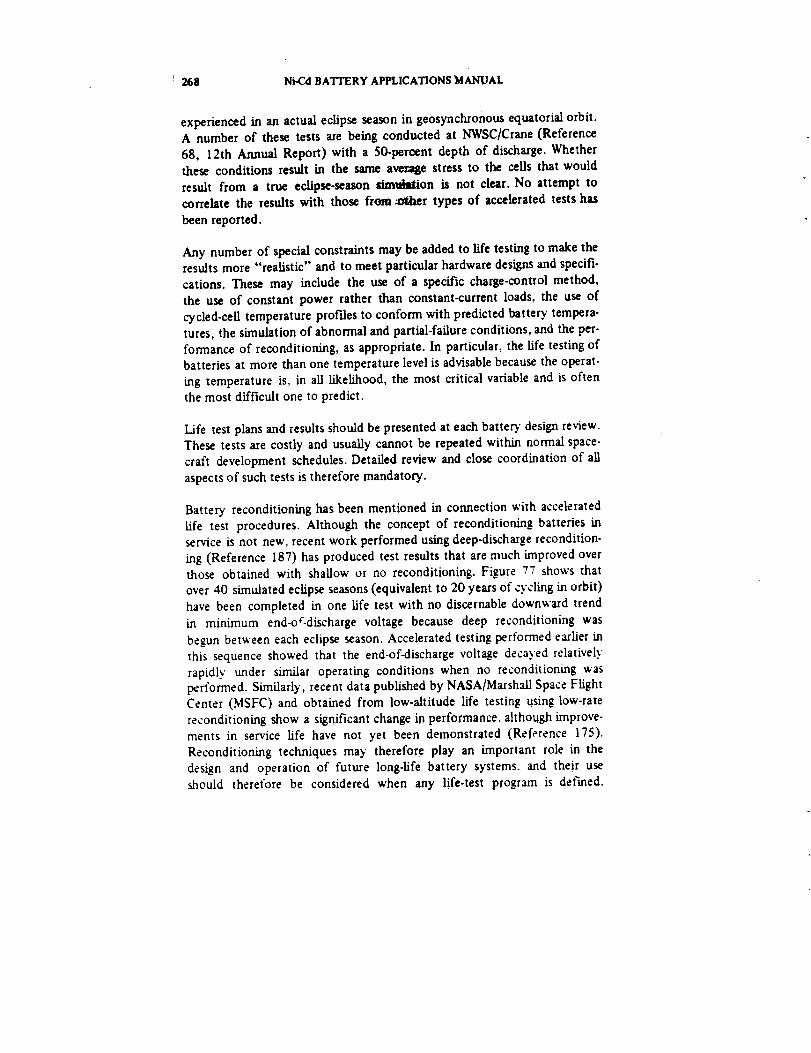
! 268 Ni-Cd BATTERY APPLICATIONS MANUAL
experienced in an actual eclipse season in geosynchronous equatorial orbit.A number of these tests are being conducted at NWSC/Crane (Reference
68, 12th Annual Report) with a 50-percent depth of discharge. Whetherthese conditions result in the same average stress to the cells that would
result from a true eclipse-season sim_ation is not clear. No attempt to
correlate the results with those from :other types of accelerated tests has
been reported.
Any number of special constraints may be added to life testing to make theresults more "'realistic" and to meet particular hardware designs and specifi-
cations. These may include the use of a specific charge-control method,
the use of constant power rather than constant-current loads, the use of
cycled-cell temperature profiles to conform with predicted battery tempera-
tures, the simulation of abnormal and partial-failure conditions, and the per-
refinance of reconditioning, as appropriate. In particular, the life testing of
batteries at more than one temperature level is advisable because the operat-
ing temperature is, in aU likelihood, the most critical variable and is often
the most difficult one to predict.
Life test plans and results should be presented at each batteD design review.These tests are costly and usually cannot be repeated within normal space-
craft development schedules. Detailed review and close coordination of all
aspects of such tests is therefore mandatory.
Battery reconditioning has been mentioned in connection with accelerated
Life test procedures. Although the concept of reconditioning batteries in
service is not new, recent work performed using deep-discharge recondition-
ing (Reference 187) has produced test results that are much improved overthose obtained with shallow or no reconditioning. Figure 77 shows that
over 40 simulated eclipse seasons (equivalent to 20 years of cycling in orbit)
have been completed in one life test with no discernable downward trend
in minimum end-o_-discharge voltage because deep reconditioning was
be_n between each eclipse season. Accelerated testing performed earlier in
this sequence showed that the end-of-discharge voltage decayed relatively
rapidly under similar operating conditions when no reconditioning wasperformed. Similarly, recent data published by NASA/MarshaU Space Flight
Center (MSFC) and obtained from low-altitude life testing using low-rate
reconditioning show a significant change in performance, although improve-
ments in service life have not yet been demonstrated (Reference 175).
Reconditioning techniques may therefore play an important role in the
design and operation of future long-life battery systems, and their useshould therefore be considered when any life-test program is defined.
CELL AND BATTERY TESTING 269
t5
t
_,...
11
0
_4_ /NOTE 1^
NOTES:
I. SEASONS 1 I'O 5: 63'% DOD; AFTER SEASOt,I 5: 75% DOD
2. END-OF-CHARGE VOLTAGE LIMIT INCREASED BY ONE LEVEL FOR UNRECONDITIONED IM,TTERY
3. GE CELLS
4. 12 CELLS P_R BATTERY PACK
5. 0 TO 5°C
L I I I J i L J i J _ I I i I 312 I2 4 6 8 10 12 14 16 18 20 72 ?4 26 28 30 34
ECLIPSE SEASON NUMBER
C UNItJECONOITIONED
_ IECONDITIONED TO 1.0VOLT/CELL
,_ IE-CONDITIONED TO < 1.0 VOLI,/I_I"IEIY PACK
000¢.0000_000000000000
Figure 77. Simulated geosynchronous accelerated life-test results
for 24-Ah battery packs.
6.5 SPECIAL ACCELERATED TESTING
The previous section discussed accelerated life testing as it is normally per-formed for sealed nickel-cadmium cells and batteries in geosynchronousapplications. The term "accelerated" was used to denote shortened overalltest time relative to a real-time mission. The test-time reductions were ob-
tained by: (a) eliminating those portions of the application profile thatcontribute relatively little stress to the cells or (b) modifying the usualvariable discharge time versus eclipse cycle profile to permit the use of asingle depth-of-discharge value that is somewhat greater than the average.It was emphasized that, when these adjustments are made, other test condi-tions remain close to the expected service conditions.
However, accelerated testing is not usually performed in this manner in
other industrial settings. Such tests are designed to hasten expected degrada-
tions or failures by stressing the device or component in a particular way or
combinations of ways. A basic hypothesis of accelerated testing so def'med
is that higher stress levels lead to higher rates of degradation. The ratio of
the rates of degradation obtained with higher-than-normal and normal stress
levels is called the acceleration factor. To distinguish this type of accelerated
testing from that discussed in Section 6.4.2, the term "special accelerated
270 Ni-Cd BATrERY APPLICATIONS MANUAL
testing" is used throughout the remainder of this section. However, note
that "special" has meaning here only in the context of aerospace nickel-
cadmium battery technology.
McCallum et al. merged accelerated _stin8 theory with battery technologyat Battelle in the late 1960's. In z _eTies of studies that culminated in
Reference 139, they attempted to construct a general methodology that
could form the basis for the later design of special accelerated test programs.
Their approach is described in Section 4. The following discussion of speci-fic methods of achieving test acceleration as they apply to cells and batteries
is drawn from the work at Battelle.
McCallum and coworkers investigated the use of elevated temperatures,
(Reference 175), elevated depths of discharge (Reference 177). and elevated
discharge rates (Reference 85) as means for increasing internal stresses innickel-cadmium cells. They observed that the number of cycles to failure*
generally decreased as temperature, depth of discharge, or discharge rateincreased, but this parameter did not appear to correlate with stress levels
in their experiments. This result was partially attributable to the fact that
the lower voltage limit chosen as a failure criterion was too high and was
reached by many cells while the discharge voltage was still on the upper
plateau. Better results were obtained by using values on the discharge-volt-
age curve to calculate a quantity called "quality': (Qv). defined as a function
of discharge rate and the difference between an assumed open-circuit cell
voltage and the measured end-of-discharge voltage: i.e..
1
Qv = (I/c) (1.3 - v)
For example, for variable discharge rates (Reference 85). a roughly linear
relationship was found between the logarithm of the acceleration factor,
(Qv at rate 2)/(Qv at rate 1), and the logarithm of the discharge rate overthe tested range of 0.5 to 8C. Similar results were obtained for increasing
temperature and increasing depth of discharge, altho_h the da_a werescattered. Different acceleration factors were found from different experi-
ments, however, indicating that other variables were not under control.Thus. the methods for accelerating degradation by increasing stress levels
cannot be considered as proven from the results reported. However. these
results were indeed promising and bear further investigation using modern
cells with greater uniformity than those available earlier.
*"Failure" was defined as an end-of-discharge voltage less than 1.10 volts during
regular cycling.
CELL AND BATI'ERY TESTING 271
One set of tests using various higher-than-normal discharge rates (Reference
162) showed that, after the data were extensively screened, the end-of-
discharge voltage was a straight-line function of the logarithm of the cycle
number, at least up to about 3000 cycles at which testing was stopped.
The slope of the straight line was a function of discharge rate; therefore, the
slope at any normal discharge rate could be calculated from the slope at a
higher rate at which the rate of change with the number of cycles was
greater. This type of logarithmic relationship was also observed on a cycle-
life test performed on recently made SAFT-America 20-Ah cells (Reference
116).
Failure analyses were performed on many of the cells from the accelerated
test experiments at Battelle. The results of some of these appear in Section
4. However, the relatively limited scope of these tests and subsequent eval-
uation studies provided what must now be considered as inconclusive
explanations for the results observed. Therein lies one limitation of this type
of accelerated testing-the tests and analyses required to determine
mechanisms and acceleration factors are often difficult and always expen-
five. Limited experiments are usually insufficient for determining that the
application of various kinds and combinations of stress have not modified
the underlying mechanisms.
NASA and the Armed Services are jointly sponsoring a special accelerated
test program at NWSC/Crane (Reference 176). The program is directed
toward low-altitude cycling and is ambitious in scope; as of October 1977,
594 cells had been placed on test in 103 packs. Although some preliminary
results have been published (References 153 and 188), major results will
not be forthcoming until detailed analyses are completed.
No similar special accelerated tests have been planned or performed for cells
intended for geosynchronous applications. Such methods could be quite
useful, however, because: (a) time-accelerated test methods still requireconsiderable test time. and (b) the use of deep-discharge reconditioning
_sth conventional testing causes the cells to exhibit low rates of end-of-
discharge voltage decline, thus creating a need for even lengthier tests inorder to identify life-limiting mechanisms. If, as it appears, dischar[e voltage
degradation is related primarily to the number of cycles and has little to do
_ith total operating time in a geosynchronous orbit, any method that
speeds up cycle-dependent degradation rates should be effective for ac-
celerating geosynchronous-related life tests. (See Section 6.4.2.)
2?2 Ni-Cd BATTERY APPLICATIONS MANUAL
6.6 MISCELLANEOUS TESTS
Two other tests, not as frequently performed, are discussed briefly here.
These are parametric tests and heat rate measurements.
6.6.1 Parametric Testing
Parametric testing consists of a group of tests, usually performed on a num-ber of cells at a time, in which charging and discharging are performed over
a range of each important operating parameter. Usually temperature, chargerate, and discharge rate are the variables, and others, such as end-of-charge
voltage, recharge ratio, and depth of discharge may be added. The purposeof such tests is to obtain performance data over the range of variables used
for predicting the envelope of cell and battery behavior to expect in service.
The range of conditions may be limited by the range expected or enforced
for a particular application. The data may be fed into a computer data fide
and used for performance simulation.
The task of structuring the test sequence is puzzling because the number of
possible combinations is unlimited. In general, it is preferable to begin atthe lowest level of temperature, charge rate, and/or discharge rate and to
progress toward the highest level. Larger intervals of temperature should beused at the low end than at the high end: O, 20, and 30 or 35°C provide
a good spread for three temperatures. Charge and discharge rates should be
varied in geometric series, each differing by a factor of 2 from the next
to obtain a good spread of effects.
The proper number of cycles to perform at each combination of variablesin order to obtain stable, reproducible data appears to vary with the operat-
ing conditions and depth of discharge used. The best compromise is about 5
cycles, with this number increasing as temperature and depth of dischargedecreases and vice versa. Some workers short the cells down on resistors
between each group of cycles under a FLxed set of variables. However.
when this is done. one or two extra cycles are needed each time to attain
a reasonably steady operating condition.
If time permits, possible bias that may be introduced because of a particularorder in which the tests are first run may be compensated for by repeating
some sequences in reverse order and combining the data. Some test plans
have addressed this potential problem by carrying out sequences in random
order. The relative merits of these different approaches are not apparent
from data available.
CELL AND BATTERY TESTING 273
The literature has reported only a few parametric test programs. Two of
these were relative to a low-Earth orbit, one involving SAFT-America
6.Ah cells (Reference 189), and the other involving General Electric 50-Ah
cells (Reference 38). A third set of te_ts was more general and involved
Eagle-Picher 3-Ah cells (Reference 63)-
6.6.2 Heat-Generation Measurement
If the necessary data on cell heat generation under certain conditions are
not available and there is reluctance to use general equations for calculating
heat effects such as those given in Section 3, actual measurements may be
necessary. This step should not be taken lightly, however, because usefuland reliable cell heat-rate measurements are very difficult to obtain, particu-
larly those that relate heat rate to varying operating conditions.
Gross (Reference 190) discussed the various methods of heat measurement
that apply to battery cells and reviewed the Literature through 1968, but he
did not include experimental details. Although calorimetric methods havebeen used most often, they suffer from inherently large thermal mass and,
hence, slow response. Reference 71 describes an elegant method involving
low-mass heat meters with negligible heat capacity outside the cell that was
used to measure essentially instantaneous heat-generation rates in a 50-Ah
cell. The results of this study agree well with values calculated from
equation 16 in Section 3.

SECTION 7
BATFERY SYSTEM DEFINITION
7.1 INTRODUCTION
This section shifts attention from the device level-the battery cell-to the
next higher level of organization. As discussed in Section 3, the term "bat-
tery system" represents the battery and certain auxiliary components. Theauxiliaries include elements required for charge and discharge control, cell
or battery protection, and battery temperature control. They act indi-
vidually and collectively to establish electrical and thermal interfaces
between the battery component and the rest of the spacecraft. However,
a battery system that includes these auxiliaries is only part of the electric
power system of the spacecraft, although the selection of its configuration
may be the most influential decision concerning spacecraft power-system
physical and performance characteristics. This section identifies some of the
factors that influence the development of a conceptual design of a battery
system. Much of the material is presented from the viewpoint of the electric
power-system engineer and is meant to serve as background for the detailed
discussions of battery-system design principles presented in Section 8.
This section begins with a review of considerations that influence the design
of spacecraft electric power systems. The material classifies and describes
various types of power systems. The treatment emphasizes the significant
role of the battery in system design and illustrates the importance of
developing the design of a total system-one that reflects not only accom-
modation of spacecraft load requirements but also those of the battery andits associated elements. The f'mal section describes methods of battery
temperature control.
7.2 ELECTRIC POWER SYSTEM DESIGN CONSIDERATIONS
This section identifies and describes major considerations that affect the
selection and design of spacecraft electric power systems. It contains general
material directed primarily toward establishing definitions of the electrical
and thermal interfaces between power-system components and other
275 ! Precedingpapblank'.
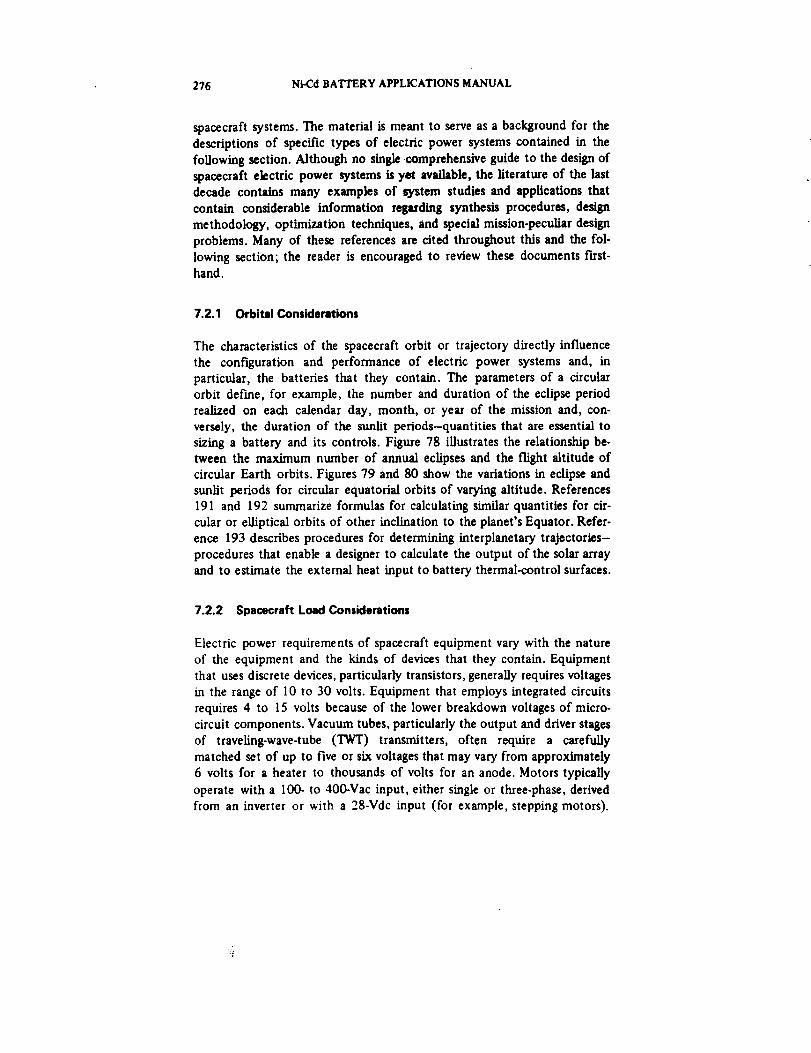
276 Ni-Cd BA1'TERY APPLICATIONS MANUAL
spacecraft systems. The material is meant to serve as a background for the
descriptions of specific types of electric power systems contained in the
following section. Although no single comprehensive guide to the design of
spacecraft electric power systems is yet available, the literature of the last
decade contains many examples of system studies and applications that
contain considerable information regarding synthesis procedures, design
methodology, optimization techniques, and special mission-peculiar design
problems. Many of these references are cited throughout this and the fol-
lowing section; the reader is encouraged to review these documents ftrst-hand.
7.2.1 Orbital Considerations
The characteristics of the spacecraft orbit or trajectory directly influence
the configuration and performance of electric power systems and, in
particular, the batteries that they contain. The parameters of a circular
orbit define, for example, the number and duration of the eclipse period
realized on each calendar day, month, or year of the mission and, con-
versely, the duration of the sunlit periods-quantities that are essential to
sizing a battery and its controls. Figure 78 illustrates the relationship be-
tween the maximum number of annual eclipses and the flight altitude of
circular Earth orbits. Figures 79 and 80 show the variations in eclipse and
sunlit periods for circular equatorial orbits of varying altitude. References
191 and 192 summarize formulas for calculating similar quantities for cir-
cular or elliptical orbits of other inclination to the planet's Equator. Refer-
ence 193 describes procedures for determining interplanetary trajectories-
procedures that enable a designer to calculate the output of the solar array
and to estimate the external heat input to battery thermal-control surfaces.
7.2.2 Spacecraft Load Considerations
Electric power requirements of spacecraft equipment vary with the nature
of the equipment and the kinds of devices that they contain. Equipment
that uses discrete devices, particularly transistors, generally requires voltages
in the range of 10 to 30 volts. Equipment that employs integrated circuits
requires 4 to 15 volts because of the lower breakdown voltages of micro-
circuit components. Vacuum tubes, particularly the output and driver stages
of traveling-wave-tube (TWT) transmitters, often require a carefully
matched set of up to five or six voltages that may vary from approximately
6 volts for a heater to thousands of volts for an anode. Motors typically
operate with a 100- to 400-Vac input, either single or three-phase, derivedfrom an inverter or with a 28-Vdc input (for example, stepping motors).
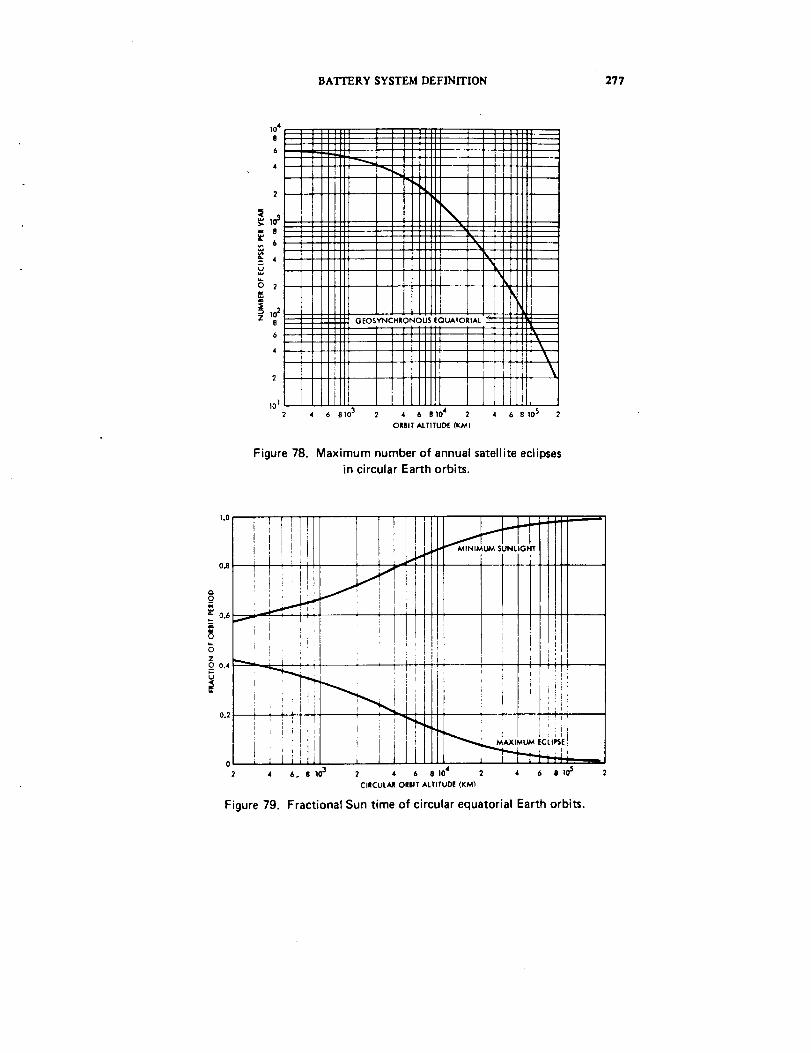
BATTERY SYSTEM DEFINITION 277
104
8
6
2
8
_J
6
4
101
2
I
4 6 810 3 2 4 6 B 104 2 4 6 8 tO§ 2
ORBIT ALTITUDE (KM)
Figure 78. Maximum number of annual satellite eclipses
in circular Earth orbits.
° I i!ii_ /.=o0, ;_ ! J
i i _ l ii]lll2 4 6. II 103 2 4 6 § 104 2 4 6 g I05
¢,RCUL_On,TALT,TUDE(KM_
Figure 79. Fractional Sun time of circular equatorial Earth orbits.
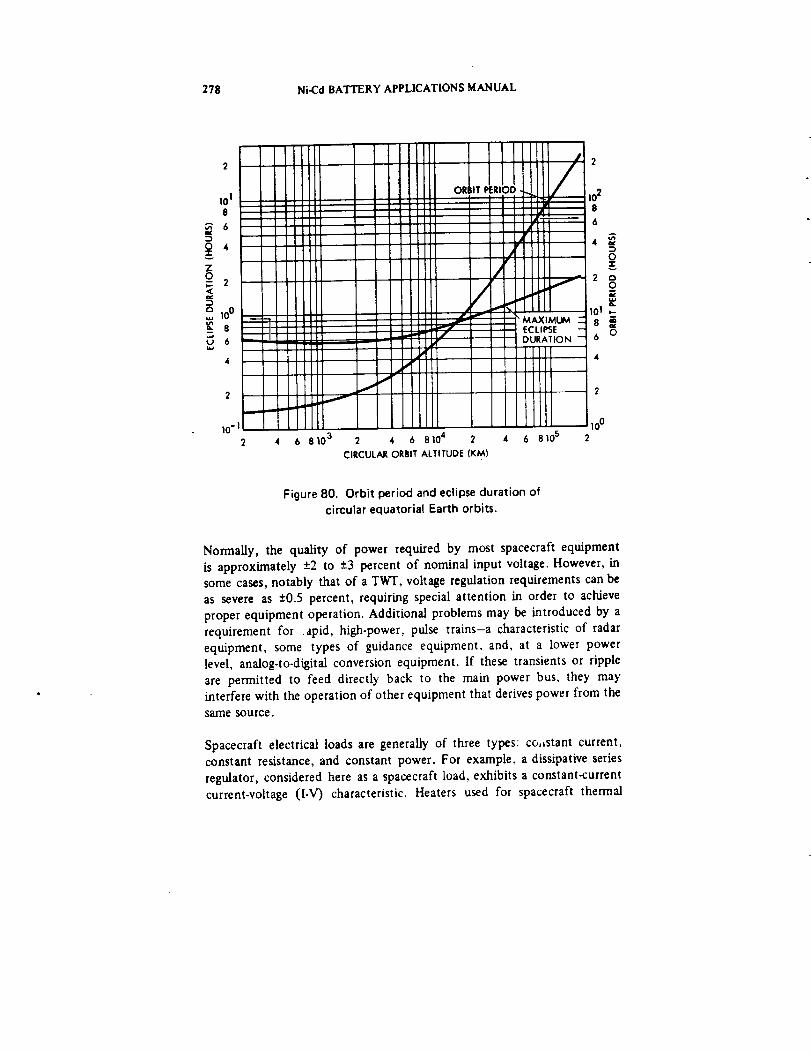
278 Ni-Cd BATTERY APPLICATIONS MANUAL
10'2 4 6 8103 2 4 6 8104 2 4 6 8105 2
CIRCULAR ORBIT ALTITUDE (KM)
2
100
Figure 80. Orbit period and eclipse duration of
circular equatorial Earth orbits.
Normally, the quality of power required by most spacecraft equipment
is approximately +2 to +3 percent of nominal input voltage. However, insome cases, notably that of a TWI', voltage regulation requirements can beas severe as +0.5 percent, requiring special attention in order to achieve
proper equipment operation. Additional problems may be introduced by arequirement for apid, high-power, pulse trains-a characteristic of radarequipment, some types of guidance equipment, and, at a lower powerlevel, analog-to-digital conversion equipment. If these transients or ripple
are permitted to feed directly back to the main power bus, they mayinterfere with the operation of other equipment that derives power from the
same source.
Spacecraft electrical loads are generally of three types: co.stant current,constant resistance, and constant power. For example, a dissipative series
regulator, considered here as a spacecraft load, exhibits a constant-currentcurrent-voltage (l-V) characteristic. Heaters used for spacecraft thermal
BATTERY SYSTEM DEFINITION 279
control are also essentially constant-resistance devices.* Examples of con-
stant-power loads include nondissipative regulators, converters, and inverters.
7.2.3 Electrical Interface Characteristics of the Solar-Cell Array
The I-V characteristics of the solar-cell array can vary considerably because
of: (a) the influence of changes in the illumination and temperature of its
solar cells, (b) the effect of degradations produced by extended exposureto the radiation and other natural environments of space, and (c) the loss
of array output capability resulting from random open-circuit failureswithin the solar-cell circuitry (Reference 194). The effect of changes in
illumination and temperature have the greatest impact. For example, a cold
solar-cell-array exiting eclipse in a geosynchronous equatorial orbit will have
an open-circuit voltage approximately twice that obtained at steady-state
operating temperatures under full illumination. This means that, in the ab-
sence of power-source voltage regulation, the input voltage of equipment
connected directly to the solar array will be in the vicinity of the open-
circuit voltage of the solar-cell array during the early part of the thermal
transient interval. Unless the equipment is designed to withstand this volt-
age stress, its performance will be affected, and its reliability will bereduced.
7.2.4 Electrical and Thermal interface Considerations for
Nickel-Cadmium Batteries
The normal I-V characteristics of nickel-cadmium cells are primarily
dependent on cell temperature, state of charge, and prior service history.
These dependencies have been illustrated and discussed in Sections 3 and 4.
Note that batteries are normally charged at a voltage about 20 to 40 percent
above their discharge levels. Thus, if the batteries are connected directly to
the power bus during both charge and discharge, they effectively determine
the degree of bus voltage regulation. To obtain better regulation, it is neces-sary to either disconnect the batteries from the bus when they are charged
or place a voltage conversion element in series between the batteries and the
power bus during either the charge or the discharge periods. Although many
battery systems have contained discharge converter/regulators, it is never-
theless desirable to avoid introducing components that contribute power
*The thermal _ower dissipated b.v a resistive heater is equivalent to the electricalpower, P = V /R. Thus, the power variation is directly proportional to the square ofthe voltage variation. This fact should be considered ff heaters are connected to anunxegulated-voltage power bus.
280 Ni-Cd BA'I'I'ERY APPLICATIONS MANUAL
losses during discharge or that must be capable of passing large currents.Such conversion elements tend to increase the size of the batteries and to
cause unwanted thermal dissipations. The electrical interface between a
battery and the electric power system is further discussed in Section 7.3
and developed fully in Section 8.
The thermal interface between batteries and other spacecraft systems is of
great importance to battery-system design. A battery, unlike most other
spacecraft components, is usuatly a variable source of thermal dissipation
throughout an orbit. Section 3 describes the thermal behavior of nickel-cadmium cells, as well as the effect of temperature on long-term cyclical
behavior. However, this is only one part of the cause-and-effect relationship
that must be considered during the battery-system synthesis process. Bat-
tory temperature characteristics are ultimately determined by the selection
of the method of temperature control, which, in turn, affects battery-
system reliability and may impact the cost and weight of other spacecraft
systems and components. It is now generally accepted that, regardless of
orbit type, long service life is obtained by maintaining average batterytemperature in the region near and above 0°C. In some short-term missions,
this requirement may be relaxed without risk to the mission, particularly
when conservative discharge/charge duty cycles are used and adequate
levels of charge monitoring and control are provided. For longer missions,
it is likely that future battery systems will be designed to provide battery
operation and in.orbit storage at reduced temperatures. This requirement
may cause an increase in battery radiator size or in the size of the solar array
because of additional battery-heater power requirements. In certain
instances, the requirement may lead to the application of active thermal-
control devices, such as heat pipes or thermal louvers. Section 7.4 contains
a general review of methods of battery thermal design and control; Section
8 describes the role of charge control in battery-system electrical and
thermal design.
7.2.5 Electric Power-System Regulation and Control
The variable I-V characteristics of the power sources make them generally
incompatible with spacecraft equipment unless some means of source-load
matching is introduced. In the majority of cases, the matching is provided
by the converter/regulators or inverter/regulators that are usu." _y required to
transform power from the voltage of the primary bus to voltage levels
required by the equipment. In the minority of cases, the equipment may
utilize power at or near the nominal primary bus-voltage level. In such in-stances, source-load matching is often achieved by solar-array regulation,
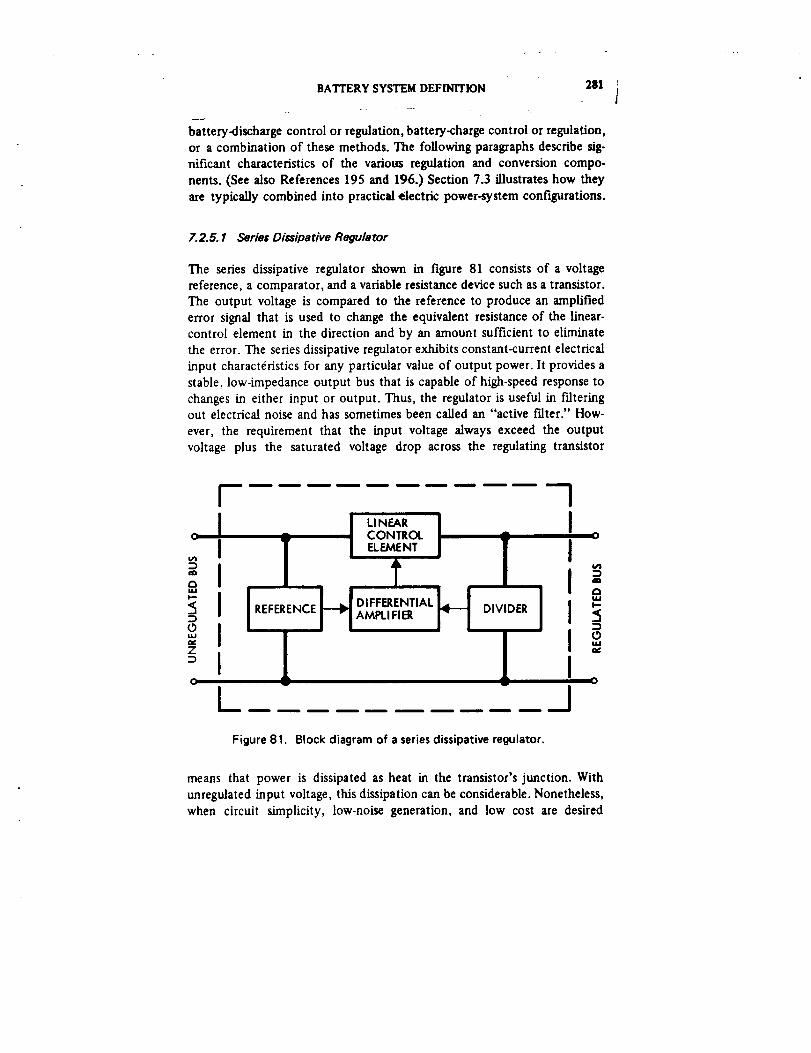
BATTERY SYSTEM DEFINITION 281
battery-discharge control or regulation, battery-charge control or regulation,
or a combination of these methods. The following paragraphs describe sig.
nificant characteristics of the various regulation and conversion compo-
nents. (See also References 195 and 196.) Section 7.3 illustrates how they
are typically combined into practical electric power-system configurations.
7.2.5. 1 Series Dissipative Regulator
The series dissipative regulator shown in figure 81 consists of a voltage
reference, a comparator, and a variable resistance device such as a transistor.
The output voltage is compared to the reference to produce an amplified
error signal that is used to change the equivalent resistance of the linear-
control element in the direction and by an amount sufficient to eliminate
the error. The series dissipative regulator exhibits constant-current electrical
input charact6ristics for any particular value of output power. It provides a
stable, low-impedance output bus that is capable of high-speed response to
changes in either input or output. Thus, the regulator is useful in filteringout electrical noise and has sometimes been called an "active f'dter." How-
ever, the requirement that the input voltage always exceed the output
voltage plus the saturated voltage drop across the regulating transistor
j i Ii CONiROL o
c j ELEMENT
"_l I _I*-! II °REFERENCE DIFFERENTIAL DIVIDER =I "l A_''_'"_
Z '_
° I I0 _ 0
k_ ___._1Figure 81. Block diagram of a series dissipative regulator.
means that power is dissipated as heat in the transistor's junction. With
unregulated input voltage, this dissipation can be considerable. Nonetheless,
when circuit simplicity, low-noise generation, and low cost are desired
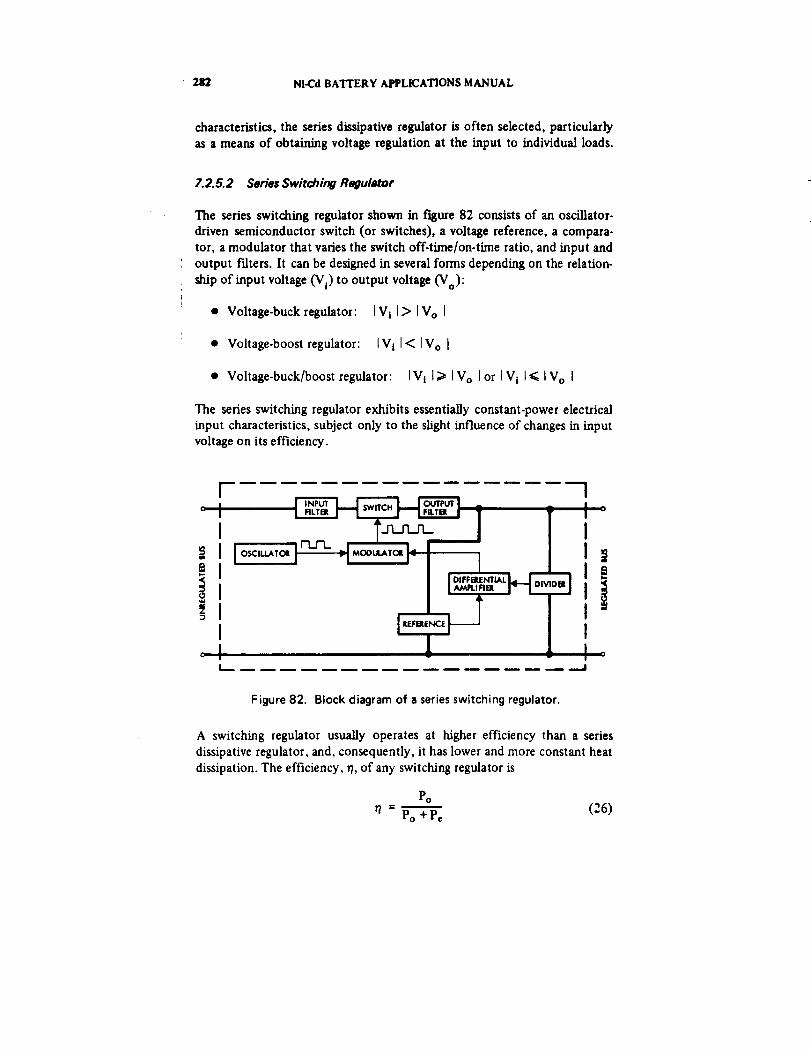
282 Ni-Cd BATI'ERY APPLICATIONS MANUAL
characteristics, the series dissipative regulator is often selected, particularly
as a means of obtaining voltage regulation at the input to individual loads.
7.2.5.2 Series Switching Regulator
The series switching regulator shown in figure 82 consists of an oscillator-
driven semiconductor switch (or switches), a voltage reference, a compara-
tot, a modulator that varies the switch off-time/on-time ratio, and input and
output falters. It can be designed in several forms depending on the relation-
ship of input voltage (Vi) to output voltage (Vo):
• Voltage-buck regulator: 1Vi I> IVo I
• Voltage-boost regulator: IV i l< IV o [
• Voltage-buck/boost regulator: IV i l_ IVo Ior IV i I_ [ V o J
The series switching regulator exhibits essentially constant-power electrical
input characteristics, subject only to the slight influence of changes in input
voltage on its efficiency.
s
t..,_ ..,..I
Figure 82. Block diagram of a series switching regulator.
A switching regulator usually operates at higher efficiency than a series
dissipative regulator, and, consequently, it has lower and more constant heat
dissipation. The efficiency, r_,of any switching regulator is
Po
rt = Po + Pe (26)
BATTERYSYSTEMDEFINITION 283
in which Pe is the sum of the power losses within the regulator, and Po is
the output power delivered at regulated output voltage, Vo. Reference 196
contains examples of the efficiency characteristics of each type of regulator
as a function of input/output voltage ratio for a particular load requirement.
Reference 197 displays a general method for calculating the efficiency of a
buck-type regulator that can be extended to include the other forms.
Depending on input and output filter design, a switching regulator can
provide line and load regulation in the range of 0.1 to 1 percent. A tradeoff
is possible between regulation and transient response characteristics. Refer-
ence 195 contains a general discussion of the electromagnetic control (EMC)
aspects of switching regulator design.
7.2.5.3 Shunt Regulators and Limiters
The shunt regulator is normally used either to limit the voltage of a solar-
cell array or to regulate its output voltage. In either case, it is a sink for
excess solar-ceU array power-power that varies considerably throughout themission. The shunt regulator/limiter can be designed in several forms:
• Full linear dissipative shunt regulator
• Sequentially controlled full or partial linear dissipative shunt regulator
• Partial linear dissipative shunt regulator
• Switching shunt regulator
• Digital shunt regulator
Dissipative shunt regulators and limiters have been incorporated into most
spacecraft electric power systems because of their simplicity and inherent
high reliability. However, because they must be capable of handling largeamounts of power, they tend to impose a considerable burden on the
spacecraft's thermal-control system. Recently developed alternative forms
offer reduced dissipation characteristics.
Figure 83 shows a simplified circuit diagram of a conventional full-shunt
regulator and how the dissipation is divided between the active controlelement and the shunt resistor. Maximum transistor dissipation equals
Psh/4 and occurs when one-half of the rated shunt power is being dissipated.
(In this discussion and those that follow, consideration of control-circuit
losses has been neglected.)
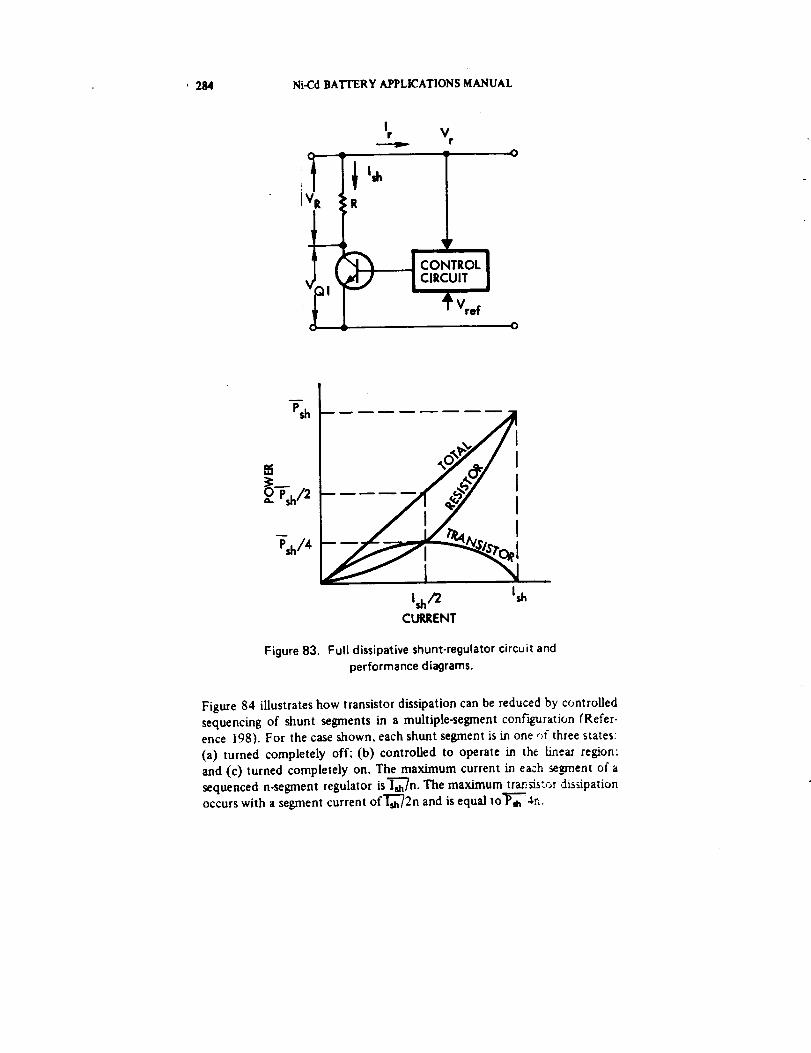
! 284 Ni-Cd BATFERY APPLICATIONS MANUAL
I' ::R4p
Ir
r
V_I
Vr
iVre f
o
o
1_/2 I_
CURRENT
Figure 83. Full dissipative shunt-regulator circuit and
performance diagrams.
Figure 84 illustrates how transistor dissipation can be reduced by controlled
sequencing of shunt segments in a multiple-segment conFzguration (Refer-
ence 198). For the case shown, each shunt segment is in one ,)f three states:
(a) turned completely off; (b) controlled to operate m the linear region;
and (c) turned completely on. The maximum current in ea:h se_'nent of a
sequenced n.segment regulator is I-'_'7_n. The maximum trar._'_or dissipationoccurs with a segment current of'_2n and is equal to'_ -in.
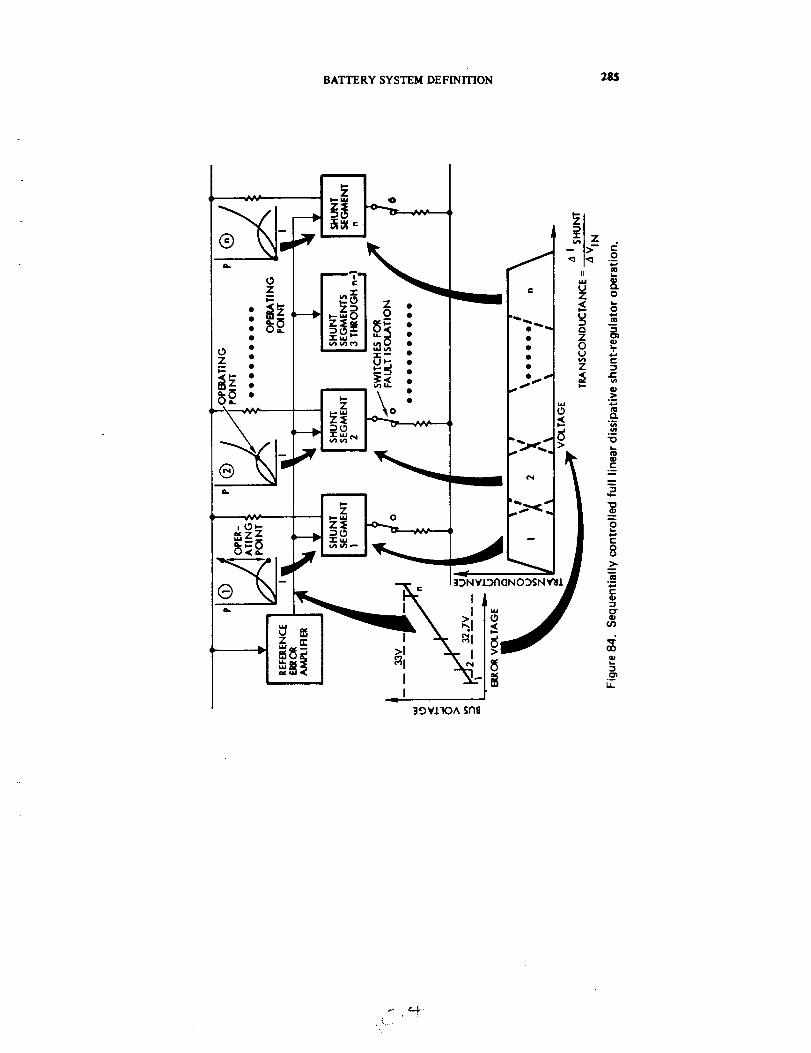
BATTERY SYSTEM DEFINITION 28S
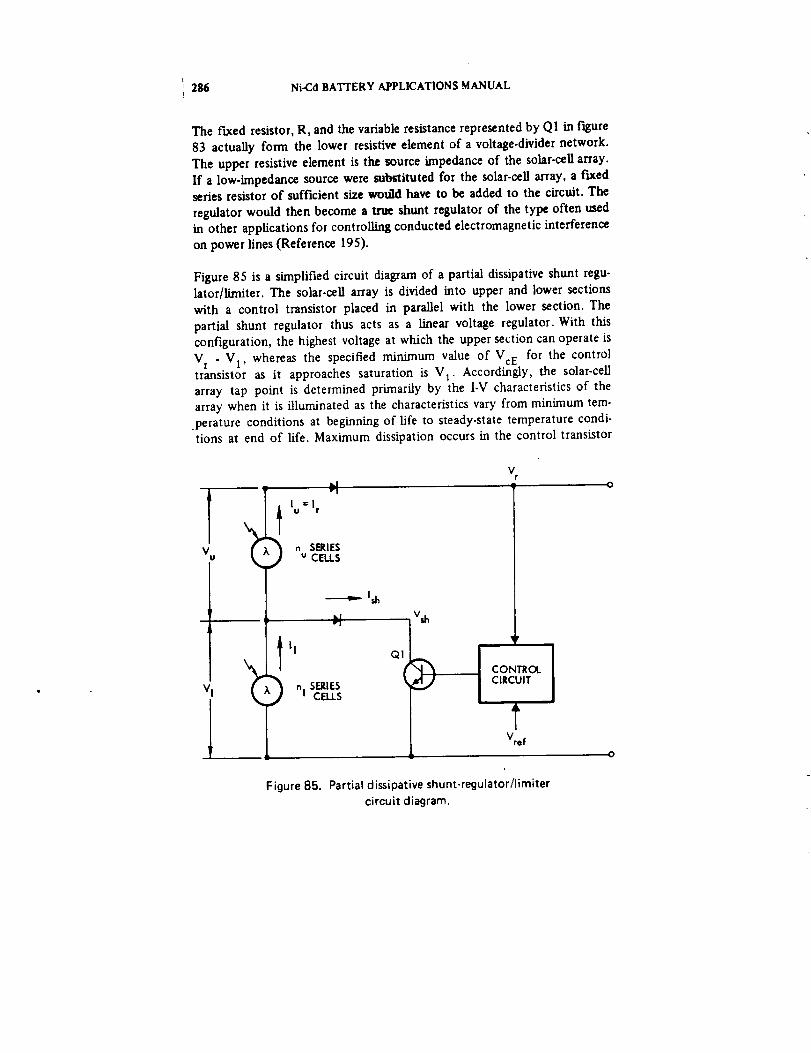
i 286 Ni-Cd BATTERY APPLICATIONS MANUAL
The t'Lxed resistor, R, and the variable resistance represented by QI in f_,ure
83 actually form the lower resistive element of a voltage.divider network.
The upper resistive element is the source impedance of the solar-cell array.
If a low-impedance source were substituted for the solar-cell array, a lutedseries resistor of sufficient size would have to be added to the circuit. The
regulator would then become a true shunt regulator of the type often used
in other applications for controlling conducted electromagnetic interference
on power lines (Reference 195).
Figure 85 is a simplified circuit diagram of a partial dissipative shunt regu-
lator/limiter. The solar.cell array is divided into upper and lower sections
with a control transistor placed in parallel with the lower section. The
partial shunt regulator thus acts as a linear voltage regulator. With this
configuration, the highest voltage at which the upper section can operate is
V t - V1, whereas the specified minimum value of VcE for the controltransistor as it approaches saturation is V 1. Accordingly, the solar-ceU
array tap point is determined primarily by the I-V characteristics of the
array when it is illuminated as the characteristics vary from minimum tem-
.perature conditions at beginning of life to steady-state temperature condi-tions at end of life. Maximum dissipation occurs in the control transistor
vg
vI
\
td
i lu=l r
n SERIESu CELLS
--_- Ish
Lli,-1
l
nI SERIES
CELLS
Q1
Vsh
CONTROLCIRCUIT
Vref
Figure 85. Partial dissipative shunt-regulator/limiter
circuit diagram.
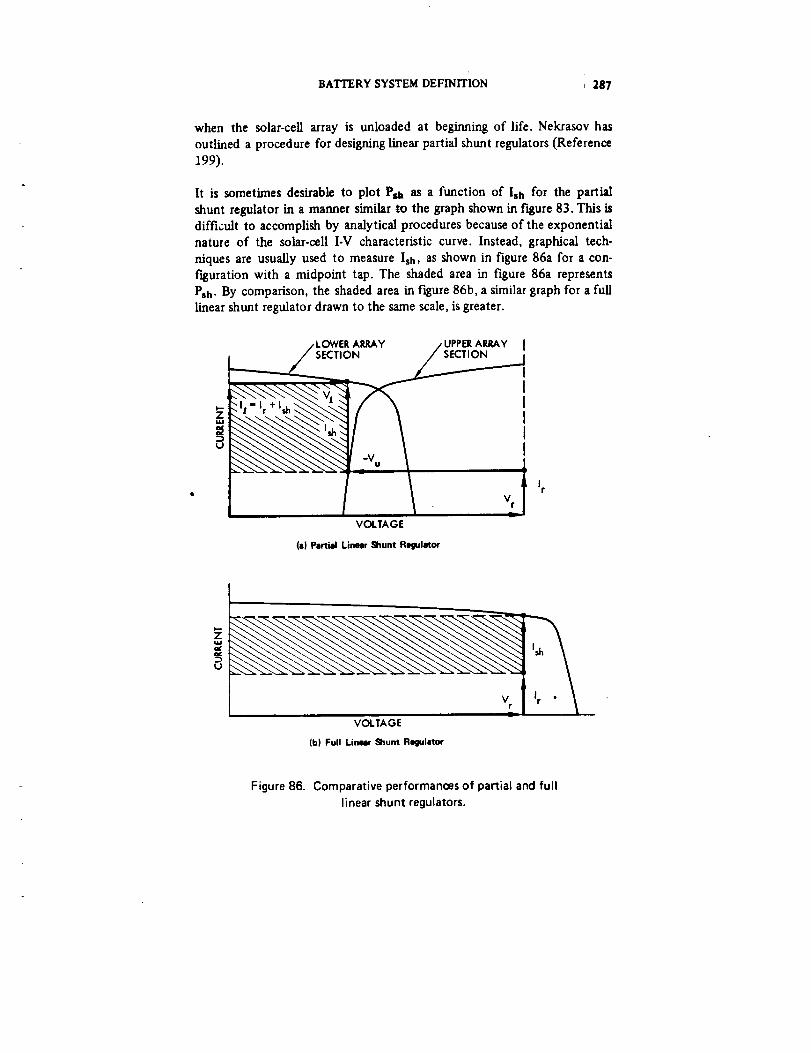
BATTERY SYSTEM DEFINITION i 287
when the solar-ceU array is unloaded at beginning of life. Nekrasov has
outlined a procedure for designing linear partial shunt regulators (Reference
199).
It is sometimes desirable to plot P_ as a function of Ish for the partial
shunt regulator in a manner similar to the graph shown in figure 83. This is
difficult to accomplish by analytical procedures because of the exponential
nature of the solar.cell I.V characteristic curve. Instead, graphical tech-
niques are usually used to measure Ish, as shown in figure 86a for a con-
figuration with a midpoint tap. The shaded area in figure 86a represents
Psh- By comparison, the shaded area in figure 86b, a similar graph for a full
linear shunt regulator drawn to the same scale, is greater.
u
/ LOWERARRAY / UPPERARRAY
j__ oo /SEa'ION
J vVOLTAGE
(a) PartialLinearShuntRegulator
VOLTAGE
(b) Full Linear Shunt Regulator
Figure 86. Comparative performances of partial and full
linear shunt regulators.
288 Ni-Cd BATTERY APPLICATIONS MANUAL
Unlike the full shunt regulator, the partial shunt regulator does not have acollector resistor in series with the control transistor. In the absence of this
current-limiting device, it is common practice to make QI in figure 85
quadredundant to protect against a_)llector-to-emitter short circuit. This
will reduce the dissipation in each _mmistor during normal operation butincrease the weight of the regulator because the size of each transistor and
its heat sinking in the quadredtmdant circuit is identical to the single controltransistor considered previously.
In general, the advantages of dissipative shunt-regulator limiters (both full
and partial) are that: (a) essentially no loss of power occurs that otherwise
can be utilized by the spacecraft loads or for battery charging, and Co) they
provide rapid response to line and load transients. Other shunt-regulator
concepts have been investigated in an effort to obtain improved thermal-
dissipation characteristics without sacrificing these advantages. A switching
shunt regulator can be designed to operate at efficiencies comparable to
those of series switching regulators. However, it is relatively more complex
than a comparable dissipative regulator, its transient response is poorer, and
it tends to be heavier. For these reasons, the switching shunt regulator has
not been used. Digital shunt regulators have been examined for high power
applications. In concept, they are similar to the sequenced full linear shunt
dissipator discussed previously, except that each segment contains only a
transistor switch. The switch is connected in parallel across an array segment
and is either on or off, depending on the error-sensing and digital-control
circuitry. When the switch is on, it is saturated (low dissipation) and effec-
tively shorts out the array segment. An alternative version of this regulator
places the switch in series with the array segment; when the switch is open,
the array segment is open-circuited. In practice, the digital shunt regulator
is augmented with a small dissipative shunt regulator to eliminate bus ripple
introduced by the full-on/full-off mode of operation.
7.2.5.4 Power Converters and Inverters
When there are requirements for ac voltages or for dc voltages that differ
from that of the primary power bus, it becomes necessary to add some form
of power-conversion equipment to the electric power system. An inverter is
a dc-to-ac component, and a converter is a dc-to-dc component. It is some-
times convenient to also define a converter as an inverter to which outputrectification and f'tltering has been added.
It is beyond the scope of this discussion to consider in detail the manytypes of converter and inverter circuits. References 200 and 201 contain

BATTERY SYSTEM DEFINITION i:289
useful background material for further study. References 202 through 205
describe particular converter and inverter circuits. In particular, Reference
196 describes four commonly used converters and presents calculated values
of mass and efficiency for each as a function of output power and modula-
tion frequency. Reference 196 also outlines a method for refuting the esti-
mate of efficiency for a typical preregulated converter in terms of output
voltage level changes and the incorporation of multiple outputs of differ-
ing voltage and power level.
7.3 TYPES OF ELECTRIC POWER SYSTEMS
In generalized form, a spacecraft electric power system is composed of a
power source, a power-source controller, a battery system that includes
both charge and discharge controls, and combinations of line regulators,
converters, and inverters. This discussion assumes that the power source is
a solar-cell array, although the configurations described may also accommo-
date other types of power sources, such as a radioisotope thermoelectric
generator (RTG). It is convenient to classify electric power systems by a
common characteristic or property. One widely used method is based on the
selection of the elements, either series or shunt, used for power-sourcecontrol. This classification scheme sometimes includes an identification of
whether or not the power-source control element is capable of tracking the
maximum power-operating point of the source (Reference 206). Anothermethod is based on whether centralized or decentralized power conditioning
equipment is used. A third method, which is more informative, categorizes
electric power systems by their primary power-bus regulation characteris-
tics. Thus, all spacecraft electric power systems fall within one of the fol-
lowing classes:
• Unregulated-voltage (UV) dc-bus systems
• Limited-voltage (LV) dc-bus systems
• Regulated-voltage (RV) dc-bus systems
• Maximum-power point-tracking (MPT) systems
Another class, regulated ac distribution systems, is not considered here
because its systems are not directly compatible with the static energy
sources usually found on board spacecraft and are, in fact, usually employed
for secondary power distribution and generation. Also, the MPT systems
may offer unregulated-, limited-, or regulated-voltage dc buses, depending
290 Ni-Cd BATTERY APPLICATIONS MANUAL
on the specific configuration selected. Table 45 lists spacecraft, categorized
by primary power-bus regulation characteristics, that represent a wide range
of Earth-orbiting missions.
7.3.1 Unregulated-Voltage dc-Bus Systems
Systems included in the unregulated-voltage dc-bus classification exhJbR
the following general characteristics:
• The primary power bus is usually connected directly to the solar-
array bus.
• No active control elements (series or shunt) are incorporated specifi-
cally to regulate or limit the voltage of the solar-array bus.
• The batteries are isolated from the primary power bus during a por-
tion of their discharge/charge cycle (usually during charge).
Spacecraft payloads and most other electrical loads draw power from
the primary power bus through power-conversion or power-inversion
equipment.
It is worthwhile to consider the implications of the first two items on prb
mary power-bus voltage characteristics. If a battery is connected directly to
the bus through a passive bilateral* element (e.g., a resistor), it wRl provide
gross regulation (between +10 and +20 percent, depending on mission and
load conditions) throughout the orbit because of its own discharge/charge
characteristics. However, if the battery is disconnected or otherwise isolated
from the bus during its period of charge and if no separate means exists for
regulating the solar array, the voltage operating point of the system will be
determined by the stable intersection points of the solar array and com-
posite load-line I-' characteristics. Under such circumstances, the illumina-
tion and temperature characteristics of the array will strongly influence the
bus voltage, and bus regulation, in its usual meaning, will all but ceaseto exist.
The foregoing situation can be tolerated if the equipment connected to the
primary power bus is designed to withstand the expected maximum voltage
stress, as is the case for at least one major spacecraft proj.ct (Reference
*A battery connected to the bus through a diode gill regulate the bus if the diode isalways forward-biased.
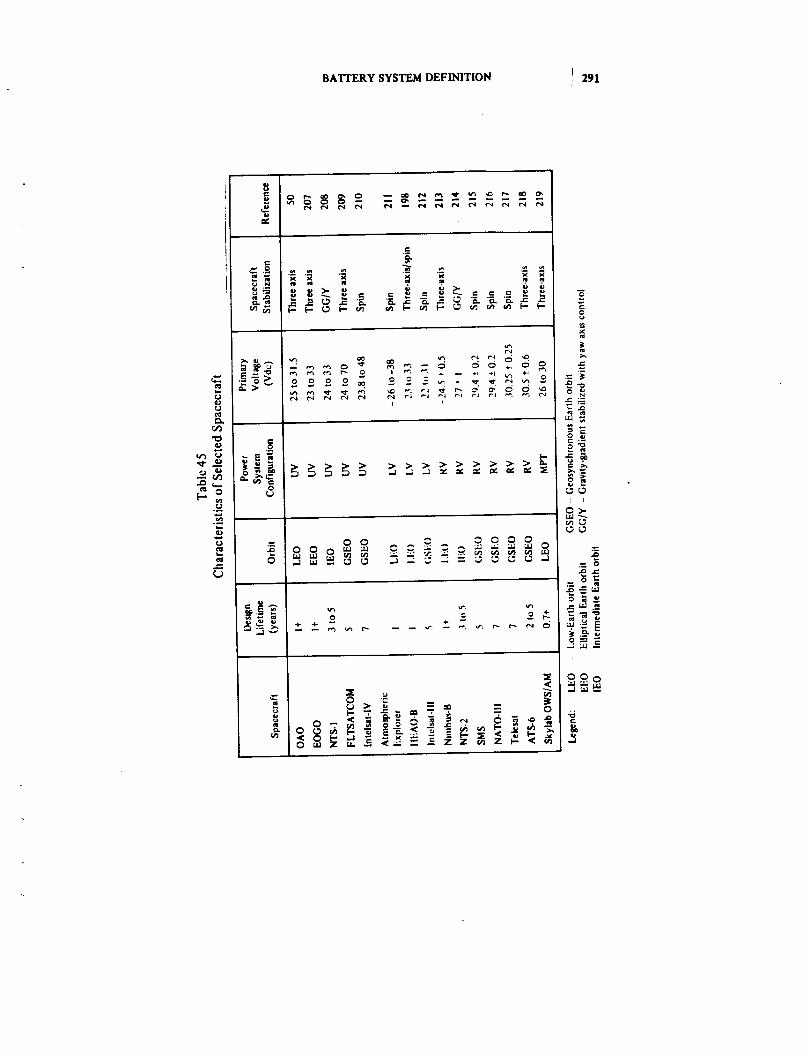
BATTERY SYSTEM DEFINITION ! 291
c.)O
_rJ

I292 Ni-Cd BA'FrERY APPLICATIONS MANUAL
209). More often, however, systems in this class will be configured or con-trolled so as to mitigate the bus-voltage excursion. The following paragraphs
describe this type of system.
Figure 87 defines the discharge _md charge controls for one of two 22-cell
nickel-cadmium batteries contained in the electric power system of a body.
stabilized geosynchronous-equatoria]-orbit communications satellite. One-
half of its flat-panel Sun-tracking solar array provides power to load bus A,
and the other half supplies power to load bus B. The following discussion
assumes that the bus-tie relay is closed. The system does not contain equip-
ment for solar-array regulation or load-bus regulation.
BYPASS BATTERY :
CELLS IELECTRONICS I
l J¢.
Ct'_RG_ REC,ULATC_. PROVIDESR_TTE_ vCXTAGE AND CIJItRENT_;_rS SELECIABLE BY CO_4AND.• OLT,t OE L;MITS ARE AUTO°
,_ATICALL'_' REDUCED AS BATTERyr _.._ER_ TU_E tl'_.ltBA SES,
SELECTA|LE HIC, HER CHARGE
tAT| PERMITS CI"_RGtt_G BOTH_TTEIlIE$ SEQUE_"-TLALLY FROt_C'_E CHARGE EEGUI.AT_.
COMMA ND -SELECTAIH.E VOLTAGE.I_ITS ACC_OOATE
FAILED BATTEIIY CELLS.
T_E CHARGE BATE IS REDUCEDTC THE TRICKLE CHARGE LEVEL BYCC_,b_ANO ,,VHEN FIJI.L CHARGE
IS RE.AC_ED.
DISCI't, AR_E RELAY (Is.l). CLUESAUTCW_AATIC_LLY .'vHEN THESC_.AR ARRAY "¢OLTAG| IS_F.SS THAI_. 22 VOLTS TO PEIIMIT
BATTERY DISCHAIIGE , OR BYCC'MMA_O. IT IS O¢'ENED BYCC,_v_,r.,O (AFTER ECLIPSE) TOE/_ELE THE CHARGE REGULATOL
Figure 87. Battery discharge/charge controls•
Relay K1 closes either automatically or by command when the load-bus
voltage falls below 22 volts as a result of inadequate array power to support
the load, such as upon entry into eclipse. The combined I-V characteristics
of the battery and the load establish the load-bus voltage during the dis-
charge period. When the spacecraft exits from an eclipse, the KI relay is
commanded open and the buck/boost batter)' charger is turned on in con-
trolled sequence. The buck/boost charger accommodates solar-array voltages
above and below the battery charge voltage that may occur as a result of
ORIGINAL PAGE Is
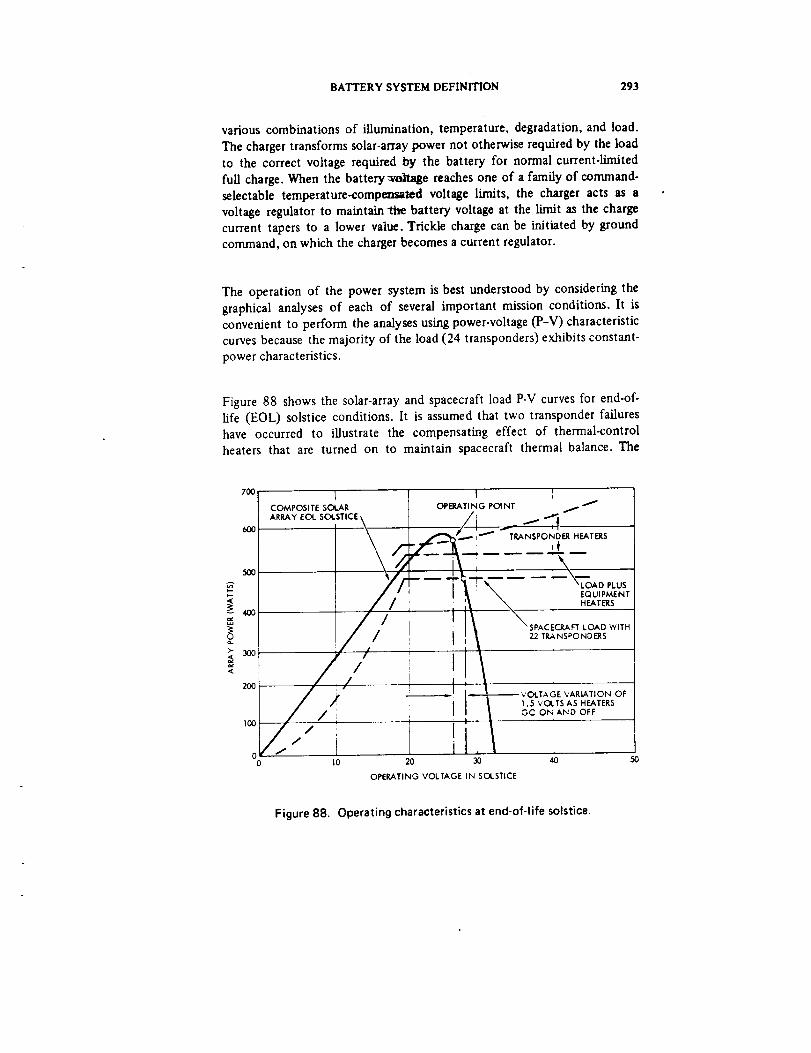
BATTERY SYSTEM DEFINITION 293
various combinations of illumination, temperature, degradation, and load.
The charger transforms solar-array power not otherwise required by the load
to the correct voltage required by the battery for normal current-limited
full charge. When the battery voltage reaches one of a family of command-
selectable temperature-comp=ma_ed voltage limits, the charger acts as a
voltage regulator to maintain _tte battery voltage at the limit as the charge
current tapers to a lower value. Trickle charge can be initiated by ground
command, on which the charger becomes a current regulator.
The operation of the power system is best understood by considering the
graphical analyses of each of several important mission conditions. It is
convenient to perform the analyses using power-voltage (P-V) characteristic
curves because the majority of the load (24 transponders) exhibits constant-
power characteristics.
Figure 88 shows the solar-array and spacecraft load P-V curves for end-of-
life (EOL) solstice conditions. It is assumed that two transponder failures
have occurred to illustrate the compensating effect of thermal-controlheaters that are turned on to maintain spacecraft thermal balance. The
700,
600
5O0
-,oo
o
20O
100
00
I 1 1compositesou,_ O_rING Poi_r EAR_YE_ SOLSTICE\ /I !-- _ "_'!!
I // i !It/ _ I 22 TRANSPONDERS!/ / ,
/ i7',' I\i
I J, '- -- I-----_I,--VOLTAGE VARIATION Of/ '_ ] I I 1 1.5 VOLTS AS HEATERS
/ / ' i I I l GC ONA_D OFF
t0 20 30 40 50
OPERATING VOLTAGE IN SOLSTICE
Figure 88. Operating characteristics at end-of-life solstice.
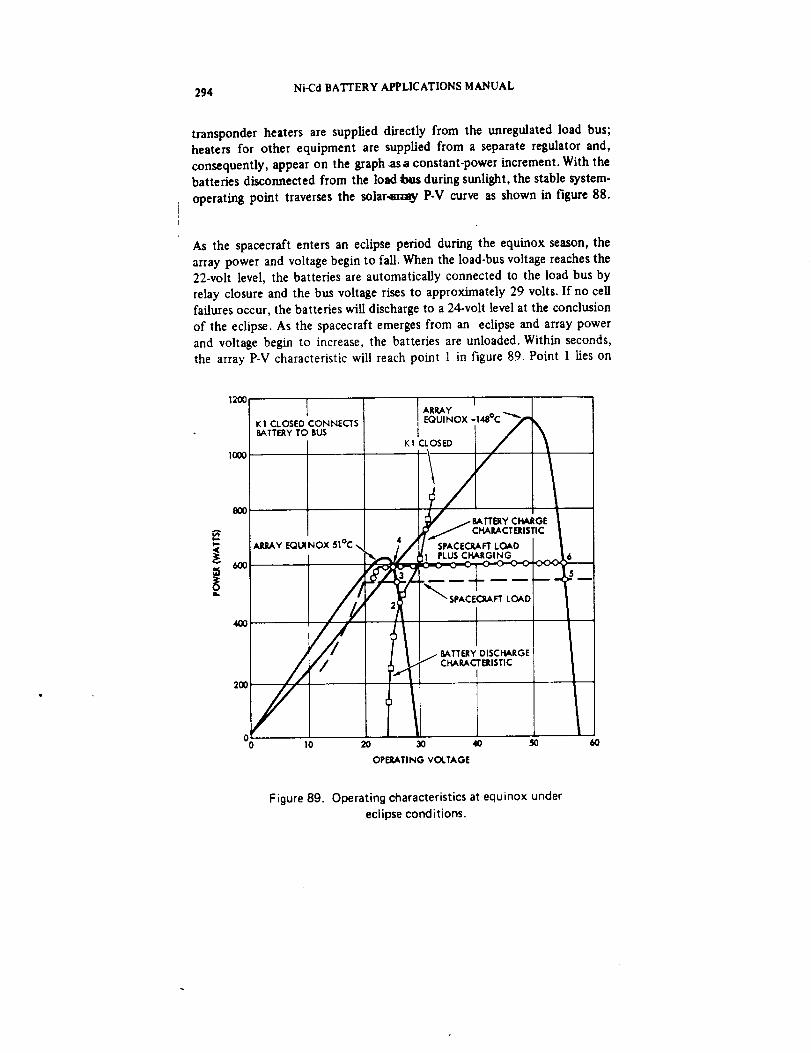
: 294 Ni-Cd BATTERY APPLICATIONS MANUAL
transponder heaters are supplied directly from the unregulated load bus;heaters for other equipment are supplied from a separate regulator and,
consequently, appear on the graph .as a constant-power increment. With thebatteries disconnected from the load _ during sunlight, the stable system.
operating point traverses the solar4r_ay P-V curve as shown in figure 88.
As the spacecraft enters an eclipse period during the equinox season, thearray power and voltage begin to fall. When the load-bus voltage reaches the22-volt level, the batteries are automatically connected to the load bus by
relay closure and the bus voltage rises to approximately 29 volts. If no cellfailures occur, the batteries will discharge to a 24-volt level at the conclusion
of the eclipse. As the spacecraft emerges from an eclipse and array powerand voltage begin to increase, the batteries are unloaded. Within seconds,the array P-V characteristic will reach point 1 in figure 89. Point 1 lies on
i
1200
1000
800
600
KI CLOSEDCONNECTSBATTERYTO BUS
AiUlAY EQUINOX 5|°C •
2(11
/o
o lo 2o
I
E_uR_YNox.148°C "",_ _,
_...._ C_CT_Isnc I/
• 2_ " SPACEC3tAFTLOADI!
lb BATTERYDISCHARGE
CHARACTERISTIC
OPERATINGVOLTAGE
Figure 8g. Operating characteristics at equinox under
eclipse conditions.
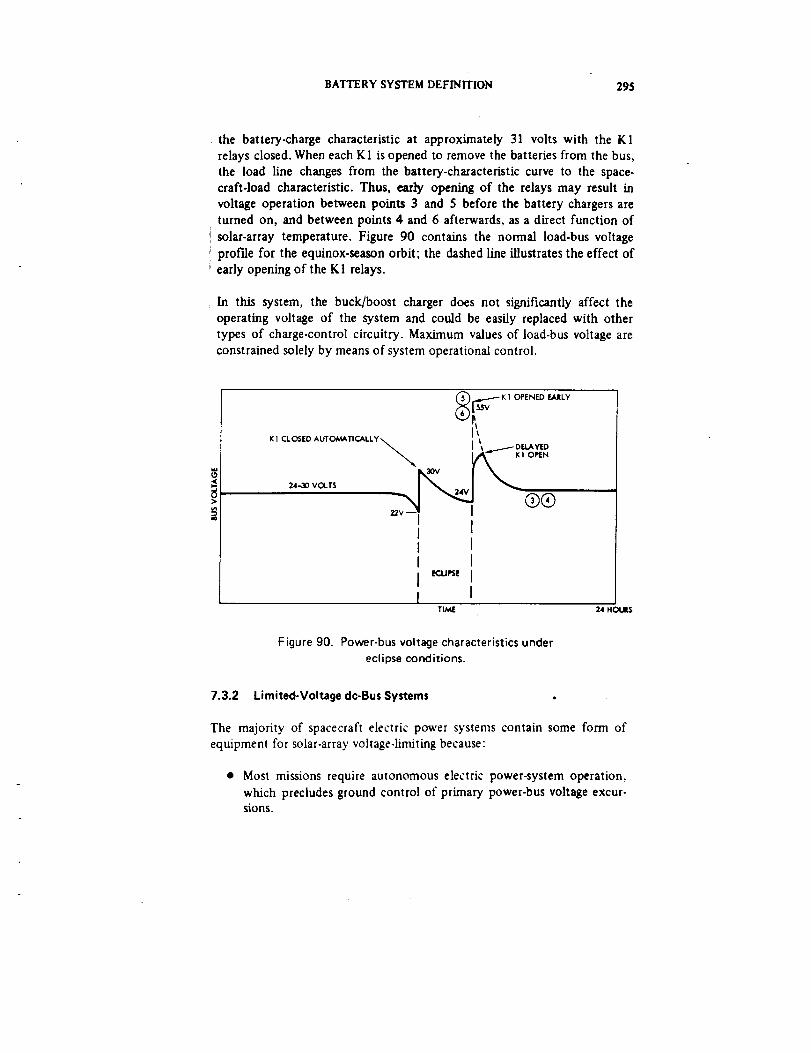
BATTERY SYSTEM DEFINITION 295
the battery-charge characteristic at approximately 31 volts with the K1relays closed. When each KI is opened to remove the batteries from the bus,
the load line changes from the battery-characteristic curve to the space.craft-load characteristic. Thus, early opening of the relays may result involtage operation between points 3 and 5 before the battery chargers areturned on, and between points 4 and 6 afterwards, as a direct function of
solar-array temperature. Figure 90 contains the normal load-bus voltageprof'de for the equinox.season orbit; the dashed line illustrates the effect ofearly opening of the K1 relays.
In this system, the buck/boost charger does not significantly affect theoperating voltage of the system and could be easily replaced with othertypes of charge-control circuitry. Maximum values of load-bus voltage areconstrained solely by means of system operational control.
am
K I CLOSED AUTOMATIC.ALLY_
gl OPENED EARLY
r,,\ _,._..._- DELAYED
OI_N
24-30 VOLTS 30__4V
22V __w
IIII
j ECUPSE
Irl_
®®
24 H C)UL_
Figure 90. Power-bus voltage characteristics under
eclipse conditions.
7.3.2 Limited-Voltagedc-BusSystems
The majority of spacecraft electric power systems contain some form ofequipment for solar-array vohage-limiting because:
• Most missions require autonomous electric power-system operation.
which precludes ground control of primary power-bus voltage excur-sions.
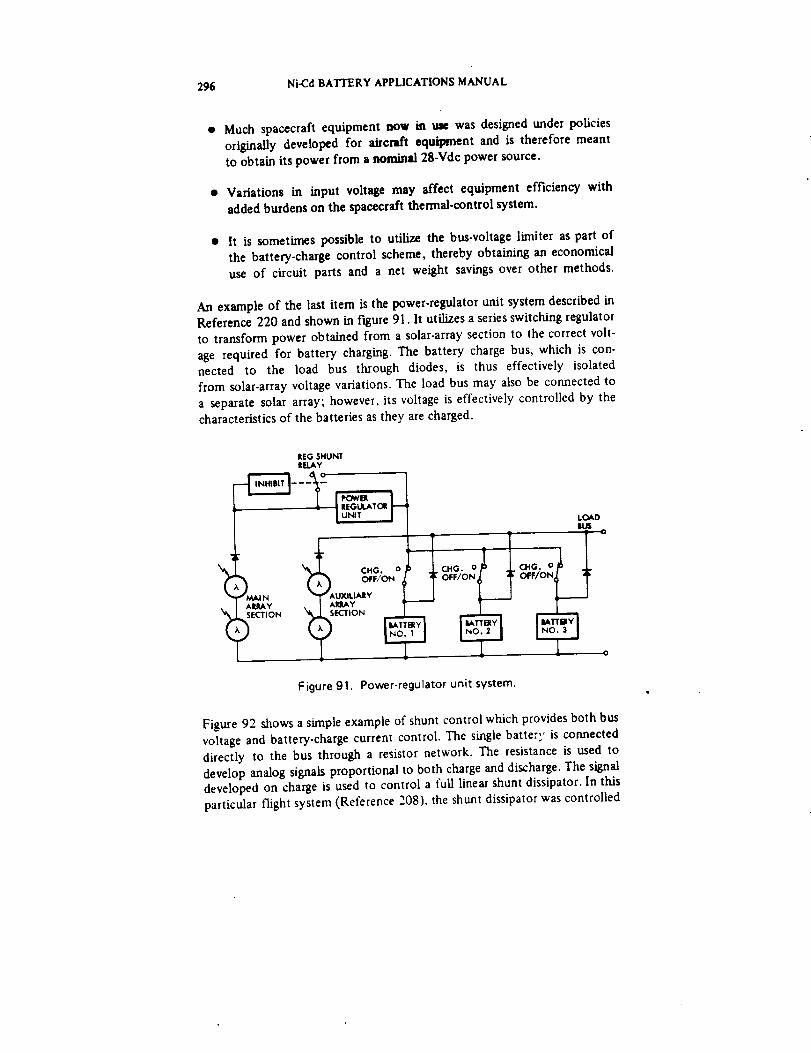
296 Ni-Cd BATTERY APPLICATIONS MANUAL
• Much spacecraft equipment now in use was designed under policies
originally developed for aircraft equipment and is therefore meant
to obtain its power from a nominal 28-Vdc power source.
• Variations in input voltage may affect equipment efficiency with
added burdens on the spacecraft thermal-control system.
• It is sometimes possible to utilize the bus-voltage limiter as part of
the battery-charge control scheme, thereby obtaining an economical
use of circuit parts and a net weight savings over other methods.
An example of the last item is the power.regulator unit system described inReference 220 and shown in figure 91. It utilizes a series switching regulator
to transform power obtained from a solar-array section to the correct volt-
age required for battery charging. The battery charge bus, which is con-nected to the load bus through diodes, is thus effectively isolated
from solar-array voltage variations. The load bus may also be connected to
a separate solar array; however, its voltage is effectively controlled by thecharacteristics of the batteries as they are charged.
REG SHUNTRELAY
,_LOAD
CHG. oOFF/ON"AUXILIARY
ARRAY
_)SECTION
Figure 91. Power-regulator unit system.
Figure 92 shows a simple example of shunt control which provides both bus
voltage and battery-charge current control. The single batter,' is connected
directly to the bus through a resistor network. The resistance is used to
develop analog signals proportional to both charge and discharge. The signaldeveloped on charge is used to control a full linear shunt dissipator. In this
particular flight system (Reference 208). the shunt dissipator was controlled
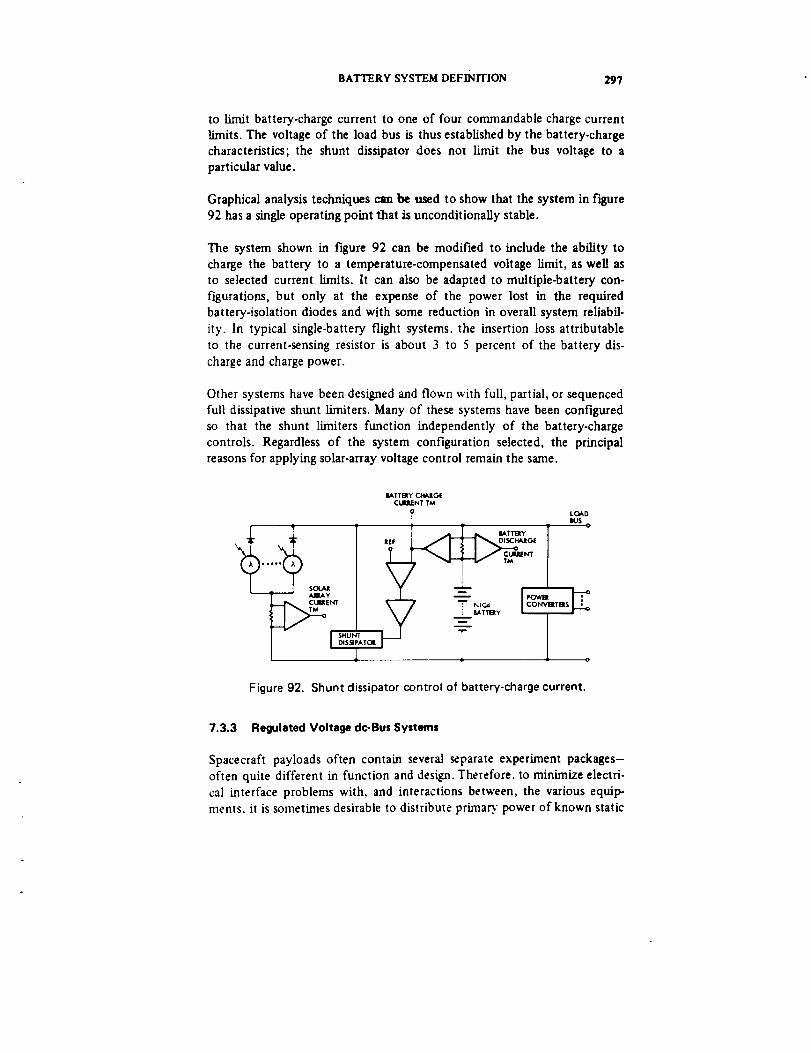
BATTERY SYSTEM DEFINITION 297
to limit battery-charge current to one of four commandable charge current
limits. The voltage of the load bus is thus established by the battery-charge
characteristics; the shunt dissipator does not limit the bus voltage to a
particular value.
Graphical analysis techniques can be used to show that the system in figure
92 has a single operating point Bat is unconditionally stable.
The system shown in figure 92 can be modified to include the ability to
charge the battery to a temperature-compensated voltage limit, as well as
to selected current limits. It can also be adapted to multiple-battery con-
figurations, but only at the expense of the power lost in the required
battery-isolation diodes and with some reduction in overall system reliabil-
ity. In typical single-battery flight systems, the insertion loss attributable
to the current-sensing resistor is about 3 to 5 percent of the battery dis-
charge and charge power.
Other systems have been designed and flown with full, partial, or sequenced
full dissipative shunt limiters. Many of these systems have been configured
so that the shunt limiters function independently of the battery-charge
controls. Regardless of the system configuration selected, the principal
reasons for applying solar-array voltage control remain the same.
AIIL_Y
ENT
IAI'TBY CI'e_IGE
CUI_ENT T/e
? LOAD|US
, j _LT_j_,. iAT.rl_ Y , o
.F I / _ _=sc,.,_ot
___ '_='_" ,
I ; g,ATTI_ Y | I -
'ATOll
Figure 92. Shunt dissipator control of battery-charge current.
7.3.3 Regulated Voltage dc-Bus Systems
Spacecraft payloads often contain several separate experiment packages-
often quite different in function and design. Therefore. to minimize electri-
cal interface problems with, and interactions between, the various equip-
ments, it is sometimes desirable to distribute primaD" power of known static
298 Ni..CdBATTERYAPPLICATIONSMANUAL
anddynamiccharacteristics.Also, it is sometimes possible to reduce or
eliminate preregulation requirements of equipment supplied by the primarypower bus if the bus is closely regulated with low-ripple content and if the
power is derived from a low-impedance source capable of fast response toload transients.
Bus regulation can be achieved through the use of either series or shunt
regulators. Both dissipative and switching series regulators have been applied
successfully, although use of the dissipative type has been generally re-
stricted to low-power applications because of semiconductor device limita-
tions* and general difficulties in managing thermal dissipation. Application
of either type of series regulator results in a power loss that the solar.array
and batteries must accommodate. However, the switching series regulator is
capable of tracking the maximum power point of the solar array, which, ifaccomplished, may result in an increase in energy transfer from the solar
array to the loads and batteries during sunlight periods.
Power transfer in regulated-bus systems is improved if a shunt regulator is
used for bus control during sunlight periods. However, if this is done, it is
necessary to incorporate a separate regulation function for bus control dur-
ing eclipse periods. This function is always provided by either a buck or
boost battery-discharge regulator. If a buck-discharge regulator is used, it
is usually configured either as a dissipative regulator or as a switching regu-
lator. If a boost-discharge regulator is selected, it may be either a switching
regulator or a converter regulator. Regardless of type of regulator used, the
discharge regulator represents a power loss during discharge periods that
the battery must accommodate.
The selection of the battery-discharge scheme establishes the allowable
range of series cells in the battery. Factors that must be considered in
determining the number of series ceils are:
a. Regulated-bus voltage
b. Minimum allowable voltage drop across the regulator
*The current and power ratings of a power transistor are based on measurements ofits thermal characteristics when it is operated as a linear de_ace under steady-stateconditions. The application of aerospace part-derating policies always tends to reducethe range of application of any particular device. The application range can be ex-tended by operating the transistor in a switching mode. thereby enabling it to processmore average power for the same junction temperature defined as a maximum forlinear operation.
BATTERYSYSTEMDEFINITION 299
c. Numberof allowablebatterycell failures if cell bypass circuitry is
included in the battery design
d. Voltage drop across a bypassed cell during discharge under open-
circuited, short-circuited, or over-discharged conditions
e. Lowest value of cell voRage expected during the mission during
normal discharge
f. Highest value of cell open-circuit voltage expected during the mission
Items a through e are used in the analysis to determine the minimum accept-able number of series cells in a battery discharged through a buck-type
regulator. The objective of the analysis is to select enough ceils to ensure
that the minimum required input voltage to the regulator is always main-
rained or exceeded. Therefore, in the case of item d, it is the maximum
value of voltage drop that reduces the terminal voltage of the battery thatis of interest.
Items a, b, and f are used in a similar analysis to determine the maximum
acceptable number of series cells in a battery, discharged through a
boost-type regulator. Here again, the objective of the analysis is to ensure
regulator operation under specified worst-case conditions.
Certain points should be considered during the process of selecting a bat-
tery-discharge-regulator configuration. First is the examination of differ-
ences in regulator efficiencies. A buck-type switching regulator is usually
2 to 4 percent more efficient than a boost-type switching regulator; it is
6 to 8 percent more efficient than a boost converter/regulator. The secondconsideration is the nonlinear relationship between the number of series
cells in a battery and their ampere-hour capacit3'. Specifically, with battery
depth of discharge held constant and with the battery discharging into a
constant power load,
n / (__7)m =- 1--Z-fin/
where
m = fractional decrease (increase) in the cell ampere-hour capacity
n = fractional increase (decrease) in the number of series cells

300 Ni-Cd BATFERY APPLICATIONS MANUAL
Thus, a 25-percent increase in the number of series cells within a battery
results in only a 20.percent reduction in cell capacity. If, however, the cel
capacity, as well as the depth of discharge, is held constant as the number
of series cells increase (or decrease), the power that the battery delivers wil
increase (or decrease) by the same fractional percentage. This fact meansthat batteries with buck-type disdmrge regulators can be adapted to supply
late increases in load by adding series cells rather than by respecifying
depth of discharge or cell capacity. Because batteries with boost-type
discharge regulators are usually sized with the maximum number of series
cells permitted by the regulator design, they are somewhat less flexible in
accommodating load growth.
In general, the selection of a boost-type discharge regulator implies a
buck-type battery-charge controller and vice versa. If a buck-type charge
controller is required, it can be either dissipative or switching, and it can be
powered either from a separate solar-array section or from the main array.
When the charge controler is powered from the main array, it can be used
to regulate the primary power bus. This means that near end-of-life, when
the solar array has degraded to a point at which it can only support the
daytime spacecraft loads and provide charge to the batteries, the shunt
regulator is turned off. By comparison, systems that utilize separate battery-
charge arraysdepend on having some small amount of excess power avail-
able at end-of-mission to ensure operation of the shunt regulator and,
therefore, maintenance of bus voltage regulation.
If battery-charge power is derived from the main solar array, the compati-
bility between the number of series cells in the battery and the selected
charge controller configuration must be verified. The analysis procedure is
similar to that discussed earlier for the discharge regulator. It is not unusual
for the analyses of the charge and discharge paths to be repeated one or
more times until the proper combination of number of series cells, ceil
capacity, depth of discharge, and number of separate batteries is reached
for the system under consideration.
Thus far, rationale has been given for designing shunt-regulated electric
power systems* without discussing specific examples. An interesting aspect
of their design, which is beyond the scope of this book, is the method used
to sequence and control the operation of the regulators so that the primary
*These systems are sometimes referred to as Direct Energy Transfer (DET) Systemsbecause the soiar array is directly connected to the loads.

BATTERYSYSTEMDEFINITION 30!
power bus is regulated continuously. Detailed descriptions of several bread-
board and flight systems appear in References 216, 218, 221, and 222.
7.3.4 Maximum-Power Point-Tracking Systems
Maximum-power point-tracking systems contain series or shunt switchingregulators that are capable of forcing system operation at the voltage of the
solar-array maximum-power point under conditions of high spacecraft andbattery-load demand. This type of operation is desirable when:
a. Additional energy is available from the solar array during periods ofthermal transience (References 223 and 224)
b. Solar-array illumination and temperature characteristics changemarkedly throughout the mission
c. The electric power system is required to support high-power loads(Reference 219)
The conditions required for item a usually occur only in low-altitude orbits
with Sun-oriented fiat-panel solar arrays of rather heavy construction. The
duration of temperature rise of such arrays, from eclipse-exit to steady-state
conditions, is a significant fraction of the sunlit period. While the array is
illuminated and cold, it can generate excess power that, if averaged over the
sunlit period, is approximately equal to a 5- to 10-percent increase in
average solar-array power. However. this improvement is less pronounced
when lightweight solar arrays are used. and it is not realized in geosyn.
chronous orbits because of the extended duration of the sunlight period.
In general, any array-power improvement is offset to some degree by thelosses associated with the tracking equipment.
The conditions of item b are characteristic of solar-powered interplanetarymissions. Reference 225 defines five typical missions and shows how
conventional regulators can be combined into system configurations that
can adapt to large changes in solar-array I-V characteristics. Reference
226 summarizes an evaluation of several candidate approaches to maximum-
power point-tracking for spacecraft with solar-electric propulsion systems.
As item c suggests, electric power systems designed to dehver large amounts
of power gain several advantages from the capability of tracking the maxi-
mum-power point of the solar array. One example concerns the fact that
302 Ni-Cd BAT'I'ERY APPLICATIONS MANUAL
high power implies large solar-array area. Application of the tracking
concept helps to minimize array area with resulting savings in cost and
helps to reduce the effects of solar:pressure torques on spacecraft attitude
control. Another advantage is that, when peak solar-array power is not
required, the tracking regulators act as source-load matching elements,
thereby eliminating the need for shnnt dissipators. Detailed descriptions of
several types of maximum-power point-tracking systems appear inReferences 227 through 230.
7.4 METHODS OF TEMPERATURE CONTROL
The sensitivity of battery electrical parameters and long-term performance
characteristics to temperature is discussed in other sections. It is emphasized
that the full operational capability of a sealed-cell nickel-cadmium batterycannot be realized unless its temperature is maintained near and above
0°C during periods of both cycling and long-term storage. This section
discusses the problems and solutions associated with achieving this degree
of thermal control. In the early years of the space program, a battery sys-
tem often did not include dedicated thermal-control hardware. Batterytemperature control was obtained by standard, usually passive, thermal-
control techniques applied as if the battery were but another component
with variable dissipation characteristics. Battery temperatures generallyranged from 15 to 35°C, which was adequate for missions of that short
duration requiring only shallow battery discharges. Later, as design require-
ments became more demanding, it became necessary to reduce both the
level and the total range of temperature variation. This was accomplished by
using charge-control techniques that limited dissipation during overcharge,
by incorporating special provisions for battery temperature control, and
by reducing thermal gradients within the battery as a design requirement.
In recent years, these efforts have resulted in the operation of most batter-ies in space at temperatures of about 10 to 25°C. Certain other batteries
have been operated at between 0 and 15°C to obtain extended service life
and/or performance at greater depths of discharge.
The main purpose of a battery thermal-control system is to maintain the
temperature of the cell electrodes to within specified limits. However, it
is usually impractical to define temperature requirements at the electrode
stack level. Instead, separate analyses and tests are performed to establish
the thermophysical characteristics of particular cells (e.g., specific heat and
BATTERY SYSTEM DEFINITION : 303
thermal conductivity),* to identify major heat-transfer paths within the
cells, and to estimate temperature gradients along the paths. With a cell's
thermal behavior thus characterized, the cell-case temperature can be calcu-
lated for specific conditions of internal heat generation and external heat
sinking. The following section describes the general procedure for mapping
thermal gradients within the cell and shows how these procedures may be
extended to include evaluation of the heat-transfer path from the cell case
to the battery heat sink. Subsequent sections consider the battery as a com-
ponent whose temperature must be controlled within relatively narrow
limits and at lower levels than other spacecraft equipment. Passive and
active methods of thermal control are described with emphasis placed on
the development of specific configurations of battery heat sinks. Fluid-
loop cold-plate design is not discussed because this method of component
cooling is usually suggested by other spacecraft requirements, and, because
of its complexity, is usually not a candidate as a self-contained battery
temperature-control auxiliary. However, further information on fluid-loop
control appears in References 94 and 23 I.
7.4.1 Cell and Battery Thermal Modeling
The predominant heat-transfer mode within a cell or battery is conduction.
The general heat-conduction equation that governs the temperature distri-
bution and heat flow in a solid with uniform physical properties and aninternal heat source is
where
D2T + c32.....T+ _)2__._T+q__ 1 DT (28)_x 2 ¢3y2 _)z2 k a Dt
T = absolute temperature
x, y, z = Cartesian coordinates
q = rate of heat generation per unit volume
k = thermal conductivity
a = thermal diffusivity (k/Cpp)
*See Section 3.2 for a summary of cell thermoph.vsical properties.
304 Ni42d BATTERY APPLICATIONS MANUAL
Cp = specific heat
p = density
t -- time
If the system contains no heat sources, equation 28 reduces to the Fourier
equation,
a2T + a2T + 02T _ 1 aT (29)_x 2 ay2 0z 2 a _t
If the system is at steady state but heat sources are present, equation 29
becomes the Poisson equation,
O2T-- + _a2T + 02T_ + q =0_x 2 Oy2 az 2
(30)
In the steady state, the temperature distribution in a body containing no
heat sources must satisfy the Laplace equation,
a2T + a2T + a2T 0 (31)
ax 2 ay 2 az 2
For the one-dimensional case, equation 31 becomes d2T/dx 2 -- 0, which
yields, after integration, dT/dx = constant. This result is consistent with
the basic relation for heat transfer by conduction proposed by Fourier
q = - kS dTdx (32)
where
q = rate of heat flow by conduction or QT
S = area of the section through which the heat flows, taken perpen-dicular to the direction of heat flow
BATFERY SYSTEM DEFINITION _ 3,05
The sign convention indicates a positive heat flow with a negative tempera-
ture gradient.
The second-order partial differential equations 28 through 31 are all linear
in that each is of the first degree m independent variable T and its deriva-
tives. Exact solutions are therefore possible if, in general, the boundary
conditions are also linear. Solutions have been obtained for simple shapes
such as cylinders, spheres, and ellipsoids after transformation of the equa-
tions to the corresponding coordinate system. However, with shapes of
greater complexity and with dependency on time (transient analysis condi-
tions), the equations are usually too complex for direct closed-form solut-
tion, and approximation techniques must be used. Practical methods have
been developed on the basis of graphic, numerical, and analog approaches.
A concise overview, a comparison of these methods, and a pertinent bibliog-
raphy appear in Reference 232.
One particularly useful approximation method is based on the analogy be-tween thermal and electrical conduction. A network of thermal-conduction
paths may thus be represented by an electrical network containing resistors
and capacitors. The network is driven by ideal voltage and current sources
that correspond to temperature gradients and heat flows, respectively.
Table 46 defines the thermal/electrical analogies. It follows that, to solve
any heat-conduction problem by this method, the following steps apply:
a. Draw a mechanical schematic diagram of the heat-transfer problem.
b. Assign and number nodes for the heat source, the heat sink, and eachconductive element between the source and the sink. Parallel heat-
conduction paths may exist between the source and sink. A single
conductive body may be partitioned into small volumes with a node
representing the temperature at the geometric center of the volume.
Adjacent volumes must then transfer heat by conduction through acommon cross-sectional area. The thermal conductance of a contact
joint between two bodies is modeled by assigning a node to each
opposing surface of the joint.
C. Draw a thermal schematic diagram for the problem by connecting
thermal resistances and capacitances between each node as appro-
priate. If the thermal capacitance of a path is small, it may sometimes
be neglected in favor of simplicity or combined with other capaci-tances within the network.
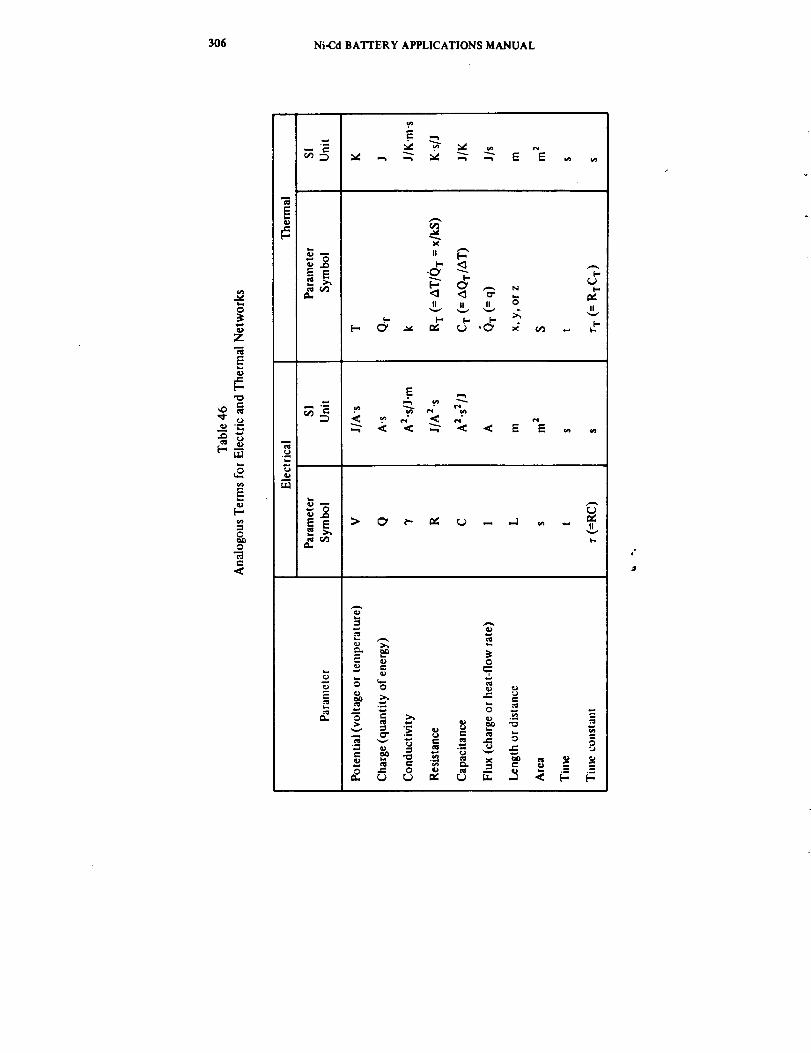
306 Ni-Cd BATTERY APPLICATIONS MANUAL
o
Z
O
O
e..
II _"
_ _ N tu
_ > o ,. =<<__ ._. _ ,_,
o-fT_ ->" _ _
J
BATTERY SYSTEM DEFINITION 307
d. Draw an equivalent electrical schematic diagram for the thermal
network. Include voltage sources necessary for establishing initial
conditions analogous to initial temperature, current sources to modelthe flow of heat, and a common electrical ground point representing
the heat sink.
e. Simplify the electrical network by combining the resistances and
capacitances in accordance with standard formulas for adding circuit
elements in series of parallel.
f. Write and solve network equations using Kirchhoffs current and volt-
age laws. If the network contains capacitors, the equations will be
differential equations with solutions given in terms of the voltages
across lumped capacitances.
g. Determine the voltages (temperatures) at other nodes in the network
by using the solutions of step f. This is accomplished by retracing the
steps taken earlier to simplify the network.
Figure 93 shows a two-node thermal network and its electrical analog. Inthe latter network, all switches are shown in their position at t<0. At
t = 0, all switches are switched simultaneously to their opposite state. It is
seen that the voltage source is used simply to establish the initial condition
tor the capacitor. The constant-current source and its shunt switch repre-
sent the application of heat to the network as a step function at t = 0.
The differential equation of the network,
dv 1C_ +_v -- i (33)
is obtained using Kirchhoff's current law. This equation is of the general
first-order form.
+ v = vt (34)
where vt is the forcing function. Reference 233 contains its solutions for
various forcing functions, which can be quickly determined by Laplacetransform methods. However, solution for the case at hand is quite straight-
forward.
The steady-state voltage across nodes 1 and 2, after the capacitor has
become fuUy charged, is vr = IR. The natural component of voltage is
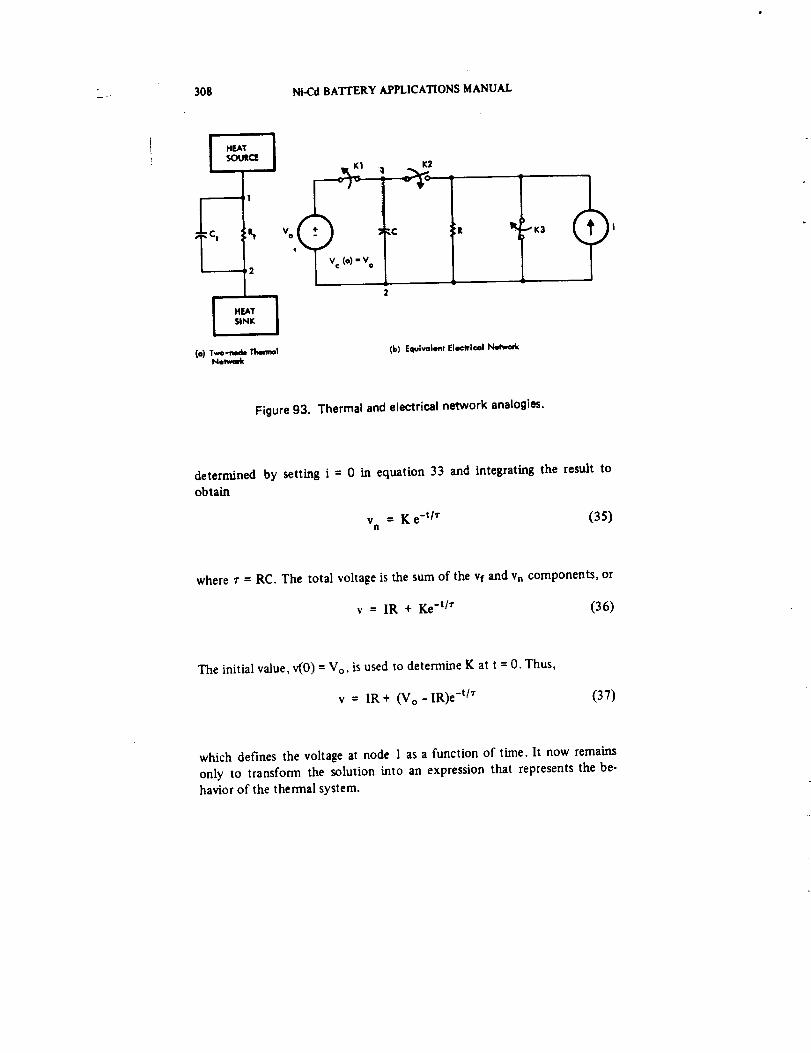
308 Ni-Cd BATTERY APPLICATIONS MANUAL
!=o|
i', v.
2
l-*iSINK
(a) Two-_,_le T_I
__._K I _ I(2
)V¢ (o)= Vo
)
!. ' .--K3
(b) Eqvivoiertr Elecwicol
Figure 93. Thermal and electrical network analogies.
determined by setting i = 0 in equation 33 and integrating the result to
obtain
v = Ke -t/_ (35)n
where _"= RC. The total voltage is the sum of the v( and vn components, or
v = IR + Ke -t/r (36)
The initial value, v(O) = Vo, is used to determine K at t = O. Thus,
v = IR+ (Vo - IR)e -t/r (37)
which defines the voltage at node 1 as a function of time. It now remains
only to transform the solution into an expression that represents the be-
havior of the thermal system.
BATTERY SYSTEM DEFINITION 309
Because the voltage, v(t), is measured between nodes 1 and 2, it follows
that its thermal analog is a temperature difference. Preserving the conven-
tion adopted in the definition of heat conduction (equation 32), v(t)
corresponds to AT = T 2 - T l with T 1 ;_ T2. Thus, equation 37 may berewritten as
AT -- AT E + (AT o - ATE)e-t/YT (38)
wherein the temperature differences are always taken between nodes 1 and
2 in the same sense, and the subscripts, 0 and E, refer to the initial (t = 0)
and equilibrium (t -, _) conditions, respectively. This is the general tem-
perature-response equation for a body when constant thermal power, Q,
is applied at a point (node 1) as a step function at t = 0. During the transient
period, the amount of heat flowing through the thermal resistance is given
by
ATo
qr = Q(1- e-t/rT) + --_--T e-t/rT (39)
By similar analysis, the equation that describes the cooling of a body
when its constant thermal input power is removed at t = 0 is
AT = AT 0 + (ATE- AT0) e-t/rT (40)
with
(1 - e-t/rT)qR = Qe-t/rT + RT (41)
If the heat-sink temperature, T 2, is known, the temperature of node 1 is
completely specified by the appropriate pair of expressions for AT* and qR.
Otherwise, the equations may be used to specify the thermal input to node
2 as part of a separate analysis of its thermal energy balance.
When r T is small, the thermal system will reach its steady-state condition
rapidly; conversely, a massive body (large CT), or one connected to a heat
sink through a low-conductance (large RT) path, will reach equilibrium
*Equations 38 and 40 differ in form from those reported on page 32 of Reference73. The equations in the reference are incorrect because they are based on the trans-sient characteristics of a series RC electric circuit rather than on the parallel cireuhof figure 93.
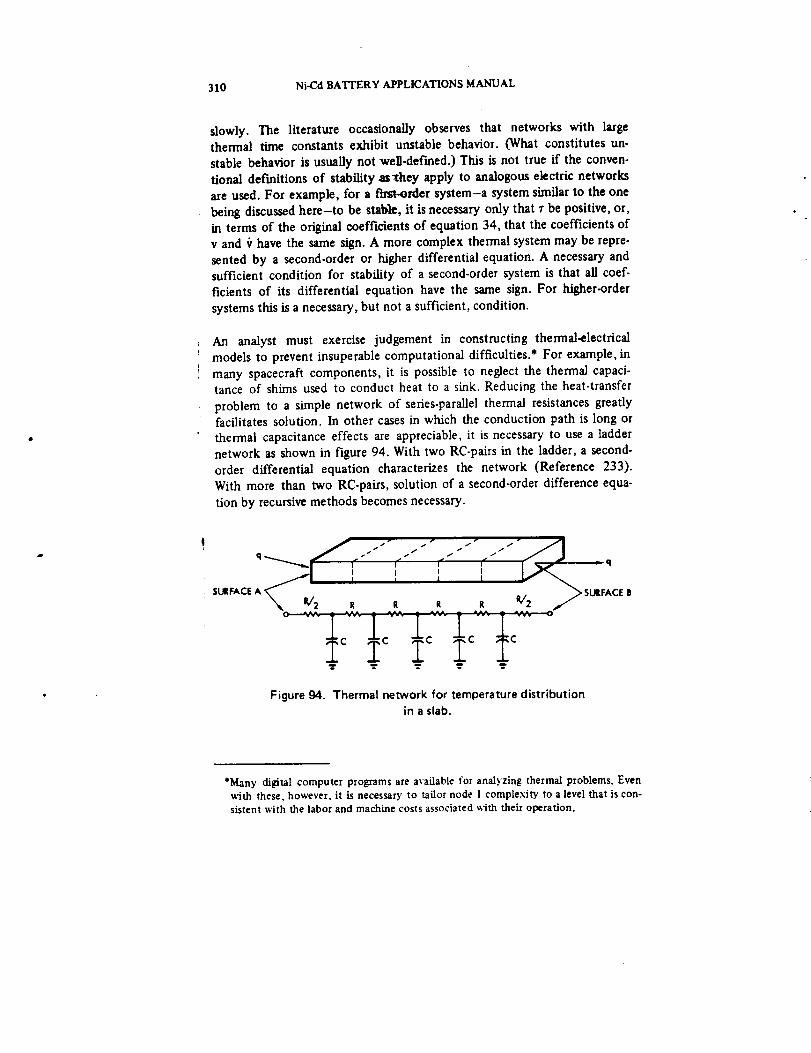
310 Ni-Cd BATTERY APPLICATIONS MANUAL
slowly. The literature occasionally observes that networks with largethermal time constants exhibit unstable behavior. (What constitutes un-
stable behavior is usually not well-deCreed.) This is not true if the conven-
tional dePmitions of stability as_hey apply to analogous electric networks
are used. For example, for a fi_-order system-a system similar to the one
being discussed here-to be stable, it is necessary only that _"be positive, or,
in terms of the original coefficients of equation 34, that the coefficients of
v and _ have the same sign. A more complex thermal system may be repre-
sented by a second-order or higher differential equation. A necessary and
sufficient condition for stability of a second-order system is that all coef-
ficients of its differential equation have the same sign. For higher-order
systems this is a necessary, but not a sufficient, condition.
An analyst must exercise judgement in constructing thermal-electrical
models to prevent insuperable computational difficulties.* For example, in
many spacecraft components, it is possible to neglect the thermal capaci-tance of shims used to conduct heat to a sink. Reducing the heat-transfer
problem to a simple network of series-parallel thermal resistances greatlyfacilitates solution. In other cases in which the conduction path is long or
thermal capacitance effects are appreciable, it is necessary to use a laddernetwork as shown in figure 94. With two RC-pairs in the ladder, a second-
order differential equation characterizes the network (Reference 233).
With more than two RC-pairs, solution of a second-order difference equa-
tion by recursive methods becomes necessary.
S_FACEA _2 R t R R t/2 /_ S_FACEBR _ _ _ O
Figure _,. Thermal neraork for temperature distribmionin a slab.
*Many digital computer programs are available for analyzing thermal problems. Evenvdth these, however, it is necessary to tailor node I complexity to a level that is con-sistent with the labor and machine costs associated with their operation.
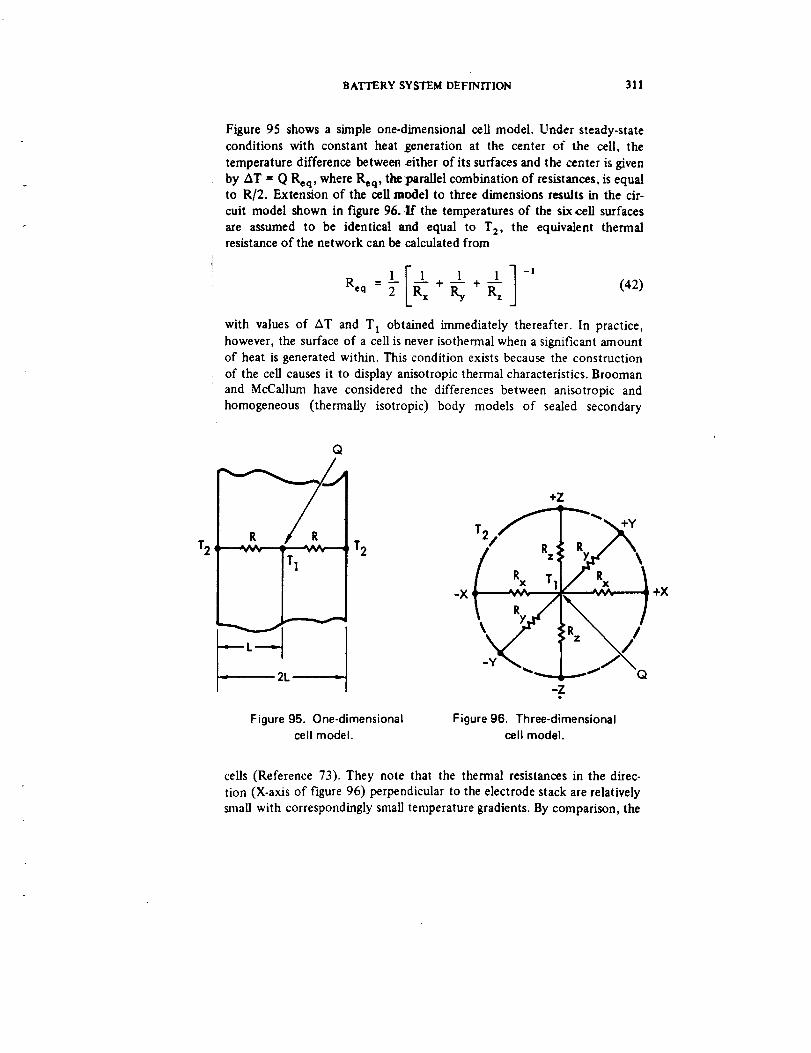
BATTERY SYSTEM DEFINITION 311
Figure 95 shows a simple one-dimensional cell model. Under steady-state
conditions with constant heat generation at the center of the cell, the
temperature difference between _either of its surfaces and the center is given
by AT = O Req, where Req, the_parallel combination of resistances, is equalto R/2. Extension of the ceil model to three dimensions results in the cir-
cuit model shown in figure 96. If the temperatures of the six cell surfaces
are assumed to be identical and equal to T 2, the equivalent thermalresistance of the network can be calculated from
1 I_ x 1 1 l-n
with values of AT and T l obtained immediately thereafter. In practice,
however, the surface of a cell is never isothermal when a significant amount
of heat is generated within. This condition exists because the construction
of the cell causes it to display anisotropic thermal characteristics. Brooman
and McCallum have considered the differences between anisotropic and
homogeneous (thermally isotropic) body models of sealed secondary
T21...o--- L_
Q
2L
T2
Figure 95. One-dimensionalcell model.
+Z
n e.. T,I/)" P, '_1 ,"
/LXo-Z
o
Figure 96. Three-dimensionalcell model.
÷X
cells (Reference 73). They note that the thermal resistances in the direc-
tion (X-axis of figure 96) perpendicular to the electrode stack are relatively
small with correspondingly small temperature gradients. By comparison, the
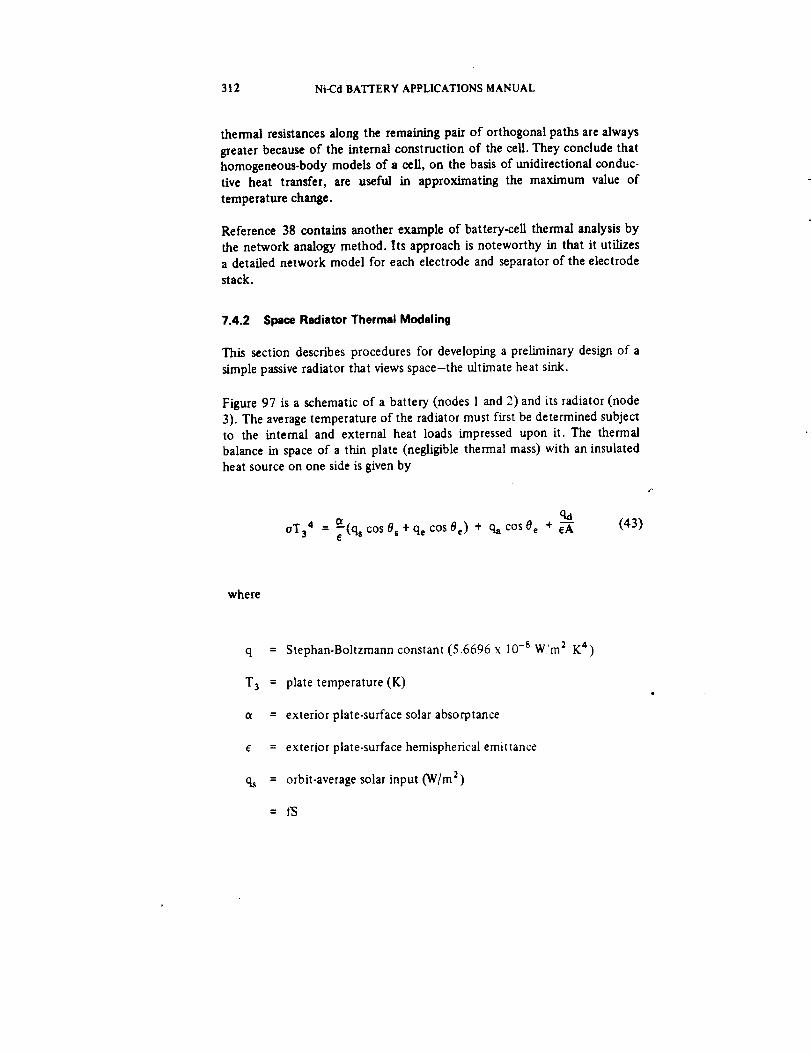
312 Ni-Cd BATTERY APPLICATIONS MANUAL
thermal resistances along the remaining pair of orthogonal paths are always
greater because of the internal construction of the cell. They conclude that
homogeneous-body models of a cell, on the basis of unidirectional conduc-
tive heat transfer, are useful in approximating the maximum value of
temperature change.
Reference 38 contains another example of battery-cell thermal analysis by
the network analogy method. Its approach is noteworthy in that it utilizesa detailed network model for each electrode and separator of the electrode
stack.
7.4.2 Space Radiator Thermal Modeling
This section describes procedures for developing a preliminary design of a
simple passive radiator that views space-the ultimate heat sink.
Figure 97 is a schematic of a battery (nodes 1 and 2) and its radiator (node
3). The average temperature of the radiator must first be determined subject
to the internal and external heat loads impressed upon it. The thermal
balance in space of a thin plate (negligible thermal mass) with an insulated
heat source on one side is given by
qa(43)
°Ta 4 = _-(qs cos 0 s + qe cos Oe) + qa cosO e + _-_
where
q = Stephan-Boltzmann constant (5.6696 x 10 -s W:'m 2 K 4)
T 3 = plate temperature (K)
a = exterior plate-surface solar absorptance
e = exterior plate-surface hemispherical emittance
qs = orbit-average solar input (W/m 2)
= fS
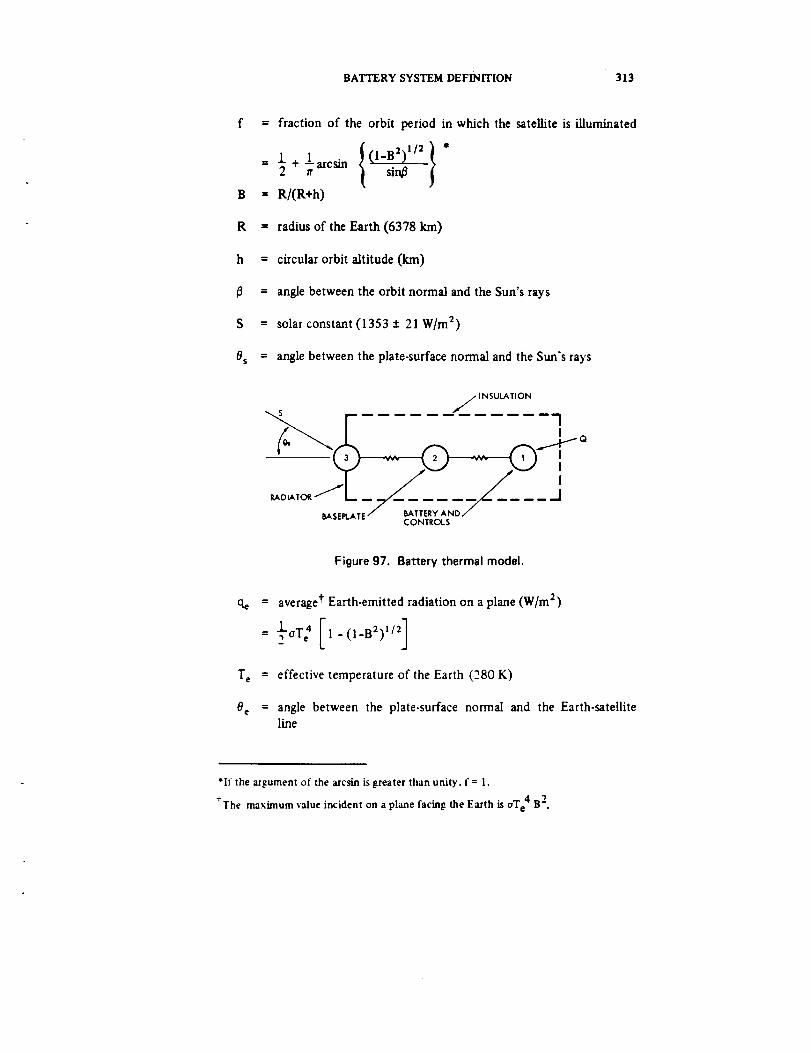
BATTERY SYSTEM DEFINITION 313
f = fraction of the orbit period in which the satellite is illuminated
J }"= I + l_arcsin _2 it
B = R/(R+h)
R = radius of the Earth (6378 km)
h = circular orbit altitude (km)
/_ = angle between the orbit normal and the Sun's rays
S = solar constant (1353 + 21 W/m 2)
0s = angle between the plate-surface normal and the Sun's rays
INSULATION
,..... i
f 'gADIATC_, _ I
BASEPLATE / BATTERY AND_CONTROLS
Figure97. Battery thermal model.
ch = average t Earth-emitted radiation on a plane (W/m 2)
Te = effective temperature of the Earth (280 K)
0e = angle between the plate-surface normal and the Earth-satelliteline
*It the argument of the arcsin is greater than unity, f = 1.
+The maximum value incident on a plane facing the Earth is oT 4 B 2"
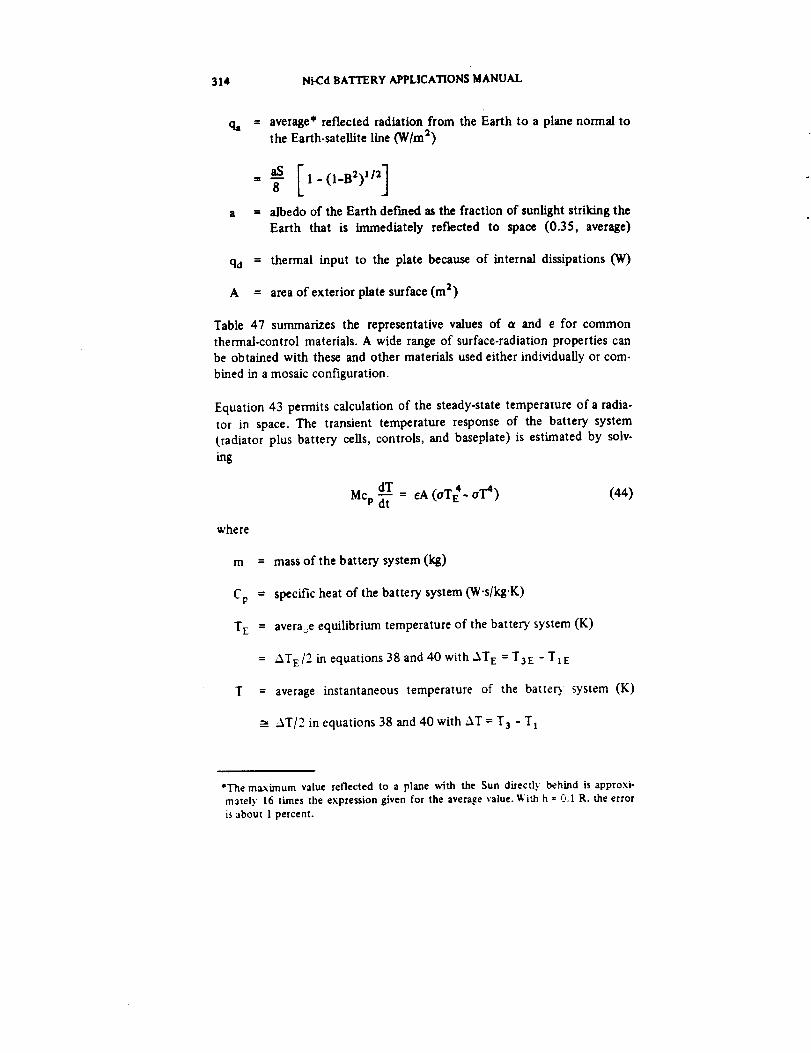
314 Ni-Cd BATTERY APPLICATIONS MANUAL
a
= average* reflected radiation from the Earth to a plane normal tothe Earth-satell/te line (W/m2)
aS8 [ 1 - (1-B2)1/21
albedo of the Earth defined as the fraction of sunlight striking theEarth that is immediately reflected to space (0.35, average)
qd = thermal input to the plate because of internal dissipations Ok')
A = area of exterior plate surface (m 2)
Table 47 summarizes the representative values of a and e for common
thermal-control materials. A wide range of surface-radiation properties can
be obtained with these and other materials used either individually or com-
bined in a mosaic configuration.
Equation 43 permits calculation of the steady-state temperature of a radia-tor in space. The transient temperature response of the battery system(radiator plus battery ceils, controls, and baseplate) is estimated by solv-
ing
where
m
TE
dT (oT_- oT4)Mcp _" = eA (44)
= mass of the battery system (kg)
= specific heat of the battery system (W.s/kg.K)
= average equilibrium temperature of the battery system (K)
= ATE/2 in equations 38 and 40 with AT E = T3E - TIE
= average instantaneous temperature of the battery system (K)
__ AT/2 in equations 38 and 40 with AT = T3 - T !
*The maximum value reflected to a plane with the Sun di_ectl._ behind is approxi-
matel.v 16 times the expression given for the average value, gi',h h = C,.1 R. the erroris about 1 percent.
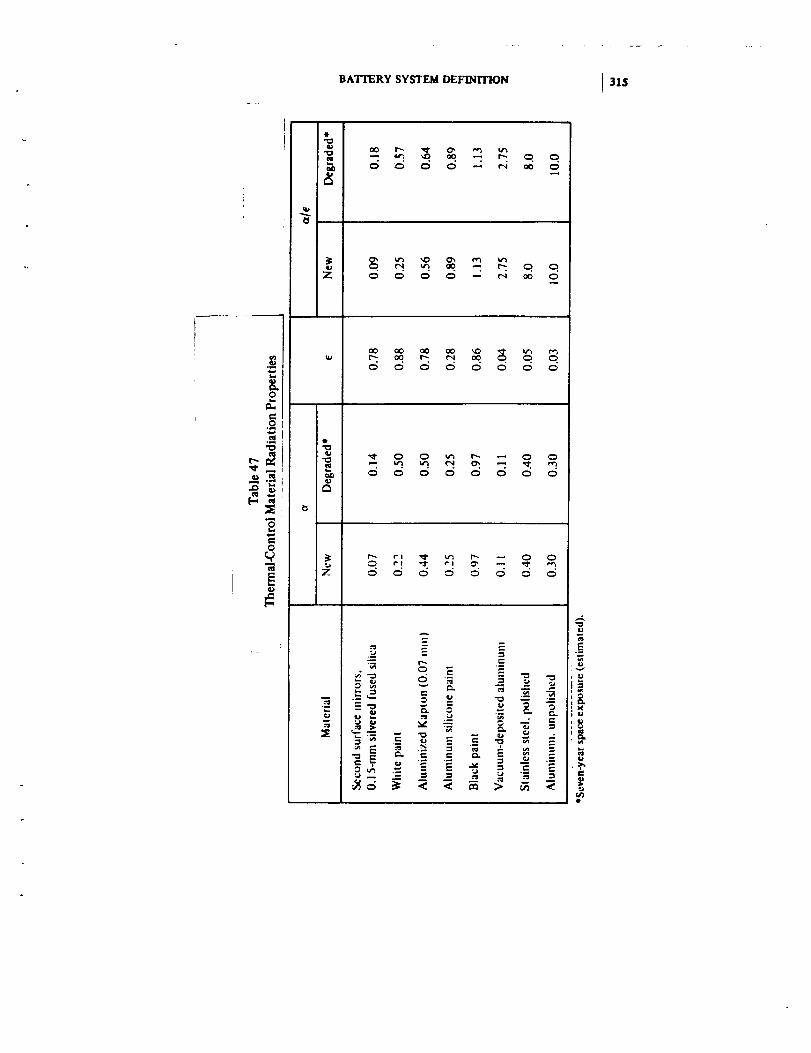
BATTERY SYSTEM DEFINrrIoN315
q_
o
..=
o
CO r_- _" _- e_
-- _ _. _ -- r-- o o.
Z O O O O _ C,4 oO O
00 00 oO 00 _D _ t_ t'__-- _ r-- _ _. . o od o d o o o o o
4_
z
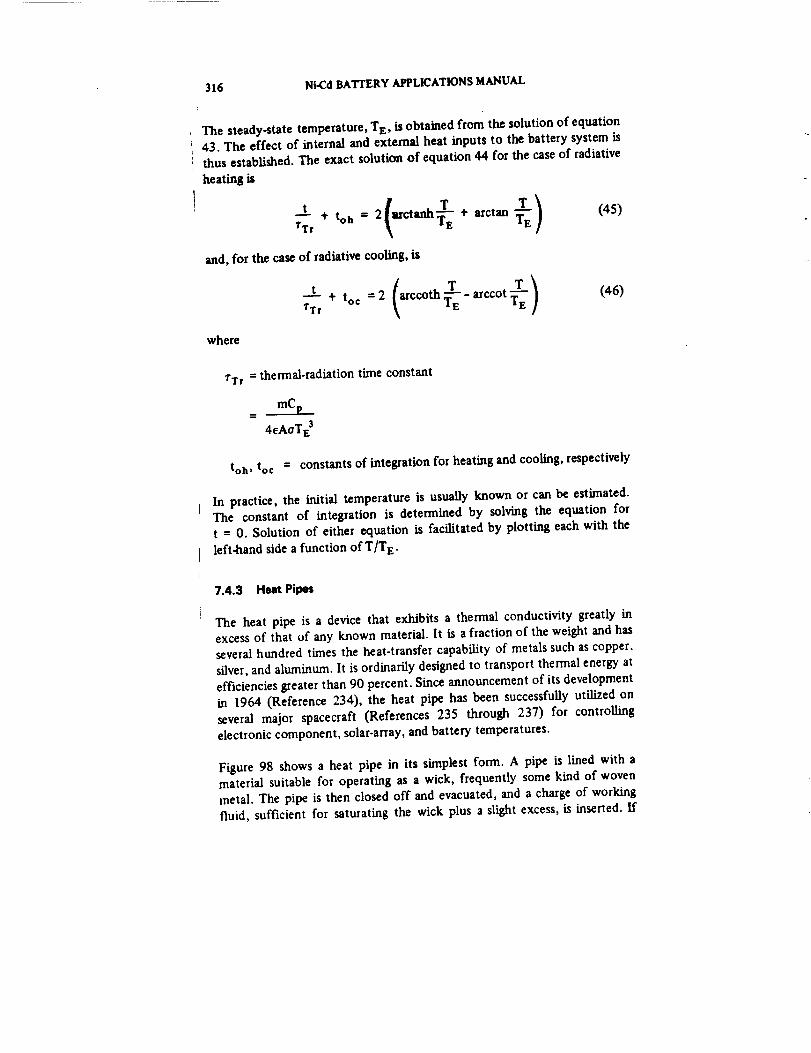
316 Ni-Cd BATTERY APPLICATIONS MANUAL
The steady-state temperature, T E, is obtained from the solution of equation43. The effect of internal and external heat inputs to the battery system is
thus established. The exact solution of equation 44 for the case of radiative
heating is
fTr
and, for the case of radiative cooling, is
____t+ toc = 2 (arccoth T__ arccot _-E ) (46)TTr
where
TT r ffi thermal-radiation time constant
mC I,w
4eAoT_
toh, toc = constants of integration for heating and cooling, respectively
In practice, the initial temperature is usually known or can be estimated.The constant of integration is determined by solving the equation for
t = 0. Solution of either equation is facilitated by plotting each with the
left-hand side a function ofT/T E.
7.4.3 Heat Pipet
The heat pipe is a device that exhibits a thermal conductivity greatly inexcess of that of any known material. It is a fraction of the weight and has
several hundred times the heat-transfer capability of metals such as copper,
silver, and aluminum. It is ordinarily designed to transport thermal energy at
efficiencies greater than 90 percent. Since announcement of its development
in 1964 (Reference 234), the heat pipe has been successfully utilized on
several major spacecraft (References 235 through 237) for controlling
electronic component, solar-array, and battery temperatures.
Figure 98 shows a heat pipe in its simplest form. A pipe is lined with amaterial suitable for operating as a wick, frequently some kind of woven
metal. The pipe is then closed off and evacuated, and a charge of working
fluid, sufficient for saturating the wick plus a slight excess, is inserted. If
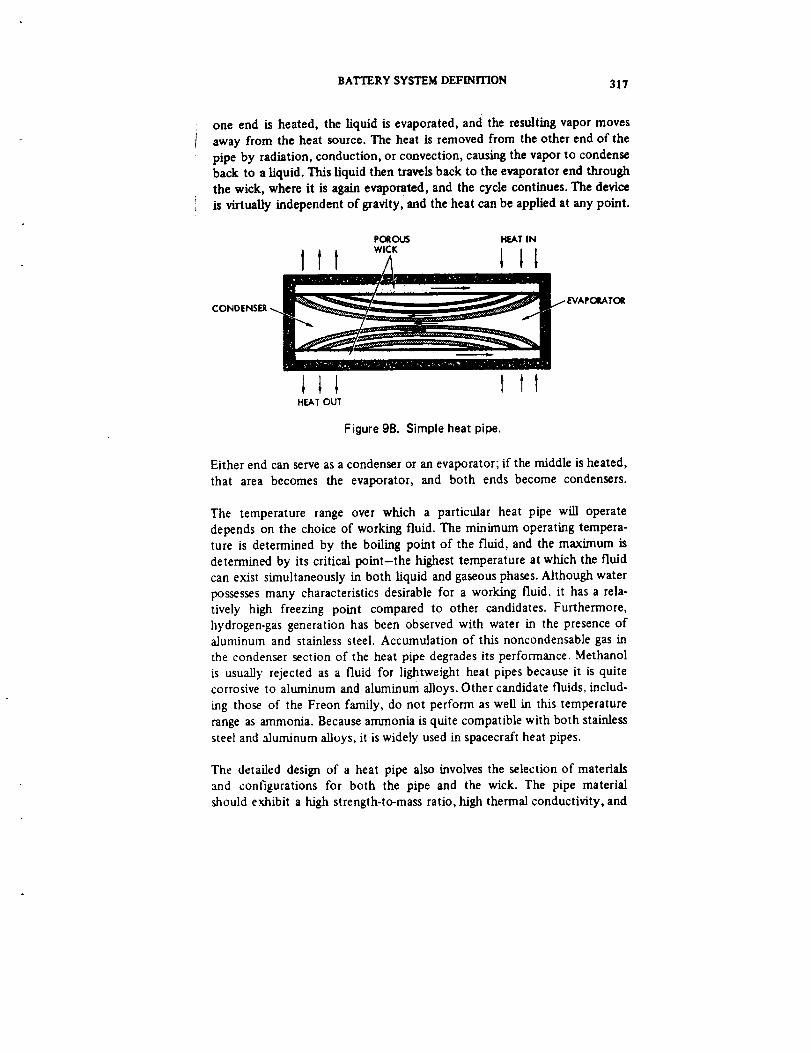
BATTERYSYSTEMDEFINITION ' 317
oneendis heated, the liquid is evaporated, and the resulting vapor moves
away from the heat source. The heat is removed from the other end of the
pipe by radiation, conduction, or convection, causing the vapor to condenseback to a liquid. This liquid then travels back to the evaporator end through
the wick, where it is again evaporated, and the cycle continues. The device
is virtually independent of gravity, and the heat can be applied at any point.
POROUS HEATIN
_ _-EVAPC)RATOR
CONDENSER_._
tttHEATOUT
Figure 98. Simple heat pipe.
Either end can serve as a condenser or an evaporator; if the middle is heated,
that area becomes the evaporator, and both ends become condensers.
The temperature range over which a particular heat pipe will operate
depends on the choice of working fluid. The minimum operating tempera-ture is determined by the boiling point of the fluid, and the maximum is
determined by its critical point-the highest temperature at which the fluid
can exist simultaneously in both liquid and gaseous phases. Although water
possesses many characteristics desirable for a working fluid, it has a rela-
tively high freezing point compared to other candidates. Furthermore,hydrogen-gas generation has been observed with water in the presence of
aluminum and stainless steel. Accumulation of this noncondensable gas in
the condenser section of the heat pipe degrades its performance. Methanol
is usually rejected as a fluid for lightweight heat pipes because it is quitecorrosive to aluminum and aluminum alloys. Other candidate fluids, includ-
ing those of the Freon family, do not perform as well in this temperature
range as ammonia. Because ammonia is quite compatible with both stainless
steel and aluminum alloys, it is widely used in spacecraft heat pipes.
The detailed design of a heat pipe also involves the selection of materials
and configurations for both the pipe and the wick. The pipe material
should exhibit a high strength-to-mass ratio, high thermal conductivity, and
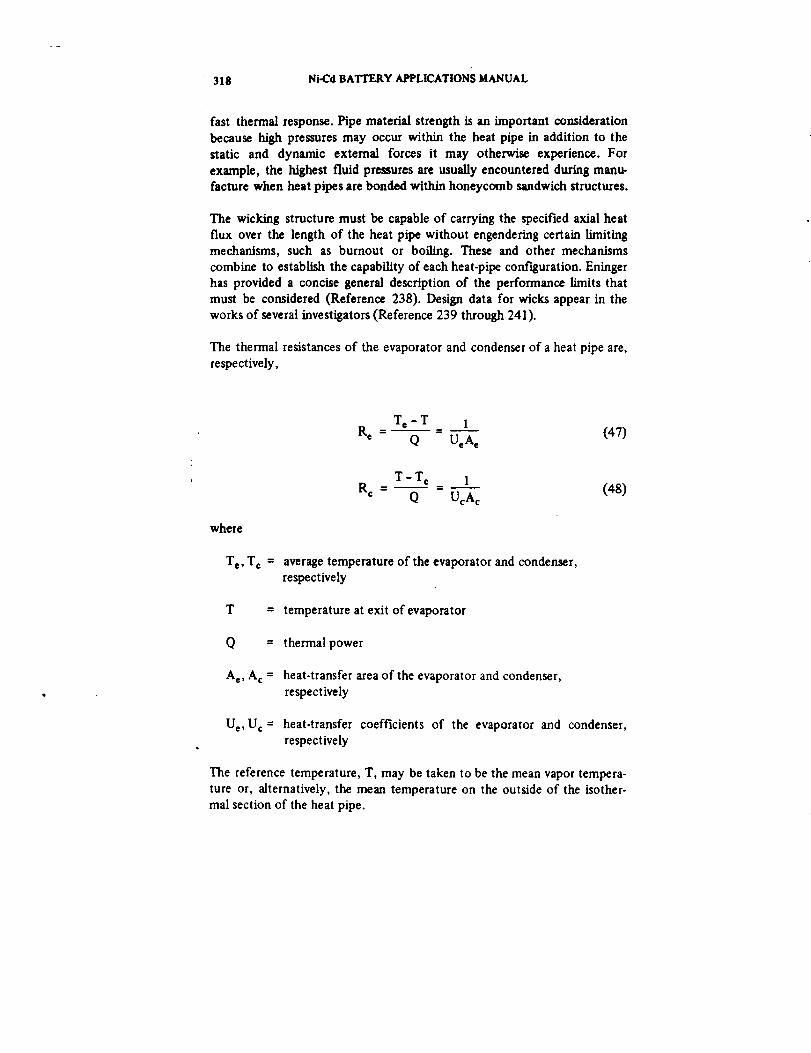
318 Ni-Cd BATTERY APPLICATIONS MANUAL
fast thermal response. Pipe material strength is an important consideration
because high pressures may occur within the heat pipe in addition to the
static and dynamic external forces it may otherwise experience. For
example, the highest fluid pressures are usually encountered during manu-
facture when heat pipes are bonded within honeycomb sandwich structures.
The wicking structure must be capable of carrying the specified axial heat
flux over the length of the heat pipe without engendering certain limiting
mechanisms, such as burnout or boiling. These and other mechanisms
combine to establish the capability of each heat-pipe configuration. Eninger
has provided a concise general description of the performance limits that
must be considered (Reference 238). Design data for wicks appear in the
works of several investigators (Reference 239 through 241).
The thermal resistances of the evaporator and condenser of a heat pipe are,
respectively,
where
Te, Tc =
Q =
Ae, Ac =
Te - T 1
R e - Q - UeAe (47)
T - Tc 1
Rc - Q = UcA---'-_ (48)
average temperature of the evaporator and condenser,
respectively
temperature at exit of evaporator
thermal power
heat-transfer area of the evaporator and condenser,
respectively
U e, U c = heat-transfer coefficients of the evaporator and condenser,respectively
The reference temperature, T, may be taken to be the mean vapor tempera-
ture or, alternatively, the mean temperature on the outside of the isother-
mal section of the heat pipe.
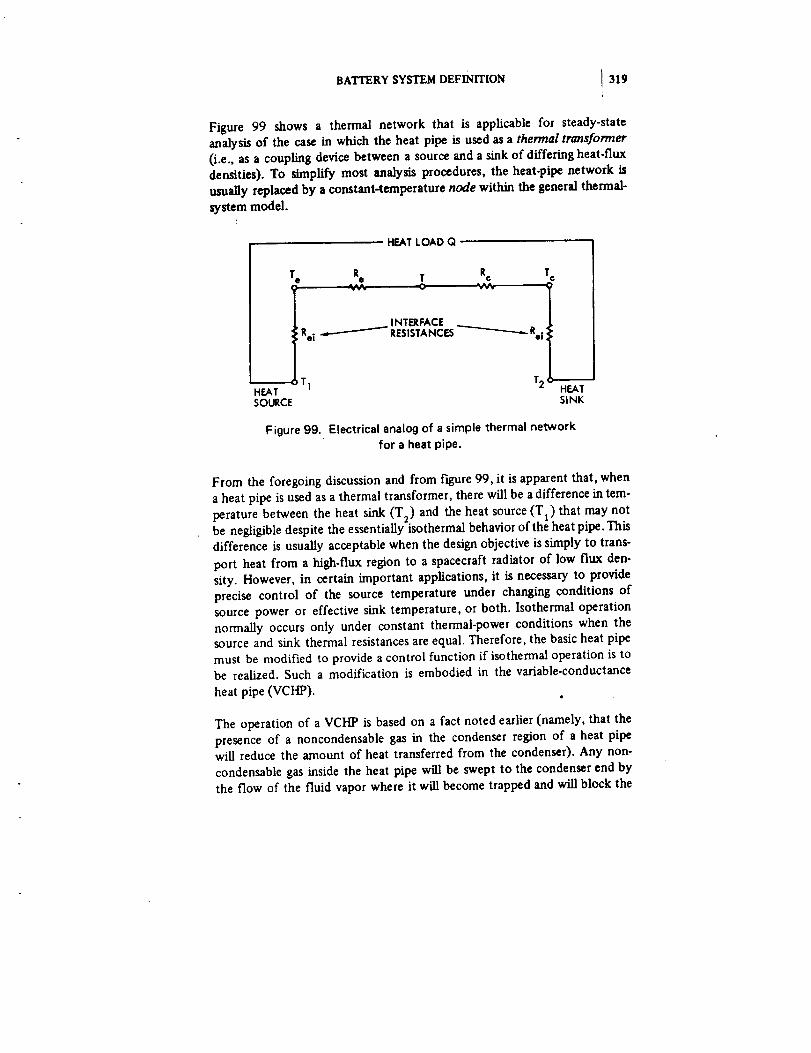
BATTERY SYSTEM DEFINITION 319
Figure 99 shows a thermal network that is applicable for steady-state
analysis of the ease in which the heat pipe is used as a thermal transformer
(i.e., as a coupling device between a source and a sink of differing heat-flux
densities). To _plify most analysis procedures, the heat-pipe network is
usually replaced by a constant-temperature node within the general thermal-
system model.
HEAT LOAD Q
Te R T Rc Tc
INTERFACERei -._ RESISTANCES
HEAT o T1 HEATSOURCE SiNK
Figure 99. Electrical analog of a simple thermal network
for a heat pipe.
From the foregoing discussion and from figure 99, it is apparent that, when
a heat pipe is used as a thermal transformer, there will be a difference in tem-
perature between the heat sink (T2) and the heat source (TI) that may not
be negligible despite the essentially isothermal behavior of the heat pipe. This
difference is usually acceptable when the design objective is simply to trans-
port heat from a high-flux region to a spacecraft radiator of low flux den-
sity. However, in certain important applications, it is necessary to provide
precise control of the source temperature under changing conditions of
source power or effective sink temperature, or both. Isothermal operation
normally occurs only under constant thermal-power conditions when the
source and sink thermal resistances are equal. Therefore, the basic heat pipe
must be modified to provide a control function if isothermal operation is to
be realized. Such a modification is embodied in the variable-conductance
heat pipe (VCHP).
The operation of a VCHP is based on a fact noted earlier (namely, that the
presence of a noncondensable gas in the condenser region of a heat pipe
will reduce the amount of heat transferred from the condenser). Any non-
condensable gas inside the heat pipe will be swept to the condenser end by
the flow of the fluid vapor where it will become trapped and will block the
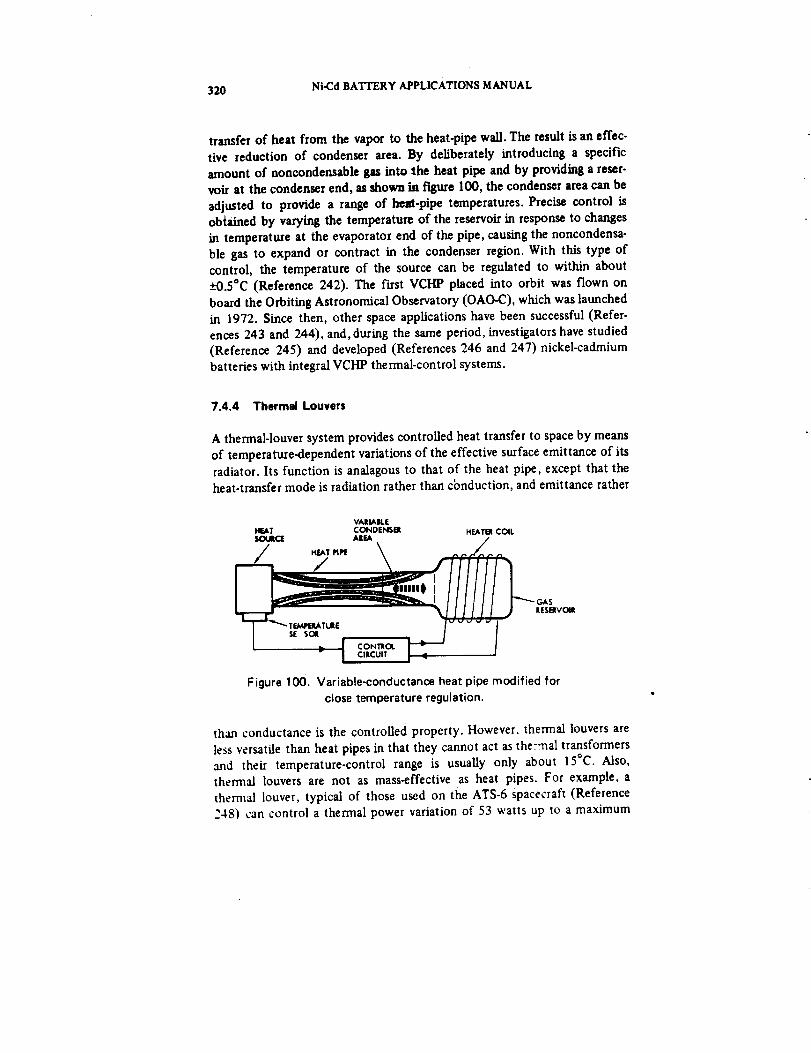
320 Ni-Cd BATTERY APPLICATIONS MANUAL
transfer of heat from the vapor to the heat-pipe wall. The result is an effec-
tive reduction of condenser area. By deliberately introducing a specific
amount of noncondensable gas into the heat pipe and by providing a reser-
voir at the condenser end, as shown in figure 100, the condenser area can be
adjusted to provide a range of hezt-pipe temperatures. Precise control isobtained by varying the temperature of the reservoir in response to changes
in temperature at the evaporator end of the pipe, causing the noncondensa-
ble gas to expand or contract in the condenser region. With this type of
control, the temperature of the source can be regulated to within about
_+0.5°C (Reference 242). The first VCHP placed into orbit was flown on
board the Orbiting Astronomical Observatory (OAO-C), which was launched
in 1972. Since then, other space applications have been successful (Refer-
ences 243 and 244), and, during the same period, investigators have studied
(Reference 245) and developed (References 246 and 247) nickel-cadmiumbatteries with integral VCHP thermal-control systems.
7.4.4 Thermal Louvers
A thermal-louver system provides controlled heat transfer to space by means
of temperature-dependent variations of the effective surface emittance of its
radiator. Its function is analagous to that of the heat pipe, except that the
heat-transfer mode is radiation rather than cbnduction, and emittance rather
VARIABLE
HEAr CONDENSER
$OUBCIE AREA
/ \
I I r . • -- _llllit I
_"_ TF._I_IIAT_t E
I sE sot
" I CIRCUITII
HEATB COIL
Figure 100. Variable-conductance heat pipe modified for
close temperature regulation.
than conductance is the controlled property. However. thermal louvers are
less versatile than heat pipes in that they cannot act as the:rnal transformers
and their temperature-control range is usually only about 15_C. Also,thermal louvers are not as mass-effective as heat pipes. For example, a
thermal louver, typical of those used on the ATS-6 spacecraft (Reference
248) can control a thermal power variation of 53 watts up to a maximum
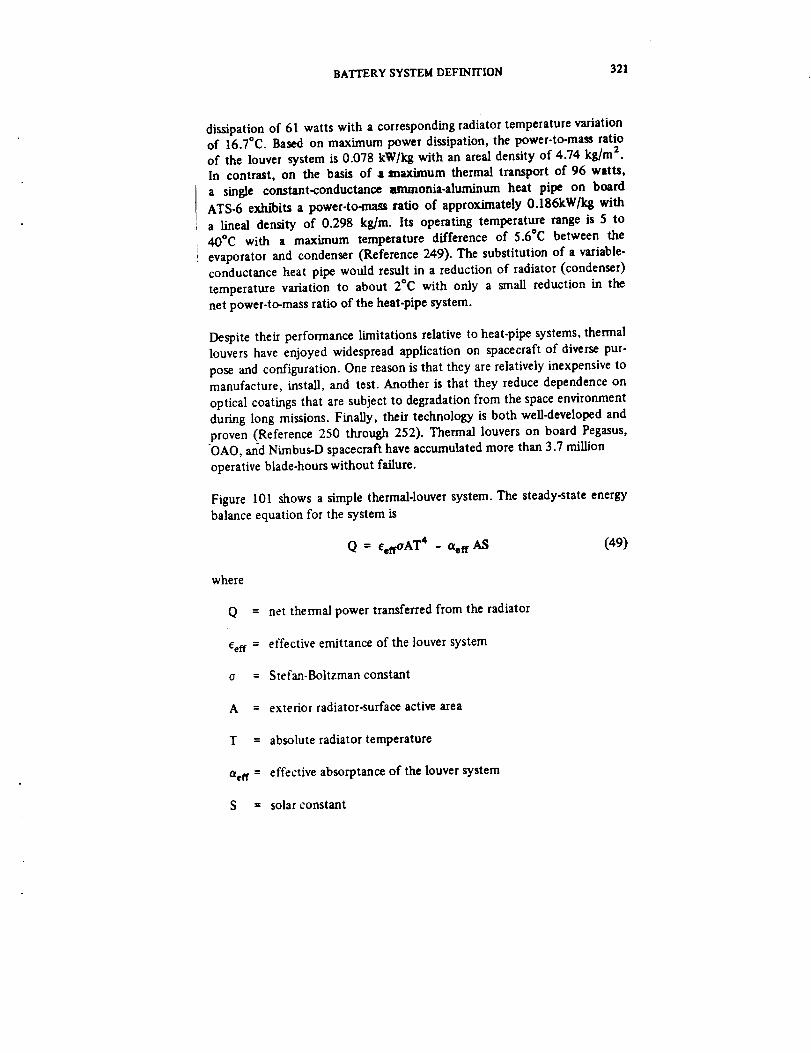
BATTERY SYSTEM DEFINITION 321
dissipation of 61 watts with a corresponding radiator temperature variationof 16.7°C. Based on maximum power dissipation, the power-to-mass ratioof the louver system is 0.078 kW/k8 with an areal density of 4.74 kg/m 2.In contrast, on the basis of a maximum thermal transport of 96 watts,
a single constant-conductan_ m_anonia-aluminum heat pipe on boardATS-6 exhibits a power-to-mass ratio of approximately 0.186kW/kg witha lineal density of 0.298 kg/m. Its operating temperature range is 5 to40°C with a maximum temperature difference of 5.6°C between the
evaporator and condenser (Reference 249). The substitution of a variable-conductance heat pipe would result in a reduction of radiator (condenser)
temperature variation to about 2°C with only a small reduction in the
net power-to-mass ratio of the heat-pipe system.
Despite their performance limitations relative to heat-pipe systems, thermallouvers have enjoyed widespread application on spacecraft of diverse pur-
pose and configuration. One reason is that they are relatively inexpensive tomanufacture, install, and test. Another is that they reduce dependence on
optical coatings that are subject to degradation from the space environmentduring long missions. Finally, their technology is both well.developed andproven (Reference 250 through 252). Thermal louvers on board Pegasus,OAO, and Nimbus-D spacecraft have accumulated more than 3.7 million
operative blade-hours without failure.
Figure 101 shows a simple thermal-louver system. The steady-state energy
balance equation for the system is
Q = eenoAT 4 - aen AS (49)
where
Q = net thermal power transferred from the radiator
eelr = effective emittance of the louver system
o = Stefan-Boltzman constant
A = exterior radiator-surface active area
T = absolute radiator temperature
aef r = effective absorptance of the louver system
S -- solar constant
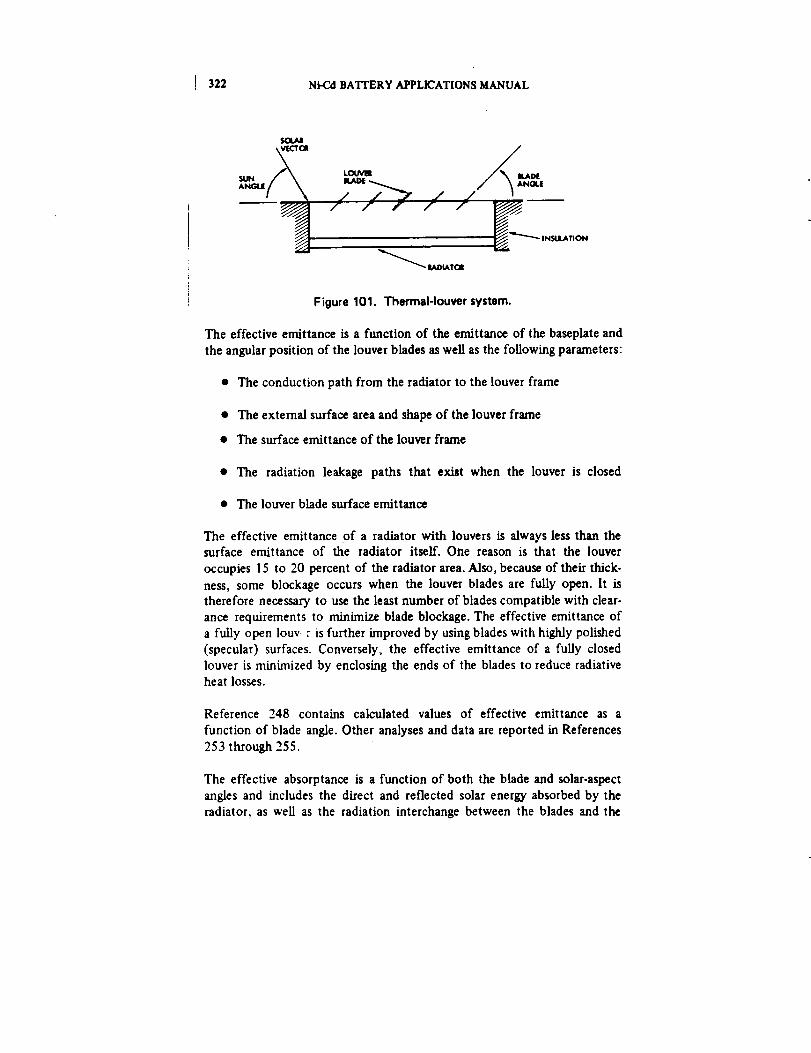
[ 322 Ni-Cd BATrERY APPLICATIONS MANUALI
$¢X/Ul
/{__NGU
_"_ IADIAIroII
Figure 101. Thermal-louver system.
The effective emittance is a function of the emittance of the baseplate and
the angular position of the louver blades as well as the following parameters:
• The conduction path from the radiator to the louver frame
• The external surface area and shape of the louver frame
• The surface emittance of the louver frame
• The radiation leakage paths that exist when the louver is closed
• The louver blade surface emittance
The effective emittance of a radiator with louvers is always less than thesurface emittance of the radiator itself. One reason is that the louver
occupies 15 to 20 percent of the radiator area. Also, because of their thick-
ness, some blockage occurs when the louver blades are fully open. It is
therefore necessary to use the least number of blades compatible with clear-
ance requirements to minimize blade blockage. The effective emittance of
a fully open louv : is further improved by using blades with highly polished
(specular) surfaces. Conversely, the effective emittance of a fully closed
louver is minimized by enclosing the ends of the blades to reduce radiativeheat losses.
Reference 248 contains calculated values of effective emittance as a
function of blade angle. Other analyses and data are reported in References
253 through 255.
The effective absorptance is a function of both the blade and solar-aspect
angles and includes the direct and reflected solar energy absorbed by the
radiator, as well as the radiation interchange between the blades and the

BATTERYSYSTEMDEFINITION 323
radiator. Reference 248 contains calculated values of effective absorptance.
It is sometimes advantageous to reduce the effect of solar heating by placing
the louver system behind a reflecting skin; however, although this improvesheat rejection in sunlight, it reduces the heat-rejection capability of thelouvers in the shade (Reference 256).

sF.cnoN sBATYERY SYSTEM DESIGN
• 8.1 INTRODUCTION
Section 7 described the relationship of the battery system to the electric
power and thermal-control systems.* This section builds on the under-
standing thus acquired regarding the role of the battery system and concen-
trates on the definition, analysis, and interpretation of various important
aspects of the battery system itself. It emphasizes the thorough definitionand understanding of all requirements and constraints and how these mat-
ters impact the design. Examples from the authors' experience illustrate
the importance of early and complete interface definition. The topics
proceed from the general to the specific in a manner that sustains a con-tinuing and parallel discussion of both low- and high-altitude orbit battery-
system applications. This approach is helpful for comparing important
design details when they differ because of orbit-related mission factors.
Cell and battery technology considerations are introduced when they can
best serve the narrative. Design guidelines are presented when they are
available.
8.2 REQUIREMENTS AND CONSTRAINTS
This section describes mission requirements and constraints in terms of their
effect on the design of the battery system and, by implication, of the
electric power system. The discussion encompasses a wide variety of designsituations• Some of the remarks that follow apply to all battery systems,
whereas others apply to specific mission applications. Their presentation is
meant to convey that battery-system design should not be performed in an
information vacuum, but that all relevant information and data regarding
mission objectives, spacecraft system design, and proposed spacecraft opera-
tional policies and procedures should be considered early in and throughout
the design phase.
It would be convenient to have an available methodology for analyzing
requirements and constraints as they apply to the battery, the battery
system, the electric power system, and higher levels. It is beyond the scope
*Section 1 contains definitions of terms used in this section and throughou t the manual.
325 ', Precedingpageblank
326 i Ni-Cd BATTERY APPLICATIONS MANUAL
of this manual to consider all of the nuances of spacecraft design that are
necessary for the full development of such a methodology. However,
Reference 232 outlines a general approach, and Section 7.2 discusses other
aspects of battery and electric power-system requirements analysis.
8.2.1 Mission Requirements
The mission requirements that have primary effect on the battery system
are: (a) the orbit or trajectory parameters, (b) the service and ground-
storage times, (c) the spacecraft reliability goal, and (d) special environmen-
tal considerations.
The orbit definition is necessary for establishing the discharge/charge cycle
profile, including the number of cycles, for the mission. Section 7.2.1contains the characteristics of circular equatorial orbits and reference lists
for the characteristics of other orbits and trajectories. Although it is usually
sufficient to design on the basis of the maximum eclipse duration and the
maximum number of eclipse periods expected in a year, the designer should
recognize that many orbits result in variable eclipse profiles, particularlythose at low altitudes with nonzero orbit inclination. Also, the support of
peak loads during sunlight periods may add to the number of cycles in an
equivalent sense.
The required service time directly affects the depth of discharge and the
operating temperature regime selected. These design parameters, plus the
allocated reliability goal for the battery system, help in determining the
size and numbor of the batteries. Storage time affects battery-supply and
logistic considerations and, therefore, cost to the project, as well as directly
influencing performance.
The reliability goal for the spacecraft is the basis for reliability goal alloca-
tions at the power and battery-system levels. In general, a reliability goal
defined at either the cell or battery level is of limited use; reliability esti-
mates must be made at the battery-system level to incorporate: (a) the
unreliabilities introduced by discharge/charge controls and other auxiliaries,
and (b) the reliability enhancement provided by redundancy.
Special environments must be defined so that their effect can be determined
early in the battery-definition phase. For example, a requirement for mag-
netic cleanliness aboard a scientific spacecraft may necessitate special wiring
practices or may prohibit the use of nickel-cadmium batteries altogether
BATTERY SYSTEM DESIGN 327
(References 2, 257, and 258). Similarly, a requirement for sterilization may
require a unique cell or battery development effort (References 103 and
259).
8.2.2 Operational Requirements
Spacecraft power systems may be categorized in terms of their operationalcharacteristics. Many may be considered to be automatic in that they
operate without direct control from the ground, particularly spacecraft in
low-Earth orbits that may not be in contact with ground stations for long
periods of time. An incident of failure is handled by automatically switching
to redundant channels or by placing the system into a "safe" mode until
diagnostic and corrective procedures can be done. Battery discharge or
charge control is also automatic. Some military spacecraft are also con-
sidered to be autonomous because they must be able to function unat-
tended for long periods with full operational capability even if a failure
occurs. Interplanetary spacecraft (flybys, orbiters, and landers) with
complex mission profiles and flight trajectories have high levels of
autonomy.
Spacecraft in geosynchronous equatorial orbits are candidates for eithersemiautomatic or manual control from the ground. Commercial communica-
tions satellites have been operated in this manner with dedicated ground
stations for some years. On-board circuitry is simplified, with many of the
decision functions performed by software in ground-based computers.
The operational control philosophy, as it pertains to battery control and
protection, must be established early in the def'mition phase. A decision
to operate batteries by ground control, for example, must be consideredcarefully because it implies the definition of many new requirements for
precision telemetry measurements and data processing. Assumptions onthe available time for battery reconditioning must be checked against atti-
tude-control-system requirements for stationkeeping if electric thrusters are
used (Reference 260) or verified against payload programming schedules.
8.2.3 System Requirements
System requirements are derived from mission requirements, the particularcharacteristics of payload and housekeeping equipment required to satisfy
the mission requirements, and proven design principles, practices, standards,
328 Ni-Cd BATTERY APPLICATIONS MANUAL
and procedures. For the battery and power systems, such requirements are
primarily those associated with the electrical loads, the environments
developed throughout the mission to which the hardware is exposed, and
the need to ensure that reliability goals are met.
8.2.4 System Design Constraints
Mission, operational, and system requirements tend to limit the options for
design and to impose various constraints on the spacecraft and its equip-
ment. Constraints on the spacecraft configuration affect the batteries in
several ways. They must be positioned carefully with respect to the centerof mass of the spacecraft and other heavy components. Limitations on solar-
array area imply limitations on power for battery charging and for thermal-control heaters. Relatively few locations may be available for adequate
thermal radiators, and special provisions may be required for maintaining
and controlling the temperature of the batteries to within the range required
for long service life. (Batteries should be operated near and just above O°C;
they should not be permitted to operate above 20°C for long service life.)
Prelaunch and launch environments may directly affect the configuration
and performance of the battery system. When they are installed on the
spacecraft, it may be difficult to cool batteries during ground test and
checkout. Charge controls may limit the charge if battery temperatures are
above the normal performance range. During ascent, the battery radiators
may be blocked by solar panels, or they may be exposed to abnormal insola-
tion for extended periods. Launch-window constraints and ground-station
telemetry coverage limitations associated with spacecraft antenna configura-
tions often combine to place the solar array or the batteries in an unfavor-
able position with respect to the Sun during ascent. Therefore, the batteries
may be required to discharge or charge while warm-the latter often at lowvalues and with a periodic current profile because of stowed solar-array
characteristics.
Mass limitations usually represent a constraint to the battery system,
particularly for missions at high orbital altitudes. The batteries are usuallyone of the heaviest items on board a spacecraft. For economy, spacecraft
mass is usually matched to the capability of the launch vehicle. When the
Space Transportation System (STS) becomes operational, apportionmentsundoubtedly will be made .of its payload-to-orbit weight capability, and
appropriate corresponding assignments made to each spacecraft payload.
There may thus be continued emphasis on battery.mass reductions, as well
as battery-cost reductions in the era of the STS.
BATTERYSYSTEMDESIGN 329
83 METHODS OF CHARGE CONTROL
A wide range of battery charge controls have been developed and suc-
cessfully applied. Some perform equally well in both low- and high-alti.tude orbits, whereas others are restricted in use. Some methods are best
used as backup to others" rather than as primary controls themselves. It
would be unnecessarily restrictive to the future development of spacecraft
battery and power systems to suggest that one or two approaches have clear
advantage over others and should therefore be used exclusively. However,in recent years, certain trends in battery-charge control have become
evident.
Typically, on low-altitude spacecraft, approximately one-half of the solar-I
i array power is allocated to battery charging because 35 to 40 percent of the
orbit period can be spent in eclipse. The batteries can experience up to
6000 discharge/charge cycles per year exclusive of peak load demands.
High-charge currents and fast recharge require moderately complexelectronics for controlling overcharge and for preventing undesirable battery
heating. Battery overheating was a common problem in early spacecraft.
It was difficult to correctly specify simple temperature-sensitive controls
that would ensure energy balance, provide overcharge protection, and
control thermal dissipation throughout a mission-with changing environ-
ments and battery I-V characteristics. This was attributable in part to a lack
of full understanding of battery-operating parameters and their mutual
interaction. For example, early battery systems typically exhibited recharge
ratios greater than 1.2 and sometimes as high as 1.6. Their temperatures
were often in the vicinity of 30 to 350C or higher. With continued cycling
and corresponding battery degradation, the recharge ratios tended to
increase, thereby driving the temperatures yet higher. Single voltage-tem-
perature limits were set too high and were therefore inadequate for theirintended purpose. These problems were circumvented on the OrbitingAstronomical Observatory (OAO) by specifying a ground-commandable
family of voltage limits that permitted stepwise adjustment of recharge
ratios. This, in turn, permitted battery thermal dissipation and tempera-
ture to be controlled and reduced and permitted adjustment to accommo-
date battery-voltage degradation with life. The OAO batteries also benefited
from an active thermal-control system.
Table 48 summarizes other low-Earth-orbit batteries and charge controls,
with early projects on the left and more recent designs on the right. It is
evident that NASA spacecraft now have a strong tendency to utilize the
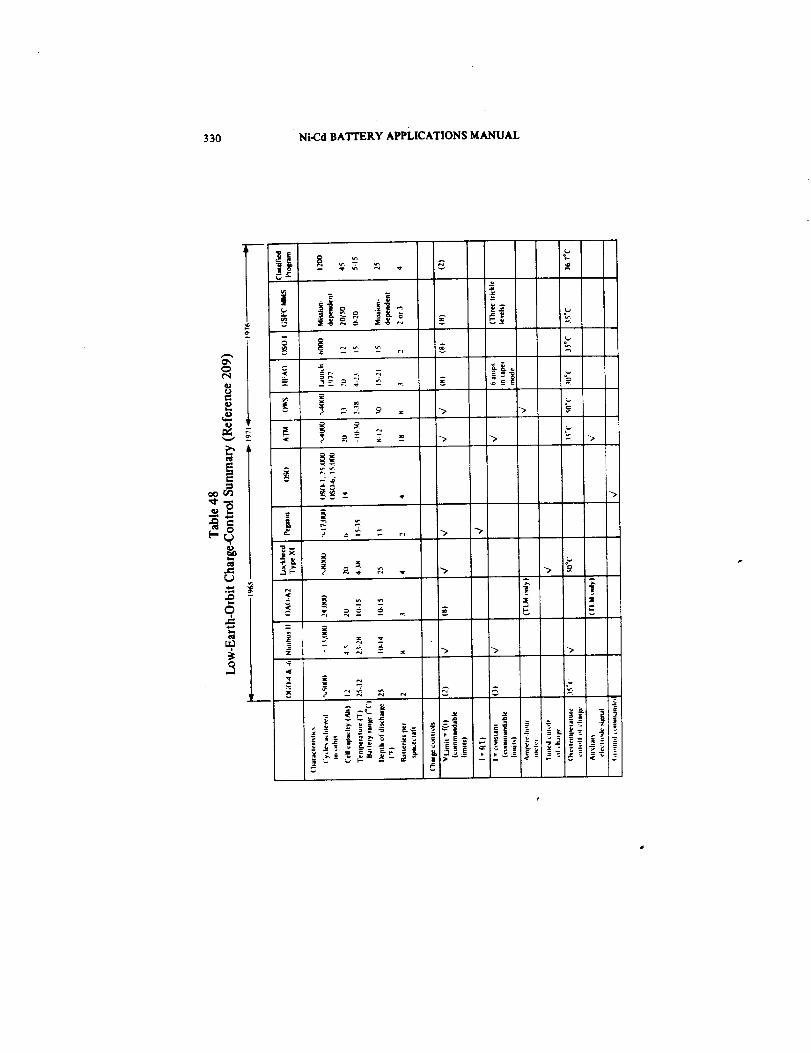
330 Ni-Cd BATTERY APPLICATIONS MANUAL
_ _ _ ,, -_
i _ :E_ _ = ....
_, . = - "-> -_
w.
-> -> ->

OF PO_._, qUALi'I'Y
BATTERY SYSTEM DESIGN 331
iEE
.,q.
e_t
?O
x_
e-
I
332 Ni-Cd BATTERY APPLICATIONS MANUAL
voltage-limited control method wi_multiple voltage limits. Higher capacity
batteries are favored, and the tread in operating temperature range is
generally downward.
Geoshynchronous spacecraft encounter approximately 90 eclipses per year,
the longest of which takes up 5 percent of the 24-hour orbit period. Avail-able minimum battery-recharge time is 22.8 hours, which can be reduced by
peak-load events that may require solar-array/battery load sharing. Becauseof the extended sunlight period, the solar-array power devoted to battery-
charging is only approximately 15 to 20 percent of the total array capability
at equinox. Therefore, charge currents are determined primarily by the
charge-acceptance characteristics of the battery at low rates.
Table 49 summarizes charge controls used on recent geosynchronous space-
craft. Because most NASA and military spacecraft must operate auto-
matically or autonomously for extended periods, they use the voltage-
limited or temperature-limited methods of charge control as reasonablyaccurate means of determining switchover from high- to low-rate (trickle)
charging. Spacecraft with dedicated ground stations utilize telemetered
battery data for recharge ratio-estimation and control. All primary battery-
charge functions are managed from the ground by the command link,
thereby minimizing battery-system complexity.
8.3.1 Current-Limited Charging
In the current-limited or constant-current method of charge control, a
regulator limits charge current to one or more selected values. The limits
are defined so that charge rates are: (a) high enough to ensure full recharge
after a discharge, (b) low enough to limit thermal dissipation during over-
charge, and (c) low enough to maintain cell oxygen pressures at safe levels.
The simplest version of this method applies a single current limit throughout
the charge and overcharge periods. The limit thus represents a compromise
between the requirement for energy balance and the necessities of tempera-
ture control and safe charging. For example, a C/20 rate is considered to be
safe in terms of cell-pressure stability during overcharge at O'C; higher
rates are permissible at higher temperatures when pressure stability is the
only consideration. The C/20 rate provides adequate recharge at 0°C, but
requires longer charge periods (higher recharge ratios) at higher tempera-
tures. However, the C/20 rate is too high for extended periods of overcharge
because the thermal dissipation produced within the battery tends to drive
BATrERY SYSTEM DESIGN 333
its temperature to excessive levels with passive cooling techniques. It is
therefore necessary to constrain the application to orbits with short sunlight
periods or to use a second, lower limit during overcharge periods. Some
early low-altitude spacecraft used the single.limit approach, but it was soon
discarded because it could only accommodate depths of discharge of about
5 to 10 percent.
The single-limit constant-current charge-control scheme is no longer used in
pure form in any spacecraft application because of the thermal-control
problem it engenders. Some dual-limit applications exist in which the higherlimit is determined by the capability of the source to deliver current at a
rate acceptable for charge but not necessarily for overcharge, and the lowerlimit is controlled somewhat more carefully during overcharge periods. The
following paragraphs present a rationale for selecting high and low current
limits.
As mentioned earlier, it is important to select charge-current limits that
provide safe charging, especially during periods of continuous overcharge.
The current passing through a battery cell during overcharge causes oxygen
to evolve from its positive electrodes. The gas is recombined at the negativeelectrodes. The evolution rate will balance the recombination rate at partic-
ular combinations of charge rate, cell pressure, and cell temperature. No in-
crease in pressure will occur at this equilibrium condition unless the rate,
the temperature, or both increase. The relationship between these variables,
shown in figure 32 for one manufacturer's cells, provides the basis for theselection of the high current limit. Figure 32 shows that, as the charge rate
is increased at a particular temperature, there is a transition from a region
of low equilibrium pressure to a region of high pressure. Thus, the higher
the initial charge rate, the greater the oxygen pressure if any significant
period of overcharge occurs and, therefore, the greater the need for prompt
action to reduce the charge current to safe levels before pressure builds.
If the initial charge rate is set too high, hydrogen evolution may also occur,
particularly with lower cell temperatures. Oxygen evolution on overcharge
and hydrogen evolution on charge are discussed in the sections on "GasEvolution and Pressure During Discharge" and "Maximum Allowable
Voltage on Charge," respectively, for new reference-design cells.
Figure 32 is not useful for defining the lower or trickle-charge limit. The useof a current rate at the lower boundary of the indeterminant region (in
the "low" pressure region) of figure 32 will result in high heat-generation
rates during continuous overcharge and corresponding temperature instabil-
ities. It is necessary, therefore, to reduce the trickle-charge limit to a value

334 Ni-Cd BATTERY APPLICATIONS MANUAL
that will maintain charge and provide the desired temperature performance.
A C/60 trickle-charge limit will maintain cell capacity at temperature up to
20°C; C/100 has proved to be adequate at temperatures in the vicinity of10°C. Some data exist to support the use of a C/150 trickle-charge rate
with cell temperatures near 0°C, although flight experience has yet to con-
firm this.
An example of a dual-limit charge-control system in a geosynchronous
application is the Fleet Satellite Communications (FLTSATCOM) system
recently developed for the Navy. Each of its batteries are separately chargedfrom dedicated-charge solar arrays at rates between C/10 and C/15. When
the voltage of a battery reaches a value that corresponds approximately to a
recharge ratio (ampere-hours throughput/ampere-hours discharged) between1.1 and 1.2, it is automatically switched from the charge array to a C/100
trickle-charge array. Trickle-charging is performed at about 10°C.
8.3.2 Voltage-Limited Charging
in the voltage-limited method of charge control, the current rate is con-
trolled indirectly during overcharge. A regulator limits battery-charge volt-
age so as to reduce charge current from an initial value to a low value that
corresponds to a trickle-charge rate. The voRage limit is always defined as a
function of battery temperature with a negative slope because, as tempera-ture rises, the current that a cell accepts at particular combinations of volt-
age and state of charge also increases. Thus, applying a constant-voltagelimit wiLl result in a runaway condition during overcharge in which anincrease in temverature leads to an increase in current, which results in a
further increas_ of temperature (Reference 261). The definition and applica-
tion of temperature-compensated battery-voltage limit (BVL) curves has
received considerable attention during the last 10 years.
The voltage-limited method was first used in low.altitude orbit applications
in conjunction with efforts to increase battery depth of discharge from the
very low levels achievable with constant-current charge-control techniques.Controls that permitted depths of discharge up to 20 to 30 percent were
designed with a single BVL. Full charge-current rates of up to C/2 were
used, sometimes with a current limit and sometimes without, depending on
battery temperatures and solar-array characteristics. The design of these
systems involved considerable effort in cell current-voltage characterization,BVL circuit design, and computer modeling of battery performance.Particular attention was devoted to the sensitivity of battery-system perfor-
"- mance to slight changes in BVL level and slope and, specifically, to changes

BATI'ERY SYSTEM DESIGN 335
in cell and battery characteristics with time and service. It soon became
evident, that, for most appll_ions, it was desirable to have available at theend of the mission a different BVL from that used at the start of the
mission.
More experience in voltage-limited charge-control methods also indicated
that interactions between the battery and its thermal-control system were
too complex to predict accurately. Some direct means of controlling bat-
tery dissipation was required to compensate for changes that occur in
battery heat-generation rates and the surface properties and other character-
istics of thermal radiators and associated devices during flight. The use of a
single BVL did not permit control of the battery's recharge ratio and, con-
sequently, of its rate of heat generation during overcharge. Also, a single
BVL did not compensate for a partial or complete cell short circuit during
battery charge. These considerations led to the present general practice of
using multiple temperature-compensated BVL's, each selectable by ground
command.
The limiting function is used in one of two ways: (a) overcharging is per-
formed with battery voltage held to a value determined by the BVL, or (b)
the charge current is switched from the normal full-charge rate to a con-
trolled lower rate when the battery voltage reaches the BVL level. In ap-
proach (a), the battery's characteristics determine the value of current that
it will accept. Continued charging at a limit results in a tapering of the
current in the overcharge region. For this reason, the voltage-limited charg-
ing method is sometimes referred to as twpered-charge control. In approach
(b), the switch-down may be either to a trickle-charge rate or to zero cur-
rent. Some battery systems have been designed that incorporate both
approaches, with the switch-down option used during long periods of con-
tinuous sunlight.
Several controllable or measurable battery parameters interact during cycl-
ing with voltage-limited charge control. Table 50 shows the effect of increas-
ing one parameter while holding others constant. This is an idealized situa-
tion, and no statement is made on the relative magnitudes of the changes.
In practice, a moderate change of one parameter (e.g., depth of discharge)
will affect another parameter (particularly in a short-period orbit with pas-
sive battery temperature control), thereby shifting the overall equilibrium
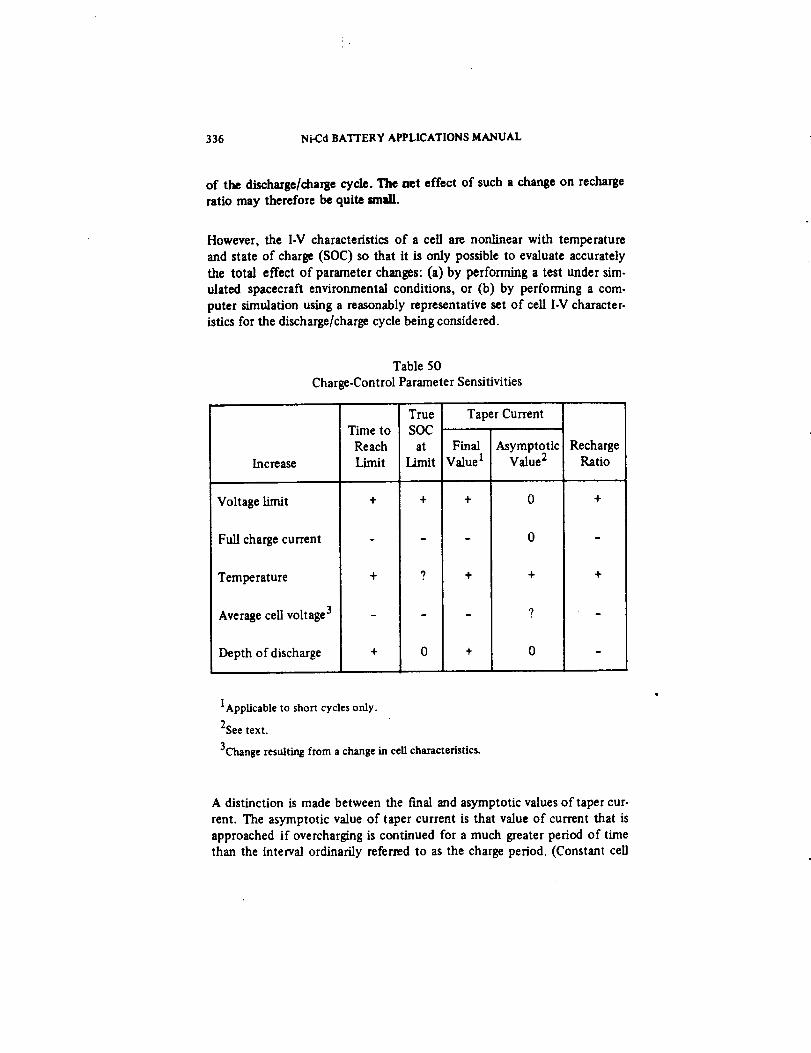
r
336 Ni-Cd BATFERY APPLICATIONS MANUAL
of the discharge/charge cycle. The net effect of such a change on recharge
ratio may therefore be quite small.
However, the l-V characteristics of a cell are nonlinear with temperature
and state of charge (SOC) so that it is only possible to evaluate accurately
the total effect of parameter changes: (a) by performing a test under sire.
ulated spacecraft environmental conditions, or (b) by performing a corn.
puter simulation using a reasonably representative set of cell l-V character-istics for the discharge/charge cycle being considered.
Table 50
Charge-Control Parameter Sensitivities
Increase
Voltage limit
Full charge current
Temperature
Average cell voltage 3
Depth of discharge
Time to
Reach
Limit
+
True Taper CurrentSOC
at Final AsymptoticLimit Value I
+ +
9 +
0 +
RechargeValue 2 Ratio
0 +
0
+ +
?
0
IApplicable to short cycles only.
2See text.
3Change resulting from a change in cell characteristics.
A distinction is made between the final and asymptotic values of taper cur.
rent. The asymptotic value of taper current is that value of current that is
approached if overcharging is continued for a much greater period of time
than the interval ordinarily referred to as the charge period. (Constant cell
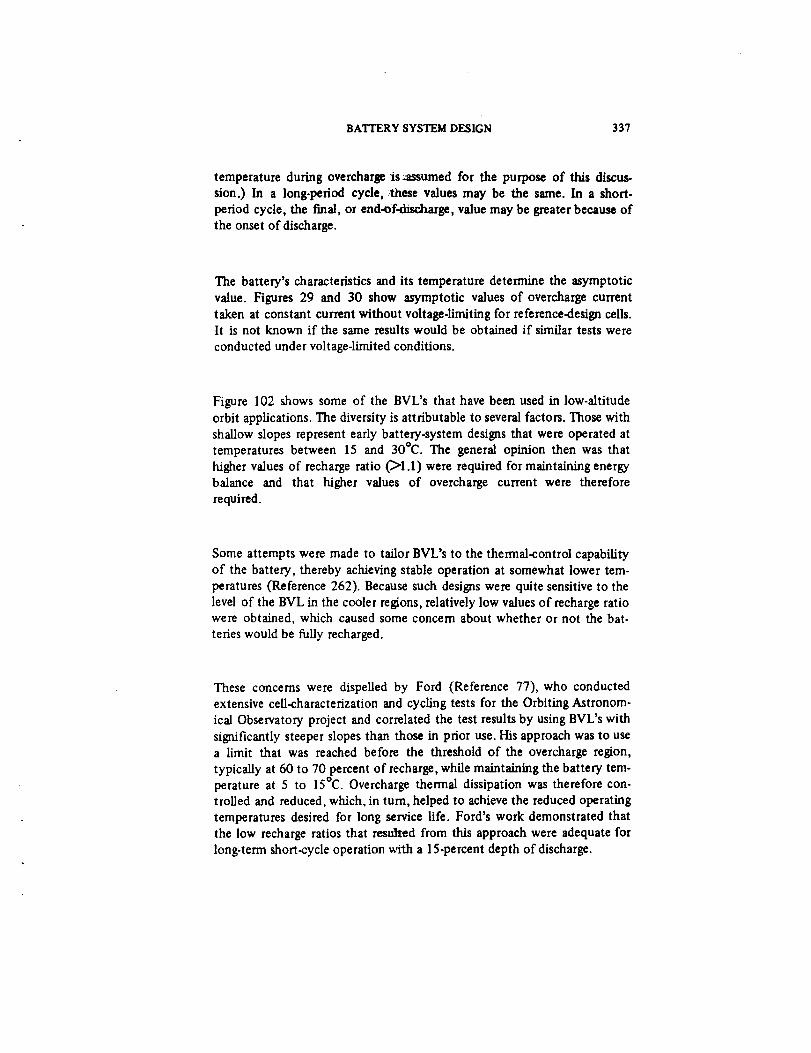
BATI'ERY SYSTEM DESIGN 337
temperature during overcharse "is=assumed for the purpose of this discus-
sion.) In a long.period cycle, _hese values may be the same. In a short-
period cycle, the final, or end-of-discharge, value may be greater because of
the onset of discharge.
The battery's characteristics and its temperature determine the asymptotic
value. Figures 29 and 30 show asymptotic values of overcharge current
taken at constant current without voltage.limiting for reference-desigu cells.It is not known if the same results would be obtained if similar tests were
conducted under voltage-limited conditions.
Figure 102 shows some of the BVL's that have been used in low-altitude
orbit applications. The diversity is attributable to several factors. Those with
shallow slopes represent early battery-system designs that were operated at
temperatures between 15 and 30°C. The general opinion then was that
higher values of recharge ratio C_l.1) were required for maintaining energy
balance and that higher values of overcharge current were therefore
required.
Some attempts were made to tailor BVL's to the thermal-control capability
of the battery, thereby achieving stable operation at somewhat lower tem-
peratures (Reference 262). Because such designs were quite sensitive to the
level of the BVL in the cooler regions, relatively low values of recharge ratiowere obtained, which caused some concern about whether or not the bat-
teries would be fully recharged.
These concerns were dispelled by Ford (Reference 77), who conducted
extensive cell-characterization and cycling tests for the Orbiting Astronom-
ical Observatory project and correlated the test results by using BVL's with
significantly steeper slopes than those in prior use. His approach was to usea limit that was reached before the threshold of the overcharge region,
typically at 60 to 70 percent of recharge, while maintaining the battery tem-
perature at 5 to 15°C. Overcharge thermal dissipation was therefore con-
trolled and reduced, which, in turn, helped to achieve the reduced operating
temperatures desired for long service life. Ford's work demonstrated that
the low recharge ratios that resulted from this approach were adequate for
long-term short-cycle operation with a 15-percent depth of discharge.
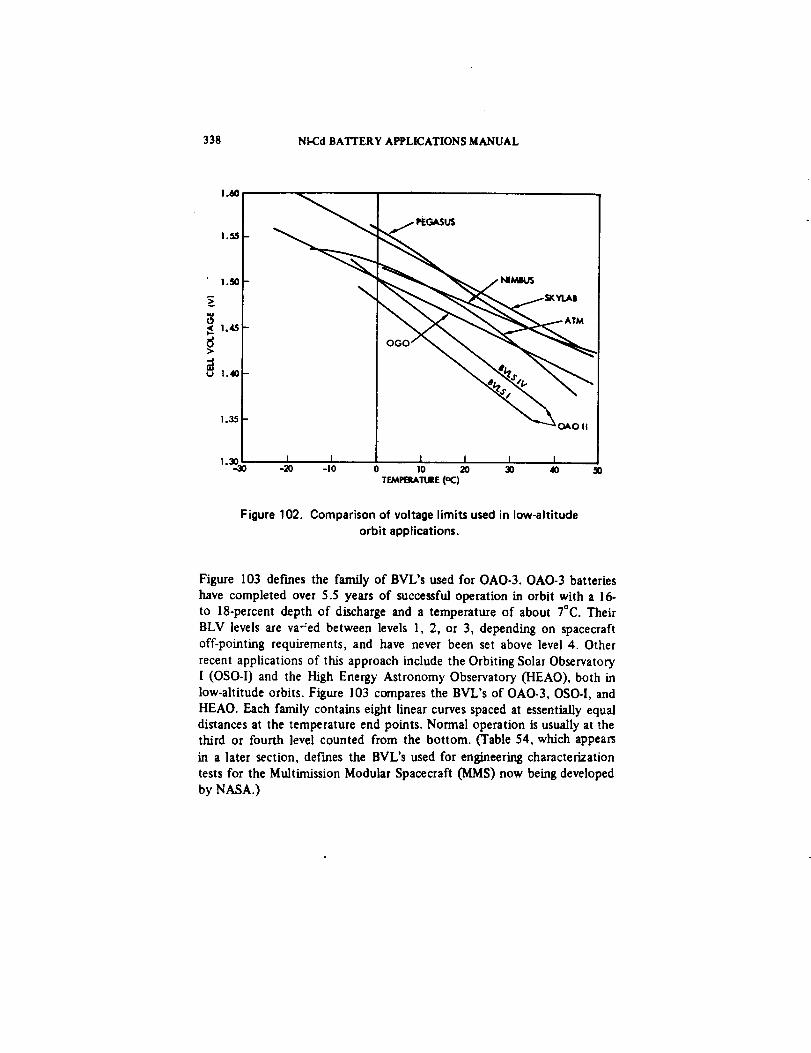
338 Ni-Cd BATTERY APPLICATIONS MANUAL
1.60
l.SO
v 1.40
1.35
/ RGASUS
I I I I I I-20 -I0 0 I0 20 30 40
Tr_._'_tATURE(_)5O
Figure 102. Comparison of voltage limits used in low-altitude
orbit applications.
Figure 103 defines the family of BVL's used for OAO-3. OAO-3 batteries
have completed over 5.5 years of successful operation in orbit with a 16-
to 18-percent depth of discharge and a temperature of about 7°C. Their
BLV levels are va'%d between levels 1, 2, or 3, depending on spacecraft
off-pointing requirements, and have never been set above level 4. Other
recent applications of this approach include the Orbiting Solar Observatory
I (OSO-I) and the High Energy Astronomy Observatory (HEAO), both in
low-altitude orbits. Figure 103 compares the BVL's of OAO-3, OSO-I, and
HEAO. Each family contains eight linear curves spaced at essentially equal
distances at the temperature end points. Normal operation is usually at the
third or fourth level counted from the bottom. (Table 54, which appears
in a later section, defines the BVL's used for engineering characterization
tests for the Multimission Modular Spacecraft 0VIMS) now being developed
by NASA.)
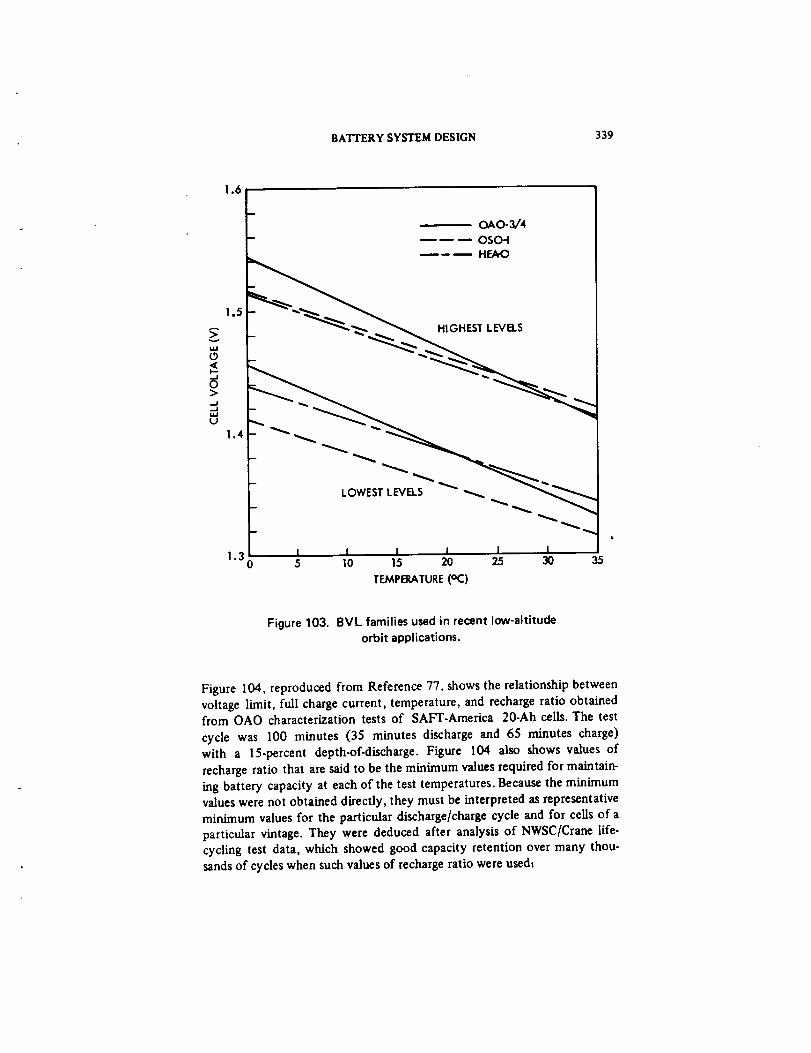
BA3_I'ERY SYSTEM DESIGN 339
1.6
I _ 0A0-3/4OSO-iHEAO
g
_ __,,_ _.,.
- LOWEST LEVRS _ _ _ "_'_
- _
i I I I I I1.3 5 I 0 15 20 25 30 35
TEMPERATURE (o(3)
Figure 103. BVL families used in recent low-altitude
orbit applications.
Figure 104, reproduced from Reference 77, shows the relationship between
voltage limit, full charge current, temperature, and recharge ratio obtained
from OAO characterization tests of SAFT-America 20-Ah cells. The test
cycle was 100 minutes (35 minutes discharge and 65 minutes charge)
with a 15-percent depth-of-discharge. Figure 104 also shows values of
recharge ratio that are said to be the minimum values required for maintain-ing battery capacity at each of the test temperatures. Because the minimum
values were not obtained directly, they must be interpreted as representative
minimum values for the particular discharge/charge cycle and for cells of aparticular vintage. They were deduced after analysis of NWSC/Crane life-cycling test data, which showed good capacity retention over many thou-sands of cycles when such values of recharge ratio were used..
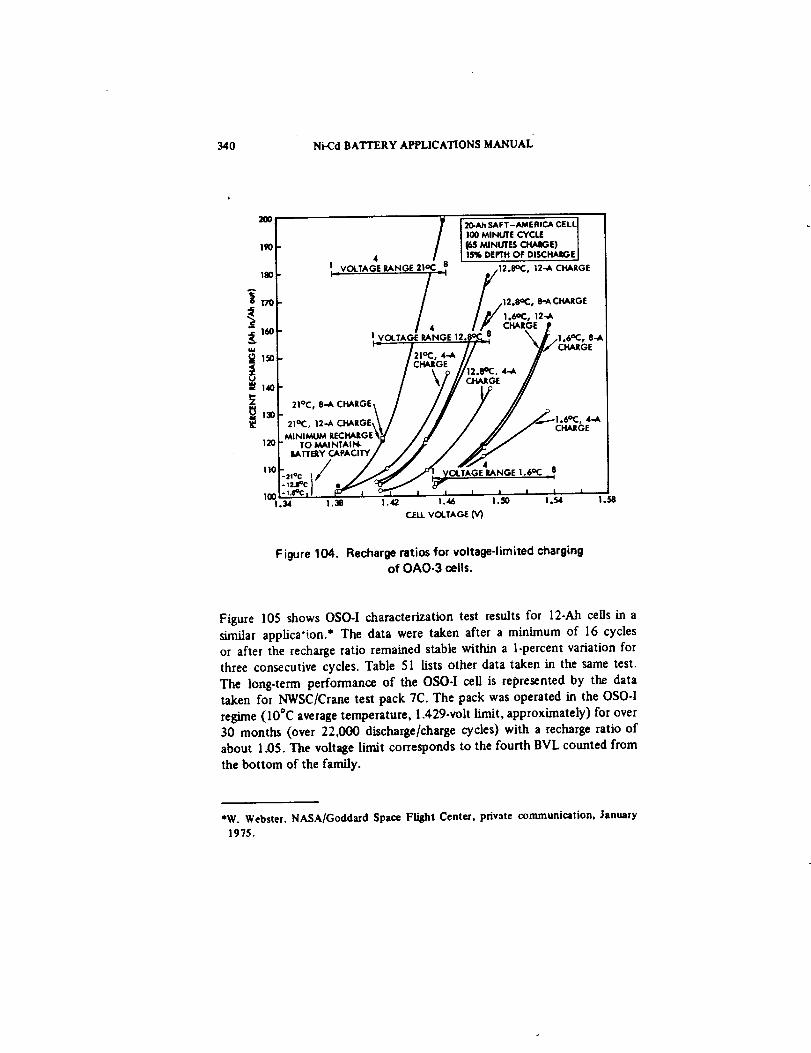
340 Ni-Cd BATTERY APPLICATIONS MANUAL
200
190
u
170
II0
I_'_s_'-"_"'c_ cE,qJ I00 MINUTE CYCLE ]I _ MINOTU _0 I
4 [ lS%oErrH OF D,SCHA_E IIIjVOLTAGE RANGE 21°(:_ 8 ,,12.8oC, 12-A CHARGE
I / p/,._c, ,_-_I 4 jr if_ CHARGE p
I v_.TXG__NGE12._J \ I_1.6°C, 8-*' /,,o_.,_// 7/ c._,o,
/ ',,///_a_ ' //////.
MINIMUM RECHAJLGE _r / _ / // / L..IIAK'._,I:
_'d_._:',,..... o,- s
1.38 1.4,2 1.46 i.50 1.54 1.58
CELLVOLTAGE(V)
Figure 104. Recharge ratios for voltage-limited chargingof OAO-3 cells.
Figure 105 shows OSO-I characterization test results for 12-Ah cells in a
similar applica'ion.* The data were taken after a minimum of 16 cycles
or after the recharge ratio remained stable within a l-percent variation for
three consecutive cycles. Table 51 lists other data taken in the same test.
The long-term performance of the OSO-I cell is represented by the data
taken for N-WSC/Crane test pack 7C. The pack was operated in the OSO-I
regime (10°C average temperature, 1.429-volt limit, approximately) for over
30 months (over 22,000 discharge/charge cycles) with a recharge ratio of
about 1.05. The voltage limit corresponds to the fourth BVL counted from
the bottom of the family.
*w. Webster. NASA/Goddard Space Flight Center, private communication, January
1975.
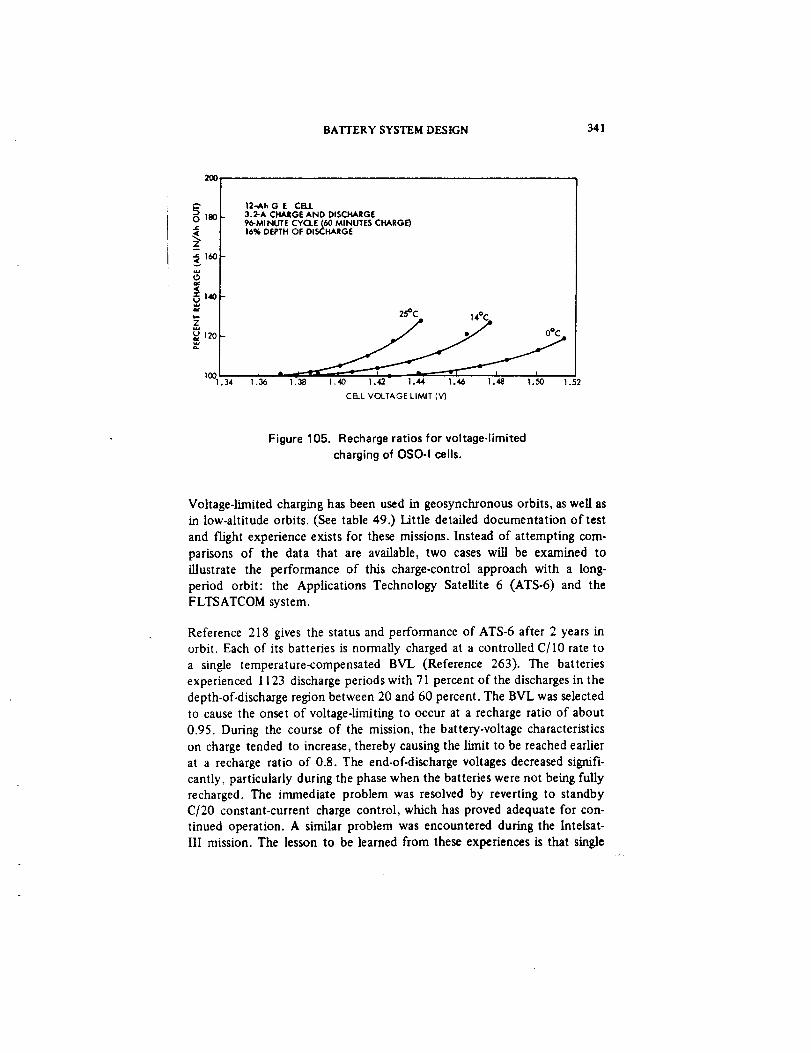
BATTERY SYSTEM DESIGN 341
20o
A
os,=
,20¢L
12-Ah G E CFIL
3.2-A CHARGE AND DISCHARGE
96-MINUTE CYCLE (60 MINUTES CHARGE)16% DEPTH OF DISCHARGE
2"5°C 14°C
1001.34 1.36 1.38 1.40 1.42 1.44 1.46 1.48 1.50 1.52
CELL VOLTAGE LIMIT (V')
Figure 105. Recharge ratios for voltage-limited
charging of OSO-I cells.
Voltage-limited charging has been used in geosynchronous orbits, as well as
in low-altitude orbits. (See table 49.) Little detailed documentation of test
and flight experience exists for these missions. Instead of attempting com-
parisons of the data that are available, two cases will be examined to
illustrate the performance of this charge-control approach with a long-
period orbit: the Applications Technology Satellite 6 (ATS-6) and the
FLTSATCOM system.
Reference 218 gives the status and performance of ATS-6 after 2 years in
orbit. Each of its batteries is normally charged at a controlled C/IO rate to
a single temperature-compensated BVL (Reference 263). The batteries
experienced 1123 discharge periods with 71 percent of the discharges in the
depth-of-discharge region between 20 and 60 percent. The BVL was selected
to cause the onset of voltage-limiting to occur at a recharge ratio of about
0.95. During the course of the mission, the battery-voltage characteristics
on charge tended to increase, thereby causing the limit to be reached earlier
at a recharge ratio of 0.8. The end-of-discharge voltages decreased signifi-
cantly, particularly during the phase when the batteries were not being fully
recharged. The immediate problem was resolved by reverting to standby
C[20 constant-current charge control, which has proved adequate for con-
tinued operation. A similar problem was encountered during the Intelsat-
III mission. The lesson to be learned from these experiences is that single

342 Ni-Cd BATTERY APPLICATIONS MANUAL
qL_
c_
L'I
6O
U._
O
o0 o, - _ _ o
0 0 0 0 0 --
• . _, _. _ _- _. _o o 6 o o d - -
0
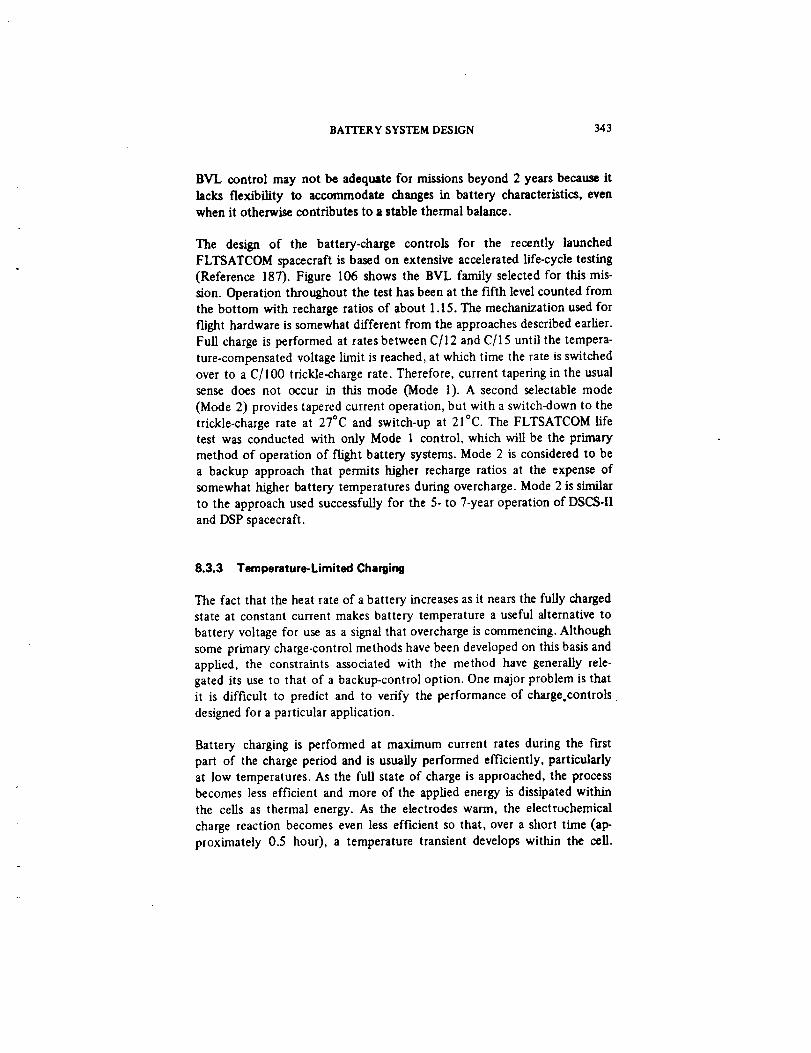
BATFERY SYSTEM DESIGN 343
BVL control may not be adequate for missions beyond 2 years because it
lacks flexibility to accommodate changes in battery characteristics, evenwhen it otherwise contributes to a stable thermal balance.
The design of the battery-charge controls for the recently launched
FLTSATCOM spacecraft is based on extensive accelerated life-cycle testing
(Reference 187). Figure 106 shows the BVL family selected for this mis-
sion. Operation throughout the test has been at the fifth level counted fromthe bottom with recharge ratios of about 1.15. The mechanization used for
flight hardware is somewhat different from the approaches described earlier.
Full charge is performed at rates between C/12 and C/15 until the tempera-
ture-compensated voltage limit is reached, at which time the rate is switchedover to a C/100 trickle-charge rate. Therefore, current tapering in the usual
sense does not occur in this mode (Mode 1). A second selectable mode
(Mode 2) provides tapered current operation, but with a switch-down to the
trickle-charge rate at 27°C and switch-up at 21°C. The FLTSATCOM life
test was conducted with only Mode 1 control, which will be the primary
method of operation of flight battery systems. Mode 2 is considered to be
a backup approach that permits higher recharge ratios at the expense of
somewhat higher battery temperatures during overcharge. Mode 2 is similar
to the approach used successfully for the 5- to 7-year operation of DSCS-II
and DSP spacecraft.
8.3.3 Temperature-Limited Charging
The fact that the heat rate of a battery increases as it nears the fully charged
state at constant current makes battery temperature a useful alternative to
battery voltage for use as a signal that overcharge is commencing. Although
some primary charge-control methods have been developed on this basis and
applied, the constraints associated with the method have generally rele-
gated its use to that of a backup-control option. One major problem is that
it is difficult to predict and to verify the performance of charge.controls •
designed for a particular application.
Battery charging is performed at maximum current rates during the first
part of the charge period and is usually performed efficiently, particularly
at low temperatures. As the full state of charge is approached, the process
becomes less efficient and more of the applied energy is dissipated within
the cells as thermal energy. As the electrodes warm, the electrochemical
charge reaction becomes even less efficient so that, over a short time (ap-
proximately 0.5 hour), a temperature transient develops within the cell.
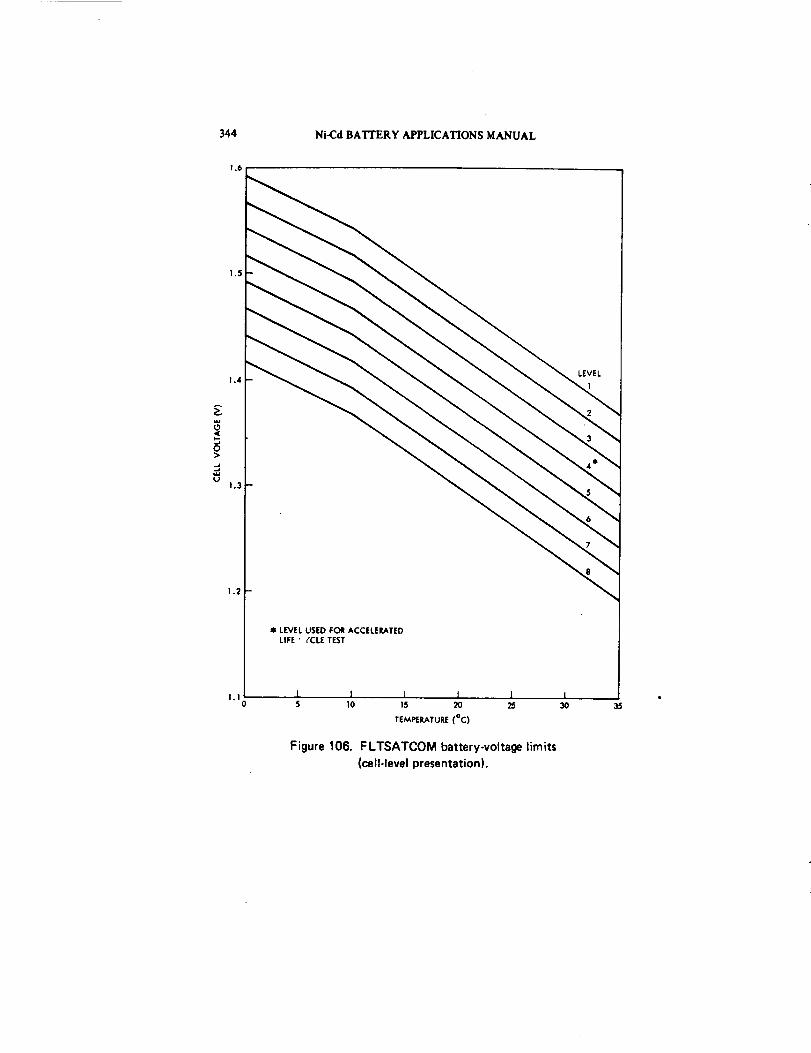
344
1.6
Ni-Cd BATTERY APPLICATIONS MANUAL
O
u
1.10
LEVEL USED FOR ACCELERATEDLIFE ' (CLE TEST
$ 10
Figure 106.
I 1 I15 20 25
TEMPERATURE (°C)
3O
FLTSATCOM battery-voltage limits
(cell-level presentation).
35

I BATTERY SYSTEM DESIGN 345
The magnitude of the transient _s _he difference between the mean elec-
trode-stack temperature and the _c_ernal surface of the cell container. The
magnitude depends on the thernud time constant of the cell (primarily
the electrode stack) and the forcing function (current). (See Section 7.4.1.)
A temperature difference between stack and cell surface will always exist
while heat is being generated within the cell. However, during the transient,
the difference may exceed the steady.state differential temperature other-
wise obtained during extended periods of overcharge. (If overcharge is per-
formed at maximum rates, the average cell temperature will be significantly
higher than the temperatures associated with the charge period.)
The effectiveness of using a temperature signal for primary charge control
is therefore dependent on the thermophysical properties of the cell and
the particular battery-system design application. It is assumed that the
temperature sensor is either attached to the cell-container cover near the
terminals or embedded in a thermal shim. Therefore, the effectiveness of
the method is not necessarily dependent on the overall thermal design of the
battery when that design is made to accommodate steady-state conditions
of thermal dissipation. With short cycles and high-rate charging, which are
usual for low-altitude orbits, there is not sufficient time for the electrode
stack to absorb the heat produced and to exhibit a temperature rise beforethe end of the charge period. A considerable amount of oxygen may be
evolved before the temperature signal is sufficient to cause a reduction of
overcharge current. This time delay is essentially independent of cell size
and is rather an intrinsic characteristic of the cell type. The time scales are
much more favorable for long-period orbits, and, accordingly, these are the
missions in which the temperature-limited charge-control method is used.
One version of the method that has been used on several military space-
craft permits a battery to charge at full rate until its temperature reaches27°C. The current is then reduced to a trickle rate and maintained at that
level until the battery cools to 24°C, when the full charge rate is restored. If
the temperature of the battery reaches the switch point beyond the end of
discharge, the discharged battery is automatically placed on trickle charge
until it cools. In this application, the battery thermal-control system is de-
signed so that battery temperature after maximum discharge does not reach
the switch point.
The foregoing temperature limits reflect a compromise between a desire to
maintain average battery temperatures at low levels and the realities of the
particular missions and spacecraft configurations. Operation has proved
346 Ni-Cd BATFERY APPLICATIONS MANUAL
satisfactory for geosynchronous missions of 3 to 7 years with 40- to 55-
percent depths of discharge. The dmge controls are quite simple (figure
107). Discharge occurs through the closed relay contacts when the battery
is below the thermal switch setting; otherwise, discharge is through the
diode/resistor pair. Full charge occurs through the closed relay until the
battery temperature limit is reached. When the relay is open, the resistor
limits trickle-charge current. The battery is always connected to the bus
through the diode to support peak discharges. A shunt regulator limits bus
voltage.
PRIMARY POWER BUS
f t!
m
Figure I q7. Controls for temperature-limited charging.
The temperature limits can be lowered if the battery's thermal-control
system is adjusted to provide a lower average battery-operating temperature.
Few data are available on the performance of temperature-limited systems
operated at lower temperatures, although there is some evidence that a
significant lag exists between the pressure buildup within acc 'I at cold tem-
peratures and the measured increase in its temperature (Reference 51).
This effect could cause the cells to exhibit higher average pressures ascycling proceeds.
Other mechanizations involving temperature have been suggested as a means
for charge control. One approach is based on the measurement of the
temperature difference between the battery and a reference point on the
BATTERYSYSTEMDESIGN 347
spacecraft structure (Reference 264). With a known thermal resistance be-
tween the measurement points, the controller acts as a form of heat meter
that is independent of reference temperature level. An increase in battery
temperature because of overcharge may therefore be detected directly and
may be distinguished from the effect of external heat inputs to the battery.
Another approach involves the determination of rate and sense of tempera-
ture change. This implies the use of controls with a memory function that
may now be practical with the advent of low-cost microprocessor tech-nology.
Despite limited application as a primary method of direct charge control,
the use of temperature as a control parameter is widely used as backup to
other methods. Most charge-control systems, whether automatic or ground
commanded, include overtemperature and undertemperature protection
functions. Overtemperature protection usually involves placing the battery
into a trickle charge or low-rate (reconditioning) discharge mode until its
temperature has cooled to a second, lower limit. Overtemperature limits in
the range of 30 to 450C have been used with the upper limit to some
extent-a reflection of past applications with high average battery tempera-
tures. The selection of a value for an overtemperature limit is somewhat
arbitrary because it is not usually a primary control parameter. However,
sustained operation above 25 to 30"C has a strong negative .effect on service
life, and, beyond 40°C, the possibility of failure because of overpressure
effects becomes significant. For these reasons, it is recommended that the
overtemperature limit be maintained at or below 35"C.
Undertemperature protection ensures that the battery will not be operated
at temperatures: (a) that are detrimental to its long-term performance
characteristics, (b) that are beyond the range of the primary charge con-troller, or (c) that could produce immediate damage. The latter could result
if a failure placed the battery in an open-circuited condition with no exter-
nal source of heat. It would therefore cool at a rate dependent on the
characteristics of its thermal-control system and could, in the extreme,
reach temperatures at which electrolyte in its cells would freeze (< -60°C).
Undertemperature limits in the range of-5 to +10°C have been specified.When the limit is reached, heaters, which are usually located between the
battery and its mounting surface, are activated. Normally, the heaters are
powered only during certain trickle-charge periods when external sources of
heat are reduced (eqg., when the battery's radiator receives no solar input).
Battery heaters represent an additional power requirement that must be metby the solar array.
348 Ni-Cd BATTERY APPLICATIONS MANUAL
8.3.4 Pressure Limited Charging
This method is motivated by the fact that oxygen is evolved at an increas-
ing rate as the point of full charge is approached and, depending on the rateof simultaneous recombination of the gas, a net pressure increase win occur
within the cell. The rise in pressure can be used to generate a signal for
charge control in one of two ways. When the pressure reaches a Ikniting
value, the charge current can be switched from a high to a low, or trickle-
charge, rate. Alternatively, the signal can be used to modify the shape of a
temperature-compensated battery or cell voltage limit used for primary
charge control. In either case, the effect is to provide a reduction in charge
rate in response to pressure. However, the pressure within an otherwisenormal cell may fluctuate to an extent that it may become difficult to use
it as a signal source. Also, unknown accumulations of hydrogen tend to
make total pressure-sensing unreliable as an end-of-charge indicator.
Cell pressure can be measured with a pressure transducer or gage or with an
externally mounted strain gage (Reference 38). Neither method has been
widely used in flight spacecraft. Pressure transducers have limited accuracy
and repeatability at pressures near atmospheric ambient and are not sensi-
tive to small changes in pressure. The installation of a pressure transducer
means that a feedthrough must be installed in the cover, thereby possibly
affecting the cell's reliability.
A strain gage bonded to the surface of a true pressure vessel will detect
pressure changes within the vessel that are sufficient to cause surface deflec-
tions. Prismatic cells, which are usually packaged in a compressed stack,
offer few surfaces appropriate for mounting a strain gage. Those that are
available are us1 ally the cover or the narrow sides and are quite stiff. Deflec-
tions at low values of pressure are small, making calibration of the gage
difficult. Hysteresis effects interfere with the repeatability of the measure-
ments.
An alternative to these methods involves the use of cells equipped with a
third or auxiliary electrode that produces a current in proportion to oxygen
pressure when it is connected through a resistance to the n_ative electrode.
The voltage signal developed across the resistive load can be used to control
charge parameters. The theory and design of auxiliary electrodes are dis-
cussed in Section 2.3.3.9. References 52 and 265 contain an example of
detailed application. These references describe the development of auxiliary
electrode controls that were used as a backup to the primary charge-control
system of the Orbiting Astrononfical Observatory battery. Reference 49
BATTERYSYSTEMDESIGN 349
describes the characterization and development of primary charge controls
using auxiliary electrode signals for the Skylab Apollo Telescope Mount
(ATM) power system. References 266 and 267 describe other uses of third-
electrode cells in primary charge-control applications. In all cases, the work
applied to low-altitude Earth.orbR applications.
Cells equipped with auxiliary electrodes will provide service in the geosyn-
chronous orbit on board the International Ultraviolet Explorer (IUE)
Spacecraft (Reference 93). Considerable data and experience have already
been obtained with similarly equipped cells as part of the development of an
advanced geosynchronous orbit battery for the U.S. Air Force (Reference
51). Implementation was unusual in that every cell was equipped with an
auxiliary electrode that was used to control the level of a temperature-
compensated voltage limit dedicated to the cell. This forward bypass circuit
thus provided effective closed-loop control of two parameters at the cell
level: overcharge current and pressure-both as function of temperature.
Despite the efforts cited, pressure sensing and control with an auxiliaryelectrode are at a less advanced stage of development than some of the
methods of charge control described in earlier sections. Although cell manu-
facturers have provided cells with functional third electrodes, the nature of
their designs have not been investigated rigorously, and uniform specifica-
tions have not been developed or applied. Differences between third-
electrode cells made by various suppliers are not well understood. Available
characterization data have been taken for only a relatively small population
of cells. Life-cycling test data and flight experience generally show that
auxiliary electrode performance is unstable over long periods and, in
particular, following changes in battery-system operating conditions.
Certain application problems must be considered before selecting thismethod of charge control. First is the question of the variation of pressure
characteristics between cells in a battery. Under normal conditions, a wide
range of pressures will be obtained; yet a single cell, equipped with an
auxiliary electrode, will provide total charge control based only on its own
performance. There is also the question of cell-to-cell variations in the
sensitivity of the auxiliary electrode to pressure. The charge controls must
provide for initial adjustment to compensate for these variations. Through-
out a mission, the sensitivity to pressure may change because of certain
phenomena (e.g., electrolyte redistribution within the cell). (It is assumed
that the behavior of the negative electrode of the cell, to which the auxiliaryelectrode is referenced, is normal throughout the mission. Little is known
about the interaction between the negative and auxiliary electrodes over
350 Ni-Cd BATYERY APPLICATIONS MANUAL
long periods of cycling.) Finally, there is the question of the behavior of the
auxiliary electrode as a function of temperature when it delivers current to
a fixed value of load resistance. There appears to be little doubt that uni-
form behavior can be obtained within a narrow temperature range with
repetitive cycling by proper selection of a resistance value. But, if the
temperature increases, the sensitivity to pressure with a fixed-load resistance
may decrease even though the auxiliary electrode itself tends to exhibit
increasing sensitivity with increasing temperature when properly monitored.
The net effect is one of self-compensation because the oxygen-recombina-
tion rate is higher at higher temperatures. Nevertheless, adjustment of the
load resistance should be considered if the range of control is to be
extended beyond a narrow temperature regime. (See also Section 3.4.1.4.)
For these reasons, the auxiliary-electrode charge-control technique cannot
be considered so much more advantageous than other charge-control
methods as to warrant its use as a primary method of control without other
types of backup controls. As more is learned about specifying and pro-
ducing third-electrode cells and as improved circuits are developed for com-
pensating for changes in auxiliary-electrode characteristics caused by long-
term cycling effects and temperature variations, this situation may change.
Until then, the method should be generally restricted to the followingcircumstances:
a. Batteries operated with repetitive cycling between 0 and 15°C-The
nickel-cadmium system is most sensitive to overcharge current in this
regilTle.
b. As a method of augmenting the primary charge-control system-The
auxiliary-electro, ._ controls should be set so that they do not inter-
fere with the normal range of recharge-ratio adjustment provided by
the primary controls.
C. With other means provided for limiting the generation of hydrogen-
The oxygen-signal characteristics are believed to be affected by the
presence of significant amounts of hydrogen.
d. Minimal effect on battery-system reliability-lf the battery contains
only one cell equipped with an auxiliary electrode and its proper
charge control depends on that cell's performance, there will be a
significant effect on battery-system reliability if the cell or the auxil-
iary electrode fails.
BATTERY SYSTEM DESIGN 351
e. As a technique for monitoring the characteristics of a battery in
orbit-Useful information regarding the typical performance of cells
may be obtained through the telemetry system.
The decision to incorporate auxiliary-electrode controls into a battery
system should be made with clear objectives in mind. Item e may be reason
enough because the data obtained are useful in determining the effect of
charge management procedures instituted in response to changes in battery
performance throughout the mission (Reference 50).
8.3.5 Recharge-Ratio Control
Of the four methods described, two (temperature-limited and pressure-
limited control) do not generally permit direct adjustment of the recharge
ratio. Automatic versions of single-limit constant-current controls do not
provide for such adjustments. The voltage-limited or ground-controlled dual-
limit constant-current methods do, however, and that explains their wide
use.
In all automatic systems in which recharge-ratio control is obtained, it is
accomplished by indirect means, such as the switching to a different voltageor current limit. Therefore, values of recharge ratio are provided in steps
that cannot be accurately predicted beforehand. Each step corresponds to a
new equilibrium condition for the cycle in response to changes in state of
charge and temperature. This granularity is usually not a problem with
voltage-limited control based on the use of a family of BVL's. However,
the effect of changing a constant-current limit can be significant.
A more direct method of recharge-ratio control is to perform an ampere-
hour integration with respect to time to determine the specific point of
charge cutoff. (Charge cutoff is def'med as a reduction of charge current to
zero or to a trickle-charge level that, under subsequent charging, has littleadditional effect on the recharge ratio.) The integration is required for dis-
charge, as well as charge, with the values retained for computation of the
recharge ratio. The calculations may be performed by either ground-based
computer using telemetered battery current, voltage, and temperature data
or an on-board ampere-hour meter. The former approach is practical for
geosynchronous applications with dedicated ground stations, whereas the
latter is necessary for low-altitude missions or for interplanetary spacecraft.
On the OAO-2 and .3 spacecraft, an ampere.hour meter was connected to
each battery. A self-contained ampere-hour meter was also used aboard the
352 Ni-Cd BATI'ERY APPLICATIONS MANUAL
Skylab Airlock Module" for both charge-control and monitoring functions.
This meter is discussed at the system level in Reference 219 and describedin detail in Reference 229.
Both the development of advanced on-board computers and the current
expansion of microprocessor technology open new avenues for developing
compact, low-cost, "smart" charge controls. Reference 268 surveys the
prospects for Earth-orbiting spacecraft and Reference 269 considers specific
approaches applicable to interplanetary missions.
One limitation to using direct methods of recharge-ratio control is the re-
quirement for battery performance data in a format that correlates recharge-
ratio values with discharge/charge cycle parameters, operating mode (cycl-
ing or storage), temperature, control parameters (current voltage and
pressure), and service history and time. To use the method in a primary
charge-control mode, these data must be obtained by extensive cell charac-
terization and life-cycling tests. Even when the method is used as an adjunct
to the l_rimary controls, some testing is necessary for verifying the recharge.
ratio criteria planned for mission operation. This was indeed the case for the
Skylab applications (Reference 49).
Another issue involves the question of measurement and computational
accuracies. In the future, the former may be of more concern than the
latter, particularly with the availability of dedicated on-board ampere-hour
meters that are independent of spacecraft processors and data-bus con-
figurations. Low-loss accurate current sensors are required with the capabil-
ity of measuring a wide range of currents on both charge and discharge.
The capability to accurately measure other battery parameters will be keyto the full realiz tion of the potential of this method.
8.4 METHODS OF CELL AND BATTERY PROTECTION
The degree of protection a battery cell may require is directly proportional
to increasing depth of discharge, temperature, and mission length. As these
parameters increase, the possibility of overdischarge o, overvoltage oncharge also increases. Protection from the effect of these stresses takes
the form of either circuitry designed to limit currents through the affected
cell when either degraded condition develops or battery-level charge
management decisions based on voltage-current measurements made at the
BATTERY SYSTEM DESIGN 353
cell level. When properly implemented, either approach ensures that exces-
sive pressures do not develop in a failing ceil that might otherwise lead to
rupture of the hermetic seal and consequent leakage of cell gasses and/or
electrolyte.
At the battery level the term "protection" is used in a somewhat different
sense. Avoiding overpressure within the cells is still a major concern. How-
ever, in the absence of specific cell-level protection against such effects,
it is common practice to size the battery system conservatively and to
provide sufficient charge-control capability so that cell overpressure be-
comes improbable. Battery-level protection, instead, refers to provisions in
the battery or battery-system design that accommodate the effects of an
open-circuited cell or one or more short-circuited cells. Both types of
failures represent a far greater potential loss of available battery-system
capacity than the partial failure of one or two cells when the cells are
individually protected. The accommodation of open-circuit failures may be
in the form of either additional (redundant) batteries or a simple bilateral
network that bypasses current around the defective cell. The accommoda-
tion of complete short-circuit failures requires no special provisions other
than ensuring that the battery system is initially designed to maintain the
voltage of the primary power bus above its specified minimum value if such
failures occur. The accommodation of partially shorted cells-an issue of
greater complexity-is discussed in subsequent sections.
8.4.1 Failure Modes and Protection Requirements
Battery cells are prone to any of three general modes or states of failure:
(a) short-circuit (zero impedance), (b) excessive capacity degradation mani-fested as reduced cell terminal voltage (finite variable impedance), and (c)
open circuit (infinite impedance). Figure 108 illustrates the transition from
a state of "good health" to one or more of these states of partial or full
failure (Reference 270). Six transition paths are realistically possible.
The strong left-to-right progression from state to state is not meant to
imply that states "to the right" exclude the types of failure associated with
states "to the left." For example, in a capacity-lost-to-opened transition,
it is not assumed that the cell regains capacity. Rather, all failures are
assumed to be permanent. It is assumed in each case, however, that the
effect of the succeeding state on the terminal characteristics of the cell will
dominate those of all preceding states. Thus, ff a ceil has lost capacity and
then suddenly experiences an open circuit, the open condition is assumed to
govern the cell's behavior.
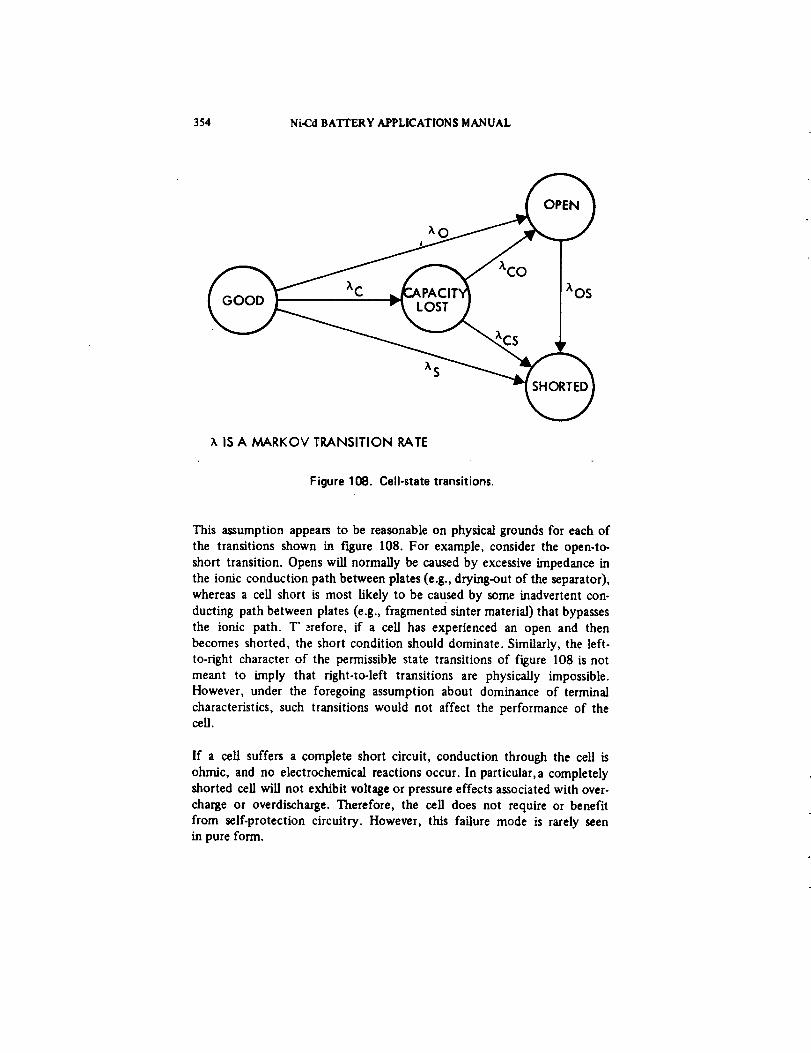
354 Ni-Cd BATTERY APPLICATIONS MANUAL
X IS A MARKOV TRANSITION RATE
Figure 108. Cell-state transitions.
This assumption appears to be reasonable on physical grounds for each of
the transitions shown in figure 108. For example, consider the open-to-
short transition. Opens will normally be caused by excessive impedance in
the ionic conduction path between plates (e.g., drying-out of the separator),
whereas a cell short is most likely to be caused by some inadvertent con-
ducting path between plates (e.g., fragmented sinter material) that bypasses
the ionic path. I" _'refore, ff a cell has experienced an open and then
becomes shorted, the short condition should dominate. Similarly, the left-
to.right character of the permissible state transitions of figure 108 is not
meant to imply that right-to-left transitions are physically impossible.
However, under the foregoing assumption about dominance of terminal
characteristics, such transitions would not affect the performance of thecell.
If a cell suffers a complete short circuit, conduction through the cell is
ohmic, and no electrochemical reactions occur. In particular, a completely
shorted cell will not exhibit voltage or pressure effects associated with over-
charge or overdischarge. Therefore, the cell does not require or benefit
from self-protection circuitry. However, this failure mode is rarely seen
in pure form.
BATTERY SYSTEM DESIGN 355
Most cell failures fall into the capacity degradation class, and nearly allcell failures exhibit some behavior associated with this class as the transi-
tion is made from a state of good health to a state of failure. (Note, how-
ever, that improper charge control and/or cell design may also produce
symptoms similar to those observed for cells with states within the capacity
degradation class.) These cells continue to behave as electrochemical devices
and are capable of overcharge and overdischarge reactions in varying
degrees. Some form of cell protection may therefore be required to accom-
modate such partial or complete failures if the battery-system design
requires operation with failures present.
If a cell develops a complete open circuit,* the battery containing the cell
is lost unless there are provisions for bypassing discharge and charge currents
around the affected cell. This failure mode is rarely seen in pure form but is
probable enough to warrant consideration in developing the design of long-life battery systems.TThe presence of cen-level or battery-level redundancy
is usually sufficient to accommodate the open-circuit failure mode.
8.4.2 Battery-Level Redundancy
Two or more parallel-connected batteries are used for most low-Earth-
orbit (LEO) missions. Redundancy is provided in the form of extra bat-
teries. If cell failures occur, the affected batteries are removed from service,
and those that remain share operation at deeper depths of discharge. The
battery system is always sized to accommodate the event-however unlikely
-that enough failures occur at the beginning of the mission to effectively
eliminate redundancy for the remainder of the mission. The value of maxi-
mum depth of discharge selected for the sizing calculation is determined by
cycle life characteristics and battery-system reliability considerations.
Battery systems used in LEO missions may experience from 500 to 30,000
discharge/charge cycles in typical applications, with most missions falling
within the range of 3,000 to 10,000 cycles. Thus, in general, the maximum
depth of discharge for LEO missions is constrained to shallow levels. (SeeSection 8.7.4.) At or above these levels (for systems with all batteries in
*This includes the condition of high internal impedance caused by loss of electrolytefrom the separators.
tA survey of failure-mode distribution data conducted by TRW in 1977 revealed thefollowing breakdown: capacity degradation: 72.5 percent; short circuits: 22.0 per-cent; and open-circuits: 5.5 percent.

356 - Ni-Cd BATTERY APPLICATIONS MANUAL
service), a failing cell is unlikely to reverse in voltage during discharge so
abruptly that the event re_t_ _moticed during routine examination of
battery telemetry data. In the past, this has been an important considera-
tion because, with notable exceptions, batteries in LEO spacecraft have
been operated at warm temperatures, which would contribute to over-
pressure effects during reversal. Also, the LEO spacecraft can be out of sight
of a ground station for several successive orbits.
The situation is similar for higher orbits with longer eclipse and orbit
periods but with fewer discharge/charge cycles. In these orbits, batteries are
operated at .greater depths of discharge and for longer mission times. Con-
sideration must therefore be given to the margin between the specified value
of maximum depth of discharge (with no redundant batteries remaining
in service) and the expected capability of the nickel-cadmium system asdemonstrated by life-cycle tests and orbital performance measurements.
If too little margin is provided, cell reversals will probably occur during
normal discharges near the end of the mission. At the present time, there is
no general agreement regarding an appropriate value for this margin. The
single published guideline was developed in 1973 for general application to
U.S. Air Force geosynchronous spacecraft (Reference 271). It suggests
reducing the expected (mean) cell cycle-life characteristic curve-determined
by analyzing observed data-by approximately 20 percentage points over a
40- to 70-percent range of depth-of-discharge values to derive an acceptably
safe value of maximum depth of discharge. However, the work leading to
this recommendation was necessarily qualitiative because applicable data
were sparse, and the study did not consider the effect of reconditioning or,
in a parametric sense, the effect of operating temperature. Although more
data are now available, comprehensive analyses have not yet been reported
that define gee ynchronous service life capability as a function of maximum
depth of discharge, temperature, cell configuration, reconditioning policy,
and charge-control method or the confidence limits associated with the
deC'tuitions. Furthermore, the capability definitions based on accelerated
life-cycling tests and limited orbital data must eventually be reconciled with
real-time performance data if a high level of confidence in the capabilitydeC'tuitions is to be achieved. Until these tasks are performed, estimates of
life capability and margin will be based on engineering ju._gment supported
by the analysis of the trend of available test and flight data.
The preceding discussion provides a brief overview of the state of affairs
concerning the evaluation and prediction of geosynchronous battery mission
life and reliability. Various approaches are reflected in the recent literature,and it is evident that they are being formulated in response to: (a) particular
customer concerns and requirements, (b) the availability and quality of test
BATI'ERYSYSTEMDESIGN 357
and flight data, (c) the variability of cell.design features from project to
project, and (d) a general awareness that certain cell materials and manu-
facturing processes may have inherent limitations in terms of meeting long-
service lifetime requirements.
Certain issues have been thoroughly discussed throughout the industry.
In the applications area, the beneficial effect of low-temperature operation
of batteries in both low- and high-altitude orbit applications has received
widespread acceptance on the basis of an overwhelming amount of flight
and ground test data. Other issues are being investigated and discussed.
For example, the effect of reconditioning and the definition of correct
reconditioning procedures and schedules are under debate. In the area of
cell design, some investigators contend that improvements in performance
and reliability might be obtained if a cell were specifically developed forgeosynchronous applications and, in particular, for long-life service. This
general situation is reflected in table 52, which summarizes views expressed
by representatives of several battery-system developers at the 1976 Goddard
Space Flight Center Battery Workshop. This table shows the diversity of
opinion in the industry regarding expected capabilities and design guidelinesbased on the expectations.
8.4.3 Cell-Level Redundancy
Individual battery ceils may be equipped with circuitry designed: (a) to
accommodate an open-circuit failure, or (b) to protect the ceil or its battery
from the effects of overdischarge and/or overvoltage on charge if it should
develop. If item b is completely satisfied, item a is also satisfied, but the
reverse situation is not necessarily true. On Intelsat-IV spacecraft, open-circuit failures are accommodated by bypassing each cell with diodes in
both directions (Reference 210). Intelsat-V spacecraft batteries will also
be protected against open-circuit cell failures and will include provisions for
measuring individual cell voltages. Intelsat-IIl battery cells had reversal
protection circuits (Reference 212). The FLTSATCOM batteries have cir-
cuits that protect against both overdischarge and overvoltage on charge. A
brief survey of other applications of ceil and battery protection circuitsappears in Reference 272.
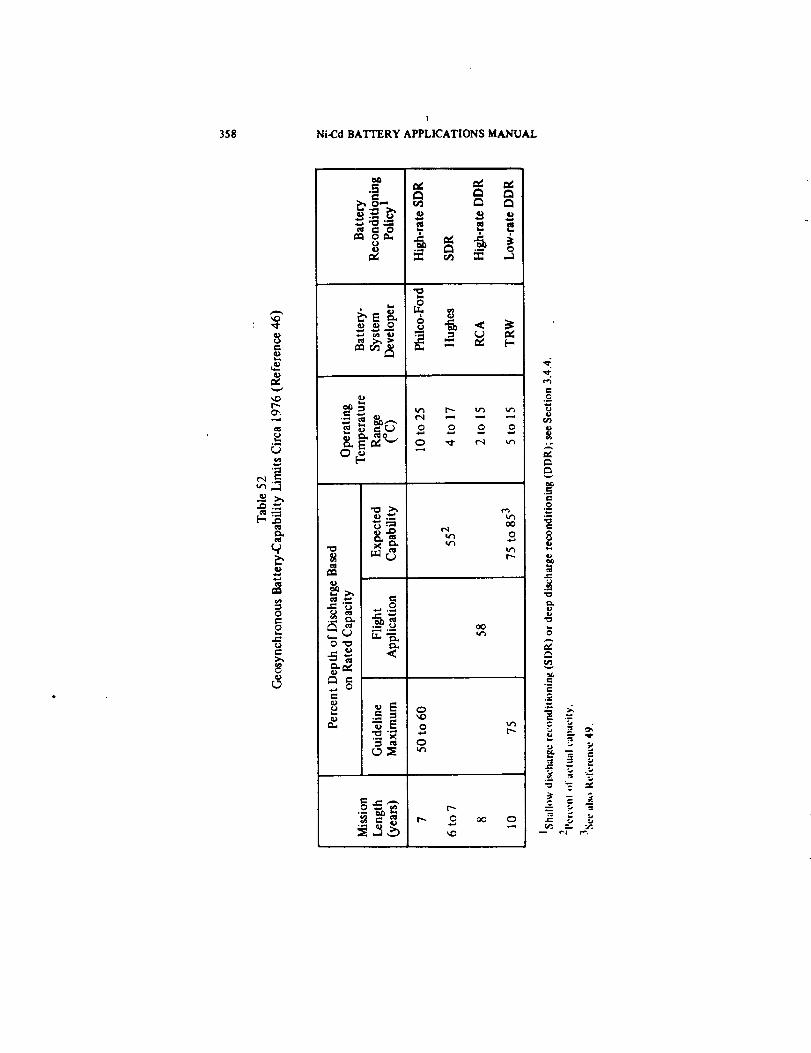
358
!
Ni-Cd BATTERY APPLICATIONS MANUAL
O
.o
['-- .ce_
O
e.-
OO
O
O"_
e..
_O
O
o
OO
t_
e_
e_
o
O
BAI"TERY SYSTEM DESIGN 359
8.4.3. 1 Open-Circuit Failure Protection
The simplest form of open-circuit protection involves the use of diodes
connected in parallel with the cell to permit the passage of charge and dis-
charge currents. A single diode is sufficient in the discharge direction.Under conditions of normal discharge, it does not conduct. If the cell
develops an open circuit at any time during discharge, the diode will
conduct all of the battery current with a forward voltage drop determined
by the device itself. Battery terminal voltage is reduced by an amount
that is equal to the sum of all normal cell-voltage contributions lost to open-
circuit failure and of all forward voltage drops of the discharge bypass
diodes that are forced to conduct.
A somewhat similar situation exists during charge. Here, however, it is
necessary to use multiple diode junctions in series to obtain a forward
characteristic that does not limit normal charge currents by limiting the
cell's voltage. Thus, when silicon diodes are used, it is necessary to have
three in series because the forward voltage of each device is typically in the
range of 0.6 to 0.8 volt, and the cell must be permitted to charge in the
vicinity of 1.5 volts. With normal cell operation, a negligible amount of
charge current is bypassed.
If a cell develops an open circuit, the charge bypass diodes will conduct all
of the charge current. The battery terminal voltage will increase an amount
(for each bypassed cell) equal to the difference between the total forward
voltage drop of the diodes and the normal cell voltage contribution that is
lost because of the failure. This significantly affects the selection of battery-
level temperature-compensated voltage limits if such a scheme is used forcharge control. For example, if a single voltage limit is used, a cell failure
will cause the limit to be reached earlier, thereby reducing battery recharge.
Accommodating thermal dissipation in the diodes when they are conduct-
ing is an important design consideration. The instantaneous dissipation
within a discharge diode is about 3.5 times as great as within an unfailed
cell that carries the same current. This establishes the design requirement
for a thermal shim if it is used to control both cell and diode temperatures.
Discharge diode dissipation is always greater than the dissipation in a single-
charge diode. Ceil discharge dissipation is always greater than the cell dissi-
pation obtained during trickle charge and is nearly always greater than the
heat generated during overcharge at safe current rates. In general, parallel-
ing diodes to reduce thermal dissipation is not feasible because of inevitable
differences in forward I.V characteristics and junction temperatures.
360 Ni-Cd BATrERY APPLICATIONS MANUAL
Although other passive devices have been suggested as replacements for the
silicon diode to achieve a reduction in thermal dissipation, they suffer in
comparison. For example, germanium devices exhibit a lower application
temperature range, higher reverse leakage currents, and less radiation res-sistance. Schottky-barrier power rectifiers have been considered because
their forward voltage is in the range of 0.3 to 0.6 volt. However, they are
less reliable than silicon diodes and may be more reliable than the battery
cells they are meant to protect.* Also, Schottky devices have reverse leakage
currents in the mA range rather than in the nA range, as is the case with
most good siliconP/N junctiondiodes.
8.4.3.2 Active-Element Failure-Protection Circuits
Active-element failure-protection circuits, usually referred to as active-
bypass circuits, provide cell.level redundancy in an equivalent sense. The cir-cuits act to either place a low-impedance path around a failing or failed cell
or limit the cell's voltage in the overdischarge or overcharge regions. An
example of the former is the use of a sirlgle-pole double-throw (SPDT)
relay to disconnect and bypass a cell from its battery, leaving the cell's
terminals open-circuited (Reference 273). Another example is the instal]a-
tion of a single-pole single-throw normally open relay across each cell to
provide a current path on relay closure. Design considerations in such
applications include selection of adequate relay contact ratings and cir-
cuit application procedures (Reference 274), circuit power consumption
(i.e., if magnetic self-latching devices are not used), electrical state indica-
tion provisions, relay performance in vibration, and shock environments,
weight, and volume.
Relay protection implies significant added battery weight because large
relays are usually required to handle the maximum expected discharge
current. A designer is usually faced with two specific considerations: (a)
contact life at nominal current ratings, and (b) limitations on the maximum
current-carrying capability of the contacts. Derating policies normally
applied to power relays, particularly in battery-control applications, tend tolimit the choice to relays of the largest space-qualified size.
*The usual failure mode of all diode types is a short circuit d_ough the junction,
possiblyfollowed by an open circuit if sufficientpower is availablecoburn the shortopen. The metal semiconductorbarrier at the junction of the 5chottky tends todil'fuse into the silicon.This effect is undesirableand leadsto a kighe'r incidence ofshort circuits.

BATTERY SYSTEM DESIGN 361
Active bypass circuits usually limit cell voltages in the overdischarge or over-
voltage on charge regions by linear control of current passed through a
shunt transistor placed in parallel with the cell. On overdischarge, the limit
._set within the range of -50 to -200 millivolts. That is, the ,protected cellis not permitted to reverse in voltage on discharge to a value more negative
than the preset limit. The extreme limit of-200 mV is usually associatedwith values of cell current at the threshold of the range of currents that
contribute to rapid pressure buildup when the cell reverses. The relation-
ships between reversal voltage, overdischarge current, temperature, cell
design and construction, age and service history, and failure pathology arenot amenable to exact description. Much of a cell's behavior during rever-
sal depends on: (a) the amount of residual available capacity in the negative
electrode when the positive electrode is exhausted,* and (b) the physical
causes of the capacity degradation process. A reversed cell will pass a
specific value of discharge current when its voltage is limited to a particularvalue, but the exact value of current cannot be predicted with a high level
of confidence in the statistical sense. When the discharge bypass circuit is
properly designed, it will pass the majority of the discharge current; how-
ever, characteristics of the cell always determine the ratio of the shuntedcurrent to the cell current.
Hydrogen is generated during early reversal with the maximum theoretical
rate given by
A._..P_P_ 3600 RT (50)
ACod 2 VF
where
AP = pressure increment (kN'm -2)
ACod = overdischarge capacity increment (All)
3600 = seconds per hour
R = gas constant (8.314 J.K -t mole -t)
T = absolute temperature (K)
2 = number of electrons per molecule of generated hydrogen
*A positive-limited cell configuration is assumed.
362 Ni-Cd BATTERY APPLICATIONS MANUAL
V
F
= cellvoidvolume (m s)
= Faraday'sconstant(9.65E+04 A-s'mole-l)
Observed rates are generally below the theoretical, leading to the hypothesis
that hydrogen recombination takes place at low but measurable rates during
overdischarge (Reference 12). Some experimental work indicates thatdeliberate reversal of unfailed cells-as might occur toward the end of a low-
rate deep-reconditioning discharge-can be accomplished with stable cell
pressures below 30 psig if the current through the reversed cell is maintained
at sufficiently low rates:
• New 24-Ah General Electric cells: C/120 to C/60
• New 12-Ah SAFT.America cells: C/260 to C/130
• Extensively cycled 12-Ah SAFT-Amen_ca cells: C/130 to C/65
If the cell reversal voltage is limited to -50 mV or is held more positive,
cell currents in these ranges are realizable (Reference 275).
If a cell is permitted to overdischarge at normal rates, the negative, as well
as the positive, electrode will usually be eventually discharged and the
reverse potential will reach -1.3 to -1.5 volts. Both oxygen and hydrogen
will be generated, and internal pressures of several hundred psi will beobserved if terr..,nal seals have not otherwise leaked or the cell case has not
ruptured. The intermediate region between -0.2 and -1.3 volts is associated
with rapid pressure buildup at normal discharge rates and should also be
avoided.
It has been suggested that no two cells will exhibit identical behavior in
the reversal region because of individual differences and, usually, becauseof diverse reasons for degrading to the failed condition. Cel;s seldom reach a
state of failure in swift, dramatic fashion; the degradation is gradual over
many cycles. In any particular discharge, the failing cell may contributesome energy before it reverses. Even if relatively high currents are presentwithin the cell, whether or not it is protected, the period of gas evolution
may be only a fraction of the total discharge period. The literature does notreport simulations of the cumulative effect of gradual cell degradation.
BATTERY SYSTEM DESIGN 363
Analysis of the effect is difficult and can be accomplished only under ratherrestrictive assumptions and constraints. It is reasonable to believe, however,
that the rate of pressure buildup within a failing cell will double in propor:i lion to the rate of degradation. If discharge bypass protection is provided,
; the model will have a sigmoid (s-curve) shape.
The active-discharge bypass circuit should be capable of shunting the
maximum expected value of battery-discharge current without reaching
saturation, with accompanying loss of control of the voltage limit. The
effect of cell failures should be considered in calculating maximum dis-
charge current. In a multiple-battery system, a maximum number oftolerated cell failures are usually specified for each battery. The mechanical
packaging of the power-handling elements of the bypass circuitry mustinclude adequate provisions for thermal control if failures occur in adjacent
cells within the same battery. Power for transistor drive circuits and refer-
ence circuits should be derived from a stable external source. The use of
adjacent cells to provide auxiliary power is not recommended because thesimultaneous reversal of two electrically adjacent cells will result in a loss
of protection for one of the cells.
A similar approach has occasionally been used for overcharge protection.
.A separate shunt transistor with its own reference and control circuitry is
used for current bypass. For adequate protection, it is necessary to provide
a temperature-compensated voltage limit. The voltage limit is usually
designed to prohibit excessive generation of hydrogen during overcharge,
particularly at temperatures in the vicinity of 0Oc. (See figure 31.) Whenthe charge-control system utilizes a family of temperature-compensated
battery-voltage limits, the higher levels may permit high battery-level charge
voltages at cold temperatures. With such a condition, hydrogen evolution at
or near full charge rates may occur in one or more high-voltage cells. Thesituation is aggravated by the tendency for the range of individual cell
voltages to increase at cold temperatures. The cell-level overcharge protec-tion feature acts to limit this condition. This approach is not required in
low-altitude orbit applications (depth of discharge < 20 percent) that utilize
BVL families set low to control overcharge.
8.4.4 Cell Parameter Sensing
Longer missions and "the use of greater depths of discharge have combinedto create a desire on the part of battery, system, and operations engineers
for more battery.performance information in greater detail. At the time of
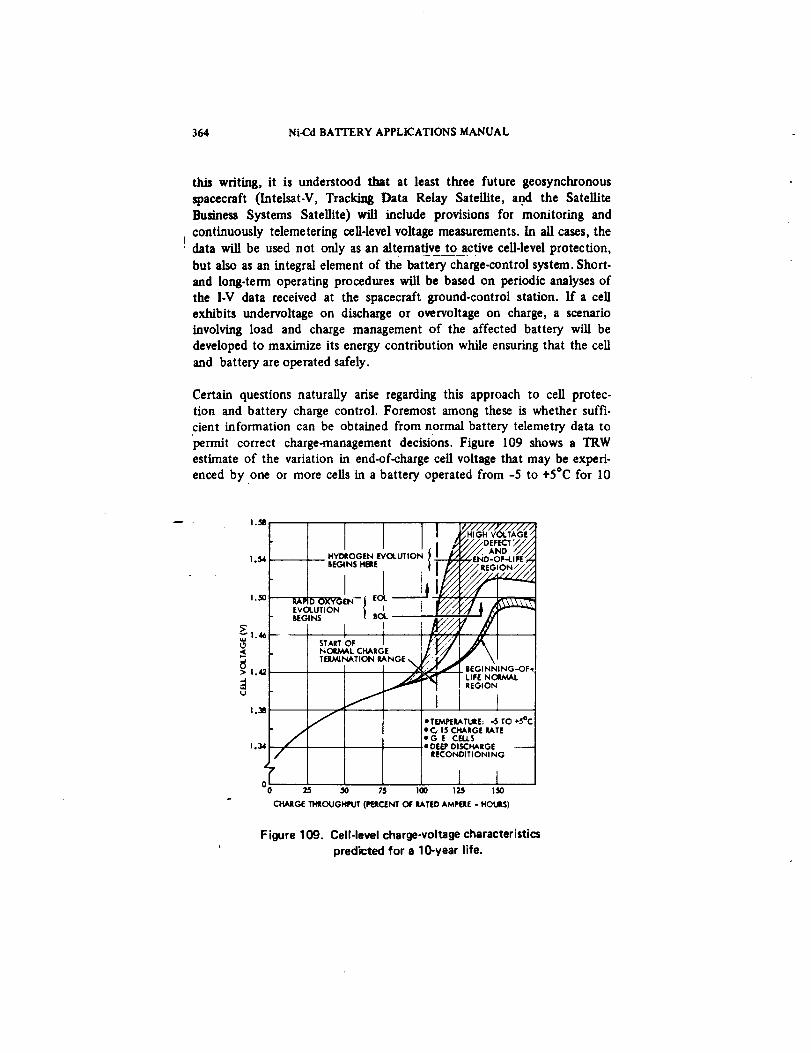
364 Ni-Cd BA'ITERY APPLICATIONS MANUAL
th_ writing, it is understood that at least three future geosynchronous
spacecraft (Intelsat-V, Tracking Data Relay Satellite, and the Satellite
Business Systems Satellite) wilt include provisions for monitoring and
I continuously telemetering cell-level voltage measurements. In all cases, thedata will be used not only as an alternative to active cell-level protection,
but also as an integral element of the battery charge-control system. Short-
and long-term operating procedures will be based on periodic analyses of
the I-V data received at the spacecraft ground-control station. If a cell
exhibits undervoltage on discharge or overvoltage on charge, a scenario
involving load and charge management of the affected battery will be
developed to maximize its energy contribution while ensuring that the cell
and battery are operated safely.
Certain questions naturally arise regarding this approach to cell protec-tion and battery charge control. Foremost among these is whether suffi-
cient information can be obtained from normal battery telemetry data to
permit correct charge-management decisions. Figure 109 shows a TRW
estimate of the variation in end-of-charge cell voltage that may be experi-enced by one or more cells in a battery operated from -5 to +5"C for 10
1.511
1o_4
1.50
o
> 1.42
u
I //I///,r/Z/Z/.,,i
o,N CXU_IALCHARGE _y//
, o,NN,No-o,,
1.34 /
00_ 25 50
/
75
i ieTF.M_RATURE: -5 TO ÷5°CeC, 15 CHARGE RATE• G E CEU.SeDE_ DISCHARGE
RECONOITIONI NG
I 1100 125 150
CHARGE THROUGHPUT (I_JCENT OF RATEO AMPERE - HOURS)
Figure 109. Cell-level charge-voltage characteristics
predicted for a lO-year life.
BATTERY SYSTEM DESIGN 365
years. The estimates are based on real-time geosynchronous tests "at 0°C
conducted at NWSC/Crane (packs 203A, 205A, and 206A) and on data
from the U.S. Air Force Aero Propulsion Laboratory (USAF/AFAPL)
Long-Life Battery Advanced Development Project.
The beginning-of-life (BOL) curve represents a recharge from a shorted con-dition. The charge throughput required to reach the point of rapid voltage
rise is therefore greater than that required during continuous cycling above
1 volt. However, the relative position of the curves on the voltage scale is
believed to be valid for normal eclipse-season cycling.
It is seen that a minimum increase in end-of-charge voltage of 0.02 volt per
ceLl is predicted, with the maximum increase being of the order of 0.1 volt.
Voltages at which rapid oxygen evolution may begin at BOL and end of
life (EOL) are indicated to show the onset of pressure rise. At EOL the
oxygen-evolution voltage is closer to the hydrogen-evolution voltage than atBOL. This assertion is based on the assumption that the oxygen overvoltage
on the positive electrode remains approximately the same throughout life
and, hence, that the change in cell voltage is due mainly to a shift of the
potential of the negative electrode at end of charge.
Figure 110 shows the corresponding battery terminal-voltage characteris-
tics during charge of a 24-cell battery. The two upper solid curves bound
the region of uncertainty in predicting the average and distribution of cell
voltages at the end of 10 years in orbit. It is assumed that only a fractionof the ceils will show high voltage in the worst case. The range of uncer-
tainty of battery voltage at EOL in the region of recharge ratio of interest
(100 to 130 percent) is seen to be about 0.5 volt. The dashed curve shows
one example of a characteristic that could result from a number of combina-
tions of cell voltages and voltage distributions, two of which are indicated
on the figure 110. More than one cell at higher voltage would produceother curves within the uncertainty band. Therefore, even if the battery-
voltage sensor and telemetry channel were capable of essentially "infinite"
resolution, one or more high-voltage cells could not be distinguished from a
smaller increase in average cell voltage by observation of the battery termi-
nal voltage on charge.
We now consider whether voltage degradation on discharge can be detected
by monitoring battery-terminal voltage. Figure 111 shows various typical
cell discharge-voltage curves, each with a single discharge. These curves were
synthesized from the aggregate of real-time available synchronous-orbit
data. Curve A represents cells early in life, whereas curves B, C, and D
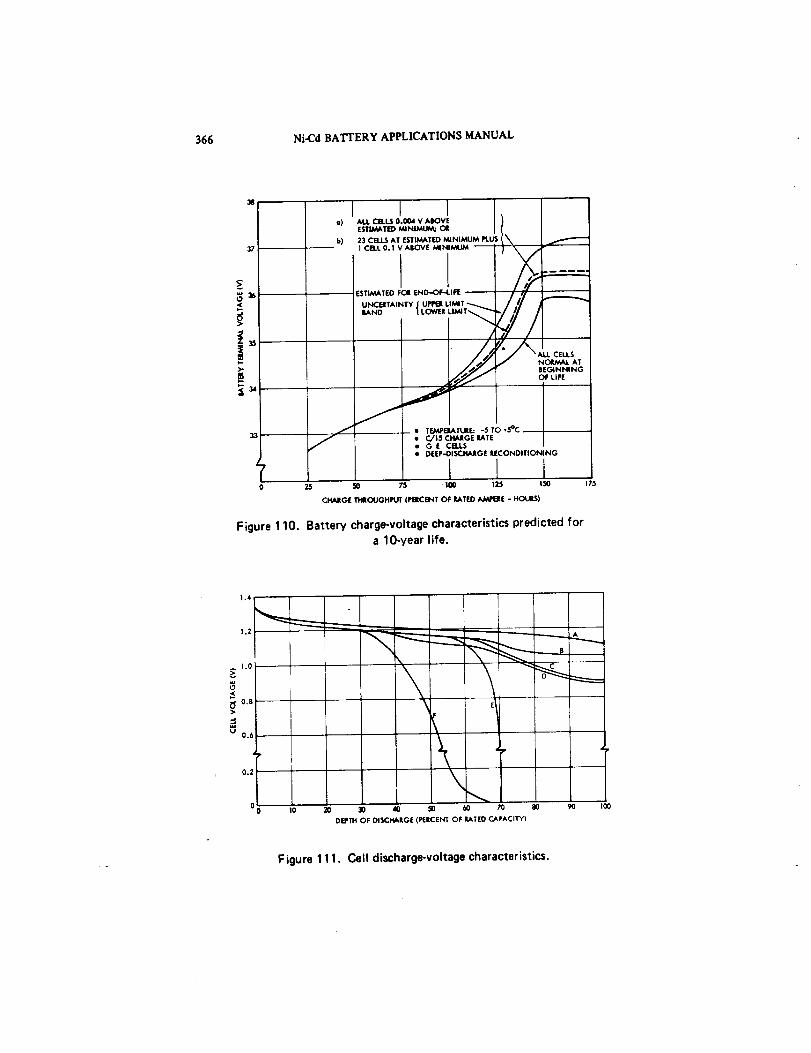
366 Ni-Cd BATTERY APPLICATIONS MANUAL
3S
E
>
70
a)
b)
__ • TEMIP_TulIE: -5 TO +5°C -- •
• C./15 CHAIGE lATE• G E CELLS
• DEEP.-OISCHAIIGE RECONOITIONING
25 5O 75 - 100 125 150
CHARGE THtlOUGHPUT (PERCENT OF RATED AMII_RE - HOUr)
175
Figure 110. Battery charge-voltage characteristics predicted fora lO-year life.
1.4
1.2
1.0
0,8
>
0.6
0.2
!0 o
I10 _) 30 40 _) 60 70 80 90 100
DEPTH OF OI.$CHARG£ (PERCENT OF RATED CAPACITY)
Figure 1 1 1. Cell discharge-voltage characteristics.
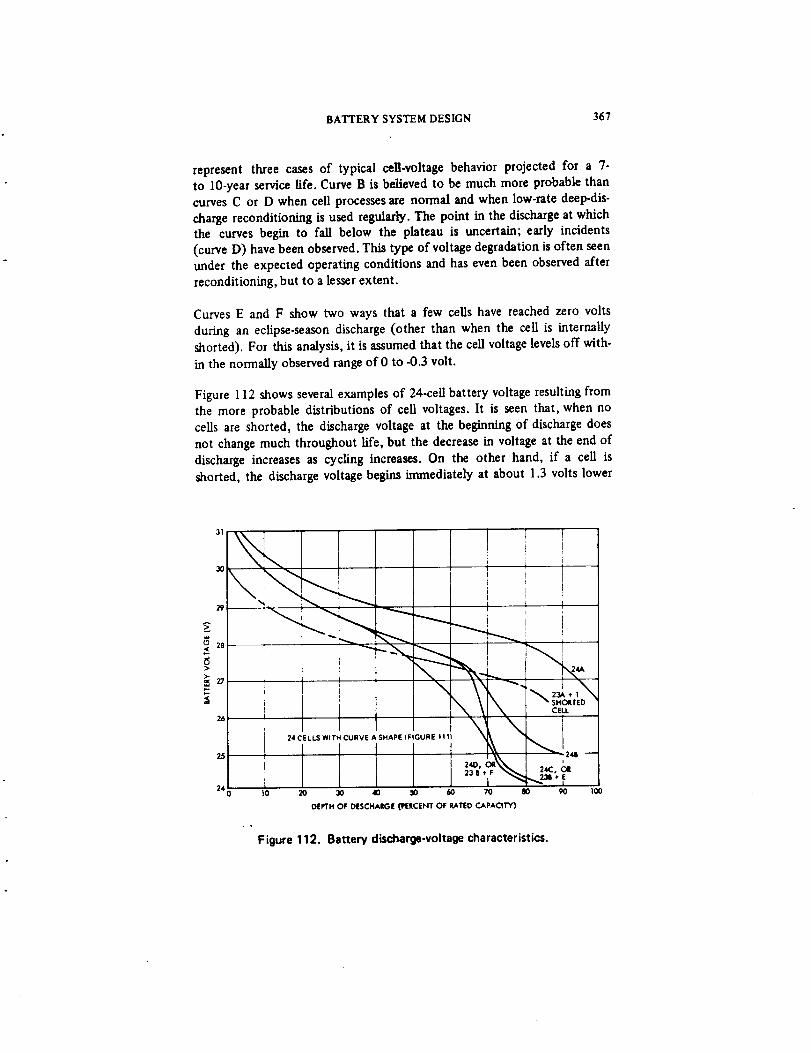
BATTERY SYSTEM DESIGN 367
represent three cases of typical cell-voltage behavior projected for a 7-
to lO-year service life. Curve B is believed to be much more probable thancurves C or D when cell processes are normal and when low-rate deep-dis-
charge reconditioning is used regularly. The point in the discharge at whichthe curves begin to fall below the plateau is uncertain; early incidents
(curve D) have been observed. This type of voltage degradation is often seen
under the expected operating conditions and has even been observed after
reconditioning, but to a lesser extent.
Curves E and F show two ways that a few cells have reached zero volts
during an ecLipse-season discharge (other than when the cell is internally
shorted). For this analysis, it is assumed that the cell voltage levels off with-
in the normally observed range of O to -0.3 volt.
Figure 112 shows several examples of 24-cell battery voltage resulting from
the more probable distributions of cell voltages. It is seen that, when no
cells are shorted, the discharge voltage at the beginning of discharge does
not change much throughout life, but the decrease in voltage at the end of
discharge increases as cycling increases. On the other hand, if a cell is
shorted, the discharge voltage begins immediately at about 1.3 volts lower
31
I
24 CELLS WITH CURVE A SHAPE (FIGURE 1111 _IL •
t_25
2,o, oe\\
240 lO 20
3O
2a
>.
30 40 50 60 70
DEPTH OF DIE$CHAIIGE (PIERCENT OF RATED CAPACITY)
E
I
CELL
\124C, OI
IN) 90 I00
Figure 112. Battery discharge-voltage characteristics.
368 Ni-Cd BATTERY APPLICATIONS MANUAL
than normal and continues at about 1 volt below normal throughout the dis-
charge. Therefore, if the battery voltage were to be followed closely by
telemetry throughout a complete discharge before and after the occurrence
of a shorted cell, it should be possible to detect such a short by comparing
the two curves. If only a spot check of voltage near the end of discharge is
made, the effects of a short could not be distinguished from those of other
forms of cell-voltage degradation, as indicated by the intersection of the
broken curve with all three of the lower solid curves in figure 112.
It would appear that, if a cell in the battery behaves as shown by curve E or
F (figure I 11), it could be easily detected by watching the battery terminal
voltage. Abrupt as the cell-voltage change may be at the end of discharge,
the effect on the battery terminal voltage characteristic will not be dis-
tinguishable from that resulting from a number of other, more probable
cell-voltage distributions. As shown by the lower two solid curves, the
battery-voltage curve resulting from all 24 cells discharging on curve C is
practically identical to that for 23 cells discharging on curve B and one cellon curve E. Similarly, the battery terminal-voltage curve for all cells dis-
charging on curve D is practically identical to that for 23 cells on curve Band one cell on curve F detected by monitoring these currents. With
multiple batteries whose output terminals are connected at a common
point, the current-sharing characteristics under these conditions will be nomore useful than battery terminal voltage for distinguishing between one
cell reversing on overdischarge and a large number of cells in a battery going
to some slightly lower than usual voltage at end of discharge. It is therefore
concluded that, regardless of the fineness of resolution of the battery
voltage and current telemetry from spacecraft to ground, overdischarge of
an individual cell with degraded capacity cannot be reliably detected in a
battery that has operated for a few years simply by observation of battery
terminal voltages and currents. Cell reversals and possible further damage to
degraded cells cannot be reliably prevented by management from the
ground on the basis of such data alone.
A related issue concerns the question of whether a small number of battery-
voltage sensing points, or taps, can be used to provide data for battery-control decisions. It can be shown analytically that taps at the first cell,
or at the quarter- and half.battery points (referenced to the grounded termi-
nal), may provide voltage measurements of sufficient accuracy to permitdetection of an anomalous cell within the group. However, above the half-
I_attery point, the probability that a defective cell will remain undetectedincreases dramatically. Therefore, the use of a limited number <if sensing
taps does not provide information that is uniformly complete or accurate
regarding the condition of an cells within a battery.
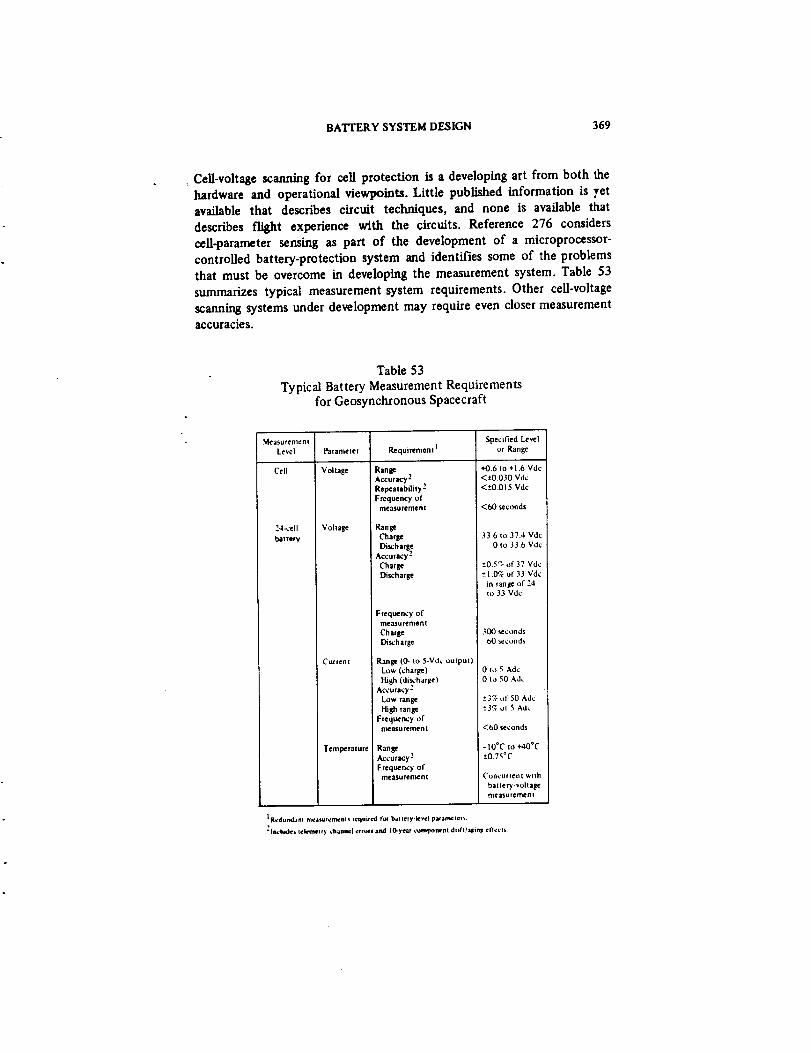
BATrERYSYSTEMDESIGN 369
Cell-voltage scanning for cell protection is a developing art from both the
hardware and operational viewpoints. Little published information is yet
available that describes circuit techniques, and none is available that
describes flight experience with the circuits. Reference 276 considers
cell-parameter sensing as part of the development of a microprocessor-
controlled battery-protection system and identifies some of the problemsthat must be overcome in developing the measurement system. Table 53
summarizes typical measurement system requirements. Other cell-voltage
scanning systems under development may require even closer measurementaccuracies.
Table 53
Typical Battery Measurement Requirementsfor Geosynchronous Spacecraft
Measurement
Level
Cell
24<eil
baltery
Voltage
Curlenl
Tem_rature
SpecifiedLevel
Requirement I or Range
RangeAccuracy 2Repeatability 2
Frequency ofmeasurement
RangeCharge
DischargeAccuracy 2
ChargeDischarge
Frequency ofmeasurementCharge
Discharge
Range (0- to 5-Vdc output) iLow (charge)
High (di_harge)Accuracy-
Low range
_gh rangeFrequency of
measurement
RangeAccuracy 2
Frequency ofm_asufenle tit
+0.6 to +1.6 Vdc<±0.030 Vdc<±0.015 Vdc
<643 seconds
33.6 to 37,4 Vdc
0 to 33,6 Vdc
±0.52 of 37 Vd¢±1.0_of33 Vdc
in Tange of 24to 33 Vdc
3_conds
00 _conds
0 to 5 Ado0 to 50 Ado
-*3% ot 50 Ado*-3_ ol 5 Ado
<60 seconds
-10°C to +40°C
±0.75°C
Concur_en t with
battery-voltagemeasurement
tRedulw_anl nteamr_:rl_.,nl_required foe bat lery -level pa¢amelet,.
21nc1_1¢_ teknwlr) chamtel elfora and tO-year L_am!_olwnt d_ift/aatng cl'tects
370 • Ni-C.dBATTERY APPLICATIONS MANUAL
8.5 METHODS OF DISCHARGE CONTROL
Batteries are discharged to the primary power bus either directly, through
isolation diodes, or through discharge regulator/converters. The insertion
of any power-handling element between a battery and the power bus intro-duces voltage and power losses that must be accommodated by an increase
in battery size, in the form of either additional cells or cells of larger
capacity. In synthesizing an electric power system, the first, or baseline,
approach examined should always be one that utilizes the direct-discharge
method because it will usually result in batteries of minimum size. The base-
line system must satisfy all performance requirements, including bus-voltage
regulation, safe charge control of individual batteries, and system reliabilityallocations.
When batteries are connected in parallel directly to a bus or to a bus
through isolation diodes, their ability to share the load current in equal
parts becomes important. An imbalance between discharge currents means
that the batteries will each have different depths of discharge and, poss_ly,
different temperatures. It is necessary to consider separately what this may
mean in either low-altitude or geosynchronous-altitude orbit applications.
In the former case, with depths of discharge up to 30 percent, such
imbalances are normal and may result from: (a) temperature differences
between batteries during charge, (b) mismatches in the impedance of the
power cables, and (c) imbalanced battery capacities. In the absence of cell
failures such as short-circuits, these conditions have different and sometimes
self-compensating effects on the cells during cycling with the net result that,
within certain limits, the overall energy balance of the ceils is affected little
or not at all. Special tests recently performed at NASA/GSFC have deter-
mined these limits for state-of-the-art low-altitude orbit applications.*
Later paragraphs of this section summarize some of the test results.
The effect of failed or severely degraded cells in one, two, or more paral-
leled batteries is not usually a problem from the viewpoint of current-
sharing in low-altitude orbit applications because the battery containing
these cells will be effectively decoupled from the rest of the battery system
during all or most of the discharge period. The normal batteries will run at
deeper depths of discharge, but this will be no worse than the case in which
failed batteries have been disconnected with no redundancy remaining for
the rest of the mission. The worst-case values of depth of discharge so ob-
tained for the "good" batteries, and the corresponding profiles of "good"
*Floyd E. Ford, NASA/GSFC, private communicati3n, February 1978.
i BATTERY SYSTEM DESIGN 371
battery temperature, should be examined to ensure that: (a) the battery
system can support the mission in the absence of redundancy, and Co) the
power system undervoltage requirements will be met. The situation involv-
ing battery-level redundancy in geosynchronous applications is similar. Afailure in a battery may be tolerated (ff secondary effects of localized heat-
ing are not severe), or the weak battery may be disconnected.
Unbalanced discharge currents are more of a problem with paralleled
batteries that have cell-level protection. Such batteries are designed for con-
tinued service with one or more failed cells and may be operated with
depths of discharge in the 60- to 75-percent range. A serious imbalance
between battery currents can result in the early exhaustion of one or more
of the batteries, leading to a significant reduction in power-bus voltage at
end of discharge. Also, as the end of discharge is approached, the batteries
containing bypassed cells will deliver most of the discharge current. For a• particular system, this value of current may represent the maximum condi-
tion for the design of the discharge bypass circuit and relays or other
devices connected in series in the discharge path.
This section discusses the load-sharing characteristics of batteries discharged
in parallel directly to a load bus. Later paragraphs describe approaches for
achieving discharge current balance among batteries in geosynchronous
applications.
8.5.1 Parallel Battery Operation
Batteries installed aboard a spacecraft and operated in parafiel during dis-
charge behave with slight differences from one to another because ofinevitable differences between: (a) their local thermal-control system
characteristics, (b) their power distribution cabling, and (c) their initial
,capacity, I-V, and charge efficiency characteristics. These differences are
!_eflected in the instantaneous performance of each battery, but, if morethan one are present, the interactions are so complex that they defy analysis
by any method other than detailed computer simulation. Testing is anothermatter, however, and the following paragraphs present certain results
developed by NASA/GSFC that should prove useful in developing low-
altitude spacecraft batteries.
A starting point for this discussion is the consideration of the relationship
between battery temperature, state of charge, recharge ratio, and I-V
_characteristics. Temperature differences between batteries during discharge
do not cause significant differences in their discharge I-V characteristics.
372 Ni-CdBA1WERYAPPLICATIONSMANUAL
(Thispresumesthatthecomparisonsaremadeat the same values of true
state of charge with batteries of identical capacity.) However, temperature
differences during charge can result in each battery being at a slightly dif-
ferent state of charge at the beginning of the discharge period. When bat-
teries are charged in parallel from a common voltage-limited source, the
initial charge currents will be imhalanced because of differences in tempera-ture and state of charge, but their initial voltages will be similar. With low
BVL levels, the coldest battery will tend to limit the others. With high
BVL levels, the reverse situation will tend to occur. In a two-battery system,
the battery at the higher temperature will exhibit the higher final value of
taper current, although no definite statement can be made regarding therelative values of the true states of charge of the batteries at the same point
in the cycle.
Figure 113 shows data taken during a load-sharing test recently performed
at NASA/GSFC during the development of the electric power module of the
Multimission Modular Spacecraft (MMS). Two batteries were charged in
parallel from a single charger that had battery voltage-limiting capability.Table 54 defines the levels of the family of temperature-compensated bat-
tery-voltage limits (BVL's) that were used for the test. A lO0-minute cyclewas used with 64 minutes of charge time. The batteries were discharged in
parallel. Battery A was maintained at an average temperature of 10°C.
Battery B was permitted to range 10°C above and below the temperature of
battery A.
Figure 113 shows the variations in recharge ratio with temperature differ.ence for each battery when four voltage limits are successively used. The
maximum percent depth of discharge obtained with each battery when
battery B is a_ 20°C is shown at the right-hand side of the figure.
Two points are evident from this figure. First, under ideal conditions,both batteries might be expected to exhibit the same recharge ratio when
their temperatures were identical, and this is nearly the case. The fact that
the trend lines for each battery with a particular BVL are not perfect mirror
images of one another is due to inevitable differences between the charac-teristics of the batteries (true capacity and current-voltage, for example)
and to experimental technique. Second, it is seen that, with a 10°C tempera-ture difference between the batteries, only a small difference exists be-
tween the maximum depths of discharge even though large differences exist
between the corresponding values of recharge ratio. With the higher BVL
levels (5, 6, and 7), the recharge ratio of the warmer battery is generally
and noticeably higher than that of the cooler battery. The lowest BVL
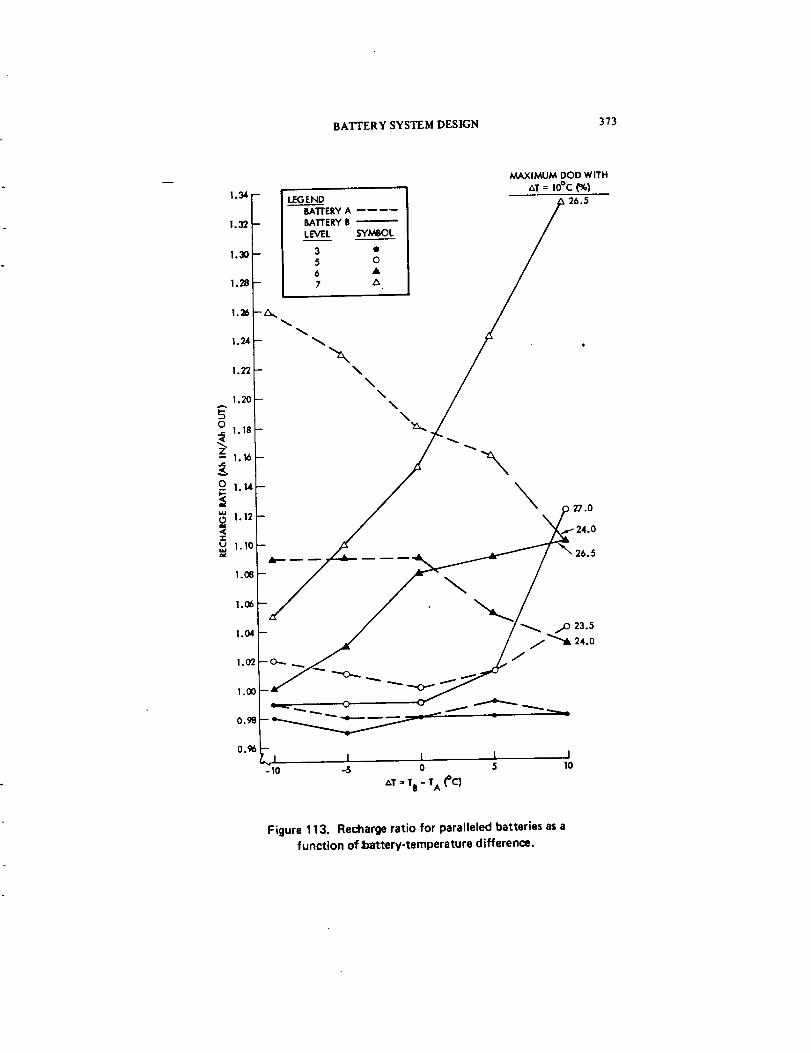
BA'FfERY SYSTEM DESIGN 373
MAXIMUM DOD WITH
AT -- 10°C (%)
1._ UGE,O _ 26s---"B_ERY A /
i. 32 BATrERY B _ /
LEVEL SYMBOL /
1,28 7 A.
1.26-_.
1.24 -- _,_ ,
1.22- \\
1.20 - %%
j \ /1.1e_- "_ "
----!.16 k / \
i 1.12
1.10[-- ._ . _......_'7-_ 26 5
1 o4- / /_ ,,;023.5• _ / /""& 24.0
1o'_-__ o _oJ ._ ____0.98 -- _
0,96-
..,I I i I I- 10 -5 0 5 10
AT - TI - TA (_C}
Figure 113. Recharge ratio for paralleled batteries as a
function of battery-temperature difference.
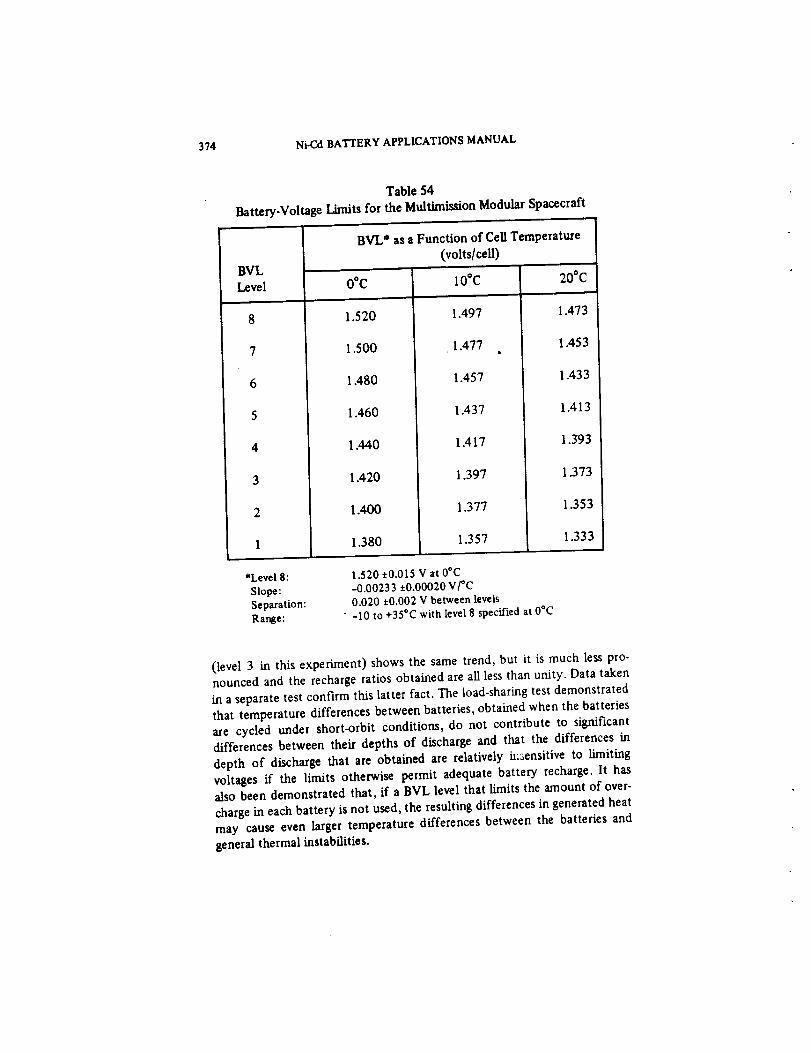
374 Ni-Cd BATrERY APPLICATIONS MANUAL
Table 54
Battery-Voltage Limits for the Multimission Modular Spacecraft .
BVL
Level
8
7
6
5
4
3
2
1
*Level 8:Slope:Separation:Range:
BVL* as a Function of Cell Temperature
(volts/ceU)
0°C 10°C
1.520 1.497
1.500 . 1.477 .
1.480 1.457
1.460 1.437
1.440 1.417
1.420 1.397
1.400 1.377
1.380 1.357
1.520 ±0.015 V at O°C-0.00233 ±0.00020 V/'C0.020 ±0.002 V between levels
• -10 to +35°C with level 8 specified at 0°C
20"C
1.473
1.453
1.433
1.413
1.393
1.373
1.353
1.333
(level 3 in this experiment) shows the same trend, but it is much less pro-nounced and the recharge ratios obtained are all less than unity. Data taken
in a separate test confirm this latter fact. The load-sharing test demonstrated
that temperature differences between batteries, obtained when the batteries
are cycled under short-orbit conditions, do not contribute to significantdifferences between their depths of discharge and that the differences in
depth of discharge that are obtained are relatively iu3ensitive to limiting
voltages if the limits otherwise permit adequate battery recharge. It has
also been demonstrated that, if a BVL level that limits the amount of over-
charge in each battery is not used, the resulting differences in generated heat
may cause even larger temperature differences between the batteries and
general thermal instabilities.
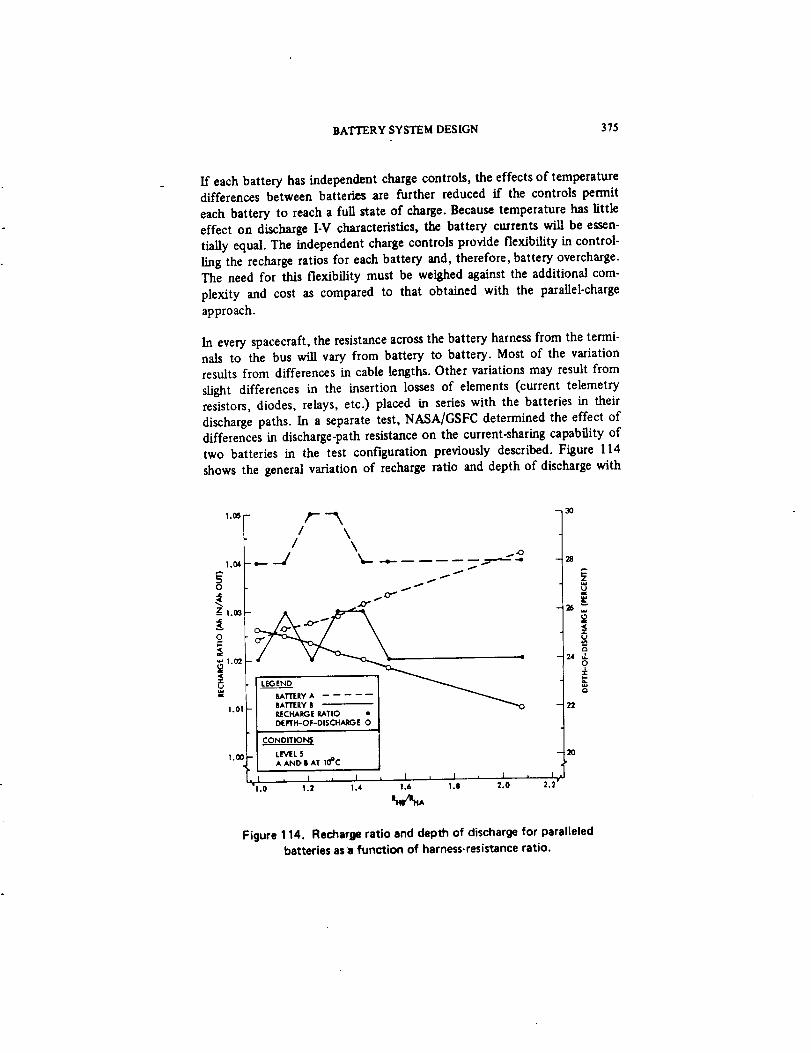
BATTERY SYSTEM DESIGN 375
If each battery has independent charge controls, the effects of temperaturedifferences between batteries are further reduced if the controls permit
each battery to reach a full state of charge. Because temperature has littleeffect on discharge I-V characteristics, the battery currents will be essen-tially equal. The independent charge controls provide flexibility in control-
ling the recharge ratios for each battery and, therefore, battery overcharge.The need for this flexibility must be weighed against the additional com-
plexity and cost as compared to that obtained with the parallel-charge
approach.
In every spacecraft, the resistance across the battery harness from the termi-nals to the bus will vary from battery to battery. Most of the variationresults from differences in cable lengths. Other variations may result from
slight differences in the insertion losses of elements (current telemetryresistors, diodes, relays, etc.) placed in series with the batteries in theirdischarge paths. In a separate test, NASA/GSFC determined the effect ofdifferences in discharge-path resistance on the current-sharing capability oftwo batteries in the test configuration previously described. Figure 114
shows the general variation of recharge ratio and depth of discharge with
1.04 _'--
o _Z 1.00
O
,_ 1.02
<-r
1.01
1.00
/ \/ \
__,/I
i!.6
Im¢%_
_TTER¥ A
RECHARGE RATIO •
DEFTH-OF-OISCHARGE O
CONDITION_,
LEVEL 5
A AND. g AT 10°C
, I , I L , 1 , I%1'.0 1.2 1.4 1.8 2.0
--30
28
25
24,
22
2O
Ij2.2
o
o
o
Figure 114. Recharge ratio and depth of discharge for paralleled
batteries as a function of harness-resistance ratio.
376 Ni-Cd BATTERY APPLICATIONS MANUAL
ratios of equivalent harness resistances. As the ratio of (or the difference
between) harness resistances increases, the difference between the depths of
discharge of the batteries also increases. The battery with the lowest dis-
charge-path resistance attains the highest depth of discharge and the highest
recharge ratio and vice versa. This result suggests that differences between
the internal impedances of paralleled batteries tend to be masked by the dis-
charge path resistances, if the latter are large by comparison. Thus, in most
applications, the presence of an isolation diode in each discharge path will
tend to equalize current-sharing between normal batteries.
Other factors that influence cell and battery I-V and charge efficiency
characteristics are sometimes considered in terms of their effect on parallel
battery-system performance. For systems with batteries charged and dis-
charged in parallel, it is common practice to require that the batteries be
closely matched in capacity to minimize differences in I-V characteristics interms of the state-of-charge parameter. A typical example is the battery
system of the Orbiting Astronomical Observatory. Its three 20-Ah batteriesare matched to within +1.5 All, and the cells for each battery are matched
to within +0.5 Ah (Reference 50). For similar reasons, it is sometimes
required that all of the cells be manufactured with plates from the same lot.
8.5.2 Parallel Battery Operation with Cell Protection
Long.life geosynchronous spacecraft batteries often use some form of cell-
level protection or, in an equivalent sense, redundancy. To minimize the sizeof the battery system, the batteries are often discharged directly to the
power bus. If one or more cells within one of the parallel batteries are dis-
charged or ,_ cell-protection circuitry becomes operative, the dischargecurrent from the battery will be affected. The discharge voltage of the
parallel battery system will be lower than normal, and the other batteries
will provide most of the load current until the system voltage reaches the
operating range of the low-voltage battery. At that point, the batteries will
begin to share current more equally. As the discharge continues, the goodbatteries will tend toward depletion and their currents will be reduced.
The low-voltage battery wilt therefore deliver most of the load currenttoward the end of the discharge period. Figure 115 shows a computer
simulation of the one example of this situation as it occurs during a maxi-
mum geosynchronous eclipse discharge. The three batteries are charged
independently so that the effect of battery temperature variations on the
discharge currents is small. It is seen that the maximum value of cell bypasscurrent occurs at the end of discharge for the case considered.
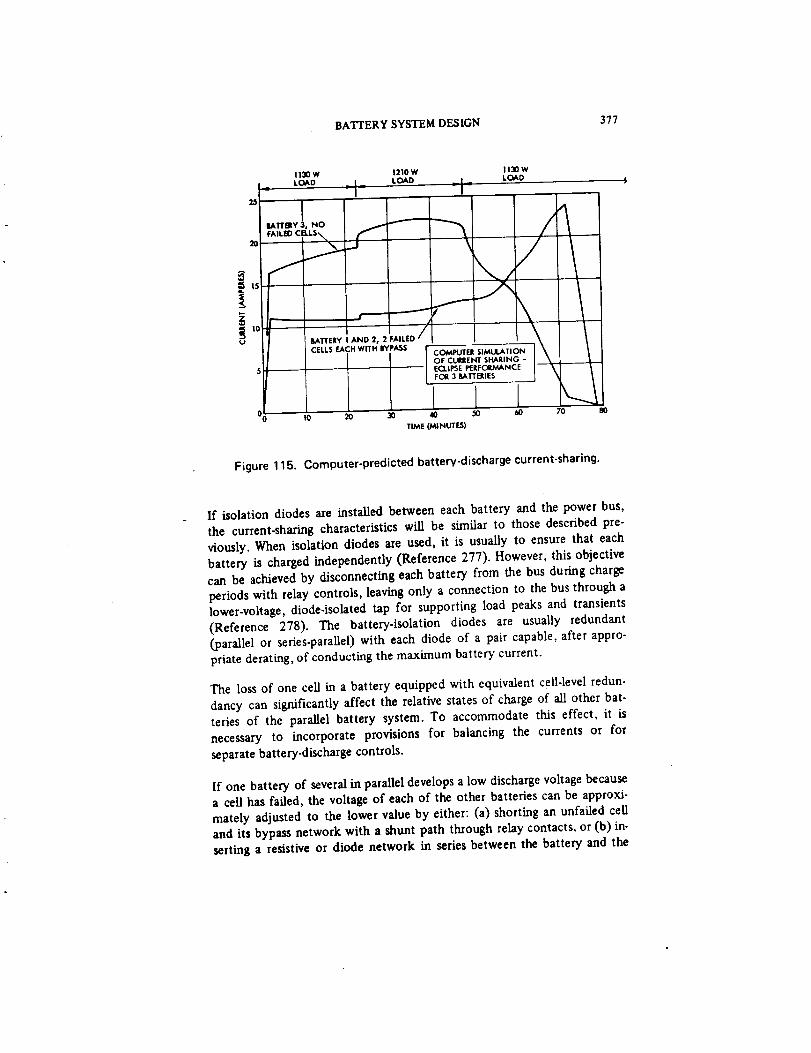
BATTERY SYSTEM DESIGN 377
2O
A
!
u
1130 W
LOAD
IIATImY 3, NO
FAILED C_L$,_
1210 W
LOAD = _.
Ii'mW
LOAD
\1
FOR 3 BATTERIES
I0 20 310 4(3 50
TiME (MINUTES)
/60 70 ,,.1
Figure 115. Computer-predicted battery-discharge current-sharing.
If isolation diodes are installed between each battery and the power bus,
the current-sharing characteristics will be similar to those described pre-
viously. When isolation diodes are used, it is usually to ensure that each
battery is charged independently (Reference 277). However, this objective
can be achieved by disconnecting each battery from the bus during charge
periods with relay controls, leaving only a connection to the bus through a
lower-voltage, diode-isolated tap for supporting load peaks and transients
(Reference 278). The battery.isolation diodes are usually redundant
(.parallel or series-parallel) with each diode of a pair capable, after appro-
priate derating, of conducting the maximum battery current.
The loss of one cell in a battery equipped with equivalent cell-level redun-
dancy can significantly affect the relative states of charge of all other bat-
teries of the parallel battery system. To accommodate this effect, it is
necessary to incorporate provisions for balancing the currents or for
separate battery-discharge controls.
If one battery of several in parallel develops a low discharge voltage because
a cell has failed, the voltage of each of the other batteries can be approxi-
mately adjusted to the lower value by either: (a) shorting an unfailed ceU
and its bypass network with a shunt path through relay contacts, or (b) in-
serting a resistive or diode network in series between the battery and the

378 Ni-Cd BATTERY APPLICATIONS MANUAL
bus. Approach (a) is preferred because it has least impact on battery or
spacecraft thermal design. The magnitude of the matching problem dependson the voltage drop actually developed across the bypass network of the
failed ceil. For example, ff a bypass diode is activated because of an open-
circuited cell, the battery voltage will be reduced by approximately 2 volts
(the contribution of the lost cell plus the diode's forward voltage drop).Removal of one or two cells in a parallel battery lowers the voltage of that
battery by about 1.2 or 2.4 volts, respectively. If two cells are removedfrom each unfailed battery in the system, the battery with the bypassed
cell will actually have a higher current at the beginning of discharge and
will eventually reach a greater depth of discharge than either of the good
batteries-the reverse of the situation encountered when unbalanced
current-sharing is tolerated. Of course, because cells are removed from the
good batteries, the entire system can store less energy, and all batteries will
experience greater than normal depths of discharge. Nevertheless, this
approach avoids large disparities between the states of charge of batteries
in the energy-storage system.
Another approach, applicable to batteries that are discharged directly to theload bus, involves the use of separate load buses, each dedicated to a single
battery. If a cell failure occurs, the battery simply discharges to a greater
depth of discharge at a higher current. (A constant power load is assumed.)This split-bus approach has been applied successfully on several of the
Intelsat spacecraft, on which multiple transponder loads facilitate the
apportionment of the total spacecraft load between the batteries. Thedefinition of balanced load groups between separate buses is more difficult
for spacecraft with other types of payloads or mission proFdes. Split-bus
electric power systems are usually designed as two or more separate power
systems witk cross-strapping as required for critical functions (e.g., source
power for command receiver power supplies) and reliability enhancement.
8.5.3 Discharge Through Regulator/Converters
Many systems contain batteries that discharge through converter/regulators.Most of this type of flight systems have the batteries p°'alleled at the input
to a single but redundant discharge unit. This approach is usually takenbecause it minimizes the number of parts, weight, and cost associated with
the power.conversion equipment. But, as power levels increase, it becomes
impractical to perform all of the power conversion in a single unit. There-fore, the concept of modular energy-storage units, each containing a single
battery with both discharge- and charge-control functions, becomes
attractive.
BATTERYSYSTEMDESIGN 379
When each battery in a power system contains its own discharge unit, the
batteries axe effectively isolated, one from another, dunng discharge. Such
systems are functionally equivalent to the split.bus direct-discharge con-
figurations described previously: As cells degrade or fail (assuming cell-
level protection), both discharge current and maximum value of depth of
discharge increase. The output power levels of the converter/regulators
will be similar-subject primarily to variations introduced by shifts in effi-
ciency caused by differences in converter/regulator input voltages and slight
differences between electronic component performance characteristics.
The assignment of a discharge converter/regulator to each battery permits
consideration of methods of obtaining forced discharge current sharing.
Here, the objective is to maintain equal discharge currents among all bat-
teries regardless of the effects of degradation or of cell failures. Dischargecurrents are individually sensed, and the corresponding voltage signals are
used to develop error signals proportional to the current imbalances. The
error signals are used to control the duty cycles of the corresponding con-
verter/regulators. With identical input currents and a common output vol-
tage, the discharge units do not contribute power identically to the load
power bus. The circuitry required for this approach becomes complex asthe number of energy storage modules increases. The mechanization is, how-
ever, relatively simple for a two-battery system. The approach offers the
advantage of maintaining the batteries at the same depth of discharge, even
though they no longer exhibit similar I-V characteristics. Degradation and
cell failures tend to be borne uniformly by all batteries in the system.
8.6 SYNTHESIS OF BATTERY-SYSTEM CONFIGURATIONS
In many respects, the synthesis problem is more complex than the analysis
problem. It involves the combination of basic components into particular
configurations that each meet the requirements and constraints imposed at
the system level. Yet, each component must satisfy certain requirementsand must have compatible interfaces with other components and subsys-
tems. In the real world, other factors affect the process. For example, there
is usually considerable interest in finding ways to use existing hardwarebecause it has been developed, designed, and tested and therefore represents
reduced risk and a potential cost advantage to the project. The designers of
power and battery systems must therefore apply considerable ingenuityand creativity to their task, particularly if the mission requirements repre-
sent a significant departure from those studied in the past. By comparison,the analysis problem is usually straightforward and, if properly decreed,
can be solved with standard engineering techniques and methods.
380 Ni-Cd BATTERY APPLICATIONS MANUAL
8.6.1 Interactive Roles of Battery-, Power-, and Thermal-
System Designers
The importance of a team approach to the development of battery and
power systems cannot be overemphasized. The battery is one of the ele-ments that has the most influence on the configuration of the power
system, particularly if the spacecraft is designed to orbit the Earth or a
planet. Its charge and discharge must be controlled, and, under certain
circumstances, its cells must be protected. Its performance characteristicshave a direct effect on the size of the solar array and, often, on the voltage
level of the primary power bus. It exhibits a variable heat-generation profile
with high dissipation peaks relative to many other spececraft components,
yet its temperature must be maintained within close limits at a level below
that of other parts of the spacecraft. The performance characteristics of
its cells are influenced by a wide range of design, manufacturing, and
application variables. These considerations combine to form system and bat-
tery-level design problems that usually yield only to an interdisciplinary
approach.
8.6.2 Development of Preliminary Power-System Configurations
Before a power system can be synthesized, it is necessary to analyze and
define the requirements it must meet. Several types of definition studies
can aid this development process.
8.6.2. I Load Power-Profile Analysis
There may be several load power-time profiles for a particular mission:
single-orbit, single-day, single-week, by service mode, by season, or by mis-
sion phase. The single-orbit profile is most common and is usually the basis
for battery energy-balance calculations. Because the payload duty cycles ofsome low.aRitude Earth surveillance missions vary from orbit to orbit,
energy balance is required only over a 14- to 16-orbit "day." Similarly,
the loads of some geosynchronous communications satellites may be pro-
grammed on a weekly basis to account for periods of heavy or light traffic.
Other spacecraft may be designed to serve dual functions, each occurring
during different periods of its service lifetime. Separate load profdes areusually defined for geosynchronous spacecraft during the equinox and
solstice seasons. Finally, it is always necessary to develop a load power
timeline from prelaunch, through launch and ascent, to a point in the final
orbit when the spacecraft isfully operational.
BATTERYSYSTEMDESIGN 381
Whatever the basis for the load-prof'de definition, it is not uncommon for
the power-system designer to experience great difficulty in assembling
accurate load information early in the spacecraft definition phase. Without
it, however, there can be no rational basis for power- and battery-system
sizing calculations.
The payload power profde is developed by accumulating unit-load powerdata. The unit or load group power requirements are defined in terms of
input voltage, duty cycle, operating mode, transient specifications, and
notations of special conditions. Converters that supply power at secondary
voltages must be identified in terms of the loads they serve and their effi-ciencies or losses. A similar profile is constructed for housekeeping l_ower
requirements, including those of the power system, and the two combined.Battery-charge power is sometimes not included in the total spacecraft
load-power prof'fle but is handled separately in the power-system/battery-
system sizing calculations.
A launch/ascent timeline is prepared for: (a) calculating the battery state
of charge at liftoff and the drains incurred during ascent when array power
is minimal or the spacecraft is eclipsed, (b) identifying solar-array deploy-ment events, (c) ensuring that sufficient loads are maintained to protect
the solar-array shunt limiter/dissipator, and (d) evaluating the effect on
battery and power-bus voltage regulation of firing pyrotechnic devices.
8.6.2.2 Load-Bus Voltage Level and Regulation Studies
Most spacecraft are designed with nomirial +28-Vdc primary power buses
because most payload equipment requires power at this voltage level. If a
significant amount of load power is required at another level, it is desirableto consider methods of energy generation and storage at that level in order
to eliminate losses in conversion/inversion equipment. In some cases, bus
voltages in the 56- to 112-Vdc (high voltage) range are used, and, in certain
special instances, those in the kilovolt (very high voltage) region may beconsidered.
If a high voltage load is on during the eclipse period, it can be supported
only in one of two ways: (a) low-voltage batteries that discharge to the load
through a voltage-boost converter/regulator, or (b) high-voltage batteries
that discharge directly to the load. The low-voltage batteries will always
be larger in capacity because they deliver the same watt-hours of energy for
the load at a lower voltage and they must be sized to accommodate the
382 Ni-Cd BATTERY APPLICATIONS MANUAL
inefficiency of the discharge regulator. The high-voltage batteries will be
less reliable because they contain about three to four times as many cells in
series. With battery-level redundancy applied to both approaches, the
system with high-voltage batteries will generally weigh more than one with
low-voltage batteries and discharge converter/regulators.
As spacecraft power levels increase, the power losses within cables andharnesses also increase because: (a) the spacecraft dimensions tend to be
larger and longer cables are therefore required, and (b) the low-voltage
power buses must carry higher currents. Wire weight is directly proportional
to current or power and inversely proportional to tl_ voltage drop across
a unit length. It is often desired to specify a total voltage drop from the
power source to a load so that the increment of power-source weight re-
quired for compensating for the voltage drop across the cable is minimized.This condition exists when
where
AV
P
u
mG
/--K'ff'--
av = 4""mG
= voltage drop across a wire of length £ (return wire not included)
= density of conductor (wire insulation omitted)
= conductor resistivity
= incremental specific weight of the power generator (source)
Reference 279 contains the derivation; however, equation 3.9 of thereference is incorrect. It should be
M AMG P- £ - _" _/m G pO
The ordinate of figure 3.28 in Reference 279 should therefore be labeled as
"Minimum Cable (Power and Return) Weight (lb/ft)."
The foregoing corrected equation shows that the wire or cable mass (M), or
the increment of power-source mass (AMG), per unit length varies in direct
proportion to transmitted power and in inverse proportion to transmission
voltage level. The latter fact is often used as an argument for the use of
BATTERYSYSTEMDESIGN 383
high-voltage distribution systems, particularly at higher power levels. There
is merit in this approach in many circumstances. However, note that the op-
timization involves only the power source and the distribution cable. A
more complete optimization, as outlined in Reference 280, incorporates the
characteristics of postsource and preload conversion equipment.
In addition to influencing the size of the power sources, the cable voltage
drops can also affect the voltage regulation of the power buses. When bus
voltage is determined by the characteristics of the battery, it may be neces-
sary to design the distribution cable for minimum voltage drop rather than
for optimum weight.
Determining voltage regulation requirements is an important preliminary
step before system synthesis can begin. Most payload equipment is compati-
ble with a coarsely regulated 28-Vdc power bus. For many components,
however, there are specific voltage limits. The lower limits usually have the
greatest impact on battery design because they often determine the number
of cells in series. The system and battery designers must also consider the
specification of the undervoltage limit used for fault detection and isolationbecause it establishes the battery tap point. When cell-level protection is
provided, the effect of cell failures below the tap may influence selection
of the limit. If the batteries are connected to the power bus during their
charge period, their maximum achievable charge voltage will determine the
maximum bus voltage unless the bus is limited by other means.
8.6.2.3 Power-Source Regulation Definition
It is not immediately obvious that the decision to regulate the power source
would greatly affect the battery system. However, if no source regulation is
provided and the batteries are connected to the bus, the batteries may act
as a shunt regulator for the source. When this is the case, care must be
exercised to ensure that the batteries are not overstressed during the charge
period. Specifically, we refer to a condition in which the charge rate (high),
temperature (low), and state of charge (high) may combine so that hydro-
gen is generated in one or more of the battery's cells.
Conditions that lead to the presence of high-charge currents are maximum
solar.array output (e.g., at beginning of life or on eclipse exit when the solar
array is below steady-state temperature conditions) and/or reduced space-
craft electrical loads. The combination of low battery temperatures and high
charge rates results in a tendency for individual cells within a battery to
384 Ni-Cd BATTERY APPLICATIONS MANUAL
diverge in voltage on charge. The cells with higher voltages may therefore
enter the voltage region associated with the evolution of hydrogen. (See
the section on "Maximum Allowable Voltage on Charge.") Because the
recombination rate of hydrogen is low, a possibility exists for the generation
of high cell pressures. Given this possibility, the final result is dependent on
the duration of gas generation, as well as on the rate.
The critical period occurs during orbits with eclipse durations that producelow-to-intermediate values of battery depth of discharge but are long
enough to cool the solar-array significantly. These conditions are mostsevere when the orbit is at geosynchronous altitude (negligible Earth radia-
tion and albedo to mitigate array temperature excursions) and when the
solar array is of lightweight construction. On exit from eclipse into sunlight,
the array output power will be at a maximum value that depends on the
voltage operating point determined by the battery. Current available from
the array at that voltage that is not otherwise required by the spacecraft
loads enters the battery. During part of this transient period, the battery
current may be at a higher-than-normal charge rate. High rates applied to
high state-of-charge cells may therefore result in a period of gas generation
terminated eventually when the battery voltage reaches its limit or the
transient period ends.
8,6.2.4 Pre/iminary Definition of Battery-System Therrna/
and Mechanical In terfaces
It is important to establish the options that are available regarding battery
thermal control and physical location early in the system definition phase
when spacecraft concepts are still fluid and major shifts in direction have
least impact. There is a strong tendency to use familiar, reliable, and simple
techniques. Often, these approaches are directed toward use of designs,
techniques, tools, and processes that are immediately available or that have
proved to be cost-effective in past applications. Thus, there is impetus to
apply passive thermal.control techniques to batteries, as well as to other
spacecraft components. There is nothing wrong with this, as many suc-
cessful applications have demonstrated. Note, however, that the develop-
ment of passive thermal controls for batteries is not a cookbook exercise,
particularly when their operating and standby temperature range must belower than that of other spacecraft components. The requirements of many
missions, particularly those in low-altitude Earth orbit can be completelysatisfied only by active thermal-control systems. Such needs should be
identified early in case they conflict with pre-established ground rules for
the project.
BATTERYSYSTEMDESIGN 385
The responsibility of the battery designer to the thermal-systems engineer
is twofold. First, he must define the temperature-control requirements
in unambiguous terms. Second, he must provide complete and accurate
heat-generation data for all expected operating modes of the cells and
batteries. Although the first is somewhat easier to, accomplish during the
synthesis phase than is the second, it is no less important.
The responsibility of the thermal.systems engineer to the battery designeris fundamental. He must conceive alternative viable approaches for con-
trolling battery temperature and provide information to support perfor-
mance, weight, cost, and reliability tradeoffs. In addition, he must justify
and document his analytical models and translate key assumptions into
appropriate design requirements for the thermal analyst who supports the
design of the mechanical packaging of the batteries and their auxiliaries.
The power-systems engineer is responsible for ensuring that these technical
interactions take place and that the developing designs are consistent with
the overall requirements of the electric power system. He is responsible
for overall power-system performance and energy balance. He is also in the
best position to identify unusual operating modes or potential failure
conditions that may affect the battery and thermal systems.
8.6.3 Development of Preliminary Battery-System Configurations
The starting point in developing a preliminary battery-system design is to
completely define the requirements and constraints that it must satisfy.
Some of the requirements will have been identified in part during studies
directed toward synthesizing the design concept. With the tradeoffs com-
pleted and a system configuration selected, it is essential that all of the re-
quirements be reconsidered for completeness and accuracy. If the review
uncovers any gaps or inconsistencies, it has served its purpose.
When general requirements are established, it is possible to perform certain
well-defined investigations:*
a. Cell and battery size study and deFinition-Sizing is performed as part
of a reanalysis of the power system defined during the conceptual
phase and is done using best available load information. Cell-deFinition
studies are directed toward the preliminary definition of a cell-
*See also Section 9.
386 Ni-CdBATI"ERYAPPLICATIONSMANUAL
b,
Co
d.
e.
f.
procurement specification. Other outputs of this task include defini-
tion of preliminary cell current-voltage and heat-generation data for
use in subsequent analyses.
Charge-control method and logic definitions-Here, the purpose is to
analyze in detail the selected charge-control method to identify allnormal and abnormal operating modes, to identify all signal and con-
trol parameters and their expected range of values, to establish pre-
liminary tolerance requirements on measurements, and to identify
data requirements for the detailed design phase and subsequent test
and flight operations.
Definition of thermal-control requirements-This study is conducted
jointly with the thermal-system designer to assess the effect of adjust-
ing certain requirements on the battery temperature profile during all
operating modes. Issues that were not dealt with in detail during
conceptual design studies are examined; for example, requirements
for heater power, tradeoffs of radiation area and weight variations in
heat.generation profiles, effects produced by repositioning the bat-teries, effects and advantages produced by relaxing the temperature
range during discharge, requirements for battery component thermal
design, effect of failures on temperature characteristics, and require-
ments for auxiliary cooling during ground testing and prelaunchcheckout.
Definition of cell-protection methods-If cell-level protection or
monitoring is required, a study is warranted to establish the electrical,
thermal, and mechanical characteristics of the networks in sufficient
detail to support the procurement of long-lead items and the develop-
ment of preliminary packaging concepts.
Definition of battery reconditioning policies-This area consists of a
review of available data to determine if and how reconditioning is to
be implemented in terms of controls and sequences of operations.
The policy is reflected in the plan for accelerated or real-time cycle-life tests.
Definition of preliminary battery mechanical configuration-The
packaging concept must be assessed to ensure compatibility with thespacecraft structure, the equipment and harness layouts, and the
thermal-control system. Requirements for control of thermal grad-
ients within the battery assembly must be evaluated with respect
to weight, producibility, and cost.
BATrERY SYSTEM DESIGN 387
g. Definition of preliminary battery-system electronic-circuit configura-tions-The requirements for charge and discharge control, cell pro-
tection and monitoring functions, command and telemetry capability,
heater controls, power distribution, fault detection and isolation, and
power quality and electromagnetic compatibility (EMC) must betranslated into circuit concepts to support parts selection and procure-
ment activities and preliminary packaging and thermal design.
h. Defmiton of preliminary battery electronic-circuit mechanical con-
figurations-Early decisions must be made on incorporating electronicfunctions into the battery package. Configurable items must be identi-
fied, and steps must be taken toward establishment of their interfaces.
i. Definition of preliminary battery-system component-mass properties-These characteristics, especially weight and mounting surface area,
tend to deviate from early estimates during this phase of design and,
accordingly, must be monitored to ensure that individual design
decisions will not adversely affect mechanical performance.
j. Definition of battery-system reliability-Early estimates of battery-
system reliability can be improved as the design of system compo-
nents proceeds. Models are developed for cell and battery reliability,and alternative methods of implementing redundancy are evaluated.
Many other tasks of limited scope must be performed during the prelimi-
nary design phase. The foregoing list applies generally to all battery andbattery-system designs. The manner in which they are planned and executed
may vary from organization to organization or from project to project, but
the objectives remain clear: (a) to establish specifications at the battery-
system and component level, (b) to perform analyses to support anddocument the specifications, (c) to define a preliminary cell-procurement
document, (d) to establish preliminary circuit and packaging designs on the
basis of component specifications, (e) to identify and release long-lead
parts, and (f) to identify electrical, mechanical, and thermal interfaces forlater def'mition during the final design phase. Section 9 describes the
development process in further detail.
8.6.4 Tredeoff Studies
Tradeoff studies usually involve performance, weight, reliability, and cost,.ItltoU_ll othci factoas alto play an important part. For example, known
customer preferences regarding design approach or the experience and

388 Ni-Cd BATTERY APPLICATIONS MANUAL
capability of the spacecraft supplier may limit the range of candidates for
comparison. This usually has favorable effect because too many design op-
tions may result in a superficial treatment of each.
i Most tradeoff studies are performed during the project def'mition phase orl are treated by the organization as proprietary and, therefore, are generally
' undocumented for the public. Some examples, however, can be found in theliterature. They contain a great deal of useful procedural information on
the synthesis of power and battery systems (References 196, 197, 206,
225,281, and 282).
8.7 ANALYSIS OF BATTERY-SYSTEM CONFIGURATIONS
Many analyses are required for defining and designing a battery system.
The following sections discuss some that are basic to its development
process. The reader is encouraged to familiarize himself with their detailseven though some of the procedures are somewhat specialized and outside
the realm of battery-component engineering. The benefit will be increased
awareness of overall performance and interface requirements.
8.7.1 Electric Power-System Modeling
This section discusses methods of modeling and simulating the performance
of electric pow.r systems. Procedures for developing approximate graphical
analyses of power systems are identified, as well as various types of com-
puter programs that have been used to improve analysis accuracy and to
reduce required labor and time. Battery computer programs per se are ex-
cluded because none are described in the literature, although such models
are always incorporated into electric power-system simulation computer
programs.
The development of a battery simulation model is usually best accomplished
along empirical lines. Battery.cell [-V characteristics are measured under
controlled conditions of state-of-charge, temperature, and discharge/charge
BATTERYSYSTEM DESIGN 389
cycle specifications (discharge time, cycle period, and maximum depth of
discharge) and are arranged in tabular form. The program software merely
handles the battery cell as one additional circuit element-albeit, a nonlinear
dement-that has been characterized parametrically and uses interpolation
and other numerical techniques to obtain a solution to a simple system of
network equations. Battery-cell dissipation is calculated by the methodsdescribed in the sections on "Heat Generation During Charge" and "Heat
Generation During Discharge."
8.7, 1. 1 Graphical Analysis Techniques
Solar.cell arrays and batteries have nonlinear I-V characteristics that are
strongly dependent on other variables (e.g., illumination, temperature, or
state of charge). Power control and conditioning equipment also exhibit
nonlinear I-V characteristics or, at best, characteristics that are only piece-
wise linear. The presence of nonlinearities means that analytic solution of
system network equations is not usually possible and that computer simu-lation techniques must be used when accurate, repetitive, system perfor-
mance calculations are required. Nonetheless, it is often desirable to have at
hand the capability of performing a rough but fast check on system opera-
tion, particularly when candidate systems are being synthesized. Reference
283 describes a detailed graphical-analysis procedure that may be readily
applied to most electric power systems. Reference 225 contains other
examples of graphical analysis and shows how the techniques may be used
m advantage in performing tradeoffs of candidate electric power systems
over a wide range of operating conditions.
One important use of graphical-analysgs techniques is the verification of
system stability. For a system operating point to be stable, it must satldythe criterion (Reference 226),
d Pload > dPsource (52)dV dV
Figure 116 shows the I-V characteristic_of a converter/regulator superim-
posed on the I-V characteristic of a solar-cell array. From the origin of the
graph to point 1, the input voltage to the converter/regulator is below that
required for maintaining regulation, and the load line therefore approxi-mates a constant resistance load. The converter/regulator begins to regulate
at point 1, and, as the source voltage increases, the load line follows curve
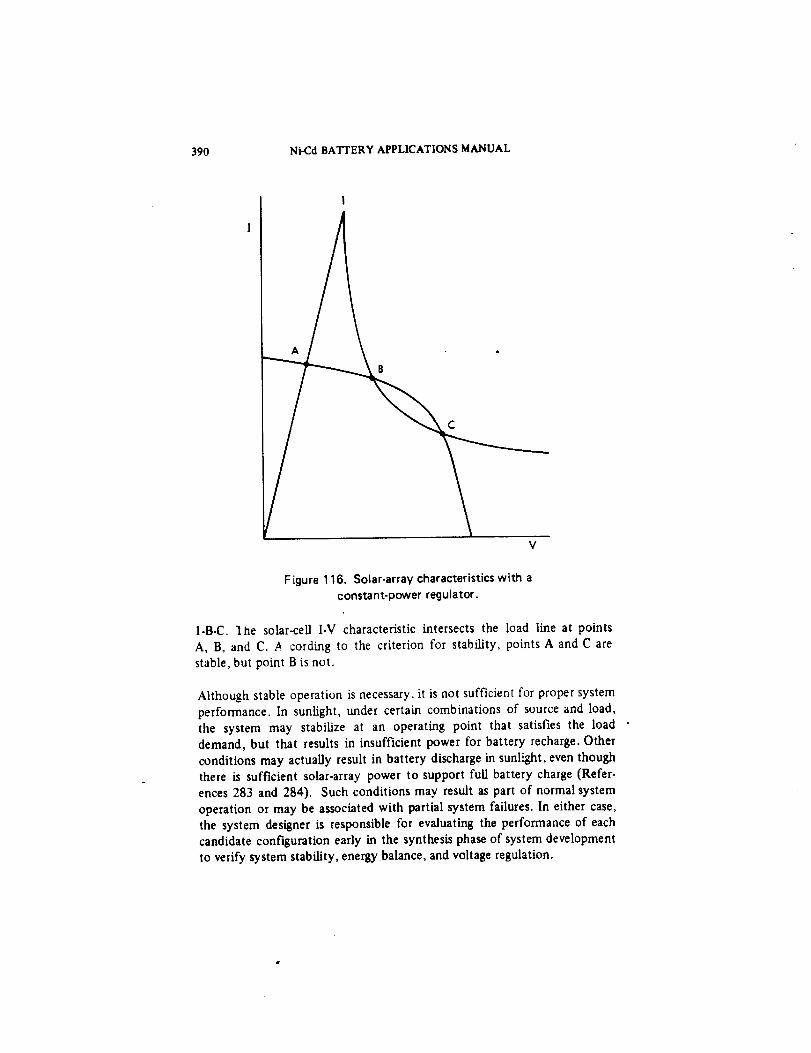
390 Ni-Cd BATTERY APPLICATIONS MANUAL
V
F igure 116. Solar-array characteristics with aconstant-power regulator.
1-B-C. 1he solar-cell I-V characteristic intersects the load line at points
A, B, and C. /_ cording to the criterion for stability, points A and C are
stable, but point B is not.
Although stable operation is necessary, it is not sufficient for proper system
performance. In sunlight, under certain combinations of source and load,
the system may stabilize at an operating point that satisfies the load •demand, but that results in insufficient power for battery recharge. Other
conditions may actually result in battery discharge in sunlight, even though
there is sufficient solar-array power to support full battery charge (Refer-
ences 283 and 284). Such conditions may result as part of normal system
operation or may be associated with partial system failures. In either case,
the system designer is responsible for evaluating the performance of each
candidate configuration early in the synthesis phase of system development
to verify system stability, energy balance, and voltage regulation.
BATTERY SYSTEM DESIGN 391
8.7. 1.2 Electric Power_ystem Simulation Programs
Design calculations for all but the simplest electric power systems are com-
plex and tedious and must often be repeated many times. Each major sup-
plier of aerospace hardware has developed digital computer simulation pro-
grams to reduce labor time and cost and to improve accuracy. Although no
two programs are alike in detail, they share common features within certain
categories.
Many computer programs perform complete simulations of electric power-
system performance throughout single or multiple orbits or specified tra-
jectories. One group of such programs evolved under NASA auspicies forthe Television Infrared Observational Satellite (TIROS) and Lunar Orbiter
spacecraft series (Reference 285) and for the Nimbus series (Reference
286). A similar program was developed for the OAO missions (Reference
62).
The programs contain subroutines that each model one of the major system
components. In a typical example, the subroutines are called by a main
program that contains the system network equations and the integration
routines necessary for determining system energy balance. Iterative proce-
dures are used to converge on the system operating point-the same operat-
ing point that could otherwise be obtained by graphical methods. The solar-
array and battery models are semiempirical. Their I-V characteristics are
inputted as measured data selected for the particular mission and translated
for their predetermined temperature prof'des. (In the case of the solar array,other translations are required; for example, for illumination intensity,
for radiation and other space environmental effects, etc.) In the particular
case of the battery model, tables of measured battery cell voltage data are
stored in the computer's memory. The voltage data are a function of state
of charge (independent variable), charge and discharge current rates, and
temperature.
Intermediate values are obtained by interpolation, using a special sub-
routine. The program requires battery temperature profiles as input data,
but calculates the heat-generation prof'des for the batteries as part of the
simulation. The temperature predictions can therefore be improved by
successive iterations of the separate electrical and thermal-system computer
programs. Versions of this basic program have been used in the design of
low (References 62 and 285 through 287), intermediate (Reference 208),
and geosynchronous (Reference 263) orbiting spacecraft.

392 Ni_d BATFERY APPLICATIONS MANUAL
A second group of programs has been developed in response to analysis
requirements imposed by large, complex, geosynchronous satellites. In
such spacecraft, the thermal-design problem is more difficult and demandsmore accurate estimates of unit.level dissipations, especially those that vary
with time. Accordingly, simulation programs have been developed that
incorporate multinode thermal models of key components, such as thebatteries. Temperatures, as well as dissipations, are calculated at each orbit
time-step and are immediately used in calculating system electrical param-eters. The electrical/thermal calculations are performed successively until
total energy balance is achieved. The time counter is then advanced one
interval, and the process is repeated. The general approach taken in the
development of these programs has been analytical, with battery and solar-
cell data processed at other times with other software. References 288 and289 describe one of the system simulation programs of this group. Refer-
ence 290 describes another program, which was developed for the simula-
tion of interplanetary missions.
All of the system simulation programs just identified contain a model of
the battery's electrical characteristics and, in some cases, of its thermalcharacteristics. These models are usually in subroutine form and are often
used to obtain general performance predictions. Their effectiveness usually
depends on an associated data base of measured battery parameters. Other
investigators have taken a different approach and have attempted to develop
cell performance models based on the use of equivalent electrical circuits.One model is based on a diode/resistor/capacitor network (Reference 291);
another uses only resistors (Reference 292). Such approaches are clever and
usually reproduce battery characteristics with fidelity if the particular
underlying assumptions and constraints are not violated. Usually, however,
the circuit approach is not quite as flexible in application as techniques that
make direct use of empirical data.
8.7.2 Call- and Battery-Sizing Calculations
If all decisions that must be made in performing battery-system sizing cal-
culations were organized into a logical pattern, the resulting flow chart
would take several large pages and be a confusing network of boxes and
crisscrossing lines. The process is interactive with other power- and thermal-system analyses and is iterative in nature. This section describes a few
fundamental steps that apply to all battery systems in any phase of thedesign process.
BATTERYSYSTEMDESIGN 393
The size of a battery (in the electrical sense) depends on the energy it must
deliver during discharge. Stated somewhat differently, the battery mustdeliver current at a voltage above a minimum value for a period of time.
Although the current may be constant, it usually varies as a result of either
the load type (constant power, resistive) or load programming during the
discharge. An estimate of the average value of current during discharge is
usually sufficient for preliminary sizing.
As more cells are added to a battery, the average discharge current required
to support a constant power load is reduced. The opposite is true for a
constant resistance load. By def'mition, changes in battery voltage do not
affect the current required of a constant current load. Constant power loadsare dominant in most spacecraft, and it is usually adequate to use a
constant-power I.V relationship for analysis. (The exception is when there
are significant heater loads.)
It is therefore clear that the starting point in sizing is the determination of
the number of series cells in the battery. Sections 8.3 and 8.4 describe
certain aspects of the analysis with regard to accounting for voltage drops
produced by elements in series with the battery and the effect of cell-
protection circuitry. Let it suffice to simply restate that the battery must
make up all voltage losses on discharge between the battery terminal and the
primary power bus. These may include diode, relay contact, current-sensing
resistor, or discharge regulator insertion losses, as well as battery harnesslosses.
The effect of these voltage drops must be measured against the under-
voltage limits specified for the power system. Three types of undervoltage
limits are possible, and all may be present in a particular design. The first
type is a limit imposed on the primary bus for fault detection and is of
concern only in terms of the selection of a battery tap point for a fault-
isolation current path to the bus. The second is a limit defined for the pri-
mary bus to protect loads that are sensitive to sustained undervoltage
conditions. The third type of limit is imposed at the battery output terminal
as a means of battery protection. It is applicable only when the battery's
voltage is independent of the voltage of other batteries within the power
system.* The battery must have sufficient voltage under normal and
tolerated (by design) abnormal operating conditions, with all series losses
accommodated, to exceed these limits with some margin.
*This requirement can be circumvented when batteries are connected in parallel duringdischarge by applying a limit to groups of cell groups in each battery. A battery isdisconnected when one of its ceg groups develops an undervoltage condition.
394 Ni-CdBATTERYAPPLICATIONSMANUAL
Withthenumberof seriescells established, it is a simple matter to calculate
the average battery-discharge current under normal and exceptional condi-
tions. The battery-discharge voltage determines the load-bus voltage, which
may then be used to calculate the load current from knowledge of the I-Vcharacteristic of the spacecraft load, either directly (assuming a constant
power load) or graphically. If the battery is connected directly to the loadbus through passive elements, the battery current is equal to the load cur-
rent. If a regulator is in the discharge path, it will modify the current in
accordance with its characteristics as power converter.
The number of batteries must be established on the basis of a reliability
analysis of the mission. Section 8.'7.5 contains an outline of the applicable
techniques. However, because the results of this separate task are not avail-able at the time of preliminary sizing, it is necessary to assume a number
that is consistent with the type of redundancy envisioned. With battery-
level redundancy, the minimum allowable number of operative batteries will
establish the preliminary value of maximum depth of discharge for each
operative battery. With cell.level redundancy, there will be at least two
batteries and perhaps more.* The preliminary value of maximum depth of
discharge is computed on the basis of all operative batteries but with a pre-determined combination of cells bypassed. (The combination may provide
for unequal numbers of bypassed cells in each of the batteries. For prelimi-
nary sizing, however, the computation is simplified by considering that allbatteries are equal in terms of the number of operative and bypassed cells.)
Because the average battery current is divided between the operative bat-
teries, the capacity discharged from each battery is thus approximately the
product of its at-rage discharge current and the discharge time.
For the initial calculation, a preliminary value of maximum depth of dis-
charge may be assumed. It will be based on an analysis of the mission
requirements and an assessment of the battery thermal environment for the
proposed spacecraft. In particular, the number and kind of discharge/
charge cycles and the expected operating temperature range will determinethe initial estimate. See the data summarized in Sections 3.4, 8.3, and 8.4.
*Although it is conceivable that a single battery with cell-level redundancy could beused in certain applications, a case can usually be made for havin8 a second battery.Some of the arguments for the second battery ate: (a) that series elements couldfail, leading to a complete loss of a sinsle battery; and (b) that the power system isvulnerable to the effect of faults xhat could occur during the time that a single battery
is being reconditioned.
BATTERY SYSTEM DESIGN 395
A preliminary value of battery and, therefore, cell capacity is obtained by
dividing the capacity discharged by the preliminary maximum depth of
discharge. As the design process continues, these calculations may be
repeated several times until final values are obtained.
The procedure outlined here is traditional. It is based on the tacit assump-tion that the maximum depth of discharge, when selected as a result of
documented industry-wide experience with similar applications, will have
associated discharge characteristics of a particular kind (i.e., the cell voltage
will be above a particular level at end of discharge, and, after the required
number of discharge/charge cycles have been achieved, the cell capacity
will be above a particular minimum value (percent of initial rated capacity)).
Neither the voltage level nor the value of minimum capacity are identified
explicitly in the underlying analyses. Therefore, no data or proceduresare available, based on life-cycle test results, for sizing the battery on the
basis of end-of-mission requirements.
8.7.3 Battery Electronics Design Analysis
As in battery thermal design, the battery engineer is not usually responsible
for the detailed design of electronic auxiliaries mounted to the battery or of
the major discharge/charge control elements. He interprets the mission re-
quirements as they affect battery performance, service time, and reliabilityand analyzes the impact of constraints imposed on the battery system by
the spacecraft and electric power-system configurations. He must usually
define battery electrical performance characteristics for the power-system
and power-equipment design engineers, often on the basis of incompletedata. Nevertheless, his models of cell and battery behavior are essential to
the development of energy-storage and power systems.
The battery engineer is responsible for more than simply providing a charac-
terization of battery performance. He must play an active part in defining
limits, set-points, tolerances, and mode transitions for each of the electroniccircuits that interfaces with the battery. In this regard, he must develop a
general understanding of circuits in common use and their particular limita-
tions. There are no clear procedures for obtaining this knowledge and ex-
perience, and it is beyond the intent of this book to attempt to define a
methodology. Instead, a few short topical discussions are presented to il-lustrate some of the concerns that may require attention by the battery
engineer or by the power systems engineer.
396 Ni-Cd BATFERY APPLICATIONS MANUAL
Three aspects of power COherent design and analysis are of specific
importance to the battery engineer: circuit technique, device selection, and
specifications. The following -topics fall into one or more of these areas:
It is generally not possible to regulate more than one parameter at
a time. For example, a charge controller may limit current in an early
mode with one circuit and limit voltage in a later mode with a second
circuit. Although the controlling element may be a single device,
two independent regulating networks are required for controlling
it, one overriding the other.
Current sensing may be accomplished by measuring the voltage dropacross a resistive network (which produces a power loss) in series
with the battery and noting the polarity of the analog signal. Alter-
natively, a magnetic amplifier may be used with a wire-loop flux
detector to generate an analog signal proportional to current. Al-
though the latter method introduces essentially no insertion power
loss, it requires a separate regulated power supply with its accom-
panying inefficiency.
A temperature-compensated battery-voltage limit (BVL) has a toler-ance band that is a function of the circuit, the desired slope, shape,
and accuracy of the limit curve, and the devices used within the cir-
cuit. Part of the tolerance may result from predictable time-related
drifts, and part may be random. When a family of BVL's is defined
for a long-term mission, the intercurve spacing should account for
probable drift effects and for predicted end-of-mission battery-voltage
performance. The overall spacing should accommodate a specified
number of shorted or degraded cells and must provide adequate
resolution for controlling overcharge and heat generation. Decreas-
ing end-of-charge voltages are to be expected at end of mission in
low-altitude orbit applications. The opposite case is typical for higher
orbit applications.
Solid.state thermal switches (SSTS) used for controlling battery
heaters or for generating signals used for charge control generally
have hysteresis characteristics at both the open and close switch
points. These SSTS characteristics should be considered as part of a
detailed electrical thermal performance simulation.
BA'I'rERY SYSTEM DESIGN 397
A long list of similar items culled from experiences obtained on many hard-
ware projects could be added to the foregoing. Such a list is not required
for support of the point we now make, namely, that interaction leading to
mutual understanding is required between all contributors to a battery
system design in order that requirements and constraints be satisfied with
low cost and risk to the project.
8.7.4 Battery-SystemReliability Analysis
Reliability is defined as the probability that a system, subsystem, compo-nent, or part will perform its intended functions under defined conditionsfor a specified operating period (Reference 293). Explicit in the definitionis the concept that equipment performance can be represented by probabi-listic models, as well as by deterministic models. As the art of reliability
engineering has developed, it has shown that probabilistic effects stronglyinfluence both short- and long-term equipment characteristics. In thebroadest sense, short-term effects are attributable to: (a) design misjudg-
ments or misapplication of parts or processes, and (b) variations in themanufacturing quality control of items ranging from the smallest device tothose at the system level. Long-term effects are the failures or degradationsthat are not easily predicted by deterministic methods but that are
expected, even though the design and application of the equipment isconservative, it has been manufactured to high standards, and it has beenoperated in the manner for which it was designed. Earlier sections of thismanual considered various aspects of cell and battery reliability in terms of
proper identification and control of their design and manufacturingvariables. This section discusses the methodology ordinarily used for estimat-
ing the probability of mission success for the battery system, as well as oneof the two major contributions that reliability engineering has made to thedevelopment of a battery system. The other major contribution is a formalFailure Modes and Effects Analysis (FMEA).*
*The FMEA process is not described in detail because each manufacturer of aerospaceequipment has usually defined procedures that fit within his Product AssuranceOrganization's policy guidelines. It is assumed that a battery designer in such anorganization is familiar with the applicable policies. It is sufficient to note thatan FMEA usually includes detailed analyses of elecUical, mechanical, and thermalfunctions down to the piece-part level. Their objectives are to identify critical items,single-point failures, and actions to eliminate or control single-point failures
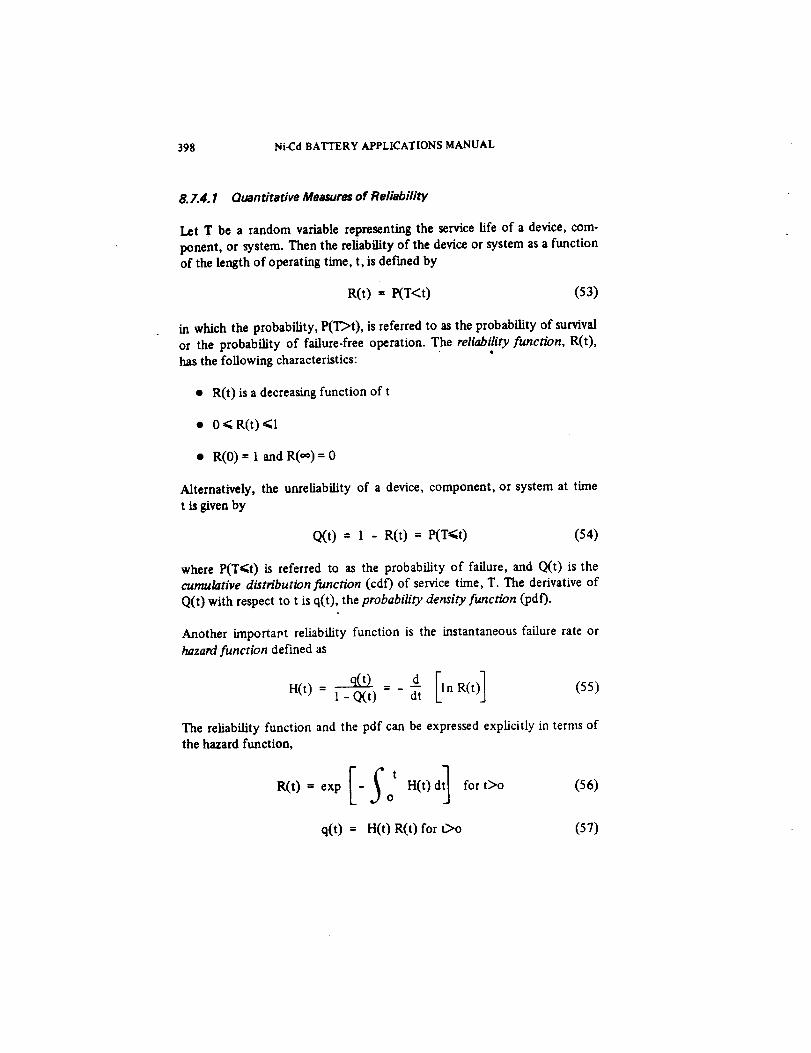
398 Ni-Cd BATTERY APPLICATIONS MANUAL
8. 7.4.1 Quantitative Measures of Reliability
Let T be a random variable representing the service life of a device, com-
ponent, or system. Then the reliability of the device or system as a function
of the length of operating time, t, is defined by
R(t) = P(T<t) (53)
in which the probability, P(T>t), is referred to as the probability of survival
or the probability of failure-free operation. The reliability function, R(t),
has the following characteristics:
• R(t) is a decreasing function of t
• 0 _ R(t) _1
• R(0) = 1 and R(**) = 0
Alternatively, the unreliability of a device, component, or system at time
t is given by
Q(t) = 1 - R(t) = P(Tgt) (54)
where P(T_t) is referred to as the probability of failure, and Q(t) is the
cumulative distribution function (cdf) of service time, T. The derivative of
Q(t) with respect to t is q(t), the probability density function (pdf).
Another importapt reliability function is the instantaneous failure rate or
hazard function deiVmed as
H(t) = 1-[Q(t) = - dt n R(t (55)
The reliability function and the pdf can be expressed explicitly in terms ofthe hazard function,
[StR(t) = exp - H(t) d for t>o (56)o
q(t) = H(t) R(t) for t>o (57)
BA2"rERYSYSTEMDESIGN 399
The mean failure rate for a time period, t, is defined as the average of thehazard function, or
h(t) 1_1f = H(t) dt for t_ (58)
When an exponential reliability function is used, h(t) = H(t) = X and the
term failure rate CA) is then synonymous with the terms, hazard functionand mean failure rate.
The mean time to failure (MTTF) is the expectation of T or, simply, theexpected time to first failure,
_O °°MTTF -- E(T) = t q(t) dt (59)
These equations are the basis for all reliability calculations. They are used in
conjunction with models of failure characteristics of the device or system
(or service function) that are fitted either to experimentally obtained life
test results or to data obtained from service histories, or both.
8.7.4.2 Cell Reliability Models
If a representative sample of battery cells from a population is subjected to
continuous, repetitive, discharge/charge cycling under controlled conditions
(e.g., depth of discharge, charge and discharge rates, temperature, voltage
limit, and cycle period), the reliability function can be estimated as
ntR(c) = l -- (60)
nt
where nf and nt axe the number of cells failed and tested (sample total),
respectively, and the number of cycles, c, represents operating time. How-
ever, most testing is actually performed with test packs containing small
groups of series-connected cells. When a pack is judged to have failed,
possibly because of only one problem cell, it is usually removed from the
test.* Under such conditions of cell discontinuation, at any point in the
test,
"A def'mition of failure is not requiredfor the purpose of this discussion.
4OO Ni-Cd BATrERY APPLICATIONS MANUAL
nfR(c) = 1 - -- (61)
no - nr
where no and nr are the number of cells originally on test and removed
before cycle c, respectively. A plot of equation 58 appears as a series of
steps rather than a smooth curve because R(c) changes value only at the
cycle times when a failure or a pack removal occurs. The basic cell reliabil-
ity modeling problem is one of fitting an analytic expression for R(c) or
R(t) to the empirically derived reliability function so that discontinuationdata are handled in a manner that is mathematically consistent with the way
that failure data are treated. The method of maximum likelihood is a classi-
cal statistical approach that is suited to this problem. It has been applied
in connection with the development of a general reliability model for low-
altitude orbit battery systems (Reference 122).
It is beyond the scope of this manual to describe in detail the specificmodels used in reliability work. Instead, this section describes two distri-
butions--exponential and Weibull-that are of prime importance in battery
cell reliability estimation work. Figure 117 summarizes the mathematicalform of these distributions and their associated reliability and hazard func-
tions. References 294 through 296 contain further information. The remain-
ing discussion refers primarily to the reliability function because it can be
calculated directly from failure data.
The exponential is the most frequently used reliability function because
it is simple and because its associated constant-hazard function is represen-
tative of a wide variety of devices when they are properly used and main-mined within : controlled environment. But, this distribution is not satis-
factory for modeling a population of devices such as nickel-cadmiumcells that may exhibit pronounced wearout with extended service in addi-tion to the effect of random failures. The Weibull model provides a better
fit. By adjusting the Weibull parameters, a (scale) and B (shape), it is pos-sible to match the R(c) obtained from equation 59 or 60 for a particular
cell-test category with small error (References 114, 122, and 297). TheWeibuil distribution contains the exponential distributi.:n when f3 = 1.0.The mean failure rate obtained with the Weibull model is tt_-t/a.
Figures 57 through 59 of Section 3 display part of the results obtained from
an analysis of 90-minute discharge/charge cycle data obtained from two
sources: (a) the continuing NASA-sponsored cell-test project at the Naval
Weapons Support Center (NWSC), Crane, Indiana (NWSC/Crane), and (b)
a government and industry-wide survey of available low.Earth orbit-flight
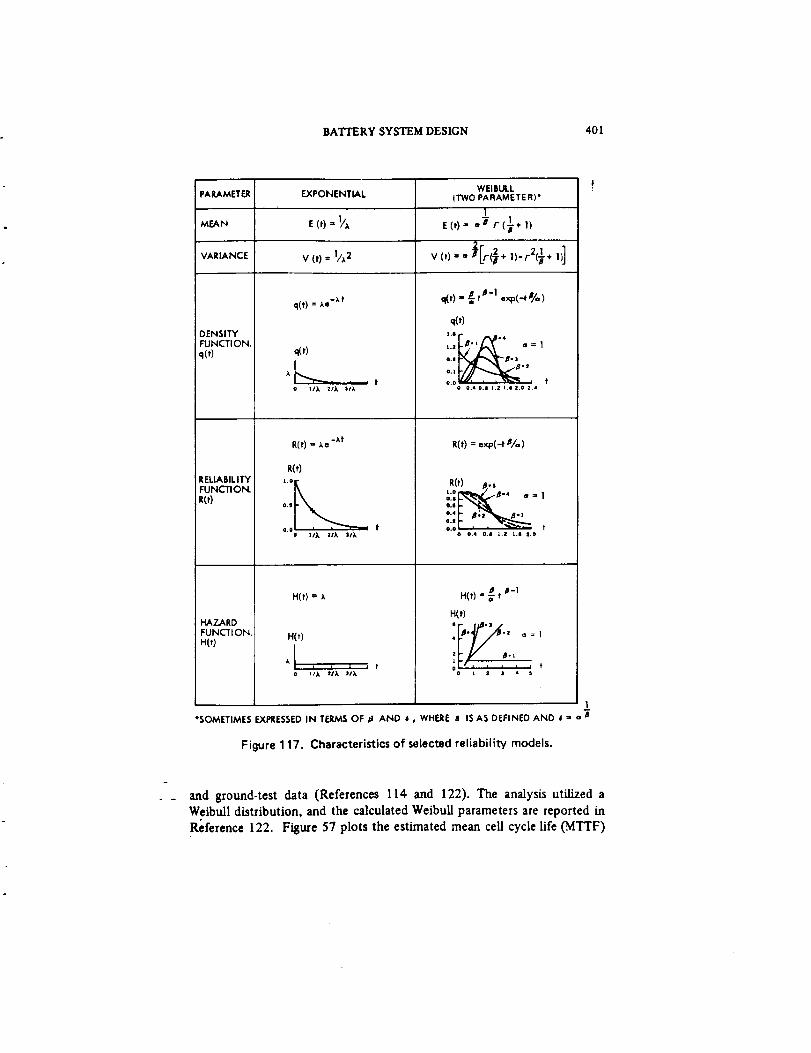
BATTERY SYSTEM DESIGN 401
PARAMETER EXPONENTIAL
MEAN
VARIANCE
DENSITYFUNCTION.
q(t)
RELIABIL ITYFUNCTION,e(0
HAZARDFUNCTION.H(t)
v (t)= IA2
q(t) : ;_e -_'t
q(t)/
o ]IX 2IX 3l_
R(t) = _e TM
R(t)
0,9-
°'°o iix =Ix 31), t
WEIBULLiTWO PARAMETER)"
1
-E(t)= =mr( +1)
v.).. .-::. .]
__ D-I_t) =. t ,xp(-t%)
q(t)
"i., LY'"_.= .e ==I
o.I " _-.)
0'0 0 0.40.j |.2 1,12.0 2.4 t
R(t) = exp(-t B/a)
R(t) .S:,I.o "4_'_l_..,_8 a = 10.=
O.4 .
o. o o., o., ,., _., ,., t
H(0
,I
H(t) = x
, , A * t
]/A ZI_ J/X
BtB-1H(t) = 3"
H(t)
4_ -Z a:l
, -/, _.,
!*SOMETIMES EXPRESSED IN TERMS OF _i AND 6, WHERE 8 IS AS DEFINED AND i = o a
Figure 1 17. Characteristics of selected reliability models.
and ground-test data (References 114 and 122). The analysis utilized aWeibuU distribution, and the calculated Weibull parameters are reported inReference 122. Figure 57 plots the estimated mean cell cycle life (MTTF)
402 Ni-Cd BATTERY APPLICATIONS MANUAL
ts a function of depth of discharge and operating temperature. Figures 58and 59 show the calculated cell reliabilities at 6,000 and 12,000 cycles, re-
spectively, as functions of these same parameters.
Note that battery.cell reliability modeling is a developing art and is sub-
jective in terms of both model selection and the selection and interpretationof the cell-failure data base. For example, Reference 297 reports the resultsof a Weibull treatment of a data base similar to that used in developing
Figures 57 through 59; however, the calculated Weibult parameters and cellreliability predictions are different, probably because of differences in the
approaches to handle the effect of temperature and depth of discharge onthe calculated parameters. Earlier attempts to apply WeibuU techniques
(References 111 and 298) also involved complex formulations of the
Weibull parameters in terms of temperature and depth of discharge. Finally,note that European investigators (Reference 113) found that, for certain
categories of failure exhibited in the unscreened NWSC data, a Gompertz
model* produced a better fit to the empirical reliability function than theWeibull model. It is clear that the Weibull model presented in this section
should be considered for use primarily for preliminary analysis and design.
Greater reliance on the model should be withheld pending the development
of a thorough understanding of the cell-test data base that it reflects and of
ref'mements that may result from considering other data subsequently
collected. The model of Reference 122 is valid only for 90-minute orbit
applications. At the present time, comparable cell reliability analysis dataare not available for the 24-hour orbit or for intermediate-altitude orbits.
8,7.4.3 Battery Reliability Models
In addition to the complement of series-connected cells, a battery reliability
model may include other related elements such as regulators (charge anddischarge), cell-protection circuits and their power supplies, power switches
(relays or solid-state devices), battery-reconditioning circuits, heaters andassociated controls, isolation diodes, and transducers for monitoring electri-
cal and thermal parameters. When an element is present, it must be repre-
sented in a reliability block diagram. A complete reliability block diagramshows all redundant and nonredundant elements and provides a visual
representation of the total battery reliability calculation. Each block must
define, as a minimum, a hazard function and a duty cycle. The hazard
function is specified because, when the elements of a system are nonre-
*The Gompertz model is of the form R(t) = exp [- a/b (ebt - 1) ] and has a corre-
spondin 8 mean faih_e rate of (a/bt) exp (bt).
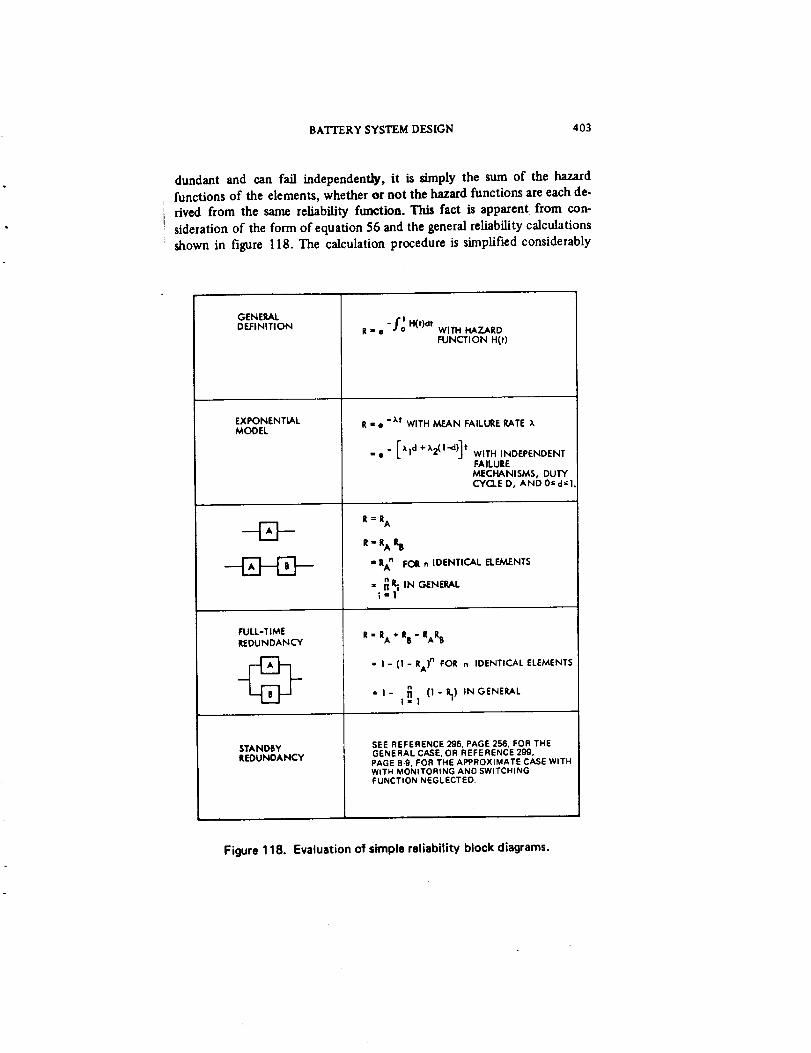
BATTERY SYSTEM DESIGN 403
dundant and can fail independently, it is s_nply the sum of the hazardfunctions of the elements, whether m not the hazard functions are each de.rived from the same reliability function. This fact is apparent from con-
sideration of the form of equation 56 and the general reliabiJity calculationsshown in figure 118. The calculation procedure is simplified considerably
GENERALDEFINITION Rmll
EXPONENTIALMODEL
FULLTIME
REDUNDANCY
STANDBYREDUNDANCY
-fo t _,),J,WITH HAZARDFUNCTION H(t)
R = • °xt WITH MEAN FAILURE RATE x
-. [Xld +X2(1 d)] t WITH INDEPENDENT
FAILUREMECHANISMS, DUTYCYCLED AND0=d=I
R=R A
R = RA lllj
" RAn FOR fl IDENTICAL ELEMENTS
= IN GENERAL|
R = RA + RB - RARB
= I (1 RA)n FOR n IDENTICAL ELEMENTS
= I _ (! Ri) IN GENERALI=1
SEE REFERENCE 295, PAGE 256, FOR THEGENERAL CASE, OR REFERENCE 29t3.PAGE B-9. FOR THE APPROXIMATE CASE WITHWITH MONITORING AND SWITCHINGFUNCTION NEGLECTED.
Figure 118. Evaluationof simple reliability block diagrams.

4O4 Ni-Cd BATTERY APPLICATIONS MANUAL
when failure rates associated with the exponential distribution are used or
ff the reliability of the element is przcomputed, as can be the case when a
Weibull cell reliability model is used.
Battery systems may be either norLredundant or redundant. The choice
depends on: (a) the numerical reliability allocation for the battery system,
and (b) judgments made regarding risk to the mission resulting from failure
of a nontedundant battery system. In the early days of the space program
when payload weight was constrained and missions were short, nonre-dundant batteries were often chosen; in recent times, however, this
approach has been rarely taken for new spacecraft designs. The amount ofredundancy and its method of implementation are now affected, more often
than not, by considerations beyond those of mathematical reliability predic-
tion because nickel-cadmium ceUs axe prone to varying degrees of wearout.
Nevertheless, interest appears to be increasing regarding the possibilities of
developing improved predictive tools for both reliability and end-of-mission
battery performance estimates. Motivation for this interest comes primarily
from the desire to extend mission times, coupled with the availability of a
growing data base of ground-test and flight-battery performance data. The
remaining paragraphs of this section outline several approaches to battery
and battery-system reliability modeling.
The reliability of a single battery without cell-level redundancy is easily
calculated by using the formulas shown in figure 118. Several batteries, each
with its own auxiliary elements (regulators, diodes, etc.), may be con-
nected in parallel for supporting the eclipse and peak-load demands. Extra
batteries are required for meeting the desired battery-system reliability re-
quirement. If R B = RB(t) is the reliability of one battery, the reliability
R s = Rs(t ) of an entire battery system in which k batteries out of m must
successfully operate is given by
m
m!
Rs = '_ x!(m-x)! RB(I - RB)m-x (62)x=k
• Battery-level redundancy is therefore based on the assumption that an
anomalous condition-one open cell, one or more short-circuited cells, or
several severely degraded cells within a battery-is sufficient for removing
the battery from the system. The individual batteries within the system
must therefore be sized for reliable operation with k operative batteries.

BATTERYSYSTEM DESIGN 405
Equation 62 does not directly account for the effect of cell failures on the
depth of discharge and temperature of affected and unaffected batterieswithin the system. This limitation may be dealt with by calculating the cell
reliability by the Weibull method for values of depth of discharge and
temperature that are representative of the ranges of these parameterstraversed as batteries are removed from service. A precise analytical solution
to this general problem is complex and requires computer solution (Refer-
ence 299).
Cell-level redundancy introduces significant additional complexity to the
estimate of battery-system reliability. The redundancy is achieved by some
form of bypass circuitry that compensates, as a minimum, for open-cir-
cuited cells and that may also provide protection from the effects of over-
charge or overdischarge. The action of the bypass circuits, combined with
the behavior of the cell under a particular failure mode, results in a lower
voltage from the protected cell than that generally obtained from each ofthe other unfailed cells in the battery. The resulting voltage degradation at
the output of the single-battery system may be tolerated if the output volt-
age is above the minimum level required by the subsystem. Otherwise, the
battery will have failed. A single-battery system, redundant at the cell
level, _ fizod to accommodate one or more cell failures before battery
failure occurs.
Several approaches to estimating the reliability of a battery with cell-level
redundancy have been taken. The simplest involves conventional analysis
techniques. The reliability of an element-a cell and its bypass circuits-is
calculated by using the formulas for £ull-time or standby redundancy,
whichever is appropriate. The reliability of a series string of these elements
is then computed by using equation 62 with m equal to the total number of
series elements and k equal to the minimum number of series elements
required for sustaining battery operation. The reliabilities of the completebattery and the battery system (if multiple paraUel batteries are used)
are then calculated by using standard expressions from figure 118.
This conventional approach requires simple def'mitions of ceil failure (e.g.,
open.circuited, short-circuited, or severely degraded). The latter corresponds
to a situation encountered in life-cycling tests in which a minimum dis-
charge voltage limit criterion is not met. In practice, the degraded modeoccurs far more often than the others. Usually, however, it is dffficut to
separate the effect of random failures of cells that exhibit degraded voltagebehavior from the behavior of other cells in the battery that are me:ely
406 Ni-Cd BATTERY APPLICATIONS MANUAL
experiencing normal degradations associated with battery use. Two ap-
proaches have been developed that deal with this problem in the contextof estimating the reliability of batteries with cell-level redundancy.
The first approach, which applies to a single-battery system only, utilizes a
Markov reliability model (References 94 and 270). In the Markov approach,
states are defined that correspond to various numbers and kinds of failures,
and state-transition probabilities are determined from the mean failure
rates of the various parts of the system. (See Section 8.4.1 and, in particu-
lar, figure 108.) One of the main advantages of this approach is that thefailure rates of some parts of the system can be pern_itted to be dependent
on the good/failed status of other parts of the system. As an example of
why this is desirable in a battery reliability model, suppose that a cellsuffers a loss of capacity. It will then tend to go into voltage reversal on
deep discharge, which will cause hydrogen gas to be evolved at the positiveelectrode. In turn, this effect will increase the hazard of seal failure because
of hydrogen pressure, after which loss of electrolyte may occur with conse-
quent open-circuiting of the cell. The reverse voltage limiting action of a
discharge bypass circuit will strongly inhibit this sequence of events ff thecircuit itself has not failed. Thus, the capacity-loss to open-transition rate
of a cell is substantially influenced by whether the associated discharge
bypass circuit is working. This transition rate will also be influenced by the
reverse voltage limiting capability of the bypass circuit, with more negative
limits on reverse voltage resulting in higher transition rates. Likewise,
bypass circuit failure rates may be assumed to be influenced by the states
of the respective cells (e.g., if the cell is good, the bypass circuit will remain
in a "standby" condition and can therefore be represented by a lower
failure rate). Another advantage of a Markov model is that it permits failure
rates to be time varying. Thus, time-increasing failure rates may be used to
represent a "wearout" type of cell degradation.
The Markov reliability modeling technique has not yet been applied to
multiple-battery systems. Extension of the method is not trivial because
a significant amount of computation is required for a single battery. An
alternative approach has been developed and applied that accounts for the
interaction (load sharing) of multiple batteries with cell-level redundancyunder various conditions and combinations of cell failure and degradation
(References 300 and 301). The modeling process is based on the perfor-mance of a Monte Carlo simulation of the battery system. Network equa-
tions are written that represent the battery system and preserve the identity
of each cell. The conditions at a mission point (e.g., an eclipse season) are
simulated to determine the voltage-proi'de contribution of each cell and the

BATTERY SYSTEM DESIGN 407
current sharing between batteries. Before the simulation, a state or condi-tion is assigned at random to each cell. Associated with each state is a dis-charge I-V profile that lies somewhere in the continuum between a "good"and a "'poor" cell and that is defined as a function of the cumulativeamount of stress to which the cell has been exposed before the point in the
mission that is being simulated. If bus voltage exceeds the minimum re-quirement, the simulation is declared a success, and the next mission pointis simulated; if not, the total mission is declared a failure. This process is
repeated until many total missions have been simulated. The ratio of thenumber of successful missions to the number of missions simulated is an
estimate of battery-system reliability.

SECTION 9
BATTERY DESIGN AND DEVELOPMENT
9.1 INTRODUCTION
The design and development of sealed nickel-cadmium batteries for space-
craft use require the careful attention of the battery engineer. The com-
plete definition of the battery-system and battery configurations is the first
key step that leads to the proper selection of the cell and to the correctspecification of the battery.
The electrical design requirements are derived from the power system re-
quirements. The mechanical design requirements are determined by general
requirements imposed on all spacecraft components and by a series of trade-
offs and analyses performed to meet weight, volume, and cost criteria at
the spacecraft level. Thermal-design requirements are developed similarly
and are also strongly influenced by the special need to impose temperature
constraints and controls on the battery for achieving the required lifetime.
The contribution of each engineering discipline to satisfying these require.
merits must be planned, coordinated, and reviewed continuously throughoutthe design phase.
The selected method of thermal control is by far the most critical factor in
attempts to achieve long service life and to improve performance. Thisaspect of battery system design is emphasized in earlier sections and is con-
tinued at the battery-component level. However, correct specification and
procurement of cells and careful attention to packaging cells into a batteryare of no less importance. A packaging approach must be selected that mini.
mizes weight and yet provides good structural support for the cells-duringboth dynamic launch operations and over operational periods in which the
structure is subjected to fatigue from pressure and thermal cycling. Formaldesign reviews should be held throughout the design activities to ensure that
these requirements are met and that all interfaces are correctly defined. The
reviews should also verify that manufacturing can build the battery as de-signed in an economical manner.
The following sections deal with the design, manufacture, test, and storageof sealed-cell nickel-cadmium batteries.
409
t ....... "
; Precedingpageblank
410 Ni-CdBATTERYAPPLICATIONSMANUAL
9.2 DEFINITION OF THE BATTERY CONFIGURATION
The definition of a spacecraft battery configuration is an iterative and, at
times, complex process. Considered simply as a component without auxili-aries, the battery requires the support and coordination of electrical/electro-chemical, mechanical, and thermal-design specialties. The addition of auxili-aries, such as integrally mounted charge or cell-protection circuitry, intro-duces the element of electronic design and may add to the complexity of
packaging and heat-transfer problems. All of these disparate skills mustinteract effectively if the requirements and constraints imposed on the
battery and battery system are to be satisfied.
A new battery design usually evolves through three distinct phases - con-ceptual design, preliminary design, and final design. Each phase involvescertain key activities that relate to one another as shown in the designprocess flow chart (figure 119). This flow chart shows the major activitiesthat typically occur during the design, manufacture and test, integration,and flight of a battery as planned and executed by a prime spacecraftcontractor. Though somewhat elaborate, this flow chart is representative ofthe work that must eventually be done during the course of a spacecraft
project. Many activities involve functional groups outside the group pri-marily responsible for the battery. This is simply a reflection of the numer-ous interfaces between the battery and other spacecraft systems and com-
ponents that must be analyzed and defined. When a single organizationproduces both the spacecraft and the battery system hardware, the project
may be structured in different ways to obtain the necessary levels of coordi-nation. The resulting work flow plan might be different in detail from
figure 119, but it should produce the same desired results. When a space-craft contractor purchases battery hardware, the activities differ somewhatfrom those shown in figure 119. The spacecraft contractor must performmany activities of the conceptual and preliminary design phases so that
requirements for. and constraints on, the battery are properly defined insufficient time for procurement. The battery equipment specification andelectrical schematic le_ d on the battery supplier should include these def-initions. Section 5 describes the special considerations that apply to such a
procurement.
The conceptual design phase is devoted to reconciling the battery or bat-tery-system design ori_nally proposed with the provisions of the negotiatedcontract and any other agreements made between buyer and seller. Require-ments for the battery system are reassessed in light of revised requirementsdefined for the electric power system. Electrical, mechanical, and thermal
design constraints are identified, and their impact on the battery system is

BATTERY DESIGN AND DEVELOPMENT 411
VII AIF tC_ ! tO_
SPAt|CRAfT
glr mAJCIURI[ S
LAYOUI' ANO
ACC! SS AttAr V_S
CO_P0GURATtOi_ _ TH|RMAt CONTRO¢
_,,ooR,o I I "_'*" I iSPACECRAFT
[OUtPIdFNT
IISI |NVlAOIWdik l At
gPt Ctf ICATK'_I
REQUIA_Id[ NIS
m|(_RJlA| MI _t lS _ (_Ot4C _ P TUAt
AkCI ¢'O4qS r Iq 41NI S
AmAt YS_S Dt StGtt
.,v,,.V/Jt_tU (.q_SIf_,t| It
AGR( t MI _tl$
q
Olqllt rat
tttSSN_
JUtIAL Y
1i "'--BF_¢IS
ANAt YSIS
R| [ IARILITY _._AL LCK_AIlONS
T_ALVS_
q aA fT[ImT ___
LOGISTK_
&NAt. YSJS
t-,, t.t*_lPYUtt DISlt_P_ PiStil I_lt -- PAll IMttt tit Vi
CfllttCI P r_At
_|VlfW
Figure 119. Typical battery design and development process flow chart(sheet 1 of 3).
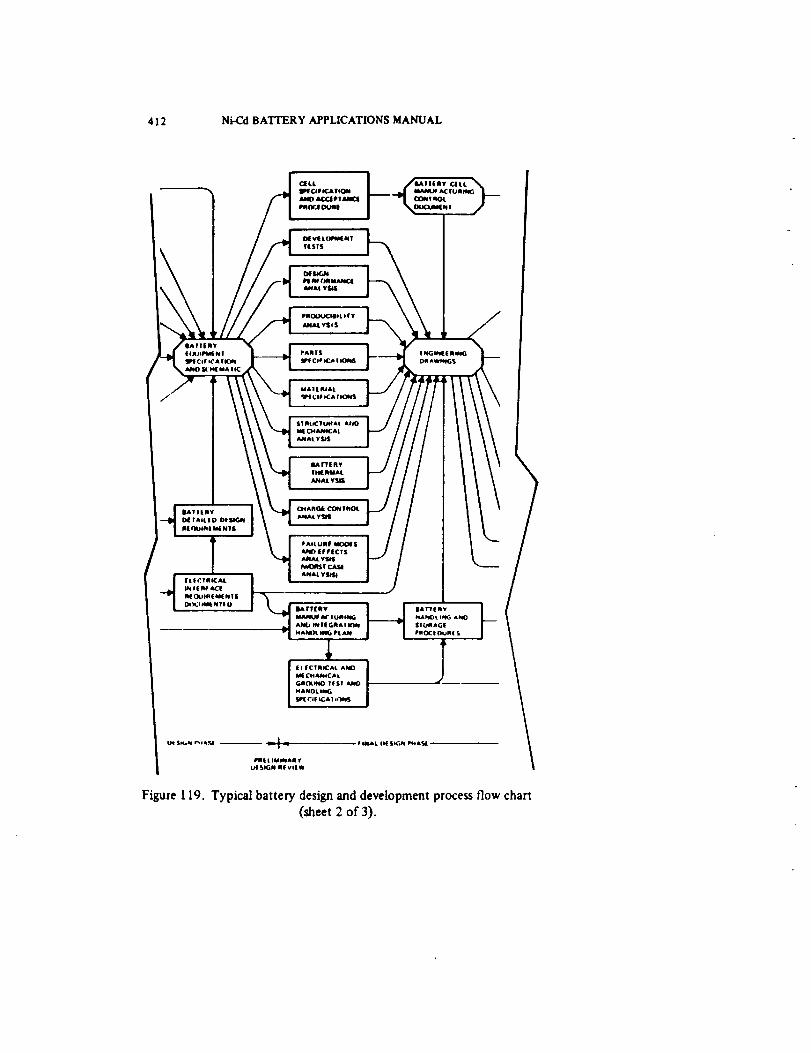
412 Ni-Cd BATTERY APPLICATIONS MANUAL
Figure 119. Typical battery design and development process flow chart
(sheet 2 of 3).

BATTERYDESIGNANDDEVELOPMENT 413
_ C(t L IK)gqNO_J
MAIK# AC IUAI 4C¢|PT AN(_|
C! t tS _ MATCHtk_
QUAt tF *CA TI()N
I[$1 P_OCE DUA| S P I ANC!
J_C| P YANCf Aki_
OUAL Of ICA _ I_N
w_ I_ I'Tf RYSI(_AG| J-'iIN |E Gll A_[ H)N L ALJ4CH
_ i _ |AITtltY * 7AC[CnA_ r
--| --llA_IU/A_TUIIIIK*I_(AS_[ 4m_IN|EGAA|I(_NPHA_nO'_ ItLtq*_4| --
CRO ! _ At
Ot S*GN All Vt(W
Figure 119. Typical battery design and development process flow chart
(sheet 3 of 3).
414 Ni-C,dBATTERY APPLICATIONS MANUAL
determined. Critical interfaces are analyzed, and tradeoffs are performed to
achieve an appropriate balance between performance, weight, cost, and re-
liability. The output of these efforts is a conceptual battery-system design
that represents a point of departure for preliminary design activities. The
number of batteries, the number of cells in each battery, the size of the cell,
the selected redundancy approach, the method of charge control, the oper-
ating and in-orbit storage temperature ranges, and the packaging concept are
determined. Preliminary estimates of battery weight, volume, mounting-
surface area, and heat-generation profiles are developed.
The preliminary design phase is concerned with the engineering analyses
required for preparing a battery equipment specification and an electrical
schematic diagram. Two analyses are performed: (1)those that are neces-
sary for a firm definition of all interfaces between the battery, its auxili-
aries, and other spacecraft systems and components; and (2) those per-
formed in conjunction with general electric power-system analyses and siz-ing calculations. The cell procurement process is usually under way during
this phase with a preliminary version of the cell procurement specification
available for review and negotiation with the selected supplier.
The final design phase encompasses all of the detailed analyses and liaison
required for preparing specifications, drawings, and test plans and proce-
dures that the battery and its auxiliaries require. Manufacturing plans and
procedures are developed, and tooling and special test equipment are de-
signed and released for manufacture or procurement. The battery cell Man-
ufacturing Control Document (MCD) is finalized. Cell manufacturing begins,
and engineering verification and characterization tests are conducted.
A design review usually concludes each design phase. When the third, or
critical, design review is successfully completed, the component is releasedfor manufacture and test.
9.2.1 Analysis of Requirements'and Constraints
The analysis of require:aents and constraints is the most critical step in the
battery-design process. The requirements for the battery system and the
batteries per se are derived from an evaluation of constraints and interfaces
that is determined by:
• Launch trajectory and orbit or mission'trajectory characteristics
• Spacecraft electrical power requirements
BATTERY DESIGN AND DEVELOPMENT 415
• Spacecraft thermal-control system capability and performance charac-teristics
• Spacecraft structural configuration and dynamic-response character.istics
• Natural or manmade radiation environments
• Special considerations such as generated magnetic moment character-istics or sterilizability
• Battery-system and component reliability allocations
• Component producibility guidelines and goals
• Spacecraft integration plans that identify battery logistic schedules,
support equipment requirements, and power-system and battery-sys.tern checkout and test objectives.
The importance of complete and early definition of interface requirementscannot be overemphasized. These requirements should be defined before
the preliminary design review (PDR) and documented in a power-system
specification and/or in an interface requirements document issued to in-
dude the battery system and its configured (separately identified) compo-nents.
9.2.2 Electrical Design
The development of the electrical design of a battery system involves sever-
al major activities. This section discusses the activities that are directly con-
cerned with the battery, component. Specific discussion of design activities
that are necessary for developing battery auxiliaries (e.g., charge or dis-
charge control and power conversion circuitry) is beyond the scope of this
manual. This should not be an inconvenience because the general designprocess for electronic equipment development is quite well-known. The
main problem that confronts the responsible battery-system designer is that
of coordinating parallel design activities to ensure that requirements are
met, that interfaces are compatible, and that engineering verification testsare properly defined and conducted.
9.22. 1 Electrical Performance Analyses
Electrical performance analyses are usually performed in conjunction with
power-system analyses and may be coordinated with spacecraft thermal-
system design analyses. Before and during the conceptual design phase, it is
416 Ni-Cd BATrERY APPLICATIONS MANUAL
usually sufficient to use approximate calculation techniques. For the pre-
liminary and final design, the analyses are simplified, particularly for Iow-
altifude orbit applications, through the use of computerized cell- and
battery-simulation models. Section 8 describes simulation models that apply
to both performance and reliability calculations.
The performance analyses are conducted to determine the following param-
eters as they vary throughout selected discharge/charge cycles:
• Battery state of charge
• Battery charge and discharge currents
• Battery charge and discharge voltages
• Battery heat-generation and temperature profiles
The selected cycles represent key in-orbit situations that involve extremes
of eclipse or full sunlight duration, extremes of insolation on battery heatrejection surfaces, cell or battery failures within specified acceptable limits,
or cases of anticipated degraded cell performance. The results of these
analyses are used in the final determination of battery electrical dimen-
sions (i.e., number of cells and cell capacity), in the assessment of electric
power-system voltage-regulation characteristics, and in the prediction ofbattery-system reliability.
The electrical performance analyses are updated several times during the
engineering phase as the power-system load requirements change. Past ex-
perience has shown that a positive battery-load growth margin is necessary
at the time of the conceptual design review to avoid major changes to the
battery design after the preliminary design review. The battery engineer
must negotiate design margins vigorously to ensure that they are adequate
and that the opportut,,ty for minimizing cost and schedule risk to the proj-ect is not lost.
9.2.2.2 Baffery-Cell Selection
The primary output of the electrical performance analyses is the requiredsize of the cell in terms of its rated capacity. However, this calculated size is
not necessarily the size finally selected. Each supplier of sealed nickel-
cadmium cells has a catalog of sizes that have been fiight-qualified and
BATTERY DESIGN AND DEVELOPMENT 417
otherwise subjected to developmental testing and documentation. As may
be expected in a competitive market, two or more suppliers may offer a
cell at or near the same value of rated capacity. Therefore, it is almost
always desirable to coordinate the electrical performance analyses with the
available qualified cells to minimize project risk and the costs associated
with developing a significantly different cell design. This does not mean
that efforts for minimizing battery-system weight must be completely com-
promised. An existing qualified cell design/size may be scaled up or down
in the direction of larger or smaller cells that are also qualified with little
risk, if the same plate and separators are used, the same plate area per unit
capacity and plate separation distance are used, the same ratio of electro-
lyte-to-plate area or void volume is used, and the same processing is used.
The cells from each manufacturer will exhibit certain characteristics unique
to that supplier's design and manufacturing process. The performancecharacteristics of most concern that tend to be different are:
* Voltage and pressure increase on overcharge, especially at low temp-
eratures (< IO°C), is much greater in some manufacturers' cells.
• End-of-charge voltage increases with cycling more rapidly in some
cells; therefore, for missions exceeding 2 or 3 years, voltage-limited
charging from a FLxed bus is not compatible with such cells.
9.2.2.3 Cell Development Testing
Tests should be performed to confirm that the selected cell design will per-
form as expected in the particular environments and operational regimeto which the batteries will be exposed. Stable cyclical operation should
be demonstrated with charge control performed by using nominal values of
control parameters with expected operating temperature profiles and limits.
Typical methods for demonstrating these capabilities are:
• Parametric electrical characterization tests
• Extended cycle tests
• Charge control verification tests (may be conducted as part of para-
metric characterization tests or electrical subsystem tests)
• Overcharge-rate safety-verification tests (applicable to any system
operating at low temperatures in overcharge)
• Reconditioning verification tests

418 Ni-CdBATTERYAPPLICATIONSMANUAL
9.2.24 Definition of Battery Heat.Genera_'on Profiles
The design of battery thermal controls must be based on a definition of
the heat-generation profdes over the orbit for the range of expected opera-
tion conditions. Preliminary estimates of heat rate versus time may be made
manually by using equations such as those in the section on "Heat Genera-
tion During Charge," with charge efficiency data as shown in the section on
"Charge Efficiency and Charge Acceptmce." As the design progresses, a
large number of repetitive calculations 0f:heat-rate profdes may be needed,
and a computer program that includes the heat-generation equation will
greatly facilitate this work. To minimize the impact of uncertainties in the
values of charge efficiencies, results of the computations may be validated
at certain points by results from direct measurements of heat rates on thecells to be used.
For low-altitude orbit applications, sufficiently accurate estimates of aver-
age battery temperature may be obtained from orbit-average values of heat
dissipation because instantaneous maximum and minimum temperatures do
not depart far from the average. For geosynchronous orbits, variations in
heat rate are widely separated in the orbit, and, consequently, battery
temperature varies over a wider range (e.g., 20°C or more) unless an ex-
tremely efficient active thermal-control device (such as a heat pipe) is used.
Because of this variation, point-to-point temperature calculations are usual-
ly necessary for the longer orbits. This is particularly necessary if battery
temperature is used as an input to the charge-control logic, either directly
to terminate charge at a selected battery temperature or to compensate a
voltage-limit level for battery temperature.
9.2.2.5 Preparation of Cell.Procurement Specifications
Cell-procurement specifications must be prepared to procure the cell designs
needed for each specific design application. General guidelines for prepar-
ing this specification appear in Section 5.
NASA has developed a specification (NASA/GSFC 74-15000) for manu-
facturing spacecraft-quality cells (Reference 302). This specification reflects
the analysis of more than a decade of observations of cell-procurement
activity on NASA-sponsored spacecraft projects and the experience gathered
on related activities involving cell and battery standardization. In its present
form. it does not conform to format requirements for procurement for
military programs, but thetechnical content may be used as the basis in
any t\_rmat. (See Section 5.)
The degree of applicability of the NASA specification to a particular
project is usually decided after: (a) evaluation of the mission requirements,
BATTERY DESIGN AND DEVELOPMENT 419
(b) evaluation of the technical data available to the buyer for the cell he
has selected, (c) reassessment of the buyer's procurement experience with
the selected supplier, and (d) consideration of customer requirements and
concerns.
9.2.26 Negotiation of a Manufacturing ConxTol Document
Cells should not be procured for a spacecraft project without a full set ofmanufacturing control documentation. The battery engineer should care-
fully review the Manufacturing Control Document (MCD) to ensure that it
is complete and that it will satisfy the objective of process control and
repeatability. Detailed guidelines for this review appear in Section 5.
NASA has supported the development of MCD's at the following cell man-ufacturers:
• Eagle-Picher Industries, Inc., Electronics Division
Joplin, Missouri 64801
• General Electric, Battery Business Department
Gainesville, Florida 32601
• SAFT-America, Inc.
Valdosta, Georgia 31601
• Yardney Electric
Pawcatuck, Connecticut 02891
The development of a new and significantly different MCD for a spacecraft
cell can be a lengthy process and, hence, should be considered withcaution.
9. 22. 7 Preparation of Cell Accgotanco and Oualification Test Procedures
Cell acceptance and qualification test procedures vary widely throughout
the industry. For example, government and commercial sponsors some-
times disagree on what procedures are best. NASA/GSFC 74-15000 (Refer-
ence 302) establishes one set of requirements and procedures that can be
used totally or selectively to accept and qualify cells. (See Section 6.)
Cell qualification test procedures are usually not required except for com-
pletely new cell designs. When they are invoked, the qualification test
420 Ni-Cd BATTERY APPLICATIONS MANUAL
procedures should include the acceptance tests described previously andother tests that verify that the new design will withstand the specified en-vironments and intended application:
Vibration - Three :axis vibration based on a mission overstress safety
factor 1.5 times greater than the expected force transmissibility at
resonance experienced when the cell is installed in the battery assem-bly.
• Shock - Demonstration of a shipping/handling and a mission shock
survival capability
• Storage - Determination of effects of shorted, open-circuit, andtrickle charge
Duty-cycle capability - Performance of an accelerated life test orpartial real-time test to demonstrate that the new cell design meets
the specification and will provide stable performance in the intendedapplication
9.22.8 Specifications for Battery Auxiliarie_
Batteries often include temperature sensors, heaters and heater controls,
cen-protection circuitry, and other accessories. The battery equipment spec-ification must specify these auxiliaries. If the auxiliaries require uniquedevices, new device procurement specifications may be necessary. Thesespecifications should be identified early in the design phase to ensure thatapprovals are obtained for space application in sufficient time for deviceprocurement. Such devices and parts are often long-lead procurement items.
9.2.2.9 Battery Schematicsand Outline Drawings
The electrical design activity includes the preparation of the battery electri-_'al schematic, interface data sheets, the parts list, and wiring diagrams. Theelectrical schematic del'mes the battery electrical circuitry up to the con-
aector interface. Complete electrical interface det'mition is usually docu-mented separately on data sheets that def'me for specific functions bothsource (input) and load (output) characteristics on both sides of the inter-face. The parts list identifies the electrical and electronic parts for use byprocurement, reliability, and manufacturing planning. The wiring diagram
det'mes the battery harness configuration and is made in conjunction withmechanical-packaging concept development. Both the schematic and wiring
dia_ams should contain definitions of electrical test points and cabling.
BATI'ERY DESIGN AND DEVELOPMENT 421
9.2.3 Mechanical Design
The objective of the mechanical design activity is to integrate the battery
cells, sensors and controls, and structure into a single package. The mechan-
ical design requirements, identified by the battery equipment specification,
include:
• Weight
• Size and envelope constraints, including mounting orientation
• A mounting interface that is compatible with the spacecraft structure
in terms of the dynamic launch environment deFmed at the interface
• Provisions for containing cells without deformation with maximum
predicted cell pressures (usually 100 to 300 psig)
Provisions for containing cells without damage or deformation during
dynamic launch environments (with a safety factor of 1.5 times the
expected force transmissibility a't resonance)
Ability to withstand low-cycle fatigue stresses induced by thermal
and pressure cycling within the cells throughout the battery service
life
• Provisions for adequate heat-transfer paths to meet thermal-gradient
design requirements
• Provisions for external cooling during vound test operations
• Compatibility with spacecraft-level requirements for accessibility and
replaceability
• Compatibility with manufacturing tooling-and spacecraft-integration
handling FLxtures
• Compatibility with radiation hardening requirements
The mechanical design activity performs the following analyses and tasks
in developing and demonstrating the mechanical design:
• Materials are reviewed and selections are made to meet weight,
strength, and thermal-design requirements. Materials selection trade-offs should be made before the PDR to ensure that these requirements
422 Ni.C.d BATTERY APPLICATIONS MANUAL
are met and that availability, workability, and cost considerations
are satisfied.
• Thermal analyses are performed on power-handling and temperature-
sensing devices and parts to ensure that they are maintained within
safe operating temperature limits under worst-case failure/degradation
operating modes.
• Structural analyses are made to define the shape and dimensions of
load-bearing members. These analyses should not be overly conserva-
tive at the predicted qualification levels to avoid unneeded weight
in the battery and in the spacecraft structure at the mounting inter-
face. Structural analyses are typically required for:
- Dynamic loads at liftoff
- Preloading applied to cells in the battery assembly •
- Loading that results from pressures generated within cells during
worst-case or abnormal operations
- Battery mounting fastener and mounting panel insert integrity
under dynamic loading at liftoff and separation
• Detailed battery mass properties analyses are prepared by PDR and
maintained current as the design progresses. This is an estimate of
battery weight and center of gravity based on piece-part data (esti-
mated or measured).
• Manufacturing methods reviews are scheduled regularly as the me-
chanical design progresses to ensure that the battery is manufactur-
able and that proper assembly tooling is designed and provided. The
equipment must be repairable..
Detailed parts and assembly drawings are prepared to define themechanical design and assembly. Preliminary drawings of the assembly
and schematics should be available by PDR. Final drawings made to
the standards of the manufacturing drawing system should be pre-
sented at the critical design review (CDR) with final release to manu-
facturing after CDR approval.
• Assembly procedures are developed by manufacturing _ith support
and review by both electrical and mechanical design en_neers. The
BATTERY DESIGN AND DEVELOPMENT 423
assembly procedures should include precise definition of all sub-
assembly tasks, final assembly tasks, and in.process inspections. Safety
precautions should be defined in the assembly procedures.
9.2.4 Thermal Design
The battery.system thermal design often directly and significantly affects
the spacecraft thermal-system design. Therefore, the thermal characteristics
of the battery itself must be accurately defined. The main source of heat
dissipation in a battery is the battery cells. However, if the battery also
comprises power resistors, diodes, or other semiconductor devices that
may carry heavy currents during certain operating modes, the overall heat-
dissipation profile must be determined. Section 9.2.2.4 gives the calcula-
tion of the profile for the cells. The calculation for other parts is more
straightforward after currents and voltages are established. If semiconductor
devices are used to bypass cells during overcharge or overdischarge, calcula-
ting the division of battery current between the cell and the bypass devicecan be difficult.
As implied previously and discussed in Section 8, considerable interactionoccurs between several design specialists. The battery engineer gives and
receives information to a thermal-system component designer and a com-
ponent thermal-design specialist. The thermal engineers also interact with
the electric power-system engineer. Other key contributors to the overall
design process are the spacecraft electrical- and mechanical-system engineers
and the structural-system en_dneer.
When a thermal-control concept has been established and requirements have
been defined for the batter3.-system components, the thermal-system com-
ponent designer is responsible for translating the concept into hardware
that satisfies other allocations of weight, cost, and reliability. At the battery
level, the main objectives of the thermal analysis and design activities are to:
• Define and minimize thermal gadients between the cells within the
batter3- package
• Define and minimize thermal gadients between the cells and the heat-
rejection surface aboard the spacecraft
• Maintain the temperature of electrical and electronic auxiliaries
mounted to the batteD within specified limits
• Define the position and mounting of temperature sensors and heaters

424 Ni-Cd BA]"rERY APPLICATIONS MANUAL
• Select thermal-control materials and coatings and analyze their effect
• Analyze and design integrally mounted thermal-control auxiliaries
• Analyze battery thermal performance during ground operations with
external cooling
• Develop thermal simulation models of the cells and the primary heat-
transfer paths
• Prepare battery thermal-design verification test plans and provide
technical support to the verification tests
The battery engineer is responsible for coordinating these activities and for
ensuring that the resulting definitions are compatible with electrical and
mechanical requirements for the battery. Incomplete or inadequate thermal-
design analyses have resulted in both prelaunch and postlaunch problemsfor several spacecraft. Less obvious are the effects on long-term operational
performance that may occur because of neglect in developing the battery
thermal design during the spacecraft definition studies and conceptual
design phases. Therefore, the importance of the role of the battery en-gineer in identifying, guiding, and monitoring thermal-system and thermal-
component design activities during this early period cannot be over-
emphasized.
Section 3 summarizes cell thermal properties, and section 7 describes bat-
tery thermal-design techniques. Although this information can be used for
preliminary design, detailed cell data used for design should be validated by
the test for the actual components used. Battery-cell cyclical and incre-
mental charge efficiencies vary with design. Beginning-of-life to end-of-life
charge and trickle-charge rates significantly affect resultant battery heat-
dissipation characteristics. Thus, it is necessary to perform thermal analyses
at the beginning- and end.of-life design point_ for all battery systems. The
resulting thermal performance predictions should be incorporated into
electric power- and tL.rmal-control system models to verify total space-
craft energy balance.
9.2.5 Battery Equipment Specification
A battery equipment (or component) specification is mandatory for each
spacecraft battery. It defines battery-design and interface requirements and
establishes the basis for acceptance, qualification, and handling of the com-
ponent. The battery equipment specification is derived from, and referenced
BATTERY DESIGN AND DEVELOPMENT 425
to, the electric power-system specification. A preliminary version of the
specification should be approved at the time of PDR before the detailed
design phase is begun.
NASA has developed specifications for a standard nickel-cadmium battery
that can be used as models for other battery equipment specifications.
Reference 182 describes the design and acceptance requirements for the
standard battery, and Reference 181 describes the requirements for quali-
fying the standard battery. These specifications provide guidelines for
aerospace nickel-cadmium battery design and design verification that reflect
a general consensus among Air Force, Navy, and NASA battery technologycenters.
9.2.6. Design Reviews
Scheduled design reviews are important milestones in the design and de-
velopment process because they provide an opportunity to detect prob-
lems that might otherwise remain undetected until budgets and schedules
or spacecraft performance are f'mally impacted. They also facilitate dis-
semination of design details to all concerned personnel. An effective review
should be preplanned to ensure that all aspects of the design are covered
and, if problems are discovered, that proper resources are brought to bear
on their solution. Technical specialists, both independent and those involved
with the design, should be given an opportunity to review a design summary
data package before the review so that questions and comments can be
properly formulated. The responsible battery engineer and key contributors
to its design should present the design and provide answers to the questions
at the review. Customer representatives, as well as functional and project
management representatives of the project contract, should be present. Pro-
duct Assurance and Reliability Engineering representatives should attend
all major design reviews. Minutes of the meeting should be taken, and action
items, agreements, and expressed concerns should be recorded. The tone of
the meeting and all related activities should be constructive rather than
adversary.
At least six reviews are usually performed during a typical battery develop-
ment project:
Conceptual design review - Before beginning battery component
specification, review of battery interfaces and performance require-ments: definition of a baseline design
• Preliminary design review - Identification of updated battery perfor-
mance and interface requirements; presentation of the cell specification
426 Ni-Cd BATTERY APPLICATIONS MANUAL
and design/development plans; review of analyses and tradeoffs made
in support of configuration detail definition
Critical design review - Review of the final design, additional analy-
ses, and engineering development test results; determine if the designis ready for release to manufacturing
• Manufacturin 8 readiness review by engineering - Review of the designwith manufacturing to interpret drawings and design data
Manufacturin8 readiness review by manufacturin_ - Review of manu-
facturing and inspection plans, procedures, and tooling to verify thebattery producibility
First article open-box review - Review of first battery assembly
before closing and beginning the acceptance tests to confirm that the
as.built configuration meets design requirements and workmanshipstandards
A design review checklist for each of these events appears in table 56.
9.3 BATTERY MANUFACTURING
The manufacture of sealed-cell nickel-cadmium batteries requires skilled
personnel and facilities comparable to those required for producing aero-
space electronic equipment. Mechanical assembly and electrical wiring oper-
ations are performed in a contamination-controlled environment. Special
tools and fLxtures are required for assembly and handling. This is usually
necessary for assembly because the cells are often packaged under a com-
pressive preioad and, therefore, part tolerances must be verified, matched,
and adjusted with shimming techniques; for handling, this requirement is
simply because the complete battery assembly is relatively heavy andawkward to move and position.
Each battery represents the application of a considerable amount of mate.
rials technology. Certain surfaces must be electrically insulated from one
another. Certain joint thermal conductances must be maximized. Materials
and coating must be compatible to avoid corrosion problems duringprelaunch storage and handling-problems that may occur either in the
battery component or at the interfaces between it and temporary fixtures.
In some designs, cell cases are modified before battery assembly by applying
:oaung or electroplating, by attaching thermally conductive shims by
bonding, or simply by applying a dielectric layer.
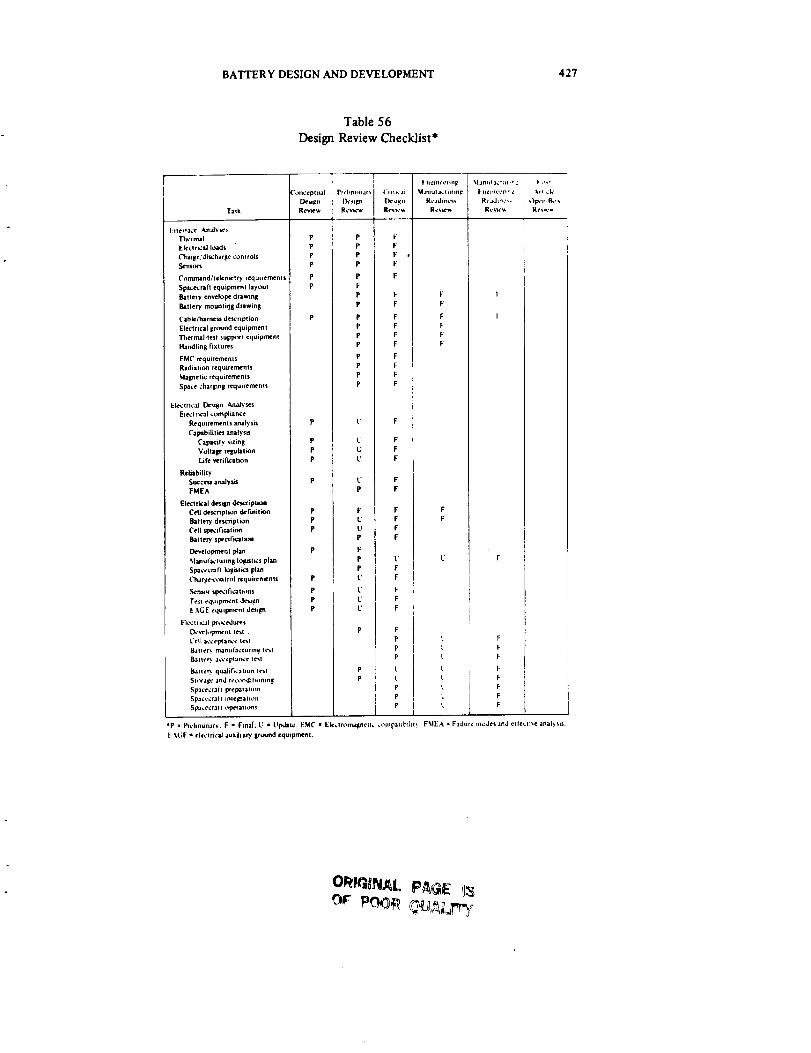
BATTERY DESIGN AND DEVELOPMENT 427
Table 56
Design Review Checklist*
Task
I:*tettJce Analyses
Thermal
Eleczrtca] loads
Charge/discharge controls
Sensors
('t_mmind/zelemetry [ecluiremenls
Spacecraft equipmgnl ]ayoul
Battery envelope drawing
Batte_ mountirjg drawing
Ciibie/ha mess descripzton
Electrical ground equipment
Thee'real-test support equiprnen!
Handling fixtures
EMC _equirefi'lenl s
Radialion requirements
Magnelic requirements
Space ¢hafgmg requirements
_|e_tric_d Design AJlaJyM_$
Eleclrical compliance
Requirements analysis
Capabilities analysts
Capacity sizing
Voltage regulation
Life verification
Reliability
Succeu artalylas
FMEA
Electrical desilpt des_iptton
Cell description definition
Battery description
Cell specification
Bat t el_. lpecific,_lt loft
Development plan
.%l_.nul_lu*'mg Iotvsttcs plan
Spacecraft IofJslk.*s plan
ChJr_e-control requirements
S_,nso¢ specifiCatit_ns
Test equlpnl,_nt design
EAGE equipnlcnt despot
Elect flcal pt',_.:ed ures
[X,_lopment lest .
Cellacceptal_e lest
Batte¢_, rnanufacturln_ le_,l
Baiter) acceptance test
B.tI|eQ. quaJific3uon levi
Slofa_*'." .Irtd ft_cont_[IOfllnt
Sp:]L'ec ra I't pt'epara[ltm
SpacecTafl inlel_atlon
S[yJvc_ f311 ,_pefatlon$
Co.ccp(ual
Eks*¢.
Review
P
P
P
P
Pwehmi,_Jr _
l)..+slgn
RCvIL_
t'l_lkat
[ II_Incc[III_
M Jllu1.1¢ Illfln_ l- ii_ i,iv ¢ i1 y: _1
RcJdl¢_¢_ RgaJLn¢,.
F I-
F
F I:
F
F
F
F
F
C F
ir
t F
t F
F
F
4
"P • I_'¢lmunary. F - Finai: U • ILPp_ite. EMC • Ekclroma_netic .:,,.u_llbzh[_ FMEA = F_ldur.: ru._.Jes and etle_ti_e anal_.sis_
_"_(;F " el_%'trlcal aUXl]l ary I_ound equipment.
OK_G_NAL P_GE _13
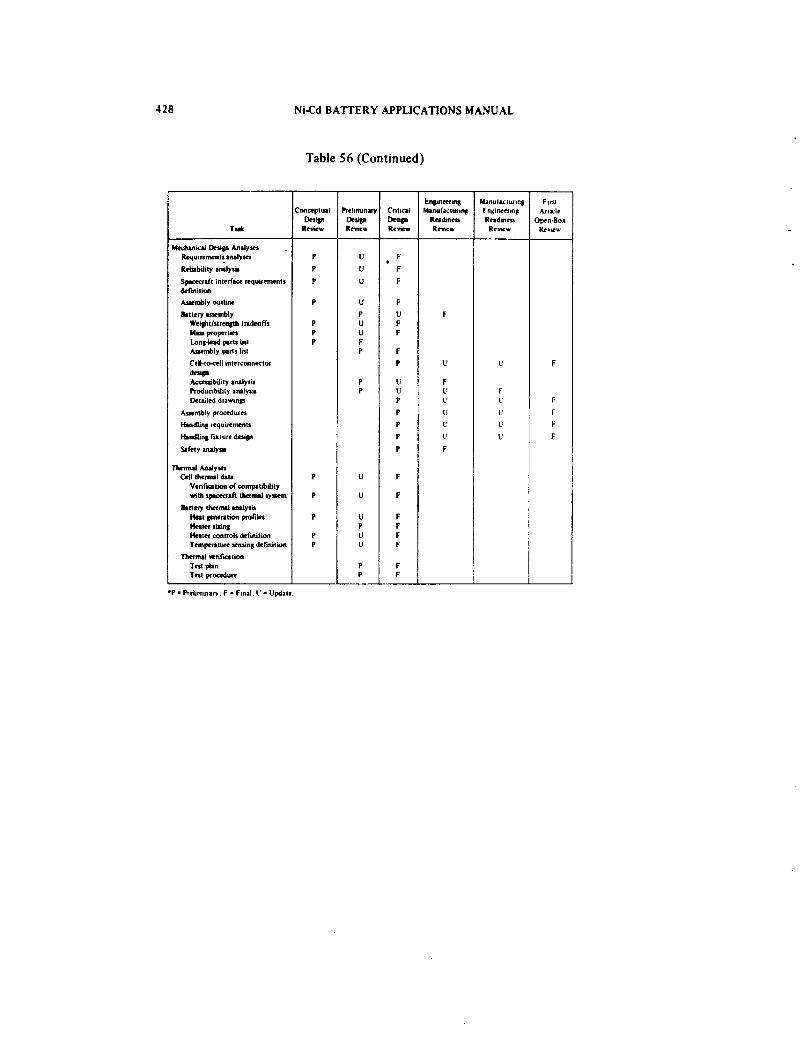
428 Ni-Cd BATTERY APPLICATIONS MANUAL
Table 56 (Continued)
Tad(
Con_,ptual _¢1i fnllhlff
v¢_ oe mReview Rewew
EnlpneermS Manulactt_m 8 Firtt
Critical Menu ftctwmtt F ngt neeltrqt Asta:le
Design Re_dmen Rradmess Open-Box
Review Revscw Renew Review
! Mechtna:aJ Desqgn A_alyse$
Reqmzements. analyses P U * F
Reliabili_ anllysis P U F
S_mcecraft interface _*quirements P U F
defmilim
Al_mbly outline P U F
Battery e.,q_embly P O
Weql_t/st renll_h t radeoffs P U F
Mass wopertm P U F
Long-teed F_m bst P F
Assembly Ixtrts list P F
Cell.to-cell interconnectoc P
Accembilit y aruilysis P U
Producibilit y analysis P U
Deuuled drawings P
As_mbly procedures P
Handlmll zequu'errtents P
Handtinll fixture design P
Safety analysis P
Thermal Aaalym
Cell thermal data P U F
Vet, ificetion of compatibility
with slxict_mtft tiwrmal system P U F
Battery thermad enalysis
Itelt I_nerttion IxofiJes P U F
Heater _ P F
Hateg contTols definition P U F
Temperature sensin| definition P U F
Th_mlll _erification
Test plan P F
Test procedure P F
"P = Preiimmar_ : F = Final. U = UIx:lale.
U U F
F
U F
L' L" F
U U F
U U F
U U F
F
BATFERY DESIGN AND DEVELOPMENT 429
A key aspect of battery manufacturing involves the understanding and sup-
port of the product assurance function within the battery manufacturer's
organization. Many manufacturing operations are unique to the battery
product line, and their definition and implementation should be coordinated
with quality engineers and inspectors in the earliest stages of development
to ensure that product assurance objectives are met. Therefore, an appropri-
ate theme for the manufacturing phase is that of teamwork among contribu-
tors with various skills and functions.
Detailed planning is essential to the economical production of high-quality
components. This is particularly true for nickel-cadmium batteries becausetheir cells are normally considered to have a limited shelf life when stored
under ambient environmental conditions. (Storage at reduced temperatures
provides sufficient shelf lifetime extensions for most projects.) Plans aretherefore needed that reflect best use of battery manufacturing personnel
and facilities and that are coordinated with logistic constraints and top-level
production schedules for the spacecraft project. Among these are the fol-
lowing documents: "
• Facilities allocation plan
• Capital equipment allocation plan
• Tool, fixture, and special test-equipment development plan
• Battery manufacturing control document
• Manufacturing flow chart
• Personnel training plan
• Manufacturing schedule
The battery engineer should monitor the development of these plans, docu-
ments, and schedules to ensure that they are compatible with the battery
design and other project schedules. All manufacturing plans should receivefinal approval as part of the critical design review for the component.
9.4 BATTERY ACCEPTANCE TESTING
Acceptance tests are performed to verify that each manufactured battery is
properly assembled and that it complies with the requirements for accep-tance.
430 Ni-Cd BA'FI'ERY APPLICATIONS MANUAL
9.4.1 Test Requirements
Acceptance test requirements are def'med by the battery equipment specifi-
cation and by the spacecraft component environmental specification, if
there is one. A typical test sequence is as follows:
• Physical measurements
• Physical inspection
• Functional tests
Electrical insulation resistance
Electrical continuity
Connector bonding resistance
Temperature sensor operation
Thermostatic switch operation
Heater-circuit operation
Seal-leakage test
Capacity verification test
Charge-retention test
Peak-load test
• Vibration
• Peak load
• Thermal vacuum
Capacity tests
Functional tests
Conditioning
Seal-leakage test
Charge-retention test
Electrical insulation resistance
Electrical continuity
Connector bonding resistance
• Physical inspection
e
BATTERY DESIGN AND DEVELOPMENT 431
9.4. 1. 1 Physical Measurements
Battery dimensions and weight are verified by physical measurement. Onlythose dimensions that are critical to interfaces should be used for accep-
tance purposes.
9. 4. 1.2 Visual Inspection
A visual inspection is made to ensure that the battery comphes with its
drawings and imposed workmanship standards and that no physical damage
(cosmetic or structural) has occurred during assembly and in-process testing.
The inspection should include solder joints, inserts and fasteners, electrical
insulations, degree of cure of potting and encapsulating compounds, and
general cleanliness.
9.4. 1.3 Functional Tests
Certain tests are necessary for verifying that the battery has been assembled
properly and performs as designed. Some of these tests are performed only
once, but others are performed both before and after planned environ-
mental acceptance tests:
Electrical insulation resistance - the resistance between the positive
terminal of the battery to the battery case and between the positive
terminal of the battery and each externally mounted transducer
(thermistor, strain gage, etc.) is measured with a megohmeter at 100
Vdc for 1 minute. (It is assumed that the batter)" is used in a negative-
ground electric power system.) The measured resistance values shall be
greater than 100 megohms.
• Electrical continuity - Each wire in the batteD' harness is checked to
verify the electrical path and terminations.
Connector bonding resistance - The resistance between the connector
shells and the battery case is measured to verify that electrical ground-
ing requirements are met. The resistance should be typically less than
5 milliohms. (This test is a relatively new requirement and is one of
the design criteria developed in response to studies of spacecraft
space-charging phenomena.)
432 Ni-Cd BATI'ERY APPLICATIONS MANUAL
Temperature sensor operation - A calibration curve is generated from
test data taken over the expected battery temperature range. The data
are reviewed to verify proper sensor operation.
Thermostatic switch operation - The battery is temperature-cycledwhile in a discharged and shorted state to verify thermal-switch set
points and operation.
Heater-circuit operation - Heater circuits are operated to verify that
the proper current is conducted at a selected voltage. Both primaryand redundant circuits are verified.
Seal-leakage test - Seal-leakage tests may be performed after assembly
and at selected intervals during testing. The test most often used
involves the application of a 0.5- to 1.0-percent phenolphthalein solu-tion around the terminals and exposed cell-weld areas. A red indica-
tion is evidence of potassium hydroxide leakage. A second positive
indication should be obtained before rejection. A nonaqueous solu-
tion is sometimes used to prevent corrosion caused by residual water
and to prevent spurious indications caused by the electrolysis of waterin the test solution. The seal-leakage test is usually performed during
or immediately following an overcharge test.
Capacity verification test - CapaciD' verification is accomplished bycharging and discharging the battery in a particular manner. The test
is performed differently by several companies. A typical method is:
The battery is first conditioned with a C/IO charge for 24 hours at
24 :!:2°C, foll6wed by a C/2 discharge to 1.0 volt per cell average.
(No cell is permitted to discharge below 0.5 volt.) Each cell is then
discharged to zero volts through individual resistors.
The battery is next charged as it would be during normal space-
craft operations and discharged to 1.0 volt per cell average at the
normal spacecraft rate. (No cell is permitted to discharge below
0.5 volt.) Individual cell voltages are monitored to verify uniform
voltage behavior. The cycle is repeated several times (three is
typical) to deternune that measured capacity meets the specifica-
tion requirement.
An alternate method appears in Reference 182.
• Charge-retention test - This test can be performed in different ways.
BATTERY DESIGN AND DEVELOPMENT 433
NASA uses the voltage recovery method (Reference 182). The charge-
retention method is used widely throughout the industry. (See Refer-
ence 83.) Proper conditioning of the battery before either test is per-
formed is essential (See Reference 83.)
• Peak-load test - A peak load applied at a 3C discharge current rate is
used to verify battery performance following vibration. This test
usually follows a C/2 discharge for 1 hour, and the 3C rate is appliedfor 5 minutes. The minimum allowable voltage is usually specified at
1.10 volts for any cell. Care should be exercised to verify that the bat-
tery can tolerate the 3C rate.
• Environmental acceptance tests - These tests vary from project to
project, but they are usually designed to meet certain well-defined
objectives. Vibration testing verifies structural, fastener, and harness
integrity and demonstrates electrical continuity throughout exposureto an environment similar to that which will be encountered at
launch. Thermal-vacuum testing verifies temperature sensor operation
and the integrity of adhesive bonds and encapsulants. It is usually
performed with temperature limits set 10°C beyond the expected
extreme operating temperature limits. The duration of thermal-
vacuum testing at the component level should be determined by evalu-
ating the amount of subsequent exposure planned during spacecraft-
level tests. (There may be little ot no exposure if installation on the
spacecraft is delayed until just before launch.) Sufficient testing
should be performed to ensure that the battery is adequately out-
gassed before launch.
9.4.2 Data Analysis and Acceptance Criteria
Properly written specifications, test procedures, and test data sheets permit
unambiguous pass/fail interpretations of the inspection and functional test
results. However, additional information is necessary. Individual cell volt-
ages should be monitored to within -+1.0 mV throughout acceptance testingand recorded. These data are used to determine the degree of voltage bal-
ance among the ceils. If an imbalance develops, the battery should be ex-amined closely to determine the cause because this condition may signal
later failure. Data collected at this time also serve as a basis for comparison
with data collected during spacecraft integration and prelaunch checkout
tests.
434 Ni-Cd BATTERY APPLICATIONS MANUAL
9.5 BATTERY QUALIFICATION TESTING
A battery can be qualified by means of either analysis or testing or both.
depending on the amount of new design work required for its development.
Minor changes can normally be qualified by similarity to proven designs.
Major changes and new designs should be tested to verify that the design is
adequate.
9.5.1 Basisfor Design Qualification Tests
The purpose of design qualification tests is to demonstrate the ability of the
battery to meet all performance requirements without degradation when
exposed to environments more severe than those expected during accep-tance testing, prelaunch, launch, orbit injection, spaceflight, or reentry.
Certain safety margins are included within the qualification test limits:
Ground mode - Test levels are selected to bound the conditions that
are normally expected during fabrication, integration, and test.
Ground handhng, transportation, and other prelaunch activities that
could impose environmental stress (e.g., shock) are usually accom-
modated by applying special precautions and by using specially
designed handhng fixtures and packaging.
• Launch mode - Dynamic levels and exposure durations are extended
by multiplying predicted levels by a factor of 1.5.
Orbital mode - One guideline (Reference 303) for setting qualifica-
tion temperature limits requires that the predicted high- and low-
temperature values be extended by 10*C.
9.5.2 Qualification Methods
It is current practic_ to perform very limited qualification tests on new cell
designs-generally only vibration and life tests-and, instead, to concentrate
on qualifying complete battery assemblies. Most new cell designs are derived
and scaled from proven designs and do not require environmental qualifica-
tion testing; qualification by analysis is acceptable. Therefore, most qualifi-
cation testing occurs within three categories:
• Cell-level design verification - Cell-level qualification requirementsare contained in cell procurement specifications. Qualification by sim-
ilarity is usually adequate because most cell-design changes are simply
BATTERY DESIGN AND DEVELOPMENT 435
scaled from previously proven designs. If a completely new design is
developed, fuU dynamic environmental qualification may be per.
formed along with performance characterization tests and life-cycle
tests.
Battery assembly qualification - Battery assembly qualification test
requirements are specified in the battery equipment specification and
the spacecraft environmental qualification requirements specification.
Battery qualification includes all acceptance tests as described in Sec-tion 9.4.1. More severe vibration and thermal-vacuum tests are usually
used to validate the mechanical and thermal-design features of the bat-
tery than those required for acceptance testing. Vibration require-
ments are determined by spacecraft dynamics analyses on the basis of
the method of launch and type of spacecraft structure used.
Spacecraft interface qualification - Spacecraft interface qualification
is as important as the battery assembly qualification tests. It is unreal-istic to test large, heavy batteries as separate assemblies for shock
survival because the shock characteristics experienced by the batteD'
in a spacecraft are a function of the spacecraft's response to booster
separation and other dynamic loads. Therefore, battery qualification
for shock should be verified by analysis at the battery level and de-
ferred to spacecraft-level testing. Similarly, the battery electrical and
thermal interface test results at the spacecraft level should be carefully
reviewed as part of the battery qualification and launch readiness
reviews.
Useful guidelines for battery qualification testing appear in Reference 181.
9.5.3 Cell and Battery Test Equipment and Facilities
Cell and battery, test equipment are not available as standard equipment.
Each battery requires special test features and instrumentation. Standard
laboratoD' facilities are suitable for cell and battery testing.
9.5.3. I Standard Conditions for Test Areas
Environmental conditions must be controlled so that they do not interfere
with handling of the battery. Suitable conditions for performing functional
tests before or after environmental exposure are:
• Temperature: 20 to 250C

436 Ni-Cd BATTERY APPLICATIONS MANUAL
• Relative humidity: 30 to 70 percent
• Barometric pressure: room ambient
• Cleanliness: planned and controlled to prevent contamination or
degradation in accordance with FED-STD-209B
• Safety and handling requiremeats: Practices and procedures covering
all aspects of cell and battery safety shall be available. Personnelshould be trained in their use and periodically reviewed to verify com-
pliance.
9.5.3.2 Measurements
All battery measurements should be made with precision instrumentation.Instrument calibration should be made in accordance with MlL-C-45662A.
Tolerances appropriate to the collection of battery test data are:
• Temperature: +-I°C
• Relative humidity: +0,-5 percent
• Vibration amplitude: sinusoidal, +10 percent; random (overall rms
level), +10 percent; power spectral density, +3 dB
• Vibration frequency: +2 percent or l Hz, whichever is greater
• Shock spectral response: +50, -lO percent
• Acoustics: tolerances on all octave bands, +3 dB and -6 dB; overall
spectrum levels, +-l dB
• Linear acceleration: +0, -5 percent
• Weight: +-5 grams or +-O.l percent of the total weight, whichever is
greater
• Center of gravity: +-2.5 mm
• Moment of inertia: +-1.5 percent
• Voltage: +-0.1 percent of battery voltage: +-1 millivolt, cell voltage
BATTERY DESIGN AND DEVELOPMENT 437
• Current: -+0.1 percent offuU scale
• Time: -+1 second
• Impedence: +-5 percentB
9.5.3.3 Special Equipment
Batteries are tested with test apparatus and fixtures specially designed to
accommodate the battery:
• Battery vibration fixture
• Battery thermal-vacuum baseplate fixture
• Battery electrical performance and functions tester
• Battery cables (for both inside the thermal-vacuum chamber and to
the tester)
• Battery-discharge conditioning assemblies
• Battery connector savers (all battery connectors and connector savers
to be mechanically keyed to prevent accidents)
9.6 BATTERY STORAGE, MAINTENANCE, AND INSTALLATION
This section presents approaches to battery handling, including the storage,maintenance, and installation of batteries in spacecraft. Much of the avail-
able industry data shows that battery handling and logistics methods sig-
nificantly influence battery performance and life in orbit. A good battery
logistics plan can help to reduce project cost and can help prevent in-orbit
performance problems. However, some spacecraft-integration concepts incurrent use may actually shorten the service life of the batteries.
The spacecraft-integration process is most economical if flight batteries
are installed and used to support integration testing of the flight spacecraft.The data and criteria discussed in this section are in direct conflict with this
cost-effective integration approach. The battery engineer must therefore be
prepared to negotiate an approach for battery handling that is usually,
of necessity, a compromise between spacecraft-integration economics andpotential limitations on ultimate battery life.
438 Ni-Cd BATTERY APPLICATIONS MANUAL
9.6.1 Prelaunch Environments
The prelaunch environments for batteries should be carefully defined in the
battery component specifications and in a battery handling practice that is
used by manufacturing and by spacecraft integration and test to control
the battery environment and operation. Several environmental requirements
should be considered:
Exposure of cells to shipping temperatures above 350C should be lim-
ited and monitored. Temperature-sensitive indicators can be included
in the cell packages during shipment to verify that selected maximum
temperatures have not been exceeded.
Exposure of cells to room-ambient temperatures should be minimized
regardless of whether they are charged or discharged. Suggested limitsfor batteries that are fully charged are 90 days in trickle-charge stor-
age and 24 hours open-circuit storage per event (5°days of open-
circuit storage has proved to be acceptable for a single storage inter-
val).
During periods of storage, or during standby periods of over 90 days,batteries should be maintained at low temperatures on the order of0°C. Batteries can be stored as low as -20°C without danger of ice-
crystal formation in the cells. Caution should be exercised to ensure
proper desiccation within the package during low-temperature storage
to prevent corrosion of the cells and battery packaging. Cautionshould also be exercised to ensure that batteries are not stored at
thermal switch-operating points to prevent long-term switch stress and
failure.
The following section describes practices for prelaunch handling and envi-
ronmental controls that have proved to be successful.
9.6.2 Battery Storage md Reconditioning
Since 1960. the aerospace industry' has used many methods of battery stor-
age and reconditioning. During the 1960"s. batteries were usualJy stored on
trickle charge and were commonly installed aboard spacecraft immediately
after acceptance testing in support of spacecraft-integration test and accep-
tance. Early in 1970, NASA/GSFC (Reference 304) reported a definite
trend of early battery failures that indicated that exposure to spacecraft-
inte_ation handling and testing caused severe cell de_adation. Figure 120shows the effect to be loss of overcharge capability and ver3 high voltages
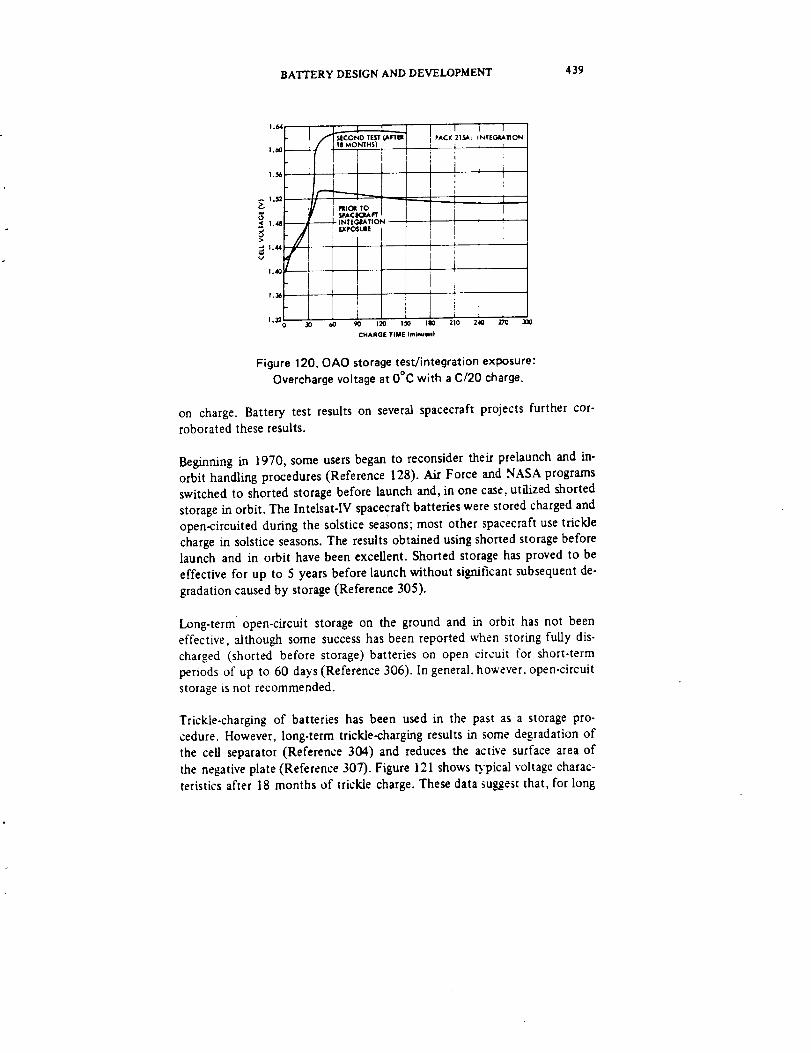
BATTERY DESIGN AND DEVELOPMENT 439
1.64
1.2
1.4e
Figure 120. OAO storage test/integration exposure:
Overcharge voltage at 0°C with a C/20 charge.
on charge. Battery test results on several spacecraft projects further cor-
roborated these results.
Beginning in 1970, some users began to reconsider their prelaunch and in-
orbit handling procedures (Reference 128). Air Force and NASA programsswitched to shorted storage before launch and, in one case, utilized shorted
storage in orbit. The lntelsat-lV spacecraft batteries were stored charged and
open-circuited during the solstice seasons; most other spacecraft use trickle
charge in solstice seasons. The results obtained using shorted storage beforelaunch and in orbit have been excellent. Shorted storage has proved to be
effective for up to 5 years before launch without significant subsequent de-
gradation caused by storage (Reference 305).
Long-term open-circuit storage on the ground and in orbit has not been
effective, although some success has been reported when storing fully dis-
charged (shorted before storage) batteries on open circuit for short-term
periods of up to 60 days (Reference 306). In general, however, open-circuit
storage is not recommended.
Trickle-charging of batteries has been used in the past as a storage pro-
cedure. However, long-term trickle-charging results in some degradation of
the cell separator (Reference 304) and reduces the active surface area of
the negative plate (Reference 307). Figure 121 shows Dpical voltage charac-teristics after 18 months of trickle charge. These data surest that, for long

440 Ni-Cd BATTERY APPLICATIONS MANUAL
service life, trickle-charging should be limited before launch. Recent data
(Reference 30) also show that storage at temperatures at or above roomambient reduces the life of the cells by causing the negative-plate overcharge
protection to be reduced. Section 4 describes the mechanism of this process.
Trickle-charging at room.ambient temperatures tends to increase cell tem-
peratures above ambient, further accelerating the degradation processes.When trickle-charging is used, the procedure should limit the upper temper-
ature limits as much as practical, and trickle-charge rates should be mini-
mized to levels required to maintain the cells charged as shown in figure122.
9.6.3 Battery Standby Operations
The following practices are general guidelines for battery storage and recon-
ditioning:
Standby trickle charge - The battery should be trickle-charged be-
tween C/75 and C/50 at room-ambient temperatures. Battery temper-
atures should be maintained below 30°C and, preferably, below 10°C.
The trickle-charge rate should be adjusted as a function of tempera-
ture in accordance with figure 121. The battery should be discharged
and boost-charged before operation. Trickle-charge periods should be
limited to a 90-day cumulative maximum for long-life applications.
Standby open circuit - Fully charged open-circuit storage should belimited to 5 consecutive days as a planned single event. (Twenty-
four hours is a preferred limit when several events must be accom-
modated.)
Fully discharged open circuit storage should be limited to 14 consecu-
tive days. All cells of the battery must be individually short-circuited
for at least 16 hours after battery discharge prior to putting the bat-
tery on open-circuit stand.
Open-circuit stand intervals over 2 to 4 hours should be followed by
special conditioning, such as a short discharge before the reinitiating
of charging to avoid possible hydrogen-burst phenomena or other side
effects. Batteries subjected to short discharges should always be fully
recharged to prevent cumulative capacity degradation effects.
Cumulative open.circuit stand time should be minimized, but exact
specification limits have not yet been identified.
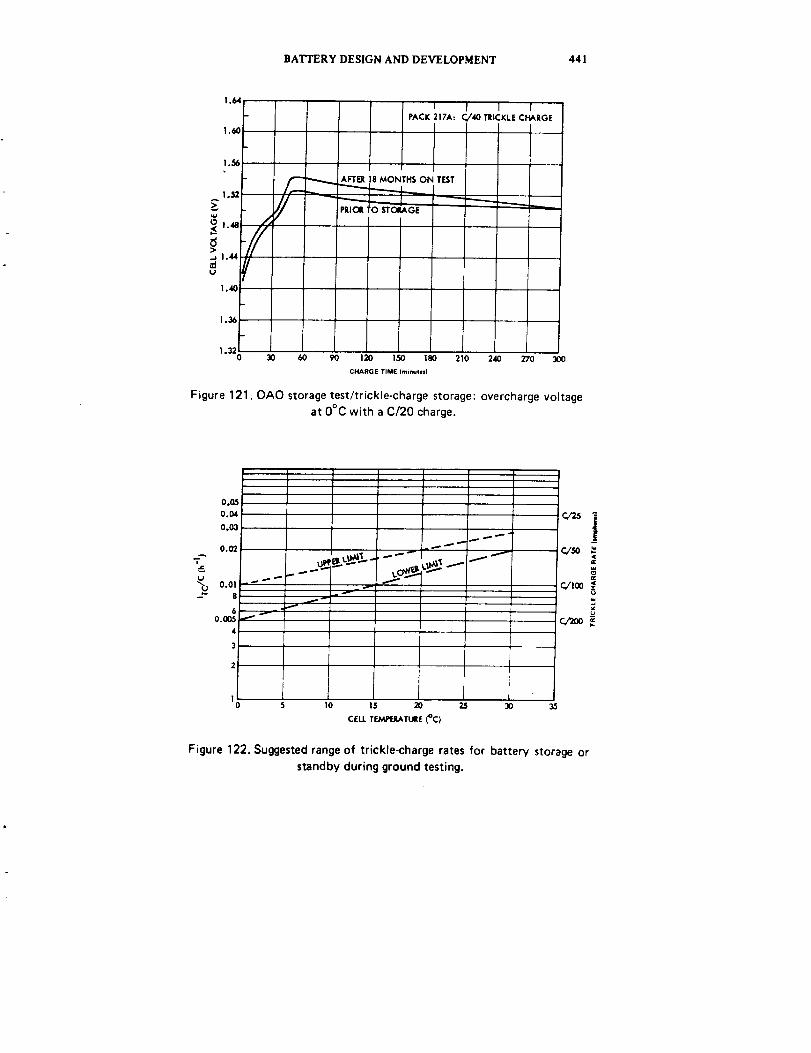
BATTERY DESIGN AND DEVELOPMENT 441
1.60
1.56
1,52
'-//.._ 1.4,1
1.1ll
1,36
1.32
I 1 I 1PACK 217A: C,/40 TRICKLE CHARGE
I
r_ AFTER 18 MONTHS ON TEST
// PRIOa fo src_Ge
30 60 90 120 150 180
CHARGE TIME (minutes)
--.......
210 240 270 300
Figure 121. OAO storage test/trickle-charge storage: overcharge voltage
at 0°C with a C/20 charge.
0.05
0.04
0.03=.,.=..=.- "_
0.02 - "" "" _
..._._ "_.._ ._._.!__Uu 0.01 -_ ,_ I-_" 8
4 I
2
,io s I0 15 2o 25 30 35
CEIL T_TURE _C)
Jc/5o _
_ioo
c,r2oo _
Figure 122. Suggested range of trickle-charge rates for battery storage or
standby during ground testing.
442 Ni-Cd BATTERY APPLICATIONS MANUAL
Battery storage - Batteries stored over 90 days should be dischargedand shorted at the cell level. Practical temperature limits for storage
are -5 + 10°C, but thermal switch operating points should be avoided.
Batteries that are stored shorted should be recharged and tested peri-
odically to verify that components are operational and that cell per-formance remains normal.
Batteries to be stored less than 90 days should be discharged and
shorted at the cell level. Although storage at low temperature is
preferred, storage at room ambient is acceptable. Again, the thermal
switch operating points should be avoided during storage.
Battery storage after activation should be minimized by spacecraft
logistics planning. Several spacecraft contractors limit the battery acti-vated life before launch to less than 1 to 2 years. An experimental
work (Reference 180) is now in process attempting to define the
limits for storage before launch, but this effort has not been com-
pleted. Preliminary data show acceptable performance after storage
of at least 5 years.
9.6.4 Shipment and Installation
Procedures for shipping and installing batteries into spacecraft vary widely
throughout the aerospace industry. Three general approaches have been suc-
cessfully applied:
Shipping batteries to the launch site discharged and shorted: charging
and testing the batteries at the launch site; and installing the batteries
in the spacecraft before placing the spacecraft on the launch stand.
Although this concept represents minimum risk to battery life, it
provides the least verification of the battery-to-spacecraft interfaces.
Charging the batteries and installing them in the spacecraft just before
shipping the pacecraft to the launch site; shipping the batteries
installed in the spacecraft on trickle charge or open circuit with a 24-
hour maximum shipping period: and placing the spacecraft directlyon the launch stand on arrival at the launch site. Although this prac-
tice provides limited verification of the spacecraft interfaces before
shipping, it provides no launch site verification of the battery.
Charging the batteries and installing them in the spacecraft just before
the spacecraft acceptance thermal-vacuum and spin-balance tests: test-
ing the batteries during spacecraft thermal-vacuum tests: discharging
BATTERY DESIGN AND DEVELOPMENT 44 3
and shorting the batteries on the spacecraft following thermal-vacuum
testing; shipping the spacecraft to the launch site and then recharging
and retesting the batteries at the launch site before placing the space-
craft on the launch stand. This practice requires special cooling pro-
visions at the launch site and a capability of the spacecraft/support
equipment for charging the batteries. This concept provides an excel-lent validation of the battery-to-spacecraft interfaces and battery per-
formance after shipping.
Other approaches or variations of the foregoing can be adopted. However,
the battery engineer should not accept any approach unless it is supported
by a thorough, well-documented battery and spacecraft logistics plan. As
discussed in Section 9.6.2, spacecraft integration checkout and testing with
installed flight batteries should be avoided or minimized to reduce risk of
battery damage and degradation. The selected approach should reflect
this ground rule to the greatest practical extent.
At a lower level of detail, several points are worthy of consideration when
shipping and installation procedures are developed:
Battery connectors and cell terminals must always be protected to
prevent personnel injury and equipment damage from shorts. The useof connector savers is recommended for in-transit or standby charging.
• Batteries should not be shipped in a charged state without utilizing
special handling practices.
Batteries should be shipped in packing containers that protect against
shock and transport vibration. Containers designed in accordancewith Federal Standard PPP-B-566 or PPP-B-636 can be used for ship-
ping batteries. Containers in which the batteries are securely mounted
to a support structure are preferred over free-floating package configu-rations.
Personnel concerned with transporting and installing flight batteries should
be completely familiar with the logistics plans, project-specific procedures,
and all applicable design practices.

SECTION I0
APPLICATIONS
10.1 INTRODUCTION
This section describes examples of both past and present battery-
development activities and briefly considers the role of the sealed nickel-
cadmium cellin terrestrial applications. Numerous examples of electric
power systems, battery systems, and battery component applications
have been identified and discussed in earlier chapters. The purpose here
is to catalog some of the most representative items of hardware and,
thereby, to simultaneously show features both common and unique to
the selected designs. The configurations described have been successful,
and some reflect imaginative departures in design. They are offered not
as an endorsement of a "correct" design approach, but as a point of
departure in the development of future lightweight, low-cost, energy-
storage systems of high reliability.
10.2 BATTERY-SYSTEM HARDWARE DESCRIPTIONS
Sections 10.2.1 through 10.2.8 summarize the electrical and physicalcharacteristics of batteries used on certain low-altitude and geosynchronous
spacecraft, as well as their environmental capabilities. These data wereobtained from Reference 308 and were reformatted for this manual. The
spacecraft are listed by increasing battery-cell size. Certain characteristics
are included only when applicable.
Reference 308 is part of a f'mal report prepared by the Aerospace Corpora-
tion for NASA Headquarters as a consequence of a Standardization and
Program Effect Analysis conducted during 1975. Part C of Volume IV,
Equipment Compendium, summarizes the characteristics of not only
batteries but also battery chargers, discharge regulators, power-control
equipment, power converters, series-load regulators, shunt regulators, and
solar arrays. This reference also describes the spacecraft from which the
hardware examples are drawn.
445 I Precedingpageblank[.
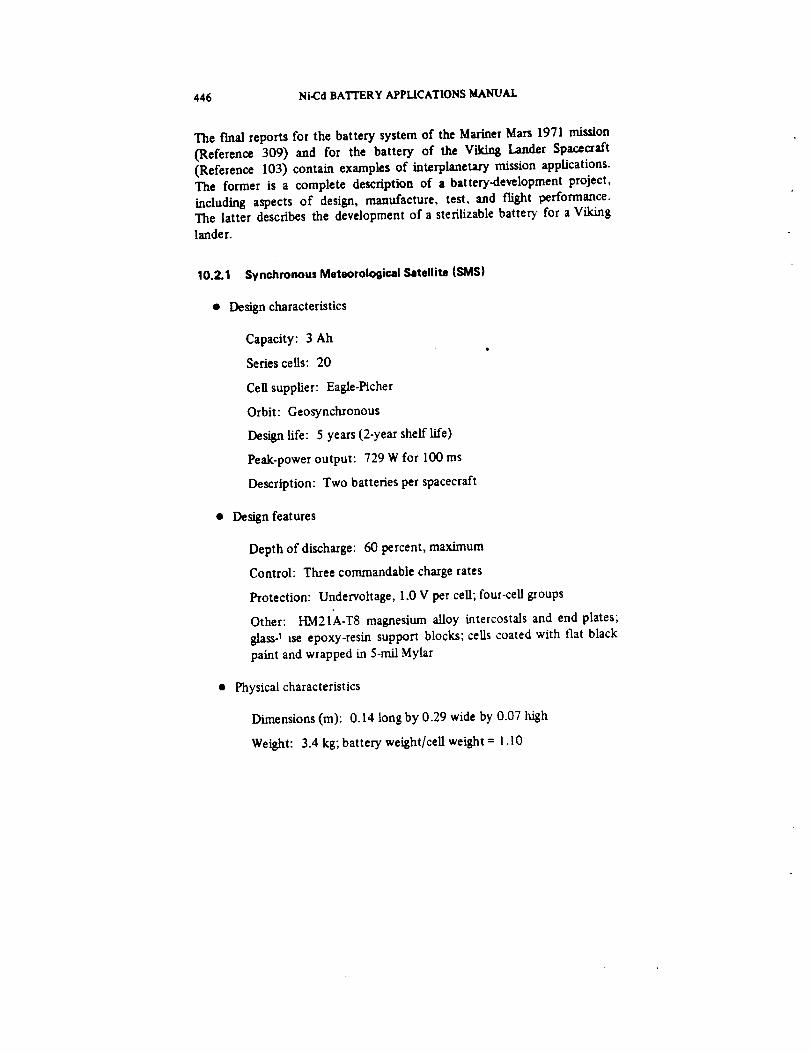
446 Ni-Cd BATI'ERY APPLICATIONS MANUAL
The final reports for the battery system of the Mariner Mars 1971 mission
(Reference 309) and for the battery of the Viking Lander Spacecraft
(Reference 103) contain examples of interplanetary mission applications.The former is a complete description of a battery-development project,
including aspects of design, manufacture, test, and flight performance.The latter describes the development of a sterilizable battery for a Viking
lander.
Synchronous Meteorological Satellite (SMS)10.2.1
• Design characteristics
Capacity: 3 Aha
Series cells: 20
Cell supplier: Eagle-Picher
Orbit: Geosynchronous
Design life: 5 years (2-year shelf life)
Peak-power output: 729 W for 100 ms
Description: Two batteries per spacecraft
• Design features
Depth of discharge: 60 percent, maximum
Control: Three cornmandable charge rates
Protection: Undervoltage, 1.0 V per cell; four-cell groups
Other: I-IM21A-T8 magnesium alloy intercostals and end plates;
glass -1 tse epoxy-resin support blocks; cells coated with fiat black
paint and wrapped in 5-mil Mylar
• Physical characteristics
Dimensions (m): 0.14 long by 0.29 wide by 0.07 high
Weight: 3.4 kg; battery weight/cell weight = 1.10
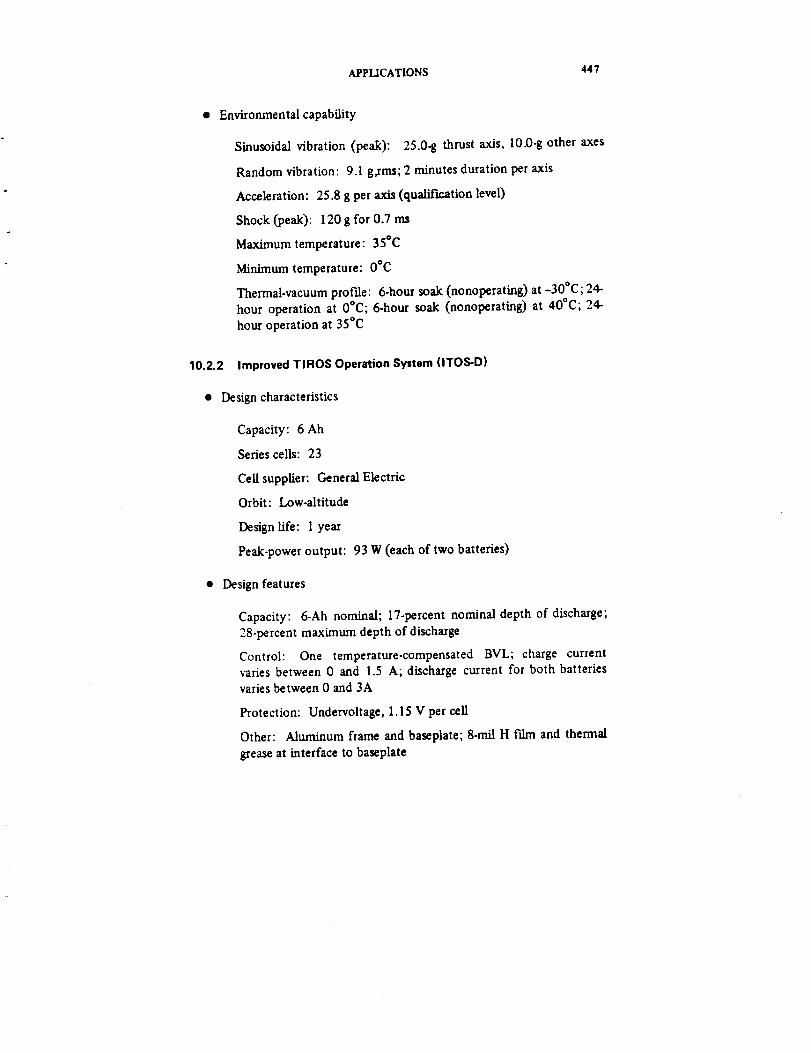
APPLICATIONS 447
Environmental capability
Sinusoidal vibration (peak): 25.0-g thrust axis, 10.O-g other axes
Random vibration: 9.1 g,rrm; 2 minutes duration per axis
Acceleration: 25.8 g per axis (qualification level)
Shock (peak): 120 g for 0.7 ms
Maximum temperature: 35"C
Minimum temperature: OOC
Thermal-vacuum profile: 6-hour soak (nonoperating) at -30°C; 24-
hour operation at 0*C; 6-hour soak (nonoperatin8) at 40"C; 24-
hour operation at 35°C
Improved TIROS Operation System (ITOS-D)
Design characteristics
Capacity: 6 Ah
Series cells: 23
Cell supplier: General Electric
Orbit: Low-altitude
Design life: I year
Peak-power output: 93 W (each of two batteries)
Design features
Capacity: 6-Ah nominal; 17-percent nominal depth of discharge;
28-percent maximum depth of discharge
Control: One temperature-compensated BVL; charge current
varies between 0 and 1.5 A; discharge current for both batteries
varies between 0 and 3A
Protection: Undervoltage, 1.15 V per cell
Other: Aluminum frame and baseplate; 8-mil H film and thermal
grease at interface to baseplate
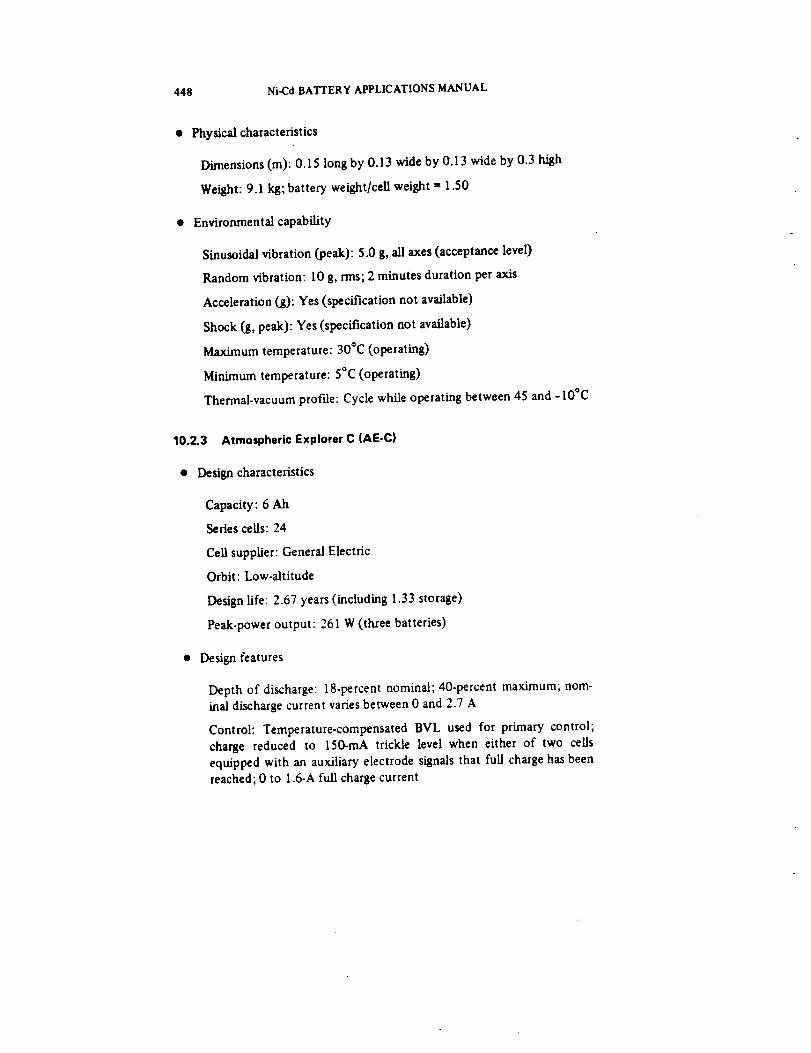
448 Ni-Cd BATFERY APPLICATIONS MANUAL
Physical characteristics
Dimensions (m): 0.15 long by 0.13 wide by 0.13 wide by 0.3 high
Weight: 9.1 kg; battery weight/cell weight -- 1.50
Environmental capability
Sinusoidal vibration (peak): 5.0 g, all axes (acceptance level)
Random vibration: l0 g, rms; 2 minutes duration per axis
Acceleration (g): Yes (specification not available)
Shock (g, peak): Yes (specification not available)
Maximum temperature: 30°C (operating)
Minimum temperature: 5°C (operating)
Thermal-vacuum profile: Cycle while operating between 45 and ol0°C
10.2.3 Atmospheric Explorer C (AE-C)
• Design characteristics
Capacity: 6 Ah
Series cells: 24
Cell supplier: General Electric
Orbit: Low-altitude
Design life: 2.67 years (including 1.33 storage)
Peak-power output: 261 W (three batteries)
• Design features
Depth of discharge: 18-percent nominal; 40-percent maximum; nom-
inal discharge current varies between 0 and 2.7 A
Control: Temperature-compensated BVL used for primary control;
charge reduced to 150-mA trickle level when either of two ceUs
equipped with an auxiliary electrode signals that full charge has beenreached; 0 to 1.6-A full charge current
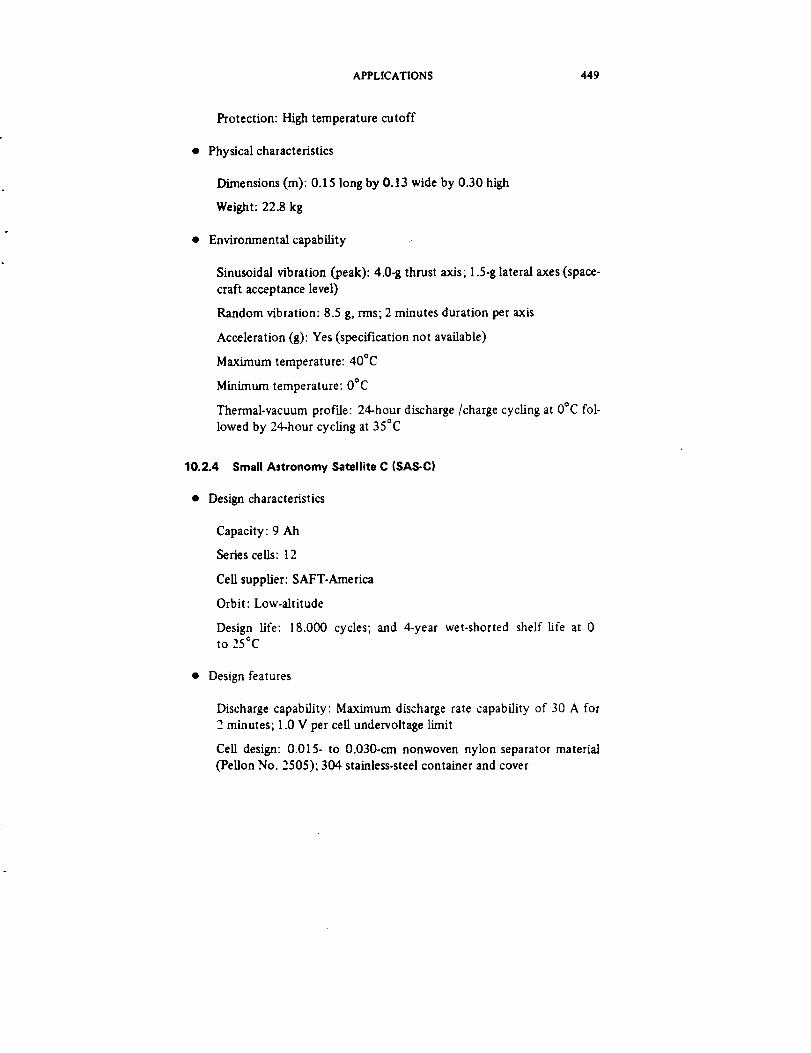
APPLICATIONS 449
Protection: High temperature cutoff
Physical characteristics
Dimensions (m): 0.15 long by O.13 wide by 0.30 high
Weight: 22.8 kg
Environmental capability
Sinusoidal vibration (peak): 4.0-8 thrust axis; 1.5-8 lateral axes (space-
craft acceptance level)
Random vibration: 8.5 8, rms; 2 minutes duration per axis
Acceleration (8): Yes (specification not available)
Maximum temperature: 400C
Minimum temperature: O°C
Thermal-vacuum proFde: 24-hour discharge/charge cycling at OOC fol-
lowed by 24-hour cycling at 35°C
Small Astronomy Satellite C (SAS-C)
Design characteristics
Capacity: 9 Ah
Series cells: 12
Cell supplier: SAFT-America
Orbit: Low-altitude
Design life: 18.000 cycles; and 4-year wet-shorted shelf life at 0to 25°C
Design features
Discharge capability: Maximum discharge rate capability of 30 A for
2 minutes; 1.0 V per cell undervoltase limit
Cell design: 0.015- to 0.030-crn nonwoven nylon separator material
(Pelion No. 2505); 304 stainless.steel container and cover

450 Ni-Cd BATFERY APPLICATIONS MANUAL
• Physical characteristics
Cell dimensions (m): 0.03 long by 0.06 wide by 0.07 high
Weight: 6.2 kg
• Environmental capability
Sinusoidal vibration (peak): 37-8 thrust, 8-g lateral
Random vibration: 16.5 g, rms; 4 minutes duration per axis
Acceleration: 40 g for 3 minutes thrust; 20 g for 1 minute, transverse
Maximum temperature: 25°C operating; 50 nonoperating
Minimum temperature: 0°C operating; -20 nonoperating
10.2.5 Orbiting Solar Observatory I (OSO-I)
• Design characteristics
Capacity: 12 Ah
Series cells: 21
Cell supplier: General Electric
Orbit: Low-altitude
Design life: I year
Description: Two packs per battery with 10 and 11 cells, respectively
• Design features
Capacity: 12-.-_h minimum at "3 ° +-2°C after 1 year (5500 discharge/
charge cycles) of operation to an average depth of discharge of 15 per-
cent at average charge and discharge current levels of 3.2 A
Control: Eight commandable temperature-compensated BVL's
Protection: Undervoltage, 1.18 V per cell measured at the spacecraft
bus; over-temperature, open circuited at 35°C
Other: 40-rail extruded 6063-T6A thermal shims, with 2-rail hard
anodize coating; end plates, 7075-T6AL; two titanium tension bars;

APPLICATIONS 451
fiberglass cell retainers; cells coated with 2-rail black epoxy paint and
wrapped with 5-raft Mylar
• Physical characteristics
Dimensions (m): 10-cell pack, 0.31 long by 0.12 wide by 0.12 high;
I 1-cell pack, 0.33 long by 0.12 wide by 0.12 high
Weight: 10-cell pack: 6.0 kg; 11.cell pack: 6.6 k8; battery weight/cell
weight = 1.14
• Environmental capability
Sinusoidal vibration (peak): 12 g at 100 to 200 Hz in thrust axis;
14 g at 30 to 60 Hz in lateral axes
Random vibration: 18.6 g, rms; 4 minutes duration per axis
Maximum temperature: 35°C
Minimum temperature: -10°C
Thermal-vacuum prof'de: 1 x 10 -s torr; 6-hour soak at 35°C followed
by &hour soak at -10°C; 10°C/hour maximum rate of change
10.2.6 Applications Technology Satellite 6 (ATS-6)
• Design characteristics
Capacity: 15 Ah
Series cells: 19
Cell supplier: SAFT-America
Orbit: Geosynchronous
Design life: 2 years
Peak-power output: 500 W (two batteries)
• Design features
Control: One temperature-compensated BVL; C/20 and C/60 com-
mandable trickle-charge rates

452 , Ni-Cd BA'ITERY APPLICATIONS MANUAL
Protection: Undervoltage, 1.00 V per cell; multiple-cell groups; over
temperature, 35°C
Other: 125-rail extruded 6063-T5 thermal shunts with 2.rail type 5
hard anodize; 2024-T351 aluminum frame; end plates secured
under 1.03 x 10⁶ N/m 2 (150 psi) load; cells wrapped in 2.5-mi1
mylar
• Physical characteristics
Dimensions (m): 0.30 long by 0.23 wide by 0.19 high
Weight: 17.0 kg total; 19 active cells, 12.96; two dummy cells, 0.136;
battery weight/cell weight = 1.31
• Environmental capability
Sinusoidal vibration (peak): 12-g all axes
Random vibration: 17 g, rms; 4 minutes duration per axis, operating
Acceleration: 9-g thrust axis; 3.9-g other axis, operating
Maximum temperature: 25°C (operating)
Minimum temperature: 0°C (operating)
Thermal.vacuum profile: -10 to 35°C, operating, at 10s tort
10.2.7 FLTSATCOM
• Design characteristics
Capacity: 24 Ah
Series cells: 24
Cell supplier: General Electric
Orbit: Geosynchronous
Design life: 5 years
Peak-power output: 410 W for 1.2 hours (each of three batteries)

APPLICATIONS 453
t,
Design features
Capacity: 600 Wh per battery above 24 Vdc; >70-percent normal
depth of discharge and >85-percent with two failed cells in each oftwo batteries
Control: Eight commandable temperature-compensated BVL's control
two modes: (1) switch to C/IO0 trickle charge; (2) current taper
Protection: Forward and reverse cell-bypass circuits; forward is
temperature-compensated voltage limit; reverse limits to -200-mV
maximum on discharge; over and under temperature
Other: Magnesium thermal shims and battery baseplate
Physical characteristics
Dimensions (m): 0.39 long by 0.30 wide by 0.22 high
Weight: 29.9 kg; cells, 22.5 kg
• Environmental capability
Random vibration (g, rms): OveraU level not specified at component
level; 3 minutes duration per axis
Acceleration: 12 g per axis
Maximum temperature: 32"C
Minimum temperature: 4"C
Thermal-vacuum profile: 12-hour soak at -2°C followed by 12-hour
soak at 380C
10.2.8 Defense Meteorological Satellite Program (DMSP)
• Design characteristics
Capacity: 30 Ah
Series cells: 17
Cell supplier: General Electric
Orbit: Geosynchronous
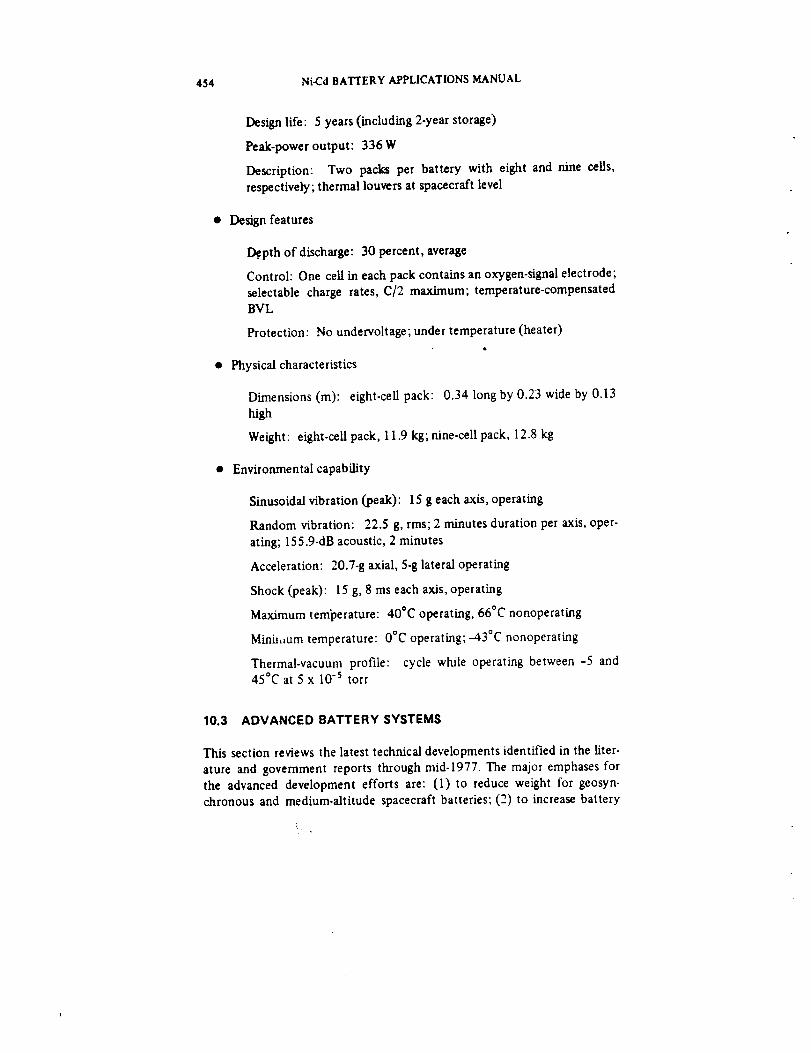
454 Ni-Cd BATTERY APPLICATIONS MANUAL
Design life: 5 years (including 2-year storage)
Peak-power output: 336 W
Description: Two packs per battery with eight and nine ceils,
respectively; thermal louvers at spacecraft level
Design features
l_.pth of discharge: 30 percent, average
Control: One ceil in each pack contains an oxygen-signal electrode;
selectable charge rates, C/2 maximum; temperature-compensated
BVL
Protection: No undervoltage; under temperature (heater)
Physical characteristics
Dimensions (m): eight-cell pack: 0.34 long by 0.23 wide by 0.13
high
Weight: eight-ceU pack, 11.9 kg; nine-cell pack, 12.8 kg
Environmental capability
Sinusoidal vibration (peak): 15 g each axis, operating
Random vibration: 22.5 g, rms; 2 minutes duration per axis, oper-
ating; 155.9-dB acoustic, 2 minutes
Acceleration: 20.7-g axial, 5-g lateral operating
Shock (peak): 15 g, 8 ms each axis, operating
Maximum tem'perature: 400C operating, 66°C nonoperating
Minh,um temperature: 0*C operating;-43°C nonoperating
Thermal-vacuum profile: cycle while operating between -5 and45°C at 5 x 10 -s tort
10.3 ADVANCED BATTERY SYSTEMS
This section reviews the latest technical developments identified in the liter-
ature and government reports through mid-1977. The major emphases for
the advanced development efforts are: (1) to reduce weight for geosyn-chronous and medium-altitude spacecraft batteries; (2) to increase battery
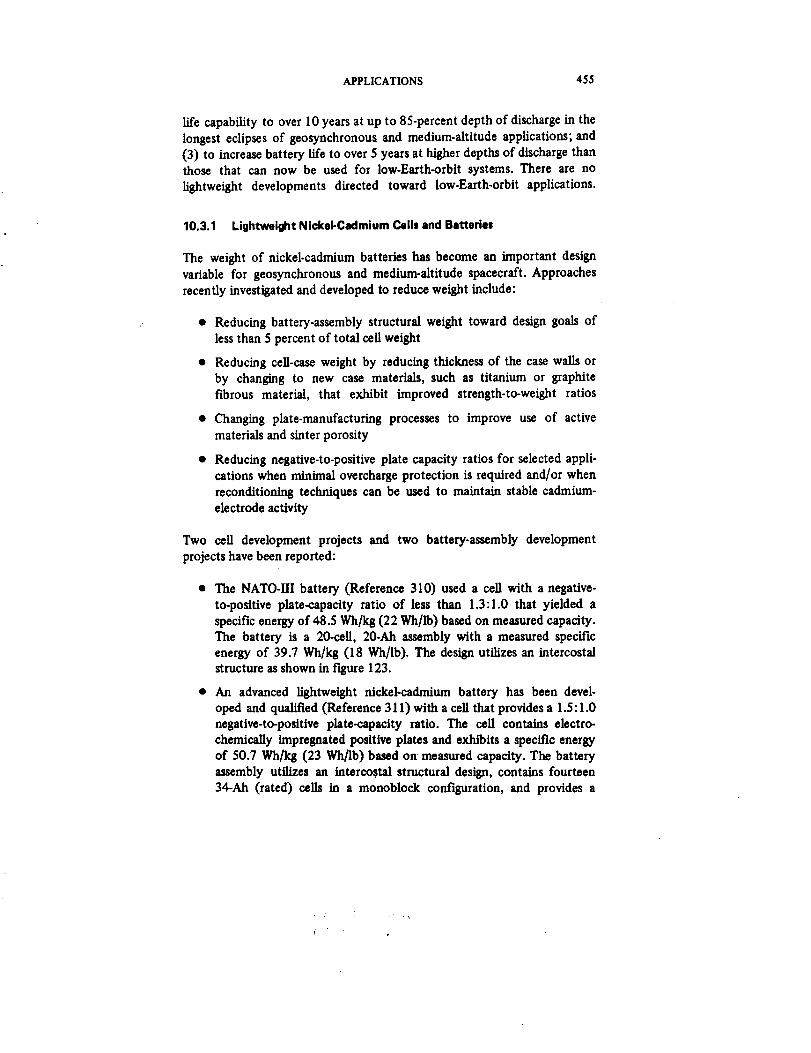
APPLICATIONS 455
life capability to over 10 years at up to 85-percent depth of discharge in the
longest eclipses of geosynchronous and medium-altitude applications; and
(3) to increase battery life to over 5 years at higher depths of discharge thanthose that can now be used for low-Earth-orbit systems. There are no
lightweight developments directed toward low-Earth-orbit applications.
10.3.1 Lightweight Nickel-Cadmium Cells and Batteries
The weight of nickel-cadmium batteries has become an important design
variable for geosynchronous and medium-altitude spacecraft. Approaches
recently investigated and developed to reduce weight include:
• Reducing battery-assembly structural weight toward design goals of
less than 5 percent of total cell weight
• Reducing cell-case weight by reducing thickness of the case wafts or
by changing to new case materials, such as titanium or graphite
fibrous material, that exhibit improved strength-to-weight ratios
• Changing plate.manufacturing processes to improve use of active
materials and sinter porosity
• Reducing negative-to-positive plate capacity ratios for selected appli-
cations when minimal overcharge protection is required and/or when
reconditioning techniques can be used to maintain stable cadmium-
electrode activity
Two cell development projects and two battery-assembly development
projects have been reported:
• The NATO-III battery (Reference 310) used a cell with a negative-
to-positive plate-capacity ratio of less than 1.3:1.0 that yielded a
specific energy of 48.5 Wh/kg (22 Wh/lb) based on measured capacity.The battery is a 20-cell, 20.Ah assembly with a measured specific
energy of 39.7 Wh/kg (18 Wh/lb). The design utilizes an intercostal
structure as shown in figure 123.
• An advanced lightweight nickel-cadmium battery has been devel-
oped and qualified (Reference 311) with a cell that provides a 1.5:1.0
negative-to-positive plate-capacity ratio. The cell contains electro-
chemically impregnated positive plates and exhibits a specific energy
of 50.7 Wh/kg (23 Wh/lb) based on measured capacity. The battery
assembly utilizes an intercostal structural design, contains fourteen
34-Ah (rated) ceils in a monoblock configuration, and provides a
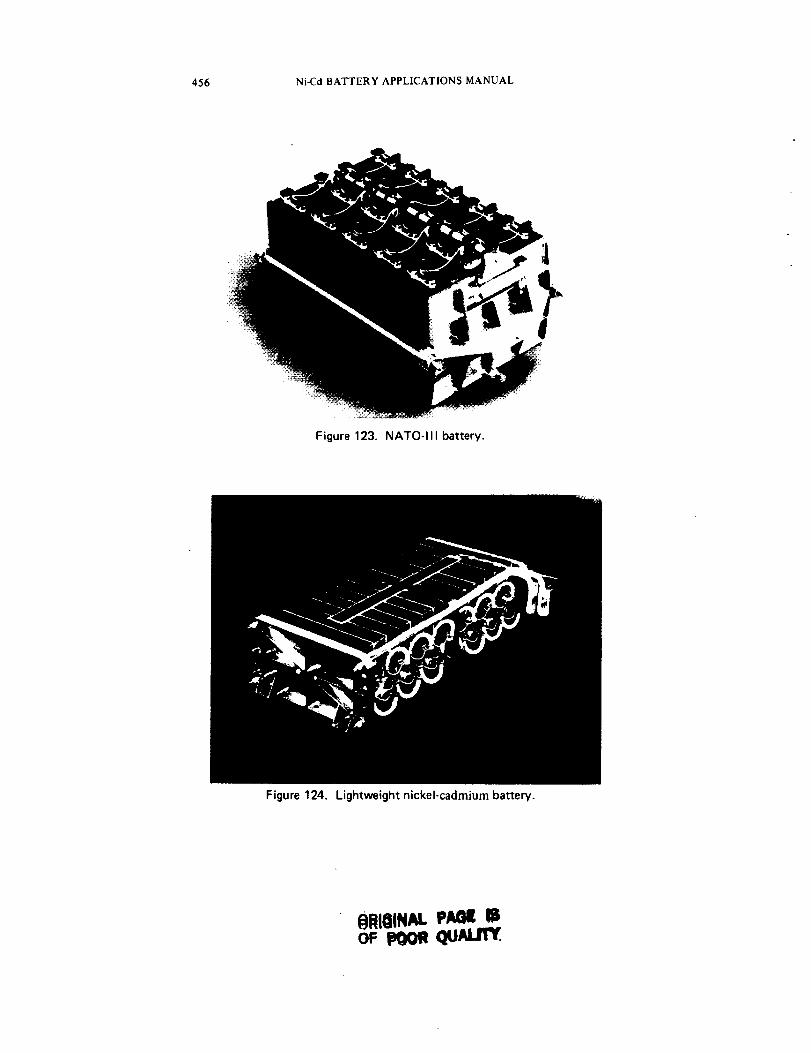
456 Ni-Cd BATTERY APPLICATIONS MANUAL
Figure 123. NATO-III battery.
Figure 124. Lightweight nickel-cadmium battery.
@ftlOINALPARIKSOF _ QIJ_
APPLICATIONS 457
measured specific energy of 46.3 Wh/kg (21 Wh/lb). The unit is shown
in figure 124.
Accelerated cycle-life tests have verified the performance of these light-
weight battery designs. The technology is new and represents more design
risk for spacecraft than the heavier conventional flight-proven designs de-
scribed earlier. However, the tedmology is maturing rapidly, and it is ex-
pected that these advanced designs will be considered for new spacecraft
with severe weight and life requirements (Reference 312).
10.3.2 Trends in Battery-Charge Control
Advanced charge-control development work is being performed primarily
with the objectives of achieving compatibility with future on-board space-
craft computer systems and of achieving improved cell monitoring and
control capability for long-life battery management. Three studies either
have been or are being conducted:
• The Jet Propulsion Laboratory is studying automated power-system
management (Reference 269). This study is investigating methods of
control and identifying sensors needed for battery control with an
on-board computer system.
• The Intelsat-V and NASA/GSFC TDRSS spacecraft projects are
developing scanners capable of transmitting a data stream of pre-
cisely measured individual cell voltages by telemetry to the ground.
Data on all battery cells in the spacecraft can be obtained within 30
seconds if necessary.
• Ampere-hour integrators and associated charge-control logic networks
are being studied utilizing newly available microprocessor technology.These studies are new and not well-documented at this time.
Because of the preliminary nature of these activities, most current space-
craft battery-system designs rely on the proven technical approaches re-
ported in Section 8.
10.4 TERRESTRIAL APPLICATIONS
Recently, many consumers have become aware of nickel-cadmium cells
because of their use in calculators, electric shavers, and hand power tools.
The cells are usually one of the small standard sizes (table 57). They are
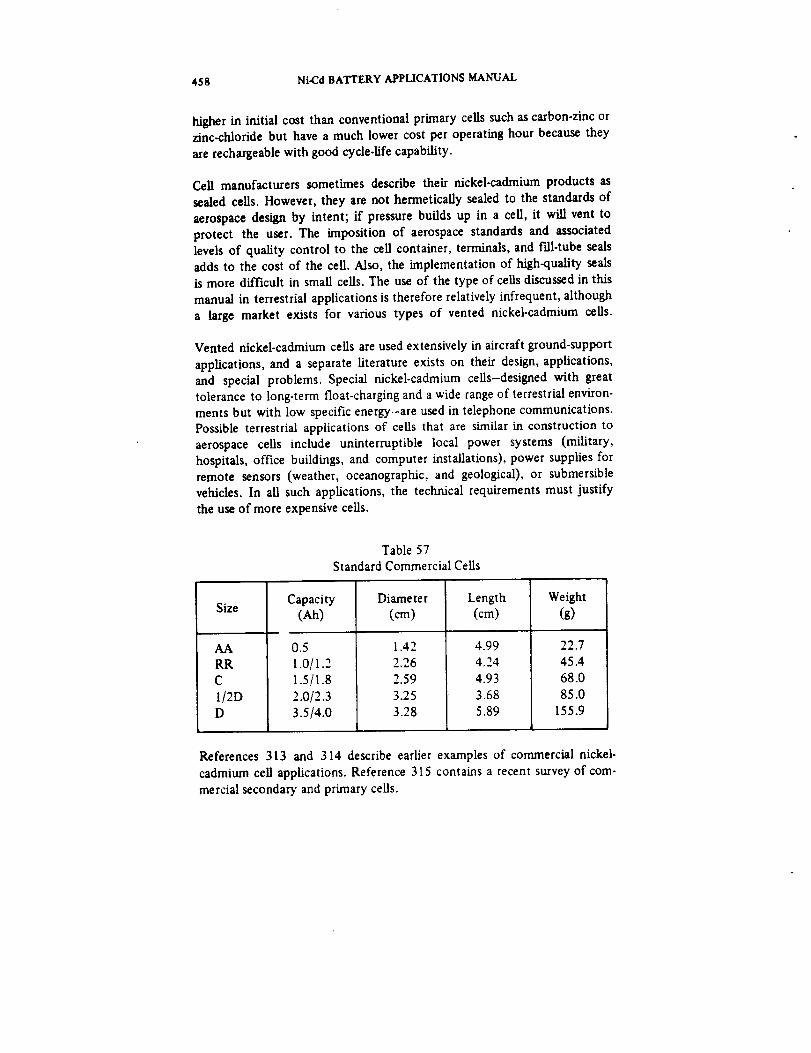
458 Ni-Cd BATTERY APPLICATIONS MANUAL
higher in initial cost than conventional primary cells such as carbon-zinc orzinc.chloride but have a much lower cost per operating hour because they
are rechargeable with good cycle-life capability.
Cell manufacturers sometimes describe their nickel-cadmium products as
sealed cells. However, they are not hermetically sealed to the standards of
aerospace design by intent; if pressure builds up in a cell, it will vent to
protect the user. The imposition of aerospace standards and associatedlevels of quality control to the cell container, terminals, and fall-tube sealsadds to the cost of the cell. Also, the implementation of high-quality seals
is more difficult in small cells. The use of the type of cells discussed in this
manual in terrestrial applications is therefore relatively infrequent, although
a large market exists for various types of vented nickel-cadmium cells.
Vented nickel-cadmium cells are used extensively in aircraft ground-support
applications, and a separate literature exists on their design, applications,
and special problems. Special nickel-cadmium cells-designed with great
tolerance to long-term float-charging and a wide range of terrestrial environ-
ments but with low specific energy-are used in telephone communications.
Possible terrestrial applications of cells that are similar in construction to
aerospace cells include uninterruptible local power systems (military,
hospitals, office buildings, and computer installations), power supplies for
remote sensors (weather, oceanographic, and geological), or submersible
vehicles. In all such applications, the technical requirements must justify
the use of more expensive cells.
Table 57
Standard Commercial Cells
Size
AA
RR
C
I/2DD
Capacity(Ah)
0.5
1.0/1.2
1.5/1.8
2.0/2.3
3.5/4.0
Diameter
(cm)
1.42
2.26
2.59
3.25
3.28
Length
(cm)
4.99
4.24
4.93
3.68
5.89
Weight
(g)
22.7
45.4
68.0
85.0
155.9
References 313 and 314 describe earlier examples of commercial nickel-
cadmium cell applications. Reference 315 contains a recent survey of com-
mercial secondary and primary cells.
REFERENCES*
°
.
.
Francis, H. T., Space Battery Handbook, NASA CR-56514 (N64-
25802), 1963.
Bauer, P., Batteries For Space Power Systems, NASA SP-172 (N69-
18042), 1968.
Halpert, G., "The 1976 Goddard Space Flight Center Battery Work-
shop," Proc., Greenbelt, Maryland, NASA TM X-71284 (N77-21550),
November 1976.
4. Encyclopedia of Chemical Technology, 2nd Edition, Vol. 3, John
Wiley and Sons, Inc., New York, 1963.
5. Falk, S. Uno, and Alvin J. Salkind, Alkaline Storage Batteries, John
Wiley and Sons, Inc., New York, 1969.
6. General Electric Co., "Nickel-Cadmium Battery Application Engineer-
ing Handbook," Publication GET-3148, Gainesville, Flordia, 1971.
7. Conv, ay, B. E., and E. Gileadi, "Electrochemistry of the Nickel-Nickel Oxide Electrode, Part IV," Canad/an J. Chem., 40, 1962,
pp. 1933-1942.
8. Seiger, H. N., Sinter of Uniform, Predictable, Blemish-Free Nickel-
Plaque for Large Aerospace Nickel-Cadmium Cells, Final Report,
NASA CR-132481 (N75.18717), February 1975.
.
10.
Seiger, H. N., "Role of Tetravalent Nickel in Nickel Oxide Elec-
trodes," American Chemical Society Meeting, San Francisco, Cali-
fornia, 1976.
MacArthur, D. M., "Electrochemical Properties of Nickel Hydroxide
Electrodes," Power Sources 3, D. H. Collins, ed., Oriel Press Ltd.,
England, 1970, pp. 91-118.
*Numbers in parentheses are NASA Scientific and Technical Information Serviceassession numbers.
459
460 Ni-Cd BATTERY APPLICATIONS MANUAL
11. Halpert, G., "Electrolyte Concentration Changes during Operation ofthe Nickel-Cadmium Cell," NASA TM X.70977 (N75-33497), May
1975.
12. Ritterman, P. F., "Hydrogen Recombination in Sealed Nickel-Cad-
mium Cells," Proc. 27th Power Sources Symposium, Atlantic City,
New Jersey, (A77-28153), 1976, pp. 111-114.
13. Halpert, G., and W. H. Webster, Jr., Secondary Aerospace Batteriesand Battery Materials, A Bibliography, 1923-1968, NASA SP-7027
(N70-22825), August 1969.
14. McDermott, P., G. Halpert, S. Ekpanyaskun, and P. Nche, Secondary
Aerospace Batteries and Battery Materials, A Bibliography, 1969-
1974, NASA SP-7044 (N7716437), July 1976.
15. Holleck, G., Development of Uniform and Predictable Battery
Materials for Nickel-Cadmium Aerospace Cells, Final Report, NASA
CR-130094 (N73-10050), January 1972.
16. "The 1975 GSFC Battery Workshop," Proc., Greenbelt, Maryland,
NASA TM X-71104 (N76.24704), November 1975.
17. Scott, W. R., A Study of Degradation of Plates for Nickel-Cadmium
Spacecraft Cells, Final Report, NASA CR-141357 (N75-15164),
June 1974.
18. Menard, C., "Recent Development in Porous Structures for Nickel
Hydroxide Electrodes," Proc. Advanced Battery Technology Sympo-
sium, Volume 2, December 1966, pp. 76-98.
19. Halpert, C,., "Nickel-Cadmium Battery Test Project-Relationship
Between Operation, Life and Failure Mechanism. Vol. III. Analysisof the Cells and Their Components," NASA TM X-63550 (N69-
28089), March 1969.
20. Kroger, H., "Nickel Hydroxide Battery Electrode Development,"
1st Interim Report, Contract F33-615.69-C-1312, Report GE S-70-
1025, General Electric Co., Gainesville, Florida. December 1969.
REFERENCES 461
21.
22.
23.
Doran, R., "Further Studies of Aging and Impurity Effects in the
Nickel Hydroxide Electrode," Proc. Second International Symposium
on Batteries, October 1960, pp. 26/1-26/13.
Rubin, E. J., and M. J. Turchan, Nickel-Cadmium Cells, Final Report,
NASA CR-143175 (N75-21792), August 1974.
Lemer, S., and H. N. Seiger, An Investigation of the Nickelq3xide
Electrode, Final Report, NASA CR-72465 (N69-10584), September
1968.
24. Lerner, S., P. F. Ritterman, and H. N. Seiger, lnvestigation of BatteryActive Nickel Oxides, Final Report, NASA CR-72128 (N67-15153),
September 1966.
25. Dunlop, J., "The 1976 Goddard Space Flight Center Battery _/ork-
shop," Proc. Greenbelt, Maryland, NASATM X-71284 (N77-21550),
1976, pp. 233-242.
26.
27.
28.
29.
30.
31.
Rampel, G. G., "Process of Forming Rechargeable Electrodes Utiliz-
ing Unsintered Fluorocarbon Binder," U.S. Patent 3,630,781, Decem-
ber 28, 1971; and "Rechargeable Electrodes Utilizing UnsinteredFluorocarbon Binder, U.S. Patent, 3,954,501, May 4, 1976.
"The 1973 GSFC Battery Workshop, First Day," Proc., Greenbelt,
Maryland, NASA "I'M X-72536 (N75-15152), November 1973.
Rampel, G. G., "Cell Having Anode Containing Silver Additive for
Enhanced Oxygen Recombination," U.S. Patent No. 3,877,985,
April 15, 1975.
Baker, H., S. D. Toner, and W. F. Cuthrell, "Evaluation of Separator
Materials Used in NiCd Satellite Batteries," Report NBS 10-956.
National Bureau of Standards, November 1972.
Lira, H. S., et al., "Studies on the Stability of Nylon Separator Ma-
terial," Proc. 27th Power Sources Symposium, Atlantic City, New
Jersey, (A77-28126), 1976, pp. 83-85.
Jakobi, W., Research and Development Program on Sealed Nickel-
Cadmium Cells for Space Use, Final Report, NASA CR-55845 (N64-
16699), April 1963.
462 Ni-Cd BATTERY APPLICATIONS MANUAL
32.
33.
34.
35.
36.
"'The 1971 NASA/Goddard-Aerospace Industry Battery Workshop,
Volume I," Proc. Greenbelt, Maryland, NASA TM X-68828 (N72-
27061), November 1971.
"The 1971 NASA/Goddard-Aerospace Industry Battery Workshop,
Volume 2," Proc. Greenbelt, Maryland, NASA TM X-68829 (N72-
27062), November 1971.
"The 1972 NASA/GSFC Battery Workshop, First Day."Proc. Green-
belt, Maryland, NASA TM X-69240 (N73-21956), November 1972.
"The GSFC Battery Workshop, 1974," Proc., Greenbelt, Maryland,
NASA TM X-70822 (N75-16976), November 1974, p. 185.
Bauer, J. L., and A. Garcia, "Graphite/Epoxy Nickel-Cadmium Cell
Case Development, Final Report," Report 730-3, Jet Propulsion
Laboratory, Pasadena, California, December 1977.
37. Scott, W. R., A Study of the State-of-the-Art of Hermetic Seals for
Secondary Alkaline Spacecraft Cells, Final Report. NASA CR-97888
(N69-12833), March 1968.
38. Levy, E., Jr., E. C. Duncan, C. E. Maiden, W. Michel, and G. I. Card-well, "Low Earth Orbit Battery Development Project. Final Report,"
Contract F33-615.7342-1710, Report AFAPL-TR-72-60,
AD-902570L (X73-72130), July 1972.
39. Turner, D. R., W. E. Howden, Y. Okinara, and E. J. McHen_'.
"Developments Toward an Improved Sealed Ni-Cd Battery. PowerSources, D. H. Collins, ed., Pergamon Press. New York. 1966. pp.
349-370.
J¢O.
41.
42.
Tuomi, Donald, "The Forming Process in Nickel Positive Electrodes."
J. ElectrochemicalSoc., 112 (1), January 1965. pp. 1-12.
Casey, E. J., A. R. Dubois, P. E. Lake, and W. J. Moroz. "'Effects of
Foreign Ions on Nickel Hydroxide and Cadmium Electrodes." J.Electrochemical Soc., 112 (4), April 1965, pp. 371-383.
Yamashita, D., "The Effect of Lithium and the Formation of Active
Material from the Nickel Plaque on the Positive Plates of Sintered-
Type Alkaline Storage Batteries." Power Sources. D. H. Collins. ed..
Pergamon Press, New York, 1966, pp. 297-308.
REFERENCES 463
43.
4.
45.
46.
47.
48.
49.
50.
51.
Gross, S., Nickel-Cadmium Cell Designs, Negative to Positive Material
Ratio and Precharge Levels, NASA CR-153904 (N77-27501), June
1977.
Voyentzie, P. R., G. Rampel, and W. N. Carson, Jr., "Characterizationof Recombination and Control for Spacecraft Nickel-Cadmium Cells
Containing Electrodes, Final Report," NASA Contract NAS 5-11547,
General Electric Company, March 1970.
(a) "NASA/GSFC 1970 Battery Workshop, First Day," Proc., Green-
belt, Maryland, NASA TM X-67200 (N71-28659), November
1970.
(b) "NASA/GSFC 1970 Battery Workshop, Sessions 3 and 4,"Proc., Greenbelt, Maryland, NASA TM X-67186, (N71-28672).
November 1970.
"The 1976 Goddard Space Flight Center Battery Workshop," Proc.,
Greenbelt, Maryland, NASA TM X-71284 (N77-21550), November
1976.
Carson, W. N., Jr., G. Rampel, and I. B. Weinstock, Characterization
of Recombination and Control Electrodes for Spacecraft Nickel-
Cadmium Cells, Final Report, NASA CR-93427 (N68-18826), January
1968.
Lerner, S., Characterization of Recombination and Control Elec-
trodes for Spacecraft Nickel-Cadmium Cells, Final Report. NASA
CR-93244 (N68-17741), June 1967.
Kirsch, W. W., and A. E. Shikoh, "Summary Report on Nickel-
Cadmium Batteries for Apollo Telescope Mount," Contract NAS8-
20055. Sperry Rand Space Support Division, Huntsville. Alabama.
June 22. 1970.
Ford, F.. "'Performance of 3rd Electrode Cells in OAO." Proc. 25th
Power Sources Symposium, Atlantic Oty, New Jersey, (A73-29581).
May 1972, pp. 43-46.
Scott, W. R.. "Two Kilowatt Long Life Battery." Final Technical
Report, Contract F33-615-70-C-1627, Report AFAPL-TR-76-47.
AD-B0___47L (X78.70547), August 1976.
464 Ni-Cd BATTERY APPLICATIONS MANUAL
52.
53.
54.
55.
56.
Ford, F.E., "Overcharge Control of Nickel-Cadmium Spacecraft Bat-
teries using the Auxiliary Electrode Signal," NASA TM X-63177
(N68-22377), March 1968.
Cahoon, N.C. "The Operation and Use of Reference Cells," Electro-
chemical Technology, 3 (1-2), January/February 1965, pp. 3-9.
Puglisi, V.J., and E.L. Ralph, "Development of Nickel AlkalineBatteries for Aerospace Lightweight Secondary Power, Final
Report," Contract F33-615-73-C-2012, Report AFAPL-TR-75-64,
AD-A022350 (N76-29720), June 1975.
Kantner, E., Production of Uniform Nickel-Cadmium Battery Plate
Materials, Final Report, NASA CR-131914 (X73-75451), 1972.
Seiger, H.N., D.F. Pickett, V.J. Puglisi, P.F. Ritterman, and R.L.Oliver, "High Energy Density Sintered Plate Type Nickel-Cadmium
Battery Cells, Part I: The Positive Electrode/Plaque Relationship,"Contract F33-615.75-C-2012, Report AFAPL-TR-74-56-I, AD-
AO00103 (N75-19849), August 1974.
57. Miller, L., Study of Process Variables Associated with Manufacturing
Hermetically-Sealed Nickel-Cadmium Cells, Final Report, NASA CR-
139025 (N74.26501), April 1974.
58. H_iusler, E., "Electrochemical Impregnation of Porous Sintered Nickel
Grids according to the 'Kandler-process,' " Power Sources, D.H. Col-
lins, ed., Pergamon Press, New York, 1966, pp. 287-296.
59. Kroger, H., "Nickel Hydroxide Battery Electrode Development,
Second Interim Report," Contract F33-615-69-C-1312, ReportAFAPL-'rR-71-12, AD-883905 (X71-78940), January 1971.
60. Pickett, D.F., V.J. Puglisi, H.N. Seiger, and R. Oliver, "High Energy
Density Sintered Plate Type Nickel-Cadmium Battery CeLls, Part 2:
Electrochemical Impregnation Methods to Produce Nickel-Oxide
Electrodes," Contract F33-615-73-C-2012, Report AFAPL-TR-74-
56-I1, AD-A002142 (N75-19850), August 1974.
REFERENCES 465
61.
62.
63.
64.
65.
66.
67.
68.
69.
70.
Pickett, D.F., "Fabrication and Investigation of Nickel-Alkaline Cells,Part I: Fabrication of Nickel-Hydroxide Electrodes Using Electro-
chemical Impregnation Techniques," Report AFAPL-TR-75-34-I,
AD-A018517, (N76-24737).October 1975.
Gaston, S., M. Wertheim, and J.A. O'Rouke, OAO Battery Data
Analysis, Final Report, NASA CR-130233 (N73-20045), February
1973.
Armantrout, J.D., SMS/GOES Cell and Battery Data Analysis, NASA
CR-156739 (N78.21606), December 1977.
Halpert, Gerald, "A Screening and Selection Method for Nickel-
Cadmium Cell Plates," NASA TM X-63962 (N70-33091), April 1970.
Haas, R.J., and D.C. Briggs, "20 Watt-hour per Pound Nickel-Cadmium
Energy Storage for the NATO III Communication Satellite," AIAA
Paper 76-287, April 1976.
Bogner, R.S., and A.A. Uchiyama, "Coordinated NASA Nickel-
Cadmium Battery Technology Program," AIAA Paper 77-516, March
1977.
Font, S., "Study of Nickel-Cadmium Batteries for Use in Applications
Satellites, Phase 2: Evaluation of Electrical Impedance as a Function
of the Frequency at Various Temperatures and Charge States of NiCdV023S Batteries," Contract ESTEC-1358/71-sl, Report ESRO-CR(P)-
326 (N74-16813), February 1973 (in French).
"Evaluation Program for Secondary Spacecraft Cells." Annual Reports
of Cycle Life Test, Contracts WlI,,.5.B, W12.397, $23404G, and
$53742AG, Weapons Quality Engineering Center. Naval Weapons
Support Center, Crane, Indiana, 1965-1976.
"The GSFC Battery Workshop, 1974." Proc.. Greenbelt. Maryland,
NASA TM X-70822 (N75-16976), November 1974. pp. 32-38.
Brooman, E.W., and J. McCallum, "Heat Transfer in Sealed Nickel-
Cadmium Spacecraft Cells and Batteries." Contract AF33(615)-
3701, Report AFAPL-TR-69-21, AD-851880 (X69-16296), April1969.
466 Ni-Cd BATTERY APPLICATIONS MANUAL
71.
72.
73.
74.
75.
76.
77.
78.
79.
80.
Haugen, H., W.R. Scott, D.N. Stager, and D.W. Zerbel, "Two Kilo-
watt Long Life Battery," First Interim Report, Contract F33-615-70-C-1627, Report AFAPL-TR-71-43, AD-885779 (X71-81816),
June 1971.
Brooman, E.W., and J. McCaUum, "The Thermal Conductivity ofSealed Nickel-Cadmium Cells," Contract F33-615-69-C-1537, Report
AFAPL.TR-71-75, AD.737519 (N72.24055), February 1972.
Brooman, E.W., and J. McCallum, "The Thermal Properties and Be-
havior of Nickel-Cadmium and Silver-Zinc Cells and their Compo-
nents," Contract AF-33(615)-3701, Report AFAPL.TR-68-41,
AD-834300 (X68-1882 l), June 1968.
Crawford, R.L., J.M. Gondusky, P.V. Popat, and EJ. Rubin, "Heat
Sterilizable and Impact Resistant Ni-Cd Battery Development, Eighth
Quarterly Report," NASA CR-106364 (N69-40742), June 1969.
Font, S., "Study of Nickel-Cadmium Batteries for Use in Applications
Satellites, Phase 2: Evaluation of Charging Efficiency of V023S
NiCd Batteries," Contract ESTEC-1358/71-sl, Report ESRO-CR(P)-
325 (N75-16998), February 1973 (in French).
Font, S., "Study of Nickel-Cadmium Batteries for Use in Applications
Satellites, Phase 2: Evaluation of NiCd Batteries V023S Overcharge,"Contract ESTEC-1358/71-sl, Report ESRO-CR(P)-329 (N75-17817),
May 1973 (in French).
Ford, F.E., "Characterization of the 20-Ah Nickel-Cadmium Cell Used
for Energy Storage on the Orbiting .Mtronomical Observatory,"
NASA TM X-66093(N73-11040), September 1972.
Lackner, J., "The 1976 Goddard Space Flight Center Battery Work-
shop," Prec., Greenbelt, Marylatgl, NASA TM X-71284 (N77-21550),
November 1976, pp. 191-198.
"The GSFC Battery Workshop. 1974," Prec.. Greenbelt, Maryland,
NASA TM X-70822 (N75-16976), November 1974, pp. 43-62.
Elder, J.P., and E.M. Jest, "Statistical Studies of Rechargeable Battery
Systems," Electrochemical Technology, 116(5), May 1969, pp. 687-
693.
REFERENCES 467
81.
82.
83.
84.
85
86.
87.
88.
89.
90.
Carson, W.N., Jr., J.A. Consiglio, and J.F. Wilbore, "'Study of Nickel-
Cadmium Cells," NASA Contract NAS 5-9586, Report $67-1116,
General Electric Company, Schenectady, New York, July 1967.
Font, S., "Study of Nickel-Cadmium Batteries for Use in Applications
Satellites, Phase 2: Evaluation of Charge Storage of Charged Ni-Cd
V023S Batteries," Contract ESTEC-1357/71-sl, Report ESRO42R
(P)-324 (N74-16812), December 1972 (in French).
Scott, W.R., "A Study of Short Test and Charge Retention TestMethods for Nickel-Cadmium Spacecraft Cells, Final Report," NASA
CR-143189 (N75-27566), April 1975.
Otzinger, B., "VO-75 Nickel-Cadmium Cell, Special Charge Retention
Test Program," Report 21329, Electro-Optical Systems, Pasadena,
California, April 1974.
McCallum, J., E.A. Roeger, Jr., and G.H. Miller, "Rate of Dischargefor Accelerated Life Tests of Nickel-Cadmium Cells," Contract F33-
615-694:-1537, Report AFAPL-TR-72-67, AD-748253 (N73-13065),
August 1972.
Harivell, J.P., B. Morignat, and J. Migeon, "Investigations on the Nega-
tive Electrode of Nickel-Cadmium Cells with Sintered Plates," Batteries
2, D.H. Collins, ed., Pergamon Press, New York, 1964, pp. 107-127.
Rubin, E.J., Heat Sterilizable and Impact Resistant Ni-Cd Battery De-
velopment, Final Report, Volume 2, NASA CR- 109855 (N70-34013),
January 1970.
Gross, S., and R.J. Glockling, The Cadmium Electrode, A Review of
the Status of Research, Final Report, NASA CR-149860 (N77-19572),
September 1976.
Turner, Dennis R., "The Effect of State-of-Charge of the Cadmium
Electrode on Oxygen Recombination in Sealed Nickel-Cadmium
Cells," Electrochemical Tech., 2(11-12), November/December 1964,
pp. 313-319.
Font, S., "Improved Nickel4:admium Cells for a Communications
Satellite at Synchronous Orbit, Final Report," Report DT/SAS-
184172, SAFT-America, Inc., Valdosta, Georgia, April 1972.
468 Ni-CBATYERYAPPLICATIONSMANUAL
91. Dunlop,LD., and M. Earl, "Evaluation of lntelsat IV Nickel-Cadmium
Cells," Proc. 23th Power Sources Symposium, Atlantic City, New
Jersey, (A73-29581), May 1972, pp. 40-42.
92. Gottlieb, Melvin H., and T.H. Willis, "Operating Characteristics ofSealed Nickel-Cadmium Batteries at Low Temperatures," Electro-
chemical Tech., 4(11-12), November/December 1966, pp. 515-519.
93. Baer, David A., "Summary of the Manufacturing and Testing of 12-Ah
Nickel-Cadmium Cells for the IUE Spacecraft," NASA TM X.71094
(X76-10697), January 1976.
94. Scott, W.R., "Two Kilowatt Long Life Battery," Final Technical
Documentary Report, Contract F33615-69-C-1291, Report AFAPL-
TR-70-61, AD-876484 (X71-71744), September 1970.
95. Baumstark, G., A. Fitchman, and S. Thorneil, Cell-Core Compression
Studies on Nickel-Cadmium Cells, Final Report, NASA CR-72317
(N68-13010), November 1967.
96. Jakobi, W.W., Encyclopedia of Chemical Technology, 2nd ed., Vol. 3,
John Wiley and Sons, Inc., New York, 1963, pp. 161-208.
97. Menard, C., "Recent Development in Porous Structures for Nickel
Hydroxide Electrodes," Proc. Advanced Battery Technology Sym-
posium, Volume 2, December 1968, pp. 76-98.
98. Milner, P.C., and U.B. Thomas, Advanced in Electrochemistr._' and
Electrochemical Engineering, Vol. 5, Charles W. Tobias, ed.. Inter-
science Publishers, New York, 1967.
99. Luksha, _., and D.J. Gordy, Non-Gassing Nickel-Cadmium BatteryElectrodes and Cells, Final Report, NASA CR.128355 (N72-33056).
July 1972.
100. Luksha, E.. and D.J. Gordy, Non-Gassing Nickel-Cadmium BarrettElectrodes and Cells, Supplementary Report, NASA CR-130932
(N73-19060), February 1973.
101. Gordy, D.J., Fabrication and Testing of Negative-Limited SealedNickel-Cadmium Cells, Final Report, NASA CR-143628 (N75-33493).
March 1975.

REFERENCES 469
102.
103.
104.
I05.
106.
107.
108.
i09.
110.
111.
Popat, P.V., Heat Sterilizable and Impact Resistant Ni-Cd Battery De-velopment, Ninth Quarterly Report, NASA CR- 108170 (N70-18977),
September 1969.
Newell, D.R., Viking Lander Spacecraft Battery, Final Report, NASA
CR-152618 (N77.20557), September 1976.
Garratt, P., and S. Pomroy, "A Study of the Effect of Temperature
and Depth of Discharge on the Performance and Cycle Life of Her-metically Sealed NiCd Cells," Report RAE-TR-67026, Royal Air
Force Establishment, Great Britain, February 1967.
Kent, J.R., "Analysis and Evaluation of Spacecraft Battery Acceler-
ated Life Test Data," NASA Contract W 12,397, Report QE/C 70-687,
U.S. Naval Ammunition Depot, September 1970.
Kent, J., Analysis and Evaluation of Spacecraft Battery Life Test
Data, Phase 2, Summary Report, NASA CR-107119, (N70-12539),
October 1969.
Kitsch, W.W., et al., "Experimental Investigation and Model Develop-
ment of the Skylab ATM Secondary Nickel-Cadmium Batteries, In-
terim Test Report," Contract NAS8-21812, Report 40M22412,
Marshall Space Flight Center, Huntsville, Alabama, May 1974.
Johnson, C.R., "HEAO Battery Cell Long-Term Cycle Test (Mod.
100)," Engineering Report 77-8725.6-101, TRW Systems Group,Redondo Beach, California, January 17, 1977.
Mauchly, J.W., and J.H. Waite, "Computer Methods for the Reduc-
tion, Correlation and Analysis of Space Battery Test Data, Phase I,
Final Report." NASA Contract NAS 5-10203, December 1966.
Epstein, S.D., J.W. Mauchly, and J.H. Waite, Computer Methodsfor the Reduction. Correlation and Analysis of Space Battery Test
Data, Phase 2, Part 1, Final Report, NASA CR-98659 (N69-21107),December 1967.
Lear),, J., "Statistical Analysis of NiCd Battery Cell Cycle Life Data,Parts I and II." Contract F04.701-72-C-0073, Report TOR-O073
(3420-02)-2, Aerospace Corporation, Los Angeles, California, July
1972.
470 Ni-CdBATrERY APPLICATIONS MANUAL
112.
113.
114.
115.
116.
117.
118.
Eliason, J.T., "'Preliminary Evaluation of Nickel-Cadmium Battery
Reliability," Report SP-250-0834, Sperry Rand Corporation, Hunts-
viUe, Alabama, June 1974.
Broberg, H., A. Henningson, and A. Loewnertz, "Space Battery Re-
liability Assses_aent," ESTEC Contract 1827/72, Report FTL-C-
A16-37, NASA-DCAF-F010430 (X77-70256), October 1973.
Robertson, L.G., and E.H. Barnett, "HEAO Battery Reliability
Study," Report 26000-200-008, TRW Systems Group, Redondo
Beach, California, May 1975.
Thierfelder, H., "ITOS Battery Life Cycling Test, Final Report,"
Report TM-SP-PO-100, RCA, Hightstown, New Jersey, March 1968.
Johnson, C.R., "HEAO Battery Cell Life Test (Mod. 100), Final
Report," Engineering Report 77.8725.6-108, TRW Systems Group,Redondo Beach, California, February 22, 1977.
Harkness, J.D., "Evaluation Program for Secondary Spacecraft Cells:
Synchronous Orbit Testing of Sealed Nickel-Cadmium Cells," Report
WQEC/C 77-134, Naval Weapons Support Center, Crane, Indiana,
June 1977.
Harkness, J., "Evaluation Program for Secondary Spacecraft Cells,
13th Annual Report of Cycle Life Test," Contract $53742AG, Re-
port WQEC/C 77-87. Naval Weapons Support Center, Crane, Indiana,
March 1977.
119. Harkness, J., "Evaluation Program for Secondary Spacecraft Cells,
Sixth Annual Ri_port of Cycle Life Test," Contract W12,397, Report
QE/C 7:-173. Naval Weapons Support Center, Crane, Indiana, March
1970.
120. Ford, F.E.. "Summary of Test Results on Spare Nickel-Cadmium
Cells from OAO-A-2 Flight Batteries," NASA TM X-65588 (N76-
71921), April 1971.
121. Bean, E.E., C.E. Bloomquist, and J. Finkelstein "More Reliability
Data from In-Flight Spacecraft," Proc., Annual Reliability and Main-
tenance Symposhmz. Philadelphia, Pennsylvania, (A73-33625),
January 1973, pp. __4-_37.
REFERENCES 471
122.
123.
124.
125.
126.
127.
128.
129.
130.
131.
132.
Robertson, L.G., and L. Gordon, "A Temperature- and Depth-of-
Discharge Dependent Weib.ull Reliability Model for Satellite Battery
Systems," Report 76-2286.56, TRW Systems Group, Redondo
Beach, California, July 23, 1976.
Scott, W.R., "The 1976 Goddard Space Flight Center Battery Work-
shop," Proc., Greenbelt, Maryland, NASA TM X-71284 (N77-21550),
November 1976, pp. 199-202.
Lim, H., "The 1975 GSFC Battery Workshop," Proc., Greenbelt,
Maryland, NASA TM X-71104 (N76-24704), November 1975, pp. 915.
Scott, W.R., "The 1975 GSFC Battery Workshop," Proc., Greenbelt,
Maryland, NASA TM X-71104 (N76-24704), November 1975, pp.
154-161.
Lanier, R., "A Nickel-Cadmium Battery Reconditioning Circuit,"
NASA TN D-8508, Marshall Space Flight Center, April 1977.
Dunlop, J., "The 1973 Battery Workshop, First Day," Proc., Green-
belt, Maryland, NASA TM X-72536 (N75-15152), November 13,
1973, pp. 81.90.
Dunlop, J., "The 1972 GSFC Battery Workshop, Second Day,"
Proc., Greenbelt, Maryland, NASA TM X-69239 (N73-21957), No-
vember 15, 1972, pp. 24-37.
Krause, S., "The 1973 GSFC Battery Workshop, First Day," Proc.,
Greenbelt, Maryland, NASA TM X-72536 (N75-15152), November
1973, pp. 71-79.
Armantrout, J., "The 1975 GSFC Battery Workshop," Proc., Green-
belt, Maryland, NASA TM X-71104 (N76-24704), November 1975,
pp. 137-140.
Briggs, D., "The 1975 GSFC Battery Workshop," Proc., Greenbelt,
Maryland, NASA TM X-71104 (N76-24704), November 1975, pp.144-148.
"Testing of NiCd Cells over Geostationary Orbit Type CyclingPeriod," Contract ESTEC-I185/70-HP. Report ESRO-CR(P)-504
(N75-10596), January 14, 1974.
472 Ni-Cd BATTERY APPLICATIONS MANUAL
133.
134.
135.
136.
137.
138.
139.
140.
141.
142.
Fougere, P., "Cycle Life Tests of SAFT Aerospace Sealed Nickel-Cadmium Cells for Space Applications," Report DT/SAS 589/74,
SAFT-America, Inc., Valdosta, Georgia, December 1974.
Napoli, J., "The 1976 Goddard Space Flight Center Battery Work-
shop," Proc., Greenbelt, Maryland, NASA TM X-71284 (N77-21550),
November 1976, pp. 185-190.
Krause, S., ''The 1975 GSFC Battery Workshop," Proc., Greenbelt,
Maryland, NASA TM X-71104 (N76-24704), November 1975, pp.
45-48.
Pickett, D., "The 1976 Goddard Space Flight Center Battery Work-
shop," Proe., Greenbelt, Maryland, NASA TM X-71284 (N77.21550).
November 1976, pp. 55-67.
Schulman, I., "The 1976 Goddard Space Flight Center Battery Work-
shop," Proc., Greenbelt, Maryland, NASA TM X-71284 (N77-21550),
November 1976, pp. 41.54.
McCallum, J., and G.H. Miller, "Failure Mechanisms and AcceleratedLife Tests of Nickel-Cadmium Batteries, Part I," Contract F33-615-
69-C-1537, Report AFAPL-TR-70-44-I (X70-18112), July 1970.
McCallum, J., R.E. Thomas, and J.H. WaRe, "Accelerated Testing of
Space Batteries," NASA SP-323 (N73-21958), 1973.
McCallum, J., and C. L. Faust, "Failure Mechanisms in Sealed Bat-
teries, Part 4, Semiannual Technical Report," Contract AF-33(615)-
3701, Report AFAPL-TR-67-48-4, AD-848981 (X69-17161), October1968.
Faust, C.L.. and J. McCaUum, "Failure Mechanisms in Sealed Bat-
teries, Part 6. Final Technical Report," Contract AF-33(615)-3701.
Report AFAPL-TR-67-48-6, AD-854592 (X69-18120), June 1969.
Cover, P.W., J. McCaUum, and A.H. Reed, "Failure Mechanisms and
Analyses of Sealed Batteries, Technical Report," Contract AF-33
(615)-3701, Report AFAPL-TR-69-74, AD-859690 (X70-10185).
September 1969.
REFERENCES 4"/3
143.
144.
145.
146.
147.
148.
149.
150.
151.
152.
McCallum, J., and G.H. Miller, "Failure Mechanisms and AcceleratedLife Tests of Nickel-Cadmium Batteries, Annual Technical Report,
No. 2," Contract F33-615-69-C-1537, Report AFAPL-TR-70-44-II,
AD-730345 (N72-14042), Sep_mber 1971.
Faust, C., and J. McCallum. "Failure Mechanisms in Sealed Batteries,
Part 2, Semiannual Technical Report," Contract AF33(615)-3701,
Report AFAPL-TR-67-48-11, AD-821895 (X68-12295), October1967.
Parry, John M., "Development of Uniform and Predictable BatteryMaterials for Nickel-Cadmium Aerospace Cells," Sixth Quarterly
Report, NASA Contract NAS 5-11561, Tyco Laboratories, Inc.,March 1970.
Catotti, A.J., and H.H. Kr_er, "Chemical Analysis of Nickel-Cad-
mium Electrodes," Proc. 24th Power Sources Symposium, Atlantic
Oty, New Jersey, (A71-13026), 1970, pp. 4-6.
Halpert, G., W.H. Webster, Jr., C.C. Jones, and O. Ogunyankin, "Pro-
cedure for Chemical Analysis of Nickel-Cadmium Cell Materials,"
NASA TM X-70767 (X75-10157), October 1974.
Stofel, E., "The GSFC Battery Workshop, 1974," Proc., Greenbelt,
Maryland, NASA TM X-70822 (N75-16976), November 1974, pp.246-260.
Kelley, J., S. Orenstein, and W. Bulla, Alkaline Battery Separator
Characterization Studies, Final Report, NASA CR-130154 (N73-
16030), June 1972.
"Interim Model Specification for High Reliability Nickel-Cadmium
Spacecraft Cells," NASA/GSFC Specification S-716-P-23, April 30,1969.
Harkness, J.D., Evaluation Program for Secondary Spacecraft Cells,
Annual Report, Cycle Life Test, NASA CR-148208 (N76-26687),
February 1976.
Goodman, L.A., Accelerated Test Program for Sealed Nickel-Cad-
mium Spacecraft Batteries/Ceils, NASA CR-148209 (N76-26688),February 1976.
474 Ni-Cd BATTERY APPLICATIONS MANUAL
153.
154.
155.
156.
157.
158.
159.
160.
161.
162.
Sommeffeldt, E.E., and P.P. McDermott, "Analysis of Data from the
Accelerated Test Program on Aerospace Nickel-Cadmium Cells,"
NASA TM X-71390 (X77-10242), July 1977.
van Ornmering, G., and A.J. Appleby, Electrochemical Society,
Atlanta Meeting, Extended Abstracts, 77-2, October 1977, pp. 117-
119.
Scott, W.R., "The GSFC Battery Workshop, 1974," Prec., Greenbelt,
Maryland, NASA TM X-70822 (N75.16976), November 1974, pp.125-130.
Scott, W.R., "The 1975 GSFC Battery Workshop," Prec., Greenbelt,
Maryland, NASA TM X-71104 (N76-24704), November 1975, pp.201-206.
"The 1972 GSFC Battery Workshop, First Day," Prec., Greenbelt,
Maryland, NASA TM X-69240(N73-21956), November 1972, p. 5.
"The 1973 Battery Workshop, First Day," Prec., Greenbelt, Mary-
land, NASA TM X-72536 (N75-15152). November 1973, p. 35.
"Prec. Conference on OAO Battery Trouble Shooting, Third Day."
Goddard Space Flight Center, Greenbelt, Maryland, October 1968,
p. 59.
McCallum, J., and G.H. Miller, "Failure Mechanisms and AcceleratedLife Tests on Nickel-Cadmium Batteries, Part III," Contract F33615-
69-C-1539, Report AFAPL-TR-70-44-III. AD-749129 (N73-14061).
August 1972.
Gross, S. "Causes of Failure in Sealed Nickel.cadmium Batteries,"
Energy Conversion, 11 (A71-29701), June 1971, pp. 39-45.
Roeger, E.A., Jr., J. McCaLlum. and G.H. Miller, "Analysis of Accel-
erated Life Test Data for Aerospace Nickel-Cadmium Cells, Final
Report," Contract F33-615-73-C-2024. Report AFAPL-TR-74-75.
AD-A002848 (N75-21809), October 1974.
REFERENCES 475
163. Gross, Sidney, "Transient Pressure Considerations in Charge Controlof Scaled Batteries," J. Electrochemical Soc., 119(3), Match 1972,
pp. 347-349.
164. McDermott, P.P., "Study of;the Mechanisan Associated with the Fail.
ure of Positive Plates in Aerospace Nickel-Cadmium Cells when Sub-
jected to High Depth of Discharge at Cold Temperature (0°C), ''NASA TM X-70820 (X75-10159), October 1974.
165.
166.
167.
168.
169.
170.
171.
172.
McDermott, P-P., Cadmium Migration in Aerospace Nickel-Cadmium
Ce//s, NASA CR-144753 (N77-23606), March 1976.
Mayer, S.W., "Electrophoretic Mobilities of Cadmium Hydroxide,
Nickel-Hydroxide, and Silver Oxide in Nickel-Cadmium and Silver-
Zinc Battery Electrolytes, Interim Report," Contract F04.701-74-
C-0075, Report No. SAMSO TR-74-163, AD-783853 (N75-11472).
July 1974.
Barney, D.L., A.J. Catotti, and S.F. Pensabene, "Effect of Carbonateon the Performance of Scaled Nickel-Cadmium Cells," Power Sources
3, D.H. Collins, ed., Oriel Press Ltd., England, 1971, p. 119.
Hess, HJ., and F.G. Will, Cadmium Electrode Mechanism Electrode
Morphology and Capacity, Final Report, NASA CR-72777 (N71-
21329), March 1971.
Chua, D., "Relationship of Electrode Structures and Cell Perfor-
mance in Sealed, Sintered-Type Nickel-Cadmium Button Cells During
Cycling," Thesis (N74-27520), 1974.
"The 1971 NASA/Goddard-Aerospace Industry Battery Workshop,
Volume 2," Proc., Greenbelt, Maryland, November 1971, pp. 378-
400.
"The 1972 GSFC Battery Workshop, Second Day," Proc., Greenbelt,
Maryland, TM X-69239 (N73-21957), November 15, 1972, pp. 24-37.
"l_he 1973 GSFC Battery Workshop, First Day," Proc., Greenbelt,
Ma.ry/and, NASA, TM X-72536 (N75-15152), November 13, 1973,
pp. 81-90.
1"7
476 Ni-Cd BA'I'I'ERY APPLICATIONS MANUAL
173. Wagner, O.C., and D.D. Williams, "Investigation of Charging Methodsfor Nickel-Cadmium Batteries," Proc. 26th Power Sources Sym-
posium, AD-A037699 (N77-80148), 1974, pp. 96-99.
174. "The 1971 NASA/Goddard-Aerospace Industry Battery Workshop,
Volume 2," November 17, 1971, pp. 123-143.
175. Brooman, E.W., J. McCallum, E.A. Roeger, Jr., and G.H. Miller,
''Temperature and Temperature Gradients for Accelerated Life Testsof Nickel-Cadmium Cells," Contract F33.615-69-C-1537, Report
AFAPL-TR-72-66, AD-748252 (N73-13066), August 1972.
176. Hennigan, T.J., "Accelerated Test Plan for Nickel-Cadmium Space-craft Batteries," NASA TM X.70524 (N74-12741), October 1973.
177. Reed, A.H., and J. McCallum, "Depths of Discharge for AcceleratedLife Tests of Cadmium Electrodes," Contract F33-615-69-C-1537,
Report AFAPDTR-72-20, AD.743017 (N72-31088), May 1972.
178. "Standardization Policies, Procedures, and Instructions, Chapter V:
Outline of Form and Instructions for the Preparation of Specifica-
tions and Associated Documents," Defeme Standardization Manual
4120.3-M, Office of the Assistant Secretary of Defense, Washington,
D.C., January 1972.
179. "Specification for the Manufacturing of Aero-Space Nickel-CadmiumStorage Cells," NASA/GSFC Specification 74-15000, January 1974.
180. Stanley, C., "Spacecraft Battery Testing, 4-Year Storage Life," USAF/
SAMSO Contract F04701.71-C-0131, Report 16439-93-002-601,
TRW Systems Group, Redondo Beach, California, April 1976.
181. "Specification for the Qualification of a Standard Nickel-CadmiumBattery," NASA/GSFC Specification S-711-17, March 1976.
182. "Specification for Standard Nickel-Cadmium Spacecraft Battery,"
NASA/GSFC Specification S-71116. Revision A, February 1976.
183. Bauer, P., and R.H. Sparks, "Nickel-Cadmium Batteries for the Or-
biting Geophysical Observatory. Volume II," NASA CR-156678
(N78-72729), February 1964.

REFERENCES 477
184.
185.
186.
187.
188.
189.
190.
191.
192.
193.
194.
Sanders, J.A., "ATM Cell Testing and Battery Analysis, Final Report,
Volume I," Report 40M21617, Marshall Space Flight Center, Hunts-
ville, Alabama, March 1971.
Paschal, L.E., "Experimental Investigation and Model Development
of the Skylab ATM Secondary Nickel-Cadmium Batteries," Report40M22412, Marshall Space Flight Center, Huntsville, Alabama,
May 1974.
Naval Weapons Support Center, "Results of Continuous Synchronous
Orbit Testing on Sealed Nickel-Cadmium Cells," Report WQEC/C
77-134, Crane, Indiana, June 1977.
Sparks, R.H., and W.R. Scott, "Application of Nickel-Cadmium Bat-teries in Deep Discharge Synchronous Orbit Applications," Proc. 11th
IECEC, State Line, Nevada, (A77-12662), 1976.
Naval Weapons Support Center, "Accelerated Test Program for Sealed
Nickel-Cadmium Spacecraft Batteries/Cells," Report WQEC/C 76-8,
Crane, Indiana, February 1976.
Betz, F.E., K.E. Preusse, R.C. Shair, and J. Sylvia, "Parametric Charge
Studies for Aerospace Nickel-Cadmium Batteries," Proc. Fourth Inter-
society Energy Conversion Engineering Conference, Washington, D.C.,
(A69-42236), September 1969, pp. 705-709.
Gross, S., "Heat Generation in Sealed Batteries," Energy Conversion,
9, (A69-34780), June 1969, pp. 55-62.
Wolverton, R.W., ed., Flight Performance Handbook for Orbital
Operations, John Wiley and Sons, Inc., New York, 1961.
Cunningham, Fred G., "Calculation of the Eclipse Factor for EUipti-cal Satellite Orbits," ARS Journal, 32(9), September 1962, pp. 1399-
1400.
Lesh, H.F., Determination of Interplanetary Trajectories, NASA
CR-100490 (N69-21292), November 1968.
Rauschenbach, H.S., Solar Cell ArraT Design Handbook, Volumes
I and 2, NASA CR-149364 (N77-14193), October 1976.
:0
478 Ni-Cd BATrERY APPLICATIONS MANUAL
195.
196.
197.
Pro, S., "Power Conditioning for Satellite Systems," Aerospace Cor-
poration, Report TR- 1001(2307)-6 (N68-12046), March 1967.
"Study and Analysis of Satellite Power System Configurations forMaximum Utilization of Power," NASA CR-898, October 1967.
Johnson Space Center, "Manned Mission Photovoltaic Power System
Study Final Report Volume II, Technical Discussion," NASA Con-
tract NAS9-5266, Houston, Texas, June 1967.
198. Reppucci, G.M., "Design of the High Energy Astronomy Observatory
(HEAO) Power Subsystem," Proc. Eleventh Intersociety EnergyConversion Engineering Conference, State Line, Nevada, (A77-
12662), 1976.6
199. Nekrasov, P., "Partial Shunt Regulation," Proc. 14th AnnuaIMeeting
of the American Astronautical Society, Dedham. Massachusetts, May
13-15, 1968.
200.
201.
202.
Moore, E.T., and T.G. Wilson, "Basic Considerations for I3C to DC
Conversion Networks," 1EEE Trans. on Magnetics, MAG-2(3), Sep-
tember 1966, pp. 620-624.
Schwarz, F.C.,PowerProcessing, NASA SP-244 (N72-15229), 1971.
LaVigna, T.A., "A Low Noise Switching Converter-Regulator for Main
Power Control in a Space Power System." NASA TM X-55758,
November 1966.
203. Farber, B.F., Analysis of Aerospace Power Conditioning ComponentLimitations, Final Report, NASA CR-97000 (N69-23417). April
1969.
204. Schoenfeld, A.D., and Y. Yu, ASDTIC Control at_ Standardi:ed In-
terface Circuits Applied to Buck, Parallel, and Buck-boost DC to DCPower Converters, Final Report, NASA CR-121106 (N74-16806).
February 1973.
205. Bedford, B.D., and R.G. Hoft, Principles of Inverter Circuits, John
Wiley and Sons, Inc., New York, 1964.
206. Study of Power Supply Configurations for Advanced .Vimbus Mis-sions, Final Report, NASA CR-100529 (N69-22175), Januar?' 1969.
REFERENCES 479
207.
208.
209.
210.
211.
212.
213.
214.
215.
Krausz, A., aria R.L. Robinson, "'The Electric Power Supply of the
Orbiting Geophysical Observatory," AIAA Unmanned Spacecraft
Meeting Record, Los Angeles,California, March 1-4, 1965.
Ewen, W., D. Rusta, and tL Steinberg, "Power Subsystem SimulationStudies for the Timation IliA Spacecraft," Proc. Ninth lntersociety
Energy Conversion Engineering Conference, San Francisco, Cahfomia,
(A75.10476), pp. 26-35.
Reppucci, G.M., "Advanced Power System Development, Final Re-
port," Report 76-8213.3-035, TRW Systems Group, Redondo Beach,
California, December 1976.
Levy, E., Jr., and F.S. Osugi, "Design and Performance of the IntelsatIV Power Subsystem," Proc. Seventh 1ntersociety Energy Conversion
Engineering Conference, San Diego, California, (A73-22751), 1972,
pp. 483-492.
Obenschain, A., J. Bacher, and P. CaUen, '`The Atmospheric Explorer
Power Subsystem," Proc. Ninth Intersociety Energy Conversion En-
gineering Conference, San Francisco, California, (A75-10476), 1974,
pp. 43-52.
Wright, W.H., "Design and Orbital Performance of the Intelsat III
Power System," Proc. Seventh Intersociety Energy Conversion Engi-
neering Conference, San Diego, California, (A73-22751), 1972,
pp. 472-482.
Brown, I., "The Nimbus B Solar Power Supply," EASTCON 67Technical Convention Record, Supplement to IEEE Trans. on Aero-
space and Electronic Systems, AES-3(6), November 1967.
Salim, A.A., "A Simplified Minimum Power Dissipation Approach
to Regulate the Solar Array Output Power in a Satellite Power Sub-
system," Proc. Eleventh lntersociety Energy Conversion Engineering
Conference, State Line, A'erada, (A77-12662), 1976, pp. 1437-1442.
Briggs, D.C., and H.N. McKinney, "Electrical Power Subsystem for
the Synchronous Meteorological Satellite (SMS),'" Proc. Seventh
lntersociety EnerD" Conrersion Engineering Conference, San Diego,
California, (A73-22751), 1972. pp. 493.500.
480 Ni-Cd BA'FrERY APPLICATIONS MANUAL
216. McKinney, H.N., and D.C. Briggs, "Electrical Power Subsystem for
the NATO 'III Communications Satellite," Prec. Eleventh Inter-
society Energy Conversion Engineering Conference, State Line,
Nevada, (A77-12662), pp. 1408-1413.
217. Wick, H.M., "Design and Performance of the Telesat Power Sub-
system," IVoc. Ninth Intersociety Energy Conversion Engineering
Conference, San Francisco, California, (A75-10476), 1974, pp.
53-60.
218. LaVigna, T.A., and F.L. Hombuckle, "The ATS-6 Power System:
Hardware Implementation and Orbital Performance," Proc. Eleventh
lntersociety Energy Conversion Engineering Conference, State Line,
Nevada, (A77-12662), 1976.
219. Graft, C., and R. Lanier, Jr., "Skylab Electrical Power System."
Proc. 1971 Intersociety Energy Conversion Engineering Conference,
Boston, Massachusetts, (A71-38901), 1971.
220. Purcell, J., and D.M. Witters, ed., "Low Cost Modular Spacecraft
Description," NASA TM X.70912 (X75-10227), May 1975.
221. Nekxasov, P., et al., "Power System Analysis and Optimization Using
Advanced Voltage Regulation Techniques," AIAA Paper 64.742.
1964.
222. Bums, W.W., III, et al., "A Digital Computer Simulation and Study of
a Direct Energy Transfer Power Conditioning System." 1975 IEEEPower Electronic Specialists Conference Record, IEEE Publication 75
CHO 965-4-AES, 1975.
223. Nekraso_. P., "Systems Comparison and Analysis of Tracking and
Non-Tracking Space Power Supplies," Proc. Fourth Space Congress.
Cocoa Beach, Florida, 1967.
224. Bolton, Charles N., and Paul S. Nekrasov, "Analysis of the Advanced
Nimbus Power Systems," NASA TM X-55852, July 1967.
225. Binckley, W.G., "Power System Configuration Study and Reliability
Analysis, Final Report," NASA/Jet Propulsion Laboratory. Contract
951574, TRW Report 07171-6001-R000, September 18. 1967.
REFERENCES 481
226.
227.
228.
229.
230.
231.
232.
233.
234.
Costogue, E.N., and S. Lindena, "Comparison of Candidate Solar
Array Maximum Power Utilization Approaches," Prec. Eleventh
Intersociety Energy Conversion Engineering Conference, State Line,
Nevada, (A77-12662), 1976, pp. 1449-1456.
Cherdak, A.S., and J.L. Douglas, "Maximum Power Point Tracker,"
U.S. Patent 3,566,143, February 23, 1971.
Berard, C.A., Jr., "A Second Generation (High-Speed) Maximum
Power Tracker for Space Applications," Prec. Fifth Space Congress,
Cocoa Beach, Florida, (A68-37762), 1968.
Gruber, R., "High Efficiency Solar Cell Array Peak Power Tracker and
Battery Charger," 1970 IEEE Power Conditioning Specialists Con-
ference Record, Greenbelt, Maryland, IEEE Publication C31-AES 70
(A70-41206), 1970.
Paulkovich, J., and G.E. Rodriquez, "Maximum Power Transfer by
Conductance Comparison," 1970 IEEE Power Conditioning Special-
ists Conference Record, Greenbelt, Maryland, IEEE Publication C31-
AES-70 (A70-41206), 1970, pp. 114-127.
Thurman, J.L., "Optimization of Steady-State Thermal Design of
Space Radiators," or. Spacecraft and Rockets, 6(10), October 1969,
pp. 1114-1119.
Introduction to the Derivation of Mission Requirements Profiles for
System Elements, NASA SP-6503 (N68-15683), 1967.
Trimmer. J.D., Response of Physical Systems, John Wile)' and Sons.Inc.. New York, 1950.
235.
Grover. G.M.. T.P. Cotter, and G.F. Erickson, "Structures of Very
High Thermal Conductance," J. Applied Physics, 35(6). June 1964.
pp. 1990-1991.
Harkness. R.E., "The GEOS'-II Heat Pipe System and Its Performance
in Test and Orbit," Report TG-1049, Johns Hopkins Universit) Ap-
plied Physics Laboratory, 1969.
236. Hinderman. J.D., J. Madson, and E.D. Waters, "An ATS-E Solar Cell
Space Radiator Utilizing Heat Pipes," AIAA Paper 69-630. 1969.
482 Ni-Cd BATI'ERY APPLICATIONS MANUAL
237.
238.
239.
240.
241.
242.
243.
244.
245.
246.
247.
Eby, R.J., R.D. Karam, and W.H. Kelley, "Thermal Control of ATSF&G," Proc. the SAE/ASME/AJAA Life Support and Environmental
Control Conference, San Francisco, California, ASME Publication 71-
AV-28 (A71.36395), 1971.
Eninger, J.E., "'The Transport Capacity of a Heat Pipe," Quest. 1(1),TRW Systems Group, Redondo Beach, California, Winter 1976/
1977.
Kunz, H.R., I.S. Langston, B.H. Hilton, S.S. Wyde, and G.H. Nashick,
"Vapor Chamber Fin Studies-Transport Properties and BoilingCharacteristics of Wicks," NASA CR-812, 1967.
Katzoff, S., "Heat Pipes and Vapor Chambers for Thermal Control
of Spacecraft," AIAA Paper 67-310 (A68-21372), 1967.
Phillips, E.C., Low-temperature Heat Pipe Research Program, NASA
CR-66792 (N75-70027), 1969.
Marcus, B.D., Theory and Design of Variable Conductance Heat Pipes,
NASA CR-2018 (N72-23953), April 1974.
Mock, P.R., B.D. Marcus, and E.A. Edelman, "Communications Tech-
nology Satellite: A Variable Conductance Heat Pipe Application."
AIAA Paper 74-749, 1974.
Wanous, D.J., B.D. Marcus, and J.P. Kirkpatrick, "A Variable Con-
ductance Heat Pipe Flight Experiment: Performance in Space."
AIAA Paper 75-725, 1975.
Maiden, C.E., A.F. Ahrens, R.R. Eliason, I.L. Kerper, E. Levy, andR.J. McGr th. "Near Earth Orbit Battery for Satellite Secondar)'
Power." Contract AF33-615-73-C-2007, Report AFAPL-TR-74-21.
Hughes Aircraft Company, June 1974.
Coggi, J.V., "Heat Pipe Thermal Control of Spacecraft Batteries,"
Proc. Fifth lntersocieO' Energy Conversion Engineering Conference,
Las Vegas, Nevada, (A73-25976), 1970, pp. 7-20 - 7-260.
Fleischman. G.L.. and D.J. Wanous, "Active Control Heat Pipe Per-
formance for Long Life Battery Cooling," ASME Paper 72-WA/
HT43 _A73.15813). November 1972.
,t
REFERENCES 483
248.
249.
250.
251.
252.
253.
254.
255.
256.
257.
258.
Michalek, T.J., E.A. Stipandic, and MJ. Coyle, "Analytical and
Experimental Studies of an All Specular Thermal Control Louver
System in a Solar Vacuum Environment," AIAA Paper 72.268 (A72-
25209), April 1974.
Dynatherm Corporation, "'ATS F&G Heat Pipe Critical Design ReviewPresentation," To Fairchild Space and Electronics Company, German-
town, Maryland, August 25-26, 1971.
Neglia, M., L. Olshan, W. Ducan, and K. Hill, "'OAO Louver Sun Com-
pat_ility Test," Report TLTR-67-14, Grumman Aerospace Corpora-
tion, Bathpage, Long Island, New York, September 1967.
Clausen, O.W., and J.P. Kirkpatrick, "Thermal Tests of an Improved
Louver System for Spacecraft Thermal Control," AIAA Paper 69-
627 (A69-33269), June 1969.
Streed, E., "Analysis and Test of a Thermal Control Louver Assem-
bly," Report T05-71-48953-001, Martin Marietta Corporation, Den-
ver, Colorado, June 1971.
Plamondou, J.A., "Analysis of Movable Louvers for Temperature
Control," J. Spacecraft and Rockets, 1(5), September-October 1964.
Ollendorf, S., "Analytical Determination of the Effective Emittance
of an Insulated Louver System," AIAA Paper 65-425, 1965.
Boscia, A.J., "A Laboratory Method for the Determination of Effec-
tive Emittance of Spacecraft Thermal Control Louvers," Proc. Joint
Meeting oi" the AAS and the ORS, Denver, Colorado, June 17-20,
1969.
Parmer, J.F., and D.L. Buskirk, "Thermal Control Characteristics
of Interior Louver Panels," ASME Paper 67-HT-64, 1967.
Rubeazer. J., "The 1972 GSFC Battery Workshop, Second Day,"
Proc. Greenbelt, Maryland, November 15, 1972, NASA TM X-69239
(N73-21957), 1972.
Rubenzer, J., "The 1973 GSFC Battery Workshop. Second Day,"
Proc. Greenbelt, Maryland, November 14, 1973, NASA TM X-72540
('N75-17808), 1973.
484 Ni-Cd BATTERY APPLICATIONS MANUAL
259.
260.
261.
262.
263.
264.
265.
266.
267.
Newell, D.R., "The 1976 Goddard Space Flight Center Battery Work-
shop," Proc. Greenbelt, Maryland, NASA TM X.71284 (N77-21550),
November 1976.
Rusta, D., "Power Source Requirements of Electric Propulsion Sys-
tems Used for North-South Stationkeeping of Communication Satel-
lites," Proc. Eleventh Intersociety Energy Conversion Engineering
Conference, State Line, Nevada, (A77.12662), 1976, pp. 1429-1436.
Eicke, W.G., Jr., "The 'Vicious Cycle' in Secondary Batteries - A
Mathematical Approach," J. Electrochemical Soc., 109(5), May
1962, pp. 364-368.
Bacher, Joel, and Douglas Rusta, "The Analysis of Voltage-Limited
Battery Charging Systems," IEE Trans. Aerospace and Electronic Sys-
tems, AES-4(5), September 1968, pp. 792-798.
LaVigna, T.A., "The ATS-6 Power System - An Optimized Designfor Maximum Power Source Utilization," Proc. Tenth lntersociety
Energy Conversion Engineering Conference, Newark, Delaware,
(A75-45920), 1975, pp. 1048-1055.
Oakes, J.B., and W.J. Billerbeck, "A New Charge Control System for
Satellite Batteries," Report CM-1041, Johns Hopkins University Ap-
plied Physics Laboratory, July 1963.
Miller, W., W. Stewart, and J. Yagelowich, "OAO State of Charge
Unit," NASA TM X.63757 (N70-14252), June 1968.
Breeskin, S.D., and A.D. Taylor, "Battery and Third Electrode Per-formance Characteristics for Varying Charge and Discharge Rates,"
Proc. 197' lntersociety Energy Conversion Engineering Conference,
Boston, Massachusetts, (A71-38901), 1971, pp. 18 l-187.
Corbett, R.E., M.C. Glass, and R.G. Matsui, "Development of a
Power Module Using Third Electrode Battery Charge Control,"
Proc. Ninth IntersocieO' Energy Conversion Engineering Conference,
San Francisco, California, (A75-10476), 1974, pp. 137-143.
268. Imamura, M.S., N.R. Sheppard, and T.D. Patterson, "Digital Tech-
niques in Future Spacecraft Automated Power Systems," Proc.
Ninth IntersocieO' Energy Conversion Engineering Conference, San
Francisco, California, (A75.10476), 1974, pp. 10-19.
-d,
REFERENCES 485
269.
270.
Imamura, M.S., L. Skelly, and H. Weiner, "Conceptual Definition of
Automated Power Systems Management," Proc. l_velfth Intersociety
Energy Conversion Engineering Conference, Volume 2, Washington,
D.C., (A77-48701), 1977, pp. 1343-1348.
Robertson, L.G., "Theory and Procedure for Using the Computerized
Markov-and-Multinomial Single-Battery Reliability Models," CADM
Report D.00608, TRW Defense and Space Systems Group, June 1973.
271. Kettler, J.R., and H.J. KiUian, "Depth of Discharge for Long-Life
Nickel-Cadmium Batteries in Synchronous Orbit," Aerospace Cor-
poration Report TOR-O074(4901-02)-4, September 1973.
272. Layte, H.L., and D.W. Zerbel, "Battery Cell Control and ProtectionCircuits," IEEE Power Processing and Electronic Specialists Confer-
ence, San Diego, California, September 25-29, 1972.
273.
274.
275.
276.
277.
278.
Donovan, R.L., and M.S. Imamura, "Cell-Level Battery Charge/Dis-
charge Protection System - Electronic Control Techniques," Proc.
Twelfth Intersociety Energy Conversion Engineering Conference,
Washington, D.C., (A77-48701), 1977, pp. 302-310.
Thomas, E.U., and L.W. Wendling, "Guidelines for Reliable Relay
Application and Selection," (A69-28045), Relay Division, Leach Cor-
poration, 1969.
Ritterman, P.F., "Nickel-Cadmium Battery Charge Management
Study, Final Report," Report 74-8216.6-059, TRW Systems Group,
Redondo Beach, California, December 1974.
Imamura, M.S., R.L. Donovan, J.L. Oberg, L.A. Skelly, and D.H. Jul-
seth, "Microprocessor-Controlled Battery Protection System," Proc.
Tenth Intersociety Energy Conversion Engineering Conference,
Newark, Delaware, (A75-45920), 1975, pp. 1307-1317.
McKinney, H.N., and D.C. Briggs, "Electrical Power Subsystem forthe NATO III Communications Satellite," Proc. Eleventh Inter-
society Energy Conversion Engineering Conference, State Line,Nevada, (A77-12662), 1976, pp. 1408-1413.
Reppucci, G.M., "Design of the High Energy Astronomy Observatory
(HEAO) Power Subsystem," Proc. Eleventh Intersociety Energy
Conversion Engineering Conference, State Line, Nevada (A77-12662),
1976.
486 Ni-Cd BATYERY APPLICATIONS MANUAL
279. Kxausz, A., Space Vehicle Electrical Power Processing Distribution
and Control Study: Volume 2, Technical Report, NASA CR-123908
(N72-33054), June 1972.
280. "Study of Advanced Flight Vehicle Power Systems, Volume 1:
Analytical Studies," Report ASD TR 61-368, The Marquart Corpora-
tion, Astro Research Division, January 1962.
281.
282.
Szego, G.C., and B. Paiewonsky, "Optimization of Energy Storagefor Solar Space Power," Proc. 1967 lntersociery Energy Conversion
Engineering Conference, Miami Beach, Florida, August 13-17, 1967.
Fono, P., "Battery and Cell Redundancy Cc_nsiderations for Long
Duration Space Missions," Proc. Ninth Intersociety Energy Conver-
sion Engineering Conference, San Francisco, California, (A75-10476),
1974, pp. 128-136.
283. Bolton, Charles N., and Paul S. Nekrasov, "Multiple Operating Pointsin Photovoltaic Power Systems," NASA TM X-63251, May 1968.
284. Schwartzburg, M., "Analysis of Solar Array/Battery Lock-Up Com-
puter Simulation of Electric Power System Performance," Proc.1971 Intersociety Energy Conversion Engineering Conference, Bos-ton Massachusetts, (A71-38901), 1971, pp. 995-1002.
285. Pessin, L., and D. Rusta, "A Comparison of Solar-Cell and Battery-
Type Power Systems for Spacecraft," IEEE Trans. Aerospace and
Electronic Systems, AES-3, November 1967, pp. 889-897.
286. Hyland, P", and R. Rasmussen, "Program Report - Energy Balance
Computer Program for Advanced NIMBUS Power Systems," NASAContract NAS5-11549, RCA, Hightstown, New Jersey, December
1968.
287. Imamura, M.S., A.A. Conn, A.J. Peszko, and R.C. Scott, "Computer
Simulation Concept for a Large Solar Array/Battery Power System,"
Proc. Seventh lntersocieO' Energy Conversion Engineering Confer-
ence, San Diego, California, (A73-22751), 1972, pp. 607-619.
288. Bauer, Paul, "Computer Simulation of Satellite Electric Power Sys-
tems," IEEE Trans. on Aerospace and Electronic Systems, AES-5(6),
November 1969, pp. 934-942.
REFERENCES 487
289.
290.
291.
292.
293.
294.
295.
296.
297.
298.
Schwartzburg, M., "Performance Analysis of Satellite Electric Power
Systems by Computer Simulation," Proc. Fourth Intersociety EnergyConversion Engineering Conference, Washington, D.C., 1969.
Weiner, H., and S. Weinstein, "Power Subsystem Performance Pre-
diction (PSPP) Computer Program," Proc. Seventh lntersociety Ener-
gy Conversion Engineering Conference, San Diego, California, (A73-
22751), 1972, pp. 581-606.
Zimmerman, H.G., and R.G. Peterson, "An Electrochemical Cell
Equivalent Circuit for Storage Battery/Power System Calculations by
Digital Computer," Proe. 1970 lntersociety Energy Conversion En-
gineering Conference, Las Vegas, Nevada, (A73-25976), 1972, pp.
5-33-5-39.
Durando, A.R., Modeling, Identification and Control Optimization
of a Satellite Power System, Thesis, University of California, Los
Angeles, (N74-13758), 1973.
"Reliability Program Provision for Space System Contractors," NASA
Reliability Publication NPC-250-1, July 1963.
Practical Reliability: Volume IV - Prediction, NASA CR-1129,
August 1968.
Von /Liven, William H., ed., Reliabifity Engineering, Prentice-Hail,
Inc., New Jersey, 1964.
Au, T., et al, "Fundamentals of Systems Engineering: Probabilistic
Models," Addison-Wesley Publishing Co., Reading, Massachusetts,
1972.
Kirsch, W.W., and L.E. Paschal, "Nickel-Cadmium Cell Composite
Reliability Model," Proc. Eleventh Intersociety Energy Conversion
Engineering Conference, State Line, Nevada, (A77-12662), 1976,
pp. 521-527.
Eliason, J., "Nickel-Cadmium Battery Reliability for Shuttle Serviced
Spacecraft," Proc. Tenth lntersociety Energy Conversion Engineering
Conference, Newark, Delaware, (A75-45920), 1975, pp. 1297-1306.
299. "Reliability Prediction of Electronic Equipment," MIL-HDBK-217B.
488
300.
Ni-Cd BATrERY APPLICATIONS MANUAL
Barnett, E.H., "Parallel Battery Simulation Computer Program,"
Report 74-2286.004, TRW Systems Group, Redondo Beach, Cal-
ifornia, January 1974.
301. Robertson, L.G., "Theory and Implementation of the 'Monte Carlo'
Parallel Battery Model," Report 74-2286.055, TRW Systems Group,
Redondo Beach, California, July 1974.
302. "Specification for the Manufacture of Aerospace Nickel-Cadmium
Storage Ceils," NASA/GSFC Specification 74-15000, March 1975.
303. U.S. Air Force, "Military Standard, Test Requirements for Space
Vehicles," MIL-STD-1504A, May 1974.
304. Ford, F., '`The 1972 GSFC Battery Workshop, Second Day," Proe.
Greenbelt, Maryland, NASA TM X-69239 (N73-21957), 1972.
305. Stanley, C., "Spacecraft Battery Testing - 5 Year Storage Life,"USAF/SAMSO Contract F04701-71-C-0131, Report 16439-93-
002-602, TRW Systems Group, Redondo Beach, California, 1976.
306. Scott, W., "'The 1973 GSFC Battery Workshop, First Day," Proc.,
Greenbelt, Maryland, NASA TM X-72536 (N75-15152), 1973.
307. Salkind, A.J., and G.W. Bodamer, "Changes in Physical Chemical
Properties of Secondary Battery Electrodes During Cycling," Proc.Fourth International Symposium, Brighton, England, September
1964.
308. Aerospac- Corporation, "Standardization and Program Effect Analy-
sis Final Report. Volume IV: Equipment Compendium, Part C, Elec-
trical Power Subsystem," Report ATR-75 (7364)-1, Los Angeles,
California, November 28, 1975.
309. Bogner, R.S., Mariner Mars 1971 Battery Design, Test, and Flight
Performance, NASA CR-132986 (N73-25095), April 15, 1973.
310. Armantrout, J D., "'Accelerated Life Tests on NATO III Batteries," The
1976 Goddard Space Flight Center Battery Workshop, Proe., Green-
belt, Maryland, NASA TM X-71284 (N77-21550), November 1976.
311. Ritterman, P.F.. The 1977 Goddard Space Flight Center Battery
Workshop, NASA CP.2041, 1977, pp. 271-279.
REFERENCES 489
312. Kerr, R.L., and D.F. Pickett, "Space Battery Technology for the
1980's," AIAA Paper 77-482 (A77-23902), March 1977.
313. Malkin, B., "Energy Cell Selections and Related Circuits," ASME
67-DE-37, 1967.
314. Howard, P.L., "Latest Battery Improvements and Mathematical
Techniques for their Selection," ASME 65-MD-44, 1965.
315. Gould, J., and P. Garmany, "Power Up With Batteries," Design
News, March 21, 1977.

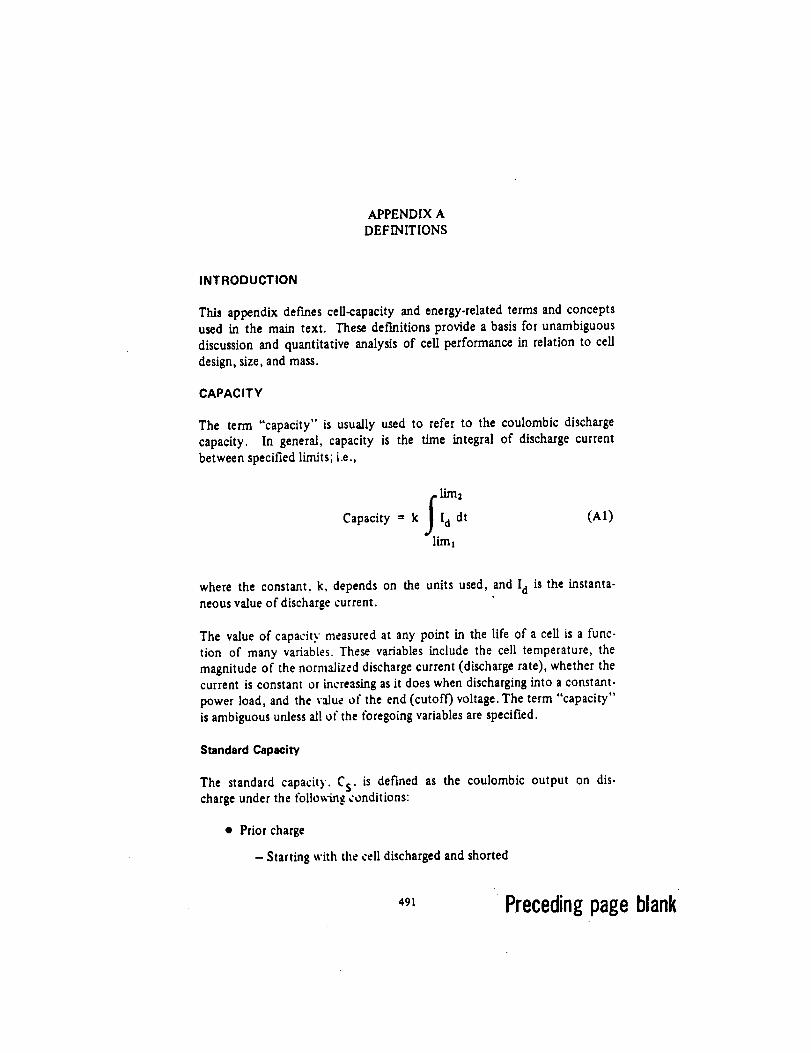
APPENDIXADEFINITIONS
INTRODUCTION
This appendix def'mes cell-capacity and energy-related terms and concepts
used in the main text. These definitions provide a basis for unambiguous
discussion and quantitative analysis of cell performance in relation to cell
design, size, and mass.
CAPACITY
The term "capacity" is usually used to refer to the coulombic discharge
capacity. In general, capacity is the time integral of discharge current
between specified limits; i.e.,
[, lima
Capacity = k J Id dt (AI)limt
where the constant, k, depends on the units used, and [d is the instanta-
neous value of discharge current.
The value of capacity measured at any point in the life of a ceil is a func-
tion of many variables. These variables include the cell temperature, the
magnitude of the normalized discharge current (discharge rate), whether thecurrent is constant or increasing as it does when discharging into a constant-
power load, and the value of the end (cutoff) voltage. The term "capacity"
is ambiguous unless all of the foregoing variables are specified.
Standard Capacity
The standard capacity. Cs. is defined as the coulombic output on dis-charge under the following conditions:
• Prior charge
- Starting with the cell discharged and shorted
'" Precedingpage blank

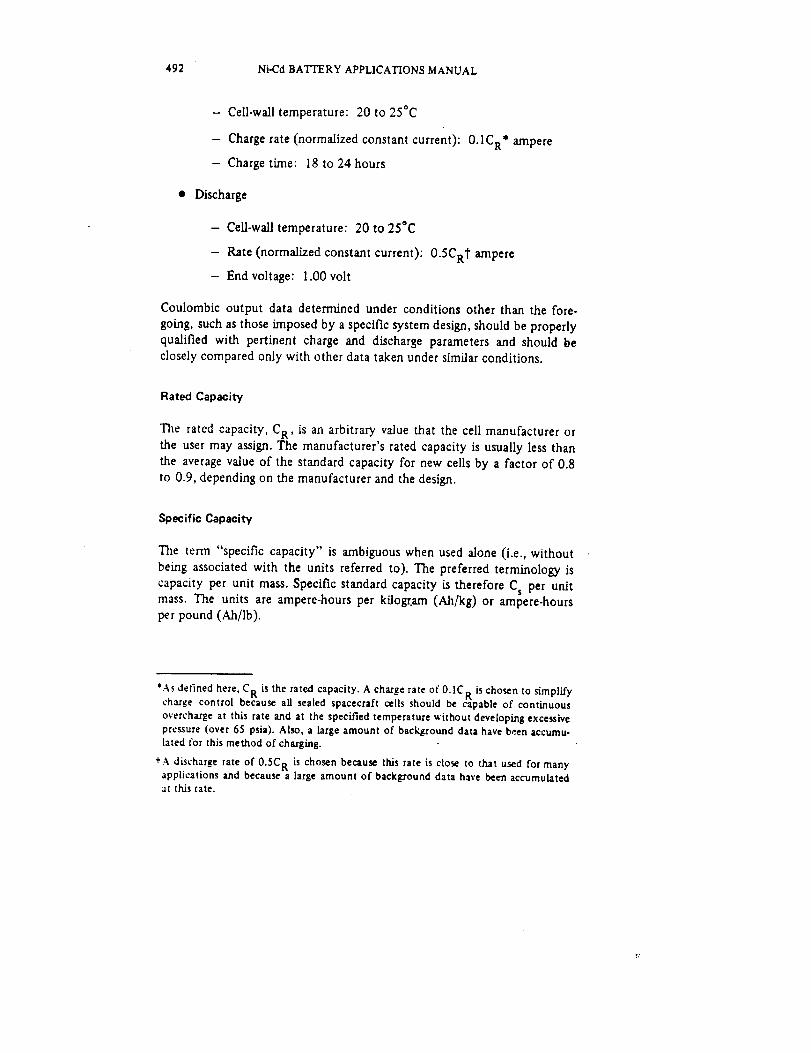
492 Ni-Cd BATTERY APPLICATIONS MANUAL
- Cell-wall temperature: 20 to 25°C
- Charge rate (normalized constant current): 0.1CR* ampere
- Charge time: 18 to 24 hours
• Discharge
- Cell-wall temperature: 20 to 25"C
- Rate (normalized constant current): 0.5CRt ampere
- End voltage: 1.00 volt
Coulombic output data determined under conditions other than the fore-
going, such as those imposed by a specific system design, should be properlyqualified with pertinent charge and discharge parameters and should be
closely compared only with other data taken under similar conditions.
Rated Capacity
The rated capacity, CR, is an arbitrary value that the cell manufacturer or
the user may assign. The manufacturer's rated capacity is usually less than
the average value of the standard capacity for new cells by a factor of 0.8
to 0.9, depending on the manufacturer and the design.
Specific Capacity
The term "specific capacity" is ambiguous when used alone (i.e., without
being associated with the units referred to). The preferred terminology is
capacity per unit mass. Specific standard capacity is therefore Cs per unitmass. The units are ampere-hours per kilogr.am (Ah/kg) or ampere-hoursper pound (Ah/lb).
*As defined here, CR is the rated capacity. A charge rate of 0.1C R is chosen to simplifycharge control because all sealed spacecraft cells should be capable of continuousovercharge at this rate and at the specified temperature without developing excessivepressure (over 65 psia). Also, a large amount of background data have been accumu-lated for this method of charging.
+A discharge rate of 0.5C R is chosen because this rate is close to that used for manyapplications and because a large amount of background data have been accumulatedat this rate.

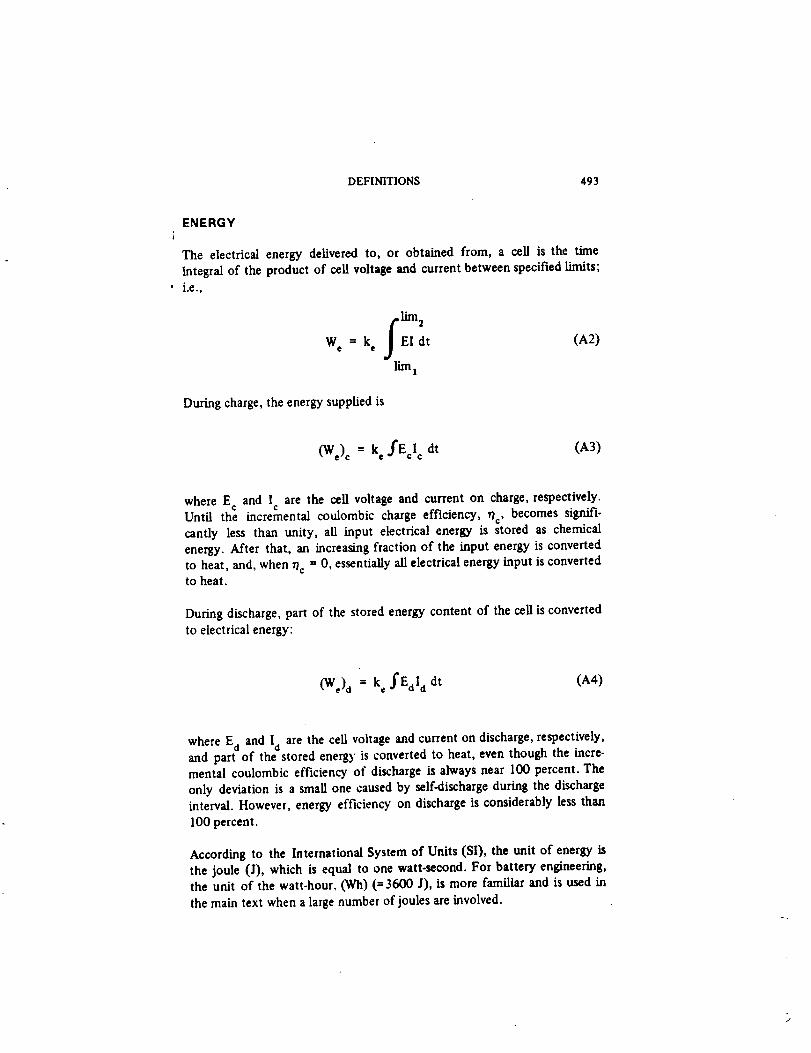
DEFINITIONS 493
ENERGY
The electrical energy delivered to, or obtained from, a cell is the time
integral of the product of cell voltage and current between specified limits;
' i.e.,
flimWe = k e El dt (A2)
lira I
During charge, the energy supplied is
(W) c = k e fEcl c dt (A3)
where E c and Ic are the cell voltage and current on charge, respectively.Until the incremental coulombic charge efficiency, ¢1c, becomes signifi-
cantly less than unity, all input electrical energy is stored as chemical
energy. After that, an increasing fraction of the input energy is converted
to heat, and, when r?c = 0, essentially all electrical energy input is convertedto heat.
During discharge, part of the stored energy content of the cell is converted
to electrical energy:
(W) d = k fEdI d dt (A4)
where E d and Id are the cell voltage and current on discharge, respectively,and part of the stored energy is converted to heat, even though the incre-mental coulombic efficiency of discharge is always near 100 percent. The
only deviation is a small one caused by self.discharge during the dischargeinterval. However, energy efficiency on discharge is considerably less than
100 percent.
According to the International System of Units (SI), the unit of energy is
the joule (J), which is equal to one watt-second. For battery engineering,the unit of the watt-hour. (Wh) (= 3600 J), is more familiar and is used in
the main text when a large number of joules are involved.
494 Ni-Cd BATTERY APPLICATIONS MANUAL
Because the actual value of electrical energy delivered on discharge is a func-
tion of the same variables as those of capacity as listed above, careful defini-
tion of energy terms is required. The following definitions are extensions of
this deVmition of energy.
Standard Energy Output
The standard energy output is the electrical energy delivered by a cell during
a discharge to measure standard capacity, as defined in the foregoing section
on "Standard Capacity."
Specific Energy (Energy Density)
The terms "specific energy" and "energy density" are used interchangeably
to refer to energy output per unit mass. The authors prefer the term "spe-
cific energy." When the meaning of "energy per unit volume" is intended, it
will be spelled out.
The units of specific energy by the SI system are joules per kilogram (J/kg).
For engineering purposes and in the main text, watt-hours per pound
(Wh/lb) are used.
Specific Mass or Specific Weight
The term "spec.ic mass (or weight)" is often used to refer to the ratio of
mass-to-energy output (i.e., to the reciprocal of specific energy). Although
this ratio is a useful parameter, the shorthand terminology is ambiguous inthat the other factor besides mass in the ratio is not specified by the terms
per se. For this reason, these terms are not recommended. Instead, the com-
ponent parts of the ratio intended (e.g.. mass per unit energy (kgfWh))
should be spelled out.
STATE OF CHARGE AND DEPTH OF DISCHARGE
The term "state of charge" is used in several ways in the literature (i.e., to
refer to the amount of charge put through the cell and to refer to the level
of usable charge existing in the cell at any point). Because the incremental
coulombic charge efficiency at high states of charge becomes low andbecause cell behavior correlates well with true state of charge and not
necessarily to charge throughout _ithout taking charge efficiency into ac-
count, the term "state of charge" refers only to the true state of charge
retained by the cell.

DEFINITIONS 495
As normally used, state of charge does not refer to capacity per se, but to
the ratio of the actual (measurable) capacity, Ca, at a given point to some
reference capacity, Cref; i.e.,
State ofcharge = Ca__._.._ (AS)Cref
Cre f may be chosen as equal to rated capacity or to the maximum capacityachievable under the conditions of interest.
True state of charge in a sealed nickel-cadmium cell cannot be measured
reliably by any direct method in spite of considerable work to develop
such a method. The only widely accepted method for determining the
state of charge is to discharge the cell, measure the output, and divide by
the reference capacity. Because this definition makes state of charge a
function of the parameters that control discharge output (i.e., cell tem-
perature, discharge rate, and end voltage), these parameters should be
specified with the data.

APPENDIXBAUTHOR INDEX
Ahrens, A. F., 320
Appleby, A. J., 196,202Armantrout, J. D., 53, 169, 273,455Au, T., 400
Bacher, J., 291,337Baer, D. A., 112, 126, 349Baker, H., 22,169,194Barnett, E. H., 136, 147, 155, 157,
400, 401,406Barney, D. L., 204Bauer, J. L., 26
Bauer, P., 3, 4, 10, 67, 68, 70, 97,100, 102, 103, 104, 116,265,327,392
Baumstark, G. A., 118, 199
Bean, E. E., 156, 157Bedford, B. D., 289Berard, C. A., Jr., 302
Betz, F. E., 86, 87,273Billerbeck, W. J., 347Binckley, W. G., 301,388,389
Bloomquist, C. E., 156, 157Bodamer, G. W., 439
Bogner, R. S.. 64, 446Bolton, C. N., 301,389,390Boscia. A. J.. 322Breeskin. S. D.. 349
Briggs. D. C., 62,169, 291,301,377Broberg. H.. 136. 157,402Brooman. E. W., 73, 74, 75, 76, 78,
104.217.268.270, 309, 311Brown. 1.. 291
Bulla, W.: 194Bums, W. W.. III. 301
Buskirk, D. L.. 323
Cahoon, N. C.. 46Callen, P.. 291Cardwell. G. I.. 29, 73, 93, 169, 196,
273, 312,348
Carson, W. N., Jr., 41, 43, 45, 56,100, 152
Casey, E. J., 32Catotti, A. J., 192, 194, 204
Cherdak, A. S., 302Chua, D., 205
Clausen, O. W., 321Coggi, J. V., 320Conn, A. A., 391
Consiglio, J. A., 100Conway, B. E., 9, 10Corbett, R. E., 349
Costogue, E. N., 301,389Cotter, T. P., 316Cover, P.W., 179, 192, 194, 201Coyle, M. 1., 320, 322, 323Crawford, R. L., 77, 78
Cunningham, F. G., 276Cuthrell, W. F., 22, 169
Donovan, R. L., 360, 369Doran, R., 18
• Douglas, J. L., 302Dubois, A. R., 32
Ducan, W., 321Duncan, E. C., 29, 73, 93, 169, 196,
273,312,348
Dunlop, J. D., 19, 111, 156, 165,169, 173, 176, 196, 202, 205,265,439
Durando, A. R., 392
Earl, M., 111, 196, 205,265
Eby, R. J., 316Edelman, E. A., 320
Eicke, W. G., Jr., 334Ekpanyaskun, S., 13Elder, J. P., 95,107,108, 127Eliason, J. T., 136, 153. 154Eliason, R. R.. 320. #,02
Eninger, J. E., 318
497Precedingpageblank


498 Ni-Cd BATTERY APPLICATIONS MANUAL
Epstein, S. D., 136Erickson, G. F., 316
Ewen, W., 291,296, 297,391
Falk, S. U., 9, 13, 32, 115, 123
Farber, B. F., 289Faust, C. L., 179, 181, 183, 192,
198,201Finkelstein, J., 156, 157
Fitchman, A., 118, 199Fleischman, G. L., 320
Fono, P., 388Font, S., 67, 68, 70, 71, 84, 88, 91,
92, 93, 94, 95, 97, 98, 101, 104,109, 128,205
Ford, F. E., 43, 45, 86, 111, 140,149, 150, 151, 152, 168,174, 188,
260, 265, 291,337,339,348, 351,370, 376,438,439
Fougere, P., 169, 170, 171Francis, H. T., 3
Garcia, A., 26
Garmally, P., 458Garrett, P., 135, 136, 142Gaston, S. J., 53, 148, 149, 258,
260, 265,391Gibson, L., 136Gileadi, E., 9, I0Glass, M. C., "_49
Glocking, R. J.. 108, 128, 203, 204,205,207
Gondusky, J. M., 77, 78Goodman, k. A., 196,216, 217,219Gordon, L., 156, 158, 159. 160,400.
401,402
Gordy, D. J., 128,202Gottlieb, M. H., 11 I
Gould, J., 458Graff. C., 291,301,352Gross, S., 39, 41, 108, 100. 128,
201, 202, 203, 204, 205. 207, 273Grover, G. M., 316
Gruber, R., 302, 352
Haas, R. J., 62
Halpert, G., 4, 10, 13, 16, 53, 136,192, 193, 194, 196, 198, 202, 216
Harivell, J. P., 108Harkness, J. D., 142, 150, 165, 169,
170, 174, 196Harkness, R. E., 316
Haugen, H., 73, 119,273l-lgusler, E., 53Hennigan, T. J., 217,219,271Henningson, A., 136, 157,402Hess, H. J., 205Hill, K., 321Hilton, B. H., 318Hinderman, J. D., 316Hoft, R. G., 289Holleck, G., 15, 16, 47, 114, 124,
198
Hornbuckle, F. L., 291,301,341
Howard, P. L., 458Howden, W. E., 32
Hyland, P. J., 391
Imamura, M. S., 352,360, 369,391,457
Jakobi, W. W., 24, 77, 123Johnson, C. R., 136, 139, 140, 148,
265, 271
Jones, C. C., 192, 193,194Jost, E. M., 95,107, 108, 127Julseth, D. H., 369
Kantner, E., 47, 49Karam, R. D., 316Katzoff, S., 318
Kelley, J. J., 194Kelley, W. H., 316Kent, J., 136, 185, 186, 187, 192,
194, 216
Kerper, I. L., 320Kerr. R. L., 457
Kettler, J. R., 356Killian, H. J., 356
Kirkpatrick, J. P., 320, 321Kirsch, W. W., 43, 45,136, 139, 140,
150, 152, 167, 168,348,352,358,400. 402
OR IN, L P, CE IS

AUTHORINDEX ' 499
Krause, S., 169, 173, 176 Michel, W., 29, 73, 93, 169, 196,Krausz, A., 291,382 273,312, 348
Kr_Sger, H. H., 16, 18, 19, 32, 50, 53, Migeon, J., 108124, 125, 127, 192, 194, 198, 207 Miller, G. H., 104, 179, 180, 181,
Kunz, H. R., 318 183, 192, 198, 201,217,218, 268,
Lackner, J., 92, 176
Lake, P. E., 32Langston, I. S., 318Lanier, R., 168, 291,301,352LaVigna, T. A., 289, 291, 301,341,
391
Layte, H. L., 357Leafy, J., 136, 154, 155,402Lerner, S., 18, 43, 45, 95, 126, 152Lesh, H. F., 276Levy, E., Jr., 29, 73, 93, 169, 196,
273,291,312, 320, 348,357Lim, H. S., 24, 165, 166, 205, 206,
440
Lindena, S., 301,389Loewnertz, A., 136, 157,402Luksha, E., 128.202
MacArthur, D. M., 10Madson, J., 316Maiden, C. E., 29. 73, 93, 169, 196,
273,312,320, 348Malkin, B.. 458Marcus, B. D., .__0Matsui, R. G., 349
Mauchly, J. W.. 136Maurer, D., 108. 109. 111. 129. 194,
204
Mayer, S. W., 204McCallum, J., 73, 74. 75, 76, 78,
104, 179, 180, 181. 183, 192, 194,198, 201. 217, 218. 268. 270. 271,
309,311McDermott, P. P.. 13. 196. 202,203,
216. 217,219,271McGrath, R. J.. 320McHenry. E. J.. 32McKinney, H. N.. 291. 301. 377Menard. C. J.. 16, 124Michalek. T. J., 320. 322.323
270, 271i
Miller, L., 51, 52, 114, 125, 126, 130
Miller, W., 348Milner, P. C., 124Mock, P. R., 320Moore, E. T., 288
Morignat, B., 108Moroz, W. J., 32
Napoli, J., 176Nashick, G. H., 318Nche, P., 13
Neglia, M., 321Nekrasov, P., 287,301,398,390Newel.l, D. R., 129, 166, 327,446
Oakes, J. B., 347Obenschain, A., 291
Oberg, J. L., 369Ogunyankin, O., 192, 193, 194
Okinara, Y., 32Oliver, R. L., 47, 53, 124Ollendorf, S., 322Olshan, L., 321Orenstein, S., 194
O'Rouke, J. A., 53, 148, 149, 258,260,265,391
Osugi, F. S., 291,357Otzinger, B., 101, 102
Paiewonsky, B., 388Parmer, J. F., 323
Parry, J. M., 192, 194Paschal, L. E., 265,400,402Patterson, T. D., 352
Paulkovich, J., 320Pensabene, S. F., 204Pessin, L., 391Peszko, A. J., 391Peterson, R. G., 392Phillips, E. C., 318Pickett, D. F., 47, 53, 124, 176,457

500 :Ni-Cd BATTERY APPL[CATIONS MANUAL
Plamondou, J. A., 322Pomroy, S., 135, 136, 142
Popat, P. V., 77, 78, 129Preusse, K. E., 273Pro, S., 281,283,286
Puglisi, V. J., 46, 47, 53, 123, 124,125,128
Purcell, J., 296
Ralph, E. L., 46, 123, 124, 125, 128Rampel, G. G., 19, 20, 36, 41, 43,
45, 56, 114, 115, 152,203Rasmussen, R., 391
Rauschenbach, H. S., 279Reed, A. H., 179, 192, 194, 201,
218,270Reppucci, G. M., 284,290, 291. 292.
330, 331,377Ritterman, P. F., 11, 18, 47, 118,
124,362,455Robertson, L. G.. 136, 147, 155,
156, 157, 158, 159, 160,353,400.401,402,406
Robinson, R. L., 291
Rodriguez, G. E., 302Roeger, E. A., Jr., 104, 201, 217,
218,268,270, 271Rubenzer, J. F., 327Rubin, E. J., 18. 77. 78. 108.124.
198Rusta, D. W.. 291. 296, 297. 327.
337, 391
Salirn, A. A.. 291Salkind, A. J.. 9. 13. 32. 115. 123.
439
Sanders, J. A., 265Schoenfeld. A. D.. 289
Schulman, 1. M., 64. i 76Schwartzburg, M.. 390. 392Schwarz, F. C.. 288Scott, R. C., 391
Scott, W. R., 16, 17, 18, 2_. 41.43,44, 45, 73, 101, 102, 112. 118,
119, 124, 129, 130. 156. 168.169, 170, 171, 173, 174, 176. 177.188, 196, 198, 207,253,254, 255,257, 265, 266, 267,268,273. 303,343,346, 349,406,433,439
Seiger, H. N., 9, 10, 18, 43, 47, 49,
53, 95, 114, 122, 124, 126, 129,202
Shair, R. C., 273
Sheppard, N. R., 352Shikoh, A. E., 43, 45, 136, 139, 140,
150, 152, 167, 168, 348, 352. 358
Skelly, L. A., 352,369,457Sommerfeldt, E. E., 196, 216, 217,
219,271Sparks, R. H., 265,268,343
Stager, D. N., 73, 119,273Stanley, C. L., 258,439,442Sternberg, R., 291,296,297,391Stewart, W., 348Stipandic, E. A., 320, 322,323Stofel, E., 192
Streed, E., 321Sylvia. J.. 273
Szego. G. C., 388
Taylor. A. D., 349Thierfelder. H., 136,139,148Thomas. E. U., 360Thomas. R. E., 179,270
Thomas. U. B., 124Thor-nell. S.. 188, 199Thurman. J. L., 303Toner. S. D.. 22, 169Trinuner, J. D.. 307,310Tuomi. D.. 32
Turchan. M. J., 18Turner. D. R.. 32, 109
Uchiyama. A. A.. 64
van Ommermg. G.. 196,202
Von Alven, W. H., 400,403
Voyentzie. P. R.. 41,43, 45. 152

I
'AUTHOR INDEX
Wagner, O. C., 207Waite, J. H., 136, 179, 270Wanous, D. J., 320Waters, E. D., 316Webster, W. H., Jr., 13, 192, 193,
194,340
Weiner, H., 352,392, 457Weinstein, S., 392Weinstock, 1. B., 43, 45, 56, 152
Wendling, L. W.. 360Wertheim. M., 53, 148, 149, 258,
260, 265,391Wick, H. M., 291Wilbore, J. F., 100Will, F. G.. 205
Williams, D. D., 207
Willis, T. H., 111Wilson, T. G., 288Witters, D. M., 296Wolverton, R. W., 276
Wright, W. H., 291,357Wyde, S. S., 318
Yagelowich, J., 348Yamashita, D., 32Yu, Y., 289
Zerbel, D. W., 73,273, 357Zimmerman, H. G., 392
501

APPENDIX C
ORGANIZATION INDEX
Aero Propulsion Laboratory (U.S.Air Force), 1,365
Aerospace Corporation, 445Armed Services, 246, 271
Battelle Columbus Laboratories, 270,271
Canadian Defence Research Establish-
ment, 24, 43COMSAT Laboratories, 265
Eagle Picher Industries, Inc., 14, 15,20, 47, 51, 52, 53, 59, 60, 61, 62,63, 75, 81, 134, 136, 162, 165,
239,261,273,419, 446
NASA Headquarters, 445NASA/MSFC, 268NWSC/Crane, 2, 68, 134, 139, 142,
143, 144, 145, 147, 148, 149, 150,151, 153, 154, 155,156, 158, 160,
161, 162, 164, 165,166, 167, 169,172, 174, 192, 194, 195,196,205,217, 219, 265, 268,271,339,340,365,400,402
Pelion Corporation, 22
Radio Corporation of" (RCA), 358
America,
General Electric, Battery Business
Department, 14, 15, 19, 20, 34, 36,38, 47, 53, 59, 60, 61, 63, 75, 82,87, 88, 92, 93, 114, 115,116, 117,124, 126, 134, 136, 139, 142, 143,144, 145, 148, 153,155, 161,162,163, 170, 175, 190, 203,239,261,
267, 269, 273,341,364. 366,419,
447,448,450,452,453Gould 124. 155Gulton Industries, 59, 60.89
Jet Propulsion Laboratory. 1
SAFT-America, Inc., 14, 15, 20, 34,38, 41, 43, 47, 48, 49, 50, 53, 59,60, 61, 63, 64, 69, 70, 71, 75, 83,86, 89, 91, 93, 94, 95, 96, 97, 98,105, 117, 126, 134, 136, 139, 140,
142. 143, 144, 145,148, 149,152,155. 161, 162, 170, 173,239,261,271. 273,339,340,419,449. 451
SAFT-France, 14, 15, 20, 47, 53, 58,59.60.84, 92
• Satellite Business Systems, 364Sonotone Corporation, 47, 136, 155
Marathon Batter3.' Corporation, 47
NASA. 1, 2. 3. 4. 51. 64. 158, 195.219, 226, 235. 246. 247. 259. 262.265, 271, 329. 332. 338. 391.400,
418,419,425. 433. 439NASA/GSFC. 1, 3, 246. 247. 248,
251, 252. 253. 254. 256. 257. 262.340, 370, 371. 372. 375.418.419,438,457
TRW. 175,247, 355,358, 364
U.S. Air Force, 247, 248. 349, 356,365,425
U.S. Navy, 334,425
Yardney Electric Company. 64, 419
503 Precedingpageblank4


APPENDIX D
SUBJECT INDEX
The index is presented alphabetically with h.ierachical notations to assist the
reader in quickly locating the correct term. To find a term that is not used in
the index, for which there is a synonym that is used, the reader will encounter
the following reference:
Muspratt solution
Use: Ammonium hydroxide/chloride solution
There will also be a reference to indicate that the reader need not look under
synonymous terms that are not used in the index:
Ammonium hydroxide/chloride solution
Use for: Muspratt solution
The following hierarchical notes are used: RT, NT, and BT. RT indicates
that another term appears at the same hierarchical level that may refer thereader to other useful information. NT notifies the reader that there are more
specific terms (narrower terms) that might be more useful. BT notifies the
reader that there are broader terms that might be more useful; for example:
Measurement methods
NT: Accelerated-time tests, Acceptance
tests, Atomic-absorption spectroscopy
Accelerated-time tests
BT: Measurement methods
The abbreviations, ft. and def., are used in the index. Ff. means that the term
appears on many of the foLlowing pages. Def. means that on that page the
term is defined, for example:
Capacity
120 ff., 352
Normalized current
79 (def.), 86, 88
505 Precedingpageblank

506 Ni-Cd BATTERY APPLICATIONS MANUAL
Absolute temperature, 303,361
Absorber-type separators, 21,24
Accelerated cycling, 258
tests, 174, 176, 196,198,217, 218,
266,267,269,343BT: Measurement methods
Acceleration factor, 269 (def.), 270
Acceptance requirements, 258,433
tests, 54, 65, 68, 100, 115,131,
230 ft., 250, 259,264
BT: Measurement methods
(batteries), 246, 261,429,430
(cells), 246-251,262
Accordion.fold separators, 25 (def.)
Accountability, 238
Active-bypass circuits, 360, 363Use for: Active-element failure-
protection circuits
Active charge, 79,182,208voltage, 107
BT: Cell voltage
charged-negative material, 41
BT: Charged-negative materialcontrol elements, 290
element failure.protection circuits
Use: Active-bypass circuitsfalter
Use: Series dissipative regulatorAdditives. 193
Adhydrode electrode
Use: Oxygen signal electrodeAdsorbed-hydrogen electrode
Use: Oxygen signal electrode
Advanced battery systems, 454
Aerospace part-derating policies, 298
Agglomeration, 205
Aging, 153
Air, 202Albedo, 384
Aluminum, 315
Ambient temperature. 79, 143
Ammonium hydroxide/chloride solu-tion, 194
Use for: Muspratt solution
Ampere-hour capacity. 121-2
integration, 351-hours, 181,185
Analog signals, 296.396
Anomalous cell behavior, 179
Anomalous cell-voltage behavior, 46
Antipolar material, 19Apparent reactance, 70
Apparent resistance. 70
Applications Technology Satellite 6
(ATS-6). 45 l
Area loading, 106, 123 (def.), 124
RT: Plate loading
Array
Use: Solar-cell array
Assembly drawing. 8
Asymptotic value of taper current,
336 (def.)
Atmospheric Explorer C (AE-C), 448
Automatic power systems. 327
Atomic-absorption spectroscopy (AA),194
BT: Measurement methods
Autonomous power systems. 327
Auxiliary devices. 8. 414-15. 420
Auxiliary electrodes.43. 138. 152. 348
NT: Oxygen simaal electrode,Recombination electrode,Reference electrode
Average charge efficiency. 92
BT: Charge efficiency
Bag separators. 25
Battery, 8 (def.)
assembly qualification. 435
-cell dissipation. 389-cell failures. 299
-cell thermal analysis. 311-12-characteristic curve. 295
-charge bus. 296
-charge controls, 259. 281-297,
300,343,364,457

SUBJECT INDEX 507
-charge current control, 296-7
computer programs, 388
configuration, 409,410current, 132
design, 239,395, 411-413
design review, 268
development, 380, 411-413,446
-discharge control, 281,292,298,377
engineer, 222 ft., 256, 395,409,416,429,443
equipment specification, 414, 424
(def.)
failure, 180 (def.), 416
failure criteria, 180 (def.)
harness, 260
heater, 347
installation, 437
isolation diodes, 297, 377
.limited power system, 65
logistics plan, 437,443
maintenance, 437
manufacturing, 245,426
mass, 422
measurements, 436
model, 416
performance analysis, 97
procurement, 22 I, 239.40
qualification, 262-3,425,434
reliability, 157-8, 164.402
responses, 67
sizing, 120. 276,385. 392,393
specification, 222, 224,240,409
standby operations, 440
structure, 131
system, 8 (def.), 96,409
-system configuration, 227, 385-7
-system design, 275,280
-system interfaces, 384
-system mass, 328
-system reliability, 280, 355,387
temperature, 186, 334, 337, 343,
347.371-5
testing, 243-5thermal-control system, 8 (def.),
276
thermal environment, 394
voltage limit (BVL), 337,344, 372,374
voltage limit families, 339
-voltage sensing points
Use: TapsBeginning-of-charge voltage, 109, 187
Beginning-of-discharge voltage, 116,187
Blisters, 195
Boost-discharge regulator, 298-300
Breakage, 200
Brushing, 51
Buck/boost charger, 295Buck discharge regulator, 298-300
Bus ripple, 288
voltage, 294, 297,346,407
voltage regulation, 279,296,300,370
Butt-type geometry
Use: Interface geometry
Bypass circuits, 405
Cable mass, 382
Cables, 382,420Cadmium active material, 18, 38-9, 56,
108, 195
Use for: Negative active material
Cadmium additives, 18
-cadmium cell, 199
hydroxide, 195,204
migration, 191. 203-5,216-17
Cady gage, 36
Calendaring, 25 (def.)Can
Use: Cell case
Capacitive reactance, 72
Capacity, II, 14, 33, 54, 66, 76-7,
94-99, 107-9, 120-26, 123-7,
128-30, 135, 141, 150-51, 160-
68, 174, 187 (def.), 218, 250,

508 Ni-Cd BATTERY APPLICATIONS MANUAL
257,263,371,395BT: Performance characteristics
NT: Discharge capacity, Negative
capacity, Rated capacity,Relative capacity, Specific
capacity, Theoretical capa-
city, Thermal capacity.
degradation, 41,174-5,353-5,361loss, 188, 196, 198,217
matching,259-61
measurement, 131,188,193,258-9
ratios,33, 38, 54, 107, I08, IlI,
114, 128, 166,216
Use for:Negative-to-positiveratios
requirements,56
retention,102,339
verification test, 432
BT: Measurement methods
Caps, 28Carbonate, 33, 56, 163, 193, 196,204,
217
Case wall
Use: Cellcase
Catalog-itemsealedaerospacecells,34
Caustictreatment,49-56
Cd(OH)2, I0
Ceil,8
acceptance.239,419
acceptancefailure,247-8
area, 57
assembly. 55. 202
bypass circuitry, 299
capacity. 41, 53, 74,129,134,138. 219. 300
case, 25 (def.), 26-7, 44-6,362casedimensions,I12
caseheight.58.61
case materials properties, 27
case temperature, 66, 79, 80,133,
303
case tl_._ckgess, 26, 27, 58, 61,76casevolume,37, 58
configuration,42, 356
NT: Cylindrical cells
Prismatic cells
construction, 361
cover, 25 (def.), 26-31
current, 121,138, 181-5
current voltage, 386-definition studies, 385
degradation, 140, 176, 180 (def.),239,264,271,362,379,406
biT: Degradation/failure deter-minants, Degradation/failure
mechanisms: Degradation/
failure modes; Degradation
models, Degradation rate
RT: Cell failure
degradation analysis, 179
degradation/failure mode, 182
design, 12, 38, 46, 100-111,
122-3,159,176, 180,209,
229,235,262,361
design audit, 224
development testing, 417
dimensions, 66, 76
failure, 180 (def.), 181,264,
379,383,405-6,416
RT: Cell degradation
failure analysis, 179, 198
failure criteria, 180 (def.)
failure mechanisms, 179
failure rate, 152-155, 164, 175
geometry, 33
internal pressure. 66
leakage. 42,215. 362
-level design verification. 434
level protection 376 ff.
lot acceptance. 256manufacturer's tests. 100
manufacturing. 47.54.65.80,107. 113. 123-130. 150. 176.
180. 216. 245
Use for: Manufacturing
mass, 33.58 ff., 126.128
B'l': Static properties
matching, 258-62,378model, 311. 392. 416
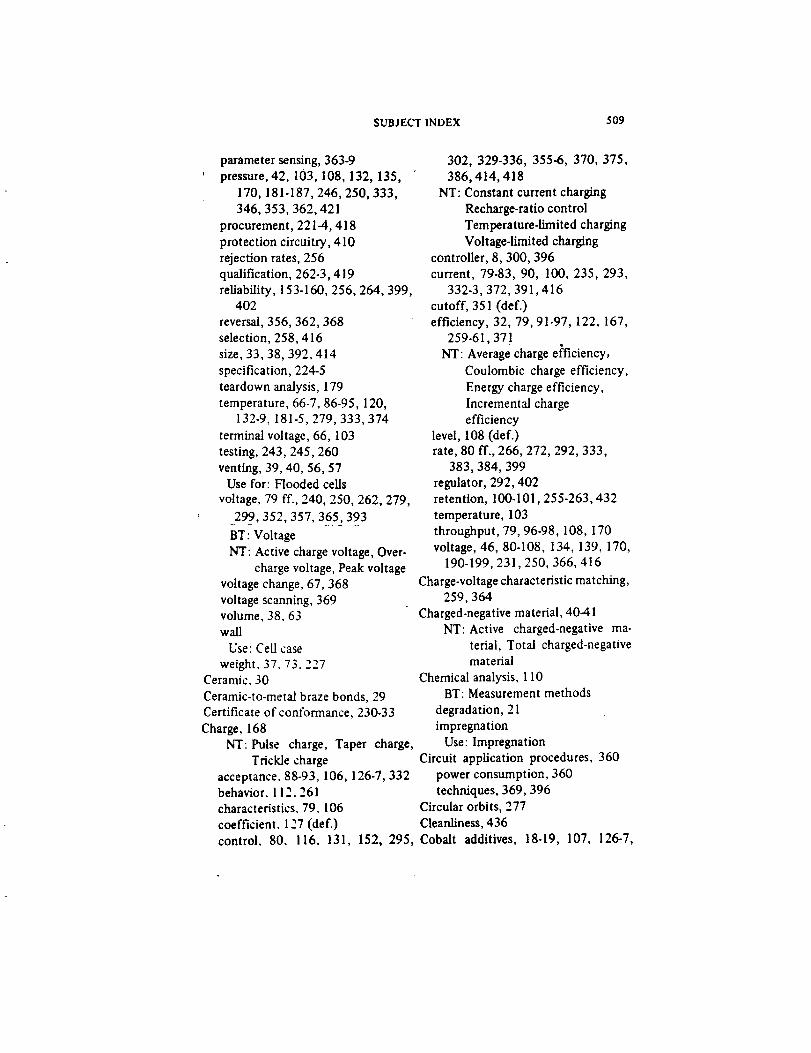
SUBJECT INDEX 509
302, 329-336, 355-6, 370, 375,
386,414, 418
NT: Constant current charging
Recharge-ratio control
Temperature-limited charging
Voltage-limited charging
controller, 8,300, 396
current, 79-83, 90, 100, 235,293,
332-3,372,391,416
cutoff, 351 (def.)
efficiency, 32, 79, 91-97, 122, 167,259-61,371
NT: Average charge efficiency,
Coulombic charge efficiency,
Energy charge efficiency,
Incremental charge
efficiency
level, 108 (def.)rate, 80 ff., 266,272,292,333,
i 383,384, 399
regulator, 292,402retention, 100-101,255-263,432
temperature, 103
throughput, 79, 96-98, 108, 170
voltage, 46, 80-108, 134, 139, 170,190-199,231,250, 366, 416
Charge-voltage characteristic matching,259,364
Charged-negative material, 40-41NT: Active charged-negative ma-
terial, Total charged-negativematerial
Chemical analysis, 110BT: Measurement methods
degradation, 21
impregnation
Use: Impregnation
Circuit application procedures, 360
power consumption, 360
techniques, 369,396
Circular orbits, 277
Cleanliness, 436
parameter sensing, 363-9
pressure, 42, 103,108, 132, 135,
170, 181-187,246, 250, 333,
346, 353,362,421
procurement, 221-4, 418
protection circuitry, 410
rejection rates, 256
qualification, 262-3,419
reliability, 153-160,256, 264, 399,402
reversal, 356, 362,368
selection, 258,416
size, 33, 38,392,414
specification, 224-5
teardown analysis, 179
temperature, 66-7, 86-95,120,132-9, 181-5,279,333,374
terminal voltage, 66, 103
testing, 243,245,260
venting, 39, 40, 56, 57Use for: Flooded cells
voltage, 79 ff., 240, 250, 262,279,
299,352,357,365,393
BT: Voltage
NT: Active charge voltage, Over-
charge voltage, Peak voltage
voltage change, 67,368
voltage scanning, 369volume, 38.63
wall
Use: Cell case
weight. 37.73. 227Ceramic. 30
Ceramic-to-metal braze bonds, 29
Certificate of conformance, 230-33
Charge, 168NT: Pulse charge, Taper charge,
Trickle charge
acceptance. 88-93. 106,126-7,332behavior. 112. 261
characteristics. 79, 106
coefficient. 127 (def.)
control. 80. 116, 131, 152, 295, Cobalt additives, 18-19, 107, 126-7,
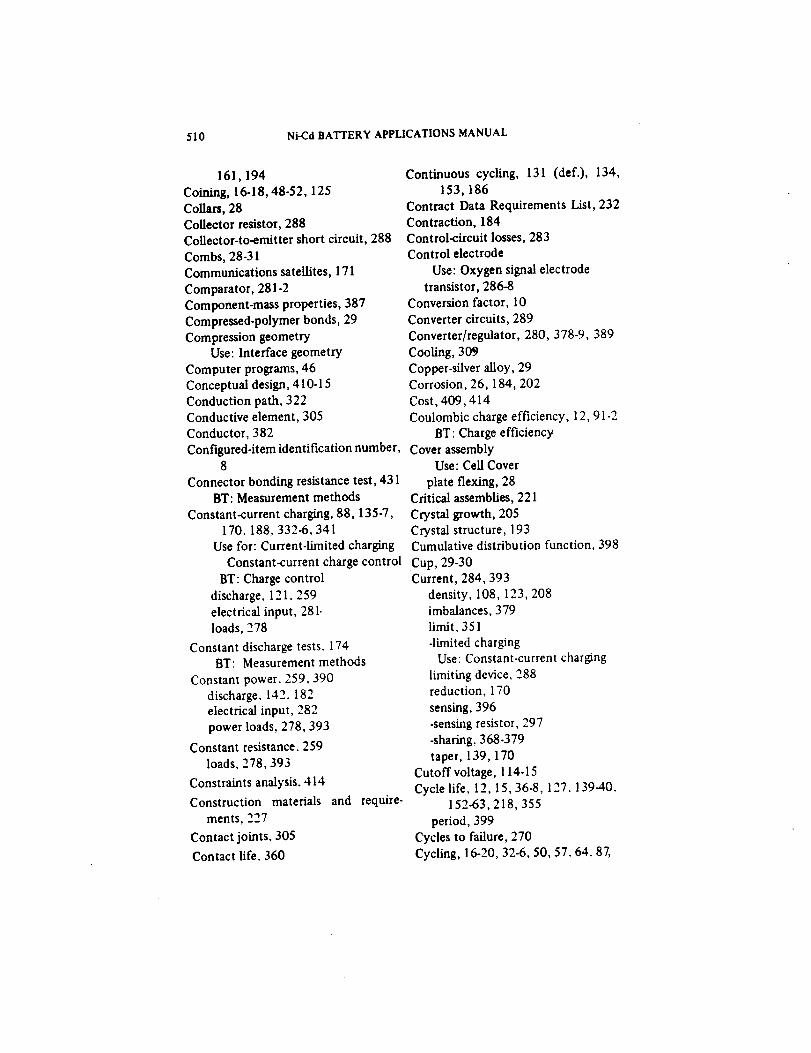
510 Ni-Cd BATI'ERY APPLICATIONS MANUAL
161,194
Coining, 16-18,48-52,125
Collars, 28Collector resistor, 288
Collector-to-emitter short circuit, 288
Combs, 28-31
Communications satellites, 171
Comparator, 281-2
Component-mass properties, 387
Compressed-polymer bonds, 29
Compression geometryUse: Interface geometry
Computer programs, 46
Conceptual design, 410-15
Conduction path, 322Conductive element, 305
Conductor, 382
Configured-item identification number,8
Connector bonding resistance test, 431BT: Measurement methods
Constant-current charging, 88, 135-7,
170, 188,332-6,341
Use for: Current-limited charging
Continuous cycling, 131 (def.), 134,
153, 186
Contract Data Requirements List, 232
Contraction, 184
Control-circuit losses, 283Control electrode
Use: Oxygen signal electrode
transistor, 286-8
Conversion factor, 10
Converter circuits, 289
Converter/regulator, 280,378-9,389
CooLing, 309
Copper-silver alloy, 29Corrosion, 26, 184,202
Cost, 409,414
Coulombic charge efficiency, 12, 91-2
BT: Charge efficiency
Cover assemblyUse: Cell Cover
plate flexing, 28Critical assemblies, 221
Crystal growth, 205
Crystal structure, 193Cumulative distribution function, 398
Constant-current charge control Cup, 29-30
BT: Charge control
discharge. 121. 259
electrical input, 281.
loads, 278
Constant discharge tests. 174BT: Measurement methods
Constant power, 259,390
discharge. 142,182electrical input, 282
power loads, 278,393
Constant resistance. 259
loads, 278,393
Constraints analysis. 414
Construction materials and
ments, 227
Contact joints. 305
Contact life. 360
require-
Current, 284,393
density, 108,123,208
imbalances, 379
limit, 351
-limited charging
Use: Constant-current charging
limiting device, 288reduction, 170
sensing, 396-sensing resistor, 297
-sharing, 368-379
taper, 139,170
Cutoff voltage, 114-15
Cycle life, 12, 15, 36-8, 127.139-40,152-63,218,355
period, 399
Cycles to failure, 270
Cycling, 16-20, 32-6, 50, 57.64.87,
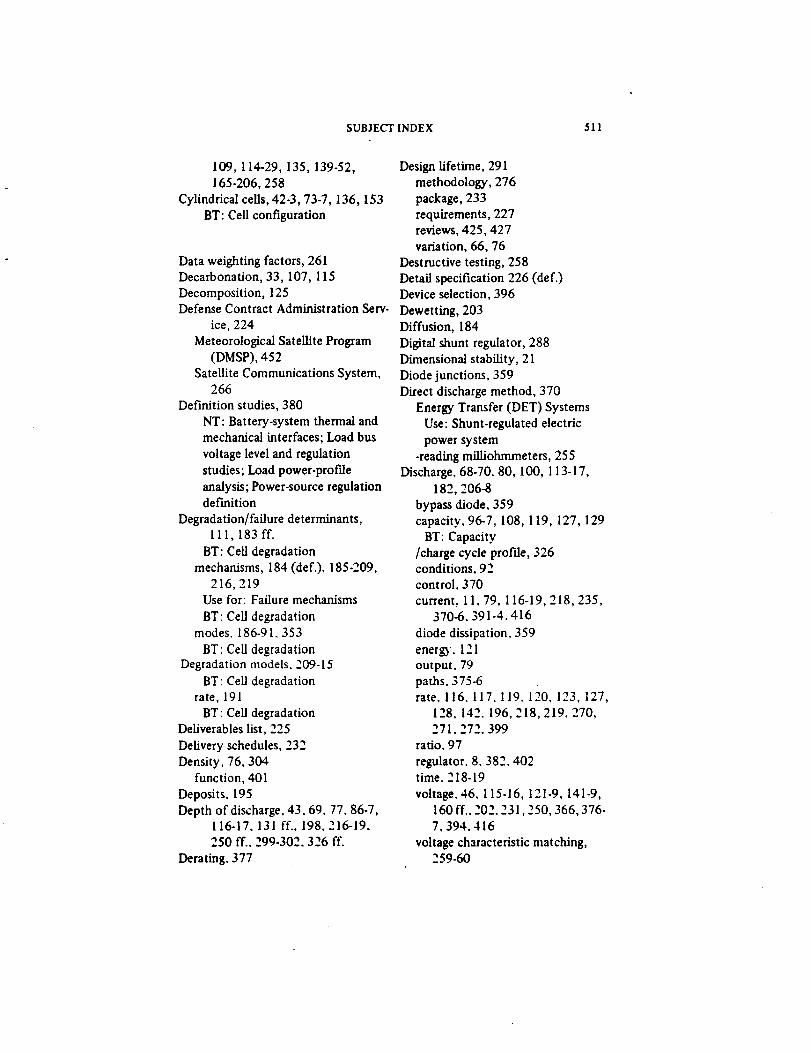
SUBJECT INDEX 511
109, 114-29, 135,139-52,
165-206, 258
Cylindrical cells, 42-3, 73-7,136, 153
BT: Cell configuration
Data weighting factors, 261Decarbonation, 33,107, 115
Decomposition, 125
Design lifetime, 291
methodology, 276
package, 233
requirements, 227reviews, 425,427
variation, 66, 76
Destructive testing, 258
Detail specification 226 (def.)Device selection, 396
Defense Contract Administration Serv- Dewetting, 203ice, 224
Meteorological Satellite Program
(DMSP), 452
Satellite Communications System,266
Definition studies, 380
NT: Battery-system thermal and
mechanical interfaces; Load bus
voltage level and regulation
studies; Load power-profile
analysis; Power-source regulationdef'mition
Degradation/failure determinants,111,183 ff.
BT: Cell degradation
mechanisms, 184 (def.), 185.209,
216,219
Use for: Failure mechanisms
BT: Cell degradationmodes. 186-91. 353
BT: Cell degradationDegradation models. 209-15
BT: CeU degradationrate, 191
BT: Ceil degradationDeliverables list, 225
Delivery schedules, 232
Density, 76, 304
function, 401
Deposits. 195
Depth of discharge, 43.69.77.86-7,116-17. 131 ff.. 198.216-19.
250 ff.. 299-302.326 ff.
Derating. 377
Diffusion, 184
Digital shunt regulator, 288
Dimensional stability, 21
Diode junctions, 359
Direct discharge method, 370
Energy Transfer (DET) Systems
Use: Shunt-regulated electric
power system
-reading milliohmmeters, 255
Discharge, 68-70. 80, 100, 113-17,
182,206-8
bypass diode, 359
capacity. 96-7, 108, 119, 127, 129
BT: Capacity/charge cycle profde, 326
conditions, 92control. 370
current, 11.79, 116-19,218,235,370-6.391-4. 416
diode dissipation, 359
energy. 121
output. 79
paths. 375-6rate, 116. 117.119. 120, 123,127,
128, 142. 196,218,219, 270,
271. 272.399
ratio. 97
regulator, 8.382. 402time. 218-19
voltage. 46.115-16, 121-9, 141-9,160 ft.. 202.231,250, 366,376-
7. 394. 416
voltage characteristic matching,259-60
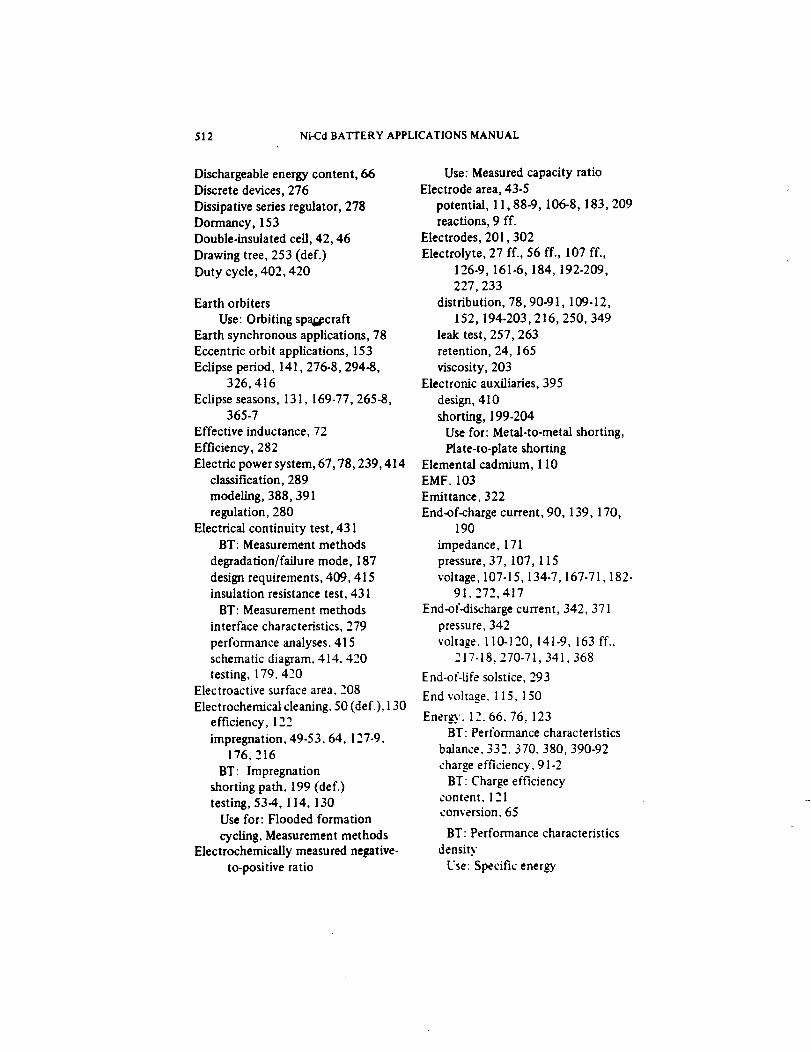
512 Ni-Cd BATTERY APPLICATIONS MANUAL
Dischargeable energy content, 66Discrete devices, 276
Dissipative series regulator, 278
Dormancy, 153
Double-insulated cell, 42, 46
Drawing tree, 253 (def.)
Duty cycle, 402,420
Earth orbiters
Use: Orbiting spagecraft
Earth synchronous applications, 78
Eccentric orbit applications, 153
Eclipse period, 141,276-8,294-8,326,416
Eclipse seasons, 131, 169-77,265-8,365-7
Effective inductance, 72
Efficiency, 282
Electric power system, 67, 78,239, 414classification, 289
modeling, 388, 391
regulation, 280
Electrical continuity test, 431BT: Measurement methods
degradation/failure mode, 187
design requirements, 409,415
insulation resistance test, 431BT: Measurement methods
interface characteristics, 279
performance analyses. 415
schematic diagram. 414.420
testing, 179. 420Electroactive surface area. 208
Electrochemical cleaning. 50 (def.), 130
efficiency, 122
impregnation, 49-53.64. 127-9.
176,216
BT: Impregnationshorting path. 199 (def.)
testing, 53-4, 114. 130Use for: Flooded formation
cycling, Measurement methodsElectrochemically measured negative-
to-positive ratio
Use: Measured capacity ratio
Electrode area, 43-5
potential, 11,88-9,106-8,183,209
reactions, 9 ff.
Electrodes, 201,302
Electrolyte, 27 ff., 56 ff., 107 ff.,
126-9,161-6, 184, 192-209,
227,233
distribution, 78, 90-91, 109-12,
152,194-203,216,250,349
leak test, 257,263
retention, 24, 165
viscosity, 203Electronic auxiliaries, 395
design, 410
shorting, 199-204
Use for: Metal-to-metal shorting,
Plate-to-plate shortingElemental cadmium, 110
EMF, 103
Emittance, 322
End-of-charge current, 90, 139,170,190
impedance, 171
pressure, 37, 107, 115
voltage, 107-15,134-7,167-71,182-91. 272,417
End-of-discharge current, 342, 371
pressure, 342
voltage. 110-120, 141-9, 163 ff.,
217-18,270-71,341,368
End.of-life solstice, 293
End voltage. 115,150
Ener_'. 12.66.76, 123BT: Performance characteristics
balance. 332. 370. 380,390-92
charge efficiency, 91-2
BT: Charge efficiencycontent. 121conversion. 65
BT: Performance characteristics
density
Use: Specific energy
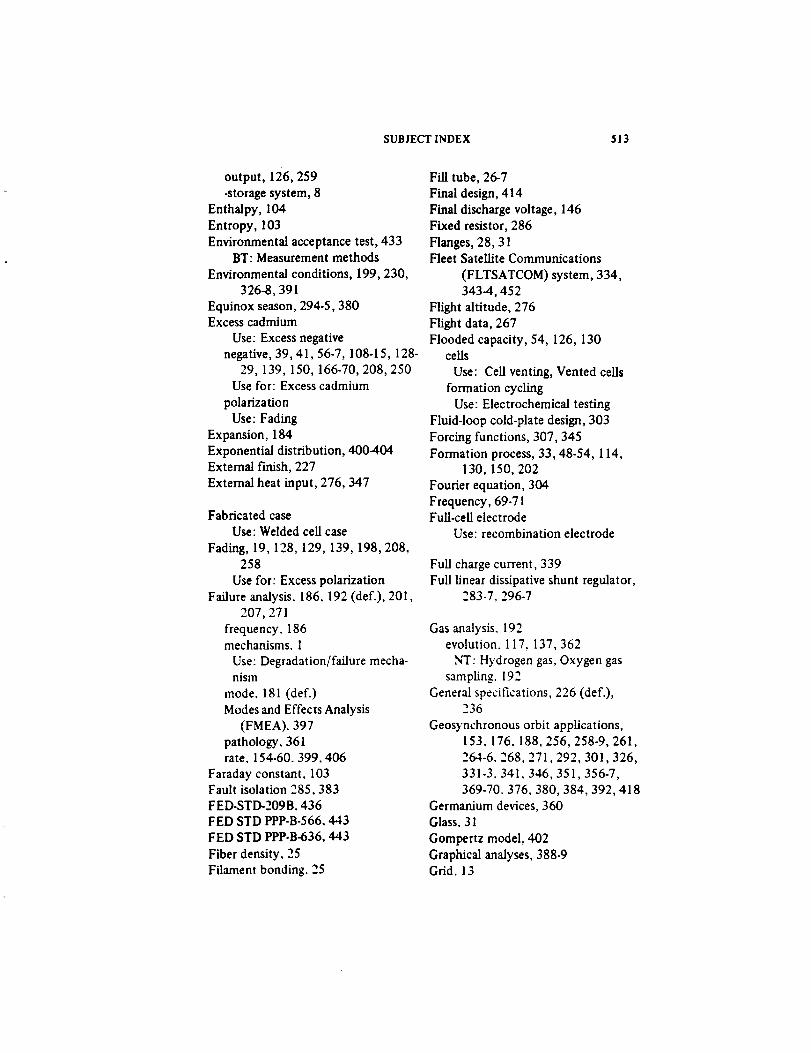
SUBJECT INDEX 513
output, 126,259
-storage system, 8
Enthalpy, 104
Entropy, 103
Environmental acceptance test, 433BT: Measurement methods
Environmental conditions, 199,230,
326-8, 391
Equinox season, 294-5,380Excess cadmium
Use: Excess negative
negative, 39, 41, 56-7, 108-15,128-29, 139, 150, 166-70, 208,250
Use for: Excess cadmium
polarization
Use: Fading
Expansion, 184
Exponential distribution, 400-404External finish, 227
External heat input, 276,347
Fabricated case
Use: Welded cell case
Fading, 19, 128,129, 139, 198,208,258
Use for: Excess polarization
Failure analysis. 186, 192 (def.), 201,
207,271
frequency. 186mechanisms. I
Use: Degradation/failure mecha-nism
mode. 181 (def.)
Modes and Effects Analysis
(FMEA). 397
pathology. 361rate. 154-60. 399. 406
Faraday constant, 103Fault isolation 285,383FED-STD-209B. 436
FED STD PPP-B-566. 443
FED STD PPP-B-636, 443
Fiber density. 25
Filament bonding. 25
Fill tube, 26-7
Final design, 414
Final discharge voltage, 146
Fixed resistor, 286
Flanges, 28, 31Fleet Satellite Communications
(FLTSATCOM) system, 334,
343-4,452
Flight altitude, 276
Flight data, 267
Flooded capacity, 54, 126, 130cells
Use: Cell venting, Vented cells
formation cycling
Use: Electrochemical testing
Fluid-loop cold-plate design, 303
Forcing functions, 307,345
Formation process, 33, 48-54, 114,130, 150, 202
Fourier equation, 304
Frequency, 69-71Full-cell electrode
Use: recombination electrode
Full charge current, 339
Full linear dissipative shunt regulator,283-7, 296-7
Gas analysis. 192
evolution. 117, 137,362
NT: Hydrogen gas, Oxygen gas
sampling. 192
General specifications, 226 (def.),236
Geosynchronous orbit applications,
153. 176. 188,256,258-9, 261,
264-6. 268,271,292,301,326,
331-3. 341. 346,351,356-7,
369-70. 376, 380, 384,392,418
Germanium devices, 360
Glass. 31
Gompertz model, 402
Graphical analyses, 388-9Grid. 13
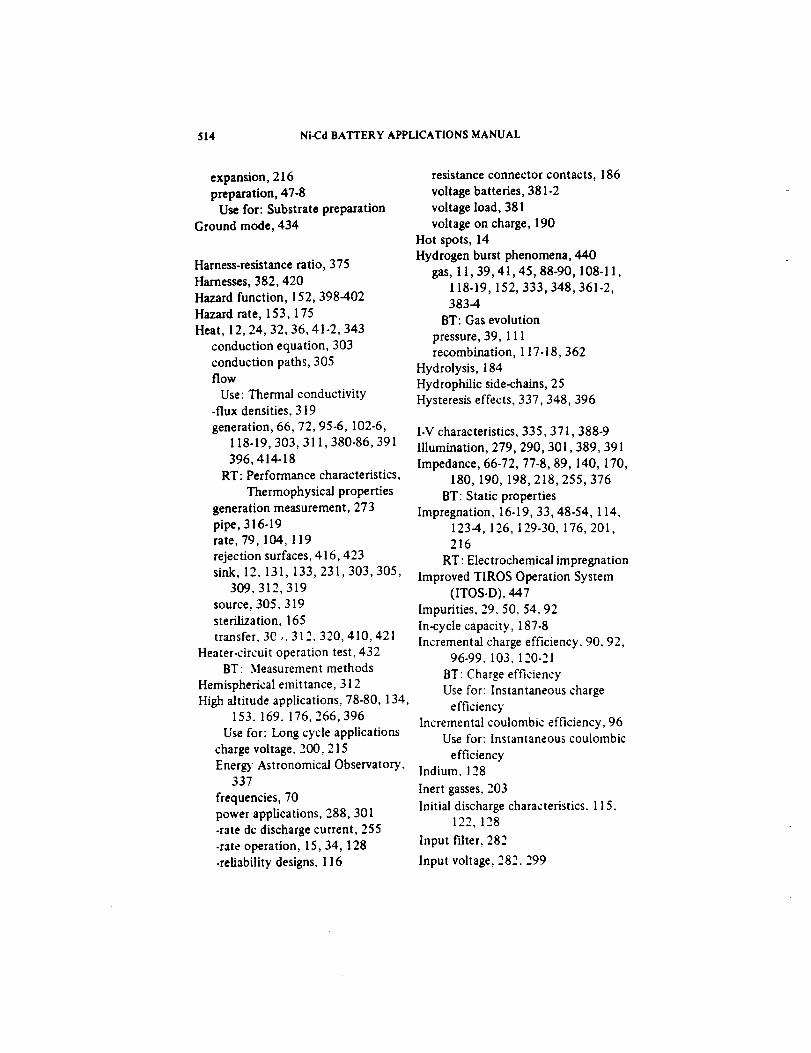
514 Ni-Cd BATTERY APPLICATIONS MANUAL
expansion, 216
preparation, 47-8Use for: Substrate preparation
Ground mode, 434
Harness-resistance ratio, 375
Harnesses, 382,420
Hazard function, 152,398-402
Hazard rate, 153,175
Heat, 12, 24, 32, 36, 41-2,343
conduction equation, 303
conduction paths, 305flow
Use: Thermal conductivity
-flux densities, 319
generation, 66, 72, 95-6, 102-6,118-19,303, 311,380-86,391
396,414-18
RT: Performance characteristics,
Thermophysical properties
generation measurement, 273
pipe, 316-19rate, 79, 104, 119
rejection surfaces, 416,423sink, 12, 131,133,231,303,305,
309. 312, 319
source, 305, 319
sterilization, 165
transfer, 30_, 312. 320,410,421
Heater-circuit operation test, 432BT: Measurement methods
Hemispherical emittance, 312
High altitude applications, 78-80, 134,153. 169, 176,266,396
Use for: Long cycle applications
charge voltage. 200, 215
Energy Astronomical Observatory,337
frequencies, 70
power applications, 288,301-rate dc discharge current, 255
-rate operation, 15, 34, 128
-reliability designs, 116
resistance connector contacts, 186
voltage batteries, 381-2
voltage load, 381
voltage on charge, 190
Hot spots, 14
Hydrogen burst phenomena, 440
gas, 11,39, 41,45, 88-90, 108-11,
118-19,152, 333,348,361-2,383-4
BT: Gas evolution
pressure, 39, 111recombination, 117-18,362
Hydrolysis, 184
Hydrophilic side-chains, 25
Hysteresis effects, 337,348, 396
I-V characteristics, 335, 371,388-9
Illumination, 279,290,301,389,391
Impedance, 66-72, 77-8, 89, 140, 170,
180, 190, 198,218,255,376
BT: Static properties
Impregnation, 16-19, 33, 48-54, 114,123-4, 126, 129-30, 176, 201,
216
RT: Electrochemical impregnation
Improved TIROS Operation System
(ITOS-D), 447
Impurities, 29, 50, 54, 92
In-cycle capacity, 187-8
Incremental charge efficiency. 90, 92,
96-99. 103, 120-21
BT: Charge efficiency
Use for: Instantaneous charge
efficiency
Incremental coulombic efficiency, 96Use for: Instantaneous coulombic
efficiencyIndium. ! 28
Inert gasses, 203
Initial discharge characteristics. 115.122, 128
Input filter, 282
Input voltage, 282. 299
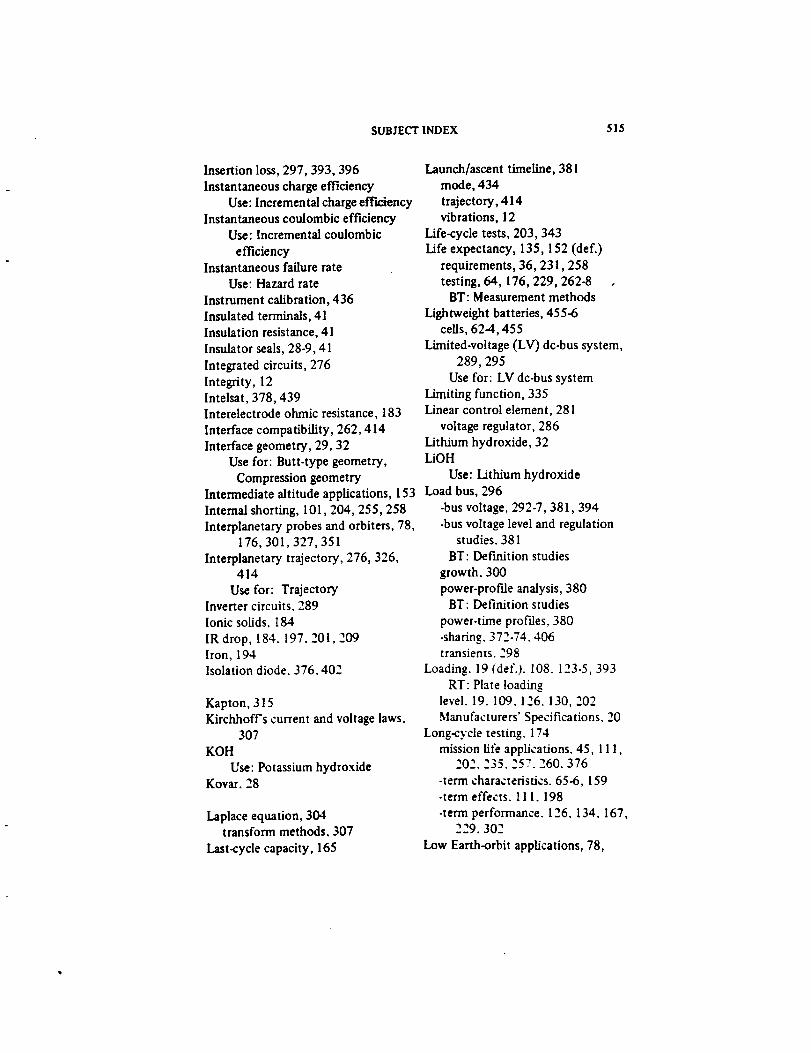
SUBJECT INDEX 515
Insertion loss, 297,393,396
Instantaneous charge efficiency
Use: Incremental charge eff'u:_ncy
Instantaneous eoulombic efficiencyUse: Incremental coulombic
efficiencyInstantaneous failure rate
Use: Hazard rate
Instrument calibration, 436
Insulated terminals, 41
Insulation resistance, 41
Insulator seals, 28-9, 41
Integrated circuits, 276
Integrity, 12Intelsat, 378,439
Interelectrode ohmic resistance, 183
Interface compatibility, 262,414
Interface geometry, 29, 32
Use for: Butt-type geometry,
Compression geometry
Launch/ascent timeline, 381
mode, 434
trajectory, 414
vibrations, 12
Life-cycle tests, 203,343
Life expectancy, 135, 152 (def.)
requirements, 36, 231,258testing, 64, 176,229,262-8 ,
BT: Measurement methods
Lightweight batteries, 455-6
ceils, 62-4,455
Limited-voltage (LV) dc-bus system,
289,295
Use for: LV dc-bus system
Limiting function, 335
Linear control element, 281
voltage regulator, 286
Lithium hydroxide, 32LiOH
Use: Lithium hydroxide
Intermediate altitude applications, 153 Load bus, 296
Internal shorting, 101,204,255,258
Interplanetary probes and orbiters, 78,176,301,327,351
Interplanetary trajectory, 276, 326,414
Use for: TrajectoryInverter circuits. 289
Ionic solids. 184
IR drop, 184. 197. 201,209
Iron, 194Isolation diode. 376.402
Kapton, 315Kirchhoff's current and voltage laws.
307
KOH
Use: Potassium hydroxideKovar. 28
Laplace equation, 304transform methods. 307
Last-cycle capacity, 165
-bus voltage, 292-7,381,394
-bus voltage level and regulationstudies. 381
BT: Def'mition studies
growth, 300
power-profile analysis, 380BT: Definition studies
power-time prof'fles, 380
-sharing. 372-74. 406transients. 298
Loading. 19 Idef.). 108. 123-5,393
R'I': Plate loadinglevel. 19. 109. 126, 130, 202
Manufacturers' Specifications, 20
Long-cycle testing. 174
mission Life applications, 45, 111,202. 235. 257. 260. 376
-term characteristics. 65-6, 159-term effects. 111. 198
-term performance. 126, 134, 167,229. 302
Low Earth-orbit applications, 78,
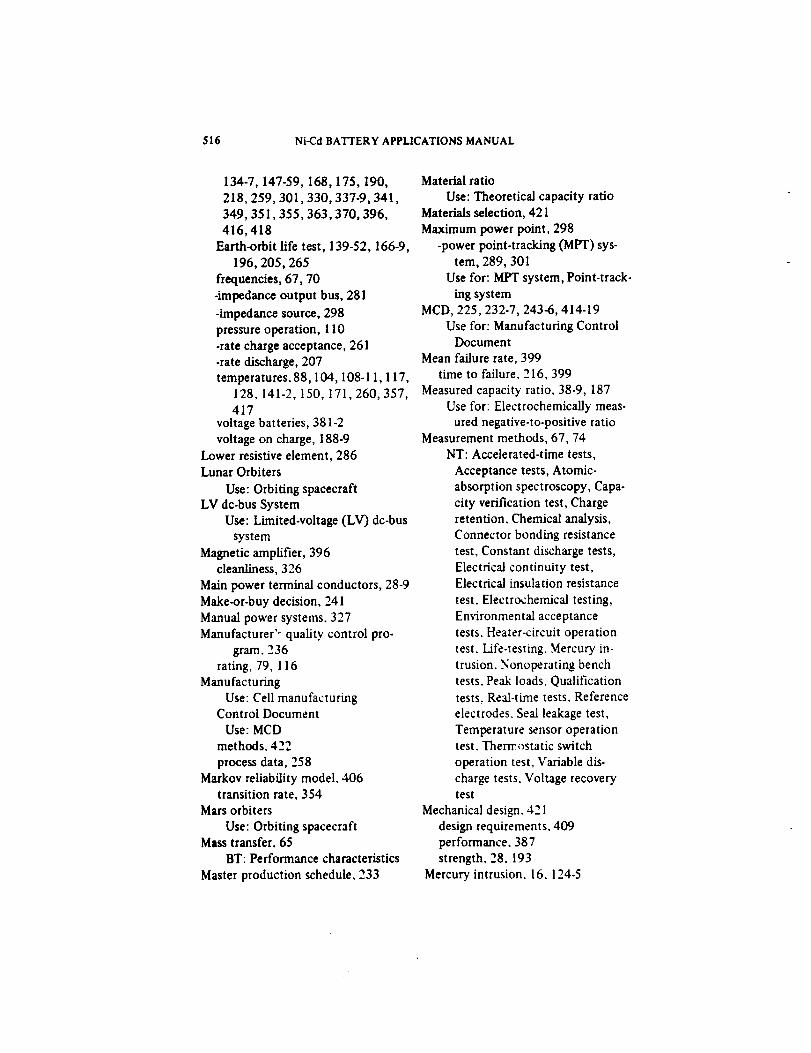
516 Ni-Cd BATTERY APPLICATIONS MANUAL
134-7,147-59,168,175,190,
218, 259,301,330, 337-9,341,
349, 35I,355,363,370, 396,
416,418
Earth-orbitlifetest,139-52,166-9,
196, 205,265
frequencies,67, 70
-impedance output bus, 281
-impedance source, 298
pressure operation, 110
-rate charge acceptance, 261
-rate discharge, 207
temperatures, 88,104,108-11, 117,
128,141-2,150, 171,260,357,417
voltage batteries, 381-2
voltage on charge, 188-9
Lower resistive element, 286Lunar Orbiters
Use: Orbiting spacecraft
LV de-bus System
Use: Limited-voltage (LV) de-bus
system
Magnetic amplifier, 396cleanliness, 326
Main power terminal conductors, 28-9
Make-or-buy decision, 241
Manual power systems. 327
Manufacturer" quality control pro-
gram. 236
rating, 79, 116
Manufacturing
Use: Cell manufacturingControl Document
Use: MCD
methods. 422
process data, 258
Markov reliability model. 406transition rate, 354
Mars orbiters
Use: Orbiting spacecraftMass transfer. 65
BT: Performance characteristics
Master production schedule. 233
Material ratio
Use: Theoretical capacity ratio
Materials selection, 421
Maximum power point, 298
-power point-tracking (MPT) sys-
tem, 289, 301
Use for: MPT system, Point-track-
hag system
MCD, 225,232-7,243-6,414-19
Use for: Manufacturing ControlDocument
Mean failure rate, 399
time to failure, 216,399
Measured capacity ratio, 38-9, 187
Use for: Electrochemically meas-
ured negative-to-positive ratio
Measurement methods, 67, 74
NT: Accelerated-time tests,
Acceptance tests, Atomic-
absorption spectroscopy, Capa-
city verification test, Charge
retention. Chemical analysis,
Connector bonding resistance
test, Constant discharge tests,
Electrical continuity test,Electrical insulation resistance
test. Electrochemical testing,
Environmental acceptance
tests. Heater-circuit operation
test. Life-testing. Mercury in-
trusion. Nonoperating benchtests. Peak loads, Qualification
tests, Real-time tests. Reference
electrodes. Seal leakage test,
Temperature sensor operationtest. Thermostatic switch
operation test, Variable dis-
charge tests. Voltage recoverytest
Mechanical desi_. 421
design requirements. 409
performance. 387
strength. 28. 193
Mercury intrusion. 16.124-5

SUBJECT INDEX 517
Use for: Measurement methods
-mercuric oxide electrode, 46
Metal substrate
Use: Plaque
-to-metal shorting
Use: Electronic shorting
Metallic cadmium, 204
Mid-charge voltage, 187, 189
Mid-discharge characteristics, 142-6,165,187
Migration, 195-6,216
MIL-C-45662A, 436
Mild steel, 47
Minimum temperature conditions, 286Mirrors, 315
Mission length, 352
requirements, 326,394-5
Modeling, 74, 75,395-402Modulator, 282
Monte Carlo simulation, 406
Motors, 276
Mounting, 414, 421
MPT system
Use: Maximum-power point-track-
ing system
Multimission Modular Spacecraft, 374
Multiple-battery configurations, 297
Muspratt solution
Use: Ammonium hydroxide/chloride solution
NASA/GSFC Specification 74-15000,
248,256,418-19
NASA/GSFC Specification S-71 I- 16.262
NATO-III battery, 456
Negative active materialUse: Cadmium active material
capacity, 110,218. 258
BT: Capacityelectrode, 39-40, 54-6, 90, 128.
139, 183, 197-213. 250
-limited cell, 118
overvoltage. 108
plates, 108, 128, 142, 163,194terminal, 44
-to-positive ratios
Use: Capacity ratios
Net-energy conversion, 65
Network equations, 389, 391
Nickel, 73
-active material, 9, 18-19, 38-9,
79, 126, 193,202
braze material, 29
cell cases, 26-7
-hydroxide, 10, 128 •
powder, 48, 51-2,123,125,130substrate, 47, 51-2
NiOOH, 9 ff.
Nitrate, 192-3,217
Nitrogen gas, 57,202
Noncondensable gas, 319-20
Noncyclic conditions, 186Nonhardware items, 232
Nonnormal environmental conditions,228
Nonoperating bench tests, 261BT: Measurement methods
Nonwoven separators, 67, 165
Normal environment requirements,228
Normalized current, 79 (def.), 86, 88
Nylon. 73.107.112
hydrolysis. 205-6, 216
separators, 67, 76-7, 112, 129,
155. 163-5,198,203,206
NT: Pelion separators
Off-pointing requirements. 338Off-time/on-time ratio, 282
Ohmic conduction, 354
Ohmic resistance. 43, 67
One-at-a-time cycles, 78 (def.), 80
One-dimensional cell model, 3 ! I
Open circuit. I00-101,180, 191 (def.),200-201. 299,353-7,405
-circuit cell voltage, 104-5,255,270
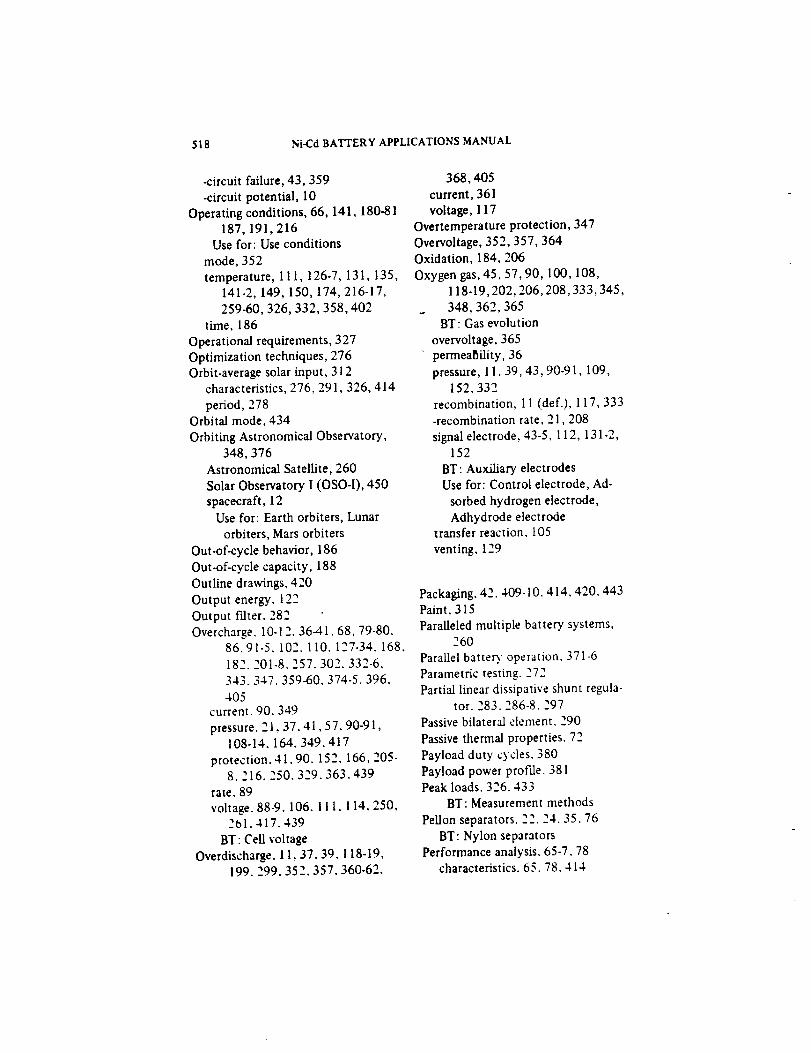
518 Ni-Cd BATTERY APPLICATIONS MANUAL
-circuit failure, 43,359
-circuit potential, 10
Operating conditions, 66, 141, 180-81187, 191,216
Use for: Use conditions
mode, 352
temperature, 111,126-7, 131,135,141-2,149,150, 174,216-17,
259-60,326,332,358,402
time, 186
Operational requirements, 327
Optimization techniques, 276Orbit-average solar input, 312
characteristics, 276, 291,326, 414
period, 278Orbital mode, 434
Orbiting Astronomical Observatory,
348,376Astronomical Satellite, 260
Solar Observatory I (OSO-I), 450
spacecraft, 12Use for: Earth orbiters, Lunar
orbiters, Mars orbiters
Out-of-cycle behavior, 186
Out-of-cycle capacity, 188
Outline drawings, 420
Output energy, 122
Output fdter. 282
Overcharge. 10-12.36-41,68, 79-80,86.91-5. 102. 110. 127-34. 168.
182. 201-8,257. 302. 332-6,
343. 347. 359-60.374-5. 396,
4O5current. 90.349
pressure. 21,37.41,57.90-91,108-14. 164. 349. 417
protection. 41.90. 152. 166,205-8.216. 250. 329. 363. 439
rate. 89
voltage. 88-9. 106.111.114. 250,261. 417. 439
BT: Cell voltage
Overdischarge. 11,37.39, 118-19,199. 299. 352,357. 360-62,
368,405
current, 361
voltage, 117
Overtemperature protection, 347
Overvoltage, 352,357,364Oxidation, 184, 206
Oxygen gas, 45, 57, 90,100,108,
118-19,202,206,208,333,345,
_ 348,362,365
BT: Gas evolution
overvoltage, 365
permeability, 36
pressure, 11, 39, 43, 90-91, 109,
152,332recombination, 11 (def.), 117, 333
-recombination rate, 21,208
signal electrode, 43-5, 112, 131-2,152
BT: Auxiliary electrodesUse for: Control electrode, Ad-
sorbed hydrogen electrode,
Adhydrode electrodetransfer reaction, 105
venting. 129
Packaging. 42. 409-10.414,420, 443
Paint, 315
Paralleled multiple battery, systems,260
Parallel battery operation. 371-6
Parametric testing. 272
Partial linear dissipative shunt regula-tor. 283. 286-8. 297
Passive bilateral element. 290
Passive thermal properties. 72
Payload duty cycles. 380
Payload power profde. 381Peak loads. 326.433
BT: Measurement methods
Pellon separators. 22.24.35.76
BT: Nylon separators
Performance analysis. 65-7.78characteristics. 65.78.414
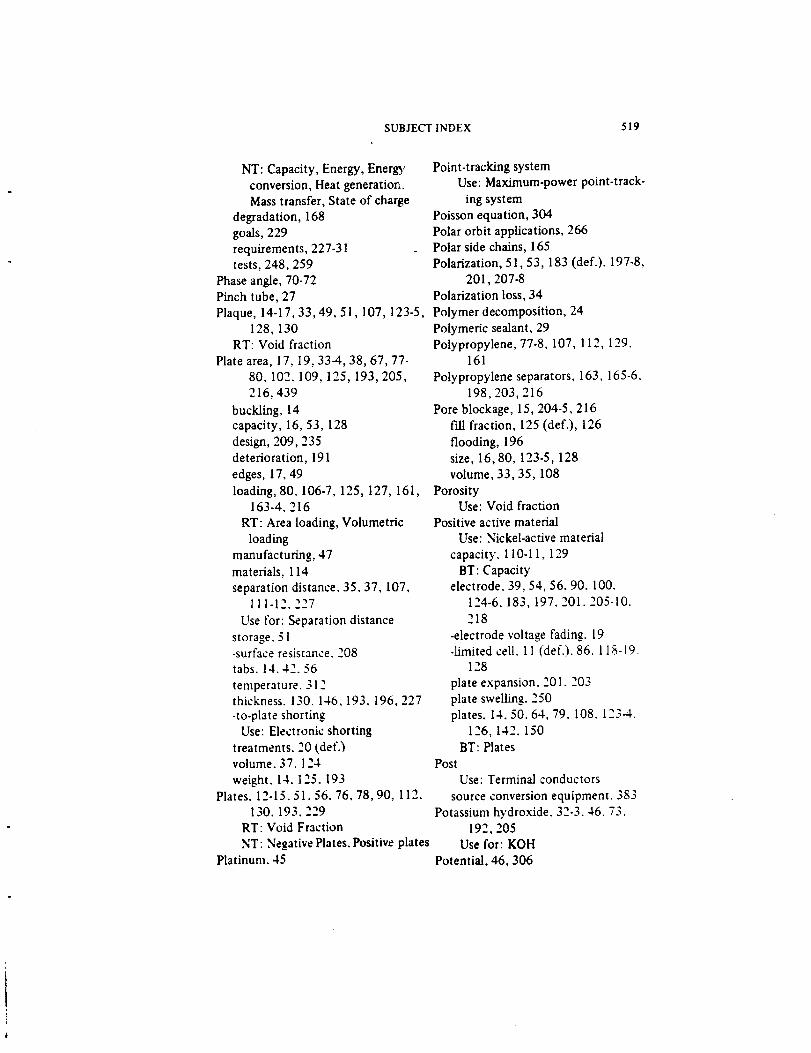
SUBJECT INDEX 519
NT: Capacity, Energy, Energy
conversion, Heat generation.Mass transfer, State of charge
degradation, 168
goals, 229
requirements, 227-31tests, 248,259
Phase angle, 70-72Pinch tube, 27
Plaque, 14-17, 33, 49, 51,107,123-5,
128, 130RT: Void fraction
Plate area, 17, 19, 33-4, 38, 67, 77-
80, 102. 109,125,193,205,
216,439
buckling, 14
capacity, 16, 53,128
design, 209,235deterioration, 191
edges, 17, 49
loading, 80. 106-7, 125, 127, 161,163-4. 216
RT: Area loading, Volumetric
loading
manufacturing, 47
materials, 114
separation distance. 35, 37,107,111-12.227
Use for: Separation distance
storage. 51-surface resistance. 208
tabs. 14.42.56
temperature. 312thickness. 130. 146. 193,196,227
-to-plate shortingUse: Electronic shorting
treatments. 20 (def.)volume. 37.124
weight. 14. 125. 193Plates. 12-15.51.56.76, 78, 90, 112.
130. 193. 229
RT: Void Fraction
NT: Negative Plates. Positive platesPlatinum. 45
Point-tracking system
Use: Maximum-power point-track-
ing systemPoisson equation, 304
Polar orbit applications, 266
Polar side chains, 165
Polarization, 51,53,183 (def.). 197-8,
201,207-8
Polarization loss, 34
Polymer decomposition, 24
Polymeric sealant, 29
Polypropylene, 77-8, 107, 112, 129.161
Polypropylene separators, 163, 165-6.
198,203,216
Pore blockage, 15,204-5, 216
fill fraction, 125 (def.), 126
flooding, 196
size, 16, 80, 123-5,128
volume, 33, 35,108
PorosityUse: Void fraction
Positive active material
Use: Nickel-active material
capacity, 110-11,129BT: Capacity
electrode, 39, 54, 56.90, 100.
124-6. 183,197. 201. 205-10.
218
-electrode voltage fading. 19
.Limited cell. 11 (def.). 86. 118-19.128
plate expansion. 201. 203
plate swelling. 250
plates. 14.50, 64, 79. 108. 123-4.126,142. 150
BT: Plat es
PostUse: Terminal conductors
source conversion equipment. 383
Potassium hydroxide. 32-3.46.73.
192,205Use for: KOH
Potential, 46,306
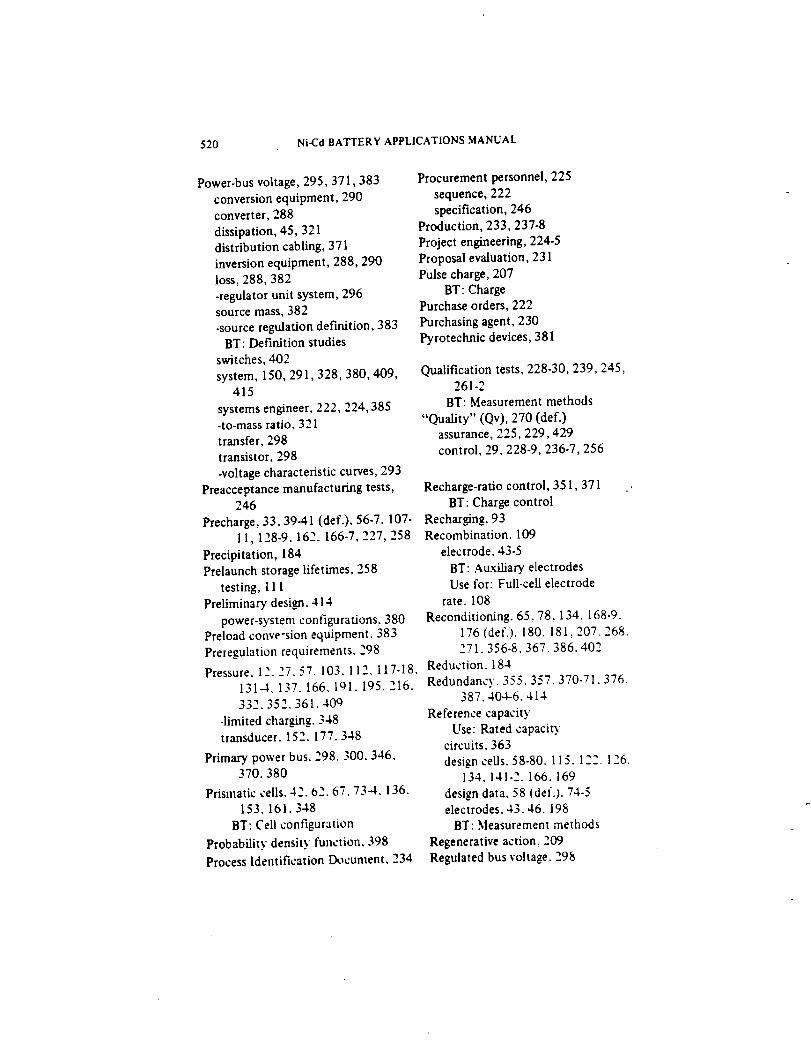
520 Ni-Cd BATTERY APPLICATIONS MANUAL
Power-bus voltage, 295, 371,383
conversion equipment, 290
converter, 288
dissipation, 45,321distribution cabling, 371
inversion equipment, 288,290
loss, 288, 382
-regulator unit system, 296source mass, 382
-source regulation definition, 383
BT: Definition studies
switches, 402
system, 150,291,328,380,409,415
systems engineer, 222,224,385-to-mass ratio, 321
transfer, 298
transistor, 298
-voltage characteristic curves, 293
Preacceptance manufacturing tests,246
Precharge, 33.39-41 (def.). 56-7. 107-
11,128-9,162. 166-7,227, 258
Precipitation, 184Prelaunch storage lifetimes, 258
testing, 111
Preliminary design. 414
power-system configurations, 380Preload conve-sion equipment. 383
Preregulation requirements. 298
Procurement personnel, 225
sequence, 222
specification, 246Production, 233,237-8
Project engineering, 224-5
Proposal evaluation, 231
Pulse charge, 207BT: Charge
Purchase orders, 222
Purchasing agent, 230
Pyrotechnic devices, 381
Qualification tests, 228-30,239,245,261-2
BT: Measurement methods
"Quality" (Qv), 270 (def.)assurance, 225,229,429
control, 29,228-9,236-7,256
Recharge-ratio control, 351,371 ..
B'l': Charge control
Recharging, 93Recombination. 109
electrode. 43-5
BT: Auxiliary electrodes
Use for: Full-cell electrode
rate. 108
Reconditioning. 65.78. 134.168-9.
176 (def.). 180. 181,207. 268.271. 356-8. 367. 386. 402
57. _ 7-18. Reduction. 184Pressure. 12. _7. 103.11_. 11131-4. 137. 166.101.195.216. Redundancy. 355. 357. 370-71. 376.
332. 352. 361. 409_
-limited charging. 348
transducer. 152. 177. 348
Primary power bus. 298. 300. 346.370.380
Prismatic cells. 42.62.67.73-4. 136.
153. 161. 348
BT: Cell configuration
Probability density function. 398
Process Identification Document, 234
387. 404-6. 414
Reference capacity
Use: Rated capacitycircuits. 363
design ceils. 58-80.115.1 _.22.126.134. 141-2. 166. 169
design data. 58 ldef0.74-5electrodes. 43.46. 198
BT: Measurement methods
Regenerative action, 209
Regulated bus voltage. 298

SUBJECT INDEX 521
Regulated-voltage (RV) dc-bus system.
289,297-8Use for: RV dc-bus system
Regulator efficiency, 299
Relative capacity, 120
BT: Capacity
Relay closure, 294
contact ratings, 360
protection, 360
Reliability block diagrams, 403
function, 398-401
goals
Use: System reliability
Request for Proposal, 222-31
Requirements analysis, 414section, 228
Resistance, 14, 35-6, 45, 67, 198-204,
214-16,255,263,281,286,
306,376
Resistivity, 15, 27, 32Rest, 167
Reversal, 19, 117-18
Reversal voltage. 361
Reverse leakage currents, 360
Runaway condition. 334
RV dc-bus system
Use: Regulated-voltage (RV)
dc-bus system
Safety margins. 434
Sampling instructions. 230
Saturated voltage drop. 281
Scaling. 79Seal failure. 28. 155
leakage test. 432BT: Measurement methods
Sealed cells. 115. 123-30. 198
Use for: Starved cells
Self-discharge. 95. 101
Semiautomatic power systems. 327
Semiconductor s_vitch. 282
Separation distance
Use: Plate separation distance
Separator compression. 30.44.56
degradation, 110, 191,195-6,
205, 217,439design, 21, 78, 129
drying, 36, 191,202
forms, 25
materials characteristics, 21-4,
36-7, 45, 77,229
oxidation, 205
redistribution, 36
structure, 25
Separators, 26, 35, 56, 64, 69, 76, 78,183,194,197,199-201,209,213
Sequentially controlled full lineardissipative shunt regulator, 283,
285,297
Sequentially controlled partial linear
dissipative shunt regulator, 283,297
Series cells, 300
Series dissipative regulator, 281Use for: Active rdter
Series switching regulator, 282,288,
296,298,301
Service history, 279,352,361
life, 256,258. 262,265,268,
398,409
Shelf life. 429
Shipping conditions. 239Shock environments. 12.21,262,419
Short-circuits. 299. 335,353-4,368
Short-cycle applications. 78, 90, 134,
141. 152. 155. 167-8, 188
-cycle testing. 136. 141. 198
Short orbit operation. 80, 152. 176.374
Shorted failure mode, 199
Shorting paths. 199
Shorts, 14.21.35.42.44.56.93.
101. 109. 118. 140. 155. 166.
175. 180. 190 (def.). 201. 205.214.218
Shottky-barrier power rectifiers. 360

522 Ni-CdBATTERY APPLICATIONS MANUAL
Shunt-regulated electric power system,300
Use for: Direct Energy Transfer
(DET) Systems
Shunt regulator/limiters, 283,301,346, 381
Shunt transistor, 361,363
Shunting resistance, 70
Signal behavior, 152electrode
Use: Oxygen-signal electrode
performance, 45
sensitivity, 152
voltage, 112
Silver, 194, 199cadmium ceils, 129
treatment, 20, 162-5
Simplified equivalent circuit, 70, 72Sine-wave ac current. 255
Single.insulated cell, 41-2
Single-orbit prof'de, 380
Single-pole double-throw (SPDT)
relay, 360
Single-pole double-throw normally
open relay. 360
Sinter. 14-19, 48 (def.). 50-52,108,114. 125. 130. 194. 196. 202
Sintered-nickel substrate. 32, 50
Sintered plate 13. 209
Sintering process. 125
Sizing. 125 (def.). 355. 414. 421
Skylab Airlock Module. 352
Slurry viscosity. 48.125
Small Astronomy Satellite C (SAS-C).449
Solar absorptance. 3 ! 2
Solar-array/battery load sharing. 332
cell array area. 302. 380
cell array power. 292.2q4
-cell array regulation. 280
-cell array tap point. 28t_
-cell array temperature. 205
.cell array voltage. 294constant. 321
pressure torques, 302
Solder joints, 186
Solder lug, 26-31Solid-state thermal switches, 396
Solstice season, 380
Source impedance, 286
inspection, 224-5,237-8-load matching, 280,302
Space radiator thermal modeling, 312Spacecraft characteristics, 291,414
electrical loads, 259,276,278
integration, 438-9
interface qualification. 435-load characteristics, 295.415
logistics plan. 443
power systems. 121. 414stabilization, 291,414thermal balance. 293
thermal system design analyses, 415
Special tests. 245,246,258,263
Specific capacity. 121-2.128, 130
BT: Capacity
energy. 16, 17.34.46, 62, 64, 76,1 I1. 121-3. 127. 130
Use for: Energy density
gravity. 73heat. 73.78. 304
mechanism. 184 (def.)
Specification performance require-ments. 250
sheets. 226 (def.)
Specifications. 396Specimen contract. 225
Split bus electric power systems. 378
Sponge type plates. 129
SSTSUse: Solid-state thermal switches
Stabilization cycling. 250Stainless steel. 73.315
Stainless steel cell cases. 26-7
Stainless steel combs. 28
Stand periods. 101
Standard capacity
Use: Rated capacity
Standard specifications. 226 (def.)Starved cells
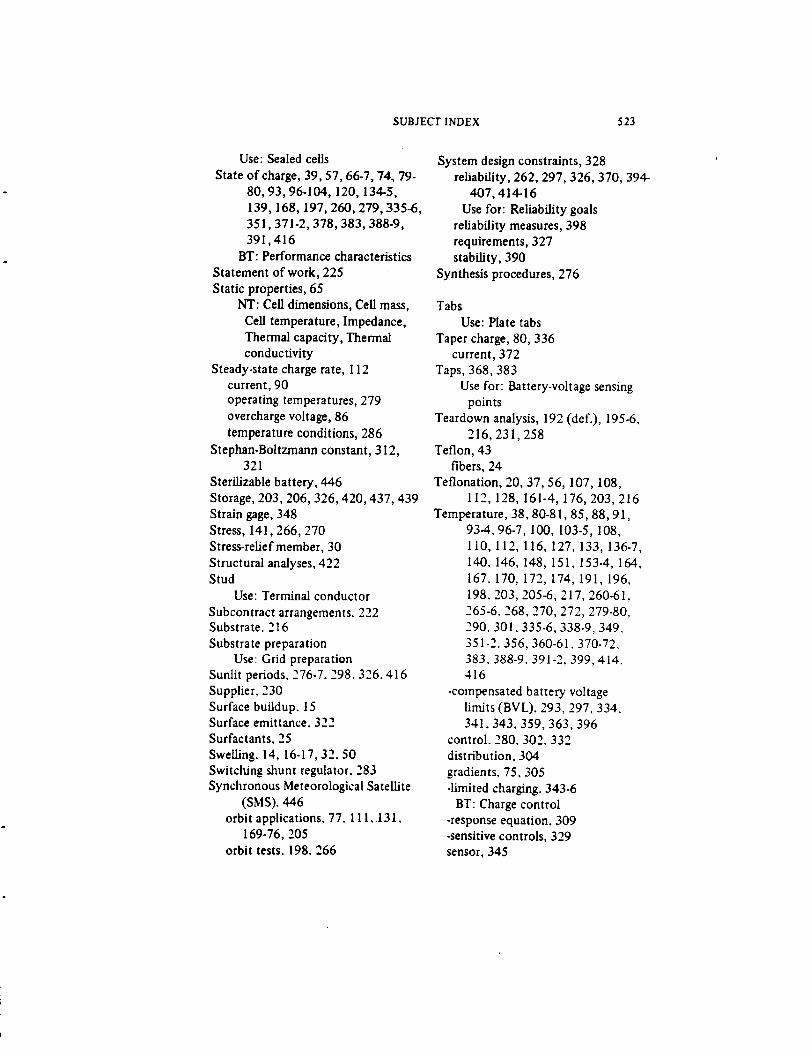
SUBJECT INDEX 523
Use: Sealed cells
State of charge, 39, 57, 66-7, 74. 79-
80, 93, 96-104, 120, 134-5,
139,168, 197, 260,279,335-6,
351,371-2,378,383,388-9,
391,416BT: Performance characteristics
Statement of work, 225
Static properties, 65
NT: Cell dimensions, Cell mass,
Cell temperature, Impedance,
Thermal capacity, Thermalconductivity
Steady-state charge rate, 112current, 90
operating temperatures, 279
overcharge voltage, 86
temperature conditions, 286
Stephan-Boltzmann constant, 312,321
Sterilizable battery, 446
Storage, 203,206,326,420,437, 439
Strain gage, 348
Stress, 141,266,270
Stress-reLief member, 30
Structural analyses, 422Stud
Use: Terminal conductor
Subcontract arrangements. 222Substrate, 216
Substrate preparationUse: Grid preparation
Sunlit periods, 276-7.298. 326,416
Supplier, 230
Surface buildup. 15Surface emittance. 322
Surfactants, 25
Swelling. 14, 16-17, 32.50
Switching shunt regulator. 283
Synchronous Meteorological Satellite
(SMS). 446
orbit applications. 77.111.131.169-76,205
orbit tests. 198. 266
System design constraints, 328
reliability, 262,297,326,370, 394-
407,414-16
Use for: Reliability goals
reliability measures, 398
requirements, 327stability, 390
Synthesis procedures, 276
Tabs
Use: Plate tabs
Taper charge, 80,336
current, 372
Taps, 368,383
Use for: Battery-voltage sensing
points
Teardown analysis, 192 (def.), 195-6,
216,231,258
Teflon, 43
fibers, 24
Teflonation, 20, 37, 56, 107,108,
112, 128, 161-4, 176, 203,216
Temperature, 38, 80-81, 85, 88, 91,
93-4, 96-7, I00, 103-5,108,
110, 112, 116, 127, 133, 136-7,
140. 146, 148, 151,153-4, 164,
167. 170, 172, 174, 191,196,
198. 203,205-6,217, 260-61,
265-6. 268,270, 272, 279-80,
290.301. 335-6,338-9,349.
351-2. 356,360-61. 370-72.
383. 388-9. 391-2, 399,414.416
-compensated battery voltage
limits (BVL), 293,297,334,341. 343.359,363,396
control. 280. 302. 332
distribution. 304
gradients. 75,305
-limited charging, 343-6
BT: Charge control
-response equation, 309-sensitive controls, 329
sensor, 345
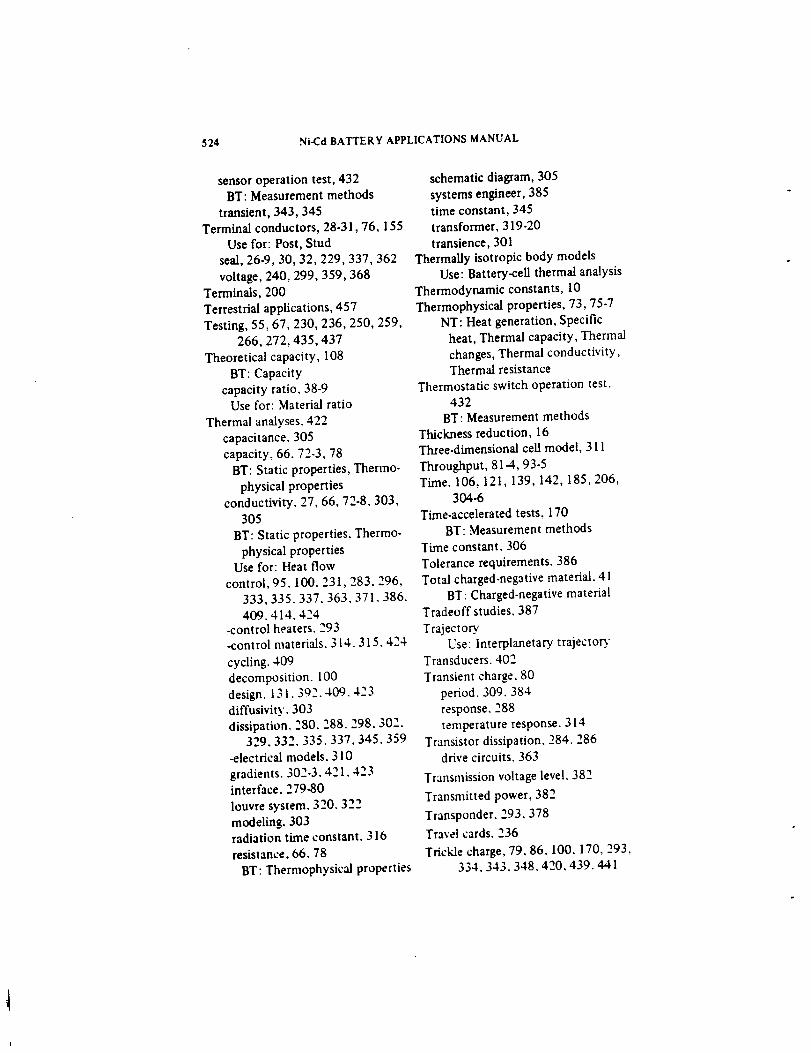
524 Ni-Cd BATTERY APPLICATIONS MANUAL
sensor operation test, 432BT: Measurement methods
transient, 343,345Terminal conductors, 28-31,76,155
Use for: Post, Stud
seal, 26-9, 30, 32,229,337,362
voltage, 240, 299,359,368
Terminals,200
Terrestrial applications, 457
Testing, 55,67,230,236,250, 259,266,272,435,437
Theoretical capacity, 108
BT: Capacity
capacity ratio, 38-9Use for: Material ratio
Thermal analyses, 422
capacitance. 305
capacity, 66• 72-3, 78
BT: Static properties, Thermo-
physical propertiesconductivity. 27, 66, 72-8,303,
305
BT: Static properties• Thermo-
physical propertiesUse for: Heat flow
control, 95. 100. 231,283,296,
333,335. 337. 363. 371. 386.
409• 414. 424-control heaters. 293-control materials. 314.315. 424
cycling. 409decomposition. 100
"s 4--_• _c__. 409. _"design. 1., l " _diffusivity. 303
dissipation. 280. 288. 298. 302•329. 332. 335. 337. 345. 359
-electrical models. 3 l0
gradients. 302-3• 42 l. 423interface. 279-80
louvre system. 320.322
modeling. 303radiation time constant. 316
resistance. 66, 78
BT: Thermophysical properties
schematic diagram, 305
systems engineer, 385time constant, 345
transformer, 319-20
transience, 301Thermally isotropic body models
Use: Battery-cell thermal analysis
Thermodynamic constants, 10
Thermophysical properties, 73, 75-7NT: Heat generation, Specific
heat, Thermal capacity, Thermal
changes, Thermal conductivity,Thermal resistance
Thermostatic switch operation test.
432
BT: Measurement methods
Thickness reduction, 16
Three.dimensional cell model, 311
Throughput, 81-4, 93-5Time, 106, 121,139,142,185,206,
304-6
Time-accelerated tests, 170
BT: Measurement methods
Time constant, 306
Tolerance requirements. 386
Total charged-negative material. 4 i
BT: Charged-negative material
Tradeoff studies, 387
Trajectory.Use: Interplanetary tra)ector3'
Transducers. 402
Transient charge. 80
period. 309. 384
response. 288temperature response. 314
Transistor dissipation. 284. 286
drive circuits. 363
Transmission voltage level. 382
Transmitted power, 382
Transponder. 293,378
Travel cards. 236
Trickle charge, 79.86. 100. 170, 293,334. 343. 348. 420. 439. 441
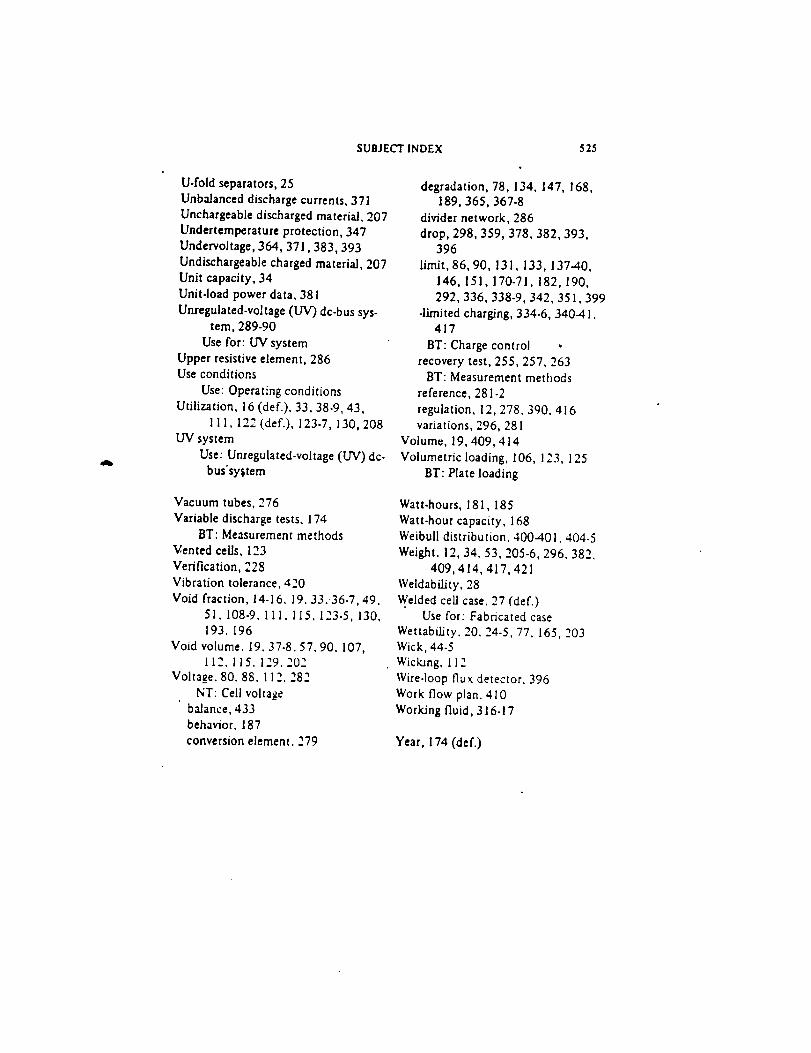
SUBJECT INDEX 525
U-fold separators, 25
Unbalanced discharge currents, 371Unchargeable discharged material, 207
Undertempcrature protection, 347
Undervoltage, 364, 371,383,393
Undischargeable charged material, 207
Unit capacity, 34
Unit-load power data, 381
Unregulated-voltage (UV) dc-bus sys-tem, 289-90
Use for: UV system
Upper resistive element, 286Use conditions
Use: Operating conditions
Utilization, 16 (def.), 33, 38-9, 43,
11 I, 122 (def.), 123-7, 130,208UV system
Use: Unregulated-voltage (UV) dc-bus'system
degradation, 78,134, 147, 168,189,365, 367-8
divider network, 286
drop, 298,359,378,382,393,396
limit, 86, 90, 131, 133,137-40,
146, 151,170-71,182, 190,
292,336, 338-9,342, 351,399
•limited charging, 334-6, 340-4 I.417
BT: Charge control •
recovery test, 255,257, 263BT: Measurement methods
reference, 281-2
regulation, 12,278,390, 416variations, 296, 281
Volume, 19,409,414
Volumetric loading, 106, 123, 125
BT: Plate loading
Vacuum tubes, 276
Variable discharge tests, 174BT: Measurement methods
V,ented cells, 123
Verification, 228
Vibration tolerance. 420
Void fraction, 14-16.19.33.,36.7, 49.
51. 108-9. 111. 115. 123.5,130,193. 196
Void volume, 19.37-8.57.90. 107,112, 115. 129. 202
Voltage. 80.88. I 12. 282
NT: Cell voltagebalance, 433behavior. 187
conversion element. 279
Watt-hours, 181,185
Watt-hour capacity, 168
Weibull distribution, 400-401. 404.5
Weight. 12, 34.53,205-6,296. 382,
409,414,417,421
Weldability, 28
Welded cell case. 27 (def.)Use for: Fabricated case
Wettability. 20, 24-5, 77, 165,203Wick, 44-5
Wickmg, 112
Wire-loop flux detector. 396
Work flow plan. 410
Working fluid, 316-17
Year, 174 (def.)

b'lp
Copyright © 2022 FDOKUMEN