
16 000–64 000 B pMTU experiments with simulation: The case for super jumbo frames at...
11
This article was originally published in a journal published by Elsevier, and the attached copy is provided by Elsevier for the author’s benefit and for the benefit of the author’s institution, for non-commercial research and educational use including without limitation use in instruction at your institution, sending it to specific colleagues that you know, and providing a copy to your institution’s administrator. All other uses, reproduction and distribution, including without limitation commercial reprints, selling or licensing copies or access, or posting on open internet sites, your personal or institution’s website or repository, are prohibited. For exceptions, permission may be sought for such use through Elsevier’s permissions site at: http://www.elsevier.com/locate/permissionusematerial
-
Upload
independent -
Category
Documents
-
view
0 -
download
0
Transcript of 16 000–64 000 B pMTU experiments with simulation: The case for super jumbo frames at...
This article was originally published in a journal published byElsevier, and the attached copy is provided by Elsevier for the
author’s benefit and for the benefit of the author’s institution, fornon-commercial research and educational use including without
limitation use in instruction at your institution, sending it to specificcolleagues that you know, and providing a copy to your institution’s
administrator.
All other uses, reproduction and distribution, including withoutlimitation commercial reprints, selling or licensing copies or access,
or posting on open internet sites, your personal or institution’swebsite or repository, are prohibited. For exceptions, permission
may be sought for such use through Elsevier’s permissions site at:
http://www.elsevier.com/locate/permissionusematerial

Autho
r's
pers
onal
co
py
Optical Switching and Networking 4 (2007) 121–130www.elsevier.com/locate/osn
16 000–64 000 B pMTU experiments with simulation: The case forsuper jumbo frames at Supercomputing ’05
W. Rutherforda,∗, L. Jorgensonb, M. Siegertc, P. Van Eppc, L. Liuc
a RRX Network, Vancouver, BC V5R 5W2, Canadab Apparent Networks, Vancouver, BC V6B 1B8, Canada
c WestGrid Laboratory, Simon Fraser University, Burnaby, BC V5A 1S6, Canada
Received 20 April 2006; accepted 10 October 2006Available online 21 November 2006
Abstract
This paper presents a case study including the results and preliminary simulations for a series of Ethernet-based Xnet “superjumbo frame” (SJF) experiments conducted prior to and at Supercomputing ’05, for up-to-64 000 B path MTU. As far as we areaware, the first public supercomputing demonstration of a router passing 64 000 B frames was performed in our Xnet SJF booth.While Gigabit Ethernet based network architectures typically show reduced zero payload node latency performance relative tointerconnect solutions (Myrinet, SP Switch and InfiniBand), some with higher path MTU equivalent, Ethernet continues to bethe most widely deployed and may remain so for the forseeable future. Cumulative jumbo frame research spanning several years,combined with theoretical calculations and extrapolations from experimental data obtained during Supercomputing ’05 indicatesthe possible practical feasibility of SJF-based network mechanics as a potential means to realize practical long term performancegoals for high throughput streaming. Some of the lessons and implications of the SJF approach are discussed in relation to theevolution of novel network architectures, particularly in relation to explicit path systems for the high performance computingcommunity, pending deployment of 40 and/or 100 Gb Ethernet.c© 2006 Elsevier B.V. All rights reserved.
Keywords: Network testing; Network protocols; Maximum transmission unit; Super jumbo frames; Path MTU
1. Introduction
Successive Ethernet standards have ensured wide-spread inter-operability and become the de factoimplementations which support the majority of short-to-medium range network links. Core networks based onWAN technologies, such as SDH and SONET, supportlong range links possibly interfaced using HDLC/PPP
∗ Corresponding author. Tel.: +1 604 435 2500; fax: +1 604 4358181.
E-mail addresses: [email protected] (W. Rutherford),[email protected] (L. Jorgenson), [email protected](M. Siegert), [email protected] (P. Van Epp), [email protected] (L. Liu).
or GFP mediating encapsulation to Gigabit Ethernetphysical ports. A somewhat difficult and gradualtransition from a Maximum Transmission Unit (MTU)of 1500 B to values in the order of 9000 B has takenplace for research and education networks over the pastfew years. While 1518 B was mandated by previousEthernet standards, Gigabit Ethernet introduced thepossibility of larger frame sizes, although without aspecified upper limit. It remains to be seen if commonlyadopted values like 9000 B will become a workingstandard for commercial networks, as well as highperformance networks.
1573-4277/$ - see front matter c© 2006 Elsevier B.V. All rights reserved.doi:10.1016/j.osn.2006.10.001
Autho
r's
pers
onal
co
py
122 W. Rutherford et al. / Optical Switching and Networking 4 (2007) 121–130
The benefits and pitfalls of a 9000 B path MTU(pMTU) for high performance networks have beeninvestigated [1] by our team, mainly in the context ofGigabit Ethernet and 10 Gb Ethernet [2,3]. It has beendemonstrated using Protocol Offload Engines (POE)more specifically TCP Offload Engines (TOE) [4]that it is possible to achieve a beneficial effect for10 Gb Ethernet using smaller packets [5]. These resultsindicate that it is achievable to work around the needfor a 9000 B (jumbo frame) configuration over theend-to-end path and obtain similar performance levelsusing 1500 B MTU for short range or low inter-frame(inter-header) gaps. However, from our experimentalwork on long range, wide area network (WAN) 9000 BMTU throughput [6], it is generally concluded thatinterframe gap tends to increase with Round TripTime (RTT). Combining the results of our preliminary65 442 B MTU experiments with previous data andlooking ahead through theoretical extrapolations topossible 40–100 Gb Ethernet [7] deployment we presentthe case that Maximum Segment Size (MSS) is afundamental scalability factor of increasing importance,for streaming performance, as line rate increases.
2. Background
An increase of average path MTU (pMTU), in the In-ternet, as opposed to just the high performance comput-ing (HPC) and grid communities, implies a gradual up-grade of equipment over a long period, combined withcovariant improved awareness of complex pMTU is-sues in a heterogeneous context. While this may seem adaunting task, experience has indicated that an increasein average pMTU and MSS is one of the overall sim-plest mechanisms to change the boundary conditions ofInternet network traffic. Notably the maximum packetpayloads of a representative cross section of short rangehigh performance networks including InfiniBand [8],Quadrics [9], Myrinet [10], GSN (HIPPI-6400) [11],HyperTransport [12], RapidIO [13] and SP Switch [14]generally vary from 4, or less, up to 64 kB or greater.Gigabit Ethernet still dominates the top 500 [15] list atSupercomputing ’05 pulling a 49.8% share followed byMyrinet with 20.2%. Significantly Myrinet has “no re-striction” on packet payload. From the end-to-end (e2e)perspective an increase in average MSS for Internet traf-fic may not fundamentally alter the traditional focus ofintelligence at the end nodes with relatively minimal in-tervening network modifications. Similarly a scaled in-crease in MSS may not imply a radical change in endnode architecture design, in contrast to approaches re-quiring significant, possibly proprietary, shifts in net-work interface or software handlers. In retrospect the
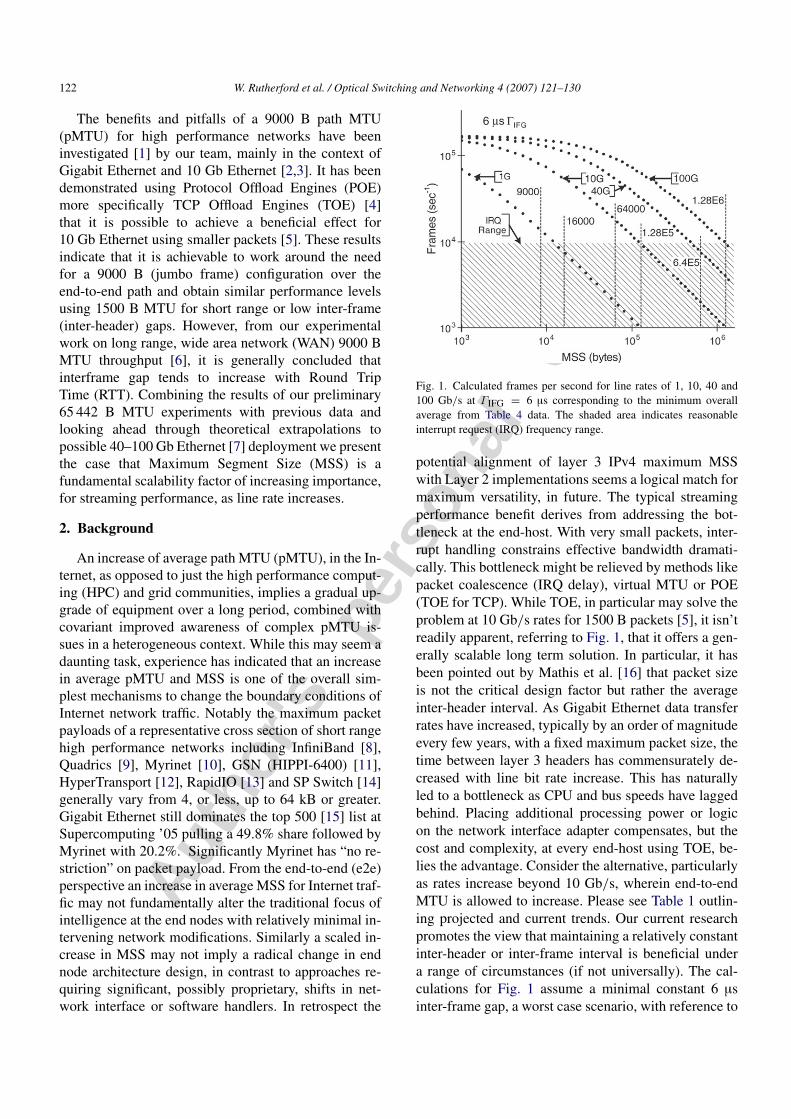
Fig. 1. Calculated frames per second for line rates of 1, 10, 40 and100 Gb/s at ΓIFG = 6 µs corresponding to the minimum overallaverage from Table 4 data. The shaded area indicates reasonableinterrupt request (IRQ) frequency range.
potential alignment of layer 3 IPv4 maximum MSSwith Layer 2 implementations seems a logical match formaximum versatility, in future. The typical streamingperformance benefit derives from addressing the bot-tleneck at the end-host. With very small packets, inter-rupt handling constrains effective bandwidth dramati-cally. This bottleneck might be relieved by methods likepacket coalescence (IRQ delay), virtual MTU or POE(TOE for TCP). While TOE, in particular may solve theproblem at 10 Gb/s rates for 1500 B packets [5], it isn’treadily apparent, referring to Fig. 1, that it offers a gen-erally scalable long term solution. In particular, it hasbeen pointed out by Mathis et al. [16] that packet sizeis not the critical design factor but rather the averageinter-header interval. As Gigabit Ethernet data transferrates have increased, typically by an order of magnitudeevery few years, with a fixed maximum packet size, thetime between layer 3 headers has commensurately de-creased with line bit rate increase. This has naturallyled to a bottleneck as CPU and bus speeds have laggedbehind. Placing additional processing power or logicon the network interface adapter compensates, but thecost and complexity, at every end-host using TOE, be-lies the advantage. Consider the alternative, particularlyas rates increase beyond 10 Gb/s, wherein end-to-endMTU is allowed to increase. Please see Table 1 outlin-ing projected and current trends. Our current researchpromotes the view that maintaining a relatively constantinter-header or inter-frame interval is beneficial undera range of circumstances (if not universally). The cal-culations for Fig. 1 assume a minimal constant 6 µsinter-frame gap, a worst case scenario, with reference to

Autho
r's
pers
onal
co
py
W. Rutherford et al. / Optical Switching and Networking 4 (2007) 121–130 123
Table 1Extrapolated ethernet trends
Rate Year Current Ideal Possible(Mb/s) MTU Packet time MTU Packet time MTU Packet time
(kB) (µs) (kB) (µs) (kB) (µs)
10 (Ethernet) 1982 1.5 1200 1.5 120010E2 (Fast E) 1995 1.5 120 12 96010E3 (GigE) 1998 1.5 12 96 768 64 52510E4 (10 GigE) 2002 1.5 1.2 750 600 625 50010E5 (100 GigE) 20XX 6000 480 6250 50010E6 (1 TerE) 2XXX 50 000 400 62 500 500
current gigabit routed network measurements. The ben-efits of interval scaling are not simply future consider-ations though. Further to the claims of TOE, there areseveral other objections that might be raised:
(1) Header congestion: Header congestion describesa condition wherein a device causes packets tobe dropped when the interval between headers forcontiguous packets falls below some limit. Similar tothe usual forms of congestion wherein packet drops areoccasioned by excessive rates of data transfer overfillingfinite queues, header congestion occurs when too manyindividual headers pend processing and hash table limits(or other similar internal storage limits) overfill. Whilequeues fill and subsequently drop packets by design, itis surmised that the observed cases of header congestionare inadvertent consequences of design.
(2) Path MTU discovery: The primary obstacle to theintroduction of jumbo packets can be attributed to thefact that Layer 3 is generally broken with regard to pathMTU. Extant implementations of RFC 1191 (pMTUdiscovery) are largely ineffective, incomplete or wrong.This state of affairs has persisted largely due to thefact that pMTU could be ignored as most interfacesdefault to 1500 B. The apparent failure of the industryto address the broken nature of pMTU (the IETF iscurrently working on a new Draft for pMTU [17])has led to overwhelming legacy inertia. That Layer 3discovery is essentially broken should not necessarilycontinue to be disregarded in favour of compensating,by work arounds at other layers.
(3) Wizard Gap: While TOE and other customizedPOE engineering may offer solutions for the expert,the average performance level will continue to fallin comparison. The Wizard Gap [18] describes thedifference between performance achievable by anexpert with sufficient resources and time using anoff-the-shelf implementation that has not receivedsignificant attention (e.g. TCP tuning). This gaphas been consistently increasing and is apparently
resulting in an overall decline in average performance.Specialized niche solutions will not likely address theoverall problem.
(4) Scaling practicality: As a matter of practicality, itseems generally advisable to keep end-hosts simple andfocus on solutions implemented at the edge, or the core.End-users do not typically have the expertise to dealwith complications, while the core is engineered andmaintained by domain experts. Further, solutions at end-hosts do not scale as well as solutions in the mid-pathdue to the relative number of end-point devices.
3. Experiments and results
On the Supercomputing ’05 floor our SCInet-Xnetbooth team attempted planned 64 000 and 16 000 BSJF network analysis using dual pair single modefiber (SMF) circuits between booths, providing thecontext for demonstrating SJF based network diagnostictools and distributed file systems. The SMF circuitused an Enterasys ER16 router in combination withappropriately configured end hosts and NICs. TheEnterasys ER16 [19] is an older model router designedin a somewhat different manner compared to morerecent models, none of which apparently are ableto support significantly greater than 9000 B [20],possibly making the ER16 unique as the only currentlyavailable router capable of 64 000 B MTU. Networkdiagnostic demos included appareNet [21] and NetworkDiagnostic Tool (NDT) [22], which used in combinationillustrate actual path MTU, buffer and other factorsfor SJF performance tuning. Preliminary experiments,based in the Canadian Grid Initiative (CGI) booth viathe Enterasys ER16 router, were attempted to determinepossible effects on distributed storage, using tuningblock, mount and sector sizes, with other parameters,in the context of MSS variation and tuning.
SJF router performance was investigated by usinga Spirent AX/4000 XLP network analyzer [23] in theframework of the circuit using the Enterasys ER16

Autho
r's
pers
onal
co
py
124 W. Rutherford et al. / Optical Switching and Networking 4 (2007) 121–130
Fig. 2. Network analyzer experimental data recorded at Supercom-puting ’05 as a function of MSS from 512 to 64 000 B, with the-oretically calculated derivative duplex throughput ξdn as a functionof increasing MSS with curve fit ΓIFG of 10 ns compared to 19 and32.55 µs curve fit ΓIFG from Table 4 data, corresponding to averagevalues from Abilene and CA∗net.
router up to 64 724 B at gigabit line rate over multimodefiber. A separate experiment using the other AX/4000XLP network analyzer in the CGI booth was set up toexplore a combination of an Enterasys Matrix X8 [19]router and LightPath Accelerator [24] optical switch at10 Gb line rate up to 64 724 B.
(1) Technical difficulties: Unfortunately as a resultof technical difficulties with the wiring, not allexperiments scheduled were completed as planned.Notably testing of up to the 65 442 B MTU limit ofan ER16, shipped directly from the factory, proceededas expected, indicating minimal packet drops atthe extreme high end range approaching 64 724 B,as indicated in Fig. 2. Previous measurements, inpreparation for Supercomputing ’05, using a productioncampus ER16 router at Simon Fraser University (SFU)WestGrid Lab, dropped packets around, or above, anMSS of 63 000 B, as indicated in Table 2. Apparentlythere was considerable campus traffic transiting otherports of the ER16 during the testing. Notably up to halfof the 64 000 B MSS packets were dropped. Referringto Fig. 2 the experimental data points from testingat Supercomputing ’05 are plotted at the top with acorresponding curve fit, aligned to a fixed interval 10ns ΓIFG. The complete lack of packet drops in the Xnetbooth seems to imply the drops during testing at SFUmight have been caused by cross traffic or a fault ofsome form.
Table 2ER16 packet loss
MSS Throughput Packetloss
(B) (Mb/s) (%)
64 000 ∼500–900 ∼50–1063 000 999.51 0.014860 000 999.64 030 000 999.30 016 000 999.87 012 000 998.31 0
9000 997.76 06000 996.65 03000 993.39 01500 986.97 0512 963.60 0
Results prior to SC ’05.
(2) 9000 MTU testing: Experimental data, summarizedin Table 4, with symbol definitions in Table 3, fromaccumulated Internet2 9000 MTU Project testing [1,2]on Abilene and CA∗net was used to calculate averageΓIFGe values at the same MTUe values. The ξdn valuesare plotted with fixed interval ΓFG I curve fit in the lowercurves of Fig. 2. The average ΓIFG of 32.55 µs for theInternet2 Abilene network is taken from the “Overall”section at the bottom of Table 4. The ΓIFG calculationsfor the CA∗net R & E network data, results in an averageof about 19 µs, somewhat less than Abilene. The triptime (TT) column and correlation between ΓIFG and TTin Table 4 is for Abilene only.
4. Simulation
With more complete characterization of ΓIFG weshould be in a better position to provide insight intodesign considerations for higher line rates.
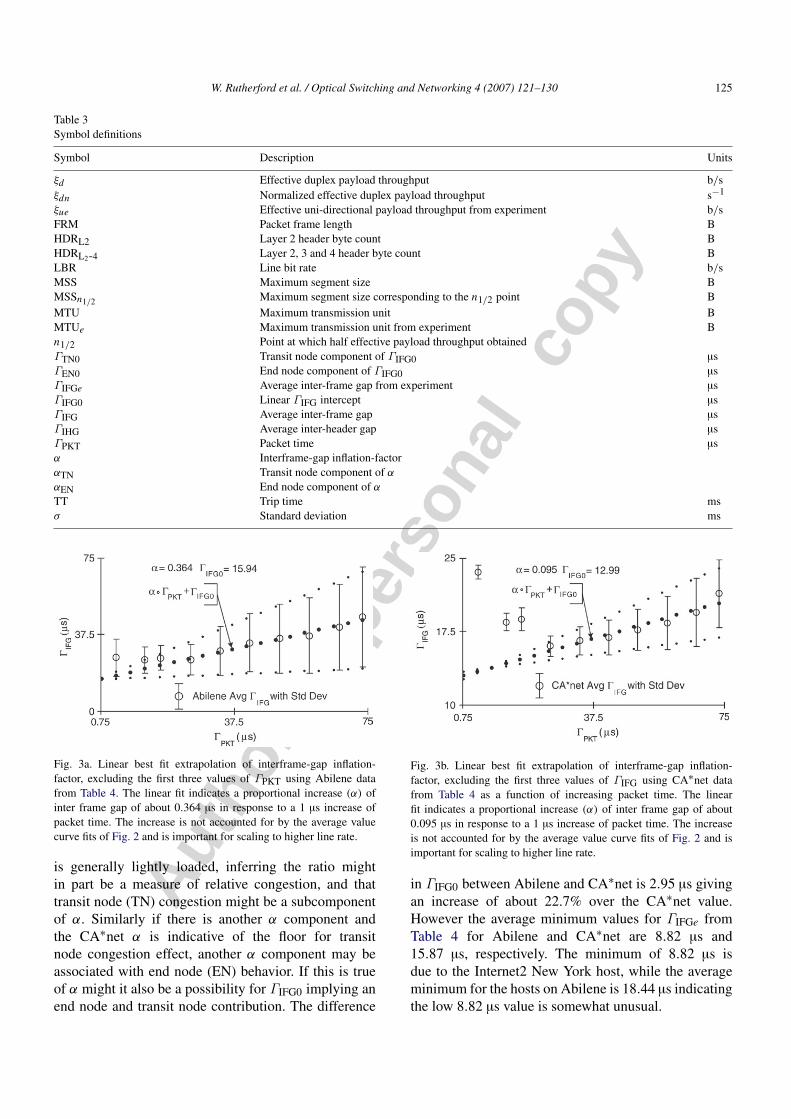
(1) Modeling interframe gap inflation: Plotting ΓIFGdata from Table 4 in Figs. 3a and 3b reveals a regularincrease for the latter seven values. A preliminary linearbest fit (1) indicates an increase in ΓIFG of
ΓIFG(ΓPKT) = α ◦ ΓPKT + ΓIFG0 (1)
0.364 µs for each µs of ΓPKT in Abilene, with asomewhat reduced 0.095 µs in CA∗net. The ΓIFG0values for both networks are similar with 15.94 µs forAbilene and 12.99 µs for CA∗net. The α coefficientmight be termed “interframe-gap inflation-factor”, andis clearly critical for modeling over a wide rangeof ΓPKT. The interpretation of α may be facilitatedby considering possible subcomponent contributions.Consider the ratio of Abilene α to CA∗net α of about3.83. A clue as to the possible cause is that CA∗net
Autho
r's
pers
onal
co
py
W. Rutherford et al. / Optical Switching and Networking 4 (2007) 121–130 125
Table 3Symbol definitions
Symbol Description Units
ξd Effective duplex payload throughput b/sξdn Normalized effective duplex payload throughput s−1
ξue Effective uni-directional payload throughput from experiment b/sFRM Packet frame length BHDRL2 Layer 2 header byte count BHDRL2-4 Layer 2, 3 and 4 header byte count BLBR Line bit rate b/sMSS Maximum segment size BMSSn1/2 Maximum segment size corresponding to the n1/2 point BMTU Maximum transmission unit BMTUe Maximum transmission unit from experiment Bn1/2 Point at which half effective payload throughput obtainedΓTN0 Transit node component of ΓIFG0 µsΓEN0 End node component of ΓIFG0 µsΓIFGe Average inter-frame gap from experiment µsΓIFG0 Linear ΓIFG intercept µsΓIFG Average inter-frame gap µsΓIHG Average inter-header gap µsΓPKT Packet time µsα Interframe-gap inflation-factorαTN Transit node component of α
αEN End node component of α
TT Trip time msσ Standard deviation ms
Fig. 3a. Linear best fit extrapolation of interframe-gap inflation-factor, excluding the first three values of ΓPKT using Abilene datafrom Table 4. The linear fit indicates a proportional increase (α) ofinter frame gap of about 0.364 µs in response to a 1 µs increase ofpacket time. The increase is not accounted for by the average valuecurve fits of Fig. 2 and is important for scaling to higher line rate.
is generally lightly loaded, inferring the ratio mightin part be a measure of relative congestion, and thattransit node (TN) congestion might be a subcomponentof α. Similarly if there is another α component andthe CA∗net α is indicative of the floor for transitnode congestion effect, another α component may beassociated with end node (EN) behavior. If this is trueof α might it also be a possibility for ΓIFG0 implying anend node and transit node contribution. The difference
Fig. 3b. Linear best fit extrapolation of interframe-gap inflation-factor, excluding the first three values of ΓIFG using CA∗net datafrom Table 4 as a function of increasing packet time. The linearfit indicates a proportional increase (α) of inter frame gap of about0.095 µs in response to a 1 µs increase of packet time. The increaseis not accounted for by the average value curve fits of Fig. 2 and isimportant for scaling to higher line rate.
in ΓIFG0 between Abilene and CA∗net is 2.95 µs givingan increase of about 22.7% over the CA∗net value.However the average minimum values for ΓIFGe fromTable 4 for Abilene and CA∗net are 8.82 µs and15.87 µs, respectively. The minimum of 8.82 µs isdue to the Internet2 New York host, while the averageminimum for the hosts on Abilene is 18.44 µs indicatingthe low 8.82 µs value is somewhat unusual.

Autho
r's
pers
onal
co
py
126 W. Rutherford et al. / Optical Switching and Networking 4 (2007) 121–130
Table 4Statistics by MTUe
MTUe CA∗net Abilene Calc CA∗net Abilenecount count type ξdn IFGe ξdn ΓIFGe TT Correlation
(µs) (µs) (ms) ΓIFG–TT
512 12 94 Avg 0.28 23.63 0.28 26.26 22.5 0.30Max 0.29 25.06 0.71 42.47 53.4Min 0.26 22.65 0.16 6.96 1.8σ 0.01 0.72 0.11 9.23 12.9
1500 12 92 Avg 0.78 18.50 0.66 25.03 22.3 0.37Max 0.81 19.62 1.32 39.74 53.4Min 0.75 17.20 0.45 5.99 1.8σ 0.02 0.91 0.14 6.33 13.0
2048 10 81 Avg 0.92 18.82 0.78 26.13 21.9 0.32Max 0.99 20.06 1.07 39.94 53.4Min 0.89 16.52 0.57 13.98 1.8σ 0.03 1.17 0.11 6.03 12.7
3072 10 60 Avg 1.21 16.03 1.00 25.18 19.6 0.33Max 1.26 17.88 1.32 46.73 47.9Min 1.15 14.40 0.68 12.43 2.2σ 0.03 1.07 0.13 7.42 11.4
4096 10 82 Avg 1.33 16.57 1.08 29.57 22.5 0.39Max 1.38 18.68 1.56 59.34 53.5Min 1.27 14.49 0.71 9.15 1.8σ 0.04 1.43 0.19 12.05 13.0
5120 10 78 Avg 1.41 16.89 1.13 33.53 21.7 0.40Max 1.46 20.06 1.63 78.39 53.4Min 1.34 15.21 0.68 9.16 1.8σ 0.04 1.79 0.20 14.29 13.3
6144 10 80 Avg 1.47 17.72 1.20 35.56 22.1 0.38Max 1.54 20.47 1.74 79.64 53.5Min 1.41 14.77 0.76 7.46 1.8σ 0.05 2.10 0.23 16.85 13.2
7168 10 78 Avg 1.51 18.38 1.26 37.02 21.3 0.35Max 1.60 22.02 1.74 86.68 53.4Min 1.44 14.20 0.79 8.48 1.8σ 0.05 2.72 0.22 18.57 12.5
8192 10 82 Avg 1.54 19.49 1.27 41.07 21.5 0.32Max 1.64 24.86 1.81 103.27 53.5Min 1.45 14.14 0.77 7.01 1.8σ 0.06 3.54 0.23 21.06 12.1
9000 17 82 Avg 1.54 21.41 1.26 46.29 21.1 0.20Max 1.65 25.50 1.81 120.28 53.5Min 1.48 15.12 0.75 7.54 0.0σ 0.06 3.50 0.23 24.67 11.7
Overall 111 809 Avg 1.20 19.00 0.98 32.55 21.7 0.33Max 1.65 25.50 1.81 120.28 53.5Min 0.26 14.14 0.16 5.99 0.0σ 0.04 1.96 0.18 13.64 12.6
(2) Scaling: Using (1) the static average ΓIFG curve fitof Fig. 2 is corrected in Fig. 4 indicating a projectedsignificant reduction of ξdn in the 9000–64 000 BMSS range. To calculate projections for 10, 40 and100 Gb networks we modify the scaling of ΓIFGcontributions. The most important contribution is from
the α coefficient subcomponents. For the αTN factor, ifend host adapters on the current network were of higherline rate one might expect there to be no change as thecore network transit nodes would not react differentlyto a given MSS and hence ΓPKT would be constant,however at the end nodes the time scale would be

Autho
r's
pers
onal
co
py
W. Rutherford et al. / Optical Switching and Networking 4 (2007) 121–130 127
Fig. 4. Normalized duplex throughput ξdn at 1 Gb/s, withextrapolation using data from Table 4 and the interframe-gap inflation-factor linear fit ΓIFG models from Figs. 3a and 3b. The linear fitΓIFG models reduce projected ξdn for both the CA∗net and Abilenenetworks, at MSS above 9000 B, as compared to the constant averageΓIFG model. CA∗net is less loaded than Abilene indicating potentialcauses for the difference in α values.
compressed for ΓPKT for which bits are necessarilycontiguous implying an increase in ΓIFG contributionassuming ΓIHG is constant. This seems to imply that theeffect of the αTN contribution in the frame of referenceof the higher line rate end node is scaled by the ratioof the new line rate to the previous line rate, used toexperimentally determine αTN. While the ΓIFG at thehigher line rate given constant ΓIHG is clearly largerby the extent required to account for ΓPKT decrease thechange in ΓIFG is now in relation to a ΓPKT in a reducedtime-increment frame and therefore αTN must itself bereduced by the same scale (2) in order to maintain thesame core transit node relation. Assuming LBR 1 isthe lower line rate and LBR 2 the higher, αTN 2 shouldbe reduced by a factor LBR 1/LBR 2 with respect toαTN 1.
∂ΓTN
∂ΓPKT 2= αTN 2 =
LBR 1LBR 2
◦ αTN 1. (2)
Similarly αEN is in relation to end node behaviordetermined by a differing time-increment frame and assuch should be transformed by the same relation (3)
∂ΓEN
∂ΓPKT 2= αEN 2 =
LBR 1LBR 2
◦ αEN 1. (3)
The ΓIFG0 components ΓTN0 and ΓEN0 have lesseffect with higher line rate and as such are assumedconstant. One might speculate that the base value ofΓEN0 may diminish with time if adapter and host
performance increase on average, however ΓIFG0 isless critical for our preliminary scaling model and isassumed constant.
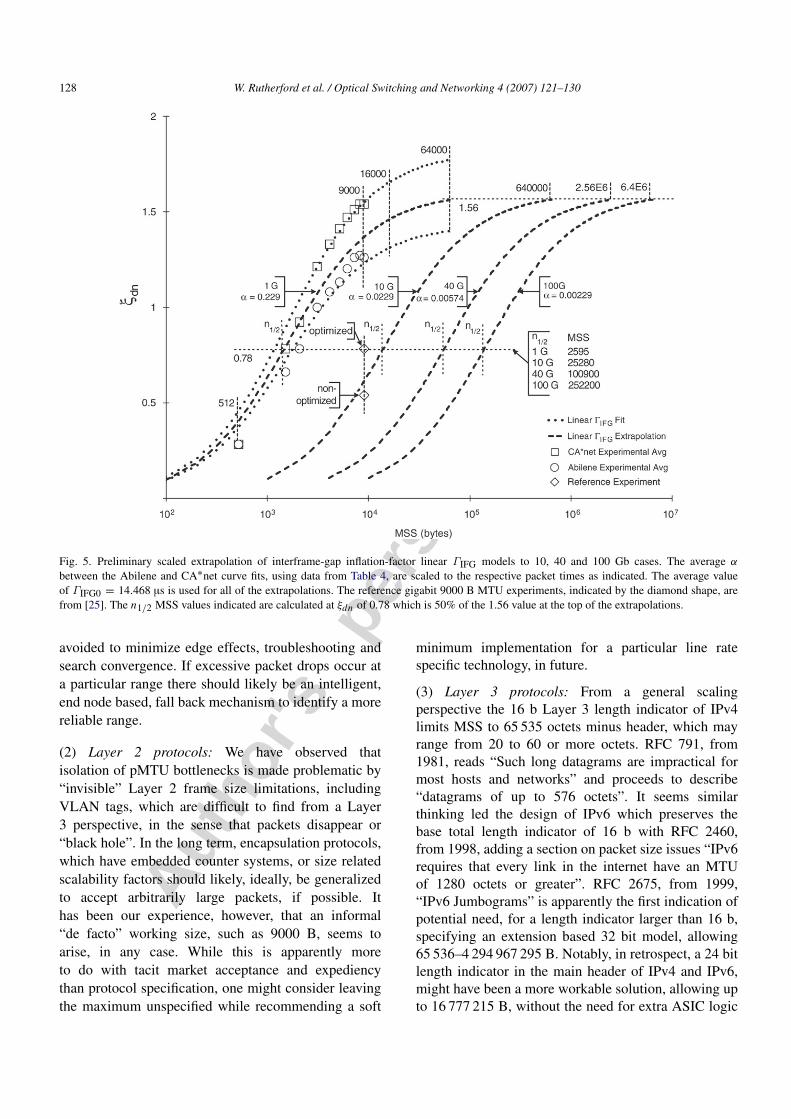
(2) Higher line rate simulation: Plotting ξdn data inFig. 5 using scaled α for 10, 40 and 100 Gb line ratesindicates MSS values for peak ξdn in the range ofMTU values in Table 1. The projections use an averagescaled α between the Abilene and CA∗net projectionscorresponding to a range from
MSSn1/2(LBR,ΓIFG) = HDRL2–4 +ΓIFG ◦ LBR
8(4)
light to medium network loading. At the n1/2 point ξdnis half peak and the MSSn1/2 is given by (4). Whilethe projections of Fig. 5 maintain equivalent inter-framegap inflation relationships, comparable improvement oftransit and end nodes are implied at higher line rate.
Peak ξdn is about 1.56 with 0.78 at the n1/2 point.The α gap inflation values range from 0.229 at onegigabit to 0.0229 at 10, 0.00574 at 40 and 0.00229 at100 Gb. The n1/2 MSS values may be more indicativeof practical average size and range from 2595 B at onegigabit to 25 280 at 10, 100 900 at 40 and 252 200 at100 Gb. Two reference 10 Gb test points from [25] areplotted in Fig. 5, where the lower point represents astock TCP/IP stack with a commonly available interfaceadapter and no tuning, while the optimized upper point(diamond shape) represents what might be considered“wizard gap” tuning of the TCP/IP stack and some otherrelated parameters.
5. Discussion
Applying some of the lessons and implications ofthe SJF approach may be useful. As such we offersome preliminary, somewhat tentative, observations andrecommendations.
(1) Discovery systems: Robust pMTUd [17] is criticalto smooth operation. The pMTUd system should notrely on network engineers to set equipment parameters,or pose security risks, such that it is disabled, as aprecautionary measure. Discovery should work with areliable, rapid, minimal probe response schema, at eachtransit node hop. Ideally transit node hops should not“black hole” packets with larger MTU than permissible,while covariantly minimizing the possibility of apMTUd based attack. If the preliminary probe doesnot function correctly an end node based binary searchmechanism should likely come into play, as a backupsystem. Minor deviations from regular values of MTU,such as are sometimes caused by VLANs should be
Autho
r's
pers
onal
co
py
128 W. Rutherford et al. / Optical Switching and Networking 4 (2007) 121–130
Fig. 5. Preliminary scaled extrapolation of interframe-gap inflation-factor linear ΓIFG models to 10, 40 and 100 Gb cases. The average α
between the Abilene and CA∗net curve fits, using data from Table 4, are scaled to the respective packet times as indicated. The average valueof ΓIFG0 = 14.468 µs is used for all of the extrapolations. The reference gigabit 9000 B MTU experiments, indicated by the diamond shape, arefrom [25]. The n1/2 MSS values indicated are calculated at ξdn of 0.78 which is 50% of the 1.56 value at the top of the extrapolations.
avoided to minimize edge effects, troubleshooting andsearch convergence. If excessive packet drops occur ata particular range there should likely be an intelligent,end node based, fall back mechanism to identify a morereliable range.
(2) Layer 2 protocols: We have observed thatisolation of pMTU bottlenecks is made problematic by“invisible” Layer 2 frame size limitations, includingVLAN tags, which are difficult to find from a Layer3 perspective, in the sense that packets disappear or“black hole”. In the long term, encapsulation protocols,which have embedded counter systems, or size relatedscalability factors should likely, ideally, be generalizedto accept arbitrarily large packets, if possible. Ithas been our experience, however, that an informal“de facto” working size, such as 9000 B, seems toarise, in any case. While this is apparently moreto do with tacit market acceptance and expediencythan protocol specification, one might consider leavingthe maximum unspecified while recommending a soft
minimum implementation for a particular line ratespecific technology, in future.
(3) Layer 3 protocols: From a general scalingperspective the 16 b Layer 3 length indicator of IPv4limits MSS to 65 535 octets minus header, which mayrange from 20 to 60 or more octets. RFC 791, from1981, reads “Such long datagrams are impractical formost hosts and networks” and proceeds to describe“datagrams of up to 576 octets”. It seems similarthinking led the design of IPv6 which preserves thebase total length indicator of 16 b with RFC 2460,from 1998, adding a section on packet size issues “IPv6requires that every link in the internet have an MTUof 1280 octets or greater”. RFC 2675, from 1999,“IPv6 Jumbograms” is apparently the first indication ofpotential need, for a length indicator larger than 16 b,specifying an extension based 32 bit model, allowing65 536–4 294 967 295 B. Notably, in retrospect, a 24 bitlength indicator in the main header of IPv4 and IPv6,might have been a more workable solution, allowing upto 16 777 215 B, without the need for extra ASIC logic
Autho
r's
pers
onal
co
py
W. Rutherford et al. / Optical Switching and Networking 4 (2007) 121–130 129
or code cycles to parse header extensions [26]. On thebasis of our search for equipment capable of performingLayer 2 functionality at 64 000 B, it seems unlikely thatthe 16 bit length indicator of IPv4 will be fully utilized,in the near future; due to wide spread tacit equipmentimplementation limitations adopted.
(4) Layer 4 protocols: Clearly, as indicated inRFC 2675, Layer 4 protocols would need to betweaked to accommodate SJF above 65 536 B. Stackimplementation issues might require tuning, such aspossibly TCP window size adjustment to an integralnumber of packets at a given MSS. It seems likely alarge contribution to ΓEN0 may be due to Layer 4 relatedalgorithms, and as such research on minimization maybe beneficial.
(5) Network adapter design: In general an increase inEthernet integrated circuit buffer sizes, or the use ofa high bandwidth off chip memory is important fordeployment of SJF. Any of these options may be moreexpensive than standard high volume commodity parts,so the increased performance needs to be worthwhile tojustify the investment. We expect this will usually betrue for the HPC community; however it may be moreproblematic for the commodity market, where cost isthe primary factor.
(6) Transit node design: Apparently the ER16 ability toaccommodate near 64K MTU is ironically due to theline adapter Ethernet integrated circuits having limitedon chip storage, thus alternately using direct memoryaccess (DMA) to a common main memory system.More recent Ethernet integrated circuits generallyhave local internal 64 or 128 kB buffers. Fromexperience, the timescale of core R & E 9000 B MTUdeployment took in the order of several years to gofrom notional concept, with the emerging availabilityof jumbo capable Gigabit Ethernet adapters, switchesand routers [20], to enabling core networks across NorthAmerica. SJF deployment may take longer.
(7) End node design: Stock kernels may requireredesign to accommodate SJF. Multiple SJF stacks mayconsume considerable kernel memory. With randomaccess memory (RAM) prices dropping, this may notbe problematic, however it is still something to consider,especially if the goal is to roll out SJF everywhere. Witha lower frame rate, and reduced interrupt frequency,next generation multi-processor systems may be in aposition to provide enhanced per packet services.
(8) Distributed storage design: A 65 536 B MTU (whichthe ER16 can’t quite do anyway) is still too small.
What we really want is 65 536 B plus headers, sothe data portion can be such, for example, that acomplete buffer fits in a single SJF packet. Connectingdistributed storage area networks (SAN) may benefit ifthe WAN systems can communicate via SJF technologywhich matches or exceeds local buffer sizes, reducingfragmentation and reassembly, as well as optimizingeffective throughput.
(9) Explicit path systems: Investment in explicit pathsystems such as National LambdaRail (NLR) [27] with“on ramps”, like HOPI [28], may reduce networkrelated interframe-gap inflation-factors such as αTN toa minimal value. The effect on the projected curve fitsof Fig. 5 would be to move the top of the curves up andto the left, likely slightly more so than the CA∗net datafit, possibly enabling ξdn in the 1.8–1.9 range. In thelong term this might shift HPC optimization emphasisto reduction of the end node inter-frame gap inflationfactor αEN.
(10) Virtual overlay systems: The implementationof large scale innovative virtual networks such asthe Global Environment for Network Innovations(GENI) [29], part of which may operate over SJFenabled core networks, might benefit similarly todistributed storage, by relieving constraints on packetsize.
(11) Interconnect solutions: HPC communities requirevery low latency inter-process communications com-bined with excellent streaming characteristics. Intercon-nect systems with specialized intrinsic protocols maybenefit from SJF similarly to distributed storage, wherespecialized local frames can be either dynamically tun-neled or reformatted over WAN links with minimal per-formance loss.
(12) QoS considerations: Troubleshooting of multicastjumbo frame MTU limitation issues, has hinted atthe potential basic feasibility of SJF based multicast.In general we expect SJF technology may have asignificant beneficial effect on collaborative videostreaming. A gradually increasing presence of SJFpackets on routed networks, also used for voice over IP(VoIP), may require tuning of Quality of Service (QoS)algorithms.
Acknowledgments
The SCInet-Xnet SJF experiments at Supercomput-ing ’05 and SFU WestGrid would not have been possiblewithout the encouragement, support and organizationalskills of E. Paul Love and Paul Daspit (co-chairs ofXnet), who were responsible for identifying our team’s

Autho
r's
pers
onal
co
py
130 W. Rutherford et al. / Optical Switching and Networking 4 (2007) 121–130
work as something of potential interest, and organizingthe Xnet SJF booth. We would like to acknowledge thekind participation and exemplary support of EnterasysNetworks (Randy Ottman, Arnold Sodder) and SpirentCommunications (Greg Goddard, Bob Anderson), with-out whom the Xnet SJF experiments would not haveproceeded. Often tricky measurements over the last sev-eral years on Abilene and CA∗net were kindly facili-tated by John Moore at NCSU, Kevin Walsh at SDSC,Paul Schopis at ITEC-Ohio and Bryan Caron at the Uni-versity of Alberta-Subatomic Physics. This work wassupported via technical and equipment support from En-terasys Networks, Spirent Communications and SimonFraser University.
References
[1] L. Jorgenson, W. Rutherford, Using jumbo packets for ap-plication performance, Internet2 Summer 2005 Joint TechsWorkshop, Vancouver, BC. http://events.internet2.edu/2005/JointTechs/Vancouver/sessionDetails.cfm?session=2106&event=238, July 2005.
[2] J. Battaglia, B. Booth, J. D’Ambrosia, S. Garrison, B.Kohl, The Ethernet Ecosystem. http://www.ethernetalliance.org/technology/white papers/ethernet eco.pdf, January 2006.
[3] Gigabit Ethernet. grouper.ieee.org/groups/802/3.[4] E. Yeh, H. Chao, V. Mannem, J. Gervais, B. Booth, Introduction
to TCP/IP offload engine (TOE). http://www.ethernetalliance.org/technology/white papers/10gea toe.pdf, April 2002.
[5] W. Feng, P. Balaji, C. Baron, L.N. Bhuyan, D.K. Panda,Performance characterization of a 10 Gb ethernet TOE, HOTI,2005.
[6] W. Rutherford, L. Jorgenson, The case for jumbo packets withWestGrid examples, BCNET Advanced Network Conference,Vancouver, BC, April 2005.
[7] Ethernet Alliance. www.ethernetalliance.org.[8] InfiniBand architecture specification release 1.2, InfiniBand
Trade Assoc., October 2004.[9] Quadrics. www.quadrics.com.
[10] Myrinet. www.myri.com.[11] HIPPI. www.hippi.org.[12] HyperTransport I/O link specification, HyperTransport Technol-
ogy Consortium. www.hypertransport.org, April 2005.[13] RapidIO interconnect specification, Part X: Data streaming
logical layer, Phase I, RapidIO Trade Assoc., June 2005.[14] SP Switch. www.ibm.com.[15] Top 500 list. http://www.top500.org, November 2005.[16] M. Mathis, Pushing up the Internet MTU Internet2/NLANR
Joint Techs Meeting, Miami, Florida. http://www.psc.edu/∼mathis/papers/MTU200302/MTU200302.pdf, March 2003.
[17] M. Mathis, J. Heffner, Path MTU discovery (Internet-Draft).http://www.ietf.org/internet-drafts/draft-ietf-pmtud-method-05.txt, October 2005.
[18] B.L. Tierney, TCP tuning techniques for high-speed wide-areanetworks. http://dsd.lbl.gov/TCP-tuning/TCP-Tuning-Tutorial.pdf.
[19] Enterasys Networks. www.enterasys.com.[20] J. St Sauver, Practical issues associated With 9K MTUs, Inter-
net2/NLANR Joint Techs Meeting, Miami, Florida. http://www.uoregon.edu/∼joe/jumbos/jumbo-frames.pdf, February 2003.
[21] appareNet. www.apparentNetworks.com.[22] Network Diagnostic Tool (NDT). e2epi.internet2.edu/ndt.[23] Spirent AX/4000. www.spirentcom.com.[24] Lightpath AcceleratorTM System. www.bigbangwidth.com/pdf
files/ADS.pdf.[25] W. Feng, J. Hurwitz, H. Newman, S. Ravot, R. Cottrell, O.
Martin, F. Coccetti, C. Jin, X. Wei, S. Low, Optimizing 10 Gbethernet for networks of workstations, Clusters, and Grids: ACase Study, in: Proc. of ACM/IEEE SC 2003, November 2003.
[26] E.P. Love, Internet2, Ann Arbour, MI, July 2005 (privatecommunication).
[27] National LambdaRail (NLR). www.nlr.net.[28] W. Rutherford, UCLPv2-HOPI Issues BoF, Internet2 Summer
2005 Joint Techs Workshop, Vancouver, BC. http://events.internet2.edu/2005/JointTechs/Vancouver/sessionDetails.cfm?session=2106&event=238, July 2005.
[29] T. Anderson, D. Blumenthal, D. Casey, D. Clark, D. Estrin,L. Peterson, D. Raychaudhuri, J. Rexford, S. Shenker,J. Wroclawski, GENI: Global environment for networkinnovations (Conceptual Design Project Execution Plan). http://www.geni.net/GENI-10-JAN-06.pdf, January 2006.