13C-isotope-based protocol for prenyl lipid metabolic analysis in zebrafish embryos
11
© 2013 Nature America, Inc. All rights reserved. PROTOCOL NATURE PROTOCOLS | VOL.8 NO.12 | 2013 | 2337 INTRODUCTION The various classes of biological metabolites have extremely dif- ferent chemical properties. There is no analytical method available that can measure them all, and thus the experimental evaluation of dynamic modifications of metabolites within cells requires the use of different specific biochemical techniques and approaches. Among those, radioactive or stable isotope labeling of an intracel- lular chemical precursor, coupled with metabolite profiling liquid chromatography–mass spectrometry (HPLC-MS) or NMR, is a powerful method, which allows direct detection of downstream metabolites from a specific precursor 1,2 . This approach allows the distinction within the cells between downstream metabolites that are produced by enzymes with unique activities and the unla- beled form of the metabolite that is derived from native metabolic processes. Such a metabolic analysis is very useful when novel enzymatic activities must be demonstrated to exist by the identi- fication of product-specific downstream metabolites 3–5 . Among all classes of biological molecules, lipids still remain poorly defined metabolites. Lipids are fundamental structural components of biological membranes, and they are responsible for a complex signaling system that provides life’s most dynamic and efficient fueling and energetic needs 6,7 . Lipids have remark- able cellular capacities and functions, but the same properties that make them so vital also make them difficult to study. This has resulted in lipids being an underappreciated subset of the metabo- lome: the so-called lipidome. Therefore, experimental determi- nation of in vivo metabolic rates by methods using analysis with isotope tracers is a pivotal approach in unraveling the structure and regulation of metabolic lipid networks 1,8,9 . Isotope labeling experiments of lipid metabolites have been successfully performed in cultured cell lines and in tissues. Such studies aimed to achieve comprehensive measurements of the lipid metabolites of interest, thereby providing a functional rea- dout of the tissues’ physiology and homeostasis 10,11 . The next step was to apply such methods to whole organisms, linking the lipidome to development or even to genetic variants and pheno- typic traits 12,13 . Here we exploit zebrafish (Danio rerio) embryos to perform iso- tope-based metabolic tissue analyses in vivo. We describe in detail our protocol for profiling the prenyl lipid metabolite CoQ10 (also known as CoenzymeQ10 or ubiquinone) by using an isotopic tracer ( 13 C) in zebrafish embryos and tissues. The CoQ10 molecule is composed of a redox active benzoquinone ring connected to a polyisoprenoid side chain of nine or ten units in vertebrates. CoQ10 is known for its crucial role in the mitochondrial electron transport chain 14 , but it also functions as a lipid-soluble antioxidant in cellular membranes by scavenging reactive oxygen species 15 . In metabolic pathways investigated herein, highly hydrophobic prenyl lipid molecules (such as CoQ10) are generated by the enzyme prenyltransferase from a hydrophilic starting precursor, 4-hydroxy-benzoate. Although several laboratories have shown that the zebrafish can be used as a model for metabolomic analyses and metabolite profile studies 16–19 , our protocol represents the first example of using this model system for isotope-based metabolic lipid analy- ses for both steady-state and flux analyses. The protocol has been developed and optimized for prenyl lipid analysis in zebrafish tissues, but it is adaptable to the analysis of other categories of lipid metabolites, such as sterols, fatty acids and more. Similarly, the protocol can be modified for specific experimental require- ments, such as flux analyses, targeted and untargeted metabo- lomic studies, and even metabonomics during the development of live vertebrate embryos. 13 C-based flux analysis represents the next exclusive step to experimentally quantify the integrated responses of metabolic networks in this vertebrate model system. The possibility to manipulate enzyme activity and the efficacy of delivering stable isotopes during development and adulthood indicate that the zebrafish is going to be a valuable system for performing isotope- based metabolomic and flux analyses in different genetic settings. This new approach can then provide new functional insights about the associations between risk factors and the development of complex common diseases by helping to find new therapeutic solutions for specific inherited metabolic disorders 20,21 . 13 C-isotope-based protocol for prenyl lipid metabolic analysis in zebrafish embryos Vera Mugoni 1 , Claudio Medana 1 & Massimo M Santoro 1–3 1 Department of Molecular Biotechnology and Health Sciences, University of Turin, Turin, Italy. 2 Laboratory of Endothelial Molecular Biology, Vesalius Research Center, Vlaams Instituut voor Biotechnologie (VIB), Leuven, Belgium. 3 Laboratory of Endothelial Molecular Biology, Vesalius Research Center, Department of Oncology, Katholieke Universiteit (KU) Leuven, Leuven, Belgium. Correspondence should be addressed to M.M.S. ([email protected]). Published online 31 October 2013; doi:10.1038/nprot.2013.139 Metabolism has a decisive role in many fundamental biological processes, including organism development and tissue homeostasis. Here we describe a protocol for fast and reliable 13 C-isotope-based in vivo metabolic profiling. This protocol covers the loading of isotope precursor; extraction, preparation and quantification of the labeled lipid metabolites (e.g., the prenyl lipid CoQ10) by the means of HPLC-MS; and its analysis in zebrafish embryos. This protocol can be applied to different types of experimental settings, including tissue-specific metabolic analyses or dynamic metabolic changes that occur during vertebrate embryogenesis. The protocol takes 5–7 d to complete, requiring minimal equipment and analytical expertise, and it represents a unique alternative to the existing ex vivo (e.g., cell lines) isotope-based metabolic methods. This procedure represents a valuable approach for researchers interested in studying the effect of gene manipulation on lipid metabolism in zebrafish and in understanding the genetic conditions that result in metabolism dysfunction.
-
Upload
independent -
Category
Documents
-
view
1 -
download
0
Transcript of 13C-isotope-based protocol for prenyl lipid metabolic analysis in zebrafish embryos
©20
13 N
atu
re A
mer
ica,
Inc.
All
rig
hts
res
erve
d.
protocol
nature protocols | VOL.8 NO.12 | 2013 | 2337
IntroDuctIonThe various classes of biological metabolites have extremely dif-ferent chemical properties. There is no analytical method available that can measure them all, and thus the experimental evaluation of dynamic modifications of metabolites within cells requires the use of different specific biochemical techniques and approaches. Among those, radioactive or stable isotope labeling of an intracel-lular chemical precursor, coupled with metabolite profiling liquid chromatography–mass spectrometry (HPLC-MS) or NMR, is a powerful method, which allows direct detection of downstream metabolites from a specific precursor1,2. This approach allows the distinction within the cells between downstream metabolites that are produced by enzymes with unique activities and the unla-beled form of the metabolite that is derived from native metabolic processes. Such a metabolic analysis is very useful when novel enzymatic activities must be demonstrated to exist by the identi-fication of product-specific downstream metabolites3–5.
Among all classes of biological molecules, lipids still remain poorly defined metabolites. Lipids are fundamental structural components of biological membranes, and they are responsible for a complex signaling system that provides life’s most dynamic and efficient fueling and energetic needs6,7. Lipids have remark-able cellular capacities and functions, but the same properties that make them so vital also make them difficult to study. This has resulted in lipids being an underappreciated subset of the metabo-lome: the so-called lipidome. Therefore, experimental determi-nation of in vivo metabolic rates by methods using analysis with isotope tracers is a pivotal approach in unraveling the structure and regulation of metabolic lipid networks1,8,9.
Isotope labeling experiments of lipid metabolites have been successfully performed in cultured cell lines and in tissues. Such studies aimed to achieve comprehensive measurements of the lipid metabolites of interest, thereby providing a functional rea-dout of the tissues’ physiology and homeostasis10,11. The next step was to apply such methods to whole organisms, linking the lipidome to development or even to genetic variants and pheno-typic traits12,13.
Here we exploit zebrafish (Danio rerio) embryos to perform iso-tope-based metabolic tissue analyses in vivo. We describe in detail our protocol for profiling the prenyl lipid metabolite CoQ10 (also known as CoenzymeQ10 or ubiquinone) by using an isotopic tracer (13C) in zebrafish embryos and tissues. The CoQ10 molecule is composed of a redox active benzoquinone ring connected to a polyisoprenoid side chain of nine or ten units in vertebrates. CoQ10 is known for its crucial role in the mitochondrial electron transport chain14, but it also functions as a lipid-soluble antioxidant in cellular membranes by scavenging reactive oxygen species15. In metabolic pathways investigated herein, highly hydrophobic prenyl lipid molecules (such as CoQ10) are generated by the enzyme prenyltransferase from a hydrophilic starting precursor, 4-hydroxy-benzoate.
Although several laboratories have shown that the zebrafish can be used as a model for metabolomic analyses and metabolite profile studies16–19, our protocol represents the first example of using this model system for isotope-based metabolic lipid analy-ses for both steady-state and flux analyses. The protocol has been developed and optimized for prenyl lipid analysis in zebrafish tissues, but it is adaptable to the analysis of other categories of lipid metabolites, such as sterols, fatty acids and more. Similarly, the protocol can be modified for specific experimental require-ments, such as flux analyses, targeted and untargeted metabo-lomic studies, and even metabonomics during the development of live vertebrate embryos.
13C-based flux analysis represents the next exclusive step to experimentally quantify the integrated responses of metabolic networks in this vertebrate model system. The possibility to manipulate enzyme activity and the efficacy of delivering stable isotopes during development and adulthood indicate that the zebrafish is going to be a valuable system for performing isotope-based metabolomic and flux analyses in different genetic settings. This new approach can then provide new functional insights about the associations between risk factors and the development of complex common diseases by helping to find new therapeutic solutions for specific inherited metabolic disorders20,21.
13C-isotope-based protocol for prenyl lipid metabolic analysis in zebrafish embryosVera Mugoni1, Claudio Medana1 & Massimo M Santoro1–3
1Department of Molecular Biotechnology and Health Sciences, University of Turin, Turin, Italy. 2Laboratory of Endothelial Molecular Biology, Vesalius Research Center, Vlaams Instituut voor Biotechnologie (VIB), Leuven, Belgium. 3Laboratory of Endothelial Molecular Biology, Vesalius Research Center, Department of Oncology, Katholieke Universiteit (KU) Leuven, Leuven, Belgium. Correspondence should be addressed to M.M.S. ([email protected]).
Published online 31 October 2013; doi:10.1038/nprot.2013.139
Metabolism has a decisive role in many fundamental biological processes, including organism development and tissue homeostasis. Here we describe a protocol for fast and reliable 13c-isotope-based in vivo metabolic profiling. this protocol covers the loading of isotope precursor; extraction, preparation and quantification of the labeled lipid metabolites (e.g., the prenyl lipid coQ10) by the means of Hplc-Ms; and its analysis in zebrafish embryos. this protocol can be applied to different types of experimental settings, including tissue-specific metabolic analyses or dynamic metabolic changes that occur during vertebrate embryogenesis. the protocol takes 5–7 d to complete, requiring minimal equipment and analytical expertise, and it represents a unique alternative to the existing ex vivo (e.g., cell lines) isotope-based metabolic methods. this procedure represents a valuable approach for researchers interested in studying the effect of gene manipulation on lipid metabolism in zebrafish and in understanding the genetic conditions that result in metabolism dysfunction.
©20
13 N
atu
re A
mer
ica,
Inc.
All
rig
hts
res
erve
d.
protocol
2338 | VOL.8 NO.12 | 2013 | nature protocols
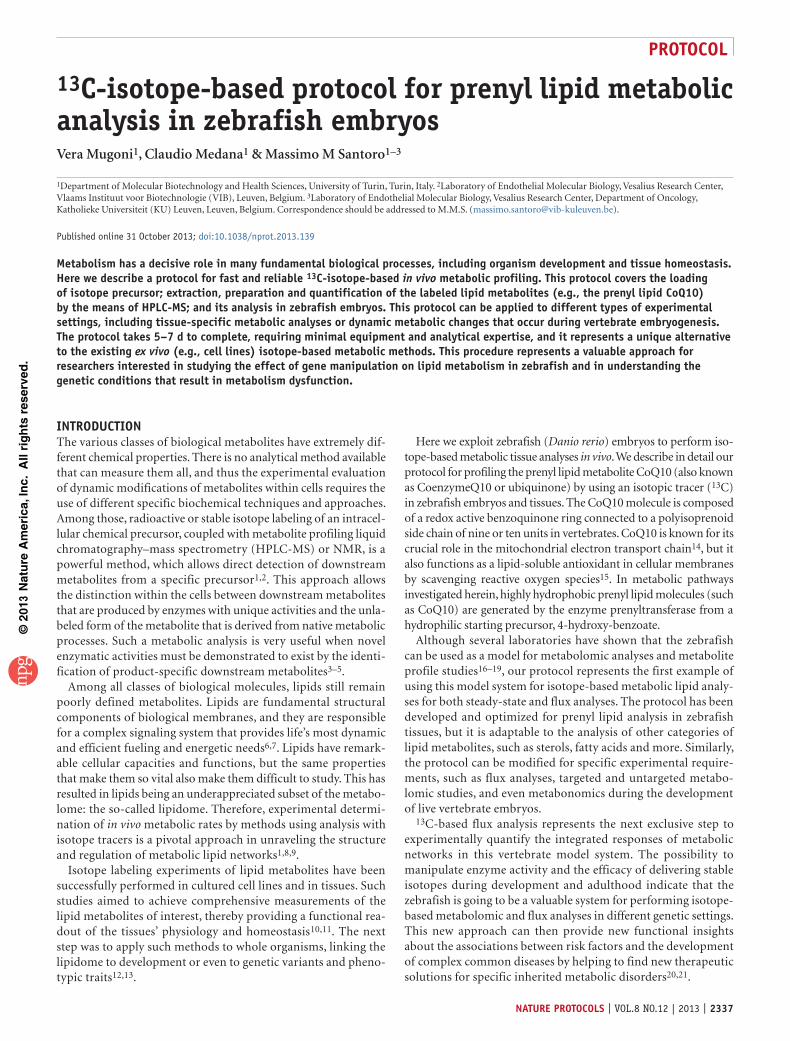
Development of the protocolWe initially performed a forward genetic screen in zebrafish to identify mutations affecting cardiovascular development and homeostasis22. Among these mutants, we identified the mutant barolo, which showed severe cardiovascular defects5. By posi-tional cloning, we found that barolo is a null mutant of the ubiad1 (UbiA prenyltransferase domain-containing 1) gene. As the UbiA prenyltransferase domain is known to catalyze the synthesis of the CoQ10 precursor 4-hydroxy-3-polyprenyl ben-zoate (PPHB, Fig. 1)23, we tested whether Ubiad1 might catalyze such a crucial reaction for the biosynthesis of CoQ10 in live zebrafish embryos.
To provide biochemical evidence that Ubiad1 is a 4-hydroxy-benzoate-prenyl transferase with the ability to synthesize CoQ10, we analyzed whether it could convert 4-hydroxy-benzoate to PPHB and, then, CoQ10 in tissues and animals. For this purpose, we established a metabolomic-based approach in zebrafish embryos to compare barolo mutants and normal siblings for CoQ10-forming activity by advanced HPLC-MS techniques5 and 13C-based analy-sis. The use of stable isotopes, and in particular 13C-labeling, is an exclusive approach to experimental quantification in the integrated response of metabolic networks9. As Ubiad1 was a putative 4-hydroxy-benzoate prenyltransferase, we decided to use 4-hydroxybenzoate as our labeled precursor. We used 4-hydroxybenzoate in its salt form, as at physiological pH levels it is highly soluble in water (carboxylic pKa = 4.4) (Fig. 1). In addi-tion, 4-hydroxybenzoate is commercially available at a reason-able cost. In preliminary experiments, we were able to detect and measure the 13C-4-hydroxy-benzoate-labeled product in emerg-ing zygotic tissues, providing evidence that it is correctly delivered from the yolk sac to embryonic tissues throughout development. After the administration of 13C6-labeled 4-hydroxy-benzoate to zebrafish embryos at the one-cell stage, lipids were extracted and analyzed by HPLC-MS for the amount of 13C6-CoQ10 formed. By using our protocol, we were also able to detect 13C6-CoQ9 pro-duction, indicating that both CoQ9 and CoQ10 are synthesized in zebrafish tissues5.
In summary, we developed a protocol for zebrafish embryos to measure the activity of Ubiad1 as a 4-hydroxy-benzoate prenyl transferase enzyme that is required for CoQ10 and CoQ9 biosyn-thesis in vivo. By loading zebrafish embryos with a 13C-precursor and by measuring new, labeled PPHB metabolites in normal and mutant zebrafish embryos, this new method allowed us to locate a specific metabolite (CoQ10) and then identify the specific enzyme function from which it is impaired in the barolo mutant.
The protocol described here is relatively inexpensive and accessible to laboratories with minimum equipment and analytical expertise.
Applications of the methodOur protocol can be applied to several different experimental settings with appropriate modifications. The following are some examples:
The protocol can be applied to many other specific metabolites, and it may help in the discovery of novel enzymatic activities in development and disease. Accordingly, it can be used to test inhibitors or activators of rate-limiting enzymes in metabolic pathways.This protocol would be practical in assessing the metabolic effects of loss-of-function (LOF) and gain-of-function (GOF) mutations of enzymes. LOF and GOF mutations of a particular enzyme can be quite easily introduced in zebrafish embryos, and the effect of such mutations can then be studied for their in vivo metabolic effects.Metabolic protocols similar to this one can be used in forward genetic screening to identify new enzymes and/or specific mutations affecting a specific metabolic pathway. This will allow for metabolomic analyses in different genetic settings to better define the genetic-metabolic links in animals and tissues.Other precursors of different biochemical pathways, with a wider range of metabolites than 4-hydroxy-benzoate (e.g., 13C-glucose, 13C-glycerol, 13C-α-ketoisovalerate or 13C-α-ketobutyrate), can also be studied using this protocol.This 13C-based labeling procedure in live embryos can be used to achieve global biochemical profiling (metabolomics) of tar-geted metabolites, making it suitable for describing the dynamic changes that occur during embryogenesis. An example could be the use of 13C-glucose to study glycolysis and the pentose phos-phate pathway in different conditions (e.g., during embryonic development and with different genetic mutants).In general, experimental approaches can be divided into metabolic stationary and metabolic nonstationary. Metabolic stationary experiments aim to quantify intracellular fluxes, whereas nonstationary experiments are used to identify reaction
•
•
•
•
•
•
COOΘ
4–Hydroxy-benzoate
HO
HO
COOΘ
13C6 4–hydroxy-benzoate
O O
OO
OΘ OΘOΘ
10P P
Trans-decaprenyl-PP
UBIAD1UbiA domain–containingprenyltranferase enzyme
OH
COOH
H10
PPHB
OH
COOH
H10
13C6 PPHB
O
O
O
O
H10
CoQ10
O
O
O
O10
13C6 CoQ10
Figure 1 | Schematic representation of PPHB formation and CoQ10 synthesis mediated by UbiA domain–containing prenyltransferase enzymes. The rate-limiting step in the biosynthesis of CoQ10 is represented by the transfer and condensation of the polyprenyl- pyrophosphate side chain (decaprenyl-PP) onto the ring of 4-hydroxy-benzoate to generate the PPHB. This reaction is catalyzed by the UbiA-domain-containing enzymes such as the Ubiad1 protein. Additional reactions (i.e., O-methylations and C-methylations, hydroxylations and decarboxylations) are required to modify the structure of the PPHB and to form the CoQ10 complete molecule. The 13C6-labeled precursors and the 13C6-labeled final product (violet) are represented in parallel to endogenous isotopes (black). Stars indicate 13C atoms.
©20
13 N
atu
re A
mer
ica,
Inc.
All
rig
hts
res
erve
d.
protocol
nature protocols | VOL.8 NO.12 | 2013 | 2339
kinetics, such as substrate affinities and allosteric inhibition. By using this protocol, the connection between metabolome and fluxome measurements and Michaelis-Menten–type kinetics can be measured for specific enzymes during different developmental stages2.
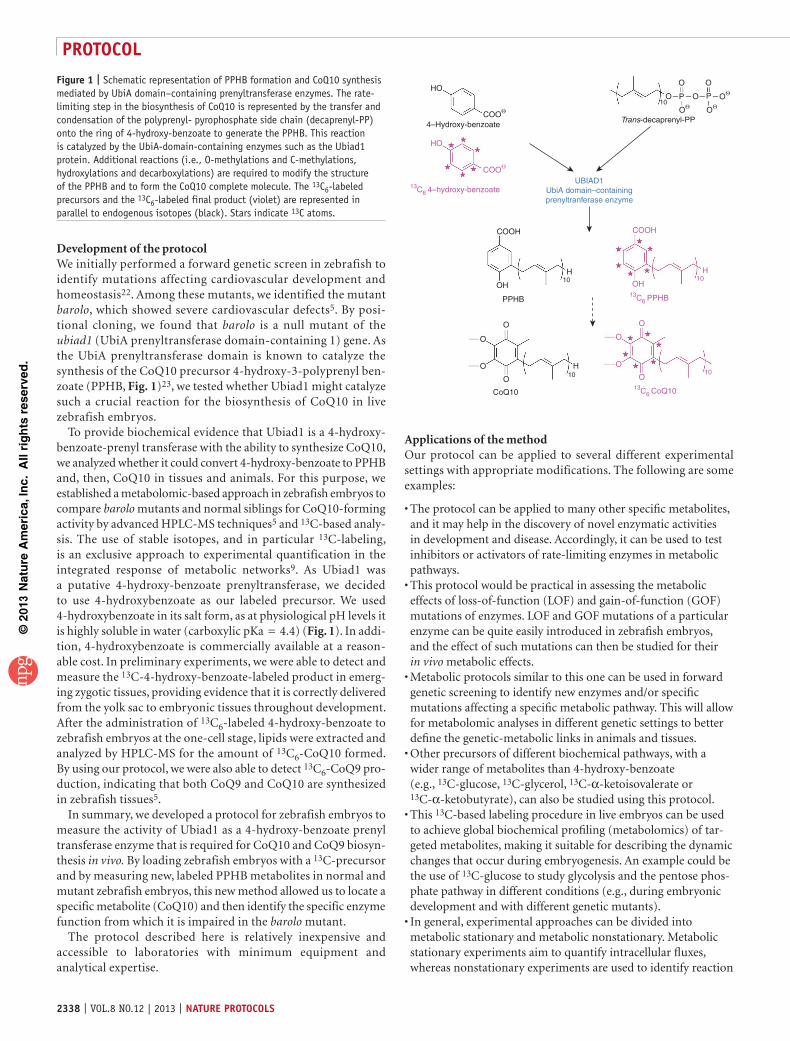
Experimental designThe workflow of this protocol is shown in Figure 2.
Zebrafish embryo maintenance and egg production. The pro-tocol described here is based on zebrafish eggs and embryos with implications of appropriate laboratory procedures for their han-dling. In particular, ARRIVE (animal research: reporting in vivo experiments) guidelines are recommended for reporting experi-ments in this protocol24. Important details about zebrafish care and maintenance are described in Reagent Setup. A wide range of zebrafish strains, genetic backgrounds and transgenic lines can be used to perform 13C labeling analyses; however, it is important to bear in mind that the genetic background may influence the metabolism of several categories of molecules including lipids. Depending on the purpose of the project, the protocol requires the use of wild-type or mutant lines. When a mutant line is selected (e.g., the mutant barolo line), it is essential to compare data between mutants and their respective siblings and not use wild-type embryos coming from parents of different genetic backgrounds. Accordingly, if other types of manipulation are per-formed (e.g., small-molecule incubation), embryos from the same
clutch of eggs must be used as controls to avoid differences that may arise from dissimilar genetic backgrounds or developmental conditions. Besides genetic and developmental inconsistencies, an important aspect for the success of this protocol is represented by diet. Eggs and embryos coming from adults that were fed with dif-ferent diets may have different metabolisms and different maternal lipid contributions. Consequently, data regarding one group of fish should not be combined with the data coming from fish that are maintained with a different diet regime. The rule of thumb is that eggs coming from a set of parents should not be mixed with eggs from parents of a different batch or different genetic strain.
Preparation of 13C-labeled precursor. Preparation of the 13C-labeled precursor (Fig. 2a) is a crucial step (especially in rela-tion to the viability of the developing embryos). To minimize the potential toxicity of the precursor molecule and increase its delivery into the embryos’ tissues, the 13C-labeled precursor needs to be dissolved in nontoxic solvents such as water or DMSO. Zebrafish embryos are very sensitive to chemicals, and thus most solvents used to dissolve lipid molecules (e.g., methanol) are toxic if injected into eggs. DMSO is one of the most applied chemicals for the delivery of drugs to zebrafish embryos, because it increases the cell membrane permeability to dissolved substances. To inject the smallest amount of diluent (e.g., DMSO) possible, serial dilutions in water containing labeled precursors must be made. Another important aspect to be considered during the planning of the experiment is the chemical nature of the 13C-labeled precursor and its solubility in nontoxic solvents. We took this into consider-ation with regard to testing Ubiad1 enzyme activity, and we prefer using 13C-4-hydroxy-benzoate instead over 13C-decaprenyl-PP. As no data on the stability of 13C6-4-hydroxy-benzoate in DMSO are available, we recommend making fresh stock solution and dilutions for each experiment.
13C-labeled precursor delivery into zebrafish eggs by microin-jection. The microinjection of 13C-precursor is one of the most crucial steps of this protocol (Fig. 2b). Therefore, microinjec-tion-related procedures such as glass needle pulling and injection volume calibration need to be adjusted optimally in order to get a successful delivery of 13C-precursor with minimal side effects. The microinjection of 13C-labeled precursor entails the introduc-tion of exogenous chemical substances into developing zebrafish embryos. To minimize the possible toxicity related to the delivery of exogenous molecules, it is necessary to avoid or reduce all other variables that may damage the eggs. Such variables are primarily represented by the volume of injected solution and by the dimen-sion of the glass needle tip. Helpful instructions to manage these technical aspects can be found in the literature25. With regard to the amount of 13C6-4-hydroxy-benzoate solution injected into the eggs, we recommend a volume of ~4 nl. The microinjected solution is progressively adsorbed together with the yolk by the developing embryo. A sign of incorrect delivery of the precursor is when the injected solution is still clearly visible as a cluster of yellowish dots in the yolk sac of the injected embryos at 48 h post fertilization (h.p.f.). Delivery of stable isotope precursors at the one-cell stage requires that the compound be distributed and diluted uniformly in the developing cells/tissues. As time passes, this may result in precursor concentration that is too low for measuring the enzyme activity. Therefore, the catabolism rate of
a b
cd
e f
Steps: 1–3Preparation of 13C-labeled precursor(∼20 min)
Steps: 4 and 513C-labeled precursor delivery intozebrafish eggs by microinjection(∼5 h)
Steps: 6–10Selection and pooling of zebrafishembryos or tissue(variable)
Steps: 11–21Embryo and tissue homogenization(∼3 h)
Steps: 26–31HPLC-MS data acquisition and processing(variable)
Steps: 22–25Organic extraction for lipid analysis andsample preparation for HPLC-MS analysis(∼3 h)
Organic phaseInterphase
Hydrophilic phase
HO
COOH
* ****
*
Figure 2 | Representative scheme of the workflow for prenyl lipid 13C-based analysis in zebrafish embryos. (a–f) The protocol steps are summarized here in fundamental sections involving delivery of 13C-labeled precursor (a,b), sample preparation (c–e) and HPLC-MS analysis (f).
©20
13 N
atu
re A
mer
ica,
Inc.
All
rig
hts
res
erve
d.
protocol
2340 | VOL.8 NO.12 | 2013 | nature protocols
the precursor must be taken into consideration for long incuba-tion periods (days), and short time periods between delivery and extraction and measurement are preferred.
Selection and pooling of zebrafish embryos for further analysis. It is possible to start the selection and pooling of the embryos at different times after the injection of the 13C-labeled precursor, depending on specific experimental needs such as the onset of the mutant phenotype (Fig. 2c). The whole embryo or selected organs (e.g., heart) can be used for further analyses26,27. The amount of selected embryos or tissue cells is strictly related to the natural abundance and the biosynthetic kinetic rate of the metabolite analyzed (here, CoQ10). Metabolites that are synthesized at a very low rate can be undetectable if small numbers of embryos (≤10) are pooled. Conversely, large numbers of embryos (≥50) are also not beneficial, as the extraction efficiency is saturated (this is par-ticularly true for abundant metabolites such as cholesterol). With regard to 13C6-CoQ10, no less than 25 embryos at 72 h.p.f. should be considered for reliable and repetitive quantifications.
Embryo and tissue homogenization. Pooled embryos must be collected in bottom-flat tubes and dissolved by using a micro-homogenizer (Fig. 2d). The homogenization process is complete when all tissues are dissolved and a homogeneous cloudy solution is obtained. Use freshly prepared pooled embryos (avoid freezing materials before homogenization) and wash the microhomog-enizer before processing the next sample, as described in Step 14, to avoid contaminating the samples.
Organic extraction for lipid analyses and sample preparation for HPLC analyses. Lipid molecules are extracted from homogenate tissues by using n-heptane (Fig. 2e). The volume of n-heptane added to the sample is equivalent to the volume of the tissue homogenate. To allow appropriate lipid extraction, it is man-datory to mix extensively the organic solvent (n-heptane) with the aqueous phase of the tissue homogenate. Thus, the organic phase containing extracted lipids (the upper phase in Step 18) is finely separated from the hydrophilic phase by centrifugation. To achieve high performance in lipid extraction, repeat this process twice. At the end, the organic phases are collected and concen-trated by vacuum drying. This step is particularly important for molecules with low abundance such us CoQs. Afterward, the lipid pellet is suspended with a mix of organic solvents specifically compatible with the HPLC setting: n-heptane and methanol. All these procedures are performed in the presence of air oxygen, and thus only the oxidized form of CoQs is measured; the reduced form is negligible. Extracted lipids must be protected from light exposure and stored at room temperature (20–25 °C), avoiding freezing. It is important to bear in mind that CoQs extracted from zebrafish matrices are more sensitive to temperature than corresponding standards dissolved in n-heptane. Moreover, to ensure the repeatability of analyses, it is crucial to analyze extracts immediately after their extraction. The stability of lipid molecules extracted from zebrafish samples is compromised after 48 h.
HPLC-MS data acquisition and processing. Lipid metabolites and their 13C isotopomers are measured by using an HPLC instru-ment coupled to a high-resolving-power hybrid mass analyzer (LTQ-Orbitrap) with electrospray ionization (ESI) (Fig. 2f).
Thus, CoQs analyzed with these settings result in sodiated adduct ions [M + Na] + (positive ion mode). The mass spectrometric analyzer must be set to acquire spectra at high resolving power, working in profile full mass mode with the resolution R = 30,000 (full width at half-maximum (FWHM)) at 500 m/z. The resulting mass accuracy obtained is better than 10 p.p.m., and it also allows for qualitatively identifying untargeted molecules related to the studied metabolites. The quantitative analyses are carried out by applying a quality assurance (QA) procedure according to guide-lines for industry bioanalytical method validation (http://www.fda.gov/downloads/Drugs/GuidanceComplianceRegulatoryInformation/Guidances/UCM070107.pdf).
To ensure reliability in measurements, the HPLC-MS analysis of each blank, standard or experimental sample has to be per-formed in technical triplicate, by using an internal standard added at a fixed concentration. We used CoQ6 as an internal standard, after careful verification of the absence of this compound in our biological samples (data not shown28). When you are perform-ing the protocol for the first time, we suggest evaluating how the fish matrix might influence the extraction efficiency of the CoQs analytes by performing a calibration curve with fixed concentra-tion of the standard analytes (Step 12). Such a calibration curve will be useful to normalize the HPLC data (e.g., real peaks) in analyte concentrations.
Chromatographic peak areas of signals corresponding to the molecular [M + Na] + ions of CoQ6, CoQ9, CoQ10, CoQ9-13C6 and CoQ10-13C6 are integrated by means of Xcalibur 2.0.7 soft-ware with a mass accuracy of 10 p.p.m. For each sample, quantita-tive measurements of analytes are derived from the peak area after normalization with the recovery of CoQ6. Moreover, quantitative measurements of single analytes were found to be related to the protein content of corresponding samples, reporting measured quantities of ng of CoQs per mg of proteins.
LimitationsThe high proportions of yolk proteins in the embryos interfere with any proteomic application, rendering the zebrafish model ineffective as a model system for proteomic applications29. Thus, while setting up extraction protocols for specific metabolites in zebrafish embryos, one must also consider the presence of the yolk sac throughout development, which may interfere with protein and related metabolite extractions.
The availability of the standard compounds and labeled precur-sors that are required to perform these 13C-isotope–based meta-bolic HLPC analyses can represent a limitation for such studies. Commercial standards and labeled precursors are often limited, and custom-made production cannot always be achieved or can be very expensive and time-consuming.
Other detection methods such as NMR could provide more structural information (e.g., stereochemistry) than HPLC-MS can provide. This information can be crucial for the study of sugars and proteins.
Owing to the small size of a zebrafish embryo, it may be dif-ficult to deliver the stable isotope into a single organ or tissue (and then isolate and extract that metabolite from it). By using this approach, the possibility of not extracting enough biologi-cal materials (e.g., lipids, proteins, sugar, amino acids) for meta-bolic analyses is a limitation that must be taken into consideration before starting this type of experiment.
©20
13 N
atu
re A
mer
ica,
Inc.
All
rig
hts
res
erve
d.
protocol
nature protocols | VOL.8 NO.12 | 2013 | 2341
MaterIalsREAGENTS
Zebrafish strains (AB, TL) were purchased at the Zebrafish International Resource Center. No specific ethic approval under EU guidelines is required for this protocol, as all zebrafish used in this study are between 0 and 5 d old, which is in accordance with the European law (Council Directive (86/609/EEC) that excludes fetal and embryonic forms ! cautIon The pro-cedures related to animal use are accurately described in the proposal and conform to all regulations protecting animals used for research purposes, including those of the DL 116/92. The experiments described in the pro-posal are performed according to the detailed internal regulations drawn up according to UK Coordinating Committee on Cancer Research guidelines30.Methanol, CHROMASOLV, for HPLC, ≥99.9% (Sigma, cat. no. 34860, CAS no. (67-56-1))Formic acid, 98–100% (FA; Fluka, cat. no. 06440, CAS no. (64-18-6))2-Propanol for HPLC (Sigma, cat. no. 34863, CAS no. (67-63-0))n-Heptane for HPLC (Sigma, cat. no. 34873, CAS no. (142-82-5))CoenzymeQ6, internal standard (CoQ6; Spectra2000, cat. no. AVA900150O; CAS no. (1065-31-2))CoenzymeQ9 (CoQ9; Sigma, cat. no. 27597, CAS no. (303-97-9))CoenzymeQ10 (CoQ10; Sigma, cat. no. C9538, CAS no. (303-98-0))13C-4-hydroxy-benzoate (also known as 4-hydroxybenzoate-ring 13C6), 99% (Cambridge Isotope Laboratories, cat. no. CLM-4745-PK, PSO no.11F-507)DMSO (Sigma, cat. no. D2650, CAS no. (67-68-5))Ethyl 3-aminobenzoate methanesulfonate salt (Tricaine; Sigma, cat. no. A5040, CAS no. (886-86-2))N-Phenylthiourea (PTU; Sigma, cat. no. P7629, CAS no. (103-85-5))Sea salts (Instant Ocean; Tecniplast, cat. no. XPSIO25R)Tris-HCl solution, 1 M, pH 9.0 (Fisher Scientific, cat. no. 50-843-271)Agarose, low melting point (Sigma, cat. no. A9414, CAS no. (39346-81-1))Phenol red (Sigma, cat. no. P3532, CAS no. (143-74-8))Protein assay kit I (Bio-Rad, cat. no. #500-0001)Protein standard (Bio-Rad, cat. no. 500-0007)Ultrapure water (Milli-Q)Parafilm M (VWR, cat. no. 291-1214)Microinjection mold (Adaptive Science Tools, cat. no. TU-1)Liquid nitrogen for applying gas to the mass spectrometer ionization sourceHelium 5.5 grade, for applying gas to the mass spectrometer ion trapHPLC mobile phase: two eluents are used as mobile phase—eluent A is 0.05% (vol/vol) FA dissolved in ultrapure water and eluent B is methanol crItIcal Carefully check the pumping system of the HPLC instrument, as the retention time of metabolites is dependent on the water percentage in the mobile phase. Slight differences in the composition of the mobile phase owing to pumping system variations can significantly affect metabolite elution time.MS calibration solution (Thermo Scientific, Pierce LTQ ESI positive ion calibration solution, cat. no. 88322)
EQUIPMENTBorosilicate needles for microinjection (Drummond Scientific Company, cat. no. 3-000-203-G/X), microloader tips, 0.5–10 µl (Eppendorf)Microhomogenizer (Disperser T10 basic; IKA) coupled with a stainless steel tip (cat. no. S10N-5G)Polystyrene cuvettes with 1-cm path length (Bio-Rad, cat. no. 223-9955)Vertical borosilicate needle puller (P-30; Sutter Instruments)Picospritzer III (Parker)Stereomicroscope (MZ16F; Leica)Air incubator set at 28 °C (International PBI)UV-visible spectrophotometer (Beckman, DU530)Pipettes and tips suitable for handling organic solvents (Microman, Gilson)Screw cap autosampler glass vials (2 ml) assembled with polypropylene caps and rubber/polytetrafluoroethylene septa (Kinesis, cat. no. KVP6118)Analytical column Jupiter C4, 2.0 mm diameter, 150 mm length, 300-Å pore size and spherical particles of 3 µm (Phenomenex, cat. no. 00F-4167-B0)Precolumns, Luna C4, 2.0 mm diameter, 4 mm length (SecurityGuard; Phenomenex, cat. no. AJ0-4329)Polyetheretherketone (PEEK) tubing, 0.005 inch internal diameter (Sigma, cat. no. Z227307) crItIcal Tubing length should be minimal. In the present experimental setup, injector to column peek tubing is 39 cm long and column to ESI source is 25 cm long.Ultimate 3000 liquid chromatography system equipped with an internal degasser, sample cooler and column heater (Dionex)
•
•
••••
•••
••
•••••••••••••
•
•
•
••••••••
•
•
•
•
LTQ-Orbitrap hybrid mass analyzer equipped with ESI sources (Thermo Scientific)Gastight glass syringe, 0.250 ml (Hamilton-Bonaduz Schweiz)Software: Xcalibur mass spectrometry and data management software 2.0.7 (Thermo Scientific), Chromeleon 6.8 chromatography management software (Dionex) and Microsoft Excel 2007
REAGENT SETUPZebrafish handling Wild-type (TL/AB strain) and mutant (or transgenic) lines are maintained under standard laboratory conditions (density of 10–15 fishes in 3.5-liter tanks with a 14-h light/10-h dark cycle at 28 °C). It is required that female and male zebrafish adults be derived from the same genetic background (e.g., strain). crItIcal Fish maintenance must comply with relevant ethical guidelines on animal experimentation.Fish water (embryo medium) Prepare a solution by dissolving 60 mg of Instant Ocean sea salts in 1 liter of Milli-Q water (60 µg ml − 1 sea salts final concentration). This solution can be stored at room temperature for up to 30 d.N-Phenylthiourea Prepare the stock solution by dissolving 0.165 g in 100 ml of sterilized fish water. This solution can be stored up to 30 d at 4 °C. For a working solution, dilute this stock solution by adding 1 ml to 99 ml of sterilized fish water. crItIcal Stock solution must be protected from direct light.Tricaine/ethyl 3-aminobenzoate methanesulfonate salt Prepare the stock solution by dissolving 400 mg of tricaine in 100 ml of water, and adjust the pH to 7.0 by using 1 M Tris (pH 9). Store the stock solution at 4 °C for a maximum of 30 d. To anesthetize zebrafish embryos, dilute tricaine stock to 80 µg ml −1 final concentration in fish water.Phenol red Prepare a ready-to-use 0.5% (wt/vol) solution in water. Prepare aliquots and store them at −20 °C for up to 1 month.CoenzymeQ6 Dissolve 59.08 mg of CoQ6 powder into 1 ml of methanol to prepare a 100 mM stock solution. Store the stock in the dark at −20 °C for up to 1 month. Seal the vials to prevent evaporation.CoenzymeQ10 Dissolve 86.33 mg of CoQ10 powder into 1 ml of methanol to prepare a 100 mM stock solution. Do not reuse dilutions. Store the stock in the dark at −20 °C for up to 1 month. Seal the vials to prevent evaporation.EQUIPMENT SETUPMicroinjection plate Dissolve 2.5% (wt/vol) low-melting agarose in 50 ml of sterile fish water. Pour agarose (40–50 °C) into a Petri dish, lay a microinjection mold with angled lanes on the top of the dish, and then allow the gel to solidify at room temperature. Remove the mold and store the plate at 4 °C. Before use, warm the plate in a zebrafish incubator at 28 °C.Microinjection capillaries Pull glass capillaries with a needle puller to obtain a long and fine needle. Then, break them with fine forceps to create a 2–3-µm tip.Microinjection setup Set up the Picospritzer III injection apparatus by connecting it to a source of compressed air with a pressure of at least 20 p.s.i. Set the pulse duration interval between 5 and 20 ms and use a micrometer to achieve a 4-nl injection volume.HPLC-MS instrument setup To achieve the required mass accuracy, the LTQ-Orbitrap mass spectrometer requires calibration. Calibration proce-dures should be done at the beginning of each sample acquisition according to the manufacturer’s guidelines. The instrument should be calibrated weekly with fresh calibration solution. Finally, set the mobile phases (see Reagents), check the degasser operation and be sure to prime the system pump and tubing. Install the precolumn cartridge before the column and place the column in the column oven conditioned at 30 °C. Precondition the column system for at least 30 min before the first analytical run by setting the isocratic elution conditions: the mobile phase is 5% A and 95 % B (vol/vol) (Reagents); flow rate should be 0.200 ml min−1. Verify that no column wash-ing or reconditioning is necessary in between isocratic analytical runs by excluding any carryover effect. To do this, a series of blank samples should be analyzed immediately after a corresponding series of standard solutions at the maximum concentration level. Source parameters are set as follows: source voltage, 4.5 kV; capillary voltage, 48 V; tube lens voltage, 180 V; and capillary temperature, 265 °C. Program the inlet sequence file and place the vials inside the autosampler (20 °C). Program the injection system to operate in sequential mode, and then load the syringe with an appropriate volume of
•
••
©20
13 N
atu
re A
mer
ica,
Inc.
All
rig
hts
res
erve
d.
protocol
2342 | VOL.8 NO.12 | 2013 | nature protocols
the sample to inject in the full loop mode (loop volume, 20 µl). Ensure that the injection needle is washed with methanol between injections.General maintenance of HPLC-MS The atmospheric pressure ionization source of the instrument can become unclean during analysis, leading to
possible changes in instrument sensitivity over time. Systematic cleaning of the instrument should be carried out according to the manufacturer’s speci-fications. We perform a source cleaning after 30–35 analytical runs (6–7 h of continuous operation).
proceDurepreparation of 13c6-labeled precursor for in vivo delivery ● tIMInG 20 min1| Dissolve 14.4 mg of 13C6-4-hydroxy-benzoate in 1 ml of DMSO to make a 100 mM stock solution. Vortex until the powder is completely dissolved. ! cautIon 13C6-4-hydroxy-benzoate at solid state (powder) and DMSO are irritants. DMSO can be adsorbed by skin and mucosae; take appropriate laboratory precautions for the handling of these chemicals. crItIcal step Weigh the 13C6 precursor compound with an analytical balance. Prepare the stock solution shortly before use. Avoid light and air exposure after dissolution in DMSO. Use the stock solution within 24 h.
2| Pipette 40 µl of 100 mM 13C6-4-hydroxy-benzoate stock into 360 µl of sterile water in order to prepare a 10 mM 13C6-4-hydroxy-benzoate solution.
3| Preparation of microinjection solution containing the isotope precursor. Mix the following reagents: 3 µl of 13C6-4- hydroxy-benzoate (10 mM), 6 µl of phenol red and 21 µl of sterile water. Store the mixture at room temperature. crItIcal step After the injection at the one-cell stage, the embryos can be processed at different developmental stages ranging from a few h.p.f. to a few days after fertilization. If processing and analyses are performed shortly after injection (i.e., 10–24 h), it is important to reduce the possible side effects of 13C6-4-hydroxy-benzoate by preparing the following microinjection solution instead: 1.5 µl of 13C6-4-hydroxy-benzoate (10 mM stock), 6 µl of phenol red and 22.5 µl of sterile water. Please note that this experimental condition is not desirable when labeled analytes are analyzed at larval stages. crItIcal step Protect the tube from light. As you pipette the labeled compound into phenol red, you should expect that the solution will change from red to orange. Dispose of the solution after use.
Microinjection of labeled precursor (13c6-4-hydroxybenzoate) into zebrafish eggs ● tIMInG 5 h! cautIon All in vivo experiments on zebrafish adults, larvae and eggs need to be carried out according to standard operating laboratory procedures (Reagent Setup).
4| Collect fertilized eggs at the one-cell stage and position them in a prewarmed (28 °C) agarose Petri dish for microinjection.
5| Inject 4 nl of the solution containing the 13C6-4-hydroxybenzoate (Step 3) into the egg yolk. Immediately after microinjection, transfer the eggs into a new Petri dish with fresh fish water and incubate them at 28 °C for 3–4 h. crItIcal step Proper calibration of injected volumes and needles are crucial parameters to guarantee consistency between different experiments. Inject the same volume for solutions of different concentrations. Do not inject different volumes of the same solution in order to achieve different concentrations of the injected precursor. Define the best nontoxic concentration of the isotope so that at least 70% of injected eggs reach the 24 h.p.f. stage (as stated in Step 7).? trouBlesHootInG
Zebrafish embryo preparation: screening and pooling ● tIMInG 3 d crItIcal The different uptake kinetics of different metabolites must be taken into consideration when calculating the timing of this step. It can also vary according to the state (e.g., active or inactive) of the metabolic pathway that you are studying.
6| At 3 h after injection, injected embryos can be screened for the successful delivery of the isotope precursor into the developing embryo. Discard underdeveloped or damaged embryos. Annotate the number of live and available embryos for statistical analysis.? trouBlesHootInG
7| The next day (~24 h.p.f.), screen for surviving embryos that have reached the normal developmental stage. Note the number of live and available embryos for statistical analysis. Change the embryo medium, add fresh fish water containing
©20
13 N
atu
re A
mer
ica,
Inc.
All
rig
hts
res
erve
d.
protocol
nature protocols | VOL.8 NO.12 | 2013 | 2343
PTU (Reagent Setup) and incubate the embryos at 28 °C for a further 48 h (or for a different time according to specific experimental requirements).? trouBlesHootInG
8| At 65 h.p.f., anesthetize the injected zebrafish embryos for 5 min in fish water containing tricaine (Reagent Setup). Select the mutant and wild-type (siblings) embryos and make pools of 35 embryos (or a different number, according to experimental needs) displaying the same phenotype and specific experimental characteristics. For example, at 65 h.p.f., barolo mutant embryos are selected for characteristic cardiovascular phenotypes, and they are clearly distinguishable from their respective wild-type siblings5. For each condition (e.g., mutant versus siblings), two different pools should be prepared. Collect embryos in tubes with a large bottom (e.g., 2-ml tubes). crItIcal step The developmental stage at which this step should be performed depends on the specific experimental setting. Avoid pooling embryos coming from different strains or genetic backgrounds, as this may affect global metabolic response.
9| Wash the embryos twice with 1 ml of fresh fish water without PTU or tricaine. Next, remove all the fish medium.
10| Wash the embryos once with 1 ml of water. Next, remove all the water with a thin tip.
preparation of organic extracts from zebrafish embryos: homogenization and lipid extraction ● tIMInG 3 h for up to six samples crItIcal Keep the samples protected from light from this step onward.11| Add 20 µl of CoQ6 stock (100 µM in methanol) as internal standard into each dried sample.
12| To generate the calibration curve for the quantification of the CoQ10 analyte from the fish matrix, collect an additional six pools of 35 embryos each. Process these pools as described in Steps 8–11. To each of these samples, add one of six different concentrations of CoQ10 standards (0.1, 5, 10, 25, 50 and 100 µM in methanol). In this way, six points of the calibration curve will be generated for further processing. Afterward, proceed with Step 13. Protect CoQ10 and CoQ6 standards and samples from light exposure.
13| Add 200 µl of water and 300 µl of isopropanol into each sample. ! cautIon Isopropanol is toxic and highly flammable.
14| Homogenize the samples with a microhomogenizer for 3 min to obtain a homogeneous cloudy solution. crItIcal step Ensure that all samples are homogenized with the same efficacy. Always clean the steel of the homogenizer between samples by sequentially washing in water, isopropanol and n-heptane. Dry the steel after the cleaning procedure.
15| Remove 20 µl of homogenate tissue for the protein quantification assay. Put these aliquots into a new precooled 1.5-ml tube and keep it on ice. Centrifuge the samples at 15,294g for 2 min at 4 °C. For protein quantification, use a commercially available kit (protein assay kit) according to the manufacturer’s instructions. crItIcal step As the homogenate does not contain protease inhibitors, process the sample for protein quantification as soon as possible.
16| Add 500 µl of n-heptane and seal the samples from Step 14 with laboratory film (e.g., Parafilm). Vortex the tube for 2 min at maximum speed in order to mix up the n-heptane with the homogenized solution.
17| Centrifuge the mixture at 15,294g for 30 min at room temperature.
18| Collect the upper phase (organic phase, no less than 500 µl) and transfer it to a 1.5-ml tube with a close-fitting bottom. Avoid touching lower phases with the pipette tip. crItIcal step Accuracy in collecting the upper phase is important to ensure appropriate extraction of the sample.
19| Repeat Steps 16–18 with the lower phase and collect the residual upper phase together with the previously collected upper phase. Discard the remaining lower phase.
©20
13 N
atu
re A
mer
ica,
Inc.
All
rig
hts
res
erve
d.
protocol
2344 | VOL.8 NO.12 | 2013 | nature protocols
20| Dry the upper-phase samples in a vacuum concentrator for 20 min at 30 °C, pressure 67 kPa, mode: ventilation. crItIcal step Excessive drying of samples results in unreliable quantifications. Adjust the time according to the temperature used. crItIcal step We remind the user to keep the samples protected from light exposure.? trouBlesHootInG
21| Suspend the dried pellets in 200 µl of methanol/n-heptane (9:1). ! cautIon n-Heptane and methanol are toxic and highly flammable, and they should be handled under a fume hood.
preparation for Hplc-Ms analysis: pellet reconstitution ● tIMInG 15 min22| Seal the tubes and vortex them for 2 min at room temperature.
23| Sonicate the tubes with the following parameters: temperature, 24 °C; frequency, 60 KHz; and time, 2 min.
24| Centrifuge the tubes at 15,294g for 5 min at room temperature in order to verify that the dried pellet is completely dissolved in the suspension volume. If this is the case, no particles should be visible at the bottom of the tube.? trouBlesHootInG
25| Transfer 200 µl of the solution into autosampler glass vials. Do not expose the vials to light, air or temperature changes. crItIcal step Do not store the vials at low temperature and do not freeze them.
Hplc-Ms acquisition ● tIMInG 7–8 h26| Place the glass vials in the autosampler conditioned at 20 °C. Ensure that the autosampler cover does not allow the vials to be exposed to light.
27| Check for the presence of sufficient eluents, helium and nitrogen gases, and carry out instrument operation (Equipment Setup). crItIcal step Check the LC lines for air bubbles and tubing connections for leakage by verifying back-pressure stability.? trouBlesHootInG
28| Prepare the data acquisition sample list. Typically, a batch of 15–20 samples, including blanks, standards and QC samples, is consecutively analyzed in triplicate. The acquisition list should be randomized.
29| Acquire LC-accurate mass data in the LC-LTQ-Orbitrap instrument by using the instrument-specific parameters described in HPLC-MS instrument setup. The ESI ionization source must be selected. Each analytical run takes 12 min. pause poInt Raw analytical data can be stored on hard disks or other digital storage devices until further processing.
Hplc-Ms data processing ● tIMInG 3–4 h 30| Use appropriate software (Xcalibur 2.0.7) to extract and automatically integrate the analytes [M + Na] + mass signals. Use a mass accuracy filter of 10 p.p.m., extracting the m/z ion current traces for the predicted values of the selected analytes: 885.6731 (CoQ10), 891.6935 (13C6-CoQ10), 817.6105 (CoQ9), 823.6309 (13C6-CoQ9) and 613.4227 (CoQ6). Typical retention time values are 3.6 min (CoQ6), 3.8 min (CoQ9) and 4.2 min (CoQ10).? trouBlesHootInG
31| Report the peak areas for each analyte (CoQ10, 13C6-CoQ10, CoQ9 and 13C6-CoQ9) and internal standard (CoQ6) in a Microsoft Excel data sheet. Next, calculate the absolute concentration values by interpolation of the peak area values on the calibration curve equation. Always evaluate the matrix effect for the efficiency of extraction and background of endogenously synthesized CoQ9 and CoQ10. Normalize the obtained values with the protein content obtained from the sample aliquot taken in Step 15.
? trouBlesHootInGTroubleshooting advice can be found in table 1.
©20
13 N
atu
re A
mer
ica,
Inc.
All
rig
hts
res
erve
d.
protocol
nature protocols | VOL.8 NO.12 | 2013 | 2345
● tIMInGSteps 1–3, preparation of 13C6-labeled precursor for in vivo delivery: 20 minSteps 4 and 5, microinjection of labeled precursor (13C6-4-hydroxybenzoate) into zebrafish eggs: 5 hSteps 6–10, zebrafish embryo preparation: screening and pooling: 3 dSteps 11–21, preparation of organic extracts from zebrafish embryos: homogenization and lipid extraction: 3 h for up to six samplesSteps 22–25, preparation for HPLC-MS analysis: 15 minSteps 26–29, HPLC-MS data acquisition: 7–8 h, depending on the number of samples; each analytical run takes 12 minSteps 30 and 31, HPLC-MS data processing: 3–4 h, depending on the number of samples
taBle 1 | Troubleshooting table.
step problem possible reason solution
5 The needle doesn’t eject the same quantity of solution each time; the volume injected is unreliable; the solution is blocked inside the needle
The solution contains microcrystals of poorly dissolved 13C6-hydroxy-benzoate that block the opening of the injection needle
Prepare a fresh stock solution of the 13C6-compound and microinjection solution. Use a new needle with freshly prepared solution. Do not increase the diameter of the needle
6 Large numbers of deformed or underdeveloped embryos
The injected solution interfered with the embryo development
Check the needle calibration
The injected solution is toxic Check that the needle doesn’t contain glass debris at the tip. Remove debris by scratching very carefully the needle over paper or laboratory film (e.g., Parafilm)
7 Large percentages of dead embryos (≥70%)
The injected solution is not correctly metabolized by developing embryos
Reduce the final concentration of labeled compound
20 The dried pellet is not visible The pellet is too dried Add resuspension solution as described in Step 21, seal the tube with Parafilm and wait 2 h before proceeding to Step 22
24 Some particles are still visible at the bottom of the tube
The dried pellet has not been dissolved properly
Repeat Steps 22 and 23 twice
27 High LC back-pressure Occlusions are present in pump outlet frit, peek tubing, injector needle, injector loop and/or column
Search for the clogged section(s) sequentially, isolating each section from column back to the pump outlet
Low LC back-pressure Eluent leakage or reservoir out of eluent(s)
Verify the tightness of connections and check eluent(s) reservoir filling
Poor chromatography peak shape
Column degradation Clean or replace the column
Carryover Incorrect injector wash solvent Check for the appropriate wash solvent
Low MS sensitivity The external surface of the ESI source is contaminated
Open and clean the ESI source chamber
Capillary is protruding too far from the end of the ESI needle
Reduce the length of the capillary
Alteration in retention time Pump-proportioning valves malfunction Verify flow of eluent(s) from pump-proportioning valves
30 Poor HR mass accuracy Old calibration Recalibrate the instrument according to the manufacturer’s guidelines

©20
13 N
atu
re A
mer
ica,
Inc.
All
rig
hts
res
erve
d.
protocol
2346 | VOL.8 NO.12 | 2013 | nature protocols
antIcIpateD resultsBy using this protocol, we analyzed two specific labeled metabolites (13C6-CoQ10 and 13C6-CoQ9) in different biological samples that correspond to different genetic conditions5. In one case, we used zebrafish samples with Ubiad1 prenyltrans-ferase enzyme activity impaired (barolo zebrafish mutant and corresponding siblings5). In the second case, we overexpressed the zebrafish Ubiad1 prenyltransferase enzyme in zebrafish embryos. The labeled precursor 13C6-4-hydroxy-benzoate was
10095908580757065605550454035R
elat
ive
abun
danc
eR
elat
ive
abun
danc
e
3025201510
50
100 4.2 CoQ10m/z = 885.6731
80
60
40
20
0
884.5 885.0 885.5
885.6738a
cd e
886.6739
887.6808
886.0m/z
886.5 887.0 887.5 888.0 888.5
10095908580757065605550454035R
elat
ive
abun
danc
e
302520151050
891.0
120
90
60
***30
ng 13
C6
CoQ
10 p
er m
g pr
otei
ns
0
sibs8
47
bars8
47
891.5 892.0 892.5 893.0 893.5 894.0
891.6936b
892.6968
893.6976
m/z
13C-CoQ10m/z = 891.6935
100 4.2
80
60
40
20
0
CoQ9m/z = 817.6105
1003.8
80
60
40
20
0
13C-CoQ9m/z = 823.6309
1003.8
80
60
40
20
00 1 2 3 4 5
Time (min)
6 7 8 9 10 11
20
15
10
***5
ng 13
C6
CoQ
9 pe
r m
g pr
otei
ns0
sibs8
47
bars8
47
f g120
90
60
**
30
ng 13
C6
–CoQ
10 p
er m
g pr
otei
ns
0
CTRL
z ubia
d1
20
15
10
*
5
ng 13
C6
–CoQ
9 pe
r m
g pr
otei
ns
0
CTRL
z ubia
d1
Figure 3 | HPLC-MS analysis of zebrafish lipid extracts after delivery of 13C6-4-hydroxy-benzoate. (a,b) LC-HRMS spectra of lipid extracts from wild-type zebrafish embryos show isotopic patterns of CoQ10 (a) and 13C6-CoQ10 (b). Both analytes are profiled in lipid extracts derived from the same zebrafish embryos. (c) The LC-HRMS chromatograms of samples of zebrafish embryos. The signals corresponding to the following ions are reported: CoQ10: 885.6731 m/z; 13C6-CoQ10: 891.6935 m/z; CoQ9: 817.6105 m/z; 13C6-CoQ9: 823.6309 m/z (mass accuracy 10 p.p.m.). (d,e) The histogram shows HPLC-MS quantification of 13C6-CoQ10 (d) and 13C6-CoQ9 (e) corresponding to barolo mutants (bar s847) and control siblings (sibs847). (f) Overexpression of mRNA encoding for wild-type zebrafish Ubiad1 (z ubiad1) significantly increases the de novo synthesis of 13C6-CoQ10 in zebrafish embryos. (g) The biosynthesis of 13C6-CoQ9 is upregulated by the expression of z ubiad1. Data are means ± s.d. of three technical replicates. *P < 0.05, **P < 0.01, ***P < 0.001 by a two-tailed Student’s t test. Wild-type zebrafish embryos were injected at the one-cell stage with a solution containing ubiad1 mRNA (80 pg) (z ubiad1) or the fluorescent protein H2B-cherry (CTRL) plus the labeled 13C6-4-hydroxy-benzoate (final concentration, 0.5 µM). Phenol red was added as a tracer. All embryos were injected with 4 nl of the above solution and processed for HPLC-MS extraction at 72 h.p.f. The 13C6-4-hydroxy-benzoate was prepared as described in this protocol, whereas the mRNA was synthesized as described in ref. 5.
©20
13 N
atu
re A
mer
ica,
Inc.
All
rig
hts
res
erve
d.
protocol
nature protocols | VOL.8 NO.12 | 2013 | 2347
equally administered to both experimental conditions. After precursor administration, incubation and lipid extraction, the final output of such a procedure is represented by an HPLC-MS chromatogram as shown in Figure 3. Endogenous CoQ10 (885.6731 m/z, mass accuracy 10 p.p.m.; Fig. 3a) and de novo–synthetized 13C6-CoQ10 (891.6935 m/z, mass accuracy 10 p.p.m.) (Fig. 3b) are shown in representative HPLC-HRMS spectra of zebrafish lipid extracts. In addition, Figure 3c HPLC-MS chromatograms show the different metabolism of 13C6-CoQ10 and 13C6-CoQ9 with regard to CoQ10 and CoQ9 in the same embryo extracts.
To quantitatively measure the absolute and relative abundance of CoQs isotopomers, HPLC-HRMS chromatograms were analyzed and peaks corresponding to selected analytes are automatically integrated by using the Xcalibur software. Each sample was usually analyzed in triplicate. Relative s.d. of each measurement should be <20%. Subsequently, mean peak areas corresponding to the same sample were converted to relative concentration values. To better normalize results coming from HPLC-MS quantification of our biological sample, we normalized values of the analyte with the protein content of each sample (Step 31). Although the 13C6-4-hydroxy-benzoate precursor was equally loaded in all conditions, embryos in which the Ubiad1 enzyme (bars847) is deleted showed a reduced amount of both 13C6-CoQ10 and 13C6-CoQ9. In contrast, in the same experimental conditions, overexpression of the zebrafish Ubiad1 enzyme increased the conversion of 13C6-4-hydroxy-benzoate into 13C6-CoQ10 and 13C6-CoQ9 in the same time frame5. Figure 3d,e shows histograms of 13C6-CoQ10 and 13C6-CoQ9 measurements from zebrafish barolo mutants and their siblings, respectively. Figure 3f,g shows histograms of 13C6-CoQ10 and 13C6-CoQ9 measurements from zebrafish embryos overexpressing the Ubiad1 enzyme (z ubiad1) by mRNA injection compared with embryos injected with control mRNA (H2B-cherry), respectively.
acknowleDGMents M.M.S.’s laboratory was supported by research grants from the Marie Curie Action IRG 247852, Telethon GGP10195 and AIRC MFAG-8911. We thank E.J. Corcoran for editorial assistance.
autHor contrIButIons V.M. and M.M.S. designed the study. V.M., C.M. and M.M.S. performed the experiments, analyzed the data and discussed this study. V.M., C.M. and M.M.S. wrote the manuscript.
coMpetInG FInancIal Interests The authors declare no competing financial interests.
Reprints and permissions information is available online at http://www.nature.com/reprints/index.html.
1. Crown, S.B. & Antoniewicz, M.R. Parallel labeling experiments and metabolic flux analysis: past, present and future methodologies. Metab. Eng. 16c, 21–32 (2012).
2. Klein, S. & Heinzle, E. Isotope labeling experiments in metabolomics and fluxomics. Wiley Interdiscip. Rev. Syst. Biol. Med. 4, 261–272 (2012).
3. Kalen, A., Appelkvist, E.L., Chojnacki, T. & Dallner, G. Nonaprenyl-4-hydroxybenzoate transferase, an enzyme involved in ubiquinone biosynthesis, in the endoplasmic reticulum-Golgi system of rat liver. J. Biol. Chem. 265, 1158–1164 (1990).
4. Bequette, B.J., Sunny, N.E., El-Kadi, S.W. & Owens, S.L. Application of stable isotopes and mass isotopomer distribution analysis to the study of intermediary metabolism of nutrients. J. Anim. Sci. 84 (suppl.), E50–E59 (2006).
5. Mugoni, V. et al. Ubiad1 is an antioxidant enzyme that regulates eNOS activity by CoQ10 synthesis. Cell 152, 504–518 (2013).
6. Fahy, E. et al. Update of the LIPID MAPS comprehensive classification system for lipids. J. Lipid Res. 50 (suppl.), S9–S14 (2009).
7. Fahy, E. et al. A comprehensive classification system for lipids. J. Lipid Res. 46, 839–861 (2005).
8. Raamsdonk, L.M. et al. A functional genomics strategy that uses metabolome data to reveal the phenotype of silent mutations. Nat. Biotechnol. 19, 45–50 (2001).
9. Zamboni, N. 13C metabolic flux analysis in complex systems. Curr. Opin. Biotechnol. 22, 103–108 (2011).
10. Trethewey, R.N. Gene discovery via metabolic profiling. Curr. Opin. Biotechnol. 12, 135–138 (2001).
11. Lv, H. Mass spectrometry-based metabolomics towards understanding of gene functions with a diversity of biological contexts. Mass Spectrom. Rev. 32, 118–128 (2013).
12. Fiehn, O. Metabolomics--the link between genotypes and phenotypes. Plant Mol. Biol. 48, 155–171 (2002).
13. Adamski, J. & Suhre, K. Metabolomics platforms for genome wide association studies-linking the genome to the metabolome. Curr. Opin. Biotechnol. 24, 39–47 (2013).
14. Crane, F.L. Biochemical functions of coenzyme Q10. J. Am. Coll. Nutr. 20, 591–598 (2001).
15. Bentinger, M., Dallner, G., Chojnacki, T. & Swiezewska, E. Distribution and breakdown of labeled coenzyme Q10 in rat. Free Radic. Biol. Med. 34, 563–575 (2003).
16. Huang, S.M., Xu, F., Lam, S.H., Gong, Z. & Ong, C.N. Metabolomics of developing zebrafish embryos using gas chromatography- and liquid chromatography-mass spectrometry. Mol. Biosyst. 9, 1372–1380 (2013).
17. Nath, A.K. et al. Chemical and metabolomic screens identify novel biomarkers and antidotes for cyanide exposure. FASEB J. 27, 1928–1938 (2013).
18. Hayashi, S. et al. A novel application of metabolomics in vertebrate development. Biochem. Biophys. Res. Commun. 386, 268–272 (2009).
19. Ong, E.S., Chor, C.F., Zou, L. & Ong, C.N. A multi-analytical approach for metabolomic profiling of zebrafish (Danio rerio) livers. Mol. Biosyst. 5, 288–298 (2009).
20. Mootha, V.K. & Hirschhorn, J.N. Inborn variation in metabolism. Nat. Genet. 42, 97–98 (2010).
21. Weiss, R.H. & Kim, K. Metabolomics in the study of kidney diseases. Nat. Rev. Nephrol. 8, 22–33 (2012).
22. Jin, S.W. et al. A transgene-assisted genetic screen identifies essential regulators of vascular development in vertebrate embryos. Dev. Biol. 307, 29–42 (2007).
23. Bentinger, M. et al. Polyisoprenoid epoxides stimulate the biosynthesis of coenzyme Q and inhibit cholesterol synthesis. J. Biol. Chem. 283, 14645–14653 (2008).
24. Kilkenny, C., Browne, W.J., Cuthill, I.C., Emerson, M. & Altman, D.G. Improving bioscience research reporting: the ARRIVE guidelines for reporting animal research. PLoS Biol. 8, e1000412 (2010).
25. Rosen, J.N., Sweeney, M.F. & Mably, J.D. Microinjection of zebrafish embryos to analyze gene function. J. Vis. Exp. 2009, 1115 (2009).
26. Singleman, C. & Holtzman, N.G. Heart dissection in larval, juvenile and adult zebrafish, Danio rerio. J. Vis. Exp. 2011, 3165 (2011).
27. Gupta, T. & Mullins, M.C. Dissection of organs from the adult zebrafish. J. Vis. Exp. 2011, 2839 (2010).
28. Turunen, M., Olsson, J. & Dallner, G. Metabolism and function of coenzyme Q. Biochim. Biophys. Acta 1660, 171–199 (2004).
29. Link, V., Shevchenko, A. & Heisenberg, C.P. Proteomics of early zebrafish embryos. BMC Dev. Biol. 6, 1 (2006).
30. United Kingdom Co-ordinating Committee on Cancer Research (UKCCCR) guidelines for the welfare of animals in experimental neoplasia (second edition). Br. J. Cancer 77, 1–10 (1998).


![Conversion of Hyperpolarized [1-13C]Pyruvate in Breast ...](https://static.fdokumen.com/doc/165x107/6328a69be491bcb36c0bdd22/conversion-of-hyperpolarized-1-13cpyruvate-in-breast-.jpg)