12 years of 7Be and 210Pb in Mt. Cimone, and their correlation with meteorological parameters
15
12 years of 7 Be and 210 Pb in Mt. Cimone, and their correlation with meteorological parameters L. Tositti a , E. Brattich a, b, * , G. Cinelli b, c , D. Baldacci a a Environ. Chemistry and Radioactivity Lab., Dept. of Chemistry “G. Ciamician”, Alma Mater Studiorum University of Bologna, Via Selmi 2, 40126 Bologna, BO, Italy b Dept. of Biological, Geological and Environmental Sciences e Section of Geology, Alma Mater Studiorum University of Bologna, Piazza di Porta San Donato 1, 40126 Bologna, BO, Italy c European Commission, DG JRC, Institute for Transuranium Elements, Via E Fermi 2749, I-21027 Ispra, VA, Italy highlights 7 Be and 210 Pb activities over the period 1998e2011. Seasonal/interannual variations of 7 Be and 210 Pb and of their activity ratio. Frequency distribution of radiotracers and of other atmospheric variables. Correlations of radiotracers with meteorological and compositional atmospheric variables. Possible use of the studied radiotracers as potential proxies is examined. article info Article history: Received 12 August 2013 Received in revised form 4 January 2014 Accepted 6 January 2014 Keywords: Atmospheric radiotracers 7 Be 210 Pb Stratosphere-to-troposphere exchange Ambient aerosol Saharan Dust PM10 abstract Simultaneous measurements of airborne radionuclides 7 Be and 210 Pb, together with aerosol mass load PM 10 , have been routinely carried out at the Global WMO-GAW station of Mt. Cimone (Italy, 2165 m a.s.l., 44 12 0 N, 10 42 0 E) from 1998 to 2011. The experimental activity was started with the purpose of gaining a better understanding of the vertical and horizontal transports taking place at this site affecting the atmospheric chemical composition. The time series of the collected data is presented and discussed in this paper. The 7 Be concentrations in this period are in the range 0.05e15.8 mBq m 3 with the presence of two distinct relative maxima during winter/spring and summer, suggesting an origin from different physical processes. The 210 Pb concentrations collected during the period are in the range 0.05e2.30 mBq m 3 and are characterized by a single maximum during the warm period. The 7 Be/ 210 Pb ratio was in the range 0.5e127.8 and is characterized by a maximum during the cold period. The fre- quency distributions of the three parameters and the seasonal/interannual variabilities are investigated and presented. Ó 2014 Elsevier Ltd. All rights reserved. 1. Introduction In the course of the last decades airborne radionuclides have long been investigated within the framework of atmospheric sci- ence. Initially the focus concerned the emission of artificial radio- activity during weapon testing (see for example chapter 9 of Eisenbud and Gesell, 1997; Pállson et al., 2013) which pointed out to the scientists both the safety issues connected with radioactivity hazard as well as the remarkable efficiency of atmospheric trans- port processes at the global scale. It was soon recognized that at- mospheric radioactivity had also a not negligible background component capable to trace both the gaseous and the particulate phases enabling the quantitative description of fundamental pro- cesses of atmospheric dynamics. Airborne radioactivity has long been playing a relevant role in the study of atmospheric transport processes as detectable from the frequency of scientific publica- tions (Burton and Stewart, 1960; Junge, 1963; Reiter et al., 1971; Gaggeler, 1995; Arimoto et al., 1999; Turekian and Graustein, 2003; WMO-GAW Report n. 155, 2004; Dibb, 2007; Papastefanou, 2008; Rastogi and Sarin, 2008; Froehlich and Masarik, 2010; Sykora and Froehlich, 2010; Lozano et al., 2011). * Corresponding author. Environ. Chemistry and Radioactivity Lab., Dept. of Chemistry “G. Ciamician”, Alma Mater Studiorum University of Bologna, Via Selmi 2, 40126 Bologna, BO, Italy. E-mail addresses: [email protected] (L. Tositti), [email protected] (E. Brattich), [email protected] (G. Cinelli), [email protected] (D. Baldacci). Contents lists available at ScienceDirect Atmospheric Environment journal homepage: www.elsevier.com/locate/atmosenv 1352-2310/$ e see front matter Ó 2014 Elsevier Ltd. All rights reserved. http://dx.doi.org/10.1016/j.atmosenv.2014.01.014 Atmospheric Environment 87 (2014) 108e122
Transcript of 12 years of 7Be and 210Pb in Mt. Cimone, and their correlation with meteorological parameters

lable at ScienceDirect
Atmospheric Environment 87 (2014) 108e122
Contents lists avai
Atmospheric Environment
journal homepage: www.elsevier .com/locate/atmosenv
12 years of 7Be and 210Pb in Mt. Cimone, and their correlation withmeteorological parameters
L. Tositti a, E. Brattich a,b,*, G. Cinelli b,c, D. Baldacci a
a Environ. Chemistry and Radioactivity Lab., Dept. of Chemistry “G. Ciamician”, Alma Mater Studiorum University of Bologna, Via Selmi 2, 40126 Bologna,BO, ItalybDept. of Biological, Geological and Environmental Sciences e Section of Geology, Alma Mater Studiorum University of Bologna,Piazza di Porta San Donato 1, 40126 Bologna, BO, Italyc European Commission, DG JRC, Institute for Transuranium Elements, Via E Fermi 2749, I-21027 Ispra, VA, Italy
h i g h l i g h t s
� 7Be and 210Pb activities over the period 1998e2011.� Seasonal/interannual variations of 7Be and 210Pb and of their activity ratio.� Frequency distribution of radiotracers and of other atmospheric variables.� Correlations of radiotracers with meteorological and compositional atmospheric variables.� Possible use of the studied radiotracers as potential proxies is examined.
a r t i c l e i n f o
Article history:Received 12 August 2013Received in revised form4 January 2014Accepted 6 January 2014
Keywords:Atmospheric radiotracers7Be210PbStratosphere-to-troposphere exchangeAmbient aerosolSaharan DustPM10
* Corresponding author. Environ. Chemistry andChemistry “G. Ciamician”, Alma Mater Studiorum Un2, 40126 Bologna, BO, Italy.
E-mail addresses: [email protected] (L. Tos(E. Brattich), [email protected] (G. Cine(D. Baldacci).
1352-2310/$ e see front matter � 2014 Elsevier Ltd.http://dx.doi.org/10.1016/j.atmosenv.2014.01.014
a b s t r a c t
Simultaneous measurements of airborne radionuclides 7Be and 210Pb, together with aerosol mass loadPM10, have been routinely carried out at the Global WMO-GAW station of Mt. Cimone (Italy, 2165 ma.s.l., 44� 120 N, 10� 420 E) from 1998 to 2011. The experimental activity was started with the purpose ofgaining a better understanding of the vertical and horizontal transports taking place at this siteaffecting the atmospheric chemical composition. The time series of the collected data is presented anddiscussed in this paper. The 7Be concentrations in this period are in the range 0.05e15.8 mBq m�3 withthe presence of two distinct relative maxima during winter/spring and summer, suggesting an originfrom different physical processes. The 210Pb concentrations collected during the period are in the range0.05e2.30 mBq m�3 and are characterized by a single maximum during the warm period. The 7Be/210Pbratio was in the range 0.5e127.8 and is characterized by a maximum during the cold period. The fre-quency distributions of the three parameters and the seasonal/interannual variabilities are investigatedand presented.
� 2014 Elsevier Ltd. All rights reserved.
1. Introduction
In the course of the last decades airborne radionuclides havelong been investigated within the framework of atmospheric sci-ence. Initially the focus concerned the emission of artificial radio-activity during weapon testing (see for example chapter 9 ofEisenbud and Gesell, 1997; Pállson et al., 2013) which pointed out
Radioactivity Lab., Dept. ofiversity of Bologna, Via Selmi
itti), [email protected]), [email protected]
All rights reserved.
to the scientists both the safety issues connected with radioactivityhazard as well as the remarkable efficiency of atmospheric trans-port processes at the global scale. It was soon recognized that at-mospheric radioactivity had also a not negligible backgroundcomponent capable to trace both the gaseous and the particulatephases enabling the quantitative description of fundamental pro-cesses of atmospheric dynamics. Airborne radioactivity has longbeen playing a relevant role in the study of atmospheric transportprocesses as detectable from the frequency of scientific publica-tions (Burton and Stewart, 1960; Junge, 1963; Reiter et al., 1971;Gaggeler, 1995; Arimoto et al., 1999; Turekian and Graustein,2003; WMO-GAW Report n. 155, 2004; Dibb, 2007; Papastefanou,2008; Rastogi and Sarin, 2008; Froehlich andMasarik, 2010; Sykoraand Froehlich, 2010; Lozano et al., 2011).

L. Tositti et al. / Atmospheric Environment 87 (2014) 108e122 109
At present nuclear safety is still a basic issue at the global scaleas demonstrated by the follow up of Chernobyl and Fukushimaaccidents (see for example Papastefanou et al., 1988; Hötzl et al.,1992; Davison et al., 1993; Vakulovsky et al., 1994; chapter 12 ofEisenbud and Gesell, 1997; Diaz Leon et al., 2011; Lozano et al.,2011; Manolopoulou et al., 2011; Masson et al., 2011; Pittauerováet al., 2011; Tositti et al., 2012; Ioannidou et al., 2013) or as aresult of episodic cases such as the fall of nuke-fed satellites(Cosmos 954, Kosmos 1402, see for example chapter 12 of Eisenbudand Gesell, 1997) or the accidental melting of orphan sources/metals scraps in high temperature processes (e.g., Algeciras acci-dent, Krysta and Bocquet, 2007; on this occasion 137Cs, a radionu-clide which is usually below detection limit at Mt. Cimone, wasdetected at this site in two samples at very low levels). Moreoverthe need for monitoring potential violations of the Nuclear BanTreaty has recently promoted the constitution of a global networkfor artificial radioactivity whose efficiency has been successfullytested following the recent Fukushima emergency (Masson et al.,2011; Hernández-Ceballos et al., 2012; Thakur et al., 2013).
Cosmogenic and naturally occurring radionuclides have longbeen investigated either per se or as normalizing and referencefactors in the study of artificial radioactivity or again both as effi-cient tracers in environmental science and as geochronometers.Altogether this field of research has been crucial to the compre-hension of several basic processes such as interhemispherictransport, stratosphere-to-troposphere exchange (STE) and timescales of atmospheric dynamics, while posing the basis for basicconcepts in environmental science such as biogeochemistry, envi-ronmental monitoring management and exposure/dosimetry con-cepts presently extended to stable “classic” pollutants such as forexample ozone and/or airborne particulate matter.
At present though the application of radiotracers constitutes aniche approach, the simultaneous use of artificial and natural ra-diotracers still provides a solid background for the characterizationof atmospheric transport (Arimoto et al., 1999; Paatero and Hatakka,2000; Dueñas et al., 2011) the testing of atmospheric models (Kochet al., 1996; Liu et al., 2001, 2004; Heinrich and Jamelot, 2011;Christoudias and Lelieveld, 2013) as well as in supporting sourceapportionment of pollutants (Li et al., 2002; Cuevas et al., 2013).
Among the most used naturally occurring radionuclides thereare 7Be, 210Pb, 222Rn and others included in the group of the keyatmospheric components that should be routinely monitoredwithin the WMO-GAW network (WMO-GAW Report n. 155, 2004).In particular the importance of 210Pb and 7Be relies upon theirdistinct natural sources. 210Pb (half-life, T1/2 ¼ 22.1 years) is sup-plied to the atmosphere at ground level by the radioactive decay ofits precursor, 222Rn (T1/2 ¼ 3.83 days). As the 222Rn flux from theocean is negligible, 210Pb is considered a continental tracer of airmasses (Balkanski et al., 1983; Turekian et al., 1983; Baskaran,2011). In contrast, 7Be is a relatively short lived (T1/2 ¼ 53.3 days)radionuclide of cosmogenic origin, produced by cosmic ray spall-ation reactions with light atmospheric nuclei of nitrogen and ox-ygen (Usoskin et al., 2009): most of the 7Be production (w75%)occurs in the stratosphere while the remaining part (w25%) isproduced in the troposphere, and particularly in the upper tropo-sphere (Johnson and Viezee, 1981; Usoskin and Kovaltsov, 2008).The production rate of 7Be has a latitudinal dependence (Ioannidouet al., 2005), while it has a negligible dependence from season andlongitude, but a remarkable variation due to the 11-year solar cycle(Hötzl et al., 1991; Megumi et al., 2000; Cannizzaro et al., 2004;Ioannidou et al., 2005; Leppanen et al., 2012). Once formed, 7Beand 210Pb undergo rapid association onto submicron-sized aerosolparticles both peaking in the accumulation mode (Papastefanouand Ioannidou, 1995; Winkler et al., 1998; Gaffney et al., 2004;Ioannidou et al., 2005). Thereafter, 7Be and 210Pb are removed
from the atmosphere by wet and dry scavenging of the carrieraerosol (Feely et al., 1989; Kulan et al., 2006). Most of the 7Beproduced in the stratosphere does not readily reach the tropo-sphere because of its short half-life compared to the longer resi-dence times of aerosols in the stratosphere (which, depending onthe size of the particles, is equal to one or more years as estimatedfrom Hamill et al., 1997; Rasch et al., 2008). In fact, the relativelyhigh production rates of 7Be in the upper troposphere (UT), com-bined with transport from the lower stratosphere (LS) to the uppertroposphere usually maintain a steep vertical concentrationgradient between the upper and the lower troposphere (Feely et al.,1989). Nevertheless, the UTeLS may cause high 7Be concentrationsin the surface air, easily detectable at a high altitude stations such asfor example Mt. Cimone station (Bonasoni et al., 1999, 2000a,2000b; Cristofanelli et al., 2003, 2006; Cristofanelli et al., 2009a).
Due to the similar tropospheric physico-chemical behaviour,variations in the 7Be/210Pb ratios reflect both vertical and horizontaltransport in the atmosphere. Because of the different origins of thetwo radionuclides, the use of the combination of 7Be and 210Pb asactivity ratio has been shown to provide clearer information aboutthe origin of the air masses (Graustein and Turekian, 1996;Bonasoni et al., 2000a, 2000b, 2004; Zheng et al., 2005), and itsseasonal variability over continents has been studied for examiningvertical exchange transport processes (Koch et al., 1996). Thesimultaneous measurements of 7Be and 210Pb, together with theirratio can provide useful information about the vertical motion of airmasses as well as on convective activity in the troposphere (Brostet al., 1991; Koch et al., 1996; Lee et al., 2004; Tositti et al., 2004;Lee et al., 2007). Recently, Lozano et al. (2012) studied thedifferent synoptic patterns and air masses types associated toranges of 7Be and 210Pb activity concentrations in the southwesternIberian Peninsula, indicating the differences between the arrival ofmaritime and continental air masses and confirming that both ra-dionuclides can be used as two independent atmospheric transportmarkers.
In this workwe present a basic overview of the time series of 7Beand 210Pb collected at the WMO-GAW station of Mt. Cimone from1998 until 2011. This activity has been already the object of severalpapers devoted to specific topics, in particular the use of 7Be in STE(Stratosphere-to-Troposphere Exchange), a rather classic applica-tion of this radionuclide, though not thoroughly understood yet(Bonasoni et al., 1999, 2000a, 2000b; Cristofanelli et al., 2003;Cristofanelli et al., 2006; Cristofanelli et al., 2009a). The follow upof Fukushima accident was also investigated at this station andresults have been recently published either at the European scale ina collective paper by Masson et al. (2011) or at the regional scalecomparing the radionuclidic pool at two nearby stations includingMt. Cimone (Tositti et al., 2012). Finally another recent paper con-cerned the PM10 matrix in which pioneristically all the radionu-clides herein treated are measured since the beginning of thisexperiment, providing a long-term overview of PM10 behaviour inthe core of theMediterranean region (Tositti et al., 2013). This paperpresents and discusses a statistical analysis of frequency distribu-tions, seasonality, interannual variation, correlations of the 7Be,210Pb (and their ratio) data of acquired from 1998 to 2011 at theWMO-GAW station of Mt. Cimone, with the purpose of gainingbetter insights into the different physical mechanisms at the basisof their variabilities.
2. Material and methods
2.1. Measurement site
Mt. Cimone station (44�120 N, 10� 420 E) is located on top of thehighest peak of the Italian Northern Apennines (2165 m a.s.l.). The

L. Tositti et al. / Atmospheric Environment 87 (2014) 108e122110
station is a global WMO-GAW managed by the MeteorologicalOffice of the Italian Air Force and by the Institute of atmosphericand climate science of the National Council of Research(ISAC-CNR). It has a 360� free horizon and is fairly off mainpollution sources such as cities and industrialized areas in thenorth (Po valley) and south (Tuscan plain) of the Apenninic range;Mt. Cimone has an elevation such that the measurement sitehosted by “O. Vittori” station lies above the planetary boundarylayer during most of the year, so that it can be considered repre-sentative for the South-European free troposphere (Bonasoni et al.,2000b; Fischer et al., 2003), even if an influence of the innermostlayer cannot be completely ruled out, in particular during warmmonths because of the increased vertical mixing (thermal con-vection) and mountain/valley breeze regimes (Fischer et al., 2003;Cristofanelli et al., 2007). For these reasons, the measurement siteis a suitable location to investigate the influence of regional andlong-range transport of polluted air masses on the background freetroposphere (Tositti et al., 2013; Cristofanelli et al., 2013), locatedat the center of the Southern Europe and the Mediterranean basin,a region which is recognized as a hot-spot both in terms of climatechange and air-quality.
Unlike the surrounding area (temperate-continental) theclimate of the mountain top is classified as alpine, due to itsheight. The mean yearly temperature is about 2 �C, with a winterminimum of �22 �C and a summer maximum of 18 �C (Colomboet al., 2000). Mt. Cimone is the windiest site among the Italianmeteorological stations, with wind speeds reaching intensities of216 km h�1, with a mean daily wind speed of 40 km h�1 duringwinter, probably due to the isolated position of the site. In theregion the precipitations are maximum during November (sec-ondary maximum in spring) and the absolute minimum in July(secondary minimum in January). At this station, the annualaverage precipitation amounts (L) to 696.3 mm (period 1964e2004; Serban et al., 2007), which is much lower than the onerecorded in the period 1961e1980, equal to 744.7 mm (Rapetti andVittorini, 1989). During the year prevailing winds blow from SeSWin the warm season and NeNE in the cold one. Generally speaking,typical synoptical circulations in Emilia-Romagna are character-ized by winter fluxes originating NE and fast currents from SW allover the rest of the year. In the first case the presence of an an-ticyclone on the Eastern Europe or of a depression centred on theSouthern Italy or on the Central Adriatic can determine the accessin the Po Valley of air masses that reach the Adriatic slope of theTuscan-Emilian Apennines; the most frequent case is the secondone, in which high streams from SW associated to a depression inthe Gulf of Genoa affect the Tuscan-Emilian Apennines. In fact, Mt.Cimone can be affected by intense cyclogenetic activity oftenoriginating in the near Gulf of Genoa area (Buzzi et al., 1984;Davies and Schuepbach, 1994). This phenomenology has beenwidely connected with STE events relevant to the well-knownincreases of both ozone and 7Be.
The Italian Air Force, which is in charge for the meteorologicalservice in Italy, is responsible for the facility which hosts and in-tegrates the research activity led by ISAC-CNR. Besides meteo-rology, the Italian Air Force e General Bureau for Meteorology e
manages the collection of atmospheric CO2 data presently consti-tuting the longest time series of this fundamental greenhouse gasin Europe, dating back to 1979. It is to note that in the past thisstation served also as one of the Italianmonitoring sites for weapontest fallout (Dietrich et al., 1997; Argiero et al., 1961), an activitydismissed in the 90’s.
Several scientific programs have been established at Mt. Cimonewith the scope of studying both climatologically relevant gases andthe physico-chemical characteristics of atmospheric aerosols (seeweb page http://www.isac.cnr/cimone/).
2.2. Experimental
At Mt. Cimone station 7Be, 210Pb and aerosol mass loading in theform of PM10 have been measured since the early 1990’s, butmeasurements became regular only since 1998 following theacquisition of a PM10 high volume sampler. Aerosol sampling hasbeen carried out with a time resolution of about 48 h by using aThermo-Environmental PM10 high-volume sampler with a flowrate of 1.13 m3 min�1. PM10 is collected on rectangular glass fiberfilters (Whatman, 20.3 cm � 25.4 cm). The PM10 sampler collectsairborne particulate matter with a mean aerodynamic diameterlower than 10 mm that carries the radionuclides, which tend topopulate the fine fraction (<1.0 mm) (Winkler et al., 1998; Gaffneyet al., 2004), as a consequence of their physical origin. Samplesare transferred to the Laboratory of Environmental Chemistry andRadiochemistry of Bologna University, where they are conditionedfor 24 h at constant temperature (22e24 �C) and relative humidity(30%) inside a desiccator. The net mass load on filters is determinedgravimetrically by an electronic microbalance with a sensitivity of0.0001 g (Ohaus). After weighing, the PM10 samples are subjectedto non-destructive high-resolution g-spectrometry with two HyperPure Germanium crystal detectors (HPGe) for the determination ofairborne radiotracers 7Be and 210Pb, respectively at 477.6 and46.5 keV. The characteristics of the two detectors are the followingones: one p-type coaxial detector by Ortec/Ametek with relativeefficiency 32.5% and FWHM1.8 keV at 1332 keV and one planar DSGdetector with an active surface 1500 mm2 and FWHM 0.73 keV at122 keV, respectively for higher and lower energy ranges (100e2000 keV and 0e900 keV).
Spectra are accumulated for at least one day and then processedwith a specific software package (GammaVision-32, Ortec). Effi-ciency calibration is determined on both detectors with a blankglass fiber filter traced with accurately weighted aliquots of astandard solution of mixed radionuclides (QCY48, Amersham)supplementedwith 210Pb, homogeneously dispersed dropwise overthe filter surface. Once dried under a hood under ambient condi-tions, the calibration filter is folded into a polystyrene container inthe same geometry as the unknown samples. Quantitative analysison samples is carried out by subtracting the spectrum of a blankfilter in the same geometry, while uncertainty on peaks (k ¼ 1, 68%level of confidence) is calculated propagating the combined errorover the efficiency fit previously determined with the countingerror. Minimum detectable activity is calculated making use of theTraditional ORTEC method with a peak cut-off limit of 40%. Activitydata is corrected to the midpoint of the time interval of collectionand for the decay during spectrum acquisition.
All the concentrations have been normalized at 25 �C and 1 atm.
3. Results and discussion
3.1. Seasonality and interannual variability
Fig. 1(a,b,c) shows the time series of 7Be and 210Pb and of the7Be/210Pb ratio measured at Mt. Cimone from 1998 to 2011. Thelarge gap presented by the data in 2007 is due to technical prob-lems with the aerosol sampler. Besides interannual variabilities, adistinct seasonal pattern can be observed for the two tracers, whichwill be discussed further on in the paper: while 7Be exhibits twoseasonal maxima, one during the cold season and one during thewarm one, 210Pb presents only one peak during the summermonths. Because of the simultaneous occurrence of the 7Be and210Pb peaks during the warm season, their ratio time series exhibitsonly one peak during the cold season.
Similar towhat has been previously reported for PM10 dataset ofMt. Cimone (Tositti et al., 2013) radiotracers as well as 7Be-to-210Pb

Fig. 1. (aec). Time series of the data acquired at Mt. Cimone from 1998 to 2011 and seasonal fluctuation of the variable obtained after the application of the KZ (3,21) filter: a) 7Be; b)210Pb; c) 7Be/210Pb.
L. Tositti et al. / Atmospheric Environment 87 (2014) 108e122 111
ratio show remarkable sample to sample fluctuations (“anomalies”)overlapped to a lower frequency periodicity linked to seasonality.These anomalies, defined as the ”synoptically influenced deviationsfrom the seasonal cycle”, are highlighted in Fig. 1(a,b,c) followingthe application of the KolmogoroveZurbenko filter (Zurbenko,1986), denoted as KZ(m,n). This filter is based upon the calcula-tion of a moving average zt centred over a time window of n values(with n odd integer), i.e.:
zt ¼ 1n
Xtþðn�1Þ=2
i¼ t�ðn�1Þ=2yi
The moving average is then iterated m times. The reader isreferred to Eskridge et al. (1997) and Rao et al. (1997) for a detaileddescription of this filter. The seasonal fluctuationwas obtained afterthe application of the KZ(3,21) filter, i.e. themoving average appliedthree times over a time window of 21 days (crosses in Fig. 1): thenumber of iterations as well as the time window of the filter werechosen evaluating the spectral response of the filter, which gua-rantees an almost perfect separation of the seasonal and synoptictime-scales (Rao et al., 1997).
Interannual variations of 7Be, 210Pb and of the 7Be/210Pb ratio arereported in Fig. 2(a,b,c). The vertical box encloses the middle 50% ofthe data. The median is the horizontal line inside the box and thesquare represents the mean value. Whiskers cover the range 10the90th percentile. Minimum and maximum values are plotted asindividual points with a line, whereas a cross indicates the 1st and99th percentiles. Annual changes are commonly ascribed todifferent factors, especially meteorological conditions, such as theamount of precipitation, atmospheric stability, relative humidity,temperature (Ioannidou et al., 2005; Dueñas et al., 2009; Phamet al., 2011; Carvalho et al., 2013) and, in the case of 7Be, also the11-year solar cycle (Ioannidou et al., 2005; Kulan et al., 2006;Steinmann et al., 2013).
For instance, the decrease in 7Be and 210Pb mean activity (and inPM10 concentration, not shown, but available in Tositti et al., 2013)from 1998 to 1999 could be tentatively attributed to the increasedtotal amount of precipitation (total precipitation in 1998 equal to296 mm, whereas in 1999 the total precipitation was equal to641 mm), whereas the increase in 7Be and 210Pb activity from 2002to 2003 (similar amount of precipitation: 2002 total precipitationequal to 328 mm, 2003 total precipitation equal to 308 mm) mightbe due to the extremely high temperature recorded in the wholeEuropean region, possibly contributing to enhanced convection andradon exhalation, especially during the summermonths (Pace et al.,2005; Cristofanelli et al., 2009b) and connected also to anomaloushigh ozone concentrations at Mt. Cimone as reported byCristofanelli et al. (2007).
The effect due to the frequency and trends of different air masstransports, such as Saharan Dust incursions for instance, cannot becompletely ruled out, however, and a paper focussing on it is inpreparation.
Fig. 3(a, b, c) depicts box and whiskers plots with seasonalvariations of 7Be, 210Pb and of the 7Be/210Pb ratio.
The 7Be concentration starts to increase during the warm periodfrom May to August, with a maximum during the months of JuneeJuly. The seasonal variation is higher for 7Be, as highlighted bymaximum and minimum values, as well as by 1st and 99thpercentile, which in the case of 7Be with larger deviations from themean value than for 210Pb. Anyway, the variability is high for bothtracers during the sampling period, with a percentage standarddeviation from the mean of 55% for 7Be and 65% for 210Pb. A sec-ondary maximum for 7Be is observed during the cold period fromNovember to February.
210Pb shows instead a simpler seasonal behaviour, with an in-crease starting during the spring and reaching its summermaximum in August. The minimum values are observed during thecold months, a behaviour analogous to PM10 (Tositti et al., 2013)with which 210Pb shares a large part of the source term, i.e. theEarth’s crust, as distinguished by 7Be whose main source terms are

Fig. 2. (aec). Interannual variations at Mt. Cimone during the sampling period 1998e2011, represented by box and whiskers plot, of: a) 7Be; b) 210Pb; c) 7Be/210Pb.
L. Tositti et al. / Atmospheric Environment 87 (2014) 108e122112
located in the stratosphere and upper troposphere. Similarly toPM10, during the cold season 210Pb is not uplifted to Mt. Cimone topowing to the decoupling of the Continental Boundary Layer fromthe free troposphere. As a result mean 210Pb values at Mt. Cimone inthe cold season should be representative of background free-troposphere concentrations for this tracer.
Fig. 3. (aec). Seasonal variations at Mt. Cimone during the sampling period 1998e
7Be/210Pb shows maximum values during the cold months fromNovember to February, while the spring and summer season arecharacterized by lower values. The variability of the ratio is lowerduring the summer season and secondarily during winter (stan-dard deviation percent from the mean equal to 53% and to 57%,respectively), while the variability is maximum during the
2011, represented by box and whiskers plot, of: a) 7Be; b) 210Pb; c) 7Be/210Pb.

L. Tositti et al. / Atmospheric Environment 87 (2014) 108e122 113
transition seasons (standard deviation percent from the meanequal to 67% and to 72%, respectively for autumn and spring). Thewinter maximum of the 7Be/210Pb ratio at the height of Mt. Cimoneis mainly caused by the scarce availability of 210Pb and of its pre-cursor 222Rn, whose lift up above the PBL (Planetary BoundaryLayer) is inhibited by the limited thermal convection in the coldseason.
The summer maxima of 7Be and 210Pb, and the consequentminimum of their ratio during this season, are due to enhancedvertical mixing, thermal convection and mountain/valley breezesduring this period of the year. As already highlighted byBaltensperger et al. (1997), Cristofanelli et al. (2003), Lee et al.(2007) and Tositti et al. (2013) during the warm season the mix-ing height reaches high levels, while thermal convection leads tointense vertical exchange in the troposphere. Rising warm air fromthe boundary layer brings about high values of 210Pb, being some-how counterbalanced by cold air sinking from the upper tropo-sphere enriched in 7Be. As shown in Fig. 3(a,b) the warm periodmaxima of 7Be and 210Pb are not completely simultaneous, though.While 7Be shows a maximum during the months of JuneeAugust, abehaviour which, as reported by Tositti et al. (2013), is shared byPM10, 210Pb shows its maximum during August. PM10 and 210Pbshare similar sources and one would expect their concentrationsfollow similar trends. A detailed analysis of the seasonality of airflows at this site is presently in progress and will be the objective ofa coming paper (Brattich et al., in preparation), however it can beanticipated that during the summer months the prevailing flowsare short range transports from North Western Europe and fromWest, even if themajor influence of Saharan Dust during spring andsummer, especially linked to 210Pb and PM10, cannot be completelyruled out.
In particular, our results indicate that the influence of SaharanDust on the PM10 concentration is maximum during the summerseason (about 49% of the peaks/events are due to this source) with aslight decrease in the transition seasons (about 44% during springand 43% during autumn), while during winter the African sourcecontribution to aerosol transport is significantly lower (11%), as wellas the mean concentration of PM10 ascribed to this source. Even ifSaharan Dust transports have a seasonal frequency maximumduring spring-autumn, it is during the summer season that SaharanDust mass load contribution is especially high, with effects on themonthly averages which are rather unpredictable due to differentamounts in the coarse fractions lifted up and transported awayfrom the source region. In this respect while the influence ofSaharan Dust events is mainly reflected by the relevant contribu-tion to mass loadings due to the importance of the coarse fractiontypical of these transports, the influence on 210Pb is not straight-forward and needs further investigations. In fact, while for regionalscale transports we believe (Tositti et al., 2013) that there is a closeconnection between thermal convection (a dominant dynamicalcondition during the warm season in the investigated area), finefraction and 210Pb as derived from exhaled radon (the so-calledexcess or “unsupported” 210Pb), the decoupling of 210Pb and PM10peak concentration may have different reasons. In particular wespeculate that the amount of the coarse fraction transported bySaharan Dust which is a fairly stochastic or rather event-basedfactor in terms of efficiency in the lifted up and transportedamounts of mineral dust, may affect the concentration of 210Pb inseveral ways: geochemistry (mineral dust composition is not uni-form in the whole northern African region, as suggested e.g., byMoreno et al., 2006; Formenti et al., 2008; Formenti et al., 2011,affecting also the content in natural radionuclides e still scarcelyknownewhile Saharan Dust source regions are known to fluctuatein longitude during the year, as observed by, for example, Barkanand Alpert, 2008; Israelevich et al., 2012), secondly different
amounts of suspended mineral dust, and finally the occurrence ofboth supported (associated with the coarse mineral particles) andunsupported 210Pb. All the effects so far discussed though reason-able cannot be definitely interpreted on the basis of the availabledata, but need to be clarified by further investigations and mea-surements suitably designed to the scope.
The secondary maximum of 7Be during the cold months(December, January, February and March) is due to an increase inStratosphere-to-Troposphere events during this season, as alreadyreported by e.g., James et al. (2003), Stohl et al. (2003), Trickl et al.(2010). Moreover Cristofanelli et al. (2009a) introduced a strato-spheric index based on 7Be, relative humidity and ozone mea-surements at Mt. Cimone enabling the assessment of a higherincidence of STE events during the period from October toFebruary with respect to the warm season, when thermal con-vection and the rising of the tropopause promote vertical mixingwhich acts as confounding factor in STE detection. As reported byJames et al. (2003) the reason of this behaviour is mostly theseasonal differences of rapid descent within the troposphere itself,rather than the differences in Stratosphere-to-TroposphereTransports (STT).
The higher frequency of rapid subsidence in winter at mid-latitudes Northern Hemisphere can be ascribed to the intensity ofbaroclinic systems which is greatest in wintertime. In fact, well-developed tropopause folds and rapid deep intrusions are mostlikely to occur in the wake of intense cyclogenesis, usually limitedto the wintertime storm track regions (James et al., 2003).
Previously, Elbern et al. (1997), identified a principal late wintermaximum and a secondary maximum around September andOctober, with clear minima during early summer for deep strato-spheric intrusions at the Zugspitze (2962 m a.s.l., Germany) andWank (1776 m a.s.l., Germany) summits, widespread on themesoscale. Cyclones developing in the Gulf of Genoa, which arewell known to have a close link to STE (e.g., Aebischer and Schär,1998; Stohl et al., 2000), are a constant feature over the wholeyear (Trigo et al., 2002; Campins et al., 2006), a feature which couldbe somehow in contrast with the above statement. However, evenif they are more frequent during summer, it is during winter thatthey are deeper and connected to more severe weather (Trigo et al.,2002). In the Gulf of Genoa both orography and dynamical pro-cesses (upper level troughs) play the most important cyclogeneticroles (Anagnostopoulou et al., 2006): the upper-level dynamicsseem to be more important in spring and autumn, while theorographic effect seems to contribute more significantly in winterand spring (Campins et al., 2006), but during winter there is alsothe further influence of the thermal contrast between seawater andair (Maheras et al., 2002), which is at its maximum during thisseason (Reiter, 1975a).
The seasonal variations of both 7Be and 210Pb are modulatedeven by seasonal precipitation patterns. As typical of mid-latitudes,summer months are usually associated to lower rates of precipi-tation with respect to the transition seasons and winter: as alreadyoutlined before, in the region the precipitations are maximumduring November (secondarymaximum in spring) and the absoluteminimum appears, even if speaking about a mountain site precip-itation includes both rain and snow.
3.2. Basic statistics
Table 1 presents basic statistics results obtained on the overallradionuclides and ratio dataset (1609 observations for 7Be and 1443observations for 210Pb) including arithmetic mean (AM), geometricmean (GM), median (ME), minimum and maximum values (Min,Max), standard deviation (SD), 10th percentile (PC10), 90thpercentile (PC90), skewness (SK) and kurtosis (KU).
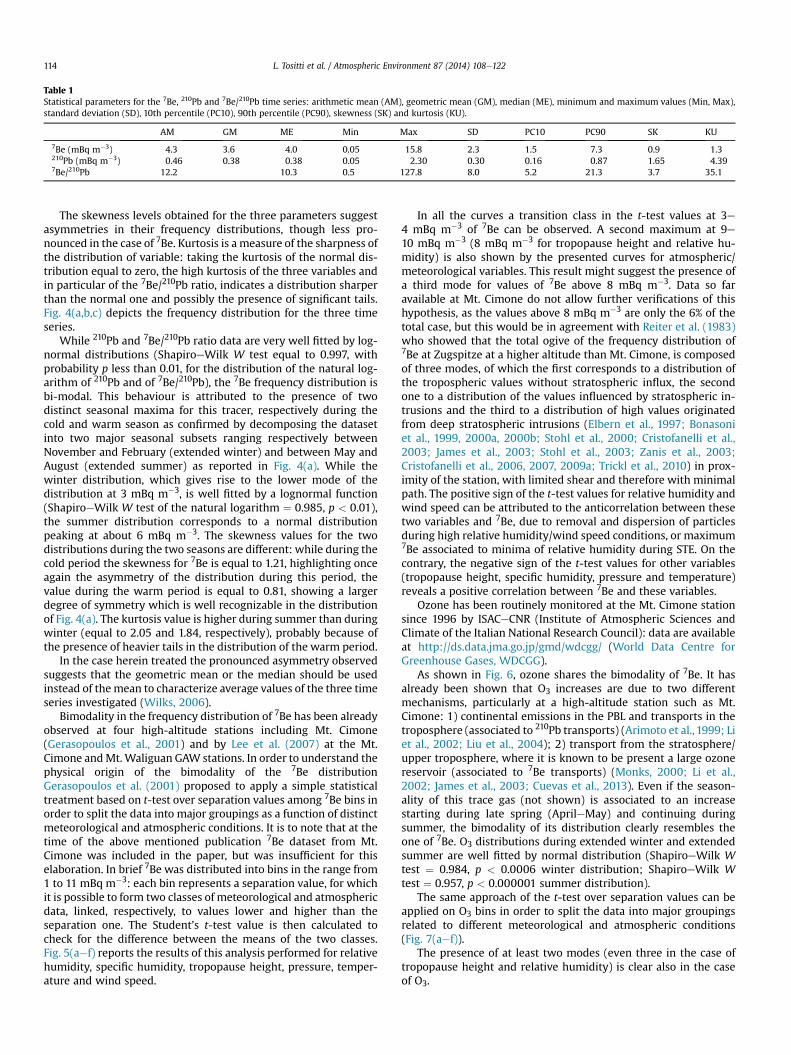
Table 1Statistical parameters for the 7Be, 210Pb and 7Be/210Pb time series: arithmetic mean (AM), geometric mean (GM), median (ME), minimum and maximum values (Min, Max),standard deviation (SD), 10th percentile (PC10), 90th percentile (PC90), skewness (SK) and kurtosis (KU).
AM GM ME Min Max SD PC10 PC90 SK KU
7Be (mBq m�3) 4.3 3.6 4.0 0.05 15.8 2.3 1.5 7.3 0.9 1.3210Pb (mBq m�3) 0.46 0.38 0.38 0.05 2.30 0.30 0.16 0.87 1.65 4.397Be/210Pb 12.2 10.3 0.5 127.8 8.0 5.2 21.3 3.7 35.1
L. Tositti et al. / Atmospheric Environment 87 (2014) 108e122114
The skewness levels obtained for the three parameters suggestasymmetries in their frequency distributions, though less pro-nounced in the case of 7Be. Kurtosis is a measure of the sharpness ofthe distribution of variable: taking the kurtosis of the normal dis-tribution equal to zero, the high kurtosis of the three variables andin particular of the 7Be/210Pb ratio, indicates a distribution sharperthan the normal one and possibly the presence of significant tails.Fig. 4(a,b,c) depicts the frequency distribution for the three timeseries.
While 210Pb and 7Be/210Pb ratio data are very well fitted by log-normal distributions (ShapiroeWilk W test equal to 0.997, withprobability p less than 0.01, for the distribution of the natural log-arithm of 210Pb and of 7Be/210Pb), the 7Be frequency distribution isbi-modal. This behaviour is attributed to the presence of twodistinct seasonal maxima for this tracer, respectively during thecold and warm season as confirmed by decomposing the datasetinto two major seasonal subsets ranging respectively betweenNovember and February (extended winter) and between May andAugust (extended summer) as reported in Fig. 4(a). While thewinter distribution, which gives rise to the lower mode of thedistribution at 3 mBq m�3, is well fitted by a lognormal function(ShapiroeWilk W test of the natural logarithm ¼ 0.985, p < 0.01),the summer distribution corresponds to a normal distributionpeaking at about 6 mBq m�3. The skewness values for the twodistributions during the two seasons are different: while during thecold period the skewness for 7Be is equal to 1.21, highlighting onceagain the asymmetry of the distribution during this period, thevalue during the warm period is equal to 0.81, showing a largerdegree of symmetry which is well recognizable in the distributionof Fig. 4(a). The kurtosis value is higher during summer than duringwinter (equal to 2.05 and 1.84, respectively), probably because ofthe presence of heavier tails in the distribution of the warm period.
In the case herein treated the pronounced asymmetry observedsuggests that the geometric mean or the median should be usedinstead of the mean to characterize average values of the three timeseries investigated (Wilks, 2006).
Bimodality in the frequency distribution of 7Be has been alreadyobserved at four high-altitude stations including Mt. Cimone(Gerasopoulos et al., 2001) and by Lee et al. (2007) at the Mt.Cimone andMt.Waliguan GAW stations. In order to understand thephysical origin of the bimodality of the 7Be distributionGerasopoulos et al. (2001) proposed to apply a simple statisticaltreatment based on t-test over separation values among 7Be bins inorder to split the data into major groupings as a function of distinctmeteorological and atmospheric conditions. It is to note that at thetime of the above mentioned publication 7Be dataset from Mt.Cimone was included in the paper, but was insufficient for thiselaboration. In brief 7Be was distributed into bins in the range from1 to 11 mBq m�3: each bin represents a separation value, for whichit is possible to form two classes of meteorological and atmosphericdata, linked, respectively, to values lower and higher than theseparation one. The Student’s t-test value is then calculated tocheck for the difference between the means of the two classes.Fig. 5(aef) reports the results of this analysis performed for relativehumidity, specific humidity, tropopause height, pressure, temper-ature and wind speed.
In all the curves a transition class in the t-test values at 3e4 mBq m�3 of 7Be can be observed. A second maximum at 9e10 mBq m�3 (8 mBq m�3 for tropopause height and relative hu-midity) is also shown by the presented curves for atmospheric/meteorological variables. This result might suggest the presence ofa third mode for values of 7Be above 8 mBq m�3. Data so faravailable at Mt. Cimone do not allow further verifications of thishypothesis, as the values above 8 mBq m�3 are only the 6% of thetotal case, but this would be in agreement with Reiter et al. (1983)who showed that the total ogive of the frequency distribution of7Be at Zugspitze at a higher altitude than Mt. Cimone, is composedof three modes, of which the first corresponds to a distribution ofthe tropospheric values without stratospheric influx, the secondone to a distribution of the values influenced by stratospheric in-trusions and the third to a distribution of high values originatedfrom deep stratospheric intrusions (Elbern et al., 1997; Bonasoniet al., 1999, 2000a, 2000b; Stohl et al., 2000; Cristofanelli et al.,2003; James et al., 2003; Stohl et al., 2003; Zanis et al., 2003;Cristofanelli et al., 2006, 2007, 2009a; Trickl et al., 2010) in prox-imity of the station, with limited shear and therefore with minimalpath. The positive sign of the t-test values for relative humidity andwind speed can be attributed to the anticorrelation between thesetwo variables and 7Be, due to removal and dispersion of particlesduring high relative humidity/wind speed conditions, or maximum7Be associated to minima of relative humidity during STE. On thecontrary, the negative sign of the t-test values for other variables(tropopause height, specific humidity, pressure and temperature)reveals a positive correlation between 7Be and these variables.
Ozone has been routinely monitored at the Mt. Cimone stationsince 1996 by ISACeCNR (Institute of Atmospheric Sciences andClimate of the Italian National Research Council): data are availableat http://ds.data.jma.go.jp/gmd/wdcgg/ (World Data Centre forGreenhouse Gases, WDCGG).
As shown in Fig. 6, ozone shares the bimodality of 7Be. It hasalready been shown that O3 increases are due to two differentmechanisms, particularly at a high-altitude station such as Mt.Cimone: 1) continental emissions in the PBL and transports in thetroposphere (associated to 210Pb transports) (Arimoto et al., 1999; Liet al., 2002; Liu et al., 2004); 2) transport from the stratosphere/upper troposphere, where it is known to be present a large ozonereservoir (associated to 7Be transports) (Monks, 2000; Li et al.,2002; James et al., 2003; Cuevas et al., 2013). Even if the season-ality of this trace gas (not shown) is associated to an increasestarting during late spring (AprileMay) and continuing duringsummer, the bimodality of its distribution clearly resembles theone of 7Be. O3 distributions during extended winter and extendedsummer are well fitted by normal distribution (ShapiroeWilk Wtest ¼ 0.984, p < 0.0006 winter distribution; ShapiroeWilk Wtest ¼ 0.957, p < 0.000001 summer distribution).
The same approach of the t-test over separation values can beapplied on O3 bins in order to split the data into major groupingsrelated to different meteorological and atmospheric conditions(Fig. 7(aef)).
The presence of at least two modes (even three in the case oftropopause height and relative humidity) is clear also in the caseof O3.
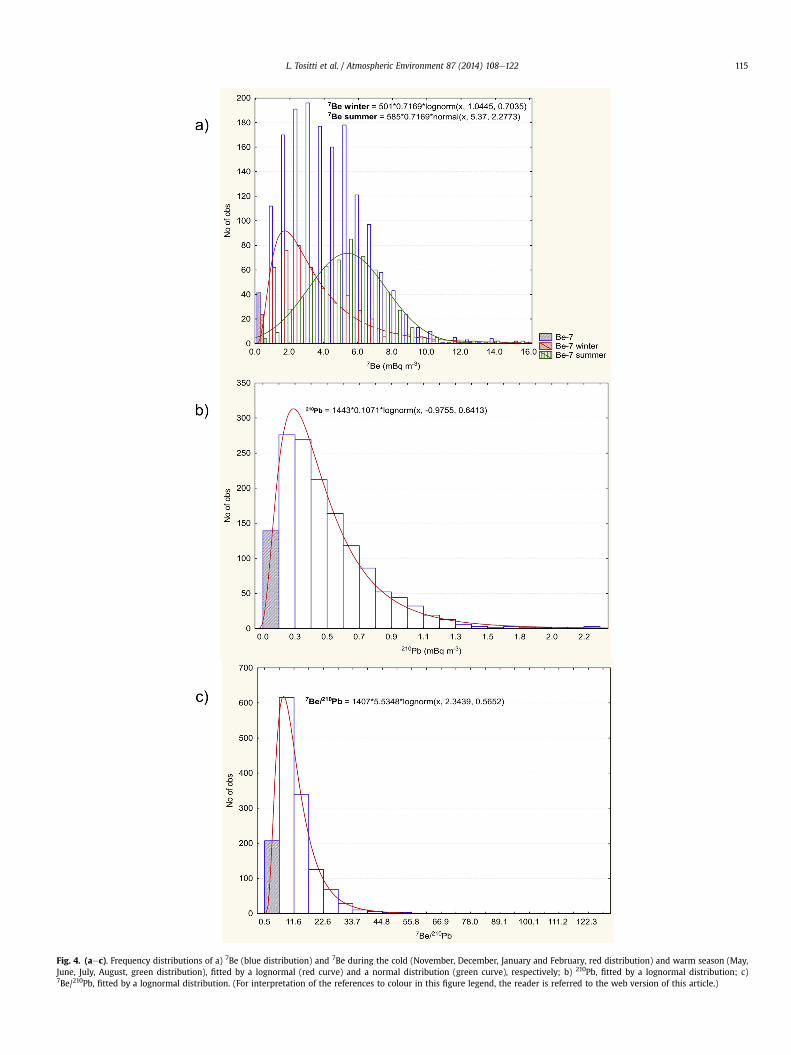
Fig. 4. (aec). Frequency distributions of a) 7Be (blue distribution) and 7Be during the cold (November, December, January and February, red distribution) and warm season (May,June, July, August, green distribution), fitted by a lognormal (red curve) and a normal distribution (green curve), respectively; b) 210Pb, fitted by a lognormal distribution; c)7Be/210Pb, fitted by a lognormal distribution. (For interpretation of the references to colour in this figure legend, the reader is referred to the web version of this article.)
L. Tositti et al. / Atmospheric Environment 87 (2014) 108e122 115

Fig. 5. (aef). t-test values for the significance of the difference between the means of meteorological and atmospheric parameters, when sorted according to a separation value of7Be: a) relative humidity; b) specific humidity; c) tropopause height; d) pressure; e) temperature; f) wind speed. Lines connecting the values are polynomial b-splines.
L. Tositti et al. / Atmospheric Environment 87 (2014) 108e122116
Even in this case, the positive sign of the t-test highlights thepresence of anticorrelation of ozone with relative humidity andwind speed; the negative sign instead highlights its correlationwith the tropopause height (same as 7Be, as the lower tropopauseheight during winter is associated with increased STE and trans-ports of both O3 and 7Be from the UTeLS, but also the higher
Fig. 6. Frequency distributions of O3 (blue distribution) and O3 during the cold (NovemberAugust, green distribution), fitted by two normal distributions. (For interpretation of the refarticle.)
tropopause during summer is associated to the maximum seasonalO3, transported from the polluted boundary layer), pressure (anti-cyclonic conditions are associated to increased photochemical ac-tivities and therefore to increased ozone production) andtemperature (increased photochemical production of ozone duringsummer with increased temperatures).
, December, January and February, red distribution) and warm season (May, June, July,erences to colour in this figure legend, the reader is referred to the web version of this

Fig. 7. (aef). t-test values for the significance of the difference between the means of meteorological and atmospheric parameters, when sorted according to a separation value ofO3: a) relative humidity; b) specific humidity; c) tropopause height; d) pressure; e) temperature; f) wind speed. Lines connecting the values are polynomial b-splines.
L. Tositti et al. / Atmospheric Environment 87 (2014) 108e122 117
3.3. Correlations with other atmospheric species
In order to investigate the potential use of 7Be and 210Pb as at-mospheric tracers Spearman’s rank correlation coefficients of 7Beand 210Pb and of PM10 concentrations with a series of meteoro-logical and compositional parameters such as a set of trace gasesand black carbon among those monitored at Mt. Cimone have beencalculated and results are presented in Table 2.
In general the relationship between ozone and 7Be is widelyrecognized as a traditional field of investigation concerning STE (seefor example Reiter,1975b;Dutkiewicz, andHusain,1979; Reiter et al.,1983; Dutkiewicz andHusain,1985; Tremblay and Servranckx,1993;Allen et al., 2003; Gerasopoulos et al., 2005; Trickl et al., 2010). Theapproach was extended to the relationships between ozone and 7Beand/or 210Pb due to the complex source terms of O3 which can besuccessfully intercepted by both the radionuclides representing twoof themajor sources for this fundamental gaseous component i.e. thestratosphere and the PBL (see for example Prospero et al., 1995;Graustein and Turekian, 1996; Arimoto et al., 1999; Li et al., 2002;Liu et al., 2004; Lee et al., 2007; Cuevas et al., 2013).
Less frequent is the use of the radiotracers with other gasesapart from CO2 (Zheng et al., 2011) or Hg (Lamborg et al., 2000). Inthis paper we have taken into account the following atmosphericspecies measured at Mt. Cimone observatory i.e. O3, CO2, CO by
Table 2Spearman’s rank correlation coefficients of 7Be, 210Pb, PM10 and ratio 7Be/210Pb with metespecific humidity SH, tropopause height TH, wind speedWS), trace gases (ozone O3, carbo(FP and CP).
p(mbar)
T (�C) RH % SH(kg kg�1)
TH(m)
WS(m s�1)
O3 (ppb) CO2
(ppm)
7Be (mBq m�3) 0.49 0.46 �0.56 0.21 0.34 �0.32 0.47 �0.36210Pb (mBq m�3) 0.45 0.61 �0.25 0.51 0.43 �0.28 0.55 �0.35PM10 (mg m�3) 0.37 0.60 �0.22 0.54 0.32 �0.23 0.64 �0.337Be/210Pb �0.05 �0.25 �0.24 �0.38 �0.17 0.04 �0.16 0.05
IAFMS (Italian Air Force) and ISACeCNR (Institute of AtmosphericSciences and Climate of the Italian National Research Council)available theWorld Data Centre for Greenhouse Gases (at http://ds.data.jma.go.jp/gmd/wdcgg/) while Black Carbon and fine(0.3 mm � Dp < 1 mm) and coarse particle (1 mm � Dp � 20 mm)number densities are available at EBAS database (at http://ebas.nilu.no/). Measurements at Mt. Cimone from different researchgroups, as well as meteorological and atmospheric parameters,such as temperature, pressure, relative humidity, wind speed andtropopause height (determined from radiosoundings at S. PietroCapofiume station, the closest ground based station in the Po Valleyfor which this observational activity is available) were retrievedtogether and averaged to the same time resolution of two-days asPM10 and radionuclides for statistical homogenization of data.
The non-parametric Spearman’s rank correlation coefficientshave been applied instead of Pearson’s approach, because, as pre-viously observed, the parameters herein discussed are not normallydistributed and therefore the former method is preferable (Wilks,2006). Except for carbon monoxide, whose measurement startedonly in 2007 and therefore has a poor statistics, all the correlationcoefficients are significant at p < 0.05.
An elevated correlation is found for 210Pb and PM10 with tem-perature, suggesting the role of thermal convection during thewarmer months in increasing vertical mixing within the
orological/atmospheric variables (pressure p, temperature T, relative humidity RH%,n dioxide CO2, carbon monoxide CO), black carbon (BC) and fine and coarse particles
BC(mg m�3)
CO(ppb)
7Be(mBq m�3)
210Pb(mBq m�3)
PM10
(mg m�3)FP(N cm�3)
CP(N cm�3)
7Be/210Pb
0.47 �0.12 1.00 0.56 0.51 0.36 0.07 0.310.62 �0.12 0.56 1.00 0.70 0.54 0.28 �0.540.74 �0.07 0.51 0.70 1.00 0.65 0.29 �0.31
�0.26 0.01 0.31 �0.54 �0.31 �0.27 �0.26 1.00

L. Tositti et al. / Atmospheric Environment 87 (2014) 108e122118
troposphere. During the warm season the combination of an up-wardmotion due tomixed layer expansion, thermal convection andmountain/valley breeze regime, results in an uplift of 210Pb, PM10and other substances from the polluted boundary layer (ozone,elemental carbon, all positively correlated with 210Pb and PM10).Relative humidity is negatively correlated with all the particulateassociated parameters suggesting the effect of wet scavenging. Infact maxima of relative humidity are associated with precipitationleading to minima in aerosol load due to wet scavenging (notshown). However the anticorrelation between 7Be and relativehumidity is much stronger than for the other parameters indicatingthe role of downward transport from the extremely dry UTeLS aircausing simultaneous increases of 7Be (and ozone) and decrease ofrelative humidity due to stratosphere depletion in water vapour.Both 7Be and ozone show bimodal frequency distributions withbehaviours slightly different for each of them. In this framework itis to note that specific humidity and relative humidity are notcompletely equivalent: in principle, specific humidity would bepreferable for the identification of stratospheric intrusions beingconserved in an air mass. However, stratospheric air masses usuallymix with tropospheric ones during the descent to the lowertroposphere, and since specific humidity in tropospheric air ishighly variable (lower values in winter and at high altitudes andhigher values in summer and close to the surface), the use of spe-cific humidity as a tracer for stratospheric intrusions would resultin the identification of excess STE during winter and at higherstations (Stohl et al., 2000). This is the reasonwhy the observationalclimatology of stratospheric intrusions is generally based on rela-tive humidity instead of specific humidity.
Table 3 reports again Spearman’s rank correlation coefficientsin this case calculated on a seasonal basis: winter (DecemberJanuary February), spring (March April May), summer (June JulyAugust) and autumn (September October November). In this caseit was chosen to study the correlations on a “normal” four sea-sons basis, which was preferred to the use of the two periodsextended winter/summer used for the distribution of 7Be, inorder to better study the difference between the two transitionseasons, too.
The table highlights how the correlation can be significantlydifferent during the seasons.
Table 3Spearman’s rank correlation coefficients of 7Be, 210Pb, PM10 and ratio 7Be/210Pb with metespecific humidity SH, tropopause height TH, wind speedWS), trace gases (ozone O3, carbo(FP and CP) for each season (winter, spring, summer, autumn).
p(mbar)
T (�C) RH % SH(kg kg�1)
TH(m)
WS(m s�1)
O3
(ppb)CO2
(ppm)B(
Winter7Be (mBq m�3) 0.50 0.15 �0.64 �0.46 0.22 �0.19 0.44 �0.29 �210Pb (mBq m�3) 0.24 �0.03 �0.29 �0.30 0.03 �0.19 0.36 �0.24 �PM10 (mg m�3) 0.01 �0.26 �0.12 �0.24 �0.20 0.00 0.19 �0.02 �7Be/210Pb 0.33 0.24 �0.45 �0.18 0.24 �0.07 0.18 �0.20 �Spring7Be (mBq m�3) 0.53 0.46 �0.59 0.17 0.39 �0.32 0.40 �0.28210Pb (mBq m�3) 0.41 0.39 �0.28 0.27 0.24 �0.20 0.37 �0.28PM10 (mg m�3) 0.53 0.43 �0.35 0.29 0.36 �0.23 0.35 �0.277Be/210Pb 0.00 0.00 �0.22 �0.11 0.03 �0.03 �0.04 0.01 �Summer7Be (mBq m�3) 0.21 0.34 �0.43 �0.05 0.02 �0.15 0.36 �0.27 �210Pb (mBq m�3) 0.43 0.63 �0.37 0.42 0.31 �0.16 0.37 �0.18PM10 (mg m�3) 0.33 0.57 �0.41 0.28 0.11 �0.06 0.30 �0.31 �7Be/210Pb �0.28 �0.44 0.07 �0.53 �0.32 0.07 �0.14 �0.02 �Autumn7Be (mBq m�3) 0.50 0.38 �0.59 �0.09 0.25 �0.31 0.40 �0.25 �210Pb (mBq m�3) 0.48 0.57 �0.25 0.32 0.34 �0.21 0.44 �0.17PM10 (mg m�3) 0.35 0.49 �0.15 0.38 0.20 �0.10 0.39 �0.287Be/210Pb �0.03 �0.26 �0.33 �0.45 �0.08 �0.08 �0.05 �0.06 �
During summer 210Pb shows its maximum correlation withtemperature (0.63) and specific humidity (0.42), while itsmaximum correlation with pressure is shown during autumn(0.48), when the maximum 210PbePM10 correlation (0.67) and210PbeO3 are also found. During spring 210Pb shows its maximumcorrelation with temperature (0.46).
Fine particles show maximum correlation coefficients with 7Be,210Pb and PM10 during winter, while during the other seasons nosimple correlation is found for this variable.
PM10 is correlated with temperature during summer (0.63),while a partial correlation with pressure can be found duringspring.
7Be shows its maximum anticorrelation with relative humidityduring the winter (�0.64), decreasing during the transition seasonsand showing its minimum value during summer. During the coldseason anticorrelation (�0.46) is found also in respect with specifichumidity, emphasizing the role of active STE in the cold period.Gerasopoulos et al. (2001) reported an analogous correlationpattern for 7Be and relative-specific humidity: they explained thatthe elevated correlation between the above parameters respec-tively throughout the year and during cold months with thedominating effect of wet scavenging during the warm period, whilein the cold period vertical transport becomes important as previ-ously explained.
In the cold season the highest 7BeeO3 correlation is alsoobserved, which could highlight the same UTeLS origin of thesetwo parameters during this season when ozone photochemistryand transport from PBL are limited; this observation is in agree-ment with Cristofanelli et al. (2009a). In the summer the highcorrelation among temperature, 210Pb and PM10 confirms the in-fluence of enhanced convective vertical mixing, affecting simulta-neously the concentrations of 7Be (downward motion), 210Pb, PM10and other trace gases all uplifted to Mt. Cimone from the pollutedboundary layer as mentioned before.
In the Supplementary Material some scatterplots of special in-terest between the treated variables are presented; in fact lowvalues of the correlation coefficients are not necessarily due to lackof correlation between couples of variables, but could be due tothe presence of bivariance as found in this work, which in turnmight be due to different seasonal correlation patterns or to other
orological/atmospheric variables (pressure p, temperature T, relative humidity RH%,n dioxide CO2, carbon monoxide CO), black carbon (BC) and fine and coarse particles
Cmg m�3)
CO(ppb)
7Be(mBq m�3)
210Pb(mBq m�3)
PM10
(mg m�3)FP(N cm�3)
CP(N cm�3)
7Be/210Pb
0.08 �0.09 1.00 0.49 0.13 �0.43 �0.15 0.680.07 �0.15 0.49 1.00 0.40 �0.51 �0.10 �0.260.18 �0.37 0.13 0.40 1.00 �0.52 �0.09 �0.220.01 �0.20 0.68 �0.26 �0.22 �0.22 �0.13 1.00
0.15 0.10 1.00 0.51 0.55 0.06 0.25 0.400.28 0.18 0.51 1.00 0.59 0.00 0.25 �0.530.05 0.14 0.55 0.59 1.00 0.18 0.29 �0.140.16 �0.21 0.40 �0.53 �0.14 0.02 �0.02 1.00
0.07 0.13 1.00 0.52 0.62 0.09 �0.07 0.240.04 0.09 0.52 1.00 0.61 0.11 0.06 �0.640.01 0.05 0.62 0.61 1.00 0.05 �0.09 �0.160.08 �0.04 0.24 �0.64 �0.16 0.01 �0.09 1.00
0.05 0.12 1.00 0.54 0.40 0.04 0.01 0.330.08 0.03 0.54 1.00 0.67 0.19 0.07 �0.500.21 0.00 0.40 0.67 1.00 �0.12 �0.19 �0.420.28 �0.02 0.33 �0.50 �0.42 �0.13 0.08 1.00
L. Tositti et al. / Atmospheric Environment 87 (2014) 108e122 119
different mechanisms promoting different covariance in theatmosphere (see for example the scatterplot between the 7Be/210Pbratio vs. O3, Fig. S1a).
As previously highlighted, ozone increase can be due both totransports of air pollution from the boundary layer (correlationwith 7Be and 210Pb, low 7Be/210Pb ratio; see Arimoto et al., 1999;Bonasoni et al., 2004; Liu et al., 2004; Marinoni et al., 2008;Tositti et al., 2013) and in such cases it is correlated with both 7Beand 210Pb during thewarmmonths) as well as from transports fromthe UTeLS (correlation with 7Be only, elevated 7Be/210Pb ratio; seeBonasoni et al., 1999; Bonasoni et al., 2000a, 2000b; Liu et al., 2004;Cristofanelli et al., 2006, 2009a).
The pattern highlighted in the scatterplots of 7Be/210Pb(Fig. S1b,c,d) clearly show how an elevated ratio can be linked bothto increases as well as to decreases in aerosol mass load, and in thenumber density of both fine and coarse particles.
Marinoni et al. (2008) suggested North Italy, west Europe andeast Europe as source regions for black carbon and number densityof fine particles; moreover, they reported the seasonal cycle of fineand coarse particles as characterized by highest values in springesummer and the lowest values in autumnewinter. The bivariancein the scatterplot of 210Pb vs. black carbon and carbon monoxide(Fig. S2(a,c)) show that they share some source regions/season-alities, but not all of them: the likely influence of Saharan Dusttransports as source of increases of 210Pb but not of black carbon(and carbon monoxide) depending on the occasional occurrence ofbiomass burning in that region might be the cause of the bivariancein the scatterplots.
The bivariance of the scatterplot of 210Pb vs. CO2 (Fig. S2(b))could be due instead to the different seasonal behaviour of the twovariables: while 210Pb at Mt Cimone has been shown to exhibit asummer maximum, CO2 presents the typical Northern Hemisphereseasonal patternwith a winter maximum and a summer minimum,which are known to be due to the seasonal modulation in carbonfluxes (Cleveland and Kauffmann, 2007).
Finally, the scatterplot in Fig. S3 highlights that besides thesummer thermal convection giving rise to both 7Be and fine par-ticles increases, other mid-scale transports can be responsible ofonly fine particles (Western/Eastern Europe, for instance, inagreement with Tositti et al., 2013).
4. Summary and conclusions
This work reports the results of a study concerning temporalvariations and statistical analysis for the atmospheric radiotracers7Be, 210Pb and of their activity ratio at the WMO-GAW station of MtCimone from 1998 to 2011.
1. Both radiotracers similarly to PM10 discussed in a previous paper(Tositti et al., 2013), have a marked seasonal variation. Interan-nual variations are ascribed to amounts of overall precipitation,atmospheric stability, relative humidity, mean temperature. Ona first approximation all of the three parameters have a winterminimum and a summer maximum.
2. Frequency distributions of the two radionuclides and of theirratio reveal a lognormal distribution for 210Pb and for the ratio7Be/210Pb, while a bimodal distribution is associated to 7Be. Thebimodality of the 7Be distribution reflects the different seasonalbehaviour of this tracer, and is further investigatedwith the helpof a statistical t-test over separation values among 7Be as afunction of distinct meteorological and atmospheric conditions.In fact, while 210Pb summer maximum is mainly due to thehigher mixing height and enhanced uplift from the boundarylayer as a result of thermal convection, the seasonal fluctuationof 7Be is more complex, being characterized by two relative
maxima, one during the cold season, which is associated toStratosphere-to-Troposphere transport and one in the warmseason, mainly (but not exclusively) associated to troposphericsubsidence balancing low tropospheric air masses ascent occa-sionally accompanied by STE. 7Be/210Pb ratio presents a seasonalmaximum during the cold period due to the intensity of baro-clinic systems during this period. The resulting modes and datasub-grouping found with the help of t-test are associatedrespectively to the tropospheric values without stratosphericinflux, while 7Be modes with a tail above 8 mBq m�3 shows astrong influence from STE events suggesting the presence of athird mode in the distribution, potentially associated with deepstratospheric intrusions.
3. Frequency distribution was determined also for ozone, one ofthe main tropospheric trace gases which, besides in situphotochemical production is known to be due to two differenttransport mechanisms (from the polluted boundary layer like210Pb, and from UTeLS like 7Be). Similarly to 7Be, ozone, alsopresents a bimodal distribution, which is not strictly linked to itsseasonal pattern, but is confirmed by the t-test approach, too:two or even three modes were found for ozone with thismethod, connected with different meteorological/atmosphericconditions, which in turns might be linked to different mecha-nisms causing increases in the trace gas.
4. The correlation patterns of the radionuclides and of their ratiowith physical and compositional variables, namely particulatematter, ozone, and other gases such as CO2, CO, black carbon andparticles in the fine and coarse ranges, are examined, both on atotal as well as on a seasonal basis. The role of thermal con-vection leading to increases in both the radionuclides (highcorrelation with temperature, tropopause height), and of wetscavenging as the most efficient removal mechanism (anti-correlation with relative humidity) is stressed. The anti-correlation of 7Be with relative humidity is further emphasizedby downward transport from the extremely dry UTeLS. Ozone iscorrelated with 7Be during the cold season when they are bothcontributed by STE, while in the warm season it is highlycorrelated with 210Pb, PM10 and trace gases all uplifted from thepolluted boundary layer.
5. Finally, bivariance between 7Be/210Pb vs. O3, PM10, fine andcoarse particle number density, 210Pb vs. black carbon, CO andCO2, 7Be vs. fine particles number density is introduced sug-gesting other less conventional but potentially promising ap-plications of the studied radiotracers in atmosphericinvestigations, useful in the complex framework of climatechange and consequent modifications of circulation patterns.
Acknowledgements
Italian Air ForceMeteorological Office (IAFMS) and ISAC-CNR aregratefully acknowledged for their precious technical support at theMt. Cimone station and for the help in the collection of composi-tional datasets.
IAFMS is gratefully acknowledged for providing meteorologicaland carbon dioxide data; ISAC-CNR is gratefully acknowledged forproviding aerosol size distribution, carbon monoxide, black carbonand ozone data, besides infrastructural access at the WMO-GAWGlobal Station Italian Climate Observatory “O. Vittori” at Mt.Cimone. The Italian Climate Observatory “O. Vittori” is supported byMIUR and DTA-CNR throughout the Project of National InterestNextData.
World Data Centre for Greenhouse Gases (http://ds.data.jma.go.jp/gmd/wdcgg/) and EBAS Databases (http://ebas.nilu.no/) areacknowledged for making available ozone, carbon dioxide, carbon
L. Tositti et al. / Atmospheric Environment 87 (2014) 108e122120
monoxide, fine and coarse particle number density and black car-bon data useful for this research work.
We thank two anonymous referees for their valuable sugges-tions and comments, which improved the quality of our paper.
Appendix A. Supplementary data
Supplementary data related to this article can be found at http://dx.doi.org/10.1016/j.atmosenv.2014.01.014.
References
Argiero, L., Manfredini, S., Palmas, G., 1961. Measurements of air radioactivity onItaly and their relation to the first Sahara atomic explosion. Nature 190, 618e619.
Aebischer, U., Schär, C., 1998. Low-level potential vorticity and cyclogenesis to theLee of the Alps. J. Atmos. Sci. 55, 186e207.
Allen, D.J., Dibb, J.E., Ridley, B., Pickering, K.E., Talbot, R.W., 2003. An estimate of thestratospheric contribution to springtime tropospheric ozone maxima usingTOPSE measurements and beryllium-7 simulations. J. Geophys. Res. Atmos. 108(D4). http://dx.doi.org/10.1029/2001JD001428.
Anagnostopoulou, C., Tolika, K., Flocas, H., Maheras, P., 2006. Cyclones in theMediterranean region: present and future climate scenarios derived from ageneral circulation mode (HadAM3P). Adv. Geosci. 7, 9e14.
Arimoto, R., Snow, J.A., Graustein, W.C., Moody, J.L., Ray, B.J., Duce, R.A.,Turekian, K.K., Maring, H.B., 1999. Influences of atmospheric transport path-ways on radionuclide activities in aerosol particles from over the North Atlantic.J. Geophys. Res. 104 (D17), 301e321.
Balkanski, Y.J., Jacob, D.J., Gardner, G.M., Graustein, W.C., Turekian, K.K., 1983.Transport and residence times or tropospheric aerosols inferred from a globalthree-dimensional simulation of 210Pb. J. Geophys. Res. 98, 20573e20586.
Baltensperger, U., Gäggeler, H.W., Jost, D.T., Lugauer, M., Schwikowski, M.,Weingartner, E., Seibert, P., 1997. Aerosol climatology at the high-alpine siteJungfraujoch, Switzerland. J. Geophys. Res. 102 (D16), 19,707e19,715. http://dx.doi.org/10.1029/97JD00928.
Barkan, J., Alpert, P., 2008. Synoptic patterns associated with dusty and non-dustyseasons in the Sahara. Theor. Appl. Climatol. 94, 153e162. http://dx.doi.org/10.1007/s00704-007-0354-9.
Baskaran, M., 2011. Po-210 and Pb-210 as atmospheric tracers and global Pb-210fallout: a review. J. Environ. Radioact. 102, 500e513.
Bonasoni, P., Evanegelisti, F., Boanfé, U., Feldmann, H., Memmesheimer, M., Stohl, A.,Tositti, L., 1999. Stratosphere-troposphere exchanges: case studies recorded atMt. Cimone during VOTALP project. Phys. Chem. Earth C 24 (5), 443e446.
Bonasoni, P., Evangelisti, F., Bonafé, U., Ravegnani, F., Calzolari, F., Stohl, A., Tositti, L.,Tubertini, O., Colombo, T., 2000a. Stratospheric ozone intrusion episodesrecorded at Mt. Cimone during VOTALP project: case studies. Atmos. Environ.34, 1355e1365.
Bonasoni, P., Stohl, A., Cristofanelli, P., Calzolari, F., Colombo, T., Evangelisti, F.,2000b. Background ozone variations at Mt Cimone station. Atmos. Environ. 34,5183e5189.
Bonasoni, P., Cristofanelli, P., Calzolari, F., Bonafé, U., Evangelisti, F., Stohl, A., ZauliSajani, S., van Dingenen, R., Colombo, T., Balkanski, Y., 2004. Aerosol-ozonecorrelations during dust transport episodes. Atmos. Chem. Phys. 4, 1201e1215.
Brattich, E., Orza, J.A.G., Tositti, L., 2014. Advection Patterns Influencing PM10 andAtmospheric Radiotracers at the WMO-GAW Station of Mt. Cimone: Associationand Temporal Variability in preparation.
Brost, R.A., Feichter, J., Heimann, M., 1991. Three-dimensional simulation of 7Be in aglobal climate model. J. Geophys. Res. 96, 22423e22445.
Burton, W.M., Stewart, N.G., 1960. Use of long-lived natural radioactivity as an at-mospheric tracer. Nature 186, 584e589.
Buzzi, A., Giovannelli, G., Nanni, T., Tagliazucca, M., 1984. Study of High OzoneConcentrations in the Troposphere Associated with Lee Cyclogenesis duringALPEX, vol. 57. Beiträge zur Physik der Atmosphäre, pp. 380e392.
Campins, J., Jansà, A., Genovés, A., 2006. Three-dimensional structure of westernMediterranean cyclones. Int. J. Climatol. 26, 323e343.
Cannizzaro, F., Greco, G., Raneli, M., Spitale, M., Tomarchio, E., 2004. Concentrationmeasurements of 7Be at ground level air at Palermo, Italy e comparison withsolar activity over a period of 21 years. J. Environ. Radioact. 72, 259e271.
Carvalho, A.C., Reis, M., Silva, L., Madruga, M.J., 2013. A decade of 7Be and 210Pbactivity in surface aerosols measured over the Western Iberian Peninsula.Atmos. Environ. 67, 193e202.
Christoudias, T., Lelieveld, J., 2013. Modelling the global atmospheric transport anddeposition of radionuclides from the Fukushima Dai-ichi nuclear accident.Atmos. Chem. Phys. 13, 1425e1438. http://dx.doi.org/10.5194/acp-13-1425-2013.
Cleveland, C.J., Kauffmann, R., 2007. Mauna Loa curve. In: The Encyclopedia of Earth.Available at: http://www.eoearth.org/view/article/154520/ (last accessed31.07.13.).
Cristofanelli, P., Bonasoni, P., Collins, W., Feichter, J., Forster, C., James, P.,Kentarchos, A., Kubik, P.W., Land, C., Meloen, J., Roelofs, G.J., Siegmund, P.,Sprenger, M., Schnabel, C., Stohl, A., Tobler, L., Tositti, L., Trickl, T., Zanis, P., 2003.
Stratosphere-to-troposphere transport: a model and method evaluation.J. Geophys. Res. 108 (D12), 8525. http://dx.doi.org/10.1029/2002JD002600.
Cristofanelli, P., Bonasoni, P., Tositti, L., Bonafé, U., Calzolari, F., Evangelisti, F.,Sandrini, S., Stohl, A., 2006. A 6-year analysis of stratospheric intrusions andtheir influence on ozone at Mt. Cimone (2165 m above sea level). J. Geophys.Res. 111, D03306. http://dx.doi.org/10.1029/2005JD006553.
Cristofanelli, P., Bonasoni, P., Carboni, G., Calzolari, F., Casarola, L., Zauli Sajani, S.,Santaguida, R., 2007. Anomalous high ozone concentrations recorded at a highmountain station in Italy in summer 2003. Atmos. Environ. 41, 1383e1394.
Cristofanelli, P., Calzolari, F., Bonafé, U., Duchi, R., Marinoni, A., Roccato, F., Tositti, L.,Bonasoni, P., 2009a. Stratospheric intrusion index (SI2) from baseline mea-surement data. Theor. Appl. Climatol. 97, 317e325.
Cristofanelli, P., Marinoni, A., Arduini, J., Bonafé, U., Calzolari, F., Colombo, T.,Decesri, S., Duchi, R., Facchini, M.C., Fierli, F., Finessi, E., Maione, M., Chiari, M.,Calzolai, G., Messina, P., Orlandi, E., Roccato, F., Bonasoni, P., 2009b. Significantvariations of trace gas composition and aerosol properties at Mt. Cimone duringair mass transport from North Africa e contributions from wildfire emissionsand mineral dust. Atmos. Chem. Phys. 9, 4603e4619.
Cristofanelli, P., Fierli, F., Marinoni, A., Calzolari, F., Duchi, R., Burkhart, J., Stohl, A.,Maione, M., Arduini, J., Bonasoni, P., 2013. Influence of biomass burning andanthropogenic emissions on ozone, carbon monoxide and black carbon at theMt. Cimone WMO-GAW global station (Italy, 2165 m a.s.l.). Atmos. Chem. Phys.13, 15e30. http://dx.doi.org/10.5194/acp-13-15-2013.
Colombo, T., Santaguida, R., Capasso, A., Calzolari, F., Evangelisti, F., Bonasoni, P.,2000. Biospheric influence on carbon dioxide measurements in Italy. Atmos.Environ. 34, 4963e4969.
Cuevas, E., Gonzalez, Y., Rodríguez, S., Guerra, J.C., Gómez-Peláez, A.J., Alonso-Pérez, S., Bustos, J., Milford, C., 2013. Assessment of atmospheric processesdriving ozone variations in the subtropical North Atlantic free troposphere.Atmos. Chem. Phys. 13, 1973e1998.
Davies, T.D., Schuepbach, E., 1994. Episode of high ozone concentrations at theearth’s surface resulting from transport down from the upper troposphere/lower stratosphere: a review and case studies. Atmos. Environ. 28, 53e68.
Davison, W., Hilton, J., Hamilton-Taylor, J., Kelly, M., Livens, F., Rigg, E., Carrick, T.R.,Singleton, D.L., 1993. The transport of Chernobyl-derived radiocaesium throughtwo freshwater lakes in Cumbria, UK. J. Environ. Radioact. 19 (2), 125e153.
Diaz Leon, J., Jaffe, D.A., Kaspar, J., Knecht, A., Miller, M.L., Robertson, R.G.H.,Schubert, A.G., 2011. Arrival time and magnitude of airborne fission productsfrom the Fukushima, Japan, reactor incident as measured in Seattle, WA, USA.J. Environ. Radioact.. http://dx.doi.org/10.1016/j.envrad.2011.06.005.
Dibb, J.E., 2007. Vertical mixing above Summit, Greenland: insights into seasonaland high frequency variability from the radionuclide tracers 7Be and 210Pb.Atmos. Environ. 41, 5020e5030.
Dietrich, E., Favale, B., Passamonti, V., 1997. Trentasei anni di misure di radioattivitàbeta nell’aria sull’Italia al livello del suolo. Valori medi mensili dal 1957 al 1992.CNR-IFA Internal Report 97-15.
Dueñas, C., Fernández, M.C., Cañete, S., Pérez, M., 2009. 7Be to 210Pb concentrationratio in ground level air in Màlaga (36.7�N, 4.5�W). Atmos. Res. 92, 49e57.
Dueñas, C., Orza, J.A.G., Cabello, M., Fernández, M.C., Cañete, S., Pérez, M., Gordo, E.,2011. Air mass origin and its influence on radionuclide activities (7Be and 210Pb)in aerosol particles at a coastal site in the western Mediterranean. Atmos. Res.101, 205e214.
Dutkiewicz, V.A., Husain, L., 1979. Determination of stratospheric ozone at groundlevel using 7Be/ozone ratios. Geophys. Res. Lett. 6 (3), 171e174. http://dx.doi.org/10.1029/GL006i003p00171.
Dutkiewicz, V.A., Husain, L., 1985. Stratospheric and tropospheric components of7Be in surface air. J. Geophys. Res. Atmos. 90 (D3), 5783e5788.
Eisenbud, M., Gesell, T., 1997. Environmental Radioactivity. From Natural, Industrialand Military Sources, fourth ed. Academic Press, ISBN 0-12-235154-1, p. 656.
EBAS Database. http://ebas.nilu.no/ (last accessed 01.08.13.).Elbern, H., Kowol, J., Sládkovic, R., Ebel, A., 1997. Deep stratospheric intrusions: a
statistical assessment with model guided analyses. Atmos. Environ. 31 (19),3207e3226.
Eskridge, R.E., Ku, J.Y., Rao, S.T., Porter, P.S., Zurbenko, I.G., 1997. Separating differentscales of motion in time series of meteorological variables. Bull. Am. Meteorol.Soc. 78, 1473e1483.
Feely, H.W., Larsen, R.J., Sanderson, C.G., 1989. Factors that cause seasonal variationsin 7Be concentrations in surface air. J. Environ. Radioact. 9, 223e249.
Fischer, H., Kormann, R., Klüpfel, T., Gurk, Ch., Königstedt, R., Parchatka, U., Mühle, J.,Rhee, T.S., Brenninkmeijer, C.A.M., Bonasoni, P., Stohl, A., 2003. Ozone produc-tion and trace gas correlations during the June 2000 MINATROC intensivemeasurement campaign at Mt Cimone. Atmos. Chem. Phys. 3, 725e738.
Formenti, P., Rajot, J.L., Desboeufs, K., Caquineau, S., Chevaillier, S., Nava, S.,Gaudichet, A., Journet, E., Triquet, S., Alfaro, S., Chiari, M., Haywood, J., Coe, H.,Highwood, E., 2008. Regional variability of mineral dust from western Africa:results from the AMMA SOP0/DABEX and DODO field campaigns. J. Geophys.Res. Atmos. 113 (D23). http://dx.doi.org/10.1029/2008JD009903.
Formenti, P., Schütz, L., Balkanski, Y., Desboeufs, K., Ebert, M., Kandler, K., Petzold, A.,Scheuvens, D., Weinbruch, S., Zhang, D., 2011. Recent progress in understandingphysical and chemical properties of African and Asian mineral dust. Atmos.Chem. Phys. 11, 8231e8256.
Froehlich, K., Masarik, J., 2010. Radionuclides as tracers and timers of processes inthe continental environment e basic concepts and methodologies. In: Radio-activity in the Environment, vol. 16Elsevier, pp. 27e49. http://dx.doi.org/10.1016/S1569-4860(09)01602-7 (Chapter 2).

L. Tositti et al. / Atmospheric Environment 87 (2014) 108e122 121
Gaffney, J.S., Marley, N., Cunningham, M.M., 2004. Natural radionuclides in fineaerosols in the Pittsburgh area. Atmos. Environ. 38, 3191e3200.
Gaggeler, H.W., 1995. Radioactivity in the atmosphere. Radiochim. Acta 70-71, 345e353.
Gerasopoulos, E., Zanis, P., Stohl, A., Zerefos, C.S., Papastefanou, C., Ringer, W.,Tobler, L., Hübener, S., Gäggeler, H.W., Kanter, H.J., Tositti, L., Sandrini, S., 2001.A climatology of 7Be at four high-altitude stations at the Alps and the NorthernApennines. Atmos. Environ. 35, 6347e6360.
Gerasopoulos, E., Zanis, P., Papastefanou, C., Zerefos, C.S., Ioannidou, A., Hernli, H.,2005. Deep stratosphere-to-troposphere transport (STT) over SE Europe: acomplex case study captured by enhanced 7Be concentrations at the surface of alow topography region. Atmos. Chem. Phys. Discuss. 5, 101e129.
Graustein, W.C., Turekian, K.K., 1996. 7Be and 210Pb indicate an upper tropospheresource for elevated ozone in the summertime subtropical free troposphere ofthe eastern North Atlantic. Geophys. Res. Lett. 23, 539e542.
Hamill, P., Jensen, E.J., Russell, P.B., Bauman, J.J., 1997. The life cycle of stratosphericaerosol particles. Bull. Am. Meteorol. Soc. 78, 1395e1410.
Heinrich, P., Jamelot, A., 2011. Atmospheric transport simulation of 210Pb and 7Be bythe LMDz general circulation model and sensitivity to convection and scav-enging parameterization. Atmos. Res. 101, 54e66.
Hernández-Ceballos, M.A., Hong, G.H., Lozano, R.L., Kim, Y.I., Lee, H.M., Kim, S.H.,Yeh, S.W., Bolívar, J.P., Baskaran, M., 2012. Tracking the complete revolution ofsurface westerlies over Northern Hemisphere using radionuclides emitted fromFukushima. Sci. Total Environ. 438, 80e85.
Hötzl, H., Rosner, G., Winkler, R., 1991. Correlation of 7Be concentrations in surfaceair and precipitation with the solar cycle. Naturwissenschaften 78, 215e217.
Hötzl, H., Rosner, G., Winkler, R., 1992. Sources of present Chernobyl-derivedcaesium concentrations in surface air and deposition samples. Sci. Total Envi-ron. 119, 231e242.
Ioannidou, A., Manolopoulou, M., Papastefanou, C., 2005. Temporal changes of 7Beand 210Pb concentrations in surface air at temperate latitudes (40�). Appl.Radiat. Isot. 63 (2), 277e284.
Ioannidou, A., Giannakaki, E., Manolopoulou, M., Stoulos, S., Vagena, E.,Papastefanou, C., Gini, L., Manenti, S., Groppi, F., 2013. An air-mass trajectorystudy of the transport of radioactivity from Fukushima to Thessaloniki, Greeceand Milan, Italy. Atmos. Environ. 75, 163e170.
Israelevich, P., Ganor, E., Alpert, P., Kishcha, P., Stupp, A., 2012. Predominant trans-port paths of Saharan dust over the Mediterranean Sea to Europe. J. Geophys.Res. Atmos. 117 (D2). http://dx.doi.org/10.1029/2011JD016482.
James, P., Stohl, A., Forster, C., Eckhardt, S., Seibert, P., Frank, A., 2003. A 15-yearclimatology of stratosphere-troposphere exchange with a Lagrangian particledispersion model 2. Mean climate and seasonal variability. J. Geophys. Res. 108(D12), 8522. http://dx.doi.org/10.1029/2002JD002639.
Johnson, W., Viezee, W., 1981. Stratospheric ozone in the lower troposphere: i.Presentation and interpretation of aircraft measurements. Atmos. Environ. 15,1309e1323.
Junge, C.E., 1963. Air Chemistry and Radioactivity. Academic Press/EnvironmentalScience and Technology, New York.
Koch, D.M., Jacob, J., Graustein, W.C., 1996. Vertical transport of troposphericaerosols as indicated 7Be and 210Pb in a chemical tracer model. J. Geophys. Res.101, 18651e18666.
Krysta, M., Bocquet, M., 2007. Source reconstruction of an accidental radionucliderelease at European scale. Q. J. Royal Meteorol. Soc. 133 (623), 529e544.
Kulan, A., Aldahan, A., Possnert, G., Vintersved, I., 2006. Distribution of 7Be in sur-face air of Europe. Atmos. Environ. 40, 3855e3868.
Lamborg, C.H., Fitzgerald, W.F., Graustein, W.C., Turekian, K.K., 2000. An examina-tion of the atmospheric chemistry of mercury using 210Pb and 7Be. J. Atmos.Chem. 36, 325e338.
Lee, H.N., Wan, G., Zheng, X., Sanderson, C.G., Josse, B., Wang, S., Yang, W., Tang, J.,Wang, C., 2004. Measurements of 210Pb and 7Be in China and their analysisaccompanied with global model calculations of 210Pb. J. Geophys. Res. 109,D22203. http://dx.doi.org/10.1029/2004JD005061.
Lee, H.N., Tositti, L., Zheng, X., Bonasoni, P., 2007. Analyses and comparisons ofvariations of 7Be, 210Pb and 7Be/210Pb with ozone observations at two GlobalAtmosphere Watch stations from high mountains. J. Geophys. Res. 112, D05303.http://dx.doi.org/10.1029/2006JD007421.
Leppanen, A.-P., Usoskin, I.G., Kovaltsov, G.A., Paatero, J., 2012. Cosmogenic 7Be and22Na in Finland: Production, observed periodicities and the connection to cli-matic phenomena. J. Atmos. Sol. Terr. Phys. 74, 164e180.
Li, Q., Jacob, D.J., Fairlie, T.D., Liu, H., Martin, R.V., Yantosca, R.M., 2002. Stratosphericversus pollution influences on ozone at Bermuda: reconciling past analyses.J. Geophys. Res. 107 (D22), 4611. http://dx.doi.org/10.1029/2002JD002138.
Liu, H., Jacob, D.J., Bey, I., Yantosca, R.M., 2001. Constraints from the 210Pb and 7Be onwet deposition and transport in a global three-dimensional chemical tracermodel driven by assimilated meteorological fields. J. Geophys. Res. 106 (D11),12109e12128.
Liu, H., Jacob, D.J., Dibb, J.E., Fiore, A.M., Yantosca, R.M., 2004. Constraints on thesources of tropospheric ozone from 210Pb-7Be-O3 correlations. J. Geophys. Res.109, D07306. http://dx.doi.org/10.1029/2003JD003988.
Lozano, R.L., Hernández-Ceballos, M.A., Adame, J.A., Casas-Ruíz, M., Sorribas, M., SanMiguel, E.G., Bolívar, J.P., 2011. Radioactive impact of Fukushima accident on theIberian Peninsula: evolution and plume previous pathway. Environ. Int. 37,1259e1264.
Lozano, R.L., Hernández-Ceballos, M.A., San Miguel, E.G., Adame, J.A., Bolívar, J.P.,2012. Meteorological factors influencing the 7Be and 210Pb concentrations in
surface air from the southwestern Iberian Peninsula. Atmos. Environ. 63, 168e178.
Maheras, P., Flocas, H.A., Anagnostopoulou, C., Patrikas, I., 2002. On the verticalstructure of composite surface cyclones in the Mediterranean region. Theor.Appl. Climatol. 71, 199e217.
Manolopoulou, M., Vagena, E., Stoulos, S., Ioannidou, A., Papastefanou, C., 2011.Radioiodine and radiocesium in Thessaloniki, Northern Greece due toFukushima nuclear accident. J. Environ. Radioact. 102, 796e797.
Marinoni, A., Cristofanelli, P., Calzolari, F., Roccato, F., Bonafé, U., Bonasoni, P., 2008.Continuous measurements of aerosol physical parameters at the Mt CimoneGAW Station (2165 m asl, Italy). Sci. Total Environ. 391, 241e251.
Masson, O., Baeza, A., Bieringer, J., Brudecki, K., Bucci, S., Cappai, M., Carvalho, F.P.,Connan, O., Cosma, C., Dalheimer, A., Didier, D., Depuydt, G., De Geer, L.E., DeVismes, A., Gini, L., Groppi, F., Gudnason, K., Gurriaran, R., Hainz, D.,Halldorsson, O., Hammond, D., Hanley, O., Holey, K., Homoki, Zs., Ioannidou, A.,Isajenko, K., Jankovic, M., Katzlberger, C., Kettunen, M., Kierepko, R., Kontro, R.,Kwakman, P.J.M., Lecomte, M., Leon Vintro, L., Leppänen, A.-P., Lind, B.,Lujaniene, G., Mc Ginnity, P., Mc Mahon, C., Mala, H., Manenti, S.,Manolopoulou, M., Mattila, A., Mauring, A., Mietelski, J.W., Møller, B.,Nielsen, S.P., Nikolic, J., Overwater, R.M.W., Palsson, S.E., Papastefanou, C.,Penev, I., Pham, M.K., Povinec, P.P., Ramebäck, H., Reis, M.C., Ringer, W.,Rodriguez, A., Rulik, P., Saey, P.R.J., Samsonov, V., Schlosser, C., Sgorbati, G.,Silobritiene, B.V., Söderström, C., Sogni, R., Solier, L., Sonck, M., Steinhauser, G.,Steinkopff, T., Steinmann, P., Stoulos, S., Sykora, I., Todorovic, D., Tooloutalaie, N.,Tositti, L., Tschiersch, J., Ugron, A., Vagena, E., Vargas, A., Wershofen, H.,Zhukova, O., 2011. Tracking of airborne radionuclides from the damagedFukushima Dai-Ichi nuclear reactors by European Networks. Environ. Sci.Technol. 45, 7670e7677. http://dx.doi.org/10.1021/es2017158, 28323, 28332.
Megumi, K., Matsunami, T., Ito, N., Kiyoda, S., Mizohata, A., Asano, T., 2000. Factors,especially sunspot number, causing variations in surface air concentrations anddepositions of 7Be in Osaka, Japan. Geophys. Res. Lett. 27 (3), 361e364.
Monks, P.S., 2000. A review of the observations and origins of the spring ozonemaximum. Atmos. Environ. 34, 3545e3561.
Moreno, T., Querol, X., Castillo, S., Alastuey, A., Cuevas, E., Herrmann, L.,Mounkaila, M., Elvira, J., Gibbons, W., 2006. Geochemical variations in aeolianmineral particles from the Sahara-Sahel Dust corridor. Chemosphere 65 (2),261e270.
Mt. Cimone Web site. http://www.isac.cnr/cimone/ (last accessed 01.08.13.).Paatero, J., Hatakka, J., 2000. Source areas of airborne 7Be and 210Pb in Northern
Finland. Health Phys. 79 (6), 691e696.Pace, G., Meloni, D., di Sarra, A., 2005. Forest fire aerosol over the Mediterranean
basin during summer 2003. J. Geophys. Res. 110, D21202. http://dx.doi.org/10.1029/2005JD005986.
Pállson, S.E., Howard, B.J., Bergan, T.D., Paatero, J., Isaksson, M., Nielsen, S.P., 2013.A simple model to estimate deposition based on a statistical reassessment ofglobal fallout data. J. Environ. Radioact. 121, 75e86.
Papastefanou, C., Manolopoulou, M., Charalambous, S., 1988. Radiation measure-ments and radioecological aspects of fallout from the Chernobyl reactor acci-dent. J. Environ. Radioact. 7 (1), 49e64.
Papastefanou, C., Ioannidou, A., 1995. Aerodynamic size association of 7Be inambient aerosols. J. Environ. Radioact. 26, 273e282.
Papastefanou, C., 2008. Radioactive aerosols. In: Radioactivity in the Environment,vol. 12Elsevier B.V., pp. 11e58 (Chapter 2). http://dx.doi.org/10.1016/S1569-4860(07)12002-7.
Pham, M.K., Betti, M., Nies, H., Povinec, P.P., 2011. Temporal changes of 7Be, 137Cs and210Pb activity concentrations in surface air at Monaco and their correlation withmeteorological parameters. J. Environ. Radioact. 102, 1045e1054.
Pittauerová, D., Hettwig, B., Fischer, H.W., 2011. Fukushima fallout in NorthwestGerman environmental media. J. Environ. Radioact. 102, 877e880.
Prospero, J.M., Schmitt, R., Cuevas, E., Savoie, D.L., Graustein, W.C., Turekian, K.K.,Volz-Thomas, A., Diaz, A., Oltmans, S.J., Levy II, H., 1995. Temporal variability ofsummer-time ozone and aerosols in the free troposphere over the easternNorth Atlantic. Geophys. Res. Lett. 22, 2925e2928.
Rao, S.T., Zurbenko, I.G., Neagu, R., Porter, P.S., Ku, J.Y., Henry, R.F., 1997. Space andtime scales in ambient ozone data. Bull. Am. Meteorol. Soc. 78, 2153e2166.
Rapetti, F., Vittorini, S., 1989. Aspetti del clima nei versanti tirrenico ed adriaticolungo l’allineamento Livorno-Monte Cimone-Modena. In: Atti della SocietàToscana di Scienze Naturali, Memorie, Serie A, 96, pp. 159e192.
Rasch, P.J., Tilmes, S., Turco, R.P., Robock, A., Oman, L., Chen, C., et al., 2008. Anoverview of geoengineering of climate using stratospheric sulfate aerosols.Philos. Trans. Royal Soc. A Math. Phys. Eng. Sci. 366 (1882), 4007e4037.
Rastogi, N., Sarin, M.M., 2008. Atmospheric 210Pb and 7Be in ambient aerosols overlow- and high-altitude sites in 34 semiarid region: temporal variability andtransport processes. J. Geophys. Res. 113. http://dx.doi.org/10.1029/2007JD009298.
Reiter, R., Sladkovich, K., Pötzl, K., Carnuth, W., Kanter, H.J., 1971. Studies on theinflux of stratospheric air into the lower troposphere using cosmic-ray pro-duced radionuclides and fallout. In: Archiv für Meteorologie, Geophysik undBioklimatologie, Serie A, vol. 20(3), pp. 211e246.
Reiter, E.R., 1975a. Weather phenomena of the Mediterranean basin. Part 1. Generaldescription of the meteorological processes. In: Handbook for Forecasters in theMediterranean Basin. Environment Prediction Research Facility. Naval Post-graduate School/U.S. Department of Commerce, Monterey, California. Availableat: http://www.dtic.mil/cgi-bin/GetTRDoc?AD¼ADA024271 (last accessed01.08.13.).
L. Tositti et al. / Atmospheric Environment 87 (2014) 108e122122
Reiter, E.R., 1975b. Stratospheric-tropospheric exchange processes. Rev. Geophys.Space Phys. 13 (4), 459e474.
Reiter, R., Munzert, K., Kanter, H.J., Potzl, K., 1983. Cosmogenic radionuclides andozone at a mountain station at 3.0 km a.s.1. In: Archiv fur Meteorologie, Geo-physik und Bioclimatologie, Serie B, vol. 32, pp. 131e160.
Serban, E., Santaguida, R., Lauria, L., 2007. The pluviometric surplus and deficit, asclimatic risk phenomena at Monte Cimone weather station, Italy. In: SeminarulGeografic “D. Cantemir” 28, pp. 33e42.
Steinmann, P., Zeller, M., Beuret, M., Ferreri, G., Estier, S., 2013. Cosmogenic 7Be and22Na in ground level air in Switzerland. J. Environ. Radioact. 124, 68e73.
Stohl, A., Spoichtinger-Rakowsky, N., Bonasoni, P., Feldmann, H.,Memmesheimer, M., Scheel, H.E., Trickl, T., Hübener, S., Ringer, W., Mandl, M.,2000. The influence of stratospheric intrusions on alpine ozone concentrations.Atmos. Environ. 34, 1323e1354.
Stohl, A., Wernli, H., James, P., Borqui, M., Forster, C., Liniger, M.A., Seibert, P.,Sprenger, M., 2003. A new perspective of stratosphere-troposphere exchange.Am. Meteorol. Soc., 1565e1573. http://dx.doi.org/10.1175/BAMS-84-11-1565.
Sykora, I., Froehlich, K., 2010. Radionuclides as tracers of atmospheric processes. In:Elsevier (Ed.), Radioactivity in the Environment, vol. 16, pp. 51e88. http://dx.doi.org/10.1016/S1569-4860(09)01603-9 (Chapter 3).
Thakur, P., Ballard, S., Nelson, R., 2013. An overview of Fukushima radionuclidesmeasured in the northern Hemisphere. Sci. Total Environ. 458-460, 577e613.
Tositti, L., Hübener, S., Kanter, H.J., Ringer, W., Sandrini, S., Tobler, L., 2004. Inter-comparison of sampling and measurement of 7Be in air at four high-altitudelocations in Europe. Appl. Radiat. Isot. 61, 1497e1502.
Tositti, L., Brattich, E., Cinelli, G., Previti, A., Mostacci, D., 2012. Comparison ofradioactivity data measured in PM10 aerosol samples at two elevated stations innorthern Italy during the Fukushima event. J. Environ. Radioact. 114, 105e112.
Tositti, L., Riccio, A., Sandrini, S., Brattich, E., Baldacci, D., Parmeggiani, S.,Cristofanelli, P., Bonasoni, P., 2013. Short-term climatology of PM10 at a highaltitude background station in southern Europe. Atmos. Environ. 65, 145e152.
Tremblay, J., Servranckx, R., 1993. Beryllium-7 as a tracer of stratospheric ozone: acase study. J. Radioanal. Nucl. Chem. 172 (1), 49e56.
Trickl, T., Feldmann, H., Kanter, H.-J., Scheel, H.-E., Sprenger, M., Stohl, A., Wenli, H.,2010. Forecasted deep stratospheric intrusions over central Europe: case studiesand climatologies. Atmos. Chem. Phys. 10, 499e524.
Trigo, I.F., Bigg, G.R., Davies, T.D., 2002. Climatology of cyclogenesis mechanisms inthe Mediterranean. Mon. Weather Rev. 130, 549e569.
Turekian, K.K., Benninger, L.K., Dion, E.P., 1983. 7Be and 210Pb total deposition fluxesat New Haven Connecticut and at Bermuda. J. Geophys. Res. 88, 5411e5415.
Turekian, K.K., Graustein, W.C., 2003. Natural radionuclides in the atmosphere. In:Keeling, R.F. (Ed.), The Atmosphere. In: Holland, H.D., Turekian, K.K. (Eds.),Treatise on Geochemistry, vol. 4. Elsevier-Pergamon, Oxford, pp. 261e279.
Usoskin, I., Kovaltsov, G., 2008. Production of cosmogenic 7Be isotope in the at-mosphere: full 3D modelling. J. Geophys. Res. 113, D12107.
Usoskin, I.G., Field, C.V., Schmidt, G.A., Leppänen, A.-P., Aldahan, A., Kovaltsov, G.A.,Possnert, G., Ungar, R.K., 2009. Short-term production and synoptic influenceson atmospheric 7Be concentrations. J. Geophys. Res. 114, D06108. http://dx.doi.org/10.1029/2008JD011333.
Vakulovsky, S.M., Nikitin, A.I., Chumichev, V.B., Katrich, I.Y., Voitsekhovich, O.A.,Medinets, V.I., Pisarev, V.V., Bovkum, L.A., Khersonsky, E.S., 1994. Cesium-137and strontium-90 contamination of water bodies on the areas affected by re-leases from the Chernobyl nuclear power plant accident: an overview.J. Environ. Radioact. 23 (2), 103e122.
Winkler, R., Dietl, F., Frank, G., Thiersch, J., 1998. Temporal variation of 7Be and 210Pbsize distributions in ambient aerosols. Atmos. Environ. 32, 983e991.
Wilks, D., 2006. Statistical Methods in the Atmospheric Sciences. In: InternationalGeophysics Series, second ed. Academic Press.
WMO-GAW (World Meteorological Organization, e Global Atmosphere Watch)Report No. 155, 2004. In: 1st International Expert Meeting on Sources andMeasurements of Natural Radionuclides Applied to Climate and Air QualityStudies, (Gif-sur-Yvette, France, 3e5 June 2003) (WMO TD No. 1201). Avail-able at: ftp://ftp.wmo.int/Documents/PublicWeb/arep/gaw/gaw155.pdf (lastaccessed 01.08.13.).
World Data Centre for Greenhouse Gases (WDCGG). http://ds.data.jma.go.jp/gmd/wdcgg/ (last accessed 01.08.13.).
Zanis, P., Gerasopoulos, E., Priller, A., Schnabel, C., Stohl, A., Zerefos, C.,Gäggeler, H.W., Tobler, L., Kubik, P.W., Kanter, H.J., Kanter, H.J., Scheel, H.E.,Luterbacher, J., Berger, M., 2003. An estimate of the impact of stratosphere-to-troposphere transport (STT) on the lower free tropospheric ozone over the Alpsusing 10Be and 7Be measurements. J. Geophys. Res. 108 (D12), 8520. http://dx.doi.org/10.1029/2002JD002604.
Zheng, X., Wang, G., Tang, J., Zhang, X., Yang, W., Lee, H.N., Wang, C., 2005. 7Be and210Pb radioactivity and implications on sources of surface ozone at Mt. Wali-guan. Chin. Sci. Bull. 50 (2), 167e171.
Zheng, X.D., Wan, G., Tang, J., 2011. Source characteristics of O3 and CO2 at Mt.Waliguan Observatory, Tibetan Plateau implied by using 7Be and 210Pb. Sci.China Earth Sci. 54 (4), 550e560.
Zurbenko, I.G., 1986. The Spectral Analysis of Time Series. North-Holland,Amsterdam.