Comparison of Everolimus- and Sirolimus-Eluting Stents in Patients With Long Coronary Artery Lesions

Strategy and Approach
to Quality by Design
9th Drug Evaluation Forum, Tokyo, Japan
Dr Talia Buggins, PhD, AstraZeneca R&D Macclesfield, UK
Ms Maria Edebrink, MSc, AstraZeneca R&D Södertälje,
Sweden
11 April 2012
From Viewpoints of Simultaneous Global Development

Strategy and Approach to Quality by Design
From Viewpoints of Simultaneous Global Development
Overview of Presentation
Why Quality by Design?
QbD Foundations
Basis for QbD Development
Drug Product Case Study
Drug Substance Case Study
Design Space in Marketing Application
Summary
Acknowledgment
Questions
Dr Talia Buggins Ms Maria Edebrink
2 AstraZeneca R&D

Why Quality by Design?
Dr Talia Buggins Ms Maria Edebrink
AstraZeneca R&D 3

Why Quality by Design?
To perform development work in a more efficient, streamlined way
To provide opportunities for developing more reliable, robust processes and products and thus deliver increased value to our patients and the business
To allow continuous improvement of manufacturing processes and control strategies throughout the product lifecycle with reduced need for post-approval changes.
4 Dr Talia Buggins Ms Maria Edebrink
AstraZeneca R&D

QbD Foundations
Dr Talia Buggins Ms Maria Edebrink
AstraZeneca R&D 5

QbD Foundations
6 Dr Talia Buggins Ms Maria Edebrink
AstraZeneca R&D
Q8
Ph
arm
aceu
tical D
evelo
pm
en
t
Q9
Qu
ality
Ris
k M
an
ag
em
en
t
Q1
0
Ph
arm
ac
eu
tica
l Qu
ality
Sys
tem
s
Q11
(Dra
ft)
De
ve
lop
me
nt a
nd
ma
nu
fac
ture
of d
rug
su
bs
tan
ce
s

Basis for Drug Substance
and Drug Product QbD
Development
Dr Talia Buggins Ms Maria Edebrink
AstraZeneca R&D 7

QbD Development Basis for Drug Substance & Drug Product QbD Development
8 Dr Talia Buggins Ms Maria Edebrink
AstraZeneca R&D
Drug Product
CQA
Drug Substance
CQA
Drug Product
CQA
Drug Substance
CQA DS Design Space
DS Control Strategy
DP Design Space
DP Control Strategy
QRA Process understanding
Several iterations
may be needed
Patient Safety and Efficacy
Quality Target Product Profile
based on Clinical/Toxicological data
Desired DP properties

Product Risk
Product Knowledge
Overview of Steps in a typical QbD Development
Collate Prior Knowledge
Perform High Level Risk Assessment
Conduct Experimental Evaluation
2nd Iteration of Risk Assessment
Evaluate impact of highest risk variables on in vivo performance
Develop detailed process understanding
Review Risk Assessment
Construct Design Space
Construct Quality Target Product Profile
Establish Control Strategy
9

Product Risk
Product Knowledge
Overview of Steps in a typical QbD Development
Collate Prior Knowledge
Perform High Level Risk Assessment
Conduct Experimental Evaluation
2nd Iteration of Risk Assessment
Evaluate impact of highest risk variables on in vivo performance
Develop detailed process understanding
Review Risk Assessment
Construct Design Space
Construct Quality Target Product Profile
Establish Control Strategy
10

QbD Development Quality Risk Assessment, DoE & Kinetics
11 Dr Talia Buggins Ms Maria Edebrink
AstraZeneca R&D
Quality Risk Assessment – Failure Mode, Effects and Criticality Analysis
(FMECA)
How we applied FMECA:
Each Critical Quality Attribute (CQA) assessed separately
Based on Experimental data and scientific judgment
Risk priority number = Probability * Severity * Detectability (P*S*D)
Criticality number = Probability * Severity (P*S*Detectability API Spec only)
Iterative process delivering Method of manufacture & Control Strategy

QbD Development Quality Risk Assessment, DoE & Kinetics
12 Dr Talia Buggins Ms Maria Edebrink
AstraZeneca R&D
Initial QRA
Experiments and simulations
Enough data
aquired?
Criticality P*S*D (spec only)
Risk Priotiry P*S*D
All risks Low?
Apply Control Strategy
Yes
No
Established Process
Yes
No
Steer development work
Finalize the Control Strategy

QbD Development Quality Risk Assessment, DoE & Kinetics
13 Dr Talia Buggins Ms Maria Edebrink
AstraZeneca R&D
Table 1 Overview of the criticality
CQA Charging Reaction Work-up Distillation Crystallisation Isolation Drying
Description Low Low Low Low Low Low Low
Identity Low Low Low Low Low Low Low
Assay Low Low Low Low Low Low Low
Absolute
configuration
Low Low Low Low Low Low Low
Organic impurities Low Medium Low Low Low Low Low
Solvents Low Low Low Medium Low Low Low
Water Low Low Low Low Low Low Low
Sulphated ash Low Low High Low Low Low Low
Polymorphic form Low Low Low Medium Low Low Low
Particle size Low Low Low Medium Medium Low Low
Microbiologya Low Low Low Low Low Low Low

Drug Product Case Study:
Linking the Design
Space to clinical performance
Dr Talia Buggins Ms Maria Edebrink
AstraZeneca R&D 14

Case study: linking the Design Space to clinical performance
Understanding the in vivo impact of product and process variables is
an important foundation of any QbD development
When linked to meaningful in vitro tests, this enables:
evaluation multiple aspects of the Design Space and
development of science and risk based specifications
One approach is to confirm mechanistic understanding by producing
product variants that incorporate the highest risk variables, and then
evaluating their performance
A case study will be presented here which focuses on the risks
relating to dissolution and bioequivalence, but the principles apply
equally to all Critical Quality Attributes
Dr Talia Buggins Ms Maria Edebrink
15 AstraZeneca R&D

Product Risk
Product Knowledge
Case study: linking the Design Space to clinical performance
Collate Prior Knowledge
Perform High Level Risk Assessment
Conduct Experimental Evaluation
2nd Iteration of Risk Assessment
Evaluate impact of highest risk variables on in vivo performance
Develop detailed process understanding
Review Risk Assessment
Construct Design Space
Construct Quality Target Product Profile
Establish Control Strategy
1. Conduct Quality Risk Assessment
2. Develop Appropriate CQA tests
3. Understand the in vivo importance of changes
4. Establish Appropriate CQA limits
5. Use the product knowledge in subsequent
QbD steps
Dr Talia Buggins Ms Maria Edebrink
16 AstraZeneca R&D

Compound properties
Formulation
Immediate release (IR) tablet, manufactured by a wet granulation process
API properties
Low solubility in buffers <10g/mL across the physiological pH range
Moderate permeability
Absolute bioavailability: F = 36%, estimated fabs = 51 %
However, highly solubility in human intestinal fluid = 0.5 mg / mL
Believed to be due to presence of micelles
BCS class 4.
Dissolution
Poorly soluble in aqueous buffers therefore surfactant media chosen
For this drug surfactant media may have more in vivo relevance, as they are
likely to mimic the solubilisation mechanism in the intestinal environment due
to presence of micelles
Dr Talia Buggins Ms Maria Edebrink
17 AstraZeneca R&D

Step 1: Risk assessment
An FMECA-based QRA identified highest risk process and formulation parameters for in vivo performance
In vitro screening in several dissolution media confirmed that these factors did impact dissolution in a variety of media
We now needed to confirm if these changes in in vitro dissolution
would result in changed bioavailability
Used the BCS scientific framework to structure
this discussion / decision on whether further
investigations are required
Dr Talia Buggins Ms Maria Edebrink
18 AstraZeneca R&D

Dissolution limits which assure exposure by BCS Class for a QbD based design space (Dickinson et al. 2008)
1 3
2 4
Complete dissolution
within 15 minutes in most
discriminating ‘simple’
media (physiological pH
range).
If slower: bioavailability
data or additional
mechanistic information
Complete dissolution within
30 minutes in most
discriminating ‘simple’
media (physiological pH
range).
If slower: bioavailability data
or additional mechanistic
information
Limit set based on clinical
‘bioavailability’ data
Limit set on case by case
basis:
Solubility High Low
Bioequivalence Study;
Or follow principles of
BCS2 or BCS3 if can
demonstrate that
compound behaves more
like BCS2 or BCS3 in vivo
Dickinson et al. (2008) AAPS Journal. 10: 380-90. Dr Talia Buggins Ms Maria Edebrink
19 AstraZeneca R&D

Step 1: Risk assessment
The case study compound is BCS4 – therefore a clinical IVIVC-type
study will be needed to determine the relevance of in vitro changes
for in vivo performance, and define clinically meaningful in vitro tests
and specifications
Tablet variants were produced incorporating the highest risks from
the QRA for use in a clinical study
In vivo exposures from these variants were compared to the standard
Phase 3/commercial tablet, and an oral solution, in healthy
volunteers
Aims of study:
1. Demonstrate the impact of highest risk parameters on in vivo performance, to help define the Design Space
2. Provide in vivo data to enable selection of a relevant QC dissolution test which could assure in vivo performance
Dr Talia Buggins Ms Maria Edebrink
20 AstraZeneca R&D

Tablet variants selected for in vivo study
Description Dissolution risks addressed from initial QRA
Variant A Process variant : Over granulated and over-compressed
Granulation (high risk);
Compression (medium risk).
Change in filler grade causing change in granulation or compression behavior (medium).
Variant B Process variant : Over granulated (extreme) and over-compressed, only large (>1 mm) particles used for compression
Granulation (high);
Compression (medium).
Change in filler grade causing change in granulation or compression behavior (medium).
Variant C Formulation variant Vary the amount of binder and disintegrant
Binder - change in grade (high); Disintegrant - change in grade (medium).
It is not necessary to study all possible parameters in vivo, since
several lead to the same mechanism of slowing dissolution
API quality attributes are fixed by the Drug Substance Design Space Dr Talia Buggins Ms Maria Edebrink
21 AstraZeneca R&D

Step 2: Develop appropriate CQA tests
4x
Standard Tablet
Variant A
Variant B
Variant C
x
1.5x
1.5x
Surfactant 1: Quite similar discrimination
(rank order). Standard tablet very rapid
Surfactant 2: Similar discrimination,
slower profiles
Surfactant 3: Similar discrimination, Slower
profiles
FaSSIF: Media qualitatively similar to in vivo
environment. Useful to build confidence &
understanding
Same rank order for all media
Dissolution of the tablet variants was performed in several surfactant media:
Dr Talia Buggins Ms Maria Edebrink
22 AstraZeneca R&D

Step 3: Understand the in vivo importance of changes
+ = standard and side
batches based on most
relevant manufacturing
variables.
*For this type of
approach to be
acceptable the most
relevant risks to clinical
quality need to have
been assessed (i.e. in a
QbD setting).
Cha
nge
in C
max o
r A
UC
(%
)
0
-10
-20
-30
Time to x% dissolution (min)
-40
-50
+
+ +
+ +
+
+
+
1. ‘IVIVC’
2. ‘Safe Space’ 3. ‘Mixed safe space / IVIVC’
3 possible outcomes from the in vivo study:
1. An IVIVC is established, and a specification that controls Cmax and AUC by maximum +/-10% can be set.
2. “Safe space” - no effect seen in the clinical study, specification is set based on the slowest dissolution profile tested in the clinical study (i.e. set at the boundary of knowledge rather than on a biological effect).
3. Mixed safe space / IVIVC result - clinical pharmacokinetics only affected for a few of the variants tested clinically. Again this would allow a dissolution specification to be set that allowed Cmax and AUC to be controlled to +/- 10%.
Dickinson et al. (2008) AAPS Journal. 10: 380-90
Dr Talia Buggins Ms Maria Edebrink
23 AstraZeneca R&D

Clinical study results
• The tablet variants all fall within standard bioequivalence limits
compared to the standard tablet, indicating that exposures were
equivalent
• ”Safe space” result – the differences in in vitro performance were
not sufficiently large to affect in vivo performance
Treatment: Solution Standard Tablet Variant A Variant B Variant C
Pla
sma
Co
nce
ntr
ati
on
(n
g/m
L)
0
100
200
300
400
500
600
Protocol Time (hr) 0 4 8 12 16 20 24 28 32 36 40 44 48 52 56 60 64 68 72
Tablet comparison
AUC Geomean ratio (90% CIs)
Cmax Geomean ratio (90% CIs)
Variant A/ Standard
0.97 (0.90, 1.05) 1.05 (0.95, 1.16)
Variant B/ Standard
1.02 (0.94, 1.10) 1.04 (0.94, 1.15)
Variant C/ Standard
0.97 (0.89, 1.05) 0.91 (0.83, 1.00)
Dr Talia Buggins Ms Maria Edebrink
24 AstraZeneca R&D

Step 4: Using the in vivo data to establish appropriate dissolution limits
The in vitro dissolution methods are over-discriminatory
with respect to in vivo performance
relatively large changes in in vitro dissolution
performance only corresponded to very minor changes
in vivo, which are not sufficient to impact bioavailability
‘Safe Space’ dissolution window
The study data can therefore be used in conjunction with
the discriminatory dissolution methods to allow a
specification to be set that assures in vivo performance
i.e., assures that tablets from the design space will
have equivalent performance to batches used in the
pivotal safety and efficacy studies
Dr Talia Buggins Ms Maria Edebrink
25 AstraZeneca R&D

Step 4: Using the in vivo data to establish appropriate dissolution limits
Any tablet with a dissolution profile faster than Variant C would be expected to give equivalent in vivo exposures to the standard tablet
a specification set anywhere above this will guarantee equivalent safety and efficacy to the pivotal trials
This is a wider specification than would be derived using a traditional batch history approach
but it is scientifically supported by the increased understanding gained from a QbD development
Only relevant for this Design Space, as the risk assessment included certain assumptions specific for this e.g. process type, formulation inputs etc.
Dr Talia Buggins Ms Maria Edebrink
26 AstraZeneca R&D

Step 5: Using the knowledge gained in subsequent QbD steps
The dissolution method and in vivo relevant specification
were used during subsequent QbD development to:
1. Further develop mechanistic understanding of the process and
formulation
2. Define the Design Space to ensure that every tablet produced
within it will have equivalent performance to those in the pivotal
clinical studies
Extent to which highest risks could parameters can be varied
without impacting clinical performance understood following
clinical study
Assured that lower risk variables had no impact on in vivo
performance through in vitro testing only
3. Assure product quality during routine production as part of the
Control Strategy
Dr Talia Buggins Ms Maria Edebrink
27 AstraZeneca R&D

Linking the Design Space to clinical performance: Conclusions
The Design Space and Control Strategy should be developed to
guarantee efficacy and safety equivalent to the pivotal trials
CQAs, including dissolution, should be linked to safety and
efficacy
Need to develop product-specific understanding of in vivo
performance in order to achieve this
Based on this, specifications lower than clinical batch history may be
appropriate, as long as safety and efficacy remains unchanged
Major regulatory agencies have accepted the principal of linking
dissolution to clinical performance, but applied it to specification
setting in different ways
Potential to end up with different specifications in different regions
Still an emerging area of regulatory science
Dr Talia Buggins Ms Maria Edebrink
28 AstraZeneca R&D

Drug substance Case Study
Basis for Drug Substance & Drug Product QbD Development
Registered Starting Materials
Quality Risk Assessment, Design of Experiments and Kinetics
Scale & equipment dependence
Dr Talia Buggins Ms Maria Edebrink
AstraZeneca R&D 29

QbD Development Basis for Drug Substance & Drug Product QbD Development
30 Dr Talia Buggins Ms Maria Edebrink
AstraZeneca R&D
Drug Product
CQA
Drug Substance
CQA
Drug Product
CQA
Drug Substance
CQA DS Design Space
DS Control Strategy
DP Design Space
DP Control Strategy
QRA Process understanding
Several iterations
may be needed
Patient Safety and Efficacy
Quality Target Product Profile
based on Clinical/Toxicological data
Desired DP properties

Registered Starting
Materials
Dr Talia Buggins Ms Maria Edebrink
AstraZeneca R&D 31

Product Risk
Product Knowledge
Overview of Steps in a typical QbD Development
Collate Prior Knowledge
Perform High Level Risk Assessment
Conduct Experimental Evaluation
2nd Iteration of Risk Assessment
Evaluate impact of highest risk variables on in vivo performance
Develop detailed process understanding
Review Risk Assessment
Construct Design Space
Construct Quality Target Product Profile
Establish Control Strategy
32

QbD Development
RSM
33 Dr Talia Buggins Ms Maria Edebrink
Foundations for RSM
Stereochemistry investigated in-depth
and described in detail
Comprehensive understanding of
impurities and their fate in the process
AstraZeneca R&D

QbD Development RSM
Stereochemistry
In-depth literature survey
Ab-initio calculations
Experimental work to support conclusions from literature
Manufacture of possible stereoisomers
Chiral control of registered starting materials (RSM)
Statistics to eliminate analysis of the other enantiomer in API
Specification of enantiomers in RSM
Diastereomer control
Comprehensive understanding shared with regulatory authorities to
support knowledge based controls
34 Dr Talia Buggins Ms Maria Edebrink
0.5% 0.5% = 25 ppm
AstraZeneca R&D

QbD Development
RSM
Impurity tracking
Identification of impurities
Tracking of impurities
Fate of impurities
Spiking above specification limits
or
Selection of batches with elevated levels
Analysis in FI’s and/or Drug Substance
Knowledge used to support specifications related to process capability for RSMs
35 Dr Talia Buggins Ms Maria Edebrink
AstraZeneca R&D

Quality Risk Assessment,
Design of Experiments &
Kinetics
Dr Talia Buggins Ms Maria Edebrink
AstraZeneca R&D 36

QbD Development Quality Risk Assessment, DoE & Kinetics
Method:
Failure mode, effects and criticality analysis (FMECA) for risk assessment
Design of Experiments (DoE) incl Factorial Experimental Design
Statistic Evaluation
Kinetics
Scale independence justification
37 Dr Talia Buggins Ms Maria Edebrink
AstraZeneca R&D
Organic
impuritiesIPC control: volume and water Control to
Specification
Crystallisation
Dissolution time
Chargting rate
Antisolvent amount
Final temperature
Distillation DryingIsolation
Washing amount
Reaction
Acid volume
Solvent volume
Reaction temperature
Reaction time
Work-Up

QbD Development
Factors:
Time, temperature, amount of acid,
solvent volume
Statistical evaluation:
Identify significant parameters and
interactions
Create a statistical model
Evaluate contour plots
Included in S2.6 in the application:
Coefficient plots (all factors)
Coefficient plots (significant factors)
Contour plots
38 Dr Talia Buggins Ms Maria Edebrink
AstraZeneca R&D
Quality Risk Assessment, DoE & Kinetics

QbD Development Quality Risk Assessment, DoE & Kinetics
Investigations of kinetics:
Justify design space for a chemical reaction
Experimental data at different temperatures used to determine the rate expression for the main reaction and the competing side reaction
Rate expressions used to determine and visualise the design space
39 Dr Talia Buggins Ms Maria Edebrink
AstraZeneca R&D
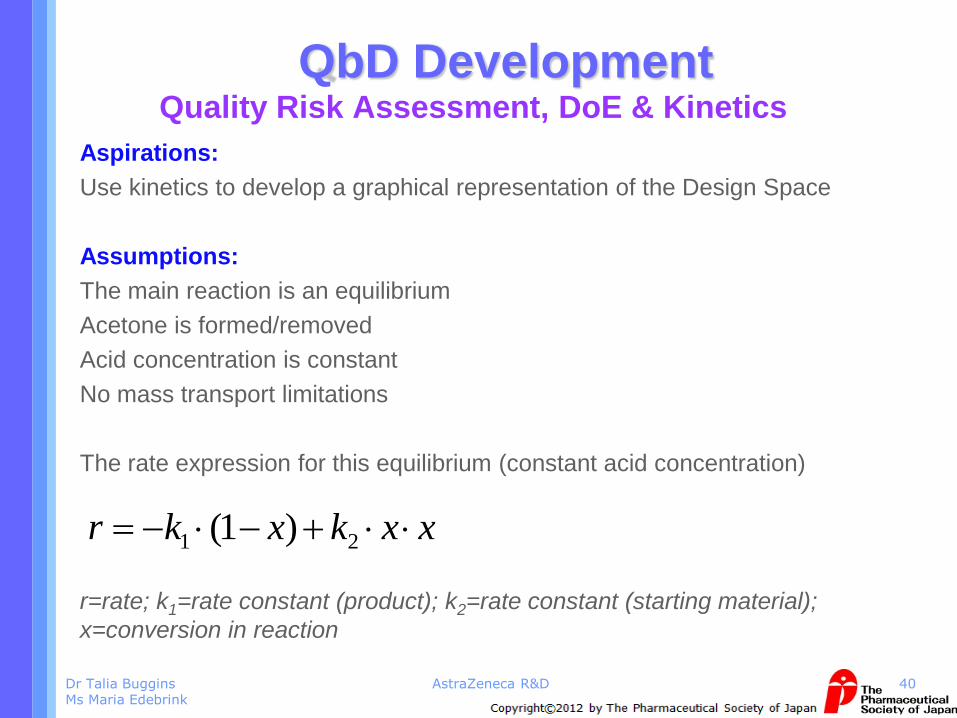
QbD Development Quality Risk Assessment, DoE & Kinetics
Aspirations:
Use kinetics to develop a graphical representation of the Design Space
Assumptions:
The main reaction is an equilibrium
Acetone is formed/removed
Acid concentration is constant
No mass transport limitations
The rate expression for this equilibrium (constant acid concentration)
r=rate; k1=rate constant (product); k2=rate constant (starting material);
x=conversion in reaction
40 Dr Talia Buggins
Ms Maria Edebrink
xxkxkr 21 )1(
AstraZeneca R&D

QbD Development QRA, DoE & Kinetics
Method:
Conversion of starting material
investigated
Conversion measured as a function
of time
From 15 C up to 60 C
Result:
Rate expression for the conversion
of starting material to product
41 Dr Talia Buggins Ms Maria Edebrink
xxexer TRTR
3326549303
8 8626)1(10051.2
x = conversion in reaction; R = gas constant (8.31); T = temperature in Kelvin
AstraZeneca R&D

QbD Development QRA, DoE & Kinetics
Method:
Reaction kinetics investigated
Impurity formation measured as a
function of time
15 C up to 60 C
Result:
Rate expression for the formation of
the impurity A
42 Dr Talia Buggins Ms Maria Edebrink
x = conversion to impurity A; R = gas constant (8.31); T = temperature in Kelvin
AstraZeneca R&D
min
1:1108.3
94724
12 unitxer TR

QbD Development QRA, DoE & Kinetics
Result:
Graphical representation of Design
Space based on rate expression
developed from experimental data
43 Dr Talia Buggins Ms Maria Edebrink
AstraZeneca R&D

Scale & Equipment
Dependence
Dr Talia Buggins Ms Maria Edebrink
AstraZeneca R&D 44

QbD Development
Scale and Equipment
Dependence
Matrix Risk Assessment
CQAs v/s Unit operations
Supported with experimental data
Scale and equipment flexibilities
within the predicted range claimed in
S2.2
Flexibilities supported by data
presented in S2.6 in the Marketing
Application
45 Dr Talia Buggins Ms Maria Edebrink
AstraZeneca R&D
Reaction – Stability, establishment of
power input per volume
Distillation – Thermal stability and
distillation time simulation
Isolation – Provoked levels of impurities,
poor mixing, extreme wash conditions
Drying – Thermal Stability

Design Space in the Marketing Application
Dr Talia Buggins Ms Maria Edebrink
AstraZeneca R&D 46

Product Risk
Product Knowledge
Overview of Steps in a typical QbD Development
Collate Prior Knowledge
Perform High Level Risk Assessment
Conduct Experimental Evaluation
2nd Iteration of Risk Assessment
Evaluate impact of highest risk variables on in vivo performance
Develop detailed process understanding
Review Risk Assessment
Construct Design Space
Construct Quality Target Product Profile
Establish Control Strategy
47

Drug Product Design Space - an example
Design Space presented in P2.01 and P2.3
Supporting experimental data and risk assessments in P2.2 and P2.3
Fixed formulation inputs and process type
Drug substance CQAs assured by the drug substance Design Space
Represented as a series of manufacturing process steps
Design Space boundaries for equipment and process parameters are given for each unit operation
Scale independent parameters have been used to constrain some process steps in a multivariate manner eg. Spray Flux for the granulation step
Dr Talia Buggins Ms Maria Edebrink
48 AstraZeneca R&D

Drug Product Design Space
Represented as a series of process steps
Design Space boundaries for equipment and process parameters are given for each unit operation
Dr Talia Buggins Ms Maria Edebrink
49 AstraZeneca R&D
Equipment Intermediate product attributes or parameters
Direct heating; fluidised solids bed
Inlet air ≤ 85 C, moisture content ≤ 2%w/w
eg. Drying step

Drug Product Design Space
Scale independent parameters have been used to constrain some process steps in a multivariate manner eg. Spray Flux for the granulation step
Dr Talia Buggins Ms Maria Edebrink
50 AstraZeneca R&D
Equipment Intermediate product attributes or parameters
Wet high shear granulation; vertical. Scale up to 1800 L
Water: 20-30%w/w Speed: 3-8 m/s Time: 6-20 min Impeller tip speed 4.0 to 9.4 m/s Spray flux ratio 0.2 to 1.4
(GEA)
eg. Wet granulation step

Scale independent parameters in Design Space: Spray Flux for control of granulation step
Area flux of liquid
- Liquid flowrate (water quantity,
spray time, number of nozzles)
- Droplet size
Area flux of powder - Powder velocity
- Projected spray width
Y = Hapgood (2004) Y
Dr Talia Buggins Ms Maria Edebrink
51 AstraZeneca R&D

Scale independent parameters in Design Space: Spray Flux for control of granulation step
Dr Talia Buggins Ms Maria Edebrink
52 AstraZeneca R&D
Scale independent Design Space for granulation presented in the file
Granulation constrained by spray flux (within experimental experience) and extreme parameter ranges
Proposed scale constraints beyond our experience
Flexibility up to 1800L (2.25 x) requested
Limited acceptance by Health Authorities to include this flexibility as part of the Design Space
Some authorities required data from >800L prior to increase in scale AZ obliged to follow-up post-approval legislation

QbD Development
Drug Substance Design Space in Marketing Application
S2.6 Development History CQA description
Risk Assessment Summaries
Step-by-Step Narrative
DoE summaries including statistics
Kinetics
Scale and equipment dependence
Product Quality System
S2.2 Method of Manufacture Process Description
Graphical Representation of Design Space
Scale & Equipment limitations included
53 Dr Talia BugginsMs Maria Edebrink
AstraZeneca R&D
Organic
impuritiesIPC control: volume and water Control to
Specification
Crystallisation
Dissolution time
Chargting rate
Antisolvent amount
Final temperature
Distillation DryingIsolation
Washing amount
Reaction
Acid volume
Solvent volume
Reaction temperature
Reaction time
Work-Up

Global QbD filings
A knowledge based development can lead to a control strategy that effectively assures product quality, that is different from a traditional approach.
However this is open to different interpretation by regulatory authorities globally
Health Authorities are still learning in this area and may have different perspectives
Can lead to multiple rounds of questions
May lead to different outcomes in different territories eg. different specifications.
Different approaches may be needed for countries that are ICH vs Non-ICH
Industry’s approach to QbD is also still evolving, as we learn from each development and regulatory interaction
Keen to work with Health Authorities to ensure our approaches to QbD evlove in a harmonious manner
Dr Talia BugginsMs Maria Edebrink
AstraZeneca R&D 54

Summary
Dr Talia Buggins Ms Maria Edebrink
AstraZeneca R&D 55

Summary
Why QbD •Efficiency, Flexibility and Continous
Improvement
Foundations •Guidelines working together; Development,
Quality Risk Management, Product Quality
System
QbD Development A more consistent and structured approach to
development
•Risk assessments focus effort on the important
factors
56 Dr Talia Buggins Ms Maria Edebrink
AstraZeneca R&D
Drug Product Case Study •Design Space assures consistent quality , safety
and efficacy of all batches manufactured
•Understanding relationship of CQAs to
clinical performance enables meaningful
specifications to be set
•Improved robustess of commercial supply
•Facilitated scale up and scale down
Drug Substance Case Study •Comprehensive understanding & data of
chemistry and impurities
•Factorial Experimental Design & Kinetics
•Comprehensive understanding and data of scale-
up effects
QbD Marketing Application •Comprehensive, structured knowledge shared
•Divergent reviews can impeed innovation and
implementation of QbD

Questions?
Dr Talia Buggins Ms Maria Edebrink
57 AstraZeneca R&D

Acknowledgements
Ms Kristina Bredin
Dr Martin Bohlin
Mr Daniel Edvardsson
Ms Emma Friman
Dr Martin Hedberg
Ms Helena Hellström
Mr Nils Iverlund
Mr Jeroen Koningen
Dr Magnus Larsson
Mr Lars Lilljeqvist
Mr Joakim Ludvigsson
Dr Magnus Sjögren
Ms Anna Karin Sverdrup
Ms Malin Vågerö
Dr Mikael Wernersson
Mr Andreas Westermark
And the rest of the AstraZeneca team
Dr Talia Buggins Ms Maria Edebrink
58 AstraZeneca R&D
Dr Paul Stott
Dr Gavin Reynolds
Dr James Kraunsoe
Dr Paul Dickinson
Dr Jonathan Sutch
Dr Renli Teng
Mr Mark Hindle
Dr Ian Bromillow
Dr David Holt
Copyright © 2022 FDOKUMEN