1012021-12312021-Rate-Certification-Report.pdf - DHCS
118
Two-Plan, Geographic Managed Care, Whole Child Model, Regional, and County Organized Health Systems Models State of California Department of Health Care Services Capitated Rates Development Division January 28, 2021
-
Upload
khangminh22 -
Category
Documents
-
view
3 -
download
0
Transcript of 1012021-12312021-Rate-Certification-Report.pdf - DHCS

Two-Plan, Geographic Managed Care, Whole Child Model, Regional, and County Organized Health Systems Models
State of California Department of Health Care Services Capitated Rates Development Division January 28, 2021

Mr. Rafael Davtian Division Chief California Department of Health Care Services Capitated Rates Development Division 1501 Capitol Avenue, PO Box 997413 MS 4413 Sacramento, CA 95899-7413 January 28, 2021
Subject: Two Plan, Geographic Managed Care, Whole Child Model, Regional, and County Organized Health Systems Models — Rate Range Development and Certification for January 1, 2021 through December 31, 2021.
Dear Mr. Davtian:
The State of California Department of Health Care Services (DHCS) contracted with Mercer Government Human Services Consulting (Mercer), as part of Mercer Health & Benefit LLC, to develop actuarially sound Medicaid capitation rates for Two Plan, Geographic Managed Care (GMC), Whole Child Model (WCM), Regional and County Organized Health Systems (COHS) Models for use during the rating period for calendar year January 1, 2021–December 31, 2021 (CY 2021). This letter presents an overview of the analyses and methodology used in Mercer’s managed care rate range development for the purpose of satisfying the requirements of the Centers for Medicare & Medicaid Services (CMS).
Actuarially sound is being defined by Mercer as follows: Medicaid capitation rates are “actuarially sound” if, for business in the state for which the certification is being prepared and for the period covered by the certification, projected capitation rates and other revenue sources provide for all reasonable, appropriate, and attainable costs. For the purpose of this definition, other revenue sources include, but are not limited to, expected reinsurance and governmental stop loss cash flows, governmental risk adjustment cash flows, and investment income. For purposes of this definition, costs include, but are not limited to, expected health benefits, health benefit settlement expenses, administrative expenses, cost of capital, and government mandated assessments, fees, and taxes.
(Note: Please see page 2 of the Actuarial Standard of Practice No. 49: Medicaid Managed Care Capitation Rate Development and Certification, from the Actuarial Standards Board, http://www.actuarialstandardsboard.org/wp-content/uploads/2015/03/asop049_179.pdf).

Contents 1. Executive Summary .................................................................................................................... 1
2. General Information .................................................................................................................... 4
• Program History .................................................................................................................... 4
• Managed Care Organization Participation ............................................................................. 5
• Covered Services .................................................................................................................. 6
• Covered Populations ............................................................................................................. 7
• Rate Structure ....................................................................................................................... 8
• Federal Medical Assistance Percentage ................................................................................ 9
• Rate Methodology Overview ............................................................................................... 10
• Medical Loss Ratio .............................................................................................................. 12
• Rate Ranges ....................................................................................................................... 12
3. Data .......................................................................................................................................... 14
• Base Data ........................................................................................................................... 14
• Base Data Adjustments ....................................................................................................... 16
• Data Smoothing .................................................................................................................. 28
• Other Base Data Considerations ......................................................................................... 30
• Maternity Supplemental Payment ........................................................................................ 33
• Hepatitis C Supplemental Payment ..................................................................................... 35
• Behavioral Health Treatment Supplemental Payment ......................................................... 35
• Home- and Community-Based Services High Supplemental Payment ................................ 36
4. Projected Benefit Costs and Trends .......................................................................................... 37
• Pharmacy Add-On ............................................................................................................... 38
• Coronavirus Disease 2019 Add-On ..................................................................................... 38
• Trend .................................................................................................................................. 39
• Program Changes ............................................................................................................... 42
• Pharmacy Efficiency Adjustments ....................................................................................... 49
• Inpatient Efficiency Adjustment ........................................................................................... 50
• Emergency Department Efficiency Adjustment .................................................................... 50
• Physician-Administered Drugs ............................................................................................ 51
• Population Adjustments ....................................................................................................... 52
• Cost-Based Reimbursement Clinics in Los Angeles County ................................................ 54
• Maternity Supplemental Payment Development .................................................................. 54
• Home- and Community-Based Services High Supplemental Payment Development .......... 56
• Other Items ......................................................................................................................... 56
• Third-Party Liability ............................................................................................................. 57
• Member Cost Sharing ......................................................................................................... 57
• Retrospective Eligibility Periods .......................................................................................... 57
• Mental Health Parity and Addiction Equity Act ..................................................................... 58
• Institution for Mental Disease .............................................................................................. 58
• Provider Overpayments ....................................................................................................... 58
• Aetna Better Health and UnitedHealthcare .......................................................................... 58
5. Projected Non-Benefit Costs ..................................................................................................... 59
• Administration ..................................................................................................................... 59

• Underwriting Gain ............................................................................................................... 62
• Managed Care Organization Tax......................................................................................... 63
• Health Insurance Providers Fee .......................................................................................... 64
6. Whole Child Model .................................................................................................................... 65
• Executive Summary ............................................................................................................ 65
• Program History .................................................................................................................. 65
• Data .................................................................................................................................... 68
• Projected Benefit Costs and Trends .................................................................................... 71
• Projected Non-Benefit Costs ............................................................................................... 73
7. Risk Adjustment ........................................................................................................................ 75
• Application of Risk Adjustment in the Rate Calculation ........................................................ 76
8. Special Contract Provisions Related to Payment ...................................................................... 79
• Incentive Arrangements ...................................................................................................... 79
• Withhold Arrangements ....................................................................................................... 80
• Risk Sharing Mechanisms ................................................................................................... 80
• Pass-Through Payments ..................................................................................................... 81
• Delivery System and Provider Payment Initiatives ............................................................... 87
9. Certification and Final Rates ................................................................................................... 110

Two-Plan, GMC, WCM, Regional and COHS Models Capitation Rate Development and Certification January 1, 2021–December 31, 2021
State of California Department of Health Care Services
Capitated Rates Development Division
1
1
Executive Summary California DHCS contracted with Mercer, as part of Mercer Health & Benefits LLC, to develop actuarially sound capitation rates for use during the rating period of January 1, 2021 through December 31, 2021 (CY 2021). The capitation rates that are the subject of this certification report include those developed for the Two-Plan, GMC, WCM, Regional, and COHS models, as well as the Coordinated Care Initiative (CCI) Medi-Cal Only and partial dual-eligible beneficiaries. This is a change from the prior rating period where WCM capitation rates were the subject of a separate certification. The WCM population is a subset of the COHS models plans in all COHS counties except Ventura. Future references to the COHS model will be assumed to cover WCM members unless explicitly noted otherwise. Additionally, DHCS’ rate development now operates on a calendar year basis, mainly to enable DHCS and Mercer to evaluate, plan, and adjust for legislative changes affecting managed care, which have historically occurred with minimal time prior to the start of the rating period.
This report describes the rate development process and provides the certification of actuarial soundness required by 42 CFR §438.4. This report was developed to provide the requisite rate documentation to DHCS and to support the CMS rate review process. This report follows the general outline of the CMS 2020–2021 Medicaid Managed Care Rate Development Guide (RDG) dated July 2, 2020, which is the applicable version of the guide for CY 2021. The rate development process included the historical practice of developing rate ranges. However, the actuaries are certifying to a final rate within the developed rate ranges as federally required.
Multiple attachments are also included as part of this rate certification package. These attachments include summaries of the CY 2021 capitation rates (including the final and certified capitation rates), capitation rate calculation sheet (CRCS) exhibits and stand-alone methodology documents, which provide more detail around various rate setting components. These attachments are referenced throughout the body of this report. The final certified capitation rates by managed care organization (MCO), county/rating region, and category of aid (COA) groupings (synonymous with rate cell), including a comparison to the prior Rating Period (RP) 19-20 certified capitation rates, can be found in the attached files, listed below:
• FINAL CY 2021 Medi-Cal Detail CRCS Package LB Rate Smry 2021 01 28.xlsx
• FINAL CY 2021 CA CCI Medi-Cal Only & Partial Dual Rate Ranges 2021 01 28.xlsx
• FINAL CY 2021 Medi-Cal Hep C BHT Supp Rate Exhibits 2021 01 28.xlsx
Mercer has not trended forward the previous year’s rates, but has done a comprehensive exercise of rebasing using more recent program experience. The rebasing means that rates for various groups do

Two-Plan, GMC, WCM, Regional and COHS Models Capitation Rate Development and Certification January 1, 2021–December 31, 2021
State of California Department of Health Care Services
Capitated Rates Development Division
2
not always move similarly, even with similar trend forces operating on them. The new base may emerge differently than expected in the prior year’s rate development.
One significant change for the CY 2021 rating period is the decision to carve pharmacy out of managed care. The initial plan was for this change to be effective January 1, 2021, but a three-month delay is being implemented, which resulted in the need to develop a managed care capitation rate for pharmacy for the January 1, 2021–March 31, 2021 period. The development of this pharmacy rate is consistent with other base data and rate development for the CY 2021 period, but is handled as a rate add-on for the effective period.
There are specific capitation rates at the MCO, county/rating region, and COA level, which had large positive or negative changes when compared to the prior capitation rates (RP 19–20). Within the files listed above, there is a tab labeled “Large Changes” that describes the drivers of the change for particular capitation rates that had large changes. The drivers of the change are described for any capitation rate that had a change greater than 10% or less than -1% when compared to the RP 19–20 capitation rates. The changes are described with the inclusion of the pharmacy and COVID add-ons within the CY 2021 rates, as this provides for an apples to apples comparison to the prior year rates. Outside of those two rate add-ons, the changes are described after the application of the risk-adjustment process, but before add-on amounts are applied to the capitation rates. As a result, the rate changes described exclude the impact of the MCO Tax, any hospital pass-through payments, specialty mental health (MH) add-on amounts for Kaiser in Sacramento County, and any other remaining add-on payments. Rate changes for rates effective April 1, 2021 through December 31, 2021 are not described in the file, but those rates show material decreases from the RP 19–20 capitation rates, since pharmacy is carved out within capitation rates for this time period when compared to capitation rates effective for RP 19–20.
Proposition 56 add-ons are contingent on appropriations of funds being provided by the California Legislature. Absent continued appropriations, some elements of Prop 56 add-ons will sunset on June 30, 2021. To account for this uncertainty while setting prospective rates, Mercer developed these add-ons to be reasonable and appropriate for both six-month and twelve-month effective periods, and Mercer actuaries certify these add-ons as actuarially sound regardless of the budget outcome and subsequent effective dates of the add-ons.
As such, there will be either two or three different sets of capitation rates applicable for CY 2021, dependent upon the Prop 56 budget appropriations.
• If the budget appropriations are not provided and programs sunset effective June 30, 2021, there are three different sets of capitation rates:
─ One set of rates applicable for the three-month period of January 2021 to March 2021
─ One set of rates applicable for the three-month period of April 2021 to June 2021
─ One set of rates applicable for the final six-month period of July 2021 to December 2021
Two-Plan, GMC, WCM, Regional and COHS Models Capitation Rate Development and Certification January 1, 2021–December 31, 2021
State of California Department of Health Care Services
Capitated Rates Development Division
3
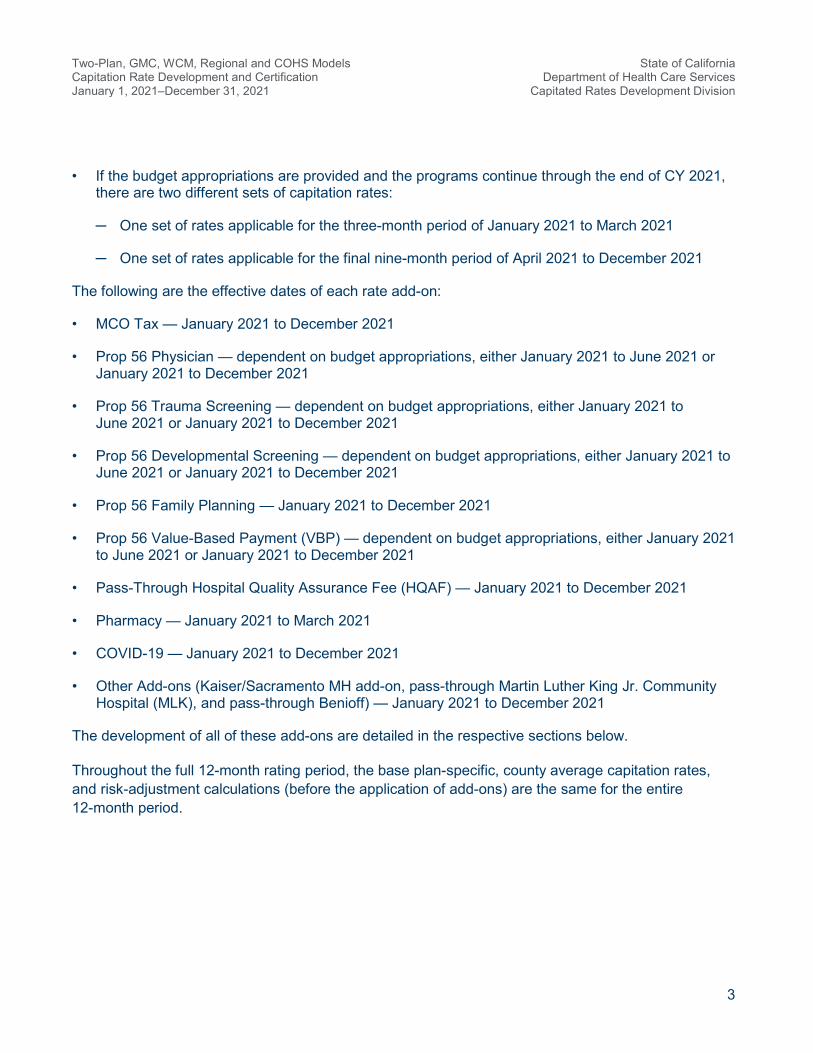
• If the budget appropriations are provided and the programs continue through the end of CY 2021, there are two different sets of capitation rates:
─ One set of rates applicable for the three-month period of January 2021 to March 2021
─ One set of rates applicable for the final nine-month period of April 2021 to December 2021
The following are the effective dates of each rate add-on:
• MCO Tax — January 2021 to December 2021
• Prop 56 Physician — dependent on budget appropriations, either January 2021 to June 2021 or January 2021 to December 2021
• Prop 56 Trauma Screening — dependent on budget appropriations, either January 2021 to June 2021 or January 2021 to December 2021
• Prop 56 Developmental Screening — dependent on budget appropriations, either January 2021 to June 2021 or January 2021 to December 2021
• Prop 56 Family Planning — January 2021 to December 2021
• Prop 56 Value-Based Payment (VBP) — dependent on budget appropriations, either January 2021 to June 2021 or January 2021 to December 2021
• Pass-Through Hospital Quality Assurance Fee (HQAF) — January 2021 to December 2021
• Pharmacy — January 2021 to March 2021
• COVID-19 — January 2021 to December 2021
• Other Add-ons (Kaiser/Sacramento MH add-on, pass-through Martin Luther King Jr. Community Hospital (MLK), and pass-through Benioff) — January 2021 to December 2021
The development of all of these add-ons are detailed in the respective sections below.
Throughout the full 12-month rating period, the base plan-specific, county average capitation rates, and risk-adjustment calculations (before the application of add-ons) are the same for the entire 12-month period.

Two-Plan, GMC, WCM, Regional and COHS Models Capitation Rate Development and Certification January 1, 2021–December 31, 2021
State of California Department of Health Care Services
Capitated Rates Development Division
4
2
General Information This section provides a brief overview of California’s managed care programs and an overview of the rate setting process, including the following elements:
• Program history
• MCO participation
• Covered services
• Covered populations
• Rate structure
• Federal Medical Assistance Percentage (FMAP)
• Rate methodology overview
The information provided in this section should be supplemented with the MCO contract information for additional detail.
Program History California’s Two-Plan, GMC, Regional, and COHS managed care delivery models have been in existence since the 1980s. Managed care was first introduced in California through the COHS delivery model in San Mateo and Santa Barbara counties. Through the years, the COHS model has expanded and there are now 22 COHS counties operating in Medi-Cal managed care. In COHS counties, there is only one plan operating in each county/rating region. The GMC model began operating in Sacramento County in 1994 and in San Diego County in 1998. In GMC counties, there is no limit on the number of MCOs that can operate in these counties. The Two-Plan model was implemented in 1996 in Alameda and San Joaquin counties and expanded to 10 additional counties by 1999. In 2011, the Two-Plan model expanded to include both Kings and Madera counties, bringing the total count of Two-Plan counties to 14. Within the Two-Plan model, two MCOs operate within each county, one a commercial plan and one a Local Initiative health plan. In 2013, California expanded its Medi-Cal managed care program with the Regional model, which consists of 20 counties. Two commercial plans operate within each Regional model county, with the exception of San Benito, which only has one commercial plan.

Two-Plan, GMC, WCM, Regional and COHS Models Capitation Rate Development and Certification January 1, 2021–December 31, 2021
State of California Department of Health Care Services
Capitated Rates Development Division
5
Pursuant to the Affordable Care Act (ACA) and the subsequent Supreme Court ruling, California elected to expand Medicaid coverage to low-income adults effective January 2014. Capitation rate development for the ACA Expansion population is covered within this certification. References of the Two-Plan, GMC, Regional and COHS models below include the ACA Expansion population unless otherwise noted.
Since 2014, DHCS currently administers a CCI program within four Two-Plan model counties: Los Angeles (LA), Riverside, San Bernardino, and Santa Clara; two COHS model counties: Orange and San Mateo; and one GMC model county: San Diego. As part of this initiative, the MCOs in these counties are responsible to cover all long-term care (LTC) services and certain home- and community-based services (HCBS) not covered in other counties including Multipurpose Senior Services Program (MSSP) services only, for their members age 21 or older. For the CCI program, the capitation rate development process is done separately for members with full Medicare and Medicaid coverage (full-dual eligible members), and members with partial Medicare coverage (partial duals) or no Medicare coverage (non-duals). Capitation rate development for non-dual and partial dual eligible members is covered within this certification. The rate development for full-dual CCI beneficiaries is covered in a separate rate certification. Unless otherwise noted, references to CCI within this certification refer to non-dual and partial dual eligible beneficiaries only.
The Two-Plan, GMC, Regional and COHS models encompass all 58 counties within California (14 counties are part of the Two-Plan model, two counties are part of the GMC model, 20 counties are part of the Regional model and 22 counties are part of the COHS model). For a list of the counties within each model type, please refer to the Excel file titled FINAL CY 2021 Medi-Cal Detail CRCS Package LB Rate Smry 2021 01 28.xlsx, which has a tab that lists each model and the applicable counties within each model. For capitation rate payment purposes, different rates are paid to the MCOs for each county in which they operate with the following exceptions. Within the Regional model, there is one rating region that consists of 18 combined counties for which capitation rates are paid. Kaiser Foundation Health Plan (Kaiser) only operates in three of the 18 combined counties, so one capitation rate is developed for Kaiser, which spans all three of these counties. For Partnership HealthPlan of California (PHC), there is one rating region for which capitation rates are paid. In the prior rating period (RP 19-20), PHC was split into two rating regions; these have been consolidated into one rating region for CY 2021 final capitation payments consisting of all counties in which PHC operates. However, the rate development process did utilize two rating regions prior to a final member weighted blending of the two regions.
Mercer has served as California’s contracted actuarial firm supporting the Medi-Cal managed care program and rate development since 2005.
Managed Care Organization Participation For CY 2021, there are 24 distinct MCOs that operate in the Two-Plan, GMC, Regional, and COHS managed care programs. Each MCO has different counties in which they operate. Some MCOs only operate in one county while other MCOs operate in multiple counties. For a complete list of the MCOs and counties in which they operate, please see the rate summary sheets, which can be found in the

Two-Plan, GMC, WCM, Regional and COHS Models Capitation Rate Development and Certification January 1, 2021–December 31, 2021
State of California Department of Health Care Services
Capitated Rates Development Division
6
attached Excel file titled FINAL CY 2021 Medi-Cal Detail CRCS Package LB Rate Smry 2021 01 28.xlsx. Capitation rates are shown for each MCO and county/rating region combination.
Covered Services Generally, services covered through the Two-Plan, GMC, Regional, and COHS models include hospital services (including inpatient (IP), outpatient (OP) and emergency room (ER) services), physician services, applied behavioral analysis services, transportation services, laboratory and radiology services, hospice care services, community-based adult services (CBAS), and prescription drugs. Additionally, certain MH services for members with mild to moderate MH conditions are covered.
There are differences in covered services that do exist between the COHS and non-COHS managed care models as well as the CCI program. These differences are noted below:
• In all COHS counties and for CCI beneficiaries within Two-Plan and GMC counties, LTC services are covered for the entire period in which a member resides in a LTC facility. For all other recipients (members under age 21 or classified as ACA Expansion members in Two-Plan and GMC CCI counties, all members in non-CCI Two-Plan and GMC counties and all members in Regional model counties), LTC services are covered for members who reside in a facility for the month of admission plus one additional full month.
• Members and services for members needing a major organ transplant, including the transplant event itself, are covered within COHS counties. Within Two-Plan, GMC, and Regional counties, members needing a major organ transplant (with the exception of kidney transplants) are disenrolled from managed care and covered via the fee-for-service (FFS) payment delivery system. This disenrollment is effective the first of the month where a beneficiary was approved as a major organ transplant candidate. All services from that month and forward, including the major organ transplant event itself, are paid in FFS.
• In all CCI counties (Two-Plan, GMC, and COHS), MSSP services are covered in managed care for members age 21 and older. This benefit is carved out and paid via FFS in all other counties and situations.
Notable services carved out of all managed care programs and counties (with exceptions listed below) include the following:
• Specialty MH services (including IP and OP behavioral health (BH) services, with exceptions noted below):
─ Kaiser in Sacramento County and the Kaiser global subcapitation population in Solano County (PHC globally subcapitates members to Kaiser) covers specialty MH services not covered by any other MCO within the Medi-Cal program. These specialty MH services include psychiatric IP, OP, and pharmacy (Sacramento County only).
• Alcohol and substance use disorder treatment services.
Two-Plan, GMC, WCM, Regional and COHS Models Capitation Rate Development and Certification January 1, 2021–December 31, 2021
State of California Department of Health Care Services
Capitated Rates Development Division
7
• HCBS (with the exception of CBAS in all counties and MSSP services in CCI counties as noted previously).
• Dental services except medically necessary Federally Required Adult Dental Services and fluoride varnish dental services that may be performed by a medical professional.
• Certain pharmaceutical products, including blood factor drugs, erectile dysfunction drugs, HIV/AIDS drugs, and psychotherapeutic drugs:
─ Health Plan of San Mateo (HPSM) covers psychotherapeutic drugs; and HPSM, CalOptima and CenCal cover HIV/AIDS drugs.
• Services covered under the California Children’s Services (CCS) program in Two-Plan, GMC, Regional and Ventura counties. In COHS counties (except for Ventura), CCS services are a managed care covered benefit. CCS-eligible members in these counties make up the WCM rate cell.
• Effective April 1, 2021, the following pharmacy benefits when billed by a pharmacy on a pharmacy claim: covered OP drugs, including physician administered drugs, medical supplies, and enteral nutritional products.
Services new to the managed care programs during CY 2021 include psychiatric collaborative care management services. More details on this are provided in the program changes section.
Covered Populations The program currently covers children, parents/caretakers, adults without dependent children, pregnant women, and seniors and persons with disabilities (SPD), including those dually eligible for Medicare. Individuals served through California’s Children’s Health Insurance Program (CHIP) are covered under the same managed care contracts. Generally, managed care enrollment is mandatory for the Two-Plan, GMC, Regional, and COHS models. Notable exceptions to mandatory managed care enrollment are beneficiaries dually eligible for Medicare in non-CCI and non-COHS counties, as well as members residing in San Benito County (regardless of dual eligibility status). Managed care enrollment is voluntary in these instances. There are no significant changes to covered populations for CY 2021.
Within the CCI counties, Medi-Cal recipients aged 21 and older eligible for full Medicare benefits (defined as having Part A and Part B Medicare coverage) are covered within the Medi-Cal program, but are enrolled in the CCI program. Rates developed for the full-dual CCI members are included in a separate capitation rate package with a separate certification. An exception to this is full-dual members with an ACA Expansion aid code. These members are not eligible for the CCI program and are included within the SPD/Full-Dual COA group for capitation rate payment purposes.
For the SPD/Full-Dual COA group, Medi-Cal managed care only covers non-qualified Medicare beneficiaries (non-QMB) and non-specified low-income Medicare beneficiaries (non-SLMB) qualified duals. The same aid codes for the non-dual SPD population are utilized for the dual population. The

Two-Plan, GMC, WCM, Regional and COHS Models Capitation Rate Development and Certification January 1, 2021–December 31, 2021
State of California Department of Health Care Services
Capitated Rates Development Division
8
QMB Plus and SLMB Plus qualified duals are not part of the non-dual managed care population and are in FFS.
Share of cost members (recipients who establish eligibility for Medicaid by deducting incurred medical expenses) are not part of the non-CCI Two-Plan, GMC, and Regional managed care population; therefore, none of these costs are included in the development of the Two-Plan, GMC, and Regional rate ranges. Share of cost members are part of the COHS managed care population and the Institutional populations (only) in CCI counties; however, share of cost members are not deemed eligible until they have met their share of cost obligation. Therefore, these members’ costs are included in the development of the COHS and CCI rate ranges only after the point at which their share of cost obligations have been met.
Rate Structure The base data sets used to develop the Two-Plan, GMC, Regional, and COHS CY 2021 capitation rate ranges were divided into cohorts that represent consolidated COA (or Aid Code) or supplemental groupings, which inherently represent differing levels of risk. Rate ranges are developed for each of these cohorts. As noted for the COA and supplemental payment groupings below, there are differences that exist across the various counties. The COA groups for which capitation rates are paid and supplemental payment groupings are listed below (with variations noted as well).
Capitation Rate Category of Aid Groups (Rate Cells)
• Child
• Adult
• ACA Expansion
• SPD
─ In CY 2021, DHCS/Mercer consolidated the SPD rate cell with the Breast and Cervical Cancer Treatment Program (BCCTP) members.
• SPD/Full-Dual
─ In non-CCI counties, this COA consists of SPD/Full-Dual members (all ages) and dual eligible members with an ACA Expansion aid code.
─ In CCI counties, this COA consists of SPD/Full-Dual members under age 21 and dual eligible members with an ACA Expansion aid code.
• LTC (COHS counties only)
• LTC/Full-Dual (COHS counties only)

Two-Plan, GMC, WCM, Regional and COHS Models Capitation Rate Development and Certification January 1, 2021–December 31, 2021
State of California Department of Health Care Services
Capitated Rates Development Division
9
─ In non-CCI COHS counties, this COA consists of all full-dual eligible beneficiaries with an LTC aid code, for all ages
─ In CCI COHS counties, this COA consists of all full-dual eligible beneficiaries with an LTC aid code, only for beneficiaries under the age of 21
• Omnibus Budget Reconciliation Act (OBRA) (Solano, Napa and Yolo counties only)
• Institutional (applicable in Two-Plan and GMC CCI counties only)
• WCM (COHS counties only, not included in Ventura County)
Supplemental Payment Groupings
• Behavioral Health Treatment (BHT)
• Health Homes Program (certified separately)
• Hepatitis C
• Maternity
• HCBS High (applicable in CCI counties only)
MCOs are compensated through monthly capitation payments for the COA cohorts noted above. The capitation rates for the COA cohorts include all services under the managed care contract, with the exception of services specific to those covered under the supplemental payments (BHT, Hepatitis C, HCBS High in CCI counties and maternity). Services specific to the supplemental payments are carved out of the monthly capitation rates and reimbursed to the MCOs only when applicable members meet the criteria necessary for the MCOs to receive the supplemental payment. More detail on the supplemental payments is provided later in this certification report.
Federal Medical Assistance Percentage Depending on the Medicaid managed care program, some services or populations may be subject to a different FMAP than the regular California FMAP. Recognizing this, CMS expects the signing actuary to indicate the proportions or amounts of the costs subject to a different FMAP and show this information. If there are proposed differences among the capitation rates to covered populations, CMS requires valid rate development standards are applied and are not based on the rate of FMAP associated with the covered populations. This subsection addresses these FMAP concerns from CMS.
The rates certified in this report include coverage of several populations that receive higher FMAP than the regular FMAP received for most populations.
In particular, populations that receive a higher FMAP than the regular FMAP include the BCCTP population (now a subset of the SPD population) who meet federal standards, the CHIP population

Two-Plan, GMC, WCM, Regional and COHS Models Capitation Rate Development and Certification January 1, 2021–December 31, 2021
State of California Department of Health Care Services
Capitated Rates Development Division
10
and the ACA Expansion population. For CY 2021, the BCCTP and CHIP populations receive 65% FMAP. For CY 2021, the ACA Expansion population receives 90%.
DHCS uses aid codes in its capitation payment system to identify qualifying recipients for higher FMAP. With certain exceptions, such as individuals who do not have satisfactory immigration status for whom federal financial participation is available for emergency and pregnancy-related services only, the full capitation rate for these recipients receives the higher FMAP.
The COA groups for which capitation rates are paid are tied to the aid codes and since FMAP is also tied to these aid codes, there is an apparent but non-substantive relationship between FMAP and the COA groups. The most expensive COA groups are the Institutional, LTC, LTC/Full-Dual, and SPD COA, which all receive the standard 50% FMAP with the exception of the BCCTP group (a subset of SPD), which receives 65% FMAP. The next most expensive COA groups are the Adult, ACA Expansion, and SPD/Full-Dual COA, with the Adult and SPD/Full-Dual COAs both receiving a 50% FMAP and the ACA Expansion COA receiving the FMAP detailed above. The least expensive COA group is the Child COA, which receives a combination of the standard FMAP for the non-CHIP population and an enhanced FMAP for the CHIP population.
The implementation of the Families First Coronavirus Response Act (H.R. 6021) provides a temporary 6.2 percentage point increase for certain populations effective January 1, 2020, and extending through the last day of the calendar quarter in which the public health emergency, declared by the Secretary of Health and Human Services for COVID-19, including any extensions, terminates. The 6.2 point increased FMAP percentage applies to the standard 50% FMAP, and smaller increases apply to the BCCTP and CHIP population FMAPs.
Rates are developed for each population based on expected cost and homogeneity of risk. The FMAP for each population is not taken into account and is not a consideration. Non-benefit costs are developed using a method that does not consider FMAP for different populations. This includes the provision for underwriting gain and return on capital.
In addition to the populations that receive enhanced FMAP, there are services for which the State receives a different FMAP than the regular FMAP, which applies on a population basis. Those services include, but are not limited to, family planning, for which the FMAP is 90%, and adult preventive services, which earns an additional 1% pursuant to section 4106(b) of the ACA. Mercer and DHCS prepare separate memoranda that describe and document the process for estimating the proportion of the capitation rate subject to these different FMAPs.
Rate Methodology Overview Capitation rates for the Two-Plan, GMC, Regional, COHS, and CCI models were developed in accordance with rate setting guidelines established by CMS. As noted previously, the actuaries continued the historical practice of rate range development for the Two-Plan, GMC, Regional, COHS, and CCI models. However, the actuaries are certifying to a rate within the developed rate range.
Two-Plan, GMC, WCM, Regional and COHS Models Capitation Rate Development and Certification January 1, 2021–December 31, 2021
State of California Department of Health Care Services
Capitated Rates Development Division
11
For rate range development for the Two-Plan, GMC, Regional, COHS (with minor differences associated with WCM detailed later in this document), and CCI model MCO populations, Mercer used CY 2018 MCO-reported encounter data, the CY 2018 rate development template (RDT) data (from direct contractors with DHCS and also the MCOs’ global subcontractors) and other ad hoc claims data reported by DHCS and the Two Plan, GMC, Regional, COHS, and CCI model MCOs. The most recently available Medi-Cal-specific financial reports submitted to the California Department of Managed Health Care (DMHC) at the time the rate ranges were determined were also considered in the rate range development process.
The RDT data used in the development of the rate ranges is data collected from each MCO within the Medi-Cal managed care program separately for each county (or rating region) in which each MCO operates. The data requested from each MCO is completed by the MCOs at the level of detail needed for rate setting purposes, which includes membership, medical utilization, and medical cost data for the most recent CY (CY 2018 for the CY 2021 rate ranges) by COA group and by category of service (COS).
Adjustments were made to the selected base data to match the covered population risk and the State Plan approved benefit package for CY 2021. Additional adjustments were then applied to the selected base data to incorporate:
• Prospective and historic (retrospective) program changes not reflected (or not fully reflected) in the base data.
• Budget-neutral relational modeling for smoothing.
• Any observed changes in the population case mix and underlying risk of the MCOs from the base data period.
• Trend factors to forecast the expenditures and utilization to the rating period.
• Administration and underwriting gain loading.
Subsequent to these adjustments, DHCS takes five additional steps in the measured matching of payment to risk:
• Application of a maternity supplemental payment.
• Application of a Hepatitis C supplemental payment (for the first quarter of 2021 only).
• Application of a BHT supplemental payment.
• Application of a HCBS High supplemental payment (within CCI counties only).
• Application of risk-adjusted county/region average rates (where applicable).

Two-Plan, GMC, WCM, Regional and COHS Models Capitation Rate Development and Certification January 1, 2021–December 31, 2021
State of California Department of Health Care Services
Capitated Rates Development Division
12
The above approach has been utilized in the development of the rate ranges for the CY 2021 Two-Plan, GMC, Regional, COHS, and CCI models. DHCS will offer the final certified rates within the actuarially sound rate ranges of each MCO, as developed by the actuaries. Each MCO has the opportunity and responsibility to independently review the rates offered by DHCS and to determine whether the rates are acceptable based on their individual financial requirements.
The various steps in the rate range development are described in the following sections.
Medical Loss Ratio Mercer confirms the capitation rate development process and resulting rates, as outlined in this certification and supporting documentation, are reasonable, appropriate and attainable and that MCOs are assumed to reasonably achieve medical loss ratio (MLR) greater than 85%.
The CY 2021 internal rate ranges utilize a full rebase incorporating the most complete and current data period (CY 2018). This rebase, along with the non-medical loads, detailed below by model, result in aggregate priced-for effective MLRs greater than 85%.
By model, the aggregate priced-for effective MLR is greater than 85%:
• Two-Plan, GMC and Regional models:
─ Assumed upper bound MLR: 100% – 13.05% (upper bound non-medical load) = 86.95%.
─ Assumed lower bound MLR: 100% – 9.25% (lower bound non-medical load) = 90.75%.
• COHS models:
─ Assumed upper bound MLR: 100% – 13.20% (highest upper bound non-medical load across COHS plans) = 86.80%.
─ Assumed lower bound MLR: 100% – 10.20% (highest lower bound non-medical load across COHS plans) = 89.80%.
• CCI Institutional in Two-Plan and GMC models: 100% – 4.25% (highest upper bound non-medical load) = 95.75%.
The State has chosen to not impose remittance provisions related to this MLR for CY 2021.
Rate Ranges To assist DHCS during its rate discussions with each MCO, Mercer provides DHCS with rate ranges developed using an actuarially sound process. The COA-specific rate ranges were developed using appropriate actuarial considerations to arrive at both a lower and upper bound rate. To the extent the final contracted rates fall within the bounds of the Mercer rate ranges, the contracted rates will be

Two-Plan, GMC, WCM, Regional and COHS Models Capitation Rate Development and Certification January 1, 2021–December 31, 2021
State of California Department of Health Care Services
Capitated Rates Development Division
13
determined actuarially sound and certified as such. Mercer is certifying the contracted rates and not the rate ranges.
The lower and upper bounds of the rate ranges are developed by varying certain assumptions throughout the rate development process. Once the “best estimate” assumption is determined, the assumption is then varied by an appropriate amount to reflect a degree of uncertainty and the potential for variability in actual results by MCO. The total variation produced by the assumptions is reviewed for reasonableness to ensure that the final rate ranges represent reasonable, appropriate, and attainable rates for the covered populations during the rating period.
Two-Plan, GMC, WCM, Regional and COHS Models Capitation Rate Development and Certification January 1, 2021–December 31, 2021
State of California Department of Health Care Services
Capitated Rates Development Division
14
3
Data Base Data The information used to form the base data for the Two-Plan, GMC, Regional, and COHS (with minor differences associated with WCM detailed later in this document) model rate range development was MCO encounter data, requested MCO RDT data (including global subcontracting MCO RDTs), ad hoc claims data and DMHC-required Medi-Cal specific financial reporting. CY 2018 served as the base data period. The CY 2018 encounter and CY 2018 RDT claims data included utilization and unit cost detail by COA group, by county/region, by MCO and by 19 consolidated provider types or COS, including:
• IP Hospital
• OP Facility
• ER
• LTC
• Primary Care Physician (PCP)
• Specialty Physician (SP)
• Federally Qualified Health Center (FQHC)
• Other Medical Professional (NPP)
• MH — OP
• BHT Services
• Pharmacy
• Laboratory and Radiology
• Transportation
• CBAS
• Hospice

Two-Plan, GMC, WCM, Regional and COHS Models Capitation Rate Development and Certification January 1, 2021–December 31, 2021
State of California Department of Health Care Services
Capitated Rates Development Division
15
• MSSP
• In-Home Supportive Services (IHSS)
• Other HCBS
• All Other
A requirement of 42 CFR 438.3(c)(ii) is that all payment rates under the contract are based only upon services covered under the State Plan to Medicaid-eligible individuals. As described above, MCO RDT and encounter data served as the starting base data for rate setting. The RDT data submissions are thoroughly reviewed, vetted, and discussed with each MCO during the rate setting process. Encounter data undergoes considerable edits within DHCS to ensure quality and appropriateness of the data for rate setting purposes. Base period MCO COA eligibility (described below) and encounter data were pulled consistent with service code mappings from DHCS, including lists of excluded services, such as abortion. Mercer has relied on data and other information provided by the MCOs and DHCS in the development of these rate ranges. Mercer has reviewed the data and information for reasonableness and Mercer believes the data and information utilized in the rate development to be free of material error and suitable for rate range development purposes for the populations and services covered under the Two-Plan, GMC, Regional and COHS model contracts. Mercer did not audit the data or information, and if the data or information is materially incomplete or inaccurate, Mercer’s conclusions may require revision. However, Mercer did perform alternative procedures and analyses, which provide a reasonable assurance as to the data’s appropriateness for use in capitation rate development under the State Plan.
The RDT submissions already include incurred but not reported (IBNR) adjustments that are reviewed for appropriateness, and discussed with the health plans as part of the rate development process. If necessary, adjustments were applied to amounts reported by the health plans based on this review. The encounter data did receive adjustments to reflect underreporting and additional runout. These underreporting factors are applied to recognize the encounter data is likely underreported by the MCOs (e.g., encounters may be missing from providers who are paid via a capitation arrangement), and not reflective of all liabilities still outstanding for the CY. These factors were developed uniformly for all MCOs (they are not plan-specific factors) by COS. Actuarial judgment was used to ensure the factors were reasonable.
Ultimately, the actuaries deemed the RDT data as the most reliable base data source. Therefore the final base data for rate setting is tied back to each MCO’s RDT experience, after the adjustments and smoothing process detailed below. Similar to prior rate development periods, there are a few exceptions (WCM, Kaiser in all counties/rating regions, and Anthem Blue Cross in San Benito County, detailed below), which are consistent with the base data development process described for these unique instances previously.

Two-Plan, GMC, WCM, Regional and COHS Models Capitation Rate Development and Certification January 1, 2021–December 31, 2021
State of California Department of Health Care Services
Capitated Rates Development Division
16
The final base data, after base data adjustments and smoothing, is further adjusted to reflect the impact of historical program changes, trend applications and potential managed care adjustments. This is discussed in later sections in the certification report.
The base data utilized was managed care data without any disproportionate share hospital payments or adjustments for FQHCs or Rural Health Clinic (RHC) reimbursements. FQHC costs considered in rate development are the costs incurred by the MCOs, net of any wrap-around payment by DHCS to reimburse the FQHC at their Prospective Payment System rate. The data did not include any adjustments for catastrophic claims. MCOs report this information as part of the base data and it is included in the aggregate rates. Information on catastrophic claims is reported separately by MCOs within the RDT submission and is reviewed and discussed with the MCOs. No adjustments are made to the base data, as all of these amounts are already included; however, the data smoothing subsection below illustrates how these events were handled in the rate range development.
Base Data Adjustments The MCO-reported RDT experience was adjusted with a number of utilization and unit cost base data adjustments. As detailed below, many of these adjustments align the base data with the varying payment structures for CY 2021. This includes carving out experience for members covered through different COA groups or rate cells (e.g., WCM members) or for services reimbursed through supplemental payments (e.g., Hepatitis C drug therapies). In specific instances, other adjustments were necessary to appropriately reflect reasonable medical cost and utilization for the covered populations. The adjustments are as follows:
• Hospital Adjustments
• WCM Adjustment
• Hepatitis C Drug Carve Out
• BHT Carve Out and Comprehensive Diagnostic Exam (CDE) Reallocation
• HCBS High and IHSS Carve Out
• Global Non-Medical Expense Adjustment
• MH — OP
• CenCal Health MH Capitation Adjustment
• Provider Incentive Adjustments
• SPD/Full-Dual Non-Covered Services Adjustment
• “In Lieu Of” Services Adjustment
• Transportation

Two-Plan, GMC, WCM, Regional and COHS Models Capitation Rate Development and Certification January 1, 2021–December 31, 2021
State of California Department of Health Care Services
Capitated Rates Development Division
17
• LA County Cost-Based Reimbursement Clinics (CBRC)
• San Francisco CBAS Pricing Adjustment
• MCO Withdrawal From Sacramento County
• CalOptima Base Data Adjustments
• HPSM Burlingame LTC Facility Adjustment
• LA Care IBNR Adjustment
• Hemlibra®
• SPD and BCCTP Consolidation
Hospital Adjustments
Adjustments to MCO-reported hospital costs were necessary in some select cases. These adjustments occurred for three MCOs: Health Plan of San Joaquin (HPSJ), CalOptima, and PHC. Details for each adjustment are described below.
Health Plan of San Joaquin
In the RDT discussion guide process, HPSJ noted they recognized a particular provider was billing for a higher than normal volume of high cost drugs throughout CY 2018 dates of service. Upon review, HPSJ began denying some of these high cost drug claims starting in CY 2019. HPSJ indicated they were in the process of restructuring and negotiating a new contract with this particular provider, which would result in lower costs for future periods moving forward.
To appropriately account for this in the base data, DHCS/Mercer worked with HPSJ to identify the anticipated savings to develop an appropriate adjustment to apply to the base data. The following amounts were removed from the CY 2018 base data:
County Dollars Removed San Joaquin ~$1.8 million Stanislaus ~$21.9 million
DHCS/Mercer will continue to work with HPSJ on this item in future rating periods.
CalOptima
In the prior rate setting period, DHCS/Mercer adjusted the reported hospital capitation expenditures for the ACA Expansion COA. Following communication with DHCS/Mercer and the downward rate adjustment, CalOptima adjusted their hospital capitation contracting to reasonable and appropriate

Two-Plan, GMC, WCM, Regional and COHS Models Capitation Rate Development and Certification January 1, 2021–December 31, 2021
State of California Department of Health Care Services
Capitated Rates Development Division
18
levels. Given that the reporting levels for CY 2018 were still not reflective of reasonable contracting levels, CalOptima provided the hospital capitation per member per month (PMPM) amounts through the end of CY 2019. This reporting showed, for the ACA OE COA, a clear decrease starting for the July 2019 to December 2019 period. Upon review, Mercer found these reimbursement levels to be reasonable and appropriate and used the reported capitation levels as the best representation of the go-forward reimbursement levels.
To account for this in the base data, Mercer developed the following adjustment. The capitation amounts for the July 2019 to December 2019 period were de-trended, using the trends discussed later in the trend section, to the CY 2018 period. The differences between the reported CY 2018 levels and the de-trended go-forward amounts were removed in the following amounts for the ACA OE COA: ~$36 million for IP, ~$7 million for OP and ~$4 million for ER. The same analysis showed no adjustment was necessary for other COA groups.
Partnership HealthPlan of California
In the prior rate setting cycle, PHC indicated they were in the midst of making significant changes to their hospital contracting arrangements. Overall, PHC indicated they were able to hold payment levels relatively flat because of these contract negotiations, with general decreases to the ACA Expansion COA and increases to other COAs. A reduction of ~$39.3 million was made to the CY 2018 base data for the IP COS. This ~$39.3 million reduction was derived by assuming PHC was able to hold contracted rates flat for 15 months and making a base data adjustment that reflected this, consistent with the feedback received from PHC regarding their ability to hold contracted rates flat. It should also be noted that while ~$39.3 million was removed in total, ~ $53.6 million was removed from the ACA Expansion COA and ~$6.9 million was removed from the Child COA, while ~$21.2 million was redistributed to the Adult and SPD COAs. This was done to be consistent with the contracting process done by PHC, in addition to bringing IP hospital costs per day in line across the COAs.
Across the Two-Plan and COHS models (there were no hospital adjustments within the GMC or Regional models); these hospital pricing adjustments removed a total of ~$110 million from the CY 2018 base data.
Whole Child Model Adjustment
With the exception of San Mateo County (detailed below), WCM members and their respective utilization and cost data are included within the MCO RDT submissions. To evaluate experience specific to the WCM population, DHCS/Mercer instructed health plans to submit supplemental data requests (SDR) similar in reporting structure to the RDT, specific to WCM members containing their cost and utilization experience for CY 2018. Mercer used this SDR experience to isolate WCM members and their associated cost and utilization data within the base data. Encounter data specific to these WCM members was used to validate and support the amounts. In general, the adjustments associated with the WCM members varied by county/rating region based on the coverage status of CCS services for CY 2018-specific to each county/rating region.

Two-Plan, GMC, WCM, Regional and COHS Models Capitation Rate Development and Certification January 1, 2021–December 31, 2021
State of California Department of Health Care Services
Capitated Rates Development Division
19
For CY 2018, the coverage of CCS services varied across COHS counties:
• San Mateo County was the first county to cover CCS members as a stand-alone managed care rate cell, prior to the wider WCM implementation. The WCM San Mateo member experience has been reported in a stand-alone SDR, and these members are not included in the mainstream RDT described previously. As such, there is no WCM adjustment for San Mateo County, as the CCS members were not reported in the initial base experience.
• Santa Barbara County and the Partnership South rating region (Napa, Solano, Yolo, and Marin counties) covered CCS services as a managed care benefit during CY 2018. As such, the PMPM impact of removing these members is significant and downward for the Child (~$34 PMPM reduction across both MCOs) and SPD (~$96 PMPM reduction across both MCOs) COA groups.
• The counties of Monterey, Santa Cruz, Merced, and San Luis Obispo began covering CCS services as a managed care benefit starting July 1, 2018. There is a large, though not quite as large, impact from removing these members from Child (~$17 PMPM reduction across both MCOs) and SPD (~$21 PMPM reduction across both MCOs) COA groups.
• Orange County along with the PHC counties of Sonoma, Mendocino, Del Norte, Humboldt, Lake, Lassen, Modoc, Shasta, Siskiyou and Trinity County covered CCS members with the standard managed care benefit plan in CY 2018, but with the actual CCS-specific benefits being covered in FFS. As such, the PMPM impacts tend to be smaller in magnitude and downward for the Child rate cell (~$3 PMPM reduction across all MCOs) and upwards for the SPD rate cell (~$25 PMPM increase across all MCOs).
Across all COHS counties (noting there is no impact to San Mateo or Ventura County), the adjustment associated with WCM members resulted in a net decrease of ~337 thousand member months (MMs) and the removal of ~$249.2 million from the base data of the non-WCM COA groups. These amounts were then recognized in the WCM rate development as detailed later in the certification.
Hepatitis C Drug Carve-Out
Since DHCS will continue to utilize a supplemental payment to reimburse the MCOs for costs associated with Hepatitis C drug therapies during the first quarter of 2021, it is necessary to remove Hepatitis C drug costs from the capitation rates. MCO-submitted encounter data for Hepatitis C drug therapies was used in conjunction with MCO-reported Hepatitis C drug therapy costs as reported in the RDT (MCOs are required to report utilization and costs specific to Hepatitis C drug therapies within the RDT). From a review of both of these data sources, appropriate dollar amounts to carve-out of the base data are calculated for each applicable MCO, county and COA combination.
For the CY 2018 period, ~$266.6 million of Hepatitis C drug cost was removed from the base data across the Two-Plan, GMC, Regional, and COHS models.
Two-Plan, GMC, WCM, Regional and COHS Models Capitation Rate Development and Certification January 1, 2021–December 31, 2021
State of California Department of Health Care Services
Capitated Rates Development Division
20
Behavioral Health Treatment Carve Out and Comprehensive Diagnostic Exam Reallocation
Since DHCS utilizes a supplemental payment to reimburse the MCOs for costs associated with BHT services, it is necessary to remove BHT costs from the capitation rates. The MCO-reported CY 2018 base costs for BHT services also included amounts for CDEs. However, beginning in RP 19–20 CDEs were no longer covered under the BHT supplemental payment, and instead are covered under the capitation rate. Within the CY 2018 RDT, MCOs reported all costs for both BHT services for direct members as well as the BHT supplemental payments made to global subcontractors. Separately in the RDT, the MCOs are required to report monthly cost and utilization information separately for BHT services performed for their beneficiaries. Using this separately reported data, the BHT costs as reported by the MCOs were removed from the BHT COS line. Further, the BHT supplemental payments made to global subcontractors included costs specific to CDEs; those costs related to CDEs were moved from the BHT COS line to the Other Medical Professional COS line. For validation purposes, the MCO-reported BHT data was reviewed against historical BHT utilization and therapy costs per hour over time by MCO in addition to being compared to regional and statewide figures. This data was reviewed and discussed with each MCO as part of the rate development process. No adjustments were made to the RDT-reported information.
For the CY 2018 period, ~$485 million of BHT cost was removed from the base data across the Two-Plan, GMC, Regional and COHS models. No CDE costs were removed from the base data, but ~$1 million in CDE cost was reallocated (in a budget neutral fashion) to the Other Medical Professional COS line.
Home- and Community-Based Services High and In-Home Supportive Services Carve Out
Within CCI counties, DHCS utilizes a supplemental payment to reimburse the MCOs for costs associated with MSSP and CBAS services. Effective January 1, 2018, IHSS services were carved out of the managed care contracts and were thus not included in the RDT reported data for the CY 2018 period. As a result, it is necessary to remove CBAS and MSSP costs reported in the CY 2018 base experience in CCI counties, since none of these costs will be paid for within the capitation rates. To remove the costs associated with these services, the RDT-reported amounts for each of these COS lines were removed.
During the second half of state fiscal year (SFY) 2017–2018 and the entire SFY 2018–2019 contract periods, there was a component of IHSS care coordination built into the All Other COS for the HCBS High supplemental payments following the carve-out of IHSS on January 1, 2018. MCOs confirmed in the data review process for CY 2021 rates that this IHSS-specific care coordination is reported within the larger care coordination amounts in the CY 2018 RDT reporting for direct members. However, the HCBS High supplemental payments for globally subcapitated members that MCOs reported in their RDTs for CY 2018 still reflected the additional care coordination consideration no longer necessary for prospective rate development. As such, Mercer utilized the COS distribution within the SFY 2017–2018 and SFY 2018–2019 HCBS High payment rates, along with the reported HCBS High

Two-Plan, GMC, WCM, Regional and COHS Models Capitation Rate Development and Certification January 1, 2021–December 31, 2021
State of California Department of Health Care Services
Capitated Rates Development Division
21
global payment counts from the RDT reporting, to make a downward adjustment to the All Other COS for removal of this IHSS care coordination component.
For the CY 2018 period, ~$107.8 million of CBAS, MSSP, and All Other costs were removed from the base data across the CCI counties.
Global Non-Medical Expense Adjustment
Some MCOs choose to enter into global subcapitation arrangements (defined here as delegating the entire or vast majority of the risk of a beneficiary to another health plan) to administer managed care coverage to the entire Medi-Cal population. The MMs capitated and the capitation amounts paid in these arrangements are reported within the RDT by rate cell and included in the base data. Mercer reviews this data and information (in conjunction with global subcontractor RDT submissions and encounter data) as part of the base data-development process. As these global arrangements and capitation payments include considerations for administrative duties and underwriting gain, it is necessary to remove these non-medical expenses from the base data. After removal from the medical portion of the CY 2018 base data, these non-medical data elements are considered when developing the broader non-medical capitation rate loads.
For CY 2018, the following factors were used to remove non-medical loads from reported global subcapitation payments in the RDT data: 4% for instances where the global subcontractor is Kaiser, 7% otherwise. Further, Santa Clara Family Health Plan (SCFHP) delegates a large portion of medical services to Valley Health Plan (VHP) in Santa Clara County (not reported by SCFHP as a global subcontractor within the RDT). In this instance, a 4% adjustment factor was used to remove the non-medical loads from the payments made to VHP within the base data development. Mercer arrived at these factors after a review of global subcontractor and direct contractor experience, including historical administrative costs and MCO-reported financials. Across the Two-Plan and COHS models (there are no global arrangements within the GMC or Regional models), this adjustment removed ~$196 million from the CY 2018 base data.
Mental Health — Outpatient
The coverage of MH services for recipients with mild to moderate MH conditions became a new managed care benefit on January 1, 2014. For the CY 2021 capitation rates, Mercer reviewed five years (January 2014 through December 2018) of Medi-Cal managed care MH services experience. Along with CY 2018 RDT-reported information, supplemental data was provided by each MCO for each county/region in which they operate, and contained MH utilization and cost experience by quarter through September 2017. Based on this data, it was clear the mild-to-moderate MH experience was not completely ramped up during the CY 2018 base data period. Data from Medicaid programs within other states, which cover similar MH services, were also used to help inform the expectation of utilization for the MH carve-in. The MH — OP PMPMs were developed by MCO, county/region and COA group for all Medi-Cal managed care recipients.
The RDT-reported MH — OP COS line was adjusted using the analysis described in the preceding paragraph. This adjustment added ~$31.5 million to the CY 2018 base data across all models.

Two-Plan, GMC, WCM, Regional and COHS Models Capitation Rate Development and Certification January 1, 2021–December 31, 2021
State of California Department of Health Care Services
Capitated Rates Development Division
22
CenCal Health Mental Health Capitation Adjustment
During review of the CY 2018 RDT reported RDT data for the development of the MH — OP PMPMs (described above), Mercer identified utilization of MH — OP capitated services within CenCal Health’s reporting not accompanied by any cost experience. Mercer utilized CenCal Health’s COA-specific FFS unit cost levels to determine appropriate capitated dollar amounts to shift from other professional service categories (PCP, SP, and FQHC) with a budget-neutral effect on the reported RDT experience.
Provider Incentive Adjustments
Within the MCO-submitted RDTs, there is a schedule for MCOs to describe their provider incentive arrangements, in addition to providing the amounts paid in provider incentives separately in the RDT. Through a review of this information, it was determined there were multiple instances of provider incentive arrangements not indicative of expected future cost levels during CY 2021. As a result, base data adjustments were made for multiple MCOs. The adjustments specific to each affected MCO are described below.
Inland Empire Health Plan
Through review of the incentive programs Inland Empire Health Plan (IEHP) had in effect during CY 2018, two incentive programs were identified for adjustment within the CY 2018 base data. Each program is described below along with a description of the adjustment that was made:
• Provider Capital Fund: This program was described by IEHP to provide additional clinical workspace for providers, including the development and/or lease of new clinic facilities or expansion of existing facilities. This was not viewed as an approved medical expense to be included within the medical component of the base data. Additionally, through discussions with IEHP in review of their RDT submissions, it was noted this program ended prior to the start of CY 2021. As a result of these two factors, the dollars reported for this program were removed from the CY 2018 base data.
• Through the RDT process, it was noted by IEHP that a pay-for-performance (P4P) incentive arrangement had zero dollars associated with it in CY 2018, whereas approximately $12 million was reported in the CY 2017 RDT. Through discussions with IEHP, it was discovered that IEHP changed the payment structure for this P4P program and how they report it in the RDT. Previously, IEHP would establish a measurement year and then pay out incentives for the measurement year at some point in the following year. Historically these costs were also reported in the measurement year’s RDT. Effective with the CY 2018 measurement year, IEHP indicated they changed the payment structure to the providers to be paid on a monthly basis beginning July 2019, rather than a lump sum in the year following the measurement period. Further, IEHP indicated they intentionally did not report any dollars associated with this arrangement in the CY 2018 RDT, and would begin reporting the dollars paid to providers based on when they actually made the payments. As a result, it was deemed this would be an incurred expense for IEHP going forward into the CY 2021 contract period that was not included within their reported costs. To account for this, a $14.4 million upward adjustment was made to IEHPs CY 2018 base data, to account for the additional costs they are expected to incur in CY 2021 as a result of this arrangement. The

Two-Plan, GMC, WCM, Regional and COHS Models Capitation Rate Development and Certification January 1, 2021–December 31, 2021
State of California Department of Health Care Services
Capitated Rates Development Division
23
$14.4million adjustment was the best estimate budgeted amount that IEHP indicated they expect to pay out for this P4P program each year.
San Francisco Health Plan
Within the CY 2018 RDT, San Francisco Health Plan (SFHP) reported provider incentive dollars within their submission for a Strategic Use of Reserves (SUR) program. As described by SFHP, the goal of the SUR program is to achieve a margin, which is then distributed back to the provider networks. In the event SFHP has excess reserves of more than two months of capitation revenue, they make payments to providers based on certain performance metrics. Since the SUR program is predicated on only distributing additional funds to providers if SFHP is making a profit and in an excess reserve position, these dollars were removed from the CY 2018 base data. SFHP also noted this program ended prior to the start of CY 2021. Additionally, profit is already a component of the capitation rate development process (as noted in Section 5 of this certification), and including these dollars would in essence double count any dollars associated with profit built into the capitation rates.
CalOptima
CalOptima has a shared risk pool incentive arrangement with their professional providers, which pays professional providers an incentive if their delegated members stay under a specified budgeted amount for hospital costs. This arrangement exists for all COA groups. When reviewing PMPM costs specific to this incentive arrangement, it was noted the PMPM costs were disproportionately high for the ACA Expansion COA group compared to other COAs. Additionally, CalOptima also has a pay for value professional incentive program that rewards providers for meeting certain quality performance standards.
A majority of the ACA Expansion professional incentive payments were from the shared risk pool incentive, while the pay for value program made up the majority in the other COAs. An adjustment was applied to the incentive payment amount for the ACA Expansion population to reduce the total professional incentive payment to be 10% of total professional expenditures in the base data. The 10% assumption was derived using actuarial judgement, but also from reviewing incentive payment data across all MCOs for the ACA Expansion COA. When all MCOs’ professional incentive dollars as a percentage of total professional expenditures were lined up for the ACA Expansion COA, the following statistics show the distribution of the percentages across all plans (excluding CalOptima):
• Minimum Percentage: 0.1%
• Maximum Percentage: 15.0%
• Median Percentage: 2.5%
• Straight Average Percentage: 3.9%
• Eightieth Percentile Percentage: 5.8%
Two-Plan, GMC, WCM, Regional and COHS Models Capitation Rate Development and Certification January 1, 2021–December 31, 2021
State of California Department of Health Care Services
Capitated Rates Development Division
24
A broad 10% assumption was utilized as it was viewed as an appropriate amount in line with other MCO reporting, and took into consideration CalOptima reporting for other COA groups. Additionally, this percentage is consistent with similar adjustments that have been applied to the ACA Expansion COA group in prior rate years.
California Health & Wellness
In California Health & Wellness (CHW’s) RDT submission, the plan reported a revenue sharing program specific to Imperial County. This program, while reported under incentives, reflects a local initiative contract with the county, where CHW will share 20% of any net profit that exceeds 3% of revenue. Through review of documentation and discussion with CHW, it was determined the amounts paid out in incentive payments are solely determined by the net profits by COA and have thus been removed from the base data and CY 2021 rate development.
Seniors and Persons with Disabilities/Full-Dual Non-Covered Services Adjustment
Consistent with how DHCS makes capitation payments for this population, MCOs were instructed to report Medi-Cal beneficiaries with an ACA Expansion aid code and full-dual coverage (Medicare Part A and Part B) within the SPD-Full/Dual reporting bucket of the RDT. Historically, these members were grouped in the ACA Expansion COA group, but should not have been since no dual-eligible beneficiaries should be included in this COA. In many instances, MCO contracting for these members was performed at the rate cell level, which did not include appropriate considerations for Medicare coverage. In the CY 2018 base data; this was especially an issue in situations where the MCO had capitation arrangements with providers. As such, an adjustment was needed for the SPD/Full-Dual rate cell to remove MCO payments for services that should be covered by Medicare, leaving only cost profiles that reflect Medicaid as a payer of last resort within the base data.
The adjustment was calculated in the following manner. For COS lines where a significant portion of costs are generally covered by Medicare (such as IP and professional services), the RDT data for these services were first compared to the prior year base data for the SPD/Full-Dual COA group (CY 2017) after the application of the Non-Covered Services Adjustment. The data was also compared to the CY 2016 base data after the application of the Medicare part B/D efficiency analyses. If, in aggregate, PMPM costs for these Medicare-covered services exceeded 10% of the base PMPM costs seen in CY 2017, the PMPMs were adjusted to be 10% higher than the CY 2017 amounts. The adjusted CY 2016 and CY 2017 data is more representative of a true full-dual population where Medicaid acts as the payer of last resort. For COS lines generally not covered by Medicare (namely, LTC, Transportation, and CBAS), no adjustments to the RDT-reported amounts were made (since the plan should have paid these costs as the primary payer and should continue to pay these costs as the primary payer going forward). After these adjustments were made to the reported RDT data, the SPD/Full-Dual data for each plan was run through a smoothing and credibility adjustment process to arrive at the final base data.
Additionally, full-dual beneficiaries with an ACA Expansion aid code in CCI counties are not eligible for the CCI program. As a result, if one of these members resides in a nursing facility (NF) for the month
Two-Plan, GMC, WCM, Regional and COHS Models Capitation Rate Development and Certification January 1, 2021–December 31, 2021
State of California Department of Health Care Services
Capitated Rates Development Division
25
of admission plus one additional month, the member should be moved into the FFS delivery system based on the MCO contracts specific to non-CCI populations. Through review of the RDT submissions, it was noted LTC PMPM costs for the SPD/Full-Dual COA in Two-Plan and GMC CCI counties were much higher than anticipated. Through this review, it was determined some MCOs were not moving these ACA Expansion full-dual members into the FFS delivery system when they resided in a NF for the required period. Since months beyond the month of admission plus an additional month are much more costly than the average month for an SPD/Full-Dual member, an adjustment to the LTC COS line was made to account for this. To make this adjustment, the LTC PMPMs were reduced to a level more in line with other LTC PMPM levels for the SPD/Full-Dual COA in non-CCI counties, based on a smoothing and credibility adjustment process.
Across the Two-Plan, GMC, Regional, and COHS models, ~$52.0 million was removed from the SPD/Full-Dual rate cell for the CY 2018 period.
In Lieu of Services
As part of the CY 2018 RDT data submissions, the MCOs were required to report costs for services that were not a part of the State Plan benefit package during the base data year (CY 2018), but were provided as an in lieu of service. For the Two-Plan, GMC, Regional, COHS, and CCI model plans, eight MCOs reported costs for in lieu of services within this section of the RDT, totaling approximately 0.06% of total medical expenditures across those health plans. Since the use of these in lieu of services was not defined in the MCO contracts, the costs reported by these health plans were removed from the base data. In lieu of services will continue to be monitored in future base data and rate setting periods.
Across all Two-Plan, GMC, Regional, COHS, and CCI models, ~$8.3 million was removed from the CY 2018 base data as a result of this adjustment.
Transportation
Through the supplemental transportation data and further clarification provided by the health plans to inform the Non-Medical Transportation (NMT) and Ground Emergency Medical Transportation (GEMT) program changes, it was discovered that Blue Shield of California/San Diego had reported GEMT supplemental payments in the second half of CY 2018 in their CY 2018 RDT. To avoid building in the adjustment both in the base and as a program change, these supplemental payments totaling to $671K across all COAs were removed from the plan’s base data.
Contrary to appropriate practice where transportation to and from a CBAS facility should be billed to the CBAS facility by the transportation provider and incorporated into the CBAS facility daily rate paid by MCOs to the CBAS facility, Molina was directly paying transportation providers for trips to and from CBAS facilities. This is in addition to paying a daily rate to the CBAS facilities, which already included a transportation component. These trips were thus double-counted in the CY 2018 RDT. Effective October 2019, CBAS trips are no longer paid for by Molina separately. As such, while these CBAS trips were reported in the CY 2018 RDT, they have been removed from the base data as they would
Two-Plan, GMC, WCM, Regional and COHS Models Capitation Rate Development and Certification January 1, 2021–December 31, 2021
State of California Department of Health Care Services
Capitated Rates Development Division
26
reflect transportation costs that would not be incurred in CY 2021. This adjustment resulted in a $13.9 million decrease to the CY 2018 base data across all Molina counties.
Los Angeles County Cost-Based Reimbursement Clinics
In LA County for the SPD COA and FQHC COS only, in addition to the general base data development of the FQHC COS, the base data includes an additional adjustment to account for the portion of the CBRC costs not historically reflected in the base data and not reported in the RDT data. Going back to the original transition of the SPD population from a voluntary managed care COA to a mandatory managed care COA, the full costs associated with CBRCs had been historically included with the Senate Bill 208 program change adjustments. For CY 2021, these costs are reflected within the base data. As a result of this adjustment, a PMPM amount of $54.95 was added to the base data for LA Care and $22.32 for Health Net in the FQHC COS line for the SPD COA only.
The data for this adjustment utilized CY 2018 CBRC experience provided by LA County Department of Health Services (LA DHS). This data reflected the LA Care and Health Net SPD CBRC experience from this period, which aligned with the base data utilized for rate setting. The CY 2018 RDT information from each of the MCOs was also utilized as it represented the baseline information prior to the subsequent adjustment. The differential between the amounts of LA DHS reported experience for each MCO and the underreported MCO experience dictated the needed adjustment.
It should be noted that due to higher costs associated with CBRCs and the disproportionate distribution of CBRC services across the MCOs within LA County for the SPD COA, a further refinement was necessary. The CBRC cost was divided in two components: an arms-length transaction amount reflective of cost levels in line with typical professional services, which includes administrative and underwriting gain loads and is subject to risk adjustment, and a “not subject to risk adjustment” carve-out amount, which includes only medical costs and is not subject to risk adjustment. This occurs at a later step in the rate development process and is described in more detail within Section 4 of this report.
San Francisco Community-Based Adult Services Pricing Adjustment
During the follow up and data validation process with respect to the CY 2018 RDT data reported by the MCOs; SFHP disclosed that effective July 1, 2018, their negotiated contracts with CBAS providers increased by 20%. This was due to multiple years with no CBAS cost per day increase in the contractual arrangements between SFHP and the CBAS providers. SFHP also provided supplemental CBAS data by month after the CY 2018 base data period, which showed the higher per day rates. As such, a base data adjustment was applied to reflect the higher CBAS cost per day rates as a result of this contract renegotiation.
Limited to only SFHP in San Francisco County, this adjustment results in an increase of ~$0.5 million in the CY 2018 base data.
Two-Plan, GMC, WCM, Regional and COHS Models Capitation Rate Development and Certification January 1, 2021–December 31, 2021
State of California Department of Health Care Services
Capitated Rates Development Division
27
Managed Care Organization Withdrawal from Sacramento County
UnitedHealthcare (United) began as a Medi-Cal managed care plan in Sacramento County on October 1, 2017. However, United quickly began taking losses and communicated to DHCS their intent to withdraw from Sacramento County. Effective November 1, 2018, United withdrew from Sacramento County. As a result, an adjustment was applied to account for the high-risk beneficiaries formerly enrolled in United transitioning to other Sacramento County MCOs. Mercer analyzed the emerging cost and utilization data of the United members, as reported in the CY 2018 RDT, who would transition to other Sacramento County managed care plans. An upward adjustment was made to account for the transition of these former United members into the remaining Sacramento County MCOs.
Specific to Sacramento County, this base adjustment resulted in a ~$3.3 million increase to the CY 2018 base data.
CalOptima Base Data Adjustments
In addition to the hospital pricing adjustment mentioned above, two further base data adjustments were required for CalOptima:
1. Professional capitation cost adjustment: The CY 2018 RDT reported outlier cost levels for the professional services (a subtotal of the PCP, SP, FQHC, and NPP COS groups) for the ACA OE COA group, driven largely by capitation cost levels. To avoid certifying to a two-tier payment system, DHCS/Mercer adjusted the CalOptima reported ACA OE professional data downward to a targeted level equivalent to an 80/20 blend of the professional PMPMs for the Adult and SPD COA groups. This 80/20 blend was informed by the historical and on-going acuity reviews of the ACA OE COA group relative to Adult and SPD. This blend was further reviewed with comparable COHS model cost levels and deemed appropriate. The result of targeting this professional cost PMPM was the removal of ~$68.8 million.
2. Global member LTC adjustment: A review of the CY 2018 RDT showed costs incurred at LTC facilities for the global member LTC population were inadvertently excluded from the RDT reporting. Mercer used encounter submissions from these global members to add the appropriate costs. The total added to the base data for this adjustment was ~$1.5 million.
DHCS/Mercer will continue to monitor both of these items in CalOptima’s reporting for future rating periods.
Health Plan of San Mateo Burlingame Long-Term Care Facility Adjustment
During follow up communication with HSPM, DHCS learned of a settlement with an LTC provider, San Mateo Medical Center — Burlingame Facility. The settlement resulted in multiple rate adjustments not reflected in the CY 2018 RDT reporting. HPSM provided supplemental information detailing the rate adjustments, which resulted in a 38.18% average increase to the rates paid to the provider throughout CY 2018. This lead to an overall base increase of ~$2.1 million to HPSM’s LTC facility costs.

Two-Plan, GMC, WCM, Regional and COHS Models Capitation Rate Development and Certification January 1, 2021–December 31, 2021
State of California Department of Health Care Services
Capitated Rates Development Division
28
Los Angeles Care Incurred But Not Reported Adjustment
LA Care had greater uncertainty in the IBNR portion of its RDT data. With May 2019 runout of CY 2018 incurred claims reported in the RDT, LA Care initially estimated ~$88.0 million of IBNR liability. LA Care later provided updated lag triangles with April 2020 runout, which showed further claim payments of $59.04 million and $6.50 million of residual IBNR remained at that point. This resulted in a net downward adjustment of $22.50 million from LA Care’s CY 2018 base data. The adjustment was applied proportionally by COS and COA to the base data.
Hemlibra
Hemlibra is a “blood factor like” drug that is carved out of managed care and paid through FFS, consistent with blood factor. Because the decision to carve out Hemlibra was made during CY 2018, it was necessary to remove any managed care Hemlibra spend that occurred in CY 2018 from the base. In total, ~ $0.33 million were removed statewide across all MCOs.
Seniors and Persons with Disabilities and Breast and Cervical Cancer Treatment Program Consolidation
With intentions of operational simplicity and better matching payment to risk, DHCS elected to combine the SPD and BCCTP COA groups for the CY 2021 rating period. The CY 2018 base data for the SPD and BCCTP COA groups was blended, based up on the CY 2018 membership and PMPM cost levels, into a consolidated SPD COA group. Mercer actuaries certify that this blended COA approach is actuarially sound. Further references of the SPD COA group refer to the consolidated SPD and BCCTP COA group. This blended approach was budget neutral to the base data.
Data Smoothing After the base data adjustments, described above, were applied to the RDT data, a smoothing and data credibility adjustment process was applied in a manner consistent with the process applied historically within the Medi-Cal managed care rate setting process.
Smoothing and Data Credibility Adjustment Process
Utilization and unit cost information from the plan-specific encounter and adjusted RDT data was reviewed at the COA group and COS detail levels for reasonableness. For the majority of the COS listed above, ranges of reasonable and appropriate levels of utilization and unit cost were then established for each COS within each COA group. Averages of the reasonable and appropriate levels for these services were also established for the encounter and the RDT data. This process, in essence, produced four potential data elements of utilization and unit cost for each COS within each COA group:
1. Plan specific encounter data
2. Plan specific RDT data

Two-Plan, GMC, WCM, Regional and COHS Models Capitation Rate Development and Certification January 1, 2021–December 31, 2021
State of California Department of Health Care Services
Capitated Rates Development Division
29
3. Average (smoothed) encounter data
4. Average (smoothed) RDT data
These four data elements were then applied credibility factors dependent upon the plan-specific data being reasonable and appropriate, as well as based on the enrollment size of the population of the COA.
The credibility factors can be different for each MCO, COA, and COS. Depending on the MMs for the base data year (CY 2018) for an MCO and COA combination, base factors are established, giving credibility to the plan-specific RDT data, plan-specific encounter data, smoothed RDT data, and smoothed encounter data.
Larger MM counts correspond to more credibility given to the plan-specific RDT and encounter data and less to the smoothed amounts. For example, for a fully credible plan based on MMs exceeding 25,000, these amounts would be 70% plan-specific RDT data, 20% plan-specific encounter data, 7.5% smoothed RDT data, and 2.5% smoothed encounter data. For a smaller COA, having less than 5,000 but greater than 2,500 MMs, these amounts would be 58% plan-specific RDT data, 14% plan-specific encounter data, 21% smoothed RDT data, and 7% smoothed encounter data.
Another component of this process includes having the plan-specific RDT and encounter data run through smoothing ranges, based on reasonable ranges of PMPM and unit cost. If the plan-specific data (separate by COA and COS) is not deemed reasonable (i.e., does not fit into the smoothing ranges), that plan-specific data element is given zero credibility and the base factors are re-normalized to add to 100%. For example, if the plan-specific encounter data was not deemed reasonable, but the RDT was reasonable, these amounts would be 87.5% plan-specific RDT data, 0% plan-specific encounter data, 9.375% smoothed RDT data, and 3.125% smoothed encounter data for a fully credible COA. Based on this, it is possible for both plan-specific RDT and encounter data to be deemed unreasonable and all credibility would be given to the smoothed values in this instance. It is also possible for RDT data to be deemed reasonable with encounters unreasonable or vice versa. All credibility factors are re-normalized based on which plan-specific data elements were deemed reasonable. Note also that the smoothed RDT and encounter data are based on averages of the data (across multiple plans) that fell within the smoothing ranges for each COA and COS combination. It should also be noted there are instances where a plan-specific data element may be perfectly reasonable for that plan (this is often the case for a plan that has a higher than normal volume of FQHC activity), but not reasonable for the smoothed averages. In these cases, these data elements are excluded from the smoothed averages, but that plan-specific data element is given credibility only for that MCO, COA, and COS combination.
This smoothing and credibility process was applicable for all COS listed above with the exception of the following: MH — OP, BHT Services, CBAS, MSSP, and IHSS. For these remaining COS, below is a description of the process used to develop the base data:
• CBAS: CBAS services vary widely by county within the Medi-Cal managed care program. Some counties have many CBAS facilities while other counties may have zero CBAS facilities. Due to
Two-Plan, GMC, WCM, Regional and COHS Models Capitation Rate Development and Certification January 1, 2021–December 31, 2021
State of California Department of Health Care Services
Capitated Rates Development Division
30
these differences, per member utilization and cost data for CBAS vary greatly across MCOs and counties. Therefore, the smoothing and credibility process described previously does not work well for this particular COS. For this service, both RDT and encounter utilization and cost data were reviewed separately for each MCO and county and an appropriate PMPM amount was developed using these data sources. For the CCI counties, these services are reimbursed through the HCBS High supplemental payment for recipients age 21 and older and are therefore not included in the base data.
• MH — OP: The process described in the “Base Data Adjustments” subsection above produces the final MH — OP base data figures. As a result of the separate process for this COS, no smoothing and credibility process is applied, since all base data considerations are incorporated in the separate process.
• BHT Services: As noted in the “Base Data Adjustments” subsection, all BHT services are removed from the base data due to the presence of a supplemental payment for these services. Additionally, cost for CDEs have been reallocated to the Other Medical Professional COS. As a result, no smoothing and credibility adjustment process is applied, since base data values are zero for this COS. Additional detail regarding the development of the supplemental payment is described further in a separate methodology report.
• IHSS and MSSP: During the CY 2018 base data period, IHSS was not a managed care covered benefit and MSSP services were managed care covered for MCOs operating in CCI counties only. As previously described in the “Base Data Adjustments” subsection, IHSS is no longer a managed care covered benefit, while MSSP services are reimbursed through a supplemental payment. As a result, all PMPM values for these COSs are zeroed out in the rate development process.
Relational Modeling
The Two-Plan, GMC, Regional, COHS and CCI model programs are very large, covering millions of beneficiaries. In aggregate, each MCO has a fully credible population base for rate setting purposes. However, there are a number of MCO COA groups for which there is concern over specific COA group credibility. In those instances, Mercer analyzed data and information on a more aggregate level and, from this, developed factors, or relativities, to overcome any excessive variation brought on by small membership, or extraordinary (high or low) utilization or unit costs. Adjustments were made via a budget-neutral smoothing and relational modeling process. In general, no dollars were gained or lost in this process. Similar to prior rate development periods, there are a few exceptions (Kaiser and Anthem Blue Cross in San Benito County, detailed below) which are consistent with the base data development process described for these unique instances previously.
Other Base Data Considerations It should be noted the smoothing and credibility process alone was not used for unique situations for certain MCOs or populations. There are some situations where a modified approach was more appropriate to utilize. These instances are described in the next three subsections.

Two-Plan, GMC, WCM, Regional and COHS Models Capitation Rate Development and Certification January 1, 2021–December 31, 2021
State of California Department of Health Care Services
Capitated Rates Development Division
31
Two-Plan/GMC CCI Institutional Rate
Given the relatively small number of non-dual Institutional members throughout CCI counties, the managed care data for the Institutional rate cell in CCI counties is subject to large swings from year-to-year and is not fully reliable for rate setting purposes. As such, the base data for these populations is developed at a county level instead of by MCO for an added measure of consistency. The RDT-reported data by CCI health plans was the starting point for the county base data. To arrive at the base data for this population, a credibility and smoothing process was implemented consistent with other Two-Plan and GMC COA groups.
Kaiser
Given data inconsistencies observed during the RP 19–20 rate setting process between the CY 2016 and CY 2017 RDT reporting, Kaiser’s RDT-reported information was not deemed appropriate to use in the development of the base data last cycle. Mercer has continued to observe anomalies, including very high professional figures, reported in Kaiser’s CY 2018 RDT information. As a result, this information was not deemed appropriate to use in the development of the CY 2018 base data for CY 2021 rate setting purposes either.
To develop base data for CY 2021 for Kaiser, a process consistent with RP 19–20 rate development and historical processes prior to the CY 2016 base period was used (additionally, this same process was used with 50% credibility in the SFY 2018–2019 rate development). Specifically, the county/region average base data was established for all other MCOs within Sacramento, San Diego and the regional counties separately. Then, Medicaid Rx risk score relativities were reviewed for Kaiser versus the average of the other MCOs within each respective county/region. Kaiser’s base data is then calculated as the ratio of their risk score relativity factor compared to the average of the other MCOs multiplied by the county/region average base data PMPM based on the other MCOs in each county/region. This process was applicable for the Child, Adult, ACA Expansion, and SPD COAs in all Kaiser counties/regions.
For Kaiser’s SPD COA in the three regional counties, an additional step was used as well, since the population is relatively small compared to the other instances (4,848 MMs in CY 2018). To develop the base data, the process described in the prior paragraph was utilized, but this data was then credibility weighted with the 18 county regional average SPD base data and the final CY 2017 base data developed for RP 19–20, to recognize the population is small and risk scores are subject to more volatility from year-to-year.
Kaiser in Sacramento County (and as a global subcontractor for PHC in Solano County) also covers specialty MH services not covered by any other MCO within the Medi-Cal program. These specialty MH services include psychiatric IP, OP, and pharmacy (first quarter of 2021 only). These specialty MH services are not a part of the base data for Kaiser in Sacramento County and are excluded from the rate calculation process and treated as an add-on PMPM amount after the development of the risk-adjusted rates. As a result, these services are not included in the county average rate calculations necessary for the risk-adjusted rate process (described later in the certification report).

Two-Plan, GMC, WCM, Regional and COHS Models Capitation Rate Development and Certification January 1, 2021–December 31, 2021
State of California Department of Health Care Services
Capitated Rates Development Division
32
To develop the Kaiser Sacramento MH add-on PMPMs, Kaiser provided summary-level information regarding the CY 2018 utilization and cost of specialty MH services for their members in Sacramento County. This data source was summarized by COA group and service type. This data was also reviewed against the analogous CY 2016 information provided by Kaiser and CY 2016 specialty MH FFS data for non-Kaiser members in Sacramento and surrounding areas, which formed the basis of the CY 2016 base data for these services. As a result of this review, the data provided by Kaiser for CY 2018 was deemed reasonable for rate setting purposes. To project costs for these services into the rating period, trend factors were applied to the base data (consistent with the trend factors described later in this report) to derive the projected medical expenses for CY 2021 (pharmacy was only trended to the first quarter of CY 2021). Subsequently, administrative and underwriting gain loads were added to the projected medical expenses to arrive at the MH add-on PMPMs applicable to Kaiser in Sacramento County. The administration loads are consistent with the fixed and variable administration calculation done for all non-specialty MH services as a percentage by COA, while the underwriting gain loads are consistent with non-specialty MH services as well. The MH add-on PMPMs for Kaiser in this county can be found in the Excel file titled FINAL CY 2021 Medi-Cal Detail CRCS Package LB Rate Smry 2021 01 28.xlsx (please see the “KFH_SAC RAR” tab within this file). The add-on PMPMs are developed separately by COA. Note that more details on the trend factors utilized, administrative loads and underwriting gain loads are described later in this report.
Anthem Blue Cross Seniors and Persons with Disabilities Base Data in San Benito County
For the SPD population in San Benito County, managed care enrollment is voluntary. As a result, the SPD population enrolled in managed care for San Benito County is very small (1,183 MMs for the CY 2018 base data period). Further, the managed care data for the SPD COA in this county is subject to large swings from year-to-year and not fully reliable for rate setting purposes.
To arrive at the base data for this population, the credibility and smoothing process described previously was utilized for this small population, with a modification to reflect the age and gender distribution of Anthem’s SPD population in San Benito County. Specifically, the smoothed average RDT and encounter data (as described previously within this section) were adjusted to an expected value based on Anthem San Benito’s SPD age and gender distribution, which does vary significantly when compared to the mandatory managed care SPD population enrolled in the balance of Medi-Cal managed care. For example, in CY 2018, children aged zero through 20 represented approximately 41% of Anthem San Benito’s voluntary SPD population, while children aged zero through 20 represented 17% of the all Two-Plan, GMC, and Regional average. Since services covered under CCS are a carved out benefit (as noted in Section 2), Anthem San Benito’s SPD expected risk is lower than the average SPD population for the balance of the program. To adjust the smoothed RDT and encounter data for this calculation, cost relativity factors were applied to the age and gender distribution of Anthem San Benito and the Two-Plan, GMC, and Regional average. Based on this, an adjustment factor was calculated based on the expected risk for Anthem San Benito divided by the expected risk for the Two-Plan, GMC, and Regional average. This adjustment factor was applied to the smoothed RDT and encounter data for the SPD population. Next, the plan-specific RDT and encounter data was calculated as a blend of three years of base data in order to increase the

Two-Plan, GMC, WCM, Regional and COHS Models Capitation Rate Development and Certification January 1, 2021–December 31, 2021
State of California Department of Health Care Services
Capitated Rates Development Division
33
credibility of the plan-specific component. Finally, the credibility adjustment process as described previously in this section was applied, with credibility given to blended Anthem San Benito’s plan-specific RDT and encounter data, and remaining credibility given to the age and gender adjusted smoothed RDT and encounter data. This process created the base data utilized for the SPD COA for Anthem in San Benito County.
The age and gender factors utilized in this calculation were derived based on MCO-reported data by age and gender group. As part of the RDT data submissions, MCOs are required to submit cost data by COA by age and gender breaks.
Aetna Better Health and UnitedHealthcare
Aetna Better Health (Aetna) entered Sacramento and San Diego counties effective January 1, 2018 and UnitedHealthcare (United) entered San Diego County effective October 1, 2017. Membership for these plans began to slowly ramp up after their entrances into the Medi-Cal program and throughout CY 2018. Due to this and the continued expected ramp up for these two plans during CY 2021, a decision was made to develop base data for these two plans based on county average base data for both counties separately, consistent with previous rating periods.
The Excel rate range spreadsheets contain detailed CRCS for the Two-Plan, GMC, Regional and COHS model rate development. Base data are presented by COS as annual utilization per 1,000 members, average unit cost and the resulting PMPM calculations and are reflected in columns (A), (B), and (C) of the CRCS, respectively. The various COA groupings are each represented by their own separate CRCS.
Maternity Supplemental Payment To further enhance the measured matching of payment to risk, DHCS utilizes a maternity supplemental payment, which used to be implemented only for non-COHS counties and effective January 1, 2021 for program design consistency, is now expanded to all COHS counties as well. Pertaining to gender, the primary issue that could result in significant variance among the MCOs’ enrolled population and hence their risk, is the event of maternity and its related cost. Costs for pregnant women are on average substantially higher than the average medical cost of care for men and non-pregnant women with similar demographic characteristics. To mitigate the maternity risk issue within the rates, DHCS includes a maternity supplemental payment, which represents costs for the delivery event. Pre-natal and post-partum care costs are not part of the supplemental payment, but remain within the capitation rates for their respective COA. A MCO receives the lump sum maternity supplemental payment when one of its current members within the Child, Adult, and ACA Expansion COA groups gives birth and DHCS is appropriately notified a birth event has occurred. Note that non-live birth expense data and non-live birth outcomes are excluded from the maternity supplemental payment analysis and the corresponding development of the CY 2021 maternity supplemental payments. This results in non-live birth expenses being included in the base capitation rates rather than being included in the supplemental payment. Separate maternity supplemental payments enhance matching payment to risk in large part because they mitigate potential adverse selection
Two-Plan, GMC, WCM, Regional and COHS Models Capitation Rate Development and Certification January 1, 2021–December 31, 2021
State of California Department of Health Care Services
Capitated Rates Development Division
34
effects across plans for the non-COHS models and protect the COHS plans from the impact of changing delivery prevalence.
Maternity Supplemental — Design
• Payment made on delivery event that generates a state vital record.
• One supplemental payment per delivery regardless of number of births.
• One blended supplemental payment combining caesarean and vaginal deliveries.
• Supplemental payment varies by county/region, but not by MCO within a county/region.
• Supplemental payment reflects cost of delivery event only (mother and baby, excluding pre-natal, and post-partum care).
• Supplemental payment is for the entire CY 2021.
• Same supplemental payment is utilized for the Child, Adult, and ACA Expansion COA groups and WCM if a delivery event occurs.
• Carve out maternity costs from the Child, Adult, and ACA Expansion COA groups.
Maternity Supplemental — Base Data Development Approach
In general, a similar process used for the development of the base data by COA group is utilized in the development of the base data for the maternity supplemental payment. The RDT data is used as the main base data source for this base data development. The general process for the development of the maternity base data is described below:
• Calculate per delivery costs and utilization from CY 2018 MCO RDT data by delivery type and COS.
• Same general data selection process used as in regular rate range development:
─ Smoothing and data selection process done by MCO and delivery type (caesarean and vaginal).
• Develop smoothed data points to replace missing or unreasonable data.
• Blend reported and smoothed base costs from the MCOs to generate base data by MCO, delivery type, and COS.
• Aggregate base data across county/region and delivery type.
In the final step of the base data development process, the MCO-specific data (after smoothing and credibility adjustments) is blended together across MCOs in each county/region and across caesarean and vaginal deliveries. As part of this process, the caesarean and vaginal ratios reported by each

Two-Plan, GMC, WCM, Regional and COHS Models Capitation Rate Development and Certification January 1, 2021–December 31, 2021
State of California Department of Health Care Services
Capitated Rates Development Division
35
MCO are reviewed and appropriate adjustments are made when the reported ratios are unreasonable. In studying historical averages in birth rate types, as well as applying actuarial judgement, an acceptable range of caesarean births as a percentage of total birth count was developed as a quantitative measure in examining what appropriate ratio levels should be. It is our experience that from year-to-year the majority of plan-reported data would fall within an acceptable range conducive to matching payment with risk. However, in some instances when it is clear data quality might compromise the soundness of the rate, Mercer deems it necessary to adjust a more normalized level. Please note that maternity supplemental base data smoothing and adjustment process is cost neutral to the rate development process across the regular capitation rate and maternity supplemental payment rate as any adjustment only redistributes the costs between the regular capitation rate and maternity supplemental payment, and will not change the total costs used for rate development.
Hepatitis C Supplemental Payment To enhance the measured matching of payment to risk, DHCS will utilize a Hepatitis C supplemental payment for the first quarter of 2021. This aligns with the pharmacy benefit in managed care continuing for an additional quarter. Hepatitis C pharmaceutical therapy costs were removed from the CY 2018 base experience as a base data adjustment to allow the supplemental payment to cover the anticipated pharmaceutical therapy costs associated with Hepatitis C. Please see the following attachment (Q1 2021 Hepatitis C Supplemental Payment Methodology 2020.12.17.pdf) for further details on the Hepatitis C supplemental payment methodology and subsequent rate development. Additionally, exhibits showing the final capitation rates and CRCS can be found in the Excel file titled FINAL CY 2021 Medi-Cal Hep C BHT Supp Rate Exhibits 2021 01 28.xlsx.
Behavioral Health Treatment Supplemental Payment Effective September 15, 2014, MCOs became responsible for BHT services to address autism spectrum disorder. Effective July 1, 2018, the MCOs’ responsibility to cover these services expanded to include children not diagnosed with autism. These benefits are available for beneficiaries ages zero to 20 years old who are eligible for the EPSDT program and meet medical necessity criteria for the service. To further enhance the measured matching of payment to risk, DHCS utilizes a BHT supplemental payment for CY 2021. BHT services were removed from the CY 2018 base experience to allow the supplemental payments to cover the anticipated costs for these services. Effective July 1, 2019, CDEs are no longer covered under the BHT supplemental payment, and instead are covered under the capitation rate. Therefore, CDE base costs remained in the base data used for the capitation rates and were not used in the development of the BHT supplemental payment. Please see the following attachment (CY 2021 BHT Supplemental Payment Methodology January 2021.pdf) for further details on the BHT supplemental payment methodology and subsequent rate development. Additionally, exhibits showing the final capitation rates and CRCS can be found in the Excel file titled FINAL CY 2021 Medi-Cal Hep C BHT Supp Rate Exhibits 2021 01 28.xlsx.

Two-Plan, GMC, WCM, Regional and COHS Models Capitation Rate Development and Certification January 1, 2021–December 31, 2021
State of California Department of Health Care Services
Capitated Rates Development Division
36
Home- and Community-Based Services High Supplemental Payment To further enhance the measured matching of payment to risk, DHCS also utilizes an HCBS High supplemental payment in CCI counties for CY 2021. Through the RDT, MCOs reported the cost and utilization associated with CBAS and MSSP for eligible members, as well as utilizer counts per month for CBAS, MSSP, and IHSS. These HCBS costs were removed from the CY 2018 base experience to allow the supplemental payment to cover the anticipated HCBS costs associated with CBAS and MSSP services (IHSS is no longer a benefit during CY 2021, as described above). In general, a similar process used for the development of the Two-Plan and GMC CCI county Institutional COA base data is utilized in the development of the base data for the HCBS High supplemental payment. The RDT data is used as the main source for this base data development. The general process for the development of the HCBS High base data is described below:
• Data is blended to a county level, consistent with the payment structure.
• Calculate countywide per utilizer costs for CBAS and MSSP services and utilization of IHSS, CBAS, and MSSP services from CY 2018 MCO RDT data.
• Develop smoothed data points to replace missing or unreasonable data.
• Blend reported and smoothed base costs by county to generate base data.
Although only CBAS and MSSP services are covered through this supplemental payment, there are three types of members health plans are eligible to receive payment for: members who receive CBAS, members who are clients of MSSP sites, and members who receive IHSS and are classified as “Severely Impaired”. Exhibits showing the final supplemental payment rates and CRCS can be found in the Excel file titled FINAL CY 2021 CA CCI Medi-Cal Only & Partial Dual Rate Ranges 2021 01 28.xlsx.

Two-Plan, GMC, WCM, Regional and COHS Models Capitation Rate Development and Certification January 1, 2021–December 31, 2021
State of California Department of Health Care Services
Capitated Rates Development Division
37
4
Projected Benefit Costs and Trends The adjusted base data (described in Section 3) was projected to the rating period. The adjustments used to produce the projected benefit costs and trended costs are described within this section and are listed below:
• Pharmacy Add-On
• Coronavirus Disease 2019 Add-On
• Trend From CY 2018 to CY 2021
• Program Changes
• Pharmacy Efficiency Adjustments
• IP Efficiency Adjustment
• Emergency Department (ED) Efficiency Adjustment
• Physician-Administered Drugs
• Population Adjustments
• CBRC in LA County
• Maternity Supplemental Payment Rate Development
• HCBS High Supplemental Payment Rate Development
The adjustments listed above are shown within the various columns of the CRCS by county/region, MCO, COA group, and COS, and as capitation rate add-ons. The exact columns are noted within each subsection below. Note that the maternity and HCBS high supplemental payment rate developments are shown in their own CRCS.
Additionally, the final subsection within this section addresses other items not listed above where no explicit adjustments to the data are applied.
Two-Plan, GMC, WCM, Regional and COHS Models Capitation Rate Development and Certification January 1, 2021–December 31, 2021
State of California Department of Health Care Services
Capitated Rates Development Division
38
Pharmacy Add-On One significant change for the CY 2021 rating period is the decision to carve pharmacy out of managed care. The initial plan was for this change to be effective January 1, 2021, but a three-month delay is being implemented, which resulted in the need to develop a managed care capitation rate for pharmacy for the January 1, 2021–March 31, 2021 period. The development of this pharmacy rate is previously described and consistent with other base data and rate development for the CY 2021 period. A 2% administration load was assumed for the pharmacy add-on. This is consistent with the assumed administrative load adjustment associated with the updated administrative load for capitation rates that exclude pharmacy (effective April 1, 2021 through December 31, 2021).
Coronavirus Disease 2019 Add-On CY 2021 capitation rates include PMPM add-ons to reflect the impact of the Coronavirus Disease 2019 (COVID-19) pandemic. Significant national uncertainty exists regarding the impact of COVID-19 during CY 2021 due to the ever-changing situation with regionalized infection rates, responses driven by local governments and new treatment protocols, to name a few factors. Utilization and cost assumptions considered many elements, including infection rate and severity mix of cases, the impact of social distancing, the Federal Government’s involvement in COVID-related funding (e.g., HHS and FEMA), and the availability of a vaccine. Given the limited experience resulting from the COVID-19 pandemic, Mercer used several data sources to develop the COVID-19 impacts to CY 2021 capitation rates, including Mercer and Oliver Wyman internal modeling, and national and state data sources.
Given the uncertainty surrounding COVID-19, Mercer separated assumptions into the following categories.
Testing
Testing costs were developed using a bottom-up approach. An assumed testing rate was developed through a combination of statewide-expected testing outcomes and rate cell demographic information. The analysis includes testing for current infection and antibody testing. Costs were included for both the test, priced at DHCS published fees, as well as associated administrative costs and any corresponding services (e.g., ED or office setting).
Treatment
Treatment costs considered the estimated cost of treatment based on case severity. Scenarios were considered that ranged from in-home care for mild cases to hospitalization, including the intensive care unit, for more severe cases. Average treatment costs were developed based on projected treatment protocols, including average days in the hospital. The treatment costs were then weighted based on an assumed distribution of incidence rate and severity of cases, which varied by rate cell. For example, older members are assumed to be at higher risk for more severe infection, requiring more costly treatment than younger members. Results were calibrated based on rate cell demographic information.
Two-Plan, GMC, WCM, Regional and COHS Models Capitation Rate Development and Certification January 1, 2021–December 31, 2021
State of California Department of Health Care Services
Capitated Rates Development Division
39
Deferred Care
Deferred care assumptions were developed based on an assumed percentage of projected utilization, which is delayed with a portion of these delayed services assumed to be canceled. Delayed or canceled services can result from restricted provider capacity, beneficiary choice to not engage in care, services considered elective or lower urgency, or services ultimately deemed unnecessary. Mercer varied these assumptions by service category. These deferred care utilization assumptions were then applied to projected expense by rate cell, which reflected a rate cell-specific mix of service categories. Mercer assumed deferred care will continue through September 2021 and will end by October 2021.
Mental Health Outpatient Services Acuity
Acuity changes may occur as new needs develop and treatment becomes warranted. Based on national evidence that the pandemic is having a material impact on MH needs, Mercer is forecasting an uptick in BH-related services, including the mild to moderate MH conditions covered by managed care. The COVID-19 add-on includes additional costs for this increase, modeled as a 10% increase in the projected MH OP services.
Administration and Underwriting Gain
The COVID-19 add-on is loaded for administration and underwriting gain consistent with the base capitation rate as described in Section Projected Non-Benefit Costs.
Considered But Not Adjusted
The following impacts were not explicitly adjusted in the COVID-19 program change:
• Coverage of Vaccines — given the uncertainty surrounding the availability and uptake of a vaccine, DHCS carved both the vaccine and vaccine administration out of managed care. In addition, per the CMS vaccine toolkit, there is no assumed Medicaid liability for the cost of the vaccine itself in CY 2021. Consequently, no explicit adjustment was made for these costs.
• Long-Term Impact of COVID-19 — given uncertainty around long-term implications of COVID-19, Mercer did not make an explicit assumption specific to this potential impact for CY 2021.
Trend Trend is an estimate of the change in the overall utilization and cost of medical services over a finite period of time. Trend factors are necessary to estimate the expenses of providing health care services in a future period. As part of the CY 2021 rate range development for the Two-Plan, GMC, Regional, COHS, and CCI model programs, Mercer developed trend rates at the COA level for each provider type or COS separately by utilization and unit cost components. For all COA group cohorts in the January 1, 2021 through December 31, 2021 rating period, their CY 2018 base data was trended forward 36 months from the mid-point of CY 2018 to the mid-point of CY 2021. The pharmacy benefit

Two-Plan, GMC, WCM, Regional and COHS Models Capitation Rate Development and Certification January 1, 2021–December 31, 2021
State of California Department of Health Care Services
Capitated Rates Development Division
40
was only trended 31.5 months from the mid-point of CY 2018 to the mid-point of the first quarter of 2021 to align with limited three-month continuation of this benefit in managed care.
Mercer reviewed and utilized multiple sources of data and information for trend development. These include recent MCO encounter and RDT data, MCO Medi-Cal only financial statements, Medi-Cal-specific hospital IP and OP payment data, Consumer Price Index, National Health Expenditures updates, and multiple industry trend reports including the CMS Medicaid actuarial report. Each of these data and information sources has strengths and challenges, and those strengths and challenges may change over time. Hence, no one, or combination of, data and information source(s), was utilized within a prescribed formula. Rather, each was reviewed for its potential applicability and utilized collectively with other data and information via actuarial judgement in order to inform the final trends.
The overarching trend development approach remains consistent with prior rate periods as a combination of “top-down” and “bottom-up” claim cost trend development. Mercer conducted historical annual trend calculations to inform directional changes of emerging trends for consolidated service categories at the major COA level. To the extent the emerging trends, along with the host of data and information described above, indicated a material increase or decrease of service utilization or unit cost, Mercer adjusted the trends established in the prior year’s rates incrementally as the new trends for the current rates in order to reflect the directional changes. This is also referenced as a “change-in-the-change” approach for the purpose of continuity of trend assumptions between different rating periods. In addition to “bottom-up” claim cost trend analysis, a considerable amount of actuarial judgement was used in the final trend development based upon Mercer’s longstanding Medi-Cal-specific program knowledge and extensive experience in working with the majority of the largest Medicaid programs in the country.
As a confirmation, ACA Optional Expansion trends are the same as the Adult trends for each COS.
The one major trend COS where significant changes in annual claim cost trends took place was IP, where annual PMPM trend factors changed more than 0.50% from RP 19–20 to CY 2021 to reflect the more recent trend experience. Please see the table below for detailed changes of trend assumptions for this COS.
IP Annual Trend Factors COA RP 19–20 CY 2021 Change Adult 2.98% 3.50% 0.52% SPD 1.92% 2.44% 0.52% SPD/Full-Dual -0.24% 0.27% 0.51%
Note that any low or negative utilization trends would be a by-product of the above process and were viewed by Mercer as reasonable and appropriate. In particular, the negative utilization trends for IP were informed by the consistent negative utilization trends as projected by CMS actuaries for Medicaid

Two-Plan, GMC, WCM, Regional and COHS Models Capitation Rate Development and Certification January 1, 2021–December 31, 2021
State of California Department of Health Care Services
Capitated Rates Development Division
41
population(s) nationwide for the roughly corresponding trend periods. Such trends are documented, for example, in the 2018 CMS Medicaid actuarial report.1
The report provides the following examples:
IP Hospital Population 2019 (over 2018) 2020 (over 2019 2021 (over 2020) Persons with Disabilities -9.3% -8.1% -7.0% Child Enrollees -5.1% -3.1% -3.1%
Mercer did not use negative utilization trend factors as aggressive as these since there clearly were many sources (some of it conflicting/contradictory) of IP experience and projections. Instead, Mercer has used positive IP utilization trends for the Adult and ACA Optional Expansion COAs and reduced the magnitude of negative IP utilization trends for Child and SPD categories of Aid in the current CY 2021 rates to account for more recent positive utilization trend experience. However, in our opinion these annual CMS Medicaid actuarial reports provide excellent independent data and information around trends and their directionality.
Note that trends for the LTC provider type are displayed as 0.0% for both utilization and unit cost. Due to the relatively high level of legislatively mandated changes surrounding LTC, Mercer has handled LTC trends through the program changes section of the methodology, with one exception. The one exception to this is within the Two-Plan and GMC CCI Institutional rates, in which a small unit cost trend assumption was applied (0.5% at the mid-point) to account for increased pricing pressures communicated to Mercer through conversations with the CCI health plans. Similarly, unit cost trends for the Hospice COS are displayed as 0.0% for similar reasons (including the Two-Plan and GMC CCI Institutional rates).
After the mid-point/best estimate trends were determined, a trend range was created by adding 0.25% to each of the utilization and unit cost components as the upper bound and subtracting 0.25% as the lower bound, with the exception that no range was created for an individual COS like LTC, where the best estimate trends were determined to be zero and handled through other rate setting components. In aggregate, the annualized lower bound claim cost trends, across all MCOs, all COA groups, and all COS (excluding the three months of pharmacy), average 0.1% for utilization and 2.6% for unit cost or 2.6% PMPM. This represents a decrease of 0.4% over the aggregate trend figures at the lower bound from the RP 19–20 capitation rates. Note that the RP 19–20 total annual trend figures include pharmacy, while CY 2021 does not include pharmacy within the totals due to the carve-out being
1 https://www.cms.gov/files/document/2018-report.pdf, pages 48-49.
Two-Plan, GMC, WCM, Regional and COHS Models Capitation Rate Development and Certification January 1, 2021–December 31, 2021
State of California Department of Health Care Services
Capitated Rates Development Division
42
effective April 1, 2021. If we remove pharmacy from RP 19–20 total annual trend figure, the total annualized non-Rx PMPM trend change would be an increase of 0.2%
The specific lower bound trend levels by utilization and unit costs for the 19 COS are displayed in columns (D) and (E) of the CRCS, respectively, for each COA group and the maternity supplemental payment. These annual trend figures are applied for the number of months represented in the time periods section in the upper right hand corner of the CRCS. The number of trend months is determined by comparing the mid-point of the base period to the mid-point of the rating period.
Program Changes Program change adjustments recognize the impact of benefit or eligibility changes that took place during or after the base data period. The program changes incorporated in the development of the rates were based on information provided by DHCS staff. The program changes detailed below were viewed to have a material impact on capitation rates and were reviewed, analyzed, and evaluated by Mercer with the assistance of DHCS.
The next several subsections are the program changes adjustments explicitly accounted for within the CY 2021 capitation rates. A summary showing the managed care impact by county/region, MCO, and COA group can be found within the program change charts provided within the Excel files titled FINAL CY 2021 Medi-Cal Detail CRCS Package LB Rate Smry 2021 01 28.xlsx and FINAL CY 2021 CA CCI Medi-Cal Only & Partial Dual Bridge Period Program Change Chart 2021 01 28.xlsx. Additionally, the program change adjustments identified below are applied in columns (F) and (G) of the CRCS, unless otherwise indicated.
Long-Term Care Rate Changes
As noted in the Trend subsection, trend factors were not developed for the LTC COS. In lieu of a trend adjustment, rate increases for LTC services are handled through a program change adjustment and are based on legislatively mandated annual FFS rate increases. In general, managed care payment levels have aligned closely with FFS payment levels for these services and it was deemed reasonable and appropriate to use the FFS rate increases in the managed care rate setting process. Historically, rate increases for all LTC facilities typically occurred August 1 of each year. Beginning CY 2021, rate increases for AB 1629 LTC facilities occur January 1 of each year, while rate increases for non-AB 1629 LTC facilities will continue to occur on August 1 of each year. The LTC rate increase factors are developed separately for each county (or rating region) within the Two-Plan, GMC, Regional, and COHS model programs. To calculate the adjustment factors for each county, costs and rate increases by the different LTC facility types are analyzed by county/region, and the final adjustment factor is developed using this information.
In addition, DHCS implemented a 10% fee increase for LTC facilities effective for the duration of the public health emergency, declared by the Secretary of Health and Human Services for COVID-19, beginning March 1, 2020. The underlying assumption is that this increase will be applicable for six months of the CY 2021 rating period.

Two-Plan, GMC, WCM, Regional and COHS Models Capitation Rate Development and Certification January 1, 2021–December 31, 2021
State of California Department of Health Care Services
Capitated Rates Development Division
43
Hospice Rate Increase
Similar to the LTC COS, unit cost trend factors were not developed for the Hospice COS. Instead, Hospice price increases are handled through a program change adjustment and are based on legislatively mandated annual FFS rate increases. In general, managed care payment levels have aligned closely with FFS payment levels for these services and it was deemed reasonable and appropriate to use the FFS rate increases in the managed care rate setting process. There are two components to the Hospice rate increase: the rate increases for Hospice services that occur on August 1 of each year, and the rate increases for Hospice room and board that occur on October 1 of each year. To calculate the adjustment factor applied in the capitation rates, the rate increases for Hospice services are weighted with the rate increases for Hospice room and board. One adjustment factor is developed at a statewide level across all populations.
Non-Medical Transportation
NMT became a managed care covered benefit effective July 1, 2017. NMT refers to non-emergent transportation to and from medical appointments for beneficiaries where the mode of transportation has no medical component associated with it. This includes modes of transportation such as taxicabs and public transportation, and does not include modes of transportation such as non-emergent ambulance transportation or transportation via a wheelchair van, which are referred to as non-emergent medical modes of transportation. To develop a rate adjustment for this program change, supplemental transportation data was provided by the MCOs by three grouped modes of transportation (emergent, non-emergent medical, and non-medical), by COA and by quarter for CY 2018 and CY 2019. The data was provided by quarter to evaluate the ramp up of the NMT benefit through the most recently available quarter of data prior to the January 1, 2021 rating period start date. Additionally, this data was supplemented with data from other state Medicaid programs to develop a benchmark NMT PMPM by COA. To develop the NMT adjustment PMPMs, the following process was applied.
Project Non-Medical Transportation Per Member Per Months for CY 2021
To project the total NMT PMPMs for the rating period, each plan’s NMT PMPMs reported by quarter were reviewed as a percentage of the NMT PMPM benchmarks in total across all COA groups. Based on the ramp up seen in the third and fourth quarters of 2019, a plan-specific percentage of the NMT benchmark was assumed for each plan and county/region combination for CY 2021. Each plan’s assumed NMT PMPM in the rating period was calculated as the assumed percentage times the NMT benchmark PMPMs. The same percentage was used for each COA. This was done in a consistent manner for each plan and county/region combination.
Calculate Non-Medical Transportation Costs Assumed in the CY 2021 Rates
NMT data as reported by the MCOs in the CY 2018 base data period were used as the basis for the NMT amounts assumed in the rates. These amounts reported by the MCOs were trended to CY 2021 (using the trend factors developed for the Transportation COS line).

Two-Plan, GMC, WCM, Regional and COHS Models Capitation Rate Development and Certification January 1, 2021–December 31, 2021
State of California Department of Health Care Services
Capitated Rates Development Division
44
Calculate Non-Medical Transportation Per Member Per Month Adjustment
The final NMT PMPM adjustment was calculated as the difference between the projected NMT PMPMs in the rating period minus the NMT PMPMs assumed in the rates. This was done separately for each MCO, county/region, and COA.
Ground Emergency Medical Transportation Fee Increase
Pursuant to approved State Plan Amendment (SPA) 18-0004, and subsequent continuances in approved SPAs 19-0020 and 20-0009, DHCS makes add-on payments to GEMT providers in the State’s FFS program that meet specified requirements using proceeds from a GEMT provider qualify assurance fee. Both State law (Welfare & Institutions Code § 14129.3(b)) and the approved SPAs establish that the combination of the State’s FFS base and add-on payments constitutes the Rogers rates that MCOs must pay to non-contracted GEMT providers serving Medi-Cal managed care enrollees for those fiscal years in which the GEMT add-on is effective. A program change adjustment has been included in the certified capitation rates to account for this MCO obligation.
In order to develop the GEMT program change adjustment, the managed care population was first split into two subpopulations (by COA group, MCO, and county):
1. Non-dual members and dual members only eligible for Medicare Part A.
2. Members fully eligible for Medicare and members eligible for Part B only.
This split was done because Medicaid is the primary payer for GEMT services for non-dual/Part A only members, while Medicare is primary for full-dual/Part B only members (with Medi-Cal the payer of last resort).
For the non-dual/Part A subpopulation, two data sources were utilized (CY 2018 and CY 2019 dates of service were compiled for both data sources):
1. SDRs sent out to the health plans to report on their transportation utilization and claims cost information, separated by mode of transportation (emergent, non-emergent medical and non-emergent non-medical), as well as trip counts for the affected GEMT codes (A0225, A0427, A0429, A0433, and A0434).
2. Health plans-submitted encounter data limited to the GEMT codes affected by the fee increase (A0225, A0427, A0429, A0433, and A0434).
Based on review and analysis of these two data sources, utilization per 1,000 statistics were developed for the non-dual/Part A subpopulation (by health plan, COA, and county). These utilization per 1,000 statistics were then applied to the GEMT unit cost add-on amount to develop the COA, county, and plan-specific GEMT PMPM amounts for non-dual/Part A only members.
For the full-dual/Part B subpopulation, the impact of this adjustment is much smaller since Medicare is the primary payer for GEMT services. The first step for the dual eligible members was to evaluate

Two-Plan, GMC, WCM, Regional and COHS Models Capitation Rate Development and Certification January 1, 2021–December 31, 2021
State of California Department of Health Care Services
Capitated Rates Development Division
45
each GEMT code after the Medi-Cal fee increase to see if any crossover Medi-Cal liability existed by code. To do this, the Medicare ambulance fee schedule was reviewed for the applicable codes (A0225, A0427, A0429, A0433, and A0434). Based on this review, it was determined crossover Medi-Cal liability would only exist for code A0429 and only in certain counties, since 80% of the Medicare fee schedule fell below the Medi-Cal fee schedule in certain counties for this code only.
The next step in the adjustment for full-dual/Part B only members was to estimate the total number of GEMT trips for dual eligible members billed with code A0429. Note that Medi-Cal-specific data (i.e., encounter and SDR data) for dual eligible members is likely under-reported since providers will not necessarily submit a record to Medi-Cal after being reimbursed in full by Medicare. To do this, the total GEMT trips in Medicare (across all Medicare members, regardless of Medi-Cal eligibility) were estimated using provider submitted data DHCS had collected, which included a breakout by payer. Based on this data, 1.1 million total Medicare GEMT trips were assumed (across all codes). Since this was a total Medicare trips number, regardless of dual eligibility, the next step was to estimate the number of trips for dual eligible members. Based on an eligibility and literature review, it was assumed 25% of Medicare eligible members were also dually eligible for Medi-Cal. Based on this; it was assumed 275,000 total GEMT trips would exist for dual eligible members (1.1 million times 25%). Next, using encounter data split by code across Medi-Cal, it was assumed ~34% of these trips were billed with code A0429. The resulting number of A0429 trips was then converted into a statewide-assumed utilization per 1,000 statistic for code A0429 for full-dual/Part B only members. Due to the county-specific Medicare fee schedules, the unit cost add-ons varied by county and resulted in county-specific GEMT PMPM amounts for these full-dual/Part B only members.
The final step in the GEMT PMPM calculation was to blend the non-dual/Part A GEMT PMPMs with the GEMT PMPMs for the full-dual/Part B PMPMs by COA group, since COA groups are comprised of members with differing dual statuses (in particular, SPD). The final adjustment PMPMs were developed by MCO, county/region, and COA group and applied in the transportation COS within the CRCS.
This GEMT add-on only applies to non-contracted GEMT providers as required by State law. Within the base data in future rating periods, the current plan is for plans to report data without these add-ons included. At this time, the state and its actuary anticipate the need for this adjustment to be made in future rating periods.
Pediatric Palliative Care
Pediatric palliative care services became a managed care covered benefit effective January 1, 2019. Previously, pediatric palliative care services were covered in FFS through a waiver only in select counties. With this program change, pediatric palliative care services are now available in all counties. To develop a program change adjustment for this, two components were reviewed: costs for members already utilizing the services in FFS through the waiver and costs for the broader population not historically utilizing these services. For the broader population, no specific adjustment was made to the capitation rates for the addition of this benefit. This assumption was based on studies that have shown palliative care services can reduce ED use and hospital costs for those who utilize the services.
Two-Plan, GMC, WCM, Regional and COHS Models Capitation Rate Development and Certification January 1, 2021–December 31, 2021
State of California Department of Health Care Services
Capitated Rates Development Division
46
As such, no rate adjustment was made for this component. For members utilizing the waiver services previously, the FFS pediatric palliative care costs for these members were shifted from FFS to managed care to account for the cost of these additional services. This small rate adjustment was applied to the WCM and Child COA and only in counties that participated in the waiver.
Diabetes Prevention Program
Effective January 1, 2019, the Diabetes Prevention Program (DPP) became a managed care covered benefit. The DPP is a lifestyle change program for adults age 18 and older designed to prevent or delay Type 2 diabetes among people who have prediabetes and women with a previous diagnosis of gestational diabetes. The DPP consists of core sessions (months 1–6), core maintenance sessions (months 7–12) and ongoing maintenance sessions (months 13–24). Payments made to DPP providers are based on participants meeting various requirements under the program, including reaching weight loss goals as well as attending a certain number of sessions, which trigger a payment. PMPM adjustments were derived using multiple assumptions:
• The proportion of the population with prediabetes, which was based on Center for Disease Control Statistics.
• The proportion of the eligible population that would enter the program during CY 2021, which was based on experience from comparable programs operating in different states.
• The percentage of those entering the program that would meet the various requirements of the program that trigger a payment, which was based on actuarial judgement and consultation with clinical resources.
Los Angeles County Mobile Vision
Mobile vision services in LA County were carved out of managed care effective July 1, 2018. As a result, it was necessary to remove the base costs included for these services in the capitation rate development process. To account for this benefit change in LA County, relevant expenditures were removed from the Child COA base data for both LA Care and Health Net in total across both MCOs. The dollars removed were consistent with the dollars added in as a program change adjustment when mobile vision services were added to the benefit package in LA County in prior rate years.
Adult Optional Benefits
Effective January 1, 2020, DHCS restored coverage for optional benefits for all adults age 21 or older in all settings. The optional benefits restored include vision (optometric and optician services, except certain lens fabrication not covered under managed care), audiology, speech therapy, podiatry, and incontinence creams and washes. DHCS already provides these services under the early and periodic screening & diagnosis treatment (EPSDT) benefit for individuals under 21 years of age and for pregnant women and beneficiaries receiving LTC in a NF. This benefit change is accounted for as a PMPM adjustment to the All Other COS for all applicable COAs.

Two-Plan, GMC, WCM, Regional and COHS Models Capitation Rate Development and Certification January 1, 2021–December 31, 2021
State of California Department of Health Care Services
Capitated Rates Development Division
47
To develop the PMPM adjustment for audiology, speech therapy, podiatry, and incontinence creams and washes, two data sources were utilized:
1. Medi-Cal FFS data specific to each service for members age 21 or older from when the benefits were previously covered in Medi-Cal. The FFS data included dates of service from July 1, 2007 through June 30, 2009.
2. Separately provided data from certain MCOs in the Medi-Cal program that already cover these benefits on their own. Note that these services were not part of the State Plan benefit package and were not reported within the MCOs’ RDT experience. This data included dates of service in CY 2017.
To derive the PMPM adjustments, both of these data sources were trended to CY 2021 (the period in which the benefits are effective) using trends in line with historical trend factors for the Other Medical Professional and All Other COS lines. Then, a blend of each data source was utilized for each service and applied consistently for each COA. The blending factors utilized were based on actuarial adjustment; no specific formulas were used to develop them. The PMPMs were developed at a statewide level, with no variation across counties, since recent data was not available to make reliable PMPM assumptions by county/region.
For vision services, the PMPM adjustment was developed by estimating the price for frames and lens dispensing fees, as well as developing an assumed utilization of the benefit. To estimate the price for frames and lens dispensing fees, encounter data from CY 2017 to CY 2019 was utilized, as this benefit is already covered in Medi-Cal for children under age 21, pregnant women, and beneficiaries residing in a NF. From this data, a price per eyeglasses was developed for CY 2021, which includes frames and lens dispensing fees only, as costs for lens fabrication provided by the Prison Industry Authority (PIA) are not covered in managed care. To develop the utilization assumption, historical figures budgeted by DHCS along with data estimates from the California Optometric Association estimate were reviewed. The California Optometric Association estimated approximately two million Medi-Cal beneficiaries aged 21–64 need eyeglasses.2 Using this estimate as a benchmark, an assumption was then made on the number of those who need eyeglasses would actually get them in CY 2021 (the period in which the benefit is effective). The ramp up assumption used was 50% and was based on actuarial judgement.
Lens Fabrication
Generally, lens fabrication is not covered in managed care in the Medi-Cal program, except when it is not provided by the PIA. In San Mateo, Santa Barbara, and San Luis Obispo counties, all lens fabrication has been a covered benefit, as these benefits have not been provided by the PIA in these counties. Effective January 1, 2020, certain lens fabrication benefits typically covered by the PIA in most counties (non-specialty lenses) will no longer be covered under managed care in these three counties. As a result, a program change adjustment was applied to remove lens fabrication costs from
2 https://calmatters.org/health/2019/04/california-eyeglasses-medi-cal-restoring-benefitsr

Two-Plan, GMC, WCM, Regional and COHS Models Capitation Rate Development and Certification January 1, 2021–December 31, 2021
State of California Department of Health Care Services
Capitated Rates Development Division
48
the CY 2021 rates. To remove the costs associated with lens fabrication, CY 2018 data specific to lens fabrication was requested from CenCal Health (who operates in Santa Barbara and San Luis Obispo) and HPSM. This data was reviewed for reasonableness and formed the basis of the adjustment. The final adjustment carved out only the appropriate portion of lens fabrication costs based on review of managed care encounter data.
Community-Based Adult Services AB 97 Buyback
Effective July 1, 2019, Medi-Cal restored CBAS facility payment rates to levels in effect prior to the AB 97 10% rate reduction applied to certain CBAS facilities, which is expected to produce corresponding pricing pressures in managed care. As a result, a unit cost program change adjustment was applied to the CBAS COS line to account for this. This program change adjustment was developed by reviewing CY 2018 RDT and encounter data specific to CBAS. Based on the review of this data, if it was observed that a plan was paying a CBAS rate less than $76.27 (the state fee schedule CBAS daily rate without the AB 97 10% reduction applied (based on code S5102, which makes up the vast majority of CBAS)), an adjustment was made in these instances to raise the unit cost to $76.27. If a plan was paying CBAS daily rates in excess of this amount, no adjustment was made.
Multipurpose Senior Services Program Rate Increase
Effective July 1, 2019, Medi-Cal increased the MSSP site payment rates by 25% in FFS, which is expected to produce corresponding pricing pressures in managed care. This program change is only reflected in the rate development for the HCBS High supplemental payment, since this is the only payment rate where these costs are reflected within the scope of this certification. As a result of this change, a 25% unit cost adjustment factor is applied to the MSSP COS line in the development of this supplemental payment.
Psychiatric Collaborative Care Management Services
Effective January 1, 2021, Medi-Cal will begin to cover three Psychiatric Collaborative Care Management (Psych CoCM) service current procedural terminology (CPT) codes (99492, 99493, 99494) for treatment of MH or substance use conditions billed by the treating physician or other qualified health professional. No Medi-Cal claims experience specific to the Psych CoCM codes were available at the time when a PMPM adjustment was derived. Therefore, various assumptions were used to develop a PMPM adjustment by COA for adding coverage of these new codes, detailed below.
• The proportion of the population with BH conditions, which was estimated based on pharmacy records submitted for the Medicaid Rx risk adjustment analysis.
• The proportion of the eligible population that would utilize the Psych CoCM services during CY 2021, which was based primarily on review of another State's Medicaid experience, consultation with clinical resources and actuarial judgement.
• FFS reimbursement rate for each CPT code provided by DHCS.

Two-Plan, GMC, WCM, Regional and COHS Models Capitation Rate Development and Certification January 1, 2021–December 31, 2021
State of California Department of Health Care Services
Capitated Rates Development Division
49
American Indian Health Services Carve-Out
Starting January 1, 2018, MCOs were no longer at risk for all eligible American Indian Health Services (AIHS) and are paid via a separate payment arrangement that is not part of these capitation rates. The MCOs manage these services on an Administrative Services Only contract with DHCS. AIHS costs were excluded from the CY 2018 RDT reporting and are therefore excluded from the rate development base.
Pharmacy Efficiency Adjustments The pharmacy components of the managed care data also received adjustments related to the following efficiency analyses: Maximum Allowable Cost (MAC) and Medicare Part B/D (for partial-dual beneficiaries only). Both of these adjustments are applied to the Pharmacy COS within columns (K) and (L) of the CRCS in the Excel file titled FINAL CY 2021 Medi-Cal Pharmacy Detail CRCS Package LB Rate Smry 2021 01 28.xlsx.
Efficiency Adjustment — Maximum Allowable Cost
For the first quarter of 2021 when the pharmacy benefit is covered in managed care, DHCS is utilizing an adjustment to the managed care data that analyzes the effectiveness of each Two-Plan, GMC, Regional, and COHS model MCO’s pharmacy cost management through a maximum allowable cost (MAC) avoidable cost analysis.
To identify potentially avoidable costs due to reimbursement inefficiencies, Mercer utilized the Two-Plan, GMC, Regional, and COHS model MCOs’ CY 2018 pharmacy encounter data and reviewed the reimbursement contracting for generic products. Each pharmacy claim was compared against a benchmark Medicaid MAC list for the same timeframe to create a cost savings amount for each claim. To calculate the cost savings amount, a derived paid amount, which utilized the unit price from the benchmark MAC list, was calculated for each claim and subtracted from the actual paid amount on each claim. The total cost savings for each claim was then combined and aggregated for each MCO to calculate the total cost savings for each MCO. In instances where the actual paid amount was less than the derived paid amount (negative cost savings), the negative amount was counted against the cost savings amount. The adjustment is applied to the non-dual aid groups and varies by COA group for each MCO and county/region.
Efficiency Adjustment — Medicare Part B/D
For the first quarter of 2021 when the pharmacy benefit is covered in managed care, DHCS is utilizing an adjustment to the managed care data that identifies pharmacy claims paid for recipients who had Medicare coverage under either Part B or Part D for the same timeframe for partial dual members. Because of the overall adjustment made to the SPD/Full-Dual COA (see “SPD/Full-Dual Non-Covered Services Adjustment” in Section 3), which included utilizing pharmacy PMPMs from the prior year RP 19–20 rate development that included this adjustment from the prior year, this adjustment was not made to the SPD/Full-Dual COA using the CY 2018 pharmacy data.
Two-Plan, GMC, WCM, Regional and COHS Models Capitation Rate Development and Certification January 1, 2021–December 31, 2021
State of California Department of Health Care Services
Capitated Rates Development Division
50
In making this adjustment, Mercer identified paid OP pharmacy claims for partial dual-eligible recipients in the CY 2018 MCO encounter data, which should have been paid by either the Part B benefit or by a Medicare Part D prescription drug plan. Mercer first identified claims for recipients who were eligible for Part B on the date of service and filling products that met the Part B requirements that follow. The remaining claims were then reviewed for Part D eligibility on the date of service. Those claims with a zero or negative days’ supply, quantity, billed amount, or allowed amount were excluded from the analysis. This adjustment is applied to the SPD COA (which includes partial dual beneficiaries) and varies by each MCO and county/region combination.
Inpatient Efficiency Adjustment The IP component of the managed care base data also received an adjustment related to an efficiency analysis. This adjustment is applied to the IP Hospital COS within column (K) of the CRCS in the Excel file titled FINAL CY 2021 Medi-Cal Detail CRCS Package LB Rate Smry 2021 01 28.xlsx.
Efficiency Adjustment — Potentially Preventable Admissions
For CY 2021, DHCS is utilizing an adjustment to the managed care IP base data that analyzes levels of inefficiency and/or potentially avoidable expenses present in the MCO encounter data.
Potentially preventable admissions (PPA) were identified through the CY 2018 Medi-Cal MCO encounter data using criteria from the Agency for Healthcare Research and Quality (AHRQ) Guide to Prevention Quality Indicators (PQI) and Pediatric Quality Indicators (PDI). Additional exclusions for enrollment duration and risk were made as part of the analysis.
This analysis represents a reasonable approach to identifying and quantifying potentially unnecessary expenditures utilizing the AHRQ definitions for each PQI and PDI and their specific exclusions (e.g., deaths and transfers to other facilities). Additionally, only individuals meeting specific Medicaid Rx risk score criteria and enrollment durations by PQI and PDI in the same Medi-Cal MCO are considered for the analysis. A benchmark methodology was utilized in order to apply an adjustment factor based on a PPA level that has been achieved by some of the MCOs. The adjustment is applied to the non-dual COA groups of Child, Adult, ACA Expansion, and SPD and varies by each MCO and county/region.
Emergency Department Efficiency Adjustment Mercer performed a retrospective analysis of the CY 2018 encounter data to identify ED visits considered preventable or preemptive. For the CY 2021 rate development, Mercer analyzed preventable or preemptive low acuity non-emergent (LANE) visits. This analysis was not intended to imply members should be denied access to EDs or MCOs should deny payment for ED visits. Instead, the analysis was designed to reflect DHCS’ objective that MCOs provide effective, efficient, and innovative managed care — care that could have prevented or preempted some members’ need to seek care in the ED setting for low acuity, primary care treatable conditions.

Two-Plan, GMC, WCM, Regional and COHS Models Capitation Rate Development and Certification January 1, 2021–December 31, 2021
State of California Department of Health Care Services
Capitated Rates Development Division
51
The criteria used to define LANE ED visits were based on publicly available studies, as well as input and evaluation from Mercer’s licensed clinicians, including practicing ED physicians and those with primary and urgent care experience. ICD-10 primary diagnosis code information was the basis for identifying a LANE ED visit. Preventable percentages ranging from 5% to 90% (opioid codes were set at 0% and excluded from the analysis) were assigned to each diagnosis code to account for external factors that can influence and impact variation in ED use.
The percent preventable is only applied to a LANE ED event that includes an Evaluation & Management (E&M) Code of 99281-99283. E&M codes 99284 or 99285 are excluded due to the higher clinical complexity of the patients receiving this service.
Replacement cost offsets (average cost physician visit, and if applicable, average laboratory and radiology costs) were made for the majority of LANE visits deemed potentially preventable to reflect the costs associated with ambulatory OP care for the conditions. Replacement offsets vary depending on accepted clinical interventions expected for a LANE diagnosis.
The components of the replacement cost offset include:
• Physician office visit
• Laboratory
• Radiology
These replacement cost offsets are calculated by determining the cost of an average E&M visit (statewide) using CPT codes 99201–99215, average costs of common laboratory tests and average costs of common radiology testing. The replacement cost offsets dampen the value of potentially preventable LANE visits by adding costs back into the rate in recognition that care and services would still need to be rendered in an OP setting.
Physician-Administered Drugs The final efficiency adjustment Mercer completed was to identify potentially avoidable costs due to reimbursement inefficiencies for physician-administered medications. Mercer reviewed the MCO CY 2018 professional encounter data to identify the drug-related health care common procedure coding system (HCPCS) codes with the highest reimbursement expense. The top 50 HCPCS codes were included in the analysis; these were chosen based on each drug having significant spend and reliable data from the health plans.
To identify the potentially avoidable costs, Mercer compared the MCO per unit reimbursement rate to an industry benchmark. For the industry benchmark, Mercer used the Medicare Part B reimbursement rate (CMS average sales price (ASP) plus 6%) for the same period. Prior to calculating the avoidable dollars, Mercer adjusted for outlier claims for which MCO unit prices were not consistent with the benchmark unit price or other MCO unit prices for a given HCPCS code.

Two-Plan, GMC, WCM, Regional and COHS Models Capitation Rate Development and Certification January 1, 2021–December 31, 2021
State of California Department of Health Care Services
Capitated Rates Development Division
52
Inefficient MCO spend is defined as the amount the MCO paid above the re-priced benchmark of ASP+6%. Mercer recognizes that MCOs may be able to price more aggressively than the benchmark for some drugs. In these cases, inefficient spend is offset. Total net potential savings reflect the overall inefficient spend by MCOs when compared to the benchmark.
This adjustment was applied to both the OP and Specialty Physician COSs to reflect where physician administered drugs are expected to occur.
Population Adjustments For CY 2021, two additional adjustments based on population changes and trends were applied to the managed care data. Both of these adjustments are applied within column (K) of the CRCS in the Excel file titled FINAL CY 2021 Medi-Cal Detail CRCS Package LB Rate Smry 2021 01 28.xlsx. More detail on each adjustment is described in the next two subsections.
Population Acuity Adjustment
In the prior rate setting period (RP 19–20), Mercer applied a population acuity adjustment based on changes in the underlying acuity level across the membership. The need for the adjustment was driven by a consistent decrease in the Medi-Cal enrollment, resulting in lower acuity members dis-enrolling and higher acuity members remaining enrolled. The prior adjustment was developed using Medicaid Rx risk-adjustment factors, and measuring the change in risk from the base period to a more current period closer to the rating period.
Since the beginning of the public health emergency (beginning March 1, 2020), Medi-Cal ceased dis-enrolling members. With the exception of members who moved out of state, passed away, or voluntarily requested to be dis-enrolled, no other members were dis-enrolled from Medi-Cal. As a result, the Medi-Cal managed care enrollment numbers began increasing significantly; a reversal of the trend observed prior to March 1, 2020.
Similar to the methodology behind the population acuity adjustment applied for RP 19–20, Mercer analyzed how the changing enrollment counts affected the underlying risk of the remaining population. Due to the nature of the increasing enrollment driven largely by members remaining enrolled with Medi-Cal who otherwise would have been dis-enrolled, Mercer analyzed risk-adjustment factors based on relevant population segments. A risk study was performed using a 12-month period from July 1, 2018 through June 30, 2019. The Medi-Cal managed care population was broken into three segments: leavers, joiners, and constant members. Leavers were defined as members who left Medi-Cal, and were not enrolled in the six months following the study period. Joiners were defined as members who were not enrolled for the six months preceding the study period. The ‘six month’ criteria was used to ensure members who may have had temporary/short-term gap in enrollment were not included as leavers or joiners. Constant members were defined as those members who did not meet the leaver or joiner criteria. Using Medicaid Rx, risk scores were developed for each population segment; leavers and joiners exhibited a materially lower risk score compared to constant members.
Two-Plan, GMC, WCM, Regional and COHS Models Capitation Rate Development and Certification January 1, 2021–December 31, 2021
State of California Department of Health Care Services
Capitated Rates Development Division
53
Then Mercer analyzed the distribution of leavers, joiners, and constant members in the enrollment counts, comparing the distribution in the CY 2018 base period to observed enrollment up through September 2020. Mercer projected how the distribution might further change into the CY 2021 rating period, with the assumption that the public health emergency would only extend through June 2021. In the development of the adjustment, the mix of leavers (i.e., members who would have otherwise left the program if not for the public health emergency) as a proportion of total enrollment was assumed to increase. Due to the increase in leavers, the joiner and constant proportion necessarily decreased.
The COA groups that experienced the most significant enrollment changes from the start of the public health emergency were Child, Adult, ACA Expansion, and SPD; therefore, these were the populations included as part of the population acuity analysis. The SPD COA group was the exception in that it did not experience a material increase in leavers and did not warrant an adjustment. The Child, Adult, and ACA Expansion populations did exhibit a material increase in leavers and adjustments were applied to those populations. The adjustment varied by MCO based on MCO-specific enrollment observations, but the statewide average adjustments for Child, Adult, and ACA Expansion were -0.2%, -0.9%, and -1.1%, respectively. This adjustment is applied to all COS within column (K) of the CRCS in the Excel file titled FINAL CY 2021 Medi-Cal Detail CRCS Package LB Rate Smry 2021 01 28.xlsx.
Regional Model Full-Dual Community-Based Adult Services Adjustment
Within the SPD/Full-Dual COA group, CBAS dollars in the regional model counties (specifically, Imperial County and the 18 regional counties) have remained relatively consistent (flat) throughout the past several years. However, MMs for this COA group have increased at a very high rate. This is likely due to the following factors:
• Effective December 2014, members utilizing CBAS in these counties needed to enroll into managed care in order continue receiving the CBAS benefit. Prior to this, members could receive the CBAS benefit while enrolled in the FFS program. Due to this transition, all CBAS costs in these counties moved into managed care. Additionally, there are only a limited number of CBAS facilities and these facilities have capacity. As a result, dollars in total have stayed relatively flat in these counties through years subsequent to this transition.
• In November 2013, these counties began offering managed care as a delivery system option for its beneficiaries. Previously, beneficiaries in these counties could only be enrolled in the state FFS program. Additionally, managed care enrollment in these counties is voluntary for dual members. It is likely that as managed care has become an option, more beneficiaries have begun to voluntarily enroll in managed care, which has increased enrollment in the years subsequent to this transition in November 2013.
As a result of this phenomenon, the CBAS members and dollars were all moved into managed care in December 2014, and these members represented a larger portion of the population in the period right after this transition. As more members have enrolled in managed care, the CBAS members now make up a lower portion of the total enrollment and CBAS PMPM costs have subsequently decreased through the years. The increase in MMs is still occurring even after CY 2018 base data period. The purpose of this adjustment is to account for the PMPM decline expected from the CY 2018 base data

Two-Plan, GMC, WCM, Regional and COHS Models Capitation Rate Development and Certification January 1, 2021–December 31, 2021
State of California Department of Health Care Services
Capitated Rates Development Division
54
period to CY 2021 as a result of relatively consistent CBAS dollars and increasing MMs. This adjustment is based on a projection of CBAS dollars for each MCO by county/region divided by a projected MM count for CY 2021 to arrive at a projected CBAS PMPM for CY 2021. The projected CBAS dollars were based on a review of CY 2016, CY 2017, and CY 2018 RDT-reported CBAS dollars validated by encounter data for the same period. The eligibility data used to project MMs was based on enrollment through October 2020, which was the latest known eligibility data at the time the adjustment was made. This projected CBAS PMPM figure was then divided by the trended base PMPM to arrive at the adjustment factors. This adjustment is applied to Imperial County and the 18 regional counties, and impacts the SPD/Full-Dual COA and CBAS COS only. The adjustment factors can be found in column (K) of the CRCS.
Cost-Based Reimbursement Clinics in Los Angeles County As discussed in Section 3, additional amounts for CBRCs were added to the FQHC base data for the SPD COA in LA County. These additional amounts were projected into CY 2021 using the FQHC trend factors. As a result, these CBRC amounts are fully reflected in column (O) of the CRCS for both LA Care and Health Net for the SPD COA (in addition to the original FQHC and CBRC costs already reflected in the base data and projected to CY 2021). As noted previously, due to the higher costs associated with CBRCs, the CBRC costs were split into two components, one component subject to risk adjustment that reflects unit cost levels in line with typical professional services, and a “not subject to risk adjustment” carve-out amount containing the cost levels above and beyond typical professional services cost levels. Within column (P) of the CRCS, the carve-out amounts not subject to risk adjustment are removed from the plan-specific rate calculation (both medical and administrative and underwriting gain loads are included in this removal). The rates subject to risk adjustment can be found in column (Q) of the CRCS. These plan-specific rates then flow into the blended plan-specific and risk-adjusted county average rate calculation process, which is described later in this certification report. Once the blended plan-specific and risk-adjusted county average rates are calculated, the medical component of the “not subject to risk adjustment” carve-out amount is added back into the capitation rates for both LA Care and Health Net. This element of the adjustment is consistent with the prior approach within the Senate Bill 208 adjustments for CBRC not including additional administrative load or underwriting gain. The lower bound medical component carve-out amounts that are added back into the capitation rates are $52.25 and $21.20 for LA Care and Health Net, respectively.
Maternity Supplemental Payment Development In the development of the maternity supplemental payment, the base data (as described in Section 3) was projected into CY 2021. The steps below describe the process utilized in the development of the CY 2021 maternity supplemental payment rates, as well as subsequent steps taken to remove costs associated with these payments from the capitation rates applicable to the Child, Adult, and ACA Expansion COA groups.
• Trend base costs forward to the mid-point of the rating period (the trend development process is described in a previous subsection).

Two-Plan, GMC, WCM, Regional and COHS Models Capitation Rate Development and Certification January 1, 2021–December 31, 2021
State of California Department of Health Care Services
Capitated Rates Development Division
55
• Adjust for applicable program changes:
─ No program changes were applied to the maternity supplemental payment rate.
• Add load for administration and underwriting gain:
─ Note that the development of non-benefit load assumptions is described in Section 5 of this certification report. For the maternity supplemental payment, the assumed administrative expense load leveraged the process described in Section 5 for the standard CY 2021 capitation rates, with a focus on the variable component that typically represents approximately half of the total administrative loading. This is a supplemental payment and is consistent with other supplemental payments in that only the variable portion of the administrative load is applied since the fixed portion is included in the member’s monthly capitation payment. Section 5 provides a summary of the detailed administrative loading percentages specific to supplemental payments including maternity. The underwriting gain load for this payment rate is consistent with those applied for the standard CY 2021 capitation rates (1.5% at the lower bound, 2.5% at the midpoint and 3.5% at the upper bound).
• Calculate delivery counts and birth rates by MCO:
─ Rely on Medi-Cal maternity supplemental payment count and birth count information generated by DHCS and CY 2018 RDT information provided by the MCOs.
─ Medi-Cal eligibility is the primary data source for Child, Adult, and ACA Expansion MMs.
─ Calculate historical birth rates by MCO (prior years reviewed for consistency) for the Child, ACA Expansion, and Adult COA groups.
─ Project number of delivery events based upon birth rates and CY 2021 projected MMs for applicable COA groups.
• Remove PMPM amount from Child, Adult, and ACA Expansion population costs by MCO.
Across all Two-Plan, GMC, Regional model, and COHS MCOs, the equivalent PMPM adjustment for the maternity supplemental payment is $0.97 for Child, $3.88 for ACA Expansion, and $48.89 for Adult at the lower bound of the rate range for CY 2021.
For the prior rating period (RP 19-20), across all Two-Plan, GMC and Regional model MCOs, the equivalent PMPM adjustment for the maternity supplemental payment was $0.80 for Child, $3.26 for ACA Expansion, and $36.22 for Adult at the lower bound of the rate range.
This methodology is budget-neutral, projecting the same total dollar outlays under a pre-and post-maternity supplemental payment approach.

Two-Plan, GMC, WCM, Regional and COHS Models Capitation Rate Development and Certification January 1, 2021–December 31, 2021
State of California Department of Health Care Services
Capitated Rates Development Division
56
Home- and Community-Based Services High Supplemental Payment Development In the development of the HCBS High Supplemental Payment, the base data (as described in Section 3) was projected into CY 2021. The steps below describe the process utilized in the development of the CY 2021 HCBS High Supplemental Payment rates.
• Trend base costs forward to the mid-point of the rating period (the trend development process is described in a previous subsection).
• Adjust for applicable program changes (as described above):
─ CBAS AB 97 Buyback.
─ MSSP Rate Increase.
• Add load for administration and underwriting gain:
─ Note that the development of non-benefit load assumptions is described in Section 5 of this certification report. For the HCBS High Supplemental Payment, the assumed administrative expense load leveraged the process described in Section 5 for the standard CY 2021 capitation rates, with a variation to account for MCO administrative responsibility for IHSS. IHSS is not a covered service through the supplemental payment because it was removed from CCI counties as a managed care covered benefit starting January 1, 2018. However, MCOs continue to be required to have responsibility for some administrative duties related to their members that utilize IHSS (e.g., member tracking for reporting purposes). Given that, CBAS and MSSP utilization varies widely from county to county within CCI, much more so than IHSS, the resulting CY 2021 HCBS High Supplemental payment rates also vary widely. To achieve appropriate administrative PMPM levels for members that utilize CBAS, MSSP, and IHSS, Mercer varied the administrative percent of premium by county dependent on the relative size of the payment rate. The range of lower bound administration loads is between 3.0% and 11.5%, dependent on county, and is located in the attached rate exhibits. Counties with lower CBAS and MSSP utilization (and thus a lower supplemental payment) have an administration load at or near the top of this range, while counties with higher CBAS and MSSP utilization (and thus a higher supplemental payment) are at or near the bottom. The resulting aggregate administrative load percentages across all CCI counties for the CY 2021 HCBS High Supplemental Payment were 5.2% at the lower bound, 6.2% at the midpoint and 7.2% at the upper bound. The underwriting gain load for this payment rate is 1.5% at the lower bound, 2.5% at the midpoint and 3.5% at the upper bound.
Other Items Health Care-Acquired Conditions
Section 2702 of the ACA of 2010 required CMS to establish regulations prohibiting federal Medicaid payments to states for amounts expended for Health Care-Acquired Conditions (HACs). On
Two-Plan, GMC, WCM, Regional and COHS Models Capitation Rate Development and Certification January 1, 2021–December 31, 2021
State of California Department of Health Care Services
Capitated Rates Development Division
57
June 30, 2011, CMS published the final rule implementing the requirements set forth in Section 2702 of the ACA, but delayed compliance action until July 1, 2012.
This Medicaid regulation builds upon the Medicare program experience with payment adjustments for HACs and “never events.” The regulation applies to Medicaid non-payment for most Medicare HACs and “never events” as a baseline, but also expands the settings in Medicaid and provides states with additional flexibility to define and implement the rules. For example, Medicare’s rules exclude critical access and children’s hospitals; however, under the Medicaid rule, no IP hospital facility is excluded, including out-of-state facilities.
As such, Mercer initially reviewed potential encounter data information for making an appropriate adjustment. Unfortunately, the required information (a present on admission indicator, for example) is not currently part of the encounter data. This is an ongoing process without any current information available for a rate adjustment. Other studies and other state experience have shown limited needed adjustments related to these types of conditions. This issue will continue to be reviewed. No adjustments have been included within these rates. It should be noted that reductions related to potentially preventable IP admissions have been included as part of Mercer’s efficiency adjustments related to the base managed care data, as noted previously.
Graduate Medical Education
With regard to Graduate Medical Education (GMED) costs and along with item AA.3.9 of “Documentation Requirements for Actuarially Sound Capitation Rates, Effective Date: November 15, 2014”, DHCS staff has confirmed there are no provisions in the Two Plan, GMC, Regional, COHS, and CCI model managed care contracts regarding GMED. The Two Plan, GMC, Regional, COHS, and CCI model MCOs do not pay specific rates that contain GMED or other GMED-related provisions. As MCO data serves as the base data for the rate ranges, GMED expenses are not part of the capitation rate development process.
Third-Party Liability The MCO experience used to develop the base data was reported net of any Third-Party Liability; therefore, no adjustment was necessary in the capitation rate development process.
Member Cost Sharing The Medi-Cal program requires no member copayments or other cost sharing; therefore, cost-sharing considerations do not impact rate development.
Retrospective Eligibility Periods MCOs in the Two-Plan, GMC, Regional, COHS, and CCI model managed care programs are not required to cover retrospective eligibility periods for their enrollees. These periods are covered in the Medi-Cal FFS program. Since MCO data serves as the base data for the rate ranges, retrospective
Two-Plan, GMC, WCM, Regional and COHS Models Capitation Rate Development and Certification January 1, 2021–December 31, 2021
State of California Department of Health Care Services
Capitated Rates Development Division
58
eligibility periods are not part of the capitation rate development process. No adjustments are necessary.
Mental Health Parity and Addiction Equity Act With regard to the Mental Health Parity and Addiction Equity Act (MHPAEA), DHCS staff has confirmed there are no provisions in the Two-Plan, GMC, Regional, COHS, and CCI model managed care contracts in violation of MHPAEA.
Institution for Mental Disease Covered benefits associated with these capitation rates do not include services associated with an Institution for Mental Disease (IMD). If a managed care member is in an IMD in a given month, the state does not pursue federal match for that individual for that month. Therefore, the only potential rate impact from a federal perspective for members utilizing an IMD for more than 15 days in a given month would be associated with the potential impact of those members experiencing significantly higher costs than other non-IMD utilizing members. The consideration of this potential limited impact was viewed as immaterial and no adjustments were made to the base data. This element of the rate setting process will continue to be monitored in future rate setting periods.
Provider Overpayments The RDT and encounter data used for rate setting are net of provider overpayments. The MCOs are instructed to report medical expenditures net of provider overpayments within the RDT submissions, and have policies and procedures for these types of payments per 42 CFR § 438.608(d).
Aetna Better Health and UnitedHealthcare As stated earlier, there was limited data available and significant continued ramp up expected for Aetna and United during CY 2021. Therefore, the GME developed for these two plans is based on county average rate information for both counties separately, consistent with previous rating periods.
Two-Plan, GMC, WCM, Regional and COHS Models Capitation Rate Development and Certification January 1, 2021–December 31, 2021
State of California Department of Health Care Services
Capitated Rates Development Division
59
5
Projected Non-Benefit Costs The projected costs as described in Section 4 represent the benefit costs. This section describes the components of the rate that are not directly related to benefit costs, which include the following:
• Administration
• Underwriting gain
• MCO tax
• Health Insurance Providers Fee (HIPF)
Capitation rates appropriately include provision for the administrative expenses that MCOs incur as they operate under the risk contract requirements, as well as the MCOs’ risk and cost of capital.
Administration Below is a table detailing the aggregate mid-point administrative percentages assumed within the rate development for all model types for CY 2021. Note there was a change to the administrative load development process due to pharmacy carve-out as planned by DHCS for CY 2021. The administrative load was first developed in a consistent manner as the prior rate period (RP 19–20) assuming no change to pharmacy services as covered benefits in the rates. Then Mercer converted the initially developed “Rx In” administrative load to a “Rx Out” administrative load in a cost neutral manner based on Mercer’s established pharmacy specific administrative load assumption (2% of Rx component of the rate) as informed by the Mercer pharmacy sector’s experience and industry knowledge. To facilitate year over year comparison of administrative load assumptions with the prior rate period, “Rx In” administrative load assumptions are listed in the table below though only “Rx Out” administrative load assumptions were used for CY 2021 rate development. Please also note that the table below included explicit “Rx Out” administrative load assumptions for all applicable CY 2021 supplemental payments including maternity supplemental payment, BHT supplemental payment, and various non-Rx related add-on rates. They represent the variable component of the applicable regular administrative loads, which are equal to 50% of the applicable “Rx Out” regular administrative loads. All quoted figures below are mid-point administrative loadings. The range for the regular administrative loading is +/- 0.9% at the upper/lower bound from the mid-point value for the Two-Plan, GMC and Regional models, +/- 0.5% for the COHS model and +/- 0.25% for the CCI Institutional rates.

Two-Plan, GMC, WCM, Regional and COHS Models Capitation Rate Development and Certification January 1, 2021–December 31, 2021
State of California Department of Health Care Services
Capitated Rates Development Division
60
Model or COHS plan RP 19–20 Administrative
Load
CY 2021 “Rx In”
Administrative Load
CY 2021 “Rx Out”
Administrative Load For Regular
Capitation Rates
CY 2021 “Rx Out”
Administrative Load For
Supplemental Payments and
Non-Rx Related Add-On Rates
Two-Plan/GMC/Regional 7.65% 7.50% 8.65% 4.325% CenCal Health 6.80% 6.55% 7.55% 3.775% HP of San Mateo 6.80% 6.80% 8.10% 4.050% Central California Alliance 8.20% 8.10% 9.05% 4.525% CalOptima 4.70% 4.60% 5.30% 2.650% Gold Coast HP 8.00% 7.90% 9.20% 4.600% PHC 5.50% 5.25% 5.65% 2.825% COHS Total 6.09% 5.93% 6.69% 3.347% All Two-Plan/GMC/ Regional/COHS
7.25% 7.10% 8.14% 4.071%
CCI Institutional 2.75% 2.50% 2.50% N/A
The following describe the data, methodology, and assumptions used to develop CY 2021 administrative loads with a focus on “Rx In” administrative loads.
For CY 2021, the administration loading for the Two-Plan, GMC, Regional, and COHS model MCOs is developed in aggregate across all COA groups, including ACA Expansion. The administration loading for COHS counties is developed using MCO/county-specific experience due to material differences in the covered populations compared to the other model types. In COHS counties, LTC accounts for a material portion of the covered populations, and has different administrative needs compared to general acute populations covered by the other model types. To recognize such differences, Mercer used each COHS MCO/county’s experience as the primary data source to develop MCO-specific administration loading for the covered populations. Across the MCOs in the COHS model, the MCO-specific administrative loadings ranged from a low mid-point value of 4.60% to a high mid-point value of 8.10%. For the remaining model types (Two-Plan, GMC, and Regional), the same administration loading is developed across all plans given their similarities in covered populations as opposed to the COHS model. Ultimately, part of the goal to use the same targeted administration percentage for all plans (other than COHS plans) is to increase program MCO administrative efficiency while of course providing appropriate funding for contractual requirements. Mercer believes DHCS continues to make long-term progress on that goal. The administration load factor is expressed as a percentage of the capitation rate (that is, percent of premium).

Two-Plan, GMC, WCM, Regional and COHS Models Capitation Rate Development and Certification January 1, 2021–December 31, 2021
State of California Department of Health Care Services
Capitated Rates Development Division
61
As can be anticipated with a program the size and scope of Medi-Cal, a massive amount of historical and current data and information, from a wide variety of sources, is gathered and analyzed for each capitation rate setting component, with the administration load component being no exception. These sources include data and information collected from the annual RDTs used for rate setting (base CY experience as well as contract year projections by the MCO), quarterly and annual Medi-Cal-specific financial reports submitted by the MCOs to DHCS, and quarterly and annual (and in some cases monthly) financial reports submitted by the MCOs to the California Department of Managed Health Care.
As has been previously discussed, there has been administration percentage variation by commercial MCO, Local Initiatives, Two-Plan, GMC, COHS plan, etc. for a wide variety of reasons based on the plan reported actual experience. The following table provides a percentile distribution of actual reported administrative percentage experience on a unique combination of plan and county basis for the most recent base period.
Percentile CY 2018 RDT Administrative Cost 25th 4.95% 50th 6.77% 75th 7.65% 100th 12.99% Weighted Average 6.01%
The mid-point percentage was developed in large part from a review of the MCOs’ historical-reported administrative expenses. The administrative costs are reviewed to ensure they are appropriate for the approved State Plan services and Medicaid eligible members. Mercer also utilized its experience and professional judgment in determining the mid-point and lower/upper bound percentages to be reasonable. Based on the review of the most recent Medi-Cal specific administrative cost data and information, which indicates an overall decrease of administration percentage from multiple data sources including the most recent quarterly financial data through the last quarter of CY 2019, Mercer lowered the assumed administration percentage level accordingly for CY 2021 rates for Two-Plan/GMC/Regional and most COHS plans.
While the above is the overall targeted aggregate administrative percentage, the administrative expense associated with each COA group varies from the overall percentage. The administrative component can be viewed in two pieces: a fixed cost component and a variable cost component. The fixed cost component represents items such as accounting salaries, rent, and information systems, while the variable cost component represents items such as claims processing and medical management per eligible. Allocating the administrative costs as a uniform percentage of capitation rate for each of the COAs is an appropriate method; however, it does not take into account the differences in fixed versus variable administrative costs for each.
Two-Plan, GMC, WCM, Regional and COHS Models Capitation Rate Development and Certification January 1, 2021–December 31, 2021
State of California Department of Health Care Services
Capitated Rates Development Division
62
Certain COA groups have capitation rates 10 (or more) times larger than other COAs. In these instances, the uniform percentage allocation methodology will produce an administrative component for the more expensive COA 10 (or more) times larger than the administrative component for the less expensive COA groups. While a more expensive eligible is probably more administratively intensive for the medical management component, this 10 (or more) to one relationship in administrative costs on a PMPM basis is most likely exaggerated since the fixed cost component is more likely less variable between a more expensive COA group and a less expensive COA group.
If the fixed cost component of administrative costs is broken down and viewed on a PMPM basis, then this fixed dollar amount is a larger percentage of the capitation rate of the less expensive COA groups and a smaller percentage of the capitation rate for the more expensive COA groups. This concept has been applied in a budget-neutral fashion (no administrative dollars have been gained or lost) to the capitation rates, whereby the administrative percentage will be greater for less expensive COA groups than the aggregate administrative percentage over the entire population. Similarly, the administrative percentage for the more expensive COA groups will be less than the aggregate administrative percentage over the entire population.
The application of the administrative PMPM and percentages can be found in the bottom right corner of the CRCS rate sheets.
Underwriting Gain The mid-point underwriting gain was adjusted from 3.0%, used in previous rating periods, to 2.5% for the CY 2021 rating period across all Two-Plan, GMC, Regional, and COHS model MCOs, with the exception of the Two-Plan and GMC CCI Institutional rates (adjusted from 1.75% to 1.25% at the mid-point). The range for the underwriting gain component is +/- 1.0% at the upper/lower bounds from the mid-point value for all models with the exception of the Two-Plan and GMC CCI Institutional rates (which have a range of +/- 0.25% at the upper/lower bounds). Mercer has implicitly and broadly considered the cost of capital within our rating assumptions.
Mercer’s conclusion is that our assumptions surrounding underwriting gain, as well as the income an MCO generates from investments, are sufficient to cover at least minimum cost of capital needs for the typical MCO.
Mercer utilizes a proprietary model for underwriting gain analysis. The option to shift the underwriting gain range downward is not new. DHCS and Mercer believe the timing is appropriate. Multiple state Medicaid managed care programs utilize underwriting gain loads under 2.0%, with some even lower than 1.5%. A reduction in this assumption reduces program costs for state and federal taxpayers, CMS, and DHCS.
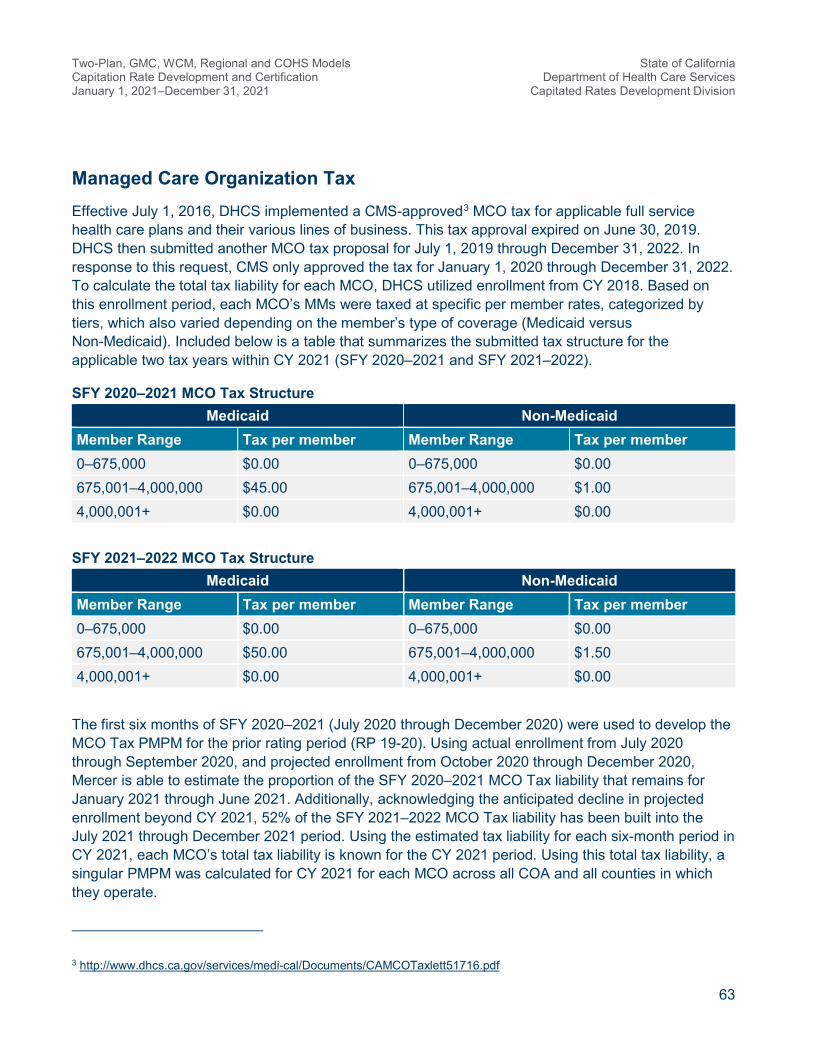
Two-Plan, GMC, WCM, Regional and COHS Models Capitation Rate Development and Certification January 1, 2021–December 31, 2021
State of California Department of Health Care Services
Capitated Rates Development Division
63
Managed Care Organization Tax Effective July 1, 2016, DHCS implemented a CMS-approved3 MCO tax for applicable full service health care plans and their various lines of business. This tax approval expired on June 30, 2019. DHCS then submitted another MCO tax proposal for July 1, 2019 through December 31, 2022. In response to this request, CMS only approved the tax for January 1, 2020 through December 31, 2022. To calculate the total tax liability for each MCO, DHCS utilized enrollment from CY 2018. Based on this enrollment period, each MCO’s MMs were taxed at specific per member rates, categorized by tiers, which also varied depending on the member’s type of coverage (Medicaid versus Non-Medicaid). Included below is a table that summarizes the submitted tax structure for the applicable two tax years within CY 2021 (SFY 2020–2021 and SFY 2021–2022).
SFY 2020–2021 MCO Tax Structure Medicaid Non-Medicaid
Member Range Tax per member Member Range Tax per member 0–675,000 $0.00 0–675,000 $0.00 675,001–4,000,000 $45.00 675,001–4,000,000 $1.00 4,000,001+ $0.00 4,000,001+ $0.00
SFY 2021–2022 MCO Tax Structure
Medicaid Non-Medicaid Member Range Tax per member Member Range Tax per member 0–675,000 $0.00 0–675,000 $0.00 675,001–4,000,000 $50.00 675,001–4,000,000 $1.50 4,000,001+ $0.00 4,000,001+ $0.00
The first six months of SFY 2020–2021 (July 2020 through December 2020) were used to develop the MCO Tax PMPM for the prior rating period (RP 19-20). Using actual enrollment from July 2020 through September 2020, and projected enrollment from October 2020 through December 2020, Mercer is able to estimate the proportion of the SFY 2020–2021 MCO Tax liability that remains for January 2021 through June 2021. Additionally, acknowledging the anticipated decline in projected enrollment beyond CY 2021, 52% of the SFY 2021–2022 MCO Tax liability has been built into the July 2021 through December 2021 period. Using the estimated tax liability for each six-month period in CY 2021, each MCO’s total tax liability is known for the CY 2021 period. Using this total tax liability, a singular PMPM was calculated for CY 2021 for each MCO across all COA and all counties in which they operate.
3 http://www.dhcs.ca.gov/services/medi-cal/Documents/CAMCOTaxlett51716.pdf

Two-Plan, GMC, WCM, Regional and COHS Models Capitation Rate Development and Certification January 1, 2021–December 31, 2021
State of California Department of Health Care Services
Capitated Rates Development Division
64
The MCO tax is added to the rate ranges after the blend of the plan-specific and risk-adjusted county average rates, which is described in Section 7.
Health Insurance Providers Fee HIPF is no longer applicable due to the discontinuation after the CY 2019 premium year.

Two-Plan, GMC, WCM, Regional and COHS Models Capitation Rate Development and Certification January 1, 2021–December 31, 2021
State of California Department of Health Care Services
Capitated Rates Development Division
65
6
Whole Child Model As stated previously, the WCM population is a subset of the COHS model plans in all COHS counties except Ventura. Previous references to the COHS model have been assumed to cover WCM members unless explicitly noted otherwise. This following section is being provided to acknowledge the elements associated with those differences and to act as a transition as the WCM certification moves from a stand-alone document to being incorporated directly into this broader certification.
Across all counties, MCOs, and COA groups, the final CY 2021 WCM capitation rates are a 10.6% increase when compared to the final RP 19–20 capitation rates (July 1, 2019 through December 31, 2021), excluding the impacts of the add-on PMPMs and BHT and Hepatitis C supplemental payment rates.
Executive Summary Below is a brief overview specific to California’s WCM managed care program and an overview of the rate setting process, including the following elements:
• Program history
• MCO participation
• Covered services
• Covered populations
• Rate structure
• FMAP
• Rate methodology overview
The information provided in this section should be supplemented with the MCO contract information for additional detail.
Program History DHCS implemented the WCM program beginning with SFY 2018–2019 with the objective to improve and provide better integration of care for children who qualify for the CCS program. The WCM program was implemented in certain COHS counties as follows:
• Phase 1: Began July 1, 2018
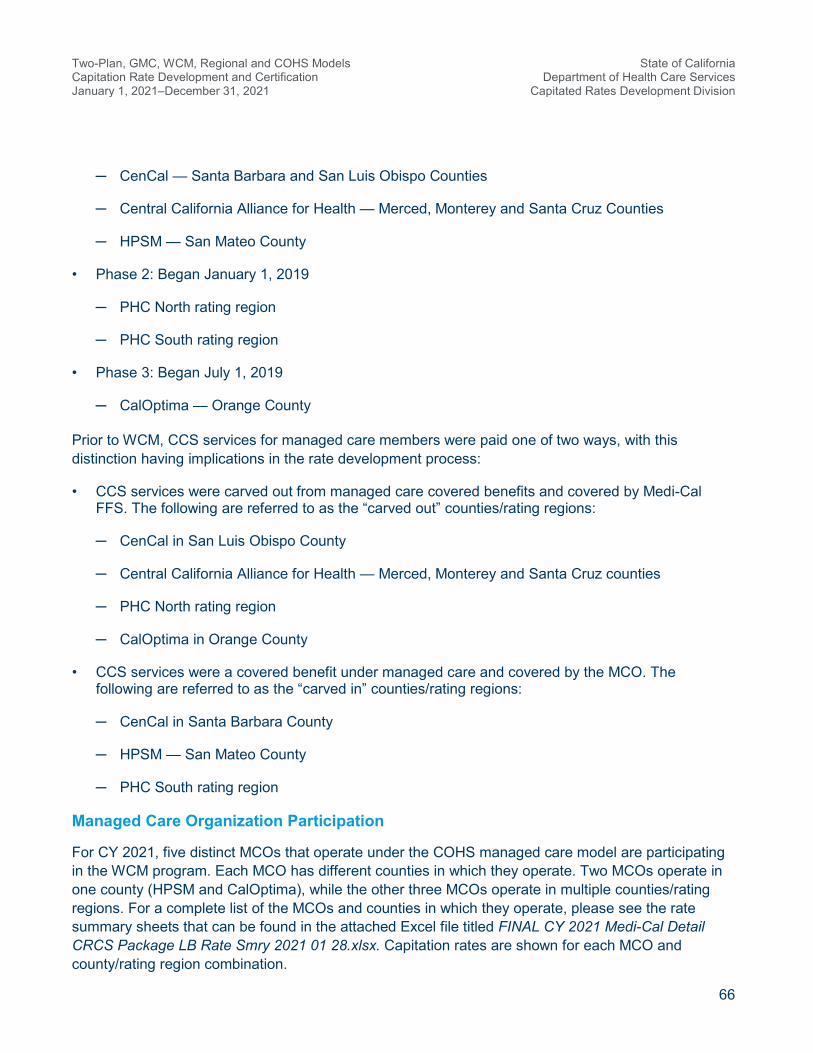
Two-Plan, GMC, WCM, Regional and COHS Models Capitation Rate Development and Certification January 1, 2021–December 31, 2021
State of California Department of Health Care Services
Capitated Rates Development Division
66
─ CenCal — Santa Barbara and San Luis Obispo Counties
─ Central California Alliance for Health — Merced, Monterey and Santa Cruz Counties
─ HPSM — San Mateo County
• Phase 2: Began January 1, 2019
─ PHC North rating region
─ PHC South rating region
• Phase 3: Began July 1, 2019
─ CalOptima — Orange County
Prior to WCM, CCS services for managed care members were paid one of two ways, with this distinction having implications in the rate development process:
• CCS services were carved out from managed care covered benefits and covered by Medi-Cal FFS. The following are referred to as the “carved out” counties/rating regions:
─ CenCal in San Luis Obispo County
─ Central California Alliance for Health — Merced, Monterey and Santa Cruz counties
─ PHC North rating region
─ CalOptima in Orange County
• CCS services were a covered benefit under managed care and covered by the MCO. The following are referred to as the “carved in” counties/rating regions:
─ CenCal in Santa Barbara County
─ HPSM — San Mateo County
─ PHC South rating region
Managed Care Organization Participation
For CY 2021, five distinct MCOs that operate under the COHS managed care model are participating in the WCM program. Each MCO has different counties in which they operate. Two MCOs operate in one county (HPSM and CalOptima), while the other three MCOs operate in multiple counties/rating regions. For a complete list of the MCOs and counties in which they operate, please see the rate summary sheets that can be found in the attached Excel file titled FINAL CY 2021 Medi-Cal Detail CRCS Package LB Rate Smry 2021 01 28.xlsx. Capitation rates are shown for each MCO and county/rating region combination.

Two-Plan, GMC, WCM, Regional and COHS Models Capitation Rate Development and Certification January 1, 2021–December 31, 2021
State of California Department of Health Care Services
Capitated Rates Development Division
67
Covered Services
Generally, services covered through the WCM are consistent with those covered under the underlying COHS plan model with the addition of CCS services.
Covered Populations
The WCM program covers enrollees under age 21 who are eligible for full-scope Medi-Cal coverage and are enrolled in the CCS program. Identifying applicable members and enrolling them in the CCS program is the responsibility of the county entity where the enrollee receives coverage. Examples of CCS-eligible conditions include, but are not limited to, chronic medical conditions such as cystic fibrosis, hemophilia, cerebral palsy, heart disease, cancer, traumatic injuries, and infectious diseases producing major sequelae. Prior to the implementation of the WCM, CCS services were covered under FFS for managed care members in the carved out counties/rating regions and were covered by the MCO for members in the carved in counties/rating regions. CCS eligible services are now provided by the MCOs participating in the program.
Rate Structure
Because of the inherent risk for all members in WCM, only one COA rate range is developed. Prior to WCM, eligible members may have been enrolled in various Medi-Cal COA groups, primarily the Child and SPD groups. The base data set used to develop the WCM CY 2021 capitation rate ranges combined all WCM members, for a given county/rating region, into one COA.
The capitation rates include all services under the managed care contract with the exception of services specific to those covered under the supplemental payments (maternity, BHT and Hepatitis C). Services specific to the supplemental payments are carved out of the monthly capitation rates and reimbursed to the health plans only when applicable members meet the criteria in order for the MCOs to receive the supplemental payment. Detail on the supplemental payments was provided earlier in this certification letter.
Rate Methodology Overview
Capitation rates for the WCM program were developed in accordance with rate setting guidelines established by CMS. As noted previously, the actuaries continued the historical practice of rate range development for the WCM program. However, the actuary is certifying to a rate within the developed rate range.
For rate range development for the WCM population, Mercer utilized various data elements: CY 2017 and CY 2018 MCO-reported encounter data, CY 2017 and CY 2018 SDR data, CY 2017 and CY 2018 FFS data and other ad hoc claims data reported by DHCS and the MCOs. The base data, as described below, utilizes different data elements based on the carved in or carved out status prior to the implementation of the WCM program. The most recently available Medi-Cal-specific financial reports submitted to the California Department of Managed Health Care at the time the rate ranges were determined were also considered in the rate range development process.
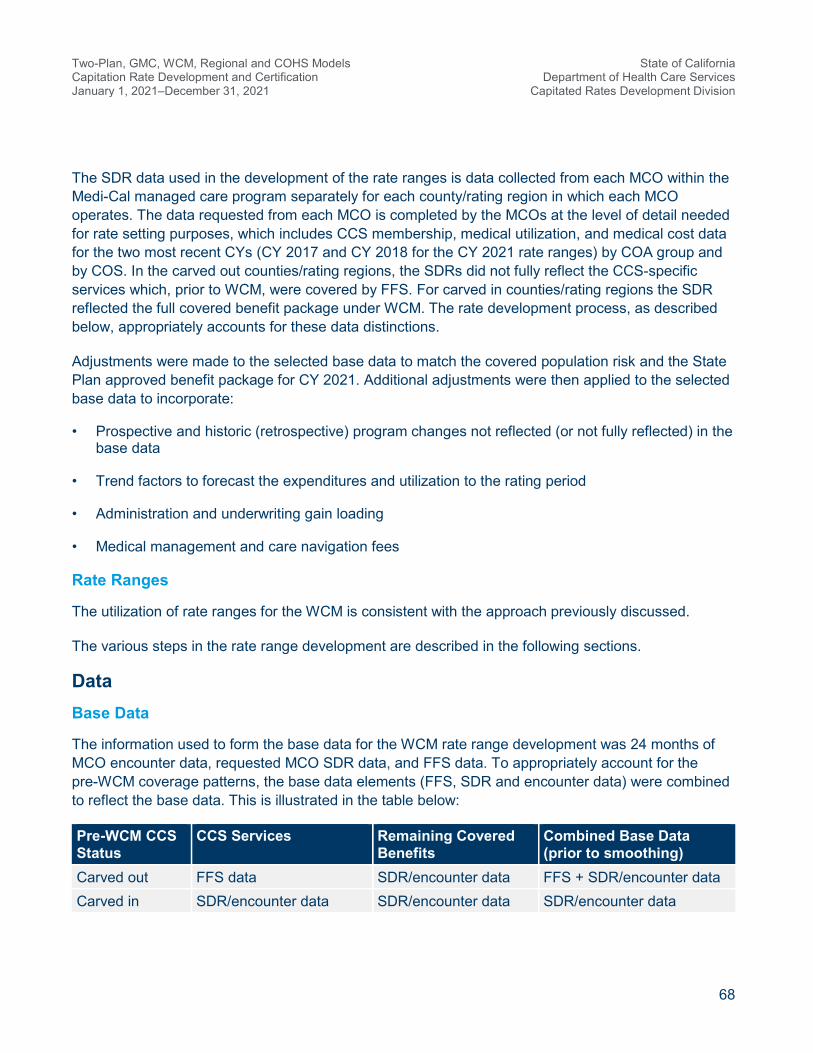
Two-Plan, GMC, WCM, Regional and COHS Models Capitation Rate Development and Certification January 1, 2021–December 31, 2021
State of California Department of Health Care Services
Capitated Rates Development Division
68
The SDR data used in the development of the rate ranges is data collected from each MCO within the Medi-Cal managed care program separately for each county/rating region in which each MCO operates. The data requested from each MCO is completed by the MCOs at the level of detail needed for rate setting purposes, which includes CCS membership, medical utilization, and medical cost data for the two most recent CYs (CY 2017 and CY 2018 for the CY 2021 rate ranges) by COA group and by COS. In the carved out counties/rating regions, the SDRs did not fully reflect the CCS-specific services which, prior to WCM, were covered by FFS. For carved in counties/rating regions the SDR reflected the full covered benefit package under WCM. The rate development process, as described below, appropriately accounts for these data distinctions.
Adjustments were made to the selected base data to match the covered population risk and the State Plan approved benefit package for CY 2021. Additional adjustments were then applied to the selected base data to incorporate:
• Prospective and historic (retrospective) program changes not reflected (or not fully reflected) in the base data
• Trend factors to forecast the expenditures and utilization to the rating period
• Administration and underwriting gain loading
• Medical management and care navigation fees
Rate Ranges
The utilization of rate ranges for the WCM is consistent with the approach previously discussed.
The various steps in the rate range development are described in the following sections.
Data Base Data
The information used to form the base data for the WCM rate range development was 24 months of MCO encounter data, requested MCO SDR data, and FFS data. To appropriately account for the pre-WCM coverage patterns, the base data elements (FFS, SDR and encounter data) were combined to reflect the base data. This is illustrated in the table below:
Pre-WCM CCS Status
CCS Services Remaining Covered Benefits
Combined Base Data (prior to smoothing)
Carved out FFS data SDR/encounter data FFS + SDR/encounter data Carved in SDR/encounter data SDR/encounter data SDR/encounter data
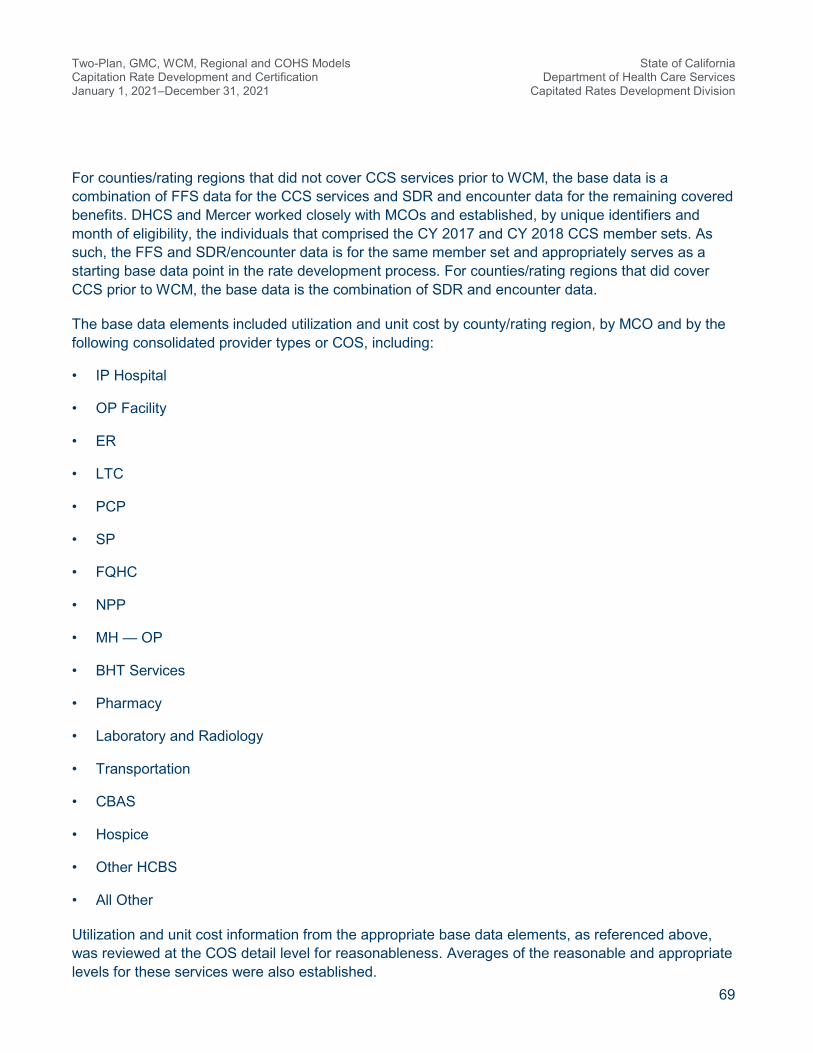
Two-Plan, GMC, WCM, Regional and COHS Models Capitation Rate Development and Certification January 1, 2021–December 31, 2021
State of California Department of Health Care Services
Capitated Rates Development Division
69
For counties/rating regions that did not cover CCS services prior to WCM, the base data is a combination of FFS data for the CCS services and SDR and encounter data for the remaining covered benefits. DHCS and Mercer worked closely with MCOs and established, by unique identifiers and month of eligibility, the individuals that comprised the CY 2017 and CY 2018 CCS member sets. As such, the FFS and SDR/encounter data is for the same member set and appropriately serves as a starting base data point in the rate development process. For counties/rating regions that did cover CCS prior to WCM, the base data is the combination of SDR and encounter data.
The base data elements included utilization and unit cost by county/rating region, by MCO and by the following consolidated provider types or COS, including:
• IP Hospital
• OP Facility
• ER
• LTC
• PCP
• SP
• FQHC
• NPP
• MH — OP
• BHT Services
• Pharmacy
• Laboratory and Radiology
• Transportation
• CBAS
• Hospice
• Other HCBS
• All Other
Utilization and unit cost information from the appropriate base data elements, as referenced above, was reviewed at the COS detail level for reasonableness. Averages of the reasonable and appropriate levels for these services were also established.
Two-Plan, GMC, WCM, Regional and COHS Models Capitation Rate Development and Certification January 1, 2021–December 31, 2021
State of California Department of Health Care Services
Capitated Rates Development Division
70
This process results in plan-specific base data elements and average (smoothed) base data elements by COS. Credibility factors, deemed reasonable and appropriate for this highly acute, comparatively low membership population, were then applied to these two components. The reasonability of the plan-specific data elements was considered when developing the credibility factors.
This process includes having the plan-specific data elements run through smoothing ranges, based on reasonable ranges of PMPM and unit cost. If the plan-specific data (separate by COS) is not deemed reasonable (i.e., does not fit into the smoothing ranges), that plan-specific data element is given zero credibility and the base factors are renormalized to add to 100%. For example, for a county that, prior to WCM, was CCS carved in, the plan-specific encounter data was not deemed reasonable but the SDR was reasonable, these amounts would be 35.0% plan-specific SDR data, 0% plan-specific encounter data, 60% smoothed SDR/FFS data, and 5.0% smoothed encounter data. Based on this, it is possible for all plan-specific data elements to be deemed unreasonable and all credibility would be given to the smoothed values in this instance. All credibility factors are renormalized based on which plan-specific data elements were deemed reasonable. Note also that the smoothed data elements are based on averages of the data (across multiple plans) fell within the smoothing ranges for each COS. It should also be noted that there are instances where a plan-specific data element may be perfectly reasonable for that plan (this is often the case for a plan that has a higher than normal volume of FQHC activity), but not reasonable for the smoothed averages. In these cases, these data elements are excluded from the smoothed averages, but that plan-specific data element is given credibility only for that MCO and COS combination.
This smoothing and credibility process was applicable for all COS listed above with the exception of the following: MH — OP and BHT Services. The process for these COS aligns with the process discussed previously in this certification.
CY 2017 and CY 2018 served as the 24-month base data period. All selected base data was adjusted (as appropriate) to reflect the impact of historical program changes within this period. This is discussed further in the program changes section.
The data elements utilized did not include any disproportionate share hospital payments. SDR and encounter data did not include any adjustments for FQHC or RHC reimbursements. FQHC costs considered in rate development are the costs incurred by the MCO, net of any wrap-around payment by DHCS to reimburse the FQHC at their Prospective Payment System (PPS) rate. The FFS data required an adjustment, as discussed below, to be appropriate for managed care rate setting. Data elements were not adjusted for catastrophic claims. No adjustments are made to the base data as all of these amounts are already included; however, these amounts were monitored and the data smoothing methodology illustrates how these events were handled in the rate range development.
The SDR submissions already include IBNR adjustments that are reviewed for appropriateness. No further adjustments were applied. Utilizing the two year base, as well as reviewing MCO-reported completion patterns, resulted in the determination that encounter and FFS data did not require adjustments to reflect underreporting or additional runout.

Two-Plan, GMC, WCM, Regional and COHS Models Capitation Rate Development and Certification January 1, 2021–December 31, 2021
State of California Department of Health Care Services
Capitated Rates Development Division
71
Ultimately, the data combination of the various base data elements, as outlined above, with consideration of pre-WCM carve in and carved out status, was deemed by the actuaries as a reliable, reasonable and appropriate base data source.
A requirement of 42 CFR 438.3(c)(ii) is that all payment rates under the contract are based only upon services covered under the State Plan to Medicaid-eligible individuals. As described above, the SDR, FFS, and encounter data served as the starting base data for rate setting. The SDR data submissions are thoroughly reviewed, vetted, and discussed with each MCO during the rate setting process. FFS and encounter data undergoes considerable edits within DHCS to ensure quality and appropriateness of the data for rate setting purposes. Base period MCO COA eligibility (described below) and encounter data were pulled consistent with service code mappings from DHCS, including lists of excluded services, such as abortion. As discussed previously, Mercer has relied on data and other information provided by the MCOs and DHCS in the development of these rate ranges.
The Excel rate range spreadsheets contain detailed CRCS for the WCM rate development. Base data are presented by COS as annual utilization per 1,000 members, average unit cost and the resulting PMPM calculations and are reflected in columns (A), (B), and (C) of the CRCS, respectively.
Data Smoothing
The WCM program is a large program and in total covers approximately 31,000 members, based on CY 2018 SDR information. However, the MCO’s vary in member size and because of the high cost nature of the CCS population, a two-year base was used to enhance credibility. For smoothing purposes, Mercer analyzed data and information on both a plan specific and an aggregate level, as discussed above, developed factors, or relativities, to overcome any excessive variation brought on by small membership or extraordinary (high or low) utilization or unit costs.
Projected Benefit Costs and Trends Trend
Trend factors for WCM follow the same reasoning and development used in the development of the SPD population trends previously discussed in Section 4.
Financial Adjustments Made to Fee-For-Service Data
Certain adjustments were made to the CCS FFS data prior to being combined with the MCO reported SDR data. These adjustments are described below in the subsections.
Inpatient Adjustment for Non-Federal Share Costs in Designated Public Hospitals
The FFS claims for Designated Public Hospitals (DPHs) in California are processed through a Certified Public Expenditures methodology in which the federal government covers the federal share and the county covers the non-federal share of costs. The FFS hospital claims in the base data contained only federal share costs paid by the state for DPHs, and so adjustments to account for the non-federal share of costs for DPHs were included in the base rate development.

Two-Plan, GMC, WCM, Regional and COHS Models Capitation Rate Development and Certification January 1, 2021–December 31, 2021
State of California Department of Health Care Services
Capitated Rates Development Division
72
Federally Qualified Health Center Adjustment for Fee-For-Service Data
FQHC reported data in FFS represents the full PPS payment amount. The PPS amount may exceed the arms-length transaction payment amount that an MCO may likely pay. An adjustment was made to the FFS FQHC amounts to better align with the anticipated FQHC payments within an MCO.
Pharmacy Rebates
Pharmacy data as reported in FFS is gross of rebates. Because of this, an adjustment was made to reflect costs net of rebates. This adjustment varied by MCO and was estimated based on data provided by the MCOs as reported in the SDRs.
Program Changes
Program change adjustments recognize the impact of benefit or eligibility changes that took place during or after the base data period. The program changes incorporated in the development of the rate ranges were based on information provided by DHCS staff. The program changes detailed below were viewed to have a material impact on capitation rates and were reviewed, analyzed, and evaluated by Mercer with the assistance of DHCS.
The next several subsections are the program changes adjustments explicitly accounted for within the CY 2021 capitation rates. A summary showing the managed care impact by county/region and MCO can be found within the program change charts that are provided within the Excel file titled FINAL CY 2021 Medi-Cal Detail CRCS Package LB Rate Smry 2021 01 28.xlsx. Additionally, the program change adjustments identified below are applied in columns (F) and (G) of the CRCS, unless otherwise indicated.
The following changes are consistent with those applied and described in Section 4:
• LTC Rate Changes
• Hospice Rate Increase
• NMT
• GEMT
• Pediatric Palliative Care
• Lens Fabrication
Spinraza®
Spinraza is a high cost drug that was approved by the FDA on December 23, 2016, to treat spinal muscular atrophy (SMA). Because the cost for this treatment is not fully present in the base period (CY 2017/CY 2018), it was necessary to include a program change to estimate the cost associated with this treatment. Mercer utilized encounter and FFS data to identify individuals by county/rating

Two-Plan, GMC, WCM, Regional and COHS Models Capitation Rate Development and Certification January 1, 2021–December 31, 2021
State of California Department of Health Care Services
Capitated Rates Development Division
73
region, who are either currently using Spinraza and are expected to continue or conclude treatment by the rating period as well as those with an SMA diagnosis who are potential candidates for treatment. This information was used to arrive at anticipated Spinraza utilization and cost during the rating period, which formed the basis of the program change factor. Offsetting Spinraza costs and utilization observed in the base data period were considered in development of this adjustment. The program change for Spinraza was applied to both the Pharmacy component (only applicable for the first quarter of 2021) and the OP COS to account for physician-administered drugs.
Projected Non-Benefit Costs Administration
The administration loading for the COHS MCOs was developed from a review of the MCOs historical reported administrative expenses, which are submitted as part of their attested RDT on an annual basis. The administrative costs are reviewed to ensure they are appropriate for the approved State Plan services and Medicaid eligible members. Mercer utilized its experience and professional judgement in determining the mid-point and lower/upper bound percentages for the WCM population that are reasonable and appropriate within the context of this certification, but also are more broadly consistent with the administrative loads of COHS MCOs after the consideration of fixed and variable costs and the specialized nature of the WCM population. The mid-point administration load varies by MCO from 3.04% to 4.11%. The range for the administrative component is +/-0.33% at the upper/lower bounds from the mid-point value. There was a mix of changes upward and downward at the COHS plan level from the prior rating period.
The application of the administrative PMPM and percentages can be found in the bottom right corner of the CRCS.
Underwriting Gain
The mid-point underwriting gain was established at 2.5% across all WCM MCOs. The range for the underwriting gain component is +/-1.0% at the lower/upper bounds from the mid-point value. Mercer has implicitly and broadly considered the cost of capital within Mercer’s rating assumptions. Mercer’s conclusion is that Mercer’s assumptions surrounding underwriting gain, as well as the income an MCO generates from investments, are sufficient to cover at least minimum cost of capital needs for the typical MCO.
These amounts are unchanged from the prior rating period.
Medical Management and Care Navigation
Certain services for medical management and care navigation were shifted from the counties to the MCOs as part of the WCM. The allocation of costs was determined by reviewing the services provided and whether the county or the MCO would retain responsibility. This allocation was provided to Mercer by DHCS and built in to the rate as shown on the CRCS, specific for each MCO/county. The load was
Two-Plan, GMC, WCM, Regional and COHS Models Capitation Rate Development and Certification January 1, 2021–December 31, 2021
State of California Department of Health Care Services
Capitated Rates Development Division
74
set at a PMPM. The resulting lower-bound percentage, as shown on the CRCS sheet, varies by MCO from 4.20% to 8.52%. The PMPM does not vary by rate range.
Managed Care Organization Tax
The MCO tax component is consistent with the development referenced in Section 5.
Other Items
Coronavirus Disease 2019
The approach for COVID-19 impacts aligns with previous discussion in Section 4.

Two-Plan, GMC, WCM, Regional and COHS Models Capitation Rate Development and Certification January 1, 2021–December 31, 2021
State of California Department of Health Care Services
Capitated Rates Development Division
75
7
Risk Adjustment Capitation rates for DHCS’ Two-Plan, GMC and Regional models are risk-adjusted using the most recently available version of the Medicaid Rx health-based payment model developed by University of California, San Diego (UCSD). The risk adjustment applies to the Child, Adult, ACA Expansion, and SPD COA groups only. In addition, since a separate maternity payment rate has been developed, maternity costs were excluded from the risk-adjustment process for the Child, Adult, and ACA Expansion COA groups.
Since risk adjustment is applied to distribute funds to MCOs within a county/region and COHS models only have one MCO per county/region, capitation rates for DHCS’ COHS models are not risk-adjusted. Risk adjustment is not applied to the Institutional capitation rates in CCI counties, since no readily available model exists for this population and the capitation rate is specific to members residing in a LTC facility, which in itself matches payment to risk appropriately. Similarly, risk adjustment is not applied to the WCM rates since no readily available model exists for this population and there is only one MCO per county/region.
Capitation rates for the SPD/Full-Dual COA group are not risk-adjusted. The application of risk adjustment to the capitation rates is to better match the payment to the risk. For the SPD/Full-Dual COA, there are two main reasons these populations are not risk-adjusted. First, the Medicaid Rx model utilizes pharmacy data within the process of producing risk scores. The dual populations have very limited pharmacy experience within the Medi-Cal program, as the vast majority of their pharmacy claims are covered by Medicare Part D. Further, even when using a non-pharmacy (that is, diagnosis) based risk-adjustment model, much of the claims history is captured through Medicare, further complicating the use of risk adjustment for dual members. Second, for the SPD/Full-Dual COA, the majority of the dollars paid for all medical claims are covered by the Medicare benefit. The capitation rates only represent the costs of the services not already covered through Medicare. The current cost weights developed for the Medi-Cal program assume all managed care covered services are paid by the Medi-Cal MCOs. Creating a risk-adjustment system for the dual populations would require a unique set of cost weights that account for services paid through Medicare and a methodology to overcome the data issues mentioned above. This additional level of resources, with potentially limited benefit of better matching payment to the limited remaining risk for these dual eligible members, was not performed.
The individual acuity factors and final plan factors in effect for January 2021 through December 2021 were based on pharmacy encounters and claims incurred February 1, 2019 through January 31, 2020 (referred to as the study period), using encounter data submitted by the MCOs to DHCS by April 30, 2020. After individual acuity factors were calculated using the above study period, these

Two-Plan, GMC, WCM, Regional and COHS Models Capitation Rate Development and Certification January 1, 2021–December 31, 2021
State of California Department of Health Care Services
Capitated Rates Development Division
76
acuity factors were aggregated by MCO and COA groups using each plan’s enrollment snapshot as of June 2020 to calculate the unadjusted risk factors for each Two-Plan, GMC and Regional model MCO.
To ensure that the risk-adjustment process does not increase or decrease the total amount of capitation payments, the MCOs’ risk factors are adjusted for budget neutrality. The intent of this adjustment is to recalibrate all the MCO risk-adjustment factors to yield a county/region average of 1.0000. Each MCO’s own risk-adjustment factors are then applied to the county/region average base capitation rates to arrive at each MCO’s risk-adjusted rate. The risk-adjusted county average rates for each MCO are then blended at a 75% weight, with the historical MCO “plan-specific” rate approach blended at 25%. Mercer believes this blending approach is appropriate and consistent with the risk-adjustment process utilized in previous rate development processes.
DHCS continues to validate encounter data and is working with the MCOs to support and monitor their efforts to continually improve the collection and reporting of encounter data. For example, prior to running the pharmacy encounter data through the Medicaid Rx classification system, the reasonableness of the pharmacy claims and encounter data volume were reviewed by calculating the monthly average number of claims per recipient across the MCOs. Analyses and reviews were performed on the pharmacy claims and encounters to measure claims without National Drug Code (NDC) information and to evaluate the validity of reported NDCs.
DHCS and Mercer used the prospective Medicaid Rx model to evaluate risk differences between the participating Two-Plan, GMC, and Regional model MCOs. The risk-adjustment process only includes experience data for individuals who have at least six months of total Medi-Cal eligibility within the 12-month study period. Individuals who do not meet the six-month eligibility criterion are assigned the respective MCO’s average risk factor associated with that individual’s COA group, with an exception in LA County. Members in LA County who did not receive a score were assigned an assumed score based on the county average risk score for scored recipients by the Medicaid Rx age and gender demographic groups.
The most recently available version of the Medicaid Rx health-based payment model was updated by UCSD to include a recent set of NDC codes and has been further adjusted to more closely align with the risk associated with the Two-Plan, GMC and Regional model covered benefits. For example, the cost weights reflected in the national Medicaid Rx model were developed assuming a comprehensive acute care and BH benefit package, utilizing over 30 states’ data. Since the model is applied to the Two-Plan, GMC and Regional programs, Mercer modified the cost weights to reflect California Medi-Cal-specific data and services covered under the Two-Plan, GMC and Regional managed care programs. For additional details of the risk adjustment methodology, please see the separate documents CY 2021 CA RAR Methodology Letter FINAL 2020.12.17.pdf.
Application of Risk Adjustment in the Rate Calculation In an effort to encourage and reward cost efficiencies and effectiveness, DHCS is using a blended plan-specific and risk-adjusted county average rates approach for CY 2021, which is consistent with the approach used for prior rate development periods. As mentioned in the prior subsection, the

Two-Plan, GMC, WCM, Regional and COHS Models Capitation Rate Development and Certification January 1, 2021–December 31, 2021
State of California Department of Health Care Services
Capitated Rates Development Division
77
CY 2021 blend is 75% of the risk-adjusted county average approach, and 25% of the MCO plan-specific approach. Each of these approaches produces actuarially sound rates or rate ranges; blending the approaches does not impact actuarial soundness but enhances DHCS program goals.
Plan-Specific
The same general methodology employed for the 25% blend in the RP 19–20 rate development has been utilized for the 25% blend portion for CY 2021. While a large number of rate setting factors/components/loads are not MCO-specific (items such as utilization trend, unit cost trend, administration, and underwriting gain are the same for all MCOs), at the mid-point, the medical expense base data has a strong relationship to recent MCO claims experience. For this reason, this approach has often been referred to as plan-specific rate setting. In spite of the stated caveats, Mercer retains that terminology.
Risk-Adjusted County Average Rates
County-specific rates are developed on a weighted average basis using projected CY 2021 MMs. All MCO data/experience in a county considered in the plan-specific approach are considered here. In Mercer’s opinion, with two or more MCOs in a county, a best practice is to also incorporate the use of risk adjustment, where an MCO’s plan-specific budget-neutral risk scores are applied to the applicable county specific rates.
For CY 2021, this blending applies to the Child, Adult, ACA Expansion and SPD COA groups. The maternity and HCBS High Supplemental Payments were developed on a county-specific basis and the Hepatitis C Supplemental Payment was developed on a statewide basis. All other COA/supplemental groups, other than the above seven, are plan-specific.
Application of Risk-Adjustment Factors
The final (budget neutral) risk-adjustment plan factors are applied to the capitation rates after the application of administrative and underwriting gain loads, but before the addition of several add-on PMPM amounts, which include the following:
• MCO Tax PMPMs.
• Kaiser Sacramento MH Add-On PMPMs.
• The LA County CBRC medical component “not subject to risk adjustment” carve-out PMPM amount, which contains full utilization for the CBRCs and costs above and beyond typical professional services costs that are paid to these clinics.
• Proposition 56 Physicians Directed Payment PMPMs (described in the next section).
• Pass-Through Payment PMPMs (described in the next section).
• Pharmacy add-on PMPMs Applicable to the First Quarter of 2021.
Two-Plan, GMC, WCM, Regional and COHS Models Capitation Rate Development and Certification January 1, 2021–December 31, 2021
State of California Department of Health Care Services
Capitated Rates Development Division
78
• COVID-19 Add-on PMPMs (described in an earlier section).
The risk-adjustment process described in this section is budget neutral, and is not intended to increase or decrease the total capitation payments made by DHCS to the MCOs.
Managed Care Organizations Excluded From Risk Adjustment
The risk-adjustment process described in this section is applicable to all Two-Plan, GMC and Regional model MCOs, with the following exceptions:
• Anthem Blue Cross in San Benito County: There is only one plan in the county. Therefore, risk adjustment does not apply.
• Kaiser in the Three Kaiser Regional Counties: Kaiser is the only MCO that exclusively operates in these three regional counties alone and has a comparatively smaller population size than the two MCOs that operate in the broader 18 regional counties. As a result, risk adjustment does not apply to Kaiser in these three counties.
• Aetna in Sacramento and San Diego counties and United in San Diego County: Since these MCOs are exhibiting considerable ramp up, which is expected to continue into CY 2021, a decision was made to not apply risk adjustment to these two MCOs in these counties.

Two-Plan, GMC, WCM, Regional and COHS Models Capitation Rate Development and Certification January 1, 2021–December 31, 2021
State of California Department of Health Care Services
Capitated Rates Development Division
79
8
Special Contract Provisions Related to Payment This section describes the following contract provisions that impact the rates and the final net payments to the MCOs for reasons other than risk adjustment under the MCO contract:
• Incentive arrangements
• Withhold arrangements
• Risk-sharing mechanisms
• Pass-through payments
• Delivery system and provider payment initiatives
None of these items explicitly appear within the CRCS, but were considered within the rate development process.
Incentive Arrangements The state is implementing the Behavioral Health Integration (BHI) Incentive Program during CY 2021, which provides incentive payments to MCOs for achievement of specified milestones and measures. These incentive payments will not exceed 5% of the capitation rates.
The purpose of the BHI Incentive Program is to incentivize Medi-Cal MCOs to improve physical and BH outcomes, care delivery efficiency, and patient experience by establishing or expanding integrated care in the MCO’s network using teams who deliver coordinated comprehensive care for the whole patient.
Twenty-two MCOs submitted BHI Incentive Program applications to the DHCS. The MCOs collected and scored proposals from network providers for individual projects, and associated milestones and measures, that advanced one or more BHI Incentive Program goals. After initial scoring of proposals by the MCOs, DHCS received approximately 200 applications representing over 500 individual projects broken out by county. DHCS reviewed all MCO-proposed projects and approved those that most closely aligned with, and were deemed most likely to advance, BHI Incentive Program goals. DHCS provided determination letters to each MCO identifying the particular projects and maximum earnable funding amounts approved. The total maximum incentive funding that may be earned across
Two-Plan, GMC, WCM, Regional and COHS Models Capitation Rate Development and Certification January 1, 2021–December 31, 2021
State of California Department of Health Care Services
Capitated Rates Development Division
80
all participating MCOs and the full duration of the program is $190 million. The BHI Incentive Program has no effect on the development of capitation rates.
The BHI Incentive Program will be for a fixed period of two program years (PYs):
• PY 1 will be January 1, 2021 through December 31, 2021, which will align with California’s CY 2021 rating period.
• PY 2 will be January 1, 2022 through December 31, 2022, which will align with California’s CY 2022 rating period.
The enrollees covered by the BHI Incentive Program include Medi-Cal beneficiaries that are impacted by the BHI projects. Approved projects cover a wide distribution across the state with balanced inclusion of rural, suburban, and urban counties.
The services/project options covered by the BHI Incentive Program include options that can be applied in pediatric, adolescent, and/or adult practices:
• Basic BHI
• Maternal Access to MH and Substance Use Disorder Screening and Treatment
• Medication Management for Beneficiaries With Co-Occurring Chronic Medical and Behavioral Diagnoses
• Diabetes Screening and Treatment for People With Serious Mental Illness
• Improving Follow-Up After Hospitalization for Mental Illness
• Improving Follow-Up After ED Visit for BH Diagnosis
The providers covered by the BHI Incentive Program include primary care, specialty care, perinatal care, hospital based and BH providers, FQHCs/RHCs, AIHS providers, public providers, and others.
Additional detail regarding the BHI Incentive Program is available through the managed care contract, associated All Plan Letters, and similar instruction issued to MCOs.
Withhold Arrangements There are no withhold arrangements between DHCS and the MCOs. This subsection is not applicable to this rate certification.
Risk Sharing Mechanisms The state is continuing two-sided risk corridors associated with the five Proposition 56 directed payment initiatives. These arrangements are further discussed in the Delivery System and Provider Payment Initiative subsection of this report.
Two-Plan, GMC, WCM, Regional and COHS Models Capitation Rate Development and Certification January 1, 2021–December 31, 2021
State of California Department of Health Care Services
Capitated Rates Development Division
81
Pass-Through Payments Pass-through payments, as described below, are applied in the Two-Plan, GMC, Regional, and COHS Model CY 2021 capitation rates.
Private Hospital — Hospital Quality Assurance Fee and District and Municipal Public Hospitals
Historical adjustments associated with the private hospital HQAF and District and Municipal Public Hospitals (DMPHs) (formerly known as Non-Designated Public Hospitals) are continuing for CY 2021. The approach for making these adjustments within the capitation rates are being addressed through two paths: 1) Pass-through Payments as defined by 42 CFR 438.6(d) and 2) Directed Payments as defined by 42 CFR 438.6(c). The directed payment approach is described later within this certification report and with the exception of the Proposition 56 directed payments, does not currently impact the certified rates. The pass-through components of the HQAF/DMPH adjustments are being included within the certified rates and have been developed in a fashion similar to historical approaches. The approach takes into consideration the private hospital (IP and OP/ER services) and DMPH (IP services only) components of the capitation rates. The private hospital/DMPH components of the capitation rates are being increased based upon a uniform percent increase to IP rates (14.75%) and a uniform percent increase to OP/ER rates (15.82%), such that the targeted total impact of $1,797.4 million is produced across all of the California managed care models (Two-Plan, GMC, COHS, and Regional models) for the 12-month rating period. The DMPH targeted expenditure accounts for approximately 7.57% of the total IP + DMPH combined targeted expenditure; the DMPH targeted expenditure is approximately $97.4 million across the 12-month period. The DMPH total is a subset of the IP factor and the DMPH targeted expenditure of $97.4 million is part of the $1,797.4 million total impact. We would note that the prior year certification was for the 18-month bridge period and the prior year certification reflected a total targeted impact of $2,846.1 million for the entire 18-month period, which equated to ~$1,897.4 targeted spend for a 12-month equivalent.
The aforementioned IP and OP/ER percentages were applied to the private/DMPH components of the capitation rates to produce PMPM adjustments that are added to the post risk adjustment rate ranges. The PMPM adjustments were developed based upon the MCO specific upper bound GME, as well as MCO information submitted through a SDR. The SDR included CY 2018 summarized payment information by hospital type (private, public, University of California (UC), and DMPH). This data included information by COS and payment arrangement (capitation and whether FFS payments were contracted or not). This information was leveraged to produce percentages of private hospital (including DMPH for IP) expenditures that could be applied to the base rate PMPM to produce a total projected spend equivalent to the aforementioned totals. For purposes of calculating the HQAF percent add-on to the base rates, the upper bound PMPM from the base rates were selected. It should be noted that the GME amounts utilized to produce the baseline amounts were prior to the removal of maternity costs. This approach was taken so that these adjustments did not impact the maternity supplemental payments (this is consistent with historical practice). Sacramento and San Diego counties had two new MCOs join during the SFY 17–18 rating period. Because these plans did not

Two-Plan, GMC, WCM, Regional and COHS Models Capitation Rate Development and Certification January 1, 2021–December 31, 2021
State of California Department of Health Care Services
Capitated Rates Development Division
82
have credible information to submit within the SDR, county averages have been utilized to supplement the needed factors for this adjustment.
Included attachments labeled Exhibit A CY 2021 Private Hospital DMPH IP HQAF Pass-through 2021 01 28.pdf and Exhibit B CY 2021 Private Hospital OP ER HQAF Pass-through 2021 01 28.pdf; these attachments contain the detailed components behind these calculations. The IP chart below, which is an excerpt of the “Exhibit A” file, displays the elements involved:
• {H} is the upper bound base rate PMPM from the rates
• {I} is the estimated percent that private and DMPH hospitals compose of the total base rate, based on the payment information from the SDR
• {J} = {H} * {I} is the product of the first two elements
• {K} is the IP factor that produces approximately 70% of the targeted spend amounts mentioned above; there is also a corresponding OP/ER factor computation that achieves the remaining 30% spend of the targeted spend amounts, which when combined with IP, produces 100% of the targeted spend amounts
• {L} = {J} * {K} produces the final add-on PMPM amounts included in the final certified rates
{H} {I} {J} = {H} * {I} {K} {L} = {J} * {K}
COA Rate PMPM Private/DMPH Share (PMPM)
Private/DMPH PMPM Add-on % Add-on
PMPM Child $10.41 85.9% $8.94 14.75% $1.32 Adult $108.67 85.7% $93.08 14.75% $13.73 ACA OE $103.21 82.5% $85.13 14.75% $12.56 SPD $311.21 82.6% $256.96 14.75% $37.91 LTC $1,571.94 85.4% $1,341.99 14.75% $197.96 OBRA $163.17 0.0% - 14.75% - AIDS Non-Duals $462.40 88.8% $410.43 14.75% $60.54 WCM $821.82 86.7% $712.24 14.75% $105.06 All COAs $82.61 83.5% $69.00 14.75% $10.18
A similar process was applied to the OP/ER components; 15.82% is being applied to the private OP/ER PMPM. These calculations are included in “Exhibit B”. As noted above, the actuary has continued the historical practice of developing rate ranges; however, there was no variation of the developed add-on PMPMs across the rate ranges. The development of these add-on amounts did not impact the underlying data or assumptions associated with the regular development of the capitation

Two-Plan, GMC, WCM, Regional and COHS Models Capitation Rate Development and Certification January 1, 2021–December 31, 2021
State of California Department of Health Care Services
Capitated Rates Development Division
83
rates. Consistent with historical approaches, no additional administrative load or underwriting gain is included within these add-on amounts for HQAF/DMPH.
HQAF is paid to hospital providers.
The non-federal share of the pass-through payment is financed utilizing quality assurance fees provided by hospitals and voluntary intergovernmental transfers (IGTs) provided by local government entities.
Martin Luther King Jr. Community Hospital in Los Angeles County
Historical program change adjustments for the MLK IP component of the LA County SPD and ACA Expansion rate cells are being presented as pass-through payments based upon our and DHCS’ interpretation of the definition of a pass-through within 42 CFR 438.6(d). The detailed build-up of the adjustments associated with the MLK pass-through payment are included in the attached “Exhibit C” (Exhibit C CY 2021 MLK IP Pass-through 2021 01 28.pdf). In alignment with the prior program change adjustment, additional costs not included within the base data are added to the IP COS to meet the requirements of Senate Bill 857 that establishes IP payment levels for MLK. A uniform percentage for the IP COS was established to provide the needed adjustments to reflect the required costs. The development of these adjustments also include a 3.875% administrative load, which aligns with administrative costs assigned to supplemental payments such as the maternity payment as well as the administrative load included with the Proposition 56 physician directed payment add-on payments discussed below. An underwriting gain of 1.5%, also consistent with the other payment mechanisms previously mentioned, is included as part of the add-on payment. The total adjustment including administrative load and underwriting gain is $25.8 million across CY 2021 based upon enrollment projections that utilize actual experience through October 2020.
MLK is a hospital provider.
The non-federal share of the pass-through payment is financed utilizing State General Funds.
Benioff Children’s Hospital Oakland in Alameda County
Historical base data adjustments for Benioff Children’s Hospital Oakland (BCHO) in Alameda County for the Child and SPD rate cells are being presented as pass-through payments based upon our and DHCS’ interpretation of the definition of a pass-through payment within 42 CFR 438.6(d). As described in prior certifications, the payment levels incorporated within the base data utilized for rate development did not reflect the costs the hospital was incurring to serve the Medi-Cal population. Based upon a review of the cost information provided from the MCOs and the hospital, adjustments have been introduced to produce add-on PMPM amounts that reflect the difference between costs included in the base capitation rates and the actual costs. The detailed build-up of these adjustments are included in the attached “Exhibit D” (Exhibit D CY 2021 BCHO Pass-through 2021 01 28.pdf). “Exhibit D” contains information for the three adjustments for IP, OP/ER, and non-facility COSs. A uniform percentage increase across the three COSs has been established by MCO and COA to reflect the needed adjustments to reflect total costs. The development of these adjustments also include a
Two-Plan, GMC, WCM, Regional and COHS Models Capitation Rate Development and Certification January 1, 2021–December 31, 2021
State of California Department of Health Care Services
Capitated Rates Development Division
84
3.875% administrative load that aligns with administrative costs assigned to supplemental payments such as the maternity payment as well as the administrative load included with the Proposition 56 physicians directed payment add-on payments discussed below. An underwriting gain of 1.5%, also consistent with the other payment mechanisms previously mentioned, is included as part of the add-on payment. The total adjustment including administrative load and underwriting gain is $21.9 million across CY 2021 based upon the baseline enrollment projection that utilized actual experience through October 2020.
A summary exhibit of the pass-through payments described above is included in the first tab within the attached spreadsheet (Summary Exhibit CY 2021 Medi-Cal MC Pass-through and Directed Payment Exhibits 2021 01 28.xlsx).
BCHO is a hospital provider.
The non-federal share of the pass-through payment is financed utilizing voluntary IGT’s from a public entity.
Pass-Through Payments Base Amount Calculation
For the CY 2021 rating period, DHCS has confirmed that the projected aggregate amount of pass-through payments to hospitals does not exceed either of:
1. The amount specified by 42 CFR § 438.6(d)(3)(i), which was calculated by DHCS in accordance with the methodology described below.
2. The amount specified by § 438.6(d)(3)(ii).
For this determination, Mercer has relied upon the methodology applied and calculations performed by DHCS.
Amount of Historical Pass-Through Payments, § 438.6(d)(3)(ii)
The amount of historical pass-through payments to hospitals identified in managed care contract(s) and rate certification(s) in accordance with § 438.6(d)(1)(i) is $2,405,046,774. This amount is unchanged from prior rating periods.
Phased-Down Base Amount, § 438.6(d)(3)(i)
General Methodology
DHCS calculated the phased-down base amount as the sum of:
1. Seventy percent of the base amount defined at § 438.6(d)(2) applicable to the period of January 1, 2021 through June 30, 2021; and
2. Sixty percent of the base amount defined at § 438.6(d)(2) applicable to the period of July 1, 2021 through December 31, 2021.
Two-Plan, GMC, WCM, Regional and COHS Models Capitation Rate Development and Certification January 1, 2021–December 31, 2021
State of California Department of Health Care Services
Capitated Rates Development Division
85
The aggregate amount resulting from this calculation is $2,207,183,907, as displayed in the exhibit CY 2021 Base Amount Calculation 01.29.21.pdf.
The § 438.6(d)(2)(i) component of the base amount is equal to the aggregate difference between the amounts calculated in accordance with §§ 438.6(d)(2)(i)(A) and (d)(2)(i)(B). This amount is the differential between the amount paid under Medicaid managed care and the amount Medicare FFS would have paid for inpatient and outpatient hospital services provided to eligible populations under the Medicaid managed care contracts for the 12-month period immediately two years prior to the CY 2021 rating period, which corresponds to CY 2019.
The § 438.6(d)(2)(i)(A) calculation includes two elements: unit cost and utilization. Unit costs were based on Office of Statewide Health Planning and Development (OSHPD) statewide data for Medicare FFS beneficiaries. CY 2018 data was leveraged to arrive at estimated CY 2019 average unit costs for IP and OP hospital services. To maintain consistency with the approach used for the § 438.6(d)(2)(i)(B) component, unit cost trend was applied to the CY 2018 data in order to determine a reasonable estimate of CY 2019 unit costs. The trend applied was based on the average Consumer Price Index for All Urban Consumers (CPI-U) for hospital related services over the previous five state fiscal years (SFY 2015-16 through SFY 2019-20). The resulting estimated IP and OP unit costs are 3.97% higher year-over-year compared to the CY 2018 unit costs.
Utilization was calculated based on CY 2018 base data used in Medi-Cal managed care rate development that was trended forward to CY 2019. Distinct trends were applied for IP and OP hospital services based on the average base data utilization change over the previous four calendar years (CY 2015 through CY 2018). For simplicity, the base period data was not trended to the rating period; however, the state may elect to apply trend adjustments, as appropriate, in the calculation of the base amount applicable to future rating periods.
Unit cost was multiplied by utilization for both IP and OP hospital services, respectively. The resulting IP and OP amounts were then summed to determine the total amount for the § 438.6(d)(2)(i)(A) component of the calculation.
The§ 438.6(d)(2)(i)(B) calculation includes three elements: unit cost, utilization, and directed payments. CY 2018 data was trended to arrive at estimated CY 2019 average unit costs for IP and OP hospital services. The same trend used for the § 438.6(d)(2)(i)(A) component of the calculation was utilized here. Utilization is identical to that used for the § 438.6(d)(2)(i)(A) component of the calculation. Unit cost was multiplied by utilization for both IP and OP hospital services, respectively. The resulting amounts were then summed and further increased by the amount of applicable directed payments for IP and OP hospital services for the CY 2019 base period. The applicable directed payments were made as part of the Designated Public Hospital Enhanced Payment Program and the Private Hospital Directed Payment Program. These directed payments were first implemented beginning on July 1, 2017.

Two-Plan, GMC, WCM, Regional and COHS Models Capitation Rate Development and Certification January 1, 2021–December 31, 2021
State of California Department of Health Care Services
Capitated Rates Development Division
86
Aggregate Difference
The aggregate difference between the total amounts of §§ 438.6(d)(2)(i)(A) and (d)(2)(i)(B) is $3,395,667,549. This amount was multiplied by a factor of 0.65 to account for the 70% and 60% phase-down levels associated with the fourth and fifth fiscal years, respectively, occurring after July 1, 2017.
Trend Adjustments
At the time of this calculation, CY 2019 cost and utilization data specific to Medi-Cal managed care was not readily available for use in this calculation. As per the standard Medi-Cal managed care rate development process, and to allow adequate time for claims completion and MCO reporting, CY 2019 base data had been only recently collected from MCOs and had not been reviewed, validated, or aggregated yet.
Therefore, both unit cost and utilization trends were applied in the calculation of the amount specified by § 438.6(d)(2)(i). Trends were applied consistently for both §§ 438.6(d)(2)(i)(A) and (d)(2)(i)(B).
The unit cost trend adjustment is based on the CPI-U: Hospital and Related Services. The average year-over-year growth from July 1, 2015 through July 1, 2020 was used to determine an annual trend percentage of 3.97%. This source of growth is consistent with the annual growth rate historically approved by CMS in the preprint for the state’s Quality Incentive Program. Based on CMS’ approval of this data source for determining unit cost growth, DHCS believes this source is reasonable and appropriate. While alternative trends are possible and may be reasonable, that fact does not diminish the reasonableness of the state’s approach in utilizing an established cost index to inform the trend assumption.
The utilization trend adjustment is based on the average year-over-year growth in from CY 2015 through CY 2018 of the base data used for rate development. This data source remains consistent with the utilization driving the base amount calculation beginning with the SFY 2017-18 rating period.
Fiscal Impact
The following displays the fiscal impact of applying unit cost and utilization trends on the phased-down base amount:
• Phased-Down Base Amount with Trends = $2,207,183,907
• Unit Cost Trend removed = $2,025,290,069
• Utilization Trend removed = $2,135,049,377
• Unit Cost Trend and Utilization Trend removed = $1,955,910,505
DHCS believes that both the unit cost and utilization trends applied in this calculation are reasonable and appropriate. However, of note, the removal of either utilization or unit cost trend, or both, would

Two-Plan, GMC, WCM, Regional and COHS Models Capitation Rate Development and Certification January 1, 2021–December 31, 2021
State of California Department of Health Care Services
Capitated Rates Development Division
87
not change the fact that the phased-down based amount exceeds the projected aggregate amount of pass-through payments for the CY 2021 rating period.
The 42 CFR 438.6(d)(2)(ii) component of the base amount is assumed to be equal to $0, consistent with the approach used for prior rating periods. The amount in accordance with 42 CFR 438.6(d)(2)(ii) is the differential between the amount paid under Medicaid FFS and the amount Medicare FFS would have paid for inpatient and outpatient hospital services provided to eligible populations through the Medicaid FFS delivery system for the 12-month period immediately two years prior to the CY 2021 rating period that have subsequently shifted to the Medicaid managed care delivery system. As there were no major shifts of inpatient and outpatient hospital services, or of eligible populations, from Medicaid FFS to Medicaid managed care for the applicable time periods, DHCS assumed that no such material payments meet this definition.
Delivery System and Provider Payment Initiatives There are several directed payment initiatives applicable to the Two-Plan, GMC, Regional, and COHS model CY 2021 capitation rates. The following subsections provide more detail around each initiative.
Proposition 56 Directed Payments
Consistent with 42 CFR §438.6(c), DHCS is utilizing the following five provider directed payment initiatives. All of them share the same designation of “Proposition 56” as all five payment initiatives are funded for their State shares through a ballot proposition to increase the excise tax rate on cigarettes and other tobacco products under the California Healthcare, Research and Prevention Tobacco Tax Act of 2016 (Proposition 56).
• Physician Proposition 56
• Trauma Screening (Adverse Childhood Experiences Screening as named in the Pre-Print) Proposition 56
• Developmental Screening Proposition 56
• Family Planning Proposition 56
• VBP Proposition 56
Proposition 56 add-ons are contingent on appropriations of funds being approved by the California Legislature. Absent continued appropriations, some elements of Proposition 56 add-ons will sunset on June 30, 2021. To account for this uncertainty while setting prospective rates, Mercer developed these add-ons to be reasonable and appropriate for both six-month (January 1, 2021 through June 30, 2021) and 12-month (January 1, 2021 through December 31, 2021) effective periods, and Mercer actuaries certify these add-ons as actuarially sound regardless of the budget outcome and the subsequent effective dates of the add-ons. The Family Planning initiative is expected to be effective for the entire contract period.

Two-Plan, GMC, WCM, Regional and COHS Models Capitation Rate Development and Certification January 1, 2021–December 31, 2021
State of California Department of Health Care Services
Capitated Rates Development Division
88
To facilitate CMS rate review for each of the five Proposition 56 payment initiatives, the rest of this section is structured to provide documentation individually for each as required by the 2020–2021 Medicaid Managed Care RDG.
Physician Proposition 56 Add-On Per Member Per Month
The Physician Proposition 56 add-on PMPM provides a uniform dollar adjustment across 12-specific Evaluation and Management (E&M) CPT codes and 10 specific preventive visit CPT codes utilized by providers (listed in the following table).
Pre-Prints for this payment initiative have been approved for prior rating periods and the renewal version applicable to the current rating period has been submitted to CMS for approval on December 31, 2020, with no changes to major terms and conditions with the lone exception of dropping a single, minor E&M code (90863).
The dollar adjustments vary by E&M and preventive visit CPT code as displayed in the following table:
Procedure Code Description Uniform Dollar Amount
99201 Office/OP Visit New $18.00 99202 Office/OP Visit New $35.00 99203 Office/OP Visit New $43.00 99204 Office/OP Visit New $83.00 99205 Office/OP Visit New $107.00 99211 Office/OP Visit Est $10.00 99212 Office/OP Visit Est $23.00 99213 Office/OP Visit Est $44.00 99214 Office/OP Visit Est $62.00 99215 Office/OP Visit Est $76.00 90791 Psychiatric Diagnostic Evaluation $35.00 90792 Psychiatric Diagnostic Evaluation With Medical Services $35.00 99381 Preventive Visit New $77.00 99382 Preventive Visit New $80.00 99383 Preventive Visit New $77.00 99384 Preventive Visit New $83.00 99385 Preventive Visit New $30.00 99391 Preventive Visit Est $75.00 99392 Preventive Visit Est $79.00
Two-Plan, GMC, WCM, Regional and COHS Models Capitation Rate Development and Certification January 1, 2021–December 31, 2021
State of California Department of Health Care Services
Capitated Rates Development Division
89
Procedure Code Description Uniform Dollar Amount
99393 Preventive Visit Est $72.00 99394 Preventive Visit Est $72.00 99395 Preventive Visit Est $27.00
The application of these adjustments across all managed care models and all impacted COA groups is shown in the table below. The table highlights the components of the total amounts including the projected MMs (based upon the baseline enrollment projection that utilized actual experience through September 2020), projected impacted E&M and preventive visits, the resulting PMPMs and the total dollars. The payment adjustments for the given E&M and preventive codes are being made to all eligible contracted providers who perform these services for managed care enrollees. Services where Medicare would be the primary payer (Full-dual and Part B partial dual members) are excluded from the add-on payments. Services provided within FQHC/RHC facilities are also excluded from the add-on payments due to the wrap-around payment structure associated with these types of facilities. Additional payments to AIHS providers and CBRCs are also excluded.
Physician (January 2021–June 2021)
COA Projected MMs Prop 56 Add-on Projected Units Total PMPM Total Dollars
Child 27,373,158 4,027,928 $8.33 $228,061,584 Adult 10,193,956 1,859,677 $9.47 $96,513,642 ACA OE 21,305,378 3,599,855 $8.94 $190,503,721 SPD 4,571,944 1,262,565 $15.41 $70,432,273 LTC 72,510 13,943 $10.96 $794,640 OBRA 852 141.835798 $8.34 $7,106 WCM 154,314 53,639 $21.15 $3,264,194 AIDS Non-Duals 2,100 622.294154 $16.30 $34,230 All COAs 63,674,212 10,818,369 $9.26 $589,611,389
The PMPM adjustments were developed based upon MCOs’ encounter data as well as MCO information submitted through the RDT. These two data sources, the encounters and RDT data, were then utilized in developing a distribution and projected utilization of the impacted codes. Through a blended approach of the two data sources, similar in structure to the base data development that reviews the reasonableness of each data element, a final PMPM was developed based upon the projected utilization by code and the resulting needed add-on amount associated with each code. As described previously, certain provider types (FQHC/RHCs, AIHS providers, and CBRCs) were excluded from the analysis, as well as the exclusion of services provided where Medicaid was not the
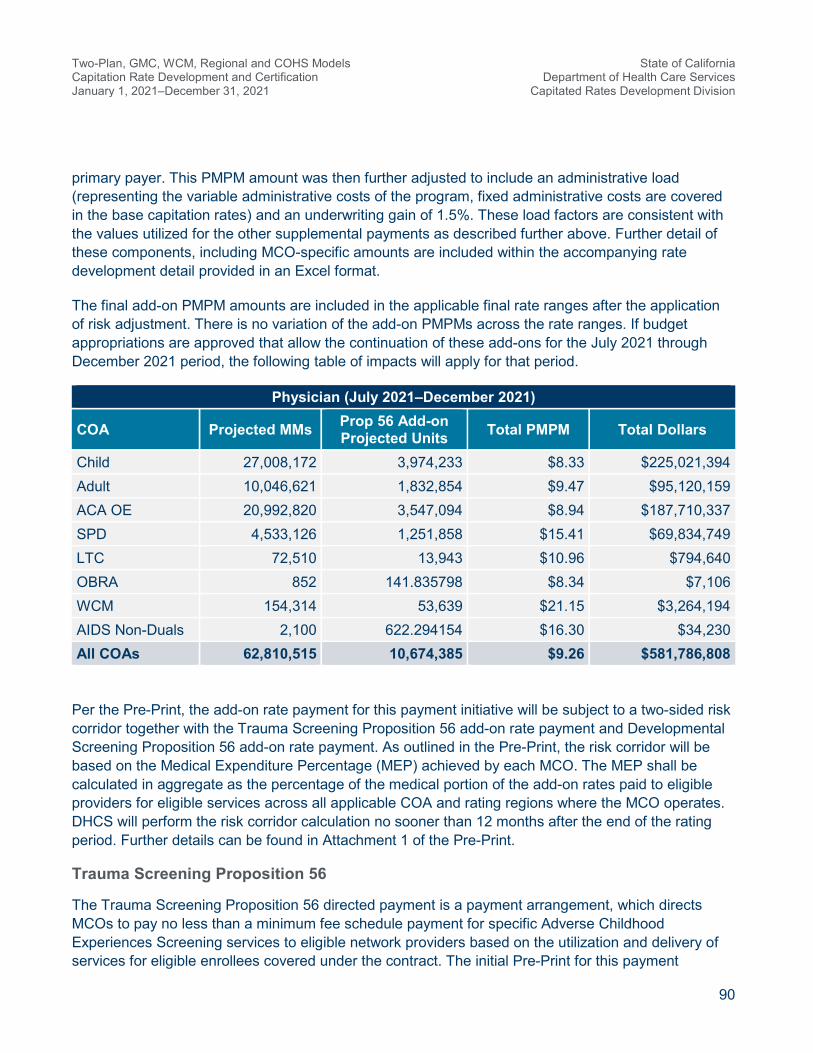
Two-Plan, GMC, WCM, Regional and COHS Models Capitation Rate Development and Certification January 1, 2021–December 31, 2021
State of California Department of Health Care Services
Capitated Rates Development Division
90
primary payer. This PMPM amount was then further adjusted to include an administrative load (representing the variable administrative costs of the program, fixed administrative costs are covered in the base capitation rates) and an underwriting gain of 1.5%. These load factors are consistent with the values utilized for the other supplemental payments as described further above. Further detail of these components, including MCO-specific amounts are included within the accompanying rate development detail provided in an Excel format.
The final add-on PMPM amounts are included in the applicable final rate ranges after the application of risk adjustment. There is no variation of the add-on PMPMs across the rate ranges. If budget appropriations are approved that allow the continuation of these add-ons for the July 2021 through December 2021 period, the following table of impacts will apply for that period.
Physician (July 2021–December 2021)
COA Projected MMs Prop 56 Add-on Projected Units Total PMPM Total Dollars
Child 27,008,172 3,974,233 $8.33 $225,021,394 Adult 10,046,621 1,832,854 $9.47 $95,120,159 ACA OE 20,992,820 3,547,094 $8.94 $187,710,337 SPD 4,533,126 1,251,858 $15.41 $69,834,749 LTC 72,510 13,943 $10.96 $794,640 OBRA 852 141.835798 $8.34 $7,106 WCM 154,314 53,639 $21.15 $3,264,194 AIDS Non-Duals 2,100 622.294154 $16.30 $34,230 All COAs 62,810,515 10,674,385 $9.26 $581,786,808
Per the Pre-Print, the add-on rate payment for this payment initiative will be subject to a two-sided risk corridor together with the Trauma Screening Proposition 56 add-on rate payment and Developmental Screening Proposition 56 add-on rate payment. As outlined in the Pre-Print, the risk corridor will be based on the Medical Expenditure Percentage (MEP) achieved by each MCO. The MEP shall be calculated in aggregate as the percentage of the medical portion of the add-on rates paid to eligible providers for eligible services across all applicable COA and rating regions where the MCO operates. DHCS will perform the risk corridor calculation no sooner than 12 months after the end of the rating period. Further details can be found in Attachment 1 of the Pre-Print.
Trauma Screening Proposition 56
The Trauma Screening Proposition 56 directed payment is a payment arrangement, which directs MCOs to pay no less than a minimum fee schedule payment for specific Adverse Childhood Experiences Screening services to eligible network providers based on the utilization and delivery of services for eligible enrollees covered under the contract. The initial Pre-Print for this payment

Two-Plan, GMC, WCM, Regional and COHS Models Capitation Rate Development and Certification January 1, 2021–December 31, 2021
State of California Department of Health Care Services
Capitated Rates Development Division
91
initiative has been approved for the prior rating period and the renewal version applicable to the current rating period has been submitted to CMS for approval on December 31, 2020, with no changes to major terms and conditions. The following provides a brief description of this payment initiative:
• The type of this directed payment arrangement is a minimum fee schedule payment initiative.
• MCOs are required to pay the eligible providers for the applicable incurred period using the following minimum fee schedule for qualifying covered services provided to eligible managed care enrollees up through age 64.
Procedure Code Description Minimum Fee Amount 96160U1 Adverse Childhood Event Screening $29.00 96160U2 Adverse Childhood Event Screening $29.00
Further details about the funding source, eligible providers and eligible enrollees for this payment initiative can be found in the Pre-Print.
This payment initiative is included in the capitation rates as a rate adjustment. The following describes the data, assumption, and methodology used to develop these add-on rates.
As a newly added service in CY 2020, there was no credible and complete claims experience data available in the base period. Similar to the rate development approach used for the prior period, Mercer identified eligible enrollees in the most recent full year (CY 2018) of eligibility data based on their Medicare coverage status and specific age groups (age group 0–18 and age group 19–64) within each COA across all model types to calculate the percentage of members eligible for this service within each COA. Note that enrollees above age 65 or with Medicare part B coverage are not eligible for this service. Mercer worked together with the State to develop age group specific take-up assumptions around the percentages of eligible members within each age group who will receive this service within the contract period. Note that this service is primarily intended for children, but adults under 65 are also eligible to receive this service if deemed medically necessary. Therefore, the assumed take-up assumptions are much lower for adults compared to children. Given the assumed utilizations for each group, the age group mix for each COA, and the known unit cost (minimum fee schedule), Mercer then calculated the expected claims PMPM as the benefit cost component of the add-on rate for each of the two six-month periods. Lastly, this PMPM amount was adjusted to include half of the plan-specific administrative load, which provides for the variable component of the expenses while the fixed administrative costs are covered in the base capitation rates, and an underwriting gain of 1.5%. Further detail of these components, including MCO-specific amounts are included within the accompanying rate development detail provided in an Excel format.

Two-Plan, GMC, WCM, Regional and COHS Models Capitation Rate Development and Certification January 1, 2021–December 31, 2021
State of California Department of Health Care Services
Capitated Rates Development Division
92
See the table below for detailed impacts for the six-month period:
Trauma Screening (January 2021–June 2021)
COA Projected MMs Prop 56 Add-on Projected Units Total PMPM Total Dollars
Child 27,373,158 499,894 $0.56 $15,297,572 Adult 10,193,956 43,098 $0.13 $1,318,942 ACA OE 21,305,378 90,532 $0.13 $2,769,699 SPD 4,571,944 25,237 $0.17 $772,384 LTC 72,510 166 $0.07 $5,076 OBRA 852 2 $0.08 $68 WCM 154,314 2,812 $0.55 $85,454 AIDS Non-Duals 2,100 11 $0.17 $357 All COAs 63,674,212 661,753 $0.32 $20,249,552
The final add-on PMPM amounts are included in the final rate ranges after the application of risk adjustment. There is no variation of the add-on PMPMs across the rate ranges. If budget appropriations are approved that allow the continuation of these add-ons for the July through December 2021 period, the following table of impacts will apply for that period.
Trauma Screening (July 2021–December 2021)
COA Projected MMs Prop 56 Add-on Projected Units Total PMPM Total Dollars
Child 27,008,172 493,229 $0.56 $15,093,610 Adult 10,046,621 42,475 $0.13 $1,299,889 ACA OE 20,992,820 89,204 $0.13 $2,729,067 SPD 4,533,126 25,022 $0.17 $765,827 LTC 72,510 166 $0.07 $5,076 OBRA 852 2 $0.08 $68 WCM 154,314 2,812 $0.55 $85,454 AIDS Non-Duals 2,100 11 $0.17 $357 All COAs 62,810,515 652,922 $0.32 $19,979,347
Per the Pre-Print, the add-on rate payment for this payment initiative will be subject to a two-sided risk corridor together with the Physician Proposition 56 add-on rate payment and the Developmental Screening Proposition 56 add-on rate payment. As outlined in the Pre-Print, the risk corridor will be
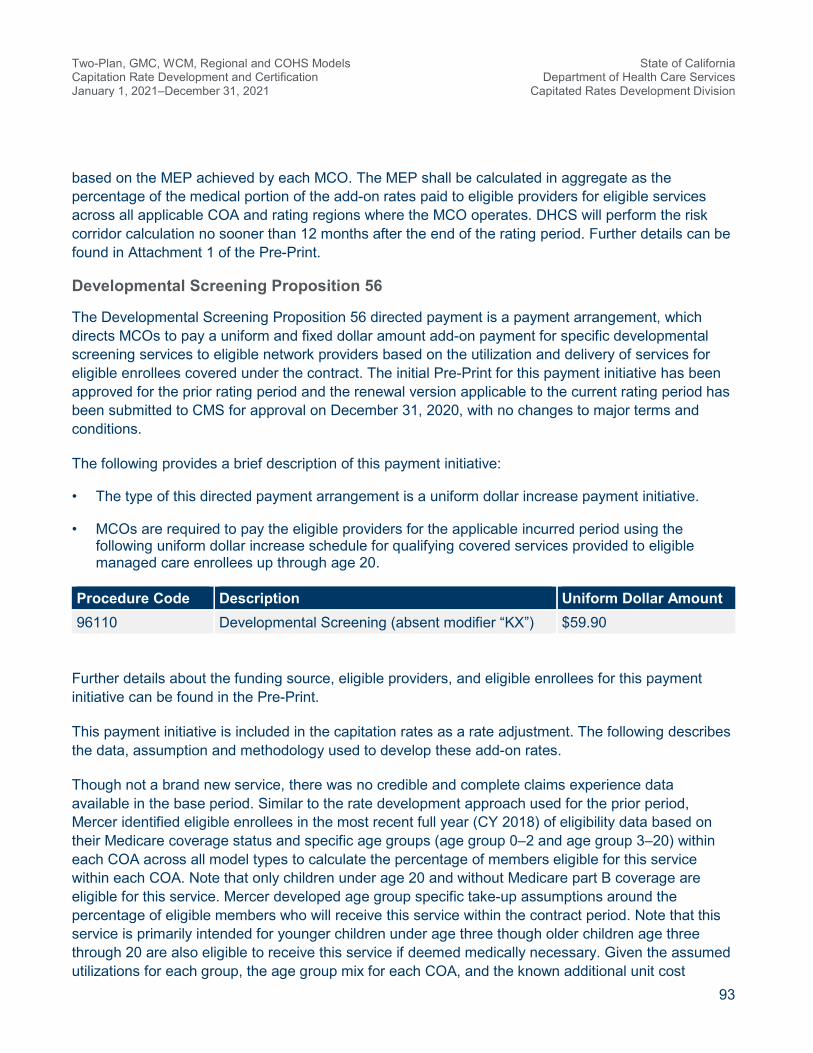
Two-Plan, GMC, WCM, Regional and COHS Models Capitation Rate Development and Certification January 1, 2021–December 31, 2021
State of California Department of Health Care Services
Capitated Rates Development Division
93
based on the MEP achieved by each MCO. The MEP shall be calculated in aggregate as the percentage of the medical portion of the add-on rates paid to eligible providers for eligible services across all applicable COA and rating regions where the MCO operates. DHCS will perform the risk corridor calculation no sooner than 12 months after the end of the rating period. Further details can be found in Attachment 1 of the Pre-Print.
Developmental Screening Proposition 56
The Developmental Screening Proposition 56 directed payment is a payment arrangement, which directs MCOs to pay a uniform and fixed dollar amount add-on payment for specific developmental screening services to eligible network providers based on the utilization and delivery of services for eligible enrollees covered under the contract. The initial Pre-Print for this payment initiative has been approved for the prior rating period and the renewal version applicable to the current rating period has been submitted to CMS for approval on December 31, 2020, with no changes to major terms and conditions.
The following provides a brief description of this payment initiative:
• The type of this directed payment arrangement is a uniform dollar increase payment initiative.
• MCOs are required to pay the eligible providers for the applicable incurred period using the following uniform dollar increase schedule for qualifying covered services provided to eligible managed care enrollees up through age 20.
Procedure Code Description Uniform Dollar Amount 96110 Developmental Screening (absent modifier “KX”) $59.90
Further details about the funding source, eligible providers, and eligible enrollees for this payment initiative can be found in the Pre-Print.
This payment initiative is included in the capitation rates as a rate adjustment. The following describes the data, assumption and methodology used to develop these add-on rates.
Though not a brand new service, there was no credible and complete claims experience data available in the base period. Similar to the rate development approach used for the prior period, Mercer identified eligible enrollees in the most recent full year (CY 2018) of eligibility data based on their Medicare coverage status and specific age groups (age group 0–2 and age group 3–20) within each COA across all model types to calculate the percentage of members eligible for this service within each COA. Note that only children under age 20 and without Medicare part B coverage are eligible for this service. Mercer developed age group specific take-up assumptions around the percentage of eligible members who will receive this service within the contract period. Note that this service is primarily intended for younger children under age three though older children age three through 20 are also eligible to receive this service if deemed medically necessary. Given the assumed utilizations for each group, the age group mix for each COA, and the known additional unit cost

Two-Plan, GMC, WCM, Regional and COHS Models Capitation Rate Development and Certification January 1, 2021–December 31, 2021
State of California Department of Health Care Services
Capitated Rates Development Division
94
(uniform dollar increase), Mercer then calculated the expected claims PMPM as the benefit cost component of the add-on rate. Lastly, this PMPM amount was adjusted to include half of the plan-specific administrative load, which provides for the variable component of the expenses while the fixed administrative costs are covered in the base capitation rates, and an underwriting gain of 1.5%. Further detail of these components, including MCO-specific amounts are included within the accompanying rate development detail provided in an Excel format.
See the table below for detailed impacts for the six-month period:
Developmental Screening (January 2021–June 2021)
COA Projected MMs Prop 56 Add-on Projected Units Total PMPM Total Dollars
Child 27,373,158 431,986 $1.00 $27,305,153 Adult 10,193,956 1,613 $0.01 $101,940 ACA OE 21,305,378 6,743 $0.02 $426,108 SPD 4,571,944 6,510 $0.09 $411,475 LTC 72,510 - - - OBRA 852 - - - WCM 154,314 2,425 $0.99 $152,221 AIDS Non-Duals 2,100 - - - All COAs 63,674,212 449,277 $0.45 $28,396,896
The final add-on PMPM amounts are included in the final rate ranges after the application of risk adjustment. There is no variation of the add-on PMPMs across the rate ranges. If budget appropriations are approved that allow the continuation of these add-ons for the July 2021 through December 2021 period, the following table of impacts will apply for that period.
Developmental Screening (July 2021–December 2021)
COA Projected MMs Prop 56 Add-on Projected Units Total PMPM Total Dollars
Child 27,008,172 426,226 $1.00 $26,941,096 Adult 10,046,621 1,589 $0.01 $100,466 ACA OE 20,992,820 6,644 $0.02 $419,856 SPD 4,533,126 6,454 $0.09 $407,981 LTC 72,510 - - - OBRA 852 - - - WCM 154,314 2,425 $0.99 $152,221

Two-Plan, GMC, WCM, Regional and COHS Models Capitation Rate Development and Certification January 1, 2021–December 31, 2021
State of California Department of Health Care Services
Capitated Rates Development Division
95
Developmental Screening (July 2021–December 2021)
COA Projected MMs Prop 56 Add-on Projected Units Total PMPM Total Dollars
AIDS Non-Duals 2,100 - - - All COAs 62,810,515 443,339 $0.45 $28,021,620
Per the Pre-Print, the add-on rate payment for this payment initiative will be subject to a two-sided risk corridor together with the Physician Proposition 56 add-on rate payment and the Trauma Screening Proposition 56 add-on rate payment. As outlined in the Pre-Print, the risk corridor will be based on the MEP achieved by each MCO. The MEP shall be calculated in aggregate as the percentage of the medical portion of the add-on rates paid to eligible providers for eligible services across all applicable COA and rating regions where the MCO operates. DHCS will perform the risk corridor calculation no sooner than 12 months after the end of the rating period. Further details can be found in Attachment 1 of the Pre-Print.
Family Planning Proposition 56
The Family Planning Proposition 56 directed payment is a payment arrangement, which directs MCOs to pay a uniform and fixed dollar amount add-on payment for specific family planning services to eligible network providers based on the utilization and delivery of services for eligible enrollees covered under the contract. The initial Pre-Print for this payment initiative has been approved for the prior rating period and the renewal version applicable to the current rating period has been submitted to CMS for approval on December 31, 2020, with no changes to major terms and conditions.
The following provides a brief description of this payment initiative:
• The type of this directed payment arrangement is a uniform dollar increase payment initiative.
• MCOs are required to pay the eligible providers for the applicable incurred period using the following uniform dollar increase schedule by procedure code for qualifying covered services provided to eligible managed care enrollees.
Procedure Code4 Description Uniform Dollar Amount
J7296 LEVONORGESTREL-RELEASING IU COC SYS 19.5 MG $2,727.00 J7297 LEVONORGESTREL-RLS INTRAUTERINE COC SYS 52
MG $2,053.00
4 Note: Services billed for the following Current Procedural Terminology codes with modifiers UA or UB are excluded from these directed payments: 11976, 11981, 58300, 58301, 55250, 58340, 58555, 58565, 58600, 58615, 58661, 58670, 58671, and 58700.

Two-Plan, GMC, WCM, Regional and COHS Models Capitation Rate Development and Certification January 1, 2021–December 31, 2021
State of California Department of Health Care Services
Capitated Rates Development Division
96
Procedure Code4 Description Uniform Dollar Amount
J7298 LEVONORGESTREL-RLS INTRAUTERINE COC SYS 52 MG
$2,727.00
J7300 INTRAUTERINE COPPER CONTRACEPTIVE $2,426.00 J7301 LEVONORGESTREL-RLS INTRAUTERINE COC SYS 13.5
MG $2,271.00
J7307 ETONOGESTREL CNTRACPT IMPL SYS INCL IMPL & SPL
$2,671.00
J3490U8 DEPO-PROVERA $340.00 J7303 CONTRACEPTIVE VAGINAL RING $301.00 J7304 CONTRACEPTIVE PATCH $110.00 J3490U5 EMERG CONTRACEPTION: ULIPRISTAL ACETATE 30
MG $72.00
J3490U6 EMERG CONTRACEPTION: LEVONORGESTREL 0.75 MG (2) & 1.5 MG (1)
$50.00
11976 REMOVE CONTRACEPTIVE CAPSULE $399.00 11981 INSERT DRUG IMPLANT DEVICE $835.00 58300 INSERT INTRAUTERINE DEVICE $673.00 58301 REMOVE INTRAUTERINE DEVICE $195.00 81025 URINE PREGNANGY TEST $6.00 55250 REMOVAL OF SPERM DUCT(S) $521.00 58340 CATHETER FOR HYSTEROGRAPHY $371.00 58555 HYSTEROSCOPY DX SEP PROC $322.00 58565 HYSTEROSCOPY STERILIZATION $1,476.00 58600 DIVISION OF FALLOPIAN TUBE $1,515.00 58615 OCCLUDE FALLOPIAN TUBE(S) $1,115.00 58661 LAPAROSCOPY REMOVE ADNEXA $978.00 58670 LAPAROSCOPY TUBAL CAUTERY $843.00 58671 LAPAROSCOPY TUBAL BLOCK $892.00 58700 REMOVAL OF FALLOPIAN TUBE $1,216.00
Further details about the funding source, eligible providers and eligible enrollees for this payment initiative can be found in the Pre-Print.

Two-Plan, GMC, WCM, Regional and COHS Models Capitation Rate Development and Certification January 1, 2021–December 31, 2021
State of California Department of Health Care Services
Capitated Rates Development Division
97
This payment initiative is included in the capitation rates as a rate adjustment. The following describes the data, assumption, and methodology used to develop these add-on rates.
There was relatively complete and credible claims experience data available in the base period though they are subject to encounter under-reporting and other data issues. Similar to the rate development approach used for the prior period, Mercer leveraged the most recent full year (CY 2018) of existing claims data using the list of procedure codes to develop the base utilization by COA for each procedure code across all model types. Mercer adjusted the base utilization for estimated encounter under-reporting and anticipated ramp-up due to the enhanced payment under this payment initiative based on literature review of expected national utilization levels of family planning services by the following major service types among child bearing age females.
• Long-acting contraceptives
• Other contraceptives (other than oral contraceptives) when provided as a medical benefit
• Emergency contraceptives when provided as a medical benefit
• Pregnancy testing
• Sterilization procedures (for females and males)
Given the assumed utilizations for each code by COA and the known additional unit cost (uniform dollar increase schedule), Mercer then calculated the expected claims PMPM on a statewide basis as the benefit cost component of the add-on rate. Services provided within FQHC/RHC facilities are also excluded from the add-on payments due to the wrap-around payment structure associated with these types of facilities. Additional payments to AIHS providers and CBRCs are also excluded. In addition, because the network provider mix varies substantially across individual MCOs and individual rating regions, Mercer further adjusted the statewide claims PMPM using rating region specific and MCO-specific provider exclusion factors to develop the final claims PMPM, which vary by MCO and rating region. Lastly, this PMPM amount was adjusted to include half of the plan-specific administrative load, which provides for the variable component of the expenses while the fixed administrative costs are covered in the base capitation rates, and an underwriting gain of 1.5%. Further detail of these components, including MCO-specific amounts are included within the accompanying rate development detail provided in an Excel format.
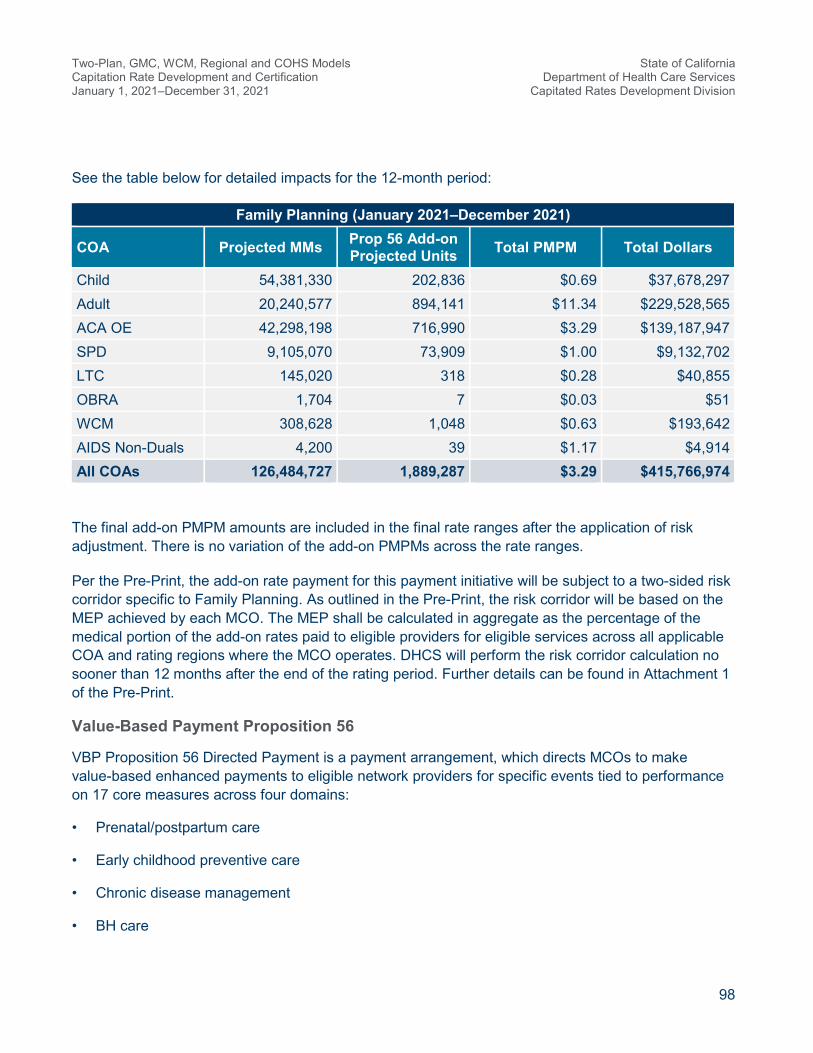
Two-Plan, GMC, WCM, Regional and COHS Models Capitation Rate Development and Certification January 1, 2021–December 31, 2021
State of California Department of Health Care Services
Capitated Rates Development Division
98
See the table below for detailed impacts for the 12-month period:
Family Planning (January 2021–December 2021)
COA Projected MMs Prop 56 Add-on Projected Units Total PMPM Total Dollars
Child 54,381,330 202,836 $0.69 $37,678,297 Adult 20,240,577 894,141 $11.34 $229,528,565 ACA OE 42,298,198 716,990 $3.29 $139,187,947 SPD 9,105,070 73,909 $1.00 $9,132,702 LTC 145,020 318 $0.28 $40,855 OBRA 1,704 7 $0.03 $51 WCM 308,628 1,048 $0.63 $193,642 AIDS Non-Duals 4,200 39 $1.17 $4,914 All COAs 126,484,727 1,889,287 $3.29 $415,766,974
The final add-on PMPM amounts are included in the final rate ranges after the application of risk adjustment. There is no variation of the add-on PMPMs across the rate ranges.
Per the Pre-Print, the add-on rate payment for this payment initiative will be subject to a two-sided risk corridor specific to Family Planning. As outlined in the Pre-Print, the risk corridor will be based on the MEP achieved by each MCO. The MEP shall be calculated in aggregate as the percentage of the medical portion of the add-on rates paid to eligible providers for eligible services across all applicable COA and rating regions where the MCO operates. DHCS will perform the risk corridor calculation no sooner than 12 months after the end of the rating period. Further details can be found in Attachment 1 of the Pre-Print.
Value-Based Payment Proposition 56
VBP Proposition 56 Directed Payment is a payment arrangement, which directs MCOs to make value-based enhanced payments to eligible network providers for specific events tied to performance on 17 core measures across four domains:
• Prenatal/postpartum care
• Early childhood preventive care
• Chronic disease management
• BH care

Two-Plan, GMC, WCM, Regional and COHS Models Capitation Rate Development and Certification January 1, 2021–December 31, 2021
State of California Department of Health Care Services
Capitated Rates Development Division
99
This arrangement directs MCOs to make additional enhanced payments for events tied to beneficiaries diagnosed with a substance use disorder, serious mental illness or who are homeless (also referenced as “At Risk Users” in the following VBP schedule). The initial Pre-Print for this payment initiative has been approved for the prior rating period and the renewal version applicable to the current rate period has been submitted to CMS for approval on December 31, 2020, with no changes to major terms and conditions.
The following provides a brief description of this payment initiative:
• The type of this directed payment arrangement is a VBP initiative.
• MCOs are required to pay the eligible providers for the applicable incurred period using the following VBP schedule by core measure for specified services provided to eligible managed care enrollees.
Measure Measure Uniform Dollar Amounts for All
Users
Uniform Dollar Amount for At Risk
Users 1 Prenatal Pertussis (‘Whooping Cough’)
Vaccine $25.00 $37.50
2 Prenatal Care Visit $70.00 $105.00 3 Postpartum Care Visit (First Visit) $70.00 $105.00 3 Postpartum Care Visit (Second Visit) $70.00 $105.00 4 Postpartum Birth Control $25.00 $37.500 5 Well Child Visits in First 15 Months of
Life (Six Month Visit) $70.00 $105.00
5 Well Child Visits in First 15 Months of Life (Nine Month Visit)
$70.00 $105.00
5 Well Child Visits in First 15 Months of Life (12 Month Visit)
$70.00 $105.00
6 Well Child Visits Year Three $70.00 $105.00 6 Well Child Visits Year Four $70.00 $105.00 6 Well Child Visits Year Five $70.00 $105.00 6 Well Child Visits Year Six $70.00 $105.00 7 Childhood Vaccine — Two Year Olds
(DTaP) $25.00 $37.50
7 Childhood Vaccine — Two Year Olds (PCV)
$25.00 $37.50
7 Childhood Vaccine — Two Year Olds (IPV)
$25.00 $37.50

Two-Plan, GMC, WCM, Regional and COHS Models Capitation Rate Development and Certification January 1, 2021–December 31, 2021
State of California Department of Health Care Services
Capitated Rates Development Division
100
Measure Measure Uniform Dollar Amounts for All
Users
Uniform Dollar Amount for At Risk
Users 7 Childhood Vaccine — Two Year Olds
(Hep B) $25.00 $37.50
7 Childhood Vaccine — Two Year Olds (Rotavirus)
$25.0 $37.50
7 Childhood Vaccine — Two Year Olds (Influenza)
$25.00 $37.50
7 Childhood Vaccine — Two Year Olds (HiB)
$25.00 $37.50
8 Blood Lead Screening $25.00 $37.50 9 Dental Fluoride Varnish $25.00 $37.50 10 Controlling Blood Pressure $40.00 $60.00 11 Diabetes Care $80.00 $120.0 12 Control of Persistent Asthma $40.00 $60.00 13 Tobacco Use Screening $25.00 $37.50 14 Adult Influenza (‘Flu’) Vaccine $25.00 $37.50 15 Screening for Clinical Depression
(CDF) $50.00 $75.00
16 Management of Depression Medication $40.00 $60.00 17 Screening for Unhealthy Alcohol Use $50.00 $75.00
Further details about the funding source, eligible providers, and eligible enrollees for this payment initiative can be found in the Pre-Print.
This payment initiative is included in the capitation rates as a rate adjustment. The following describes the data, assumptions, and methodology used to develop these add-on rates.
There was limited claims experience data available in the base period to support add-on rate development. Similar to the rate development approach used for the prior period, Mercer leveraged existing eligibility data in the most recent full year (CY 2018) of eligibility data to identify the eligible group within each COA for each targeted service or event as defined under this payment initiative and then worked together with the State to develop the utilization assumption for each eligible group for each targeted service on a statewide basis. Given the assumed utilizations for each targeted service by each eligible group, eligible member mix within each COA and the known enhanced payment (VBP schedule), Mercer calculated the expected claims PMPM on a statewide basis by COA for each core measure as the benefit cost component of the add-on rate. Services provided within FQHC/RHC facilities are also excluded from this add-on payment due to the wrap-around payment structure
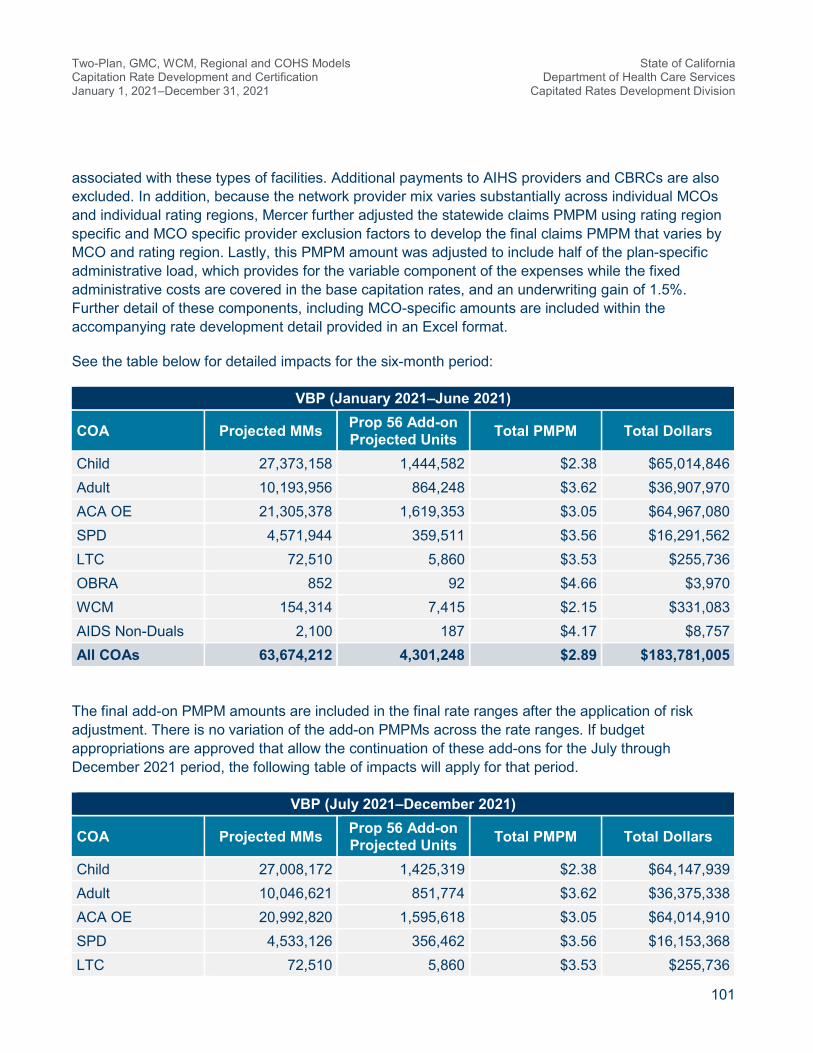
Two-Plan, GMC, WCM, Regional and COHS Models Capitation Rate Development and Certification January 1, 2021–December 31, 2021
State of California Department of Health Care Services
Capitated Rates Development Division
101
associated with these types of facilities. Additional payments to AIHS providers and CBRCs are also excluded. In addition, because the network provider mix varies substantially across individual MCOs and individual rating regions, Mercer further adjusted the statewide claims PMPM using rating region specific and MCO specific provider exclusion factors to develop the final claims PMPM that varies by MCO and rating region. Lastly, this PMPM amount was adjusted to include half of the plan-specific administrative load, which provides for the variable component of the expenses while the fixed administrative costs are covered in the base capitation rates, and an underwriting gain of 1.5%. Further detail of these components, including MCO-specific amounts are included within the accompanying rate development detail provided in an Excel format.
See the table below for detailed impacts for the six-month period:
VBP (January 2021–June 2021)
COA Projected MMs Prop 56 Add-on Projected Units Total PMPM Total Dollars
Child 27,373,158 1,444,582 $2.38 $65,014,846 Adult 10,193,956 864,248 $3.62 $36,907,970 ACA OE 21,305,378 1,619,353 $3.05 $64,967,080 SPD 4,571,944 359,511 $3.56 $16,291,562 LTC 72,510 5,860 $3.53 $255,736 OBRA 852 92 $4.66 $3,970 WCM 154,314 7,415 $2.15 $331,083 AIDS Non-Duals 2,100 187 $4.17 $8,757 All COAs 63,674,212 4,301,248 $2.89 $183,781,005
The final add-on PMPM amounts are included in the final rate ranges after the application of risk adjustment. There is no variation of the add-on PMPMs across the rate ranges. If budget appropriations are approved that allow the continuation of these add-ons for the July through December 2021 period, the following table of impacts will apply for that period.
VBP (July 2021–December 2021)
COA Projected MMs Prop 56 Add-on Projected Units Total PMPM Total Dollars
Child 27,008,172 1,425,319 $2.38 $64,147,939 Adult 10,046,621 851,774 $3.62 $36,375,338 ACA OE 20,992,820 1,595,618 $3.05 $64,014,910 SPD 4,533,126 356,462 $3.56 $16,153,368 LTC 72,510 5,860 $3.53 $255,736

Two-Plan, GMC, WCM, Regional and COHS Models Capitation Rate Development and Certification January 1, 2021–December 31, 2021
State of California Department of Health Care Services
Capitated Rates Development Division
102
VBP (July 2021–December 2021)
COA Projected MMs Prop 56 Add-on Projected Units Total PMPM Total Dollars
OBRA 852 92 $4.66 $3,970 WCM 154,314 7,415 $2.15 $331,083 AIDS Non-Duals 2,100 187 $4.17 $8,757 All COAs 62,810,515 4,242,726 $2.89 $181,291,101
According to the Pre-Print, the add-on rate payment for this payment initiative will be subject to a two-sided risk corridor specific to VBP. As outlined in the Pre-Print, the risk corridor will be based on the MEP achieved by each MCO. The MEP shall be calculated in aggregate as the percentage of the medical portion of the add-on rates paid to eligible providers for eligible services across all applicable COA and rating regions where the MCO operates. DHCS will perform the risk corridor calculation no sooner than 12 months after the end of the rating period. Further details can be found in Attachment 1 of the Pre-Print.
Hospital Directed Payments
The following directed payments: Private Hospital Uniform Dollar Increase (UDI), DPH FFS UDI, DPH Capitation, and DPH/DMPH Quality Incentive Pools (QIP) outlined below have been submitted to CMS, and the actual payments associated with these directed payments will be paid in the future. However, information included in the second tab of the attached spreadsheet (Summary Exhibit CY 2021 Medi-Cal MC Pass-through and Directed Payment Exhibits 2021 01 28.xlsx) includes the estimated PMPM impacts associated with these directed payments.
Private Hospital Uniform Dollar Increase
Private Hospital UDI directed payment Pre-Prints for this payment initiative have been approved for prior rating periods and the renewal version applicable to the current rate period has been submitted to CMS for approval on December 31, 2020, with no changes to major terms and conditions. The approach for developing the anticipated Private Hospital UDI impacts was very similar to the approach utilized for the private hospital HQAF Pass-through payments. The upper bound GME PMPM from the rates for the impacted COS (IP and OP/ER) was adjusted based on the SDR information for not only the private hospital share (please note DMPHs are excluded within the directed payment calculations with the exception of DMPH QIP) of expenditures, but also for the contracted share of those expenditures (payments associated with the MCO having a contract in place with the private facilities). This “contracted private share” of revenue was then further broken down into unit cost and utilization levels based upon information provided within the SDR. These calculations produced estimated private contracted days or visits that then form the basis for creating a uniform dollar increase that would total the intended directed payment target. The directed payment target for the IP and OP/ER adjustments was $3,527.53 million for the entire 12-month rating period. The IP uniform add-on of $990 and the OP/ER uniform add-on of $111 produced impacts of $2,469.27 million and $1,058.26

Two-Plan, GMC, WCM, Regional and COHS Models Capitation Rate Development and Certification January 1, 2021–December 31, 2021
State of California Department of Health Care Services
Capitated Rates Development Division
103
million for the respective COS. The excerpt below is from a prior PDF exhibit of “Exhibit Ia” which contains the calculations for the IP COS. The attached exhibit (Exhibit I CY 2021 Private Hospital Directed Payments 2021 01 28.pdf) contains the full detail of these calculations for the IP and OP/ER COS. The rows align with the COA presented in the excerpt from the Private Hospital HQAF exhibit and are listed in “Exhibit Ia”. The final results are included in the second tab of the attached spreadsheet (Summary Exhibit CY 2021 Medi-Cal MC Pass-through and Directed Payment Exhibits 2021 0128.xlsx) as noted previously.
• {H} is the upper bound GME PMPM from the rates
• {I} is the estimated private share based on the payment information from the SDR
• {J} is the contracted proportion of the private elements
• {K} = {H} * {I} * {J} is the product of these three elements
• {D} is calculated from {K} and {G} (contracted private PMPM and private unit costs)
• {L} is the uniform add-on unit cost based on the contracted days from {D}
• {N} reflects the add-on percent change, calculated based on the add-on unit cost that is applied to {K} to produce the PMPM impact {O}
A similar process is performed for the OP/ER components and these calculations can be found in “Exhibit Ib” in the attached PDF exhibits.
The methodology that will be used to allocate actual payments associated with this directed payment will be consistent with the methods discussed in this certification and the CMS approved Pre-Print.
Designated Public Hospital Fee-For-Service Uniform Dollar Increase
DPH FFS UDI directed payment Pre-Prints for these payment initiatives have been approved for prior rating periods and the renewal versions applicable to the current rate period have been submitted to CMS for approval on December 31, 2020, with no changes to major terms and conditions. The approach for developing the anticipated DPH FFS impacts was very similar to the approach utilized for the Private Hospital UDI directed payments. The upper bound GME PMPM from the rates for the
{B} {C} = {D} / {B} {D}={A}*{K}/{G} {E} {F} {G}={E}*(1 + {F}) {H} {I} {J} {K}={H}*{I}*{J} {L} {M}={G}+{L} {N}={L}/{G} {O}={K}*{N}
Total Days from Rates
Estimated Private
Contracted Days (%)
Estimated Private
Contracted Days
Rate Unit Cost
Estimated Unit Cost
Differential
Estimated Private Unit Cost
Rate PMPM
Private Share of Total (PMPM)
Contracted Private % (PMPM)
Private Contracted
PMPM
Uniform Unit Cost Add-on
New Unit Cost Add-on % Add-on PMPM
4,827 86.2% 4,161 3,907$ 1.6% 3,968$ 11.20$ 89.8% 97.5% 9.81$ 1,012.56$ 4,981$ 25.5% 2.50$
18,291 65.4% 11,971 3,153$ 6.0% 3,340$ 94.59$ 73.2% 94.7% 65.59$ 1,012.56$ 4,353$ 30.3% 19.88$
39,104 49.4% 19,316 3,823$ 6.8% 4,082$ 100.79$ 61.8% 85.3% 53.16$ 1,012.56$ 5,095$ 24.8% 13.19$
41,247 54.7% 22,554 3,571$ 6.9% 3,819$ 307.07$ 63.2% 92.6% 179.55$ 1,012.56$ 4,832$ 26.5% 47.60$
32 47.6% 15 2,661$ 6.4% 2,831$ 347.56$ 60.2% 84.2% 176.11$ 1,012.56$ 3,843$ 35.8% 62.99$
- 0.0% - -$ 6.4% -$ -$ 0.0% 0.0% -$ 1,012.56$ 1,013$ 0.0% -$
- 0.0% - -$ 6.4% -$ -$ 0.0% 0.0% -$ 1,012.56$ 1,013$ 0.0% -$
103,501 56.1% 58,017 3,608$ 6.4% 3,840$ 87.73$ Total Impact 59.3% 52.05$ 1,012.56$ 4,853$ 26.4% 13.80$

Two-Plan, GMC, WCM, Regional and COHS Models Capitation Rate Development and Certification January 1, 2021–December 31, 2021
State of California Department of Health Care Services
Capitated Rates Development Division
104
impacted COS (IP, LTC, OP/ER and non-facility [PCP, Specialist and other providers {FQHCs are excluded}]) was adjusted based on the SDR information for not only the DPH share of expenditures, but also for the contracted share of those expenditures (payments that were associated with the MCO having a contract in place with the DPH facilities). This “contracted DPH share” of revenue was then further broken down into unit cost and utilization levels based upon information provided within the SDR. These calculations produced estimated DPH contracted days or visits that then form the basis for creating a uniform dollar increase that would total the intended directed payment target for the given Classes of DPHs. The total impact of this directed payment across the Classes is targeted to be approximately $742.28 million. The excerpt below is from a prior PDF of exhibit “Exhibit IIa” which contains the calculations. The attached PDF exhibits (“Exhibit II” through “Exhibit VI” for the Class A to Class E impacts) contain the full detail of these calculations for the impacted COS. Classes A through E are outlined below:
• Class A is comprised of Santa Clara and San Francisco counties
• Class B is comprised of Alameda, San Bernardino, Kern, Monterey, Riverside, and Ventura counties
• Class C is comprised of Contra Costa, San Joaquin, and San Mateo counties
• Class D is comprised of all counties served by UC facilities
• Class E is comprised of LA County
The final results are also included in the second tab of the attached spreadsheet (Summary Exhibit CY 2021 Medi-Cal MC Pass-through and Directed Payment Exhibits 2021 01 28.xlsx). Within this second tab, a summary of the varied Class impacts for this adjustment is included at the bottom.
• {H} is the upper bound GME PMPM from the rates
• {I} is the estimated DPH share based on the payment information from the SDR
• {J} is the contracted proportion of the DPH elements
• {K} = {H} * {I} * {J} is the product of these three elements
• {D} is the contracted DPH days calculated from {K} and {G} (contracted DPH PMPM and unit costs)
• {L} is the uniform add-on cost based on the contracted days from {D}
• {N} reflects the add-on percent change that is applied to {K} to produce the PMPM impact {O}

Two-Plan, GMC, WCM, Regional and COHS Models Capitation Rate Development and Certification January 1, 2021–December 31, 2021
State of California Department of Health Care Services
Capitated Rates Development Division
105
A similar process is performed for the LTC, OP/ER and non-facility components and these calculations can be found in “Exhibit II” through “Exhibit VI” (sub-letters b through d) in the attached PDF exhibits.
The methodology that will be used to allocate actual payments associated with these directed payments will be consistent with the methods discussed in this certification and the CMS approved Pre-Prints. As described in the DPH Pre-Prints, acuity factors will be applied within the final calculations. The application of the acuity factors will be done in a budget neutral fashion whereby the pooled amounts will still be distributed in total. The exclusion of an adjustment for acuity within these current calculations was driven by the insufficient level of detail within the base data and supplemental data utilized in this estimated impact development. However, the resulting estimates produced are considered appropriate for this process.
Designated Public Hospitals Capitation
The DPH Capitation directed payment Pre-Print for this payment initiative has been approved for prior rating periods and the renewal version applicable to the current rate period has been submitted to CMS for approval on December 31, 2020, with no changes to major terms and conditions.
The DPH Capitation directed payment increase impacts Class A (Santa Clara and San Francisco Counties) and Class E (LA County). The approach for producing the uniform increase leveraged the estimated capitation payments DPH assigned members anticipated during the rating period relative to the targeted amounts for each class and the projected MMs for the DPH assigned members. The DPH Capitation directed payment leverages total GME expenditures across all COS within the calculations. The excerpt below is a sample from a prior PDF exhibit of “Exhibit IIe” which contains the calculations. The attached PDF exhibits (“Exhibit IIe” and “Exhibit VId” for the Class A and Class E impacts respectively) contain the full detail of these calculations. The final results are also included in the second tab of the attached spreadsheet (Summary Exhibit CY 2021 Medi-Cal MC Pass-through and Directed Payment Exhibits 2021 01 28.xlsx). The total results produce a $1,050.25 million impact across Class A ($312.02 million) and Class E ($738.23 million).
• {H} is the estimated total cap expenditures based on {B} (projected DPH assigned members MMs) and {G} (DPH assigned members capitation payments)
{B} {C} = {D} / {B} {D}={A}*{K}/{G} {E} {F} {G}={E}*(1 + {F}) {H} {I} {J} {K}={H}*{I}*{J} {L} {M}={G}+{L} {N}={L}/{G} {O}={K}*{N}
Total Days from Rates
Estimated DPH Contracted
Days (%)
Estimated DPH Contracted
Days
Rate Unit Cost
Estimated Unit Cost
Differential
Estimated DPH Unit Cost
Rate PMPM
DPH Share of Total (PMPM)
Contracted DPH %
(PMPM)
DPH Contracted
PMPM
Uniform DPH Add-on
New Unit Cost
Add-on % Add-on PMPM
3,859 31.6% 1,218 3,400$ -4.4% 3,252$ 18.30$ 30.2% 100.0% 5.52$ 1,209.30$ 4,461$ 37.2% 2.05$
11,031 21.9% 2,418 1,876$ -5.4% 1,774$ 83.36$ 20.7% 100.0% 17.28$ 1,209.30$ 2,983$ 68.2% 11.78$
30,631 32.1% 9,832 2,664$ -4.0% 2,558$ 87.87$ 30.8% 100.0% 27.08$ 1,209.30$ 3,767$ 47.3% 12.80$
29,822 22.4% 6,686 1,668$ -2.9% 1,620$ 208.21$ 21.8% 100.0% 45.32$ 1,209.30$ 2,829$ 74.7% 33.84$
30 32.3% 10 2,668$ -2.9% 2,591$ 323.53$ 31.4% 100.0% 101.47$ 1,209.30$ 3,801$ 46.7% 47.36$
- 0.0% - -$ 0.0% -$ -$ 0.0% 0.0% -$ 1,209.30$ 1,209$ 0.0% -$
- 0.0% - -$ 0.0% -$ -$ 0.0% 0.0% -$ 1,209.30$ 1,209$ 0.0% -$
75,373 26.8% 20,164 2,192$ -3.9% 2,108$ 77.47$ Total Impact 26.8% 20.75$ 1,209.30$ 3,317$ 57.4% 11.43$
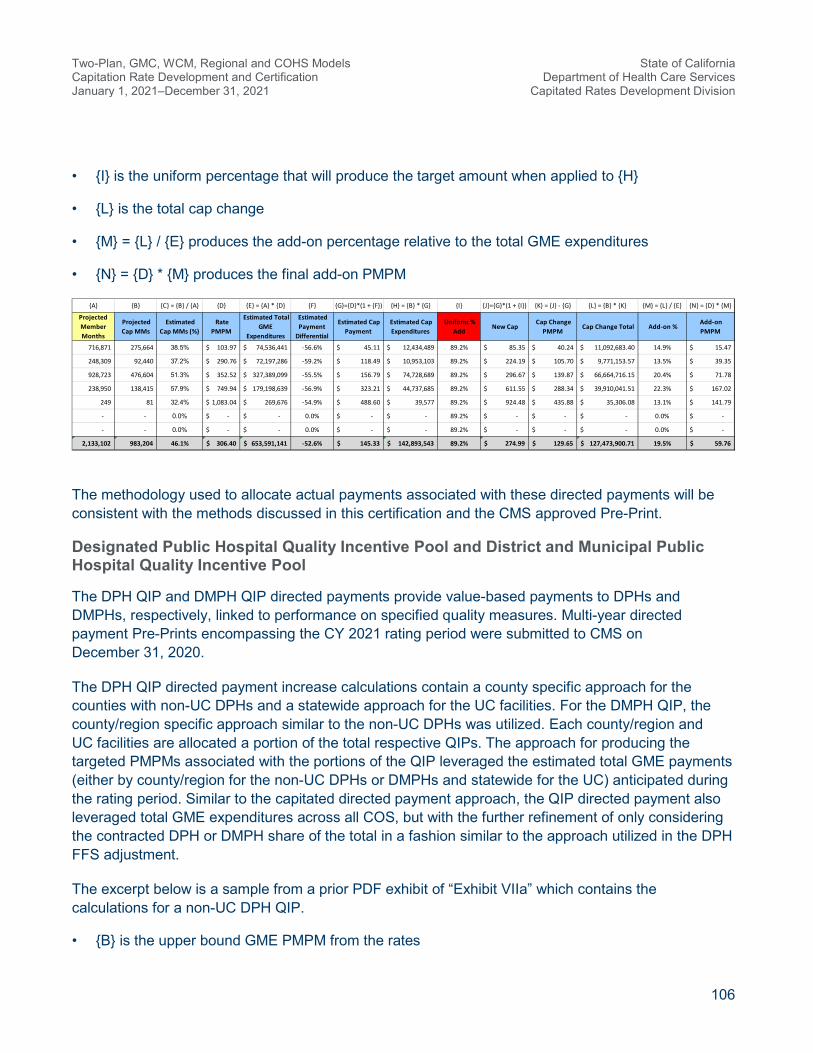
Two-Plan, GMC, WCM, Regional and COHS Models Capitation Rate Development and Certification January 1, 2021–December 31, 2021
State of California Department of Health Care Services
Capitated Rates Development Division
106
• {I} is the uniform percentage that will produce the target amount when applied to {H}
• {L} is the total cap change
• {M} = {L} / {E} produces the add-on percentage relative to the total GME expenditures
• {N} = {D} * {M} produces the final add-on PMPM
The methodology used to allocate actual payments associated with these directed payments will be consistent with the methods discussed in this certification and the CMS approved Pre-Print.
Designated Public Hospital Quality Incentive Pool and District and Municipal Public Hospital Quality Incentive Pool
The DPH QIP and DMPH QIP directed payments provide value-based payments to DPHs and DMPHs, respectively, linked to performance on specified quality measures. Multi-year directed payment Pre-Prints encompassing the CY 2021 rating period were submitted to CMS on December 31, 2020.
The DPH QIP directed payment increase calculations contain a county specific approach for the counties with non-UC DPHs and a statewide approach for the UC facilities. For the DMPH QIP, the county/region specific approach similar to the non-UC DPHs was utilized. Each county/region and UC facilities are allocated a portion of the total respective QIPs. The approach for producing the targeted PMPMs associated with the portions of the QIP leveraged the estimated total GME payments (either by county/region for the non-UC DPHs or DMPHs and statewide for the UC) anticipated during the rating period. Similar to the capitated directed payment approach, the QIP directed payment also leveraged total GME expenditures across all COS, but with the further refinement of only considering the contracted DPH or DMPH share of the total in a fashion similar to the approach utilized in the DPH FFS adjustment.
The excerpt below is a sample from a prior PDF exhibit of “Exhibit VIIa” which contains the calculations for a non-UC DPH QIP.
• {B} is the upper bound GME PMPM from the rates
{A} {B} {C} = {B} / {A} {D} {E} = {A} * {D} {F} {G}={D}*(1 + {F}) {H} = {B} * {G} {I} {J}={G}*(1 + {I}) {K} = {J} - {G} {L} = {B} * {K} {M} = {L} / {E} {N} = {D} * {M}
Projected Member Months
Projected Cap MMs
Estimated Cap MMs (%)
Rate PMPM
Estimated Total GME
Expenditures
Estimated Payment
Differential
Estimated Cap Payment
Estimated Cap Expenditures
Uniform % Add
New Cap Cap Change
PMPM Cap Change Total Add-on %
Add-on PMPM
716,871 275,664 38.5% 103.97$ 74,536,441$ -56.6% 45.11$ 12,434,489$ 89.2% 85.35$ 40.24$ 11,092,683.40$ 14.9% 15.47$
248,309 92,440 37.2% 290.76$ 72,197,286$ -59.2% 118.49$ 10,953,103$ 89.2% 224.19$ 105.70$ 9,771,153.57$ 13.5% 39.35$
928,723 476,604 51.3% 352.52$ 327,389,099$ -55.5% 156.79$ 74,728,689$ 89.2% 296.67$ 139.87$ 66,664,716.15$ 20.4% 71.78$
238,950 138,415 57.9% 749.94$ 179,198,639$ -56.9% 323.21$ 44,737,685$ 89.2% 611.55$ 288.34$ 39,910,041.51$ 22.3% 167.02$
249 81 32.4% 1,083.04$ 269,676$ -54.9% 488.60$ 39,577$ 89.2% 924.48$ 435.88$ 35,306.08$ 13.1% 141.79$
- - 0.0% -$ -$ 0.0% -$ -$ 89.2% -$ -$ -$ 0.0% -$
- - 0.0% -$ -$ 0.0% -$ -$ 89.2% -$ -$ -$ 0.0% -$
2,133,102 983,204 46.1% 306.40$ 653,591,141$ -52.6% 145.33$ 142,893,543$ 89.2% 274.99$ 129.65$ 127,473,900.71$ 19.5% 59.76$

Two-Plan, GMC, WCM, Regional and COHS Models Capitation Rate Development and Certification January 1, 2021–December 31, 2021
State of California Department of Health Care Services
Capitated Rates Development Division
107
• {D} is the estimated DPH (or DMPH) share based on the payment information from the SDR
• {E} is the contracted proportion of the DPH (or DMPH) elements
• {F} = {B} * {D} * {E} is the product of these three elements
• {G} is the total DPH (or DMPH) expenditures
• {H} is the uniform QIP percent based on the target amount {P1} relative to {G} (across county/region or state for UCs)
• {I} = {G} * {H} is the targeted QIP dollars by COA
• {J} = {I} / {C} is the QIP dollars as a percent of total expenditures
• {K} = {B} * {J} is the final add-on PMPM based on the percentage from {J}
The approach is the same for DMPH facilities and similar for the UC facilities except statewide totals are utilized versus county/region totals. The attached PDF exhibits (“Exhibits VIIa” for the non-UC DPHs QIP, “Exhibit VIIb” for the UC facilities QIP, and “Exhibit VIII” for the DMPH QIP) contain the full detail of these calculations. The final results are also included in the second tab of the attached spreadsheet (Summary Exhibit CY 2021 Medi-Cal MC Pass-through and Directed Payment Exhibits 2021 01 28.xlsx). The total DPH QIP results produce a $1,833.21 million impact across non-UC DPHs ($1,576.94 million) and UC facilities ($256.27 million). The total DMPH QIP results produce a $155.95 million impact across DMPH facilities.
The methodology that will be used to allocate actual payments associated with these directed payments will be consistent with the methods discussed in this certification and the CMS approved Pre-Prints.
{B} {C} = {A} * {B} {D} {E} {F}={B}*{D}*{E} {G}={A}*{F} {H}={P1}/"county"{G} {I}={G}*{H} {J}={I}/{C} {K}={B}*{J} {L} {M} {N}={K}+{L}+{M} {O} = {A} * {N} {P}
Rate PMPM Total Expenditures
DPH Share of Total (PMPM)
Contracted DPH % (PMPM)
DPH Contracted
PMPM
DPH Expenditures Uniform QIP % QIP Dollars Add-on % Add-on
PMPM Admin UW Gain Total PMPM Total Dollars Total Dollars
84.47$ 142,186,124$ 2.3% 97.1% 1.88$ 3,159,827$ 50.50% 1,595,657$ 1.1% 0.95$ 0.95$ 1,599,107$
268.41$ 163,636,518$ 9.2% 98.4% 24.28$ 14,803,595$ 50.50% 7,475,552$ 4.6% 12.26$ 12.26$ 7,474,272$
330.56$ 490,269,431$ 11.2% 97.5% 36.12$ 53,573,416$ 50.50% 27,053,621$ 5.5% 18.24$ 18.24$ 27,052,820$ {P1}
849.65$ 407,608,554$ 10.1% 98.8% 84.66$ 40,615,968$ 50.50% 20,510,340$ 5.0% 42.75$ 42.75$ 20,508,714$ County Target
1,129.44$ 277,841$ 2.7% 100.0% 30.57$ 7,521$ 50.50% 3,798$ 1.4% 15.44$ 15.44$ 3,798$ 69,719,701$
-$ -$ 0.0% 0.0% -$ -$ 50.50% -$ 0.0% -$ -$ -$ Target %
-$ -$ 0.0% 0.0% -$ -$ 50.50% -$ 0.0% -$ -$ -$ 50.5%
282.89$ 1,203,978,467$ Total Impact 9.3% 26.35$ 112,160,327$ 56,638,967$ 4.7% 13.31$ 13.31$ 56,638,712$
67.94$ 25,456,786$ 2.4% 65.2% 1.06$ 398,182$ 50.50% 201,075$ 0.8% 0.54$ 0.54$ 202,335$
252.09$ 31,541,085$ 11.8% 88.4% 26.34$ 3,295,510$ 50.50% 1,664,174$ 5.3% 13.30$ 13.30$ 1,664,056$
238.36$ 103,425,792$ 12.6% 87.7% 26.27$ 11,397,873$ 50.50% 5,755,723$ 5.6% 13.26$ 13.26$ 5,753,673$ {P2}
893.80$ 91,127,815$ 12.6% 94.5% 106.03$ 10,810,433$ 50.50% 5,459,076$ 6.0% 53.54$ 53.54$ 5,458,724$ QIP Total
1,050.77$ 37,828$ 3.6% 100.0% 37.71$ 1,358$ 50.50% 686$ 1.8% 19.04$ 19.04$ 685$ 69,718,186$
-$ -$ 0.0% 0.0% -$ -$ 50.50% -$ 0.0% -$ -$ -$
-$ -$ 0.0% 0.0% -$ -$ 50.50% -$ 0.0% -$ -$ -$
242.91$ 251,589,306$ Total Impact 10.3% 25.01$ 25,903,357$ 13,080,734$ 5.2% 12.63$ 12.63$ 13,079,474$
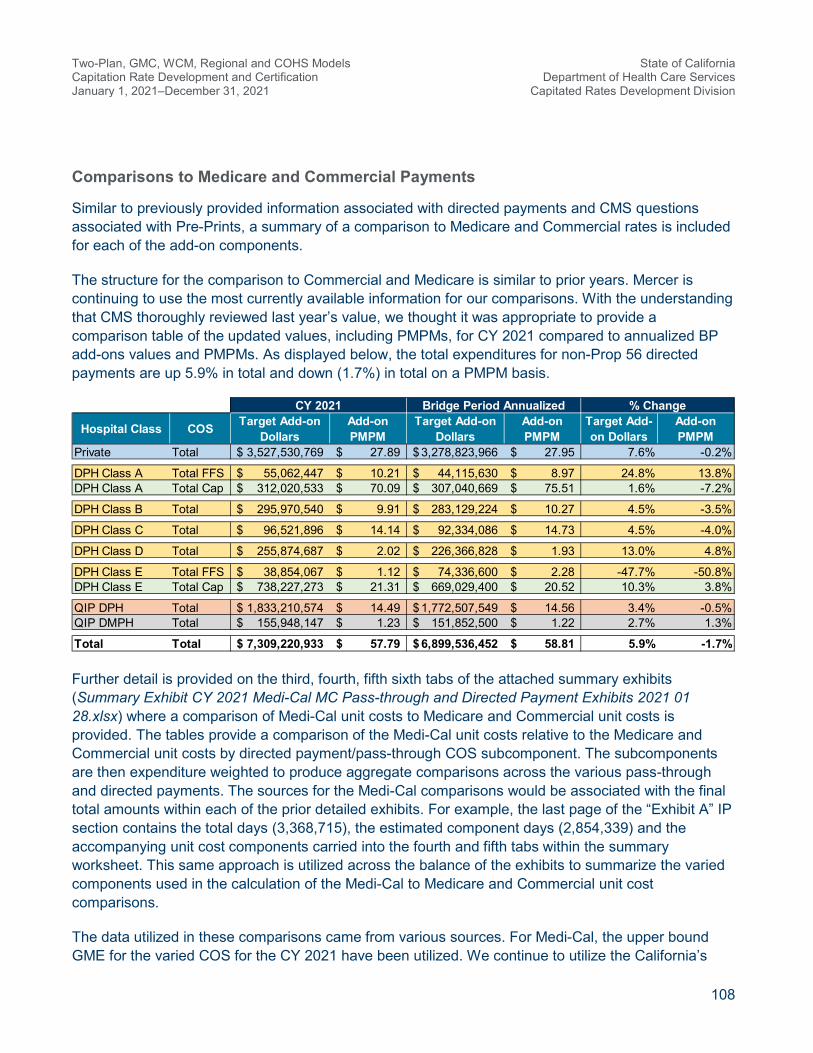
Two-Plan, GMC, WCM, Regional and COHS Models Capitation Rate Development and Certification January 1, 2021–December 31, 2021
State of California Department of Health Care Services
Capitated Rates Development Division
108
Comparisons to Medicare and Commercial Payments
Similar to previously provided information associated with directed payments and CMS questions associated with Pre-Prints, a summary of a comparison to Medicare and Commercial rates is included for each of the add-on components.
The structure for the comparison to Commercial and Medicare is similar to prior years. Mercer is continuing to use the most currently available information for our comparisons. With the understanding that CMS thoroughly reviewed last year’s value, we thought it was appropriate to provide a comparison table of the updated values, including PMPMs, for CY 2021 compared to annualized BP add-ons values and PMPMs. As displayed below, the total expenditures for non-Prop 56 directed payments are up 5.9% in total and down (1.7%) in total on a PMPM basis.
Further detail is provided on the third, fourth, fifth sixth tabs of the attached summary exhibits (Summary Exhibit CY 2021 Medi-Cal MC Pass-through and Directed Payment Exhibits 2021 01 28.xlsx) where a comparison of Medi-Cal unit costs to Medicare and Commercial unit costs is provided. The tables provide a comparison of the Medi-Cal unit costs relative to the Medicare and Commercial unit costs by directed payment/pass-through COS subcomponent. The subcomponents are then expenditure weighted to produce aggregate comparisons across the various pass-through and directed payments. The sources for the Medi-Cal comparisons would be associated with the final total amounts within each of the prior detailed exhibits. For example, the last page of the “Exhibit A” IP section contains the total days (3,368,715), the estimated component days (2,854,339) and the accompanying unit cost components carried into the fourth and fifth tabs within the summary worksheet. This same approach is utilized across the balance of the exhibits to summarize the varied components used in the calculation of the Medi-Cal to Medicare and Commercial unit cost comparisons.
The data utilized in these comparisons came from various sources. For Medi-Cal, the upper bound GME for the varied COS for the CY 2021 have been utilized. We continue to utilize the California’s
CY 2021 Bridge Period Annualized % Change
Hospital Class COS Target Add-on Dollars
Add-on PMPM
Target Add-on Dollars
Add-on PMPM
Target Add-on Dollars
Add-on PMPM
Private Total 3,527,530,769$ 27.89$ 3,278,823,966$ 27.95$ 7.6% -0.2%
DPH Class A Total FFS 55,062,447$ 10.21$ 44,115,630$ 8.97$ 24.8% 13.8%DPH Class A Total Cap 312,020,533$ 70.09$ 307,040,669$ 75.51$ 1.6% -7.2%
DPH Class B Total 295,970,540$ 9.91$ 283,129,224$ 10.27$ 4.5% -3.5%
DPH Class C Total 96,521,896$ 14.14$ 92,334,086$ 14.73$ 4.5% -4.0%
DPH Class D Total 255,874,687$ 2.02$ 226,366,828$ 1.93$ 13.0% 4.8%
DPH Class E Total FFS 38,854,067$ 1.12$ 74,336,600$ 2.28$ -47.7% -50.8%DPH Class E Total Cap 738,227,273$ 21.31$ 669,029,400$ 20.52$ 10.3% 3.8%
QIP DPH Total 1,833,210,574$ 14.49$ 1,772,507,549$ 14.56$ 3.4% -0.5%QIP DMPH Total 155,948,147$ 1.23$ 151,852,500$ 1.22$ 2.7% 1.3%
Total Total 7,309,220,933$ 57.79$ 6,899,536,452$ 58.81$ 5.9% -1.7%

Two-Plan, GMC, WCM, Regional and COHS Models Capitation Rate Development and Certification January 1, 2021–December 31, 2021
State of California Department of Health Care Services
Capitated Rates Development Division
109
OSHPD experience to provide consistent comparisons. Mercer is now using the latest CY 2019 OSHPD data. This OSHPD data provides county specific (or groups of counties) IP and OP Medicare and Commercial payment levels. Professional unit cost information leveraged the CY 2019 CMS provider detail files numbers 3 and 4. Time periods utilized in the analysis were the CY 2021 Medi-Cal capitation rates (upper bound), CY 2019 OSHPD data, and the CY 2019 professional Medicare data. The Medicare and OSHPD data was trended forward 24 months to align with the CY 2021 Medi-Cal rates utilizing Medi-Cal rating trends from the rating period (annual trends of 3.89% for IP, 4.07% for OP/ER, and 1.97% for professional). The supporting documentation of these data sources is included in the final two tabs of the attached spreadsheet (Summary Exhibit CY 2021 Medi-Cal MC Pass-through and Directed Payment Exhibits 2021 01 28.xlsx).
If specific unit cost add-ons were not applicable for a given component, then the unit cost impacts were based upon the total expenditures for the given adjustment relative to the total expenditure within that COS. For example, the $21.96 unit cost adjustment for the $694.3 million Proposition 56 directed payments component was based upon the relationship of the Proposition 56 adjustment of $694.3 million relative to the underlying professional total costs of $3,692.7 million. This $3,692.7 million professional cost is based on the visits (31,614,182) and unit cost ($116.81) from the non-facility detail in “Exhibit Vc” (the UC exhibits contain statewide totals). This 18.8% relationship produced the additional $21.96 unit cost adjustment (18.8% times the $116.81 base unit cost). The new total unit cost of $138.77 is then compared to Medicare and Commercial unit costs trended to the midpoint of the CY 2021 period. A similar approach was utilized for the other components with consideration of the new add-on unit costs. As stated previously, these comparisons are displayed on the third, fourth, fifth and sixth tabs of the attached summary exhibit (Summary Exhibit CY 2021 Medi-Cal MC Pass-through and Directed Payment Exhibits 2021 01 28.xlsx).

Two-Plan, GMC, WCM, Regional and COHS Models Capitation Rate Development and Certification January 1, 2021–December 31, 2021
State of California Department of Health Care Services
Capitated Rates Development Division
110
9
Certification and Final Rates This certification assumes items in the Medicaid State Plan or Waiver, as well as the MCO contract, have been approved by CMS.
In preparing the capitation rates described, Mercer has used and relied upon enrollment, eligibility, claim, reimbursement level, benefit design, and financial data and information supplied by DHCS, its MCOs, and its vendors. DHCS, its MCOs, and its vendors are solely responsible for the validity and completeness of this supplied data and information. Mercer has reviewed the summarized data and information for internal consistency and reasonableness, but we did not audit it. In Mercer’s opinion, it is appropriate for the intended rate-setting purposes. However, if the data and information are incomplete or inaccurate, the values shown in this report and associated exhibits may differ significantly from values that would be obtained with accurate and complete information; this may require a later revision to this report.
Because modeling all aspects of a situation or scenario is not possible or practical, Mercer may use summary information, estimates, or simplifications of calculations to facilitate the modeling of future events in an efficient and cost-effective manner. Mercer may also exclude factors or data that are immaterial in our judgment. Use of such simplifying techniques does not, in our judgment, affect the reasonableness, appropriateness, or attainability of the results for the Medicaid program. Actuarial assumptions may also be changed from one certification period to the next because of changes in mandated requirements, program experience, changes in expectations about the future, and other factors. A change in assumptions is not an indication that prior assumptions were unreasonable, inappropriate, or unattainable when they were made.
Mercer certifies that the Two-Plan, GMC, Regional, and COHS (including WCM) models’ capitation rates and CCI Non-Dual Institutional rates, for CY 2021, January 1, 2021 through December 31, 2021, were developed in accordance with generally accepted actuarial practices and principles, and are appropriate for the Medi-Cal covered populations and services under the managed care contract. Capitation rates are “actuarially sound” if, for the business for which the certification is being prepared and for the period covered by the certification, projected capitation rates and other revenue sources provide for all reasonable, appropriate and attainable costs. For purposes of this definition, other revenue sources include, but are not limited to, expected reinsurance and governmental stop-loss cash flows, governmental risk adjustment cash flows and investment income. For purposes of this definition, costs include, but are not limited to, expected health benefits, health benefit settlement expenses, administrative expenses, the cost of capital, and government-mandated assessments, fees, and taxes. Collectively, the undersigned actuaries are members of the American Academy of Actuaries and meet its qualification standards to certify to the actuarial soundness of these Medicaid managed care capitation rates.

Two-Plan, GMC, WCM, Regional and COHS Models Capitation Rate Development and Certification January 1, 2021–December 31, 2021
State of California Department of Health Care Services
Capitated Rates Development Division
111
Capitation rates developed by Mercer are actuarial projections of future contingent events. All estimates are based upon the information and data available at a point in time, and are subject to unforeseen and random events. Therefore, any projection must be interpreted as having a likely, and potentially wide, range of variability from the estimate. Any estimate or projection may not be used or relied upon by any other party or for any other purpose than for which it was issued by Mercer. Mercer is not responsible for the consequences of any unauthorized use. Actual MCO costs will differ from these projections. Mercer has developed these rates on behalf of DHCS to demonstrate compliance with the CMS requirements under 42 CFR 438.4 and in accordance with applicable law and regulations. There are no stop loss, reinsurance, or incentive arrangements in these rates. Use of these rates for any purpose beyond that stated may not be appropriate.
MCOs are advised that the use of these rates may not be appropriate for their particular circumstance, and Mercer disclaims any responsibility for the use of these rates by MCOs for any purpose. Mercer recommends that any MCO considering contracting with DHCS should analyze its own projected medical expense, administrative expense, and any other premium needs for comparison to these rates before deciding whether to contract with DHCS.
DHCS understands that Mercer is not engaged in the practice of law, or in providing advice on taxation matters. This report, which may include commenting on legal or taxation issues or regulations, does not constitute and is not a substitute for legal or taxation advice. Accordingly, Mercer recommends that DHCS secure the advice of competent legal and taxation counsel with respect to any legal or taxation matters related to this report or otherwise.
This certification report assumes the reader is familiar with the Medi-Cal program, Medi-Cal eligibility rules, and actuarial rating techniques. It has been prepared exclusively for DHCS and CMS, and should not be relied upon by third parties. Other readers should seek the advice of actuaries, or other qualified professionals competent in the area of actuarial rate projections, to understand the technical nature of these results. Mercer is not responsible for, and expressly disclaims liability for, any reliance on this report by third parties.

Two-Plan, GMC, WCM, Regional and COHS Models Capitation Rate Development and Certification January 1, 2021–December 31, 2021
State of California Department of Health Care Services
Capitated Rates Development Division
112
DHCS agrees to notify Mercer within 30 days of receipt of this report if it disagrees with anything contained in this report or is aware of any information or data that would affect the results of this report that has not been communicated or provided to Mercer or incorporated herein. The report will be deemed final and acceptable to DHCS if nothing is received by Mercer within such 30-day period.
If you have any questions on the above or the certification report, please feel free to contact Robert O’Brien at robert.j.o'[email protected], Jim Meulemans at [email protected], Marcie Gunnell at [email protected], or Cassidy Misbach at [email protected].
Sincerely,
Robert J. O’Brien, ASA, MAAA James J. Meulemans, ASA, MAAA, FCA Principal Partner
Marcie Gunnell, ASA, MAAA, FCA Cassidy Misbach, ASA, MAAA Principal Associate
Services provided by Mercer Health & Benefits LLC.
Mercer Government 2325 East Camelback Road, Suite 600 Phoenix, AZ 85016 www.mercer-government.mercer.com