101 A Novel Approach for Region Based Image Partitioning ...
6
Kavita Deshmukh* and Uday Pratap Sinngh** Abstract : As par the previous literature, the key point of image processing is the image segmentation. Images can be segmented by the various methods like a region based, edge based etc. In this paper we focus on the procedure of image segmentation using graphical models. Such as proximity graph, BN unified graphical models etc. In the segmentation procedure we partition the input image into different regions, or based on the similarity of the pixels. Region based segmentation is a vital step towards the area of image segmentation. The application area of this approach is the pattern matching, image analysis etc. However, in the world we have N no. of images and each image has its own properties and nature. So in numerous cases it is very tough task to handle all type of images because there is no exclusive approach for all nature of images such as color, grayscale image. Here we are discussing the segmentation using graphical model which is easier and meaningful approach to simplify the complexity of image segmentation. Keywords : Partition based on region, region developing and combining, proximity graph model, partitioning procedures. IJCTA, 9(23), 2016, pp. 101-106 � International Science Press * Department of Computer Engineering K. J. Somaiya College of Engineering, Mumbai, Maharashtra, India Email- Kavitadeshmukh277 @gmail.com ** Department of Mathematics and Engineering MITS, Gwalior, Madhya Pradesh, India Email- [email protected] 1. INTRODUCTION Now a day everything is based on multimedia and digitized, so the area of image processing is also growing very fast. Every application needs accurate and efficient Results so the various methods we have to introduce which simplifies the work according to todays demand [4]. Image segmentation is one of the approaches of efficient image processing who simplify the problem but the segmentation of image itself is a big problem [1-3]. However, in various no. Of cases, exclusive solution for the image segmentation does not exist [1]. The partitioning approach of an image is called image segmentation in which the image gives the results in the form of no. of regions. All the regions are having some common computational Properties like color, shape, texture etc. [2]. Segmented image processing give the depth knowledge of objects which is useful for analyze the images and applicable on various field such as MRI in the medical field, satellite images, and geographical monitoring. In this paper we are focusing how the segmentation takes place, example for any given image I ,the procedure subdivides the image I into N no. of regions, like [R1,R2,R3…..Rn][10].every partitioned region is having collection of pixels and all pixels are having some attributes. The inverse procedure of region partitioning is called region merging. There are no. of algorithms are working for the same but the working criteria is depends on the image nature [9-10]. The rest of the paper is organized as follows. Classification of image segmentation is explained in section II. Use of graph based technique for partitioning of image in section III. Experimental results in section IV. Concluding and scope for future work in section V.
-
Upload
khangminh22 -
Category
Documents
-
view
3 -
download
0
Transcript of 101 A Novel Approach for Region Based Image Partitioning ...
101A Novel Approach for Region Based Image Partitioning Methods Using Graphical Model
Kavita Deshmukh* and Uday Pratap Sinngh**
Abstract : As par the previous literature, the key point of image processing is the image segmentation. Imagescan be segmented by the various methods like a region based, edge based etc. In this paper we focus on theprocedure of image segmentation using graphical models. Such as proximity graph, BN unified graphicalmodels etc. In the segmentation procedure we partition the input image into different regions, or based on thesimilarity of the pixels. Region based segmentation is a vital step towards the area of image segmentation. Theapplication area of this approach is the pattern matching, image analysis etc. However, in the world we haveN no. of images and each image has its own properties and nature. So in numerous cases it is very tough taskto handle all type of images because there is no exclusive approach for all nature of images such as color,grayscale image. Here we are discussing the segmentation using graphical model which is easier and meaningfulapproach to simplify the complexity of image segmentation.Keywords : Partition based on region, region developing and combining, proximity graph model, partitioningprocedures.
IJCTA, 9(23), 2016, pp. 101-106��International Science Press
* Department of Computer Engineering K. J. Somaiya College of Engineering, Mumbai, Maharashtra, India Email- [email protected]
** Department of Mathematics and Engineering MITS, Gwalior, Madhya Pradesh, India Email- [email protected]
1. INTRODUCTION
Now a day everything is based on multimedia and digitized, so the area of image processing is also growingvery fast. Every application needs accurate and efficient Results so the various methods we have to introducewhich simplifies the work according to todays demand [4]. Image segmentation is one of the approaches ofefficient image processing who simplify the problem but the segmentation of image itself is a big problem [1-3].However, in various no. Of cases, exclusive solution for the image segmentation does not exist [1]. The partitioningapproach of an image is called image segmentation in which the image gives the results in the form of no. ofregions. All the regions are having some common computational Properties like color, shape, texture etc. [2].Segmented image processing give the depth knowledge of objects which is useful for analyze the images andapplicable on various field such as MRI in the medical field, satellite images, and geographical monitoring. In thispaper we are focusing how the segmentation takes place, example for any given image I ,the proceduresubdivides the image I into N no. of regions, like [R1,R2,R3…..Rn][10].every partitioned region is havingcollection of pixels and all pixels are having some attributes. The inverse procedure of region partitioning iscalled region merging. There are no. of algorithms are working for the same but the working criteria is dependson the image nature [9-10].
The rest of the paper is organized as follows. Classification of image segmentation is explained in section II.Use of graph based technique for partitioning of image in section III. Experimental results in section IV. Concludingand scope for future work in section V.
102 Kavita Deshmukh and Uday Pratap Sinngh
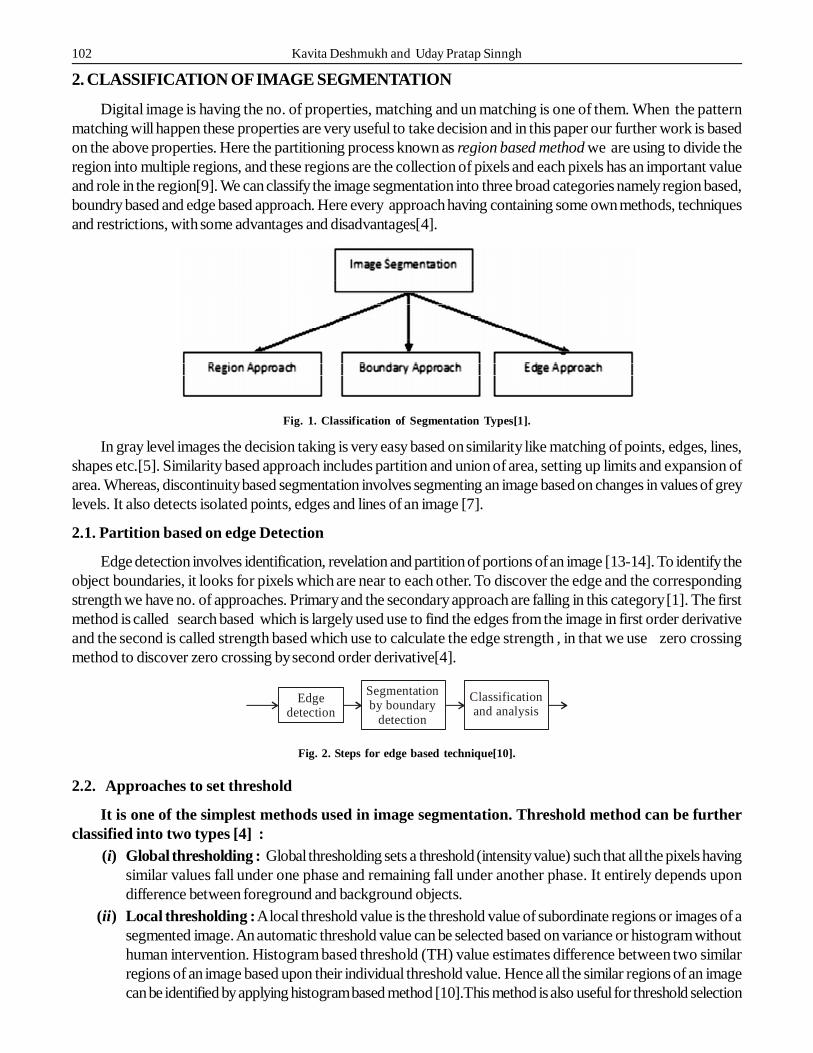
2. CLASSIFICATION OF IMAGE SEGMENTATION
Digital image is having the no. of properties, matching and un matching is one of them. When the patternmatching will happen these properties are very useful to take decision and in this paper our further work is basedon the above properties. Here the partitioning process known as region based method we are using to divide theregion into multiple regions, and these regions are the collection of pixels and each pixels has an important valueand role in the region[9]. We can classify the image segmentation into three broad categories namely region based,boundry based and edge based approach. Here every approach having containing some own methods, techniquesand restrictions, with some advantages and disadvantages[4].
Fig. 1. Classification of Segmentation Types[1].
In gray level images the decision taking is very easy based on similarity like matching of points, edges, lines,shapes etc.[5]. Similarity based approach includes partition and union of area, setting up limits and expansion ofarea. Whereas, discontinuity based segmentation involves segmenting an image based on changes in values of greylevels. It also detects isolated points, edges and lines of an image [7].
2.1. Partition based on edge Detection
Edge detection involves identification, revelation and partition of portions of an image [13-14]. To identify theobject boundaries, it looks for pixels which are near to each other. To discover the edge and the correspondingstrength we have no. of approaches. Primary and the secondary approach are falling in this category [1]. The firstmethod is called search based which is largely used use to find the edges from the image in first order derivativeand the second is called strength based which use to calculate the edge strength , in that we use zero crossingmethod to discover zero crossing by second order derivative[4].
Edgedetection
Segmentationby boundary
detection
Classificationand analysis
Fig. 2. Steps for edge based technique[10].
2.2. Approaches to set threshold
It is one of the simplest methods used in image segmentation. Threshold method can be furtherclassified into two types [4] :
(i) Global thresholding : Global thresholding sets a threshold (intensity value) such that all the pixels havingsimilar values fall under one phase and remaining fall under another phase. It entirely depends upondifference between foreground and background objects.
(ii) Local thresholding : A local threshold value is the threshold value of subordinate regions or images of asegmented image. An automatic threshold value can be selected based on variance or histogram withouthuman intervention. Histogram based threshold (TH) value estimates difference between two similarregions of an image based upon their individual threshold value. Hence all the similar regions of an imagecan be identified by applying histogram based method [10].This method is also useful for threshold selection
103A Novel Approach for Region Based Image Partitioning Methods Using Graphical Model
based on histogram ,which is also based on the success of estimation TH value that divide the twohomogenous regions of the object and backdrop of an object.[8]All uniform regions in the image areobtained by using histogram based method.
2.3. Segmentation based on region
Now a day, consequently there are many different and popular approaches for partitioning of images areavailable. Among the N no. of methods these two methods are well known, namely Region based and edge basedsegmentation [14]. It divides the whole region, based on the resemblance. Every part of the image contains N no.of pixels, and those pixels are having some common features. Based on these common points we can merge allpartition collectively. Region growing, region splitting and merging are the well suitable methods for the aboveaspects respectively. As we can imply, splitting and merging methods serves on quad tree [4]. The quard tree is thedata structure which we are using for image processing has four no. of branches. Splitting the region into quardsand merging them is the continuous process until no further partitioning is possible [9].
2.3.1. Region Growing
Region growing mechanism initiate with quite a few pixels called as seeds. In image partitioning scheme theseseeds are playing an important role and responsible for region growing until the entire image traverse at least once[16]. There are no. of seeds are there so the seeds particles which has similar kind or same attributes we have torecognize and select them , and form a group of those seeds particles .for Example consider a group of seeds arehaving similar gray value, so this approach can unite those seeds together. Continue the process for combine thesimilar attributes seeds until no seed found which has same value[3-6].
(a) Region growing : In every step N and for each region Rn(N) , where (i) n = 1,…n. we Test; If thereis any unclassified pixels in the 8-neighbourhood of each pixel of the region border .
(b) Before Formerly allocating such a pixel p to a region Rn(N),we test whether the region similarity is T orF: if H(Rn(N) U {p}) = T , then it is valid ,we assign the pixels.
(c) Mathematically we can calculate arithmetic mean AM and standard deviation SD of a group Rn having ino. Of pixels.
AM = ((1/i)(R,C) € R(n)�I(R,C) (1)SD = sqrt((1/i)(R,C). €.R(n)�[I(R,C)-M]2) (2)
Where I(R.C) is represents strength of the image.(d) Decision Test : Partition R1 and R2 are allowed to merge, if
|AM1 – AM2| < (N)sd{n} , n = 1, 2, then R1 and R2 is satisfied then we can combine.(e) Equality Conformation : Here we are checking the pixel strength or intensity is close to the Region
mean value.|Intensity of pixels I(R, C)-RAM
(n)| <= Threshold Q (3)(f) In above step the mentioned Threshold value Qwhere Qi differ as per values of region R and the pixel
intensity value I(R,C).we can express it by this way:Qi = {1 – [sd(n)/AM(n)]}Q (4)
2.3.2. Region Shrinking
As the name implies the region shrinking is the compliment process of region growing method. This method isconsidering the whole image as a uniform entity. If the notion of uniformity is not true then the entire image partitionedinto four sub images. It is a top down approach. This partitioning process will continue until we divide the entireimage into uniform regions [9]. Another essential aspects for image segmentation is, The Splitting and mergingmechanism, it is the iterative process in which we can divide and combine the image in each iteration’s [4-6].
104 Kavita Deshmukh and Uday Pratap Sinngh
(a) In the first Test of algorithm we are checking the region inequality. If any given region is R1 and R2 is notequal or not similar then the result for[(R1)= False] and then divide the region R1 into N no. of parts orsub region where the value of N = 4.
(b) The in the second test If region R1 and R2 are the two adjacent regions and both are having the similarvalue R1 = R2 or [R1 U R2 = TRUE] then, we can merge those regions.
(c) In above steps [(a)(b)],we already mentioned the equality and inequality operations . Stop the processafter the above iterative test, if no more splitting is possible. Same process can apply for merging. Thisstep will give you dense results as compare to pure splitting algorithm.
3. USAGE OF GRAPH FOR IMAGE PARTITIONING
Usage of graphs for image partition is a very well-known idea. To decrease the difficulties of image segmentationand simplify the approach the graph based method is very helpful [15]. There are no. of different models areavailable and each and every model has some unique properties which is useful for the image processing area indifferent manner. The advantage of using these models is the Graphical models are able to give no. of facility andability to combine a variety of information existing in the data into the model [14-16]. In literature we have seenvarious proposed approaches for extracting information from an given image and partition it into multiple regionswhich we called as sub regions [4]. Extraction of information is a key feature of any graphical model and theavailable models are subdivided into two main categories namely directed and undirected models. All the modelslike Proximity Graph, Markov random fields, conditional random field etc. falls in the above categories [10]. Otherprobabilistic methods include discriminative models without using graphical models. The advantage of graphicalmodel for segmentation is to combine information analytically from the image as well as collect other relatedknowledge about the previous data.
3.1. Phases of Image Partition algorithm using Proximity graph
Previously we discussed the image segmentation algorithm, here we presenting the steps creation of proximitygraph which helps the process of segmentation algorithm [10-12]:
1. Consider the image I as an input image.2. The expected outcome of the image I is a segmented image after using the graph based approach.(i) Step 1: consider the graph G which intended the input image I. Graph is a collection of nodes and edges,
To Shows the nodes of graph the considered graph we can use N and the parameters of image we arerepresenting by Sd, Si, r respectively where r is the radius of the image pixels. In the beginning of theprocess we are trying to produce edges to connect all the nodes according to their pixel position anddistance of the pixels r which we can calculate by the unit distance per pixel [9-11].once the edges areconnected then we calculate the Weight of the every edge and the weight calculation is different based onthe nature or attributes of any given image i.e. color or grayscale.Outcome : Every adjacent pixel now connected with each other within a radius r. So the every nodehaving at least 2 incidence edges in proximity graph.
(ii) Step 2 : To estimate the sequence of density variation (DV) for the graph G. To compute the value of DV,we are using the iterative methods. The i is representing the iteration and for every iteration we have tocalculate the minimum density MD and find out the weakest pixel WP. This step gives the no. of MDvalues [4-9]. After every iteration i the procedure gives you a MD value ,change this density value withthe adjacent item of the graph for this calculation Fibonacci heaps is a useful approach to compute theminimum value and replace with old one.
(iii) Step 3 : To make out the core pixels based on the above calculated MD. Here we are using twoparameters x and y to recognize core pixels. Where x represents the decrease rate of D value of theidentified pixel and y will control the size of group of identified pixels[4]. Parameter x and y both will workfor the minimum value and after the calculation all positive rates should be arrange in ascending order.After processing Expected Outcome of the above step will be the set of positive core pixels.
105A Novel Approach for Region Based Image Partitioning Methods Using Graphical Model
(iv) Step 4: To divide the core pixel or the set of core pixels in to clusters, which we identify in the previousstep[9]. There is no. of core pixels we identify; now we can consider them as a core of a segment. In thisstep we are processed for weak edges, to partition adjacent core groups which reside within r pixels.Here we introducing one threshold value representing by t = 0.1[4].This value is useful to compare theweight of edges with threshold and remove the weak edges that are having less weight in the graph. Herethe input will be a core pixels and the expected outcome will be the partition of the cores which wegrouped. Now the graph is created with new pixels (core) and we have to remove the weak edges thatare having less weight than q where q = 0.1 (Threshold).BFS and DFS algorithms are the best suitedmethods to find all connected components of the graph [4].
(v) Step 5: For the effective results, extend the groups of core pixels and obtain the results of imagesegmentation. In this final step the calculated MD variable and M is escalate from low to high value forthe region on the proximity graph[14]. While checking the sequence, we assign pixels to the most alikesegment. This PG model improves the whole segmentation accuracy and reduces the total user’s concern.
4. EXPERIMENT AND RESULT
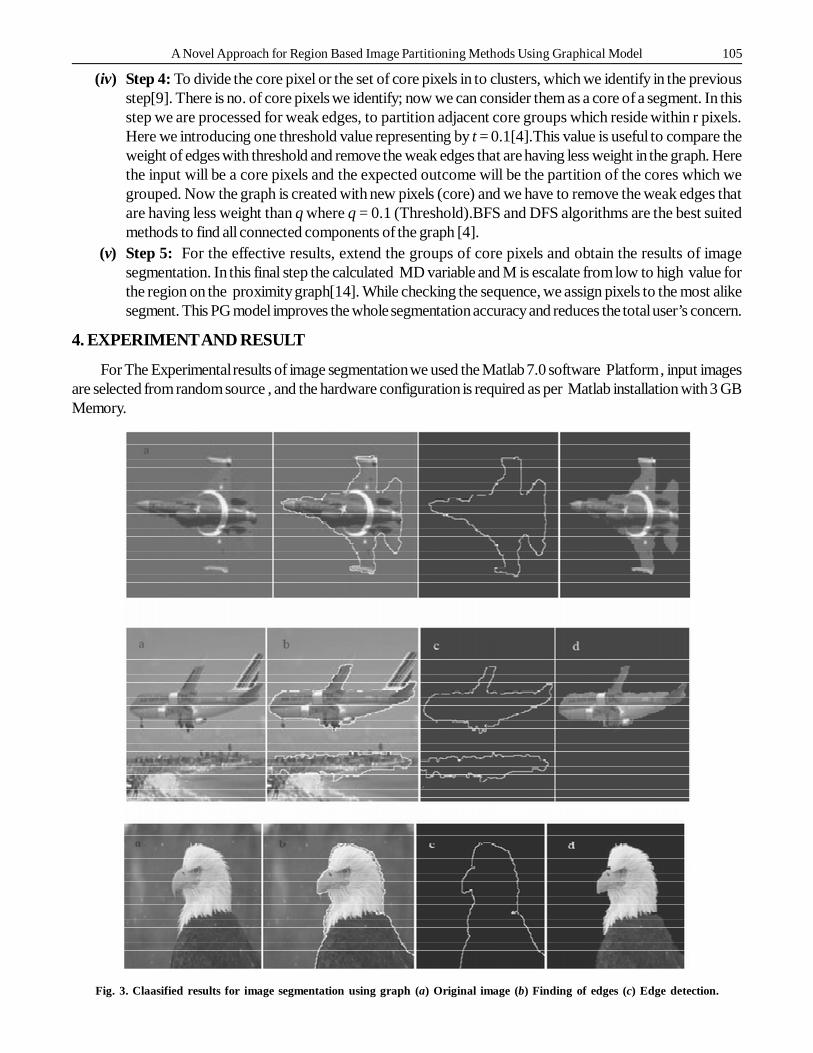
For The Experimental results of image segmentation we used the Matlab 7.0 software Platform , input imagesare selected from random source , and the hardware configuration is required as per Matlab installation with 3 GBMemory.
Fig. 3. Claasified results for image segmentation using graph (a) Original image (b) Finding of edges (c) Edge detection.
106 Kavita Deshmukh and Uday Pratap Sinngh
5. CONCLUSION
The idea of image segmentation is to simplify the presentation of image something that is more understandableand meaningful. The image segmentation using different graphical models is an effective way to achieve betterresults. In this paper we proposed various segmentation methods and how we can use proximity graph for theimage segmentation. This graph is useful to divide the whole image into regions, using graph we performed iterativeoperations on regions and calculate results based on image nature like intensity or colors etc. This method isconstant and robust to noise because it identifies and uses the pixels in cores of segments. But if we are focusing onthe outcome of the color have on segmentation it is a serious issue which have been neglected by the researches.So in future we will work for the integrated approach of edge preservation with color smoothening and partitioningto get better and precise results.
6. REFERENCES
1. Kabade Mankarnika Manohar, A. S. Patil,”A Review on techniques of image segmentation” International Journal ofAdvanced Research in Computer and Communication Engineering Vol. 5, Issue 3, March 2016. DOI 10.17148/IJARCCE.2016.53116B.
2. Christopher J. Quinn, Negar Kiyavash, Todd P. Coleman “Directed Information Graphs” IEEE Transactions on informationtheory, VOL. 61, NO. 12, December 2015.
3. Arti Taneja, Priya Ranjan,Amit Ujjlayan, “A performance study of image segmentation techniques” 978-1-4673-7231-2/15/$31.00 ©2015 IEEE.
4. Akanksha B.,Shailendra N. Singh, “A rieview on the stratagies and techniques of image segmentation”,Internationalconference on advanced computing and communication tech2015.
5. Mircea Weingart, Orest Vascan ,”Image segmentation processing –some Techniques and experimental results” ©2013IEEE .
6. F. Noushin Golabchi and Dana H. Brooks,”Axon segmentation microscopy images ,A graphical model based approach”©2012 IEEE.
7. Rajitha B. Anjana Tiwari Suneeta Agarwal,” Image segmentation and defect detection technique using homogeneity”1st International conference on futuristic trend in computational analysis and knowledge management (ABLAZE 2015)978-1-4799-8433-6/15/$31.00 © 2015 IEEE.
8. Guangyun Zhang, Xiuping Jia, and Jiankun Hu”Superpixel-Based Graphical Model forRemote Sensing Image Mapping“ IEEE Transactions on geosciences and remote sensing, VOL. 53, NO. 11, November 2015.
9. Fahim Irfan Alam, Iker Gondra” A Bayesian Network-based Tunable Image Segmentation Algorithm For ObjectRecognition” 978-1-4673-0753-6/11/$26.00 ©2011 IEEE.
10. Yu-Chi Hu, Michael D. Grossberg and Gig S. Mageras” Fast Graph-based Medical Image Segmentation with ExpertGuided Statistical Information” ©2010 IEEE.
11. Image clef http://imageclef.org/2010.
12. Yuri Boykov. Graph Cuts and Efficient N-D Image Segmentation. I J C V,70(2):109-131, 2006.
13. C.Pantofaru, M.Hebert: “A Comparison of Image Segmentation Algorithms”, Robotics Institute, Carnegie MellonUniversity, Pittsburgh, Pennsylvania. (2005).
14. Kittipat Kampa, Jose C. , Duangmanee , Anand Rangarajan” Data –driven tree structured bayesian network for imagesegmentation” 978-1-4673-0046-9/12/$26.00 ©2012 IEEE
15. Lei Zhang, Qiang Ji,” Image Segmentation with a Unified Graphical Model”, IEEE TRANSACTIONS on pattern analysisand machine intellegence, VOL. 32, NO. 8, AUGUST 2010.
16. Rui Huang, Vladimir Pavlovic, and Dimitris N. Metaxas” A Graphical Model Framework for Coupling MRFs and DeformableModels” Proceedings of the 2004 IEEE Computer Society Conference on Computer Vision and Pattern Recognition(CVPR’04)1063-6919/04 $20.00 © 2004 IEEE
17. Gabriel Mihai, Alina Doringa, Liana Stanescu” Graphical Interface for Evaluating Three Graph-Based Image SegmentationAlgorithms” Proceedings of the International Multiconference on Computer Science and Information Technology pp.735-740, 978-83-60810-27-9/09/$25.00 © 2010 IEEE
18. L. Kotoulas and I. Andreadis,” Colour histogram content-based image retrieval and hardware implementation” , r IEE,2003-IEE Proceedings online no. 2003048,1IEE Proc.-Circuits Devices Syst., Vol. 150, No. 5, October 2003.


![[5437]-101 M.Sc ENVIRONMENTAL SCIENCE EVSC 101](https://static.fdokumen.com/doc/165x107/631d8020ec7900c0c80d1eb7/5437-101-msc-environmental-science-evsc-101.jpg)