
100 9678b2059f3
27
Credit risk emanates from a bank’s dealings with an individual, corporate, bank, financial institution or a sovereign. The present paper is designed to study the implementation of the Credit Risk Management Framework by Commercial Banks in India. To achieve the above mentioned objective a primary survey was conducted. The results show that the authority for approval of Credit Risk vests with ‘Board of Directors’ in case of 94.4% and 62.5% of the public sector and private sector banks, respectively. This authority in the remaining banks, however, is with the ‘Credit Policy Committee’. For Credit Risk Management, most of the banks (if not all) are found performing several activities like industry study, periodic credit calls, periodic plant visits, developing MIS, risk scoring and annual review of accounts. However, the banks in India are abstaining from the use of derivatives products as risk hedging tool. The survey has brought out that irrespective of sector and size of bank, Credit Risk Management framework in India is on the right track and it is fully based on the RBI’s guidelines issued in this regard. Credit Risk Management Framework at Banks in India Introduction Credit Risk is intrinsic to banking and it is as old as banking itself. Credit risk is defined as the possibility of losses associated with diminution in the credit quality of borrowers or counterparties. In a bank’s portfolio, losses stem from outright default due to inability or unwillingness of a customer or counterparty to meet commitments in relation to lending, trading, settlement and other financial transactions. Alternatively, losses result from reduction in portfolio value arising from actual or perceived deterioration in credit quality. Credit risk emanates from a bank’s dealings with an individual, corporate, bank, financial institution or a sovereign. In recent years, financial sector failures and banking sector weaknesses have induced policy makers to devise prudent risk management mechanism. Against this backdrop, Basel Capital Adequacy norms, originally conceived during 1988, brought about broad agreement among G-10 central banks for applying Common Minimum Capital Standards to their banking industries. Such standards are aimed at putting all banks on an equal footing with respect to capital adequacy so as to promote safety and soundness in banking. Keeping in view the seriousness of credit risk and need to manage the same appropriately, RBI issued guidelines on Credit Risk Management on October 12, 2002. These guidelines focused that the banks should give credit B S Bodla* and Richa Verma** * Professor, Department of Management, Kurukshetra University, Kurukshetra 136119, India. E-mail: [email protected] ** Faculty Research Associate, National Institute of Bank Management, Pune 411048, India. E-mail: [email protected] © 2009 The Icfai University Press. All Rights Reserved.
-
Upload
independent -
Category
Documents
-
view
0 -
download
0
Transcript of 100 9678b2059f3

47Credit Risk Management Framework at Banks in India
Credit risk emanates from a bank’s dealings with an individual, corporate, bank, financialinstitution or a sovereign. The present paper is designed to study the implementation ofthe Credit Risk Management Framework by Commercial Banks in India. To achieve theabove mentioned objective a primary survey was conducted. The results show that theauthority for approval of Credit Risk vests with ‘Board of Directors’ in case of 94.4%and 62.5% of the public sector and private sector banks, respectively. This authority inthe remaining banks, however, is with the ‘Credit Policy Committee’. For Credit RiskManagement, most of the banks (if not all) are found performing several activities likeindustry study, periodic credit calls, periodic plant visits, developing MIS, risk scoringand annual review of accounts. However, the banks in India are abstaining from the useof derivatives products as risk hedging tool. The survey has brought out that irrespectiveof sector and size of bank, Credit Risk Management framework in India is on the righttrack and it is fully based on the RBI’s guidelines issued in this regard.
Credit Risk Management Frameworkat Banks in India
Introduction
Credit Risk is intrinsic to banking and it is as old as banking itself. Credit risk is defined as thepossibility of losses associated with diminution in the credit quality of borrowers or counterparties.In a bank’s portfolio, losses stem from outright default due to inability or unwillingness of acustomer or counterparty to meet commitments in relation to lending, trading, settlement andother financial transactions. Alternatively, losses result from reduction in portfolio value arisingfrom actual or perceived deterioration in credit quality. Credit risk emanates from a bank’sdealings with an individual, corporate, bank, financial institution or a sovereign.
In recent years, financial sector failures and banking sector weaknesses have induced policymakers to devise prudent risk management mechanism. Against this backdrop, Basel CapitalAdequacy norms, originally conceived during 1988, brought about broad agreement amongG-10 central banks for applying Common Minimum Capital Standards to their banking industries.Such standards are aimed at putting all banks on an equal footing with respect to capitaladequacy so as to promote safety and soundness in banking. Keeping in view the seriousness ofcredit risk and need to manage the same appropriately, RBI issued guidelines on Credit RiskManagement on October 12, 2002. These guidelines focused that the banks should give credit
B S Bodla* and Richa Verma**
* Professor, Department of Management, Kurukshetra University, Kurukshetra 136119, India.E-mail: [email protected]
** Faculty Research Associate, National Institute of Bank Management, Pune 411048, India.E-mail: [email protected]
© 2009 The Icfai University Press. All Rights Reserved.

The Icfai University Journal of Bank Management, Vol. VIII, No. 1, 200948
risk prime attention and should put in place a loan policy to be cleared by their boards thatcovers the methodology for measurement, monitoring and control of credit risk. Basel Committeehas proposed Standardized Approaches, Foundation Internal Rating Based Approach andAdvanced Internal Rating Based Approach for credit risk capital charge calculations.
Basel-I played a significant role in strengthening the financial system. It provided capitalcharge for credit risk only. It put strong and weak borrower at par and did not provide fordifference between regulatory risk and bank’s actual risk. This led to the evolution of Basel-IIcapital accord, which considers estimation of minimum capital requirements for credit, marketand operational risk. In Basel-II, credit risk has been elaborately defined and risk weights havebeen scientifically determined for strong and weak borrowers. The major issue before the bankspresently is the implementation of this new framework as per RBI and Basel directives. In thisbackdrop, present study is an attempt to investigate the implementation of the Credit RiskManagement Frame the work in commercial banks in India.
Review of Existing Literature
To formulate the problem and to design the survey instruments, a review of existing literaturewas made. Gist of these previous studies pertaining to Credit Risk Management is prescribed asfollows:
Rajagopal (1996) made an attempt to overview the bank’s risk management and suggestsa model for pricing the products based on credit risk assessment of the borrowers. He concludedthat good risk management is good banking, which ultimately leads to profitable survival of theinstitution. A proper approach to risk identification, measurement and control will safeguardthe interests of banking institution in long run.
Froot and Stein (1998) found that credit risk management through active loan purchaseand sales activity affects banks’ investments in risky loans. Banks that purchase and sell loanshold more risky loans (Credit Risk and Loss loans and commercial real estate loans) as apercentage of the balance sheet than other banks. Again, these results are especially strikingbecause banks that manage their credit risk (by buying and selling loans) hold more risky loansthan banks that merely sell loans (but don’t buy them) or banks that merely buy loans(but don’t sell them).
Treacy and Carey (1998) examined the credit risk rating mechanism at US Banks.The paper highlighted the architecture of Bank Internal Rating System and Operating Designof rating system and made a comparison of bank system relative to the rating agency system.They concluded that banks internal rating system helps in managing credit risk, profitabilityanalysis and product pricing.
Duffee and Zhou (1999) model the effects on banks due to the introduction of a market forcredit derivatives; particularly, credit-default swaps. Their paper examined that a bank can useswaps to temporarily transfer credit risks of their loans to others, reducing the likelihood thatdefaulting loans trigger the bank’s financial distress. They concluded that the introduction of acredit derivatives market is not desirable because it can cause other markets for loanrisk-sharing to break down.

49Credit Risk Management Framework at Banks in India
Ferguson (2001) analyzed the models and judgments related to credit risk management.The author concluded that proper risk modelling provides a formal systematic and disciplinedway for firms to measure changes in the riskiness of their portfolio and help them in designingproper strategic framework for managing changes in their risk.
Bagchi (2003) examined the credit risk management in banks. He examined risk identification,risk measurement, risk monitoring, risk control and risk audit as basic considerations for creditrisk management. The author concluded that proper credit risk architecture, policies andframework of credit risk management, credit rating system, monitoring and control contributesin success of credit risk management system.
Muninarayanappa and Nirmala (2004) outlined the concept of credit risk management inbanks. They highlighted the objectives and factors that determine the direction of bank’s policieson credit risk management. The challenges related to internal and external factors in credit riskmanagement are also highlighted. They concluded that success of credit risk managementrequire maintenance of proper credit risk environment, credit strategy and policies. Thus theultimate aim should be to protect and improve the loan quality.
Louberge and Schlesinger (2005) aim to propose a new method for credit risk allocationamong economic agents. Their paper considers a pool of bank loans subject to credit risk anddevelops a method for decomposing the credit risk into idiosyncratic and systematic components.The paper shows how financial contracts might be redesigned to allow for banks to manage theidiosyncratic component for their own account, while allowing systematic component to beretained, passed off to capital market or shared with borrower.
Bandyopadhyay (2006) aims at developing an early warning signal model for predictingcorporate default in emerging market economy like India. He also presented the method fordirectly estimating probability of default using financial and non-financial variable. For predictingcorporate bond default multiple discriminant analysis is used and logistic regressions model isemployed for estimating Probability of Default (PD). The author concluded that by using ‘Z’score model, banks and investors in emerging markets like India can get early warning signalsabout the firm’s solvency status and reassess the magnitude of default premium they requireon low grade securities. The PD estimate from logistic analysis would help banks to estimatecredit risk capital and set corporate pricing on a risk adjusted return basis. This model has highclassification power of sample and high prediction power in terms of its ability to detect badfirm in sample.
On making the review of the previously conducted studies, it is clear that majority of thestudies that focus on credit risk management practices in banks provide conceptual framework.Hence, empirical studies on credit risk framework of banks in India are yet to be effected.Moreover, no study has made a size-wise and sector-wise comparison of the credit riskmanagement among banks in India. The present study is an attempt to address the aboveissues pertaining to the credit risk management framework of banks in India.
Research Objective and Methodology
The present study is undertaken primarily to examine the credit risk management framework ofSchedule Commercial Banks (SCBs) in India, which is followed in pursuance to Basel Accords

The Icfai University Journal of Bank Management, Vol. VIII, No. 1, 200950
and RBI guidelines. An attempt is also made to examine the size and ownership effect on thecredit risk management practices in banks. In sync with the above-mentioned objectives, thestudy intends to test the following null hypotheses: (i) There is no difference between credit riskmanagement practices of large banks and small banks; and (ii) There is no difference in creditrisk management practices of Public Sector Banks (PSBs) and Private sector Banks (PBs).
As the concept of risk management in the emerging scenario is quite new, the present studyis both exploratory as well as descriptive in nature. The study being comprehensive one coversall the three sectors (public, private and foreign) of Indian Banking Industry. To achieve theobjectives of this study, we have resorted to sampling techniques and accordingly the data wascollected through field survey using structured questionnaire (the questionnaire can be obtainedfrom the authors on request) facilitating face-to-face interviews with bank’s officials and otherpersons connected with risk management operations. The genesis of the different questionsincorporated in this questionnaire was to bring out and analyze the credit risk managementpractices adopted by the banks.
This study is based on a sample of 26 SCBs comprising 18 PSBs, eight private sector banksand a foreign bank. This sample of 26 banks is made up of 19 small banks and seven largebanks (Exhibit 1). For the purpose of the analysis foreign banks are included in the category ofprivate sector banks. In order to measure the importance attached by the responding banks torisk management aspects, the response was obtained on seven-point scale ranging from 1 to 7.Here 1 means the lowest importance and 7 means the highest importance given to an item. Foranalysis purpose, mean score has been computed. To examine the significance of differenceabout the importance given to various items between PSBs and PBs as well as small and largebanks t-test was applied. Chi-square test was applied to examine whether responses areindependent of sector and size of the banks under study.
Credit Risk Management – Survey Results
This section shows the survey results regarding ‘Credit Risk Management’ practices of SCBs inIndia. The first question raised to bankers was about the relative importance of varioustransactions, which cause credit risk in their bank. The responses obtained according to sectorand size in this regard are presented in Tables 1a and 1b respectively. The former table, whichpresents the sector-wise details of the responses obtained, indicates that ‘direct lending’ (withmean score, 4.72) and ‘guarantees or letter of credit’ (mean score, 3.72) contain the highestand second highest level of credit risk. In the case of private sector banks also the maximumcredit risk is associated with ‘direct lending activities’ (mean score, 4.75) followed by ‘CrossBorder Exposure’ (mean score, 3.75). The sector-wise comparison of the responses indicatesthat there is no significant difference between the PSBs and PBs in so far as the importanceassigned to various transactions leading to credit risk is concerned.
Bank size-wise data as given in Table 1b presents that in the case of large size banks,‘direct lending’ obtains the highest mean score (4.29) and hence it is the major source of creditrisk. ‘Guarantees or letter of credit’ and ‘cross border exposure’ with mean score of 3.43 each

51Credit Risk Management Framework at Banks in India
are other two important factors causing credit risk. Similarly, ‘direct lending’ activities (with meanscore, 4.89) followed by ‘cross border exposure’ (mean score, 3.71) are the major sources ofcredit risk in case of small size banks. The size-wise comparison shows that each of the sources ofcredit risk gets slightly higher score in case of the small size banks than that in case of large sizebanks. However, this difference is statistically insignificant and hence the size does not make adifference in the importance of various sources of credit risk for commercial banks in India.
After examining the major sources of credit risk in the banks, the bankers were next askedabout their views on the introduction of ‘Securitization Ordinance Act, 2002’, as a movetowards effective management of credit risk in SCBs in India. According to this survey, 61.1%of PSBs and 37.5% of PBs are of the view that ‘Securitization Ordinance’ is very important incredit risk management in banks (Table 2).
Table 1a: Sector-Wise Level of Credit Risk on Various Transactions
Mean Score Standard Mean t Sig.
Transactions Deviation Score Value Level
Public Private Public Private Difference
Direct Lending 4.72 4.75 1.27 1.28 –2.78E-02 –0.051 0.960
Guarantees or Letter of Credit 3.72 3.38 0.83 1.30 0.35 0.826 0.417
Cross Border Exposure 3.56 3.75 1.59 1.75 –0.19 –0.263 0.795
Table 1b: Size-Wise Level of Credit Risk on Various Transactions
Mean Score Standard Mean t Sig.
Transactions Deviation Score Value Level
Large Small Large Small Difference
Direct Lending 4.29 4.89 1.38 1.20 –0.61 –1.106 0.280
Guarantees or Letter of Credit 3.43 3.68 1.27 0.89 –0.26 –0.580 0.567
Cross Border Exposure 3.43 3.71 1.51 1.69 –0.28 –0.376 0.710
Table 2: Effectiveness of Securitization Ordinance Act, 2002in Credit Risk ManagementSector-Wise Frequency Size-Wise Frequency
Distribution Distribution Levels of Overall Public Private Chi- Large Small Chi-Effectiveness Sector Sector Square Banks Banks Square
Banks Banks Value (df) Value (df)
Very Much 14 (53.9) 11 (61.1) 3 (37.5) 2 (28.6) 12 (63.2)
Some What 10 (38.5) 6 (33.3) 4 (50) 5 (71.4) 5 (26.3)
Not at All 1 (3.8) – 1 (12.5) 3.138 (2) – 1 (5.3) 4.096 (2)
No Response 1 (3.8) 1 (5.6) – – 1 (5.3)
Total 26 18 8 7 19
Note: Figures in parentheses are the percentage of total.
Six (33.3%) PSBs are of the view that, the act will be of ‘some what help’ in dealing withcredit risk. The similar response is obtained in case of four (50%) PBs. Although, the responseof one PB is negative towards the aforesaid ordinance, not even a single PSB have respondednegatively to it. The table further indicates the response obtained from large and small sizebanks. Two (28.6%) large banks and 12 (63.2%) small size banks have responded favorably to

The Icfai University Journal of Bank Management, Vol. VIII, No. 1, 200952
this question. They believe that ‘Securitization Ordinance’ will be of great help to them indealing with credit risk. But, five (71.4%) large and five (26.3%) small size banker are of viewthat it will be of some what ‘help’ to them in dealing with risk. One small size bank did notrespond to it and one responded negatively. We next asked the bankers, who is responsible forapproval of ‘credit risk policy’ in their bank. The response obtained in this regard is presentedin Table 3. This table clearly indicates that ‘Board of directors’ is responsible for approval of‘credit risk policy’ in as many as 17 (94.4%) PSBs and the Credit Policy Committee approvecredit risk policy in one PSB out of 18 surveyed. In the case of private sector banks, the ‘Boardof Directors’ is responsible in case of five (62.5%) banks and the same task is performed byCredit Policy committee in three (37.5%) banks.
Table 3: Responsibility of Approval of Credit Risk Policy Sector-Wise Frequency Size-Wise Frequency
Authority for Distribution DistributionCredit Risk Overall Public Private Chi- Large Small Chi-Policy Sector Sector Square Banks Banks Square
Banks Banks Value (df) Value (df)
Board of Directors 22 (84.6) 17 (94.4) 5 (62.5) 5 (71.4) 17 (89.5)
Senior Management – – – – –
Credit Policy 4 (15.4) 1 (5.6) 3 (37.5)4.342**(1)
2 (28.6) 2 (10.5)1.280 (1)
Committee
Total 26 18 8 7 19
Note: Figures in parentheses are the percentage of total.** significant at 0.05 level.
The above analysis shows that the authority for credit risk policy depends on the ownershippattern of the banks. This is confirmed by the chi-square test which was applied to test the nullhypothesis that the authority for effecting credit risk policy is independent of ownership patternthis hypothesis is rejected at 5% level of significance. The results clearly indicate that seniormanagement is not given responsibility for credit risk management in even a single bank. Banksize-wise analysis indicates that in as many as five (71.4%) large banks and 17 (89.5%) smallsize banks, the ‘Board of Directors’ is responsible for approval of credit risk policy and sametask is performed by credit policy committee in two large (28.6%) and two small (10.5%)banks. The chi-square test value offers that the size effect on the decision regarding to whom togive the responsibility for credit risk management does not depend on size of the bank. That issize is not an important factor in taking decision about the authority for credit risk policy.
Next, the bankers were asked a question about the instruments/techniques used by them formanaging credit risk in their bank. Let me mention here that ‘Credit Risk Management’encompasses a host of management techniques, such as credit approving authority, prudentiallimits, risk ratings, risk pricing, portfolio management and loan review mechanism. As per RBIguidelines each bank should have a carefully formulated scheme of delegation of powers. Thebank should also evolve multi-tier credit approving system where the loan proposals all approvedby a ‘committee’ comprising of at least 3 or 4 officers. The response obtained regarding theinstruments of ‘credit risk management’ used by the banks under survey is presented in Table 4.This table shows that, at the overall level, ‘Risk Rating’ techniques is found in use by the

53Credit Risk Management Framework at Banks in India
maximum banks in India (i.e., 92.3%) followed by ‘credit approval authority’ (88.5%),‘prudential limits’ and ‘loan review policy’ (80.8%) and so on. It is also clear from the tablethat the banks are using more than one instrument/techniques for managing their risk. Further,the table clearly indicates that ‘risk rating’ technique of managing credit risk is used by as manyas 17 (94.4%) PSBs for managing credit risk. Prudential Limits, Credit Approval Committeeand Loan Review Policy are used as ‘credit risk management technique’ by 16 (88.9%),15 (83.3%) and 14 (77.8%) banks respectively. Portfolio management is applied by twelve(66.7%) banks. Similarly, 10 (55.6%) banks are making use of RAROC. Only three (16.7%) ofthe sample PSBs are making use of other tools like collateral, credit audit and problem loanmanagement as a tool of credit risk management in their bank.
Table 4: Instruments of Credit Risk Management Sector-Wise Frequency Size-Wise Frequency
Distribution Distribution
Technique Overall Public Private Chi- Large Small Chi-Sector Sector Square Banks Banks SquareBanks Banks Value (df) Value (df)
Credit ApprovalAuthority 23 (88.5) 15 (83.3) 8 (100) 1.507 (2) 6 (85.7) 17 (89.5) 0.071 (1)
Prudential Limits 21 (80.8) 16 (88.9) 5 (62.5) 2.483 (1) 5 (71.4) 16 (84.2) 0.538 (1)
Risk Ratings 24 (92.3) 17 (94.4) 7 (87.5) 0.376 (1) 6 (85.7) 18 (94.7) 0.586 (1)
Risk Pricing/RAROC 14 (53.8) 10 (55.6) 4 (50) 0.069 (1) 3 (42.9) 11 (57.9) 0.465 (1)
PortfolioManagement 17 (65.4) 12 (66.7) 5 (62.5) 0.042 (1) 3 (42.9) 14 (73.7) 2.148 (1)
Loan ReviewPolicy 21 (80.8) 14 (77.8) 7 (87.5) 0.337 (1) 5 (71.4) 16 (84.2) 0.538 (1)
Any OtherTechnique 6 (23.1) 3 (16.7) 3 (37.5) 1.354 (1) 3 (42.9) 3 (15.8) 2.111 (1)
Total 26 18 8 7 19
Note: Figures in parentheses are the percentage of total.
Contrarily, 100% of the private sector banks favor ‘Credit Approval Authority’ for credit riskmanagement. Seven banks (87.5%) are making use of ‘risk rating’ and ‘loan review policy’ asa tool of risk management. Prudential limits and portfolio management exercise are performedby five (62.5%) among the sample private sector banks. The table further presents the responseobtained from large and small size banks. Bank size-wise analysis of the responses aboutinstruments of Credit Risk Management as given in Table 4 indicates that ‘Credit ApprovalAuthority’ and ‘Risk Ratings’ are used as tools of credit risk management by 85.7% of the largesize banks and 89.5% of the small banks. Five banks (71.4%) among the PSBs under study aremaking use of ‘Prudential Limits’ and ‘Loan Review Policy’. The remaining instruments likeRAROC, Portfolio management are used by three (42.9) banks. In the case of small size banks,as many as 18 (94.7%) banks are making use of ‘Risk Rating’ for managing credit risk. PrudentialLimits and Portfolio Management are used by 16 (84.2%) and 14 (73.7%) of the small banksunder study. 57.9% of the small banks are making use of ‘risk pricing technique’ for managingcredit risk in their bank’s portfolio. Thus, the preceding analysis brings out that the choice for

The Icfai University Journal of Bank Management, Vol. VIII, No. 1, 200954
instruments of ‘Credit Risk Management’ is neither dependent on size nor on sector. The aboveis confirmed by the results of chi-square test applied for the purpose.
We have observed from Table 4 that large majority of the sample banks have favored‘Credit Approval Authority’ for managing credit risk. Now, the next question arises about thelimits at which the approval is required from the Credit Approval Authority. The responsesobtained in this regard are presented in Table 5.
Table 5: Credit Limits for Seeking Approval from Credit Approval Committee Sector-Wise Frequency Size-Wise Frequency
Distribution Distribution Credit Limit Overall Public Private Chi- Large Small Chi-
Sector Sector Square Banks Banks SquareBanks Banks Value (df) Value (df)
Above 20 Lakhs 4 (15.4) 1 (5.6) 3 (37.5) 1 (14.3) 3 (15.8)
Above 50 Lakhs 3 (11.5) 2 (11.1) 1 (12.5) – 3 (15.8)
Above 1 Crore 17 (65.4) 13 (72.2) 4 (50) 3.860 (2) 6 (85.7) 11 (57.9) 1.578 (2)
No Response 2 (7.7) 2 (11.1) – – 2 (10.5)
Total 26 18 8 7 19
Note: Figures in parentheses are the percentage of total.
The table clearly indicates that in 13 (72.2%) of the selected PSBs and four (50%) of theselected PBs, the approval of Credit Approval Committee is taken for the credit of aboveRs. 1 cr. Two PSBs and one PB seek this approval when the credit limit is above Rs. 50 lakhsbut less than Rs. 1 cr. For ‘credit of above Rs. 20 lakhs and less than Rs. 50 lakhs’, the approvalis taken by one PSB and three PBs. The size-wise analysis indicates that majority of banks(i.e., 85.7% large size banks and 57.9% small size banks) seek the approval from the credit approvalauthorities, when the credit is above Rs. 1 cr. One large size banks seek approval when the amountof credit is above Rs. 20 lakhs but less than Rs. 50 lakhs. Three small banks (15.8%) perform thesame exercise in the case of exposure of above Rs. 20 lakhs but less than Rs. 50 lakhs.
Now, the question arises, at what level these committees are working in the banks. Bankscan have credit approving committees at various operating levels, i.e., large branches levels,regional levels, zonal levels, head offices, etc. The survey results in regard to levels of creditapproving committees are exhibited in Table 6. It is obvious from this table that majority ofbanks (76.9%) have their credit approval committee at ‘Head Office Level’. Sector-wise responsereveals that in 15 (83.3%) PSBs and five (62.5%) PBs, the credit approval committees areworking at Head Office level. In 12 (66.7%) PSBs, the approval committees are set up atZonal Level and same is true in the case of one PB. These committees are working at Regionallevel in four PSBs and two PBs. Approval committees are set up at Branch level by only onePSB and two PBs. The above analysis brings out that the preference for head office level andZonal level approval committee is more in PSBs than that of PBs.
Size-wise analysis (Table 6) offers that the approval committees are set up at head officelevel in case of five (71.4%) large banks and 15 (78.9%) small banks. Four large PSBs and

55Credit Risk Management Framework at Banks in India
Table 6: Level at which Approval Committees are Set-Up
Sector-Wise Frequency Size-Wise Frequency Distribution Distribution
Level Overall Public Private Chi- Large Small Chi-Sector Sector Square Banks Banks SquareBanks Banks Value (df) Value (df)
Branch Level 3 (11.5) 1 (5.6) 2 (25.0) 1.883 (1) 1 (14.3) 2 (10.5) 0.048 (1)
Regional Level 6 (23.1) 4 (22.2) 2 (25.0) 0.006 (1) 1 (14.3) 5 (26.3) 0.503 (1)
Zonal Level 13 (50.0) 12 (66.7) 1 (12.5) 7.354* (1) 4 (57.1) 9 (47.4) 0.103 (1)
Head Office Level 20 (76.9) 15 (83.3) 5 (62.5) 2.252 (1) 5 (71.4) 15 (78.9) 0.446 (1)
Total 26 18 8 7 19
Note: Figures in parentheses are the percentage of total.* significant at 0.01 level.
nine small PBs have set up the committees for credit approval at zonal level. While the committeesare working at ‘Branch Level’ in only one large bank and two small size banks, one large bankand five small banks have set up this committee at ‘Regional Level’.
Table 7a: Sector-Wise Response on the Aspects Considered for DefiningPrudential Limits
Mean Score Standard Mean t Sig.
Aspects Deviation Score Value Level
Public Private Public Private Difference
Stipulate Benchmark for Ratios 5.22 4.50 0.94 1.52 0.72 1.393 0.178
Single/Group Borrower Limits 5.50 5.29 0.79 1.50 0.21 0.472 0.642
Exposure Limits 5.56 5.14 0.78 1.46 0.41 0.920 0.367
Maximum Exposure to Industry 5.39 5.29 0.92 0.76 0.10 0.264 0.794
Consideration of MaturityProfile of Loan Book 4.89 4.14 0.83 1.21 0.75 1.768 0.090
Table 7b: Size-Wise Response on the Aspects Considered for Defining PrudentialLimits
Mean Score Standard Mean t Sig.
Aspects Deviation Score Value Level
Large Small Large Small Difference
Stipulate Benchmark for Ratios 4.50 5.22 1.97 0.65 –0.72 –0.880 0.416
Single/Group Borrower Limits 5.57 5.39 1.13 0.98 0.18 0.401 0.692
Exposure Limits 5.43 5.44 1.13 0.98 –1.59E-02 –0.035 0.973
Maximum Exposure to Industry 5.29 5.39 1.11 0.78 –0.10 –0.264 0.794
Consideration of MaturityProfile of Loan Book 4.57 4.72 1.40 0.83 –0.15 –0.336 0.740
In order to limit the magnitude of credit risk, prudential limits should be laid down onvarious aspects of credit, such as benchmark for ratios, borrowers limits, exposure limits, maturityprofile of loan book, etc. In view of this, a question—what aspects of credit banks generallyconsider for defining prudential limits was asked during the survey. The responses obtained in thisregards are presented in Tables 7a and 7b after converting them in score from a seven-point scale.

The Icfai University Journal of Bank Management, Vol. VIII, No. 1, 200956
The former table indicates that ‘exposure limits’ and ‘single/group borrower limits’ withmean of 5.56 and 5.50, respectively are the most important and second most importantaspects that are generally considered for defining prudential limits in PSBs. ‘Maximum exposureto industry’ (mean, 5.39) and ‘benchmarking for ratios’ gains the third and fourth position interms of importance. In the case of private sector banks, ‘single/group borrower limits’ and‘maximum exposure to industry’ with the mean score of 5.29 are the most important aspectsfor defining prudential limits. ‘Exposure limits’ (mean, 5.14) and ‘stipulate benchmark forratios’ (mean score, 4.50) attain second and third position in terms of importance.The ‘Consideration of Maturity Profile of Loan Books’ with the lowest mean of 4.89 in PSBsand 4.14 in PBs is the least important aspect for defining prudential limits. While makingsector-wise analysis of the mean score, we observe that the score obtained by almost eachaspect of prudential limits is more in PSBs in comparison to PBs. But, the same is not confirmedby the t-test as the t-values for various aspects are insignificant at 5% level.
Table 7b presents size-wise statistical output of the information obtained from risk managersof banks. This table shows that in the large size banks, ‘single/group borrower limits’, ‘exposurelimits’ and ‘maximum exposure to industry’, ‘consideration of maturity profile of loan book’stood at first, second, third and fourth position with the mean score of 5.57, 5.43, 5.29 and4.57 respectively. ‘Stipulate benchmark for ratios’ with the lowest mean of 4.50 turns the leastimportant aspect generally considered. In the case of small size banks, ‘exposure limits’ withthe mean score of 5.44 claimed the highest importance level in defining prudential limits.‘Single/group borrower limits’ and ‘maximum exposure to industry’ with the mean score of5.39 each shares the second position in terms of importance. ‘Stipulate benchmark for ratios’and ‘consideration of maturity profile of loan book’ gains third and fourth position in terms ofimportance. Thus, the size-wise analysis reveals that all the aspects except one (single/groupborrower limits) are considered slightly more important in case of small banks than in largebanks. But, this difference in score is not found significant statistically.
Besides defining the prudential limits, banks further go for different activities like industriesstudies, plant visits, risk rating, etc., for managing credit risk in their portfolio. In the presentsurvey, an attempt was made to gather the information about the tendency of the commercialbanks in India about various activities performed for credit risk management. The survey resultsare presented in Table 8. The survey brought out that ‘Credit risk rating’ and ‘annual review ofaccounts’ are performed by all PSBs. ‘Development of MIS’, ‘industries studies’ and ‘periodicvisits of plants’ are performed by 94.4%, 88.9% and 83.3% banks, respectively. Thirteen(72%) PSBs make periodic credit calls for managing credit risk. All the PBs have favored‘annual review of accounts’ and remaining activities like industries studies, periodic credit calls,periodic visits of plants, development of MIS, credit risk rating are performed by as many asseven (87.5%) of private sector banks under survey. The table under reference also indicatesthe response obtained according to size of banks. It is found that all the large size banksperform each and every activity except ‘industries studies’ for managing credit risk in theirbank. Only six (85.7%) banks are found going for industries studies for credit risk management.‘Annual review of accounts’ is performed by each of the small banks and ‘credit risk rating’ by94.7% banks. 89.5% of the small banks perform ‘Industries studies’ and have ‘MIS’ for managingcredit risk. Periodic visits of plants and periodic credit calls are performed by 15 (78.9%) and13 (68.4%) banks, respectively. The above analysis provides that ‘periodic credit calls’ is a

57Credit Risk Management Framework at Banks in India
Table 8: Activities Performed for Credit Risk Management
Sector-Wise Frequency Size-Wise Frequency Distribution Distribution
Activities Overall Public Private Chi- Large Small Chi-Sector Sector Square Banks Banks SquareBanks Banks Value (df) Value (df)
Industries Studies/Profiles 23 (88.5) 16 (88.9) 7 (87.5) 0.845 (1) 6 (85.7) 17 (89.5) 0.686 (1)
Periodic Credit Calls 20 (76.9) 13 (72.2) 7 (87.5) 0.728 (1) 7 (100) 13 (68.4) 2.874** (1)
Periodic Visits ofPlants 22 (84.6) 15 (83.3) 7 (87.5) 0.074 (1) 7 (100) 15 (78.9) 1.742 (1)
Develop MIS 24 (92.3) 17 (94.4) 7 (87.5) 0.376 (1) 7 (100) 17 (89.5) 0.798 (1)
Credit Risk Rating/Risk Scoring 25 (96.1) 18(100) 7 (87.5) 2.340 (1) 7 (100) 18 (94.7) 0.383 (1)
Annual Reviewof Accounts 26 (100) 18(100) 8 (100) – 7 (100) 19(100) –
Total 26 18 8 7 19
Note: Figures in parentheses are the percentage of total.* significant at 0.01 level.
more popular activity among the large banks than their counterpart small banks. The same isconfirmed by chi-square test as its value was found significant at 10% level. However, thechi-square values are insignificant pertaining to the remaining activities. Thus, size of the bankdoes not affect the importance level of various activities necessary for credit risk management.
Table 9: Presentation of Bank’s Rating
Sector-Wise Frequency Size-Wise Frequency
Presentation of Distribution Distribution
Rating Overall Public Private Chi- Large Small Chi-Sector Sector Square Banks Banks SquareBanks Banks Value (df) Value (df)
Numbers 9 (34.6) 6 (33.3) 3 (37.5) 0.042 (1) 3 (42.9) 6 (31.6) 0.287 (1)
Alphabets 10 (38.5) 6 (33.3) 4 (50.0) 0.650 (1) 4 (57.1) 6 (31.6) 1.412 (1)
Alpha-Numeric 8 (30.8) 6 (33.3) 2 (25.0) 0.181 (1) 2 (28.6) 6 (31.6) 0.022 (1)
Symbol 1 (3.8) – 1 (12.5) 2.340 (1) 1 (14.3) – 2.823* (1)
Descriptive Terms 3 (11.5) 1 (5.6) 2 (25.0) 2.052 (1) 1 (14.3) 2 (10.5) 0.071 (1)
Total 26 18 8 7 19
Note: Figures in parentheses are the percentage of total.* significant at 0.01 level.
The analysis of Table 8 has shown that ‘Risk rating’ is given the maximum importance as acredit risk management activities amongst the commercial banks, irrespective of their sector orsize. Now, the question arises. How the banks are presenting their ratings? Whether it is with thehelp of numbers or alphabets? The response obtained in this regard is presented in Table 9.This table clearly indicates that, at the overall level, the highest percentage of banks use alphabets(38.5%) followed by those uses numbers (34.6%) and alpha-numeric (30.8%). Only one bank

The Icfai University Journal of Bank Management, Vol. VIII, No. 1, 200958
was found using symbols. Sector-wise analysis reveals that use of numbers, alphabets, andalpha-numeric variables is equally practiced among PSBs. Only one PSB is making use ofdescriptive terms. In case of private sector banks alphabets are used by half of the sampledbanks. ‘Numbers’ are used by three private banks (37.5%) under study. Two (25%) privatebanks are making use of alpha-numeric variables and other two use descriptive terms.
The size-wise pattern of frequency distribution regarding the way of presenting Bank’s Ratingindicates that 57.1% large size banks make use of alphabets. Numbers and alpha-numericvariables are used by 42.9% and 28.6% of the large banks, respectively. However, in the caseof small size bank, none is found making use of symbols. Each method, i.e., Numbers, alphabetsand alpha-numeric characters are used by 31.6% banks. Only two small size banks are makinguse of descriptive terms. The next question asked pertain to the frequency with which thebankers assess the risk in their banking portfolio. The outcome of the processed data regardingthe above question is presented through Table 10. This table exhibits that, on the whole, noneof the sample banks assess the credit risk monthly. The majority of the banks perform annualassessment of credit risk. The above is true irrespective of sector as well as size of the bank.11.1 PSBs and 25% PBs perform this exercise bi-annually. The quarterly credit risk assessmentis done by three (16.7%) PSBs and one PB. In the case of large size banks, the highestpercentage of banks assess credit risk annually followed by those do the same quarterly.The above also holds true in case of small size banks.
Table 10: Frequency of Credit Risk Assessments Sector-Wise Frequency Size-Wise Frequency
Distribution DistributionFrequency Overall Public Private Chi- Large Small Chi-
Sector Sector Square Banks Banks SquareBanks Banks Value (df) Value (df)
Monthly – – – – –
Quarterly 4 (15.4) 3 (16.7) 1 (12.5) 2 (28.6) 2 (10.5)
Bi-Annually 4 (15.4) 2 (11.1) 2 (25.0)0.833 (2)
1 (14.3) 3 (15.8)1.292 (2)
Annually 18 (69.2) 13 (72.2) 5 (62.5) 4 (57.1) 14 (73.7)
Total 26 18 8 7 19
Note: Figures in parentheses are the percentage of total.
Table 11: Preparation of Credit Quality Reports
Sector-Wise Frequency Size-Wise Frequency
Nature of Distribution Distribution
Purpose Overall Public Private Chi- Large Small Chi-Sector Sector Square Banks Banks SquareBanks Banks Value (df) Value (df)
Yes 15 (57.7) 10 (55.6) 5 (62.5)0.109 (1)
5 (71.4) 10 (52.6)0.740 (1)
No 11 (42.3) 8 (44.4) 3 (37.5) 2 (28.6) 9 (47.4)
Total 26 18 8 7 19
Note: Figures in parentheses are the percentage of total.
The next question raised to bankers was about the preparation of credit quality report by them.Table 11 indicates that on the whole, more than half of the banks prepare credit quality reports.

59Credit Risk Management Framework at Banks in India
The above is true irrespective of ownership pattern and size of the bank. However, thepercentage of those who do not prepare the credit quality reports is abnormally high, i.e.,42.3%, on the whole. Hence, both large as well as small banks in either of the sector need toconsider this activity sincerely.
Next question asked to the bankers is about RAROC, an important technique of credit riskmanagement, which is gaining importance day by day. Bankers were asked: whether they havedeveloped RAROC framework for risk pricing in their bank? The responses obtained in thisregard are presented in Table 12. The table clearly indicates that at the overall level, only38.5% of the banks have given positive response about the use of risk pricing frameworknamed as RAROC. Sector-wise analysis reveals that 22.2% of the sample PSBs and 75% PBshave responded favorably to this question. The chi-square value is found significant at 0.01levels; hence the proportion of users of RAROC framework is higher among PSBs than that ofPBs. However, there is no such difference between the small and large size banks.
We further asked the bankers about the factors they generally consider for pricing risk intheir bank. The responses obtained in this regard are presented in Table 13a and 13b. Accordingto the statistics presented in the former table, ‘future business potential’ and ‘value of collateral’with the mean score of 5.06 and 4.94 are the most important and second most importantfactors considered for pricing credit risk in PSBs. ‘Market forces’ and ‘portfolio quality’ with themean score of 4.89 and ‘perceived value of accounts’ with mean score of 4.88 have claimedthird and fourth position respectively, in terms of their importance. ‘Strategic reasons’ (score,4.25) and ‘portfolio industry exposure’ (scores, 4.00) have lowest position in terms of importance.Similarly, in case of PBs, ‘future business potential’ (mean of 5.25) has greatest importance inpricing credit risk. ‘Portfolio quality’, ‘value of collateral’ and ‘portfolio industry exposure’ withmean of 5.13 shares the second position jointly. ‘Perceived value of accounts’, ‘strategic reasons’and ‘market forces’ stood at third, fourth and fifth position in terms of importance in pricingcredit risk in banks. On the sector-wise comparison, we find that all the factors except marketforces and perceived value of accounts have obtained relatively higher score in private banks incomparison to PSBs. However, the same is not confirmed by the value of t-test, which gave thevalues –0.438, –0.570, –0.522, –2.631 and –0.607 in case of portfolio quality, value ofcollateral, future business potential, portfolio industry exposure and strategic reasons respectively.The t-values are judged as insignificant in case of each of the above factors. Table 13b presents
Table 12: Development of RAROC Framework for Risk Pricing Sector-Wise Frequency Size-Wise Frequency
Nature of
Distribution Distribution
ResponseOverall Public Private Chi- Large Small Chi-
Sector Sector Square Banks Banks SquareBanks Banks Value (df) Value (df)
Yes 10 (38.5) 4 (22.2) 6 (75.0) 3 (42.9) 7 (36.8)
No 15 (57.7) 14 (77.8) 1 (12.5) 4 (57.1) 11 (57.9)
No Response 1 (3.8) – 1 (12.5)8.466*(1)
– 1 (5.3)0.033 (1)
Total 26 18 8 7 19
Note: Figures in parentheses are the percentage of total.* significant at 0.01 level.

The Icfai University Journal of Bank Management, Vol. VIII, No. 1, 200960
Table 13a: Sector-Wise Response to Factors Consideredfor Pricing Credit Risk in Banks
Mean Score Standard Mean t Sig.
Factors Deviation Score Value Level
Public Private Public Private Difference
Portfolio Quality 4.89 5.13 1.32 1.13 –0.24 –0.438 0.665
Value of Collateral 4.94 5.13 0.94 0.64 –0.18 –0.570 0.575
Market Forces 4.89 4.38 0.76 1.30 0.51 1.273 0.215
Perceived Value of Accounts 4.88 4.75 1.17 1.04 0.13 0.274 0.787
Future Business Potential 5.06 5.25 0.94 0.71 –0.19 –0.522 0.606
Portfolio Industry Exposure 4.00 5.13 1.12 0.64 –1.13 –2.631 0.015
Strategic Reasons 4.25 4.57 1.29 0.79 –0.32 –0.607 0.551
Table 13b: Size-Wise Response to Factors Consideredfor Pricing Credit Risk in Banks
Mean Score Standard Mean t Sig.
Factors Deviation Score Value Level
Large Small Large Small Difference
Portfolio Quality 4.71 5.05 1.98 0.91 –0.34 –0.436 0.676
Value of Collateral 4.86 5.05 1.07 0.78 –0.20 –0.513 0.612
Market Forces 4.86 4.68 1.46 0.75 0.17 0.400 0.693
Perceived Value of Accounts 4.67 4.89 1.97 0.74 –0.23 –0.278 0.791
Future Business Potential 5.29 5.05 0.95 0.85 0.23 0.602 0.553
Portfolio Industry Exposure 4.17 4.42 1.47 1.02 –0.25 –0.480 0.636
Strategic Reasons 5.00 4.17 1.00 1.15 0.83 1.467 0.157
size-wise data. The table indicates that ‘future business potential’ and ‘strategic reasons’ withthe mean score of 5.29 and 5.00 are the most important and second most important factorsfor pricing credit risk in large size banks. ‘Value of collateral’ and ‘market forces’ with the meanvalue of 4.86 shares the third position. ‘Portfolio quality’ and ‘perceived value of accounts’with the mean of 4.71 and 4.67 stood at fourth and fifth position in terms of importance.‘Portfolio industry exposure’ with lowest mean of 4.17 stood at lower position as a factor forpricing credit risk.
‘Portfolio quality’, ‘value of collateral’ and ‘future business potential’ with the mean of5.05 shares the first position in terms of importance in pricing credit risk amongst the small sizebanks. ‘Perceived value of accounts’, ‘market forces’ and ‘portfolio industry exposure’ stood atsecond, third and fourth position with mean score of 4.89, 4.68 and 4.42 respectively. On thesize-wise analysis, we find that portfolio quality, value of collateral, perceived value of accounts,portfolio industry exposure with higher mean value are relatively more important factorsconsidered for pricing credit risk in small banks in comparison to larger ones. However, theabove-mentioned statement is not confirmed by the value of t-test.
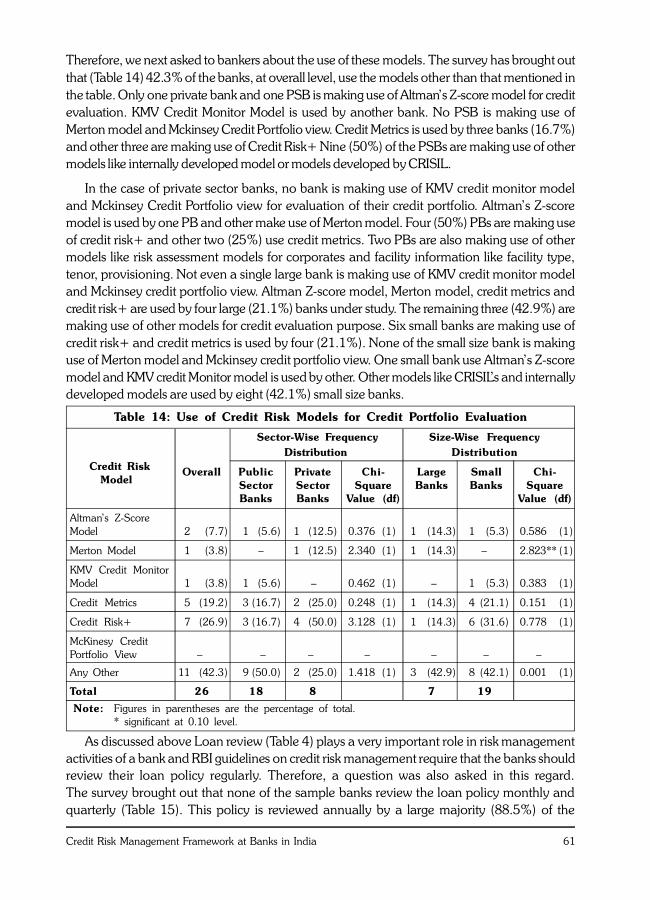
Banks now-a-days are making use of various credit risk models for evaluating their creditportfolio. The important among these models include Altman’s Z-score Model, Merton Model,KMV Credit Monitor Model, Credit Metrics, Credit Risk+, Mckinsey Credit Portfolio View, etc.
61Credit Risk Management Framework at Banks in India
Therefore, we next asked to bankers about the use of these models. The survey has brought outthat (Table 14) 42.3% of the banks, at overall level, use the models other than that mentioned inthe table. Only one private bank and one PSB is making use of Altman’s Z-score model for creditevaluation. KMV Credit Monitor Model is used by another bank. No PSB is making use ofMerton model and Mckinsey Credit Portfolio view. Credit Metrics is used by three banks (16.7%)and other three are making use of Credit Risk+ Nine (50%) of the PSBs are making use of othermodels like internally developed model or models developed by CRISIL.
In the case of private sector banks, no bank is making use of KMV credit monitor modeland Mckinsey Credit Portfolio view for evaluation of their credit portfolio. Altman’s Z-scoremodel is used by one PB and other make use of Merton model. Four (50%) PBs are making useof credit risk+ and other two (25%) use credit metrics. Two PBs are also making use of othermodels like risk assessment models for corporates and facility information like facility type,tenor, provisioning. Not even a single large bank is making use of KMV credit monitor modeland Mckinsey credit portfolio view. Altman Z-score model, Merton model, credit metrics andcredit risk+ are used by four large (21.1%) banks under study. The remaining three (42.9%) aremaking use of other models for credit evaluation purpose. Six small banks are making use ofcredit risk+ and credit metrics is used by four (21.1%). None of the small size bank is makinguse of Merton model and Mckinsey credit portfolio view. One small bank use Altman’s Z-scoremodel and KMV credit Monitor model is used by other. Other models like CRISIL’s and internallydeveloped models are used by eight (42.1%) small size banks.
Table 14: Use of Credit Risk Models for Credit Portfolio Evaluation
Sector-Wise Frequency Size-Wise Frequency Distribution Distribution
Credit Risk Overall Public Private Chi- Large Small Chi- Model Sector Sector Square Banks Banks Square
Banks Banks Value (df) Value (df)
Altman’s Z-ScoreModel 2 (7.7) 1 (5.6) 1 (12.5) 0.376 (1) 1 (14.3) 1 (5.3) 0.586 (1)
Merton Model 1 (3.8) – 1 (12.5) 2.340 (1) 1 (14.3) – 2.823** (1)
KMV Credit MonitorModel 1 (3.8) 1 (5.6) – 0.462 (1) – 1 (5.3) 0.383 (1)
Credit Metrics 5 (19.2) 3 (16.7) 2 (25.0) 0.248 (1) 1 (14.3) 4 (21.1) 0.151 (1)
Credit Risk+ 7 (26.9) 3 (16.7) 4 (50.0) 3.128 (1) 1 (14.3) 6 (31.6) 0.778 (1)
McKinesy CreditPortfolio View – – – – – – –
Any Other 11 (42.3) 9 (50.0) 2 (25.0) 1.418 (1) 3 (42.9) 8 (42.1) 0.001 (1)
Total 26 18 8 7 19
Note: Figures in parentheses are the percentage of total.* significant at 0.10 level.
As discussed above Loan review (Table 4) plays a very important role in risk managementactivities of a bank and RBI guidelines on credit risk management require that the banks shouldreview their loan policy regularly. Therefore, a question was also asked in this regard.The survey brought out that none of the sample banks review the loan policy monthly andquarterly (Table 15). This policy is reviewed annually by a large majority (88.5%) of the

The Icfai University Journal of Bank Management, Vol. VIII, No. 1, 200962
commercial banks, at the overall level. The above pattern is found true irrespective of ownershippattern as well as size of bank. Infact, only one PSB and two PBs are found reviewing theirloan policy bi-annually. Each of these three banks reviewing their loan policy bi-annually is ofsmall size.
Who is responsible for review of loan policy in the banks? This question also needs to beanswered by the banks. The response obtained in this regard is presented in Table 16.
Table 15: Frequency of Review of Loan Policy Sector-Wise Frequency Size-Wise Frequency
Distribution Distribution Interval for Overall Public Private Chi- Large Small Chi- Review Sector Sector Square Banks Banks Square
Banks Banks Value (df) Value (df)
Monthly – – – – –
Quarterly – – – – –
Biannually 3 (11.5) 1 (5.6) 2 (25) 2.052 (1) – 3 (15.8) 1.249 (1)
Annually 23 (88.5) 17 (94.4) 6 (75) 7(100) 16 (84.2)
Total 26 18 8 7 19
Note: Figures in parentheses are the percentage of total.
Table 16: Responsibility of Review of Loan Policy
Sector-Wise Frequency Size-Wise Frequency Distribution Distribution
Risk Management Overall Public Private Chi- Large Small Chi- Authority Sector Sector Square Banks Banks Square
Banks Banks Value (df) Value (df)
Board of Director 21 (80.8) 16 (88.9) 5 (62.5) 2.483 (1) 6 (85.7) 15 (78.9) 0.151 (1)
Credit AdministrationDepartment 4 (15.4) 1 (5.6) 3 (37.5) 4.342 (1) – 4 (21.1) 1.742 (1)
Loan Review Officer 3 (11.5) 1 (5.6) 2 (25.0) 2.052 (1) 1 (14.3) 2 (10.5) 0.071 (1)
Any Other 1 (3.8) 1 (5.6) – .462 (1) – 1 (5.3) 0.383 (1)
Total 26 18 8 7 19
Note: Figures in parentheses are the percentage of total.
The table clearly indicates that on the whole, Board of directors is responsible for review ofloan policy among as high as 80.8% of the banks. The pattern holds good in case of bothPSBs and PBs irrespective of their size. Credit Administration Department is responsible for thesame in case of only 21.1% of the small size banks. The loan policy is reviewed by loan reviewofficer in one PSB and two PBs. Sometimes other individuals from management perform thereview of loan policy. In the case of large size banks, the Board of directors’ reviews loan policyin six (85.7%) banks. Board of Directors’ is responsible for review in 15 (78.9%) small sizebanks.
With the increasing off-balance sheet exposures in the banks, it is important to study thisquestion. Do banks have defined any exposure to manage off-balance sheet exposure in theirbooks? The responses in regard to this ratio are presented in Table 17. This table indicates that,at the overall level, 73.1% of the banks responded positively to the above-mentioned question.

63Credit Risk Management Framework at Banks in India
There is no difference both across the ownership pattern and size of the banks in so far as theresponse of this question is concerned. The table further indicates that 66.7% of PSBs and 87.5%of PBs have defined exposure for off-balance sheet exposure. But the response of five (27.8%)PSBs and one (12.5%) PB was negative towards it. One PSB has not responded to this question.Five (71.4%) large banks and 14 (73.7%) small banks have positively responded towards thedefinition of off-balance sheet exposure.
Table 17: Definition of Exposure for Managing Off-Balance Sheet Exposure
Sector-Wise Frequency Size-Wise Frequency
Nature of Distribution Distribution
Purpose Overall Public Private Chi- Large Small Chi-Sector Sector Square Banks Banks SquareBanks Banks Value (df) Value (df)
Yes 19 (73.1) 12 (66.7) 7 (87.5) 5 (71.4) 14 (73.7)
No 6 (23.1) 5 (27.8) 1 (12.5) 0.853 (1) 2 (28.6) 4 (21.1) 0.111 (1)
No Response 1 (3.8) 1 (5.6) – – 1 (5.3)
Total 26 18 8 7 19
Note: Figures in parentheses are the percentage of total.
The banks also need to develop a framework for studying inter-bank exposure. An attemptwas made to know whether the bankers have this type of framework. The survey has broughtout that (Table 18) 16 (88.9) PSBs and six (75%) PBs have responded favorably to it.
Table 18: Development of Framework for Studying Inter-Bank Exposure
Sector-Wise Frequency Size-Wise Frequency Distribution Distribution
Response Overall Public Private Chi- Large Small Chi-Sector Sector Square Banks Banks SquareBanks Banks Value (df) Value (df)
Yes 22 (84.6) 16 (88.9) 6 (75) 7(100) 15 (78.9)
No 3 (11.5) 1 (5.6) 2 (25) – 3 (15.8)
No Response 1 (3.8) 1 (5.6) –1.883 (1)
– 1 (5.3)1.326 (1)
Total 26 18 8 7 19
Note: Figures in parentheses are the percentage of total.
Size-wise analysis reveals that seven large (100%) banks and fifteen (78.9%) small bankshave developed system for studying inter-bank exposure. Thus, majority of the banks irrespectiveof their ownership pattern and size, have developed procedure for investigating inter-bank exposure.Further, we asked the bankers, what aspects they generally consider for evaluating bank-wiseexposure. The responses obtained in this regard are presented in Tables 19a and 19b.
The former table indicates that ‘Study of Financial Performance’ is the most importantfactor (mean score, 5.67) followed by ‘past experience’ (mean score, 5.44) and ‘ManagementQuality’ (mean score, 5.38) in case of PSBs. ‘Operating Efficiency’ and ‘bank rating on creditquality’ with mean of 5.31 and 4.94 follow the above aspects in terms of importance.

The Icfai University Journal of Bank Management, Vol. VIII, No. 1, 200964
In the case of private sector banks, ‘past experience’ with mean score of 5.88 and ‘study offinancial performance’ and ‘bank rating on credit quality’ with mean score of 5.63 are themost important and second most important aspects for managing bank-wise exposure.‘Management quality’ (mean, 5.13) and ‘operating efficiency’ (mean, 4.75) stood at third andfourth position in terms of importance. ‘Internal Matrix for studying counter party or countryrisk’ got the lowest mean score in PSBs (4.12) as well as in PBs (4.63) and hence this is theleast important aspect considered for bank-wise exposure. The sector-wise analysis indicatesthat ‘study of financial performance’, ‘operating efficiency’ and ‘management quality’ aresignificantly important aspects considered in PSBs in comparison to PBs. All other objectivesare found relatively more important in PBs in comparison to PSBs. The t-values, which werecomputed to test the significance of difference of the mean score obtained by various factorsconsidered for evaluating bank exposure in case of small and large size banks are insignificant.Hence, size as well as ownership pattern do not affect the importance of various aspects.
Table 19a: Sector-Wise Importance Assigned to Aspects Consideredfor Evaluating Inter-Bank Exposures
Mean Score Standard Mean t Sig.
Aspects Deviation Score Value Level
Public Private Public Private Difference
Study of Financial Performance 5.67 5.63 0.82 0.74 4.17E-02 0.120 0.906
Operating Efficiency 5.31 4.75 0.95 1.67 0.56 1.062 0.300
Management Quality 5.38 5.13 0.89 1.73 0.25 0.474 0.640
Past Experience 5.44 5.88 0.81 0.35 –0.44 –1.832 0.081
Bank Rating on Credit Quality 4.94 5.63 1.82 0.52 –0.68 –1.432 0.167
Internal Matrix for StudyingCounter Party or Country Risk 4.12 4.63 1.83 1.69 –0.51 –0.661 0.515
Table 19b: Size-Wise Importance Assigned to Aspects Consideredfor Evaluating Inter-Bank Exposures
Mean Score Standard Mean t Sig.
Aspects Deviation Score Value LevelLarge Small Large Small Difference
Study of Financial Performance 5.50 5.71 1.22 0.59 –0.21 –0.550 0.588
Operating Efficiency 4.17 5.44 1.72 0.86 –1.28 –2.434 0.023
Management Quality 4.67 5.50 1.97 0.79 –0.83 –1.011 0.354
Past Experience 5.50 5.61 0.84 0.70 –0.11 –0.322 0.750
Bank Rating on Credit Quality 5.57 5.00 0.79 1.75 0.57 0.824 0.418
Internal Matrix for StudyingCounter Party or Country Risk 4.71 4.11 1.80 1.78 0.60 0.759 0.456
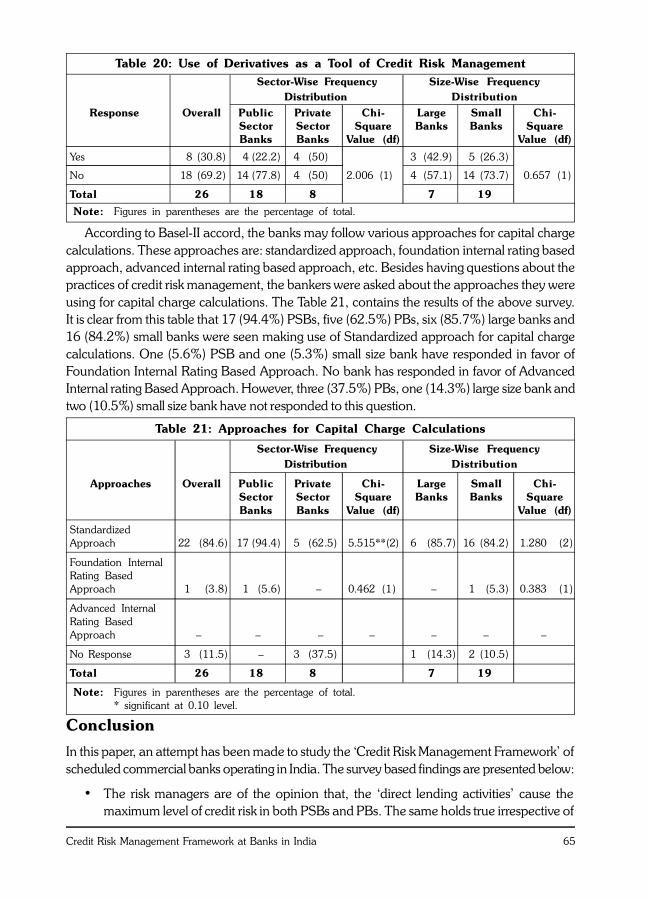
With the growing Derivatives Market, it was considered necessary to ask the bankers, whetherthey use derivatives for managing Credit Risk in their bank. The data obtained in this regard ispresented in Table 20. This table clearly indicates that the majority of the bankers respondednegatively about the use of derivatives. The above holds true irrespective of size of the banksand ownership pattern.
65Credit Risk Management Framework at Banks in India
According to Basel-II accord, the banks may follow various approaches for capital chargecalculations. These approaches are: standardized approach, foundation internal rating basedapproach, advanced internal rating based approach, etc. Besides having questions about thepractices of credit risk management, the bankers were asked about the approaches they wereusing for capital charge calculations. The Table 21, contains the results of the above survey.It is clear from this table that 17 (94.4%) PSBs, five (62.5%) PBs, six (85.7%) large banks and16 (84.2%) small banks were seen making use of Standardized approach for capital chargecalculations. One (5.6%) PSB and one (5.3%) small size bank have responded in favor ofFoundation Internal Rating Based Approach. No bank has responded in favor of AdvancedInternal rating Based Approach. However, three (37.5%) PBs, one (14.3%) large size bank andtwo (10.5%) small size bank have not responded to this question.
Table 20: Use of Derivatives as a Tool of Credit Risk Management Sector-Wise Frequency Size-Wise Frequency
Distribution Distribution Response Overall Public Private Chi- Large Small Chi-
Sector Sector Square Banks Banks SquareBanks Banks Value (df) Value (df)
Yes 8 (30.8) 4 (22.2) 4 (50) 3 (42.9) 5 (26.3)
No 18 (69.2) 14 (77.8) 4 (50) 2.006 (1) 4 (57.1) 14 (73.7) 0.657 (1)
Total 26 18 8 7 19
Note: Figures in parentheses are the percentage of total.
Table 21: Approaches for Capital Charge Calculations
Sector-Wise Frequency Size-Wise Frequency Distribution Distribution
Approaches Overall Public Private Chi- Large Small Chi-Sector Sector Square Banks Banks SquareBanks Banks Value (df) Value (df)
StandardizedApproach 22 (84.6) 17 (94.4) 5 (62.5) 5.515**(2) 6 (85.7) 16 (84.2) 1.280 (2)
Foundation InternalRating BasedApproach 1 (3.8) 1 (5.6) – 0.462 (1) – 1 (5.3) 0.383 (1)
Advanced InternalRating BasedApproach – – – – – – –
No Response 3 (11.5) – 3 (37.5) 1 (14.3) 2 (10.5)
Total 26 18 8 7 19
Note: Figures in parentheses are the percentage of total.* significant at 0.10 level.
Conclusion
In this paper, an attempt has been made to study the ‘Credit Risk Management Framework’ ofscheduled commercial banks operating in India. The survey based findings are presented below:
• The risk managers are of the opinion that, the ‘direct lending activities’ cause themaximum level of credit risk in both PSBs and PBs. The same holds true irrespective of

The Icfai University Journal of Bank Management, Vol. VIII, No. 1, 200966
size of the banks. In order to manage and control credit risk, the majority of banks haveresponded favorably to the enactment of ‘Securitization Ordinance Act, 2002’.
• Regarding the authority for approval of the Credit Risk Policy, it was found that in84.6% of the banks, the same is approved by Board of Directors. The authority of creditrisk management is set up at ‘Head Office’ level in most of the banks. The creditsanction of the authority is obtained from for exposures of more than Rs. 1 cr.
• The survey indicated that more than 90% of the banks favor risk rating as an instrumentfor ‘Credit Risk Management’. The other instruments such as ‘proper credit administrationin form of credit sanctions’, ‘prudential limits’ and ‘loan review’ are also given very highimportance by the banks.
• For management of credit risk, RBI has suggested various prudential limits like cleardefinition of exposure limits and single/group borrower limits. Amongst these limits, theformer is favored more in public sector banks and the latter gains more importance inprivate banks. Size-wise analysis has revealed that the large size banks favor ‘single/group borrower limits’, but ‘exposure limits’ have more importance in small size banks.
• The risk rating is the most important activity performed by banks for credit riskmanagement. For risk rating the design of MIS is considered as an important requirementfor banks now-a-days. The survey brought out that more than 90% of banks performrisk rating exercise and they have started developing MIS. In most of the banks therating is presented in the form of ‘Alphabets’.
• Regarding frequency of the credit risk assessment exercise, it has been observed that thebankers perform it annually. The other most important technique for credit riskmanagement, as suggested by RBI, is ‘Risk adjusted pricing of the portfolio’. The surveyhas indicated that Risk pricing is favored by around 60% of the banks. The surveyfurther exhibited that the ‘Future Business Potential’ is the most important factorconsidered for pricing credit risk in banks.
• Regarding model for evaluation of their credit portfolio, it came to light that most of thebanks favored CRISIL’s models and internally designed models. Around 90% of thebanks in India make the annual review of their loan policy and this exercise is performedby Board of Directors in more than 80% of banks.
• The survey also brought out that 73.1% of the banks have clearly defined theiroff-balance sheet exposure.
• ‘Study of Financial performance’, ‘operating efficiency’ and ‘management quality’ areassumed as more important aspects in PSBs in comparison to PBs for evaluating inter-bank exposure.
• The use of derivatives in banks for credit risk management is almost negligible.
• For capital charge calculation, almost 85% of the banks have favored standardizedapproach of credit risk.

67Credit Risk Management Framework at Banks in India
The survey has, thus, brought out that irrespective of sector and size of bank, Credit RiskManagement framework in India is on the right track and it is fully based on the RBI’s guidelinesissued in this regard. While ‘risk rating’ is the most important instrument, the others propercredit administration, prudential limits and loan review are used as very highly importantinstruments of credit risk management. Most banks have their credit approving authority at‘Head Office Level’. Borrower limits and exposure limits are major prudential limits for creditrisk management. Risk pricing is a modern tool for pricing credit risk in banks. However, thebanks in India are not very enthusiastic to use derivatives products as risk hedging tools as tilldate they are not used in majority of the banks. The risk managers were of the opinion that theimplementation of credit risk related guidelines was not a problem for them, but lack of theunderstanding of the methodologies/instruments was a cumbersome task for many of them.They needed to undergo some training/education program in this regard. Hence, the concernedbanks as well as RBI should take appropriate steps to organize high training programs on riskmanagement at some institute of high credibility. H
References
1. Bagchi S K (2003), “Credit Risk Management – A Panacea or Conundrum?”, SBI MonthlyReview, Vol. 42, No. 10, pp. 497-504.
2. Bandyopadhyay Arindam (2006), “Predicting Probability of Default of Indian CorporateBonds: Logistic and Z-Score Model Approaches”, The Journal of Risk Finance, Vol. 7,No. 3, pp. 255-272.
3. Duffee Gregory R and Zhou Chunseng (1999), “Credit Derivatives in Banking: UsefulTools for Managing Risk?” Research Program in Finance – 289, University of California,Berkeley.
4. Ferguson Roger W (2001), “Credit Risk Management – Models and Judgement”, PNBMonthly Review, Vol. 23, No. 10, pp. 23-31.
5. Froot Kenneth A and Jeremy C Stein (1998), “Risk Management, Capital Budgeting, andCapital Structure Policy for Financial Institutions: An Integrated Approach”, Journal ofFinancial Economics, Vol. 47, pp. 55-82.
6. Guidance Note on Credit Risk Management, October 12, 2002, Department of BankingOperations and Development, Reserve Bank of India.
7. Louberge Henri and Schlesinger Hanis (2005), “Coping with Credit Risk”, The Journal ofRisk Finance, Vol. 6, No. 2, pp. 118-134.
8. Muninarayanappa and Nirmala (2004), “Credit Risk Management in Banks – Key Issues”,Journal of Accounting & Finance, Vol. 18, No. 1, pp. 94-98.
9. Rajagopal S (1996), “Bank Risk Management – A Risk Pricing Model”, SBI MonthlyReview, Vol. 35, No. 11, pp. 553-567.
10. Treacy William F and Carey Mark S (1998), “Credit Risk Rating at Large US Banks”,Federal Reserve Bulletin, November.

The Icfai University Journal of Bank Management, Vol. VIII, No. 1, 200968
Exhibit 1: List of Respondents (Banks)Size-Wise Sector-Wise
Large Banks Public Sector Banks
Public Sector Banks Allahabad Bank (AlB)
Bank of Baroda (BOB) Andhra Bank (AB)
Canara Bank (CB) Bank of Baroda (BOB)
Punjab National Bank (PNB) Canara Bank (CB)
State Bank of India (SBI) Central Bank of India (CBI)
Private Sector Banks Indian Bank (IB)
HDFC Bank Ltd. (HDFC) Oriental Bank of Commerce (OBC)
ICICI Bank Ltd. (ICICI) Punjab National Bank (PNB)
UTI Bank Ltd. (UTI) Syndicate Bank (SyB)
UCO Bank (UCOB)
Small Banks Union Bank of India (UBI)
Public Sector Banks Vijaya Bank (VB)
Allahabad Bank (AlB) State Bank of Hyderabad (SBH)
Andhra Bank (AB) State Bank of India (SBI)
Central Bank of India (CBI) State Bank of Indore (SBIn)
Indian Bank (IB) State Bank of Patiala (SBP)
Oriental Bank of Commerce (OBC) State Bank of Saurashtra (SBS)
Syndicate Bank (SyB) State Bank of Travancore (SBT)
UCO Bank (UCOB)
Union Bank of India (UBI) Private Sector Banks
Vijaya Bank (VB) Bank of Rajasthan Ltd. (BoR)
State Bank of Hyderabad (SBH) Citibank N.A. (CITI)*
State Bank of Indore (SBIn) HDFC Bank Ltd. (HDFC)
State Bank of Patiala (SBP) ICICI Bank Ltd. (ICICI)
State Bank of Saurashtra (SBS) IndusInd Bank Ltd. (INDUS)
State Bank of Travancore (SBT) Karnataka Bank Ltd. (KB)
Private Sector Banks Kotak Mahindra Bank Ltd. (KMB)
IndusInd Bank Ltd. (INDUS) UTI Bank Ltd. (UTI)
Bank of Rajasthan Ltd. (BoR)
Kotak Mahindra Bank Ltd. (KMB)
Karnataka Bank Ltd. (KB)
Citibank N.A. (CITI)*
Note: * Foreign Bank.

69Credit Risk Management Framework at Banks in India
Questionnaire on Credit Risk Management
1) (a) Please indicate the level of Credit Risk being faced by your bank on the following transactions(on a scale of 1 to 7, where 1 = no risk; 2 = very low; and 7 = very high)
1 2 3 4 5 6 7
I. Direct Lending
II. Guarantees or Letter of Credit
III. Cross Border Exposure
(b) To what extent the ‘Securitization Ordinance’ Act, 2002 is effective in Credit Risk Managementfor your bank?
Very much ________ Some what ________ Not at all ________
2) (a) Who is responsible for approval of Credit Risk Policy in your bank? (Please tick)
I. Board of Directors
II. Senior Management
III. Credit Policy Committee
IV. Any other, please specify
(b) Which technique/instrument, do you use for Credit Risk Management in your bank? (Pleasetick)
I. Credit Approval Authority
II. Prudential Limits
III. Risk Ratings
IV. Risk Pricing or Risk Adjusted Return on Capital (RAROC)
V. Portfolio Management
VI. Loan Review Policy
VII. Any other, please specify
3) (a) What is the credit limit for seeking approval from Credit Approval Committee in your bank?(Please tick)
I. Above 20 Lakhs
II. Above 50 Lakhs
III. Above 1 Crore
(b) At what level the Approval Committees are set up in your bank? (Please tick)
I. Branch Level
II. Regional Level
III. Zonal Level
IV. Head Office Level
(Contd...)

The Icfai University Journal of Bank Management, Vol. VIII, No. 1, 200970
(c) Please indicate the relative importance of the following aspects of credit, you considerwhile defining prudential limits (on a scale of 1-7, where 1 = not used; 2 = unimportant;
7 = very important)
1 2 3 4 5 6 7
I. Stipulate Benchmark for ratios
II. Single/Group borrower limits
III. Exposure limits
IV. Maximum exposure limits to Industry
V. Consideration of Maturity Profile
of Loan Book
(d) Does your bank perform the following activities for Credit Risk Management? (Please tick)
I. Industries Studies\Profiles
II. Periodic Credit Calls
III. Periodic Visits of Plants
IV. Develop MIS
V. Credit Risk Rating/Risk Scoring
VI. Annual Review of Accounts
(e) Please tick, which of the following is applicable for rating in your bank?
I. Number
II. Alphabets
III. Alpha-Numeric
IV. Symbol
V. Descriptive Terms
4) (a) At what interval the Credit Risk assessment is repeated in your bank?
Monthly Quarterly Bi-annually Annually
(b) Do you prepare ‘Credit Quality Reports’ for signaling loan loss in any portfolio?
Yes No
(c) Have you developed ‘Risk Adjusted Return on Capital (RAROC)’ Framework for Risk
Pricing in your bank? Yes No
Questionnaire on Credit Risk Management (...contd)
(Contd...)

71Credit Risk Management Framework at Banks in India
5) (a) Please indicate, the relative importance of the following factors you consider for pricingCredit Risk (on a scale of 1 to 7, where 1 = not used, 2 = unimportant; 7 = very important)
1 2 3 4 5 6 7
I. Portfolio Quality
II. Value of Collateral
III. Market forces
IV. Perceived value of accounts
V. Future business potential
VI. Portfolio Industry Exposure
VII. Strategic Reasons
VIII. Any other, please specify _____________
(b) Please identify which of the following ‘Credit Risk Model’ you use for evaluation of CreditPortfolio.
I. Altman’s Z-Score Model
II. Merton Model
III. KMV Credit Monitor Model
IV. Credit Metrics
V. Credit Risk+
VI. McKinesy Credit Portfolio View
VII. Any other, please specify
6) (a) At what interval the ‘Loan Policy’ is reviewed?
Monthly Quarterly Bi-annually Annually
(b) Who review the ‘Loan Policy’ in your bank? (Tick the appropriate)
I. Board of Directors
II. Credit Administration Department
III. Loan Review Officer
IV. Any other, please specify
(c) Do you have defined exposure for managing off-balance sheet exposure?
Yes No
7) (a) Have you developed any framework to study the inter-bank exposures?
Yes No
Questionnaire on Credit Risk Management (...contd)
(Contd...)

The Icfai University Journal of Bank Management, Vol. VIII, No. 1, 200972
(b) Please indicate the relative importance of the following aspects that you consider forevaluating bank-wise exposures (on a scale of 1 to 7, where 1 = not used, 2 = unimportant;7 = very important)
1 2 3 4 5 6 7
I. Study of Financial Performance
II. Operating Efficiency
III. Management Quality
IV. Past Experience
V. Bank rating on Credit Quality
VI. Internal Matrix for studyingcounter party or country risk
(c) Does your bank use ‘Derivatives’ to manage Credit Risk?
Yes No
8) Which approach you are using for measuring capital requirement for Credit Risk?
I. Standardized Approach
II. Foundation Internal Rating Based Approach
III. Advanced Internal Rating Based Approach
Questionnaire on Credit Risk Management (...contd)
Reference # 10J-2009-02-03-01