1 Relationship between Split-Step Timing and Leg Stiffness in ...
40
1 Relationship between Split-Step Timing and Leg Stiffness in World-Class Tennis Players when Returning Fast Serves Sami Mecheri 1 , Guillaume Laffaye 2,3 , Céline Triolet 2,3 , David Leroy 4 , Matt Dicks 5 Mohamed A. Choukou 6 , Nicolas Benguigui 7 1 Laboratory for Road Operations, Perception, Simulators and Simulation IFSTTAR, Université Paris-Est, France 2 CIAMS, Univ. Paris-Sud, Université Paris-Saclay, 91405 Orsay Cedex, France 3 CIAMS, Université d’Orléans, 45067, Orléans, France 4 CETAPS Laboratory, Faculty of Sports Sciences, UniRouen, Normandie Université, France 5 Department of Sport and Exercise Science, University of Portsmouth, United Kingdom 6 Center for Interdisciplinary Research in Rehabilitation and Social Integration, Department of Rehabilitation, Université Laval, Canada 7 CESAMS Laboratory, University of Caen Normandie, France Accepted for Publication in Journal of Sports Sciences on the 4 th April, 2019 Corresponding Author Sami Mecheri Laboratory for Road Operations, Perception, Simulators and Simulation French Institute of Sciences and Technology for Transport, Development and Networks Paris-Est University 14-20 Boulevard Newton, Cité Descartes Champs sur Marne, F-77447 Marne la Vallée Cedex 2, France Phone: +33 1 81 66 83 46 E-mail: [email protected] Abstract count: 198 Word count (excluding acknowledgements and references): 7070
-
Upload
khangminh22 -
Category
Documents
-
view
2 -
download
0
Transcript of 1 Relationship between Split-Step Timing and Leg Stiffness in ...
1
Relationship between Split-Step Timing and Leg Stiffness in World-Class Tennis
Players when Returning Fast Serves
Sami Mecheri1, Guillaume Laffaye2,3, Céline Triolet2,3, David Leroy4, Matt Dicks5
Mohamed A. Choukou6, Nicolas Benguigui7
1 Laboratory for Road Operations, Perception, Simulators and Simulation
IFSTTAR, Université Paris-Est, France
2 CIAMS, Univ. Paris-Sud, Université Paris-Saclay, 91405 Orsay Cedex, France
3 CIAMS, Université d’Orléans, 45067, Orléans, France
4 CETAPS Laboratory, Faculty of Sports Sciences, UniRouen, Normandie Université, France
5 Department of Sport and Exercise Science, University of Portsmouth, United Kingdom
6 Center for Interdisciplinary Research in Rehabilitation and Social Integration, Department of
Rehabilitation, Université Laval, Canada
7 CESAMS Laboratory, University of Caen Normandie, France
Accepted for Publication in Journal of Sports Sciences on the 4th April, 2019
Corresponding Author
Sami Mecheri
Laboratory for Road Operations, Perception, Simulators and Simulation
French Institute of Sciences and Technology for Transport, Development and Networks
Paris-Est University
14-20 Boulevard Newton, Cité Descartes
Champs sur Marne, F-77447 Marne la Vallée Cedex 2, France
Phone: +33 1 81 66 83 46
E-mail: [email protected]
Abstract count: 198
Word count (excluding acknowledgements and references): 7070
2
Abstract
This study investigated split-step timing when returning serves and whether this
timing is related to neuromechanical capabilities in world-class tennis players. In
Experiment 1, the split-step timing of four groups of world-class players (male and
female ATP/WTA seniors, and ITF juniors) was measured on court when returning
serves of the same level players. The four groups initiated the split-step at a similar
time, starting around the time ball-racket contact in the serve stroke and landed when
early ball-flight information was available. In Experiment 2, the neuromechanical
capabilities (leg stiffness and vertical jump performance) of a group of world-class
players and three groups of less-skilled tennis players were examined. The results
showed an increase in leg stiffness with an increase in level of expertise. A cross-
experiment analysis in world-class male players (ATP/ITF, n = 10) revealed that the
timing of initial foot movement was significantly correlated with the leg stiffness
(r2=0.54), with later lateral step after the serve in the players who had higher
stiffness. The findings support the hypothesis that world-class tennis players adapt
perceptual-motor control on the basis of their neuromechanical capabilities and
maximise the time before initiating their interceptive action to rely on more reliable
information.
Keywords: Perception, Action, Interception, Expertise, Spring-mass model

3
Relationship between Split-Step Timing and Leg Stiffness in World-Class
Tennis Players when Returning Fast Serves
The performance of dynamic interceptive actions is highly challenging because
of the restrictive spatiotemporal constraints on performance. In sports situations such
as the tennis serve-return, the available time for returning a serve hit at 200 km.h-1 is
less than 600 ms (Abernethy & Wollstein, 1989). With such spatiotemporal pressure,
that impose a highly challenging constraint on the returning tennis stroke, it is
remarkable that expert players are still able to return the ball in a large number of
situations (80% of serve-returns are in the court at Grand Slam level, see Gillet, Leroy,
Thouvarecq, & Stein, 2009).
A first proposition to explain this ability was based on the assumption that
expert racket sports players possess superior reaction times to produce shorter response
latencies. However, research using non-sport-specific reaction time measures (e.g.,
press a key as soon as possible in response to a stimulus) has not revealed consistent
differences between experts and novices (e.g., in badminton and squash players:
Abernethy, 1991; in tennis players: Rowe & McKenna, 2001). Research has also
focused on athletes' anticipation ability. An extensive body of literature illustrates
skilled performers' superiority over less-skilled athletes in perceptual judgment tests
of anticipation skill (Williams & Ward, 2007). In tennis, expert players have been
shown to make better predictions of serve direction than novice players based on
advance kinematic information (i.e., pre-ball-flight: Farrow & Abernethy, 2003) and
younger players based on situational probability information (i.e., patterns of opponent
play: Farrow & Reid, 2012). This advantage in anticipatory skill is thought to provide
expert tennis players with the opportunity to initiate an accurate movement response
before an opponent’s stroke.

4
A recent attempt to quantify the prevalence of anticipation during professional
tennis matches (involving current or former top 20 ATP players) revealed, however,
that the observed frequency of anticipatory behaviour (defined as lateral motion of the
racket, the hips, the shoulders or the feet before the opponent’s stroke) was relatively
low, occurring between only 6% and 13% of all match situations (including passing
shots, return and volley, see Triolet, Benguigui, Le Runigo, & Williams, 2013).
Although prior research demonstrated that collegiate tennis players did not move
before ball-racket contact when facing live groundstrokes (Shim, Carlton, Chow, &
Chae, 2005), a striking finding in the study by Triolet et al. (2013) was the low level
of anticipation (less than 10%) in elite players when returning first serves, which are
known to create pressing spatiotemporal constraints. This finding was interpreted as
possible evidence of a ‘conservative’ strategy used by players in which they wait for
information emanating from early ball flight before initiating responses. Importantly,
the results from Shim et al. (2005) and Triolet et al. (2013) both revealed no response
errors (i.e., moving to the wrong side) when participants initiated their responses after
the opponent contacted the ball.
Shim et al. (2005) also revealed that the response latencies of skilled
performers were significantly earlier when returning balls hit by a live opponent than
when returning balls projected from a cloaked ball machine. Therefore, it seems
possible that skilled performers use advance kinematic information not solely in order
to anticipate the opponent’s action, but also to reduce the response delay and get a
better synchronisation of responses to the opponent’s actions (Navia, Dicks, van der
Kamp, & Ruiz, 2017).
Few studies have examined the preparatory leg movements of tennis players
referred to as the split-step. This action corresponds to a small bound, which is timed
5
relative to the opponent’s stroke, in order to initiate a movement toward the ball. From
a biomechanical perspective, the split-step allows players to increase ground reaction
forces and the restitution of mechanical energy by taking advantage of the pre-stretch
applied to the lower limbs extensors for a more explosive displacement (Nieminen et
al., 2014). The mechanical efficiency of this “bouncing” phase can be assessed by
measuring Leg Stiffness. Leg Stiffness is used to characterise whole lower extremity
function in stance during bouncing gait, like hopping or running, based on a simple
spring-mass model, which considers the human body as a mass on a massless spring
(Blickhan, 1989; McMahon & Cheng, 1990).
The timing of the split-step in skilled senior tennis players (national and
regional French level) when returning first serves was first examined in a technical
report by Avilès, Benguigui, Beaudoin and Godart (2002). This study revealed that the
timing of the split-step take-off and landing were similar between expertise levels,
occurring 40ms before the stroke and 160ms after the stroke, respectively. In a more
recent report, a post-stroke take-off (+34 ms) and landing (+151 ms) were reported in
male and female juniors with a high national ranking in their respective categories
(Avilès, Pérez, Sanz, & Navia, 2014).
Other research on the split-step has been undertaken in laboratory conditions
using a light direction signal preceded by three preparatory light blinks (Nieminen,
Piirainen, Salmi, & Linnamo, 2014; Uzu, Shinya, & Oda, 2009). Uzu et al. (2009)
reported that male collegiate tennis players land approximately 180 ms after the signal
in order to produce a quick and reliable lateral step toward the target. With earlier
landing times, participants were able to reduce the total time to reach the target but
they also made more errors in response accuracy. Furthermore, Nieminen et al. (2014),
revealed that when male tennis players with a competitive background utilised a
6
preparatory split-step action – in which they landed 208 ms after the direction signal
– they required less time to reach the target (13.1% faster) than when they did not use
a preparatory split-step.
Only a small number of studies have investigated Leg Stiffness in tennis
players. During jumping and hopping tests, Durand, Ripamonti, Beaune, and Rahmani
(2010) assessed Leg Stiffness in thirteen male regional tennis players (mean age = 23.0
years) and reported values of 34.8 kN.m-1 which were comparable to elite sprinters
and significantly correlated to 20-m sprinting speed and counter-movement jump
height. Maquirriain (2013) found a mean value of 18.8 kN.m-1 in ten players (nine men
and one woman, mean age = 17.6 years) competing at national or international level
in a hopping task. Girard and Millet (2009) calculated a Leg Stiffness of 19.9 kN.m-1
during jumping and hopping tests in twelve young players (mean age = 13.6 years),
and reported no correlation between tennis level (ranking) and Leg Stiffness.
Altogether, results are rather scattered with studies reporting similar Leg Stiffness
values between young players of different ages (Girard & Millet, 2009; Maquirriain,
2013) and rare data (but obviously higher values) in senior players (Durand et al.,
2010; see also Girard, Lattier, Micallef, & Millet, 2006). In addition, it is unclear from
prior literature whether Leg Stiffness influences tennis-specific performance in elite
senior players, requiring further work to ascertain whether a greater Leg Stiffness
would result in more efficient on-court actions, and thus supports better performance.
To date, few studies have examined the timing of the split-step sequence when
returning serves (Avilès et al., 2002, 2014) and although the neuromechanical
parameters involved in the split-step have been studied in the laboratory (Nieminen et
al., 2014; Uzu et al., 2009), no study has attempted to examine both aspects to provide
a more complete understanding of this behaviour. This issue may be worth
7
investigating in tennis to confirm and extend research from Dicks, Davids and Button,
(2010) in soccer, who reported that goalkeepers who were more agile with shorter
movement times were found to wait later before initiating their actions and saved more
penalty kicks in comparison with less agile goalkeepers. This Leg Stiffness adaptation
hypothesis is that expert interceptive performance is not rendered by providing a
maximum time period to execute the action (i.e., an earlier response) irrespective of
action capabilities, but in contrast, by scaling the timing of responses relative to one’s
own action capabilities in order to provide a maximum time period before initiating
the response to use more reliable information (see also, Fajen, 2005). In this context,
we conducted two experiments to investigate the split-step timing of world-class tennis
players in a serve-return task (Experiment 1) and Leg Stiffness and vertical jump
performance of world-class and less-skilled tennis players (Experiment 2). Further
cross-experiment analysis was conducted on the relationship between split-step timing
and the Leg Stiffness measures to determine whether world-class tennis players adapt
perceptual-motor control to their neuromechanical capabilities.
Experiment 1: Split-Step Timing in Serve-Return
The objective of Experiment 1 was to examine the split-step timing of world-
class tennis players when facing fast serves. The serve-return task was used as it
requires execution of the split-step with minimum timing error to satisfy the high
spatiotemporal demands. Four groups of world-class tennis players were tested: male
and female seniors and juniors. The innovative rationale for testing these groups was
to provide a broader view of the timing of the split-step by examining possible
differences between males and females and/or between juniors and seniors. In line
with Shim et al. (2005) and Triolet et al. (2013), all groups of players were expected
8
to initiate the split-step and lateral displacement movements after the racket-ball
contact to rely on more consistent information (i.e., early ball flight) and avoid errors
in decision-making (Dicks et al., 2010). In addition, while no significant split-step
timing difference was expected between juniors and seniors in line with a previous
finding (Avilès et al., 2002), greater consistency in split-step timing was expected in
senior players as a result of a better attunement to the opponent’s unfolding action.
Method
Participants
Twenty-two male and female world-class tennis players participated
voluntarily and gave written informed consent. The players were recruited from the
French Tennis Federation elite training program and were assigned to four groups: (i)
senior females, (ii) senior males, (iii) junior females and (iv) junior males. Senior
groups consisted of seven men (mean age = 27.1 ± 4.9 years) and five women (mean
age = 22.4 ± 3.9 years) with an average duration of intense practice of 14.9 ± 5.4 and
10.4 ± 2.3 years, respectively. At the time of testing, senior players were all ranked in
world top 500 ATP or WTA world rankings. Junior groups consisted of five men
(mean age = 16.8 ± 0.7 years) and five women (mean age = 16.8 ± 0.8 years) with an
average duration of intense practice of 7.6 ± 2.2 and 8.4 ± 2.2 years, respectively.
Junior players were all in the top 100 ITF junior world rankings. All participants had
normal or corrected-to-normal vision and were naïve with respect to the hypotheses
under investigation. The experiment was approved by the local ethics committee
Human Subject Review Board.
Task and Procedure
9
The experiment took place on a hard court. The participants had to return a
series of 20 first serves in the advantage court diagonal executed by a participant from
the same group. Servers produced fast first serves (without spin) as they would do in
competition. Serves were directed to two targets 0.80 m × 0.80 m delimitated in both
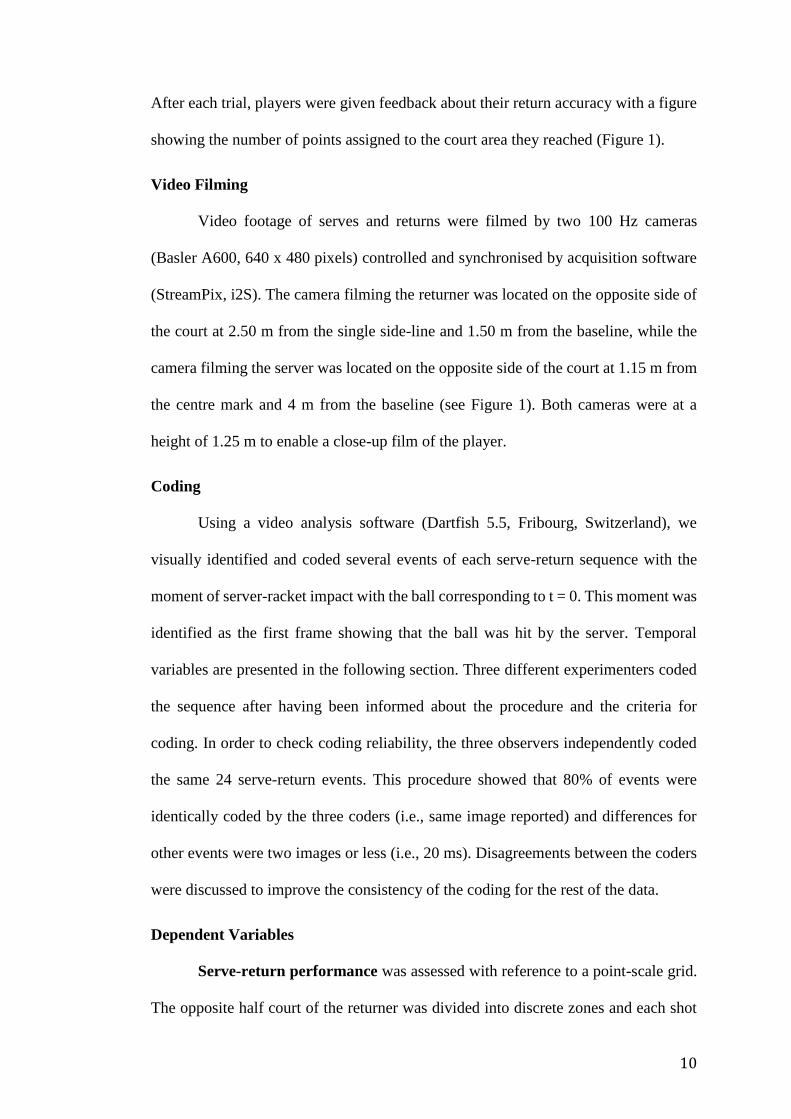
corners (Left [ZSL] and Right [ZSR] Zones of Serve, see Figure 1). Ten serves were
played down the centre of the court (ZSL) and 10 wide (ZSR) following a test script.
In order to be used in the experiment, serves were required to land in the intended
square in the service rectangle and satisfy speed requirements (between 140 and 170
km.h-1 in females and between 160 and 190 km.h-1 in males) measured with a speed
gun (Stalker ATS sports radar, USA). All servers received feedback about their stroke
performance after each trial (speed and accuracy). The trials for which the serves did
not meet speed and location requirements were excluded from the analyses. The serve-
returns that did not lead to a performance score of a minimum of three points (ball into
the opposite half court) were also ruled out to avoid analysing ineffective returns. On
this basis, 12.1 ± 2.6 serve-return sequences were analysed in seniors and 9.8 ± 2.4 in
juniors (mean ± SD). The mean speed of the selected serves was 154.0 ± 6.8 (juniors)
and 160.3 ± 7.4 (seniors) km.h-1 in females, and 169.1 ± 9.7 (juniors) and 176.6 ± 9.6
(seniors) km.h-1 in males. Consistent with the speed requirements for serve selection,
a 2 (Expertise) × 2 (Gender) ANOVA on serve-speed data only revealed a significant
main effect of Gender.
Participants were informed about the nature and response requirements of the
task before undertaking a self-selected warm-up. They were told that they had to return
serves as they would in a normal competition. No strict constraints were imposed on
their initial positioning, except that they should be between zero and two metres from
the baseline in order to avoid significant differences in the time available to return.
10
After each trial, players were given feedback about their return accuracy with a figure
showing the number of points assigned to the court area they reached (Figure 1).
Video Filming
Video footage of serves and returns were filmed by two 100 Hz cameras
(Basler A600, 640 x 480 pixels) controlled and synchronised by acquisition software
(StreamPix, i2S). The camera filming the returner was located on the opposite side of
the court at 2.50 m from the single side-line and 1.50 m from the baseline, while the
camera filming the server was located on the opposite side of the court at 1.15 m from
the centre mark and 4 m from the baseline (see Figure 1). Both cameras were at a
height of 1.25 m to enable a close-up film of the player.
Coding
Using a video analysis software (Dartfish 5.5, Fribourg, Switzerland), we
visually identified and coded several events of each serve-return sequence with the
moment of server-racket impact with the ball corresponding to t = 0. This moment was
identified as the first frame showing that the ball was hit by the server. Temporal
variables are presented in the following section. Three different experimenters coded
the sequence after having been informed about the procedure and the criteria for
coding. In order to check coding reliability, the three observers independently coded
the same 24 serve-return events. This procedure showed that 80% of events were
identically coded by the three coders (i.e., same image reported) and differences for
other events were two images or less (i.e., 20 ms). Disagreements between the coders
were discussed to improve the consistency of the coding for the rest of the data.
Dependent Variables
Serve-return performance was assessed with reference to a point-scale grid.
The opposite half court of the returner was divided into discrete zones and each shot
11
was scored using a point system that awarded higher values on deep returns (see Figure
1). The percentage of successful returns (i.e., in the court) was also calculated for each
player.
Temporal variables. Three variables related to split-step timing were
measured:
Split-step take-off corresponded to the frame at which the last of the player’s
feet in contact with the court had left the ground when initiating the split-step.
Split-step landing corresponded to the frame at which the first of the player’s
feet had touched the ground when completing the split-step.
Split-step duration was defined as the time between the split-step take-off and
landing.
Two other variables related to the initiation of the lateral response to move
toward the ball were calculated (see Triolet et al., 2013 for a similar method):
Initial racket movement was defined as the first frame when a directional
movement of the racket toward the ball was observable.
Initial foot movement (or lateral step) was defined as the first frame when a
directional movement of any of the player’s feet toward the ball was observable.
The sampled values used to calculate each temporal variable were also
employed to calculate their variability (i.e., standard deviation, SD).
Statistical Analysis
Serve-return performance, temporal variables, and variability of the temporal
variables were analysed using a 2 (Expertise: junior, senior) × 2 (Gender: females,
males) factorial ANOVA. Descriptive statistics were reported using the mean and the
12
standard deviation (mean ± SD). All tests were completed with p set at .05. The family-
wise error rate for the 10 ANOVAs on temporal variables and their variability was
controlled using the Holm-Bonferroni step-down procedure by ranking the p-values
from smallest to largest and comparing them to a sequentially adjusted alpha (Holm,
1979). To not only allow conservative conclusions about significant differences in the
split-step timing, however, we considered the results that were significant by
conventional standards but did not meet the Holm-Bonferroni adjusted alpha (alphaadj)
as marginally significant. The assumption of homogeneity of variances was checked
using a Levene test. Post-hoc analyses were conducted with Bonferroni-corrected
pairwise comparisons. Partial eta-squared (ηp2) was calculated for each significant
effect to determine the proportion of explained variance.
Results
The serve-return performance was not related to Expertise or Gender. No
interaction effect was observed. Participants averaged a serve-return performance of
7.6 (±1.7) (junior females: 8.7 (±1.3); junior males: 6.7 (±2.8); senior females: 7.7
(±1.1); senior males: 7.3 (±1.4). Regarding the percentage of returns in the court, data
were transformed by means of angular transformation (arcsine transformation) prior
to performing an ANOVA. No main effects of Expertise and Gender, nor an interaction
effect was found. Participants averaged 50.0% (±18.3) of returns in the court.
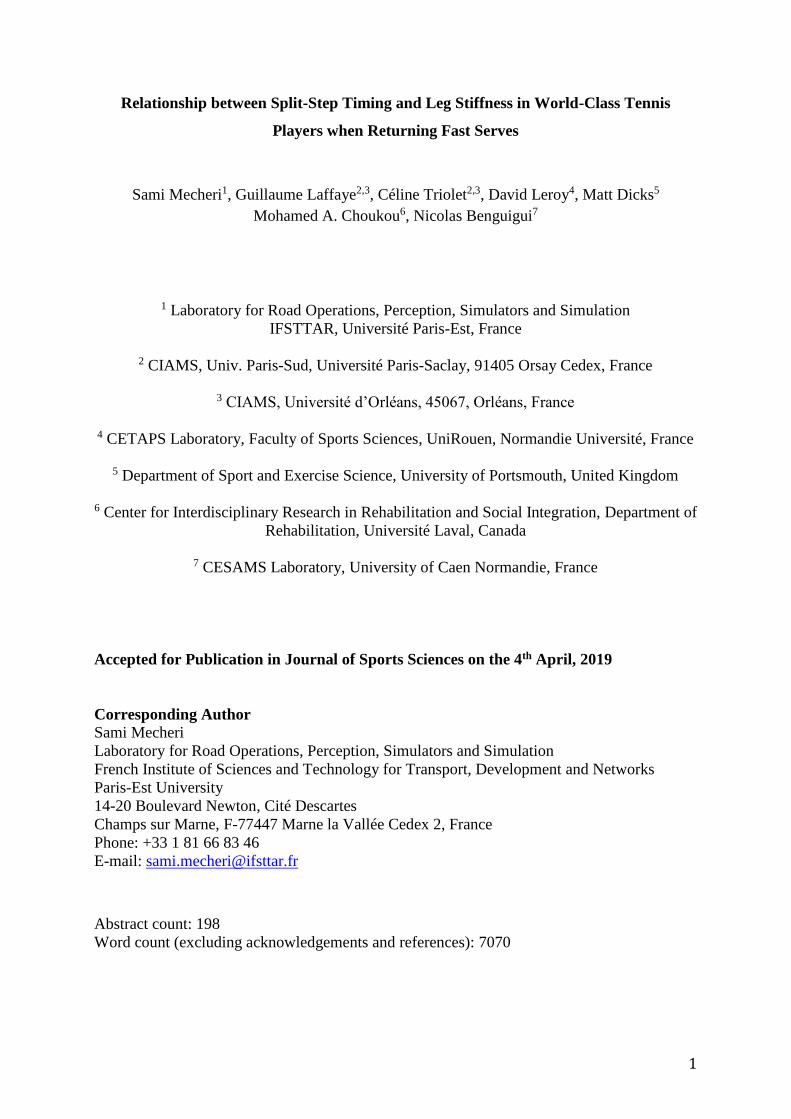
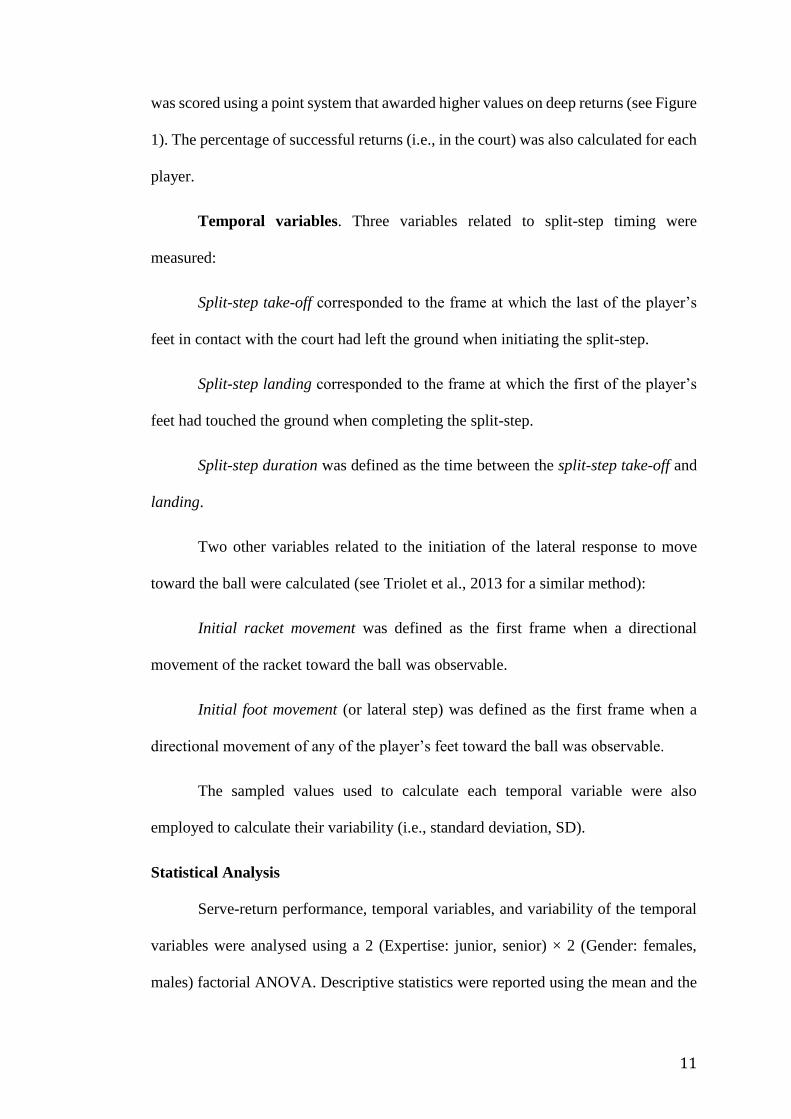
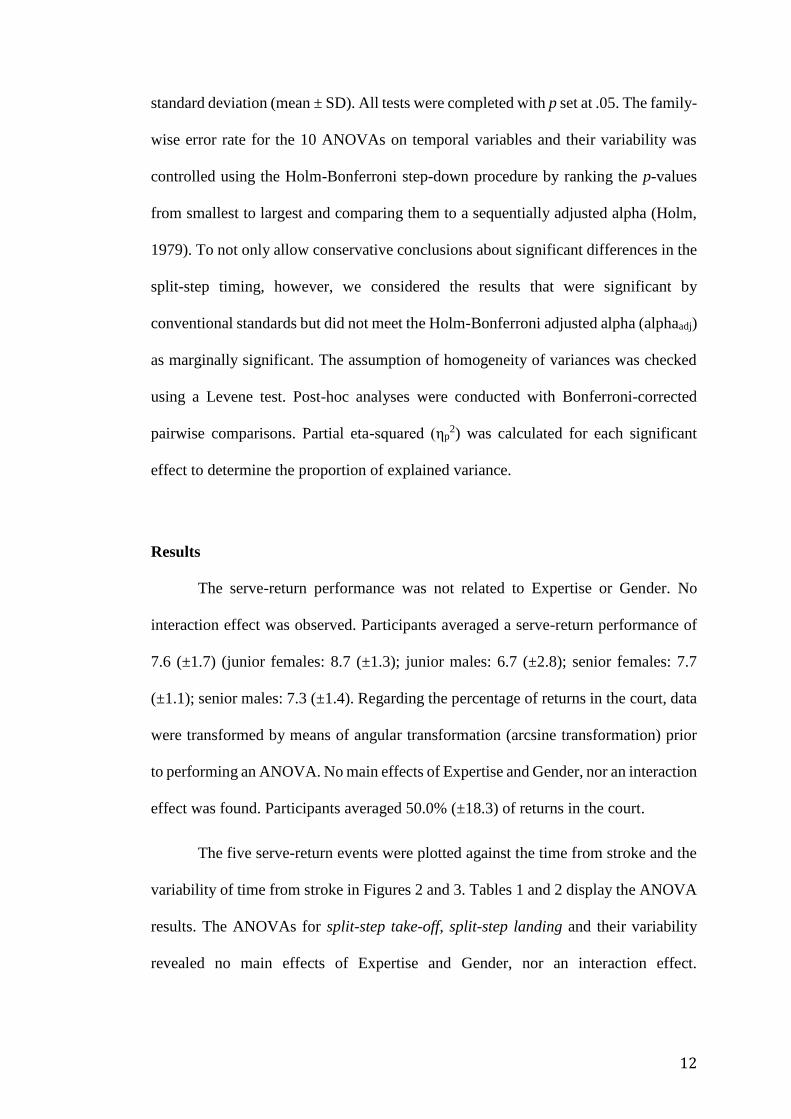
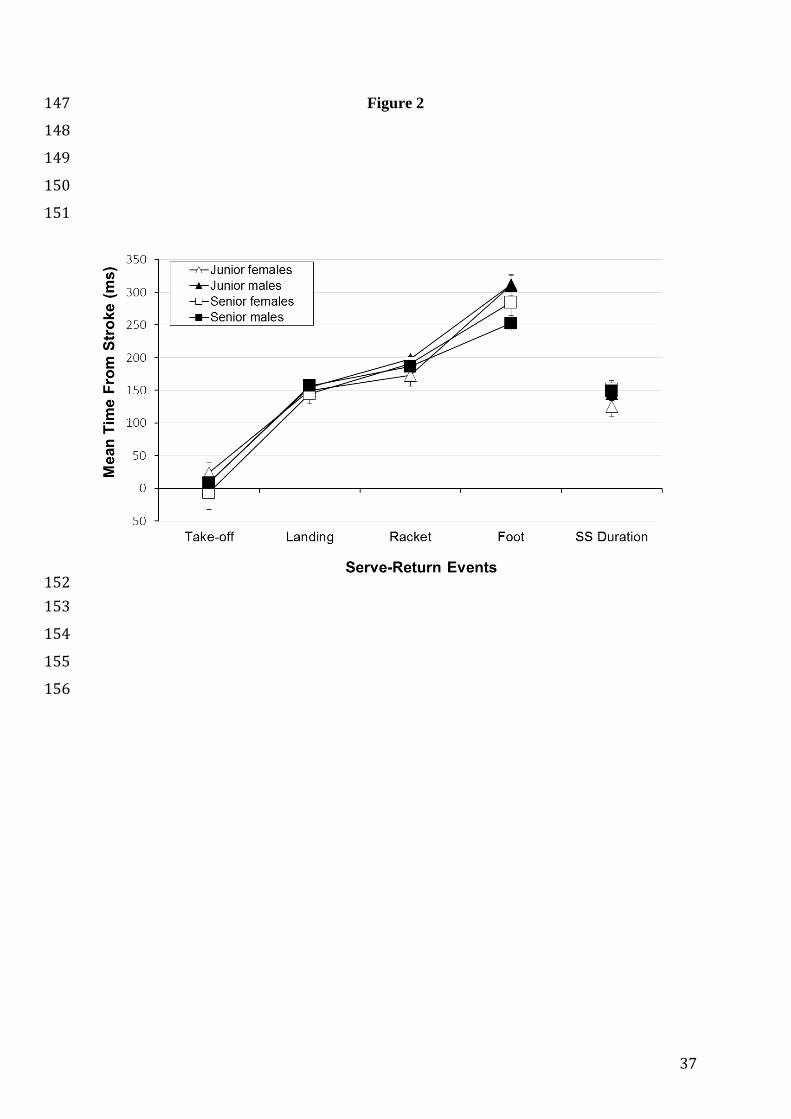
The five serve-return events were plotted against the time from stroke and the
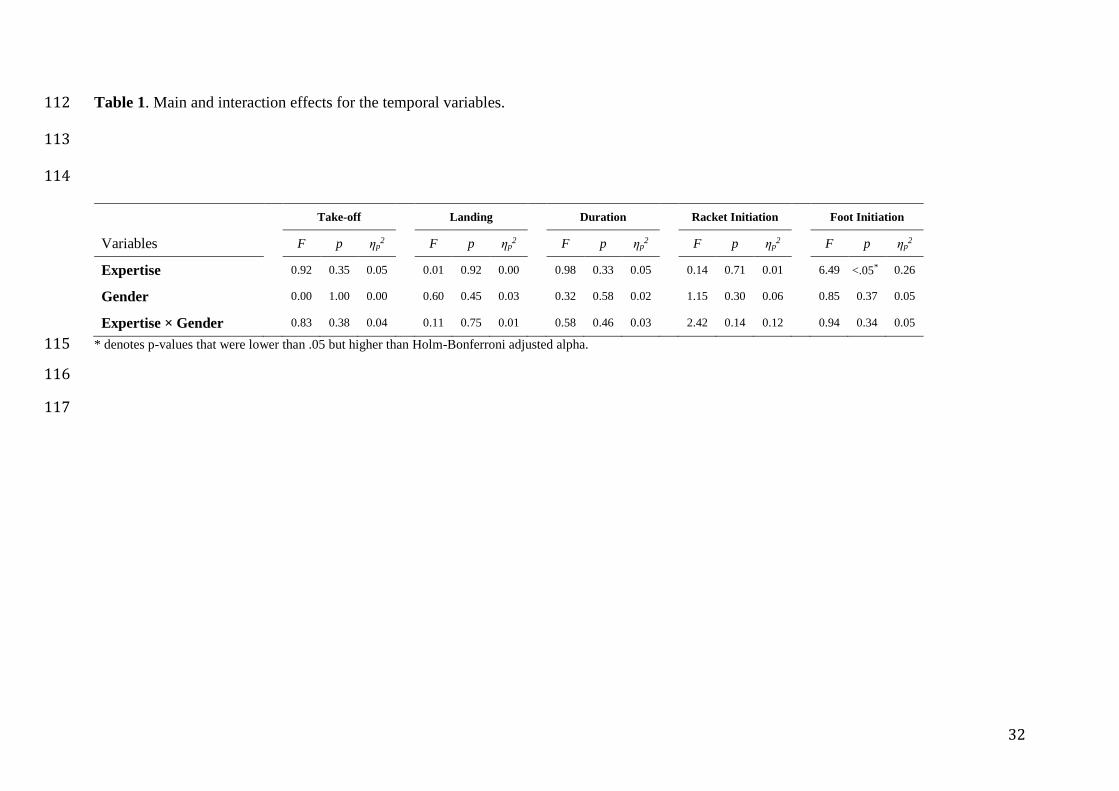
variability of time from stroke in Figures 2 and 3. Tables 1 and 2 display the ANOVA
results. The ANOVAs for split-step take-off, split-step landing and their variability
revealed no main effects of Expertise and Gender, nor an interaction effect.
13
Participants averaged a take-off time of 9 ms (± 36) and a landing time of 152 ms (±25)
after server-racket ball contact.
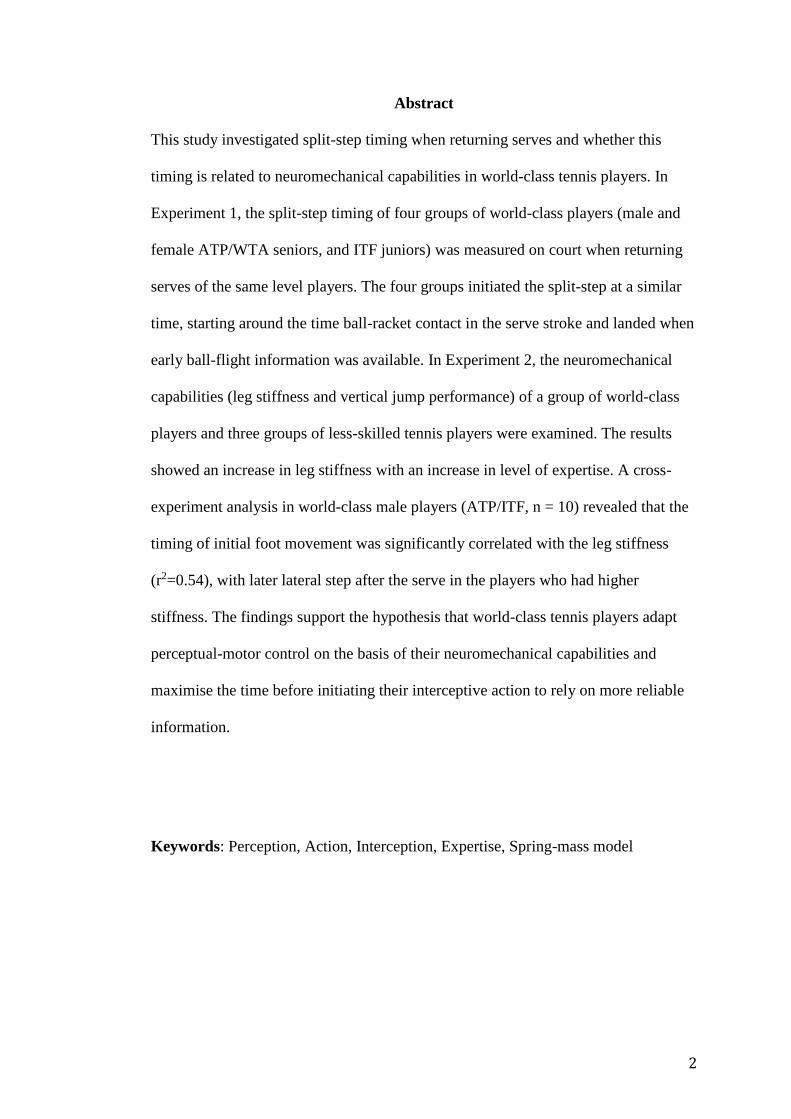
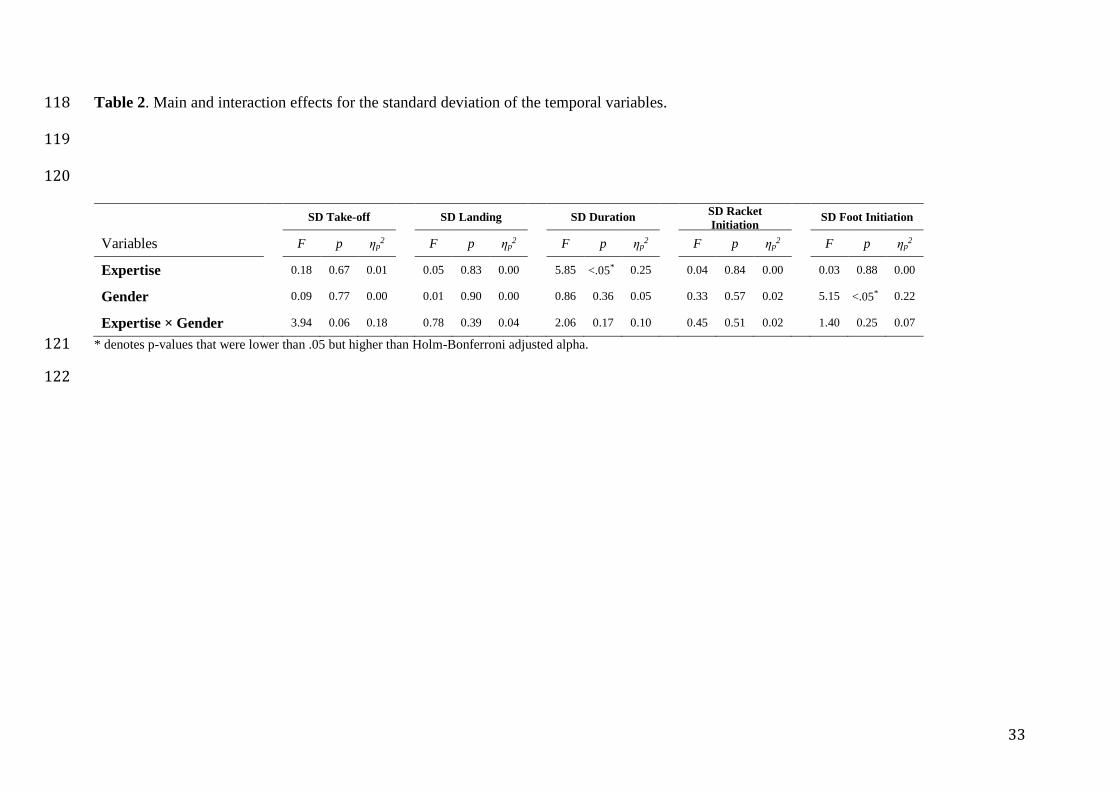
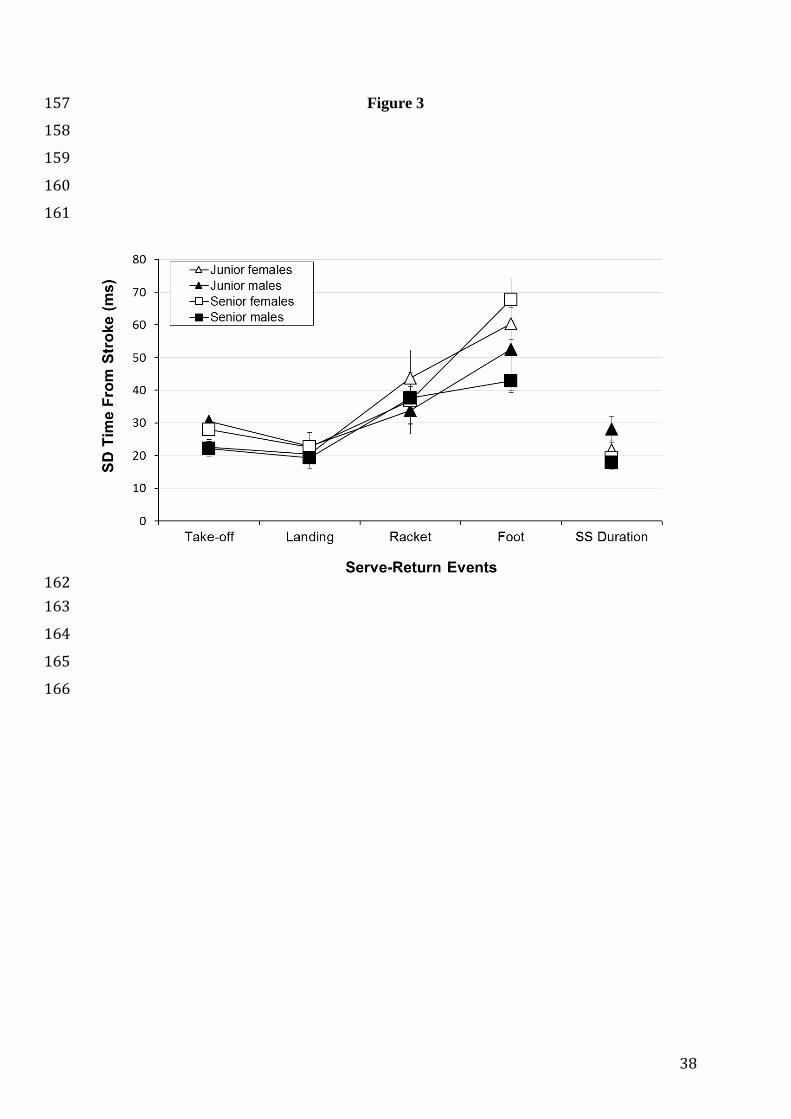
The ANOVA for split-step duration revealed no main effects of Expertise and
Gender, nor an interaction effect. The standard deviation of this variable, however,
revealed a main effect of Expertise (F1,18 = 5.85, p =.026, alphaadj =.006, ηp2 = 0.25),
with significantly lower variability in seniors (18 ms ±4) than in juniors (25 ms ±8),
but the significance fell outside of the conservative Holm-Bonferroni limits. The
ANOVAs for initial racket movement and its variability revealed no main effects of
Expertise and Gender, nor an interaction effect. Participants averaged an initial racket
movement of 187 ms (±22).
A main effect of Expertise (F1,18 = 6.49, p =.020, alphaadj =.005, ηp2 = 0.26)
was found for initial foot movement, showing significantly shorter time in seniors (266
ms ±43) than in juniors (311 ms ±33), but the significance fell outside of the
conservative Holm-Bonferroni limits. No other main effect or interaction effect was
observed. The ANOVA for initial foot movement variability only revealed a significant
main effect of Gender (F1,18 = 5.15, p =.036, alphaadj =.006, ηp2 = 0.22), showing
significantly lower foot orientation variability in males (47 ms ±19) than females (64
ms ±13), but the significance fell outside of the conservative Holm-Bonferroni limits.
Discussion
The results revealed no significant difference between the four groups for the
proportion of returns in the court and for serve-return performance. This indicates that
the experimental task was similar for all participants as they faced a server from their
own training group, enabling comparisons of return behaviours that emerged under
spatiotemporal conditions commensurate with each participant level. The proportion
14
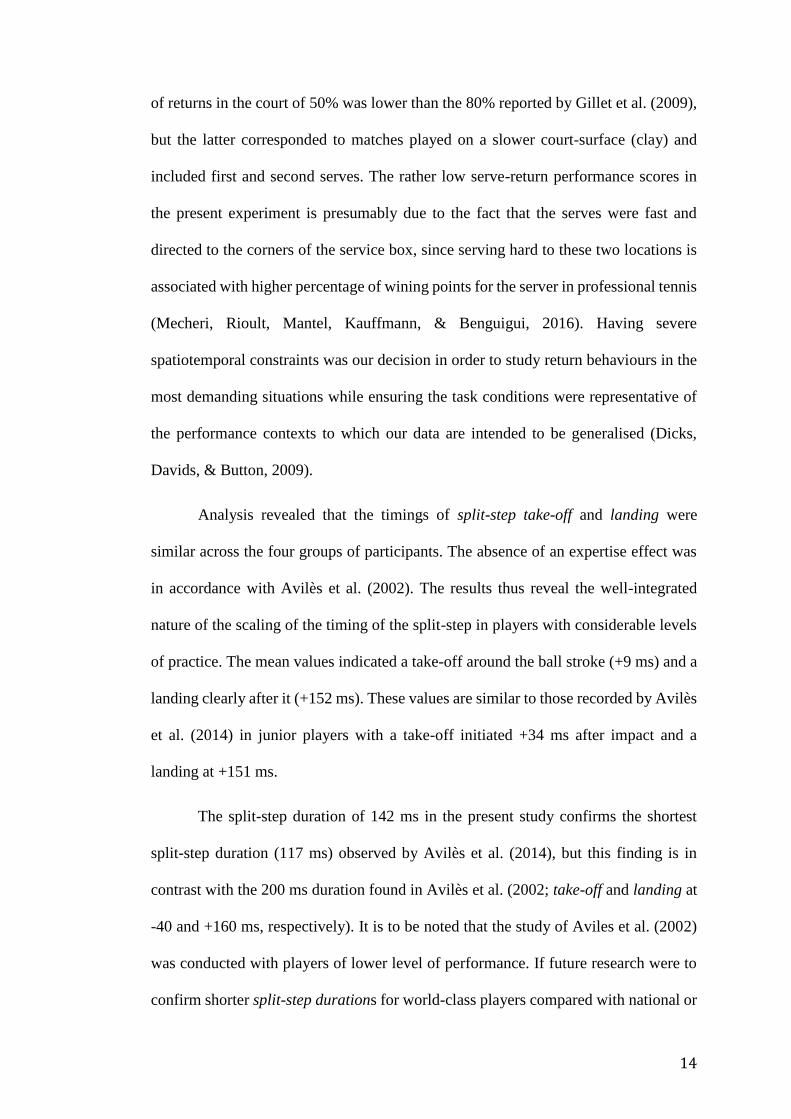
of returns in the court of 50% was lower than the 80% reported by Gillet et al. (2009),
but the latter corresponded to matches played on a slower court-surface (clay) and
included first and second serves. The rather low serve-return performance scores in
the present experiment is presumably due to the fact that the serves were fast and
directed to the corners of the service box, since serving hard to these two locations is
associated with higher percentage of wining points for the server in professional tennis
(Mecheri, Rioult, Mantel, Kauffmann, & Benguigui, 2016). Having severe
spatiotemporal constraints was our decision in order to study return behaviours in the
most demanding situations while ensuring the task conditions were representative of
the performance contexts to which our data are intended to be generalised (Dicks,
Davids, & Button, 2009).
Analysis revealed that the timings of split-step take-off and landing were
similar across the four groups of participants. The absence of an expertise effect was
in accordance with Avilès et al. (2002). The results thus reveal the well-integrated
nature of the scaling of the timing of the split-step in players with considerable levels
of practice. The mean values indicated a take-off around the ball stroke (+9 ms) and a
landing clearly after it (+152 ms). These values are similar to those recorded by Avilès
et al. (2014) in junior players with a take-off initiated +34 ms after impact and a
landing at +151 ms.
The split-step duration of 142 ms in the present study confirms the shortest
split-step duration (117 ms) observed by Avilès et al. (2014), but this finding is in
contrast with the 200 ms duration found in Avilès et al. (2002; take-off and landing at
-40 and +160 ms, respectively). It is to be noted that the study of Aviles et al. (2002)
was conducted with players of lower level of performance. If future research were to
confirm shorter split-step durations for world-class players compared with national or
15
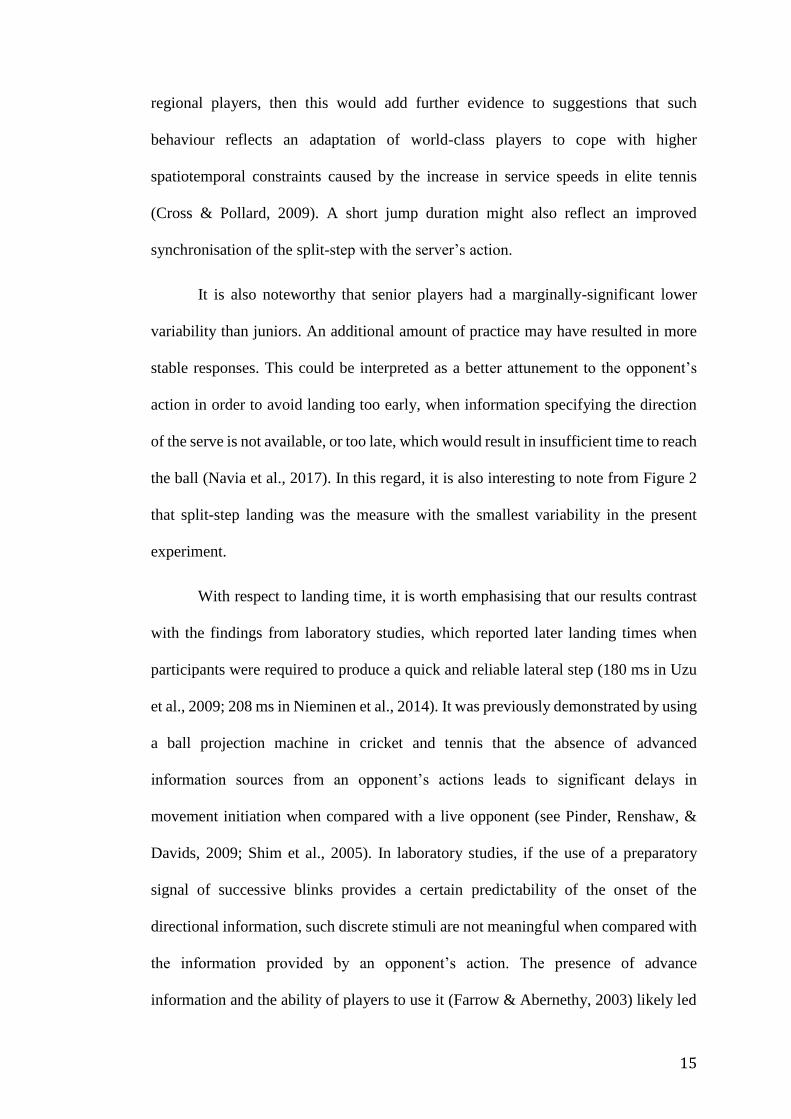
regional players, then this would add further evidence to suggestions that such
behaviour reflects an adaptation of world-class players to cope with higher
spatiotemporal constraints caused by the increase in service speeds in elite tennis
(Cross & Pollard, 2009). A short jump duration might also reflect an improved
synchronisation of the split-step with the server’s action.
It is also noteworthy that senior players had a marginally-significant lower
variability than juniors. An additional amount of practice may have resulted in more
stable responses. This could be interpreted as a better attunement to the opponent’s
action in order to avoid landing too early, when information specifying the direction
of the serve is not available, or too late, which would result in insufficient time to reach
the ball (Navia et al., 2017). In this regard, it is also interesting to note from Figure 2
that split-step landing was the measure with the smallest variability in the present
experiment.
With respect to landing time, it is worth emphasising that our results contrast
with the findings from laboratory studies, which reported later landing times when
participants were required to produce a quick and reliable lateral step (180 ms in Uzu
et al., 2009; 208 ms in Nieminen et al., 2014). It was previously demonstrated by using
a ball projection machine in cricket and tennis that the absence of advanced
information sources from an opponent’s actions leads to significant delays in
movement initiation when compared with a live opponent (see Pinder, Renshaw, &
Davids, 2009; Shim et al., 2005). In laboratory studies, if the use of a preparatory
signal of successive blinks provides a certain predictability of the onset of the
directional information, such discrete stimuli are not meaningful when compared with
the information provided by an opponent’s action. The presence of advance
information and the ability of players to use it (Farrow & Abernethy, 2003) likely led
16
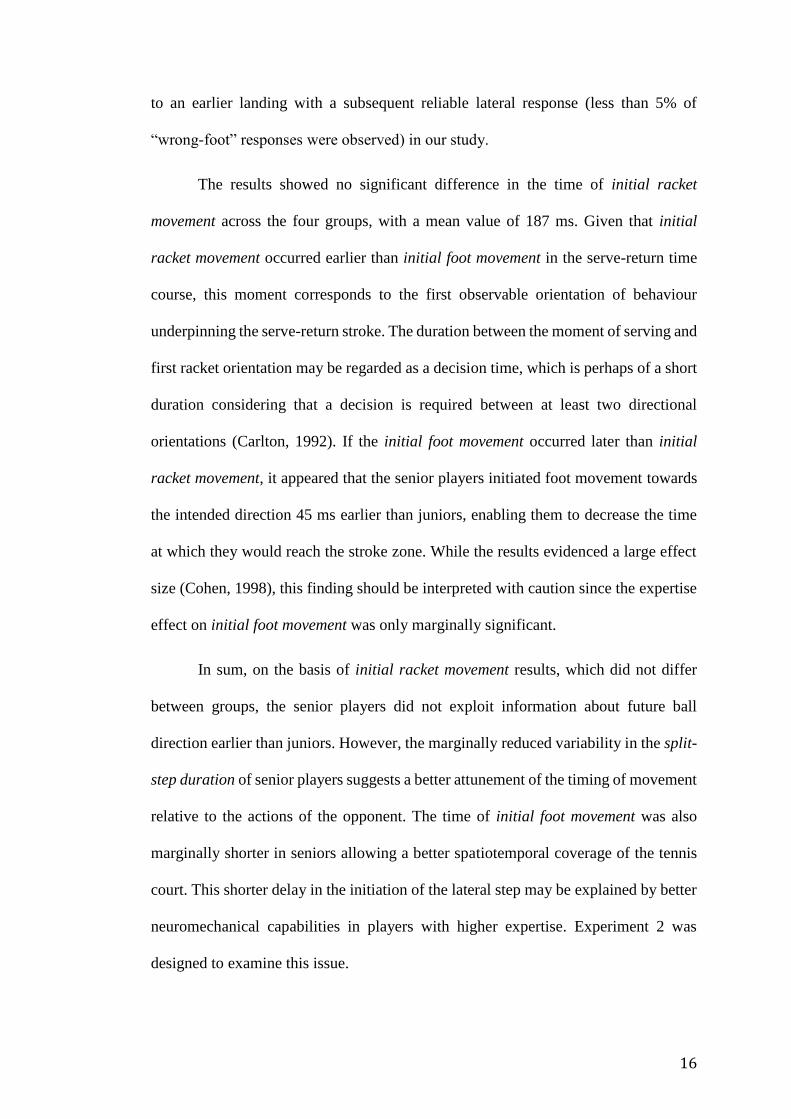
to an earlier landing with a subsequent reliable lateral response (less than 5% of
“wrong-foot” responses were observed) in our study.
The results showed no significant difference in the time of initial racket
movement across the four groups, with a mean value of 187 ms. Given that initial
racket movement occurred earlier than initial foot movement in the serve-return time
course, this moment corresponds to the first observable orientation of behaviour
underpinning the serve-return stroke. The duration between the moment of serving and
first racket orientation may be regarded as a decision time, which is perhaps of a short
duration considering that a decision is required between at least two directional
orientations (Carlton, 1992). If the initial foot movement occurred later than initial
racket movement, it appeared that the senior players initiated foot movement towards
the intended direction 45 ms earlier than juniors, enabling them to decrease the time
at which they would reach the stroke zone. While the results evidenced a large effect
size (Cohen, 1998), this finding should be interpreted with caution since the expertise
effect on initial foot movement was only marginally significant.
In sum, on the basis of initial racket movement results, which did not differ
between groups, the senior players did not exploit information about future ball
direction earlier than juniors. However, the marginally reduced variability in the split-
step duration of senior players suggests a better attunement of the timing of movement
relative to the actions of the opponent. The time of initial foot movement was also
marginally shorter in seniors allowing a better spatiotemporal coverage of the tennis
court. This shorter delay in the initiation of the lateral step may be explained by better
neuromechanical capabilities in players with higher expertise. Experiment 2 was
designed to examine this issue.

17
Experiment 2: Leg Stiffness and Expertise
The analysis of split-step timing in Experiment 1 revealed that landing and
initial response movements occurred after the opponent’s ball-racket contact during
the serve stroke, highlighting the importance of exploiting information from an
opponent’s action and ball-flight to return serves in world-class tennis players. As
such, waiting as long as possible to exploit more reliable information can support
adaptive interceptive behaviour in returning serves. It is therefore plausible that a
highly dynamic, fast stretch-shortening cycle movement in world-class players could
support their superior serve-return performance in allowing them to wait longer than
less-skilled players by using their ability to move quickly after the split-step landing.
To assess this possible link, the goal of Experiment 2 was to measure different dynamic
lower extremity neuromuscular performance variables during squat, countermovement
jumping and a hopping task across different levels of expertise in tennis. Although
only limited evidence exists on the relation between Leg Stiffness and expertise in
tennis players (see Girard & Millet, 2009, in young players), it was hypothesised that
Leg Stiffness would best discriminate skill-level among the neuromuscular variables
(power, jumping performance and leg stiffness), based on findings from other sports
(Blickhan, 1989; McMahon & Cheng, 1990). Although Leg Stiffness is a relatively
simple expression of neuromuscular performance as it does not measure directly the
return of energy in a stretch shortening cycle, evidence has shown that this measure
discriminates expert and novices in jumping and running (for a review, see Brughelli
& Cronin, 2008). It was thus expected that the higher the level of tennis played, the
higher the Leg Stiffness in order to increase mechanical efficiency of the split-step.
Method

18
Participants
Thirty-seven male senior tennis players (5 of whom took part in Experiment 1) were
recruited on a voluntary basis to participate in this experiment. Participants were
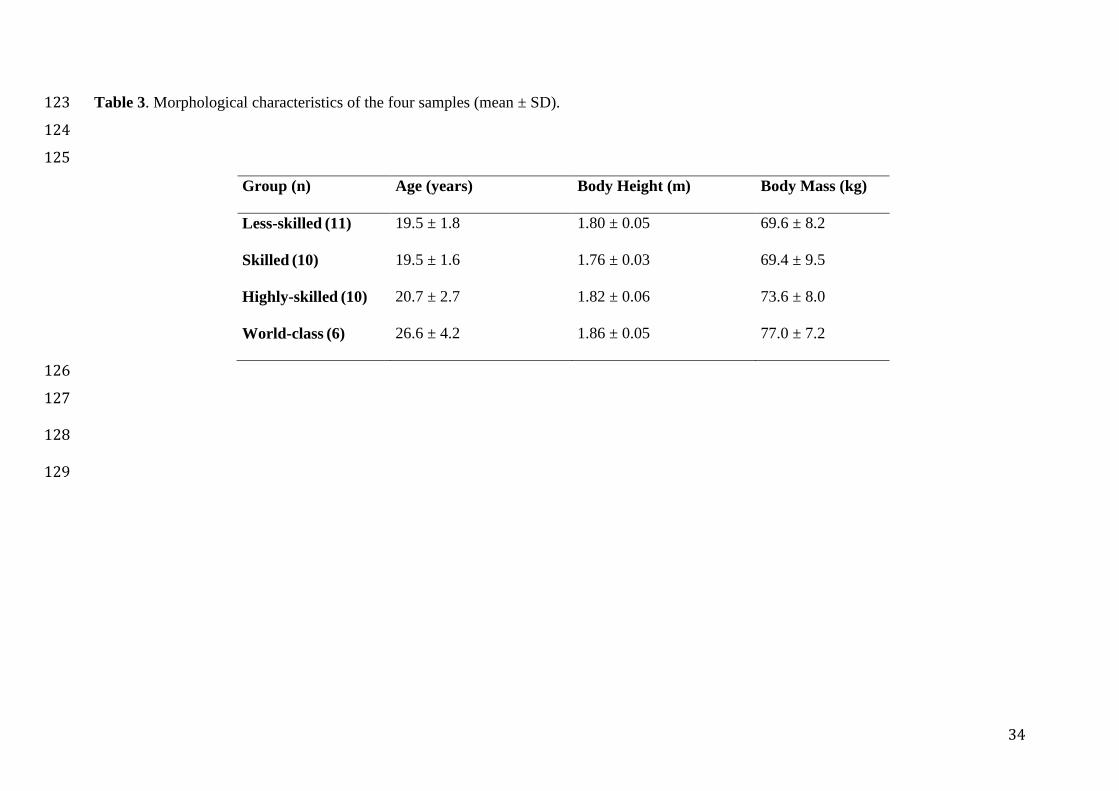
classified into four groups according to their level of expertise (Table 3). The level of
expertise was defined according to the French ranking classification, categorised as
either world-class players (corresponding to the 50 first French players based on ATP
rankings, n=6; 5 took part in Experiment 1 as ATP senior players; these five players
were not randomly selected, since their participation depended on their coaches’
decision), highly-skilled players (corresponding to a rank between 1,000 to 3,000 in
the French national ranking, n=10), skilled players (corresponding to a rank between
3,000 to 20,000, n=10) and less-skilled players (corresponding to a rank between
20,000 to 57,000, n=11). A minimum experience of three years in competitive tennis
and a minimum training frequency of three times per week were required for
recruitment in the skilled and less-skilled players. The experiment was approved by
the local ethics committee Human Subject Review Board.
Measurements, Task and Procedure
For anthropometric measurements, we followed the standardised techniques
recommended by the International Society for the Advancement of Kinanthropometry
(Marfell-Jones, Olds, Stewart, & Carter, 2006). Body height was measured using an
anthropometer, with 0.1 cm accuracy. Body mass was measured using bio-electric
impedance scales (Weinberger model DJ-156; Weinberger GmbH & Co, Germany),
with 0.1% accuracy.
Three jumping tasks were performed:
19
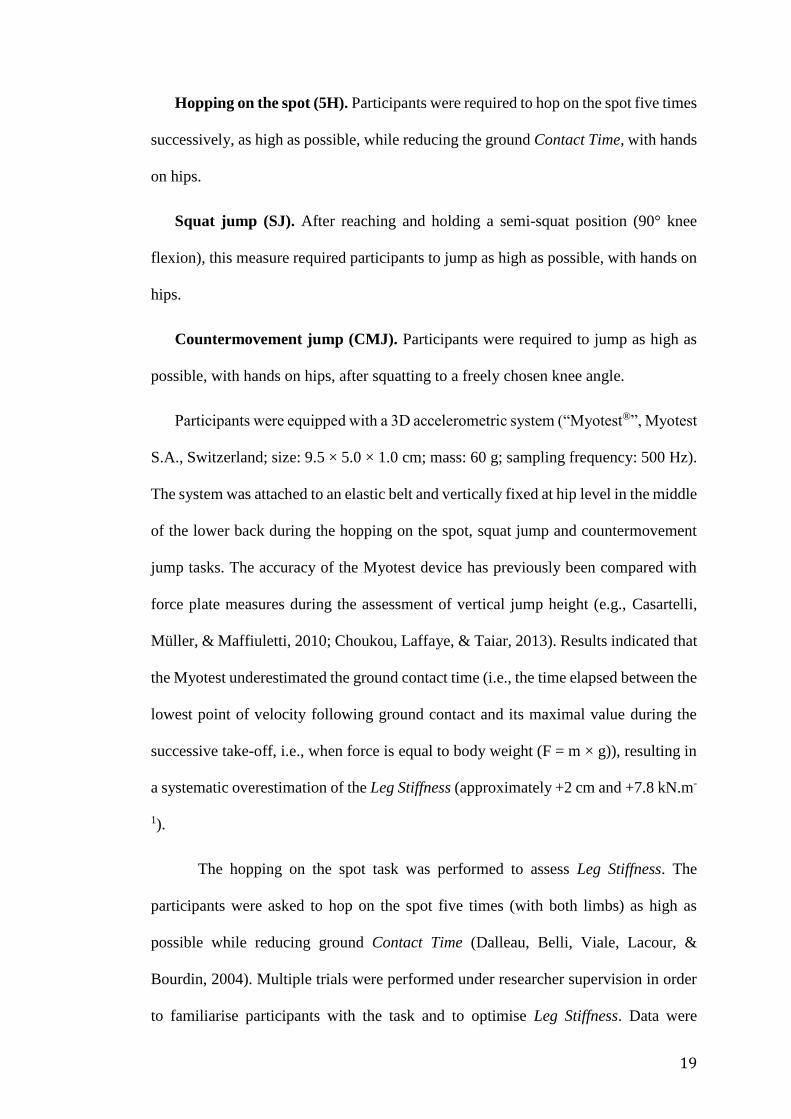
Hopping on the spot (5H). Participants were required to hop on the spot five times
successively, as high as possible, while reducing the ground Contact Time, with hands
on hips.
Squat jump (SJ). After reaching and holding a semi-squat position (90° knee
flexion), this measure required participants to jump as high as possible, with hands on
hips.
Countermovement jump (CMJ). Participants were required to jump as high as
possible, with hands on hips, after squatting to a freely chosen knee angle.
Participants were equipped with a 3D accelerometric system (“Myotest®”, Myotest
S.A., Switzerland; size: 9.5 × 5.0 × 1.0 cm; mass: 60 g; sampling frequency: 500 Hz).
The system was attached to an elastic belt and vertically fixed at hip level in the middle
of the lower back during the hopping on the spot, squat jump and countermovement
jump tasks. The accuracy of the Myotest device has previously been compared with
force plate measures during the assessment of vertical jump height (e.g., Casartelli,
Müller, & Maffiuletti, 2010; Choukou, Laffaye, & Taiar, 2013). Results indicated that
the Myotest underestimated the ground contact time (i.e., the time elapsed between the
lowest point of velocity following ground contact and its maximal value during the
successive take-off, i.e., when force is equal to body weight (F = m × g)), resulting in
a systematic overestimation of the Leg Stiffness (approximately +2 cm and +7.8 kN.m-
1).
The hopping on the spot task was performed to assess Leg Stiffness. The
participants were asked to hop on the spot five times (with both limbs) as high as
possible while reducing ground Contact Time (Dalleau, Belli, Viale, Lacour, &
Bourdin, 2004). Multiple trials were performed under researcher supervision in order
to familiarise participants with the task and to optimise Leg Stiffness. Data were

20
recorded only if the bouncing technique was acquired. Leg Stiffness (kleg)
corresponded to the ratio of maximal force (Fc, when vertical force is equal to zero)
relative to the centre of mass displacement (∆CoM) during grounding (Dalleau et al.,
2004). Leg Stiffness was calculated as an absolute (in kN.m-1) and relative value, by
normalising its absolute value to body mass (in kN.m-1.kg-1).
CoMcleg Fk (kN.m-1)
The Leg Stiffness value was directly calculated by the device. We checked the
linearity of the lower limb movements during the ground contact time and their
correspondence with theoretical linear spring behaviour, in order to ensure that the
linearity of the curve of the vertical force as a function of the vertical displacement of
centre of mass was verified. An r²>.80 was chosen as a threshold to consider bouncing
behaviour as a linear spring oscillation based on studies reporting of lower-limb
spring-like behaviour (e.g., r2= .81 and .84 in females and males, respectively; see
Laffaye, Choukou, Benguigui, & Padulo, 2016). All retained jumps met this criterion.
Such criterion enabled us to have an accurate value of Leg Stiffness, although this did
not permit the measurement of the efficiency of the stretch shortening cycle. In order
to perform a countermovement jump, the participants were instructed to flex their
knees freely and to jump once as high as possible. For the squat jump test, the
participants were asked to bend and hold a semi-squat position (~90° knee flexion
controlled by a 40 × 40 set square, maintained by the experimenter, as biofeedback),
until an acoustic signal was given, and then to jump, once, as high as possible. Jump
height was calculated by the accelerometric system as follows:
8/)(10081.9 2
maxmin vv ttHafterpeak
Statistical Analysis
21
Five one-way ANOVAs followed by Fisher’s post-hoc test (or Kruskal-Wallis
test followed by Dwass–Steel–Critchlow–Fligner pairwise comparisons in variables
with homogeneity violations) were applied for the comparison of the four groups. The
alpha level was set at .05. As in Experiment 1, the Holm–Bonferroni correction was
applied. The assumption of homogeneity of variances was checked using a Levene
test. Partial eta-squared (ηp2) or eta-squared (for Kruskal-Wallis test, η2) was
calculated for each significant effect to determine the proportion of explained variance.
Results
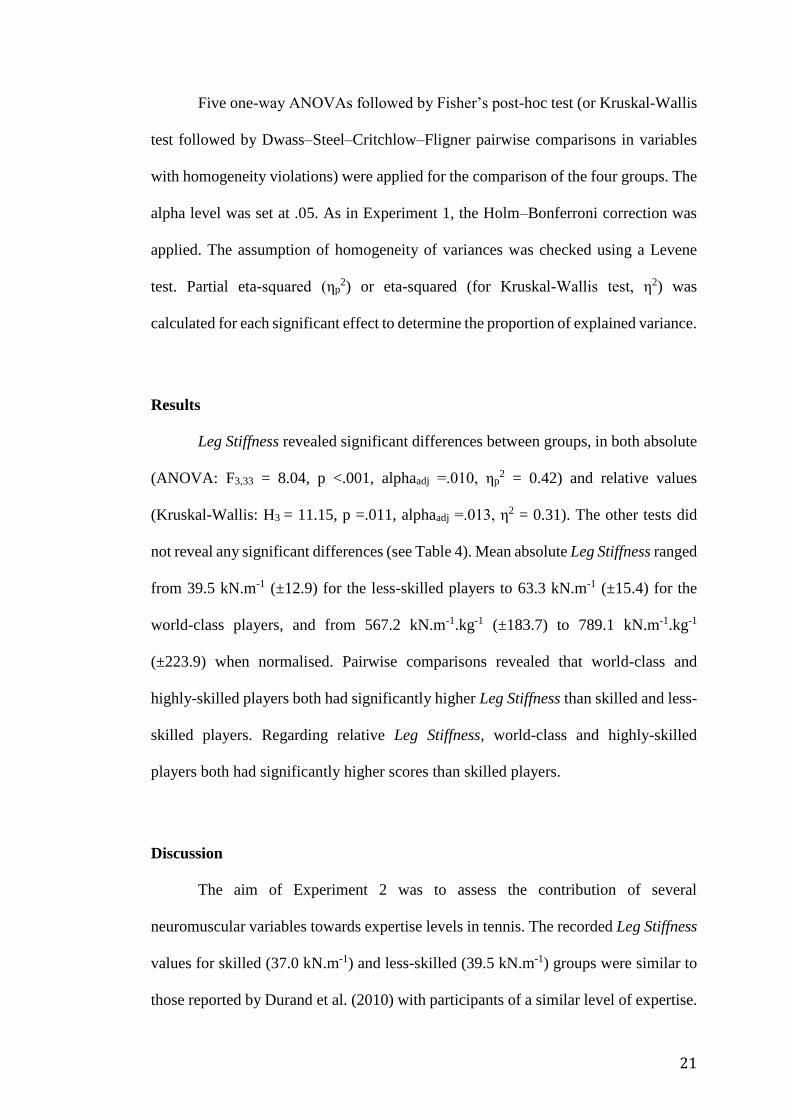
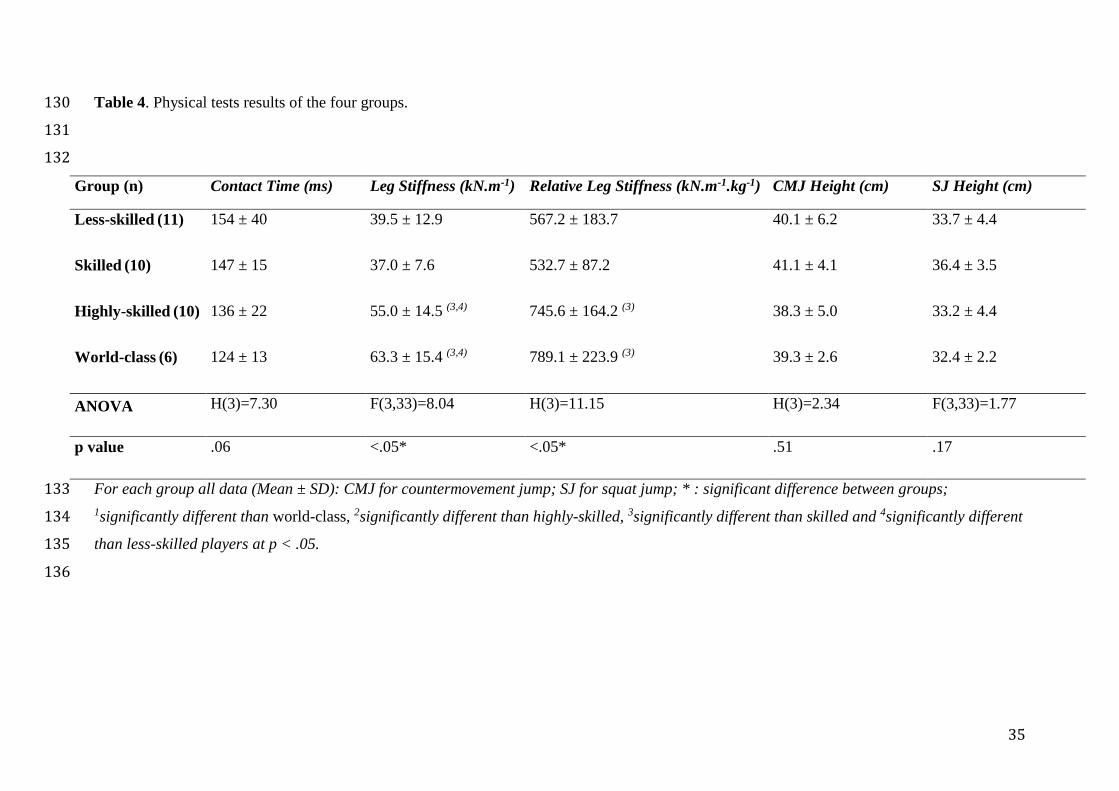
Leg Stiffness revealed significant differences between groups, in both absolute
(ANOVA: F3,33 = 8.04, p <.001, alphaadj =.010, ηp2 = 0.42) and relative values
(Kruskal-Wallis: H3 = 11.15, p =.011, alphaadj =.013, η2 = 0.31). The other tests did
not reveal any significant differences (see Table 4). Mean absolute Leg Stiffness ranged
from 39.5 kN.m-1 (±12.9) for the less-skilled players to 63.3 kN.m-1 (±15.4) for the
world-class players, and from 567.2 kN.m-1.kg-1 (±183.7) to 789.1 kN.m-1.kg-1
(±223.9) when normalised. Pairwise comparisons revealed that world-class and
highly-skilled players both had significantly higher Leg Stiffness than skilled and less-
skilled players. Regarding relative Leg Stiffness, world-class and highly-skilled
players both had significantly higher scores than skilled players.
Discussion
The aim of Experiment 2 was to assess the contribution of several
neuromuscular variables towards expertise levels in tennis. The recorded Leg Stiffness
values for skilled (37.0 kN.m-1) and less-skilled (39.5 kN.m-1) groups were similar to
those reported by Durand et al. (2010) with participants of a similar level of expertise.
22
World-class (63.3 kN.m-1) and highly-skilled (55.0 kN.m-1) players had higher values
of Leg Stiffness than those calculated in younger players during hopping (18.8 kN.m-
1, Maquirriain, 2013) and hopping and jumping (19.9 kN.m-1, Girard & Millet, 2009),
as well as lower level adults during hopping and jumping (34.8 kN.m-1, see Durand et
al., 2010). As hypothesised, Leg Stiffness differentiated world-class and highly-skilled
players that compete at national and international level from skilled and less-skilled
players that compete at a comparatively lower level.
The absence of significant differences between world-class and highly-skilled
players in the current study could be due to high intra-group variability in these two
groups. From these results and a previous study, we hypothesise that a Leg Stiffness
threshold of 50 kN.m-1 in hop-like actions may be a threshold for fast, elite level
racquet sports. This value is close to findings for elite badminton players (Phomsoupha
& Laffaye, 2017), with Leg Stiffness values reported of 52.5 ± 5.4 kN.m-1 using the
same methodology as the current study. The spatiotemporal demands are comparable
between both badminton and tennis, with elite badminton shuttle speeds reaching 70
m.s-1 following a smash (Phomsoupha & Laffaye, 2014) compared with 55 m.s-1 for
elite tennis serves (Cross & Pollard, 2009).
The increase in Leg Stiffness in the two highest levels of tennis players in this
study may be due to the many maximal actions that occur during tennis such as fast
sprints and jumps for serves and smashes and the numerous split-steps that precede all
strokes. These actions require a reactive stretch-shortening cycle and consequently
high visco-elastic properties of lower-limb muscles. Durand et al. (2010) reported that
Leg Stiffness explained 58% of the variance with performance in countermovement
jump in tennis players with a similar level of expertise to our skilled and less-skilled
groups. The split-step allows players’ to behave like a linear spring by bouncing stiffly
23
in the direction of the ball. Indeed, in a laboratory-based study, Uzu et al. (2009) and
Nieminen et al. (2014) showed that players executed faster movements in a split-step
condition when compared with a no split-step condition. The split-step allows a
reduced response time and muscular pre-activation, both of which are factors that
support performance as they facilitate faster movements to intercept the ball. On this
basis, one can expect that players who have the best neuro-muscular capacities can
afford to wait longer before initiating their action, which in turn enables them to rely
on more reliable information (Dicks et al., 2010). This was the goal of the additional
analysis between the two sets of experimental data presented below.
Cross-Experiment Analysis: Linking Split-Step Timing and Neuromechanical
Factors
Experiment 1 revealed that players with a higher level of expertise tended to
initiate the lateral step after landing with less time from service impact than juniors,
while Experiment 2 revealed an increase in Leg Stiffness with level of expertise. In this
section, the relationship between the timing of the return sequence and
neuromechanical indicators were investigated for a better understanding of the
movement control mechanisms used by world-class players. In line with previous
findings showing that faster goalkeepers tended to wait later before initiating
movement in comparison with slower goalkeepers (Dicks et al., 2010), it was
hypothesised that world-class tennis players will scale the timing of their split-step to
their own neuromechanical capabilities (van Andel, Cole & Pepping, 2017).
To test this hypothesis, we focused on a sample of ten word-class male players
(i.e., the five ATP seniors that took part in both experiments, and the five ITF juniors
that took part in Experiment 1, but were also tested following the same protocol
24
adopted in Experiment 2). Correlation analyses were performed between performance
in countermovement jump and squat jump as predictor variables (Contact Time, Leg
Stiffness, Relative Leg Stiffness, CMJ Height and SJ Height) and split-step timing as
the dependant variables (Split-step take-off, Split-step landing, Split-step duration,
initial racket movement and initial foot movement).
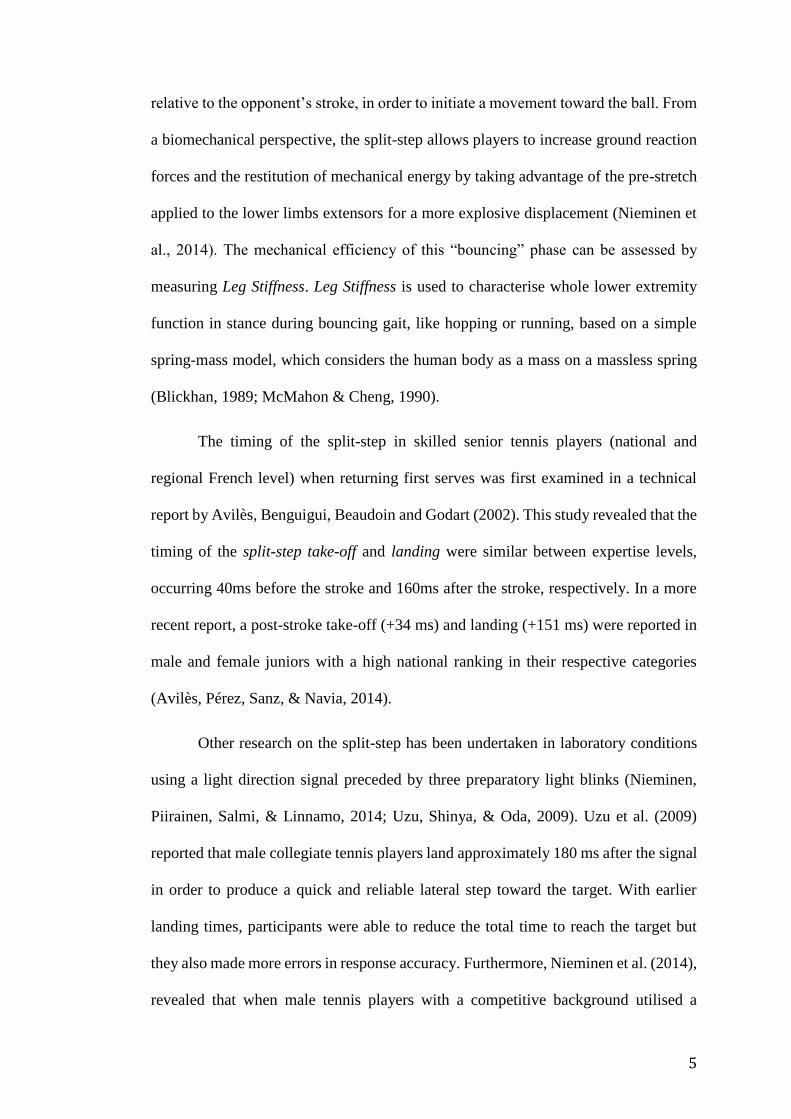
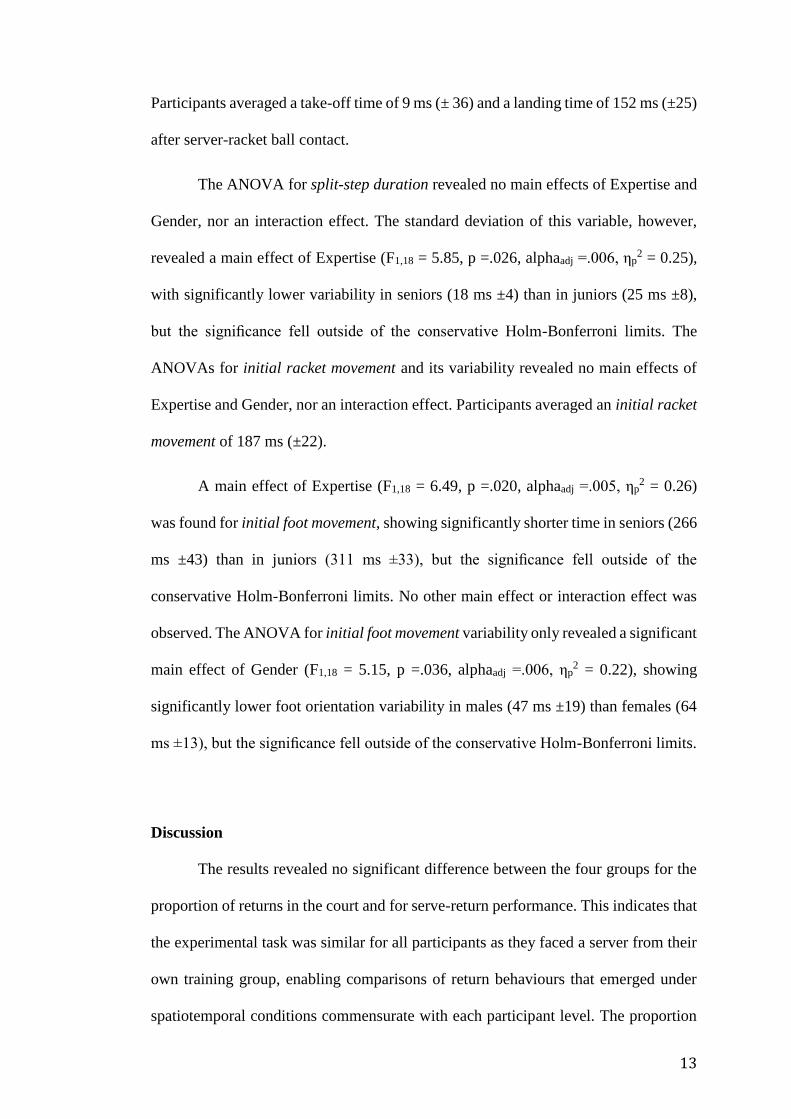
The results revealed a significant correlation between the value of the
normalised Leg Stiffness and the time of initial foot movement (r² =.54, p <.05, Figure
4). Although it should be noted that this significant relation is modest in size since
small samples can produce inflated correlations (Yarkoni, 2009), and that the use of
juniors and seniors violates random sampling assumptions, the result highlights that
the players who had the higher Leg Stiffness appeared to initiate their displacement
later than the players who had lower Leg Stiffness.
General Discussion
The present study investigated the split-step timing of world-class tennis
players (Experiment 1), the neuromechanical parameters of world-class and less-
skilled tennis players (Experiment 2), and whether the split-step timing was related to
the players’ neuromechanical capabilities (cross-experiment analysis). In Experiment
1, results revealed that the split-step sequence appears to be a well-learned preparatory
behaviour, due to consistent take-off (around the ball stroke) and landing (around 150
ms) times across the four groups. As predicted, the mean landing time and the first
orientation of the response (racket) occurred after initial ball flight. This coincided
with the pick-up of reliable kinematic and ball-flight information about ball direction,
leading to a small number of wrong-foot responses (less than 5%). Notably, the landing
time necessary for quick and reliable actions was shorter than previous laboratory
25
estimates (180–208 ms) that were obtained in the absence of advance kinematic
information (Nieminen et al., 2014; Uzu et al., 2009). This point emphasises that
interceptive actions must be assessed in a representative task design, wherein athletes
are allowed to function naturally to provide a full picture of skilled performance in
perceptual-motor tasks (Dicks et al., 2009; Pinder, Davids, Renshaw, & Araújo, 2011).
In the serve-return time course, while the moment of racket movement initiation was
similar between the four groups, a marginally-significant effect of expertise revealed
that senior players initiated the lateral step with shorter time than juniors, which raised
the question whether such behaviour is due to better neuromechanical capabilities.
Experiment 2 showed that the neuromechanical capabilities of male tennis
players were related to their level of expertise. World-class and highly-skilled players
both had significantly higher Leg Stiffness than skilled and less-skilled players, with
the values of world-class and highly-skilled players comparable to those observed in
other racket sports such as badminton, which necessitate high levels of efficiency
during the stretch shortening cycle (Phomsoupha & Laffaye, 2017). Such lower-limb
properties are likely a consequence of extensive tennis practice, which are developed
through high-intensity running, jumping, and specific strength training (Laffaye et al.,
2016). This suggests that Leg Stiffness may be one of the key variables in tennis
performance, as it likely contributes to shorter times for the initiation of displacements
to intercept the ball. Future research should strive to confirm this finding with
prospective data or measure other variables like strength that might explain the
association between apparent Leg Stiffness and performance level in tennis.
The cross-experiment analysis revealed a significant relationship between Leg
Stiffness and initial foot movement in world-class players, showing later initiation of
lateral displacement in the players who had higher Leg Stiffness. Although the small
26
sample size limits the strength of evidence for this finding, it is in line with previous
behavioural results in time-constrained interceptive tasks showing that skilled
performers scale the timings of their response relative to their action capabilities
(Dicks et al., 2010; see also van Andel et al., 2017). The results therefore support the
view that world-class tennis players with higher lower-limb neuromuscular
capabilities – and therefore, better ability to cover the court – initiated their
displacement later to exploit more reliable sources of information arising from the final
moments of the opponent’s serve and early ball-flight. Nonetheless, it would be
necessary to follow up this analysis on a larger scale with a higher number of world-
class tennis players as an extension of this study, but also through a prospective study
examining the suitability of the neuromuscular factors considered in the present study.
On a practical level, our findings shed new light on the potential importance of
training Leg Stiffness in order to enhance serve-return performance (see Wilson, Dicks,
Milligan, & Alder, 2019, for a recent study in soccer). Spending more time in training
Leg Stiffness in young players’ programs would not only increase their court coverage,
but may also provide them with the flexibility to use different information-movement
couplings to rely on more reliable information when controlling their interceptive
actions. This is hypothesised to provide more adaptability in players across their
development (Savelsbergh & Wormhoudt, 2019).
The findings of this study can also serve as a reference point for practitioners
who seek to develop improvements in tennis serve returns. In the current study world-
class players were found to initiate the split-step slightly after the ball stroke and used
a shorter subsequent split-step duration to synchronise with the opponent’s unfolding
action. Subsequently, training aimed at improving both Leg Stiffness properties (see
Wilson et al., 2019) as well as the scaling of the split-step timing relative to an

27
opponent’s serve may be meaningful, since such improvements would possibly help
junior players to refine their synchronisation to the opponent’s serve and to cope with
increasing serve velocities during their development. Training the timing of the split-
step sequence as well as its neuro-muscular efficiency should be also a new objective
as it provides a potential to gain the milliseconds which make a difference in the
production of efficient responses and shots in the high level competition. Future
research geared towards these lines of enquiry would help to better understand the
factors that underpin expert interceptive actions in elite sport.
Acknowledgments
This research was supported by funding from the Institut National du Sport, de
l’Expertise et de la Performance (INSEP, grant number 12R36). The authors are
grateful to the French Tennis Federation (FFT) for the partnership and the support for
the research project and the experiments. They also thank staff from the FFT Bernard
Pestre, Paul Quetin, Pascal Supiot and Laurent Raymond. The authors are also grateful
to Heloïse Baillet, Franck Bouzard, Maroua Mallek, Cynthia Mandil, Dominic Orth
and Régis Thouvarecq for their help during the experiments.
Declaration of Interest Statement
The authors report no conflict of interest.
28
References 1
Abernethy, B. (1991). Visual search strategies and decision-making in sport. International 2 Journal of Sport Psychology, 22(3–4), 189–210. 3
Abernethy, B., & Wollstein, J. (1989). Improving anticipation in racquet sports. Sports 4 Coach, 12(4), 15–18. 5
Avilés, C., Benguigui, N., Beaudoin, E., & Godart, F. (2002). Developing early perception 6 and getting ready for action on the return of serve. ITF Coaching & Sport Science 7 Review, 28, 6–8. 8
Avilés, C., Pérez, L. R., Sanz, D., & Navia, J. (2014). Adaptive and reactive skills involved in 9 the return of serve in tennis. ITF Coaching & Sport Science Review, 64, 6–8. 10
Blickhan, R. (1989). The spring-mass model for running and hopping. Journal of 11 Biomechanics. 22, 1217–1227. 12
Brughelli, M., & Cronin, J. (2008). A review of research on the mechanical stiffness in 13 running and jumping: methodology and implications. Scandinavian Journal of Medicine 14 & Science in Sports, 18(4), 417–426. 15
Carlton, L. G. (1992). Visual processing time and the control of movement. In L Proteau & D 16 Elliott (Eds.), Vision and Motor Control (pp. 3–31). Amsterdam: Elsevier Science. 17
Casartelli, N., Müller, R., & Maffiuletti, N.A. (2010). Validity and reliability of the myotest 18 accelerometric system for the assessment of vertical jump height. Journal of Strength 19 and Conditioning Research, 24, 3186–3193 20
Choukou, M. A., Laffaye, G., & Taiar, R. (2013). Validity of an accelerometric system for 21 measuring force–time-based data during jumping tasks. Computer Methods in 22 Biomechanics and Biomedical Engineering, 16, 84–85. 23
Cohen, J. (1998). Statistical power analysis for the behavioral sciences (2nd ed.). Hillsdale, 24 NJ: Erlbaum. 25
Cross, R., & Pollard, G. (2009). Grand Slam men’s singles tennis 1991-2009 Serve speeds 26 and other related data. ITF Coaching & Sport Science Review, 49, 8–10. 27
Dalleau, G., Belli, A., Viale, F., Lacour, J-R.R., & Bourdin, M. A. (2004). A simple method 28 for field measurements of leg stiffness in hopping. International Journal of Sports 29 Medicine, 25, 170–176. 30
Dicks, M., Davids, K., & Button, C. (2010). Individual differences in the visual control of 31 intercepting a penalty kick in association football. Human Movement Science, 29(3), 32 401–11. 33
Dicks, M., Davids, K., & Button, C. (2009). Representative task design for the study of 34 perception and action in sport. International Journal of Sport Psychology, 40(4), 506. 35
29
Durand, S., Ripamonti, M., Beaune, B. & Rahmani, A. (2010). Leg ability factors in tennis 36 players. International Journal of Sports Medicine, 31, 882–886. 37
Fajen, B. R. (2005). Perceiving Possibilities for Action: On the Necessity of Calibration and 38 Perceptual Learning for the Visual Guidance of Action. Perception, 34(6), 717–740. 39
Farrow, D., & Abernethy, B. (2003). Do expertise and the degree of perception-action 40 coupling affect natural anticipatory performance? Perception, 32(9), 1127–1140. 41
Farrow, D., & Reid, M. (2012). The contribution of situational probability information to 42 anticipatory skill. Journal of Science and Medicine in Sport, 15(4), 368–373. 43
Girard, O., & Millet, G.P. (2009). Physical determinants of tennis performance in competitive 44 teenage players. Journal of Strength and Conditioning Research; 23: 1867–1872 45
Girard, O., Lattier, G., Micallef, J.-P., & Millet, G.P. (2006). Changes in exercise 46 characteristics, maximal voluntary contraction, and explosive strength during 47 prolonged tennis playing. British Journal of Sports Medicine, 40, 521–526. 48
Laffaye, G., Choukou, M. A., Benguigui, N., & Padulo, J. (2016). Age-and gender-related 49 development of stretch shortening cycle during a sub-maximal hopping task. Biology of 50 Sport, 33(1), 29. 51
Laffaye, G., Taiar, R., & Bardy, B. G. (2005). The effect of instruction on leg stiffness 52 regulation in drop jump. Science and Sport, 20, 136-143. 53
Maquirriain, J. (2013). The interaction between the tennis court and the player: how does 54 surface affect leg stiffness? Sports Biomechanics, 12(1), 48–53. 55
Marfell-Jones, M. J., Olds, T., Stewart, A. D., & Carter, L. (2006). International standards for 56 anthropometric assessment. Potchefstroom, South Africa: International Society for the 57 Advancement of Kinanthropometry (ISAK). 58
McMahon, T. A., & Cheng, G. C. (1990). The mechanism of running: how does stiffness 59 couple with speed? Journal of Biomechanics. 23, 65–78. 60
Mecheri, S., Rioult, F., Mantel, B., Kauffmann, F., & Benguigui, N. (2016). The serve impact 61 in tennis: First large‐scale study of big Hawk‐Eye data. Statistical Analysis and Data 62 Mining: The ASA Data Science Journal, 9(5), 310–325. 63
Navia, J. A., Dicks, M., van der Kamp, J., & Ruiz, L. M. (2017). Gaze control during 64 interceptive actions with different spatiotemporal demands. Journal of Experimental 65 Psychology: Human Perception and Performance, 43(4), 783-793. 66
Nieminen, M. J. J., Piirainen, J. M., Salmi, J. A., & Linnamo, V. (2014). Effects of 67 neuromuscular function and split step on reaction speed in simulated tennis response. 68 European Journal of Sport Science, 14(4), 318–326. 69
30
Pinder, R. A., Davids, K., Renshaw, I., & Araújo, D. (2011). Representative learning design 70 and functionality of research and practice in sport. Journal of Sport & Exercise 71 Psychology, 33(1), 146–55. 72
Pinder, R. A., Renshaw, I., & Davids, K. (2009). Information–movement coupling in 73 developing cricketers under changing ecological practice constraints. Human Movement 74 Science, 28(4), 468–479. 75
Phomsoupha, M., & Laffaye, G. (2014). Shuttlecock velocity during a smash stroke in 76 badminton evolves linearly with skill level. Computer Methods in Biomechanics and 77 Biomedical Engineering, 17(sup1), 140–141. 78
Phomsoupha, M., & Laffaye, G. A. (2017). A multiple repeated sprint ability test with four 79 changes of direction for badminton players (part 2): predicting skill level with 80 anthropometry, strength, shuttlecock and displacement velocity. Journal of Strength & 81 Conditioning Research. Epub ahead of print, 82 https://doi.org/10.1519/jsc.0000000000002397 83
Rowe, R. M., & McKenna, F. P. (2001). Skilled anticipation in real-world tasks: 84 Measurement of attentional demands in the domain of tennis. Journal of Experimental 85 Psychology: Applied, 7(1), 60-67. 86
Savelsbergh, G. J. P., & Wormhoudt, R. (2019). Creating adaptive athletes: The Athletic 87 skills model for optimizing physical literacy. Movement and Sport Sciences – Science & 88 Motricité. Epub ahead of print, https://doi.org/10.1051/sm/2019004 89
Shim, J., Carlton, L. G., Chow, J. W., & Chae, W.-S. (2005). The use of anticipatory visual 90 cues by highly skilled tennis players. Journal of Motor Behavior, 37(2), 164–175. 91
Triolet, C., Benguigui, N., Le Runigo, C., & Williams, A. M. (2013). Quantifying the nature 92 of anticipation in professional tennis. Journal of Sports Sciences, 31(8), 820–30. 93
Uzu, R., Shinya, M., & Oda, S. (2009). A split-step shortens the time to perform a choice 94 reaction step-and-reach movement in a simulated tennis task. Journal of Sports Sciences, 95 27(12), 1233–1240. 96
van Andel, S., Cole, M. H., & Pepping, G.-J. (2017). A systematic review on perceptual-97 motor calibration to changes in action capabilities. Human Movement Science, 51, 59–98 71. 99
Van der Kamp, J., Rivas, F., Doorn, H. van, Savelsbergh, G., & Bennett, S. (2008). Ventral 100 and dorsal system contributions to visual anticipation in fast ball sports. International 101 Journal of Sport Psychology, 39(2), 100–130. 102
Williams, A. M., & Ward, P. (2007). Anticipation and Decision Making: Exploring New 103 Horizons. In G. Tenenbaum & R. C. Eklund (Eds.), Handbook of Sport Psychology (pp. 104 203–223). John Wiley & Sons. 105

31
Wilson, R., Dicks, M., Milligan, G. & Alder, D. B. (2019). An Examination of Action 106 Capabilities and Movement Time during a Soccer. Movement and Sport Sciences – 107 Science & Motricité. Epub ahead of print, https://doi.org/10.1051/sm/2019001 108
Yarkoni, T. (2009). Big correlations in little studies: Inflated fMRI correlations reflect low 109 statistical power—Commentary on Vul et al. (2009). Perspectives on Psychological 110 Science, 4, 294–298. 111
32
Table 1. Main and interaction effects for the temporal variables. 112
113
114
Take-off Landing Duration Racket Initiation Foot Initiation
Variables F p ηp2 F p ηp
2 F p ηp2 F p ηp
2 F p ηp2
Expertise 0.92 0.35 0.05 0.01 0.92 0.00 0.98 0.33 0.05 0.14 0.71 0.01 6.49 <.05* 0.26
Gender 0.00 1.00 0.00 0.60 0.45 0.03 0.32 0.58 0.02 1.15 0.30 0.06 0.85 0.37 0.05
Expertise × Gender 0.83 0.38 0.04 0.11 0.75 0.01 0.58 0.46 0.03 2.42 0.14 0.12 0.94 0.34 0.05
* denotes p-values that were lower than .05 but higher than Holm-Bonferroni adjusted alpha. 115
116
117
33
Table 2. Main and interaction effects for the standard deviation of the temporal variables. 118
119
120
SD Take-off SD Landing SD Duration SD Racket
Initiation SD Foot Initiation
Variables F p ηp2 F p ηp
2 F p ηp2 F p ηp
2 F p ηp2
Expertise 0.18 0.67 0.01 0.05 0.83 0.00 5.85 <.05* 0.25 0.04 0.84 0.00 0.03 0.88 0.00
Gender 0.09 0.77 0.00 0.01 0.90 0.00 0.86 0.36 0.05 0.33 0.57 0.02 5.15 <.05* 0.22
Expertise × Gender 3.94 0.06 0.18 0.78 0.39 0.04 2.06 0.17 0.10 0.45 0.51 0.02 1.40 0.25 0.07
* denotes p-values that were lower than .05 but higher than Holm-Bonferroni adjusted alpha. 121
122
34
Table 3. Morphological characteristics of the four samples (mean ± SD). 123
124
125
Group (n) Age (years) Body Height (m) Body Mass (kg)
Less-skilled (11) 19.5 ± 1.8 1.80 ± 0.05 69.6 ± 8.2
Skilled (10) 19.5 ± 1.6 1.76 ± 0.03 69.4 ± 9.5
Highly-skilled (10) 20.7 ± 2.7 1.82 ± 0.06 73.6 ± 8.0
World-class (6) 26.6 ± 4.2 1.86 ± 0.05 77.0 ± 7.2
126
127
128
129
35
Table 4. Physical tests results of the four groups. 130
131
132
Group (n) Contact Time (ms) Leg Stiffness (kN.m-1) Relative Leg Stiffness (kN.m-1.kg-1) CMJ Height (cm) SJ Height (cm)
Less-skilled (11) 154 ± 40 39.5 ± 12.9 567.2 ± 183.7 40.1 ± 6.2 33.7 ± 4.4
Skilled (10) 147 ± 15 37.0 ± 7.6 532.7 ± 87.2 41.1 ± 4.1 36.4 ± 3.5
Highly-skilled (10) 136 ± 22 55.0 ± 14.5 (3,4) 745.6 ± 164.2 (3) 38.3 ± 5.0 33.2 ± 4.4
World-class (6) 124 ± 13 63.3 ± 15.4 (3,4) 789.1 ± 223.9 (3) 39.3 ± 2.6 32.4 ± 2.2
ANOVA H(3)=7.30 F(3,33)=8.04 H(3)=11.15 H(3)=2.34 F(3,33)=1.77
p value .06 <.05* <.05* .51 .17
For each group all data (Mean ± SD): CMJ for countermovement jump; SJ for squat jump; * : significant difference between groups; 133
1significantly different than world-class, 2significantly different than highly-skilled, 3significantly different than skilled and 4significantly different 134
than less-skilled players at p < .05. 135
136

36
Figure 1 137
138
139
140
141
142
143
144
145
146
37
Figure 2 147
148
149
150
151
152
153
154
155
156
38
Figure 3 157
158
159
160
161
162
163
164
165
166

39
Figure 4 167
168
169
170
171
172
173
174
175
40
Figure Captions 176 177 178 Figure 1. Organisation of the experimental tennis court. Ret: Starting position of the Returner; 179
Serv: Starting position of the Server; CamR: Camera filming the returner; CamS: Camera 180
filming the server; ZSL and ZSR: Left and Right Zones of Serve; ZR1–ZR6: Zones of Return 181
(ZR6 = 20 points, ZR5 = 16 points, ZR4 = 12 points, ZR3 = 10 points, ZR2 = 8 points, ZR1 = 182
6 points). Points were also distributed for a stroke out of the court (3 points), hitting the net (2 183
points) or that did not reach the net (1 point). Zero points were awarded in the case of an ace 184
(i.e., untouched serve). 185
186
Figure 2. Time from stroke of the different serve-return events for male (filled symbols) and 187
female (open symbols) players in juniors (triangles) and seniors (squares). Zero represents the 188
moment of serving (SS is for split-step). The error bars represent the standard error of the mean. 189
190
Figure 3. Variability of time from stroke of the different serve-return events for male (filled 191
symbols) and female (open symbols) players in juniors (triangles) and seniors (squares). Zero 192
represents the moment of serving (SS is for split-step). The error bars represent the standard 193
error of the mean. 194
195
Figure 4. Correlation between Normalised Leg Stiffness and initial foot movement in world-196
class players (grey and black points are for juniors and seniors, respectively). 197
198