1 Feasibility Study Report 1 - Koppers Texarkana Site 11 ...
280
fl 1 1 Document No. 4040·001 .. soo 'I 1 Feasibility Study Report 1 Koppers Texarkana Site 11 Texarkana, Texas I Volume l - Technical Report I I \1 \1 I I I I I I Prepared for KOPPERS COMPANY, INC. Pittsburgh, PA June 1988
-
Upload
khangminh22 -
Category
Documents
-
view
3 -
download
0
Transcript of 1 Feasibility Study Report 1 - Koppers Texarkana Site 11 ...

fl 11 Document No. 4040·001 .. soo
'I 1 Feasibility Study Report 1 Koppers Texarkana Site
11 Texarkana, Texas
I Volume l - Technical Report I I
\1 \1 I I I I I I
Prepared for
KOPPERS COMPANY, INC. Pittsburgh, PA
June 1988

~ f - ' - • ' - - • • • I •' '
.. ' - - ~-~ '-----~- t----·-.- - -- -----~- ----,,_ ~ -~~-----·-·-- J~___i;,__J __ · _· -~~~ . ,:- . __ :._____:__. ___ ,.. ____ _,__..!,_=-----~----------
I I I ·1 -I
~I I I I I I I I I I I I
• h I '
UNITED STATES ENVIRONMENTAL PAOTECTION AGENCY AEGION VI
July 1 t 1988
Hs. Shannon K. Cra 1 g
1445 ROSS AVENUE, SUITE 1200 OALLAS, fl!XAS 7520:2
Program Manager, Previously Operated Properties Keystone Env1ronment31 Services, Inc. 436 Seventh Avenue, Suite 1940 Pittsburgh, PA 15219
Re: Ffnal feasibility Study Report~ Texarkana Site
De a r '1 s • C r i i g ;
The~. S. En,ironmental Protection Agency (EPA) received the final Feasib111ty Study report for the Koppers Texarkana site on June 30. EPA has reviewed the report, and is. by this letter, conditionally approving the report. Our condition fs that EPA does not agree with the cleanup levels proposec by Koppers in the report.
1988.
The reasibil1ty Study report recommends a soil cleanup level of a maximum concentration of 1000 ppm carcinogenic PAHs and a ground water level of no observable free phase creosote. EPA has not yet decided the necessary c~eanup levels to protect human health and the environment; therefore. EPA cannot approve of these levels. The decision on cleanup levels will t>:e described fn September in the Record of Decisiont and wfll be hased on information in the Remedial Investigation report. the Feasibility Study report (including the risk assessment), the ATSDR health assessment {1f available), de,isions at oth~r similar CERCLA sites. and any applicable information received by EPA during the public co!ilTlent period.
Sincerely you~s,
;f~~ Larry 0. Wrightt P.E. Chief, Superfund Enforcement Section
cc: D. So~rells, TWC
"" i-I'('\
(\J
~
0

- f:. ___ :',. } __ ',_, :_: -.----'-------'- _._ -~-- ... :. ·~ ~--~: _.·:_ .: - .' _____ :·: ---~·-- ___ ' _______ ··: _· ._:_ - ----~~- ·--- .
I I I I I I I I I I I I I I I I I I I
I - • it • -
• I 1 - I
..
nThe use in this document of any citations or references to u.s. EPA, or other formulae, studies, documents, classifications,
and/or conclusions {collectively, "writings"} is not to be
construed as approval of., or agreement with, such writings or the reasoning, rationale, or methodology upon which they are bas~d, unless approval or agreement is specifically stated." 0

I I I I I I I I I I I I I I I I I I I
EXE:UTIVE SUMMARY
1.0 INTRODUCTION
TABLE OF CONTE~lTS
1.1 The F~asibility Study Process
1.2 Site Background Information
1.2.l Site Location and Description 1.2.2 Site History
1.2.3 Investigation and Observation History
1.2.3.1 TDWRfs Initial Inspection, 1980 1.2.3.2 EPA's Field Inves~igat~on
Team Sampling I~·•estigation, 1981 1.2.3.3 Koppers Site Inspection, 1982
1.2.3.4 Koppers Hydro1eologic
Investigation, 1983
1.2.3.5 EPA's Emergency Response
Branch Investigation, 1984
1.2.3.6 EPA'a Investigation of Carver
Terr.ace Subdivision, 1985
1.2.3.7 EPA's PCDF and PCDD Investigation, 1985
1.2,3.8 Soil/Sod Barrier Placement, 1985 1.2.3.9 Carver Terrace Municipal Water
System Sampling, 1985
1.2.3.10 August, October, and December 1987 Sampling Programs
1.2.3.11 Weston Spar Technical
Assistance Team Investigation, 1986
1.2.3,12 Remedial Investigation, 1985-1987
1.3 Nature and Extent of Problem 1,4 Report Organization 1,5 References
Page
1~1
1-1
1-2 1-2
1-6 1-12
l ·~ 12
1-13 1-13
1-14
1-15
1-16
1-17
1-17
1-17
1-19
1-19
1-20 1 .. 21
1~23
1-26
0
.
I I 2.0
I I I I I I I I I I I I I I
TABLE OF COJtTENTS (Cont'd)
FINAL PUBLIC HEALTH AND ENVIRONMENTAL ASSESSMENT
2.1 Hazard Identification and Toxicity Assessment 2. 1. 1
2.1.2
Database
Selection of PCOCs 2.2 Exposure Assessment
2.2.l Potential Exposure Pathway3 2.2.1.1 Surface Soils 2.2.l.2 Seeps
2.2.1,3 Sediments
2.2.1.4 Subsurface Soils 2.2.1.5 Ground Water
2.2.2 Estimation of Chemical Intakes 2. 2. 3 Potential Maximum Concentration
Exposu~e Scenario for Carver Terrace Residents
2. 2. 4
2. 2. 5
2.2,3.l Potential Current Intakes
2.2.3.2 Potential Future Intakes
Potential Geometric Mean Concentration Exposure 2.2.4.1
2.2.4.2
Scenario at Carver Terrace Potential Current Intakes
Potential Future Intakes Potential Minimum Concentration
Exposure Scenario at Carver Terrace
2.2.5.l Potential Current Intakes 2.2.S.2 Potentiol Future Intakes
2.2.6 Potential Exposures at Kennedy Sand and Gravel 2.2.6.l
2.2.6.2 Potential current Intakes Hypothetical ruture Intakes
2,2.7 Potential Exposure at Seeps
2.2.7.1 Potential Current Intakes 2.2.7.2 Potential Future Intakes
Page
2-1 2-2 2-2 2-2 2-3 2-3 2-3 2-9
2-9 2-9
2-10 2-10
?.-13
2-13 2-23
2-24
2-24
2-27
2-27
2-27 2-30
2-30
2-30
2-J2 2-35 2-35
2-37
'° r-f'("\
('J
~
0
I I I I I I I I I I I I I I I I I I I
2.3
TABLE OF CONTENTS (Cont'd)
Page
2,2.8 Potential Exposure to Sediments 2-37
2.2.8.1 Potential Current Intakes 2-37 2.2.8,2 Potential Future Intakes 2-40
2.2.9 Potential Exposures to Subsurface
Soils 2-40 2.2.9.1 Potential Current Intakes 2-40 2,2.9.2 Potential Future Intakes 2-46
2.2.10 Hypothetical Future Exposures to Ground r-
Water 2-46 Risk Characterization 2-48 2,3,1 Introduction 2-48
2.3.2 Potential Health Risks for the Maximum C
Concentration Exposure Scenario at Carver Terrace 2-50
2,3,2.1 Potential Carcinogenic Risks 2-50 2.3,2,2 Potential Non-Carcinogenic
Chronic Riska 2-Sl 2,3.3 Potential Health Risks for the
Geometric Mean Exposure Scenario at Carver Terrace 2-54
2.3.3,1 Potential Carcinogenic Risks 2-55 2.3,3,2 Potential Non-Carcinogenic
Risks 2-55 2,3,4 Potential Health Risks for the Minimum
Concentration Exposure Scenario at Carver Terrace 2-58
2.3,4.1 Potential Carcinogenic Risks 2-58 2.3.4.2 Potential Non-carcinogenic
Chronic Riska 2•59 2,3.5 Potential Health Risks at Kennedy Sand
and Gravel 2-62 2.3.5,1 Potential Carcinogenic Risks 2-62
2.3.5.2 Potential Non-Carcinogenic Risks 2-64
I I I I ii I I I I I I I I I I I I I
11
TABLE OF CONTENTS (Cont'd)
2.3.6 Potential Health Risks at Seeps
2.3,6.1 Potential Carcinogenic Risks 2.3.6.2 Potential Non-Carcinogenic
Risks
2.3.7 Potential Health Risks from Sediments
2.J.7.1 Potential Carcinogenic Risks 2.3.7.2 Potential Non-Carcinogenic
Risks
2.3.8 Potential Health Risks from Subsurface Soils
2.3.8.1 Potential carcinogenic Risks 2.3.8.2 Potential Non-Carcinogenic
Risks 2.3,9 Potential Health Risks from Hypothetical
Future Ground Water Cse
2.3.9,1 Potential Carcinogenic Risks 2.3.9,2 Potential Non-Catcinogenic
Risks
2.3.l0 Summary of Potential Health Risks 2,4 Environmental Assessment
2.4.1 Hazard Identification 2.4,2 Exposure Assessment
2.4.3 Ecological Risk Assessment 2.5 Sources of Uncertainty
2.5.1 Hazard Identification and Potential
Contaminant of Concern Selection 2.5.2 Estimation of Potential Exposure 2.5.3 Dose-Response Assessment 2.5.4 Risk Characterization
2.5,5 Summary of Sources of Uncertainty 2.6 References
3.0 APPLICABLE OR RELEVANT AND APPROPRIAT£ REQUIREMENTS
3,1 Introduction
Page
2-67
2-67
2-67
2-71
2-71 cc
2-71 r-
"' (\J
2-71 or-
2-71 0
2-75
2-75 2-75
1-75
'2-78
2-83
2-83
2-83 2-87 2-88
2-89
2-90 2-94 2-96
2-97 2-98
3-1 J-1

I I I I 4 I !)
I I I I I I I I I I I I I
'I' ABLE OF CONTENTS (Cont I d )
3.2 Chemical-Specific ARARS
3,2.l Water Quality
3,2.2 Air Quality 3.2.3 Soil Quality
3.3 Location-Specific ARARs 3.4 Action-Specific ARARs 3.5 References IDENTIFICATION AND SCREEN!NG OF REMEDIAL ACTION TECHNOLOGIES 4.1 Remedial Response Objectives
4.2 General Response Actions
4.3 identification of Remedial Action Technologies
4.4 Screening of Remedial Action Technologies 4.4.1 No Action
4.4.2 Institutional Controls 4.4.2,l Monitoring
4.4.2.2 Limited Access
4.4.2.3 Building Ordinances
4.4,2.4 Deed Restrictions 4.4.3 Containment Structures
4.4.3.1 Subsurface Barriers 4.4.3.2 Capping 4.4,3.3 Grading
4,4.3.4 Revegetation 4.4.4 Ground Water Withdrawal
4.4.4.1 Ground Water Pumping
4.4.4.2 Interceptor Drains 4.4.5 Removal {Complete and Partial)
4.4.5.1 Excavation and Removal of Soils 4.4.6 Direct Treatment
4.4.6.1 Activated Carbon Adsorption 4.4.6.2 Biological Treatment 4.4.6.3 Filtration
Page
3-2 3-2 3-8 3-8 3-11 3-11 3-19 CJ',
,-4-1 tr\
4-1 N '\9'9
4-5 0 4-6
4-6
4-9
4-9
4-9
4-9
4-10
4-10
4-10
4-10
4-12
4-12
4-15 4-15
4-15
4-16
4-16
4-16 4-16
4-17 4-17
4-18

I I I I I I I I I I I I 5.0
I I I I I I I
TABLE OF CONTEN:s (Cont'd)
4.4.6.4 Precipitation/Flocculation/ Sedimentation
4.4.6.5 4.4.6,6
4,4,6.7
4.4.6.8
4.4.6.9
F<.everse Osmosis Gravity Separation Ait Stripping Steam Stripping
Chemical Oxidation 4.4.6,10 Chemical Reduction
4,4,6.11 Incineration 4.4.7 In-Situ Treatment
4.4.7.l Biological 4.4,7.2 Chemical 4.4.7,3 Physical
4,4.8 Disposal
4.4.a.1 Off-Site Landfilling 4.4.8.2 On-Site Landfilling
4.4.8,3 Discharge to Publicly~Owned Treatment Wor~s (POTW)
4.4.8.4 NPDES Discharge
4.5 Summary of Remedial Action Technology Screening DEVELOPMENT AND SCREENING OF REM!JIAL ACTION ALTERNATIVES
5.2
5.3
SARA Overview
Development of Remedial Action Alternatives Description of Potentially Applicable RAAs 5.3.1 Alternative SL-1: No Action/Monitoring/
Institutional Controls
5,3.2 Alternative SL-2: Capping/Monitoring/ Institutional Controls
5.3.3 Alternative SL-3: In-Situ Biodegradation
Monitoring/Institutional Controls 5,3,4 Alternative SL-4: Excavation/Soil
Treatment/Institutional Controls
Page
4-18 4-19;
4-20
4-20 4-20
4-21 0
4-21 ~ --4-21 1<'1
4-22 N ~
4-23 0 4-23
4-26 4-27
4-27
4-28
4-28
4-28 4-29
5-1
5-1 5-2
5-6
5-6
5-7
5-10
5-11

. . ' 1
• ' ' 1
-1
I I • • -- - -.. - - - '. • - - - T • - -- • ~ - • - • •
. .
. . :,._ . , • ., , . ' I ' , ·♦ : . " , . . . ' .
I I y
I I I I I I I I I I I I I I I I I I
'I., - ... ,, • ~ -
6.0
T~BLE OF CONTENTS (Cont 1 d)
5.3.5 Alternative GW-1:
5.3.6 Alternative GW-2: No Action/Monitocing
Ground Water Withdrawal Via Subsurface Dcains/Ground Water
Treatment/Discharge of Treated Water 5,4 Screening of Remedial Action Alternatives
5.4.1 Environmental and Public Health Screening 5,4.2 Cost Screening
DETAILED ANALYSIS OF REMEDIAL ACTION ALTERNATIVES
6.1 Noncost Evaluation Criteria 6.2 Cost Evaluation Criteria
6.3 Detailed Evaluation of the Unsaturated Soils (SL) Response Media Unit Alternatives
6.3.1 Alternative SL-1: No Action/Monitoring/ Institutional Controls
6.3.1.1 Noncost Evaluation
6.3.1.2 Cost Evaluation
6.3.2 Alternative SL-2: Capping/Monitoring/
Institutional Controls
6.3.2.1 Noncost Evaluation
6.3.2.2 Cost Evaluation
6.3.3 Alternative SL-3: In-Situ Biodegradation/ Monitoring
6.3.3.1 Noncost Evaluation
6.3.3.2 Cost Evaluation
6.3.4 Alternative SL-4: Excavation/Soil Treatment/Institutional Controls
6.3.4.1 Noncost Evaluation
6.3.4.2 Cost Evaluation
6.4 Detailed Evaluation of the Ground Water (GW) Response Media Unit Alternatives
6.4.1 Alternative GW-1: No Action/Monitoring 6.4.1.1 Noncost Evaluation
6.4.1.2 Cost Evaluation
Page
5-15
5-18
5-25 5-25
5-29 ~
6-1 0)
6-1 fl'\
6-4 (\J
~
0 6-5
6-5
6-5
6-7
6-10
6-10
6-11
6-15
6-15
6-16
6-19
6-19
6-25
6-33
6-33 6-33
6-33
I I I I I I I 7 ~ . ~
I I I I I I I I I I I I
TABLE OF CONTENTS (Cont 1 d)
Page
6.4.2 Alternative GW-2: Ground Water Withdrawal:
Subsurface Drains/Ground water Treatment/ Discharge of Treated Water
6.4.2.1 Noncost Evaluation
6.4.2.2 Cost Evaluation
6-34
6-34
6-37 6.5 rnteration of RAAs Associated with Each Response
Media Unit
6.6 References
SUMMARY OF REMEDIAL ACTION ALTERNATIVES
7.1 Unsaturated Soil Response Media Unit Alternatives
1.1.1 SL-1: No Action/Monitoring/
7.1.2
7.1.3
Institutional Controls SL-2: Capping/Institutional Controls
SL-3: In-Situ Biodegradation/
6-42
6-42
7-1
7-1
7-1 7-7
Monitoring/Institutional Controls 7-8
7.2
7.1.4 SL-4 Option (A): Excavation/Mechanical Soil Washing/Institutional Controls 7-9
7.1.5 SL-4 Option (B): Excavation/On-Site
7.1.6
Incineration/Institutional Controls
SL-4 Option (C): Excavation/Off-Site 7-10
Incineration/Institutional Controls 7-10
7.1.7 SL-4 Option (D): Excavation/Off-Site
Landfill/Institutional Controls 7-11
7.1.8 SL-4 Option {E): Excavation/Passive
Soil Washing/Monitoring/Institutional Controls
Ground Water Response Media Onit Alternatives
7.2.l GW-1: No Action/Monitoring
7.2.2 GW-2: Ground Water Withdrawal/Treatment
via Option (A) or (B)/Discharge/ Monitoring
7-12
7-13
7-13
7-14
N 00 n N ~
0

-----------------------------------
. . ,, . '
--· ___ .....,,,_ - .. :.. ' ..... ~.~- ... :-- -,-.-=-----·-""!"""l'-~/-.~ ~--;,:......:~~---·-~ ... ~-r------ -·--- - -- - .. -.,.-,------'-,, ' ---~------ -----
. . • • • it, •
I ~
I I I I I I I I I I I I I I
. ' : . \ ' . . .. . .
A??:.NDiCES:
APPENDIX 2-A AP?'.:::ND!X 2-B APPE~DIX 2-C APi-END tX 2-D A??E:NO!X 2-S
APP~NDIX 2-F
AP?::s::nx 2-G
TABLE OF CONTE,NTS (Cont'd)
MAX:MUH ANO H!NIMJM PCOC CONCENTRArIONS CEOMETR!C MEAN CONCENl.'RATIONS
CALCULATION OF CARVER TERRACE HALF [,IVES ORGANLEPT;C THRESHO~DS POR TASTE
f!ISTORIC USE DATA
ESTIMATION OF A HALF-LIFE FOR B!NZO(a)PYRENE IN SURFACE SOILS
ESTIMATION OF INHAL,TION RISKS OF UTILITY
WORKERS FROM VOLA~ILIZATION vF ?OTENTIALLY CARCINOGENIC PAH FROM SUBSURFACE JOILS
A?PSNDIX 4-A TREATABILI~Y. STUDY REPORT
AP?!ND!X 6-A COS7ING TABLES ASSOCIATED WITH THC UHSATURA!ED
SOI~ RESPONSE MEDIA UNIT ALTERNATIVES APPENDIX 6-B COSTING TAB~ES ASSOCIATED ~!TH THE GROUND WAreR
MEDIA UNIT ALTERNATIVES
I 8201A/9337A/9705A
I I
C

I I I I I I I I I ,I I I I I I I
Tat-:e
1-:.
2-:
2-2
2-4
2-5
2-7
2-a
2-9
2-11
2-12
2-13
2-14
2-15a
2-16
2-17
L!S: OF TABL!S
Title ____________ ,. __________ , _____ _ Sequence of Property T:ansfers from closure to Prtaent
Potential Contaminants of Concern Selected f~r D•tailed Asaesaeent at the Kopper• ':'exarkana Site
PotentiAlly Carcinogenic PAR
summary of the Potential Exposure Pathways and Potential Receptors Identified for Quantification at the Koppers Texarkana Site
A Summary of Potential E~poaure Asau~ptions
Potential Maximum current Carver Terrace Intakes
Potential 11-"!Xilllum Future Cacver Terrace Intakes
Potential Geometric Mean Current Carver Terrace Intakes
Potenti~l Geometric Mean Future Carver Terrace Intakes
Potential Minimum Current Carver Terrace Intakes
Potential Minimum Future Carver Terrace Intakes
Potential Maximum, Geometric Mean, and Minimum current Kennedy sand & Gravel Intakes
Potential Maximum, Geometric Mean and Minimum Future Kennedy S3nd & Gravel Intakes
Potential Maximum Seep Intakes
Potential Minimum Seep Intakes
Potential Maximum Sediment Intakes
Potential Geometric Mean Sediment Intakes
Potential Minimum Sediment Intakes
Pct~ntial Maximum Utility Worker IntakeJ
1-9
2-6
2--17
l-20
2-25
2-26
2-28
2-29
2-31
2-Jl
2-36
2-38
2-39
2-41
2-42
2-44
2-45
~
co
"' N

I I I I I I I I I I I I I I I \I I I 11 I
Tac.!e ~lo.
2-:a 2-19
2-20
2--21
2-22
2-2 3
2-25
2-26
2-27
2-28
2-29
2-30
2-31
2-32
2-32a
2-3]
2-34
2-35
LIST o, TABLES (Continued)
Title
Poten~lal Minimum Utility Worker Intakes
Potential Hypothetical Groundwater Intakes
?otential Maximum CJrtent Carver Terrace Risks
Potential Maximum Puture Carver T~rrace Riska
Potential Geometric Mean Current Carver Terrace Risks
Potential Geometric ~ean Future Carver Terrace Risks
Potential Minimum Current Carver Ierrace Risks
Potential ~inimum Future Carver Terrace Risks
Potential ~aximum, Geometric ~ean and Minimum
Page
2-47
2-49
2-51
2-52
2-57
2.-60
2-61
current Kennedy Sand & Grav~l Cancer Risks 2-63
Potential ~a~imum, Geometric Mean and Minimum Current Kennedy Sand & Gravel Threshold Risks 2-65
?otential Maximum, Geometric Mean and Minumum Future Kennedy Sand & Gravel carcinogenic Risks 2-66
Potential Maximum, Geometric Mean, and Minimum Future Kennedt Sand, Gravel Threshold Risks 2-68
Potential Maximum Seep Risks 2-69
Potential Minimum Seep Risks 2-70
Potential Maxiumum Sediment Risks 2-72
Potential Geometric Mean Sediment Risks 2-73
Potential Minimum Sediment Risks 2~74
Potential Maximum Utility Worker Risks 2-76
Potential Minimum Utility Worker Risks 2-77

I I I I I I I I I
Taole !'tO I
2-36
2-37
2-38
2-39
2-40
3-1
3-2
3-3
3-4
3-5
3-7
3-8
4-1
4-2
5-1
5-3
LIST or TABLES (Continued)
Title ---------------------------Potential Hypothetical Groundwater Risks
summary of Potential Carcinogenic Risks
Summary of Potential Hazard Indices
Wagner Cre*k Fish Spec.es and Rank Order Abundances
A List of the Endangered arl Threatened Species of Bowie County, Texas
Federal Chemical-Specific ARARs
Texas State ARARs
Water Quali~y Chemical-Specific Applicable or Relevant and Appropriate Requirements (ARARs)
Texas Promulgated water Quality Standards for Specific Toxic Materials
Multimedia Environmental Goals (MEGs) for the Potential Contaminant~ of Concern
EPA Toxic Equivalency Factors for PCDD and PCPF Isomers
Federal Location-Specific ARARs
Federal Action-Specific 1\RARs
General Response Actions and Associated Remedial Technologies - Koppers Texarkana Site
Appropriate Remedial Action Technologies -Koppers Texarkana Site
RAAs Potentially Applicable to Each Response Media Unit Identified for the Koppers Texarkana Site
Distribution of Potentially Applicable RAAs with Respect to the General Category Listing
Environmental and Public Health Screening of RAAs
~a2e
2-79
2-80
2-81
2-84
2-86
3-3
3-4
)-5
3-9
3-10
3-12
3-14
3-15
4-7
4-30
5-5
S-27
0

I I I I I I I I I I I I
·1 I I I I I
-
Table ~lo.
6-:
6-2
6-3
6--t
6-5
6-6
6-7
6-8
6-9
6-10
6-11
6-14
6-15
6-16
6-17
6-19
7-1
LIST OF TABLES (Continued)
Title --------- --------Alternative SL-1: Baseline Capital Costs
Alternative SL-1: Operation and Maintenance Cost Estimate
Altern~tive SL-2: Baselin8 Capital Costs
Alternative S~-2: Operation and Maintenanc@ Cost Estimate
Alt&rnative SL-3: Ba1ellne Capital Costs
Alternativt SL-3: Operati~n and Maintenance Cost Estimate
Alternative SL-4(A): Baseline Capital Costs
~Jternative SL-4(8): Baseline Capital Costs
Alternative SL-4(B): Baseline Capital Costs
Alternative SL-4(C): Baseline Capital Costs
Alternative SL-4lD): Baseline Capital Costs
Alterna~ive SL-4(E): Baselin~ Capital Costs
Alternative GW-1: Oper~tion and Maintenance Cost Estimate
6-9
6-12
6-14
6-18
6-26
6-27
6-28
6-29
6-30
6-31
6-)5
Alternative GW-2(A}: Baseline Capital Costs 6-38
Alternative GW-2(8): Baseline capital Costs 6-39
Alternative GW-2(A): Operation and Maintenance Cost Estimate 6-40
Alternative GW-2(B): Operation and ~aintenance Cost Estimate 6-41
Potential RAAs for Complete Site Remediation
Summary of Detailed Evaluation of Remedial Action Alternatives
6-43
7-2
r-co I<)
(.'\J
0
I I I I I I I I I I I I I I I I I
FigJre ~Io.
1-2
1-3
1-4
1-5
1-6
LIST OF FIGURES
Title
General Location Map
Location of Koppers Texarkana Site Within TeAarkana 7.5 Minute Quadrangle
Koppers Texarkana Site Map
1954 Aerial Photograp~ of the Koppers Texarkana Site
Protective Barrier Map
Total PAH Iscconcentration Map
1-1 Approximate Impact Plume Boundaries
4-.:
4-2
4-3
5 < - '
5-2
5-3
5-4
5-5
Process for D~termining Applicable Remedial Action Technologies
Mul~ilayered Cap - Typical
Soi:/Sod Barrier - Typical
Cross-Section of Typical Soil/Sod Protective Barrier
Cross-Section of the Proposed Withdrawal and Recharge Systems
Cross-Section of the Proposed Sump Collection System
Map of Kennedy Sand and Gravel Co, Property Showing Proposed Location of the Withdrawal and Recharge systems and Water Tr.eatment Unit
Flow Diagram for the Alternative screening Process
!:_age
1-3
1-4
1-5
1-7 0)
1-i8 (X)
I'<"\ 1-22 (\J
1-24 "t-
0
4-2
4-13
4-14
5-9
5-20
5-21
5-23
5-26

I I I I I I I I I I I I I I I I I
ACls AIC AOC
ARARs AIJOC roe Cl::RCLA CVA ORE
EPA FIT FS
Ill
MCL l'iCLG
MEGs MAAQS IICP
NPOES
NP!. O&M
PAH
PCDDs
LIST Cf ACRONYMS USEO IN THE FEAS1SILJTY s·uov REPORT
ALTERNATIVE CONCENTRATION LIMITS ACCEPTABLE CHRONIC INTAKES AOMIMIS7RATIV~ ORDER ON CONSENl APPLICABLE OR PELEVANT AND APPROPRIATE REQUIREMENTS AMSIENl UATE~ QUALITY CRJ7ERIA CENTERS FOR DIStASE CONTROL
COMPREHENSIVE ENVIRONMENTAL RESPONSE, COf.lPENSA1JON ANO LIABILITY ACT CLEAN liATER ACT DESTRUCTION AND REMOVAL Eff!CIENCY ENVIRONHENfAL PROlECTION AGENCY FIELD lNVESflGATION tEAM FEASlBlLllY STUDY IIAZARO lMOEX
MAXIMUM CONT~MINANT LEVEL MAXIMUM CON1AMINANT LEVEL GOAL MULTlMEOtA tHVtRONMENTA~ GOALS ~ATIONAL ~MBlEUt AIR QUALITY STANOAROS NATIONAL OIL AND HARZARDOUS SUBSTANCES COMTIMGENCY PLAN llATIONAL POLLUTANT O ISCHARGE ELIMIMAT I ON SVSTEH llAtlONAL PRIORITY LIST OPERATION AND MAINlENANCE POLYNUCLEAR AROf,IATJC HYDROCARBONS POLYCHLORINATEO OIBENZO·P-DIOXINS
PCOFs POLYCHLORINATEO OIBENZOfURANS PCOCs PCP PEPS PHEA POHi OA oc RAA RCRA Rl llMCl.
SARA S0\4A
SMCLs Sw'DA TAT
TOIJR TEFs Tl,IC
(acronyms)
POlENTIAL COMTAHINANTS OF CONCERN PENTACHLOROPHENOL POTENTIAL EXPOSURE PATHIJAYS ~UBLIC HEALTH ANO ENVIRONMENTAL ASSESSMENT PUBLICALLY·O'IJMEO TREATMENT UORKS OUALIT~ ASSURANCE OUALllY CONTROL REMEDIAL ACT 10N ALlERtiAllVE RESOURCE, CONSERVATION AND RECOVERY ACT REMEDlAL INVESTIGATIOM RECOI-IMEHOED KAJ<IMUM COMTAMIHAHT LEVELS SUPERfUNO AOMENOMENTS ANO REAUTHORIZATION ACT OF 1986 SAFE ORlNKING ~ATER ACT SECONDARY MAXIKUM CGNTA~lMANT LEVELS SOLIO UASTE DISPOSAL ACT TECHNICAL ASSISTANCE TEAM lEXAS DEPARTMENT Of WATER RESOURCES TOXIC EOUIVALENCY FACTORS TEXAS UATER COMMISSION
0

I I I I I I I I I ii I I I I I I I I I
1.0 INTRODUCTION
This report presents the Feasibility Study (FS) completed for Koppers formEr wood-treating plant site in Texarkana, texas. Wood-tre,ting acti•,ities began in 1910 when The
Nationa: Lumber and Creosot~ Company built the plant. The Wood Preserving Company, a wholly-owned subsiniary of Koppers
Company, acquired the plant site in 1938. In 1940, Koppers Company merged with The Wood Preserving Company and continued
to operate the plant until its closure in 1961. The Remedial Investigation (RI) characterized air, surface water, sediment, soil, and ground water quality at the site.
The results of the ~J have identified the nature and
extent of contamination at the site. The data from the investigations has been used in this ~S to identify and
evaluate the remedial action alternatives which may be taken to remedy the site and to achieve specitic objectives ioentified for the site.
This FS was conducted in accor<iance with ..:he gu.ldelines and procedures delineated in the National Contingency Plan (NCP) (40 CFR 300). Regulations were promulgated under the
Compr1hensive Environ~ental Response, Comp~nsation, and Liab~lity Act (CERCLA), commonly referred to as Superfund and
aw.dnded by the Superfund Amendments and Reauthorization Act (SARA) signed into law in December 1986.
1.1 The Feasibility Study Proces~
The FS evaluates the remedial options available for a given site; whereas. the remedial investigation defines the nature and extent of contamination at a site. The FS process involves the development, screening, and analysis of alternatives as follows:
1-1
0 ~
I")
(\J
0

I I I I I I I I I I I I I I I I I
c development of alternatives, including the
establishment of remedial objectives, identification ot possible remediation techno:ogies, anc the design
of specific methods for clean-up of the site:
0
0
initial screening of alternatives on the basis of
potential human health and environmental effects,
technical considerations, and costs; and
detailed evaluation of those remedial alternatives
remaining after the initial screening.
1.2 Site Background Information
1.2.1 Site Locatio~ and Description
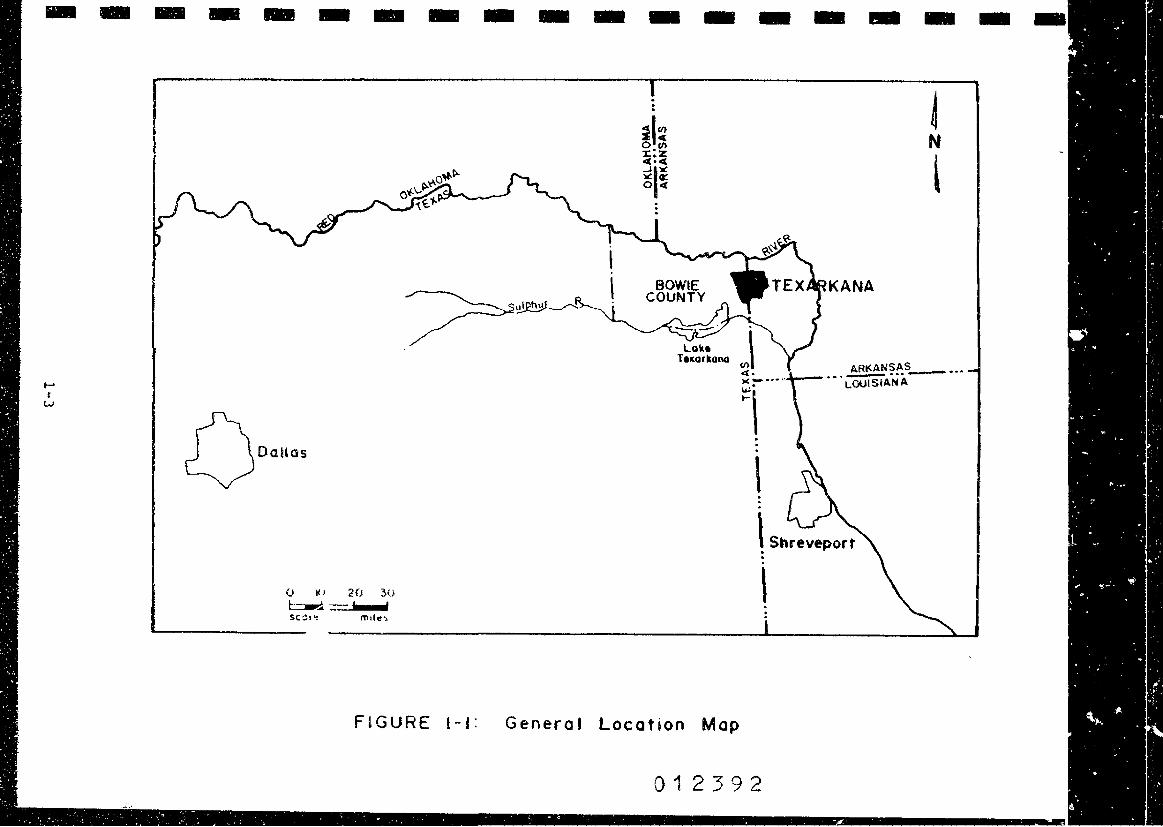
The Koppers Texarkana Site is located in Bowie County, the
nor:heastern most coenty of Texas, in the City of Texarkana. Tex3rkana, itself, ts actually situated on the Texas-Arkansas
st3:e line about 28 miles southeast of Oklahoma and 33 miles north of Louisiana. Dallas, Texas is approximately 178 miles
west of the city and Shreveport, Louisiana is about 70 miles south (Figure 1-1, General Location Map). The 62-acre Koppers
site is located within the Texas boundaries of Texarkana in the
southern section of the city. It is about one mile from the
Texas-Ark3nsas state line (Figure 1-2).
Locally, the site is bordered by the Texas and Pacific
Railroad to the north, an unnamed tributary to the northwest, Wagner Creek to the southwest, Jameson Street to the south, and
a drainage ditch to the southeast. Several areas along the easl and west boundaries of the site are bordered by dense
trees (Figure 1-3).
~ithin the site, the ~rea consists of a housing
development, a former sand and gravel operation, and a church. The housing development, Carver Terrace Subdivision, occupies
the northern 33-1/2 acres and consists of 79 one-story houses and five roads. Three of the roads, Milam, Fannin, and Tilson,
0
--------------------
..... r
w
ODallos
20 30
FIGURE l-1:
. . .
Genera I Location Map
(/)
4• )C ....... ~1 . .
\ .
\ Shreveport .
\
012392
j N
l

I I I I I I I I I I I I I I I I I I
I II 4-N
South
SCALE 1.24 000 0 I MIU:.
~:::=:i===3C:::::E=EC::::iiiaa:==e!!!!!!C:=:!'!':!!!:':!!~~~====~==================== l
'.'JOO 1000 2000 JOO() 4000 5000 f,QOO 1000 F£[T =~=t:J::HS:::EH:3::====:::::F.EE-+--+--3=::=3:::::=======C===.:=:E=====C:::===
5 0 . ::::;a._E--a; E-3 EH
CONTOUR INT£QVAL 10 FEET NATIONAL GEOuETIC 1/ERi'ICAL DATUM OF 1929
FI Gu RE I & 2: Loco t i0n of Kappe rs Texarkc:no Site within Texarkana 7. 5 Minuta Quadrangle.


I I I I I I I I I I I I I I I I I I
rJ:: north and south, and the other two, Travis lwenlie and West T~:rd Street, run east and ~est. The Mt. Zion Missionary
Baptist Church occupies a l/2 acre lot just south of West Third
St!'eet and west of Tilson Avenue. The remainder of the site, the southern 28 acres, is fenced and is owned by Mr. Bruce
Ke~nedy of Kennedy Sand and Gravel Company. In addition, the s:~e area also consists of a small piece of property
immediately east of the church. This property contains a house Which was built on top of the foundation of the old plant
office. This property is presently owned by Mr. J·esse Pace. A pla~ view of the entire Koppers Texarkana Site can be seen on FigJre 1-3.
1.2.2 Site History
In 1910, The National Lumber and Creosote Company built
and began operation of a wood treating facility at the subject
Texarkana Site. In 1938, The National Lumber and Creosote
Company was acquired by rhe Wood Preserving Company, a whollyowned subsidiary of Koppers Company. tn 1940, The Wood
Pres~rving Company was merged into Koppers Company. In 19441
Koppers Company incorporated and became Koppers Company, Inc.
A 1954 aerial photograph of the Koppers Texarkana Site
shows the various plant facilities and features. This aerial photograph is presented as Fit•re 1-4. The facilities on the
site consisted of several buildings which housed wood treating processing equipment, offices, and a laboratoryi railroad spurs
which fed into the main railroad line to the north and south; extensive lumber storage yards; and a wastewater lagoon. Based
on the 1954 aerial photograph, treated lumber was stored on the western sections of the site. Untreated lumber appeared to have been stored in the northeastern section of the site. Processing operations, including treating cylinders, work
tanks, drip-tracks, and the wastewater lagoon were located in the east-c~ntral portion of the plant site. The work tanks
were fed with wood preser.vativ~s from the main storage tanks and were used as intermediate storage during the treating
1-6
rl j
·I • I ____ P~~h ... o_rue._.:_4_12_1_22_1_.2_6_9_4 ___ 43_6_S_e_ve_n_th_A_v_en_u_e._s_ui_te_l_94_0_, _Pi_u_sh_u_rg_h_. P_A_1_s_21_9 ___ F_ax_:_4_12_12_2_1_-2_4J_6 __ _
·I ·I .J
,,1 I:
j
ill I
II
EXPRESS MAIL
Dear Mr. Wright:
June 28, 1988
Mr. Larry Wright, P. E. (6H-EE) Chief, Superfund Enforcement Section U. s. Environmental Protection Agency Region VI 1445 Ross Avenue Dallas, TX 75202
RE: Texarkana Final Feasibility study
Enclosed please find six copies document, Volumes 1 and 2~ Two forwarded by regular mail.
of the Final Texarkc,a additional copies will
SKC/mrw Enclosure
cc: D. Sorrels Lynn Mays
(TWC) (COM)
sincerely,
' ,:JJ1
J-,:.__/_ojl...., 'f j [, !lLI ; l
Shannon K. cr.aig Program Manager
V
Koppers Previously operated Properties
FS be
0
000184

0
I\)
\.,>l
'° -.J
... '
·,
' . .'· '-i
7" - - ...
J!,
..
PAPIIING AREA
J ·J'' I .. ,r" •·
<f-
•·'
... -1- ....
' ..
f., ' ·T}.t: . . I , ,
·' ' '. ' _:. ,(,. ~- C • ' ·'l.j
i., - ;
t • .. 8 ., . ' ' . '
I I I ,, I I I I I I I I I I I I I I I
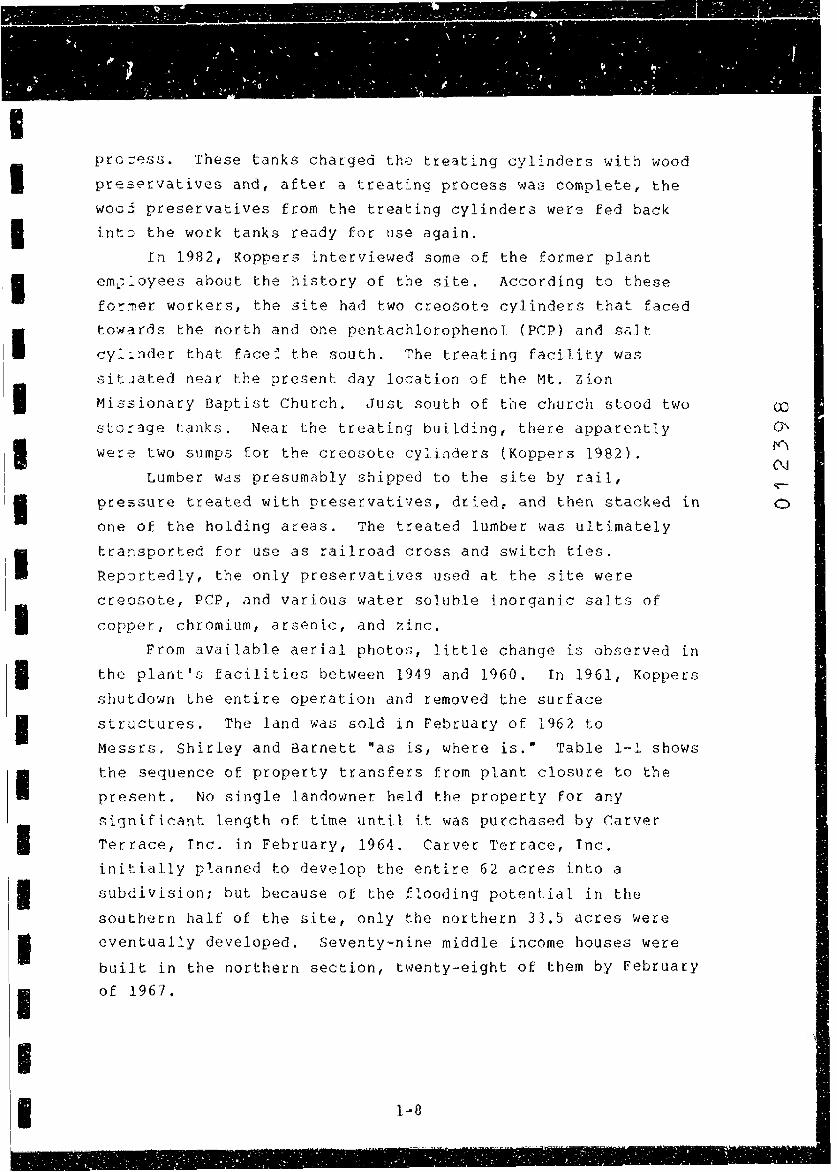
pro=~ss. These tanks charged the treating cylinders with wood pres~rvatives and, after a treat~ng process was complete, the wooj preservatives from the treating cylinders were fed back int~ the work tanks ready for use again.
In 1982, Koppers interviewed some of the former plant emJ:oyees about the history of the site. According to these
fo~~er workers, the site had two creosot~ cylinders that faced tow¾rds the north and one pentachlorophenol (PCP) and s< cy::nder that face~ the south. The treating facility was
sitJated near the present day location of the Mt. Zion
Missionary Baptist Church. Just south of t~e church stood two sto~3ge tanks. Near the treating building, there apparently
were two sumps for the creosote cylinders (Koppers 1982).
Lumber WdS presumably shipped to the site by rail,
pressure treated with preservatives, dried: and then stacked in one of the holding areas. The treated lumber was ultimately
tra~sported for use as railroad cross and switch ties.
Reportedly, the only preservatives used at the site were
creosote, PCP, and various water soluble inorganic salts of
copper, chromium, arsenic, and zinc.
From available aerial photos, little change is observed in the plant's facilities between 1949 and 1960. In 1961, Koppers
shutdown the entire operation and removed the surface
structures. The land was sold in February of 1962 to
Messrs. Shirley and Barnett "as is, where is." Table 1-l shows the sequence of property transfers from plant closure to the present. No single landowner held the property for any significa~t length of time until it was purchased by Carver Terrace, Inc. in February, 1964. Carver Terrace, Inc. initially planned to develop the entire 62 acres into a
subdivision; but because of the flooding potential in the
southern half of the site, only the northern 33.5 acres were eventually developed. Seventy-nine middle income houses were
built in the northern section, twenty-eight of them by February of 1967.
ro
°' "" (\J
0

I I I I I I I I I
I I I I I
' . . ""•• ,,• • •• ::. •_' • ..- -t•• :•'II••: • •.: •~ ~••••:~• ••·• ... ,/t,•.•" •- • -•: "ll••• .. •~ :-:. •·• • •,l'l•• •,:• ! 0 -,.••••• .. , r • L" • 11,.•• • • •• ·•~• :
'l'ARLE 1-l
SEQUENCE OF PROPERTY TRANSFF.RS FROM PLAt>.J'l:' CLOSURE ~O PRRSEN~
Site Pronertv
2/27/62 - Warrantv Deed, Koooers Companv, Inc. to P.H. Rhirlev and John Barnett fl ~ere, 4q_4 acreH, 4.43? acres, 7.2S acres an-1 l.24 acres).
S/15/63 - Warrantv need, P. H. Shirlev an~ wife, Lea Mae Shirlev; an-l Joh!'l 'Barnett anrl wife, Oorothv Bar11ett, to Lewie P. Henrv ana Dale Griffin fl acre, 48.4 acres, 4.432 acres, 7.25 acres and l.?.4 acres: conveved 1/2 interest onlv) •
2127/~4 - Quit ~latm ~~e<l, P.H. Shi~lev an~ wife, Lea Mae ~hirley and John Barnett and wife, norothv Barn~tt, to Lewie Henrv an~ Dale Griffin (l ocre, 48.4 acres, 4.4!? acres, 7.2S a~res and 1.24 acres\.
2/28/~4 - Warranty need, Lew!e P. Henrv an~ Dale Griffin to Carver Terrace,. tnc. (1 acre, 4f3.4 acres, 4.432 acres, 7.2C: acres, l.24 acres and 55/100 acres).
Bruce Kenne,v Prooertv -~
P.
4/17/7~ - Warrantv Deen, Carver Terrace, Tnc. to Bruce Kenne~v Sand & Gravel, a •rexas corooration (conveverl 4~.4 acr:es, 4 • .112 acres, 1.2s acres and 1.14 acres: save an~ except 33.~42 acres that were to r~main as Carver ~er.race and the tract of lann conveved to ~t. 7.ion Fitst ~issionarv Baotist ~hurch\.
Mt. ~ion First ~issionarv Bantist Church
ll/l7/7S - Warrantv Deed, Archie~. Simon to the ~t. iion First Missionary Baptist Church.
Jesse Pace Prooerty
(Lots 8 through 14, Block~, Drver an~ Elliott A~~ition)
2/27/f',2 - Warranty Deed, Konpers Comoanv, Tnc. tr) P. H. Shirlev and John Barnett (conveveA Lots 8 through 14, Rlock ~).
5/15/~] - Warrantv need, P. R. Shirlev an<l wife, Lea ~ae Shirley, and John Rarnett and wife, Dorothv ~arnett, to Lewie P. Henrv and nale Griffin (l/2 interest in Lots 8 throuqh 14 , Bloc k S ) •
0\
°' I'<'\
N ~
0
I I I I I I I I I I I I I I I I I I
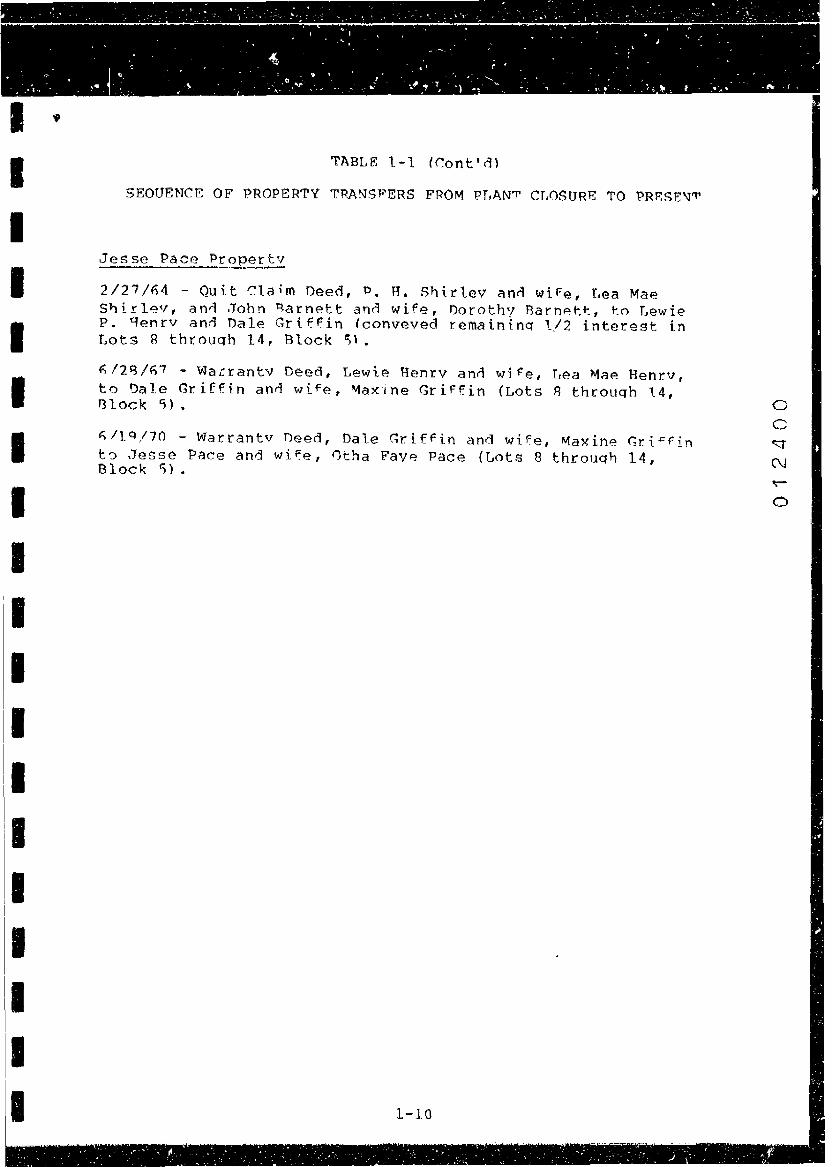
SEQUENCE OF PROPERTY ~PANSPERS FROM PLAN~ CLOSURE TO PRSSE~~
Jesse Pace Prop~
2/27/~4 - Quit Claim Deed, P.H. Shirlev anA wiFe, Lea Mae S~irl~v, an~ John qarnett an~ wife, norothy Rarn~tt, tn Lewie P. 9enrv and Dale GrlFFin (conveved remainina l/2 interest in Lots 8 throuqh 14, Block~'.
~/2~/61 - Wacrantv Deed, Lewi~ Henrv ann wife, Lea Mae Henrv, to Dale Griffin anA wife, ~axine Griffin (Lots R throuqh 14, Block 5).
~/lq/70 - Warrantv need, Dale ~rlfFin and wi~e, Maxine GriFFin t0 Jesse Pace and wife, 0tha Fave Pace {Lots 8 throuqh 14, Block: S) •
0 0 "'1 (\J
0

I I I I I I I I I I I I I I I I
The entire southern portion of the site, with the
exception of a half a~re lot, was sold to Bruce Kennedy of
Ke~nedy Sand and Gravel Company on April 17, 1975. This area
o: land was bor1ered on the west side by Wagner Creek and on the east by the site drainage ditch. Kennedy Sand and Gravel
Co~pany excavated two adjacent gravel borrow pits approximately 700 feet long by 10 feet deep with a maximum wiath of 150
fe<:?t. Most of this excavation was done from the mid to late 1970's. The east drainage ditch was extended to the west
sometime after 1975 by the property owner, Bruce Kennedy, to improve drainage of his property. Kennedy filled in most of a
draina9~ ditch thaL t3n north and south through the middle of his property. Grass and weeds covered the remaining areas on
this half of the site (Koppers 1982). Carver Terrace, Inc. sold the remaining half-acre lot ~ear
West Third street and Tilson Avenue to Mr. H.L. Walter. The lot is now owned and occupied by the Mt. Zion Missionary
Baptist Church. The church was apparently built immediately east of the former wastewater lagoon and over the southern part
of the former proces~ing plant area. Mr. Jesse Pace owns a brick house that was built on top of
the foundation of the old plant office. The original plant laboratory and office storage building stood behind the house.
Both structures are still there. This is the approximate location of where the two m~in creosote storage tanks existed
du:ing plant operation (Koppers, 1982). On April 16, 1984, the Texas Department of water Resources
(TDWR) recommended to the U.S. Environmental Pr.otec~ion Agency (EPA} Region VI that the Kopper::i Texarkana Site be ,:,laced on
the updated EPA' s National Friorities List (NPL). :'he NPL is actually Appendix B to the National Oil and Hazardous Substanc@
Contingency Plan (NCP), 40 CFR Part 300, and is required by the Comprehensive Environmental Respo~se, compensation, and
Liability Act of 1980 (CERCLA) to be included as part of the NCP and to be revised at least once ~e~ year (Federal Register 1984).
1-11
0

I I I I I I I I I I I I I I I I I I I
I~ September 1984, the TDWR requested tha~ the Kennedy
Sa~d and Gravel Corrpany cease and desist all operations. 0n October 15, 1984, the Koppers Texarkana Site was
included on the second proposed update of the NPL along with 243 ot~er proposed sites (FedPLll Register 1984).
On June 10, 1986, EPA added the Koppers Texarkana Site to t~~ NPL. Ranked according to decreasing HRS scores, the
Koppers Texarkana Site is currently listed at 677 out of the
770 sites included on the NPL (Federal Register, July 22, 1987; Volume 52, Number 140, P~ge 27820).
An Administrative Order on Consent {AOC) was signed in December 1984 by Kennedy Sand and Gravel Company, Koppers
Co~pany, and the EPA stipulating that the southern half of the
site would be fenced and mining operations ~ould cease. In
March 1985, an AOC was signed by Koppers Company and the EPA
stipulating that Koppers would implement the tasks detailed in a Remedial Investigation/Feasibility Study (RI/FS} Work P!an
that had been approved by the EPA. A third AOC was signed by
Keppers Company and the EPA in July 1985. This AOC stiplllated
that Koppers would: place a protective soil/sod barrier on specified areas within Carver Terrace; sample and inspect
additional areas of Car:ver Terrace~ sarnple the munici1Jal water
system at carver Terrace; and place an ero~ion prevention structure in the southwest corner of the Kennedy Sand and Gravel property.
1.2.3 Investigation and Obrervation History
1.2,3.l TDWR's Initial Inspection, 1980
On April 18, 1979, Congressman Eckhardt, then
Chairman of the Hcuse Subcommittee on Oversight and
Investigations, requested information concerning past waste
disposal practices of the 50 largest domestic chemical companies, of ~hich Koppers Company, Inc. is one.
1-12
(\j
0 '1'" (\J
0
I I I I I I I I I I I I I I I I I
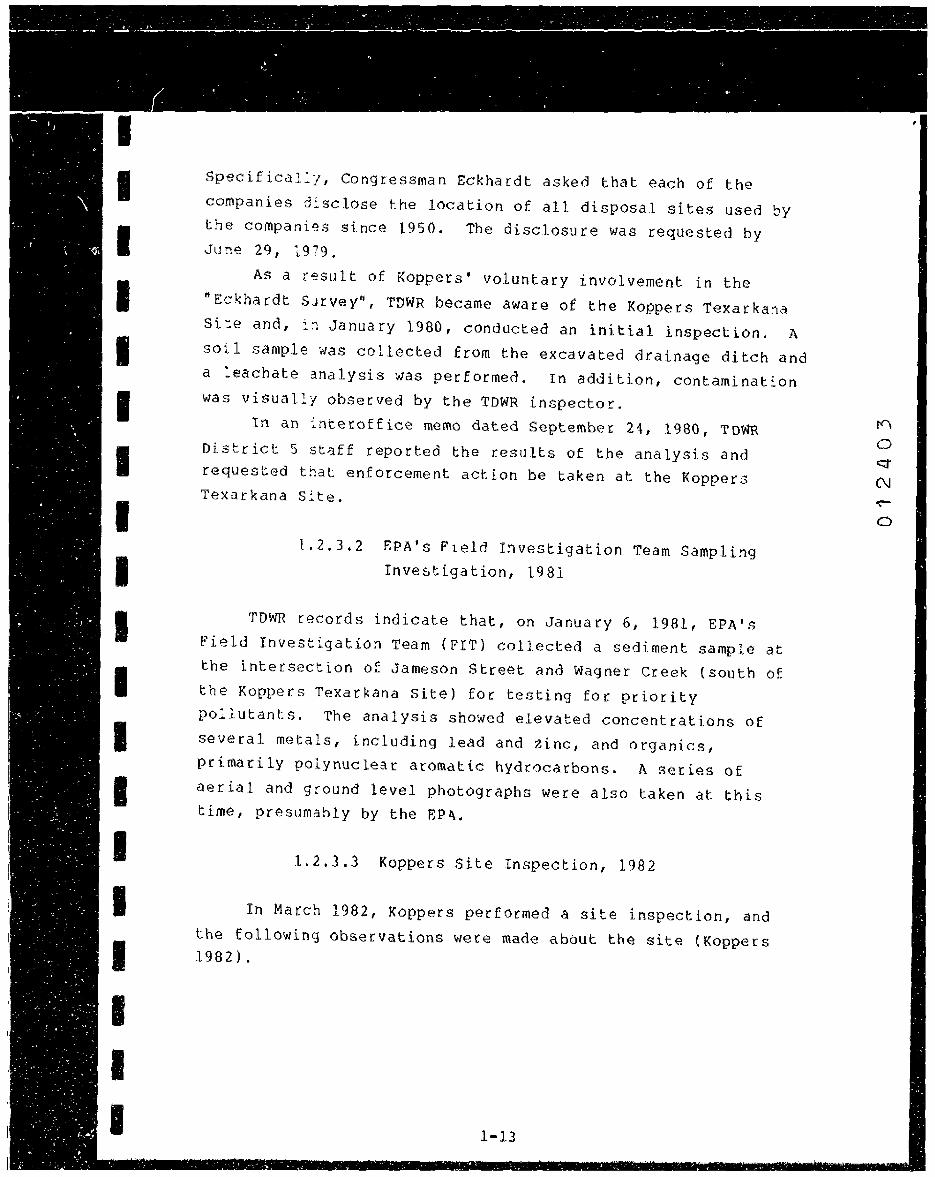
Specifica1:1, Congressman Eckhardt asked that each of the
companies disclose the location of all disposal sites used by
the companigs since 1950. The disclosure was requested by
Ju:1e 29, 1979.
As a r~sult of Koppers' voluntary involvement in the
ttEckhardt SJrvey", TDWR became aware of the Koppers Texarka~a
Si~e and, :~ January 1980, conducted an initial inspection. A
soil sample ~as collected from the excavated drainage ditch and
a :eachate analysis was performed. In addition, contamination was visually observed by the TDWR inspector.
In an ~nteroffice memo dated September 21, 1980, TDWR
District 5 st~ff reported the results of the analysis and requested that enforcement action be taken at the Koppers Texarkana S:te.
1.2.3.2 EPA's Field I~vestigation Team Sampling Investigation, 1981
TDWR records indicate that, on January 6, 1981, EPA's
Field Investigation Team {FIT) collected a sediment sample at
the intersection of Jameson Street and Wagner Creek (south of.
the KoDpers Texarkana Site) for testing for priority
po:lutants. The analysis showed elevated concentrations of
several metals, including lead and zinc, and organics,
primarily polynuclear aromatic hydrocarbons. A series of
aerial and ground level photographs were also taken at this time, presumably by the EP~.
1.2.3.3 Koppers Site Inspection, 1982
In March 1982, Koppers performed a site inspection, and
the following observations were made about the site (Koppers 1982).
l-13
0

I I I I I I I I I I I I I I I I I I I
0
0
0
~agner Creek, which is essentially the main artery
that carries run-off from the old plant site, did not show visible signs of contamination.
Most of the visible soil contamination and oil
sediments were found in the eastern drainage ditch approximately 20 feet from the south boundary of the church lot. This is within 250 feet of ~he approximate location of the wastewater lagoon,
treating facility, and two small sumps that existed during plant operations.
Leachate was observed entering the gravel pits,
o The Carver Terrace Subdivision looked like a typical
residential area. All plant structures had been razed.
1.2.3.4 Koppers Hydrogeologic Investigation, 1983
In :983, Koppers undertook a hydrogeologic investigation of the former plant site. The investigation was designed to assess the soil and ground water quality within the former plant site•s boundaries.
Twe!ve shallow monitoring wells, one intermediate depth well, two deep monitoring wells, and a soil boring were logged and installed during this investigation. Two ground water sampling roulids were performed on each of the fifteen monitoring wells. The analyses that were run measured pH, total organic carbon, chemical oxygen demand, phenol, dissolved solids, PCP, conductivity, chloride, chromium and zinc.
Additionally, depth to ground water was measured during each sampling round.
Soil samples were collected from the soil boring and from most of the borings completed as monitoring wells. Selected samples were sent to an analytical laboratory for chemical analyses.
1-14
• • • • • • ' ! • • .~ • • 1 • ,. . . . . . . ...
0
I I I I I I I I I
;I
I I I I I I I I I
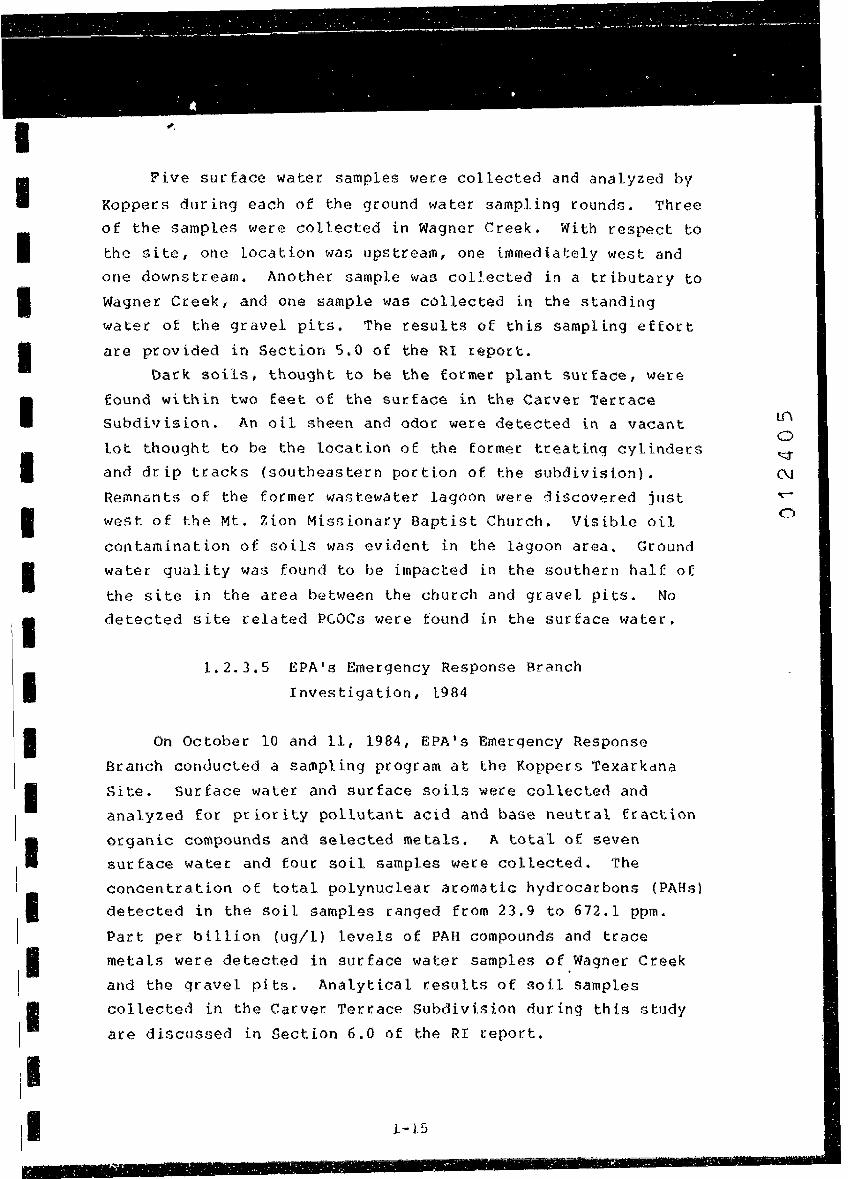
Five surface water samples were collected and analyzed by
Koppers during each of the ground water sampling rounds. Three
of the samples were collected in Wagner Creek. With respect to
the site, one location was upstream, one lmmediately west and
one downstream. Another sample was collected in a tributary to
Wagner Creek, and one sample was collected in the standing
water of the gravel pits. The results of this sampling effort
are provided in Section 5.0 of the RI report.
Dark soils, thought to be the former plant surface, were
found within two feet of the surface in the Carver Terrace
Subdivision. An oil sheen and odor were detected in a vacant
lot thought to be the location of the former treating cylinders
and drip tracks (southeastern portion of the ~ubdivision).
Remn~nts of the former wastewater lagoon were discovered just
west of the Mt. Zion Missionary Baptist Church. Visible oil
contamination of soils was evident in the lagoon area. Ground
water quality was found to be impacted in the southern half. of
the site in the area between the church and gravel pits. No
detected site related PCOCs were found in the surface water.
1.2.3.5 EPA 1 s E~ergency Response Branch
Investigation, 1984
On October 10 and 11, 1984, EPA's E~ergency Response
Branch conducted a sampling program at the Koppers Texarkana
Site. Surface water and surface soils were collected and
analyzed for priority pollutant acid and base neutral fraction
organic compounds and selected metals. ~ total of seven
surface water and four soil samples were collected. The
concentration of total polynuclear aromatic hydrocarbons (PAHsl
detected in the soil sampl~s ranged from 23.9 to 672.1 ppm.
Part per billion (ug/1) levels of PAH compounds and trace
metals were detected in surface water samples of Wagner Creek
and the gravel pits. Analytical results of soil samples
collected in the Carver Terrace Subdivision during this study
are discussed in Section 6.0 of the RI report.
1-15
a
I I I I I I I I I I I I I I I I I I I
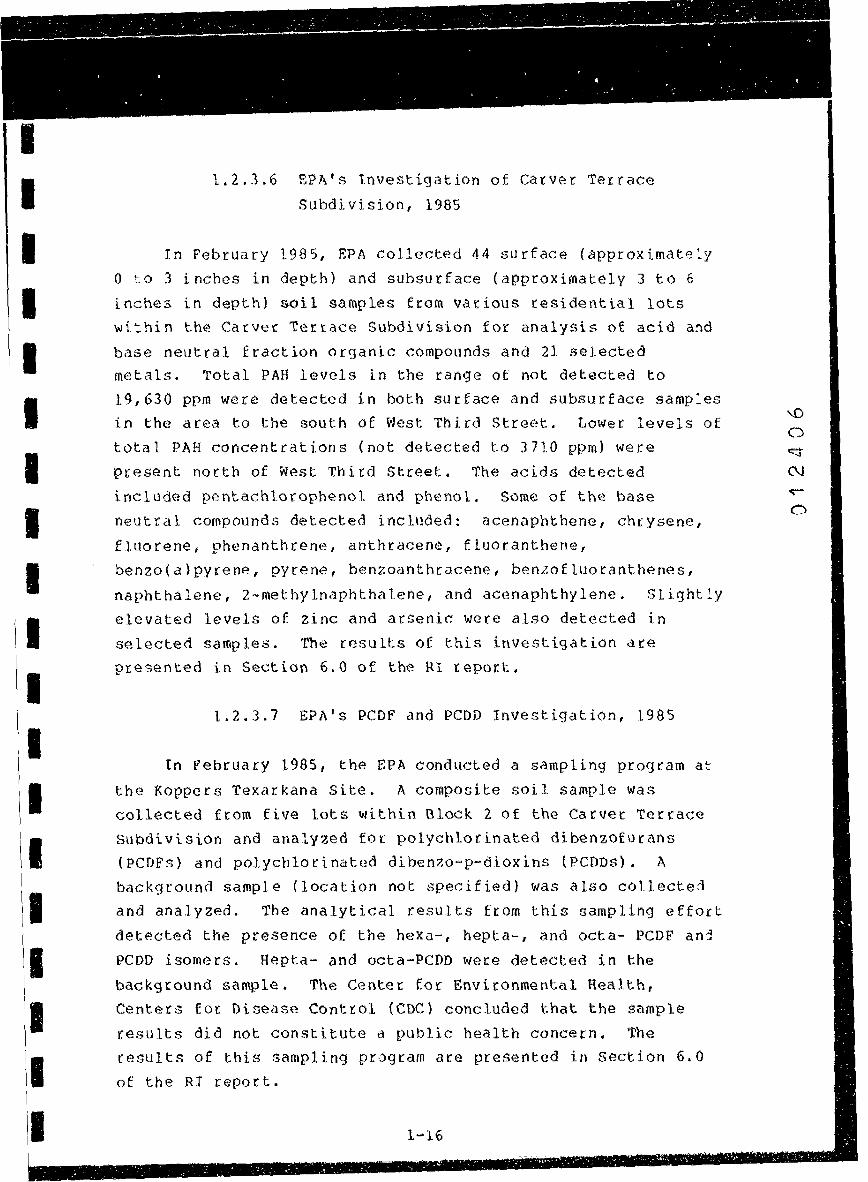
1.2.3.6 EPA's Investigation of carver Terrace Subdivision, 1985
In February 1985, EPA collected 44 surface (approximat~:y Oto 3 inches in depth) and subsurface {approximately 3 to 6
inches in depth) soil samples from various residential lots
wi~hin the Carver Terrace Subdivision for analysis of acid and base neutral fraction organic compounds and 21 selected metals. Total PAH levels in the range of not detected to
19,630 ppm were detected in both surface and subsurface samp:es in the area to the south of West Third Street. Lower levels of
total PAH concentrations (not detected to 3710 ppm} were
present north of West Third Street. The acids detected
included pentachlorophenol and phenol. Some of the base
neutral compounds detected included: acenaphthene, chrysene, fluorene, phenanthrene, anthracene, fluoranthene,
benzo(a)pyrene, pyrene, benzoanthracene, benzofluoranthenes,
naphthalene, 2-methylnaphthalene, and acenaphthylene. Slightly elevated levels of zinc and arsenic were also detected in
selected samples. The results of this investigation are presented in Section 6.0 of the RI report.
1.2.3.7 EPA's PCDf and PCDD Investigation, 1985
In February 1985, the EPA conducted a sampling program at the Koppers Texarkana Site. A composite soil sample was
collected from five lots within Block 2 of the Carver Terrace Subdivision and analyzed for polychlorinated dibenzofurans (PCDFs) ana polychlorinated dibenzo-p-dioxins (PCDDs). A
background sample (location not specified) was also collected
and analyzed. The analytical results from this sampling effort
detected the presence of the hexa-, hepta-, and octa- PCDF an~ PCDD isomers. Hepta- and octa-PCDD were detected in the
background sample. The Center for Environmental Health,
Centers for Disease Control (CDC) concluded that the sample results did not constitute a public health concern. The
results of this sampling program are presented in Section 6.0 of the RI report.
1-16
0
I I I I I I I I I I I I I I I I I I I
1.2.3.8 Soil/Sod Barrier Placement, 1985
In May of 1985, the EPA notified Koppers Company, Inc.
th~t a soil/sod protective barrier would be required in several
of the residential lots in the carver Terrace subdivision. In
response to that notification, Koppers and the EPA entered into the July 1985 AOC to install a protective soil barrier and to
perform additional soil sampling and analyses. The Iocat:ons
of the soil/sod protective barriers are shown on Figure 1-5. In September of 1985, Koppers initiated the placement of a
soi:/sod barrier on the ten residential lots on the south side
of Nest Third Street, in a portion of Mr. Jesse Pace's yard,
and in an area of the Mt. Zion Missionary Baptist church. The
war~ was completed by November 8, 1985.
In order to determine if any additional lots would require
protective barrier placement, Koppers, in conjunction with EPA,
col:ected soil samples and inspected the lots in Carver Terrace
which had not been previously sampled by the EPA and for w~ich
access permission had been obtained. Fifty five lots in Carver
Terrace were additionally inspected. As a result, a soil/sod
pro~~ctive barrier was placed on portions of ten lots with
homes, and portions of five vacant lots (one of which was only seeded). The work was completed by March 12, 1986.
1,2.3.9 Carver Terrace Municipal Water System
Sampling, 1985
The municipal water system in the Carver Terrace
Subdivision was sampled on August 22, 1985 in response to the
July 1985 AOC. Samples were collected from residences near the point where the water main entered and exited the subdivision
and at five intermediate locations. The samples were analyzed for priority pollutant acid extractables, base/neutral
extractables and metals. The analytical results showed no indication that the municipal water supply system in Carver
Terrace was being affected by the site.
1-17
r--0 q
(\j
0

-
l<EYNAP
--===r--z t=l I
LEGEND
m -SOIL/SOO BARRIER
■ --'RE-'S $£8)£.0
- - - -
SCAI..E 0:-EETI
0 Sal ~
- - - - - - -
---------------
@ONE _,.. .
- -
PRIJTECTIVE BARRIE/; IMP
TEX.ARKAN.A. TEXAS
- - - -
!al u < "' "' kl .... i,:
'"" > "' < u z -"' z 0
or, ... ' < co ...... g,-J .., .., "' • :.,
: ,-I 1.: .... ... .... "' "' < Ill
w > ... f-u i,:, .. 0 0: c.. C 0
"' ..... ~ ... 0
"'
-

I I I I I I I I I I
I I I I I
1.2.3.10 August, October, and December 1985 Sampling Programs
Sampling and inspections were conducted at the directio~ of the u.s. EPA by Koppers Co., Inc. and in conju~ction with
the U.S. EPA on August 20 to 22, 1985; October 2, 1985; and December 16, 1985 on properties in the Carver Terrace Subdivision for which access permission had been obtained, b~t
for which samples had not previously been collected by the U.S.
EPA. Fourteen near-surface soil samples were sent for analysis of acid and base neutral fraction organic compounds. Total ?AH concentrations for these fourteen samples ranged from not
detected to 4520 ppm, with the exception of one sample that h1d naphthalene detected at a concentration of 240,000 ppm. The
results of these sampling programs are presented in Section 6.0 of the RI report.
1.2.3.11 Weston Sper Technical Assistance Team Investigation, 1986
The Weston Sper Technical Assistance Team (TAT) conducted a soil sampling program at the Koppers Texarkana Site in May 1986. The TAT collected ten soil samples from five locations within a recreational field in Carver Terrace. The objective of this program was to sample the high traffic areas of the
field to determine the potential exposure of local residents to possible PCDDs on the site. The samples were analyzed for
PCDDs and PCDFs, The isomers detected in the samples included
penta-, hexa-, hepta~, and octa-PCDFs, and hexa-, hepta-, and
octa-PCoos. The results of this sampling effort are presented in section 6.0 of the RI report.
1-19
0
I I I I I I I I I I I I I I I I I I I
1.2.3.12 Remedial Investigation, 1985-1987
On March 28, i985, Koppers Company, Inc., entered into an
AOC with the a.s. 8PA, Region VI. The Consent Order (CERCLA
VI-7-85) stated that the mutual objectives of EPA and Koppers
are: (1) to determine the nature and extent of potential contamination which may be causing a threat to the public
health or environment through a RI: and (2) to evaluate
remedial action alternatives to prevent or mitigate potential migration or threatened release of contaminants through a FS.
A copy of the AOC is presented in Appendix M of the RI report. In April 1985, a Work Plan describing the tasks to be
performed as part of the RI and FS was prepared by Camp Dresser & McKee, Inc. (COM), a consulting firm. ~ifteen tasks were
formulated within the Work Plan to carry out the RI and FS for the Koppers Texarkana Site.
The RI was conducted in general accordance with four of the tasks within the Work Plan. Th~se tasks include~ Task 1 -Compile and Evaluat~ Background Information, Task 2 - Perform Field Investigations, Task 5 - Prepare Draft Remedial
Investigation Report, and Task 6 - Prepare Final Remedial
Investigation Report. The remedial investigations conducted at
the site were conducted in general accordance with the subtasks of Task 2 which include:
Subtask - -
2A 2B 2C
2D
2E 2F
2G 2H
DescriEtion
Surface Water Characterization
Surface Sediment Characterization Geophysical Surveying
Subsurface Soil Sampling
Shallow Ground Watar Investigation
Deeper Ground Water Investigation .
Nonsoil Materials Investigation Air Quality Investigation
1-20
0

I I I I I I I I I I I I I I I I I I I
The results of the subtasks, with the exception of
Subtasks 2C and 2G, are presented in the RI report. The
geophysical survey was deleted from the RI on November 8,
1985. The reason for the omission was due to the presence of
buried and overhead utilities and metal fences between most of
the residential lots in the Carver Terrace Subdivision . It
was also determined that because the power auger boring and
drill rig soil boring programs would ptovid~ enough data to
characterize the site. A November 8, 1985 letter from the U.S.
EPA to Koppers Co., Inc. documents this deletion. This letter
is presented in Appendix G of the RI report. No non-soil
mat~rials were found during the field studies. Therefore, the
non-soil investigation was also not conducted.
1.3 Nature and Extent of Problem
Based upon the results of the RI and other past studies,
site related contaminants were found in soils in the
unsaturated zone and the saturated zone within the shallow
aquifer. Base neutral fraction compounds, specifically PAHs,
are the predominant class of organic compounds detected in the
site soils. Several of the more predominant PAHs detected on
the Koppers Texarkana Site include acenaphthene, anthracene,
chrysene, naphthalene, fluoranthene, phenanthrene, and py~ene.
The concentrations of these compounds ranged from being
undetected to 10 5 ppb {refer to Section 6.0 of the RI
report). Soil beneath the shallow aquifer does not appear to
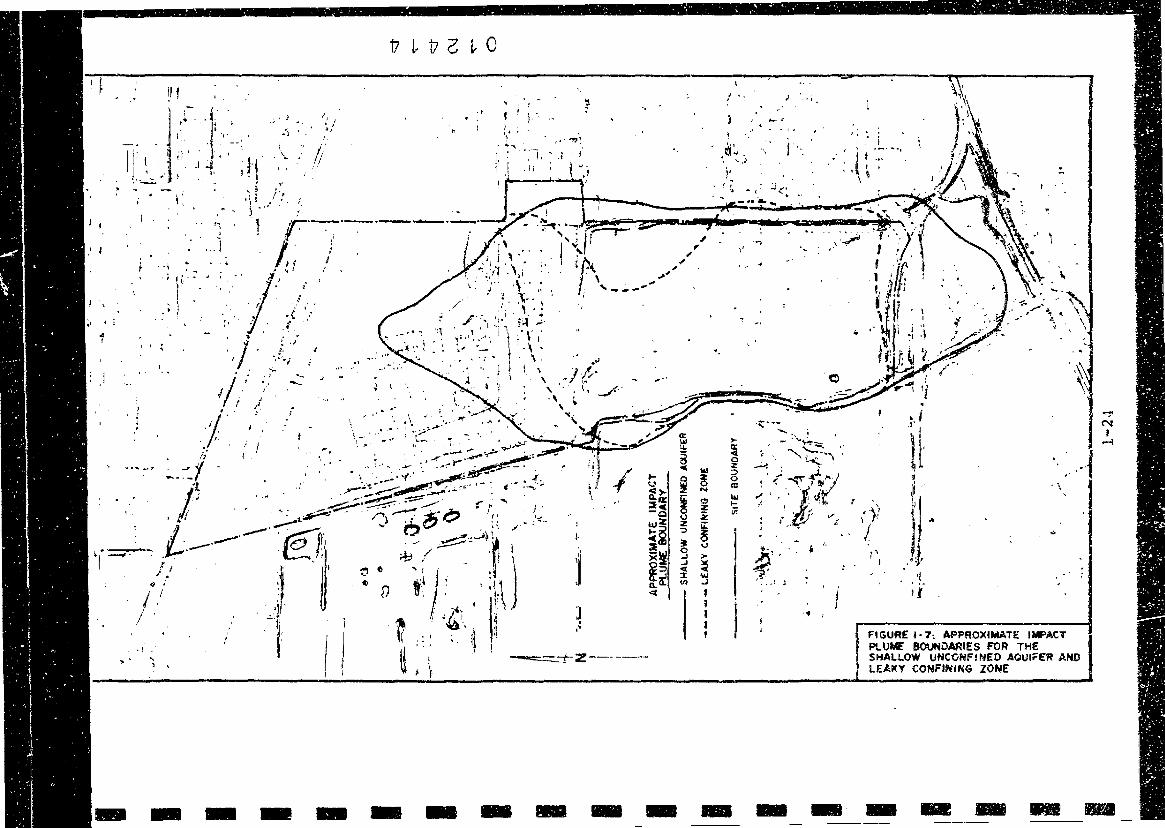
be impacted. Firy~re 1-6 has been included to show the areas of
illipacted surface and subsurface soils based upon total PAR
isoconcentrations. This figure was composited from figures pres~nted in Section 6.9 of the RI report.
The vertical extent of subsurface contamination is related to the geology of the ground water table aquifer at the site.
The results of the ground water data (Section 7.0 of the RI report) and saturated soil data (Section 6.0 of the RI report)
collected during the RI indicate that the shallow unconfl~ed
aquifer has been impacted in the southern portion of the Carver
1-21

I I I I I I I I I I I I I I I I I I I
• .. -t.-.__..~--
.......__.....,_
1• ~~-=-
N
. \:¼ ' .. - -
,,
, '\_'
(J - • \ • -;.,~ I ~< \ /" •. \!' . :"'\:,. -~ : . ;..- ,1- ---.1- V ''"
~.:=,-- ""\ C"\.I. \ ) •~ ' I ,- .
----- I \jJ\' ', \_ •,
I\'\ _l'\,_ •I ' ·. •. ~ ~- F":_~ \T ,, ·~ ~ 11 .._.._"_' ~.,:.:.~~:-•-"" ~~= J .,
-------------- '-- l . .., . :,, I' • ~ • ~ ,.· •
,..·-, l.;._. I r,-.. ._~ I~ ••
, -, (~ I
___ ~ t~> .· ~0i, ~- ..::_~ '-~---. t. ,"' - . ~ ·~ . \, .. . \)
TOTAL P.t.H _ ISOCONCE~TRI.TION LINES
UNSATURATED $U9SU~ SOILS
-10---- 10~ --10•-----100--- IOOP9ffl --100- ---
IOOOPl}ffl----
•
,,
--- ... ....__ .._ . -I
1--I -7'-~ --=--~--- ~;-:;-- -- •
' . . ,,., - --. ... ' - -1- • • --· -- .
,.,. -,
,~ ~f ""'+ ~ __ .,.•~-"'-..,;.,,
' t p:-,t_, .. .f. - • ,_.
(\J
0

I I I I I I I I I 'I I I I I I I I I I
Terrace Subdivision, the Kennedy Sand and Gravel Property,
off-site locations to the south (within approximately 500 feet
of the site), and off-site locations immediately adjacent to
the Kennedy Sand and Gravel property (within approximately 50
feet of the site). The predominant organic compounds detected were base neutral fraction compoundR including but not limited
to naphthalene, acenaphthene, fluorene, pyrene, and
phe:1anthrene. The concentrations of these compounds ranged
from being undetected to 105 ppb (refer to Sect~on 6.0 of the
RI report). The leaky confining zone silt and clay beneath the
sha:low ground water aquifer has been partially penetrated by
the more mobil organic species (i.e., benzene) in, for example,
the Kennedy Sand and Gravel Compiny p0rtion of the site. The
groJnd water quality in the semiconfined aquifer was not shown
to have detectable concentrations of the analyzed organic
compounds. Figure 1-7 shows the approximate area of the
impacted shallow unconfined aquifer and the leaky confining
zone.
1.4 Report Organization
This FS Report is orga~izea in eight sections plus appendices. Section 1.0 includes introductory information such
as the FS process, site background, and ~ummary of the nature
and extent of the problem.
Section 2.0 of the FS report contains the Final Public
Health and Environmental Assessment of the site. Subsections
of this section include potential r.azard identification, toxicity assessment, exposure assessment, risk
characterization, environmental assessment, and sources of
uncertainties.
Section 3.0 of the report contains the applicable or
relevant and appropriate requirements (ARARs) identified for
the Koppets Texarkana Site. Section 4.0 of the FS report contains the remedial
response objectives and the identification and screening of the
remedial action technologies.
0
I
.J
... (..'
t► ::I~ -0 wZ
~~ :l 2 0 ><~ ..J
..J
~:) -:t ::r. G.ir ~
<:I'
"" i N
0 z z ~ V ;,,-
~ 1AI J
I l l I I
;,,-
~ Cl ~ :::, 0 cc
"' f-ir.
. \
•/ I:,..,
Fl GUR£ I· 7, APPROXIMATE IMPACT Pt.UME 80UNuARIES FOR THE SHALLOW UNCONFINED AQUl.:ER AND LEAKY CONFINING ZONE
- - - - - - - - 1!111 - - - - --- ........

I I I I I I I I I I I I I I I I
Section 5.0 includes the development and initial screening of ~he remedial action altertatives.
section 6.0 contains the jetailed evaluation of the developed remedial action alternatives. This evaluation is
based upon both noncost and cost criteria. Noncost criteria inc:udes effectiveness, implementability and community and sta:e acceptance.
Section 7.0 of the report presents an overview and summary of the detailed analysis of each remedial action alternative
described in Section 6.0. Items addressed in this section
inc:uae technic&l feasibility, environmental protection, ~ublic
hea:th, ARARs, capital and operation and maintenance costs, and present worth and sensitivity analyses.
hppendices contain the specific details of the evaluation analyses and any supporting data and information.
1-25
0

I I I I I I I I I I I I I I I I I I
1.5 REFERENCES
Cam~, Dresser & McKee, Inc. April 1985. Interim Site
Characterization Report for Koopers/Texarkana1 Texarkana: T~~n~. RemP-cttal tnvestiaation/Feasibilitv Studv.
ERT, Inc. April 1988. Remedial Investigati~n Report, Koopers Texarkana Site. Taxarkana. Texas. Volumes I, rr. III. and IV.
Federal Register, October 15, 1984. 49(200): 40320-40334.
Federal Register, June 10, 1986. 51(111): 21053-21098.
Federal Register, June 22, 1987. 52tl40l: 27820.
Koppers Company, Inc. ~pril 6, 1982. Interoffice
Corr~snondence From D.L. King to T.A. Marr.8Ei Old Texarkana Plant Site.
Koppers Company, Inc. April 1984. HydrogeologiG Investigation_ of Koooers Comoanv. Inc. Former Texarkana, TX, Plant Site.
Koppers Company, Inc. May 1985. _Health apd Safety Plan for
Remedial Investiqation, Koooers/Texarkana Site. - -·. ·-
Koppers Company, Inc. October 1985. Field ~amollnq and
Analytical Plan. Remedial Investiaation/Feasibilitv Studv. Texarkana.
Koppers Company, Inc. May 1986. ,>er Action Report lm~ed~a~e
Remeqiai Action. l{oppers Texar~ana Site, Admiriistrative
Order on Consent. CERCLA VI-13-85.
0
I I I I I I I I I I I I I I I I I I I
2.0 FINAL PUBLIC HEALTH AND ENVIRONMENTAL ASSBSSMENT
This section of the FS includes the Final Public Health
and Environmental Assessment (Final PHEA} for the Koppers
Texarkana Site. The format of this assessment follows the
methodology recommended by the EPA (1986a) and is summarized
below. It builds upon the work presented in Section 9.0 of the Remedial Investigation Report for the Koppers TeKarkana Site.
o Hazard Identification: Review of the compounds found
in various media and choice of potential contaminants of concern ("PCOCs") for detailed assessment, based on concentrationt distribution, potential toxicity and consistency of detection.
0 Exposure Assessment: Identification of potential exposure pathways (PEPs), estimation of potential
exposure point concentration, comparison of concentrations to applicable standards and criteria,
and calculation of doses from the exposure scenarios identified in the RI Report.
o Toxicity Assessment: Review of the toxicity of each PCOC (primarily from the literature supporting
standards and criteria} and an estimation of the relationship of quantity of intake (dose) to risk of
toxic response.
o Risk Characterization: Comparison of estimated
intake to dose-response estimation in order to quantify potential risk for specific site conditions.
The steps of hazard identification, including selection of
PCOCs, and toKicological profiles have already been eKecuted in Section 9.0 of the RI Report. The results of those steps are
summarized briefly in Section 2.1 Hazard Identification and Toxicity Assessment of this report. Section 9.0 of the Rt
Report also identified the potential exposure pathways and the potential human receptors most likely to be exposed to
2-1
r-

I I I I I I I I I I I I I I I I I I
ccntaminants from the site. Section 2.2 of this report begins by summarlzing these findings and then attempts to quantify
within the limits of the specific procedures potential current
ar.d hypothetical future exposure and risk for each of the pctential pathways and human receptors. To provide a range of
p~tential exposure and risk, three levels of exposure based on either the maximum, minimum, or the geometric mean of soil ccncentrations are developed for Carver Terrace Residents.
Only maximum and/or minimum PCOC concentration are evaluated
for other media and receptors because data for other scenarios
were limited or potential health risks associated with maximum concentrations were not large. Section 2.3, Risk Characterization, combines the intakes derived in Section 2.2
with available toxicological data (reviewed in Section 9.0 of
the RI Report) to determine if the site poses any potential
health risks and, if it does, to estimate their magnitude within the limits of the specified procedures. Section 2.4
presents some 0£ the environmental risks that may be associated with the site. Section 2.5 discusses some of the sources of
uncertainty in the risk assessment process.
2.1 Hazard Identification and Toxicity Assessment
2.1.1 Database
The data used for determining potential health risk at the
Koppers Texarkana Site were presented in Sections 5.0, 6.0, 7.0
and 8.0 of the RI Report (ERT 1987). This data was obtained
from samples collected by ERT in 1986 and 1987 as part of the Remedial Investigation, and samples collected by Koppers and
the U.S. EPA prior to the Remedial Investigation.
2.1.2 Selection of PCOCs
The sampling rounds conducted at the Koppers Texarkana Site have focused primarily on constituents potentially present
2-2
5722F 4040-001-600
ro

I I I I I I I I I I I I I I I I I I I
at the site given the past use of the property as a wood
preserving facility. Creosote, pentachlorophenol (PCP) and
treating salts were the principal preservatives reported to
have been used at the site (ERT, 1987). All operations at the
Koppers Texarkana facility were permanently terminated in 1961.
As a result of reviewing the analytical results obtained
from the Koppers Texarkana Site and given the past use of the
property as a wood preserving facility, focus has been placed
on the preservative chemicals believed to have been formerly
used at the site. A list of the PCOCs is given in Table 2-1.
The basis for selecting these PCOCs is presented in detail in
Section 9.0 of the RI Report. Also included on Table 2-1 are
the acceptable chronic intakes {AIC), and potential oral and
inhalation carcinogenic potencies. Appendix R of the the RI
Report also contains toxicological profiles for the PCOCs;
therefore, the profiles have not been included in the Final
PHEA.
2.2 Exposure Assessment
2.2.1 Potential Exposure Pathways
Potential exposure pathways (PEPs) are the routes by which
potential receptors may be exposed to PCOCs in air, water, or
solid media (soils, sediments or sludges). Primary exposure
pathways include ingestion, inhalation, and dermal contact.
Potentially important PEPS have already been identified in
Section 9.0 of the RI Report. The PEPs judged to be important
and that need to be quantified are presented in Table 2-3.
2.2.1.1 su~face Soils
carve.r_Terrace Residents
Two potential current and future PEPs involving soils have
been identified at the Carver Terrace Subdivision: inadvertent
2-3
5722F 4040-001-600
0

I I I I I I I I I I I I I I I I I I I
.. TABLE 2-1 ( a)
POTENTIAL CONTAMINANTS OF CONCERN SELECTED FOR DETAILED
ASSE:SSMENT AT THE KOPPERS TEXARKANA SITE
AIC(b) AIC Potential Potential Oral Inhalation Oral Inhalation
(mg/kg (mg/kg Carcinogenic Carcinogianic ?COCs /day) . /day) P'?t;ency Potency.
Arsenic NA NA L 50E+00 5.00E+l
Benzen~ NA NA 5.200-2 2.60E-2
Potentially Carcinogenic PAH(c) NA NA 1. 15E+l 6.11
Total PAH
ChromiJm VI 5.00E-3 NA NA 4.lOE+l
Copper 3. 70E-2 1.00E-2 NA NA
Ethylb~nzene 1. 00E-1 NA NA
PCDDs/?CDFs NA NA 1. 56Ei-5 1.56[',t.5
Lead (!:1organic) 1. 40E-3 NA NA
Mercury (Inorganic) l.40E-3 NA NA
Pentac~lorophenol 3.00E-2 NA NA
Toluene 3.00E-1 1. 50 NA NA
Total Xylenes 2 \ E-2 4.40E-1 NA NA
Zinc 2.lOE-1 NA NA
(a) The health based criteria presented in Table 2-1 are taken from an update of EPA 1986a. An "NA" indicates that EPA does not consider that criteria appropriate for evaluating the adverse human health effects potentially caused by that chemical. A"-" indicates that EPA has not developed a health criteria to use for evaluating the potential adverse health effects caused by that chemical.
(b) AIC = acceptable chronic intake. (c) Potentially carcinogenic PAH include benzo(a)anthracene,
chrysene, benzo(b}flouranthene, benzo(a)pyrene, dibenzo(a,h)anthracene, and indeno(l,2,3-cd)pyrene.
2-4
C,
(\J
q
(\I
~
0

I • "
TABLE 2-2
I POTENTIALLY CARCINOGENIC PAH
I Benzo(alanthracene Benzo(a)pyrene
I Benzo(b)fluoranthene Chrysene
I Dibenzo(a,h}anthracene
Indeno(l,2,3-cd)pyrene
I -r-(\J
I q
(\J
~
I 0
I I I I I I I I I I I 2-5
I I I I I I I I I I I I I I I I I I I
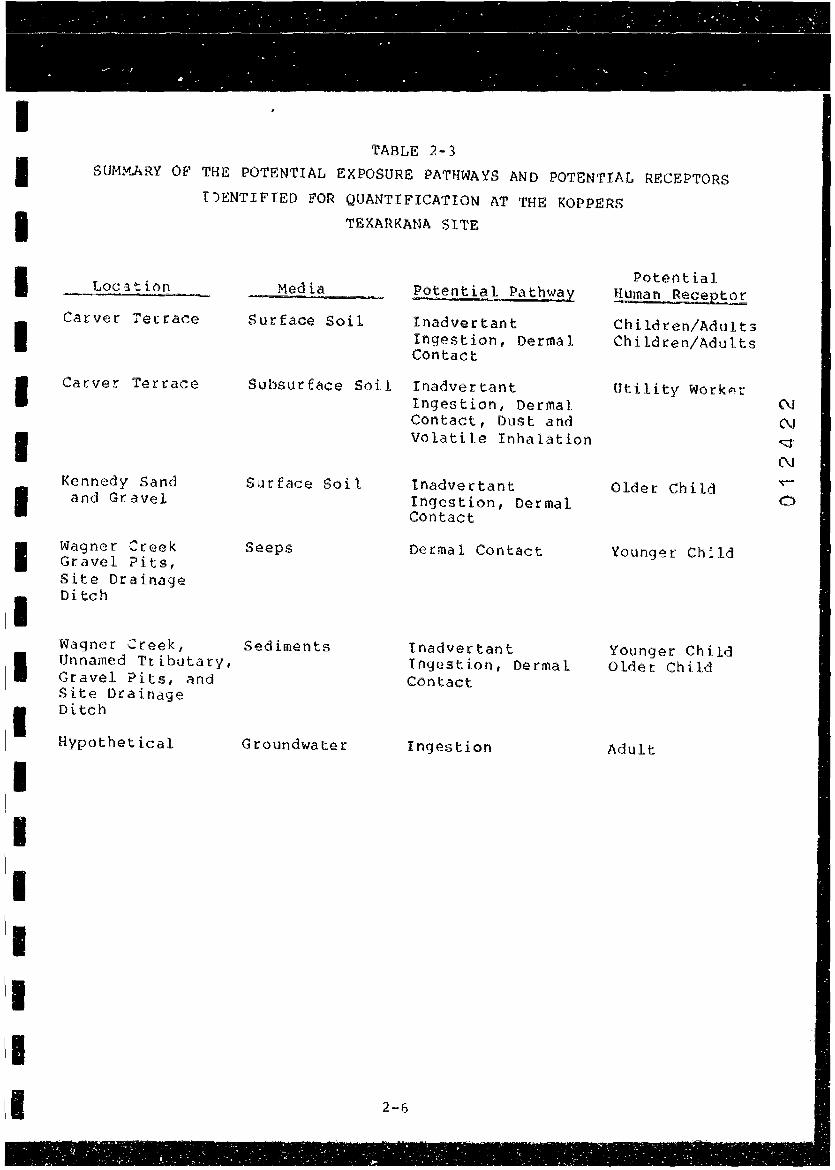
TABLE 2-3
SUMMARY OF THE POTENTIAL EXPOSURE PATHWAYS ANO POTENTIAL RECEPTORS
I)ENTIFIEO FOR QUANTIFICATION AT THE KOPPERS
Loe.at ion
Carver Terrace
Carver Terrace
Kennedy Sand and Gravel
TEXARKANA SITE
Media Pot~ntial Pathwa~
Surface Soil Inadvertant Ingestion, Dermal Contact
Subsurface Soil Inadvertant Ingestion, Dermal Contact, Oust and Volatile Inhalation
Surface Soil lnadvertant Ingestion, Dermal Contact
Wagner Creek Seeps Dermal Contact Gravel ?its, Site Drainage Ditch
Wagner ~reek, Sediments Unnamed Ttibutary, Gravel ?its, and Site Drainage Ditch
Hypothetical Groundwater
Inadvertant Ingestion, Dermal Contact
Ingestion
2-6
Potential Hu~an Recee,tor
Children/Adult3 Children/Adults
Utility Work~r
Older Child
Young~r Ch:ld
Younger Child Older Child
Adult
(\J
(\J
c;;;;f'
(\J

I I I I I I I I I I I I I I I I I I I
ingestion of soil and dermal contact with contaminated soils.
Potential current and future intakes have been calculated for
children and adults. Three current and three future exposure scenarios were evaluated for Carver Terrace residents. The
only difference among the three scenarios is the soil
concentration of PCOCs used to generate the exposures. The
remaining exposure assumptions are identical in all three
scenarios. Exposure scenarios using different soil
concentrations were developed because variation was observed from one soil sample and sample locati~n to the next. This
variation in soil concentrations will likely lead to variation
in potential exposure. This makes estimating a single
representative potential exposure very difficult, especially
since, during most of their lifetime, residents are likely to spend much of their time on their own lots and, therefore, most
of their potential exposure may be a result of the
concentrations of PCOCs on their own lots. In order to at
least bound the potential exposures, maximum PCOC
concentrations were used to derive an upper limit estimate of potential exposure (maximum concentration scenario); minimum
soil concentrations were used to derive a lower limit estimate
of potential exposure (minimum concentration scenario); and, a
geometric mean PCOC concentration based on all of the valid
samples was used to derive a middle estimate of potential exposure (geometric mean concentration scenario). Maximum,
minimum, and geometric mean PCOC concentrations used in the
Final PHEA are presented in data summary tables in Appendices
A, Band C of this report. The maximum concentration scenario
assumed sodding and seeding of certain areas had no effect on
surface soil concentrations. The geometric mean concentration scenario was used in an attempt to estimate ~representative" PCOC concentrations and "representative" exposures. The
minimum concentration scenario assumed that the concentration
of PCOCs was half the detection limit in sodded areas and in soil samples at which no PCOCs were detected.
2-7
5722F 4040-001-600
C

I I I I I I I I I I I I I I I I I I I
One concern with using the geometric mean of PCOC
co~centrations at Carver Terrace was that it may not be a good
measure of central tendency because surface soil samples ~ere
no~ evenly distributed between areas that were judged, based on
his:orical use, to have potentially high PCOC concentrations
and areas that were judged to have potentially low PCOC
co~:entrations. Delineation of Carver Terrace into four areas
based on historical use, revealed that more surface soil
samples were collected from potentially high PCOC concentration
areas than from potentially low PCOC concentration areas. surface soils in the two regions of Carver Terrace that we:e
mos~ likely to have high PCOC concentrations, based on
his~orical use, were sampled at the rate of nearly two samples per acre. The two regions that were least likely to have high
PCOC concentrations were sampled at a rate of approximately two
thirds of a sample per acre. Appendix 2-E contains a diagram
of carver Terrace broken down by historic site use and
calculations showing the number of samples per acre in eac~ of
the historical use areas. Due to time limitations and ocher
practical constrains the samples were not weighted to adjust
for oversampling of potentJally high PCOC concentration areas
and undersampling of potentially low PCOC concentration ar~as.
Thus the geometric mean calculated based on the samples as
currently collected is probably slightly greater than the true
geometric mean and probably over-estimates true soil
concentrations.
Ken11_edy sand and Gravel
Two PEPs have been identified at Kennedy Sand and Grav~l:
dermal contact with potentially contaminated soils; and,
inadvertent ingestion of potentially contaminated soils. Three
potential current ond future intake scenarios have been
quantitatively evaluated for older children (ages 7 to 18) trespassing on the property. One current and future scenario
is based on maximum PCOC concentrations measured in surface
2-8
0

I I I I I I I I I I I I I I I I I I I
soil at Kennedy Sand and Gravel, the second current and future
sce~arios are based on the geometric ~ean of PCOC
concentrations in surface soi~ and the third set of scenarios
is based on minimum PCOC concentratic~s measured in surfac~
soi~. Soil samples incorporating the :irst split spoon
sampling interval (0-2 feet) of topso~l are considered surface
soils. Hypothetical future scenarios involving development of
the property were not directly quanti:ied for Kennedy Sand and
Gravel, but are discussed qualitative:y and in comparison with
future exposures at Carver Terrace.
2.2.1.2 Seeps
Potential exposure to contaminan:3 in seeps has been
assessed for one PEP: dermal contact with seeps. This pathway
has only been assessed for younger ch::dren (ages 2 to 6).
7hey were considered most likely to be most attracted to the
s~eps. Thus they were judged to bet~~ most likely to come
into contact with the seeps.
2.2.1.3 Sediments
Section 9.0 of the RI Report ider.:ified dermal contact and
inadvertent ingestion as the two PEPs 7ia which receptors could
fotentially be exJosed to PCOCs in sed:ments. Younger children
(aged 2 to 6) and older children (agec 7 to 18) were identified
as potentially coming into contact wit~ sediments. Potential
c~rrent and future exposures are quant:fied for these two PEPs
using maximum, geometric mean, ar.d min:mum PCOC concentrations.
2.2.1.4 Subsurface Soils
Section 9.0 of the RI Report iden~ified 3 PEPs for utility
workers who may be exposed to PCOCs in subsurface soils during
excavation. The three PEPS are: inacvertent ingestion of subsurface soil; dermal contact with s~bsurface soil; and,
2-9
LC\
N
" (\J
0
I I I I I I I I I I I I I I I I I I I
i~halation of subsurface soil entrained in the air as a result
of excavation activities. Potential current and future utility
worker exposures are quantified for these three PEPs. Both
maximum and minimum PCOC concentrations in subsurface soils are
evaluated. At the request of the EPA, Appendix 2-G evaluates the
potential contribution to inhalation risk of volatilized
potentially carcinogenic PAH. The calculations in the appendix
a~e worst case since they do not even account for dispersion of the volatilized pot~ntially carcinogenic PAH and still show
that the contribution of volatilization is small (and the
potential cancer risks are small, about 1 X 10⁻⁹ ) comp~red to
the contribution of entrained soil particles as estimated in
the final PHEA. Therefore the contribution of volatilized
potentiaily carcinogenic PAH has not been included in the
estimation of utility ~orker exposures from subsurface soils.
2.2.1.5 Ground water
Section 9.0 of the RI report identified ingestion of
ground water containing PCOCs from a hypothetical non-existing
domestic well as a PEP. Potential hypothetical future e~posure
to PCOCs are quantified for this PEP. A representative well
(MW03-002) is chosen that has PCOC concentrations below
organoleptic thresholds assuming that individuals will not
consume water with an objectionable taste and odor.
2.2.2 Estimation of Chemical Intakes
The summary of PEPs pr·esented above and in Table 2-2
indicates that humans may currently be exposed to PCOCs through
the following PEPs at the Koppers Texarkana Site: inadvertant
ingestion of soil and sediments, dermal contact with soil,
sediments, and seeps, and inhalation of PCOCs on entrained
dust. Future PEPS include all of the above, and additionally,
hypothetical ingestion of ground water and residential
5722F 4040-001-600 2-10
0

I I I I I I I I I I I I I I I I I
development of the Kennedy Sand and Gravel property. A dis~ussion of the general approach used to estimate potential
PCOC intake through these PEPS is presented first. It is
fo::owed by a more detailed discussion of the PEPs which
includes a description of the assumptions used to estimate PCOC
intakes for the groups of potential receptors that have been
ide~tified as being potentially exposed to PCOCs in soil,
sediments and ground water. Those potential receptors are:
younger children (ages 2 to 6) living in Carver Terrace; older
children {ag9s 7 to 18) in Carver Terrace; adults living in
Carver Terrace: and utility workers in Carver Terrace. As
discussed above, three scenarios based upon on different soil
cor.centrations are developed for current and future Carver Terra~e exposures. Degradation of PCOCs has been accounted for
in the Carver Terrace and Kennedy Sand and Gravel surface soil fut~re scenarios, but not in the current scenarios.
Degradation of PCOCs was not accounted for in seeps, sediments
and subsurface soils because half-lifes appropriate for those
exposure scenarios could not be located in the literature.
Potential Inadvertent Ingestion of Soil or Sediments
Children may inadvertently ingest soil while they play out
of doors and adults may inadvertently ingest soil while they
perform yardwork or engage in other outdoor activities.
Inadvertent soil ingestion e~posure is estimated by combini~g
the concentration of the PCOC in soil, the rate of soil ingestion, the weight of the person ingesting the soil, and how
often the person ingests soil.
Thus the calculation of soil ingestion is!
Ingestion {mg PCOC/kg/day) ~
PCocs concentration (mg/kg soil) X ingestion rate (mg
soil/person/day) ~bodyweight (kg/person) X days on site (day/day) X years on site (year/year) x unit correction
factor (kg soil/106 mg soil).
2-11
0

'i I I I I I I I I I I I I I I I I I I
Potential Dsrmal Contact With Soil or Sediments
When children and adults are outside and contact soil,
they not only may inadvertently ingest soil but they may also absorb some of the contaminants through skin. Dermal exposure to contaminants in soil is estimat&d by combining the concentration of the PCOC in soil, the amount of skin exposed
to soil, the amount of soil on skin, the weight of a person, a factor to account for reduced absorption of PCOCs through
intact skin, and how often a person contacts soil.
The calculation of dermal exposure to PCOCs in soil ls:
Dermal intake (mg PCOC/kg/day) * PCOC concentration (mg/kg soil) X eKposed skin
(cm2/person/day) X soil on skin (mg/cm2) 7 body weight (kg/person) X days on site (day/day) X years on site
(year/year) X absorption adjustment factor (unitlessJ X
unit adjustment factor (kg soil/106 mg soil) .
Potential Inhalation of Airborne Particulates _______ ... ___ .
The earthmoving equipment utility w)rkers use to excavate
soils may generate dust containing PCOCs. The amount of PCOCs
inhaled is estimated by combining the concentration of PCOCs in
the soil, the concentration of respirable particulates of soil
origin in the air, the amount of air breathed, the weight of a
worker, and how long a ~orker is exposed to the particulates. The calculation of inhalation eKposure from PCOCs on
airborne particulates is:
Inhalation intake (mg PCOC/kg/dayJ s
PCOC soil concentration (mg PCOC/kg soil) X soil in air
(mg soil/m3 air) X amount of air breathed (m3 air/day)
X days on site (day/day) X years on sitG (year/y~ar) ~
body weight (kg/person) X unit correction factor (kg soil/106 mg soil).
co C\J q-
C\J
I I I I I I I I I I I I I I I I I I
Potential Hypothetical IngestiorLof Ground water
The EPA suggests that, at some time in the future, a hypothetical non-existing well may provide ground water for
domestic use, although the ready and economic availability of potable water from the City of Texarkana should preclude installation of any such hypothetical wells. Ingestion
exposure to PCOCs in ground water is estimated by combining the
concentration of l?COCs in ground water, the weight of a person,
and how much ground water they are assumed to ingest.
The calculation of hypothetical ingestion exposure to
PCOCs in ground water is:
Hypothetical Ingestion i~take (mg PCOC/kg/day) • PCOC ground water concentration (mg PCOC/liter water} X
water consumed (liter/person/day)+ body weight (kg/person).
2.2.3 Potential Maximum Concentration Exposure
Scenario for Carver Terrace Residents
2.2.3.l Potential Current Intakes
e__Qtential tnadvit:ten.t soi.l In_gest..i..Qn
The risk assessment assumes that a person lives in Carver Terrace for their entire 70 year lifetime and inadvertently ingests and comes into contact with contaminated soil.
The EPA (1986a) has suggested that children between the ages of two and six are the individuals for whom ingestion of surface soils should be of a special concern. Estimates of the amount of soil ingested by children in the relevant age group
&te based on littla direct data and vary widely. The minimum
soil ingestion reported in the literature is 10 micrograms per cay, based on presumed intake of soiled candies (Dayr et al, l97S), while the highest is the upper portion of the range
5727.F 4040-001-600 2-13
0

I I I I I I I I
'I I I I I I I I I I
estimated by Kimbrough, et al (1984); 10 grums per day. The
high end of predicted soil ingestion rates has been adjusted
downward to sro grams of soil per day (EPA, 1986a), and it has been acknowledged by EPA that the high level of intake is
probably only pertinent for children with pica {a syndr0me in
which children intentionally eat foreign objects).
Two studies using trace elements in fecal material have recently been published in the peer reviewed literature. In
the first, Binder et al. (1986) estimated that one to three
year old children ate soil at the rate of between 181 and 184 milligrams of soil pet day to about 1834 milligrams of soil per
day. They cautioned that their values were only estimates,
however, since understanding of the metabolism and absorption
of trace elements is limited and other sources of trace
elements in a childs' diet were not accounted for. They suggested that more studies with appropriate controls are
needed. A study incorporating some of the recommendations of
Binder et al. (1986) was conducted by Clausing et al. (1987).
That study estimated that nursery school aged children ingest approximately 100 milligrams of ~oil per day with a standard
deviation of 67 milligrams per day. Clausing et al. (1987)
also measured trace element intake of a control group of
children. These were hospitalized children unable to go
outside and be exposed to soil. When their intake of trace
elements is accounted for, the estimate of a Childs' rate of
soil ingestion decreases to 55 milligrams per day. Because the estimates still have uncertainty associated with them, and in
order to be protective of public health, this 1:isk. assessment assumes that children ingest 100 milligrams of soil per day,
nearly twice the amount estimated by Clausing et al. {1981).
The rate of soil ingestion used here is the same as that recommended by Paustenbach at al. (1987) after a critical review of available information for dioxin in soil risk
assessments.
'l:'he risk assessment assumes that young children, (ages 2 through 6) will be outside and in prolonged contact with soil
5722F 4040-001-600 2-14
0

I I I I I I I I I I I I I I I I I I
fer 180 days of the year. This corresponds to approximately
three and one half days per week. Several factors suggest that
a child may be in prolonged contact with on-site soil for fewer
days per year. Younger children are not likely to be outside
when the weather is extremely hot and humid, as it often is in
the summer in Texarkana. Younger children are also not likely
to be outside fot prolonged periods when the weather is cool,
and/or wet as it can be in the winter months. Younger children are also likely to be taken by their parents when they go offsite to run errands. Taking all of these factors into account, the assumption that younger children will be outside and in
prolonged contact with soil for 180 days per year is considered
to be a reasonable, if not conservative, assumption for the
average child. Note that only direct observation can determine the exact amount of time a child is outdoors and playing in
soil.
Older children and adults are assumed to engage in outdoor
activity as well; however, no peer reviewed information has
been located regarding their rate of soil consumption. The
risk assessment assumes that these people inadvertently ingest soil at the same daily rate as has been measured in young
children ( 100 mg soi 1/da:··' but that they ingest soi 1 less
frequently than young children. Older children (ages 7 to 18}
are assumed to be in prolonged contact with soil for one day
per week. This is eq•tal to 52 days per year. Older children are assumed to have decreased exposure compared to younger
children. In addition to some of the factors mentioned above
for younger children, as a child gets older he or she is more
likely to spend more time off- site visiting more in~eresting areas, engaging in after school or other civic activities, and participating in organized sports. Thus the risk assessment assumes that older children are exposed only one day per week.
As with younger children, the exact amount of time an older
child spends or. site in prolonged contact with soil can only be accurately determined by direct observation. Adults are assumed to be in prolonged contact with on-site soil only 26
5722F 4040-001-600 2-15

. ; . . . ·. ~ . ., . . , . . . .· . - . . . . . ~ - . . . . ~ - . . - • • < • •
I
I
I I I I I I I I I I I I I I II I
1• I
' . . i - --;/ . .
. . . 'l. : ·." . . . ' .
days per year. This is equivalent to one day a week for half
of the weeks out of the year. This frequency of exposure may
be typical of an adult who does yard work for six months out of the year. Children aged 2 to 6 are assumed to weigh 17
kilograms. Older children are assumed to weigh 50 kilograms. Adults are assumed to weigh 70 kilograms. The exposure a3sumptions used are listed in Table 2-4.
PCOC intake via inadvertent soil ingestion of children and adults living in Carver Terrace was estimated for three
different PCOC concentrations. The potential exposure
estimates based on maximum soil concentrations assume that all
of a child's and adult"s on-site outdoor time is spent on the most contaminated parts of Carver Terrace. This is an
unrealistic assumption because it means that when a person is
outdoors, he or she most visit the sampling location with the highest concentration ot the first PCOC, then visit the
sampling location with the highest concentration of the next PCOC and continue doing this until he or she has visited all sampling points with a maximum PCOC concentration. It is
further assumed that they do this for their entire lifetime and for everyday the assessment assumes they are outdoors.
Additionally, the assumptions used to estimate dermal
adsorption and inadvertant soil ingestion are very conservative
and result in an over-estimate of exposure for all residents,
but do provide an upper bound for potential exposures. Thus, even though the exposure assumptions are possible but very
unlikely, assumptions used to estimate maximum soil PCOC
assumptions make this scenario unrealistic. Similarly, the potential exposure estimates based on minimum PCOc
concentrations probably underestimate exposure since they
assume that Carver Terrace residents spend all of their outdoor on-site time in the least contaminated areas of Carver
Terrace. Potential exposures based on the geometric mean of
the PCOC concentrations represent some measure of central tendency; however, the potential exposures based on the
geometric mean should not be interpreted as an average or
5722F 4040-001-600
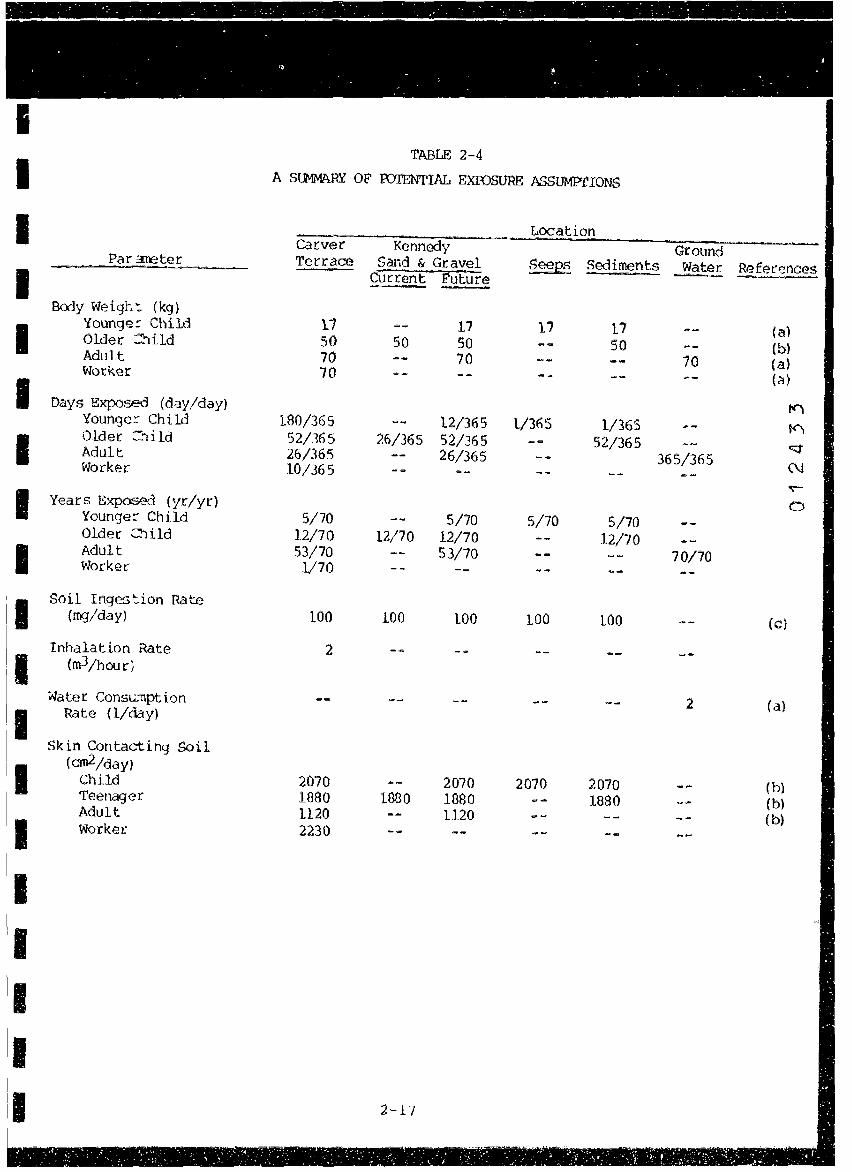
. . . . . . . . ' ' . .- . . ~ ~ . . , . . -
. . ' I~ Ji • .,
- .
I TABLE 2-4
I A Sll-1MA.RY OF romNTIAL EXffiSURE ASSUMPrIONS
I Location -· --Carver Kennedy Ground _ ~ar 31\':!ter Terrace Sand & Gravel See~ Sediments Water ~fer:_:~nces -- .. . . .
I Current Future _, - -
Body Weigh-.: (kg)
I Younge:- Child 17 11 17 17 .,._ (a) Older :::hild 50 50 50 50 (b) Adult 70 70 70 (a) Worker 70 .. - (a)
I Days Exposed (day/day)
""" Younge::- Child 180/365 12/365 1/365 1/365 t<'\
I Older :::"·lild 52/365 26/365 52/365 52/365 c:::1' Adult 26/365 26/365 365/365 N Worker 10/365 ~
I Years Exposed (yr/yr) 0 Younge::- Child 5/70 5/70 5/70 5/70 Older C'lild 12/70 12/70 12/70 12/70
I Adult 53/70 53/70 70/70 Worker 1/70
'I Soil Inges :.ion Rate {~/day) 100 100 100 100 100 (c}
Inhalation Rate 2
I (m3/hour)
Water Consu.-nption 2 (a)
I Rate {1/day)
Skin Contacting Soil
I {cm2/day)
Child 2070 2070 2070 2070 (bl Teenager 1880 1880 1880 1880 (b) Adult 1120 1120 ... - (b)
I worker 2230 .. -
I .... j
I I I
11 2-17
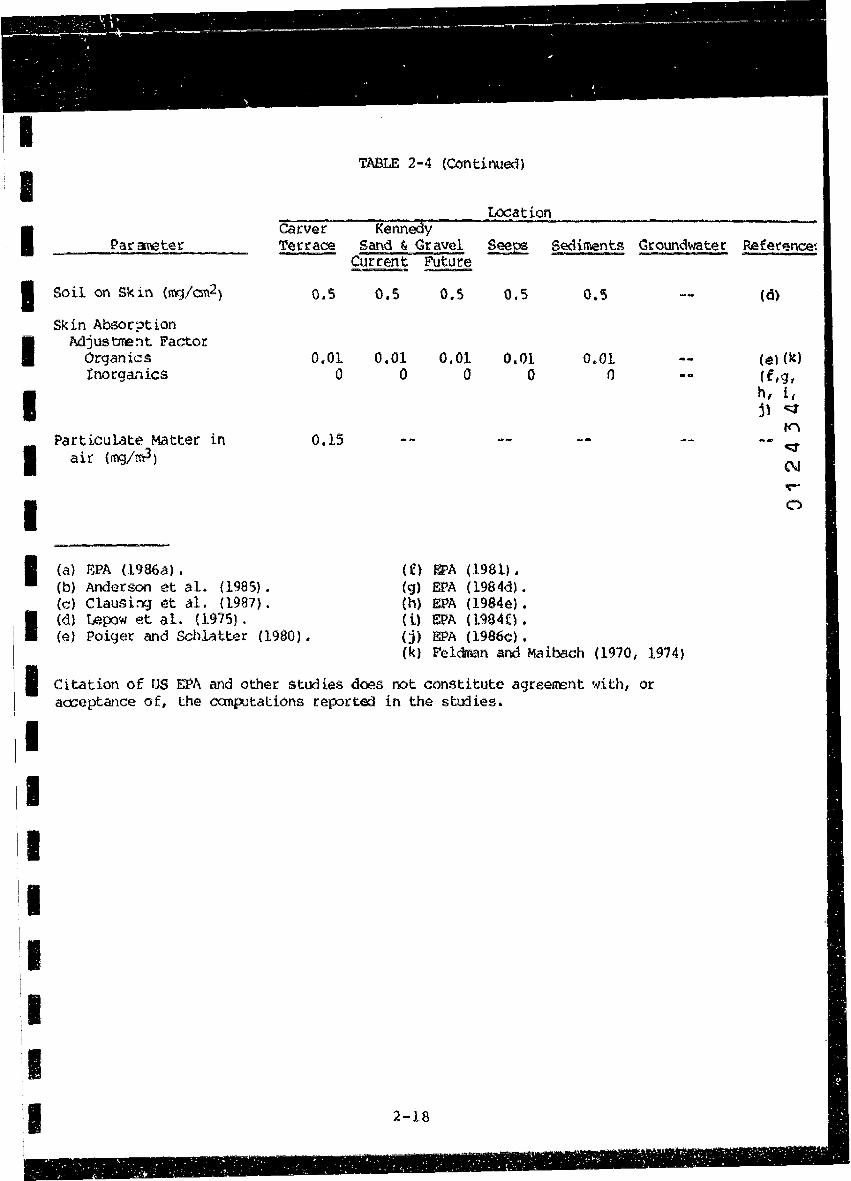
TABLE 2-4 (Continued)
Location Kennedy
I I I Par: :3f'eter
Carver Terrace Sand & Gravel S~QS Sediments Groundwater Reference:
Current Future
I Soil on Skin (~/cm.2}
I I
Skin Absor?tion Mjusb"l'ent Factor
Organics Inorganics
Particulate Matter in I air (!W:J/m3)
I I (a) Ef'A (1986a) •
(b) Anderson et al. {1985). (cl Clausirq et al. {1987}.
I (d) uap.:iw et al. (1975}. (e) Poiger and SchL:ltter (1980).
o.s
0.01 0
0.15
0.5
0.01 0
(f} (g) (h) (i) (j) {k)
0.5
0.01 0
0.5
0.01 0
EPA (1981) , EPA ( 1984d) • EPA (l984e) • EPA (1984£).
0.5
0.01 0
EPA (1986c) , Feldman and Maibach (1970, 1974)
I Citation of us EPA and other studies does not constitute agreerrent with, or aa:eptance of, the canµ;tations reported in the stu:lies.
I I I I I I I I 2-18
(d)
(el (k) (f,g, h, l, j) "1'
n c:::rN
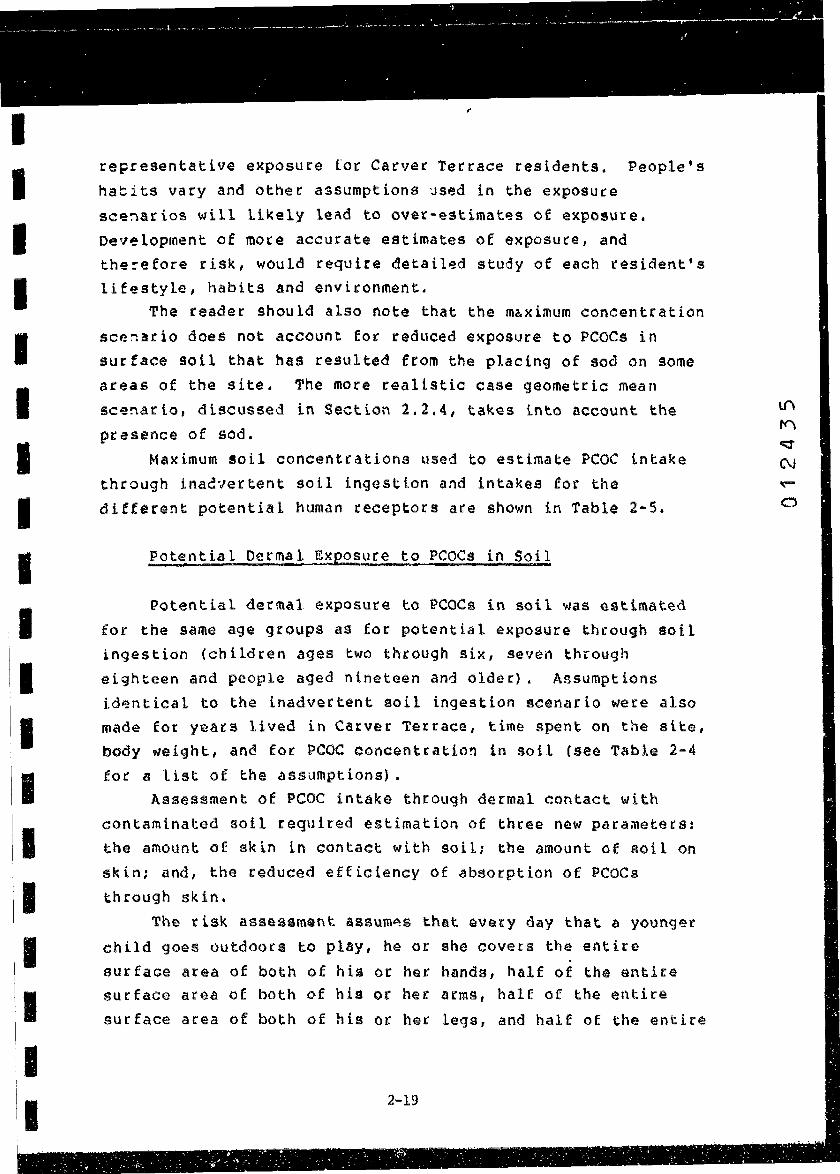
I I
I I I I I I I I I I I I I I I I I I
representative exposure for Carver Terrace residents. People's hacits vary and other assumptions used in the exposure
sce~arios will likely leAd to over-estimat@s of exposure. Development of more accurate estimates of exposure, and the~efore risk, would require detailed study of each resident's lifestyle, habits and environment.
The reader should also note that the moximum concentration
sce~ario does not account for reduced exposure to PCOCs in surface soil that has resulted from the placing of sod on some areas of the site. The more realistic case geometric mean
sce~arlo, discussed in Section 2.2.4, takes into account the presence of sod.
Maximum soil concentrations used to estimate PCOC intake through inad~ertent soil ingestion and intakes for the different potential human receptors are shown in Table 2-5.
Po~~ntial Dermal ~KE~~ure to PCOCs in SoiJ
Potential dermal exposure to PCOCs in soil was estimated for the same age groups as for potential exposure through soil ingestion (children ages two through six, seven through
eighteen and people aged nineteen and older}. Assumptions
id~ntical to the inadvertent soil ingestion scenario were also made for years lived in Carver Terrace, time spent on the site,
body ~eight, and for PCOC concentratio~ in soil {see Table 2-4 for a list of the assumptions).
Assessment of PCOC intake through dermal contact with
contaminated soil required estimation of three new para~eters: the amount of skin in contact with soili the amount of soil on
skin; and, the reduced efficiency of absorption of PCOCs
through skin.
The risk assessm&nt assum~s that Gvery day that a younger child goes outdoors to play, he or she covers the entire
surface area of both of his or her hands, half of the ~ntire surface area of both of his or her arms, half of the entire
surface area of both of his or her legs, and half of the entire
2-19
0

-
"" I· N 0
- - - - - - - - - - - - - - -'l'tle pot:em: ia, cf.aHy im:ak:e. avera,ed o,ve,r a I Uc,t ~IM, of e-~rr detected PCOC it ~hoWl'I h1r a persQl'l li..,msi at Car\lff lerrace cirld
potentiaUy eio!p09ed to the -imun cOt1Centra,tie>n i,f PCDCs in Cer-.ref' Terre.cl:! IJl"lder Cllol'.rrmt r;onc:Uti~. P'otllll\tiat iot&ke ls broken down Cl/f ?!:P and b-/ e.ge of p&rson being f1Kili0$CO. ihe test eoh.rrn shows the potentiat dlliHI!' Ufettme intake. PCOC corteentretions
used' tc generate t:he potent i•l intakes are shown in tl\e s.ec«d cotU1n. PCOCs not l hted were not detected.
PCOC
Tout PAK Pot. Ci,rc. PI\H ( a,} PCP 2,:s, ;,s-n:oo TEs krseni.; Chir-omiun C:~t'
Lead Kel'ec,wy Zfnc
M'axinun Ccnc:e!"lti-a,t ion
C,ag/k"! soH >
2S4460 202t
16 0.000167
S,3,3'5,
57.5 101
298.0,S
C.355 :nro
Potenti&t Lifetime Oel"l'll&i Intake Potential
Tou,t ---QGG-=-=--=~~•aa~==aa••··••-=••avmagmaama■••-~-· 3~~mo=agaR~~--•a~:aa=~~==~=:~=~==~g•===~==~~~= Lifetime
'l'oung Ch Hd Older Child ~dutt 't'OU'\9 Child Older Child ~dut t tnt&ke Cmg/lcg/dey} (mg//i:9/d&y) (mg,lk:g/day) (mg/lt.Q/day) (119/li:9/daoy) (mg/kg/~) (~lcQ/day)
S.27E·D2 t .24E•02 1 .92E·02 S.46e-03 1.t1E·03 l.08E·03 9.2tE-02 4.19E-04 9.87E-05 L53E•!)4 ,.:ne-os 9 • .?ee-06 8.56E·G6 7,31E·04 3.3~-06, 1.82E-0,7' l.21E·C6 3.4lE-07 7.lSE·OO 6.?7E·OS s.m-ot> 1.S9E-10 :S.~!-Tl ~.SOf·ll 1.64E·ll 3.SZE-ll :S.2SE·\2 2.7SE·10 1. ltE·ID5 2.61E•D6 4.0:SE·06 O.OOE+OO O.OOE•OO O.OOE+OO , . ne-lttS 1.19:-05 2.81'E•06 4.3SE·06 O.OOE+OO 0.001:•00 O.OOe•OO l.9'1E·05 2.&;,E·C'S 4.95E•e6 7 .64E·06 ti .OOe.+00 0. OOE•OO O.OOE•OO 3.3S.E·05 6. tae-05 T:.46E·O:'S 2.~E-05 tli.OOE+OO o.ooe .. oo O.OOE+CO 9.88E-05 r .36e-ee t.ne-oa 2:.f>SE·CS O,.OOE+OO O.OOE+OO o.ooe..oo l.1BE·07 6.98E•04 1.65E·04 2.551H)4 0.00E+O:O O.OOE+OO O.OOE•OO 1. 121:-05
012436
- -

I I I I I I I I I I I I I I I I I I 11
su:face area of both of his or her feet with soil. The total
ex9osed surface area is assumed to be 2070 cm2 (Anderson
et al. 1985). Half of the surface area of a child's arms
corresponds to a child getting soil on one side of his or her
arm from its hand to its shoulder or to getting soil on all
sides of both of its arms up to the elbow. The assumed exposures for a childls legs can be described similarly.
Getting soil over one half of the surface area of a child's feet corresponds to a child walking barefoot every time he or
she goes outside to play. The above assumptions for how much
of a child's surface area is exposed to soil contact are likely
to over- estimate exposure since they assume that every time a
child goes outside he or she will: (1) get soil on the exposed
area of skin; and (2) his or her arms, l~gs, and feet will be
uncovered. In many instances this will not be the case because
only a pottion of a child's appendages will be uncovered.
Older children (ages 7 through 18) are assumed to have a
smaller proportion of their surface area exposed to soil. The
risk assessment assumes that only one half of the entire
surface area of both an older child's hands will be covered
with soil. for example, only the palms will have soil adhering
to them. The risk assessment further assumes that one quarter
of the entire surface area of an older child's arms and legs
will come into contact with contaminated soil from the site.
This corresponds to the fronts of both shins and both forearms
being exposed to soil on the site. The total exposed surface
area of an older child is 1880 cm2 (Anderson et al. 1985).
Adult residents (ages 19 through 70) are assumed to have one
half of the entire surface of both of their hands come into contact with soil and also one quarter of the entire surface
area of both of their arms. Thus the exposed area of adults is
assumed to be 1120 cm2 {Anderson et al. 1985).
The risk assessment assumes that a person's skin has 0.5
milligrams of soil per square centimeter. This is based on the study of Lepow et al. {1975} that used tape to take soil off of
the hands of children and deterro!ned that approximately 0,5
2-21
0

I I I I I I I I I .I I I I I I I I I I
mil:igrams of soil per cm2 adhered to a child's hand. A
recent review of assumptions used for PCDDs in soil risk
assessments also reported that 0.5 mg soil/cm2 is a realistic
est:mate of tne amount of soil on skin (Paustenbaucr. et al.
1986).
Little information about dermal absorption is available
for most of the PCOCs and for most organic compounds,
espe=ially when adsorbed onto soil, as they are at the Texa:kana site. Measurements of the dermal absorption of
several organic compounds and pesticides dissolved in acetone
when applied on the forearms of human subjects and allowed to
remain in contact with skin for 24 hours have revealed a large
range in absorption varying from less than a peccent of the
applied dose (diquat, hippuric acid, nicotinic acid, and
thic~rea} to over fifty percent of the applied dose (carbatyl
and dinitrochlorobenzene) (Feldman and Maibach 1970, 1974).
The average absotption foe the thirty-three compounds tested
was ~ifteen percent. Note that this value 1s for compounds
dissolved in a solvent and then applied directly to the skin
for a twenty-four hour period. Dissolution of PCOcs in an
organic solvent greatly increases compound mobility when
compared to a compound's mobility when adsorbed onto soil.
These conditions are not representative of exposures at
Texarkana where contaminants have been mixed with and adsorbed
onto soil for many years, where exposure duration will be much
shorter because soil will be washed off when bathing, and where
areas of skin with varying absorptive capacity will be
exposed. All of these factors will serve to decrease the
amount of PCOCs absorbed from soil at the Texarkana site,
The effect of adsorption of P.COCs onto soil can be taken
into account, in part; by using the results of Poiger and
Schlatter (1J80). They applied dioxin diluted in various solvents and also dioxin diluted in water and soil to the skin
of rats. Absorption from the soil and water application ranged from 0.05\ to 2% and was between 9 and 330 times lower than
from the solvent application. Longer-soil-contaminant contact
times and lower doses, both of which occur at Texarkana, served
2-22
ro tr\ q
N
0

I I I I I I I I I I I I I I I I I
to decrease the amount of dioxin absorbed. Combining the
results from the above experiments suggests th~t ibsorption of
organic compounds from soils may vary from about 2.0% to much
less than 0.1% and has a geometric mean of about ().3\. True
rates of absorption are likely to be even lower than the range
listed above because people on the site are not exposed for
twenty-four hours at a time and because some of the organic PCOCs, i.e., TCDD and PAHs, have a high affinity for soil
adsorption and have been in contact with soil for ~any years. PCP is assumed to behave similarly to TCOO and PAHs. In order
to be protective of the public health, the risk assessment uses
an absorption adjustment factot of l\ for. organic PCOCs in
soil, this factor is about thrP-e times greater than the
geometric mean of absorption rates described above, Dermal
absorption of inorganic contaminants is assumed to be
negligible compared to other exposure routes (EPA 1981; EPA
1984d; EPA 1984e; EPA 1984f).
The PCOC concentxations used to estimate contaminant
intake for the maximum concentration exposure scenario through potential dermal exposure to contaminated soil are shown in
Table 2-5. Contaminant intakes for younger children ages two
through six, older children ages seven through eighteen and for
adults are also shown in Table 2-S.
Eotenti_al Total w:,ntaminant Intake
An average daily lifetime potential contaminant intake can
be calculated for the worst case exposure scenario at Carver
Terrace by summing the potential intakes from inadvertent soil
ingestion and dermal exposure to contaminants. The results are shown in Table 2-5.
2.2.3.2 Potential Future Intakes
Potential future intake of PCOCs by Carver Terrace
residents exp0sed to maximum PCOC concentrations was estimated
5722F 4040-001-600 2-23

I I I I I I I I I I I I I I I I I I I
using exposure assumptions identical to those used to estimate current expo5ures (Table 2-4). The only difference between the
two scenarios occurs in estimation of soil concent:ation. In developing the future scenario, half lives, listed in SPHEM (EPA 1986a}, were employed to model the decrease in PCOC concentration over the next 70 years. (See Appendix 2-C for a description of the method used to calculate average exposures that include helf-lives,) Values for half lives wtra only available for PAHs and TCDD; they were 3,8 years (tee Appendix 2-F) and 12 years (EPA 1986a), respectively. All other organic PCOCa and all inorganic PCOCs in surfac& soils were assumed to not break down. The potential intake of PCOCs in the maximum concentration future scenario is presented in Table 2-6 along with the potential intake for each PEP and the maximum PCOC concentrations used.
2,2.4 Potential Geometric Mean Concentration Exposure Scenario at Carver Terrace
2.2.4.l Potential Current Intakes
The approach used to derive estimates of chronic intakes fot the current geometric mean exposure scenario at Carver Terrace is the same as for the maximum concentration scenario described above in Section 2.2.3. The only differenc~ between
these two scenarios arises because different soil concentrations were used. The current geometric mean scenario accounts for the presence of a sod barrier by assuming that all sampling points covered by the barrier have PCOC concentrations equal to the lowest concentration measured in Carver Terrace. The geometric mean scenario also assumes that samples at which no PCOCs were detected have a PCOC concentration equal to the lowest concentration detected anywhere in Carver Terrace.
The PCOC soil concentrations upon which the geometric mean scenario is basQd are shown in Table 2-7 along with the intake from each PEP and the intake of all PEPs totalled.
S722F 4040-001-600 2-24
0 c::t' c::r N
0

IV
' /Iv VI
-
PCOC
- - - - - - - - - - - - - -TM po,te1"W:fi111t da:Hy, intake. &vel"ag,i:d ~I" a lifetime, of ~Y deu~tfld PCOC ts ~ tw • pet'SQft li1tit'IQ •t C.........
feorrace and potencfeUy ~~ to the maJtiftl:ll:I; eonce<"<tiration, of PCOCs in C~I" fec"l"CICC' !lldor funtrc- COJ\Clht.,.. ,Ot....,ti•l tftudile
is bl"oken dolol!"I by PEP aC'd by•~ of p.o::r-s,on bf:lno e~. The tut cotUIII'\ snow,, ,._. potential dllHy Uf•tt• intaik•. PCOC concentvaitiOl'IS t.lSed to ;enevatc- the ,otenttat ~ntl»kn al",: shOWl'll tn tt\e s..c...i cotU1Jn. i?OJCs not listed Wflf'e Mt dottected.
Meicid:11:.111 Potenti111t life-ti~ Sotl l~tioo Poi.-.nt i«t t. i f•t ,_, l>et9al lntell•
Potential tot•l ·----•&••·---····-·····-···········-······ •••---•••---•••••--•••a•-••••••••- lUettM
Concentr-a,tion 't~ ChHa Olde'r- ChHd A4kJh l'l:Ulg 01 Hd otder Child («191/kg soiC)
-
,...., Jntat,: (1119/kg/da,y) (1119/1¢!,1/dity > (.119/kgl_,'r') (IRQ/itg/$y) (IQ/kg/day) (-,k91dll)f) (111/ka/dayJ ========:==-="""'""'============--=-a========•====-=============•===-========•-===acgoc~mo=c:a:ac:aaa•ca,....•--•-•=••--••R•••••• ,otat P'.-Jt 1St20 l.7Se-Ol a.sse-04 ,.ne-os J.39e·04 Pot. Care. PA!f (a)
(a) See Tabfe Z-Z for a list c.1' potent~trHy ca~einogenic P'-ff.
8.3<'1:-05 1.61!·05 6.Sdie-OJ 1144 2'.98E·05 ;r. o,;e-06 1.&Pe-05 3.09E-06 6.6.1E·01 o.1oe-o, s.z1e-os PCP
1'6 3.32E·06 7.SZE-07 1.c1E·06 3.4le-07 7.lS!-N 6.77E•G8 $ • 1'IIE · 06 2,3, 7,S-TCDO res O.Ofl018l 3.TSE-11 S."4!•12 1.31!·i1 ,.a.ae-12 8,l1E·1l 7.66E·ll 6.S.SE-11 Arsenic Sl.35 l. 11E·05 2,611!:·06 4,03£·06 o.ooe.oo O.GOf•OO 0.00hOD 1.11!:•0S ChromiUII 57.5 1.19e-05 2.ate-06 4.35(-06 o.ooe+oo O.OO!f+OO O.OClf•flli Uil'l!•OS Copper
1011 2.991: ·05 4.'>l1Hl6 1.64-e-06 0-00!•00 o.ooe4 o.ooe.,oo 5.lS( •05 l.ead
~-05 6, 18e·El5 1.46.:-&S l,.?SE·OS o.ooe..oc, 0.00!+00 O.OOE:•• 9.--0,, M'ercur-y 0.355 7.36E•OS ,.rn-oe 2'.68E-08 0.00!•00 0.00!.oo o ..... 1. 1!1!! ·07 Zinc 1370 6.9&: ·04 l .6SE•()4 2,SSE-04 O.OOE..00 O.QO!+OO o .... I. l.21Hll
012441
- -
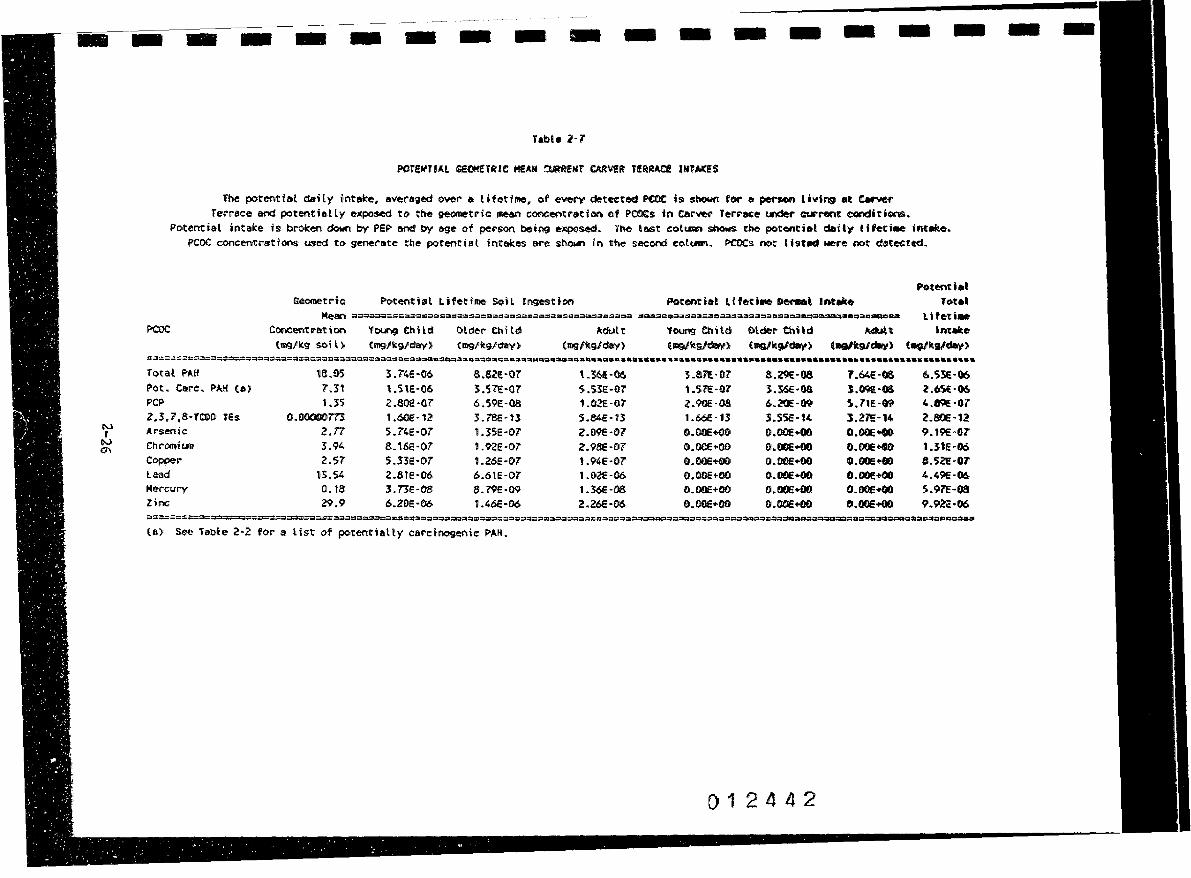
-
N f
Cv 0-,
- - - - - - - - - - - - - - - -V.blc 2·7
The potential daHy intak:e. avera9ed WOI" a Ufetime, of every dl!:teeted Poot is slMM'll for a pee-son th,ingi at c.-w,r Teri-ace arid po,tent:ially exposed to the geometric 111ean concentration c,f PCOCs in ca~ Teri-ace IA'lder current conditions.
Potential intake js brok:en dowr'I by PEP- am by age of person being e~sed. ihe l&St cotUIS'I snows. the port~tial deity l ifetiN iM••· PCOC concentrations used to, generate the potentiat int&lcss are shown in the second col~. PCOCs not listed were not detected.
?Coe:
Total PAR Pot. Care. PAff Ca) PCP z. 3. 7 ,s-riooo l'Es Arsenic C:hr()lltit.m
Copper Lead Merc::t1ry zinc::
Geometric
COflCent rr-e.t ; en. (mg/lt:9 so,; l)
,a.os 7.3t 1.35
o.ooooom Z.T! 3.94 2.57
15.54 a. ts 29.9
't 01.Jn!J Ch H d (mg/kg/day)
3 .T~e-06 1.'i\E·06 z.soe-or 1.60E· l2 S.74E·07 8. tSE-07 S.33E·Oi 2.8tE•06 ,.ne-os 6.20E·66
Older Chtld (1D9/kg,fda,y)
a.!21!'.•or S.51E·07 6.59E·08 3.7SEH3 1. 35.E •07 1.9·2E·07' 1.26E·07 6.6tE·07 8.79E-09 1 .46E·fl'6
(a) see Table 2·2 for a Hs:t of potentially carcinogenic PAti.
Adt.ll t (mgfll,g/d&,y)
'. 3,6.i ·06 S.SlE·07 L02E.·IJl7 S.84E·tl 2.09E·07 2.98E·07 l.94E·07' 1.02E·06 1.l6tH)8 2.26E·06
Potential I. i fet iaie Denial Int eke Potentiel
lotel lifetiM
'f OU"l9 0'i H d t1D91111.s!d&)r)
1.&it·0.1 1.571:.-ilT .?.90e·08 1.661:· 13 0. OOE +00 O.OOf:1-();0 O.OOE+-00 O.OOE+OO O.OOE+OO O.OOl:+00
Olde-r Child l lll9lk9/dert)
S.29E.·08 :s.w-oa &.20IH)9 l.55E·14 O.OOE+-00 o.eoe+-00 O.OOE•OO O.OOE+-00 O.OOE•OO o.ooe..oo
012442
~1t lm:llfte (-alkg/dlri,) (ao/11.i/dey)
1.64E·OIS 6.S3E·06 1.09€-08 2.6Si·06 S.11e.-09 4.89!·07 l.2'1E·14 2.801:-12 o.ooe.oo 9.191H)7 O.OOE+lfl 1.:ne-06 D.OOE•OO S.S2'E!·OT O.OOE+CIO 4.4'-E·06. 0.00£4 S.97E-08 o.ooe4 9.92'.:•06
- -
I I I I I I I I I I I I I I I I I I I
2.2.4.2 Potential Future Intakes
Potential future intake of PCOCs by Carver Terrace residents exposed to geometric mean PCOC concentrations was es~imated using exposure assumptions identical to those used for estimating current exposures (Table 2-4). The only difference between the two scenarios occurs in estimation of
PCOC concentration in soil. In developing the future scenario1 the risk assessment assumed that the sod and soil barriers would break down and Car.vet Terrace residents could be exposed to PCOCs under the soil and sod barriers. The future geometric mean scenario also assumed PAHs and TCDD toxic equivalents break down at the same rates as assumed in the maximum scenario. The potential future intake of PCOCs broken down by
PEP for the geometric mean scenario is presented in Table 2-8.
2.2.5 Potential Minimum Concentration Exposure Scenario at Carver Terrace
2.2.s.1 Potential Current Intakes
The approach used to derive potential current PCOC intake estimates for the minimum concentration scenario was identical to that used to derive potential current exposures for the other two Carver Terrace scenari0s. Differences in potential exposure are due to the use of alternative PCOC soil concentrations. The minimum soil concentration scenario assumed that the PCOC concentration was one ha.1£ of the method
detection limit at all sodded areas and also all sampling points where no PCOCs where detected. The concentrations used
to estimate potential current intakes for the minimum concentration scenario are shown in Table 2-9 along with the estimated potential current intakes.
2-27
5722F 4040-001-600
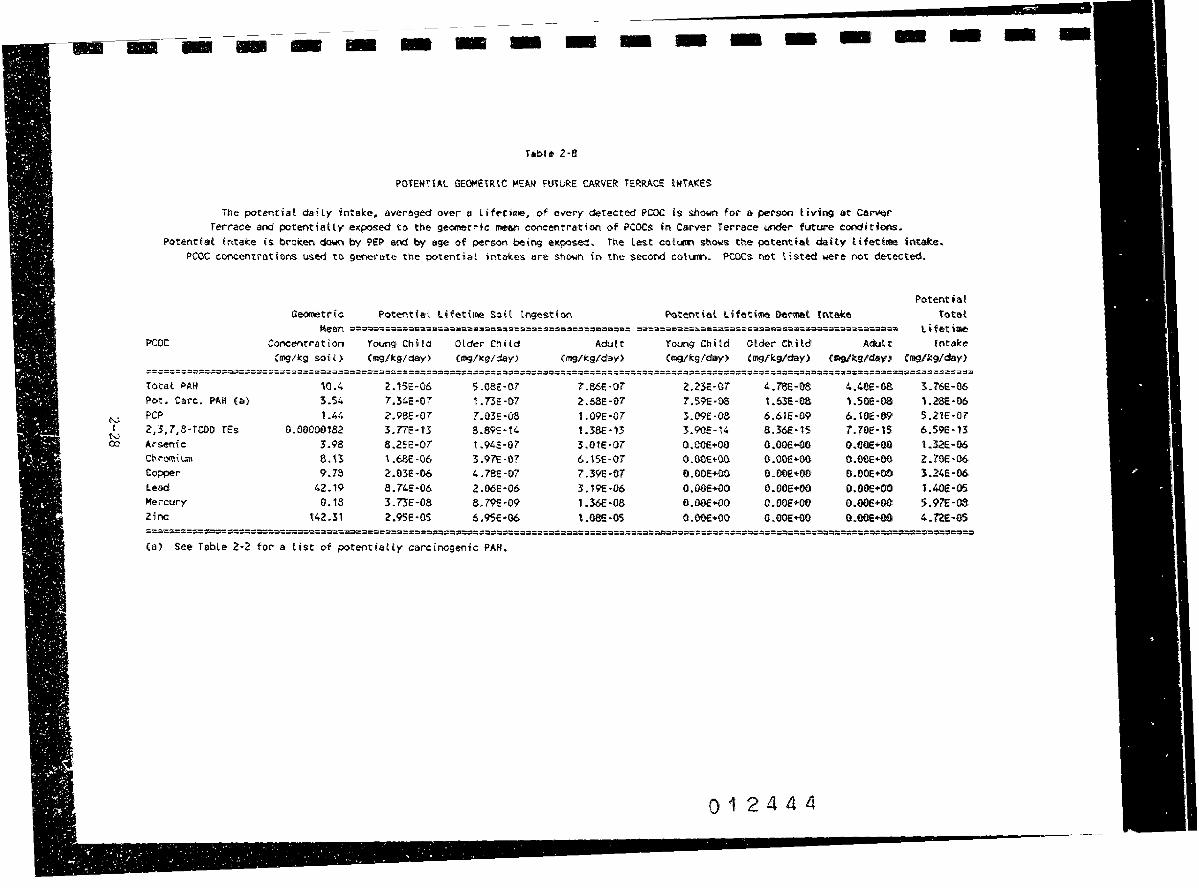
----------iiiiiiiil-------------------------.;;-.;;;---;;;;--;- - - - - - - - - -
IV I
N 00
Table 2-8
POTEMVt~L GEOMEiRIC MEAM FUiURE CARVER TERRACE tMTAKES
T/:le potential da·i ty intake, averaged ewer a life-time, of every detected PCOC is shown for a person t h•ing at Carwir Terrace and poten,tially e11:posed to the geometric l'IINt'I concentration of PCOCs in Carver Terrace under futw-e conditfons.
Potenciiat fntak.e is br-olcen cb.«'I by PEP end by age of pee-son being eitposed. The lest cotum shows the po•tentiail daily lifetime intake. PCOC c:oncentrations used ti) generate the potential intltice-s are shown in the second coltll'n. P-COCs not Usted were not cietected.
PCOC
tota•t ?i\ff
?ot. Care. ?Alt (a.> PCP 2,3, 7,8-TCOD res Arsenic Chromium Copper-
Lead Mercury Zinc
Geometric. Potential
total M~an =====~====~•-=•==~•==•-~D•~==a=~=~===~===~m===~= ==========~===~=====~======~==~~~==~=~:=====• lifetiw.e
Concentration Young ChHd Older Cl'lild Adult Young Child Older Child' Adult lnt•k.e Cmg/lcg solil) (mg/leg/day) (1119/k9/day) (mg/kg/day) (mg/kg/day) Cmg/lc5Ji/day) (mg/li::9/0'<1V) €mg/leg/day)
'\0.4 2:.1.SE·66 5.08E·0:7 7.66E-07 2:.2:~·07 4.78E·08 4..40E·OS. 3..76£-06 3.54 7.34E•07 "I.TIE-07 2:.68E-07 7.S9E·08 LME-08. 1.soe-oa 1 .2:8E·06 1.4t, 2.98E·Oi 7.03E·08 1.09E·07 :S.09E-08 6.6TE·09 6.10E·D9 S.2:1E-07
O.OOOOOJS2 3.ne-u 8.89E·14 1.38E·l> 3.90E-t4 8.36e-t5 T.TOE-15 6.59E-13 3.98 8.25E•Oi t.94!Hl7 3.0tE•Oi 0.00E+OO o.ooe+eo O.OOE+OO 1.32E·06 8.13- 1 .68E-06 3.97E·O?' 6.t5E·OT O.OOE-t-00 O.OOE+-00. O.OCE+OO 2.TOE-06 9.7a 2:.03E·06 4.78E·07 7_3c;,e.o,7 O.OOE+OO O.OOE+OO 9.00E•OO l.24E·06
4Z. 19 8.74E·06 2.06E•06 3. ,9E-06 O.OOE+OO O.OOE+OO O.OOE+O(IJ 1.40e-os o. 18 3.7.5E·08 8.79e·09 1.36E·08 O.OOE+OO 0.0-0E+OO o.oae+oo S.97e·08
t42.3l 2.9Se-os 6,9SE·06 ,.ose-os O.OOE+OO o.ooe+00 0.0.0E+OO 4.mH\S
(a) See iabte 2-2 for a list o,f potentially carcinogenic f>Aff.
012444
- -

---.-----=--------===-----==,=----------==~.:::::-----;~-----a;...._~,.~_~_• __ .. ,.. -............ - - - - - -
N l
N
"°
Table 2·9
PO'l'eNTIAL MINIMUM CURRE/lli CARVER TERRACE INTAKES
fhe potentiol daily intake. averaged over a llfeti-, of ~very c:w:tected PCQC is shown for a ?trson li~ing at Cerver terrace eind potenttaUy exposed to mininun .:oncentr1ttion PCOClil in carver Terrace under cwrent conditions. Potential intake
is broken, d0tm by PEP and by age of person being eicposed. The lest colutl'l, snows the potential daily lifetime intake. PCOC concentrat,ons used to generate the potential i-ntalc:es are shown in the second colum. PCOCs not listed were not detected.
PCOC
Totat PA!f * Pot. Care. PAK Ca)• PCP"'
2,3,7,8-TCOO iEs Arsenic* ChromiLm • ~r• Lead* Merct.rY • Zil"IC,.
Mtnimt.m Con..ffltre.tton
Cmg/kg soil>
2.56 0.96 a.a
0.000000038
1 2'.5 2.5 0.1
2
Potential Lffetime sofl Ingestion
Young Child (mg,/lc:g/da,y)
5.30E·07' l.99E·07 ,.66E·07 T.87E-15 2.07E·07 2.0TE•Ol" 5. \SE·0:7 S.18E·07 2.07E·08 4.14E•07
Otder Child (mg/leg/day)
1.25E·07 4.69E•08 l.9~E-OS 1.86f-l5 4.8&:-08 4.68E-08 t.22E·D7 ,.22E·07 4.881:·09 9.ne-oa
"-G.tl t (mg,/lc:g/d.iy)
1.94E•07 7.26E·08 6.0SE·OS. 2.S7E•15 7.S6E·08 7.56E·08 't.69f-07 l .89E•07 7.56E-09 1.51E-07
Potential Lifetime Der.D Intake Potential
Total Lifetime
'fotlW\9 Child (mg/1:.g/d&'(')
S.49E·08 2.06e-oa 1.72E-OS 8.15E·116 O.OOE+OO o.aoe .. oo o.ooe .. oo O.OOE+OO o.ooe .. oo· o.ooe+oo
Otd&r Child (mg/k:91/d&y)
1.18e-08 4.41!·09 3.67e.-Q9 1. 74E-16 o,.ooe .. oa O.OOE .. 00 0.00£+00 o.ooe+oo o.ooe .. oo O·.llOE"'OO
~dUlt [ntake (1119/kg/d&V) (mg/ftg/cl6y)
l.08E·o& 9.27e·07 4.06E·09 3.41l:·07 3.39E·09 V~OE·07 1.61E· l6 1.3SE· ,4 0.00E+OO 3.l2E•07 O.OOE+OO 3.321:-07 O.OOl:+00 a.29E·07 o.ooe .. oo 8.29fHl7' o.ooe .. oo 3.32E·08 O.GOE+OO 6.63E·07
• AA 59-tedsk foU01ittn9 the name ~fa PCOC irdk&tt:$ tt-.at that PCOC was l'\Q,t detected in at least one Sal\'l!)lir-.g po.int and the.t the minillUII corcentration for that PCOC is equal to one hatf of the method detection limit.
(a) See Table 2·2 for the list of potentietty c:ti,rcinogenic PAK.
012445
- -
I I I I I I I I I I I I I I I I
2.2.5.2 Potential Future Intakes
Potential future intake of PCOCs by Carver Terrace residents exposed to minimum PCOC concentrations was estimated
using exposure assumptions identical to those used for estimating current exposures (Table 2-4). Differences arise
due to different assumptions about concentrations of PCOCs in
soil (see discussion in Section 2.2.4.1). The risk assessment
assumed that the sod and soil barrf.ars would break down and Carver Terrace residents could be exposed to PCOCs under the
soil and sod barriers but that PAHs and PCOO/PCOFs break down at the same rates as assumed in the maximum and geometric mean
scenarios. The potential intake of PCOCs in the future for the
minimum concentration scenario is presented in Table 2-10 along
with the potential intake from each PEP and the minimum PCOC concentrations.
2.2.6 Potential Exposures at Kennedy Sand and Gravel
2.2.6.l Potential Current Intakes
At present, a four foot high fence surrounds the Kennedy
Sand and Gravel property. The property is also posted with
warning signs around its perimeter. The presence of the fence
~nd location of the property with respect to nearby residences
. ;s assumed to deter younger children, ages 2 to 6, from gaining access to the property. The fence and signs were
assumed to deter adults from trespassing on the property. The fence is not high enough to deter older children from
trespassing on the property. Older children were assumed to
come into contact with soils on the Kennedy Sand and Gravel every other week. Several factors suggest that this is likely
to be an ov~r-estimate for most older children. The most
attractive aspect of the property are the water filled gravel pits. These, however, have high banks, are on average only
three feet deep, and are not suitable for swimming. In
5722F 4040-001-600 2-30
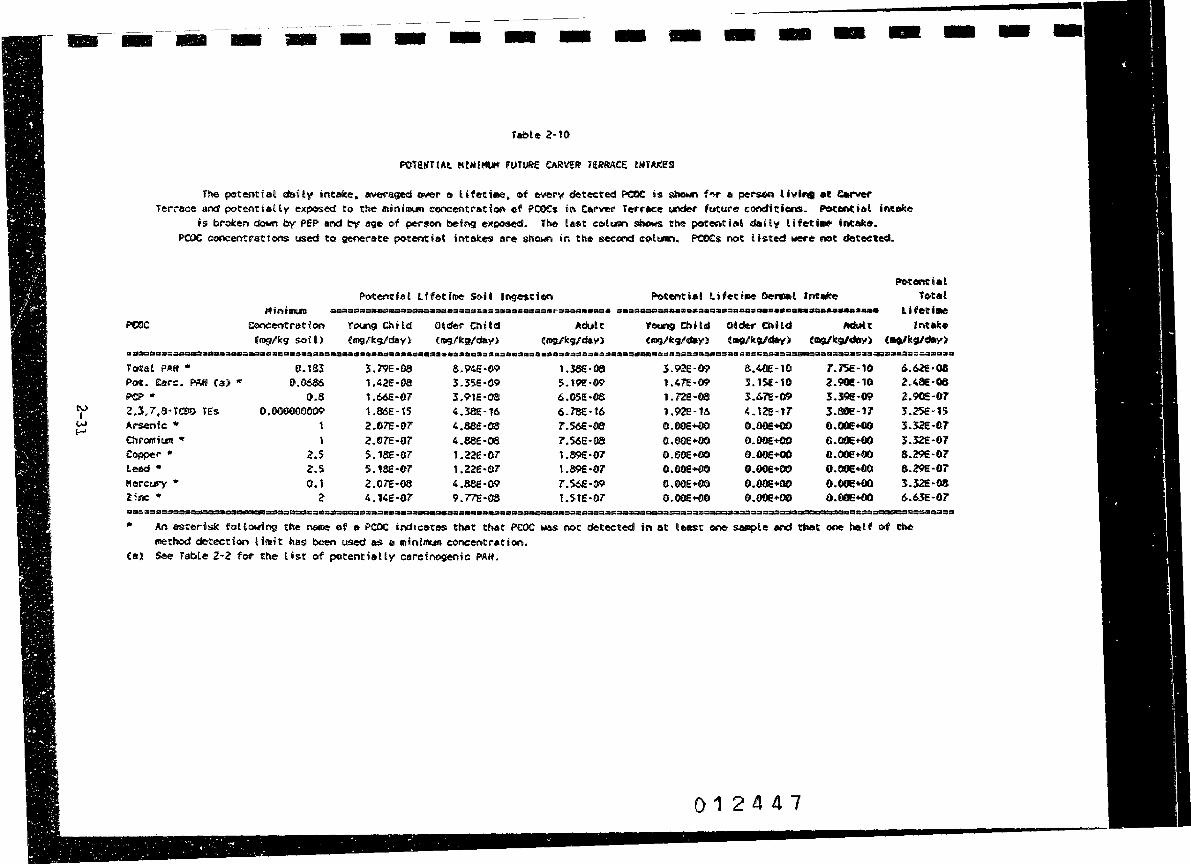
t'V i
t.J I-'
- - - - - - - - - - - - - - -Table Z-10
The potent fat d'aH'!" intak.e. ~~ ewer e t ifeti~. &f eo.,eri ~tected PCtlC is $llOwn f"!f' o pe,r-SCln livi"I et C..-ver Terrace and potentially eiq!>OSed to tlte minim:.m concentration of f'COCs in carvev Teruce ta"ldef" future condit:lans. PotMlthal iMllllke
is broken clown by PEP and t-y age of ~r:,on being 1Mposed. 1~ last cotlllln shows the potential daily life-ti• iritake. PCOC c:oncentra;tfans us:ed to generate potential int&Jces are shown in the sec:orw:t eoli:.flW'I. Pa:IC:s not i isted were ,iot detected.
Teitel Plllff "'
Pot. E:ae-c. PAff Ca) "" PCP,.
2,3,7,8-T!:90 TEs Al"Senfc * Chromi1,a11 .. Copper• Lead• Mercury• 2: itlC •
Cenc:entrotion €11191/kg so,H)
0.183, 0.0686
0.13: 0.000000009
1 1
2.5 2.S e,. t
2'
3.79E-88 1.4ZE·Da 1,66E-07 1.86E·15 VJ7E•0:7 2.07E-07' 5, 18E-07 5. 18E·07' 2'.ore-oa 4.14E·07
8.94E·09 1.38e·06 3.92e-~ 3. :SSE· 09 5,. \9!•09 l.47'1Hl9 3.~lE·08' 6.ose:-os: 1. ne-oa 4.38i·l6 6.78E-16 1.ffl-16 ,.sei:-aa 7'.56E-00 O.OOE+OO 4.88t:a!)8 T.56e-oa &.OOE•OO 1.221:-07' 1 • 89E • 07 0.60E•OO 1.221:-€17 1.89e·07 O.OOE+OO 4.881H)9 7' .56E•09 C.OCE•OO 9.TrE-08 1.StE·OT O.OOE-t-00
8.40f-10 :s. 15,E • 10 3.67'E-09 4. tZE-17' o.ooe.oo fll.Of>e:...00 O.OOE+CIO 0.00£+00 o.ooe+00 O.ot'E•OO
Potentti•l Total
lHetriM lielul t Entllke
CIIQ/lt9fdoy) (ao,lk!J,ldlliy)
7.75e-10 Z.981!·10 3.R-09 3.SCle-17 o.ooe+oo O.OOE+OO O.OOE•OO O.OOE+OO o.ooe+oo O.OOE!+OO
d,.62e•08 ?.,481•08 ?.90e·07 :S.25€•15 3.:SZE-07 3.32E-07 8.29e-07 8.2'9E·07 3.321:-08 6.&Je-01
.. An astedsfc t'oHowing the~ of I· PCOC inchcHn that that PCOC was not detected in at least ot1e s.aapte ard that OC1e helf Ctf the inethod dctect:iffl li~it hasi been used 8$ a miniffll.lll concenuat: ion,
(a) See Table 2·2 for the l•st of potenti•lly carcinogenic PAH.
012447
- -

'I I I I I I I I I I I I I I I I
addition, the site has numerous fire ant colonies that are li~ely to discourage repeated visits to the site. There also
~as no evidence of abundant activity on the site CERT observation during site visit), When on the site, older
children were assumed to have a total surface area of 1880 cm2 exposed to soil (one half of the surface area of hands and one quarter the surface area of legs and arms) and that 0.5 mg of soil adhered to each square centimeter of skin (~able 2-4). Dermal exposure was estimated using the f~rmula described earliet.
Older children are also assumed to inadvertantly ingest soil while on the property. Because no studies h~ve
investigated the rate of inadvertant soil i~gestion in older children, a rate of 100 milligrams, as estimated for younger
children, is applied to older children as well {Table 2-4).
This is likely to be an over- estimate because older child~en
do not exhibit the mouthing behaviors that younger children
do. Unttl additional studies are performed, however, an accurate estimate is not available. Inadvertant soil ingestion intake of PCOCs was estimated using the formula described
earlier. Dermal and inadvertant ingestion exposures for current
conditions were estim~ted for the maximum PCOC concentrations at Kennedy Sand and Gravel and the minimum PCOC
concentrations. These estimates should bound the range of
potential exposure and risks. The maximum and minimum PCOC concentrations are presented in Table 2-11. The total
potential current intake of PCOCs and a breakdown of PCOC intake by PEPs is also show in Table 2-11,
2.2.6.2 Hypothetical Future Intakes
The Kennedy sand and Gravel area is currently idle, being
fenced and posted with warning signs. It is unclear what development, if any, will occur in the future, While the
Kennedy Sand a~d Gravel area is ~Jrdered on two sides by
2-32
OJ c::j
q
C\J
C

IV I
w w
- - - - - - SI - - - -
PO Toita£ PAff Pot. Car-c.
Arsenic • Chromhlff •
Copper" Zinc
The potentiat dally dermal and i~tion inito•lce, &vel'"aged over • lifetime, of e~r, deteet~ PCOC is sttown f0-l" en c.tdel" child tl"espasstng on t~ Sandi a!ld Gravel Pr09-trty Ul."lder current
conditiOl'lS. Tota! po-tencie,l daily Ufettm& intake is Mown for m1dmtA, ~oetri, !Mart vid 1Mni11U11 ,coc ~onc~trat if>nf. tne Pax: eoncentr•t\Ol"ls useo to, ;enere,te the potent \al \~ta.Ir.es ave als,o, shown.
P~}I (a),
Ma;.iaitlQ
C~tration (mg/kg SOH)
Ell.a 291 22l
14.9 12
9.68 35-.2
PCOCs not listed were not detected.
Pocentrat Tot&l lifetime Geometric Mean
!ntaic:e Cmi;tkglday}
2.14\H)8 7'.7S!H:16 5. 90E·0.6 3.64f-07 2.93E-07 2.36f·07 S.60E·07
Conc:entl"6tion (~fkg s.e.i l)
o.a l44
88.2 tt..9
,2 9.68 33.6
Potentiat iotllil Li fet faw:
lnta.::e (1\'19fk9.lday)
2 .1'4.E ·08,
3.Bse-06 2.¾e-06 3.64e-o7 2.93E-07 2.36€-07 8.:?le•OT
Potenuial MinilllUII Total Lifetillle
Cor, .'~trait , on (ll'O/k9 SC.\~)
0.8 2.5,6 0.96
t 1
2.5 30.2
lnt&le.e (al9/ii:g/day)
2.14E·08 6,Me-08 2.56E•88 2.«E-08 2.44E·08 6. ?1E·06 1'.38E-C7
.. See Tabte 2-2 few the tist of potentiatty carcinogel"li,._ P~H.
~n 0$te~isk ileside a. ?O!)C name irdieates that t~ ?COC "'6$ r,o,t detected at at teas.t l!K"le ~ins locetiOf\ Uld t!'lat tne zfai1111,.1:Q =nceotr-ati0t1 r-"1X)C',ed' in th,e ,able Is ~t to one ha,U the 111echod •feteetion limit.
012449
- - - - -
I I I I I I I I I I I I I I I I I
residential development it is also adjacent to other idle
property that was once surface mined for sand and gravel. In addition, all of the Kennedy Sand and Gravel areas are located
within the 100-year flood plain and a portion of the property
is within the floodway for Wagner Creek. Future po~ential
exposure via contact with surface soils in the Kennedy Sand and
Gravel area will be evaluated for two possible conditions. The first is a scenario in which the fence is not maintained and
the property remains idle. The second is a hypothetical
scenario where the Kennedy Sand and Gravel area is developed as
a residential subdivision. Potential degradation of some PCOCs
is accounted for iu both future hC~narios. Potential future PCOC intakes at Ken~edy Sand and Gravel
fer the scenario in which the fence is not maintained and that
the property remains idle were estimated in the risk
assessment. This future scenario differs from the current
Kennedy Sand and Gravel scenario in its assumptions about age groups that gain access to the property and how often people
gain access. Othe.: assumptions are identica~ to those used in
current Carver Terrace and current Kennedy Sand and Gravel
scenarios (Table 2-4). In this t~ture scenario, older children
are assumed to trespass on the property once a week (52 times
per year). This is twice as often as is assumed for the
current scenario. If fire ants continue to spread on the site,
this is likely to be an overestimate. Without a fence around
the perimeter, younger children are also assumed to have access
to the properly. Because of the property's location and
infestation with fire ants, younger children are assumed to
visit the property once a month (12 times per year), every year
from gges two through six. This is very likely an overestimate
for childr~n aged two through four, but may be appropriate for
children five and six years old. Adults are assumed to be
exposed to PCOCs on the site 26 days per year (Table 2-4)
because the Kennedy Sand and Gravel property does not have
features that are attractive to adults and their awareness of
the historical use of the site would also limit their visits
5722F 4040-001-600
0

I I I I I I I I I I I I I I I I I I
onto the property. Potential future exposures to minimum,
geometric mean, and maximum PCOC concentrations in surface
soils are evaluat&d (Table 2-12). The future scenarios do
account for potential degradation of PAHs in surface soils and
assume degradation rates equal to those used in the future
Carver Terrace scenarios.
If the property were to be developed in the future,
exposures to PCOCs would be no greater than were estimated for
future conditions at Carver Terrace (Sections 2.2.3.4, and 5).
Two factors suggest that future exposures at Kennedy Sand and
Gravel would be even lower, possibly much lower, than the
exposures estimated £or Carver Terrace. First, the surface
soils in Kennedy Sand and Gravel have lower concentrations of
PCOCs than surface soil in Carver Terr~ce. Thus exposure will
be lower. Second, the Kennedy Sand and G~avel property is
approximately five feet below the base flood elevation. The
local flood ordinance requires that any building be either
floodproofed or be raised above the level of the base flooJ
elevation. Several feet of fill would need to be spread over
the Kennedy Sand and Gravel property for hypothetical
development to occur. Such fill would act as a cover and
reduce, or possibly eliminate, any hypothetical future
exposures to PCOCs.
Because the hypothetical future scenario involving
residential development of Kennedy Sand and Gravel is not well
defined, and is therefore difficult to quantify, the risk
assessment assumes that the future exposures estimated for
Carver Terrace represent an upper bound for hypothetical
residential future exposures at Kennedy Sand and Gravel. Thus,
hypothetical future exposures for a residential scenario are
not explicitly quantified for Kennedy Sand and Gravel.
2.2.7 Potential Exposure at Seeps
2.2.7.1 Potential Current Intakes
The risk assessment explicitly estimates only potential
current PCOC exposures at seeps. Hypothetical future exposures
5722F 4040-001-600 2-35
0

-
tv I
w Cl\
- -
PCP Total PM! Pot. Cai:-c. PA.ff (a}
Arsenic * Chromh.111 * Cot:ll)ei- • Zine
- - - - - - - - - - - -Tabte 2·12
POTENTIAL MA.lCU«.JM, GEOMETIUC MEAN f<MO M[M!MUH FUTURE KENNEDY SA.ND & GRA.\iEL INTAKES
The potential daily deMlllll and ingestion intake, averaged over a lifetime, of every detected PCOC is shown for Et person trespassing on Kennedy Sand & Grave[ property under future conditions.
Tot~t potential daily lifetime ;ntalce is shown for maKinun, geometric mean, and mininu:n PCOC concentrations. PCOC concentratioos used to generate the potential intakes are shown in the second colum.
PCOCs not listed wer-e riot detected.
-
Maxinin concentration Geometric Mean Concentration MinilllllP Concentration
-
1itaJCiinu11 Concentration (mg/leg sott>
Poteni:ia,l Total Lifetime
Intake {mg/leg/day)
Geometric Mean Co-,centrat ion
(mg/leg soi[)
Potential Tota! Lifetime
lnteke (mg/leg/day)
Potential Minimuo Total Lifetime
Concentration Intake (mg/leg soil). (mg/kg/day}
o.a 1.19E·07 0.8 1.19E·07 0.8 1.19E·07 20.6 3.09E·06 10.3 1.53E·06 0.18 2.67E·08 15.8 2.35E·06 6.1 9.361:•07 0.07 1.04E·08 14.9 2.06E·06 14.9 2.06E·06 1 1.38E-07
i2 1.66E-06 12 1.66E·06 1 1.38E·07 9.68 1.34E·06 9.68 1.34E·06 2.5 3.46E·07 35.2 4.87E·06 33.6 4.6SE·D6 30.2 4. 18E·06
* An asterisk following the naoe of a PCOC indicates that the PCOC was not detected in at least one SSll!ple and that the rainil!IUD concenti-ati:on is equat to one half of the method detection limit.
Ca> see Tabte 2-2 for- the Ust o.f pctentiatty carcinogenic PAH.
012452
- -
a I I I I I I I I I I I I I I I I I I
were assumed to be identical; therefore they need not be
estimated separately. Only younger children were judged to be
likely to come into contact with seeps as they explore their
surroundings. Older children and adults wQre assumed to be
cognizant of the seeps and to not come into contact with them.
Only the seep located at the bend of Wagner Creek is in an area
that is accessible to younger children. In order to reach it,
they must get down a steep embankment and gravelly slope.
Because of its location and bad taste, younger children were
assumed to come into contact with this seep infrequently, only
once a year for six years. Other exposure assumptions are
presented in Table 2-4. Maximum and minimum PCOC
concentrations measured in seeps were used to estimate
potential intakes and are shown in Table 2-13 and Table 2-14,
respectively. The maximum and minimum estimated dermal intake
of PCOCs is shown in Table 2-13 and Table 2-14, respectively.
2.2.7.2 Potential Future Intakes
The risk assessment explicitly estimates only potential
current exposure to PCOCs in seeps. Potential future exposures
were assumed to be identical, therefore, they need not be
estimated separately.
2.2.8 Potential Exposure to Sediments
2.2.a.1 Potential Current Intakes
Potential current exposures to PCOCs in sediments via
inadvertant ingestion and dermal contact were estimated for the
Texarkana Site. Younger and older children were assumed to
come into contact with sediments containing PCOCs at the rate
of 1 and 52 days per year respectively. Younger children were
assumed to contact sediments at the same frequency as they
contact seeps since the most accessible sediments are located
by the seep at the bend in Wagner Creek. Older children were
5722F 4040-001-600 2-37
0

- - - - - -Table 2-13
POTE~TIAl MA.XIHUM SEEP £~TAKES
The potential daily intake, averaged over a lifetime, of every detected PCOC is shown for a young chitd potentially exposed to
a seep. Kaxinun PCOC concentrations used to generate the potent1al intakes. are shown in the second colum. PCOCs not
listed were not detected.
Maxfoun Potenti1at
l)ermal Intake Potential
Total PCOC Co~entration Young Child lntmke
-
N (mg/l::.9 soil) (mg/leg/day) (mg/kg/day)
l - -----=----=-----------==========~-$-===~--~~==================== 0:, Total PAH 1'450 1.67E-08 1.671Hl8
Pot. Care. PAK Ca) 74 8.S2E·10 8.52E·10 Arsenic " t O.OOE+OO 0.0DE+DO Chromiun"' 1 O.OOE+OO O.OOE+OO Copper ,.. 2.5 O.OOE+OO O.OOE+OO Lead 12 o.oee+oo O.OOE+OO Mercury 0.12 O.OOE+OO O.OOE+OO Zinc 22 O.OOE+OO O.OOE+OO Ethyl Benzene 5.4 6.22E·11 6.22E·11 Toluene 2.9 3.34E-11 3.34E-11 Xylenes 5.6 6.45E•11 6.45e-n
lin asterisk aifter the name of a PCOC indicates that that PCOC 1tas not detected in any samples and that the max.ill'Un concentration is equal to one half of the method detection limit.
(a) see Table 2-2 for- the list of potentially ea-rcinogenic PA.ff.
- - - - - - - - - -
0 1 2 4 5 4

-
I\J,
' w \0
- .. - - - - -Table 2·14
?0TENTIA1 Mlt.l!MUM SEEP INTAKES
The potentra,[ ,,.a,-; ly intake, eiveraged over a lifetime, of every detected ?COC is shown for a young chHd potentially exposed to
a seep. Mintl!Ul) PCOC concentrations used to generate the potential intakes are shown in tne second cotUTn. PCOCs not
iisted were not detected.
Potential
PCOC Concent~at~on Your,9 Chile tnta-ke (mg/leg soil) (1119/i.:.g/day) {mg/kg/day)
Potential Total
------------------.... --~-=-=-=--==========::::;:::=::=====:":•.~--==:.:===~====--= Total PAff 1450 L67E-08 t.67E·08 Pot. Care. PAff (a) 74 8.52E-10 s.s2e.- to Arsenic *
O.OOE+OO 0.00E+OO Chromi~ * 1 O.OOE+OO 0.00E+OO Copper* 2.5 0.00E+OO O.OOE+OO l.ead * 0.5 O.OOE+OO 0.00E+OO Hercu·ry * o.~ O,OOE+OO 0.00E+OO Zfnc 20.7 O.OOE+OO O.OOE+OO Ethyl Benzene t.3 1.soe-11 1.50E·1 t Totuene 0.5 s. 76E-,2 5. 76E· 12 X:ylenes 3.6 4. l4E·rt 4.14e-,: -------------------~.---~====;~~-=~=-===============~=====
* An asterisk aft:er the name of a ~OC indicates that that PCOC was no-t detected in at least ~ s~te al"'i· that the miniir.n· concentration is equa! to one hat f of the method detection t imi e.
(i3) See Tabte 2-2 for t~e list of potentially carcinogenic PAH.
- - - - - - - - -
D12455

I I I I I I I I I I I I I I
I I
assumed to contact sediments once a week, every week of the
year1 for 12 years. This is the same rate of contact as was
assumed for the future scenario~ ~~ no fence for Kennedy Sand
and Gravel surface soils. Other e .. posure assumptions are
identical to those used for estimating expoAure to soils in
other scenarios (Table 2-4). Current exposures were estimated
for maximum, geometric mean, and minimum PCOC concentrations in sediments to provide a range of potential exposure. The
estimated maximum intake of PCOCs from sediments is shown in Table ~-15 along with the maximum PCOC concentrations.
Potential exposures due to geometric mean PCOC concentration
are shown in Table 2-lSa and potential exposures due to minimum PCOC concentrations are shown in Table 2-16.
2.2.s.2 Potential Future Intakes
The risk assessment explicitly estimates only potential current exposure to PCOCs in sediments. Potential future
exposures were assumed to be identical, or lower if degradation
were to be factored in; therefore they need not be estimated separately.
2.2.9 Potential Exposures to Subsurface Soils
2.2.9.l Poten~ial Current Intakes
Receptors judged to potentially have prolonged contact
with subsurface soils at Carver Terrace were utility workers. Utility workers may potentially be exposed to PCOCs via
inadvertant ingestion of soil, dermal contact with soil, and
inhalation of particulates containing PCOCs. (Volatilization
of potentially carcinogenic PAH has been shown not to be an
important PEP; see Section 2.2.1.4 and also Appendix 2-G.) The
formulas used to estimate exposures via these PEPs have been
described above. Utility workers were assumed to be on-site
5722F 4040-001-600
0
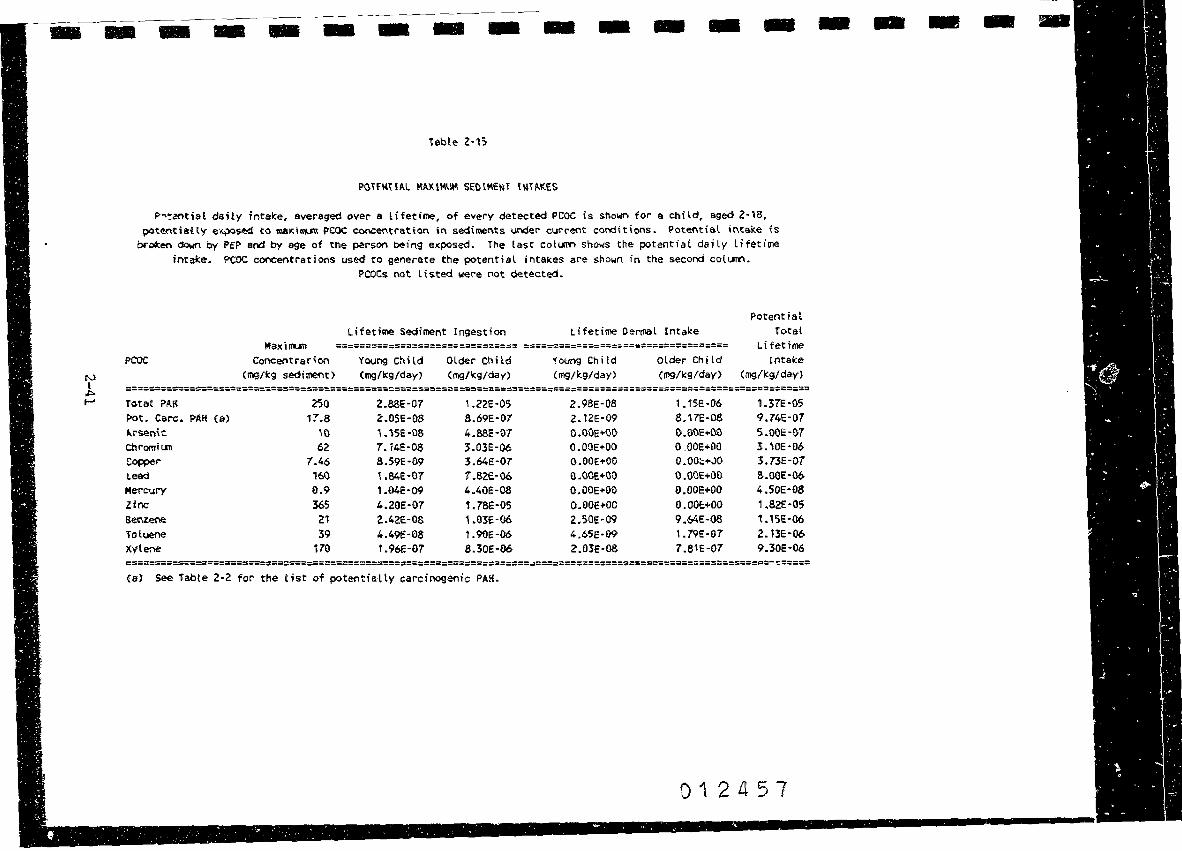
N l
,i:::,. t-'
- .. - - - - - -iable 2·1'>
p-.~c?r"rtial daHy Intake, averaged over a lifetime, of every detected PCOC is shown for a child, aged 2-18, potentiaily e..;io.~ to maKillUll PCOC COC'\C.el\tration in sedimeots under cu:-rel'lt coooitioos. Potential intake {s
brolcen down by PE? and by age of the pars.on being eJ<:posed. The last cotum shows the potential daily lifetime intake. PCOC c()l"IC:entrations used to generate the potential intakes are shown in the second co(l,.ffl"I.
PCOCs not Listed. were not detected.
P'COC
Totat PAK Pot. Care:. l,,rseok ctiromiL.rn Copper t.e&d
Mercury Zinc aeru:ene Toluene Xylene
PAH (I.'!)
Concentrar•on (mg/kg sediment)
250 l7.8
11> 62
7.46 160 0.9 365 2t 39
170
Lifetime Sediment Ingestion
Young Child Cmg/li:g/day)
2.88E-07 2.0SE-08 i.'l5E·O& 7.14E·08 8.59E·09 LS4E·07 1 .04E·09 4.20E·07 2.42E·06 4.49E·08 1.96E·07
Older Chi td (mg/kg/day)
1.22E·05 8.69E·07 4.88E·07 3.03E-06 :S.64E·07 7.82E·06 4.40E-08 L78E·05 1.03E·06 1.90E·06 8.30E·06
{a) See fabte 2·2 for the tist of potenti at ly carcinogenic PA!-!.
Lifetime Oennal lntake
'!'oung Chi td (mg/kg/day)
2.98E·08 2. t2E·09 O.OOE+OO O.OOE+OO O.OOE+OO O.OOE+OO O.OOE+OO o.ooe .. oo 2.50E·09 4.65E•09 2.03e-oa
Older Child (1119/1::g/day}
1.tSE-06 8. 17E·OS 0.00E+OO 0 OOE+OO 0.00::+JO 0.00E+OI)
o.ooe~oo 0.001:+00 9.64E·08 1.79E•07 7.S1E-07
Potential Total
Lifetfme tntake
(mg/l::9/day)
1.37E·05 9.74E·07 S.OOE-1)7 J. '\0E·06 :S.73E·OT 8.00E·06 4.50E·08 1.82E·05 1. ,se.-06 2. t3E·06 9.30E·06
012457
- - - - ..

- - - - - .. - - -POTEIIIHAL GEr.,,,eTR[C MEAN sr:blHENT [Ml'AICES
Po·tential daily intake, over-aged ever- a tifetime, of e'lery detected PCOC is shown for a child, aged 2-1a, potentiaHy e,cposed to geometdc mean PCOC concentr-ation in sediments under c~rrent conditions. Potential
intake is broken .;;own by PEP and by age of the per£on being el(.l)Osed. the last coLWI'\ shows the potential daily lifetime intake. PCOC concentrations used to gene-rate the potential intakes are shown in tne secord ~olurn.
PCOCs not listed W£re not dete~ted.
Lifetime Sediment Ingestion Lifetime Dermal Intake G~tric ~ean =====~========================= =============~================~====
PCOC Concentr-ation Young Child Older Chi Ld Young Child Older Child (mg/kg sediment) (t119/k9/d.r.y} (mg/1:g/day} (mg/kg,/day) Cmg/k.g/da',')
Potential Total
Lifetime Intake
Cmg/kt)!day)
ti,,.,) ==---=-====~-===-==---====-===-===~~===~======;========~~========~============~==================•==~~========;===~=== l
p tv
Tota•l PAil 122 1.40E-07 5.96E-06 Pot. Care. PAii Ca) U,.9 t .951:!-08 8.25E•07 Arsenic: 4.77 5.49E·09 2.33E-07 ct,;rom•iUil 8.3 9.55E-09 4.05E·07 Copper 7.46 8.59E-09 3.64E-07 lee<i \3.?' \.SSE-OS 6.69E·07 ll'ercury 0.24 2.761:-10 1.17E-08 Zinc 44.5 5. \2E-08 2.17E·06 Benzene 2t 2.42E-08 1.03E-06 Toluene :S9 4.49E-oa 1.90E-06 Xylene 170 1.96E-07 8.30E-06
Ca} see Table 2-2 tor the li~t cf potentialty carcinogenic ?A~.
1,45E-08 5.60E·07 6.67E·06 2,01E·09 7. 76E·08 9.25E·07 0.00!:+00 o.OOE+OO 2.38E·07 O.OOE+OO o.ooe+oo ~.15E-07 n.ooe+oo O.OOE+OO l. 7.!::·07 0.0*+00 o.ooe-~oo 6.BSE-07 o.ooe+oo O.OOE+OO 1.2oe-0o O.OOE+OO O.OOE+OO 2.22E·06 2.50Hl9 9.64E-08 1.~SE-06 4.65E·09 1,79E·07 Z.tlE-06 2.0:SE-08 7.81E-07 9.30E-06
012458
- - - -

-
t-.> l
.i::. w
- - - - - - - .. - - - -l'ablo 2-16
POTENrr,L l'IINIMUM SEOII-\ENT INTAKES
P~tentiat daily intake, averaged over a lifeii,re, of every detected PCOC is shown for a child, aged 2-18, potentially exposed to mininun PCOC concent,ation in sediments under current conditi· ns.
Potentiel inulce is broken i:town by PEP and by age of the person being exposed. The last colurn shows the potential daily Hfetime jntake. PCOC concentrations used to ~rate the potential intakes are shown in the
sec:ond col1:1m, PCOCs not listed were not detected.
Total f>Art * Pot. care. PAH Arser.ic "' Chromium " Copper " lead" Mercury"' Zinc* Benzene* Toluene• )Cytere *
(8) ..
MinillU'll• Conc:entrat ion
(~/kg sediinent)
2'-56 0.96
' 1 2.5 0.5 0.1
2 2.5 2.5 2.5
Ufetime Se<H .. .ent (ngest(nn
Vour;g Child (mg/kg/day)
2'.95E-09 t .HE-09 1.t5E·oq 1.15E·09 2-88E·09 5. 76£-10 1.1se-10 2.30E·09 2.88E·09 2.8&·09 2.88E·09
Older Child Cmg/k:g/day>
'i.2:SE-07 4.69E-08 4.SSE-08 4.88E·08 1.22E-07 2.44E·08 4.SBE-09 9.77E·08 1.22E·07 \.22:E·OT 1.22E-07
Lifetime Dermal tntake
'f01:.1r1g Child (mg/kg/day)
l.OSE-10 1. T4E-t0
O.OOE+OO O.OOE+OO O.OOE+OO O.OOE+OO O.OOE+OO O.OOE+OO 2.98E-10 2.9BE·10 2.9ae-,o
Older Chi td (mg/kg/day)
l. \BE-08 4.4TE-09 O.OOE+OO O.OOE+OO O.OOE+OO O.OOE+OO O.OOE+OO O.OOE+OO ,.,se-oe 1.1SE-08 1.15E-08
Potential Total
lifetime Intake
(mg/kg/day)
1.40E-07 5.25E·08 5.,,oe-oa S.OOE-08 1.2SE-07 2.50E-08 5.ooe-09 l.OOE-07 1.37E-07 1 .37'e.-07 1.37E•07
M asterisk foHowing the name of a F·COC indicates that in at least or.e saq:>le that PCOC was not detected and the rninin.m concentration is equal to one lialf of the method detection limit
(a) see Table 2-2 for the tist of potentially carcil'l')9e~ic PAH.
012459
- - - -

I I I II l
I I I I I I I I I I I I I I I
for a total of ten days, eight h~urs per day. This wa3 judged
to be a long enough time period to complete a major repair.
Workers wurc assumed to have 2230 square centimeters of skin
come into contact with soil. This is equal to the entire
surface area 0£ both ~heir hands and 0ne half of the entire
surface area of both of their arms. Other dermal exposure
assumptions were identical to those used for adults contacting
soil in other Carver Terrace exposure scenarios (Table 2-4).
While on-site, ~orkers were also assumed to inadvertantly
ingest 100 milligrams of subsurface soil per day (Table 2-4).
While working around heavy earth moving equipment, workers
may potentially inhale soil particles that contain PCOCs.
Estimation of inhalation exposures require that the amount of
air a worker breathes and the amount of particulates in ~1ir be
estimated. Typically, an adult is assumed to inhale 20 cubic
meters of air per day (EPA 1586a). This is equal to about 1
cubic meter per hour and is representative of an inhalation
rate for someone who is not performing strenuous exercise. As
level of activity increases, inhalation rate increases also.
Workers were assumed to be physically active and thus
potentially be breathing at twice the standard rate. The risk
assessment assumes ~orkers breathe at the rate of 2 m3 an
hour, or a total of 16 m3 per day while working on site. Air
at the worksite was assumed to.contain 150 micrograms of
particulate matter per cubic meter (Table 2-4). This is equal
to the National Ambient Air Quality Standard for particul~te
matter. All of the particulate matter is assumed to be
respirable and of subsurface soil origin. Thus, workers are
assumed to breathe air with 150 micrograms of particulate
matter per cubic meter the entire eight hours of every day they
are on site. These assumptions will likely lead to an
over-estimate of potential worker inhalation exposures.
In order to bound the potential utility worker exposures,
the risk assessment estimates exposures for both maximum and
minimum subsurface soil PCOC concentrations. The estimated total potential maximum intakes are shown in Table 2-17 along
5722F 4040-001-600 2-44
0
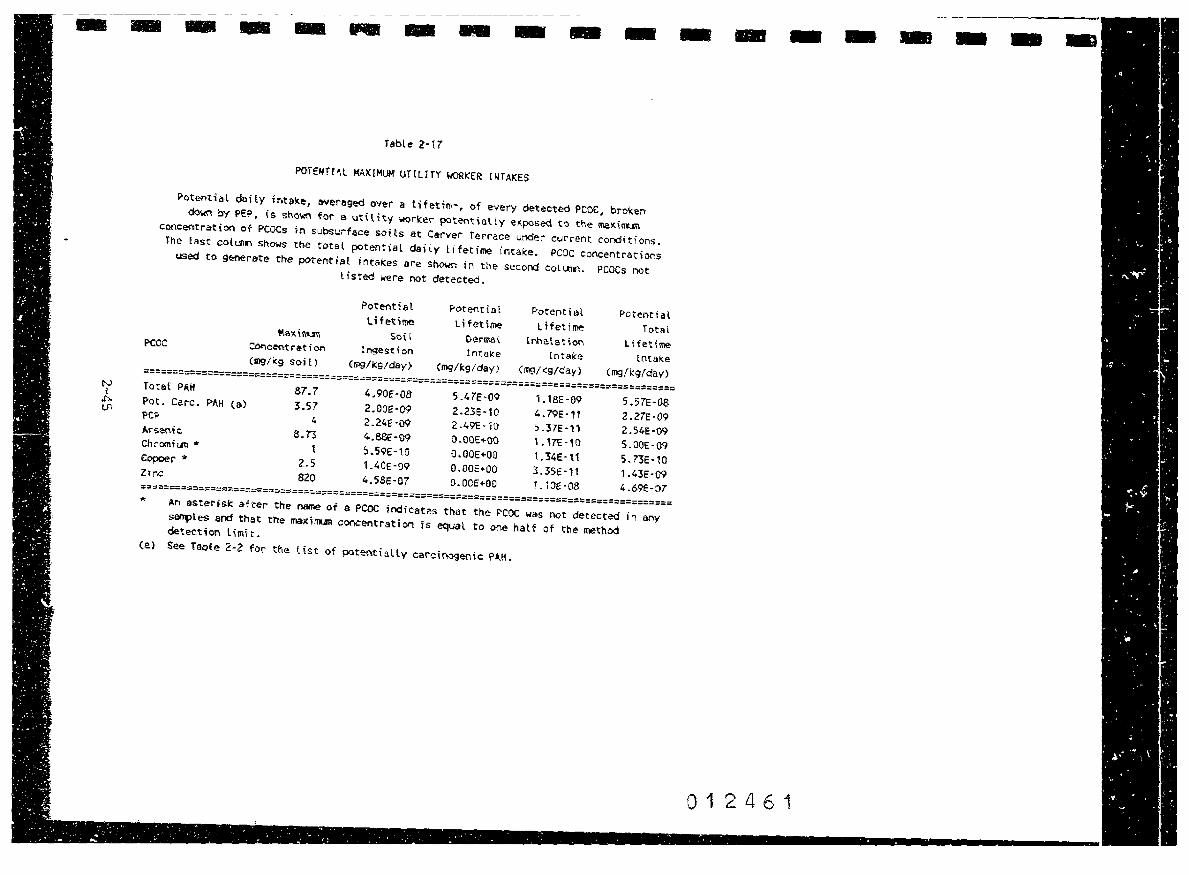
N· a ~ Ul
- - - - .. - - - - -POTENTl'I.L HAlCIMUM UTIUTY WORICER ENTAKES
Potential deHy ir.tooce, averaged over a· tifetfo,-, of every detected PCOC, brokendown by PEP. is sho'offl fo!" a utility worker potential t y exposed to the maK 1 RU\\
coocentration of PCOCs fn subsurface soHs at Carver Terrace under current conditions. The last coli.m, shows the total potential daily lffetime intake. PCOC concentrations
used to generate the potential intakes are~ in the second coll.Am. PCOCs net listed were not detected.
Potential Potential Potential Potential Lifetimo l.lfetime Ufet ime Total Meudnun Soil Dermal lnhahthm LHetime PCOC C0'1<:entration Ingestion Intake Intake Entake (119'/icg soil) (mg/kg/day) {mg/kg/day) (mg/leg/day) (rng/1::g/day) ----------=----==--===-==-=================~=====================================-======= To.tel P~lf 87.7 4.90E·08 5.47E·09 1.18E·09 S.57E•08 Pot. Care. Pl\.lf Ca) 3.57 2.00E-09 2.23E·10 4.79E·1t 2.27E•09 PCP· 4 2.24E•09 2 .49'i: • i0 5.37E·"l1 2.S4E·09 Arsenic B.73 4.88E-89 O.OOE+OO 1.17E-10 5.00E-09 Chromhn • l 5.59£-10 0.00E+OO 1.34E·t1 5. 73E·10 Copper-* 2.5 1.40E·09 O.OOE+OO l.35E·l1 1.43E·09 Zinc 820 4.58E·07 O.OOE+OO t.t:lE-08 4-69E-07
An asterisk after the name of a PCOC indicates that the PCOC was not detected in any s-.:>les and that the maxill'UII concentration is equal to one hat f o.f the method detection limit.
(a> See Table 2-2 for the list of potentially carci!iOgenic P~M.
- - - - - - - ..,
012461
I I I I I I I I I I I I I I I I I I I
with the maximum PCOC concentrations used to generate th8
estimates. The estimated total potential minimum int~kes are
shown in 'iabJe 2-18 along with the minimum PCOC concentrations used to generate the estimates.
2.2,9.2 Potentta~ Future Intakes
The risk assessment explicitly estimates only potential current exposure of utility workers to PCOCs in sub~urface
soils at Carver Terrace. Potential future utility worker
exposures were assumed to be identical, therefore, they need not be estimated separately.
2.2.10 Hypothetical Future Exposures to Ground Water
A remote possibility exists that at some time in the
future, people using a hypothetical, currently non-existing, domestic ground water well may be exposed to PCOCs in the
ground water. Although this is judged to be very unlikely, such hypoth~tical future exposures were evaluated at EPA's request.
Users of hypothetical, non-existing, domestic well were assumed to ingest 2 liters of water per day (EPA 1986a) for
their entire seventy year lifetime (Table 2-4). The
hypothetical non-existing well was assumed to not contain free
phase creosote and to not have PCOC concentrations that would
trigger organoleptic effects because ground water from any well having such effects would either not be used or would be
treated. Data from an existing monitoring well was S€lected to evaluate the hypothetical future exposure. Ground water in
most existing ground water monitoring wells that met the above requirements had few PCOCs and the PCOCs were present in low
concentrations. The selected well {MW03-002) contained all of
the light aromatic PCOCs and some of th& inorganic PCOCs. It
was not analyzed for PAHs, PCP and some of the inorganic PCOCs, however. qround water monitoring wells with ground water
5722F 4040-001-600 2-4fi
0
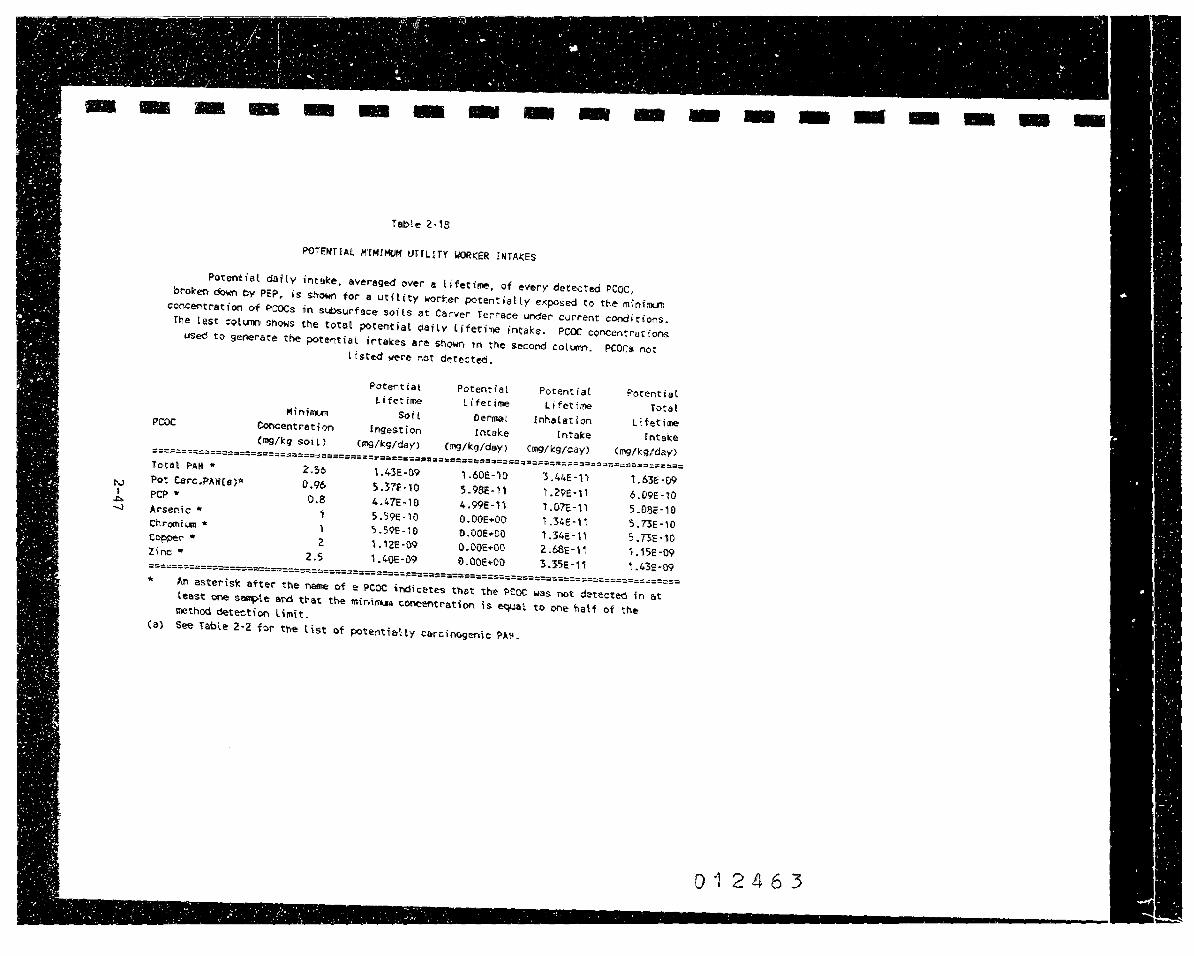
-
IV l
A --.,l
- - - - - - - - - -Table Z•18
POTElfHA!. M'fH[MUM 1.HILU'f !,/ORICER ENTA.ICES
Potentiat daily intake, averaged over o lifettme, of every detected PCOC, broken down by PEP, is show, for a utility wor~er potentially exposed to the miniroun
concentration of PCOCs 1in swsurface soils at Carver Terrace under current conditions. The last coll.lTr'I shows the total potential daily lifetime intak~. PCOC concentrations
used to generate the potential intalces are shown in tne second coltm'l. PCOr.11 no: l isttd 11er-e not de-tected.
Poter,tial Potential PotentiaC Potential Lifetime Lifetime Lifetime Total Mininun Soi( Dermal Enholation Lifeti!lle PCOC Concentration Engestion Intake Intake Intake (mg/leg soi l) (mg/kg/day) (mg/kg/dsy) Cmg/kg/day) Crng/kg/day} TO·Ul PAl'I * 2.56 l .43E·09 1.60E-'I0 3.44E-1l i .63E·09 Pot Cer-c.PAH(a)• 0.96 S-.37t•10 5.981H1 't.2'9E-ll 6.09E·1D PCP• 0.8 4.47E-10 4.99E-1l 1.0?E-\1 5.0BE-10 Ar-senic * 1 5.59E-10 O.OOE+OO , .34E·ll S.73E·l0 Ch romi 1.11t • l S.59'i:-10 o.ooe .. oo t.1r.e-1, s.Tie-10 C~r• 2 ,.1ze-09 O.OOE+OO Z.68e-11 ,.1se-09 Unc • 2.5 1.40E·09 o.ooe.-oo 3.lSE-11 1•.43E·09
* Ari Hterisk. after the l'l8ll'le of e: ?COC indicetes tha-t the ?toe was not detected in act least or.oe s~Le and that the m1n,inu11 concentration• is, equat to one l'lalf of the method detect; on Umi t.
(a)- See- l'&ble 2·2 far the list of poteritie,Hy carcinogenic PA.K.
- - - - - - -
012463
I I I I I I I I I I I I I I I I I I
containing PAHs had total PAH levels above organoleptic
thresholds {see Appendix 2-D for a list of organoleptic
thresholds). Hypothetical future domestic use of such wells is
not considered to be plausible. Hypothetical future exposure
to PCOCs via ingestion of ground water by users of a
hypothetical, non-existing domestic well are presented in Table
2-19. The assumed concentration of PCOCs in the ground water
is also presented in Table 2-19.
2.3 Risk Characterization
2. 3 .1. Introduction
Two general types of health risks are characterized for
each of the potential exposure scenarios: potential
carcinogenic risks; and, non-carcinogenic risks fcom chronic
exposures. Potential carcinogenic risks are estimated by
multiplying the intakes derived in Section 2.2 by the upper 95
percent bound of the carcinogenic potency estimate derived by
the EPA. Potential carcinogenic risks are expressed as the
excess hypothetical chance, over and above background, that a
person has of getting cancer over the course of a lifetime (70
years}.
The potential for exposed people to suffer adverse non
carcinogenic chronic health effects is determined by comparing
th~ intakes of PCOCs estimated in Section 2.2 to acceptable
chronic intakes (AIC} derived by the EPA (presented in Table
2-1). The results of this comparison can be expressed as a
Hazard Index (HI) which in a measure of the p~tential for
adverse health effects to occur. The HI is equal to the
estimated intake divided by the AIC. When this ratio exceeds
unity, the estimated intake is greater than the allowable
intake and a potential for adverse health effects may exist.
When it is less than one, the estimated intake is less than the
allowable intake and no adverse health effects are expected.
Not!d that for some compounds sufficient information does not
5722F 4040-001-600 2-48
0

- - - - - - -Table 2-19
Potei:-.tial daily intake, averased over ao lifetime-, of every PCOC is shown for a per-son hypothetica•l ty expo,9ed to PCOC concentrations in grOtJndwater. PCOCs not listed were not
detected. it~tts fr0t11 wett M\.103·002 were used.
Potential ltypotl'let icat oa Hy
PCOC rntake Cocicentration Intake Total
PC0C Cmg/t) <R.l9tl::.9/day) Cmg/k.g/day} ti,...) ------------=-===-=====~=========~===~==;===;===•=-===~=~~====== l Chromhrn A \D
0.00,5 1.43E-84 't.43E-04 Copper 0.0125 3.57E-04 3.57E-04 Zinc 0.5-5 '· 571:-02' l•.57E-02 Sem:ene 0-036 1.03E-03 1.03E·03 Ethylbentene 0.037 1.06E•03 1-06E·03 Toluene
0.002$ 7.14E·65 7. i4E•05 lfylene 0,025 7.14E-04 T.14E·04
(a) See Tabte Z·Z for- the list of potentially carcinogenfc PAH.
- - - - - - - - IIIIIE
012465
I I I I I I I I I II
I II
I \I I
1• II \
\I I
•
exist to develop AICs and thus their potential to cause adverse
health effects cannot be evaluated,
The potential for adverse health effects is first
discussed for the maximum concentration scenario at Carver
Terrace. The geometric mean scenario at Carver Terrace is
presented next followed by a presentation of the minimum
concentration scenario. The potential for adverse health
effects at Kennedy Sand and Gravel is then evaluated followed
by evaluations of pot~ntial adverse health effects associated
with potential exposure to seeps, sediments, subsurface soils,
and hypothetical future ground water use. The results are
summarized in section 2.3.10.
2.3.2 Potential Health Risks for the Maximum Concentration
Exposure Scenario at Car.ver Terrace.
2.3.2.1 Potential Carcinogenic Risks
Estimates of the upper bound excess lifetime potential
carcinogenic risk of a person exposed to the maximum PCOC
concentrations in surface soils at Carver Terrace are presented
in Table 2-20 for potential current eKposures and Table 2-21
for hypothetical future exposures.
CY.,rrent Risks
It is important to recognize that the potential current
risks estimated here are not representative of the potential
risks to the average resident of Carver Terrace. They are an
upper bound estimate of potential risks to a resident of Carver
Terrace visiting the most contaminated portions of the site for
70 years. This is an unrealistic exposure scenario given how
maximum soil PCOC concentrations were derived. Most areas have
much lower concentrations of PCOCs in surface soils and people
visiting them would have much lower excess lifetime potential
5722F 4040-001-600 2-50

N l
l,}1
"'"'
- - - - - - - - - - - - - - - -Table 2·.?0
POlEMl1Al MAX?MUM CORRE~T CARVER lERR~C! RiSKS
'fhe hu.atd it'ldell. for potenttal chronic effects CcottlTrl 6) and the 95::: upper botXld exc~ss l Hetime cancer risk (colutn 8) ts shown for a person potentia.tly eitposed to ma-xinun PCOC soil coricentrstior,s 'ir, Carver ierrace uooe:r curroot cond'i'!ions.
itle poterlt\at total intake end its break~ by Pt\'> is also s\:iO'tll\. l>COCs. ru>t Ustetl were !'1¢t detected.
PCOC
Total ?Ali
~ct. Care. P~~ (e> r'C?
Z.3,7,S·TCOO ifs Al"$el'\1C
Chromh.111 { c) Coppe,r t.ead MercUl"y Cd) Z1oc
f>otential Lifetime ChE"onic tntai:e
Totat (mg/1,::g,/day)
9.2lE·02 7.3'\E·04 5. 79E•Oe, 2. 78E· 10 L77E·05 t.91E ·05 3.35E·05 9.88E·05 1.18E ·07 L 12E·03
Percent Due fo Soil
f nges t i on
91.64'¼ 9, .64¼ 9\ .64% 91 .64¾.
100.00¾ 100.00¾ 100.()0¾ t00.00¾ 100.00¾ 100.00X
Percent Due To Oerma-l
Contact
8.36¾ S.36¼ $.36¼ 8.36¼ 0,00¾ o.OO¾ O.OO¼ 0.00% 0.00¾ 0.0(1%
Mon·carci:oogenic Effects
Acceptable ChrOf'lic
!ntake Cmg/kg/day)
(&} (a•)
3.00E-02 ( e.)
Ca) 5.00E·03 3. 70E-02 L40E·03 t.40E·03 2.10E·Ol
Si.mned Index "'
(a)
ta)
i.'nE-04 Ca> (e.)
.3 .lHe:-03 9.0SE-04 7.06E·02 8.41E-05 5.32E·03
8,09E·02
Carcinogenic Effects
Cer-ci~enic Potency
Factor{day-k9/mg)
1. 'IS.1: .. 0, Cb)
1. 5.6E. .. OS t5oe~ao
Cb) (b)
Cb> Cb) (b)
Suimed' ri$k ,.
Ell:cess Ufetime
Caneer Risk
8.38E ·03 Cb>
4.33E·OS 2,65E·OS
Cb) (b> (b,}
Cb) Cb)
8.45E·03
-=--=----------=---------=----------~=--~---=---====--=-~---~---=-----~-=--------=----=-----------------=----=-=--------~=---=======--------<a>: EPA. has not derived an 11.lC far that c~. (bl: the ~- is n0't COl'\S.tdered to be carc.ir,ogeoic through the oral or dermal route. {c): l~e ~tc for cnromii.i11 Vt was used in the table. Cd): ihe AIC for fnorganic mercury was used in the tebte, Ce): see iabte 2·2 for a list of p<)tentiatty carcin<)genic f'Aff.
012467
- -
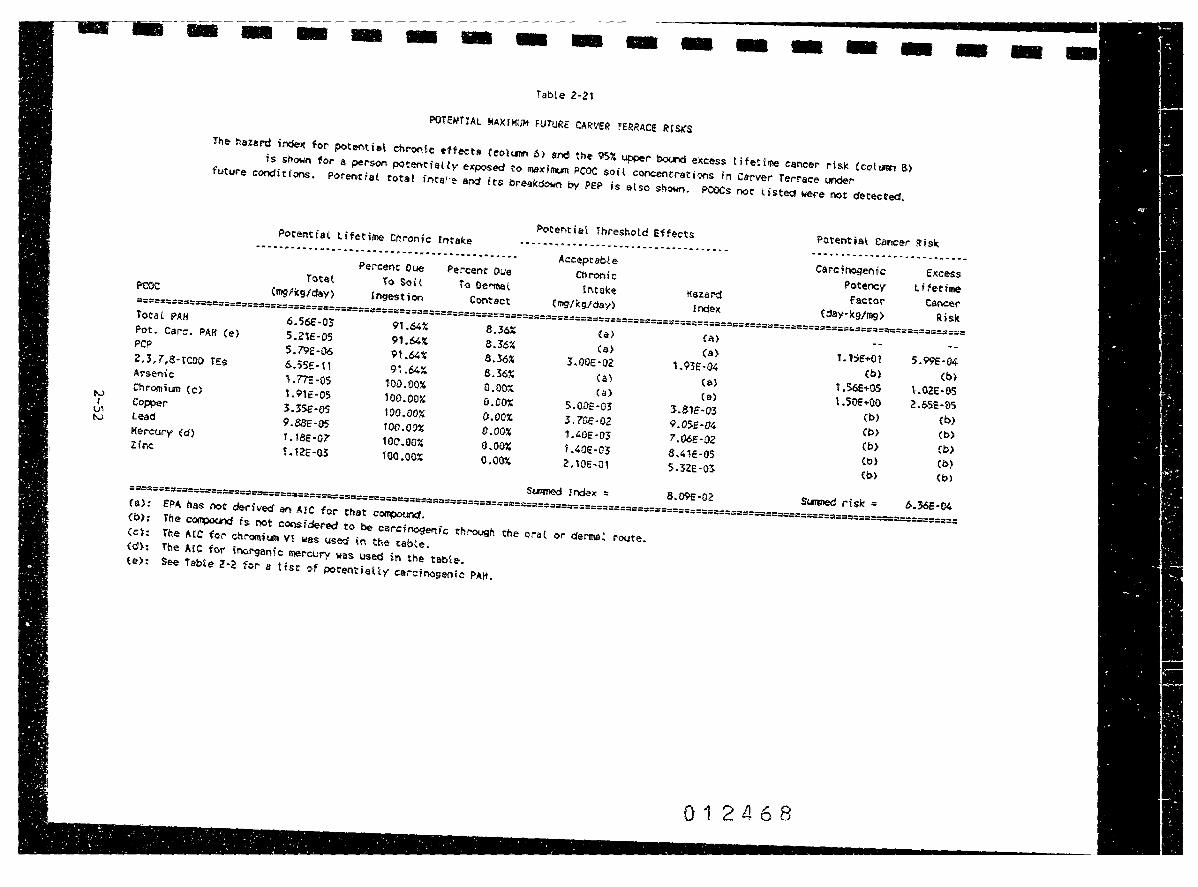
____ _, ______ liiiiiiiiii,-.. - - - - - - - - - -
l'.l r
V1 tv
- - -Table 2·21
POTENl'!AL !i!AX!MUM FUTURE CARVER TERRACE IHSKS
The hazard inde>< for pot11:nth,l chr-onic c-ffttts Ceoh.m, 6) and the 9S~ ~r bol.n:J excess tifetime cancer risk (colt.1111 8) is shown for a, person potentially eit.posed to m.!tidmun PCOC soil concentrations in CB!rver Terrace under-
future conditions. Potential totat intal·e and' its breakdown by PEP is atso s~OWI'). PCOCs not t isted were not detected.
PCOc
Total PAH Pot. Care. PAff Ce) PCP 2,3,r,a-rcoo res Arserdc Chromiun Cc) Copper lead !o!ercury (d)
Z:inc
Potential lifetime Chronic Intake
Total (mgficg/day)
6.56€-03 5.2lE·05 5.79E-06 6.55E-11 1.77E-05 t.91E-05 3.35E·05 9.88E·05 1.18E·07 t.12E-03
Percent Oue To Soil
[ngestion
91.64¾ 91 .64¾ 9t.64% 91.64¼
100.00X 100.00¾ 100.00% 100.00% 100.00% 100.00¾
Percent Oue l'o Oermet
Contact
8.36¾ 8.36% S.36¾ tU6% o.oox 0.00% o.oo,:; 0.00% 0.00% o.oox
Potential Threshold Effects
Acceptab!e Chi-onic
!ntal:e (mg/kg/day)
{a)
(a)
J.ooe-02 Ca) Ca)
5.00E·OJ 3.70E·02 L40E·03 1.40E-03 2.\0E·0\
Suimed fndeic: =
Ca> (a)
1.93!Hi4 (&}
(&)
:une-03 9.05E-04 7.06E·OZ 8,41E·05 5.l2E·03
8.09E·02 Cai>: EPA has not derived an AIC for that COl!JlOtlnd,
Cb): 'l"he c~ is not coosidel'ed to be carc;nogenk through the or-al or dermet route. (c): rne ~re for chi-om,~ vc was used in the tabte. Cd): The Arc for il"IOrganic mercury was used in the table. Ce): See tabte 2-2 for a tisr of potentialty car·c,nogenic f'Alt.
012468
Potential Cancer Risk
Carcinogenic Potency facto,
(day•lc:9/mg)
1.l5E+01 Cb)
t .56€-1-0S 1.soE~oo
Cb) Cb} Cb> Cb> Cb>
Sunned r J sic: =
Excess lifetime
Cancer Risk
5.99E·04 <b>
1.0ZE·OS 2.6-SE·OS
CbJ Cb) Cb) Cb) <bl
&.36E·04
-
I I I I I I I I
I I I I I I
carcinogenic risks. Sources of uncertainty that could lead to an over-estimate of adverse health effects are discussed in Section 2.5.
Three PCOCs (potentially carcinogenic PAH, PCDD/PCOFs and arsenic) contribute to the potential current summed risk of
about eight in one thousand (8.S x 10- 3), however, the risks
estimated from potentially carcinogenic PAH are the largest and
make up more than 95 percent of the summed risk. PCDDs and PCDFs and arsenic make up the remainder of the risk.
Table 2-20 also indicates that inadvertant ingestion of soil
accounts for the majority of a person•s potential lifetime intake of PCOCs.
Future Risks
The future potential carcinogenic risks for people exposed to maximum PCOC concentrations in Carver Terrace soils are
shown in Table 2-21. As with potential curr~nt exposures three PCOCs {potentially carcinogenic PABs, PCDD/PCDFs and arsenic}
contribute to the summed risk of 6.4 in 10,000 (6.4xl0- 4).
Note that summed risk from all PCocs and the contribution of
potentially carcinogenic PAHs and TCDo TEs and the total risk
has decreased when compared to potential current risks. Total risk has decreased from 8.5 x 10- 3 to 6.4x10- 4 and the
contribution of arsenic has increased from less than 1% to 4%
(compare Tables 2-20 and 2-21). Thie occurs because the future
scenario assumes that the organic compounds will degrade, but that arsenic will not.
2.3.2.2 Potential Non-Carcinogenic Chronic Risks
Estimates of. the potential for non-carcinogenic adverse
health effects caused by potential chronic ~xposure to maximum concentrations of PCOCs at Carver Terrace are shown in Table
2-20 for potential current exposures and Table 2-21 for future
2-53
0

I I I I I I I I I ;I
I I I I I
maximum exposures.
current Risks
The hazard indices tor individual PCOCs and the summed haza~d index of 0.08 for current exposures do not exceed one
and thus indicate that little potential for non-carcinogenic adverse health effects exists (Table 2-20).
Euture BisM
The future potential non-carcinogenic health risks for
people exposed to maximum PCOC concentrations in Carver Terrace soils are shown in Table 2-21. As with potential current
exposures neither the hazard index for individual PCOCs, nor
all PCOCs summed, exceeds unity, indicating that little
potential for non- carcinogenic adverse health effects exists.
2.3.3 Potential Health Risks for the Geometric Mean
Exposure Scenario at Carver Terrace
Only assumptions about PC0C surface soil concentrations differ between the geometric mean scenario risks at Carver
Terrace and the muximum concentration scenario risks. The
current geometric mean scenario assumes that sodded areas have concentrations of PCOCs equal to the lowest observed
concentration, while the future scenario assumes sodding has
had no effect on PCOC concentrations but that degration of
selected organic PCOCs occurs. Other assumptions do not differ
between the two scenarios. Geometric mean scenario risk
estimates should not be interpreted as representative of the
average risk to residents of Carver Terrac~, although the
estimates for this scenario are likely more representative than those estimated for the other two scenarios.
2-54 5722F 4040-001-600
0 f""-<::;j
(\J
0

I I I I I I I I I I I I I I I I I I I
2.3.3.1 Potential Carcinogenic Risks
Current Risks ------Estimates of the current excess lifetime potential
ca::-cinoge:nic risk of a person exposed to geometric m.ean
concentrations of PCOCs is surface soils at Carver Terrace are prgsented in Table 2-22. The summed excess lifetime
car=inogenic risk from all PCOCs is about 3.2 in 100,000
(3.2xl0- 5). Risk from potentially carcinogenic PAR accounts for most of the summed risk.
Future Risks
Estimates of the potential future carcinogenic risks
caJsed by potential exposure to geometric mean concentrations
of PCOCs in surface soils at Carver Terrace are presented in
Table 2-23. The summed risk is 1.7x10- 5, compared to
potential current risks of 3.2x10-S {Table 2-22). Potential
fut~re risks are lower because of degradation of the
potentially carcinogenic organic PCOCs.
2.3.3.2 Potential Non-Carcinogenic Risks
Current R_isks
Estimates of the potential for non-carcinogenic health
risks resulting from current exposure to geometric mean
concentrations of PCOCs in surface soils are shown in
Table 2-22. Neither the total HI nor the Ht for any PCOC
exceeds one, indicating that little pctential exists for
non-carcinogenic chronic effects in people potentialiy exposed
to geometric mean concentrations of PCOCs at Carver Terrace.
2-55
0

l's)
J Ul a-.
- - - - -
POTENTIAL GEOMETRfC MEAN CURRENT CARVER TERRACE R[SKS
The haiard io:lex for potential chronic effects Cco!UIV'l 6) and the 95X upr..er bound excess lifetime cancer risk (colt:.111'1 8) is stiown for a person potentially exposed to geometric mean PCOC soil concentrations in Carver Te~race
under current ccndhions. f'otential totat intake and i.ts breakdown by ?E? is also shown. ?COCs not Usted 1o1ere l'IOt detected.
Potential Threshold Effects Potential cancer Risk
PCOC
Totat PA'.ff Pot. Care. PAH Ce} PCP 2,3,7,8-TCOO ,Es Arsenic: Chromiun Cc) Copper Lead Mercury (d) Zinc
Potential lifecime Chronic Intake
Tota! Cmg/!cg/day)
6.53E·06 2.65E·06 4.89E·O? 2.80E·12 9.19E·07 1 • .3-tE·06 B.'>2E-07 4.49E-06 5.97E·Oo
9.92E·06
Perocent Oue To Sc-il
tngest1'on
?1.64¾ 9i .64% 91.64% 91.64%
100.00¾ 100.00" 100.00,; 100.00% 100.00% 100.00%
Percent Oue To 0enr,sl
Contact
8.36% 8.36% 8.36¾
8.36% 0.00¾ 0.00% O,OO't. 0.00% 0.00% 0.00¾
(a): El>A has not derived s.i A.IC for that c/Jlll)Ound.
Acceptab!e Chronic
lnta!r::e (mg/kg/day)
(a> Ca>
3.00E·02 Ca> (a)
S.00£·03 3.70E·02 1,40E·03 1.40E-03 2.10E·01
Sll!'med f ndex =
(b): The c~ is not considered to be cei•rcinogenic through the oral or dermal route. (c}: The AlC for chromiu.~ Vt was used i~ the tBbte. (d): The A.IC for inorganic merc1:1ry was used in th' tabte. Ce): See Tabte 2·2 for a lfst of potentially carcinogenic PAtt.
Hazard lndex
(a} ca>
t .63E·OS (a)
ca> 2.61E·04 2.30E·O5 3.21E·03 4.26E-05 4,72E•05
Carcinogenic Potency
Factor Cday-!<:g/mg)
L 15E+Ol
Cb) 1.56E+05 1.soe .. 00
(b)
Cb) Cb> (b)
Cb)
3,60E·03 Sumied risk=
012472
Excess lifetime
Cancer Risk
3.04E•05 (bl
4.36E·07 1.38E·06
(I:>)
Cb} (b)
(b}
Cb>
3.22E-05
- -

POtENl(AL GfOHETRIC MfAM FUtURE CARVER TERRACE RISKS
The nazan:f index for potential cttrooic effects 11rd :he 95X t,pper bound excess ti fetime c&neer risk is snown tor- a person potentially exposed ta geCffll!tric mean ~COC soil concentrations in Carve· Terrace under futur-e
conditions. Potential total intake and its breakdown by PEP is also shown. PCOCs not listed i.ere not detected.
Potential Threshold Effects Potential Cancer Risk
PCOC
Total ?Alf Pot. Care. PAN (e) PCP Z,3,7,S·lo:DO fEs Arsenic Chr011h111 Ce) Copper Lead Mercury (d)
Zinc
Potential lifeti11e Chronic Intake
lt>tet (111g/i:9/dey)
3.76E·06 1.28E-06 s.2,e-01 6.59e•13 ,.::i«-06 2.10E·06 3.24e-E)6 ,.,oe-os 5.97'E·ll3 ,.ne-os
Percent Due To Soil
ti,gestion
91.64% 9i.64% 91.64~ 91.641
\00.00t 100.00% 100.00% 100.00X 100.00X 100.00X
Percent Due
To DeMNll
Contact
8.36X 8.36% 8.36X 8.S6X o.oox o.oox o.oox o.oox o.ooi o.oot
(a): EPA has net dltrived an AIC for that c~.
Acceptable Chronic
lntai:e (~/kg/day)
(8)
Ca> l.OOE·02
(8)
Ca) 5.00E·Ol 3.70E·02 1.40E·03 l.40E·0l 2. 10E·Ot
s~ Index,.
(b): The cCllllpC)Und is not considered to b& carciM9fll\ic through the ora\ or t<el"ffll-l route. iC): The AIC for cllrOlllh.a 1/1 1116& used in the table. Cd>: The AIC flX' inot";a.tic 11ercury was used in the table. (eJ: see Table 2·Z for a list of potentially carcinogenic PAH.
liclZ&rG
Index
Ca)
Ca> \.74f·05
(8)
(8)
5.39E·04 8.77E•05 9.99E·03 4.26E·05 .t.Z5E·04
1.09E·02
012472 001
.
Carcinogenic Potency factor
(day-k9/1QS)
1.15E+01 Cb)
\.'j6h05 ,.sOF. .. oo
(b> Cb-> (b)
(b)
(b}
SIJlllled ,.. i sic "
Excess Lifetiae
Cancer Risk
l .47e·05 Cb>
\ .03t·07 t .98E·06
Cb) Cb) Cb) (b) Cb)
1.68E·0S
I I I I I I I I I I II 11 \
\I l1 \1 11 I
11
Euturk Risks
EstimatPs of the potential future non-carcinogenic risks
caused by potential exposure to geometric mean concentrations
of PCOCs in surface soils at Carver Terrace are presented in
Table 2-23. Note that the HI calculated for potential future
expo~ures is greater than the HI for potential current
exposures (Tables 2-22 and 2-23). This is caused by the
assumption that in the future sod and soil barriers will
breakdown and the residents may be exposed to the PCOCs
currently covered by the barriers. However, neither the total
Hl nor the HI for any PCOC exceeds unity, indicating that
little potential exists for non-carcinogenic adverse health
effects to occur in the future (Table 2-23).
2.3.4 Potential Health Risks for the Minimum
Concentration Exposu~e Scenario at Carver Terrace
Only the surface soil concentration cf PCOCs differed
be:ween this and the other two Carver Terrace exposure
scenarios. Potential exposure~ in this scenario were developed
using the lowest measured concentration of each PCOC. If a
PCOC was not detected in a sample, its concentration was
assumed to be one half the detection limit in that sample and
in this scenario. The potentii1l exposures and risks estimated
in this scenario should be reg~rded as a relative lower limit
for Carver Terrace residents. It should be noted that the term
lower limit refers only to potential exposures and not to the
dose response aEsessment characterization methods prescribed by
EPA, Use of alternative dose-response and risk
characterization methods may result in lower risks.
2.3.4.l Potential Carcinogenic Risks
Cll~
The total estimated 95\ upper bound excess lifetime
potential carcinogenic risk for Carver Terrace residents
5722F 4040-001-600 2-58
0

I I I I I I I I I I I I I I I I I I I
potentially exposed to the current minimum concentrations of FCOCs is about four in one million (4.5x10- 6, Table 2-24).
All of the excess lifetime carcinogenic risk is due to
potentially carcinogenic PAHs, PCDO/PCDf and arsenic.
Estimates of the potential futJre carcinogenic risks caused by potential exposure t~ minimum concentrations of PCOCs in surface soils at Carver Terrace are presented in
Table 2-25. The total future risk of 7.8xlo-7 (Table 2-25)
is about eight times lower than the potential current risk
(Table 2-24} due to the assumed breakdown of organic PCOCs.
2.3.4.2 Potential Non-Carcinogenic Chronic Risks
Current Risks
Estimates of the potential for non-carcinogenic health risks resulting from potential current exposure to PCOCs
assuming minimum soil concentrations are shown in Table 2-24.
The summed HI is equal to 0.0007 indicating that little
potential exists for chronic exposures to cause adverse human health effects, given the exposure assumptions.
Future Risks
Esti · ,tes of the potential fut'Jre noa-carcinogen ic risks
caused by potential exposure to minimum concentrations of PCOCs in surface soils at Carver Terrace are presented in
Table 2-25. Neither the total HI, no( the HI for any
individual PCOC e}:cecds unity, indicating that little potential
exists for non-carcinogenic adverse health effects to be caused
by minimum PCOC surface soil concentrations i~ the future {Table 2-25).
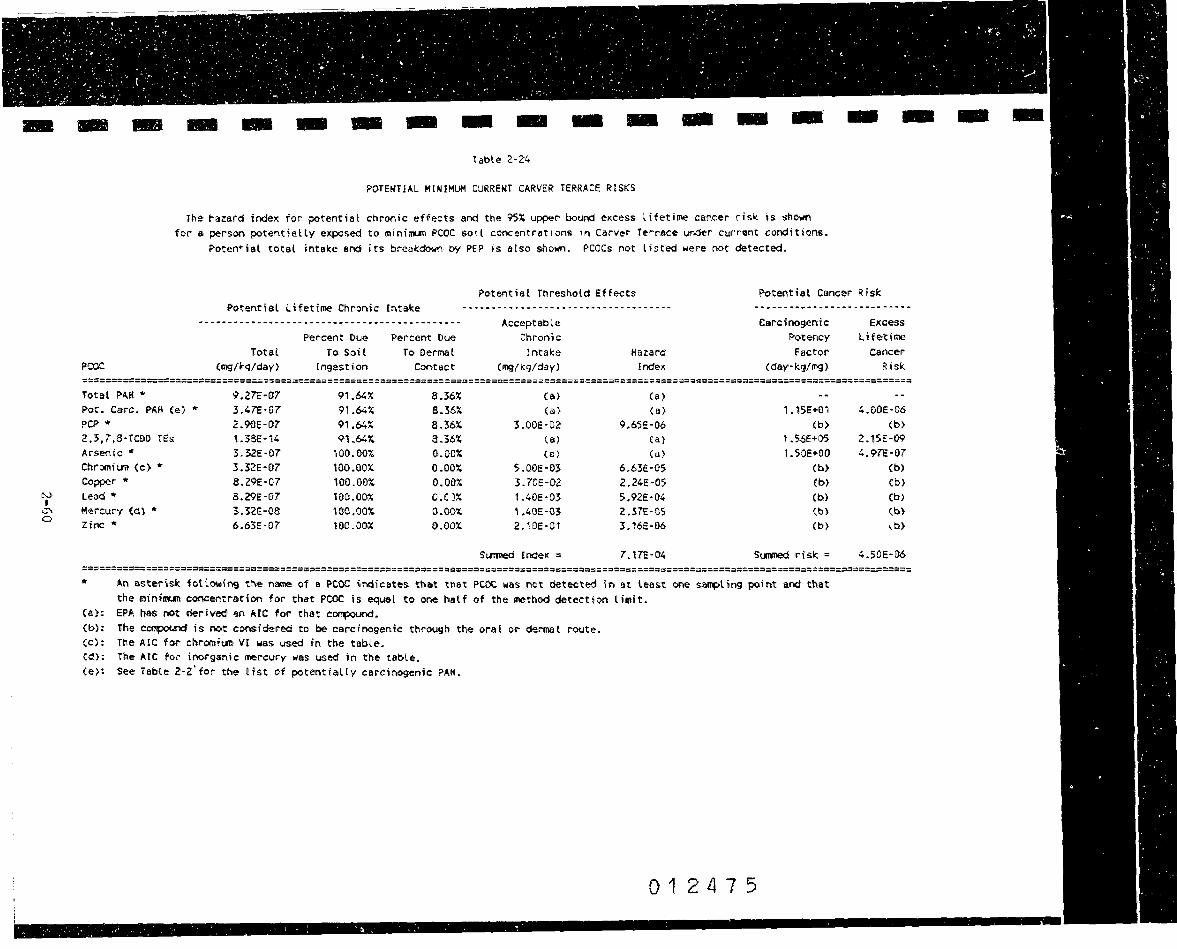
-
r:,.,.): t
r,J\ 0
- - - - - - - - - - - - - -Table 2·24
POTENTIAL MtN!MUM CURRENT CARVER TERRACE RISKS
The hazard indeK fQr potential chronic effects end the 9SX upper bound eKcess lifetime cancer risk is shown for a person potentially eKposect to minil!UII PCOC sott concentrations 1n Carver Terrace under current conditions.
Potenrial total intake and its breakdown, by PEP is also shown. PCOCs not listed were not detected.
- -
Potential Threshold Effects P'Otential cancer Rist
Total PAH"' Pot. ca,rc. PAH (e). * PCP* 2,3,7,S•imo res Arsenic • Chromh.m (c) * Copper* Lead* "er::uc-y (d} * Zi'MC *
Potential Lifetime Chronic Intake
Total (mg/lrq/day>
9.27E-07 3.47E-07 Z.90E·07 t.3SE·t4 3.32E-07 3.32E·07 8.29E·07 8.29E-07 3.32.E-08 6.63E-07
Percent Oue To Soil
lngesti,on
91.6/iX 91.64% 91.64% 91.64X
100.00~ 100.00% 100.00% 100.00%: \00,00¾ 100.00X
Percent Due
To Dermal Contact
8.36% 8.36%
8.36% 8.36%: 0.00·¾ o.oox 0.00% C.C lX 0.00?; o.oox
Acceptable Chronic
Intake (mg/kg/day)
Ca ► (a)
3.00E-02 (a)
(a)
5.00E-03 3.70E-02 t.40E·05 \.40E·03 2.1oe-01
St.mned EndeK =
Hazard Index
Ca) (a>
9.65E·06 Ca} Ca>
6,63E·05 2.24E·05 5,92E·04 Z.57E-05 3.16E·06
7.17E-04
Carcino9enic Potency
Factor (day-leg/mg)
1.15E+01 (b)
t.56E+05 1.50ۥ00
Cb> Cb> Cbl (b)
(b),
SUM!ed risk.=
* M asterisk toHowing tllle name of a PCOC incHc:ates that that PCOC was no,t detected in at least one saftl)'Ung point and that the minillUlt conc:entretion for' that PCOC is equal to one half of the method detection Umit.
(e):
Cb): Cc): (d):
Ce):
EP'A has not derived 'ln AIC for that c~·. 'l'he ~ is not cons,idered to be carcinogenic through the oral or dermal route. The AIC for chromh.m VI was used l'n the table. ihe AlC for inorganic mercvry was used in the table. See i'abte 2·2"for the Hst of potentiaUy carcinogenic PAH.
012475
EKcess Lifetime
cancer Risk
4.00E-06 Cb)
2. t5E-09 4.97E·07
Cb) Cb) Cb> (I:)}
,b)
4.50E·D6
-

-
N; I ,r-.
I-'
- - - - - - - - - - - - - - -pQ,TENHAl JlllNtHUM FUTURE CARVER TERRACE RISKS
TM Mtard iMeit for poterttie.t ch.ronic effects (coltll'n 6t e.nd the 95X upper~ el'.cess lifetiate cancer rid: (cotl.lN\ &) ht. U<llffl for a person poteoti&Hy e)(posed to mi-ninun, PCOC so.it concentrations in Carver Tenac:e under future- c:ondhions.
Potentiat total intake and its breali:o'01.1n by PEP is also shown. PCOCs not tisted were n.ot detected.
P-otential Threshold Effe::ts Poteotia,t Ctlneer Risk
PCOC
Total PAH '"" Pot. Care. P'Afl· (e) ., PCP"' 2,3, 7,S·TCOO ves Arsenic"" Chromh.m (c} * Copper* Lead" Kercu.ry Cd} * z;r.c "
?otentiat Lifatime Chronic Entake
6.62E·08 Z.481:-08' 2.90E·0:7 3.25E·t5 3.:SZE-07 3-.32E·07 8.29E·07 s.29e-or 3.32E·08 6.63e-or
Percent Due ro Soil
Ingestion
91.64X 91.64¾ 9l.64X 9t.64X
100.00X lOO.OOX 100.oo~ 100.0~ 100.00X 100.0lX
?ercent Oue
To E>e rma I
Contact
8,36X 8.36t S.36X 8.36X o.oox 01.00X o.o~ o.oox o.oox o.oox
Accepuble Chron-ic
ln,take (mg/kg/day)
(a)
Ca) 3,00\:-02
Ca) ~a)
5,00E•013 3 • TOE· 0.2 1,40€·03 t.40E·03 2.lOE·Ol
St.ftltied fndei,;: "
(8)
(a)
9.6'>E ·06
ۥ) (a)
6.6lE·05 2.245-05 5.9,?1:·04 2.37E·05 3. 1·6E•ll6
7.17E·04
Carcinogen,ic Potency
Factor (day·ll:9/mg)
1.15E+01 (b)
1. 561:•05 i .50E•OO
(b)
(b)
(b)
Cb) (b,)
St.llllled risk=
El!.c:es.s 1. ifetime
Cancer Risk
2.86E·07 (b)
5.06E·10 4.97E•07
(b)
(b)
(b)
(b)
(b)
7.Sle-07
.. An asterisk fotlowing r:he name of a PCOC. iookates that t!ult PCOC was not detected ,n at leost ooe ~le and! thftt one l\&lf of tt\e method! dete,ctfon limit has been used a,s a minin.m concentration.
(a):
{b}:
Cc): (d),:
(e):
E?~ has not derived an AFC fo.r that c~'-Tne t.~ is no,t considered te> be c:arc:i,r,ogenk through the oral or dei-mat route. ihe Ate for chromit.ii VI was IJSed in the table. The AIC for inorganic mercury was u,sed in the tabte. See Tabte 2·2 for the Ust of potentially carcinogenic PAlf.
012476
- -

I I I I I I I I I I I I I I I I I I I
2.3,5 Potential Health Risks at Kennedy Sar.d and Gravel
A current exposure scenario, in which the fence is assumed to deter trespassers, and two future scenarios were evaluated
fo: Kennedy Sand and Gravel. The first, and more possible of the f~ture scenarios, assumes that the fence is not maintained but the property remains idle and that PAHs degrade. Risks associated with this scenario were estimated quantitatively. The second future scenario assumed hypothetical residential development of Kennedy Sand and Gravel property. Risks associated with this scenario were not quantified but are
discussed in relation to risks estimated for potential :uture
exposures at Carver Terrace, The most likely future scenario, for which risks were also not quantified, assumes that the fence is maintained, some organic PCOCs degrade, and exposure frequency is identical to the current scenario,
2.3.5.1 Potential Carcinogenic Risks
Current
Two potentially carcinogenic PCOCs were identified in the soil on Kennedy Sand and Gravel Property: potentially carcinogenic PAH and arsenic. The total estimated upper bound
excess lifetime potential carcinogenic risk, given assumptions for current exposures described in Section 2.2, ranges from 3.3xlo-7 to 6,9xlo- 5 or the minimurr. and maximum PCOC
surface soil concentrations, respectively (Table 2-26), with a geometric mean risk of 2.8 x 10-s.
Future Risks
Potential carcinogenic risks in the future at Kennedy Sand and Gravel, assuming the fence is not maintained and the
property remains idle, range from 3.0xlo-5 to 3.3x10⁻⁷ for
maximum and minimum surface soil concentrations (Table 2-28),
2-62
.... 0
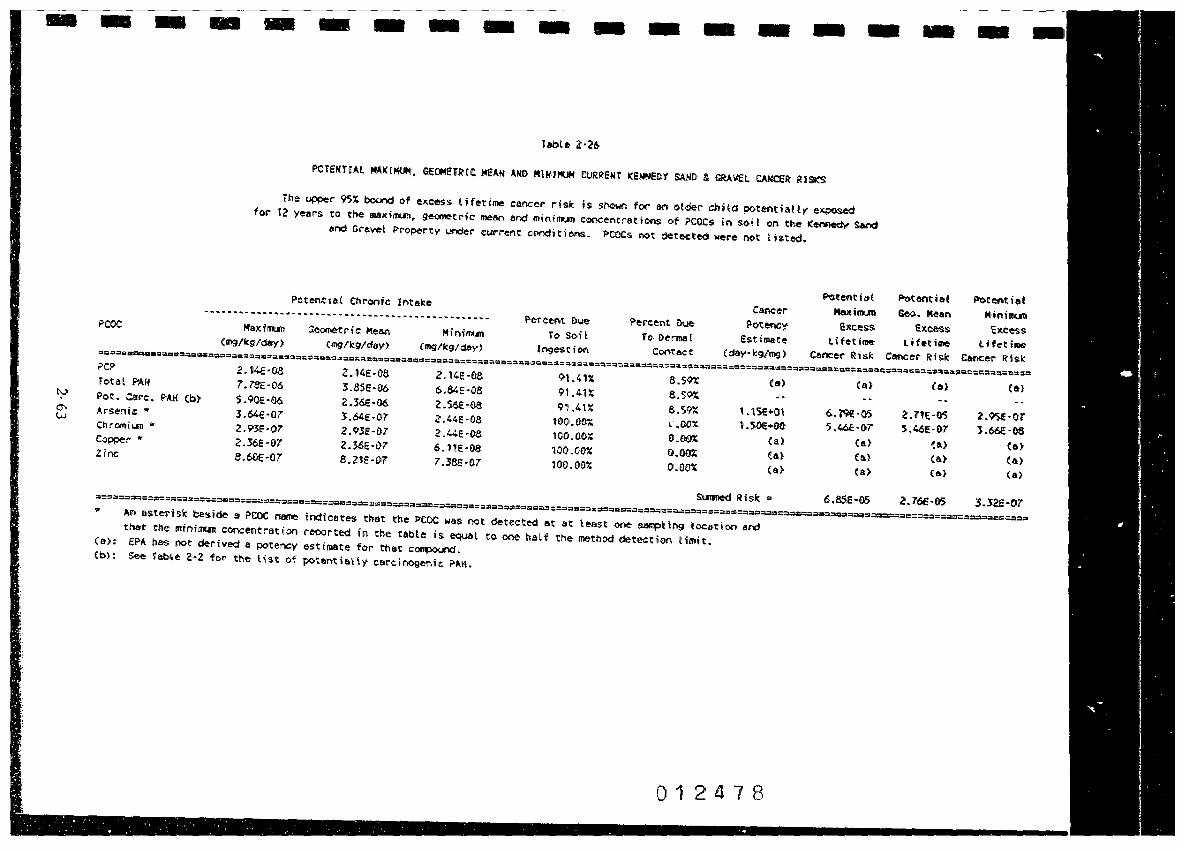
-
":-' a-, w
- - - - - - - - - - - - - - -P(),fENTEAL MAJ<EMUM·, G!f»!ElilUC 141:AN AN& MINIMUM CURRENT ICENIED,Y SAMO & GAA\i£t. CANCER RISKS
The ~r 95% bouf'ld of' eitcess Ufetime cancer risk is $hown for an otder c:hHd potentially elC(!)OSfld fol" t2 years to, the uxioun, ge0111etrh: mean and minillUQ concentrations of PCOCs in soH on the (erinedf Sefld
and' Gravel Property 18'1der current cmditions. PCOCs not detected weN not tistod,
POX
PCP Z.14E·08 Total PAff 7,78c•06 ?ot. care. PAK (b) S.90E·06 Arsenic * 3.6'E·07 C:hromi11111 ,. l,913E·07 Copper* 2,l6E·07 Zinc 8.60e-07
Geometric Mean (1119/li:!il'/day)
2.14E·0'8 3.85e·06 2.36E•06 3.6'E-07 2.9'3E-07 2.36E·07' a.21:e-or
M'inirrun (mg/k:9/d,ay)
2.14!!·08 6.84!!•08 2:.56£-06 2,44E·08 2.441:•08 6.1tE•08 7.!BE-07
P.erceot l>u& To Soil
Ingestion
91.4t:C 91 .41t 91.4\~
too,.oox too.cox tOO.OOX ,oo.ooi
Caneer Pe-rcent &ue Po,,:ency
fo Dermal Estimate Contact (da',"·li:9/1119)
8.S9X (a)
8.S~ 6.S9Z 1.15E+O\ \',OO·X l • 5,0e fo(IO
0·.00% (a)
0.002: (a)
o.oox Ca)
Sumied Risk=
An 11,stei-isk beside a ?toe neme indicates tbat tl'le PCOC was not detected at at least ooe ~- ingi loc:&tion and thait the mfni,ffUI c:onc:enti-ation reported in the table is equat to one hatf the rnethed detection t imiit.
EPA has not derived a potency estimate fol" that c:~. See Tabte 2-Z fo-r the list of potentially eeircinogenic P.AII.
012478
Potem:i•t Mallian e~ce:ss
lifetime Cancer Risk
(&)
&.7'€-0S S.46e·07
(a)
(a.) (a)
6.8SE·05
Potential Geo. Mean
EllcHS L ifetillle-
cancer Risk
(lll)
2.i"tE•OS s.~·07
<•> (a)
(0)
2.761:-0S
-
Potentie1l Mini...-bces.s
LifetilN catw:er Risk
Ce>
l.9SE·OT J.661E·OS
(a)
(&) (a)
3.321:·07

I I I I I I I I I
'I I I I I I I I I I
with a geometric mean cancer risk of 1.4 x 10- 5• Future
risks for the scenario in which a hypothetical residential development is constructed on Kennedy Sand and Gravel would be no greater than those estimated for future conditions at Carver Terrace (Tables 2-21, 2-23, and 2-25}. Note thdt several reasons explaining why hypothetical future exposures at Kennedy Sand and Gravel may be lower than future exposures at Carver Terrace were listed in Section 2.2.6.2. Thus, the potential future risks estimated for Carver Terrace should not be regarded as representative of hypothetical future risks for
residential development of Kennedy Sand and Grav~l. These will likely be lower.
2.3.5.2 Potential Non-Carcinogenic Risks
Current
Esti~ates of potential non-carcinogenic health risks resulting from potential current eKposure to PCOCs in surface soils at the Kennedy Sand and Gravel Property are shown in
Table 2-27. The summed hazard indices for maximum, geometric
mean and minimum surface soil concentrations are much less than one indicating that estimated current chronic intakes, given
the exposure assumptions used, do not exceed allowable chronic intakes for any of the PCOCs. Therefore, no adverse
non-carcinogenic heaith effects are anticipated from potential current exposures to PCOCs in surface soils at Kennedy Sand and Gravel.
Future Risks
Assuming the fence is not maintained, the property remains idle and that degradation of PAHs occurs, the summed hazard
indices for potential non~ carcinogenic risks in the future at Kennedy Sand and Gcavel are much less than one for maximum,
geometric mean and minimum surface soil concentrations (Table
2-64
0

-
~ I
0' (.,'"I
- ... - - - - - - - - - - - - -Jable 2·27
The chr-cnic hazard index for potentiat threshhold effects is shown for an older child potentially exposed for 12 years to the ma:,,;.hlun, ge<:iRYatrk mean end mi>1i!l'Utl concentrations o,f POOCs
fc-1 soHs- CCl the Kennedy Sand and Sravel Property. PCOCs not listed were not detected.
POtefltiat Chronic Intake Acceptable ••••-•••--•--•••w•••••--•••••••••~•••••••••~•••~• Percent Pue Percent Due Chronic
PCOC Iota~,- Geomet r f.c Mean I'\ i r, \ !IU'\I To So\l lo O.ermat tntake (mg/icg/day) Cmg/icg,/day) (mg/ic9/day} ingest fon Conte.cc Cmg/kg•/day)
PCP 2.14E-08 2.14E-08 2.14E·08 91.41% 8.59% 3.00E·02 Total PAFf 7.78E·06 3.85,E-06 6.84E·08 91.41% 8.59% Ca) Pot. Care. PA.It (c) 5.90E·06 2 .:\6E ·06 "''i6E·08 91.41X 8.59% Ca) Ar-senic,. 3-,64E-07 3.64E-07 ' '>E·08 100.00X o.oox Ca) Chromit.ffl Cb) " 2.93E·07 2.93E ·07 •• 44E·08 ,,oo.oox 0.00% 5.00E-03 Coppe!"* 2.36E-07 2.36E-07 6. HE.·00 ,oo.oo,: 0.00% 3.70E·O2: Zinc 8.60E·07 8.21E·C7 7.38E·07 100.00X 0.00% 2.,01:-01
Staned E nde1t.
An &Sterislc beside> e ?toe name indicates that the ?CCC w·as not detected at at le&st one s~U ng tocati on and tha,t the mfoin.111 concentration reported in the table is equal to ooe half the method detection limit.
(a): E?A has not derived an allowable chronic intake for that c~und. Cb}: lhe aHowbl<!' chrot'\Ic intake t'oi:- chi:-ome Vt was used. Cc>: See fabte 2·2 fo·r the l is.t ot potential ty carcinogenic ?AH.
012480
?otentiat Maximun Chronic
Ka,tard rrKtex
7.l2E·07 Ca> Ca) Ca)
5.86E·05 6.39E·06 4.09E·06
6.98E·05
- - -
?otential ?-otential Geo. Mean Minim,.,.m
Chronic Cl:1ronic tt•azard "1ue.rd
Index Index
7. l2E·0•7 7. t2E•07 (a> (a) (a) (a)
Ca) (a)
5.86E·05 4.88E·06 6.39E·06 1.65E·06 3.91E·06 3.51E·06
6.96-f-05 1.08E·05

-
tv r
0-, O'I
- - - - - - - - - - - - - - -
PCOC
PCP Totat PAH ?ot. C&rc. PAK Cb) A.r-senic "' Chromi·un. "' Copper • Zinc
Table 2·28
POfEMTIAl MAXIMUM, GEOMETRIC MEAN ANO MINIMUM FUTURE KENNEDY SAND & GRAVEL CARCfNOGEN!C RISKS
The upper 95X bound of excess l i fet lme cancer r hie: i a 11,hown for o porson potmt I 11,I I y expo11od for l'O y.ao to the ll'lt;lxi11uu, geometric lflean end minillUll concentrations of PCOCs in soil on the Kennedy Send & Gravel property under
future conditions. ?CCCs not Listed were not detected.
Potential Chronic fntak:e Potentiet Potential
~---~-----~-·--------~-~·-·-~~-·---~-~~·~--- Cl!lncer Mall;ll!Ul't Geo. llleim MSl<lllUII Geomeu i c Hean Minil!'U11 Percent Due Percent Due P<;>tency E;,c:cess E;,c:cess
Totat Total Total To Soi t To Dermal Factor Lifetime Lifetime Cmg/k:g/day) (mg/k:g/day) (mg/leg/day) [ngestiori Contact (day-kg/mg) Cancer Risk Cancer Risk
1,19E-0.7 ,.,9€-07 1.19E-07 9~.09't. 6-.9\X (a) (B} (a)
3.09E-06 L5:SE-06 2.67E•08 93.09% 6.9t~ 2.JSE-06 9.36E-07 1.04E·08 93.09% 6.9\t 1.15f.+01 2.70E·OS t.08E·05 2.06E'·06 2.06e-06 1.38.'.E-07 t00.00% o.oox 1.5-0E+OO 3.09E-06 3.09E-06 1.66E-06 1.66e·06 1.38E·07 t00.00¾ 0.00% (a) Ca) (Eli)
1 .34E-06 L34E-06 :5.46E.·07 t00.00.Z 0.00¾ Ca) <a> (a)
4.87E-06 4.65E·06 4.18E·06 100.00% 0.00% (a) (a) ( a)
Slffllled r!$k " 3.0tE•05 l.38E-05
F>otential M fr,i :TU'II
EKcess Lifettme
Cancer Risk
(&)
1 .20E•07 2.07E•07
(a)
(a)
(&)
3.27E·07
.. An asterisk: following the name of a PCOC indicates that the PCOC was not d~tected in at least one sa~te and that the mininun concentration is equal to one half or the method detection Umit.
(a): EPPi n-as no,t del"ived El potency estimate far- that c~. (b): See Table 2·2 for- the list of potentially carcinogenic Polk._
Table 2·29
P01TEMnAl HA)(lMtJM', CiHlMl!:'TRIC H~A!-1, ANO HHHMUH FmURE K[t,IMEOV SANO & t.RAVEL tl!RESHOLO RISKS
012481
-

I I I I I I I I I I II
1• 11 I I ii
I• \1 \,
I
2-29} indicating chat estimated future intakes do not exceed
allowable levels. Future non-carcinogenic risks for the
scenario in which a hypothetical residential development is constructed on Kennedy Sand and Gravel would be no greater than those estimated for future conditions at Carver Terrace (Taoles
2-21, 2-23, and 2-25) but several reasons explaining why
hypothetical future exposures at Kennedy Sand and Gravel may be lower than future exposures at Carver Tetrace, were listed in
Section 2.2.6.2. These included lower PCOC concentrations at Kennedy Sand and Gravel than at Carver Terrace and that a
substantial layer of fill would need to be placed over existing
soil, for development to occur.
2.3.6 Potential Health Risks at Seeps
2.3.6.1 Potential Carcinogenic Risks
Estimates of the potential carcinogenic risks caused by
potential exposure to maximum PCOC concentrations in soils at
seeps is presented in ~able 2-30. The total estimated upper
95% bound excess lifetime cancer risk, assuming the exposure
assumptions described in Section 2.2.7, is about lxl0-8
(Table 2- 30). Minimum risks at seeps are shown in Table
2-31. They are identical to maximum seep risks.
2.3.6.2 Potential Non-Carcinogenic Risks
Estim~tes of the potential future non-carcinogenic risks
caused by potential exposures to maximum and minimum PCOC
concentrations in seeps are presented in Tables 2-30 and 2-31,
respectively. The total HI is much less than one indicating that. Little potential exists for non-carcinogenic adverse health effects to be caused by maximum or minimum PCOC concentrations in seeps. Potential current and hypothtetical
future risks are not differentiated because current and future exposures {Section 2.2.7) were assumed to be identical.
2-67 5722F 4040-001-600
('\J
co ,::j'"
(\J
0
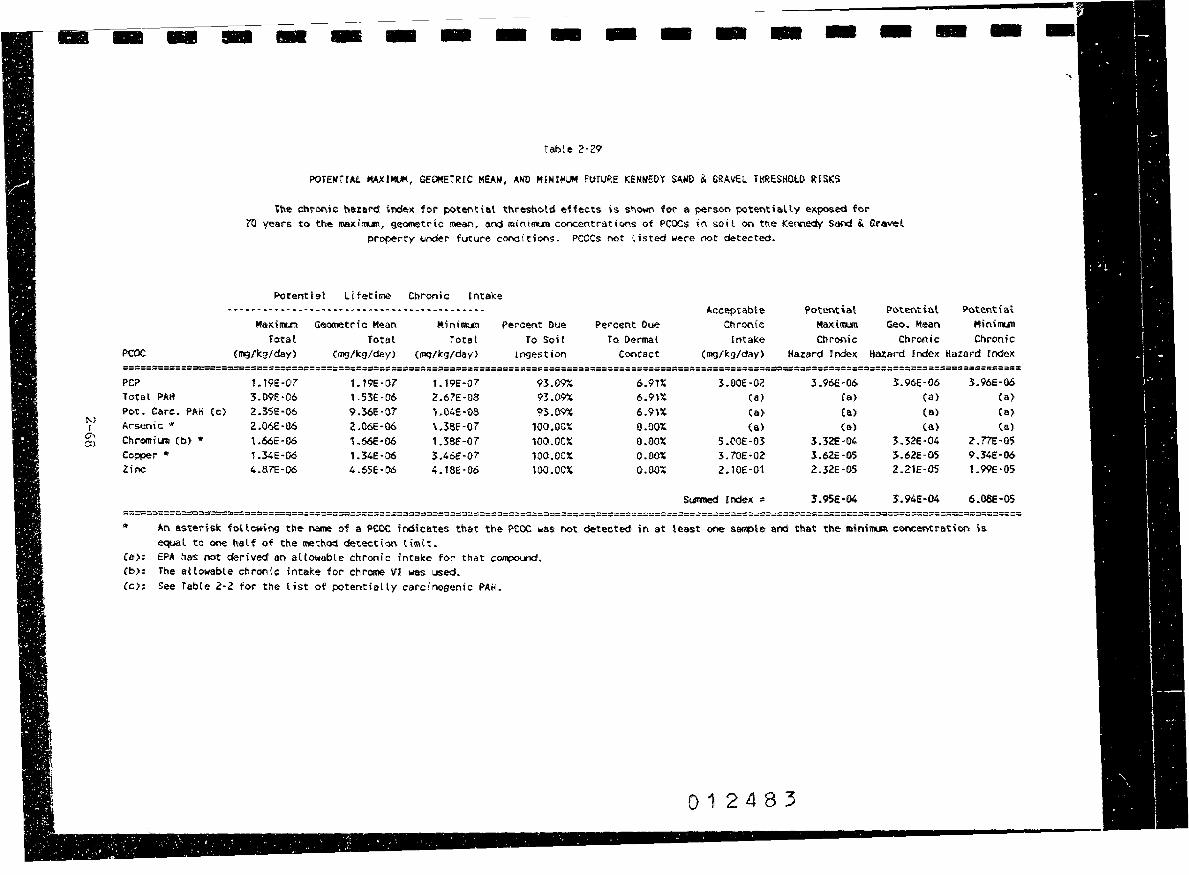
11'-1 f
a-, cu
- -
PCOC
PCP lota·l PAlt Pot. Care. Pt.It Arsenic• Ch!romi1.m Cb) :tr
Copper * Zinc
- - - - - - - - - - - - - - -
(c)
rabte 2-29
POTEHnAf. MAXIMUM, GEOMETIHC MEAM, ANO HIN !MUM FUTl!/RE ICEN"NEDY SAHD & GRAVEL TltRESffOLD RISKS
Ttl.e cl:'ll"cnic h8>Hl'd tnd&1t for l)Otel'\ti&l threshc.ld effects is shown for a person potentially e1tpos.ed foi-ro years to the llllltiaun, gecmetr-ic mean,~ mint!IUl'I c00Centraticins of PCOCs in soil oo thie ICennedy Sand & Gf'avel
property under future conditions. PCOCs not listed were not detected.
Potentiat Lifetime Chronic Intake Potffit:h,l POtef'otial
MaKillU'a: Geometric Mean Total
(mg/k:9/day)
Miniaun 'l'otat
(1119'/lcg/day)
Percent Due To Soil
h"lgestion
Percent Que ro Dermal
Concacc
-.cceptable Chronic
ll'ltalc.e (mg/kg/day)
MaK ht·un Geo. Mean Minfoun Total
(mg/kg/day)·
1. r9e-o,r 3.09E-06 2;.3SE·06 2:.06E·06 1.66E-06 11.34E-06-4.BTE-06
1.?9E•07 t .53E•06 9.36E•07 2.06E·06 1.66E·06 1.34E-06 4.65E·06
t.19E•07 93.09% 6.9T1' 2.67E·08 93.~ 6.91X "Ul4f·08 93.09% 6.9'\X 1.18F•07 10O.00X o.oox 'l.38c-07 100.00" o.oox 3.46E·07 100.00X 0 .OO"l 4.18E·06 100.00X o.oox
Chronic Chronic Chronic Kazard fndeK Hazard Index Hazard lnclex
3.DOE-02 3.96E·06, 3:.96E-06 3.96E-06 Ca) Ca> ca.) Ca) (a) (a,) (a) Ca) (a) (&) ca> Ca)
5.CQE·03 3.32E·04 3-.32E·04 2.m-os J. 70E·02 l.62E-05 :S.62E-05 9.34E·06 2. tOE-01 2.32!:·0S 2'.2tE·05 l.99f·05
S1.11111ed E ndex = 3.95e·04 J.94E·04 6.08E·0S
~n asterisk fotlCW'ing the name of a PtoC indicates that the PCOC was not de-tect:ecfa in at least one s~le at'ld that the mininul\ eOl'\Centrat:ion is equal to ,x,e half of the method detecti® limit.
Ce): Cb):
EPA hes not del"ived' an altowable chronic intalce for that e~. The at towable chronic: intake for chrome VI \ll'&S used.
Ce): See Table 2·2 for the list of potentially carcinogenic PAff.
012483
-
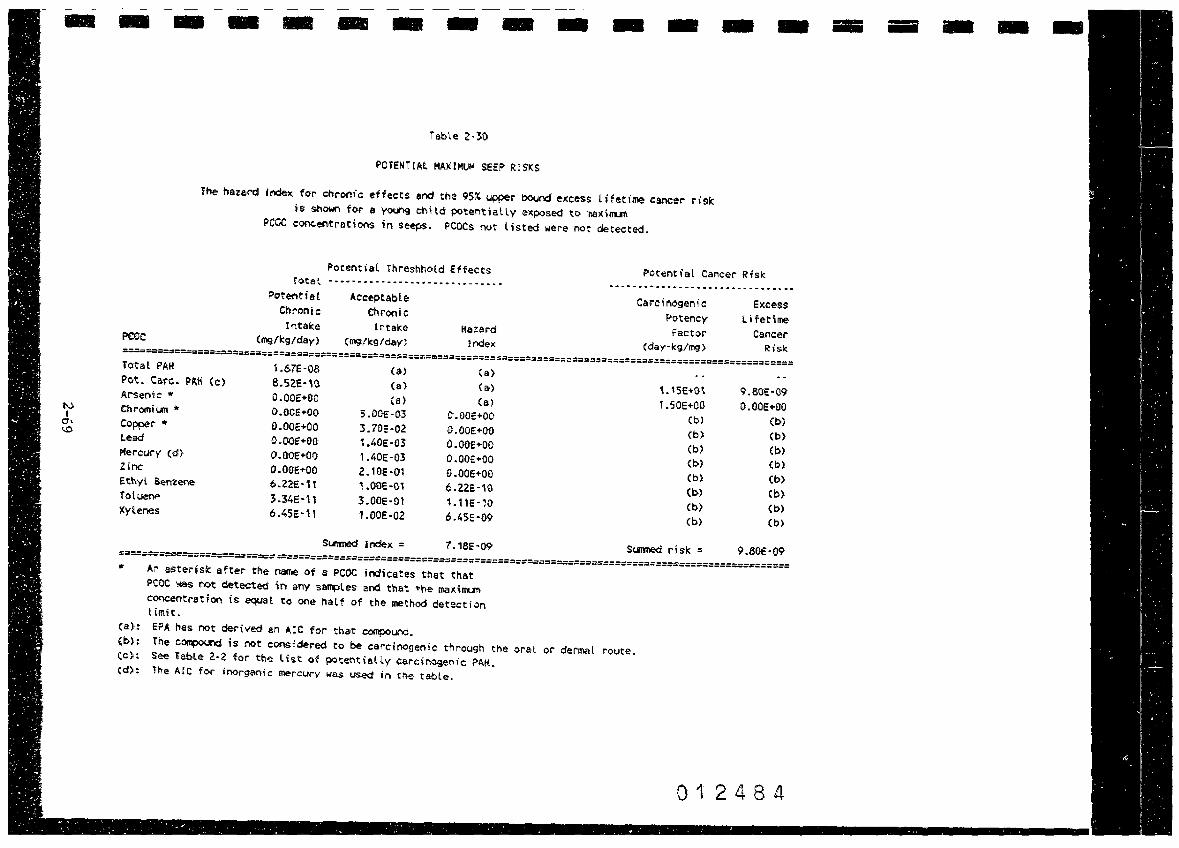
-
lV I a,
"°
- - - - - - - - - -POTENT!At. MAXIMUM SEEi> RISKS
The tun:ar;-d index for chronf c effects and the 95X upper bound excess lifetime cancer r isl: i's sh01oln for a YOU"l9 chl la potentially exposed te> aiaxilTUfl
PCCC cooc.entre.tioos in seeps. PCOCs !10t listed were not detected.
- -
Potential Threshhotd Effects Total ··········-···--•--···••······
Potential Cancer Risi:
iotat PA!f
Pot • Care. P'-1'1 (c)
Arsenk * ChromiUT1 * Copper* t.ead Pl!ercury Cd) Zinc Ethyl Senzene, ioluen,o,,
Xytenes
Potential Chi-onic Intake
Cmg/1:gfday)
1.67E-08 S.5.2.E·\O O.OOE+OO· O.OOE+OO O.OOE+OO o.ooe+oo O.OOE+OO O.OOE+OO 6.22E·it 3.34E·H 6.451:-11
Acceptable Chronic
lntalce (mg/1:g/day),
(3)
(a)
(a)
5.00E-03 :S.70E·02 1 .4oe-o,:s 1.40E·03 2. 10E·01 1.00E-01 3.00E-01 1.00E-02
Sumied Index:
Hazard !ridex
(a)
( et)
Ca~ 0.00E+OO O.OOE+OO 0.00E+OO O.OOE+OO O.OOE+OO 6-2.21:-10 L 11E·10 6.45E·09
7.18E·09
An esterisk after the naaie of s PCOC indicates that that PCOC we.s mt detected in any sflll'f,les and that •he ma:ie.irrun concentration is equal tc one half of the method detection limit.
(a,),:
(b):
(c): (d):
EPA has not derived an AIC for that compoUl"ld. The c~ is not consfdered to be carcinogenic through the oral See table 2·2 for th'/: l\st of potentially carcioog,enic PA~. The AfC for inorganic mercury was used in the table.
CarciMge!"li:e Potency Factor
(day·kg/mg)
1.t5E+Ol ,.soe+oo
Cbl (b)
Cb) (b)
Cb)
Cb)
Cb~ (b>
Sc.mned risk :::
or dermal rotite.
Excess Lifetime
Cancer Risk
9.80E·09 O.OOE+OO
(b)
Cb) Cb> (b)
Cb> Cb) Cb) (b)
9.80E·09
012484
iill iiiiil - - -

-
r-.., I
-..J <;j
- - - - - - - - - - -POTENTIAL MfNlMUM SEEP RISKS
The hazard index for chronic effects and the 95% upper bound excess lifetime cancer risk is s~own for a young child potentialty exposed to minil!U!l PCOC concentrations in seeps.
PCOCs not listed' were not detected.
- -
Po,tent i al 'l'hreshhotd Effects Potential Cancer Risk
PCOC
fote,l PAI!
Pot. Care. PAff Ccl Arsenic • Chromit.lfl • Copper• Lead" Mel"CI.K"Y (d) * Zinc Ethyl Senzene Toluene >Cylenes
Total-·····-···-···•-··········--·· Potential
Ctm,nic Intake
CRIS/kg/day)
1.67E·08 8.52E-~O O.OOE+OO O.OOE+OO O.OOE+OO O.OOE•OO O.OOE+OO O.OOE+OO 1.50E·11 5.76E·12 4. t4E·'l1
Acceptable !:hronic
Intake (mg/kg/day)
Ca> {a)
Ca) 5.00E-03 3.70E·02 1.40E·03 1.f.OE·03 2.10E-Ot 1.00E·01 3.00E-01 l .00E·02
Stllllled I rde11: =
lfazard Cndeit
(a)
(a)
(It)
O.OOE+OO O.OOE+OO O.OOE+OO O.OOE+OO O.OOE+OO 1.SOE·TO 1.92e-1, 4.14E·09
4.31E-09
Carcinogenic Potency
Factor (day-kg/mg>
\.15E+O'\ t.SOE+OO
(b) Cb) Cb) Cb) Cb) (b) Cb> (b)
Sl.llllled d sr.: "'
Excess Lifetime
cancer Risk
9 .SOE-09 O.OOE+OO
Cb) Cb) Cb) (b)
Cb) Cb)
(b-)
(b-)
9.80E·09
• ~n estertsk.after the name of a PCOC indicates that that PCOC was not detected in at least one sample end that the miniflUII concentration is ~t to one half of the .nethod detection timit.
(a): (b):
Cc): Cd>:
EP"- has not der-ived an A.IC tor that c~. The c~ fs not considered to be carcinogenic through the orator dermal route. See Table 2-2 for the list of potentially carcinogenic PAH. The AEC for inoorganic mercury was used in the tabte.
012485
- - - - -

. \ . ' . ·- - ,; {
·. _ -~'-~-:-'-----;;..~--•~-----=.....,,;.....;;..;..,;..;.!..;..;,.. __ e:,,,;.,_~;;,_.;..:..,;,;..L.;...:_~.;..;;...:=.::.L.;,!;_.:_,,;,..:,._ __ -~,,.~-:,;_:.:.,: __ ,,..;..~_:_=.;..L...;,;;._;_:__;_ __ ..,..;;__.,;_J. ~.:.:._..::._:.:_.;..,_.;..:.
I I I I I I I I I
I I I I I I I I
j
2.3.7 Potential Health Risks from Sediments
2.3.7.l Potential Carcinogenic Risks
Estimates of the potential carcinogenic risks caused by
potential exposure to maximum, geometric near minimum PCOC
concentrations in sediments are presented in Table 2-32, Table
2-32a, and Table 2-33, respectively. The total estimated upper
95% bound excess lifetime cancer risk, assuming the exposure
assJmptions described in section 2.2.8, ranges from about
6.9x10⁻⁷ to 1.2x10-S with a geometric mean risk of about
l.lxlo-5 (Table 2-32a). Potential current and hypothetical
futJre risks are not differentiated because current and
hypothetical future exposures {Section 2.2.8) were assumed to
be identical.
2.3.7.2 Potential Non-Carcinogenic Risks
Estimates of the hypothetical future non-carcinogenic
ris~s caused by potential exposures to maximum, geometric mean,
and minimum PCOC concentrations in sediments are presented in
Table 2-32, Table 2-32a and Table 2-33, respectively. Neither
the total nor individual Hts exceed one. Thus, little
potential exists for non-carcinogenic adverse health effects to
be caused by maximum or minimum PCOC concentrations in
sediments. Potential current and future risks are not
differentiated because current and future exposures (Section
2.2.8) were assumed to be identical.
2.2.8 Potential Health Risks from Subsurface Soils
2.3.8.1 Potential Carcinogenic Risks
Estimates of the carcinogenic risks caused by potential
utility worker exposure to maximum and minimum PCOC
concentrations in subsurface soils is presented in Table 2-34
2-71
\()
cc q
(\J
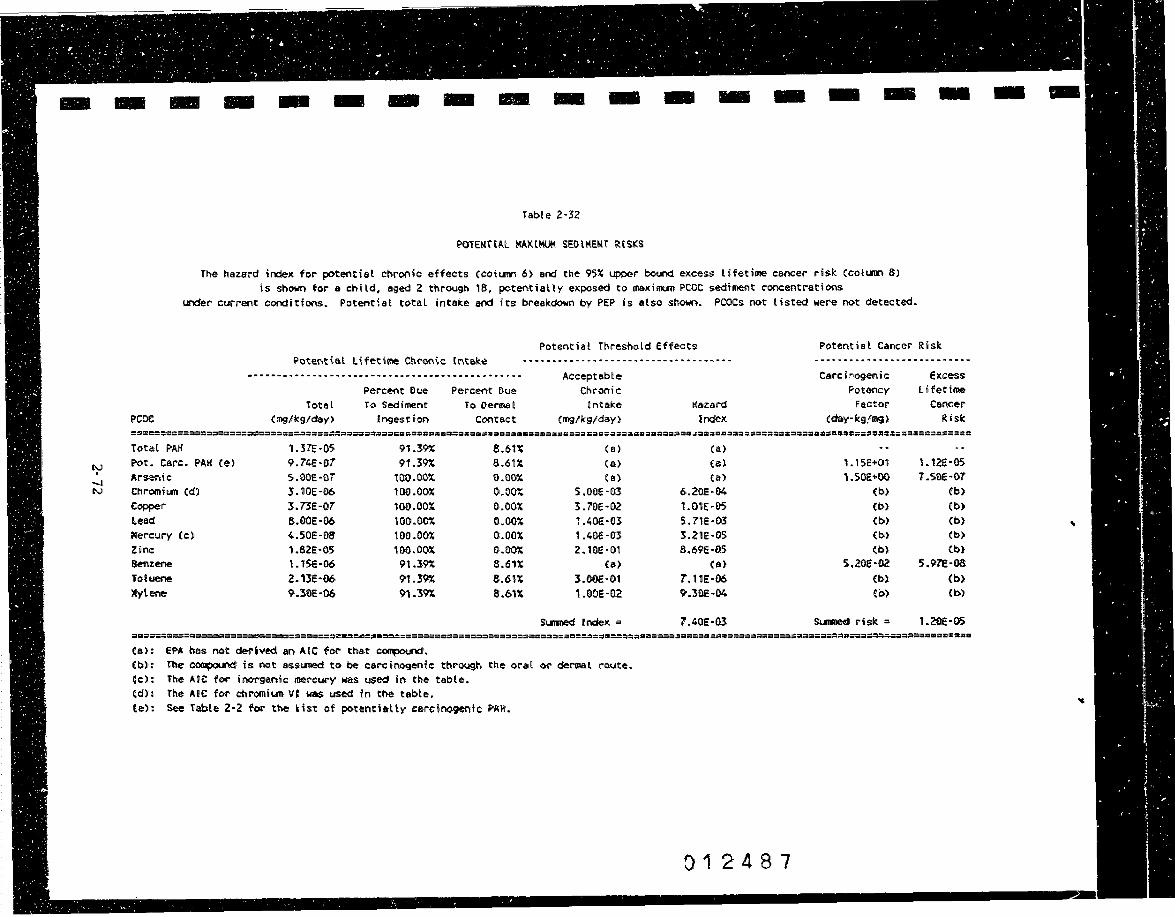
-
[\) . -..J N
- - - - - - - - - - - - - - -
The hazard irdex for potential ct'lronic effects (cohm1 6) and the 95X upper bound excess l Heti111e cancer risk Ccolum 8} ts shOldf'I for a child, aged 2 through 18:, po-tel"ltiaHy expo-sed to ma-xillll..fll PCOC sediment c-oncenti-ations
t.Aider current conditions. Potential total intake and its breakdown by PE? is also shown. PCOCs not listed were not detected.
-
Potential Threshold Effects Pote!i'\tiel Cancer Risk
PCOC
Total PA.Ii Pot. Care. ?Ail Ce) Arsenic Chromit.1'1'1 Cd) Copper Lead ~ercury Cc) Zinc Benzene
Totuene )(ylene-
Poter.tiat LH'eti111e CnrOl'ltc Intake
Toteil (mg/kg/day)
1.37E·05 9.74E·07 S.OOE·OT 3.10E·06 3.73E·07 8.00E-06 {,,.50E·08 L82E·05 t.lSE-06 2.UE•06 9.300.·06
Pee-cent Due To Sediment
Ingest i· on,
91.39'X 91.39%
,oo.ocx 100.oox 100.00X 100.0CX 100.0~ 100.oox
91.39'.t
91.39X 9'1.3~
?ercent Due r o Oerlll8 I
Contact
8.61X 8.6tX o.o~ tU)OX o.oox o.oox o.oox Q;.01);
8.6,X 8.6tX 8.61X
fa): EP.l has not derived an Arc for that co11~01.nd.
"cceptebte Chc-onic
Intake (mg/kg/day)
Ca) Ca> (a)
5,00E·03 3.70E·02 t.40E·O(S 1.401:·03 2.1oe-01
Ca) 3.00IH!)t t.OOE-02
Si.mnec:I f ndex =>
(b)·: The c~ is not asst.rneel to be car-cin~n!e thr-ough; the oral ~ denna.l route. tc): The MC for inorganic mercu,r-y was used in the table. td): The AIC far chromiu:n Vt was used in the table. te): See Table 2-2 for the tht o,f potentiaHy 1:arcinogentc P'AH',
(~)
(e)
(a)
6.20E·04 1.01E ·05 5.7tE·03 3.21E•05 6.69E•05
(II}
7. t1E·06 9.30E-04
7.40E·Ol
012'487
Carci~genic ~otency
factor (day· kgfmg >
\.l5E+Ol l.SOE+OO
(b)
(b}
{b,)
(b> Cb}
5,20E·02 (b)
to>
Sl:fflDed risk"'
Excess: Lifetime
Cancer Risk
1.12e-os 7.51)f·07
Cb> Cb) Cb) Cb) Cb)
5.97E-oa (b)
Cb)
1.28€·05
-
..

-
CV f
..J w
- - - - - - - - - - - - - - -
The hazard il"ldex for potent lat r:flrontc effects (cotwn 6) w the 95,X upper ~ excess l ifeUM Ql'leer risk (colta, 8) i$ s~ fo,r a child. aged ~ tnroc.,gh \8, potentially •~ to 9e'Qllmric 11&an PCot S1e,,,jiment CC'ftecintr11tiGnS
under- cuvr,mt conditions. Potential total intalce and its brelllcdown by PEP is ats.o sho..n. PCOCs not listed wiere Mt detected.
Piotential Threshotd Effects
PCOC
Total ?Alf Pot. Care. P~ff Ce> '-r'$entC
Chromh.111 (ct)
COpper le-ad: Mercury (cl ?inc Bem:ene Toluene »,tene
1'oitet (1119/li:QJ/cfa,,n
6.67E-06 9.25e-01 2.38E-01 4.15e·07' 3.73E·ll!7 6.8SE·0·7 1.20E•08 2.22E•Oo 1.1se-06 2.13E-06 9.!0e-06
Percfll'llt ~ue To Sedil!lll!lnt:
Ingestion
91.3-~ 9t.3~
100.eot 1100.00,: 160.FJ,OX too.~ ,oo.oe,: ,oo.o~ 91.m 91.]v.( 91.m
Percent Due To Oet\\\el
Contact
8.6U S.61:C o.oox 0.00% 0.00% 0.00',t 0 ••
o.~ 8.61l 8.6tl 8.6'\\:C
Acc:-,,t aot it Chronic
tnt.oke (1119/lci/day)
Ca) Ca) hi>
5.00E-03 3.10E•02 t.40E-03 1.401Hli3 2.1oe-01
(a)
3.ooe-o; 1 .OOE-02
Suned lrdex = Co): EPA has net derived an A!C for that c~.
Cb): l'he ~ is mt asSUlled ta, be corc'inosenic thr-- the oral or deF'At route. (c>: 'l'he AIC for itlOl:"glanic ~rcuryi wes used in the tablle. (d);": The AIC f04" Chromiun 'II was used ll'I the tablle. (eh See 'l'ebll.c i-? fer the list of potentially c11;rci~tc ?'414.
Ca) ta) (a,)
8.lOe-05 1.01E·OS 4.69E-Q4 8.STE•06 1.06&·05
(a)
1'. 11E·06 9.SUE-04
'LS4E·03
012488
Potential tencer Risk
Cercinogenfc PotetlCi,
fa-cUir <•·lcg/11$)
1.1SE+01 1.SOE..00
(b)
(b)
(C.)
(b)
(b)
5.Z'Oe-02 Cb) (b.)
su.ect risti: =
fKCdS !.. t tetillll'
CUICC"'
Risk
1.0SE-OS s.sae-01
(b)
(b)
(b)
(b)
(b)
5.ffl-G& (b)
tb)
1.1oe-os
- -•
..

-
r,.,: I
--.I ~
- - - - - - - - - - - - -fable 2·ll
POTENllAl MINIMUM SEDIMENT RISKS
The bllzard il'ldeic for pol:ent6aa chr11nic effects (co,lurn 6'> end the 95:t upper '=«nl e11Cess ti foci• CllfEer risk (cot..,_ 8) i,s stiown fl)I' • chHd, eg:ed 2 th-rougn, t8. poteotiaUy e111pos;ed to mini .... Pea: sediNnt corcentratians
-
l.l'lder curr---1t conditions. Potential. totat in1take Md its DC"u«.do.Wr\ by Pe.I> is also shown. PCOCs Mt Usted were Mt cbtectcd.
Total ?Alt•
.Pot. care. PAH' Ce) "' Arsenic "' Chr-omii.m Cd) • Copper • Lead• MerCIJl"Y' (C) "'
Zinc* Ben:ene • Tc,,h,ene •
)Cylerle "'
Tot:d Cffi9/k9,/da·.,.)
1.,.llE-07' 5.lSE-08 5.00E-08 5.00E•OS t.2SE•07 Z.50E·08 S.OOE-09 1.00E•C7' 1.37E-07 1.37E·Oi" L37E-ll7
P.erc,:nt &~e To Sediment
lngestim
t1 .39:t 9\.lft
100.00X 100.0&X 100.00:t 100.€1(1« 100.00: 100.00X 91."1% 91.39% 91.19%
P.ei-r:ent lkle To DettMl
contact
8.61% 8.6tX o.oox o.~ o.o~ o.oac o.oox 0.00'.t S.611' 8.6tX 8.61X
Acceptable C"',ronie
lnu,l.te (lll9/kg/day>
fa)
<•> (llt)
5.00'e•M 3.roE·DZ 1.4e!•C3 \.40E·Dl Z. lOE-01
(llt)
:s.ooe-cn t.OOE•02
Summed Index ::i
ttaz:ard lndeit
(a)
U,) (1!11)
t .OOE-05 3.$8E·06 1.79E·05 3.5i'E·06 4.161:•01
¢at 4.56E-07 1.37E·05
4.94!·05
An a$terisfl: foltowi1111 the name 011' • PCOC incl•tco,tes thet in at leest one NfflP,te tha1: POOi!: was not detected ltf'd the minhan c:oc,cen,tration is ecp:,el to one l'laU of the mett\od detectio,t liait.
Ca);
lb): Cc): Cd>:
E?~ hos not cle<rtved an kEC fQ.r tl\at c~. 'l'he c~ is not assuned to be carcinogenic ,;rtrougn Che oral cur del"ll'at roui:e. The AIC fer inovganh: mercury wos ueedl in the t~le. The AIC for chrCll'ihm 'II wn U5ed if\ the Ubte.
Ce): See Table 2-Z fer- the ttst of potentially carcinosenic ?Aff.
012489
CllrCino,teftiC
hte,ir:y Factor
(day•l:g/a!I)
1. ,se.01 1.SDE+GO
(b)
(b) Cb) Cb) (b)
5.ZOl!-02 Cb) Cb)
Slaled rist •
hens lifetiM
Cancer Risk
6.0C.E•07 7.50E·08
(b)
(b)
Cb) (b)
tb> 7. UE-09
(b)
(b)
6.8'6E·01'
- -
..

I I I I I I I I I I I I I I I I I I I
and Table 2-35, respectively. The total estimated upper 95\
b~und excess lifetime cancer risk, assuming the exposure
assumptions described in Section 2.2.9, ranges from about
9.7xl0- 9 to 9.Sxlo-8 (Tables 2-34, 2-35}. Potential
c~rrent and future risks are not dif(erentiated because current and future exposures (Section 2.2.9) were assumed to be
identical.
2.3.8.2 Potential Non-carcinogenic Risks
Estimates of the potential future non-carcinogenic risks caused by potential exposures to maximum and minimum PCOC
concentrations in subsurface soils are presented in Table 2-34
and Table 2-35, respectively. The total HI a~d individual Hls
do not exceed unity, thtts little potential exists for noncarcinogenic adverse health effects to be caused by maximum or
minimum PCOC concentrations in subsurface soils. Potential
current and future risks are not differentiated because current and future exposures (Section 2.2.9) were assumed to be
identical.
2.3.9 Potential Health Risks from Hypothetical Future
Ground Water Use
2.3.9.1 Potential Carcinogenic Risks
Estimates of the potential carcinogenic risks caused by
hypothetical future use of ground water by a non-existing
domestic well are presented in Table 2-36. The total estimated
upper 95% bound excess lifetime cancer risk, assuming the
exposure as5umptions described in Section 2.2.10, is about 5.4
in one hundred thousand (Table 2-36).
2.J.9.2 Potential Non-Carcinogenic Risks
Estimates of hypothetical future non-carcinogenic risks caused by potential exposures to PCOCs in ground water drawn
2-75 5722F 4040-001-600
0

- - - - - - - - - - - - - -POTE!U!Al. MAXIMUM' UHUlil' UORKER: RISKS
The nazal"d index for potenHet chronic effects and the 9SX Ull)per ~ e.Kcets llfeti• c,ncer riak ,, ~ fN' • uliHtv wO\l"lcer- potmt i at I y eJ1:posed to oiax. ifllUQi PCOC sr.bsur-face soi, l c~el"lt r1:1t ions in Carver Terrace ~ current cordi t ions. The potential
total intake ard its brealcdown by PEP is also shOt«"i. PCOCs not listed were not detected.
-
Potent ie.t CVtCer Risk
Total ?-AK
Pot. Care. PAK Ce), PCPCd) Arsenic Ch!"omi~c) •
Copper"' Z:!"IC:Ccl)
P'otential Lifetime Chronic h"ltake
Total (1119,tkg/day),
5.571HIB 2.27E·09 2.54E-09 5.00E-09 5.73€·10 1.43E-09 4.691::-07
Pel"cent D'ue To Soil
tng:estion
ea.on 88.0?X ea.on: 97.66X 97.66~ 97.66); 97.66X
P·er-cent Due
lo Dermal Contact
9·.62X 9.82X 9.8.?X o.oox o.oor. o.oox o.oox
Acceptable Percent Chronic lnteili:e Chronic l~take
flue To, Il"lhataticn l~tion rntiatat ion (mg,/1:glday) (mg/lc.91/cfay)
2. l 1X (a) Ca) 2.U'l: (a) (a)
2.11X 3.00E-02 3.00E-02 2'.34X Ca) (ll,)
2 .34'1. (a} S.OOE·O:S 2'.34X LOOE-02 3.10€-02 2.34X 2.10E·01 2.10E·01
Sumied Index::
An ~terfsfc after the N111e of a PE:OC indic:a,tes that the PCOC was not detected in my s~tes ard thait th:e ma,daun COl'ICentra-tlion is equal to one half of the method detection timit. EPA has not derived an A.IC for that c:on1)ound. Tlie c0ll1)0U'ld is not considel"ed to be carcinogenic through the oral or dermal OI" il'lh&lation route. The MC fol" chl"omiUl\ Vt was used in the cable.
Carcinogenic Carcinogenic Excess Potency Factor PotfK'IC'r" Factor I. i fet ime
Ka.?anf ll'lNl!lation Ingestion cancer-ll'ldex (da,y~kg/1119)) (dlly·ltg/mEJ) Risk
<•> Ca) 6.11E•OO , • l5E..01 8:.61E·OS
6.47E-08 Cb) Cb) Cb)
(a) 6.60E+OO t .SOE+OO 8.63i·09 1.12E-07 4.1&E•01 (I)) s.soe-10 4.UE-08 Cb) Cb) Cb) 2.2.;.1Hl6 Cb) Cb) (b)
2.47E·06. Sumied R i s.k: 9.53E-OS
Ca): (bl: (c};
Cd): (e):
EPA has not derived an AIC fOf' that e~' .. d~ inhetation. Therefore, the AfC fo.r ingestion is wed fo.r- potential expoSlW'es fl"OIII inhalation. See Table 2·2 fol" ttle Ust of po·tentially ca,rcinogenic P'AH.
012491
-

-
Ev I
-.J -..J
- .. 1111 - - - - - - - - - - - - - - -
Vhe h-azard inde,c. for potent~al chronic effects and the 95::t ypper bound e-itcess ! Hetiine cancer risk is shown fl)C" & 1:.1tit ity worker potentially eitposed to mini!IU'II PCOC sl;Jbsurfece soil concentrat~ons iri Cat'ver Terrace \:Elder current coric:litiOf\S. The potentia,l
total intake and its breakdOW!'I by PEP is also shown. PCOCs not listed were not detected.
'Fetal PII.H' * Pot. Care. P·AH'(e)*
PCP(d) * Arsenic* Ch,omi1:111(c:) * Coppe-:- * ZincCd') *
Threshold Effects Potentieit Lifetime Chronic Intake
--·--~·············-·····················--········--··-·· Acceptable Acceptable
rout Cmg/lcg/da,y)
1.63E•09 6.09E·t0i 5.08E•10 5.73E-10 5. 73E·10 1 .1,5E•09 1.43E-09
P~i:-cent Oue Percer,t Due Percel'\t Chror-.ic !r.tatte Chronic tntake To SoH To Oermat Due To lnha.tatioo Ingestion
togestion Contact fnhatation (mg/leg/day) (1n9/kg,/day)
88.07'¾ 9.82X 2.nx Ca•) Ca) sa.orx. 9.82:C 2.11:t (a) {a)
88.0rl 9.82% 2. ,~x 3.00E·O:? 3.i>OE·02 97.66:C o.oox 2.34X (a) Cs> 97.66:t o.oox 2.34% (8) S..OOE-03 97.66':4 o.o~ 2:.34':t l.OOE-02 3.70E·02 97.66X o.oox 2.34% 2. lOE-01 2. tOE·Ot
Stmned !ndex:
Hszard Endex
Ca> Ca)
t..S9E-~ Ca)
1.12E·07 3.29E·08 6.821:-09
t.68E-07
Carcinogenic Carcinogenic Excess Po,tel"lcy Factor ~otency Fl:lCtor Lifotime
Inhate,tion Ingestion Cancer (da,y•k9/mg} (day·lcg/mg) Risk
6.11e..-oo 1.lS.E+Ot 8.09E·09 Cb> {b) Cb>
8.00E+-00 1.50E+OO 1 .02E·09 4.10E+01 Cb) S.S.OE· 10
Cb) Cb) (b)
(b> Cb> (b)
Sumied Risk: 9.66E·09
An asterisk: after the name o,f a PCOC indicates that the PCOC was not detected in at least one s~le and that the mtnirrun concent;a,tion is equal to one ~atf of the method detection limit.
€a): fPA has not derived an Ate for that c~. (b): The c~ is not considered to be car-cinogen•ic through the oral or- denna-t or fnhalstion route. (c): The Ate for chromi1.111 V( was used in the table. Cd}: EPA nas not derivecl an MC for that c~ via inhatation. Ce): See Table 2·2 for the List of potentially carcinogenic PA~.
fher-efore, the A[C for ingestion is used' for potential exposures from inhatatioo.
012492

-
1\,,1 I
•.J cc
- - - - - - - - - - - -Tabte 2·36
POTE~f!AL HYPOTttEVICAL GROUMD~ATER RISKS
Ttle ha.:i:ard inde11. for l)(>tentiat chronic effects and the 9'i% upper bcKind e11:cess lHetfaie cancer risk is shown fo~ a person potentially eJCf)Osed to hypothetic:al PCOC groundwater concentrations.
PCOCs not listed were not detected.
-
Potential Threshold Etfeets
Potentiat ········-···-··-···--·--·-·-·-··· t>otent,at cancer Ri~
PCOC
Ch;cmh,m (d) Copp&:"
Zinc Bentene Ethylbentene Toluene Xylene
Concentra,tion (mg,/t)
o.oo~ 0.0125
0·.55 0.036, 0.037
0.0025 0.02s
DaHy tntal:.e Total
(fllg/lcg/day)
1.4:SE-04 3.57E·04 t.57e•02 1.03E-03 1.06E·03 7.14E·05 7.14E-04
Acceptable ctwon!c
Intake (mg,/k:g/day)
5.00E-03 3.70E·02 2. tOE·01
Ca) ,.ooe-01 3.00E-01 1.00E-02
Stdlle'! ,ndex. =
lfatard Index
2.86€-02 9.6SE·03 i".48E·02
Ca} 1.06E-02: 2:.38E·04 7.14E·02
l .95E·Ol
€a): EPA has not dertved an Ate for that c~.
(b>: The c~ is not considered to be carcinogenic through the 01"at route. Cc): See Tabte 2-2 for the list of po•tentratty carcinogentc PAK. (d>: The AlC for c:hr0fflil.l'II VI was used in the table.
Carcinogenic Potency Factor
(day-kg/mg)
Cb> Cb) (b)
5.ZOE·02 Cb) (b)
Cb)
Sl.lffiled dsk .::
012493
Excess I. ifet im.e
Cancer Risk
Cb) Cb) (b)
5.35E·OS Cb) Cb> Cb)
5.3SE-06
- - - -
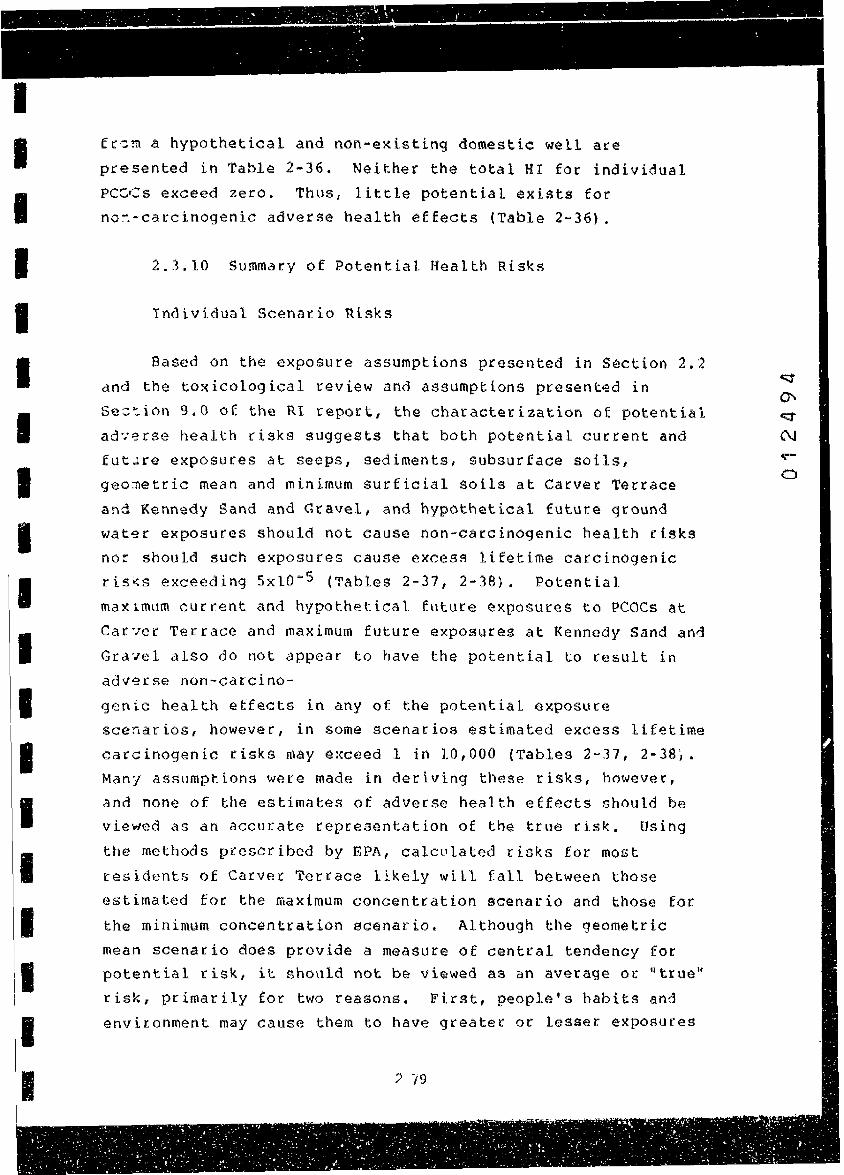
I I I I I I I I I I I I I I I I I I
frcm a hypothetical and non-existing domestic well are
presented in Table 2-36. Neither the total Hr for individual PCC<:s exceed zero. Thus, little potential exists for no~-carcinogenic adverse health effects (Table 2-36).
2.3.10 Summary of Potential Health Risks
Individual Scenario Risks
Based on the exposure assumptions presented in Section 2.2 and the toxicological review and assumptions presented in
se~tion 9.0 of the RI report, the characterization of potentiai ad~~rse health risks suggests that both potential current and futJre exposures at seeps, sediments, subsurface soils, geo~etric mean and minimum surficial soils at Carver Terrace
and Kennedy Sand and Gravel, and hypothetical future ground water exposures should not cause non-carcinogenic health risks nor should such exposures cause excess lifetime carcinogenic ris<s exceeding sxio- 5 (Tables 2-37, 2-38). Potential
maximum current and hypothetical future exposures to PCOCs at Carver Terrace and maximum future exposures at Kennedy Sand and
Gravel also do not appear to have the potential to result in adqerse non-carcino-
genic health effects in any of the potential axposure scenarios, however, in some scenarios estimated excess lifetime
carcinogenic risks may exceed 1 in 10,000 (Tables 2-37, 2-38~. Many assumptions were made in deriving these risks, however, and none of the estimates of adverse health effects should be viewed as an accurate representation of the true risk. Using
the methods prescribed by EPA, calculated risks for most
residents of Carver Terrace likely will fall between those estimated for the maximum concentration scenario and those for the minimum concentration scenario. Although the geometric
mean scenario does provide a measure of central tendency for potential risk, it should not be viewed as an average or "true"
risk, primarily for two reasons. First, people's habits and environment may cause them to have greater or lesser eKposures
c:::t ()\
q-
N
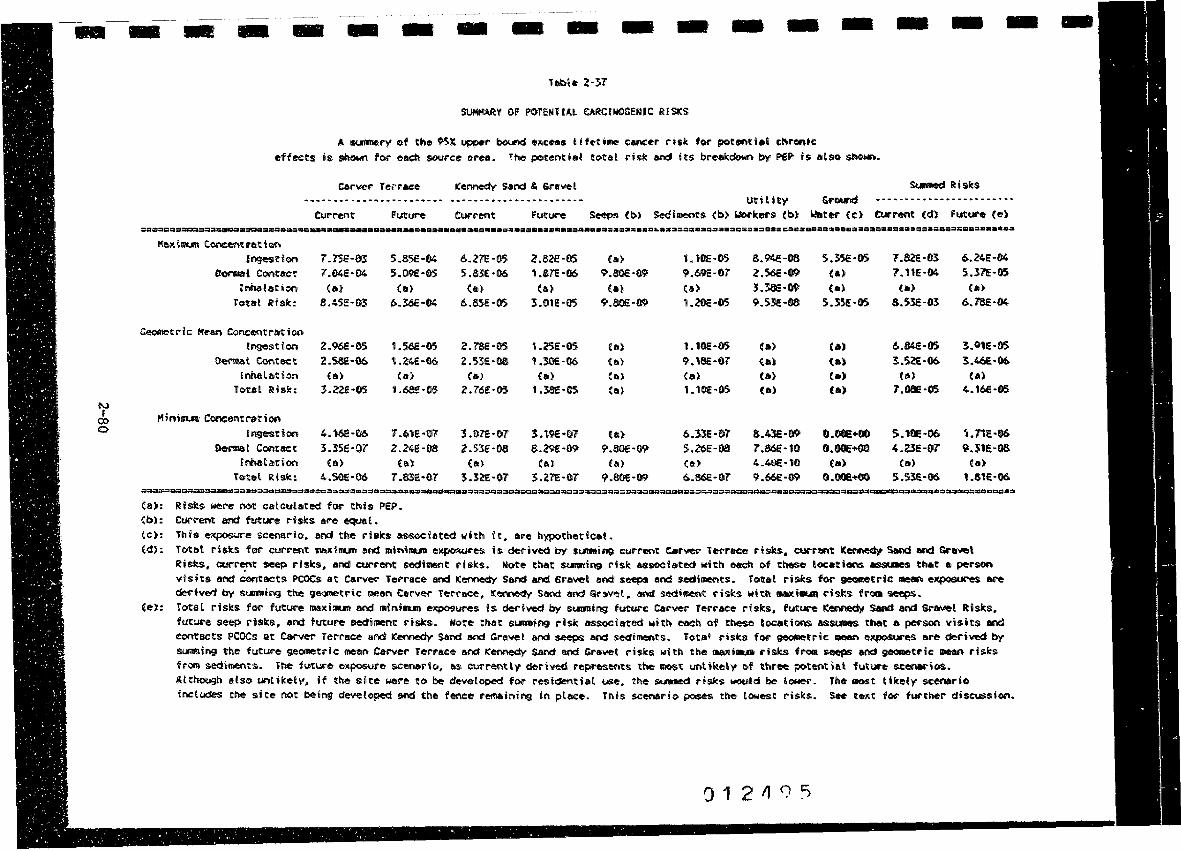
-
t,..,)
r o:> 0
- - - - - - - - - - - - - - - - -SUMKAAY OF POJr£:M'iE~L CA~INOGENIC IHSKS
A IIUll'llery of the ~l ~r bound tt11:c"s e i ft-t i1mr c:uic•r risk for potent i•l chrontc: effects is shown fo,r each ,ource area. ~he potential to,tal rid: Mid its bre11kdolon by PEP is alsao IUIOM"i.
~ Risks utility &rourd ··········-·······-····•
Current l'uture
M&~tmut1 CQnCcntr&ttcn Jngesi:ion T .T5€·01:S 5.85E·04
&onial Contact 7.0'4EHl4 5.09£-05 Zt'lhatation Ca> (l'.I)
l'otat Rtsk: a.,se-o:s 6.l6E·0'4
~tric Mean Co~entrbtion IF1geSti01"1 2.961:-1)5 1.~-05
Oef'l'Mlt Contact z.sae.-06 \.?4£-06 Inhalation €a) fa)
'l'otol Ris5':: l.22E•OS 1.6ae-0'5
MiniGJ/.R' Concentration Ingestion 4.16!·06 7 .61E•0i7'
Der111al CMt;act 3.35E·07 Z.24E·lil8 fnttat~cion (8) h,)
Total Risi:.: 4.50£-06 7.83E•07
(a): Risk.s wel"e no>t catcuh.ted fGr tMs PEP. (b): Current and future risks al"e equa,t.
Current
6.ZTE-05 2.B2e·OS 5.831H)6 1.8TE·06 (e) (II)
6.&SE·OS 1.,m-cs
2."/'Sc·M 1.25E·05 z.s3e.-oe 1.30£-06
(6) Ca)
2.76f.Hli 1.3Sf-C5
3.07E•0J7' l.1tE•0J7 2.5:SE-08 &.291:·09
(a) Cal, S.:S~·OT S.27'E·CT
Seeps (b) Sediments (b) UWkers (b) li!litef' Cc> Current (d) Future (e)
(a> 1. 10f:-05 8.9'!:-08 5.l5.e·05 7.82E·Ol 6.24E·04 9.SOE·~ '!1.691:-01 2.56e-09 <•> 7. 11E·04 S.l7E·05 (sl £a) 3.38e·ot (11) <•> (Ii)
9 .SOE:·® L2'0E-OS 9'.>Je-08 5.lSE-05 8.SlE-03 6.18E·04
(a) 1.18e·05 <•> (,11) 6.&Ke-05 3_0,e.05 (a) 9.1ee-or (II) (II) l.SZ£•Q6. l.46£·06. Ca> (a) (elo C•> (Ii) (II)
ta) 1.10i·05 (II) (a) 7.081Hl5 4.16e·OS
0) 6.llc-07 &.4:Je-09 O.OOE+OO Si. lOE-06 ,.ne-06 ;;i.SOE-89 5.26E·OO 7.861:-10 o.•+oo 4.Zle-07 9.51E·06
(a) (e,) 4.40E-10 (a) (a) (a)
9.86£-01? 6.86E-07 9.66£-09 O.OOE1-00 S.S3E.·06 US1E·06.
tc>: This elCposure Scet'lal"ioc, and the risks 41:-&SOC:ia,ted whhi h. a,-e ~thetteet. Cd): Totail risll:s fc;n- current Jla)lllillUII and 11dhilfUII e~PMUres is derived by SJtSIU!illlQJ currenu C.r',Je,r lerr-ace risks. currant Kennedt Sandi arid Sra-..ei
Risli:s, CUl"'l"~t seep risks, and c:urrent sediment risks. Note th.at SUffl'ling r-isk. a,ssociated with each of these 8ocatiOC'IS assuaes that a pitrson vrsits al'ld' contacts- PCOCs at l:al"\lel" Terr-ace and KennedY Sand arid Gr~lo'e't and seeps and sediments. To.1t&l risks far ~tc-ie mean e~ are derived by' Sl.m'lling tt\e ;eOl'lletric mean C&rwt" 'l'ec-l"ace, !C~ S&M and &ra~t, ~ sediment risks witti Mltiam rim froca ~-
(e): iot&l risl:s few future 1111txi11Uft and minill'Ull eJCpOSures is deriYed by st.ltffltng future: Carver- Tei"rac:e dsli:s, f'Ultuve- i.:ennect,, Sflfld and Gc-wel Risks, futw-e seep risks, and future eediment rtsli:.s. Note that s1.11mf<ng s-isk. associated with, each of these tocations a&maes that a person ... isl ts and contacts PCOCsi at Carver Tee-race ard ICer,nedy sand and Gravel ard seeps and sediments. To,ta' risics f016' geoillet:ric Man e~es 111re derived by
SUffllll'l9 the futucre geometric me~n Carver Terrace and Kennedy Sand· and Gravel risks with th:e ~•- risks from seeps and ~tric mean risks from sedifl)entS.. 11'1e future e)!.po,sure scena,rio, t,.$ eurremly cfe.r1~ re~ems the Ul()$t tmllke\y e>f three potent'ieil futur-er $CeNitios. Although also untilc:ety, if the site liel"e to be developed fOll' restd'entiat use, the sUIIN:d r-is.ks would be l~. Ti'ut IIIO$t ti!l:ely s.cenal"'io inchides the site not being developed i!lrd the feru:e remainil'lg in ptace. rnis scene,rio pose-s the lowest riS1ks. See tel'lt for further diseU$sion.
-
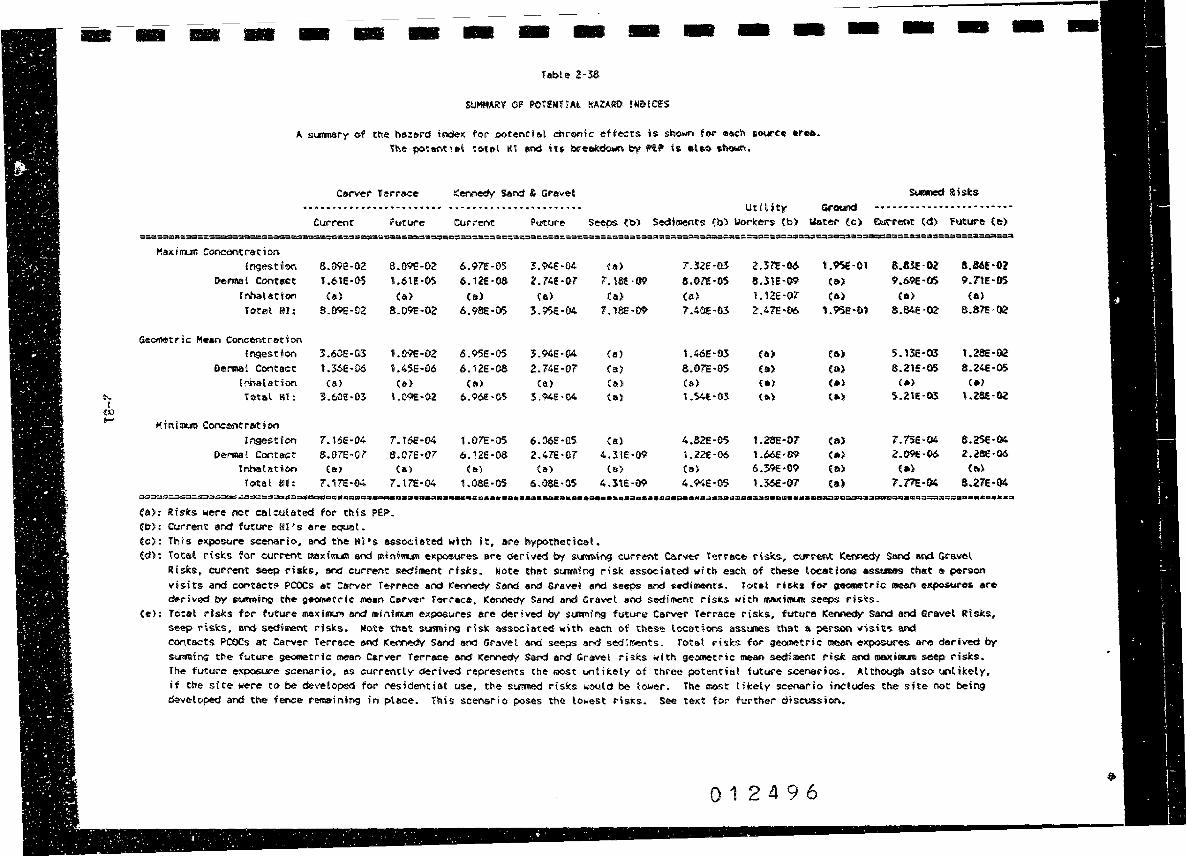
- - - - - - - - - - - - -'fable 2-38
SUMHAA'f OF POYEN'OAI. HAZARD INiHCES
A stnnall"y of the hazard index for potenth,l chll"onic: effects i& st.own tor each 1ource lll'"M. 'fhe poter.Het tooA IH and iu brHkdown by l!'lP , .. •l•o shown.
- - - -
S'811edRists
~tility GrOU!1d ·•····-··--------·--·--· Current seeps Cb) Sediments (b) worlcel"S (b) Voter (c) E:urrent f.d) future le)
Maxiaun Concentration Ingest fon B.09e-oz S.IWE-02: 6.97f•05 3.t4E•f>4 Ca) 7.321H'.l3 2 .31'e·06 1.'?SE-01 8.81!·02 a.NE-02
Derma,t Contcrct t.61E·OS 1.6U·OS 6.12e·08 2'.74!•f>7 7.HtE-09 8.0l'E·OS 8,31E-09 (&) 9.69e-os 9.TtE·OS lmaletton- Ca) (a) (a) Ca) Ca) Ca) l. 12e·07 C•> <•> <•> Totet IU: s.09E-ai 8.09E·02 6.98E-05 3.9SE-04 ? • lSE•fl.'P' 7.41!1E-03 2:.47E•&6 1.9'Se-01 a.84e-02 a.an-~
Gecmetric Mean Concentration lrngestfon 3.60E·OO 1.09£-02 6.95E•05 3.94E·04 (a,) 1.'6E·03 (a> (ii) 5.13.E•Ol t.28e·02
Dermal COt"ltact t.36E-06 1.45E•C6 6. 12e-oa 2.74E•07 (a) 8.07E•OS <•> (8i) s.2,e-05 8.24e•OS lnhab,tion Ca) (&) Ca) (a,) (a) (a) (a) (a) C•> C•> Tota.l Kl: 3.lfi.Oe-03 1.09£-02 ~.96E·O~ 3.941Hl4 (Iii,) l.S4l·O:S. 0) <•) S..?UH)3 l.ZSE·OZ
Minimun, ConeM'ltration rngesticn T.t6E·0'4 T.16E·04 1.07E-05 6.06E•Q,S (a) 4.82E·OS 1.26E•07' (a) 7.75E·04 8.ZSE-04
Oenaa l Contact 8.07E•0'7 8.07E-07 6. lZE-08 Z.47E·07 4.31'E·09 1.22E·06 1.66e•09 <•> 2.09£-06, Z.281:·06 lnhalAtion Ca) (&) (a) (&) (8) ta> 6.391:-89 (a) t•) ta>
Tc»t&l II: 7. \11:-€)4 7. t7fHJ4 1.oae-os 6.0SE•QS 4.l1.E·09 4.~E-05 1.:i6€•07 (a) 7.Tre.-04 8.27E·04 ~======n===~~Ds=ao:m•==--m••••••••-•-••---••=-••••••••-•-•••-••••••••••••--•••a••••••-•••••••••--=a•~•~~••mD=t=~•==-••••••••a (a): Rigks were not cateulated for this PEP. (b-): current end future HS's are equal. ( c) : TM s exposure 9':en&r-i o, and the Kl' s associated with I t. are h't'pothet i cal • (d): Totat c-isb for' current ma11:i11U11 and 111tnin.m e,cposures are derived trf ~il'\9, clolrre-M. Ca.Net 'C1P1rrece risii.ll, cur~ Kennedy sand and Gravel
Riska. current seep risks, and current lled'iment rfsts. Note that s1.111ning li"i&k associated ~ith each of these Locations asSUDll!ts that• per-son visits and contact!' PCOCs at carver Terr~e ard Kemedy Sand and &rall'f'l and seeps and s.dl1111tnts. rot•l risks for a-tric: mean e~ur•s e,re cfer-ived by SU!ffling the ,_tric: ine■n Ca!"Yes- fernc:e, Konnedy Sal'ld and G-ravet end sediment risks with nraicinuu seeps rislts.
(e); Total risks for future maxi.-m lltld m,inimi.n el(p08Ures are derived by st.mning futu,r-fi Carver Ter:-li"ac:e risks, ftttur-e ICenfledy Sand and Gf"avel Risks, seep risk.s, and sedimer.t risks. Mote that suimir9 dsk &&soeh·ted with each of these loc:ations ass1.111es th:a.t a person ll'ish~ and contacts PCOCs at Cai-ver 'l'eri-ace end Kennedy Sand and' Gravel and seeps and sediments. Total rists fOI" geometric Gle&n e~es are deriYed by
sumtinq the futut'e geometric me,a~ Caf'ver Tef"race and Kennedy Sand and Cravel risks with geometrk mean sediment ri~ ard l.flBXiQlt.lC seep· ris.fcs. The futw-e eicposure scenali"io, as .:urrentty derived represen-ts the most un•likely of three potential future scenarios. Altht'lu9h $lso unlikely. if the site were to· be developed for resideotiat use, the suined risks would be lower. The most likely sicen:ario includes the site not being, developed and the fence remafo.iing- iin p\ace. 'fhis scen&rio poses the lowest risks. See text for further discussion.
012496
-

I I I I I I I I I I I I I I
I
I I I I
than estimated in that scenario. Second, some of the
assumptions used in the scenario will result in estimat~s of
risk greater than the average. For example, the use of a 95%
upper bound carcinogenic potency estimate means that the
estimated carcinogenic risks are not average carcinogenic risks
but are instead the upper 95% confidence limit. The average,
or best estimate, of carcinogenic risk will be lower. Further,
many of the assumptions have a great deal of uncertainty
associated with them and this uncertainty can lead to over and
underestimates of risk. For example, risk to utility workers
might be underestimated because the effect of light aromatic
compounds was not accounted tor but is overestimated because
the air was assumed to be much dustier than normal. The more
important sources on uncertainty and how much they could affect
th~ estimates of health risk are discussed in Section 2.4.
summed Risks
The last two columns in Tables 2-37 and 2~38 represent the
surrunation of risks from the Carver Terrac~, Kennedy Sand and
Gravel, seep and sediment scenarios. No summed Hazard Index
exceeds one, (Table 2-38), thus little potential exists for
adverse non-carcinogenic effects to be caused by ~xposures t0
PCOCs, given the assumptions used in the risk assessment. Both
the current and future maximum summed carcinogenic risks exceed . ( -4) one in ten thousand lxlO , however, both current and
future geometric mean and minimum scenario summed risks are -4 less than lxlO (Table 2-37). Several factors need to be
considered, however, when interpreting these summed
carcinogenic risks.
First, summation of risks assumes that a person is playing
or doing yard work on their property, and also visits Kennedy
Sand and Gravel, and also visits seeps, and also visits
sediments at the rates described in the risk assessment. It is
very unlikely, but not impossible, that a person would do this
for 70 years of their lifetime. 2-82
5722F 4040-001-600
0
I I I I I I I I I
,1 I I I I I I I I I
Second, the future summed geometric mean ris~ assumes that
Carver Terrace remains residential and that the only change on
Ke~nedy Sand and Gravel is the deterioration of the f~nce.
This increases the frequency of exposure, ahd risk, at Kennedy
Sa~d and Gravel. The future summed geometric mean scenario is
the least likely of all possible future scenarios because it
assJmes the fence deteriorates. This is unlikely, however,
given that the administrative order :equires that the fence be ma:~tained. The future risks associated with a residential
development on Kennedy Sand and Gravel would be no greater, and
most likely less than, the future risks associated with Carver
Terrace. These risks would be about 20 times lower than those
reported in Table 2-37.
The most li~ely future scenario, no residential
development and maintenance of the fence surrounding Kennedy
Sand and Gravel, has the lowest risks. Thus, excess lifetime cancer ris~s associated with likely futur~ scenarios are iess
than those shown for the summed future geometric mean scenario {Table 2-37) and are less than 4.2x10-s.
2.4 Environmental Assessment
2.4.1 Hazard Identification
h variety of PCOCs have been selected for assessment based on human health considerations (Table 2-1). These PCOCs, which
have been found in surface water, sediments, seeps, or surface
soils, will also be considered for the environmental
assessment. Ground water is not conside~ed in the
environmental assessment.
2.4.2 Exposure Assessment
Wagner Creek and associated surface waters and sediments provide habitat for a limited variety of fishes (Table 2-39)
and aquatic invertebrates. The majority of the area is on the
2-83
0)
~
<::;:j"
N
0

I I I I I I I I I I I I I I I I I
TABLE 2-39
WAGNER CREEK FISH SPECIES ANO
RANK OROgR ABUNDANCES
Species
Ictalurus punctatus {Channel catfish)
Leponds megaloty { longear sunfish}
Micropter:us sa lmoiqes (t.arg~mouth bass)
NQ.ti'migonus crvsoleucas (Golden shiner)
Gambusia atJinis (Mosquito fish)
Notropis atrocandalis (Blackspot shiner)
2-84 4763F 1040-0Jl-600
4
2
6
5
1
3

I I I I I I I I I I I I
11 I II I I I
-~
floodplain and is sometimes inundated with water. These areas also provide food and some cover for birds and mammals. Wooded uplands near the site offer different habitat for terrestrial wildlife in the area. The list of endandgered species that may
reside in county in which the site is located are listed in Table 2-40. The site itself, in addition to the residential development, is dominated by adventitious grasses, other herbacious vegetation, and soma shrubs. Fire ants are currently prevalent across the southern portion of the site.
Biota may be exposed to PCOCs via a variety of media:
• Surface water
• Seeps • Surface soils
• Sediments
There are a number of potential exposure pathways (PEPs).
These may be direct or inditect P£Ps by which fish and/or
wildlife can be exposed to the PCOCs at the site. Direct
pathways include direct contact, inadvertant ingestion or
inhalation of PCOCs. Indirect exposure is generally related to
the food chain, animals consuming other animals or plants that
contain PCOCs or residues of the PCOCs.
SJ,1.tface water .and s_edimentB ·
Wagner Creek supports a number of species of fish from different trophic levels. Swamp crayfish (£.roco.mba.ru.s act:tts) have also been collected at the site. It is likely that a
variety of amphibians and reptiles also inhabit this a~ea.
Dermal absorption, especially via gill surfaces, and ingestion
would be PEPs for these organisms fro~ surface water and
sediments. Some organisms would be e~posed to the sediments to
a greater degree. These include invertebrate~ living in and on
the sediments for at least a portion of their life cycles,
benthic feeding fish, and nest building fish.
2-85 5722F 4040-001-600
re• r rm w:,rar: · · w;a
0 0 U'\
C\J
0

I I I I I I I I I I I I I I I I I I I
'l'ABLR 2-40
A l,tST OF THE !NOANGRREO 1\NO THRBA.'t!iNED (a) SPectes OF BOWilt COUNTY, 'l!l!K.AS
Endangered Speetes
••soar, Black C~. am.erJGanue) 0 •Kagle, Bald (HaJlaeetus leycocephalus> **"Tern, Least, Interior (S~&rna ll)tillarum athat48SOJ.) "**Woodpecker, Red-Cockaded (gicoiges b,Qreoli&> ***Paddlefish (Polyooon §Qathula)
**Shovelnose Sturgeon (Scaphithynchyg R.latorynchus)
***Kite, swallow-Tailed, American (~lanotde§ .fgrficatus) •••stork, Wood (MYcterta americana)
•••sparrow, Bachman's (Atmophila !e..Stivatis)
*Falcon, Peregrine, Arctic (E,al(i__o g__erQgr1nus tundrtus)
•••Ltzard, Horned, Texas (Phrmosoma corqutwg)
***Rattlesnake, 'timber (crotalu2 h.9rr-ldu~}
•snake, scarlet, Northern (Cemo~hor_~ ¼...occlnea f,QRB\) ***Creek Chubsucker (Eri.mvzon oblongus)
"'**131.ackside Darter (Perclna inacula.ta.)
**Blue Sucker (C;:cleptu§ elongatus)
(a)source: Bngangered/'t'hreatened Species Data File, Texas
Parks and Wildlife Department 04/20/87.
***Confirmed species - verified recent occurrence
**Probable species - unconfirmed, but within general distribution pattern of the species
*Possible species - unconftrmed, but at periphery of known distribution of the species
2-86
4763F 4040-001-600
0 I.(\
(\J

I I I I I I I I I I I I I I I I I I I
PAH, arsenic, chromium, copper, lead, mercury, zinc,
benzene, toluene, ~nd xylene have been found in one or reore
se1iment samples (Table 2-15). Not surprisingly, surface water samples show only low levels of some PCOCs. These include arsenic, mercury, lead, and zinc.
Seesu
Terrestrial organisms and semi-aquatic organisms may be
exposed to the PCOCs in seeps by direct contact and ingestion. At the site, PAH, lead, mercury, zinc, ethylbenzene, toluene, and xylene have been measured in one or more seep samples (Table 2- 13).
Sur f,ace Soi ls
PAH, PCP, PCDD/PCDF, arsenic, chromium, copper, and zinc
have been identified in one or more surface soil samples (Table
2-5, 2-11). Organisms living in or burrowing in the soil could
be exposed via direct contact or ingestion. Other animals may ingest some soils while consuming plants or rooting for soil invertebrates. Grooming and preening activities may also result in some inadvertant ingestion of soils.
E.09;d,_ Chain
Some PCOCs may be transmitted via the food chain. Some a re more readily bioco.1centrated and bioaccumulated than
others. Organisms higher in the food chain may show adverse
effects, due to higher body burdens of the PCOCs than at lower trophic levels.
2.4.3 Ecological Risk Assessment
The following is a qualitative discussion of the potential risks posed to the environment due to exposure to PCOCs at the
2-87 5722F 4040-001-600
N 0 lJ"\ (\J

I I I I I I I I I I I I I I I I I
Koppers Texarkana Site. Quantification is nGt justified or
possible because biota have not been completely surveyed at the
site, and standards/criteria are not available for most
exposure media.
It is not known to what extent wildlife are present at the
site itself. PCOCs have been identified in surface soils at
the site, but it is unlikely that mammals or birds would remain
in open areas of the site for any length of time. Wildlife
exposure would likely be intermittent and at low levels, since
soil would only be inadvertantly encountered or ingested. This
is also true for the seeps which are not numBrous.
On the other hand, exposure is more continuous for aquatic
and semi-aquatic organisms. Although fish may be able to
behaviorly avoid contaminated areas by moving along the river
reach, most of the invertebrates are not that free-ranging.
Metals tend to be ubiquitous in sediments in developed areas, and since most aquatic organisms spend a great deal of time in
contact with the sediments, some accumulation would be
expected. These metals could also be transferred to
terrestrial wildlife via the food chain. In spite of the
presence of PCOCs in the sediments, populations of a number of
species appear to be thriving. Juvenile specimens collected
for many species indicate that reproductive success is possible.
Although the possibility of adverse effects on sensitive
fish and wildlife cannot be precluded, this is considered
unlikely. In Wagner Creek, apparently healthy populations of
fish and crayfish have been observed. Terrestrial organisms
would only be present at the site for brief periods (perhaps to
feed), and thus, exposure to contaminated soils, which would be
inadvertant, would be minimized.
2.5 Sources of Uncertainty
The process of health risk assessment at national priority
list sites involves several general steps: identification and
selection of PCOCs; quantification of potential exposures;
2-88
5722F 4040-001-600
!'(",
0 Lf\ (\J
0

I I I I I I I I I I I I I I I I I I I
evaluation of the potential toxicity of the PCOCs; and the
prediction of potential risk from these contaminants. Within
any of these steps, numerous assumptions must be made. Some cf
the assumptions have a great deal of scientific basis and are
based on a considerable amount of information, others have very
li~tle. Because we are not absolutely certain about any of the
assumptions, some level of uncertainty is introduced into the
risk assessment every time an assumption is made. In this
section, some of the assumptions that introduce the greatest
amounts of uncertainty and their effect on the estimates of
risk are discussed. The discussion of their effect will be
qualitative, not quantitative, because in most instances we do
not yet have enough information to quantify how large or small
the uncertainties may be. This section is divided into
subsections that correspond to the four steps involved in the
risk assessment process.
2.5.1 Hazard Identification and Potential
Contaminant of Concern Selection
During this step of a risk assessment, information on the
types, concentrations, distribution and frequency of
contaminants on the site is combined with measures of the
potential toxicity of each of those contaminants to determine
their potential risk. In determining the potential risk;
uncertainty can be introduced in several places. Some of the
more important sources of uncertainty are presented below.
sampling error. The sampling locations on the site may
not identify all the compounds on, and contaminated areas of,
the site. Generally, however, enough sampling has taken place
so that all widely distributed compounds and highly
contijminated areas are accounted for in the risk assessment.
This source of ,1ncertainty should make a small contribution to
the total uncertainty. Some uncertainty is introduced into
this risk assessment because some volatile organic compounds
2-89 5722F 4040-001-600
'1'
0 I.(\
N
0
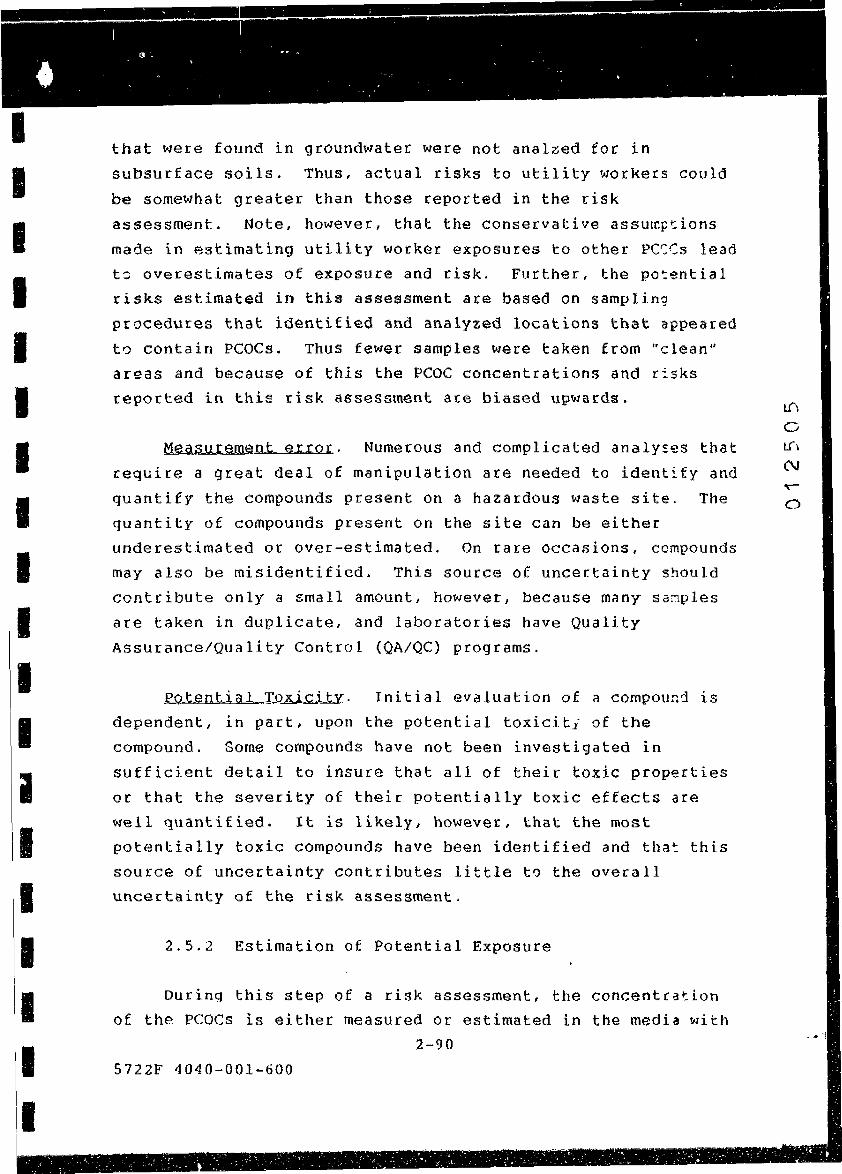
I I I I I I I I I 'I I I i I I I I I I
that were found in groundwater were not analzed for in
subsurface soils. Thus, actual risks to utility workers could
be somewhat greater than those reported in the risk
assessment. Note, however, that the conservative assump~ions
made in estimating utility worker e~posures to other PCCCs lead
t~ overestimates of exposure and risk. Further, the po:ential
risks estimated in this assessment are based on sampling
procedures that identified and analyzed locations that appeared to contain PCOCs. Thus fewer samples were taken from "clean"
areas and because of this the PCOC concentrations and risks
reported in this risk assessment are biased upwards.
M!;!:asurement e;:_ror. Numerous and complicated analy~es that
require a great deal of manipulation are needed to identify and
quantify the compounds present on a hazardous waste site. The
quantity of compounds present on the site can be either
underestimated or over-estimated. On rare occasions, ccmpounds
may also be misidentified. This source of uncertainty should
contribute only a small amount, however, because many sanples
are taken in duplicate, and laboratories have Quality
Assurance/Quality Control (QA/QC) programs.
:eotential Toxic:Lt.y. Initial evaluation of a compound 1s
dependent, in part, upon the potential toxiciti of the
compound. Some compounds have not been investigated in
sufficient detail to insure that all of their toxic properties
or that the severity of their potentially toxic effects are
well quantified. tt is likely, however, that the most
potentially toxic compounds have been identified and tha: this
source of uncertainty contributes little to the overall
uncertainty of the risk assessment.
2.5.2 Estimation of Potential Exposure
During this step of a risk assessment, the concentration
of the PCOCs is either measured or estimated in the media with
2=90
5722F 4040-001-600
I.{\
0 lJ\ (\J
0

I I I I I I I I I I I I I I I I I I I
which human or environmental receptors will come into contact.
In many cases, contaminant levels in media that may be contacted by a receptor cannot, or have not, been measured directly. In such cases concentrations need to be estimated or
modeled. Estimates and models require assumptions and these
lead to uncertainty. Once the concentration in a medium is known, human exposure end dose need to be estimated. These,
too, require assumptions that lead to uncertainty. The more important sources of uncertainty are discussed below.
Selection of PEPs to Qu,,antify, At the Koppers Texarkana Site detailed information about the activity of residents is
not avialable. Because it is possible, but unlikely, that
residents will visit all of the contaminated areas, exposures
and risks have been estimated for most of the possible exposure
routes. Many of these routes will not be applicable to all
residents and thus summation of exposures from individual PEPs
will lead to an overestimate of exposure and risk for most
residents. While all important PEPs have been quantified, some
PEPs such as consumption of home grown vegetables have not been
quantified due either to lack of data that are needed to
quantify the exposure or because few or no people are engaged
in that activity, or both. If a person were to be exposed to
PCOCs via PEPs that have not been quantified, their risks could
be greater than those presented in this risk assessment,
however, the overestimates of ~Aposure from the quantified PEPs
caused by the use of many conservative assumptions should
account for any underestimates of exposure and risk.
E.stimation, of Soil Concentrations. At the Koppers
Texarkana Site information on the distribution and
concentration of PCOCs in every house lot was not available and
very few measurements were taken on Kennedy Sand and Gravel
Property. Typically when limited information is available a worst case exposure estimate is used as was done in the Final
PHEA for the maximum and geometric mean scenarios. These
2-91
5722F 4040-001-600
'° 0 lf"\ (\J
0

I I I I I I I I I I I I I I I I I I
almost always result in an over- estimate of exposure and
risk. The intent is to err on the side of public health. Because PCOCs at Carver Terrace varied a great deal from
one house lot and sampling point to another, an exposure
scenario based on soil concentrations that could be interpreted
as truly representative for Carver Terrace residents could not be derived. Aa an alternative the range in potantial exposure caused by varying soil concentrations was estimated using the
maximum and minimum FCOC concentrations measured in Carver
Terrace. These exposures should be viewed only as extremes of
potential exposure. Most residents will have potential
exposures that fall in between these two extremes. In order to provide some measure of central tendency for potential exposure, a third exposure scenario using the geometric mean of
soil concentrations was developed. Estimated potential
exposure under this scenario comes closest to representing true
potential exposures for Carver Terrace residents, however, it
must be stressed that most, if not all, people will have
potential exposures different from those calculated in this
scenario. Any one person's exposure and risk will depend upon
the soils they come into contact with and this can only be
assessed on a case-by-case basis.
De5.1radation o,t __ Po..tential Con,taminanf:Lof concern. In some
scenarios, no account has been made for the natural degradation
of PCOCs at the Koppers Texarkana Site. Half-lives for some of
the PCOCs have been published in the literature {EPA
1986a; also see Appendix 2-F for PAH half-lives used for surface soils in future scenarios of Carver Terrace and Kennedy
Sand and Gravel). Use of degradation rates would reduce the amount of PCOCs available for chemical intake. Neglecting the
degradation of PAH and PCOD/PCOF compounds in sediments, seeps,
groundwater, and subsurface soils leads to an over-estimation
of risk. This is especially true for potential chronic exposure over a 70 year time period and for soils, sediments
and waters exposed to the sun where degradation rates are
2-92 5722F 4040-001-600
r-0 I.('\
C\J
0

I I I I I I I I I I I I I I I I II I
I I
expected to be highest due to photolysis. The PAH degradation
rates used in the risk assessment for surface soils are based
on a survey of rates from the literature (see Appendix 2-F).
Review of the scientific literature indicates that many
site-specific parameters influence degradation of PAHs.
Because of this, a degradation rate equal to the upper 95 percentile was chosen, and consequently, it is likQly that degradation of PAH's has been underestimated. A mean
degradation rate, based on a review of the literature (Appendix
2-F) would have been 3.7 times faster.
F,eguency of Potential Exocsur,. Once the concentr~tion
of PCOCs in water, soil, or air is known by either measurement
or modeling, the amount of the PCOCs that humans are
potentially exposed to must be estimated. This entails making
assumptions about how often people are exposed, and what
percentage of the PCOC is taken up by those people who are
exposed.
Some of the assumptions used to estimate frequency of exposure can be quite uncertain. For example, the frequency at
which teenagers trespassing onto Kennedy Sand and Gravel
property and are exposed to PCOCs on the site is unknown. Nor is the frequency at which children eat soil known.
tn the absence of such data, assumptions need to be made
to estimate exposure frequency. These depend upon the
location, surrounding, accessibility and us~ of the site.
Since Carver Terrace is d residential neighborhood, a greater
exposure frequency was used for children (half the days per
year} and for adults (26 days per year). Because Kennedy Sand
and Gravel is fenced, only older children were assumed to be exposed. It is unlikely, but possible, that exposures will be more frequent than has been assumed, Exposures could be much
lower, however. If a resident of Carver Terrace does not spend
most of their time on site, then their potential exposure would
be reduced and the estimated health risks ceported here wouJ~ be high.
5722F 4040-001-600
co 0 I.(\
C\l
0

I I I I
, I
I I I I I
11 I I I I I I
,I I
Similarly, assumptions need to be made about how much soil
people ingest and how much of their skin comes into contact
with contaminated soil. Many of the assumptions used to
estimate these parameters are based on experimental data, so
uncertainty is reduced. It is always possible that people
visiting a contaminated area have either higher or lower
potential exposures and risks than have been assumed. tn
general, the assumptions used are thought to lead to an overestimate of exposure, rather than an underestimate for most,
but not necessarily all, people.
2.5.3 Dose-Response Assessment
Accepted practice divides potential health effects of
concern at hazardous waste sites into two general categories:
effects with a threshold, and effects without a threshold.
Dose- response assessments for both of these types of effects
share many of the same sources of uncertainty. In the
discussion below the more important sources are presented.
Assumptions that are anticipated to create more uncertainty for
one class of eff~~~s than the other are noted.
Animal tQ human eztragQlation. For many comp0unds animal studies proviee the only reliable information on which to base
an estimate of adverse human health effects. Extrapolation
from animals to humans introduces a great deal of uncertainty
in the risk assessment. Some of this uncertainty can be
reduced if a compound's fate and the mechanism by which it
causes adverse effects is known in both animals and humans.
When the fate and mechanism is unknown, uncertainty increases.
The procedures used to extrapolate from ~nimals to humans make
conservative assumptions such that over-estimation of effects
in humans is far more likely than underestimation.
Nevertheless, because the fate of compounds can differ in humans and animals, it is possible that animal experiments will
not reveal an adverse effect tha: w0uld manifest itself in
2-94 5722F 4040-001-600
0-,.
0 Lf\
N
0
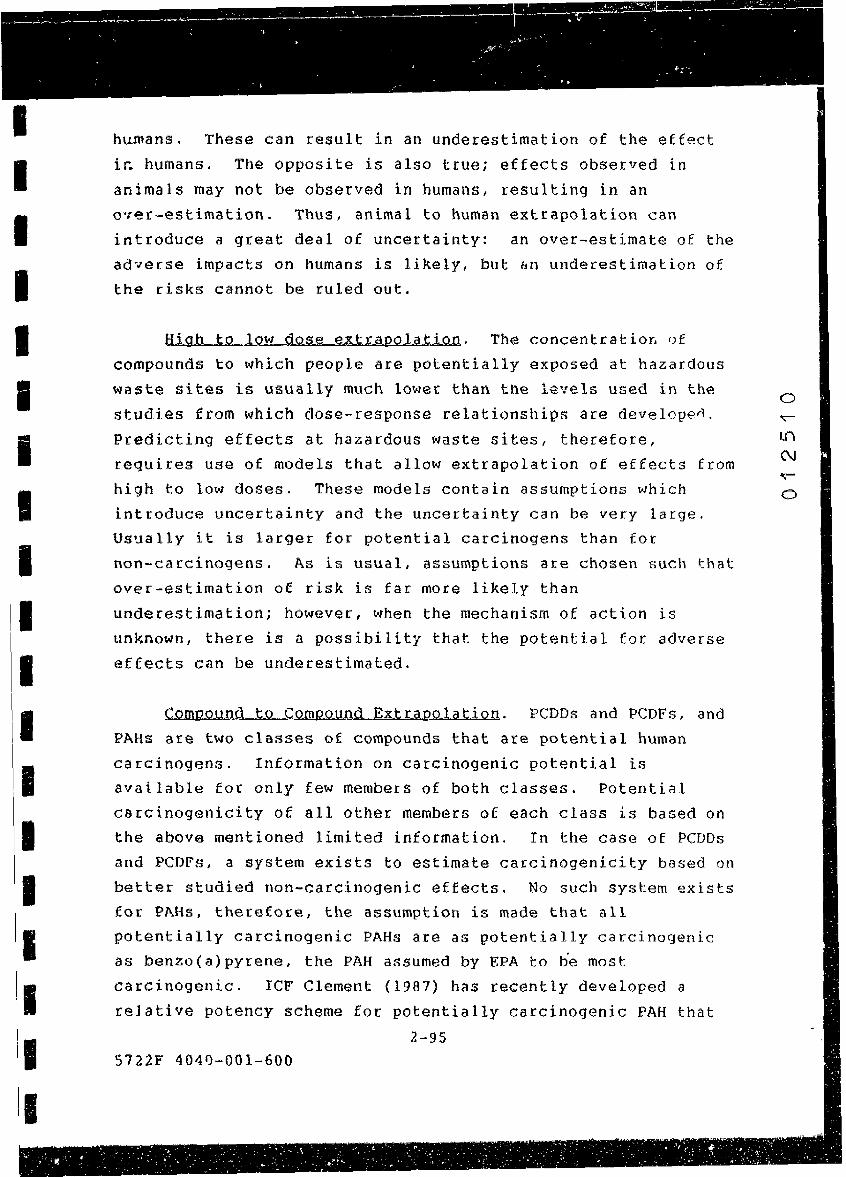
I I I I I I!! I
I I I I I I I I I I I I I
humans. These can result in an underestimation of the effect
in humans. The opposite is also true; effects observed in
animals may not be observed in humans, resulting in an
o·,~r-estimation. Thus, animal to human extrapolation can
introduce a great deal of uncertainty: an over-estimate of the
adverse impacts on humans is likely, but &n underestimation of
the risks cannot be ruled out.
Higb to low dose extrapolat.i..Qn. The concentratior, rJf
compounds to which people are potentially exposed at hazardous
waste sites is usually much lower than tne levels used in the
studies from which dose-response relationships are developeA.
Predicting effects at hazardous waste sites, therefore,
requires use of models that allow extrapolation of effects from
high to low doses. These models contain assumptions which
introduce uncertainty and the uncertainty can be very large.
Usually it is larger for potential carcinogens than for
non-carcinogens. As is usual, assumptions are chosen such that
over-estimation of risk is far more likely than
underestimation; however, when the mechanism of action is
unknown, there is a possibility that the potential for adverse
effects can be underestimated.
Compound to Compound Extrapolation. PCDDs and PCDFs, and PAHs are two classes of compounds that are potential human
carcinogens. Information on carcinogenic potential is
available for only few members of both classes. Potential
carcinogenicity of all other members of each class is based on
the above mentioned limited information. In the case of PCDDs
and PCDFs, a system exists to estimate carcinogenicity based on
better studied non-carcinogenic effects. No such system exists
for PAHs, therefore, the assumption is made that all
potentially carcinogenic PAHs are as potentially carcinogenic
as benzo(a)pyrene, the PAH assumed by EPA to be most
carcinogenic. ICF Clement (1987) has recently developed a
relative potency scheme for potentially carcinogenic PAH that
2-95
5722F 404Q-001~600
0
Lf\ (\J
0
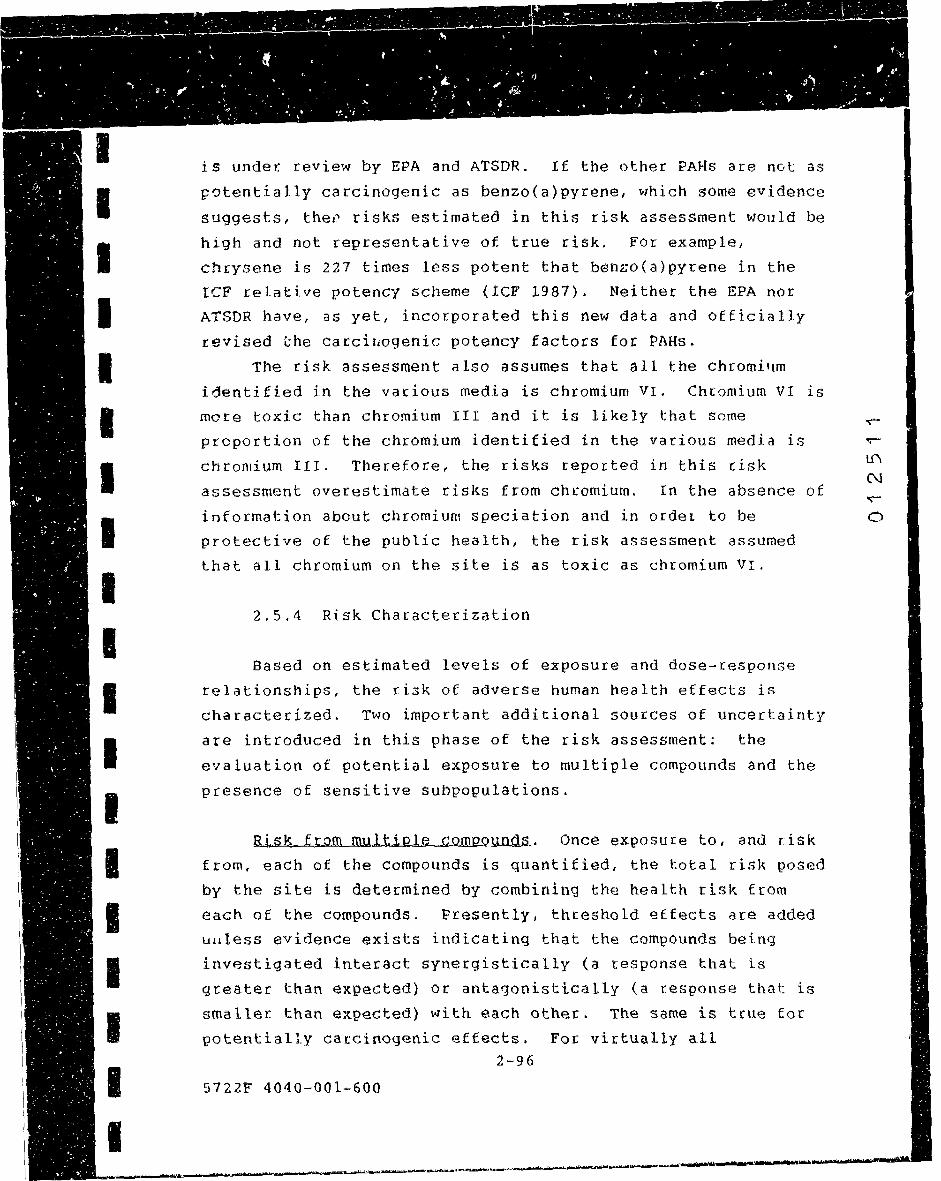
I I I I I I I I I I I I I I I I I I
is under review by EPA and ATSDR. If the other PAHs are not as
p0tentially carcinogenic as benzo(a)pyrene, which some evidence
suggests, thev risks estimated in this risk assessment would be
high and not representative of true risk. For example,
chrysene is 227 times less potent that benzo(a}pyrene in the
tCF relative potency scheme (!CF 1987). Neither the EPA nor
ATSDR have, as yet, incorporated this new data and officially
revised the carcihogenic potency factors for PAHs.
The risk assessment also assumes that all the chromi11m
identified in the various media is chromium VI. Chromium VI is
more toxic than chromium III and it is likely that some
proportion of the chromium identified in the various media is
chromium III. Therefore, the risks reported in this .risk
assessment overestimate risks from chromium. In the absence of
information about chromium speciation and in ordet to be
protective of the public health, the risk assessment assumed
that all chromium on the site is as toxic as chromium VI.
2.5.4 Risk Characterization
Based on estimated levels of exposure and dose-response
relationships, the risk of adverse human health effects is
characterized. Two important additional sources of uncertainty
are introduced in this phase of the risk assessment: the
evaluation of potential exposure to multiple compounds and the
presence of sensitive subpopulations.
Risk from ro.u.ltiple comp_ou.ruiJi. Once exposure to, and risk
from, each of the compounds is quantified, the total risk posed
by the site is determined by combining the health risk from
each of the compounds. Presently, threshold effects are added
u11less evidence exists indicating that the compounds being
investigated interact synergistically (a response that is
greater than expected) or antagonistically (a response that is
smaller than expected) with each other. The same is true for
potentially carcinogenic effects. For virtually all 2~96
5722F 4040-001-600
If\
N

·1 I I I I I I I I I I
I
11
I
I I I I I 11 I
' c~mbinations of compounds at hrlzardous waste sites, litlle if
any evidence on interaction is available. Therefo~e,
additivity is assumed. The assumption of additivity adds
uncertainty and, while the exact magnitude is unknown, it is
net expected to be large. Whether assuming additivity leads to
an underestimation or over- estimation of risk is also unknown
and will vary on a case-by- case b~sis.
Ris~ tQ sensitive PoPulation~. The health risks estimated
in the risk characterization section gerterally are applicable
to the average resident near the site. Human sensitivity
varies from person to person. In some cases it is possible to
identify sensitive populations that may be exposed to
contaminants on the site and quantify a separate risk for that
group. At other times it may not be possible to identify such
groups. At Carver Terrace, children were identified as such a
group. In all cases, some people will be more sensitive than
the average person and, therefore, will be at greater risk.
This source of uncertainty is difficult to quantify, but the
underestimation of risk due to varying sensiti'lities is more
than compensated for by the use of assumptions throughout the
risk assessment that over-estimate risk to the average person.
2.5.5 Summary of Sources of Uncertainty
The most important sources of uncertainty in this risk
assessment appear to be: selection of PCOCs to monitor in
subsurface soils; selection of concentrations of potentjql
contaminants of concern in soil; neglect in some scenarios of
degradation of potential contaminants of concern over time;
and, potential carcinogenicity of PAHs as a class. Assumptions
were made in every case, except the first, that could lead to
potentially large. over-estimates of health ris 1·,s. As discussed
elsewhere in the report, any one person's potential exposure
and risk are influenced by all the parameters mentioned in
Section 2.4 and thus, must be estimated on a case-by-case basis.
2-97 5722F 4040-001-600
(\J
I.(\
(\J
0
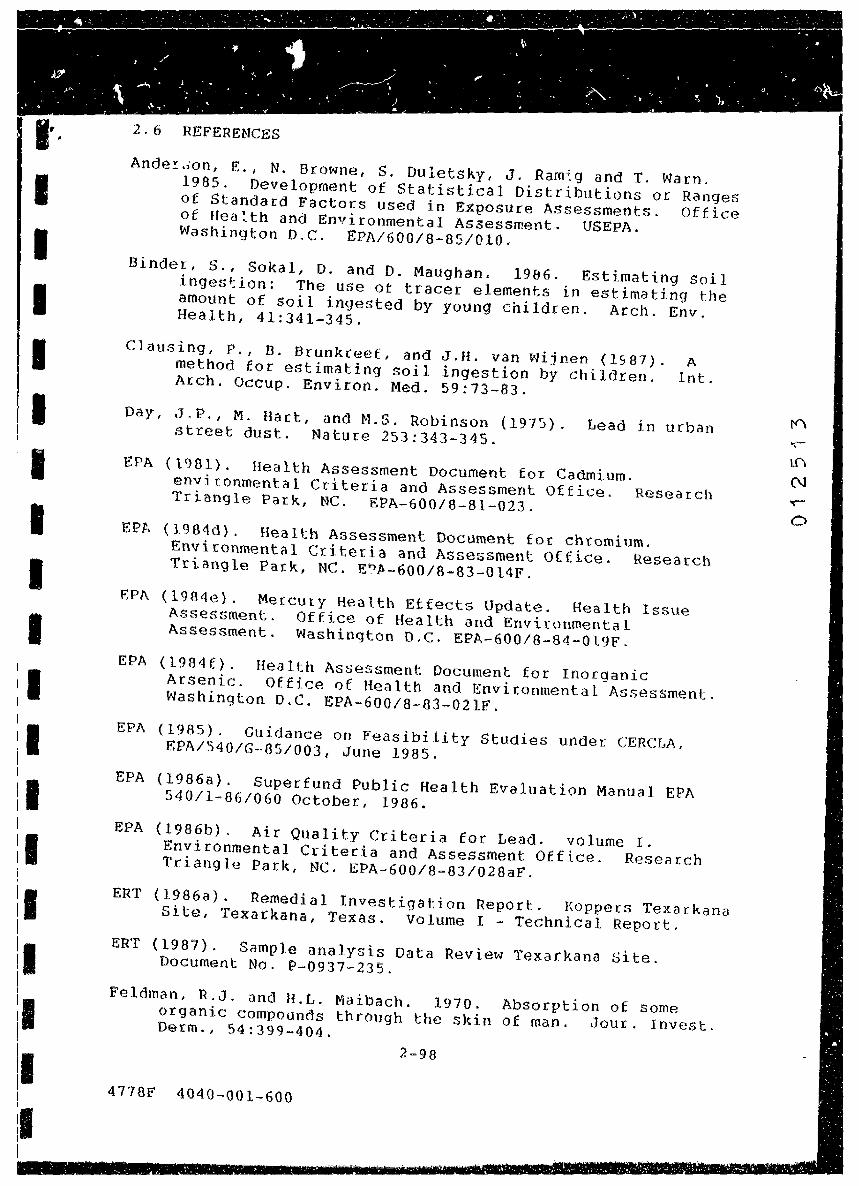
,~. I I I I I I I I I I I I
I
2.6 REFERENCES
Ander~on, E., N. Browne, S. Duletsky, J. Ram:g and T. Warn. 1985. Development of Statistical Distributions or Ranges of Standard Factors used in Egposure Assessments. Office of Hea~th and Environmental Assessment. USEPA. Washington D.C. EPA/600/8-85/010.
Binder, S., Sokal, D. and D. Maughan. 1986. Estimating soil ingestion: The use of tracer elements in estimating the amount of soil ingested by young children. Arch. Env. Health, 41:341-345.
Clausing, P., B. Brunkreef, and J.H. van Wijnen (1S87). A method for estimating soil ingestion by children. Int. Arch. Occup. Environ. Med. 59:73-83.
Day, J.P., M. Hart, and M.S. Robinson {1975). Lead in urban street dust. Nature 253:343-345.
EPA (1981). Health Assessment Document for Cadmium. environmental Criteria and Assessment Office. Research Triangle Park, NC. EPA-600/8-81-023.
EPA {l984d). Health Assessment Document for chromium. Environmental Criteria and Assessment Office. Research Triangle Park, NC. Ery~-600/8-83-014F.
EPA (1984e). Mercury Health Effects Update. Health Issue Assessment. Office of Health and Environmental Assessment. Washington o.c. EPA-600/8-84-019F.
EPA (1984£). Health Assessment Document for Inorganic Arsenic. Office of Health and Environmental Assessment. Washington D.C. EPA-600/8-83-021F.
EPA (1985). Guidance on Feasibility Studies under CERCLA, EPA/540/G-85/003, June 1985.
EPA (1986a}. Superfund Public Health Evaluation Manual EPA 5 4 0 I 1-8 6 / 0 6 O Oct o be r , 1 9 8 6 •
EPA (1986b). Air Quality Criteria for Lead. volume r. Environmental Criteria and Assessment Office. Research Triangle Park, NC. EPA-600/8-83/028aF.
ERT (1986a). Remedial Investigation Report. Koppers Texarkana Site, Texarkana, Texas. Volume I - Technical Report.
ERT (1987). Sample analysis Data Review Texarkana Site. Document No. P-0937-235.
Feldman, R.J. and H.L. Maibach. 1970. Absorption of some organic compounds through the skin of man. Jour. Invest. Derm., 54:399-404.
2-98
4778F 4040-001-600
lf\
N -c--
0

I I I I I I I I I I I I I I I I I I I
References (Cont5nu~1)
Fe!1man, H.J. and H.L. Maibach. 1174. Percutaneous ~~netration of some pesticides and herbicides in man. Toxic~l. and Appl. Pharmacol., 28:128-132.
ICF. 1987. Comparative Potency Approach for Estimation of the Total Cancer Risk Associated with Exposure to Mixtures of Polycyclic Aromatic Hydrocarbons in the Environment. ICF Clement Association.
Kapish. 1974. Investigations into sources environment of urban children. Envi rot.
.;ad in the s., 10:415-426.
Lepow, M.L., L. Bruckman, M. Gillette, S. Markowtiz, R. Robino and J. Kapish. 1975. Investigations into sources of lead in the environment of urban children. Environ. res., 10:415-426.
Paustenbach, D.J., H.P. Shu and examination of assumptions dioxin contaminated soil. 284-307.
F. J. Murray. 1986. A critical used in risk assessments of Reg. Tox. and Pharmacol., 6:
Poiger, H. and C. Schlatter. 1980. Influence of solvents and absorbents on dermal and intestinal absorption of TCDD. Food cosmet. Toxicol., 18:477-481.
Verschueren, K. 1983. H~ndbook of Environmental Data on Organic Chemicals. Second Edition. 1310 pp. Van Nostrand Reinhold Company, Ne~ York, Ny. USA.
2-99
4778F 4040-001-600
I.('\
C\I

I I I I I I I I I I I I I I I I I I I
3.0 APPLICABLE OR RELEVANT ~ND APPROPRIATE
REQUIREMENTS
3.t Introduction
Requirements under CERCLA (Section 12l(d)), as amended by
the Superfund Amendments and Reauthorization Act of 1986 (SARA)
state that remedial actions must comply with applicable or cel~vant and appropriate requirements (AAARs) of federal laws
and more stringent, prom·:lgated state laws. A requirement may be either "applicable" or 11 relevant and
apprcpciate 11 to a remedial action, but not both. Applicable
reqJirements are cleanup standards, criteria, or requirements
established under federal or promulgatcj under state law that specifirally address a hazardous substance, pollutant,
contaminant, remedial action, location, or other circumstance at a C6RCLA site. Relevant and app~opriate requirements may
not be "applicable" to a hazardous substance, pollutant, contaminant, remedial action, location, or other circumstance
at a CERCLA site, but they do address problems or situations
sufficiently similar to those encountered at the CERCLA site in
such that their use is well suited to the particular site.
Even though there are several types of ARARs, they can,
for clarification, be divided into three separate groups: che~ical-specific, location-specific, and action-specific.
Chemical-specific ARARs ace requirements which set health
or risk-based concentration limits or ranges for specific hazardous substances, pollutants, or contaminants. MaKimum Contaminant Levels {MCLs) and National Air. Quality Standards
are examples of chemical-specific ARARs. Location~specific ARARs set restriction~ on activities
based upon the characteristics oC the site and/or the nearby
suburbs. Examples of this type of ARAR include federal and
state siting laws for hazardous waste facilities and sites on the National Register of Historic Places.
l(\
I..(\
N

I I I I I I I I I I I I I I I I I I I
The third clas3ification of ARARs, action-specific, refers to the requirements that set controls or restrictions on particular acti~ ~s related to the management of hazardous
substances, pollutants, or contaminants. RCRA regulationd for
closure of hazardous waste storage units, RCRA incineration
sta~dards, and pretreatment standards under the Clean w~ter Act
for discharges to POTWs ctre examples of action-specific ARARs.
Actual ARARs can be identified only on a site-specific
basis. They depend on the detected chemicals at a site,
spe~ific site characteristics, and particular remedial actions
proposed for the site. ARARs identified for the Koppers Texarkana Site are di$cussed below.
3.2 Chemical-Specific ARARs
As previously stated, c:hemic~,~-specific ARARs set health
or risk-based concentration limits or ranges for specific
haz3rdous substances, pollutants, and/or contaminants. Table
3-1 presents a review of the potential federal chemical
specific ARARs. The potential contaminants of concern
identified in the RI for the Koppers Texarkana Site include: arsenic, chromium, copper, lead, mercur 0 1 light aromatics,
PAHs, PCDDs/PCDFs, pentachlorophenol, and zinc. Chemical
specific ARARs relevant to the Koppers Texarkana Site are
discussed below according to water quality, soil quality, and
air quality. State chemical-specific ARARs are presented in
Table 3-2.
3.2.1 Water Quality
Table 3-3 . is ts the chemical- specific ARAR.s iden ti f i~d £or
the Koppers Texarkana Site based on water quality. The ARARs
included on the table are the Maximum Contaminant Levels,
Secondary Maximum Contaminant Levels. and proposed Maximum Contaminant Level Goals, set by the Saf~ Drinking Water Act and the Ambient Water Quality Criteria (AWQCs) for human health and
aquatic life set by the Clean Water Act. Maximum contaminant levels are not available for all of the contaminants. Also
3-2
lf\
(\J
0
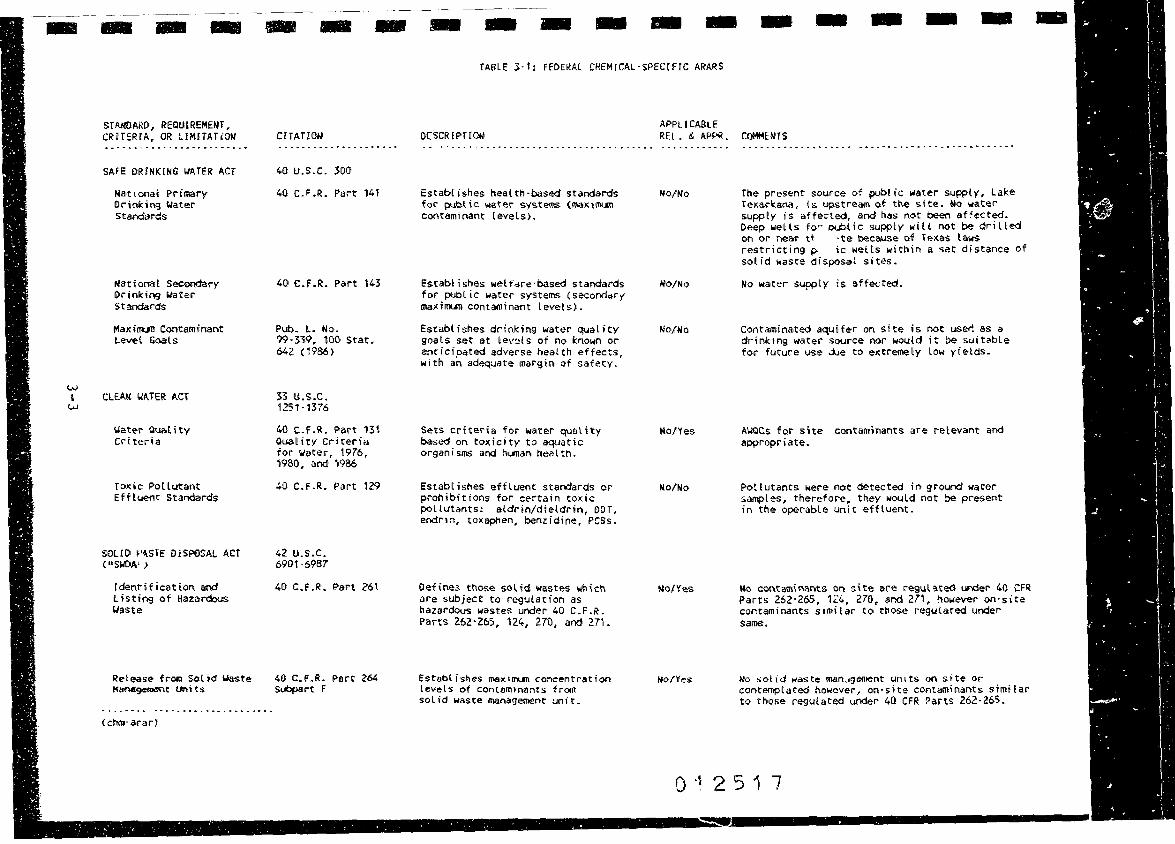
-
w \
(.,.I
- 111111
STAlroARD, REQUIREMENT, CR!FER!A, OR Ur,tHATiOf.l
SAFE ORfNKING w'ATER ACT
Na,t ionat Primary Orioking Water Standards
Natiooat Secondary fi)C"inking 1/ater Standards
Maximt.lll Contaminant Levet Goals
CLEA~ r.tATER ACT
!Jater Cluali ty er i teria
Toxic Pollutant Effluent Standards
SOUi) ~•<1.SfE OtSf'OSAL ACT ( ••sWOA.' >
ldentHication and listing of Hazardous waste
Release from SOl icl Waste K~~t ~HS
Cchm-arar)
- -CHATrON
40 u.s.c. 300
40 C.F.R. Part 14T
40 C.f.R. Part 143
?ub. L. No. ?9· 339, 100· Stat. 642 C 1986 >
:s:s u.s.c. 1251 · 1376
40 C. F .R. Part 131 Oua!ity Criterfa for Water, 1976, 1980, and W86
40 C.f.R. Part 129
42 u.s.c. 690t -6987
40 C.F.R. Pan 26\
40 C.F.R. Part 264 St,Jbpart F
- - - - - - - - - -TABLE 3-t: FEDERAL CHEM!CAL-S?ECfflC ARARS
APPLICABLE O(SCR !PT[Ot, RF.[ . &. APPR. COMMEIHS
Establishes health-based standards for publtc w-e.ter systell\S (maximu11 contaminant levels}.
EstaM i shes welf o1ro: · based s tand'ards for p'-lblic water systems (secondQry maxilTIUll contaminant levets).
Establishes drinking water quality goats set at tev~ls of no lc:nown or enticf,c,ated adverse health effects, with an adequate mar-gin o,f safety.
Sets criteri« fer water q1Jality based on toxicity to aquatic organisms and hi.,nan health.
Establishes effluent standards or prohibftfons for certain toxic pollutants: aldrin/dieldrin, ODT, endrin, toxap/1.en, benzidine, PCBs.
Oefines those solid wastes wh,ch are subject to regulation as hazardous wastes under 40 C.F.R. Parts 262·265, 124, 270, and 271.
Estabt ishes 11l81dmun concentration levels of contaminants from solid waste management unit.
llo/Mo
MO/No
No/No
No/No
The pres~nt source of public water supply, Lake Texarkan~, is upstream. ot tne site. Uo water suppty is affected, and has not been af'ected. Deep welts fo~ public supply will not be drilled on or near' ti , t e because of t e:..as laws restricting~ ic wells within a set distance of solfd waste disposal sites.
No water supply is affected.
Contaminated aquifer on site is not user. as a drinkrng water source nor would it be suitable for future use si.Je to extremely lo~ yietds.
AWOCs for site contaminants are relevant and appropriate.
Pot lutants wel'e not detected ir1 ground water ~an,ples, therefore, they would not be present in the operable unit effluent.
Ne coritamfoants on s,te a-re i:"%}.ule:1ted under' 4.0 CFR Parts 262·265, 12,., 270, and 271, howevef' on-site contaminants similar to tnose regulated under same.
110 solid WdSte man.,gement units on site or contemptateo however, on-site contaminants similar to those regulated under 41) CFR Parts 262-265.
0 '1 2 5 1 7
-

-
w I
.,.:.
- - - -STANOARD, REQU!REMEMT, CRITERIA, OR L!MITATION
CON1TAMINAtH SPECIFIC:
ALLOWABLE LIMITS OF METALS IN DR(NK[tro WATER
WATER CUAllTr STANOAROS FOR SU~FACE WATERS
PROff!BiTIOH )F PER COlvTAMIM·AMTS VrffCff ADVERSELY EFFECT HUMAN HEALTH AMO THE ENV.RONMENT
CONTROL OF AIR POU.UTION FROM 1/ISIBLF. EM! ssrows AND PARTlCUlAlE MATTER
SLJt.FUR, FlUORfDE, ANO BERYLLIUM Co,,tPOUNOS I~ AIR
ACTION SPECIFIC:
STORAGE OF vot.Ai(LE ORGANIC CEJMPOUNos
Oll/1,/A:fER: SEPARATORS
'lllflAA( PROOUCIKG SYSTEKS
lOCA T fOH; SPEC! FIC:
LOCATION OF WEllS USED FOR ORHIKUlG WATER SUl>PUES
- - - - - -TABLE 3-2: TEXAS S;ATE ARARS
STATE AGE'HC'( Df$CRIPT!ON
DEPT OF ~EALTH ESTABLISHES HEAtTH·SASEO STANDARDS FOR PUBLIC wt\TfR SYSTEMS.
WAT!:R COMMISSION SETS CR!TER!A FOR WATER QUAUT'I' BA.SEO UPON TOXICITY TO ACUAnc ORGANISMS AND HUHAH HEALiH.
A!R CONTROL BOAR9 GENERAL RESTR!CTION 1,/tflCH IS INTER· PRETEO SY THE STATE TO REQUIRE CO'IPLIANCE IJ!TH OCCUPAfWNAl HEALTH UMITS.
AiR CO~TROL BOARD SETS HAXIUMUM ALLOWABLE LEVELS OF PARTICULATES IN AIR_
A[R CONTROL BOARD SETS MAXIMUM ALLO\.IABLE E~[SS!ONS FOR THESE COMPOONDS.
- - -APPLICABlE/ REL & APPROP
NO/YES
YES/NO
NO/YES
YES/NO
AJR CONTROL BOARD REGULATES !IANDUNG OF TANKS CONTAIN· YES/NO
AIR CONTROL BOAR:O
AIR CON~ROl 80~RO
AIR CONTROL BOARD
DEPT OF HEAL Hf
[NG VOLATrtES.
REQU,RES !tETttOOS FOR MINIMlZfNG EMISSfONS FROM SEPARATORS.
REOI.HRES UtClN!:RMlON OF EMiSSlotlS ABOVE A THRESHOLD.
REOU!RES INC(NERATfON OF E~rssrows
RES TR [CTS TffE PlACEME!H or \JELLS USED FOR ORiNKIHG WATER, ANO THE l..OCAllON OF SOLID WASTE DISPOSAL.
YES/NO
YES/1£0
NO/NO
'<ES/N'O
012518
- - -C(X,IMENf
mrnn CAL 1'0 THE FEDERAL PRIMARY ANO SE(ONOARY tlMlfS fOR MEFALS.
CRITERIA FOR TOKICANTS WERE AP?ROVEO rn l\?RI\.. CF wsa..
CRfiER!A ARE GENERALLY THE S,J1E AS OS~A REQUIREMENTS.
CRITERIA ARE ARARS ONt.Y lF AN !HCfNERAT!ON OPT!ON rs SELEC1E~ AS A REMEDY.
THESE COHPOONOS ARE NOV FOUND ON StTE.
O~lY AN ARAR IF VOLATILES IHLL BE CONTAINED IN A TANK.
OfL/WATER SEPAPAT!O!I IS A PART OF THE GROUND WATER REMEO!iH ION.
ONLY If,,\ VACUUM RECOVER'!" !SA PART OF GROUND WATER REMEO r AT[ O!L
NOT CHARACTER!STlC OF T~E S!TE
REQUIRES l~STITUIIONAL CC.-'-lfROLS EF l'f/E REME'Ol' CON5itiUTES RCRA DEFINED D!SPOS~,l.
- -

- - - ... - - - - - - - - - - -
w I
U1
l"COCs
Lead
Mercury
PAHs (potendaUy ca:rc i.n<>genic)
l"AHs (noncarcinoge:ni.c) Ac,;,-napblhei.e Fluo.ranthene t-la ph t.t. a. t ette
Benzene
E:thylbenzene
Toluene
Safe
MC1,h}
~ (\.().':,
o.os
0,.05
0.002
o,.oos
i>r-i nk i ng Waler Act
l .O
s.o
Proposf!d M'C[J; ( C )
(mgU >
0.22
(J.68
2.0
o.44
TABLE 1-,
(d} lean ~ater Act - !u«1'lettt Water Q~ality c~lter\4 (AWQ€}
~ ft<!'a r ( h AW~r: IJ.-.t,.r and A<(uat 1, Organisms (u5/i)
o.on (C.l
so ('r)
0, L44 (T)
0-028 (C}
20 (0) t,10
NP
100 (T)
6.6 (C)
14,300 (T}
Aquatic l.i fe AWQ€ 1-'re-gh Wat@r
foG_/l)
440 (!\}
0. 75 ( 24-hr),
l 700 (A} 1980 (A) :noo ( ti.}
55 (A) 3.2(CR)
47 (2'4-hr)
5300 (A)
32,000 CA)
t7,500 (A)
(a) Ma:xi1It,..m Contaminant Levels Standard~. pro,uubgated under lhe Safo lkinkirig ;.;Her- Act (t,O CF'R 141 ). (b) Secondary Ma,cimum Con~aminant Levels, p.-oposed under the Saf,;,- Odn·l<ing Wate.- Act (4(} CF"R l4t ). (c} Proposed Maximu,n Contaminant Level Coals.
(d} !\lllbi.ent Wale,: Quality Criteri.a fo,;- tl-:e (),otecti.on of l:wman l~ealtn, 11rcmutg.ate<l. under the ('.\ee.:, °riit.l,.i:- Act. Basis fo, er ite.-i.a designated as fol lows: A = Ac,1te toi<iclty; C = Carcinogencity at the 10-~ risk; 01 • Chronic totcicity;
rDxicity; 24 hour average va LUe; ili.ld
I ,0
o.os
0.002
5.()
Rr::RA Gro•md Water
Prot i>d i <ln ( f) S~&ndat"i!I
0.05
0.002
Suff,cio>nt data not available to derive au AWQC, 0 Organoleptic effect;
(,d Ma><1,,..,111 AHo ... at>le Limits of the '!'exas De?art.nent of l:!<'alth Drinking Wal.;r St.,nda!"rls, adopted hy o,e ,e><as Board of 11.-11.lth on .lune 41
1'}77 ;rnd l.1sf r.-s,i,;Pd un October 19, !'}B<;.
(t} M,ui,au111 Cor,tamin«nl Lev<-!ls un<l,;,-r RCRA (40 CF"R 264,'14).
012519
-=-

I I I I I I I I I I I I I I I I I I I
• included on this tab:e are the Texas Drinking Water Standards
set by the Texas Board of Health. These standar~s are the sa~e
~s the standard~ set under the Safe Drinking water Act.
~WQCs are developed for exposure conditions that include inyestion of fish and drinking water from the same surface
water body and ingestion of only fish. A'WQCs are not appropriate for comparison to ground water concentrations.
The SDWA, as amended, ensure that the nation's water sufply systems serving the punlic meet minimum national
standards for the protection of. public health. The SOWA established primary regulations for the protection of public
health and secondary regulationR for the protection of public welfare. The prim.::.ry regulations cover maximum contaminant
levels (MCLs), recommended maximum C?ntaminant levels (RMCLs),
monitoring requirements, analytical requirements,
recordkeeping, and procedures for public notification. The secondary regulations cover secondary maximum contaminant
levels (SMCLs), which are guidelines associated with aesthetics
(e.g., taste and odor). These secondary regulations are not
federally enforceable, but are intended as stat4 guidelines. According to the SOWA and EPA National Primary Drinking
Wat~r Regulations, an ~CL is:
11 the maximum permissible level of a contaminant in water which is delivered to any user of a public water system."
A RMCL is:
"the maximum level of a contaminant in drinking water at which no known or anticipated adverse effect on the health
of persons would occur, and which includes an adequate
margin of safety."
The SOWA states that RMCLs published ,,efore the enactment of
the 1986 amendments will be treated as maximum contaminant
level goals. Following the enactment, a maximum contaminant
3-6
0 N t.(\
N
0

I I I I I I I I I· I I I I I I I I I I
level goal will be proposed simultaneously with any proposed or
promulgated primary regulation. MCLs and RMCLs have been
established for both organic and inorganic chemicals.
The EPA National Secondary Drinking Water Regulations
describes SMCLS as ma~imum contaminant levels:
0 which apply to public water systems and which, in the
judgement of the Administrator, are requisite to protect
the public welfare. 0
SMC~s have been presented for contaminants such as copper,
fluoride, iron, odor, pH, sulfate, total dissolved solids, an~
zinc. These SMCLs are considered to be reasonable goals for
dri~king water quality, but states may establish higher or
lower levels that are appropriate.
The RCRA Ground Water Protection Standard establishes
maximum contaminant concentrations that can be released from
permitted Solid Waste Management Units. These are identified
to the SDWA MCLs.
The Texas Department of Health has established allowable
limits of metals in dri~king water. These are identical to the
federal primary and secondary limits for metals.
According to EPA regulation 40 CFR 110:
"no person shall discharge or cause or permit to be
discharged into or upon the navigable waters of the United
Statesr adjoining shorelines .. , any oil, in harmful
quantities •.. include discharges which violate
applicable water quality standards, or cause a film or
sheen upon or discoloration of the surface of the water or
adjoining shorelL'":!S .•• 11
The T€xas Water Commission has promulgated standards for
ambi~nt surface waters. These standards inclut~ specific
concentration levels for some toxics, mostly metals and
3-7
N m (\I
0
I I I I I I I I I I I I I I I
T O • O O • ~ ,. T • r ~ • • ~ • • • ~ • ~ • • • r • • .; •• • • • • • • • : ; - • • , • •
pesticides. In a<ldition, the state prohibits oil sheens.
Ta::-le 3-4 lists the standards which apply to the 1'C0Cs for the Koppers Texarkana Site.
3.2.2 Air Quality
National ambient air quality standards (NAAQS) are federal
ARARs established for air quality. Specifically, NAAQS have
not been established for the potential contaminants of concern
associated with the Koppers Texarkan~ Site, with the exception
of lead. T~e NAAQS for lead is 1.5 ug/m3 for an average time of 90 days.
Multimedia environmental goals (MEGs) have been
established as guidelines for comparing field measurements to
ambient air quality. Specific compound concentrations are
established by MEGs as they relate to possible health effects
fMultimedia Environmental Goals for Environmental Assessment,
Volume 1, EPA~600-7-77-136a]. MBGs are long-term levels of
exposure to specific compounds deemed acceptable to prevent
certain negative health effects to surrounding populations,
MEGs are guidelines only, but they have been derived through
the use of existing threshold limit values (TLVs). The ~EGs
established for the potential contaminants of concern fot the Koppers Texarkana Site are listed on Table 3-5.
Texas ambient air quality standards have not been
established for any of the potential contaminants of concern.
Available state ARARs for air quality are presented in Table 3-2.
The Texas Air Control Board has established regulations
governing the storage of volatile organic compounds and design
of oil/water separators would be applicable should these
activities be a part of any remedial action.
3.2.3 Soil Quality
ARARs have not been devaloped tor contamination of soils
and/or sediments. However, there are g1.1i-:'eli11es that have been
used or established for a few of the potential contaminants of
3-8
N N I.('\
N
0

I
I i
t l,
w I
...0
- - - - - - - - - - - - - - - - -TABLE 3-4: iEXAS PROMULGATED WAfER QUAlfTY STANDARDS FOR SPECIFIC TOXIC MATER!AtS
PCOCs. FRESlf ACUTE FR'ESH CflRON'IC MARl~E ACUTE MAR I NE CKRmH C CRITERIA
CR! rERIA CRITER!ll CRlliERIA Cug/L} (ug/t > Cug/l} (ug/ l >
----.. - . - - ..... -.... -- - - .. ~ ... ■ - - •• ■ • - - .... - ...... - - - ......... - - •
... .... -- .. - . - - - --- - - ....... - . - . - .... - ---- ... + ■■----
~ ... - -... ARSEIHC 3'60
190 149 78 CflROMWM (HEX) 16 tl HOO 50
COPPER e (0.9422Ctn(~ardness)J·l.3844) (0.8545fln(hardness>I-1.386
e 4.37 4."57 LEAD e
(1.273(ln(hardness)l·1.460) 0. 273 [tr,,(hardness)} ·4. 705) e 140 5.6 MERCURY' 2.4
0.012 2. l 0.025 PENTAC~tOROP!feNOt tl.OO~(pH}·4.830J (1 .005(pff)-5 .2901 e
e 15.14 9_56 C0.8473(Ln{hardness)J+C.8604) (0 .8437 [ln(hardness)J1 +O. i"6l4) ZINC e
e 98 89 - - - .. ■ • - ..... ■ - - • - ....
(tr.-h2o)
012523
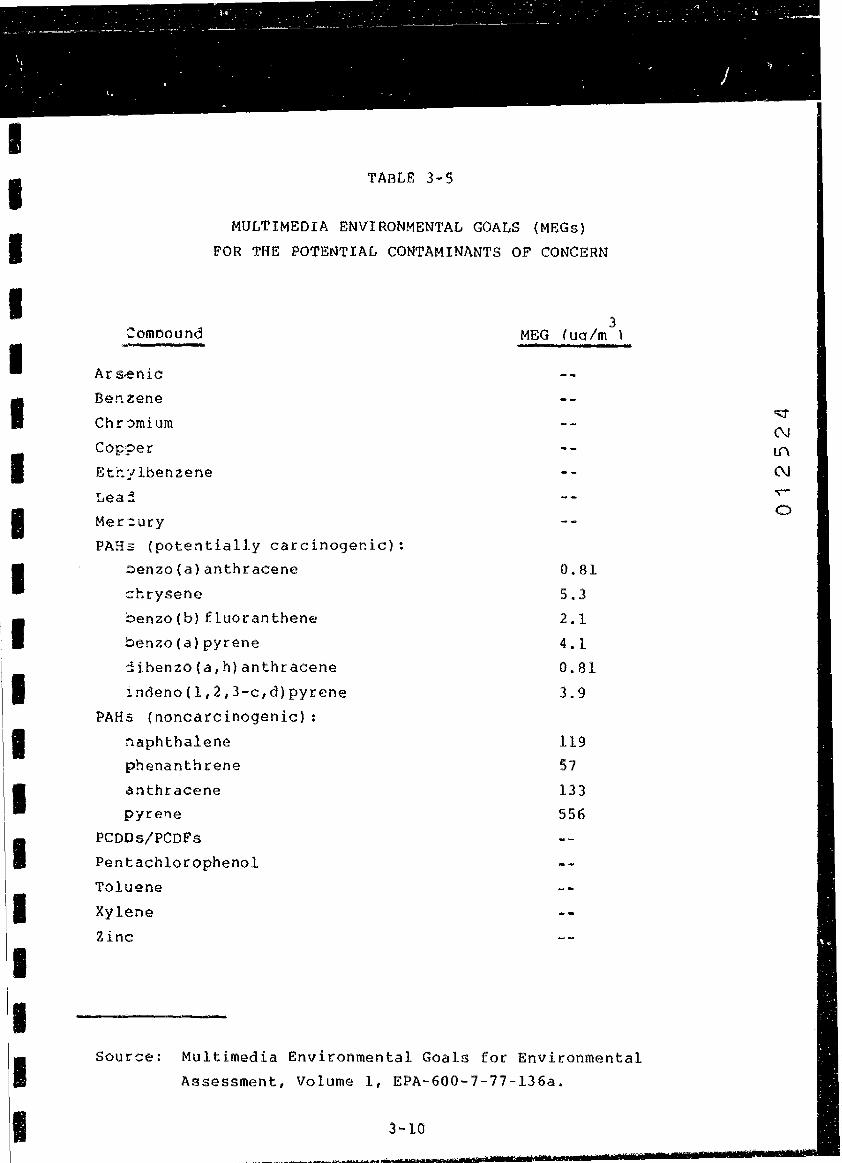
I I I I I I I I I I I II I I
11
I I I
1•
TABLE 3-5
MULTIMEDIA ENVIRONMENTAL GOALS (MEGs)
FOR THE POTENTIAL CONTAMINANTS OF CONCERN
:omoound
Ar s-enic
Benzene
Ch r '.)mi um
Co~?er Etr.y lbenzene
Lea::.
Mer:::ury PAHs (potentially carcinogenic):
~enzo(a}anthracene
:::hrysene ~enzo(b)fluoranthene
oenzo(a)pyrene
~ibenzo(a,h)anthracene
indeno(l,2,3-c,d)pyrene
PAHs {noncarcinogenic):
:1aphthalene
phenanthrene
anthracene pyrene
PCDOs/PCOF's
Pentachlorophenol
Toluene
Xylene
Zinc
3 MEG (uq/m \
0.81
5.3
2.1
4.1
0.81
3.9
119
57
133
556
Source: Multimedia Environmental Goals for Environmental
Assessment, Volum~ 1, EPA-600-7-77-136a.
3-10
<:;;f"
0J I.!\
(\J
0

I I I I I I I I I I I I I I I I I I I
co~cern identified for the Koppers Texarkana Site. These
include guidelines for pentachlorophenol {PCP), PCDDs/PCOFs,
and total PA.Hs.
The Centers for Disease Control (CDC) derived an action level for 2,3,7,8-tetrachlorodibenzo-p-dioxin (2,3,7,8-TCDO) in
residential soils. The action level was established at l ppb
for a 10- 6 excess lifetime risk (Kimbrough, 1984). The EPA has developed a method for relating the toxicities
of penta-, hexa-, hepta-, and octa-PCDDs and PCDFs to the
toxicity of 2,3,7,8-TCDD. This method translates the
con~entrations of PCOD/PCDF isomers into equivalent
con~entrations of 2,3,7,8-TCOD {Table 3-6).
3.3 Location-Specific ARARs
Location-specific ARARs are requirements that set
res~rictions on activities based upon the characteristics of
the site and nearby suburbs. Table 3-7 presents a review of potential location-specific ARARs. Although not an ARAR, a
local city ordinance restricts new construction within the
100-year flood plain. The majority of the Texarkana Site lies
within the 100-year flood plain. The City of Texarkana also
has a zoning ordinance. The Kennedy Sand and uravel Company
property is zoned as industrial.
3.4 Action-Specific ARARs
ARARs applicable to the development of the remedial action alternatives for the Koppers Texarkana Site and to the FS
process include CERCLA as amended by SAM, SOWA, RCRA and CWA.
Table 3-2 presents state location-specific ARARs. Table 3-8
presents a detailed evaluation of federal action-specific
ARARs. A discussion of the significance of CERCLA and RCRA to
the FS process is presented below.
3-11
If\
N LC'\
(\J
0
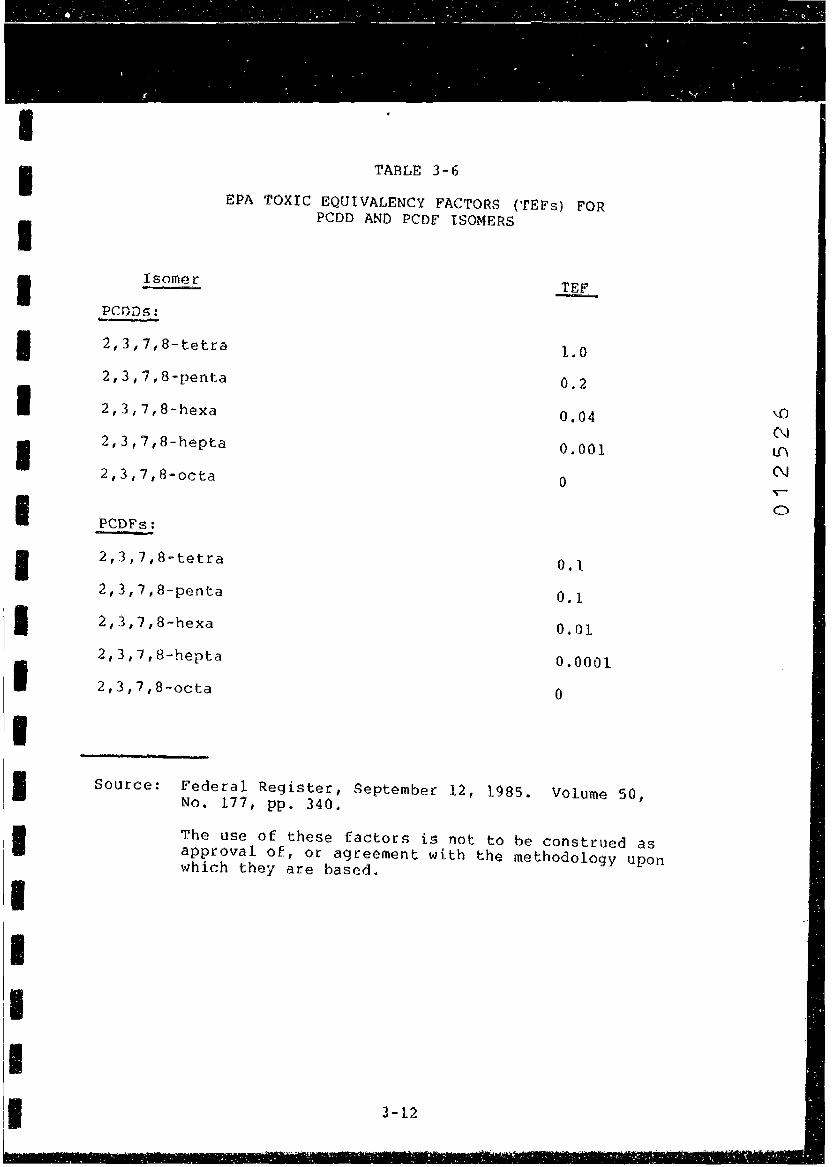
I I I I Isomer
PCOD5:
TABLE 3-6
EPA TOXIC EQUIVALENCY FACTORS (TEFs) FOR PCDD AND PCDF ISOMERS
TEF
I 2,3,7,8~tetra l.O
I I I I
'I I I I I I I I I I
2,3,7,8-penta
2,3,7,8-hexa
2,3,7,8-hepta
2,3,7,8-octa
PCDFs:
2,3,7,8-tetra
2,3,7,8~penta
2,3,7,8-hexa
2,3,7,8-hepta
2,3,7,8-octa
0.2
0.04
0.001
0
0.1
0. 1
0.01
0.0001
0
Source: Federal Register, September 12, 1985. Volume 50, No • l 7 7 , pp . 3 4 0 •
The use of these factors is not to be construed as approval of, or agreement with the methodology upon which they are based.
3-12
'° N If\ (\J
~
0
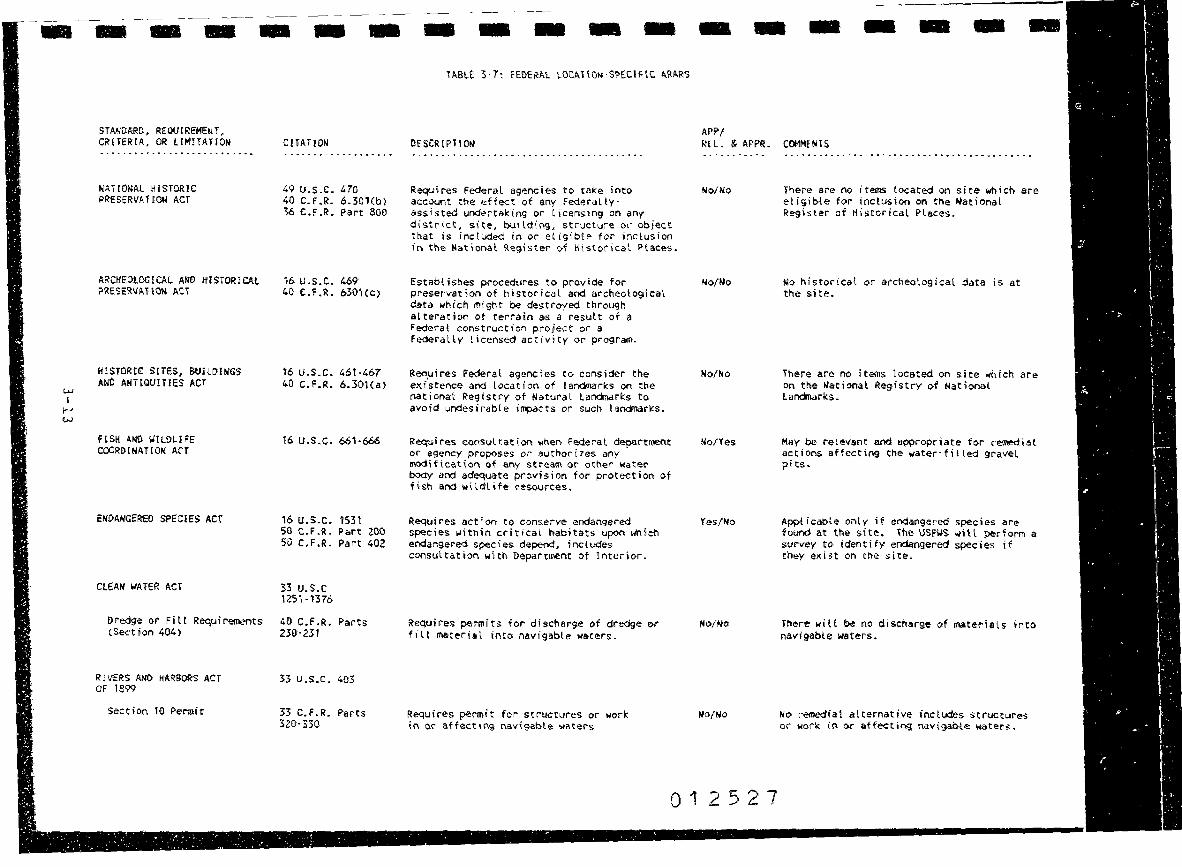
-
w I
1--' w
- - - - - - - - - - - - - - - - - -STANDA.RO·, REQUIREMENT, CRHER!A., OR UM!iAHON· .... - ~ --....... - --.... --.. - .... ,. ......
NATION'Al HISTORIC PRESERVAf!ON ACT
ARCl:IEOt.OGICA~ AN[), 1-!lSTORICAI.. PRESER\ffl.HOM fl.CT
HISTORIC sures, BUILDINGS ANO A.NTIQIJ[ Tl ES ACT
F[Si-1 ANf> WILDLIFE COORDINATION Arr
CI.EAN' WATER ACT
CHAHON ......... ., ................. .
49 u.s.c. 470· 40C.F.R. 6.30l(b,} ~ C.F.R. Part 800
16 u.s.c. 469 40 C.F.R. 630\(C)
16 u.s.c. 46t-467 40 c.F.R. 6.301Ca>
16 u.s.c. 661·666
16 u.s.c. 1531 SO C.F.R. Part ZOO SO C.F.R. Part 402
33 u.s.c \2Sl-n76
Dredge ocr FiH Requirements 40 C.F.R:. Parts (Section 404) 230·231
REVERS ANO tfARBORS ACT OF 1899
Sect ion 10 Permit
33 u.s.c. 403
33 C.F.R. ?arts 3Z0·330
Requires Federal agencies to take into account the effect of any Federally· assisted undertaki119 or ticensing on any di strict, site, building, structure 01· object t!lat is included in or et i9ibte for inclusion in the Nationat Re9ister of Kistorical Places.
Establ isties procedures to provide for preservation of historical and archeologi,eal data which might be destroyed through atteration of terrain as a resutt of a Federal construct;on project or a Federatly licensed activity or program.
Requires Federal agencies to consider tne eKi stence and Location of ! andrnarks on th,e national Registry of Natural landnar~s to avofd undesirable illf)a::ts on, such tardnarks.
Requires coMul~ation when Federal department or agency proposes or authorizes any 11\0d,ficat,or,; of any streaA\ or other water body and adequate provision for protection of fist, and w\ldlife resources.
Requires act i,on to conserve endangered species within critical habitats upon which endangere-:f species depend, includes consultation witl'I Department ot Interior.
Requires permits for dischar9e of dredge or fitt rnaterill into navigable waters.
Requires permit for structures or work in or affectil'I<;) navigable watel"s
APP/ ~ll. & APPR. COMMlNtS
No/No
No/No
Mo/No
Mo/Yes
Yes:/No
No/Ho
"o/No
... ................................... -~ .............. ~ ........ ,,. .. .
There are no items located on site which are etigible for inclusion on the National Register of Historical Places.
No historical or archeotogicat data is at the site.
ihel"e are no items located on s.ite wh.ich are on the National Registry of National lardnarks.
May be relevant and awropriate for remedial actions affecting tile water·filled gravel pits.
Applicabte only if endangered species are found at the site. the USFl.iS wiH perform a survey to, identify endangered species if they exist on the site.
There wilt ~ no discharge o,f materials. into navi-gable waters.
No remedial alternative includes structures or work in or affecting navigable waters.
012527

- - - - - -STMJOARO,, R'l!'OUIRE~MT, CRtTERIA, OR L[M[iAT[OM
?ROTECTIOH OF WEH.AMDS
EXECUTIVE OROER ON FLCOOP't.AfM HA~AGEMENT
WILOER'NESS ACT
MA HOMllL W'U .. OL I FE REFUGE SYSTE!'!
SCENIC RIVER ACT
----.--------·· .. ···----·-·---- .. -·--
CHI\TlO!-'
Exec. Order N'o. 11,990
40 C.F.R. 6.302(a) and Appendix A
Exec. Order No. n,988
16 U.S.C. l131 50 C.F.R. 3S.1
~6 u.s.c. 668 50 C.F.R. 27
16 u.s.c. 1271 40 c.F.R. 6.302Ce>
- - - - - - - - - - - -II.PP/
OfSCRIPTIOM f!i L. II. APPR.
Requires Federal agencies to avoid to the Yes/No extent possible, the adverse i~cts associated with the destr~·tion or loss of wetlands and to avoid support of new. construction in wetlands if a practica-l alte,native &xists.
Requires Federal agencies to evaluate the Yes/No potential effects of actions they may tal::e in & floodplain to avoid, to the extent possible, the adverse in-pacts associated with direct and indirect developnent of a floodplain.
Actninister Federally-owned wilderness area Mo/No to leave it uni~cted.
Restdcts activities within a Nationat !io/"o Wildlife Refuge.
Prohibits adverse effects on a scenic river. No/No
012528
l:OMME!,HS
Wetlands hiwe been ide11tified ac the site.
?ortions of the site a,e .iithin the 100·year floodplain.
No wilderness area on site or adjacent to the site.
/.lo, wilderness area, on site or adjacent to the sfte.
Ho scenic river in area.
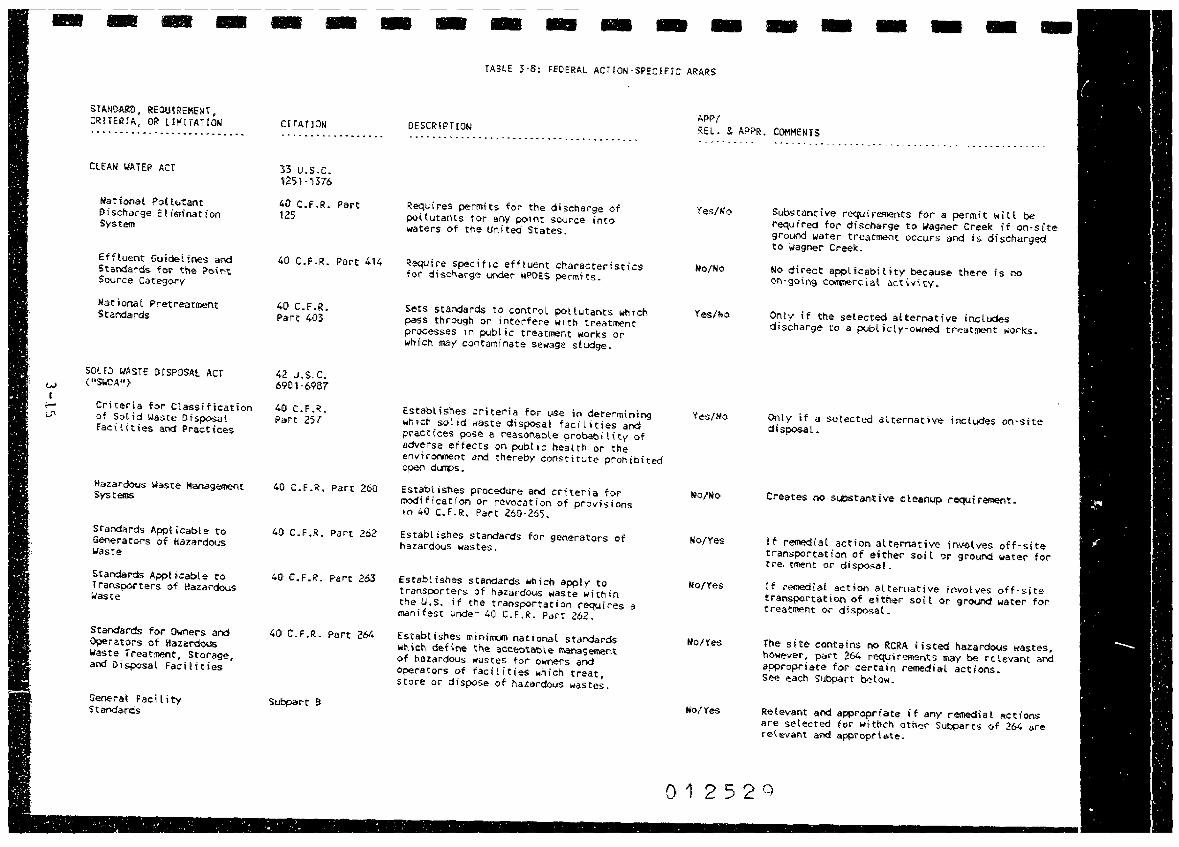
-
w I .....
U'
- -Sill.tlDII.RD, 11:EQUtREMENi, CRITERIA, OR LIMITATION
CLEAN UA.TER ACT
N'at i anal PoHutant !>ischarge E! iminatfon, System
Effluent Guidelines and Standards for the Po,nt Source Category
Mationat Pretreatment Standards
SOLID WASTE DISPOSAL II.CT ("SWOA" )·
Criteria for Classification o·f So! id IJ,aste Disposal Faci ti ties and Practices
Hazardous Waste Management Systems
Standard's Applicable to Generatl)f"S of Hazardous lo'aste
Standards App! icable to Transporters of Hazardous wa:ste
Standards for Owners and Operators of ffaLardous lo'aste Treatment, Storage, and ~isposal Facilities
Generat Facility Sti!ll"lda.rds
- - - - - - - - - - - - - - -CITATION
33 u·.s.c. 1251 · U.76
40 C.F.R. Part 125
40 C.F.R. Pert 414
40 C.F.R. Par-t 40'3
42 u.s,c. 6901-6987
40 C.F.R. Part 257
40 C.F.R. ?art 260
40 C.F.R. Pa,rt 262
40 C. F .R. Pa•rt 263
40 C.F.R. Part 264
St.ibpart B
TASlE ~-8: FEDERAL ACTION·SPECJF!C ARARS
OE SCR I P'H ON
Requires permits for the discharge of pollutants for any point source into waters of the United States.
Require specific effluent characteristics fOI" discharge under MPDES permits.
Sets standards to control pottutants which pass through or interfere with treatment processes in public treatment works or which may contaminate sewage sludge.
Establi-shes criteria for 1.1se in determining which solid waste disposal facilities and practices pose a reasonable probability of adverse effects on pubtic health or the envirorvrient 11nd thereby constitute prohibited open d~.
Establishes procedur-e and criteria for modification or revoca,tion of provisions tn 40 c.F.R. Part 260·265.
Estabt isties standai-ds for generato-rs: of hazardous wastes.
Establ fshes standards wMch appfy to transporters of hazardous waste within the U.S. if the transportation requires a manifest under 40• C.F.R. ?art 262.
Establishes minimun national starda,rds wt'det-1 define- the acceptable management of hazardous wastes for owners and operators of facilities which treat, store or dispose of !"iai::arc:lous wastes.
11.P,r>f REL. & APPR. COf,1MENTS
Yes/No
No/No
Yes/No
Yes/No
No,f\"es
Nol'(es
Substantive requirements for a permft will be required for discharge to ~agner CreeK if on·site ground water treatment occurs and is discharged to ~agner Creek.
No direct applicability because there is no on-goil'lg coo-rnercial acttv,ty.
Onty if the selected alternative includes discharge to a publicly-owned tr~atment wor~s.
Only if a setected alternative includes on·site disposal.
Creates no substantive cleanup requirement.
If remedi.at action alternative inv~lves off•site transpo•l"tation o,f either soil ?r ground water for tre; tment or disposal.
If remedial action alter-uative involves off-site transportation of eith~r soil or ground water for treatment or disposa~.
The site contains no RCRA listed hazardous ~astes, however, ~rt 264 requirements may be relevant and appropriate for certain remedial act,ons. See each Subpart below.
Relevant and appropriate if any remedial RCtions are selected for i,;i then other Sut,parts of 264 ar-e relevant arid appropriate.
01252Q
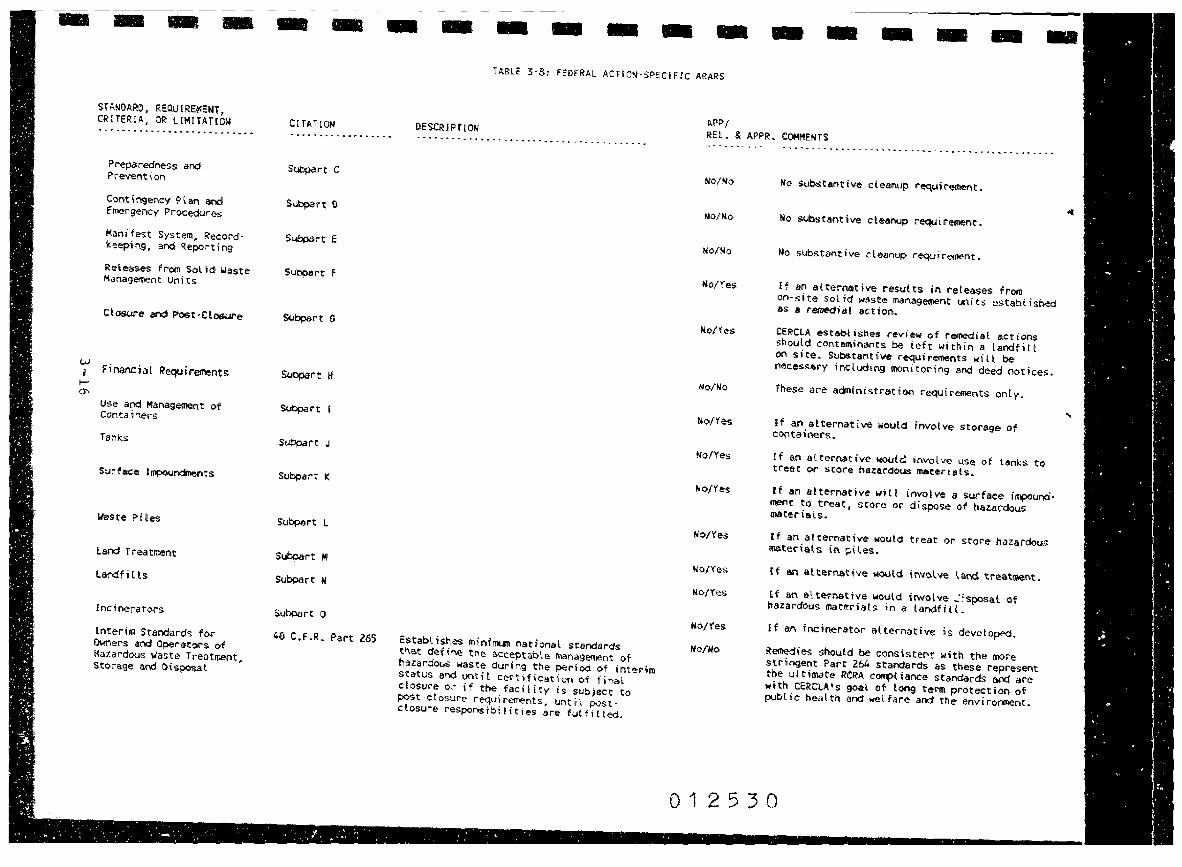
- - - -STANOA.RI!)·, RECUIREMENt, CRITERIA, OR llMITATIOW
Preparedness and· Prevention
Contingency P'tan and Emergency Procedures
Mani fest System·, Recoi-d· keeping, and Reporting
Releases from S,:,l td W·aste Management Units
Closwe aird Po1n•E:l06Ul"e
w 1 Finaeiciat Requirements
I-' a,
use and Management of Conta·iners
Tanks
Surface llll!)OYr.dmients
Waste PHes
Land Treatment
Landfi Us
Inc iner-atQrs
lnterim Stanclard~ for 01.!ners atd Operato,r-s of Hazardous Waste Treatment, StQra~e and Oi~at
- - - - - - - - - - - - - -Cl TA HOM
Subpart C
Subpart f
SYbpart G
Sc.ibpa,r t i
Sl.ibpart J
Subpa,l"t L
Subpart M'
Sybpart N
Subpa,rt 0
40 C.F.R. Part 265
TABLE 3·8: FEDERAL ACflON·SPECIF!C ARA.RS
DESCRIP-TrON ........ - - - - •• - ..... " ... - .......... - ■ ~ - ... - - ....... - .. ■ •
Establishes minin.m nationat sranda,rds t!\at define the acceptable management of hazardoi.r.; waste during the period of interim stat\JS and \IF\tit certification of final c!osure or if the facility is subject to pos.t·closure requtrements, until post· closure responsibilities are futfitted.
r.,P?{ REL. & A.PPR. COMMENTS
NO/No
No/Yes
Nol'<es
No/NO
Mo/Yes
No/Yes
No/Yes
No/Yes
No/tes
No/HO
No su.bl.:tantive cleanup requirement.
No substantive cleanup requirE:fflent.
No substantive cleanup l"equirement.
If an alternative results in releases from on-site sol id waste management units established as • remedial action.
CERCLA establish.es review of remedial act ions should cont11111insnts be left within a landfitt on site. Substantive requirements wilt be (lecessory including monitoring and deed notices.
these are adninistration requirements only.
If an alternative would ,nvotve storage of containers.
tf an alternative woulC: involve use of tanks to tre&t or store h-a.i:a-rdous tnaterials.
Han alternative wit! j,f)volve a surface i~unci• ment to treat, store or dispose of hazardous materials.
If an altei-native would treat or store hazardous materials in ~iles.
If an alternati-ve would trw~lve land treat~t.
tf an e.tternative would involve ..::sposal of hazardous matrriats in a landfill.
If an incinerator alternative is developed.
Remedies should be constste~t with the more stringent ?art 264 standards as these represent the ultima,te RCRA eOftl)t iance standards and are with CER'CLA's goal of long term protection of public heiil tn and wet fare and the envi roroient.
012530
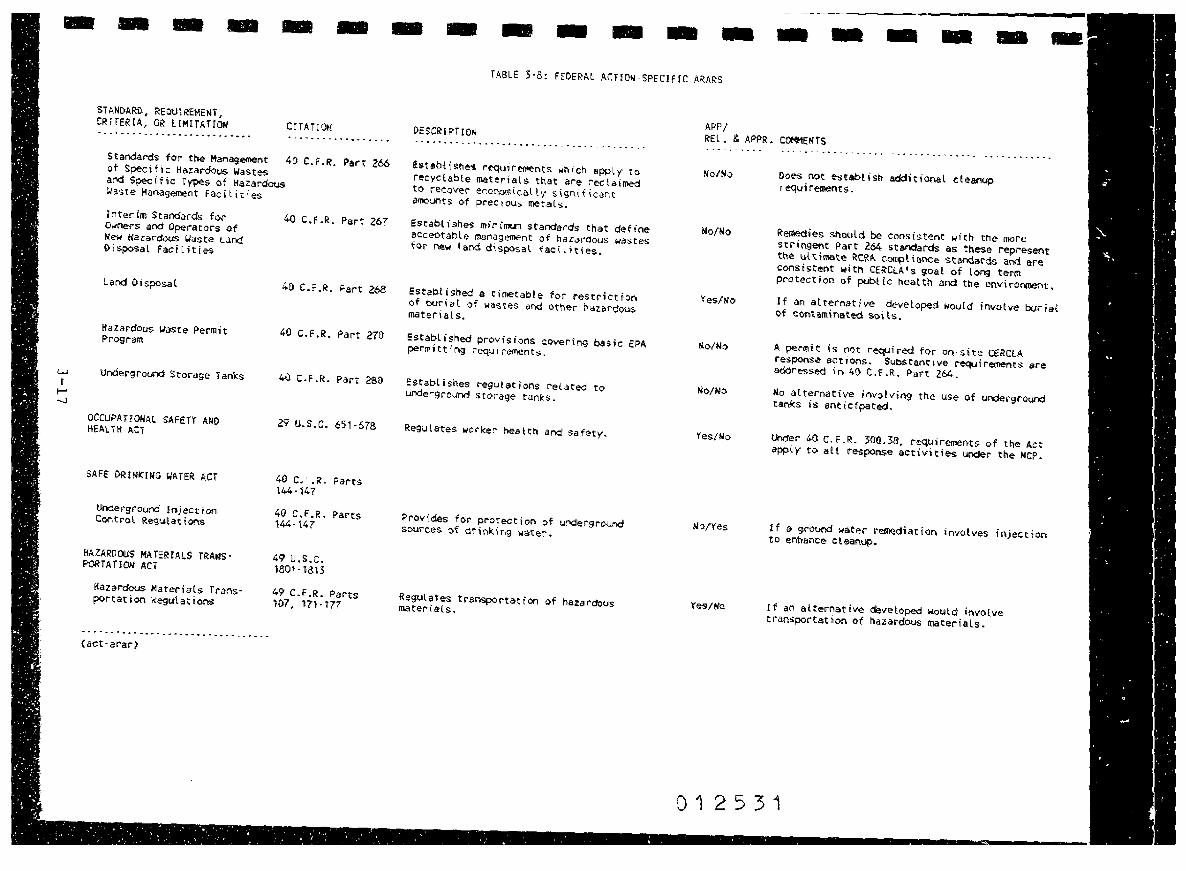
- - - - - -
w r
I-' ...J
STANOARI), REWlREHENi, CRiiERIA, OR LIMITKTION - - - - .. - .... - - .. - ■ .......... - ............ - ....
CrTATIOff ·----·--- .............. .
Standards for the Maiiag,ement 40 C.F.R. Part 2'66 of Specific Kazar-dou,s wastes and Spec i h c 'l''fi)es of HazardOIJS \Jaste Managemen,t Fae iii ti es
Interim Standards for 40 C.F.R. Part 267 owners and Operators of Ne'iol Hazardous w·aste Land Disposal Faci t ities
Landi Disposat 40 C.F.R. Fart 268
Hazardous waste Permit Program
Underground Storage Tanks
OCCUPATIONAL SAFETY ANO KEAL'\'l:t ACT
SAFE ORIN«:lflG WATER ACT
Underground Jnjection Control Reg.ulatiOM
HAZAFW·OIJS HATERlALS TRAN!S· PORTATION ACT
Hazardous Materials Trans• portation iegulations
- ... 4'. - - - - • - - • ,. .. - .. - ...... - ............... - .. - ...
Cact·arac-)
40· C.F.R. Part 270
29 u. s. c. 65, ·678
40 C. · • R. Parts \44-147
40 c.F.R. Parts 14'· \47
49 u.s.c. 1801-1813
49 c.F.R. P'srts 1017, 171-ln
- - - - - - - - - - - - -TABLE 3·8: FEDERAL ACTIOM·SPECIFIC MARS
D-ESCR!P'T!ON .. - ........ - - - .... - .. - .. ,. ..... - ...... - ......... - ... - ... ■ •••
IEst•blis~s requirements which appty to recyclable meteriats tt\at are reda.imed to recQll'er ec~ically significant amounts of precious metals.
Establishes mfninun standards that define acceptabte management of hazardous wastes for new land disposal facilities.
Established a timetable for restriction of burial of wastes arid other hazardous materials.
Established provisions covering basic EPA pel"fflitting requirements.
Establishes regulations related to underground storage tanks.
Regi;lates worker health llnd safety.
Provides for protection of undersir·ound sources of drinking water.
Regulates transportation of hazardous materials.
APP/ REL. & APPR. COM11EN,TS
No/No
No/No
Yes/No
No/No
Ho/No
Yes/No
No/Yes
Yes/No
Ooes not establish additional cteaa;p r equi rements.
Remedies sho1Jld' be consistent with the more stringent Part 264 standards as these represent the ultimate RCRA compA i al'\Ce standards and are consistent with CERCLA's goat of lo,;g term protection of public neatth and the envirorwnent.
If an, atternative developed would involve burial of cont!lfflinated soils.
A permit is not required for on-site CERCLA response actions. SubStantive requirements are addressed in 40 C.f.R. ?art 264.
No alternative involvin9 th~ use of urider9round tanks is. anticipated.
Urlder 40 C.F.R. 300.38, requirements of the Act apply to all response activities under the NCP.
If a ground water remediation involves injection to enhance cleanup.
rf an alternative developed would involve transportation of hazardous materials.
012531

I I I I I I I I I
,1
I I I I I I I I I
CERCLA/SARA
This FS was conducted in accordance with CERCLA as amended
by SARA and specifically with the NCP guidelines. The goals of a CERCLA cleanup are defined in Section 300.68 of the NCP,
which states:
11 Remedial actions are those responses to releaees that are consistent with perman~nt remedy to prevent or minimize
the release of hazardous substances or pollutants or
contamina~ts so that they do not migrate to cause
substantial danger to present or future public health or welfare or the environment. 11
Additionally, the SARA amendments indicate a preference to
treatment rather than disposal when considering remedial
actions.
R~source. Conservation and Recoverv Act <RCRA)
The development of alternatives within this FS are bas8.d
upon requirements stipulated in RCRA. These regulations may
govern the handling, storage, and disposal of any hazardous
wastes that may be generated during the implementation of a remedial action RCRA requirements regarding site monitoring
associated with a corrective action program would also be
applicable. These requirements also address the establishment
of alternate concentration limits (ACLs) defining the levels
that must be achieved for aquifer restoration.
N I'<\
LI\
N
0

I I I I I I I I I I I I I I I I I I I
3.5 References
EPA, "Health Assessment Document for Epichlorohydrin, Final Report, 11 EPA-600-8-83-032F, pp. 7-62, 1984.
Fed~ral Register, September 12, 1985. 50(177) :340.
Kimbrough, R.D., Falk, H., Stehr, P., and Fries, G., 11 Health Implications of 2,3,7,8-tetrachlorodibenzodioxin
Contamination of Residential Soil, 0 J. Tox & Envir. Health, 14 47-93, 1984.
0
I I I I I I I I I I I I I I I I I I I
4.0 IDENTIFICATION AND SCREENING OF REMEDIAL ACTION TBCHNOLOGIES
This sect!on of the FS contains the identification of the rem~dial response objectives, the general response actions, and
the applicable remedial action technologies. First, remedial res~onse objectives and general response actions are
ide~tified, based upon site-specific information and
env:ronmental concerns. For each general response action, a
list of remedial action technologies are identified and then screened, based upon site-specific information,
characteristics, and/or technical feasibility. list of potentially applicable t2chnologies for
waste
As a result, a the site is
developed. The process for determining this list of
pote~tially applicable technologies is presented on Figure 4-1.
4.1 Remedial Response Objectives
Prior to the development of the general response actions
pertinent to the site, remedial response objectives must be deve:oped. Remedial response 0bjectives identified for the
Koppe:c Texarkana site were established based upon
site-specific information, public health and environmental
concerns {the results of section 2.0), and requirements under federal, state and local regulations. Fout specific remedial
response objectives were identified for the site and are as follows:
o cont&in or control seepage into Wagner Creek.
o contain or control the migration of impacted ground
water originating from the site area.
4-1
0
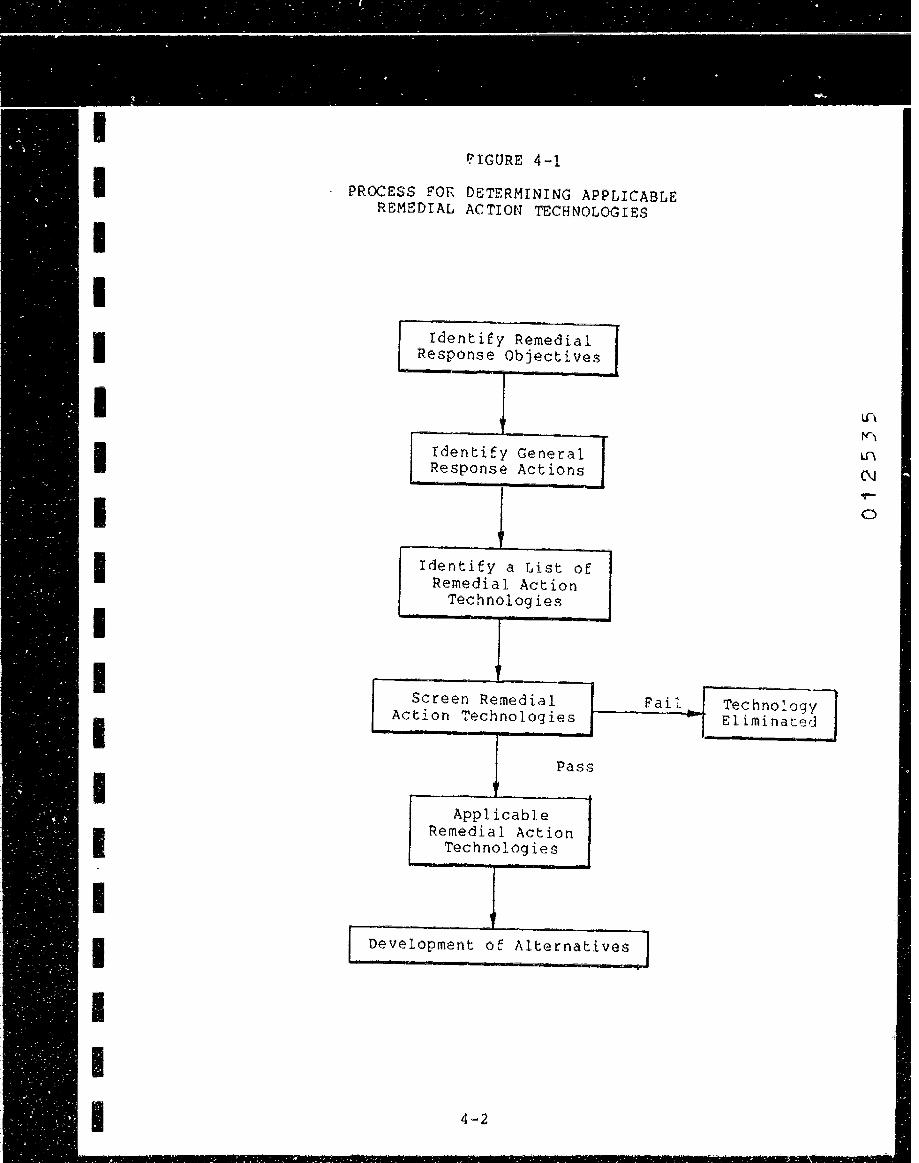
I I I I I I I I I I I I I I I I I
f?!GURE 4-1
PROCESS FOR DETERMINING APPLICABLE REMEDIAL ACTION TECHNOLOGIES
Identify Remedial Response Objectives
I
Identify General Response Actions
, Identify a List of
Remedial Action Technologies
Screen Remedial Action Technologies
Pass
Applicable Remedial Action
Technologies
i
Fail
/ Development of Alternati;es 1
4-2
Technology Eliminated
0

I I I I I I I I I ,I
I I I I I I I I I
o Contain or conttol localized areas of soil contamination to eliminate the potentia: for exposure to soils with concentrations greater tr.an 1,000 ppm of total carcinogenic PAHs.
o Eliminate the negative ve:tical gradient now being exerted on the shallow unconfined aqui:~r by the water-filled gravel pits.
These remedial response objectives will guide the deve:opment and screening of the remedial action alternatives
(RAAs) for the Koppers Texarkana Site. Each of tte objectives
wil: be discussed below, along with the basis for their development.
The first response obj~ctive, to contain or control
seepage into the creek, was established because, during the RI,
seeps were observed entering Wagner Creek. According to the Texas Water Quality Standards, 31 TAC 333.17(a)~
"Surface waters shall be maintained so that oil, grease,
or related residue will not produce a visibl~ film of oil
or globules of grease on the surface or coat the banks or bottoms of the watercourse.ft
Also, according to EPA regulation 40 CFR 110:
•no person shall discharge or cause or permit to be
discharged into or upon the navigable waters of the United
States, adjoining shorelines •.• any oil, in harmful
quantities ... incl~de discharges which violate
applicable water quality standards, or cause a film or
sheen upon or discoloration of the surface of the water or adjoining shorelines •.. "
4-3
N
I I I I I I I I I I I I I I I I I I I
The second response objective is to contain or control the mig:ation of impacted ground water. The lateral extent of impacted ground water was determined to extend throughout the Ken~edy Sand and Gravel Company property, to the southern areas
of Carver Terrace, and to limited off-site areas. The response objective to contain or to control the migration of impacted
gro~nd water is an objective identified in the NCP as being part of the overall approach to site clean-up. The concept of
containing or controling migration is discussed in terms of source control measures and/or management of migration measures
in the NCP [40 CFR 300.68(e)) as:
11 • • • whether the threat can be prevented or minimized by
controlling the source of the contamination at or near the
area where the hazardous substances were originally
located (source control measures) and/or ... hazardous substances have migrated from the area of or near their original location {management of migration) •.. •
From the results of the RI, it was determined that
potentially carcinogenic PAHs are directly associated with free-phased creosote. Therefore, the second response objective
goal will be to remove the free-phased creosote from the shallow aquifer.
The third response objective is to contain or to control localized areas of soil contamination to eliminate the
potential for exposure to soils with concentrations greater than 1,000 ppm carcinogenic PAHs. Past studies of the Koppers
Texarkana Site, including the RI, have identified areas of surface soil contamination located in Carver Terrace and the
Kennedy Sand and Gravel properties. The objective to contain or to control a,&aa of soil contamination was based on the
rasults of the Final Public Health and Environmental Assessment (Final PHEA) presented in Section 2.0.
4-4
rt"\ I!\
N ,-0
I I I I I I I I I I I I I I I I I I I
The final remedial response objective is to eliminate the
negative vertical gradient now bei~g exerted on the shallow ur.confined aquifer by the water-fi::ed gravel pits. As a res~lt of the termination of the gravel mining operation, the
water level in the gravel pits has risen, causing localized ar~as where there is a negative vertical gradient between the
shallow unconfined aquifer and the deep semiconfi~ed aquifer. If this action were to continue, the impacted ground water in
the shallow unconfined aquifer could be forced downward through the leaky confining zone and eventually into the deeper
aqJifer. Due to this fact, the objective to eliminate the negative vertical gradient was developed for the Koppers
Texarkana Site.
4.2 General Response Ac~ions
General response measures have been identified for the
Koppers Texarkana Site based upon the results of the Final
PHEA. The Final PHEA indicates that impacted ground water and soils from the site may potentially present an increased risk
to public health and welfare and to the environment. General
response actions are developed to provide solutions to site
problems and to address methods for eliminating potential contaminant transport pathways. These general actions form the
basis for identifying technologies corresponding to each response action and subsequent detailed screening of the
technologies.
The response actions listed below were identified for the
Koppers Texarkana Site. These general response actions pr~sent an initial identification of potential actions to address
ground water contamination and contaminant ~eepage into Wagner Creek as well as soil contamination at the Koppers Texarkana Site:
4-5

I I I I I I I I I I
0 No action
0 Institutional Controls
0 Containment 0 Ground Water Withdrawal
0 Complete removal 0 Partial removal 0 Direct treatment 0 In-situ treatment
0 Disposal
4.3 Identification of Remedial Action Technologies
Remedial action technologies were identified for each of the general response actions listed in the previous section.
Ta~le 4-1 presents a list of the general response actions along with the set of associated remedial action technologies.
4.4 Screening of Remedial Action Technologies
As part of the next step in the FS process, each remedial
action technology identified on Table 4-1 is screened based I upon site applicability and technical feasibility.
I I I I I I I I
Screening with respect to site applicability consists of identifying the technologies which are not applicable to the
Koppers Texarkana Site due to site-specific conditions and/or contaminant characteristics. Site-specific conditions may
include climate, geology, hydrology; extent of contamination, etc. Contaminant chara~teristics may include toxicity,
solubility, type, migration potential, etc. Screening with respect to technical feasibility consists
of evaluating the technology 1 s performance, reliability, and implementability. Performance is measured by the technology 1 s
ability to meet the remedial response objectives; reliability is measured by the performance/failure record for the technology; and implementability is measured by the construction, operation and maintenance history of the technology.
4-6
0

I I I I I I I I I
I I I I I I I I
TABLE 4-1
GENERAL RESPONSE ACTIONS AND ASSOCIATED REMEDIAL ACTION TECBNOLOGIES - KOPPERS TEXARKANA SITE
GENERAL RESPONSE ACTION
NO ACTION
INSTITUTIONAL CONTROLS
CON~AINME:-;t
GROJND WATER WITHDRAWAL
COMPLETE rtE~OVAL
PARTIAL REMOVAL
DIRECT TREATMENT
IN-SITU TREATMENT
MEDIA
Liquid/Soil
Liquid/Soil
Soil
Liquid
Soil
Soil
Liquid Liquid Liquid Liquid
Liquid Liquid/Soil Liquid Liquid Liquid Liquid Liquid/Soil Soil
Liquid/Soil
4-7
REMEDIAL ACTION TECHNOLOGY
No Action
Monitoring Limited Access Building Ordinances Deed Restrictions
Subsurface barriers Capping Grading Revegetation
Well point system Deep wells suction wells Ejector wells Interceptor drains
Excavate and remove soils
Excavate and remove soils
Activated carbon Biological treatment Filtration Precipitation/ flocculation/
sedimentation Reverse osmosis Air stripping Steam stripping Gravity separation Chemical oxidation Chemical reduction Incineration Soil washing
Biological: - Biodegradation
{bioreclamation)
0 <:"::l"
lf'\
N
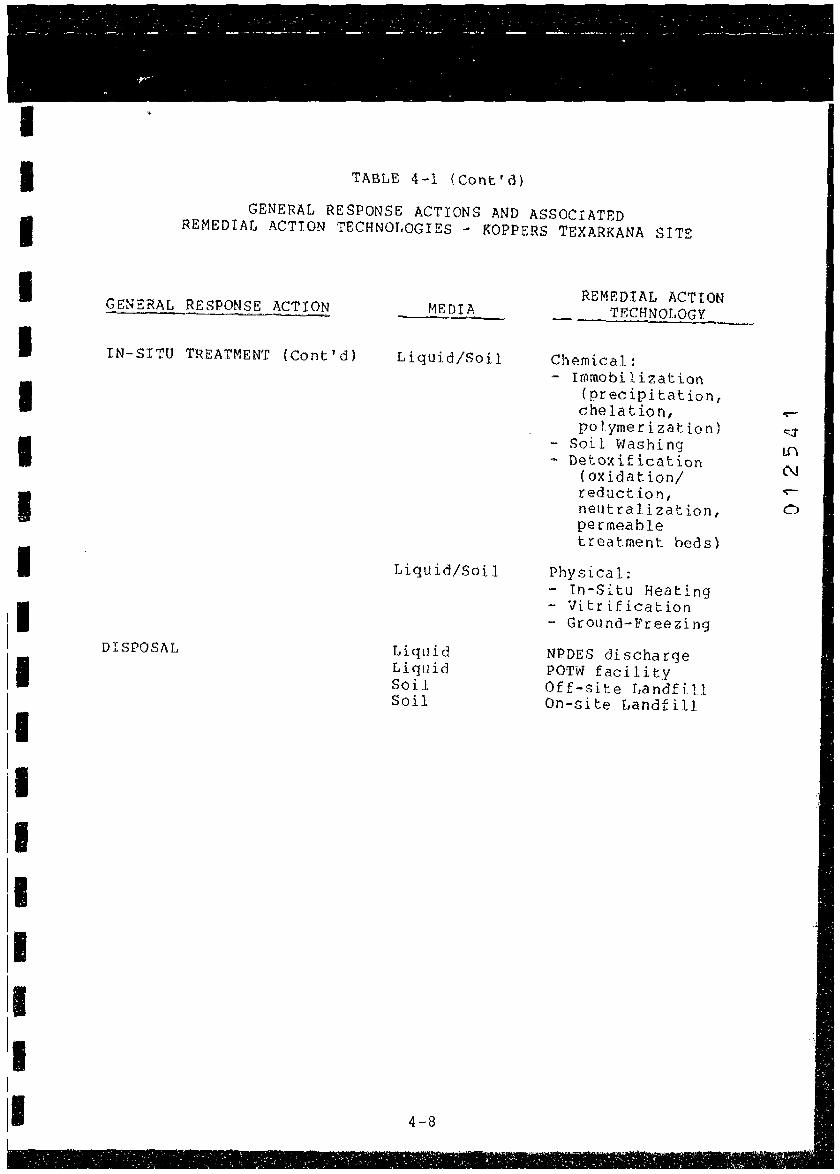
I I I I I I I I I I I I I I I I I I I
GENERAL
IN-SITU
DISPOSAL
TABLE 4~1 {Cont'd)
GENERAL RESPONSE ACTIONS AND ASSOCIATED REMEDIAL ACTION TECHNOLOGIES - KOPPERS TEXARKANA SITE
REMEDIAL ACTION RESPONSE ACTION MEDIA TECHNOLOGY
TREATMENT {Cont'd) Liquid/Soil Chemical: - rrnmobi 1 i za t ion
(precipitation, che la tio n, polymerization)
- Soil Washing - Detoxification
(oxidation/ reduction, neutralization, permeable treatment beds)
Liquid/Soil Physical: - In-Situ Heating - Vitrification - Ground-Freezing
Liquid NPDES discharge Liquid POTW facility Soil Off-site Landfill Soil On-site Landfill
-<::.;t
Lf\ (\J
..-0

I I I I I I I I ii I I I I I I I I I
No single remedial action technology addresses every remedial response objective identified for the Koppers
Texarkana Site. Therefore, during the screening process, each tectnology is screened based upon its effect when applied to a
specific problem. A brief description of each identified remedial action
technology along with the screening results follows.
4.4.1 No Action
The National Contingency Plan (NCP) states that a no
action alternative should be evaluated. This alternative
provides an evaluation of baseline conditions against which other remedial alternatives may be evaluated.
Under the no action alternative, additional remedial activities would not be performed and all contaminated soils and ground water would remain in place. The no-action alternative will be retained for further evaluation.
4.4.2 Institutional Controls
4.4.2.1 Monitoring
A long-term monitoring program can be considered as an institutional control. A monitoring program could, if necessary, be established to pLovide continuing information
regarding the effectiveness of remedial activities on site. Thi~ is a feasible action and will be retained for further
evaluation. Monitoring may be considered in conjunction with
other alternatives.
4.4.2,2 Limited Access
Limited access can be considered as an institutional
control. Limited access to a site can be maintained by the use of fences and/or no trespassing signs restricting trespassers
from entering the ~ite or portions theteof. A fence has
4-9
C\J e::j"
Lf\
C\J

I i
I I I I I I I I
I I I I I 1, I I
pre·;iously been installed on the Kennedy sand and Gravel
froperty and must be maintained as required by an AOC. This
co~:rol will be retained for further evaluation.
4.4.2,3 Building Ordinances
Institutional controls such as building codes (i.e., no construction within a 100-year floodplain) may also be
co~sidered, The City of Texarkana has a local ordinance
restricting new construction within a 100-year floodplain. A
ma~or portion of the Koppers Texarkana Site lies within the
100-year floodplain; therefore, this control will be retained
fo~ further evaluation.
4.4.2,4 Deed Restrictions
Deed restrictions or land use restrictions may b~ used as
an i~stitutional control measure. Selected areas within a site
may be subject to a deed restriction thereby limiting the
futJre use of that land. A typical example is a RCRA
landfill. After a landfill has been closed, that area of land
becomes subject to a deed restriction providing that no future
distJrbance (development, excavation, etc.) is permitted. This
control measure may be applicable to the Koppers Texarkana Site
and, therefore, will be retained for further evaluation.
4,4.3 Containment Structures
4.4.3.1 Subsurface Barriers
Subsurface barriers are low permeability cut-off walls or
diversions installed below ground to contain, capture, or
redirect ground water flow in the vicinity of a site. Typical
examples of subsurface barriers are slurry wallsr grouted
barriers, sheet piling cut-offs, and bottom seals. Slurry walls are low permeability bar~iers conatructed in
vertical trenches that are excavated and filled with a slurry (usually bentonite and wate~). The trench is backfilled with a
4-10
q
Lf\
(\J
0

I I I I I I I I I I I I I I I I I I I
soi:/bentonite mixture that provides the desired permeability and resists degradation. A slurry wall is generally "keyed-in
to bedrock or to a low permeability confining layer such as clay. The wall usually is constructed around a site to limit
the horizontal migration of contaminants in the saturated zone,
and it is generally two to three feet wide and can be, but not typically, as deep as 100 feet. A confining clay layer is present at varying depths ranging to approximately 70 feet at the Koppers Texarkana Site. Due to the depth and variability of the confining layer, this technology will be eliminated from
further evaluation.
A grout curtain is another example of a subsurface
barrier. This barrier is created in unconsolidated materials by pressure injection. ~ major limitation of grout curtains that they are generally incapable of attaining truly low permeabilities in unconsolidated materials. They are seldom applied to hazardous waste sites; therefore, this technology will be eliminated from further discussion.
is
A sheet piling wall is driven into the ground to form a subsurface barrier much like a slurry wall or grout curtain.
The wall is a prefabricated structure which is installed by
interlocking individual sections together before they are
driven int~ the ground. Steel sheet piles are more effective
than ones made of wood or pre-cast concrete in terms of ground water cut-off and cost. The integrity of a sheet piling wall is unpredictable, and sometimes, like in the case of coarse,
sandy soils, the wall may never completely seal at the seams. This type of wall is seldom used except for temporary
dewatering in preparation for construction, so it will no
longer be discussed as an appropriate technology for this site.
Bottom sealing refers to methods used to place a barrier
beneath a site to act as a floor and prevent the downward
migration of contaminants. There has not been any docum~nted application of this technology to hazardous waste sites, so it
will not be considered any further.
4-11
q
q
L.(\
N ~
0
I I I I I I I I I I I I I I I I I I I
4.4.3.2 Capping
Capping techniques are employed whenev~r conta~inated
materials are to be buried or left in place at a site. There
are many variations in cap designs and mate~ials that are
ava:lable. Possible capping materials inclJde: flexible
synthetic membranes, bentonite (clay), natural soils, admixed
soils, chemical stabilizers/cements, portland cement, and bitumen (emulsified asphalt). Most caps are designed to conform to RCRA requirements, therefore, consisting of multiple
layers of materials (Figure 4-2). Single-layered caps can be
used for special purposes such as a physica: contact barrier.
The most effective single-layered caps are composed of concrete and/or bituminous asphalt.
A special type of cap that hds p!eviously been employed at the Koppers Texarkana Site is a soil/sod barrier (Figure 4-3).
This cap consists of natural top soil with sod placed on top. The soil/sod barrier is not a low permeability barrier, but
rather is a physical contact barrier. A soi!/sod barrier can r~duce the risk of direct contact with conta~inated soils.
Capping is a reliable technology for sealing off contamination from the aboveground environment, for ~inimizing
underground migration of wastes, and for use as a physical contact barrier. The asphalt cap (physical contact) and the
soil/sod barri8r (physical contact) Will be retained for further evaluation. The multilayered cap will not be retained as an appropriate technology for the Koppers Texarkana Site.
It is not feasible that a five-foot thick cap would be placed
in the residential yards in carver Terrace nor within the 100-year flood plain in the Kennedy Sand and Gravel area.
4.4.3.3 Grading
Grading techniques are used to modify the natural topography and run-off characteristics of waste sites in order to control infiltration and erosion. The major elements of a
grading operation are excavation, hauling, spreading, and
4-12
i.n
0::::-
... 0

I I I I I I I I I I I I I I I I
0.5'
1.5'
1.0'
2.0'
'- \. '\._ \.._' . \..\.A'-'
Vegetation
Topsoil
~ '.; ·1/ ·~ >;;;>~ ::,..:// ~~/~ Soll Fil I ~~~~;w ~~~-'1/1/,
Geotextile
Drainage Layer (sand)
Geotextlle
Synthetic Membrane ( 20 mil minimum)
Compacted Clay
Canto mi noted Soi I
FIGURE 4·2: Multi/aye-red Cap - Typical
4-13
0
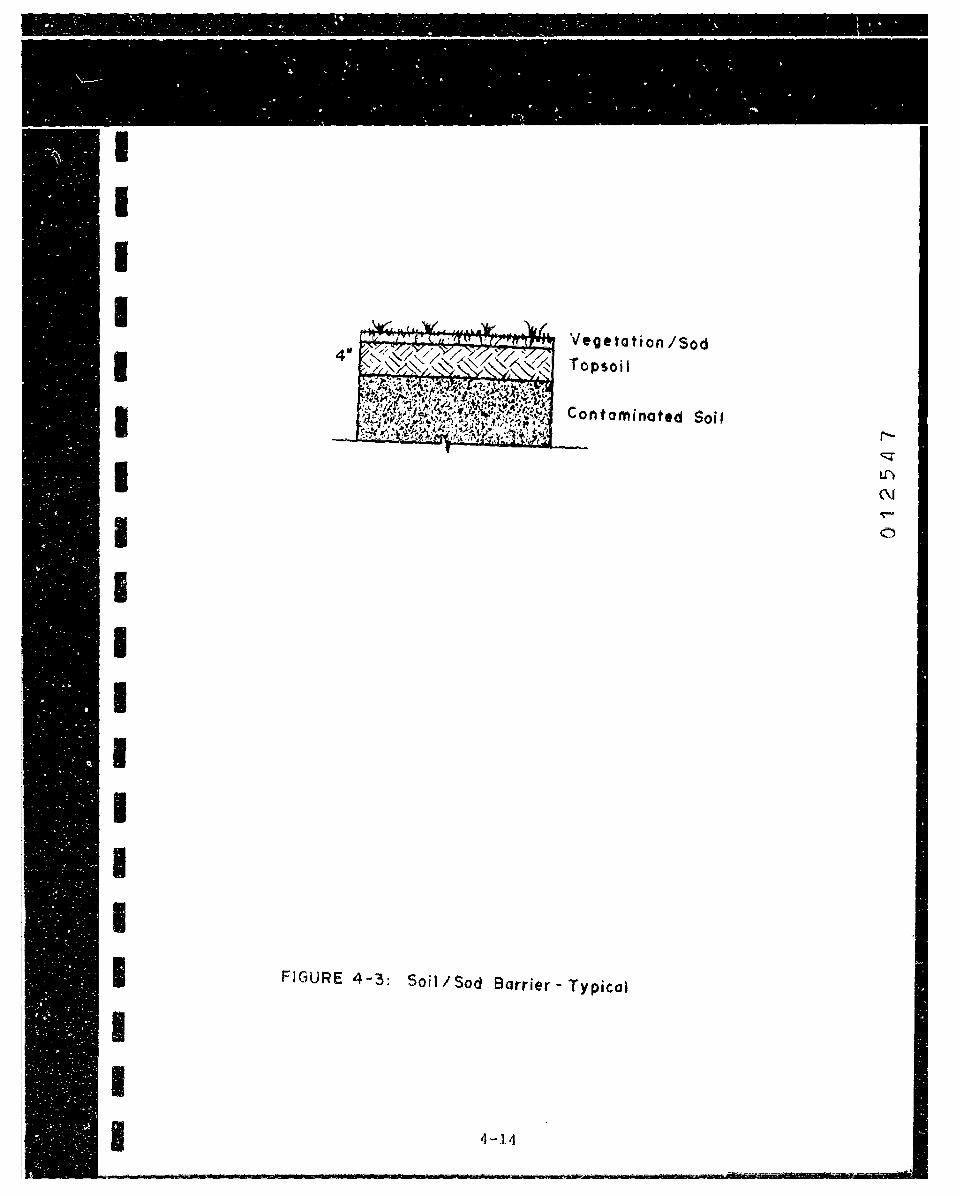
I I I I I I I I I I I I I I I I I I
Veoetation /Sod Topsoil
Contaminated Soi f
FIGURE 4-3: Soil I Sod Barrier - Typical
4-14
I I I I I I I I I
,1 I I I I I I I I I
compacting. Grading vehicles include scrapers, crawler dozers, crawler loaders, and compactors. Grading is often performed
along ~ith surface sealing practices and reveg~tation. The techniques and equipment used in grading are well established
and widely used in all forms of land development. This
techno:ogy will be retained for further evaluation,
4.4.3.4 Revegetation
Revegetation provides a cost-effective means of
stabilizing the surface of hazardous waste disposal sites,
especially when preceeded by capping and grading. It decreases
erosion by wind and water and can be used to upgrade the appearance of disposal sites. A revegetation plan could include: the selection of suitable plant species; seedbed preparation: seeding/planting: mulching and/or stabilization; fertilization: and maintenance. Revegetation will be re~ained for further evaluation.
4.4.4 Ground Wa~er Withdrawal
4.4.4.1 Ground Water Pumping
Ground water pumping techniques involve manipulating
ground water in order to contain or to remove a plume or to adjust ground water levels in order to prevent formation of a
plume. The types of wells used in this technology include well points, suction wells, ejector wells, and deep wells. Well
points and suction wells are best suited for shallow aquifers where extraction is only needed to depths less than 20 feet.
Deep wells and ejector wells are used for extraction depths greater than 20 feet, Impacts to the shallow aquifer at the
Koppers Texarkana Site appears to be confined to depths less than 20 feet. The results of the pump teat conducted during
the RI, though, indicate that pumping the shallow aquifer would not be feasible, Therefore, the above-mentioned pumping
techniques will not be retained for further evaluation.
4-15

I I I I I I I I I I I I I I I I I I I
4,4,4.2 Interceptor Drains
subsurface drains essentially function like an infinite line of extraction ~ells and, the~efore, can be used to contain
or t~ remove a plume or to lower the ground water table, Interceptor drains, a type of subsurface jrain, are used to
intercept a plume and are typically locat~d hydraulically down3radient from the contaminant source. These drains are
installed perpendicular to ground water flow and are used to inte:cept ground water. Frequently, interceptor drains are
used together with a barrier wall so as to prevent infiltration
of clean water into the drain. For hazardous waste site
applications, pipe drains are frequently Jsed; although french or g~avel drains have been used when the amount of water to be
drained is small and velocities are low. The major disadvantage in using subsurface drains is that they are
generally limited to shallow depths, Since the shallow aquifer is of concern at the Koppers TQ~atkana Site, interceptor drains
will be retained for further evaluation.
4.4.5 Removal (Complete and Partial}
4.4.5,1 Excavation and Removal of Soils
Excavation and removal involves the physical removal of
contaminated soils by using conventional heavy construction
equipment such as backhoes, cranes, dozers, and loaders. This is a common and well-established technique used at many
hazardous waste sites, A typical practice is to excavate and remove contaminated •hot spots~ and to employ other remedial
technologies for less contaminated soils. Excavation and removal is appropriate for the Koppers Texarkana Site and will
be retained for further evaluation.
4,4.6 Direct Treatment
Various direct waste treatment methods are appropriate for treating aqueous and solid waste streams produced at hazardous
waste sites, Many of these methods are used in industrial 4-16
o-. ~
'-" N
0

I I I I I I I I I I I I I I I I I I I
was:e treatment applications. A treatab~lity study report prepared by Keystone Environm~ntal Resources, Inc. for the
Koppers Texarkana Site is presented as Appendix 4-A, This report presents the treatability tesults of several groundwater and soil treatment technologies.
4.4.6.1 ~ctivated Carbon Adsorption
Treatment by activated carbon is a well developed technology for the treatment of aqueous hazardous waste streams. In particular, the technology is suited for the remo~al of mixed organics from aqueous wastes, but it is quite sensitive to suspended solids and oil and grease concentrations. Activated carbon adsorption will be retained for further evaluation, with the assumption that pretreatment of the ground water will occur, as the process alone would not be capable of treating the ground water at the site.
4.4,6.2 Biological Treatment
Biological treatment involves removing organic matter from an aqueous waste stream through microbial degradation, A number of treatment processes exist that may be applicable to aqueous hazardous waste streams, including ~ctivated sludge, aeration tank, fluidized reactor bed, contact stabilization, and fixed film systems (trickling filter and rotating
biological contactor}. Typically, a process involves aerating the aqueous waste for several hours while a suspended or attached active microbial population degrades the organic matter in the waste and produces new cells. The new cells form a sludge, which settles out.
Even though biological treatment has not been as widely
used at hazardous waste sites as activated carbon, filtration, and precipitation/flocculation, it is a well-established process for treating a wide range of organic contaminants. In tests, this process has been ~ffective in treating PARs. The tteatability study perfcrmed by Keystone Environmental Resources, Inc. reviewed three biological treatments: aeration
4-17
0 If'\
i..n
N
I I I I I I I I I I I I I I I I I I
tan~, fixed film reactor, and fluidized reactor bed. The
tre¼tability report indicates that the fluidized reactor bed yie:ded the best overall performance, and therefore biological treatment via a fluidized reactor bed will be retained for fur~her evaluation.
4.4.6.3 riltration
Filtration is an effective mean, of removing low levels of suspendec solids from solution by forcing the fluid through a
porous medium. This porous filter media consists of a bed of gra~ular particles (i.e., sand or sand with anthracite or coal)
contained within a basin. The bed is supported by an underdrain system that draws off the filtered liquid.
Suspended solids become trapped on top of or within the bed as the solution is passed through the filter. The filter is
bac,.washed to dislodge the trapped particles and prevent plugging. This backwash requires further treatment.
Granular-media filters have been successfully operated at hazardous waste sites and will, therefore, be retained for
further evaluation. Filtration may be appropriate for the Koppers Texarkana Site as a pretreatmer~ process for activated
carbon.
4.4.6.4 Precipitation/Flccculation/Sedimentation
Precipitation is a process that transforms part or all of
a substance in a solution into a solid form. The most common application of precipitation in wastewater treatment is the removal of metals as hydroxides or sulfides. Typically, lime
or sodium sulfide is added to the wastewater to initiate precipitation.
Flocculation follows precipitation. In this process, small, unsettleable suspended particles are made to agglomerate
into larger particles. This is accomplished by: 1) adding flocculating agents (alum, lime, ferric chloride,
polyelectrolytes) to ~he waste stream; 2) rapidly mixing the
4-18
lf\
Lf\
C\J
0
I I I I I I I I I I I I I I I I I I I
solution to disperse the agents: and then 3) gently mixing the solution to allow for contact between small particles. Once
the suspended solids have been flocculated, they can usually be removed by sedimentation. Oil/water emulsions have been
successfully separated by flocculation/sedimentation. Precipitation can be used to remove most metals, including
zinc, cadmium, chromium, copper, fluoride, lead, manganese, and mercury. This process is applicable to most aqueous hazardous
waste streams, but, in some cases, organic compounds may form complexes that could inhibit precipitation.
Precipitation, flocculation, and sedimentation are wellestablished technologies. Since precipitation is generally
appropriate for removing metals, it will be retained for further evaluation. Flocculation/sedimentation will be retained for further evaluation because of its success with oil/water emulsion separation.
4.4.6.5 Reverse Osmosis
Reverse osmosis is the process of forcing a concentrate~
aqueous solution through a semipermeable membrane, resulting in a b~ild-up of impurities on one side OE the membrane and
cleaner water transported through to the other side of the membrane.
Rever8e osmosis is used to reduce the concentrations of dissolved solids, both organic and inorganic. In treating
hazardous waste streams, this process would be primarily limited to polishing low flow stre~ms containing highly toxic
contaminants. Reverse osmosis will not reliably treat wastes with high
organic content. There is a tendency for organics to dissolve the membrane. Reverse osmosis also requires appropriate pretreatment of wastes, such as suspended solids removal, pH
adjustments, and oil and grease removal. The process has not
been widely used for treatment of hazardous wastes; thereforet it will not be evaluated as an appropriate technology.
4-19
N L(\
L(\
N
0

I I I I I I I I I I I I I I I I I I I
4.4.6.6 Gravity Separation
Gravity separation is a physical process in which oil is per~itted to separate from water in a conical tank. Gravity
separators are generally used to treat two-phased aqueous wastes. Emulsions between water and oil are common, so emu:sion breaking chemicals must frequently be added for efficient treatment.
Gravity separation offers an effective means to provide phade separation, This technology will be retained for f~rther eva:uation.
4.4.6.7 Air Stripping
Air stripping is a process whereby volatile organic
contaminants in water or soil are transferred to gas. Since
the Koppers Texarkana Site has predominantly PAH contaminants which are not a~enable to air stripping, this process will be eliminated from further evaluation.
4.4.6.8 steam stripping
Steam stripping or steam distillation is a process in
which steam is in direct contact with the distilling system in
either a batch or continuous operation. Typical uses of steam stripping include removing trace quantities of volatile
impurities from various aqueous materials. This process is generally not applicable for anything except the removal of
dilute concentrations of volatile organics, ammonia, and
hydrogen sulfide, In addition, it requires frequent operation
and maintenance; therefore, it will not be retained for further evaluation.
4-20
0
I I I I I I I I I I I I I
4.4.6.9 Chemical Oxidation
Chemical oxidation is the process in which the oxidation
sta~e of treated compound(s} is raised. Typical oxidants used
in this process include potassium permanganate, hydrogen peroxide, calcium or sodium hypochlorite, chlorine gas, and ozo~e.
Chemical oxidation is generally used for the
detoxification of cyanide and for the treatment of dilute waste streams containing oxidizable organics (i.e., aldehyde,
mercaptans, phenols, benzidene}.
A major limitation of this process is that frequently the
oxidation reactions are not complete. Chemical oxidation is not well suited to high-strength, complex wastewater streams. Oxidation via ozone addition (ozone/UV treatment), followed by ultra-violet light irradiation has been implemented in treating ground water from inactive wood treatment plants. The performance of this technology at some of these sites has not
been consistently effective, therefore it will not be retained for further evaluation.
4.4.6.10 Chemical Reduction
Chemical reduction is the process in which the oxidation
state of a substance is reduced, due to the addition of reducing agents such as sulfite salts, sulfur dioxide, or base
metals. This process is generally used for reduction of hexavalent chromium, mercury, and lead. Presently, there are
I no practical applications involving organic compounds. This
I I I I I
technology will not be retained for further evaluation.
4.4.6.11 Incineration
Incineration is a thermal destruction method that uses
high-temperature oxidation to degrade a substance into u
product consisting of gases and an ash. This method can be
employed to destroy organic contaminants in liquid, gaseous, and solid wagte streams. The most common incineration methods
4-21
q
L(\
I.(\
N
0

I I I I I I I I I I I I I I I I I I
app:icable to hazardous wastes include liquid injection, rotary
kil~, multiple hearth, and fluidized bed. Each of these
mettods will be discussed below.
Liquid injection is appropriate for destroying pumpable
wastes or gases. It has been used to destroy PCBs, solvents, still bottoms, polymer wastes, and pesticides. It is not effective in the destruction of inorganic wastes. Since none
of these compounds were detected at the Koppers Texarkana Site, this method will be eliminated from further evaluation.
Rotary kilns can handle a variety of solid and liquid
wastes independently or in combination. They have treated
PCBs, tars, obsolete munitions, and polyvinyl chloride wastes.
These kilns are preferred tor treating mixed hazardous solid
residues because of their ability to handle waste in any form
and their high incineration tfficiency. Rotary kilns will be
retained for further evaluation. Multiple hearth incinerators can be used for the
destruction of all forms of combustible industrial waste
materials, including sludges, tars, solids, liquid, and gases.
They are best suited for hazardous sludge destruction. This
technology will be retained for further evaluation.
Fluidized bed incinerators are relatively new. They are
well-suited for high-moisture wastes, sludges, and wastes
containing large quantities of ash. These incinerators,
however, have had only limited use for hazardous wastes. They will, therefore, be eliminated from further evaluation.
4.4.7 In-Situ Treatment
In-situ treat~ents involve the use of chemical or
biological agente ~r physical manipulations that degrade;
remove, or immobilize contaminants. The treatment processes
can be categorized into three basic groups: biological, chemical, and physical.
4-22
lC\ I.(\
Ii)
(\J
0
I I I I I I I I I I I I I I I I I I I
••. • 0 • 0 0 ~ • 0 ~ 0 • L• 0 T •_: • • • 0 0 • • 0 0 • • •• • • 0 • •
4.4.7.1 Biological
Biological in-situ treatment involves bioreclamation, also
known as biodegradation. This is a technique for treating
contaminated zones by microbial degradation. ~~is technology has developed rapidly in the past years. Considerable research
has been conducted to confirm that microorganisms are capable of breaking down many organic compounds at hazardous wastes sites.
Aerobic (oxygen-requiring) microbial processes have been
the bioreclamation method most developed and found to be most
feasible for in-situ treatment. This method provides the
oxygen source and nutrients to the subsurface through injection wells or an infiltration system to enhance microbial activity. PAHs, ph~nols, halogenated aromatics, and most pesticides can
be degradated by aerobic bioreclamation. This technology will be retained for further evaluation.
4.4.7.2 Chemical
In-situ chemical treatment technologies can be divided into three categories: immobilization, soil washing, and
det~xification.
Immobilization
Immobilization techniques (precipitation, chelation, and polymerization) are designed to render contaminants insoluble
and, therefore, prevent their movement from the area of contamination. Precipitation is a promising method for
immobilizing dissolved metals such as lead, cadmium, zinc, iron, and some forms of arsenic, chromium, and mercury. This
technique is most applicable to sites with sand or coarse si:t strata. The Koppers Texar~ana Site does not have a dissolved metals problem; therefore, precipitation techniques will be eliminated from further evaluation.
4-23
0
' ~ ' • ~ - - - L ,. • • • •
• .cl, • - • '
• .. • - I _ _1 , . .
I I I I I I I I I I I I I I I I I I I
Chelation, another technique, may also be an effective
mea~s of immobilizing metals, but more research is needed in
thi= ar~a. It will not be retained for further discussion. Polymerization of an organic monomer involves injecting a
catalyst into a ground water plume that will transform a once £1Ll~d substance into a gel-like, nonmobile mass. This
tec~nique is best suited for ground water cleanup following
spi:1s or leaks of a pure monomer (styrene, vinyl chloride,
isofrene ... ). It has very limited applications for hazardous was~e sites, and, therefore, will not be retained for further
discJssion.
Soil Washing
Soil washing, also termed "solvent Zlushing," "soil
flusning," "ground leaching," or "solution mining,~ is a
physical separation process that washes organic and inorganic contaminants from contaminated soils. This is accomplished by
injecting water or an aqueous solution into the area of contamination and then pumping the contaminated water to the
sur:ace for treatment, recirculation, or removal. Potential
flushing solutions include water, acids or bases, complexing
and chelating agents, and surfactants. The solutions, along with a listing of the type of compounds each may be able to
extract, are as follows: water (water-soluble organics and inorganics); dilute acids (metal ions and basic organics such
as amines, ethers, and anilines); complexing and chelating agents (heavy metals); and surfactants (emulsify nonsoluble
organics) . Surfactant washing is one of the most promising in-situ
chemical treatment methods, but, to date, the use of
surfactants has been restricted to laboratory research. Most
of this research has been centered around tertiary oil
recovery. However, because of promising field studies being
conducted on this technology, surfactant washing will be retained for further evaluation.
4-~2 4
rt('\
L.(\
N
0
I I I I I I I I I I I I I I I I
I
Detoxification .. ·---
Detoxification methods used to destroy, degrade, or red~:e the toxicity of contaminants include neutralization,
oxidation/reduction, and permeable treatment beds. The us& o~ these techniques at hazardous waste sites may be limited
beca~se they are applicable to specific chemical contaThinants. Neutralization consists of injecting dilute acids or bases
into the ground water to alter the pH, This technology can be used as a pretreatment step, thereby optimizing the pH r3nge :~
neutralize acidic or basic plumes that need no other treatmen:,
or to increase the hydrolysis rate of certain organics lester5,
amides, carbamates, pestcides). This technolo;y will not be retained for further evaluation since pH is not a problem at the ioppers Texarkana Site.
Oxidation/reduction reactions can detoxify, precipitate, decompose, and/or solubili~~ metals and organics. The oxidation of inorganics in s~ils is generally limited to
arsenic and possibly some lead compounds. Hydrogen peroxide,
ozone gas, and hypochlorites have been considered potentially usef~l as oxidizing agents in the in-situ detoxification of organics in ground water and soil. Ozone gas is a strong oxidizing agent that must be generated on site prior to
application. It is used in the treatment of drinking water,
municipal wastewater, and industrial waste, but never in the
treatment of contaminated soils or ground water. Hypochlorite
has been used to treat drinking water, municipal wastewater, and industrial waste, but again not contaminated soils or
ground water. A major limitation is that the reaction of many organics with hypochlorite results in the formation of
chlorinated organics, which can actually be more toxic than the
original contaminant. Hydrogen peroxide appears to be the most
feasible in-situ detoxification treatment. It has been used in industrial waste treatment to detoxify cyanide and various organic pollutants and also used in municipal wastewater treatment.
4-25
<X)
lf\
Lf\
(\J

I I I I I I I I I I I I I I I I I I
Chemica: reductio~, a pro:ess that reduces the oxidation sta:e of a compound, does not appear to be as promising as ox:~ation for the treatment of organics. It does, though,
apf~ar to be promising for the treatment of chromium and
se:~~ium in soils. A number of disadvantages are associatea wit~ using oxidation/reduction techniques at hazardous waste
si~~s. If one of these techniques is employed, there is a potential of creating a new ground water 9ollution problem.
oxtjation/reduction will not be retained for evaluation. Permeable treatment beds are excavated trenches located
perpendicula~ to ground water flow and backfilled with specific material to t~eat the contaminated ground water plume. Typical
mat~rials used in a treatment bed are limestone, crushed shell, act:vated carbon, glauconitic green sands, and synthetic ion
excjange resins. The beds have the potential to reduce the a~ount of contaminants in a plume, and they ar~ applicable to
re:atively shallow ground water tables, Various disadvantages are associated with permeable treatment beds, including
sat1ration of bed material, plugging of bed with precipitates, and short life of tr~atment materials. These beds should
probably be considered a temporary action rather than a
permanent one; therefore, they will be eliminated from further eva:uation.
4.4,7.3 Physical
Physical in-situ methods involve the manipulation of the subsurface in order to immobilize or detoxify waste
constitutents. Many of the methods are presently being developed and include: in-situ heating, vitrification, and ground-~ fr eez i:-:g.
In-situ heating is being developed to destroy or remove
organic conta~inants in the subsurfac~ through thermal decomposition, vaporizati~n, and distillation. One type of
process of in-situ heating involves laying a row of horizontal conductors on the surface and exciting them with an RF
generator.. Decontamination is accomplished in a temperature
4-26
.,
O' f.('\
I.{'\
C\.I
0

I I I I I I I I I I I I I I I I I I I
range of 300° to 400°C, assisted with steam. Field experiments have been conducted for the recovery of hydrocarbons and they
appear promising, but more research is needed to verify the tectnology's effectiveness. Therefore, this technology will
not be retained for further evaluation. ~rtificidl ground freezing involves installing freezing
loops in the ground with a self-contained refrigeration system that pumps coolant around the loops. The freezing is done on the soil surrounding the wastes, rendering it practically impermeable, This technology is useful only as a temporary
treatment because of the thermal maintenance expense. For this reason, it will be eliminated from further discussion.
In-situ vitrification is to be used for the stablization of transuranic (and other) contaminated wastes. The technique involves passing electrical current through a molten mass, theteby converting the contaminated soil into durable glass and pyrolyzing or crystallizing the wastes. In-situ vitrification is currently being developed and laboratory-scale and pilot-scale tests have been conducted. Since it is not a proven technology at hazardous waste sites, in-situ vitrification will not be retained for further evaluation.
4.4.8 Disposal
4,4.8.1 Off-Site Landfilling
Landfilling of hazardous materials has become increasingly expensive and difficult, primarily due to the more stringent regulatory control of this technology. Wastes that can be treated or incinerated should be separated from those wastes for which no treatment alternative is known. Off-site landfilling will be retained for further evaluation.
4-27
C
'° U')
(\J

I I I I I I I I I I I I I I I I I I I
4.4.8.2 On-Site iandfilling
On-site landfilling has many limitations. The des!gn of a lar.=fill is required to have a double liner system with two lea:~ate detection, collection, and removal systems. RCRA req~irements under 40 CPR Part 264 restrict the locating of a
lan~:ill in areas of seismic instability, in a 100-year flood pla~n, or where the integrity of the liner system would be
adversely affected. The majority of the Koppers Texarkana Site lies within the 100-year flood plain, therefore, this
tec~~ology will not be further evaluated.
4.4.8.3 Discharge to Publicly Owned Treatment Works (POTW)
The discharge of ground water to the local POTW system
presents a ground water disposal technology. This technology is an effective and proven treatment technique for water
con~aminated with a variety of organic and inorganic cons~ituents. This technology transfers the bulk of the
treatment operation off site. In the case of the Koppers Tex3:kana Site, treatment of the ground water may be required
prior to discharge to the Texarkana POTW. This technology is feasible and will be retained for further evaluation.
4.4.S,4 NPDES Discharge
Another ground water disposal technology is direct
discharge of extracted ground water to a surface water body (iAe., Wagner Creek). This technology by itself is effective
for ground water with dilute contaminant concentrations. This type of discharge must meet the requirements specified by a National Pollutant Discharge Elimination System {NPDES) permit. For the Koppers Texarkana Site, treatment may be
required prior to discharge. This technology will be retained for further evaluation.
4-28
'° II'\
"'

I
I I I I I I I I I I I
4.5 Summary of Remedial Action Technology Screening
The initial screening process eliminated those remedial act:on technologies that were determined to be inappropriate
for the site-specific characteristics of the Koppers Texarkana Site. The applicable remedial action technologies that passed the initial screening are listed in Table 4-2 by media (ground wat•r and soil). These remaining technologies will be ass~mbled in Section 5.0 to form a variety of remedial alt~rnatives for the site.
The set of developed alternatives will undergo a screening bas~d 1pon environmental and public health criteria. This
screening will eliminate those alternatives that provide ina:equate public health protection or have adverse env::onmental impacts that preclude their use.
4-29
0

I I I I I I I I I I I I I I I I I I I
Media
Soil (Cont'd)
TABLE 4-2 (Cont'd)
APPROPRIATE REMEDIAL ACTION TECHNOLOGIES KOPPERS TEXARKANA SITE
General Response Action
Direct Treatment
In-situ Treatment
Disposal
4-31
Appropriate Remedial Ac~ion Technology
Incineration
Soil washing
Biodegradation Soil washing
Off-site landfill
tr\ I
'° I.{\
(\J
0
I I I I I I I I I I
5.0 DEVELOPMENT AND SCREENING OF REMEDIAL ACTION ALTERNATIVES
Remedial action alternatives (RAAs) are developed by
com~ining one or more feasible technologies that will best
remediate specific site problems. Based upon the Superfund
Ame~dments and Reauthorization Act (SARA}, a set of RAAs should be developed ranging from alternatives that, to the extent
possible, will eliminate the need for long-term maintenance, including monitoring, to alternatives involving treatment that
will reduce toxicity, mobility, or volume as their principle
element. A RAA consisting of containment with little or no
treatment should also be included in the set of RAAs along with
a no-action alternative. For purposes of this section, the
RAAs will be categorized under the following fi~e general
listings: 1) no action, 2) containment of contaminants, 3)
treatment of contaminants, 4) no long-term maintenance and 5)
innovative technology. In this section of the FS, those
remedial action technologies identified in Section 4.0 that
were determined to be technically applicable and feasible to
I the Koppers Texarkana Site are combined and assembled into RAAs. The resulting RAAs will then be screened based upon
I I I I I I I I
environmental and public health criteria, followed by an
uorder-of-magnitude" cost screening.
5.1 SARA overview
The advent of SARA has brought about changes to the FS
process, specifically pertaining to the selection of remedial
actions. Section 121 of SARA states that: "Remedial actions in
which treatment which permanentl.y and significantly reduces the
volume, toxicity, or mobility of the hazardous substances,
pollutants, and contaminants is a principal element, are to be
preferred over remedial actions not involving such treatment.
The off-site transport and disposal of hazardous substances or
5-1
0

I I I I I I I I I I I I I I I I I I I
contaminated materials without such treatment should be the
least favored alternative remedial action where practicable treatment technologies are available."
In addition, SARA also states that a RAA should be
"protective of human health and the environment,
cost-effective, and should utilize permanent solutions and
alternative treatment technologies or resource recovery tec~nologies to the maximum extent practicable."
A RM that results in any contaminants remaining at a
must be reviewed no less often than every five years after initiation of the RAA to assure that human health and the
environment are being protected. Additional future action be required at the site as a result of the review.
site
the
may
to Pertaining to the degree of cleanup a RAA is required
attain, SARA states that the RAAs "shall attain a degree of
cleanup of hazardous substances, pollutants, and contaminants released into the environment and of control of further release
at a minimum which assures protection of human health and the environment." The RAAs must attain both federal and /or state
applicable or relevant and appropriate requirements (ARARs). In the sections that follow, remedial technologies that
passed the initial screening in Section 4.0 will be combined or used singly to form a set of pote,1tially applicable RAAs for
the Koppers Texarkana Site. The RAAs will undergo an initial two-stage screening ba~ed upon environmental and public health
as well as cost criteria. The RAAS remaining after the
screening will be carried forth to the detailed evaluation.
5.2 Development of Remedial Action Alternatives
The RAAs developed for the Keppers Texarkana Site can be
categorized by two response media units: 1) unsaturated soils:
and 2) ground water within the shallow aquifer, which also
includes saturated soils. The on-site 5oil cuttings contained within four 40-cubic yard roll offs (bulk solids) will be
considered as part of the unsaturated soil media unit. These cuttings are a result of the sampling program implemented
5··2
U"\
'° tr\
(\J
~
0
I I I I I I I I I I I I I I I I I I I
dur:ng the r.emedial investigation. The categorization into
res_?Onse media units allows for the independent evaluation of var~ous alternatives for each affected medium. A completely
dev~loped RAA for the Koppers Texarkana Site may consist of a
RAA from both of the response media units.
Table 5-1 presents a list of potentially applicable RAAs dev~loped tor the Koppers Texarkana Site accordi~g to each
res?onse media unit. This table lists four RAAs pertaining to tinsaturated soils and two RAAs pertaining to ground water
wit::.in the shallow aquifer. Within some of these RAAs, there
are various options which can be considered. A detailed
des=ription of each of the alternatives listed on Table 5-1 is
presented in Section 5.3.
Several of the RAAs listed on Table 5-1 ar.e directly
depe:1.dent on other RAAs. One RAA treats unsaturated soil and
bulk solids by placing them in the on-site gravel pit and
treating them with ground water. Therefore a ground water RAA
must be implemented along with this unsaturated soils RAA.
Treatment of the bulk solids are directly dependent on the
method the unsaturated soils will be remediated. For example, it would not be reasonable to incinerate the bulk ~olids on
sit~ if the unsaturated soils are excavated and disposed off
site. The potential interactions between the above-mentioned
RAAs and other RAAs associated with each media response
cat~gory will be discussed in the detailed evaluation (Section
6. 0) •
Table 5-2 presents a representative listing of the RMs
with respect to the five general listings of: (l} no action,
(2) containment, (3\ treatment, (4) no long-term management,
and (5) innovative. This table shows that the RAA identified
for the Koppers Texarkana Site considers a proper distribution
of the five categories.
5-3
"° \()
tf\
N

I I I I I I I I I I I I I I I I I I I
1.
2.
3.
4.
1.
2.
TABLE S-1
RAAs POTENTIALLY APPLICABLE TO EACH RESPONSE MEDIA UNIT IDENTIFIED FOR THE KOPPERS TEXARKANA SITE
UNSATURATED SOILS AND BULK SOLIDS "' M E/111- i5jZRp
No Action/Monitoring/Institutiona.l Controls (SL ... 1)
Capping/Monitoring/Institutional Controls (SL-2)
In-situ biodegradation/Monitortng/Institutional Controls ( SL-3)
Excavation/Soil Treatment/Institutional Controls (SL•4)
Treatment Options
a. Mechanical soil washing b. on-site incineration c. Off~site incineration d. Off-site landfill e. Passive soil washing
GROUND WATER
No Action/Monitoring (GW-1)
Ground Water Withdrawal: Subsurface Drains/Ground Water Treatment/Discharge of Treated Water (GW-2}
a. Activated carbon with oil and water separator
b. Biological treatment -fluidized carbon bed with oil and water separator
5 .. 4
_. . D!,echarge Ogtions
a. Discharge
b. Reinjection
0
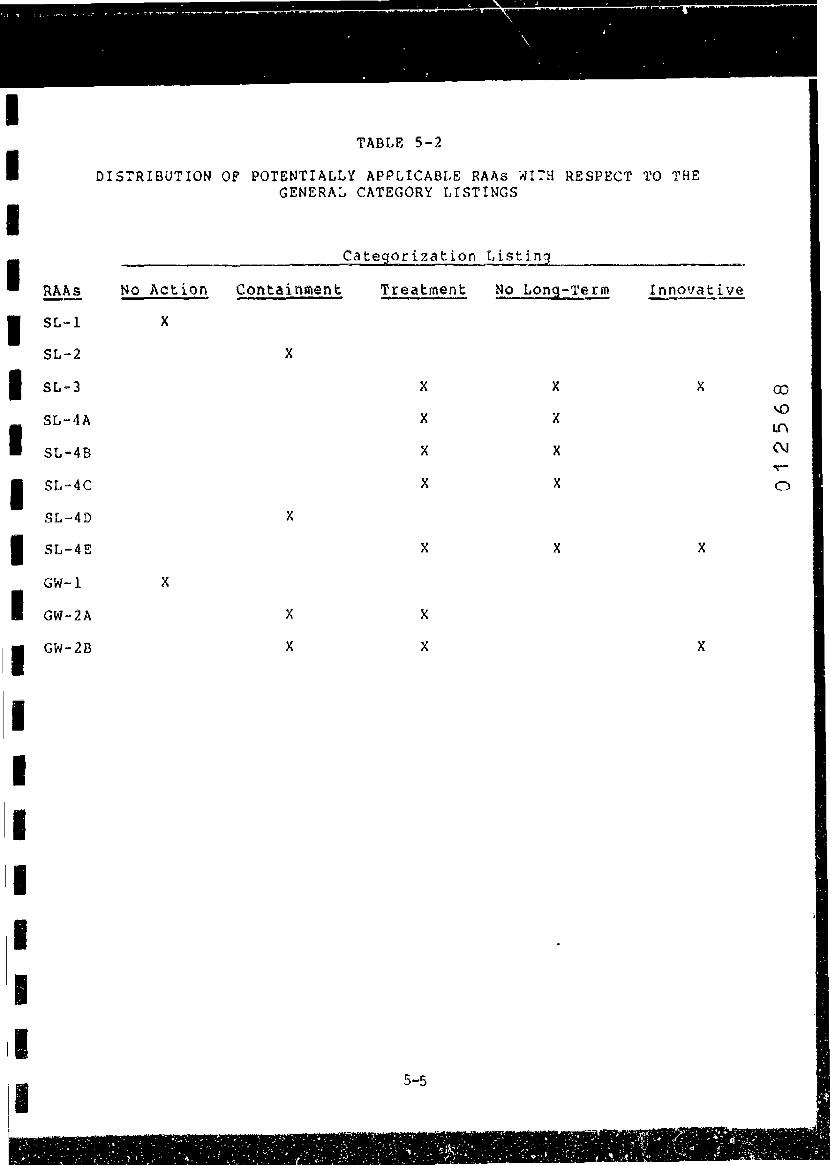
I I I I RAAs -I SL-1
SL-2
I SL-3
I SL-4A
SL-43
I SL-4C
SL-4!>
I SL-4E
GW-1
I GW-2A
I GW-28
I I I I I I I I
TABLE 5-2
DISTRIBUTION OF POTENTIALLY APPLICABLE RAAs WITH RESPECT TO THE GENERAL CATEGORY LISTINGS
Categorization Listing
No A.ction Containment Treatment No Long-Term Innovative
X
X
X X X
X X
X X
X X
X
X X X
X
X X
X X X
5-5
co
'° i.n (\J
~
0

I I I I I I I I I I I I I I I I I I I
5.1 Description of Potentially Applicable RAAs
5.3.1 Alternative SL-1: No Action/Monitoring/ Institutional Controls
Under Alternative SL-1, the site remains as it prese~tly
exists, monitoring is conducted and other institutional con~rols such as limited access, building ordinances, and deed notices are implemented. With respect to a monitoring pr,gram, soil samples will be collected periodically within the areas determined by the remediation goals developed in Section 4.0.
The samples will be collected at depths to one foot and
ana:yzed for PAHs and arsenic: these are the PCOCs which
contribute to the potential risks at the Koppers Texarkana Site as indicated in Section 2.0. In order to deter unauthorized
access to the site, the fence and warning signs constructed around the Kennedy Sand and Gravel property as part of the December 1984 Administrative Order of Consent will be maintained. The fence is a hogwire/barbed wire barrier. need (land use) notices will be placed on areas within the site where appropriate The deed notices will notice that potential hazardous substa11ces may remain below the surface.
Some PCOCs within the unsaturated soils at the Koppers
Texarkana Site are anticipated to decrease due to natural biodegradation. The monitoring program employed at the site will aid in determining the extent of this biological action. The monitoring program will be incorporated until the analytical soil results are below the remediation levels.
Operation and maintenance (O&M) requirements for Alternative SL-1 will include periodic inspections of the existing fence and signs and a monitoring program for the surficial unsaturated soils. It is anticipated that on an annual basis, approximately one percent of the hog wire/barbed
wire fence will be in need of replacement or repair. The soil monitoring program will consist of collecting unsaturated soil samples annually from areas dotermined by the remediation goals
5-6
(")

I I I I I I I I I I I I I I I I I I I
developed in Section 4.0. The samples will be analyzed for
PAHs and arsenic. Under this alternative, the bulk solids
con~ained within the four 40-cubic yard roll-offs will be
placed within the gravel pits to be treated with the ground
water if a ground water treatment alternative is implemented.
A more detailed description of this type of soil treatment will
be described under Alternative SL-4 Option (e). If ground
wat~r is not treated, the bulk solids will be treated off sita.
5,3,2 Alternative SL-2: Capping/Monitoring/Instiutional
Controls
Alternative 5L-2 involves the construction and maintenance
of a single-layered cap at the Koppers Texarkana Site limited
to areas determined by the remediation goals developed in
Section 4.0. The principal objective of this single-layered
cover system is to eliminate the potential for direct physical contact with surface soils containing PCOCs concentrations
~bove the remediation goals. A single-layered cover system
does not necessarily act as a low permeability barrier;
therefore the potential for the migration of contaminants via
surface water infiltration exists. Based upon the results of
the treatability study presented in Appendix 4-A, the potential
for contaminant leaching may not be a potential concern at the
Koppers Texarkana Site. Two capping options have been
identified as being applicable to the Koppers Texarkana Site:
a soil/sod barrier and an asphalt cap. A description of these two options follows.
In 1985/1986, a soil/sod barrier as required by an Administrative Order on Consent (VI-13-85) was placed on
several lots within the Carver Terrace subdivision as shown
back on Pigure 1-5 in Section 1.0. The cover was constructed
by covering graded lots with approximately four inches of
natural topsoil overlain with sod. The soil/sod layer had to
be of sufficient thickness to prevent erosion. The soil/sod barrier proposed as Alternative SL-2
incorporates similar elements of the previous soil/sod
barrier. This soil cover system design utilizes a protective

I I I I I I I I I I I I I I I I I I
..
b~=rier approach not a low permeability approach; therefore it
wi:l ~ot eliminate the infiltration of surface water through thE cover to the underlying soils. The proposed soil/sod
ba=:ier under Alternative SL-2 will be similar to the barrier pla=ed during 1985/1986 with the exception that it will have a
tot3l thickness of one foot. This will include ten inches of tofsoil and two inches of sod for any areas lying with the rem~diation limits. Figure 5-1 presents a typical crcEs-section of the proposed soil/sod barrier.
A bituminous asphalt cap is an effective single layered cap. The design of the asphalt cap would consist of a 0.5 foot
de~=h Class B gravel base, a 0.25 foot crushed surfacing top co~:se, and a 0.15 foot depth Class B asphalt concrete
pav~ment. An asphalt cap not only will serve as a physical
bar=ier but it may also minimize infiltration through the soi.:.
Both capping options are potentially applicable to the Koppers Texarkana Site. The type of cap to be used will be
based upon land use, i.e., asphalting areas used for parking and soil/sod in yards. Generally, only one cap type is
pote~tial for any given land parcel on site. Therefore, the two capping options are combined into one alternative.
The O&M requirements associated with Alternative SL-2 involve maintenance of the cover until it has been established and thereafter, periodic inspections and repairs. For the soi:/sod barrier, if there in evidence of vegetative stress,
the affected area will be inspected and resodded, For the asphalt cap design, maintenance requirements will include
infrequent crack repair and periodic surface seal coating applications.
The institutional controls associated with Alternative SL-2 include limited access, building ordinances and deed
notices. As described in Section 5.3.1, the existing fence and postings constructed around the Kennedy Sand and Gravel property will be maintained in order to deter unauthorized
access to the site. Deed notices will notice that hazardous substances will remain below the surface.
5-8
r-1..f\ (\J
0

I I I I I I I I I I I I I I I I I I
2 11 ~~~~~~~t;:~~=~+~~~~~ Veg et at i on / Sod 1011 Top soi I
FIGURE 5-1 Cross-section of Typical Soil/Sod
Protective- Btirrier
5-9
(\J
r--1.f)
(\J
0
I I I I I I I I I I I I I I I I I I I
Unde: this alternative, the bulk solids contained within
the four 40-cubic yard roll-offs will be either treated via
grcJnd water or created off site as previously described under the no action alternative in Section 5.3.1.
3.3.3 Alternative SL-3: In-Situ Biodegradation/
Monitoring/Institutional Controls
Alternative SL-3: In-Situ Biodegradation/Monitoring/
Institutional Controls involves treating the unsaturated soils
wit~in the area determined by the remediation goals to a depth
of one foot via in-situ biodegradation. tn-situ biouegradation
is ~ccomplished through aeration and the addition of lime,
water, and fertilizers to the soils. Under this alternative,
an automatic sr~inkler system will be installed to provide
water on a pre-scheduled basis. In addition, the lots will be
periodically aerated and fertilizers and lime added. As part
of the alternative, the treated upper soils (0 to 1 foot} will
be biannually monitored by sampling to document the rate of
degradation. The soil samples will be analyzed for PAHs and
arsenic. Treatment will continue until the concentrations of the PCOcs in the soil meet the remediation goa1.
AS stated earlier for the no action alternative in Section
5.3.1, the concentrations of PCOCs within the unsaturated soils
at the Koppers fexarkana Site are anticipated to decrease due
to natural biodegradation. Under Alternative SL-3, the rate of
degradation is expected to be enhanced due to the aeration and
fertilization factors and remediation should take no longer than ten years ..
Institutional controls will include maintaining the fence
in order to deter unauthorized access to the Kennedy Sand and Gravel property.
Under this alternative, the bulk solids contained within the four 40-cubic yard roll-offs will be either created via
ground water or treated off site as previously described in Section 5. 3 .1.
s-10
0

I I I I I I I I I I I I I I I I I I I
5.3.4 Al:ernative SL-4: Excavation/Soil Treatment/
Institutional Controls
Alternative SL-4: Excavation/Soil Treatment/Institutional
co~~rols consists of excavating the unsaturated soils lying wit~in the areas determined by the remediation gocl~ developed
in Section 4.0. The unsaturated soils will be. ated to a de~~h of one foot and treated or disposed by one o~ five opt:ons: (a) mechanical soil washing, (b) on-site
incineration, (c) off-sit~ incineration. (d) off-site landfill, or (e) passive soil washing. The excavated areas will be
bac~filled with clean soil and revegetated. The institutional
controls under Alternative SL-4 will include maintaining the fence around the Kennedy Sand and Gravel property to limit unaJthorized access.
Under this alternative, the bulk solids contained within the four 40-cubic yard roll-offs will be treated in the same
mar.~er as the implemented soil treatme1: option.
A description of each of the soil treatment options under
Alternative SL-4 are presented below.
Mechanical soil washing - 02tion (a)
Soil washing is a physical separation procedure for
detoxifying contaminated soil that involves the washing of contaminants from the soil (or other inert solids) into a liquid medium. This technique can be carried out in eq•Iipment that is designed for contacting excavated soil with liquid. After contact with the soil, the washing solution is treated for removal of the contaminants and then recycled for additional soil washing. In some cases multiple washings are
required to reduce the contaminant conc~ntration to acceptably low levels. The decontaminated soil is typically redeposited
in the excavation area after treatment. Effective detoxification by soil washing requires an
understanding of two basic mechanisms by which contaminants ar~ held within a soil environment. One is by chemical adsorption
of the contaminant to the surface of the soil particles and the
5-ll
0

I I I I I I I I I I I I I I I I I I I
oth~r involves the r~tention of contaminant within the
interstic~s of the soil particles. The relative influence of these two m,~chanisms for retention of the contawinant may va;:y
sig~ificantly from site to site 6epending on several site
spe~ific variables. Removal of contaminants from the soil
matrix is accomplished by both physical displacement of loosely held contaminants and desorption of contaminants that are more
tightly bound to the soil particles. The most important parameters that influence the
effectiveness of soil washing are the organic content, initial water content, particle size gradation of the soil, and the
contaminant type for a given soil matrix. As contaminants seep into a soil environment, the volume of contaminants that fill
or partially fill the soil int~rstices is a function of the soil particle gradation. The subsequent adsorption of
contaminants onto the particles• surfaces is more a function of the soil organic content and surface a~ea. Water that is
present in the soil at the time of introduction of the contamir.a~t reduces the pre-space available for contaminant
migration. The type of contaminant, i.e., whether it is organic or inorganic and properties such as water solubility
and density, have a significant impact on the mooility of the contamina~ts in the soil matrix. Since the above parameters
can vary widely at different sites, the type and degree of
contaminant retention can also vary significantly. The time
required to detoxify the site similarly varies from site to site.
Liquids t~at are employed for soil washing include;
o Water
o Water with surfactants o Water with chelating agents
o Acids or bases o Solvents (organic, supercritical fluids).
5-12
LC"\
t-1.f'\ (\J
0

I I I I I I I I I I I I I I I I I I I
The choice of a washing liquid for a particular application is
primarily dictated by the contaminant type, the soil matrix, and the degree 01 :fficulty in separating the contaminant from
the washing liquid.
Under Alternative SL-4, soil washing will be carried cut
on-site in a system that is constructed within the Kennedy sand
and Gr~vel property. Keystone F.nvironmental Resources has
already conduct~d a treatability study for this technology based upon samples collected fro~ the Koppers Texarkana Site;
the results are presented in Appendix 4-A.
On-Site Incineration - OQtion Jb)
For treatment of the excavated soils, on-site incineration
technologies may be applicable to the Koppers ·rexarkana Site.
The analytical soil results presented in Section 6.8 of the RI
Report indicate that no tetra-polychlorinated
dibenzo-p-dioxins, penta-polychlorinated dibenzo-p-dioxins, or tetra-polychlorinated dibenzofurans we~e detected in any of the
soil samples obtained at the site. However, because of the presence of other polychlorinated dibenzo-p-dioxin and
dibenzofuran isomers in certain soils at the site, incineration
must be conducted in accordance with 40 CFR 264.343 and
265.362. These regulations require that processes burning dioxin-containing wastes must achieve a destruction and removal
efficiency (DRE) of 99 9999 percent for each principal organic hazardous constit~ent designated in its permit.
The operation of an incineration system results in the generation of residual/eFfluent streams consisting of ash,
decontaminated soils, scrubber water or blowdown, and flue
gases. It is assumed that the decontaminated soil can be used
as fill material on the Kennedy sand and Gravel property. The
ash will therefore require testing and perhaps delisting in
order to dispose of it on site. The ash must be tested in
accordance with standard EP toxicity to determine its potential
for delisting. If the ash cannot be delisted it will require handling as a hazardous waste, which will result in
significantly higher costs than if the ash can be used as fill
5-13

I I I I I I I I I I I I I I I I I I I
mat~rial~ Scrubber. water or blowdown will be treated on site in -=onjunction with a ground water treatment alternative if chosen, or collected and treated off site. Treatment residuals fro~ the treatm~nt of the scrubber water or blowdown such as any solids that are generated also require appropriate
disposal. The flue gases effiitted during the incineration process are required to m~et the stringent standards set forth in RCRA regulations.
It is .A .. (..icipated that a rota~y kiln incinerator will be
applicable for on~site incineration at the Koppers Texarkana Sit~. ~otary kiln incinerators consist of a mobile rotating
k~l~ slightly tilted from the horizontal. Waste is typically introduced at the top of the kiln and burns as it slowly falls to the bottom of the unit, where it is removed as ash. During operation, kiln rotation exposes fresh soil surfaces to
oxidation. Unburned gaseous and suspended particulate organics are bnrned in a secondary combustion chamber or afterburner.
The off-gases require quenching and scrubbing prior to being discharged into the environment. Mobile rotary kiln
incinerators have already been developed for the treatment of
hazardous solid and liquid wastes. The EPA has a mobile rotary
kiln that has already been proven as a technology for the treatm_nt of dioxir-containing soils.
Off-$itc Incineration - O2~~on (c)
Option {c} under Alternative SL-4 includes transporting
the excavated soils for treatment to an approved off-site incineration facility. The nearest hazardous waste
incineration facility capable of handling dioxin-containing and metal wastes in addition tu other hazardous wastes is operated
by Rollins Environmental Services of TX, Inc. located in Deer Park, Texas. This facility is approximately 300 miles away
from the Koppers Texarkana Site. Deer Park is located immediately east of the city limits of Houston, Texas.
Under Option (c) of Alternative SL-4, the excavated soils will be transported to the Rollins facility and the excavated areas backfilled and revegetated.
5-14
rrI.(\
{\J
0

I I I I
I I I I I I I I I I I I I
Qf.{-Site ~andfjll - _Qption {<P.
Option (d) of Alternative SL-4 consists of transporting
and disposing Lhe excavated soils at an approved off-site
lan,-::fill. The nearest hazardous waste landfills eligible to
receive CERCLA wastes a re located approximately 3 00 miles south of t~e Koppers Texarkana Site. Under Optiun (d) of Alternative
SL-4, the excavated soils will be transported to an approved landfill, and the affected areas will be backfilled and revegetated.
Passive S01 w_ashing_ - Option (e)_
Option {e) of Alt~rnative SL-4 consists of excavating the soil to a depth of one foot and placing the soils int~ the
on-site gravel pits located within the Kennedy Sand and Gravel property. This alternative is applicable only if a ground
water withdrawal/treatment ~lternative is implemented. The
objestive of Alternative SL-4(Q) is to treat the impacted soils
via ground water treatment. The unsaturated soils once placed into the pits will be considered as part of the saturated
zone. A suitable ground water withdrawal system would be
capable of flushing the now saturated soils with water which
will be treated. The soils within the pits would be sampled periodically to mt"nitor the effectiveness of treatment.
Afterwards, the soils will remain in place in the pits. The excavated areas will be backfilled with clean fill and ~evegetated.
5.3.5 Alternative GW-1: No Action/Monitoring
Under Alternative GW-1: No Action/Monitoring, the ground water in the shallow aquifer will be left as is. No remedial
actions will be implemented. This no action alternative is required by thg NCP to provide a baseline for comparison with
other ground water alternatives. Under this alternati.ve, the PCOcs identified in the ground water will remain in the qhallow aquif~r, which will result in the potential for. the migration
5-15
co tL(\
(\J

I I I I I I I I I I I I I I I I I I I
i
of these constituents. Periodic sampling and an2lysis of the
ground water in the shallow, intermediate, and
will be conducted as part of this alternative.
that the monitoring program indicates that the
deep aquifers
In the event
ground water
conditions are deteriorating, other actions will be taken.
If Alternative GW-1 is implemented, restoration of the
shallow aquifer may result via natural processes, such as
biological degradation, advection, and dispersion. Each of
these processes are briefly described below.
~iological Degradat!on
The biodegradatio~ of organic constituents in ground water
occurs by microbial activity of indigenous microorganisms. Microorganisms which are attached to soil particles or
contained within the void spaces can transform selected organic
constituents in the ground water (McCarty et al. 1981).
Because of their hydrophobic characteristics, PAHs exhibit
a strong tendency to adsorb on soils. This property plays a
major role in the environmental fate and transport of PAHs in
the ground water. The level of adsorption of PAHs onto soils
increases exponentially with increasing molecular weight.
Phenols show little tendency for adsorption into the soils;
however, microbial degradation plays a major role in the
environmental fate and transport of phenols in the ground
waLer. Tarvin and Buswell (1934) and Healy and Young (1979)
found that several mononuclear aromatic compounds, including
phenol, can be transformed to methane and carbon dioxide under
anaerobic conditions. Ehrlich et al. {1982} observed
biodegradation of phenolics in ground water at a site in St. Louis Park, Minnesota. Biodegradation of PCP is likely to be
slower than for simple phenol, but, as with PAHs, even slow degradation could cause a significant decrease in concentration
of the slow-moving PCPo
5-16
0-r---l.f\
(\J
0

I I I I I I I I I
-I I I I I I I I I
- '
• Advection
Advection is the component of PCOC movem~nt due to its
tra:isport by the flowLtg ground water. The PCoc movement is
~on:rolled by transport in the bulk mass of the flowing fluid.
AdvEctive transport will cause the movement of PCOCs to f.oll~w the general patt~rns of ground water flow. These patt~rns are defined by the spatial and temporal distributions of the
average linear velocity of the fluid (Freeze and Cherry 1979).
Dispersi~
If advection were the only operative transport mechani;-~, nonreactive constituents being transported by the ground water would move as a plug. In reality, there is also a mixing
process, hydrodynamic dispersion, that causes a constituent to sprea~. Hydrodynamic dispersion is comprised of both
mechanical dispersion processes and diffusion processes. Mechanical dispersion is caused by variations in the
microscopic velocity within each pore channe! and from one
channel to another. The tendency for dispersion to occur is a property of the porous medium, known as the dispersivity. A
larger dispersivity produces greater mixing of the constituent
front as it advances. Characterisitc of the dispersive process is the spreading of the constituent in directions transverse to
the flow path and in the longitudinal flow direction, as w~ll as a reduction of the peak concentration within the aquifer.
Mechanical dispersion in the transverse direction is generally
a weaker process than dispersion in the longitudinal direction (Freeze and Cherry 1979).
Diffusion is a dispersion process in which ionic or molecular constituents move under the influence of their
kinetic activity in the direction of their concentration
gradient (Freeze and Cherry 1979). At low or i~significant ground water velocities, diffusion is the primary mixing
process. If the ground water is flowing, both diffusion and mechanical dispersion (caused entirely by the motion of flo~ing
5-17
0 CD
Lf\
N
0

I I I I I I I I I I I I I I I I I I
groJnd water) cause mixing of ionic or molecular constituents. The diffusion process ceases only when the concentration
gradients of C(mstitue11ts in the ground water are nonexistent (Freeze and Cherry 1979).
Necessary Actions
The O&M requirements associated with implementing Alternative GW-1 include ground water sampling fro:.1 monitoring
wells currently existing at the site. If the results of the monitoring plan indicate that the ground water quality is
deter io·· ~ting, the need for remed ia. t ion will be evaluated.
5.3.6 Alternative Gw-2: Ground Water Withdrawal Via
Subsurface Drains/Ground Water Treatment/Discharge of Treated Water
Alternative GW-2: Ground Water Withdrawal Via Subsurface
Drains/Ground Water Treatment/Discharge of Treated Water
consists of withdrawing impacted ground water from the shallow
aquifer, treating the water on site via one of two treatment options, reinjecting a portion of the treated water back into
the sytem and discharging the remaining treated wat~r via one
of two options. Installation of the subsurface drain system will consist of excavating a trench to a depth of one foot
below the interface of the sand and gravel layer (Fluviatile
Terrace Deposits) and the Wilcox Group. Excavation will be accomplished using a backhoe. The bottom of the excavated
trench will be lined with plastic. A perforated glazed tile
pipe will be sur.rodnded by a gravel envelope and placed in the
trench. The gravel en~elope will be wrapped with filter fabric to prevent overlying fine-grained rr.aterials from filling the
void spaces. The remaining part of the trench will be
backfilled with excavated soils. The soils will be excavated
a~d backfilled in the order they we~e excavated (i.e., soils
5-1.8
ro tf\
N
0

I I I I I I I I I I
'I I I I I I I I I
• ex~avated below the water table wili be backfill~d iirst).
F:g1re 5-2 shows a cross-section of the proposed drain system.
Corrugated metal sumps (approximately 36 inch I.D.) will be
spaced throughout the drainag2 system. The bottoms of the
su~ps will ue ?Ositioned appr0xi~ately four to ~ive feet beiow
tr.e jrainage pipes to allow drainage from the pipes and permit su::icient volume of water for pumping (Figure 5-3). The
bot:om of the sumps placed in the Wilcox Group will be
gro~ted. At least one pump will be placed in each of the sumps.
The location of the subsurface drain system is determined by the direction of the ground water flow, the topography of
the Nilcox Group, and the impa~ted ground weter plume. These
items were identified during the remedial investigation and are
pre:ented in Section 4.0 and 7.0 of the RI report. From the RI
res~lts, it was determined that the drain system must be
constructed circumferentially around most of the impacted
ground water plume to allow the ground water to flow into the drain system via gravity,
Installation of the recharge trenches, for reinjection
purposes, will consist of excavating a serier. of trenches to an
average depth of three feet. A layer of gravel will be plac~d in the bottom of each trench. A perforated pipe will t~en be
placed in each trench; additional gravel will be backfille1
around the ,ipe to form an envelope. The gravel envelope will
be covered with filter fabric to prevent overlying fine-grained materials from filling the void spaces of the envelope, The
remaining part of the trench will be backfilled with excavat~a soils.
The collection of ground water co~siders as an option installation of a sump pump and storage tank within Carver
Ter:ace in th~ empty lot north of Moni~oring Well MW-08, This may be necessary to expedite collecting the pocket of
~ontaminated ground water in the area. The collected water
will be periodically pumped into a tankard truck and hauled to
the treatment unit described below. Any apparatus under this
option will be en~losed within a building. The need for this
recovery unit will be investigated during the remedial design.
5-19
N co Lr\
N
0

I I I I I I I I I I I I I I I I I I
SUBSURFACE DRAINS
GRADED FILTER
MATERIAL PERFORATED
VITRIFIED CLAY PIPE
RECHARGE TRENCHES -PERFORATED
PIPE MISCELLANEOUS
BACKFILL
,_ - -
-- -, I I
GEOTEXTILE GRADED FILTER
MATERIAL:.-
FLUVIATILE TERRACE
DEPOSITS
Figure 5-2: cress-Section cf the Proposed Withdrawl a.pd Recharge Systems
5-20
I""'\
CD LC\
(\J
0
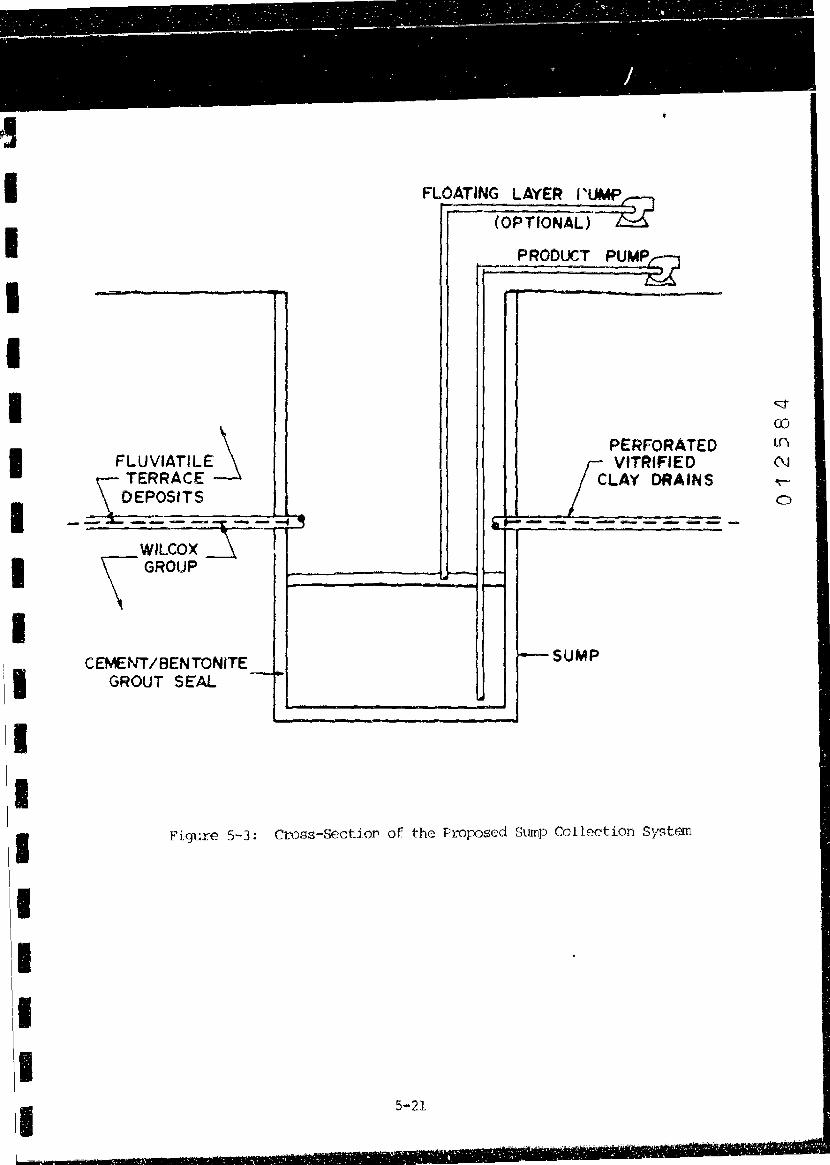
! I I I I I I I
FLUVIATILE \ TERRACE J
DEPOSITS
. \WILCOX I \ GROUP
CEMENT /BENTONITE GROUT SE'AL
-·
(OPTIONAL)
PRODUCT
PERFORATED VITRIFIED
CLAY DRAINS
SUMP
Figure 5 .. 3: cross-Sectioro of the Prorosed Sump Collection Sy.::tan
I
I I I I I
s-21
c::j"
OJ m N
0

I I I I I I I I I I I I I I I I I
The ground water recovered from the withdrawal system will
be directed to an on-site treatment unit. The treatment
options listed under this alternative include: {a} activated
carbon adsorption, and (b) fluidized carbon bed reactor.
Pretreatment via an oil and water separator and filtration will be included regardless of which treatment option is
imp:emented. Once treatedt nutrients or surfactants will be
added to a stream of ground water and it will be piped to the
recharge trenches to be reinjected back into the treatment
system. This process will serve as an in-situ soil washing
system. In addition, it will enhance the ground water recovery
system. The remaining streams of treated ground water will
either be discharged off site and/or reinjected back into the sha:low aquifer. Figure 5~4 depicts the major elements
included under Alternative GW-2 including the proposed
locations of the subsurface drains and recharge trenches,
The pretreatment method and both of the treatment options
are briefly described below. Keystone Environmental Resources
has comoleted a treatability study for both of the treatment
options; the results are presented in Appendix 4-A.
Pretreatment
Prior to treatment, gravity oil/water separation and
filtration pretreatment will be used for the removal oil and
grease and suspended solids. Both cationic and anionic
polymers will be used to aid the separation and settling of the
emulsified components and the water. PAH reduction is achieved by removing the portion that stays within the oil phase.
Activated Carbon Adsorpt_io~n -:- ~0£!:i_on (a)
Activated carbon adsorption will be evaluated as a
potential treatment alternative for the removal of PCG~~ ~n the ground water at the site. Carbon adsorption isotherm tests can
be cvnducted in order to estimate the adsorpt un capacity of carbon at different contaminant influent concentrationst
5-22
Ln
ro U'\ (\J
0
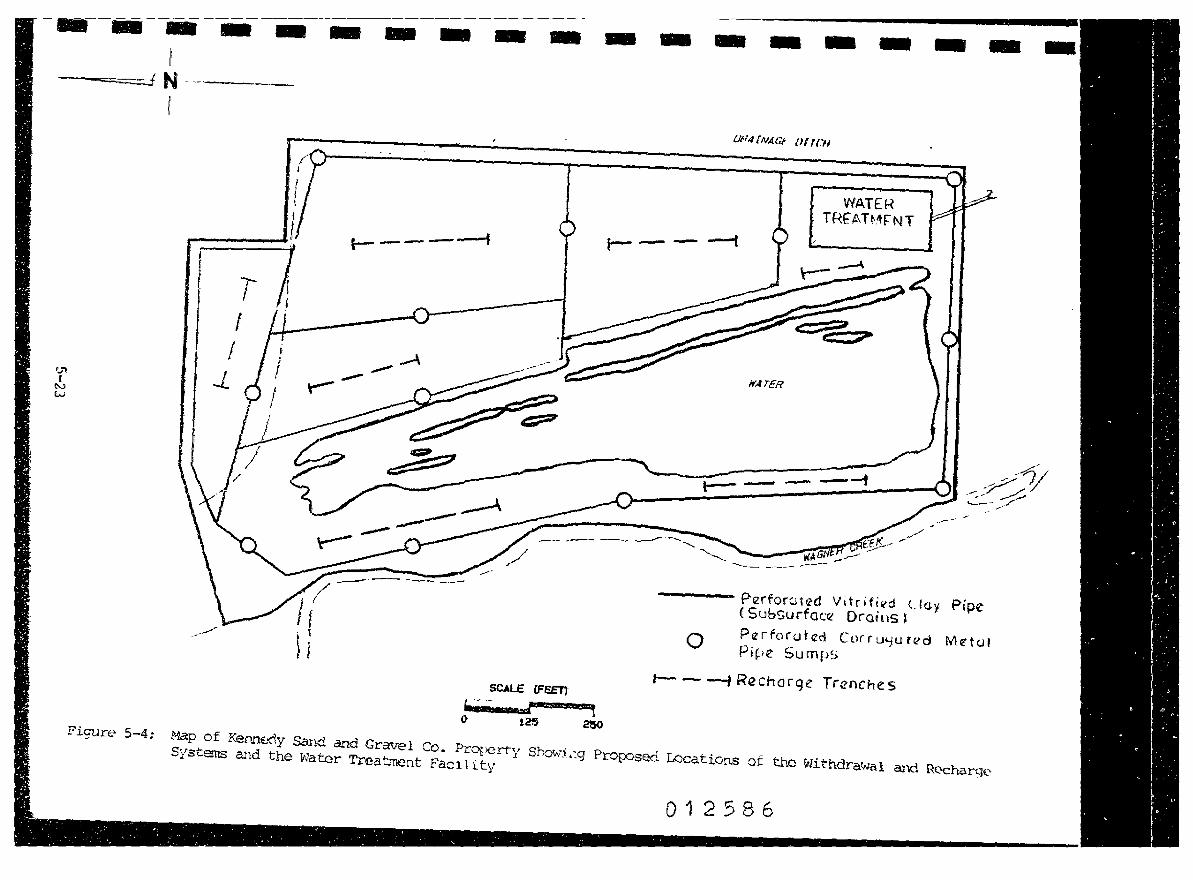
-----------------/ ----===J N -------
"Jl I
N w
Figure 5-4:
1
l- -----1
-' --
SCALE CFEET)
Vi -r T A1"a151!11:1Bam~9 0 !25 280
1--- - --1
WATER TR~ATMFNT
.-- - ---t
WA ------ --·-- - -----
---- Perfornted Vitrifictd t loy Pipe ( Subsurfoc:<2 Drains l;
0 PtZrforotczd Coriru':J•Uted M12"to1 Pi~,e Sumps
t-- - --f R~chorge Trenches
Masypsr~~ ~~dE..'Cithyesw~n~~ andT· Gravel Co. Pr<:>ricrty ShowL:g Proposed. Locations of the Withdrawal --=u;::. ._.., auc.:r reat.ment Fac1 11.ty and Rc-charqe
012586

I I I I I I I I I I I I I \I
~ I
therefore they can determine the feasibility of using granular
activated carbon treatment. Additionally, accelerated carbon
testing can determine the carbon usage rate.
Pl~idized Bed Reactor - Oetion (b)
Fluidized bed treatment is a proven technology for removal
of biodegradable chemical compounds generally present in wood
preservative site ground waters and surface waters. The
process consists of a cylindrical column with a
distribution/support pl~te located in its bas~. The column is
partially filled with a fine grained medium such as sand. A
tank is used as a reservoir from which water is pumped through
the column at a high flow rate to provide a stream of water
necessary for fluidizing the bed. Growth of the microbes and contact with the organic substrate takes place within the
fluidized bed.
O&M
The operation and maintenance requirements associated with
th~ insta!lation of the ground water withdrawal, recharge, and
pump systems under this alternative consist of frequent inspection and monitoring of the systems. In addition,
adjustment of the pump positions within each sump will be required during the start-up period to ensure that the pump
intak~ is set at the appropriate depth. Once the correct pump
positions are attained, adjustments will be required depending
upon seasonal water-table fluctuations. Additional maintenance of the pump system will consist ~f inspection and appropriate
repair of electrical and piping connections within each system.
There are many operation and maintenance requirements for
each ground water treatment system. These may include operator labor to monitor the system and perform required maint~nance
procedures; utilities costs for pumping, heating, blowing, etc.; and carbon r~placement and carbon disposal costs (for tne
appropriate options). Finally, an appropriate disposal for any generated waste oils and/or biological sludges will be required.
5-24
rro L(\
(\J
0

I I I I I I I I I I I I I I I I
5.4 Screening of Remedial Action Alternatives
In this section, the RAAs described in the preceeding sections above will be screened based upon environmental and
pu=lic health criteria, followed by an ~order-of-magnitude"
cost screening. This two-stage screening process eliminates
RAAs which do not provide adequate protection to public health,
we::are, and the environment and those RAAs which are much more
costly without providing a significant increase in protection.
A flow diagram of the alternative screening process is show•. in Fig~re 5-5. The rationale for eliminating any RAA based u~on this screening will be documented.
5.4.1 Environmental and Public Health Screening
The environmental and public health screening is the first par~ of the two-stage initial screening process. During this
screening, adverse environmental or public health impacts which cou:d be caused by the implementation of each assembled
alt~rnative will be identified. As a result, the alternatives
that may have significant adverse impacts or do not adequately
protect the environment and public health will be eliminated from further evaluation. Only those alternatives that
cont~ibute effectively to the protection of the environment and
public health will be forwarded to the "order-of-magnitude" cost screening,
Table 5-3 presents the environmental and public health screening results. The results indicate that all action RAAs
will improve the environment and/or public health and welfare. The no action alternatives will be retained as required by the NCP to act as a basis for comparison with other RAAs.
Therefore, all of the alternatives will be retained fot the order-of-magnitude cost screening.
00 ro ~
N
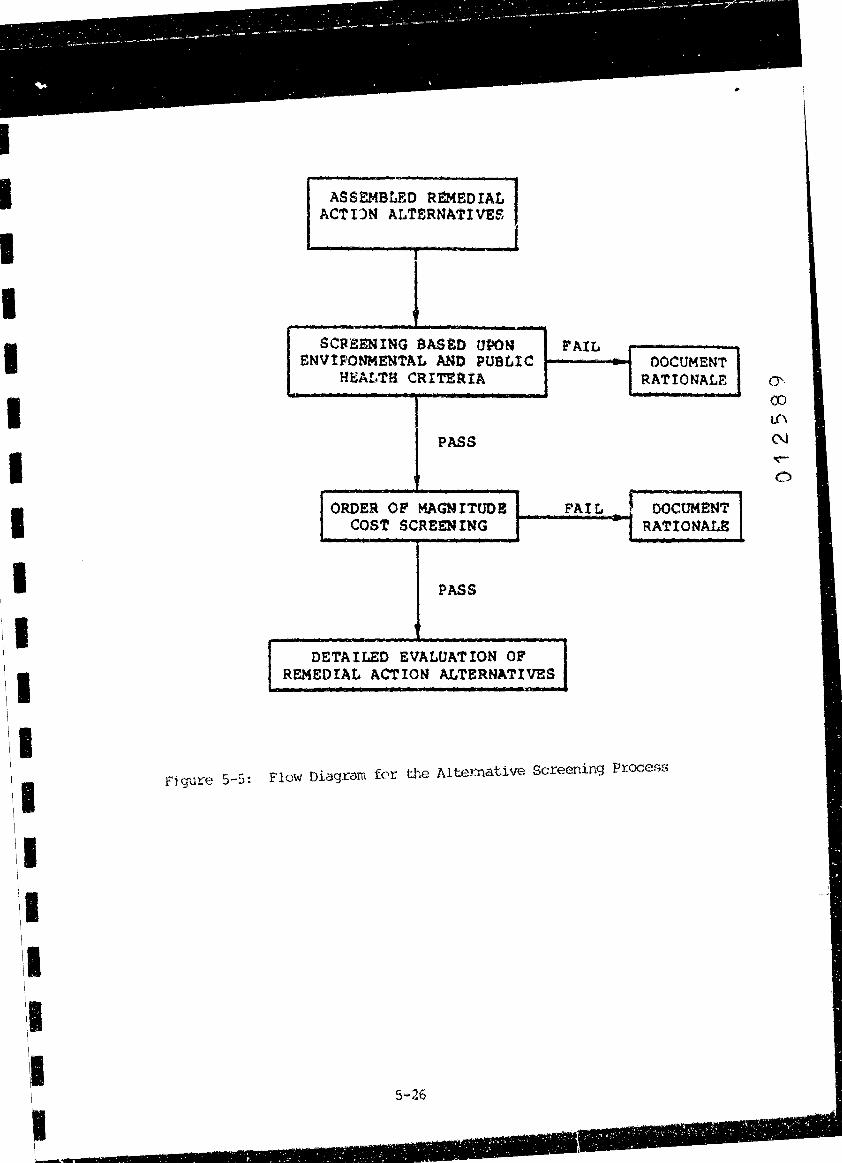
I I I I I I I I I ii
I I I I I I 1,
I
Fjgure 5-5:
ASSEMBLED REMEDIAL ACTI.JN ALTERNATIVES
SCREENING BASSO UPON FAIL ENV!F10NMENTAt ANO POSttC ,.._ __ ....,
ffgAt,TH CRITERIA
PASS
DOCUMENT RATIONALE
ORDER OP MAGN ITODB . FA! L OOCOMENT COST SCRE!N!NG ,__ ___ ...., RATIONALE
PASS
DETAILED EVALUATION OP REMEDIAL ACTION ALTERNATIVES
Flow Diagram f0r the Altemative Screening Proce~s
5 ... 26
O'co l.f\
N
0

.. .. .. .. .. .. ... .. .. .. ..
012590

U1 I
N r,r
- .. - - - - - - - - ... - -RAA NO.
6W·1
GW.-28
Cphscrn)
E~~iR~~EWiAl/PUS:LIC HEALTH cRnrn1i1.
,. POTENTIAL ISOLATEO!-f OF RESmrnTS TO CARVER TERRACE SOH S
* POTEfiTIAL ISOLATION Of RESIDEIHS TO KEN~DY SANO AMO G~AVEL SOILS
* POTEN'HAL ISOLATEON o;: RESrnrnrs TO CARVER TERRACE SOILS
* POTENTEAL !SOLAT!OM OF RESIDENTS TO KEMNEOY SANO AMO GRAVEL SOILS
• NO ISOLATEO'J OF RECEPTORS * POiENTIAl FOR AFFECTED GROUND WATER
MlGRAi[Qij
* POTENTEAL S·T PH&E EFFECTS DURING EXCAVAf!ON * REDUCES POTENTIAL FOR L·T EXPOSURE TO SOflS * AESTHETICS [MPROVED
* POTENTfAl S·T PH&E EFFECTS DURING EXCAVAfION * REDUCES POTENTIAL FOR L·T EXPOSURE TO SOILS * AESTHETICS fMPROVED
A• POTEPH !Al FOR LONG· TERM EXPOSURE FROf,I MIGRATION TO GROUND WATER
* POTENHAL fSOLAHON OF RECEPTORS * REDUCES POTENTIAL FOR LONG-TERM EXPOSURE * POTENTIAL S·T PH&E EFFECTS DURIIIG TRENCH FROM M!GRAT!ON TO c;:R·OUNO 1./ATER
EXCAVATION
* POTENTJAL ISOLATION OF RECEPTORS * REDUCES POTENTIAL FOR LONG-TERM EXPOSURE * PO'TEl-fT!AL S·T PH&E EFFECTS DURING TRENCK FRc+t HIGRAHON TO GROUNO WATER
EXCAVATION
012591
- - - - -RESUU
RETAINED
RETAINED
REiAiNEO
REfA!MEO

I I I I I I I I I I I I I I I I I I I
5.4.2 Cost Screening
The second part of the i~itial two-stage screening process
consists of an "order-of-magnitude" cost screening. The
objective of this scree~ing phase is to eliminate the RMs that
are an ordBr of magnitude more costly than other RAAs andt at the same time, do not provide significantly greater
environmental or public health benefits.
No alternative was screened out based upon environmental
and public health concerns. A detailed cost evaluation will be
conducted for all alternatives in Section 6.0. Therefore, the
order-of-magnitude cost screening will not be conducted here in Section 5.0.
5-29
0
I I I I I I I I I I I I I I I I I I I
6. 0 OETAILE!D EVALUATION OF REMEDIAL, ACTION ALTERNATIVES
This section presents the detailed evaluation of the
po~e~tially applicable RAAs previously listed on Table 5-1.
The evaluation is based on both noncost and cost criteria. The
nor.cost evaluation is accomplished by further developing and assessing the effectiveness and implementability of each
al~ernative. The cost evaluation involves a comparative
analysis of the alternatives on the basis of pr~sent worth
costs for both capital and operation and maintenance
expenditures. Section 6.1 and 6.2 discuss the evaluation
criteria that will be addressed during the noncost and cost eva:J3tions, respectively.
6.1 Soncost Evaluation Criteria
:'he effectiveness, implementability, and community and
state acceptance of each alternative is assessed within the
noncost evaluation. Both the short-term and long-term effects
associated with each alternative are addressed. A brief disc~ssion on effectiveness, implementability and community and
state acceptance follows.
Effectiveness ------T~e effectivness of an alternative is its ability to
perfor~ its intended function. In accor.dance with the tnterim
Guidance on Superfund selection of Remedy (U.S. EPA 1986), the
effectiveness of an aiternative is assessed "taking into
account whether or not a~ alternative adequately protects human health and the environment and attains federal and ~tate ARARs,
wheth8~ or not it significantly and permanently reduces the
toxicity, mobility, or volume of ha~ardous constituents, and
whether or not it is technically reliable». To conduct the evaluation of an alternative•s
effectiveness in accordance with the above criteria, the
effectiveness of an alternative is evaluated by identifyinq a~d
assessing the following, when applicable:
6-1

. • • • , _" • • • _ . • • • _ 0 • _ , • • • ._ • .. • I _ • _ • • • I
' J • • • •• • • • •1 • • ~ I
~ • 1 , •
. . . . . , . .' , ,, . . , . . , ' . . ' .
I I I I I I I I I I I I I I I I I I I
0
0
0
0
0
0
0
0
0
0
the treatment processes to be utilized by the
alternative and the materials to be treated;
the amount of hazardous materials to be destroyed or treated;
the anticipated degree of reduction in toxicity, mobility or volume;
the degree to which the treatment is expected to be irreversible;
the residuals that will remain following treatment,
considering the persistence, toxicity, mobility, a~d
propensity to bioaccumulate of such hazar.dous substances and their constituents;
the magnitude of reduction of existing risks;
the potential short-term risks to the community,
workers, nr the environment that may occur during the
implem2ntation of an alternative. This includes the
potential threats to human health and the environment
associated with excavation, transportation, and redisposal or containment;
the estimated time required to complete the remedial action;
the type and degree of long-term management required after the implementation of an alternative, including
monitoring and operation and maintenance;
the potential for exposure of human and environmental receptors to remaining waste considering the
potential threat to human health and the environment associated with excavation, transportation, or containment;
6-2
tj
O'L('\
(\]
0

I I I I I I I I I I I I I I I I I
o the long-term reliability of the engineering and
institutional controls, including uncertainties
associated with land disposal of untreated wastes and
residuals: and
o the potential need for replacement of the remedy; and
o ability to meet federal and state ARARs. Il}'lp lementabi_l i ty
The implementability of an alternative is evaluated by
assessing its constructability and estimated construction
time. The feasibility and ease of the c0nstruction activities
as well as the ability to obtain all necessary permits required
to implement the remedial alternative are also evaluated.
The following factors are assessed, wh~n appropriate,
during the evaluation of the implementability of an slternative:
o the degree of difficulty associated with constructing
the alternative;
o the anticipated operational reliability of the
technologies comprising the alternativ~;
o the need for necessary approvals and permits and the
requirements to obtain them;
o the availability of necessary equipment and
specialists; and
o the available capacity and location of needed
treatment, storage, and disposal services.
The time necessary to construct and implement an alternative is evaluated taking into account all studies,
permitting, pilot plant operation, and design and construction activitie1 that may be necessary. The time estimates do not
consider unquantifiable factors such as: (1) availability and
6-3
l.f\
(\J
0

I I I I I I I I I I I I I I I I I I I
performance of subcontractors; (2} availability and timely
delivery of equipment and materials; ~nd (3) weather conditions.
Communitv and State Acceotance
The local community's and state's acceptance to an
alt~rnative is considered as part of the noncost evaluation.
For the Koppers Texarkana Site, these acceptances cannot be
evaluated at this time. Instead they will be considered and
evaluated during the public comment period.
6.2 Cost Evaluation Criteria
The cost eva1uation consists of a comparative analysis of
the alternatives on the basis of present-worth costs for both
capital and operational expenditures. In accordance ~ith
"Guidance on Feasibility Studies Under CERCLA. 11 (U.S. EPA,
1985), more extensive sources of information and more detailed
preliminary design information are used during the detailed
evaluation, such that costs are developed for each alternative
within an accuracy range of -30 to +SO percent.
An additional cost to account for health and safety
precautions are included in the cost estimates. This cost
accounts for the time which would be required of a health and
safety officer to be on site during remediation activities.
The accuracy of each cost developed during the detailed
evaluation depends upon the assumptions made and cost
information available. These assumptions ar8 associated with
the design, implementation, and operation of an alternative. A
sensitivity analysis is conducted on each alternative by
varying major direct capital cost components by +10 percent and
-5 percent. This process generdtes high and low cost estimates
for each alternative. Comprehensive listings of each
alternative's cost components and sensitivity analyses are included in Appendix 6-A for the unsaturated soil response
media unit alternatives, and Appendix 6-B for the ground water response media unit alternatives.
6-4
'° 0--1.f\
C\l
0
----------•'lll'iiiil.• ... ·· t --·· ., iJll:lliilloil: __ _ m

I I I I I I I I I 'I I I I I I I I I I
Present-wocth costs are pcesented assuming a 30-year
operational period, a ten percent interest rate and a zero per~ent inflation rate.
6.3 Detailed Evaluation of the Unsaturated Soils (SL) Response
Media Unit Alternatives
6.3.1 Alternative SL-1: No Action/Monitoring/
Institutional Controls
6.3.1.1 Noncost Evaluation
Effectiveness
Alternative SL-1 may be effective in reducing the
pote~tial for direct human contact with soils within the
Kennedy Sand and Gravel property through the use of the fence and warning signs. The hog wire/barbed wire fence and signs bordering the Kennedy Sand and Gravel property will remain
intact. Periodic inspections to detect potential vandalism will be performed, with repairs and maintenance conducted as
n~eded. Fencing is a proven, low cost response measure to
restrict access to a site. The above-mentioned measures can
effectively deter unauthorized entry onto the site; however,
these restrictions can potentially be violated.
The pot~ntial for direct human contact with soils within
the Carver Terrace Subdivision will exist although most of the
areas containing PCOCs greater than the remediation limit are
presently covered by a six-inch soil/sod barrier. A long-term
soil sampling program will be implemented under this
alternative.
Under this alternative, the soils within the remediation limits remain. PCOCs concentrations within the soils may be
reduced via natural biodegradation. The effectiveness of
6-5
r-0',
lf\
N
0

I I I I I I I I I I I I I I I I I I I
natJral biodegradatio~ of soil PCOCs at the Koppers Texar~ana
Si~e is difficult to ~stimate. As discussed previously in
Section 5.0, numerous factors can affect the biodegradation
rates such as: the types of microorganisms present,
temperature, moisture content, and dissolved oxygen
concentration.
Under Alternative SL-1, no measures will be implemented to
reduce potential infiltration of rainwater through the soils. Infiltration of rainwater may result in the leaching of PCOCs
from the soil into the ground water in the shallow aquifer. Although, the treatability study presented in Appendix 4-A
indicates little potential for PAHs leaching off soilsf and
leaching may not present a future problem.
There will not be any short-term risks posed to workers or
the community by implementing this alternative, since the fence
and signs on the Kennedy Sand and Gravel property are already
in place. In addition, this assumes that the existing soil/sod
barrier will remain intact.
Institutional controls are required for the Koppers
Texarkana Site under Alternative SL-1. The fence will be
maintained in order to deter unauthorized access to the site.
Deed notices will notice that hazardous substances remain below
the surface. Institutional controls provide an effective
method to control the development of a site. and they have been
implemented at hazardous waste sites throughout the country.
Alternative SL-1 does not attain ARARs since no clean up
activities will take place. The areas with soils containing
carcinogenic PAHs greater than the remediation goal will remain
at the site.
Imp_leme..!2tabi l i t.Y,
Alternative SL-1 is easily implemented. The fence
surrounding the Kennedy Sand and Gravel property"to restrict
site access has already been constructed and the signs alr~ady
posted. Periodic inspections of the fence and postings and
periodic soil monitoring will be required.
6-6
,-.
0

I I I I I I I I I I I I I I I I I I I
6.3.1.2 Cost Evaluation
As shown on Table 6~1, there are no capital expenditures
associated with the Carver Terrace soils component of
Alt~rnative SL-1: No Action/Monitoring/Institutional
Controls. There are, though, capital expenditures associated with the bulk solids contained within four roll-off boxes
located on the Kennedy Sand and Gravel property. The range of
capital costs associated with the implementation of Alternative
SL-1 are estimated as follows:
Low
$26,000
~aeJtal Cost
Baseline
$27,000
High
$29,000
The detailed cost information associated with the sensitivity
analysis is presented in Appendix 6-A. The O&M costs
associated with the alternative for maintaining the fence and
sampling the unsaturated soils to a depth of one foot from 22
lots are presented in Table 6-2. As shown, it ls estimated
that the annual operation and maintenance cost for years 1-30
is approximately $14,000.
Utilizing the direct capital cost and the O&M cost, and
assuming ten percent interest and zero percent inflation, the
30-year present worth values are approximately:
30-Year Present Worth Cost
Low Baseline High_
$158,000 $159,000 $161,000
0

I I
fA9LE 6·1: ALTERNATIVE SL·1: BASELINE CAPITAL COSTS
NO ACTION/MONITORING
I COST COI-IPONE:N~ OUANltTY UNll UNtT COST TOTAL COST COMMENlS
I CARVER TERRACE: SOILS: NO CAPITAL EXPENDITURES
I BULK SOLIDS TO BE TREATED UITH GROUND UATER:
I LOAD BUL( SOLJOS 160 CY S100 $16,000 FOUR 40·CY ROLL·OFFS CONrAIN·
ING SOIL CUTTINGS FROM THE RI ON·SITF. ~ULING 160 CY $3 t480 "AULEO TO T"E G~AVEL PITS, TO
BE TREATED BY GROIJND UATER
I HEAL TH & SAFETY UEEK $4,000 $4,000 H&S OFFICER DURING REMEDIA·
flON; HNU,RESPIRAlOR,CLOTHING
DIRFCT CAPliAL COST
I $20,480
ENGlMEERtNG & DESIGN (11t) $2,253
I CONTINGENCY (20¾) $4,096
TOTAL CAPITAL COST $26,829
I APPROXIMATE TOTAL CAPITAL COST $27,000
I <DCC· SU)
I I I I I I I 6-8
0
0
"° (\J
0

I I I I I I I I I I I I I I I I I I
•ABLE 6·2 ALTERNATIVE SL·1
OPERATION AND MA.1HiENANCE COSi ESTIMATE
NO ACTION/MONITORING
08M COMPONENT ANNUAL COST CO/.!MENTS ........... _.. .. --......... "' -. -.................... ,. ...
FENCE: PERIOOIC INSPECTIONS $4,800 4 INSPECilONS ~ $1200 EACH;
(INCLUOES $400 LABOR PLUS TRAVEL PER INSPECTION)
$400 1% OF FENCE PER YEAR
SOIL MONITORING: COLLECT SAMPLES $1,760 8 SAMPLES COLLECTED/DAV;
$40/HR PLUS TRAVEL; ANALYSIS $6,930 1 SAMPLE PER LOT; AJ,!ALYZE FOR
PAHs AND ARSENIC (~315/SAMPLE}
TOTAL ANNUAL o&l4 COSTS $13,890
(Approximate Value) $14,000 FOR YEARS 1 TO 30
COM·SL1}
6-9
-c--
0
'° (\J
~
0

I I I I I I I I I I I I I I I I I I I
6.3.2 Alternative SL-2: Capping/Monitoring/Institutional
Controls
6.3.2.1 Noncost Evaluation
Effectiveness
Capping is a reliable technology for isolating impacted
soil. The remedial technology has been implemented at
hazardous waste sites around the country with excellent
performance and reliability. The beneficial results of a cover
system occur immediately upon implementation. Periodical
monitoring are required for the proposed cover systems to
ensure the integrity of the system.
There are public health concerns associated with the
installation of a cover system for both residents and workers.
During regrading activities there may be a potential risK of
exposure to workers due to contact and potential inhalation of
particulates. Health and safety precautions will be r~quired
as appropriate. Once regrading and the installation of the
bottom-most layer of the cover (i.e., topsoil or gravel) has
been completed, safety considerations for exposure to impacted
soils will be reduced.
The potential exposure to residents and workers during the
implementation of Alternative SL-2 will be reduced through the
use of continued ambient air monitoring, roping the work areas
off by means oE orange ribbon surrounding the perimeter, and
through dust suppressing activities. The Final Public Health
Endangerment Assessment (Section 2.0) indicates that direct
exposure to the soil is the major health concern associated
with the nature and e~tent of the PCOCs at the Koppers
Texarkana Site. The soil/sod barrier and asphalt cap can
prohibit direct contact with the soil, thereby reducing this
poteutial exposure route. Deed notices placed on the Koppers
Texarkana Site will notice that potentially hazardous
substances may remain below the surface.
~lternative SL-2 can be designed to meet the requirements
of the ARARs identified for the Kopp~rs Texarkana Site.
6-10
0
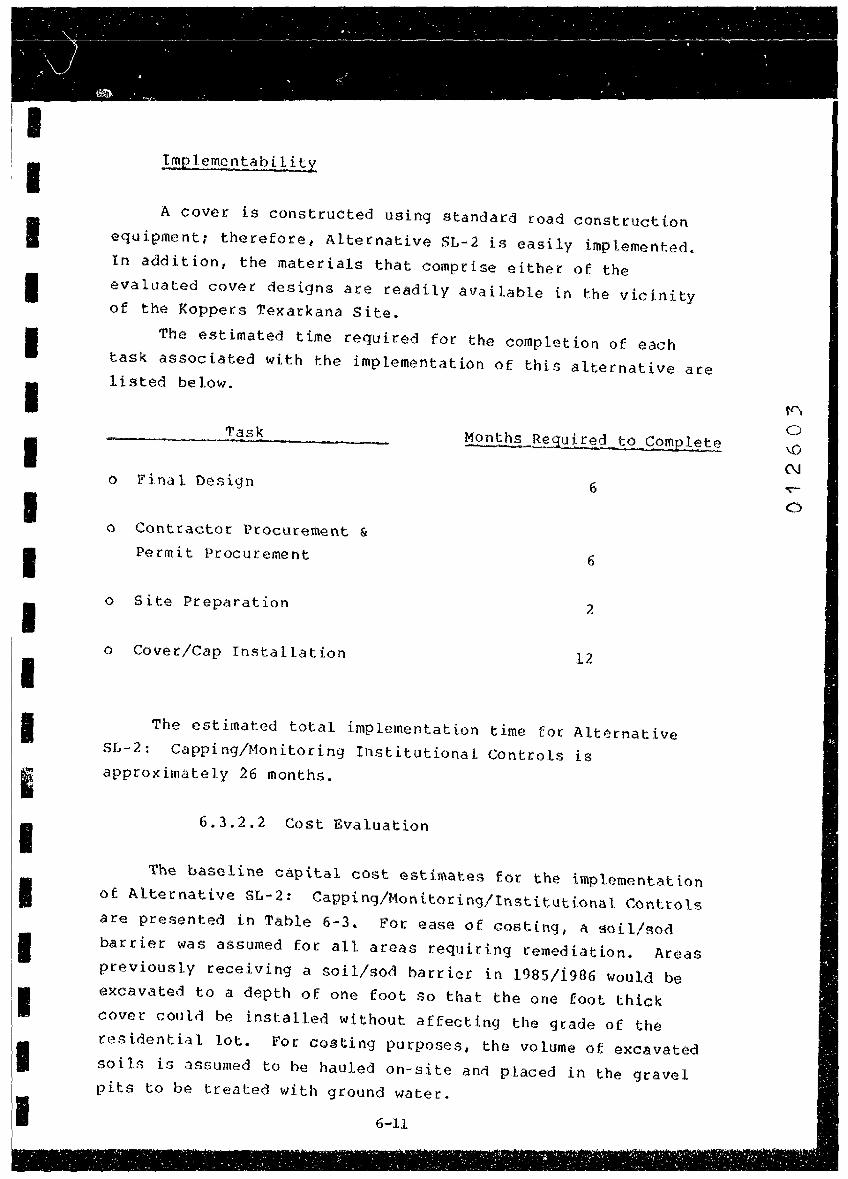
I I I I I I I I I I I I I I I I I I I
Im2lementability
A cover is constructed using standard road construction
equipment; therefore, Alternative SL-2 is easily implemented~
In addition, the materials that comprise either of the
evaluated cover designs are readily available in the vicinity of the Koppers Texarkana Site.
The estimated time required for the completion of each
task associated with the implementation of this alternative are
listed below.
Task
o Final Design
o Contractor Procurement &
Permit Procurement
o Site Preparation
o Cover/Cap Installation
Mont_hs _Reg!:!_ i re_d to Compl~t~
6
6
2
12
The estimated total implementation time for Alt~rnative
SL-2: capping/Monitoring Institutional controls is
approximately 26 months.
6.3.2.2 Cost Evaluation
The baseline capital cost estimates for the implementation
of Alternative SL-2: Capping/Monltoring/Institutional Controls
are presented in Table 6-3~ For ease of costing, a soil/sod
barrier was assumed for all areas requiring remediation. Areas
previously receiving a soil/sod barrier in 1985/i986 would be excavated to a depth of one foot so that the one foot thick
cover could be installed without affecting the grade of the
residential lot. For costing purposes, the volume of excavated
soils is assumed to be hauled on-site an~ placed in the gravel pits to be treated with ground water.
6-11
l'C\
0
'° N
0
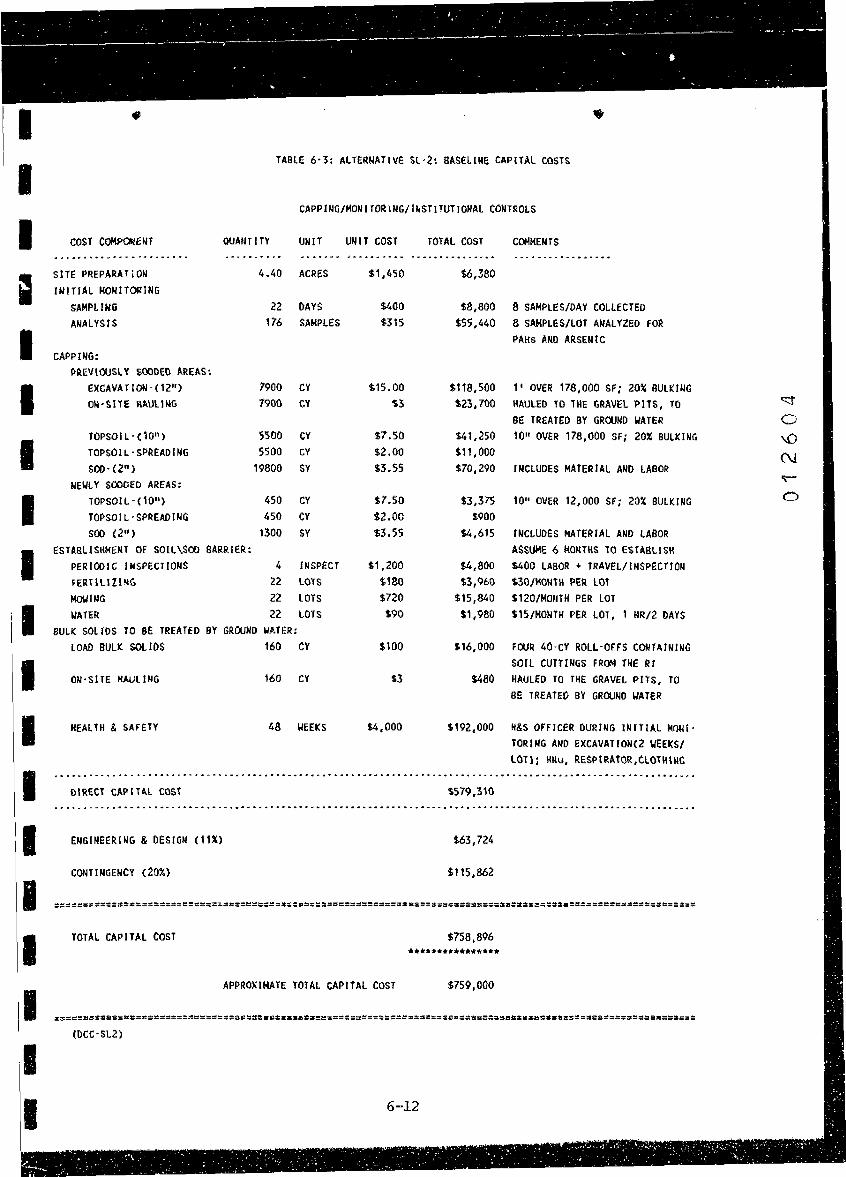
I I a I I I I I I I I I I I I I I I
TABLE 6·3: ALTERNATIVE SL·2: 8AS€LIIIE CAPITAL COSTS
CAPPJNG/MONlfORlNG/lhSTJTUTJONAL CONTROLS
COST COMPOli~Ml OUAIHITY UN tr .................. ~ ............ SITE PREPARATiON INITIAL MONIT~ING
SAMPLING ANALYSIS
CAPPING: PR.EVlOOSlY SOOOEO. AREAS:
EXCAVATION· ( 12") Qt.I· SI TE 1\1'.Ull llG
TOPSOIL· ( 10")
TOP50IL·SPREADING S00· (2")
NEWLY SOOOEb AREAS: TOPSOIL-(1011 )
TOPSOIL·SPREADJNG S00 (2")
ESTABLISHMENT Of SOlL\SOO BARRIER: PERIOOJC INSPECTIONS fERTlllZlffG
MOIJING UATER
4.40 ACRES
22 DAYS 176 SAMPLES
1900 CV 7900 CY
5500 CY 5500 CY
19800 SY
450 CY 450 CY
1300 SY
4 fNSPECT 22 LOlS 22 LOTS 22 LOTS
BULK SOLIDS TO BE TREATED BY GROUND WATER: LOAD BULK SOLIDS 160 CV
ON·SITE H.1..UllNG 160 CY
HEAL TH & SAFETY 48 WEEKS
OIRECT C~PIT~L COST
ENGINEERING & DESIGN (11%)
CONTINGENCY {20%)
TOTAL CAPITAL COST
UNIT COSl
$1,450
$400 $315
$15.00 $3
'1,7.50
$2.00 $3.55
$7.SO $2.00 $3.55
$1,200 $180
$720 $90
$100
$3
$4,000
TOTAL COST COf,IMENTS
$6,380
S8,800 8 SAMPLES/DAY COLLECTED $55,440 8 SAMPLES/LOT AMALYZED FOR
PAHs ANO ARSENIC
$118,500 $23,700
$41,250 $11,000 $70,290
$3,375 $900
11 OVER 178,000 Sf; 20% BULKING HAULED TO THE GRAVEL PITS, TO BE TREATED BY GROOND WArER 10 11 OVER 178,000 Sf; 20¾ BULKING
INCLUDES MATERIAL AND LABOR
10" OVER 12,000 Sf; 20¾ SULKING
$4,615 lMCLUbES MAlERIAL AND LABOR ASSUME 6 MONTHS TO ESTABLISH
$4,800 $400 LABOR~ TRAVEL/INSPECTION $3,960 $30/MONTH PER LOT
$15,840 $120/MONTH PER LOT $1,980 $15/MONTH PER LOT, 1 HR/2 DAY$
$16,000 FOUR 40·CY ROLL-OFFS CONTAINING SOfl CUTTINGS FROM THE Rt
$480 HAULED TO THE GRAVEL PITS, TO BE TREATEO av GROUND ~ATER
$192,000 H&S OFFICER DUP.ING INITIAL MOUi· TORING ANO EXCAVATION(2 WEEKS/ LOT); HNu, RESPIRATOR,ClOlHIMG
$579,310
$63,724
$115,862
$758,896 ······**•*******
APPROXIMATE TOTAL CAPITAL COST $759,000
(DCC·SL2)
6-·12
0

I I I I I I I I I I I I I I I I I I
In actuality, if a ground water treatment alternative is not
implemented or if this option for treatment of soil is not
feasibleT the excavated soils would be treated either via
mechanical soil washing, off-site incineration, or off-site lar.:Hilling.
As stated in Section 6.1.2, in addition to the baseline capital cost estimates, a sensitivity analysis on the capital
cost components was completed. The detailed cost information associated with the sensitivity analysis is presented in
Appendix 6-A. The range of capital costs associated with the implementation of Alternative SL-2 are estimated as follows:
Cap ~tal Cost
Low Baseline J-Ii h " - g ..
$723,000 $759,000 $831,000
The O&M costs associated with Alternative SL-2 as
presented on Table 6-4 is approximately $5,200 for years 1 to
30. This assumes that the cover will be established within six months an1 will not need maintenance thereafter.
Using the annual O&M cost estimates and the direct capital costs, the JO-year present worth costs associated with the
alternative are:
JO-Year Present Worth Co6t
Low Baseline
$772,000 $808,000 $880,000
l.f'I
0 \,()
N
0

I I I I I I I I I I I I
I I II 11 11 I I I I 11
TABLi: 6·4 AL!ERNATIV€ SL·2
OPERATION AND HAINfENANCE COST ESflMATE
CAPPING/MONITORING/INSTITUTIONAL CONTROLS
o&M COMPONENT
FENCE: PERIOO!C INSPECTIONS REPAIR
TOTAL ANNUAL a&M COSTS
(Approxi~~te Value)
(OM·SL2)
ANNUAL COST ............. - • ■ ..........
$4,800
$400
$5,200
$5,200
6-14
COMMENTS
4 INSPECTS~ i1200 EACH REPLACE 1% OF FENCE/YEAR
fOR YEARS 1 TO 30
0
I I I I I I I I I I I I I I I I I
6.3.3 Alternctive SL-3: In~Situ Biodegradation/ Monitoring
6.3.3.l Noncost Evaluation
E!ffectivene!!
Treatment of impacted soils via in-situ biodegradation is an effective technology. Under Alternative SL-3, it ls
anticipated that the unsaturated surface soils within the areas determined by the remediation goals will be treated via biodegradation to a depth of one foot. The time required to
achieve the remediation goal is difficult to estimate because
biodegradation rates are dependent on various factors such as
temperature, moisture content, dissolved oxygen concentrations, and the microorganisms present. For costing purposes a ten year treatment duration will be assumed.
During the initial implementation of the alternative there may bP potential health risks to workers and the residents, specifically associated with the aeration activities. As treatment continues, potential risks will decrease.
Alternative SL-3 involves minimal disruption of the Carver Terrace area during site remediation activities.
Under Alternative SL-3 a soil monitoring program must be conducted periodically during treatment. In addition, ambient air monitoring will be conducted during implementation. No long-term management will be required after treatment.
The ARARs identified for the Koppers Texarkana Site will be met if Alternative SL-3 is implemented,
Imp lementabi l_i t;y
Alternative SL-3 will require standard landscaping
equipment and therefore will be easily implemented.
1\ddi.t.ionally, the materials needed are readily available.
The estimated time required for the completion of each task associated with the implemention of Alternative SL-3 is listed below.
6 ... 15
r-0
'° C\l

I I I I I I I I I I I I I I I I I I I
Task
o Final Design
o Material/Contractor Procurement
o Site Preparation
o Treatment Operation
Months R!!_guired to Complete
6
6
3
120 (maximum estimate)
Therefore, the estimated time required to implement Alternative SL-3 should take no longer than 135 months.
6.3.3.2 Cost Evaluation
The baseline capital cost estimate for the implementation of Alternative SL-3: In-Situ Biodegradation/Monitoring/
Institutional Controls is presented in Table 6-5. In addition to the baseline capital cost estimate, a sensitivity analvsis
on the capital cost components was completed, Detailed costing information for Lhis analysis is presented in Appendix 6-A. As
a result of the sensitivity analysis, range of capital costs associated with the implementation of Alternative SL·3 are:
__ tow
$1,419,000
Caeital_Cost
Baseline
$1,494,000
_High_
$1,643,000
The annual O&M cost associated with Alternative SL-3 as shown on Table 6-6 is approximately $72,000 for years 1 to 10
and $5,200 for years 11 to 30. This estimate takes into
account the cost for treating and monitoring the soils for ten years. Using the annual O&M costs and the capital costs, the 30-year present worth cost associated with the alternative are as follows:
6-16
--· ... ·-·-·- ········--~- .. - --.·· --.
co 0
'° (\J

. > • • • : • . • • . • • . _' - •. : __ · ____ · __ - . _: . - ·_ -- --- .
I I I I I I I I I I I I I I I I I I I
. . . .
TULE 6-S: ALTERNATIVE SL·3: BASELINE CAPITAL COSTS
OUANfl TV ...... -. . .. . . .. .. . . . . .. . ... . .. -......... ..
SJlE PRE~ARAT;ON !NIT!Al f.lONtTOlttNG
SAAPLING ANALYSIS
INSTALL SPRINl~£R SYSTEM lN·SITU BfOltEC;.AMAffON
4.40
22 176
22 7000
LOTS CY
BULK SOLIDS TO BE TREATED U1TU GROUND UAtER; LOAD 1t,O Cl
ON·StTE IWJllN.G 160 C'f
HEAL TH & SAFETY 16 WEEKS
IN·SITU BfOOEGRADATION
UMIT COST TOTAL cosr COMMENTS • .. • • • • .. • • ... .. • • .. .. ... .... • • .. • • .. • • .. ... ,.. ......... ■ ........ ..
t400 $315
$2,000 $135
SiOO
S4,000
S6,3no
'8,000 $55,440
S44,000 S945,000
s\o,ooo
$4$0
$64,000
8 SAMPL£S COtLECTEO/DAY 8 SAMPLES/LOT ANALYZEO FOR PAHg ANO ARSENIC INCL, BOX AND METER 190,000 SF TREATED TO A DEPTH Of 1 FT; NO SULKING
FOOR 40-CY ROLL-OFFS Co»tAJN· ING $0fl CUTTINGS FROM fHE RI HAYLEO TO tKE GRAVEL ~ITS TO BE TREATEO BY GROONO UATER
~ts OfFJCER DURING i:ONITORING & REMEOIATIOU; IINu,R.liSPIR.ATOR
..................................................................... ,.. ...................................... _ ...................... ~ .......................... . DIRECT CAPITAL cosr
~HGlHEERlHG & 0tSlGH (11i)
CONttNGENCY (20%}
TOiAL CAPITAL COST
APPROXIMATE TOTAL CAPITAL COST
(OCC·Sl3}
$1,140,100
i 1,493,531
$1,494,000
6-17
c-0
'° (\J
~
0
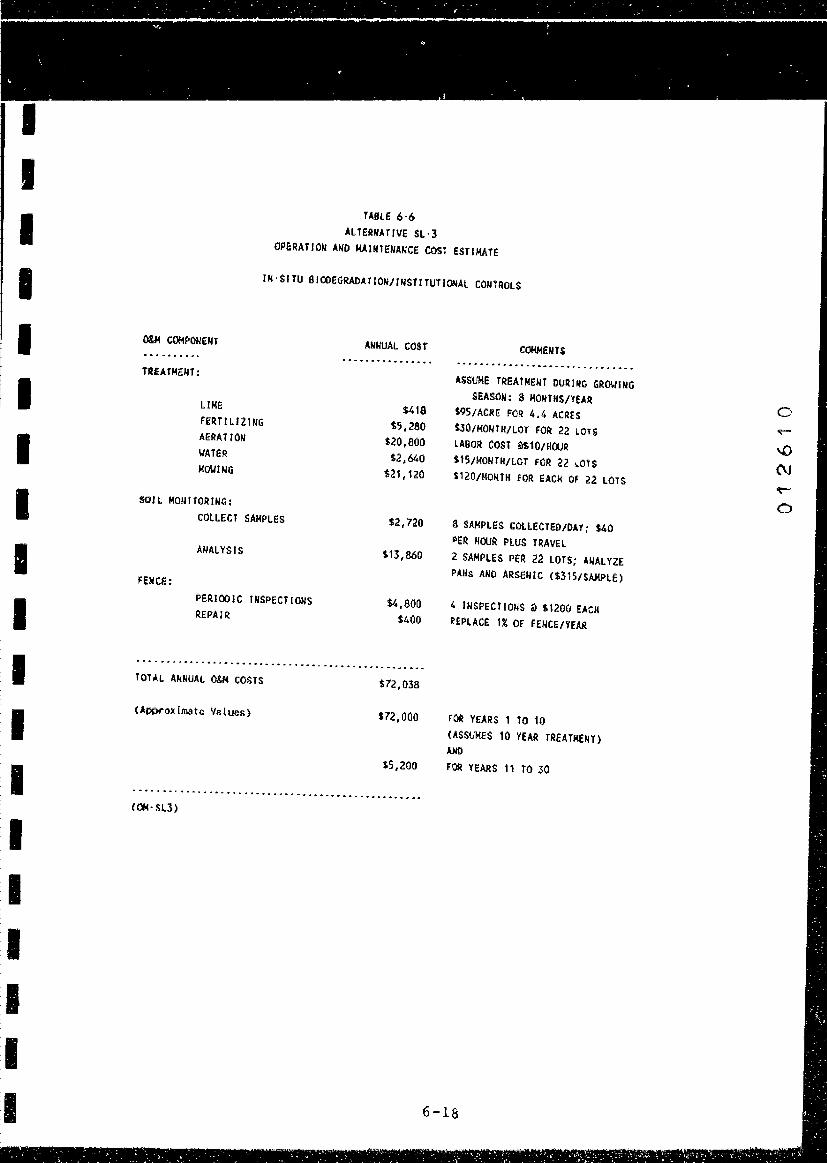
- - - . - - . - . • - .•. · ·_ _· . ·• - ' .· r - - . - --- _: _ _:_ __ -~------------ - _· ·_ - - - , . . . .• . - ' . • - i
----- ---- - - ---- - ----- - 'I,.~-- -- - - - - •
~ .
,_ . - -
• • . . . . I
I I I I I I I I I I I I I I I I I I I
. . . - -
TABLE 6-6 ALTERNATfVf SL·3
OPSRATtO!I AND MAINfENAHCE COS, ESTIMATE
IK·SITU BIOOEGRADATIOH/fNSflTUTICWAL CONTROLS
o&M COMPONENT . . .. -........ TIU:AfMENT:
LrHE
FERTILIZING AERATION !.'ATER MO\.IING
SOIL MONlfORING: COLLECT SAMPLES
ANALYSIS
FENCE:
PERIOOIC t!ISPECTIONS REPAIR
TOTAL ANNUAL otM COSTS
<Approximate Values)
C04·Sl3)
ANNUAL COST ... -.. -................ ,. ..
1418 $5,280
$20,800 $2,640
$21,120
Si?, 720
$13,860
£4,800 $400
$72,038
S72,000
S-5,200
COfOIENTS . ................................................ ASSUME TREATMENT DUR!-G GROWING
SEASON: 8 HONTIIS/YEAA $95/ACRE FOR 4.4 ACRES $30/HONTH/LOT FOft 22 LOTS
LABOR COST al$10/H(XJR
$15/MONTH/LOT FOR 22 ~ors $120/HONTH FOR EACH OF 22 LOTS
8 SAMPLES COlLECTEO/DlY; $40 PER HOUR PLUS TRAVEL 2 SAMPLES PER 22 LOTS; ANALYZE PAHs ANO ARSENIC {$315/SAM.PLE)
4 INSPECTIONS~ $1200 EACH
REPLACE 1% OF FENCE/YEAR
FOii YEARS 1 TO 10 (ASSUMES 10 YEAR TREATMENT) ANO
fOR YEARS 11 TO 30
6-18
0 'I"'-
'° "' 't"'""'
0
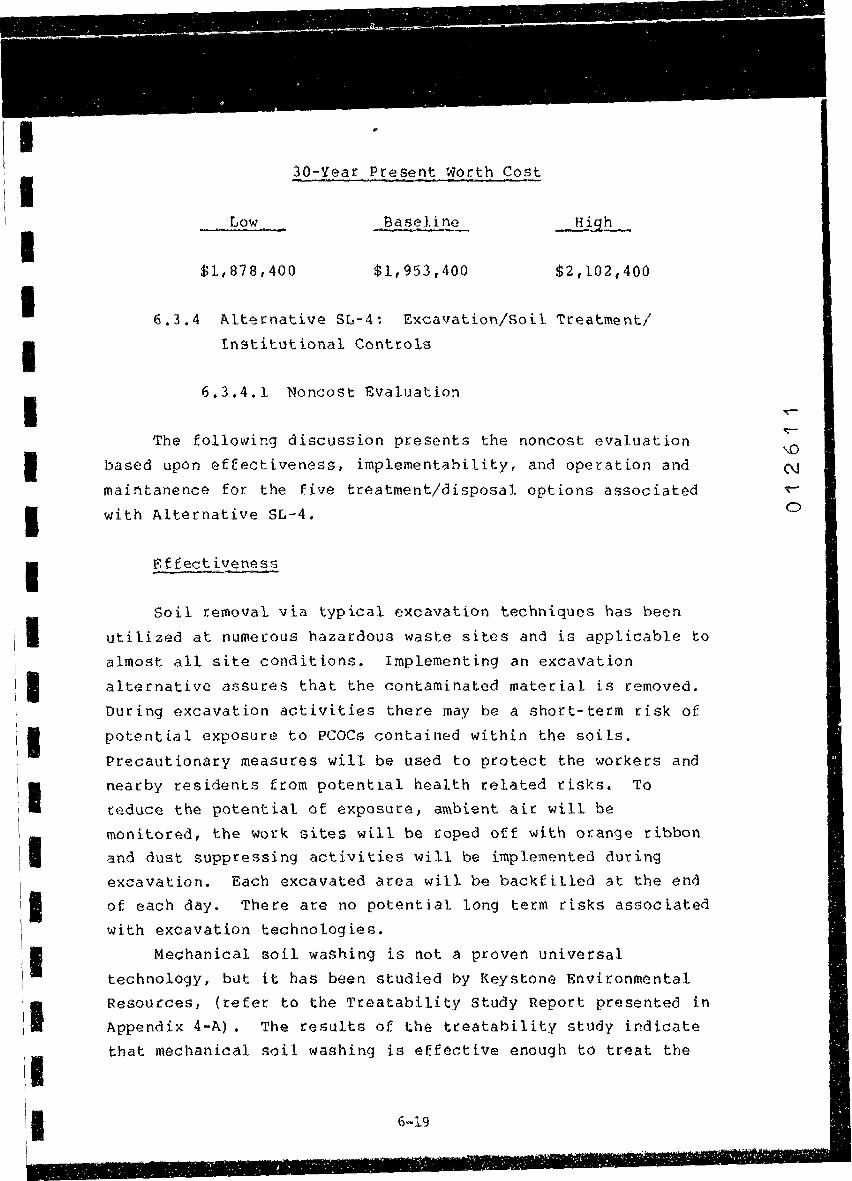
I I I I I I I I I I I I I I I I I I I
6.3.4
.,
30-Year Present Worth Cost ........ - ... -
Low Baseline -... :l!,..o,b.__&
$1,878,400 $1,953,400 $2,102,400
Alternative SL-4: Excavation/Soil Treatment/ Institutional Controls
6.3.4.l Noncost Evaluation
The following discussion presents the noncost evaluation based upon effectiveness, implementability, and operation and
maintanence for the five treatment/disposal options associated with Alternative SL-4.
Effectiveness
Soil removal via typical excavation techniques has been
utilized at numerous hazardous waste sites and is applicable to almost all site conditions. Implementing an excavation
alternative assures that the contaminated material is removed.
During excavation activities there may be a short-term risk of
potential exposure to PCOCs contained within the soils.
Precautionary measures will be used to protect the workers and nearby residents from potential health related risks. Tc
reduce the potential of exposure, ambient air will be
monitored, the work sites will be roped off with orange ribbon and dust suppressing activities will be implemented during
excavation. Each excavated area will be backfilled at the end
of each day. There are no potential long term risks associated with excavation technologies.
Mechanical soil washing is not a proven universal
technology, but it has been studied by Keystone Environmental
Resources, (refer to the Treatability Study Report presented in
Appendix 4-A). The results of the treatability study indicate that mechanical soil washing is effective enollgh to treat the
6-19
'° (\J

I I I I I I I I I I I I I I I I I I I
soils at the Koppers Texarkana Site to a level so that the
cle~ned soils can be disposed within the Kennedy Sand and
Gravel property. Regardless of the final concentrations, soil
wasr. ing will reduce the volume of contaminated soils.
On-site incineration of soil for the removal and
destruction of organic constituents is a demonstrated
tech,ique. Equipment is well-developed and reliable. There
are potential short-term risks associated with on-site
inci~eration, therefore federal and state requirements were
developed to assure a certain level of protection must be met.
Duri~g the operation of the on-site incinerator there will be
the ~otential for hot gases to leak from the kiln seals which
can result in worker and resident exposure and injury. Residue
from the incinerator is typically discharged at temperatures as high as 500 degress fahrenheit and therefore requires special
hand:ing procedures to minimize potential injury. The
performance of an incineration system is based on its ability
to achieve a DRE of 99.9999 percent of the principal organic
hazardous constituent. The rotary kiln incinerator has
achieved at least 99.9999 percent DRE for dioxin-containing
materials. On-site incineration will reduce the volume of
conta-uinated soil although an ash is generated as a result of
the process. If the ash resulting from the incineration is
characterized as nonhazardous, the ash will be used as backfill
within the Kennedy Sand and Gravel property. There is a
potential that the ash will not be delisted due to the metallic content of the soilst therefore the ash will require disposal
off site. Disposal of this ash will need to be consistent with
the land ban. To construct and use an on-site incinerator, no
permit is required but substantial requirements must be met during implementation. Due to the close proximity of nearby
residents and the associated potential risks involved, on-site incineration may not be feasible for the Koppers Texarkana Site.
Off-site incineration is a reliable and effective technology. The Deer Park, Texas incinerator facility operated
by Rollins Environmental Services of TX, Inc. is capable of handling the PCOCs contained within the soils at the Koppers
Texarkana Site. This technology will meet the requirements of the ARARs identified for the Koppers Texarkana Site.
6-20
(\J
\[)
(\J
C)

• • • • • r • : • r • • • ,- : • • .: • - - • • 1" • • • • '- • • ; . . . . . . . . -
I I I I I I I I I I I I I I I I I I I
' . .. -' . . .
. . . . . . . . . . . . . . . . '
Off-site landfilling of contaminated soils has been a
widely used practice at many hazardous waste sites. With the
ad·Jent of SA.RA, though, more permanent destruct ion or treatment technologies are now sought. Therefore,
this technology is the least favorable.
may not comply with the future land ban soil and debris.
under the statute,
Off-site landfilling
regulations for CERCLA
The passive soil washing option under Alternative SL-4 is entirely site specific and unique to the Koppers Texarkana
Slte. It has not been proven and would require additional stJdies to determine its potential effectiveness and
reliability. This alternative will meet the requirements of the ARARs identifieJ for the site.
J !11E 1 e me n t ab i l i t l
The equipment used for completing the excavation
activities associated with this alternative consists of
standard excavation equipment and so the excavation activities are, therefore, relatively easily implemented. Since
excavation will take place to a depth of only one foot, no
temporary relocation of residents will be required. The
implementability of Alternative SL-4 will be controlled by the
availability, constructability, and feasibility of the soil
treatment/disposal options as described below for each option.
o Mechanical Soil Washing
A treat~ent unit will be mobilized or constructed at the site within the Kennedy Sand and Gravel property. This unit will have to be protected from the 100-year flood. Soil
samples and treated water samples will require analysis to
determine the effectiveness of treatment. Air monitoring will
be required during implementation. Local building codes,
electrical and water supply hook-ups will be considered during the final design of the treatment system.
6-21
'° (\J
0

I I I I I I I I I I I I I I I I I I I
The time required to complete the key activities
associate1 with the implementation of Option (a) of Alternative SL-4 are approximately:
Task
o ?ilot Study/Final Design
o Equip~ent Procurement
o ~obilization/Demobilization
o Site Preparation
o Treatment
Months Required to C~elete
12
6
3
2
12
Once operating, it is estimated that approximately 12
months would be required to excavate and treat the unsaturated
soils at the Koppers Texarkana Site. The rate of treatment is
assumed to be 2.5 tons per hour. Ther~fore the time to
implement Alterna ti ,•e SL··4 ( a) is estimated to be approximately
3 5 months.
o On-Site Incineration
A trial burn will be required to operate a mobile
incinerator at the site. No permit will be required, but other
substantial requirements must be met. The ash will also
require testing to determine if it can be delisted. Local
building codes, electrical and water supply hookups and air
emissions requirements will be considered during the final
design of the system.
The time required to complete the key activities
associated with the imple,nentation of Alternative SL-4 (b) are
estimated as f◊llows:
6-22
'° N
0

I I I I I I I I I I I I I I I I I I I
Task Months Requ i r_~q to £_oro2,le!:,e -0 Trial Burn 8
0 ?reliminary Design 6
0 F'i na 1 Design 12
0 Zgu ipment Procurement 8
0 ~obilization/Demobilization 3
0 site Preparation 2
() 1'reatment 6
The estimated time required for the installation ~f the incineration system is at most 39 months. Once operating, it
is estimated that approximately six months would he required to excavate and treat the soils at the Koppers Texar~ana Site.
The rate of throughput for the incinerator was assumed to be approximately 50 tons per day.
Off-Site Incineration
Standard excavation and hauling equipment and standard
excavation activities will be required for Option (c} of Alternative SL-4. Prior to loading onto trucks, the soils must
first be containerized in 20-gallon plastic containers. This i~ a requirement of the off-site incinerator facility.
Hauling of the soils off-site will be conducted in
accordance with governing Federal, State, and local
transportation regulations.
The time required to complete the key activities
associated with the implementation of Alternative SL-4 (c) are approximately:
I.(\
'° (\J
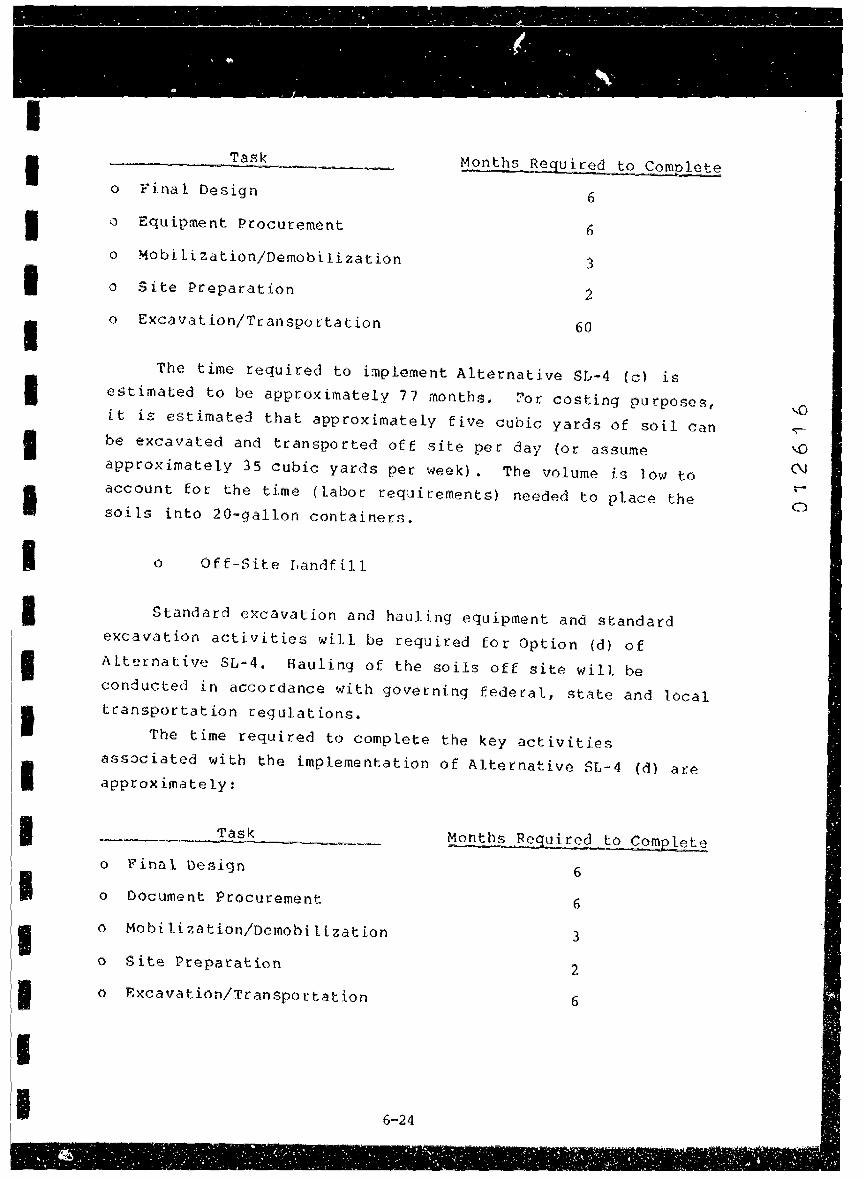
I I I I I I I I I I I I I I I I I I I
_Task
o Fina 1 Design
o Equipment Procurement
o ~obilization/Oemobilization
o Site Preparation
o Excavation/Transportation
M_Qnths Required_ to Comelet~
6
6
3
2
60
The time required to implement Alternative SL-4 (cl is estimated to be approximately 77 months. ~or costing purposes, it is estimated that approximately five cubic yards of soil can be excavated and transported off site per day (or assume approximately 35 cubic yards per week). The volume is low to account for the time ( labor requirements) needed to place the soils into 20-gallon containers.
o Off-Site Landfill
Standard excavation and hauling equipment and standard excavation activities will be required for Option (d) of
Alternative SL-4. Hauling of the soils off site will be
conducted in accordance with governing federal, state and local transportation regulations.
The time required to complete the key activities ass~ciated with the implementation of Alternative SL-4 {d) are approximately:
Task
o Final Design
o Document Procurement
o Mobilization/Demobilization
o Site Preparation
o Excavation/Transportation
6-24
6
6
3
2
6
'° (\J
a

I I I I I I I I I I I I I I I I I I
The time required to implement Alternative SL-4 (d) is
est~mated to be approximately 23 months. This assumes tha~
exc3vation and restoration will be conducted in half of a lot at ,::ne time.
o Passiv~ Soil Washing
Standard excavation equipment and activities will be req~ired for. Option (e) of Alternative SL-4. Therefore, the
alternative will be easily implemented. Flood protection controls for the gravel pits may be needed for this option
during the remediation activities. The time required to
implement this alternative is estimated to be the same as for Opti.:>n (d) , being appi:oximately !3 months.
6.3.4.2 Cost Evaluation
The baseline capital cost estimates for the implementation
of Alternative SL-4: Excavation/Soil Treatment-Disposal/
Institutional Controls are presented in Tables 6-7 through
6-12. A separate costing table is included for all five
options. In addition, for the on-site
separate table is included for the ash
for the off-site disposal of the ash.
incineration option, a
being delisted and one In addition to the
baseline capital cost estimates, a sensitivity analysis on the capital cost components was completed. The detailed cost information associated with the sensitivity analysis is presented in Appendix 6-A. The approximate range of capital
costs associated with each of the treatment/disposal scenarios are as follows.
6-25
0

I I I I I I I I I I I I I I I I I I I
TABLE 6·7: ALTERHATIVE SL·4(A): BASELINE CAPITAL COSTS
EXCAVAtlOH/SOJL YASHJNG
COST CCMP'ONENT OUAMTITY LIMIT UNIT COST TOTAL COST COf,U,IENTS ............................. ...... "' .......... - . .. .. .. .. .. .. . . ... ... ... ..,_ -.... ., ............ ---·-·•• .. ·-···--· SITE PREPARATION 4.4 ACkES $1,450 $6,380 INITIAL MONITOR:IHG
SAMPLING 22 OAYS S400 $8,800 8 SAMPLES COLLECTED/DAY ANALYSIS 176 SAJ.IPLES ~315 $55,440 8 SAMPLES/LOT AMALYZEO
SOILS FROM THE CARVER TERRACE SUBDIVISION: EXCAV!UlON 8400 CY t15 t,26,000 1 H OEf>TII OVER 190,000 Sf;
20% BULKING ON·slle HAULING 8400 CY $3 $25,200
BULK SOLIDS FROM THE KENNEDY SAND AND GRAVEL PROPERlY: LOAO 160 CY $.100 $16,000 FOUR 40·CY ROLL·OffS ON-SITE HAULING 160 CY $3 $480
SOIL ~ASHING lREATMENT SYSTEM: TREATMENT SYSTEM MOB/Of.MOB 1 LP SUM $14,000 $14,000 TREATMEHT EQUtP. RENTAL 12 M01'111S $58,000 $6%,000 1 WCU 'tlES RE A·~·TORS ,
(TREATED AT A RATE OF 2.5 TONS TANKS, HIXERS, PER HCUR@ 10 HOORS PER OAY) HOPPER
CHEMICALS 1 LP SUM $18,000 $18,000 UTlLITtES ' LP SUM $11,000 $11,000 UAH IJATER iREATMENT 1 LP SUM $6,750 t6,750 OPERATION & SUPERVISION 1 LP SUM $165,000 $165,000 AIR MOM ITOR I NG 12 MONTHS $3,000 $36,000 BACKflLLlijG OF TAEAiEO SOILS 8560 CV U.00 $25,680 CARVER TERRACE SOILS ANO
BULt SOLIDS; PLACED WITHIN
SITE RESTORATION: THE ~S&G PROPERTY
ClEAN 13ACKF1LL·£1011 ) ?000 CY $5.00 $35,000 ONLY FOR CARVER TERRACE AREA SPREADING 7000 CY $2.00 $14,000 SOD (2") 21!00 SY $3.55 $74,905 ONLY FOR CARVER TERRACE AREA
HEAL Tli & SAFET'i' 52 UEEKS $4,000 $208,000 H&s OURING INITIAL MONITOR· fNG ANO EXCAVATION/TREATMENT
..... .., .... " .... _ ................................................. ,:, ............ ,.._ ............... .., ...... --· .......... "' ...... ~- .............. -. -- .. -. ~. -.... -- ..... - -........... -DIRECT CAPITAL cos~
ENGINEERING & DESIGN ~11¾)
CONT!NGEMCY (20%)
TOTAL CAPITAL COST
APPROXIMATE TOTAL CAPITAL COST
CDCCSL4A)
6··26
$1,542,635
$169,690
$308,527
$2,020,852 "**•*llr'ltfr!it*A-*•"·~
$2,021,000
Q)
._-
\('J
N ~
0

I I I I I I I I I I I I I I I I I I
TABLE 6·8: ALTERNATIVE Sl·4CB): BASELINE CAPITAL toSTS
EXCAVATJON/ON·SITE INCINERATION/BACKFILL ASH
cost C~ENT dUANTITY UNIT UNIT COST ............ ~ ....... --...... ,.. -. ... ... ., .. --.... ................
SITE PREPARAfZON ,., ,.c.~es s1.,so lNlllAL MCN110R1NO
SAMP!.ING 22 DAYS $400 ANALYSlS 176 SAMPLES S3\S
SOlLS fROM HI£ CAi:tVER fER.RACE SUBOlVISlOO: EXCAVATION 8400 CY $15
ON·SITE KA1JLING 84110 CY $3.00
BULK SOLIDS fRCM THE KENNEDY SAND AND GRAVEL PROPERTY: LOAD ON·SITE MAULING
ON·SITE l~ClNE~ATOR SYSTEH: MOB/DEMOB TEST BU1U,
INCINERATIOM ELECTR & lNSlRU~ AIR MONlfORING
ASH TES~ING (DELlSTlNG) ASH SPRE.AlllNG
SITE RESTORATION: CLEAN SACk:FILL•(10 11 )
SPREADING S00 (2">
HEAL TH & SAFETY
160 160
1
8560
' 6 t
4280
7000 7000
21100
28
CY $100 CY $3.00
LP SUM $100,000 lf> SUM "80,000 CY t250 lP SUK $95,000 MONTHS $3,000 LP SUM $100,000 CY $3.50
CY ss.oo CY sz.oo SY S3,55
MEEKS '4,000
TOTAL COST COHKl!MTS . ...... ., .......... -"
II .a••• a,.. ■■ • ,e- 4- .. • • •
$6,380
sa,aoo 8 SAHPLES CCLLECTEO/OAY lSS,440 & SWL£S/LOI AMALY2&b
f()fl: PAHs AMO AJ!HEHJC
$126,000 1 FT DEPTH OVER 190,000 SF; 20, BULKING, EXCAVATE 1/2 Of A LC1 AT A TIME· ONE IIEEK
$25,200
$16,000 fOUR 40·CY ROLL•OfFS S480
$100,000 iao,ooo
$2,140,000 50 CY PER OAY $95,000 $18,000
$.100,000 $14,980 ASSUME 50% VOLUME LOSS;
PLACED ~ITHIN KS&G PROPERTY
$35,000 ONLY FOR CARVER TERRACE AREA $14,000 $74,905 ONLY FOR CARVER TERRACE AREA
'112,000 H&S OFFICER DURING MOHITotl:JNG & EXCAVATION; HNu, RESPIRATOR
.... - • - ............... - •• - .. ■ ............. a, ... -- ... + ......... - ••• - ...... .,. ........................................ .a .... ,. ..... - .................. - ......... + ....... .
OIRECT CAPITAL COST $3,022,185 .......................................................................... ~ ....................................................................................................... .
E~GINEERING & DESIGN (11%)
CONTINGENCY (20%)
TOTAL CAPITAL cost
$332,440
$604,437
$3,959,062 ***"'"'***********
APPROXIMATE TOTAL CAPlTAL COST $3,959,000
(DCCSL48)
6-27
(J\
~
'° (\J
~
a

I I I I I I I I I I I I I I I I I I
TASLE 6·9: ALTEQNATIVE SL·4(B): BASELINE CAPlfAL COSTS
EXCAVATION/ON•SITE INCINEi.ATION/OfF·SlfE DISPOSAL OF ASH
COST CGIPONENt OIJANTITT lmlT UMIT COST TOTAL COST CCf!HENTS ............... ------·---·~-- .................. .. ........... ......................... • • + ., "' + • • ■ • II • • • • ,. ,.
sire PRfPARATIO!l 4.4 INITIAL MO~ITOl!iNG
ACRES $1,450 $6,380
UJWL(NG 22 l'>AYS S400 '8,800 i SAMPLES COLLEC'iO/DAY ANALYSIS 176 SAHPUS H15 $55,'40 8 SAHPLES/LOT ANALYZED
SOILS FRM Tkf CARVEil flUACE SU901VISUlll: FM PAH• AND ARSfNIC
EXCAVATlON MOO CY S1~ $126,000 1 Ff DEPTH OVER 190,000 SF; Z0% BULKING; EXCAVATE 1/2 Of A LOT At A TIME· QM£ \IEEK
ON·SlfE HAULING 8400 CY u.oo s2s,200 BULK SOLIDS ,tc»t THE KENNEDY SAND ANO GRAVEL PROf)ERfY:
LOAD 160 CY $100 $16,000 FOUR 40-CY ROLL·OFfS ON ·SITE 11..lllltNG 160 CY $3.00 St.SO
ON·SITE INCINERATOR SYSTEH: M08/DEM08 LP SUJ.f SI00,000 SI00,000 H:S'f auRit \.P SUM $80,000 $.80,000 INCINERATION 8560 CY S250 S2,1t.0,000 50 CY PER DAY ELECTR & tNSTRUH 1 LP SUH S95,000 $95,000 AIR MONlfORING (j MONTHS S3,000 \18,000 ASH TESTING (DELISTING) 1 LP SUM 1100,000 St00,000 ASH DIS~AL:
LOAOUu, ASH 42SO CY $3.50 $14,980 ASSUME sot VOLUME LOSS; 1 RAN Sfi'ORT A ft ON 99000 U! V..GO $396,000 300 HILES ONE·IIAY; 13 CY/20 TOil TRUCK:330 ~OAOS OISl)()UL 4280 CY S2.00 U.56,1100 b!SPOSED Al Ml Off·SltE SITE RES10RATIOll:
CLEAN IIAO:FIU·(10") 7000 CY ss.oo S35,000 ONLT fOR CARVER TERRACE AREA SPREADING 7000 CY S2.00 $14,000 soo <211 ) 21100 SY Sl,55 S74,90S ONLY fOl! CARVER TERRACE AREA
HEALTH & SAfETY 28 IIEEKS ~.ooo $112,000 ll&S OFFICER DURING MONlfORIHG & EXCAVATJON/JNClNERATIOll; IINu ANO RESPIRAfORS
-······· ........................... - .......... ~ ...... + ... - ..... .a.,.,. .................... ,. .................................................. a, ............. ...
DIRECT C>J>ITAl COST $4,274,185 ......... - .. -......................................................................... ,.. ............................. .,,. ................................................. .,. ... ., .................. .
ENGINEERING & DESIGN (11%)
CONTINGENCY (20%)
TOTAL CAPlfAL COST
APPROXIMATE tOTAL CAPITAL COST
6-28
1470,160
$854,837
lS,599, 182 ••••••••••••••••
$5,599,000
0 N
'° (\J
~
0

I I I I I I I I I I I I I
I I I I I
TABLE 6·10: ALTERNATl~E Sl·4(C): 8ASELJNE CAPITAL cosrs
EXCAVATION\Off·SITE fNCINERAfIOH
COST cet!PONEN1 QUANTITY UNIT UIHT COST TOTAL COST COMMENTS . -....................... . .. • .. • • .. .. • .. ... .. .. .. • • • ... .. • • • • • .. .. .. .. - ••••• + ... - ... - ••
SlfE PREPARAr::m INlflAL MONJTOIING
SAMPLING ANALYSIS
4.4 ACRES
22 176
SOILS fRCfol THI CARVER TElQACE SUBDIVISION: EXCAVATE 8400 CY
TRANSPOiiU.T lON 194100 LM INCIMUA ,£ 8400 CY
BULK SOLIDS F•31 THF. KENNEDY SAND AND GRAVEL PROPeRTY: LOAD I NG &.u:: SOLi OS 160 CY T RANSPOfH A Tl ON 1200 LM JNCJNERArE 160 CY
SITE RESTORATION: llACl:fllL (1011 ) 7000 CY SPREADING 7000 CY soo (211 ) 21100 SY
HEAL TH & S.\FETY 244 WEE/CS
DIRECT CAP:TAL COST
S1 ,450
$400 £315
S4 $1,700
S.100 $4
$1,700
ss.oo $2.00 U.55
$4,000
$6,380
iS,800 $55,440
8 SAMPLES COLLECTED/OAY 8 SAMPLES/LOT AHALYZEO FM PAHs ANO AASENIC
S126,000 1 FT DEPTH OVER 190,000 SF;
Sn6,400 $14,280,000
S16,000 $4,800
$272,000
$35,000 $14,000 $74,905
$976,000
$16,645,725
2ml BULKING; 3S CY/\IEEK EXCAVATED PLACED IN 20·GALLON CONT4IMERS 300 Ml ONE-~AY; 13CY/20 lOII TRUCK
ONLY FOR CARVER TERRACE AREA
OijLY fOR CARVER TERRACE AREA
H&S OFFICER DURING HONITORING & EXCAVATfON; HNu 4NO RESPIUTORS
- - - ••• - ■ ............ - - - • - ...... - ... - - ... - - ■ ......................... ■ .. - - ............... - .................................... '"' .... '"' .. ■ ..... +- .. - ....... - ........ - •• - - ....... - .... ..
ENGINEERING & OESIGN (11¾)
CONTINGENCY (20¾)
TOTAL CAPITAL COST
APPROXIMAfE TOTAL CAPITAL COST
(DCCSL4C)
$1,831,030
$3,329,145
t21,80S,900 ****************
$21,806,000
6-29
N
'° (\J
0

I I I I
I I I I I I I I
I I I I I
TABLE 6·11: ALTERNATIVE SL·4{0): BASELINE CAPITAL COSTS
EXCAVATIOO/O~F-SITE LANDFILL
... . .. -..................... ..
Slff PREPARATION !Nlf!AL MONITORING
SNlPt,JMG
A.NA.I. Ys.t S
<IUJ.HH TY . .. . . .. ... . . . .
4.4
22 176
UWlf
ACRES
l>AYS
SAMPLES
SOILS fROM TYE CA.IVER TERRACE SUBDIVIS(ON: EXCAVATION 8400 CY
TRANSPORT 194100 LH
OISPOSil.l 8400 CY
UHIT COST . . . . . ... .. .. .. .
t 1,450
!400 1315
$15
$4.00
$200
BULK SOl IDS FR(»,! THE l(EHNEDY SAND AHO GRAVl:L Pi:IOPER.TY: LOAD 9Ult SOL,DS 160 CY H!ANSPORT 1200 LM OlSPOSAL 160 CY
SIT£ RESTORATION: CLEAN BACKFILL 0011 )
SPIIEAO ING
soo <2")
HU.l HI & SA.FEH
DIRECT CAPITAL COST
ENGINEERING & DESIGN (11X)
COMTlHGEHCY (20l)
7000 CY 7000 CY
21100 SY
28 \IUKS
$100 $4.00 $2.00
$5.00 $2.00
S3.55
~.ooo
tOTM. COST - ..... " -............
$6,380
$8,800 $55,440
$126,000
$776,400
$1 ,680,00C
$16,000 ti.,800
i-32,000
$35,000 $14,000 $74,905
$112,000
$323,590
$588,345
TOTAL CAP I f AL COST $3, tS3, 660
APPROXIMAlE TOTAL CAPITAL COST $3,854,000
6-30
ca,u.iENTS . ............... -..........
8 SAMPLES COLLECTEDJl)AY & SAMPLES/LOT ANALYZED f()R ~A~s AND A~SENtC
1 ,r DEPfH OVER 190,000 s,; 20X SULKING; EXCAVATE 1/2 Of A LOT Af A TIME· ONE IJEEK 300 HILES ONE-MAY,
t3 CYS PER 20 TOO TRUCK" (;47 tRUCIC LOAOS
fCUR 40·CY ROLL-OFFS
O!flV FOR CARVER T~RRAC£ AREA
ONLY FOR CARVER TERRACE AAEA
H&S OffJCER bURING MONITORING & EXCAVATIOH; WHu,RESPtRArrn:is
(\J
(\J
'° (\J
~
0

I I I I I I I I I I I I I I I I I I
• I ~ J --. :: • • ..,
- - '• . . ", e ; , •
,. • i
. -
TABLE 6·12: ALYERNAtlVE SL·4(E): BASELINE CAP(fAL COSTS
EXCAVATION/PASSIVE SOIL WASHING
COST C(iMPONENl ...........................
OUANflTY ................
UNIT IJUIT COST TOTAL COST COMHENTS .. ... ., .... ,... .......................... . ................ _
SITE PREPAAAT:ON INITIAL MONIT::itJNG:
SAMPLING ANALYSIS
1 LP SUM
22 OAYS 176 SAMPLES
SOILS fR<»t TM( CAqVER T&RRACE SUBDIVISION: EXCAVA!E 8400 CV
ON·SITE AAULING 8400 CY
BULK SOLIOS JlQ4 THE KENNEDY SANO ANO GRAVEL PROPERTY: LOAO 8ULI'. SOLIDS 160 CY ON·SIT£ IWJLING
SITE RESTORATION: CLEAN 8A.Ct:F I LL C 1011 )
SPREADING soo (2")
HEAL Tit & SAFETY
160 CY
7000 CY 7000 CY
21100 SY
28 \JfEKS
S.?,000
S400 S315
$1S
$3
$100 $3.00
$5.00 $2.00 $3.55
$4,000
$2,000
$8,800 8 SAMPLES COLLECTED/OAY $55,440 8 SAMPLES/LOT ANALYZED
FOR PAHs ANO ARSENIC
$126,000 1 Ff OEPiH OVER 190,000 SF; 20X BULKING; EXCAVTE 1/2 OF A LOT AT A TIME· ONE UEEK
$25,200 HAULEO TO THE GRAVEL PITS; TO BE TREATED U/GROUNO WATER
$16,000 fOUQ 40·CY ROLL·OFFS $480 ffAULED TO THE GRAVEL PITS;
TO BE TREATeO U/GROUNo WATER
S3S,OOO ONLY FOR CARVER TERRACE AREA $14,000 $74,905 ONLY FOR CARVER TERRACE AREA
$112,000 H&S OFFICER DURING MONITORING & EXCAVATION, HNu, RESPIRATOR
............................................................ ···-·· ........................................... . DIRECT CJJ>ITAL COST
S469,82S ····························································································•··············•··
ENGINEERING & DESIGN (11¾)
CONTINGlNCY C20X}
TOTAL CAPliAL COST
APPROXIMATE TOTAL CAPllAl COST
(DCCSL4E)
SS1,681
$93,965
$615,471 ****************
$615,000
re\
(\J
'° (\J
~
0

I I I I I I I I I I I I I I I I I I I
Treatment/Disposal CaEital;_ __ Go~t
oetion _L()W Bas~line Hi_gh - riifflrr . -·- .
(a) Mechanical Soil Washing $ 1,921,000 $ 2,021,000 $ 2,221,000
( b) On-Site Incineration
Ash backfilled $ 3,779,000 $ 3,959,000 $ 4,318,000 Off-Site disposal $ 5,3381000 $ 5,599 ,oo 0 $ 6,122,000
of ash (C) Off-Site Incineration $20,716,000 $21,806,000$ $23,986,000
(d) Off-Site r .. andf ill $ 3,661,000 $ 3,854,000 $ 4,238,000
( e) Passive Soil Washing $ 585,000 $ 615,000 $ 677,000
There are no O&M costs associated with Alternative SL-4 Options (a), (b), (c), and (d) other than the cost of
approximately $5,200 per year to inspect and repair the fence. Under Option (e) of Alternative SL-4, in addition to the O&M
cost of $5,200 for the inspection and repairing of the fence, a
cost of approximately $2,400 for monitoring the soils placed
within the gravel pits must be included. This O&M cost assumes four samples per year will be collected and analyzed for PAHs
and arsenic. Therefore, the total O&M cost associated with
implementing Option (e) of Alternative SL-4 is approximately
$7,600. This cost is assumed for a 30 year period. Therefore,
the 30-year present worth costs associated with each
treatment/disposal design are:
Treatment/Disposal
--~ OQtiO!l
(a) Mechanical Soil Washing (b) On-Site Incineration
Ash backfilled Off-Site disposal of ash
(c) Off~Site Incineration (d) Off•Site Landfill (e) Passive Soil Washing
JO-Year Present Worth Cost - -•oil ... - .... . - .- -
LQW
$1,970,000
$3,828,000
$5,387,000
$.20,765,000
$ 3,710,000
$ 656,600
6-32
Baseline . - -·~
$ 2,070,000
$ 4,008,000 $ 5,648,000
$21,855,000
$ 3,903,000
$ 686,600
$2,270,000
$4,367,000 $6,171,000
$24,035,000
$ 4,287,000
$ 748,600
...-0
I I I I I I I I I I I I I I I I I I I
6.4 Detailed Evaluation of the Ground Water (GW) Response Media Unit Alternatives
6.4.1 Alternative GW-1: No Action/Monitoring
6.4.1.1 Noncost Evaluation
Effectiveness
The potential risks associated with implementing Alternative GW-1 (i.e., current site conditions) have been
evaluate1 in detai~ in Seeton 2.0. This alternative will not
meet the requirements of all ARARs, specifically the Texas
surface water quality standard pertaining to oil in a surface water body.
The effectiveness of this alternative will be directly associated with the extent of aquifec restoration that can be
achieved via natural processes. It may not however be
effective in stopping the continuing migration of heavy
creosote jn the lower aquifer. Aquifer restoratiot1 will be
monitored by the implementation of a ground water monitoring program.
IrQ,ple~enta~ilfu
The it:tplementation of Alternative GW-1 requires minimal
effort other than the development and implementation of a
ground water monitoring program. Therefore, this alternative is easily implemented, requiring only the coordination of laboratory services and sampling personnel.
6.4.1.2 Cost Evaluation
The only capital expenditure associated with Alternative GW-1 is the replacement cost for the nine monitoring wells. rt is assumed that each of the nine wells will be replaced once during a 30-year period. Assuming a replacement cost per well
of $5,000 results in a capital cost ~stimate of approximately $45,000.
IS";
N
'° N ..--0
I I I I I I I I I I I I II
I I I \I I
II I
Annual O&M costs, which will include periodic monitoring of the
ground water in the shallow, intermediate, and deep aquifers
from approximately nine existing wells will be approximately
$9,000, as shown on Table 6-13. Utilizing the capital and O&M
cost estimates and assuming a ten percent interest rate and
zero percent inflation, a 30-year present worth cost of
approximately $129,800 is associated with implementing
Alternative GW-1 for 30 years.
6.4.2 Alternative GW-2: Ground water Withdrawal:
Subsurface Drains/Ground Water Treatment/
Discharge of Treated Water
6.4.2.l Noncost Evaluation
The noncost evaluation for Alternative GW-2 based upon
effectiveness, implementability, and operation and maintenance
is presented in the f.ollowing sections. The discussion
pertains to both of the treatment options under Alternative
GW-2 unless noted otherwise.
Effectiveness
Installation of subsurface drains at other hazardous waste
sites has shown this technology is effective for ground water
removal. Aquifer restoration within the shallow aquifer at the
Koppers Te~arkana Site will occur under ~lternative GW-2 via
ground water recovery and treatment.
Potential short-term risks associated with Alternative
GW-2 may exist during the installation and operation of the
ground water withdrawal and pump systems (i.e., tcench and
sumps). For the most part, the Carver Terrace residents will
not be affected because most of the e~cavation activities will
take place in a confined area away from the subdivision. The exception to thi~ is the placement of the subsurface drains
south of the fence near the Carver Terrace and Kennedy Sand and
Gravel property border. To reduce potential risk, only a
limited area will be eKposed, and the excavated areas will be covered daily. In addition, potential short-term risks may
6-.14
0
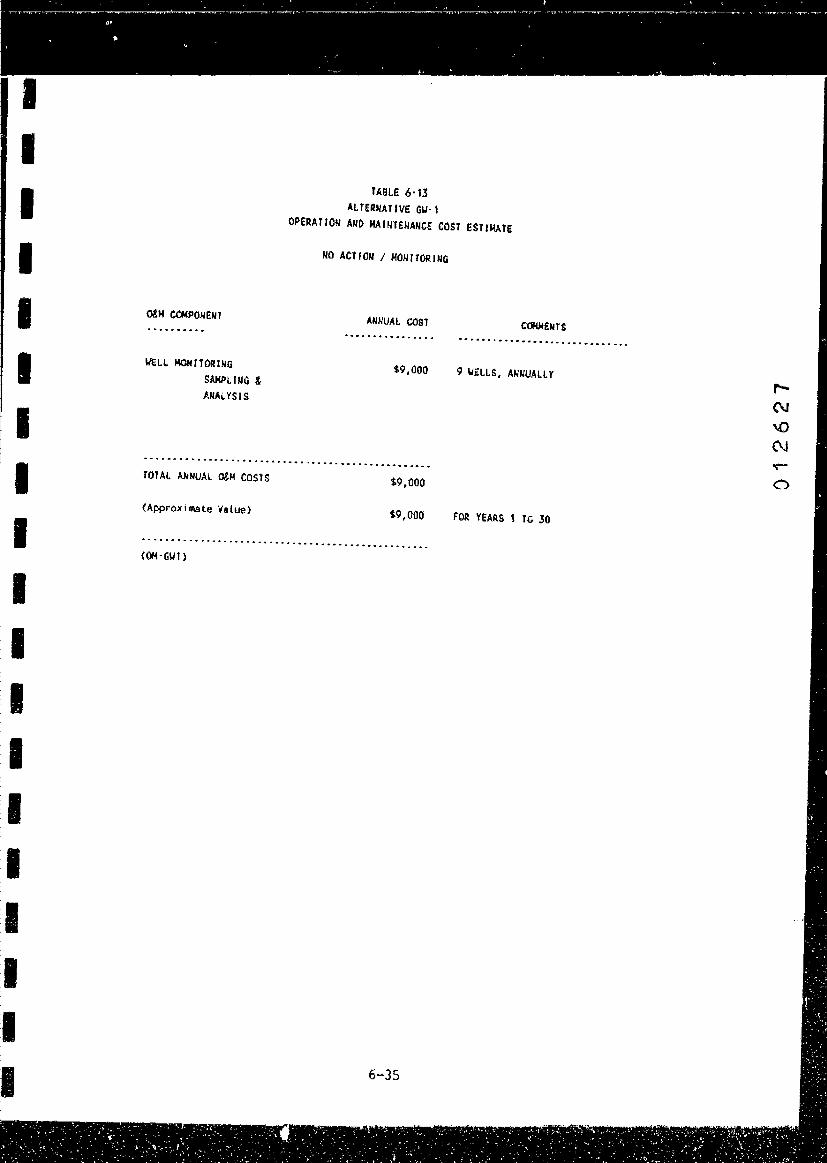
--,-.-T~~:-=~ ............... ~..-:-:--1"""""'F~---~.-- - ---~=---•--.~..:.....~ ......... ...,.,~---=-=r=-==._ .,.....: p-- -,r-=--,;,_,..--,,rr-~~~. -'":"'~~-~- < - =-"'.,.. - - -,..-- -r.
G' . . . . . . . . . "
I I I I I I I I I I I I I I I I I I I
o&M Clt!PON ENT
I/ELL MOHITOIUNG
SAMPLING & ANALYSIS
. . ·- .
TABLE 6·13 ALfERNATfVE GU·1
. - .
OPERATION AND HAfNTSNANCf COST ESTIMATE
NO ACTfON / MONl!ORJNG
ANNUAL COST ..... -.... .,. .. "' ...... ... . ............................................. .
$9,000 9 MELLS, ANNUALLY
................................................................... TOTAL AflNUAL o&M COSTS $9,000
{Approxilll9te Value) $9,000 fOR YEARS 1 TG 30
(OH· GIJ1}
6-35
r(\J
\()
(\J
0
I I I I I I I I I ,I I I
exist during the installation of the optional sump pump/storage
tan< facility within the Carver Terrace subdivision. Ambient air monitoring will be conducted. Therefore, the proper health
and safety precautions will be fellowed during the installation
of the ground water withdrawal system. Soil removed during the
installation activities will be handled in accordance with the selected soil remedial al te rna ti ve.
The treatment systems will remove, at a minimum, PAH constituents from the ground water recovered from the shallow
aquifer. Removal and treatment: of the impacted ground water from the shallow aquifer will reduce the potential for the
PCOCs to enter the surface water bodies via aquifer discharg~.
Implementation of Alternative GW-2 will eliminate the seeps
entering the surface water, thereby solving the potential
migration problem.
The flooding potential within the Koppers Texarkana Site
may affect the effectiveness of Alternative GW-2. Flood
control cechnologies may be required if this alternative is implen,ented.
rhe ARARs identified for the Koppers Texarkana Site will be met under Alternative GW~2.
The Implementability of Alternative GW-2 is controlled by
subcontractor a1,d equipment availability. The estimated timE!
required for the completion of each task associated with the
implementation of this alternative is listed below:
Task
o Final Design
o Equipment Procurement and Subcontractor. Mobilization
o Installation of WiLhdrawal System
o Installation and Calibration of Pump System
o Installation and Cal~bration of Treatment System 6-36
Month~~qu i req to _9omplete
6
6
8
6
6
co N
"° (\J

I I I I I I I I I I I I I I
I
Therefore, the estimated time required to implement Alternative
GW-2 is approximately 32 months, It is unknown how long it
wi:l take to complete the remediation, but could take as long
as 30 years.
6.4.2.2 Cost Evaluation
The baseline capital cost estimates for the implementation
of Alternative GW-2 are presented in Tables 6-14 and 6-15 for tre~tment via activated carbon and fluidized carbon bed,
res?ectively. For costing purposes, discharge of the treated water to Wagner Creek has been assumed.
A sensitivity analysis was also completed for Alternative GW-2. The detailed cost information associated with the
ana:ysis is presented in Appendix 6-B. The range of capital
cos:s associated with Alternative GW-2 are as follows:
Treatment ca12.it~al Cost ~
~ Low Baseline nigh
(a) Activated carbon $1,192,000 $1,248,000 $1,359,000
(b) F' lu il'.i; -:~ci: Carbon Bed $1,252,000 $1, 311,000 $1,428,000
The O&M costs associated with both of the treatment
options are presented on Tables 6-16 to 6-17. These tables
indicate that the annual costs for operating an activated carbon syst~m is approximately $~11,000 and for a fluidized
carbon bed is approximately $324,000. Using these annual O&M costs and the capital costs, the JO-year present worth costs
associat~d with the implementation of Alternative GW-2 for a 30
year treatment duration are~
Treatment Option
(a) Activated carbon
{b} Fluidized Carbon Bed
30-Year LOW
$4,123,500
$4,306,000
6 ... 37
Present Worth Cost
Baseline High -$4,179,500 $4,290,000
$4,165,000 $4,482,000
(J'.
N
'° N
0
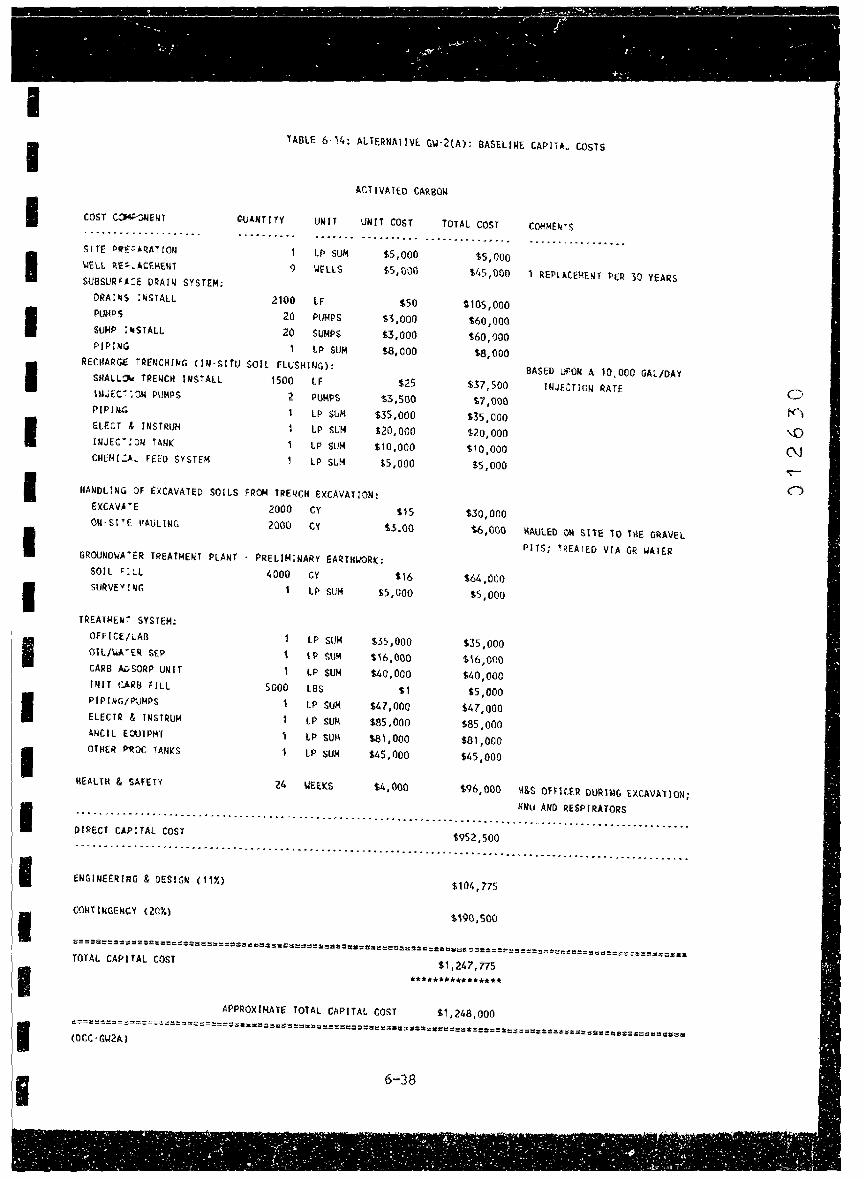
I I I I I I I I I I I I I I I I I I I
TASLE 6·14: ALTERNAllVf. GY·2(A): BASELINE CAPITAL COSTS
ACT!vAre:o CARBON
COST C~ENT OUAHfJTV UNU Ul.llf COST TOTAL COST COHMEM .. S .......... - .,. • - ........ - - - •• + .................. .......... .,.. ......... ... ... -........... ., . -. - .. - .... - • - y ............ - -
SITE Plf~•RATION 1 LP SUM $5,000 $5,000 WELL RE~~ACEMENT 9 \JELLS $5,000 v.s,ooo 1 REPLACE~E~T PER 30 YEARS SUBSURFl:£ DRAIN SYSTEM:
OitAIMS :'4STALL 2100 lF sso 11105,000 PUMPS 20 PUMPS $3,000 $60,000 SUMP :•STALL 20 SUMPS $3,000 $60,000 PIPING 1 LP SUM $8,000 ta,000
RECHARGE TRENCHING CIN·SITU SOIL FLUSHING): BASED UPOM A 10,000 GAL/DAV SHALLOW TRENCH INSTALL 1500 Lf $25 $37,500 INJECTION RATE INJEC-~ :~ PUMPS 2 PUMPS '3,500 t.7,000 PIPING 1 LP SUM $35,000 $35,000 ELECT & TNSTRUM 1 LP SUM S20,000 s20,ooo INJEC-:011 TANK LP SUM $10,000 $10,000 CHEMI.:A~ FEED SYSTEM LP SUM $5,000 $5,000
HANDLING OF £XCAVATED SOILS FROM TRENCH EXCAVATION: El(CAVA~E 2000 CY 115 $30,000 01H;t•E IIAUllllG 2000 CV f.3.00 ~.ooo HAULED OW SllE TO THE GRAVEL
PITS; tP.EATEO VIA GR YATER GROUNOYA.ER TREATMENT PLANT· PRELIMINARY EARTH\JORK:
SOIL F:LL 4000 CY $16 $64,000
SURVE" !NG 1 LP SUM $5,000 $5,000
TREATMEN~ SYSTEM: OFflCE/LA8 LP SUM $35,000 $35,000 OIL/WA•ER SEP ' LP SUM $16,000 $16,000 CARS Ai-SORP UNIT 1 LP SUM $40,000 '40,000 INJT CARB FILL 5000 Us $1 $5,000 PIPING/PUMPS 1 LP SUM $47,000 SL.7,000 ELECTR & INSTRUM LP SUM. sas,ooo $85,000 ANCI l EOUlPI.Jl ' LP SUM $81,000 $81,000 OTHER P~OC TANKS 1 LP SUM $45,000 S45,000
HEALTH & SAFETY 24 UEEKS $4,000 $96,000 M&S Of~ICER OURl~G EXCAVATION; HNu ANO RESPIRAlORS
............................................................................................................................................ ,.. ........................... . OIRECT CAPITAL cosr $952,500 ............... + .............................. ■ ......... --·- ...................................... # ........ - ................................. ,; ..... a---•--··· ....... ..
ENGINEERING & DESIGN (11t)
CONTINGENCY {20%)
TOTAL CAPITAL COST
(DCC·GU2AJ
$104,775
$190,500
$1,247,775 .................. APPROXIMAtE TOtAL CAPITAL COST
6-38
C· t<'I
'° (\J
~
0

I I I I I I I I I I I I I I I I I I
"ABLE 6·15: ALTERNATIVE G~·2(B): BASELINE CAPITAL COSTS
FLUID1?ED CARBON BED
UNIT cost TOTAL COST COMMENTS COST COM:>ONENT OUANTJT':' UNIT .. • .. .,- ,o .a• • a .... M • ■ ... _, .... ,,_ • . ........ ____ ........................ ... ................. .,. ..... .. ................ SITE PREPA~AT!ON LP SUM \lELl REPLACEMENT v WELLS SUBSURFACE DRAIN SYSTEM:
DUii.iS !liSTALL 2100 LF FLOAUN(', PUMPS zo PUMPS SUMP IIISTALL 20 SUMPS Pt PING LP SUM
RECHARGE TREWCHlNG (tN·SliU SOll FLUSHING): SHALLO\J TRENCH INSTALL 1500 LF INJECTION PUMPS 2 PUMPS PIP!IJG
ELECT & INSTRUM (ij,iEC:T tcN TAIIIC
CHEMICAL FEED SYSiEM
LP SUH LP SUM LP SUM LP SUM
$5,000 tS,000
$5) $3,0CO $3,000 $8,000
$25.00 $3,500
$35,00C $20,000 $10,000 $5,000
HANDLING OF EXCAVA~ED SOILS FROM TRENCH EXCAVATION: EXCAVATE 200C CY $15 ON·SITE HAULING 2000 CY $3.CO
GRQIJNO~ATER lREATME~i PLANT • PRELIM:NARY EARTH\.IORK: SOIL FILL 4000 CY $16 SUlr,1E'flf.lG Lf> SUM is,oor.
lREAT~ENf SYSTEM: OFFICE/LAIi LP SUM t.35,000 01 L/\JATER SEP LP SUH $16,000 fLUID REC REACT t LP SUM t.15,000 PIPING/PUMP~ 1 :,p SUM $65,000 ELEClR & 1NS1RUH 1 LP SUM tS'S,000 ANCIL EQUIPMT 1.P SUM $101,000 OTHER PROC iAMKS LP SUH '65,000
HEAL Tt,1 & SAFEtv 24 LIEEKS $4,000
$5,000 $45,000 1 Rf PLACEMENT PER 30 YEARS
$105,000 $60,000 $60,000 $8,000
BASED UPON A 10,000 GPO $37,500 INJECT! OM RA TE
$7,000 $35,000 t20,000 $\0,000 $5,000
$30,000 $6,0l'.lO HAULED OM SITE TO GRAVEL
PITS; TREATED VIA GR UATER
$64,00C
$5,000
$35,000 $16,000 t.35,000 $65,000 '85,000
$101,000 $65,000
$96,000 H&S OFFICER DURING EXCAVATION; IIMu AND RESP IRAlORS ........................................................................................................................................
DIRECT CAP!lAL COST $1,000,500
.............................................................................................................................................................................
ENGINEERING & DtSJGU (11%)
CONTHIGENCY {20%)
$110,055
$2.00, 100
$1,310,655 ..............................
APPROXIMATE ~0lAL CAPITAL cosr $1,311,000
(()CC·G\12B)
6-39
.;;:-
~
'-.()
C\I .,_-
C

I I I I I I I I I I I I I I I I I I I
TABLE 6· 16 ALTERNATIVE GIJ·2A
OPERATION AND MAINfENANCE COST ESTIMATE
ACTIVATED CARSON
O&M CCMPONENT ANNUAL COST
SUBSURFACE DRAINS: OPERAT & MAINT $15,000
UTILlfJES $1,000
IJELL MOM I TORI NG:
SAMPLING & ANALVSIS $9,000
RECHARGE TRENCHING (IN-SITU SOIL FLUSHING): CHEMICALS $70,000 UlltlflES LABOR AND ADMINISTRATION
CARBON ADSORPTION UNIT: UTILITIES CHEMICALS ANALY PLANT MONITOR VIRGJN CARBON CARBON DISPOSAL LABOR & MAINT
TOTAL AHtiUAL o&M COSTS
(Approximate Value)
$5,000 $50,000
$5,000 $7,000
$12,000 $3,000 $9,000
$125,000
S.311,000
$311,000
..... ~.- ....................... '"' ................. ~ .................. _ ................ . (OM• GIJ2A)
6-40
COMMENTS ................ - ................. _ ................ .,
9 IJELLS, ANNUALLY
fOR YEARS 1 TO 30
N t<\
'° N
0
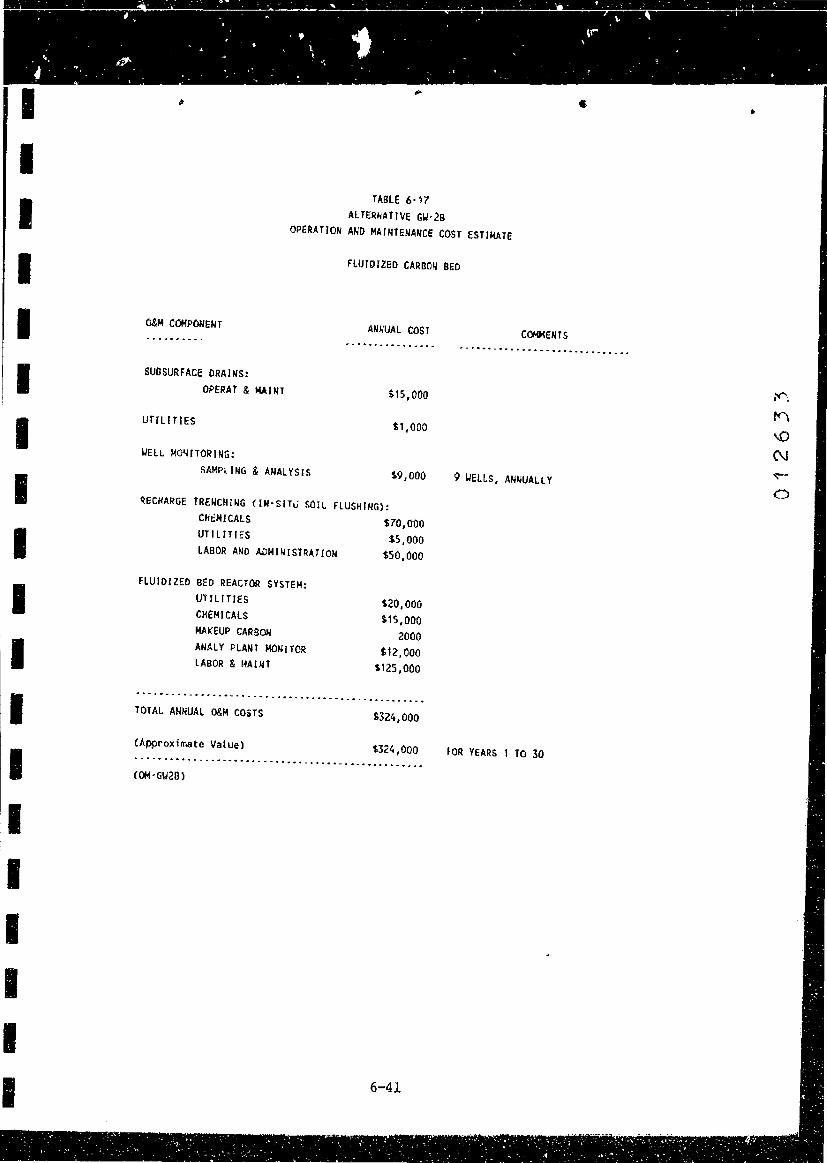
I I I I I I I I I I I I I I I I I I
TABLE 6· 17 ALTERNATIVE GU·2B
OPERATION AND MAINTENANCE COST ESTIMATE
fLUIOIZEO CARBON BED
o&M COMPONENT
SUBSURFACE DRAINS: OPERAl & MAI NT
UTILI f!ES
UELL ~O~ITORING:
SA!-lPI_ I MG & ANALYSIS
ANNUAL COST ., ......................... .
$15,000
$1,000
$9,000
RECHARGE tRENCHING CIN·SITu SOIL FLUSHIMG): CHtMICALS $70,000 UTILITIES $5,000 LABOR AND ADMINISTRATION $50,000
FLUIDIZED BED REACTOR SYSTEM: UTILITIES CHEMICALS MAKEUP CARBON ANALY PLANT MONITOR LABOR & f.!AIIIT
TOTAL ANNUAL O&M COSTS
(Approximate Value)
{OH·G\128)
$20,000 $15,000
2000 $12,000
$125,000
$324,000
$324,000
6-41
CCMCENTS
9 UELLS, ANNUALLY
fOR YEARS 1 lO 30
0
I I I I I I I I I I I I I I I I I II I
6. 5 Interaction of . .A.As Associated with Each i:<esponse Media Unit
Complete site remediation of the Koppers Texarkana Site
may involve the implementation of a RAA associated with both of
the response media units (unsaturated soils and ground water) identified for the site. The various combinations of thf".
response media unit alternati9es listed on Table 5~1 are
presented on Table 6-18. As shown on the table, there are eight separate alternative combinations that could be
implemented. rn addition, within some of the alternatives,
there are other treatment or disposal option3. Because such a large variety of potential site remediation alternatives and
options exist for the Koppers TeRarkana Site, a separate
discussion associated with the potential interactions between
each media unit alternative and their subsequent effects has not been included in this section.
6.6 Referenc~s
Ehrlich, G.G., Georlitz O.F., Godsy E.M., and Hult M.F., Degradation of Phenolic Contaminants in Ground Water by Anaerobic Bacteria: St. Louis Park, Minnesota, Groundwater, 30, 1982.
Freeze, R.A., Cherry, J.A. (1979), Groundwater, Prentice Hall, Inc., Englewood Cliffs, New Jersey.
Healy, J.B., J~. and Young L.Y. (1979), Anaerobic Biodegradation of Eleven Aromatic Compounds to Methane, ~pl~ Environ. Microbiol., 38.
dl5IIII< --- a;e - . -·- ------
McCarty, P.L., Reinhard, M., and Rittman, B.E. (1981), Trace Organics in Groundwater • .§~vit9n. Sci! __ and_Tech. V. 15.
Tarvin, D. and Buswell, A.M. (1934), The Methane Fermentation of Organic Acids and Carbohydrates. J. Am. C_bem. §_oc. v. 56.
U.S. EPA (1985), Guidance on Feasibility Studies Under CERCLA. EPA/540/G-85/003.
U.S. EPA (1986), Interim Guidance of Superfund Selection of Remedy. OSWER, Directive No. 9J55. 0-19.
6-42
C)

..
I "
I TASLE 6·18: POlENT!AL RAAs FOR COHPLETE SITE REMEDIATION
RESPONSE MEOIA UNIT ALTERNATIVES
I COHBINEO ........... -........................................................................... RAA UNSATURAlED 110. SOILS GROOIIO IJATER
I .. ........ - ..... - ....... .. ........ - ..... -...... -
NO ACTION NO AClION I MONITORfNG MONITORING INST IT. COIHROLS
I 2 SUBSURFACE DRAINS l.f'\ NO ACTION MOIHfOIHNG GIi TREATMENT "'1 (IISTtT. CONtROLS DISCHARGE Of GW
'° I C\J ...... I 0
3 CAPPING 110 ACTION MONJlORING MONHO!WJG INSTIT. CONTROLS
I 4 C/1.i'.>PING SUBSURFACE DRAINS
MON!TORrnG GI./ TREATHEIIT I lNSTlf. COIITROLS DISCHARGE OF GI./
I 5 IN·stru B(OOEGRADTN MO ACTION MONlfORINu MONfTORING
I INSrrr. CONTROLS
6 IN·SITU BIOOEGRAOTN SUBSURFACE DRAINS I MONi'rORfNG GW fRE"ATMENT INSTIT. CONTROLS DISCHARGE Ot GW
I 7 EXCAVATION NO ACTlON
SOIL TREATMENT MONITORING I INSTIT. CONTROLS
1• 8 EXCAVAllON SUBSURFACE DRAINS
SOIL TREAiMEUT GW TREATMENT INSTJT. CONTROLS 0 I SC HM GE OF GI./
I ;o- .......... ■'" •••
(COHB·RAA)
1' 11 6-43
ti I I I I I I I I I I I I I I I I
7.0 SUMMARY OF REMEDIAL ACTION ALTERNATIVES
This Feasibility Study has identified and evaluated a wide
rar19e of remedial actions ".!ntially applicable to the
rem~diation of the unsaturated soils and bulk solids and the
gro~nd water in the shallow aquifer ~t the Koppers Texarkana Sit~. This section of the report summarizes the remedial
action alternatives and their evaluatio~ based upon short-term
effectiveness; long-term effectiveness; reduction in toxici~y,
mobility or volume: implementability; compliance with ARA.Rs;
cos~; and overall protection of human health and the
environment. Table 7-1 presents a summary of each remedial
action alternative evaluation. In addition to the table, a
brief discussion with respect to th~ advantages and
dis~dvantages of implementation of each alternative follows.
7.1 Unsaturated soil Response Media unit Alternatives
7.1.1 SL-1: No Action/Monitoring/Institutional Controls
Under Alternative SL-1 no remedial actions will take
place. A long-term soil monitoring program will be implemented
in ajdition to institutional controls such as a fence around
Kennedy Sand and Gravel and deed notices to reduce the
pote~tial that site contaminants are disturbed. The principal
advantages associated with Alternative SL-1 are:
o It has the lowest present worth cost of any of the
other unsaturated soils alternatives.
o No site remediation related risks incurred such as
those associated with excavation activities.
The principal disadvantages associated with Alternative SL-1
are:
7-1
'° V\
\0 N
0
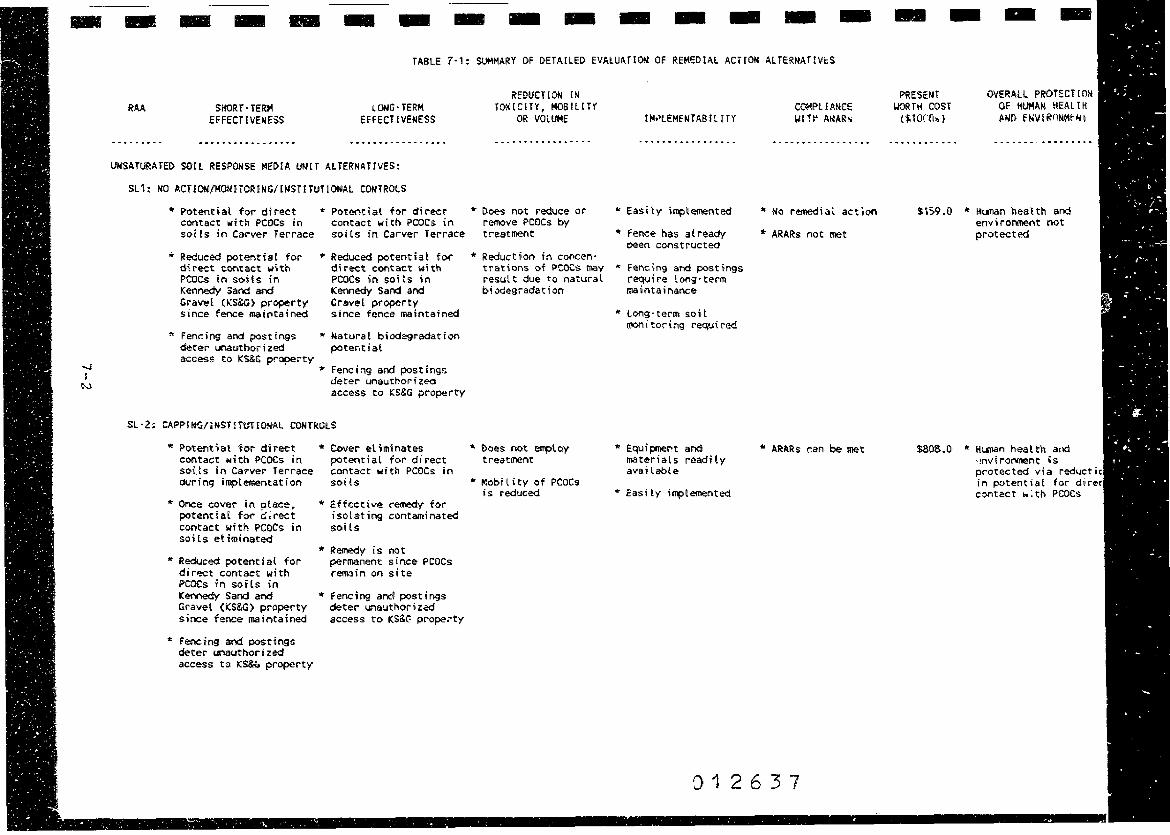
,-------------------------------------· - - - - - - - - - - - - - -TASLE 7·1: SUMMARY OF DETAILED EVAlUA.TION OF REMEDIAL ACHON ALTER!MTEVl::S
....;
I N
RAA SffORf·TERM lONG·TERII\ EFFECT !VENESS EHECHVENESS
-- .. - ..... -- .............. - -....... - ·-·------- .. --···· UNSATURATED SO!!. RESPON'SE MEDIA WH ALTERNATIVES:
SL1: NO ACTION(MOHITORING/[NSTITUTIONAL CONTROLS
" Potential for direct contact with PCOCs in soils in Carver Terrace
• Reduced potential for direct contact 1o1~th PCOCs in sotls in Kennedy Sac,d and Gravel (11:s&G) proper·ty since fence maintained
* Fencing and postings deter unauthorized access to KS&G prope~ty
* Potential for d'i i"ect contact with PCOCs in soils in Carver Terrace
.. Reduced potential for ctirect contact with PCOCs in soi ts in Kennedy Sand and Crewel p!'Operty since fence maintatned
* Natural biod~gradation potenti a,l
* Fencing and posting~ deter unauthorized access to KS&G property
SL·2: CAPPHl~(lNST!WHON·AL COtHRGlS
"Potentiat tor direct contact with PCOCs in soHs in Carver ierrace during implementation
~ Once cover in ptace, potential for c:;rect contact wit~ PCOCs in soHs etiminated
" Reduced potentii:ll for direct contact with PCOCs rn soils in K:ennedy Sand at"ld Gravel (KS&G) property since fenee maintained
* Fencing aoo postings deter unauthorized access to KS&u property
* Cover ellminates potential for dir-ect contact with PCOCs in soi ls
* Effective remedy for isolating contaminated soi ls
* Remedy is not permanent since PCOCs rem3in on site
* fencing and postings deter unauthoriz~ access to KS&~ prope~ty
REDUCT ION [M
TOKICH¥, MOBIL ff(
OR VOLUME
- --............ -- - -
* Does not reduce or remove PCOCs by treatment
* Reduction in concen· trat,ons of PCOCs may result due to natural bivde9radation
• ~oes not ~loy treatment
* ~obility of PCOCs is reduced
lt•h'lEMEtl TAB I l ! TY
... ~ .. -... ., ....... - -
* Easily implemented
"Fence has already been constructed
" Fer.cing and posbn9s require long-term maintair.ance
* long· term soi t moni todng required
"'Equipment and materials readily available
~ Easi ty i~tementect
CCl(-IPtli\!KE IJIH' A~ARs
.....................
* No remedial action
* I\RARs not met
• I\RI\Rs can be met
012637
- - - -PRESEIH OVERALL PROTECTION
IKJRTH COSI OF HU1'1AN ttEAl TK ($toC:O~} /1,1,'[} fM\I I Rf1t,tMt- !o
- ....... -. -- .. - .. - - - ... - - C .. - - - ..... 0, ••
$\59.0 * ttunan health and environment not protected
$808.0 " HU'l'lan health and '!rWi roroment \S protected via rediJcti( in potential for dire, contact ~:th PCOCs
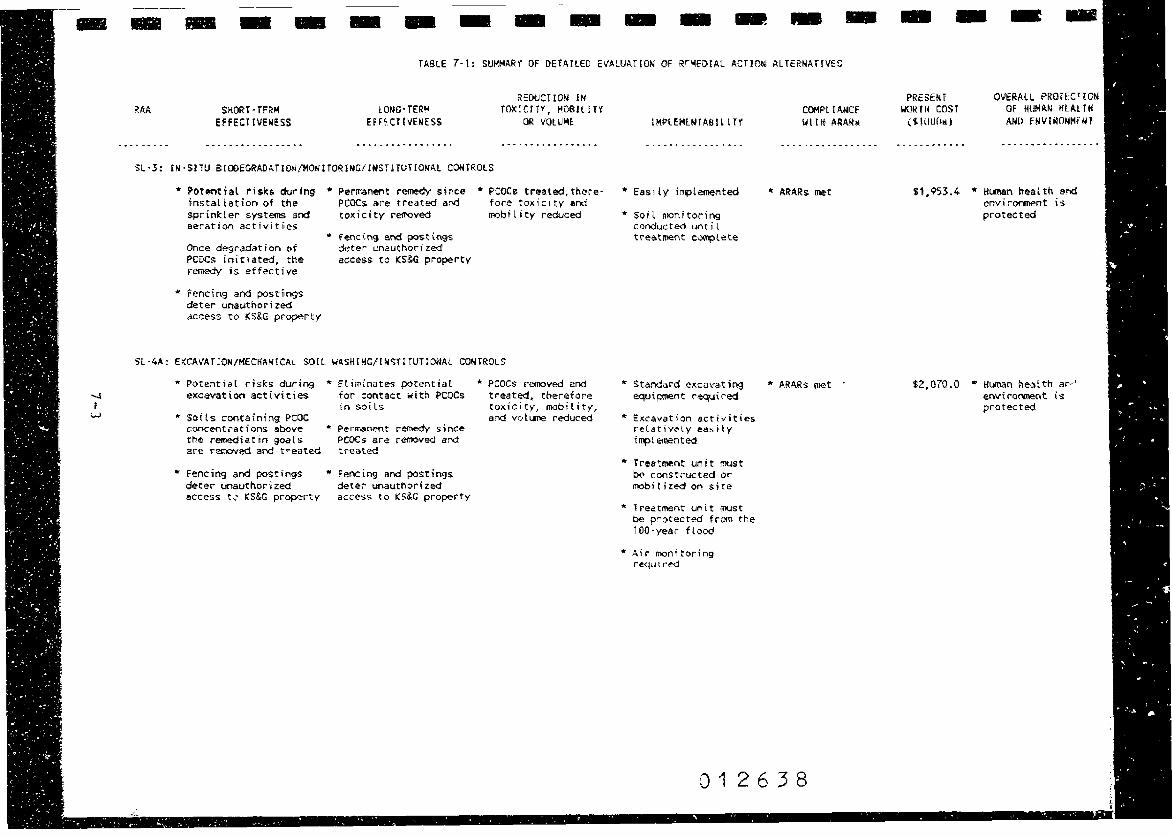
-
--1 I
w
- - - - - - - - - - - - - -TABLE 7-1: SUMMARY OF DETAILED EVALUATION Of R'""IEDIAL ACTIOl'ol ALTERNATIVE!:
REDUCTION IN RAA SHORT·TFRM lONG·TERM TOlCICIH', MOBIL IT'!'
EFFECTIVENESS EFH.CTIVENESS OR VOlUM~
-. -.. - ....... ------ .. ·-------"· --... - -............ - .. --- . ----.... - .. -......... -...
SL-3: IN'·S!TU BIOOEGRAOATIOH/MONITOR!NG/INSTiiUHOHAL COf,ITROtS
* Pot•ntial risk& durin9 installation of the sprinkler systems and aeration activities
Once degradation of PCOC!; initiated, the ,emedy is effective
* fencing and postings deter unat.1thoi- i zed ac~ess to KS&G property
• Permanent remedy since * PCOCs treated,th~re· PCOCs are treated and fore toxicity and toxicity removed mobility reduced
,. fencing and postings deter unauthortzed access to· (S&G property
Sl ·4i\: El(CAVAT ;QN/MECH'AMtCAL SOIL IIA.S.IHMG/INSTI TUTIOHAL CONTROLS
" Potential risks during * Et iminates potential excavation activities for contact with PCOCs
in soils * Soils containing PCOC
,:;oncen-tracions above the remediacin goals are i-emo.ved ancl trea,ted
• Fencing and postings deter unauthod zed access t~ KS&G property
* Permanent remedy since P'COCs are removed and treated
* Fencing and postings deter unauthorized access to KS&G property
* PCOCs removed and treated, therefore toxicity, mobility, and volltlle reduced
IMPLEMENTA8!l ll'Y
..........................
* Easily implemented
* Soil n10nitoring conducted until treatment c~tete
* s.tandard excava,ting equ,~nt required
* Excavation activities relatively easily implemented
* Treatment unit must bE' constructed or mobitized on site
* Treatment unit must be protected from the 100-year flood
* Air monitoring required
COMPt CANCE WI rn /\IM!h;
... ..... ·---·····----
* ARARs met
• ,'_RA.Rs met ·
012638
- - - -PRESEIH OVERALL PROTECTION
WORTII COST OF ltllMAN HtP.t rtl ( i. Hltlrhil) ANO ft,IVIMON!ilftH
·-·--····-·· ...............................
S1,9S3.4 * Hunan health e•d envfrorment is protected
l2:,070-.0 * !l1.1Dan heal th ar-··' envi.rorwent is protected

- - - - - - - - - - - - - - -TABLE 7-l: SUMMARY OF OETA[lED EVALUATION OF R~MEDIAL ACT!ON ALTERNATIVES
REDUCTION IN RAA SHORT-TERM LONG-TERt-t TOXICITY, MOS!ll TY EHEC"f l \fENESS EHECT i\fEMESS OR VOLUME
. -- .... ---. -----··---------- ................................. ........................
SL-48: EXCAVAHON/ON ·SITE ENCrNERATION/1 NST I TUHONAL CONTROLS
* Potential risks during "Eliminates potential eitcavation activities for contact with PCOCs
in soi ls r Softs containing PCOC
concentrations above the remediatin goats are remo\led & destroyed
"' Fenci,n9 and post frigs deter uoauthori zed access to KS&G property
r Potential risks during incineration
* Permanent remedy since PCOCs are removed' and treated
* fenctng and postings deter unautho!'"ized access to KS&G property
* PCOCS removed and eated, therefore
toxicity, mobility, aoo vol .ine reduced
SL-4C: E)(CAVATION/OFF·SITE INCINERATIOH/INSTIWHONM. CONTROLS
* Potential risks during * Eliminates potential excavation actjviti~ for contact with PCOCs
* Soils containing PCOC concentrations above the ,emediatin goals a,;e removed & destroyed
,. Fencing arid postings deter unauthorized access to KS&G pl"Operty
in soi ts
* Permanent remedy since PCOCs are removed and treated
* Fencing and postings deter unauthorized ac~ess to KS&-G property
* PCOCs removed and treated, therefore toxicity, mobility, and vott.flle reduced
IM\>LEMEtH MU UT'(
-■••-···---- .... -- ..
* Standard excavating equ i prient required
r Excavation activities relatively easily implemented
* Treatment unit must be constructed or mobilized on site
* Treatment unit must be protected froro the lOO·yeac- flood
* Air monitoc-ing required
* Incineration equipmerit is ~ell developE:d and reliable
* Standard excavating equipment required
* Excavation activities relatively easily implemE'titt.--d
COMPLIANCE -.ant MlARs
.. ............................
* ARARs met
* ARARs met
012639
- -PRESENT OVERALL PROiECTION
WORTH CO-ST OF HU!-iAM lffA.lTH ($\0OOs.} Mltl EM',HRONl-1HH
• - - - - ■ .... - - + .. ·------- - ■ ...... - - ....
$4,008.0 r Hunan heat th and (ash back- env,ror,nent is filled) protected
$5,648.0 (off-site disposal of aso)
$21,85~.o * HUTian health and erwi ronnent is prote,:ted
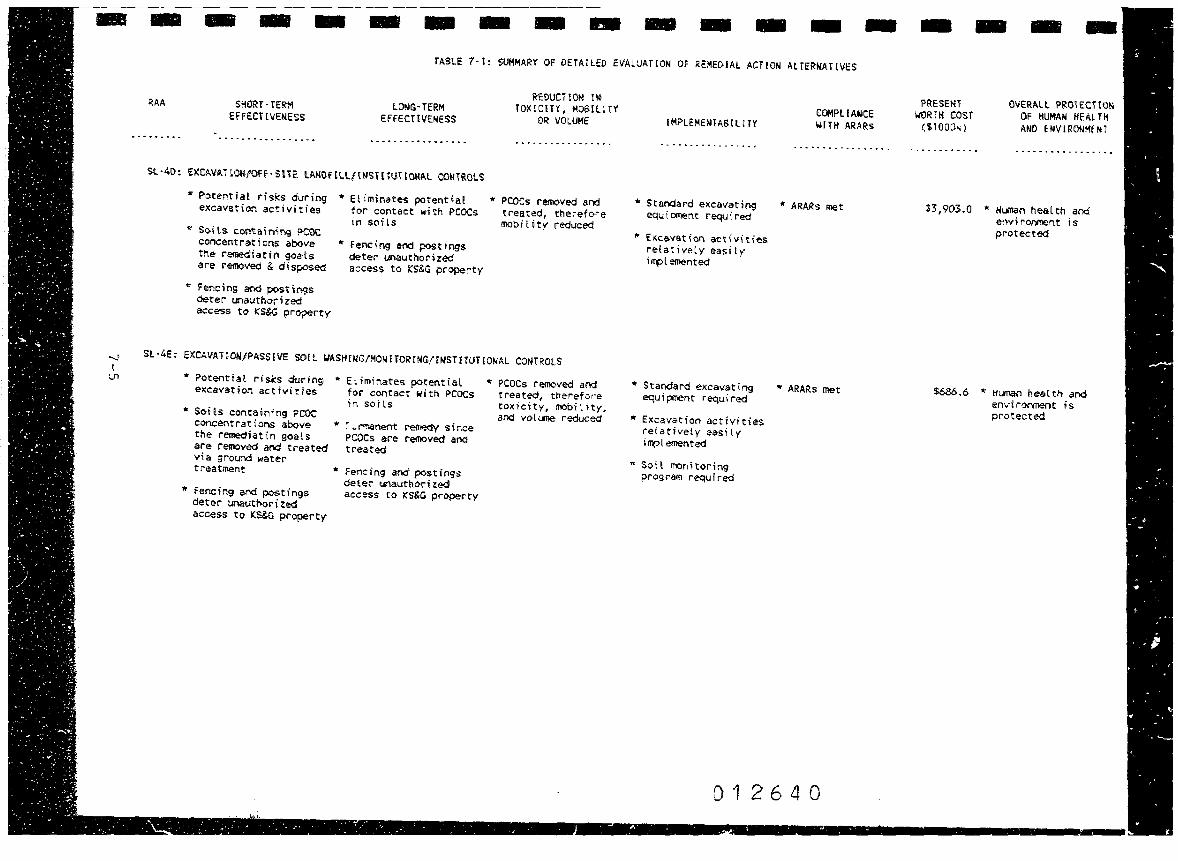
..
--.J t
Ln
- - - - - - - .. - - - - -TASLE 7·1: SUHMMY OF DETAILED EVALUATION OF REMEDIAL ACTION AtTERNAHVES
11:AA SHORT-TERM LONG·TERM EFFECT[VENESS EFFECT [VENESS
... -..... - .. - - . - - - - .. - ..... - - . - .. -. ................... ., ....
Sl ·40·: El(CA.\IAHON/OFF • SHE LA.HOF H.Lf{IISH RH tOttAL CONTROLS
* Potential risks during excavation activities
" Soils contairifr,g ?COC concent ra,t ions above the remediatin goals are removed & disposed
* Fendns and post fr19s deter unauthcr i zed access tc> KS&G property
* Eliminates po,tentia! tor contact with PCOCs in soils
" fencing and postings deter unauthorized access to KS&G property
REDUC710M H~ TOK[ClH, HOS:IU TY
OR VOLUME
- ......... - .,. -. -- ... - - ... ~
* PCOCs removed and treated, therefore mobit ity reduced
SL • 4E : EXCA \i'A."I" I ON/?ASS f 1/E so I l WASH I MG/MOM HOR HIG/! N'STi wn ONA L CONTROLS
* Potentiat risks during excavation activities
* Soi ts containi,ng PCOC concentrations above the remediatin goals are removed and treated via ground water treatment
* Fencing and postings deter unaut~orized access to Ks&G property
* Eliminates potential for contact with PCOCs in soils
* ~- ~t~nent reffiP.dy since PCOCs are removed and treated
* Fericing and postings deter unauthorii::ed access to KS&G property
""PCOCs removed and treated, tllerefor·e toxjcity, mobility, and volU'lle reduced
IMP'LEMENTAB tU TY
-- ....... ·ft•-- .......
* Standard excavating equipment required
* Excavation activities re!ativety easily i frP l emented
* Standard excavating equipment required
* Excavation activities retatively ~asily iivt emented
"Soil monitoring program required
COMPLIA~CE Wint AR:Ms
................... ·-
* ARARs met
,. ARARs met
012640
- - -PRESENT OVERALL '?ROiECrtUW:
\JORTH COST OF HUMAN HEI\L HI ($1000-.) ANO EINIRONM! r.lT
. -·----•----- -. -- - . - ... - -. - .. -...
13,903.0 * Nl..illan health aoo erwironment is protected
$686.6 * ijumao health and environment is protected
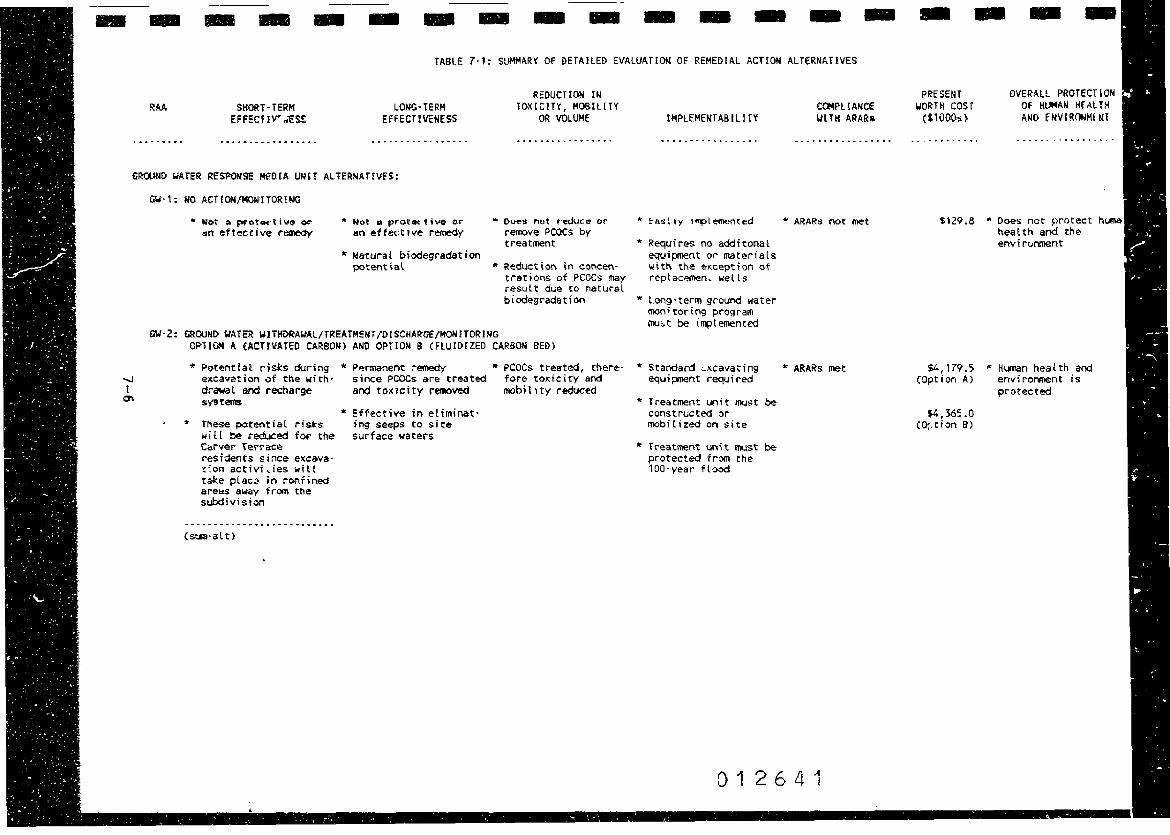
.. - - - - - - - - - - - - -TABLE 7-l: SUMMARY OF DETAILED EVALUATION OF REMEDIAL ACT!ON ALTERNt.TfVES
RAA SKORT·TERM LQijG-TERM EFFECf iv~ .. est EffECTIVENESS
.... - --.... ·····----·--····- .... -------- .... ----
GROUOO WATER RES~ MfO[A U~H AL'l"ERNAHVFS:
GW-1: NO ACTIOM/MONITOR!NIG
- Not a pr~t..-tiY~ o~ an effective remedy
,. N•ot " prot It( , i ve or an effe~t1ve remedy
* Natural biodegradation l)l>tent ~al
REDUCTION IN TOXIC! H, MOS! LIT'(
OR VOLUME
•• ■ ......... - - - ... - .........
• ~oe~ not reduce or remove PCOCS by treatment
* Reduction in concen· trations of PCOCs may result due to natural bi odegrada ti on
GW • 2: GROUND· WAT ER \.IHHORAI./Al /TREA TMEHT /0 I SCHARGE /MON HOR HIG
-.J I
O'I
OPHOO A (ACT!\fAfED CARSO") ANO OPT!Olol B (FLUIDIZED CARBON BED)
* Potential risks durir-g eKcav~tion of the with· drawal and recharge S)"lltems
~ These potential risks will be ,educed fOf' the Car'Vel" 'l'eri'ace residents since excava· c:on activLies will take plac~ in confined are~s away from the subdivision
(sua-alt}
* P~nnanent remedy since PCOCs are treated and toxicity removed
* Effective in eliminat· rng seeps to site surface waters
* PCOCs treated, there· fore toxicity and mob it i ty reduced
CCMPl!A!tCE IMPLEMENT AB I LI r¥ Ill TH ARARs
. ~ .. - - .. - ... - - - - ... -- ~ ........ - .. - --.....
" <~sL ly t~lemented "' ARAR~ not met
* Requires no additonat equipment or materials w Hn the e;,:.cept ion er reptac~n. wells
,. Long·term ground water monitoring program mu;,t be i~temented
* Standard ~xcavating equipment required
* rreatment unit must be constructed or mobilized on site
* Treatment uoH iw,st ~ protected from the 100-year flood
* AR:ARs met
012641
- - -PRESENT OVERALL PROTECTION
I.IORTI-I cosr OF HUMAN Kf Al Hf ($. 1000:.} MIO fMVIRONM!IH
• • C • ........... •. + • • • • • • + ~ -0 • ,< • • >- • r •
$129.8 "Does not prr,tect heat th and the envir(.lrnient
$4,179.5 * Hi.man heal th and (Option A) enviromient is
protected
$4,365.0 co;. tion B>

I I I I I I I I I I I I I I I I I I I
o The identified PCOCs for the dite are not treated nor
destroyed.
o A potential e~ists for direct contact with the PCOCs
in the soils in Carver Terrace.
o Does not provide for s~ort-term and possibly not
lonq-term effectiveness.
7.1.2 Capping/Institutional Controls
under Alternative SL-2, the areas determined by the
remediation goals would be covered with a protective barrier,
eithet' soil/sod or asphalt. Institutional controlg such as
fence around Kennedy Sand and Gravel and deed notices would be
implemented to reduce tt~ potential that site contaminants are
.disturbed. The principal advantages associated with
Alternative SL-2 are:
o The co1ler eliminates the potential for direct contact
with PCOCs in the soils.
o It provides for both short-term and long-term
effectiveness and could for the long term provided
that the cap remains intact.
o It is easily implemented since required equipment and
materials are readily available.
o It provides aesthetic improvements.
The major disadvantages ~ssociated with Alternative SL-2 are:
o The identified PCOCs for the site are not treated nor
destroyed and may provide for future exposure pat h\lrny s.
7-7
•,
..--0

I I I I I I I I I I
:I I I I I I I I I
o A potential for exposure to PCOCs exists during grading/excavation activities.
7.1.3 SL-3: In-Situ Biodegradation/Monitoring/ Institutional Controls
Under Alternative SL-3, the areas determined by the
remediation goals would be treated in place via
biodegradation. This is accomplished by enhancing the
unsaturated soils to a depth of one foot with fertilizers,
lime, water and oxygen (aeration). A soil monitoring program
woulj be implemer.ted in order to determine when the soils have
been treated to the level determined by the remediation goals.
Institutional controls would also be implemented to control
site access and reduce the potential for the disruption of
soils within the Kennedy Sand and Gravel property. Th~ major advantages associated with Alternative SL-3 are:
o SL-3 involves treatment of the soils, thereby reducing toxicity.
o Minimal excavatio~ is required for installation of sprinkler systems.
o SL-3 is easily implemented.
o It provides aesthetic improvements.
The major disadvantages associated with Altr~~!tive SL-3 are:
0
0
Potential risks associated with connecting the
sprinkler systems to the water main.
Treatment may be necessary for several years in order to achieve the remediation goals.
7-8
0
I I I I I I I I I I
o It is a relativ~ly new technology, and therefore a
pilot study will be required in order to determine its ultimate suitability.
7.1.4 SL-4 Option (A): Excavation/Mechanical Soil Washing/Institutional Controls
Under Alternative SL-4 Option (A), the areas determined by
the remediation goals will be •xcavated to a depth of one foot and treated on site via a soil washing unit. Institutional
controls will be implemented to control site access and reduce the potential for the disruption of soils within the Kennedy
Sard and Gravel property. ~he primary advantages associated with Alternative SL-4 Option (A) are:
o Excavation provides for near complete removal of
PCOCs from surficial soils in residential areas.
0 It provides for both short-term and long-term effectiveness.
I The major disadvantages associated with SL-4A are;
I I I I I I I I
0
0
0
Potential exposure risks are incurred during excavation activities.
Excavating activities may be distracting and
disrupt:ve for several Carver Terrace residents.
Mechanical soil washing is a relatively new technology, and therefore site specific
implementability will need to be evaluated during the desi.gn phase.
7-9

I I I I I I I I I I I I I I I I I
7.1.5 SL-4 Option (B): Excavation/On-Site Incineration/ Institutional Controls
Under Alternative SL-4 Option (B) the areas determined by
the remediation goals will be excavated to a depth of one foot and treated on site via a mobile incinerator unit. Institutional controls will be implemented to control site
access and reduce the potential for the disruption of soils wit~in the Kennedy Sand and Gravel property. The principal advantages associated with Alternative SL-4(8) are:
o It provides for near complete removal and destruction
of PCOCs from surficial soils in residential areas.
o It provides for both short-term and long-term effectiveness.
o Incineration is a proven technology.
The major disadvantages associated with Alternative SL-48 are:
o Potential exposure risks are incurred during
excavation activities and during treatment operations.
0 Excavating activities may be distracting and
disruptive for several Carver Terrace residents.
o It is a relatively expensive alternative as compared to the other alternatives.
o The ash generated from incineration may need to be
disposed off site and as a result will need to meet any land ban regulations applicable at the time.
7.1.6 SL-4 Option (C): Excavation/Off-Site Incineration/ Institutional Controls
Under Alternative SL-4 Option (C), the areas determined by
the remediation goals will be excavated to a depth of one foot
I I I I I I I I I I I I I I I I I I I
and transported off site to an approved incinerator facility.
Institutional controls will be implemented to control site
access and reduce the potential for disruption ot soils within
the Kennedy Soil and Gravel property. The primary advantages associated with Alternative SL-4C are:
o It provides for near complete removal and treatment
of PCOCs from surficial soils in residential areas ..
o It provides for both short-term and long-term effectiveness.
o It is a proven technology.
o A likely incinerator has been locate<l.
The major disadvantages associated with Alternative SL-4C are:
o Its present worth cost is the highest of all the unsaturated soil alternatives.
0
0
Potential exposure risks are incurred during excavation activities.
Excavation activities may be distracting and
disruptive for several Carver Terrace residents.
o Treatment may be necessary for several years in order to achieve the remediation goals.
7.1.7 SL-4 Option {O): Excavation/Off-Site Landfill/ Institutional Controls
Under Alternative SL-4 Option {D), the areas'determined by
the remediation goals will be excavated to a depth of one foot and transported to an approved landfill facility.
InstitL1tional controls will be implemented to control site
7-11
0

I I I I I I I I I I I I I I I I I I I
access and reduce the potential for disruption of soils within
the Kennedy Sand and Gravel property. The primary advantages ass~ciated with Alternative SL-4D are:
o It provides for complete removal of PCOCs from
surficial soils in residential areas.
0 It provides for both short-term and long-term effectiveness at the site.
The major disadvantages associated with Alternative SL-4D are:
o Near-future RCRA land ban regulations may make this
alternative inappropriate.
0
0
0
There is still a liability associated with the
disposed soils since they are not treated by some means.
Potential exposure risks are incurred during
excavation activiti~s.
Excavation activities may be distracting and
disruptive for several Carver Terrace residents.
7.1.8 SL-4 Option (E): Excavation/Passive Soil Washing
/Monitoring/Institutional Controls
Under Alternative SL-4 Option (B), the areas determined by
the remediation goals will be excavated to a depth of one foot and placed on site in the gravel pits, thereby becoming part of
the saturated zone. A ground water withdrawal/treatment alternative must be implemented with this alternative so that
the soils will be treated. Institutional controls will be implemented to control site access and reduce the potential for
disruption of soils within the Kennedy Sand and Gravel
property. The primary advantages associated with Alternative
SL-4E are:
7-12
0
I I I I I I I I I I I I I I I I
---·-~---~- ' 0 • • • -,r~.-....~ - ' I • ~ i I •
. I ~ \ , . • - Jj. .. ~
. I _\ / ·l
o It provides for complete removal and treatment of
PCOCs from surficial soils in residential soils.
o It provides for both short-term and long-term effectiveness.
o Its present worth is the lowest of all the
unsaturated soils alternatives, not including the no action alternative.
The primary disadvantages associated with Alternative SL-4E are:
o Potential exposure risks are incurred during excavation activities.
o Excavation activities may be distracting and disruptive for several Carqer Terrace residents.
o It is an innovative technology and may require a
pilot study to determine its ultimate suitability.
7.2 Ground Water Response Media Unit Alternatives
7.2.l GW-1: No Action/Monitoring
Under Alternative GW-1, no remedial actions will take place. A long~term ground water monitoring program will be
implemented. The principal advantages associated with Alternative GW-1 are:
o It has the lowest present worth cost compared to the
other ground water alternatives.
o No site remediation related risks incurred such as those associated with excavation activities.
7-13
0
'
--- ' ~ ~ . - • , -- - .. . . I J i , . ·,
~ .
. . . ' .·
I I I I I I I I I
...
The primary disadvantages associated with Alternative GW-1 are:
o The identified PCOCs within the ground water of the shallow aquifer are not treated or destroyed.
o Migration not reduced; seeps will not be eliminated.
o Does not provide for short-term and possibly not long-term protectiveness.
o Violates Texas Water Quality Standards.
7.2.2 GW-2: Ground Water Withdrawal/Treatment Via
Option (A) or {B)/Discharge/Monitoring
!I
Under Alternative GW-2, the affected ground water within
the shallow aquifer will be reco~ered via a subsurface drain
system and then treated on site by either an activated carbon
system (Option A) or a fluidized carbon bed (Option B). The
treated water will be partially reinj~cted back into the
aquifer after being enhanced with nutrients or surfactants and partially discharged Off site. The primary advantages
associated with Alternative GW-2 regardless of the treatment method are:
I I I I I I I
o It provides for near complete removal and treatment of free-phased creosote.
o It provides for long-term effectiveness.
It is effective in eliminating seeps to surface waters.
The primary disadvantages associted with Alternative GW-2 are:
o Potential exposure risks are incurred during
excavation activities even though most excavation
will take place in confined areas within the Kennedy Sand and Gravel property.
7-14
0
I 0 Treatment may be necessary for many years i.n order to
I achieve the remediation goals.
I 0 Fluidized carbon bed is an innovative technology, and therefore site specific implementability will need to
I be evaluated during the design ph~.se.
I I 0
IS\
'° I N or--
I 0
I I I I I I I I I I 9788A
I 7-15