
Exploratory study to identify workload factors that ... - IRSST
Upload
khangminh22Category
view
0download
0
ORE Open Research Exeter
TITLE
Combining GWAS and FST-based approaches to identify targets of Borrelia-mediated selection innatural rodent hosts
AUTHORS
Cornetti, L; Tschirren, B
JOURNAL
Molecular Ecology
DEPOSITED IN ORE
10 March 2020
This version available at
http://hdl.handle.net/10871/120212
COPYRIGHT AND REUSE
Open Research Exeter makes this work available in accordance with publisher policies.
A NOTE ON VERSIONS
The version presented here may differ from the published version. If citing, you are advised to consult the published version for pagination, volume/issue and date ofpublication

1
Combining GWAS and FST-based approaches to identify targets of 1
Borrelia-mediated selection in natural rodent hosts 2
3
Luca Cornetti1,2 & Barbara Tschirren3* 4
5
1Department of Evolutionary Biology and Environmental Studies, University of 6
Zurich, Zurich, Switzerland 7
2Zoological Institute, University of Basel, Basel, Switzerland 8
3Centre for Ecology and Conservation, University of Exeter, Treliever Road, 9
Penryn, TR10 9FE, United Kingdom 10
11
*Correspondence: 12
Barbara Tschirren, Email: [email protected] 13
14
Running title: Targets of Borrelia-mediated selection 15

2
Abstract 16
Recent advances in high-throughput sequencing technologies provide 17
opportunities to gain novel insights into the genetic basis of phenotypic trait 18
variation. Yet to date, progress in our understanding of genotype-phenotype 19
associations in non-model organisms in general and natural vertebrate 20
populations in particular has been hampered by small sample sizes typically 21
available for wildlife populations and a resulting lack of statistical power, as 22
well as a limited ability to control for false positive signals. Here we propose to 23
combine a genome-wide association (GWAS) and FST-based approach with 24
population-level replication to partly overcome these limitations. We present a 25
case study in which we used this approach in combination with Genotyping-26
by-Sequencing (GBS) SNP data to identify genomic regions associated with 27
Borrelia afzelii resistance or susceptibility in the natural rodent host of this 28
Lyme disease-causing spirochete, the bank vole (Myodes glareolus). Using 29
this combined approach we identified four consensus SNPs located in exonic 30
regions of the genes Slc26a4, Tns3, Wscd1 and Espnl, which were 31
significantly associated with the voles’ Borrelia infectious status within and 32
across populations. Functional links between host responses to bacterial 33
infections and most of these genes have previously been demonstrated in 34
other rodent systems, making them promising new candidates for the study of 35
evolutionary host responses to Borrelia emergence. Our approach is 36
applicable to other systems and may facilitate the identification of genetic 37
variants underlying disease resistance or susceptibility, as well as other 38
ecologically relevant traits, in wildlife populations. 39
40

3
Keywords: host-parasite interactions, wild immunogenetics, pathogen-41
mediated selection, evolutionary change, RAD sequencing (RAD-seq), 42
conservation genetics 43
44

4
Introduction 45
Testing evolutionary theories of host-parasite interactions and resistance 46
evolution is hampered by a lack of understanding of the genetic architecture 47
of host defence and susceptibility (Lazzaro & Little, 2009). This is particularly 48
the case for natural populations of non-model organisms, for which very little 49
functional genetic information is currently available (Spurgin & Richardson, 50
2010). Infectious diseases are a major cause of wildlife population declines 51
(Smith, Sax, & Lafferty, 2006) and pose a substantial threat to global 52
biodiversity (MacPhee & Greenwood, 2013). At the same time, wildlife 53
diseases can spillover into human populations and are thus of public health 54
concern (Daszak, Cunningham, & Hyatt, 2000; Jones et al., 2008; 55
Wiethoelter, Beltrán-Alcrudo, Kock, & Mor, 2015). A better understanding of 56
the genetic basis of wildlife disease resistance or susceptibility is thus crucial 57
for conservation efforts (Jones et al., 2007; Margres et al., 2018) but also to 58
understand and predict the dynamics of zoonotic diseases (Beldomenico & 59
Begon, 2010; Price, Spencer, & Donnelly, 2015). 60
Recent advances in high-throughput sequencing technologies have 61
made it possible to obtain extensive genomic information for non-model 62
organisms (Tagu, Colbourne, & Nègre, 2014). Yet challenges to associate 63
genetic variants with phenotypic traits of interest remain formidable (e.g. Hong 64
& Park, 2012). Two main approaches are typically used to identify genomic 65
regions of interest. The first approach, genome-wide association 66
(GWAS)(Amos, Driscoll, & Hoffman, 2011), tests for associations between 67
phenotypic traits of interest and genomic variants across the whole genome 68
(Petersen, Fredrich, Hoeppner, Ellinghaus, & Franke, 2017). A second 69

5
approach (FST outlier approach; Vitti, Grossman, & Sabeti, 2013) used to 70
identify genomic regions associated with phenotypic trait variation is based on 71
the premise that natural selection acting on a locus of interest will result in 72
differences in allele frequencies among populations subject to different 73
environmental conditions or showing different phenotypes. The FST outlier 74
approach identifies regions with unusually large (when compared to the 75
genome-wide FST distribution) genetic differentiation between populations 76
suggesting that they are under selection. 77
Although these two approaches have been successfully used to 78
identifying genomic regions of interest in humans (e.g. Visscher et al., 2017) 79
and model organisms (e.g. Flint & Eskin, 2012; Togninalli et al., 2018; 80
Wangler, Hu, & Shulman, 2017), so far outcomes were mixed for non-model 81
organisms in general, and natural vertebrate populations in particular (Santure 82
& Garant, 2018). A key limitation is that sample sizes available for GWAS in 83
wildlife populations are typically several magnitudes smaller than for humans 84
or model organisms (Amos et al., 2011; Hong & Park, 2012). Furthermore, it 85
remains notoriously difficult to control for false positive signals when testing 86
for associations between genetic variants and phenotypes (Amos et al., 2011; 87
McCarthy et al., 2008), and distinguishing between molecular signals of 88
natural selection and genetic drift with FST outlier approaches is non-trivial 89
(Hoban et al., 2016; Vitti et al., 2013). 90
In order to increase statistical power to identify genomic regions 91
associated with phenotypic traits of interest, and at the same time control for 92
false positive signals, it has been suggested to combine approaches and to 93
apply population level replication (Chanock et al., 2007; Santure & Garant, 94

6
2018; Schielzeth, Rios, & Burri, 2018). Yet, to our knowledge this approach 95
(i.e. the combination of GWAS and FST -based tests and application of 96
population-level replication) has not been used to identify targets of pathogen-97
mediated selection in wildlife disease systems to date. 98
Borrelia afzelii is the most common Borrelia genospecies in Europe 99
and one of the causative agents of human Lyme disease (Steere, Coburn, & 100
Glickstein, 2004). It is transmitted by ticks (Ixodes sp.) and rodents, such as 101
the bank vole (Myodes glareouls), are its main natural hosts (Kurtenbach et 102
al., 2006; Mannelli, Bertolotti, Gern, & Gray, 2012). Recently, it has been 103
experimentally shown that B. afzelii has negative fitness consequences for 104
bank voles (Cayol et al., 2018). Defense mechanisms that prevent or control 105
Borrelia infections in natural hosts will thus be favored by natural selection. 106
Using a candidate gene approach, we have previously demonstrated 107
that naturally occurring genetic variants of Toll-like receptor 2 (TLR2) are 108
associated with the Borrelia infection status of bank voles (Cornetti et al., 109
2018; Tschirren et al., 2013). Yet, Borrelia susceptibility is most likely 110
influenced by many genes and the variation explained by a single candidate 111
gene remains limited (Wilfert & Schmid-Hempel, 2008). In this study, we 112
performed genome-wide scans to identify potential targets of Borrelia-113
mediated selection using a combination of complementary approaches and by 114
applying a population replication criterion. Specifically, we used (1) a GWAS 115
approach to identify genetic variants associated with Borrelia infection status, 116
and (2) a FST-based analysis between Borrelia-infected and -uninfected bank 117
voles within seven independent populations to identify outlier SNPs. The latter 118
was combined with (3) a population level replication criterion in which we 119

7
considered only SNPs that were identified as outliers in multiple populations. 120
Finally, we (4) overlaid the results of these complementary approaches to 121
identify consensus candidate SNPs, which were found to explain significant 122
amount of variation in bank vole Borrelia infection status. 123
124
Materials and Methods 125
Field sampling 126
Bank voles (Myodes glareolus) were captured during summer 2014 at seven 127
locations in the Kanton Graubünden, Switzerland (Table 1; Supporting 128
information Figure S1) using live-traps (Longworth Mammal Traps, Anglian 129
Lepidopterist Supplies). A high Borrelia infection prevalence has previously 130
been documented in bank voles at these sampling sites (Cornetti et al., 2018). 131
Caught bank voles (N = 177; Table 1) were weighed (to the nearest g), aged 132
following Gliwicz (1988)(adults (>20 g), subadults (15-20 g), and juveniles (< 133
15 g)), and a small ear biopsy was collected and stored in 95% ethanol. The 134
animals were then released at their capture site. Vole capture, handling and 135
tissue sampling complied with the current laws of Switzerland and were 136
performed under a license issued by the Department of Food Safety and 137
Animal Health of the Kanton Graubünden, Chur, Switzerland (permit number 138
2012_17). 139
140
Borrelia infection in bank voles 141
Genomic DNA was extracted from the ear biopsy using the QIAGEN DNeasy 142
Blood & Tissue Kit (Qiagen, Venlo, the Netherlands). To determine the B. 143
afzelii infection status of bank voles, we used a highly sensitive quantitative 144

8
real-time PCR (qPCR) assay using the flaB B. afzelii-specific primers Fla5F: 145
5‘-CACCAGCATCACTTTCAGGA-3‘ and Fla6R: 5‘-146
CTCCCTCACCAGCAAAAAGA-3‘ (Råberg, 2012) on a StepOnePlus real-time 147
qPCR machine (Applied Biosystems, Foster City, CA, USA). We focused on 148
B. afzelii because a pilot study using reverse line blot (Herrmann et al., 2013) 149
had revealed that B. afzelii is the only Borrelia genospecies present in bank 150
voles at our study sites (unpublished data). 151
The amplification was carried out in a total volume of 20 μl, including 152
10 μl SYBR® Select Master Mix (2x, Applied Biosystems), 0.8 μl of each 153
primer (10 μM) and 4 μl extracted genomic DNA. The qPCR protocol 154
consisted of two initial holding steps first at 50 °C and then at 95 °C for 2 min 155
each, followed by 42 cycles of 95 °C for 15 sec, 59 °C for 30 sec, and 72 °C 156
for 30 sec (Råberg, 2012). Eight negative controls and eight serially diluted 157
positive controls were included on each plate. Samples with a cycle threshold 158
(Ct) value > 0 and a melting temperature between 76.4 °C and 77.8 °C were 159
considered to be B. afzelii-positive (Råberg, 2012). All samples were analyzed 160
in duplicate on two different plates (see Cornetti et al., 2018 for details). 161
162
Genotyping-by-Sequencing and SNPs calling 163
Samples of 118 adult bank voles were used for Genotyping-by-Sequencing 164
(GBS). Only adult bank voles were included because variation in Borrelia 165
infection status among juveniles and subadults is likely due to variation in 166
exposure rather than resistance (Tschirren et al., 2013). An equal number of 167
Borrelia-infected and uninfected individuals were randomly selected for each 168

9
site, whenever possible. Overall, 45% of the sequenced individuals were B. 169
afzelii infected (Table 1). 170
Extracted genomic DNA was sent to the GBS platform 171
(http://www.biotech.cornell.edu) of Cornell University, USA in July 2015. GBS 172
libraries were prepared using a double digest protocol with SbfI and Hpall as 173
restriction enzymes (Poland, Brown, Sorrells, & Jannink, 2012). Sequencing 174
(100-bp single-end reads) was performed on IlluminaHiSeq 2500. 175
In total 264,483,546 reads were obtained. Illumina adapters were 176
removed from raw sequences using Trimmomatic 0.33 (Bolger, Lohse, & 177
Usadel, 2014) . Sequences were aligned to the prairie vole (Microtus 178
ochrogaster) reference genome (MicOch1.0, (McGraw, Davis, Young, & 179
Thomas, 2011)) using Bowtie2 (Langmead & Salzberg, 2012). The prairie 180
vole and the bank vole are members of the same subfamily (Arvicolinae) and 181
their divergence time has been estimated to be 5.9±0.8 Mya (95% confidence 182
interval: 4.6-7.6 Mya) based on nuclear genes (Abramson, Lebedev, Tesakov, 183
& Bannikova, 2009). To date, the prairie vole is the closest relative of the bank 184
vole with a high quality genome assembly (McGraw et al., 2011). The current 185
version of the prairie vole reference genome consists of 28 main scaffolds, 186
corresponding to 17 autosomes, the X chromosome and ten linkage groups 187
(Zerbino et al., 2018). The average mapping rate to the prairie vole genome 188
was about 80%. Samtools 1.3 was used to filter the BAM alignments for 189
quality (-q 20) before SNP calling was performed with GATK 3.7 (Van der 190
Auwera et al., 2013). The final set of SNPs was obtained with VCFtools 0.1.15 191
(Danecek et al., 2011) by filtering for quality (minimum genotype quality score 192
of 20), coverage (minimum genotype depth of 6 per individual) and rare 193

10
variants (minor allele frequency of 0.01), requiring that at least 70% of all 194
individuals passed the filters. 195
196
Bank vole population structure 197
Population structuring was assessed using a Multi-Dimensional Scaling 198
(MDS) approach implemented in Plink 1.90 (Chang et al., 2014), as well as 199
using the software Structure 2.3.4 (Pritchard, Stephens, & Donnelly, 2000). As 200
input for Structure we used a reduced dataset of 1555 SNPs, which included 201
variants with no missing data, and, to fulfill Structure model assumptions of 202
independence of loci (i.e. no linkage disequilibrium within populations), only 203
one SNP per read. Analyses were performed using an admixture model with 204
correlated allele frequencies for ten independent runs. We determined the 205
most likely number of genetic clusters (K) exploring K values between one 206
and seven (i.e. the number of sampling sites). Burn-in periods of 100,000 207
were used, followed by 500,000 iterations. The most plausible number of 208
genetically well-defined groups was determined by comparing the likelihood at 209
different K values (Pritchard et al., 2000) using Structure Harvester (Earl & 210
VonHoldt, 2012). 211
Furthermore, we calculated the fixation index FST among populations 212
as a measure of population differentiation using the software Arlequin version 213
3.5 (Excoffier & Lischer, 2010) and tested for isolation-by-distance (IBD), by 214
correlating the pairwise genetic differentiation and geographic distance among 215
populations using Mantel test (Mantel, 1967). Linear geographic distances 216
between locations were calculated with the Geographic Distance Matrix 217
Generator version 1.2.3 (Ersts, 2017). The relationship between the linearized 218

11
FST (FST /(1- FST)) and the log-transformed linear geographic distance 219
(log(km)) was estimated using the Isolation-by-Distance Web Server (Jensen, 220
Bohonak, & Kelley, 2005). 221
222
Identifying targets of Borrelia-mediated selection 223
To identify putative targets of Borrelia-mediated selection we used a 224
combination of two approaches. First, we tested for an association between 225
bank vole SNPs and Borrelia infection status using the R package GenAbel 226
(Aulchenko, Ripke, Isaacs, & van Duijn, 2007). GenAbel allows performing 227
genome-wide association (GWAS) between SNPs and a phenotype while 228
correcting for population structure. We first computed a kinship matrix for our 229
samples using the function ibs. Then, using an Eigenstrat method, we 230
calculated the probability of each SNP to be associated with the phenotype 231
(i.e. Borrelia infection status), after correcting for kinship within the whole 232
dataset (Aulchenko et al., 2007) using the function egscore. This method uses 233
the genomic kinship matrix to derive axes of genetic variation (principal 234
components) and adjusts both the trait (i.e. Borrelia infection status) and the 235
genotypes onto these axes (Price et al., 2006). Corrected genotypes are 236
defined as residuals from regression of genotypes onto axes. Correlation 237
between corrected genotypes and the phenotype is computed, and test 238
statistics is defined as the square of this correlation times (N - K - 1), where N 239
is the number of genotyped subjects and K is the number of axes (Aulchenko 240
et al., 2007). The association analysis was performed using the combined 241
dataset (i.e. all individuals, N = 118, across all populations and all 21,811 242
SNPs). 243

12
Second, we complemented the GWAS approach with an independent 244
analysis based on FST to identify outlier SNPs between Borrelia-infected and 245
uninfected bank voles within populations. In each of the seven populations, 246
we calculated for each SNP the FST value between Borrelia-infected and 247
uninfected individuals using VCFtools 0.1.15 (Danecek et al., 2011). The 248
rationale of this approach is that no neutral population differentiation is 249
expected between infected and uninfected animals within a population, and 250
significantly differentiated SNPs suggest an association with Borrelia 251
resistance or susceptibility. Within each population, we selected the outlier 252
SNPs that lay within the top 10% of the population-specific FST distribution 253
(Bankers et al., 2017; Myles, Davison, Barrett, Stoneking, & Timpson, 2008; 254
Zueva et al., 2014). Given the significant population differentiation and distinct 255
genetic clustering of the sampled bank vole populations (see Results), these 256
populations represent independent replicates. 257
To control for false positive FST outliers within populations, we applied a 258
population replication criterion and only considered FST outliers that were 259
among the top 10% of the population-specific FST distribution in at least three 260
of the seven populations (40%) (see Simulations below). This approach is 261
conservative because it assumes that the same genetic mechanisms underlie 262
variation in Borrelia resistance or susceptibility in different populations. 263
Because genetic variants underlying variation in resistance or susceptibility to 264
infectious diseases are typically found to be exonic (Hill, 2012), we specifically 265
focused on SNPs located in exons in both approaches. 266
In a final step, we overlapped the results of the GWAS approach and of 267
the population-level replicated FST-based approach to identify consensus 268

13
candidate SNPs that were associated with Borrelia infection status in both 269
analyses. Candidate SNPs were annotated with SNPdat (Doran & Creevey, 270
2013), a tool specifically designed for non-model organisms. We then used a 271
generalized linear mixed model with a binomial error structure and site 272
included as a random effect to test for associations between these consensus 273
candidate SNPs and Borrelia infection status. Significance of fixed effects was 274
determined by comparing nested models (with and without the variable of 275
interest) using likelihood ratio tests. We considered both additive and 276
dominant modes of gene action of candidate SNPs. Analyses were performed 277
using the package lme4 (Bates, Maechler, & Bolker, 2011) in R version 3.6.1. 278
(R Core Team, 2014). 279
280
Neutral simulations 281
We performed neutral simulations to quantify the false-positive rates 282
when using a GWAS approach alone, a FST approach without population 283
replication, a FST approach with a two population replication criterion and a 284
FST approach with a three population replication criterion, as well as a 285
combined approach that focuses on consensus SNPs identified with both 286
approaches to identify putative targets of Borrelia-mediated selection. We 287
used the forward-time genetic simulator SLiM version 3.3 (Haller & Messer, 288
2019) to generate neutral polymorphisms based on the number of SNPs (N = 289
21’811) and individuals (N = 118) included in the empirical dataset, repeated 290
100 times. The commented SLIM script describing the simulation process is 291
presented in the Supporting information. In short, we generated sequences of 292
27’999 bp in length, with a mutation rate of 2 × 10⁻⁴ per base per generation 293

14
and a recombination rate of r = 0.05. At generation 1, seven subpopulations 294
appear and evolve independently for 4999 generations with some gene flow 295
among them. At the end of the simulations (i.e. after 4999 generations) a 296
subsample of each population is randomly selected according to the actual 297
sample size of the empirical data. The data is written in seven VCF files that 298
are used for further analyses. 299
The parameters used in the simulations were selected, after many pilot 300
runs, by taking into account computational and temporal constraints and in 301
order to obtain a total number of SNPs and population differentiation (in 302
particular in term of FST values) similar to the ones observed in the real 303
dataset. For each of the 100 simulated datasets, we randomly assigned 304
infected and uninfected individuals within each population, according to the 305
real data (for example, in Sagong, 10 infected and 9 uninfected individuals 306
were defined). Then, the seven VCF files were merged using GATK version 4 307
(McKenna et al., 2010); during this step, we also constrained the total number 308
of SNPs and the amount of missing data to be comparable to the observed 309
data. The resulting 100 VCF files, including 118 samples from seven 310
populations, were used to perform GWAS with Genabel (Aulchenko, Ripke, 311
Isaacs, & van Duijn, 2007) based on the full dataset (118 samples), and FST-312
based calculation between infected and uninfected individuals within each of 313
the populations. 314
315
Results 316
Bank vole population structure 317

15
A total of 21,811 SNPs were retained after quality filtering. Population 318
differentiation (FST) was comparably high considering the relatively small size 319
of the study area (maximum linear distance between sampling sites: 34 km), 320
and varied from 0.052 (Sagogn-Flims, the second closest locations) to 0.111 321
(Malans-Sagogn, the most distant locations, Supporting information Table 322
S1). All FST values were statistically significant (Supporting information Table 323
S1). 324
Within the study area, population structure was well defined. The MDS 325
analysis highlighted seven distinct groups corresponding to the seven 326
sampling locations (Figure 1). Similarly, using Structure we found that K = 7 327
was the most supported partition (Supporting information Figure S2), with the 328
seven well defined genetic clusters corresponding to the seven sampling 329
locations (Figure 1, Supporting information Figure S3). The relationship 330
between genetic and geographic distance was positive (r = 0.87, Supporting 331
information Figure S4) and statistically significant (Mantel test, p < 0.001), 332
suggesting pronounced isolation-by-distance across populations. 333
334
Neutral simulations 335
The neutral simulations demonstrated the weaknesses of using GWAS 336
and FST -based tests in isolation (Supporting information Figures S5 and S6) 337
and the significant reduction in false-positive rates when using a three-338
population replication criterion for the FST-based test (Supporting information 339
Figure S5). The simulations furthermore showed that combining GWAS and 340
FST -based tests with population replication substantially reduces false-341

16
positive rates, and thus increases the power to identify core candidate SNPs 342
(Figure 2). 343
344
Identifying targets of Borrelia-mediated selection 345
a) GWAS approach 346
Using a GWAS approach that corrects for population structure, we identified 347
1065 SNPs that were associated (p < 0.05) with the Borrelia infection status of 348
bank voles (Supporting information Figure S6). As expected given the 349
comparably small number of individuals included in this GWAS, none of these 350
associations reached statistical significance when accounting for multiple 351
testing using the Benjamini-Hochberg procedure (Supporting information 352
Figure S6). The identified SNPs were distributed across the whole genome 353
(Supporting information Figure S7). After correcting for chromosome size, 354
chromosome 15 and chromosome 19 showed the highest and lowest number 355
of putatively Borrelia-associated SNPs, respectively (chr 15: 1.02 SNPs/MB; 356
chr 19: 0.17 SNPs/MB; Supporting information Figure S7). Among the 1065 357
SNPs, 53 were located in exonic regions of 48 unique genes (Supporting 358
information Table S2). 359
360
b) FST-based approach with population-level replication 361
In a second step, we performed a FST -based analysis between Borrelia 362
infected and non-infected individuals within each of the seven populations and 363
applied a population-level replication criterion, by considering only FST outliers 364
that were among the top 10% of the population-specific FST distribution in at 365
least three of the seven population. The top 10% FST threshold ranged from 366

17
0.079 (Flims) to 0.145 (Rodels, Supporting information Figure S8). We 367
obtained 305 SNPs that showed consistent differentiation between Borrelia-368
infected and uninfected bank voles in at least three independent population 369
replicates, 70 of which were also identified using the GWAS approach (Figure 370
2). Among the 305 SNPs, nine were located in exonic regions of nine unique 371
genes (Table 2). 372
373
c) Consensus candidate loci 374
When overlapping the results of the GWAS and the FST-based test, there 375
were four SNPs in coding regions that were associated with Borrelia infection 376
status in both analyses (Table 2). These four SNPs were located in the exonic 377
regions of the genes Slc26a4 (Solute carrier family 26, member 4), Tns3 378
(Tensin 3), Wscd1 (WSC domain containing 1) and Espnl (Espin-like). The 379
less frequent allele of Slc26a4 (allele A; χ2 = 4.414, DF = 1, P = 0.036) and 380
Tns3 (allele A; GLMM: χ2 = 6.859, DF = 1, P = 0.009) were associated with a 381
lower probability of Borrelia infection (Figure 3, Supporting information Table 382
S3), whereas the less frequent allele of Wscd1 (allele G; χ2 = 5.790, DF = 1, P 383
= 0.016) and Espnl (allele C; χ2 = 6.488, DF = 1, P = 0.011) were associated 384
with a higher probability of Borrelia infection (Figure 3, Supporting information 385
Table S3). Models that treated the heterozygous and homozygous state of the 386
less frequent allele as separate genotypes are presented here. Models that 387
combined the heterozygous and homozygous state of the less frequent allele 388
are presented in Supporting information Table S4. 389
390
Discussion 391

18
For most non-model organisms, and wild-living vertebrates in particular, the 392
genetic basis underlying infectious disease resistance or susceptibility is 393
poorly understood (Spurgin & Richardson, 2010), which hampers progress in 394
our understanding of the eco-evolutionary dynamics of host-parasite 395
interactions and wildlife disease. Here we present a case study in a natural 396
rodent-Borrelia system in which we combined a GWAS and a FST-based 397
approach with population-level replication to identify genomic regions 398
associated with variation in Borrelia infection status. 399
Borrelia prevalence in bank voles was high at all seven study sites, 400
with 31-61% of adult bank voles being Borrelia infected across sites. Given 401
the negative fitness consequences a Borrelia infection has for the rodent host 402
(Cayol et al., 2018), natural selection is expected to favour mechanism that 403
control or prevent infection. Using a GWAS approach we identified a large 404
number (1065) of SNPs that were associated (p < 0.05) with the voles’ 405
Borrelia infection status while controlling for population structure. Given the 406
relatively relaxed criteria that were applied to identify genotype-phenotype 407
associations in this GWAS approach, many of these SNPs were likely false 408
positives. Indeed, the risk of false positive signals in GWAS increases when a 409
large number of SNPs but a small number of individuals are included (Hong & 410
Park, 2012), which was the case in our study, and is typical for most studies 411
on wildlife populations. 412
In order to increase statistical power to detect true signals while 413
controlling for false positives, we complemented the GWAS approach with an 414
FST-based analysis, replicated across populations. We observed pronounced 415
(given the relatively small geographical distances among study sites) genetic 416

19
differentiation of bank voles across study sites and strong isolation-by-417
distance. Furthermore, Bayesian assignment analysis identified seven well 418
defined genetic clusters, corresponding to the seven sampling sites. These 419
results indicate that the seven bank vole populations are sufficiently isolated 420
to represent independent replicates for the identification of targets of Borrelia-421
mediated selection. Within each population we identified SNPs lying within the 422
top 10% of the population-specific FST distribution and considered SNPs that 423
were among these extreme 10% in multiple populations to be putatively 424
associated with Borrelia infection status. This FST -based approach assumes 425
that the same mechanisms underlie Borrelia resistance or susceptibility in 426
multiple populations, which does not necessarily need to be the case. Indeed, 427
quantitative trait loci (QTL) are often found to be population-specific 428
(Schielzeth et al., 2018; Tschirren & Bensch, 2010), and previous work in 429
other systems has demonstrated variation in host responses to pathogen 430
infection across populations (Bankers et al., 2017; Kurtz et al., 2014). 431
Applying a population-level replication criterion is conservative and will 432
prevent identifying such population-specific SNPs associated with Borrelia 433
infection status, yet it also allows us to control for false positive signals. 434
Indeed, the neutral simulations demonstrated the power of using a population 435
replication criterion to reduce false positive signals. 436
The simulations furthermore showed that false-positive rates are 437
further reduced when GWAS and FST-based approaches are combined. Using 438
such a combined apporach, we identified four consensus polymorphisms 439
located in exonic regions representing promising targets of Borrelia-mediated 440
selection in bank voles. Interestingly, for most of the genes in which the 441

20
consensus SNPs were located, a functional association with response to 442
bacterial infection has previously been demonstrated in rodents: Slc26a4 443
encodes the anion exchanger Pendrin and is expressed in membranes of ion-444
transporting epithelia where it regulates luminal pH and fluid transport 445
(Royaux et al., 2000). Slc26a4 has been found to be significantly upregulated 446
in mouse macrophages experimentally stimulated with live B. burgdorferi 447
(Gautam et al., 2011). Similarly, mice infected with the bacterial pathogen 448
Bordetella pertussis, the etiological agent of whooping cough, exhibited 449
significant Slc26a4 upregulation (Scanlon et al., 2014). Tns3 encodes a 450
phosphoprotein thought to act as a link between the extracellular matrix and 451
the cytoskeleton (Lo, 2004). This gene was found to be significantly 452
upregulated in mice experimentally infected with the bacterium 453
Mycobacterium bovis, the main etiological agent of bovine tuberculosis 454
(Aranday-Cortes et al., 2012). Another member of the tensin gene family, 455
Tensin 1, was downregulated and upregulated 4 h and 24 h respectively, after 456
stimulation of mouse macrophages with live B. burgdorferi (Gautam et al., 457
2011), suggesting a general role of the tensin gene family in the response to 458
bacterial infections. Wscd1 encodes a protein with sulfotransferase activity 459
(Smith, Blake, Kadin, Richardson, & Bult, 2018). Wscd1 has been found to be 460
significantly downregulated in mice five days after infection with the bacterium 461
Yersinia pseudotuberculosis (Heine et al., 2018). Taken together, these 462
previous findings suggest that several genes identified as candidates in our 463
study play a role in the response to bacterial infections in rodents. However, 464
the exact mechanisms by which these genes may confer resistance or 465

21
susceptibility to Borrelia in bank voles are currently unknown and will be the 466
focus of future work. 467
Previously, we have demonstrated that naturally occurring 468
polymorphisms at the innate immune receptor Toll-like receptor 2 (TLR2) are 469
significantly associated with the Borrelia infection status of bank voles in 470
multiple populations, including the current study population (Cornetti et al., 471
2018; Tschirren et al., 2013; Tschirren, 2015). These findings were in line with 472
biomedical research that has identified TLR2 as a candidate gene for Borrelia 473
resistance in laboratory mice (Alexopoulou et al., 2002; Dennis et al., 2009; 474
Singh & Girschick, 2006; Wooten et al., 2002). Interestingly, however, TLR2 475
was not identified as a potential candidate gene in this study, also not when 476
considering the results of GWAS and FST-based approaches separately. It 477
demonstrates the limitations of reduced-representation sequencing 478
approaches, which do not cover the whole genome (Davey & Blaxter, 2010). 479
Depending on the density and distribution of SNPs, as well as recombination 480
rates in regions of interest, the power to detect signals might be low. In our 481
study, no GBS SNP was close enough to possibly pick up signals of selection 482
acting on TLR2. In fact the closest SNP was about 46kb away from TLR2, a 483
physical distance larger than the linkage disequilibrium decay estimated for 484
natural rodent populations (r2<0.2 ~20 kb; Staubach et al, 2012). This 485
suggests that some other putative candidate regions were likely missed with 486
our approach because of insufficient SNP coverage. At the same time, we can 487
exclude the possibility that the SNPs identified in our study were physically 488
linked to TLR2. TLR2 is located on chromosome 1 in the prairie vole, whereas 489
Tns3, Wscd1 and Espnl are located on chromosome 7, linkage group 1 and 490

22
linkage group 4, respectively. Slc26a4 is located on chromosome 1 as well, 491
but separated by more than 40 Mb from TLR2. One possible way to obtain a 492
more conclusive list of candidate genes associated with Borrelia infectious 493
status would be to increase SNP density or sequence the whole genome. 494
However, costs associated with especially the latter approach are still 495
excruciatingly high, in particular when large numbers of individuals are 496
included and the study species has a large genome size, as is the case for 497
mammals (Catchen et al., 2017). 498
In conclusion, by combining GWAS and FST-based approach with 499
population-level replication we identified consensus SNPs in exonic regions of 500
genes for which a functional association with host responses to bacterial 501
infections has previously been demonstrated. These loci thus represent 502
promising new candidate genes that may allow tracking evolutionary changes 503
in host populations in response to Borrelia emergence. More generally, the 504
combined approach used in this case study can be applied to other systems 505
and may contribute to a better understanding of genotype-phenotype 506
associations in wildlife populations. 507
508
Acknowledgements 509
This study was supported by the University of Zurich Research Priority 510
Program “Evolution in Action: from Genomes to Ecosystems”, the Faculty of 511
Science of the University of Zurich, the Baugarten Stiftung and the Stiftung für 512
wissenschaftliche Forschung an der Universität Zürich. We thank the 513
numerous people who contributed to sample collection in the field, Peter 514

23
Fields for suggestions on genetic simulations, and Jacek Radwan and two 515
anonymous reviewers for their constructive comments on the manuscript. 516
517
518
Author Contributions 519
LC and BT designed the research, LC performed laboratory work and 520
analysed the data, LC and BT wrote the paper. 521
522
Data accessibility 523
The Genotyping-by-Sequencing data are deposited in NCBI BioProject 524
PRJNA306409, SRA experiment SRR3031372. The quality filtered SNP file 525
used for population genomic analyses and information on population and 526
infection status of individual bank voles are deposited in the Dryad repository 527
doi:10.5061/dryad.c866t1g3t.528

24
References 529
Abramson, N. I., Lebedev, V. S., Tesakov, A. S., & Bannikova, A. A. (2009). 530
Supraspecies relationships in the subfamily Arvicolinae (Rodentia, 531
Cricetidae): An unexpected result of nuclear gene analysis. Molecular 532
Biology, 43(5), 834–846. doi:10.1134/S0026893309050148 533
Alexopoulou, L., Thomas, V., Schnare, M., Lobet, Y., Anguita, J., Schoen, R. 534
T., … Flavell, R. A. (2002). Hyporesponsiveness to vaccination with 535
Borrelia burgdorferi OspA in humans and in TLR1- and TLR2-deficient 536
mice. Nature Medicine, 8(8), 878–84. doi:10.1038/nm732 537
Amos, W., Driscoll, E., & Hoffman, J. I. (2011). Candidate genes versus 538
genome-wide associations: Which are better for detecting genetic 539
susceptibility to infectious disease? Proceedings of the Royal Society B: 540
Biological Sciences, 278(1709), 1183–1188. doi:10.1098/rspb.2010.1920 541
Aranday-Cortes, E., Hogarth, P. J., Kaveh, D. A., Whelan, A. O., Villarreal-542
Ramos, B., Lalvani, A., & Vordermeier, H. M. (2012). Transcriptional 543
profiling of disease-induced host responses in bovine tuberculosis and 544
the identification of potential diagnostic biomarkers. PLoS ONE, 7(2). 545
doi:10.1371/journal.pone.0030626 546
Aulchenko, Y. S., Ripke, S., Isaacs, A., & van Duijn, C. M. (2007). GenABEL: 547
An R library for genome-wide association analysis. Bioinformatics, 548
23(10), 1294–1296. doi:10.1093/bioinformatics/btm108 549
Bankers, L., Fields, P., McElroy, K. E., Boore, J. L., Logsdon, J. M., & 550
Neiman, M. (2017). Genomic evidence for population-specific responses 551
to co-evolving parasites in a New Zealand freshwater snail. Molecular 552
Ecology, 26(14), 3663–3675. doi:10.1111/mec.14146 553

25
Bates, D., Maechler, M., Bolker, B. & Walker, S. (2011). Fitting linear mixed-554
effects models using lme4. Journal of Statistical Software, 67(1), 1-48. 555
Beldomenico, P. M., & Begon, M. (2010). Disease spread, susceptibility and 556
infection intensity: vicious circles? Trends in Ecology and Evolution, 557
25(1), 21–27. doi:10.1016/j.tree.2009.06.015 558
Bolger, A. M., Lohse, M., & Usadel, B. (2014). Trimmomatic: A flexible 559
trimmer for Illumina sequence data. Bioinformatics, 30(15), 2114–2120. 560
doi:10.1093/bioinformatics/btu170 561
Catchen, J. M., Hohenlohe, P. A., Bernatchez, L., Funk, W. C., Andrews, K. 562
R., & Allendorf, F. W. (2017). Unbroken : RADseq remains a powerful tool 563
for understanding the genetics of adaptation in natural populations. 564
Molecular Ecology Resources, 17, 362–365. doi:10.1111/1755-565
0998.12669 566
Cayol, C., Giermek, A., Gomez-Chamorro, A., Hytönen, J., Kallio, E. R., 567
Mappes, T., … Koskela, E. (2018). Borrelia afzelii alters reproductive 568
success in a rodent host. Proceedings of the Royal Society B: Biological 569
Sciences, 285(1884), 20181056. doi:10.1098/rspb.2018.1056 570
Chang, C. C., Chow, C. C., Tellier, L. C. A. M., Vattikuti, S., Purcell, S. M., & 571
Lee, J. J. (2014). Second-generation PLINK: rising to the challenge of 572
larger and richer datasets, 1–16. doi:10.1186/s13742-015-0047-8 573
Chanock, S. J., Manolio, T., Boehnke, M., Boerwinkle, E., Hunter, D. J., 574
Thomas, G., … Collins, F. S. (2007). Replicating genotype–phenotype 575
associations. Nature, 447, 655-660. doi: 10.1038/447655a 576
Cornetti, L., Hilfiker, D., Lemoine, M., & Tschirren, B. (2018). Small-scale 577
spatial variation in infection risk shapes the evolution of a Borrelia 578

26
resistance gene in wild rodents. Molecular Ecology, 27(17), 3515–3524. 579
doi:10.1111/mec.14812 580
Cornetti, L. & Tschirren, B. (2020) Data from: Combining GWAS and FST-581
based approaches to identify targets of Borrelia-mediated selection in 582
natural rodent hosts; Dryad; doi: 10.5061/dryad.c866t1g3t. 583
Cornetti, L. & Tschirren, B. (2020). NCBI Sequence Read Archive (BioProject 584
ID: PRJNA306409, SRA experiment SRR3031372). 585
https://www.ncbi.nlm.nih.gov/bioproject/PRJNA306409. 586
Danecek, P., Auton, A., Abecasis, G., Albers, C. A., Banks, E., DePristo, M. 587
A., … Durbin, R. (2011). The variant call format and VCFtools. 588
Bioinformatics, 27(15), 2156–2158. doi:10.1093/bioinformatics/btr330 589
Daszak, P., Cunningham, A. A., & Hyatt, A. D. (2000). Emerging infectious 590
diseases of wildlife - threats to biodiversity and human health. Science, 591
287, 443–449. doi:10.1126/science.287.5452.443 592
Davey, J. L., & Blaxter, M. W. (2010). RADseq: Next-generation population 593
genetics. Briefings in Functional Genomics, 9(5–6), 416–423. 594
doi:10.1093/bfgp/elq031 595
Dennis, V. A., Dixit, S., O'Brien, S. M., Alvarez, X., Pahar, B., & Philipp, 596
M. T. (2009). Live Borrelia burgdorferi spirochetes elicit inflammatory 597
mediators from human monocytes via the toll-like receptor signaling 598
pathway. Infection and Immunity, 77(3), 1238–1245. 599
doi:10.1128/IAI.01078-08 600
Doran, A. G., & Creevey, C. J. (2013). Snpdat: easy and rapid annotation of 601
results from de novo snp discovery projects for model and non-model 602
organisms. BMC Bioinformatics, 14(1), 45. doi:10.1186/1471-2105-14-45 603

27
Earl, D. A., & VonHoldt, B. M. (2012). STRUCTURE HARVESTER: A website 604
and program for visualizing STRUCTURE output and implementing the 605
Evanno method. Conservation Genetics Resources, 4(2), 359–361. 606
doi:10.1007/s12686-011-9548-7 607
Ersts, P. J. (2017). Geographic Distance Matrix Generator (version 1.2.3). 608
Retrieved July 18, 2017, from 609
http://biodiversityinformatics.amnh.org/open_source/gdmg 610
Excoffier, L., & Lischer, H. E. L. (2010). Arlequin suite ver 3.5: A new series of 611
programs to perform population genetics analyses under Linux and 612
Windows. Molecular Ecology Resources, 10(3), 564–567. 613
doi:10.1111/j.1755-0998.2010.02847.x 614
Flint, J., & Eskin, E. (2012). Genome-wide association studies in mice. Nature 615
Reviews. Genetics, 13(11), 807–817. doi:10.1038/nrg3335 616
Gautam, A., Dixit, S., Philipp, M. T., Singh, S. R., Morici, L. A., Kaushal, D., & 617
Dennis, V. A. (2011). Interleukin-10 alters effector functions of multiple 618
genes induced by Borrelia burgdorferi in macrophages to regulate lyme 619
disease inflammation. Infection and Immunity, 79(12), 4876–4892. 620
doi:10.1128/IAI.05451-11 621
Gliwicz, J. (1988). Seasonal dispersal in non-cyclic populations of 622
Clethrionomys glareolus and Apodemus flavicollis. Acta Theriologica, 33, 623
263–272. doi:10.4098/AT.arch.88-20 624
Haller, B. C., & Messer, P. W. (2019). SLiM 3: Forward genetic simulations 625
beyond the Wright-Fisher model. Molecular Biology and Evolution, 36(3), 626
632–637. doi:10.1093/molbev/msy228 627
Heine, W., Beckstette, M., Heroven, A. K., Thiemann, S., Heise, U., Nuss, A. 628

28
M., … Dersch, P. (2018). Loss of CNFYtoxin-induced inflammation drives 629
Yersinia pseudotuberculosis into persistency. PLoS Pathogens 14(2), 630
e1006858. doi:10.1371/journal.ppat.1006858 631
Hill, A. V. S. (2012). Evolution, revolution and heresy in the genetics of 632
infectious disease susceptibility. Philosophical Transactions of the Royal 633
Society B: Biological Sciences, 367(1590), 840–849. 634
doi:10.1098/rstb.2011.0275 635
Hoban, S., Kelley, J. L., Lotterhos, K. E., Antolin, M. F., Bradburd, G., Lowry, 636
D. B., … Whitlock, M. C. (2016). Finding the genomic basis of local 637
adaptation: pitfalls, practical solutions, and future directions. American 638
Naturalist, 188(4), 379–397. doi:10.1086/688018 639
Hong, E. P., & Park, J. W. (2012). Sample size and statistical power 640
calculation in genetic association studies. Genomics & Informatics, 10(2), 641
117–122. doi:10.5808/GI.2012.10.2.117 642
Jensen, J. L., Bohonak, A. J., & Kelley, S. T. (2005). Isolation by distance, 643
web service. BMC Genetics, 6, 13. doi:10.1186/1471-2156-6-13 644
Jones, K. E., Patel, N. G., Levy, M. A., Storeygard, A., Balk, D., Gittleman, J. 645
L., & Daszak, P. (2008). Global trends in emerging infectious diseases. 646
Nature, 451(7181), 990–993. doi:10.1038/nature06536 647
Jones, M. E., Jarman, P. J., Lees, C. M., Hesterman, H., Hamede, R. K., 648
Mooney, N. J., … McCallum, H. (2007). Conservation management of 649
Tasmanian devils in the context of an emerging, extinction-threatening 650
disease: Devil facial tumor disease. EcoHealth, 4(3), 326–337. 651
doi:10.1007/s10393-007-0120-6 652
Kurtenbach, K., Hanincová, K., Tsao, J. I., Margos, G., Fish, D., & Ogden, N. 653

29
H. (2006). Fundamental processes in the evolutionary ecology of Lyme 654
borreliosis. Nature Reviews Microbiology, 4(9), 660–669. 655
doi:10.1038/nrmicro1475 656
Kurtz, J., Behrens, S., Schulenburg, H., Bornberg-Bauer, E., Peuß, R., 657
Milutinović, B., … Esser, D. (2014). Infection routes matter in population-658
specific responses of the red flour beetle to the entomopathogen Bacillus 659
thuringiensis. BMC Genomics, 15(1), 445. doi:10.1186/1471-2164-15-445 660
Langmead, B., & Salzberg, S. L. (2012). Fast gapped-read alignment with 661
Bowtie 2. Nature Methods, 9(4), 357–9. doi:10.1038/nmeth.1923 662
Lazzaro, B. P., & Little, T. J. (2009). Immunity in a variable world. 663
Philosophical Transactions of the Royal Society B: Biological Sciences, 664
364(1513), 15–26. doi:10.1098/rstb.2008.0141 665
Lo, S. H. (2004). Tensin. International Journal of Biochemistry and Cell 666
Biology, 36(1), 31–34. doi:10.1016/S1357-2725(03)00171-7 667
MacPhee, R. D. E., & Greenwood, A. D. (2013). Infectious disease, 668
endangerment, and extinction. International Journal of Evolutionary 669
Biology, 2013, 1–9. doi:10.1155/2013/571939 670
Mannelli, A., Bertolotti, L., Gern, L., & Gray, J. (2012). Ecology of Borrelia 671
burgdorferi sensu lato in Europe: transmission dynamics in multi-host 672
systems, influence of molecular processes and effects of climate change. 673
FEMS Microbiology Reviews, 36(4), 837–61. doi:10.1111/j.1574-674
6976.2011.00312.x 675
Mantel, N. (1967). The detection of disease clustering and a generalized 676
regression approach. Cancer Research, 27, 209-220. 677
Margres, M. J., Jones, M., Epstein, B., Kerlin, D. H., Comte, S., Fox, S., … 678

30
Storfer, A. (2018). Large-effect loci affect survival in Tasmanian devils ( 679
Sarcophilus harrisii ) infected with a transmissible cancer. Molecular 680
Ecology, 27(21), 4189–4199. doi:10.1111/mec.14853 681
McCarthy, M. I., Abecasis, G. R., Cardon, L. R., Goldstein, D. B., Little, J., 682
Ioannidis, J. P. a, & Hirschhorn, J. N. (2008). Genome-wide association 683
studies for complex traits: consensus, uncertainty and challenges. Nature 684
Reviews. Genetics, 9(5), 356–369. doi:10.1038/nrg2344 685
McGraw, L. A., Davis, J. K., Young, L. J., & Thomas, J. W. (2011). A genetic 686
linkage map and comparative mapping of the prairie vole (Microtus 687
ochrogaster) genome. BMC Genetics, 12(1), 60. doi:10.1186/1471-2156-688
12-60 689
McKenna, A., Hanna, M., Banks, E., Sivachenko, A., Cibulskis, K., Kernytsky, 690
A., … DePristo, M. A. (2010). The genome analysis toolkit: A MapReduce 691
framework for analyzing next-generation DNA sequencing data. Genome 692
Research, 20(9), 1297–1303. doi:10.1101/gr.107524.110 693
Myles, S., Davison, D., Barrett, J., Stoneking, M., & Timpson, N. (2008). 694
Worldwide population differentiation at disease-associated SNPs. BMC 695
Medical Genomics, 1(1), 22. doi:10.1186/1755-8794-1-22 696
Petersen, B. S., Fredrich, B., Hoeppner, M. P., Ellinghaus, D., & Franke, A. 697
(2017). Opportunities and challenges of whole-genome and -exome 698
sequencing. BMC Genetics, 18(1), 1–13. doi:10.1186/s12863-017-0479-5 699
Poland, J. A., Brown, P. J., Sorrells, M. E., & Jannink, J. L. (2012). 700
Development of high-density genetic maps for barley and wheat using a 701
novel two-enzyme genotyping-by-sequencing approach. PLoS ONE, 7(2). 702
doi:10.1371/journal.pone.0032253 703

31
Price, A. L., Patterson, N. J., Plenge, R. M., Weinblatt, M. E., Shadick, N. A., 704
& Reich, D. (2006). Principal components analysis corrects for 705
stratification in genome-wide association studies. Nature Genetics, 38(8), 706
904–909. doi:10.1038/ng1847 707
Price, A. L., Spencer, C. C. A., & Donnelly, P. (2015). Progress and promise 708
in understanding the genetic basis of common diseases. Proceedings of 709
the Royal Society B: Biological Sciences, 282(1821), 20151684. 710
doi:10.1098/rspb.2015.1684 711
Pritchard, J. K., Stephens, M., & Donnelly, P. (2000). Inference of population 712
structure using multilocus genotype data. Genetics, 155(2), 945–959. 713
doi:10.1111/j.1471-8286.2007.01758.x 714
R Core Team (2014). R: A language and environment for statistical 715
computing. R Foundation for Statistical Computing, Vienna, Austria. 716
Råberg, L. (2012). Infection intensity and infectivity of the tick-borne pathogen 717
Borrelia afzelii. Journal of Evolutionary Biology, 25(7), 1448–53. 718
doi:10.1111/j.1420-9101.2012.02515.x 719
Royaux, I. E., Suzuki, K., Mori, A., Katoh, R., Everett, L. A., Kohn, L. D., & 720
Green, E. D. (2000). Pendrin, the protein encoded by the pendred 721
syndrome gene (PDS), is an apical porter of iodide in the thyroid and is 722
regulated by thyroglobulin in FRTL-5 cells. Endocrinology, 141(2), 839–723
845. doi:10.1210/endo.141.2.7303 724
Santure, A. W., & Garant, D. (2018). Wild GWAS - association mapping in 725
natural populations. Molecular Ecology Resources, 18(4), 729–738. 726
doi:10.1111/1755-0998.12901 727
Scanlon, K. M., Gau, Y., Zhu, J., Skerry, C., Wall, S. M., Soleimani, M., & 728

32
Carbonetti, N. H. (2014). Epithelial anion transporter Pendrin contributes 729
to inflammatory lung pathology in mouse models of Bordetella pertussis 730
infection. Infection and Immunity, 82(10), 4212–4221. 731
doi:10.1128/iai.02222-14 732
Schielzeth, H., Rios, A., & Burri, R. (2018). Success and failure in replication 733
of genotype-phenotype associations: How does replication help in 734
understanding the genetic basis of phenotypic variation in outbred 735
populations? Molecular Ecology Resources, 18(4), 739–754. 736
doi:10.1111/1755-0998.12780 737
Singh, S. K., & Girschick, H. J. (2006). Toll-like receptors in Borrelia 738
burgdorferi-induced inflammation. Clinical Microbiology and Infection, 739
12(8), 705–717. doi:10.1111/j.1469-0691.2006.01440.x 740
Smith, C. L., Blake, J. A., Kadin, J. A., Richardson, J. E., & Bult, C. J. (2018). 741
Mouse Genome Database (MGD)-2018: Knowledgebase for the 742
laboratory mouse. Nucleic Acids Research, 46(D1), D836–D842. 743
doi:10.1093/nar/gkx1006 744
Smith, K. F., Sax, D. F., & Lafferty, K. D. (2006). Evidence for the role of 745
infectious disease in species extinction and endangerment. Conservation 746
Biology, 20(5), 1349–1357. doi:10.1111/j.1523-1739.2006.00524.x 747
Spurgin, L. G., & Richardson, D. S. (2010). How pathogens drive genetic 748
diversity: MHC, mechanisms and misunderstandings. Proceedings of the 749
Royal Society B: Biological Sciences, 277(1684), 979–88. 750
doi:10.1098/rspb.2009.2084 751
Staubach, F., Lorenc, A., Messer, P. W., Tang, K., Petrov, D. A., & Tautz, D. 752
(2012). Genome patterns of selection and introgression of haplotypes in 753

33
natural populations of the house mouse (Mus musculus). PLoS Genetics, 754
8(8), e1002891. doi:10.1371/journal.pgen.1002891 755
Steere, A. C., Coburn, J., & Glickstein, L. (2004). The emergence of Lyme 756
disease. Journal of Clinical Investigation, 113(8), 1093–1101. 757
doi:10.1172/JCI200421681 758
Tagu, D., Colbourne, J. K., & Nègre, N. (2014). Genomic data integration for 759
ecological and evolutionary traits in non-model organisms. BMC 760
Genomics, 15(1), 490. doi:10.1186/1471-2164-15-490 761
Togninalli, M., Seren, Ü., Meng, D., Fitz, J., Nordborg, M., Weigel, D., … 762
Grimm, D. G. (2018). The AraGWAS Catalog: A curated and 763
standardized Arabidopsis thaliana GWAS catalog. Nucleic Acids 764
Research, 46(D1), D1150–D1156. doi:10.1093/nar/gkx954 765
Tschirren, B., Andersson, M., Scherman, K., Westerdahl, H., Mittl, P. R., & 766
Råberg, L. (2013). Polymorphisms at the innate immune receptor TLR2 767
are associated with Borrelia infection in a wild rodent population. 768
Proceedings of the Royal Society B: Biological Sciences, 280, 20130364. 769
doi:10.1098/rspb.2013.0364 770
Tschirren, B. (2015). Borrelia burgdorferi sensu lato infection pressure shapes 771
innate immune gene evolution in natural rodent populations across 772
Europe. Biology Letters, 11, 20150263. doi:10.1098/rsbl.2015.0263 773
Tschirren, B. & Bensch, S. (2010). Genetics of personalities: no simple 774
answers for complex traits. Molecular Ecology, 19(4), 624–626. doi: 775
10.1111/j.1365-294X.2009.04519.x 776
Van der Auwera, G. A., Carneiro, M. O., Hartl, C., Poplin, R., del Angel, G., 777
Levy-Moonshine, A., … DePristo, M. A. (2013). From FastQ data to high-778

34
confidence variant calls: the genome analysis toolkit best practices 779
pipeline. In Current Protocols in Bioinformatics. John Wiley & Sons, Inc. 780
doi:10.1002/0471250953.bi1110s43 781
Visscher, P. M., Wray, N. R., Zhang, Q., Sklar, P., McCarthy, M. I., Brown, M. 782
A., & Yang, J. (2017). 10 years of GWAS discovery: biology, function, 783
and translation. American Journal of Human Genetics, 101(1), 5–22. 784
doi:10.1016/j.ajhg.2017.06.005 785
Vitti, J. J., Grossman, S. R., & Sabeti, P. C. (2013). Detecting natural 786
selection in genomic data. Annual Review of Genetics, 47, 97–120. 787
doi:10.1146/annurev-genet-111212-133526 788
Wangler, M. F., Hu, Y., & Shulman, J. M. (2017). Drosophila and genome-789
wide association studies: a review and resource for the functional 790
dissection of human complex traits. Disease Models & Mechanisms, 791
10(2), 77–88. doi:10.1242/dmm.027680 792
Wiethoelter, A. K., Beltrán-Alcrudo, D., Kock, R., & Mor, S. M. (2015). Global 793
trends in infectious diseases at the wildlife–livestock interface. 794
Proceedings of the National Academy of Sciences USA, 112(31), 9662–795
9667. doi:10.1073/pnas.1422741112 796
Wilfert, L., & Schmid-Hempel, P. (2008). The genetic architecture of 797
susceptibility to parasites. BMC Evolutionary Biology, 8(1), 1–8. 798
doi:10.1186/1471-2148-8-187 799
Wooten, R. M., Ma, Y., Yoder, R. A., Brown, J. P., Weis, J. H., Zachary, J. F., 800
… Weis, J. J. (2002). Toll-like receptor 2 is required for innate, but not 801
acquired, host defense to Borrelia burgdorferi. Journal of Immunology, 802
168(1), 348–355. 803

35
Zerbino, D. R., Achuthan, P., Akanni, W., Amode, M. R., Barrell, D., Bhai, J., 804
… Flicek, P. (2018). Ensembl 2018. Nucleic Acids Research, 46(D1), 805
D754–D761. doi:10.1093/nar/gkx1098 806
Zueva, K. J., Lumme, J., Veselov, A. E., Kent, M. P., Lien, S., & Primmer, C. 807
R. (2014). Footprints of directional selection in wild atlantic salmon 808
populations: Evidence for parasite-driven evolution? PLoS ONE, 9(3). 809
doi:10.1371/journal.pone.0091672 810
811

36
Tables 812
813
Table 1. Sampling locations and number of analysed bank voles 814
Elevation and study site coordinates, the number of genotyped adult bank voles (N), the number of genotyped Borrelia-free bank 815
voles (N uninf) and the number of genotyped Borrelia-infected bank voles (N inf) and Borrelia prevalence in adult bank voles at the 816
study sites are reported. 817
818
Location Label Elevatio
n (masl) North East N N uninf N inf
Borrelia
prevalence (%)
Bonaduz BON 944 46.799 9.352 16 8 8 50.0
Rodels ROD 630 46.760 9.425 17 13 4 31.2
Sagogn SAG 693 46.783 9.233 19 10 9 48.4
Flims FLI 1138 46.827 9.280 15 9 6 54.5
Malans MAL 560 46.992 9.557 19 10 9 44.8
Passugg PAS 732 46.840 9.538 13 6 7 61.5

37
Trimmis TRI 762 46.882 9.559 19 9 10 44.8
819
820

38
Table 2. FST outlier SNPs 821
Exonic SNPs that were identified as outliers in multiple populations when comparing Borrelia-infected and Borrelia-free bank voles 822
using a FST-based approach. SNPs in bold were also identified to be associated with Borrelia-infection status using a GWAS 823
approach. The SNP position refers to the prairie vole genome version MicOch1.0. 824
825
Chromoso
me
Number
SNP
Position
Start of
exon
End of
exon Protein ID Gene description
Number of
populations in
which the SNP was
an outlier
1 8281217
0
8281212
2 82812285
ENSMUSP0000000
1253
Solute carrier family 26,
member 4 3
5 9062805
7
9062645
6 90630654
ENSMUSP0000008
1880
Golgin subfamily A
member 4 3
7 8114766
8
8114756
3 81147724
ENSMUSP0000008
1864
Dynein, axonemal, heavy
chain 17 3

39
7 2713691
7
2713673
6 27136920
ENSMUSP0000010
4150
WSC domain containing
1 4
7 2581122
6
2581081
2 25812290
ENSMUSP0000005
5806 Haspin 3
8 7265577
7
7265562
7 72655797
ENSMUSP0000005
9419 Sideroflexin 3 3
LG1 8299897 8299839 8299951 ENSMUSP0000002
0695 Tensin 3 4
LG4 6044582
2
6044511
6 60446729
ENSMUSP0000008
6294 Espin-like 3
LG5 3878388
1
3878385
7 38783985
ENSMUSP0000003
0187 Talin-1 3
826
827

40
Figures 828
Figure 1. Multi-dimensional scaling of bank vole genetic diversity. 829
Different colours represent different sampling sites. The inset shows the proportion of ancestry for each sampled bank vole (N = 830
118) for seven genetic clusters inferred with STRUCTURE (see Supplementary Figures S2 and S3 for additional information). 831
832
833
−0.04 −0.02 0.00 0.02 0.04 0.06
−0.04
−0.02
0.00
0.02
0.04
Bonaduz
Rodels
Sagogn
Flims
Malans
Passugg
Trimmis
Coordinate 1
Coo
rdin
ate
2
Sagogn Flims Bonaduz Rodels Passugg Trimmis Malans

41
Figure 2. Simulations of false-positive rates. 834
We used a simulation approach to quantify the false positive rate of the GWAS approach (a), the FST-based approach with a three 835
population replication criterion (b), and (c) the combined approach (i.e. consensus SNPs identified in (a) and (b)). The red asterisk 836
indicates the number of identified SNPs observed in the real data using the respective approach. 837
838
839
Number of SNPs associated with Borrelia infection status
Freq
uenc
y
850 900 950 1000 1050 1100 1150
02
46
810
02
46
810
50 100 150 200 250 300 350
05
1015
0 20 40 60 80
Freq
uenc
yFr
eque
ncy
Number of SNPs identified as Fst outliers
Number of consensus SNPs
a)
c)
b)
*
*
*

42
Figure 3. Genetic polymorphisms at the four consensus candidate loci are associated with Borrelia infection status in 840
bank voles. 841
Animals that carried the rarer allele of Slc26a4 (a, allele A) and Tns3 (c, allele A) were less likely to be Borrelia-infected, whereas 842
animals that carried the rarer allele of Wscd1 (b, allele G) and Espnl (d, allele C) were more likely to be Borrelia-infected. Error bars 843
represent standard errors. 844
845
846
0.00
0.25
0.50
0.75
1.00
Slc26a4 (AA)
Borrelia
infe
ctio
n pr
eval
ence
0.00
0.25
0.50
0.75
1.00
0.00
0.25
0.50
0.75
1.00
0.00
0.25
0.50
0.75
1.00
Borrelia
infe
ctio
n pr
eval
ence
Borrelia
infe
ctio
n pr
eval
ence
Borrelia
infe
ctio
n pr
eval
ence
Slc26a4 (AG) Slc26a4 (GG) Wscd1 (GG) Wscd1 (GT) Wscd1 (TT)
Espnl (GG)Espnl (CG)Espnl (CC)Tns3 (GG)Tns3 (AG)Tns3 (AA)
a) b)
c) d)

1
Supporting information
Combining GWAS and FST-based approaches to identify targets of Borrelia-mediated selection in natural rodent hosts
L. Cornetti & B. Tschirren
1. Supporting Methods Neutral simulations Script used for the simulations initialize() { initializeMutationRate(2e-4); ## mutation rate initializeMutationType("m1", 0.5, "f", 0.0); ## mutation type description: non-coding or synonymous initializeGenomicElementType("g1", c(m1), c(100)); ## mutation occurrence initializeGenomicElement(g1, 0, 27999); ## size of the simulated chromosome initializeRecombinationRate(0.05); ## recombination rate } 1 { ## at generation 1 seven subpopulations appear sim.addSubpop("p1", 100); ## population size of p1 sim.addSubpop("p2", 100); ## population size of p2 sim.addSubpop("p3", 100); ## population size of p3 sim.addSubpop("p4", 100); ## population size of p4 sim.addSubpop("p5", 100); ## population size of p5 sim.addSubpop("p6", 100); ## population size of p6 sim.addSubpop("p7", 100); ## population size of p7 p1.setMigrationRates(c(p2,p3,p4,p5,p6,p7), c(0.05,0.05,0.05,0.01,0.03,0.01)); ## migration rates into population p1 from the others p2.setMigrationRates(c(p1,p3,p4,p5,p6,p7), c(0.05,0.03,0.03,0.01,0.05,0.03)); ## migration rates into population p2 from the others p3.setMigrationRates(c(p1,p2,p4,p5,p6,p7), c(0.05,0.03,0.05,0.01,0.01,0.01)); ## migration rates into population p3 from the others p4.setMigrationRates(c(p1,p2,p3,p5,p6,p7), c(0.05,0.03,0.05,0.01,0.03,0.03)); ## migration rates into population p4 from the others p5.setMigrationRates(c(p1,p2,p3,p4,p6,p7), c(0.01,0.01,0.01,0.01,0.03,0.03)); ## migration rates into population p5 from the others

2
p6.setMigrationRates(c(p1,p2,p3,p4,p5,p7), c(0.03,0.05,0.01,0.03,0.01,0.05)); ## migration rates into population p6 from the others p7.setMigrationRates(c(p1,p2,p3,p4,p5,p6), c(0.01,0.03,0.01,0.03,0.05,0.03)); ## migration rates into population p7 from the others } 4999 late() { ## number of generation simulated bonaduz = p1.sampleIndividuals(16).genomes; ## number of samples selected from p1 according to the sample size of Bonaduz bonaduz.outputVCF(filePath="/home/p1.vcf"); ## the SNPs are written in a VCF file rodels = p2.sampleIndividuals(17).genomes; ## number of samples selected from p2 according to the sample size of Rodels rodels.outputVCF(filePath="/home/p2.vcf"); ## the SNPs are written in a VCF file sagogn = p3.sampleIndividuals(19).genomes; ## number of samples selected from p3 according to the sample size of Sagogn sagogn.outputVCF(filePath="/home/p3.vcf"); ## the SNPs are written in a VCF file flims = p4.sampleIndividuals(15).genomes; ## number of samples selected from p4 according to the sample size of Flims flims.outputVCF(filePath="/home/p4.vcf"); ## the SNPs are written in a VCF file malans = p5.sampleIndividuals(19).genomes; ## number of samples selected from p5 according to the sample size of Malans malans.outputVCF(filePath="/home/p5.vcf"); ## the SNPs are written in a VCF file passugg = p6.sampleIndividuals(13).genomes; ## number of samples selected from p6 according to the sample size of Passugg passugg.outputVCF(filePath="/home/p6.vcf"); ## the SNPs are written in a VCF file trimmis = p7.sampleIndividuals(19).genomes; ## number of samples selected from p7 according to the sample size of Trimmis trimmis.outputVCF(filePath="/home/p7.vcf"); ## the SNPs are written in a VCF file }

3
Supporting Figures Figure S1. Map of the sampling sites in the Kanton Graubünden, Switzerland.

4
Figure S2. Estimate of the number of genetically well defined groups (K) based on mean likelihood (Pritchard, Stephens, & Donnelly, 2000).
1 2 3 4 5 6 7K
108000
106000
104000
102000
100000
98000
Mean o
f est
. Ln
pro
b o
f data
L(K) (mean +- SD)

5
Figure S3. STRUCTURE plot describing the bank vole population structure in the study area using K=2 to K=7 as most probable number of genetic groups.
K=3
K=4
K=5
K=6
K=7
K=2
Sagogn Flims Bonaduz Rodels Passugg Trimmis Malans
Sagogn Flims Bonaduz Rodels Passugg Trimmis Malans

6
Figure S4. Isolation-by-distance of bank vole populations across our study sites.
0.6 0.8 1.0 1.2 1.4 1.60.050
0.059
0.068
0.077
0.086
0.095
0.104
0.113
0.122
0.131
0.140
Geographic distance (log(Km))
Gen
etic
dis
tanc
e (F
st/(1
-Fst)

7
Figure S5 False positive rates of FST -based approach. We used a simulation approach to quantify the false positive rate of the FST-based approach when using no population replication (a), a two population replication criterion (b), and a three population replication criterion (as used in the main study) (c). The red asterisk indicates the number of outliers observed in the real data using the respective approach.
5400 5600 5800 6000 6200 6400 6600
900 1000 1100 1200 1300 1400 1500
50 100 150 200 250 300 350
Freq
uenc
y
02
46
810
02
46
810
05
1015
Freq
uenc
yFr
eque
ncy
Number of outlier SNPs
Number of outlier SNPs
Number of outlier SNPs
a)
b)
c)
*
*
*

8
Figure S6. Association scan for Borrelia infection status in bank voles using a GWAS approach. Associations between SNPs and bank vole Borrelia infection status after correcting for population structure (–log10(P-value)) are plotted for each chromosome and linkage group. The red line represents the P = 0.05 threshold. Dots above this line represent SNPs possibly associated with Borrelia infection status.
0.0e+00 2.0e+07 4.0e+07 6.0e+07 8.0e+07 1.0e+08 1.2e+08
0.0
0.5
1.0
1.5
2.0
2.5
chr1
position (bp)
−log
10(P−v
alue
)
0e+00 2e+07 4e+07 6e+07 8e+07 1e+08
0.0
0.5
1.0
1.5
2.0
2.5
3.0
3.5
chr2
position (bp)
−log
10(P−v
alue
)
0e+00 2e+07 4e+07 6e+07 8e+07
0.0
0.5
1.0
1.5
2.0
2.5
chr4
position (bp)
−log
10(P−v
alue
)
0e+00 2e+07 4e+07 6e+07 8e+07
0.0
0.5
1.0
1.5
2.0
2.5
chr5
position (bp)
−log
10(P−v
alue
)
0e+00 2e+07 4e+07 6e+07 8e+07
0.0
0.5
1.0
1.5
2.0
2.5
chr6
position (bp)
−log
10(P−v
alue
)
0e+00 2e+07 4e+07 6e+07 8e+07
0.0
0.5
1.0
1.5
2.0
2.5
3.0
chr7
position (bp)
−log
10(P−v
alue
)

9
0e+00 2e+07 4e+07 6e+07 8e+07
0.0
0.5
1.0
1.5
2.0
2.5
chr8
position (bp)
−log
10(P−v
alue
)
0e+00 2e+07 4e+07 6e+07 8e+07
0.0
0.5
1.0
1.5
2.0
2.5
3.0
chr10
position (bp)
−log
10(P−v
alue
)
0e+00 1e+07 2e+07 3e+07 4e+07
0.0
0.5
1.0
1.5
2.0
2.5
chr15
position (bp)
−log
10(P−v
alue
)
0e+00 1e+07 2e+07 3e+07 4e+07 5e+07 6e+07
0.0
0.5
1.0
1.5
2.0
2.5
chr16
position (bp)
−log
10(P−v
alue
)
0.0e+00 5.0e+06 1.0e+07 1.5e+07 2.0e+07 2.5e+07 3.0e+07 3.5e+07
0.0
0.5
1.0
1.5
2.0
chr17
position (bp)
−log
10(P−v
alue
)
0e+00 1e+07 2e+07 3e+07 4e+07 5e+07 6e+07 7e+07
0.0
0.5
1.0
1.5
2.0
2.5
3.0
chr18
position (bp)
−log
10(P−v
alue
)
0e+00 1e+07 2e+07 3e+07 4e+07 5e+07 6e+07
0.0
0.5
1.0
1.5
chr19
position (bp)
−log
10(P−v
alue
)
0e+00 1e+07 2e+07 3e+07 4e+07 5e+07
0.0
0.5
1.0
1.5
2.0
chr21
position (bp)
−log
10(P−v
alue
)
0.0e+00 5.0e+06 1.0e+07 1.5e+07 2.0e+07 2.5e+07 3.0e+07 3.5e+07
0.0
0.5
1.0
1.5
2.0
2.5
chr22
position (bp)
−log
10(P−v
alue
)
0.0e+00 5.0e+06 1.0e+07 1.5e+07 2.0e+07 2.5e+07 3.0e+07 3.5e+07
0.0
0.5
1.0
1.5
2.0
chr24
position (bp)
−log
10(P−v
alue
)
0.0e+00 2.0e+06 4.0e+06 6.0e+06 8.0e+06 1.0e+07 1.2e+07 1.4e+07
0.0
0.5
1.0
1.5
chr26
position (bp)
−log
10(P−v
alue
)
0e+00 1e+07 2e+07 3e+07 4e+07 5e+07
0.0
0.2
0.4
0.6
0.8
1.0
1.2
1.4 chrX
position (bp)
−log
10(P−v
alue
)

10
0e+00 1e+07 2e+07 3e+07 4e+07 5e+07 6e+07
0.0
1.0
2.0
LG1
position (bp)
−log
10(P−v
alue
)
0e+00 1e+07 2e+07 3e+07 4e+07 5e+07
0.0
1.0
2.0
LG2
position (bp)
−log
10(P−v
alue
)
0e+00 1e+07 2e+07 3e+07 4e+07
0.0
1.0
2.0
LG3
position (bp)
−log
10(P−v
alue
)
0e+00 1e+07 2e+07 3e+07 4e+07 5e+07 6e+07
0.0
1.0
2.0
LG4
position (bp)
−log
10(P−v
alue
)
0e+00 1e+07 2e+07 3e+07 4e+07 5e+07 6e+07
0.0
1.0
2.0
LG5
position (bp)
−log
10(P−v
alue
)
0.0e+00 5.0e+06 1.0e+07 1.5e+07 2.0e+07 2.5e+07
0.0
1.0
2.0
LG7
position (bp)
−log
10(P−v
alue
)
0.0e+00 5.0e+06 1.0e+07 1.5e+07 2.0e+07 2.5e+07
0.0
1.0
2.0
3.0
LG8
position (bp)
−log
10(P−v
alue
)
0e+00 1e+07 2e+07 3e+07 4e+070.
01.
02.
0
LG9
position (bp)
−log
10(P−v
alue
)
5.0e+06 1.0e+07 1.5e+07
0.0
1.0
2.0
LG10
position (bp)
−log
10(P−v
alue
)
0e+00 1e+06 2e+06 3e+06 4e+06 5e+06
0.2
0.6
LG12
position (bp)
−log
10(P−v
alue
)
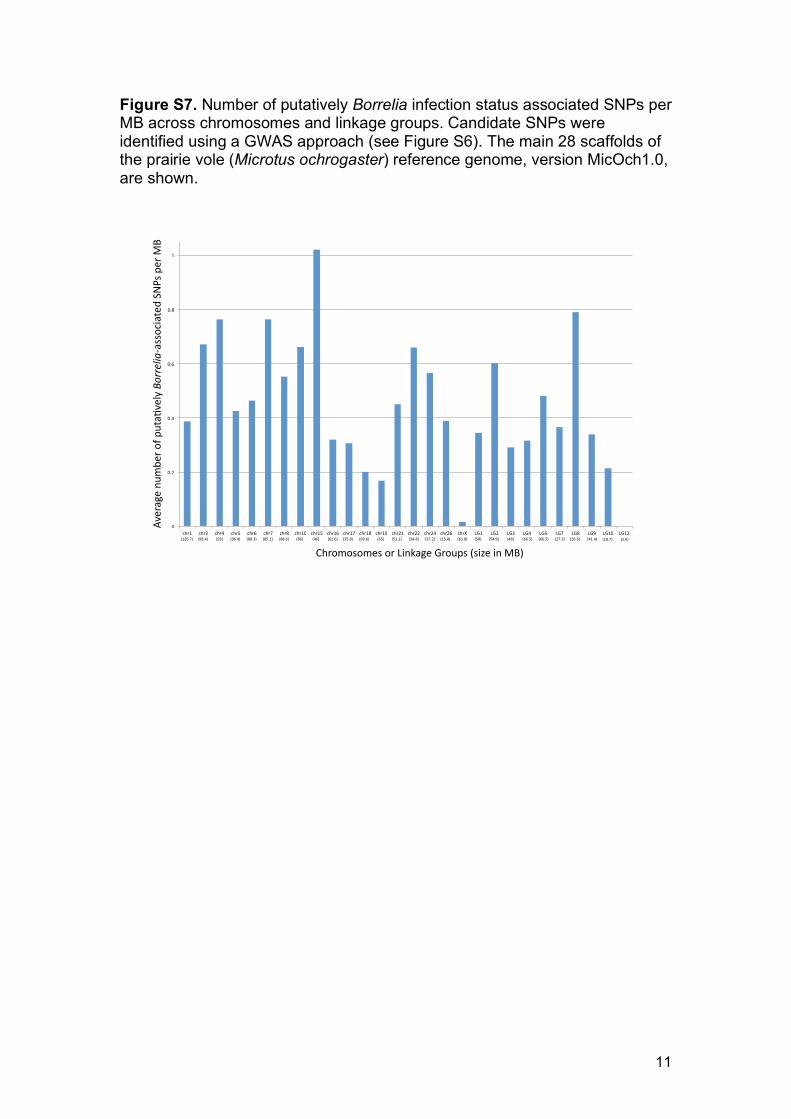
11
Figure S7. Number of putatively Borrelia infection status associated SNPs per MB across chromosomes and linkage groups. Candidate SNPs were identified using a GWAS approach (see Figure S6). The main 28 scaffolds of the prairie vole (Microtus ochrogaster) reference genome, version MicOch1.0, are shown.
0
0.2
0.4
0.6
0.8
1
chr1(126.7) (98.4) (93) (96.4) (88.3) (85.1) (88.6) (86) (46) (62.6) (35.8) (69.6) (65) (51.1) (34.8) (37.2) (15.4) (61.8) (58) (54.9) (48) (66.5) (66.5) (27.3) (26.6) (41.4) (5.6)(18.7)
chr2 chr4 chr5 chr6 chr7 chr8 chr10 chr15 chr16 chr17 chr18 chr19 chr21 chr22 chr24 chr26 chrX LG1 LG2 LG3 LG4 LG5 LG7 LG8 LG9 LG10 LG12
ChromosomesorLinkageGroups(sizeinMB)
Averagenu
mbe
rofp
uta�
velyBorrelia-associatedSN
PsperM
B

12
Figure S8. FST distribution of SNPs across the seven study populations. The red colour represents the SNPs falling into the 10% highest FST values when comparing Borrelia-infected vs uninfected bank voles within each population.
Fst infected vs non-infectedFst infected vs non-infected
Fst infected vs non-infected
Freq
uenc
yFr
eque
ncy
Freq
uenc
y
Fst infected vs non-infected Fst infected vs non-infected
Freq
uenc
y
Freq
uenc
y
Fst infected vs non-infectedFst infected vs non-infected
Freq
uenc
y
Freq
uenc
y
Bonaduz Malans
Trimmis Passugg
SagognFlims
Rodels
-0.2 -0.1 0.0 0.1 0.2 0.3 0.4 0.5
-0.2 -0.1 0.0 0.1 0.2 0.3 0.4 0.5-0.2 -0.1 0.0 0.1 0.2 0.3 0.4 0.5
-0.2 -0.1 0.0 0.1 0.2 0.3 0.4 0.5
-0.2 -0.1 0.0 0.1 0.2 0.3 0.4 0.5-0.2 -0.1 0.0 0.1 0.2 0.3 0.4 0.5
-0.2 -0.1 0.0 0.1 0.2 0.3 0.4 0.5
0 0
015
0010
0050
0
1500
1000
500
015
0010
0050
0
015
0010
0050
020
0020
040
060
080
010
00
020
040
060
080
010
00
020
040
060
080
010
0012
00

13
Supporting Tables Table S1. Pairwise FST based on 21,811 genome-wide SNPs (above the diagonal) and linear distance (km) between locations (below the diagonal). All FST values are statistically significant (p < 0.05).
Bonaduz Rodels Sagogn Flims Malans Passugg Trimmis Bonaduz - 0.063 0.068 0.062 0.110 0.083 0.092 Rodels 7.06 - 0.084 0.073 0.101 0.069 0.083 Sagogn 9.24 14.86 - 0.052 0.111 0.095 0.099 Flims 6.31 13.33 6.07 - 0.094 0.086 0.087 Malans 25.55 27.71 33.90 27.95 - 0.096 0.066 Passugg 14.89 12.39 24.09 19.70 16.98 - 0.076 Trimmis 18.27 16.99 27.16 22.10 12.25 4.94 -

14
Table S2. List of 53 exonic SNPs putatively associated with Borrelia infection status in bank voles, identified using a GWAS approach. Genes with more than one SNP per GBS read are underlined, and genes for which SNPs were observed in two different exons and two different GBS reads are highlighted with an asterisk (*). Candidate SNPs identified with both the GWAS and the FST -based approach with population replication are highlighted in bold. The SNP position refers to the prairie vole genome version MicOch1.0. Chromosome
Number SNP
Position Start of exon End of exon Protein ID Gene description LG2 46643179 46643140 46643278 ENSMUSP00000001183 formiminotransferase cyclodeaminase
1 82812170 82812122 82812285 ENSMUSP00000001253 solute carrier family 26, member 4 21 900079 899816 900277 ENSMUSP00000005015 papillary renal cell carcinoma (translocation-associated) 21 900160 899816 900277 ENSMUSP00000005015 papillary renal cell carcinoma (translocation-associated) 10 43932666 43932619 43932690 ENSMUSP00000010007 succinate dehydrogenase complex, subunit B, iron sulfur (Ip) 15 25218452 25218178 25218816 ENSMUSP00000016172 cadherin, EGF LAG seven-pass G-type receptor 1 15 25218467 25218178 25218816 ENSMUSP00000016172 cadherin, EGF LAG seven-pass G-type receptor 1 15 25218528 25218178 25218816 ENSMUSP00000016172 cadherin, EGF LAG seven-pass G-type receptor 1
LG8 4254355 4253368 4254449 ENSMUSP00000016399 tubulin, beta 1 class VI LG1 8299897 8299839 8299951 ENSMUSP00000020695 tensin 3
7 29565141 29565139 29565229 ENSMUSP00000021259 guanylate cyclase 2e 15 2823221 2823152 2823685 ENSMUSP00000023720 keratin 84 24 8453004 8453003 8453147 ENSMUSP00000026500 advillin 22 11931974 11931956 11932112 ENSMUSP00000026922 homer scaffolding protein 2
LG5 54679380 54679319 54680259 ENSMUSP00000027035 SRY (sex determining region Y)-box 17 LG2 23030453 23030389 23030539 ENSMUSP00000027257 MIT, microtubule interacting and transport, domain containing 1 LG4 60476015 60476012 60476048 ENSMUSP00000027532 selenocysteine lyase
6 23429687 23428593 23430689 ENSMUSP00000027706 leucine rich repeat protein 2, neuronal 5 74480869 74480842 74481033 ENSMUSP00000034961 immunoglobulin superfamily, DCC subclass, member 3

15
5 81380322 81380142 81380335 ENSMUSP00000035232 kelch domain containing 8B LG4 19571145 19570722 19571251 ENSMUSP00000036699 immunity-related GTPase family, Q
4 17036091 17035966 17036136 ENSMUSP00000039271 fucokinase 7 83424112* 83423459 83425210 ENSMUSP00000043643 BAH domain and coiled-coil containing 1 7 83439688* 83439647 83439722 ENSMUSP00000043643 BAH domain and coiled-coil containing 1 2 2946490 2946456 2946531 ENSMUSP00000046544 small G protein signaling modulator 1
24 33941679 33941663 33941821 ENSMUSP00000048309 stabilin 2 21 14567230 14566282 14567610 ENSMUSP00000052306 phospholipid phosphatase related 4 7 25811175 25810812 25812290 ENSMUSP00000055806 germ cell associated 2, haspin
22 25313647 25313056 25313865 ENSMUSP00000073855 synemin, intermediate filament protein 2 6446782 6446705 6447009 ENSMUSP00000075488 serine/arginine repetitive matrix 4
LG4 13915780 13915721 13915902 ENSMUSP00000076093 utrophin 2 16862787 16862779 16862865 ENSMUSP00000078198 rabphilin 3A 2 16862810 16862779 16862865 ENSMUSP00000078198 rabphilin 3A
15 26699638 26699630 26699696 ENSMUSP00000079575 RIKEN cDNA 1810041L15 gene 4 79583497 79583457 79583535 ENSMUSP00000079752 low density lipoprotein receptor-related protein 2 7 77798465 77798372 77798499 ENSMUSP00000081398 kinesin family member 19A
LG4 60445822 60445116 60446729 ENSMUSP00000086294 espin-like 15 28737242 28737225 28737356 ENSMUSP00000086582 meiotic double-stranded break formation protein 1 7 78870838 78870772 78870933 ENSMUSP00000091439 myosin XVB 6 23134593 23134517 23134713 ENSMUSP00000092148 neurofascin
LG9 16293329 16293222 16293422 ENSMUSP00000093587 spectrin repeat containing, nuclear envelope 1 LG8 25004183 25003387 25004577 ENSMUSP00000096813 zinc finger, CCHC domain containing 3
8 74431200 74431102 74432722 ENSMUSP00000096972 cyclin M2 2 4016724 4016690 4016844 ENSMUSP00000099642 acetyl-Coenzyme A carboxylase beta
10 75362360 75362298 75362460 ENSMUSP00000102320 podocan 22 2174486 2174390 2174566 ENSMUSP00000102745 myosin VIIA

16
7 27136917 27136736 27136920 ENSMUSP00000104150 WSC domain containing 1 7 30401083 30400232 30401249 ENSMUSP00000104314 netrin 1 5 15411871 15411823 15411894 ENSMUSP00000111093 adaptor protein complex AP-1, mu 2 subunit
6 55777259 55777095 55777561 ENSMUSP00000113964 leucine-rich repeat, immunoglobulin-like and transmembrane domains 1
8 38709839 38709811 38709966 ENSMUSP00000115356 aldehyde dehydrogenase 3 family, member B2 6 40936018 40935948 40936067 ENSMUSP00000126464 acyl-Coenzyme A oxidase 2, branched chain
15 10977462 10977321 10977467 ENSMUSP00000129100 5-oxoprolinase (ATP-hydrolysing)

17
Table S3. Allele frequencies at the four consensus candidate genes identified with both the GWAS and the FST-based approach. Frequencies of the reference allele are shown.
Gene
N Borrelia-infection
status Slc26a4 Tns3 WSC1 Espin-like
Chromosome chr1 chr7 LG1 LG4
Position 82812170 27136917 8299897 60445822
Alleles A / G G / A G / T G / C Reference allele A G G G
118 all 35.5 83.9 19.8 58.0
53 infected 27.5 92.7 28.9 48.1
65 uninfected 42 76.1 12.5 66.1

18
Table S4. Analysis of consensus candidate loci We used generalized linear mixed models with a binomial error structure and location included as a random effect to test for associations between consensus SNPs and Borrelia infection status of bank voles. Models that combined the heterozygous and homozygous state of the less frequent allele are presented here. Models that treated the heterozygous and homozygous state of the less frequent allele as separate genotypes are presented in the main text (see Figure 3 in main text for a visualization of the effects). SNP Test statistics Slc26a4 χ2 = 5.679, DF = 1, P = 0.017 Tns3 χ2 = 9.346, DF = 1, P = 0.002 Wscd1 χ2 = 5.639, DF = 1, P = 0.018 Espin-like χ2 = 3.162, DF = 1, P = 0.075

19
References Pritchard, J. K., Stephens, M., & Donnelly, P. (2000). Inference of population
structure using multilocus genotype data. Genetics, 155(2), 945–959. doi:10.1111/j.1471-8286.2007.01758.x
Copyright © 2022 FDOKUMEN