1 8G,3 - World Bank Documents & Reports
255
A WORLD BANK COUNTRY STUDY 1 8G,3 Belarus A, 7i,-, ., .1 I, fai tk.s, t/sli(II, tlto' p/ r.s'c R(,I} 0/ Public Disclosure Authorized Public Disclosure Authorized Public Disclosure Authorized Public Disclosure Authorized
-
Upload
khangminh22 -
Category
Documents
-
view
0 -
download
0
Transcript of 1 8G,3 - World Bank Documents & Reports
A WORLD BANK COUNTRY STUDY
1 8G,3
BelarusA, 7i,-, ., .1 I, fai tk.s, t/sli(II, tlto' p/ r.s'c R(,I} 0/
Pub
lic D
iscl
osur
e A
utho
rized
Pub
lic D
iscl
osur
e A
utho
rized
Pub
lic D
iscl
osur
e A
utho
rized
Pub
lic D
iscl
osur
e A
utho
rized

A WORLD BANK COUNTRY STUDY
BelarusPrices, Markets, and Enterprise Reform
The World BankWashington, D.C.
Copyright X 1997The International Bank for Reconstructionand Development/THE WORLD BANK1818 H Street, N.W.Washington, D.C. 20433, U.S.A.
All rights reservedManufactured in the United States of AmericaFirst printing July 1997
World Bank Country Studies are among the many reports originally prepared for internal use as partof the continuing analysis by the Bank of the economic and related conditions of its developing membercountries and of its dialogues with the governments. Some of the reports are published in this series withthe least possible delay for the use of governments and the academic, business and financial, and develop-ment communities. The typescript of this paper therefore has not been prepared in accordance with theprocedures appropriate to formal printed texts, and the World Bank accepts no responsibility for errors.Some sources cited in this paper may be informal documents that are not readily available.
The World Bank does not guarantee the accuracy of the data included in this publication and acceptsno responsibility whatsoever for any consequence of their use. The boundaries, colors, denominations,and other information shown on any map in this volume do not imply on the part of the World BankGroup any judgment on the legal status of any territory or the endorsement or acceptance of suchboundaries.
The material in this publication is copyrighted. Requests for permission to reproduce portions of itshould be sent to the Office of the Publisher at the address shown in the copyright notice above. TheWorld Bank encourages dissemination of its work and will normally give permission promptly and, whenthe reproduction is for noncommercial purposes, without asking a fee. Permission to copy portions forclassroom use is granted through the Copyright Clearance Center, Inc., Suite 910, 222 Rosewood Drive,Danvers, Massachusetts 01923, U.S.A.
ISSN: 0253-2123
Library of Congress Cataloging-in-Publication Data
Belarus: prices, markets, and enterprise reform.p. cm. - (A World Bank country study)
Includes bibliographical references.ISBN 0-8213-3976-11. Belarus-Economic conditions-1991- 2. Belarus-Economic
conditions-1991- -Statistics. 3. Economic stabilization-Belarus.I. World Bank. II. Series.HC340.17.B475 1997338.9478-dc2l 97-13283
CIP
CONTENTS
Acknowledgments ................................................ vii
Abstract ................................................ viii
Selected Indicators Table ................................................ ix
List of Abbreviations ................................................ xi
EXECUTIVE SUMMARY ................................................ xiii
1. THE ECONOMIC CRISIS - SOURCES AND SOLUTIONS ............................I
A. Origins of the Economic Crisis .......... 2......................................2Inflation, Credit, and Banking ........................................................... 2Sectoral Allocation of Credit ........................................................... 5Growth and Expenditure ........................................................... 9External Trade .......................................................... 15Exchange Rate .......................................................... 16Enterprise Profitability .......................................................... 27Fiscal Policies and Perfornance .......................................................... 30
B. Restoring Economic Stability and Growth ................................................ 31Stability .......................................................... 31Growth and Structural Change .......................................................... 31
C. Conclusions ................................................ 32
2. ESTABLISHING A MARKET-FRIENDLY ENVIRONMENT ........................ 33
A. Attracting Investment for Growth ................................................ 33
B. Establishing Market-Determined Prices ................................................ 35Price Decontrols .......................................................... 35Demonopolization and Privatization .......................................................... 38External Trade Policy .......................................................... 39Financial Discipline, Price Formation, and Bankruptcy .......................................................... 42Prices, Subsidies, and Social Protection .......................................................... 42Monetary and Credit Policies .......................................................... 43
C. Transparent, Equitable Legal Framework ..................... ........................... 45Risks and Investment .......................................................... 45Barriers to Entry and Exit .......................................................... 45Contracts, Hard Budget Constraints and Bankruptcy .......................................................... 46Foreign Trade and Payments .......................................................... 47Taxation .......................................................... 49
D. Supportive Environment ................................................ 54Law and Social Order .......................................................... 54Vital Public Goods and Services .......................................................... 54
E. Conclusions ................................................ 55Market-Determined Prices .......................................................... 55Transparent, Equitable Legal Framework .......................................................... 55Supportive Environment .......................................................... 55
iii
3. ESTABLISHING PROFIT-ORIENTED PRODUCERS .................................. 56Background .56
A. State Enterprises: The Current Situation .57Causes of Loss-Making .58State Enterprise Response and Adjustment .59Restructuring Strategy for the Future .61
B. The Privatization Process .62Privatization Policy Perspectives .63Incentives to Privatization .65
C. Private Enterprise Development .65
D. Fringe Benefits and Social Asset Divestiture .66Need for Divestiture .66Approaches to Divestiture .69
E. Summary .71
4. PROTECTING THE PEOPLE .72
A. Maximizing Employment to Minimize Poverty .72Small Enterprise Development .72
B. An Effective and Fiscally Sustainable Social Safety Net is Needed .73Developing a New Social Protection Strategy .74Improving Labor Market Flexibility .74Establishing a Well Targeted Social Safety Net .75Reforming Social Insurance .75
C. Conclusions .78Maximizing Employment to Minimize Poverty .78Fringe Benefit Restructuring .78Programs to Reduce Poverty During the Transition .78Social Insurance Programs .78
5. REFORM AGENDA AND MACRO PROSPECTS .. 79
A. Reform Agenda .79
B. Macroeconomic Prospects .79Policy Reform Scenario .80High Debt Scenario .81Low Growth Scenario .82Financing Requirements .84
C. Key Themes and Conclusions .86
Notes.87
References .93
iv
STATISTICAL APPENDIX ...................................... 95
TECHNICAL ANNEXES ...................................... 161
A. Social Asset Divestiture by Enterprises (D. Sewell) ........................................ 163
B. Agro-Industry Sector Review (S. Sen Gupta) ........................................ 193
C. The Sustainability of External Debt (S. Shatalov) ........................................ 209
D. Macroeconomic Projection Framework (Y. Sobolev) ........................................ 215
E. Purchasing Power Parities (J. Hansen) ........................................ 221
Map IBRD 28262R ........................................ 230
Text Figures1.1 Cumulative Inflation in FSU Countries .21.2 Credit and Inflation .41.3 Money Supply Expansion and Inflation .41.4 Allocation of Credit by Sector .51.5 Availability of Real Credit .51.6 Annual Inflation and Per Capita Growth Rates, 127 Countries . 91.7 GDP Decline in FSU, 1989-1995 .101.8 Trends in GDP Decline .101.9 GDP Growth/Decline in FSU, 1995 .11.10 Industrial Output .111.11 Time Profiles of Output Decline .121.12 Trends in Expenditure .131.13 Investment and Rates of Return in Soviet Industry .141.14 Real and Dollar Monthly Wage Rates .141.15 Imports and Exports to the World .151.16 Foreign Trade Balance .161.17 Trade Deficit with West and Real Exchange Rate .161.18 Real Exchange Rate Index .171.19 Wage Rates in Competitor Countries .191.20 Loss-Making Enterprises .272.1 Foreign Direct Investment per Person, 1993 .332.2 FDI as Share of GDP in FSU, 1994 .332.3 FDI Inflows and Liberalization Speed .342.4 Liberalization and FDI .342.5 Market Share of State in Retail Sales .382.6 Tax Revenues and Per Capita GDP, 1994 .503.1 Proportion of Firms Making Losses, First Quarter 1996 .583.2 Balance Sheets of Selected SOEs .593.3 Employment by Property Ownership .623.4 Enterprise Privatization and Corporatization .63
v
Text Tables1.1 Annual Purchase of Agricultural Equipment ............................................. 121.2 Decline in Export Profitability During 1995 ............................................. 183.1 Production, Employment, and Investment in Industry .............................. 573.2 Unsold Stocks, April 1996 ............................................... 583.3 Loss-Making Enterprises by Subsector ............................................... 583.4 Enterprise Arrears ............................................... 593.5 Enterprises Transformed through Privatization and Corporatization ........ 633.6 Private Business Growth ................................................ 653.7 Expenditures on Non-Wage Benefits, 1995 .............................................. 675.1 Policy Reform Scenario ............................................... 805.2 High Debt Scenario ............................................... 825.3 Low Growth Scenario ............................................... 835.4 Balance of Payments, 1995-2000 ................................................ 85
Text Boxes1.1 Fixed Exchange Rate Anchors ............................................... 171.2 Purchasing Power Parity Indexes ............................................... 212.1 There Is No Free Lunch ................................................ 372.2 There Is No Free Ride ............................................... 44
vi
ACKNOWLEDGMENTS
This report is based on the findings of the analysis and recommendations presenteda World Bank team that visited Belarus in here.April/May 1996. The team included John The team would also like to expressHansen (Mission Leader and Principal its appreciation to Yuri Dikhanov forAuthor), Elliott Hurwitz (Industrial Reforms), preparation of the macroeconomic modelingDavid Sewell (Divestiture of Social Assets), framework used for the report, to Konstantinand Sudhee Sen Gupta (Agro-industrial Senyut for assistance with data collection andReforms). The work of the mission in the field analysis in Minsk, to Ivan Kupchenko for hiswas guided by a CEM Steering GrOUP under work on external debt, to Yuri Sobolev forthe Chairmanship of the Minister of Economy, preparing the macroeconomic projections, towith representatives of key ministries and Zhicheng Li and Yuliya Merkulova fororganizations including Agriculture, Anti- preparing the statistical annex, and to LeighMonopoly, Cabinet of Ministers, Industry, Hammill for assistance with copy editing andFinance, Foreign Economic Relations, Labor document preparation. Special thanks are alsoPrices, Supreme Soviet, and due to Elena Klochan for interpretation andVneshekonombank. Staff from the ResidentMission in Minsk who prepared major written trnlio.Tsreotwsppadudrthguidance of Basil Kavalsky (Director), Jamescontributions to the report include Sergei Harrison (Division Chief), and ChristopherKritchevsky (Trade) and Nikolai Lisai Willoughby (Resident Representative). The(Competition and Public Finance). David peer reviewers are Joel Bergsman (FIAS) andPhillips prepared the chapter on enterprise William Easterly (PRDMG). Jack Baranson,reform. previously of the World Bank and most
The analysis in this report draws on a recently of the Intemational Executive Serviceseries of special studies that were prepared by Corps office in Minsk, was the externalBelarusian teams of experts headed by L.A. reviewer.Khankevich (Taxation), V.V. Pinigin The report was discussed with the(Enterprise Debts), B. Shapiro (Agriculture), Government in early 1997. Special thanks areL. Zlotnikov (Trade), and G. Turban due to Prime Minister Sergei Ling and his(Exports). Sergei Shatalov (IECIF) prepared a colleagues for their excellent comments on thenote on the external debt of Belarus. A list of draft and for the opportunity to discuss thethe background documents used in preparing findings and policy recommendations of thethis report is in the References section at the report in detail. Although some statisticalend of the report. The report draws updating was done on the basis of thesesignificantly on the macroeconomic analysis discussions, the report reflects primarily theand data prepared by the IMF during a parallel situation in Belarus as of late 1996mission, but the Bank is solely responsible for
vii
ABSTRACT
Belarus is in a major economic crisis, have stayed away, and the falling levels ofThe trade deficit has become unsustainable, real net investments in fixed capital formationExternal reserves have fallen to negligible have created further barriers to renewedlevels. The number of loss-making enterprises economic growth.is increasing rapidly. Budget revenues are The situation has become notablyfalling far short of targets, and the the stuto hs becm entalworse in the last 18 months because theGovernment has announced its intention to Government, instead of focusing on monetarypursue expansionary monetary and credit discipline and structural reforms, began topolicies to support the loss-making enterprises intervene actively in the foreign exchangein industry and agriculture, to pay workers, market to maintain an artificially stableand to cover its own expenses. exchange rate. The three-fold real
Like all former Soviet republics, appreciation of the Belarusian rubel againstBelarus suffered the twin shocks of higher the US dollar since the end of 1994 has beenenergy prices and the loss of traditional the major factor causing the unsustainablemarkets when the Soviet Union collapsed. The trade deficit. It has also led directly to theBelarusian response to these shocks, however, rising rate of financial failure amonghas been very cautious. This has seriously Belarusian enterprises.delayed the structural changes that are needed Escaping the current crisis andto increase efficiency and develop new export restoring growth will require rapid creation ofm-l1arkets. At the same time, the Government a stable, predictable business environment thatsought to cushion the shock of the adjustment will attract the domestic and foreignprocess through expansionary credit policies investment needed to improve productiveand lax financial discipline on enterprises. efficiency and international competitiveness.Further delays will make the transition Establishing a good investment climate willincreasingly difficult. require the immediate implementation of
The adverse effects of high inflation policies that will assure the competitiveon the investment climate were compounded market determination of prices (especially forby unpredictable tax enforcement and foreign exchange), strict financial disciplineextensive government controls on pricing, enforced by the effective and immediate threatbusiness establishment, credit, and access to of bankruptcy, a competitive market structuresuitable business premises. The business dominated by independent, privately ownedenvironment was further degraded by slow enterprises, a transparent and predictable legalprivatization and continued widespread framework (especially for taxes), even-handedpresence of large state enterprises with administration of laws, access to criticalpreferential access to credit, subsidies, and infrastructure services, and an efficient, well-government purchase orders. Faced with this, targeted social safety net to protect those whoprivate investors, both domestic and foreign, need help during the transition period.
viii
BELARUS - SELECTED INDICATORS TABLE
Actual
Indicators 1991 1992 1993 1994 1995
Part A: Main Macro Aggregates
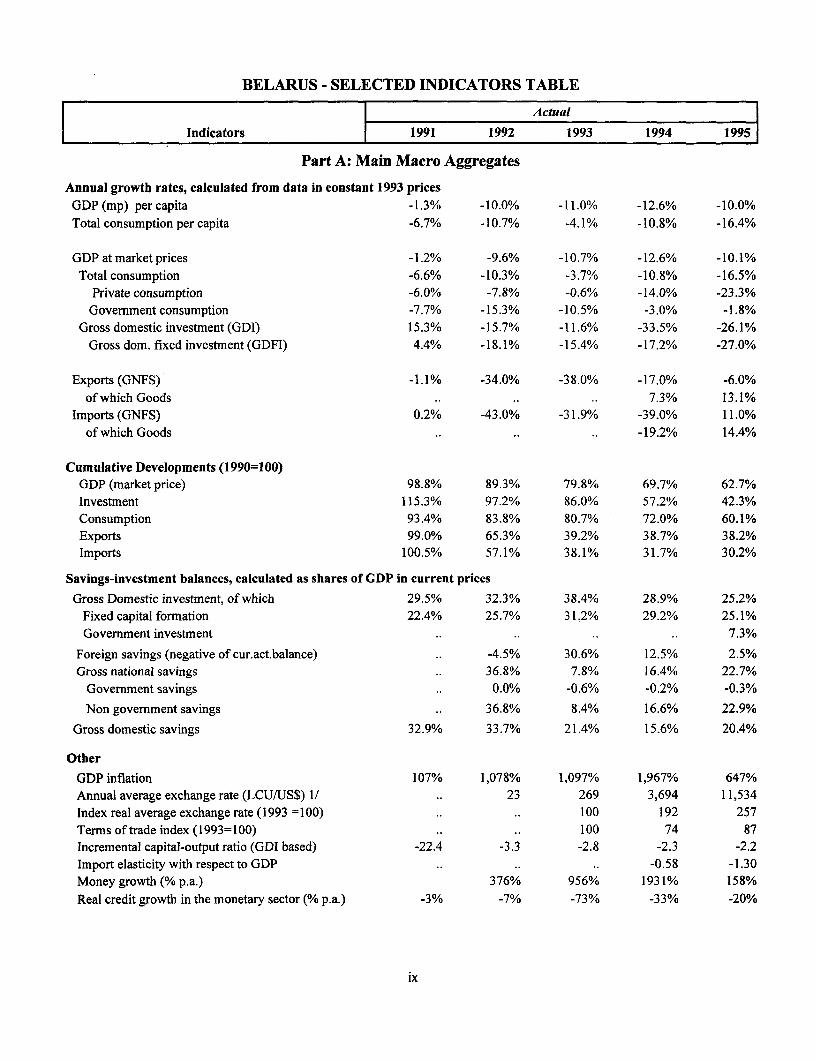
Annual growth rates, calculated from data in constant 1993 pricesGDP (mp) per capita -1.3% -10.0% -11.0% -12.6% -10.0%Total consumption per capita -6.7% -10.7% -4.1% -10.8% -16.4%
GDP at market prices -1.2% -9.6% -10.7% -12.6% -10.1%Total consumption -6.6% -10.3% -3.7% -10.8% -16.5%
Private consumption -6.0% -7.8% -0.6% -14.0% -23.3%Government consumption -7.7% -15.3% -10.5% -3.0% -1.8%
Gross domestic investment (GDI) 15.3% -15.7% -11.6% -33.5% -26.1%Gross dom. fixed investment (GDFI) 4.4% -18.1% -15.4% -17.2% -27.0%
Exports (GNFS) -1.1% -34.0% -38.0% -17.0% -6.0%of which Goods .. .. .. 7.3% 13.1%
Imports (GNFS) 0.2% -43.0% -31.9% -39.0% 11.0%of which Goods .. .. .. -19.2% 14.4%
Cumulative Developments (1990=100)GDP (market price) 98.8% 89.3% 79.8% 69.7% 62.7%Investment 115.3% 97.2% 86.0% 57.2% 42.3%Consumption 93.4% 83.8% 80.7% 72.0% 60.1%Exports 99.0% 65.3% 39.2% 38.7% 38.2%Imports 100.5% 57.1% 38.1% 31.7% 30.2%
Savings-investment balances, calculated as shares of GDP in current prices
Gross Domestic investment, of which 29.5% 32.3% 38.4% 28.9% 25.2%Fixed capital formation 22.4% 25.7% 31.2% 29.2% 25.1%Government investment .. .. .. .. 7.3%
Foreign savings (negative of cur.act.balance) .. -4.5% 30.6% 12.5% 2.5%Gross national savings .. 36.8% 7.8% 16.4% 22.7%
Government savings .. 0.0% -0.6% -0.2% -0.3%
Non government savings .. 36.8% 8.4% 16.6% 22.9%
Gross domestic savings 32.9% 33.7% 21.4% 15.6% 20.4%
Other
GDP inflation 107% 1,078% 1,097% 1,967% 647%Annual average exchange rate (LCU/US$) 1/ .. 23 269 3,694 11,534Index real average exchange rate (1993 =100) .. .. 100 192 257
Terms of trade index (1993=100) .. .. 100 74 87
Incremental capital-output ratio (GDI based) -22.4 -3.3 -2.8 -2.3 -2.2Import elasticity with respect to GDP .. .. .. -0.58 -1.30
Money growth (% p.a.) 376% 956% 1931% 158%Real credit growth in the monetary sector (% p.a.) -3% -7% -73% -33% -20%
ix
BELARUS - SELECTED INDICATORS TABLE
I [ Actual l
Indicators 1991 1992 1993 1994 1995
Part B: Government Finance Indicators
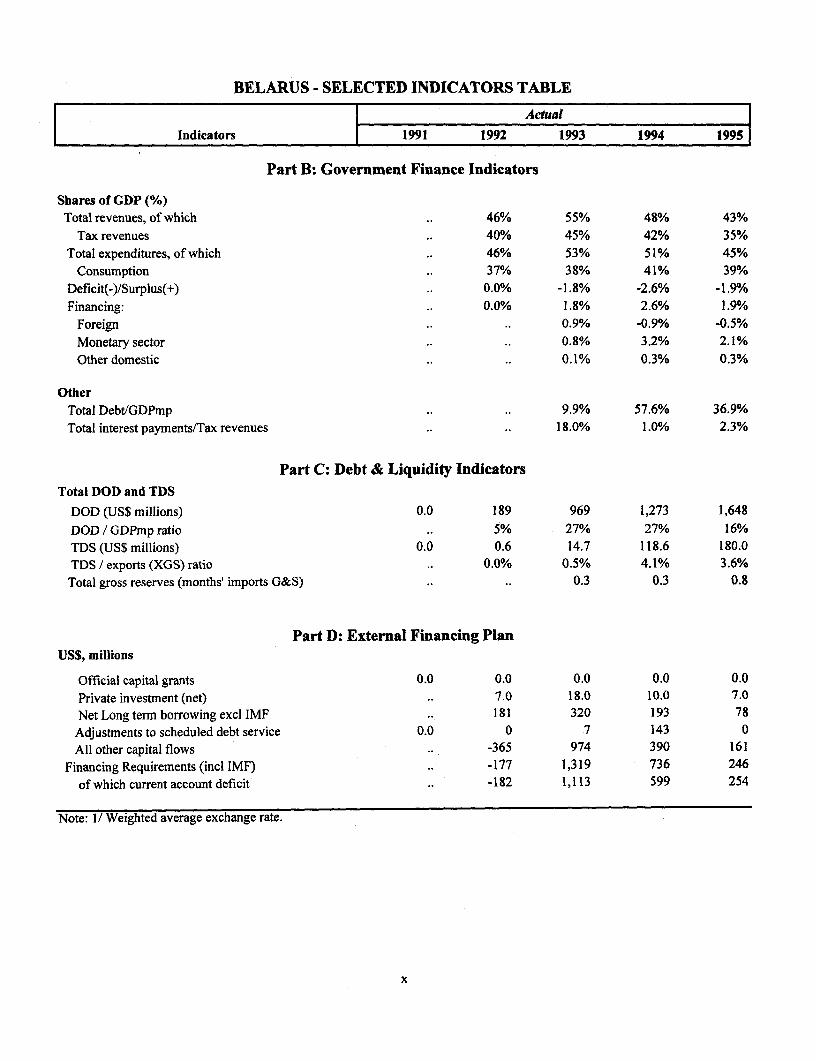
Shares of GDP (%)Total revenues, of which 46% 55% 48% 43%
Tax revenues 40% 45% 42% 35%
Total expenditures, of which .. 46% 53% 51% 45%
Consumption .. 37% 38% 41% 39%Deficit(-)/Surplus(+) .. 0.0% -1.8% -2.6% -1.9%
Financing: .. 0.0% 1.8% 2.6% 1.9%
Foreign .. .. 0.9% -0.9% -0.5%Monetary sector .. .. 0.8% 3.2% 2.1%
Other domestic .. .. 0.1% 0.3% 0.3%
OtherTotal Debt/GDPmp .. .. 9.9% 57.6% 36.9%
Total interest payments/Tax revenues .. .. 18.0% 1.0% 2.3%
Part C: Debt & Liquidity IndicatorsTotal DOD and TDS
DOD (US$ millions) 0.0 189 969 1,273 1,648
DOD / GDPmp ratio .. 5% 27% 27% 16%TDS (US$ millions) 0.0 0.6 14.7 118.6 180.0TDS / exports (XGS) ratio .. 0.0% 0.5% 4.1% 3.6%
Total gross reserves (months' imports G&S) .. .. 0.3 0.3 0.8
Part D: External Financing PlanUS$, millions
Official capital grants 0.0 0.0 0.0 0.0 0.0
Private investment (net) .. 7.0 18.0 10.0 7.0Net Long term borrowing excl IMF .. 181 320 193 78
Adjustments to scheduled debt service 0.0 0 7 143 0All other capital flows .. -365 974 390 161
Financing Requirements (inc IMF) .. -177 1,319 736 246
of which current account deficit .. -182 1,113 599 254
Note: 1/ Weighted average exchange rate.
x
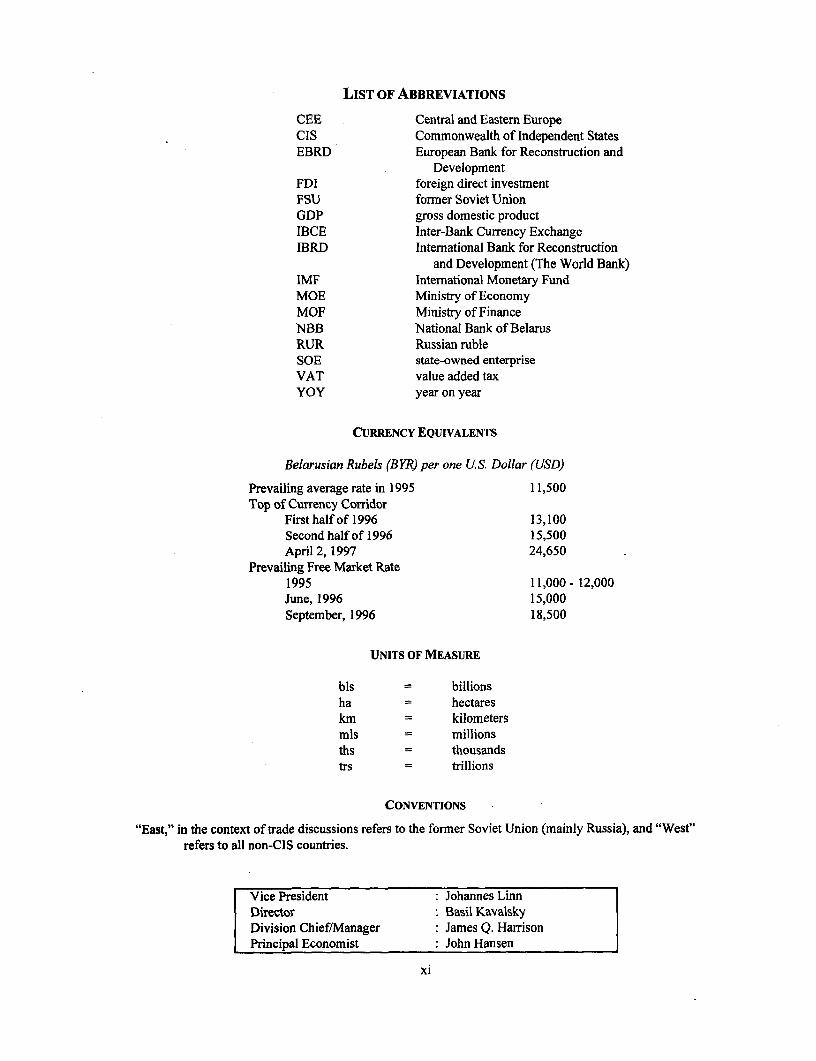
LIST OF ABBREVIATIONS
CEE Central and Eastern EuropeCIS Commonwealth of Independent StatesEBRD European Bank for Reconstruction and
DevelopmentFDI foreign direct investmentFSU former Soviet UnionGDP gross domestic productIBCE Inter-Bank Currency ExchangeIBRD International Bank for Reconstruction
and Development (The World Bank)IMF International Monetary FundMOE Ministry of EconomyMOF Ministry of FinanceNBB National Bank of BelarusRUR Russian rubleSOE state-owned enterpriseVAT value added taxYOY year on year
CURRENCY EQUIVALENTS
Belarusian Rubels (BYR) per one US. Dollar (USD)
Prevailing average rate in 1995 11,500Top of Currency Corridor
First half of 1996 13,100Second half of 1996 15,500April 2, 1997 24,650
Prevailing Free Market Rate1995 11,000- 12,000June, 1996 15,000September, 1996 18,500
UNITS OF MEASURE
bis = billionsha = hectareskm = kilometersmIs = millionsths = thousandstrs trillions
CONVENTIONS
"East," in the context of trade discussions refers to the fonner Soviet Union (mainly Russia), and "West"refers to all non-CIS countries.
Vice President . Johannes LinnDirector Basil KavalskyDivision Chief/Manager James Q. HarrisonPrincipal Economist John Hansen
xi

Executive Summary
Belarus faces a serious economic crisis. protecting people against poverty. They mustAlthough the Government has managed to reduce understand the importance of allowing prices tothe rate of inflation significantly and output is be determined by the normal interaction of supplyexpanding in a few areas of the economy, the and demand. They need to understand thatoverall picture is unsatisfactory. Aggregate everyone-individuals as well as enter-industrial output continues to fall. The number of prises-must pay for what they consume. If thisloss-making enterprises is increasing sharply consensus of understanding and support can bemonth by month. Enterprise non-payments are developed, Belarus can quickly lay the foundationcreating serious problems. The trade deficit has for restoring living standards.become unsustainable. Foreign exchange reserveshave fallen to excessively low levels. The budget Backgroundis seriously short of resources. The lack of When Belarus became independent inadequate structural adjustments in the enterprise 1991, it was the richest of the twelve republics ofsector is creating pressures on the budget and the the Commonwealth of Independent States (CIS)banking system that could easily rekindle high in terms of per capita income-a status reflectingrates of inflation. And living standards continue the republic's steady growth during the 1970s andto fall. But these problems can be overcome. The early 1980s. It had developed an industrial sectornecessary policy changes do not require extensive that, in terms of share of total GDP, made it oneresearch, nor are major capital investments of the most heavily industrialized countries in therequired. The changes could be launched almost world. The agriculture sector was modernized andliterally at the stroke of a pen. came to depend not only on heavy equipment,
omuch of which was manufactured in Belarus, butThough simple in concept and eas tot also on imported fuel and fertilizers. Industrial
initiate, these policy changes will lead to other and agricultural development was based on oilchanges that will have a profound impact on the and gas from Russia that was priced at less thanfuture prospects for Belarus. These policy 10 percent of world prices in 1990. Enterprises inmeasures will create an environment that Belarus also enjoyed access to material inputs forstimulates investors-both foreign and domestic processing and final assembly at internal transfer-to increase production in Belarus and to make prices, as well as heavy infusions of capitalit more efficient. New jobs, larger export investment, and preferential access to the marketsvolumes, a more stable balance of payments of the former Soviet Union (FSU) and Easternsituation, and lower domestic inflation will soon Europe due to artificially low transport costs andfollow. Despite these benefits, the reforms will be no customs barriers. As a result, Belarus becamedifficult to sustain because, in the short term, they one of the most trade-reliant nations in the world,will require adjustments such as closing or with imports and exports each constituting 50 toradically restructuring some failing enterprises 60 percent of GDP. It was also one of the FSUwith no future prospects for efficient, competitive republics most deeply dependent on intra-regionalproduction in their current lines of business. trade, which was equivalent to 70 percent of total
The people of Belarus need to understand trade.why a continuation of past policies would be Belarus lost its privileged position withruinous, and therefore why the reforms must be the breakup of the former Soviet Union.completed despite the short run difficulties. They Traditional markets collapsed, and the cost ofmust understand what needs to be done to prevent critical inputs (especially energy) increasedBelarus from sliding deeper and deeper into a sharply in real terms. The terms of trade loss insevere economic crisis. They must understand 1991-92 has been estimated at 11 percent of GDP.that distorted prices cannot be the basis for The resulting decline in production and increase
xiii
xiv Belarus: Prices, Markets, and Enterprise Reform
in inflation were primary factors contributing to of Belarus. According to World Bank data thethe current economic crisis. Other countries average poverty rate has risen from about 5experienced similar problems in 1990-91, but percent to about 25 percent. Only about fivehave found it easier to control inflation, stabilize percentage points of this increase in poverty hastheir economies, and begin to restructure been the result of higher income inequality. Theenterprises. rest has been the direct result of economic
In Belarus, the problems caused by the decline. This report discusses ways in which thecollapse of the Soviet system were compounded Government can protect the very poor during theby econorlic policies that sought to cushion and transition process, but most of the emphasis is ondelay the transition to a market economy. Rather restoring satisfactory rates of economic growth,than implementing policies that would encourage for this is the only way that Belarus will be ablepeople to adjust their living standards to the new to afford to take the majority of today's poorrealities and encourage enterprises to restructure above the poverty line.and become internationally efficient, the Although the Belarusian people livedGovernment sought to maintain living standards well under the Soviet system, a return to the pastand employment through expansionary monetary is not feasible because, as history has shown, theand credit policies. As a result, aggregate demand Soviet system of command and control has toofar exceeded domestic production, leading to many built-in inefficiencies. The Soviet systemserious macroeconomic imbalances. These worked for many years because of the vast naturalproblems were made even worse by the resources and limited population density of thedistortions that were introduced to compensate for FSU, but eventually the degradation of thethese imbalances and sustain living standards. For region's environmental and physical capital, theexample, the directed credits that were used to low efficiency of enterprises, and the growingsupport failing enterprises led to high rates of inability to meet the needs of consumers led toinflation; efforts since early 1995 to control the system's collapse.'inflation by stabilizing the exchange rate have The potential for restoring growth inproduced a serious overvaluation of the exchange Belarus is excellent. The nation has a highly
rate. This has seriously eroded the competitive- educated population, a disciplined work force,ness and profitability of the enterprise sector in close proximity not only to traditional Russianthis traditionally open and heavily trade- markets, but to the rich European markets as well,dependent country. and a history of heavy reliance on external trade.
These policies were part of an attempt to In the late 1980s, it exported a higher percentagefind a third way, a system that would combine the of its output to other FSU republics than any ofbest of planned and market economic systems. the other republics. By Soviet standards, itsThe attempt has failed. The output decline is now manufactured products were highly sophisticated.as severe in Belarus as for the average economy Nostalgia about the Soviet regime, under whichof the FSU. And while other economies are Belarusians lived well, has led many Belarusianstarting recover, the economy of Belarus is only citizens and leaders to seek an alternative tobeginning to stabilize and is at risk of further market reforms including continued statedeclines in the future. By postponing the ownership of production facilities. But as thisnecessary structural adjustments, Belarus has report demonstrates, a return to the past isfailed to establish the foundations of enterprise impossible. Instead Belarus needs to implementproductivity needed for restored growth. The lack the policy measures presented in this report; aof structural adjustments in the enterprise sector measure will allow Belarus to move out of thenow threatens even the modest price stability that current stagnation and decline associated with thehas taken Belarus so long to achieve. collapse of the Soviet-era command economy and
The failure of past policies to restore improve living standards for all.growth on a sustainable basis has hurt the people
Executive Summary xv
Belarus now needs to press forward to market forces. Price controls on manufacturedtransform its economy into an efficient, market- goods were removed in 1992-93, and most of thebased economy. This will require (a) major remaining price controls on food and other "itemsimprovements in the policy framework to provide of popular consumption" were officially removedincentives for efficient production; and (b) in November 1994. However, the nationalsubstantial investments to improve the energy Government still publishes "indicative" prices forefficiency, product quality and competitiveness of various agricultural goods that tend to be treatedthe existing industrial and agricultural infra- at the local level as the allowable market prices.structure. This infrastructure was poorly suited More importantly, local governments imposefor competition in world markets when the former profit margin controls on certain socially sensitiveSoviet Union collapsed in 1991, and it is in even goods such as dark bread and milk. Because theworse condition today because of inadequate cost accounting systems of Belarusian enterprisesinvestment-even for maintenance in many do not make adequate allowance for the impact ofcases-during the intervening years. The inflation and, in some cases, do net allow certaininvestment required vastly exceeds that which the production and marketing expenses to be countedGovernment could possibly mobilize. One of the as costs, profits are often seriously overstated,top priorities of the Government today is and controls on profit margins therefore result intherefore to attract private investors, both foreign a severe erosion of working capital. Such controlsand domestic. Current rates of net fixed capital should be eliminated at all levels as soon asformation are close to zero, and foreign direct possible to help assure the financial viability ofinvestment is among the lowest in the FSU and enterprises, and the efficient use of their goodsEastern Europe on a per capita basis, reflecting and services. Concerns that monopolistic marketserious problems with the business and structures will distort prices are legitimate. Ininvestment climate in Belarus today. One of the such cases, the Government should use regulatedkey objectives of this report is to identify these prices as a last resort, working instead whereverproblems more clearly and to find feasible possible to create competitive markets throughsolutions that will allow Belarus to attract the demonopolization, privatization, and removal ofinvestment required to restore growth, generate barriers to trade and private sector development.productive jobs, and improve the productivity of This would also help reduce the de facto priceinvestment, thereby allowing the country to distortions caused, for example, by government-improve living standards.2 owned trading enterprises that hold prices to
Among the most important tasks artificially low levels for "social" reasons.
identified in this report for improving the The Government has significantlyinvestment climate are (a) establishing the legal reduced the number of "monopolistic" goods thatand administrative structures needed to create a are subject to price controls, and has sharplymarket-friendly environment; (b) establishing the increased prices for many goods and servicesownership structures and hard budget constraints such as electricity and heating that are still subjectrequired to assure that producers seek to to state control. But much remains to be done. Formaximize profits, thereby optimizing the use of electricity and heating, the two largest elements inresources; and (c) protecting people from poverty, housing costs, charges still cover only about 70especially those who lose their jobs temporarily percent of costs, and charges for gas and hotbecause of the industrial restructuring required for water, the next two most important items, coverthe transition to a market economy. only about 55 percent of costs. Furthermore,
cross-subsidization is still a major problem, withcommercial users being forced to pay energy
Until recently Belarus had made prices well above costs-one of the factorsconsiderable progress in moving from contributing to the large number of loss-makingadministratively determined prices to prices enterprises in this sector. Price reforms aredetermined by the interaction of competitive difficult but vitally important to efficient resource
xvi Belarus: Prices, Markets, and Enterprise Reform
allocation, and thus to prospects for growth and open borders and the threat of competition fromimproved living standards, as are efforts to imports, on the other hand, would also provide-increase the efficiency of energy production and local enterprises with incentives to improveconsumption. Raising prices to allow efficient design quality and production efficiency, makingcost recovery will reduce poverty in the medium Belarusian products internationally competitiveterm by promoting efficiency and economic and providing more jobs to Belarusian workers.growth, and by increasing the resources available The improved performance would also assureto the Government for targeted poverty reduction lower prices and higher quality for goods sold toprograms. While care must be taken to control domestic consumers-for both final goods andfiscal costs, the adverse short-term social impacts intermediate inputs. The latter point is important,of full cost recovery can be reduced with because if Belarusian factories are forced to buyappropriate social safety net programs. high cost, low quality inputs from local sources,
The most seriously distorted price today their products will become non-competitive inin Belarus is the price of foreign exchange. This world markets, thus reducing the prospects for
happened because the Government attempted to growth, employment, and improved livingcontrol inflation by controlling the exchange rate. standards.The focus of anti-inflation policies should instead Establishing Profit-Oriented Producersbe on controlling monetary emission, imposing A market economy will not allocatestrict financial discipline, maintaining tight fiscal A market ess will nerally
restaint andcreaing n enironent hat resources efficiently unless producers generallyrestraint, and creating an environment that seek to maximize profits. Otherwise, resourcesencourages investment and growth. The will be used inefficiently, slowing downovervalued domestic currency has, during the past18 months, been an increasingly important cause economic growth and poverty reduction. Underof continued decline in industrial output, the the Soviet system, profit maximization was notgrowing number of loss-making enterprises, the explicitly an objective in most situations. If annsustainable trade deficit, the rising energy enterprise was in a priority sector, the state would
arresarswithbRussia, thefico,tiued reianeonerg arrange for the banking system to transfer the
administrative controls, and the loss of jobs necessary resources through directed credits toEstablishingian xchangeol ratenthatdrestoe the lkeep the enterprise in operation. The failure to setcEstabitivne an e ntet rpries is of profit maximization as a primary objective is one
competitiveness of Belarusian enterprises is of of the most important factors in the collapse ofhighest priority. the previous system. Overcoming this heritage is
An open external trade policy is also extremely difficult. Allowing prices to be set incritically important in avoiding monopolistic competitive markets as noted in the previouspricing within the domestic market. As one of the section is of course a precondition; otherwise,most heavily industrialized and trade-dependent profit maximization will become monopolisticeconomies in the former Soviet Union, Belarus exploitation. Well-functioning markets arehas factories designed to serve the entire FSU necessary but not sufficient, however. If Belarusmarket as well as major markets in Central and is to create an environment that attracts the levelEastern Europe (CEE). Belarus has sold some of foreign and domestic investment needed toproducts to international markets as well. These attain the desired levels of growth, and if thatenterprises clearly have a monopolistic position investment is to be efficient, it will also need towithin Belarus, and unless external trade policies make some fundamental structural changes toassure that they are subject to potential encourage the same kind of profit-maximizingcompetition from imported goods, these behavior that is typical in the commercialenterprises will almost certainly charge excessive, environment of a normal market economy. Mostmonopolistic prices to Belarusian consumers. importantly, it will need to: (a) impose hardBreaking up all of these large factories into budget constraints, using bankruptcy as ancompeting units is not feasible because of the loss incentive for financial responsibility whereof economies of scale in production. Maintaining necessary; (b) privatize a major share of state-
Executive Summary xvii
owned enterprises to avoid the conflicting enterprises by allowing them to delay and reduceobjectives that frequently prevent public the amounts of tax owed. Second, it allowsenterprise managers from maximizing profits and agricultural enterprises that supply food forthus using resources efficiently; and government procurement to delay payments to(c) encourage the establishment of new input suppliers without penalty. Third, thecompeting firms. Government itself is not paying its bills on time;
Hard Budget Constraints and because of policies such as the sequestration ofBankruptcy. One of the most urgent tasks for the funds, the Government's "expenditure arrears" orGovernment of Belarus at this point is to impose overdue bills have risen sharply in recent months.
and enforce hard budget constraints on all Experience throughout the worldeconomic agents in the country-enterprises, indicates that the most effective means ofindividuals, and equally important, on the imposing hard budget constraints is the credibleGovernment itself. A market-based system of threat of bankruptcy. Even if very few enterprisesallocating resources cannot work-and market- are taken into bankruptcy, the threat of losingdetermined prices will be irrelevant-if ownership of one's assets, and control of one'senterprises and others do not pay their bills. The enterprise is usually enough to assure thatGovernment does not have to act as the nation's managers will do everything possible to pay theirbill collector. However, it should establish a bills. Faced with the threat of bankruptcy,framework of laws and a system of tight fiscal managers will spontaneously reform theirand monetary discipline so that creditors, enterprises to improve efficiency or they will goespecially the banking system, will be able to take out of business, freeing resources for those whoeffective action against those who fail to pay their can manage them more efficiently. For example,bills on time. they may lease or sell unused buildings and
Non-payment has reached serious levels equipment, dismiss idle workers, seek newin Belarus. The lack of payments discipline markets, develop new products, invest in newcreates a chain of debts that leads to widespread technologies, and seek new partners, both foreignfinancialproblemsdein thaleas econ . God and domestic, who can inject new capital andeinantriseproblems in Behs e eing s .trod management expertise-all key ingredients of anyenterprises in Belarus are being destroyed by successful strate for enterrise reform. Withoutother enterprises that do not pay for their successf strategy , enterise reform s,purchases. This discourages serious investors the threat of bankruptcy, however, such reforms,from trying to do business in Belarus. Banks are including privatization, will probably have to befacing liquidity and even solvency problems imposed through administrative decree by thebecause of the overdues on loans, thus making Government, and this is generally a verybcapital excessivelydcosty to ianves,to if i inefficient way to obtain economic efficiency.aapil ale l Worsta their familes, are Therefore, an effective bankruptcy law, backed up
availabl at all .Workers and their families are with a judicial system that makes bankruptcy asuffering because enterprises do not pay wages on credible threat, is essential for meaningfultime. And the Government is facing a severe enterprise reform, an improved investmentshortage of revenues because enterprises are not climate, and restored economic growth.paying their taxes. This in turn creates pressureson the Central Bank to make loans to the Privatization. Privatization should beGovernment, creating inflationary pressures as seen not as an objective per se, but as one of thethe money supply expands. The excess of best possible ways to assure that enterprisegovernment expenditures over revenues also managers try to maximize profits, therebydiverts resources that could otherwise be invested increasing economic efficiency and growth.by the business community in economic recovery. Public enterprise managers could in theory attain
the same levels of efficiency that managers ofRather than improving the situation, the 3
Government is actually making it worse in at least private manufacturing enterprises do. However,three ways. First, it is subsidizing loss-making several factors make such occurrences quite rare.
First, because public enterprises are owned by
xviii Belarus: Prices, Markets, and Enterprise Reform
government, they are far more subject to political preparing enterprises for privatization havepressures than are private enterprises. This is seen created a serious shortage of enterprises that cantoday in Belarus-the Government asks (often be sold for vouchers.unofficially and indirectly) that enterprises retainexcess employees and provide goods and services .n sum to esaish thcrecondiionsbelow cost for social reasons. This drain on their neddfrhgrefiecyiceadivstment, restored economic growth and improvedearnings reduces the incentives for public living standards, the Government needs to moveenterprise managers to maximize efficiency, as quickly as possible to complete theincreases incentives to seek subsidies from the liberalization of prices, impose hard budgetGovernment, and distorts the prices of goods and constraints, and stimulate privatization.services in the economy. Second, the benefitsfrom efficient production in the form of extra Protecting the Peopleprofits generally go to the Government rather than If implemented in a timely manner, theto the public enterprise itself. Furthermore, measures outlined here will make a majorprofitable public enterprises commonly find contribution to reducing poverty in Belarus bythemselves subject to pressures to take on varioussocial responsibilities or to increase their revrsi The econ dl o the past fivepayments of dividends to the Government so that yer.Tetasio toamktecnyp s of dh inevitably creates social problems, however. The
these resources can be used to help ailing most difficult problem from a social perspectiveenterprises. In private enterprises, owners and is the short-term loss of jobs as workers movemanagers have their own funds at risk, and what from failing enterprises to healthy ones. Goodhappens to these funds depends on their making . .
goo deiin .Ths cobndwthtera government pohlces can prevent or reduce theseproblems. In particular, the Government needs to
threat of bankruptcy, is a powerful force for create the best possible environment for the
efficiency. Privatization also helps the development of small-scale enterprises, for theyGovernment, because once enterprises are offer the best prospects for expanding theprivatized, it is much more difficult for them to availability of new jobs. Policies such as thepressure the Goverment into extending abolition of the "propiska" (a residency/worksubsidies, concessional credits, tax relief, and permit system), the decontrol of wages, andother financial privileges, improved access to rental housing in growth areas
Privatization in Belarus has gone very should also be implemented to improve theslowly, and this helps explain why it has been so flexibility of the labor market. Finally,hard to reverse the continuing economic decline. recognizing that some people will become poorThe 1995 privatization program was never for more than a short time during the transitionapproved by the President for implementation, process, the current system of social protectionand while the 1996 program has been approved, needs to be improved to assure that it can provide,very limited progress was made during the first in a fiscally sustainable manner, a cost-effectivesix months of the year. As a result, only about 6 combination of means-tested social assistance,percent of the republican enterprises and about 10 categorical assistance to certain groupspercent of the smaller communal enterprises have (especially single-parent families with a largebeen privatized. Almost no enterprises have been number of children), unemployment insurance,"corporatized" (transformed into joint stock and insurance-based programs for health and oldcompanies) during the past year. A large share of age.the enterprises that have been corporatized remainowned by the Government, leaving them subject Th Goenetnestomk. aiaowned by theovementlevingthechange in its approach to providing a social safetyto the various non-economic pressures and net for the poor. In the past, the Government hasinefficiencies noted above. The voucher sought to help the poor-and many other groupsdistribution phase of the privatization program i s dwas completed by mid-1996, but delays in insety-by distorti pries. Fod, houing,
2 ~~energy, and transport were all made available at
Executive Summary xix
artificially low prices that did not cover the costs Past attempts to protect the poor ofof production. The Government has made it very Belarus by distorting prices are a major source ofdifficult for enterprises to get rid of excess labor, the serious economic problems facing the countrythus distorting the normal functioning of the labor today. For example, artificially low prices formarket. To compensate farming, manufacturing, bread, milk and meat have helped to destroy theand public transport enterprises for their losses financial viability of farms and the agro-due to the artificially low prices that they were processing industries. To compensate, theable to charge consumers and the excess workers Government provides excessive amounts of creditthat they were forced to retain, the Government at artificially low interest rates. This createshas distorted the prices and allocation of credit, inflation that eats away the value of the credit,energy, raw material inputs, and foreign resulting in shortages of real working capital andexchange. These distortions in prices to the investment resources despite the credit expansion.enterprise sector led to further economic To compensate, the Government providesproblems. For example, the high levels of subsidies, many of which go to the mostpayments arrears to Russia for gas developed inefficient enterprises because they have the mostbecause the gas distribution companies did not serious financial problems. To meet the fiscalreceive enough money from the enterprises to buy burden, the Government raises tax rates tothe foreign exchange needed to pay Russia. This excessively high levels that discourage honestrestricted the demand for foreign exchange, businessmen, then covers the remainingcontributing to the overvaluation of the domestic budgetary shortfall with inflationary borrowingcurrency and thereby inflicting further losses on from the Central Bank or with funds borrowedexporters in the industrial and agricultural sectors. from the enterprise sector that would better beIn short, although intended to help the people of used by the enterprises for investments in moreBelarus, in many cases the Government's past efficient equipment. Another example of thepolicies created or prolonged serious economic problems caused when the Government tries toproblems. The damage can be repaired. But doing help the poor by distorting prices is its efforts toso will require a fundamental shift in the way the hold down the price of energy, especiallyGovernment goes about protecting the poor. electricity and heating. This has been done by
The Government's draft economic plan, keeping the domestic currency overvalued and byThe Major Trends of Social and Economic charging consumers less than the full cost ofDevelopment of the Republic of Belarus for 1996- energy. The overvalued currency destroys the2000, stresses that Belarus wants to create a competitiveness of Belarusian producers in both2000, strsses tha Belarusforeign and domestic markets, leading tosocially-oriented market economy. To the extent f ailure and the losseof jsand ththat this implies a concern for basic human rights enterprise failures and the loss of jobs. And theand individual dignity, this is the objective of roblems foratil homled to financialvirtually every civilized nation in the world. pf a tyPeople are very important. But the way in which unacceptably high levels of arrears in payments togovernments help people is also very important. Russia for imported gas and oil.Belarus should be supported in its desire to create The poor need to be protected, but thisa market-based economy that creates a good should be done instead with revenues derivedliving environment for people, but for this from modest levels of taxation on economicstrategy to succeed, Belarus needs to use the activity that has been maximized by allowingapproach normally followed in successful competitive markets to price all inputs andindustrialized countries. The Government needs to outputs at their true value. With undistorted pricesmove from a social assistance strategy based for inputs and outputs, enterprise efficiency willlargely on price distortions to one based on the increase and new investors will be attracted,taxation and redistribution of efficiently produced thereby increasing output, tax revenues, and theincome. ability to fund social protection programs.
xx Belarus: Prices, Markets, and Enterprise Reform
The system for protecting the poor also * First, a return to the past is not feasible. Theneeds to be redesigned so that it depends more previous system, to which many people inheavily on means-tested social assistance Belarus would still like to return because of theprograms. Given the administrative cost of many benefits they enjoyed, collapsed becausemeans-testing, short-cut approaches will be the system was intrinsically inefficient. It triedrequired. For example, programs should be made to allocate resources based on decisions made
s; *r . af . ~~~~~~~~by a relatively small group of government"self-selective, placing the burden on those who b eaieysalgopo oemn"self-selctive," pacing theburden onthose whoadministrators based on a variety of economic,want assistance to come forward and prove their social and political considerations. This system,eligibility. Claims from high risk groups such as despite its high ideals, cannot compete in thefamilies headed by a single parent and families real world with economic systems wherewith a large number of children could generally resources are allocated to maximize profits,be accepted at face value with only limited and consumer welfare is based on therandom audits. Actual means testing, aside from individual decisions of those most directlyreviewing the papers submitted to support such affected.claims, could be limited to groups falling outside * Second, the inefficiency by world standards ofthe high-risk categories, thus minimizing the Belarusian enterprises today, particularly thoseadministrative burden of introducing a means- in industry and agriculture, is the main sourcetested income transfer program. Improvements of the country's economic decline and poverty.are also needed in the efficiency and equity of the * Third, this inefficiency can only be overcomeinsurance programs for unemployment, health by creating the competitive, efficient productinsurance, and old age. and factor markets and profit-maximizing
production systems in Belarus that exist inEurope and elsewhere in the industrialized
After a review of recent economic world.developments in Chapter 1, the report identifies * Fourth, substantial investments will be requiredthe measures needed to create an efficient, to physically transform the production sector inproductive market economy that will attract the Belarus, and this level of investment can onlyinvestment necessary for increasing productivity be attained if Belarus creates (a) an investmentand improving living standards in Belarus. climate that attracts private investment fromChapter 2 examines the measures that are needed both domestic and foreign sources, and (b) a
market-driven incentives framnework thatto establish the market-determined prices required ensur ien prodution and salto guide the efficient allocation of resources. denures efficient production and salesChapter 3 outlines the actions required toestablish profit-maximizing enterprises. Recog- * Fifth, these goals cannot be reached in a systemnizing that these actions will involve major short- where the majority of production activities arenizin tha thee acionswill nvole maor sort-still controlled by the state. Attempting thisterm dislocations for many Belarusian workers as still cotrly the tae Attemptin thi
they mov from nn-viabl to viale jobswould simply perpetuate the problems of thethey move from non-viable to viable jobs, past. Consequently, privatization, which hasChapter 4 describes the actions needed to protect moved very slowly to date, must be acceleratedpeople, particularly the poor, during the transition dramatically to assure appropriate incentivesprocess. Chapter 5 concludes the report with a for profit-maximizing behavior of managersdiscussion of three scenarios that illustrate the within a market-oriented environment such asfuture prospects of the Belarusian economy under exists in all successful industrialized countries.alternative policy strategies, and of the resources . Sixth, hard budget constraints-rules that forcethat will be required to finance the transition of enterprises to spend no more than they earn orBelarus to a market economy. can responsibly borrow-must be imposed to
control inflation and to provide the incentivesKey Themes and Conclusions that will lead to spontaneous, efficiency-
The analysis presented in this report leads oriented privatization and production decisions.
to the following important conclusions, which are * Seventh, the transition process will involvedeveloped more fully in the following chapters: hardships for those who must leave their
Executive Summary xxi
present jobs and look for new ones. The social new, more productive jobs. The social safetysafety net needs to be focused on protecting net should be provided through programsthese workers and their families while, at the financed with tax revenues, not by distortingsame time, maintaining their incentives to find the prices of goods and services.

z
The Economic Crisis - Sources and Solutions
Belarus faces a serious economic crisis. economic crisis. Other countries experiencedGDP continues to fall; the trade deficit has similar problems in 1990-91, but have found itbecome unsustainable; foreign exchange reserves easier to control inflation, stabilize theirhave fallen sharply; the number of loss-making economies, and begin to restructure enterprises.enterprises is increasing sharply month by month; . .the budget is seriously short of resources; and In Belarus, however, the iitial problemsmonetary pressures are building that could easily policies that sought to cushion if not avoid therekindle high inflation, transition to a market economy following the
When Belarus became independent in collapse of the Soviet system. Rather than1991, it was the richest of the twelve republics of implementing policies that would encouragethe Commonwealth of Independent States (CIS) people to adjust their living standards to the newin terms of per capita income, a status reflecting realities, and encourage enterprises to restructurethe republic's steady growth during the 1970s and and become internationally efficient, theearly 1980s. It had developed an industrial sector Government sought to maintain living standardsthat, in terms of share of total GDP, made it one and employment through expansionary monetaryof the most heavily industrialized countries in the and credit policies. These policies were part of anworld. The agricultural sector was modernized attempt to find a third way, a system that wouldand came to depend not only on heavy equipment, combine the best of planned and market economicmuch of which was manufactured in Belarus, but systems. The attempt has failed. The outputalso on imported fuel and fertilizers. Industrial decline is now as severe in Belarus as for theand agricultural development benefited from oil average economy of the FSU. And while most ofand gas from Russia that was priced at less than the other FSU economies are starting recover, the10 percent of world prices in 1990. Enterprises in economy of Belarus continued to decline, untilBelarus also enjoyed the benefits of access to 1996 when, stimulated by factors that may not bematerial inputs for processing and final assembly sustainable, the economy reportedly grew by 2.6at internal transfer prices, heavy infusions of percent. (These factors are outlined below in thecapital investment, and preferential access to the section on GDP growth.) By postponing themarkets of the former Soviet Union and Eastern necessary structural adjustments, Belarus hasEurope with artificially low transport costs and no failed to establish the foundations of enterprisecustoms barriers.4 As a result, Belarus became productivity needed for restored growth. The lackone of the most trade-reliant nations in the world, of structural adjustments in the enterprise sectorwith imports and exports each constituting 55 to now threatens even the price stability that has60 percent of GDP in 1992. It was also one of the taken Belarus so long to achieve.FSU republics most deeply dependent on intra- Bregional trade, which was equivalent to 70 Based on an analysis of developmentsover the past five years, this report recommendspercent of total trade. policy actions that can help Belarus restore the
Belarus lost its privileged position with international competitiveness of its production.the breakup of FSU. Traditional markets The Government is very concerned aboutcollapsed, and the cost of critical inputs- mobilizing the investment resources needed toespecially energy-increased sharply in real improve production efficiency, reduce the use ofterms. The terms of trade loss in 1991-92 has energy, and raise product design and quality tobeen estimated at I1 percent of GDP. The international standards. Heavy investments willresulting decline in production and increase in indeed be required. Much of the existinginflation were primary factors in the current equipment did not meet international standards
I
2 Chapter I
even when new, and the clearly inadequate levels Belarus is to make a successful transition to aof investment in fixed capital asset renewal since more market-oriented economy, much of the1991 have left much of the current stock in a required investment will have to come from theseriously depreciated condition. private sector. The report therefore focuses on
measures that can be taken to improve theFar more important than investment per ivsmn lmt nBlrs
se is to implement the policies needed to makeBelarus attractive to investors and to create a This report places heavy emphasis onclimate in which investments, both old and new, growth-oriented policies because, as indicated incan potentially operate with world-class the Bank's recently completed povertyefficiency and productivity. Such efficiency, assessment for Belarus, economic growth is thewhich is essential to attract additional investment, only feasible way for Belarus to reduce poverty,requires that prices be determined by competitive which is caused primarily by the current lowmarket forces, not by administrative intervention, levels of output.and that enterprises and consumers alike be The next section analyzes the keyobligated to pay for whatever they consume-that developments since independence in major"hard budget constraints" be imposed on dimensions of the economy-inflation, fiscal andeveryone to assure universal financial discipline, monetary policies, growth, and external trade.Privatization must play an important role in this The concluding section outlines the policyprocess, for the Government cannot possibly initiatives that will be required to stimulate theafford to undertake this investment on its own structural reforms needed to restore growth andaccount-nor should it attempt to do so. If living standards.
A. ORIGINS OF THE ECONOMIC CRISIS
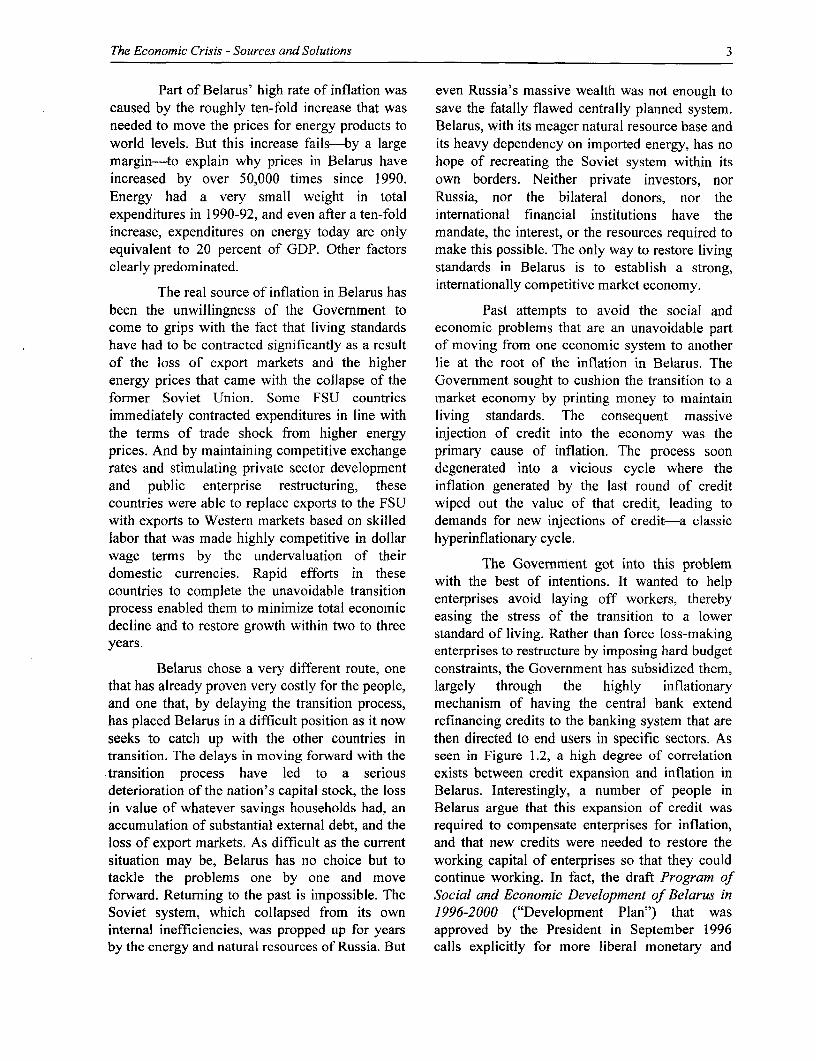
The current economic crisis in Belarus leaving Belarus second only to Turkmenistan inoriginated in large measure in the country's credit terms of record levels of inflation for 1995.and banking policies, which led to high rates ofinflation. High inflation and other lax monetary Figure 1.1: Inflation in Belarus has been welland fiscal policies excerbated problems in other above average.areas of the economy including economic growth Cumulative Inflation in FSU Countries,
and expenditure patterns, external trade balances, 1989-95 (CPI, 1989=100)
the exchange rate, enterprise profitability, andfiscal performance. 00 10,0 00 000,0 0 0,00 c0,00 0
T urk m en istan
Inflation, Credit, and Banking Ukraine
The Level and Causes of Inflation. Belarus _
Inflation has been a more serious problem for Kazakstan
Belarus than for most of the former republics of Russia
the Soviet Union. Of countries not severely Uzbekistan
affected by civil or military conflict following the Moldova _
breakup of the FSU, only Turkmenistan Kyr0 yz
experienced significantly more inflation over this LithuaniaEstaoni a
period than did Belarus and Ukraine, which bothsaw prices rise by 55,000-60,000 times between Geo rgia
1989 and the end of 1995 (Figure 1.1). Recent Armenia
experience is not any more encouraging. In fact, Tajikistan I *Ukraine cut its rate of inflation in half between Strife-TnAzerbaijan ri n uontr-e1994 and 1995, and even the previously strife-torn countries had reduced their inflation sharply, Source: World Bank data.
The Economic Crisis -Sources and Solutions 3
Part of Belarus' high rate of inflation was even Russia's massive wealth was not enough tocaused by the roughly ten-fold increase that was save the fatally flawed centrally planned system.needed to move the prices for energy products to Belarus, with its meager natural resource base andworld levels. But this increase fails-by a large its heavy dependency on imported energy, has nomargin-to explain why prices in Belarus have hope of recreating the Soviet system within itsincreased by over 50,000 times since 1990. own borders. Neither private investors, norEnergy had a very small weight in total Russia, nor the bilateral donors, nor theexpenditures in 1990-92, and even after a ten-fold international financial institutions have theincrease, expenditures on energy today are only mandate, the interest, or the resources required toequivalent to 20 percent of GDP. Other factors make this possible. The only way to restore livingclearly predominated. standards in Belarus is to establish a strong,
The real source of inflation in Belarus has internationally competitive market economy.
been the unwillingness of the Government to Past attempts to avoid the social andcome to grips with the fact that living standards economic problems that are an unavoidable parthave had to be contracted significantly as a result of moving from one economic system to anotherof the loss of export markets and the higher lie at the root of the inflation in Belarus. Theenergy prices that came with the collapse of the Government sought to cushion the transition to aformer Soviet Union. Some FSU countries market economy by printing money to maintainimmediately contracted expenditures in line with living standards. The consequent massivethe terms of trade shock from higher energy injection of credit into the economy was theprices. And by maintaining competitive exchange primary cause of inflation. The process soonrates and stimulating private sector development degenerated into a vicious cycle where theand public enterprise restructuring, these inflation generated by the last round of creditcountries were able to replace exports to the FSU wiped out the value of that credit, leading towith exports to Western markets based on skilled demands for new injections of credit-a classiclabor that was made highly competitive in dollar hyperinflationary cycle.wage terms by the undervaluation of their The Govemment got into this problem
domestic currencies. Rapid efforts in these with the best of intentions. It wanted to helpcountries to complete the unavoidable transition enterprises avoid laying off workers, therebyprocess enabled them to minimize total economic easing the stress of the transition to a lowerdecline and to restore growth within two to three standard of living. Rather than force loss-making
years. enterprises to restructure by imposing hard budget
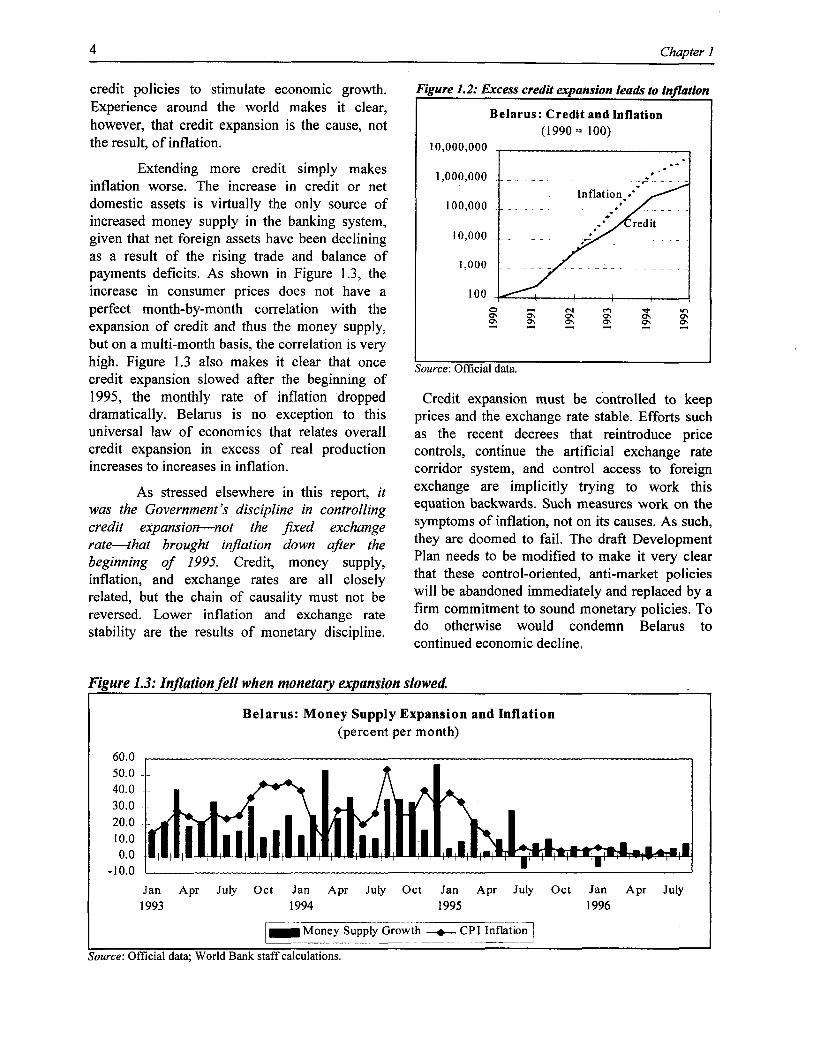
Belarus chose a very different route, one constraints, the Government has subsidized them,that has already proven very costly for the people, largely through the highly inflationaryand one that, by delaying the transition process, mechanism of having the central bank extendhas placed Belarus in a difficult position as it now refinancing credits to the banking system that areseeks to catch up with the other countries in then directed to end users in specific sectors. Astransition. The delays in moving forward with the seen in Figure 1.2, a high degree of correlationtransition process have led to a serious exists between credit expansion and inflation indeterioration of the nation's capital stock, the loss Belarus. Interestingly, a number of people inin value of whatever savings households had, an Belarus argue that this expansion of credit wasaccumulation of substantial external debt, and the required to compensate enterprises for inflation,loss of export markets. As difficult as the current and that new credits were needed to restore thesituation may be, Belarus has no choice but to working capital of enterprises so that they couldtackle the problems one by one and move continue working. In fact, the draft Program offorward. Returning to the past is impossible. The Social and Economic Development of Belarus inSoviet system, which collapsed from its own 1996-2000 ("Development Plan") that wasinternal inefficiencies, was propped up for years approved by the President in September 1996by the energy and natural resources of Russia. But calls explicitly for more liberal monetary and
4 Chapter I
credit policies to stimulate economic growth. Figure 1.2: Excess credit expansion leads to inflationExperience around the world makes it clear, Belarus: Credit and Inflationhowever, that credit expansion is the cause, not (1990 =100)
the result, of inflation. 10,000,000
Extending more credit simply makes 1,000,000 r -
inflation worse. The increase in credit or net Inflation.
domestic assets is virtually the only source of 100,000increased money supply in the banking system, .*redit
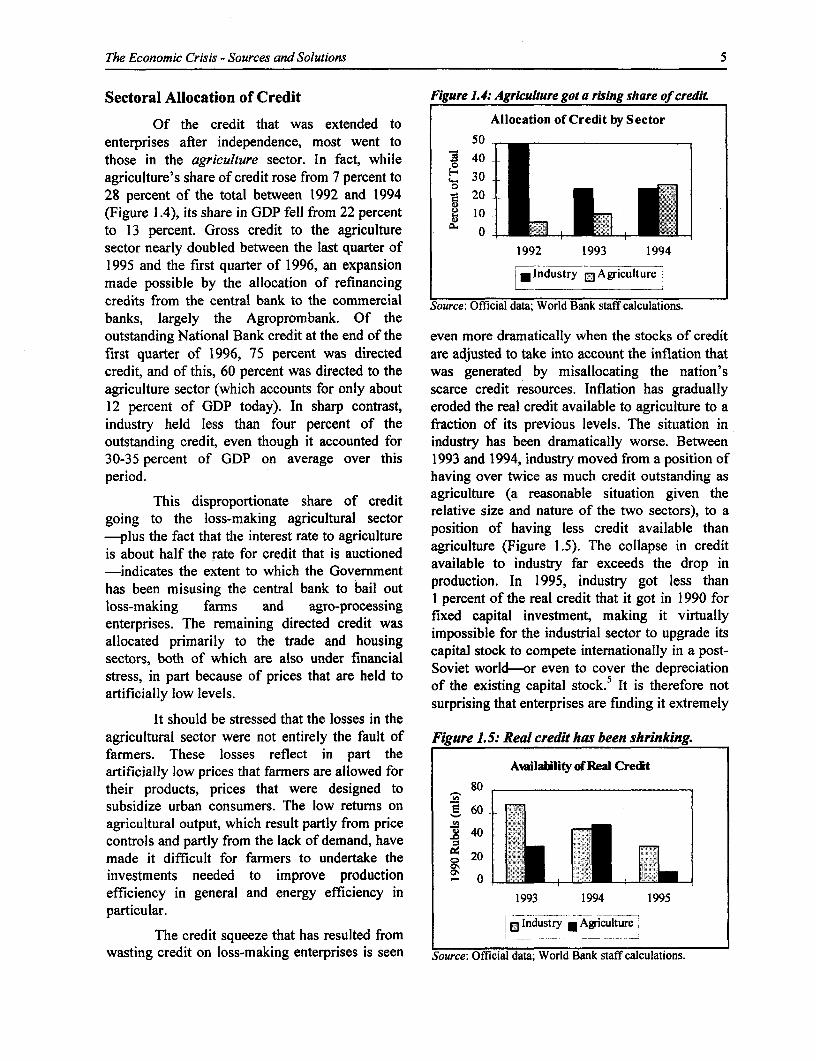
given that net foreign assets have been declining 10,000 .as a result of the rising trade and balance of 1,000payments deficits. As shown in Figure 1.3, theincrease in consumer prices does not have a 100perfect month-by-month correlation with the _expansion of credit and thus the money supply,but on a multi-month basis, the correlation is veryhigh. Figure 1.3 also makes it clear that once Source: Official data.
credit expansion slowed after the beginning of1995, the monthly rate of inflation dropped Credit expansion must be controlled to keepdramatically. Belarus is no exception to this prices and the exchange rate stable. Efforts suchuniversal law of economics that relates overall as the recent decrees that reintroduce pricecredit expansion in excess of real production controls, continue the artificial exchange rateincreases to increases in inflation. corridor system, and control access to foreign
As stressed elsewhere in this report, it exchange are implicitly trying to work thiswas the Government's discipline in controlling equation backwards. Such measures work on thecredit expansion-not the fixed exchange symptoms of inflation, not on its causes. As such,ratehat brought inflation down after the they are doomed to fail. The draft Developmentbeginning of 1995. Credit, money supply, Plan needs to be modified to make it very clearinflation, and exchange rates are all closely that these control-oriented, anti-market policiesrelated, but the chain of causality must not be will be abandoned immediately and replaced by areversed. Lower inflation and exchange rate firm commitment to sound monetary policies. Toreverstied. Lower resulats oneand dsch lnge. r do otherwise would condemn Belarus tostability are the results of monetary discipline, continued economic decline.
Figure 1.3: Inflation fell when monetary expansion slowed
Belarus: Money Supply Expansion and Inflation(percent per month)
60.0 -50.0
40.030.0 ;
-10.0
Jan Apr July Oct Jan Apr July Oct Jan Apr July Oct Jan Apr July1993 1994 1995 1996
Money Supply Growth + CPI Inflation l
Source: Official data; World Bank staff calculations.
The Economic Crisis -Sources and Solutions 5
Sectoral Allocation of Credit Figure 1.4: Agriculture got a rising share of credit.
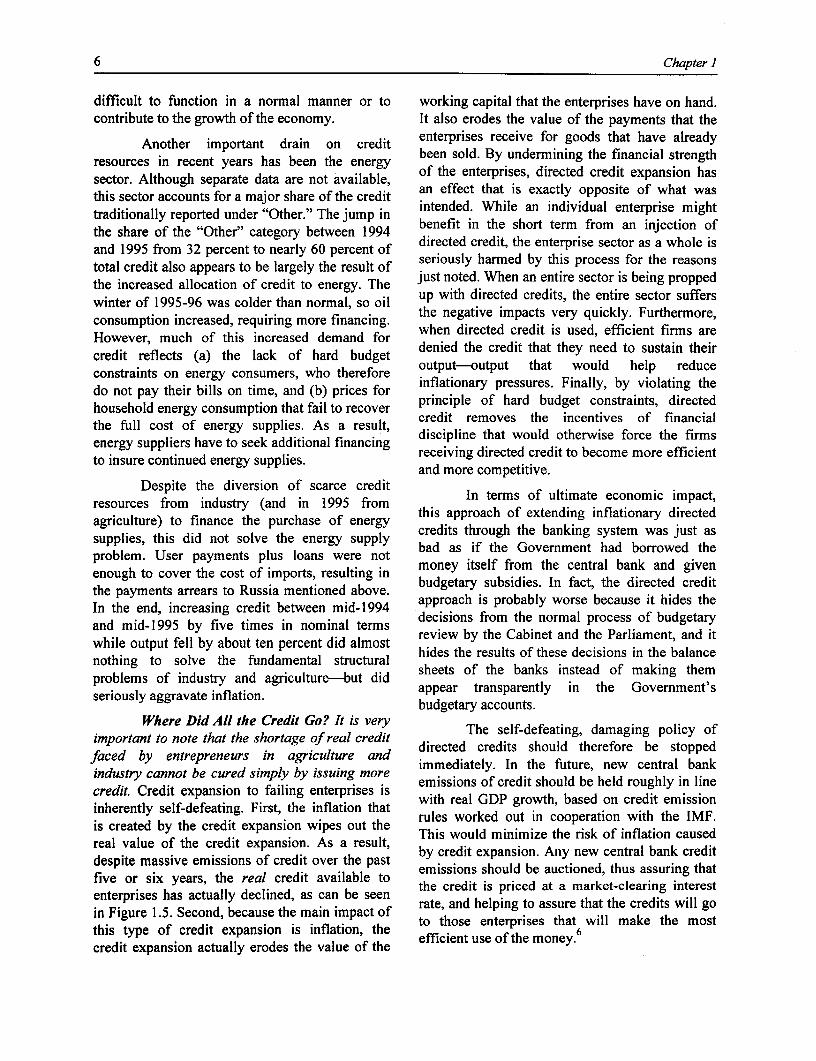
Of the credit that was extended to Allocation of Credit by Sectorenterprises after independence, most went to 50those in the agriculture sector. In fact, while 5 40agriculture's share of credit rose from 7 percent to 9 3028 percent of the total between 1992 and 1994 : 20 [ I'll'](Figure 1.4), its share in GDP fell from 22 percent 1 l0 __l_ _
to 13 percent. Gross credit to the agriculture 0 LLsector nearly doubled between the last quarter of 1992 1993 19941995 and the first quarter of 1996, an expansionmade possible by the allocation of refinancing *lndustrY 0 Agriculture
credits from the central bank to the commercial Source: Official data; World Bank staff calculations.banks, largely the Agroprombank. Of theoutstanding National Bank credit at the end of the even more dramatically when the stocks of creditfirst quarter of 1996, 75 percent was directed are adjusted to take into account the inflation thatcredit, and of this, 60 percent was directed to the was generated by misallocating the nation'sagriculture sector (which accounts for only about scarce credit resources. Inflation has gradually12 percent of GDP today). In sharp contrast, eroded the real credit available to agriculture to aindustry held less than four percent of the fraction of its previous levels. The situation inoutstanding credit, even though it accounted for industry has been dramatically worse. Between30-35 percent of GDP on average over this 1993 and 1994, industry moved from a position ofperiod. having over twice as much credit outstanding as
This disproportionate share of credit agriculture (a reasonable situation given thegoing to the loss-making agricultural sector relative size and nature of the two sectors), to a-plus the fact that the interest rate to agriculture position of having less credit available thanis about half the rate for credit that is auctioned agriculture (Figure 1.5). The collapse in credit
-indicates the extent to which the Government available to industry far exceeds the drop inhiiasbee misusing exthentral bankh theGovbail t production. In 1995, industry got less than
farmbeenmis singthe centrandbank to 1ailou percent of the real credit that it got in 1990 forloss-making farm and agro-processing fixed capital investment, making it virtuallyenterprises. The remaining directed credit was impossible for the industrial sector to upgrade itsallocated primarily to the trade and housing cptlsokt opt neainlyi otsectors, both of which are also under financial capital stock to compete internationally in a post-
inctors, parth becausehofpri are hlsoundeldfina Soviet world--or even to cover the depreciationstress, of the existing capital stock.5 It is therefore notartificially low levels.
surprising that enterprises are finding it extremelyIt should be stressed that the losses in the
agricultural sector were not entirely the fault of Figure 1.5: Real credit has been shrinking.farmers. These losses reflect in part theartificially low prices that farmers are allowed for AMuilabiIitofReal Credittheir products, prices that were designed to 80subsidize urban consumers. The low returns on 60agricultural output, which result partly from price 4controls and partly from the lack of demand, havemade it difficult for farmers to undertake the 20 *i r1investments needed to improve production __ __ _ __ _ _
efficiency in general and energy efficiency in 1993 1994 1995particular.
lo Industry AgicultThe credit squeeze that has resulted from I
wasting credit on loss-making enterprises is seen Source: Official data; World Bank staff calculations.
6 Chapter I
difficult to function in a normal manner or to working capital that the enterprises have on hand.contribute to the growth of the economy. It also erodes the value of the payments that the
Another important drain on credit enterprises receive for goods that have alreadyresources in recent years has been the energy been sold. By undermining the financial strengthsector. Although separate data are not available, of the enterprises, directed credit expansion hasthis sector accounts for a major share of the credit an effect that is exactly opposite of what wastraditionally reported under "Other." The jump in intended. While an individual enterprise mightthe share of the "Other" category between 1994 benefit in the short term from an injection ofand 1995 from 32 percent to nearly 60 percent of directed credit, the enterprise sector as a whole istotal credit also appears to be largely the result of seriously harmed by this process for the reasonsthe increased allocation of credit to energy. The just noted. When an entire sector is being proppedwinter of 1995-96 was colder than normal, so oil up with directed credits, the entire sector suffersconsumption increased, requiring more financing. the negative impacts very quickly. Furthermore,However, much of this increased demand for when directed credit is used, efficient firms arecredit reflects (a) the lack of hard budget denied the credit that they need to sustain theirconstraints on energy consumers, who therefore output-output that would help reducedo not pay their bills on time, and (b) prices for inflationary pressures. Finally, by violating thehousehold energy consumption that fail to recover priciple of hard budget constraints, directedthe full cost of energy supplies. As a result credit removes the incentives of financialenergy suppliers have to seek additional financing discipline that would otherwise force the firmsto insure continued energy supplies. receiving directed credit to become more efficient
and more competitive.Despite the diversion of scarce credit In terms of ultimate economic impact,
resources from industry (and in 1995 from this aproach of extendin inflationa directedagriculture) to finance the purchase of energy ceis through theextnking systionary justedsupplies, this did not solve the energy supply credits through the banking system was JUSt as
bad as if the Government had borrowed theproblem. User payments plus loans were notenough to cover the cost of imports, resulting in money itself from the central bank and giventhe payments arrears to Russia mentioned above budgetary subsidies. In fact, the directed creditIn the end, increasing credit between mid-i 994 approach is probably worse because it hides theand mid-1995 by five times in nominal terms decisions from the normal process of budgetarywh iedoutput9fell by about tmesin pentdidaltrmost review by the Cabinet and the Parliament, and itwhnle output fell by about ten percent dsd almost hides the results of these decisions in the balancenothing to solve the fundamental structural set ftebnsisedo aigteproblems of industry and agriculture-but did sheets of the banks instead of making themseriously aggravate inflation. appear transparently in the Government's
budgetary accounts.Where Did All the Credit Go? It is very The self-defeating, damaging policy of
important to note that the shortage of real credit directed credits should therefore be stoppedfaced by entrepreneurs in agriculture and immediately. In the future, new central bankindustry cannot be cured simply by issuing more of credit should be held roughly in line
credit. Credit expansion to failing enterprises is with real GDP growth, based on credit emissioninherently self-defeating. First, the inflation that rules worked out in cooperation with the IMF.
is created by the credit expansion wipes out the This would minimize the risk of inflation causedreal value of the credit expansion. As a result, by credit expansion. Any new central bank creditdespite massive emissions of credit over the past emissions should be auctioned, thus assuring thatfive or six years, the real credit available to the credit is priced at a market-clearing interestenterprises has actually declined, as can be seen rate, and helping to assure that the credits will goin Figure 1.5. Second, because the main impact of to those enterprises that will make the mostthis type of credit expansion is inflation, the . r 6
credit expansion actually erodes the value of the e
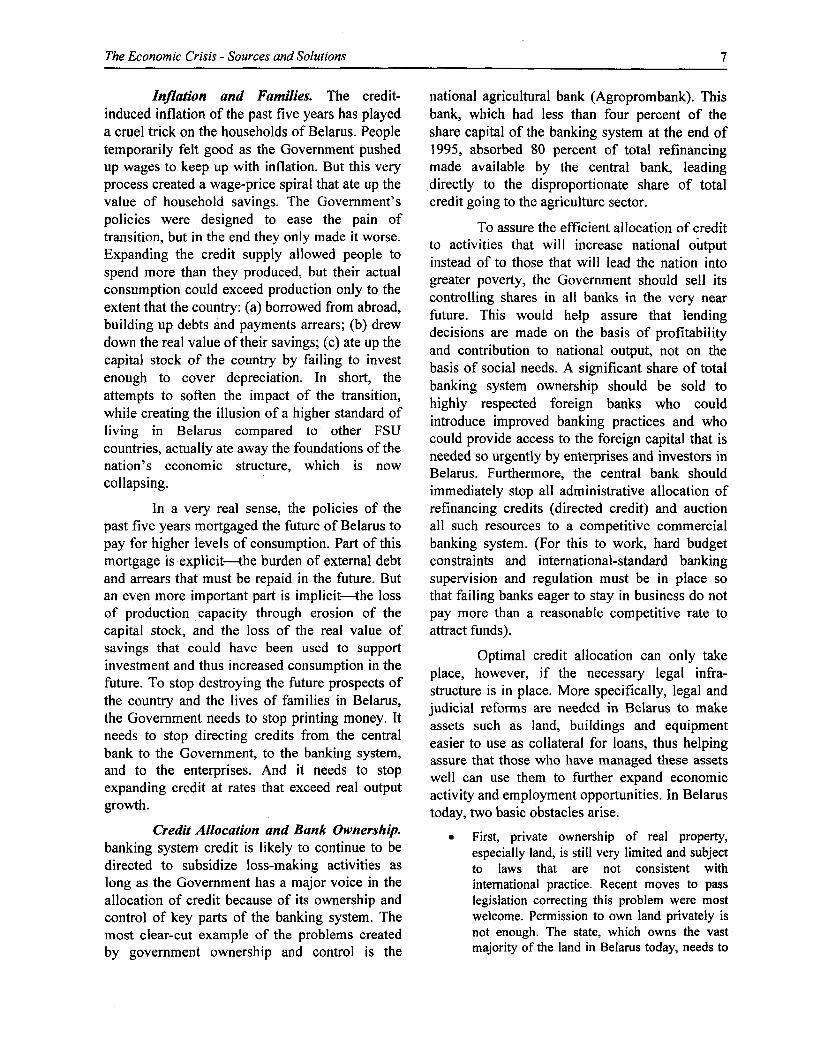
The Economic Crisis - Sources and Solutions 7
Inflation and Families. The credit- national agricultural bank (Agroprombank). Thisinduced inflation of the past five years has played bank, which had less than four percent of thea cruel trick on the households of Belarus. People share capital of the banking system at the end oftemporarily felt good as the Government pushed 1995, absorbed 80 percent of total refinancingup wages to keep up with inflation. But this very made available by the central bank, leadingprocess created a wage-price spiral that ate up the directly to the disproportionate share of totalvalue of household savings. The Government's credit going to the agriculture sector.policies were designed to ease the pain of To assure the efficient allocation of credittransition, but in the end they only made it worse. to activities that will increase national outputExpanding the credit supply allowed people to instead of to those that will lead the nation intospend more than they produced, but their actual greater poverty, the Government should sell itsconsumption could exceed production only to the controlling shares in all banks in the very nearextent that the country: (a) borrowed from abroad, future. This would help assure that lendingbuilding up debts and payments arrears; (b) drew decisions are made on the basis of profitabilitydown the real value of their savings; (c) ate up the and contribution to national output, not on thecapital stock of the country by failing to invest basis of social needs. A significant share of totalenough to cover depreciation. In short, the banking system ownership should be sold toattempts to soften the impact of the transition, highly respected foreign banks whowhile creating the illusion of a higher standard of introduce improved banking practices and who
living~ ~ ~ ~ ~ ~ ~~ itodc imroe banking practices and whorFSliving in Belarus compared to other FSU could provide access to the foreign capital that iscountries, actually ate away the foundations of the needed so urgently by enterprises and investors innation's economic structure, which is now Belarus. Furthermore, the central bank shouldcollapsing. immediately stop all administrative allocation of
In a very real sense, the policies of the refinancing credits (directed credit) and auctionpast five years mortgaged the future of Belarus to all such resources to a competitive commercialpay for higher levels of consumption. Part of this banking system. (For this to work, hard budgetmortgage is explicit-the burden of external debt constraints and international-standard bankingand arrears that must be repaid in the future. But supervision and regulation must be in place soan even more important part is implicit-the loss that failing banks eager to stay in business do notof production capacity through erosion of the pay more than a reasonable competitive rate tocapital stock, and the loss of the real value of attract funds).savings that could have been used to support Optimal credit allocation can only takeinvestment and thus increased consumption in the place, however, if the necessary legal infra-future. To stop destroying the future prospects of structure is in place. More specifically, legal andthe country and the lives of families in Belarus judicial reforms are needed in Belarus to makethe Government needs to stop printing money It assets such as land, buildings and equipmentneeds to stop directing credits from the central easier to use as collateral for loans, thus helpingbank to the Government, to the banking system, assure that those who have managed these assetsand to the enterprises. And it needs to stop well can use them to further expand economicexpanding credit at rates that exceed real output activity and employment opportunities. In Belarusgrowth. today, two basic obstacles arise.
Credit Allocation and Bank Ownership. * First, private ownership of real property,banking system credit is likely to continue to be especially land, is still very limited and subjectdirected to subsidize loss-making activities as to laws that are not consistent withlong as the Government has a major voice in the international practice. Recent moves to passallocation of credit because of its ownership and legislation correcting this problem were mostcontrol of key parts of the banking system. The welcome. Permission to own land privately ismost clear-cut example of the problems created not enough. The state, which owns the vastby government ownership and control is the majority of the land in Belarus today, needs to
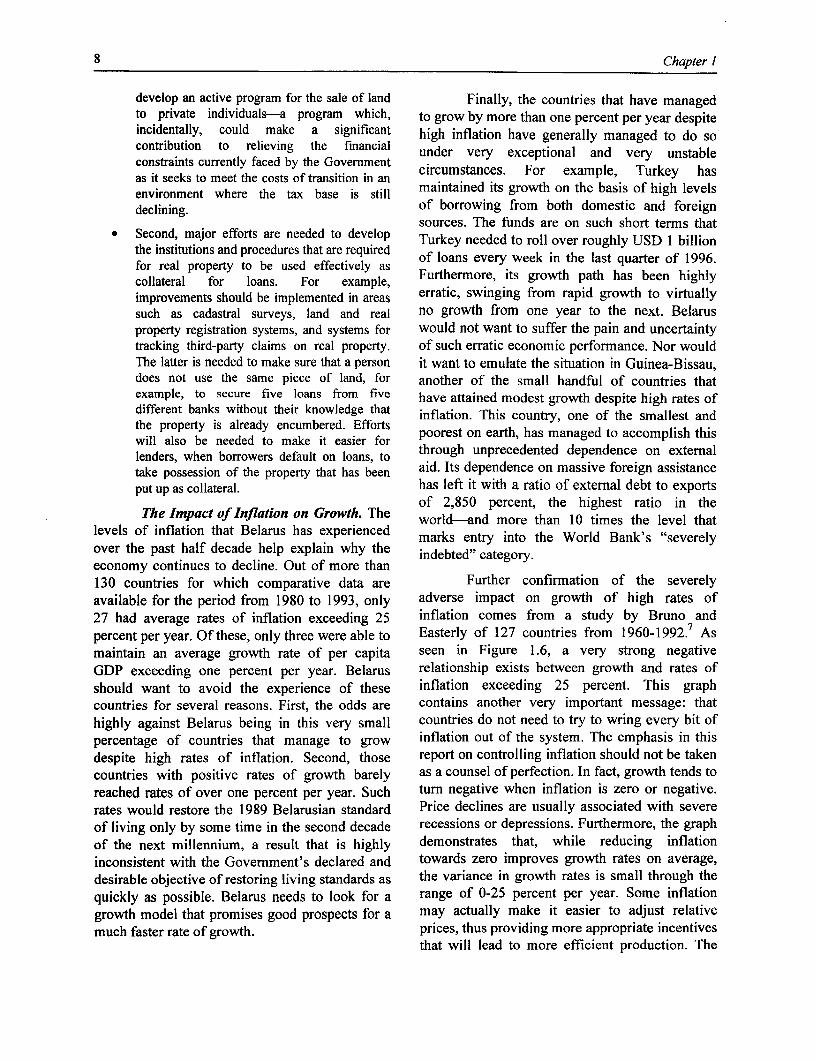
8 Chapter I
develop an active program for the sale of land Finally, the countries that have managedto private individuals-a program which, to grow by more than one percent per year despiteincidentally, could make a significant high inflation have generally managed to do socontribution to relieving the financial under very exceptional and very unstableconstraints currently faced by the Government circumstances. For example, Turkey hasas it seeks to meet the costs of transition in anenvironment where the tax base is still maintained its growth on the basis of high levelsdeclining. of borrowing from both domestic and foreign
sources. The funds are on such short terms thatSecond, major efforts are needed to develop Turkey needed to roll over roughly USD I billionthe institutions and procedures that are required of loans every week in the last quarter of 1996.for real property to be used effectively as lorery w th pat harten highlycollateral for loans. For example, Furthermore, its growth path has been highlyimprovements should be implemented in areas erratic, swinging from rapid growth to virtuallysuch as cadastral surveys, land and real no growth from one year to the next. Belarusproperty registration systems, and systems for would not want to suffer the pain and uncertaintytracking third-party claims on real property. of such erratic economic performance. Nor wouldThe latter is needed to make sure that a person it want to emulate the situation in Guinea-Bissau,does not use the same piece of land, for another of the small handful of countries thatexample, to secure five loans from five have attained modest growth despite high rates ofdifferent banks without their knowledge that inflation. This country, one of the smallest andthe property is already encumbered. Efforts poorest on earth, has managed to accomplish thiswill also be needed to make it easier for poors onpearth,tha manaedct om thislenders, when borrowers default on loans, to through unprecedented dependence on externaltake possession of the property that has been aid. Its dependence on massive foreign assistanceput up as collateral. has left it with a ratio of external debt to exports
of 2,850 percent, the highest ratio in theTshe Impact of Inflation on Growth. The world-and more than 10 times the level that
levels of inflation that Belarus has experienced marks entry into the World Bank's "severelyover the past half decade help explain why the indebted" category.economy continues to decline. Out of more than130 countries for which comparative data are Further confirmation of the severelyavailable for the period from 1980 to 1993, only adverse impact on growth of high rates of27 had average rates of inflation exceeding 25 inflation comes from a study by Bruno andpercent per year. Of these, only three were able to Easterly of 127 countries from 1960-1992.7 Asmaintain an average growth rate of per capita seen in Figure 1.6, a very strong negativeGDP exceeding one percent per year. Belarus relationship exists between growth and rates ofshould want to avoid the experience of these inflation exceeding 25 percent. This graphcountries for several reasons. First, the odds are contains another very important message: thathighly against Belarus being in this very small countries do not need to try to wring every bit ofpercentage of countries that manage to grow inflation out of the system. The emphasis in thisdespite high rates of inflation. Second, those report on controlling inflation should not be takencountries with positive rates of growth barely as a counsel of perfection. In fact, growth tends toreached rates of over one percent per year. Such turn negative when inflation is zero or negative.rates would restore the 1989 Belarusian standard Price declines are usually associated with severeof living only by some time in the second decade recessions or depressions. Furthermore, the graphof the next millennium, a result that is highly demonstrates that, while reducing inflationinconsistent with the Government's declared and towards zero improves growth rates on average,desirable objective of restoring living standards as the variance in growth rates is small through thequickly as possible. Belarus needs to look for a range of 0-25 percent per year. Some inflationgrowth model that promises good prospects for a may actually make it easier to adjust relativemuch faster rate of growth. prices, thus providing more appropriate incentives
that will lead to more efficient production. The
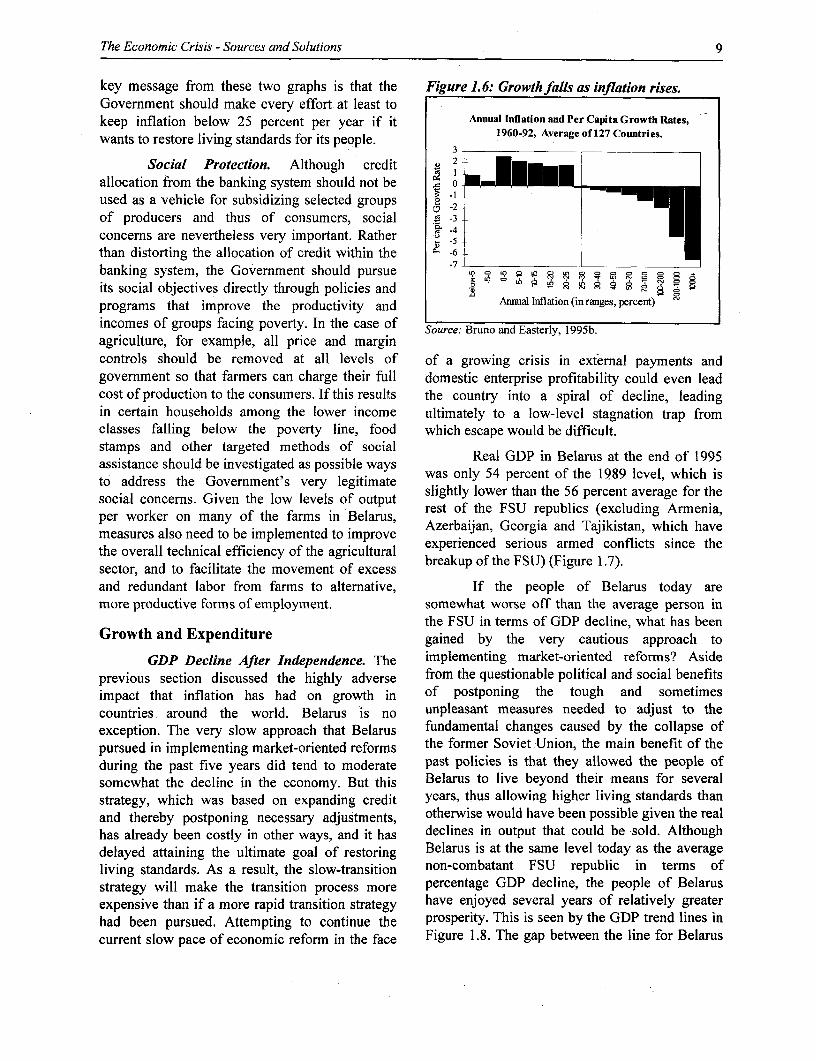
The Economic Crisis - Sources and Solutions 9
key message from these two graphs is that the Figure 1.6: Growth falls as inflation rises.Government should make every effort at least tokeep inflation below 25 percent per year if it Annual Inflation and Per Capita Growth Rates,
wants to restore living standards for its people. 1960-92, Average of 127 Countries.3 -_ _ _ _
Social Protection. Although credit 2
allocation from the banking system should not be io
used as a vehicle for subsidizing selected groups -2of producers and thus of consumers, social -3concerns are nevertheless very important. Ratherthan distorting the allocation of credit within the -6-I-
banking system, the Government should pursue 7 L9 In R P 8 ° °
its social objectives directly through policies and I
programs that improve the productivity and Annual hnflation (in ranges, percent)
incomes of groups facing poverty. In the case ofagriculture, for example, all price and margincontrols should be removed at all levels of of a growing crisis in external payments andgovernment so that farmers can charge their full domestic enterprise profitability could even leadcost of production to the consumers. If this results the country into a spiral of decline, leadingin certain households among the lower income ultimately to a low-level stagnation trap fromclasses falling below the poverty line, food which escape would be difficult.stamps and other targeted methods of social Real GDP in Belarus at the end of 1995assistance should be investigated as possible waysto address the Government's very legitimate was only 54 percent of the 1989 level, which issocial concerns. Given the low levels of output slightly lower than the 56 percent average for thesocal oncms.Givn te lw lvel ofoutut rest of the FSU republics (excluding Armenia,per worker on many of the farms in Belarus, rbaijlnug havemeasures also need to be implemented to improve Azerbaijan, Georgia and Tajikistan, which havethe overall technical efficiency of the agricultural experienced serious armed conflicts since thesector, and to facilitate the movement of excess breakup of the FSU) (Figure 1.7).and redundant labor from farms to alternative, If the people of Belarus today aremore productive forms of employment. somewhat worse off than the average person in
the FSU in terms of GDP decline, what has beenGrowth and Expenditure gained by the very cautious approach to
GDP Decline After Independence. The implementing market-oriented reforms? Asideprevious section discussed the highly adverse from the questionable political and social benefitsimpact that inflation has had on growth in of postponing the tough and sometimescountries around the world. Belarus is no unpleasant measures needed to adjust to theexception. The very slow approach that Belarus fundamental changes caused by the collapse ofpursued in implementing market-oriented reforms the former Soviet Union, the main benefit of theduring the past five years did tend to moderate past policies is that they allowed the people ofsomewhat the decline in the economy. But this Belarus to live beyond their means for severalstrategy, which was based on expanding credit years, thus allowing higher living standards thanand thereby postponing necessary adjustments, otherwise would have been possible given the realhas already been costly in other ways, and it has declines in output that could be sold. Althoughdelayed attaining the ultimate goal of restoring Belarus is at the same level today as the averageliving standards. As a result, the slow-transition non-combatant FSU republic in terms ofstrategy will make the transition process more percentage GDP decline, the people of Belarusexpensive than if a more rapid transition strategy have enjoyed several years of relatively greaterhad been pursued. Attempting to continue the prosperity. This is seen by the GDP trend lines incurrent slow pace of economic reform in the face Figure 1.8. The gap between the line for Belarus
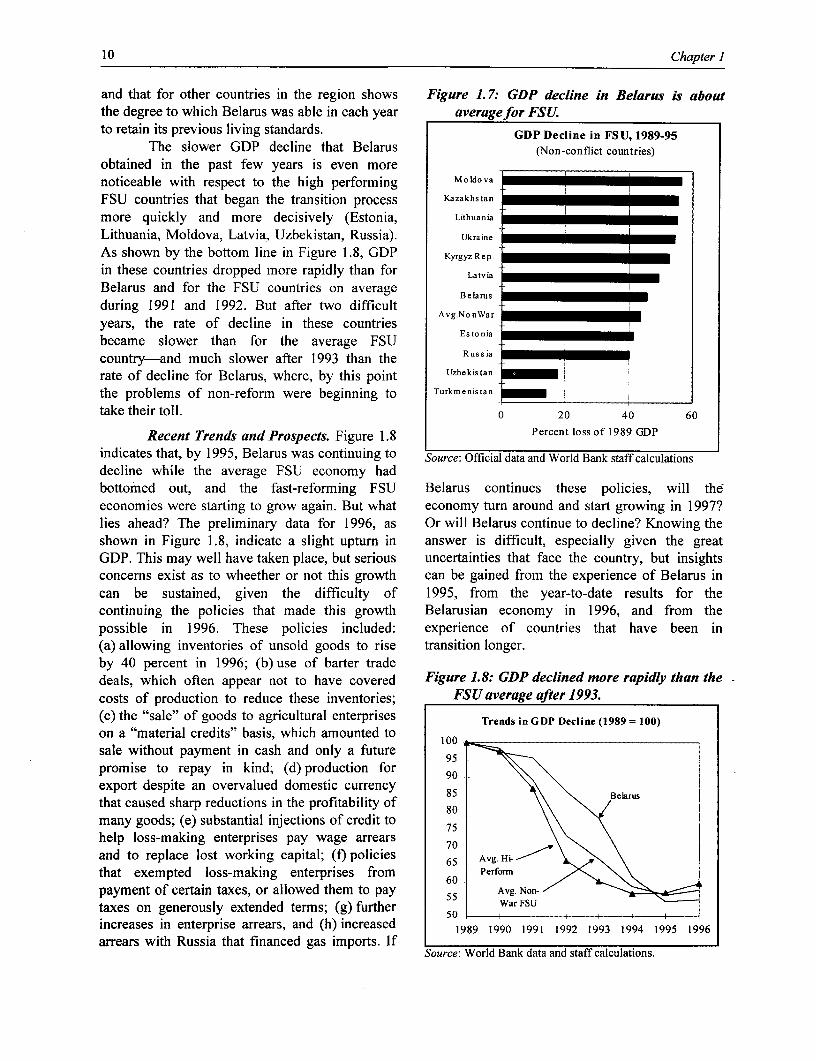
10 Chapter I
and that for other countries in the region shows Figure 1.7: GDP decline in Belarus is aboutthe degree to which Belarus was able in each year average for FSU.to retain its previous living standards. GDP Decline in FSU, 1989-95
The slower GDP decline that Belarus (Non-conflict countries)
obtained in the past few years is even morenoticeable with respect to the high performing Moldova
FSU countries that began the transition process Kazakhstan
more quickly and more decisively (Estonia, Lithuania
Lithuania, Moldova, Latvia, Uzbekistan, Russia). Ukraine
As shown by the bottom line in Figure 1.8, GDP Kyrgyz Rep .
in these countries dropped more rapidly than for Latvia -Belarus and for the FSU countries on average a lduring 1991 and 1992. But after two difficult Belarus _
years, the rate of decline in these countries Avg.NonWar r
became slower than for the average FSU Es to nia _
country-and much slower after 1993 than the Russia
rate of decline for Belarus, where, by this point Uzbekistan
the problems of non-reform were beginning to Turkmenis tan
take their toll. 0 20 40 60
Recent Trends and Prospects. Figure 1.8 Percent loss of 1989 GDP
indicates that, by 1995, Belarus was continuing to Source: Official data and World Bank staff calculations
decline while the average FSU economy hadbottomed out, and the fast-reforming FSU Belarus continues these policies, will theeconomies were starting to grow again. But what economy turn around and start growing in 1997?lies ahead? The preliminary data for 1996, as Or will Belarus continue to decline? Knowing theshown in Figure 1.8, indicate a slight upturn in answer is difficult, especially given the greatGDP. This may well have taken place, but serious uncertainties that face the country, but insightsconcerns exist as to wheether or not this growth can be gained from the experience of Belarus incan be sustained, given the difficulty of 1995, from the year-to-date results for thecontinuing the policies that made this growth Belarusian economy in 1996, and from thepossible in 1996. These policies included: experience of countries that have been in(a) allowing inventories of unsold goods to rise transition longer.by 40 percent in 1996; (b) use of barter tradedeals, which often appear not to have covered Figure 1.8: GDP declined more rapidly than thecosts of production to reduce these inventories; FSU average after 1993.(c) the "sale" of goods to agricultural enterprises Trends in GDP Decline (1989 = 100)
on a "material credits" basis, which amounted to 100sale without payment in cash and only a future 95promise to repay in kind; (d) production for 90export despite an overvalued domestic currency 85 Belarus
that caused sharp reductions in the profitability of 80 /many goods; (e) substantial injections of credit to 75help loss-making enterprises pay wage arrears 70and to replace lost working capital; (f) policies 65 Avg. H i-
that exempted loss-making enterprises from 60 -Perform
payment of certain taxes, or allowed them to pay 55 Avg. Non-
taxes on generously extended terms; (g) further 50 War FSU l l
increases in enterprise arrears, and (h) increased 1989 1990 1991 1992 1993 1994 1995 1996
arrears with Russia that financed gas imports. If Source_WorldBank_dta_an _staffcalcultions
Source: World Bank data and staff calculations.
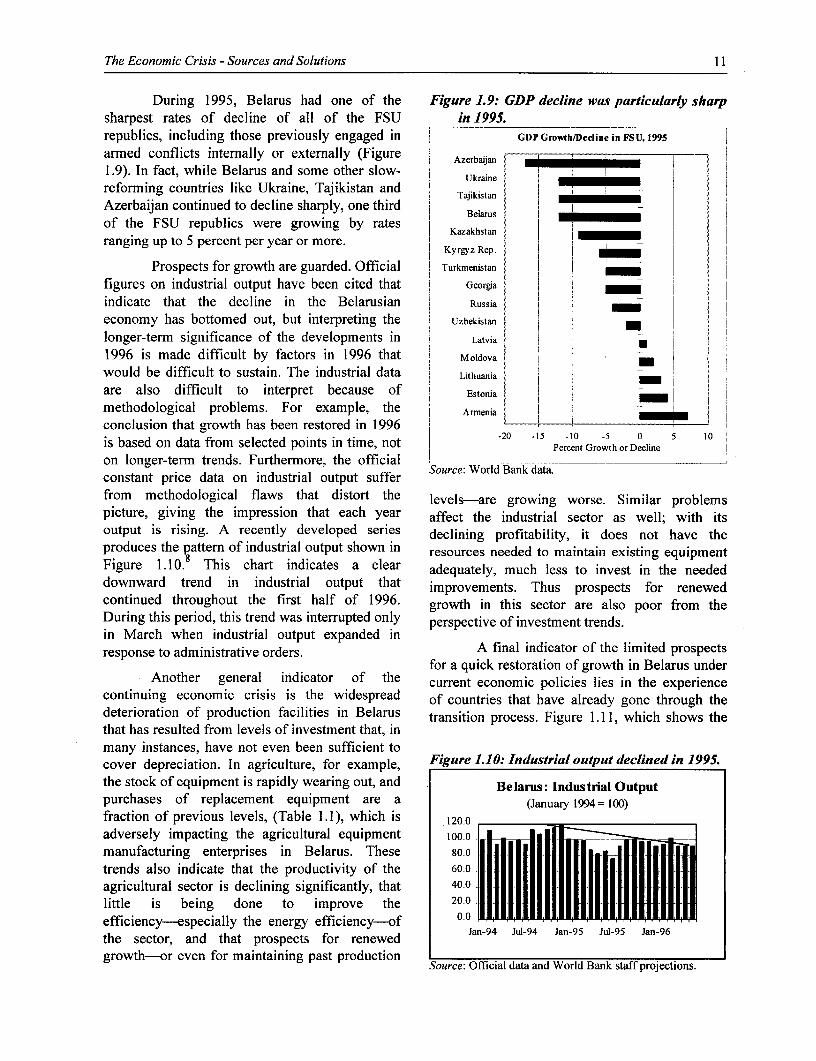
The Economic Crisis - Sources and Solutions I I
During 1995, Belarus had one of the Figure 1.9: GDP decline was particularly sharpsharpest rates of decline of all of the FSU in 1995.republics, including those previously engaged in GDPGrowth/Decine in FSU, 1995
armed conflicts internally or externally (Figure Azerbaj _- 1 -1.9). In fact, while Belarus and some other slow- Ukraine l
reforming countries like Ukraine, Tajikistan and Tajikistan
Azerbaijan continued to decline sharply, one third Belarus
of the FSU republics were growing by rates IKzkhstanranging up to 5 percent per year or more. iKyrgyz Rep.
Prospects for growth are guarded. Official Turkmenistan
figures on industrial output have been cited that Georgia
indicate that the decline in the Belarusian Russia
economy has bottomed out, but interpreting the Uzbekistan
longer-term significance of the developments in l Latvia I i
1996 is made difficult by factors in 1996 that Moldova
would be difficult to sustain. The industrial data i Lithuania
are also difficult to interpret because of Estonia
methodological problems. For example, the Armenia . __l
conclusion that growth has been restored in 1996is based on data from selected points in time, not Percent Growth or Decline 0
on longer-term trends. Furthermore, the official ISource: World Bankdata. constant price data on industrial output sufferfrom methodological flaws that distort the levels-are growing worse. Similar problemspicture, giving the impression that each year affect the industrial sector as well; with itsoutput is rising. A recently developed series declining profitability, it does not have theproduces the pattern of industrial output shown in resources needed to maintain existing equipmentFigure 1.10.° This chart indicates a clear adequately, much less to invest in the neededdownward trend in industrial output that improvements. Thus prospects for renewedcontinued throughout the first half of 1996. growth in this sector are also poor from theDuring this period, this trend was interrupted only perspective of investment trends.in March when industrial output expanded inresponse to administrative orders. A final indicator of the limited prospects
for a quick restoration of growth in Belarus underAnother general indicator of the current economic policies lies in the experience
continuing economic crisis is the widespread of countries that have already gone through thedeterioration of production facilities in Belarus transition process. Figure 1.11, which shows thethat has resulted from levels of investment that, inmany instances, have not even been sufficient tocover depreciation. In agriculture, for example, Figure l1.O: Industrial output declined in 1995.the stock of equipment is rapidly wearing out, and Belarus: Industnial Outputpurchases of replacement equipment are a (January 1994 = 100)fraction of previous levels, (Table 1.1), which is 120.0
adversely impacting the agricultural equipment 100.0.manufacturing enterprises in Belarus. These 80.0
trends also indicate that the productivity of the 60.0
agricultural sector is declining significantly, that 40.0E I mirN
little is being done to improve the 20.0
efficiency -especially the energy efficiency-of 0.0the sector, and that prospects for renewed Jan-94 Jl 94 Jan-95 Jul-95 Jan-96
growth-or even for maintaining past production uSource: Of ficial data and World Bank staff projections.
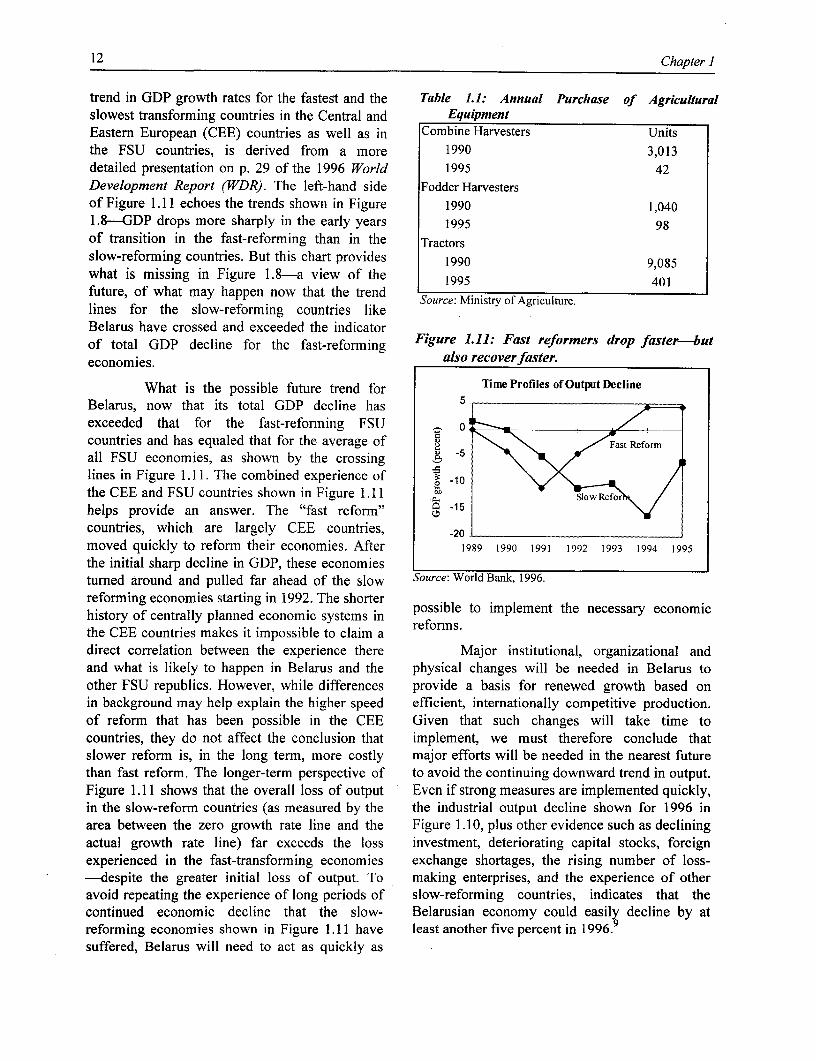
12 Chapter I
trend in GDP growth rates for the fastest and the Table 1.1: Annual Purchase of Agriculturalslowest transforming countries in the Central and EquipmentEastern European (CEE) countries as well as in Combine Harvesters Unitsthe FSU countries, is derived from a more 1990 3,013detailed presentation on p. 29 of the 1996 World 1995 42Development Report (WDR). The left-hand side Fodder Harvestersof Figure 1.11 echoes the trends shown in Figure 1990 1,0401.8-GDP drops more sharply in the early years 1995 98of transition in the fast-reforming than in the Tractorsslow-reforming countries. But this chart provides 1990 9,085what is missing in Figure 1.8-a view of the 1995 401future, of what may happen now that the trend Source: Ministry of Agriculture.lines for the slow-reforming countries likeBelarus have crossed and exceeded the indicatorof total GDP decline for the fast-reforming Figure 1.11: Fast reformers drop faster-buteconomies. also recoverfaster.
What is the possible future trend for Time Profiles of Output DeclineBelarus, now that its total GDP decline has 5 -exceeded that for the fast-reforming FSU zI 0countries and has equaled that for the average of Fast Reform
all FSU economies, as shown by the crossing Xlines in Figure 1.11. The combined experience of -10the CEE and FSU countries shown in Figure 1.11 S l owhelps provide an answer. The "fast reform" -countries, which are largely CEE countries, -20 -moved quickly to reform their economies. After 1989 1990 1991 1992 1993 1994 1995
the initial sharp decline in GDP, these economies _____
turned around and pulled far ahead of the slow Source: World Bank, 1996.
reforming economies starting in 1992. The shorter possible to implement the necessary economichistory of centrally planned economic systems in reforms.the CEE countries makes it impossible to claim adirect correlation between the experience there Major institutional, organizational andand what is likely to happen in Belarus and the physical changes will be needed in Belarus toother FSU republics. However, while differences provide a basis for renewed growth based onin background may help explain the higher speed efficient, internationally competitive production.of reform that has been possible in the CEE Given that such changes will take time tocountries, they do not affect the conclusion that implement, we must therefore conclude thatslower reform is, in the long term, more costly major efforts will be needed in the nearest futurethan fast reform. The longer-term perspective of to avoid the continuing downward trend in output.Figure 1.11 shows that the overall loss of output Even if strong measures are implemented quickly,in the slow-reform countries (as measured by the the industrial output decline shown for 1996 inarea between the zero growth rate line and the Figure 1.10, plus other evidence such as decliningactual growth rate line) far exceeds the loss investment, deteriorating capital stocks, foreignexperienced in the fast-transforming economies exchange shortages, the rising number of loss--despite the greater initial loss of output. To making enterprises, and the experience of otheravoid repeating the experience of long periods of slow-reforming countries, indicates that thecontinued economic decline that the slow- Belarusian economy could easily decline by atreforming economies shown in Figure 1.1 1 have least another five percent in 1996.9suffered, Belarus will need to act as quickly as
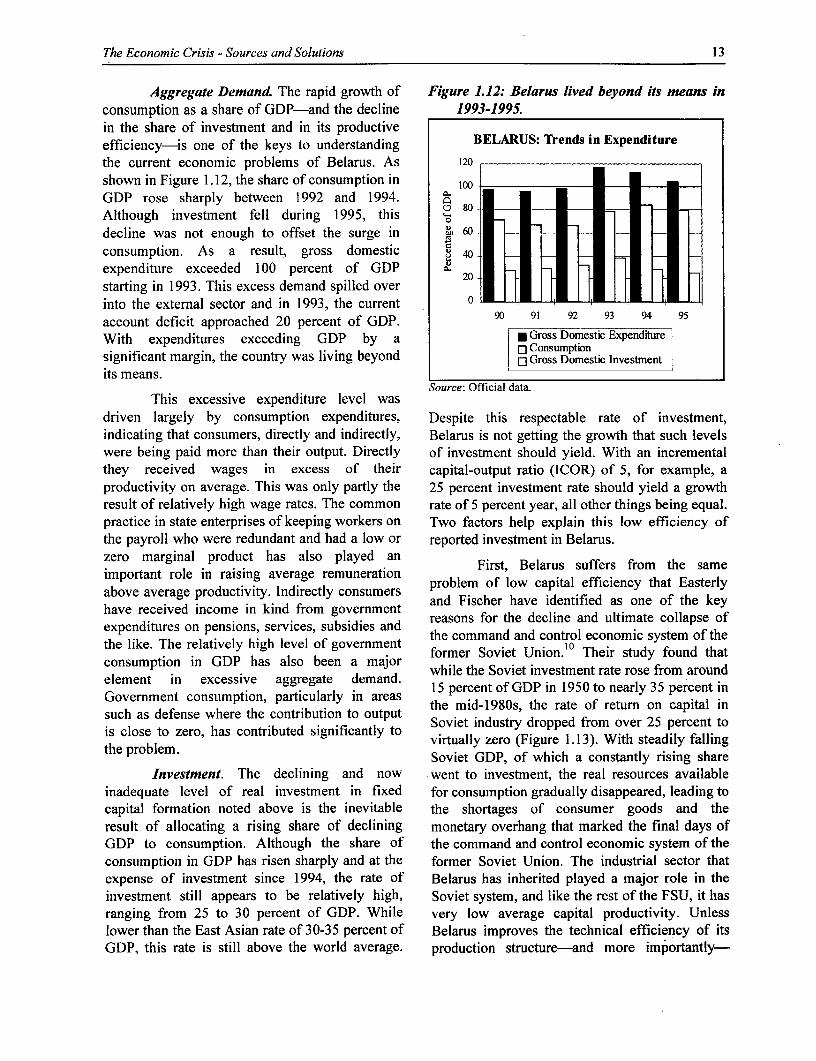
The Economic Crisis - Sources and Solutions 13
Aggregate Demand The rapid growth of Figure 1.12: Belarus lived beyond its means inconsumption as a share of GDP-and the decline 1993-1995.in the share of investment and in its productiveefficiency-is one of the keys to understanding BELARUS: Trends in Expenditurethe current economic problems of Belarus. As 120
shown in Figure 1.12, the share of consumption in lo_GDP rose sharply between 1992 and 1994.Although investment fell during 1995, this _-_
decline was not enough to offset the surge in 60 -
consumption. As a result, gross domestic 40 -
expenditure exceeded 100 percent of GDP 20 -
starting in 1993. This excess demand spilled overinto the external sector and in 1993, the current 0
account deficit approached 20 percent of GDP. 90 91 92 93 94 95
With expenditures exceeding GDP by a N Gross Domestic Expenditure 1significant margin, the country was living beyond r-o ConsumptionGross Domestic Investmentits means.
Source: Official data.This excessive expenditure level was
driven largely by consumption expenditures, Despite this respectable rate of investment,indicating that consumers, directly and indirectly, Belarus is not getting the growth that such levelswere being paid more than their output. Directly of investment should yield. With an incrementalthey received wages in excess of their capital-output ratio (ICOR) of 5, for example, aproductivity on average. This was only partly the 25 percent investment rate should yield a growthresult of relatively high wage rates. The common rate of 5 percent year, all other things being equal.practice in state enterprises of keeping workers on Two factors help explain this low efficiency ofthe payroll who were redundant and had a low or reported investment in Belarus.zero marginal product has also played anImportant role In raising average remuneration Frt eau ufr rmtesmabpoveat avrae pnroducivin. andraec consers problem of low capital efficiency that Easterlyabove verag princme in kInd from goverment and Fischer have identified as one of the keyhave received income in kind from govemmen..reasons for the decline and ultimate collapse ofexpenditures on pensions, services, subsidies and the command and control economic system of thethe like. The relatively high level of government former Soviet Union.'t0 Their study found that
consumption in GDP has also been a major while the Soviet investment rate rose from aroundelement in excessive aggregate demand. 15 percent of GDP in 1950 to nearly 35 percent inGoverment consumption, particularly in areas the mid-1980s, the rate of return on capital insuch as defense where the contribution to output Soviet industry dropped from over 25 percent tois close to zero, has contributed significantly to virtually zero (Figure 1.13). With steadily fallingthe problem. Soviet GDP, of which a constantly rising share
Investment. The declining and now went to investment, the real resources availableinadequate level of real investment in fixed for consumption gradually disappeared, leading tocapital formation noted above is the inevitable the shortages of consumer goods and theresult of allocating a rising share of declining monetary overhang that marked the final days ofGDP to consumption. Although the share of the command and control economic system of theconsumption in GDP has risen sharply and at the former Soviet Union. The industrial sector thatexpense of investment since 1994, the rate of Belarus has inherited played a major role in theinvestment still appears to be relatively high, Soviet system, and like the rest of the FSU, it hasranging from 25 to 30 percent of GDP. While very low average capital productivity. Unlesslower than the East Asian rate of 30-35 percent of Belarus improves the technical efficiency of itsGDP, this rate is still above the world average. production structure-and more importantly-
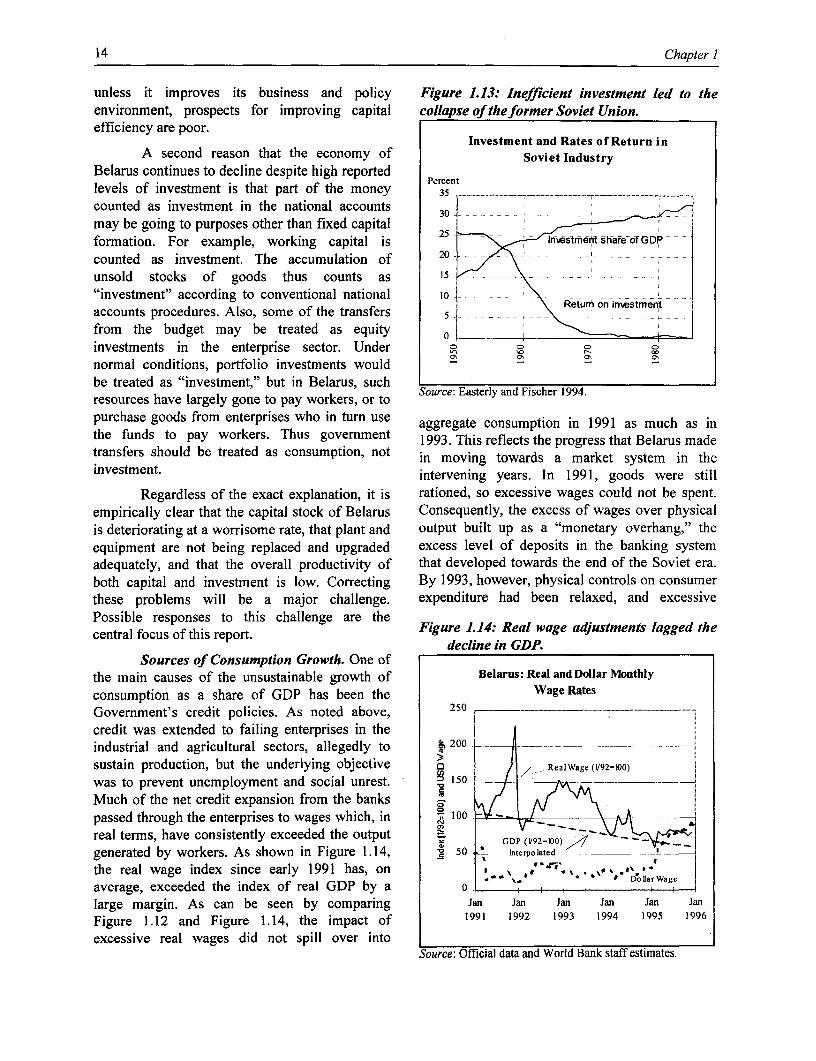
14 Chapter I
unless it improves its business and policy Figure 1.13: Inefficient investment led to theenvironment, prospects for improving capital collapse of the former Soviet Union.efficiency are poor.
Investment and Rates of Return inA second reason that the economy of Soviet Industry
Belarus continues to decline despite high reported Percent
levels of investment is that part of the money 35 ....... .....
counted as investment in the national accounts 30
may be going to purposes other than fixed capitalformation. For example, working capital is 2 -rhS1mh1t share-of GDP
counted as investment. The accumulation of 20 . _
unsold stocks of goods thus counts as 15 - - - - - - - -- - e
"investment" according to conventional national 1o-__accounts procedures. Also, some of the transfers 5-
from the budget may be treated as equity o_iinvestments in the enterprise sector. Under 0 C Cnormal conditions, portfolio investments would a, O r
be treated as "investment," but in Belarus, suchresources have largely gone to pay workers, or to Source: Easterly and Fischer 1994.
purchase goods from enterprises who in turn use aggregate consumption in 1991 as much as inthe funds to pay workers. Thus government 1993. This reflects the progress that Belarus madetransfers should be treated as consumption, not in moving towards a market system in the
investment. intervening years. In 1991, goods were still
Regardless of the exact explanation, it is rationed, so excessive wages could not be spent.empirically clear that the capital stock of Belarus Consequently, the excess of wages over physicalis deteriorating at a worrisome rate, that plant and output built up as a "monetary overhang," theequipment are not being replaced and upgraded excess level of deposits in the banking systemadequately, and that the overall productivity of that developed towards the end of the Soviet era.both capital and investment is low. Correcting By 1993, however, physical controls on consumerthese problems will be a major challenge. expenditure had been relaxed, and excessivePossible responses to this challenge are thecentral focus of this report. Figure 1.14: Real wage adjustments lagged the
decline in GDP.Sources of Consumption Growth. One of
the main causes of the unsustainable growth of Belarus: Real and Dollar Monthly
consumption as a share of GDP has been the Wage RatesGovemment's credit policies. As noted above, 250 .credit was extended to failing enterprises in theindustrial and agricultural sectors, allegedly to 200
sustain production, but the underlying objective / RealWage (V92=100)
was to prevent unemployment and social unrest. 150 .- __
Much of the net credit expansion from the bankspassed through the enterprises to wages which, in 100 - -
real terms, have consistently exceeded the output GDP (V92=100) -
generated by workers. As shown in Figure 1.14, X 50 ± Interpolated . _
the real wage index since early 1991 has, on , , ; a
average, exceeded the index of real GDP by a o ilarge margin. As can be seen by comparing Jan Jan Jan Jan Jan Jan
Figure 1.12 and Figure 1.14, the impact of 1991 1992 1993 1994 1995 1996
excessive real wages did not spill over intoSource: Official data and World Bank staff estimates.
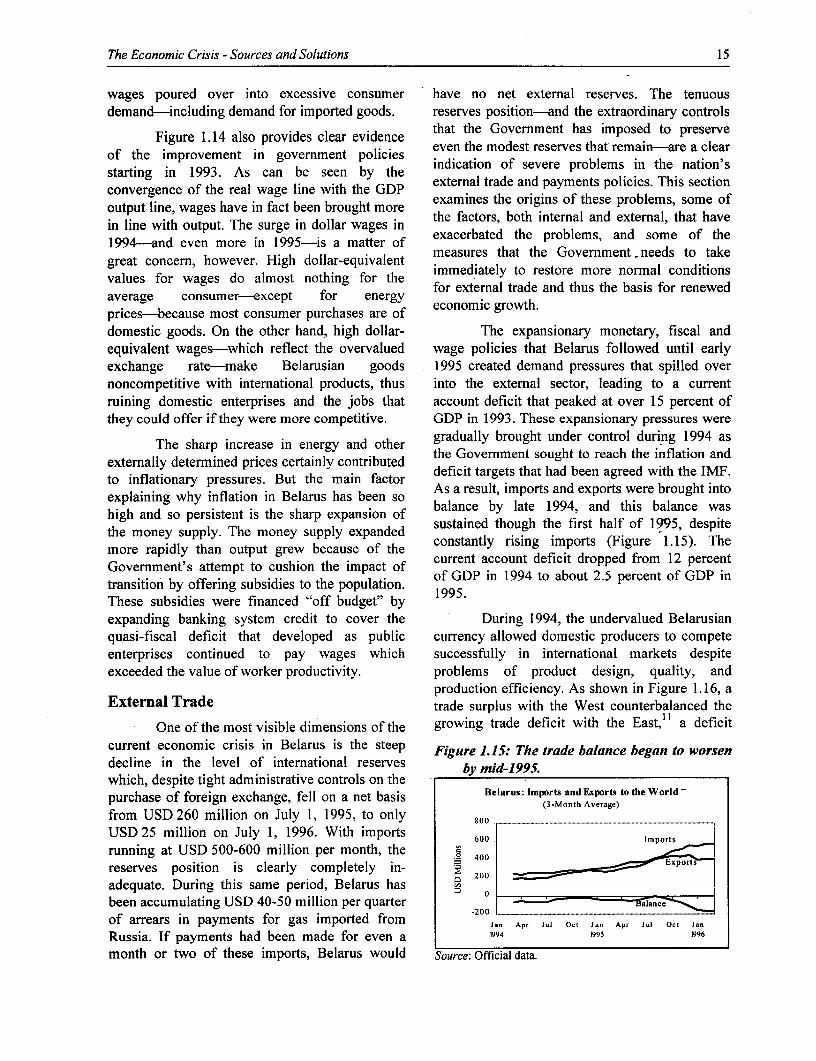
The Economic Crisis - Sources and Solutions 15
wages poured over into excessive consumer have no net external reserves. The tenuousdemand-including demand for imported goods. reserves position-and the extraordinary controls
Figure 1.14 also provides clear evidence that the Government has imposed to preserveof the improvement in ,n policies........ .even the modest reserves that remain-are a clear
starting in 1993. As can be seen by the indication of severe problems in the nation'sstartngeinc 1993. Ase ean be snee byth the GDP external trade and payments policies. This sectionconvergence of the real wage line with the GDP exmne h orgn fteeprbes"oeooutput line, wages have in fact been brought more the factors, both internal and exteral, that havein line with output. The surge in dollar wages in exacted th probl and somenal the1994-and even more in 1995-is a matter of exacerbated the problems, and some of the
measures that the Government needs to takegreat concern, however. High dollar-equivalent im dIy to restore more normal condit-
values for wages do almost nothing for the for external trade and thus the basis for renewedaverage consumer-except for energyprices-because most consumer purchases are of edomestic goods. On the other hand, high dollar- The expansionary monetary, fiscal andequivalent wages-which reflect the overvalued wage policies that Belarus followed until earlyexchange rate-make Belarusian goods 1995 created demand pressures that spilled overnoncompetitive with international products, thus into the external sector, leading to a currentruining domestic enterprises and the jobs that account deficit that peaked at over 15 percent ofthey could offer if they were more competitive. GDP in 1993. These expansionary pressures were
The sharp increase in energy and other gradually brought under control during 1994 asextmaly dterine prcescertainly contributed the Government sought to reach the inflation andexternally determined prices ce contribu deficit targets that had been agreed with the IMF.
to inflationary pressures. But the main factor Asarulimotanexrtwrebohtnoexplaining why inflation in Belarus has been so As a result, imports and exports were brought intohigh and so persistent is the sharp expansion of balance by late 1994, and this balance wasthe money supply. The money supply expanded sustained though the first half of 1995, despite
more rapidly than output grew because of the constantly rising imports (Figure 1.15). TheGovernment's attempt to cushion the impact of current account deficit dropped from 12 percenttransition by offering subsidies to the population. of GDP in 1994 to about 2.5 percent of GDP in
These subsidies were financed "off budget" by 1995.expanding banking system credit to cover the During 1994, the undervalued Belarusianquasi-fiscal deficit that developed as public currency allowed domestic producers to competeenterprises continued to pay wages which successfully in international markets despiteexceeded the value of worker productivity. problems of product design, quality, and
production efficiency. As shown in Figure 1.16, aExternal Trade trade surplus with the West counterbalanced the
One of the most visible dimensions of the growing trade deficit with the East," a deficitcurrent economic crisis in Belarus is the steep Figure 1.15: The trade balance began to worsendecline in the level of international reserves b mid-1995which, despite tight administrative controls on the Ypurchase of foreign exchange, fell on a net basis Belarus: Imports and Exports to the World
(3-Month Average)from USD260 million on July 1, 1995, to only soo ,USD 25 million on July 1, 1996. With imports 600 Imports
running at USD 500-600 million per month, thereserves position is clearly completely in- Exports
adequate. During this same period, Belarus hasbeen accumulating USD 40-50 million per quarter -20 -a
of arrears in payments for gas imported from Ja.n Apr Jul Oct Jan Apr J1u Oct Jan
Russia. If payments had been made for even a 1994 99S S96
month or two of these imports, Belarus would Source: Official data.
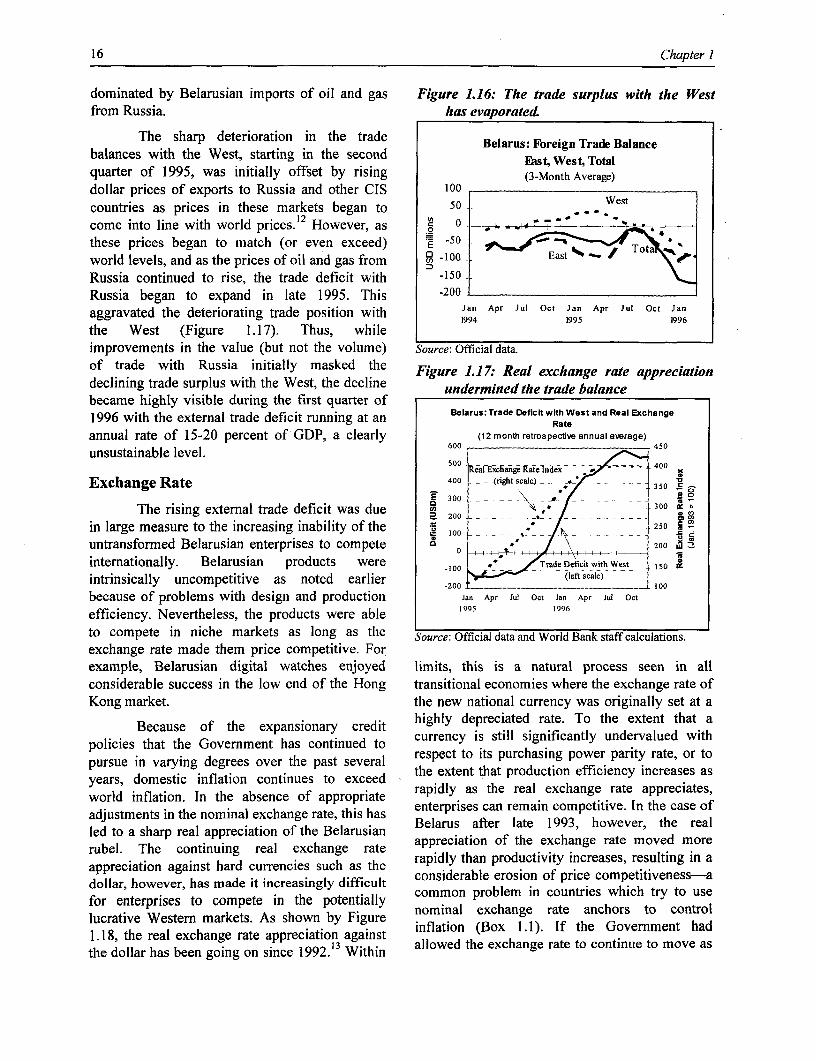
16 Chapter I
dominated by Belarusian imports of oil and gas Figure 1.16: The trade surplus with the Westfrom Russia. has evaporated.
The sharp deterioration in the trade Belarus: Foreign Trade Balancebalances with the West, starting in the second EIast, West, Total
quarter of 1995, was initially offset by rising (3-Month Average)
dollar prices of exports to Russia and other CIS 100countries as prices in these markets began to 50 West
12'come into line with world prices.' However, as 0 -
these prices began to match (or even exceed) -50 - Tota
world levels, and as the prices of oil and gas from coo00 -- tast
Russia continued to rise, the trade deficit with -150Russia began to expand in late 1995. This -200aggravated the deteriorating trade position with Jan Apr Jul Oct Jan Apr Jul Oct Jan
1994 1995 1996the West (Figure 1.17). Thus, whileimprovements in the value (but not the volume) Source: Official data.of trade with Russia initially masked the Figure 1.17: Real exchange rate appreciationdeclining trade surplus with the West, the decline undermined the trade balancebecame highly visible during the first quarter of1996 with the external trade deficit running at an Belarus:TradeDeficitwithWestandRealExchangeRateannual rate of 15-20 percent of GDP, a clearly (12 month retrospective annual average)unsustainable level. 600 450
500 teaiEchange aeInex 400
Exchange Rate 400 - rightscaie) 3 50 X
The rising external trade deficit was due _, 300
in large measure to the increasing inability of the oo250 untransformed Belarusian enterprises to compete a o l, 200 '
internationally. Belarusian products were -100 -rade Deficit with West .50 is
intrinsically uncompetitive as noted earlier -200 ..... lo.
because of problems with design and production Jan Apr Jul Oct Jan Apr Jul Oct
efficiency. Nevertheless, the products were able 1995 1996
to compete in niche markets as long as the Source: Official data and World Bank staff calculations.
exchange rate made them price competitive. Forexample, Belarusian digital watches enjoyed limits, this is a natural process seen in allconsiderable success in the low end of the Hong transitional economies where the exchange rate ofKong market. the new national currency was originally set at a
Because of the expansionary credit highly depreciated rate. To the extent that apolicies that the Government has continued to currency is still significantly undervalued withpursue in varying degrees over the past several respect to its purchasing power parity rate, or toyears, domestic inflation continues to exceed the extent that production efficiency increases asworld inflation. In the absence of appropriate rapidly as the real exchange rate appreciates,adjustments in the nominal exchange rate, this has enterprises can remain competitive. In the case ofadJustments ~ ~ ~ ~~ elru afe late 1993,a however, thee realhaled to a sharp real appreciation of the Belarusian Belarus after late 1993, however, the realrubel. The continuing real exchange rate appreciation of the exchange rate moved moreappreciation against hard currencies such as the rapidly than productivity increases, resulting in adollar, however, has made it increasingly difficult considerable erosion of price competitiveness-afor enterprises to compete in the potentially common problem in countries which try to uselucrative Westem markets. As shown by Figure nominal exchange rate anchors to controllucrabve ~ ~ ~ ~ ~ ~ ~ nfato Boxer 1.1s As Ifow the Govrnentha1.18, the real exchange rate appreciation against inflation (Box 1w1)d If the Government hadthe dollar has been going on since 1992.13 Within allowed the exchange rate to continue to move as
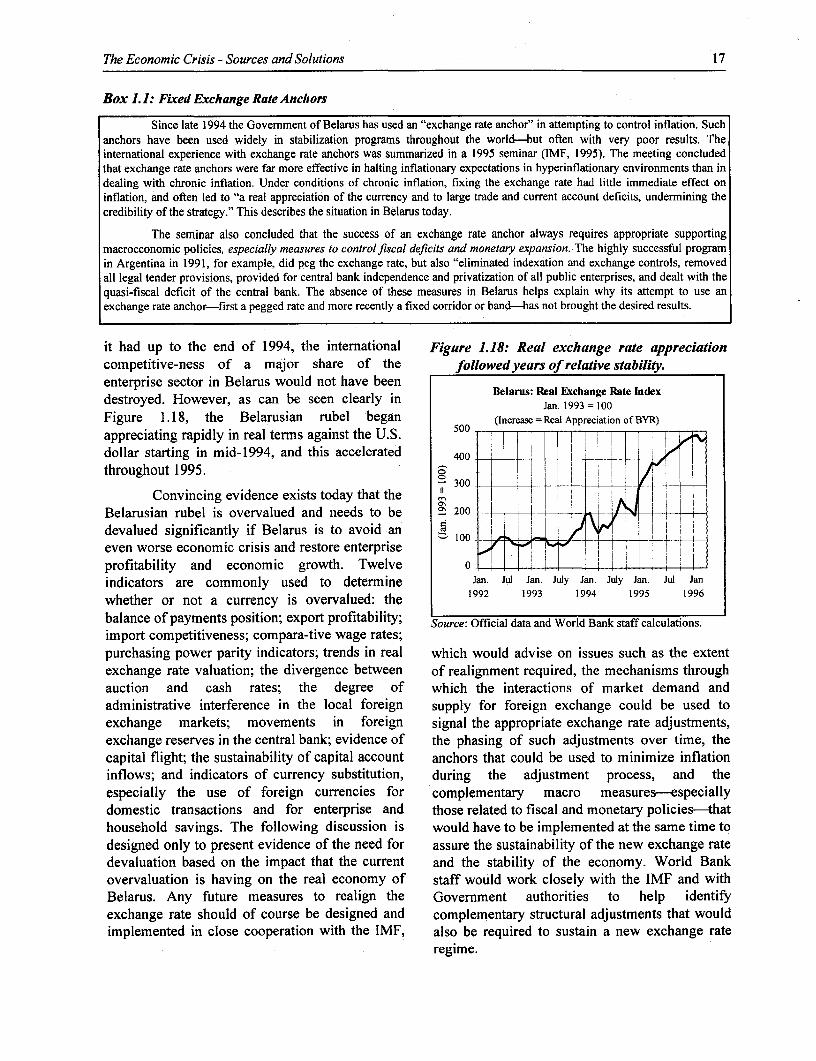
The Economic Crisis - Sources and Solutions 17
Box 1.1: Fixed Exchange Rate Anchors
Since late 1994 the Government of Belarus has used an "exchange rate anchor" in attempting to control inflation. Suchanchors have been used widely in stabilization programs throughout the world-but often with very poor results. Theinternational experience with exchange rate anchors was summarized in a 1995 seminar (IMF, 1995). The meeting concludedthat exchange rate anchors were far more effective in halting inflationary expectations in hyperinflationary environments than indealing with chronic inflation. Under conditions of chronic inflation, fixing the exchange rate had little immediate effect oninflation, and often led to "a real appreciation of the currency and to large trade and current account deficits, undermining thecredibility of the strategy." This describes the situation in Belarus today.
The seminar also concluded that the success of an exchange rate anchor always requires appropriate supportingmacroeconomic policies, especially measures to control fiscal deficits and monetary expansion. The highly successful programin Argentina in 1991, for example, did peg the exchange rate, but also "eliminated indexation and exchange controls, removedall legal tender provisions, provided for central bank independence and privatization of all public enterprises, and dealt with thequasi-fiscal deficit of the central bank. The absence of these measures in Belarus helps explain why its attempt to use anexchange rate anchor-first a pegged rate and more recently a fixed corridor or band-has not brought the desired results.
it had up to the end of 1994, the international Figure 1.18: Real exchange rate appreciationcompetitive-ness of a major share of the followed years of relative stability.enterprise sector in Belarus would not have beendestroyed. However, as can be seen clearly in Jan. 1993 =I 00
Figure 1.18, the Belarusian rubel began (Increase = Real Appreciation of BYR)
appreciating rapidly in real terms against the U.S. so0 -
dollar starting in mid-1994, and this accelerated 400throughout 1995.
Convincing evidence exists today that the n
Belarusian rubel is overvalued and needs to be 0f 200 _ i
devalued significantly if Belarus is to avoid aneven worse economic crisis and restore enterpriseprofitability and economic growth. Twelve 0 liindicators are commonly used to determine Jan. Jul Jan. July Jan. July Jan. Jul Jan
whether or not a currency is overvalued: the 1992 1993 1994 1995 1996
balance of payments position; export profitability; Source: Official data and World Bank staff calculations.import competitiveness; compara-tive wage rates;purchasing power parity indicators; trends in real which would advise on issues such as the extentexchange rate valuation; the divergence between of realignment required, the mechanisms throughauction and cash rates; the degree of which the interactions of market demand andadministrative interference in the local foreign supply for foreign exchange could be used toexchange markets; movements in foreign signal the appropriate exchange rate adjustments,exchange reserves in the central bank; evidence of the phasing of such adjustments over time, thecapital flight; the sustainability of capital account anchors that could be used to minimize inflationinflows; and indicators of currency substitution, during the adjustment process, and theespecially the use of foreign currencies for 'complementary macro measures--especiallydomestic transactions and for enterprise and those related to fiscal and monetary policies-thathousehold savings. The following discussion is would have to be implemented at the same time todesigned only to present evidence of the need for assure the sustainability of the new exchange ratedevaluation based on the impact that the current and the stability of the economy. World Bankovervaluation is having on the real economy of staff would work closely with the IMF and withBelarus. Any future measures to realign the Government authorities to help identifyexchange rate should of course be designed and complementary structural adjustments that wouldimplemented in close cooperation with the IMF, also be required to sustain a new exchange rate
regime.
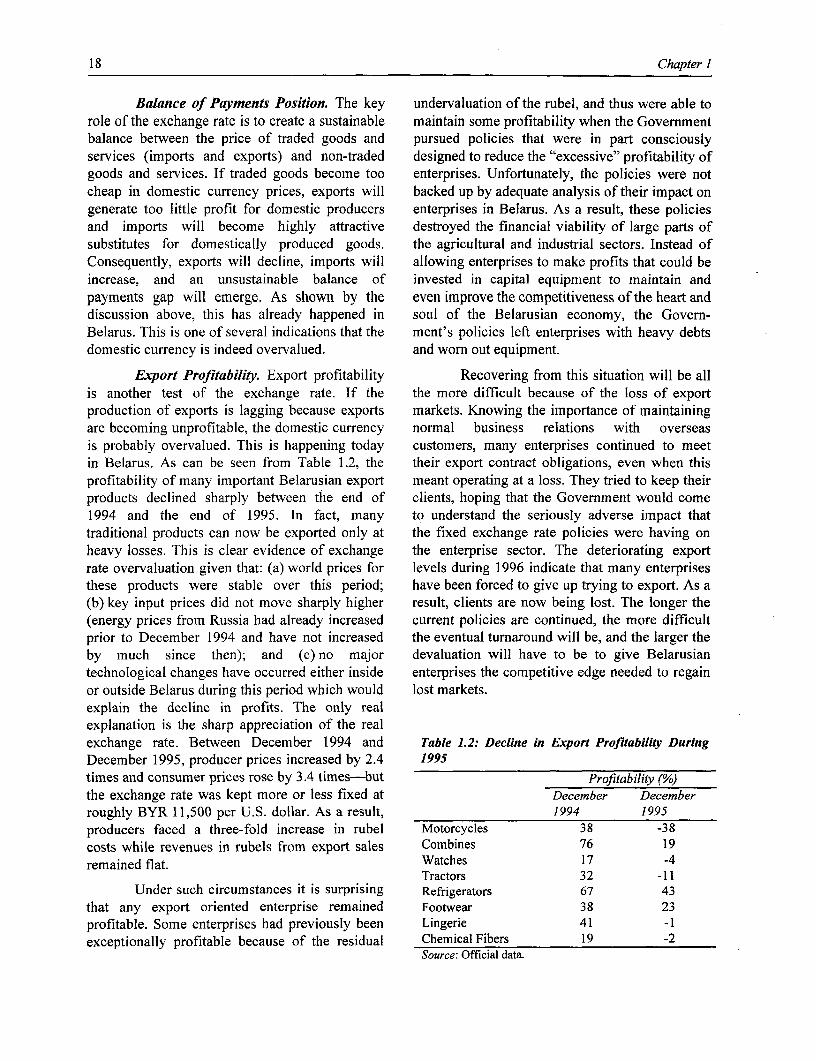
18 Chapter I
Balance of Payments Position. The key undervaluation of the rubel, and thus were able torole of the exchange rate is to create a sustainable maintain some profitability when the Governmentbalance between the price of traded goods and pursued policies that were in part consciouslyservices (imports and exports) and non-traded designed to reduce the "excessive" profitability ofgoods and services. If traded goods become too enterprises. Unfortunately, the policies were notcheap in domestic currency prices, exports will backed up by adequate analysis of their impact ongenerate too little profit for domestic producers enterprises in Belarus. As a result, these policiesand imports will become highly attractive destroyed the financial viability of large parts ofsubstitutes for domestically produced goods. the agricultural and industrial sectors. Instead ofConsequently, exports will decline, imports will allowing enterprises to make profits that could beincrease, and an unsustainable balance of invested in capital equipment to maintain andpayments gap will emerge. As shown by the even improve the competitiveness of the heart anddiscussion above, this has already happened in soul of the Belarusian economy, the Govern-Belarus. This is one of several indications that the ment's policies left enterprises with heavy debtsdomestic currency is indeed overvalued. and worn out equipment.
Export Profitability. Export profitability Recovering from this situation will be allis another test of the exchange rate. If the the more difficult because of the loss of exportproduction of exports is lagging because exports markets. Knowing the importance of maintainingare becoming unprofitable, the domestic currency normal business relations with overseasis probably overvalued. This is happening today customers, many enterprises continued to meetin Belarus. As can be seen from Table 1.2, the their export contract obligations, even when thisprofitability of many important Belarusian export meant operating at a loss. They tried to keep theirproducts declined sharply between the end of clients, hoping that the Government would come1994 and the end of 1995. In fact, many to understand the seriously adverse impact thattraditional products can now be exported only at the fixed exchange rate policies were having onheavy losses. This is clear evidence of exchange the enterprise sector. The deteriorating exportrate overvaluation given that: (a) world prices for levels during 1996 indicate that many enterprisesthese products were stable over this period; have been forced to give up trying to export. As a(b) key input prices did not move sharply higher result, clients are now being lost. The longer the(energy prices from Russia had already increased current policies are continued, the more difficultprior to December 1994 and have not increased the eventual turnaround will be, and the larger theby much since then); and (c) no major devaluation will have to be to give Belarusiantechnological changes have occurred either inside enterprises the competitive edge needed to regainor outside Belarus during this period which would lost markets.explain the decline in profits. The only realexplanation is the sharp appreciation of the realexchange rate. Between December 1994 and Table 1.2: Decline in Export Profitability DuringDecember 1995, producer prices increased by 2.4 1995times and consumer prices rose by 3.4 times-but Profitability (%)the exchange rate was kept more or less fixed at December Decemberroughly BYR 11,500 per U.S. dollar. As a result, 1994 1995producers faced a three-fold increase in rubel Motorcycles 38 -38costs while revenues in rubels from export sales Combines 76 19remained flat. Watches 17 -4
Tractors 32 -11Under such circumstances it is surprising Refrigerators 67 43
that any export oriented enterprise remained Footwear 38 23profitable. Some enterprises had previously been Lingerie 41 -1exceptionally profitable because of the residual Chemical Fibers 19 -2
Source: Official data.
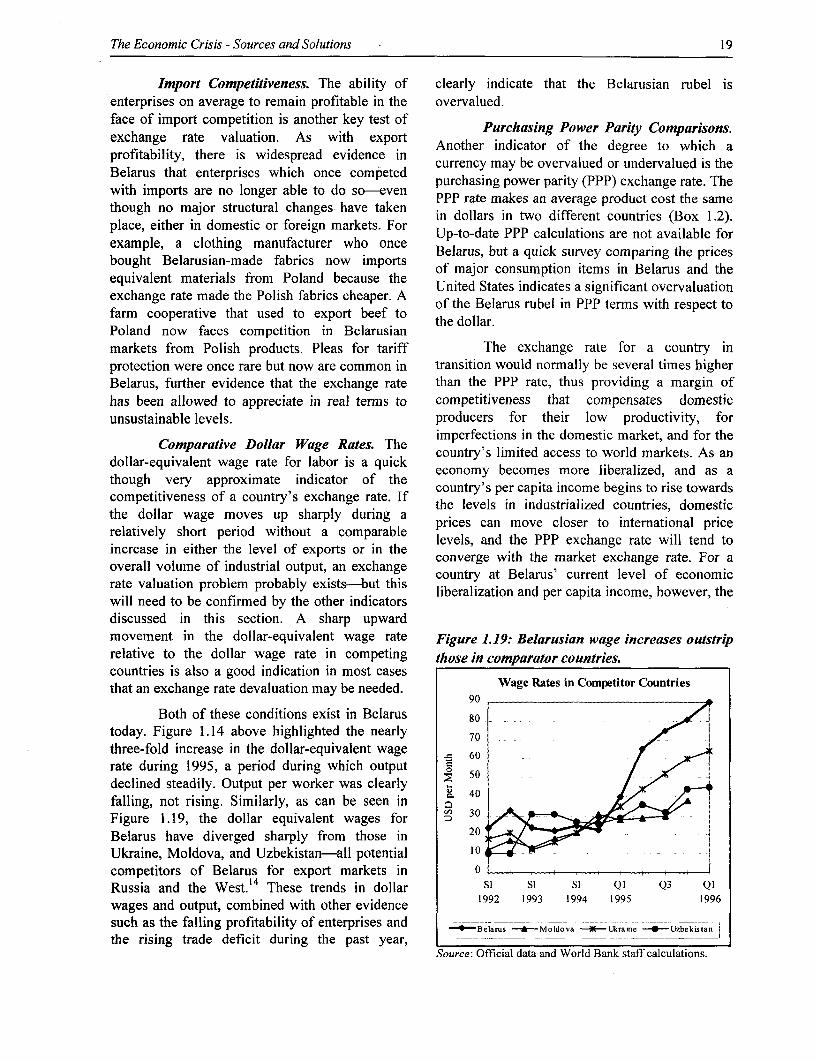
The Economic Crisis - Sources and Solutions - 19
Import Competitiveness. The ability of clearly indicate that the Belarusian rubel isenterprises on average to remain profitable in the overvalued.face of import competition is another key test of Purchasing Power Parity Comparisons.
exchange rate valuation. As with export Another indicator of the degree to which aprofitability, there is widespread evidence inI
Belaru thtetrrsswhc necmee currency may be overvalued or undervalued is thewitheimports tarenoerprioer ah tonc dom-even purchasing power parity (PPP) exchange rate. The
PPP rate makes an average product cost the samethough no major structural changes have taken in dollars in two different countries (Box 1.2).
place, either in domestic or foreign markets. For Up-to-date PPP calculations are not available forexample, a clothing manufacturer who once Belarus, but a quick survey comparing the pricesbought Belarusian-made fabrics now imports .major o r
equialet maerils fom olan beausethe of major consumption items in Belarus and theequxvalent matermals the Polabricscape A United States indicates a significant overvaluation
,nt dh . A of the Belarus rubel in PPP terms with respect tofarm cooperative that used to export beef to the dollar.Poland now faces competition in Belarusianmarkets from Polish products. Pleas for tariff The exchange rate for a country inprotection were once rare but now are common in transition would normally be several times higherBelarus, further evidence that the exchange rate than the PPP rate, thus providing a margin ofhas been allowed to appreciate in real terms to competitiveness that compensates domesticunsustainable levels. producers for their low productivity, for
imperfections in the domestic market, and for theCoprtveDla Wag Rae. Th country's limited access to world markets. As an
dollar-equivalent wage rate for labor is a quickthough very approximate indicator of the economy becomes more liberalized, and as acompetitiveness of a count's exchange rate. If country's per capita income begins to rise towardsthe dollar wage moves up sharply during a the levels in industrialized countries, domesticrelatively short period without a comparable prices can move closer to international priceincrease in either the level of exports or in the levels, and the PPP exchange rate will tend tooverall volume of industrial output, an exchange converge with the market exchange rate. For arate valuation problem probably exists-but this country at Belarus' current level of economicwill need to be confirmed by the other indicators liberalization and per capita income, however, the
discussed in this section. A sharp upwardmovement in the dollar-equivalent wage rate Figure 1.19: Belarusian wage increases outstriprelative to the dollar wage rate in competing those in comparator countries.countries is also a good indication in most casesthat an exchange rate devaluation may be needed. Wage Rates in Competitor Countries
90. __
Both of these conditions exist in Belarus 80 i|today. Figure 1.14 above highlighted the nearly 70
three-fold increase in the dollar-equivalent wage 60
rate during 1995, a period during which output 50
declined steadily. Output per worker was clearlyfalling, not rising. Similarly, as can be seen inFigure 1.19, the dollar equivalent wages for 20
Belarus have diverged sharply from those in 2
Ukraine, Moldova, and Uzbekistan-all potential 10competitors of Belarus for export markets in 0 . l_l_IRussia and the West.14 These trends in dollar Si Si Si Ql Q3 Ql
wages and output, combined with other evidence 1992 1993 1994 1995 1996
such as the falling profitability of enterprises and _Be1arus -+MoIdova -*XUkraine -- zbekist
the rising trade deficit during the past year, I __-_ Source: Official data and World Bank staff calculations.
20 Chapter I
convergence of domestic prices and exchange 1994, was highlighted in Figure. Therates with world market levels would normally deterioration of the trade surplus with the West innot exceed 15-25 percent (see figures in Box 1.2). the second half of 1995 was closely correlated
With the current market exchange rate in with the rapid appreciation of the Belarusian rubel
Belarus, however, average domestic prices against the dollar and other westei currencies.measured in PPP terms are now equal to about The real appreciation of the domestic currency50-60 percent of world levels. This has seriously had actually been going on for several years, buteroded the competitive margin that Belarusian Belarusian products remained competitive for afarms and factories need if they are to be able to while because of the strong initial undervaluationcompete with imports in the domestic market and of the rubel. Starting in January 1995 andwith foreign countries in the world's export continuing through the first quarter of 1996,markets. Assuming that a major reduction of however, the Belarusian Government maintaineddomestic prices is neither feasible nor desirable at the exchange rate at roughly BYR 11 500ptethis time for reasons discussed in more detail dollar During this same period, the domesticbelow, a substantial upward adjustmnent of the price level increased by 3.6 times. This resulted inexchange rate (devaluation of the domestic a further appreciation of the real exchange rate
currency) is the only feasible way to restore the against world currencies by about 2.5 times,urgentlynof competitiveness, taking into account international inflation during
urgently needed margin of competitiveness. the same period.15
For reasons discussed in more detail in The real appreciation during the latterAnnex E, this PPP calculation should not be half of 1995 was not offset by factors such asinterpreted as an indicator of the devaluation that residual undervaluation, which had helpedwill actually be required to make Belarusian maintain trade competitiveness in the earlierenterprises competitive. However, the PPP periods. Conse uently, the trade balancecalculations shown here do clearly confirm the deteriods. Conequethy, the trade balconclusions of the other indicators presented in deteriorated in line with the increasing realthis section that the Belarusian rubel is appreciation of the exchange rate. Belarusianovervalued at the current exchange rate and needs exports to the West stagnated after mid-1995,to be devalued. An exchange rate devaluation is then gradually began to deteriorate. An eventhe only feasible way to correct such a problem. larger problenn developed on the import side. AsThe necessary amount of devaluation and its time inflation continued to push up domestic prices, aphasing will have to be worked out with the IMF wide range of imported products becamebased on the various measures of exchange rate competitive with those produced domestically,competitiveness presented here as well as other despite the factthat Belarusian wages were stilltechnical parameters used by the IMF, but some less than five percent of those in major Westerndegree of devaluation is vital if Belarus is to trading partner countries. Part of the increasedrestore the financial health of its enterprises and flowhich was n luxury gnificas morethus prospects for renewed economic growth and drinks which were no longer significantly moreimproved living standards. expensive than Belarusian products. Even
commodities such as butter and meat, whereReal Exchange Rate Index. The real Belarus should have a comparative advantage,
exchange rate provides the final indicator that can became more expensive than comparablebe used to determine whether or not an exchange imported goods.rate adjustment is needed. This calculation can In a normally functioning marketalso be used to help determine the approximate economy, government authorities would have
amount of adjustment that is required. been forced by the erosion of external reserves to
The rapid appreciation of the Belarusian focus more quickly on the emergingrubel against the U.S. dollar, starting in early overvaluation of the exchange rate, and this1994, was seen clearly in Figure 1.18; its impact would have helped minimize the damage to theon the trade deficit with the West, starting in late industrial sector. A quicker adjustment would also
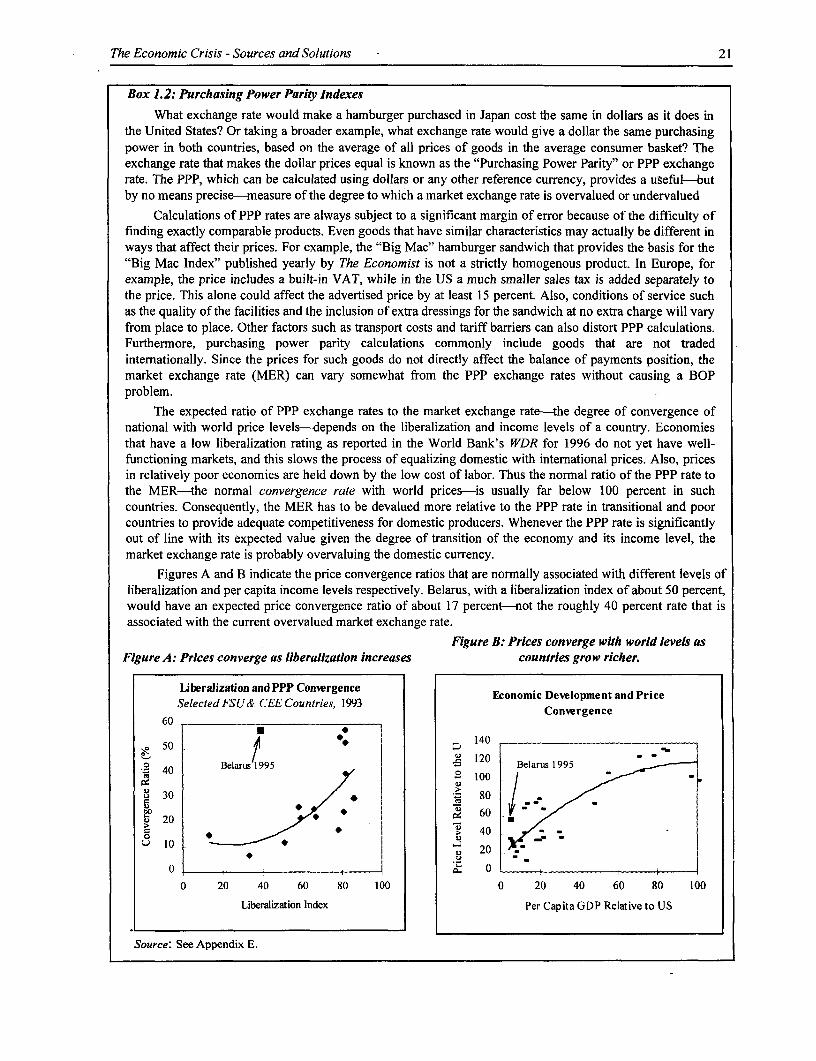
The Economic Crisis - Sources and Solutions - 21
Box 1.2: Purchasing Power Parity Indexes
What exchange rate would make a hamburger purchased in Japan cost the same in dollars as it does inthe United States? Or taking a broader example, what exchange rate would give a dollar the same purchasingpower in both countries, based on the average of all prices of goods in the average consumer basket? Theexchange rate that makes the dollar prices equal is known as the "Purchasing Power Parity" or PPP exchangerate. The PPP, which can be calculated using dollars or any other reference currency, provides a usefufbutby no means precise-measure of the degree to which a market exchange rate is overvalued or undervalued
Calculations of PPP rates are always subject to a significant margin of error because of the difficulty offinding exactly comparable products. Even goods that have similar characteristics may actually be different inways that affect their prices. For example, the "Big Mac" hamburger sandwich that provides the basis for the"Big Mac Index" published yearly by The Economist is not a strictly homogenous product. In Europe, forexample, the price includes a built-in VAT, while in the US a much smaller sales tax is added separately tothe price. This alone could affect the advertised price by at least 15 percent. Also, conditions of service suchas the quality of the facilities and the inclusion of extra dressings for the sandwich at no extra charge will varyfrom place to place. Other factors such as transport costs and tariff barriers can also distort PPP calculations.Furthermore, purchasing power parity calculations commonly include goods that are not tradedinternationally. Since the prices for such goods do not directly affect the balance of payments position, themarket exchange rate (MER) can vary somewhat from the PPP exchange rates without causing a BOPproblem.
The expected ratio of PPP exchange rates to the market exchange rate-the degree of convergence ofnational with world price levels-depends on the liberalization and income levels of a country. Economiesthat have a low liberalization rating as reported in the World Bank's WDR for 1996 do not yet have well-functioning markets, and this slows the process of equalizing domestic with international prices. Also, pricesin relatively poor economies are held down by the low cost of labor. Thus the normal ratio of the PPP rate tothe MER-the normal convergence rate with world prices-is usually far below 100 percent in suchcountries. Consequently, the MER has to be devalued more relative to the PPP rate in transitional and poorcountries to provide adequate competitiveness for domestic producers. Whenever the PPP rate is significantlyout of line with its expected value given the degree of transition of the economy and its income level, themarket exchange rate is probably overvaluing the domestic currency.
Figures A and B indicate the price convergence ratios that are normally associated with different levels ofliberalization and per capita income levels respectively. Belarus, with a liberalization index of about 50 percent,would have an expected price convergence ratio of about 17 percent-not the roughly 40 percent rate that isassociated with the current overvalued market exchange rate.
Figure B: Prices converge with world levels asFigure A: Prices converge as liberalization increases countries grow richer.
liberalization andPPP Convergence Economic Development and PriceSelected FSU& CEE Countries, 1993 Convergence
60
50. / I140
0 40 Belarus 195 10 Belarus 1995
40i 2 4 / 0 *; /30 80C 8~~~~~~~~~~~~~~~0
~20
10 I-
0 I I& 0 _ _ _ _ _ _ _ _
0 20 40 60 80 100 0 20 40 60 80 tOO
Liberalization Index Per Capita GDP Relative to US
Source: See Appendix E.
22 Chapter I
have minimized the size of adjustment that would * Import taxes had to be paid in foreignthen be required. However, a series of factors exchange, thus placing more foreign exchangeoperated in the part-command/part-market under the control of the Government and of theeconomy of Belarus during 1995 that prevented central bank.this early warning signal from emerging. Some of * International arrears accumulated, reducingthese factors were under the control of the demands for foreign exchange and allowing itGovernment and some were not. These factors to remain in the central bank.made it possible for the Government to continue * Foreign exchange borrowing of aboutits pursuit of a fixed exchange rate without USD 240 million during 1995 helped replenishresorting to direct foreign exchange controls far and maintain foreign exchange reserves.
longer than outside observers would have * Interest rate arbitrage between hard currenciesanticipated. Among the key factors behind this and soft currencies brought foreign exchangewere the following (not all of which were in force into Belarus. With an implicit guarantee ofat any given time). convertibility at a fixed exchange rate,
* Repatriation and surrender requirements speculators borrowed deutschemarks and otherforced people to transfer foreign exchange hard currencies at 5-8 percent per year andearings to the banks. invested them at 5-8 percent per month in
Belarus.* Sole legal tender rules banned use of foreign
exchange for transactions inside Belarus, thus . A foreign exchange purchase tax of 10stimulating flow of foreign exchange into the percent was imposed, allowing the Governmentbanking system by people who now needed to maintain the fiction of a fixed exchange ratelocal currency for transactions. while effectively devaluing it.
* Barter deals with foreign suppliers reduced the These measures enabled Belarus toneed for foreign exchange for imports. maintain a fixed exchange rate without violating
IMF agreements that required Belarus to avoid* Enterprise losses forced managers to bring direct controls on the purchase of foreign
foreign exchange reserves back from overseas, exchnge.Bu en the se p mares* exchange. But even these complex measures
* Bank capital requirements were changed, began to fail by the end of 1995.forcing domestic banks to convert the foreignexchange component of their base capital into On November 13, 1995, the Govemmentdomestic currency, turning the foreign suspended transactions on the Interbank Currencyexchange over to the central bank. Market and began imposing administrative
* Minimum reserve requirements on foreign controls on the right to bid for foreign exchangeexchange deposits were raised from 5.5 percent in the central bank auctions, thereby seeking toin late 1994 to 8 percent by June 1995, to 10 assure that the allowed demand and the supply ofpercent in July, and have been maintained at 12 foreign currency available would balance at apercent since August 1995, thus keeping more price within the supposedly free "corridor"foreign exchange under central bank control. (exchange rate band) that the Government had
* Lower import duties and less stringent import decreed. During 1996 the system became evencontrols encouraged the flow of foreign more complex, with demand being strictlyexchange from Russia for imports through the controlled through administrative review onBelarusian border. Tuesdays and Thursdays, the "fixing days" when
* Foreign exchange reserves of the central bank the official exchange rate was established. On thewere loaned to commercial banks "to put them other days of the week, less strict controls onto good use rather than keeping them idle," access to the market were imposed, allowing athereby injecting foreign exchange into the dual exchange rate system to develop. At thesystem while nominally keeping the foreign same time, an even more depreciated street rateexchange assets on the books of the central also began to emerge despite tight police controls.bank. Most recently, the President of the central bank
has allowed exchange dealers to charge
The Economic Crisis - Sources and Solutions - 23
"margins" for processing, thereby effectively above to influence both the demand and supply ofwidening the exchange rate band and allowing a foreign exchange.more realistic rate to emerge legally on the street. The movements in levels of foreign
The net result of these measures was to exchange reserves in the central bank indicatesdisguise the serious shortage of foreign exchange the realism of the current exchange rate. Thethat was developing during 1995 and to delay sharp decline in foreign exchange reserves innecessary adjustments in the exchange rate. This Belarus, which at points in the second half ofled to a serious deterioration both in the level of 1996 were equivalent to only a few days ofreserves and in the financial status of enterprises imports on a net basis, is clear evidence that thewhich could no longer make a profit at the highly current exchange rate is overvalued. Similarly,appreciated real exchange rate. Reserves can be the fact that up to 70 percent of demand forrestored by borrowing from abroad, but the foreign exchange cannot be met in the foreigndamage that these policies inflicted on the exchange markets on some days indicates theagricultural and manufacturing enterprises of severe shortage of reserves.Belarus will take considerably longer to repair. The exact degree of overvaluation of the
Other Indicators of Exchange Rate exchange rate cannot be determined directly fromProblems. In addition to the indicators discussed movements in reserves, however. Staff of the IMFin some detail above, several other measures also look at factors such as the sources andwould normally be considered by the IMF in sustainability of capital account. For example, theadvising a government on exchange rate policies. IMF might conclude that a country's currentA good indication of the need for a devaluation is exchange rate was appropriate despite a largea substantial divergence between auction and current account deficit if (a) the deficit wascash rates for foreign exchange. In Belarus this caused by capital goods imports, and (b) thedifference was minimized through mid-1996 by potential drain on the country's reserves positionthe measures mentioned above. In recent months, was being offset by large inflows of foreign directhowever, the market exchange rate has become so investment. On the other hand, if the reservesunrealistic that these measures no longer keep the position was being protected by heavy borrowingrates unified. In November 1996, the official from abroad, the IMF might well conclude thatexchange rate ceiling of about BYR 15,500 per the capital account position was not sustainable.U.S. dollar was still being maintained in the An even less sustainable position would involvecentral bank currency auctions (at least on the the accumulation of external payments arrears."fixing days"), but the street rate had risen to Unfortunately, all of these indicators revealaround BYR 20,000 per U.S. dollar, a difference serious problems in Belarus. Foreign investmentof about 30 percent. inflows have been negligible. Foreign borrowing
A high degree of administrative (including short-term flows to arbitrage interestinterference in the local foreign exchange rate differentials) has been substantial. And largemnarkets is another good indication that the external payments arrears have accumulated.
exchange rate is not realistic. In Belarus, as noted The presence of capital flight is anotherabove, a committee in the central bank has been indicator of an inappropriate exchange rate.clearing applications for the purchase of foreign Unfortunately, because of the open border withexchange for about a year in order to assure that Russia and weak systems for monitoring capitalthe demand for foreign exchange at the officially flight (which is difficult even in industrializeddecreed rate does not exceed the supply that is countries), we have no concrete data on this issue.projected to be available. In addition to direct Anecdotal reports indicate, however, that theadministrative controls on the demand for foreign problem has been significant-thoughexchange, the Government of Belarus has also counterbalanced in part by the flight of capitaltaken the wide range of less direct actions noted seeking higher interest rates in a country with an
24 Chapter I
exchange rate that has effectively been fixed by product enjoys high rates of export subsidy orGovernment decree. high rates of tariff protection. Consequently,
Currency substitution is a final indicator producers are willing to pay government officialsworth examining for evidence that the exchange large sums of money for such protection. Thoserate regime needs to be changed. Currency who have better political connections and thosesubstitution or "dollarization" of domestic who are willing to pay larger bribes will gettransactions was widespread prior to late 1994, at higher-and thus more distorting-levels ofwhich time it was officially banned with the protection. The import tariff and export subsidydecree that made the rubel the "sole legal tender" approach is thus highly inconsistent with theindBeree that iord to mid-19 the "solelegalGovernment's announced desire to reducein Belarus. Prior to mid-1995 when the corruption. An appropriate exchange rateGovenment began to bring inflation under adjustment can provide the same overall averagecontrol, currency substitution was also copttveesmrgnfrdoetgprdcrwidespread by those seeking to protect the value competitiveness margin for domestic producersof their savings-or even of their earnings from that is provided by import taxes and exportonef eet theirsavings r evex. otheihrd eamis from subsidies, and a good exchange rate has the veryone week to the next. Although hard data are substantial additional advantages of avoidingdifficult to find, currency substitution in distortions, reducing inefficiencies, andtransactions and savings seems to have been less accelerating economic growth.of a problem for the past year or so. It may return,however, as increased credit expansion raises Another option that has been attempted inconcerns about price stability, and increased some countries is to reduce the price of labor andindications that the exchange rate should be other non-traded goods and services rather thandevalued create uncertainty about the future value increasing the prices of traded goods through aof the rubel. devaluation. However, this would require the
Do Viable Alternatives to Devaluation authorities to force the economy into aExist? Instead of making a substantial adjustment depression, thereby driving domestic pricesin the exchange rate, the Government of Belarus down-especially those for labor-to morehas been trying to restore the competitiveness of competitive levels without changing the exchangeBelarusian enterprises in domestic and foreign rate. In the real world, however, this approachmarkets by increasing tariffs on imports and by never seems to work. For example, authorities inincreasing the subsidies for exports. This the West African countries that were members ofapproach can reduce imports and increase the French Franc Zone tried to do this for years.exports, but as proven by experience around the In the end this proved impossible, and they had toworld over the past forty to fifty years, import devalue the African currencies. Good monetarytariffs and export subsidies are at best a poor and fiscal policies can control the growth ofsubstitute for an appropriate exchange rate domestic prices and wages, thereby avoiding theregime. At worst, and this frequently happens, need for a devaluation, but they can rarely bethey create highly distorted patterns of production used to avoid a devaluation once a currency hasand high degrees of economic inefficiency. Even appreciated well beyond its equilibrium rate.if tariffs and subsidies were equal and absolutely Furthermore, worldwide experience has shownuniform across all activities, this would still be that downward adjustments of domestic pricesinferior to an appropriate exchange rate only happen during recessions or depressions, andadjustment because of the administrative costs of the last thing that Belarus wants at this point is acollecting the taxes and allocating the subsidies depression in the midst of its ongoing economicThe really serious problem with the tax-and- crisis. A devaluation is therefore the only feasiblesubsidize approach, however, is that the rates of policy alternative.protection and subsidy provided to individual Making Devaluation Work. All of theproducts and even individual producers tend to measures discussed here indicate that Belarusvary widely. This happens because producers and needs to devalue its exchange rate. Any sizabletraders can make very substantial profits if a devaluation, however, involves inflation. The
The Economic Crisis -Sources and Solutions 25
challenge is to handle the devaluation in a way If a devaluation is done poorly, it willthat limits the inflation to the minimum required rekindle long-term inflation, lead to an ongoingto accomplish the necessary adjustment of cycle of devaluations, and do nothing to solve therelative prices and to make certain that the underlying macro imbalances. In fact, repeateddevaluation does not generate an inflationary cycles of inflation and devaluation are common inspiral as has happened in the past in Belarus and the world, and it is very important to understandin so many other countries. why this happens and what can be done to prevent
Inflation is an almost inevitable part of it from happening in Belarus.any devaluation for the following reasons. To Most devaluations fail becauseattain the desired control of aggregate demand governments try to protect people from theand to restore a sustainable balance of payments reduction in aggregate demand, consumption, anddeficit, a significant devaluation needs to produce thus in living standards-reductions that are thea short-term reduction in living standards. In primary reason for having a devaluation in thetheory, if a country were investing heavily in low- first place. Governments do this either by failingproductivity activities, it could reduce aggregate to pass on the higher prices caused by thedemand by reducing investment activity, thus devaluation, or by giving people extra money toprotecting consumption and living standards. In pay the higher prices. Either strategy is verymost countries facing severe economic problems, dangerous and is likely to lead to furtherhowever, and certainly in Belarus today, the rate problems that, in the end, reduce rather thanof investment is already well below desirable increase living standards.levels and needs to be raised, not lowered.Therefore, unless prospects for future dthesfalure tonupason the ighectimprovements in living standards are to be a t rsacrificed by reducin toda's investment levels as well as direct ways, and the indirect ways are
yvenfurther the onlyway torestoreasustainoften the most serious. For example, if the priceeven further, the only way to restore a sustainable of an imported car or an imported bottle of vodka
BOPrposition resumes. to reduce consumptlOn goes up because of a devaluation, governmentsgrowth resumes. are unlikely to do anything to cushion the price
If done well, a devaluation will reduce increase, and the consumption of these goods willaggregate demand by causing a one-time surge of decline, thus helping restore the balance ofinflation that erodes the purchasing power of payments position.people's wages.16 Inflation is therefore not only Failure to pass on the indirect costs of aunavoidable, it is an essential part of the devaluation is much more likely and commonlyadjustment process. Inflation, stimulated by thedevaluati, dcauses devaluation efforts to fail. Energy providesdevaluation, drves up the prices of traded goods one of the best examples. Aside from gasoline,relative to those of non-traded goods and wages. which accounts for a small part of the importedThis has two vitally important effects. First, it which prounts for energy profuts importld
reducs therealpurchsingpowerin t energy products, few energy products are soldreduces the real purchasing power in the directly to consumers. Instead, the cost ofeconomy, thereby bringing real aggregate demand imported energy is factored into the price of rent,into line with real levels of output. Second, the utilities, and public transport. If the governmentincreased prices of traded goods relative to those does not raise the prices for rent, utilities, andof non-traded goods makes imports more costly public transport enough to fully cover theand exports more profitable, thus bringing the increased cost of the energy needed to providedemand for imports into line with export these services, the devaluation will fail. It will failearnings. The key to success is to make certain because, unless the consumers are charged-andthat the initial spurt of inflation is limited to the forced to actually pay-the full cost of theselevel induced by the devaluation and does not services, their consumption will not be reduced,trigger an inflationary spiral of the kind Belarus and the exteral balances will not be restored.suffered from 1992 to early 1995.17
26 Chapter I
The same is true for energy sources The poorest of the poor will always needsupplied to farms and factories. Unless these help from the Government, especially after majorenterprises have to pay the full cost for the devaluations. Government protection of thoseimported energy at the higher domestic prices who would suffer from malnutrition and exposureresulting from a devaluation, they will not take if not assisted is necessary in any civilizedthe necessary steps to reduce consumption and to country to protect human dignity and the fabric ofuse energy more efficiently. Unless the full cost society. Social assistance should be part of anof directly and indirectly imported goods and efficient, fiscally sustainable social safety net asservices is passed on to the consumers-be they discussed in Chapter 4. But how can suchresidential, commercial, or industrial-the subsidies be made consistent with the statementdevaluation will fail to achieve its goals. above that the Government should not increaseDevaluations around the world fail regularly for purchasing power?this reason. And this has been a central cause of The secret is to finance the social safetythe failures of past devaluations in Belarus. The net by redistributing purchasing power, not bydomestic currency has been devalued by roughly increasing it. As a country, Belarus cannot afford300,000 times since the final days of the Soviet to continue living beyond its means, but it canUnion, but it is still seriously overvalued today. redistribute its means more equitably by taxing
Attempts by governments to cushion the those with more comfortable incomes and usingimpact of a devaluation by giving people and the revenues to help assure that the poor have theenterprises more money to pay the higher costs is minimum income needed to preserve basic humanthe second common reason that devaluations fail. dignity.Additional purchasing power to offset the higher This approach is sharply different frompost-devaluation prices is typically created either the current approach in Belarus, which seeks tothrough expansionary credit policies or through protect the poor (a) by distorting the prices forlax fiscal policies. Over the past five years, the food and housing, holding them down to levelsGovernment of Belarus has done both-with the that do not recover the full cost of import andexpected results. production; (b) by ordering inflation-fueling
The Government has given enterprises credit expansion from the banks to agriculturaland thus their employees more money to pay the and industrial enterprises; and (c) by offeringhigher prices following past devaluations by deficit-increasing subsidies and tax exemptions.extending trillions of rubels of credit to these The poor should be protected through incomeenterprises. This strategy had some short-term redistribution, not through price distortions.benefits, as seen in Figure 1.8. But in the end this The draft economic strategy issued by theapproach has left the average Belarusian no better Government in October 1996 calls for theoff than the average citizen of the other FSU creation of a "socially oriented marketrepublics-and has left Belarus still faced with economy." 18 This is a highly desirable objective,making the fundamental structural adjustments one shared by most civilized nations of the world.required to move forward to prosperity after years The main difference between the countries thatof delay. succeed and those that fail lies in the approach
The only way to assure success of the chosen to attain this objective. Countries that failnext devaluation is to pass on to enterprises and depend heavily on price distortions. To helpindividuals the full increased costs of the goods selected groups of people, these countries createand services that are imported, directly and artificially low prices for goods and services suchindirectly, to insist that enterprises and as food, energy, and transport. This causes lossesindividuals pay for whatever they consume, and to the producers of such goods and services. As ato resist pressures to provide additional credit, result, the Government is forced to support themsubsidies, or tax concessions that would increase through direct budgetary subsidies, cheap loanspurchasing power. from the banking system, and concessional tax
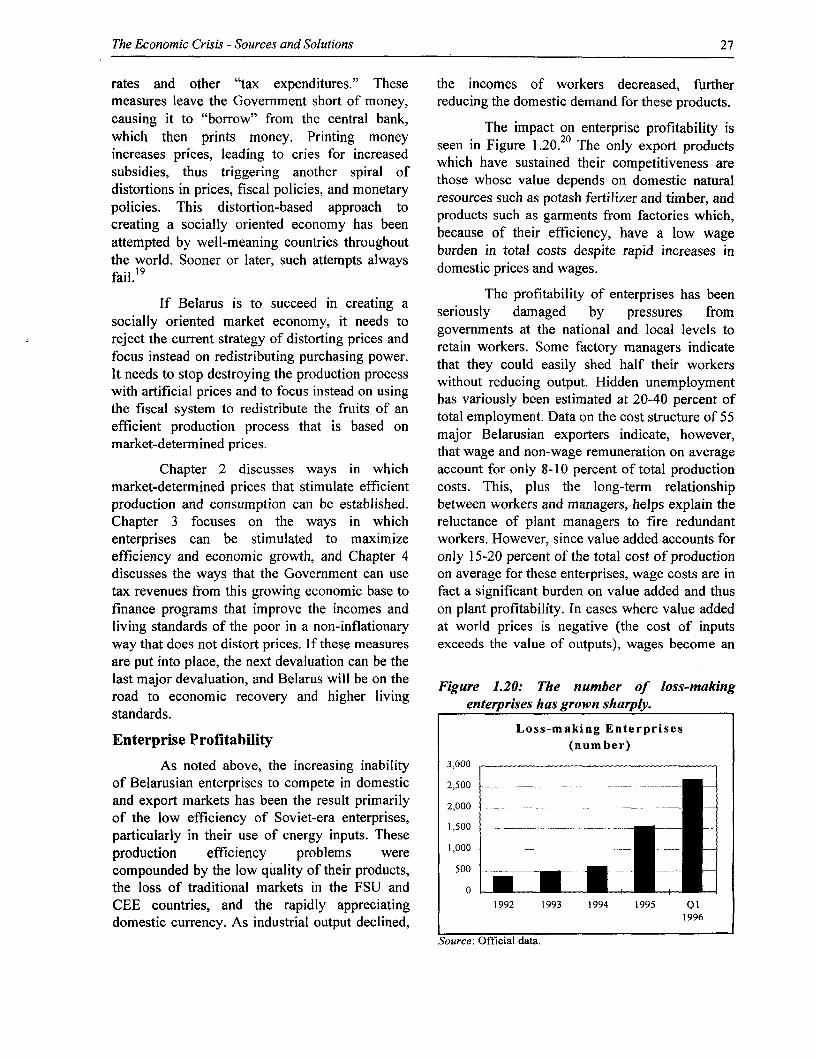
The Economic Crisis - Sources and Solutions 27
rates and other "tax expenditures." These the incomes of workers decreased, furthermeasures leave the Government short of money, reducing the domestic demand for these products.causing it to "borrow" from the central bank, The impact on enterprise profitability iswhich then prints money. Printing money seen in Figure 1.20.20 The only export productsincreases prices, leading to cries for increased which have sustained their competitiveness aresubsidies, thus triggering another spiral of those whose value depends on domestic naturaldistortions in prices, fiscal policies, and monetary resources such as potash fertilizer and timber, andpolicies. This distortion-based approach to products such as garments from factories which,creating a socially oriented economy has been because of their efficiency, have a low wageattempted by well-meaning countries throughout burden in total costs despite rapid increases inthe world. Sooner or later, such attempts always domestic prices and wages.fail.' 9
The profitability of enterprises has beenIf Belarus is to succeed In creating a seriously damaged by pressures from
socially oriented market economy, it needs to governments at the national and local levels toreject the current strategy of distorting prices and r enw s Some fatory anagerictefocus instead on redistributing purchasing power. retatn workers. Some factory managers odrcate
It needs to stop destroying the production process without reducing output. Hidden unemploymentwith artificial prices and to focus instead on using has variously been estimated at 20-40 percent ofthe fiscal system to redistribute the fruits of an total employment. Data on the cost structure of 55efficient production process that is based on major Belarusian exporters indicate, however,market-determined prices. that wage and non-wage remuneration on average
Chapter 2 discusses ways in which account for only 8-10 percent of total productionmarket-determined prices that stimulate efficient costs. This, plus the long-term relationshipproduction and consumption can be established. between workers and managers, helps explain theChapter 3 focuses on the ways in which reluctance of plant managers to fire redundantenterprises can be stimulated to maximize workers. However, since value added accounts forefficiency and economic growth, and Chapter 4 only 15-20 percent of the total cost of productiondiscusses the ways that the Government can use on average for these enterprises, wage costs are intax revenues from this growing economic base to fact a significant burden on value added and thusfinance programs that improve the incomes and on plant profitability. In cases where value addedliving standards of the poor in a non-inflationary at world prices is negative (the cost of inputsway that does not distort prices. If these measures exceeds the value of outputs), wages become anare put into place, the next devaluation can be thelast major devaluation, and Belarus will be on the Figure 1.20: The number of loss-makingroad to economic recovery and higher living enterprises hasgrown sharply.standards.
Loss-making EnterprisesEnterprise Profitability (num ber)
As noted above, the increasing inability 3,000
of Belarusian enterprises to compete in domestic 2,500 _
and export markets has been the result primarily 2,000 .
of the low efficiency of Soviet-era enterprises, 1,500
particularly in their use of energy inputs. These 1,500
production efficiency problems were . -_ _
compounded by the low quality of their products, 500 . _-
the loss of traditional markets in the FSU and 0CEE countries, and the rapidly appreciating 1992 1993 1994 1995 Ql
domestic currency. As industrial output declined, 1996
Source: Official data.
28 Chapter I
extremely large burden. Under such conditions, it Impact on Energy Suppliers. The largemay be cheaper to pay workers not to work by energy arrears underscore the need for hardgiving them a reasonably generous severance budget constraints that would force enterprisespayment than to continue running the factory. In either to remain current on their payments forfact, the savings realized from halting the energy or to shut down their operations. Russianegative value added would generate a net gain to has been reluctant to take measures such asthe economy even if the workers were to continue shutting off gas and oil supplies that would pressto be paid their working wage. The widespread Belarus to meet its payments obligations, nor hascollapse of enterprise profitability is having the Government of Belarus effectively pressuredwidespread negative effects on the rest of the the enterprises to meet their payment obligations.economy-workers, other enterprises, energy Arrears on payments for gas are a particularlysuppliers, banks, and the Government. severe problem; arrears to Russia grew to USD
Impact on Workers. According to the 400 million in late 1994 before a deal was struck,
Bank's recently completed poverty assessment, reducing this amount by half By early 1996 gasabout 95 percent of the increase in the poverty arrears totaling over USD 900 million (includingrate between 1992 and 1995 was the result of penalties) had again accumulated. In early 1996,economic decline, not worse income distribution, the Presidents of Russia and Belarus signed aeconoamicdecline, not worses income distribon. a "zero option" agreement by which Russia wouldNon-paymea nt sofures and povertyinBemplo t tdare cancel these arrears in exchange for Belarusthe leading sources of poverty in Belarus today. canceling its claims against Russia, includingCases are regularly reported of delayed payments those for environmental damage, for nuclearand non-payments to workers. In some instances, weapons materials taken from Belarus to Russiapeople work for weeks or months with no pay, wonthe maintenance of Russian troops onpartly out of dedication to their jobs, partly foruthe mainteanc of Russian troopsbecause alternative employment is hard to find in Belarusian soil, and for deposits of the Belarusbecusealtrnaiveempoyentis ardto indin Vnesheconombank that are frozen in Moscow.the current environment (which is not conducive Although implementation details were difficult toto the establishment of new enterprises), and conclude-partly because of the negative impactpartly in the hope that their enterprises will get on the financially strapped Russian budget-thethe necessary money from sales, the government, deal was reportedly completed in Septemberor the banks. In the meantime, the workers areable to take advantage of the housing and other 1996.services offered by enterprises. The lack of payments discipline has had a
.npact on Other Enterprises. Non- very negative impact on the economicpayments to other enterprises is a serious problem performance and prospects of Belarus. In the casein Belarus, jeopardizing the financial health of of energy supplies from Russia, for example, theenterprises that could otherwise be profitable. arrears have strained relations between the twoTotal overdue non-payments grew from governments. Further accumulations of arrearsessentially zero in 1990 to over 40 percent of total could lead Russia to shut off gas supplies tointer-enterprise debts by early 1996. Of these Belarus, as it has done for a number of the othernon-payments, over 70 percent were to other FSU republics that have accumulated sizableenterprises, both inside and outside Belarus. The arrears. Resolving such a situation could lead topayables to foreign enterprises exceed receivables demands that Belarus, in order to cancel its debts,
f h t ee5 give up partial or total ownership rights in
million, indicating that Belarusian enterprises are important national assets such as refineries or thenet debtors to the rest of the world (since this debt pipelines that transport Russian oil across Belarus
net debtos tto central and western Europe. Debt/equity swapsbegan as trade credits in most instances, it is not could therefore have seriously negative long-termincluded in the data on medium- and long-term impacts on the balance of ayments and on theexternal debt presented elsewhere in this report). p . yr
national Income of Belarus. For example, theOf the total overdues to foreign enterprises, a annual implicit value of gas and oil transportationmajor share is for energy supplies from Russia.
The Economic Crisis - Sources and Solutions 29
by the pipelines across Belarus is probably in the exporters had been forced-through therange of USD 200-400 million. Even if this figure imposition of effective hard budget constraints-is significantly overstated, the loss of revenues to pay all of their suppliers, workers, taxes, andthat would result from a debt/equity swap that bank loans.transferred ownership of such assets to Russia Imposing hard budget constraints andwould obviously have a major impact on the net financial discipline through mechanisms such as
balance of payments position and long-term the effective threat of bankruptcy could greatlyeconomic prospects of Belarus. improve the competitiveness of Belarusian
Impact on Exchange Rate. One of the exports and thus the profitability of Belarusianmost serious consequences of the lack of enterprises. If such discipline were imposed,payments discipline and consequent payments exports would initially decline as enterprises noarrears has been the distortions in the value of the longer exported at a loss. The drop in exportsBelarusian rubel and thus the erosion of the would increase the scarcity value of foreigncompetitiveness and profitability of Belarusian exchange, creating pressures for an exchange rateenterprises. As a result of the failure of devaluation. At the devalued rate, exports wouldBelarusian enterprises to pay the Belarusian become more profitable, allowing enterprises toenergy suppliers (Belgaz) for energy supplies, return to exporting, but this time at a profit whileBe1gaz has not had the Belarusian rubels needed fully covering their costs of production. In thisto purchase foreign exchange in the domestic way, financial relations within the economy couldmarkets to pay these bills to Russia. be put on a normal basis where enterprises paidConsequently, the demand for foreign exchange their bills in full and on time, thus bringing anhas been artificially low, contributing directly to end to the spiraling cycle of non-payments.the overvaluation of the domestic currency. The Impact on the Banking System The lowexchange rate overvaluation has been exacerbated profitability and non-payments of the enterpriseby the fact that a significant share of the sector have had a sharply negative impact on theinflationary credit expansion during 1995 went to banking sector. Between 1994 and 1995, arrearsthe gas company to help provide at least some of to commercial banks increased nearly three timesthe resources that it needed to pay for imported as a share of credits outstanding (from 4 percent
gas. This plus other factors pushed total credit to to 11 percent compared to an international normexpand more rapidly than GDP, leading to of about 2 percent for a well-performinginflationary pressures that, in turn, contributed to portfolio). These arrears are concentrated in theeven more overvaluation of the domestic . * 21
currency, given the fixed exchange rate. This has arget commercialaban, h Accout foresulted in a vicious cycle that can only be broken70 percent of total arrears. Almost 50tresughd a comInaIOUS cycl tapprprantnle brolicies* * r e * ~~~percent of the banks' total capital funds inthrough a combination of appropriate policies Belarus today needs to be set aside against badincluding a flexible exchange rate, realistic loans. The loan losses and non-payment ofdomestic prices, and hard budget constraints. interest have also hurt the profitability of the
The lack of payments discipline with commercial banks. During the first quarter ofrespect to domestically supplied inputs, including 1996, about half of them were losing money.labor, material inputs, bank loans, and These developments, which threaten togovernment services, has also contributed to the undermine the already fragile condition of theovervaluation of the currency. Belarusian banking system in Belarus clearly indicate theenterprises have continued to export-even at a importance of imposing hard budget constraints.loss-in order to obtain scarce foreign exchange. Without payments discipline, failing enterprisesEnterprises have been able to do this because they will bankrupt banks, which threatens the strengthcan cover the losses by failing to pay their bills. of otherwise healthy enterprises, which depend onAs a result, loss-making exports have contributed a sound banking system. This in turn casts a darkto a much larger supply of foreign exchange in shadow over prospects for renewed economicthe domestic market than would have existed if growth.
30 Chapter I
Impact on Government. Finally, Despite the burden of subsidies and otherenterprise non-payments are eroding the financial expenditures, the Government has consistentlyposition of the Government. In addition to done a good job of maintaining the nominalordering the banking system to extend credits to budget deficit at a modest 2-4 percent of GDP forfailing enterprises, the Government has been the past several years. However, the picture is notmaking significant subsidies available directly as positive as it might seem for several reasons:from the budget-the equivalent of about 3.5 * Belarus has a sizable quasi-fiscal budget thatpercent of GDP. Of the total subsidies in the 1996 is financed through the banking system.state budget, over half are for the agriculturalsector. Although the current subsidy number is . The Governmenthas drawn down the reservesstill large-roughly equivalent to the entire dirof the Social Protection Fund, both through
budget deficit-it represents a majordirect transfers and by charging certain pricebudget deficit-it represents aadjustment compensation payments to
improvement compared to 1993, when budgetary consumers against the fund rather than againstsubsidies were 15 percent of GDP. the budget, with the result that pensioners now
Fiscal Policies and Performance receive their payments with substantial delays.G In attempting to maintain the budget deficit
General government revenues have been and goverment borrowing targets agreeddeclining relative to overall economic activity with the IMF, the Government is increasinglysince 1993 when they reached 52 percent of GDP. operating on a cash basis, paying its bills onlyIn 1995 general government revenues were only as revenues are received. Consequently,43 percent of GDP.22 The Government hopes to wages and pensions are often paid withraise them to 47 percent of GDP in 1996, but considerable delays, and the Government is inrevenue collections are off sharply. By mid-year, arrears to suppliers, thus worsening theonly 33 percent of anticipated revenues for the financial crisis in the enterprise sectors.year had been collected. Expenditure arrears of the Government have
grown from negligible levels to a substantialMany factors account for this shortfall in share of annual expenditures.
funds. First, economic activity in Belarus With revenue collections falling well belowcontinues to decline. However, although this projections, the Government is increasinglyhelps account for an absolute decline in tax turning to sequestration of funds to preventrevenues, it does not account for the decline the deficit from exceeding the limits agreedrelative to GDP. Second, the corporate profits tax with the IMF, and sequestration tends to beaccounts for about 20 percent of total tax applied with little respect for the originalrevenues, and an increasing number of enterprises budgetary priorities agreed with Parliament.are now losing money, leaving them with no For example, expenditures during the first halfprofits upon which to pay taxes. Third, to help of 1996 were 33 percent of original plans forkeep failing enterprises afloat so that they will not 1996, reflecting a similar shortfall in
revenues. Within this total, however,have to lay off their workers, the Government has exenues onthealth w only 22wpercexpenditures on health were only 22 percentbeen granting some enterprises an extension for of the 1996 targets, but expenditures onpaying taxes and is completely exempting others defense were 41 percent of plans, the highestfrom selected taxes; in addition to seriously rate for any program area.eroding the tax base, these policies also result in public investment program has been. The pbi netetpormhsbean uneven playing field among enterprises and particularly hard hit; only 21 percent of thecreate conditions under which bribery and planned expenditures had been made by mid-corruption are inevitable. Fourth, as the size of 1996. Capital expenditures of the centralthe informal economy grows relative to total government have fallen from an average ofGDP-a development reflecting in part the 2.2 percent of GDP in 1992 and 1993 to onlyonerous government controls that make it difficult 0.7 percent of the sharply reduced GDP of thefor an honest enterprise to run a profitable first quarter of 1996.business-tax evasion has increased.
The Economic Crisis - Sources and Solltions 31
B. RESTORING ECONOMIC STABILITY AND GROWTH
Stability
Government policy reforn efforts to date However, the necessary level of investment willhave focused primarily on controlling inflation not take place until some other very importantand on softening the impact of the transition issues have been addressed.process on the people of Belarus. Unfortunately, A very rough estimate of the investmentthe latter objective has frequenitly been given
that will be required durinc thie coming years canhigher priority than controlling inflation. TheGovernent'sreluctnce t be calculated as follows. At the current marketGovernment's reluctance to Impose hard budget exhnert,heGPoBeauin19wsconstraints and to close loss-making enterprises e r
weencsayan it iee uequal to about USD 10 billion. If Belarus is toihere necessary, and its widespread use of restore previous living standards and reverse the
directed credits and budget subsidies have created curntedtoasicesngpvtynarather than controlled inflation. This approach current trend towards increasing poverty in atimely manner, it would be desirable for themay have reduced the amount of open country to grow by at least 6 percent per year.unemployment, but has done little to improve the Comparative data from around the worldcapacity of enterprises to grow and support an
D indicates that economies that -row in the range ofimproved standard of living for the Belarusian 6people. A continuation of past policies will not do investment to GDP of around 30 percent,much good in the short run, and will make it even compared to the rate of around 25 percent seen inmore costly in the long run to undertake the Belarus today. This would imply annualnecessary structural reforms. Until enterprises investments starting at about USD 3 billion perparticularly those in the industrial and agricultural investmentscstarin tsectors, have been converted into efficient, y a
Gv n' nominal GDP. A somewhat higher initial level ofprofitable operations, the Government'sobjecte of s t ad i d mliving investment may be desirable to compensate for
objectives of stabilityandthe very low status of much of the capital stock instandards will remain seriously at risk. 1990 in terms of energy efficiency and product
The priority actions in the area of stability design, and for the sharp deterioration in theare thus to free prices so that they may be capital stock since then. In 1995, for example,determined by market forces, and to hold capital investnment in the industrial andexpansion of the money supply roughly in line agricultural sectors was only about one third ofwith GDP growth to avoid inflation. the 1992 level in real terms.
Growth and Structural Change According to official statistics, the actualgross fixed capital formation in 1995 was about
Policymakers in Belarus are very USD 2.6 billion, which is close to the indicativeconcerned about the efficiency and profitability of USD 3 billion that is required. This underscoresenterprises and have focused considerable effort the point made earlier in this report that majoron identifying how the necessary investmentresources can be mobilized. An important paper capital. Otherwise increasing the GDP growthwas issued by the Government this summer on rate would require even higher levels ofpolicies to stimulate investment in the economy, investment and corresponding reductions in theand the Government recently sponsored an feasible levels of personal consumption. Giveninternational investment conference in Minsk~ to the compression of living standards that hasattract foreign investors. The need for massive already taken place, this is clearly riot theinvestment in the economy cannot be questioned. desirable option. The remainder of this reportThe physical inefficiency of equipment and sub- therefore focuses on actions that the Governmentstandard designs of products cannot be fixed witlh could take to improve thae efficiency ofsimple stroke-of-the-pen policy changes.
investment in Belarus.
32 Chapter I
Although most enterprises today in * Save and invest a higher share of GDP.Belarus are government-owned, most of the * Borrow from abroad.investment should come from private sources.The Government should be making relatively . Attract foreign direct investment, includinglittle investment in existing enterprises, and the repatriation of domestic capital that has
. . . ~~~~~~sought safety and hi-her returns abroad.should focus instead on privatizing the enterprisesso that they will be attractive to private investors. Each of these strategies is viable andThis recommendation is made from a purely should be pursued. However, one conclusion ispractical, non-political perspective-the obvious in reading the list. PotentialGovernment does not have the necessary financial investors-be they Belarusian households andresources, nor are there any prospects of its businesses, foreign lenders, or foreignmobilizing more than a relatively small part of the investors-will require a much higher degree ofrequired resources to make further investments in safety and a muchi better real return on capitalenterprises. Also, past experience in Belarus and than exists in the Belarusian market today. This iselsewhere has shown that governments should axiomatic, for if the safety and returns in thefocus on governing (including the establishment Belarusian market were already sufficiently good,of a good investment climate), and should leave the investment would already be taking place. Inthe business of business to the private sector. short, attaining the required levels of investment
Only three ways exist for Belarus to raise will require major improvements in the businessthe rate of investment by the 5-10 percent of GDP climate. The next section of this paper focuses on
- ~~~~~~measures needed to establislh a good businessthat is needed to attain the level of investment
environment in Belarus.required to grow at a desirable rate.
C. CONCLUSIONS
This review of the sources of the current * Government policies implicitly sought toeconomic crisis in Belarus indicates that the main cushion the adjustment to these externalproblems have included the following: shocks by expansionary credit and related
policies that helped to maintain employment= The twin external shocks of higher energy and living standards.
prices and the loss of traditional marketstriggered the current crisis. * The end result of these policies was excessive
demand, risin, consumption, falling- The poor quality and low production investment, and high rates of inflation.
efficiency of Belarusian goods made itdifficult for Belarus to redirect its exports to . These macroeconomic imbalances, togetherthe international markets. with cautious reforms in the areas of price
decontrol and privatization, have created an* These shocks, together with the breakup of the unfavorable climate for investment in Belarus,
former Soviet Union, made unavoidable both and have significantly delayed the transitiona transition from the previous command to a prosperous, market-based economy.economy to a market economy, and afundamental restructuring and upgrading ofdomestic production capacity.
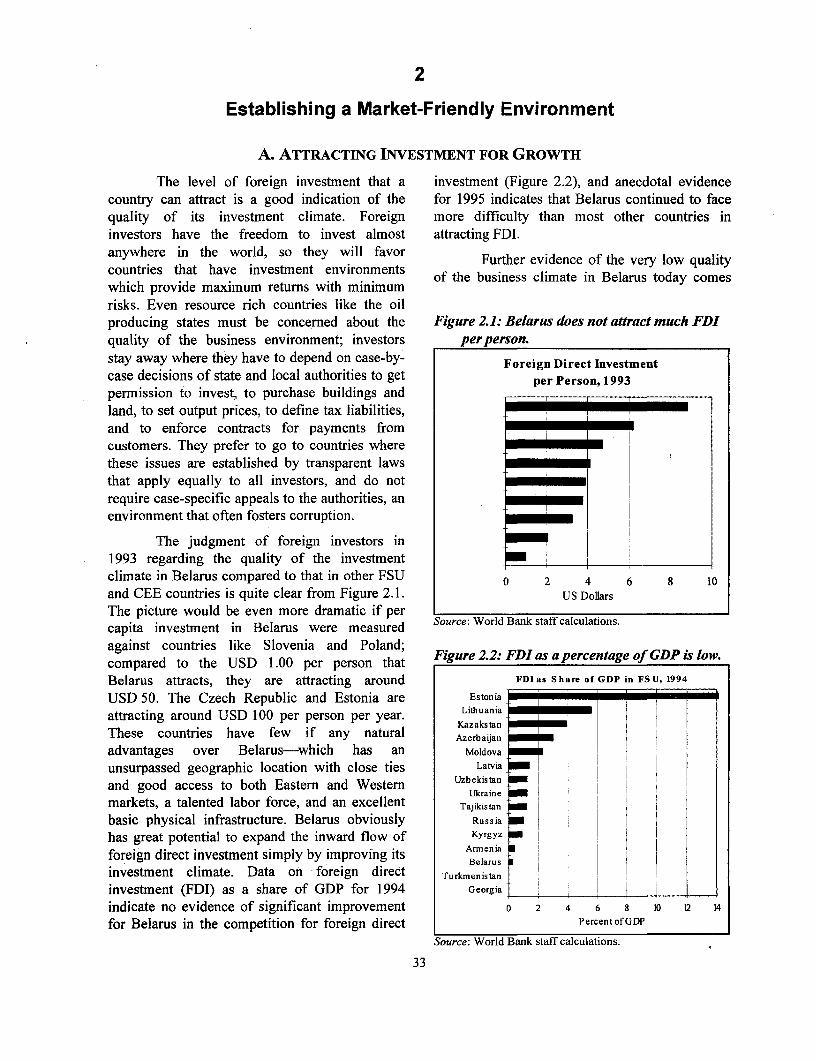
2
Establishing a Market-Friendly Environment
A. ATTRACTING INVESTMENT FOR GROWTH
The level of foreign investment that a investment (Figure 2.2), and anecdotal evidencecountry can attract is a good indication of the for 1995 indicates that Belarus continued to facequality of its investment climate. Foreign more difficulty than most other countries ininvestors have the freedom to invest almost attracting FDI.anywhere in the world, so they will favor Further evidence of the very low qualitycountries that have investment environments of the business climate in Belarus today comeswhich provide maximum returns with minimumrisks. Even resource rich countries like the oilproducing states must be concerned about the Figure 2.1: Belarus does not attract much FDIquality of the business environment; investors perperson.stay away where they have to depend on case-by- Foreign Direct Investmentcase decisions of state and local authorities to get per Person, 1993permission to invest, to purchase buildings andland, to set output prices, to define tax liabilities, _ _and to enforce contracts for payments from _customers. They prefer to go to countries wherethese issues are established by transparent lawsthat apply equally to all investors, and do notrequire case-specific appeals to the authorities, anenvironment that often fosters corruption.
The judgment of foreign investors in1993 regarding the quality of the investment _ Iclimate in Belarus compared to that in other FSU 0 2 4 6 8 10and CEE countries is quite clear from Figure 2.1. US Dollars
The picture would be even more dramatic if per S
capita investment in Belarus were measured Source: World Bank staff calculations.
against countries like Slovenia and Poland;compared tounthieslike SDl periA personth Figure 2.2: FDI as a percentage of GDP is low.compared to the USD l.uu per person thatBelarus attracts, they are attracting around FDI as Share of GDP in FS U, 1994
USD 50. The Czech Republic and Estonia are Estonia
attracting around USD 100 per person per year. Lithuania _ lThese countries have few if any natural AzerbaiJan _advantages over Belarus-which has an Moldova
unsurpassed geographic location with close ties Latvia
and good access to both Eastern and Western Uzbekismtan _Ukraine r
markets, a talented labor force, and an excellent Tajikistan _ l l
basic physical infrastructure. Belarus obviously Russia
has great potential to expand the inward flow of Kyrgyz
foreign direct investment simply by improving its ABelnia rinvestment climate. Data on foreign direct Turkmenistanus
investment (FDI) as a share of GDP for 1994 Georgia __i__
indicate no evidence of significant improvement 0 2 4 6 8 10 12 14
for Belarus in the competition for foreign direct Percent of GDP
Source: World Bank staff calculations.
33
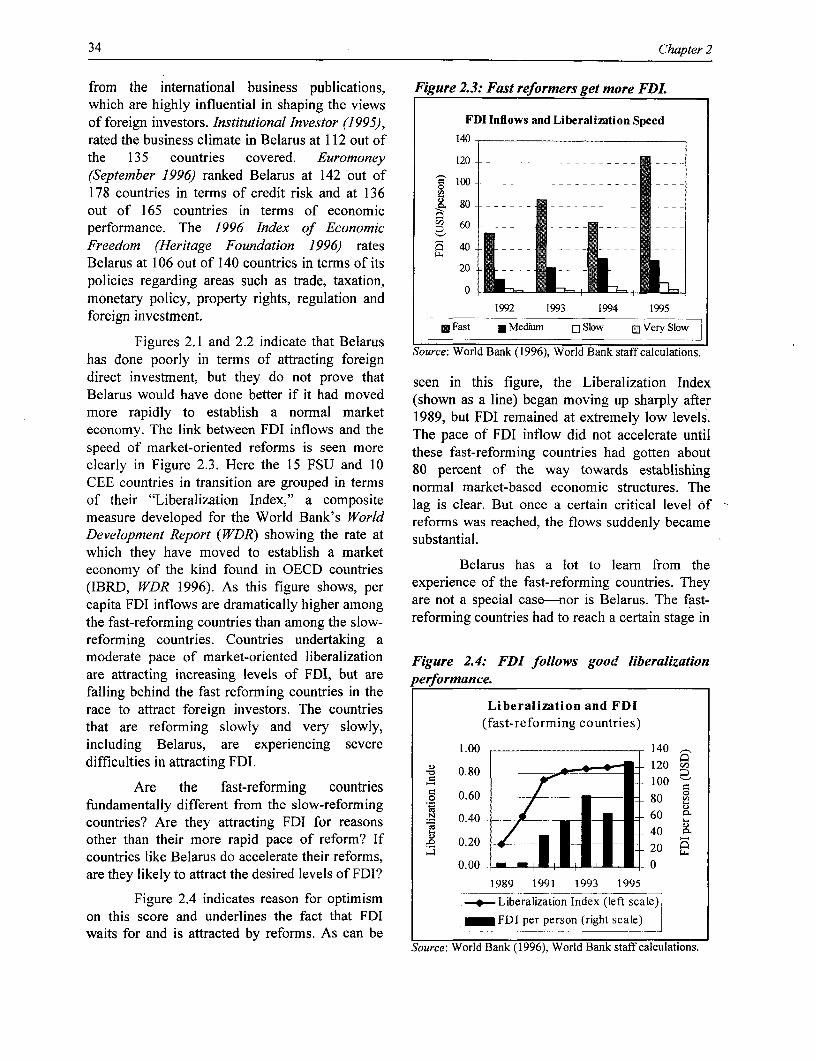
34 Chapter 2
from the international business publications, Figure 2.3: Fast reformers get more FDIwhich are highly influential in shaping the viewsof foreign investors. Institutional Investor (1995), FDI Inflows and Liberalization Speed
rated the business climate in Belarus at 112 out of 140the 135 countries covered. Euromoney 120 =
(September 1996) ranked Belarus at 142 out of loo-178 countries in terms of credit risk and at 136 8
out of 165 countries in terms of economic 60
performance. The 1996 Index of EconomicFreedom (Heritage Foundation 1996) rates : 40
Belarus at 106 out of 140 countries in terms of its 20
policies regarding areas such as trade, taxation, omonetary policy, property rights, regulation and 0
forig inetet 1992 1993 1994 1995foreign Investment.*Fast M Medim j Slow 0 Very Slow
Figures 2.1 and 2.2 indicate that Belarushas done poorly in terms of attracting foreign Source: World Bank (1996), World Bank staff calculations.
direct investment, but they do not prove that seen in this figure, the Liberalization IndexBelarus would have done better if it had moved (shown as a line) began moving up sharply aftermore rapidly to establish a normal market 1989, but FDI remained at extremely low levels.economy. The link between FDI inflows and the The pace of FDI inflow did not accelerate untilspeed of market-oriented reforms is seen more these fast-reforming countries had gotten aboutclearly in Figure 2.3. Here the 15 FSU and 10 80 percent of the way towards establishingCEE countries in transition are grouped in terms normal market-based economic structures. Theof their "Liberalization Index," a composite lag is clear. But once a certain critical level ofmeasure developed for the World Bank's World reforms was reached, the flows suddenly becameDevelopment Report (WDR) showing the rate at substantial.which they have moved to establish a marketeconomy of the kind found in OECD countries Belarus has a lot to learn from the(IBRD, WDR 1996). As this figure shows, per experience of the fast-reforming countries. Theycapita FDI inflows are dramatically higher among are not a special case-nor is Belarus. The fast-the fast-reforming countries than among the slow- reforming countries had to reach a certain stage inreforming countries. Countries undertaking amoderate pace of market-oriented liberalization Figure 2.4: FDI follows good liberalizationare attracting increasing levels of FDI, but are performance.falling behind the fast reforming countries in therace to attract foreign investors. The countries Liberalization and FDIthat are reforming slowly and very slowly, (fast-reforming countries)including Belarus, are experiencing severe 1.00 140difficulties in attracting FDI. 1 0.80 i20
Are the fast-reforming countries 100 -fundamentally different from the slow-reforming 0.60 - - 80 z
countries? Are they attracting FDI for reasons 0.40 - 60
other than their more rapid pace of reform? If | 0.20 - - 40
countries like Belarus do accelerate their reforms, 2 oare they likely to attract the desired levels of FDI? 0.00 0
1989 1991 1993 1995Figure 2.4 indicates reason for optimism p Liberalization Index (left scale)
on this score and underlines the fact that FDI -FDlipererrson (right scaleTtwaits for and is attracted by reforms. As can be -l
Source: World Bank (1996), World Bank staff calculations.
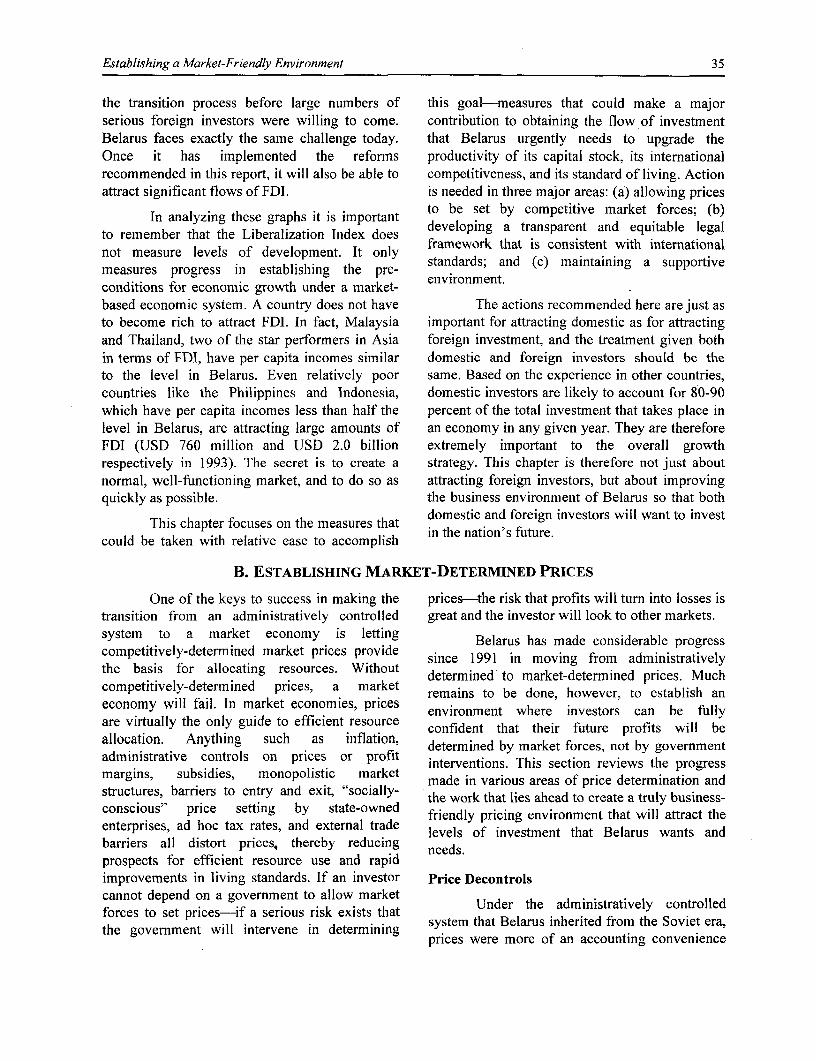
Establishing a Market-Friendly Environment 35
the transition process before large numbers of this goal-measures that could make a majorserious foreign investors were willing to come. contribution to obtaining the flow of investmentBelarus faces exactly the same challenge today. that Belarus urgently needs to upgrade theOnce it has implemented the reforms productivity of its capital stock, its internationalrecommended in this report, it will also be able to competitiveness, and its standard of living. Actionattract significant flows of FDI. is needed in three major areas: (a) allowing prices
In analyzig te gto be set by competitive market forces; (b)to~ ~~~~~~~~~~~~ Inaayigteegah,ti motn developing a transparent and equitable legal
to remember that the Liberalization Index doesnot measure levels of development. It only framework that is consistent with internationalmeasures progress in establishing the pre- standards; and (c) maintaining a supportiveconditions for economic growth under a market- environment.based economic system. A country does not have The actions recommended here are just asto become rich to attract FDI. In fact, Malaysia important for attracting domestic as for attractingand Thailand, two of the star performers in Asia foreign investment, and the treatment given bothin terms of FDI, have per capita incomes similar domestic and foreign investors should be theto the level in Belarus. Even relatively poor same. Based on the experience in other countries,countries like the Philippines and Indonesia, domestic investors are likely to account for 80-90which have per capita incomes less than half the percent of the total investment that takes place inlevel in Belarus, are attracting large amounts of an economy in any given year. They are thereforeFDI (USD 760 million and USD 2.0 billion extremely important to the overall growthrespectively in 1993). The secret is to create a strategy. This chapter is therefore not just aboutnormal, well-functioning market, and to do so as attracting foreign investors, but about improvingquickly as possible. the business environment of Belarus so that both
domestic and foreign investors will want to investThis chapter focuses on the measures that . .could be taken with relative ease to accomplish in the nation's future.
B. ESTABLISHING MARKET-DETERMINED PRICES
One of the keys to success in making the prices-the risk that profits will turn into losses istransition from an administratively controlled great and the investor will look to other markets.system to a market economy is letting Belarus has made considerable progresscompetitively-determined market prices provide since 1991 in moving from administrativelythe basis for allocating resources. Without determined to market-determined prices. Muchcompetitively-determined prices, a market remains to be done, however, to establish aneconomy will fail. In market economies, prices environment where investors can be fullyare virtually the only guide to efficient resource confident that their future profits will beallocation. Anything such as inflation, determined by market forces, not by governmentadministrative controls on prices or profit interventions. This section reviews the progressmargins, subsidies, monopolistic market made in various areas of price determination andstructures, barriers to entry and exit, "socially- the work that lies ahead to create a truly business-conscious" price setting by state-owned friendly pricing environment that will attract theenterprises, ad hoc tax rates, and external trade levels of investment that Belarus wants andbarriers all distort prices, thereby reducing needs.prospects for efficient resource use and rapidimprovements in living standards. If an investor Price Decontrolscannot depend on a government to allow market . .forces to set p rices-if a serious risk exists thatUneth adisrtvlyctoldthres govsernt wrills-if intervene rink determ ini system that Belarus inherited from the Soviet era,
prices were more of an accounting convenience
36 Chapter 2
than a device to guide production and con- remain a serious barrier- to the formation ofsumption decisions. Prices were fixed by decree, competitive markets for the allocation of manynot by competitive forces of demand and supply. agricultural goods and raw materials. AlthoughWhen an enterprise made "excessive" profits the World Bank has been working with theunder the prevailing administered prices, the national authorities through the Forestry Projectsurplus was taken away through enterprise- to establish competitive markets for standingspecific tax rates, centrally determined dividend timber, most is still allocated administratively andpayments, or by imposing various social costs transferred at a stumpage fee that is far belowsuch as housing and district heating on the competitive market prices.enterprise. When the administered prices forinputs and outputs led to losses, the government.Unotael,heGvrmtsatdinutsed subses, capita invments a d moving in exactly the opposite direction in the
used subsidies, capital investments,anlatter part of 1996. In September, a decree wascredits from the banking system to fill the gap. issued that reestablished price controls on a wide
As Belarus began the transition to a range of goods. Many of the goods explicitlymarket economy, it started liberalizing prices so listed in the decree were still under administrativethat they could be determined by market forces. control (for example,. goods and servicesIn some areas the task is essentially completed. produced by monopolistic enterprises). This partBy 1995, virtually all manufactured products, for of the decree is of less concern, however, than theexample, were free from all forms of price part that explicitly allows local governments tocontrol. This was a major accomplishment. Most apply price controls on "socially importantagro-industrial and agricultural products were goods," a loophole that could easily be abused.also free of controls, but the process has taken The decree also froze prices through the end oflonger. Profit margin controls still existed on dark 1996 on a number of important goods. The netbread, milk and meat in 1996. These limits on effect of these measures is a significant reversalselling prices, combined with minimum of previous policy progress, a reversal that willprocurement prices to farmers, have put a price make it even harder than before to establish asqueeze on the trade sector, a situation further market in Belarus where investors can depend onaggravated by the fact that the majority of the price of their inputs and outputs being set byenterprises in this sector are still government- competitive market forces rather than byowned and controlled. Local government officials government decree.pressure the managers of local wholesale and The housing and utilities sector is also inretail establishments to keep prices low "for deep crisis, with about 35 percent of thesocial reasons." Because price controls had . . -- aenterprises losing money, and price controls areofficially been abolished by the national the major problem here as well. Because of theGovernment, much of this control was not monopolistic structure of these sectors, price
documented but took the form of "telephone controls are of course required. Major utilitiescontrol." The system of state orders, particularly like electricity are national level monopolies andfor goods from the agricultural sector, also serves will need price regulation for the foreseeableas a de facto system of price control and should future. Housing, district heating, and water arebe replaced by a procurement system based on provided by hundreds of different entities aroundcompetitive bidding. Nearly 60 percent of the country, but are nevertheless effectiveenterprises in this sector are now loss-makers, monopolies in most cases as far as the individualcreating a severe crisis in the trade and catering householder or enterprise is concered. The issuesectors. Efforts to subsidize the poor by is therefore not the abolition of price controls, butcontrolling prices of "socially sensitive" fooditems has been very costly. (Box 2.1). State orders necessary costs.
Establishing a Market-Friendly Environment 37
Box 2.1: There is nofree lunch.Like many governments in third world countries, Belarus has sought to help the poor by imposing an artificially lowprice on bread. Bread is a particularly important source of nourishment for the poor, so this approach seems at firstglance to make sense. However, it is seriously flawed and ends up costing everyone, even the poor.
If a loaf of bread costs, for example, 50 cents to make and is sold for 25 cents, the bakery has to be compensated forthe loss or it will go out of business. In Belarus, part of this compensation comes in the form of artificially lowprices for flour, which are based on the artificially low prices given to farmers for the grain procured through thestate grain trading system. As of December 1995, for example, the state procurement price for grain was only $65per ton, compared to a world price of $121 per ton.
This approach pushes the burden of subsidizing bread onto the farmers, who receive less than their cost ofproduction. As a result of this and similar pricing practices for meat, milk, and other dairy products, the agriculturesector accounted for one of the largest concentrations of loss-making enterprises in Belarus as of the first quarter of1996, followed by the trade and catering sector-where losses are also caused in part by controlled prices.
To help farmers survive the low grain prices, the Government has taken two different approaches. On the one hand,it has forced the banking system to lend heavily to the agricultural sector. As a result, agriculture's share of totalcredit has increased sharply while its share in total GDP has declined. The subsidization of agriculture with largevolumes of cheap banking system credits has increased inflation and the interest rate cost of capital in Belarus. Onthe other hand, the Government also maintains an Agricultural Support Fund that provides direct budgetarysubsidies to the agricultural sector for the purchase of inputs and capital equipment.
In the end, consumers pay more than the full cost of the cheap bread. They pay higher interest rates because of thedrain of credit to loss-making enterprises in the agricultural sector. They receive lower wages due to the scarcity andhigh cost of investment funds that are needed to modernize the industrial sector and increase labor productivity, thusmaking it possible for enterprises to pay higher wages. And they pay higher taxes to finance subsidies to thefarmers.
How much more efficient it would be simply to charge the full cost of the bread in the first place and give the poor adirect cash or food-stamp subsidy to help them pay the full cost of producing the bread. An income subsidy to thepoor would cost a fraction of the current maze of subsidies required to compensate for the distorted price of bread,which ends up subsidizing everyone, not just the poor. Without the costs of compensating for all the losses causedby "cheap" bread, the Government could lower taxes and provide more adequate subsidies to those who are trulypoor. If everyone paid the real cost of bread, everyone-including the poor-would eat better.
Under the Soviet system, housing and housing has caused a crisis in the building andutilities were provided free or at token rates as construction materials industry.part of the wage package for workers. Cost The Government has made considerablerecovery for utilities became a major issue when progress since 1994 when the cost recovery ratethe cost of energy increased from insignificant for housing and utilities averaged barely 10levels to levels close to world prices. Cost percent-cost recovery for rent and water was 2recovery for housing has also become an issue for percent or less, while that for heating was under 4several reasons: (a) current cost recovery rates are percent. Out of rent, heating, hot water, andnot enuheven to cover maintenance csswith . .. 23not enough even to cover maintenance costs, electricity, the four significant housing costs,the result that the housing stock is deteriorating; only electricity had a recovery ratio exceeding 25(b) with no capital cost recovery in most cases, Despite considerable social
obsolete percent. Dstecndral oa opposition,resources are not available to replace obsolete the Govement made commendable progresshousing units; (c) the implicit subsidization durnI995inithrough under-recovery of costs from families in dure rea s. By recove rategovernment-owned housing creates a serious biasagainst private home ownership because private cost recovery for all household costs was over 60
owners will have to cover the full cost of home percent, and minor services such as radio,ownership and maintenance; and (d) the lack of telephone and TV had reached 100 percent. Costresources to maintain existing and build new recovery on the major items was as follows: rent
38 Chapter 2
(50%), heating (65%), hot water (54%), and structures in Belarus in terms of their impact onelectricity (84%). These efforts have stalled since consumers are the retail and wholesale tradingthen, however. Although average cost recovery as organizations. Some progress has been made inof mid-1996 was reportedly about 60 percent, this this area.25 However, local political pressureswas possible only because, through negotiations have made it difficult for the nationalwith Russia, Belarus was able to get a concession Government to break these up as quickly andon the cost of gas delivered to Belarus, bringing completely as would be desired. For example, agas even further below world prices than before. national plan for demonopolizing the trading
organizations-a condition for the past year for aDemonopolization and Privatization World Bank loan to support private enterprise
The previous section highlights one of the development-has been prepared, but itsmain problems that comes from not having prices implementation has been delayed.determined by competitive market forces-that Government Ownership and Privati-the government has to make decisions about zation. Despite an initial spate of activity rightappropriate prices. Unfortunately, few after independence, progress in reducing thegovernments in the world do a good job of this presence of the state in retail trade has slowedfor at least two reasons. First, being responsible markedly since 1992 (Figure 2.5). Action in thisfor social welfare and sensitive to political area needs to be accelerated sharply. Breaking uppressures, governments usually find it easier to trading companies into smaller, independent unitsset prices with one eye on what is politically helps, for this introduces some degree ofpalatable rather than setting prices strictly on the competition among them. In Gomel, for example,basis of costs and finding other mechanisms, such newly-separated units of the former retail tradingas means-tested, targeted housing support funds, organization are competing with each other into meet social objectives. Second, setting prices terms of service, product line, and accessibility.requires a decision, which requires committees, This does not really solve the problem, however.meetings, and reports. All this takes time. As long as the demonopolized enterprises are stillConsequently, prices are very likely to be out of owned by the state, they will be subject to theline with costs by the time the decision is finally same pressures noted above to price goods andreached and implemented-the well-known services on the basis of "social" rather than purelyproblem of regulatory lag. These problems are economic considerations. Also, state ownership ofuniversal and almost unavoidable whenever wholesale organizations can make it difficult forgovernments try to set prices. privatized shops to get supplies. Even without
The best way around this problem is to explicit instructions, the old-line managers ofcreate an environment where the market forces ofdemand and supply, rather than the govemment, Figure 2.5: State dominance in retail sales isset prices for goods and services-prices that will falling.accurately reflect true scarcity values, thusassuring maximum efficiency and growth. To in Retail Sales (Saestablish a market structure in Belarus that canaccurately determine prices, the authorities need 70to break up monopoly structures and reduce 60 |--------government ownership. 50 _ ____
Monopolistic Markets. The Government 40established a special Anti-Monopoly Ministry to 30 _-
deal with these problems; with the help of outside 20 -*_
experts, it has done a good job of establishing the 1 -
basic laws needed to eliminate monopolistic 9 1market structures and to control monopolistic
24practices. The most serious monopolistic Source: Official data.
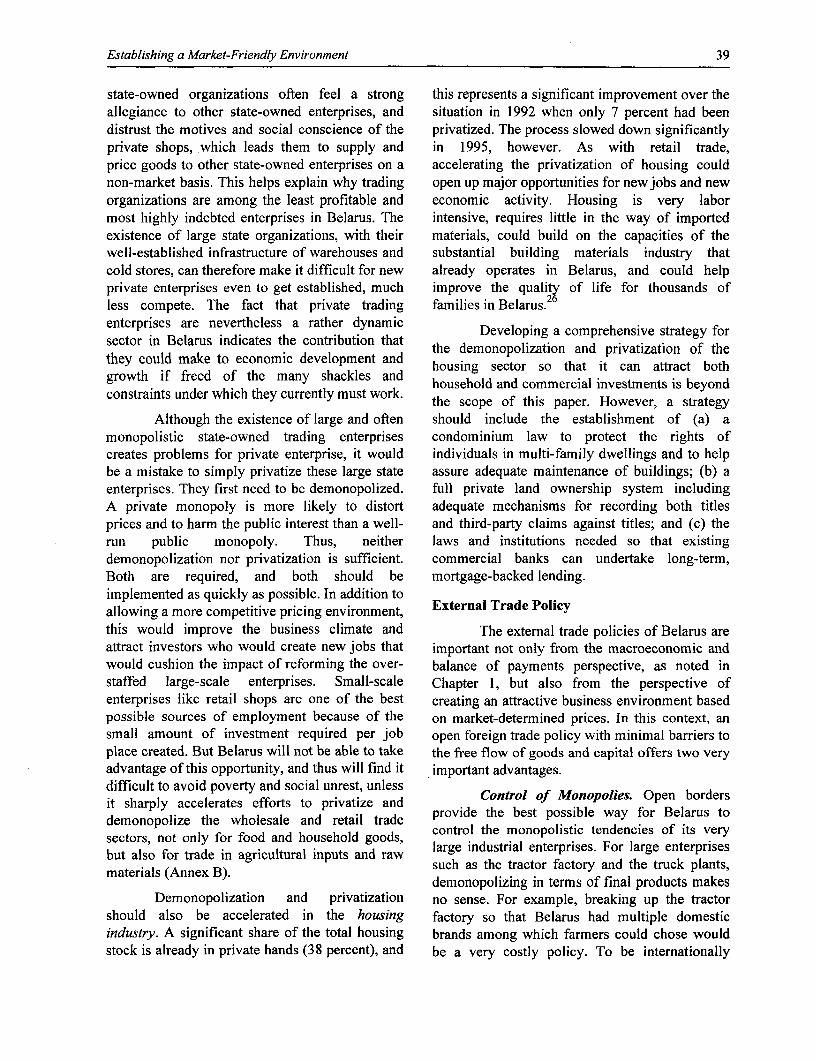
Establishing a Market-Friendly Environment 39
state-owned organizations often feel a strong this represents a significant improvement over theallegiance to other state-owned enterprises, and situation in 1992 when only 7 percent had beendistrust the motives and social conscience of the privatized. The process slowed down significantlyprivate shops, which leads them to supply and in 1995, however. As with retail trade,price goods to other state-owned enterprises on a accelerating the privatization of housing couldnon-market basis. This helps explain why trading open up major opportunities for new jobs and neworganizations are among the least profitable and economic activity. Housing is very labormost highly indebted enterprises in Belarus. The intensive, requires little in the way of importedexistence of large state organizations, with their materials, could build on the capacities of thewell-established infrastructure of warehouses and substantial building materials industry thatcold stores, can therefore make it difficult for new already operates in Belarus, and could helpprivate enterprises even to get established, much improve the quality of life for thousands ofless compete. The fact that private trading families in Belarus.enterprises are nevertheless a rather dynamic Developing a comprehensive strategy forsector in Belarus indicates the contribution that the demonopolization and privatization of thethey could make to economic development and housing sector so that it can attract bothgrowth if freed of the many shackles and household and commercial investments is beyondconstraints under which they currently must work. the scope of this paper. However, a strategy
Although the existence of large and often should include the establishment of (a) amonopolistic state-owned trading enterprises condominium law to protect the rights ofcreates problems for private enterprise, it would individuals in multi-family dwellings and to helpbe a mistake to simply privatize these large state assure adequate maintenance of buildings; (b) aenterprises. They first need to be demonopolized. full private land ownership system includingA private monopoly is more likely to distort adequate mechanisms for recording both titlesprices and to harm the public interest than a well- and third-party claims against titles; and (c) therun public monopoly. Thus, neither laws and institutions needed so that existingdemonopolization nor privatization is sufficient. commercial banks can undertake long-term,Both are required, and both should be mortgage-backed lending.implemented as quickly as possible. In addition toallowing a more competitive pricing environment, External Trade Policythis would improve the business climate and The external trade policies of Belarus areattract investors who would create new jobs that important not only from the macroeconomic andwould cushion the impact of reforming the over- balance of payments perspective, as noted instaffed large-scale enterprises. Small-scale Chapter 1, but also from the perspective ofenterprises like retail shops are one of the best creating an attractive business environment basedpossible sources of employment because of the on market-determined prices. In this context, ansmall amount of investment required per job open foreign trade policy with minimal barriers toplace created. But Belarus will not be able to take the free flow of goods and capital offers two veryadvantage of this opportunity, and thus will find it important advantages.difficult to avoid poverty and social unrest, unlessit sharply accelerates efforts to privatize and Contro of Monolies Open Bordstdemonopolize the wholesale and retail trade provide the best possible way for Belarus tosectors, not only for food and household goods, control the mronopolistic tendencies of its very
but~~~~. als fo trade In giutrlipt narge industrial enterprises. For large enterprisesmateralso for (ranex B)n agricultural inputsandraw such as the tractor factory and the truck plants,
materials (Annex B). demonopolizing in terms of final products makesDemonopolization and privatization no sense. For example, breaking up the tractor
should also be accelerated in the housing factory so that Belarus had multiple domesticindustry. A significant share of the total housing brands among which farmers could chose wouldstock is already in private hands (38 percent), and be a very costly policy. To be internationally
40 Chapter 2
competitive, factories producing such products larger market available for Belarusian products,require very large-scale production, and such thereby allowing Belarusian factories to attractfactories need to be internationally competitive more investment and to produce on a morebecause they are too large to survive based on the economic scale. Whether or not Belarus willlimited demand of the domestic market in benefit depends, however, on the degree of tariffBelarus. Some of the ancillary activities of these protection against third countries.factories, such as the production of parts like The main risk of preferential trading
hydraulic cylinders that are common to other agreements-whether customs unions or freevehicles and equipment, should almost certainly trade areas-is that, instead of creating morebe spun off to specialized producers who could, economical trade by breaking down tariff barrierswith multiple clients, produce at larger and between two or more countries, trading partnerstherefore more efficient scales. However, will divert their purchase of imports from low
breaking up production of the core products such cost extemal sources to high cost sources withinas tractors would make no sense from an the trading area because of high exteral tariffs.
economic perspective. Belarusian consumers and producers are already
The monopolistic power of such suffering from this problem under the customsenterprises should instead be controlled by union agreement with Russia. Someforcing them to compete with little or no tariff or manufacturers now find that duties on importednon-tariff protection against producers from materials can be 100 percent higher than before.around the world. Besides assuring domestic In fact, a recent survey of leading export-orientedconsumers that they can buy tractors at world manufacturing enterprises in Belarus indicatesprices, this strategy would also assure that that the most serious problem preventing themBelarusian products are competitive inter- from developing a higher volume of exports wasnationally, and thus much more attractive to the high taxes and tariffs for imported parts andinvestors who could help improve the quality and materials, second only to the appreciation of thecompetitiveness of Belarusian exports. real exchange rate noted in Chapter 1. Similarly,
Customs Union with Russia. Most consumers face prospects of sharply higher dutiesdecisionmakers in Belarus seem to be convinced for imported Westem cars, which could force
them to buy inferior Russian cars at unreasonablythat an outward-oriented strategy is appropriate yfor a country like Belarus that depends so heavily high prices.on international trade. The viability of this One of the initial attractions of joining thestrategy is being jeopardized, however, by the customs union with Russia was the prospect ofcustoms union with Russia. Russia, being a much being able to purchase energy inputs at priceslarger country, could pursue a protectionist, well below those prevailing in world markets.inward-oriented policy more easily than Belarus, This is turning out to be a false hope for twoand could more easily bear the probable economic reasons. First, the real appreciation of the Russiancosts of such a strategy because of its rich ruble plus domestic taxes has already put someendowment of natural resources. Nevertheless, Russian energy products above world prices.such an inward-oriented strategy would be costly Second, Russian prices increased by 36 timesfor Russia-and very costly for Belarus. Recent from January 1993 to December 1995. As ofmoves by Russia to increase protection against September 1995, motor vehicle gasoline costthird-country imports, such as increasing tariffs USD 327 per ton in Russia versus USD 183 onon automobiles, are thus of great concern. the world market, and diesel fuel was USD 236
Tariff-free trade between Russia and per ton versus USD 160. The only "bargains" ofBelarus is an excellent idea from the Belarusian importance to Belarus in the Russian marketperspective because (a) it should give Belarus toda are natural as and crude oil. These wereaccess to imported inputs at prices prevailing in selling at 70-75 percent of world prices inthe Russian market; and (b) it makes a much September 1995. However, Russia has agreed
with the IMF to raise domestic energy prices to
Establishing a Market-Friendly Environment 41
world-equivalent prices, which means that come from Japan and which come from Belarus,Belarus will also have to pay world prices for each shipment between partners in a free tradeenergy from Russia. area agreement is accompanied by a "certificate
To attain the advantages of a preferential of origin" indicating where the product wastrade area without the costs of being forced to made. Free trade areas have been in operationaccept and bear the costs of whatever elsewhere in the world for decades; consequently,protectionist measures Russia may decide to procedures such as rules of origin are wellimpose, Belarus should consider letting the established and should not be difficult for Belaruscurrent arrangement evolve from a de facto free and Russia to implement. Moving in the directiontrade area into a dejure free trade area. Free trade of a free trade area with Russia would help assureareas are now being used both in parts of Europe that Belarus was free to set policies that wouldand throughout North America. Such assure potential investors that they could purchasearrangements are particularly advantageous for inputs and sell their outputs at world marketcountries of markedly different size that have prices.different levels of economic development and Trade with Non-CIS Markets. Althougheconomic resource endowments. Such a move strengthening ties with Russia and otherwould of course require modification of the traditional CIS trading partners has manyexisting legislation and international agreements attractions such as familiarity and lower averagethat established the customs union with Russia. quality standards than found in Western markets,
The main difference between a customs Belarus needs to avoid trading arrangements withunion and a free trade area is that, under the the CIS that will, at the same time, discourage theformer, only one set of duties prevails with development of improved trading relations withrespect to the rest of the world, at least in theory, non-CIS markets. Trade with Western marketsrespct o te rst f te wold,at eas inthery, will offer Belarus access to the technology neededwhile under the latter each country sets its ownpolicies with respect to the rest of the world. to upgrade design and production efficiency,Given that significant differences already exist in something that is needed not only to competethe external trade policies of Belarus and Russia, profitably in the rich but demanding Westernthe main change pequired to move to a free trade markets, but increasingly to compete in the morearea would be to establish a customs border profitable, high-end segments of the traditionalbetween the two countries. This is necessary for CIS markets. As income levels increase,the following reason. Under a free trade system, it consumers in countries like Russia and Kazakstanwould be possible, for example, for Russia to will increasingly demand goods of internationalhave 100 percent duties on television sets and for quality. Learning to compete in non-CIS marketsBelarus to have zero duties. Without a border, will thus provide Belarus the experience andRussians would import TVs from Japan into expertise needed to remain competitive in itsBelarus at zero duties, then take them on into traditional markets to the East.Russia where they could be sold for half the price Trade Policy and Internationalof those imported from the same source through Agreements. Another good way for Belarus toSt. Petersburg. guarantee investors that they will enjoy continued
access to imports at close to world prices wouldFor obvious reasons, this would not be b o eau o~i h ol rd
acceptable to the Russian authorities, or to the be for Belarus to join the World TradeRussian TV manufacturers. Under a free trade Organization (WTO). As part of the accessionarrangement, a customs border is therefore process to the WTO, Belarus would have to
abuses. However, as "bind" its tariffs at a maximum rate, promisingesta to pfreventrade suchagreement,Belarus that actual rates will always be equal to or lowerpart of a free trade area agreement, Belarus ta h on ae.Blrsi aiggoshould still be able to send its own television setsinto Russia free of duty. To make it possible for progress in this direction. It was granted observer
thec sofficers to determine which TVs status to the General Agreement on Tariffs andTrade (GATT) in 1992 and to WTO as successor
42 Chapter 2
to GATT in 1995. In December 1995 the agricultural and industrial sectors. Such lendingBelarusian memorandum on trade and economic should stop immediately, because it createspolicies was forwarded to WTO, and Belarus is entirely the wrong kind of environment andnow in the process of responding to the questions priorities within commercial banks, and causesthat WTO member countries raised regarding the banks to become agents working to loosen rathermemorandum as part of the process. than tighten financial discipline, which is their
second major role. If subsidies must be given,Financial Discipline, Price Formation, and they should be channeled directly from the budgetBankruptcy to those being subsidized. Banks should be left to
Prices are irrelevant if enterprises and operate on a commercial basis. Once they are in aconsumers are not forced to pay for what they position to make all loans on the basis of normalconsume. Efforts to decontrol prices, to establish commercial criteria, they will also be in a positioncompetitive markets, to control monopolistic to enforce repayment on the same basis. When apricing, and to implement sensible foreign trade bank is forced or allowed to make loans forpolicies will be wasted if financial discipline is political reasons, it is in no position to insist thatnot strictly enforced. Producers and consumers the loans be repaid. However, if the loans aremust learn to observe "hard budget constraints" made on a commercial basis, the banks haveand to live within their means. every right-and strong incentives-to make
certain that the loans are repaid. When necessary,WiAlthout financial discipline, markets banks should use the threat of bankruptcy to
cannot set realistic prices that stimulate efficiency force repayment of loans.in both production and consumption. Ifenterprises and consumers have no intention of Bankruptcy plays an important but widelypaying for the goods and services that they misunderstood role in the process of developingconsume, they will offer to pay prices that are financial discipline and respect for hard budgetgrossly inflated in hopes of being given access to constraints in an economy. The threat ofscarce commodities. The resulting prices will be bankruptcy is far more important that bankruptcyboth unrealistic and inflationary. itself. If the owner of an enterprise knows that his
In well-functioning market economies, enterprise could be taken away from him if hefails to pay his bills, he will do whatever IS
financial discipline becomes a self-enforcing neces to assuretha he can patherebyvirtue. If an enterprise knows that it must pay for avoiding bankruptcy. The threat of bankruptcyall of the inputs that it uses, it will insist that itscustomers pay for the goods and services that will, for example, encourage him to improveproduction efficiency, sell unused assets, andthey receive from the enterprise. This pt reduce labor redundancy. The percentage of
turnfinaia on pressureong thed consum her whodwill enterprises that are actually taken into bankruptcyntuprninsis onll beingor paidyfor t they rodsuers in a market environment is actually very small. In
Enterprises will enforce payment on consumers, 1988, for example, only 0.4 percent of businessesand workers will insist on being paid so that they in the United States filed for bankruptcy.can pay their own bills. Furthermore, only 0.2 percent of all bankruptcy
The banking system has two very filings were involuntary.2 7 The vast majority ofimportant roles to play in enforcing financial bankruptcies are initiated by the enterprisesdiscipline. First, banks should only lend in cases themselves to secure protection from creditorswhere the borrower can provide solid evidence of while reorganizing in ways that will allowbeing able to repay. This would be a major creditors to be repaid as fully as possible out ofchange from the current practice in many of the the future earnings of the reorganized firm.banks in Belarus today, especially those owned bythe state. These banks are regularly used, as under Prices, Subsidies, and Social Protectionthe Soviet system, as a conduit for subsidized Governments around the world fall intocredit to loss-making enterprises in the the trap of distorting prices in a vain attempt to
Establishing a Market-Friendly Environment 43
"protect the people." They control the prices of poor. Because the rich often consume more thanbread, milk, rent, and energy in the name of the poor, the total subsidy to the rich is often far"social justice." Unfortunately, the Government greater than the subsidy to the poor. As a result,of Belarus is no exception, and this is creating the subsidy increases the disparity of incomesserious distortions in the pricing of such goods rather than reducing it. For example, artificiallyand services. These distortions lead to inefficient, low prices for household electricity are paid bywasteful use of these resources; they fail to rich and poor households alike. However, withachieve their objectives in the most cost effective their air conditioning, electric heating,manner; and they end up costing the consumers refrigerators, and electric stoves, rich householdsmore than if the consumers had paid the full cost will benefit far more in absolute terms than poorof production in the first place. households with only a few light bulbs. (This
The inefficiencies caused by underpricing phenomenon also helps explain why subsidies forare a perfectly natural and rational response to goods and services like electricity are so hard tobad pricing policies. For example, the high level eliminate-the rich who benefit the most fromof energy inefficiency in the factories and homes such subsidies are also those who have the most
of Belarus was a perfectly rationale response to political power.)the cheap energy prices that prevailed in the A key point to remember in setting pricesformer Soviet Union. Why spend extra money on and in designing social protection systems is thatinsulation and energy-efficient equipment when it is impossible to reduce the price of any good orenergy costs almost nothing? Energy pricing is service below its cost ofproduction for the societynow being corrected, and this is leading to as a whole. Sooner or later, the people will haveinvestments in its more efficient use, but more to pay the full cost of everything that is consumedneeds to be done to pass these costs fully on to the -assuming, of course, that Belarus does notconsumers, both industrial and residential, to default on international payments obligations.assure fully efficient use of energy. This was highlighted in Box 2.1 above and is
Some types of bread are currently further demonstrated here in Box 2.2.underpriced in Belarus, as noted in Box 2.1, and Monetary and Credit Policiesthis is also leading to serious waste. For example,it is reported that farmers in the Soligorsk region Another very important price in anyhave been feeding bread to their cattle and pigs economy is the price of capital. In Belarus thisbecause the bread is priced below the cost of the price is widely distorted, leading to wasteful usesgrain in the bread. From the farmers point of of this scarce commodity. The most seriousview, feeding bread to the animals is simply a problem is the highly subsidized interest ratesound economic decision based on the current charged to farmers. In the first quarter of 1996,relative prices of bread and grain. But Belarus for example, the NBB was lending directed creditcannot hope to restore and maximize growth if it funds to the Agroprombank at an annual rate ofallows such waste to continue. 37 percent, far below the auction rate of 68
percent. Housing loans, at an annual rate of 3.4The poor do need help, especially during percent, were even more seriously out of line with
the transition period, but distorting the price of the cost of capital in Belarus.valuable goods like bread and energy is not anefficient approach. First, as noted with energy and interesPartly as a result of the artificially lowgrain, artificially low prices lead to waste in hvererates in Belarus, Russian entrepreneursconsumption. Second, they discourage have been borrowing from Belarusian banks toproduction, thus leading to scarcities that may finance projects outside of Belarus,. therebyactually increase the real cost, further widening draining capital that is urgently needed to financethe gap between cost and price. Third, most working and fixed capital investments insidesubsidies based on artificially low prices are Belarus. The IMF has therefore recommendedpoorly targeted, going to the rich as well as the that the central bank authorities increase the
discount rate to parity with that in Russia, and
44 Chapter 2
that all new credit from the central bank be contribution to "getting the prices right" forauctioned. These steps would make a major capital resources.
Box 2.2: There is no free ride.A city bus ticket in Minsk only cost the equivalent of 10 U.S. cents in early 1996, and this modest price
was collected from only a fraction of those who ride the public transport system. Similarly low fares are charged forthe subway in Minsk and for inter-city rail transport. As a result of these highly subsidized prices, the averageconsumer spends only four percent of his income for public transport services according to the consumption basketmaintained by the Ministry of Statistics for calculating the Consumer Price Index. But in the end, the consumer willpay the full cost and more.
Other forms of publicly owned transportation including inter-city trucking, rail, and air are also heavilysubsidized. Although these prices have increased significantly from the Soviet era in nominal terms, they havefailed to keep up with the sharply higher real cost of energy. Nor have nominal price increases overcome the failureof the previous centrally planned system to recover capital costs. As a result, tariffs recover only a fraction of thefull cost of supply. But there is no free ride for the Belarusian consumer.
Although ticket prices for passenger traffic and tariffs for freight fail to recover the cost of these servicesfrom the users, the average Belarusian citizen pays their full cost in the end. Assuming that Belarus does not riskbeing shut off from international assistance and from world markets by defaulting on its foreign loans, the citizensof Belarus will eventually have to pay the difference between the cost of supply and the revenues collected. Thepayments to fill this gap will come in many different and often indirect ways. The inefficiencies and transactioncosts of indirectly recovering the full cost of production mean that Belarusian consumers will end up paying morefor transport services than if the costs had been collected directly from the users. The people of Belarus will pay inmany different ways.
* Higher taxes are the most obvious additional cost. The Government must charge higher taxes to cover the costof the subsidies that must be paid to the transportation authorities so that they can continue to keep thetransportation systems in operation. The cost of collecting taxes and disbursing them to the transport authoritiesfurther increases the cost to the consumer.
* Capital stock deterioration is another major cost imposed by failing to recover full costs from the users oftransport services. In the long term, the people of Belarus will have to pay to replace the capital stock that iswearing out. In the short run, capital depreciation brings another more severe cost in the form of increasedoperating costs.
* Higher operating costs due to the inability of the transport authorities to invest in more energy efficientequipment is a serious problem now that energy prices are about ten times higher in real terms than they werewhen the equipment in use today was originally purchased.
* Poor service hurts consumers every day as they wait in long lines for buses that do not show up on timebecause so many of them are out of service due to the lack money to buy replacement parts. The aggravation ofwaiting in the cold for a bus or tram, increased commuting times, late arrivals at work, and lost production areadditional costs of failing to recover an adequate share of costs directly from the users.
In short, cheap transportation is costing the people of Belarus dearly. Measures to increase cost recoveryshould be implemented as quickly as possible, accompanied by means-tested assistance to the poor to help them paythe higher transit fares. Externalities such as reduced congestion from automobile traffic may argue for modestpublic subsidies for urban transport systems, but the majority of the transport services in Belarus should be placedon a full cost recovery basis as quickly as possible, thereby reducing the cost to the average citizen.
Establishing a Market-Friendly Environment 45
C. TRANSPARENT, EQUITABLE LEGAL FRAMEWORK
Risks and Investment
Next to the potential for profit, an To provide potential investors with theinvestor's most important concern is risk. One of assurance of a level playing field where "rules ofthe most frequent concerns expressed by the game" for the conduct of business are easilyenterprises about investing in Belarus is the high understood and evenly enforced for all investors,level of risk created by the lack of a transparent, the Government should minimize the actions forequitable legal framework. Investors need a which government approval is needed, and shouldpredictable environment where they can make certain that the rules by which anyanticipate with a reasonable degree of certainty application will be judged are transparent.the rules of the game that they will face during Applications that conform to the rules should bethe life of the proposed investment. approved automatically, and the rules should be
Physical and commercial risks are sufficiently clear and limited so that there will beprobably no higher in Belarus than in any other no question as to whether or not the applicationcountry, and the risk from criminal activity may conforms to the rules.well be less than in many of the other former To provide potential investors with theSoviet states. However, investors see excessive assurance of a level playing field where rules ofrisks in the current policy framework for business the game are easily understood and evenlyin Belarus for the following reasons: enforced, the Government needs to: (a) minimize
* laws-the rules of the game-are constantly the barriers to entry and exit; (b) enforce hardchanging, which means that rules could be budget constraints, including the real threat ofimposed in the future that would turn profits bankruptcy; (c) clarify, simplify and clean up theinto losses;28 rules and administration of foreign trade and
* when the Govemnment changes laws, it payments; and (d) establish a transparent,sometimes imposes them with retroactive equitable tax code and system of taxeffect, which is hannful to businesses;29 administration which assures that all businesses
opay taxes that are modest, even, and equitably- laws are often ambiguous leading to the risk enforced. To this end, the Government is now
of adverse interpretations by those enforcing preparing a formal tax code, the first part of
the laws;30 which has already been presented to Parliament.* since laws are open to interpretation and
administrative discretion, a change in Barriers to Entry and Exitgovernment personnel could result in areversal of interpretations upon which major In 1993, about 100 different activitiesinvestment decisions had been made; required prior discretionary licensing by the
Government for establishment, a process that was* competitors may be given a more favorable so time consuming and costly that few if any new
interpretation, placing the investor in a non- enterprises were set up in these fields. Thecompetitive position; situation has improved considerably since then;
* some actions which in normal industrial only a limited number of activities now require ancountries would not require any governmental establishment license. However, virtually allapproval must, in Belarus, be taken all the licensing requirements should be removed asway to the national Parliament, a costly and soon as possible; this would improve thetime-consuming process with very uncertain attractiveness of Belarus to investors and, by
eliminating another area of discretionary* whenever laws are subject to administrative bureaucratic intervention, help the Government
interpretation, corruption is inevitable, achieve its announced objectives of reducingespecially in the area of tax law. opportunities for 32* opportumtles forcorrupthon. Entry licensing
46 Chapter 2
should be limited to narrowly defined areas such payments. The main problem appears to beas weapons, explosives, and nuclear materials instead the informal pressure that governmentwhere the purchase of the necessary equipment by officials place on public enterprises to retaincriminal elements could pose an immediate labor. (There is so little private investment indanger to public safety. Belarus at present, and most private enterprises
In most other areas such as food, are so new and small, that it is difficult to know ifmedicines, transport services and building they are also subject to such pressures.) Aftermaterials, regulation is a better approach than making certain that the labor code is consistententry licensing because it addresses the critical with normal practice in other countries competingissue-which should not be to control or prevent with Belarus for investments, the Governmentthe production of the materials, but to assure that should announce that it will not take any actionsthe products are safe to use. that would make it difficult for investors to adjust
their labor force as necessary. As noted above, theOne of the most serious barriers to entry old Soviet-era "propiska" system should also be
in Belarus today is the difficulty that legal entities abolished.face in purchasing land suitable for commercialuse. Ownership of real property provides valuable Contracts, Hard Budget Constraints andinsurance against the risk of losing control and Bankruptcyuse of property once investments have been Potential investors are willing to facemade. Furthermore, property provides collateral normal business risks, but they want assurancesthat can be used to obtain bank financing for that they will be given the same treatment by theproductive investments. The laws of Belarus Government that every other investor gets inshould be amended immediately to provide terms of laws and their enforcement.unrestricted ownership for both physical and legalpersons, foreign and national, of land plots up to, Modemn business requires scales ofsay, 25 hectares for commercial purposes. This operation that make it impossible for managers towould considerably improve the attractiveness of know personally the character and reliability ofBelarus as a venue for investment. Concerns every customer Yet modern businesses rely onabout appropriate use of land in terms of public customers to pay their bills. Business in theinterest and environmental safety should be industrialized world therefore depends onhandled through zoning regulations, not through contracts and their enforcement. The explosion ofcontrols on ownership. Unless Belarus establishes enterprise debts noted in Chapter I indicates thatthe right to private ownership of land along lines investors cannot depend on other enterprises insimilar to those prevailing in Western Europe and Belarus to respect contracts-nor can they dependother competing investment locations in Eastern on the Government to enforce these contracts,Europe, prospects for attracting foreign making Belarus a highly risky place to invest.investment will be very limited, thus casting This problem can be solved without greatdoubt on the ability of Belarus to stop its difficulty-and with tremendous benefits. In theeconomic decline and restore previous standards absence of any effective penalty for non-payment,of living. Where this is politically difficult, the debtors can always find other uses for theirGovernment should quickly implement policies money. But if faced with the effective threat ofthat would allow long-term transferable leases penalties like bankruptcy, they will find a way tothat would allow security of tenure and right to control and pay their bills.mortgage. The Government of Belarus has not taken
Unreasonable labor laws and practices the necessary actions to this end. In particular, itprovide another potential barrier to investors. In needs to rescind the current policy which saysBelarus the labor code itself appears to be that some accounts payable are more importantsensible, allowing employers to dismiss workers than others, and it needs to begin immediately tofor due cause with reasonable severance take into bankruptcy a number of companies with
Establishing a Market-Friendly Environment 47
high levels of accounts payable that have little of bankruptcy, which in Belarus is often regardedprospect of repaying these amounts out of their as a socially and economically harmful processown earnings. that destroys jobs and capital. The purpose of
For at least the past year, the Government bankruptcy is just the opposite. Jobs are lost andhas followed a policy of setting priority among capital is destroyed when enterprises are badly
folowe a oliy o setin proriy aong managed and lose money Therefore bankruntcyvarious categories of enterprise arrears. For g y Tryrexample, energy bills and taxes are given higher and related processes such as court-orderedpriority than payments to suppliers. This sends restructuring are designed to transfer thethe wrong signal to enterprise managers, giving ownership of assets to new managers who will
that some bilsuse the capital more efficiently, therebythem the impression that some pay preserving and creating jobs. With publichave to be paid on time, that some payments understanding of the true nature and purpose ofobligations are less valid and binding than others. unkrstcy,g ppthe truentureould find it
Thisencuraes nteprie mnagrs o dlay bankruptcy, the Government should find itpayments tncourthecets whoe maregiven lowdery relatively easy to move forward with bankruptcypayments to the reditorsG whovmet gundermining proceedings in a few highly visible cases, therebypriority by the Government, sending the message that non-payment and thefinancial discipline in the use of resources. lack of financial discipline and responsibility willEnterprises should learn that no resource should no ionger be tolerated. This would immediatelybe used unless the enterprise IS going to be able to n ogrb oeae.Ti ol meitl
create a better investment climate in Belarus.pay for it in a timely manner, that unpaid bills arelikely to lead to bankruptcy, regardless of the Foreign Trade and Paymentscreditor. Financial discipline will encourageenterprises to restructure, selling off unneeded Foreign Trade Administration. Anassets in order to focus on viable core business earlier section of this chapter discussed theactivities, and will encourage enterprises to be important contributions that good foreign trademore careful regarding the retention of excess policies could make to market-determined prices,labor, which, as noted in Chapter 1, reduces the efficiency, and economic growth. Good tradecompetitiveness of Belarusian products and policies are also important to investors, and thecreates inflationary pressures. current policies of Belarus need considerable
improvement. A recent survey of BelarusianThe lack of an effective bankruptcy enterprises, for example, indicated that the
system in Belarus is underscored by the fact that, Customs Administration was, by a wide margin,despite the widespread presence of enterprises the government agency that creates the mostthat are deeply in debt and have no prospects for serious problems for export activities. Customsrepaying their debts, no enterprise has ever been was cited as the source of the most seriousclosed on the basis of bankruptcy proceedings. problems by 35 of the leading firms, compared toThe country has a 1992 bankruptcy law, but only 20 who cited the Tax Inspectorate. The mainneither the law nor the supporting judicial problem is the lack of transparency and equity instructure are effective. By mid-1995, only 13 the way that the current foreign trade regulationsbankruptcy cases had been brought forward, and are written and administered. The present lawsnone of these had been resolved. A new provide wide scope for administrative discretionbankruptcy law of international standards is now regarding the allowability, classification, and thusbefore Parliament and should be approved as soon taxation of various products. A plethora of specialas possible. At the same time, the judicial ministerial, cabinet, and presidential decrees,institutions needed to enforce bankruptcy-and issued on an ad hoc basis to resolve specificrelated actions such as creditor-led reorganization problems, have contributed to the atmosphere ofalong the lines of the "Chapter 11" bankruptcy obscurity, and have increased opportunities forprocess in the United States-should be created. corruption.
The Government should also undertake a Experience in other countries indicatescampaign to educate the public about the nature that cleaning up the inefficiency and corruption
48 Chapter 2
that is common in customs administrations in but specific duties involve so many othermany developing countries can be very difficult. problems that it is better to move to ad valoremThe best way to start is to convert all import duties and reinforce the system with indicativeduties to a single ad valorem rate. With only one information on product values. Furthermore, thisrate applicable to all imports with no exemptions, invoicing problem will become much less severethe classification of goods under different if Belarus moves to a low, uniform import tax ratecategories becomes relatively unimportant and is and if, in addition, it makes foreign exchangetherefore no longer an issue that delays freely convertible as discussed below. Whenprocessing or that creates opportunities for measures like these do not solve the customscorruption. administration problem, countries such as
In addition to removing a major problem Indonesia have hired international inspectionfor investors, such a tariff policy would also have services like the Societd G6nerale de Surveillancemajor benefits in terms of removing price (SGS) to administer the customs services. Thedistortions, particularly if the new ad valorem rate increased revenues and reduced corruption aredistorption, preticularly if tr new vam loem1 rate 1 often more than enough to pay for these expertis kept relatively low (for example, 10 to 15 services, and the reduced coffuption makes itpercent). Highly differentiated tariffs distort much easier for serious investors to conductrelative prices, making it difficult for investors to business in a normal manner. This may soonproduce efficiently and for products made in beome a not manner. This may rsBelarus to compete internationally. Thus, even if become a moot point, however. Recent reportsit is not possible to move to the theoretical ideal indicate that Russia has become so concernedof free trade, a low uniform tariff rate would with the manner in which Belarusian customs aregreatly improve the situation.33 being operated-especially the diversion of
potential customs-that it is planning to replaceAnother trade-related problem that the Belarusian customs service with Russian
reduces the ability of Belarusian enterprises to officers.compete internationally relates to the duties thatmust be paid on imported inputs. The eforeign Exchange Management. The
overmen apparsto e wokin towrdsthe current foreign exchange management system hasGovernment appears to be working towards the seriously hurt the investment climate in Belarusimplementation of some form of duty drawback in two major ways. First, the domestic currency issystem that would allow exporters who depend on overvalued, which makes it difficult to competeimported inputs to avoid having to cover the cost with artificially cheap imports, and makesof these duties in the price of the exported goods. exporting unprofitable for many products thatA variety of different ways exist in which this can prting werofite fitany prod, thebe done-bonded processing areas where import previously were quite profitable. Second, thebuisae done-bondev pr sing arebats o xes iport administrative controls on foreign exchange makeduties are never paid, rebates of taxes upon it difficult to conduct trade in a normal manner.export, crediting of taxes paid towards newimports, and so on, and not all of them are As noted in Chapter 1, the real exchangemutually exclusive. Regardless of the method(s) rate appreciated by about 2.4 times betweenchosen, some form of drawback should be put January 1995 and March 1996. As policymakersinto place as soon as possible. began to realize the extremely adverse effect that
Additional measures may also be this real exchange rate appreciation was havingsuggested to improve the administration of on the viability of the enterprise sector and on the
nation's balance of payments position, ancustoms. First, to reduce the problems of over- exchange corridor" was announced, and the rateand under-invoicing, arrangements can be set up was allowed to rise to a somewhat more realisticto obtain indicative information from level. However, the central bank is still
international sources on prices for a wide range of intervening heavily in the market (primarily byproducts moving in world trade. Specific duties . . . . v(for example, U.S. dollar per cubic meter) are rejecting applications for foreign exchangesometimes used to avoid the valuation problems, purchase), forelgn exchange reserves have been
reduced to perilously low levels, and the
Estahlishing a Market-Friendly Environment 49
interbank market has been virtually shut down, Taxationmaking it almost impossible for the commercial The single most common complaint bybanks to respond in a normal manner to businesses about the investment climate incustomers' daily requests for foreign exchange. Belarus is that "taxes are too high." For example,All of these factors, plus the dramatic decline in . a .sin a recent survey of 55 major Belarusianthe profitability of exporting many of the leading enterprises, nearly 90 percent indicated that theexport products of Belarus (discussed in the next most important restraint to increasing exports waschapter), are clear evidence that the 35 percent the excessive tax burden. The problem, however,exchange rate adjustment that has been allowed is much more complex than simply the level ofunder the current administratively determined taxes. Tax reforms will have to address a numberexchange rate corridor between January and of distinct problems: level and incidence,October 1996 has not offset enough of the 250 . . .percent real appreciation in the proceeding period compliance consistncyy with interational norms,to restore the competitiveness of stability of the current tax system, and theproducts either in domestic or in foreign markets. avoidance of earmarking and extrabudgetaryUntil an appropriate adjustment has been funds.implemented in consultation with the IMF,prospects for renewed economic growth will Level and Incidence of Taxes.remain bleak. Complaints about the level of taxes on business in
The admiistrv b r tforeign Belarus miss a fundamental point-thatTxchange trsadmionistarae barsoaeriers trobbusinesses are only legal fictions. Enterprisesexchange transactions are also a serious problem phsclyaytx,buneratalyerte
for entrprise in Bearus. Uder cufent plicies physically pay taxes, but never actually bear thefor enterprises in Belarus. Under current policies, burden of taxes. The burden is ultimately bornethe only imports that qualify for the preferential b workersn directl or through deductions fromofficial rate are those determined by a small by woges by rctly or through deductions fom
grou ofoffiial to e "riorty"impots. wages), by customers (through higher prices forgvroup. of officials. to .be " priority" itmports. goods and services produced by the enterprises),Considerable administrative discretion is involved and by the individuals who own the businessesbecause there is no clear list indicating what will (through reduced after-tax profits) The taxationbe of sufficiently high "priority" at any point in of businesses is simply an administratively easytime. This creates an environment which, in most f the simen administrcesy
iftsway for the government to take resources fromcountries, would lead to administrative delays if these far-flung groups of people-who also paynot corruption. taxes on income, sales, and services.
The investment climate in Belarus could The share of total taxes that should bebe improved by establishing the free conver- collected indirectly through enterprises rathertibility of the Belarusian rubel at a uniform rate than directly from these three groups is ofdetermined by unrestricted forces of market legitimate concern, but this is more an issue ofsupply and demand. The exchange rate will of administrative efficiency and financial incentivescourse change over time to compensate for rather than economic burden. The real issue is thechanges in domestic price levels, but until total level of taxes collected by the governmentinflation is brought more firmly under control, a from the economy. Here the answer with respectfixed nominal rate does not appear to be feasible. to Belarus is unambiguous. The level of taxes isMost businessmen will find it easier to anticipate about twice the level that would be expected in amarket driven exchange rate movements than to country at Belarus' current level of per capitaguess the rate that the government might decide income. As can be seen by the trend line in Figureto set at any point in time. Furthermore, with a 2.6, the average ratio of general governmentnormally functioning foreign exchange market, revenues to GDP in countries (at the currentinvestors will be able to hedge their import and rus to me in is at ot crBelarusian income level) IS about 25export contracts by buying and selling foreign percent-compared to about 40 percent inexchange futures, thereby locking in the rates Belarus. Incidentally, the burden of governmentused in their profit and loss calculations.
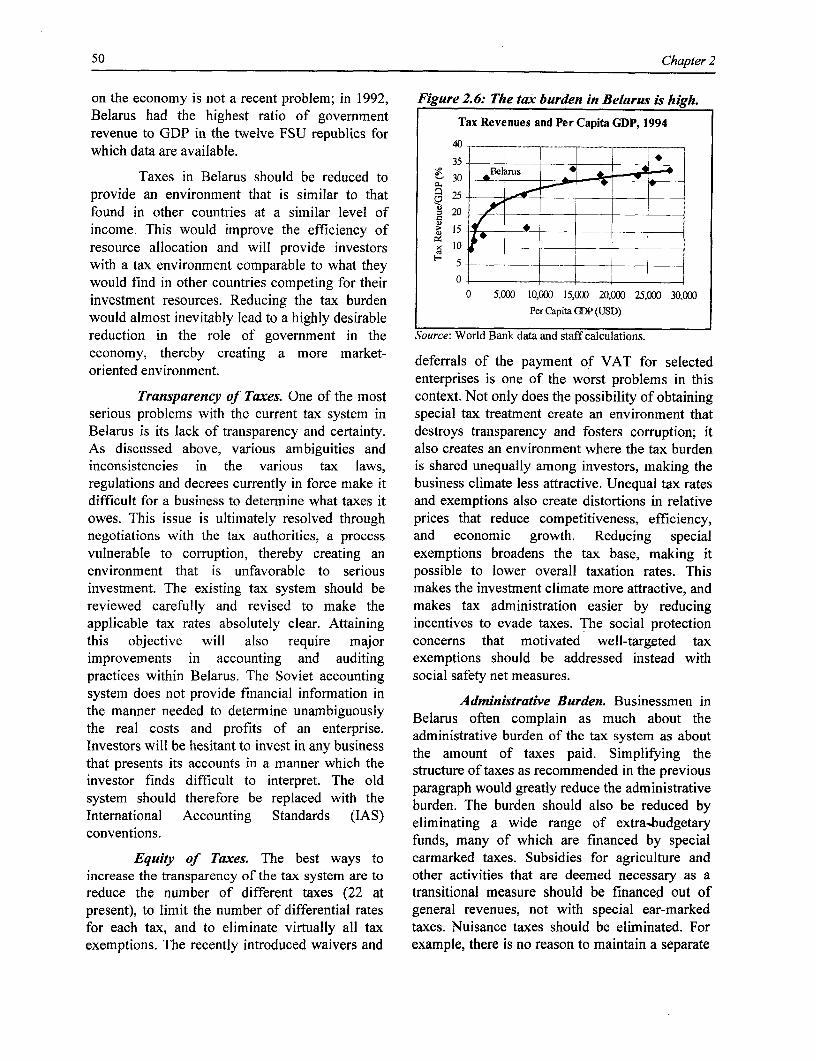
50 Chapter 2
on the economy is not a recent problem; in 1992, Figure 2.6: The tax burden in Belarus is high.Belarus had the highest ratio of government Tax Revenues and Per Capita GDP, 1994revenue to GDP in the twelve FSU republics forwhich data are available. --
Taxes in Belarus should be reduced to 30- - -
provide an environment that is similar to that 25 _- _ ll
found in other countries at a similar level of , 20 _ l
income. This would improve the efficiency of > 15 __*
resource allocation and will provide investors 10____ _
with a tax environment comparable to what they '-s -l _would find in other countries competing for their n __ _ _ l Iinvestment resources. Reducing the tax burden 0 5,O0 l0,lX 15,XO 20,O 25,XX 30,Owould almost inevitably lead to a highly desirable PerCapitaGDP(USD)
reduction in the role of government in the Source: World Bank data and staff calculations.
economy, thereby creating a more market- deferrals of the payment of VAT for selectedoriented environment.
enterprises is one of the worst problems in thisTransparency of Taxes. One of the most context. Not only does the possibility of obtaining
serious problems with the current tax system in special tax treatment create an environment thatBelarus is its lack of transparency and certainty. destroys transparency and fosters corruption; itAs discussed above, various ambiguities and also creates an environment where the tax burdeninconsistencies in the various tax laws, is shared unequally among investors, making theregulations and decrees currently in force make it business climate less attractive. Unequal tax ratesdifficult for a business to determine what taxes it and exemptions also create distortions in relativeowes. This issue is ultimately resolved through prices that reduce competitiveness, efficiency,negotiations with the tax authorities, a process and economic growth. Reducing specialvulnerable to corruption, thereby creating an exemptions broadens the tax base, making itenvironment that is unfavorable to serious possible to lower overall taxation rates. Thisinvestment. The existing tax system should be makes the investment climate more attractive, andreviewed carefully and revised to make the makes tax administration easier by reducingapplicable tax rates absolutely clear. Attaining incentives to evade taxes. The social protectionthis objective will also require major concerns that motivated well-targeted taximprovements in accounting and auditing exemptions should be addressed instead withpractices within Belarus. The Soviet accounting social safety net measures.system does not provide financial information in Administrative Burden. Businessmen inthe manner needed to determine unambiguously Belarus often complain as much about thethe real costs and profits of an enterprise. administrative burden of the tax system as aboutInvestors will be hesitant to invest in any business the amount of taxes paid. Simplifying thethat presents its accounts in a manner which the structure of taxes as recommended in the previousinvestor finds difficult to interpret. The old paragraph would greatly reduce the administrativesystem should therefore be replaced with the paragraph w ould greatly reduceta n tburden. The burden should also be reduced byInternational Accounting Standards (IAS) eliminating a wide range of extra-budgetaryconventions. funds, many of which are financed by special
Equity of Taxes. The best ways to earmarked taxes. Subsidies for agriculture andincrease the transparency of the tax system are to other activities that are deemed necessary as areduce the number of different taxes (22 at transitional measure should be financed out ofpresent), to limit the number of differential rates general revenues, not with special ear-markedfor each tax, and to eliminate virtually all tax taxes. Nuisance taxes should be eliminated. Forexemptions. The recently introduced waivers and example, there is no reason to maintain a separate
Establishing a Market-Friendly Environment 51
Fire Brigade Tax, which requires businesses to Consistency with International Norms.fill in a multiple page form and, in the end, Regardless of the exact level of taxes, investorsgenerates a trivial share of total revenue. will feel much more comfortable if the tax systemSimilarly, the Emergency (Chernobyl) Tax could is broadly consistent with international standards.well be consolidated with the other payroll taxes, Belarus has made excellent progress in this area,thus reducing the administrative burden. Better with a standard array of income, profits, payroll,yet, the tax could be eliminated as a separate item excise and VAT taxes. The main task now is fineand the Chernobyl amelioration programs could tuning. A complete review of the tax system inbe funded out of general revenues. 4 The only terms of compatibility with internationalextra-budgetary funds for which clear standards is beyond the scope of this report, but ajustification exists are a few user-specific ones few comments on some special problems relatedlike the Road Fund and the Pension and Health to the value added tax might be in order here.Funds. To reduce administrative costs and the Like most CIS countries, Belarusburden on tax payers, all national-level taxesshul be colce by a ,igeaenyth practices a dual VAT system, applying theextentbe possbleo"destination principle," common in most world
trade, to trade with the West, and the "originTax Compliance. Serious investors seek principle" to trade with the CIS. This creates a
an environment with a "level playing competitive disadvantage for enterprises that arefield"-where all investors face and pay the same investing in Belarus in order to produce fortaxes for the same level of activity or profit. In markets in Russia and other CIS countries.addition to implementing a system of uniform tax Because of the destination principle, enterprisesrates without exemptions, the highest possible must pay VAT on goods imported from the Westlevel of compliance is required so that all tax and, because of the origin principle, must paypayers are treated equally. No firm data are VAT again on goods that are being exported toavailable on tax evasion in Belarus, but anecdotal Russia and other CIS countries.information indicates that the problem is For goods moving in the oppositewidespread. This creates an uneven playing field, direction, the mix of origin and destinationmnaking it hard for the honest businesses to ..makin it ard fr th honet buinesss to principles adversely affects government revenues.compete. It also means that, to raise a given prnilsavseyfecsgvnmtrvnu.compete. It asThe Government of Belarus does not receiveamount of revenue, the tax rates have to be VAT payments on goods imported from Russiaexcessively high on those who do pay, further because the Russian Government collects thesediscouraging serious investors, taxes. If the same goods are subsequently
Tax compliance should be enforced as it exported to the West, either directly or as inputsis in industrialized countries, not as it is in to Belarusian products, the Government ofBelarus today. Under the current Belarusian Belarus again loses out because VAT will be paidsystem, the powers of the Tax Inspectorate are far on such goods only in the destination country.too broad and are not subject to the necessary This problem can be even more severe in the casechecks and balances. Tax authorities should audit of goods based on CIS inputs that go throughbusiness accounts and impose fines, but they intermediate transactions and processing inshould not have the authority to confiscate Belarus before being exported to the West. If suchproperty. This power should be left to the courts, goods are zero rated for export purposes, aand businesses should have the right to appeal standard practice in international trade, therulings of the tax authorities to these courts. The Government of Belarus has to rebate the VATprocess of improving tax compliance in a manner that was paid to the Government of Russia. Thus,consistent with practices in industrialized the Government and the business communitycountries would be greatly enhanced by reducing would both benefit if Belarus, Russia and thethe number of different tax rates, eliminating ad other CIS states were to agree on moving to thehoc concessions like tax exemptions, and moving world standard destination principle with respecttowards international accounting standards. to VAT taxation. This is but one example of the
52 Chapter 2
need for greater consistency between Belarusian hand in hand, and they are usually inflicted onand world standards of taxation. Several more fiscal systems with the very best of intentions.(such as moving from the subtraction to the For example, if the environment has beeninvoice/credit method) could be mentioned for the damaged-and this certainly was the case inVAT, and tax policies in other areas need Belarus with the Chernobyl disaster-policyadjustment as well. Many of these changes would makers want to assure that adequate funds arebe facilitated by the widespread adoption of available to resolve the problem. To make certainInternational Accounting Standards in Belarus. that, resources are not diverted to other "lessThe task of making the tax and accounting system worthy" purposes, an extra-budgetary fund isconsistent with international standards is commonly established, and to make certain thatconsiderable, but one that Belarus needs to take the fund has adequate resources, a special tax isseriously if it is to attract sizable flows of foreign commonly introduced and "earmarked" to financeinvestment.3 5 the fund. Belarus now has an exceptionally large
Stability. Most businesses can learn to number of such earmarked taxes and extra-live with almost any set of laws, including bad tax budgetary funds. It has the standard extra-laws, provided the laws remain stable so that budgetary funds for pensions, employment andbusiness decisions can be made accordingly. health insurance, and some arguments can beRetroactive changes in tax laws are particularly made for continuing these on the basis that theydamaging. The highly unstable and rapidly are insurance programs where those contributingchanging legal environment for business in can expect to receive corresponding benefits atBelarus in the past five years has created serious some point in their lives.problems, but the current paper suggests more Far more questionable, however, arechanges. How can these conflicting objectives be special funds such as those for the environment,reconciled? This can be done by announcing and roads, housing, agriculture, price regulation,implementing, according to a predefined sched- foreign exchange, exporters,36 and fire brigadesule, a multi-year legal reform program designed (Statistical Annex Table 5.6 provides furtherto create a legal environment that is as consistent information on these funds). The big problemas possible with European standards. Although with such funds and their associated earmarkedthe details would have to be worked out as the taxes is that both tend to be perpetuated long afterprocess proceeded, businesses could make their the original problem has been partially or fullyinvestment plans knowing the general direction resolved. Because such funds are not reviewed byand pace of the reforms. all concerned parties (including Parliament) as
The Government has already begun to do part of the annual budgetary review process, thethis by preparing the Plan to Attract Investment necessary efforts are not made to assure that theinto Belarus, and the Plan for the Year 2000. resources are still needed more urgently to solveThese documents could be augmented with more the original problems than to meet new needs that
specific details and commitments regarding plans have arisen in the meantime. For example, manyfor legal reforms, including reforms of the tax of the emergency expenses required to amelioratesystem, then could be approved by Parliament the effects of the Chernobyl disaster have nowand published by the President as a binding been completed, but the earmarked tax continues
to be collected and, at least in theory, allocated tocommitment to the business community. This solving the Chernobyl problem. 37
would give investors the confidence that thecurrent problems listed above in the tax and legal Another problem with extrabudgetaryenvironment of Belarus will be fixed but, at the funds is that fragmenting the budget into asame time, would provide a reasonable degree of number of different pockets makes it difficult tostability of expectations. get a complete picture of how funds are being
Extra-Budgetary Funds and Earmarked spent and what the total financing requirementsTaxes. These two budgeting problems tend to go are. To avoid the distortions created by earmarked
taxes and extra-budgetary funds, the Government
Establishing a Market-Friendly Environment 53
should seek to eliminate all but a few of the funds prioritization and management would beassociated with social insurance programs in the addressed in a proposed Public Expenditurenext budget cycle. In addition to providing a Review. A cursory review of the current situationbetter mechanism for reviewing and prioritizing indicates, however, that expenditures could bethe use of funds, this would make it possible to reduced in the following areas without hurtingreduce the number of different taxes, thus making national welfare. In fact, by reducing the role ofcompliance-and the enforcement of compliance Government in the following areas, prospects for-a much easier task. The Government could economic development and restored livingcontinue to fund existing programs at current standards could probably be improved:levels; until the World Bank has been able to eliminate production subsidies, replacingcarry out a Public Expenditure Review in Belarus, them as needed in agriculture, forit would be difficult to suggest which programsmight be cut and which might be expanded. poor households uHowever, moving to an integrated budgetary pframework with minimal reliance on earmarked * eliminate consumer subsidies, again withtaxes and extrabudgetary funds would greatly the proviso that a well-targeted socialfacilitate the process of assuring that scarce safety net would be put in place asbudgetary resources are used only for the highest required;priority programs. * eliminate most extra-budgetary funds
Expenditure Reduction - The Other Side other than those such as pensions andof the Coin. Unfortunately, reducing taxes is social insurance where those whomore complex than simply cutting tax rates. contribute the money will ultimately beWithout adjustments in expenditures, the the beneficiaries;Government would face: (d) highly inflationary * sharply reduce government involvementbudget deficits, destroying prospects for renewed in production activities, and assure thateconomic growth; (e) growing arrears in any remaining activities are essentiallypayments, aggravating the already serious self-financing from user charges;problem of non-payments in the economy; or (f)random, ad hoc expenditure cuts that are not * reduce expenditures on defense now thatconsistent with the Government's longer-term Belarus has peaceful relations withsocial and economic priorities. Any effort to neighbors both to the East and to thereduce the overall level of taxes therefore needs West; andto begin with the definition of a strategy for * reduce excess staffing wherever it mayreducing government expenditures. This strategy exist, especially in the branches of theshould begin by identifying, on the one hand, the bureaucracy that are no longer neededhighest priority areas that only the Government is because of the natural reduction of thein position to handle, and on the other, the areas role of Government as the economythat should be left to the private sector. moves from central planning and control
This report was not designed to examine to a market-based economy.government expenditures; if the Governmentagrees, the very important issues of expenditure
54 Chapter 2
D. SUPPORTIVE ENVIRONMENT
The most important contribution that the but will hesitate to do so if the country does notGovernment can make to developing an attractive have the systems of education, health, housing,investment climate in Belarus is to create a sanitation, and related services needed to assure asupportive policy environment. However, continuing supply of healthy, well-educatedgovernment expenditures are also important. In workers who can focus on their work rather thanmarket economies, investors expect governments being distracted by problems of daily survival.to focus on law and social order, and on basic Because of social externalitiesenefits to thepublic goods and services. country at large that are hard to recover from
specific recipients at any point in time-mosteducation and public health services should
Law and order is a precondition for continue to be provided by the Government. Inefficient, equitable economic development. other areas such as housing and, eventually,Investors need to be reasonably certain that they certain public utilities such as electricity andcan conduct their business without significant risk telecommunications, the Government shouldof theft, destruction of property, personal harm, or focus on creating an environment where theextortion. Belarus has been quite successful in private sector can take primary responsibility.this area since independence. Efforts will be This will allow public officials to focus scarceneeded to assure the continuation of this success government resources on tasks which the privatein a manner consistent with protecting basic sector cannot handle, and to reduce the overallhuman rights and the right of enterprises to burden of taxes and other government claims onoperate without excessive and ad hoc government national resources from the current level of 42interference. This will require improvements in percent to about 30 percent (a more normal levelthe court system and the guaranteed right of for a country with Belarus' per capita income),appeal to the courts. thereby stimulating economic activity and
growth. Improved cost recovery from users to theA far biger chalenge isthat ofcreatin extent possible IS vitally important for reducing
the administrative and judicial system needed to the fiscalbuen, for mrovsionimplement the Government's economic policies. tefsa udn o aigtepoiinoiProlemeint custheoverndmenist's onom e polies, such goods and services more attractive to privateProblems in customs administration wreinoted sector investors, and for encouraging efficient use
above.. Mao inetet insafn, riig by consumers, especially of energy-basedequipment, facilities and procedures will be servicesnsuchrs heaiand ell netiiy-.baneeded to resolve them. Similar efforts will beneeded to improve general tax administration as Potential investors also look for goodwell as the management and control of production-supporting physical infrastructureexpenditures. Another major task will be to build facilities, especially serviced sites with reliablethe capacity within the economic courts system to access to good quality supplies of power, water,handle the complex issues of various forms of and telecommunications. In Belarus, thesebankruptcy, restructuring and administration. services will almost certainly have to be providedFinally, since most of the task of privatization and by the Government for the foreseeable future.restructuring of public enterprises still lies ahead, Given the relatively good physical plant inheritedthe Government needs to make substantial from the Soviet era, the Government should focusinvestments in capacity building here as well. its increasingly limited resources on maintaining
these services, not on restructuring the state-Vital Public Goods and Services owned factories-a task best left to the private
The second major area on which the sector.38 The net revenue burden of providingGovernment of Belarus should focus is the such services should be close to zero. The ownersprovision of basic social services. Serious and users of the land who benefit from theinvestors want to make long-term commitments, improved infrastructure should repay the cost of
Establishing a Market-Friendly Environment 55
providing these services through user fees, currently add an estimated 3-4 percent toimprovement "district" assessments, valorization transport costs in Belarus, according to a Worldcharges and the like. On the other hand, Bank study. The availability of good transportgovernment investments in long-distance and transit facilities is of key importance to thetransport facilities such as highways, and in type of investors that Belarus most wants toimproved border crossing infrastructure, would attract-those who will generate export earnings.help reduce the transportation bottlenecks that
E. CONCLUSIONS
Market-Determined Prices * minimize the barriers to entry so that efficientfirms can start up and grow;
To be able to assure potential investors,foreign, tat will be* minimize the barriers to exit so that the
both domestic and foreign, that prices will be physical assets of poorly managed enterprisesdetermined by competitive market forces rather can be released for more productive uses;than by ad hoc administrative decisions, Belarusneeds to: * enforce hard budget constraints, including a
real threat of bankruptcy;* introduce an exchange rate regime that allows
the value of the Belarusian rubel to be * establish a judicial system that enforcesdetermined by the free interaction of demand contracts, including those for payment andand supply; delivery; and
e finish eliminating all forms of implicit and * establish a tax code and system of taxexplicit price controls on competitively administration which assures that allmarketed products; businesses pay taxes that are modest, even,
and equitably enforced.- eliminate monopolistic market structures
wherever possible by fostering domestic and Supportive Environmentforeign competition; To provide an attractive and supportive
- reduce the risk of government interference in environment for business development in Belarus,setting prices by privatizing virtually all trade, the Government should:manufacturing and agricultural activities, aprocess that will also improve overall * assure the maintenance of law and socialproduction efficiency; and order in a manner consistent with basic human
* minimize barriers to international trade. rights;* provide support for education, health, and
Transparent, Equitable Legal Framework other vital social services which the privatesector, under current conditions, would not be
To provide potential investors with the able to supply equitably, efficiently orassurance of a level playing field where the rules adequately;of the game are easily understood and evenlyenforced, the Government needs to: * develop and maintain an adequate system of
enforced, theGovernmentneedstphysical infrastructure, especially transportand public utilities.
3Establishing Profit-Oriented Producers
The previous chapter summarized the countries indicates that the development of newmeasures that the Government needs to take to private enterprises is one of the most importantestablish a normal market-based economy in sources of growth and employment in transitionalBelarus, one that will attract both foreign and economies-and this is an area given greatdomestic investors. Without the suggested importance today by the senior policymakers inframework of laws, policies and supportive Belarus.services, most businessmen would find it difficult The key problems of Belarusianto operate profitably and would choose to invest enterprises are like those in many other FSU
elsewhere. economies. The industrial sector comprised over
Background 40 percent of GDP in 1991, concentrated inindustries such as automobiles, electrical and
shortcomings in the macro and sectoral mechanical engineering, and chemicals. At thebreakup of the U.S.S.R., Belarus was left withenvironment. They go right into the core of most 39
enterprises operating in Belarus today, be they in 1,313 republican enterprises and 291 all-unionthe agricultural, the industrial, or the service nterises that had previously been subordinated, , ~~to the Government of the U.S.S.R ............... Thesesector. These enterprise-level problems are the enterprises, totaling about 1,600, were highly
direct result of over 75 years of operating within vertically integrated, many of which served thethe confines and distortions of a centrally planned all-union markets as well as markets in Easterneconomy. The most pervasive problem is that,utnlike the situation in many of the FSU and GEE Europe. Exports to the West were minimal forunlke he itatin i mny f te SU nd EE most enterprises, although products such ascountries, most people in Belarus still work in mos, motorpriges, waltche synthetich asenterprises that are owned by the state, and many tractors, motorcycles, watches, synthetic fibersof these enterprises still operate more like and potassium fertilizers did find a major share ofextensions of governmen stha aperot-oreike their market in non-CIS countries. A few large
efficiency-maximizing centers of production. In enterprises, accounting for only 15 percent of alltheoriciey-andmocasionally iente praducticensta units, controlled 60 percent of production.
Products were heavily biased towards capital andenterprises can be run with the same high ystandards of corporate governance that is found in energy intensive heavy industry, and manythe best-run private enterprises. But for reasons focused on electronics, optics, and transportdiscussed in this chapter, this is rare. equipment for the military. Management skills indinscqusedt pin athiszhapte thi is re. finance, sales and marketing were limitedConsequently, privatization IS commonly needed -fncilmagetadmrkigdcsosto create the incentives required to assure profit- -financoal management and marketing decisionsoriented behavior among enterprise managers. were commonly handled from Moscow. Apart
from the republican level enterprises, there are-At the same time, a number of the largest about 10,000 communal enterprises operating in
state-owned enterprises are likely to remain in the distribution, transport, construction, and catering,public sector for some time. Thus means that, and employing about 30 percent of the industrialwhere privatization is not immediately feasible, workforce. This proportion is relatively small,measures will need to be taken to create an reflecting the concentration of industry, and theenvironment within public sector corporations comparatively low value-added in distribution asthat encourages their managers to operate with the opposed to production.same focus on corporate profitability that is foundin private enterprises. Finally, while the efficient The structural problems faced by theoperation and ultimate privatization of existing tradable goods were exacerbated by the collapsestate enterprises is important, experience in other
56
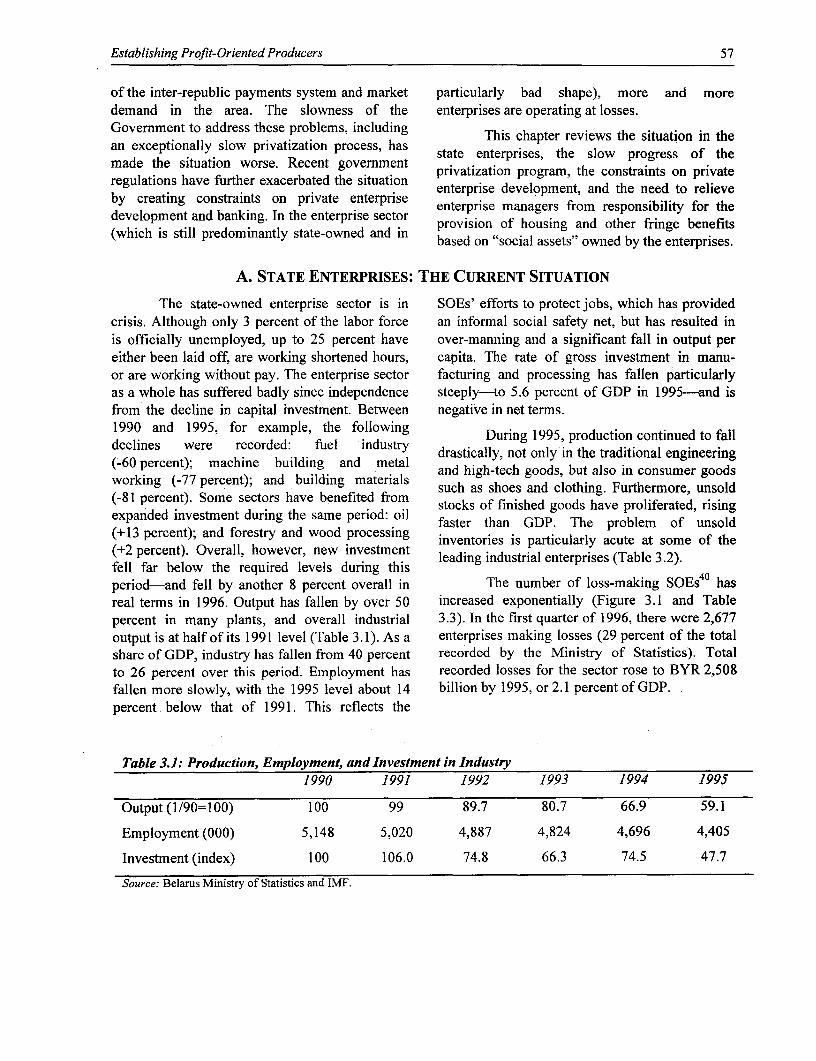
Establishing Profit-Oriented Producers 57
of the inter-republic payments system and market particularly bad shape), more and moredemand in the area. The slowness of the enterprises are operating at losses.Government to address these problems, including This chapter reviews the situation in thean exceptionally slow privatization process, has state enterprises, the slow progress of the
made the situation worse. Recent government privatization program, the constraints on privateregulations have further exacerbated the situation development, and the need to relieveby creating constraints on private enterprise enterprise development and banking. In the enterprise sector enterprise managers from responsibility for the(which is still predominantly state-owned and in provision of housing and other fringe benefits
based on "social assets" owned by the enterprises.
A. STATE ENTERPRISES: THE CURRENT SITUATION
The state-owned enterprise sector is in SOEs' efforts to protect jobs, which has providedcrisis. Although only 3 percent of the labor force an informal social safety net, but has resulted inis officially unemployed, up to 25 percent have over-manning and a significant fall in output pereither been laid off, are working shortened hours, capita. The rate of gross investrnent in manu-or are working without pay. The enterprise sector facturing and processing has fallen particularlyas a whole has suffered badly since independence steeply-to 5.6 percent of GDP in 1995-and isfrom the decline in capital investment. Between negative in net terms.1990 and 1995, for example, the following During 1995, production continued to falldeclines were recorded: fuel industry drastically, not only in the traditional engineering(-60 percent); machine building and metal and high-tech goods, but also in consumer goods
working (-77 percent); and building materials such as shoes and clothing. Furthermore, unsold(-81 percent). Some sectors have benefited from stocks of finished goods have proliferated, risingexpanded investment during the same period: aster than GDP. The problem of unsold(+13 percent); and forestry and wood processing(+2 percent). Overall, however, new investment .inv entort rly acue t sm fell far below the required levels during this leperiod-and fell by another 8 percent overall in The number of loss-making SOEs40 hasreal terms in 1996. Output has fallen by over 50 increased exponentially (Figure 3.1 and Tablepercent in many plants, and overall industrial 3.3). In the first quarter of 1996, there were 2,677output is at half of its 1991 level (Table 3.1). As a enterprises making losses (29 percent of the totalshare of GDP, industry has fallen from 40 percent recorded by the Ministry of Statistics). Totalto 26 percent over this period. Employment has recorded losses for the sector rose to BYR 2,508fallen more slowly, with the 1995 level about 14 billion by 1995, or 2.1 percent of GDP.percent below that of 1991. This reflects the
Table 3.1: Production, Employment, and Investment in Industry1990 199! 1992 1993 1994 1995
Output (1/90=100) 100 99 89.7 80.7 66.9 59.1
Employment (000) 5,148 5,020 4,887 4,824 4,696 4,405
Investment (index) 100 106.0 74.8 66.3 74.5 47.7
Source: Belarus Ministry of Statistics and IMF.
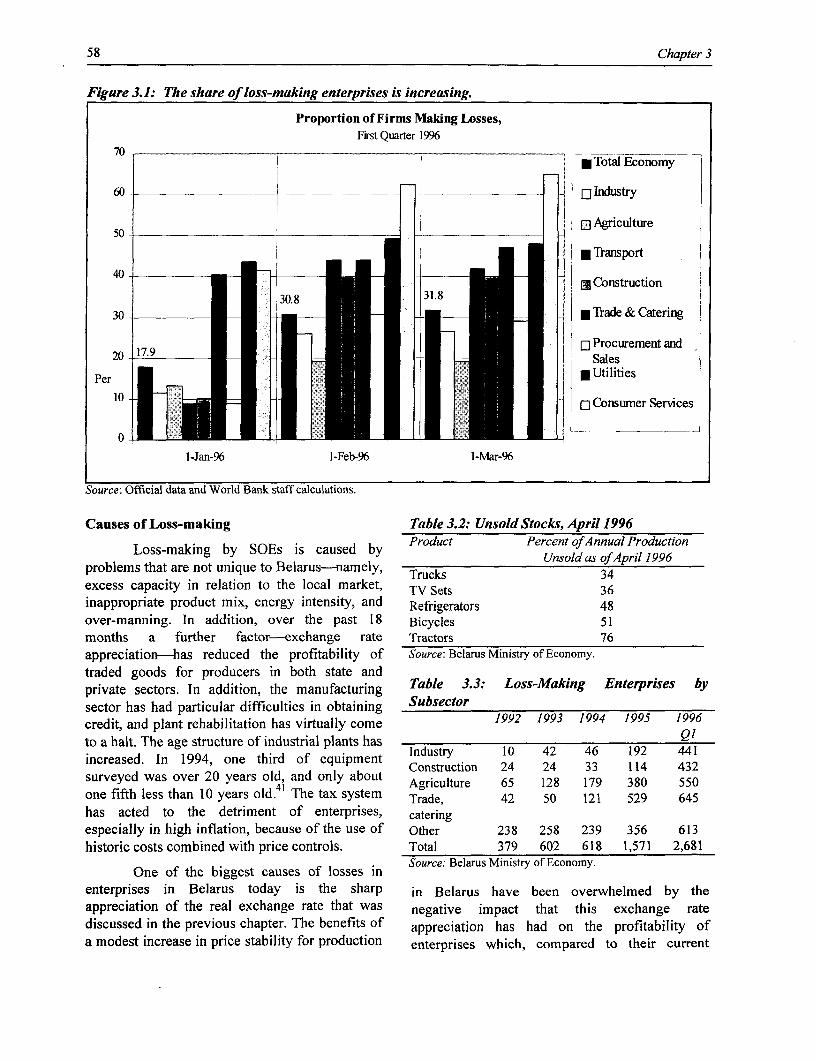
58 Chapter 3
Figure 3.1: The share of loss-making enterprises is increasing.
Proportion of Firms Making Losses,First Quarter 1996
70 __ 70 - Nr Total Economy
60 - Industry
E0 Agriculture50 _ _ _ _ _
l Transport
40 2 | L | _ 0 1 s Construction
s ;- ~~30.8 -s131.8 .30 - a Trade & Catering
D Procurement and i
1-Jan-96 1-Fe796 IMar-96
Source: OffEcial data and World Bank staff calculations.
C~auses of Loss-making Table 3.2: Unsold Stocks, April 1996
Loss-making by SOEs is caused by PDroduct Percent of Annual ProductiontUnsold as of April 1996
problems that are not unique to Belarus-namely, Trucks 34excess capacity in relation to the local market, TV Sets 36inappropriate product mix, energy intensity, and Refrigerators 48over-manning. In addition, over the past 18 Bicycles 51months a further factor cxchange rate Tractors 76appreciation-has reduced the profitability of Source: Belarus Ministry of Economy.traded goods for producers in both state andprivate sectors. In addition, the manufacturing Table 3.3: Loss-Making Enterprises bysector has had particular difficulties in obtaining Subsectorcredit, and plant rehabilitation has virtually come 1992 1993 1994 1995 1996to a halt. The age structure of industrial plants has Q/
increased. In 1994, one third of equipment icdustyryc 424 36 192 44surveyed was over 20 years old, and only about Agriculture 65 128 179 380 550one fifth less than 10 years old. The tax system Trade, 42 50 121 529 645has acted to the detriment of enterprises, cateringespecially in high inflation, because of the use of Other 238 258 239 356 613historic costs combined with price controls. Total 379 602 618 1,571 2,681
appreciatio"as reduced the profitability of~~~ Source: Belarus Ministry of Economy.
One of the biggest causes of losses in S
enterprises in B delarus today is the sharp in Belarus have been overwhelmed by theappreciation of the real exchange rate that was negative impact that this exchange ratediscussed in the previous chapter. The benefits of appreciation has had on the profitability of
a modest increase in price stability for production enterprises which, compared to their current
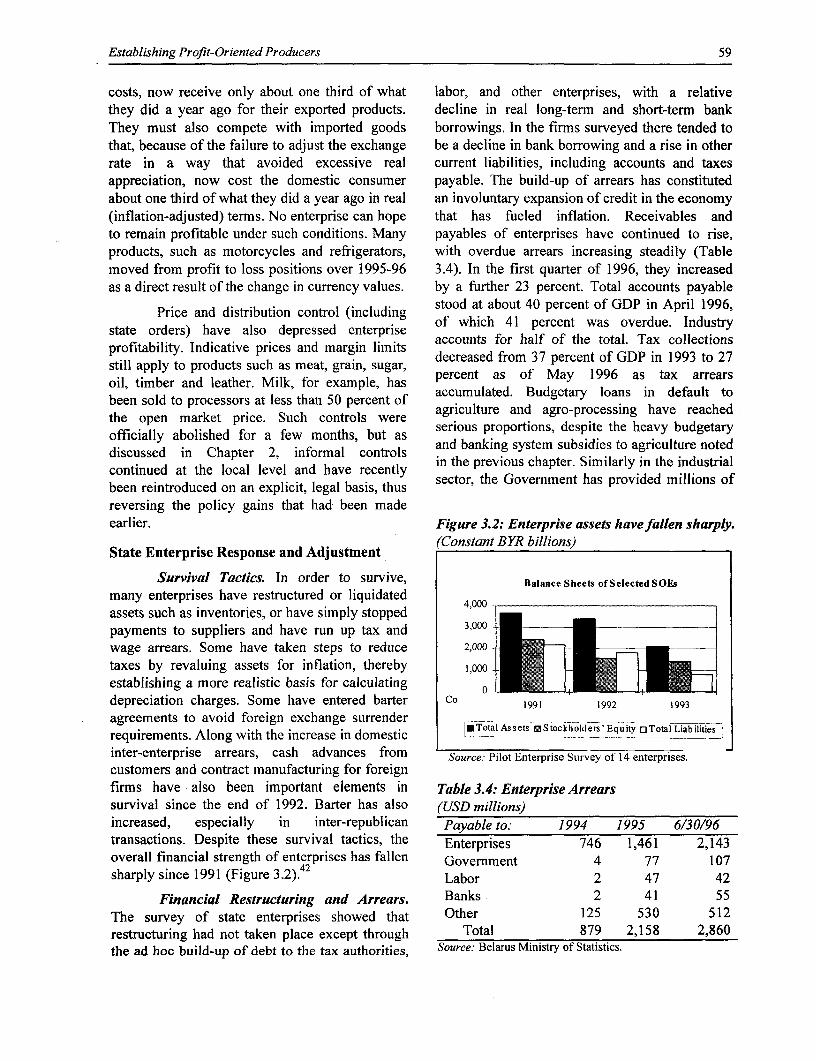
Establishing Profit-Oriented Producers 59
costs, now receive only about one third of what labor, and other enterprises, with a relativethey did a year ago for their exported products. decline in real long-term and short-term bankThey must also compete with imported goods borrowings. In the firms surveyed there tended tothat, because of the failure to adjust the exchange be a decline in bank borrowing and a rise in otherrate in a way that avoided excessive real current liabilities, including accounts and taxesappreciation, now cost the domestic consumer payable. The build-up of arrears has constitutedabout one third of what they did a year ago in real an involuntary expansion of credit in the economy(inflation-adjusted) terms. No enterprise can hope that has fueled inflation. Receivables andto remain profitable under such conditions. Many payables of enterprises have continued to rise,products, such as motorcycles and refrigerators, with overdue arrears increasing steadily (Tablemoved from profit to loss positions over 1995-96 3.4). In the first quarter of 1996, they increasedas a direct result of the change in currency values. by a further 23 percent. Total accounts payable
Price and distribution control (including stood at about 40 percent of GDP in April 1996,
state orders) have also depressed enterprise of which 41 percent was overdue. Industryprofitability Indicative prices and margin limits accounts for half of the total. Tax collections
proftabiity.Indiativ pries ad magindecreased from 37 percent of GDP in 1993 to 27still apply to products such as meat, grain, sugar,oil, timber and leather Milk, for example, has percent as of May 1996 as tax arrears
o, taccumulated. Budgetary loans in default tobeen sold to processors at less than 50 percent of rgry
s n . . ~~~~~agriculture and agro-processing have reachedthe open market price. Such controls were serious proportions, despite the heavy budgetaryofficially abolished for a few months, but as and bankions, des to avycbureteddiscussed in Chapter 2, informal controls and banking system subsidies to agriculture noteddscntused in Chelocalpleverl2 infmave rcntrols in the previous chapter. Similarly in the industrialcontinued at the local level and have recently sector, the Government has provided millions ofbeen reintroduced on an explicit, legal basis, thusreversing the policy gains that had- been madeearlier. Figure 3.2: Enterprise assets have fallen sharply.
(Constant BYR billions)State Enterprise Response and Adjustment
Survival Tactics. In order to survive, Balance Sheets of SelectedSOEs
many enterprises have restructured or liquidated 4,000
assets such as inventories, or have simply stoppedpayments to suppliers and have run up tax and 3,000-
wage arrears. Some have taken steps to reduce 2,000 -
taxes by revaluing assets for inflation, thereby 1,000 l -
establishing a more realistic basis for calculating 0
depreciation charges. Some have entered barter Co 1991 1992 1993
agreements to avoid foreign exchange surrender __1ce q T lates
requirements. Along with the increase in domestic I -- 3i
inter-enterprise arrears, cash advances from Source: Pilot Enterprise Survey of 14 enterprises.
customers and contract manufacturing for foreignfirms have also been important elements in Table 3.4: Enterprise Arrearssurvival since the end of 1992. Barter has also (USD millions)increased, especially in inter-republican Payable to: 1994 1995 6/30/96
transactions. Despite these survival tactics, the Enterprises 746 1,461 2,143overall financial strength of enterprises has fallen Government 4 77 107sharply since 1991 (Figure 3.2).42 Labor 2 47 42
Financial Restructuring and Arrears. Banks 2 41 55The survey of state enterprises showed that Other 125 530 512restructuring had not taken place except through Total 879 2,158 2,860the ad hoc build-up of debt to the tax authorities, Source: Belarus Ministry of Statistics.
60 Chapter 3
dollars in assistance to major companies such as however, and are never likely to return. BelarusHorizont, MAZ and MTZ, but this has not therefore needs to give high priority to investing
fostered the recovery of these plants. Wage in the new technologies that provide not only
arrears became a serious issue in the first part of higher product quality, but also higher energy
1996 because so many enterprises were no longer efficiency. Such investments will not be made,
profitable. The Government "fixed" this problem however, until enterprises are forced, by threat of
by ordering the banks to extend credit to the bankruptcy when necessary, to pay their energy
enterprises so that they could pay the arrears, but bills. Market prices for energy mean nothing if
this monetary expansion contributed to continued the bills are not paid. Again, a respect forinflation, which was running at an annual rate of financial discipline and the imposition of hard
35-40 percent by mid-1996, well in excess of budget constraints are vital if the Government oflevels normally associated with positive Belarus is to have any hope of restoring the living
economic growth. standards of its people.
Product Diversifi cation. Some progress Divestiture of Social Assets. In addition
has been made in converting military industries to to product diversification, enterprises have startedcivilian goods. In 50 major producers of military to shed ancillary activities which can beproducts, the share of such products was reported efficiently performed by others. The divestiture ofto have declined from 45 percent of output in "social assets" such as housing and district1988 to 20 percent in 1992. State-owned firms heating from enterprises to municipalities hashave, for example, converted production from been one of the more prominent examples of suchrocket guidance systems to precision instruments restructuring. Other social responsibilities such asfor civilian use (including medical applications), day-care facilities, clinics, and recreationand from micro-circuits to consumer durables facilities are also being transferred from
such as television sets. Similarly, a large enterprises to municipalities and, in some cases,enterprise that once made optical equipment for to non-profit organizations or even to for-profitmilitary use now produces medical instruments, enterprises in the private sector. Such
glasses, and lenses. restructuring should be encouraged, for it allows
Production Efficiency. Measuring enterprise managers to focus more clearly on thetechnical efficiency is difficult in an environment core business activities of their firms. The processwhere prices are still distorted by internal is not as critical to enterprise viability as might berigidities, inflation, an overvalued exchangerate, thought, however. Based on the widely accepted
rigidities, inflation, an overvalued exchange rate, viwta.o-rdcinrsosblte suc aand unfinished structural changes. One indicationof the physical inefficiency of Belarusian these are a considerable problem for enterprises,
enterprises, however, is the amount of GDP the mission undertook a special study of the issue,produced per unit of energy consumed. According deter mi atite inAncia burden c tedf
determined that the financial burden created forto the World Development Report 1995, Belarus the average Belarusian firm by such
produced only USD 0.70 (seventy cents) for every -average quite m - by skilogram of oi eqialn (ke in 194 ,Ih responsibilities is-now quite modest. In fact, as
same year, countries in the group of "middle enterprises sought to survive by controlling theirincome year,counomies"in tohi Beoua r belo costs, their expenditures on fringe benefits of this
incomed economies"g tof w h B.70 of GDP per type decreased from 35 percent to 12 percent ofproduced an average of USD 1.70 of GDP per total employee remuneration expenses-which inkoe-nearly 2.5 times as much. The coldkoe*erly2 time as muc.The old turn were only 5-10 percent of the total costs ofBelarusian climate explains part of the difference, the average enterprise. Further moves to divestbut similarly cold Nordic countries like Norway
and Denark prduced n averge of SDl_ 57o social assets is a logical way for firms toGnd penmark kroduTed low eeragy efficiency of restructure, but given the relatively small size of
isPpek. not srrig givenc th this problem compared to other problems (such asBelarusian production is not surprisin, , the exchange rate at which enterprises export theirartificially low energy prices that Belarus enjoyedduring the Soviet era. Such prices are gone now, products), It iS not a top policy priority.
Establishing Profit-Oriented Producers 61
Furthermore, the process needs to be handled this is through the transfer of ownership andwith care for several reasons: (a) many services demonopolization of the distribution authorities.such as housing have a high social value and help The Ministries of Agriculture and of Trade, theirprovide a form of social safety net at relatively branches, and the regional Executive Councilsmodest out-of-pocket costs; (b) many of the need to shed most of their business administrationmunicipalities are not financially able to accept functions and retain only their publicfull responsibility immediately, which could administration functions.jeopardize the delivery of these importantservices; and (c) some time is needed to attain the Restructuring Strategy for the Futurelevels of cost recovery that will make the Even under the most optimistictransition to municipal or private sector provision assumptions about privatization, many enterprisesrelatively easy. will remain under state ownership for some time.
Divestiture of Other Peripheral For reasons discussed in the previous chapterActivities. In addition to the employee-related regarding the importance of profit-maximizingactivities such as housing and sports facilities, enterprises for making a market system work, themany enterprises were also heavily involved in Government should seek to privatize virtually allothernon-core activities such as construction, and of the small and most of the medium-sizedfarming to supply food to workers. Such enterprises within the next l2 to 18 months. Someresponsibilities are more appropriately carried out of the larger enterprises will, however, takeby enterprises, preferably in the private sector, for considerably longer to privatize (beyond thewhom such activities are the core business portion sold for vouchers under the massEnterprises also need to consider shedding privatization program) because there are fewerspecialized manufacturing activities where the investors able to buy them or bring the newfactory's own demand is not enough to support capital, technology, market access, andefficient scales of production. management skills needed to restructure them. In
the meantime, the Government needs to takeDeclining Dominance of State actions to prevent the irreversible depletion of
Enterprises in Distribution. The share of state potentially valuable assets (of both fixed andand quasi-state agencies (for example human capital).Belcoopsoyuz) in distribution has fallen steadilyas private agencies have started to increase, Corporatization is a first step towardsreaching an overall market share of 33 percent in oestructuring, by creating a buffer between the1996. The traditional state distribution companies Government and enterprises. This has effectivelysuch as Agrosnab and Agrochemia have been removed enterprises from micro-management bydismantled, or have started diversifying into other the branch Ministries and from automatic accessareas of business. As private enterprise gains to budgetary resources, and can provide thecontrol, administered pricing and distribution will necessary framework for attracting buyers,disappear. In many cases procurement is now including cash investors as well as voucher andbeing done through direct dealings between buyout sales. However, corporatization needs toprocessors, traders, and producers. Also, the be accompanied by systematic measures toPresident has issued a recent decree that all agro- enforce privatization or closure.processing enterprises should be corporatized by Experience in other countries suggeststhe end of 1996, which would facilitate that major investments by the state inautonomous decision making, even though it falls restructuring are generally not cost-effective.short of privatization. Restrictions remain a Government restructuring efforts should insteadburden particularly on state-owned enterprises, focus on repair and maintenance, reorganization,and measures are needed to loosen the hold of the downsizing (including labor reduction) and, to aregional administrations and their agricultural limited extent, product mix.departments. The most effective way to achieve
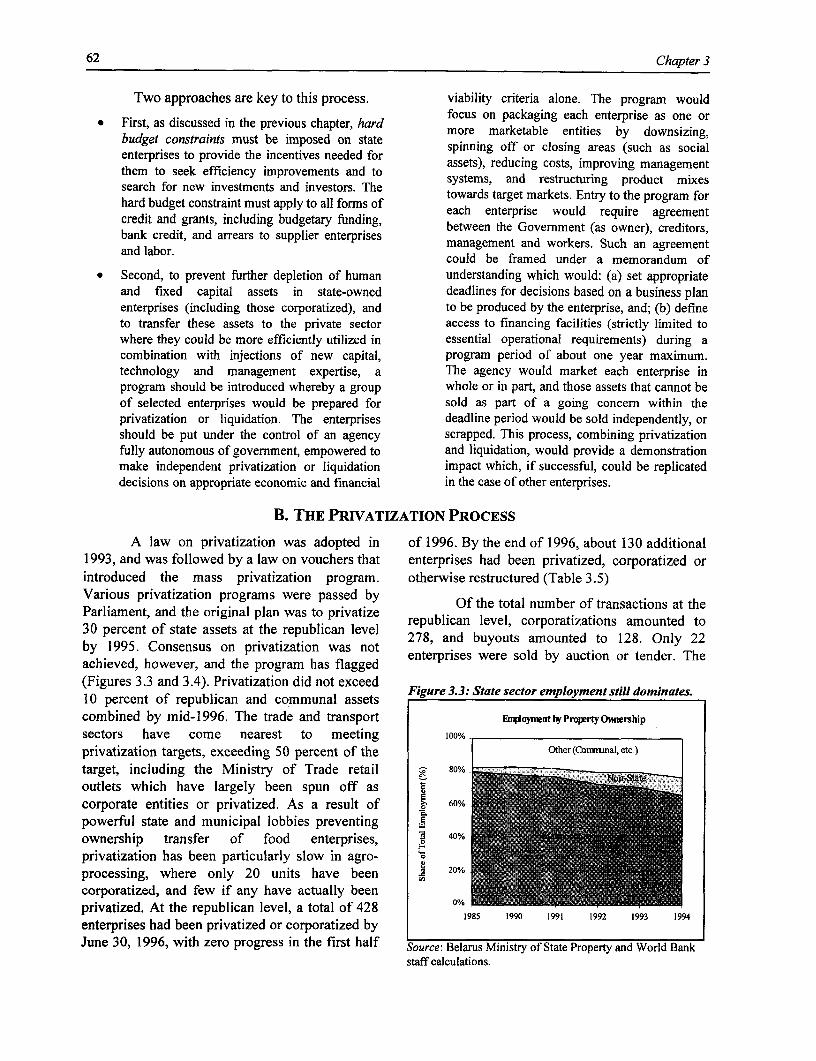
62 Chapter 3
Two approaches are key to this process. viability criteria alone. The program would• First, as discussed in the previous chapter, hard focus on packaging each enterprise as one or
* Frst asdlsussd i th prvios captr, ardmore marketable entities by downsizing,budget constraints must be imposed on state . .enterprises to provide the incentives needed for spinning off or closing areas (such as socialthem to seek efficiency improvements and to assets), reducing costs, improving managementsearch for new investments and investors. The systems, and restructuring product mixestowards target markets. Entry to the program forhard budget constraint must apply to all forms of each tenterpriewo Erequie arogree mcredit and grants, including budgetary funding,bank credit, and arrears to supplier enterprises between the Government (as owner), creditors,and labor. management and workers. Such an agreement
could be framed under a memorandum of* Second, to prevent further depletion of human understanding which would: (a) set appropriate
and fixed capital assets in state-owned deadlines for decisions based on a business planenterprises (including those corporatized), and to be produced by the enterprise, and; (b) defineto transfer these assets to the private sector access to financing facilities (strictly limited towhere they could be more efficiently utilized in essential operational requirements) during acombination with injections of new capital, program period of about one year maximum.technology and management expertise, a The agency would market each enterprise inprogram should be introduced whereby a group whole or in part, and those assets that cannot beof selected enterprises would be prepared for sold as part of a going concern within theprivatization or liquidation. The enterprises deadline period would be sold independently, orshould be put under the control of an agency scrapped. This process, combining privatizationfully autonomous of government, empowered to and liquidation, would provide a demonstrationmake independent privatization or liquidation impact which, if successful, could be replicateddecisions on appropriate economic and financial in the case of other enterprises.
B. THE PRIVATIZATION PROCESS
A law on privatization was adopted in of 1996. By the end of 1996, about 130 additional1993, and was followed by a law on vouchers that enterprises had been privatized, corporatized orintroduced the mass privatization program. otherwise restructured (Table 3.5)Various privatization programs were passed by Of the total number of transactions at theParliament, and the original plan was to privatize republican level, corporatizations amounted to30 percent of state assets at the republican level 278, and buyouts amounted to 128. Only 22by 1995. Consensus on privatization was not enterprises were sold by auction or tender. Theachieved, however, and the program has flagged(Figures 3.3 and 3.4). Privatization did not exceed Figure 3.3 State sector employment still dominates10 percent of republican and communal assets . Scombined by mid-1996. The trade and transport EnoynntbyPropertyOerenhipsectors have come nearest to meeting 100%privatization targets, exceeding 50 percent of the Other (Conymal, etc.)
target, including the Ministry of Trade retail 80%outlets which have largely been spun off as i*
corporate entities or privatized. As a result of 60%
powerful state and municipal lobbies preventingownership transfer of food enterprises, 0 40%
privatization has been particularly slow in agro-processing, where only 20 units have been 20%corporatized, and few if any have actually beenprivatized. At the republican level, a total of 428 0% 9 1991 1 1993 1994
enterprises had been privatized or corporatized byJune 30, 1996, with zero progress in the first half Source: Belarus Ministry of State Property and World Bank
staff calculations.
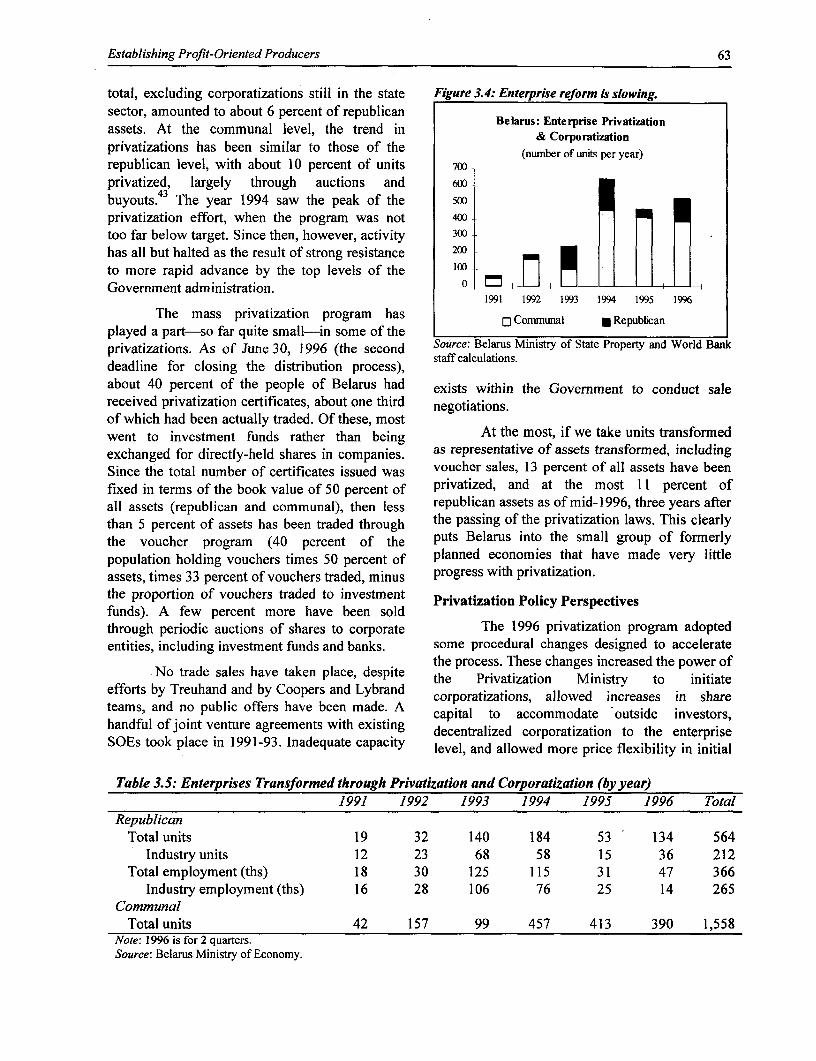
Establishing Profit-Oriented Producers 63
total, excluding corporatizations still in the state Figure 3.4: Enterprise reform is slowing.sector, amounted to about 6 percent of republican Belarus: Enterprise Privatizationassets. At the communal level, the trend in & Corporatizationprivatizations has been similar to those of the (number of units per year)republican level, with about 10 percent of units 700Xlprivatized, largely through auctions and 60 Lbuyouts.43 The year 1994 saw the peak of the 500privatization effort, when the program was not 40 +too far below target. Since then, however, activity 300 Ihas all but halted as the result of strong resistance 200 IIto more rapid advance by the top levels of the 1o0 j InGovernment administration. 0 7
1991 1992 1993 1994 1995 1996The mass privatization program has Communal a Republian
played a part-so far quite small-in some of theprivatizations. As of June 30, 1996 (the second Source: Belarus Ministry of State Property and World Bankdeadline for closing the distribution process), staff calculations.about 40 percent of the people of Belarus had exists within the Government to conduct salereceived privatization certificates, about one third negotiations.of which had been actually traded. Of these, mostwent to investment funds rather than being At the most, if we take units transformedexchanged for directly-held shares in companies. as representative of assets transformed, includingSince the total number of certificates issued was voucher sales, 13 percent of all assets have beenfixed in terms of the book value of 50 percent of privatized, and at the most 11 percent ofall assets (republican and communal), then less republican assets as of mid-1996, three years afterthan 5 percent of assets has been traded through the passing of the privatization laws. This clearlythe voucher program (40 percent of the puts Belarus into the small group of formerlypopulation holding vouchers times 50 percent of planned economies that have made very littleassets, times 33 percent of vouchers traded, minus progress with privatization.the proportion of vouchers traded to investment Privatization Policy Perspectivesfunds). A few percent more have been soldthrough periodic auctions of shares to corporate The 1996 privatization program adoptedentities, including investment funds and banks. some procedural changes designed to accelerate
Ntedespite the process. These changes increased the power ofNo trade sales have taken place, dsie the Privatization Ministry to initiate
efforts by Treuhand and by Coopers and Lybrand pratization Mincryase initiateteams, and no public offers have been made. A corporatizations, allowed increases in sharehandful of joint venture agreements with existing decentralized corporatization to the enterpriseSOEs took place in 1991-93. Inadequate capacity level, and allowed more price flexibility in initial
Table 3.5: Enterprises Transformed through Privatization and Corporatization (by year)1991 1992 1993 1994 1995 1996 Total
RepublicanTotal units 19 32 140 184 53 134 564
Industry units 12 23 68 58 15 36 212Total employment (ths) 18 30 125 115 31 47 366
Industry employment (ths) 16 28 106 76 25 14 265Communal
Total units 42 157 99 457 413 390 1,558Note: 1996 is for 2 quarters.Source: Belarus Ministry of Economy.
64 Chapter 3
share pricing. Despite this, the lack of effective right to block corporatization of theGovernment commitment has brought enterprise where they work, at a time whenprivatization to a standstill. Belarus does face broader government policies have made it verysome particularly difficult problems in trying to difficult even for well-established privatizedprivatize its very large scale enterprises. But the enterprises to make successful use of theirslow pace for communal enterprise privatization increased flexibility in decision-making.is not a technical issue and largely reflects the Although technically only a change in legalresistance of the city councils, and in some cases, structure, corporatization in Belarus is actuallyof the workers collectives. In the case of the mass very significant. As part of the process, the sharesprivatization program, a mass subscription system are allocated, which generates serious discussionswas due to have been introduced in 1995, about the rights of various groups to corporateallowing country-wide offerings of enterprises in control. Furthermore, the process ofreturn for vouchers. However, this system has not corporatization creates a desirable distanceyet started operating, and may not clear the between the corporation and the Government,market under current rigid share pricing rules. thus reducing the likelihood that the GovernmentThe Government allowed a few voucher auctions will subsidize the unit. This potential or actualto parallel the subscription process, but these have loss of access to subsidies, plus widespreadbeen jeopardized by intensive regulation and knowledge that many public enterprises,auditing of the investment funds that were especially the larger ones, are significantly over-supposed to intermediate sales. The Government staffed and thus likely to be downsized when theclosed all of these investment funds for a period enterprise can no longer depend on budgetaryin 1995, and three of the firms were still closed in support, leads many workers collectives toOctober 1996. obstruct the corporatization and thus the sale of
The sale of shares for vouchers has also vouchers and privatization.been slowed by the sporadic and inadequate The Government needs to exercise strongsupply of enterprise shares. This has been the leadership to convince workers thatresult of the very slow pace of "corporatization" corporatization and privatization are not onlyor setting up departmental enterprises as joint necessary, but also good for them in the long termstock corporations with their own boards of since this will increase efficiency, thedirectors. Progress during 1995 was sporadic, development of new small enterprises, and thusdespite government commitments to do 2,000 employment opportunities and income. Theenterprises by the end of the year. Virtually no Government needs to convey with unswervingcorporatizations had occurred in the first three clarity the message that restoring growth andquarters of 1996, and only a small number is expanding economic opportunities is going toexpected to be complete before year-end-a benefit everyone-even the poor who mustmajor shortfall compared to the program for 1996 depend on governmental income supportannounced by the President in January. The slow programs paid for out of taxes on a growingpace of corporatization has been partly the result economy-far more than spending months tryingof indecision and continuing efforts to find the to assure that every decision regarding theideal legal and administrative procedures. For allocation and use of assets inherited from the oldexample, during the past year the Government has regime is "fair." Unfortunately, the most recenthad to work on establishing a more transparent government decrees tend to be moving in thevaluation method, and has introduced a opposite direction. Although the recovery plan-mechanism by which the reservation price for through the year 2000 generally gives strongenterprise shares can be reduced if they do not support to privatization and "de-statization," itsell in the first offering. also proposes that workers' collectives be given
The delays in the privatization process the right to block any corporate restructuringThso eflect el ac initiative. Unless changed, this is likely toalso rerlect the fact that the Government has g y
given workers collectives in the enterprises the bcm eiu are oteeooi
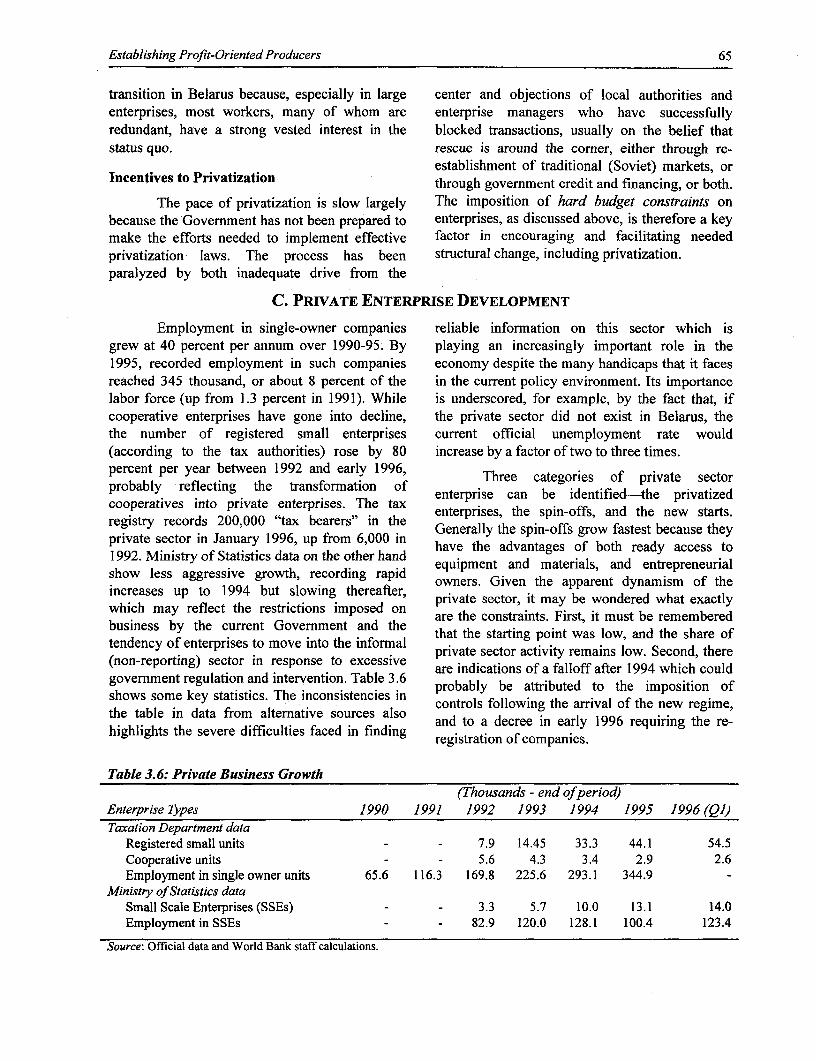
Establishing Profit-Oriented Producers 65
transition in Belarus because, especially in large center and objections of local authorities andenterprises, most workers, many of whom are enterprise managers who have successfullyredundant, have a strong vested interest in the blocked transactions, usually on the belief thatstatus quo. rescue is around the corner, either through re-
establishment of traditional (Soviet) markets, orIncentives to Privatization through government credit and financing, or both.
The pace of privatization is slow largely The imposition of hard budget constraints onbecause the Government has not been prepared to enterprises, as discussed above, is therefore a keymake the efforts needed to implement effective factor in encouraging and facilitating neededprivatization laws. The process has been structural change, including privatization.paralyzed by both inadequate drive from the
C. PRIVATE ENTERPRISE DEVELOPMENT
Employment in single-owner companies reliable information on this sector which isgrew at 40 percent per annum over 1990-95. By playing an increasingly important role in the1995, recorded employment in such companies economy despite the many handicaps that it facesreached 345 thousand, or about 8 percent of the in the current policy environment. Its importancelabor force (up from 1.3 percent in 1991). While is underscored, for example, by the fact that, ifcooperative enterprises have gone into decline, the private sector did not exist in Belarus, thethe number of registered small enterprises current official unemployment rate would(according to the tax authorities) rose by 80 increase by a factor of two to three times.percent per year between 1992 and early 1996, Three categories of private sectorprobably reflecting the transformation of enterprise can be identified-the privatizedcooperatives into private enterprises. The tax enterprises, the spin-offs, and the new starts.registry records 200,000 "tax bearers" in the Generally the spin-offs grow fastest because theyprivate sector in January 1996, up from 6,000 in have the advantages of both ready access to1992. Ministry of Statistics data on the other hand equipment and materials, and entrepreneurialshow less aggressive growth, recording rapid owners. Given the apparent dynamism of theincreases up to 1994 but slowing thereafter, ownersector, t aypaent what ofatlywhich may reflect the restrictions imposed on private sector, it may be wondered what exactlybusiness by the current Government and the har the costarints.nFirst, it must be rememberedtendency of enterprises to move into the informal thatte stoatin int wais low, and ote shareoprivate sector activity remains low. Second, there(non-reporting) sector in response to excessive are indications of a falloff after 1994 which couldgovernment regulation and intervention. Table 3.6 arenatin of atfaedo teri1994iwhic oushows some key statistics. The inconsistencies in probably be attributed to the impositon ofcontrols following the arrival of the new regime,the table in data from alternative sources also and to a decree in early 1996 requiring the re-highlights the severe difficulties faced in finding registration of companies.
Table 3.6: Private Business Growth(Thousands - end ofperiod)
Enterprise Types 1990 1991 1992 1993 1994 1995 1996 (Q1)Taxation Department data
Registered small units - - 7.9 14.45 33.3 44.1 54.5Cooperative units - - 5.6 4.3 3.4 2.9 2.6Employment in single owner units 65.6 116.3 169.8 225.6 293.1 344.9
Ministry of Statistics dataSmall Scale Enterprises (SSEs) - - 3.3 5.7 10.0 13.1 14.0Employment in SSEs - - 82.9 120.0 128.1 100.4 123.4
Source: Official data and World Bank staff calculations.
66 Chapter 3
The problems faced by private location or line of business-and the delaysenterprises, particularly new starts, have been: (a) and uncertainty in receiving them-severelythe effects of the exchange rate regime; (b) the discourage private businesses.continuation of state monopolies, especially in . Rents for space in the premises of statetrading and distribution, although this is reducing; enterprises are excessive, and in some cases(c) the continuation of (informal) price controls at have become so high as to preclude doingthe local level; (d) a relatively onerous and business.complicated tax system; (e) the lack of a * Application of regulations sometimessupportive legal framework, especially with discriminates against private companies; forrespect to private property; (f) government example, local officials or tax authorities inregulations such as the re-registration decree; and some jurisdictions reportedly harass private(g) the financial crisis and the consequent firms that successfully compete with a stateincreased difficulty of securing financing, firm.45
particularly for fixed investment. A recent survey . Tax inspectors harass private companies, foralso identified the following problems. example by attempting to levy draconian fines
* At present, there is great uncertainty because for relatively minor infractions.no new permits to operate businesses are * State enterprises discriminate against privatebeing issued.44 firms, for example by insisting on pre-
• The large number of licenses, permits, payment for supplies sold to private firms, butregistrations, and approvals from various tolerating large arrears from other statelevels of government required for each enterprises.
D. FRINGE BENEFITS AND SOCIAL ASSET DIVESTITURE
Firms in Belarus spend money on many Need for Divestiturefunctions classified in their enterprise accounting Conceptual Issues. Before discussing thesystems as "social"-housing for employees, fonceptual the tefogy sculd besummer camps for the children of employees, need for divestiture, the terminology should bespas for employees, health and dental clinics on clarified. Although the services just described aresite and specialized medical and dental facilities commonly referred to as "social assets," theyoff-site, subsidized food, creches and should really be called non-wage or "fringe"kindergartens, and vocational schools. In some benefits because most are private rather thanareas, firms also provide local infrastructure social in nature and, under current conditions,services such as district heating, electricity, and many are liabilities rather than assets from thewater and sewer systems. Extensive provision of perspective of the enterprises. The term "socialsuch local infrastructure is also common among assets" is thus quite misleading and will generallystate and collective farms. not be used in this discussion. "Fringe benefits"
will be used instead.The divestiture of such "social" functions
is commonly regarded as an important way to Fringe benefits are by no means unique toimprove the competitiveness of enterprises in enterprises in the former Soviet Union. Mosttransition economies. Such obligations reduce the enterprises, including the World Bank, offerprofitability of enterprises by diverting money various fringe benefits such as pensions, lifethat could better be used to finance investments in insurance plans, clinics for treatment of minorincreased productivity, and they divert medical problems, food service facilities, and daymanagement attention from core business care for children of employees. Such fringeactivities. This section examines (a) the need to benefits are often not entirely free, however;divest "social assets;" and (b) measures that can some contribution to full cost recovery is oftenbe taken to reduce the costs of providing such required from the employee. Other fringe benefitsfringe benefits. (A more complete discussion of such as housing, public utilities, and foodstuffs,this topic is presented in Annex A.) however, are generally provided in industrialized
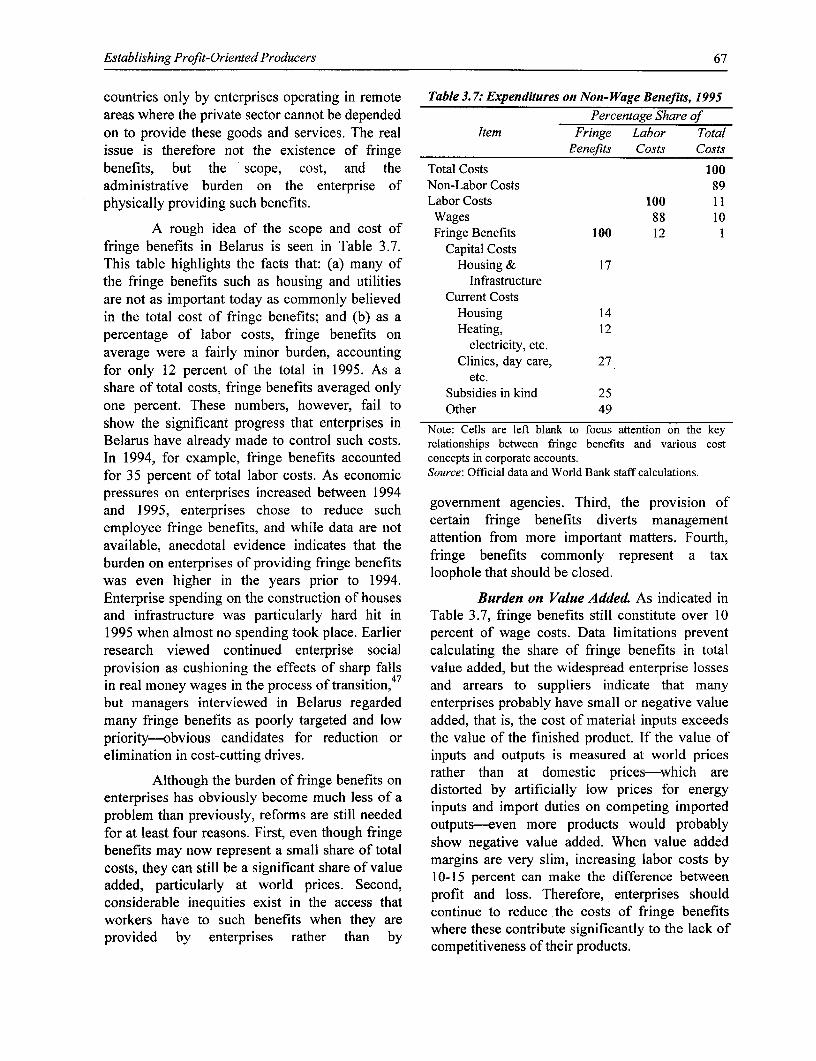
Establishing Profit-Oriented Producers 67
countries only by enterprises operating in remote Table 3.7: Expenditures on Non-Wage Benefits, 1995
areas where the private sector cannot be depended Percentage Share ofon to provide these goods and services. The real Item Fringe Labor Totalissue is therefore not the existence of fringe Benefits Costs Costs
benefits, but the scope, cost, and the Total Costs 100administrative burden on the enterprise of Non-Labor Costs 89physically providing such benefits. Labor Costs 100 11
Wages 88 1 0A rough idea of the scope and cost of Fringe Benefits 100 12 1
fringe benefits in Belarus is seen in Table 3.7. Capital CostsThis table highlights the facts that: (a) many of Housing & 17the fringe benefits such as housing and utilities Infrastructureare not as important today as commonly believed Current Costsin the total cost of fringe benefits; and (b) as a Housing 14percentage of labor costs, fringe benefits on Heating, 12average were a fairly minor burden, accounting electricity, etc.for only 12 percent of the total in 1995. As a Clinics, day care, 27share of total costs, fringe benefits averaged only Subsidies in kind 25one percent. These numbers, however, fail to Other 49
show the significant progress that enterprises in Note: Cells are left blank to focus attention on the keyBelarus have already made to control such costs. relationships between fringe benefits and various cost
In 1994, for example, fringe benefits accounted concepts in corporate accounts.
for 35 percent of total labor costs. As economic Source: Official data and World Bank staff calculations.
pressures on enterprises increased between 1994and 1995, enterprises chose to reduce such government agencies. Third, the provision ofemployee fringe benefits, and while data are not rtain fringe benefits diverts managementavailable, anecdotal evidence indicates that the attention from more important matters. Fourth,burden on enterprises of providing fringe benefits fringe benefits commonly represent a taxwas even higher in the years prior to 1994. oophole that should be closed.Enterprise spending on the construction of houses Burden on Value Added. As indicated inand infrastructure was particularly hard hit in Table 3.7, fringe benefits still constitute over 101995 when almost no spending took place. Earlier percent of wage costs. Data limitations preventresearch viewed continued enterprise social calculating the share of fringe benefits in totalprovision as cushioning the effects of sharp falls value added, but the widespread enterprise lossesin real money wages in the process of transition,47 and arrears to suppliers indicate that manybut managers interviewed in Belarus regarded enterprises probably have small or negative valuemany fringe benefits as poorly targeted and low added, that is, the cost of material inputs exceedspriority-obvious candidates for reduction or the value of the finished product. If the value ofelimination in cost-cutting drives. inputs and outputs is measured at world prices
Although the burden of fringe benefits on rather than at domestic prices-which areenterprises has obviously become much less of a distorted by artificially low prices for energyproblem than previously, reforms are still needed inputs and import duties on competing importedfor at least four reasons. First, even though fringe outputs-even more products would probablybenefits may now represent a small share of total show negative value added. When value addedcosts, they can still be a significant share of value margins are very slim, increasing labor costs byadded, particularly at world prices. Second, 10-15 percent can make the difference betweenconsiderable inequities exist in the access that profit and loss. Therefore, enterprises shouldworkers have to such benefits when they are continue to reduce the costs of fringe benefitsprovided by enterprises rather than by where these contribute significantly to the lack of
competitiveness of their products.
68 Chapter 3
Inequity in Access. Enterprises in the top or "contracting-out" services like this will bequartile in terms of firm size spent the equivalent difficult until the market mechanisms in Belarusof 15 percent of total employee compensation on have developed more fully, but this option shouldfringe benefits in 1995. During the same period, be considered when possible.firms in the bottom quartile spent only twopercent. Employees in small firms clearly have re Benefits an ta Looproles Oneof the key attractions to both enterprises andless access to fringe benefits than those in large workers of non-cash fringe benefits compared tofirms. The Government of Belarus could improvethe equity of access to services such as regular pay is that both parties gain from taxkindergartens and health care by making these loopholes with non-cash compensation under
,. , ~~~~current tax legislation. Expenditures byservices available directly rather than through ent on frin ne suchtas d yenterprises. Similarly, services such as housing centerprss and fresor faities har commonland utilities, which are not "social" or "public' allowed as deductiblebusiness expenses thatgoods, should be made available through the red ps anduthusitets edp by anprivate sector or by non-profit organizations, thusassuring equal access to all workers regardless of enterprise. However, if the cost of providing the
fringe benefits were instead given to thethe size of the enterprise in which they work. frnebeitwrensadgvn oththe ize f th enerprse i whch tey wrk. employees in cash so that they could purchase theSuch changes would of course require changes in . .
same services from other sources, the additionalthe~~~~ ~~ ditiuino.h rs annso cash given to the employees would increase the
enterprises. Workers would have to be paid moreso that they could afford to pay for services that enterprises wage bill, thereby increasing itswere previously provided as a condition of payroll tax liability. The current tax system
creates a similar bias in favor of fringe benefits inemployment, and governments would have to temnso mlye.Fig eeisrcie
receve orein axe (o reuceexpndiure in the minds of employees. Fringe benefits receivedreceive more in taxes (or reduce expenditures inimidaegnrlyntsbett aain ulower-priority areas). The financing of "social aIn ksd are generally not subject to taxation, butasset divestiture" is discussed in more detail mcash recelved u leu of frinmge benefits wouldbeow immediately be subject to income taxes.below.
Diversion of Management Attention. In To remove this bias, thereby facilitatingorder toprovivefrsiongo Maaeenefits, Atttion. Bela the transfer of "social assets" to private operators,
order to provide fringe benefits, firms in Belarus .uic ..te n te mr prpitfrequently engage directly in activities that are
providers, the Government and Parliament shouldextraneous to their core business activities. For change the nonal et an, ashasbeexample, producers of television sets and heavy done inRuiaa man legil ontris to
contrutio eqipmnt re lsoinvlve in done in Russia and many OECD countries, toconsructon euipmnt ae alo inolve in make all fringe benefits, regardless of whether
running truck farms to produce vegetables and tare pai fing cash , subject to therother foodstuffs for their employees. This diverts - * . . .o
same rate of income taxation. This would makemanagement's attention from core business emlyeinfertfomaaxpsecv,adactivities, thereby reducing efficiency and sinces cndbeued for ater purpose isprospects for economic recovery. To correct this st importan to the wor most woul teproblem, firms should try wherever possible to prfe toreceive ompent ajstments inreplace in-kind fringe benefits, such as food, with cswaes there by making itjesymfor thadditional cash payments which workers can use enterprise to shed the social assets. Wages wouldto purchase products from normal market sources. rin a dedutie sinessexpes allWhen in-kind fringe benefits such as cafeteria tementerprisettolcontinest edueis profitaservices or daycare must be provided within the burden. To remove the payroll tax bias i favor ofenterprise, enterprises in market economies often non-cash compensation, the payroll tax rate couldfind that this can be done most efficiently by be lowered by an amount that compensates onhiring specialist enterprises to provide these
average for the increased cash payments toservices, thus freeing enterprise management to workers, the ingte Governmentw thfocus on core business activities. "Out-sourcing" workers, thereby leavng the Government wgth the
same amount of tax revenue and removing the
Establishing Profit-Oriented Producers 69
bias of enterprise managers against offering cash fringe benefits, providing them only when it iscompensation to workers. In fact, such a reform necessary to attract and retain needed employees.could be used as an opportunity for a broader Likewise, workers will have the incentive to seekreform of the payroll tax system that would out new, more productive jobs with employersreduce the current bias against employing who can afford to offer attractive fringe benefitworkers and in favor of using more capital packages. Other than imposing effective hardequipment. budget constraints on enterprises, there is little
else that the Government needs to do to stimulateApproaches to Divestiture the necessary action on the part of enterprises.
With the possible exceptions of Provision of Goods and Services. Thekindergartens and some forms of medical care, Government will, however, need to implementmost of the fringe benefits provided directly to substantial changes in the allocation of staff andindividual employees do not warrant continued resources to assure that critical services continuepublic subsidy, either through government-owned to be available once the enterprises no longerenterprises or directly by state and local provide them as fringe benefits. In this context,government bodies. But many of the services like two basic groups of goods and services should behousing and utilities that formerly were provided distinguished-those which are "public" inby enterprises will clearly need to be supplied to nature, and require provision by the Government,prevent adverse impacts on individuals and and those which are "private," and can becommunities. The following key problems must supplied by the private sectortherefore be addressed when reducing the burdenof fringe benefits on enterprises-especially Very few of the fringe benefitsbenefits that are provided in-kind: (a) how can traditionally provided by the enterprises are reallyenterprises be encouraged to reduce their "public" as defined above. For example,expenditures on fringe benefits; (b) who should enterprises rarely provided public health servicesprovide goods and services no longer provided by (as opposed to clinics) or general education (asenterprises; and (c) how should the goods and opposed to day care services). Most of the fringeservices be paid for once the enterprise no longer benefits were goods and services like resorts,provides them as part of the wage package? housing, utilities, and food, which in a market
economy should be provided by the private sectorReducing Fringe Benef t Expenditures. and paid for by users. Fringe benefit reduction by
The solution to this problem is relatively easy. enterprises therefore need not necessarily createThe Government should make certain that all an additional burden for the Government.enterprises are subject to hard budgetconstraints-that they are forced to pay all of Nevertheless, because of the very weaktheir debts or be subject to bankruptcy condition of the private sector in Belarus today,proceedings. Under such conditions, enterprise the Government may have to play a transitionalmanagers will do whatever is required to remain role in providing certain goods and services. Thiscompetitive. The reduction of fringe benefits in is particularly true for housing, which is critical tothe total cost structure of enterprises from 35 labor mobility and hence to economic growth.48
percent to 12 percent of labor costs between 1994 Belarus has already made very good progress inand 1995 as described above is clear evidence privatizing its housing stock; by the end of 1995,that this process is already working in Belarus. 62 percent of housing was in private handsThe main task now, as highlighted by the (including cooperatives). Most housing should beexcessively high levels of overdue accounts privatized as rapidly as possible, but until thepayable in the enterprise sector, is to enforce the necessary conditions are fully in place, such ashard budget constraints much more effectively condominium-type laws, property registrationthan has been done in the past. This will provide systems, and mechanisms for mortgage financing,the incentives needed to assure that enterprises local governments will almost certainly have tomaximize the efficiency of their provision of pick up some of the responsibility for housing
70 Chapter 3
units no longer being maintained by enterprises government, by local governments, by quasi--and this in fact is already happening. In the governmental bodies, by non-profit organizations,longer term, most public utilities could and or by the private sector, the costs must beprobably should be privatized (subject to financed. Three basic classes of goods andappropriate regulatory controls), but in the services can be identified: (a) those to be financedmeantime, quasi-governmental bodies such as by the workers themselves; (b) those to bedistrict heating and electric power companies will financed by the government; and (c) those thathave to bear the responsibility. Kindergartens are must be temporarily discontinued.increasingly being used to provide daycare for For goods and services such as housinginfants because economic difficulties are causing and utilities that are of high priority, people will
women to cut short materity leave, and find the money out of their own pockets to payprovisions would also need to be made to assure the costs. Part of this additional burden will bethe continued availability of such services, covered by additional wages paid by enterprises
In some cases, especially where the in compensation for the fringe benefits no longerenterprises are large compared to the provided. Part will be met through householdcommunities where they are located, the most budget reallocation from less critical householdsensible approach during the transition period expenditure categories. Finally households willmay be to have the enterprise continue to supply reduce their use of services such as heat andthe services, especially when: (a) the cost is a electricity-something that happens naturally assmall percentage of enterprise value added; (b) a prices are raised to reflect the true cost of supply.program for moving to more or less full cost In the case of the very poor households, therecovery is implemented; and (c) the services are Government will need to continue providing anmanaged by a semi-autonomous part of the appropriate social safety net, as discussed in theenterprise, thus leaving plant management free to next section.focus on production, efficiency and marketing. To finance services such as housing thatSpecial arrangements will need to be made when the public sector may temporarily have toenterprises are closed to assure continuity ofcritical public services, but the fact that ciue t , tGovernment can take twoenterprises provide such services should not be measures. First, it can inrease cost recovery fromthe users. Second, it can reallocate tax revenuesused as an excuse to maintain activities that are (which should increase as enterprises becomenot profitable. more profitable), transferring them to local
The responsibility for functions should be governments-which will probably have to beardistinguished from their physical provision. Even most of the burden of supplying serviceswhen services become the responsibility of local previously supplied by enterprises-so that theygovernment bodies, they do not necessarily have will have adequate resources.to be provided by government staff. Actual As an unfortunate but unavoidable resultdelivery of these functions can be accomplished of the collapse of the previous economic system,by a number of alternative organizations, which provided a stable and, by comparison withincluding private contractors, non-governmental
organzatios an evenothe leves of some parts of the Soviet Union, good standard oforganizations and evnt oth living to virtually all people in Belarus while itgovernment under contract. lasted, some services from the previous period
Financing the Provision of Goods and may have to be suspended until economicServices. Regardless of whether goods and conditions improve. Spas, resorts, and otherservices previously provided as fringe benefits recreational facilities, for example, are non-will be provided in the future by the national essential luxuries under current conditions.
Establishing Profit-Oriented Producers 71
E. SUMMARY
Priority needs to be given to the agency to implement plans for thefollowing policy measures if Belarus is to privatization or liquidation of selectedestablish a business environment that stimulates enterprises according to a schedule agreedthe reforrn and growth of enterprises in Belarus: between the Government, creditors and
management.* Hard Budget Constraints. Eliminate as
rapidly as possible all forms of subsidized * Price Controls. Phase out price and all relatedcredit and involuntary grants. This would controls so that enterprises can base theirforce enterprises to find solutions that cut production decisions on prices determined bycosts, increase revenues, and attract new the free interaction of demand and supply incapital. the markets.
* Privatization. Remove barriers to * Private Sector Development. Remove barriersprivatization and accelerate the process by (a) to new private sector development.facilitating management/ labor buyouts of . Macroeconomic Policies. Implement thesmall and medium enterprises; (b) starting to policies needed to improve the investmentforce the "corporatization" of all enterprises climate that were outlined in the previousnot sold by April 1997, thereby improving the chapter.supply of enterprises available for voucherprivatization; (c) modifying the state- * Social Asset Divestiture. Free enterprisedetermined reservation prices for enterprises mnanagers from the responsibility forso that they have a reasonable chance of being providing in-kind fringe benefits such assold at a competitive, market-clearing price; housing, pre-schools, and food by transferring(d) establishing the capacity to negotiate trade the associated "social assets" from thesales with international investors for large enterprises to individuals, private enterprises,enterprises; (e) setting up a fully autonomous non-profit organizations, or local
governments.
4
Protecting the People
If implemented in a timely manner, the efficiency and output in a way that favorspolicy measures outlined in this report will make employment. Such policies need to be carefullya major contribution to reducing poverty in designed, however, to be fiscally viable and toBelarus by gradually reversing the 40 percent avoid creating welfare dependence by reducingeconomic decline of the past five years. This incentives to work. The remainder of this chapterdecline has been the source of almost all is arranged as follows. Section A discussesincremental poverty, which has increased from strategies for maximizing employment to5 percent in 1992 to 22 percent on a yearly basis minimize poverty during the transition -period,in 1995.49 Enterprise reforms are urgently needed and Section B looks at policies that theto increase productivity, increase jobs, raise Government can implement to help those who doincomes, and reduce poverty. fall into poverty. Despite the immense importance
of the topic, this chapter is relatively briefIf not managed well, however, such beasthWolBnkasrctycmptda
reforms will result in factory closures, mass because the World Bank has recently completed alayoffs, open and hidden unemployment, growing separate report specifically on the issues ofregional inequalities, disruptions in local poverty and social protection in Belarus duringcommunity life, and growing poverty. These costs the transition. This Poverty Assessment Reportcan be minimized with good economic and social provides a more complete discussion of the social
policies that maximize the recovery of economic protection policy issues.
A. MAXIMIZING EMPLOYMENT TO MINIMIZE POVERTY
In addition to increasing output by relatively little capital per job created, and canaccelerating the rate of foreign and domestic respond quickly to emerging market conditions.investment as rapidly as possible by taking the In addition to the policies noted above for generalmeasures recommended earlier in this report, the business development, the Government couldfollowing actions are recommended to increase take the following actions to stimulate theemployment opportunities. First, the Government development of small-scale enterprises:should give special attention to measures that will privatization of shops and other
* accelerate the piaiaino hp n testimulate the development of small businesses. small enterprises owned by government bodiesSecond, enterprises should be allowed to adjust at all levels, and sell the land with the buildings;wages and employment levels withoutinterference from the Government, thus assuring * allow legal as well as natural persons to ownlabor market flexibility. land for business purposes;
* launch a special program that would encourageSmall Enterprise Development large enterprises to "spin off' small production
Experience from countries around the units, allowing workers to set up their ownbusinesses with assets bought from the large
world, including countries already more advanced enesses wh approughte;than Belarus in the transition to a market enterprises when appropriate;economy, indicates that the best way to create . create an office or publication where anynew job opportunities is to encourage the potential investor can find out about public
enterprise assets that managers, once they begindevelopmnt of smll-scal enterprses. Asto face hard budget constraints, become ready to
indicated in the previous chapter, this experience sell.is already confirmed in Belarus by the rapiddevelopment of new jobs in the services sector- . set up "business incubator centers" where smalldespite the many handicaps that private enterprises can get easy access, on a month-by-despitethe man handicps thatprivatemonth rental basis if necessary, to buildingentrepreneurs currently face. Small firms require
72
Protecting the People 73
space and shared support facilities like modest programs. In implementing suchaccounting, shipping and advertising; and50 measures, care should be taken not to introduce
* establish business promotion centers such as special incentives based on enterprise size, suchthose now being initiated with help from as special tax concessions for small-scaleTACIS. enterprise development. Such incentives create
Such measures would greatly facilitate distortions that can hurt employment generationthe transition of workers from unproductive jobs by encouraging firms to stay small in order to
the transition of workers fromunproductivejobs take advantage of size-linked incentives. Suchin failing plants to new, more productive jobs, incentives also lead to corruption; with suchthus reducing the risk of long-term policies, entrepreneurs commonly break upunemployment and poverty. The savings in direct enterprises into fictionally separate entities so thatincome support to unemployed workers can easily they into fictally te entives.compensate for the budgetary costs of these they can take advantage of the tax giveaways.
B. AN EFFECTIVE, FISCALLY SUSTAINABLE SOCIAL SAFETY NET IS NEEDED
Since independence, the standard of equal distribution of income that developedliving for the Belarusian population has eroded, between 1992 and 1995. If this had happened,with per capita GDP falling from USD 3,440 in fewer than 10 percent of families would have1990 to USD 2,160 in 1994, and with the fallen below the poverty line instead of the 36incidence of poverty rising from 1 percent in percent that were in poverty during the first1990 to 22 percent in 1995. Movements in and quarter of 1995. The other 26 percent of familiesout of poverty have been highly volatile-the in poverty during the first quarter of 1996 wereshare of people living in poverty was 36 percent therefore in poverty because of the overall declinein the first quarter of 1995, but this dropped to in incomes. If we look not just at the families inabout 25 percent during the more temperate poverty for a single -quarter but rather than thosemonths when more in-kind income from garden who were on average in poverty throughout theplots becomes available (without in-kind income, year, we find that the percentage of familiespoverty incidence would have risen to 51 percent defined as poor drops from 36 percent to 22in 1995). Over two-thirds of all households percent. Rising income inequality, which is anwere poor at some point during the year, with one expected feature of the transition as the dispersionin six experiencing poverty for five months or of incomes increases to reflect the relative marketmore. Poverty has been periodic and brief for demand and scarcities of different skills, addedmost households to date, but there is evidence that less than five percentage points to the increase inthe poor are experiencing longer periods of the poverty rate. The remaining 25 percentagepoverty as the severe economic decline continues. points of increased poverty for the first quarter of
The increase in poverty is primarily due 1995 was caused by falling national product andto the drop in overall levels of production and thus falling aggregate household income.income. On average, wage income permits the Poverty tends to be higher for largerpoor to satisfy only 40 to 60 percent of the families and for children to age 6. Single parentsminimum consumption basket.52 Some 90 percent with children face a risk of poverty exceeding 50of poor households have one or more workers, but percent. Poverty is lower in rural than in urbanthey earn wages that cannot support a family. The areas, largely because of the greater access todegree to which the overall decline in income income in kind in the rural areas; and there is an(rather than the increasing inequality in the equal incidence of poverty among women anddistribution of income) has been the primary men in percentage terms (though numerically,source of poverty can be demonstrated as follows. more women are poor due to the demographicAssume that total household income had balance). The elderly face a relatively low risk ofremained at 1992 levels but was distributed poverty, as they have been able to accumulateamong families in a way that reflected the less retirement, labor, and garden plot income.
74 Chapter 4
The Government has introduced an Improving Labor Market Flexibilityextensive array of social insurance and socialassistance benefits that consume a high level of As was shown in Chapter 1, averageresources (36 percent of total public spending), wages since 1991 have stayed well above output.resourwcsh(36 peret done litotale t dubice spoven This disconnect between output and labor incomebut which have done little to reduce poverty has created internal inflationary pressures, andbecause of their weak targeting. Overall, the non- external ayments deficits. While wa es are oftenpoor receive 1.5 times more benefits than the exera pymet eiis hl wgearofnpoor, reeive 37 timerent ofmpore b fils hare oth a small percentage of enterprise costs, they are apoor, while 37 percent of poor families are not large share of total value added given the heavypaid family benefits even though they qualify weight of total materal iven the favyUnder the current system, introducing a 50 weight ofenergy and material input costs. In fact,percent increase in family benefits would only wages for many enterprises have become so largereduce poverty by an estimated I percent, while compared to the margin between selling price andcorrespondingly increasing the tax burden. The input costs that the enterprises cannot payfinancing of some benefits through high payroll workers-or if they pay the workers, cannot paytaxes (50 percent for pension, Chernobyl, and for their materials, energy, bank loans and taxes.nursery school programs) both drives down Wage Flexibility. If wage rates continueemployment levels and depresses wages, to exceed labor productivity, enterprises will beexacerbating the household income problem forced to fire workers once badly-needed hardnoted above. budget constraints are in place. Unemployment
can be reduced, however, by allowing moreDeveloping a New Social Protection flexibility in wages. If real wages in each
Strategy enterprise fall in line with its real, inflation-
Since most of the poverty in Belarus adjusted output, the burden of wage paymentstoday results from economic decline rather than will remain constant relative to sales revenues,from distribution problems, the best long-term and enterprises will be able to continue payingsolution to poverty would be to restore economic their workers in a timely manner, therebygrowth. Fairly modest increases in average avoiding the severe poverty that comes to workersincomes would significantly reduce the poverty who must continue working without pay, or whorate, even with no change in the pattern of income are fired. Downward flexibility in real wages wasdistribution. At the same time, achieving the quite successful in Estonia, for example, wheretransition will involve shifts in relative prices, average real wages fell by about 40 percentimposing costs on some households that will during early stages of the transition process,require development of an effective national reflecting the decline in real output. This wagesocial assistance policy. Demographic and fiscal flexibility, together with policies that created antrends will also challenge the sustainability of excellent environment for the development ofsocial insurance programs, which include old age small enterprises, allowed Estonia to pass throughand unemployment benefits. The Government the worst part of the transition process withtherefore should develop and implement a three unemployment levels that stayed below thosepronged social sector reform strategy that would: common today in the countries of Western
Europe. The economy is now recovering, and* improve Belarusian welfare by redeploying wages are rising in line with increased labor
labor to the more productive sectors of the productivity.economy, and by supporting policies that sustainreal wage growth; Wage flexibility spreads the cost of the
* ensure that a well-targeted social safety net is in transition process across all workers, allowingplace to support the transition; and almost everyone to remain employed as the
transition progresses, an approach that seems. establsh a fiscally sustainable and equitable highly consistent with the Government's
objectives of social justice. This approach alsoallows workers to improve their situations as the
Protecting the People 75
transition progresses. As investors begin to With the establishment of a newimprove conditions in the best enterprises, these household survey, the Government is wellwill become more profitable and will increase positioned to identify vulnerable segments of thewages-both to hold onto their skilled workers population, and to monitor changes in householdand to attract good workers from other enterprises income, consumption, and behavior. Thisthat are not as efficient and thus less able to pay information will help the Government to target itscompetitive wages. Workers will be able to move scarce resources away from the well-off andto these higher paying jobs as the economic towards assisting the most needy. For example,situation improves in response to a good the Government might consider replacing theinvestment climate. universal program of family benefits (which takes
Other Lahor Market Policies. Wage more from families in taxes than it redistributes in
flexibility needs to be complemented, however, benefits, with no relative gain to the poor) with awith other policies toimprovelabormar means-tested benefit of last resort. This type of
flexibility In particular the Government needs to benefit should be designed to minimize laborflexeibiity. anypar ar,ierst the Gvrmen sed to disincentives-for example, each rubel of income(a) eliminate any barriers to the dismissal of shudntrsl ntels fafulreloworkers other than the requirement of reasonable should not result in the loss of a full rubel ofnotice and reasonable severance pay; benefit. Whatever the cash benefit mix, the(b) eliminate propiska (residency and work Government will need to evaluate programpermit) requirements so that workers can move effectiveness through use of survey andfreely to the best jobs; (c) improve housing administrative data, and periodically adjust itsmarket flexibility so that workers can find rental spending in line with its available resources andhousing at competitive costs where good jobs are the needs of the population.developing;54 (d) assure that employment benefits Community social services provideare structured so that they do not reduce support to vulnerable groups that can reduceincentives to seek work; and (e) develop training reliance on cash benefits, keep populations at riskprograms in cooperation with the private sector to (such as the elderly and disabled, children) out ofhelp workers prepare for and identify better jobs. less effective and more expensive institutionalThe employment and retention of workers could care (which was extensively relied on by thealso be encouraged by sharply reducing the Soviet system), and improve the quality of life.various payroll taxes. Community services are particularly effective at
introducing a client focus that is missing in mostEstablishing a Well Targeted Social Safety cash benefit and institutional programs. The range
Net and quality of services provided in Belarus could
The current social assistance system, be improved through a review of expenditurewhich consists of an array of child and birth assignments for social care and consideration ofallowances, payments to single parents, new community programs, with a view towardscompensation programs, and other benefits, has delivering high quality services and reducing thefailed to meet the underlying objectives of currently high levels of institutionalization.poverty reduction and support to families in need. Reforming Social InsuranceIn response, the Government should introduce anew and well-integrated system that is cost- The Belarusian social insurance systemeffective in relation to its objectives, and which (covering old age, disability, and survivorsminimizes disincentives to work. Implementation pensions, unemployment benefits, maternityof a reform strategy will have to address the benefits, and sick pay) is facing a severe medium-country's lack of experience with developing, term crisis. The ratio of those on pensions tomonitoring and evaluating social policy, the lack those working and paying pension contributionsof exposure to best practice in social assistance, was 49 percent in 1991, and is expected to rise toand weak administrative capacity. 60-70 percent by the end of the decade (which
will require correspondingly higher taxes or lower
76 Chapter 4
pensions, or both, if not addressed). Consolidated cation procedures, reducing the replacement rateextra-budgetary social fund expenditures are (the ratio of the pension to working life income)expected to rise from 8.9 percent of GDP in 1992 from the current rate of over 40 percent to a levelto a projected 12.9 percent in 1996 (pension that is consistent with the prevailing support ratio,expenditures are 16 percent higher as a and introducing income taxation of socialpercentage of GDP than the OECD average). insurance to improve equity and incentives toSocial fund revenues are frequently used to work (by treating labor and benefit incomefinance non-fund expenditures, and the benefits equally). The Government should broaden the taxdelivered under this system bear no relationship base, especially by moving the Chernobyl benefitto lifetime contributions. Eligibility criteria are off of the payroll tax and onto the budget. Therehighly generous-women and men can retire at is a further need to develop the institutionalages 55 and 60, respectively, with many eligible capacity of the Government to develop a socialfor earlier retirement. Disability pensions are insurance policy, and to implement that policyoften granted to individuals whose earning effectively and transparently, while delivering acapacities have not been significantly affected by high rate of accurate processing, rapid claimthe disability. turnover, and efficient service.
The Government of Belarus therefore The Government needs in particular tourgently needs to develop a social insurance make a radical change in its approach tosystem that will ensure (a) fiscal sustainability; providing a social safety net for the poor. In the(b) system transparency, so that revenues and past, the Government has sought to help theexpenditures can be tracked in accordance with poor-and many other groups in society-TbyInternational Accounting Standards; (c) an distorting prices. Food, housing, energy, andactuarially-sound relationship between social transport were all made available at artificiallyinsurance benefits and the contributions of each low prices that did not cover the cost ofindividual so that people can shift some of their production. The Government has made it veryincome from their active years to old age, with difficult for enterprises to get rid of excess labor,different individuals receiving identical benefits thus distorting the normal functioning of the laborfor identical contributions; (d) improved service market. To compensate farming, manufacturing,to system clients (employers, employees, and and public transport enterprises for the lossesbeneficiaries); and (e) the establishment of a forced on them by the artificially low prices thatlegal, regulatory, and institutional environment they were able to charge consumers and thethat will foster the development of private excess workers that they were forced to retain, thepension alternatives over the longer term. All Government has distorted the prices andstate social insurance benefits should be viewed allocation of credit, energy, raw material inputs,as a package and harmonized (for example, and foreign exchange. These distortions in pricessickness and disability benefits). to the enterprise sector led to further economic
problems such as the high levels of paymentsTo meet these objectives, the Government arestoRsifrgsbcuethgsreie th fiscal and soca imac ofr arrears to Russia for gas because the gas
should a a distribution companies did not receive enoughrange of reform options, including movementover the long term from the current single-tier money from the enterprises to buy the foreignold-age pension system to an appropriate multi- g pillar system with both public and private tiers.55 the demand for foreign exchange, contributing topIllar sythem wirth both, pnsublnfiscand p tiars. the overvaluation of the domestic currency, and
In~~~~~~ ~ th shr.em nuigficlssanblt thereby inflicting further losses on exporters inand lowering tax rates will require aggressive the industind agrturaloses In short, inmeasures such as raising the retirement age, the ndustrial and agricultural sectors. In short, incurtailing early retirement, tightening disability Government's olicies have nearl destroyed thecriteria, introducing waiting periods and y yrevalidation requirements for unemployment economy. The damage can be repaired. But doing
benefits, developing improved eligibility certifi-
Protecting the People 77
so will require a fundamental shift in the way the government support and increases the resourcesGovernment goes about protecting the poor. available to provide this support. By moving from
The Goverment's draft economic plan, a social protection system based on priceThe Major Trends of Social and Economic distortions to one based on income redistribution,Development of the Republic of Belarus for 1996- the Government can stop the current vicious2000, stresses that Belarus wants to create a circle of distortions that lead to losses that lead to
socially oriented market economy. This is the more distortions. Moving to a system based onobjective of virtually every civilized nation in the taxation and income redistribution will replaceworld. People are very important. But the way in this vicious circle with a virtuous one wherewhich governments help people is also very undistorted prices lead to efficiency and higher
whic govrnmets hlp eopl is lso ery incomes, reducing both the number of poor andimportant. Belarus should be supported in itsdesire to create a market-based economy that the burden on the non-poor to support them.
provides a good living environment for people, A system of social protection based onbut for this strategy to succeed, Belarus needs to taxation and income redistribution has anotheruse the approach normally followed by successful advantage-it makes the costs of the system moreindustrialized countries. The Government needs to visible than they are with a system based on pricemove from a social assistance strategy based distortions. Furthermore, the actual costs oflargely on price distortions to one based on income redistribution are far lower than those ofincome redistribution. price-distorting systems like the present one in
Adjusting prices to attain social Belarus. With the present system, the price-objectives may have been an adequate approach distorting costs are very real but hard to measure.in a centrally planned system where production For example, it is difficult to measure the costs of
was driven more by administrative decree than by a farm failing to invest in cost-saving, efficiency-prices and profits. In market systems where prices enhancing equipment because its eamings wereand profits are the main factors guiding reduced by artificially low prices for the food itproduction decisions, efficiency and thus the produced. Nor is it easy to see the production
.. . . I~~~~~~~~~~osses caused by the fact that farm managers wereliving standards of the nation depend on prices forced touse theirameagertrevenuesntoepay wagesthat are not distorted. Price distortions can kill amarket system. to redundant workers-workers who sooner or
later could have produced more and earned moreIncome redistribution provides a much in alternative employment if they had been forced
more solid basis for social protection in a market- to go look for a new job.based system, because it does not distort the A fundamental principle is that hiding theprices upon which production decisions are based.A social protection system based on income costs of helping poor by distorting prices does notAedsocialbpretion tesvrystembas amonincsom reduce the costs. In fact, hiding the costs throughredistribution takes very small amounts of . .
production-based income from enterprises and price distortions increases the costs, therebyindividuals throughout the country through the reducing the ability of the economy to restoretaxation system, then provides meaningful levels living standards.of support to those who are truly poor. Since the One of the strong virtues of a tax-basedresources going to the poor are obtained by taxing income redistribution system is that the costs areincome downstream from the production process visible. This tends to focus more attention on therather than by distorting the prices of inputs and costs and efficiencies of the programs, helping tooutputs associated with the production process, assure their more efficient operation.correct price signals for producers are maintained. The system for protecting the poor needsAs a result, production efficiency is maximized, to be redesigned so that it depends more heavilythereby increasing total income levels. By on means-tested social assistance programs.generating a higher standard of living for all, this Given the administrative cost of means-testing,approach reduces the number of poor needing short-cut approaches will be required. For
78 Chapter 4
example, programs should be made "self- reviewing the papers submitted to support suchselective," placing the burden on those who want claims, could be limited to groups falling outsideassistance to come forward and prove their the high-risk categories, thus minimizing theeligibility. Claims from high risk groups such as administrative burden of introducing a means-families headed by a single parent and families tested income transfer program. Improvementswith a large number of children could generally are also needed to increase the efficiency of thebe accepted at face value with only limited insurance programs for unemployment, healthrandom audits. Actual means testing, aside from insurance, and old age.
C. CONCLUSIONS
Maximizing Employment to Minimize * Many social services should therefore be
Poverty taken over by municipalities, non-profitorganizations, or the private sector.
* Facilitate the development of small scaleenterprises. ~~~~~* Improved cost recovery is needed to help
finance the divestiture process and to* Encourage rapid small scale improve the efficiency with which such
privatization. services are used.
* Facilitate access to land and buildings. Programs to Reduce Poverty During the
* Develop business incubator programs. Transition
* Create a transparent, equitable legal * Increase opportunities for remunerativeframework. employment to reduce poverty.
* Labor market flexibility. * Social assistance programs to supplement
* Allow wage flexibility. the income of the poor should:
* Abolish propiska requirements. , require a waiting period, given theshort-term nature of most poverty in
* Remove constraints other than Belarus, to avoid disincentives toreasonable severance payment and seeking new jobs; andnotice on dismissal of labor. n be means-tested and targeted wherever
- Encourage the development of rental possible.housing in growing job market areas.
* Refuse to grant subsidies to prop up Social Insurance Programsfailing enterprises. * The financial sustainability of the pension
system is at risk unless measures are takenFringe Benefit Restructuring to:
* Although fringe benefits ("social asset * reduce expenditures on underage andexpenditures") are not a significant share of questionable disability pensions;enterprise costs on average, they can be aheavy burden on enterprises with low value * move to a system of idividualadded. accounts;
* Provision by enterprises of in-kind benefits * link pensions above a certainsuch as housing and food diverts subsistence level to lifetime earnings
such as housing and food diverts adpnincnrbtos nmanagement attention from core businessactivities. * increase reliance on individual
contributions while lowering thepayroll tax burden.
5
Reform Agenda and Macro Prospects
Although Belarus has made considerable easily rekindle inflation. This, plus the failure ofprogress since independence in liberalizing and reforms to break up and privatize state-ownedstabilizing prices, the success of these reforms monopoly structures, would prevent thecan be sustained only if Belarus accelerates the establishment of the business climate needed tostructural reforms required to create an attract investment from both foreign and domesticinvestment climate that will attract the necessary sources. Without the investment needed toinvestment. Without fundamental structural improve enterprise efficiency and internationalreforms, pressures on the budget and on the competitiveness, prospects for improved livingcentral bank to subsidize failing enterprises could standards will remain poor.
A. REFORM AGENDA
With rapid implementation of the reforms Belarus will be able to finance them only bysuggested in this paper, prospects for sustained attracting foreign and domestic privateeconomic growth are excellent. Belarus has investment resources. The Government shouldtremendous advantages over many if not most therefore create a business environment similar todeveloping countries in the world-a highly that in other countries which are competing witheducated work force, a good basic infrastructure, Belarus for investment resources. Without sucha long tradition of high tech industrial production, an environment, foreign investors will continue toa history of unusual openness to international avoid the Belarusian market, potential domestictrade, and excellent proximity to both the large investors will continue to take their moneyRussian and rich European markets. With these abroad, and any investment that does take placefavorable initial conditions, Belarus should be would probably not be competitively efficient. Asable to improve the quality and efficiency of its will be demonstrated in the remainder of thisproduction so that it competes well in chapter, efficient investment and production willinternational markets, thus providing the be vital to the future economic health of Belarus,foundation for good economic growth and and these can only be accomplished with strongimproved living standards. participation from private sector investors, both
Upgrading production facilities will Belarusian and foreign, within the context of arequire substantial investments, however, and supporting, market-oriented investment climate.
B. MACROECONOMIC PROSPECTS
This section presents three scenarios of certainly lie within the range delimited by thethe future prospects of the Belarusian cases presented here, the current politicaleconomy-the Policy Reform scenario, and two situation in Belarus makes it impossible to definelow case scenarios-GDP Decline and High Debt. a most likely scenario. At time of writing, anThe latter show what is likely to happen if emergency economic plan had just been releasedBelarus does not implement the policy reforms that stresses increased state control on prices,suggested in this report. administrative determination of the allowable
These scenarios are designed to define the range of exchange rate movement, protectionouter limits of what is likely to happen over the from imports for domestic producers, and annext few years, but none of these scenarios should rpansionary monetary policy to stimulatebe regarded as "most likely." While the "most growthlikely" or "base case" scenario will almost
79
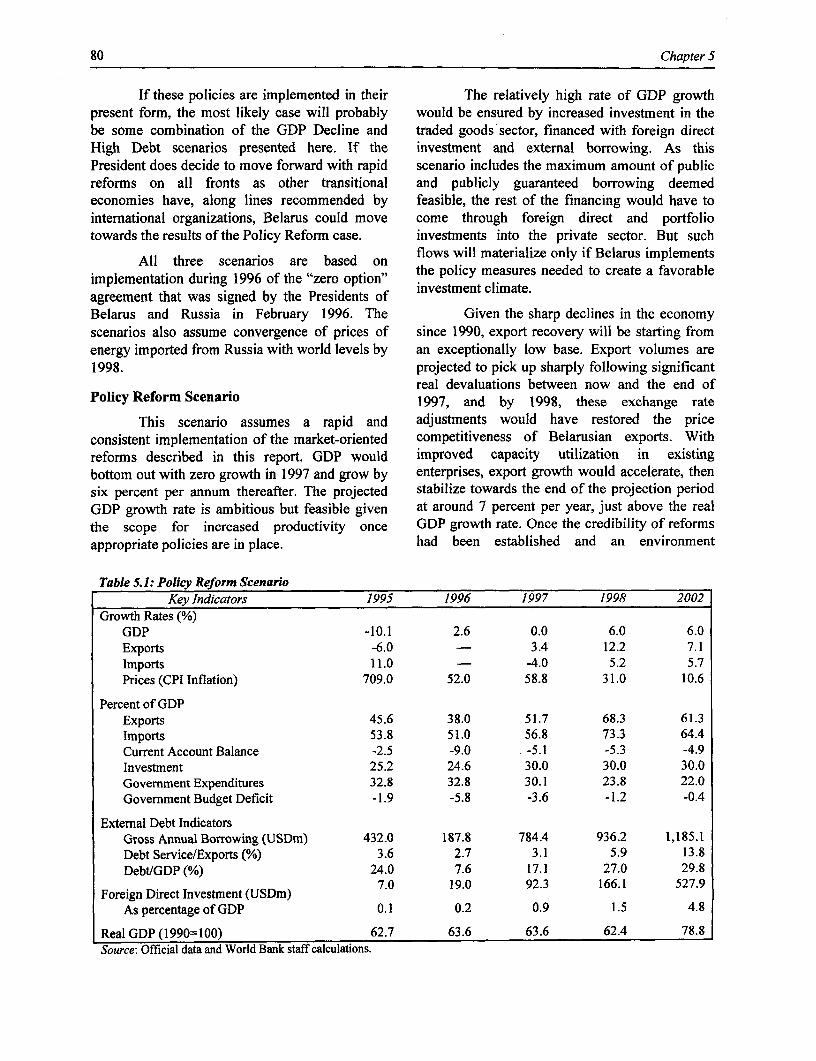
80 Chapter S
If these policies are implemented in their The relatively high rate of GDP growthpresent form, the most likely case will probably would be ensured by increased investment in thebe some combination of the GDP Decline and traded goods sector, financed with foreign directHigh Debt scenarios presented here. If the investment and external borrowing. As thisPresident does decide to move forward with rapid scenario includes the maximum amount of publicreforms on all fronts as other transitional and publicly guaranteed borrowing deemedeconomies have, along lines recommended by feasible, the rest of the financing would have tointernational organizations, Belarus could move come through foreign direct and portfoliotowards the results of the Policy Reform case. investments into the private sector. But such
All three scenarios are based on flows will materialize only if Belarus implements
implementation during 1996 of the "zero option" the policy measures needed to create a favorableagreement that was signed by the Presidents of investment climate.Belarus and Russia in February 1996. The Given the sharp declines in the economyscenarios also assume convergence of prices of since 1990, export recovery will be starting fromenergy imported from Russia with world levels by an exceptionally low base. Export volumes are1998. projected to pick up sharply following significant
real devaluations between now and the end ofPolicy Reform Scenario 1997, and by 1998, these exchange rate
This scenario assumes a rapid and adjustments would have restored the priceconsistent implementation of the market-oriented competitiveness of Belarusian exports. Withreforms described in this report. GDP would improved capacity utilization in existingbottom out with zero growth in 1997 and grow by enterprises, export growth would accelerate, thensix percent per annum thereafter. The projected stabilize towards the end of the projection periodGDP growth rate is ambitious but feasible given at around 7 percent per year, just above the realthe scope for increased productivity once GDP growth rate. Once the credibility of reformsappropriate policies are in place. had been established and an environment
Table 5.1: Policy Reform ScenarioKey Indicators 1995 1996 1997 1998 2002
Growth Rates (%)GDP -10.1 2.6 0.0 6.0 6.0Exports -6.0 - 3.4 12.2 7.1Imports 11.0 - -4.0 5.2 5.7Prices (CPI Inflation) 709.0 52.0 58.8 31.0 10.6
Percent of GDPExports 45.6 38.0 51.7 68.3 61.3Imports 53.8 51.0 56.8 73.3 64.4Current Account Balance -2.5 -9.0 -5.1 -5.3 -4.9Investment 25.2 24.6 30.0 30.0 30.0Government Expenditures 32.8 32.8 30.1 23.8 22.0Government Budget Deficit -1.9 -5.8 -3.6 -1.2 -0.4
External Debt IndicatorsGross Annual Borrowing (USDm) 432.0 187.8 784.4 936.2 1,185.1Debt Service/Exports (%) 3.6 2.7 3.1 5.9 13.8Debt/GDP (%) 24.0 7.6 17.1 27.0 29.8
Foreign Direct Investment (USDm) 7.0 19.0 92.3 166.1 527.9As percentage of GDP 0.1 0.2 0.9 1.5 4.8
Real GDP (1990=100) 62.7 63.6 63.6 62.4 78.8Source: Official data and World Bank staff calculations.
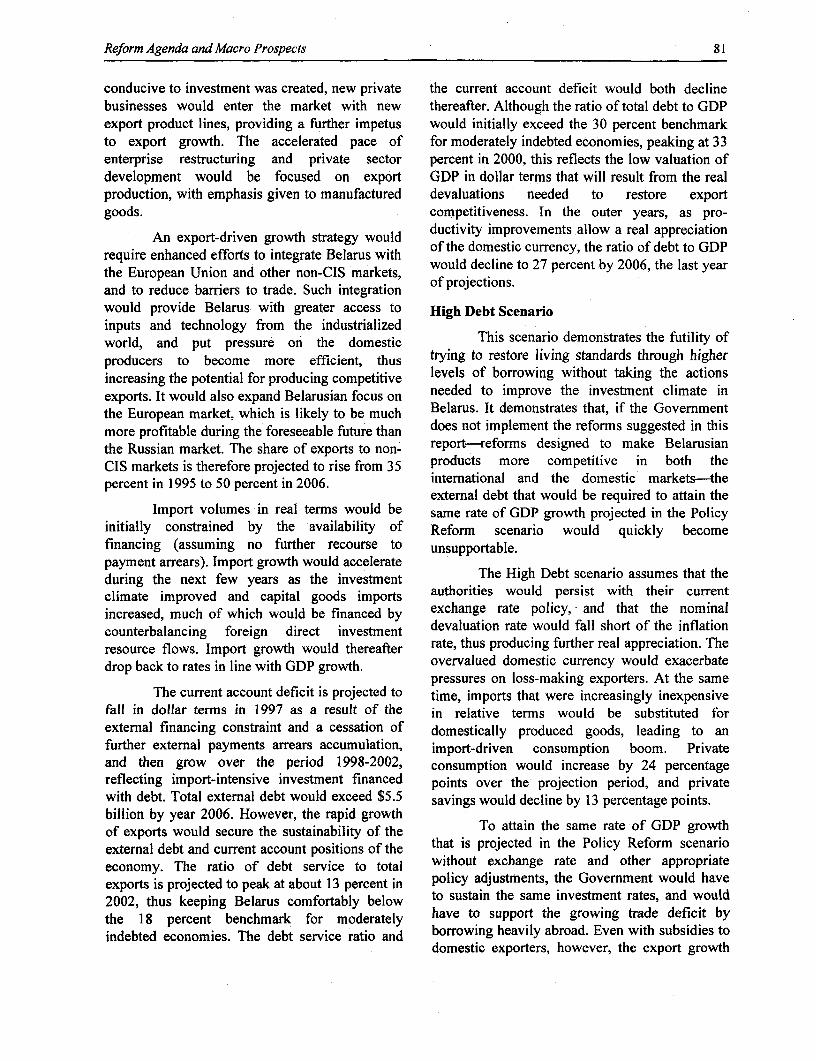
Reform Agenda and Macro Prospects 81
conducive to investment was created, new private the current account deficit would both declinebusinesses would enter the market with new thereafter. Although the ratio of total debt to GDPexport product lines, providing a further impetus would initially exceed the 30 percent benchmarkto export growth. The accelerated pace of for moderately indebted economies, peaking at 33enterprise restructuring and private sector percent in 2000, this reflects the low valuation ofdevelopment would be focused on export GDP in dollar terms that will result from the realproduction, with emphasis given to manufactured devaluations needed to restore exportgoods. competitiveness. In the outer years, as pro-
An export-driven growth strategy would ductivity improvements allow a real appreciationrequire enhanc effort tointegrateBeof the domestic currency, the ratio of debt to GDPrequire enhanced efforts to integrate Belarus with wuddciet 7pretb 06 h atya
the European Union and other non-CIS markets, would decle to 27 percent by 2006 the last yearand to reduce barriers to trade. Such integration of projections.would provide Belarus with greater access to High Debt Scenarioinputs and technology from the industrializedworld, and put pressure on the domestic This scenario demonstrates the futility ofproducers to become more efficient, thus trying to restore living standards through higherincreasing the potential for producing competitive levels of borrowing without taking the actionsexports. It would also expand Belarusian focus on needed to improve the investment climate inthe European market, which is likely to be much Belarus. It demonstrates that, if the Governmentmore profitable during the foreseeable future than does not implement the reforms suggested in thisthe Russian market. The share of exports to non- report-reforms designed to make BelarusianCIS markets is therefore projected to rise from 35 products more competitive in both thepercent in 1995 to 50 percent in 2006. international and the domestic markets-the
external debt that would be required to attain theImport volumes in real terms would be same rate of GDP growth projected in the Policy
initially constrained by the availability of Reform scenario would quickly becomefinancing (assuming no further recourse to unsupportable.payment arrears). Import growth would accelerateduring the next few years as the investment The High Debt scenario assumes that theclimate improved and capital goods imports authorities would persist with their currentincreased, much of which would be financed by exchange rate policy,d and that the nominalcounterbalancing foreign direct investment devaluation rate would fall short of the inflationresource flows. Import growth would thereafter rate, thus producing further real appreciation. Thedrop back to rates in line with GDP growth. overvalued domestic currency would exacerbate
pressures on loss-making exporters. At the sameThe current account deficit is projected to time, imports that were increasingly inexpensive
fall in dollar terms in 1997 as a result of the in relative terms would be substituted forexternal financing constraint and a cessation of domestically produced goods, leading to anfurther external payments arrears accumulation, import-driven consumption boom. Privateand then grow over the period 1998-2002, consumption would increase by 24 percentagereflecting import-intensive investment financed points over the projection period, and privatewith debt. Total external debt would exceed $5.5 savings would decline by 13 percentage points.billion by year 2006. However, the rapid growthof exports would secure the sustainability of the To attain the same rate of GDP growthexternal debt and current account positions of the that is projected in the Policy Reform scenarioeconomy. The ratio of debt service to total without exchange rate and other appropriateexports is projected to peak at about 13 percent in policy adjustments, the Government would have2002, thus keeping Belarus comfortably below to sustain the same investment rates, and wouldthe 18 percent benchmark for moderately have to sup port the growing trade deficit byindebted economies. The debt service ratio and borrowing heavily abroad. Even with subsidies to
domestic exporters, however, the export growth
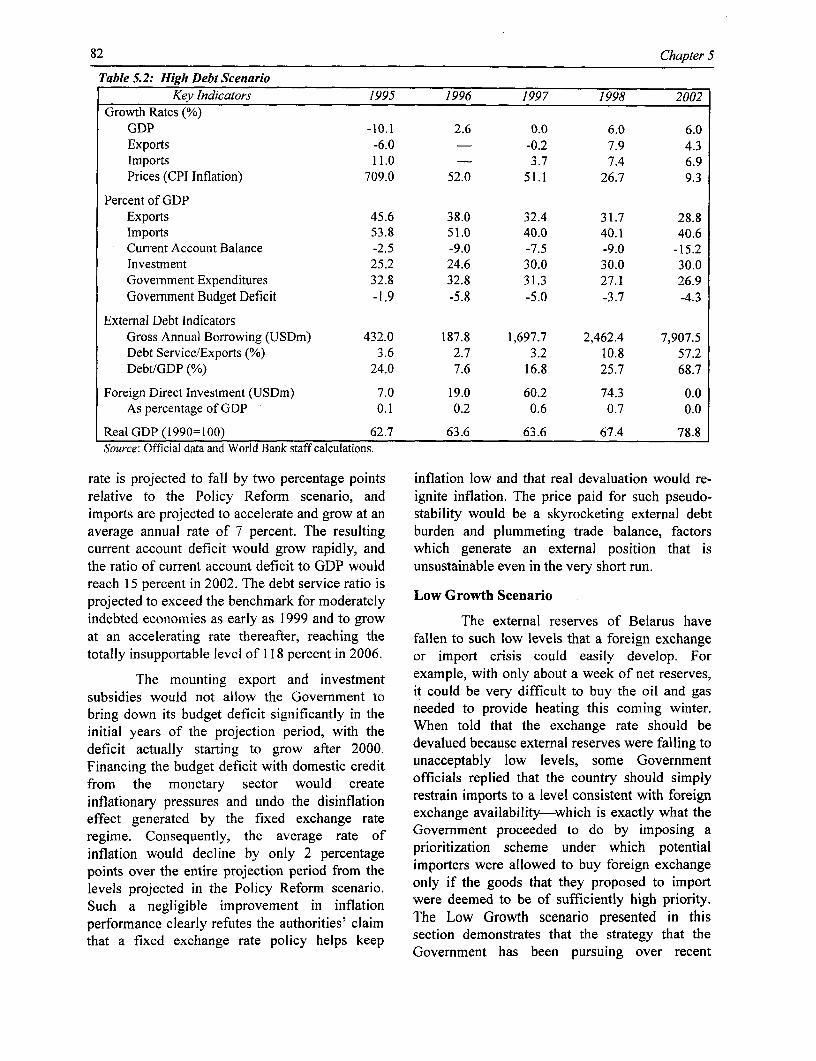
82 Chapter 5
Table 5.2: High Debt ScenarioKey Indicators 1995 1996 1997 1998 2002
Growth Rates (%)GDP -10.1 2.6 0.0 6.0 6.0Exports -6.0 - -0.2 7.9 4.3Imports 11.0 - 3.7 7.4 6.9Prices (CPI Inflation) 709.0 52.0 51.1 26.7 9.3
Percent of GDPExports 45.6 38.0 32.4 31.7 28.8Imports 53.8 51.0 40.0 40.1 40.6Current Account Balance -2.5 -9.0 -7.5 -9.0 -15.2Investment 25.2 24.6 30.0 30.0 30.0Government Expenditures 32.8 32.8 31.3 27.1 26.9Government Budget Deficit -1.9 -5.8 -5.0 -3.7 -4.3
External Debt IndicatorsGross Annual Borrowing (USDm) 432.0 187.8 1,697.7 2,462.4 7,907.5Debt Service/Exports (%) 3.6 2.7 3.2 10.8 57.2Debt/GDP (%) 24.0 7.6 16.8 25.7 68.7
Foreign Direct Investment (USDm) 7.0 19.0 60.2 74.3 0.0As percentage of GDP 0.1 0.2 0.6 0.7 0.0
Real GDP (I990=l00) 62.7 63.6 63.6 67.4 78.8Source: Official data and World Bank staff calculations.
rate is projected to fall by two percentage points inflation low and that real devaluation would re-relative to the Policy Reform scenario, and ignite inflation. The price paid for such pseudo-imports are projected to accelerate and grow at an stability would be a skyrocketing external debtaverage annual rate of 7 percent. The resulting burden and plummeting trade balance, factorscurrent account deficit would grow rapidly, and which generate an external position that isthe ratio of current account deficit to GDP would unsustainable even in the very short run.reach 15 percent in 2002. The debt service ratio isprojected to exceed the benchmark for moderately Low Growth Scenarioindebted economies as early as 1999 and to grow The external reserves of Belarus haveat an accelerating rate thereafter, reaching the fallen to such low levels that a foreign exchangetotally insupportable level of 118 percent in 2006. or import crisis could easily develop. For
The mounting export and investment example, with only about a week of net reserves,subsidies would not allow the Government to it could be very difficult to buy the oil and gasbring down its budget deficit significantly in the needed to provide heating this coming winter.initial years of the projection period, with the When told that the exchange rate should bedeficit actually starting to grow after 2000. devalued because external reserves were falling toFinancing the budget deficit with domestic credit unacceptably low levels, some Governmentfrom the monetary sector would create officials replied that the country should simplyinflationary pressures and undo the disinflation restrain imports to a level consistent with foreigneffect generated by the fixed exchange rate exchange availability-which is exactly what theregime. Consequently, the average rate of Government proceeded to do by imposing ainflation would decline by only 2 percentage prioritization scheme under which potentialpoints over the entire projection period from the importers were allowed to buy foreign exchangelevels projected in the Policy Reform scenario. only if the goods that they proposed to importSuch a negligible improvement in inflation were deemed to be of sufficiently high priority.performance clearly refutes the authorities' claim The Low Growth scenario presented in thisthat a fixed exchange rate policy helps keep section demonstrates that the strategy that the
Government has been pursuing over recent
Reform Agenda and Macro Prospects 83
months-the maintenance of an exchange rate develop in consumer goods markets, leading to athat has been kept at unrealistic levels, and the sharp increase in inflationary pressures. Theserestriction of imports to the level of available pressures will be exacerbated by the subsidies thatexport earnings to prevent erosion of net foreign the Government and the banking system will findexchange reserves-is clearly unsustainable in the necessary to prevent the collapse and closure ofmedium term and completely inconsistent with loss-making enterprises that cannot function forthe Government's objective of eliminating lack of imported inputs and export earnings.poverty and raising living standards. Inflation will quickly erode living standards,
In countries that are essentially self- bringing real consumption into line with fallingIn~ ~ ~ ~ ~ ~~~~~~ra output.e Thet posibl resultsl ofshlsraegsufficient, either because they are very large or real output. The possible results of this strategybecause they are very poor, restricting imports to are simulated in Table 5.3.levels consistent with available export earnings As the Government continues with itscan be a viable (though not desirable) strategy. In policy of overvalued domestic currency, exportsa country like Belarus, however, such a strategy are projected to drop by about ten percent inwould create extreme economic difficulties. 1997, with export volume decline continuingTrade turnover (exports plus imports) have throughout the projection period. To prevent thetraditionally been more or less equal to GDP in total erosion of net foreign exchange reserves, theBelarus. This reflects the deep dependence of the authorities would have to cut imports drastically.productive sectors on imported raw and Total volumes of imports are projected to declineintermediate materials, and on export markets for by over 20 percent in 1997, with the brunt of thesales. Reducing imports in a country like Belarus cuts being borne by consumer and manufacturedwill immediately and directly reduce economic goods imports from non-CIS countries.growth and exports because farms and factories Falling export earings would reduce thewill not have access to the inputs that they need to economy's effective demand (as opposed to need)continue production. With falling production and for energy, capital, and intermediate goods. At thelimited imports, severe scarcities will also same time, the supply of working capital needed
Table 5.3: Low Growth ScenarioKey Indicators 1995 1996 1997 1998 2002
Growth Rates (%)GDP -10.1 2.6 -7.0 -6.0 -3.0Exports -6.0 - -9.5 -7.6 -5.8Imports 11.0 - -21.3 -15.4 -9.3Prices (CPI Inflation) 709.0 52.0 110.3 109.4 305.2
Percent of GDPExports 45.6 38.0 29.3 24.1 7.5Imports 53.8 51.0 30.9 25.1 7.6Current Account Balance -2.5 -9.0 -1.6 -1.2 -0.3Investment 25.2 24.6 25.2 25.2 25.2Government Expenditures 32.8 32.8 34.2 35.1 30.4Government Budget Deficit -1.9 -5.8 -4.6 -5.1 -6.5
External Debt IndicatorsGross Annual Borrowing (USDm) 432.0 187.8 580.6 339.3 527.2Debt Service/Exports (%) 3.6 2.7 3.5 7.0 15.5Debt/GDP (%) 24.0 7.6 9.8 9.0 4.5
Foreign Direct Investment (USDm) 7.0 19.0 53.2 61.9 0.0As percentage of GDP 0.1 0.2 0.6 0.6 0.0
Real GDP (1990=100) 62.7 63.6 59.2 55.6 44.2Source: Official data and World Bank staff calculations.
84 Chapter 5
same time, the supply of working capital needed Financing Requirementsto sustain production would be severely The financing requirements for the high
circumscribed by the external financing debt and low growth scenarios do not need to beconstraint. As a result, output is projected to discussed in detail here because neither scenariocontinue to decline at an average rate of three tofour percent throughout the projection period. The ismsustaie the are preseted onlydemonstrate the serious problems that wouldGDP and exports decline rates are projected to be result from a continuation of current govermentmost acute in 1997, and then to slow down in the policies. The Policy Reform scenario, however,outer years of projections as the economy slips indicates the financing that will be required if
into self-sufficiency. The continuing GDP decline Belarus implements the necessary policyover the 1996-2002 period is projected to bring measures and maximizes its economic growth,GDP down to only 40 percent of the level at thetime of independence, a result that would parallel sct to tecrs of the nation' finitialthe experience of Zaire and Zambia between 1980 conditions in terms of the physical and financialand 1987. resources available to it today. This scenario alsoand 1987. represents the feasible upper limit of borrowing
To keep the external debt position for the following reasons. First, it assumesmanageable, the authorities would have to keep optimal economic policy performance, and ifthe current account deficit close to zero policy performance falls below the levelsthroughout the period. The debt service ratio is assumed here, Belarus will not be able to attractprojected to reach about 17 percent towards the either the debt or the equity (FDI) financing thatend of the projection period, then decline has been assumed. If policy perfornance does fallthereafter as the Government continued to below the levels assumed here, higher levels ofartificially constrain imports, thereby destroying borrowing might be desired in order to sustainthe basis for renewed economic growth. consumption and living standards in the absence
The Govemnment would seek to keep of good economic performance, but higher levels
failing enterprises afloat with budgetary subsidies of borrowing would be neither available norand directed credit. Consequently, the budget sustainable. Second, unless Belarus were to attaindeficit is projected to increase over the period and considerably better export performance than theto reach an unsustainable level of 10 percent of generous levels assumed in the Policy ReformGDP in 2006. Financing the budget deficit and scenario above, and this is unlikely for a varietythe rapidly growing portfolio of non-performing of physical reasons, higher levels of borrowingloans of commercial banks with central bank cannot be sustained even in the Policy Reform
credit, c d wcase. Thus any financing scenario other than thatshown for the Po icy Reform scenario in Table
consumer goods would rekindle high inflation. 5.1 is likel to involve lower levels of(CPI increases are projected to reach 300 percent y
on a yer-on-yer basisin 2006)Real rivat borrowing-ut if these take place without goodon a year-on-year basis In 2006.) Real private eooi efrac,tedb evcconsumption is projected to fall by over 30 economic performance, the debt serviceconsumption is prjindicators will nevertheless be less satisfactorypercent relative to its 1995 level, bringing about a than in the Policy Reform case. Thedramatic deterioration of living standards. Privateconsumption per capita in constant 1995 prices corresponding balance of payments picture iswould drop from USD 513 in 1995 to USD 347 in presented in Table 5.4.2006, thereby increasing the share of familiesbelow the poverty line to over 60 percent.
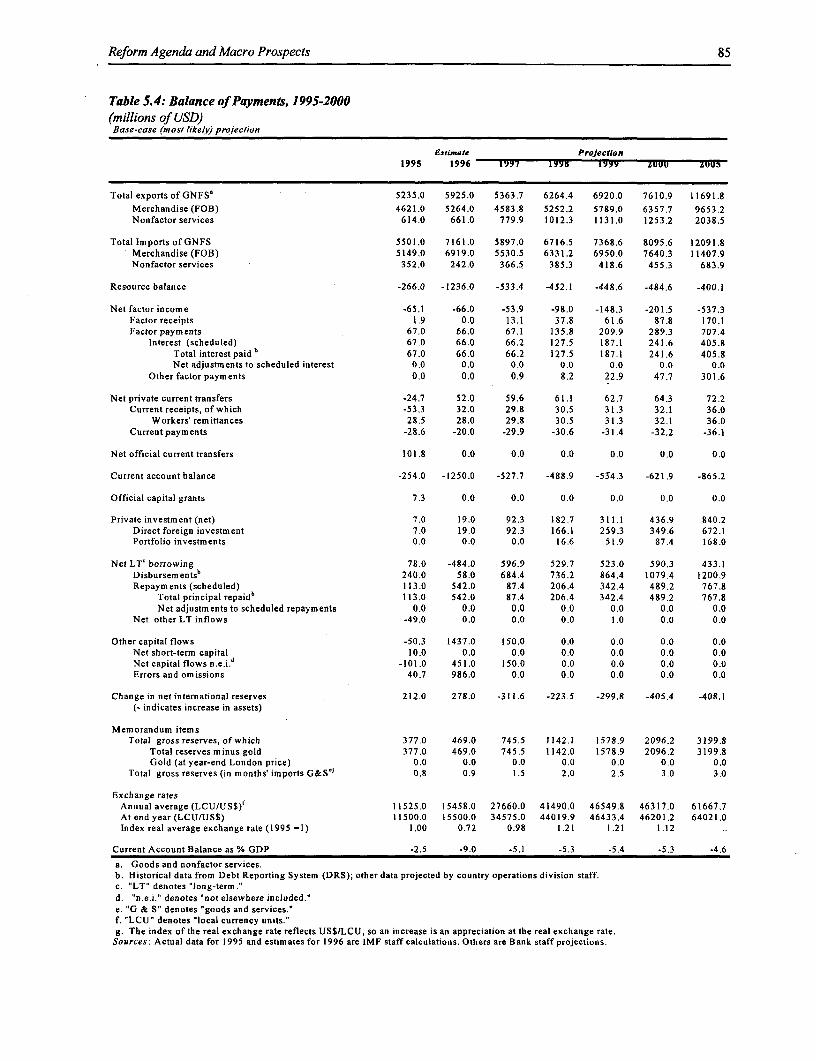
Reform Agenda and Macro Prospects 85
Table 5.4: Balance of Payments, 1995-2000(millions of USD)Base-case (ti ost likely) projection
Estimate Projection1995 1996 179 IVY5 VOY9 zuuu LUuS
Total exports of GNFS- 5235.0 5925.0 5363.7 6264.4 6920.0 7610.9 11691.8
Merchandise (FOB) 4621.0 5264.0 4583.8 5252.2 5789.0 6357.7 9653.2Nonfactorservices 614.0 661.0 779.9 1012.3 1131.0 1253.2 2038.5
Total Imports ofGNFS 5501.0 7161.0 5897.0 6716.5 7368.6 8095.6 12091.8Merchandise (FOB) 5149.0 6919.0 5530.5 6331.2 6950.0 7640.3 11407.9Nonfactor services 352.0 242.0 366.5 385.3 418.6 455.3 683.9
Resource balance -266.0 -1236.0 -533.4 -452.1 -448.6 -484.6 -400.1
Net factor income -65.1 -66.0 -53.9 -98.0 -148.3 -201.5 -537.3Factor receipts 1.9 0.0 13.1 37.8 61.6 87.8 170.1Factor payments 67.0 66.0 67.1 135.8 209.9 289.3 707.4
Interest (scheduled) 67.0 66.0 66.2 127.5 187.1 241.6 405.8Total interest paidb 67.0 66.0 66.2 127.5 187.1 241.6 405.8Net adjustments to scheduled interest 0.0 0.0 0.0 0.0 0.0 0.0 0.0
Other factor payments 0.0 0.0 0.9 8.2 22.9 47.7 301.6
Net private current transfers -24.7 52.0 59.6 61.1 62.7 64.3 72.2Current receipts, of which -53.3 32.0 29.8 30.5 31.3 32.1 36.0
Workers'remittances 28.5 28.0 29.8 30.5 31.3 32.1 36.0Current payments -28.6 -20.0 -29.9 -30.6 -31.4 -32.2 -36.1
Net official current transfers 101.8 0.0 0.0 0.0 0.0 0.0 0.0
Current account balance -254.0 -1250.0 -527.7 -488.9 -5S4.3 -621.9 -865.2
Official capital grants 7.3 0.0 0.0 0.0 0.0 0.0 0.0
Private investment (net) 7.0 19.0 92.3 182.7 311.1 436.9 840.2Direct foreign investment 7.0 19.0 92.3 166.1 259.3 349.6 672.1Portfolio investments 0.0 0.0 0.0 16.6 51.9 87.4 168.0
Net LT' borrowing 78.0 -484.0 596.9 529.7 523.0 590.3 433.1Disbursements" 240.0 58.0 684.4 736.2 864.4 1079.4 1200.9Repayments (scheduled) 113.0 542.0 87.4 206.4 342.4 489.2 767.8
Total principal repaid' 113.0 542.0 87.4 206.4 342.4 489.2 767.8Net adjustments to scheduled repayments 0.0 0.0 0.0 0.0 0.0 0.0 0.0
Net other LT inflows -49.0 0.0 0.0 0.0 1.0 0.0 0.0
Other capital flows -50.3 1437.0 150.0 0.0 0.0 0.0 0.0Net short-term capital 10.0 0.0 0.0 0.0 0.0 0.0 0.0Net capital flows n.e.i.d -101.0 451.0 150.0 0.0 0.0 0.0 0.0Errors and omissions 40.7 986.0 0.0 0.0 0.0 0.0 0.0
Change in net international reserves 212.0 278.0 -311.6 -223.5 -299.8 -405.4 -408.1(- indicates increase in assets)
Memorandum itemsTotal gross reserves, of which 377.0 469.0 745.5 1142.1 1578.9 2096.2 3199.8
Total reserves minus gold 377.0 469.0 745.5 1142.0 1578.9 2096.2 3199.8Gold (at year-end London price) 0.0 0.0 0.0 0.0 0.0 0.0 0.0
Total gross reserves (in months' imports G&Sc' 0.8 0.9 1.5 2.0 2.5 3.0 3.0
Exchange ratesAnnual average (LCU/US$)' 11525.0 15458.0 27660.0 41490.0 46549.8 46317.0 61667.7At end year (LCU/US$) 11500.0 15500.0 34575.0 44019.9 46433.4 46201.2 64021.0Index real average exchange rate (1995 =1) 1.00 0.72 0.98 1.21 1.21 1.12
Current Account Balance as % GDP -2.5 -9.0 -5.1 -5.3 -5.4 -5.3 -4.6
a. Goods and nonfactor services.b. Historical data from Debt Reporting System (DRS); other data projected by country operations division staff.c. "LT' denotes "long-term."d. "n.e.i." denotes "not elsewhere included."e. "G & S" denotes "goods and services."f. "LCU" denotes "local currency units."g. The index of the real exchange rate reflects USS/LCU, so an increase is an appreciation at the real exchange rate.
Sources: Actual data for 1995 and estimates for 1996 are IMF staff calculations. Others are Bank staffprojections.
86 Chapter 5
C. KEY THEMES AND CONCLUSIONS
The analysis presented in this report has production sector in Belarus, and this level ofled to the following important conclusions, which investment can only be attained if Belaruswere developed in the preceding chapters. creates (a) an investment climate that attracts
private investment from both domestic andFirst, a return to the past is not feasible. The foreign sources, and (b) a market-drivenprevious system, to which many people in incentives framework that ensures efficientBelarus would still like to return because of production and sales decisions.the many benefits they enjoyed, collapsedbecause the system was intrinsically . Fifth, these goals cannot be reached in ainefficient. It tried to allocate resources based system where the majority of productionon decisions made by a relatively small group activities are still controlled by the state.of Goverment administrators based on a Attempting this would simply perpetuate thevariety of economic, social and political problems of the past. Consequently,considerations. This system, despite its high privatization, which has moved very slowly toideals, cannot compete in the real world with date, must be accelerated dramatically toeconomic systems where resources are assure appropriate incentives for and focus onallocated to maximize profits and consumer profit-maximizing behavior of managerswelfare is based on the individual decisions of within a market-oriented environment such asthose most directly affected. exists in all successful industrialized
countries.* Second, the inefficiency by world standards of
Belarusian enterprises today, particularly _ Sixth, hard budget constraits-rules thatthose in industry and agriculture, is the main force enterprises to spend no more than theysource of the country's economic decline and ear or can responsibly borrow-must bepoverty, imposed to control inflation and to provide the
incentives that will lead to spontaneous,* Third, this inefficiency can only be overcome efficiency-oriented privatization and
by creating the competitive, efficient product production decisions.and factor markets and the profit-maximizingproduction systems in Belarus that exist in hrse h te transition process will involveEurope and elsewhere in the industrialized hardships for those who must leave theirworld, present jobs and look for new ones. The social
safety net needs to be focused on protecting* Fourth, substantial investments will be these workers and their families while, at the
required to physically transform the same time, maintaining their incentive to findnew, more productive jobs.
Notes
1. Easterly, William and Stanley D. Fischer, 1994. 6. This system will work only if hard budget"The Soviet Economic Decline," The World constraints and financial discipline are applied toBank Economic Review 9(3): 341-71. all enterprises equally. Otherwise, enterprises that
are desperate for money will be willing to pay
inforeoation collected largely in mid-1996. Where exorbitant rates of interest knowing that, in thepossible, key indicators have been updated end, they will probably not be forced to repay thephrossi tl, ke indiors Ahav een udate loan. The same caveat applies if interest rates
throug the nd of1996. lthouh som datacharged by commercial banks are decontrolled.were somewhat out of date at time of publication,the situation had not changed materially in terms 7. Bruno, Michael, and William Easterly. 1995.of the nature of the economic problems facing "Inflation Crises and Long-run Growth."Belarus, and almost all of the recommendations Washington, DC: The World Bank (processed).were still fully relevant at the time of final 8. The problem centers on the procedure forrevision of the published version in mid-April R Tepolmcneso h rcdr o1997. converting current price output data to constant
prices. The methodology currently in use3. The emphasis here is on manufacturing enterprises. produces a constant or comparable price series
The Belarusian authorities already accept that for industrial production that, in each year sincemost sales and service enterprises should be in the early 1990s, has shown a rising trendthe private sector, and even in relatively throughout each year, with a particularly largeindustrialized countries, public utilities and mass surge in the last two or three months of the year,transit services are often provided by public followed by a major contraction betweenenterprises because of the problems of economies December and January. This pattern of year-endof scale and the risk of non-competitive market surges became increasingly exaggerated in 1992-structures. 94 with higher rates of inflation, which tends to
confirm that the flaw in the methodology relates4. Trade data from the period do not adequatelytoheramntfris.Frnalraiv
reflect the benefits derived by Belarus under the to the treatment of prices. For an altemativeapproach to calculating the real growth of
Soviet system. For example, the trade data for industrial output in Belarus, see Belarus1990 indicate a commodity trade surplus of close Economic Trends, August 1996, Table 6.1.to RUR 2.4 billion, indicating that Belarus waseffectively a capital exporter. However, if the 9. Many Belarusians believe that the economictrade is revalued at world prices, adjusting in crisis has already been so severe that theparticular for the artificially low price of energy economy could not possibly decline further.supplies, Belarus had a trade deficit of RUR 1.2 Unfortunately, evidence from other countriesbillion. In other words, through the artificial demonstrates that the economy of Belarus willpricing of this period, Belarus enjoyed a net gain probably continue to decline absolutely, or atin commodity trading of RUR 3.6 billion, the least relatively to other countries, unless seriousequivalent of 9 percent of GDP. (Zlotnikov, structural reforms are initiated. Argentina is an1996). excellent case in point. In the early part of this
century, Argentina was a prosperous nation of5 The data on credit available to industry in 1990 wel-ucae people hav a prero captaincomake its position look more favored than it well-educated people having a per capita incomemakitsal positionb look moe"redi" favoredatn it similar to that in the United States. However, aactually was. Much of the "credit" available to cobnto ofetniesaeonrhpo
industry atti.iecudntb pn.I a combination of extensive state ownership ofindustry at this time could not be spent. It was production, control-oriented government policies,just part of the "monetary overhang" that built up non-trans .arntrulestof businent andin the banking system towards the end of the non-transparent rules of buseess conduct andSoviet era because administrative controls had taxation, populist wage and expenditure policies,prevented prices from rising to equilibrate the gly ie y
led to inflation and economic decline. By thesupply ofher mooneyn wthe Soviethecsuply. ofinearly 1990s, Argentina's per capita income was
only about one tenth that of Canada. The parallelsto the current situation in Belarus are extremely
87
88 Notes
clear. Since 1990, Argentina has begun by the ratio of domestic to world inflation. Theimplementing measures consistent with those result is usually then expressed in index numberrecommended in the present report. Hopefully, form, setting the index to 100 at some point inBelarus will do the same without first going time (January 1993, for example). Unfortunately,through years of economic stagnation and falling the economics profession has not agreed onliving standards. whether world prices or domestic prices should
10. Easterly and Fischer, 1994. go into the numerator when calculating the realexchange rate. Depending on the choice made, a
11. "East" and "West" are used as short-hand terms rising line can show either real exchange ratefor the CIS and non-CIS markets respectively. appreciation or real exchange rate devaluation.Russia dominates trade with the East, accounting The convention adopted here is that realfor 80-90 percent of such trade. Trade with the appreciation or rising real purchasing power ofWest is more diversified, but Germany is the the domestic currency in international trade isleading partner, accounting for about one fourth shown with a rising line.of Belarusian imports and about one seventh of 14. Wage rates in Russia now exceed those in
its exports to the rest of the world. Belarus, but this reflects special conditions. The
12. The dollar equivalent prices of goods traded with higher dollar wages in Russia are linked to risingRussia and other CIS countries were artificially levels of production and to a strong balance oflow in the early days of independence. Since payments position that is supported by energythen, unit prices in dollars for a wide range of exports for dollars in western markets. The higherimportant products have increased considerably purchasing power of wages in dollars is thusfaster than world dollar prices on average. This matched by export earnings in dollars.
welcome convergence with world market prices, 15. The Belarusian rubel has also appreciated againsthowever, has important implications for the the RUR, but to a much lesser extent than againstvaluation and assessment of trends in the real the USD, the DEM and other hard currencies.volume of Belarusian exports to these markets. Consequentl the real apreciation of the trade-Because aggregate import and export price index weighted exchange rate in which trade withdata do not exist for Belarus, dollar equivalent Russia has a weight of about 50 percent, isvalues for trade are commonly used as a proxy significantly lower than the real appreciationfor volumetric data. However, if the dollar prices sgnintly lw than the rea preciatio' ~~~~~~~against the USD as shown in the charts presentedfor trade with Russia are deflated to take account here. The lower appreciation of the BYR versusof the sharp increase in the dollar prices of goods the RUR as compared to the USD reflects the factmoving in this market over the past few years, it that the RUR has also been appreciating in realbecomes apparent that Belarusian exports have terms. This has been less of a problem forfallen more seriously than previously reported. Russian than for Belarus, however, because withFor example, between 1993 and 1995 the its strong natural resource base, includingnominal dollar value of exports increased by 140 exportable quantities of oil and gas, the Russianpercent, but the constant dollar value of these balance of payments situation is more sustainableexports, indicating actual physical volumes, than is the case in Belarus. Belarus needs todecreased by over 50 percent (Zlotnikov 1996, establish and keep an exchange rate that isTables I and 10). competitive in all of its markets, not just with
13. Real exchange rate appreciation occurs when respect to the West. Adjustments of the exchangedomestic inflation, which reduces the purchasing rate against the dollar are much easier to monitorpower of a unit of domestic currency, is not offset and interpret than adjustments against the RURby an exchange rate adjustment. For example, if because of the greater stability of absolute anddomestic prices increased by 10 percent, and relative prices on international as opposed to FSUthere was no inflation in world prices, the markets, and adjustments in BYR/USD exchangeexchange rate would have to be devalued by 10 rates will automatically produce parallel changespercent to maintain competitiveness unless other in the BYR/RUR exchange rates because of thefactors, such as increasing productivity or the opportunities for arbitrage.ability to accept lower profits on exports,compensated for the domestic inflation. The real 16. If Belarus chooses to devalue its currency, this
exchngerate inits oststrightorwrd frrn ismeans that it has rejected the even more painfulexchangerate, in its most straightforward form, is and probably harmful option of creating acalculated by dividing the nominal exchange rate
Notes 89
depression that will drive domestic prices and expenses are not counted until after profits havewages down until they are consistent with the been calculated.
current exchange rate. Given the size of 21. Sberbank/Belarusbank, Promstroibank, Agro-adjustment in relative prices that is needed, prombank, Belbusinesbank, Priorbank, andtogether with the fact that Belarus is already in a Vnesheconombank.severe depression, the price reduction approachmust be rejected, leaving devaluation as the only 22. In these years, revenues of the State Budgetfeasible alternative. (excluding social funds and extrabudgetary
17. The reader may think that there is a fundamental funds) were 35 percent and 30 percentinconsistency in this paragraph. On the one hand respectively.it speaks of restoring balances by reducing 23. Under full cost recovery, the share of each ofdomestic prices. On the other hand it says that the these items in the total during the winter wouldnecessary balance can be restored by raising be as follows: heating (36%), electricity (15%),prices in the domestic market. The apparent rent (13%), and hot water (13%). Source:inconsistency is easily resolved and centers on Ministry of Housing and Communal Services, asthe presence or absence of a devaluation. The reported in IMF, Recent Economic Developmentsunderlying problem is to reduce purchasing 1995, Table 74.power and thus aggregate demand. This can be
dawages, in 24. The Anti-Monopoly Ministry was abolished indone directly by reducing nominal wgs nthe summer of 1996, but the new Ministry ofwhich case there is no inflation; in fact, prices . . 'would be reduced under this approach. Aggregate Entrepreneurship will continue the anti-monopolydemand can also be reduced by reducing the work of the former ministry in addition topurchasing power of the nominal wages through working on the development of privateinflation. However, unlike the situation with a entrepreneurship.deflationary solution to the problem, the 25. For example, based on the assets of 128inflationary solution requires a substantial marketing conglomerates and trusts, about 1,200devaluation at the same time, thereby establishing independent economic entities had been set up bya sustainable balance between domestic and the end of 1996. As a result of work during 1996,foreign (or better non-traded and traded) prices. 25 trade and public catering companies out of 54Devaluation is the only way, in the inflation- that were under control as monopolistic entitiesbased approach, to assure appropriate prices for lost their dominating position and were strickenimported goods relative to those for domestic off the State Register of dominating companies.goods, thereby assuring that the purchasinggoods, there assurin tha theopurchasing 26. As a result of anti-monopoly efforts, a reasonablypower of workers is reduced for Imported as well competitive environment has been established inas for domestic goods. (A key problem during co nstructionmin al ren excep in1995 in Belarus was that the fixed exchange rate where the Minsk Leased Company ofplus rising wages actually expanded aggregate Industrialized House Building remains ademand rather than contracting it.)InutilzdHseBligrmasa
monopolist. To help remedy this problem, the18. Government of Belarus. 1996. The Major Trends Program of Demonopolizing the Belarusian
of Social and Economic Development of the Economy for 1996-97 envisages (a) improving aRepublic of Belarus for 1996-2000. system of compulsory open bidding in the
19. Minor distortions can of course be absorbed by construction sector, and tenders for allany healthy economy without creating serious construction works; (b) facilitating the develop-
probems.Howeer, inordistrtios ar usullyment of a market infrastructure for contractors;problems. However, minor distortions are usually (c);creating leasing, consulting and other firms;not sufficient to attain the degree of support for and (d) providing services to the constructionthe poor that is needed. As a result, the distortions prsooner or later are increased to the point that they sector.causes the system to break down. 27. U.S. Dept. of Commerce, 1992. Statistical
20. These figures seriously understate the true level Abstract of the United States, 1992. Tables 826of losses. The Soviet accounting system still used and 849.by most enterprises does not take inflation and 28. For example, the survey of exporters noted abovethe cost of replacing inputs into account, and a found that, other than excessive taxation, thenumber of business costs such as marketing most important problem restraining the
90 Notes
development of exports was the "unstable The 1997 State Budget of the Republic of Belaruslegislative and regulatory environment" in envisages both the abolition of payments to theBelarus. fund for maintenance of fire brigades and a
29. Examples of this are the recent Chernobyl tax reduction in the rate of the Emergency Chernobylmodification, which was applied retroactively, tax.and the taxes on turnover for the Road, 35. The Government recognizes the desirability ofAgricultural Protection, and Housing extra- moving to the world-standard destination form ofbudgetary funds, which were also applied with VAT but rightly notes that agreement must firstretroactive effect. be reached with Russia, which so far is only
applying the destination principle in its trade with30. For example, enterprises may be exempted fromUkan.TOhsrqetdhtRuiawtcthe payment of VAT and other taxes for a variety Ukraine. WTO has requested that Russia switchthrepaymenst ofe V etiand otr taxes foravaienty to the destination principle. The Government alsoof reasons at the discretion of the Government;imports may be subject to differential rates-or sees the lack of a customs border with Russia as aeven exempted entirely from duties as in the problem for good management of the VAT inTorgExpo case-depending on the discretion of cross-border trade; although this problem isTorgExpo case-depending onftheidiascreti of handled among the highly-developed countries invarious government officials; certainteErpamno,thswudb uteexpenditures may or may not be allowed as the European Union, this would be a further
argument for moving to a free trade areacapital investments, which can have a major reaiosi wit Rusi at titmeimpact on future tax liabilities; certain expenses,such as those for marketing, may not even be 36. The State Fund to Support Exporters has nowallowed as costs but must be paid for out of been eliminated.profits, depending on the judgment of the tax 37. The 1997 State Budget proposes to eliminateinspector. most extrabudgetary funds other than the State
31. For example, a major international soft drink Employment Fund and the Social Protectioncompany wants to purchase land near Minsk to Fund which, according to international practice,set up a bottling plant, but permission to purchase will continue to be kept separate because they areland can only be obtained by special application essentially insurance rather than currentto the Supreme Soviet. At time of writing, the expenditure programs. It appears that thedecision is still being debated in the Government plans to keep the extra-budgetaryparliamentary body. fund to support agricultural producers, but this
32. The international literature on reducing fund may at least be integrated with the budgetcorruption in government indicates that most during the course of the year.corruption arises because governments create 38. A full definition and defense of the role of"rent-seeking" opportunities-situations where government proposed here is beyond the scope ofgovernment officials are given the right to this report, but will form a central focus of theapprove or reject private applications for special dialogue which is anticipated in connection withprivileges. The risk of corruption is especially the proposed Public Expenditure Review forgreat when the decision-making is not based on a Belarus.transparent, competitive process, such as 39. This report follows the Belarusian convention ofauctions. distinguishing between "republican" enterprises,
33. One argument for retaining import duties is that which were under the control of ministries at thethey provide a low cost, reliable basis for revenue level of the Republic of Belarus, andgeneration, particularly in economies where tax "communal" enterprises, which were owned byadministration systems are weak and officials are governments at the oblast and municipal levels.not accustomed to dealing with a growing Republican enterprises are usually medium- andnumber of enterprises not directly owned and large-scale manufacturing and infrastructurecontrolled by the government. operations, while communal enterprises are
generally small-scale operations such as shops34. The "levy for fire service upkeep" is based on and small processing plants.
"0.005% of the value of production and non-production assets, stock of goods and valuables 40. Any data on the profits of enterprises in Belarusof the objects of mentioned purposes, located in should be treated with great caution, sincethe Republic, taking into account adjusted ratios." profitability is consistently overstated under the
Notes 91
Soviet style accounting system that is still used were issued by the Anti-Monopoly Ministry toby most enterprises in Belarus. First, the system assure restoration of fair practices. These casesdoes not allow for taking into account the impact included an injunction against the Polotskof inflation on the cost of purchasing Executive Council, which had issued a resolutionreplacements for material inputs used in making it mandatory for companies sellingproduction, a serious problem given the triple- alcoholic beverages to limit sales of vodka onlydigit rates of inflation that have prevailed until to vodka produced by the Polotsk wine-makingrecently in Belarus. On the other hand, certain factory, and an injunction against the Ministry ofexpenses, generally related to marketing, cannot Health, which had given the state enterprisesbe subtracted as working expenses but must be Belbiopharm, BeIPRO "Pharmacia," and OPOpaid out of profits, thus reducing the measure of "Pharmacia" the right to control the issue ofprofits. permnits to others to import medicines and
41. World Bank survey of 14 state enterprises, 1994. pharmaceutical substances.46. From an economics perspective, a "social"
42. The positive net worth shown in Figure 3.2 is service or good is commonly regarded as oneprobably overstated because of asset over- sevc.rgo scmol reade s nprobablyat ovrttdbcue fastoe-(like public health, sanitation, or public safety)valuation. that has significant externalities that benefit
43. The universe of enterprises varies according to society at large, and which the private sectordata source. MinStat reported 4,812 republican would not supply in optimal amounts withoutand 8,906 communal enterprises as of January government support given the difficulty of1996. However, the Tax Department reported charging individual beneficiaries. The most8,687 republican and 10,050 municipal costly "social assets" in transition economiesenterprises. -housing and public utilities-are in fact goods
and services which individuals pay for in normal44. Registration of new and existing enterprises has and ece s which ar usual
now resumed. It is not going smoothly, however, market economies and which are usuallyfor several reasons: (a) the local offices provided largely if not entirely by privateresponsible are not adequately staffed, so long enterprises.queues form, wasting hours of valuable time for 47. See Simon Commander and Richard Jackman,the entrepreneurs and investors; (b) the national "Providing Social Benefits in Russia: Redefiningand local authorities have not adequately defined the Roles of Firms and Government." Policythe requirements for registration (e.g. copies of Research Working Paper WPS 1184, Economicleases on premises required); and (c) they do not Development Institute, The World Bank, 1993.have adequate progra-ns of public information so 48. It has been estimated, for example, that a quarterthat entrepreneurs can know the requirements in of all unemployment in 1992 in Poland was dueadvance, collect all required information, and to allm pltoymno n 1992oin Pansd .as du. . ~~to limitations on labor mobility caused by lack ofhandle the entire process in one trip. In addition housing. See Fabrizio Coricelli, Krysztofto wasting time that should be spent on increasing Hagemejer and Krysztof Rybinski, "Poland," in
output and helping Belarus grow, the Simon Commander and Fabrizio Coricelli (eds),combination of long lines and non-transparent Unemployment, Restructuring, and the Laborregulations creates a breeding ground for Market in Eastern Europe and Russia, EDIcorruption. These problems could all be solved Development Studies, Washington, DC, Therather easily by reducing, clarifying, and World Bankt 1995, p. 74.announcing the detailed requirements for W B(re)registration in advance. 49. All references to "poverty" and "poverty rates" in
45. Such actions are strictly illegal, however, and the this paper refer to the percentage of households45. i-Monopoly Suchorities make every effort to with less than the minimum level of income inAnti-Monopoly authorities make every effort to cash and in kind that, given the household'sdetect, punish and prevent such activity. In 1996, casition (nd at, gende iseed'sfor example, 289 cases were inspected for composition (number, age and gender), is neededcompliance with anti-monopoly regulations. to provide the minimum acceptable level ofSome cases were initiated on the basis of nutrients and other necessities of life.complaints received, and others were initiated by 50. A network of business promotion centers is nowthe Anti-Monopoly Ministry. As a result of this being established in Belarus, and a pilot businesswork, 56 violations were exposed, and 45 orders incubator is being established in Gomel.
92 Notes
51. These figures are based on a poverty assessment estate developers to land served by basic utilitiesdone in 1996 by the World Bank in collaboration such as water and electricity, and establishing awith the Government of Belarus. Official data transparent process for obtaining buildingfrom the Ministry of Statistics are based on a permits.slightly different methodology and, as a result,the poverty impact figures vary by a few 55. Choosing an appropriate strategy and reform planpercentage points from those shown here, but the will require careful analysis of a wide range oftwo sets of numbers are very close and show a options, and development of appropriatecompletely consistent story. transition strategies. A public pillar, in theory,
52. Unlike the poverty line used by the Government, could have the objective of limiting old agethe World Bank's poverty line is differentiated poverty and redistributing income to the poor,according to family size and structure, making it while a mandatory, fully funded and privatelyaccording acurte family itsizeandsture,ment ig ith managed pillar could encourage lifetime savingsmore accurate in its measurement of the gn smot gh gee fidvda noeoeincidence of poverty. However, for the average and smooth the level of individual income overfamincidene opoverty. Howevuser fo the aerlBag one's lifetime, while also supporting financialfamily the poverty lhne used by the World Bank market development. Appropriately regulatedis very close to that defined by the Government, private savings plans would complement thesewhich it takes as 60 percent of the minimum piaesvnspaswudcmlmn hswhichnsumer itutakestas.60percenoftheminimu pillars. There are a variety of models-the publicconsumer budget. pillar could link contributions to benefits by
53. If we look not just at the families who were in channeling taxes to individualized personalpoverty for a single quarter, but rather at those accounts, which would serve as the basis forwho were on average in poverty throughout the setting an actuarially fair pension at retirement, oryear, we find that the percentage of families could consist of a social assistance benefit alongdefned as poor drops from 36 percent to 22 with a mandatory, privately managed secondpercent. pillar. Given the current state of the Belarusian
54. Housing markeflexbilitcanbeimr alegal and regulatory environment, as well as54. Housing market flexibility can be improved by a complex transitional issues, it will be important
variety of measures such as eliminating legal not to rush into any one model, but to (a)barriers to sub-leasing apartments, to renting out ete to h approp e loner-term tobetvrooms, and to the entry of private real estate forreforming the social insurance system; and (b)developers who can rehabilitate existing housing develop a strategy for getting there. For a goodand build new housing. Governments can also develof te getting there. Forld
faciltatehousfig arketdeveopmet byoverview of the underlying issues, see Worldfacilitate housing market development by Bank, Averting the Old Age Crisis-P'olicies toimproving privatization programs, creating the Protect the Old and Promote Growth. (Oxford:conditions needed to establish an active housing Oxford University Press, 1994.) xmortgage market, facilitating the access of real O
References 93
References
Bruno, Michael 1996a. "Why crises can be good for growth." DEC Notes - Research Findings.Washington, D.C.: The World Bank.
. 1996b. "Deep Crises and Reform: What Have We Learned?" Directions in Development.Washington, D.C.: The World Bank.
Bruno, Michael, and William Easterly. 1995a. "Could Inflation Stabilization be Expansionary?"Transition 6:7-8, pp 1-3.
. 1996. "Inflation's Children: Tales of Crises That Beget Reforms." American EconomicReview 86(2):213-17.
de Melo, Martha, Cevdet Denizer and Alan Gelb. "From Plan to Market: Patterns of Transition."Washington, D.C.: The World Bank.
Easterly, William. 1996. "When is Stabilization Expansionary?" Economic Policy, April 1996.
Easterly, William and Stanley D. Fischer. 1994. "The Soviet Economic Decline," The World BankEconomic Review 9(3): 341-71.
EBRD (European Bank for Reconstruction and Development). 1994. Transition Report 1994. London.
_. 1995. Transition Report 1995: Investment and Enterprise Development. London.
EuroMoney. 1996. "Country Risk: Asia's Economies Start To Slip," September, pp. 200-205.
Government of Belarus Statistics. 1996. Expenditures and income of the population in the Republic ofBelarus (household sample survey) 1995. Minsk.
Gwartney, James, Robert Lawson and Walter Block. 1996. Economic Freedom of the World: 1975-1995.Washington, D.C.: Caito Institute and others.
IMF. 1995. "Using Exchange Rate anchors in Adjustment Programs: When and How?" IMF Survey.November 20, 1995.
Institutional Investor, December 12, 1995.
Johnson, Bryan T. and Thomas P. Sheehy. 1996. 1996 Index of Economic Freedom. HeritageFoundation, Washington, DC.
Kaufmann, Daniel. 1994. "Diminishing Returns to Administrative Controls and the Emergence of theUnofficial Economy." Kiev: The World Bank.
Kiguel, Miguel A. and Nita Ghei. 1993. Devaluation in Low-Inflation Economies, (Policy ResearchWorking Paper 1224). Washington, D.C.: The World Bank.
Lipton, David and Jeffrey Sachs. 1990. "Creating a Market Economy in Eastern Europe: The Case ofPoland," Brookings Papers on Economic Activity 1:1990.
Mansur, Ahsan Habab. 1984. "Determining the Appropriate Exchange Rate in LDCs," Finance &Development. December 1984, pp. 18-21.
McAuley, Alastair. 1991. "The Economic Consequences of Soviet Disintegration," Soviet Economy1991:7:3, pp. 189-214.

94 References
Wells, Louis T. Jr. and Alvin G. Wint. 1991. Facilitating Foreign Investment: Government Institutions toScreen, Monitor, and Service Investmentfrom Abroad. Washington, D.C.: Foreign InvestmentAdvisory Service (FIAS), Occasional Paper 2.
World Bank. 1996. From Plan to Market. World Development Report 1996. New York: OxfordUniversity Press.
STATISTICAL APPENDIX
95

I
Statistical Appendix 97
STATISTICAL APPENDIX
1. Population and Employment1.1 Labor Market Indicators .............................................. 991.2 Average Employment by Sector .............................................. 100
2. National Accounts2.1 Gross Domestic Product by Sectors and Expenditures at Current Prices ....................... 1012.2 Gross Domestic Product by Sectors and Expenditures at Comparable Prices ............... 1022.3 Structure of Gross Domestic Product at Current Prices .................................................. 1032.4 Gross Domestic Product at Comparable Prices ...................................................... 1042.5 Capital Investment by Sectors at Constant Prices ...................................................... 105
3. Balance of Payments and International Trade3.1 Balance of Payments, 1993-96 ...................................................... 1063.2 Balance of Merchandise Trade, 1992-95 ...................................................... 1073.3.a Exports by Commodity Group at Domestic Prices to CIS .............................................. 108
(millions of current rubels)3.3.b Exports by Commodity Group at Domestic Prices to CIS .............................................. 109
(millions of USD)3.4.a Exports by Country at Domestic Prices ...................................................... 110
(millions of current Belarus rubels)3.4.b Exports by Country at Domestic Prices ....................................................... 111
(percentage distribution)3.5 Exports to Non-CIS Countries ...................................................... 1123.6.a Imports by Commodity Group at Domestic Prices from CIS ......................................... 113
(millions of Belarus rubles)3.6.b Imports by Commodity Group at Domestic Prices from CIS ......................................... 114
(millions of USD)3.7.a Imports by Country at Domestic Prices (millions of current Belarus rubels) ................ 1153.7.b Imports by Country at Domestic Prices (percentage distribution) ................................. 1163.8 Imports from Non-CIS Countries ...................................................... 1173.9 Trade by State Foreign Trade Organizations (FTOs) in 1993-95 ................................... 118
4. Debt4.1 External Debt Outstanding. 1992-96(QI ) ...................................................... 1194.2 Distribution of External Interenterprise Debts by Country, 1994-95 ............................. 1204.3 Sectoral Distribution of Interenterprise Receivables and Payables ................................ 1214.4 Sectoral Distribution of Energy Debts of Enterprises, 1995-96 (March) ....................... 122
5. Public Finance5.1 Summary of General Government Operations (in billions of rubels) ............................ 1235.2 Summary of General Government Operations (in percent of GDP) ............................... 1245.3 Government Debt, 1992-96 (Ql) ...................................................... 1255.4 Tax Arrears, 1993-96(QI) ...................................................... 1265.5.a State Budget, 1992-96(QI) (in billions of rubels) ...................................................... 1275.5.b State Budget. 1992-96(QI) (percentage distribution) ..................................................... 128
98 Statistical Appendix
5.6.a Extrabudgetary Funds, 1992-96 (in billions of rubels) ................................................. 1295.6.b Extrabudgetary Funds, 1992-96(QI) (in percent of GDP) ............................................. 1305.7.a Social Funds (in billions of rubels) ................................................. 1315.7.b Social Funds (in percent of GDP) ................................................. 132
6. Monetary/Financial Sector6.1 Monetary Survey ................................................. 1336.2 Real Movements in Monetary Aggregates ................................................. 1346.3.a Bank Lending by Type of Credit and Sector at Current Prices ...................................... 135
(billions of rubles, end of period balances)6.3.b Bank Lending by Type of Credit and Sector at Current Prices ...................................... 136
(percentage shares based on end of period balances)6.4 Bank Lending by Type of Credit and Sector at Comparable Prices ............................... 1376.5 National Bank Credit by Sector, 1993(Q4)-1996(Q1) ................................................. 1386.6 Average Interest Rates of NBB, 1993(Q4)-1996(Q1) ................................................. 1396.7 Purchases of Foreign Exchange by the NBB and Commercial Banks ........................... 140
7. Agricultural Statistics7.1 Agricultural Production .1417.2 Agricultural Production Sold 'rhrough State Procurement Organizations .1427.3 Private Sector in Agriculture .143
8. Industry and Energy Statistics8.1 Industrial Production at Comparable Prices ................................................. 1448.2 Production of Selected Industrial Products ................................................. 1458.3 Production and Consumption of Energy Resources ................................................. 1468.4 Enterprise Profitability and Number of Loss-Making Enterprises ................................. 1478.5 Tariffs and Cost Coverage, January 1995-January 1996 ................................................ 1488.6 Share of Total Exports in Production of Selected Industrial Products ........................... 149
9. Prices9.1 Consumer Price Indices (monthly) ................................................. 1509.2 Producer Price Indices (monthly) ................................................. 1519.3 Consumer and Producer Price Indices (yearly) ................................................. 1529.4 Price and Wage Developments ................................................. 1539.5 Nominal and Real Exchange Rates ................................................. 154
10. Indicators of Transition10.1 Transformation of State Property .15510.2 Number of Transformed Enterprises Distributed by Privatization Method .15610.3.a Number of Transformed Enterprises by Activity .157
(flow-new transformations during period)10.3.b Number of Transformed Enterprises by Activity .158
(stock-cumulative totals)10.4 Employment in Transformed Enterprises .15910.5 Housing Privatization .............. 160
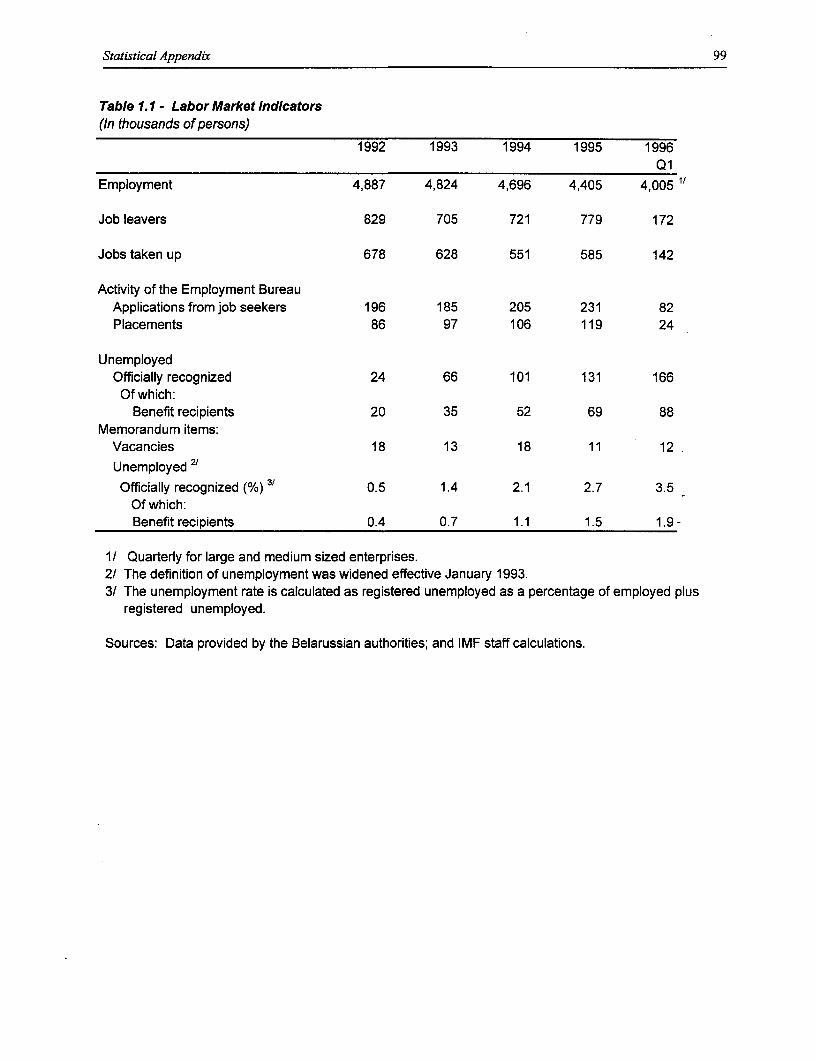
Statistical Appendix 99
Table 1.1 - Labor Market Indicators(In thousands of persons)
1992 1993 1994 1995 1996Q1
Employment 4,887 4,824 4,696 4,405 4,005
Job leavers 829 705 721 779 172
Jobs taken up 678 628 551 585 142
Activity of the Employment BureauApplications from job seekers 196 185 205 231 82Placements 86 97 106 119 24
UnemployedOfficially recognized 24 66 101 131 166
Of which:Benefit recipients 20 35 52 69 88
Memorandum items:Vacancies 18 13 18 11 12
Unemployed 21
Officially recognized (%) 3/ 0.5 1.4 2.1 2.7 3.5Of which:Benefit recipients 0.4 0.7 1.1 1.5 1.9-
i/ Quarterly for large and medium sized enterprises.2/ The definition of unemployment was widened effective January 1993.3/ The unemployment rate is calculated as registered unemployed as a percentage of employed plus
registered unemployed.
Sources: Data provided by the Belarussian authorities; and IMF staff calculations.

Table 1.2 - Average Employrnent by Sector
1991 1992 1993 1994 1995 1996 1992 1993 1994 1995 1996 0Q1 Qa
(In thousands) (Percentage change on year earlier)
Annual survey 11 5,020 4,887 4,824 4,696 4,405 4,005 -2.6 -1.3 -2.7 -6.2 -9.1
Monthly survey 21 4,646 4,469 4,318 4,124 3,812 3,625 -3.8 -3.4 -4.5 -7.6 -4.9Industry 1,495 1,433 1,366 1,294 1,160 1,093 -4.1 -4.7 -5.3 -10.4 -5.8Agriculture 3/ 1,035 990 940 882 803 710 -4.3 -5.1 -6.2 -9.0 -11.6Construction 408 385 374 336 278 242 -5.6 -2.9 -10.2 -17.3 -12.9Transport and communication 343 332 308 297 279 275 -3.2 -7.2 -3.6 -6.1 -1.4Trade and related services 4/ 310 287 270 253 223 212 -7.4 -5.9 -6.3 -11.9 -4.9Communalservices4/ 105 106 101 104 110 122 1.0 -4.7 3.0 5.8 10.9Health and social services 244 247 255 261 260 262 1.2 3.2 2.4 -0.4 0.8Education, culture, science 487 475 463 466 461 467 -2.5 -2.5 0.6 -1.1 1.3Banks and insurance 29 31 33 39 44 46 6.9 6.5 18.2 12.8 4.5Administration 4/ 57 60 66 70 73 74 5.3 10.0 6.1 4.3 1.4Other4/ 133 123 142 122 121 122 -7.5 15.4 -14.1 -0.8 0.8
(Share in total) 2/Monthly survey 100.0 100.0 100.0 100.0 100.0 100.0
Industry 32.2 32.1 31.6 31.4 30.4 30.2Agriculture 22.3 22.2 21.8 21.4 21.1 19.6Construction 8.8 8.6 8.7 8.1 7.3 6.7Transport and communication 7.4 7.4 7.1 7.2 7.3 7.6Trade and related services 4/ 6.7 6.4 6.3 6.1 5.8 5.8Communal services 4/ 2.3 2.4 2.3 2.5 2.9 3.4Health and social services 5.3 5.5 5.9 6.3 6.8 7.2Education, culture, science 10.5 10.6 10.7 11.3 12.1 12.9Banks and insurance 0.6 0.7 0.8 0.9 1.2 1.3Administration 4/ 1.2 1.3 1.5 1.7 1.9 2.0Other 4/ 2.9 2.8 3.3 3.0 3.2 3.4
(In percent)Memorandum items:Labor force participation rate 5/ 52 50.3 49.8 48.6 45.9Labor force as share ofworking age population 93.6 90.7 89.9 87.5 82.4
Share of woman in the labor force 54.4 53.6 53.5 53.9 54.5
1 Based on comprehensive annual survey data that include small enterprises.2/ Based on monthly survey data, which accounted for approximately 91 percent of the employment covered by the annual survey in 1993.31 Approximately two thirds from collective farms.4/ Data for 1993 through 1995 reflect reclassification from January 1993 on.5/ Labor force particpation rate defined as employed and registered unemployed in percent of total populabon.6/ Excluding kolkhozes.
Source: Ministry of Statisbcs and Analysis.
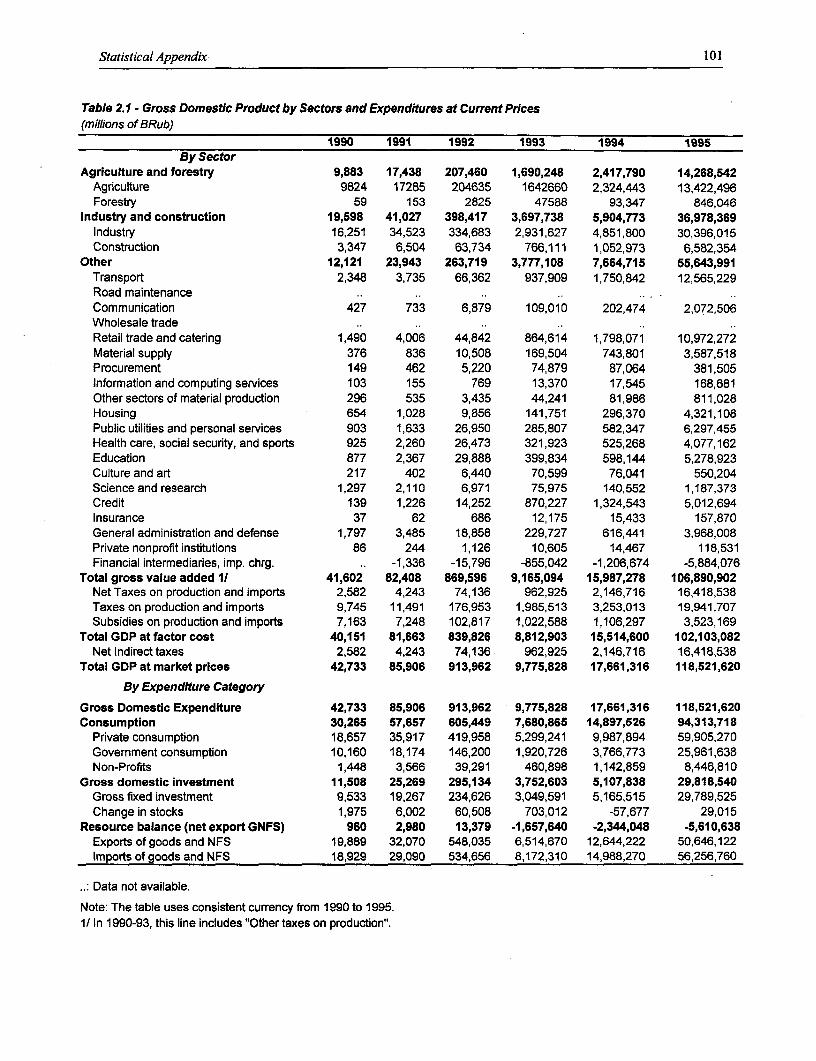
Statistical Appendix 101
Table 2.1 - Gross Domestic Product by Sectors and Expenditures at Current Prices(millions of BRub)
1990 1991 1992 1993 1994 1995By Sector
Agriculture and forestry 9,883 17,438 207,460 1,690,248 2,417,790 14,268,542Agriculture 9824 17285 204635 1642660 2,324,443 13,422,496Forestry 59 153 2825 47588 93,347 846,046
Industry and construction 19,598 41,027 398,417 3,697,738 5,904,773 36,978,369Industry 16,251 34,523 334,683 2,931,627 4,851,800 30,396,015Construction 3,347 6,504 63,734 766,111 1,052,973 6,582,354
Other 12,121 23,943 263,719 3,777,108 7,664,715 55,643,991Transport 2,348 3,735 66,362 937,909 1,750,842 12,565,229Road maintenanceCommunication 427 733 6,879 109,010 202,474 2,072,506Wholesale tradeRetail trade and catering 1,490 4,006 44,842 864,614 1,798,071 10,972,272Material supply 376 836 10,508 169,504 743,801 3,587,518Procurement 149 462 5,220 74,879 87,064 381,505Information and computing services 103 155 769 13,370 17,545 168,681Other sectors of material production 296 535 3,435 44,241 81,986 811,028Housing 654 1,028 9,856 141,751 296,370 4,321,108Public utilities and personal services 903 1,633 26,950 285,807 582,347 6,297,455Health care, social security, and sports 925 2,260 26,473 321,923 525,268 4,077,162Education 877 2,367 29,888 399,834 598,144 5,278,923Culture and art 217 402 6,440 70,599 76,041 550,204Science and research 1,297 2,110 6,971 75,975 140,552 1,187,373Credit 139 1,226 14,252 870,227 1,324,543 5,012,694Insurance 37 62 686 12,175 15,433 157,870General administration and defense 1,797 3,485 18,858 229,727 616,441 3,968,008Private nonprofit institutions 86 244 1,126 10,605 14,467 118,531Financial intermediaries, imp. chrg. .. -1,336 -15,796 -855,042 -1,206,674 -5,884,076
Total gross value added 11 41,602 82,408 869,596 9,165,094 15,987,278 106,890,902Net Taxes on production and imports 2,582 4,243 74,136 962,925 2,146,716 16,418,538Taxes on production and imports 9,745 11,491 176,953 1,985,513 3,253,013 19,941,707Subsidies on production and imports 7,163 7,248 102,817 1,022,588 1,106,297 3,523,169
Total GDP at factor cost 40,151 81,663 839,826 8,812,903 15,514,600 102,103,082Net Indirecttaxes 2,582 4,243 74,136 962,925 2,146,716 16,418,538
Total GDP at market prices 42,733 85,906 913,962 9,775,828 17,661,316 118,521,620
By Expenditure Category
Gross Domestic Expenditure 42,733 85,906 913,962 9,775,828 17,661,316 118,521,620Consumption 30,265 57,657 605,449 7,680,865 14,897,526 94,313,718
Private consumption 18,657 35,917 419,958 5,299,241 9,987,894 59,905,270Government consumption 10,160 18,174 146,200 1,920,726 3,766,773 25,961,638Non-Profits 1,448 3,566 39,291 460,898 1,142,859 8,446,810
Gross domestic investment 11,508 25,269 295,134 3,752,603 5,107,838 29,818,540Gross fixed investment 9,533 19,267 234,626 3,049,591 5,165,515 29,789,525Change in stocks 1,975 6,002 60,508 703,012 -57,677 29,015
Resource balance (net export GNFS) 960 2,980 13,379 -1,657,640 -2,344,048 -5,610,638Exports of goods and NFS 19,889 32,070 548,035 6,514,670 12,644,222 50,646,122Imports of goods and NFS 18,929 29,090 534,656 8,172,310 14,988,270 56,256,760
Data not available.
Note: The table uses consistent currency from 1990 to 1995.1/ In 1990-93, this line includes "Other taxes on production".
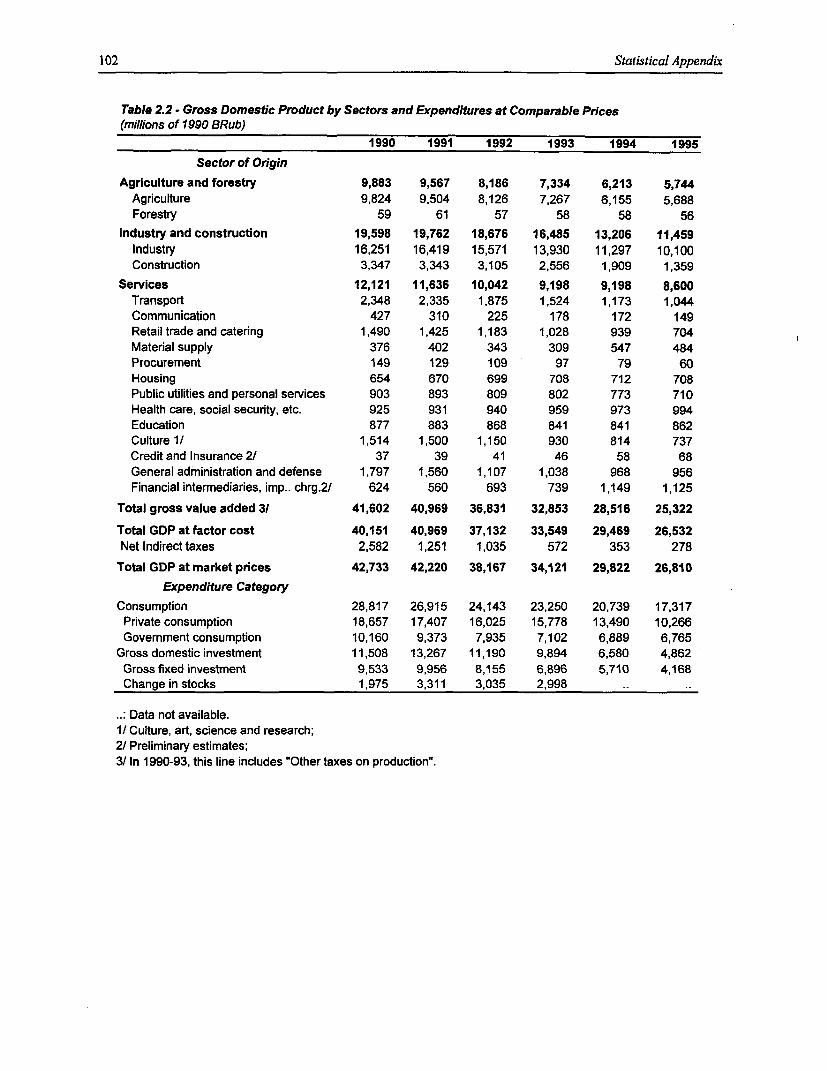
102 Statistical Appendix
Table 2.2 - Gross Domestic Product by Sectors and Expenditures at Comparable Prices(millions of 1990 BRub)
1990 1991 1992 1993 1994 1995
Sector of Origin
Agriculture and forestry 9,883 9,567 8,186 7,334 6,213 5,744Agriculture 9,824 9,504 8,126 7,267 6,155 5,688Forestry 59 61 57 58 58 56
Industry and construction 19,598 19,762 18,676 16,485 13,206 11,459Industry 16,251 16,419 15,571 13,930 11,297 10,100Construction 3,347 3,343 3,105 2,556 1,909 1,359
Services 12,121 11,636 10,042 9,198 9,198 8,600Transport 2,348 2,335 1,875 1,524 1,173 1,044Communication 427 310 225 178 172 149Retail trade and catering 1,490 1,425 1,183 1,028 939 704Material supply 376 402 343 309 547 484Procurement 149 129 109 97 79 60Housing 654 670 699 708 712 708Public utilities and personal services 903 893 809 802 773 710Health care, social security, etc. 925 931 940 959 973 994Education 877 883 868 841 841 862Culture 1/ 1,514 1,500 1,150 930 814 737Credit and Insurance 2/ 37 39 41 46 58 68General administration and defense 1,797 1,560 1,107 1,038 968 956Financial intermediaries, imp.. chrg.2/ 624 560 693 739 1,149 1,125
Total gross value added 3! 41,602 40,969 36,831 32,853 28,516 25,322
Total GDP at factor cost 40,151 40,969 37,132 33,549 29,469 26,532Net Indirect taxes 2,582 1,251 1,035 572 353 278
Total GDP at market prices 42,733 42,220 38,167 34,121 29,822 26,810
Expenditure Category
Consumption 28,817 26,915 24,143 23,250 20,739 17,317Private consumption 18,657 17,407 16,025 15,778 13,490 10,266Government consumption 10,160 9,373 7,935 7,102 6,889 6,765
Gross domestic investment 11,508 13,267 11,190 9,894 6,580 4,862Gross fixed investment 9,533 9,956 8,155 6,896 5,710 4,168Change in stocks 1,975 3,311 3,035 2,998
..: Data not available.1/ Culture, art, science and research;2/ Preliminary estimates;3/ In 1990-93, this line includes "Other taxes on production".
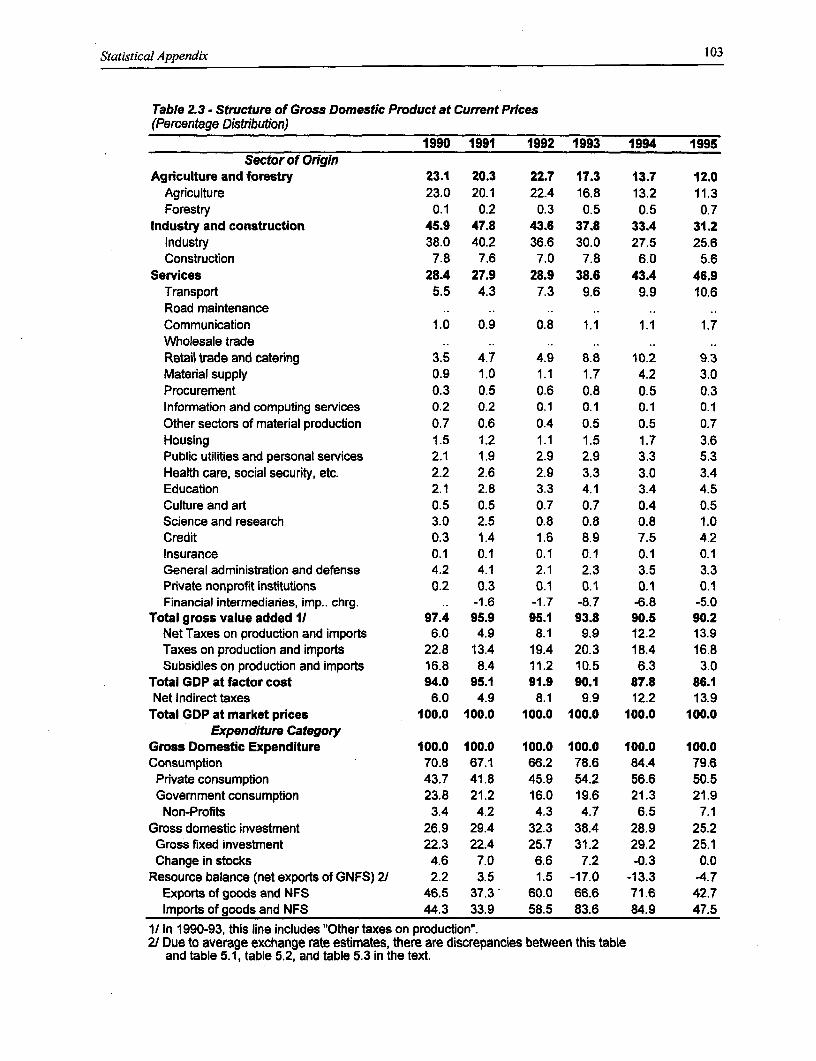
Statistical Appendix 103
Table 2.3 - Structure of Gross Domestic Product at Current Prices(Percentage Distribution)
1990 1991 1992 1993 1994 1995Sector of Origin
Agriculture and forestry 23.1 20.3 22.7 17.3 13.7 12.0Agriculture 23.0 20.1 22.4 16.8 13.2 11.3Forestry 0.1 0.2 0.3 0.5 0.5 0.7
Industry and construction 45.9 47.8 43.6 37.8 33A 31.2Industry 38.0 40.2 36.6 30.0 27.5 25.6Construction 7.8 7.6 7.0 7.8 6.0 5.6
Services 28A 27.9 28.9 38.6 43.4 46.9Transport 5.5 4.3 7.3 9.6 9.9 10.6Road maintenance .. .. ..
Communication 1.0 0.9 0.8 1.1 1.1 1.7Wholesale trade .. .. ..
Retail trade and catering 3.5 4.7 4.9 8.8 10.2 9.3Material supply 0.9 1.0 1.1 1.7 4.2 3.0Procurement 0.3 0.5 0.6 0.8 0.5 0.3Information and computing services 0.2 0.2 0.1 0.1 0.1 0.1Other sectors of material production 0.7 0.6 0.4 0.5 0.5 0.7Housing 1.5 1.2 1.1 1.5 1.7 3.6Public utilities and personal services 2.1 1.9 2.9 2.9 3.3 5.3Health care, social security, etc. 2.2 2.6 2.9 3.3 3.0 3.4Education 2.1 2.8 3.3 4.1 3.4 4.5Culture and art 0.5 0.5 0.7 0.7 0.4 0.5Science and research 3.0 2.5 0.8 0.8 0.8 1.0Credit 0.3 1.4 1.6 8.9 7.5 4.2Insurance 0.1 0.1 0.1 0.1 0.1 0.1General administration and defense 4.2 4.1 2.1 2.3 3.5 3.3Private nonprofit institutions 0.2 0.3 0.1 0.1 0.1 0.1Financial intermediaries, imp.. chrg. .. -1.6 -1.7 -8.7 -6.8 -5.0
Total gross value added 1/ 97.4 95.9 95.1 93.8 90.5 90.2Net Taxes on production and imports 6.0 4.9 8.1 9.9 12.2 13.9Taxes on production and imports 22Z8 13.4 19.4 20.3 18.4 16.8Subsidies on production and imports 16.8 8.4 11.2 10.5 6.3 3.0
Total GDP at factor cost 94.0 95.1 91.9 90.1 87.8 86.1Net Indirect taxes 6.0 4.9 8.1 9.9 12.2 13.9
Total GDP at market prices 100.0 100.0 100.0 100.0 100.0 100.0Expenditure Category
Gross Domestic Expenditure 100.0 100.0 100.0 100.0 100.0 100.0Consumption 70.8 67.1 66.2 78.6 84.4 79.6Private consumption 43.7 41.8 45.9 54.2 56.6 50.5Govemment consumption 23.8 21.2 16.0 19.6 21.3 21.9
Non-Profits 3.4 4.2 4.3 4.7 6.5 7.1Gross domestic investment 26.9 29.4 32.3 38.4 28.9 25.2Gross fixed investment 22.3 22.4 25.7 31.2 29.2 25.1Change in stocks 4.6 7.0 6.6 7.2 -0.3 0.0
Resource balance (net exports of GNFS) 2/ 2.2 3.5 1.5 -17.0 -13.3 -4.7Exports of goods and NFS 46.5 37.3 60.0 66.6 71.6 42.7Imports of goods and NFS 44.3 33.9 58.5 83.6 84.9 47.5
1/ In 1990-93, this line includes "Other taxes on production".2/ Due to average exchange rate estimates, there are discrepancies between this table
and table 5.1, table 5.2, and table 5.3 in the text.
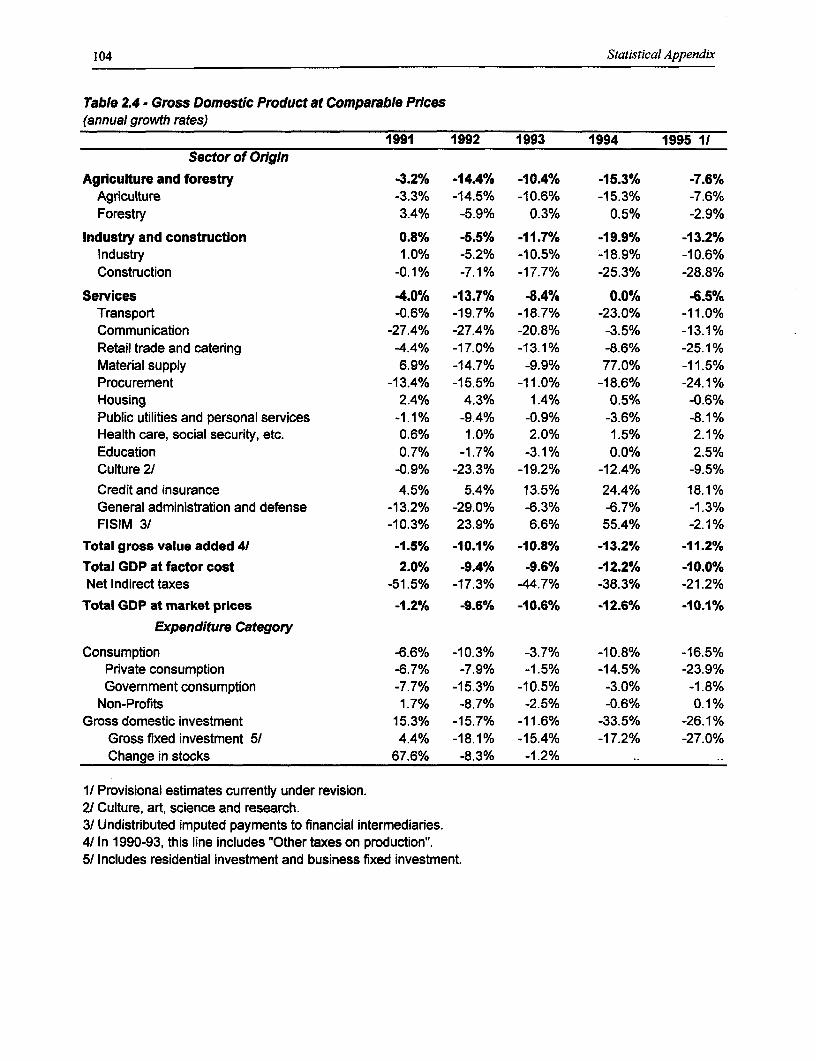
104 Statistical Appendix
Table 2.4 - Gross Domestic Product at Comparable Prices(annual growth rates)
1991 1992 1993 1994 1995 1/Sector of Origin
Agriculture and forestry -3.2% -14.4% -10.4% -15.3% -7.6%Agriculture -3.3% -14.5% -10.6% -15.3% -7.6%Forestry 3.4% -5.9% 0.3% 0.5% -2.9%
Industry and construction 0.8% -5.5% -11.7% -19.9% -13.2%Industry 1.0% -5.2% -10.5% -18.9% -10.6%Construction -0.1% -7.1% -17.7% -25.3% -28.8%
Services -4.0% -13.7% -8.4% 0.0% -6.5%Transport -0.6% -19.7% -18.7% -23.0% -11.0%Communication -27.4% -27.4% -20.8% -3.5% -13.1%Retail trade and catering -4.4% -17.0% -13.1% -8.6% -25.1%Material supply 6.9% -14.7% -9.9% 77.0% -11.5%Procurement -13.4% -15.5% -11.0% -18.6% -24.1%Housing 2.4% 4.3% 1.4% 0.5% -0.6%Public utilities and personal services -1.1% -9.4% -0.9% -3.6% -8.1%Health care, social security, etc. 0.6% 1.0% 2.0% 1.5% 2.1%Education 0.7% -1.7% -3.1% 0.0% 2.5%Culture 2/ -0.9% -23.3% -19.2% -12.4% -9.5%Credit and insurance 4.5% 5.4% 13.5% 24.4% 18.1%General administration and defense -13.2% -29.0% -6.3% -6.7% -1.3%FISIM 3/ -10.3% 23.9% 6.6% 55.4% -2.1%
Total gross value added 41 -1.5% -10.1% -10.8% -13.2% -11.2%Total GDP at factor cost 2.0% -9.4% -9.6% -12.2% -10.0%Net Indirect taxes -51.5% -17.3% -44.7% -38.3% -21.2%
Total GDP at market prices -1.2% -9.6% -10.6% -12.6% -10.1%
Expenditure Category
Consumption -6.6% -10.3% -3.7% -10.8% -16.5%Private consumption -6.7% -7.9% -1.5% -14.5% -23.9%Government consumption -7.7% -15.3% -10.5% -3.0% -1.8%
Non-Profits 1.7% -8.7% -2.5% -0.6% 0.1%Gross domestic investment 15.3% -15.7% -11.6% -33.5% -26.1%
Gross fixed investment 5/ 4.4% -18.1% -15.4% -17.2% -27.0%Change in stocks 67.6% -8.3% -1.2% ..
1/ Provisional estimates currently under revision.21 Culture, art, science and research.3/ Undistributed imputed payments to financial intermediaries.4/ In 1990-93, this line includes "Other taxes on production".5/ Includes residential investment and business fixed investment.
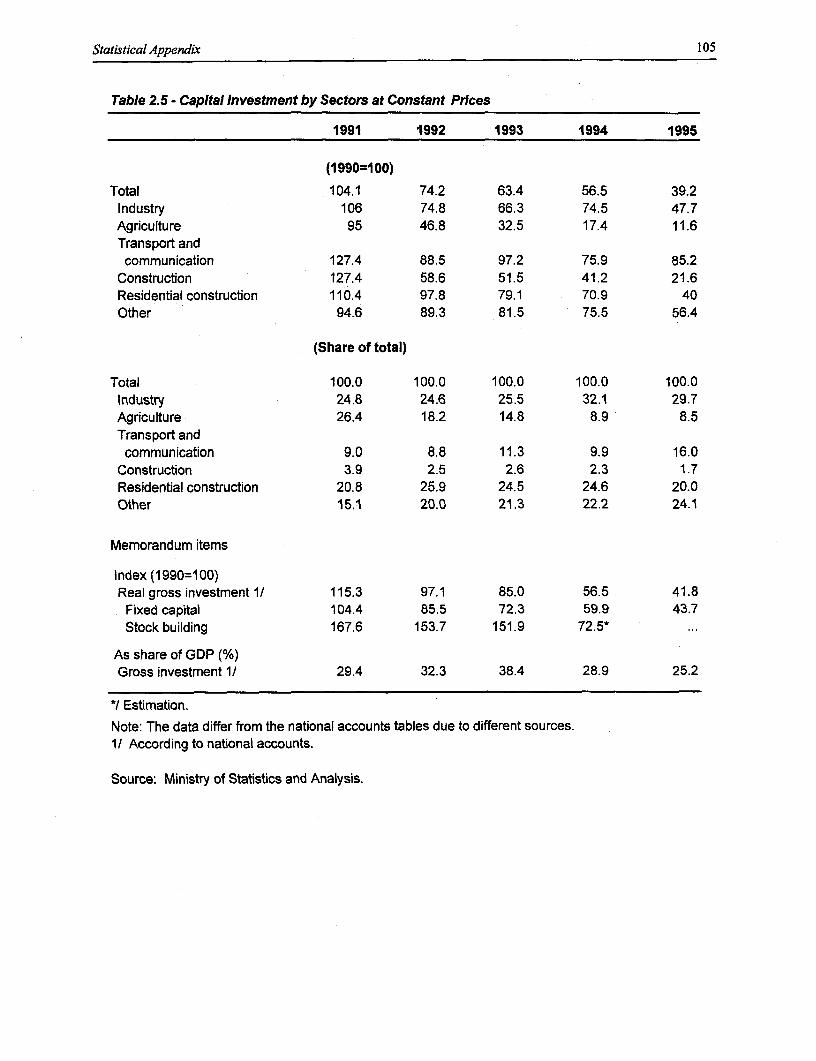
Statistical Appendix 105
Table 2.5 - Capital Investment by Sectors at Constant Prices
1991 1992 1993 1994 1995
(1990=100)
Total 104.1 74.2 63.4 56.5 39.2Industry 106 74.8 66.3 74.5 47.7Agriculture 95 46.8 32.5 17.4 11.6Transport andcommunication 127.4 88.5 97.2 75.9 85.2
Construction 127.4 58.6 51.5 41.2 21.6Residential construction 110.4 97.8 79.1 70.9 40Other 94.6 89.3 81.5 75.5 56.4
(Share of total)
Total 100.0 100.0 100.0 100.0 100.0Industry 24.8 24.6 25.5 32.1 29.7Agriculture 26.4 18.2 14.8 8.9 8.5Transport andcommunication 9.0 8.8 11.3 9.9 16.0
Construction 3.9 2.5 2.6 2.3 1.7Residential construction 20.8 25.9 24.5 24.6 20.0Other 15.1 20.0 21.3 22.2 24.1
Memorandum items
Index (1990=100)Real gross investment 1/ 115.3 97.1 85.0 56.5 41.8
Fixed capital 104.4 85.5 72.3 59.9 43.7Stock building 167.6 153.7 151.9 72.5* ...
As share of GDP (%)Gross investment 1/ 29.4 32.3 38.4 28.9 25.2
*/ Estimation.
Note: The data differ from the national accounts tables due to different sources.1/ According to national accounts.
Source: Ministry of Statistics and Analysis.
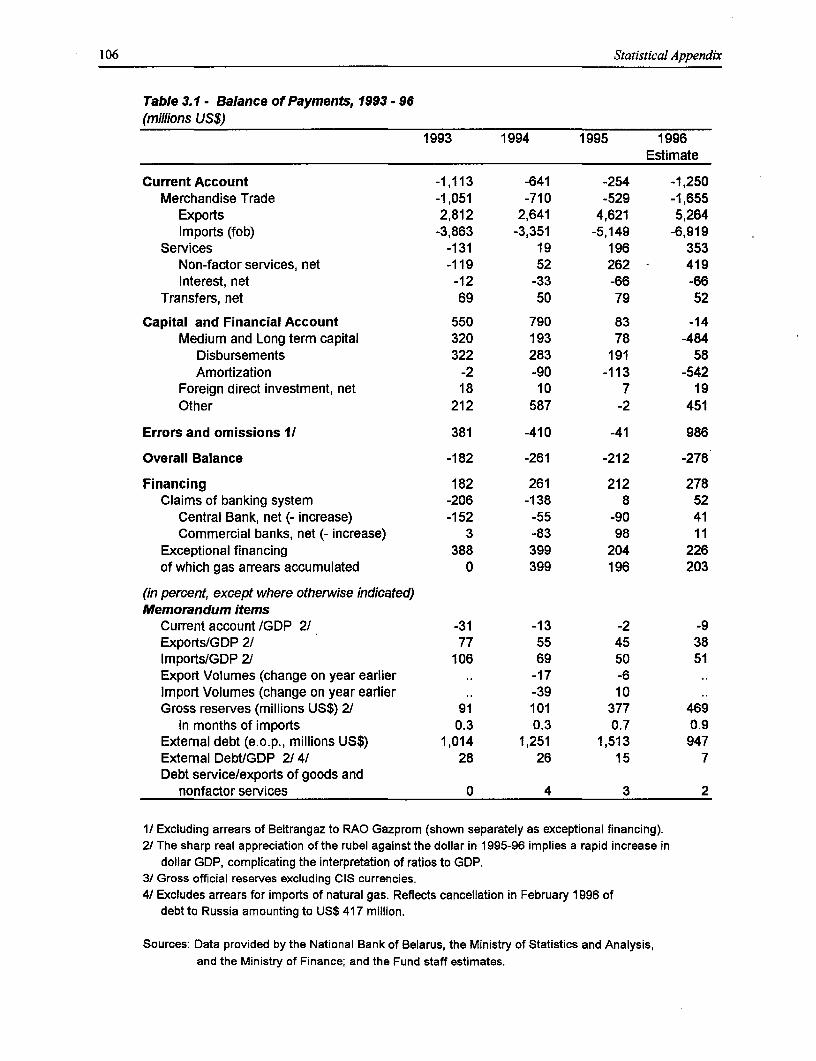
106 Statistical Appendix
Table 3.1 - Balance of Payments, 1993 - 96(millions US$)
1993 1994 1995 1996Estimate
Current Account -1,113 -641 -254 -1,250Merchandise Trade -1,051 -710 -529 -1,655
Exports 2,812 2,641 4,621 5,264Imports (fob) -3,863 -3,351 -5,149 -6,919
Services -131 19 196 353Non-factorservices, net -119 52 262 - 419Interest, net -12 -33 -66 -66
Transfers, net 69 50 79 52
Capital and Financial Account 550 790 83 -14Medium and Long term capital 320 193 78 -484
Disbursements 322 283 191 58Amortization -2 -90 -113 -542
Foreign direct investment, net 18 10 7 19Other 212 587 -2 451
Errors and omissions I/ 381 -410 -41 986
Overall Balance -182 -261 -212 -278
Financing 182 261 212 278Claims of banking system -206 -138 8 52
Central Bank, net (- increase) -152 -55 -90 41Commercial banks, net (- increase) 3 -83 98 11
Exceptional financing 388 399 204 226of which gas arrears accumulated 0 399 196 203
(in percent, except where otherwise indicated)Memorandum items
Current account /GDP 2/ -31 -13 -2 -9Exports/GDP 2/ 77 55 45 38Imports/GDP 2/ 106 69 50 51Export Volumes (change on year earlier .. -17 -6Import Volumes (change on year earlier .. -39 10Gross reserves (millions US$) 2/ 91 101 377 469
in months of imports 0.3 0.3 0.7 0.9External debt (e.o.p., millions US$) 1,014 1,251 1,513 947External Debt/GDP 2/4/ 28 26 15 7Debt service/exports of goods and
nonfactor services 0 4 3 2
1/ Excluding arrears of Beltrangaz to RAO Gazprom (shown separately as exceptional financing).2/ The sharp real appreciation of the rubel against the dollar in 1995-96 implies a rapid increase in
dollar GDP, complicating the interpretation of ratios to GDP.3/ Gross official reserves excluding CIS currencies.4/ Excludes arrears for imports of natural gas. Reflects cancellation in February 1996 of
debt to Russia amounting to US$ 417 million.
Sources: Data provided by the National Bank of Belarus, the Ministry of Statistics and Analysis,and the Ministry of Finance; and the Fund staff estimates.
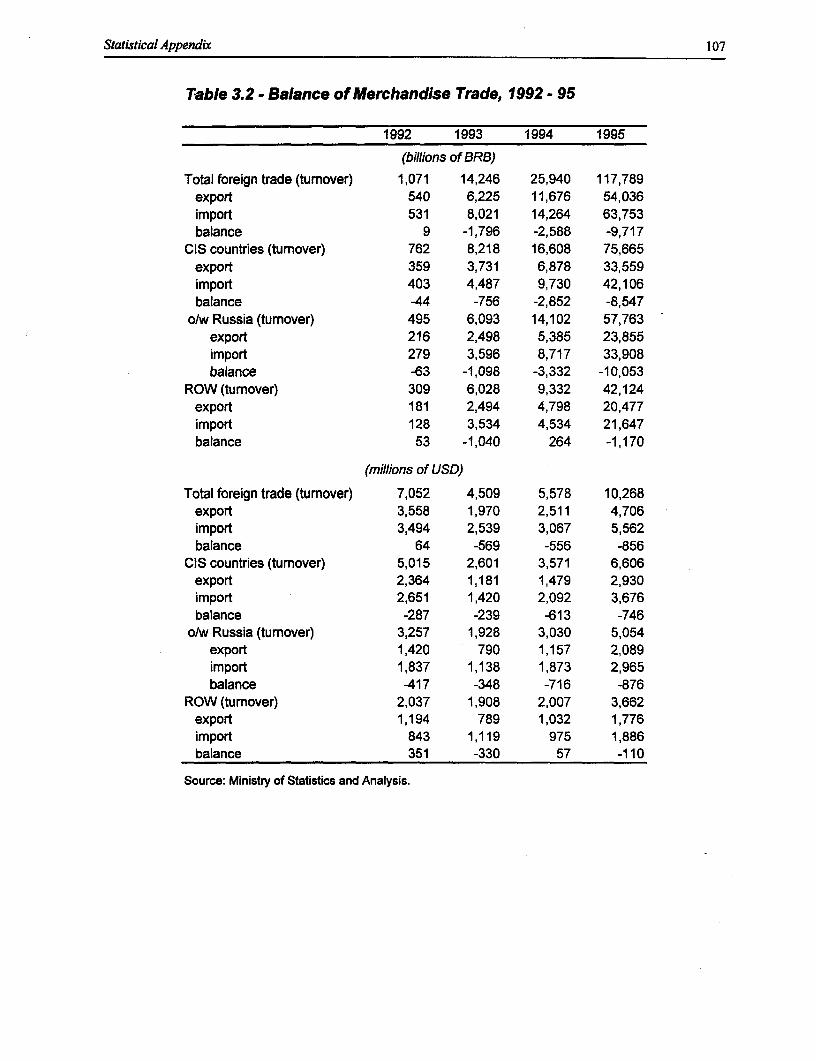
Statistical Appendix 107
T7able 3.2 - Balance of Merchandise Trade, 1992 - 95
1992 1993 1994 1995
(billions of BRB)
Total foreign trade (turnover) 1,071 14,246 25,940 117,789export 540 6,225 11,676 54,036import 531 8,021 14,264 63,753balance 9 -1,796 -2,588 -9,717
CIS countries (turnover) 762 8,218 16,608 75,665export 359 3,731 6,878 33,559import 403 4,487 9,730 42,106balance -44 -756 -2,852 -8,547
o/w Russia (tumover) 495 6,093 14,102 57,763export 216 2,498 5,385 23,855import 279 3,596 8,717 33,908balance -63 -1,098 -3,332 -10,053
ROW (tumover) 309 6,028 9,332 42,124export 181 2,494 4,798 20,477import 128 3,534 4,534 21,647balance 53 -1,040 264 -1,170
(millions of USD)
Total foreign trade (tumover) 7,052 4,509 5,578 10,268export 3,558 1,970 2,511 4,706import 3,494 2,539 3,067 5,562balance 64 -569 -556 -856
CIS countries (turnover) 5,015 2,601 3,571 6,606export 2,364 1,181 1,479 2,930import 2,651 1,420 2,092 3,676balance -287 -239 -613 -746
o/w Russia (tumover) 3,257 1,928 3,030 5,054export 1,420 790 1,157 2,089import 1,837 1,138 1,873 2,965balance -417 -348 -716 -876
ROW (turnover) 2,037 1,908 2,007 3,662export 1,194 789 1,032 1,776import 843 1,119 975 1,886balance 351 -330 57 -110
Source: Ministry of Statistics and Analysis.
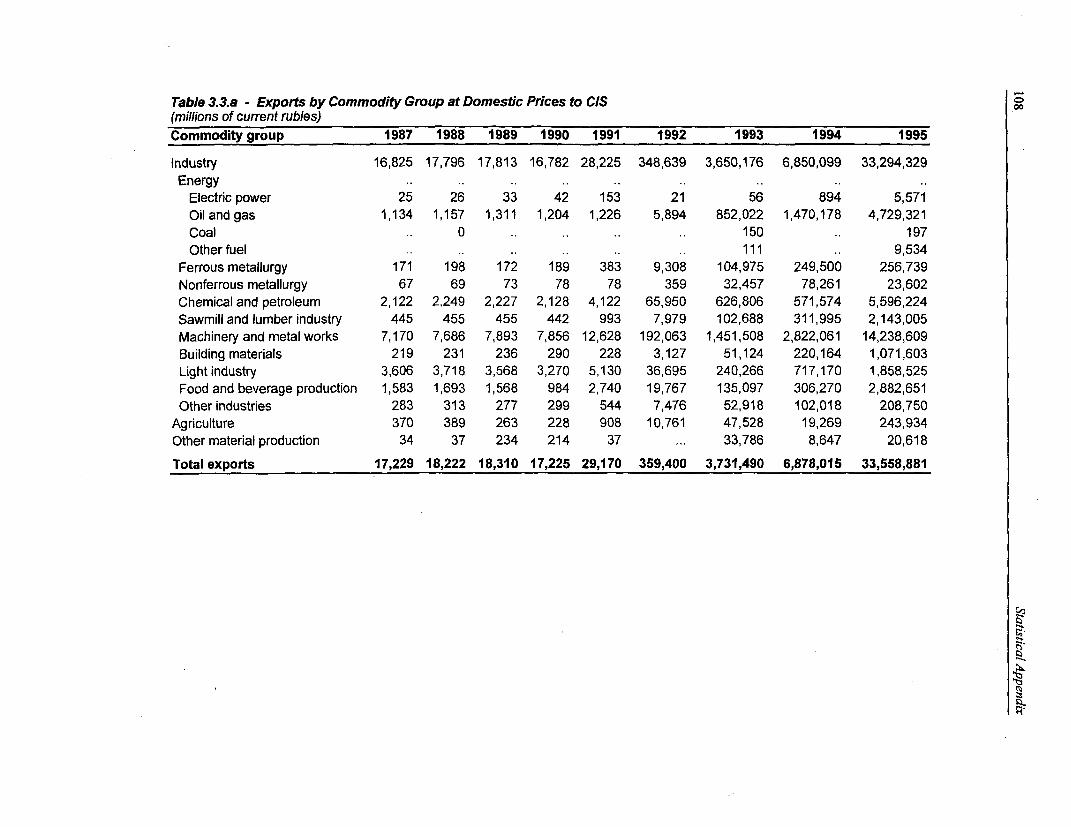
Table 3.3.a - Exports by Commodity Group at Domestic Prices to CIS(millions of current rubles)Commodity group 1987 1988 1989 1990 1991 1992 1993 1994 1995
Industry 16,825 17,796 17,813 16,782 28,225 348,639 3,650,176 6,850,099 33,294,329Energy
Electric power 25 26 33 42 153 21 56 894 5,571Oil and gas 1,134 1,157 1,311 1,204 1,226 5,894 852,022 1,470,178 4,729,321Coal 0 150 197Other fuel 111 9,534
Ferrous metallurgy 171 198 172 189 383 9,308 104,975 249,500 256,739Nonferrous metallurgy 67 69 73 78 78 359 32,457 78,261 23,602Chemical and petroleum 2,122 2,249 2,227 2,128 4,122 65,950 626,806 571,574 5,596,224Sawmill and lumber industry 445 455 455 442 993 7,979 102,688 311,995 2,143,005Machinery and metal works 7,170 7,686 7,893 7,856 12,628 192,063 1,451,508 2,822,061 14,238,609Building materials 219 231 236 290 228 3,127 51,124 220,164 1,071,603Light industry 3,606 3,718 3,568 3,270 5,130 36,695 240,266 717,170 1,858,525Food and beverage production 1,583 1,693 1,568 984 2,740 19,767 135,097 306,270 2,882,651Other industries 283 313 277 299 544 7,476 52,918 102,018 208,750
Agriculture 370 389 263 228 908 10,761 47,528 19,269 243,934Other material production 34 37 234 214 37 ... 33,786 8,647 20,618Total exports 17,229 18,222 18,310 17,225 29,170 359,400 3,731,490 6,878,015 33,558,881
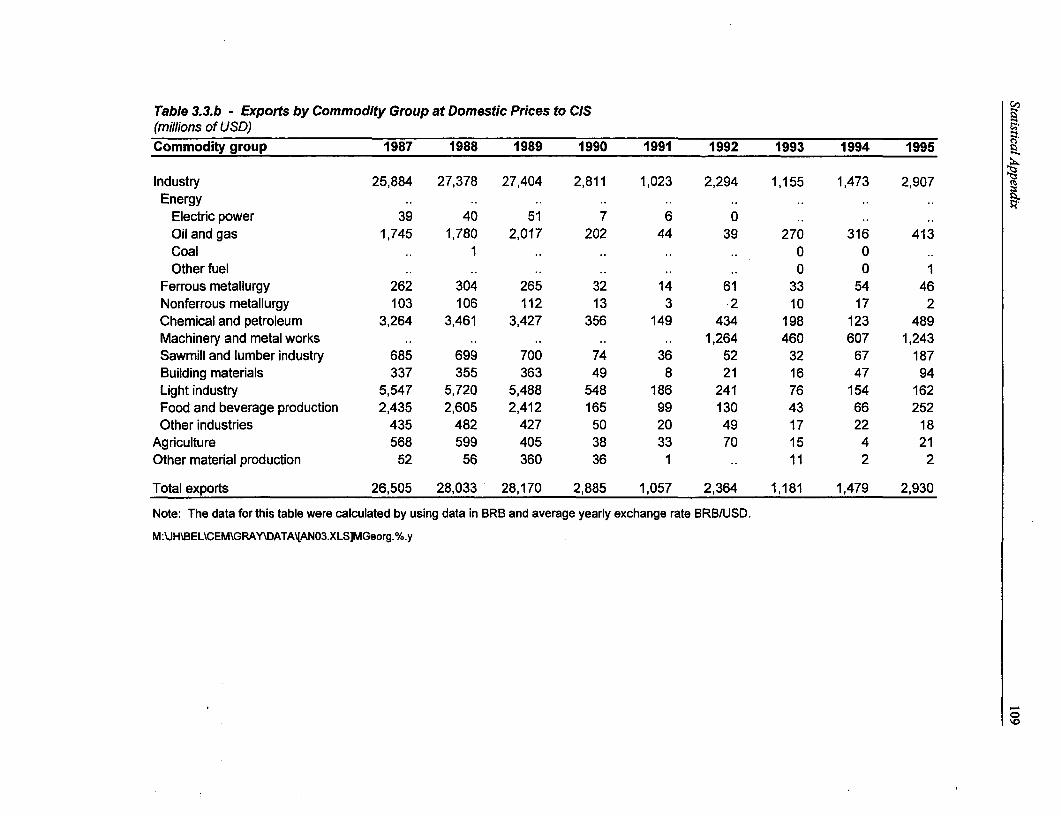
Table 3.3.b - Exports by Commodity Group at Domestic Prices to CIS(millions of USD)Commodity group 1987 1988 1989 1990 1991 1992 1993 1994 1995
Industry 25,884 27,378 27,404 2,811 1,023 2,294 1,155 1,473 2,907Energy
Electric power 39 40 51 7 6 0Oil and gas 1,745 1,780 2,017 202 44 39 270 316 413Coal 1 0 0Other fuel 0 0 1
Ferrous metallurgy 262 304 265 32 14 61 33 54 46Nonferrous metallurgy 103 106 112 13 3 2 10 17 2Chemical and petroleum 3,264 3,461 3,427 356 149 434 198 123 489Machinery and metal works 1,264 460 607 1,243Sawmill and lumber industry 685 699 700 74 36 52 32 67 187Building materials 337 355 363 49 8 21 16 47 94Light industry 5,547 5,720 5,488 548 186 241 76 154 162Food and beverage production 2,435 2,605 2,412 165 99 130 43 66 252Other industries 435 482 427 50 20 49 17 22 18
Agriculture 568 599 405 38 33 70 15 4 21Other material production 52 56 360 36 1 11 2 2
Total exports 26,505 28,033 28,170 2,885 1,057 2,364 1,181 1,479 2,930
Note: The data for this table were calculated by using data in BRB and average yearly exchange rate BRB/USD.
M:\JH\BEL\CEM\GRAY\DATA\[AN03.XLS]MGeorg.%.y
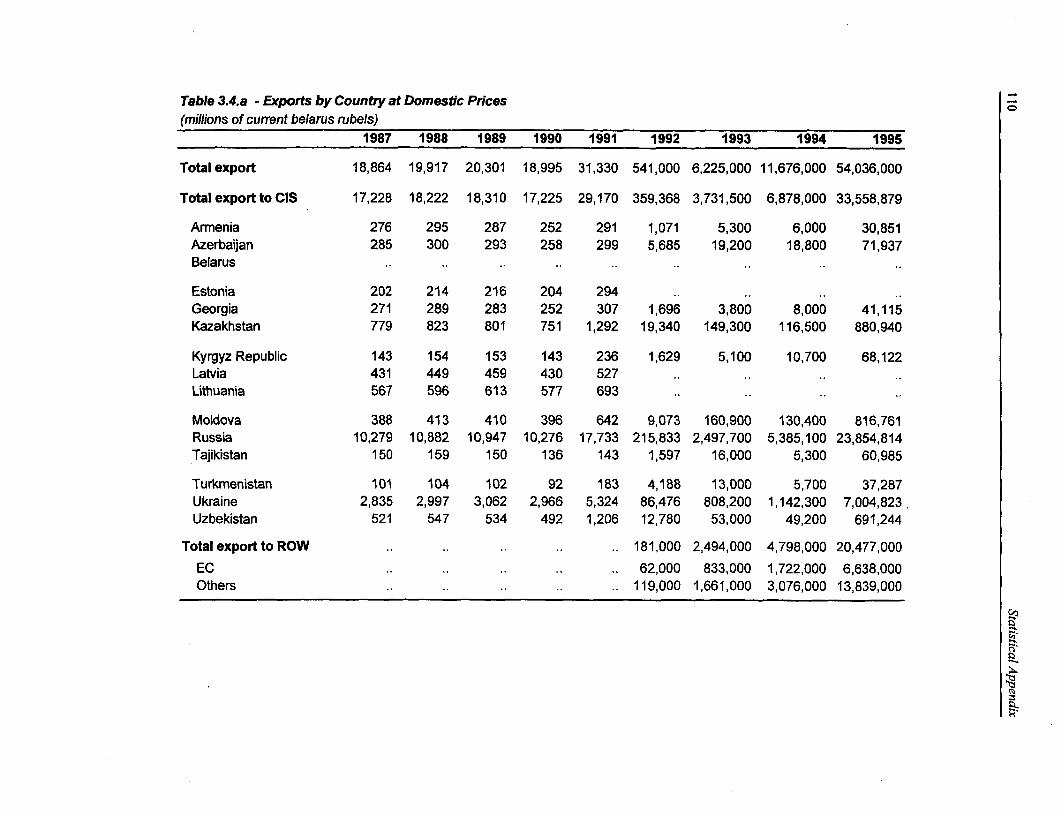
Table 3.4.a - Exports by Country at Domestic Prices _(millions of current belarus rubels)
1987 1988 1989 1990 1991 1992 1993 1994 1995
Total export 18,864 19,917 20,301 18,995 31,330 541,000 6,225,000 11,676,000 54,036,000
Total export to CIS 17,228 18,222 18,310 17,225 29,170 359,368 3,731,500 6,878,000 33,558,879
Armenia 276 295 287 252 291 1,071 5,300 6,000 30,851Azerbaijan 285 300 293 258 299 5,685 19,200 18,800 71,937Belarus
Estonia 202 214 216 204 294Georgia 271 289 283 252 307 1,696 3,800 8,000 41,115Kazakhstan 779 823 801 751 1,292 19,340 149,300 116,500 880,940
Kyrgyz Republic 143 154 153 143 236 1,629 5,100 10,700 68,122Latvia 431 449 459 430 527Lithuania 567 596 613 577 693
Moldova 388 413 410 396 642 9,073 160,900 130,400 816,761Russia 10,279 10,882 10,947 10,276 17,733 215,833 2,497,700 5,385,100 23,854,814Tajikistan 150 159 150 136 143 1,597 16,000 5,300 60,985
Turkmenistan 101 104 102 92 183 4,188 13,000 5,700 37,287Ukraine 2,835 2,997 3,062 2,966 5,324 86,476 808,200 1,142,300 7,004,823Uzbekistan 521 547 534 492 1,206 12,780 53,000 49,200 691,244
Total export to ROW 181,000 2,494,000 4,798,000 20,477,000
EC 62,000 833,000 1,722,000 6,638,000Others 119,000 1,661,000 3,076,000 13,839,000
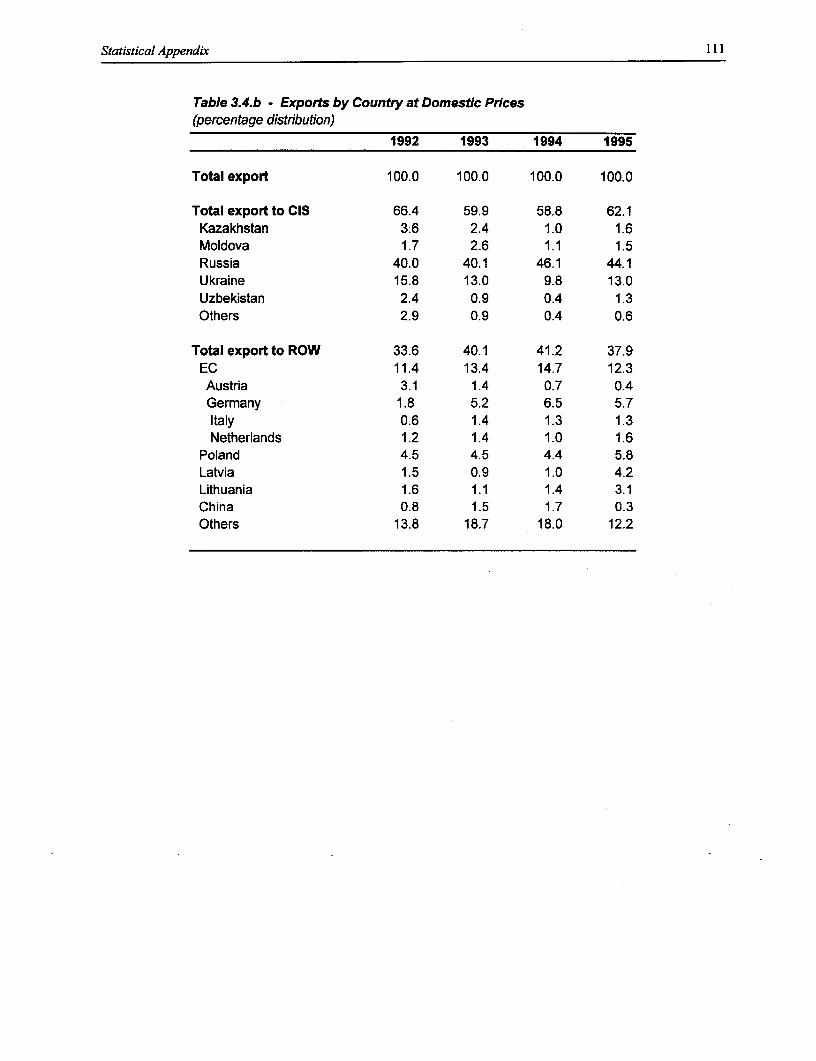
Statistical Appendix 111
Table 3.4.b - Exports by Country at Domestic Prices(percentage distribution)
1992 1993 1994 1995
Total export 100.0 100.0 100.0 100.0
Total export to CIS 66.4 59.9 58.8 62.1Kazakhstan 3:6 2.4 1.0 1.6Moldova 1.7 2.6 1.1 1.5Russia 40.0 40.1 46.1 44.1Ukraine 15.8 13.0 9.8 13.0Uzbekistan 2.4 0.9 0.4 1.3Others 2.9 0.9 0.4 0.6
Total export to ROW 33.6 40.1 41.2 37.9EC 11.4 13.4 14.7 12.3Austria 3.1 1.4 0.7 0.4Germany 1.8 5.2 6.5 5.7Italy 0.6 1.4 1.3 1.3Netherlands 1.2 1.4 1.0 1.6
Poland 4.5 4.5 4.4 5.8Latvia 1.5 0.9 1.0 4.2Lithuania 1.6 1.1 1.4 3.1China 0.8 1.5 1.7 0.3Others 13.8 18.7 18.0 12.2
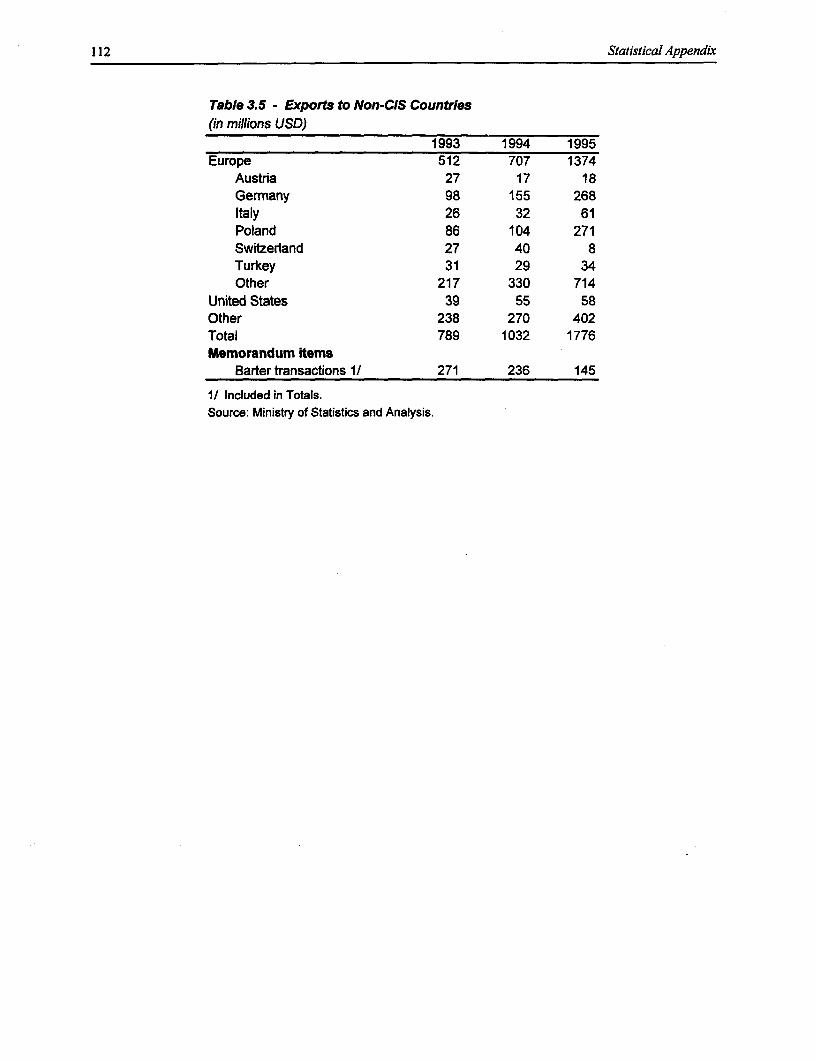
112 Statistical Appendix
Table 3.5 - Exports to Non-CIS Countries(in millions USD)
1993 1994 1995Europe 512 707 1374
Austria 27 17 18Germany 98 155 268Italy 26 32 61Poland 86 104 271Switzerland 27 40 8Turkey 31 29 34Other 217 330 714
United States 39 55 58Other 238 270 402Total 789 1032 1776Memorandum items
Barter transactions 1/ 271 236 145
1/ Included in Totals.Source: Ministry of Statistics and Analysis.
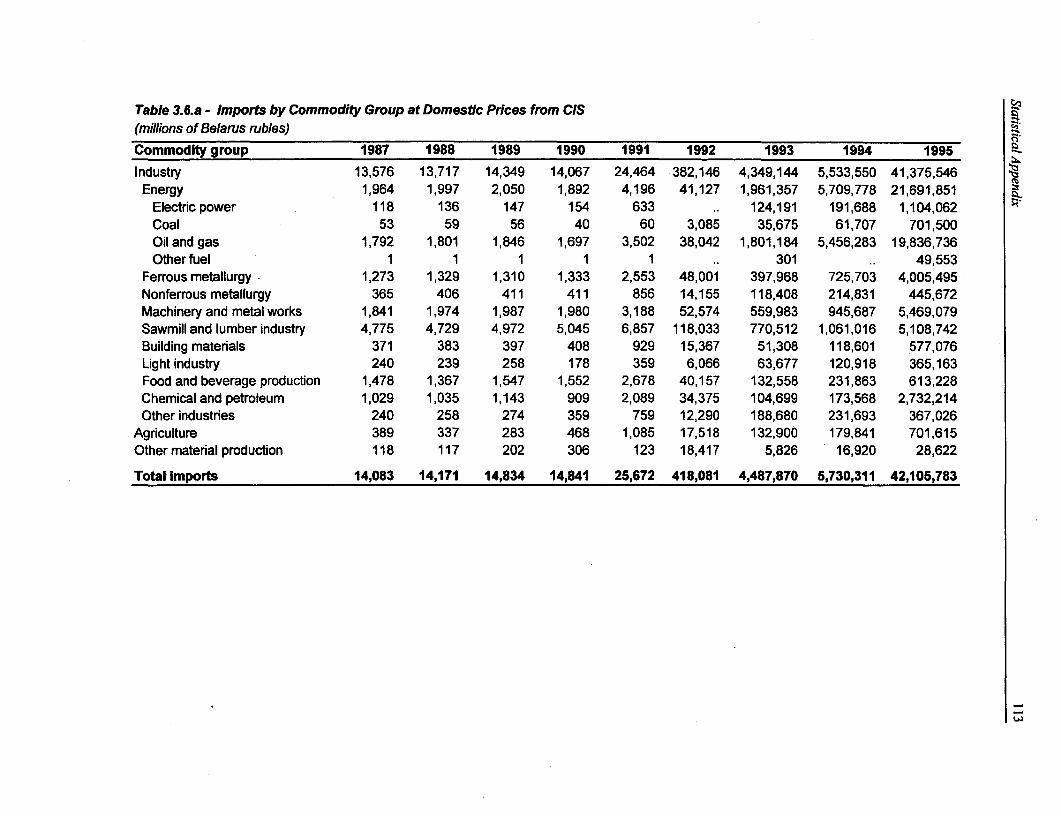
Table 3.6.a - Imports by Commodity Group at Domestic Prices from CIS(millions of Belarus rubles)
Commodity group 1987 1988 1989 1990 1991 1992 1993 1994 1995
Industry 13,576 13,717 14,349 14,067 24,464 382,146 4,349,144 5,533,550 41,375,546Energy 1,964 1,997 2,050 1,892 4,196 41,127 1,961,357 5,709,778 21,691,851
Electric power 118 136 147 154 633 124,191 191,688 1,104,062Coal 53 59 56 40 60 3,085 35,675 61,707 701,500Oil and gas 1,792 1,801 1,846 1,697 3,502 38,042 1,801,184 5,456,283 19,836,736Otherfuel 1 1 1 1 1 301 49,553
Ferrous metallurgy 1,273 1,329 1,310 1,333 2,553 48,001 397,968 725,703 4,005,495Nonferrous metallurgy 365 406 411 411 856 14,155 118,408 214,831 445,672Machinery and metal works 1,841 1,974 1,987 1,980 3,188 52,574 559,983 945,687 5,469,079Sawmill and lumber industry 4,775 4,729 4,972 5,045 6,857 118,033 770,512 1,061,016 5,108,742Building materials 371 383 397 408 929 15,367 51,308 118,601 577,076Light industry 240 239 258 178 359 6,066 63,677 120,918 365,163Food and beverage production 1,478 1,367 1,547 1,552 2,678 40,157 132,558 231,863 613,228Chemical and petroleum 1,029 1,035 1,143 909 2,089 34,375 104,699 173,568 2,732,214Other industries 240 258 274 359 759 12,290 188,680 231,693 367,026
Agriculture 389 337 283 468 1,085 17,518 132,900 179,841 701,615Other material production 118 117 202 306 123 18,417 5,826 16,920 28,622
Total Imports 14,083 14,171 14,834 14,841 25,672 418,081 4,487,870 5,730,311 42,105,783
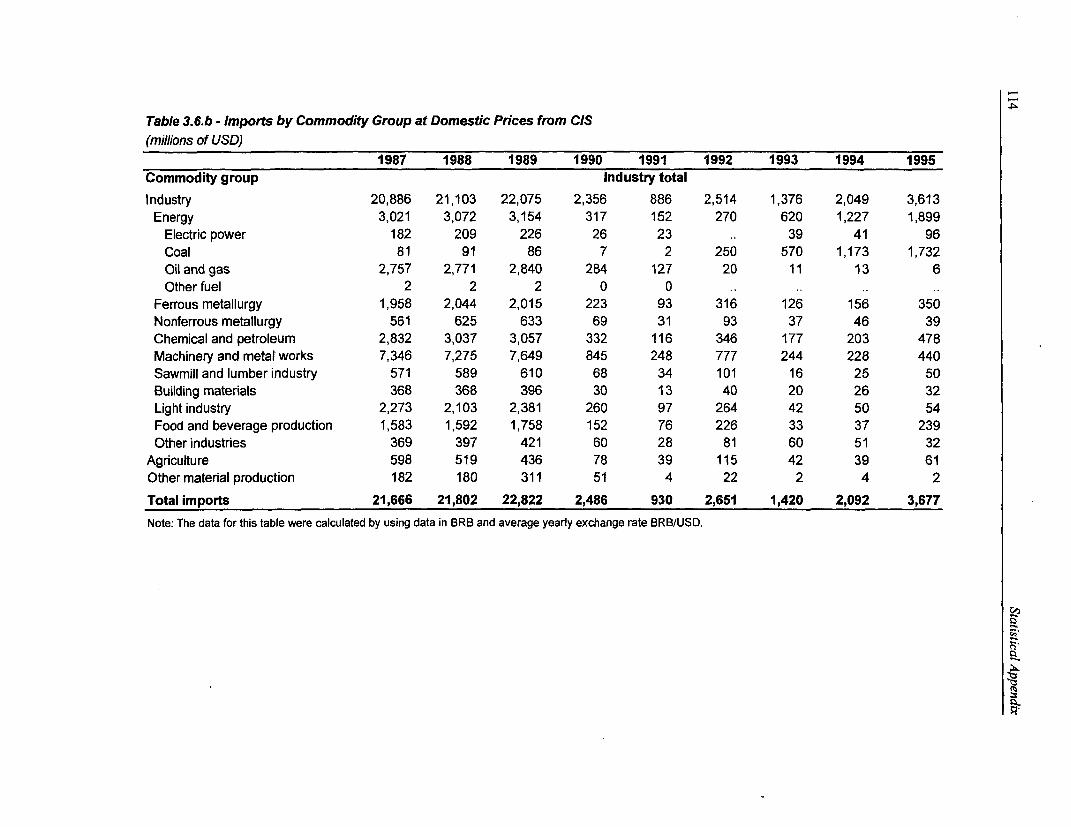
Table 3.6.b - Imports by Commodity Group at Domestic Prices from CIS(millions of USD)
1987 1988 1989 1990 1991 1992 1993 1994 1995Commodity group Industry totalIndustry 20,886 21,103 22,075 2,356 886 2,514 1,376 2,049 3,613Energy 3,021 3,072 3,154 317 152 270 620 1,227 1,899
Electric power 182 209 226 26 23 39 41 96Coal 81 91 86 7 2 250 570 1,173 1,732Oil and gas 2,757 2,771 2,840 284 127 20 11 13 6Other fuel 2 2 2 0 0
Ferrous metallurgy 1,958 2,044 2,015 223 93 316 126 156 350Nonferrous metallurgy 561 625 633 69 31 93 37 46 39Chemical and petroleum 2,832 3,037 3,057 332 116 346 177 203 478Machinery and metal works 7,346 7,275 7,649 845 248 777 244 228 440Sawmill and lumber industry 571 589 610 68 34 101 16 25 50Building materials 368 368 396 30 13 40 20 26 32Light industry 2,273 2,103 2,381 260 97 264 42 50 54Food and beverage production 1,583 1,592 1,758 152 76 226 33 37 239Other industries 369 397 421 60 28 81 60 51 32
Agriculture 598 519 436 78 39 115 42 39 61Other material production 182 180 311 51 4 22 2 4 2Total imports 21,666 21,802 22,822 2,486 930 2,651 1,420 2,092 3,677Note: The data for this table were calculated by using data in BRB and average yearly exchange rate BRB/USD.
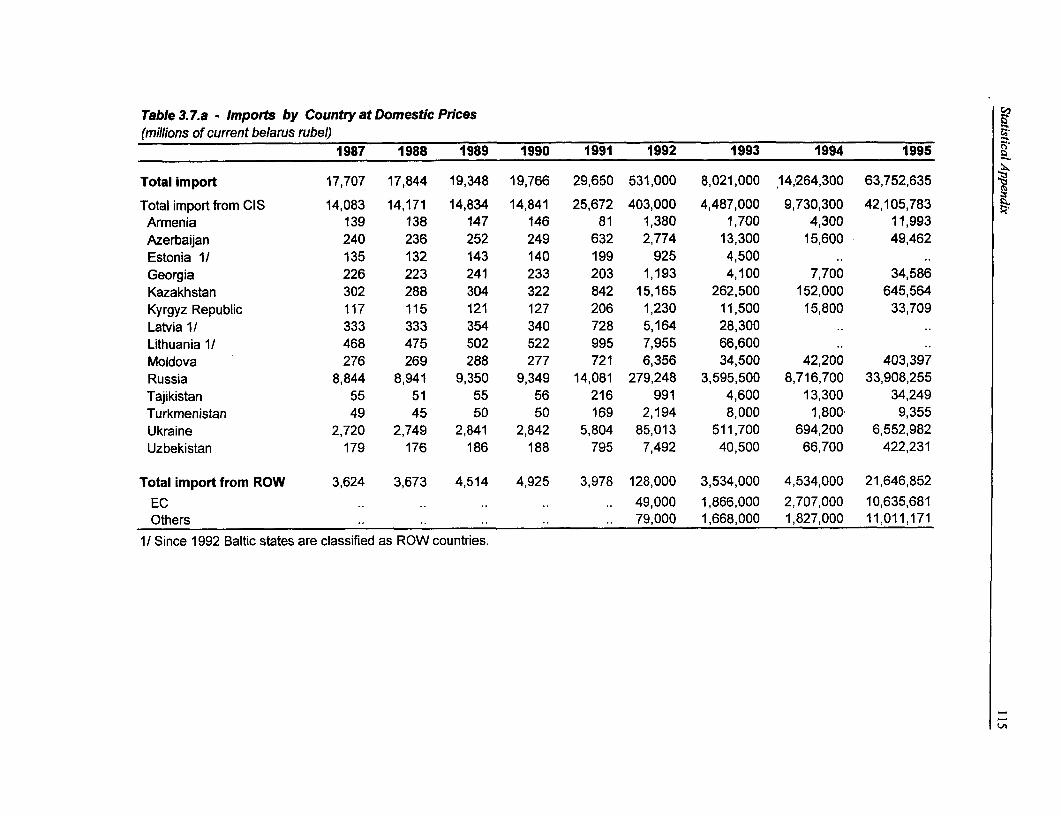
Table 3.7.a - Imports by Country at Domestic Prices(millions of current belarus rubel)
1987 1988 1989 1990 1991 1992 1993 1994 1995
Total import 17,707 17,844 19,348 19,766 29,650 531,000 8,021,000 14,264,300 63,752,635
Total import from CIS 14,083 14,171 14,834 14,841 25,672 403,000 4,487,000 9,730,300 42,105,783Armenia 139 138 147 146 81 1,380 1,700 4,300 11,993Azerbaijan 240 236 252 249 632 2,774 13,300 15,600 49,462Estonia 1/ 135 132 143 140 199 925 4,500Georgia 226 223 241 233 203 1,193 4,100 7,700 34,586Kazakhstan 302 288 304 322 842 15,165 262,500 152,000 645,564Kyrgyz Republic 117 115 121 127 206 1,230 11,500 15,800 33,709Latvia 1/ 333 333 354 340 728 5,164 28,300Lithuania 1/ 468 475 502 522 995 7,955 66,600Moldova 276 269 288 277 721 6,356 34,500 42,200 403,397Russia 8,844 8,941 9,350 9,349 14,081 279,248 3,595,500 8,716,700 33,908,255Tajikistan 55 51 55 56 216 991 4,600 13,300 34,249Turkmenistan 49 45 50 50 169 2,194 8,000 1,800 9,355Ukraine 2,720 2,749 2,841 2,842 5,804 85,013 511,700 694,200 6,552,982Uzbekistan 179 176 186 188 795 7,492 40,500 66,700 422,231
Total import from ROW 3,624 3,673 4,514 4,925 3,978 128,000 3,534,000 4,534,000 21,646,852
EC .. .. .. 49,000 1,866,000 2,707,000 10,635,681Others .. .. .. 79,000 1,668,000 1,827,000 11,011,171
1/ Since 1992 Baltic states are classified as ROW countries.
L,^
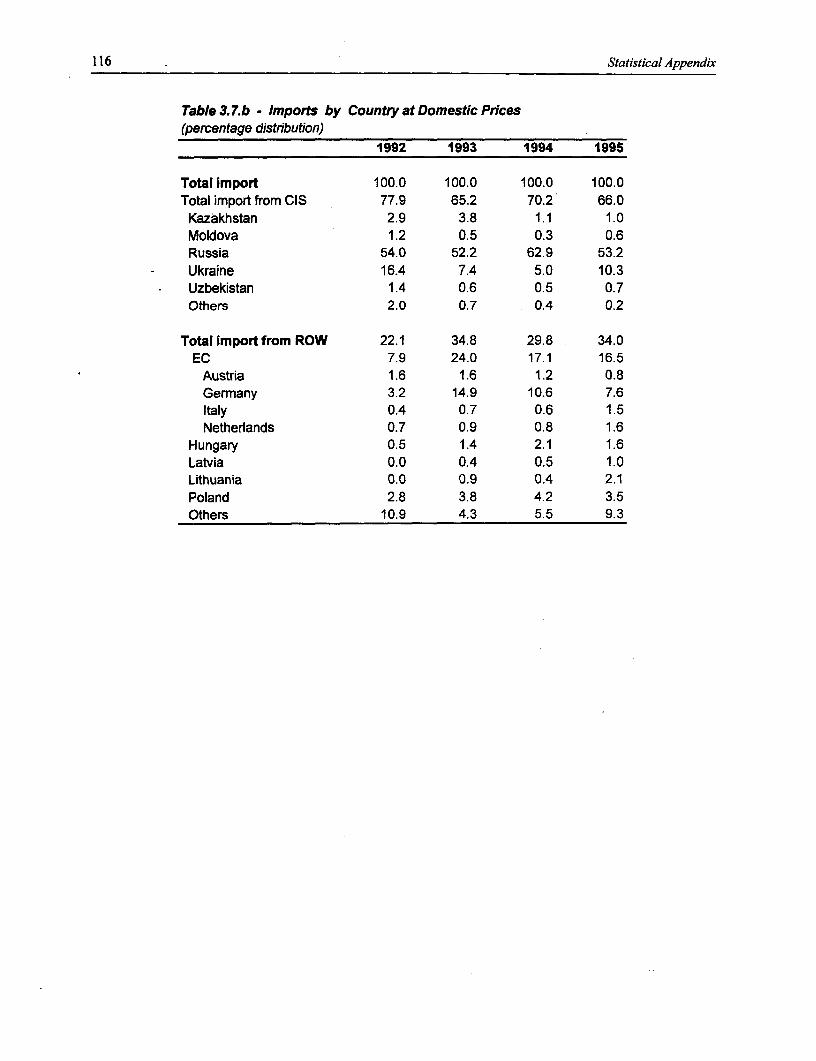
116 Statistical Appendix
Table 3.7.b - Imports by Country at Domestic Prices(percentage distribution)
1992 1993 1994 1995
Total import 100.0 100.0 100.0 100.0Total import from CIS 77.9 65.2 70.2 66.0Kazakhstan 2.9 3.8 1.1 1.0Moldova 1.2 0.5 0.3 0.6Russia 54.0 52.2 62.9 53.2Ukraine 16.4 7.4 5.0 10.3Uzbekistan 1.4 0.6 0.5 0.7Others 2.0 0.7 0.4 0.2
Total import from ROW 22.1 34.8 29.8 34.0EC 7.9 24.0 17.1 16.5
Austria 1.6 1.6 1.2 0.8Germany 3.2 14.9 10.6 7.6Italy 0.4 0.7 0.6 1.5Netherlands 0.7 0.9 0.8 1.6
Hungary 0.5 1.4 2.1 1.6Latvia 0.0 0.4 0.5 1.0Lithuania 0.0 0.9 0.4 2.1Poland 2.8 3.8 4.2 3.5Others 10.9 4.3 5.5 9.3
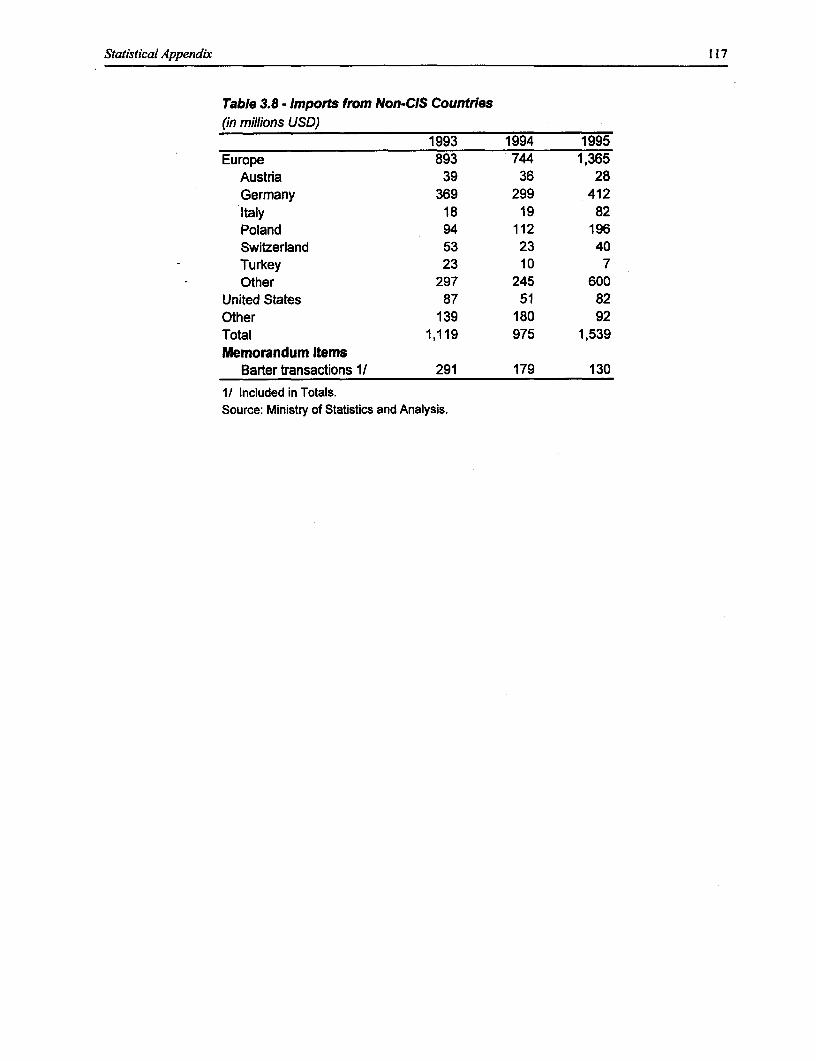
Statistical Appendix 117
Table 3.8 - Imports from Non-CIS Countries(in millions USD)
1993 1994 1995Europe 893 744 1,365
Austria 39 36 28Germany 369 299 412Italy 18 19 82Poland 94 112 196Switzerland 53 23 40Turkey 23 10 7Other 297 245 600
United States 87 51 82Other 139 180 92Total 1,119 975 1,539Memorandum items
Barter transactions 1/ 291 179 130
1/ Included in Totals.Source: Ministry of Statistics and Analysis.
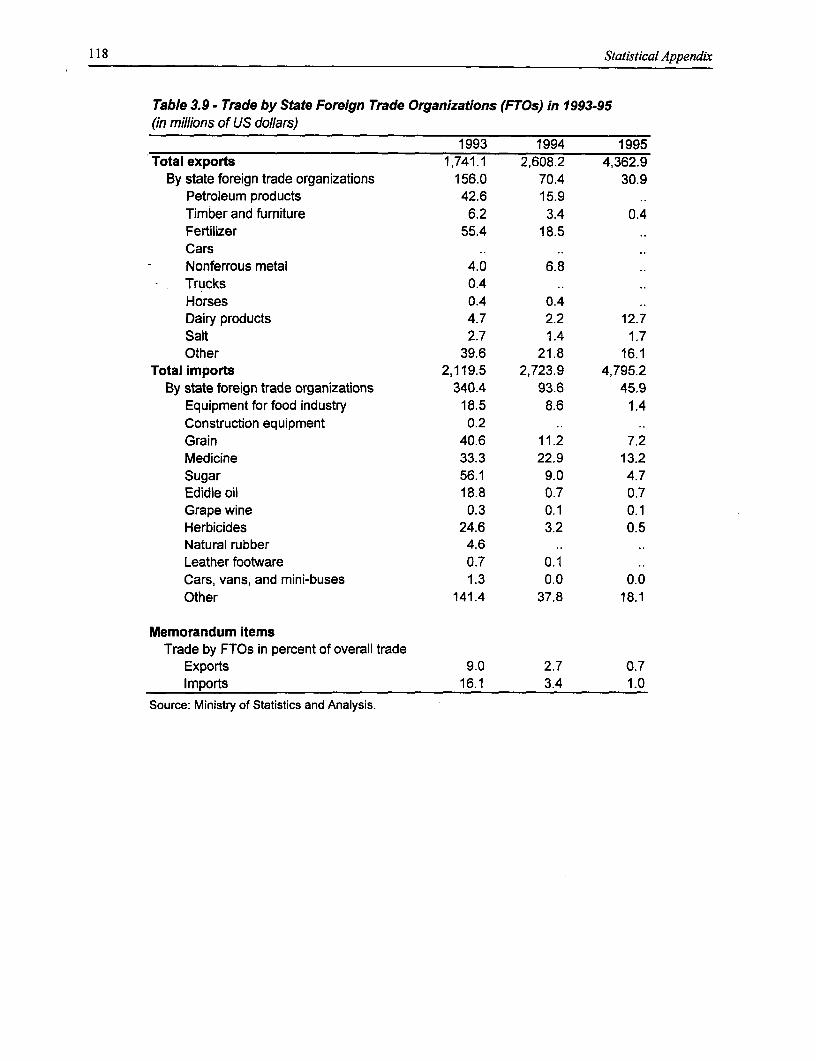
118 Statistical Appendix
Table 3.9 - Trade by State Foreign Trade Organizations (FTOs) in 1993-95(in millions of US dollars)
1993 1994 1995Total exports 1,741.1 2,608.2 4,362.9
By state foreign trade organizations 156.0 70.4 30.9Petroleum products 42.6 15.9Timber and furniture 6.2 3.4 0.4Fertilizer 55.4 18.5CarsNonferrous metal 4.0 6.8Trucks 0.4Horses 0.4 0.4Dairy products 4.7 2.2 12.7Salt 2.7 1.4 1.7Other 39.6 21.8 16.1
Total imports 2,119.5 2,723.9 4,795.2By state foreign trade organizations 340.4 93.6 45.9
Equipment for food industry 18.5 8.6 1.4Construction equipment 0.2Grain 40.6 11.2 7.2Medicine 33.3 22.9 13.2Sugar 56.1 9.0 4.7Edidle oil 18.8 0.7 0.7Grape wine 0.3 0.1 0.1Herbicides 24.6 3.2 0.5Natural rubber 4.6Leather footware 0.7 0.1Cars, vans, and mini-buses 1.3 0.0 0.0Other 141.4 37.8 18.1
Memorandum itemsTrade by FTOs in percent of overall trade
Exports 9.0 2.7 0.7Imports 16.1 3.4 1.0
Source: Ministry of Statistics and Analysis.
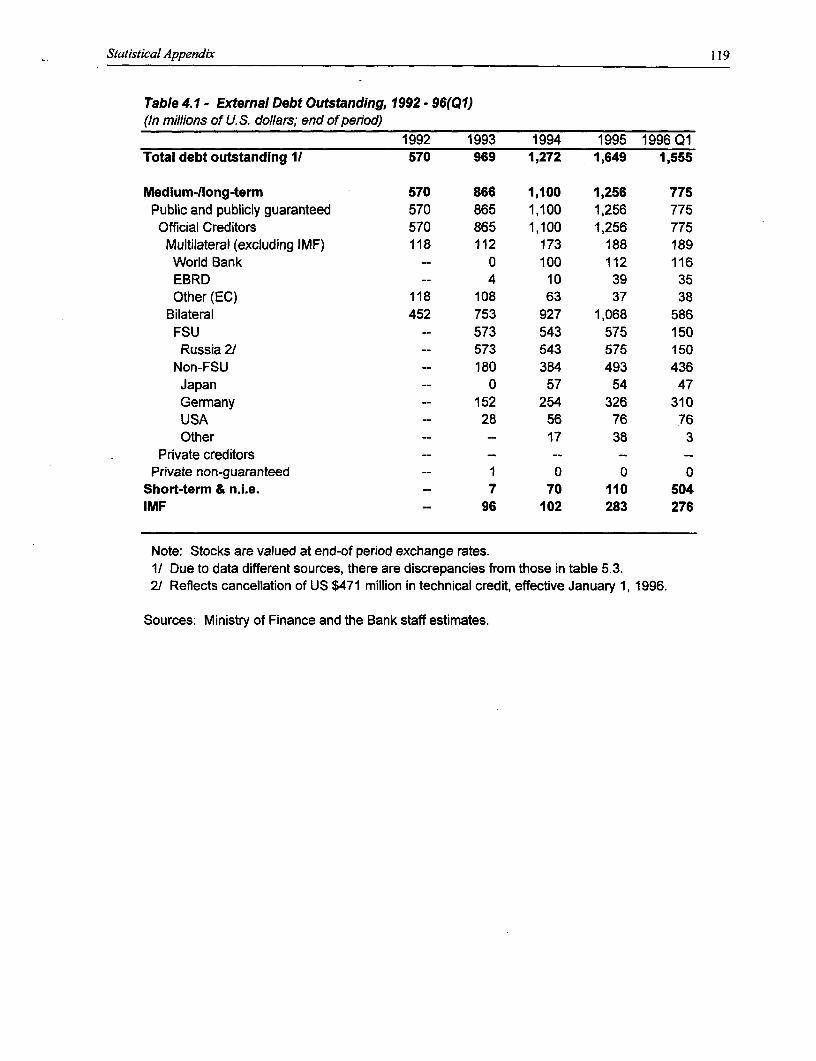
Statistical Appendix 119
Table 4.1 - External Debt Outstanding, 1992 - 96(Q1)(In millions of U. S. dollars; end of period)
1992 1993 1994 1995 1996 Q1Total debt outstanding 1/ 570 969 1,272 1,649 1,555
Medium-long-term 570 866 1,100 1,256 775Public and publicly guaranteed 570 865 1,100 1,256 775Official Creditors 570 865 1,100 1,256 775Multilateral (excluding IMF) 118 112 173 188 189World Bank - 0 100 112 116EBRD -- 4 10 39 35Other (EC) 118 108 63 37 38
Bilateral 452 753 927 1,068 586FSU -- 573 543 575 150Russia 2/ -- 573 543 575 150
Non-FSU -- 180 384 493 436Japan -- 0 57 54 47Germany -- 152 254 326 310USA -- 28 56 76 76Other -- -- 17 38 3
Private creditors -- - -- -- --
Private non-guaranteed -- 1 0 0 0Short-term & n.i.e. -- 7 70 110 504IMF -- 96 102 283 276
Note: Stocks are valued at end-of period exchange rates.1/ Due to data different sources, there are discrepancies from those in table 5.3.2/ Reflects cancellation of US $471 million in technical credit, effective January 1, 1996.
Sources: Ministry of Finance and the Bank staff estimates.

120 Statistical Appendix
Table 4.2 - Distributon of Extemal Interenterprise Debts by Country, 1994 - 95(End-of-period stocks; in billions of rubels)
1994 1995September Decemberl March June September December
Payables 2,848.0 6,113.5 7,300.9 8,729.1 10,030.2 11,613.2Azerbaijan 2.2 8.5 10.4 7.3 7.1 2.3Armenia 0.5 0.5 0.6 0.8 3.1 2.6Kazakhstan 6.1 82.1 22.1 18.9 33.3 23.2Kyrgyz republic 3.0 9.0 3.6 2.6 4 3Moldova 5.9 8.2 10.6 14.5 14.6 20.1Russia 2,716.4 5,422.6 6,310.2 6,944.7 8363.2 9532.1Tajikistan 0.9 0.7 0.6 7.4 7.9 2Turkmenistan -- 0.9 1.9 10.9 11.4 2.8Uzbekistan 4.3 12.6 17.3 95.7 106.3 135.5Ukraine 67.5 124.6 190.5 225.5 263.1 335Georgia 0.1 0.3 0.8 1.1 2 12.1Lithuania 9.3 104.2 129.5 157.2 127.1 303.4Latvia 13.1 15.3 29.9 50.3 43.9 75.1Estonia 1.0 1.8 2.9 8.3 3.6 5.6Other 17.7 322.2 570.0 1,183.9 1039.6 1158.4
Receivables 828.7 2,653.0 3,371.1 4,530.6 5,614.0 5,877.5Azerbaijan 0.8 2.3 2.5 1.7 2.6 2.6Armenia 0.2 0.4 1.9 2.1 2.3 2.7Kazakhstan 12.0 44.8 34.3 27.0 62.9 77.3Kyrgyz republic 0.6 0.5 0.4 0.3 1.2 1.6Moldova 5.3 6.0 17.4 20.2 26.4 30.5Russia 630.6 1,564.9 1,776.7 2,668.9 3,144.4 3,702.2Tajikistan 0.4 1.7 1.0 1.1 1.7 1.9Turkmenistan 0.2 1.4 0.9 0.7 1 3.3Uzbekistan 3.2 12.9 8.0 40.4 95.1 99Ukraine 103.9 210.3 324.6 354.1 492.1 423.1Georgia 0.8 0.2 1.4 1.6 2.6 2.5Lithuania 7.0 17.7 94.9 137.9 166 92.8Latvia 13.8 34.6 36.8 104.0 82.8 92Estonia 2.3 3.0 3.4 8.8 9.1 8.1Other 47.6 752.3 1,066.9 1,161.8 1,523.8 1,337.9
Net debt -2,019.3 -3,460.5 -3,929.8 -4,198.5 -4,416.2 -5,735.7Azerbaijan -1.4 -6.2 -7.9 -5.6 -4.5 0.3Armenia -0.3 -0.1 1.3 1.3 -0.8 0.1Kazakhstan 5.9 -37.3 12.2 8.1 29.6 54.1Kyrgyz republic -2.4 -8.5 -3.2 -2.3 -2.8 -1.4Moldova -0.6 -2.2 6.8 5.7 11.8 10.4Russia -2,085.8 -3,857.7 -4,533.5 -4,275.8 -5,218.8 -5,829.9Tajikistan -0.5 1.0 0.4 -6.3 -6.2 -0.1Turkmenistan -0.2 0.5 -1.0 -10.2 -10.4 0.5Uzbekistan -1.1 0.3 -9.3 -55.3 -11.2 -36.3Ukraine 36.3 85.7 134.1 128.6 229.0 88.1Georgia 0.7 -0.1 0.6 0.5 0.6 -9.6Lithuania -2.3 -86.5 -34.6 -19.3 38.9 -210.6Latvia 0.8 19.3 6.9 53.7 38.9 17.1Estonia 1.3 1.2 0.5 0.5 5.5 2.5Other 29.9 430.1 496.9 -22.1 484.2 179.5
Source: Ministry of Statistics and Analysis.
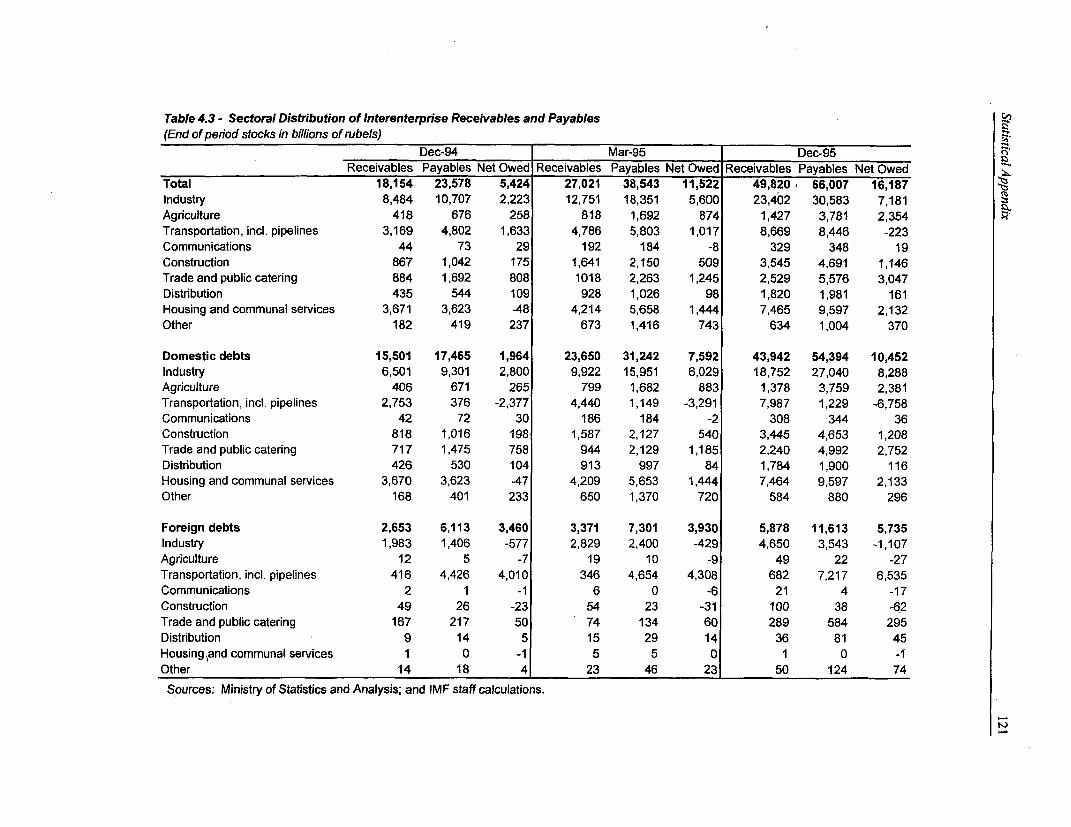
Table 4.3 - Sectoral Distribution of Interenterpnise Receivables and Payables(End of penod stocks in billions of rubels)
Dec-94 Mar-95 Dec-95Receivables Payables Net Owed Receivables Payables Net Owed Receivables Payables Net Owed
Total 18,154 23,578 5,424 27,021 38,543 11,522 49,820, 66,007 16,187Industry 8,484 10,707 2,223 12,751 18,351 5,600 23,402 30,583 7,181Agriculture 418 676 258 818 1,692 874 1,427 3,781 2,354Transportation, incl. pipelines 3,169 4,802 1,633 4,786 5,803 1,017 8,669 8,446 -223Communications 44 73 29 192 184 -8 329 348 19Construction 867 1,042 175 1,641 2,150 509 3,545 4,691 1,146Trade and public catering 884 1,692 808 1018 2,263 1,245 2,529 5,576 3,047Distribution 435 544 109 928 1,026 98 1,820 1,981 161Housing and communal services 3,671 3,623 -48 4,214 5,658 1,444 7,465 9,597 2,132Other 182 419 237 673 1,416 743 634 1,004 370
Domestic debts 15,501 17,465 1,964 23,650 31,242 7,592 43,942 54,394 10,452Industry 6,501 9,301 2,800 9,922 15,951 6,029 18,752 27,040 8,288Agriculture 406 671 265 799 1,682 883 1,378 3,759 2,381Transportation, incl. pipelines 2,753 376 -2,377 4,440 1,149 -3,291 7,987 1,229 -6,758Communications 42 72 30 186 184 -2 308 344 36Construction 818 1,016 198 1,587 2,127 540 3,445 4,653 1,208Trade and public catering 717 1,475 758 944 2,129 1,185 2,240 4,992 2,752Distribution 426 530 104 913 997 84 1,784 1,900 116Housing and communal services 3,670 3,623 -47 4,209 5,653 1,444 7,464 9,597 2,133Other 168 401 233 650 1,370 720 584 880 296
Foreign debts 2,653 6,113 3,460 3,371 7,301 3,930 5,878 11,613 5,735Industry 1,983 1,406 -577 2,829 2,400 -429 4,650 3,543 -1,107Agriculture 12 5 -7 19 10 -9 49 22 -27Transportation, incl. pipelines 416 4,426 4,010 346 4,654 4,308 682 7,217 6,535Communications 2 1 -1 6 0 -6 21 4 -17Construction 49 26 -23 54 23 -31 100 38 -62Trade and public catering 167 217 50 74 134 60 289 584 295Distribution 9 14 5 15 29 14 36 81 45Housing and communal services 1 0 -1 5 5 0 1 0 -1Other 14 18 4 23 46 23 50 124 74
Sources: Ministry of Statistics and Analysis; and IMF staff calculations.
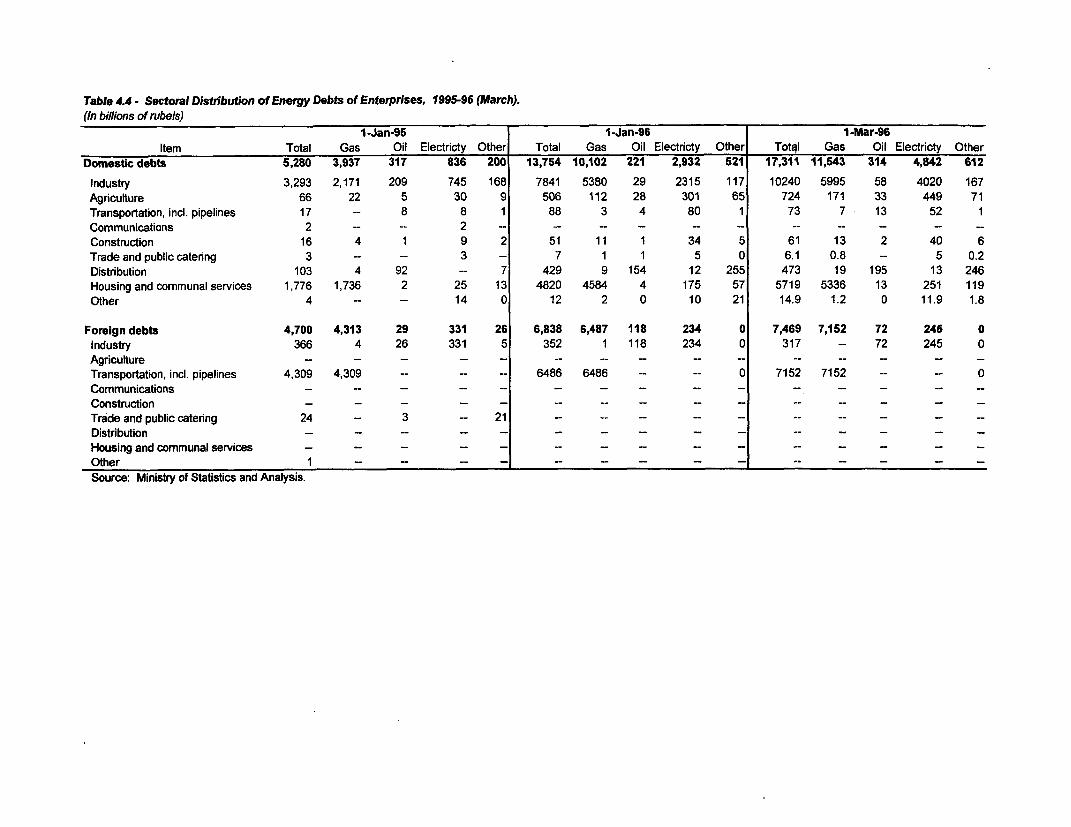
Table 4.4 - Sectoral Distribution of Energy Debts of Enterprises, 1995-96 (March).(In billions of rubels)
1-Jan-95 1-Jan-96 1-Mar-96Item Total Gas Oil Electricty Other Total Gas Oil Electricty Other Totql Gas Oil Electricty Other
Domestic debts 5,280 3,937 317 836 200 13,754 10,102 221 2,932 521 17,311 11,543 314 4,842 612
Industry 3,293 2,171 209 745 168 7841 5380 29 2315 117 10240 5995 58 4020 167Agriculture 66 22 5 30 9 506 112 28 301 65 724 171 33 449 71Transportation, incl. pipelines 17 -- 8 8 1 88 3 4 80 1 73 7 13 52 1Communications 2 -- - 2 - -- - - - -- -- -- - - -Construction 16 4 1 9 2 51 11 1 34 5 61 13 2 40 6Trade and public catering 3 - - 3 -- 7 1 1 5 0 6.1 0.8 - 5 0.2Distribution 103 4 92 - 7 429 9 154 12 255 473 19 195 13 246Housing and communal services 1,776 1,736 2 25 13 4820 4584 4 175 57 5719 5336 13 251 119Other 4 -- -- 14 0 12 2 0 10 21 14.9 1.2 0 11.9 1.8
Foreign debts 4,700 4,313 29 331 26 6,838 6,487 118 234 0 7,469 7,152 72 245 0Industry 366 4 26 331 5 352 1 118 234 0 317 - 72 245 0Agriculture - - - - - - - - - -- -- - -Transportation, incl. pipelines 4,309 4,309 -- -- -- 6486 6486 -- - 0 7152 7152 -- 0Communications - - - - - - -- _ Construction - - - - - _ _ _Trade and public catering 24 - 3 - 21 _ _ _ _ _Distribution - - - - -_ _ _ _ _ _Housing and communal services - - - - - _ _ _ _ _Other 1 _ _ _ _ _ _ _ _ _Source: Ministry of Statistics and Analysis.
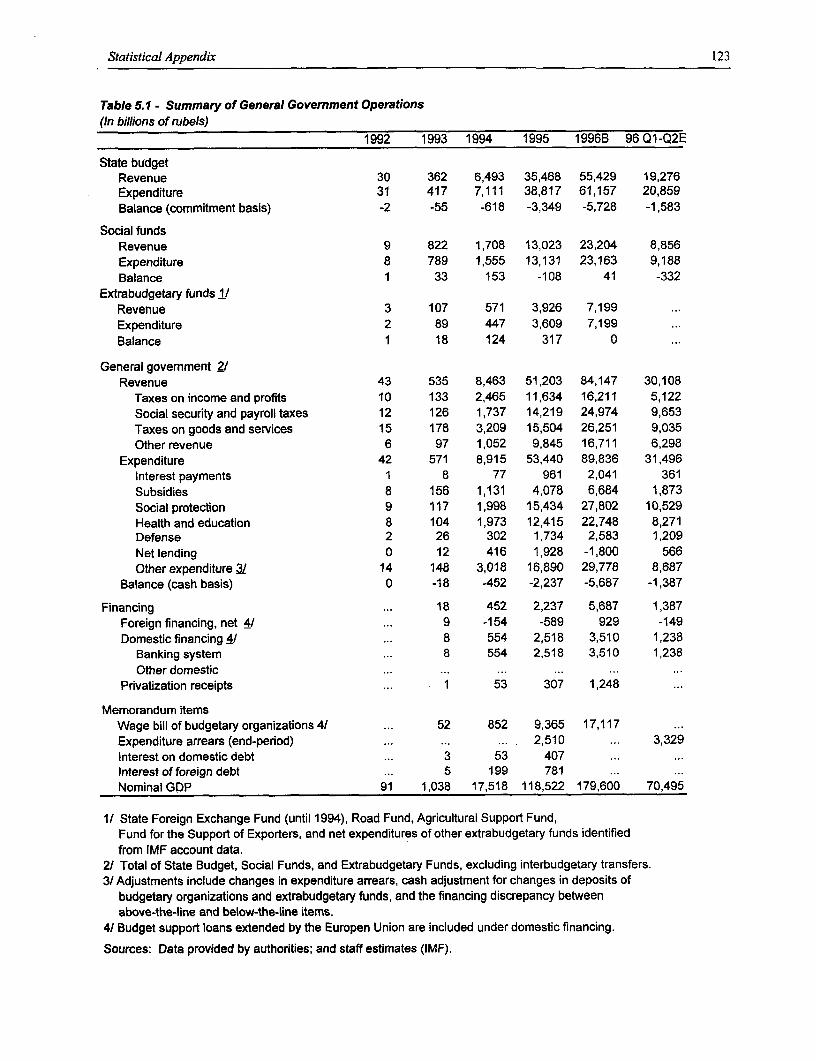
Statistical Appendix 123
Table 5.1 - Summary of General Government Operations(in billions of rubels)
1992 1993 1994 1995 1996B 96 Q1-Q2E
State budgetRevenue 30 362 6,493 35,468 55,429 19,276Expenditure 31 417 7,111 38,817 61,157 20,859Balance (commitment basis) -2 -55 -618 -3,349 -5,728 -1,583
Social fundsRevenue 9 822 1,708 13,023 23,204 8,856Expenditure 8 789 1,555 13,131 23,163 9,188Balance 1 33 153 -108 41 -332
Extrabudgetary funds 1/Revenue 3 107 571 3,926 7,199 ...Expenditure 2 89 447 3,609 7,199 ...Balance 1 18 124 317 0 ...
General govemment 2/Revenue 43 535 8,463 51,203 84,147 30,108
Taxes on income and profits 10 133 2,465 11,634 16,211 5,122Social security and payroll taxes 12 126 1,737 14,219 24,974 9,653Taxes on goods and services 15 178 3,209 15,504 26,251 9,035Other revenue 6 97 1,052 9,845 16,711 6,298
Expenditure 42 571 8,915 53,440 89,836 31,496Interest payments 1 8 77 961 2,041 361Subsidies 8 156 1,131 4,078 6,684 1,873Social protection 9 117 1,998 15,434 27,802 10,529Health and education 8 104 1,973 12,415 22,748 8,271Defense 2 26 302 1,734 2,583 1,209Net lending 0 12 416 1,928 -1,800 566Other expenditure 3J 14 148 3,018 16,890 29,778 8,687
Balance (cash basis) 0 -18 -452 -2,237 -5,687 -1,387
Financing ... 18 452 2,237 5,687 1,387Foreign financing, net 4/ ... 9 -154 -589 929 -149
Domestic financing 4/ ... 8 554 2,518 3,510 1,238Banking system ... 8 554 2,518 3,510 1,238
Other domestic ... ... ... ... ...Privatization receipts ... 1 53 307 1,248
Memorandum itemsWage bill of budgetary organizations 4/ ... 52 852 9,365 17,117 ...Expenditure arrears (end-period) ... ... .... 2,510 .. 3,329Interest on domestic debt ... 3 53 407 ... ...Interest of foreign debt ... 5 199 781 ... ...Nominal GDP 91 1,038 17,518 118,522 179,600 70,495
1/ State Foreign Exchange Fund (until 1994), Road Fund, Agricultural Support Fund,Fund for the Support of Exporters, and net expenditures of other extrabudgetary funds identifiedfrom IMF account data.
2/ Total of State Budget, Social Funds, and Extrabudgetary Funds, excluding interbudgetary transfers.3/ Adjustments include changes in expenditure arrears, cash adjustment for changes in deposits of
budgetary organizations and extrabudgetary funds, and the financing discrepancy betweenabove-the-line and below-the-line items.
4/ Budget support loans extended by the Europen Union are included under domestic financing.
Sources: Data provided by authorities; and staff estimates (IMF).
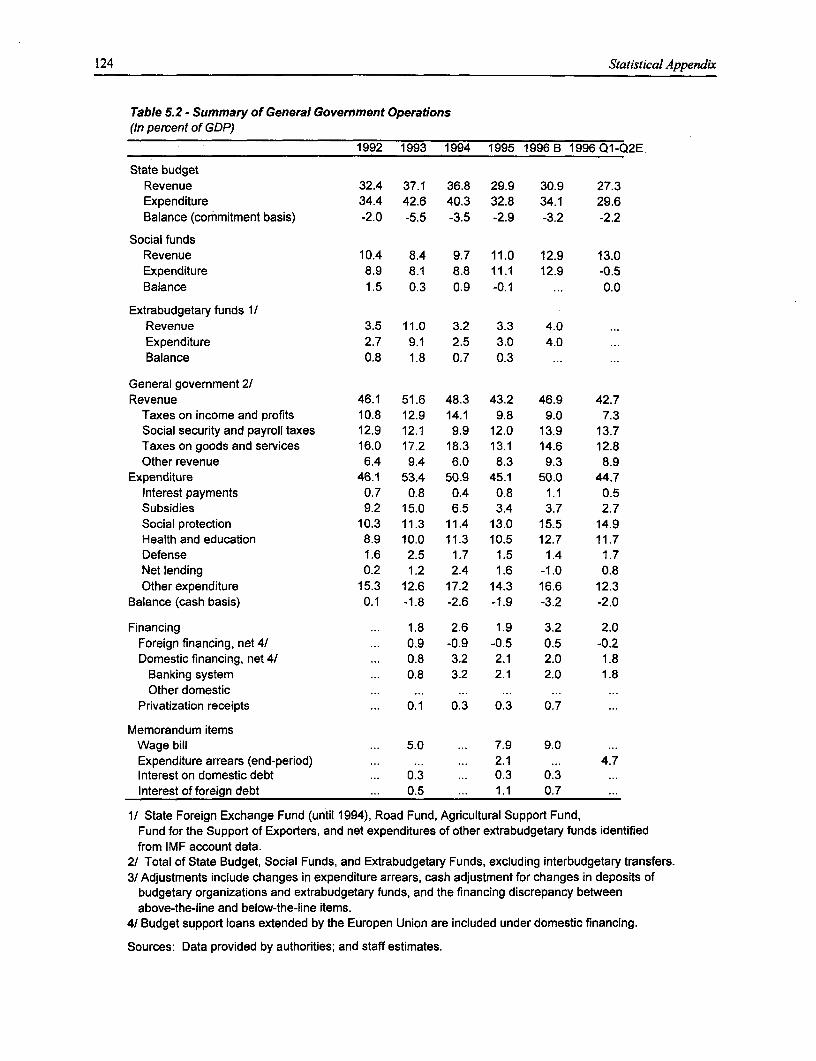
124 Statistical Appendix
Table 5.2 - Summary of General Government Operations(In percent of GDP)
1992 1993 1994 1995 1996 B 1996 Q1-Q2E
State budgetRevenue 32.4 37.1 36.8 29.9 30.9 27.3Expenditure 34.4 42.6 40.3 32.8 34.1 29.6Balance (commitment basis) -2.0 -5.5 -3.5 -2.9 -3.2 -2.2
Social fundsRevenue 10.4 8.4 9.7 11.0 12.9 13.0Expenditure 8.9 8.1 8.8 11.1 12.9 -0.5Balance 1.5 0.3 0.9 -0.1 ... 0.0
Extrabudgetary funds 1/Revenue 3.5 11.0 3.2 3.3 4.0 ...Expenditure 2.7 9.1 2.5 3.0 4.0 ...Balance 0.8 1.8 0.7 0.3 ... ...
General government 2/Revenue 46.1 51.6 48.3 43.2 46.9 42.7
Taxes on income and profits 10.8 12.9 14.1 9.8 9.0 7.3Social security and payroll taxes 12.9 12.1 9.9 12.0 13.9 13.7Taxes on goods and services 16.0 17.2 18.3 13.1 14.6 12.8Other revenue 6.4 9.4 6.0 8.3 9.3 8.9
Expenditure 46.1 53.4 50.9 45.1 50.0 44.7Interest payments 0.7 0.8 0.4 0.8 1.1 0.5Subsidies 9.2 15.0 6.5 3.4 3.7 2.7Social protection 10.3 11.3 11.4 13.0 15.5 14.9Health and education 8.9 10.0 11.3 10.5 12.7 11.7Defense 1.6 2.5 1.7 1.5 1.4 1.7Net lending 0.2 1.2 2.4 1.6 -1.0 0.8Other expenditure 15.3 12.6 17.2 14.3 16.6 12.3
Balance (cash basis) 0.1 -1.8 -2.6 -1.9 -3.2 -2.0
Financing ... 1.8 2.6 1.9 3.2 2.0Foreign financing, net 4/ ... 0.9 -0.9 -0.5 0.5 -0.2Domestic financing, net 41 ... 0.8 3.2 2.1 2.0 1.8
Banking system ... 0.8 3.2 2.1 2.0 1.8Other domestic ... ... ... ... ... ...
Privatization receipts ... 0.1 0.3 0.3 0.7 ...
Memorandum itemsWage bill ... 5.0 ... 7.9 9.0 ...Expenditure arrears (end-period) ... ... ... 2.1 ... 4.7Interest on domestic debt ... 0.3 ... 0.3 0.3 ...Interest of foreign debt ... 0.5 ... 1.1 0.7 ...
1/ State Foreign Exchange Fund (until 1994), Road Fund, Agricultural Support Fund,Fund for the Support of Exporters, and net expenditures of other extrabudgetary funds identifiedfrom IMF account data.
2/ Total of State Budget, Social Funds, and Extrabudgetary Funds, excluding interbudgetary transfers.3/ Adjustments include changes in expenditure arrears, cash adjustment for changes in deposits of
budgetary organizations and extrabudgetary funds, and the financing discrepancy betweenabove-the-line and below-the-line items.
4/ Budget support loans extended by the Europen Union are included under domestic financing.
Sources: Data provided by authorities; and staff estimates.
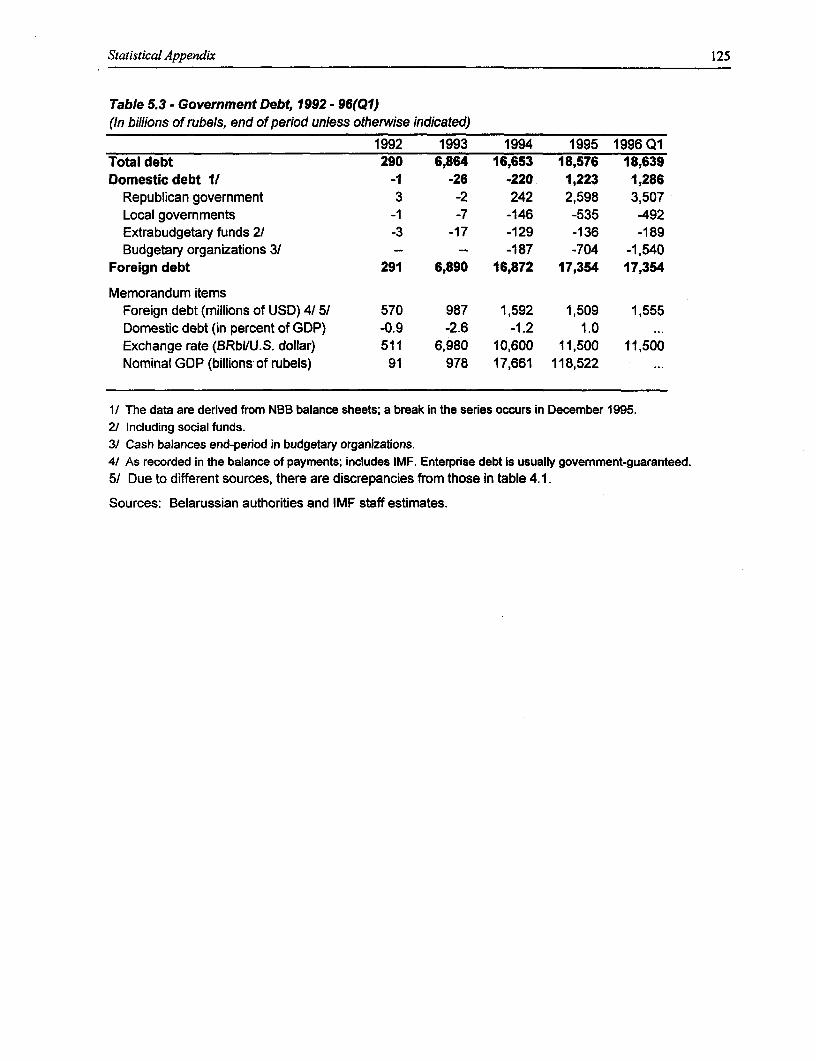
Statistical Appendix 125
Table 5.3 - Government Debt, 1992 - 96(Q1)(In billions of rubels, end of period unless otherwise indicated)
1992 1993 1994 1995 1996 Q1Total debt 290 6,864 16,653 18,576 18,639Domestic debt 11 -1 -26 -220 1,223 1,286
Republican government 3 -2 242 2,598 3,507Local governments -1 -7 -146 -535 -492Extrabudgetary funds 2/ -3 -17 -129 -136 -189Budgetary organizations 3/ - - -187 -704 -1,540
Foreign debt 291 6,890 16,872 17,354 17,354
Memorandum itemsForeign debt (millions of USD) 4/ 5/ 570 987 1,592 1,509 1,555Domestic debt (in percent of GDP) -0.9 -2.6 -1.2 1.0 ...Exchange rate (BRbVU.S. dollar) 511 6,980 10,600 11,500 11,500Nominal GDP (billions of rubels) 91 978 17,661 118,522 ...
1/ The data are derived from NBB balance sheets; a break in the series occurs in December 1995.2/ Including social funds.3/ Cash balances end-period in budgetary organizations.4/ As recorded in the balance of payments; includes IMF. Enterprise debt is usually govemment-guaranteed.5/ Due to different sources, there are discrepancies from those in table 4.1.
Sources: Belarussian authorities and IMF staff estimates.
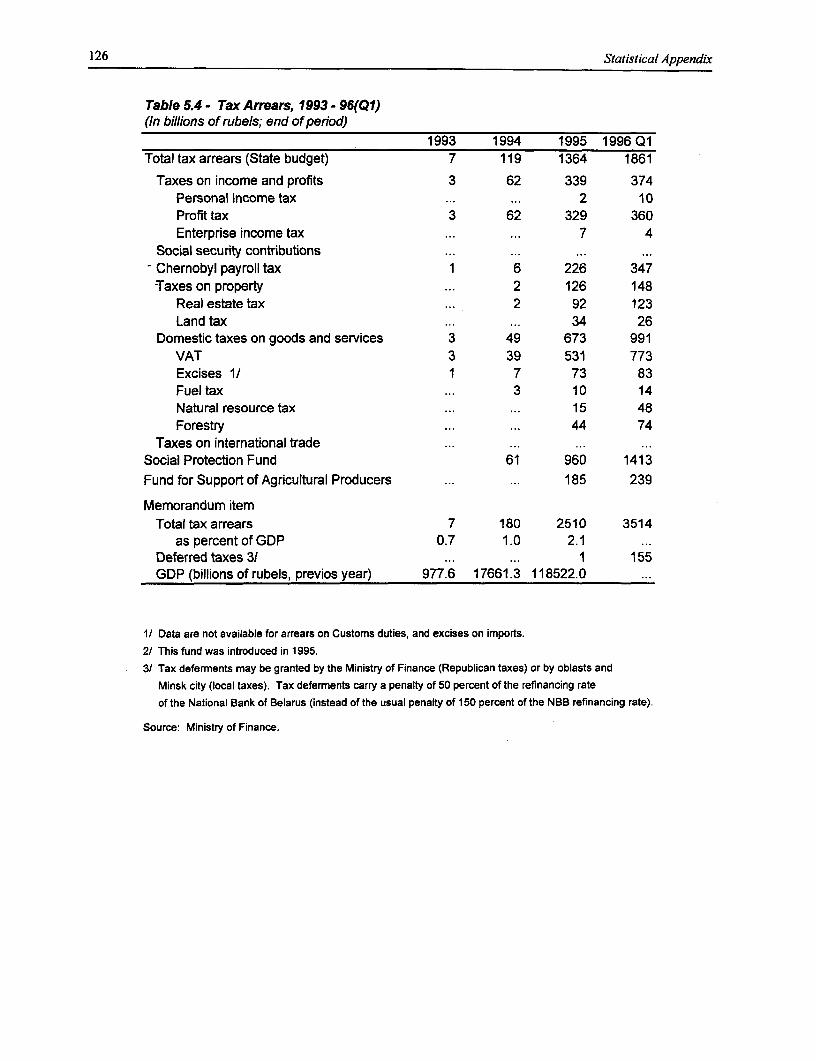
126 Statistical Appendix
Table 5.4 - Tax Arrears, 1993 - 96(Q1)(in billions of rubels; end of period)
1993 1994 1995 1996 Q1Total tax arrears (State budget) 7 119 1364 1861
Taxes on income and profits 3 62 339 374Personal income tax ... ... 2 10Profit tax 3 62 329 360Enterprise income tax ... ... 7 4
Social security contributions ... ... ... ...- Chernobyl payroll tax 1 6 226 347-Taxes on property ... 2 126 148
Real estate tax ... 2 92 123Land tax ... 34 26
Domestic taxes on goods and services 3 49 673 991VAT 3 39 531 773Excises 1/ 1 7 73 83Fuel tax ... 3 10 14Natural resource tax ... ... 15 48Forestry ... ... 44 74
Taxes on international trade ... ... ... ...Social Protection Fund 61 960 1413Fund for Support of Agricultural Producers ... ... 185 239
Memorandum itemTotal tax arrears 7 180 2510 3514
as percent of GDP 0.7 1.0 2.1 ...Deferred taxes 3/ ... ... 1 155GDP (billions of rubels, previos year) 977.6 17661.3 118522.0
1/ Data are not available for arrears on Customs duties, and excises on imports.
2/ This fund was introduced in 1995.3/ Tax deferments may be granted by the Ministry of Finance (Republican taxes) or by oblasts and
Minsk city (local taxes). Tax deferments carry a penalty of 50 percent of the refinancing rateof the National Bank of Belarus (instead of the usual penalty of 150 percent of the NBB refinancing rate).
Source: Ministry of Finance.
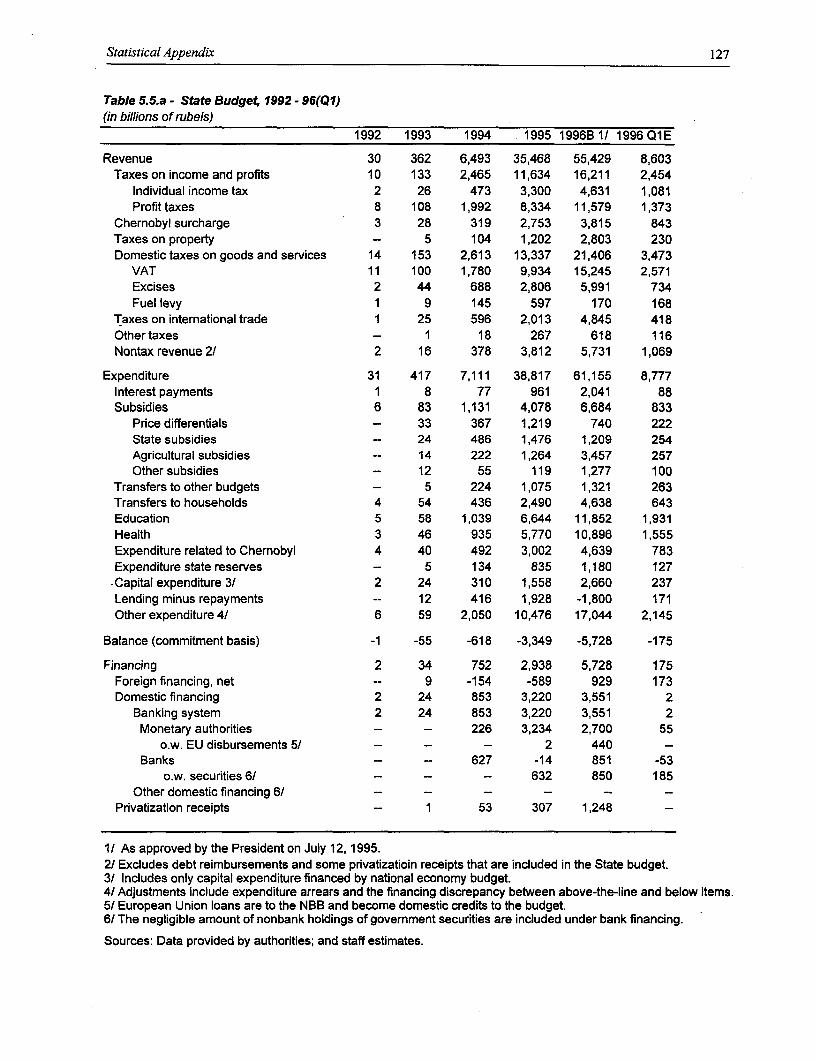
Statistical Appendix 127
Table 5.5.a - State Budget, 1992 - 96(Ql)(in billions of rubels)
1992 1993 1994 1995 1996B 1/ 1996 Q1E
Revenue 30 362 6,493 35,468 55,429 8,603Taxes on income and profits 10 133 2,465 11,634 16,211 2,454
Individual income tax 2 26 473 3,300 4,631 1,081Profit taxes 8 108 1,992 8,334 11,579 1,373
Chernobyl surcharge 3 28 319 2,753 3,815 843Taxes on property -- 5 104 1,202 2,803 230Domestic taxes on goods and services 14 153 2,613 13,337 21,406 3,473
VAT 11 100 1,780 9,934 15,245 2,571Excises 2 44 688 2,806 5,991 734Fuel levy 1 9 145 597 170 168
Taxes on international trade 1 25 596 2,013 4,845 418Other taxes -- 1 18 267 618 116Nontax revenue 2/ 2 16 378 3,812 5,731 1,069
Expenditure 31 417 7,111 38,817 61,155 8,777Interest payments 1 8 77 961 2,041 88Subsidies 6 83 1,131 4,078 6,684 833
Price differentials - 33 367 1,219 740 222State subsidies -- 24 486 1,476 1,209 254Agricultural subsidies -- 14 222 1,264 3,457 257Other subsidies -- 12 55 119 1,277 100
Transfers to other budgets -- 5 224 1,075 1,321 263Transfers to households 4 54 436 2,490 4,638 643Education 5 58 1,039 6,644 11,852 1,931Health 3 46 935 5,770 10,896 1,555Expenditure related to Chernobyl 4 40 492 3,002 4,639 783Expenditure state reserves - 5 134 835 1,180 127
-Capital expenditure 3/ 2 24 310 1,558 2,660 237Lending minus repayments -- 12 416 1,928 -1,800 171Other expenditure 4/ 6 59 2,050 10,476 17,044 2,145
Balance (commitment basis) -1 -55 -618 -3,349 -5,728 -175
Financing 2 34 752 2,938 5,728 175Foreign financing, net -- 9 -154 -589 929 173Domestic financing 2 24 853 3,220 3,551 2
Banking system 2 24 853 3,220 3,551 2Monetary authorities -- -- 226 3,234 2,700 55
o.w. EU disbursements 5/ -- -- -- 2 440 --
Banks - -- 627 -14 851 -53o.w. securities 6/ -- -- -- 632 850 185
Other domestic financing 6/ -- -- -- -- -- --
Privatization receipts -- 1 53 307 1,248 --
1/ As approved by the President on July 12,1995.2/ Excludes debt reimbursements and some privatizatioin receipts that are included in the State budget.3/ Includes only capital expenditure financed by national economy budget.4/ Adjustments include expenditure arrears and the financing discrepancy between above-the-line and below items.5/ European Union loans are to the NBB and become domestic credits to the budget.6/ The negligible amount of nonbank holdings of government securities are included under bank financing.
Sources: Data provided by authorities; and staff estimates.
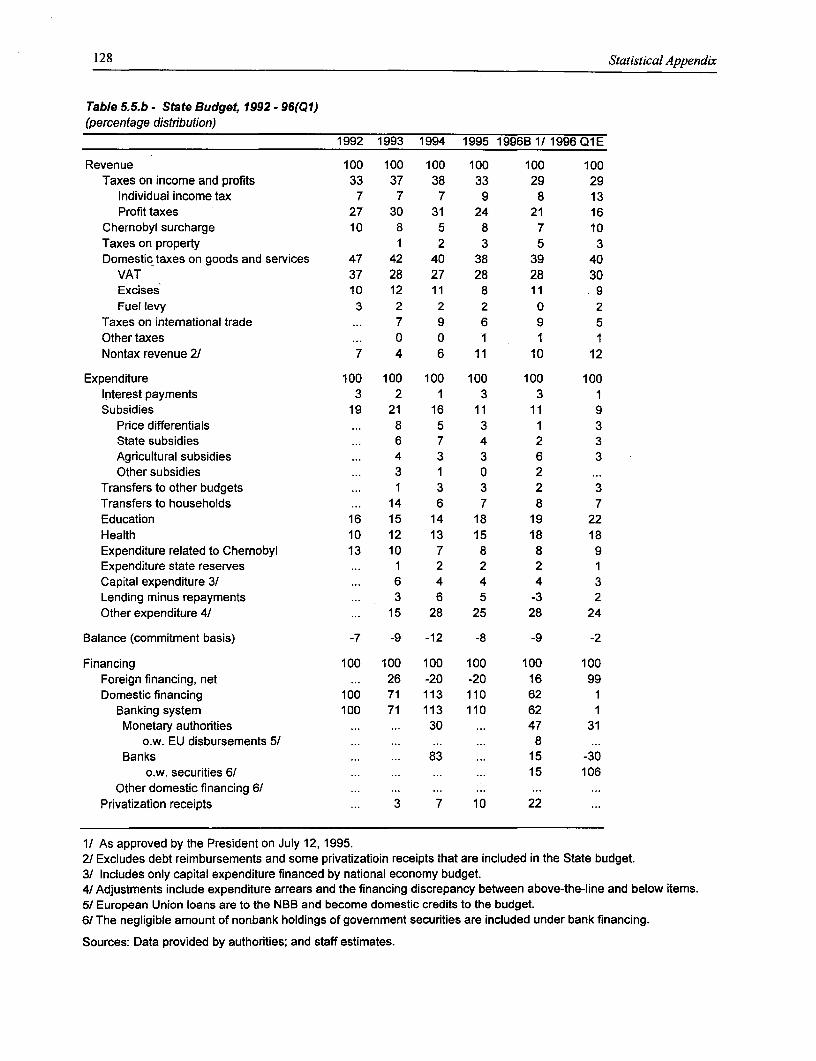
128 Statistical Appendix
Table 5.5.b - State Budget, 1992 - 96(Q1)(percentage distribution)
1992 1993 1994 1995 1996B 11 1996 Q1E
Revenue 100 100 100 100 100 100Taxes on income and profits 33 37 38 33 29 29
Individual income tax 7 7 7 9 8 13Profit taxes 27 30 31 24 21 16
Chernobyl surcharge 10 8 5 8 7 10Taxes on property 1 2 3 5 3Domestic taxes on goods and services 47 42 40 38 39 40
VAT 37 28 27 28 28 30Excises 10 12 11 8 11 9Fuel levy 3 2 2 2 0 2
Taxes on international trade ... 7 9 6 9 5Othertaxes ... 0 0 1 1 1Nontax revenue 2/ 7 4 6 11 10 12
Expenditure 100 100 100 100 100 100Interest payments 3 2 1 3 3 1Subsidies 19 21 16 11 11 9
Price differentials ... 8 5 3 1 3State subsidies ... 6 7 4 2 3Agricultural subsidies ... 4 3 3 6 3Other subsidies ... 3 1 0 2 ...
Transfers to other budgets ... 1 3 3 2 3Transfers to households ... 14 6 7 8 7Education 16 15 14 18 19 22Health 10 12 13 15 18 18Expenditure related to Chernobyl 13 10 7 8 8 9Expenditure state reserves ... 1 2 2 2 1Capital expenditure 3/ ... 6 4 4 4 3Lending minus repayments ... 3 6 5 -3 2Other expenditure 4/ ... 15 28 25 28 24
Balance (commitment basis) -7 -9 -12 -8 -9 -2
Financing 100 100 100 100 100 100Foreign financing, net ... 26 -20 -20 16 99Domestic financing 100 71 113 110 62 1
Banking system 100 71 113 110 62 1Monetary authorities ... ... 30 ... 47 31
o.w. EU disbursements 5/ ... ... ... ... 8 ...Banks ... ... 83 ... 15 -30
o.w. securities 6/ ... ... ... ... 15 106Other domestic financing 6/ ... ... ... ... ... ...
Privatization receipts ... 3 7 10 22 ...
1/ As approved by the President on July 12,1995.2/ Excludes debt reimbursements and some privatizatioin receipts that are included in the State budget.3/ Includes only capital expenditure financed by national economy budget.4/ Adjustments include expenditure arrears and the financing discrepancy between above-the-line and below items.5/ European Union loans are to the NBB and become domestic credits to the budget.6/ The negligible amount of nonbank holdings of government securities are included under bank financing.
Sources: Data provided by authorities; and staff estimates.
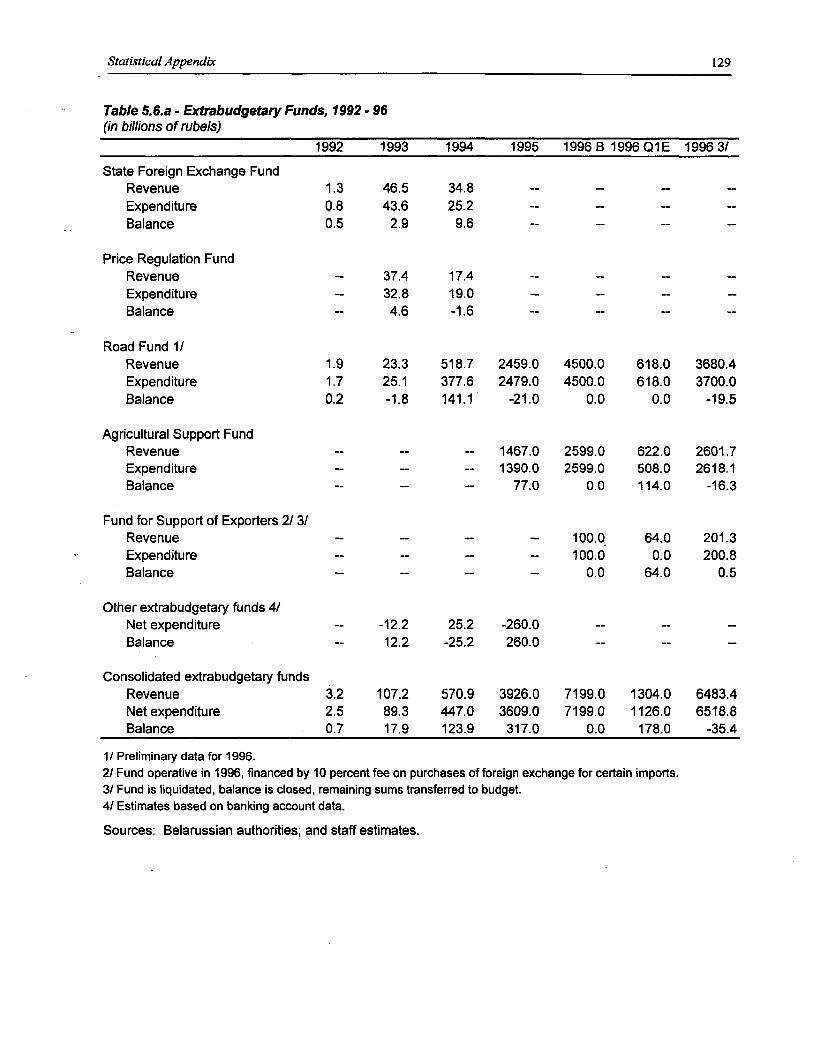
Statistical Appendix 129
Table 5.6.a - Extrabudgetary Funds, 1992 - 96(in billions of rubels)
1992 1993 1994 1995 1996 B 1996 Q 1 E 1996 3/
State Foreign Exchange FundRevenue 1.3 46.5 34.8 -- --
Expenditure 0.8 43.6 25.2Balance 0.5 2.9 9.6
Price Regulation FundRevenue -- 37.4 17.4Expenditure - 32.8 19.0Balance -- 4.6 -1.6 -- -- -- --
Road Fund 1/Revenue 1.9 23.3 518.7 2459.0 4500.0 618.0 3680.4Expenditure 1.7 25.1 377.6 2479.0 4500.0 618.0 3700.0Balance 0.2 -1.8 141.1 -21.0 0.0 0.0 -19.5
Agricultural Support FundRevenue -- -- -- 1467.0 2599.0 622.0 2601.7Expenditure -- -- -- 1390.0 2599.0 508.0 2618.1Balance -- - -- 77.0 0.0 114.0 -16.3
Fund for Support of Exporters 2/3/Revenue - - - -- 100.0 64.0 201.3Expenditure -- -- -- -- 100.0 0.0 200.8Balance -- -- - -- 0.0 64.0 0.5
Other extrabudgetary funds 41Net expenditure -- -12.2 25.2 -260.0 -- -- --
Balance -- 12.2 -25.2 260.0 -- -- --
Consolidated extrabudgetary fundsRevenue 3.2 107.2 570.9 3926.0 7199.0 1304.0 6483.4Net expenditure 2.5 89.3 447.0 3609.0 7199.0 1126.0 6518.8Balance 0.7 17.9 123.9 317.0 0.0 178.0 -35.4
1/ Preliminary data for 1996.2/ Fund operative in 1996, financed by 10 percent fee on purchases of foreign exchange for certain imports.3/ Fund is liquidated, balance is closed, remaining sums transferred to budget.4/ Estimates based on banking account data.
Sources: Belarussian authorities; and staff estimates.
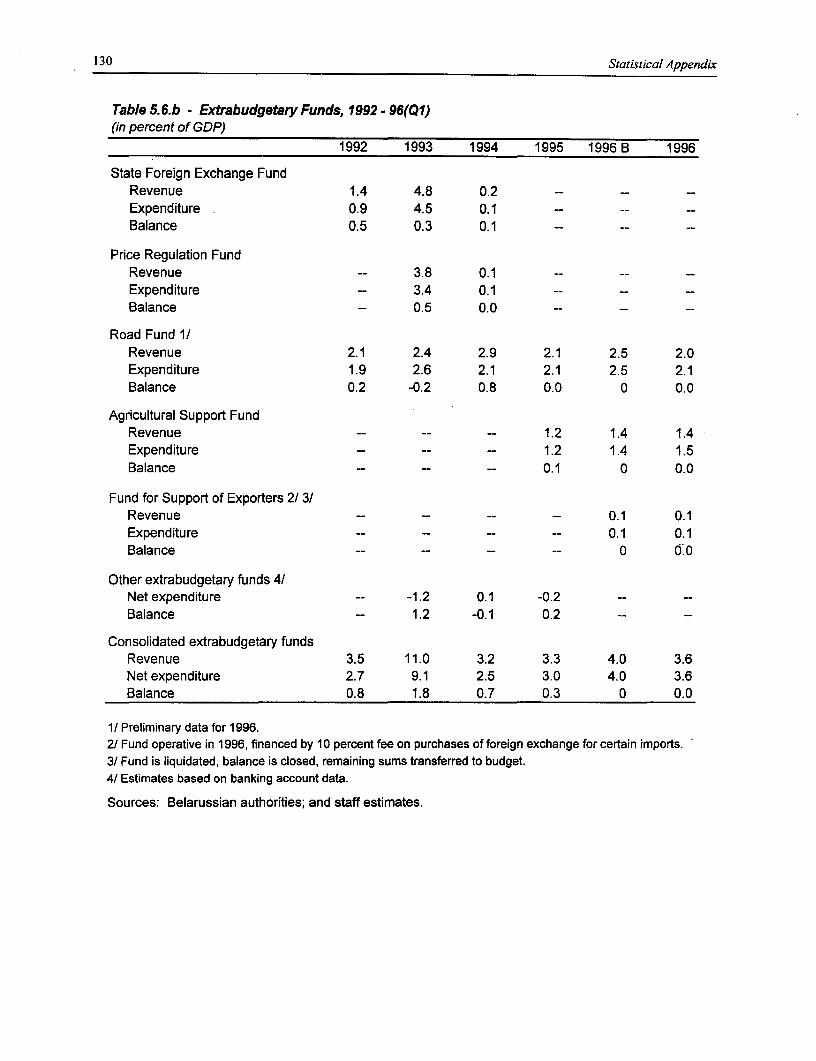
130 Statistical Appendix
Table 5.6.b - Extrabudgetary Funds, 1992 - 96(QI)(in percent of GDP)
1992 1993 1994 1995 1996 B 1996
State Foreign Exchange FundRevenue 1.4 4.8 0.2 -- -- --
Expenditure 0.9 4.5 0.1 -- -- --
Balance 0.5 0.3 0.1 -- -- --
Price Regulation FundRevenue -- 3.8 0.1 -- --
Expenditure -- 3.4 0.1 -- -- --
Balance -- 0.5 0.0 -- -- --
Road Fund 1/Revenue 2.1 2.4 2.9 2.1 2.5 2.0Expenditure 1.9 2.6 2.1 2.1 2.5 2.1Balance 0.2 -0.2 0.8 0.0 0 0.0
Agricultural Support FundRevenue -- -- -- 1.2 1.4 1.4Expenditure -- -- -- 1.2 1.4 1.5Balance - - - 0.1 0 0.0
Fund for Support of Exporters 2/ 3/Revenue -- -- -- -- 0.1 0.1Expenditure -- -- -- -- 0.1 0.1Balance -- -- -- -- 0 0.0
Other extrabudgetary funds 4/Net expenditure -- -1.2 0.1 -0.2 -- -
Balance -- 1.2 -0.1 0.2 -- --
Consolidated extrabudgetary fundsRevenue 3.5 11.0 3.2 3.3 4.0 3.6Net expenditure 2.7 9.1 2.5 3.0 4.0 3.6Balance 0.8 1.8 0.7 0.3 0 0.0
1/ Preliminary data for 1996.2/Fund operative in 1996, financed by 10 percent fee on purchases of foreign exchange for certain imports.3/ Fund is liquidated, balance is closed, remaining sums transferred to budget.4/ Estimates based on banking account data.
Sources: Belarussian authorities; and staff estimates.
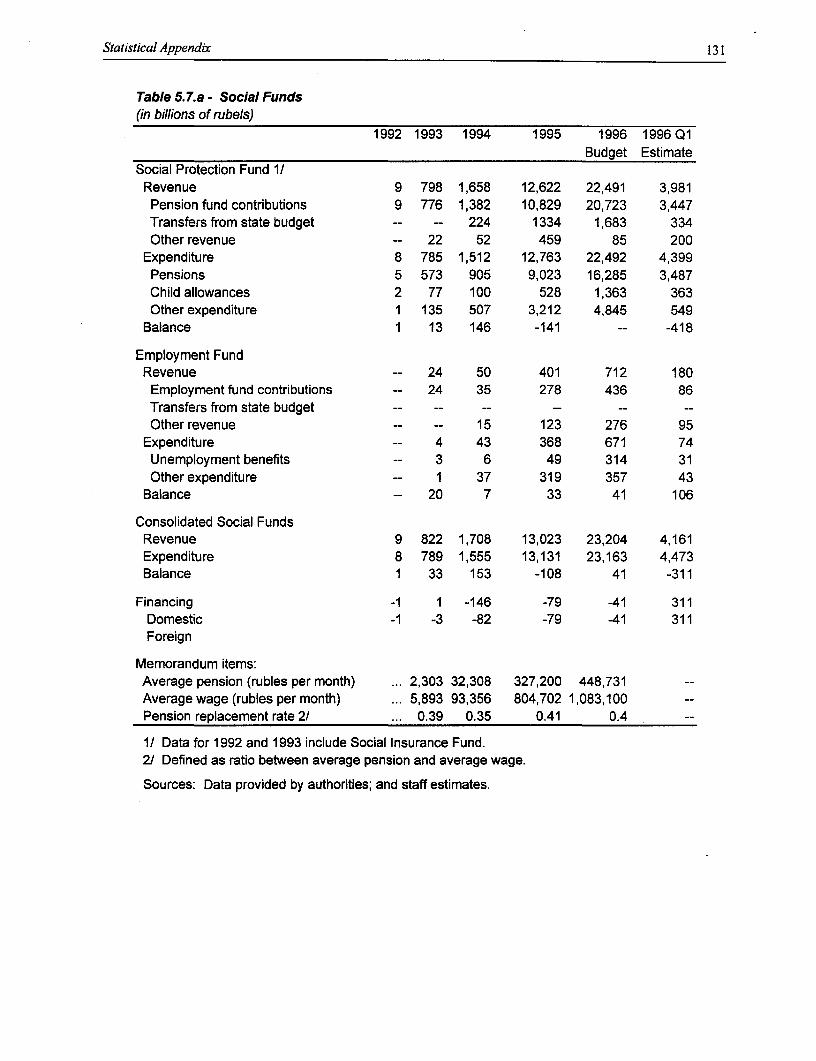
Statistical Appendix 131
Table 5.7.a - Social Funds(in billions of rubels)
1992 1993 1994 1995 1996 1996 Q1Budget Estimate
Social Protection Fund 1/Revenue 9 798 1,658 12,622 22,491 3,981Pension fund contributions 9 776 1,382 10,829 20,723 3,447Transfers from state budget -- -- 224 1334 1,683 334Other revenue -- 22 52 459 85 200
Expenditure 8 785 1,512 12,763 22,492 4,399Pensions 5 573 905 9,023 16,285 3,487Child allowances 2 77 100 528 1,363 363Other expenditure 1 135 507 3,212 4,845 549
Balance 1 13 146 -141 -- -418
Employment FundRevenue -- 24 50 401 712 180Employment fund contributions -- 24 35 278 436 86Transfers from state budget -- -- -- -- -- --Other revenue -- -- 15 123 276 95
Expenditure -- 4 43 368 671 74Unemployment benefits -- 3 6 49 314 31Other expenditure -- 1 37 319 357 43
Balance -- 20 7 33 41 106
Consolidated Social FundsRevenue 9 822 1,708 13,023 23,204 4,161Expenditure 8 789 1,555 13,131 23,163 4,473Balance 1 33 153 -108 41 -311
Financing -1 1 -146 -79 -41 311Domestic -1 -3 -82 -79 -41 311Foreign
Memorandum items:Average pension (rubles per month) ... 2,303 32,308 327,200 448,731 --Average wage (rubles per month) ... 5,893 93,356 804,702 1,083,100 --
Pension replacement rate 2/ ... 0.39 0.35 0.41 0.4 --
1/ Data for 1992 and 1993 include Social Insurance Fund.2/ Defined as ratio between average pension and average wage.
Sources: Data provided by authorities; and staff estimates.
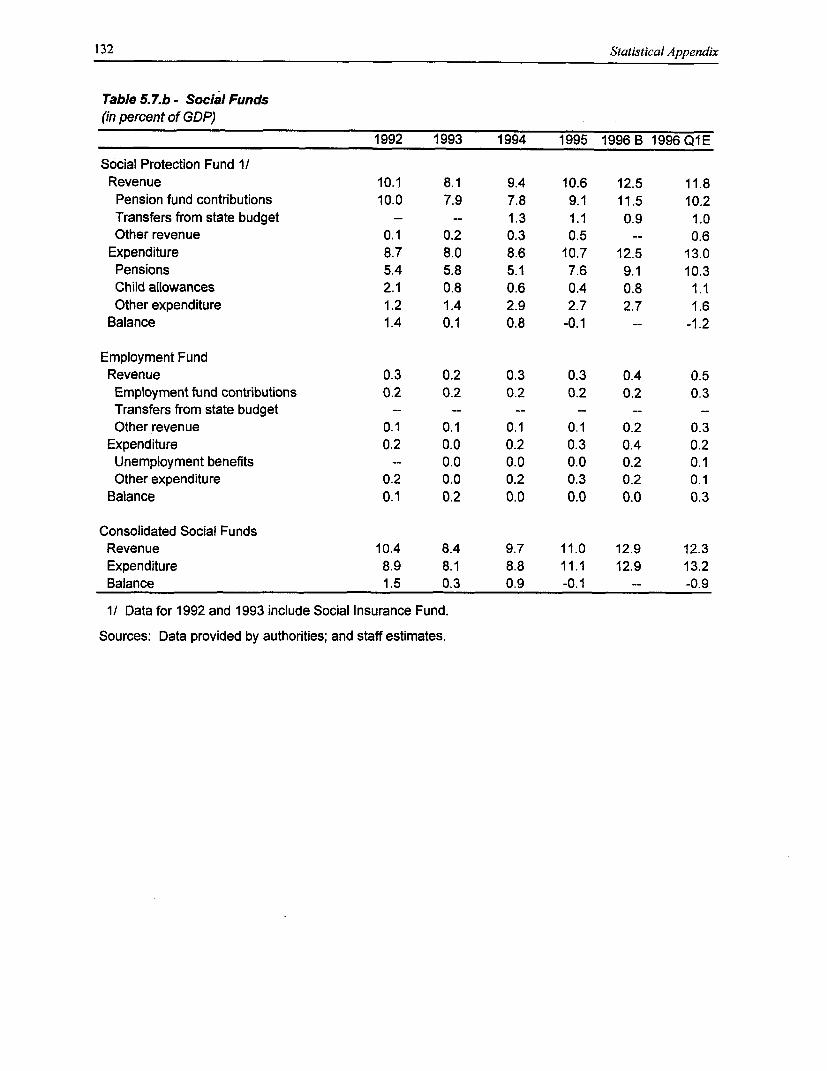
132 Statistical Appendix
Table 5.7.b - Social Funds(in percent of GDP)
1992 1993 1994 1995 1996 B 1996 Q1E
Social Protection Fund 1/Revenue 10.1 8.1 9.4 10.6 12.5 11.8Pension fund contributions 10.0 7.9 7.8 9.1 11.5 10.2Transfers from state budget - -- 1.3 1.1 0.9 1.0
Other revenue 0.1 0.2 0.3 0.5 -- 0.6
Expenditure 8.7 8.0 8.6 10.7 12.5 13.0Pensions 5.4 5.8 5.1 7.6 9.1 10.3Child allowances 2.1 0.8 0.6 0.4 0.8 1.1Other expenditure 1.2 1.4 2.9 2.7 2.7 1.6
Balance 1.4 0.1 0.8 -0.1 - -1.2
Employment FundRevenue 0.3 0.2 0.3 0.3 0.4 0.5Employment fund contributions 0.2 0.2 0.2 0.2 0.2 0.3Transfers from state budget -- -- -- -- -- --
Other revenue 0.1 0.1 0.1 0.1 0.2 0.3Expenditure 0.2 0.0 0.2 0.3 0.4 0.2Unemployment benefits -- 0.0 0.0 0.0 0.2 0.1
Other expenditure 0.2 0.0 0.2 0.3 0.2 0.1Balance 0.1 0.2 0.0 0.0 0.0 0.3
Consolidated Social FundsRevenue 10.4 8.4 9.7 11.0 12.9 12.3Expenditure 8.9 8.1 8.8 11.1 12.9 13.2Balance 1.5 0.3 0.9 -0.1 -- -0.9
1/ Data for 1992 and 1993 include Social Insurance Fund.
Sources: Data provided by authorities; and staff estimates.
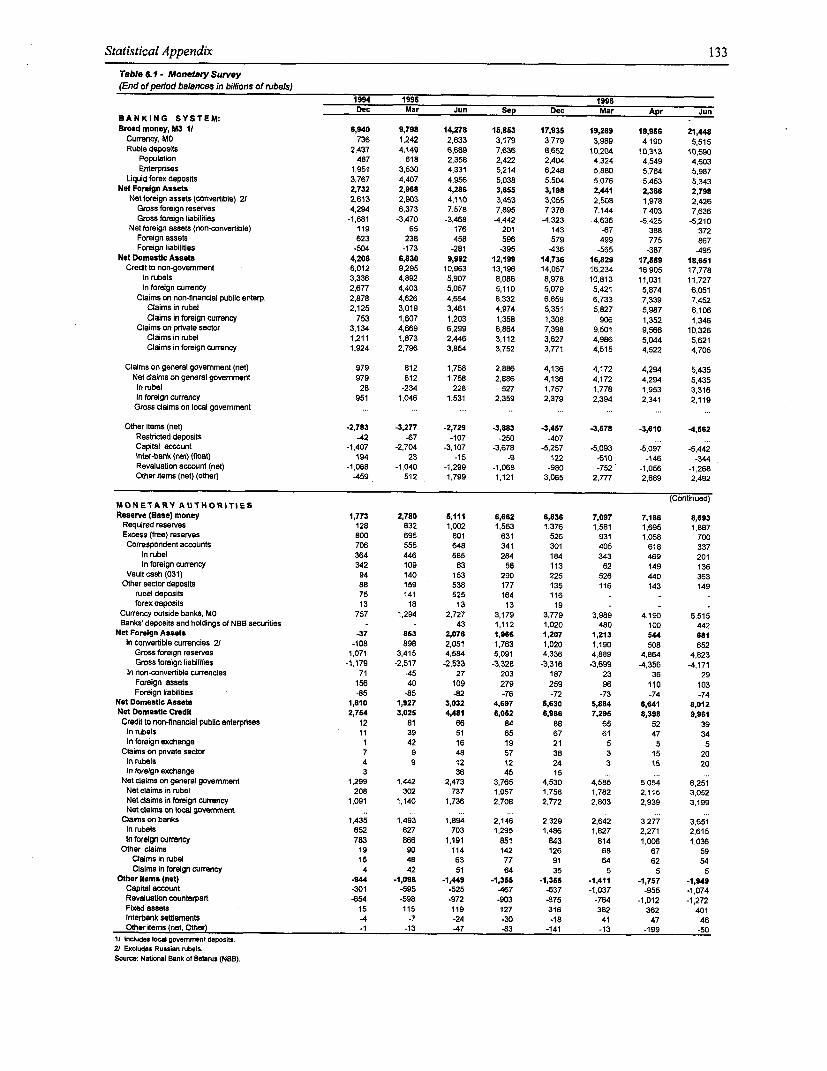
Statistical Appendix 133
Table .1- Monetary Survey(End of penod balances in billions of rubels)
1994 1995 1996Dec Mar Jun Sep Dec Mar Apr Jun
BANKING SYSTEM: -Broad money, M3 I/ 6,940 9,798 14,278 15,853 17,935 19,269 19,956 21,448
Currency, MO 736 1,242 2,633 3,179 3,779 3,989 4,190 5,515Ruble deposits 2,437 4,149 6,689 7,636 8,652 10,204 10,313 10.590
Populabon 487 618 2,358 2,422 2,404 4,324 4,549 4,603Enterprises 1,951 3,530 4,331 5,214 6,248 5,880 5,764 5,987
Liquid forex deposits 3,767 4,407 4,956 5,038 5,504 5,076 5,453 5,343Net Foreign Assets 2,732 2,968 4,286 3,665 3,198 2,441 2,366 2,798
Netforeign assets (convertible) 21 2,613 2,903 4,110 3,453 3,055 2,508 1,978 2,426Gross foreign reserves 4,294 6,373 7,578 7,895 7,378 7,144 7,403 7,636Gross foreign liabilities -1,681 -3,470 -3,468 -4,442 4,323 4,636 -5,425 -5,210
Net foreign assets (non-convertible) 119 65 176 201 143 -67 388 372Foreign assets 623 238 458 596 579 499 775 867Foreign liabilites -504 -173 -281 -395 -436 -565 -387 -495
Net Domestic Assets 4,208 6,830 9,992 12,199 14,736 16,829 17,589 18,651Credit to non-govemment 6,012 9,295 10,963 13,196 14,057 16,234 16,905 17,778
Inrubels 3,336 4,892 5,907 8,086 8,978 10,813 11,031 11,727In foreign currency 2,677 4,403 5,057 5,110 5,079 5,421 5,874 6,051
Claims on non-financial public enterp. 2,878 4,626 4.664 6,332 6,659 6,733 7,339 7,452Claims in rubel 2,125 3,019 3,461 4,974 5,351 5,827 5,987 6,106Claims in foreign currency 753 1,607 1,203 1,358 1.308 906 1,352 1,346
Claims on private sector 3,134 4,669 6,299 6,864 7,398 9,501 9,566 10,326Claims in rubel 1,211 1,873 2,446 3,112 3,627 4,986 5,044 5,621Claims in foreign currency 1,924 2,796 3,854 3,752 3,771 4,515 4,522 4,705
Claims on general govemment (net) 979 812 1,758 2,886 4,136 4,172 4,294 5,435Net claims on general govemment 979 812 1,758 2,886 4,136 4,172 4,294 5,435
In nubel 28 -234 228 527 1,757 1,778 1,953 3,316In foreign currency 951 1,046 1,531 2,359 2,379 2,394 2,341 2,119Gross claims on local govemment ... .. ..
Other items (net) -2,783 -3,277 -2,729 -3,883 4,457 -3,578 -3,610 -4,562Restriced deposits -42 -67 -107 -250 -407Capital account -1,407 -2,704 -3,107 -3,678 -5,257 -5,093 -5,097 -5,442Inter-bank (net) (float) 194 23 -15 -9 122 -510 -146 -344Revaluabon account (not) -1,068 -1,040 -1,299 -1,068 -980 -752 -1,056 -1,268Other items (net) (other) -459 512 1,799 1,121 3,065 2,777 2,689 2,492
(Continued)MONETARY AUTHORITIESReserve (Base) money 1,773 2,780 6,111 6,662 6,836 7,097 7,186 8,693
Required reserves 128 632 1,002 1,563 1,376 1,581 1,695 1,887Excess (free) reserves 800 695 801 631 526 931 1,058 700
Correspondent accounts 706 555 648 341 301 405 618 337In rubel 364 446 585 284 184 343 469 201Inforeigncurrency 342 109 63 56 113 62 149 136
Vaultcash (031) 94 140 153 290 225 526 440 363Othersectordeposits 88 159 538 177 135 116 143 149
rubel deposits 75 141 525 164 116 - - -
forex deposits 13 18 13 13 19 - -
Currency outside banks, MO 757 1.294 2,727 3,179 3,779 3,989 4,190 5,515Banks deposits and holdings of NBB securbes - - 43 1,112 1,020 480 100 442
Net Foreign Assets -37 853 2,078 1,966 1,207 1,213 544 681In convertible currencies 2/ -108 898 2,051 1,763 1,020 1,190 508 652
Grossforeign reserves 1,071 3,415 4,584 5,091 4,336 4,889 4,864 4,823Gross foreign liabilibes -1,179 -2,517 -2,533 -3,328 -3,316 -3,699 -4,356 -4,171
In non-convertible currencies 71 -45 27 203 187 23 36 29Foreign assets 156 40 109 279 259 96 110 103Foreign liabilibes -85 -85 -82 -76 -72 -73 -74 -74
Net Domestic Assets 1,810 1,927 3,032 4,697 5,630 5,884 6,641 8,012Net Domestic CredKt 2,754 3,025 4,481 6,052 6,986 7,295 8,398 9,961Credit to non-financial public enterprises 12 81 66 84 88 65 52 39
In rubels 11 39 51 65 67 61 47 34Inforeignexchange 1 42 16 19 21 5 5 5
Claims on pnvate sector 7 9 48 57 38 3 15 20In rubels 4 9 12 12 24 3 15 20Inforeignexchange 3 36 45 15
Net claims on general govemment 1,299 1,442 2,473 3,765 4.530 4,585 5,054 6,251Netdaimsinrubel 208 302 737 1,057 1,758 1.782 2,115 3,052Netdaimsinforeigncurrency 1,091 1,140 1,736 2,708 2,772 2.803 2,939 3,199Net daims on local govemment ... ... ... ...
Claims on banks 1,435 1,493 1,894 2,146 2,329 2,642 3,277 3,651In rubels 652 627 703 1,295 1,486 1,827 2,271 2,615In foreign currency 783 866 1,191 851 843 814 1,006 1,036
Other claims 19 90 114 142 126 68 67 59Claims in rubel 15 48 63 77 91 64 62 54Claims in foreign currency 4 42 51 64 35 5 5 5
Other items (net) -944 -1,098 -1,449 -1,358 -1,355 -1,411 -1,757 -1,949Capital account -301 -595 -525 -467 -637 -1,037 -955 -1,074Revaluation counterpart -654 -598 -972 -903 -875 -764 -1,012 -1,272Fixed assets 15 115 119 127 316 362 362 401Interbank settiements -4 -7 -24 -30 -18 41 47 46Other items (net, Other) -1 -13 -47 -83 -141 -13 -199 -50
it includes socat gevemment depesits.21 Excludes Ruseian mbetls.Source: Natonal Bank of Belarus (NBB).
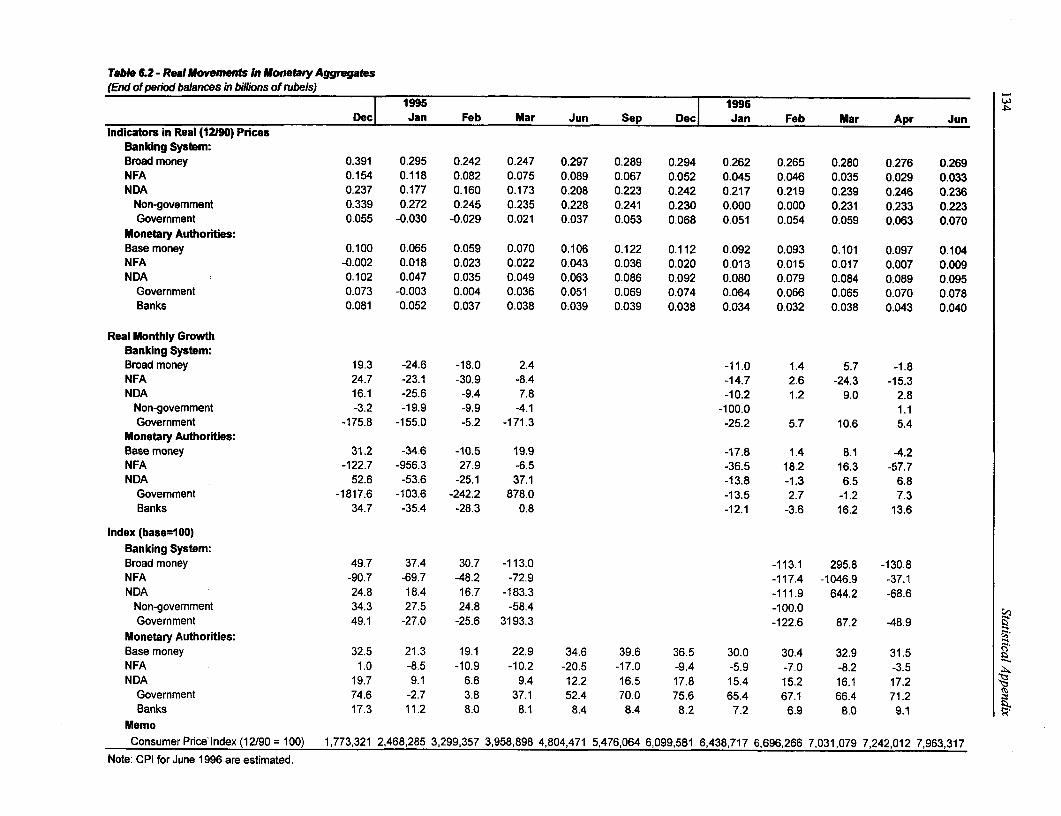
Table 6.2 - Real Movements In Monetary Aggregates(End of period balances in billions of rubels)
1995 1996Dec Jan Feb Mar Jun Sep Dec Jan Feb Mar Apr Jun
Indicators in Real (12190) PricesBanking System:Broad money 0.391 0.295 0.242 0.247 0.297 0.289 0.294 0.262 0.265 0.280 0.276 0.269NFA 0.154 0.118 0.082 0.075 0.089 0.067 0.052 0.045 0.046 0.035 0.029 0.033NDA 0.237 0.177 0.160 0.173 0.208 0.223 0.242 0.217 0.219 0.239 0.246 0.236
Non-govemment 0.339 0.272 0.245 0.235 0.228 0.241 0.230 0.000 0.000 0.231 0.233 0.223Govemment 0.055 -0.030 -0.029 0.021 0.037 0.053 0.068 0.051 0.054 0.059 0.063 0.070
Monetary Authorities:Base money 0.100 0.065 0.059 0.070 0.106 0.122 0.112 0.092 0.093 0.101 0.097 0.104NFA -0.002 0.018 0.023 0.022 0.043 0.036 0.020 0.013 0.015 0.017 0.007 0.009NDA 0.102 0.047 0.035 0.049 0.063 0.086 0.092 0.080 0.079 0.084 0.089 0.095
Government 0.073 -0.003 0.004 0.036 0.051 0.069 0.074 0.064 0.066 0.065 0.070 0.078Banks 0.081 0.052 0.037 0.038 0.039 0.039 0.038 0.034 0.032 0.038 0.043 0.040
Real Monthly GrowthBanking System:Broad money 19.3 -24.6 -18.0 2.4 -11.0 1.4 5.7 -1.8NFA 24.7 -23.1 -30.9 -8.4 -14.7 2.6 -24.3 -15.3NDA 16.1 -25.6 -9.4 7.8 -10.2 1.2 9.0 2.8
Non-govemment -3.2 -19.9 -9.9 -4.1 -100.0 1.1Government -175.8 -155.0 -5.2 -171.3 -25.2 5.7 10.6 5.4
Monetary Authorities:Base money 31.2 -34.6 -10.5 19.9 -17.8 1.4 8.1 -4.2NFA -122.7 -956.3 27.9 -6.5 -36.5 18.2 16.3 -57.7NDA 52.6 -53.6 -25.1 37.1 -13.8 -1.3 6.5 6.8
Government -1817.6 -103.6 -242.2 878.0 -13.5 2.7 -1.2 7.3Banks 34.7 -35.4 -28.3 0.8 -12.1 -3.6 16.2 13.6
Index (base=100)Banking System:Broad money 49.7 37.4 30.7 -113.0 -113.1 295.8 -130.8NFA -90.7 -69.7 -48.2 -72.9 -117.4 -1046.9 -37.1NDA 24.8 18.4 16.7 -183.3 -111.9 644.2 -68.6
Non-government 34.3 27.5 24.8 -58.4 -100.0Government 49.1 -27.0 -25.6 3193.3 -122.6 87.2 -48.9
Monetary Authorities:Base money 32.5 21.3 19.1 22.9 34.6 39.6 36.5 30.0 30.4 32.9 31.5NFA 1.0 -8.5 -10.9 -10.2 -20.5 -17.0 -9.4 -5.9 -7.0 -8.2 -3.5NDA 19.7 9.1 6.8 9.4 12.2 16.5 17.8 15.4 15.2 16.1 17.2
Government 74.6 -2.7 3.8 37.1 52.4 70.0 75.6 65.4 67.1 66.4 71.2Banks 17.3 11.2 8.0 8.1 8.4 8.4 8.2 7.2 6.9 8.0 9.1
MemoConsumer Pricelndex (12/90= 100) 1,773,321 2,468,285 3,299,357 3,958,898 4,804,471 5,476,064 6,099,581 6,438,717 6,696,266 7,031,079 7,242,012 7,963,317
Note: CPI for June 1996 are estimated.
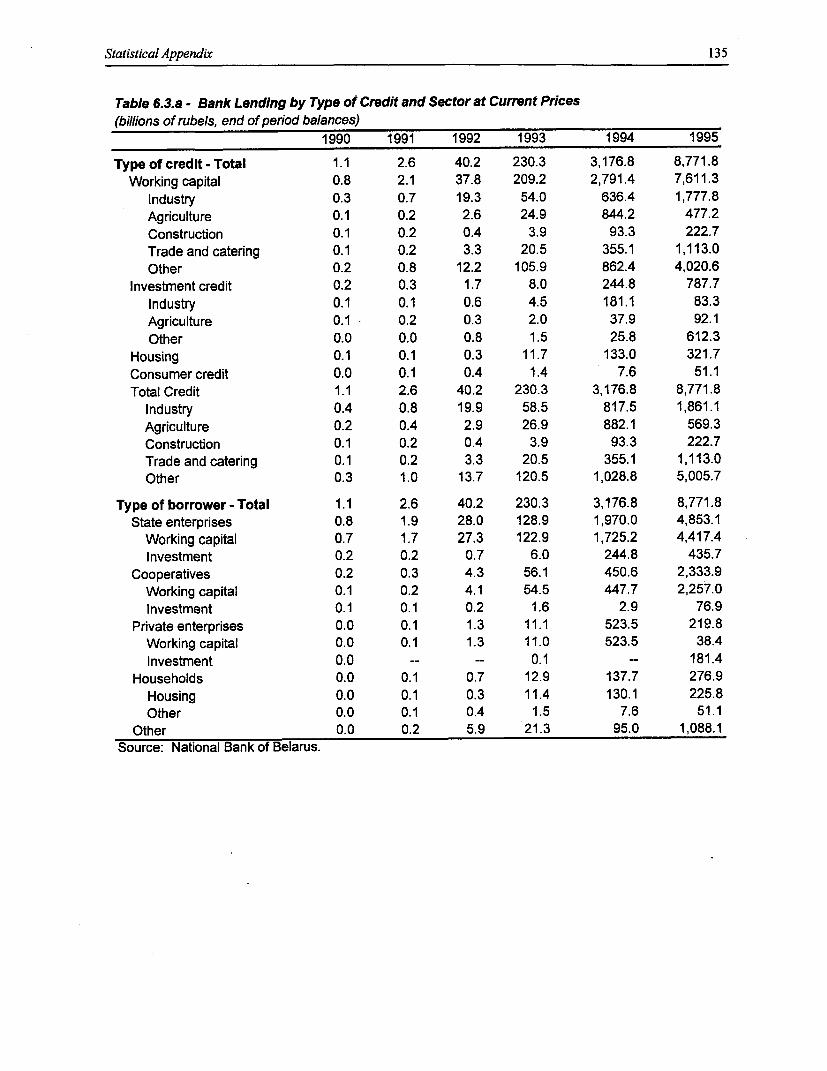
Statistical Appendix 135
Table 6.3.a - Bank Lending by Type of Credit and Sector at Current Prices(billions of rubels, end of period balances)
1990 1991 1992 1993 1994 1995
Type of credit - Total 1.1 2.6 40.2 230.3 3,176.8 8,771.8Working capital 0.8 2.1 37.8 209.2 2,791.4 7,611.3
Industry 0.3 0.7 19.3 54.0 636.4 1,777.8Agriculture 0.1 0.2 2.6 24.9 844.2 477.2Construction 0.1 0.2 0.4 3.9 93.3 222.7Trade and catering 0.1 0.2 3.3 20.5 355.1 1,113.0Other 0.2 0.8 12.2 105.9 862.4 4,020.6
Investment credit 0.2 0.3 1.7 8.0 244.8 787.7Industry 0.1 0.1 0.6 4.5 181.1 83.3Agriculture 0.1 0.2 0.3 2.0 37.9 92.1Other 0.0 0.0 0.8 1.5 25.8 612.3
Housing 0.1 0.1 0.3 11.7 133.0 321.7Consumer credit 0.0 0.1 0.4 1.4 7.6 51.1Total Credit 1.1 2.6 40.2 230.3 3,176.8 8,771.8
Industry 0.4 0.8 19.9 58.5 817.5 1,861.1Agriculture 0.2 0.4 2.9 26.9 882.1 569.3Construction 0.1 0.2 0.4 3.9 93.3 222.7Trade and catering 0.1 0.2 3.3 20.5 355.1 1,113.0Other 0.3 1.0 13.7 120.5 1,028.8 5,005.7
Type of borrower - Total 1.1 2.6 40.2 230.3 3,176.8 8,771.8State enterprises 0.8 1.9 28.0 128.9 1,970.0 4,853.1
Working capital 0.7 1.7 27.3 122.9 1,725.2 4,417.4Investment 0.2 0.2 0.7 6.0 244.8 435.7
Cooperatives 0.2 0.3 4.3 56.1 450.6 2,333.9Working capital 0.1 0.2 4.1 54.5 447.7 2,257.0Investment 0.1 0.1 0.2 1.6 2.9 76.9
Private enterprises 0.0 0.1 1.3 11.1 523.5 219.8Working capital 0.0 0.1 1.3 11.0 523.5 38.4Investment 0.0 -- -- 0.1 -- 181.4
Households 0.0 0.1 0.7 12.9 137.7 276.9Housing 0.0 0.1 0.3 11.4 130.1 225.8Other 0.0 0.1 0.4 1.5 7.6 51.1
Other 0.0 0.2 5.9 21.3 95.0 1,088.1Source: National Bank of Belarus.
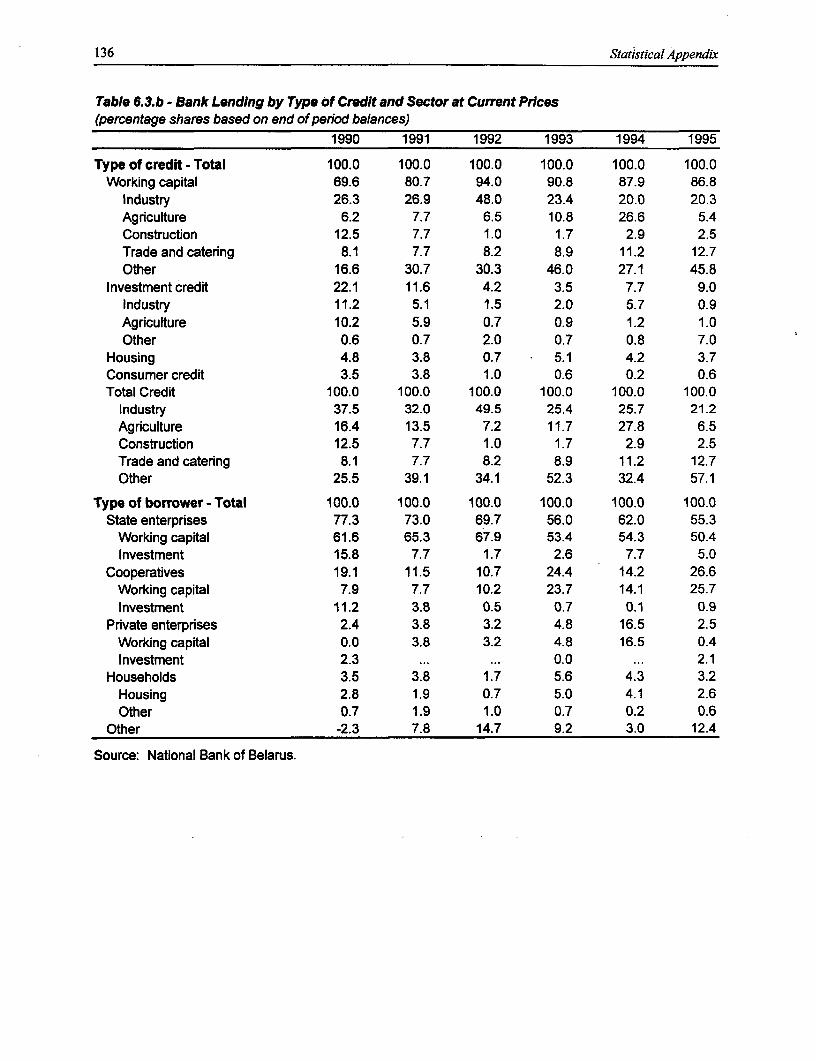
136 Statistical Appendix
Table 6.3.b - Bank Lending by Type of Credit and Sector at Current Prices(percentage shares based on end of period balances)
1990 1991 1992 1993 1994 1995
Type of credit - Total 100.0 100.0 100.0 100.0 100.0 100.0Working capital 69.6 80.7 94.0 90.8 87.9 86.8
Industry 26.3 26.9 48.0 23.4 20.0 20.3Agriculture 6.2 7.7 6.5 10.8 26.6 5.4Construction 12.5 7.7 1.0 1.7 2.9 2.5Trade and catering 8.1 7.7 8.2 8.9 11.2 12.7Other 16.6 30.7 30.3 46.0 27.1 45.8
Investment credit 22.1 11.6 4.2 3.5 7.7 9.0Industry 11.2 5.1 1.5 2.0 5.7 0.9Agriculture 10.2 5.9 0.7 0.9 1.2 1.0Other 0.6 0.7 2.0 0.7 0.8 7.0
Housing 4.8 3.8 0.7 5.1 4.2 3.7Consumer credit 3.5 3.8 1.0 0.6 0.2 0.6Total Credit 100.0 100.0 100.0 100.0 100.0 100.0
Industry 37.5 32.0 49.5 25.4 25.7 21.2Agriculture 16.4 13.5 7.2 11.7 27.8 6.5Construction 12.5 7.7 1.0 1.7 2.9 2.5Trade and catering 8.1 7.7 8.2 8.9 11.2 12.7Other 25.5 39.1 34.1 52.3 32.4 57.1
Type of borrower - Total 100.0 100.0 100.0 100.0 100.0 100.0State enterprises 77.3 73.0 69.7 56.0 62.0 55.3
Working capital 61.6 65.3 67.9 53.4 54.3 50.4Investment 15.8 7.7 1.7 2.6 7.7 5.0
Cooperatives 19.1 11.5 10.7 24.4 14.2 26.6Working capital 7.9 7.7 10.2 23.7 14.1 25.7Investment 11.2 3.8 0.5 0.7 0.1 0.9
Private enterprises 2.4 3.8 3.2 4.8 16.5 2.5Working capital 0.0 3.8 3.2 4.8 16.5 0.4Investment 2.3 ... ... 0.0 ... 2.1
Households 3.5 3.8 1.7 5.6 4.3 3.2Housing 2.8 1.9 0.7 5.0 4.1 2.6Other 0.7 1.9 1.0 0.7 0.2 0.6
Other -2.3 7.8 14.7 9.2 3.0 12.4
Source: National Bank of Belarus.
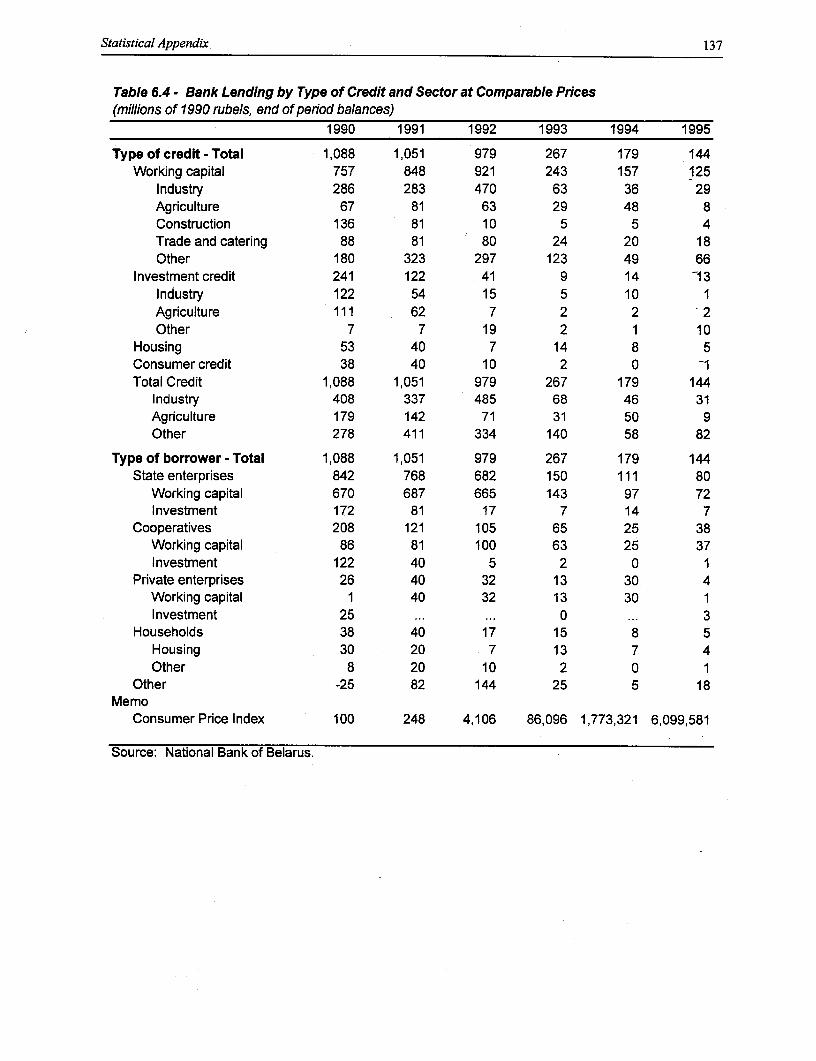
Statistical Appendix 137
Table 6.4 - Bank Lending by Type of Credit and Sector at Comparable Prices(millions of 1990 rubels, end of period balances)
1990 1991 1992 1993 1994 1995
Type of credit - Total 1,088 1,051 979 267 179 144Working capital 757 848 921 243 157 125
Industry 286 283 470 63 36 29Agriculture 67 81 63 29 48 8Construction 136 81 10 5 5 4Trade and catering 88 81 80 24 20 18Other 180 323 297 123 49 66
Investment credit 241 122 41 9 14 -13Industry 122 54 15 5 10 1Agriculture 111 62 7 2 2 2Other 7 7 19 2 1 10
Housing 53 40 7 14 8 5Consumer credit 38 40 10 2 0 -1Total Credit 1,088 1,051 979 267 179 144
Industry 408 337 485 68 46 31Agriculture 179 142 71 31 50 9Other 278 411 334 140 58 82
Type of borrower - Total 1,088 1,051 979 267 179 144State enterprises 842 768 682 150 111 80
Working capital 670 687 665 143 97 72-Investment 172 81 17 7 14 7
Cooperatives 208 121 105 65 25 38Working capital 86 81 100 63 25 37Investment 122 40 5 2 0 1
Private enterprises 26 40 32 13 30 4Working capital 1 40 32 13 30 1Investment 25 ... ... 0 ... 3
Households 38 40 17 15 8 5Housing 30 20 7 13 7 4Other 8 20 10 2 0 1
Other -25 82 144 25 5 18Memo
Consumer Price Index 100 248 4,106 86,096 1,773,321 6,099,581
Source: National Bank of Belarus.
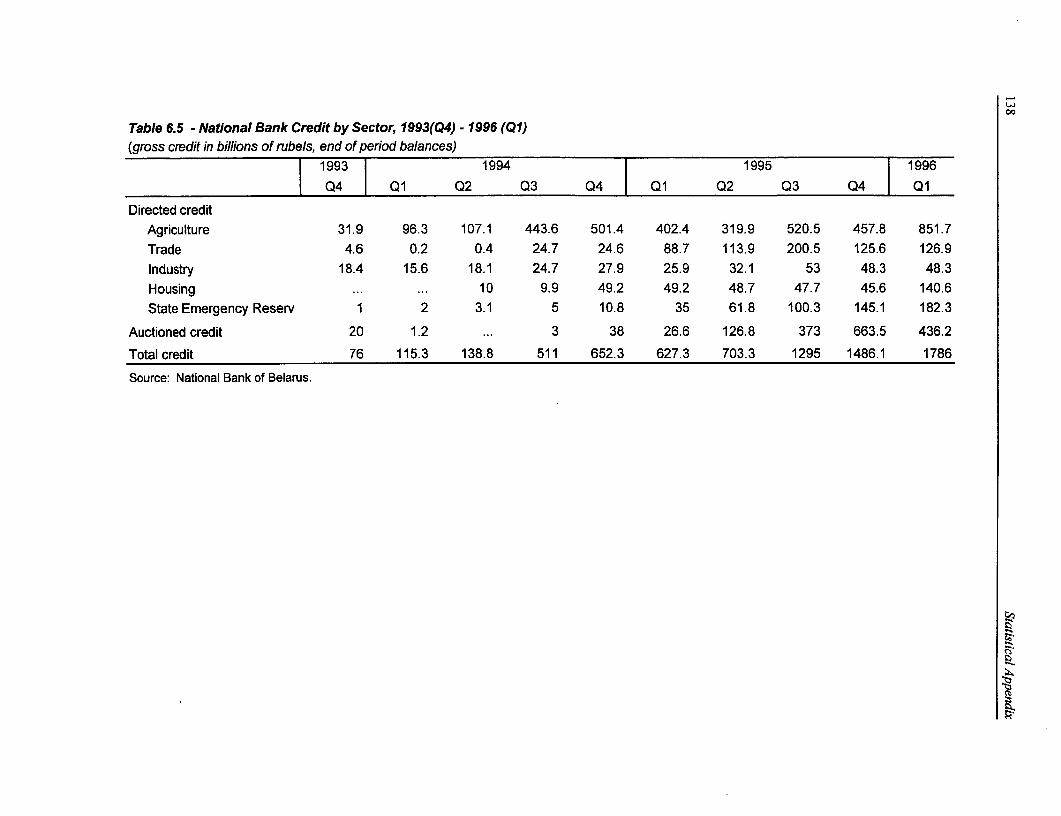
00
Table 6.5 - National Bank Credit by Sector, 1993(Q4) - 1996 (Q1)(gross credit in billions of rubels, end of period balances)
1993 1994 1995 1996
|Q4 | Q2 Q3 Q4 T Q1 Q2 Q3 Q4 1Q1Directed credit
Agriculture 31.9 96.3 107.1 443.6 501.4 402.4 319.9 520.5 457.8 851.7
Trade 4.6 0.2 0.4 24.7 24.6 88.7 113.9 200.5 125.6 126.9
Industry 18.4 15.6 18.1 24.7 27.9 25.9 32.1 53 48.3 48.3
Housing ... ... 10 9.9 49.2 49.2 48.7 47.7 45.6 140.6
State Emergency Reserv 1 2 3.1 5 10.8 35 61.8 100.3 145.1 182.3
Auctioned credit 20 1.2 ... 3 38 26.6 126.8 373 663.5 436.2
Total credit 76 115.3 138.8 511 652.3 627.3 703.3 1295 1486.1 1786
Source: National Bank of Belarus.
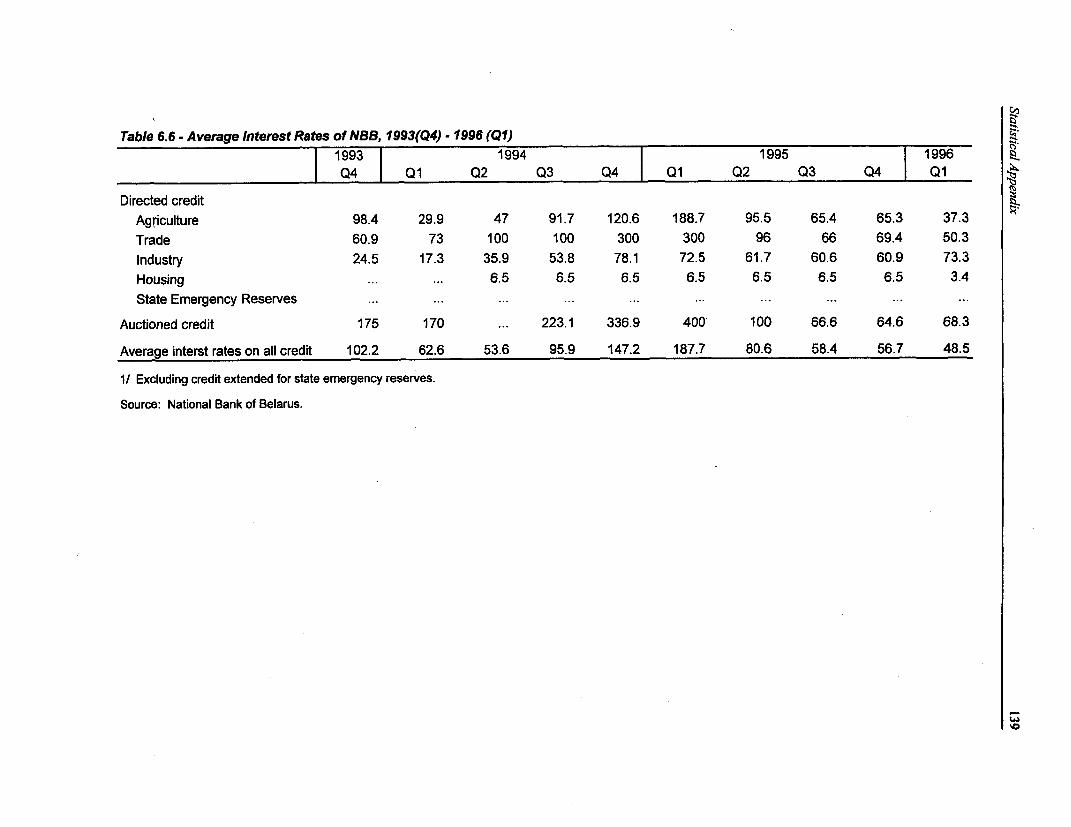
Table 6.6 - Average Interest Rates of NBB, 1993(Q4) - 1996 (Q1)1993 1994 1995 1996Q4 Ql Q2 Q3 Q4 Ql Q2 Q3 Q4 _ Q1
Directed creditAgriculture 98.4 29.9 47 91.7 120.6 188.7 95.5 65.4 65.3 37.3Trade 60.9 73 100 100 300 300 96 66 69.4 50.3Industry 24.5 17.3 35.9 53.8 78.1 72.5 61.7 60.6 60.9 73.3Housing ... ... 6.5 6.5 6.5 6.5 6.5 6.5 6.5 3.4State Emergency Reserves ... ... ... ... ... ... ...
Auctioned credit 175 170 ... 223.1 336.9 400 100 66.6 64.6 68.3
Average interst rates on all credit 102.2 62.6 53.6 95.9 147.2 187.7 80.6 58.4 56.7 48.5
1/ Excluding credit extended for state emergency reserves.
Source: National Bank of Belarus.
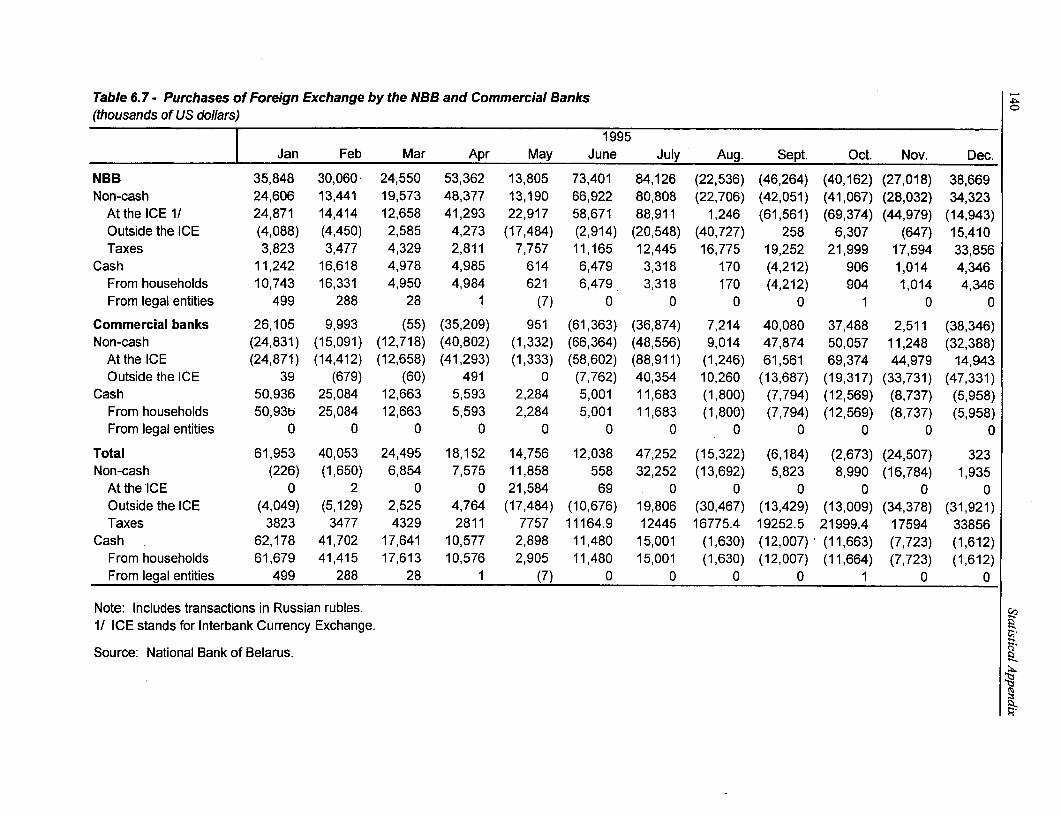
Table 6.7 - Purchases of Foreign Exchange by the NBB and Commercial Banks(thousands of US dollars)
1 995Jan Feb Mar Apr May June July Aug. Sept. Oct. Nov. Dec.
NBB 35,848 30,060 24,550 53,362 13,805 73,401 84,126 (22,536) (46,264) (40,162) (27,018) 38,669Non-cash 24,606 13,441 19,573 48,377 13,190 66,922 80,808 (22,706) (42,051) (41,067) (28,032) 34,323
At the ICE 1/ 24,871 14,414 12,658 41,293 22,917 58,671 88,911 1,246 (61,561) (69,374) (44,979) (14,943)Outside the ICE (4,088) (4,450) 2,585 4,273 (17,484) (2,914) (20,548) (40,727) 258 6,307 (647) 15,410Taxes 3,823 3,477 4,329 2,811 7,757 11,165 12,445 16,775 19,252 21,999 17,594 33,856
Cash 11,242 16,618 4,978 4,985 614 6,479 3,318 170 (4,212) 906 1,014 4,346From households 10,743 16,331 4,950 4,984 621 6,479 3,318 170 (4,212) 904 1,014 4,346From legal entities 499 288 28 1 (7) 0 0 0 0 1 0 0
Commercial banks 26,105 9,993 (55) (35,209) 951 (61,363) (36,874) 7,214 40,080 37,488 2,511 (38,346)Non-cash (24,831) (15,091) (12,718) (40,802) (1,332) (66,364) (48,556) 9,014 47,874 50,057 11,248 (32,388)
Atthe ICE (24,871) (14,412) (12,658) (41,293) (1,333) (58,602) (88,911) (1,246) 61,561 69,374 44,979 14,943Outside the ICE 39 (679) (60) 491 0 (7,762) 40,354 10,260 (13,687) (19,317) (33,731) (47,331)
Cash 50,936 25,084 12,663 5,593 2,284 5,001 11,683 (1,800) (7,794) (12,569) (8,737) (5,958)From households 50,93b 25,084 12,663 5,593 2,284 5,001 11,683 (1,800) (7,794) (12,569) (8,737) (5,958)From legal entities 0 0 0 0 0 0 0 0 0 0 0 0
Total 61,953 40,053 24,495 18,152 14,756 12,038 47,252 (15,322) (6,184) (2,673) (24,507) 323Non-cash (226) (1,650) 6,854 7,575 11,858 558 32,252 (13,692) 5,823 8,990 (16,784) 1,935
At the ICE 0 2 0 0 21,584 69 0 0 0 0 0 0Outside the ICE (4,049) (5,129) 2,525 4,764 (17,484) (10,676) 19,806 (30,467) (13,429) (13,009) (34,378) (31,921)Taxes 3823 3477 4329 2811 7757 11164.9 12445 16775.4 19252.5 21999.4 17594 33856
Cash 62,178 41,702 17,641 10,577 2,898 11,480 15,001 (1,630) (12,007) (11,663) (7,723) (1,612)From households 61,679 41,415 17,613 10,576 2,905 11,480 15,001 (1,630) (12,007) (11,664) (7,723) (1,612)From legal entities 499 288 28 1 (7) 0 0 0 0 1 0 0
Note: Includes transactions in Russian rubles.1/ ICE stands for Interbank Currency Exchange.
Source: National Bank of Belarus.
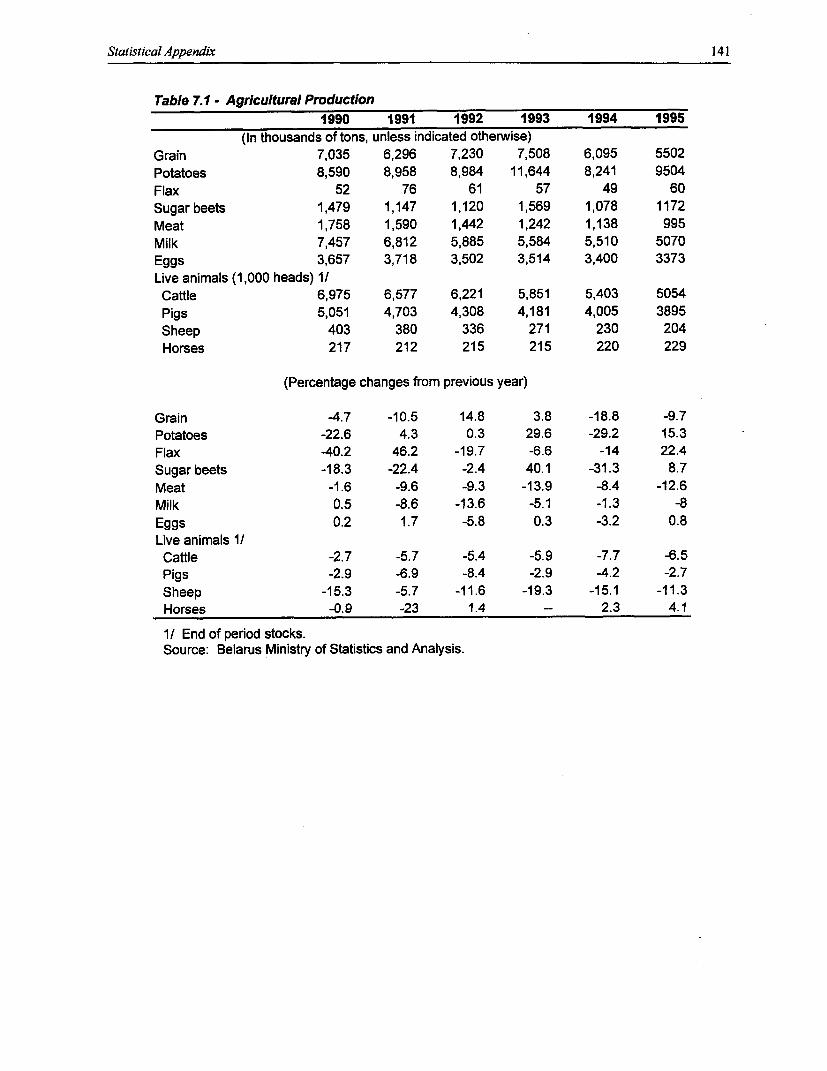
Statistical Appendix 141
Table 7.1 - Agricultural Production1990 1991 1992 1993 1994 1995
(In thousands of tons, unless indicated otherwise)Grain 7,035 6,296 7,230 7,508 6,095 5502Potatoes 8,590 8,958 8,984 11,644 8,241 9504Flax 52 76 61 57 49 60Sugar beets 1,479 1,147 1,120 1,569 1,078 1172Meat 1,758 1,590 1,442 1,242 1,138 995Milk 7,457 6,812 5,885 5,584 5,510 5070Eggs 3,657 3,718 3,502 3,514 3,400 3373Live animals (1,000 heads) 1/Cattle 6,975 6,577 6,221 5,851 5,403 5054Pigs 5,051 4,703 4,308 4,181 4,005 3895Sheep 403 380 336 271 230 204Horses 217 212 215 215 220 229
(Percentage changes from previous year)
Grain -4.7 -10.5 14.8 3.8 -18.8 -9.7Potatoes -22.6 4.3 0.3 29.6 -29.2 15.3Flax -40.2 46.2 -19.7 -6.6 -14 22.4Sugar beets -18.3 -22.4 -2.4 40.1 -31.3 8.7Meat -1.6 -9.6 -9.3 -13.9 -8.4 -12.6Milk 0.5 -8.6 -13.6 -5.1 -1.3 -8Eggs 0.2 1.7 -5.8 0.3 -3.2 0.8Live animals 1/Cattle -2.7 -5.7 -5.4 -5.9 -7.7 -6.5Pigs -2.9 -6.9 -8.4 -2.9 -4.2 -2.7Sheep -15.3 -5.7 -11.6 -19.3 -15.1 -11.3Horses -0.9 -23 1.4 -- 2.3 4.1
1/ End of period stocks.Source: Belarus Ministry of Statistics and Analysis.
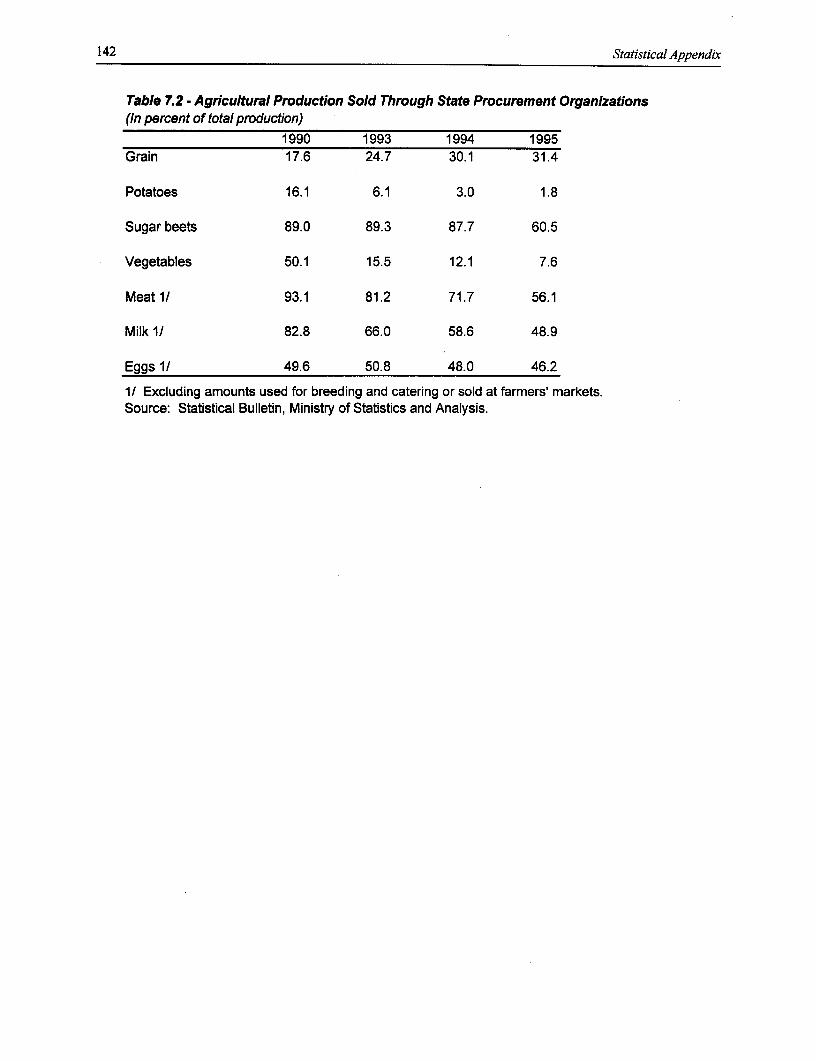
142 Statistical Appendix
Table 7.2 - Agricultural Production Sold Through State Procurement Organizations(In percent of total production)
1990 1993 1994 1995Grain 17.6 24.7 30.1 31.4
Potatoes 16.1 6.1 3.0 1.8
Sugar beets 89.0 89.3 87.7 60.5
Vegetables 50.1 15.5 12.1 7.6
Meat 1/ 93.1 81.2 71.7 56.1
Milk I/ 82.8 66.0 58.6 48.9
Eggs 1/ 49.6 50.8 48.0 46.2
1/ Excluding amounts used for breeding and catering or sold at farmers' markets.Source: Statistical Bulletin, Ministry of Statistics and Analysis.
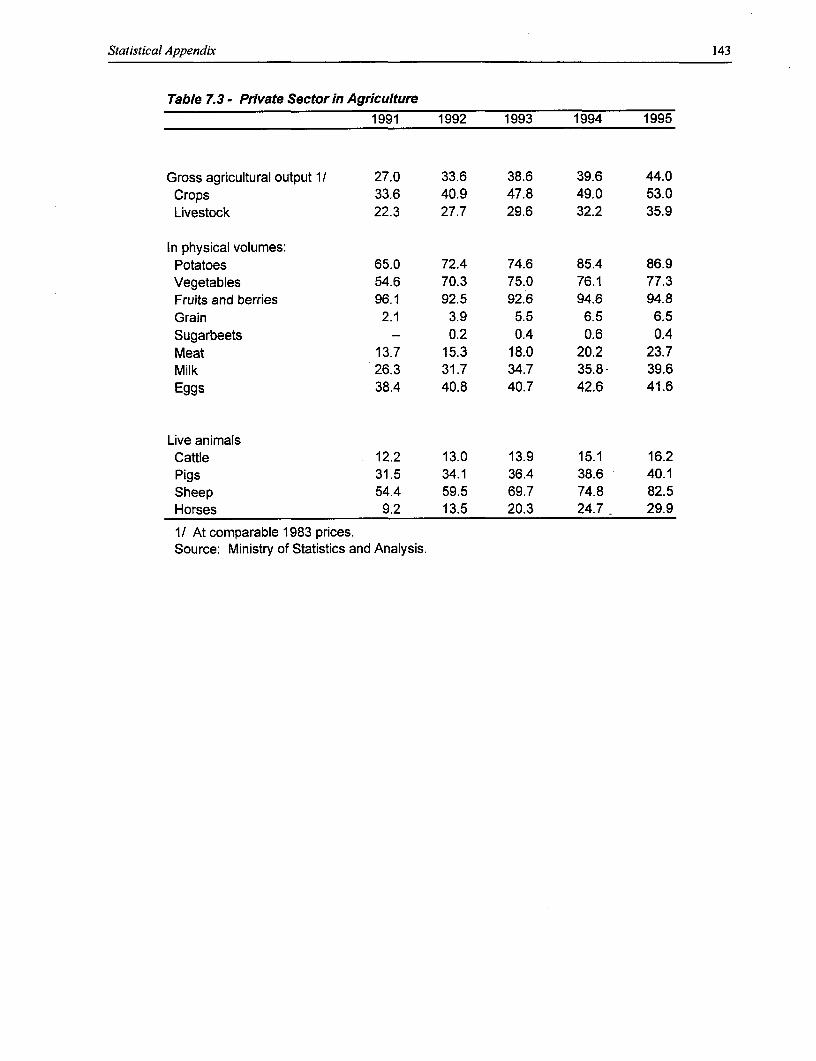
Statistical Appendix 143
Table 7.3 - Private Sector in Agriculture1991 1992 1993 1994 1995
Gross agricultural output 1/ 27.0 33.6 38.6 39.6 44.0Crops 33.6 40.9 47.8 49.0 53.0Livestock 22.3 27.7 29.6 32.2 35.9
In physical volumes:Potatoes 65.0 72.4 74.6 85.4 86.9Vegetables 54.6 70.3 75.0 76.1 77.3Fruits and berries 96.1 92.5 92.6 94.6 94.8Grain 2.1 3.9 5.5 6.5 6.5Sugarbeets -- 0.2 0.4 0.6 0.4Meat 13.7 15.3 18.0 20.2 23.7Milk 26.3 31.7 34.7 35.8- 39.6Eggs 38.4 40.8 40.7 42.6 41.6
Live animalsCattle 12.2 13.0 13.9 15.1 16.2Pigs 31.5 34.1 36.4 38.6 40.1Sheep 54.4 59.5 69.7 74.8 82.5Horses 9.2 13.5 20.3 24.7 - 29.9
I/ At comparable 1983 prices.Source: Ministry of Statistics and Analysis.
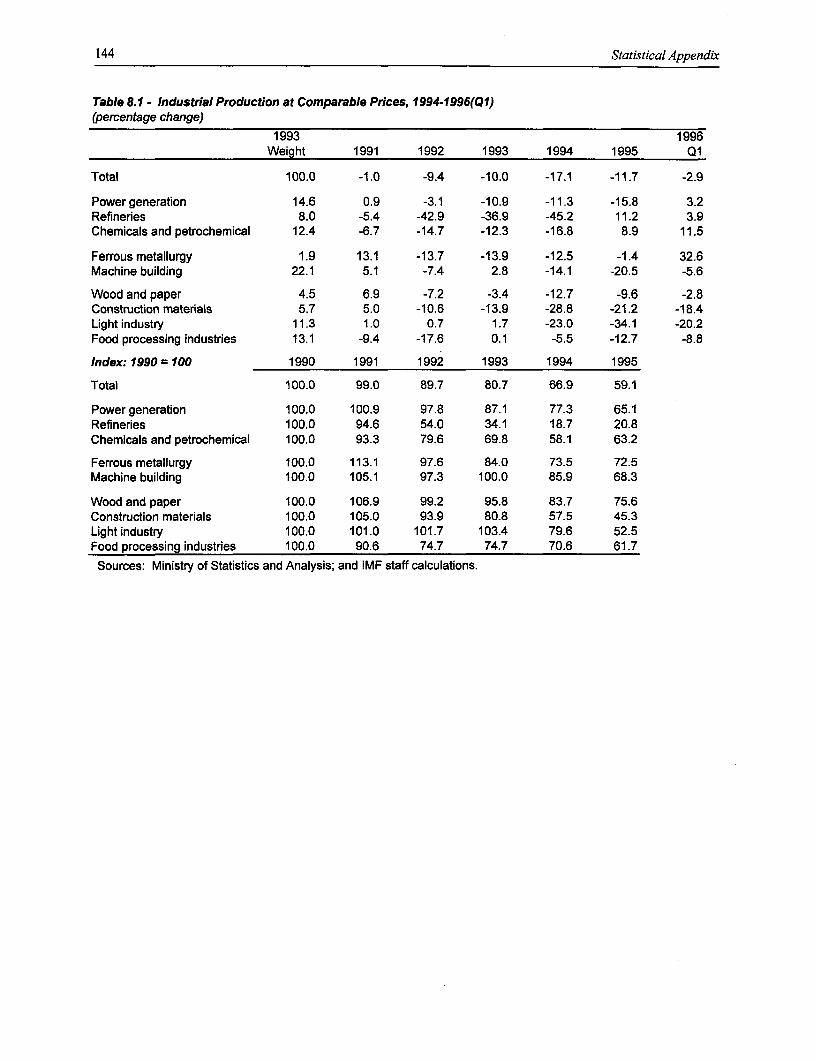
144 Statistical Appendix
Table 8.1 - Industrial Production at Comparable Prices, 1994-1996(Q1)(percentage change)
1993 1996Weight 1991 1992 1993 1994 1995 Q1
Total 100.0 -1.0 -9.4 -10.0 -17.1 -11.7 -2.9
Power generation 14.6 0.9 -3.1 -10.9 -11.3 -15.8 3.2Refineries 8.0 -5.4 -42.9 -36.9 -45.2 11.2 3.9Chemicals and petrochemical 12.4 -6.7 -14.7 -12.3 -16.8 8.9 11.5
Ferrous metallurgy 1.9 13.1 -13.7 -13.9 -12.5 -1.4 32.6Machine building 22.1 5.1 -7.4 2.8 -14.1 -20.5 -5.6
Wood and paper 4.5 6.9 -7.2 -3.4 -12.7 -9.6 -2.8Construction materials 5.7 5.0 -10.6 -13.9 -28.8 -21.2 -18.4Light industry 11.3 1.0 0.7 1.7 -23.0 -34.1 -20.2Food processing industries 13.1 -9.4 -17.6 0.1 -5.5 -12.7 -8.8
Index: 1990 = 100 1990 1991 1992 1993 1994 1995
Total 100.0 99.0 89.7 80.7 66.9 59.1
Power generation 100.0 100.9 97.8 87.1 77.3 65.1Refineries 100.0 94.6 54.0 34.1 18.7 20.8Chemicals and petrochemical 100.0 93.3 79.6 69.8 58.1 63.2
Ferrous metallurgy 100.0 113.1 97.6 84.0 73.5 72.5Machine building 100.0 105.1 97.3 100.0 85.9 68.3
Wood and paper 100.0 106.9 99.2 95.8 83.7 75.6Construction materials 100.0 105.0 93.9 80.8 57.5 45.3Light industry 100.0 101.0 101.7 103.4 79.6 52.5Food processing industries 100.0 90.6 74.7 74.7 70.6 61.7
Sources: Ministry of Statistics and Analysis; and IMF staff calculations.
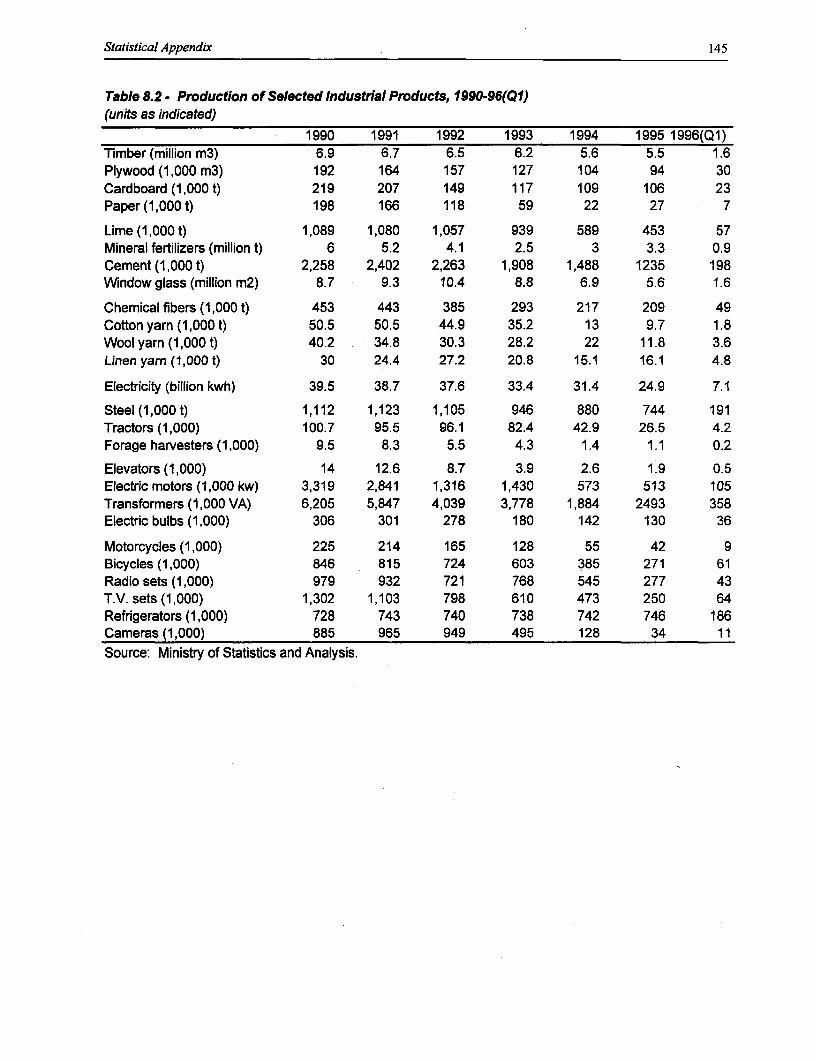
Statistical Appendix 145
Table 8.2 - Production of Selected Industrial Products, 1990-96(Q1)(units as indicated)
1990 1991 1992 1993 1994 1995 1996(Q1)Timber (million m3) 6.9 6.7 6.5 6.2 5.6 5.5 1.6Plywood (1,000 m3) 192 164 157 127 104 94 30Cardboard (1,000 t) 219 207 149 117 109 106 23Paper (1,000t) 198 166 118 59 22 27 7
Lime (1,000 t) 1,089 1,080 1,057 939 589 453 57Mineral fertilizers (million t) 6 5.2 4.1 2.5 3 3.3 0.9Cement (1,000 t) 2,258 2,402 2,263 1,908 1,488 1235 198Window glass (million m2) 8.7 9.3 10.4 8.8 6.9 5.6 1.6
Chemical fibers (1,000 t) 453 443 385 293 217 209 49Cotton yarn (1,000 t) 50.5 50.5 44.9 35.2 13 9.7 1.8Wool yarn (1,000 t) 40.2 34.8 30.3 28.2 22 11.8 3.6Linen yarn (1,000 t) 30 24.4 27.2 20.8 15.1 16.1 4.8
Electricity (billion kwh) 39.5 38.7 37.6 33.4 31.4 24.9 7.1
Steel(1,000t) 1,112 1,123 1,105 946 880 744 191Tractors (1,000) 100.7 95.5 96.1 82.4 42.9 26.5 4.2Forage harvesters (1,000) 9.5 8.3 5.5 4.3 1.4 1.1 0.2
Elevators (1,000) 14 12.6 8.7 3.9 2.6 1.9 0.5Electric motors (1,000 kw) 3,319 2,841 1,316 1,430 573 513 105Transformers (1,000 VA) 6,205 5,847 4,039 3,778 1,884 2493 358Electric bulbs (1,000) 306 301 278 180 142 130 36
Motorcycles (1,000) 225 214 165 128 55 42 9Bicycles (1,000) 846 815 724 603 385 271 61Radio sets (1,000) 979 932 721 768 545 277 43T.V. sets (1,000) 1,302 1,103 798 610 473 250 64Refrigerators (1,000) 728 743 740 738 742 746 186Cameras (1,000) 885 965 949 495 128 34 11
Source: Ministry of Statistics and Analysis.
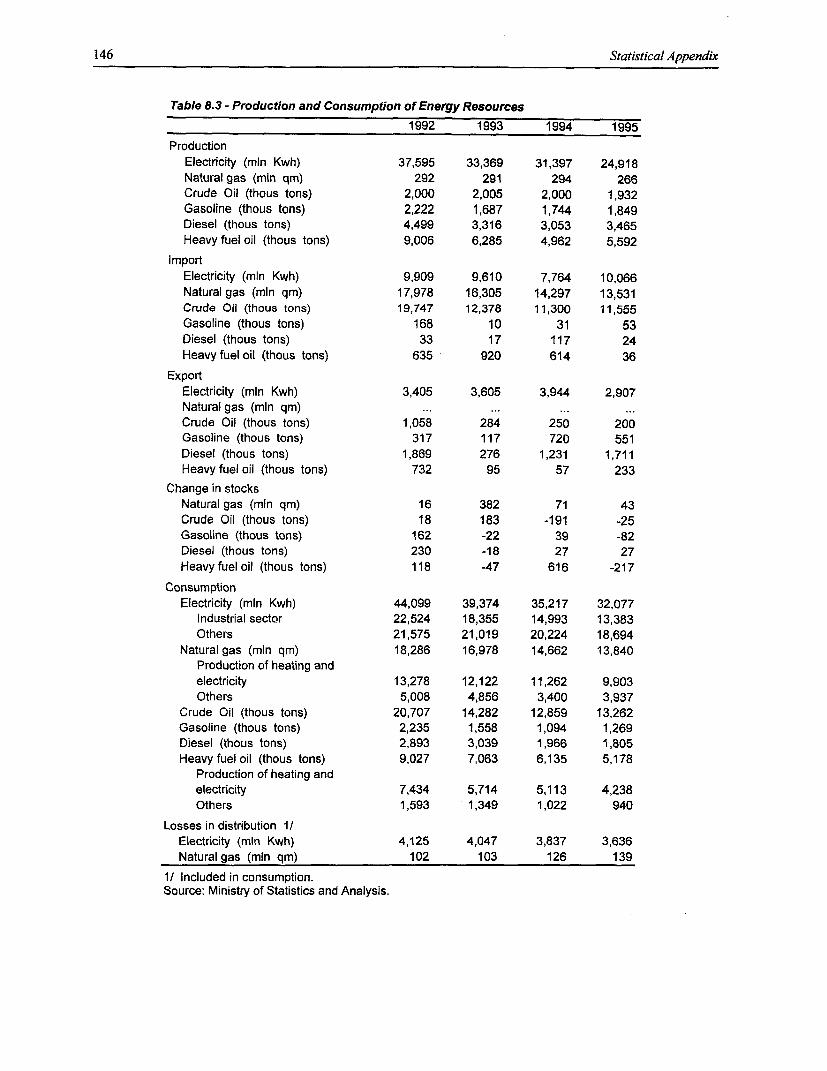
146 Statistical Appendix
Table 8.3 - Production and Consumption of Energy Resources
1992 1993 1994 1995
ProductionElectricity (min Kwh) 37,595 33,369 31,397 24,918Natural gas (min qm) 292 291 294 266Crude Oil (thous tons) 2,000 2,005 2,000 1,932Gasoline (thous tons) 2,222 1,687 1,744 1,849Diesel (thous tons) 4,499 3,316 3,053 3,465Heavy fuel oil (thous tons) 9,006 6,285 4,962 5,592
ImportElectricity (mln Kwh) 9,909 9,610 7,764 10,066Natural gas (min qm) 17,978 16,305 14,297 13,531Crude Oil (thous tons) 19,747 12,378 11,300 11,555Gasoline (thous tons) 168 10 31 53Diesel (thous tons) 33 17 117 24Heavy fuel oil (thous tons) 635 920 614 36
ExportElectricity (min Kwh) 3,405 3,605 3,944 2,907Natural gas (mln qm) ... ... ... ...Crude Oil (thous tons) 1,058 284 250 200Gasoline (thous tons) 317 117 720 551Diesel (thous tons) 1,869 276 1,231 1,711Heavy fuel oil (thous tons) 732 95 57 233
Change in stocksNatural gas (mln qm) 16 382 71 43Crude Oil (thous tons) 18 183 -191 -25Gasoline (thous tons) 162 -22 39 -82Diesel (thous tons) 230 -18 27 27Heavy fuel oil (thous tons) 118 -47 616 -217
ConsumptionElectricity (mln Kwh) 44,099 39,374 35,217 32,077
Industrial sector 22,524 18,355 14,993 13,383Others 21,575 21,019 20,224 18,694
Natural gas (min qm) 18,286 16,978 14,662 13,840Production of heating andelectricity 13,278 12,122 11,262 9,903Others 5,008 4,856 3,400 3,937
Crude Oil (thous tons) 20,707 14,282 12,859 13,262Gasoline (thous tons) 2,235 1,558 1,094 1,269Diesel (thous tons) 2,893 3,039 1,966 1,805Heavy fuel oil (thous tons) 9,027 7,063 6,135 5,178
Production of heating andelectricity 7,434 5,714 5,113 4,238Others 1,593 1,349 1,022 940
Losses in distribution 1/Electricity (min Kwh) 4,125 4,047 3,837 3,636Natural gas (min qm) 102 103 126 139
1/ Included in consumption.Source: Ministry of Statistics and Analysis.
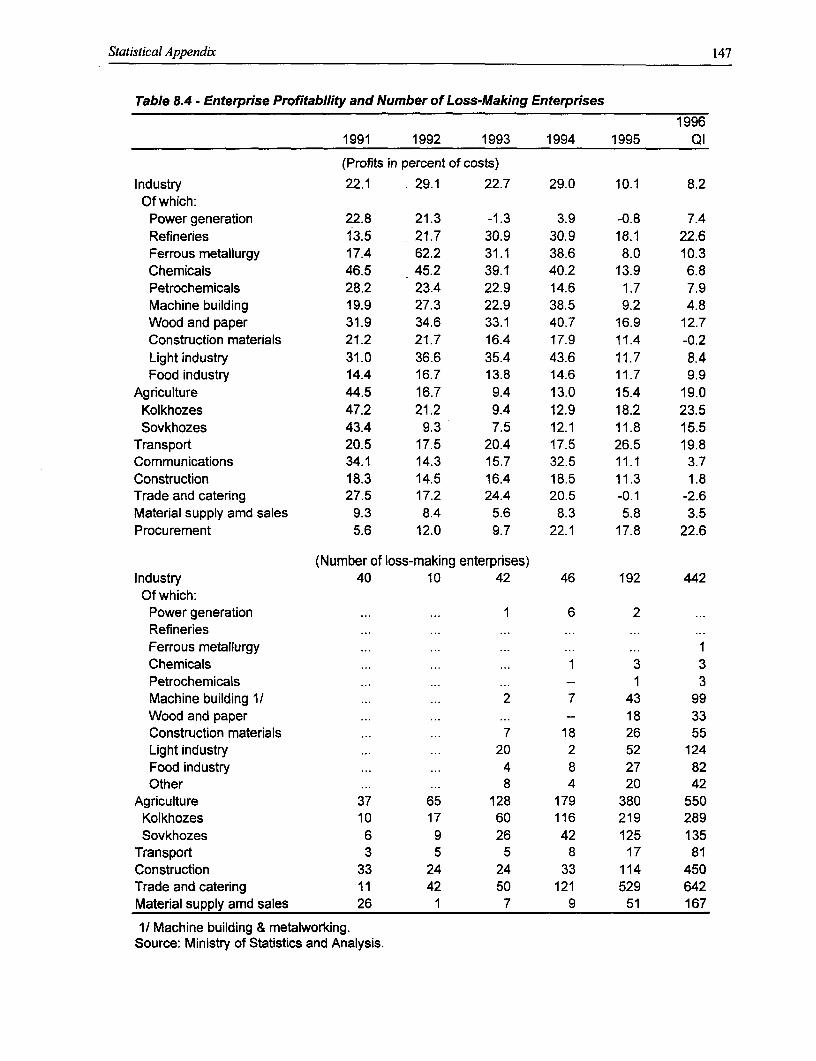
Statistical Appendix 147
Table 8.4 - Enterprise Profitability and Number of Loss-Making Enterprises
19961991 1992 1993 1994 1995 Ql
(Profits in percent of costs)
Industry 22.1 . 29.1 22.7 29.0 10.1 8.2Of which:Power generation 22.8 21.3 -1.3 3.9 -0.8 7.4Refineries 13.5 21.7 30.9 30.9 18.1 22.6Ferrous metallurgy 17.4 62.2 31.1 38.6 8.0 10.3Chemicals 46.5 45.2 39.1 40.2 13.9 6.8Petrochemicals 28.2 23.4 22.9 14.6 1.7 7.9Machine building 19.9 27.3 22.9 38.5 9.2 4.8Wood and paper 31.9 34.6 33.1 40.7 16.9 12.7Construction materials 21.2 21.7 16.4 17.9 11.4 -0.2Light industry 31.0 36.6 35.4 43.6 11.7 8.4Food industry 14.4 16.7 13.8 14.6 11.7 9.9
Agriculture 44.5 16.7 9.4 13.0 15.4 19.0Kolkhozes 47.2 21.2 9.4 12.9 18.2 23.5Sovkhozes 43.4 9.3 7.5 12.1 11.8 15.5
Transport 20.5 17.5 20.4 17.5 26.5 19.8Communications 34.1 14.3 15.7 32.5 11.1 3.7Construction 18.3 14.5 16.4 18.5 11.3 1.8Trade and catering 27.5 17.2 24.4 20.5 -0.1 -2.6Material supply amd sales 9.3 8.4 5.6 8.3 5.8 3.5Procurement 5.6 12.0 9.7 22.1 17.8 22.6
(Number of loss-making enterprises)Industry 40 10 42 46 192 442
Of which:Power generation ... ... 1 6 2 ...Refineries ... ... ... ... ... ...Ferrous metallurgy ... ... ... ... ... IChemicals ... ... ... 1 3 3Petrochemicals ... ... ... -- 1 3Machine building 1/ ... ... 2 7 43 99Wood and paper ... ... ... -- 18 33Construction materials ... ... 7 18 26 55Light industry ... ... 20 2 52 124Food industry ... ... 4 8 27 82Other ... ... 8 4 20 42
Agriculture 37 65 128 179 380 550Kolkhozes 10 17 60 116 219 289Sovkhozes 6 9 26 42 125 135
Transport 3 5 5 8 17 81Construction 33 24 24 33 114 450Trade and catering 11 42 50 121 529 642Material supply amd sales 26 1 7 9 51 167
1/ Machine building & metalworking.Source: Ministry of Statistics and Analysis.
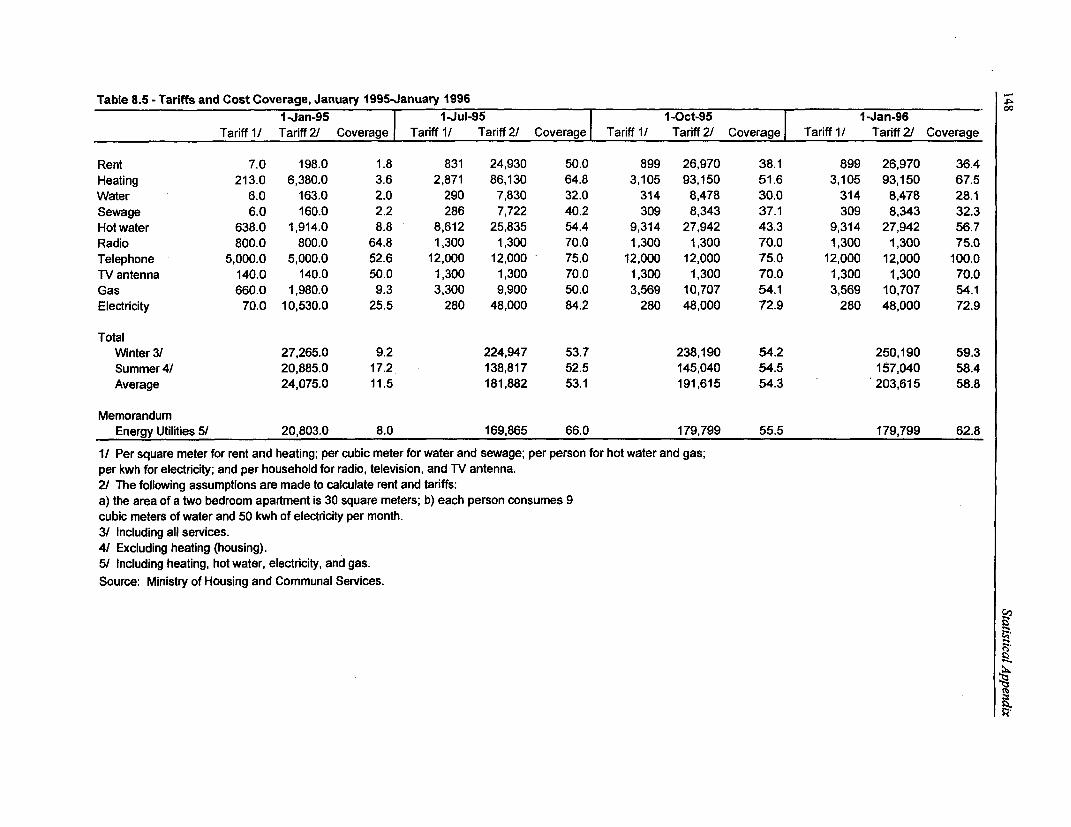
Table 8.5 - Tariffs and Cost Coverage, January 1995-January 19961 -Jan-95 -Jul-95 1 -Oct-95 1-Jan-96
Tariff 1/ Tariff 2/ Coverage Tariff 1/ Tariff 2/ Coverage Tariff 1/ Tariff 2/ Coverage Tariff 1/ Tariff 2/ Coverage
Rent 7.0 198.0 1.8 831 24,930 50.0 899 26,970 38.1 899 26,970 36.4Heating 213.0 6,380.0 3.6 2,871 86,130 64.8 3,105 93,150 51.6 3,105 93,150 67.5Water 6.0 163.0 2.0 290 7,830 32.0 314 8,478 30.0 314 8,478 28.1Sewage 6.0 160.0 2.2 286 7,722 40.2 309 8,343 37.1 309 8,343 32.3Hot water 638.0 1,914.0 8.8 8,612 25,835 54.4 9,314 27,942 43.3 9,314 27,942 56.7Radio 800.0 800.0 64.8 1,300 1,300 70.0 1,300 1,300 70.0 1,300 1,300 75.0Telephone 5,000.0 5,000.0 52.6 12,000 12,000 75.0 12,000 12,000 75.0 12,000 12,000 100.0TVantenna 140.0 140.0 50.0 1,300 1,300 70.0 1,300 1,300 70.0 1,300 1,300 70.0Gas 660.0 1,980.0 9.3 3,300 9,900 50.0 3,569 10,707 54.1 3,569 10,707 54.1Electricity 70.0 10,530.0 25.5 280 48,000 84.2 280 48,000 72.9 280 48,000 72.9
TotalWinter 3/ 27,265.0 9.2 224,947 53.7 238,190 54.2 250,190 59.3Summer4/ 20,885.0 17.2 138,817 52.5 145,040 54.5 157,040 58.4Average 24,075.0 11.5 181,882 53.1 191,615 54.3 203,615 58.8
MemorandumEnergy Utilities 5/ 20,803.0 8.0 169,865 66.0 179,799 55.5 179,799 62.8
1/ Per square meter for rent and heating; per cubic meter for water and sewage; per person for hot water and gas;per kwh for electricity; and per household for radio, television, and TV antenna.2/ The following assumptions are made to calculate rent and tariffs:a) the area of a two bedroom apartment is 30 square meters; b) each person consumes 9cubic meters of water and 50 kwh of electricity per month.3/ Including all services.4/ Excluding heating (housing).5/ Including heating, hot water, electricity, and gas.Source: Ministry of Housing and Communal Services.
EL
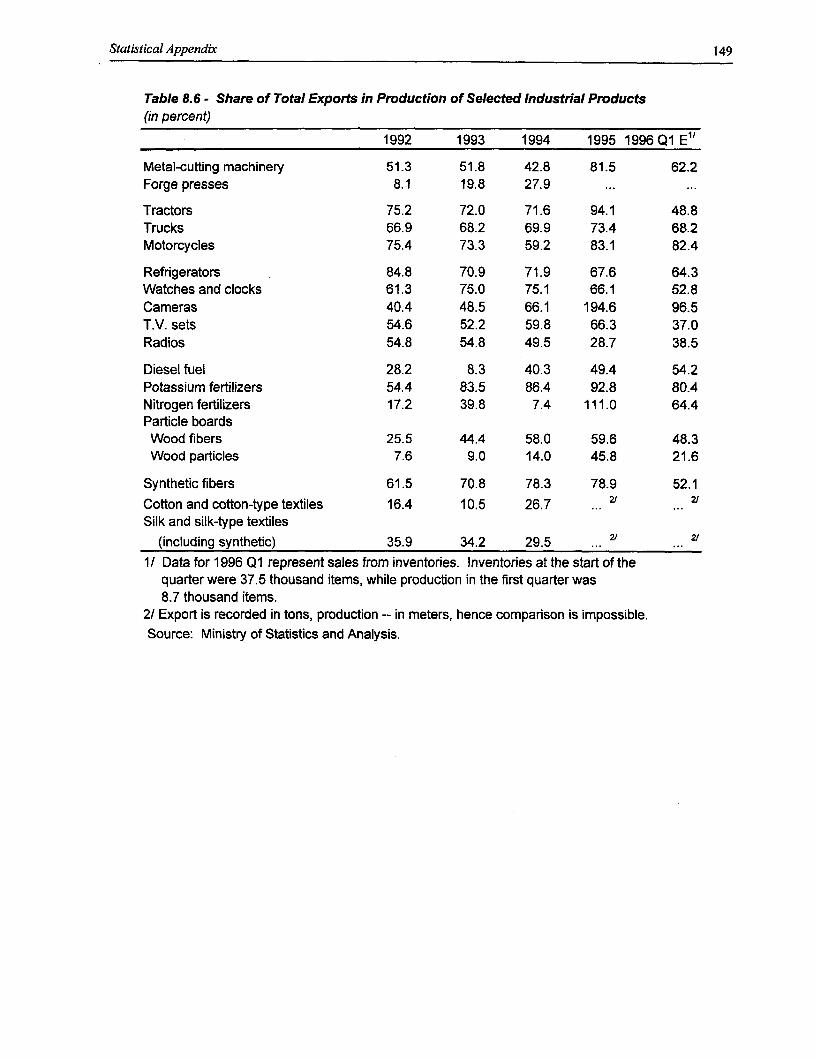
Statistical Appendix 149
Table 8.6 - Share of Total Exports in Production of Selected Industrial Products(in percent)
1992 1993 1994 1995 1996 Q1 E"
Metal-cutting machinery 51.3 51.8 42.8 81.5 62.2Forge presses 8.1 19.8 27.9 ... ...
Tractors 75.2 72.0 71.6 94.1 48.8Trucks 66.9 68.2 69.9 73.4 68.2Motorcycles 75.4 73.3 59.2 83.1 82.4
Refrigerators 84.8 70.9 71.9 67.6 64.3Watches and clocks 61.3 75.0 75.1 66.1 52.8Cameras 40.4 48.5 66.1 194.6 96.5T.V. sets 54.6 52.2 59.8 66.3 37.0Radios 54.8 54.8 49.5 28.7 38.5
Diesel fuel 28.2 8.3 40.3 49.4 54.2Potassium fertilizers 54.4 83.5 86.4 92.8 80.4Nitrogen fertilizers 17.2 39.8 7.4 111.0 64.4Particle boardsWood fibers 25.5 44.4 58.0 59.6 48.3Wood particles 7.6 9.0 14.0 45.8 21.6
Synthetic fibers 61.5 70.8 78.3 78.9 52.1Cotton and cotton-type textiles 16.4 10.5 26.7 ... 2/ ... 2
Silk and silk-type textiles(including synthetic) 35.9 34.2 29.5 .. 2/ .. 2/
i/ Data for 1996 Ql represent sales from inventories. Inventories at the start of thequarter were 37.5 thousand items, while production in the first quarter was8.7 thousand items.
2/ Export is recorded in tons, production -- in meters, hence comparison is impossible.Source: Ministry of Statistics and Analysis.
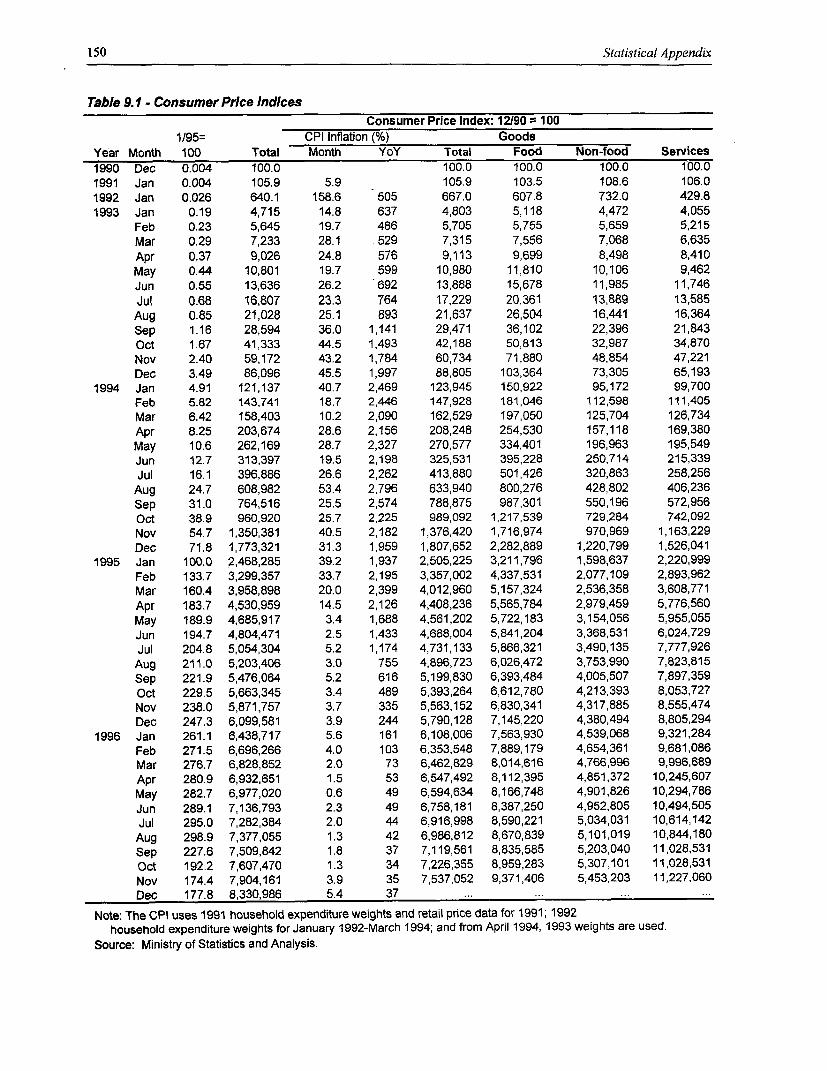
150 Statistical Appendix
Table 9.1 - Consumer Price IndicesConsumer Price Index: 12190 = 100
1/95= CPI Inflation (%) GoodsYear Month 100 Total Month YoY Total Food Non-food Services1990 Dec 0.004 100.0 100.0 100.0 100.0 100.01991 Jan 0.004 105.9 5.9 105.9 103.5 108.6 106.01992 Jan 0.026 640.1 158.6 505 667.0 607.8 732.0 429.81993 Jan 0.19 4,715 14.8 637 4,803 5,118 4,472 4,055
Feb 0.23 5,645 19.7 486 5,705 5,755 5,659 5,215Mar 0.29 7,233 28.1 529 7,315 7,556 7,068 6,635Apr 0.37 9,026 24.8 576 9,113 9,699 8,498 8,410May 0.44 10,801 19.7 599 10,980 11,810 10,106 9,462Jun 0.55 13,636 26.2 692 13,888 15,678 11,985 11,746Jul 0.68 16,807 23.3 764 17,229 20,361 13,889 13,585Aug 0.85 21,028 25.1 893 21,637 26,504 16,441 16,364Sep 1.16 28,594 36.0 1,141 29,471 36,102 22,396 21,843Oct 1.67 41,333 44.5 1,493 42,188 50,813 32,987 34,870Nov 2.40 59,172 43.2 1,784 60,734 71,880 48,854 47,221Dec 3.49 86,096 45.5 1,997 88,805 103,364 73,305 65,193
1994 Jan 4.91 121,137 40.7 2,469 123,945 150,922 95,172 99,700Feb 5.82 143,741 18.7 2,446 147,928 181,046 112,598 111,405Mar 6.42 158,403 10.2 2,090 162,529 197,050 125,704 126,734Apr 8.25 203,674 28.6 2,156 208,248 254,530 157,118 169,380May 10.6 262,169 28.7 2,327 270,577 334,401 196,963 195,549Jun 12.7 313,397 19.5 2,198 325,531 395,228 250,714 215,339Jul 16.1 396,886 26.6 2,262 413,880 501,426 320,863 258,256Aug 24.7 608,982 53.4 2,796 633,940 800,276 428,802 406,236Sep 31.0 764,516 25.5 2,574 788,875 987,301 550,196 572,956Oct 38.9 960,920 25.7 2,225 989,092 1,217,539 729,284 742,092Nov 54.7 1,350,381 40.5 2,182 1,376,420 1,716,974 970,969 1,163,229Dec 71.8 1,773,321 31.3 1,959 1,807,652 2,282,889 1,220,799 1,526,041
1995 Jan 100.0 2,468,285 39.2 1,937 2,505,225 3,211,796 1,598,637 2,220,999Feb 133.7 3,299,357 33.7 2,195 3,357,002 4,337,531 2,077,109 2,893,962Mar 160.4 3,958,898 20.0 2,399 4,012,960 5,157,324 2,536,358 3,608,771Apr 183.7 4,530,959 14.5 2,126 4,408,236 5,565,784 2,979,459 5,776,560May 189.9 4,685,917 3.4 1,688 4,561,202 5,722,183 3,154,056 5,955,055Jun 194.7 4,804,471 2.5 1,433 4,688,004 5,841,204 3,368,531 6,024,729Jul 204.8 5,054,304 5.2 1,174 4,731,133 5,866,321 3,490,135 7,777,926Aug 211.0 5,203,406 3.0 755 4,896,723 6,026,472 3,753,990 7,823,815Sep 221.9 5,476,064 5.2 616 5,199,830 6,393,484 4,005,507 7,897,359Oct 229.5 5,663,345 3.4 489 5,393,264 6,612,780 4,213,393 8,053,727Nov 238.0 5,871,757 3.7 335 5,563,152 6,830,341 4,317,885 8,555,474Dec 247.3 6,099,581 3.9 244 5,790,128 7,145,220 4,380,494 8,805,294
1996 Jan 261.1 6,438,717 5.6 161 6,108,006 7,563,930 4,539,068 9,321,284Feb 271.5 6,696,266 4.0 103 6,353,548 7,889,179 4,654,361 9,681,086Mar 276.7 6,828,852 2.0 73 6,462,829 8,014,616 4,766,996 9,996,689Apr 280.9 6,932,651 1.5 53 6,547,492 8,112,395 4,851,372 10,245,607May 282.7 6,977,020 0.6 49 6,594,634 8,166,748 4,901,826 10,294,786Jun 289.1 7,136,793 2.3 49 6,758,181 8,387,250 4,952,805 10,494,505Jul 295.0 7,282,384 2.0 44 6,916,998 8,590,221 5,034,031 10,614,142Aug 298.9 7,377,055 1.3 42 6,986,812 8,670,839 5,101,019 10,844,180Sep 227.6 7,509,842 1.8 37 7,119,561 8,835,585 5,203,040 11,028,531Oct 192.2 7,607,470 1.3 34 7,226,355 8,959,283 5,307,101 11,028,531Nov 174.4 7,904,161 3.9 35 7,537,052 9,371,406 5,453,203 11,227,060Dec 177.8 8,330,986 5.4 37 ... ... ... ...
Note: The CPI uses 1991 household expenditure weights and retail price data for 1991; 1992household expenditure weights for January 1992-March 1994; and from April 1994, 1993 weights are used.
Source: Ministry of Statistics and Analysis.
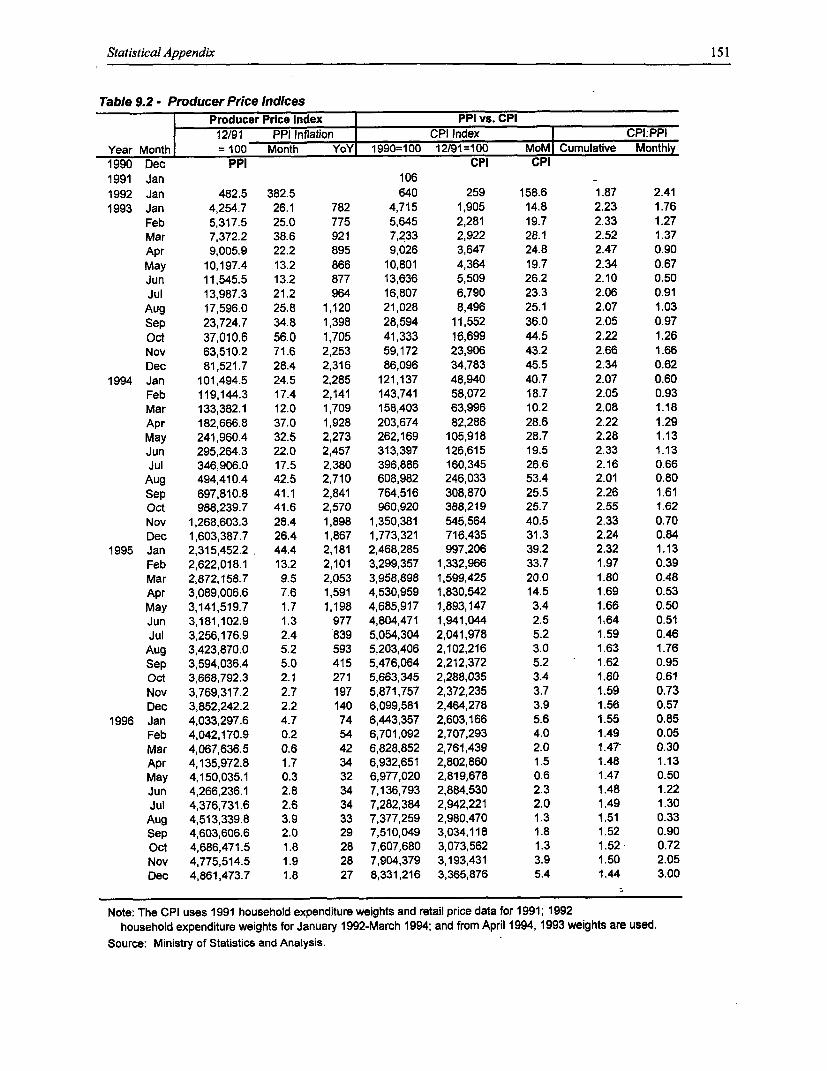
Statistical Appendix 151
Table 9.2 - Producer Price IndicesProducer Price Index PPI vs. CPI12/91 PPI Inflation CPI Index CPI:PPi
Year Month = 100 Month YoY 1990=100 12/91=100 MoM| Cumulative Monthl1990 Dec PPI CPI CPI1991 Jan 1061992 Jan 482.5 382.5 640 259 158.6 1.87 2.411993 Jan 4,254.7 26.1 782 4,715 1,905 14.8 2.23 1.76
Feb 5,317.5 25.0 775 5,645 2,281 19.7 2.33 1.27Mar 7,372.2 38.6 921 7,233 2,922 28.1 2.52 1.37Apr 9,005.9 22.2 895 9,026 3,647 24.8 2.47 0.90May 10,197.4 13.2 866 10,801 4,364 19.7 2.34 0.67Jun 11,545.5 13.2 877 13,e36 5,509 26.2 2.10 0.50Jul 13,987.3 21.2 964 16,807 6,790 23.3 2.06 0.91
Aug 17,596.0 25.8 1,120 21,028 8,496 25.1 2.07 1.03Sep 23,724.7 34.8 1,398 28,594 11,552 36.0 2.05 0.97Oct 37,010.6 56.0 1,705 41,333 16,699 44.5 2.22 1.26Nov 63,510.2 71.6 2,253 59,172 23,906 43.2 2.66 1.66Dec 81,521.7 28.4 2,316 86,096 34,783 45.5 2.34 0.62
1994 Jan 101,494.5 24.5 2,285 121,137 48,940 40.7 2.07 0.60Feb 119,144.3 17.4 2,141 143,741 58,072 18.7 2.05 0.93Mar 133,382.1 12.0 1,709 158,403 63,996 10.2 2.08 1.18Apr 182,666.8 37.0 1,928 203,674 82,286 28.6 2.22 1.29May 241,960.4 32.5 2,273 262,169 105,918 28.7 2.28 1.13Jun 295,264.3 22.0 2,457 313,397 126,615 19.5 2.33 1.13Jul 346,906.0 17.5 2,380 396,886 160,345 26.6 2.16 0.66Aug 494,410.4 42.5 2,710 608,982 246,033 53.4 2.01 0.80Sep 697,810.8 41.1 2,841 764,516 308,870 25.5 2.26 1.61Oct 988,239.7 41.6 2,570 960,920 388,219 25.7 2.55 1.62Nov 1,268,603.3 28.4 1,898 1,350,381 545,564 40.5 2.33 0.70Dec 1,603,387.7 26.4 1,867 1,773,321 716,435 31.3 2.24 0.84
1995 Jan 2,315,452.2. 44.4 2,181 2,468,285 997,206 39.2 2.32 1.13Feb 2,622,018.1 13.2 2,101 3,299,357 1,332,966 33.7 1.97 0.39Mar 2,872,158.7 9.5 2,053 3,958,898 1,599,425 20.0 1.80 0.48Apr 3,089,006.6 7.6 1,591 4,530,959 1,830,542 14.5 1.69 0.53May 3,141,519.7 1.7 1,198 4,685,917 1,893,147 3.4 1.66 0.50Jun 3,181,102.9 1.3 977 4,804,471 1,941,044 2.5 1:64 0.51Jul 3,256,176.9 2.4 839 5,054,304 2,041,978 5.2 1.59 0.46Aug 3,423,870.0 5.2 593 5,203,406 2,102,216 3.0 1.63 1.76Sep 3,594,036.4 5.0 415 5,476,064 2,212,372 5.2 1.62 0.95Oct 3,668,792.3 2.1 271 5,663,345 2,288,035 3.4 1.60 0.61Nov 3,769,317.2 2.7 197 5,871,757 2,372,235 3.7 1.59 0.73Dec 3,852,242.2 2.2 140 6,099,581 2,464,278 3.9 1.56 0.57
1996 Jan 4,033,297.6 4.7 74 6,443,357 2,603,166 5.6 1.55 0.85Feb 4,042,170.9 0.2 54 6,701,092 2,707,293 4.0 1.49 0.05Mar 4,067,636.5 0.6 42 6,828,852 2,761,439 2.0 1.47- 0.30Apr 4,135,972.8 1.7 34 6,932,651 2,802,860 1.5 1.48 1.13May 4,150,035.1 0.3 32 6,977,020 2,819,678 0.6 1.47 0.50Jun 4,266,236.1 2.8 34 7,136,793 2,884,530 2.3 1.48 1.22Jul 4,376,731.6 2.6 34 7,282,384 2,942,221 2.0 1.49 1.30
Aug 4,513,339.8 3.9 33 7,377,259 2,980,470 1.3 1.51 0.33Sep 4,603,606.6 2.0 29 7,510,049 3,034,118 1.8 1.52 0.90Oct 4,686,471.5 1.8 28 7,607,680 3,073,562 1.3 1.52 0.72Nov 4,775,514.5 1.9 28 7,904,379 3,193,431 3.9 1.50 2.05Dec 4,861,473.7 1.8 27 8,331,216 3,365,876 5.4 1.44 3.00
Note: The CPI uses 1991 household expenditure weights and retail price data for 1991; 1992household expenditure weights for January 1992-March 1994; and from April 1994, 1993 weights are used.
Source: Ministry of Statistics and Analysis.
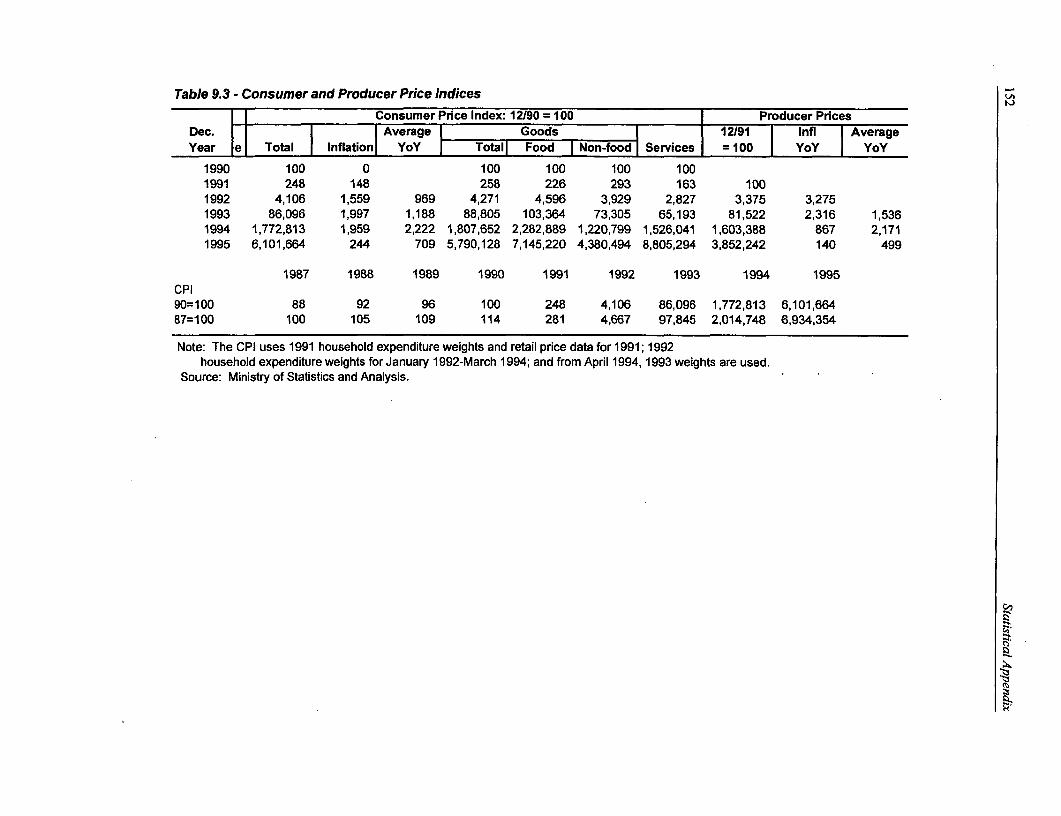
Table 9.3 - Consumer and Producer Price IndicesConsumer Price Index: 12/90 = 100 Producer Prices
Dec. _ I Average I Goods 12/91 Infl AverageYear e ITotal Inflationi YoY I Totall Food Non-food Services = 100 YoY | YoY
1990 100 0 100 100 100 1001991 248 148 258 226 293 163 1001992 4,106 1,559 969 4,271 4,596 3,929 2,827 3,375 3,2751993 86,096 1,997 1,188 88,805 103,364 73,305 65,193 81,522 2,316 1,5361994 1,772,813 1,959 2,222 1,807,652 2,282,889 1,220,799 1,526,041 1,603,388 867 2,1711995 6,101,664 244 709 5,790,128 7,145,220 4,380,494 8,805,294 3,852,242 140 499
1987 1988 1989 1990 1991 1992 1993 1994 1995CPI90=100 88 92 96 100 248 4,106 86,096 1,772,813 6,101,66487=100 100 105 109 114 281 4,667 97,845 2,014,748 6,934,354
Note: The CPI uses 1991 household expenditure weights and retail price data for 1991; 1992household expenditure weights for January 1992-March 1994; and from April 1994, 1993 weights are used.
Source: Ministry of Statistics and Analysis.
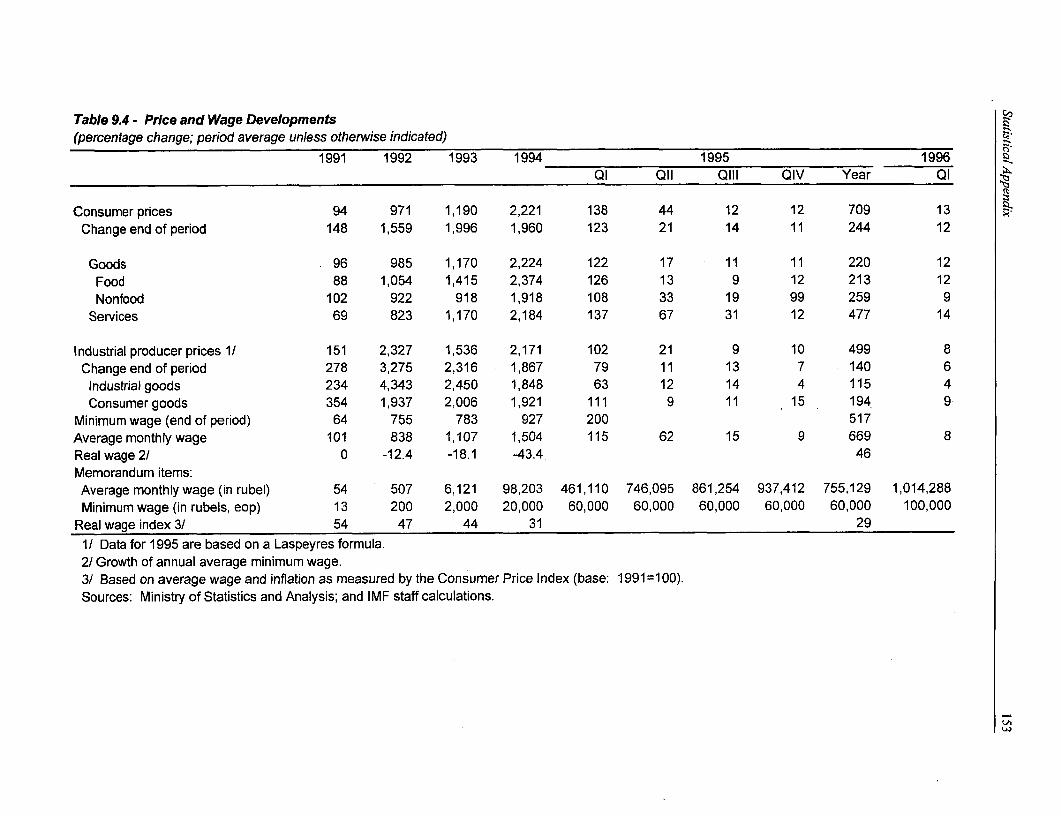
Table 9.4 - Price and Wage Developments(percentage change; period average unless otherwise indicated)
1991 1992 1993 1994 1995 1996Ql Qll Qil QIV Year Ql
Consumer prices 94 971 1,190 2,221 138 44 12 12 709 13Change end of period 148 1,559 1,996 1,960 123 21 14 11 244 12
Goods 96 985 1,170 2,224 122 17 11 11 220 12
Food 88 1,054 1,415 2,374 126 13 9 12 213 12
Nonfood 102 922 918 1,918 108 33 19 99 259 9Services 69 823 1,170 2,184 137 67 31 12 477 14
Industrial producer prices 1/ 151 2,327 1,536 2,171 102 21 9 10 499 8
Change end of period 278 3,275 2,316 1,867 79 11 13 7 140 6Industrial goods 234 4,343 2,450 1,848 63 12 14 4 115 4Consumer goods 354 1,937 2,006 1,921 111 9 11 15 194 9
Minimum wage (end of period) 64 755 783 927 200 517Averagemonthlywage 101 838 1,107 1,504 115 62 15 9 669 8
Real wage 2/ 0 -12.4 -18.1 -43.4 46Memorandum items:Average monthlywage (in rubel) 54 507 6,121 98,203 461,110 746,095 861,254 937,412 755,129 1,014,288
Minimum wage (in rubels, eop) 13 200 2,000 20,000 60,000 60,000 60,000 60,000 60,000 100,000Real wage index 3/ 54 47 44 31 29
1/ Data for 1995 are based on a Laspeyres formula.2/ Growth of annual average minimum wage.3/ Based on average wage and inflation as measured by the Consumer Price Index (base: 1991=100).Sources: Ministry of Statistics and Analysis; and IMF staff calculations.
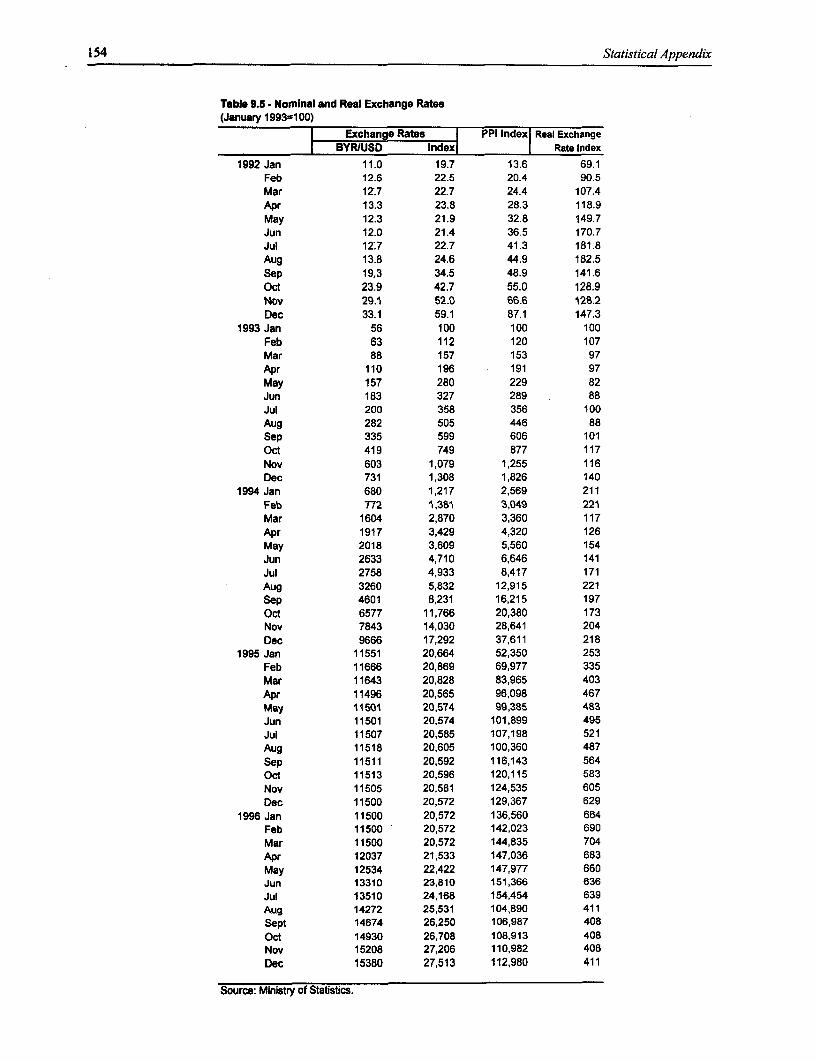
154 Statistical Appendix
Tabh 9.5 - Nominal and Real Exchange Rates(January 19935100)
Exchange Rates PPI Index Real ExchangeBYRIUSD Indeox Rate Index
1992 Jan 11.0 19.7 13.6 69.1Feb 12.6 22.5 20.4 90.5Mar 12Z.7 22.7 24.4 107.4Apr 13.3 23.8 28.3 118.9May 12.3 21.9 32.8 149.7Jun 12.0 21.4 36.5 170.7Jul 12:7 22.7 41.3 181.8Aug 13.8 24.6 44.9 182.5Sep 19.3 34.5 48.9 141.6Oct 23.9 42.7 55.0 128.9NoV 29.1 52.0 66.6 128.2Dec 33.1 59.1 87.1 147.3
1993 Jan 56 100 100 100Feb 63 112 120 107Mar 88 157 153 97Apr 110 196 191 97May 157 280 229 82Jun 183 327 289 88Jul 200 358 356 100Aug 282 505 446 88Sep 335 599 606 101Oct 419 749 877 117Nov 603 1,079 1,255 116Dec 731 1,308 1,826 140
1994 Jan 680 1,217 2,569 211Feb 772 1,381 3,049 221Mar 1604 2,870 3,360 117Apr 1917 3,429 4,320 126May 2018 3,609 5,560 154Jun 2633 4,710 6,646 141Jul 2758 4,933 8,417 171Aug 3260 5,832 12,915 221Sep 4601 8,231 16,215 197Oct 6577 11,766 20,380 173Nov 7843 14,030 28,641 204Dec 9666 17,292 37,611 218
1995 Jan 11551 20,664 52,350 253Feb 11666 20,869 69,977 335Mar 11643 20,828 83,965 403Apr 11496 20,565 96,098 467May 11501 20,574 99,385 483Jun 11501 20,574 101,899 495Jul 11507 20,585 107,198 521Aug 11518 20,605 100,360 487Sep 11511 20,592 116,143 564Oct 11513 20,596 120,115 583Nov 11505 20,581 124,535 605Dec 11500 20,572 129,367 629
1996 Jan 11500 20,572 136,560 664Feb 11500 20,572 142,023 690Mar 11500 20,572 144,835 704Apr 12037 21,533 147,036 683May 12534 22,422 147,977 660Jun 13310 23,810 151,366 636Jul 13510 24,168 154,454 639Aug 14272 25,531 104,890 411Sept 14674 26,250 106,987 408Oct 14930 26,708 108,913 408Nov 15208 27,206 110,982 408Dec 15380 27,513 112,980 411
Source: Ministry of Statistics.
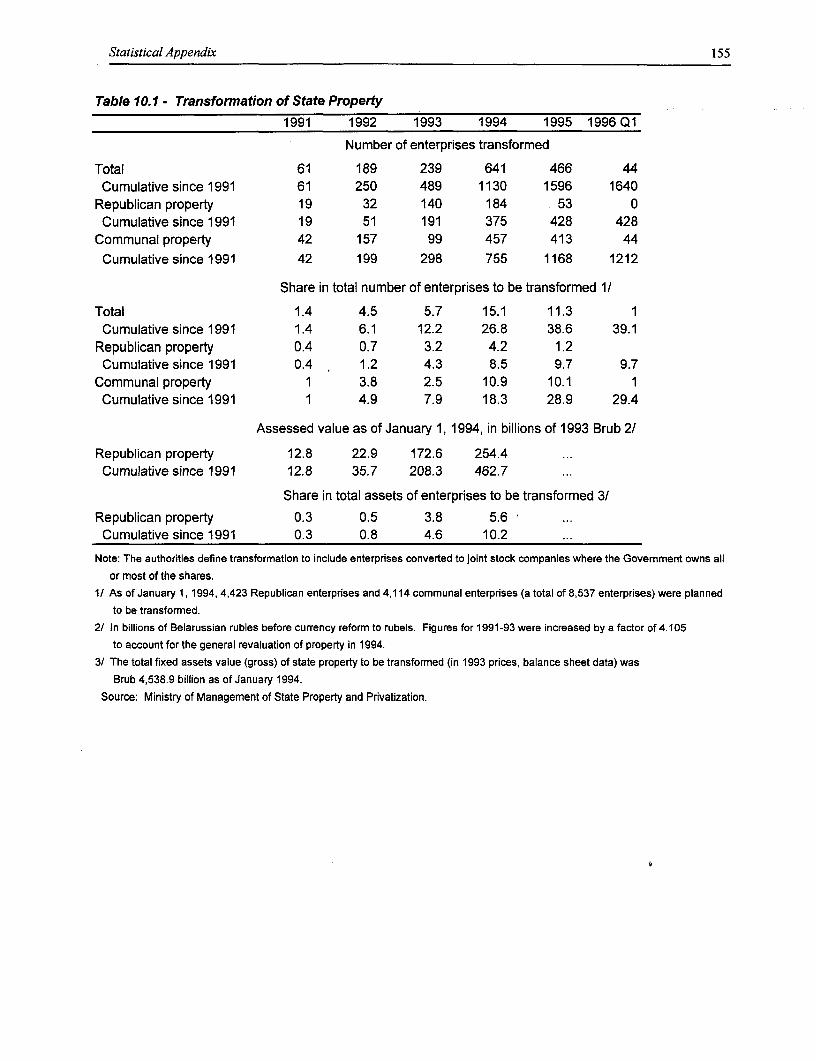
Statistical Appendix 155
Table 10.1 - Transformation of State Property1991 1992 1993 1994 1995 1996 Q1
Number of enterprises transformed
Total 61 189 239 641 466 44Cumulative since 1991 61 250 489 1130 1596 1640
Republican property 19 32 140 184 53 0Cumulative since 1991 19 51 191 375 428 428
Communal property 42 157 99 457 413 44Cumulative since 1991 42 199 298 755 1168 1212
Share in total number of enterprises to be transformed 1/
Total 1.4 4.5 5.7 15.1 11.3 1Cumulative since 1991 1.4 6.1 12.2 26.8 38.6 39.1
Republican property 0.4 0.7 3.2 4.2 1.2Cumulative since 1991 0.4 1.2 4.3 8.5 9.7 9.7
Communal property 1 3.8 2.5 10.9 10.1 1Cumulative since 1991 1 4.9 7.9 18.3 28.9 29.4
Assessed value as of January 1, 1994, in billions of 1993 Brub 2/
Republican property 12.8 22.9 172.6 254.4 Cumulative since 1991 12.8 35.7 208.3 462.7
Share in total assets of enterprises to be transformed 3/
Republican property 0.3 0.5 3.8 5.6 Cumulative since 1991 0.3 0.8 4.6 10.2..
Note: The authorities define transformation to include enterprises converted to joint stock companies where the Government owns all
or most of the shares.1/ As of January 1, 1994, 4,423 Republican enterprises and 4,114 communal enterprises (a total of 8,537 enterprises) were planned
to be transformed.2/ In billions of Belarussian rubles before currency reform to rubels. Figures for 1991-93 were increased by a factor of 4.105
to account for the general revaluation of property in 1994.3/ The total fixed assets value (gross) of state property to be transformed (in 1993 prices, balance sheet data) was
Brub 4,538.9 billion as of January 1994.
Source: Ministry of Management of State Property and Privatization.
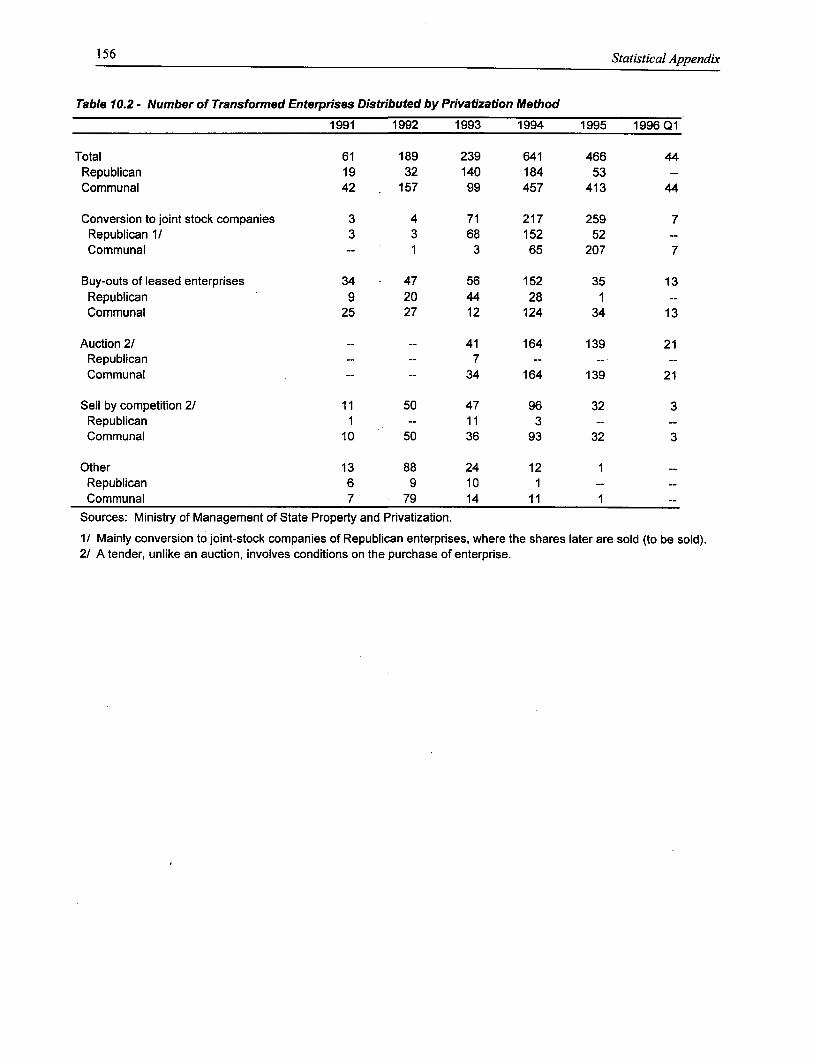
156 Statistical Appendix
Table 10.2 - Number of Transformed Enterprises Distributed by Privatization Method
1991 1992 1993 1994 1995 1996 Q1
Total 61 189 239 641 466 44Republican 19 32 140 184 53 --
Communal 42 157 99 457 413 44
Conversion to joint stock companies 3 4 71 217 259 7Republican 1/ 3 3 68 152 52 --
Communal -- 1 3 65 207 7
Buy-outs of leased enterprises 34 - 47 56 152 35 13Republican 9 20 44 28 1 --
Communal 25 27 12 124 34 13
Auction 2/ -- -- 41 164 139 21Republican 7 -- -- --
Communal -- -- 34 164 139 21
Sell by competition 2/ 11 50 47 96 32 3Republican 1 -- 11 3 -- --Communal 10 50 36 93 32 3
Other 13 88 24 12 1 --
Republican 6 9 10 1 -- --Communal 7 79 14 11 1 --
Sources: Ministry of Management of State Property and Privatization.
1/ Mainly conversion to joint-stock companies of Republican enterprises, where the shares later are sold (to be sold).2/ A tender, unlike an auction, involves conditions on the purchase of enterprise.
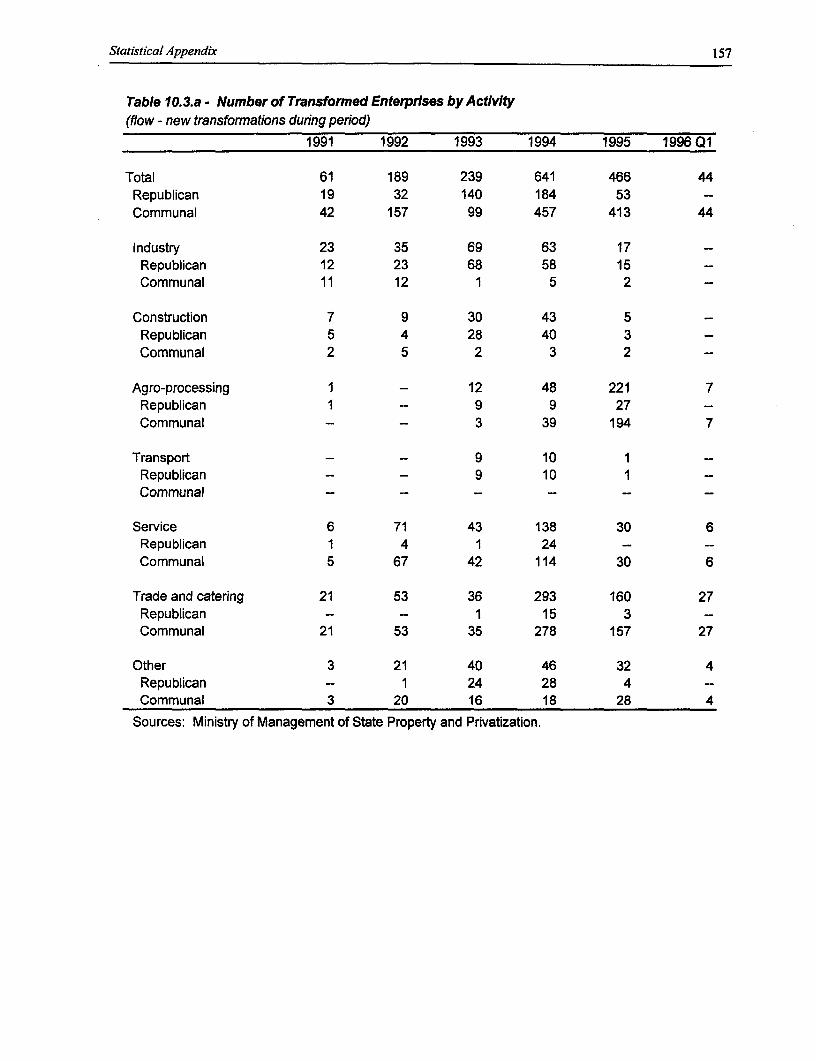
Statistical Appendix 157
Table 10.3.a - Number of Transformed Enterprises by Activity(flow - new transformnations during period)
1991 1992 1993 1994 1995 1996 Q1
Total 61 189 239 641 466 44Republican 19 32 140 184 53Communal 42 157 99 457 413 44
Industry 23 35 69 63 17Republican 12 23 68 58 15Communal 11 12 1 5 2
Construction 7 9 30 43 5Republican 5 4 28 40 3Communal 2 5 2 3 2
Agro-processing 1 - 12 48 221 7Republican 1 -- 9 9 27Communal -- - 3 39 194 7
Transport -- - 9 10 1
Republican - -- 9 10 1Communal - -- - - -
Service 6 71 43 138 30 6Republican 1 4 1 24 -
Communal 5 67 42 114 30 6
Trade and catering 21 53 36 293 160 27Republican -- -- 1 15 3
Communal 21 53 35 278 157 27
Other 3 21 40 46 32 4Republican -- 1 24 28 4 --Communal 3 20 16 18 28 4
Sources: Ministry of Management of State Property and Privatization.
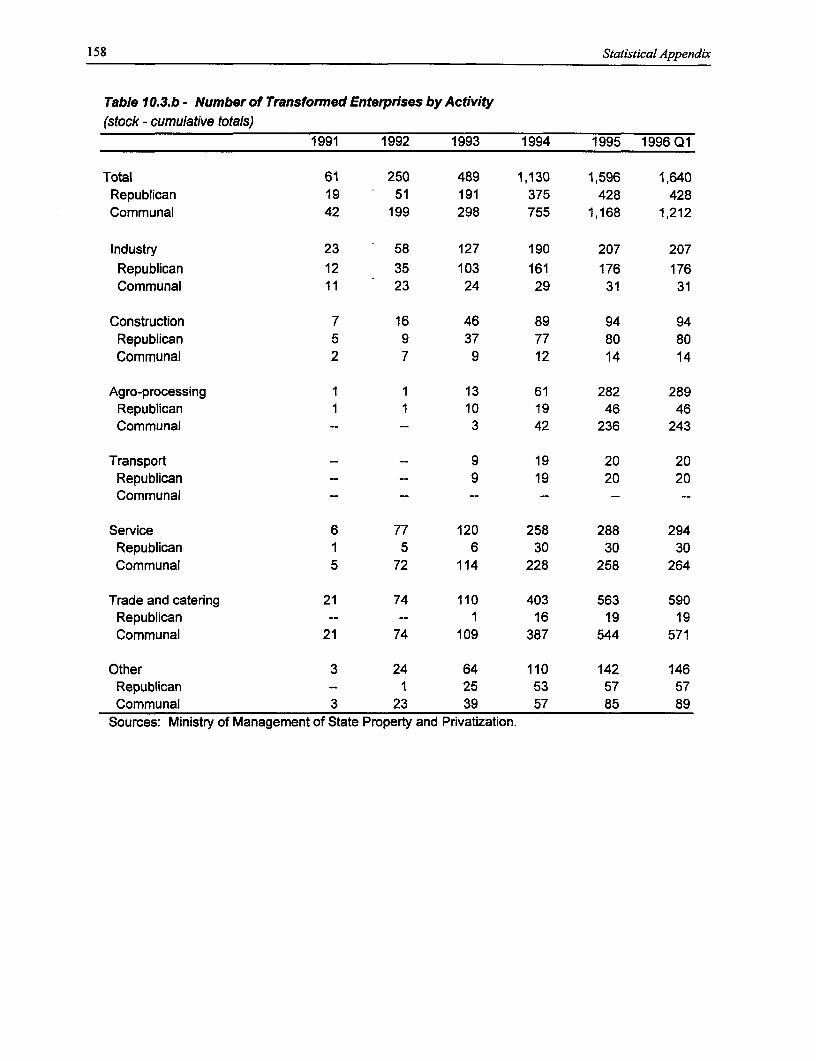
158 Statistical Appendix
Table 10.3.b - Number of Transformed Enterprises by Activity(stock - cumulative totals)
1991 1992 1993 1994 1995 1996 Q1
Total 61 250 489 1,130 1,596 1,640Republican 19 51 191 375 428 428Communal 42 199 298 755 1,168 1,212
Industry 23 58 127 190 207 207
Republican 12 35 103 161 176 176Communal 11 23 24 29 31 31
Construction 7 16 46 89 94 94Republican 5 9 37 77 80 80Communal 2 7 9 12 14 14
Agro-processing 1 1 13 61 282 289Republican 1 1 10 19 46 46Communal -- -- 3 42 236 243
Transport -- -- 9 19 20 20Republican -- -- 9 19 20 20Communal -- -- -- -- - --
Service 6 77 120 258 288 294Republican 1 5 6 30 30 30Communal 5 72 114 228 258 264
Trade and catering 21 74 110 403 563 590Republican -- -- 1 16 19 19Communal 21 74 109 387 544 571
Other 3 24 64 110 142 146Republican - 1 25 53 57 57Communal 3 23 39 57 85 89
Sources: Ministry of Management of State Property and Privatization.
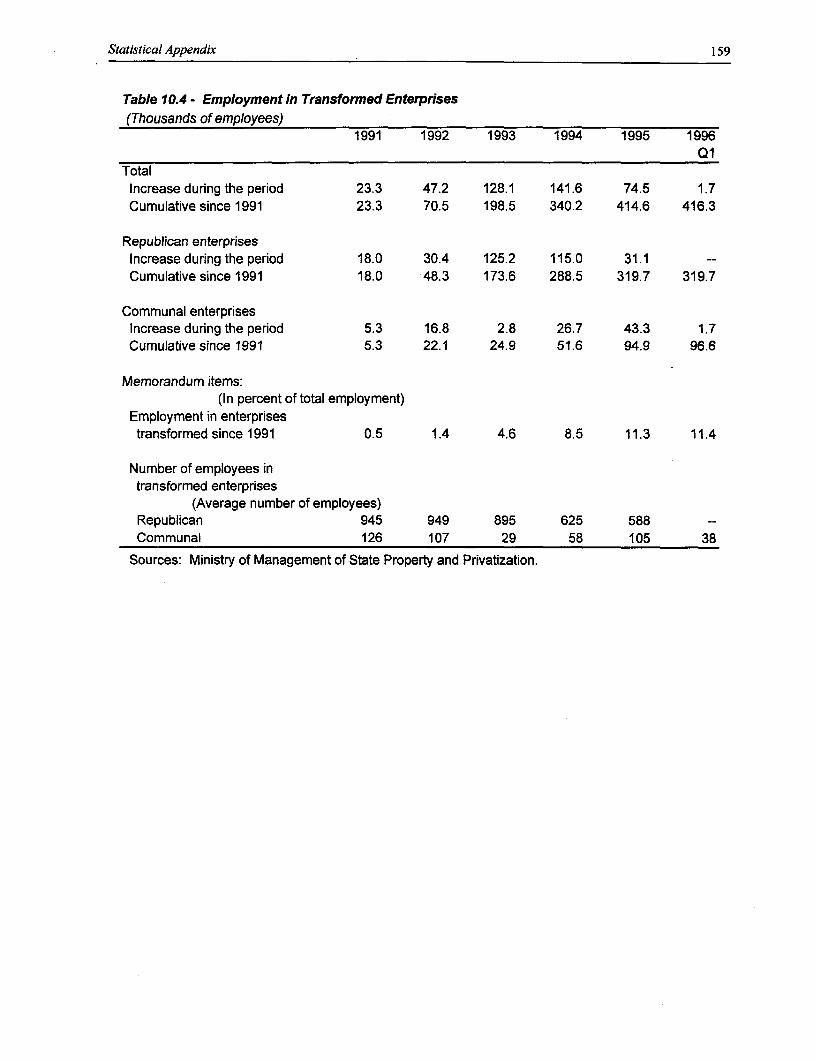
Statistical Appendix 159
Table 10.4 - Employment in Transformed Enterprises(Thousands of employees)
1991 1992 1993 1994 1995 1996Q1
TotalIncrease during the period 23.3 47.2 128.1 141.6 74.5 1.7Cumulative since 1991 23.3 70.5 198.5 340.2 414.6 416.3
Republican enterprisesIncrease during the period 18.0 30.4 125.2 115.0 31.1 --Cumulative since 1991 18.0 48.3 173.6 288.5 319.7 319.7
Communal enterprisesIncrease during the period 5.3 16.8 2.8 26.7 43.3 1.7Cumulative since 1991 5.3 22.1 24.9 51.6 94.9 96.6
Memorandum items:(In percent of total employment)
Employment in enterprisestransformed since 1991 0.5 1.4 4.6 8.5 11.3 11.4
Number of employees intransformed enterprises
(Average number of employees)Republican 945 949 895 625 588 --Communal 126 107 29 58 105 38
Sources: Ministry of Management of State Property and Privatization.
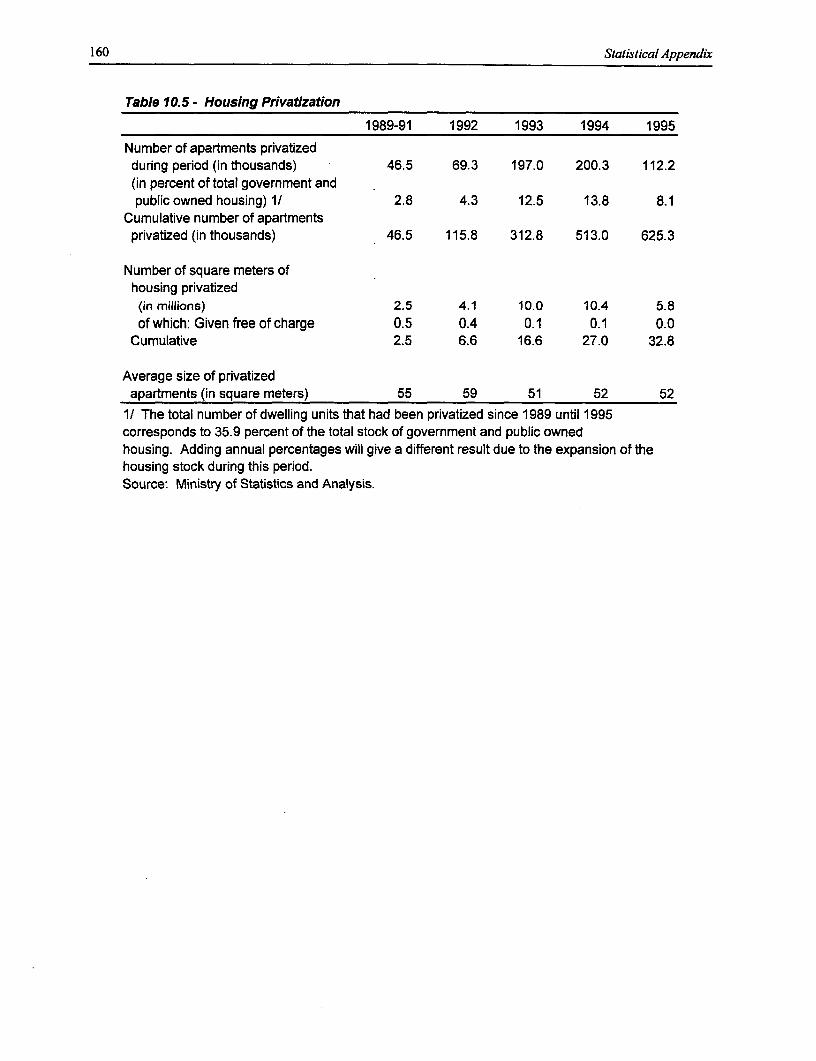
160 Statistical Appendix
Table 10.5 - Housing PrivatVzation
1989-91 1992 1993 1994 1995
Number of apartments privatizedduring period (in thousands) 46.5 69.3 197.0 200.3 112.2(in percent of total government andpublic owned housing) 1/ 2.8 4.3 12.5 13.8 8.1
Cumulative number of apartmentsprivatized (in thousands) 46.5 115.8 312.8 513.0 625.3
Number of square meters ofhousing privatized(in millions) 2.5 4.1 10.0 10.4 5.8of which: Given free of charge 0.5 0.4 0.1 0.1 0.0
Cumulative 2.5 6.6 16.6 27.0 32.8
Average size of privatizedapartments (in square meters) 55 59 51 52 52
1/ The total number of dwelling units that had been privatized since 1989 until 1995corresponds to 35.9 percent of the total stock of government and public ownedhousing. Adding annual percentages will give a different result due to the expansion of thehousing stock during this period.Source: Ministry of Statistics and Analysis.

TECHNICAL ANNEXES
161
162 Technical Annexes
Technical Annexes
A. Social Asset Divestiture by Enterprises ................................................................................... 163And Local Government Finance, D. Sewell
B. Agro-Industry Sector Review, S. Sen Gupta .193
C. The Sustainability of External Debt, S. Shatalov .209
D. Macroeconomic Projection Framework, Y. Sobolev .215
E. Purchasing Power Parities, J. Hansen .221
ANNEX A
Social Asset Divestiture by EnterprisesAnd Local Government Finance
David Sewell
163

"Social Asset" Divestiture By Enterprises And Local GovernmentFinance
David Sewell'
BACKGROUND
Firms in Belarus spend money on many directly fund some of these social functions iffunctions classified as "social" in their enterprise enterprises discontinue their funding. Ifaccounting. Examples are housing for employees, government is to be involved in continuedsummer camps for the children of employees, provision of these services, the appropriate levelspas for employees, health and dental clinics on of government has to be chosen for the purposesite and specialized medical and dental facilities and the function should be adequately funded.off site, subsidized food, creches and kinder- The objective of this paper is to examine thesegartens, and vocational schools. In some localities issues as they apply to Belarus and suggestfirms also provide local infrastructure such as appropriate policy actions.district heating, electricity, and water and sewer The Russian Govemment was the first toreticulation. Extensive provision of such local ask the World Bank for assistance with respect toinfrastructure may have been particularly enterprise social asset divestiture in early 1994.common by state and collective farms. Since then, the Bank has undertaken several loans
It has long been asserted that the in support of enterprise divestiture of functions"divestiture" of such "social" functions is critical such as housing, kindergartens, medical care,to improving the competitiveness of enterprises in enterprise privatization and related socialtransition economies. It might well be added that protection programs in Russia, Kazakhstan, andenterprise "divestiture" of such "social" functions the Kyrgyz Republic. Staff Appraisal Reports foris equally critical to appropriate functioning of these loans are a rich source of information ongovernments in transition economies. Enterprises this problem. In addition, an extensive publishedand governments should be responsible and literature is being built up on the issue. Aggregateaccountable for different and distinct sets of surveys of the problem have been undertaken forfunctions. Achievement of these goals is specific countries by authors within and outsideimpossible if enterprises share vague respon- the Bank,2 and are complemented by in-depthsibilities for social functions and are repeatedly surveys in particular fields such as kindergartens,3
subject to pressures to provide such functions by housing,4 and asset divestiture in problemmeans of unfunded government mandates. industries and regions.5 We shall draw on thisObviously, such a system of financing social literature as appropriate in our own study ofobjectives is not transparent, allows both parties Belarus, and attempt to augment it in areas which,to evade hard budget constraints, and thereby in our opinion, have not received as muchobscures and dilutes accountability to enterprise attention, such as the implications for localowners and the electorate. government and the interactions of enterprise
I transition economies, the state also has provision of these functions with the tax system.6In transition economies, the state also hasto consider whether it wishes to continue to
ANALYSIS OF ENTERPRISE SOCIAL SPENDING
Tables A. I -A.3 use enterprise statistics in size of enterprise spending on these fringeBelarus to examine characteristics of spending on benefits was compared for the years 1994 andemployee remuneration and "social development" 1995. It was also reported to us that there areand "social benefits" by type of benefit, size of systematic differences in fringe benefits availablefirm, sector of the economy and region. In to different occupations; some occupations suchaddition, but not shown in the tables, the relative as teaching allegedly receive fewer fringe
165
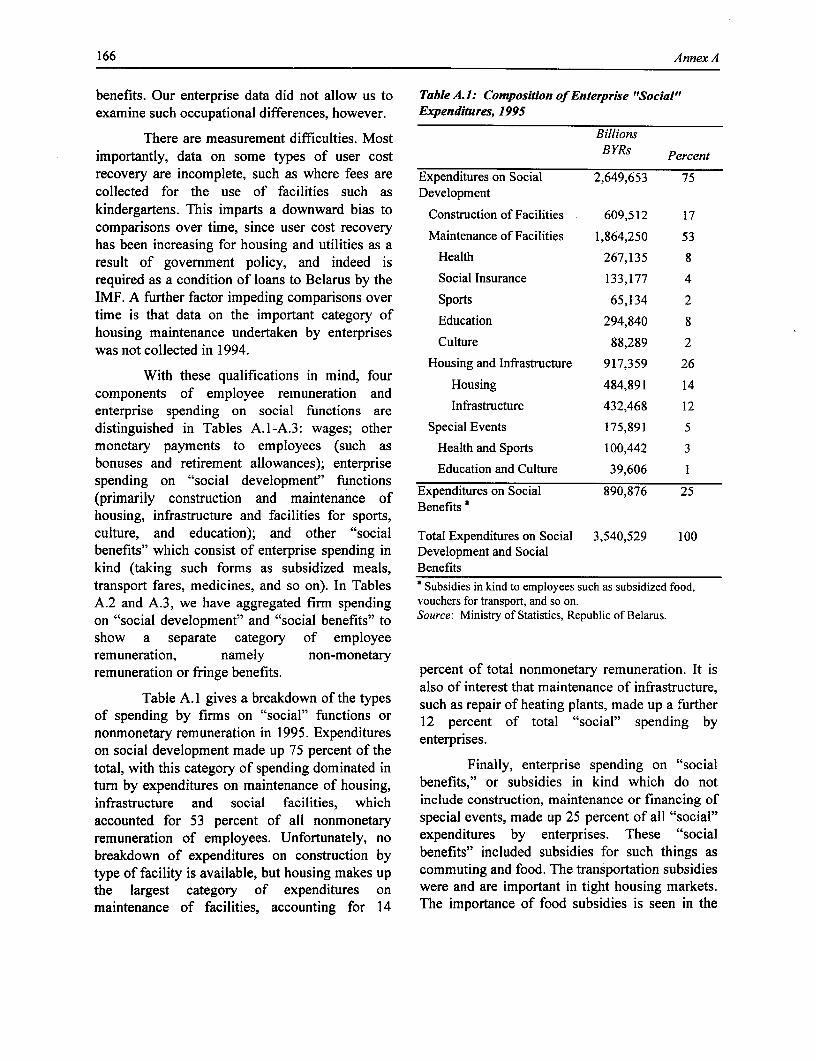
166 Annex A
benefits. Our enterprise data did not allow us to Table A.: Composition of Enterprise "Social"examine such occupational differences, however. Expenditures, 1995
There are measurement difficulties. Most Billionsimportantly, data on some types of user cost BYRs Percentrecovery are incomplete, such as where fees are Expenditures on Social 2,649,653 75collected for the use of facilities such as Developmentkindergartens. This imparts a downward bias to Construction of Facilities 609,512 17comparisons over time, since user cost recovery Maintenance of Facilities 1,864,250 53has been increasing for housing and utilities as a ' 2result of government policy, and indeed is Health 267,135 8required as a condition of loans to Belarus by the Social Insurance 133,177 4IMF. A further factor impeding comparisons over Sports 65,134 2time is that data on the important category of Education 294,840 8housing maintenance undertaken by enterpriseswas not collected in 1994. Culture 88,289 2
Housing and Infrastructure 917,359 26With these qualifications in mind, four Housin 484,891 14
components of employee remuneration and genterprise spending on social functions are Infrastructure 432,468 12distinguished in Tables A.1-A.3: wages; other Special Events 175,891 5
monetary payments to employees (such as Health and Sports 100,442 3bonuses and retirement allowances); enterprise Education and Culture 39,606 1spending on "social development" functions(primarily construction and maintenance of Benefits ahousing, infrastructure and facilities for sports,culture, and education); and other "social Total Expenditures on Social 3,540,529 100benefits" which consist of enterprise spending in Development and Socialkind (taking such forms as subsidized meals, Benefitstransport fares, medicines, and so on). In Tables ' Subsidies in kind to employees such as subsidized food,A.2 and A.3, we have aggregated firm spending vouchers for transport, and so on.on "social development" and "social benefits" to Source: Ministry of Statistics, Republic of Belarus.show a separate category of employeeremuneration, namely non-monetaryremuneration or fringe benefits. percent of total nonmonetary remuneration. It is
also of interest that maintenance of infrastructure,Taspendingble f1ives a breciakdo ofunctheiys o such as repair of heating plants, made up a further
of spending by firms on "social" functions or 12 percent of total "social" spending bynonmonetary remuneration in 1995. Expenditures enterprises.on social development made up 75 percent of thetotal, with this category of spending dominated in Finally, enterprise spending on "socialturn by expenditures on maintenance of housing, benefits," or subsidies in kind which do notinfrastructure and social facilities, which include construction, maintenance or financing ofaccounted for 53 percent of all nonmonetary special events, made up 25 percent of all "social"remuneration of employees. Unfortunately, no expenditures by enterprises. These "socialbreakdown of expenditures on construction by benefits" included subsidies for such things astype of facility is available, but housing makes up commuting and food. The transportation subsidiesthe largest category of expenditures on were and are important in tight housing markets.maintenance of facilities, accounting for 14 The importance of food subsidies is seen in the
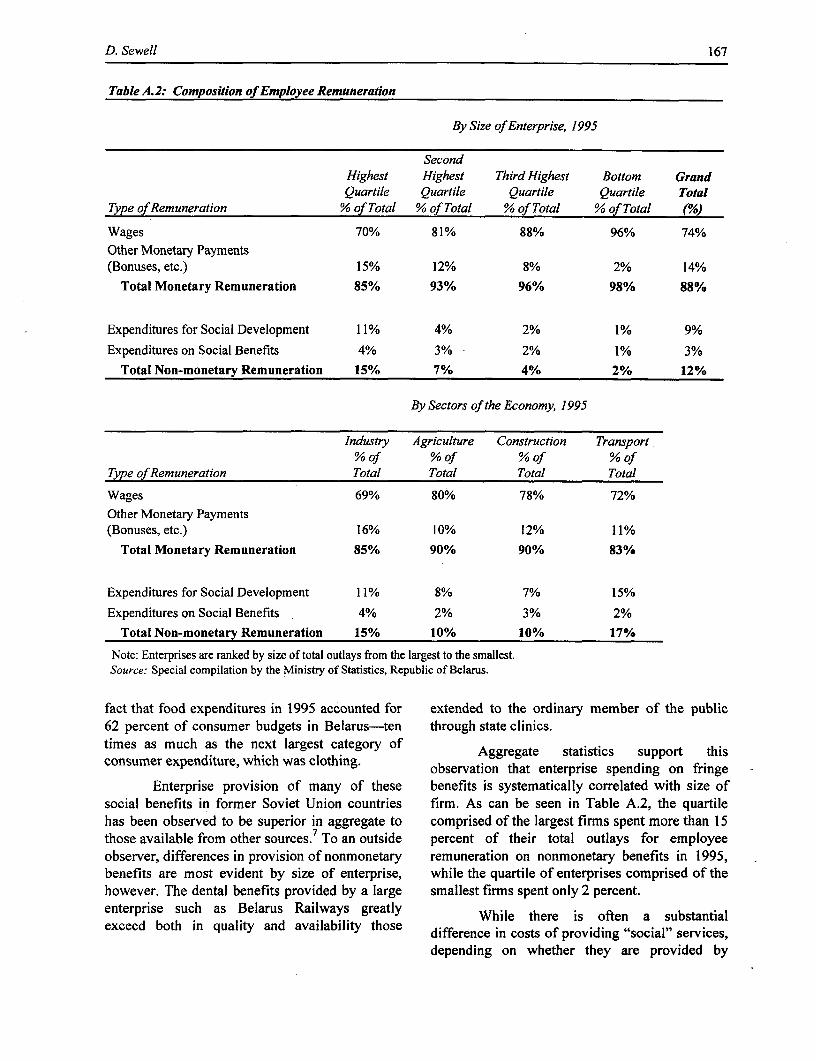
D. Sewell 167
TableA.2: Composition of Employee Remuneration
By Size of Enterprise, 1995
SecondHighest Highest Third Highest Bottom GrandQuartile Quartile Quartile Quartile Total
Type of Remuneration % of Total % of Total % of Total % of Total (M)
Wages 70% 81% 88% 96% 74%Other Monetary Payments(Bonuses, etc.) 15% 12% 8% 2% 14%
Total Monetary Remuneration 85% 93% 96% 98% 88%
Expenditures for Social Development 11% 4% 2% 1% 9%
Expenditures on Social Benefits 4% 3% - 2% 1% 3%
Total Non-monetary Remuneration 15% 7% 4% 2% 12%
By Sectors of the Economy, 1995
Industry Agriculture Construction Transport%of %of %of %of
Type of Remuneration Total Total Total Total
Wages 69% 80% 78% 72%
Other Monetary Payments(Bonuses, etc.) 16% 10% 12% 11%
Total Monetary Remuneration 85% 90% 90% 83%
Expenditures for Social Development 11% 8% 7% 15%
Expenditures on Social Benefits 4% 2% 3% 2%
Total Non-monetary Remuneration 15% 10% 10% 17%
Note: Enterprises are ranked by size of total outlays from the largest to the smallest.Source: Special compilation by the Ministry of Statistics, Republic of Belarus.
fact that food expenditures in 1995 accounted for extended to the ordinary member of the public62 percent of consumer budgets in Belarus-ten through state clinics.times as much as the next largest category of Aggregate statistics support thisconsumer expenditure, which was clothing. observation that enterprise spending on fringe
Enterprise provision of many of these benefits is systematically correlated with size ofsocial benefits in former Soviet Union countries firm. As can be seen in Table A.2, the quartilehas been observed to be superior in aggregate to comprised of the largest firms spent more than 15those available from other sources.7 To an outside percent of their total outlays for employeeobserver, differences in provision of nonmonetary remuneration on nonmonetary benefits in 1995,benefits are most evident by size of enterprise, while the quartile of enterprises comprised of thehowever. The dental benefits provided by a large smallest firms spent only 2 percent.enterprise such as Belarus Railways greatly While there is often a substantialexceed both in quality and availability those difference in costs of providing "social" services,
depending on whether they are provided by
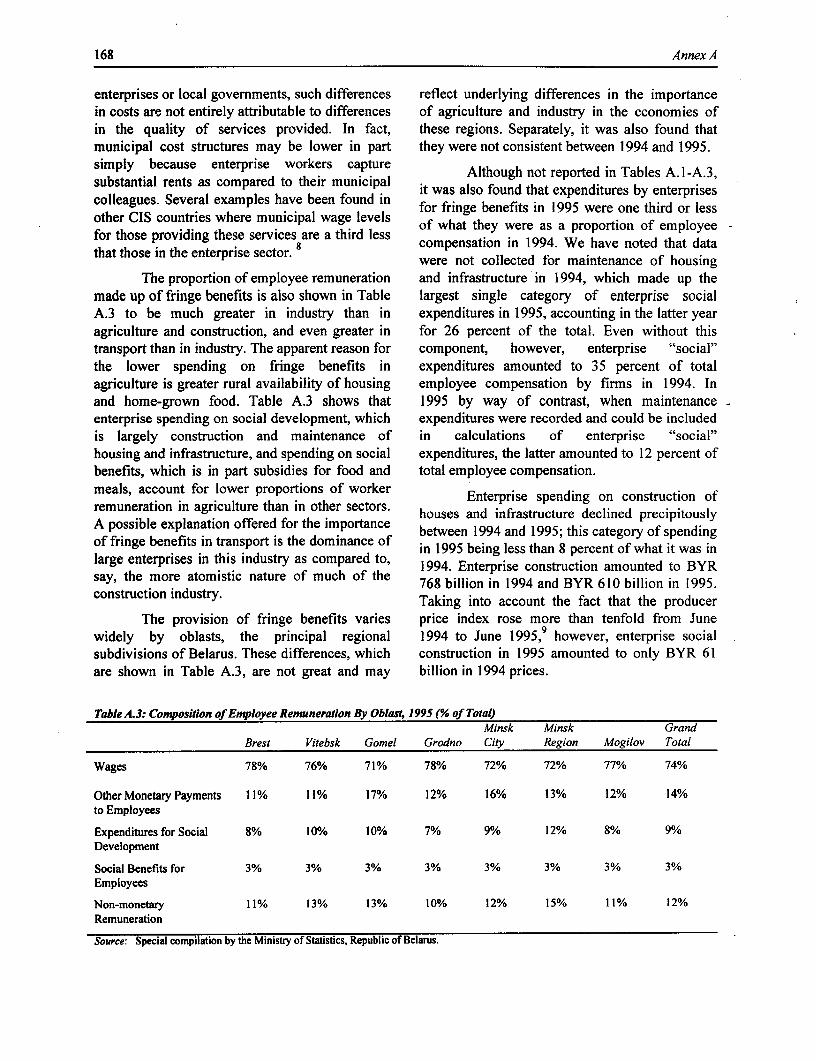
168 Annex A
enterprises or local governments, such differences reflect underlying differences in the importancein costs are not entirely attributable to differences of agriculture and industry in the economies ofin the quality of services provided. In fact, these regions. Separately, it was also found thatmunicipal cost structures may be lower in part they were not consistent between 1994 and 1995.simply because enterprise workers capture Although not reported in Tables A. 1-A.3,
substantial rents as comnpared to their municipal it was also found that expenditures by enterprisescolleagues. Several examples have been found in for fringe benefits in 1995 were one third or lessother CIS countries where municipal wage levels of what they were as a proportion of employeefor those providing these services are a third less compensation in 1994. We have noted that datathat those in the enterprise sector. 8 were not collected for maintenance of housing
The proportion of employee remuneration and infrastructure in 1994, which made up themade up of fringe benefits is also shown in Table largest single category of enterprise socialA.3 to be much greater in industry than in expenditures in 1995, accounting in the latter yearagriculture and construction, and even greater in for 26 percent of the total. Even without thistransport than in industry. The apparent reason for component, however, enterprise "social"the lower spending on fringe benefits in expenditures amounted to 35 percent of totalagriculture is greater rural availability of housing employee compensation by firms in 1994. Inand home-grown food. Table A.3 shows that 1995 by way of contrast, when maintenanceenterprise spending on social development, which expenditures were recorded and could be includedis largely construction and maintenance of in calculations of enterprise "social"housing and infrastructure, and spending on social expenditures, the latter amounted to 12 percent ofbenefits, which is in part subsidies for food and total employee compensation.meals, account for lower proportions of worker Enterprise spending on construction ofremuneration in agriculture than in other sectors. houses and infrastructure declined precipitouslyA possible explanation offered for the importance between 1994 and 1995; this category of spendingof fringe benefits in transport is the dominance of in 1995 being less than 8 percent of what it was inlarge enterprises in this industry as compared to, 1994. Enterprise construction amounted to BYRsay, the more atomistic nature of much of the 768 billion in 1994 and BYR 610 billion in 1995.
construction industry. Taking into account the fact that the producer
The provision of fringe benefits varies price index rose more than tenfold from Junewidely by oblasts, the principal regional 1994 to June 1995, however, enterprise socialsubdivisions of Belarus. These differences, which construction in 1995 amounted to only BYR 61are shown in Table A.3, are not great and may billion in 1994 prices.
Table A.3: Composition of Employee Remuneration By Oblast, 1995 (% of Total)Minsk Minsk Grand
Brest Vitebsk Gomel Grodno City Region Mogilov Total
Wages 78% 76% 71% 78% 72% 72% 77% 74%
OtherMonetaryPayments 11% 11% 17% 12% 16% 13% 12% 14%to Employees
Expenditures for Social 8% 10% 10% 7% 9% 12% 8% 9%Development
Social Benefits for 3% 3% 3% 3% 3% 3% 3% 3%Employees
Non-monetary 11% 13% 13% 10% 12% 15% 11% 12%Remuneration
Source: Special compilation by the Ministry of Statistics, Republic of Belarus.
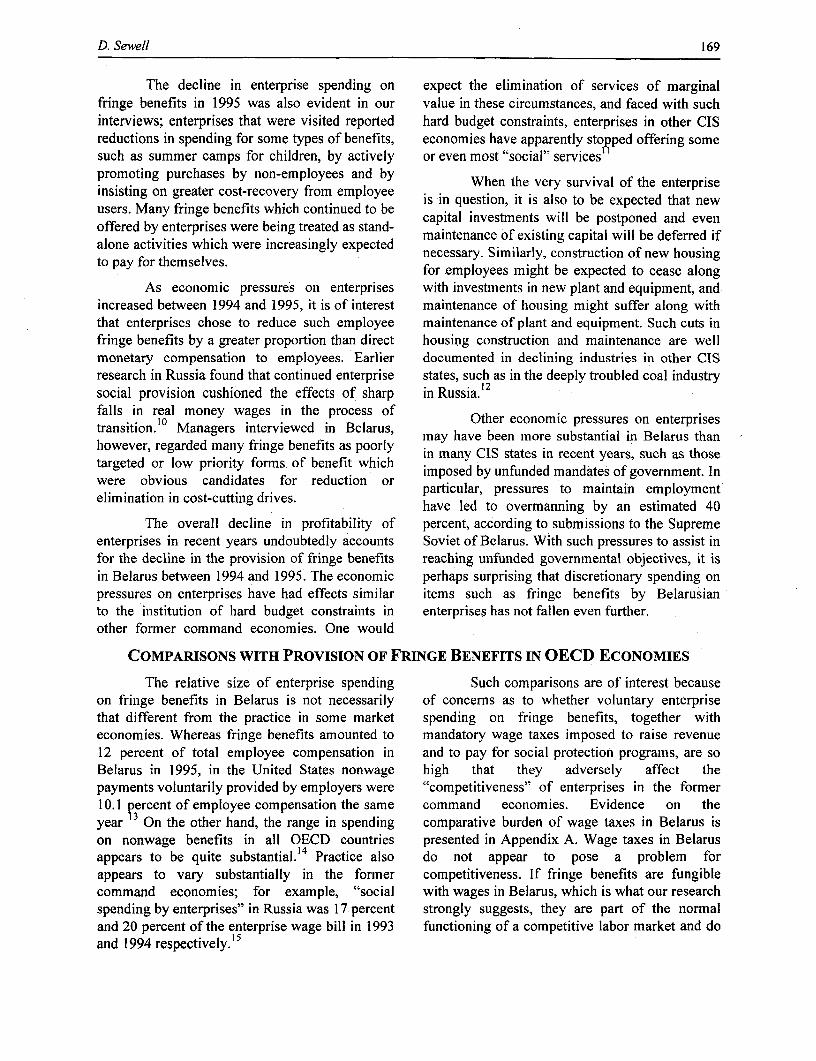
D. Sewell 169
The decline in enterprise spending on expect the elimination of services of marginalfringe benefits in 1995 was also evident in our value in these circumstances, and faced with suchinterviews; enterprises that were visited reported hard budget constraints, enterprises in other CISreductions in spending for some types of benefits, economies have apparently stopped offering somesuch as summer camps for children, by actively or even most "social" servicespromoting purchases by non-employees and by When the very survival of the enterprise
insisting on greater cost-recovery from employee is in question, it is also to be expected that newusers. Many fringe benefits which continued to beoffered by enterprises were being treated as stand- cptlivsmnswl epspndadeeoffered by enterprises were being treated as stand- maintenance of existing capital will be deferred ifalone activities which were increasingly expected necessary. Similarly, construction of new housingto pay for themselves. for employees might be expected to cease along
As economic pressures on enterprises with investments in new plant and equipment, andincreased between 1994 and 1995, it is of interest maintenance of housing might suffer along withthat enterprises chose to reduce such employee maintenance of plant and equipment. Such cuts infringe benefits by a greater proportion than direct housing construction and maintenance are wellmonetary compensation to employees. Earlier documented in declining industries in other CISresearch in Russia found that continued enterprise states, such as in the deeply troubled coal industrysocial provision cushioned the effects of sharp in Russia.12
falls in real money wages in the process oftransition. 10 Managers interviewed in Belaru*s Other economo c pressures on enterpriseshowever, regarded many fringe benefits as poorly may have been more substantial in Belarus thantargeted or low priority forms of benefit which imposed by unfunded mandates of govenment. Inwere obvious candidates for reduction or particular, pressures to maintain employment
elimination in cost-cutting drives, have led to overmanning by an estimated 40
The overall decline in profitability of percent, according to submissions to the Supremeenterprises in recent years undoubtedly accounts Soviet of Belarus. With such pressures to assist infor the decline in the provision of fringe benefits reaching unfunded governmental objectives, it isin Belarus between 1994 and 1995. The economic perhaps surprising that discretionary spending onpressures on enterprises have had effects similar items such as fringe benefits by Belarusianto the institution of hard budget constraints in enterprises has not fallen even further.other former command economies. One would
COMPARISONS WITH PROVISION OF FRINGE BENEFITS IN OECD ECONOMIES
The relative size of enterprise spending Such comparisons are of interest becauseon fringe benefits in Belarus is not necessarily of concerns as to whether voluntary enterprisethat different from the practice in some market spending on fringe benefits, together witheconomies. Whereas fringe benefits amounted to mandatory wage taxes imposed to raise revenue12 percent of total employee compensation in and to pay for social protection programs, are soBelarus in 1995, in the United States nonwage high that they adversely affect thepayments voluntarily provided by employers were ''competitiveness' of enterprises in the former10.1 percent of employee compensation the same command economies. Evidence on theyear 3 On the other hand, the range in spending comparative burden of wage taxes in Belarus ison nonwage benefits in all OECD countries presented in Appendix A. Wage taxes in Belarusappears to be quite substantial.'4 Practice also do not appear to pose a problem forappears to vary substantially in the former competitiveness. If fringe benefits are fungiblecommand economies; for example, "social with wages in Belarus, which is what our researchspending by enterprises" in Russia was 17 percent strongly suggests, they are part of the normaland 20 percent of the enterprise wage bill in 1993 functioning of a competitive labor market and doand 1994 respectively.15
170 Annex A
not adversely affect either the competitiveness of activities which are extraneous to their corethe enterprise nor the economy. business activities in order to provide fringe
The types of spending on fringe benefits benefits. It is distinctly curious to see producersin Belarus and in the OECD economies are quite of television sets and heavy constructiondifferent, however. Whereas firms in Belarus equipment running farms to produce food andspend primarily on housing, clinics, kindergartens vegetables, to mention two examples from ourand subsidies in kind, voluntary employer interviews. One suspects that the result of this isspending on nonwage benefits in the U.S., for an inefficient diversion of management time frominstance, is primarily on pensions and insurance, the core activities of the enterprise. This practiceincluding health, life, and supplemental of not hiring specialist enterprises to provideincmlu mealth life, these services was attributed to the need to ensure
reliable sources of supply in the former commandA further substantial difference is in the economy. We may expect such vertical
methods of provision. Western firms "outsource" integration in production of fringe benefits toprovision of these benefits; by hiring other decrease as alternative sources of supply becomecompanies to provide them. In Belarus, firms available in the transition to a market economy.engage directly in a variety of heterogeneous
REASONS FOR ENTERPRISE SPENDING ON SOCIAL ASSETS
The reasons for enterprise provision of for children, spas, sports clubs, vocationalmost of these social assets provide clues to their schooling and subsidized canteen meals. Weappropriate treatment in public policy. should also note that employees are expected to
Many previous studies have emphasized contribute user fees to many of these activitiesthe importance of non-economic objectives in from which they benefit, such as for use ofprovision of these fringe benefits When their kindergartens, thus explicitly recognizing thatopriions thee be nedfointsWen ther these services confer private benefits. Weopinions have been canvassed, for instance, over therefore conclude that much of what is calledhalf of Russian enterprise managers have cited "social" spending by enterprises was merely atheir social responsibilities as being an important convention of socialist enterprise accounting, andreason for their continued provision of fringe that te solialtht is" about it.
bnft.16Ti std pat.opnywt h that there is little that is "social" about it.benefits. This study parts company with the Et iesedno uhfi eeismemphasis in much of the previous literature not Enterprise spendig on such fringe benefits mayonly on the social significance of these fringe simply be regarded as part of the wage bargain
with employees. An implication is that reductionsbenefits but also on the significance of non-economic reasons for their provision.17 Simple in spending on many of these fringe benefitsexplanations based on the economics of merely represent reductions in the real wage level
enterprises and economic behavior of employers and have no wider social significance.and employees are quite successful in predicting This is not to deny the obvious-thatenterprise provision of fringe benefits and might there are social concerns with respect to thebe preferred on that basis. supply of public goods aspects of services such as
A market economist may well wonder kindergartens and public health; that the firm waswhy many of these "social" benefits were regarded as an extension of the state in supplyingprovided by enterprises and need to be provided these goods in the former command economy;prolde byentrprsesandnee tobe rovded and that whatever means of providing theseby governments. These are not classic "publicgoods," in the sense that they are not collectively services eventually evolves in Belarus, theirconsumed and non-rival in use. There are also supply in the period of transition needs attention.
few "externalities" attached to much of this With respect to kindergartens, it should also beexpenditure, or advantages that are not captured noted that the final two years of enrollment are inby households or individuals who benefit directly fact the beginning years of schooling, sincefrom them. Examples are housing, summer camps primary schooling in FSU countries begins at the
D. Sewell 171
age of seven years. This would argue for public respect to equity, a fundamental principlefinancing of kindergartens by similar means to underlying an income tax is that all income fromthat used for schooling. whatever source should be taxed similarly.2 2
If there is little that is "social" about Efficiency concerns dictate similar equality intreatment of different sources of income, so thatmany of these goods and services, however, oneresources are not wasted on avoidance activitiesto minimize tax liability or on enforcement effortsin the first place and why do they continue to be 23to counter such avoidance. It is not unusual,
provided by enterprises. A primary reason for however, to find some types of fringe benefitstheir provision by enterprises was that wages recevefial tax treatrint benefitswere centrally fixed in the former command receiving preferential tax treatment to encourageeconomy and such controls have continued into thelr provision In the United States, for instance,the period of transition. Until 1995, for example, employer-provilded health insurance premiumsenterprises in Belarus were subject to global caps are deductible business expenses in theon the wage bill which, if exceeded, led to tax calculation of corporate income taxes, are noton the wage billwhch,ifexceedd,taxable as personal income in the hands of thepenalties. But enterprises could compete for labor benby the provision of fringe benefits and such be fcr and ayr ntincompetition was a rational economic response to base for the payroll tax.the general scarcity of labor in the old command There is, in fact, a close relationshipeconomy. Such motivations were evident in between the sizes of tax rates on income and theenterprise provision of benefits such as extent to which nontaxable benefits are offered tokindergartens.20 It was especially important, employees. Recent econometric evidencehowever, for enterprises to compete for labor by suggests that lowering income tax ratesproviding housing, which was the largest form of substantially reduces the demand for nontaxablein-kind payment. I Some other subsidies in kind, benefits in the U.S.. 24
such as for transportation, also originated in this Belarus is no exception to this
need to supply housing; commuting subsidies relationship between tax rates and the extent towere offered in an effort to offset the effects of which nontaxable benefits are extended to
tight local housing markets by drawing in labor employees except that all fringe benefits infrom wider areas.from wider areas. Belarus are deductible before enterprise profit
25 -aefigWe inferred above that the breakdown of taxes are calculated. All non-wage fringe
worker pay between money wages and fringe benefits are excluded from the payroll tax base,benefits should ordinarily be of no interest to however, and such taxes amount to 46 percent ofpublic policy, if there is no bias in public payrolls. On the side of personal income taxation,treatment of the two types of remuneration. In moreover, the principal nonmonetary form ofthese circumstances, the composition of income, that from housing services which haveremuneration is strictly a matter between been substantially provided by employers, is tax-employer and employee. In fact, however, public free to the recipient-whether such housing ispolicy does not provide a level playing field in actually built by employers or acquired by meanstreatment of fringe benefits and wages in Belarus. of monetary subsidies from employers. OtherWhatever the historical origin of enterprise types of financial and non-financial benefits forprovision of nonmonetary benefits, their workers receive less favorable but stillcontinued provision appears to owe much to their advantageous tax treatment. They aretax treatment. theoretically subject to tax if they exceed 30 and
Strategic objectives in all tax systems 20 minimum monthly wages, respectively, or justStrtegc ojecive inalltaxsysems under 3 and 2 months salary for the average
involve balancing goals of raising revenue, worker.2 6 Enforcement of the latter provisionequitable treatment of individuals, efficiency in apper. infcme, oweve 27latter this
> appaears to be ineffective, however. In total, thisthe allocation of resources, and incentives for thesupply of particular goods and services. W tax treatment constitutes a powerful incentive to
172 Annex A
both employers and employees to substitute debt-finance from income taxation. Recentnontaxable benefits for wages. research challenges the conventional wisdom that
Not unnaturally, both state-owned owner equity in housing is a lightly taxed asset inenterprises and firms in the newly emerging OECDcountries, however.private sector respond to these incentives in the It is of interest that the Russiantax system to supply nontaxable benefits to Government has recently acted to make fringeemployees. Newly emerging enterprises also benefits taxable in calculation of the payroll taxbuild housing for their employees, for instance. base for social insurance programs. Although itSome of the new private enterprises are able to fell short of what was needed, a decree issued inexploit possibilities for tax avoidance in non- January 1996 expanded the payroll tax base intaxation of certain types of income in ways that Russia to include non-wage worker compensationmay be difficult for state-owned enterprises to in the form of fringe benefits and payments inemulate, however.28 kind. The Government of Belarus might well
It has been reported elsewhere that consider following the example of the Russianwo tk has beenoe trenordelsewhee .tha Government in broadening the base subject to
workers in some transition countries have opgtedfor p ro tpayroll taxation. The incentive to substitute
for preservation of these nonmonetary benefits notxbefigbnftsormeywessinstead of receiving wage hikes; the bias in tax nontaxable fringe benefits for money wages isistreatment describd wabe mayes suffe toa expin t even higher in Belarus than in Russia as a resultwhyati. Geat .cre asobe tak in givin of payroll tax burdens to finance social insurance
and related programs. Such payroll taxes amountincentives for some of these services, however, to 46 percent of wages in Belarus, as opposed towith housing being a pertinent example. Most 39 percent in Russiascitizens of Belarus pay nothing for rent in the 39 percent in Russia.sense of paying for the capital costs of housing, While pressure to provide "taxsince the latter has been provided by enterprises expenditures," or favored tax treatment foror the state. The term that is frequently translated particular activities, exists in all economies, thereas rent-in Russian oplata za zhil'e-is simply a are methods of controlling such pressure. "Basepayment for routine operation (including all broadening" by elimination of tax incentivesutility charges) and maintenance. This explains in permits revenue goals to be obtained with lowerlarge part why families in Belarus spend so little overall tax rates, and has become synonymouson housing in comparison to families in OECD with "tax reform" in many OECD economies incountries. Rent and utilities accounted for only recent years. We saw above that reduction in4.4 percent of family expenditures in Belarus in overall tax rates leads to a reduction in demands1995, less, it might be noted, than the share of for nontaxable fringe benefits. More selectivefamily budgets spent on clothing (6.3 percent) or incentives can also be substituted for blanketeven alcohol and tobacco (4.9 percent).29 By way exemptions. An example might be to eliminateof contrast, the median share of consumer tax deductibility for enterprise expenditure onexpenditures on housing and utilities in 23 OECD kindergartens but allow daycare expenditures tocountries recently surveyed was 19 percent (in be deductible from personal income taxes paid bySwitzerland).30 The virtual exemption of such a employees. Individuals might also be required tolarge sector of the economy from the tax base in declare an extensive list of fringe benefits asBelarus requires that tax rates be raised taxable income-Canada, for instance, goes so farsubstantially on remaining activities to obtain as to declare frequent flyer points as taxablegiven revenue goals and supplies a potent income for recipients! Alternatively, enterprisesincentive to seek preferential tax treatment for may not be permitted to reduce their tax liabilityother "worthy" activities. It might be objected, of by providing some fringe benefits. Australia iscourse, that owner-occupied housing in many one country which has recently tightened up onOECD economies is also known for receiving such corporate tax deductibility for fringepreferential tax treatment, taking such forms as benefits.exemption of returns and the deductibility of
D. Sewell 173
We hasten to add that none of these these base-broadening exercises is to share apolicy options is intended simply to increase given tax burden more equitably and efficientlyoverall tax revenues. The primary objective of over all sources of income.
PRIORITY PROBLEM AREAS: UTILITIES, HOUSING AND CRECHES/KINDERGARTENS
Governmental attention in Belarus is housing was formerly provided and financed, andcurrently focused on the problems of enterprise what changes have recently taken place in thisdivestiture of utilities, housing and respect. We should note that privatization ofcreches/kindergartens. housing is proceeding in Belarus, but this does
The conce. with utilities simply reflects not affect the analysis. Nor are the problemsassociated with divestiture of housing restricted to
an interest in ensuring continuity of supply where . 34
enterprises are failing or are reluctant to continue enterprises.supplying community services because of arrears We should note first that housing is ain payment. Problems with cost recovery for liability and not an asset of enterprises. Indeed, itutilities in Belarus appear to have come mostly is somewhat of a misnomer to speak offrom low cost recovery from households. enterprises "divesting" themselves of this "asset."According to a letter from the former Minister of Housing never was an asset that was available forIndustry to the Council of Ministers in December disposition by the enterprises which built it. Once1995, arrears for heat supplied to residential areas housing had been allocated to employees (all butin December 1995 amounted to over 34 billion the contract workers), it was at the disposition ofrubels, but were not consequential for enterprises, the employee. The occupants could not be evictedgovernment departments or other "budgetary" by the enterprise because they changed employersorganizations.32 and they could hold this housing after they retired
As we saw above, the final two years of from the enterprise. They could even swapkindergarten in Belarus are the beginning years of apartments with other families. Contract workersschooling, since primary schooling in the FSU were the exception, but even they had the samecountries begins at the age of 7 years. This would rights to dispose of housing if they lived in it forargue for financing of these final years of 10 years.kindergarten by means similar to those used for Whereas the connection betweenschooling. Further, expenditures on kindergartens enterprise-provided housing and employment inin part represent spending on "custodial" care an enterprise became increasingly remote with thesuch as daycare or creches. Although passage of time, enterprises were still left with thekindergarten enrollment has fallen with declining burden of maintaining the apartments theybirthrates, its use for custodial purposes has constructed-a burden they wanted someone elseincreased as a share of total enrollment. Owing to to assume. Interestingly enough, the process ofrecent economic difficulties, more mothers appear enterprises ridding themselves of their housingto have chosen early return to the labor force after responsibilities started before transition;childbirth.33 Finally, kindergartens are part and enterprise housing was being transferred to localparcel of the problem of enterprise divestiture of executive councils in the early 1980's.housing. When enterprises created housing The view set out above that enterprise-
estates, kindergartens were included in the yards produced housing is not considered to be an assetof the apartment blocks and so were a Joint cost of the enterprise is supported by Russian practicewith housing. in privatization. There, enterprises to be
Enterprise divestiture of housing remains privatized are not allowed to include housing,clearly the most substantial adjustment to be utility networks supporting housing locatedmade in the system in view of its importance to outside enterprise property, or maintenanceconsumer budgets, and an understanding of the activities in their charter capital.35
issues involved requires an understanding of how
174 Annex A
Housing nevertheless remains critical to limitations on labor mobility caused by lack ofefficient allocation of resources and growth. It has housing.36 Public policy therefore should bebeen estimated, for example, that a quarter of all concerned with continuity in the supply ofunemployment in 1992 in Poland was due to housing in the transition to a market economy.
FUTURE GOVERNMENTAL RESPONSIBILITY FOR AND FINANCING OF DIVESTED
SERVICES
Divested Services: Whose Responsibility? lead to government intervention in provision ofthese services are primarily local in nature.
Which level of government shouldassume responsibility for those social functions The suitability of services forbeing divested by enterprises that might continue decentralized provision may also differ amongto be supported by the state? The assumption in CIS states. The amount of decentralizationmost of the literature on enterprise divestiture of appropriate for Russia with its 11 time zones,"social" assets in the former Soviet Union is that numerous ethnic groups and population of 150government provision of these services should be million, for instance, may not be appropriate forundertaken by local governments. The question as Belarus with its more compact area, andto whether this is the appropriate level of homogeneous ethnic composition, and populationgovernment to undertake these functions is of only 10 million. The period of transition mayseldom if ever raised, and needs to be examined provide an opportunity for Belarus to reconsidermore closely. It is obviously appropriate for local the assignment of responsibilities between levelsgovernments to be responsible for local of government. One smaller CIS state, Armenia,infrastructure such as roads, district heating and has, in fact, reassigned responsibilities forwater and sewer reticulation. Many of the benefits education to the center.from these functions are strictly local in effect. Whatever level of government is assigned
Responsibilities for other social services responsibility for social services that are divestedappear to have been assigned to different levels of by enterprises, the means of financing thesegovernment in the past on the basis of complexity services need to be adequate to perform theof the services involved. Thus local governments function. In this respect, some observers havehave been responsible for basic education in the viewed the actual process of assigning "divestedprimary schools and for local health clinics, while social functions" to subnational governments as ahigher and more specialized levels of education form of buck-passing by central governments, inand medical care were responsibilities of the that the responsibilities have been transferrednational government. In view of their previous without assignment of adequate revenueresponsibilities, local governments may be the sources.logical level of government in the transition Another problem with the question ofeconomies to undertake some social functions what level of government should be responsiblebeing divested by enterprises. For example, for these functions in Belarus is that neither thekindergartens would seem to be a logical allocation of functions between levels ofresponsibility for local governments, given that government, nor the financing of regional (oblast)they are now responsible for primary school and district (rayon) governments suggests thateducation. there really are fully autonomous local
While not common, there are legitimate governments in Belarus. Meaningful localquestions as to whether "people" services such as government requires some autonomy in itshealth or education are appropriate local functions and financing. Although local andresponsibilities. It is not apparent, for instance, regional executive council members are elected inthat externalities in health or education which Belarus, these subnational levels of government
are, in other respects, simply lower level branchoffices of the central of government. They raise
-D. Sewell 175
little revenue themselves and often appear to organizations, and even other levels offunction as mere agents for the delivery of government under contract. Citizens of Belarusservices such as health and education; the might be surprised by some of these alternatives.parameters of providing such services are set by For example, fire services are provided entirelythe central government. In these regards, Belarus by voluntary organizations in Chile, andis typical of many countries in transition. municipal and provincial police services are often
provided by means of contracts with the federalResponsibility for vs. Delivery of Divested police force in Canada. Nor is enterpriseServices provision of these services simply a matter of
We should note that it is the replacing state-owned enterprises with privateresponsibility for functions that is in question enterprises; as has been repeatedly shown, it is thehere, and not their actual provision. Actual presence of competition and not simply statedelivery of these functions can be accomplished ownership that leads to efficient provision ofby a number of alternative organizations, these services.including private contractors, non-governmental
LOCAL GOVERNMENT FINANCE: PROBLEMS AND POSSIBLE SOLUTIONS
If some of these "social" functions are to central government subsidies in local budgetbe divested by firms but continue as a revenues has been growing rapidly in importance,governmental responsibility, it follows that they from 1.4 percent in 1992 to 24 percent in 1996.have to be acceptably financed. Existing sources
of fiancin may ot besatisactor for his . Table A.4 also confirms that there is littleof altenati sfoftfinance in independent local government financing in
purpose. costernatvey fromucers ofWhere tinclude Belarus-as compared to other countries. As aincreased cost recovery from users. Where this is proportion of local government revenues innot appropriate, financing could be sought from Belarus, Table A.4 shows that local taxesthe local or the central governments. If local accounted for the puny share of only 0.6 percentgovernments are to be used as agents of the in 1995 and are projected to account for only 0.4central government in delivering services, pnr1995 an a jc n lappropriate means of transfers have to be devisedfor this purpose. Partial or bridge financing by The so-called local taxes that regional andenterprises might also be requested to ease the district governments are permitted to levy are forproblems of divestiture. the most part minor "service" fees such as license
fees for dogs or parking charges, although localSources of Local Government Finance and governments do have the right to levy "sin" taxesTrends Over Time on tobacco and alcohol. With the exception of the
Table A.4 indicates the sources of budget sin taxes, these taxes which have been assigned torevenues for subnational governments and their local governments are not real revenue raising
changes over recent years. As will be described instruments.below, some subnational functions are also Local governments were originally givenfinanced by extrabudgetary funds. Table A.4 wider scope to impose local taxes. Khankevichreveals what appears to be a striking increase in (p.19) observes that "when the existing taxationcentralization of government in Belarus in recent system was introduced local authorities wereyears-in the period from 1992 to 1996, the share granted the right to impose within theirof total budget revenues allocated to subnational jurisdictions local taxes, duties and levies withoutgovernments decreased from 70 percent to 48 legislative restrictions as to their number,percent. The primary sources of local government composition and maximum amount." Thisrevenues are shown to be revenue sharing with experiment led to complaints by enterprises aboutthe central government and direct subsidies from tax-grabs by local authorities. As a result, thethe central government. The share of explicit taxes that local governments could impose on
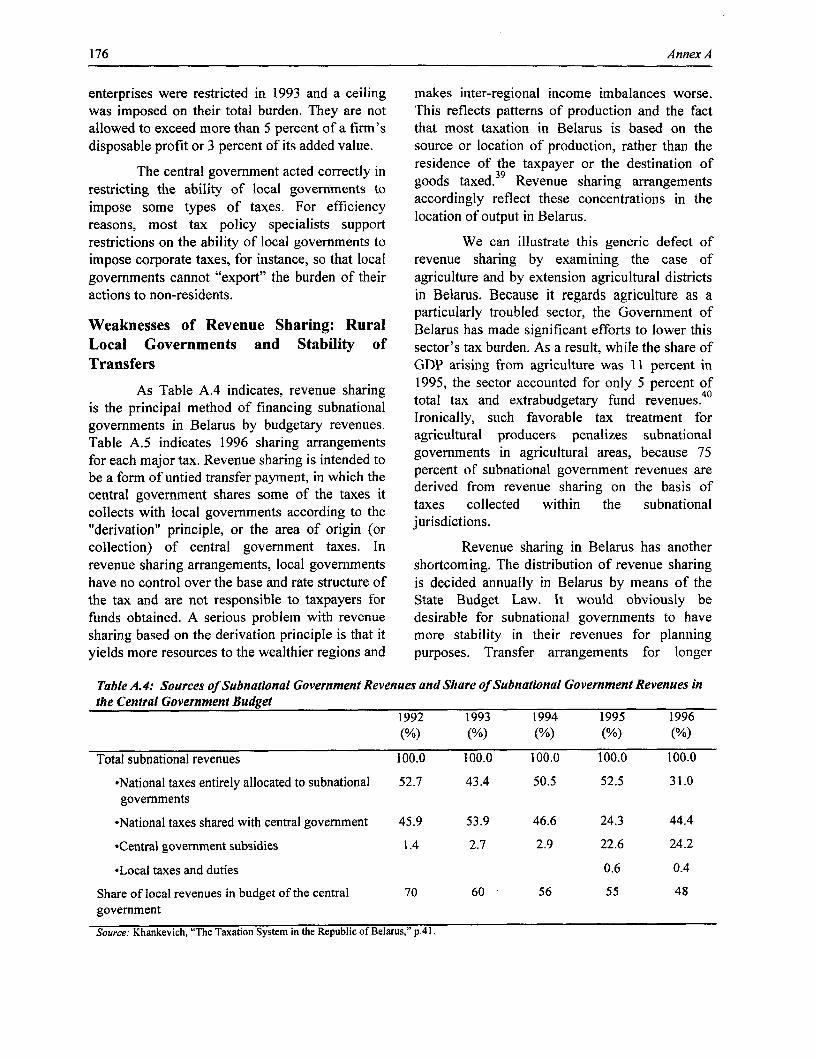
176 Annex A
enterprises were restricted in 1993 and a ceiling makes inter-regional income imbalances worse.was imposed on their total burden. They are not This reflects patterns of production and the factallowed to exceed more than 5 percent of a firm's that most taxation in Belarus is based on thedisposable profit or 3 percent of its added value. source or location of production, rather than the
The central government acted correctly in residence of the taxpayer or the destination ofrestricting the ability of local governments to goods taxed. Revenue sharing arrangementsimpose some types of taxes. For efficiency accordingly reflect these concentrations in the
reasons, most tax policy specialists support location of output in Belarus.restrictions on the ability of local governments to We can illustrate this generic defect ofimpose corporate taxes, for instance, so that local revenue sharing by examining the case ofgovernments cannot "export" the burden of their agriculture and by extension agricultural districtsactions to non-residents. in Belarus. Because it regards agriculture as a
particularly troubled sector, the Government ofWeaknesses of Revenue Sharing: Rural Belarus has made significant efforts to lower thisLocal Governments and Stability of sector's tax burden. As a result, while the share ofTransfers GDP arising from agriculture was 11 percent in
As Table A.4 indicates, revenue sharing 1995, the sector accounted for only 5 percent ofit p able of find ancin suv nat .ina total tax and extrabudgetary fund revenues.is te prncipl mehod f fiancig sbainl Ironically, such favorable tax treatrnent for
governments in Belarus by budgetary revenues. Xrically rosuch rabletax treatmentfTable A.5 indicates 1996 sharing arrangements agricultural producers penalizes subnationalfor each major tax. Revenue sharing is intended to governments in agricultural areas, because 75be a form of untied transfer payment, in which the percent of subnational government revenues arecentral govermment shares some of the taxes it derived from revenue sharing on the basis ofcollects with local governments according to the taxesdcolti"derivation" principle, or the area of origin (or jurisdictionscollection) of central government taxes. In Revenue sharing in Belarus has anotherrevenue sharing arrangements, local governments shortcoming. The distribution of revenue sharinghave no control over the base and rate structure of is decided annually in Belarus by means of thethe tax and are not responsible to taxpayers for State Budget Law. It would obviously befunds obtained. A serious problem with revenue desirable for subnational governments to havesharing based on the derivation principle is that it more stability in their revenues for planningyields more resources to the wealthier regions and purposes. Transfer arrangements for longer
Table A.4: Sources of Subnational Government Revenues and Share of Subnational Government Revenues inthe Central Government Budget
1992 1993 1994 1995 1996
(%) (%) (%) (%) (%)
Total subnational revenues 100.0 100.0 100.0 100.0 100.0
*National taxes entirely allocated to subnational 52.7 43.4 50.5 52.5 31.0governments
*National taxes shared with central government 45.9 53.9 46.6 24.3 44.4
-Central government subsidies 1.4 2.7 2.9 22.6 24.2
*Local taxes and duties 0.6 0.4
Share of local revenues in budget of the central 70 60 56 55 48government
Source: Khankevich, "The Taxation System in the Republic of Belarus," p.4
1.
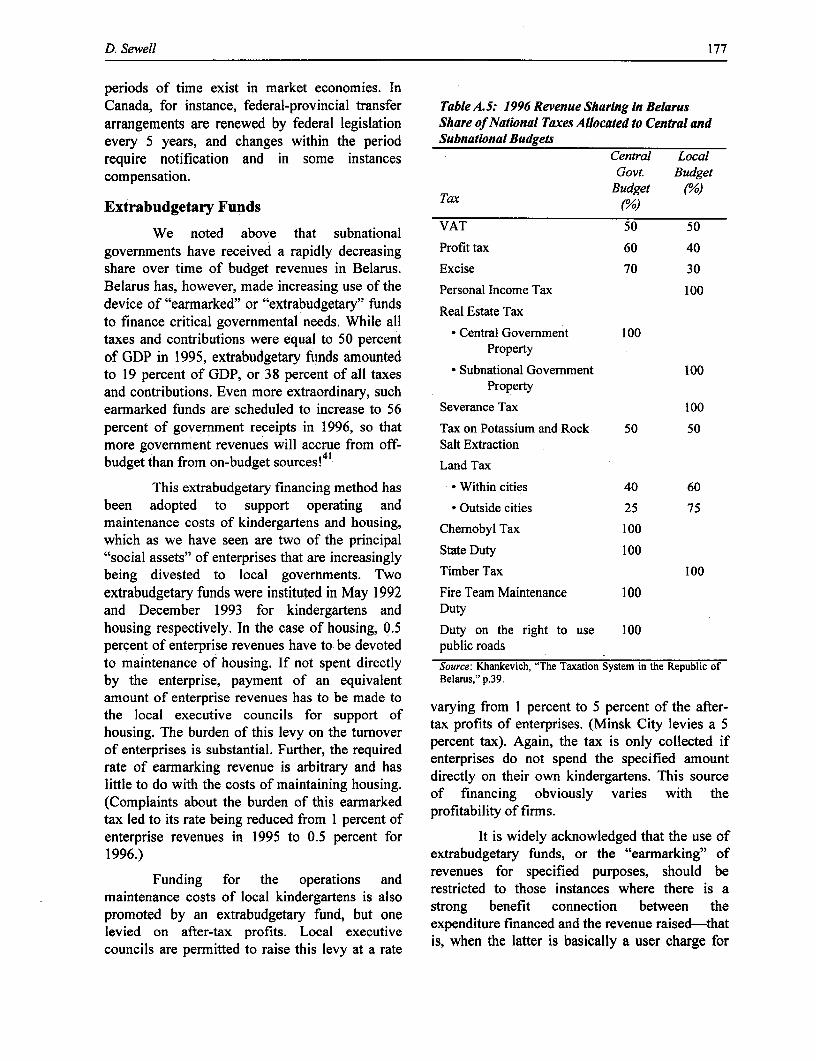
D. Sewell 177
periods of time exist in market economies. In
Canada, for instance, federal-provincial transfer Table A.5: 1996 Revenue Sharing in Belarusarrangements are renewed by federal legislation Share of National Taxes Allocated to Central andevery 5 years, and changes within the period Subnational Budgetsrequire notification and in some instances Central Localcompensation. Govt. Budget
Tax Budget (%)Extrabudgetary Funds (%)
We noted above that subnational VAT 50 50
governments have received a rapidly decreasing Profit tax 60 40
share over time of budget revenues in Belarus. Excise 70 30Belarus has, however, made increasing use of the Personal Income Tax 100device of "earmarked" or "extrabudgetary" funds Real Estate Taxto finance critical governmental needs. While all Ceal Estat e Taxtaxes and contributions were equal to 50 percent Property
of GDP in 1995, extrabudgetary funds amounted Propertto 19 percent of GDP, or 38 percent of all taxes * Subnational Government 100
and contributions. Even more extraordinary, such Propertyearmarked funds are scheduled to increase to 56 Severance Tax 100
percent of government receipts in 1996, so that Tax on Potassium and Rock 50 50
more government revenues will accrue from off- Salt Extractionbudget than from on-budget sources!4 1 Land Tax
This extrabudgetary financing method has * Within cities 40 60
been adopted to support operating and * Outside cities 25 75maintenance costs of kindergartens and housing, Chemobyl Tax 100which as we have seen are two of the principal"social assets" of enterprises that are increasingly State Duty 100being divested to local governments. Two Timber Tax 100
extrabudgetary funds were instituted in May 1992 Fire Team Maintenance 100and December 1993 for kindergartens and Dutyhousing respectively. In the case of housing, 0.5 Duty on the right to use 100percent of enterprise revenues have to be devoted public roads
to maintenance of housing. If not spent directly Source: Khankevich, "The Taxation System in the Republic of
by the enterprise, payment of an equivalent Belarus," p.39.
amount of enterprise revenues has to be made tothe local executive councils for support of varying from 1 percent to 5 percent of the after-housing. The burden of this levy on the turnover tax profits of enterprises. (Minsk City levies a 5
of enterprises is substantial. Further, the required percent tax). Again, the tax is only collected if
rate of earmarking revenue is arbitrary and has directly on their own kindergartens. This source
little to do with the costs of maintaining housing. of financing obviously varies with the(Complaints about the burden of this earmarked ofitabing obvirms.tax led to its rate being reduced from 1 percent of profitablity of firms.enterprise revenues in 1995 to 0.5 percent for It is widely acknowledged that the use of1996.) extrabudgetary funds, or the "earmarking" of
Funding for the operations and revenues for specified purposes, should bemaintenance costs of local kindergartens is also restricted to those instances where there is apromoted by an extrabudgetary fund, but one strong benefit connection between thelevied on after-tax profits. Local executive expenditure financed and the revenue raised-that
councils are permitted to raise this levy at a rate is, when the latter is basically a user charge for
178 Annex A
rationale-where the activities concerned extrabudgetary funds levied on enterprises inredistribute income, for example. All other Belarus. The financing of these major fringeprospective public programs where there is no benefits is redistributional. In the case of bothbenefit rationale should receive general fund housing and kindergartens, enterprises are footingfinancing and should compete on the same terms the bill for activities which benefit only subsets offor these limited public funds within a common their employees and which also benefit manybudgetary framework. It is therefore cause for non-employees. As we have seen, for instance,concern that 56 percent of all government receipts those now living in housing built and maintainedin Belarus are currently flowing into by enterprises often have no- past or presentextrabudgetary funds. By these standards, too, connection with the enterprise.housing maintenance and kindergartens are notappropriately financed as benefit taxes by the
POTENTIAL SOURCES OF FINANCE
User Cost Recovery government initiative to encourage additionalmetering for household water supply.42 Metering
Appropriate financing for local utilities of water supply to households has yet to berequires full cost recovery from users. Low levels adopted in many other member states of theof cost recovery for housing and utilities were a former Soviet Union. Unfortunately, it wouldmatter of deliberate redistributional policy in the seem to be impractical to meter individualSoviet Union, and low-priced energy helped to household usage of heat in many of Belarus'make this policy possible. This policy proved Soviet era apartment buildings. Installation ofdifficult for the authorities in Belarus to change. individual metering for apartments wouldAs late as 1994, the cost recovery rate for all necessitate complete replacement of the plumbinghousing maintenance and utilities was only about systems in these buildings.10 percent, and was as low as 4 percent forheating and 2 percent for housing maintenance It is enigmatic to an outsider that propertyhan wte. Thercst ror elecr ain *c owners and residents in Belarus actually continueandwasesignicantl highe tha rfor mostuiiti to receive subsidies for housing maintenance,but was siln ly 25gpercen particularly where housing is being privatized.
The principle that is applied is that if one type ofThese cost recovery rates were housing occupant gets a subsidy, all housing
unsustainable once Belarus no longer had access occupants benefit from the same subsidyto low-priced energy. In 1995, the govemment regardless of whether the housing is enterprise,pursued a policy of increasing housing and utility state or privately owned. Housing maintenancecost recovery ratios with determination. As a services are an obvious case where user costresult, household cost recovery ratios were raised recovery principles should be applied-theto 50 percent for household maintenance, 65 resident of Grodno should not be expected to paypercent for heating, 54 percent for water and 84 for maintenance of housing which has beenpercent for electricity. privatized in Minsk, for instance.
An important step towards increasing Objections to user cost recovery foruser cost recovery for household utility services is housing and utilities often rest on assumptionsto meter individual apartment usage, since this that users in transition economies will not be ableenables the household to control its own usage. In to afford the price levels entailed, given theirthe former Soviet Union, electricity usage was the current reduced incomes. Such arguments ignoreonly household utility which was individually the fact that shortfalls in cost recovery are nowmetered-which may also account for the fact being paid for somehow-by taxpayers, includingthat it had the highest cost recovery rate. Belarus those who do not use these utilities, or byhas taken an important step towards increasing "inflation taxes" arising from printing money touser cost recovery for other utilities with a finance government deficits. Cost recovery from
D. Sewell 179
users leads to savings which can be applied to such as a reformed property tax are put in place.reducing these taxes or government deficits. Indeed, there will always be a case for transfers to
It is, in fact, counterproductive to enable poorer local governments to provideItuis,dize aggact, u ounterrorductiveto- critical services in a manner similar to that in
subsidize aggregate utility use for distributional_ etroflclte.T civ hsojciereasons-better-off people benefit more from- better-off localities. To achieve this objectivesuch subsidies since consumption normally rises some systematic form of "equalization" of localwith income.43 Belarus appears to be no exception revenues is needed in Belarus. (The argument forwth thincome. Bhear95Housappearslto Bedgo e vepn such transfers is separate from that for personalto this rule. The 1995 Household Budget Survey transfers such as low-income supplements orshows that average monthly spending on rent and unemployment insurance). While the Governmentutilities rose from 57,000 rubels per family of Belarus recognizes this need, it deals with itmember in the lowest quintile of the income Bely inizes ways subsides wichdistribution to 67,000 rubels in the highest currently In ad hoc ways-by subsidies whichincome quintile.44 The Government of Belarus is differ by locality, and by changing the local shareattempting to deal with income distributional in revenues assigned to oblasts. For instance, theproblems arising from housing and utilities share of lower-income oblasts in VAT revenue ispayments in a more appropriate manner than by higher than that permitted to the city of Minsksubsidizing all users. Low-income households (which has the status of an oblast). These localsubsivedhousing al]owances. Lo-if mentousexeds revenue shares have been changed several timesreceive housing allowances if payments exceed in anatmtt eeio-noergios15 percent of household income. This approach an attempt to benefit low-income regions.targets assistance to families in greater need, and The most thoughtful approaches to thesewould also seem to be appropriate for dealing intergovernmental transfers involve formulawith distributional considerations which arise in financing for transfers from central to localprovision of services other than housing and governments, where the criteria for the transfer isutilities, such as daycare. determined in advance by legislation. Formula
financing of transfers to local government makesProperty and Real Estate Taxes possible greater stability, certainty and openness
Property and real estate taxes are in these payments. Because this formula financingappropriate means for financing municipal is systematic and open, it avoids implications thatservices to property, such as street lighting and some kind of political slush fund is involved androad maintenance. Indeed, Appendix B indicates reduces the interminable bargaining that was (andthat property taxes are the principal form of continues to be) a feature of inter-regionalautonomous finance of local governments in distribution in the former Soviet Union and manyOECD countries. Keen (p. 4) notes that property of its successor states.taxes accounted for 5.5 percent of all OECD Equalization schemes in many countriesgovernmental revenues in 1992 and only 2.7 compensate for differences in local revenue-percent of total revenues in Belarus in 1995, or raising capacity, and sometimes compensate forless than half of their comparative importance in local cost differences in supplying services.46
OECD countries. Belarus needs a more useful Such equalization payments are unconditionalform of property or real estate tax than the present with respect to uses of the funds.land use tax, which in 1995 cost more to collectthan it raised in revenue!45 Fortunately, reform of "Conditional" grants are also used ifthis tax is being considered by the Task Forces higher levels of government wish to ensure thatexamining tax reform in Belarus in 1996. local governments supply specific services such
as teaching Belarusian in schools) or to ensureAppropriate Forms of Central Transfers to that specific levels of service are providedLocal Governments in Belarus (usually minimum levels of service). Such grants
give general guidance to local governmentsIt is clear that local governments will not providing the service with respect to the
be able to finance municipal services from theirown revenues until appropriate tax instruments
180 Annex A
objectives of the donor government, but do not if they are not in "satisfactory" condition. Whilelead to the latter micro-managing the service.47 it is presumed that local governments would be
The Government of Belarus should obliged to accept most of these assets if anclfinancing, enterprise failed, some kindergartens are known
consider adoption of such formula fnnig to have been closed by enterprises rather thanSince officials in the Ministries of Economy and to ove to clovemmentseFinance are interested both in formula approaches turned over to local governmentsto equalization and in conditional grants from the Perhaps more use might be made ofrepublican to subnational governments, the World continued enterprise contributions to aidBank might well consider arranging courses for divestiture. An example might be drawn from theofficials in Belarus on such approaches to case of educational institutions where humanintergovernmental financing. capital is being created which is to some extent
specific to the enterprise. One large enterpriseContinued Partial Financing or Bridge interviewed in Minsk, for instance, had justFinancing of Services by Enterprises divested a trade school to the local authorities, but
Some incentives already exist for will continue to hire many of the graduates. Theenterprises to share the burden in transferring local authorities would seem to have a good casephysical assets to local governments. Thus local for asking for some continued support from theexecutive councils have the right not to accept enterprise for such schooling.housing or kindergartens divested by enterprises,
CONCLUSION
In Belarus as in other former command benefits, particularly those involving capitaleconomies, divestiture of "social assets" is seen expenditures such as housing construction andas a necessary process in the transformation of maintenance. The relative decline in fringeenterprises so that they can function appropriately benefit payments may not have been so great hadin a market economy. An important public policy enterprises not been required to fulfill a numberproblem in transition economies is widely of costly unfunded government mandates, such asconsidered to be that of maintaining the supply of that of maintaining employment at levelsthese services after enterprise divestiture. estimated by some to amount to overmanning
equal to 40 percent of the labor force. In effect,44 The present study finds that the term etrrssmyhv u rnebnftpyet
"social assets" is a misnomer for just about all enterprises may have cut fringe benefit paymentsenterprise activities described under this heading to pay for these unfunded mandates.in Belarus, most of which are simply fringe Larger enterprises were found to providebenefits that are part of the wage bargain with the more of these fringe benefits than other firms andemployee. Provision of these fringe benefits was the quality of enterprise provision of thesea rational response by enterprises to shortages of services is generally considered to be superior tolabor and constraints on wage offers in the old comparable services provided by government.command economy, firms in market economies Research in other CIS countries has found thathave responded similarly to such economic some enterprises collect substantial rents inincentives to provide fringe benefits. The providing these fringe benefits, however, thusfavorable tax treatment of fringe benefits explains inflating costs compared to governmentmuch of their continued importance, both in provision.Belarus and elsewhere. It is eminently debatable whether most of
These fringe benefits were cut by at least these fringe benefits should receive continuedtwo-thirds as a proportion of employee public subsidy or preferential tax treatment. Thereremuneration between 1994 and 1995 in Belarus. is a strong case for some government funding ofThe economic downturn in this period contributed the public health and kindergarten services beingto the relative decline in payment of these divested by enterprises. Enterprise divestiture of
D. Sewell 181
public subsidy or preferential tax treatment. There agriculture have also reduced revenue sharingis a strong case for some government funding of with rural local governments. There is no closethe public health and kindergarten services being link between beneficiaries and payments whichdivested by enterprises. Enterprise divestiture of would justify the use of the presentpublic utility services and housing is also a cause- extrabudgetary funds for housing maintenancefor concern during transition. As much as a and kindergartens. Too much use, in fact, is nowquarter of total unemployment in transition made of extrabudgetary funds in Belarus-theireconomies has been attributed to the lack of labor revenues now exceed those on budget so thatmobility caused by unavailability of housing. programs on the budget are not competing on a
Those services which enterprises are - level playing field for more than half of publicdivesting but which should be retained as resources. Finally, true subnational taxes-thosegovetment functions are often assumed to be the whose base and rate structure are determined byappropriate responsibility of local govesm ments subnational governments and for which the latter
Local infrastructure is clearly an appropriate local are responsible to their own electorates-raisegovernment responsibility; the reasons for insignificant amounts of revenue.
assigning services such as education and health to The financing of local utility services islocal governments are more debatable. most appropriately accomplished by user cost
Financing arrangements have not kept recovery, with any resulting income distributionalpace with the reassignment of functions to problems being addressed by direct incomesubnational governments, nor with performnance support measures, such as the housing allowance
of their existing functions-the subnational share that the Govemment of Belarus has instituted.of total government revenues declined from 70 Belarus also needs effective real estate taxes topercent in 1992 to 48 percent in 1996. Special finance local government services to property; theextrabudgetary funds have been created to finance existing land use tax has been a nuisance tax, inlocal government operation of kindergartens and that it costs more to administer than it raises in
housing maintenance. revenues. Where transfers to local governmentsare required, formula financing is suggested. Such
There are other problems with existing formula financing is appropriate for bothmeans of financing local governments. A unconditional grants to low-income localprincipal difficulty with revenue sharing, which governments and conditional grants to supportaccounts for 75 percent of subnational specific objectives such as maintaining minimumgovernment revenues, is that it yields more national standards in services delivered by localresources to wealthier regions and makes inter- governments.regional imbalances worse. Tax breaks to
182 Annex A
APPENDIX A
The Relative Burden of Wage Taxes in Belarus, the OECDand European Union
The argument that wage taxes in the OECD countries. He finds that, "at earnings offormer command economies levied to finance USD 20,000 (noted as being near the averagesocial protection programs such as pensions and earnings rate in most OECD countriesunemployment compensation are so great as to considered), the total average effective payroll taxthreaten the "competitiveness" of enterprises is rate exceeds 35 percent in 8 of the 20 countriesfrequently encountered. Payroll taxes account for tabulated; it exceeds 45 percent in Belgium,46 percent of payrolls in Belarus. The Social France, Greece and Italy."49
Protection Fund is financed by a 35 percent What might also be taken into account ispayroll tax, the Employment Fund is financed by the finding in the present study that payroll isa further I percent payroll tax and an additional
10 ercnt ax n pyrol i leiedto ay or only part of worker remuneration in Belarusmpearcest tox ameliorate the leffectspay fo t because the "social benefits" provided bymeasures to ameliorate the effects of the etrrssaenttxda ato arl,oChernobylI nuclear disaster. Social security levies enterprises are not taxed as part of payroll, orindeed as personal income. We found that suchin many CIS countries such as Russia account for fringe benefits amounted to 35 percent and 12slightly smaller total shares of payrolls, but even percent of wages and salaries in 1994 and 1995payroll taxes in the range of 35 percent to 40 respectively. Consequently, the "effective" (aspercent in many Eastern European countries opposed to nominal) wage tax would havearouse concern because of possible adverse amounted to only 30 percent of workereffects on enterprise and national competitive-ness.48 remuneration in 1994 (.46*.65=.30) and 40
percent of worker remuneration in 1995A good case can be made, however, that (.46*.88=.40). The relevance of this calculation of
these payroll taxes are not substantially larger effective payroll tax rates is shown by the recentthan similar taxes in many Western industrial decision of the Government of Russia to expandcountries. Furthermore, payroll taxes may be a the payroll tax to include non-wage workersuitable method of financing appropriately compensation, as indicated in a decree of Januarydesigned social security programs. 1996.
The importance of payroll and social It is also relevant to include income taxessecurity taxes as a source of revenues in Belarus in comparisons of tax burdens on wages. Thecan be compared with European and OECD personal income tax is almost exclusively a tax onpractice. Keen (p.4) reports that social security wages and salaries in Belarus, is levied on aand payroll taxes accounted for 26.3 percent of narrow base because of non-taxation of fringerevenues in Belarus in 1992, 25.9 percent of benefits, and does not assume the importance as arevenues of OECD member countries, and 29.3 revenue source that it does in OECD countries.percent of revenues in European Union countries. Lumping the personal income tax together with
The greater use made of payroll taxes by payroll and social security taxes in his 1996European countries is of interest from the point of inquiry, Keen (p.6) finds that these three taxesview of the competitiveness hypothesis, as is the account for 32 percent of tax revenue in Belarussize of the effective tax rate on earnings in many compared to 55 percent of tax revenue in both theof these countries. In a 1996 article, Kesselman European Union and OECD countries. Thecompares effective tax rates on earnings for differences in relation to GDP are not as marked
D. Sewell 183
but are still substantial. Keen finds that the three in a well-designed program oftaxes account for about 16 percent of GDP in social security, payroll taxes offerBelarus and about 21 percent in the European the additional advantage ofUnion and OECD countries. - posing minimal distortions to
Finally, tax specialists who have labor and other economicconsidered the question do not view payroll taxes behaviors. This potential is unlikeas an inappropriate means of financing social most other forms of taxation,security programs. Kesselman concludes for which have unavoidable
example that, ~~~~~~~~~~~efficiency costs. 5example that,
Payroll taxes in general are a In one respect, Kesselman's conclusionrelatively efficient form of suggests that our inquiry into the effects of wagetaxation in the long run, at least taxes in the former command economies has beencompared with taxes on income literally one-sided. A comprehensive assessmentor capital. They can also be of the impact of wage taxes in these countriessimple and low-cost to operate would also need to take into account the benefitsfor both governments and obtained from the social insurance programstaxpayers. When tied to benefits financed by these wage taxes.
184 Annex A
APPENDIX B
Autonomous Sources of Revenue for OECD Local Governments: Property vs. Income Taxes
Where the application of direct user One has to be careful, however, to ensurecharges are impractical, forms of the property tax that local income taxes are not simply revenuehave been the traditional source of much local sharing arrangements, where local governmentsgovernment finance in many parts of the world. In have no control over the base and rate structure ofterms of OECD usage, the property tax is the the tax and are not responsible to taxpayers forprimary (and often the only) local government tax funds obtained. As McMillan and Bird and Slackin the Netherlands and the English-speaking observe, a number of revenue sharingcountries-Australia, Canada, the United States, arrangements of this type are recorded in OECDIreland, New Zealand and the United Kingdom. statistics as local income taxes.5!Income taxes are more important as a source of Table A.6 shows that if one excludeslocal government revenues in other European income taxes identified by McMillan as revenuecountries and Japan. In his recent survey of sharing (in Austria, Germany, Norway andOECD practice for the Bank, McMillan notes that Spain) (Inusfrom Gerty taxes andout of 24 countries, local governments in 20 Spain), revenues from property taxes exceeded
counrie hav prpert taes ad i 17 ave revenues from local income taxes in the OECD iniountrces have property taxes and m 17 have 1990 by 4.5 percent (USD 283 billion as opposed
to USD 271 billion).
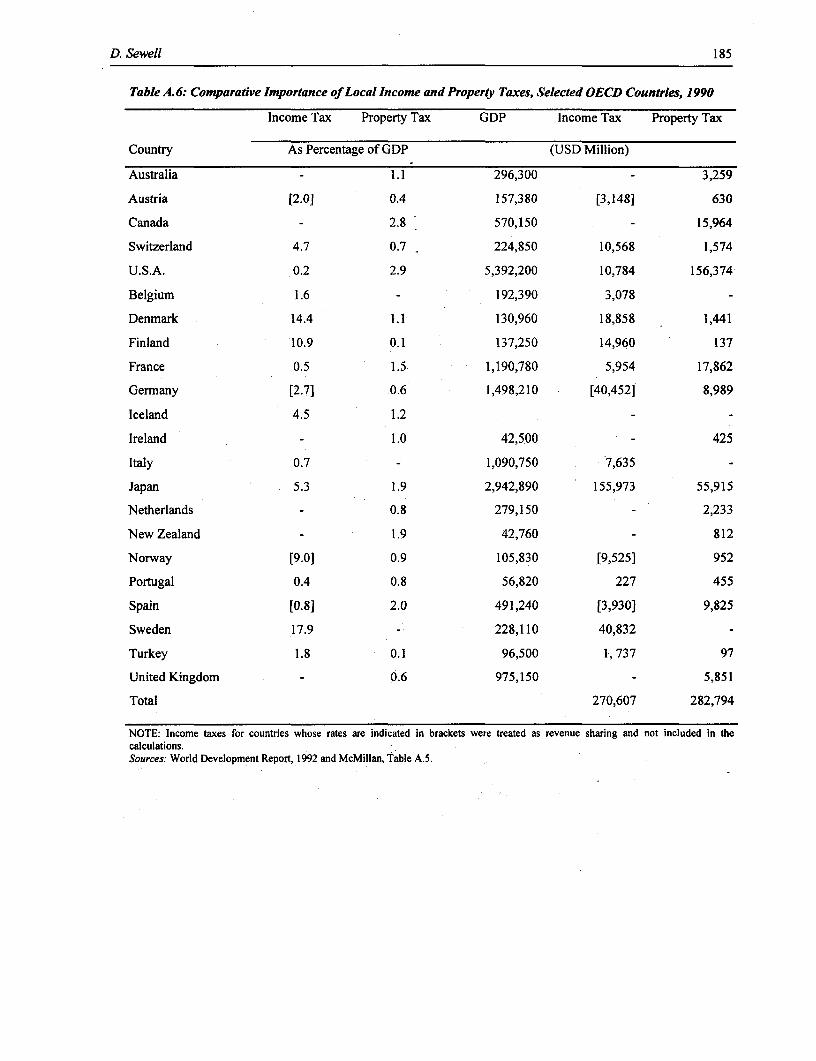
D. Sewell 185
Table A. 6: Comparative Importance of Local Income and Property Taxes, Selected OECD Countries, 1990
Income Tax Property Tax GDP Income Tax Property Tax
Country As Percentage of GDP (USD Million)
Australia 1.1 296,300 - 3,259
Austria [2.0] 0.4 157,380 [3,1481 630
Canada - 2.8 570,150 - 15,964
Switzerland 4.7 0.7 224,850 10,568 1,574
U.S.A. 0.2 2.9 5,392,200 10,784 156,374
Belgium 1.6 - 192,390 3,078
Denmark 14.4 1.1 130,960 18,858 1,441
Finland 10.9 0.1 137,250 14,960 137
France 0.5 1.5 1,190,780 5,954 17,862
Germany [2.7] 0.6 1,498,210 [40,452] 8,989
Iceland 4.5 1.2
Ireland - 1.0 42,500 - 425
Italy 0.7 - 1,090,750 7,635
Japan 5.3 1.9 2,942,890 155,973 55,915
Netherlands - 0.8 279,150 - 2,233
New Zealand 1.9 42,760 - 812
Norway [9.0] 0.9 105,830 [9,525) 952
Portugal 0.4 0.8 56,820 227 455
Spain [0.8] 2.0 491,240 [3,930] 9,825
Sweden 17.9 - 228,110 40,832
Turkey 1.8 0.1 96,500 1, 737 97
United Kingdom - 0.6 975,150 - 5,851
Total 270,607 282,794
NOTE: Income taxes for countries whose rates are indicated in brackets were treated as revenue sharing and not included in thecalculations.Sources: World Development Report, 1992 and McMillan, Table A.5.
186 Annex A
Notes
social assets) in Rossiisky Economicheski Jurnal
1. This document was produced as part of the (Russian Economic Journal), 1996, Issue 8, pp. 62-72.author's responsibility in the 1996 Belarus Countr-y 6. I have used the following sources for informationEconomic Memorandum Mission headed by John on the tax system in Belarus: Mick Keen, "Tax ReformHansen. I wish to thank Elena Klochan, Nikolai Lisai in Belarus: Preliminary Report on Economic Aspects,"and Konstantin Senyut of the World Bank's Resident EU Tacis, April 1996; and L. A. Khankevich, "TheMission in Minsk, and John Hansen and Yuliya Taxation System in the Republic of Belarus," EC4CI,Merkulova for assistance in preparing this report. I June 1996.have also benefited from specific comments from Jorge 7. "Enterprise kindergartens were considered to beMartinez-Vasquez and Richard Bird, and from superior in quality to municipal facilities, and theseextensive discussions at the Bank with Lev Freinkman differentials appear to have persisted: 1994 data forand Philip O'Keefe, both of whom are engaged in Kazakhstan show per child expenditures in enterpriseoperations work associated with this issue. kindergartens to be twice that in those run by the
2. See Simon Commander and Richard Jackman, Ministry of Education." Klugman et al., "Enterprise"Providing Social Benefits in Russia: Redefining the Divestiture of Kindergartens and ChildcareRoles of Firms and Government." Policy Research Arrangements in Central Asia," pp. 3-4. In anotherWorking Paper 1184, Economic Development 1995 study for the Bank by ADB Associates, it wasInstitute, The World Bank, 1993; Simon Commander estimated that adoption of municipal standards wouldand Une Lee with Andrei Tolstopiatenko, "Social reduce total kindergarten costs in the Kyrgyz RepublicBenefits and the Russian Industrial Firm," Joint by 20 percent. Cited in Freinkman andConference of the World Bank and the Ministry of Starodubrovskaya, "Restructuring of Enterprise SocialEconomy of the Russian Federation, Russia: Economic Assets in Russia," p.24.Policy and Enterprise Restructuring, June 1995; Lev 8. ADB Associates found that enterprise kindergartenM. Freinkman and Irna Starodubrovskaya, teachers' salaries in the Kyrgyz Republic were 10"Restructuring of Enterprise Social Assets in Russia," percent to 50 percent higher than those of municipalPolicy Research Working Paper 1635, The World kindergarten teachers (cited in Freinkman andBank, August 1966; Jorge Martinez-Vasquez, "The Starodubrovskaya, "Restructuring of Enterprise SocialChallenge of Expenditure-Assignment Reform in Assets in Russia," p.24). Lexin et al. (p.65) report thatRussia," Journal of Environment and Planning, Vol. municipal service workers (for example, in housing12, 1994, pp. 277-292; Mark E. Schaffer, Richard maintenance) received wages that were 30 percent toJackman, Gaspar Fajth and Judit Lakatos, Martin Rein, 40 percent less than those of equivalent employees ofIrina Tratch and Andreas Woergoetter, "Round table Russian coal companies.on 'Divestiture of Social Services from State-OwnedEnterprises,' " Economics of Transition, Vol. 3 (2), 9. Setting the producer price index for June 1994 to1995. equal 100, the June 1995 value of the index was 1078.
3. See for instance Jeni Klugman, Sheila Marnie, 10. See Commander and Lee with Tolstopiatenko,John Micklewright and Philip O'Keefe, "Enterprise "Social Benefits and the Russian Industrial Firm," p.i.Divestiture of Kindergartens and Childcare 11. Freinkman and Starodubrovskaya state that withArrangements in Central Asia," in Jane Falkingham, the imposition of hard budget constraints in TheJeni Klugman, Sheila Mamie and John Micklewright Kyrgyz Republic, "most enterprise non-housing social(eds), Household Welfare in Central Asia, (Macmillan, facilities were simply closed." See "Restructuring ofUK, forthcoming 1996). Enterprise Social Assets in Russia," p.8.
4. See Robert M. Buckley and Eugene M. Gorenko, 12. Lexin et al. (p. 67) report that "in the three years"Unwinding the Socialist Wage Package: The Role of preceding housing divestiture, coal associations' actualHousing in Russia," PADCO Working Paper, Dec. expenditure on housing decreased almost twofold in1995; "Russian Enterprise Housing Divestiture," Urban real terms due to the deterioration of the mines'Institute Research Paper, 1995. financial performance."
5. Vladimir Lexin, Alexander Shvetsov, and Lev 13. Survey of Current Business, May 1996, TableFreinkman. "Regionalnuye kollizii funktsionirovaniya 1.14, p.1 0 .sotsialnukh obyektov" (Regional conflicts in operating
D. Sewell 187
14. By way of contrast, Schaffer cites "costs of social way to jump the waiting list for housing provided byprovision" in a 1988 survey of West European industry the state." Buckley and Gorenko, "Unwinding thevarying from 1.4 percent to 12.0 percent of total labor Socialist Wage Package: The Role of Housing incosts in different countries, but still concludes that Russia," p 1."employees in Western firms receive social benefitsfrom their employers which are about as costly in e22. The underlying principle is that of horizontalrelative terms" as those in transition countries ' ' °(Schaffer, Economics of Transition Round Table, 23. The significant costs of such anti-avoidancep.248). activity are illustrated by the estimate that as much as
15. Freinkman and Starodubrovskaya, "Restructuring one-half of the U.S. Tax Code before 1986 (the year ofof Enterprise Socl A s isubstantial tax reform) was devoted to limiting the
extent to which taxpayers could take advantage of the16. Commander and Lee with Tolstopiatenko, lower tax rate applied to income in the form of long-"Russia: Economic Policy and Economic term capital gains. See Charles E. McLure, Jr., cited inRestructuring," p.4. Economic Council Of Canada, The Taxation of Savings
17Therin the Economics Of and Investment, (Ottawa, Ont.: Minister of Supply and17. The studies by Schaffer Sevcs 1987) p.9 .zc °Transition Roundtable and Martinez-Vasquez, "The Services, 1987), p.9.Challenge of Expenditure-Assignment Reform in 24. Stephen A. Woodbury and Daniel S. HamermeshRussia," indicate similar skepticism about the find that ." ..wages and [nontaxable] benefits are highlyimportance of non-economic motives in provision of substitutable and that the demand for benefits is pricethese fringe benefits. elastic. Changes in income taxes induce a change in the
18. Klugman et al observe that "kindergartens did relative price of benefits and wages that in theseindeed have a developmental role in the Soviet Union samples generates substantial substitution betweenand primary school curricula assumed that children wages and nonwage compensation." Their estimatesalready had basic literacy and counting skills." See suggest that cuts in average marginal tax rates of 3-6
"Enterpre Dpercent in the mid-1980s in the United States reduced"Erant merise Di of Kiartens the share of nontaxable benefits in total compensation
by one-half percentage point (from a hypothetical 1919. Interestingly enough, provision of important fringe percent to 18.5 percent). "Taxes, Fringe Benefits andbenefits such as employer-provided health insurance Faculty," The Review of Economics and Statistics, Vol.has similar origins in the United States. "Employer LXXIV, May 1992, No. 2, pp. 294-295.provided health insurance was encouraged by the 1942 25. The exception is that grants or loans to employees
Stabilization Act, which placed limits on wage for housing are only exempt up to 10 percent of after-increases but allowed employers to offer insuranceplans to their employees," (Jonathan Gruber and James r
Poterba, "Tax Subsidies to Employer-Provided Health 26. In June 1996, the minimum monthly wage wasInsurance," NBER Working Papers No. 5147, June equal to BYR 100,000. The average salary in March1995, p.5 fn. 3). 1996 was BYR 1,066,600.
20. "..enterprise provision of kindergartens ... furthered 27. Khankevich, in "The Taxation System in thestate policy of attaching employees to their place of Republic of Belarus," (p.18) comments that "evenwork to discourage unplanned turnover. Enterprise though legislation says that income tax should be paidmanagers were willing agents in this respect, as they on any form of income, in this case it is possible tohad little autonomy in setting money wages, and used calculate the tax amount but not actually collect it."noncash benefits, such as subsidized kindergartens, to interest income is untaxed, for instance, it
attactandretin orkrs Klgma etal Entrprse 28. Because meetIcm Sutxd o sac,Iattract and retain workers." Klugman et al., "Enterprise has been common practice for banks to pay theirDivestiture of Kindergartens and Childcare employees in part in the form of interest income onArrangements in Central Asia," p.3 . deposits that the banks contribute to the accounts of
21. "In all socialist countries, enterprise housing their employees'.production programs were a key means of gaining 29. Expenditures and Income of the Population inaccess to new housing... enterprises which produced Belarus: 1995, Table 11.1. Ministry of Statistics andsignificant amounts of housing were seen as attractive Aemployers. Employment with such firms provided a A r s
188 Annex A
30. Charles Yuji Horioka, "Japan's Consumption and School of Policy Studies, Queen's University, Kingston,Saving in International Perspective," in Economic Ont., Canada, 1993, p.2 2 .Development and Cultural Change, vol. 42, no. 2, Jan.,1994, Table 4, p.304. In the context of Belarus, we note that Presidential
1994, Table 4, P~3O4~ Ukase No 351 of 4 September 1995 simply orders the31. ".. it is striking that, contrary to popular belief, reduction of housing maintenance expenditures by 10-these rates [effective tax rates for house purchase 20 percent by the introduction of "contracts." Thesefinanced by equity] taking into account all relevant contracts do not reduce housing maintenance costs bytaxes are not generally low compared to other assets, encouraging competitive provision of communalparticularly in the case of zero inflation." OECD; services.Taxation and Household Saving, (Paris: OECD, 1994), 39. Personal income taxes, as well as wage taxes toP. 1 10. finance social insurance programs, are deducted by the
32. Letter to the Cabinet of Ministers from Minister employer at source in Belarus, whereas the personalV.I. Kurenkov, December 15, 1995. income tax is often based on rules applying where
33. Minsk City officials informed us that of 90,000 people live (rather than where they work) in OECD33.hMidse City ocials kinforgarmeds that ofe 90,000 countries. Profit taxes are similarly collected on thechildrenting, 5ome00 kinwergarls that the ctywars o basis of where corporate headquarters are located inoperating, some 10,000 were less than 3 years old. Blrs n rprytxsaentrlyoii-aeSuch creches were only introduced at the beginning of Belarus, and property taxes are naturally origin-based1994, when the economic situation worsened. taxes. Under GATT rules, the destination principle isPreviously, mothers stayed on paid maternity leave normally applied in taxation of goods tradeduntil children were three years old. internationally, so that tax rates are determined by the
jurisdiction in which the goods are purchased. In the34. Disposition of employer constructed housing has case of Belarus, the VAT is based on the source ofalso been a problem for government departments production although there is a lack of coherence in the(other budgetary organizations, in the nomenclature principles applied to taxing international trade. As aemployed in Belarus). Much housing formerly owned result, most Belarus taxation is source or origin based,by the Ministry of Defense, for example, was turned as opposed to residence or destination based, and tax-over to local authorities in Minsk in 1994/1995. sharing arrangements reflect concentration in the
location of production by region and hence produce35. Freinkmnan and Starodubrovskaya, "Restructuring disparities in regional revenues.of Enterprise Social Assets in Russia," p. 9.
36. Fabrizio Coricelli, Krysztof Hagemejer and 40. See Khankevich, "The Taxation System in theKrysztofiziobioncelli,Po rysztofinSimon Comander Republic of Belarus," p. 16. By way of contrast,Krysztof Rybinski, "Poland," in Simon Commander inutyacnedfr2pretofGPnd4
and Farii Coiel 'es Uemlyet industry accounted for 26 percent of GDP and 47and Fabrizio Coricefli (eds), Unemployment.Restructuring, and the Labor Market in Eastern percent of tax and extrabudgetary fund revenues.Europe and Russia, EDI Development Studies, 41. All data in this paragraph are taken fromWashington, DC., The World Bank, 1995, p. 74. Khankevich, "The Taxation System in the Republic of
37. See for instance Jorge Martinez-Vasquez, "The Belarus," p.1 1.challenge of expenditure-assignment reform in 42. The program was launched on 7 June 1994 by aRussia," Journal of Environment and Planning, 1994, decree of the Cabinet of Ministers, and consists ofVol. 12, pp. 277-292; Christine I. Wallich, "Russia's metering for both individual apartments and apartmentDilemma," in Russia and the Challenge of Fiscal blocks. Although apartment meter installation wasFederalism, a World Bank Regional and Sectoral subsidized by 75 percent in 1995 and by 50 percent inStudy, ed. Christine 1. Wallich, 1994, pp. 38-43. 1996, the subsidy is scheduled to be reduced to 25
38. According to one examination specific to the percent.efficient supply of local government services, "most of 43. For an explanation and graphical illustrations ofthe efficiency gains from contracting out have resulted this point, see the World Development Report, 1994from an increased scope for competition rather than from (Washington, DC, The World Bank, 1994), p 81.the fact that the service was provided by a private 44. Expenditures and Income of the Population incontractor." Harry Kitchen, Efficient Delivery of Local Belarus: 1995, Table 11.2E. Ministry of Statistics andGovernment Services, Discussion paper No. 93-15. Analysis, Republic of Belarus, Minsk 1996.
D. Sewell 189
45. The conventional definition of a "nuisance tax" is on income and sales in most countries do not have thisthat it costs more to levy than it raises in revenue. advantage because not only the design and
administration but even the rates of these taxes are46. Equalization schemes based on fiscal capacity almost always determined by central, not local,usually calculate the per capita revenue-raising authorities." Richard M. Bird and Enid Slack, "Financing
capacity of all taxes in different regions and Local Government in OECD Countries: The Role ofredistribute revenues to achieve some target of relative Local Taxes and User Charges," in J. Owens and G.per capita fiscal capacity in all regions. Such programs Panella eds., Local Government: An Internationalmay consist of direct redistribution between regions, as Perspective, (Amsterdam: North-Holland, 1991), p. 90.in Germany, Switzerland and Denmark, or indirectredistribution as in Canada, where equalizationschemes for provincial revenues are a constitutionalresponsibility of the federal government.
47. Conditional grants have also been recommendedfor use in Russia. For a more detailed description ofthis type of transfer, see Annex 4, "Conditional Grants:International Experience" in World Bank CountryStudy, Fiscal Management in the Russian Federation,1996, pp. 141-145.
48. Commander and Lee with Tolstopiatenko foundthat "payroll taxes and deductions comprise up to 40percent of the wage bill" for a large sample of Russianindustrial firms in 1994. See Social Benefits and theRussian Industrial Firm, p.3. Current employercontribution tax rates for social insurance in Russiaappear to be 38.1 percent of payroll, with employeespaying I percent of gross salary to the pension fund(information from Mark Sundberg, World Bank,EC3C2, 20 October, 1996). Kesselman reportsemployer contribution rates for Russia which were Ipercent lower in 1993. See Jonathan R. Kesselman,"Payroll Taxes Around the World: Concepts anaPractice, " Canadian Tax Journal 1996, Vol. 44, No 1,p.78.
49. Ibid, p.78.
50. Jonathan R. Kesselman, "Payroll Taxes in theFinance of Social Security," Canadian Public Policy,vol. 22 (June 1966), p. 1 7 4.
51. McMillan observes that "where property taxesprevail, rates are locally established. In contrast, localincome tax revenues are typically shared revenues notdetermined by local authorities. Denmark and Swedenare exceptions demonstrating the viability of true localincome taxes." Melville L. McMillan, "A LocalPerspective on Fiscal Federalism: Practices, Experiencesand Lessons from Developed Countries," World Bank(PRDPE) 1995, (p. S-1). Bird and Slack observe that"the property tax has the clear advantage from a politicaland accountability perspective that it is, as a rule at least,in part a locally designed and locally-implementedtax.. .Potentially more productive alternative "local" taxes
190 Annex A
BIBLIOGRAPHY Horioka, Charles Yuji. 1994 (January). "Japan'sConsumption and Saving in InternationalPerspective." Economic Development and
Belarus, Ministry of Statistics and Analysis. 1996. Cultural Change, 42 (2).Expenditures and Income of the Population in Keen, Mick. 1996 (April). "Tax Reform inBelarus: 1995. Minsk. Belarus: Preliminary ReporT on Economic
Bird, Richard M. and Enid Slack. 1991. "Financing Aspects." EU-Tacis.Local Government in OECD Countries: TheRole of Local Taxes and User Charges." In J Kesselman, Jonathan, R. 1996 (May) "PayrollOwens and G. Panella eds., Local Government. Taxes Around the World: Concepts andAn International Perspective. Amsterdam: Practice." Canadian Tax Journal 44 (1): 59-North-Holland. 84.
Buckley, Robert M. and Eugene M. Gorenko. . . 1996 (June). "Payroll Taxes in the1995 (Dec.). "Unwinding the Socialist Wage Finance of Social Security." Canadian PublicPackage: The Role of Housing in Russia." Policy. 22: 162-179.World Bank: Washington, D.C.. Khankevich, L.A. 1996 (June). "The Taxation
Commander, Simon and Richard Jackman. 1993. System in the Republic of Belarus." World
"Providing Social Benefits in Russia: Bank: Washington, D.CRedefining the Roles of Firms and Kitchen, Harry. 1993. Efficient Delivery of LocalGovernment." Policy Research Working Government Services. School of Policy StudiesPaper 1184, World Bank: Washington, D.C.. Discussion Paper No. 93-15. Kingston,
and Une Lee with Andrei Ontario: Queen's University.Tolstopiatenko. 1995. "Social Benefits and Klugman, Jeni, Sheila Marnie, John Micklewrightthe Russian Industrial Firm." In Russia: and Philip O'Keefe. 1996 (forthcoming).Economic Policy and Enterprise "Enterprise Divestiture of Kindergartens andRestructuring. Joint Conference of the World Childcare Arrangements in Central Asia." InBank and the Ministry of Economy of the Jane Falkingham, Jeni Klugman, SheilaRussian Federation. Marnie and John Micklewright (eds),
Coricelli, Fabrizio, Krysztof Hagemejer and Household Welfare in Central Asia.Krysztof Rybinski. 1995. "Poland." In Simon Macmillan, U.K.Commander and Fabrizio Coricelli (eds), Lexin, Vladimir, Alexander Shvetsov, and LevUnemployment, Restructuring, and the Labor Freinkman. 1996. "Regionalnuye kolliziiMarket in Eastern Europe and Russia. EDI funktsionirovaniya sotsialnukh obyektov"Development Studies. Washington, DC, The ("Regional conflicts in operating socialWorld Bank. assets") in Rossiisky Economicheski Jurnal
Economic Council of Canada. 1987. The Taxation (Russian Economic Journal), 1996, Issue 8,of Savings and Investment. Ottawa, Ontario: pp. 62-72.Minister of Supply and Services Canada. Martinez-Vasquez, Jorge. 1994. "The Challenge
Freinkman, Lev M. and Irina Starodubrovskaya. of Expenditure-Assignment Reform in1996. "Restructuring of Enterprise Social Russia," Journal of Environment andAssets in Russia," Policy Research Working Planning. 12: 277-292.Paper 1635, World Bankf: Washington, D.C.. McMillan, Melville L. 1995. A Local Perspective
Gruber Jonathan and James Poterba. 1995 (June). on Fiscal Federalism: Practices, Experiences"Tax Subsidies to Employer-Provided Health and Lessons from Developed Countries. WorldInsurance," NBER Working Paper No. 5147. Bank (PRDPE).
Schaffer Mark E., Richard Jackman, Gaspar Fajthand Judit Lakatos, Martin Rein, Irina Tratch
D. Sewell 191
and Andreas Woergoetter. 1995. "Roundtable on 'Divestiture of Social Services fromState-Owned Enterprises." Economics ofTransition. 3 (2): 247-266.
Urban Institute. 1995. "Russian EnterpriseHousing Divestiture." Urban InstituteResearch Paper.
Wallich, Christine 1. 1994. "Russia's Dilemma."In Christine I. Wallich ed., Russia and theChallenge of Fiscal Federalism. Washington,DC: World Bank Regional and SectoralStudy: 1-18.
Woodbury, Stephen A. and Daniel S.Hamermesh. 1992 (May). "Taxes, FringeBenefits and Faculty", The Review ofEconomics and Statistics. LXXIV (2): 287-296.
World Bank. 1994. World Development Report,1994. New York: Oxford University Press.
1996. "Conditional Grants:International Experience." Annex 4, WorldBank Country Study. Fiscal Management inthe Russian Federation: 141-145

ANNEX B
Agro-Industry Sector Review
Sudhee Sen Gupta
193

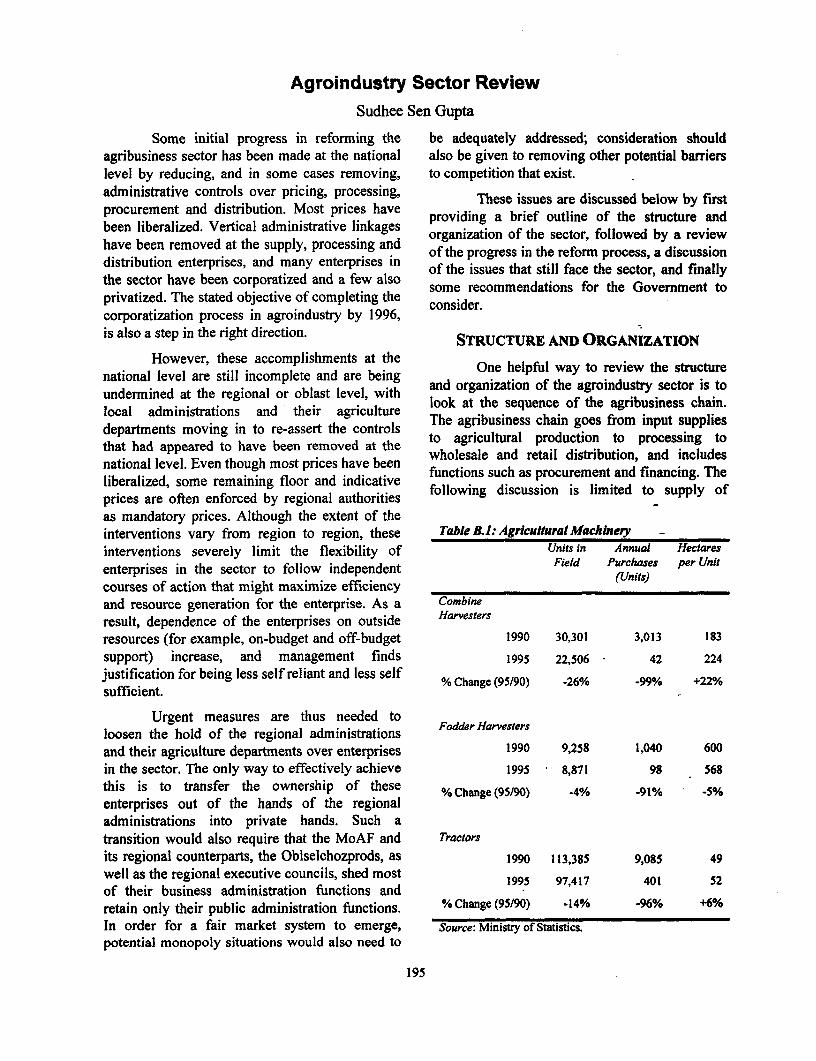
Agroindustry Sector ReviewSudhee Sen Gupta
Some initial progress in reforming the be adequately addressed; consideration shouldagribusiness sector has been made at the national also be given to removing other potential barrierslevel by reducing, and in some cases removing, to competition that exist.administrative controls over pricing, processing, These issues are discussed below by firstprocurement and distribution. Most prices have providing a brief outline of the structure andbeen liberalized. Vertical administrative linkages organization of the sector, followed by a reviewhave been removed at the supply, processing and of the progress in the reform process, a discussiondistribution enterprises, and many enterprises in of the issuess In the sector, a finallythe sector have been corporatized and a few also of the Issues that still face the sector, and finallyprivatized. The stated objective of completing the some recommendations for the Government tocorporatization process in agroindustry by 1996, consider.is also a step in the right direction. STRUCTURE AN1) ORGANIZATION
However, these accomplishments at thenational level are still incomplete and are being One helpful way to review the structureundermined at the regional or oblast level, with and organization of the agroindustry sector is tolocal administrations and their agriculture look at the sequence of the agribusiness chain.departments moving in to re-assert the controls The agribusiness cha goes from input suppliesthat had appeared to have been removed at the to agricultural production to processing tonational level. Even though most prices have been wholesale and retail distribution, and includesliberalized, some remaining floor and indicative functions such as procurement and financing. Theprices are often enforced by regional authorities following discussion is limited to supply ofas mandatory prices. Although the extent of theinterventions vary from region to region, these Table .I: Agricultural Machinery
interventions severely limit the flexibility of Units in Annual Hectares
enterprises in the sector to follow independent Field Purchases per Unit
courses of action that might maximize efficiency (Units)and resource generation for the enterprise. As a Combine
result, dependence of the enterprises on outside Harvestersresources (for example, on-budget and off-budget 1990 30,301 3,013 183support) increase, and management finds 1995 22,506 - 42 224
justification for being less self reliant and less self % Change (95/90) -26% -99% +22%sufficient.
Urgent measures are thus needed toloosen the hold of the regional administrations Fodder Harvesters
and their agriculture departments over enterprises 1990 9,258 1,040 600
in the sector. The only way to effectively achieve 1995 8,871 98 568
this is to transfer the ownership of these % Change (9S/90) -4% -91% -5%enterprises out of the hands of the regionaladministrations into private hands. Such atransition would also require that the MoAF and Tractors
its regional counterparts, the Oblselchozprods, as 1990 113,385 9,085 49well as the regional executive councils, shed most 1995 97,417of their business administration functions and 401 52retain only their public administration functions. % Change (95/90) -14% -96% +6%
In order for a fair market system to emerge, Source: Ministry of Statistics.potential monopoly situations would also need to
195
196 Annex B
inputs, procurement of agricultural products, percent of the farm output. However, theseprocessing and distribution. household farms concentrate mostly on potatoes,
Supply vegetables and some livestock. It is worth noting,InputSupply as shown in Table B.2, that production has
The bulk of agricultural machinery in the increased in potatoes and vegetables, while forcountry is supplied by an organization called grains and sugar beets, which still are producedAgrosnab. At the republican level this mainly by the state and collective farms,organization is subordinate to the MoAF. There production has fallen. Belarusian agricultureare also oblast and regional level Agrosnabs specialized in meat and dairy products in the FSUwhich used to report to the republican Agrosnab and these commodities still account for abut are now subordinated to the oblast and substantial portion (51 percent) of agriculturalregional authorities. These organizations sell output. These commodities are more capitalagricultural machinery to farms and provide a intensive, and private producers have not beenvariety of services including construction, repair able to compensate for the fall in collective andand maintenance. Selected data on machine state production.populations and trends are provided in Table B. 1. ProcessingThe data in this table seem to indicate that whilepurchases have fallen in all categories, the Food processors used to besmallest decline has been in fodder harvesters. administratively organized into four groups: (a)About 60 percent of the existing machines in this meat and dairy (including meat, poultry and milkcategory, however, are worn out. The investment processing); (b) fruits and vegetables (includinglevel, may therefore partly reflect an effort to canning, juices, jams and jellies); (c) food andcorrect this problem. On the other hand, this beverages (including items such as sugar, cookiesprobably indicates a very serious level of and confectionery, vegetable oils and margarine,deterioration in the categories where even less wine, beer, vodka and cognac, soft drinks, etc.);investment has taken place. This could be due to and (d) the bread complex (including grainsupport the government may have provided to elevators, flour and feed mills, and bakeries). Inprop up the meat and dairy subsector in which Belarus all of these groups have been absorbedBelarus had historically specialized. into the MoAF. Details on the number of
There is a parallel organization called enterprises, output trends, and employment areAgrotechnic which also provides technical provided in Tables B.3, B.4, and B.5.services to farms. Fertilizers and chemicals are Procurementsupplied by a similar organization calledAgrochemia (subordinate to the MoAF) which There are three major groups involved inalso has its counterparts at the oblast and regional the procurement of agricultural produce. Foodlevels. These counterparts also report to the oblast processors, the government (for stateand regional authorities now. In addition to procurement), and Belcoopsoyuz, the nationalfertilizer sales this organization also provides union of cooperative societies.application services for fertilizers and chemicals. * Food Processors. While a major share of
Producers procurement of agricultural produce wasdelivered to the food processors through
Agricultural production is done by state allocations and quotas under the stateand collective farms as well as by private farmers, order system, presently most processorsincluding on private household plots. Most of the procure on their own, although they havestate farms have been converted into collective to submit their requirement forecasts tofarms, which now number 2,400; only one the regional executive councils forhundred of the largest state farms remain. There agriculture. The share of procurement ofare now about 3,100 private farmsteads with 0.5 food processors has declined significantlypercent share of farmed land, accounting for I
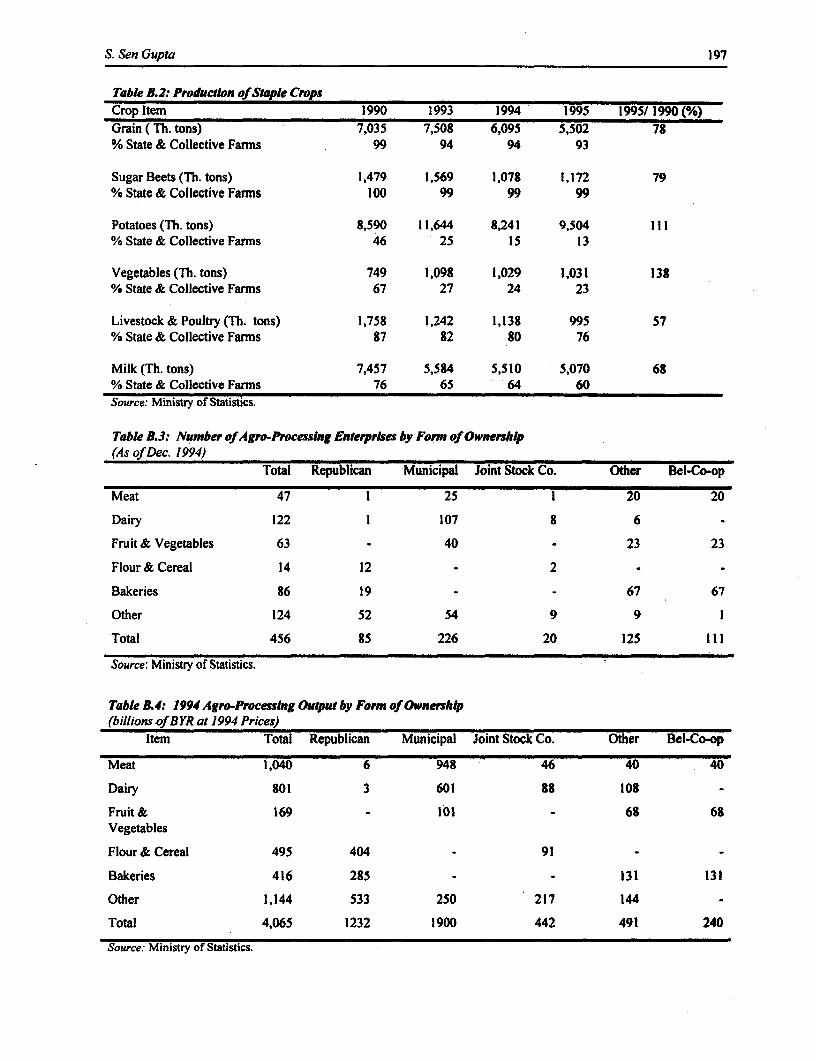
S. Sen Gupta 197
Table 5.2: Production of Staple CropsCrop Item 1990 1993 1994 1995 1995/ 1990 (°/e)
Grain ( Th. tons) 7,035 7,508 6,095 5,502 78% State & Collective Farms 99 94 94 93
Sugar Beets (Th. tons) 1,479 1,569 1,078 1,172 79% State & Collective Farms 100 99 99 99
Potatoes (Th. tons) 8,590 11,644 8,241 9,504 111% State & Collective Farms 46 25 15 13
Vegetables (Th. tons) 749 1,098 1,029 1,031 138% State & Collective Farms 67 27 24 23
Livestock & Poultry (Th. tons) 1,758 1,242 1,138 995 57% State & Collective Farms 87 82 80 76
Milk (Th. tons) 7,457 5,584 5,510 5,070 68% State & Collective Farns 76 65 64 60Source: Ministry of Statistics.
Table B.3: Number of Agro-Processing Enterprises by Form of Ownership(As of Dec. 1994)
Total Republican Municipal Joint Stock Co. Other Bel-Co-op
Meat 47 1 25 1 20 20
Dairy 122 1 107 8 6
Fruit & Vegetables 63 - 40 23 23
Flour& Cereal 14 12 - 2 -
Bakeries 86 19 - - 67 67
Other 124 52 54 9 9 1
Total 456 85 226 20 125 111
Source: Ministry of Statistics.
Table 5.4: 1994 Agra-Processing Output by Form of Ownership(billions of BYR at 1994 Prices)
Item Total Republican Municipal Joint Stock Co. Other Bel-Co-op
Meat 1,040 6 948 46 40 40
Dairy 801 3 601 88 108
Fruit & 169 - 101 - 68 68Vegetables
Flour & Cereal 495 404 - 91 -
Bakeries 416 285 - - 131 131
Other 1,144 533 250 217 144
Total 4,065 1232 1900 442 491 240
Source: Ministry of Statistics.
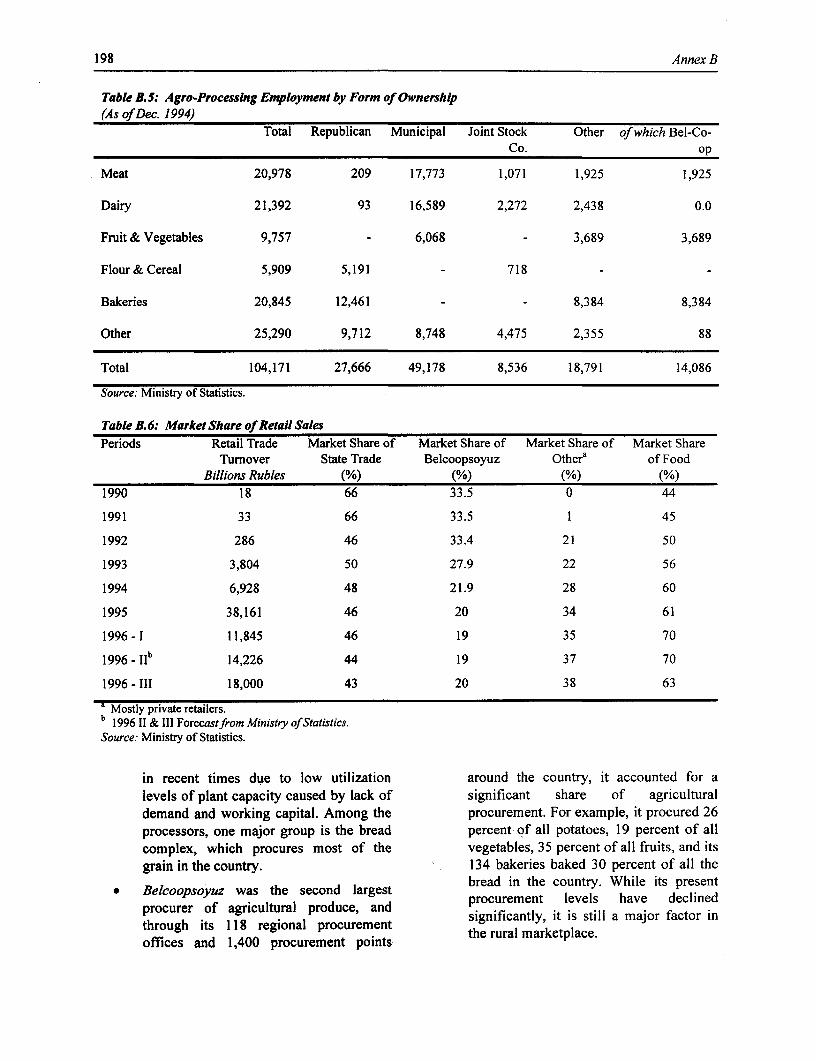
198 Annex B
Table B.5: Agro-Processing Employment by Form of Ownership(As of Dec. 1994)
Total Republican Municipal Joint Stock Other of which Bel-Co-Co. op
Meat 20,978 209 17,773 1,071 1,925 1,925
Dairy 21,392 93 16,589 2,272 2,438 0.0
Fruit & Vegetables 9,757 - 6,068 - 3,689 3,689
Flour & Cereal 5,909 5,191 - 718 -
Bakeries 20,845 12,461 - - 8,384 8,384
Other 25,290 9,712 8,748 4,475 2,355 88
Total 104,171 27,666 49,178 8,536 18,791 14,086
Source: Ministry of Statistics.
Table B. 6: Market Share of RetaU SalesPeriods Retail Trade Market Share of Market Share of Market Share of Market Share
Turnover State Trade Belcoopsoyuz Othera of FoodBillions Rubles (%) (%) (%) (%)
1990 18 66 33.5 0 44
1991 33 66 33.5 1 45
1992 286 46 33.4 21 50
1993 3,804 50 27.9 22 56
1994 6,928 48 21.9 28 60
1995 38,161 46 20 34 61
1996 -I 11,845 46 19 35 70
1996 - 11 14,226 44 19 37 70
1996 - III 18,000 43 20 38 63
Mostly private retailers.b 1996 II & III Forecastfrom Ministry of Statistics.Source: Ministry of Statistics.
in recent times due to low utilization around the country, it accounted for alevels of plant capacity caused by lack of significant share of agriculturaldemand and working capital. Among the procurement. For example, it procured 26processors, one major group is the bread percent of all potatoes, 19 percent of allcomplex, which procures most of the vegetables, 35 percent of all fruits, and itsgrain in the country. 134 bakeries baked 30 percent of all the
bread in the country. While its present* Belcoopsoyuz was the second largest poueet lvl ae dcie
procurer of agricultural produce, and signirecant ly,i ls stl e m r ctinedthrough its 118 regional procurement the rural marketplace.offices and 1,400 procurement points
S. Sen Gupta 199
* State Procurement. The share of state The MoAF warehouses generally handle fruitsprocurement has declined significantly in and vegetables, although much of therecent years and is now limited to seven consumption and (private) retail trade in this anditems: grain (31 percent of output), meat other commodities is now by-passing the(56 percent) and dairy (49 percent), fruits wholesale stage and going straight to theand vegetables (10 percent), sugar beets consumer.(60 percent), rapeseed (62 percent), and In retail distribution, Belcoopsoyuz stillflax fiber (98 percent). Grain is procured dominates in the rural areas, particularly in the
for state stocks, spirits production, and remote ones. It has several thousand food storesfood supplies for budget organizations. in rural areas including 470 mobile stores w
Similarly, meat, dairy, fruits and serve the remote areas. It also has markets at eachvegetables are procured for supplies to of the oblast centers and six in Minsk as well as
budget organizations such as hospitals another 186 markets at the rayon level. The retailand the military. For sugar beets, outlets of the Ministry of Trade, however, haverapeseed and flax, state procurement is a been largely corporatized or privatized. Theseway of financing the procurement of outlets and the retail stores of Belcoopsoyuz arethese items by the processors and beginning to see some competition from private
distributors. retail operators. With the emergence of private
A fairly large portion of the output of retailers, the market shares of the state and thefruits and vegetables (potatoes, in particular) is cooperative union have declined significantly (seegrown on family plots. While some of these are Table B.6); Belcoopsoyuz now accounts for onlysold in the open market, most are consumed by 20 percent of retail distribution in the country.households as a way of supplementing income. Table B.6 also shows that food now occupies aSeveral private traders have also begun to much larger share of retail purchases.emerge, but their share of overall procurement is PROGRESS IN THE REFORM PROCESSstill relatively small.
Distribution Prices
As in procurement, distribution is also Since 1992, prices have been steadilydominated at the wholesale level by three liberalized for most products. (see Tables B.7a-organizations-the former warehouse enterprises B .7c). With the exceptions of oil produced inof the Ministry of Trade, Belcoopsoyuz, and the Belarus, petrochemicals based on Belarusian oil,MoAF. The former warehouse enterprises of the power, natural and liquefied natural gas, certainMinistry of Trade have large central and regional communal services, transport, communications,warehouses devoted to the distribution of meat and to a limited extent vodka, prices on mostand dairy through 8 large cold storage warehouses products are said to be legally free. In cases of(6 in the oblast centers and 2 in Minsk), as well as production determined to be a monopoly, there
the distributio of general food products tremain some margin controls, and prices andthe lar getem al wr ou ( tobucts and changes in prices have to be declared and
2 inrge terminsk which ouhandle intemss lasts andrk registered with the Pricing Committee. Prices also2 In Minsk) which handle Items such as drinks, have to be declared for one type of bread, milkconfectionery, sugar, canned goods, spices, and have to bedced for one type fbread milkliur Becopou .sas ao lyri with 2-3 percent fat, and potash fertilizer. Thereliquor. Belcoopsoyuz is also a ma or player Inr
wladtuoahgttgmk are some margin limits and floor prices set forwholesale distnrbuton, although ae s tasgenera meat (5 percent) and milk (8 percent). Floor
are~~~ prmrl nterrl ara. Iths.0 genral prces are also set for some export products suchwarehouses and 26 larger terminal warehouses. Italso has 227 smaller cold storage warehouses.
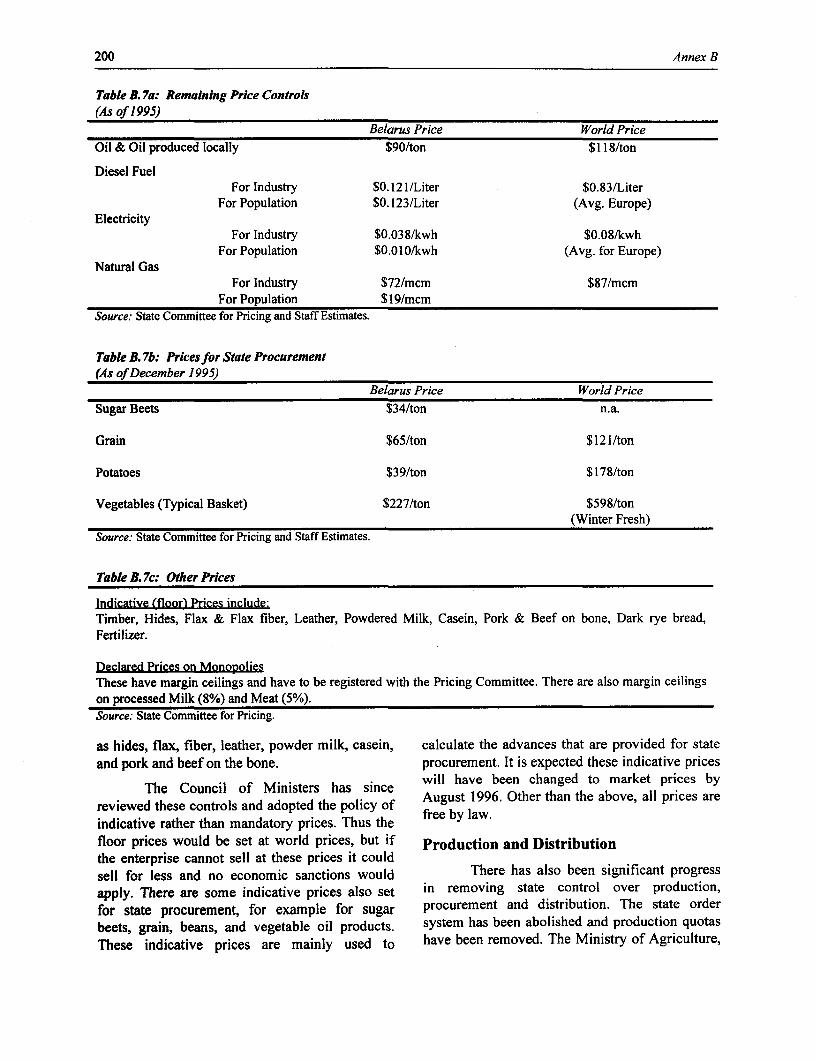
200 Anne-x B
Table B. 7a: Remaining Price Controls(As of 1995)
Belarus Price World Price
Oil & Oil produced locally $90/ton $118/ton
Diesel FuelFor Industry $0.121/Liter $0.83/Liter
For Population $0.123/Liter (Avg. Europe)Electricity
For Industry $0.038/kwh $0.08/kwhFor Population $0.01 0/kwh (Avg. for Europe)
Natural GasFor Industry $72/mcm $87/mcm
For Population $19/mcmSource: State Committee for Pricing and Staff Estimates.
Table B. 7b: Pricesfor State Procurement(As of December 1995)
Belarus Price World Price
Sugar Beets $34/ton n.a.
Grain $65/ton $121/ton
Potatoes $39/ton $178/ton
Vegetables (Typical Basket) $227/ton $598/ton(Winter Fresh)
Source: State Committee for Pricing and Staff Estimates.
Table B. 7c: Other Prices
Indicative (floor) Prices include:Timber, Hides, Flax & Flax fiber, Leather, Powdered Milk, Casein, Pork & Beef on bone, Dark rye bread,Fertilizer.
Declared Prices on MonopoliesThese have margin ceilings and have to be registered with the Pricing Committee. There are also margin ceilingson processed Milk (8%) and Meat (5%).Source: State Committee for Pricing.
as hides, flax, fiber, leather, powder milk, casein, calculate the advances that are provided for stateand pork and beef on the bone. procurement. It is expected these indicative prices
The Council of Ministers has since will have been changed to market prices byreviewed these controls and adopted the policy of August 1996. Other than the above, all prices areindicative rather than mandatory prices. Thus the free by law.floor prices would be set at world prices, but if Production and Distributionthe enterprise cannot sell at these prices it couldsell for less and no economic sanctions would There has also been significant progressapply. There are some indicative prices also set in removing state control over production,for state procurement, for example for sugar procurement and distribution. The state orderbeets, grain, beans, and vegetable oil products. system has been abolished and production quotasThese indicative prices are mainly used to have been removed. The Ministry of Agriculture,
S. Sen Gupta 201
which enterprises make deals and sign contracts 20 have been converted to joint stock companiesfor the season's procurement and delivery. In (accounting for eleven percent of total agro-many cases, agricultural procurement is now processing output) and about twelve are leasedbeing done through direct dealings between companies. While another 111 belong toprocessors, traders and the agricultural producers. Belcoopsoyuz and are therefore technicallyBy a recent decree of the President, all agro- private, these only account for about six percentprocessing enterprises have to be corporatized by of total agro-processing output.the end of 1996.
Most of the vertical structures in MAJOR ISSUES FACING THE SECTORdistribution have been dismantled. For example Regional Price Controlsthe former warehouse enterprises of the Ministryof Trade are no longer controlled by the Ministry In spite of the lack of legal grounds tobut rather are owned by and report to the regional impose price controls, many regional executiveauthorities. As mentioned before, most of the councils (Oblastpolkoms) have aggressivelyretail outlets in the country (nearly 74 percent) sought to enforce price and administrativehave been converted to joint stock companies or controls over the agribusiness enterprisesprivatized, and many of the processors deal operating in their oblasts. In spite of regulationsdirectly with these stores. The monolithic input preventing the oblast administrations from settingsuppliers of the past have also been dismantled, prices, and instances where these authorities haveand the regional Agrosnabs and Agrochemias no been taken to court for violating these regulations,longer report to their republican counterparts. In the regional executive councils, through moralfact, the republican Agrosnabs have diversified suasion, administrative harassment and otherinto other areas of business and often compete means often seek to prevent market prices fromwith their regional units for the farmer's business. emerging. Indicative and floor prices areThere is emerging private activity in imported sometimes enforced by regional authorities asfertilizer supply, which now accounts for about fixed prices deemed necessary in the best social15 percent of consumption, and about 40 percent interests of their communities. Since suchof imported consumption. This private sector enforcement is illegal, the regional executiveactivity in chemicals and fertilizer uses the council often resorts to verbal communicationsinfrastructure of the regional agrochemias on a over the telephone and other means to exert theserental basis. controls.
Ownership While conceived with good intentionsand even though limited, the price interventions
There has also been a significant that remain can often have detrimental sidereorganization of the ownership structure among effects. Anomalies often appear and disincentivesorgans and levels of government - in the are created. For example, one farmer had to sellagroindustry sector. Tables B.3 and B.4 show that raw milk to the processor at an indicative price offlour and cereal production is primarily BYR 1,700 per liter, while the open market priceconcentrated at the republican level, while the was BYR 4,000 per liter. A dairy plant on thecontrol of bakeries is shared between the other hand was unable to compete with importedrepublican authorities and Belcoopsoyuz. On the butter as its cost at this price of milk was USD 2.7other hand, meat and dairy processing is per kilogram-the same as the price of importedconcentrated at the regional level, while fruit and butter. The plant therefore had no margin forvegetable processing is shared between regional processing costs or profits. The dairy plant feltownership and Belcoopsoyuz. that the imported butter was subsidized.
The privatization program essentially Another example where price supports mightcame to a halt sometime in 1993, and very little have been detrimental is in cattle breeding, whereprogress has been made since then. Out of a total price interventions, most recently floor prices,of about 456 agro-processing enterprises, about
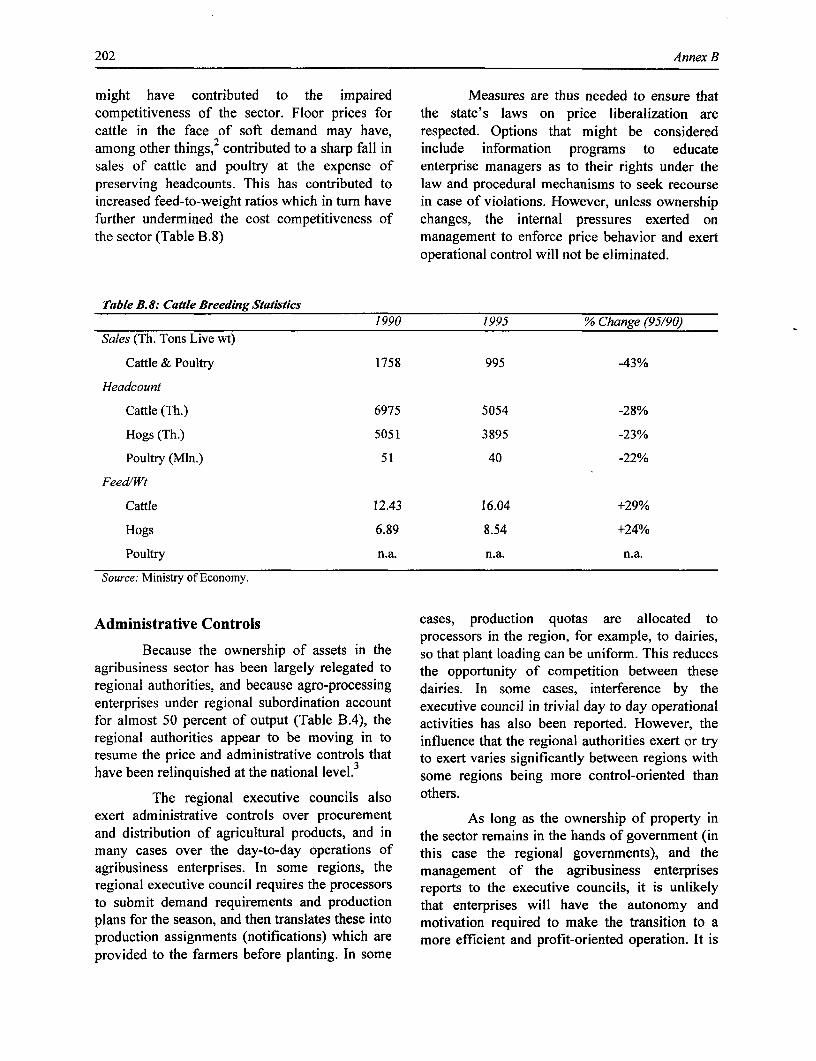
202 Annex B
might have contributed to the impaired Measures are thus needed to ensure thatcompetitiveness of the sector. Floor prices for the state's laws on price liberalization arecattle in the face of soft demand may have, respected. Options that might be consideredamong other things, contributed to a sharp fall in include information programs to educatesales of cattle and poultry at the expense of enterprise managers as to their rights under thepreserving headcounts. This has contributed to law and procedural mechanisms to seek recourseincreased feed-to-weight ratios which in turn have in case of violations. However, unless ownershipfurther undermined the cost competitiveness of changes, the internal pressures exerted onthe sector (Table B.8) management to enforce price behavior and exert
operational control will not be eliminated.
Table B.8: CaGte Breeding Statistics
1990 1995 % Change (95/90)Sales (Th. Tons Live wt)
Cattle & Poultry 1758 995 -43%
Headcount
Cattle (Th.) 6975 5054 -28%
Hogs (Th.) 5051 3895 -23%
Poultry (Min.) 51 40 -22%
Feed/Wt
Cattle 12.43 16.04 +29%
Hogs 6.89 8.54 +24%
Poultry n.a. n.a. n.a.
Source: Ministry of Economy.
Administrative Controls cases, production quotas are allocated toprocessors in the region, for example, to dairies,
Because the ownership of assets in the so that plant loading can be uniform. This reducesagribusiness sector has been largely relegated to the opportunity of competition between theseregional authorities, and because agro-processing dairies. In some cases, interference by theenterprises under regional subordination account executive council in trivial day to day operationalfor almost 50 percent of output (Table B.4), the activities has also been reported. However, theregional authorities appear to be moving in to influence that the regional authorities exert or tryresume the price and administrative controls that to exert varies significantly between regions withhave been relinquished at the national level.3 some regions being more control-oriented than
The regional executive councils also others.exert administrative controls over procurement As long as the ownership of property inand distribution of agricultural products, and in the sector remains in the hands of government (inmany cases over the day-to-day operations of this case the regional governments), and theagribusiness enterprises. In some regions, the management of the agribusiness enterprisesregional executive council requires the processors reports to the executive councils, it is unlikelyto submit demand requirements and production that enterprises will have the autonomy andplans for the season, and then translates these into motivation required to make the transition to aproduction assignments (notifications) which are more efficient and profit-oriented operation. It isprovided to the farmers before planting. In some
S. Sen Gupta 203
thus critical to accelerate the divestiture of However, incomes in the case of Belarusownership from government to private hands. can only increase through investment and fullerThere appeared to be significant support for this utilization of human resources and of theat the enterprise level, even though this was not significant existing capital stock. Since, forthe case at the ministerial or regional level. reasons of macroeconomic stability, internal
credit expansion is not an option, significantShortage of Working Capital reliance would need to be placed on foreign
There is also a severe working capital investment in order to restructure the existingshortage being reported by enterprises at all levels productive capacity to increase income levels andof the agribusiness chain. While the cost and lack regain previous standards of living. This againof credit due to macroeconomic stabilization would require a demonstrated willingness on themeasures are seen as barriers to a solution to this part of the government to privatize and create aproblem, the roots of the problem can be traced to healthy private sector environment in order toother factors as well. Closer inspection of the attract this investment.working capital problem reveals that payment Once the required structural changes arearrears by state-owned wholesale and distribution in place and privatization in the agribusinessenterprises (as well as temporary payment delays) sector starts to gather momentum, somewhich reduce the real value of eventual proceeds immediate initial infusion of working capitalare also major contributors to the working capital would be essential to restart the sector. Aproblem. These payment arrears can be traced to financial sector would also need to be in place to(a) the lack of recourse mechanisms for state- serve the normal credit needs of the privatizedowned suppliers to enforce collection on state- enterprises in the sector with adequate financialowned customers, (b) a lack of demand ascribed intermediation. This might require significantto greater demand for imported goods; and (c) the external financial as well as consultative support.mismatch between price and consumer income Without this the privatization process and thelevels. public commitment to it is likely to falter.
Again, unless the state-owned distribution Fiscal Burdenenterprises are privatized, they cannot beadequately subjected to collection processes and In the meantime, agriculture and to somethe financial discipline that these processes bring. extent agroindustry continue to consumeState-owned enterprises, albeit regional ones in significant fiscal resources. This burden is boththis case, can seldom foreclose on other state direct (on budget), as well as indirect, (offowned enterprises. The issue of import budget). There also appear to be parallel fiscalcompetition, while a positive trend, is presently activities being conducted by branch ministriessubject to certain distortions that might need to be such as the Ministry of Agriculture.addressed. The complaint often heard is that in Direct budget support to agriculture hasspite of inferior quality and higher prices, amounted to BYR 3.1 trillion in 1996, includingconsumers still prefer imports due to better BYR 808 billion in local budget subsidies topackaging. It is likely that in some cases, the clt fam for procuret ouientprice premium for the packaging and the related andcinu (mi fertlzrs,elte seed cattquality differential perceived would be much ec) Extrabudgetar financing amuts ctolBY
highr i th exhane raes ad eptup ith etc.). Extrabudgetary financing amounts to BYRhilgher If the exchange rates had kept up with 2.2 trillion, including BYR 0.4 trillion for leasinginflation. As to the mismatch between prices and of agricultural equipment. As a result, in 1996 theincomes, there may be some validity to this issue. to amount opubic Asu t arulture1 canPrices for many if not most food items are be emaeat BY 5.3 tsurillon.approaching world levels while consumerincomes remain a fraction of that. This is also In addition to off-budget supportevidenced by the larger share of food in retail accountable through the Ministry of Finance,purchases (Table 8.6). there are other funds which are mobilized and
204 Annex B
spent by ministries such as the Ministry of cold storage warehouses in portions or modules toAgriculture, thus, by-passing the Ministry of different owners who could then compete withFinance. While fully aware of the process, The one another. As additional or alternative capacityMinistry of Finance appears not to have any is built these restrictions could be relaxed.record of these fiscal transactions. Examples of Grain elevators also pose a significantthese transactions are the Centralized Investment Gram ele., alsopony a moreFunld and the Research and Development Fund. monopoly (I.e., monopsony or moreFu..d andteResarchandDvelomentun appropriately, oligopolistic) threat. GenerallyThese funds are mobilized by levying upon the each region is served by a few large elevatorindustry sector 15 percent of the depreciation, and facilities which procure, dry and store the grain.
I percent of prime cost for the former, and 1 Because most farms do not have their ownpercent of revenue for the latter. The proceeds are storage and drying capabilities, they are captive tothen provided as a subsidy to the agriculture these grain elevators enterprises. The republicansector. It was not clear if these contributions or authorities, who presently own all but 2 of thelevies were voluntary or mandatory. The exact feviges fore thesetsupport prndtogra wherexat largest of these facilities, can use this power overfigurea confirede bupport progr were inom eimated farmers to enforce price and delivery norms thatbyearious soufirces uto bere BYRn trillyestion, e are set for flour and bread products. The activities
of these elevators would have to be closelyThe total fiscal burden of the sector monitored and regulated in order to assure the
would thus be at least BYR 8-9 trillion or about 7 producers a fair and competitive market for theirpercent of GDP. output. Again as on-farm storage and drying
facilities emerge, these regulations could bePotential Monopolies relaxed and eventually eliminated.
Once privatization begins to progress and The Belcoopsoyuz could also emerge as aeconomic activity increases, the structural major monopoly in the agribusiness chain. Thisconfiguration of the agribusiness system in organization owns a significant share of theBelarus may give rise to certain monopoly agribusiness infrastructure in the rural areas. Assituations which would need to be addressed. The mentioned before, they own a significant numbermajor areas where this could occur are in the cold and share of the cold storage and warehousestorage warehouses, grain elevators, and facilities in the rural areas. They also have 10organizations such as the Belcoopsoyuz. large trucking enterprises comprising 11,000
As mentioned before, the cold storage vehicles, and presently operate over 13,000 retailcapacity of the country is concentrated in 8 large outlets in the rural areas.4 While in the otherregional cold storage warehouses. Once republics of the FSU the coop unions haveprivatized, these could begin to exert a strong essentially lost a major portion of their marketmonopolistic influence on the market. Safeguards share due to financial difficulties and competitionwould need to be in place to reduce the potential from emerging private traders, in Belarus thefor market manipulation by these entities. The coop union appears to be very much intact. Somecold storage facilities were previously used to restructuring and dismantling of this organizationmaintain buffer stocks to seasonally balance the might thus be needed in order to reduce itssupply and demand for meat and dairy products. potential monopoly threat as the economyAlthough currently these warehouses are under- strengthens.utilized due to the shortage of working capital, Although the Agrosnab organization hasand most of the trading bypasses them, upon been a potential monopoly threat in otherprivatization they could provide their owners republics of the FSU, the dismantling of itssignificant leverage over local production, supply, vertical structure and the incipient competitionand prices. One option might be to limit the between the regional and national levelowners of these facilities to only renting space Agrosnabs significantly reduce this threat. Oneand not using these facilities to store their own issue to address however, is the subsidized stateproducts. Another alternative would be to sell the
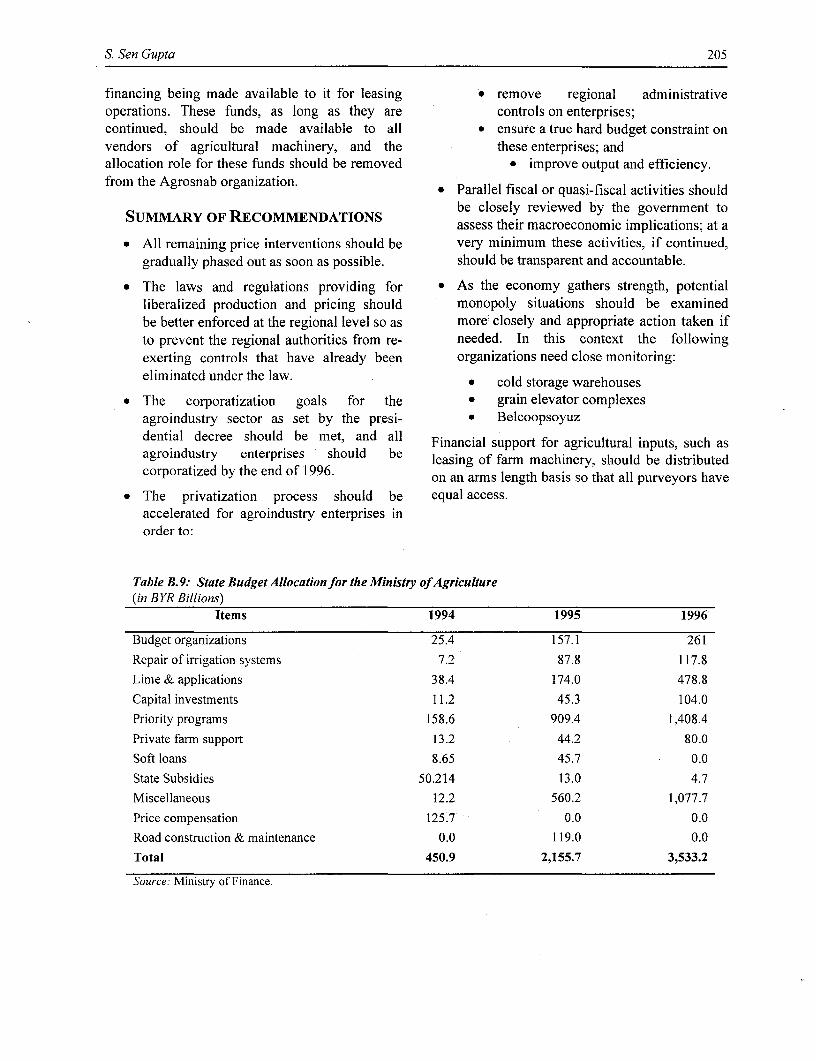
S. Sen Gupta 205
financing being made available to it for leasing * remove regional administrativeoperations. These funds, as long as they are controls on enterprises;continued, should be made available to all * ensure a true hard budget constraint onvendors of agricultural machinery, and the these enterprises; andallocation role for these funds should be removed * improve output and efficiency.from the Agrosnab organization. * Parallel fiscal or quasi-fiscal activities should
SUMMARY OF RECOMMENDATIONS be closely reviewed by the government toassess their macroeconomic implications; at a
* All remaining price interventions should be very minimum these activities, if continued,gradually phased out as soon as possible. should be transparent and accountable.
* The laws and regulations providing for * As the economy gathers strength, potentialliberalized production and pricing should monopoly situations should be examinedbe better enforced at the regional level so as more closely and appropriate action taken ifto prevent the regional authorities from re- needed. In this context the followingexerting controls that have already been organizations need close monitoring:eliminated under the law. * cold storage warehouses
* The corporatization goals for the * grain elevator complexesagroindustry sector as set by the presi- * Belcoopsoyuzdential decree should be met, and all Financial support for agricultural inputs, such asagroindustry enterprises should be leasing of farm machinery, should be distributedcorporatized by the end of 1996. on an arms length basis so that all purveyors have
* The privatization process should be equal access.accelerated for agroindustry enterprises inorder to:
Table B.9: State BudgetAllocation for the Ministry of Agriculture(in BYR Billions)
Items 1994 1995 1996
Budget organizations 25.4 157.1 261
Repair of irrigation systems 7.2 87.8 117.8
Lime & applications 38.4 174.0 478.8
Capital investments 11.2 45.3 104.0
Priority programs 158.6 909.4 1,408.4
Private farm support 13.2 44.2 80.0
Soft loans 8.65 45.7 0.0
State Subsidies 50.214 13.0 4.7
Miscellaneous 12.2 560.2 1,077.7
Price compensation 125.7 0.0 0.0
Road construction & maintenance 0.0 119.0 0.0
Total 450.9 2,155.7 3,533.2
Source: Ministry of Finance.
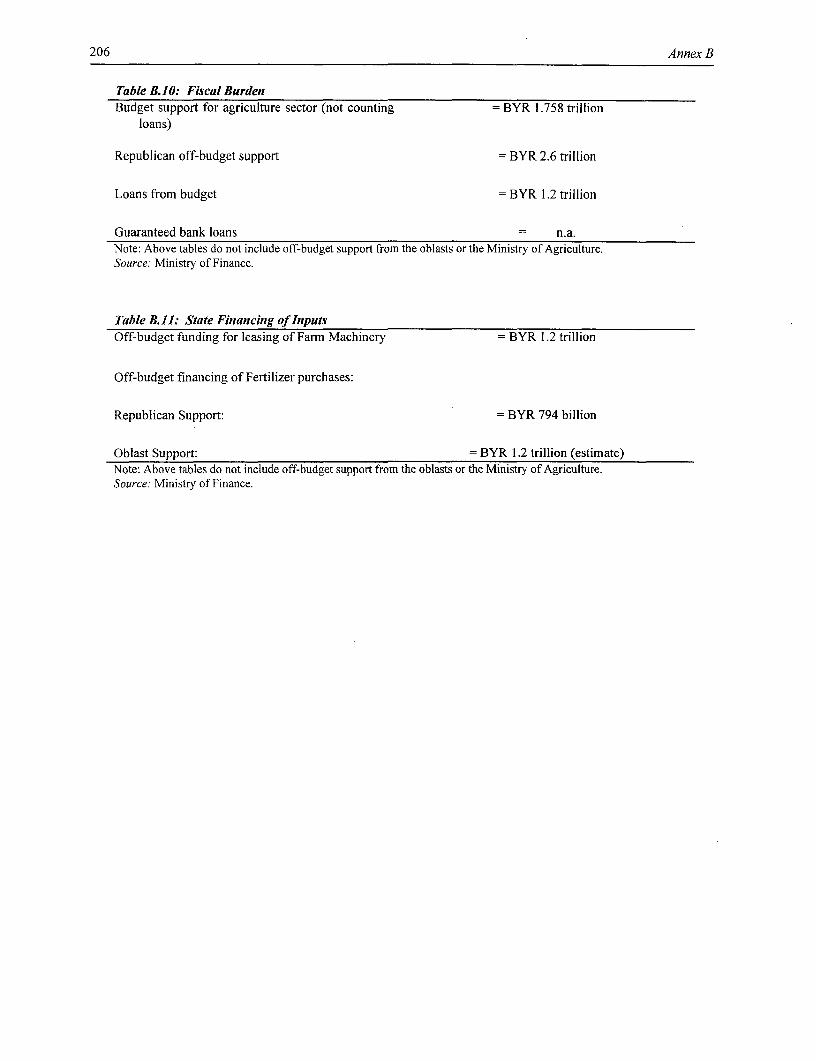
206 Annex B
Table B.10: Fiscal BurdenBudget support for agriculture sector (not counting = BYR 1.758 trillion
loans)
Republican off-budget support = BYR 2.6 trillion
Loans from budget = BYR 1.2 trillion
Guaranteed bank loans = n.a.Note: Above tables do not include off-budget support from the oblasts or the Ministry of Agriculture.Source: Ministry of Finance.
Table B. 11: State Financing of InputsOff-budget funding for leasing of Farm Machinery = BYR 1.2 trillion
Off-budget financing of Fertilizer purchases:
Republican Support: = BYR 794 billion
Oblast Support: = BYR 1.2 trillion (estimate)Note: Above tables do not include off-budget support from the oblasts or the Ministry of Agriculture.Source: Ministry of Finance.
S. Sen Gupta 207
Notes
I Interviews with a collective farm and a dairyplant.
2 For example, the effects of increased realexchange rates on exports. One collective farmvisited exported cattle to Poland for a profit at$600/ton before 1995, but today it loses moneyeven at $800/ton.
3 The administrative structure at the oblast level issomewhat complex. First, there is the regionalexecutive council (oblast plodkom) which is partof the oblast government, and then there is theOblastselchosprod which is the oblastcounterpart, and previously a branch of theMinistry of Agriculture. The enterprise reportsdirectly to the former, and indirectly to the latteron policy and technical issues. In addition, thereis the management association for the enterprise'scommodity group which straddles the twoadministrative organs and to which the enterprisealso reports. This results in significantopportunity for command and control tactics andalso provides the opportunity for conflictingdirectives.
4 This figure excludes restaurants and other publiccatering facilities.

ANNEX C
The Sustainability of External Debt
Sergei Shatalov
209

The Sustainability Of External DebtSergei Shatalov
From 1992 to 1995, external debts country's liquidity position may becomeaccumulated rapidly in Belarus. At the end of stressed.) The debt-to-GNP ratio stood at 211995, the country's external public debt stood at percent in 1995. (For this ratio, the "sustainability
USD 1.95billon.IOfthitotl,2pecentwas threshold" is widely considered to be 50 percent).USD 1.95 billion. Of this total, 24 percent was Athesm ti,exrnlndbdesha
owe t Rusi; blaerl OCDcreitrs el 4 At the same time, external indebtedness hasowed to Russia; bilateral OECD creditors held 49 grown rapidly during 1992- 1995, with most of thepercent (including both official lending and dtontractd on non-concessioa ms. thedebt contracted on non-concessional terms. Theofficially guaranteed export credits). latter is reflected in the high ratio of the presentMultilaterals, including the IMF, held 27 percent. value of debt to its nominal value, which stood at
FSU Debt 81 percent at the end of 1994 and implied a grantelement of less than 20 percent.
Belarus was one of the first CIS countriesto sign the "zero option" agreement with Russia The reasons for this rapid accumulation(on July 20, 1992).2 Under the zero option of debt become evident once the overall liabilityagreements, Russia assumed full responsibility position of Belarus is examined. In addition tofor external assets and liabilities of the FSU. This almost USD 2 billion in public debt owed by thewas confirmed on April 2, 1993 in a special central Government and public enterprises, thestatement made by the Russian Government at the latter at end- 1995 also had payment arrearsParis Club meeting. Belarus, therefore, has no totaling USD 679 million for energy imports fromliabilities arising from the external borrowing of Russia, with another USD 253 million inthe Soviet Union.3 penalties for these overdue payments. The total
external liabilities of Belarus at end-1995 thusNew Borrowing stood at USD 2.88 billion, equivalent to 31
Borrowing was undertaken in 1992-1995 percent of GDP. Russia's share in Belarus' totalboth by the central Government and by liabilities was also much higher at 49 percententerprises, with the latter contracting debt both (compared to 24 percent for the public debt only).
with and without the government guarantee. The The inclusion of enterprise cross-borderamount of non-guaranteed enterprise debt is arrears in the debt sustainability analysis is ofestimated by the Belarusian MOF at about 19 critical importance, due to the pattern ofpercent of the total debt outstanding at end- 1995. transformation of enterprise payment arrears intoIt is very important to note that even when long-term public debt. This is a region-wideenterprises contract external debt without the pattern, which is sometimes called "involuntaryexplicit payment guarantee of the central lending" and is caused by the interdependence ofGovernment, the creditors consider this debt as CIS economies, and in particular by thepublic, because all borrowers remain in public dependence of other CIS states on gas and oilownership. Since the start of sovereign borrowing imports from Russia and Turkmenistan.in 1992, the Government of Belarus was Belarus was luckier than many other FSU
displaying a commendable realism, monitoring states, since in the early 1990s its energy importenterprise debt on an equal footing with the debt prices were rising more slowly. However,of the central Government. Belarus' economy was adjusting to this terms-of-
If only the public external debt proper trade shock much more slowly than many of its(including external debts of public enterprises) neighbors, and the Government was unwilling towere taken into account, the creditworthiness pass higher energy prices on the consumers.indicators would be comfortably low. The debt Consumers continued to run up huge arrears onservice ratio in 1995 was less than 5 percent. (20 payments to Beltransgas and Beltopgas, the twopercent is often quoted as a level above which the main energy importers, which in turn
211
212 Annex C
accumulated large trade arrears to the Russian To prevent another transformation ofexporter, RAO Gazprom by early 1993. Smaller payment arrears into public debt, Belarus enteredamounts of arrears were accumulated by into bilateral negotiations with Russia, and onimporters of other CIS goods. February 27, 1996 the two sides signed an
On June 30, 1993 Russia and Belarus Intergovernmental Agreement on the Mutualsignd anagremen tha cosoliatedall Settlement of Claims. The agreement sets thesigned an agreement that consolidated all mutual claims of the two sides as follows: 5
enterprise arrears into long-term public debt ofUSD 385.4 million. Similar bilateral 1. Russian claims on Belarus:consolidation agreements were made between all aCIS republics, but in a unique exception to the amount)ofaUSD470- milliond andusual CIS practice, debt consolidation for Belarus awas granted on concessional terms (zero interest b) enterprise gas arrears and penaltiesrate, maturity of 14 years and a grace period of 7 for late gas payments in the amountyears). The consolidation loan for Belarus was of about USD 900 million (the exactdenominated in U.S. dollars, but at the same time amount to be agreed upon by the twothe agreement allowed debt servicing in kind. In sides).1993-1994, two new Russian trade credits were 2. Belarus claims on Russia:granted to Belarus that added another USD 84.6million to its external debt.4 a) claims of Belarusian enterprises on
Russian Vneshekonombank (VEB),Belarus also accumulated external debt to arising from the freezing of their
non-CIS creditors. Much of the debt contracted in accounts in VEB in 1991, of about1992-1993 from bilateral creditors (in particular, USD 200 million.Germany) was on market terms. The centralGovernment's repayment record vis-A-vis the b) liabilities of the Russian GovernmentOECD countries remains impeccable, but the arising from the transfer of fissileenterprises have run up modest arrears on their material to Russia (in the amount tohard-currency debts. These arrears are estimated be agreed upon by the two sides);by the Ministry of Finance at USD 15 million at c) claims related to the environmentalMarch 31, 1996. Belarus' long-term ability to damage inflicted in the process ofcarry external debt on commercial terms in the withdrawing Russian strategic troopsenvironment of slow growth and slow reforms from Belarusian territory (amount tomay be less than certain. be agreed upon).
Adjustment to the intra-FSU terms-of- The amount of Belarusian claims undertrade shock remained very insufficient over 1994- 2(b) and 2(c) combined is estimated by1995, as there was no improvement in the Belarusian authorities at about USD 1 billion.collection of arrears owed by domestic These detailed numbers are currently beingconsumers, and trade arrears to Russia continued reviewed by the two sides. Until theto accumulate as well. By December 31, 1995 reconciliation of debt data, it is impossible toarrears to Russia reached USD 654 million; determine whether this Agreement will eliminateanother USD 262 million was owed in penalties all of Belarus' liabilities to Russia, including theon overdue gas payments. On the other side, long- gas arrears, or whether there will remain a debtorterm debt to Russia did not represent a serious balance that will be transformed into long-termliquidity constraint in 1994-1995, since only debt (like in 1993). It is clear, however, that thesmall interest payments were falling due (about Agreement would substantially reduce the totalUSD 1 million as reported under the Debt liabilities of Belarus' public sector to Russia.Reporting System). Belarus has no arrears on its Further work is required to evaluate thepublic debt to Russia. implications of this Agreement on the debt
prospects of Belarus.

S. Shatalov 213
The Agreement's implementation passed by the Russian Government to Gasprom asmechanism remains to be clarified as well. It is a form of clearance of gas arrears owed to it byproposed that the two Ministries of Finance Belarus, and that the latter would then be able towould issue and exchange promissory notes convert these claims into equity on the territory ofwhich would then will be canceled. However, it is Belarus. It is useful to evaluate the likelihood andalso envisaged that part of these notes will be the macroeconomic and fiscal implications of
such debt-for-equity programs.
214 Annex C
Notes
I Not to be confused with the agreement signedwith Russia on February 27, 1996, on the mutualsettlement of debt claims, which is also called the"zero variant."
2 Zero option agreement of 1992 did not includethe 1992 disbursements on the territory ofBelarus under loans signed by the last SovietGovernment, in the amount of USD 131.4million. The legal status of this debt is not clear;there has been no communication between thetwo Governments regarding it since 1994.Belarusian authorities believe that Russia will notbe able to insist on its repayment.
3 The original commitment amounts for thesecredits were RUR 70 billion and RUR 150billion. The first one was utilized in full; underthe second one, only about RUR 110 billion wasdisbursed. To minimize the creditor's exchangerate risk, the stock of debt outstanding was fixedin dollars, with the ruble amount of individualdrawings under these loans converted into dollarsat the ruble/dollar rate fixed on the day of eachdrawing.
4 The text of this agreement is not available to theWorld Bank. It is summarized here on the basisof discussions with officials from Belarus MOF.
ANNEX D
Macroeconomic Projection Framework
Yuri Sobolev
215

I
Y. Sobolev 217
RMSM-X:A Flow-of-Funds Framework for Modeling Economic Policy Options
Yuri Sobolev
MODEL STRUCTURE
The model used to develop. the loans be equal to the demand. Broad moneymacroeconomic scenarios presented in this report consists of currency in circulation, demandis based on a flow-of-funds framework that relies deposits, and time deposits.3 Foreign loans areon a fundamental accounting identity- available to all domestic sectors, that is, to theexpenditures on consumption, public and private government, private, and monetary sectors.investments, and net exports (exports minus Borrowing from abroad is determined byimports) must be equal to gross domestic product the balance of payments requirement. Theat market prices. In addition, the model amounts likely to be disbursed by foreign lendersincorporates budget constraints for each of the from existing loans as well as from expectedfollowing sectors: (a) the public sector, defined as commitments to the central govemment arethe central government; (b) the financial sector,defined as the monetary system consisting of the input data on the external debt flows and stockscentral bank and commercial banks; (c) the are taken from the World Bank Debt Reporting"private" sector, defined as a residual domestic ten from the stock of eportingsector; and (d) the foreign sector or the rest of System, which provides the stock of existing debtthe world, which is defined as the balance of and projections of disbursement and repaymentpayments viewed from outside the country. The flows based on this stock. New loan commitmentspaymntsvleed romoutsde he ounry.The are entered based on the amount of borrowingbudget constraints require that the total sources consered pose om eacource (ofica(or revenues) for each sector equal the sector's internationa financial institutions, bilateraltotal uses (or expenditures), and that a use in one official creditors, commeial inders, ateralsector be a source of funds in another sector. , rcial lenders, and so on).
The model then computes the streams of grossThe model distinguishes between current and net disbursements, as well as debt service
and capital transactions. Each of the sectoral flows, for each creditor. Any additional foreignbudget equations is expressed as current or capital capital required to close the balance of paymentssources and uses of funds. The difference between financing gap is assumed to be provided by acurrent income and current expenditure is "marginal" (or residual) lender. This "gapfill"savings, which in turn are a capital source of loan is calculated and assigned in the presentfunds. Investment and capital transfers represent version of the model to the private sector rathercapital uses of funds. than the public sector because the maximum
Besides the four budget equations for borrowing thought to be possible by the publicsector is reflected in the input data for the model.each sector (current and capital sources and uses Thi ga .ln crdi isasmdt.oefo
of funds), the model incorporates four market- fris n cm eria bans.me th ten andclearing conditions for financial assets. These g ters andconditions require that the supply of broad conditions of the gapfill loan are set to be equal to
domestic the terms and conditions of a regular loan frommoney, domestic credit, government oms comeca akceiosborrowing from the private sector, and foreign
217
218 Annex D
GENERAL ASSUMPTIONS
Assumed values for the following the range of their empirical plausibility and resultvariables are entered directly into the model: in total export growth rates that are similar to(a) GDP growth rates by sector; (b) inflation per those of middle-income economies. The currentannum (GDP deflator); (c) gross domestic account deficit is limited to about 6 percent ofinvestment and foreign direct investment as GDP, thus helping assure a sustainable externalshares of GDP; (d) foreign portfolio investment as debt service position.a percentage of foreign direct investment; (e) The price indices of the country's exportsgovernment consumption and government and imports, which are not differentiated byinvestment as shares of GDP; (f) direct taxes as a product, are given exogenously based on thepercentage of GDP at factor costs; (g) monetary Manufactured Unit Value (MUV) index (which issector credit to the public sector as a percentage .of government budget deficit; and (h) broad equivalent to world inflation),. This series ismoney velocity. Thvprovided by the World Bank's Commodity andmoney velocity. The values assigned to these Policy Analysis Unit. The model calculates thevariables take into account the values for . .corresponding indicators from countries of price index of consumption goods (CPI).similar size and level of development that have The nominal exchange rate path isalready established market-based economies. determined by specifying the rate of devaluation.
The model then calculates the path of the realThe rate of growthofexprtsexchange rate by linking the nominal exchange
and non-factor services is jointly determined by rate with the GDP deflator and the MUV index. 6the following external sector parameters: (a) Devaluations of 100 and 50 percent in 1997 andelasticity of manufactured goods exports withrespect to the real exchange rate; (b) foreign the real exchange rate more or less in line with
fundamentals. These can be broadly defined asdemand for domestic exports with respect to determined by productivity growth in the tradedforeign income; and (c) assumed export growth goods sector and domestic inflation; these factorsrates for primary goods and non-factor services. plus historical trends in trade balances andThe rate of growth of imports of goods and non- movements in external reserves indicate the ratefactor services is determined by: (a) elasticities of needed to establish a competitive, sustainableimports with respect to the real exchange rate and balance-of-payments position. The real exchangeGDP; and (b) elasticity of capital goods imports rate is assumed to appreciate back to its 1995with respect to gross domestic investment. The level in the latter years of the model as the resultvalues of the above parameters are chosen within of future productivity gains.
SOLUTION PROCEDURE
The solution procedure starts with the private investment equals gross domesticgoods market. The paths of real GDP, gross investment minus government investment.domestic investment, government consumption The change in money stock is determinedand investment, and total exports and imports are through the quantity theory of money equation,calculated as specified functions of the user- which says that nominal money stock equals GDPsupplied parameters. Private consumption and in constant (base year) prices times GDP deflatorinvestment, which are the residual variables, are divided by the velocity of broad money. Thedetermined through the goods market identity: value of total banking system credit is calculatedprivate consumption equals GDP at market prices as the residual stock on the monetary sectorminus net exports minus gross domestic accounts. Since the value of the public sectorinvestment minus government consumption; and credit from the banking system is specified
exogenously as a percentage of nominal GDP,
Y. Sobolev 219
banking system credit to the private sector and all non-debt and short-term capital flows, andhence the flow of private credit can also be changes in the stock of foreign exchange reserves.determined. Net private sector borrowing from abroad is thus
The change in the country's foreign calculated as the difference between total netindebtedness--the gapfill loan charged to the capital inflow and net capital inflows to the publictndebtedness-the~ an mapnela secors Hence,d the vaueofthprivate sector-is the residual value needed to and monetary sectors. Hence, the value of theclose the foreign sector identity after allowing for gapfill loan is also known.
220 Annex D
Notes
I State-owned enterprises are thus defined asbelonging to the private sector. It is implicitlyassumed that privatization would beimplemented, that the role of governmentsignificantly reduced, and that enterprises still inthe public sector would be subjected to hardbudget constraints as recommended in thisreport, thus leading them to behave like privatesector entities. That would make the definitionof the private sector more meaningful.
2 For example, a tax payment would be a currenttransaction. Borrowing, which creates afinancial asset for the lender and a financialliability for the borrower, would be a capitaltransaction.
3 The private sector holds currency and deposits.Credit is extended to government as well as tothe private sector.
4 Defined as the ratio of the percentage change inmanufactured goods exports to a one percentchange in the real exchange rate, reflecting thefact that a competitive real exchange rate thatcompensates for domestic inflation in excess ofthat in trading partner countries is vital to thesuccess of exports.
5 Except for the price of energy imported fromRussia in the first three years of the projectionperiod. It is assumed that the Russian energyprice charged to Belarus will converge to thatprevailing in the world market as soon as in1998. Starting in 1999 the imported energy pricewill be determined by the MUV index.
6 The real exchange rate index produced by themodel is bilateral with respect to the U.S. dollar,and does not represent a trade-weightedmultilateral index.
ANNEX E
Purchasing Power Parities
John Hansen
221

Purchasing Power ParitiesJohn Hansen
Although purchasing power parity PPP U.S., an exchange rate of JPY 169 per U.S. dollarrates can be difficult to calculate and interpret, the would have been needed. Since the number of yenconcept is really very simple. It says that, once required to purchase a dollar was higher at theoverall price levels in different countries have PPP rate than at the market rate, the market ratebeen converted to a common currency, the overvalued the yen in PPP terms-by nearly 75
2national average price levels should be percent. The tendency of market rates toequal-the Law of One Price. If prices are not converge with PPP rates is seen in theequal, traders will make a profit by purchasing developments since then in the yen/dollargoods in countries where they are cheaper and exchange rate. By April 1997, the market rate hadselling them where they are more expensive. In moved to 126 yen per dollar, very close to the Bigtheory, this arbitrage will continue until prices Mac PPP rate of 121 yen per dollar.have been equalized. According to the Law of Much of the empirical work on PPP rates
One Price, if the current exchange rate does iot In the current century has been designed to findmake the prices equal, the exchange rate is eitherrates do notovervalued or undervalued. The prices of
converge as theory says they should. Theindachivdualtg s mhay of couerse v ly, and literature on this topic, which has been ablyresearch indicates that prices converge slowly and smaie yRgf 19) n miiaimperfectly, but If one takes the average national smaie yRgf 19) n miiaprices, as is done when cakculating the consumer research done for the present report reveal theprics, s isdon whe caculaingthe onsmer following factors of special relevance. First, theprice index, for example, the price levels should floigfcoso pca eeac.Frt hbrie similar ifot exchang,the prate arevel chorrt prices of goods that are not traded internationally
be s r iare not subject to arbitrage. The prices of suchaccording i to the purchasing power parity "non-traded" goods will gradually converge withprinciple. international prices, but much less quickly than
The PPP concept has been made popular those for traded goods. For example, the cost ofand easy to understand by The Economist's most non-traded goods depends heavily on wageannual publication in recent years of a "Big Mac costs, but the wages for workers producing non-Index" (BMI). The Economist uses the price of traded goods and services such as restaurantthe Big Mac hamburger sandwich that is sold in meals will not rise towards international levelsMcDonalds restaurants around the world as a until the demand for labor to produce tradedproxy for the national price levels in each goods pushes up wages in the non-traded sectorcountry. The Big Mac is a reasonably good by attracting workers into the production ofindicator for this purpose because (a) it is a traded goods and services. Second, economies inhomogenous product across countries, and (b) it transition by definition have not yet establishedhas a high domestic content. These prices are well-functioning markets, and this increases theused to calculate a PPP exchange rate that would share of goods that are not subject to arbitrage.make this hamburger cost the same in dollars as it For example, market imperfections such ascosts in the United States. This PPP exchange rate noncompetitive exchange rates, protective tariffs,is then compared with the market exchange rate. and poorly-developed international marketingIf the PPP rate is higher, the currency is common in these countries restrict the growth ofovervalued with respect to the dollar. If the PPP exports, leaving more goods in the non-tradedrate is lower, the currency is undervalued. For category and thus not subject to the direct tradingexample, in August 1995, the yen/dollar exchange and arbitrage that leads to international pricerate was JPY 97 per U.S. dollar. However, to convergence. Third, countries that are relativelymake a Big Mac in Japan cost the same as in the wealthy have usually attained this status because
223
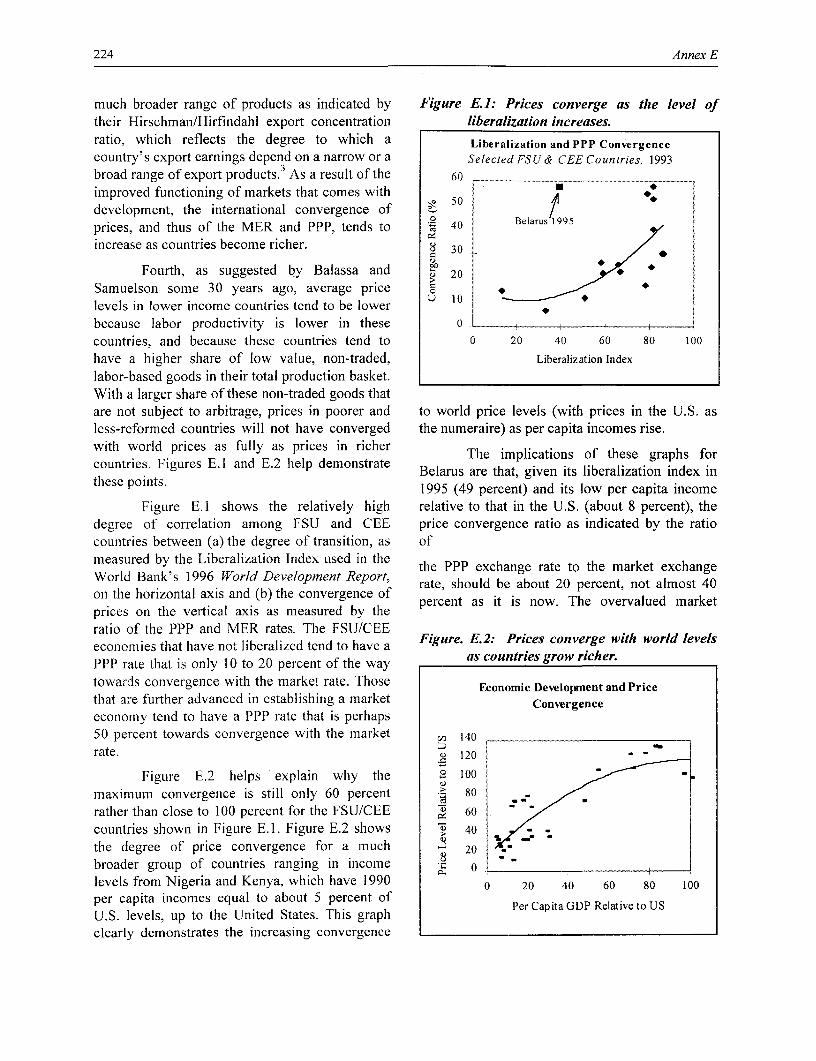
224 Annex E
much broader range of products as indicated by Figure E.1: Prices converge as the level oftheir Hirschman/Hirfindahl export concentration liberalization increases.ratio, which reflects the degree to which a Liberalization and PPP Convergence
country's export earnings depend on a narrow or a Selected FSU& CEE Countries, 1993
broad range of export products. 3 A s a result of the 60 ... 60.................................................................. -improved functioning of markets that comes withdevelopment, the international convergence of s/prices, and thus of the MER and PPP, tends to ° 40 Belarus 1995
increase as countries become richer. c
Fourth, as suggested by Balassa andSamuelson some 30 years ago, average pricelevels in lower income countries tend to be lower X 10because labor productivity is lower in these 0 l_ _ _l
countries, and because these countries tend to 0 20 40 60 80 100
have a higher share of low value, non-traded, Liberalization Indexlabor-based goods in their total production basket.With a larger share of these non-traded goods thatare not subject to arbitrage, prices in poorer and to world price levels (with prices in the U.S. asless-reformed countries will not have converged the numeraire) as per capita incomes rise.with world prices as fully as prices in richer The implications of these graphs for
countries. Figures E. 1 and E.2 help demonstrate Belarus are that, given its liberalization index inthese points. 1995 (49 percent) and its low per capita income
Figure E.1 shows the relatively high relative to that in the U.S. (about 8 percent), thedegree of correlation among FSU and CEE price convergence ratio as indicated by the ratiocountries between (a) the degree of transition, as ofmeasured by the Liberalization Index used in the the PPP exchange rate to the market exchangeWorld Bank's 1996 World Development Report, rate should be about 20 percent, not almost 40on the horizontal axis and (b) the convergence ofprices on the vertical axis as measured by theratio of the PPP and MER rates. The FSU/CEEeconomies that have not liberalized tend to have a Figure. E.2: Prices converge with world levelsPPP rate that is only 10 to 20 percent of the way as countries grow richer.towards convergence with the market rate. Those Economic Development and Price
that are further advanced in establishing a market Convergenceeconomy tend to have a PPP rate that is perhaps50 percent towards convergence with the market 140 - _
rate. 120
Figure E.2 helps explain why the ' 100jmaximum convergence is still only 60 percent Ia 80 ,rather than close to 100 percent for the FSU/CEE g 60countries shown in Figure E.I. Figure E.2 shows , 40the degree of price convergence for a much 20 - -broader group of countries ranging in income v °_l
levels from Nigeria and Kenya, which have 1990 0 20 40 60 80 100per capita incomes equal to about 5 percent ofU.S. levels, up to the United States. This graphclearly demonstrates the increasing convergence
J. Hansen 225
exchange rate is too close to the PPP rate toprovide the margin of competitiveness thatdomestic producers need to overcome thehandicaps of an economic system that isinadequately liberalized and where per capitaincomes are still far below those in theindustrialized countries.
225
226 Annex E
Notes Sources
The World Bank. 1996. From Plan to Market.I Choosing a good with high local content like a
hamburger in a restaurant avoids the problem World Development Report 1996. Newthat, as the percentage of imported content York: Oxford University Press.increases, the price converges with the price OECD. 1996. Transition Brief (1/96). Paris.determined by the dollar price and the marketexchange rate. For example, assuming no Rogoff, Kenneth. 1996. "The Purchasing Powerdifferences due to transportation, taxes, or profit Parity Puzzle," Journal of Economicmargins, the domestic price of a gallon of Literature, vol. XXXIV (June 1996), pp.imported gasoline converted to dollars at the 647-668.market exchange rate would be the same as thedollar price of the gasoline in the U.S. because The Economist. "Economics Focus: Buy Hardthe domestic price is determnined by the dollar with a Vengeance," August 26, 1995, p.price and the market exchange rate. Thus a PPP 66, and "Big MacCurrencies: Canexchange rate based on the domestic price of hamburgers provide hot tips aboutgasoline would be very similar to the market exchange rates?" April 12, 1997, p. 71.exchange rate -and this is exactly the resultfound in both Belarus and Ukraine Transition. "Purchasing Power Parities," 7(3-4),
2 The fact that Japan simultaneously had a trade March-April 1996, p. 19.surplus indicates that PPP rates must beinterpreted with caution and must be used asonly one of several indicators when determiningthe appropriate valuation of an exchange rate.The apparent explanation for the simultaneousovervaluation of the yen and a balance ofpayments surplus is that, among industrializedcountries where full price convergence hasalready taken place, a country that has a largebalance of payments surplus needs to maintainan overvalued exchange rate to bring thebalance of payments back into equilibrium.
3 The World Bank. From Plan to Market: WorldDevelopment Report 1996 (WDR 1996), pp. 192and 226.
Distributors of COLOMBIA GERMANY ISRAEL NEPAL PORTUGAL SWITZERLANDIntoenlace Ltda. UNO-Vedag Yozmot Literature Ltd. Everest Media Intemationat Services (P) Ltd. Livraea Porugal Librairie Payot Service Insatitutionnel
W orld Bank Carrera6 No. 51-21 Poppelsdorer Allee 55 PO aoxt56055 GPO BoxS443 Aparnado2681, Rua Do Carmo 70-74 C6tes-de-Montbenon 30
Apartado Aereo 34270 53115 Bonn 3 Yohanan Hasandlar Street Kathmandu 1200 Lisbon 1002 LausannePublications Santald de Bogota, D.C. Tel (49228)212940 Tel Aviv 61560 Tel: (977 1)472 152 Tel (1)347-4982 Tel (41 21) 341-3229
Priers vrrd crecdit terns vrrsjfrovr Tel (57 1)285-2798 Fax. (49 228) 217492 Tel (9723) 5285-397 Fax. (977 1) 224 431 Fax (1)347.0284 Fax: (41 21) 341-3235
covrrtrV to celtntrrV. Consillt vo er Fax (571) 285-2798 Fax (972 3) 5285-397local distribhvtor yrore placing an GREECE NETHERLANDS ROMANIA ADECO Van Diemren EditionsTechniques
(vcu) )r>fcurc jr/acing Ofl COTE D IVOIRE Papasoliriou S.A R.O.Y lntemational De LindeboortVnOr-Publkaties Compani De Librarii Bucuresti S.A. Ch de Lacuez 41order Center d'Edition et de Diflusion Atricaines 35, Stoumara Str PO BEox 13056 PO Box 202, 740 AE Haaksbergen Str. Lipscani no. 26, sector 3 CH 1807 Blonay
ARGENTINA (CEDA) 10682 Athens Tel Aviv 61130 Tel: (31 53) 574-0004 Bucharest Tel: (41 21) 943 2673Oficina del LibrolIntemacional b048 P 5d4 Tel: (301) 364-1826 Tel: (9723)5461423 Pao: (31 53) 572-9298 Tel. (40 1)813 9645 Fax: (41 21) 943 3605AtcvdeorLibro 18 tmai7 alAbidjan 04 Fee. (30 1) 384-8254 Fax: (972 3) 5461442 E-mail: lindeboo@worldonlinenit Faa: (40 1)2312 4000
1120 Buenos Aires Tel: (225) 24 6510,24 6511 E-mail: [email protected] URL: hdp:llwww .woddonline.nV-lindeboo TANZANIA
TaP (541)815-8354 Fax (225) 25 0567 HAITI RUSSIAN FEDERATION Oxuord Universfty PressTel (54 1) 85-8 54 Culhure Diffusion Palestinian Authonty/Middle East NEW ZEALAND lsdatelstvo <Ves MjD Maktaba Street, PO Box 5299
Fax. (54 1) 815-8156 CYPRUS 5, Rue Capois Index Intormation Services E8SCO NZ Ltd. 9a, Lolpachniy Pereulok Dar es Salaam
AUSTRALIA, FIJI, PAPUA NEW GUINEA, Centertfor Applied Research C.P 257 PO6 19502 Jerusalem Private Mul Bag 99914 Moscow 101831 Tel: (25551) 29209SOLOMON ISLANDS, VANUATU, AND -Cyprus College Port-au-Prince Tel. (972 2) 8271219 New Markner Tel: (7 095) 917 87 49 Foe: (255 51) 46822WESTERN SAMOA 6, Diogenes Street, Engomi Tel. (509 1)39260 Fax (9722)6271634 Auckland Fax. (7 095) 9179259D.A.SInfoRmaiN Services PO. Box 2008 Tel. (64 9) 524-8119 THAILAND6.8. WhlonoatieoServices Nicosia HONG KONG, MACAO ITALY Fax: (649)524-8067 SINGAPORE, TAIWAN, Central Books Distribution
M8cham 3132 Tel. (357 2) 44-1730 Asia 2000 LId. Licosa Commissionaria Sansoni SPA MYANMAR, BRUNEI 306 Silom Road*tom32 Fax (3572)46-2051 Sales & Circulation Department Via Duca Di Calabna, 1/1 NIGERIA Asahgate Publishing Asia Pacdc Pte. Ltd. Banghok 10500
Victoria SeabirdHase andt1181-02 Caseaff Postale 552 UniversityPness Limited 41KatlangPuddingRoad04-03 Tel:(662)235-5400
Tel (61)39210T777 CZECH REPUBLIC 22-28 Wyndham Street, Central 50125 Firenze Thnee Crowns Building Jericho Golden Wheel Building Fax: (662)237-8321
Fax (1)8392107788 National Innomnation Center Hong Kong Tel: (55) 645-415 Private Mail Bag 5095 Singapore 349316E-mail: serviceBdadirectconaTa:(574-18RIDA&TO GOURL: http://www dadirect com.au prodetna, Konviktska 5 Tel: (852) 2530-1409 Pae: (55)8641-257 lbadan Tel: (65) 741c5166 TRINIDAD & TOBAGO,
CS - 113 57 Prague 1 Pee: (852) 2528-1107 E-mail: liceosafbbcc,8 Tel: (234 22) 41-1358 Pee: (85) 742-9358 AND THE CARRIBBEANAUSTRIA Tel. (42 2) 2422-9433 E-mail: [email protected] hk Ud: hap:/lwwaw fttbcc.Micosa Fax: (234 22) 41-2056 E-mail: ashgate@asianconnect com Systematics Studies Unn
Gerald and Ca. Fax (42 2)2422-1484 URL: hbtpJ/www.asia2000.com hk 9 Watts StreetWeihburggasse 28 URL: hbp:l/www.nis.czl JAMAICA NORWAY SLOVENIA CurepeAe1011ggaWien 26 HUNGARY Ian Randle Publishers Ltd. NIC Into AVS Gospodarski Vestnik Publishing Group Trinidad, West Indies
TelO (43l1) 512-47-31W DENMARK Euro Info SeNvice 206 Old Hope Road, Kingston 6 Book Depadment, Postboks 6512 Etterstad Dunajska cesta S Tel: (809) 662-5654FaxT (43 1)51247-31-29 SamfundsLieratur Margiszgeb Europa Haz Tel: 809-927-2085 N-0606 Oslo 1000 Ljubljana Fax (809) 662-5654FaRL (431) 51247-31-29o/at.onlin RosenoemsrAn l 11 H-l (3 t B 60dpest Fa: 8089-977-0243 Tel (4722) 97-4500 Tel: (38661) 338347; 1321230 E-mail: tobeBtrnidad.netURL: hotp:/twww .geroId.colat.anIine DK-1970 Frederiksberg C Tel. (38 1(111 8061 E-mail: irtl~olctis.corn Fax: (47 22) 97-4545 Fax: (388861(133 8830
BANGLADESH Tel: (45 31)351942 Fax: (361)3025035 E-mail repansek(@gvestnik.si UGANDA
Mom Industries DevelopmentFPo: (45 31( 357822 E-nrail: [email protected] JAPAN PAKISTAN Gostro Ltd.MicrolIndustries Development Fax:(4Eastern Bek Service Mirza Book Agency SOUTH AFRICA, BOTSWANA PO Bex 9997, Madhvani Building
Assistance Society (MIDAS) ECUADOR INDIA 3-13 Hongo 3-chome, Bunkyo-ku 65, Shahrah-e-Quaid-e-Azam Intemational Subscrption Sevice Pht 16/4 Jinja Rd.
ohanmondi RtArea Libri Mundi Allied Publishers Ltd. Tokyo 113 Lahore 54000 PO Box 41095 KampalaDhaka 1309 Libreria lntemacional 751 Mount Road Tel: (81 3)3818-0861 Tel (92 42)735 3601 Craighall Tel: (256 41) 254 763
Olhaka 1209 PO. Box 17-01-3029 Madras -600 002 Fax: (81 3) 3018-0864 Faa: (92 42) 576 3714 Johannesburg 2024 Fax: (256 41) 251 468Tel: (8802)326427 Juan Leon Mera 851 Tel: (91 44) 852-3938 E-mail: [email protected] Tel: (27 11)880-1448
Fax (89802(Q811188 Oa8o Fax: (91 44) 852-0649 URL: hlpJ/www .bekkoame.orjpt-svt-ebs Oxford Universay Press Fax: (27 11) 880-6248 UNITED KINGDOM
BELGIUM Tel (593 2) 521-606: (593 2) 544-185 5 Bangalore Town E-mail: [email protected] Microinlo Ltd.Jean De Lannoy Fax (593 2) 504-209 INDONESIA KENYA Sharae Faisal PO. Box 3, Aton, Hampshire GU34 2PGJeavnDeLanoi 0E-mail: librimul Otibrimundi com.ec Pt. Indira Limited Atrica Book Senvice (E.A.) LId. PO Beox 13033 SPAIN England1 dO B 3ussels E-mail: [email protected] Jalan Borobudur 20 Quaran House, Mlangano Street Karachi-75350 Mundi-Prensa Libmos, S.A. Tel: (441420) 868481088 B3 2se8a PO Box 181 PO. Box 45245 Tel: (92 21) 446307 Castello 37 Fax: (44 1420)89889Tet. (322) 538-5169 EGYPT, ARAB REPUBLIC OF Jakarta 10320 Nairobi Fax: (92 21) 4547640 28001 Madrid E-mail: [email protected]: (32 2) 53830841 Al Ahram Distnbution Agency Tel: (62 21) 390-4298 Tel- (254 2) 223 641 E-mail: [email protected] Tel: (34 1)431-3399 URL: htp://www.nicrointo.co.uk
BRAZIL Al Galaa Street Fax. (62 21) 421-4289 Fax: (254 2) 330 272 Fax: (34i1) 575-3899P -hlicacies Tecnicas Iotemacioais Lida. Cairo Pak Book Corporation E-mail:[email protected] VENEZUELABaa Peiaxst Gomide, 209 Tel. (20 2) 578-6083 IRAN KOREA, REPUBLIC OF Aziz Chambers 21, Oueen's Road URL: http./lwww .mundipmensa.es/ Tecni-Ciencia Libros, S.A.01409uSaPeo Paulo,i 20P Fax: (20 2) 578-6833 Ketab Sara Co. Publishers Daepon Trading Co. Ltd Lahore Centro Cuidad Comercial Tamanco
Tel (55 11)P259t644 Khaled Eslamboli Ave., 6th Steet PO Box 34, Youida, 706 Seoun Bldg Tel: (92 42) 636 3222; 6360885 Mundi-Prensa Barcelona Nivel C2, CaracasTex: (55 11( 259-8990 The Middle East Observer Kusheh Delatrooz No. 8 44-6 Youido-Dong, Yeongchengpo-Ku Fax: (92 42) 636 2328 Consell de Cent, 391 Tel: (58 2) 959 5547; 5035; 0016
E-mil postmasterept5.uol.br 41, Sherd Street PO. Box 15745-733 Seoul E-mail: [email protected] pk 08009 Barcelona Fax: (58 2) 959 5636E-maL. htpostswewpw.uolbr Cairo Tehran Tel: (82 2( 785-163174 Tel: (34 3(488-3482URL http://www.uoatr Tel. (202)393-9732 Tel: (9821)8717819,8718104 Pea: (822)7784-0315 PERU Fax: (343)487-7659 ZAMBIA
CANADA Fax: (20 2) 393-9732 Fax: (98 21) 8712479 EdEtorial Desarollo SA E-mail: [email protected] Universfty Bookshop, Univeisay ot Zambia
Renouf PublishingCGo. Ltd. FINLANDE-mail: ketab-saraftedanet ir MALAYSIA Apardado 3824, Lma 1 SRI East THE GDmpus53e9anoPblihin Cs.oLd. FINLAND University at Malaya Cooperative Tel: (51 14) 285388 SRI LANKA, THE MALDIVES PO. Ben 323795389wa Cantatkrioa KP,1 Aateeminen Kir(akauppa Kowkeab Pablishers Bookahop, Lirn8ed Peax: (51 14) 288828 Lake House Bookshop LusakaOTtawa 6 notad Kit2 J PO. Box 128 Po. Bee 19575-511 PO. Box 1127 100, Sir Chidampalam Gardiner Mawatha Tel: (2601)252576
Tel: (613) 745-2665 FIN-00101 Helsinki Tehran Jalan Pantai Baru PHILIPPINES Colombo 2 Fax: (268 1) 253 952
E-mail,:ader.depl7renoufbo6 kser Tel: (3580)121 4418 Tel: (9821)258-3723 59700 Kuala Lumpur Intemational Booksource Center Inc. Tel: (94 1)32105URLhtowna.r ep@enutbap kscom Pan: (358t0)a121-4435 Fax: (9821)258-3723 Tel:(603)758-5009 1127-A Antipol St, Barangay, Venezuela Fax: (94 1432104 ZIMBABWE
URL:httpH ww.reoufookscom E-mail alkatilavvslsockmann.i Peax: (88 3) 755-4424 Makati Cit E-mail: [email protected] Longman Zimbabwe )Pvt.)LIdCHINA URL: htfp://www akateeminen.coml IRELAND Tel: (63 2) 896 6501; 6505; 6507 Toude Road, ArdbennieChina Financial & Economic Govemment Supplies Agency MEXICO Fax (632)896 1741 SWEDEN PO. BoxoST125
Househing House FRANCE Odig antSoldthair INFOTEC Wennergren-Williams AB SouthenonPublishing Jue Wodd Bank Pubhlcations 4-5 Harcourt Road Av. San Femando No. 37 POLAND R 0. Box 1305 Harare8. Ga Pa Si Gong Je 66, avenue dIdna Dublin 2 Col. Toiello Guerra lntemational Publishing Service S-1 71 25 Solna Tel: (263 4) 6216617-Tl8n 10 38257 75116 Pads Tel: (353 1)661-3111 14050 Mexico, D.F Ul. Piekna 31V37 Tel: (46 8) 705-97-50 Fax: (263 4) 821670Tel. (86 810)6403-5 Tel: (33 1)40.69-30-9557 Fax: (353 1)475-2670 Tel:(525)624-2800 00677 Warzawa Fax: (468)27-00-71Faa. (8810)86491-7385 Fax: (33 1) 40-69-30-68 Fax: (52 5) 624-2822 Tel: (48 2) 628-6089 E-mail: [email protected]
E-mail: [email protected] mx Fax: (48 2) 621-7255URL hOp /lrin.net mx E-mail: books%ipsoBkp atmcompl
URL. http//www .ipscg.wawpVipsexposrI

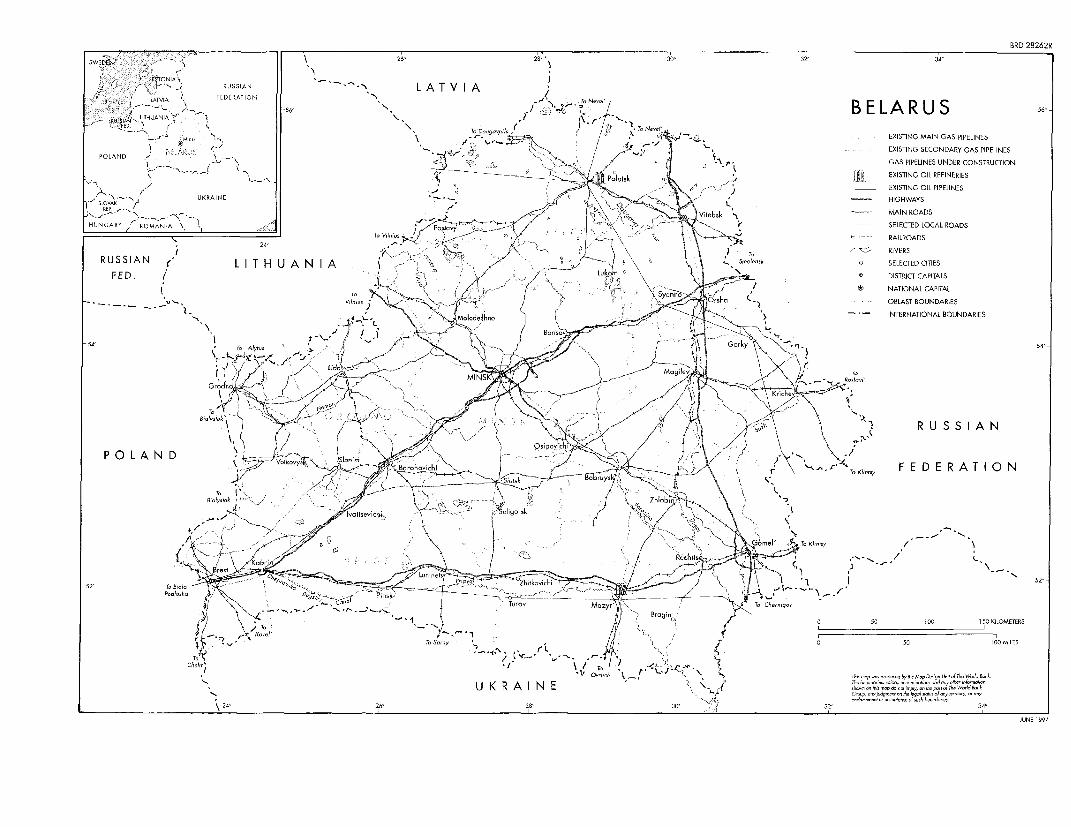
IBRD 28262R
SWLDEN , A ~ n \ 264 28E 30l 32' 34-
/ ( \K EJA t.gON> 5USr IA N -RS L A T V I AEnlP,; IATOLA 1. FEDERATION N / ThNeveI BLr A R S5
/- [RtOWvWLs,L>TH ANIA j / '54f / E 1\. r -
EXISTING MAAIN GAS PIPELINES
'-* 5 0 M 2 9 '\ 2 / *9 x. rO Nevol' EXISTING SECONDARY GAS PIPELINES
POLAND _ GAS PIPELENES UNDER CONSTRUCTION
ik N 5 jb /7EXISTING OIL REFINERIESEXISTING GIL PIPElINES
~,*~TN- N--f 00UKRAINE HIGNWAYS
5440/ -~~~~~~~~~~~~~~~~~~~~~~~~~~~~~~~~~~~~~~~ ~~~~ MAIN ROADS
HUNGARY R-'M-AN--A SELECTED LGCAL ROADS
__________________________________________ - RAILEGADS~~~~~~~~~~~~~~~~~~~~~~~RILRAD
T~ \ 24o _ b nC RIVERS
R U S S I A N r L I T H U A N I A ; - ' 1 -. X I \ 9 \ v Smolensk o SELECTED CITIES
FED. L.® DISTRICT CAPITALS
P, ~~~~~~~~~~~~~~~~~~~~* NATIONAL CAPITAL
FEDT/ Zb>svi=>> 4 X / l>\ OBLAST EGUNDARIES
- INTERNATIONAL BOUNDARIESN~~~~~~~~~~~~
< >> A-5 V ( t \ \-/t . it /W 4 \ < ~~~~~~~~~~R U S S IA N 0~~~~~~~~~~~~~~~~~~~~~~~~~~~~~~~~~~0~
P 0 LA ND V F O L A N D v:;o;v.l A ' v t s 9~~~B T KiiPk F E D E R A T I O N
; >Wx ;--.' '; ffi- = . 9 ,<- Ci '75 1 .;~~~~~~~~~~~~--- -
/ 0 50 100 1 50 KILOMETERS
? v ' Kovel' T. S-zrny r ol 50 , i . MILES
TOV
> ~~~~~~~~~~~~~~U K R A I N E 4 nn o immnn
24 26' 2U8R 30AIN 32 34E
JUNE1 97

THE WORLD BANK
Is Is I X|I Streo.. 'NAV.
Waishington. D).(. 20433 L S\
'Iclcplm ,nc: 202-477-1234
IF:csimilc: 20)2-477-6391
1.I.cl\: MC(. 64145 \V()141.1)1.VNK
\M(1 248423 WORLD)BA.\NK
( iihlc \ddl,-V.S: I NT1 .\I R\I )
\\'.\SIII 1NGT(Y'}N1) D'
I'.-n:t-il: hotsw lsNr orldlhill-o.zt-i
9B 0-8913-3976-
ISBN 0-8213-3976-1