0315 cover - ESCAP Repository
120
ECONOMIC AND SOCIAL COMMISSION FOR ASIA AND THE PACIFIC United Nations E S C A P
-
Upload
khangminh22 -
Category
Documents
-
view
0 -
download
0
Transcript of 0315 cover - ESCAP Repository

ECONOMIC AND SOCIAL COMMISSION FOR ASIA AND THE PACIFICUnited Nations
E S C A P
ESCAP is the regional development arm of the United Nations and serves as the
main economic and social development centre for the United Nations in Asia
and the Pacific. Its mandate is to foster cooperation between its 53 members and
9 associate members. ESCAP provides the strategic link between global and
country-level programmes and issues. It supports Governments of the region
in consolidating regional positions and advocates regional approaches to
meeting the region’s unique socio-economic challenges in a globalizing world.
The ESCAP office is located in Bangkok, Thailand. Please visit our website at
www.unescap.org for further information.
The shaded areas of the map are ESCAP Members and Associate members.
i
ASIA-PACIFICTRADE AND INVESTMENT
REVIEW
Vol. 1, No. 2
ECONOMIC AND SOCIAL COMMISSION FOR ASIA AND THE PACIFIC
United NationsE S C A P
New York, 2005

ii
The designations used and the presentation of the material in this publication do not imply
the expression of any opinion whatsoever on the part of the Secretariat of the United
Nations concerning the legal status of any country, territory, city or area, or of its
authorities, or concerning the delimitation of its frontiers or boundaries.
The views expressed in this publication are those of the authors and do not necessarily
reflect the views of the United Nations.
Mention of firm names and commercial products does not imply the endorsement of the
United Nations.
ASIA-PACIFIC TRADE AND INVESTMENT REVIEW
Vol. 1, No. 2
United Nations publication
Sales No. E.05.II.F.33
Copyright United Nations 2005
All rights reserved
Manufactured in Thailand
ISBN: 92-1-120446-1
ISSN: 1815-8897
ST/ESCAP/2383
iii
AIMS AND SCOPE
The Asia-Pacific Trade and Investment Review is a biannual, peer-reviewed
journal for the dissemination of timely information and research analysis on the new,
emerging issues of trade, investment and enterprise development in Asia and the
Pacific. Primarily aimed at government policymakers, researchers and representatives
of the private sector, the Review imparts information on the latest trends in trade and
investment policy issues facing the region. The Review emphasizes implications for
policy relevance and operational research rather than academic research on theoretical
and methodological issues. Articles will be drawn from research work conducted by
outside researchers as well as the staff of the Trade and Investment Division of
ESCAP and its consultants.
ADVISORY BOARD MEMBERS
Mohamed AriffMalaysian Institute of Economic Research
Kuala Lumpur, Malaysia
Sanjaya LallOxford University
Oxford, United Kingdom
Razeen SallyLondon School of Economics
London, United Kingdom
Karl P. SauvantFormerly with UNCTAD, Geneva, Switzerland
Rajah RasiahAsia-Europe Institute
University of Malaysia, Kuala Lumpur, Malaysia
John S. WilsonThe World Bank
Washington, D.C., United States of America
Patrick LowWorld Trade Organization
Geneva, Switzerland
iv
EDITORS
Chief Editor
Xuan ZengpeiDirector, Trade and Investment Division
Managing Editors
Joong-Wan ChoInvestment and Enterprise Development Section
Trade and Investment Division
Marc ProkschTrade Policy Section
Trade and Investment Division
Yann DuvalTrade Policy Section
Trade and Investment Division

v
ASIA-PACIFIC TRADE AND INVESTMENT REVIEWVol. 1, No. 2, November 2005
CONTENTS
Page
Research Articles ........................................................................................................ 1
Tham Siew Yean Japan’s Response to Globalization:
Learning from Japanese Direct Investment .... 3
Indra Nath Mukherji The Bangkok Agreement: A Negative List
Approach to Trade Liberalization in
Asia and the Pacific ........................................ 27
Rashmi Banga Foreign Direct Investment in Services:
Implications for Developing Countries .......... 55
ESCAP secretariat Issues of Interest in WTO for
Countries with Economies in Transition:
Doha Development Agenda ........................... 73
Policy Briefs ................................................................................................................ 91
The Chinese Yuan Revaluation: Effects and Implications for Exchange
Rate Policy ..................................................................................................... 93
Liberalization of Market Access in GATS Mode 4 and its Importance for
Developing Countries .................................................................................... 101
Executive Summaries of Recent Studies in Trade and Investment Publishedby the Secretariat ........................................................................................................ 109
The Role of Trade and Investment Policies in the Implementation of the
Monterrey Consensus: Regional Perspectives .............................................. 111
Asia-Pacific Trade and Investment Review Vol. 1, No. 2, November 2005
1
Research Articles

Asia-Pacific Trade and Investment Review Vol. 1, No. 2, November 2005
3
EXECUTIVE SUMMARY
The global production activities of transnational corporations (TNCs) that
are conducted via foreign direct investment (FDI) constitute one important
dimension of economic globalization. Therefore, the response of a country towards
TNC activity and FDI represents a key component of a country’s strategy towards
harnessing globalization for its national development. This article analyses the
approach of Malaysia and Japan towards the globalization of production and FDI.
Second, it will also assess whether the policies that have been utilized by Japan can be
used or adapted for Malaysia and other developing countries.
While both Malaysia and Japan tapped on the globalization of production and
investment flows for their development, the two countries differed significantly in
their response. Malaysia utilized investment inflows for acquiring the appropriate
technology that is necessary for its industrial development. In so doing, Malaysia
became part of the TNC global production networks, especially in the electrical and
electronics subsector. However, the lack of an indigenous technology base and the
utilization of foreign workers have limited its progress up the technology ladder and
its position in the TNC global production networks.
Japan’s Response to Globalization:Learning from JapaneseDirect Investment
Tham Siew Yean*
* Deputy Director and Principal Fellow, Institute of Malaysian and International Studies, National University of
Malaysia, 43600 Bangi, Selangor, Malaysia, Tel.: (60 3) 89214171, Fax: (60 3) 89261022, E-mail:
(continued on page 4)
Asia-Pacific Trade and Investment Review Vol. 1, No. 2, November 2005
4
By contrast, the export of capital from Japan is supported by its indigenous
technology development. The establishment of global production networks by
Japanese TNCs were motivated by the need to maintain cost competitiveness by
relocating their production facilities to lower-cost economies. Within Japan, global
competitive pressures have also accelerated the development of new products and new
technologies in order to preserve the technology advantage of the Japanese TNCs.
Therefore, Malaysia as well as other developing countries have to first develop
their own indigenous base if they aspire to follow Japan’s example in capital exports.
Without this technology advantage, the export of factories, as in the case of Japan,
will lead to the “hollowing-out” of the manufacturing sector in Malaysia and other
developing countries as there will no longer be any advantage to continue production
in these countries in view of the shortage of skilled labour and scientific and technical
personnel.
Concurrently, it is also equally important to learn from Japan’s biased focus on
export-oriented manufacturing activities and its recent liberalization of inward
investment in non-manufacturing activities by refocusing the development goals of
Malaysia and other developing countries beyond their manufacturing activities. Thus,
there needs to be a concerted effort to develop the service sector in Malaysia and
other developing countries and a greater effort to tap FDI for the development of
world-class competitive services.
1. INTRODUCTION
The global production activities of transnational corporations that are conducted
via foreign direct investment constitute one important dimension of economic globalization.
This is demonstrated by the increasing degree of interdependence and integration between
national economies due to the growth and spread of TNCs. The spread of TNC activity, in
turn, has led to almost all regions in the world being either home or host or home and host
of TNC activity so that there are currently very few countries in the world that are
untouched by TNC activity. Therefore, the response of a country towards TNC activity and
FDI represents a key component of a country’s strategy towards harnessing globalization
for its national development.
In terms of both source and host countries, the “Triad” is composed of Japan, the
European Union (EU) and the United States of America, has long accounted for the bulk of
international production in the world, providing and receiving most of the global FDI. Of
the three, Japan is a relatively late starter in terms of its involvement in overseas direct
(continued from page 3)
Asia-Pacific Trade and Investment Review Vol. 1, No. 2, November 2005
5
investment as its transnational investment did not take off until the late 1960s owing to
internal restrictive policies and the relatively low domestic cost of production at the time
(Dicken, 1992, p. 77).
Subsequently, Japanese direct investment (JDI) grew very rapidly, with Japan’s
share in the world’s total FDI outward stock growing from 3.5 per cent in 1980 to a peak
of 11.5 per cent in 1990 (UNCTAD, 2004: Annex table B.4). However, its share fell to
8.2 per cent in 1995 and continued to fall to 4.7 per cent in 2000 and still further to 4.1 per
cent in 2003. Despite this fall, JDI continued to be among the largest foreign direct
investors in the manufacturing sector of the economies of the Association of Southeast
Asian Nations (ASEAN), especially in the 1990s. Moreover, the number of Japanese TNCs
that joined the world’s largest 100 TNCs actually increased from 12 in 1990 to 18 in 1999,
while the network spread of Japanese TNCs, indicating the extent to which TNCs locate
their activities in foreign countries, was ranked eighth in the world in 1999 (UNCTAD,
2001, p. 95 and p. 104). In 2002, Japan had 7 of the 100 largest non-financial TNCs in the
world and their network spread was ranked ninth in the world (UNCTAD, 2004, annex
table A.I.24).
In view of the above, this article analyses the approach of Malaysia and Japan
towards the globalization of production and FDI. Second, it will also assess whether the
policies that have been utilized by Japan can be used or adapted for Malaysia and other
developing countries.
2. MALAYSIA’S RESPONSE TOWARDS THE GLOBALIZATIONOF BUSINESS AND FOREIGN DIRECT INVESTMENT
(a) Inflows
The drive to industrialize led to the choice of the manufacturing sector as the
engine for growth in Malaysia and the enactment of the Free Trade Zones (FTZs) in 1971 in
order to tap FDI for the industrialization efforts in the country. The Government’s proactive
stance towards FDI was also motivated by the need to reduce unemployment as well as to
facilitate the shift from import substitution to export promotion. This move coincided with
the globalization efforts of the electronics and textiles industries while the fiscal incentives
provided by the Government under the Investment Incentives Act (IIA) of 1968 added to
the attraction of Malaysia as a host economy.
The Government’s recognition of the importance of FDI in the industrialization
process can be ascertained from the implementation of the New Economic Policy (NEP)
targets in terms of Bumiputera1 equity participation and employment for the manufacturing
1 Bumiputera means “sons of the soil”.
Asia-Pacific Trade and Investment Review Vol. 1, No. 2, November 2005
6
sector. Although the Industrial Coordination Act (ICA)2 was enacted in 1975 in order to
ensure the achievement of the NEP targets in this sector, Rasiah (1993, p. 129) documented
evidence on fully-owned foreign firms operating in FTZs during the 1970s. This flexible
implementation of the NEP targets in the manufacturing sector contrasted sharply with the
country’s stringent application in the domestic banking sector such that the foreign share in
banking declined to less than half by the mid-1970s (Edwards, 1995, p. 690).
The recognition of the important role of FDI in the industrialization process
contributed to the Government’s favourable policy stance towards FDI in Malaysia’s
industrial development of the country. In particular, the recession in 1985 and the launch of
the First Industrial Master Plan (FIMP: 1986-1995) further heightened the Government’s
efforts to tap on FDI in order to deepen the industrialization process. Hence, the
Government actively courted for FDI with the use of fiscal incentives and the relaxation of
equity restrictions3 for the manufacturing sector. Similarly the importance of FDI is
highlighted in the Second Industrial Master Plan (SIMP: 1996-2005) in the development of
the internationally linked clusters that are primarily driven by TNCs (MITI, 1996, p. 31).
The Government’s subsequent willingness to remove all equity constraints and export
conditions in the manufacturing sector in response to the fall in inflows of FDI in the face
of the financial and economic crisis of 1997/1998, again clearly demonstrates the value of
FDI in the eyes of policymakers.
Complementary measures in terms of institutional support were also implemented
to attract FDI into the country. A one-stop agency for processing investment approvals was
established at the Malaysian Industrial Development Authority (MIDA) in 1988 in order to
reduce the bureaucratic red tape in investment approvals. Regular trade and investment
ministerial missions to sell Malaysia as a host economy are conducted by the Ministry of
International Trade and Industry (MITI).4
Nevertheless, fiscal incentives and the relaxation of equity requirements alone are
insufficient to attract FDI into a country because of the intense competition for FDI from
both developed and other developing countries, particularly after the mid-1980s when
developing countries started to adopt a more favourable view towards FDI after the debt
crisis in the early 1980s (ESCAP, 1998, p. 1). Other pull factors that have contributed to
the locational advantages of Malaysia as a host economy before the advent of the financial
crisis in 1997 were the relatively stable political and macroeconomic environment, good
2 The ICA is essentially a licensing scheme whereby any manufacturing firm employing 25 workers or more
and with a paid-up capital of at least RM 250,000 had to apply for a licence, and the issue of a licence was
subject to the fulfillment of the NEP equity and employment targets.3 See for example the replacement of the IIA with the Promotion of Investment Act (PIA) of 1986 while there
are export conditions for the relaxation of the equity restrictions.4 See Sieh (2000, p. 77) for some anecdotal evidence on the use of trade and investment missions to provide
a “personal touch” for drawing foreign companies to invest in Malaysia.

Asia-Pacific Trade and Investment Review Vol. 1, No. 2, November 2005
7
infrastructure conditions, relatively low wages, proficiency in English and the lack of
a minimum wage law for the manufacturing sector (Tham, 1998a, p. 14).
Concurrently, Malaysia has also benefited from push factors such as the significant
rise in the value of the yen and other East Asian currencies after the Plaza Accord in 1985
that triggered an outflow of JDI in search of lower production costs. This outflow was
followed by an outflow of investment from other East Asian economies in an effort to
match the competitiveness of Japanese production abroad.
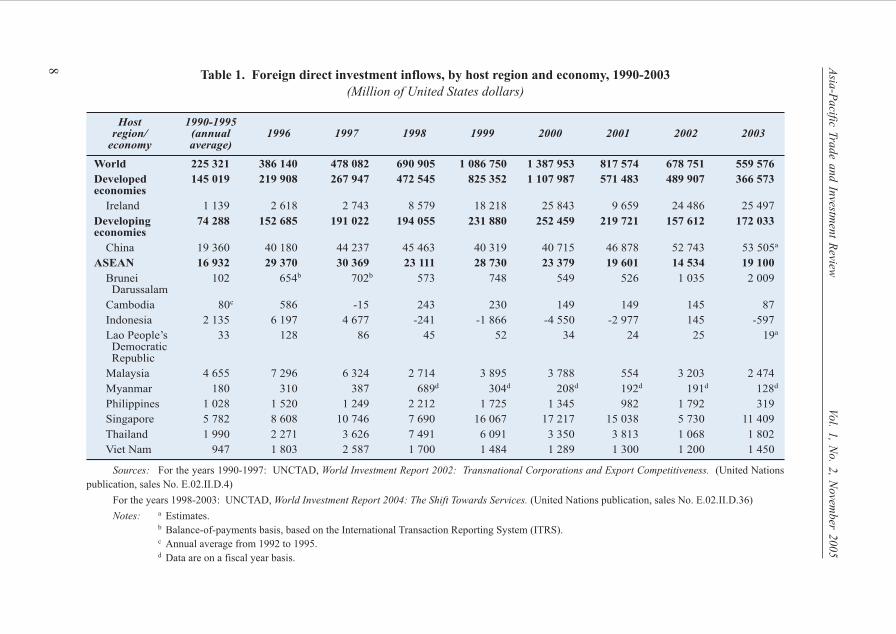
The combination of conducive internal and external factors enabled Malaysia to
become one of the 10 largest developing host economies for FDI inflows and stock in 1993.
Although inflows of FDI continued to increase until 1996 (table 1), there were signs of
increasing erosion in the locational advantages of Malaysia with the emergence of
infrastructural bottlenecks, the increasing shortage of labour, particularly skilled labour, and
the ensuing rising cost of wages and overall cost of production in the country (Tham,
1998a, p. 29). Consequently, Malaysia’s share of the total FDI inflows into the developing
countries declined from an average of 6.3 per cent between 1990 and 1995 to 4.8 per cent in
1996 (table 1).
The financial crisis in 1997 served to exacerbate this declining share. The
economic contraction in the region reduced corporate profits and negatively affected the
investment decisions of TNCs that were affected by the crisis, while the domestic economic
slowdown and subsequent recession reduced investors’ confidence in the region as a whole
and hence in Malaysia. Malaysia’s share fell further to 1.4 per cent in 1998. Although
inflows of FDI recovered with the economic recovery in 1999, FDI has yet to attain the
pre-crisis levels. In 2003, inflows of FDI amounted to only 33.9 per cent of the FDI in
1996.
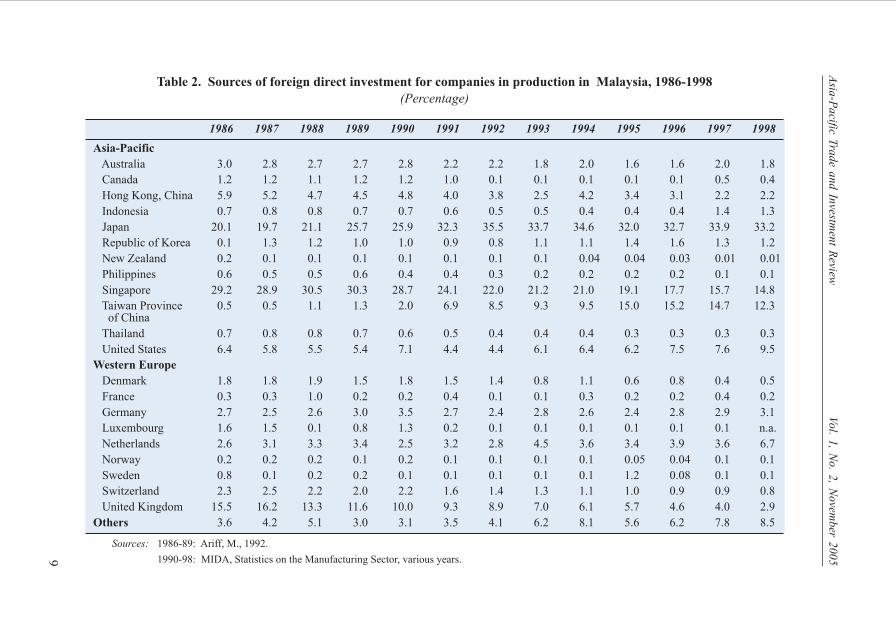
In terms of source countries, table 2 shows the increasing importance of JDI over
time in the Malaysian manufacturing sector, especially since 1991 when it became the
single largest investor, overtaking Singapore’s long-standing importance as an investor in
the country. It should be noted, however, that Malaysia has welcomed Japanese investment
since post-Independence. In fact, since the early 1970s, Malaysia has used trade and
investment missions to woo Japanese investors to Malaysia (Denker, 1994, p. 47). The
increase in Japanese investment after 1985 shows the significant impact on investment
flows when conducive host country policies coincided with the strategies of Japanese
companies in response to the changing economic environment in Japan. Although data on
companies in production are no longer available after 1998, data based on applications
received indicate that investment from Japan continues to be important for Malaysia as it
was the fourth largest foreign investor in the country in 2003 (MITI, 2004, p. 59).
Asia
-Pacific T
rade a
nd In
vestmen
t Review
Vol. 1
, No. 2
, Novem
ber 2
005
8
Table 1. Foreign direct investment inflows, by host region and economy, 1990-2003(Million of United States dollars)
Host 1990-1995region/ (annual 1996 1997 1998 1999 2000 2001 2002 2003
economy average)
World 225 321 386 140 478 082 690 905 1 086 750 1 387 953 817 574 678 751 559 576Developed 145 019 219 908 267 947 472 545 825 352 1 107 987 571 483 489 907 366 573economies Ireland 1 139 2 618 2 743 8 579 18 218 25 843 9 659 24 486 25 497
Developing 74 288 152 685 191 022 194 055 231 880 252 459 219 721 157 612 172 033economies China 19 360 40 180 44 237 45 463 40 319 40 715 46 878 52 743 53 505a
ASEAN 16 932 29 370 30 369 23 111 28 730 23 379 19 601 14 534 19 100 Brunei 102 654b 702b 573 748 549 526 1 035 2 009 Darussalam
Cambodia 80c 586 -15 243 230 149 149 145 87
Indonesia 2 135 6 197 4 677 -241 -1 866 -4 550 -2 977 145 -597
Lao People’s 33 128 86 45 52 34 24 25 19a
Democratic Republic
Malaysia 4 655 7 296 6 324 2 714 3 895 3 788 554 3 203 2 474
Myanmar 180 310 387 689d 304d 208d 192d 191d 128d
Philippines 1 028 1 520 1 249 2 212 1 725 1 345 982 1 792 319
Singapore 5 782 8 608 10 746 7 690 16 067 17 217 15 038 5 730 11 409
Thailand 1 990 2 271 3 626 7 491 6 091 3 350 3 813 1 068 1 802
Viet Nam 947 1 803 2 587 1 700 1 484 1 289 1 300 1 200 1 450
Sources: For the years 1990-1997: UNCTAD, World Investment Report 2002: Transnational Corporations and Export Competitiveness. (United Nations
publication, sales No. E.02.II.D.4)
For the years 1998-2003: UNCTAD, World Investment Report 2004: The Shift Towards Services. (United Nations publication, sales No. E.02.II.D.36)
Notes: a Estimates.b Balance-of-payments basis, based on the International Transaction Reporting System (ITRS).c Annual average from 1992 to 1995.d Data are on a fiscal year basis.
Asia
-Pacific T
rade a
nd In
vestmen
t Review
Vol. 1
, No. 2
, Novem
ber 2
0059
Table 2. Sources of foreign direct investment for companies in production in Malaysia, 1986-1998(Percentage)
1986 1987 1988 1989 1990 1991 1992 1993 1994 1995 1996 1997 1998
Asia-Pacific Australia 3.0 2.8 2.7 2.7 2.8 2.2 2.2 1.8 2.0 1.6 1.6 2.0 1.8
Canada 1.2 1.2 1.1 1.2 1.2 1.0 0.1 0.1 0.1 0.1 0.1 0.5 0.4
Hong Kong, China 5.9 5.2 4.7 4.5 4.8 4.0 3.8 2.5 4.2 3.4 3.1 2.2 2.2
Indonesia 0.7 0.8 0.8 0.7 0.7 0.6 0.5 0.5 0.4 0.4 0.4 1.4 1.3
Japan 20.1 19.7 21.1 25.7 25.9 32.3 35.5 33.7 34.6 32.0 32.7 33.9 33.2
Republic of Korea 0.1 1.3 1.2 1.0 1.0 0.9 0.8 1.1 1.1 1.4 1.6 1.3 1.2
New Zealand 0.2 0.1 0.1 0.1 0.1 0.1 0.1 0.1 0.04 0.04 0.03 0.01 0.01
Philippines 0.6 0.5 0.5 0.6 0.4 0.4 0.3 0.2 0.2 0.2 0.2 0.1 0.1
Singapore 29.2 28.9 30.5 30.3 28.7 24.1 22.0 21.2 21.0 19.1 17.7 15.7 14.8
Taiwan Province 0.5 0.5 1.1 1.3 2.0 6.9 8.5 9.3 9.5 15.0 15.2 14.7 12.3 of China
Thailand 0.7 0.8 0.8 0.7 0.6 0.5 0.4 0.4 0.4 0.3 0.3 0.3 0.3
United States 6.4 5.8 5.5 5.4 7.1 4.4 4.4 6.1 6.4 6.2 7.5 7.6 9.5
Western Europe Denmark 1.8 1.8 1.9 1.5 1.8 1.5 1.4 0.8 1.1 0.6 0.8 0.4 0.5
France 0.3 0.3 1.0 0.2 0.2 0.4 0.1 0.1 0.3 0.2 0.2 0.4 0.2
Germany 2.7 2.5 2.6 3.0 3.5 2.7 2.4 2.8 2.6 2.4 2.8 2.9 3.1
Luxembourg 1.6 1.5 0.1 0.8 1.3 0.2 0.1 0.1 0.1 0.1 0.1 0.1 n.a.
Netherlands 2.6 3.1 3.3 3.4 2.5 3.2 2.8 4.5 3.6 3.4 3.9 3.6 6.7
Norway 0.2 0.2 0.2 0.1 0.2 0.1 0.1 0.1 0.1 0.05 0.04 0.1 0.1
Sweden 0.8 0.1 0.2 0.2 0.1 0.1 0.1 0.1 0.1 1.2 0.08 0.1 0.1
Switzerland 2.3 2.5 2.2 2.0 2.2 1.6 1.4 1.3 1.1 1.0 0.9 0.9 0.8
United Kingdom 15.5 16.2 13.3 11.6 10.0 9.3 8.9 7.0 6.1 5.7 4.6 4.0 2.9
Others 3.6 4.2 5.1 3.0 3.1 3.5 4.1 6.2 8.1 5.6 6.2 7.8 8.5
Sources: 1986-89: Ariff, M., 1992.
1990-98: MIDA, Statistics on the Manufacturing Sector, various years.
Asia-Pacific Trade and Investment Review Vol. 1, No. 2, November 2005
10
Sectorally, JDI in Malaysia was much more diversified in the mid-1980s but it
became increasingly more concentrated in electrical and electronic products over time
(Tham, 2000, p. 9). For example, the share of JDI in the electrical and electronics subsector
increased substantially from 14.9 per cent in 1986 to 56.8 per cent in 1998. Data based on
approved projects show the continued interest of JDI in the electrical and electronics
subsector in Malaysia as one large project reported approved in 2003 was for the production
of plasma display panel modules and plasma display television sets with an investment
value of RM 662.9 million (MITI, 2004, p. 60).
(b) Outflows
Investment outflows or reverse investment gained prominence in the 1990s owing
again to the interplay of both internal and external factors. Domestically, the robust
economic performance from the second half of the 1980s until 1996 increased the income
and profits of Malaysian firms thereby spurring them to venture abroad in search of
strategic alliances (Tham, 1998b, p. 104). In her seven case studies, Ragayah (1999,
p. 485) observed that the need to expand abroad and to find new markets were the main
motivational factors for the firms in her study to invest abroad. At the same time, rising
labour costs as well as labour shortages in the country may have prompted some Malaysian
firms to relocate their industries to labour surplus economies such as Viet Nam and China.
Externally, the increasingly open door policies of these labour surplus economies enhanced
their attraction as host economies.
Concurrently, the Government also actively encouraged reverse investment
through the provision of various incentives such as a 50 per cent tax reduction for remitted
income earned from overseas investment. Apart from the fiscal incentives, just as in the
case of inflows, the investment guarantee agreements and double taxation agreements that
were concluded with various countries provided the legal framework for the security and
protection of Malaysian investors overseas.
Unlike investment inflows, data on investment outflows are quite sparse.
However, the Central Bank of Malaysia, which monitors the flow of investments, through
its payments and receipts forms submitted by its Balance of Payments Department, does
publish some rudimentary data on Malaysian investment abroad, as shown in table 3.
Malaysian overseas investment increased from a mere RM 318.0 million in 1980 to
RM 554.0 million in 1990 (Tham, 1998b, pp. 112-114). This increased further to
RM 1,310.2 million in 1992. More importantly, direct investment in business activities
jumped from 22.6 per cent of the total Malaysian investment abroad in 1980 to 77.0 per
cent in the first three quarters of 1994, thereby shifting away from the dominance of real
estate acquisition in Malaysian investment abroad during the period 1980-1985. Despite
the financial crisis, Malaysian investment continued to increase from RM 10,715 million in
1996 to RM 11,620 million in 1998. It continued to increase, peaking at RM 16,872 million
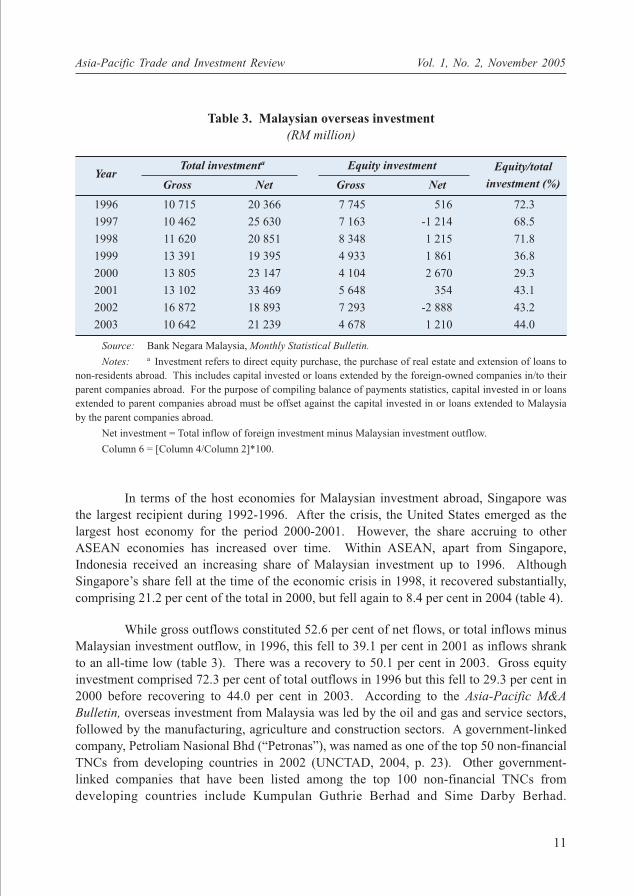
in 2002 before dropping to RM 10,642 million in 2003.
Asia-Pacific Trade and Investment Review Vol. 1, No. 2, November 2005
11
In terms of the host economies for Malaysian investment abroad, Singapore was
the largest recipient during 1992-1996. After the crisis, the United States emerged as the
largest host economy for the period 2000-2001. However, the share accruing to other
ASEAN economies has increased over time. Within ASEAN, apart from Singapore,
Indonesia received an increasing share of Malaysian investment up to 1996. Although
Singapore’s share fell at the time of the economic crisis in 1998, it recovered substantially,
comprising 21.2 per cent of the total in 2000, but fell again to 8.4 per cent in 2004 (table 4).
While gross outflows constituted 52.6 per cent of net flows, or total inflows minus
Malaysian investment outflow, in 1996, this fell to 39.1 per cent in 2001 as inflows shrank
to an all-time low (table 3). There was a recovery to 50.1 per cent in 2003. Gross equity
investment comprised 72.3 per cent of total outflows in 1996 but this fell to 29.3 per cent in
2000 before recovering to 44.0 per cent in 2003. According to the Asia-Pacific M&A
Bulletin, overseas investment from Malaysia was led by the oil and gas and service sectors,
followed by the manufacturing, agriculture and construction sectors. A government-linked
company, Petroliam Nasional Bhd (“Petronas”), was named as one of the top 50 non-financial
TNCs from developing countries in 2002 (UNCTAD, 2004, p. 23). Other government-
linked companies that have been listed among the top 100 non-financial TNCs from
developing countries include Kumpulan Guthrie Berhad and Sime Darby Berhad.
Table 3. Malaysian overseas investment(RM million)
YearTotal investmenta Equity investment
Gross Net Gross Net
1996 10 715 20 366 7 745 516 72.3
1997 10 462 25 630 7 163 -1 214 68.5
1998 11 620 20 851 8 348 1 215 71.8
1999 13 391 19 395 4 933 1 861 36.8
2000 13 805 23 147 4 104 2 670 29.3
2001 13 102 33 469 5 648 354 43.1
2002 16 872 18 893 7 293 -2 888 43.2
2003 10 642 21 239 4 678 1 210 44.0
Source: Bank Negara Malaysia, Monthly Statistical Bulletin.
Notes: a Investment refers to direct equity purchase, the purchase of real estate and extension of loans to
non-residents abroad. This includes capital invested or loans extended by the foreign-owned companies in/to their
parent companies abroad. For the purpose of compiling balance of payments statistics, capital invested in or loans
extended to parent companies abroad must be offset against the capital invested in or loans extended to Malaysia
by the parent companies abroad.
Net investment = Total inflow of foreign investment minus Malaysian investment outflow.
Column 6 = [Column 4/Column 2]*100.
Equity/total
investment (%)

Asia
-Pacific T
rade a
nd In
vestmen
t Review
Vol. 1
, No. 2
, Novem
ber 2
005
12 Table 4. Gross Malaysian investment overseas in selected countriesa, 1997-2004
Countries1997 1998 1999 2000 2001 2002 2003 2004
RM million
United States 1 334 1 654 513 3 924 4 007 5 708 994 204
(12.75) (14.23) (3.83) (28.42) (30.58) (33.83) (9.34) (0.67)
United Kingdom 1 715 822 553 532 270 822 493 182
(16.39) (7.07) (4.13) (3.85) (2.06) (4.87) (4.63) (0.60)
China 331 79 201 153 313 310 243 402
(3.16) (0.68) (1.50) (1.11) (2.39) (1.84) (2.28) (1.33)
Australia 504 2 748 104 73 304 172 167 86
(4.82) (23.65) (0.77) (0.53) (2.32) (1.02) (1.57) (0.28)
New Zealand 49 18 9 12 16 21 5 15
(0.47) (0.15) (0.07) (0.09) (0.12) (0.12) (0.05) (0.05)
ASEANIndonesia 648 229 398 536 1 683 901 356 503
(6.19) (1.97) (2.97) (3.88) (12.85) (5.34) (3.35) (1.66)
Philippines 300 106 100 109 54 78 66 6
(2.87) (0.91) (0.75) (0.79) (0.41) (0.46) (0.62) (0.02)
Singapore 1 784 2 096 1 635 2 920 2 082 1 074 845 2 533
(17.05) (18.04) (12.21) (21.15) (15.89) (6.37) (7.94) (8.35)
Thailand 132 540 151 292 134 45 226 695
(1.26) (4.65) (1.13) (2.12) (1.02) (0.27) (2.12) (2.29)
Viet Nam 143 71 142 50 88 78 86 170
(1.37) (0.61) (1.06) (0.36) (0.67) (0.46) (0.81) (0.56)
Cambodia 40 88 7 39 5 2 11 26
(0.38) (0.76) (0.05) (0.28) (0.04) (0.01) (0.10) (0.09)
Myanmar 8 84 79 2 3 – 2 –
(0.08) (0.72) (0.59) (0.01) (0.02) (–) (0.02) (–)
All other countries 3 475 3 173 9 499 5 163 4 143 7 661 7 148 25 513
(33.21) (26.55) (70.94) (37.40) (68.37) (45.41) (67.17) (84.10)
Total 10 463 11 620 13 391 13 805 13 102 16 872 10 642 30 335
(100) (100) (100) (100) (100) (100) (100) (100)
Source: Bank Negara Malaysia, Monthly Statistical Bulletin (http://www.bnm.gov.my/files/publication/msb/2005/6/xls/viii_13.xls, accessed on 24/8/2005).
Notes: Figures in parentheses are percentages of total.a Refers to the direct equity investment purchase of real estate abroad and extension of loans to non-residents abroad. This includes capital
invested or loans extended by the foreign-owned companies to their parent companies abroad. For the purpose of compiling balance of payments statistics, capitalinvested in parent companies abroad must be offset against the capital invested in Malaysia by the parent companies abroad. At present, the Cash BOP system isnot able to segregate this type of transaction.

Asia-Pacific Trade and Investment Review Vol. 1, No. 2, November 2005
13
Investments in manufacturing were largely for the manufacturing of fabricated metal
products, machinery and equipment (including electronic and electrical products), palm oil,
wood and wood-based products (Asia-Pacific M&A Bulletin, 2005, p. 1).
3. JAPANESE DIRECT INVESTMENT: RESPONDING TO THERAPIDLY CHANGING EXTERNAL ENVIRONMENT
(a) Outflows
Japan’s outward FDI grew rapidly in 1970-1972 with growth slowing in
1972-1982 and then accelerating again in 1982-1989, largely because of the boom in FDI
during 1986-1989 (Kojima, 1995, p. 99). Moreover, there was a conspicuous shift in
Japan’s FDI to the developed economies during 1982-1989, mainly in the service sector. In
1988, 76 per cent of JDI in Europe was in the service sector while only 16 per cent was in
manufacturing (Dicken, 1992, p. 78). On the other hand, the focus in Asia was on natural
resources such as mining and manufacturing.
Japanese direct investment in manufacturing arose out of the ownership
advantages for Japanese companies due to Japan’s development of its own indigenous
technology. According to Morris-Suzuki (1992, p. 139), Japan’s adaptation of imported
technology and the upgrading of indigenous techniques before the Second World War laid
the foundations for the expansion of innovative activity in leading edge industries during
the second half of the twentieth century. By 1960, Japan already had 86,000 scientific and
technical researchers (or 93 per 100,000 population) and possessed an institutional basis for
the large expansion of corporate research in the subsequent two decades of high growth.
Japanese companies thus possessed firm-specific intangible assets, in the form of
technology that is used in the eclectic ownership, location and internalization paradigm, for
explaining investment abroad in the form of FDI.
In addition to the technology advantage, the high rates of growth and savings
between the late 1960s and the mid-1970s before the maturing of the Japanese economy
also implied that Japan possessed the capacity to export capital in the form of FDI. Thus,
the progressive relaxation of investment constraints within Japan led to the first wave of
JDI between the late 1960s until the mid-1970s.
The second wave of JDI in East Asia after the Plaza Accord was motivated by
appreciation of the yen and the shortage of blue-collar workers within Japan (Tokunaga,
1992, p. 31). Japanese businesses thus were driven to undertake a global process of
horizontal specialization, primarily in the assembly and processing industries. In particular,
the availability of low-cost labour in ASEAN attracted JDI in the manufacture of electrical
machinery and appliances and other machinery. Hence Asia retained its position as the
third largest recipient of JDI, after North America and Europe, when the share of JDI to
total world investment peaked in 1989.
Asia-Pacific Trade and Investment Review Vol. 1, No. 2, November 2005
14
In the 1990s, Japanese investors faced a completely different set of external and
internal environment that affected their overseas investment strategies. Before the 1997
financial crisis, increasing global competitive pressures compelled Japanese companies to
enhance the cost competitiveness of their production bases in Asia. In particular, the
electronics industry responded by increasing the local procurement of parts and materials
that accounted for the bulk of their production costs in a bid to lower the degree of
dependency on the yen, thereby alleviating the effects of the yen’s appreciation (Takayasu
and Ishizaki, 1995, p. 13). Concurrently, there were also increasing efforts to reduce costs
through reaping the economies of scale induced by mass production, especially among the
parts producers. Therefore, small and medium-sized Japanese companies also started to
relocate their production abroad at this time.
In addition, the rapid economic growth in East Asia fueled the region’s overall
demand, particularly for electrical and electronics products. East Asia was therefore no
longer just an export platform but also became an important sales region. Japanese
companies accordingly expanded and strengthened their production in Asia, while the
number of items as well as the value added of products also increased for the products
produced there. Table 5 shows the share of Asia in total JDI increasing from 12.4 per cent
in 1990 to 24.2 per cent in 1996, thereby overtaking Europe as the second largest recipient
during 1994-1997.
However, there was a perceptible shift in the pattern of JDI within Asia in the first
half of the 1990s due to the erosion of the locational advantages in the ASEAN economies,
especially in wages and infrastructure, while the rise of China’s economy stimulated
Japanese investment there. Table 6 shows the fall in JDI in ASEAN from 5,995 billion yen
in 1990 to 3,548 billion yen in 1993 while China’s share increased steadily during the same
period. JDI in China peaked in 1995 and subsequently fell continuously until 1999. The
initial decline in 1996/1997 may be attributed to the removal of the duty free status on the
import of capital goods for the enterprises with foreign investment in April 1996. However,
its ensuing decline reflected to a certain extent the problems encountered by Japanese
corporations as a result of the Asian financial crisis as well as some disenchantment with
the Chinese market owing to heightened competition and the vague legal and tax system in
China. JDI in China, however, increased again in 2000 owing to China’s impending
accession into the World Trade Organization while its successful accession in 2001 fuelled
progressive annual increases of JDI in anticipation of further liberalization and growth in
China.
By contrast, JDI in the ASEAN economies recovered during 1994-1997 as a result
of the large surge of investment into Indonesia during that period (table 6). The fall during
1998-2000 as a result of the financial and economic crisis in the region can also be traced to
the large drop in JDI, also in Indonesia, as inflows fell from a peak of 3,085 billion yen in
1997 to a mere 464 billion yen in 2000. A reversal in the downward trend of JDI in the
ASEAN economies was seen in 2001 for the first time since the crisis in 1997. However,

Asia
-Pacific T
rade a
nd In
vestmen
t Review
Vol. 1
, No. 2
, Novem
ber 2
005
15
Table 5. Japanese outward direct investment by major region, 1990-2004(in 100 million yen)
Year
Region1990 1991 1992 1993 1994 1995 1996 1997 1998 1999 2000 2001 2002 2003 2004
North America 39 958 25 763 18 972 17 591 18 525 22 394 25 933 26 247 14 011 27 765 13 796 8 195 10 299 12 072 5 198
(47.84) (45.31) (42.81) (42.37) (43.27) (45.18) (47.94) (39.63) (26.86) (36.88) (25.55) (20.28) (22.92) (29.59) (13.60)
Latin America 5 289 4 547 3 525 3 889 5 499 3 741 5 008 7 775 8 274 8 614 5 838 9 654 7 005 5 948 6 849
(6.33) (8.00) (7.95) (9.37) (12.85) (7.55) (9.26) (11.74) (15.86) (11.44) (10.77) (23.89) (15.60) (14.58) (17.92)
Asia 10 343 8 107 8 316 7 672 10 084 11 921 13 083 14 948 8 357 8 195 6 638 8 307 6 910 7 233 10 091
(12.38) (14.26) (18.77) (18.48) (23.56) (24.05) (24.19) (22.57) (16.02) (10.88) (12.25) (20.56) (15.38) (17.73) (26.41)
Middle East 39 123 896 251 303 148 268 578 187 126 21 25 45 20 5
and Near East (0.05) (0.22) (2.02) (0.60) (0.71) (0.30) (0.50) (0.87) (0.36) (0.17) (0.04) (0.06) (0.10) (0.05) (0.01)
Europe 20 975 12 832 9 176 9 204 6 525 8 281 8 305 13 749 17 937 28 975 27 061 13 263 18 807 14 268 13 934
(25.11) (22.57) (20.71) (22.17) (15.24) (16.71) (15.35) (20.76) (34.38) (38.48) (49.93) (32.82) (41.86) (34.97) (36.47)
Africa 804 1 014 308 630 366 367 485 407 569 580 62 273 237 119 124
(0.96) (1.78) (0.70) (1.52) (0.85) (0.74) (0.90) (0.61) (1.09) (0.77) (0.11) (0.68) (0.53) (0.29) (0.32)
Oceania 6 119 4 476 3 119 2 275 1 507 2 716 1 011 2 525 2 833 1 036 777 694 1 628 1 137 2 009
(7.33) (7.87) (7.04) (5.48) (3.52) (5.48) (1.87) (3.81) (5.43) (1.38) (1.43) (1.72) (3.62) (2.79) (5.26)
Total 83 527 56 862 44 313 41 514 42 808 49 568 54 094 66 229 52 169 75 292 54 193 40 413 44 930 40 795 38 210(100) (100) (100) (100) (100) (100) (100) (100) (100) (100) (100) (100) (100) (100) (100)
Source: Ministry of Finance, Japan. http://www.mof.go.jp/english/fdi/2002a_2.htm, accessed on 20/0/2/2003, and http://www.mof.go.jp/english/fdi/
reference01.xls, accessed on 09/08/2005.
Note: Figures in parentheses are percentages of total.

Asia
-Pacific T
rade a
nd In
vestmen
t Review
Vol. 1
, No. 2
, Novem
ber 2
005
16 Table 6. Japanese outward direct investment to ASEAN countries and China, 1990-2004
(in 100 million yen)
Year
Country1990 1991 1992 1993 1994 1995 1996 1997 1998 1999 2000 2001 2002 2003 2004
Brunei – 0 – – 15 15 – – – 2 – – – – –Darussalam (–) (0.00) (–) (–) (0.04) (0.03) (–) (–) (–) (0.00) (–) (–) (–) (–) (–)
Myanmar 1 0 – – 1 22 11 5 3 11 11 – – – –(0.00) (0.00) (–) (–) (0.00) (0.04) (0.02) (0.01) (0.01) (0.01) (0.02) (–) (–) (–) (–)
Cambodia – – 4 1 – – – – – – – – – – –(–) (–) (0.01) (0.00) (–) (–) (–) (–) (–) (–) (–) (–) (–) (–) (–)
Indonesia 1 615 1 628 2 142 952 1 808 1 548 2 720 3 085 1 378 1 070 464 785 644 732 334(1.93) (2.86) (4.83) (2.29) (4.22) (3.12) (5.03) (4.66) (2.64) (1.42) (0.86) (1.94) (1.43) (1.79) (0.87)
Malaysia 1 067 1 202 919 892 772 555 644 971 658 588 256 321 98 523 135(1.28) (2.11) (2.07) (2.15) (1.80) (1.12) (1.19) (1.47) (1.26) (0.78) (0.47) (0.79) (0.22) (1.29) (0.35)
Philippines 383 277 210 236 683 692 630 642 485 711 514 989 500 222 341(0.46) (0.49) (0.47) (0.57) (1.60) (1.40) (1.16) (0.97) (0.93) (0.94) (0.95) (2.45) (1.11) (0.54) (0.89)
Singapore 1 232 837 875 735 1 101 1 143 1 256 2 238 815 1 158 505 1 435 917 364 768(1.48) (1.47) (1.97) (1.77) (2.57) (2.31) (2.32) (3.38) (1.56) (1.54) (0.93) (3.55) (2.04) (0.89) (2.01)
Thailand 1 696 1 107 849 680 749 1 196 1 581 2 291 1 755 934 1 030 1 106 614 711 1 273(2.03) (1.95) (1.92) (1.64) (1.75) (2.41) (2.92) (3.46) (3.36) (1.24) (1.90) (2.74) (1.37) (1.74) (3.33)
Viet Nam 1 0 13 52 177 192 359 381 65 110 24 97 73 79 117(0.00) (0.00) (0.03) (0.13) (0.41) (0.39) (0.66) (0.58) (0.12) (0.15) (0.04) (0.24) (0.16) (0.19) (0.31)
ASEAN 5 995 5 051 5 012 3 548 5 306 5 363 7 201 9 613 5 159 4 584 2 804 4 733 2 846 2 631 2 968Total (7.18) (8.88) (11.30) (8.55) (12.39) (10.82) (13.30) (14.53) (9.88) (6.09) (5.17) (11.71) (6.33) (6.45) (7.77)
China 511 787 1 381 1 954 2 683 4 319 2 828 2 438 1 363 858 1 114 1 819 2 152 3 553 4 909(0.61) (1.38) (3.12) (4.71) (6.27) (8.71) (5.23) (3.68) (2.61) (1.14) (2.06) (4.50) (4.79) (8.71) (12.85)
World 83 527 56 862 44 313 41 514 42 808 49 568 54 094 66 229 52 169 75 292 54 193 40 413 44 930 40 795 38 210(total) (100) (100) (100) (100) (100) (100) (100) (100) (100) (100) (100) (100) (100) (100) (100)
Source: Ministry of Finance, Japan. http://www.mof.go.jp/english/fdi/2002a_2.htm, accessed on 24/02/2003, and http://www.mof.go.jp/english/fdi/
reference01.xls, accessed on 09/08/2005.
Notes: Figures in parentheses are percentages of total.
No investments in the Lao People’s Democratic Republic.
Asia-Pacific Trade and Investment Review Vol. 1, No. 2, November 2005
17
this increase was not sustained as it dropped to an average of 2,815 million yen for the
duration 2002-2004.
Internally, the slowdown in the growth of the Japanese economy at the
beginning of the decade resulted in a fall in outflows of Japanese investment from its
peak of 90,339 billion yen in 1989 to 41,514 billion yen in 1993. Overseas investment
subsequently recovered in 1994 in tandem with economic recovery within the country and
increased further to 66,229 billion yen in 1997 (table 5). The advent of the financial crisis
in 1997 adversely affected the production of Japanese affiliates owing to the contraction in
the demand of the crisis-hit economies and foreign exchange losses for the affiliates that did
not hedge their foreign exchange earnings. The fall in corporate profits and investor
confidence in the region led Japanese investment to plunge from 66,229 billion yen in 1997
to 52,169 billion yen in 1998. After recovering strongly to 75,292 billion yen in 1999, it
fell again in 2000 and 2001 to 54,193 billion yen and 40,413 billion yen, respectively.
Although it recovered in 2002, overseas investment from Japan continued to fall from 2003
to 38,210 million yen in 2004.
The crisis also affected the share of JDI in Asia as it fell from 22.6 per cent in
1997 to 16.0 per cent in 1998 (table 5). Although this share subsequently recovered in
2001, Asia’s importance as a recipient of JDI fell to the fourth position in 2001 after
Europe, Latin America and North America. However, by 2003 Asia regained its rank as the
third most important investment destination while in 2004, it was the second most
important investment destination for JDI due to its inflows into China.
(b) Inflows
Inflows of investment into Japan were restricted after the Second World War but
these restrictions were subsequently removed in the early 1980s. Nevertheless, there is
a significant imbalance between outflows and inflows of investment into Japan. In 1990,
inflows amounted to 4,046 billion yen while outflows comprised 83,527 billion yen or
inflows were a mere 4.8 per cent of outflows (tables 7 and 5).
Miki (1995, pp. 4-6) attributed the high overall cost structure in Japan to be one of
the main deterrents of market entry and expansion for foreign investors in the country.
Other investment obstacles encountered by investors in Japan include the complicated
distribution systems, burdensome regulations that inhibit the establishment of business
facilities and hinder market access for foreign products and services as well as corporate
practices and market rules that inhibit the acquisition of Japanese firms. As further
evidence of the difficulty of local investment conditions in Japan, foreign participation in
mergers and acquisitions, which account for almost 80 per cent of the FDI among other
countries of the Organization for Economic Cooperation and Development, was virtually
nonexistent in Japan before 1997. Thus in 1997, inflows were still a relatively small
percentage of total outflows (10.2 per cent according to tables 7 and 5).

Asia
-Pacific T
rade a
nd In
vestmen
t Review
Vol. 1
, No. 2
, Novem
ber 2
005
18
Table 7. Inward direct investment into Japan, by major regions, 1990-2004(in 100 million yen)
Year
Region1990 1991 1992 1993 1994 1995 1996 1997 1998 1999 2000 2001 2002 2003 2004
North America 1 177 2 843 1 837 1 262 1 981 1 786 2 445 1 521 8 095 4 173 10 777 6 922 6 558 4 400 26 198
(29.09) (48.22) (34.62) (35.20) (45.79) (48.30) (31.73) (22.42) (60.40) (17.39) (34.48) (31.79) (30.00) (20.79) (65.06)
Latin America 146 142 981 173 136 141 656 591 343 2 895 1 680 648 2 239 4 606 1 348
(3.62) (2.41) (18.50) (4.81) (3.15) (3.81) (8.51) (8.71) (2.56) (12.07) (5.38) (2.98) (10.24) (21.77) (3.35)
Asia 188 194 128 539 271 247 1 372 742 211 1 100 418 567 455 1 614 864
(4.66) (3.29) (2.41) (15.03) (6.26) (6.69) (17.80) (10.94) (1.57) (4.58) (1.34) (2.60) (2.08) (7.63) (2.15)
Middle East 3 2 13 3 0 0 20 1 1 2 3 2 1 0 5
and Near East (0.07) (0.03) (0.24) (0.09) (0.01) (0.01) (0.25) (0.01) (0.01) (0.01) (0.01) (0.01) (0.00) (0.00) (0.01)
Europe 1 973 1 843 1 901 1 199 1 586 1 274 2 202 3 078 3 023 14 137 6 889 10 962 7 076 6 929 7 249
(48.76) (31.27) (35.82) (33.44) (36.65) (34.46) (28.57) (45.39) (22.56) (58.92) (22.05) (50.33) (32.37) (32.74) (18.00)
Africa 11 2 16 5 – 10 – 0 0 4 3 35 37 1 –
(0.26) (0.03) (0.31) (0.14) (–) (0.27) (–) (0.00) (0.00) (0.02) (0.01) (0.16) (0.17) (0.00) (–)
Oceania 33 5 0 12 33 5 14 7 1 68 69 4 58 16 4
(0.82) (0.09) (0.01) (0.32) (0.76) (0.15) (0.18) (0.10) (0.01) (0.28) (0.22) (0.02) (0.27) (0.08) (0.01)
Japana 515 865 429 393 320 233 1 000 843 1 729 1 615 11 413 2 638 5 439 3 596 4 597
(12.74) (14.68) (8.09) (10.97) (7.39) (6.30) (12.97) (12.43) (12.90) (6.73) (36.52) (12.11) (24.88) (16.99) (11.42)
Total 4 046 5 896 5 306 3 586 4 327 3 697 7 707 6 782 13 404 23 993 31 251 21 779 21 863 21 161 40 265
(100) (100) (100) (100) (100) (100) (100) (100) (100) (100) (100) (100) (100) (100) (100)
Source: Ministry of Finance, Japan. http://www.mof.go.jp/english/fdi/2002a_6.htm, accessed on 24/02/2003, and http://www.mof.go.jp/english/fdi/
reference05.xls, accessed on 09/08/2005.
Notes: a Investments from Japan are those made by foreign-owned companies in Japan.
Figures in parentheses are percentages of total.
Asia
-Pacific T
rade a
nd In
vestmen
t Review
Vol. 1
, No. 2
, Novem
ber 2
005
19
Table 8. Inward direct investment into Japan, 1990-2004 (industry total)(in 100 million yen)
Year
Industry1990 1991 1992 1993 1994 1995 1996 1997 1998 1999 2000 2001 2002 2003 2004
Food 43 171 12 104 32 41 3 22 258 15 0 352 82 507 34
(1.06) (2.90) (0.23) (2.90) (0.74) (1.11) (0.04) (0.32) (1.92) (0.06) (0.00) (1.62) (0.38) (2.40) (0.08)
Textile 26 13 7 7 1 23 9 19 36 2 24 28 41 11 89
(0.64) (0.22) (0.13) (0.20) (0.02) (0.62) (0.12) (0.28) (0.27) (0.01) (0.08) (0.13) (0.19) (0.05) (0.22)
Rubber and 1 76 96 54 40 21 107 188 48 70 11 70 – – –
leather (0.02) (1.29) (1.81) (1.51) (0.92) (0.57) (1.39) (2.77) (0.36) (0.29) (0.04) (0.32) (–) (–) (–)
Chemical 636 1 226 931 542 234 1 095 695 740 397 603 1 788 1 156 4 165 1 096 214
(15.72) (20.79) (17.55) (15.11) (5.41) (29.62) (9.02) (10.91) (2.96) (2.51) (5.72) (5.31) (19.05) (5.18) (0.53)
Metal 225 107 52 177 196 1 528 3 20 179 19 1 166 29 8
(5.56) (1.81) (0.98) (4.94) (4.53) (0.03) (6.85) (0.04) (0.15) (0.75) (0.06) (0.00) (0.76) (0.14) (0.02)
Machinery 1 164 595 829 781 1 339 182 1 558 1 452 2 129 8 652 3 519 1 385 2 706 2 813 432
(28.77) (10.09) (15.62) (21.78) (30.95) (4.92) (20.22) (21.41) (15.88) (36.06) (11.26) (6.36) (12.38) (13.29) (1.07)
Petroleum 45 234 59 59 147 20 82 58 84 135 2 534 88 619 128 178
(1.11) (3.97) (1.11) (1.65) (3.40) (0.54) (1.06) (0.86) (0.63) (0.56) (8.11) (0.40) (2.83) (0.60) (0.44)
Glass and 9 6 – 5 18 0 0 7 – 57 0 94 4 8 –
ceramics (0.22) (0.10) (–) (0.14) (0.42) (0.00) (0.00) (0.10) (–) (0.24) (0.00) (0.43) (0.02) (0.04) (–)
Others 134 149 94 108 48 29 129 185 153 85 12 105 445 280 67
(3.31) (2.53) (1.77) (3.01) (1.11) (0.78) (1.67) (2.73) (1.14) (0.35) (0.04) (0.48) (2.04) (1.32) (0.17)
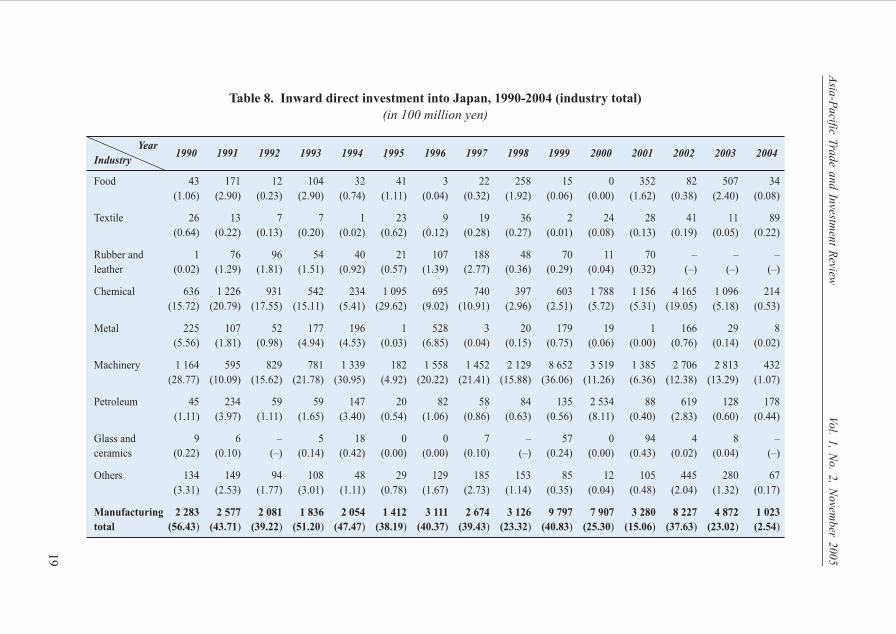
Manufacturing 2 283 2 577 2 081 1 836 2 054 1 412 3 111 2 674 3 126 9 797 7 907 3 280 8 227 4 872 1 023total (56.43) (43.71) (39.22) (51.20) (47.47) (38.19) (40.37) (39.43) (23.32) (40.83) (25.30) (15.06) (37.63) (23.02) (2.54)

Asia
-Pacific T
rade a
nd In
vestmen
t Review
Vol. 1
, No. 2
, Novem
ber 2
005
20 Table 8. (continued)
Year
Industry1990 1991 1992 1993 1994 1995 1996 1997 1998 1999 2000 2001 2002 2003 2004
Telecom- 30 136 63 32 30 53 21 33 168 3 300 7 508 8 286 1 721 604 4 663
munication (0.74) (2.31) (1.19) (0.89) (0.69) (1.43) (0.27) (0.49) (1.25) (13.75) (24.02) (38.05) (7.87) (2.85) (11.58)
Construction 13 31 0 1 4 1 0 3 14 22 0 86 23 11 34
(0.32) (0.53) (0.00) (0.03) (0.09) (0.03) (0.00) (0.04) (0.10) (0.09) (0.00) (0.39) (0.11) (0.05) (0.08)
Trading 1 065 1 073 1 554 1 005 1 135 679 1 664 996 1 759 3 485 2 761 1 090 2 582 3 691 1 073
(26.320) (18.20) (29.29) (28.03) (26.23) (18.37) (21.59) (14.69) (13.12) (14.53) (8.83) (5.00) (11.81) (17.44) (2.66)
Finance and 159 1 203 190 40 687 1 001 273 1 616 4 569 5 115 10 293 6 608 6 468 10 179 29 767
insurance (3.93) (20.40) (3.58) (1.12) (15.88) (27.08) (3.54) (23.83) (34.09) (21.32) (32.94) (30.34) (29.58) (48.10) (73.93)
Service 384 737 1 067 240 374 491 2 360 888 3 181 2 058 2 365 1 664 2 469 1 079 1 358
(9.49) (12.50) (20.11) (6.69) (8.64) (13.28) (30.62) (13.09) (23.73) (8.58) (7.57) (7.64) (11.29) (5.10) (3.37)
Transportation 18 35 25 51 8 12 10 4 61 22 57 22 27 17 2 092
(0.44) (0.59) (0.47) (1.42) (0.18) (0.32) (0.13) (0.06) (0.46) (0.09) (0.18) (0.10) (0.12) (0.08) (5.20)
Real estate 35 94 307 107 32 16 265 482 416 168 346 736 291 689 229
(0.87) (1.59) (5.79) (2.98) (0.74) (0.43) (3.44) (7.11) (3.10) (0.70) (1.11) (3.38) (1.33) (3.26) (0.57)
Others 59 11 18 274 3 32 2 87 111 25 13 7 55 20 26
(1.46) (0.19) (0.34) (7.64) (0.07) (0.87) (0.03) (1.28) (0.83) (0.10) (0.04) (0.03) (0.25) (0.09) (0.06)
Non-manufacturing 1 763 3 319 3 225 1 750 2 273 2 284 4 595 4 108 10 278 14 196 23 344 18 499 13 636 16 289 39 242total (43.57) (56.29) (60.78) (48.80) (52.53) (61.78) (59.62) (60.57) (76.68) (59.17) (74.70) (84.94) (62.37) (76.98) (97.46)
Total 4 046 5 896 5 306 3 586 4 327 3 697 7 707 6 782 13 404 23 993 31 251 21 779 21 863 21 161 40 265(100) (100) (100) (100) (100) (100) (100) (100) (100) (100) (100) (100) (100) (100) (100)
Source: Ministry of Finance, Japan. http://www.mof.go.jp/english/fdi/2002a_7.htm, accessed on 24/02/2003, and http://www.mof.go.jp/english/fdi/
reference06.xls, accessed on 10/08/2005.
Note: Figures in parentheses are percentages of total.

Asia-Pacific Trade and Investment Review Vol. 1, No. 2, November 2005
21
Nonetheless, there were some changes post-1997 as inflows doubled from 6,782
billion yen in 1997 to 13,404 billion yen in 1998 due in part to the weaker yen (table 7).
Financial deregulation within Japan also contributed to this increase as table 8 shows
clearly an increasing concentration of inward investment in non-manufacturing activities,
especially in the finance and insurance subsector since 1997. UNCTAD (2004, p. 83)
further noted that the rise in corporate failures, decline in stock valuations, reductions in
cross-shareholdings and the global mergers and acquisitions boom also contributed to the
inward FDI boom. Thus in the year 2000, inward flows increased significantly to 57.7 per
cent of outwards flows due to the rise in the former and a concurrent fall in the latter
(tables 7 and 5). In 2003, Japan also undertook specific measures to increase inward flows
of FDI (UNCTAD, 2003, p. 77). These include the dissemination of information,
improving the business environment, reforming the administration, improving employment
and living conditions, and upgrading national and local government support systems.
However, it remains to be seen whether these changes are sufficient to achieve the targeted
doubling of inward FDI by 2008 as announced by Prime Minister Junichiro Koizumi in
January 2003.
In terms of source countries, Europe and North America were the largest investors
in Japan during 1990-2001 (table 7). However, Latin America’s share of foreign investment
in Japan was larger than the share accruing to North America in 2003.
4. LEARNING FROM JAPAN’S RESPONSE
The sections above show clearly that whereas inflows are significantly more
important than outflows for Malaysia, the converse is true for Japan. This disparate
response towards the globalization of production and capital flows in the form of FDI can
be attributed to the different approaches taken towards technology and human capital
development in Malaysia and Japan.
As Malaysia has a relatively high savings rate, the need for foreign capital is not
primarily driven by a shortage of capital in the country but rather by the need for foreign
technology. On the other hand, the development of technology within Japan enabled it to
develop firm-specific ownership advantages that have contributed to the outward push of
investment flows from the country. While Japan also utilized imported technology to
develop its technology advantage, it also simultaneously developed its own indigenous
technology (Morris-Suzuki, 1992, p. 139). In Malaysia, however, the development of
technology has been driven by the purchase of technology through technology agreements
and technology spillovers from TNCs operating in the country as well as public sector
research in the agricultural sector, especially in rubber and palm oil.
Although the broad conclusion of the various studies that have been conducted on
the state of technology transfer in Malaysia indicate that TNCs in the country have
Asia-Pacific Trade and Investment Review Vol. 1, No. 2, November 2005
22
contributed significantly to the improvement of local production capabilities, they have yet
to establish their research and development (R&D) base in the country (Tham, 2004,
p. 222). Neither have they facilitated the establishment of independent product technology
due, in part, to the self-interest of parent companies that dictate the shape and pace of R&D
in their subsidiary firms abroad.
Despite anecdotal evidence of some successful technological independence for
domestically-owned firms, they are by and large as yet unwilling or incapable of investing
in efforts that will enhance their technology. This may be owing to their relatively smaller
size as these companies are usually small and medium enterprises, while the profile of R&D
expenditure as indicated by the survey respondents in the National Survey of Research and
Development shows that there is a positive correlation between sales revenue and
employment size with the R&D expenditures of the companies.
Even though gross expenditure on R&D has increased over time, Malaysia is still
very far from developing its own indigenous technology and this hampers investment
abroad, especially in China where the rapid rate of imitation in that country has shortened
the product cycle tremendously. Therefore, a strong indigenous technology base in the
source country is necessary for encouraging further investment flows from the country.
Japan’s investment outflow was also hastened by the shortage of blue-collar
workers and the rising cost of production within the country. Although Malaysia has
experienced the same problem since the beginning of the 1990s, Malaysia’s strategy of
importing cheap foreign labour, especially unskilled and semi-skilled workers, stands in
stark contrast to Japan’s strategy of exporting its factories to low-cost producing countries
in its efforts to improve cost competitiveness. Importing cheap foreign labour has
perpetuated the position of Malaysia as a production site for labour-intensive industries
despite the loss in comparative advantage of these industries in the country.
However, if Malaysia should follow Japan’s strategy of exporting factories but
without a technology advantage, it will inevitably lead to the death of the manufacturing
sector as there is no R&D to sustain manufacturing activities in the country unlike in Japan.
Malaysia’s focus on manufacturing development has led, to a certain extent, to the benign
neglect in developing the service sector in the country. For example, trade and investment
promotion in Malaysia and MIDA’s activities have focused mainly on the manufacturing
sector and the service sector, with the exception of the information, communication and
technology subsector, which has only received the attention of MITI and MIDA in the last
two years.
Similarly, Japan’s service sector development has also been lacking behind the
development of its export-oriented manufacturing activities. The McKinsey Report (2000,
pp. 1-2) noted that 90 per cent of economic activity in Japan is conducted by companies that
do not export products but instead provide domestic manufacturing and services.
Asia-Pacific Trade and Investment Review Vol. 1, No. 2, November 2005
23
Unfortunately, the productivity of this segment of the Japanese economy stands at only
63 per cent of the levels in the United States.
Therefore, in order to achieve the goal of moving up the value added chain in
manufacturing, Malaysia will have to boost its technology competency significantly and
export the assembly-end operations to other low-cost producers. This follows Japan’s
strategy of achieving both price and technology competitiveness by utilizing global
production networks as well as investment flows in its competitive export-oriented
manufacturing activities.
At the same time, an important lesson from Japan’s skewed development of its
export-oriented manufacturing activities and its domestic-oriented manufacturing and
service activities is the need for a balanced approach towards development. Hence,
Malaysia needs to refocus its development goals beyond manufacturing activities
and instead increase its efforts to enhance the development of the service sector in the
country. In this matter, Malaysia can also learn from Japan’s recent liberalization of its
non-manufacturing activities for inward investment by accelerating the shift towards
tapping FDI for the development of the service sector in the country.
5. CONCLUSION
While both Malaysia and Japan tapped on the globalization of production and
investment flows for their development, the two countries differed significantly in their
response. Malaysia utilized investment inflows in the hope of acquiring the appropriate
technology that is necessary for furthering its industrial development. In so doing,
Malaysia became part of the TNC global production networks, especially in the electrical
and electronics subsector. However, the lack of an indigenous technology base and the
utilization of foreign workers have limited its progress up the technology ladder and its
position in the TNC global production networks.
By contrast, the export of capital from Japan is supported by its indigenous
technology development. The establishment of global production networks by Japanese
TNCs was motivated by the need to maintain cost competitiveness by relocating their
production facilities to lower-cost economies. Within Japan, global competitive pressures
have also accelerated the development of new products and new technologies in order to
preserve the technology advantage of the Japanese TNCs.
Therefore, Malaysia has to first develop its own indigenous base if it aspires to
follow Japan’s example in capital exports. Without this technology advantage, the export of
factories, as in the case of Japan, will lead to the “hollowing-out” of the manufacturing
sector in Malaysia as there will no longer be any advantage to continue production in the
country in view of its current shortage of skilled labour and scientific and technical
Asia-Pacific Trade and Investment Review Vol. 1, No. 2, November 2005
24
personnel. This can be noted in the declining importance of manufacturing in Japan as
production is relocated abroad while only the core R&D developments are kept in the
country.
Concurrently, it is also equally important to learn from Japan’s biased focus on
export-oriented manufacturing activities and its recent liberalization of inward investment
in non-manufacturing activities by refocusing the development goals of Malaysia beyond its
manufacturing activities. Thus, there needs to be a concerted effort to develop the service
sector in this country and a greater effort to tap FDI for the development of world-class
competitive services.
Since Malaysia’s strategy is also utilized by other developing countries, especially
those in ASEAN, the lessons shown here are also pertinent to these other countries. While
the reliance on FDI for capital and development may assist a country to industrialize,
moving up the industrial ladder will require the developing host economies to concentrate
more on developing indigenous technology, exporting capital and a shift towards more
balanced development that may require these countries to open up their service sectors as
well.

Asia-Pacific Trade and Investment Review Vol. 1, No. 2, November 2005
25
REFERENCES
Ariff, M., 1992. “Foreign direct investment in Malaysia: trends, determinants and
implications”, Chapter 1 in M. Ariff and H. Yokoyama. (eds.), Foreign Direct
Investment in Malaysia (Tokyo, Institute of Developing Economies).
Asia-Pacific M&A Bulletin, 2005. Special Feature: Malaysia goes abroad, http://
www.pwchk.com/home/webmedia/1122530543139/m&abulletin_ap_jun2005_
my_sp.pdf, 23 August (PricewaterhouseCoopers).
Denker, M.S., 1994. “The evolution of Japanese investment in Malaysia”, Chapter 2 in
K.S. Jomo (ed.), Japan and Malaysian Development: In the Shadow of the Rising
Sun (London, Routledge).
Dicken, Peter, 1992. Global Shift: The Internationalization of Economic Activity (London,
Paul Chapman Publishing Ltd).
Edwards, C., 1995. “The role of foreign direct investment”, Chapter 26 in Malaysian
Development Experience: Changes and Challenges (Kuala Lumpur, INTAN).
ESCAP, 1998. Foreign Direct Investment in Selected Asian Countries: Policies, Related
Institutional-building and Regional Cooperation, Development Paper No. 19,
ST/ESCAP/1809, United Nations publication, sales No. E.98.II.F.62 (New York,
United Nations).
Kojima, K., 1995. “Dynamics of Japanese direct investment in East Asia”, Hitotsubashi
Journal of Economics, vol. 36, pp. 93-124 (Tokyo, Hitotsubashi University).
Malaysia, 2001. Eighth Malaysia Plan 2001-2005 (Kuala Lumpur, Malaysia National
Printers Corporation).
McKinsey Global Institute, 2000. Why the Japanese Economy is not Growing, http://www.
mckinsey.com, July.
MIDA, 1990-1998. Statistics on the Manufacturing Sector, verious years.
Ministry of International Trade and Industry (MITI), 1996. The Second Industrial Master
Plan: 1996-2005 (Kuala Lumpur).
, 2004. Malaysia International Trade and Industry Report 2003 (Kuala Lumpur).
Miki, T., 1995. “Foreign direct investment in Asia by Japan’s companies and the recent
trend of American exporters exporting to Japan”, MIGA Working Paper
(Washington, D.C., MIGA).
Morris-Suzuki, T., 1992. “Japanese technology and the new international division of
knowledge in Asia”, Chapter 5 in S. Tokunaga (ed.), Japan’s Foreign Investment and
Asian Economic Interdependence: Production, Trade, and Financial Systems
(Tokyo, University of Tokyo Press).

Asia-Pacific Trade and Investment Review Vol. 1, No. 2, November 2005
26
Rasiah, R., 1993. “Free trade zones and industrial development in Malaysia”, in K.S. Jomo
(ed.), Industrializing Malaysia: Policy, Performance, Prospects (London,
Routledge).
Ragayah, M.Z., 1999. “Malaysian reverse investments: trends and strategies”, Asia-Pacific
Journal of Management, vol. 16, No. 3, pp. 469-496.
Sieh L.M.L., 2000. Taking on the World: Globalization Strategies in Malaysia (Kuala
Lumpur, McGraw-Hill).
Takayasu, K., and Y. Ishizaki, 1995. “The changing international division of labour of
Japanese electronics industry in Asia and it impact on the Japanese economy”, RIM
Pacific Business and Industries, vol. 1, No. 27, pp. 2-21 (Tokyo, Center for Pacific
Business Studies, Sakura Institute of Research).
Tham, S.Y., 1998a. “Competition and cooperation for foreign direct investment: an
ASEAN perspective”, Asia-Pacific Development Journal, vol. 5, No. 1, ST/ESCAP/
1898, United Nations publication, sales No. E.99.II.F.2, pp. 9-36 (New York, United
Nations).
Tham, S.Y., 1998b. “Malaysia”, Chapter 5 in Foreign Direct Investment in Selected Asian
Countries: Policies, Related Institutional-building and Regional Cooperation.
ESCAP Development Paper No. 19, ST/ESCAP/1809, United Nations publication,
sales No. E.98.II.F.62 (New York, United Nations).
Tham, S.Y., 2000. “AFTA and Japanese investment in Malaysia”, paper presented at the
First Joint-Seminar Thammasat-Kobe Gakuin University on AFTA and Industrial
Restructuring Beyond 2000, 19 September, Dusit Thani Hotel, Bangkok.
Tham, S.Y., 2004. “Malaysia”, Chapter 6 in D.H. Brooks and H. Hill (eds.), Managing FDI
in a Globalizing Economy: Asian Experiences (Asian Development Bank,
Houdmills, Palgrave Macmillan).
Tokunaga, S., 1992. “Japan’s FDI-promoting systems and intra-Asia networks: new
investment and trade systems created by the borderless economy”, Chapter 1 in
S. Tokunaga (ed.), Japan’s Foreign Investment and Asian Economic
Interdependence: Production, Trade, and Financial Systems (Tokyo, University of
Tokyo Press).
UNCTAD. World Investment Reports, 2001, 2002, 2003 and 2004, United Nations
publications, sales Nos. E.01.II.D.12, E.02.II.D.4, E.03.II.D.8 and E.04.II.D.33,
respectively (Geneva, UNCTAD).

Asia-Pacific Trade and Investment Review Vol. 1, No. 2, November 2005
27
ABSTRACT
The Bangkok Agreement**, signed in 1975 at the initiative of the United
Nations Economic and Social Commission for Asia and the Pacific
(ESCAP), is a preferential trading arrangement designed to liberalize trade among
Participating States of the ESCAP region through such measures as the reduction of
tariff and non-tariff barriers and the promotion of trade-related economic cooperation.
ESCAP functions as the secretariat to this Agreement. In an important recent
development, China deposited its instrument of ratification with the ESCAP
secretariat at the fifty-seventh session of the Commission held in Bangkok, from 19 to
25 April 2001 and became the latest member.
Intraregional trade among the Participating States of the Agreement has been
growing briskly over the last decade at a pace faster than their global trade.
Intraregional trade in conceded products has been modest and no conclusive trend in
their share can be noticed. So far the Agreement countries have been following
a positive list approach to intraregional trade liberalization. Such negotiations are
generally on a product-by-product basis, which is by its very nature slow and halting
The Bangkok Agreement:A Negative List Approachto Trade Liberalization inAsia and the Pacific
Indra Nath Mukherji*
* The author is Professor of South Asian Studies, Centre for South, Central, Southeast Asian and
Southwest Pacific Studies, School of International Studies, Jawaharlal Nehru University, New Delhi,
E-mail: [email protected].
** The Bangkok Agreement was renamed the “Asia-Pacific Trade Agreement” at the first session of the
Ministerial Council, held in Beijing on 2 November 2005.
(continued on page 28)

Asia-Pacific Trade and Investment Review Vol. 1, No. 2, November 2005
28
and the process of liberalization is therefore similarly slow and protracted. In order to
facilitate more expeditious regional trade liberalization, this paper suggests that the
Participating States launch deeper and more extensive trade liberalization by adopting
a negative list approach. This approach is one in which all products are subject to
trade liberalization in a phased and time-bound manner, except those that are banned
owing to health, moral, environmental or national security reasons or those that are
not subject to trade liberalization at the initial stage either to protect nascent domestic
industries, or to secure the livelihood concerns of the vulnerable sections of the
farming community. The latter set of products could be opened up over a longer
period. Efforts must nevertheless be made to bind the list of products in the negative
(sensitive) list so that the extent and depth of regional trade liberalization are not
unduly compromised.
This paper highlights two case studies of a negative list approach to regional
trade liberalization, the ASEAN Free Trade Area (AFTA) and the India-Sri Lanka Free
Trade Agreement, and suggests that the Bangkok Agreement could draw on the basic
elements of these arrangements.
This paper further introduces the concept of potential trade between pairs of
Participating States and illustrates the applicability of this concept to selected products
having the highest potential trade with China as a market for the other members. The
study highlights the enormous trade potential that was expanded with the accession of
China to the Agreement. This paper suggests that a negative list approach should
preferably be applied over larger sectors across-the-board with the possible exceptions
of selected products in some of the sectors.
1. BACKGROUND
The Bangkok Agreement, signed in 1975 at the initiative of ESCAP, is
a preferential trading arrangement designed to liberalize trade among member countries of
the ESCAP region through such measures as the reduction of tariff and non-tariff barriers
(NTBs) and trade-related economic cooperation. The GATT Council approved the
Bangkok Agreement in March 1978. Its rules and regulations are meant, inter alia, to
ensure non-discriminatory and fair trade practices and to preserve the value of the
preferences, including compensatory action where the value of preferences is reduced or
abrogated. It also aims at cooperation in such matters as customs administration, the
standardization of procedures and the formalities relating to mutual trade, the adoption of
common tariff nomenclature and the harmonization of rules of origin and anti-dumping
(continued from page 27)

Asia-Pacific Trade and Investment Review Vol. 1, No. 2, November 2005
29
measures.1 The five original signatory countries to the Agreement are Bangladesh, India,
the Lao People’s Democratic Republic, the Republic of Korea and Sri Lanka. Several other
countries have indicated their interest in membership. So far three rounds of trade
negotiations have taken place. The third round was launched in October 2001 and is
virtually completed pending a consolidation of second and third round results. ESCAP
functions as the secretariat to the Agreement.
In an important recent development, China completed the formalities related to its
accession to the Bangkok Agreement when it deposited the instrument of ratification with
the ESCAP secretariat at the fifty-seventh session of the Commission, held in Bangkok,
from 19 to 25 April 2001.
The Bangkok Agreement is currently engaged in the process of revitalization to
reflect the changes in the international trading system. In keeping with this, a Ministerial
Council has been established to provide overall policy direction for the future negotiating
agenda of the Agreement. In addition, the Agreement has also been recently amended.
Section 2 of this paper examines the nature of concessions exchanged by the
Participating States, including those offered exclusively to the least developed countries
(LDCs), and the margin of preference (MOP) offered by them. Section 3 examines the
trend in intraregional exports of countries that are Participating States of the Bangkok
Agreement and their share in world exports from 1994 to 2002. Section 4 presents the
rationale for a Negative List approach to trade liberalization, drawing illustrations from two
case studies, the ASEAN Free Trade Area (AFTA) and the India-Sri Lanka Free Trade
Agreement. Section 5 discusses the methodology to assess potential trade under the
Negative List approach. Section 6 examines the potential for trade among Participating
States of the Bangkok Agreement highlighting, in particular, China as a market for the other
Participating States. Section 7 highlights possible modalities for trade liberalization. The
final section makes the concluding observations.
2. EXCHANGE OF CONCESSIONS2
To date the Participating States have exchanged concessions on 4,279 products
(apart from 609 that have been offered exclusively to LDCs) in the second and third
rounds of negotiations. The concessions offered for all countries nearly trebled from
1,721 products in the second round to 3,596 products in the third, while those offered to
LDCs increased fivefold from 112 to 519 respectively, as may be seen in table 1.
1 Facts About the Bangkok Agreement, ESCAP, June 2005 (http://www.unescap/tid/BAfacts.pdf).2 Currently, Participating States are in the process of finalizing their concession lists. At the most recent
Standing Committee (twenty-third session, 18-19 January 2005), Participating States agreed that they would
merge the second and third concession lists based on MOP. As a result, the number of concession items and
MOPs is subject to further change.

Asia-Pacific Trade and Investment Review Vol. 1, No. 2, November 2005
30
Combining the two rounds, China has offered the largest number of concessions (39.1 per
cent) followed by the Republic of Korea (30.3 per cent), India (13.5 per cent), Sri Lanka
(12.2 per cent) and Bangladesh (5 per cent) on products for all countries. Thus both India
and Sri Lanka have offered concessions on almost the same number of products, which
appear to be disproportionate in terms of their size. Comparing the growth in the number of
products offered concessions in the two rounds, it is clear that the Republic of Korea
offered the largest increase (5.6 times).
Table 1. Number of products offered tariff concession by Participating States undersecond and third rounds of the Bangkok Agreement with a margin of preference
(Preliminary)
Second round Third round After third round
No. of MOP No. of MOP No. of MOP
products (percentage) products (percentage) productsa (percentage)
Bangladesh 129 13.96 86 13.5 210 14.1
Chinab 902 15.4 769 40 1 671 26.7
(18) (55.1) (138) (80.9) (156) (77.9)
India 188 52.6 396 10.0 577 23.9
(33) (32.2) (24) (50.0) (57) (39.7)
Republic of Korea 214 30.3 1 204 36.4 1 298 35.4
(29) (38.2) (291) (66.3) (316) (64.6)
Sri Lanka 288 17.8 239 9.2 523 14.0
(32) (14.0) (48) (10.7) (80) (12.0)
Total 1 721 21.6 3 596 30.2 4 279 26.8(112) (32.2) (519) (62.0) (609) (58.8)
Source: ESCAP secretariat.
Notes: ( ) relate to special concessions to LDCs. China already incorporated the second round
concessions.
MOP: Margin of preference estimated as simple average of all items.
Custom tariff change with most favoured nation update.a Obtained by deducting the number of overlapped products in the third round. The number of
overlapped products for LDCs (shown in parentheses) were: Bangladesh 5, China 763 (17), India 7 (0), the
Republic of Korea 120 (4) and Sri Lanka 4 (0); 139 items of the second concessions are excluded to the third
round negotiation. b China submitted its third concession list reflecting the second round concession to the ESCAP
secretariat. Hence China’s total concession after the third round is calculated as follows:
General concession 1,671 = 902 (the second round list) + 1,671 (the third round list) –
763 (overlapped) – 139 (deleted);
Special concession 156 = 18 (the second round list) + 156 (the third round list) – 17 (overlapped)
– 1 (deleted).
Concession-
offering
States
Asia-Pacific Trade and Investment Review Vol. 1, No. 2, November 2005
31
The average MOP after the third round was 26.8 per cent for all countries and
58.8 per cent for LDCs. The highest MOP was offered by the Republic of Korea for all
countries (35.4 per cent) while the highest MOP for LDCs was offered by China (77.9 per cent).
The number of products offered concession in the two rounds has been on
a product-by-product basis (positive list approach). Even though the number of products
offered concessions have increased considerably, they constitute only a small portion of the
total number of tariff lines of these countries. Several rounds of negotiations will be
required to cover “substantially all trade”. Besides, experiences with trade liberalization
have clearly demonstrated that it is not product coverage, but product value coverage, that
really demonstrates the extent of trade liberalization. In the absence of this information, it
would be difficult to ascertain the magnitude of trade liberalization underlying the products
conceded concessions. Furthermore, the existing MOPs need to be deepened substantially
to make regional trade liberalization meaningful.
3. INTRAREGIONAL TRADE
Intraregional trade among Participating States in the Agreement has been growing
quite briskly over the period 1994 to 2002 as shown in table 2. Intraregional exports
increased from US$ 28 billion in 1994 to US$ 70 billion in 2002. During this period the
total exports of these countries to the world increased from US$ 399 billion to US$ 747 billion.
Thus, the share of intraregional exports in total exports of the Bangkok Agreement
Participating States to the world increased their share from 6.89 per cent to 9.32 per cent
during the period. In fact, the share of intraregional exports in their total exports increased
for all Participating States except Bangladesh. The Republic of Korea accounted for the
largest amount of intraregional exports, the share of which in total exports having increased
from almost 16 per cent in 1994 to a little over 20 per cent in 2002. By far the largest
intraregional export of the Republic of Korea in value terms is with China, with China’s
share of that country’s total exports also increasing. India’s intraregional exports are
the second highest after China. China’s share in India’s total exports also increased from
11.15 per cent to 13.63 per cent during this period. A little over 50 per cent of India’s
intraregional exports were destined for China. The value of intraregional exports is
considerably lower in the case of the remaining Participating States. Their shares in
their total exports have varied from 3 to 6 per cent in the case of Bangladesh, 2 to 6 per cent
in the case of the Lao People’s Democratic Republic, and 3 to 6 per cent in the case of
Sri Lanka. These figures reveal that the accession of China to the Bangkok Agreement has
created expected improvements in both absolute value as well as relative value share terms
in the intra-bloc trade of the Participating States.3
3 This is estimated from data obtained from IMF, Direction of Trade Statistics Yearbook, various issues.
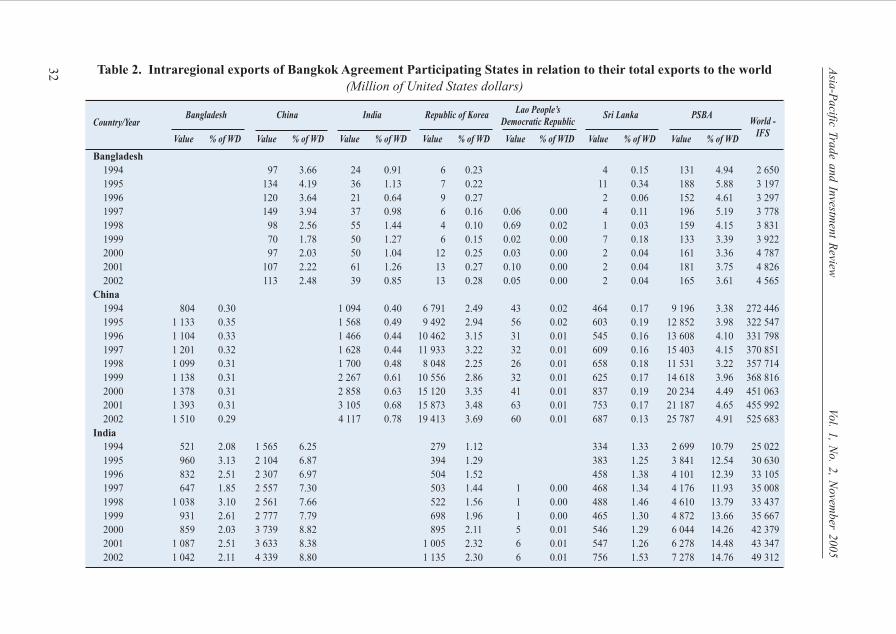
Asia
-Pacific T
rade a
nd In
vestmen
t Review
Vol. 1
, No. 2
, Novem
ber 2
005
32 Table 2. Intraregional exports of Bangkok Agreement Participating States in relation to their total exports to the world
(Million of United States dollars)
Country/YearBangladesh China India Republic of Korea
Lao People’sSri Lanka PSBA
Democratic Republic
Value % of WD Value % of WD Value % of WD Value % of WD Value % of WID Value % of WD Value % of WD
Bangladesh 1994 97 3.66 24 0.91 6 0.23 4 0.15 131 4.94 2 650
1995 134 4.19 36 1.13 7 0.22 11 0.34 188 5.88 3 197
1996 120 3.64 21 0.64 9 0.27 2 0.06 152 4.61 3 297
1997 149 3.94 37 0.98 6 0.16 0.06 0.00 4 0.11 196 5.19 3 778
1998 98 2.56 55 1.44 4 0.10 0.69 0.02 1 0.03 159 4.15 3 831
1999 70 1.78 50 1.27 6 0.15 0.02 0.00 7 0.18 133 3.39 3 922
2000 97 2.03 50 1.04 12 0.25 0.03 0.00 2 0.04 161 3.36 4 787
2001 107 2.22 61 1.26 13 0.27 0.10 0.00 2 0.04 181 3.75 4 826
2002 113 2.48 39 0.85 13 0.28 0.05 0.00 2 0.04 165 3.61 4 565
China 1994 804 0.30 1 094 0.40 6 791 2.49 43 0.02 464 0.17 9 196 3.38 272 446
1995 1 133 0.35 1 568 0.49 9 492 2.94 56 0.02 603 0.19 12 852 3.98 322 547
1996 1 104 0.33 1 466 0.44 10 462 3.15 31 0.01 545 0.16 13 608 4.10 331 798
1997 1 201 0.32 1 628 0.44 11 933 3.22 32 0.01 609 0.16 15 403 4.15 370 851
1998 1 099 0.31 1 700 0.48 8 048 2.25 26 0.01 658 0.18 11 531 3.22 357 714
1999 1 138 0.31 2 267 0.61 10 556 2.86 32 0.01 625 0.17 14 618 3.96 368 816
2000 1 378 0.31 2 858 0.63 15 120 3.35 41 0.01 837 0.19 20 234 4.49 451 063
2001 1 393 0.31 3 105 0.68 15 873 3.48 63 0.01 753 0.17 21 187 4.65 455 992
2002 1 510 0.29 4 117 0.78 19 413 3.69 60 0.01 687 0.13 25 787 4.91 525 683
India
1994 521 2.08 1 565 6.25 279 1.12 334 1.33 2 699 10.79 25 022
1995 960 3.13 2 104 6.87 394 1.29 383 1.25 3 841 12.54 30 630
1996 832 2.51 2 307 6.97 504 1.52 458 1.38 4 101 12.39 33 105
1997 647 1.85 2 557 7.30 503 1.44 1 0.00 468 1.34 4 176 11.93 35 008
1998 1 038 3.10 2 561 7.66 522 1.56 1 0.00 488 1.46 4 610 13.79 33 437
1999 931 2.61 2 777 7.79 698 1.96 1 0.00 465 1.30 4 872 13.66 35 667
2000 859 2.03 3 739 8.82 895 2.11 5 0.01 546 1.29 6 044 14.26 42 379
2001 1 087 2.51 3 633 8.38 1 005 2.32 6 0.01 547 1.26 6 278 14.48 43 347
2002 1 042 2.11 4 339 8.80 1 135 2.30 6 0.01 756 1.53 7 278 14.76 49 312
World -
IFS

Asia
-Pacific T
rade a
nd In
vestmen
t Review
Vol. 1
, No. 2
, Novem
ber 2
005
33
Republic of Korea 1994 0.00 14 218 14.81 1 160 1.21 0.00 15 378 16.02 96 013
1995 570 0.46 19 838 15.86 1 125 0.90 332 0.27 21 865 17.48 125 058
1996 519 0.40 22 677 17.48 1 185 0.91 347 0.27 24 728 19.06 129 715
1997 585 0.43 25 343 18.61 1 157 0.85 7 0.01 446 0.33 27 538 20.22 136 164
1998 503 0.38 21 256 16.06 1 669 1.26 5 0.00 409 0.31 23 842 18.02 132 313
1999 510 0.35 22 733 15.82 1 362 0.95 11 0.01 371 0.26 24 987 17.39 143 686
2000 626 0.36 29 163 16.93 1 326 0.77 4 0.00 380 0.22 31 499 18.28 172 268
2001 655 0.44 27 642 18.37 1 408 0.94 6 0.00 335 0.22 30 046 19.97 150 439
2002 506 0.31 33 900 20.87 1 384 0.85 4 0.00 305 0.19 36 099 22.22 162 471
Lao People’sDemocratic Republic
1994 8 2.66 8 2.66 323
1995 9 2.89 9 2.89 359
1996 1 0.31 0.50 0.15 2 0.62 370
1997 0.00 0.68 0.19 1 0.28 311
1998 7 1.89 0.00 7 1.89 330
1999 0.27 0.09 9 2.89 1.09 0.35 10 3.22 331
2000 0.20 0.06 6 1.82 0.52 0.16 8 2.42 298
2001 0.42 0.13 18 5.44 0.44 0.13 19 5.74 330
2002 0.22 0.07 9 3.02 0.10 0.03 9 3.02 298
Sri Lanka
1994 9 0.28 38 1.18 24 0.75 39 1.22 110 3.43 3 208
1995 12 0.32 61 1.61 32 0.84 37 0.97 142 3.74 3 798
1996 12 0.29 75 1.83 43 1.05 35 0.85 165 4.03 4 095
1997 11 0.24 62 1.34 44 0.95 44 0.95 161 3.47 4 639
1998 10 0.21 61 1.27 38 0.79 26 0.54 135 2.81 4 809
1999 12 0.26 67 1.46 49 1.07 33 0.72 161 3.50 4 594
2000 10 0.18 74 1.36 58 1.07 31 0.57 173 3.19 5 430
2001 10 0.21 58 1.20 72 1.50 28 0.58 168 3.49 4 816
2002 10 0.21 69 1.47 171 3.64 33 0.70 283 6.02 4 699
Table 2. (continued)
Country/YearBangladesh China India Republic of Korea
Lao People’sSri Lanka PSBA
Democratic Republic
Value % of WD Value % of WD Value % of WD Value % of WD Value % of WD Value % of WD Value % of WD
World -
IFS

Asia
-Pacific T
rade a
nd In
vestmen
t Review
Vol. 1
, No. 2
, Novem
ber 2
005
34
BAC
1994 1 334 0.33 15 926 3.99 2 302 0.58 7 115 1.78 43 0.01 802 0.20 27 522 6.89 399 640
1995 2 675 0.55 22 146 4.56 2 761 0.57 9 930 2.05 56 0.01 1 329 0.27 38 897 8.01 485 541
1996 2 467 0.49 25 180 5.01 2 715 0.54 11 011 2.19 31 0.01 1 352 0.27 42 756 8.51 502 482
1997 2 444 0.44 28 111 5.10 2 866 0.52 12 487 2.27 40 0.01 1 527 0.28 47 475 8.62 550 734
1998 2 650 0.50 23 983 4.51 3 462 0.65 8 600 1.62 33 0.01 1 556 0.29 40 284 7.57 532 342
1999 2 591.27 0.46 25 656 4.60 3 728 0.67 11 294 2.02 44 0.01 1 468 0.26 44 781 8.03 557 813
2000 2 873.2 0.42 33 079 4.89 4 292 0.63 16 059 2.37 50 0.01 1 765 0.26 58 119 8.59 676 546
2001 3 145.42 0.48 31 458 4.77 4 646 0.70 16 919 2.56 75 0.01 1 637 0.25 57 879 8.77 659 751
2002 3 068.22 0.41 38 430 5.14 5 711 0.76 20 594 2.76 70 0.01 1 750 0.23 69 621 9.32 747 028
Source: IMF, Direction of Trade Statistics Yearbook, various issues.
Notes: China includes mainland China and Hong Kong, China; PSBA: Participating States of the Bangkok Agreement; IFS: international financial
statistics; WD: world (export of country to the world); BAC: all Bangkok Agreement member countries.
Table 2. (continued)
Country/YearBangladesh China India Republic of Korea
Lao People’sSri Lanka PSBA
Democratic Republic
Value % of WD Value % of WD Value % of WD Value % of WD Value % of WD Value % of WD Value % of WD
World -
IFS
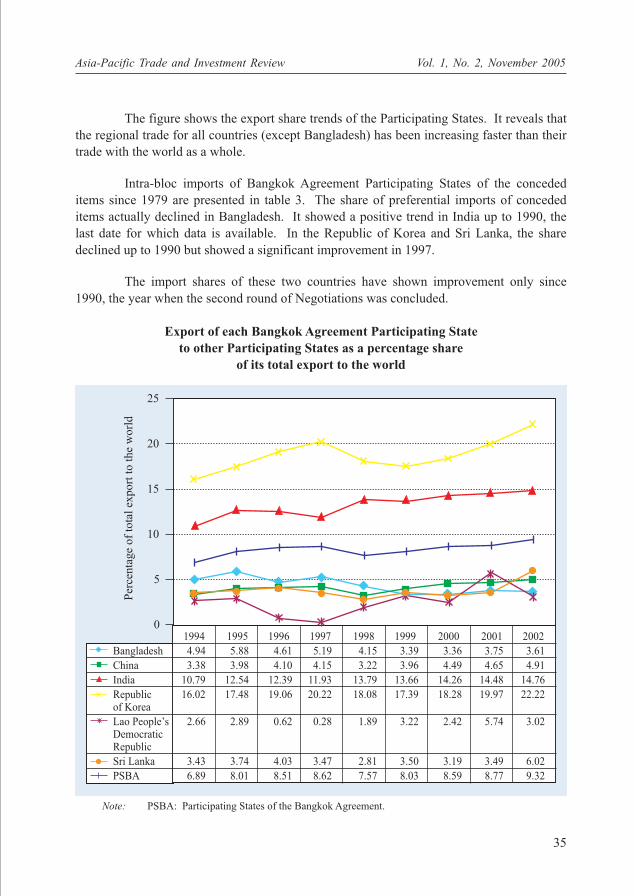
Asia-Pacific Trade and Investment Review Vol. 1, No. 2, November 2005
35
The figure shows the export share trends of the Participating States. It reveals that
the regional trade for all countries (except Bangladesh) has been increasing faster than their
trade with the world as a whole.
Intra-bloc imports of Bangkok Agreement Participating States of the conceded
items since 1979 are presented in table 3. The share of preferential imports of conceded
items actually declined in Bangladesh. It showed a positive trend in India up to 1990, the
last date for which data is available. In the Republic of Korea and Sri Lanka, the share
declined up to 1990 but showed a significant improvement in 1997.
The import shares of these two countries have shown improvement only since
1990, the year when the second round of Negotiations was concluded.
Export of each Bangkok Agreement Participating Stateto other Participating States as a percentage share
of its total export to the world
Note: PSBA: Participating States of the Bangkok Agreement.
0
5
10
15
20
25
Per
centa
ge
of
tota
l ex
port
to t
he
worl
d
1994 1995 1996 1997 1998 1999 2000 2001 2002
Bangladesh 4.94 5.88 4.61 5.19 4.15 3.39 3.36 3.75 3.61
China 3.38 3.98 4.10 4.15 3.22 3.96 4.49 4.65 4.91
India 10.79 12.54 12.39 11.93 13.79 13.66 14.26 14.48 14.76
Republic 16.02 17.48 19.06 20.22 18.08 17.39 18.28 19.97 22.22of Korea
Lao People’s 2.66 2.89 0.62 0.28 1.89 3.22 2.42 5.74 3.02DemocraticRepublic
Sri Lanka 3.43 3.74 4.03 3.47 2.81 3.50 3.19 3.49 6.02
PSBA 6.89 8.01 8.51 8.62 7.57 8.03 8.59 8.77 9.32
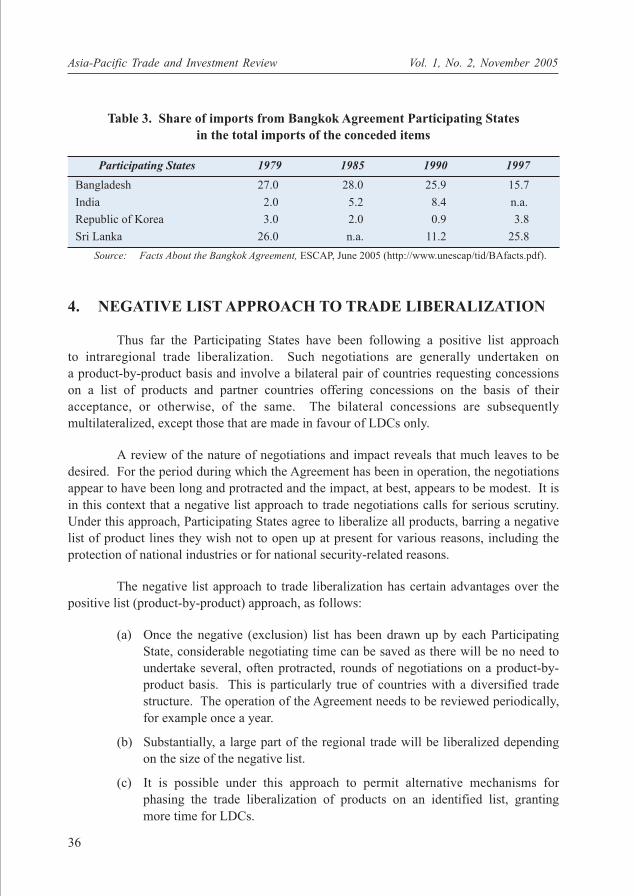
Asia-Pacific Trade and Investment Review Vol. 1, No. 2, November 2005
36
4. NEGATIVE LIST APPROACH TO TRADE LIBERALIZATION
Thus far the Participating States have been following a positive list approach
to intraregional trade liberalization. Such negotiations are generally undertaken on
a product-by-product basis and involve a bilateral pair of countries requesting concessions
on a list of products and partner countries offering concessions on the basis of their
acceptance, or otherwise, of the same. The bilateral concessions are subsequently
multilateralized, except those that are made in favour of LDCs only.
A review of the nature of negotiations and impact reveals that much leaves to be
desired. For the period during which the Agreement has been in operation, the negotiations
appear to have been long and protracted and the impact, at best, appears to be modest. It is
in this context that a negative list approach to trade negotiations calls for serious scrutiny.
Under this approach, Participating States agree to liberalize all products, barring a negative
list of product lines they wish not to open up at present for various reasons, including the
protection of national industries or for national security-related reasons.
The negative list approach to trade liberalization has certain advantages over the
positive list (product-by-product) approach, as follows:
(a) Once the negative (exclusion) list has been drawn up by each Participating
State, considerable negotiating time can be saved as there will be no need to
undertake several, often protracted, rounds of negotiations on a product-by-
product basis. This is particularly true of countries with a diversified trade
structure. The operation of the Agreement needs to be reviewed periodically,
for example once a year.
(b) Substantially, a large part of the regional trade will be liberalized depending
on the size of the negative list.
(c) It is possible under this approach to permit alternative mechanisms for
phasing the trade liberalization of products on an identified list, granting
more time for LDCs.
Table 3. Share of imports from Bangkok Agreement Participating Statesin the total imports of the conceded items
Participating States 1979 1985 1990 1997
Bangladesh 27.0 28.0 25.9 15.7
India 2.0 5.2 8.4 n.a.
Republic of Korea 3.0 2.0 0.9 3.8
Sri Lanka 26.0 n.a. 11.2 25.8
Source: Facts About the Bangkok Agreement, ESCAP, June 2005 (http://www.unescap/tid/BAfacts.pdf).
Asia-Pacific Trade and Investment Review Vol. 1, No. 2, November 2005
37
(d) The role of interest groups in hindering trade liberalization is reduced.
(e) The Agreement provides inbuilt safety factors for consultations in the event
of an unusual surge in imports following trade liberalization.
Some examples of the negative list approach to trade liberalization are discussed
below.
(a) ASEAN Free Trade Area
At the Fourth ASEAN Summit in Singapore in January 1992, the ASEAN Heads
of Government formally agreed to establish an ASEAN Free Trade Area (AFTA) and signed
the Singapore Declaration of 1992 and the Framework Agreement on Enhancing ASEAN
Economic Cooperation. The ASEAN Economic Ministers signed the Agreement on the
Common Effective Preferential Tariff (CEPT) Scheme for the ASEAN Free Trade Area.
This scheme is the main mechanism for the realization of AFTA. The six original members
of AFTA are Brunei Darussalam, Indonesia, Malaysia, the Philippines, Singapore and
Thailand. At present, AFTA has 10 members including the 4 new members, Viet Nam
(joined in 1995), the Lao People’s Democratic Republic (1997), Myanmar (1997) and
Cambodia (1999).
According to the CEPT Agreement, the ASEAN member States would reduce
intraregional tariffs on all manufactured items including capital goods and processed
agricultural products and remove NTBs over a 15-year period commencing 1 January 1993.
However, in view of the economic challenges they were facing, it was agreed at the
twenty-sixth ASEAN Economic Ministers Meeting, held in Chiang Mai, Thailand, on 22
and 23 September 1994, to shorten the time frame for the realization of AFTA from 15 to
10 years, advancing the deadline to 1 January 2003 instead of 2008, and to include
unprocessed agricultural products into the CEPT scheme.
There are two tariff reduction programmes under the CEPT Scheme for
manufactured and processed agricultural products, the Fast Track programme and the
Normal Track programme. The following were agreed under the Fast Track programme:
(a) Tariffs above 20 per cent will be reduced to 0-5 per cent within 7 years
(by 1 January 2000);
(b) Tariffs at 20 per cent and below will be reduced to 0-5 per cent within 5 years
(by 1 January 1998).
The Fast Track programme covers a set of 15 product groups as identified for
accelerated tariff reduction by the Fourth ASEAN Summit.
Asia-Pacific Trade and Investment Review Vol. 1, No. 2, November 2005
38
Under the Normal Track programme, tariffs above 20 per cent will be reduced in
stages, as follows:
(a) First, to 20 per cent within 5 years (by 1 January 1998);
(b) Subsequently, from 20 per cent to 0-5 per cent in 5 years (by 1 January 2003);
(c) Tariffs of 20 per cent and below will be reduced to 0-5 per cent within 7 years
(by 1 January 2000).
Sensitive products listed on the temporary exclusion list (TEL) are required to be
transferred into the inclusion list at a rate of 20 per cent annually, starting from 1 January
1996 to 1 January 2000. By 1 January 2003 all products in TEL should be in the CEPT
Scheme, that is tariffs at 0-5 per cent and all NTBs removed.
The 1992 CEPT Agreement had excluded unprocessed agricultural products from
the CEPT Scheme. However, at the twenty-sixth ASEAN Economic Ministers Meeting it
was decided to phase in unprocessed agricultural products into the CEPT Scheme.
Unprocessed agricultural products have been categorized into three major lists:
(a) the immediate inclusion list, (b) TEL and (c) the sensitive list.
Unprocessed agricultural products in the immediate inclusion list were included in
the CEPT Scheme on 1 January 1996. The process of tariff reduction for these products
was begun, so that by 2003, the tariffs on these products would be within the 0-5 per cent
range. AFTA member countries were also required to eliminate quantitative restrictions and
other NTBs on these products.
Unprocessed agricultural products in TEL could be kept out of the CEPT Scheme
only for a limited time. By 1 January 1997, each member country was required to phase in,
at equal installments, those unprocessed agricultural products in their TEL. By 1 January
2003, all these products in the TEL should be in the CEPT Scheme.
However, unprocessed agricultural products in the sensitive list will be treated
differently. A special arrangement with features that need not be the same as the CEPT will
be created for these products. The trade liberalization features of the special arrangement
will have to be more preferential than the commitments made by member countries under
the Agreement on Agriculture of the World Trade Organization (WTO).
Even for these sensitive unprocessed agricultural products, member countries
have agreed that there is a deadline by which they have to be phased into the CEPT
Scheme. The AFTA Council, at its Ninth Meeting in Singapore, held on 26 April 1996,
agreed to set a deadline of 1 January 2010 when all products will have to be included into
the CEPT Scheme. Hence the special arrangement for products in the sensitive list
Asia-Pacific Trade and Investment Review Vol. 1, No. 2, November 2005
39
represents a transitional and not a permanent special treatment of unprocessed agricultural
products.
There are also general exceptions. General exceptions are those products excluded
for the protection of national security, human, animal or plant life and health, and articles of
artistic, historic and archaeological value.
To accelerate AFTA, the Leaders of the AFTA member countries agreed that the
six original signatories to the Agreement on the CEPT Scheme, Brunei Darussalam,
Indonesia, Malaysia, the Philippines, Singapore and Thailand, would advance the
implementation of AFTA by one year from 2003 to 2002. They also agreed to achieve
a minimum of 90 per cent of their total tariff lines with tariffs of 0-5 per cent by the year
2000, which would account for 90 per cent of intra-ASEAN trade. Individually, each
country would commit to achieve a minimum of 85 per cent of the inclusion list with tariffs
of 0-5 per cent by the year 2000. Thereafter, this would be increased to a minimum of
90 per cent of the inclusion list in the 0-5 per cent tariff range by the year 2001. By 2002,
100 per cent of items in the inclusion list would have tariffs of 0-5 per cent with some
flexibility. Member countries also agreed to reduce, as soon as possible, tariffs to 0 per cent
and accelerate the transfer of products, which were not included in the tariff reduction
scheme, into the inclusion list. The new members of ASEAN should maximize their tariff
lines between 0-5 per cent by 2003 for Viet Nam and 2005 for the Lao People’s Democratic
Republic and Myanmar; and expand the number of tariff lines in the zero per cent category
by 2006 for Viet Nam and by 2008 for the Lao People’s Democratic Republic and
Myanmar.
The phasing in of products on TELs of the new ASEAN members has a different
time frame. For Viet Nam, the phase-in programme was to start on 1 January 1999. For the
Lao People’s Democratic Republic and Myanmar, the programme was to begin on
1 January 2001. The average regional CEPT rate for products in the inclusion list in 1998
had fallen to 5.05 per cent from 12.76 per cent in 1993. As of 1998, no product in the
inclusion list of the first six ASEAN member countries could have CEPT tariff rates higher
than 20 per cent. The average CEPT rate for the region was scheduled to fall to 3.74 per
cent by the year 2000 and then to 2.63 per cent by the year 2003.
Based on the preliminary submissions of member countries, the 1999 CEPT
package would consist of 47,160 tariff lines (84.8 per cent of total tariff lines) in the
inclusion list. These additional tariff lines would come from products being transferred
from TEL into the inclusion list.4
4 See the ASEAN Secretariat website (http://www.aseansec.org) for details.

Asia-Pacific Trade and Investment Review Vol. 1, No. 2, November 2005
40
(b) India-Sri Lanka Free Trade Agreement
The India-Sri Lanka Free Trade Agreement was signed in 1998 and came into
effect on 1 March 2000. The Agreement provides for the duty free as well as duty
preference access for goods manufactured in the two countries. Both countries have listed
products for immediate duty free entry into each other’s territory. India agreed to phase out
its tariffs on a large number of items within a period of three years. Sri Lanka will likewise
do so in eight years. Both countries have drawn up negative lists in respect of which no
duty concessions will apply. These lists include items on which protection to local industry
has been considered essential. Both countries intend to reduce the items in the negative list
through periodic consultations.
The Agreement sets out the rules of origin criteria for the eligibility for preferential
access. Products having an added domestic value of 35 per cent will qualify for preferential
market access. Sri Lanka’s exports with a domestic value addition content of 25 per cent
will also qualify for entry to the Indian market if they have a minimum 10 per cent Indian
content. In respect of a number of sensitive items, including textiles and garments,
preferential treatment is accorded with only partial lifting of quantitative restrictions.
The India-Sri Lanka Free Trade Agreement is a landmark in the bilateral relations
between India and Sri Lanka. It is expected to bring about enhanced trade between the two
countries as well as expanded and diversified cooperation in a range of economic areas,
including investments. This is the first such Agreement in the South Asian region which
could serve as a model for similar bilateral agreements in the region. It has inter alia an
institutional framework in the form of the Indo-Lanka Joint Commission, a dispute
settlement mechanism. Its significance further lies in that it can be implemented more
expeditiously and also with more flexibility, unlike the protracted nature of negotiations
generally associated with multilateral arrangements.
Under the Agreement, the elimination of tariffs by India envisages the following:
(a) Zero duty on items upon entering into force of the Agreement – the list would
be finalized within 60 days of signing of the Agreement (E): 1,351 products.
(b) Concessions on textile items restricted to 25 per cent on chapters 51-56,
58-60 and 63. Four chapters under the textile sector are to be retained in the
negative list (chapters 50, 57, 61 and 62) (TEX): 528 products.
(c) Garments covering chapters 61 and 62, while remaining in the negative list,
would be given 50 per cent tariff concessions on a fixed basis, subject to an
annual restriction of 8 million pieces, of which 6 million shall be eligible to
the concession only if made of Indian fabric, provided that no category of
garments shall exceed 1.5 million pieces per year (GAM).

Asia-Pacific Trade and Investment Review Vol. 1, No. 2, November 2005
41
(d) 50 per cent tariff preference on five tea items, subject to a quota of 15 million
kg per year (TEA): 5 products.
(e) 50 per cent margin of preference upon coming into force of this Agreement
on all items, except for those on the negative list; to be phased out to zero
duty in three years (IR): 2,799 products.
(f) A negative list of 429 items to be retained (D I): 429 products.
The elimination of tariffs by Sri Lanka envisages the following:
(a) Zero duty on about 319 items upon entering into force of the Agreement (F I):
319 products.
(b) Granting selected items a 50 per cent margin of preference upon coming into
force of the Agreement, to be reduced to zero tariff by the end of third year
(F II): 889 products.
(c) For the remaining residual items, except for those on the negative list,
preference would be not less than 35 per cent before the expiry of three years,
70 per cent before the expiry of six years and 100 per cent before the expiry
of the eighth year (SLR): 2,724 products.
(d) A negative list (D II): 1,180 products.5
The advantage of the negative list approach as illustrated in the two Agreements
cited above is that considerable negotiating time is saved as practically all of the tariff lines
have been negotiated at the first instance covering most of the regional trade. However,
some negotiating time will have to be devoted to gradually transferring products from the
exclusion list to the inclusion list as in the case of AFTA. However, if the negative list is
large, as in the case of the India-Sri Lanka Free Trade Agreement, a large part of regional
trade is pre-empted from liberalization. Another weakness of this Agreement is that, unlike
AFTA, there is no time frame for transferring products in the negative list to any category in
the inclusion list.6
5. METHODOLOGY TO ASSESS THE TRADE POTENTIALUNDER THE NEGATIVE LIST APPROACH
In this study, the methodology used to identify products for liberalization is to
compare the values of all products (at 6-digit HS classification) that each Participating State
is exporting to the world (as a supplier), which are also being imported by the other partner
5 For details of the India-Sri Lanka Free Trade Agreement see I.N. Mukherji, Saman Kelegama and Tilani
Jayawardhana, “Indo-Sri Lanka Free Trade Agreement: An Assessment of Potential and Impact” at http://
www.saneinetwork.net/pdf/SANEI_II/Work_in_progress_Indo_SriLankla.pdf.6 Ibid.
Asia-Pacific Trade and Investment Review Vol. 1, No. 2, November 2005
42
Participating States from the world as well as from the partner supplying country
(as markets). The smaller of the two values, namely, world exports of supplying
Participating State/world imports of the importing Participating States, is then deducted
from existing trade (exports of the supplying country) to arrive at a maximum bilateral
potential trade (BPT). While doing this identification, the revealed comparative advantage
(RCA) of the supplying country is also noted. Annex 1 provides the definitions of the terms
used for BPT and RCA.
Products that have an RCA>1 are sorted in terms of BPT. This list contains
products of supplying countries that have an RCA>1 in respect of which they could seek
concessions (request list). The market Participating States could consider the products so
requested for concessions as their offer list (to be included in their national list of
concessions), barring those products, which they would like to maintain in their negative
list. Such products could constitute those which could be liberalized at the first instance.
Since the supplying Participating States have favourable RCA in these products, the
possibility of trade diversion may be presumed to be less than when these products are
liberalized by the other Bangkok Agreement Participating States.7
In the first instance, this paper works out the aggregate potential trade of
Participating States by summing the values of the potential trade for all products (at 6-digit
HS classification), matching each supplying country (with an RCA>1) with the other
remaining partner country markets. Further, given the numerous products involved, the
individual product analysis of potential trade has been restricted to China as a market and
the remaining Participating States as suppliers to China. Again, given the limitations of
space, the analysis has been limited to the top 10 products in terms of potential trade. This
is designed to highlight the significance of China as a market for the other Participating
States.
The data for this study have been obtained from the United Nations Conference on
Trade and Development (UNCTAD), Trade Analysis and Information System (TRAINS),
CD-ROM, Version 8, Spring 2001, which covers trade data for the year 1999. However, the
data for the Lao People’s Democratic Republic as a market was not available in the
database and hence the analysis is limited.
7 It is possible to generate a second set of products in respect of which the supplying countries do not have
revealed comparative advantage (RCA <1), but given tariff concessions the requested products could also
enter regional trade. A wider market for such products could provide scale economies, which could make
them competitive in the longer term. The member States, constituting markets of supplying partner States,
could consider the inclusion of such products in their national list of concessions at the second phase. The
scope of this paper, however, is limited only to products that have an RCA >1.

Asia-Pacific Trade and Investment Review Vol. 1, No. 2, November 2005
43
6. POTENTIAL TRADE OF BANGKOK AGREEMENTPARTICIPATING STATES
Table 4 presents the potential trade of Participating States. The total potential
trade of all Participating States was US$ 149 billion of which the largest share could accrue
to the Republic of Korea, followed by China and India. Also to be noted is that the largest
gains could accrue to the Republic of Korea and China under trade with each other. India’s
largest potential trade could accrue from trade with China. Bangladesh and Sri Lanka also
have the highest trade potential with the Republic of Korea and China.
The product-wise estimation of potential trade with China as a market and the
other Participating States as suppliers is presented in annex 2. Table 2.1 shows that
Bangladesh’s potential exports to China in 1999 were US$ 939 million. Among the
products with the highest export potential were men’s or boys’ shirts, other bovine leather,
shrimps and prawns. India’s potential exports to China were US$ 11,409 million in iron ore
concentrates, aluminium not alloyed, single yarn of combed fibres, etc., as shown in
table 2.2.
The potential export of the Republic of Korea to China was significantly higher at
US$ 49,573 million. Products with the highest export potential to China include parts and
accessories of machines (heading No. 84.71), transmission apparatus, other monolithic
integrated circuits, petroleum oils, etc. The data are presented in table 2.3.
The potential export of the Lao People’s Democratic Republic to China was much
lower at US$ 166 million and the most important potential exports to China were tropical
wood, trousers, jerseys of cotton, etc., as shown in table 2.4.
The export potential of Sri Lanka to China was US$ 1,381 million and the
principal products with the highest export potential were non-industrial diamonds, boys’
and men’s shirts, jerseys of cotton, etc., as shown in table 2.5.
In order to expedite the offer of concessions, the Participating States may also
wish to negotiate on a sectoral basis. To facilitate this, it is possible to estimate the potential
trade at the level of sections and chapters of the Harmonized System. Under the
Harmonized System there are 21 sections, which are further classified in 97 chapters. This
enables Participating States not only to negotiate more expeditiously, but also to decide
which sectors they would like to retain in their negative list and the implication in terms of
trade coverage for both excluded and conceded items.8
8 For details of potential trade at the sectoral level, see I.N. Mukherji, “The Bangkok Agreement: a negative list
approach to trade liberalization in Asia and the Pacific”, Standing Committee of the Bangkok Agreement,
nineteenth session, 19-21 March 2003.
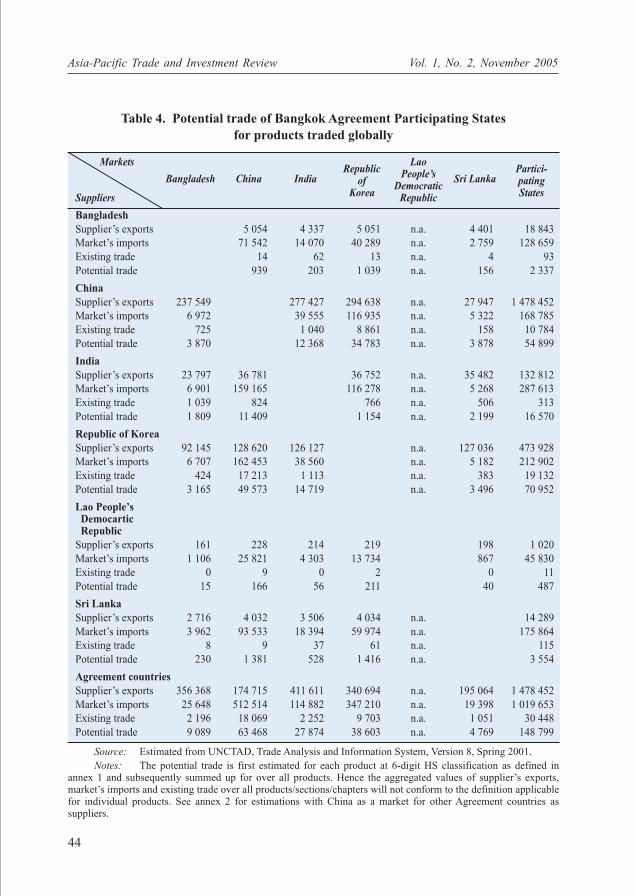
Asia-Pacific Trade and Investment Review Vol. 1, No. 2, November 2005
44
Table 4. Potential trade of Bangkok Agreement Participating Statesfor products traded globally
Markets
Bangladesh China IndiaRepublic
Lao
Sri LankaPartici-
ofPeople’s
patingKorea
DemocraticStates
Suppliers Republic
Bangladesh
Supplier’s exports 5 054 4 337 5 051 n.a. 4 401 18 843
Market’s imports 71 542 14 070 40 289 n.a. 2 759 128 659
Existing trade 14 62 13 n.a. 4 93
Potential trade 939 203 1 039 n.a. 156 2 337
China
Supplier’s exports 237 549 277 427 294 638 n.a. 27 947 1 478 452
Market’s imports 6 972 39 555 116 935 n.a. 5 322 168 785
Existing trade 725 1 040 8 861 n.a. 158 10 784
Potential trade 3 870 12 368 34 783 n.a. 3 878 54 899
India
Supplier’s exports 23 797 36 781 36 752 n.a. 35 482 132 812
Market’s imports 6 901 159 165 116 278 n.a. 5 268 287 613
Existing trade 1 039 824 766 n.a. 506 313
Potential trade 1 809 11 409 1 154 n.a. 2 199 16 570
Republic of Korea
Supplier’s exports 92 145 128 620 126 127 n.a. 127 036 473 928
Market’s imports 6 707 162 453 38 560 n.a. 5 182 212 902
Existing trade 424 17 213 1 113 n.a. 383 19 132
Potential trade 3 165 49 573 14 719 n.a. 3 496 70 952
Lao People’s Democartic Republic
Supplier’s exports 161 228 214 219 198 1 020
Market’s imports 1 106 25 821 4 303 13 734 867 45 830
Existing trade 0 9 0 2 0 11
Potential trade 15 166 56 211 40 487
Sri Lanka
Supplier’s exports 2 716 4 032 3 506 4 034 n.a. 14 289
Market’s imports 3 962 93 533 18 394 59 974 n.a. 175 864
Existing trade 8 9 37 61 n.a. 115
Potential trade 230 1 381 528 1 416 n.a. 3 554
Agreement countries
Supplier’s exports 356 368 174 715 411 611 340 694 n.a. 195 064 1 478 452
Market’s imports 25 648 512 514 114 882 347 210 n.a. 19 398 1 019 653
Existing trade 2 196 18 069 2 252 9 703 n.a. 1 051 30 448
Potential trade 9 089 63 468 27 874 38 603 n.a. 4 769 148 799
Source: Estimated from UNCTAD, Trade Analysis and Information System, Version 8, Spring 2001.
Notes: The potential trade is first estimated for each product at 6-digit HS classification as defined inannex 1 and subsequently summed up for over all products. Hence the aggregated values of supplier’s exports,market’s imports and existing trade over all products/sections/chapters will not conform to the definition applicablefor individual products. See annex 2 for estimations with China as a market for other Agreement countries assuppliers.

Asia-Pacific Trade and Investment Review Vol. 1, No. 2, November 2005
45
7. MODALITIES FOR TRADE LIBERALIZATION
As per the stipulation in Article XXIV of the General Agreement on Tariffs and
Trade (GATT), Contracting Parties in any regional integration agreement, including free
trade agreements or areas, are required to “substantially liberalize all intraregional trade”.
They are also required to notify a time frame during which free trade will be achieved
within the region. The Participating States under the Bangkok Agreement, however, have
notified WTO under the Enabling Clause where the requirements are much less stringent.
A negative list approach permitting them to liberalize regional trade in all products (barring
the negative list) should nevertheless enable the Participating States to meet their obligation
under a regional arrangement. The shorter the exclusion (negative) list, the greater will be
the possibility of compliance.
The Participating States need to set an achievable time frame, preferably 10 years,
by which time an FTA could be achieved. The negotiations could be undertaken either on
a product-by-product basis, or in terms of sectors as defined by chapters of the Harmonized
System. While a product-by-product trade liberalization is likely to be more protracted,
a sectoral approach could be more expeditious. In the latter case, liberalization could be
undertaken across the board by cutting tariffs across sections/chapters.
Initially, the Participating States under the Agreement need to draw up an
inventory of two lists, prohibited and restricted. The items included in the prohibited list
are those that are prohibited or banned from being imported on national security, health,
environmental or moral grounds. Most Participating States have such a list. The restricted
(negative) list contains those items for which the Participating States are not yet ready to
expose their industries to the forces of regional/international competition. As and when
these products are able to withstand the forces of competition, they may be phased out, over
a defined time period, from this list and transferred to the inclusion (residual) list. Once
these lists are in place, the movement to an FTA in the region over a defined time frame
could be set in motion.9 It needs to be stressed that along with tariff reductions, non-tariff
barriers also need to be addressed.
While drawing up the negative (exclusion) list, each Participating State has to be
guided by its own assessment of the need for the protection of its local/national industries.
To illustrate, under AFTA, a sensitive list containing unprocessed agricultural products has
been given a longer time frame for integration into the inclusion list. This study helps the
Participating States to make an assessment as to what the impact of exclusion would be in
terms of potential and actual trade of the excluded items. In general, the objective should
9 For methods of negotiating trade preferences and for drawing on the experiences of select regional trading
arrangements, see I.N. Mukherji, “Charting a free trade area in South Asia: instruments and modalities” in
T.N. Srinivasan (ed.), Trade, Finance and Investment in South Asia (New Delhi, Social Science Press), 2001.

Asia-Pacific Trade and Investment Review Vol. 1, No. 2, November 2005
46
be not to exclude items in respect of which a Participating State has an RCA and high
actual/potential trade. An illustration of products with a high RCA and trade potential has
been brought out in our analysis.
8. CONCLUDING OBSERVATIONS
The study has shown that the entry of China as a member of the Bangkok
Agreement considerably widens the market space for products with export potential to all
Participating States. It is true that the full trade potential indicated in this study will not be
realized in practice even with trade liberalization. Much will depend on the
competitiveness of the products from the point of view of the importing Participating
States. However, even if a small share of the trade potential is realized, the trade among
Participating States could expand considerably. The concept of potential trade at least
ensures that the products with an actual or potential trade intensity are conceded
concessions. Unfortunately, this has been lacking in past trade negotiations. In addition,
the Participating States should try to avoid trade diversion to the extent feasible. It is for
this reason that products with a high RCA by supplying countries should be favoured in
trade concessions. It also needs to be reiterated that in order to be effective, trade
preferences should not be limited to only tariff preferences, but also extended to non-tariff
preferences and supported by trade facilitation measures.
It has been observed that manufactured products have considerable trade potential
in the region. Liberalization of trade in such products with an RCA could also help to
transform the trade composition in favour of manufactured goods.
Asia-Pacific Trade and Investment Review Vol. 1, No. 2, November 2005
47
REFERENCES
ASEAN Secretariat, <http://www.aseansec.org>.
ESCAP, 2005. Facts About the Bangkok Agreement (Asia-Pacific Trade Agreement)
http://www.unescap.org/tid/BAfacts.pdf, accessed June 2005.
IMF, Direction of Trade Statistics Yearbook, various issues.
Mukherji, I.N., 2003. “The Bangkok Agreement: a negative list approach to trade
liberalization in Asia and the Pacific”, paper presented at the nineteenth session of
the Standing Committee of the Bangkok Agreement, ESCAP, Bangkok, 19-21 March
2003.
, 2001. “Charting a free trade area in South Asia: instruments and modalities” in
T.N. Srinivasan (ed.), Trade, Finance and Investment in South Asia (New Delhi,
Social Science Press).
Mukherji, I.N., Saman Kelegama and Tilani Jayawardhana, “Indo-Sri Lanka Free Trade
Agreement: An Assessment of Potential and Impact” at
http://www.saneinetwork.net/pdf/SANEI_II/Work_in_progress_Indo_SriLankla.pdf.
UNCTAD, Trade Analysis and Information System (TRAINS), CD-ROM, Version 8,
Spring 2001 (Geneva).

Asia-Pacific Trade and Investment Review Vol. 1, No. 2, November 2005
48
Annex 1
Definition of Terms
1. The revealed comparative advantage (RCA) index is defined as:
RCA ki = (Xki/Xti)/(Xkw/Xtw)
Where:
Xki represents the value of country i’s exports of commodity k
Xti represents the value of country i’s total exports
Xkw represents the value of world exports of commodity k
Xtw represents the value of total world exports (of all commodities)
The RCA of country i in the trade of product k is measured by that item’s share in
the country’s exports relative to its share in the world. The first term in equation 1
represents commodity k’s share in country i’s exports, while the second term represents
commodity k’s share in world exports. The RCA index has a quite straightforward
interpretation. If it takes a value of less than unity, which indicates that the share of
commodity k in i’s exports is less than the corresponding world share, it indicates that
country i does not have a revealed comparative advantage in commodity k. Similarly, if the
index exceeds unity then it implies that country i has a revealed comparative advantage in
that product.
2. Potential bilateral trade (PBT) in respect of product i is defined as:
PBTi = min (SEi, MIi) – (ETi)
Total PBT in respect of all products is given as:
∑ PBTi = ∑ min (SEi, MIi) – (ETi)
Where:
I = product i
SE = supplier’s global exports
MI = market’s global imports
ET = existing supplier’s exports to the market
This concept helps to identify the overall supply-demand capabilities of supplying/
market countries under the most optimistic scenario that their bilateral supply/demand is
fully utilized before allowing for third country imports. Free trade could only facilitate this
to a point at the margin. Competitiveness of exports is also important to enable this.
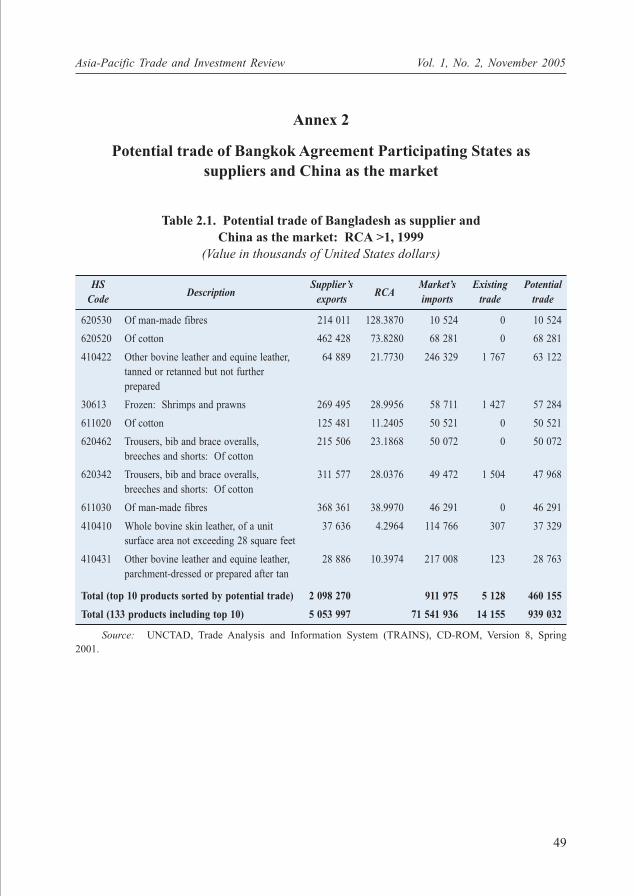
Asia-Pacific Trade and Investment Review Vol. 1, No. 2, November 2005
49
Annex 2
Potential trade of Bangkok Agreement Participating States assuppliers and China as the market
Table 2.1. Potential trade of Bangladesh as supplier andChina as the market: RCA >1, 1999
(Value in thousands of United States dollars)
HSDescription
Supplier’sRCA
Market’s Existing Potential
Code exports imports trade trade
620530 Of man-made fibres 214 011 128.3870 10 524 0 10 524
620520 Of cotton 462 428 73.8280 68 281 0 68 281
410422 Other bovine leather and equine leather, 64 889 21.7730 246 329 1 767 63 122
tanned or retanned but not further
prepared
30613 Frozen: Shrimps and prawns 269 495 28.9956 58 711 1 427 57 284
611020 Of cotton 125 481 11.2405 50 521 0 50 521
620462 Trousers, bib and brace overalls, 215 506 23.1868 50 072 0 50 072
breeches and shorts: Of cotton
620342 Trousers, bib and brace overalls, 311 577 28.0376 49 472 1 504 47 968
breeches and shorts: Of cotton
611030 Of man-made fibres 368 361 38.9970 46 291 0 46 291
410410 Whole bovine skin leather, of a unit 37 636 4.2964 114 766 307 37 329
surface area not exceeding 28 square feet
410431 Other bovine leather and equine leather, 28 886 10.3974 217 008 123 28 763
parchment-dressed or prepared after tan
Total (top 10 products sorted by potential trade) 2 098 270 911 975 5 128 460 155
Total (133 products including top 10) 5 053 997 71 541 936 14 155 939 032
Source: UNCTAD, Trade Analysis and Information System (TRAINS), CD-ROM, Version 8, Spring
2001.
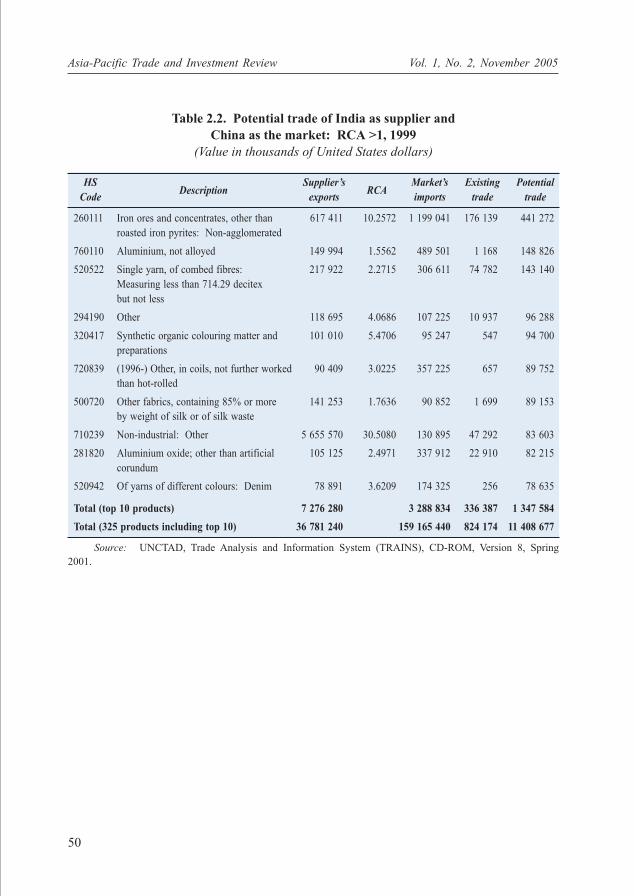
Asia-Pacific Trade and Investment Review Vol. 1, No. 2, November 2005
50
Table 2.2. Potential trade of India as supplier andChina as the market: RCA >1, 1999
(Value in thousands of United States dollars)
HSDescription
Supplier’sRCA
Market’s Existing Potential
Code exports imports trade trade
260111 Iron ores and concentrates, other than 617 411 10.2572 1 199 041 176 139 441 272
roasted iron pyrites: Non-agglomerated
760110 Aluminium, not alloyed 149 994 1.5562 489 501 1 168 148 826
520522 Single yarn, of combed fibres: 217 922 2.2715 306 611 74 782 143 140
Measuring less than 714.29 decitex
but not less
294190 Other 118 695 4.0686 107 225 10 937 96 288
320417 Synthetic organic colouring matter and 101 010 5.4706 95 247 547 94 700
preparations
720839 (1996-) Other, in coils, not further worked 90 409 3.0225 357 225 657 89 752
than hot-rolled
500720 Other fabrics, containing 85% or more 141 253 1.7636 90 852 1 699 89 153
by weight of silk or of silk waste
710239 Non-industrial: Other 5 655 570 30.5080 130 895 47 292 83 603
281820 Aluminium oxide; other than artificial 105 125 2.4971 337 912 22 910 82 215
corundum
520942 Of yarns of different colours: Denim 78 891 3.6209 174 325 256 78 635
Total (top 10 products) 7 276 280 3 288 834 336 387 1 347 584
Total (325 products including top 10) 36 781 240 159 165 440 824 174 11 408 677
Source: UNCTAD, Trade Analysis and Information System (TRAINS), CD-ROM, Version 8, Spring
2001.
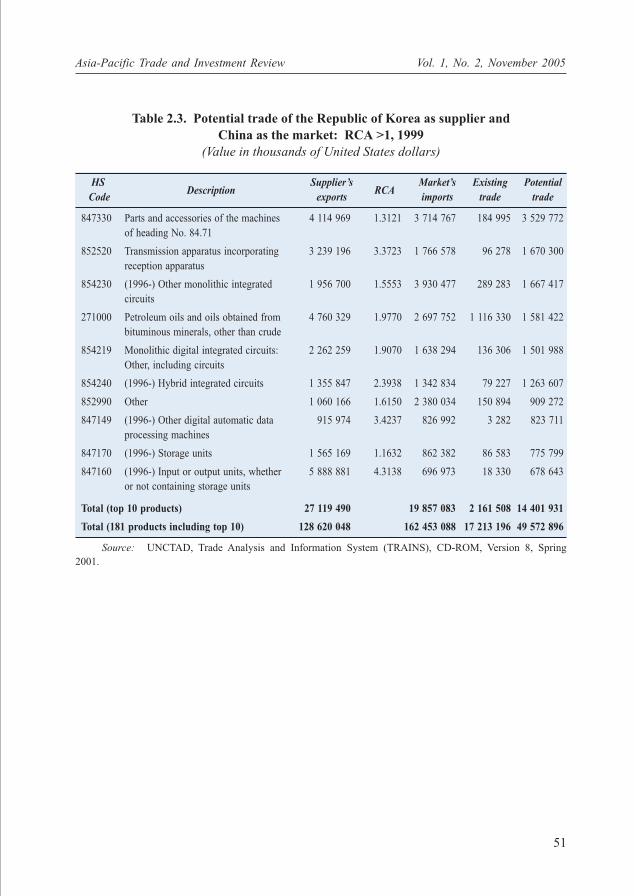
Asia-Pacific Trade and Investment Review Vol. 1, No. 2, November 2005
51
Table 2.3. Potential trade of the Republic of Korea as supplier andChina as the market: RCA >1, 1999
(Value in thousands of United States dollars)
HSDescription
Supplier’sRCA
Market’s Existing Potential
Code exports imports trade trade
847330 Parts and accessories of the machines 4 114 969 1.3121 3 714 767 184 995 3 529 772
of heading No. 84.71
852520 Transmission apparatus incorporating 3 239 196 3.3723 1 766 578 96 278 1 670 300
reception apparatus
854230 (1996-) Other monolithic integrated 1 956 700 1.5553 3 930 477 289 283 1 667 417
circuits
271000 Petroleum oils and oils obtained from 4 760 329 1.9770 2 697 752 1 116 330 1 581 422
bituminous minerals, other than crude
854219 Monolithic digital integrated circuits: 2 262 259 1.9070 1 638 294 136 306 1 501 988
Other, including circuits
854240 (1996-) Hybrid integrated circuits 1 355 847 2.3938 1 342 834 79 227 1 263 607
852990 Other 1 060 166 1.6150 2 380 034 150 894 909 272
847149 (1996-) Other digital automatic data 915 974 3.4237 826 992 3 282 823 711
processing machines
847170 (1996-) Storage units 1 565 169 1.1632 862 382 86 583 775 799
847160 (1996-) Input or output units, whether 5 888 881 4.3138 696 973 18 330 678 643
or not containing storage units
Total (top 10 products) 27 119 490 19 857 083 2 161 508 14 401 931
Total (181 products including top 10) 128 620 048 162 453 088 17 213 196 49 572 896
Source: UNCTAD, Trade Analysis and Information System (TRAINS), CD-ROM, Version 8, Spring
2001.
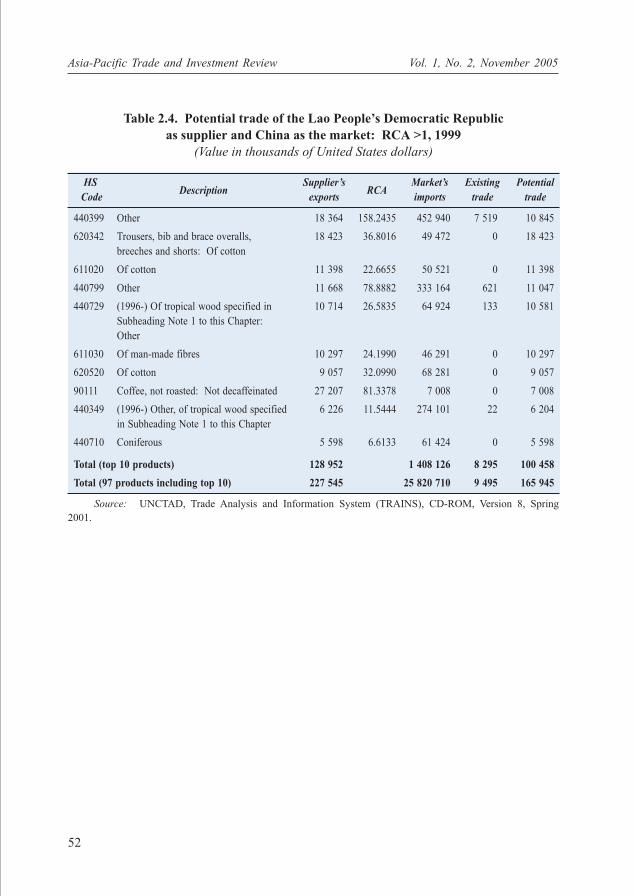
Asia-Pacific Trade and Investment Review Vol. 1, No. 2, November 2005
52
Table 2.4. Potential trade of the Lao People’s Democratic Republicas supplier and China as the market: RCA >1, 1999
(Value in thousands of United States dollars)
HSDescription
Supplier’sRCA
Market’s Existing Potential
Code exports imports trade trade
440399 Other 18 364 158.2435 452 940 7 519 10 845
620342 Trousers, bib and brace overalls, 18 423 36.8016 49 472 0 18 423
breeches and shorts: Of cotton
611020 Of cotton 11 398 22.6655 50 521 0 11 398
440799 Other 11 668 78.8882 333 164 621 11 047
440729 (1996-) Of tropical wood specified in 10 714 26.5835 64 924 133 10 581
Subheading Note 1 to this Chapter:
Other
611030 Of man-made fibres 10 297 24.1990 46 291 0 10 297
620520 Of cotton 9 057 32.0990 68 281 0 9 057
90111 Coffee, not roasted: Not decaffeinated 27 207 81.3378 7 008 0 7 008
440349 (1996-) Other, of tropical wood specified 6 226 11.5444 274 101 22 6 204
in Subheading Note 1 to this Chapter
440710 Coniferous 5 598 6.6133 61 424 0 5 598
Total (top 10 products) 128 952 1 408 126 8 295 100 458
Total (97 products including top 10) 227 545 25 820 710 9 495 165 945
Source: UNCTAD, Trade Analysis and Information System (TRAINS), CD-ROM, Version 8, Spring
2001.
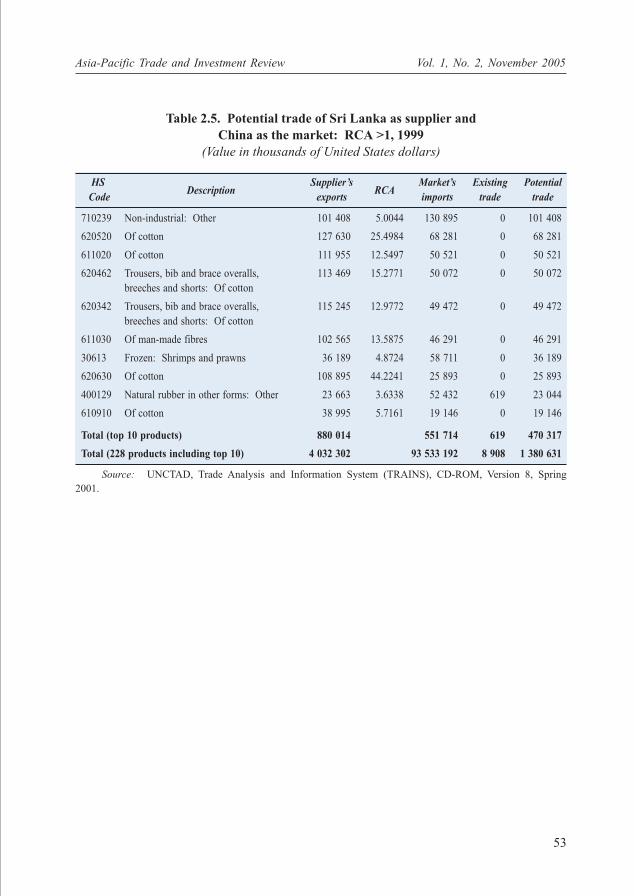
Asia-Pacific Trade and Investment Review Vol. 1, No. 2, November 2005
53
Table 2.5. Potential trade of Sri Lanka as supplier andChina as the market: RCA >1, 1999
(Value in thousands of United States dollars)
HSDescription
Supplier’sRCA
Market’s Existing Potential
Code exports imports trade trade
710239 Non-industrial: Other 101 408 5.0044 130 895 0 101 408
620520 Of cotton 127 630 25.4984 68 281 0 68 281
611020 Of cotton 111 955 12.5497 50 521 0 50 521
620462 Trousers, bib and brace overalls, 113 469 15.2771 50 072 0 50 072
breeches and shorts: Of cotton
620342 Trousers, bib and brace overalls, 115 245 12.9772 49 472 0 49 472
breeches and shorts: Of cotton
611030 Of man-made fibres 102 565 13.5875 46 291 0 46 291
30613 Frozen: Shrimps and prawns 36 189 4.8724 58 711 0 36 189
620630 Of cotton 108 895 44.2241 25 893 0 25 893
400129 Natural rubber in other forms: Other 23 663 3.6338 52 432 619 23 044
610910 Of cotton 38 995 5.7161 19 146 0 19 146
Total (top 10 products) 880 014 551 714 619 470 317
Total (228 products including top 10) 4 032 302 93 533 192 8 908 1 380 631
Source: UNCTAD, Trade Analysis and Information System (TRAINS), CD-ROM, Version 8, Spring
2001.
Asia-Pacific Trade and Investment Review Vol. 1, No. 2, November 2005
55
ABSTRACT
The service sector has emerged as the largest and fastest-growing sector in
the global economy in the last two decades, providing more than 60 per
cent of global output and, in many countries, an even larger share of employment.
The growth in services has also been accompanied by the rising share of services in
world transactions. Testimony to the rise in international supply of services is the fact
that trade in services has grown as fast as trade in goods in the period 1990-2003, that
is 6 per cent per annum. In addition, there has been a marked shift of foreign direct
investment (FDI) away from the manufacturing sector towards the service sector
worldwide. The share of services in total FDI stock has now increased to around
60 per cent since 2002 as compared with less than half in 1990 and only one quarter in
the 1970s.
However, in spite of the growing internationalization of services, there exists
very limited literature on the conceptual framework for FDI in services and its
implications for the developing countries. The main objective of this paper is to
identify some of the conceptual issues and provide a selective review of both
theoretical and empirical studies on these issues. Policy implications that emerge for
Foreign Direct Investmentin Services: Implications forDeveloping Countries
Rashmi Banga*
* Associate Professor, School of International Studies, Jawaharlal Nehru University, and affiliated to the Indian
Council for Research on International Economic Relations (ICRIER), India Habitat Centre, Core 6A,
Fourth floor, Lodhi Road, New Delhi 110003, India, Tel.: 91 (0) 11 464 5218 (232), Fax: 91 (0) 11 462 0180,
E-mail: [email protected]; [email protected].
(continued on page 56)

Asia-Pacific Trade and Investment Review Vol. 1, No. 2, November 2005
56
developing countries from this literature are discussed and future areas of research are
highlighted.
Some of the conceptual issues identified with respect to FDI in service are: the
differences between FDI in services and FDI in goods; the relevance of the “theory of
FDI” for explaining the important determinants of FDI in services. Some of the
distinctive characteristics of services are discussed along with the relevance “FDI
theory” as against “trade theory” in explaining why FDI in services occur. Further,
some of the theoretical models and empirical studies are reviewed that examine the
impact of FDI in services on the developing countries.
This paper puts forward the case for allowing FDI in services in developing
countries. It argues that the obstacles to lowering restrictions on global services can
be categorized into two broad categories: first, those indicating a lack of incentives
to, or practical difficulties in negotiations, and second, those that represent outright
opposition, particularly by developing countries, to any negotiations. An attempt is
made to suggest the way forward for the developing countries and highlight future
areas of research.
1. INTRODUCTION
Foreign direct investment has grown faster than the global output and trade over
the last two decades. This has given rise to a number of theoretical and empirical studies
that have investigated its determinants and impact on the host economies, particularly in the
developing countries. However, much of this literature has focused on FDI in
manufacturing and very few studies exist for the service sector. This is an important lacuna
in the literature of FDI as FDI is increasingly shifting towards services and the world’s
inward stock of FDI in services has quadrupled between 1990 and 2002 (UNCTAD, 2004).
In many countries, services now account for a larger share of inbound and
outbound FDI stock. In fact, the share of services in the world’s total inward FDI stock has
risen to 60 per cent in 2002 from 46 per cent in 1996 (see figure). This growth in the share
of services has been much higher for the developing countries as compared with the
developed countries. The proportion of services in the total FDI stock in the Asian and
Pacific region climbed from 43 per cent in 1995 to 50 per cent in 2002. The newly
industrialized economies of the region and the member States of the Association of
Southeast Asian Nations (ASEAN) have led the way. The share of services in total FDI
flows in ASEAN countries, for instance, has expanded from 30 per cent in 2002 to 48 per
cent in 2003. Trade in services via the commercial presence (FDI), that is Mode 3 of the
(continued from page 55)
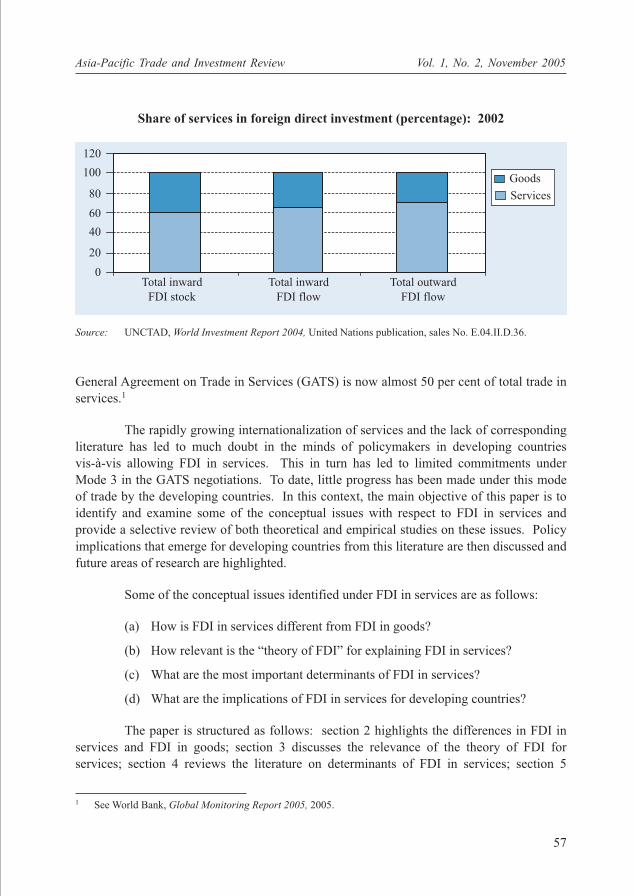
Asia-Pacific Trade and Investment Review Vol. 1, No. 2, November 2005
57
General Agreement on Trade in Services (GATS) is now almost 50 per cent of total trade in
services.1
The rapidly growing internationalization of services and the lack of corresponding
literature has led to much doubt in the minds of policymakers in developing countries
vis-à-vis allowing FDI in services. This in turn has led to limited commitments under
Mode 3 in the GATS negotiations. To date, little progress has been made under this mode
of trade by the developing countries. In this context, the main objective of this paper is to
identify and examine some of the conceptual issues with respect to FDI in services and
provide a selective review of both theoretical and empirical studies on these issues. Policy
implications that emerge for developing countries from this literature are then discussed and
future areas of research are highlighted.
Some of the conceptual issues identified under FDI in services are as follows:
(a) How is FDI in services different from FDI in goods?
(b) How relevant is the “theory of FDI” for explaining FDI in services?
(c) What are the most important determinants of FDI in services?
(d) What are the implications of FDI in services for developing countries?
The paper is structured as follows: section 2 highlights the differences in FDI in
services and FDI in goods; section 3 discusses the relevance of the theory of FDI for
services; section 4 reviews the literature on determinants of FDI in services; section 5
Share of services in foreign direct investment (percentage): 2002
Source: UNCTAD, World Investment Report 2004, United Nations publication, sales No. E.04.II.D.36.
Goods
Services
Total inward
FDI stock
Total inward
FDI flow
Total outward
FDI flow
120
100
80
60
40
20
0
1 See World Bank, Global Monitoring Report 2005, 2005.
Asia-Pacific Trade and Investment Review Vol. 1, No. 2, November 2005
58
examines the impact of FDI in services on developing countries; lastly, section 6 discuses
the policy implications and future areas of research.
2. FDI IN SERVICES VIS-À-VIS FDI IN GOODS
The foremost issue that arises with respect to FDI in services is how is it different
from FDI in goods? To answer this question we need to know how services are different
from goods and what the implication of these differences is on the emergence of FDI.
There exists an inconclusive debate on the definition of services, which began with
the classical economists who characterized services as products of labour that perish the
moment the labour is performed, giving services an air of intangibility and transitoriness.
Both of these apparent characteristics have loomed in the background ever since, and
caused great confusion when the neo-classical economists, forced for reasons of the internal
consistency of their theories, were faced with the issue of how to interpret services.
The earliest attempt to explain how services are different from goods was made by
Hill (1977, p. 336) who argues that “goods and services belong to different logical
categories.” He focuses on the fact that producers cannot accumulate a stock or inventory
of services, stressing that services must be consumed as they are produced, unlike goods
that can be produced and then stored. This makes it essential for the user and the provider
of the service to interact.
However, subsequent to this conceptualization, there have been many studies that
have noted the restrictiveness of Hill’s definition. Melvin (1989) points out that Hill’s
definition simply relates to contact services and that there exists a range of services that do
permit a separation of the location of production and consumption in space as well as time,
so that service trade may take place either at the factor or at the product level.
Bhagwati (1984) argues that services can be divided into two categories; first,
those that necessarily require the physical proximity of the user and the provider; and
second, those that do not essentially require this though it may be useful. Services that
require essential physical proximity have been further categorized into three groups:
(a) Mobile provider and immobile user, for example shifting labour to the
construction site in other country;
(b) Mobile user and immobile provider, for example hospital services;
(c) Mobile user and mobile provider, for example lectures, haircuts, etc.
However, Bhagwati further argues that services for which physical proximity is
not essential, that is long distance services, are on the rise due to technological progress.
Services such as banking and insurance fall under this category. However, unlike in the

Asia-Pacific Trade and Investment Review Vol. 1, No. 2, November 2005
59
case of goods where factor mobility and trade are distinct phenomena, in the case of
services the distinction vanishes as factor mobility and trade in services are two integral
aspects of a service transaction.
Such characteristics have implications for how trade and investment can occur.
Their intangibility and non-storability implies that in order to become tradable, services
have to be applied to, or embodied in, objects or information flow or persons. Thus, for
trade and investment to occur, the means of transporting services often have to be able or
permitted to cross national frontiers. Thus FDI in services is more complex conceptually
than FDI in goods.
Unlike goods, services have different avenues of trade. For example international
transaction in services can occur through: (a) cross-border or separated trade analogous to
trade in goods; (b) transactions that require the movement of the producer to the location of
the demander (demander-located services); and (c) transactions that imply the movement of
the consumer to the location of the provider (provider-located services). These typologies
help in assessing the role played by technology on the tradability of services. Trade may or
may not be technically feasible, depending on the type of service.
Therefore technological and regulatory considerations that determine the relative
costs associated with alternative ways of providing services become more important for
services vis-à-vis goods. For example, the “right to establish” becomes an important policy
issue for services as restrictions on factor inflows will be sufficient to hinge on service
transactions without the need for restrictive border measures on trade. This also raises an
important question relating to labour mobility and immigration that has led to the notion of
the “right of presence” or “right of market access” as softer versions of the “right to
establish”.
Thus, the basic characteristics of services that differentiate them from goods are
non-transferability and non-storability. The other associated characteristics of services that
need to be noted are that services are heterogeneous and flexible in production and
imperfect competition is highly relevant for services. This implies that consumer
preferences for variety can be easily met; also, because of simultaneity in production and
absorption, services can be regarded as heterogeneous products. FDI in services may
therefore occur owing to different reasons than FDI in goods, and require separate
interpretation.
Asia-Pacific Trade and Investment Review Vol. 1, No. 2, November 2005
60
3. HOW RELEVANT IS “THEORY OF FDI” FOR FDI INSERVICES?
As with FDI in goods, FDI in services occur to exploit a profit potential that
cannot be captured in one’s own country. However, as FDI in services is one of the modes
through which services are traded, studies differ with respect to the framework used for FDI
in services. To explain why FDI occurs, some studies have applied “FDI theories” that are
applicable for goods (for example Chanda, 2000; Schroath and Korth, 1989), while others
have applied “trade theories” (for example Markusen, et al., 1996).
Of the various theories put forward to explain FDI, Dunning’s eclectic paradigm of
international production (Dunning, 1989) has been used by many studies to explain FDI in
services. The theory combines the traditional theory of factor endowments with the theory
of economic organization. According to this theory, the extent, pattern and growth of value
added activities by transnational corporations depend on their competitive advantages
relative to local firms.
Dunning has identified the ownership, locational and internationalization
advantages of services transnational corporations. Further, Rugman and Verbeke (1992)
propose that a firm can successfully undertake direct investment abroad if it possesses some
asset advantages, which may be location bound or non-location bound.2 For service
corporations, such advantages consist of inter alia, property rights to management,
marketing and product innovation, exclusive or favoured access to input and product
markets, access to technology and information, economies of joint supply in production,
marketing.
Alternatively, studies that apply trade theory to FDI in services argue that the
theory of FDI follows in many respects the theory of international trade, except that it also
has to explain why FDI rather than trade is used in order to capture the potential profit.
Attempts have been made to endogenize multinational firms into general equilibrium trade
models. Firm-level characteristics combine with country-level characteristics and trade
costs to determine what types of firms exist in equilibrium. As in trade, there are two
distinct patterns of FDI. The first is the “vertical” or inter-industry pattern, often found in
FDI from developed to developing countries, exploiting industry-wide comparative
advantages. The second pattern is “horizontal” or intra-industry, where usually relatively
specific advantages within given industries between developed countries are exchanged. As
in trade, most FDI is of the latter type.
2 Non-location bound firm specific advantages are defined as those advantages that can be exploited globally
and lead to benefits of scale, scope or exploitation of national differences. These advantages can be
transferred abroad at low marginal costs and used effectively in foreign locations while location-bound
advantages are those advantages which cannot be easily transferred and require significant adaptation in order
to be used in another location.
Asia-Pacific Trade and Investment Review Vol. 1, No. 2, November 2005
61
Thus, the two theories of FDI in services differ with regard to their explanation as
to why FDI rather than trade occurs and what kind of FDI occurs. Both theories have their
merits. While the theory of FDI that is used to explain FDI in goods is easier to estimate
empirically, the theory of trade when applied to FDI is able to explain the nature of FDI that
takes place and also why FDI takes place rather than trade.
However, there are certain characteristics of FDI in services that merit exclusive
attention, which are not covered in either of the two theories as follows:
(a) In manufacturing, the segmentation of the production process can take place
as a result of which FDI can establish a value chain of production by splitting
the labour-intensive part and the less labour-intensive part of the production
process in different countries. However, because of the low tradability in
services, such segmentation in services is difficult to undertake. How does
FDI in services then transnationalize?
(b) Services affiliates have a lower propensity to engage in intra-firm trade than
manufacturing affiliates, again because of the problem with respect to
splitting up, but at the same time they are more skill- and capital-intensive
(precisely for the same reason) than manufacturing affiliates. What are the
implications of this on the direction of FDI in services?
Apart from the above characteristics, regulations play a much more important role
with respect to FDI and trade in services as compared with FDI and trade in goods. This
merits an exclusive exposition to FDI in services.
4. WHAT ARE THE DETERMINANTS OF FDI IN SERVICES?
As discussed earlier, though a vast literature is available on the determinants of
FDI in goods, very few empirical studies exist on the determinants of FDI in services.
Among them are UNCTC (1993), Fukao and Ito (2000), Buch (2000), Chanda (2000) and
Raff and Ruhr (2001), but most of these studies are chiefly undertaken for some of the
prominent producer services, for example banking and insurance. The determinants of FDI
in services that are identified in the literature can be categorized as follows:
(a) Market size
Market size is found to be the most important determinant of inward FDI in goods
by most of the studies. A number of studies have tried to estimate the impact of the host
country market size on the inflow of FDI in services and have arrived at mixed results. It is
found to be a significant determinant for transnational banks, international advertising
agencies and transnational insurance firms (UNCTC, 1980; UNCTC, 1992; and Schroath
and Korth, 1989).
Asia-Pacific Trade and Investment Review Vol. 1, No. 2, November 2005
62
However, UNCTC (1993) conducted an analysis of the impact of market size on
developed country FDI in services, that is FDI in services from the United States of
America, Canada, Japan, Europe and “other developed countries”, and for developing
regions FDI in services, that is Latin America, Africa and Asia, for two periods,
1976-1980 and 1980-1986, to developed countries and developing countries. The results
show that market size is not an important determinant for all kinds of FDI in services. It
can be derived that although market size is an important determinant for FDI in services, its
importance is lower than for FDI in goods.
(b) Home country business presence/local customer base
Studies have found that home business presence is one of the most important
determinants for FDI in services as this increases the number of informed customers in the
host country, who are aware of the services and therefore are more likely to create demand
for these services. That is, producer service firms locate where they find a large customer
base. They therefore follow FDI by downstream firms from the same home country and
only later become more responsive to local demand since they find it initially difficult to
attract local customers.
This has also been found by a number of case studies of individual service
industries. FDI stock (lagged by one period) has generally been used as an indicator of
home business presence in the host countries. Empirical studies in international banking
and advertising (UNCTC, 1993) have observed this follow-the-client motive. Raff and
Ruhr (2001) also find this to be true for FDI in producer services.
(c) Host government policies/openness
Similar to FDI in goods, the “rule of law” is the major barrier to FDI in services.
Categorical refusal to permit FDI in selected services still exists in many countries.
However, post GATS, many countries, mainly developing countries, are now changing their
policies and allowing FDI into selected service sectors although restrictions on the extent of
foreign ownership still exist. According to studies by UNCTC (1988), one of the most
important determinants of the location of FDI in services are government policies and
regulations. Some of the studies (UNCTC, 1992) have constructed an openness index on
the subjective evaluation of degrees of government controls and impediments, for example
controls of entry, establishment and ownership of FDI, and estimated the impact of the
index on inward FDI in the service industry and find that it has a significant impact on
inward FDI in services.
(d) Cultural distance
The various host countries have different cultures, tastes and needs, thus FDI in
services needs to be adapted to the tastes of local customers. In this respect, cultural
Asia-Pacific Trade and Investment Review Vol. 1, No. 2, November 2005
63
distance is also found to be an important determinant of FDI in services (Hofstede, 1980;
UNCTC, 1993).
(e) Competitive advantages
The competitive advantages of service firms have been elaborated in terms of
ownership, location and internalization advantages by Dunning (1989). As international
competition in services grow, competitive advantages become increasingly important
determinant of FDI in services. However, competitive advantages in services are difficult
to measure and also transfer, especially if they are culturally and institutionally embedded.
A country’s competitive advantage in a particular sector is revealed by either higher exports
from that sector or outbound FDI from that sector. Since the service sector is characterized
by location boundedness and a varying degree of tradability, outbound FDI in services has
been used by studies to an estimate the impact of competitive advantage (Sauvant, 1986).
UNCTC (1993) estimates an international competitiveness index (ICI) that combines
Balassa’s (1997) revealed comparative advantage and the intra-industry FDI.
It is found that FDI in services is positively affected by the international
competitiveness of the home country’s service industry. However, when the impact of ICI
is estimated for different services, it is found that it is not a significant determinant in the
case of trade-related services and business services. It has some effect on finance-related
services.
(f) Tradability of services
The fact that services are largely intangible and non-storable implies that the
international transaction in services can occur mainly by inward FDI or by an indigenous
firm producing under a licensing arrangement with a foreign transnational corporation.
However, the tradability of services has improved considerably with the advances made by
information technologies (Sauvant, 1986 and 1990). This has led to an emergence of
network-based trade. Thus, the location boundedness of FDI has reduced. The higher the
tradability of services is, the lower will be the chances of providing services through the
FDI route. UNCTC (1993) measures the tradability of services by the ratio of export sales
over total foreign sales in a service industry and finds that it has a negative impact on FDI
in services.
(g) Global oligopolistic reaction
Oligopolistic reactions occur when firms are mutually interdependent. FDI in
manufacturing have been found to follow both their domestic and international competitors
in setting up their units in the host countries as a defensive strategy. Terpstra and Yu (1988)
test this for FDI in the advertising industry in the United States and find that such an
Asia-Pacific Trade and Investment Review Vol. 1, No. 2, November 2005
64
oligopolist strategy does explain FDI in this service industry. This implies that FDI in
services also needs to compete on the basis of a global strategy.
(h) Firm size
International expansion is one of the major growth strategies of the firm. Larger
firms are more likely to become transnational than smaller firms. As in the manufacturing
of goods, firm size also has been found to be a significant factor in the international
behaviour of several service industries such as banking and advertising.
With respect to the determinants of FDI in services, we observe that the
determinants that are found to be significant for FDI in goods are also found to be
significant for FDI in services. However, the importance of the determinants differs. Some
of the most important determinants for FDI in services are government regulations and
policies, cultural distance and the tradability of services. For FDI in goods, the most
important determinants are market size, barriers to trade and cost differentials in production.
The above analysis of the determinants of FDI in services further strengthens the
need for a separate theory for FDI in services that would be able to incorporate the distinct
characteristics of services and also explain the cross-country pattern of FDI in services.
5. IMPACT OF FDI IN SERVICES ON DEVELOPINGCOUNTRIES
Much confusion exists in the minds of policymakers with respect to the impact of
opening the service sector to foreign direct investment. We briefly review some of the
theoretical models and empirical studies that examine the impact of FDI in services on the
host economies and discuss the arguments for and against the opening up of the service
sector.
The literature that estimates the impact of trade liberalization in services on
developing countries dates back to Goldsmith (1969), who emphasized the role of financial
services in allowing financial investments to flow to their most productive uses, and hence
in generating a growth in output. He drew a “rough parallelism” between the growth
performance and the level of financial development. Much of the latter work pointed in
a similar direction, namely that the openness and degree of development of the service
sector is associated with stronger growth performance.
Some of the theoretical models based on this typically treat services as goods and
producer services are modeled as an intermediate goods (Dee and Hanslow, 2000). These
studies show that trade liberalization in services will increase global income and welfare.
In country-level studies, Banga and Goldar (2004) empirically estimated the impact of trade

Asia-Pacific Trade and Investment Review Vol. 1, No. 2, November 2005
65
liberalization and the development of the service sector in the 1990s on the use of services
in the Indian industry. They observe that trade liberalization has positively affected the
growth of service sector, which has further contributed to industrial output and productivity
growth.
However, models typically do not explicitly represent the different modes of
supply in GATS, although more recent models capture FDI flows and labour mobility
restrictions. Winters (2002) explicitly captures the effects of Mode 4 of GATS restrictions
on service flows. Mode 3 of GATS is also captured by some of the models. The results of
these models show that liberalization involving a commercial presence can be an important
factor in service trade liberalization.
Another set of models quantify the impact of trade liberalization in services on
global and individual country output growth. Most of these models involve numerical
simulation exercises using general equilibrium models based on conventional models of
trade liberalization in goods. Barriers to trade in these models are taken as equivalent to tax
or tariff. The size of initial barriers, how they change under liberalization, elasticities and
the size of service trade flows, as well as relative country size and market structure, then
determine results as in the goods model.
Using one such set of models, the CGE models, Mattoo et al. (2001) show that
growth rates increase by 1.5 percentage points for economies that liberalize their telecom
and financial services. Dee and Hanslow (2000) show that there are large gains from
service liberalization in the Uruguay Round for certain developing countries, for example
14.6 per cent of GDP gain for China, and globally more than half of the total gains from the
liberalization of both goods and services accrue due to service liberalization. However,
Verikios and Zhang (2000) show losses to Malaysia from telecom liberalization and losses
to Indonesia from financial service liberalization. Brown et al. (2003) show global gains
from Doha Round liberalization of US$ 413 billion per year from service liberalization but
suggest that developed countries obtain the largest absolute gains.
Thus, the literature that analytically purports and quantifies the impact of the
liberalization of trade in services on growth is ambiguous. There are many conflicting and
contradictory results, which lead to several problems that are encountered in formulating
policies. From the existing literature it cannot be concluded whether trade liberalization in
services has benefited or adversely affected developing countries.
Restrictions on world trade and investment in services are central issues in the
international policy debate. A case for the restricted liberalization of services is put forward
on the following grounds:
(a) Restrictions offer protection from competitive pressure for emergent service
industries.
Asia-Pacific Trade and Investment Review Vol. 1, No. 2, November 2005
66
(b) Restrictions are required on the entry to, or scale of, services which could
impose external costs, for example in air transport or energy distribution.
(c) It is necessary to prevent foreign participation in “essential” service
industries, such as banks and other financial institutions, if independence in
monetary and credit policies is to be guaranteed.
(d) Unrestricted competition may be pernicious in services characterized by high
fixed costs and fluctuating demand such as transport and communication and
these service provisions may cater to only the most lucrative market
segments.
(e) Retaliation may also lead to restrictions as a country’s own enterprises are
subject to similar restrictions in other countries.
Based on the above arguments non-tariff barriers have been constructed to restrict
trade and investment in services. These mainly take the form of export subsidies and taxes,
discriminatory procurement policies, selective indirect taxes, restrictive technical and
administrative regulations, etc.
6. POLICY IMPLICATIONS AND AREAS OF FUTURERESEARCH
The importance of services is increasing rapidly in the international economic
scene in the twenty-first century. Services and high-tech industries are now playing
a leading part in the development of the world economy. Accordingly, we find that the
share of services in GDP has increased steadily in both developed and developing countries
in the last two decades. This growth in services has been supported by two main factors,
technological innovation and the increased tradability of services.
The role of transnational corporations in this regard also cannot be denied. FDI is
an important channel for capital flows and the transfer of technology. Supported by
technology, know-how, information networks and the ability to procure funds, they can be
major suppliers of more differentiated and higher-quality services in developing countries,
thereby stimulating the efficiency of services. The increased competition associated with
the open access to service markets also places pressure on the prices and performance of
incumbent firms, reducing input costs for firms that buy the services. Moreover, the
increased efficiency of services feeds into the system, leading to improved productivity in
other sectors, which in turn creates more demand for services. Thus, a cycle of productivity
and efficiency improvements is set in motion. Improved services can therefore play a vital
role in leading the economy to a higher trajectory of growth.
However, there exist obstacles to lowering restrictions on FDI in global services.
These obstacles fall into two categories: first, those that indicate a lack of incentive to

Asia-Pacific Trade and Investment Review Vol. 1, No. 2, November 2005
67
negotiate, or practical difficulties in negotiations and second, those that represent outright
opposition, particularly by developing countries, to any negotiations.
The obstacles that fall under the first category largely stem from the complexities
of defining and delineating services and estimating the potential economic gains from
liberalizing services. Uncertainty about the likely duration of a period of comparatively
free trade in services compounds any cost-benefit analysis of liberalization and for nations
facing probable costs of concession curtails the relevant benefit payback period.
The measurement problems do not simply impede the demonstration of gains but
also hinder the process of monitoring acceptance of, and adherence to, any agreement. The
expectation of “free-riding” by non-adherents reduces the estimated benefits for adherents,
which compounds the problem of achieving initial agreement. Additional to this is the
problem of merging any new proposals with existing agreements.3 The question that arises
is whether further liberalization is best achieved within existing agreements or whether new
initiatives and structures are likely to be more successful.
For the most part, opposition to any further liberalization by a number of
developing countries, that is those in the second category of opposition, stems from the fact
that many developing countries have only reached the peak of their competitiveness in
visible, particularly manufactured, goods and wish to see first a greater transparency in the
global market for these commodities. Also, these countries are at different stages of their
economic development and therefore have different trade aspirations.
The nationalist perspective rather than a global perspective is predominant in
determining the extent of the liberalization in services. According to Sapir (1985), the
lowering of barriers globally is not a zero-sum game. The probable benefits are likely to
outweigh the costs, but it is the differential incidence of benefits and costs that creates
obstacles to liberalization. One way to overcome this can be to devise suitable mechanisms
for compensating the “losers.” However, this too requires efforts at a multilateral level.
Regarding the issue of investment in services, there is a general consensus in the
literature regarding the beneficial economic effects of investment in services, particularly
producer services such as finance, distribution and research and development. These
services raise economic growth and performance. Where such services are in short supply,
all enterprises, both manufacturing and non-manufacturing, will be at a disadvantage.
Furthermore, such a shortage could encourage, within larger enterprises, the internal
sourcing of services. For multilocational enterprises this sourcing could occur outside the
host region leading to a loss of economic activity. These services also influence the
3 Important agreements have been achieved within a number of forums including the Organization for
Economic Cooperation and Development, the European Community and the United Nations Conference on
Trade and Development.
Asia-Pacific Trade and Investment Review Vol. 1, No. 2, November 2005
68
adaptability of a nation’s producers to changing economic conditions and advancing
technology.
Keeping the potential advantages of investment in services in mind, there is a need
for the developing countries to attract more FDI in services. However, to attract higher FDI
in services there is a necessity to clearly distinguish between the barriers to trade in services
and the barriers to investment in services. This distinction will ease the task of bringing the
type and extent of restrictions within manageable limits. This will help in reducing frictions
between developed and developing countries regarding trade using different modes. For
example, the developed countries object to lowering the restrictions with respect to the
immigration of labour.
Bearing this in mind, in view of the important role that services can play in the
development process, it is important for policymakers in developing countries to formulate
policies that not only support the growth of the service sector but also stimulate its growth
further. To this end, we draw some policy implications from the above review for
developing countries to determine what is needed to maximize the contribution that services
can make to the development process, as follows:
1. To strengthen the service sector, the importance of FDI as a vehicle to deliver
services should not be overlooked. Also, one should realize the considerable potential that
exists in transnationalization in the service sector as compared with the industrial sector.
One of the reasons that have been put forward in the literature for preferring FDI in services
is the fact that transnational corporations in services have little potential for transferring
hard technology.4 However, hard technology may constitute a very important component of
manufacturing activity but it has completely different dimensions in the service sector.
What is of utmost importance to the service sector is soft technology, the kind that which is
embodied in skills, know-how and creations, for example, the kind of knowledge that is
required to design an insurance policy.
2. An important implication relates to the movement of technical personnel.
The restriction in the movement of technical personnel implies a restriction on the transfer
of technology. Therefore, it is not possible to maximize the potential benefits from FDI in
services with the restricted movement of technical personnel.
3. One of the target groups for increasing the investment in services comprises
the firms currently serving the local markets through some non-equity mode (exporting,
licensing, etc.), as there is evidence that direct investment often precedes exports from the
source nation. Some familiarity with the local markets through initial servicing by exports
reduces the investment risk, which is often significant in the case of services, which need to
impose immediate and strict quality control or the attainment of minimal critical mass.
4 Data for the United States show that transnational corporations in the services sector undertake very little
research and development expenditure (see Sauvant, 1986).

Asia-Pacific Trade and Investment Review Vol. 1, No. 2, November 2005
69
4. Though a vast literature has emerged on services, it can still be said that this
literature concentrates on only a few aspects of services and there exists a vast scope to
explore further the many different aspects of services. In particular, we find that there is an
ever-growing literature on trade in services, but studies on the contribution of services to
growth and productivity in services are limited. The limited literature available points out
that services can substantially increase the productivity and efficiency levels of the
industrial sector thereby creating its own demand.
5. There is a need to develop separate theories for trade and investment in
services, distinct from the theories that exist for trade and investment in goods. The need
for a theory for FDI in services arises for various reasons, as discussed above. Three
reasons in particular stand out. First, it is difficult to identify firm-specific advantages in
the case of services; second, “non-equity” forms of foreign involvement, for example
licensing, management contracting and franchising, are widely used in some services;
and third, in the international context the difficulty of splintering services from output
becomes more complex. In relation to trade in services, it is important to note that foreign
sales by multinational enterprises in the service industry do not constitute trade in services
but is considered as production in the service industries. However, multinational
enterprises in manufacturing industries can be involved in trade in services. In view of
these complexities, more research efforts are required in this direction.
6. A practical question, which can be addressed in an empirical analysis, is
whether trade and FDI in services are determined by the same factors as their
manufacturing counterparts. More research is also required in estimating the competitive
advantages of different countries with respect to the various services and manufacturing
goods. An analysis of different countries will shed light on the cross-country pattern of
trade and FDI in services. The circular causation between the evolution of FDI in services
and FDI in manufacturing needs to be examined further. With services becoming an
integral part of the production process, it is FDI in manufacturing that may follow FDI in
services.
7. In most services, horizontal FDI is most likely to take place given the
difficulty in fragmenting services. In such a situation, there is a strong case of the
relationship between FDI and trade being that of “substitutes” rather than “complementary.”
However, further research is needed in this area to explore the relationship between
different kinds of FDI and trade in services.
What remains as the biggest hurdle in future research on trade and investment in
services is not the prevalence of barriers but the lack of reliable, timely and easily
interpretable data. The data that are more widely available do not currently encompass all
forms of trade in services; in particular intra-firm trade in services is not recorded. What is
required is trade data on services at a more disaggregated level that is consistent with value
added and employment data and is comparable across time.
Asia-Pacific Trade and Investment Review Vol. 1, No. 2, November 2005
70
REFERENCES
Balassa, Bela, 1977. “Revealed comparative advantage revisited: an analysis of relative
export shares of the industrial countries, 1953-1971”, Manchester School of
Economic and Social Studies, vol. 45, No. 2, pp. 327-344.
Banga, Rashmi and B.N. Goldar, 2004. “Contribution of services to output growth
productivity in Indian manufacturing: pre and post reforms”, ICRIER Working
Paper, No. 139, August.
Bhagwati, Jagdish N., 1984. “Splintering and disembodiment of services and developing
nations”, The World Economy, vol. 7, No. 2, pp. 133-143, June.
Brown, D.K., A.V. Deardorff and R.M. Stern, 2003. “Multilateral, regional and bilateral
trade policy options for the United States and Japan”, The World Economy, vol. 26,
No. 6, pp. 803-828, June.
Buch, Claudia M., 2000. “Why do banks go abroad? Evidence from German data”,
Financial Markets, Institutions & Instruments, vol. 9, No. 1, pp. 33-67.
Chanda R., 2000. Impact of Trade Liberalization on Foreign Direct investment in Producer
Services, Working Paper No. 103 (Bangalore, Indian Institute of Management),
September.
Dee, P. and K. Hanslow, 2000. Multilateral Liberalization of Services Trade, Productivity
Commission Staff Research Paper (Canberra, Ausinfo).
Dunning, John H., 1989. “Trade and foreign-owned production in services: some
conceptual and theoretical issues”, in Herbert Giersch (ed.), Services in World
Economic Growth: Symposium 1988 (London, Westview Press).
Fukao, K. and Keiko Ito, 2000. “Foreign direct investment and service trade: the case of
Japan”, Hitotsubashi University, mimeo.
Goldsmith, R.W., 1969. Financial Structure and Development (New Haven, CT, Yale
University Press).
Hill, T.P., 1977. “On goods and services”, Review of Income and Wealth, vol. 23, No. 4,
pp. 315-338.
Hofstede, G., 1980. Culture’s Consequences: International Differences in Work-related
Values (Beverly Hills, Sage Publications).
Markusen, James R., et al., 1996. A Unified Treatment of Horizontal Direct Investment,
Vertical Direct Investment, and the Pattern of Trade in Goods and Services, Working
Paper 5696 (Cambridge, MA, National Bureau of Economic Research).
Asia-Pacific Trade and Investment Review Vol. 1, No. 2, November 2005
71
Mattoo, Aaditya, Randeep Rathindran and Arvind Subramanian, 2001. Measuring Services
Trade Liberalization and its Impact on Economic Growth: An Illustration, World
Bank Policy Research Working Paper No. 2655, http://econ.worldbank.org/files/
2373_wps2655.pdf.
Melvin, James R., 1989. “Trade in producer services: a Heckscher-Ohlin approach”,
Journal of Political Economy, vol. 97, No. 5, pp. 1180-1196, October.
Raff, H. and M.V. Ruhr, 2001. “Foreign direct investment in producer services: theory and
empirical evidence” (Kiel, University of Kiel), mimeo.
Rugman, A.M. and A. Verbeke, 1992. “Shelter, trade policy and strategies of multinational
enterprises”, in Alan Rugman and A. Verbeke (eds.), Corporate Response to Global
Change (Greenwich, CT, JAI Press), pp. 3-26.
Sapir, A. 1985. “North-south issues in trade in services”, The World Economy, vol. 8,
No. 1, pp. 27-42, March.
Sauvant, K.P., 1990. “The tradability of services”, in P.A. Messerlin and K.P. Sauvant
(eds.), The Uruguay Round: Services in the World Economy (New York, World
Bank and United Nations Centre on Transnational Corporations).
, 1986. International Transactions in Services: The Politics of Transborder Data
Flows (Boulder, CO, Westview Press).
Schroath, F.W. and C.M. Korth, 1989. “Managerial barriers to the internationalization of
U.S. property and liability insurers: theory and perspectives”, Journal of Risk and
Insurance, vol. 56, No. 4, pp. 630-648.
Terpstra, V. and C. Yu, 1988, “Determinants of foreign investment of U.S. advertising
agencies”, Journal of International Business Studies, vol. 19, No. 1, pp. 33-46.
UNCTAD, 2004. World Investment Report 2004: The Shift Towards Services, United
Nations publication, sales No. E.04.II.D.33 (Geneva).
United Nations Centre on Transnational Corporations (UNCTC), 1980. Transnational
Reinsurance Operations: A Technical Paper (New York, United Nations).
, 1988. International Accounting and Reporting Issues: 1987 Review (New York,
United Nations).
, 1992. The Determinants of Foreign Direct Investment: A Survey of the Evidence,
United Nations publication, sales No. E.92.II.A.2 (New York, United Nations).
, 1993. The Transnationalization of Service Industries: An Empirical Analysis of
the Determinants of Foreign Direct Investment by Transnational Service
Corporations, United Nations publication, sales No. E.93.II.A.3 (New York, United
Nations).

Asia-Pacific Trade and Investment Review Vol. 1, No. 2, November 2005
72
Verikios, G. and X. Zhang, 2000. “Sectoral impacts of liberalising trade in services”, paper
presented to the Third Annual Conference on Global Economic Analysis,
Melbourne, Australia, 27-30 June 2000. http://www.monash.edu.au/policy/conf/
53Verikios.pdf.
Winters, L.A., 2002. “Making the case for free trade”, International Finance, vol. 5, No. 3,
pp. 471-484.
World Bank, 2005. Global Monitoring Report 2005 (Washington, D.C.).

Asia-Pacific Trade and Investment Review Vol. 1, No. 2, November 2005
73
ABSTRACT
The World Trade Organization (WTO) will hold its Sixth Ministerial
Conference in Hong Kong, China, in December 2005. At that Conference,
the current negotiations under the Doha Development Agenda will reach a critical
stage. Since the launch of the Doha Round, many deadlines have been missed and,
despite a framework agreement concluded in July/August 2004, the positions among
the various groups of countries remain far apart. This paper examines the issues, with
a focus on the main negotiation areas: agriculture, non-agricultural market access,
services, special and differential treatment, and trade facilitation, with specific
reference to developing countries in the Asian and Pacific region. While agriculture
remains at the forefront of the negotiations, countries of the region do not have
a common position as the nature of their economies differs. In the area of
non-agricultural market access (NAMA), the aftermath of the abolition of textiles and
garment quotas has raised new issues, in particular with regard to exports from China.
While agriculture and NAMA are important issues, little progress has been made to
date in the area of services, while negotiations in trade facilitation are only just
beginning. These areas are nevertheless of fundamental importance to developing
countries and deserve due attention. In particular, special and differential treatment is
an integral part of the negotiations but should not become a goal in itself. This paper
takes stock of the current state of play and outlines the road ahead in the various
negotiation areas.
Issues of Interest in WTO for Countrieswith Economies in Transition:Doha Development Agenda
ESCAP secretariat*
* This paper was prepared by Marc Proksch, Economic Affairs Officer, Trade Policy Section, with comments
from Tiziana Bonapace, Chief, Trade Policy Section, Trade and Investment Division, ESCAP.

Asia-Pacific Trade and Investment Review Vol. 1, No. 2, November 2005
74
1. INTRODUCTION
As globalization proceeds unrelentingly, the quest for a universal, free, fair, open,
predictable, rules-based and non-discriminatory multilateral trading system has assumed
special importance. Further prompted by the 11 September 2001 attack in the United States
of America, and recognizing the need to keep the momentum of multilateral trade
liberalization going, the world trading nations decided to launch a new round of multilateral
trade negotiations at the Fourth WTO Ministerial Conference which was held in Doha from
9 to 13 November 2001, at a time when many developing countries were still trying to
come to terms with the commitments they had accepted as a result of the completion of the
Uruguay Round and the establishment of WTO in 1995. In recognition of development
concerns, including the implementation of various special and differential treatment
stipulations and clauses and the need for technical assistance, as well as the complex
interrelationship between trade and development, the new round was named the Doha
Development Agenda, but has increasingly been popularly referred to as the Doha Round.
It is therefore important that trade liberalization proceed in a sustainable manner
so as to contribute to development, in particular the achievement of the Millennium
Development Goals. While trade liberalization can proceed through various modalities, it is
widely recognized that the multilateral trading system holds the best promise to effectively
and efficiently boost international trade. The current negotiations under the Doha
Development Agenda are therefore of the utmost importance, and while the negotiations
proceed slowly and are beset by numerous obstacles and problems, it is widely expected
that the Doha Round will ultimately be successfully concluded. The Sixth WTO Ministerial
Conference, scheduled to be help in Hong Kong, China, from 13 to 18 December 2005, will
therefore be a crucial milestone in the Doha Development Agenda following the failed Fifth
WTO Ministerial Conference which was help in Cancún, Mexico, from 10 to 14 September
2003 and the “July Package” agreed on 1 August 2004.
This paper briefly reviews the most important issues at stake in the Doha Round,
especially those of importance to the Asian and Pacific region. The following sectors are
reviewed: agriculture (section 2), non-agricultural market access (section 3), services
(section 4), trade facilitation (section 5) and special and differential treatment (section 6).
Section 7 concludes.
2. AGRICULTURE
(a) What are the issues?
Agriculture lies at the heart of the Doha Round. The reasons for this are clear
when one considers its importance in developing countries and countries with economies in
transition alike, in terms of its share of gross domestic product (GDP) and employment

Asia-Pacific Trade and Investment Review Vol. 1, No. 2, November 2005
75
generation. Even in the developed world, where in most cases agriculture accounts for less
than 10 per cent of GDP, agriculture remains heavily protected. In the rural areas of some
countries, subsistence farming generates up to three quarters of household income, while in
Asia and the Pacific as a whole, about 70 per cent of the region’s poor people are dependent
on agriculture for their livelihood. Notwithstanding the differing shares of GDP among
countries, agriculture remains the mainstay of most economies; it is the basis for food
security, export earnings and rural development. However, estimates show a decline in per
capita agricultural production for domestic and export markets throughout the 1990s.
World trade in agriculture has also declined and accounts for less than 10 per cent of the
total merchandise world trade. While the development towards the production and exports
of manufacturing products and services accounts for some of the decline, it is well known
that the sector remains among the most distorted. Improved export opportunities would
thus be a singularly important means of enhancing livelihood. Not surprisingly, a majority
of developing countries, notably the agricultural exporters, view agriculture as holding the
key for unlocking a pro-poor Doha Round outcome.
The Uruguay Round for the first time contained a comprehensive multilateral
Agreement on Agriculture. While the Agreement was successful in improving transparency
by converting most non-tariff barriers into tariffs, which would then be bound, the
committed reductions were made from the ceiling bindings, which, in most cases, were
much higher than actually applied rates. As a result, in practice, little, if any, actual
liberalization has occurred. The Doha Round is now expected to advance the negotiations
and include concrete liberalization. However, positions still differ widely on most issues
and the sector remains the make or break issue of the whole Round.
Most recently there have been some interesting developments which may
contribute to a revival of the Doha negotiations. Brazil and a number of African countries
successfully challenged the cotton subsidies granted in the United States under the WTO
dispute settlement mechanism, while Thailand and Brazil scored a major victory in
challenging the European Union (EU) sugar subsidies. Meanwhile, the EU has signalled
that it was ready to fully eliminate all export subsidies provided its main partners would
follow suit and an acceptable deal could be reached in the areas of domestic support and
market access.
The July Package recognized the importance of cotton, also an important product
for selected Central Asian countries and agreed that “it will be addressed ambitiously,
expeditiously, and specifically, within the agriculture negotiations”. A subcommittee on
cotton was established to further discuss the issue and agree on modalities to reduce trade
distortions in this sector. The July Package also stipulated that all three pillars of the
Agreement on Agricultural, namely, market access, domestic support and export
competition, should be tackled simultaneously if they are to have a pro-poor outcome.

Asia-Pacific Trade and Investment Review Vol. 1, No. 2, November 2005
76
(i) Market access
Tariffs for agricultural products are much higher than those for non-agricultural
products in all country groups. The high-income countries have an average bound tariff rate
of 51 per cent and an average applied tariff rate of 48 per cent. Middle-income countries
have higher bound rates but lower applied rates of 25 per cent on average. Least developed
countries (LDCs) have the highest bound rates but considerably lower applied rates of
39 per cent. However, average tariffs do not reveal the problems of tariff peaks and tariff
escalation. On some products duties are very high and increase by degree of processing.1
This makes it difficult for developing countries to enter into exports of processed products
that have higher value added.
The Uruguay Round conversion of non-tariff barriers into tariffs has led to very
high bound tariffs. In order to guarantee and slowly improve minimum market access,
so-called “tariff quotas” were established with different tariffs applying for in-quota imports
and out-of-quota imports. Many countries have argued that the administration of the tariff
quota system is not transparent and that quotas need to be expanded considerably.
Many tariffs are also specific tariffs rather than more transparent ad valorem
tariffs. Thus, a conversion to ad valorem tariffs was required to agree on a reduction
formula. A major breakthrough was achieved on 4 May 2005 when 30 key WTO members
finally agreed on the method to calculate ad valorem equivalents (AVEs). Subsequently,
members have been able to produce AVEs for all tariff lines except sugar. However, other
elements, notably the treatment of sugar and the process through which members would
verify each other’s AVEs, remain undecided.
The next step is to agree on a reduction formula. The July Package states that
tariff reductions will be made based on a tiered formula, with items falling in different tiers
being treated differently. It does not, however, specify how reductions would be made
within the different tiers. While opinions still differ widely, the application of
a harmonizing Swiss formula has received wide support. Such a formula would cut high
tariffs more than low tariffs. However, the EU and net-food importers, including some
developed countries such as Japan and Switzerland, still favour a Uruguay Round formula
which involves linear cuts similar to those made in that Round.
Under the July Package, both developed and developing countries are allowed to
designate a limited number of agricultural products as “sensitive” products which would be
subject to lower tariff cuts. Only developing countries are eligible to designate a limited
number of agricultural products as “special” products for food security, livelihood security
and rural development purposes. The establishment of a “special safeguard mechanism” for
1 Tariff peaks in selected developed countries remain very high: average tariffs (bound rates) are 83 per cent of
bound rates for sugar, 120 per cent for fruits and vegetables, 117 per cent for cocoa and 70 per cent for coffee.
Asia-Pacific Trade and Investment Review Vol. 1, No. 2, November 2005
77
developing countries has also been discussed. Such a mechanism would replace the
existing Special Safeguard (SSG) under the Agreement on Agriculture that applies to
a selected number of countries only, including developed countries.
In addition to tariffs, new non-tariff barriers have arisen, hampering market access.
In particular, sanitary and phytosanitary (SPS) measures often pose formidable obstacles to
exports of agricultural products from the less developed countries. However, as long as
such standards are in conformity with the WTO Agreement on the Application of Sanitary
and Phytosanitary Measures (SPS Agreement), there is really little that developing countries
can do except develop their capacity to meet the requirements.
(ii) Domestic support
The commitments of countries to cap and reduce domestic support are often
considered to be the most innovative element of the Uruguay Round. Negotiators
established an “amber box” for domestic policies that distort trade and a “green box” for
minimally trade-distorting policies, which are exempt from reduction commitments. A third
“blue box” was created to accommodate EU production limiting subsidies. The vast
majority of “amber box” support, known as Aggregate Measurements of Support (AMS), is
provided by the Organization for Economic Cooperation and Development (OECD)
countries. The EU, Japan and the United States account for almost 90 per cent of the total
support. Levels of AMS not exceeding 5 per cent of total agricultural production are also
exempt from reduction commitments (de minimis), 10 per cent for developing countries.
Similar provisions exist for product-specific support. There have been proposals to expand
the de minimis levels for developing countries while reducing them for developed countries
or eliminating them altogether.
However, support measures other than AMS exist. According to the OECD, total
support to agriculture in OECD countries amounted to US$ 318 billion, or 1.2 per cent of
GDP, in 2002 (OECD, 2003). This included transfers from consumers and taxpayers as
well as support to general services for the agricultural sector. Products that accounted for
the bulk of support were milk, meats, grains and sugar (World Bank, 2003). Even though
the WTO Agreement on Agriculture has special and differential treatment (SDT) provisions
for developing countries, they hardly tend to use domestic support due to lack of resources.
In countries that can finance support, the type of support is increasingly shifting,
from trade distorting “amber box” measures to reduction exempted measures and
particularly to decoupled income support. It is believed that this type of support is not
trade-distorting, or only minimally so, although there is no definition of non-trade-distorting
support. Support that is not linked to current production is less trade-distorting than
production-linked payments. The economic effect of production-encouraging support is
that it distorts production and is therefore inefficient and reduces world food prices.
However, it is argued that despite efforts by developed countries to decouple payments, all

Asia-Pacific Trade and Investment Review Vol. 1, No. 2, November 2005
78
measures that encourage production by non-competitive producers through decoupled
income support or income safety nets are de facto production- and trade-distorting. More
research is needed to understand the extent to which decoupled support distorts production
and trade.
A further problem concerning domestic support is an imbalance in the rules under
the current Agreement on Agriculture. Developed countries with greater resources are
allowed to continue to provide farm support within their total AMS commitments, whereas
developing countries with budgetary constraints, or which had different policies during the
Uruguay Round base period, have de facto zero AMS levels. The commitment in the Doha
Round that countries with higher subsidy levels will reduce much more than those with
minimal subsidies is thus an important advance in bringing about a more equitable
multilateral trading system.
The July Package stipulates that a tiered and harmonizing formula be applied to
reduce domestic support. However, as such reductions will take place on the basis of bound
levels, it remains to be seen how much actual liberalization of domestic support will take
place. It also bound the “blue box” subsidies at 5 per cent of a member’s average total
value of agricultural production during a historical period. The historical period will be
established in the negotiations. “Green box” criteria will be reviewed to ensure that
subsidies in this box indeed are not, or at worst minimally, trade-distorting.
(iii) Export competition
Export competition relates, in particular, to the issue of export subsidies. Other
issues are export credits, state trading enterprises, export taxes and food aid. Export
subsidies significantly distort agricultural trade. Currently only 25 WTO members are
allowed to use export subsidies and have made reduction commitments.2 The level of
export subsidies depends on harvests, world food prices and exchange rates, and therefore
fluctuates. Between 1995 and 2000, on average US$ 6.2 billion worth of export subsidies
were provided worldwide. SDT provisions allow certain subsidies by developing countries,
such as marketing costs and internal transport and freight charges. Also exempt from
reductions are export subsidies related to international food aid and subsidy components in
export credits.
The use of export subsidies is concentrated in a limited number of countries,
mainly developed countries, and these subsidies give a direct price advantage to the
exporters receiving them, thus directly undercutting the export competitiveness of products
from non-subsidizing countries. The provision of export subsidies is counter-cyclical with
respect to world price variations. In general, such subsidies lead to declining food prices,
2 Some exceptions for developing countries exist, and the least developed countries have no restrictions.
Asia-Pacific Trade and Investment Review Vol. 1, No. 2, November 2005
79
which hurts vulnerable producers in developing countries. The commitment reached during
the Doha Round negotiations to eliminate export subsidies is thus important. However, as
most of the export subsidies apply to temperate products such as dairy products and cereals,
it is also true that consumers in net-food-importing developing countries benefit from the
lower food prices. The needs of net-food-importing countries thus need to be taken into
consideration as an increase in food prices can have serious negative effects on the poor and
their food security.
The July Package stipulates that export subsidies and selected export credits will
be eliminated within a certain period. The length of this period is still subject to
negotiations.
(b) The way forward
Developed countries need to demonstrate their willingness to reduce substantially
both the value of subsidies they provide to their farmers and the tariffs and other non-tariff
barriers that protect their agriculture. A successful outcome in agriculture should include,
inter alia, the following elements:
� Substantial cuts in domestic subsidies for each major product sector, from
actual subsidy disbursements over the period 2000-2002, not “bound” levels.
� Elimination of agricultural export subsidies, including the subsidized
component of official export credits, by a fixed date, with accelerated
phase-outs for products of export interest to developing countries.
� Sharp reductions in high farm tariffs with no levies above a two-digit
negotiated cap, and expansion of tariff-rate quotas.
� Duty- and quota-free market access for products from LDCs.
� Special and differential treatment, including designation of a limited number
of products as “sensitive” and/or “special” products, and continuation, or
possible expansion, or existing Agreement on Agriculture SDT provisions.
Such a result would mean ending most export subsidies soon after the completion
of the Doha Round; real reductions in domestic subsidy disbursements by developed
countries on cotton and other major developing country products; deep cuts in high farm
tariffs and larger import quotas for rice. It would also entail more meaningful reforms by
middle-income developing countries of their farm trade restrictions.
Developing countries are not a homogeneous group and have different needs in
agriculture, as mirrored by the large number of divergent proposals put forward by
developing countries in the ESCAP region. The two main differences concern the degree of
liberalization and the level of special and differential treatment.

Asia-Pacific Trade and Investment Review Vol. 1, No. 2, November 2005
80
Major agricultural exporters from the region are demanding an ambitious
liberalization outcome. On the other hand, net-food-importing developing countries
concerned about rising world food prices as a result of liberalization hope to significantly
increase their own production and become less dependent on imports. Least developed and
developing countries that benefit from preferential access are concerned about preference
erosion once the most favoured nation tariffs are reduced, thus are less keen on deep
liberalization.
3. NON-AGRICULTURAL MARKET ACCESS
(a) What are the issues?
Applied industrial tariffs are modest, but tariff peaks and escalation remain key
problems that affect exports from developing countries and hinder their efforts to expand
and diversify their production and trade. Such high tariffs and escalation are especially
important in labour-intensive sectors, including textiles and clothing, footwear, leather
goods, a number of basic manufactures, and fish and fish products. This is particularly
important for Asian LDCs, landlocked and small island developing countries for which
textiles and clothing products are by far the most important export items. Given their
comparative advantage in this sector, developing countries of the region thus have a strong
interest in a comprehensive and deep liberalization in this sector.
However, some developing countries are concerned that deep concessions could
limit the scope of their industrial development programmes. This concern is heightened by
the fact that developing countries and LDCs in particular have only a limited capacity to
prepare adequately for these complex tariff negotiations, despite the significant implications
that the tariff regime has for their industrial policies and the competitiveness of their
products. Importantly, the Doha Ministerial Declaration provides some leeway for these
countries, noting the provisions of Article XXVIII bis of the General Agreement on Tariffs
and Trade (GATT) 1994 for less than full reciprocity by developing countries. Moreover,
there is frequently a substantial gap between their applied and bound rates, which is due to
the cuts made in most favoured nation tariffs under unilateral or autonomous reforms made
by developing countries in the last 10 to 15 years. Since reductions will be based on bound
rates, it provides some protection against any significant new concessions.
Another issue of concern to a number of developing countries is the erosion of
tariff preferences such as those granted under various Generalized Systems of Preferences,
other special arrangements and regional trade agreements. These negative effects are likely
to fall more heavily on beneficiaries of more substantial preferences, such as Asian,
Caribbean and Pacific countries and LDCs. Therefore, the possible negative effects
resulting from the implementation of the results of the new negotiations have to be taken
into consideration.

Asia-Pacific Trade and Investment Review Vol. 1, No. 2, November 2005
81
Finally, LDCs and other low-income countries with limited opportunities for
raising government revenue through domestic taxation are concerned about the impact that
reductions in tariffs would have on their revenues even though tariff reductions could
potentially raise the level of imports, and hence taxes.
The July Package adopted by WTO members in 2004 is not as comprehensive on
NAMA as on agriculture. It stipulates, inter alia, that a non-linear cut should be applied to
tariffs, that product coverage should be comprehensive and that non ad valorem duties
should be converted into ad valorem duties.
Numerous studies have pointed out that the highest tariffs are maintained by
developing countries on trade among themselves. According to one study, estimates of the
tariffs paid by developing country exporters of industrial goods suggested that more than
70 per cent of all duties paid by those exporters were levied by the Governments of other
developing countries (Hertel and Martin, 1999). The issue of protectionism in South-South
trade assumes even greater importance in the wake of the abolition of textile quotas under
the Multifibre Arrangement (MFA) at the end of 2004. International competition is
expected to be intense and many developing countries, including LDCs and others, which
rely heavily on this industry, will face potential export losses unless they manage to upgrade
their competitiveness in this sector or diversify their export sector in time to other products.
While quotas may be abolished, tariff barriers in both developed and developing countries
in the textiles and clothing sector will constrain potential exports and the diversification of
destination markets. Applied tariffs on textiles and clothing are three times the average in
manufacturing in industrialized countries. It is also feared that the use of anti-dumping
duties and other trade remedies may replace the quota system as significant non-tariff
measures.
Already, the phase-out of the MFA has led to an expected surge in exports of
textiles and clothing from China to the EU and the United States and both have already
invoked the safeguard clause in China’s accession agreement. Calls for anti-dumping duties
on Chinese imports have also been made.
(b) The way forward
The tariff reduction formula selected should remove tariff peaks in developed
countries on key products of interest to developing countries. Developing countries and
LDCs should increase binding coverage for the benefit of transparency and predictability,
but with flexibility for implementation and compensatory assistance for those countries that
currently are heavily dependent on import duties for government revenue. In some sectors
this goal should be achievable in an accelerated manner. Of particular interest to many
developing countries would be the reduction of tariffs and other trade barriers on textiles
and clothing to be kept to a level at least close to the average level of tariffs on all other

Asia-Pacific Trade and Investment Review Vol. 1, No. 2, November 2005
82
commodities initially and to be phased out completely over an agreed time period.
Developing countries should also use the current round to accelerate liberalization on
products of interest in their own South-South trade, where tariffs remain 4 to 5 times higher
on average. Anti-dumping duties can sometimes reach 10 times the value of applied tariffs,
thus a further contribution of the Doha Round could be to ensure that the market access
gains promised to developing countries are not eroded by the increased use of contingent
protection, especially anti-dumping measures.
4. SERVICES
(a) What are the issues?
Maximizing the development benefits from the international liberalization of trade
in services is key to pro-poor outcomes. It is also an area of significant commercial interest
to developed countries given the rapid expansion of imports into Asian and Pacific
developing countries, notably China, over the past decade, whereas for developing
countries it results in economy-wide efficiencies that increase export competitiveness.
However, greater access into developing country markets needs to be grounded in an
understanding of the role of services not only in terms of these efficiencies, but also in
terms of the well-being of their people and the current domestic availability of services.
The current round should therefore ensure (i) that the liberalization of essential services,
that is water, health and education, does not lead to the adoption of a particular economic
model, such as privatization, but gives necessary attention to domestic regulatory reform
and the expression of local collective preferences; (ii) that low-cost access to essential
services, including high-speed telecommunications infrastructure and the Internet, is
readily available in rural communities; (iii) that there are no restrictions on the ability to
cross-subsidize the provision of services to rural areas where large segments of the
population continue to live; (iv) that measures are in place to increase lending to small and
medium-sized enterprises and poor producers; and (v) that initiatives directed at attracting
foreign direct investment (FDI) do not crowd out local service suppliers.
In this regard, developing countries have encountered great difficulties in
identifying their specific sectoral interests, the barriers to their exports or the impact of
requests by developed countries on their service sectors. Of particular concern to
developing countries are the evaluation of requests received and the formulation of their
own requests and offers, which are particularly complex tasks as they need to determine
their national policy objectives and the competitiveness of each sector or subsector. They
also need to determine the optimal sequencing of the steps involved in liberalization, the
capacity of domestic firms to provide the services in question and whether this capacity
would be positively or negatively affected by further competition in the market.

Asia-Pacific Trade and Investment Review Vol. 1, No. 2, November 2005
83
The impact on employment is particularly important from a pro-poor perspective.
Of special interest to developing countries is the commitment of developed countries to the
temporary movement of service suppliers (GATS Mode 4). By providing employment
opportunities abroad, this can be an effective tool in addressing unemployment in the
domestic economy and supporting the income of poor households, thereby directly
contributing to poverty reduction. Workers’ repatriated earnings in the form of remittances
can accelerate development of the domestic economy by augmenting consumption, savings
and investment. Remittances have clearly emerged as one of the most stable, steady and
rising sources of development finance for many developing countries, while knowledge
acquired abroad stimulates entrepreneurship and the assimilation of new technologies when
workers return home. In the Asian and Pacific region, such flows constitute the second
largest source of private funding after FDI.
Commitments under Mode 1 (cross-border supply) are also of increasing interest
to developing countries. Services supplied under Modes 1 and 4 are often substitutable or
complementary for many of the types of business activities that are commonly outsourced.
In the context of securing increased Mode 1 market-opening commitments from developed
countries, developing countries are seeking to gain a parallel Mode 4 opening, which is
needed to supply services related to these activities. Higher value added activities tend to
involve the temporary movement of natural persons during their preparatory and follow-up
phases, even though the final services are provided through cross-border supply. Such
linkages imply changes in the need for the movement of natural persons at the middle level,
in that it reduces the duration of stay and the numbers of personnel. However, as countries
move up to higher value outsourcing and business process outsourcing activities, their need
for the mobility of natural persons will not diminish, but instead will shift towards higher
level service providers. Developed countries should therefore make commitments for
categories of professionals in the area of computer-related services.
Mode 1 also depends on the availability of telecommunications services as the
basic infrastructure for cross-border trade across all service sectors. This is why developing
countries are seeking progress in the liberalization of computer-based and related services
as a necessary precondition for enhancing trade in Mode 1 across all service sectors, and for
outsourcing.
(b) The way forward
Multilateral liberalization of trade in services through Mode 4 constitutes an
unfinished development agenda of the Uruguay Round. It is also an essential element of
a balanced and development-oriented outcome of the current multilateral trade negotiations.
Multilateral liberalization of Mode 4 must be buttressed by a reduction and streamlining of
market-entry conditions, if substantive development gains are to be assured by the
international trading system. Furthermore, substantial benefits could be derived by both
Asia-Pacific Trade and Investment Review Vol. 1, No. 2, November 2005
84
developed and developing countries from the liberalization of restrictive measures that
hamper the ability of workers from poor countries to take jobs in wealthier countries on
a temporary basis. Hence, market access for services, including the large pool of
semi-skilled labour from this region, and other sectors of export interest to poor countries
should be liberalized.
There is also a need to separate the Mode 4-related supply of services from
immigration-related matters so as to avoid needless political and cultural complications,
including xenophobia, that hamper the realization of the full potential of temporary Mode 4
trade for home and host countries alike. Furthermore, the liberalized, but regulated,
movement of temporary workers from developing to developed countries would help
resolve the problem of clandestine and illegal migration.
Important commitments by major developed countries in this area would include:
(a) broadening the categories of service providers covered to include independent and
contractual service providers; (b) including lower-skilled levels and occupations;
(c) eliminating economic needs tests or reducing their coverage and making them more
predictable through the establishment of transparent criteria; (d) simplifying, streamlining,
easing and making more transparent visa, work permit and licensing requirements and
procedures; and (e) facilitating the recognition of professional qualifications including
through mutual recognition agreements, and horizontal application of the General
Agreement on Trade in Services (GATS) guidelines on accountancy to other professions.
The Doha Round also provides an opportunity for developing countries to achieve
commercially meaningful market access commitments in sectors and modes of interest to
them, particularly labour-intensive services, and to devise effective benchmarks for the
implementation of GATS Article IV (Increasing participation of developing countries).
Actions by developed countries to grant enhanced market access, for example
non-reciprocal preferential access for developing country exports, and support investment
and technology flows in key service sectors of developing countries that may improve the
supply capacity and competitiveness of services are important elements of a pro-development
outcome.
At the same time, developing countries should be allowed to maintain policy
discretion regarding their own markets. They should attach specific conditions to their new
schedules of commitments, such as: (a) the unique situation in each country in relation to
the pace and path of liberalization most suitable to domestic circumstances; (b) the need for
flexibility in addressing problems that cannot be anticipated when undertaking
liberalization commitments; (c) the lack of meaningful concessions, critical barriers to
exports and supply constraints preventing developing countries from reaping benefits;
(d) the fact that benefits from privatization and liberalization do not accrue automatically
but require certain preconditions, including an appropriate regulatory framework,
entrepreneurial and technological capacity-building and complementary policies; and

Asia-Pacific Trade and Investment Review Vol. 1, No. 2, November 2005
85
(e) adjustment costs, including those entailed by the need to ensure access to universal and
essential services, in particular for the most vulnerable segments of the population.
As yet, no substantive offers have been made in services, an issue of real concern
for the successful conclusion of the Doha Round. Alarm bells have been rung and it is
hoped that the Sixth WTO Ministerial Conference, to be held in Hong Kong, China, in
December 2005, will make substantive progress in this important area.
5. TRADE FACILITATION
(a) What are the issues?
Trade facilitation has always been a priority for developed countries seeking fast,
reliable, predictable and cost-effective access to the markets of developing countries. It is
of particular importance to landlocked countries, which depend on transit trade and regional
cooperation with neighbouring countries for efficient transport and trade. Trade facilitation
also holds the potential to help domestic exporters, including microentrepreneurs, become
more competitive by reducing transaction costs at the border, both for their imported inputs
and for export shipments, thus taking full advantage of the hard-won openings in developed
country markets. This is of particular importance for countries of the region that have built
up their comparative advantage in labour-intensive assembly operations. In a vertically
integrated global supply chain, rapid, efficient and cost-effective customs clearance of raw
materials and other parts is of critical importance. For example, OECD has assessed that
transaction costs can vary between 2 and 15 per cent of trade transaction value.3 In 2000,
the Asia-Pacific Economic Cooperation (APEC) estimated that its own trade facilitation
programme would add 0.25 per cent to the GDP of its members (about US$ 46 billion at
1997 prices) by 2001 (Woo et al., 2000). A World Bank study estimated that an increase of
about US$ 280 billion could be gained if improved trade facilitation measures were
implemented in those APEC members with facilitation capacity below the average for the
group. The study argued that investment in trade facilitation would provide gains that
would be greater than tariff cuts on manufactured goods (World Bank, 2002). WTO
estimates that, at present, the number of days needed for customs clearance in
a representative group of least efficient countries is 30 times larger than in the
representative most efficient country (WTO, 2004). Second, the loss of national income
due to the declaration of lower volumes or values of trade can be significant. Consequently,
the July Package that launched negotiations in this area focuses the scope of the
negotiations on the three GATT 1994 articles, namely Article V on “Freedom of transit”,
Article VIII on “Fees and formalities connected with importation and exportation” and
Article X on “Publication and administration of trade regulations”.
3 See Business Benefits of Trade Facilitation, Working Party of the Trade Committee, OECD, TD/TC/WP8
(2001)21/FINAL, April 2002.

Asia-Pacific Trade and Investment Review Vol. 1, No. 2, November 2005
86
Trade facilitation is not new to WTO. To date, there are agreements on customs
valuation, pre-shipment inspection and import licensing as part of the Uruguay Round.
(b) The way forward
The negotiations on trade facilitation have systemic implications, as it is the first
instance where a concrete link between the negotiating process and the provision of
technical assistance for capacity-building is established. In this context, the July Package
recognizes the technical assistance and capacity-building activities of the United Nations
Conference on Trade and Development (UNCTAD) and requests WTO member States to
invite international organizations (specifically the International Monetary Fund, OECD,
UNCTAD, the World Customs Organization and the World Bank) to undertake
collaborative efforts in the provision of technical assistance. Annex D and in particular
paragraphs 5 and 6 thereof contain more concrete obligations for donor countries.4 Support
and assistance are to be extended during negotiations, as well as in the implementation
phase. This approach is unique in the history of WTO negotiations, as it contains concrete
obligations on the part of donor countries to provide the necessary technical assistance and
accepts that, lacking such assistance, developing countries may not be required to
implement negotiated commitments. If developed and developing countries can make this
link work, it is likely to be an important precedent for future negotiations that might point
the way forward for less acrimonious and more balanced outcomes in areas that extend
beyond trade facilitation.
Annex D also highlights the need for “effective cooperation between customs or
any other appropriate authorities on trade facilitation and customs compliance issues”. It
further recognizes that trade facilitation requires a cooperative effort between customs and
other appropriate national administrative authorities. Trade facilitation measures would
need to reflect the complexities of national government structures and responsibilities. This
approach is relevant not only for the identification of needs and priorities but also in
developing the effective capacity to implement the commitments.
6. SPECIAL AND DIFFERENTIAL TREATMENT
Special and differential treatment (SDT) has its origins in the mid-1960s. It
centres around the principle that developing countries should not be expected to make
reciprocal concessions in trade negotiations. This principle was later incorporated into
Part IV (Enabling Clause) of GATT. The Uruguay Round yielded a number of special and
differential treatment provisions, but disenchantment with the manner in which these
provisions were being implemented rose quickly.
4 See “Doha Work Programme – Decision Adopted by the General Council on 1 August 2004”, WTO document
WT/L/579, 2 August 2004, annex D.
Asia-Pacific Trade and Investment Review Vol. 1, No. 2, November 2005
87
(a) What are the issues?
The Uruguay Round SDT consists of 145 provisions, of which 22 apply only to
LDCs.5 They can be divided into three main types. First, developing countries are granted
longer time frames for implementing WTO agreements than developed countries. These
vary considerably from 2 years (in the case of the SPS Agreement and Agreement on Import
Licensing Procedures) to 10 years (in the case of the Agreement on Agriculture). Second,
developing countries are accorded greater flexibility in the application of many WTO
agreement provisions. Such flexibility generally takes the form of exemptions from
commitments otherwise generally applicable to members or of a reduced level of
commitments. Third, developing countries are “promised” technical assistance in several
areas, including SPS, technical barriers to trade, customs valuation, services and intellectual
property. For all of these categories, additional provisions apply specifically to LDCs.
In 2001, WTO Ministers agreed at Doha that: “all special and differential
treatment provisions shall be reviewed with a view to strengthening them and making them
more precise, effective and operational”.6 On the basis of this mandate, developing
countries made over 85 suggestions to strengthen SDT provisions in various WTO
agreements. Current negotiations tend to be overshadowed by disagreement over which
should come first: decisions on cross-cutting issues or on provisions within specific
agreements. The former include the principles and objectives of SDT, whether there should
be one, two or multiple tiers of provisions, technical assistance and capacity-building,
transition periods and graduation. Some developing countries have feared that a premature
decision on cross-cutting issues might limit the scope for subsequent agreement-specific
SDT.
Redesigning existing WTO rules to ensure that they have a positive (or at least not
a negative) impact on pro-poor development remains challenging. The proposals have
included calls for improved preferential access to developed country markets, further
exemptions from specific WTO rules, and binding commitments by developed countries to
provide technical assistance to help implement multilateral rules. Despite intensive talks,
no comprehensive agreement on these proposals has emerged. One reason is that many of
the proposals sought to convert non-binding, “best endeavours” provisions into legally
birding obligations on developed countries.
Furthermore, various new approaches to SDT have recently been advanced by
various trade analysts. These are generally based on the recognition that there is a need to
5 “Committee on Trade and Development – Implementation of Special and Differential Treatment Provisions in
WTO Agreements and Decisions – Note by the Secretariat”, WTO document WT/COMTD/W/77, 25 October
2000, p. 3.6 See “Ministerial Declaration”, Ministerial Conference, Fourth Session, Doha, 9-14 November 2001, WTO
document WT/MIN(01)/DEC/1, 20 November 2001, paragraph 44.

Asia-Pacific Trade and Investment Review Vol. 1, No. 2, November 2005
88
differentiate between developing countries if meaningful SDT provisions are to be
achieved. In order to do so, current country groupings may need to be renegotiated
(Hoekman et al., 2004). Specifically, this would mean that WTO members no longer be
allowed to self-select their developing country status and would be categorized into a larger
number of subgroups than is presently the case. An enlarged LDC group of small and poor
developing countries determined by size and per capita criteria would by and large capture
those countries in real need of SDT across all WTO agreements. Each new grouping would
then be eligible for the same SDT across all agreements. Eligibility would cease to be
based on the current self-selection system by developing countries. Eligibility would
become subject to discretionary decision-making by all WTO members. Alternatively, an
agreement-specific approach, tailoring the SDT provisions to the needs of individual
countries, could be adopted. This could be based on the assessment of the costs and the
capacity of countries to implement WTO agreements, so that the implementation of
transition periods and tailor-made technical assistance programmes could be set out (Wang,
et al., 2000). The merit of this approach rests largely on the (legal) nature of the technical
assistance commitments that the donor countries would make. An even more fine-tuned
approach consists of providing SDT on a provision-specific basis. Applicability of the SDT
would depend on the fulfilment of a number of criteria. As a result, the group of eligible
countries would be open and might differ for each SDT measure as appropriate but
potentially different criteria are attached. In addition, a provision-specific approach allows
for the automatic, that is, not subject to the acceptance of other members, application of the
SDT to additional countries with similar needs and fulfilling the same criteria. However,
the challenge of defining the appropriate and development-relevant criteria that are relevant
to specific development needs remains significant. Further research and policy analysis
would be required.
(b) The way forward
SDT remains an important horizontal negotiating issue for developing countries
due to the flexibility it provides for trade protection under specific conditions, and the
region’s experiences, for example the 1997 financial crisis, that point to the need for
developing countries to liberalize in a manner paced with their development path rather
than in a sweeping manner. The development goals should therefore be supported by
flexible implementation schedules and focused exceptions from WTO rules, accompanied
by generous technical and developmental aid from national and international financial
institutions (discussed below) in order to address the unavoidable adjustment costs. In
particular, in the design of SDT provisions, attention needs to be paid to the specificities of
individual countries, notably in terms of compliance costs and the capacity to implement
WTO agreements. Transition periods could be determined to allow for the execution of
appropriately funded technical assistance and capacity-building programmes. Furthermore,
some flexibility, including in the area of subsidies, should be allowed for developing
countries to tailor economic and social policies to their specific needs and priorities.
Asia-Pacific Trade and Investment Review Vol. 1, No. 2, November 2005
89
Notwithstanding the complexity of the issue, it would appear that agreement- and/or
provision-specific approaches should be pursued in the Doha Round as they may ensure
that these are better designed to respond to the needs of developing countries.
While SDT is certainly an important element of the negotiations, for some
countries it has become a primary negotiation goal rather than a modality for the sustainable
implementation of necessary reforms of which trade liberalization is a part. It should be
kept in mind that the negotiations will only succeed on the basis of give and take and
a common understanding that trade liberalization is essential for economic development and
poverty reduction provided it proceeds in a sustainable manner.
7. CONCLUSIONS
The issues in the Doha Round are many and complex. As a result, progress has
been limited. Most of the debate concerns issues related to developing countries. Some
have yet to accede to WTO. For the WTO members among them, it is important that they
join coalitions and negotiation groups, such as the Cairns Group or Group of 22, to advance
their trade interests. Some of those who have only acceded recently are still coping with the
implementation of their commitments. They should therefore try to take on new
commitments only to the extent that they are sustainable and in line with their existing
capacity. At the same time, they should actively work together in building supply-side
capacities to benefit from the gains in market access and face the competition that comes
with their own liberalization.
While agriculture and NAMA are important issues for developing countries, trade
facilitation and services are potentially even more so. For landlocked countries, facilitation
of transit trade is of primary importance, while service liberalization could result in more
FDI inflows in the construction of much-needed infrastructure, including transport and
telecommunications.
Special and differential treatment is an integral part of the negotiations and
deserves due attention. However, developing countries should only call for such treatment
to allow them breathing space to implement reforms and commitments in a sustainable
manner. SDT should not be the primary objective as this would go against the rationale that
trade liberalization is good for development, provided it proceeds in a sustainable manner.
The Sixth WTO Ministerial Conference, to be held in Hong Kong, China, in
December 2005, will be of critical importance for the future of the Doha Round. The
Round must not fail. Failure would result in enormous costs for all countries, and probably
most so for the developing countries. The alternative, a web of duplicating and overlapping
regional and bilateral trade agreements, is only a second-best option, which should not
replace the non-discriminatory multilateral trading system.
Asia-Pacific Trade and Investment Review Vol. 1, No. 2, November 2005
90
REFERENCES
Hertel, Thomas and Will Martin, 1999. Developing Country Interests in Liberalizing
Manufactures Trade (Washington, D.C., World Bank), February.
Hoekman, B., C. Michalopoulos and L. Alan Winters, 2004. “Special and differential
treatment of developing countries in the WTO: Moving forward after Cancún”, The
World Economy, vol. 27, No. 4, pp. 481-506, April.
OECD, 2003. Agricultural Policies in OECD Countries, Monitoring and Evaluation
(Paris).
Wang, Z.K. and L.A. Winters, 2000. Putting ‘Humpty’ Together Again: Including
Developing Countries in a Consensus for the WTO, Centre for Economic Policy
Research (CEPR) Policy Paper 4 (London, CEPR).
Woo, Yuen Pau and John Wilson, 2000. Cutting Through Red Tape: New Directions for
APEC’s Trade Facilitation Agenda (Vancouver, Asia Pacific Foundation of Canada).
World Bank, 2002. Trade Facilitation: A Development Perspective in the Asia Pacific
Region (Washington, D.C.), October.
, 2003. Trade Note: Domestic Support for Agriculture: Agricultural Policy Reform
and Developing Countries (Washington, D.C.), September.
WTO, 2004. World Trade Report 2004 (Geneva).

Asia-Pacific Trade and Investment Review Vol. 1, No. 2, November 2005
91
Policy Briefs

Asia-Pacific Trade and Investment Review Vol. 1, No. 2, November 2005
93
Background of revaluation of the Chinese yuan
On 21 July 2005, the Chinese yuan broke its peg to the United States dollar
and shifted to a so called “managed float”. The Central Bank of China set
the yuan at 8.11 to the US dollar, a 2.1 per cent increase in its value, and decreed that the
yuan currency would be traded within a narrow band of 0.3 per cent each day against
a basket of currencies.1 It was time since 1994 that China revalued its currency and linked
it to a basket of currencies, although it is not yet clear how much it will be allowed to
fluctuate.
Most observers regarded the Chinese economy as overheated and many were
skeptical that recent administrative measures would be sufficient to produce the desired soft
landing. Under such circumstances, a revaluation of the currency could be an advisable
component of a domestic adjustment package, dampening inflation and discouraging
hot-money (speculative) inflows. Many economists recognized that the yuan was
undervalued and the maintenance of the dollar peg at its previous level encouraged
speculative capital inflows that were having a negative impact on macroeconomic
performance and the stability of the banking system. It was also widely believed that the
yuan was already under domestic and foreign pressure to appreciate, as evidenced by the
The Chinese Yuan Revaluation:Effects and Implications forExchange Rate Policy*
* This paper was prepared by Joong-Wan Cho, Economic Affairs Officer, Investment and Enterprise
Development Section, Trade and Investment Division. The author benefited from comments by Marinus
Sikkel, Chief of the Investment and Enterprise Development Section, Trade and Investment Division, ESCAP.
Research assistance provided by Carlos Lopez-Arenas, during his internship with the Investment and
Enterprise Development Section, is gratefully acknowledged.1 On 11 August 2005, the Central Bank of China revealed the basket of currencies used to determine the value
of the yuan: US dollar, euro, Japanese yen and Korean won. To a lesser extent, the Singapore dollar, pound
sterling, Malaysian rinngit, Russian ruble, Australian dollar, Thai baht and Canadian dollar are also reflected
in the calculation. These currencies were chosen on the basis of their share of China’s foreign trade, foreign
debt and foreign direct investment.

Asia-Pacific Trade and Investment Review Vol. 1, No. 2, November 2005
94
massive inflows of foreign direct investment, a large current account surplus and the large
accumulation of foreign exchange reserves in recent years.
China had resisted ending the peg partly out of concern that its export goods
would become less competitive, which would cost the country jobs and curtail the growth
of its export-fueled economy. Indeed, Deutsche Bank estimates that a 5 per cent
appreciation of the yuan would slice 5-10 per cent off the profits of China-based textile and
electronics exporters, since they have narrow margins and little room to adjust prices. The
pinch will also be felt by the many foreign companies producing products in mainland
China for the export market. However, the net effect on some industrial sectors will be
positive. Automakers based in China, for example, rely heavily on parts made abroad; the
stronger yuan will effectively lower their costs by reducing their outlay for auto parts and
other imported components and intermediate goods.
An overview of the internationalexchange rate system
The current exchange rate regime of the world can be broadly classified into two
groups of exchange rate systems: the floating exchange rate system and the pegged
exchange rate system. Depending on the degree of flexibility, the floating exchange rate
system could be classified further into the independent floating system, for example the US
dollar, pound sterling and Japanese yen, group floating system, for example the euro, and
managed floating system. When the Bretton Woods system of the fixed exchange rate
system was abandoned in 1973 for a flexible exchange rate system, short-term speculative
capital movements across national borders dominated the exchange-rate movement under
the independent floating or the fully flexible exchange rate arrangement, which is well
explained by the asset-market (or the portfolio balance) approach to exchange rate
determination (Allen and Kenen, 1983).
International exchange rate system
Floating exchange rate system
Pegged exchange rate system
Group floating
Managed floating
Independent floating
Pegged to single currency
Pegged to basket currency

Asia-Pacific Trade and Investment Review Vol. 1, No. 2, November 2005
95
The pegged exchange rate system, on the other hand, can be broadly classified into
two fixed exchange rate management types: the single and basket currency pegging
arrangements. The recent Chinese revaluation is an important signal and has implications
for the world currency regime in the sense that this might be the beginning of the end of
what has been dubbed a revived Bretton Woods system of fixed exchange rates between the
Chinese yuan and the US dollar. In the case of the Chinese yuan, it was pegged to the
US dollar at 8.28 yuan per US dollar for more than 10 years until 20 July 2005, when the
yuan’s initial central rate was shifted by 2.1 per cent to 8.11 yuan per US dollar. The
Chinese authorities call it a move towards a “managed floating rate regime”, which may
well imply more management, for the time being, than the independent or free floating
system.
Most countries of the world adopt some variation of the managed flexible
exchange rate system, pegged to some basket of currencies.
Economic effects of exchange rate changes
The exchange rate – a key price in the open economy – affects the cost of imported
goods and the profitability of export industries, influencing the rate of inflation, output and
employment. Open developing economies’ policymakers are concerned with the effects of
exchange rate changes on domestic inflation, export price competitiveness of the tradable
sector and external adjustment.
The issues surrounding the current account and inflationary effects of exchange
rate changes are still debated in the theoretical, empirical and policy-related literature. It
also depends on the extent to which nominal exchange rate changes are reflected in prices
of exports and imports known as the pass-through effect of nominal exchange rate changes
(Mann, 1986; Park, 1997) and the terms of trade effect with time lag, known as the J-curve
effect.
Although the size of the recent revaluation of the Chinese yuan is small (2.1 per
cent), the economic effects of nominal exchange rate changes can be generalized.2 In
general, a stronger yuan makes exports less price competitive for Chinese firms, and makes
imports cheaper when denominated in domestic currency. This decreases export growth
and increases import growth. However, the size of these “expenditure switching” effects is
relatively modest in China, limiting the impact of the revaluation on the external current
account. A key reason is that the import content of exports remains high, despite the rapid
broadening of domestic supply chains. Moreover, investment goods, raw materials, and
intermediate goods rather than consumption goods, make up the bulk of imports in China.
2 The inflation or price level-adjusted exchange rate known as the real exchange rate movements, may be
a more important indicator for competitiveness of the export sector. See, for example, Edwards, 1989.
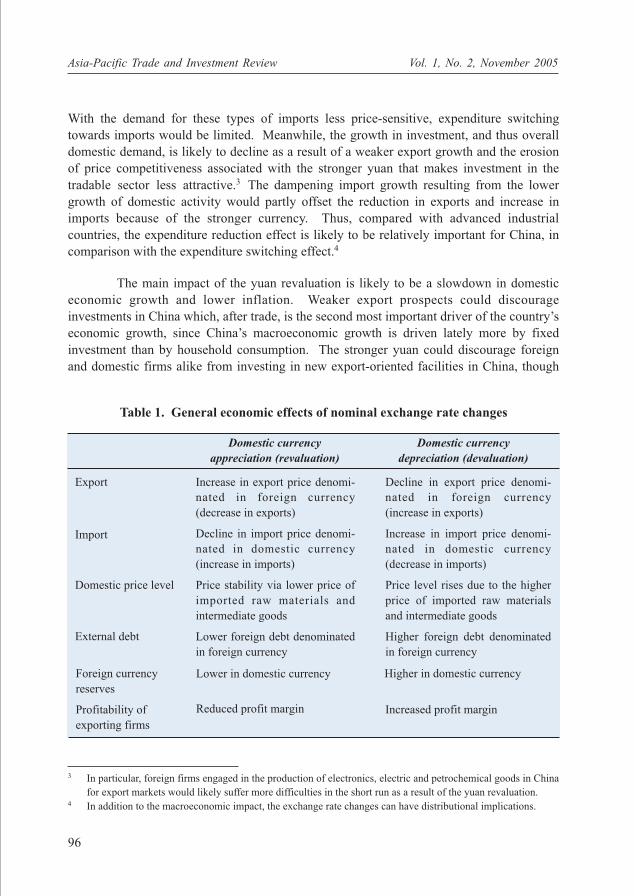
Asia-Pacific Trade and Investment Review Vol. 1, No. 2, November 2005
96
With the demand for these types of imports less price-sensitive, expenditure switching
towards imports would be limited. Meanwhile, the growth in investment, and thus overall
domestic demand, is likely to decline as a result of a weaker export growth and the erosion
of price competitiveness associated with the stronger yuan that makes investment in the
tradable sector less attractive.3 The dampening import growth resulting from the lower
growth of domestic activity would partly offset the reduction in exports and increase in
imports because of the stronger currency. Thus, compared with advanced industrial
countries, the expenditure reduction effect is likely to be relatively important for China, in
comparison with the expenditure switching effect.4
The main impact of the yuan revaluation is likely to be a slowdown in domestic
economic growth and lower inflation. Weaker export prospects could discourage
investments in China which, after trade, is the second most important driver of the country’s
economic growth, since China’s macroeconomic growth is driven lately more by fixed
investment than by household consumption. The stronger yuan could discourage foreign
and domestic firms alike from investing in new export-oriented facilities in China, though
3 In particular, foreign firms engaged in the production of electronics, electric and petrochemical goods in China
for export markets would likely suffer more difficulties in the short run as a result of the yuan revaluation.4 In addition to the macroeconomic impact, the exchange rate changes can have distributional implications.
Table 1. General economic effects of nominal exchange rate changes
Domestic currency Domestic currency
appreciation (revaluation) depreciation (devaluation)
Export Increase in export price denomi-
nated in foreign currency
(decrease in exports)
Decline in import price denomi-
nated in domestic currency
(increase in imports)
Price stability via lower price of
imported raw materials and
intermediate goods
Lower foreign debt denominated
in foreign currency
Decline in export price denomi-
nated in foreign currency
(increase in exports)
Increase in import price denomi-
nated in domestic currency
(decrease in imports)
Price level rises due to the higher
price of imported raw materials
and intermediate goods
Higher foreign debt denominated
in foreign currency
Import
Domestic price level
External debt
Foreign currency
reserves
Profitability of
exporting firms
Lower in domestic currency Higher in domestic currency
Increased profit marginReduced profit margin
Asia-Pacific Trade and Investment Review Vol. 1, No. 2, November 2005
97
foreigners might increase their investments aimed at serving the Chinese (domestic) market.
The stronger yuan also encourages more outward investments from China by making it
cheaper for Chinese firms to purchase foreign companies, real estate or other assets.
All in all, the eventual economic effects of the revaluation will depend on how far
and how fast the yuan moves from now on.
Salient implications of China’s move towardsa flexible exchange rate policy
While many countries in the region have long intervened in the currency markets
to keep their currencies undervalued and spur exports, China’s move towards a more
flexible exchange rate system also gives it leeway to step back from that practice.
Immediately following Beijing’s announcement, Malaysia ended its seven-year-old peg of
the ringgit to the dollar, which was imposed during Asia’s financial crisis to help stabilize
the faltering economy.
In the short run, China’s revaluation of the yuan could provide the rest of Asia
with a little breathing space for currency management policy. In order for their industries to
remain competitive with China’s, central bankers throughout the region have been trying to
keep their currencies from appreciating against the dollar, an increasingly difficult challenge
as their economies strengthened. Gradual revaluation of the yuan, while buying time for
continued internal reform and gradual liberalization of the capital account of the Chinese
economy, will also ease the adjustments of the exchange rates of the countries in Asia.
Those who lived through the 1997 Asian financial crisis know that there are very real risks
to premature liberalization of the capital account.
Another vital implication for future macroeconomic policy for China is that
coordination between the monetary and the exchange rate policy would be more feasible as
China’s exchange rate system is gradually moving toward a managed flexible exchange rate
system. This greater flexibility will give the country more room to use monetary policy to
steer the domestic economy by adjusting domestic interest rates and money supply.
If the real GDP continues to grow in excess of 9 per cent on an annual basis,
China’s exchange rate policymakers will probably use the currency revaluation as a tool to
slow exports as the cushion to engineer a soft landing. By moving to managed floating
with pegging to a basket of foreign currencies of the major trading partners, China will need
to diversify its enormous portfolio of foreign exchange reserves, which totalled some
US$ 660 billion by the end of the first quarter of 2005 (see table 2). The demand for the
US dollar will be lessened as a result of the shift in China’s exchange rate policy as it
diversifies away from the dollar towards other basket of currencies of its major trading
partners.
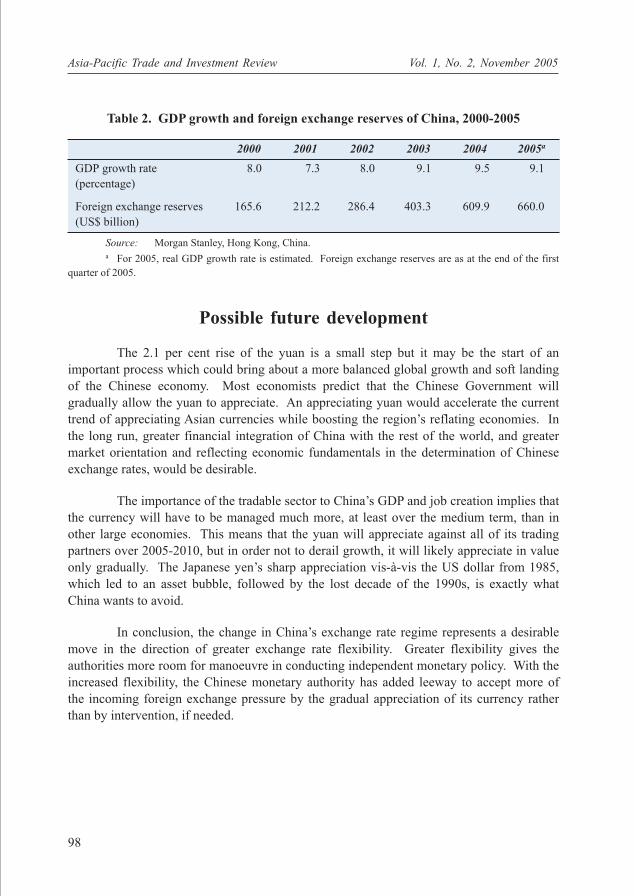
Asia-Pacific Trade and Investment Review Vol. 1, No. 2, November 2005
98
Possible future development
The 2.1 per cent rise of the yuan is a small step but it may be the start of an
important process which could bring about a more balanced global growth and soft landing
of the Chinese economy. Most economists predict that the Chinese Government will
gradually allow the yuan to appreciate. An appreciating yuan would accelerate the current
trend of appreciating Asian currencies while boosting the region’s reflating economies. In
the long run, greater financial integration of China with the rest of the world, and greater
market orientation and reflecting economic fundamentals in the determination of Chinese
exchange rates, would be desirable.
The importance of the tradable sector to China’s GDP and job creation implies that
the currency will have to be managed much more, at least over the medium term, than in
other large economies. This means that the yuan will appreciate against all of its trading
partners over 2005-2010, but in order not to derail growth, it will likely appreciate in value
only gradually. The Japanese yen’s sharp appreciation vis-à-vis the US dollar from 1985,
which led to an asset bubble, followed by the lost decade of the 1990s, is exactly what
China wants to avoid.
In conclusion, the change in China’s exchange rate regime represents a desirable
move in the direction of greater exchange rate flexibility. Greater flexibility gives the
authorities more room for manoeuvre in conducting independent monetary policy. With the
increased flexibility, the Chinese monetary authority has added leeway to accept more of
the incoming foreign exchange pressure by the gradual appreciation of its currency rather
than by intervention, if needed.
Table 2. GDP growth and foreign exchange reserves of China, 2000-2005
2000 2001 2002 2003 2004 2005a
GDP growth rate 8.0 7.3 8.0 9.1 9.5 9.1
(percentage)
Foreign exchange reserves 165.6 212.2 286.4 403.3 609.9 660.0
(US$ billion)
Source: Morgan Stanley, Hong Kong, China.a For 2005, real GDP growth rate is estimated. Foreign exchange reserves are as at the end of the first
quarter of 2005.
Asia-Pacific Trade and Investment Review Vol. 1, No. 2, November 2005
99
REFERENCES
Allen, P.R. and P. Kenen, 1983. Asset Markets and Exchange Rates: Modeling an Open
Economy (London and New York, Cambridge University Press).
Edwards, S., 1989. Real Exchange Rates, Devaluation and Adjustment: Exchange Rate
Policy in Developing Countries (Cambridge, MA, MIT Press).
Mann, C., 1986. “Prices, profit margins, and exchange rates,” Federal Reserve Bulletin,
pp. 366-379, June.
Morgan Stanley, Hong Kong, China.
Park, Jin Keun, 1997. Exchange Rate Economics (Seoul, Bakyoung Press).
People’s Bank of China, http://www.pbc.gov.cn/english
The Economist, 23 July 2005 issue, pp. 67-68.

Asia-Pacific Trade and Investment Review Vol. 1, No. 2, November 2005
101
Introduction
S ervices constitute a large and growing share of economic activity in
developing countries. This is especially the case in middle- and upper-income
developing countries where the service sector makes up about 60 per cent of GDP on
average. Concomitantly, many developing countries have also developed substantial
comparative advantages in various service activities. In addition to its direct contribution to
output, employment and export revenue, the service sector plays an integral role in terms of
its links to the other parts of the economy. Indeed, an efficient service sector helps boost
a country’s manufacturing and overall global economic competitiveness. It is in this
context that the liberalization of services trade under the multilateral framework of the
General Agreement on Trade in Services (GATS) assumes importance, particularly in the
ongoing Doha Round.
Among the four modes of supplying cross-border services, there appears to have
been least forward movement in the multilateral liberalization of Mode 4 or Movement of
Natural Persons (MNP). While negotiations on this mode began as far back as the
Uruguay Round of 1986-1993, its liberalization commitments under the GATS have
not been forthcoming. This is despite the fact that studies have indicated that the
liberalization of Mode 4 could generate welfare gains to developing countries ranging from
US$ 150-300 billion per annum directly, in addition to complementing service liberalization
in other modes, for example commercial presence (Mode 3) (Winters, 2001 and 2003).
Liberalization of Market Access inGATS Mode 4 and Its Importancefor Developing Countries*
* This paper was prepared by Rahul Sen, Fellow, Institute of Southeast Asian Studies, Singapore, and
Ramkishen S. Rajan, Visiting Associate Professor, Lee Kuan Yew School of Public Policy, National University
of Singapore.
Asia-Pacific Trade and Investment Review Vol. 1, No. 2, November 2005
102
Mode 4 trade liberalization and expected gainsfor developing countries
As defined in GATS article 1.2 (d), Mode 4 refers to the “supply of a service .. by
a service supplier of one Member, through presence of natural persons of a Member in the
territory of any other Member”. This presence is deemed to be temporary, although no time
frame is specified. The maximum length of stay permitted under this mode has often varied
across different categories of professionals, with business visitors being allowed to stay for
up to 90 days and intra-corporate transferees between two to five years. However, members
have the right to regulate the entry and stay of persons in their territory regardless of their
GATS obligations. To date only five developed members of the World Trade Organization
(WTO), Australia, Canada, the European Union (EU), Norway and Switzerland, and only
one developing member country (India) have improved upon their Uruguay Round
commitments. These improvements on their GATS obligations have entailed partial
liberalization with respect to entry for additional categories of foreign service suppliers and
extension of their duration of stay in the country, with specific commitments being largely
directed more towards promoting MNP that is related to commercial presence (Mode 3)
(Carzaniga, 2003).
Data on Mode 4 is usually measured from the balance-of-payment (BOP) statistics
in the following three categories: (a) “labour income”, that is, wages, salaries and other
compensation received by individuals working abroad for less than one year; (b) “worker
remittances”, that is, transfers from workers who stay abroad for a year or longer; and
(c) “migrants’ transfers”, that is, flows of goods and changes in financial assets associated
with international migration. Based on available statistics on these three categories only,
recent WTO estimates have found Mode 4 to have accounted for just over 1 per cent of
world services trade (WTO, 2002). However, it is important to keep in mind that BOP
statistics offer only a partial picture of the total value of Mode 4 trade, and hence the above
estimates are likely to underestimate the actual value of trade involved.
It is difficult to gauge the economic impact of Mode 4 trade because it not only
relates to international trade in services, but also to issues of migration. In general, since
developed countries increasingly face problems of skilled-labour shortages and an ageing
labour force, they constitute the countries generating demand for Mode 4 trade, and it is the
developing countries, with their large pools of competitive manpower, that generate supply.
In a widely quoted study, Alan Winters (2003) notes:
“In the case of Mode 4 trade, potentially large returns would be feasible
if medium and less skilled workers, which are relatively abundant in
developing countries, were allowed to move and provide their services in
developed countries. The review of existing empirical studies of factor

Asia-Pacific Trade and Investment Review Vol. 1, No. 2, November 2005
103
mobility and the new estimates agree that there are huge returns to even
relatively small movements of labour. An increase in developed
countries’ quotas on the inward movements of both skilled and unskilled
temporary workers equivalent to 3 per cent of their workforces would
generate an estimated increase in world welfare of over US$ 150 billion
p.a.” (p. 59).
Indeed, there is a large and growing body of case studies that support the notion
that Mode 4 trade can positively contribute to growth and development in developing
countries. One of the prime examples in the developing country context is the state of
Kerala in India. A large number of Kerala natives moved to the Middle East to work in
service industries, such as oil rigging and construction. Cash remittances have constituted
almost 10 per cent of the domestic product in Kerala. The repatriation of worker
remittances helped to partly finance the construction of the international airport in the
state’s capital city, Cochin, through a private-public partnership. Remittances from foreign
workers have played similarly positive roles in other developing countries in the Asian and
Pacific region, such as Sri Lanka, the Philippines and Bangladesh. These remittances now
constitute the second largest, and most stable, component of capital inflows after foreign
direct investment, which indicates their potential for stimulating long-run economic
development (Rajan, 2005). It also highlights that Mode 4 trade could be a useful tool for
poverty reduction in developing countries, with remittances playing a particularly key role.
Another well-known case in which a developing country has benefited from
Mode 4 trade liberalization is India in the information and communication technology
service sector, which has been fuelled by the increasing demand for on-site services such as
custom applications, software development and maintenance work. The main destination
for such services exports is the United States of America, where services are delivered
primarily to the insurance, banking, energy and telecommunications industries. On-site
services provided by Indian programmers, coders, systems analysts and maintenance
personnel, which involve the temporary movement of Indian IT professionals mainly to the
United States, accounted for as much as 50 per cent of export revenue in the IT sector.
Increasingly, there appears to be a virtuous cycle in motion. Well-educated
Indians are returning to their home country after having developed the contacts and
management know-how and amassed some amount of financial resources, which they use
to establish their own businesses in India. Those who do not become entrepreneurs have
been instrumental in stimulating multinational corporations to establish or intensify
business operations in India. Thus Mode 4 trade has helped to sell India as an attractive
destination for trade and investment by foreign investors and an attractive destination to
outsource services, which in turn has generated demand for Mode 4 trade itself. Other
developing countries in the region, such as China, Malaysia and Singapore, have shared
broadly similar experiences.
Asia-Pacific Trade and Investment Review Vol. 1, No. 2, November 2005
104
Bilateralism as an emerging vehicle forliberalizing Mode 4 trade
Given that the multilateral liberalization of Mode 4 has moved forward rather
slowly, many WTO members are increasingly using bilateral trade agreements (BTAs) as an
instrument to achieve a greater degree of liberalization. While there are certain Preferential
Trade Agreements (PTAs) that involve the full mobility of labour, for example EU and the
European Free Trade Association (EFTA), there are others that provide restricted market
access for temporary service providers. While some of these PTAs follow the GATS model,
many include some additional provisions (Neilson, 2003).
Although the bilateral liberalization of Mode 4 has been a common feature in
BTAs involving EU and the United States, it has figured only recently in BTAs in the Asian
and Pacific region. Singapore has been the most proactive in this regard, though other
neighbouring countries are also beginning to negotiate Mode 4 trade bilaterally. For
instance, ongoing negotiations for a Philippines-Japan agreement are expected to partially
liberalize requirements for the entry of a limited number of Filipino nurses into Japan.
As for Singapore, almost all of its free trade agreements, for example with Japan,
New Zealand, Australia, the United States and India, include provisions relating to the freer
movement of natural persons. Singapore’s enforced BTAs have applied provisions for the
temporary entry of professionals for business visitors, investors and intra-corporate
transferees, in which the time period for their stay in the partner countries has been
extended, depending upon the activity they intend to undertake and their hierarchy in the
organization. The basic aim is to enhance business interactions, economic cooperation and
people-to-people contacts that go beyond those committed to multilaterally.
However, it is important to keep in mind that the specifics of the agreements
negotiated by Singapore are quite diverse in terms of their scope, coverage and commitments
for liberalizing Mode 4 trade across sectors. For instance, the United States-Singapore Free
Trade Agreement (USSFTA), the Japan-Singapore Economic Partnership Agreement
(JSEPA) and the India-Singapore Comprehensive Economic Cooperation Agreement
(CECA) each devote separate chapters to the issue with more detailed offers, while the
EFTA-Singapore Free Trade Agreement (ESFTA) and the Singapore-New Zealand Free
Trade Agreement have included separate articles with much less specificity (Sen, 2005). In
most cases, cross-border skilled labour flows between partner countries have been
exempted from labour certification or economic needs test while entering the domestic
market for providing services either directly or through commercial presence (Mode 3).
However, they are still subject to the terms, conditions, reservations or limitations
scheduled by both countries for each service under their list of specific commitments. The
typical duration of stay allowed for business visitors and investors in most of these bilateral
free trade agreements (FTAs) is about 3 months, while that for intra-corporate transferees of

Asia-Pacific Trade and Investment Review Vol. 1, No. 2, November 2005
105
partner countries have ranged from 1 year to 3-4 years. The eligibility criteria are carefully
defined to be restricted to citizens and permanent residents of BTA partners who represent
a service supplier, and in certain cases, as in the USSFTA, temporary entry is subject to
numerical restrictions on cross-border labour flows (MTI, 2005).
In spite of the measures taken by developed and developing countries towards the
partial liberalization of Mode 4 bilaterally, several important barriers remain to be
dismantled. These relate mainly to the issuance of visas and work permits for Mode 4 trade
and that of mutual recognition of qualifications and differential treatment of foreign and
local workers with respect to tax and social security benefits. Thus, while some countries
such as India have proposed a separate GATS visa for the temporary entry of professionals
under Mode 4, this has not been taken up seriously at either the multilateral or the bilateral
level (Chanda, 1999). Further, many of the BTAs that have made partial commitments
under Mode 4 have fallen short of negotiating a mutual recognition agreement (MRA) for
recognition of qualifications to allow skilled professionals to take up employment.
One recent case in point is the India-Singapore CECA. Under this Agreement,
both countries have agreed to liberal norms for the temporary entry of the four categories of
business persons – business visitors, short-term service suppliers, professionals and
intra-corporate transferees – to provide services for a period ranging from two months
(for business visitors) to as long as eight years (for intra-corporate transferees). However,
while professionals from 127 subsectors of occupations are granted temporary entry, they
will be allowed to practise only in five professions, auditing, architecture, medical doctors,
dental and nursing, subject to the successful negotiation of an MRA between the two
countries during 2005-2006.1
All in all, bilateral trade agreements, which undertake partial steps towards
liberalization of Mode 4 trade, could provide important lessons for negotiations at the
multilateral level.
Concluding remarks
Significant data caveats notwithstanding, it is evident that liberalizing Mode 4
trade will lead to substantial gains for both developed and developing countries by taking
advantage of factor cost differences, as in the case of merchandise trade. Recently
proliferating regional and bilateral initiatives have indicated the willingness from both
developing and developed countries to partially liberalize Mode 4 trade. However, these
are at best second and third best options, with considerable gains to be reaped from
multilateral liberalization.
1 Chapter 9 of the Comprehensive Economic Cooperation Agreement (CECA) between India and Singapore
negotiates Mode 4 separately on a bilateral basis. See MTI (2005) for details.
Asia-Pacific Trade and Investment Review Vol. 1, No. 2, November 2005
106
For advancement of multilateral liberalization, substantial improvements in the
existing institutional and regulatory framework for negotiations to facilitate Mode 4 trade
under GATS are needed, in order to improve market access under this mode for developing
countries. Approaches for extending most favoured nation treatment for natural persons
that are currently covered under bilateral agreements should be considered. Genuine steps
at the multilateral level to ensure that domestic regulation does not undermine market
liberalization achieved for MNP should also be taken. Ongoing negotiations should achieve
transparency in detailing the qualification requirements and procedures for obtaining
recognition of qualifications. Further, there is also an urgent need to notify and review
labour regimes in a dedicated committee under the Council for Trade in Services, as
proposed by UNCTAD (2003).
Given that developed countries are concerned that temporary migration might
become permanent, it is highly likely that the model chosen for eventual negotiation at the
multilateral level will be a mix of partial labour mobility and a limited degree of market
access, especially in those sectors faced with acute labour shortages. Conversely,
developing countries are likely to move forward in other areas of the multilateral
negotiations only if there is significant forward movement in commitments by the
developed countries on Mode 4 in GATS.
Asia-Pacific Trade and Investment Review Vol. 1, No. 2, November 2005
107
REFERENCES
Carzaniga, Antonia, 2003. “The GATS, Mode 4 and Pattern of Commitments” in Aditya
Mattoo and Antonia Carzaniga (eds.), Moving People to Deliver Services
(Washington, D.C., The World Bank and Oxford University Press), pp. 21-26.
Chanda, Rupa, 1999. Movement of Natural Persons and Trade in Services: Liberalizing
Temporary Movement of Labour under the GATS, Indian Council for Research
on International Economic Relations, India (accessible at the following address:
<http://www.icrier.org>).
Ministry of Trade and Industry (MTI), 2005. Legal Text of the US-Singapore FTA and the
India-Singapore CECA, available at <http://www.fta.gov.sg>, (Singapore).
Nielson, Julia, 2003. “Labour mobility in regional trading agreements” in Aditya Mattoo
and Antonia Carzaniga (eds.), Moving People to Deliver Services (Washington, D.C.,
The World Bank and Oxford University Press), pp. 93-112.
Rajan, R., 2005. “Financing development in the Asian and Pacific region: trends and
linkages”, The Role of Trade and Investment Policies in the Implementation of
the Monterrey Consensus: Regional Perspectives, ESCAP Studies in Trade
and Investment No. 55, ST/ESCAP/2363, United Nations publication, sales
No. E.05.II.F.15 (New York, United Nations), pp. 21-74.
Sen, Rahul, 2005. “New regionalism in Asia: a comparative analysis of regional trading
agreements (RTAs) involving ASEAN, China and India”, paper presented at the
CESIfo Venice Summer Institute 2005 Workshop on Global Economic Negotiations,
Venice International University, San Servolo, Venice, Italy, 20-21 July.
UNCTAD, 2003. Increasing the Participation of Developing Countries through
Liberalization of Market Access in GATS Mode 4 for Movement of Natural Persons
Supplying Services, note by the UNCTAD Secretariat, TD/B/COM.1/EM.22/2,
(Geneva), 18 June 2003.
Winters, L. Alan, 2001. “Assessing the efficiency gain from further liberalization:
a comment”, in P. Sauvé and A. Subramaniam (eds.), Efficiency, Equity and
Legitimacy: The Multilateral Trading System and the Millennium (Chicago
University Press).
, 2003. “The economic implications of liberalizing Mode 4 trade”, in Aditya Mattoo
and Antonia Carzaniga (eds.), Moving People to Deliver Services (Washington, D.C.,
The World Bank and Oxford University Press), pp. 59-92.
WTO, 2002. GATS, Mode 4 and the Pattern of Commitments: Background Information,
presented by the WTO Secretariat, Joint WTO-World Bank Symposium on
Movement of Natural Persons (Mode 4) under the GATS, WTO, Geneva,
11-12 April 2002.
Asia-Pacific Trade and Investment Review Vol. 1, No. 2, November 2005
109
Executive Summaries of RecentStudies in Trade and Investment
Published by the Secretariat
Asia-Pacific Trade and Investment Review Vol. 1, No. 2, November 2005
111
Development, and in particular poverty reduction, is a complex process that
requires substantial amounts of financial resources. The Monterrey Consensus
adopted at the International Conference on Financing for Development in Monterrey,
Mexico, on 22 March 2002, constitutes a landmark plan of action to mobilize financial
resources for development. In addition to official development assistance (ODA), the
Monterrey Consensus clearly identifies trade and investment as major engines of growth
and in achieving the internationally agreed development goals, including those contained in
the United Nations Millennium Declaration. While ODA flows have increased in recent
years after many years of decline, it is generally accepted that private financial flows are
potentially more useful as long-term sources of finance and are sustainable as development
gains momentum. Private flows are attracted to growth economies while growth economies
need private flows to keep growing. ODA by itself would never be sufficient to meet the
financing needs of growing economies. Thus, trade, through export earnings, and foreign
direct investment (FDI) are the two principal external private financial flows that have
made an enormous contribution to the successful development of many countries in Asia
and the Pacific. However, many other less and least developed countries have yet to benefit
from trade and investment.
In the ESCAP series on Studies in Trade and Investment, No. 55 entitled The Role
of Trade and Investment Policies in the Implementation of the Monterrey Consensus:
Regional Perspectives (ST/ESCAP/2363, United Nations publication, sales No. E.05.II.F.15)
examines more closely the mechanisms through which trade and investment raise financial
resources for development and identifies the need for trade-related ODA. Chapter I of the
study notes that trade and investment have indeed played a fundamental role in the
development process and are currently crucial determinants of the rapid economic growth
of countries such as India and China. The study also identifies the success criteria for
successful trade and investment and concludes that both effective market access and
domestic supply-side capacities are needed. With regard to market access, the multilateral
trading system offers the best prospects as it is non-discriminatory, transparent, universal
The Role of Trade and InvestmentPolicies in the Implementationof the Monterrey Consensus:Regional Perspectives

Asia-Pacific Trade and Investment Review Vol. 1, No. 2, November 2005
112
and predictable. However, the slow process in the current Doha Round of multilateral trade
negotiations has prompted many countries of the region to pursue bilateral and regional
trade agreements that are potentially and often actually discriminatory and undermine the
multilateral trading system. The study explores to what extent regional cooperation and
integration in trade, investment and finance can be enhanced and consolidated.
In the second chapter, Ramkishen S. Rajan, further explores the trends and
linkages in financing development in the Asian and Pacific region in more detail. He notes,
inter alia, that workers’ remittances are an increasingly important source of external finance
and are a function of trade in services. This chapter emphasizes the importance of FDI and
outlines the nexus between FDI and other various sources of external financing and also
explores modalities for regional cooperation in mobilizing external finance, for instance
through the creation of regional bond markets. Comments are provided by Gloria Pasadilla
and Douglas Brooks.
In Chapter III, Bisweswar Bhattacharyya discusses modalities for improving
market access under the Doha Development Agenda and regional trade agreements as
a major source of financing for development in Asia and the Pacific. He notes the
importance of exports for the development process and the need for multilateral trade
liberalization. In addition, he identifies continuing obstacles to universal free and fair trade,
in particular in agriculture, but also in industrial goods and other areas.
In Chapter IV, Pierre Sauvé discusses the special problems of financing for
development in the Asian and Pacific least developed countries. He notes that the least
developed countries face problems in increasing and diversifying their exports. Some have
been very successful in the export of textiles and garments but may face difficulties in the
aftermath of the phase-out of the Multifibre Arrangement. Many also rely on agricultural
exports, which face import barriers in their traditional export markets, while others are
net-food importing countries that may face adverse effects from multilateral trade
liberalization in agriculture. Many benefit from Generalized System of Preferences
schemes to some extent but the utilization of such schemes is sometimes lacking while
preferential rates are eroded by most favoured nation (MFN) tariff reductions. He
concludes by making suggestions for improving financing for development of the least
developed countries. His paper is commented on by Bhuban B. Bajracharya and Mustafizur
Rahman.
The final chapter by William E. James explores and analyses the prospects for
clothing and textile exports of Asian and Pacific economies in the post-quota era and the
implications for external financing for development in more detail.
The publication and related materials are available online at:
http://www.unescap.org/publications/detail.asp?id=1084

Asia-Pacific Trade and Investment Review Vol. 1, No. 2, November 2005
113
GUIDELINES FOR AUTHORS
Articles should present issues and findings in an analytical but yet non-technical
manner. The Review emphasizes policy relevance and operational aspects of trade and
investment, rather than theoretical and methodological issues.
Articles submitted to the journal should be original contributions and not be under
consideration by any other publication. Articles will be subject to refereeing, and efforts
will be made to send reviewers’ comments to authors within four weeks of submission.
Articles should be submitted in English. Each article should be between 4,000
and 7,000 words in length and should be accompanied by an executive summary of 400 to
450 words. Articles are expected to be clear, concise and easy to follow. The use of
headings and subheadings is encouraged to provide the paper with structure.
Manuscripts must be typed double-spaced according to the following format:
1. The first page should contain the title of the article, author’s name and
affiliation, complete mailing and e-mail addresses, and a suggested header
(abbreviated from of the title). The author’s name and affiliation should not
appear in subsequent pages.
2. The second page should contain an executive summary of 400-450 words and
a list of key words.
3. References, tables and figures should be placed on separate pages at the end
of the manuscript and should be properly numbered. Indicate in the text
where you would prefer to have each table and figure inserted.
4. Figures should be provided in camera-ready format.
5. References in the text should follow the last name of the author-date format
(e.g., Johnson, 2004). References in the reference list at the end of the paper
should be typed according to the following formats:
Anderson, K. and R. Garnaut, 1987. Australian Protectionism: Extent,
Causes and Effects (Sydney: Allen and Unwin).
Loungani, P., 2001. “How beneficial is foreign direct investment for
developing countries?”, Finance and Development, vol. 38, No. 2., pp. 1-21.
Balwin, R.E. 1971. “Determinants of the commodity structure of U.S. trade”,
The American Economic Review, vol. 61, pp. 126-146.
Lall, Sanjaya, 1997. Attracting Foreign Investment: New Trends, Sources and
Policies, Economic Paper No. 31 (Commonwealth Secretariat).
Asia-Pacific Trade and Investment Review Vol. 1, No. 2, November 2005
114
Bosworth, B.P. and S.M. Collins, 1999. “Capital flows to developing
economies: Implications for saving and investment”, Brookings Papers on
Economic Activity, Spring.
Krugman, P., 2002. “Fire-Sale FDI”, Massachusetts Institute of Technology,
http://web.mitedu/krugman/www/firesale.htm, 5 September.
6. References in footnotes should follow the author-date format (e.g., Johnson,
2004), with full references included in the reference list at the end of
the paper as in point 5 above. The reference list should be entitled
“REFERENCES”.
Electronic submissions are preferred and should be sent as an e-mail attachment in
MS Word format to: [email protected]. Alternatively, articles can be sent by post, in
duplicate, together with a soft copy [diskette or CD] to:
Managing Editor
Asia-Pacific Trade and Investment Review
Trade and Investment Division
ESCAP
United Nations Building
Rajadamnern Nok Avenue
Bangkok 10200
Thailand

Asia-Pacific Trade and Investment Review Vol. 1, No. 2, November 2005
115
READERSHIP SURVEY
Asia-Pacific Trade and Investment ReviewVol. 1, No. 2, November 2005
The Trade and Investment Division of ESCAP is undertaking an evaluation of the
above publication with a view to improving its quality and usefulness. We would appreciate
it if you could complete this questionnaire and return it to us, at the address printed below.
QUESTIONNAIRE
Rating for quality and usefulnessExcellent Very good Good Poor
(please circle)
1. How useful is this publication for your work?
� Provision of information 4 3 2 1
� Clarification of issues 4 3 2 1
� Findings 4 3 2 1
� Policy suggestions 4 3 2 1
� Overall usefulness 4 3 2 1
2. Please indicate your assessment of the quality of this publication with respect to:
� Presentation/format 4 3 2 1
� Readability 4 3 2 1
� Coverage of subject matter 4 3 2 1
� Timeliness 4 3 2 1
� Overall quality 4 3 2 1
3. Suggestions for improvement of the publication:
...................................................................................................................................................
...................................................................................................................................................
...................................................................................................................................................
...................................................................................................................................................
4. Your background information, please:
Name: .......................................................................................................................................
Title/position: ...........................................................................................................................
Institution: ................................................................................................................................
Office address: ..........................................................................................................................
Tel: .................................................................... Fax: ............................................................
E-mail: ......................................................................................................................................
Asia-Pacific Trade and Investment Review Vol. 1, No. 2, November 2005
116
Please return this questionnaire to:
Chief Editor
Asia-Pacific Trade and Investment Review
Trade and Investment Division
ESCAP
United Nations Building
Rajadamnern Nok Avenue
Bangkok 10200
THAILAND
Fax: (66 2) 288-1026, 288-1027
Thank you for your cooperation.
Asia-Pacific Trade and Investment Review Vol. 1, No. 2, November 2005
118
United NationsE S C A P
ASIA-PACIFIC TRADE AND INVESTMENT REVIEW
Call for Papers
The Asia-Pacific Trade and Investment Review, a refereed journal launched by theUnited Nations Economic and Social Commission for Asia and the Pacific(ESCAP) in 2004, is seeking submissions for its April 2006 issue Vol. 2, No. 1.
Articles should have clear trade and investment policy relevance and should be
pertinent to the Asia-Pacific region (including Central Asia). The submission of
articles on national best practices with the potential for replication in other countries,
or articles presenting regional comparative analyses and their implications are
particularly welcome.
We are looking for articles featuring new, innovative or insightful information with
clear trade and investment policy relevance. Areas of interest include:
For details, please visit:
www.unescap.org/tid/aptir.asp
� Trade and/or investment facilitation and
promotion
� Doha Development Agenda: post Cancun
issues
� Regional vs. multilateral trade agreements
� Best practices on building supply-side
capacity for trade
� Trade and ICT, including e-trade and
e-commerce issues and best practices
� Regional mechanisms for financing trade
and investment
� Trade and the Millennium Development
Goals
� Social and environmental aspects of trade
and investment
� SME development and participation in
international trade
� Export competitiveness
Articles submitted to the Review should be original contributions and should not be
under consideration by any other publications. Articles will be subject to refereeing,
but efforts will be made to send reviewers’ comments to authors within four weeks of
submission. Articles should be submitted in English. Each article should be between
4,000 and 7,000 words in length and accompanied by an executive summary of 400 to
450 words.
Electronic submissions are preferred and should be sent as an e-mail attachment in
MS Word format to: [email protected]. Alternatively, articles can be sent by post,
in duplicate, together with a soft copy on a diskette or CD-ROM to: Managing Editor,
Asia-Pacific Trade and Investment Review, Trade and Investment Division, ESCAP,
United Nations Building, Rajadamnern Nok Avenue, Bangkok 10200 Thailand.
Printed in Bangkok United Nations publication
November 2005 – 840 Sales No. E.05.II.F.33
Copyright United Nations 2005
ISBN: 92-1-120446-1
ISSN: 1815-8897
ST/ESCAP/2383
UNESCAP works towards reducing povertyand managing globalization
United NationsE S C A P
United NationsEconomic and Social Commission for Asia and the PacificTrade and Investment DivisionUnited Nations BuildingRajadamnern Nok AvenueBangkok 10200 ThailandFax: (662) 288-1026E-mail: [email protected]