ThemeStudyOnInequality.pdf - United Nations ESCAP
124
-
Upload
khangminh22 -
Category
Documents
-
view
0 -
download
0
Transcript of ThemeStudyOnInequality.pdf - United Nations ESCAP

The shaded areas of the map indicate ESCAP members and associate members.
* The designations employed and the presentation of material on this map do not imply the expression of any opinionwhatsoever on the part of the Secretariat of the United Nations concerning the legal status of any country, territory,city or area or of its authorities, or concerning the delimitation of its frontiers or boundaries.
The Economic and Social Commission for Asia and the Pacific (ESCAP) serves as the United Nations’ regionalhub promoting cooperation among countries to achieve inclusive and sustainable development. The largestregional intergovernmental platform with 53 Member States and 9 associate members, ESCAP has emergedas a strong regional think-tank offering countries sound analytical products that shed insight into the evolvingeconomic, social and environmental dynamics of the region. The Commission’s strategic focus is to deliveron the 2030 Agenda for Sustainable Development, which is reinforced and deepened by promoting regionalcooperation and integration to advance responses to shared vulnerabilities, connectivity, financial cooperationand market integration. ESCAP’s research and analysis coupled with its policy advisory services, capacitybuilding and technical assistance to governments aims to support countries’ sustainable and inclusivedevelopment ambitions.

iINEQUALITY IN ASIA AND THE PACIFIC
INEQUALITY IN ASIA AND THE PACIFICii
United Nations publicationSales No. E.18.II.F.13Copyright © United Nations 2018All rights reservedPrinted in BangkokISBN: 978-92-1-120777-4e-ISBN: 978-92-1-363297-0ST/ESCAP/2836
Photo credits:Cover: AsiaTravel/Shutterstock.comChapter 1: Jakob Fischer/Shutterstock.comChapter 2: Travel Stock/Shutterstock.comChapter 3: Sarote Pruksachat/Gettyimages.comChapter 4: M2020/Shutterstock.comChapter 5: r.nagy/Shutterstock
This publication may be reproduced in whole or in part for educational or non-profit purposes without special permission from the copyrightholder, provided that the source is acknowledged. The ESCAP Publications Office would appreciate receiving a copy of any publication thatuses this publication as a source.
No use may be made of this publication for resale or any other commercial purpose whatsoever without prior permission. Applications forsuch permission, with a statement of the purpose and extent of reproduction, should be addressed to the Secretary of the PublicationsBoard, United Nations, New York.
INEQUALITY IN ASIA AND THE PACIFICIN THE ERA OF THE
2030 AGENDA FOR SUSTAINABLE DEVELOPMENT

iiiINEQUALITY IN ASIA AND THE PACIFIC
FOREWORD
The Asia-Pacific region has experienced a remarkable economictransformation over the past two decades. Entirely new cities have sproutedfrom fields and forests, linked to each other and the rest of the world bygleaming high-speed rail lines, internet connections, cavernous airports andsprawling industrial zones. Hundreds of millions of people have also hadunprecedented opportunities to improve their standard of living. Yet, theproceeds of this progress have not been spread evenly. Indeed, inequality ison the rise across the region, including in countries that have been held upas models of dynamism and prosperity. Market-led growth alone, it seems,is simply not able to deliver a prosperous, sustainable future for all.
Between the 1990s and 2010s, the market income Gini coefficient increasedin four of the five most populous countries in the region, representing over70 per cent of the Asia-Pacific population. China, for example, saw its income
inequality soar by close to 10 percentage points, Indonesia’s rose by over 8 percentage points, andBangladesh and India saw their levels increase by 4 and 5 percentage points respectively.
ESCAP research shows that these increases come with enormous costs. In fact, estimates suggest thata 1 percentage point increase in the Gini coefficient reduces GDP per capita by, on average, US$154 forcountries in the Asia-Pacific region.
While the aggregate costs of inequality of outcome can be high, the impact of inequality is perhapsmore corrosive at the individual or the household level. In fact, close to 153 million more people couldhave been lifted out of poverty in the Asia-Pacific region had inequality not increased in 10 countries inthe past decade. More women could have been given the opportunity to attend school. It is striking tonote that in many countries only 5 out of every 100 women from poor, rural households completesecondary education, compared with one out of two women in richer urban households.
Indoor air pollution causes more than 4 million deaths per year globally, of which more than half occurin China and India alone. A strong contributor for this is that close to half of all people in Asia and thePacific still rely on traditional and inefficient fuels for cooking and heating. Meanwhile, less than 40 percent of all people in the region have access to health-care services.
Increasingly, authorities are recognizing just how pernicious sharp differences in income and opportunitycan be for society. Inequality causes a weakening of social bonds and an erosion of public trust ininstitutions, which can raise social and political tensions and even lead to radicalization and crime. Unequalpatterns of land ownership in turn lead to worsening environmental conditions for people who live there– the poor farmers or miners, for example, who are all too often left behind from both socioeconomicdevelopment gains and technological progress.
Dovetailing into the 2030 Agenda for Sustainable Development, and its powerful pledge to “leave noone behind”, this report explores the impact that inequality is having on people and communities acrossthe region. It examines why inequalities of income and wealth can be so persistent and analyses hownew digital technologies may affect people’s employment prospects in the future.
It concludes with powerful evidence that investment in education, social protection, urban planning andconservation of the environment are effective instruments for reducing inequalities.

INEQUALITY IN ASIA AND THE PACIFICiv
I am confident that the analysis, findings and the policy agenda contained in this publication will providemember States and other stakeholders with a solid foundation to pursue evidence-based policies thatreduce social vulnerabilities, build resilience, promote more inclusive and equitable societies in Asia andthe Pacific.
I am happy to commend it to ESCAP member States, policymakers and development practitioners in theregion and beyond.
Shamshad AkhtarUnder-Secretary-General of the United Nations andExecutive Secretary, United Nations Economic and Social Commission for Asia and the Pacific

vINEQUALITY IN ASIA AND THE PACIFIC
ACKNOWLEDGMENTS
Under the overall direction and guidance of Dr. Shamshad Akhtar, Under-Secretary-General of the UnitedNations and Executive Secretary of ESCAP and of Hong Joo Hahm and Kaveh Zahedi, Deputy ExecutiveSecretaries, the study was prepared by an interdivisional team coordinated and led by Nagesh Kumar,Director, Social Development Division (SDD) of ESCAP.
The main contributors to chapter 1 were Sudip Ranjan Basu and Alberto Isgut (Macroeconomic Policy andFinancing for Development Division). Hamza Ali Malik provided substantive comments and suggestions forimprovement. Technical inputs were provided by Arman Bidarbakht Nia (Statistics Division). ConsultantsChen Wang, Guanghua Wan, and Mahesh Kumar Subedi provided substantive contributions to the chapter.Shuvojit Banerjee, Pannipa Jangvithaya, Zheng Jian, Jeong-Dae Lee, Nyingtob Norbu, Jose Antonio PedrosaGarcia and Yusuke Tateno provided useful comments and support for the preparation of the chapter.
The main contributors to chapter 2 were Patrik Andersson and Ermina Sokou (lead author) (SDD). Thestatistical and econometric analysis was undertaken by Yichun Wang and Predrag Savic, with support fromOrlando Zambrano Roman. Technical and substantive inputs were provided by Chad Anderson, ThérèseBjörk, Li Stephanie Choo, Imogen Howells, Pornnipa Srivipapattana and Le Hai Yen Tran. The InternationalLabour Organization (ILO) provided support related to microdata of the Gallup World Poll.
Stefanos Fotiou (Environment and Development Division or EDD) led the drafting of chapter 3. The maincontributors include Caridad Canales, Arun Jacob (lead author), Riccardo Mesiano (EDD), Syed Ahmed, KareffRafisura, Madhurima Sarkar-Swaisgood, and Sanjay Kumar Srivastava (Information and CommunicationsTechnology and Disaster Risk Reduction Division or IDD). Research assistance was provided by Yanan Liuand Duangta Pawa. Consultant Magnus Bengtsson provided substantive contribution to the chapter.
Mia Mikic (Trade, Investment and Innovation Division) and Tiziana Bonapace (IDD) led the drafting ofchapter 4. The main contributors were Marta Pérez Cusó (lead author), Syed T Ahmed, WitadaAnukoonwattaka, Rishiraj Dutta, Michiko Enomoto, Sung Eun Kim, Ester Lazzari, Siope Vakataki ‘Ofa, AtsukoOkuda, Kareff May Rafisura, Satyabrata Sahu, Madhurima Sarkar-Swaisgood, Sanjay Kumar Srivastava,Krishnan Srinivasaraghavan, Megha Sunger, Tengfei Wang, Yuqian Wei and Jiayang Zhang. Additionalsupport was provided by Jonas Flake and Sharon Amir.
The study was edited by Robert McGowan. Pornnipa Srivipapattana coordinated the layout design, proofreading and printing. Layout and printing were provided by Erawan Printing Ltd. Part.
The ESCAP Strategic Publications, Communications, and Advocacy Section coordinated the launch anddissemination of the report.
´

INEQUALITY IN ASIA AND THE PACIFICvi
EXPLANATORY NOTES
ESCAP groupings of countries
South and South-West Asia (SSWA): Afghanistan; Bangladesh; Bhutan; India; Iran (Islamic Republic of);Maldives; Nepal; Pakistan; Sri Lanka; Turkey
North and Central Asia (NCA): Armenia; Azerbaijan; Georgia; Kazakhstan; Kyrgyzstan; Russian Federation;Tajikistan; Turkmenistan; Uzbekistan
South-East Asia (SEA): Brunei Darussalam; Cambodia; Indonesia; Lao People’s Democratic Republic;Malaysia; Myanmar; Philippines; Singapore; Thailand; Timor-Leste; Viet Nam
East and North-East Asia (ENEA): China; Democratic People’s Republic of Korea; Hong Kong, China;Japan; Macao, China; Mongolia; and the Republic of Korea
Pacific: American Samoa; Australia; Cook Islands; Fiji; French Polynesia; Guam; Kiribati; Marshall Islands;Micronesia (Federated States of); Nauru; New Caledonia; New Zealand; Niue; Northern Mariana Islands;Palau; Papua New Guinea; Samoa; Solomon Islands; Tonga; Tuvalu; Vanuatu
Country abbreviations
Afghanistan AFG Malaysia MYS
Armenia ARM Maldives MDV
Australia AUS Mongolia MNG
Azerbaijan AZE Myanmar MMR
Bangladesh BGD Nepal NPL
Bhutan BTN New Caledonia NCL
Brunei Darussalam BRN New Zealand NZL
Cambodia KHM Pakistan PAK
China CHN Papua New Guinea PNG
Fiji FJI Philippines PHL
French Polynesia PYF Russian Federation RUS
Georgia GEO Samoa WSM
Guam GUM Singapore SGP
Hong Kong, China HKG Solomon Islands SLB
India IND Sri Lanka LKA
Indonesia IDN Tajikistan TJK
Iran (Islamic Republic of) IRN Thailand THA
Japan JPN Timor-Leste TLS
Kazakhstan KAZ Tonga TON
Korea, Democratic People’s Republic of PRK Turkey TUR
Republic of Korea KOR Turkmenistan TKM
Kyrgyzstan KGZ Uzbekistan UZB
Lao PDR LAO Vanuatu VUT
Macao, China MAC Viet Nam VNM

viiINEQUALITY IN ASIA AND THE PACIFIC
ACRONYMS
ADB Asian Development BankAI artificial intelligenceAP-IS Asia-Pacific Information SuperhighwayDESA Department of Economic and Social AffairsDHS Demographic and Health SurveysD-index Dissimilarity indexESCAP Economic and Social Commission for Asia and the PacificETR effective tax rateFDI foreign direct investmentGDP gross domestic productGII Global Innovation IndexGNI gross national incomeG7 Group of SevenG20 Group of TwentyICT information and communication technologyIHL institutes of higher learningILO International Labour OrganizationIMF International Monetary FundIoT internet of thingsIP intellectual propertyIPCC Intergovernmental Panel on Climate ChangeITU International Telecommunications UnionLDC least developed countryMAS marker-assisted selectionMICS Multiple Indicator Cluster SurveysMHT medium- and high-technologyMNC multinational corporationMOOCs massive open online coursesPM particulate matterOECD Organisation for Economic Co-operation and DevelopmentR&D research and developmentRESAP Regional Space Applications ProgrammeSDGs Sustainable Development GoalsSMEs small and medium-sized enterprisesTFP total factor productivityTVET technical and vocational education and trainingUNCTAD United Nations Conference on Trade and DevelopmentUNDP United Nations Development ProgrammeUNESCO United Nations Educational, Scientific and Cultural OrganizationUNIDO United Nations Industrial Development OrganizationV20 The Vulnerable 20 GroupWTO World Trade Organization

INEQUALITY IN ASIA AND THE PACIFICviii
CONTENTS
FOREWORD ................................................................................................................................... iii
ACKNOWLEDGMENTS .................................................................................................................. v
EXPLANATORY NOTES................................................................................................................... vi
ACRONYMS .................................................................................................................................. vii
EXECUTIVE SUMMARY .................................................................................................................. xiii
Introduction ................................................................................... 2
A. Inequality in the era of the 2030 Agenda for Sustainable Development .................................. 3B. Inequality: core concepts ........................................................................................................ 3C. Why is inequality bad? ........................................................................................................... 4D. Why this study? ..................................................................................................................... 5
Endnotes ....................................................................................................................................... 6
CHAPTER 1
Inequality of Outcomes in Asia and the Pacific:Trends, Drivers and Costs ............................................................. 8
1.1 A conceptual framework for understanding inequality of outcome ......................................... 91.2 Trends in economic inequality in the Asia-Pacific region ......................................................... 111.3 A disaggregated analysis of between-country income inequality ............................................. 161.4 Drivers of income inequality ................................................................................................... 171.5 Costs of income inequality ..................................................................................................... 181.6 Conclusions and recommendations ........................................................................................ 20
Endnotes ....................................................................................................................................... 21
CHAPTER 2
Addressing Inequality of Opportunity in Asia andthe Pacific ....................................................................................... 24
2.1 What does inequality of opportunity mean in the context of the 2030 Agenda? .................... 262.2 Why inequality in access to opportunities matters .................................................................. 262.3 Why average progress is not enough ...................................................................................... 302.4 What drives inequality of opportunity… ................................................................................. 322.5 Winners and losers – identifying those furthest behind ........................................................... 382.6 Progress over time: why policy matters ................................................................................... 412.7 Conclusions and recommendations ........................................................................................ 43
Endnotes ....................................................................................................................................... 45

ixINEQUALITY IN ASIA AND THE PACIFIC
CHAPTER 3
Inequality of Impact: Environment and Inequality ..................... 48
3.1 What is inequality of impact? ................................................................................................. 493.2 Unequal impacts of air pollution ............................................................................................. 503.3 Unequal impacts of natural resource degradation ................................................................... 533.4 Unequal impacts of climate change and natural disasters ....................................................... 563.5 Environmental Inequalities and Conflicts ................................................................................ 573.6 Conclusions and recommendations ........................................................................................ 58
Endnotes ....................................................................................................................................... 60
CHAPTER 4
Technology and Inequalities ......................................................... 62
4.1 How can technology impact inequality? ................................................................................. 634.2 Digital divide and inequality ................................................................................................... 644.3 Technology and inequality of outcome ................................................................................... 654.4 Technology and inequality of opportunities ............................................................................ 704.5 Technology and inequality of impact ...................................................................................... 734.6 Conclusions and recommendations ........................................................................................ 74
Endnotes ....................................................................................................................................... 76
CHAPTER 5
A Policy Agenda to Address the Mutually ReinforcingDimensions of Inequality .............................................................. 78
5.1 Interaction of different dimensions of inequality ..................................................................... 795.2 Policy recommendations ......................................................................................................... 81
Endnotes ....................................................................................................................................... 83
Annexes .......................................................................................... 84
Annex 1.1 Dataset on the Gini coefficient ................................................................................... 84Annex 1.2 Kakwani decomposition of the Gini coefficient for components of per capita GDP..... 84Annex 1.3 Regression analysis for the driving forces of income inequality ................................... 85Annex 1.4 Regression analysis for the impact of income inequality on growth ............................ 87Annex 1.5 The impact of inequality on extreme poverty .............................................................. 88Annex 2.1 Calculating the Dissimilarity Index .............................................................................. 90Annex 2.2 Shapley decomposition .............................................................................................. 90Annex 2.3 Who are the furthest behind in all opportunities? ...................................................... 91
References ...................................................................................... 95
INEQUALITY IN ASIA AND THE PACIFICx
Figures, tables and boxes
Figures
Inequality in the 2030 Agenda expands beyond Goal 10 ............................................................... 5Figure 1.1 Conceptual framework for income inequality ............................................................ 10Figure 1.2 Income inequality by region, changes between early 1990s and early 2010s ............. 11Figure 1.3 Changes in income inequality by country, 1990 and 2014 ........................................ 12Figure 1.4 Changes in income inequality by subregions, 1990 and 2014 ................................... 12Figure 1.5 Inequality, gross versus disposable income, in selected countries, 2014 or latest
available years .......................................................................................................... 13Figure 1.6 Changes in the ratio of average consumption of the bottom 40 per cent to the
average total consumption in the Asia-Pacific region, early 1990s and early 2010s.... 14Figure 1.7 Lorenz curves for per capita household consumption in the Asia-Pacific region,
early 1990s and early 2010s ..................................................................................... 14Figure 1.8 Lorenz curves for GNI per capita, Asia-Pacific region developing countries, 1995,
2005 and 2015......................................................................................................... 15Figure 1.9 Comparing billionaires’ net worth in Asia-Pacific and other regions, 2017................. 16Figure 1.10 Top 10 per cent share of national income, China, India, the Russian Federation
and other major economies, 2016 ............................................................................ 16Figure 1.11 Sector contributions to between-country income inequality in Asia-Pacific countries,
1990-2015 ............................................................................................................... 17Figure 1.12 Contribution of expenditure components to between-country income inequality
in Asia-Pacific countries, 1990-2015 ......................................................................... 17Figure 1.13 Poverty impact of income inequality, selected Asia-Pacific countries, 1990-2014 ....... 20Figure 2.1 Secondary school attendance gaps in Asia-Pacific countries, latest year ..................... 28Figure 2.2 Births attended by skilled personnel in Asia-Pacific countries, by wealth quintile ........ 29Figure 2.3 Availability of improved sanitation facilities, Asia-Pacific region ................................. 29Figure 2.4 Access to electricity, Asia-Pacific region..................................................................... 30Figure 2.5 D-indices for 10 basic opportunities, by subregion .................................................... 31Figure 2.6 Average D-indices in Asia-Pacific countries, grouped by subregion ............................ 32Figure 2.7 Inequality in adequate nutrition among children (non-stunted) and its decomposition
for selected countries, grouped by the most important circumstance in shapinginequality, latest year ................................................................................................ 33
Figure 2.8 Impact of mother’s education and household wealth in reducing stunting amongchildren, selected Asia-Pacific countries ..................................................................... 34
Figure 2.9 Inequality in secondary educational attainment among 20-35-year olds and itsdecomposition,countries grouped by most important circumstance, latest year ......... 34
Figure 2.10 Impact of gender and residence in completing secondary and higher education,selected Asia-Pacific countries ................................................................................... 35
Figure 2.11 Inequality in access to full-time employment and its decomposition in selectedcountries, grouped by the most important circumstance, latest year ......................... 36
Figure 2.12 Impact of education and gender in getting full-time employment ............................. 37Figure 2.13 Classification tree highlighting differences in women’s access to professional
help in childbirth in Lao People’s Democratic Republic, 2011 (15-49 years of age) ..... 39Figure 2.14 Access to professional help during childbirth, Asia-Pacific countries, latest year ......... 39Figure 2.15 Distance between the worst-off groups and average attainment of secondary
education for individuals 20 to 35 years of age, earliest and latest ............................ 41Figure 2.16 Distance between the worst-off groups and the average in stunting for
children 0 to 5 years of age, earliest and latest .......................................................... 42

xiINEQUALITY IN ASIA AND THE PACIFIC
Figure 2.17 Distance between the worst-off groups and the average in access to professionalhelp during childbirth for women aged 15 to 49, Asia-Pacific countries, earliestand latest ................................................................................................................. 42
Figure 2.18 Change in total employment and in vulnerable employment, 2000-2015.................. 43Figure 3.1 Inequality and environmental impact ........................................................................ 50Figure 3.2 Productivity loss due to pollution, percentage of GDP ............................................... 51Figure 3.3 Mechanism of transmission of impact of air pollution on inequality within countries .... 52Figure 3.4 Premature deaths from ambient air pollution (PM2.5), by region, 1990 and 2015 ..... 52Figure 3.5 Inequality and environmental degradation, within countries ...................................... 52Figure 3.6 Income inequality and particulate emission damage in selected Asia-Pacific countries,
1995-2005 and 2005-2014 ...................................................................................... 53Figure 3.7 Mechanism of transmission of impact of natural resource degradation on inequality
within countries ........................................................................................................ 54Figure 3.8 Transition of value of natural capital per capita (from forests) and market Gini
in Indonesia,1995-2014 ............................................................................................ 55Figure 3.9 Estimates for ecosystem-service dependence............................................................. 56Figure 3.10 Deaths per disaster event and per 100,000 inhabitants, by country income group,
2000-2015 ............................................................................................................... 56Figure 3.11 Impact of recorded disasters on poverty rates, selected Asia-Pacific countries,
2011-2016 ............................................................................................................... 57Figure 3.12 Natural resources rents as percentage of GDP ........................................................... 58Figure 4.1 Total fixed-broadband subscriptions by income group in 2000-2016,
excluding China ........................................................................................................ 64Figure 4.2 Fixed-broadband subscriptions in the Asia-Pacific region (percentage), 2016 ............. 65Figure 4.3 GDP per capita growth and technology .................................................................... 66Figure 4.4 Global Innovation Index, Asia-Pacific countries, 2016 ................................................ 67Figure 4.5 Changes in employment share by skill type, selected Asia-Pacific countries, annual
average, 1995-2012 ................................................................................................. 68Figure 4.6 Skill premium in selected Asian countries, percentage ............................................... 69Figure 4.7 Installed photovoltaic capacity, top ten countries, 2016 ............................................ 74Figure 5.1 Inequality of outcomes and opportunities, and their relation to vulnerability
to natural disasters ................................................................................................... 80Figure 5.2 Inequality of outcomes and opportunities, and the digital gap .................................. 82
Tables
Table 2.1 Links between opportunities, circumstances and the SDGs........................................ 27Table 2.2 Calculated D-indices for all opportunities, Asia-Pacific countries ................................ 32Table 2.3 Shared circumstances of the worst-off and best-off groups in access to opportunities .. 40Table 4.1 Gross domestic expenditure on R&D in the Asia-Pacific region, 2015 or most recent
year available, percentage of GDP............................................................................. 67Table 4.2 Approaches that promote technologies addressing the needs of low-income groups ... 71Table A.1 Driving forces of income inequality, Gini coefficient, Asia-Pacific countries ................ 86Table A.2 Relationship between GDP per capita and income inequality, Asia-Pacific countries .. 87Table A.3 Relationship between GDP per capita and income inequality, Asia-Pacific countries,
lagged variables ........................................................................................................ 88
Boxes
Box 3.1 Ecological impacts of palm oil expansion in Indonesia ............................................... 55Box 4.1 Automation and risk of job displacement .................................................................. 69Box 4.2 Digital Aadhaar: financial services for 1.2 billion people in India ................................ 72Box 4.3 Tamil Nadu, India: a climate-risk hotspot ................................................................... 73

INEQUALITY IN ASIA AND THE PACIFICxii

xiiiINEQUALITY IN ASIA AND THE PACIFIC
EXECUTIVE SUMMARY
“A rising tide lifts all boats” they say. It is a neat aphorism – build up the economic engine, and everyonewill benefit. But a closer inspection of facts and historical evidence across economies reveals large variationsin the tidal range – some boats, probably yachts, have indeed been lifted but others languish on the mudflats.While economic growth and productivity increases bring great rewards, they have by no means been evenlydistributed – and this comes at a significant cost for people, prosperity and the planet.
Inequality stifles economic growth by lowering growth rates and shortening the duration of growth spells.It hampers the effectiveness of poverty reduction by excluding large segments of the population fromdevelopment gains. Inequality also undermines social cohesion and stability by weakening social bonds andpublic trust in institutions, which can raise social and political tensions and even lead to radicalizationand crime. Inequality also negatively impacts the environment. When ownership of land and natural resourcesis concentrated in the hands of a few, it provides unchecked freedom to cut, mine and farm lands inecologically unsustainable ways – often with a disproportional impact on the poor and marginalized.
Understanding the drivers and consequences of inequality and how policies can help in shaping a moreinclusive, prosperous and sustainable future across the Asia-Pacific region is the purpose of this report.Written against the backdrop of the 2030 Agenda for Sustainable Development and its pledge to “leaveno one behind”, the report presents a convincing case for reducing inequality, drawing on a wide rangeof data sources, backed up with evidence-based studies. It does so by exploring inequality in threeinterdependent and mutually reinforcing forms: (i) inequality of outcome (disparities in material dimensionsof income and wealth); (ii) inequality of opportunity (disparities in access to basic opportunities and services,such as education, health care and clean energy); and (iii) inequality of impact (disparities between groupswith shared circumstances and the asymmetric impact of external shocks, primarily in relation to theenvironment). It also discusses how frontier technologies and the incipient Fourth Industrial Revolution mayaffect inequality trajectories – now and in the future.
Inequality in the Asia-Pacific region
Since the early 1990s, the Asia-Pacific region has experienced a tremendous socioeconomic transformation,facilitated by strong and sustained economic growth. Unfortunately, the gains from this remarkableperformance have not always benefited those most in need. For example, nearly half of all people in Asiaand the Pacific still rely on traditional and inefficient fuels for cooking and heating. As a result, many countriesin the region have experienced a widening of existing inequalities, accompanied by environmentaldegradation.
Income and wealth inequalities are on the rise …
The region’s combined income inequality, measured by the Gini coefficient, has increased by over 5percentage points in the last 20 years. This goes contrary to almost all other regions.
Income inequalities grew in almost 40 per cent of all countries. China, Indonesia, Papua New Guinea andSingapore experienced sharp increases. In countries where inequalities fell, they often did so from relativelyhigher levels. For instance, inequality decreased sharply in Azerbaijan, Kyrgyzstan, the Maldives and Georgia.By subregion, the average population-weighted Gini coefficient increased the most in East and North-EastAsia.
Steep increases in the incomes of the richest have often coincided with an increased concentration of wealth.For instance, the wealth share held by the top 1 per cent doubled in both China and the Russian Federation
INEQUALITY IN ASIA AND THE PACIFICxiv
between 1995 and 2015, from 15 to 30 per cent and from 22 to 43 per cent respectively. In 2017, thenet worth of the region’s billionaires was more than seven times the combined GDP of the region’s leastdeveloped countries (LDCs).
… access to basic opportunities are unevenly shared …
Income and wealth inequalities are strongly linked to other dimensions of development, with obvious impacton opportunities such as access to education, health care, finance, clean energy and water and sanitation.While some level of income inequality is both acceptable and expected to reflect differing levels of individualeffort and talent, no inequality in access to opportunities should be permissible in countries aspiring to thecommitments and implementation of the 2030 Agenda.
Yet, a comparison of country-specific dissimilarity indices (D-indices) for 13 core opportunities and onemultiple deprivation indicator across 21 countries reveals large inequalities, particularly in educationalattainment, ownership of a bank account, access to clean fuels and basic sanitation. The highest overallD-index is found in South and South-West Asian countries, followed closely by South-East Asian nations.
The countries that stand out as particularly unequal with respect to core opportunities are Afghanistan,Bangladesh, Cambodia, Lao People’s Democratic Republic, Myanmar, Timor-Leste and Vanuatu. Conversely,Armenia, Kazakhstan, Kyrgyzstan, the Maldives, Tajikistan, Thailand and Turkmenistan, have on averagesignificantly lower inequalities in access to the same opportunities.
… and environmental degradation and disasters are impacting the poorest
Environmental degradation is closely linked to inequality and low-income countries of the region are moreexposed to environmental degradation. Compared with 1990, exposure to air pollution is on the rise inthe region, with the sharpest increases observed in Bangladesh, Bhutan, China, India, Mongolia and Nepal.
Air pollution is estimated to claim over 4 million lives per year, mainly in developing countries in the region.In addition to the detrimental impact this has on families and communities, it also undermines economicperformance, causing a reduction of around 0.8 per cent of GDP in India and Pakistan, up to 1.5 per centin Afghanistan. Hence, reducing pollution is critical for reducing inequalities both within and amongcountries.
Poor and disadvantaged groups are also disproportionally impacted by pollution. As a result, deaths fromcardiorespiratory diseases are more likely among residents with a lower level of education.
Natural disasters also cause disproportionately greater impacts on poorer countries and households andtherefore exacerbate inequalities among countries, but also between the rich and the poor. Mortality ratesfrom disasters in low- and middle-income countries are four to five times higher than those in high-incomecountries. Climate change also magnifies the risk of disasters and increases their costs. As the climate systemhas warmed, the number of weather-related hazards globally has tripled, and the number of people livingin flood-prone areas and cyclone-exposed coastlines has doubled – a trend that is expected to intensify.
What can be done?
Economic growth alone is not sufficient to reduce inequalities. Tackling high inequalities will require fiscalpolicy interventions to support progressive investment in essential public programmes, such as health careand education.
Employment policies that encourage decent job creation also need to be in place in countries where labourmarket informality is high. This would not only build a more productive and healthy workforce – critical

xvINEQUALITY IN ASIA AND THE PACIFIC
for economic growth and closing development gaps – but also support economic and social stability. Theabundance of vulnerable and low-skilled occupations is a manifestation of existing inequality and contributesto discouragement, social exclusion and marginalization.
Inequalities in opportunities undermine human dignity and social justice and bring questions of humanrights to the forefront of the 2030 Agenda. Overall improvements in access to basic services must thereforereach everyone, particularly groups identified as being the furthest behind.
Environmental degradation, urbanization and climate-induced disasters are often missing from the policydebate on fighting inequality. Reducing inequality of both income and opportunity also requires betterconservation of natural capital. Bringing national policymaking on inequality into an overarching frameworkthat includes environmental considerations will therefore be paramount.
To an increasing extent, technologies can either exacerbate or curb inequalities. More advanced countries,often early adopters of frontier technologies, must focus on managing the impact of technological transitionson inequality. Middle-income countries should focus on upgrading technological skills and ensuring thattechnological progress is inclusive. The priority for low-income economies is to build their technologicalcapabilities, focusing on the adoption, adaptation and diffusion of existing technologies. Particularlyimportant is the development of broadband infrastructure for both technological development and bridgingof the digital divide.
In a region as diverse as Asia and the Pacific, there is no single solution to curb high and increasinginequalities. Because of the complexity and interlinkages of inequalities and the diverse impact these haveon people, society and the planet, policy reforms need to be guided by multisectoral and multi-stakeholderinvolvement at all stages from development and design to implementation and monitoring. This reportputs forward an eight-point broad policy agenda for building more equitable and inclusive societies in theAsia-Pacific region:
1. Strengthen social protection
Social protection policies, including access to health-care services, are central to closing the gaps in accessto most opportunities, while also increasing prosperity, resilience and empowerment. Expanding socialprotection to low-income families through cash transfers, or other income-support mechanisms also tendsto have strong multiplier effects, as these groups typically spend their extra income on domestic goodsand services.
2. Prioritize education
A well-educated population is fundamental for all spheres of development. It is therefore critical for nationaleducation systems to encourage higher educational attainment and at the minimum improve secondarycompletion rates by ensuring that it is accessible and affordable for all, including girls and for those livingin rural areas. Countries where the gap in educational attainment has narrowed, and where overall accessis high, should instead focus on strengthening the quality of education by investing in teachers’ educationand training, school equipment and infrastructure and making sure that current curricula correspond tofuture labour-market needs to facilitate the school-to-work transition. High-quality higher education is alsocritical for harnessing the potential of technology for inclusive development.
3. Protect the poor and disadvantaged from disproportionate impact of environmental hazards
Targeted policy measures that reduce exposure of the poor and disadvantaged to environmental hazardsare important to close inequalities within countries. Such measures could include better urban planning,establishing green corridors and regular health check-ups in schools in poorer neighbourhoods. This isespecially relevant in countries with a higher risk of pollution, natural disasters, overexploitation of naturalcapital and natural resource-related conflicts.

INEQUALITY IN ASIA AND THE PACIFICxvi
4. Address the digital divide and ICT infrastructure
Information and Communication Technology (ICT) is a development enabler and a growth sector on itsown. The development, application and adaptation of frontier technologies rely largely on the availabilityof ICT infrastructure and access to it. Thus, addressing the digital divide and developing affordable, resilientand reliable broadband infrastructure is a development priority in Asia and the Pacific. If left unaddressed,inequality could become unbridgeable, with implications for many other areas of development. As broadbanddevelopment is geography-dependent, regional and subregional cooperation is key to addressing thechallenge.
5. Address persistent inequalities in technological capabilities among and within countries
To catch up with more advanced economies, countries with low technological capabilities should considerstrengthening technological learning through public policies that focus on the adoption, adaptation anddiffusion of existing technologies. To ensure technology does not further exacerbate inequalities withincountries, ESCAP member States will need to anticipate the impact of technologies on jobs, wages andmarkets; and introduce inclusive technology and innovation policies that enable low-income and vulnerablepopulations to benefit from technology and to participate in innovation activities.
6. Increase effectiveness of fiscal policies
An effective tax system enhances public revenues and facilitates increasing investments in essential services,such as health care, education and social protection. To this end, better and effective governance will beneeded to boost overall tax compliance and improve composition and efficiency of public expenditure.Similarly, reforming tax structures to reduce their adverse effects on the poor through progressive taxes onpersonal income, property and wealth can help prevent excessive concentration of wealth and power inthe hands of a few, ensuring greater equality of opportunity within and across generations.
7. Improve data collection to identify and address inequality
To identify those at risk of being left behind and to direct policymaking at certain population groups, nationaldata collection needs to allow for better disaggregation. It also needs to capture how unequal opportunitiesimpact individual aspirations and household decisions and why certain individuals, for example, take theirchildren out of school or continue using unclean energy options, while others do not.
8. Deepen regional cooperation
Regional cooperation can be fruitful for narrowing inequalities within and among countries. Regionaleconomic cooperation and integration can help the lesser developed countries grow faster by leveragingthe dynamism of more developed economies and by exploiting the complementarities in a mutually beneficialmanner. Regional cooperation can also help in addressing common challenges, such as shared vulnerabilitiesto natural disasters and climate change, or in supporting common objectives, such as the extension ofbroadband networks, as highlighted in the report. In addition, regional platforms for sharing good practicesin addressing inequalities and extending social protection coverage can be fruitful. Member States of ESCAPhave adopted a number of resolutions for strengthening regional cooperation and integration, as well asthe Regional Roadmap for Implementing the 2030 Agenda for Sustainable Development in Asia and thePacific, which also outlines opportunities for regional cooperation in different thematic areas including oninequality. As their regional commission, ESCAP stands ready to support the member States in implementingthe Roadmap and in strengthening regional cooperation for addressing inequalities.

xviiINEQUALITY IN ASIA AND THE PACIFIC

INEQUALITY IN ASIA AND THE PACIFIC2
Introduction

3INEQUALITY IN ASIA AND THE PACIFIC
A. INEQUALITY IN THE ERA OF THE 2030AGENDA FOR SUSTAINABLE DEVELOPMENT
In September 2015 the world’s leaders gathered in NewYork to adopt the 2030 Agenda for SustainableDevelopment, pledging to “leave no one behind.” Thebackdrop was mounting disquiet about inequality, whichhad stirred in the global financial crisis of 2007/08 andgrew wings through the Occupy protests and during theArab Spring, propelled by a young generation thatincreasingly felt marginalized and shut out.
In early 2014, Thomas Piketty’s monumental book onwealth and inequality was published, and swiftly toppedbest-seller lists around the world. With carefully amassedevidence showing why inequality was rising and whatcould be done about it, Capital in the Twenty-FirstCentury made substantial waves in the economicdiscourse. The impact is still rippling through universities,international organizations, think tanks, NGOs andbusinesses – and will continue to do so. In our region,ESCAP contributed to the discourse through itspublication Time for Equality.1
Fast-forward a couple of years, and the trickle of articlesand books on inequality has become a deluge. Inequalityis now central to the policy agenda, but there is stillmuch to debate and understand about it – particularlyon how to balance peoples’ livelihoods, income andwealth at a time of unprecedented technologicaladvances and environmental degradation.
B. INEQUALITY: CORE CONCEPTS
Inequality can be defined as the difference in socialstatus, wealth or opportunity between people or groups.This report makes the distinction between three broadtypes of inequality, all of which can be damaging:inequality of outcome, inequality of opportunity andinequality of impact.
Inequality of outcome references disparities in thematerial dimensions of human wellbeing amongindividuals, such as the level of income and wealth.Inequality of outcomes primarily concerns economicinequality and is usually measured by either income orconsumption metrics. The allocation of wealth impactshouseholds across generations, often rises more rapidlythan income and is closely associated with politicalpower and influence.
Inequality of opportunity references unequal accessto fundamental rights and services required forindividuals to sustain and improve their livelihoods. Theseopportunities include access to basic services andproductive resources such as education, health care andnutrition, water and sanitation, energy, information andcommunications technology, as well as finance and
INEQUALITY IN ASIA AND THE PACIFIC4
credit. Equal access to these opportunities levels theproverbial playing field, and ensures that outcomes aremore a reflection of effort and choices made byindividuals.
Inequality of impact references the asymmetric impactexternal shocks, such as natural disasters, have ondifferent groups of people. This asymmetry usually isassociated with systemic disparities between groups withshared identities. Also referred to as group-basedinequality or horizontal inequality, this type of inequalityis often historically rooted and persists over generationsbecause of entrenched deprivation or advantage.
A more recent concern is that technological progressand frontier technologies – leading to the FourthIndustrial Revolution – could magnify inequalities by, forexample, generating significant job losses among certainlower-skilled groups of people.
Inequality of outcomes, opportunities and impact areinterdependent and mutually reinforcing. An unequalplaying field inevitably leads to disparate outcomes.Unequal outcomes in terms of income and wealthaggravate disparities in access to basic services, resourcesand decent jobs. Prejudice, discrimination and socialexclusion further reinforce inequalities of outcomes andopportunities by preventing people from leadingempowered lives. For example, disparities in accessingeducation, health care and technology are often causedby economic inequalities and lead to far-reachingdevelopment gaps. These gaps, in turn, result indeepening income disparities.
This multidimensional and mutually reinforcing natureproduces inequality traps that can persist throughgenerations. In a majority of countries in South-East Asiaand South Asia, less than 5 per cent of women frompoor, rural households complete secondary education,compared with 50 per cent of women in richer urbanhouseholds. These gaps create a direct, intergenerationaladvantage or disadvantage because a mother’seducation, along with household wealth, are the twomost significant circumstances associated with higherprevalence of stunted children.2 Stunting directlyinfluences school attendance, results and future earningspotential.
C. WHY IS INEQUALITY BAD?
Inequalities matter for intrinsic reasons – they underminehuman dignity and social justice, the principles uponwhich human rights are grounded. They also matter forinstrumental reasons – they undermine the threedimensions of sustainable development by stiflingeconomic growth, weakening social cohesion andsolidarity and hampering environmental governance.
Inequalities stifle economic growth and povertyreduction. The economic cost of ignoring inequality issignificant. Research demonstrates that countries withhigh rates of inequality have lower growth rates andshorter growth spells.3 In addition, inequality reduces theimpact of growth on poverty reduction. In other words,poverty alleviation efforts are more effective in countrieswith more equitable growth-distributions.4
Inequalities undermine social cohesion andstability. High inequality is a key factor in rising levelsof social tension and even crime because it weakens thesocial compact and undermines public trust ininstitutions. A weak social compact, in turn, reduces thewillingness to pay taxes, thereby leading to furtherdeterioration in basic public services and resources tomarginalized groups. Where group-based inequalitiesare high or rising, so is the likelihood of violence andunrest. This is particularly true when coupled with a lackof opportunity for upward social mobility and theabsence of recourse.5
Inequalities negatively impact the environment.Inequality and environmental sustainability are deeplyinterlinked. Generally, societies with higher levels ofinequality show less public support for policies protectingthe environment and regulating common goods.Furthermore, inequality in the ownership of land andnatural resources provides unchecked freedom for theadvantaged to cut, mine and farm lands in ecologicallyunsustainable ways.6 For the disadvantaged, socialresentment and lack of education can then lead towidespread free-riding and the overuse of naturalresources.7 Environmental degradation also impacts thepoor and marginalized the hardest, going against theconcept of “environmental justice”. As a consequence,vulnerable socioeconomic or ethnic minority groups aredisproportionately exposed to and affected byenvironmental hazards. They are also more exposed toair and water pollution, while being least prepared tosoften and withstand the shocks from extreme events,such as natural or man-made disasters.
Research also finds that an individual’s experience andeven expectations of inequality negatively affectattitudes, reduce individual aspirations and lead to theacceptance and internalization of a lower status, allwhile reinforcing pre-existing inequalities. The aspirationsaffected range from educational and occupational goalsto broader decisions around consumption or socialidentity.8
The sense of unfair allocation of gains and resources hasserious repercussions on personal efforts towards work,but also on investment in education, nutrition andhealth. The psychological impact of inequality has drawnincreasing attention among scholars and, while evidence

5INEQUALITY IN ASIA AND THE PACIFIC
is still thin, the impact appears more complex and morecorrosive than poverty itself. Rather than being poor, itis the notion of feeling poor that has the gravest impacton life satisfaction.9 The reaction to this feeling isa personal one, but for most people it is easier andperhaps more rewarding to focus on what is achievable,and expected for one’s social and economic circle, whileobserving from afar the lives of billionaires.
D. WHY THIS STUDY?
The Asia-Pacific regions has for several decadeswitnessed extraordinary development. This includes thereduction in the number of people living in extremepoverty, and significant improvements in food security,access to health care, education, water and sanitation,and energy, along with other basic services fundamentalfor overall socioeconomic development. Unfortunately,these noticeable improvements in basic services oftenbenefitted the already privileged rather than the poor,marginalized and vulnerable.
In places, gaps between the rich and the poor, andaccess to services such as health care and education,have continued to grow. The lives and livelihoods ofvulnerable communities are also disproportionatelyaffected by the increased frequency and intensity ofextreme weather events and environmental degradation,including increased pollution levels, which haveaccompanied economic development.
For all segments of society to benefit in a fair and justway from economic and other development gains, thosemost in need must be fully included in current andfuture development plans. Achieving the SustainableDevelopment Goals (SDGs) by 2030 means placingpeople at the centre of the development agenda, and
better balancing investments in, for example,infrastructure with investments in people and the planet.The pledge by world leaders to “leave no one behind”and “reach the furthest behind first” strongly carries thespirit of inclusion and a people-centred approach.
Given its commitment to leaving no one behind,reducing inequality is at the heart of the 2030 Agendafor Sustainable Development. Reducing inequality isemphasized in the stand-alone SDG 10 “Reduceinequality within and among countries” but is alsoa fundamental component to reach almost all otherGoals.
This report, prepared as an input to the 74th CommissionSession, aims to shed light on the latest trends ininequality, building on evidence from across the region,using the most authoritative data sources, while relyingon innovative analytical methods, to distil clear policymessages for the governments of the Asia-Pacific region.
The broad themes analysed in the report are as follows:chapter 1 discusses inequality of outcome (e.g. incomeand wealth); chapter 2 focuses on inequality ofopportunity (e.g. access to education, health care,decent jobs, water and sanitation, and electricity);chapter 3 explores the interplay between theenvironment and the inequality of impact (e.g.,environmental degradation and natural disasters);chapter 4 recognizes the prominence new technologieshave on inequality in all its forms, as well as the possibleimpact of the Fourth Industrial Revolution on jobs,incomes, opportunities and policy options; and chapter 5concludes the report and proposes a set ofrecommendations for the consideration of policymakersin their efforts to reduce inequalities and therebyfacilitate the achievement of the SDGs.
Environment
Climate change
Production and ConsumptionSustainable
(Sustainable Development Goals 6-7, 11-15)
Poverty
Employment
Economicdevelopment
(Sustainable Development Goals 1, 5, 8, 9)
Food security
Nutrition
Health care
Education
(Sustainable Development Goals 2-5)
Peace
Governance
Justice
(Sustainable DevelopmentGoal 16)
Finance
Information and communications technology
Capacity-building
Trade
Systemic issues
Data, monitoring and accountability
(Sustainable DevelopmentGoal 17)
REDUCEDINEQUALITIES
Inequality in the 2030 Agenda expands beyond Goal 10

INEQUALITY IN ASIA AND THE PACIFIC6
ENDNOTES1 Other notable contributions also included the ADB-published book, “Inequality in Asia and the Pacific: Trends, Drivers andPolicy Implications”, edited by Kanbur et al. (2014).2 United Nations, Economic and Social Commission for Asia and the Pacific (ESCAP) (2018c) (forthcoming).3 Bénabou (1996).4 Fosu (2006).5 Stewart (2016).6 Gaventa (2016).7 United Nations, Economic and Social Commission for Asia and the Pacific (ESCAP) (2015a).8 See Pasquier-Doumer (2016); Baillergeau et al. (2016).9 Payne (2017).
7INEQUALITY IN ASIA AND THE PACIFIC

INEQUALITY IN ASIA AND THE PACIFIC8
Chapter 1
Inequality of Outcomes inAsia and the Pacific: Trends,Drivers and Costs

9INEQUALITY IN ASIA AND THE PACIFIC
High and persistent inequalities of outcome area source of concern because they undermine theimplementation of the 2030 Agenda for
Sustainable Development and the associated SustainableDevelopment Goals (SDGs).1 Among several adverseimplications, they can lead to a deceleration of economicgrowth, hamper efforts aimed at eliminating extremepoverty and hunger, and weaken bonds of solidarity atthe community level. Inequalities of outcome alsocorrelate with political capture, especially by vestedinterest groups. A disproportionate political influence ofthe rich over policymaking increases rent-seekingactivities at the expense of the broader society, henceundermining the global aspiration of “leaving no onebehind”. Addressing deepening and persistinginequalities is also important to foster peace and preventwithin-country conflicts.2
This chapter builds on previous literature and evidenceon inequality of outcome, including work done by theESCAP, and aims to further examine recent trends ininequality of outcome in the region. The chapterpresents new research on the drivers and costs ofincome inequality in the region.3 Owing to dataconstraints, the chapter primarily focuses on incomeinequality at the regional and country levels.
1.1 A CONCEPTUAL FRAMEWORK FORUNDERSTANDING INEQUALITY OF OUTCOME
At a basic level, income inequality refers to the variationin how income generated in the production of goodsand services is distributed across a population. Theextent of this variation depends on a three-wayrelationship between the demand for goods andservices, how they are produced and how people areremunerated for their work. Owners of assets thatsupport productive activities, such as land, financialassets or shares of corporations, also receive income inthe form of rent, interest or dividends. Each of the threeelements of an economy are themselves dependent ona host of factors such as access to education, marketsand the extent of regulations and taxes – as illustratedin Figure 1.1.
The figure shows that the way production is organizedin a country depends on its level of technology, itsdegree of engagement in international trade andinvestment and its policies on regulations and taxation.These factors determine the share of income distributedin the form of wages and salaries vis-a-vis profits andrents. In addition, income distribution depends on accessto (and the quality of) education, tax policies, socialprotection, non-discrimination laws and philanthropy. Asdiscussed in the next section of this chapter, direct taxesand social protection can play a powerful role inameliorating market income inequality.
INEQUALITY IN ASIA AND THE PACIFIC10
Figure 1.1 Conceptual framework for income inequality
Source: ESCAP.
� Education and skills � Direct taxes� Social protection� Non-discrimination laws� Philanthropy
Income Distribution
Production of goods and services
Demand for goodsand services
� Demographics� Access to financial markets � Consumption regulations� Consumption taxes
� Technology� Monopoly power� International trade� Production regulations � Excise taxes
� Environmental regulations
Environmental impact
The production of goods and services and the paymentsit generates is not the sole driver of income distribution.Production is also driven by the demand for a country’sgoods and services, which are in turn affected bydemographic factors, access to financial services andpolicies such as consumption taxes and other fiscalmeasures. The demand for goods and services in aneconomy is also influenced by the distribution of income.The figure also shows the relationship betweeneconomic activity, the distribution of income andenvironmental impacts. Policymakers increasinglyrecognize the importance of taking a system-wideapproach that considers these interlinked and complexelements for an appropriate diagnosis of the causes ofeconomic inequality.
The booming real estate prices experienced by manycities across the Asia-Pacific region in recent yearsprovide a powerful example of how changes in theinteraction between demand and the production ofgoods and services can result in changes in incomedistribution. Spiralling prices tend to reflect risingdemand for housing, which has partly been caused byfactors such as the expansion of the middle class andlow levels of financial-market development.4 While risingpurchasing power makes housing increasingly affordablefor the middle classes, a lack of opportunities forfinancial investment is also leading to additional demandfor housing units for investment purposes by wealthyindividuals. As demand for housing increases, theproduction side of the economy responds through anincrease in the business activities of developers,constructors, producers of construction materials,
realtors and banks. Rapid increases in real-estate pricesfeed into rising income for companies in these sectors,along with landowners and real-estate speculators,leading in turn to a more unequal distribution ofincome.5
Technological progress is an important driver of changesin income distribution.6 While it facilitates the expansionof production by lowering production costs andincreasing productivity, it also leads to a concentrationof income in the hands of the most innovativebusinesses. Technological progress tends to favourcapital over labour and skilled labour over unskilledlabour, which can exacerbate differences in rates ofeconomic growth among countries and within them.7
Advances in information and communicationtechnology, along with the emergence of social mediaand information and communication technologies (ICT),for example, have spawned a new cadre of billionairesacross developed countries and emerging economies.The enormous wealth of technology giants such asApple, Google, Facebook, Amazon or Ali Baba is relatedto both the major technological breakthroughs andinnovations they have stirred and to the monopolypower they enjoy as “first movers” in a vibrant newtechnological landscape.8
A major factor affecting the distribution of income indeveloping countries, including in the least developedcountries (LDCs), is the unequal distribution of humancapital – the value of individuals’ skills, knowledge,abilities and social attributes. Through the process ofdevelopment, the production of goods and services

11INEQUALITY IN ASIA AND THE PACIFIC
tends to become more sophisticated, which requires anincreasingly well-educated and skilled workforce.Achieving this depends on sustained public investment,and arguably the participation of the private sector ineducation systems including technical and vocationaleducation and training (TVET).9 Without a substantialincrease in public investment in education, as well as inother social policies such as health care and socialprotection, a share of the population is likely to remainexcluded from the benefits of technology-led economicgrowth, perpetuating a skewed distribution of income.These issues are discussed at length in chapter 2 andchapter 4.
1.2 TRENDS IN ECONOMIC INEQUALITY INTHE ASIA-PACIFIC REGION
Economic inequality can be measured in several ways.One approach is to compare the income of a swatheof affluent people, say the top 10 per cent of the incomedistribution in a country, with the national average.Other approaches focus on the gap between the poorestin a society and the median household. The best-knownway of measuring income inequality is the Ginicoefficient, named after the Italian statistician CorradoGini. It aggregates the gaps between people’s incomesinto a single measure. If everyone in a group has thesame income, the Gini coefficient is 0; if all income goesto one person, it is 1.10 Most of the analysis in thischapter is based on the Gini coefficient, using datagathered from countries across the Asia-Pacific regionsince the early 1990s. Most of the analysis is carried outby using gross (or market) income, which does notreflect government policies to redistribute income, forinstance through direct taxes, social securitycontributions and cash transfers. Annex 1.1 providesa brief description of the data set on the Gini coefficientused in the analysis.
The data present a mixed picture – several economiesin the Asia-Pacific region experienced a considerable risein income inequality between the early 1990s and the2010s, while many other nations saw declines duringthis period. On average, according to data from 46countries, the region’s inequality increased by close to5 percentage points during this period; from 33.5 in1990-1994 to 38.4 in 2010-2014 (Figure 1.2).11
Figure 1.2 also shows the population-weighted incomeGini coefficient of Europe, Western Asia, Africa and LatinAmerica and the Caribbean. Despite a significantincrease in income inequality in the Asia-Pacific region,its population-weighed Gini coefficient is still about 7percentage points lower than that of Europe and morethan 10 percentage points lower than that of LatinAmerica and the Caribbean.12 Nevertheless, the risingtrend in Asia-Pacific is contrary to most other regions.
This overall rise in income inequality is mostly due tosharp increases in the region’s most dynamic andpopulous countries. Between 1990-1994 and 2010-2014 the market income Gini coefficient soared by9.6 percentage points in China, 8.2 percentage pointsin Indonesia, 4.6 percentage points in Bangladesh and4.3 percentage points in India. These four countries areamong the five most populous countries in the region,representing over 70 per cent of the population in2015.13 The overall picture, however, is mixed. In 60 percent of the Asian and Pacific countries, income inequalitydeclined (Figure 1.3), often from very high levels. Thesharpest fall in inequality occurred in the Maldives,followed by Kyrgyzstan, Azerbaijan and Georgia, reflectingthe recovery of those countries from the economic crisisthat followed the breakup of the Soviet Union.14
In terms of changes in income inequality by subregions,North and Central Asia experienced a sharp declinewith the Gini coefficient dropping on average 11.4percentage points for six of the nine countries forwhich data are available (Figure 1.4). As a result, during2010-14, this subregion had an average Gini coefficientof 38.3, similar to the region’s average. In South-EastAsia, the picture is mixed, with Indonesia and Singaporeexperiencing increases in income inequality and othersincluding Malaysia and Thailand seeing declines.On average, however, the population-weighted Ginicoefficient rose from 32.6 to 39.1, a similar increase inmagnitude to that seen across the entire region.
South and South-West Asia also saw mixeddevelopments, with Bangladesh, India and Sri Lankaexperiencing increases in income inequality, while theIslamic Republic of Iran, Pakistan and Turkey experienceddecreases, with an average increase from 32.1 to 34.8.
Figure 1.2 Income inequality by region, changesbetween early 1990s and early 2010s
Asia-Pacific Europe Western Asia Africa Latin America and the
Caribbean
60
50
40
30
20
10
0
Gin
i coe
ffic
ient
1990-1994 2010-2014
33.538.4
43.6 45.0 46.4 45.747.6 46.9
49.6 48.6
Source: ESCAP. See Annex 1.1 for data sources.Notes: The regional classification is based on the United Nations regionalcommissions. The Gini coefficient of each country was calculated as thesimple average of the available Gini coefficients within each 5-year period(1990-1994 and 2010-2014). Each region’s Gini coefficient is calculatedas the weighted average of the Gini coefficients of the countries in theregion using population weights.

INEQUALITY IN ASIA AND THE PACIFIC12
Figure 1.3 Changes in income inequality by country, 1990 and 2014
Source: ESCAP. See Annex 1.1.Note: Labels next to each bar show each country’s average market income Gini coefficient for 2010-2014. The Gini coefficient of each country wascalculated as the simple average of the available Gini coefficients within each 5-year period (1990-1994 and 2010-2014).
ChinaPapua New Guinea
SingaporeIndonesia
UzbekistanSri Lanka
BangladeshJapan
Republic of KoreaIndia
Viet NamTajikistan
TurkmenistanLao PDRAustralia
New ZealandTonga
PhilippinesMicronesia (Federated States of )
MongoliaTurkey
ArmeniaMalaysia
SamoaTuvalu
PakistanNepal
VanuatuSolomon Islands
KazakhstanIran (Islamic Republic of )
Timor-LesteCambodia
AfghanistanThailand
Russian FederationBhutan
FijiGeorgia
AzerbaijanKyrgyzstan
Maldives
Increasedinequality
Decreasedinequality
425647
3740
3932462935
4033
4338
4847
3843
4232
40314543
4630
414447
273732
32373841
3936
4119
2840
Percentage Points
-25-30 -20 -15 -10 -5 0 5 10 15
In East and North-East Asia inequality rose in China,Japan and the Republic of Korea, but decreased inMongolia, with the subregional average increasing from33 to 41.9. In the Pacific, 6 of the 13 countries for whichdata are available experienced an average drop in theGini coefficient of 3.4 percentage points; however,income inequality increased in the subregion’s mostpopulous countries, Australia, New Zealand and PapuaNew Guinea, and the average Gini coefficient for thesubregion edged up from 45.3 to 49.1.
In interpreting these trends, it is important to keep inmind that the measure of income utilized excludes theeffect of taxes and transfers, which can contributesignificantly to ameliorating income inequalities. OECDdata shows that the average Gini coefficient after taxesand transfers is considerably smaller than the gross
Figure 1.4 Changes in income inequality bysubregions, 1990 and 2014
Source: ESCAP. See Annex 1.1.Notes: The subregional classification is based on the United Nations ESCAP’sclassification of Asia and the Pacific. The Gini coefficient of each country foreach of the subregions was calculated as the simple average of the availableGini coefficients within each 5-year period (1990-94 and 2010-14). Eachsubregion’s Gini coefficient is calculated as a weighted average of the Ginicoefficients of the countries in the subregion using population weights. Thenumber of countries with available data on the Gini coefficient in eachsubregion is noted in parentheses.
Pacific (13) North and Central Asia
(9)
East and North-East
Asia (4)
South-EastAsia (10)
South and South-West
Asia (10)
Gin
i co
effic
ien
t
60
50
40
30
20
10
0
1990-199 2010-2014
45.349.1
44.5
38.333.0
41.9
32.6
39.1
32.134.8

13INEQUALITY IN ASIA AND THE PACIFIC
income Gini coefficient in developed countries. Asshown in Figure 1.5, the Gini coefficient of net (or after-tax) income for seven developed countries, which aremembers of ESCAP, was 33.8 compared with 49 whenincome is measured on a gross or market basis.
Similarly, the average Gini coefficients for five countriesin the region included in the OECD database – China,India, Republic of Korea, Russian Federation and Turkey– were 41.7 for net income, compared with 46.2 forgross income. These findings highlight the important rolefiscal policies can play in redistributing incomes throughtaxes and transfers and their potential to play a largerrole in reducing inequality of outcomes in the region.15
1.2.1 Trends in consumption inequality
Inequality of outcome can be gauged using othereconomic measures besides income. One option is toconsider inequality in the consumption of goods andservices. Compared with income, this measure excludessavings, which are higher for richer households. As such,inequality in consumption is expected to be lower thaninequality in income. In fact, using data for 20 countries,representing 90 per cent of the Asia-Pacific population,we find that the average population-weighted Ginicoefficient increased by just 1.7 percentage points: from33.2 in the mid-1990s to 34.9 in the mid-2010s. Asnoted above, this increase also reflects the weight ofcountries such as China, India and Indonesia.
A related measure of interest is the ratio of the averageconsumption of the poorest 40 per cent of thepopulation over the average consumption for all thepopulation. If this indicator increases over time, it will
contribute to meeting Target 10.1 of the SustainableDevelopment Goals: “By 2030, progressively achieve andsustain income growth of the bottom 40 per cent ofthe population at a rate higher than the nationalaverage.” Changes in this indicator between the early1990s and the early 2000s are shown in Figure 1.6,confirming the finding that inequality increased mostsharply in the region’s most populous countries – China,India and Indonesia. Overall, the ratio of the averageconsumption of the bottom 40 per cent of thepopulation over the average consumption for the wholepopulation declined from 50.3 per cent to 48 per cent.Nevertheless, inequality decreased significantly in someNorth and Central Asian countries, consistently with thefindings shown in Figures 1.3 and 1.4.
A feature of interest in Figure 1.6 is that data for China,India and Indonesia are broken down for the urban andrural populations. In China and India, inequalityincreased more in urban areas than in rural areas, butthe opposite is true for Indonesia.
It is also possible to use the Lorenz curve to illustratethe distribution of income or consumption in a countryor region. Figure 1.7 shows two Lorenz curves for percapita household consumption in Asia and the Pacific,one for the early 1990s and another for the early 2010s.The vertical axis shows the cumulative share ofconsumption, and the horizontal axis shows thatcumulative share of population. Both the horizontal andvertical axes are normalized between 0 and 100.Because the curves are constructed using data onhousehold consumption per capita by decile from 20Asia-Pacific countries, they reflect both within- andbetween-country inequality.
Figure 1.5 Inequality, gross versus disposable income, in selected countries, 2014 or latest available years
Source: ESCAP, based on OECD Income Distribution Database, available from http://www.oecd.org/social/income-distribution-database.htm (accessed9 March 2018).
ChinaIndia
Russian Federatio
n
Republic of K
orea
TurkeyJa
pan
Australia
New Zealand
Netherla
nds
United States
United Kingdom
France
Gin
i co
effic
ien
t60
50
40
30
20
10
0
Gross Net
54.8
51.4
50.8
49.5
48.5
37.6
34.1
29.5
42.9
40.4
48.8
33.0
48.3
33.7
46.2
34.9
45.7
30.3
50.6
39.0
52.0
36.0
51.6
29.5

INEQUALITY IN ASIA AND THE PACIFIC14
The Gini coefficient can be estimated from a Lorenzcurve as the ratio of the area between the 45-degreeline and the blue or orange line in the figure (area A inthe figure) and the total area between the 45-degreeline and the horizontal axis (areas A + B in the figure).16
The Gini coefficients calculated from the Lorenz curvesin Figure 1.7 are 44.7 for the early 1990s and 46.6 forthe early 2010s.
Another advantage of estimating Lorenz curves fordifferent periods is that they provide information onchanges in inequality for different segments of thepopulation. For instance, in Figure 1.7, the two curvescross at around the 85th consumption percentile. Belowthat threshold, the early 2010s curve is below the early1990s curve. This means that inequality rose for thepoorest 85 per cent of the population, but it declinedfor the richest 15 per cent of the population. Thispattern reflects the rapid rise in purchasing power ofricher segments of the population in large countries.
100
90
80
70
60
50
40
30
20
10
00 10 20 30 40 50 60 70 80 90 100
A
B
1995 2013 45-degree line
Source: ESCAP based on data from World Bank’s PovcalNet database.Notes: The curve was obtained by combining data on consumption per decilefor 20 countries of the region representing 90 percent of the population. Threeof them, China, India and Indonesia, have consumption decile data for both ruraland urban populations. The data for all countries is adjusted for country differencesin purchasing power using PPP exchange rates. Data for the early 1990s and theearly 2010s for each country are based on the most recent Gini coefficientavailable, respectively, for 1990-1996 and 2010-2016. The Gini coefficient isdefined as the ratio of the area A over the area (A + B) in the figure.
Figure 1.7 Lorenz curves for per capita householdconsumption in the Asia-Pacific region, early1990s and early 2010s
Figure 1.6 Changes in the ratio of average consumption of the bottom 40 per cent to the average totalconsumption in the Asia-Pacific region, early 1990s and early 2010s
Source: ESCAP based on data from World Bank’s PovcalNet database.Notes: Three countries, China, India and Indonesia, have separate data for rural and urban populations. They are noted in red. Data for the early 1990sand the early 2010s for each country are based on the most recent Gini coefficient available, respectively, for 1990-1996 and 2010-2016.
China – Urban
China – Rural
Indonesia – Rural
Indonesia – Urban
India – Urban
India – Rural
Nepal
Sri Lanka
Lao PDR
Georgia
Viet Nam
Bangladesh
Turkey
Mongolia
Philippines
Pakistan
Thailand
Azerbaijan
Iran (Islamic Republic of )
Russian Federation
Kazakhstan
Kyrgyzstan
Increasedinequality
Decreasedinequality
-12 -8 -4 0 4 8 12 16 20 24 28 32
Percentage points
15INEQUALITY IN ASIA AND THE PACIFIC
1.2.2 Trends in between-country incomeinequality
To further explore changes in inequality amongcountries, Figure 1.8 shows three Lorenz curves basedon gross national income (GNI) per capita in currentUS dollars for three years: 1995, 2005 and 2015. TheseLorenz curves capture exclusively the between-countrydimension of inequality in the region because theirconstruction assumes that all persons in a countryearn the average income in that country.17 The Ginicoefficients based on these Lorenz curves show a cleardecline in overall between-country inequality, from48.3 in 1995 to 43.5 in 2005 and 39.5 in 2015.However, a closer look at the lower half of thedistribution, below the 65th percentile, reveals anincrease in inequality between 2005 and 2015, as theLorenz curve for the latter year is lower. In contrast, the2015 curve is higher than both the 1995 and the 2005curves above the 65th percentile. This means that all thereduction of between-country inequality in the regionis entirely due to a less concentrated distribution ofincome in the top third of it. These results are consistentwith those presented in Figure 1.6 and are largelyexplained by the rise of the middle class in China overthe last two decades.
inequality at the top third of the distribution. However,other low- and low-middle-income countries grew at amuch slower pace than China, especially during the pastdecade. This explains the worsening of the incomedistribution at the bottom two-thirds of the distribution.
1.2.3 Trends in wealth inequality
Besides income and consumption, inequality can also bemeasured on the basis of wealth. Income and wealthinequality are related and reinforce each other. Increasesin income inequality tend to lead to even larger increasesin wealth inequality because wealth is based on theaccumulation of past savings and because the richtypically save more than the poor. Concentration ofwealth, in turn, can lead to a disproportionate politicalinfluence of the rich in policymaking, reducing thelikelihood of adopting policies such as taxation or socialsecurity to mitigate inequalities. Thus, wealth inequalitycan contribute to perpetuating income inequality.
Although systematic data on wealth inequality arescarce, some clues can be obtained through publiclyavailable information on the net worth of the world’sbillionaires. Forbes’ billionaires list, for instance, showsthat the aggregate net worth of the world’s 2,043billionaires for which information is available amountedto US$7.7 trillion in 2017. 18 This is well above the totalgross domestic product of the world’s least developedcountries, landlocked developing and small islanddeveloping states in 2017. These data also show thatin several countries in the Asia-Pacific region, thebillionaires’ combined net worth amounted to morethan half of those nations’ entire economic output (GDP)in 2017. Figure 1.9 shows that Asia and the Pacific hasmore billionaires (846 in 2017) than any other region,with an aggregate net worth second only to that ofbillionaires in the United States. In 2017, their combinednet worth of more than US$2.5 trillion was more thanseven times higher than the combined economic outputof the region’s least developed countries.
Research by Thomas Piketty and his collaborators isfeeding into new and hopefully more accurate measuresof wealth and income inequality, based on combineddata from national accounts, survey data, fiscal data andwealth rankings. Figure 1.10 shows the share of totalnational income accounted for by the top 10 per centof earners in three large Asia-Pacific countries in 2016.
Of the three Asia-Pacific countries shown, India is themost unequal, with the top 10 per cent of earnersreceiving 54.2 per cent of the total national income. Thefigures for Africa and Brazil are similar (54 and 55 percent respectively). In the Russian Federation, the shareof the top 10 per cent of earners is 45.5 per cent, slightlybelow the United States and Canada (47 per cent). In
Figure 1.8 Lorenz curves for GNI per capita,Asia-Pacific region developing countries, 1995,2005 and 2015
Source: ESCAP based on data from United Nations’ National AccountsMain Aggregates database.Notes: The figure excludes high-income economies with per capita GNIof US$15,000 or more in 1995: Australia; Brunei Darussalam; FrenchPolynesia; Hong Kong, China; Japan; Macao, China; New Caledonia; NewZealand; and Singapore.
100
90
80
70
60
50
40
30
20
10
00 10 20 30 40 50 60 70 80 90 100
1995 2005 45-degree line 2015
In 1995 China was a low-income country, with a GNIper capita of US$585. Ten years later it had more thantripled to US$1,735 per capita, and by 2015 it hadsoared to US$8,000. This shift of hundreds of millionsof people from low-income to high- and middle-incomestatus explains the reduction of between-country

INEQUALITY IN ASIA AND THE PACIFIC16
China the top 10 per cent of earners received 41.4 percent of total income, exceeding the 37 per cent receivedby the top 10 per cent of earners in Europe.19
among countries into 1) the share of the componentsof GDP per capita and 2) changes in inequality withineach component (See Annex 1.2 for details). The analysisis conducted year-by-year between 1990 and 2015.
First, the impact of the three productive sectors,agriculture, manufacturing and services, on incomeinequality among countries, as measured by GDP percapita, is examined. While the share of themanufacturing sector in the GDP grew from 18.5 percent in 2000 to 23.6 per cent in 2015, the share of theagriculture sector in GDP remained at about 7 per cent,on average, in the period. The service sector thereforeaccounts for the bulk of the region’s GDP.
The findings indicate that the services sector accountedfor more than half of the total income inequalitythroughout the period of analysis (Figure 1.11). Thecontribution of both services and industry to inequalityhas declined over time, while the contribution of theagricultural sector to inequality was negligible during theperiod of analysis. This suggests that the services sectoris the dominant driver of between-country inequality inthe Asia-Pacific region.
Next, we examine the impact on GDP per capitainequality of its demand-side components: privateconsumption, government spending, investment and netexports. In recent years, GDP growth has relied moreon domestic demand because of weakening global tradeand investment flows. Between 2000 and 2015 privateconsumption was the dominant component of
Figure 1.9 Comparing billionaires’ net worth in Asia-Pacific and other regions, 2017
Source: ESCAP, based on Forbes online (accessed on 9 January 2018).
Africa Western Asia Latin America and the
Caribbean
Europe Asia-Pacific North America
No. of Billionaires Net worth Billion ($)
3 500
3 000
2 500
2 000
1 500
1 000
500
0
Nu
mb
ers
15 58 38 117 89
378 451
1 712
846
2 513
604
2 888
Figure 1.10 Top 10 per cent share of nationalincome, China, India, the Russian Federation andother major economies, 2016
Source: ESCAP, based on World Inequality Report 2018.
China RussianFederation
India Europe US-Canada
Africa Brazil Middle-East
Perc
enta
ge
of n
atio
nal
inco
me
70
60
50
40
30
20
10
0
41.445.5
54.2
37.0
47.0
54.0 55.0
61.0
1.3 A DISAGGREGATED ANALYSIS OFBETWEEN-COUNTRY INCOME INEQUALITY
In the previous section, we found that between-countryinequality has fallen over the past 20 years in theAsia-Pacific region. This section explores the reasons forthis reduction by considering the role of structural andlong-run changes, both in the structure of productionand that of aggregate demand. The methodologydisaggregates changes in inequality in GDP per capita

17INEQUALITY IN ASIA AND THE PACIFIC
aggregate demand, representing around half of thetotal, followed by investment, which contributed morethan one-third of GDP (Figure 1.12).
The analysis shows that private consumption is thedominant contributor to GDP per capita inequality fromthe demand side – on average it accounted for nearlyhalf of income inequality in 1990-2015. The secondlargest contributor is investment, which accounted foraround 37 per cent of income inequality. While thecontribution of consumption to inequality has declinedmarkedly, the contribution of investment decreased from1990 to 2007 and then displayed a rising trend.Government spending is the third largest contributor toinequality – it increased from 12 per cent in 1990 to18 per cent in 2015. Finally, the contribution of netexports has been quite small, averaging about 4 per centover the past two decades.
1.4 DRIVERS OF INCOME INEQUALITY
This section examines the role of various drivers ofincome inequality at the country level, including the wayaggregate income per capita is generated: the stock ofphysical capital, the skillset of the labour force, thesectoral composition of GDP, the use of fiscalinstruments, trade and global economic integration, thelevel of technology and environmental indicators.Furthermore, the analysis considers the impact ofgovernance and institutional frameworks, and tries toaccount for the possibility of capture of power byvested-interest groups and political elites, which canpotentially limit the implementation of policies to reduceincome inequality.20
The way aggregate income per capita is generated in acountry is a traditional determinant of income inequality.According to the Kuznets hypothesis, income inequalityrises in the early stages of industrialization as peopleleave the land, become more productive and earn morein factories. Once industrialization is complete, better-educated citizens demand redistribution and inequalityfalls, illustrated by the famous inverted U-shapedcurve.21 However, attributing rising income inequality toonly economic growth can be misleading because offactors that drive both economic growth and incomedistribution. For example, while globalization maypromote overall economic growth, it may also be acause of rising inequality in countries. The past 30 yearshas shown that the Kuznets curve no longer necessarilyholds sway – an upper-case N-shaped graph, oftenreferred to as the “elephant curve”, has become morecommon. Understanding this change requires takinginto account globalization-related measures such astrade, investment and technology.
The accumulation of physical capital or investment innew technology is associated with economic growth butmay also contribute to rising income inequality. Thereason, as argued by Piketty, is that capital accumulationis usually associated with a faster expansion of capitalincome compared with labour income, and the formeris more unequally distributed across the population thanthe latter.22 Furthermore, technological progress canlead to labour-saving production techniques, which canfeed into rising income inequality. Technologies such asthe internet and mobile phones can provide newopportunities for income-generating activities to a broadsegment of the population. These issues are furtherdiscussed in chapter 4. However, accessing theseopportunities requires access to these technologies aswell as a certain level of education, skills and trainingto take advantage of them, which, as discussed inchapter 2, cannot be taken for granted. In all, it isimportant that both capital accumulation andtechnological change be accounted for in the analysis.
Source: ESCAP.
Figure 1.11 Sector contributions to between-country income inequality in Asia-Pacific countries,1990-2015
19
90
19
91
19
92
19
93
19
94
19
95
19
96
19
97
19
98
19
99
20
00
20
01
20
02
20
03
20
04
20
05
20
06
20
07
20
08
20
09
20
10
20
11
20
12
20
13
20
14
20
15
Ind
ex v
alu
e
0.60
0.50
0.40
0.30
0.20
0.10
0
Service Industry Agriculture
Figure 1.12 Contribution of expenditurecomponents to between-country incomeinequality in Asia-Pacific countries, 1990-2015
Source: ESCAP.
Ind
ex v
alu
e
0.60
0.50
0.40
0.30
0.20
0.10
0
-0.10 19
90
19
91
19
92
19
93
19
94
19
95
19
96
19
97
19
98
19
99
20
00
20
01
20
02
20
03
20
04
20
05
20
06
20
07
20
08
20
09
20
10
20
11
20
12
20
13
20
14
20
15
Private consumption Government spending
Investment Net exports

INEQUALITY IN ASIA AND THE PACIFIC18
In addition, given the role of human capital in facilitatingaccess to opportunities arising from the disseminationof new technologies, an index of human capital needsto be considered.
As mentioned above, fiscal policy instruments, includingdirect taxes and transfers, play a very important role asa tool for redistributing income. In addition, tax revenue,from both direct and indirect taxes, provides a primarysource of financing of public expenditure on varioussocial services including education, health care andvocational training support. These investments enabledisadvantaged and marginalized groups in a society toimprove their skills and access better-paying jobs.Therefore, it is also necessary to account for fiscal policyin general and tax policy in particular in the analysis ofthe drivers of income inequality.
Environmental degradation, including pollution and thedepletion of the natural resource base, tend to have adisproportionately higher impact on the poor anddisadvantaged, thus exacerbating income inequality. Forexample, medical costs and lost days of work caused byhealth problems associated with particulate emissionscan affect disproportionately workers who work outsideor people who lack modern cooking facilities at home,who tend to be poor. In addition, the depletion of acountry’s natural capital can deprive farmers andfisherfolk from their sources of income, also leading toa worsening of income inequality.23 Environmentalindicators, which are further discussed in chapter 3, aretherefore included in the analysis.
Among the various other factors determining incomeinequality, the rule of law and good governance cannotbe overemphasized. Strong, efficient and transparentinstitutions are essential for maintaining environmentalstandards, tax collection and ensuring that basic publicservices are shared and delivered. These factors are thusalso considered in the analysis.
The empirical analysis is based on cross-country, time-series regressions, and the dependent variable is the Ginicoefficient. Further details on the variables, data sources,and results are included in Annex 1.3. The regressionresults seem to support the Kuznets hypothesis, withinequality initially growing and subsequently decreasingas per capita income grows - exhibiting the classicinverted U-shaped relationship.
The findings provide strong support for policies thatenhance human capital development as a means toreduce income inequality. The analysis also finds thatcapital accumulation, technological growth and tradeopenness all have significantly positive coefficients in theregressions, indicating that these factors havecontributed to an increase in income inequality, onaverage, in Asia and the Pacific.
Changes in the structure of production as the economiesof the region move from primary to secondary and/ortertiary sectors – captured by the ratio of manufacturingvalue added to agriculture value added – contribute todecreasing income inequality. This can be explained bythe so-called Lewis model of development economics,where labour shifts from agriculture to manufacturing.24
Initially, this process leads to rising income inequalitybecause the supply of agricultural labour is very largeand real wages are close to subsistence. However, asmore and more opportunities arise in the manufacturingor service sectors, labour becomes scarce and wagesstart to rise, with a related fall in inequality.
The analysis suggests fiscal policies may not initially beeffective but that they may help reduce incomeinequality above a certain threshold. This could reflectthe substantial investment required to expand access tohigh quality education and health services.
The empirical evidence further shows that environmentaldamage, measured as airborne pollution, has aU-shaped relationship with income inequality. At lowlevels of pollution, its increases are associated withdecreases in inequality, but at higher levels, they areassociated with increases in the level of inequality.Reducing pollution benefits both health and inequality.In addition, the analysis shows that there is a negativeassociation between the stock of natural capital andincome inequality, supporting the hypothesis that thedepletion of a country’s natural capital has adverseconsequences for low-income economic groups such asfarming and fishing communities.
Finally, two measures of governance considered in theanalysis, i.e. political stability and regulatory quality, havea statistically significant inverted-U relation with the Ginicoefficient, meaning that inequality increases at lowlevels of these measures but decreases at high levels.This result is similar to the finding that tax revenuescontribute to reducing inequality only at high levels oftax revenues. They suggest that only at high levels ofregulatory quality and political stability furtherimprovements in these governance indicators cancontribute to decreasing inequality.
1.5 COSTS OF INCOME INEQUALITY
High and persistent income and wealth inequalities stifleeconomic growth and progress towards furtherreduction in poverty. The economic cost of ignoringincome inequality is large and significant. A burgeoningnumber of studies suggests that countries with highincome inequality may experience both lower economicgrowth and a reduced effectiveness of economic growthin lifting people out of poverty.25 This section reviewsthe literature on the impact of income inequality on GDP
19INEQUALITY IN ASIA AND THE PACIFIC
per capita and poverty reduction and presents newempirical evidence for Asia and the Pacific based oncross-country, time-series regression analyses.
1.5.1 Inequality and growth
Barro (2000) suggests three reasons why inequality cannegatively impact economic growth. First,underdeveloped capital markets constrain investment byentrepreneurs with limited income and wealth. In thiscontext, the more unequally distributed income andwealth are, the less opportunities people will have toinvest in entrepreneurial activities, limiting economicgrowth.26 Second, high inequality may lead to politicalpressures for the implementation of populistredistributive policies, which may lead to macroeconomicinstability and adversely affect investment.27 Third, high-levels of income inequality may result in an increase incriminal activities and political unrest, reducing incentivesfor investment.28 More recently, Rajan (2010) andAcemoglu (2011) suggested that income inequality mayalso adversely affect economic growth by increasingthe likelihood of financial crises in the event ofloose monetary and regulatory policies leading toover-indebtedness of low-income, credit-constrainedhouseholds.
High and persistent income inequality may lead toequally high and persistent inequality of opportunities,as discussed in chapter 2. For instance, De La Croix andDoepke (2004) find that income inequality reducesinvestment in human capital and increases the fertilityrate among the poor. Evidence from various countrystudies in the Asia-Pacific region indicates that risingincome inequality impairs both the quantity and thequality of education of individuals living in poorhouseholds and adversely affects intergenerationalmobility.29The strong relationship between inequality ofoutcomes and inequality of opportunities can beexplained by the power held by economic elites in highlyunequal societies, which tend to oppose expanding theprovision of public goods.30 This may further intensifyincome inequality because the poor tend to benefit morethan the rich from public goods provision.31
With regards to recent econometric evidence, Dabla-Norris and others (2015) investigate the effect of anincrease in the shares of different income quintiles oneconomic growth. They find that while a 1 percentagepoint increase in the income share of the top 20 percent is associated with a lower GDP growth by 0.08percentage points in the following five years, a1 percentage point increase in the income share of thebottom 20 percent leads to a 0.38 percentage point risein economic growth. Cingano (2014) comes to a similar
conclusion, arguing that income inequality has anegative and statistically significant effect on subsequentgrowth prospects.32
The adverse impact of inequality on economic growthis confirmed in the regression results reported in Annex 1.4. The estimates of the Gini coefficient in theregressions are significantly negative. It suggests thata 1 percentage point increase in the Gini coefficientreduces the GDP per capita, on average, by US$154 forthe countries in Asia and the Pacific region. Thisstatistical relationship is robust to different specificationsof the regression model.
While the adverse impact of inequality on economicgrowth is an important reason on itself to promotepolicies to reduce inequality, lower economic growthalso harms efforts to reduce poverty. Countries are mostsuccessful in reducing income poverty when theygenerate earnings opportunities through the expansionof employment and businesses for those at the bottomof the income distribution.33 The inequality-povertynexus is further discussed below.
1.5.2 Inequality and poverty
The growth-poverty-inequality nexus has been studiedby Bourguignon (2004) and others. An important resultis that if economic growth is held constant, povertyreduction is negatively affected by increases ininequality.34 Understanding this relationship is importantfor assessing the prospects and pace of povertyreduction in the region.
Following a methodology proposed by Zhang and Wan(2006) described in Annex 1.5, we estimate the impactof changes in inequality on extreme poverty in 24selected countries between 1990 and 2014. We findthat in ten countries of the region for which inequalityincreased over the period studied – Bangladesh, China,India, Indonesia, Lao People’s Democratic Republic,Republic of Korea, Singapore, Sri Lanka, Tajikistan andViet Nam – an additional 153 million, representing about5 per cent of their combined population, could havebeen lifted out of poverty if inequality had not increased.On the other hand, in 14 countries – Armenia,Azerbaijan, Bhutan, Islamic Republic of Iran, Kazakhstan,Kyrgyzstan, Malaysia, Mongolia, Nepal, Pakistan,Philippines, Russian Federation, Thailand, and Turkey –in which income inequality declined during the period,the improvement in income distribution helped14 million people come out of extreme poverty. In sum,the region could have at least lifted around 139 millionpeople out of poverty if inequality had not changedduring the past decade (Figure 1.13).

INEQUALITY IN ASIA AND THE PACIFIC20
Paki
stan
Russ
ian
Fed
erat
ion
Thai
lan
d
Kyrg
yzst
an
Iran
(Isl
amic
Rep
ub
lic o
f)
Nep
al
Aze
rbai
jan
Turk
ey
Kaz
akh
stan
Phili
pp
ines
Mal
aysi
a
Arm
enia
Bh
uta
n
Mo
ng
olia
Sin
gap
ore
Rep
ub
lic o
f Ko
rea
Tajik
ista
n
Lao
PD
R
Sri L
anka
Vie
t N
am
Ban
gla
des
h
Ind
on
esia
Ind
ia
Ch
ina
140
120
100
80
60
40
20
0
-20
-40
Pop
ula
tio
ns
in m
illio
ns
Increase Decrease Total
1.6 CONCLUSIONS AND RECOMMENDATIONS
This chapter had set out to better understand the trendsof income and wealth inequality in the Asia-Pacificregion. It has also examined the sources of regionalincome inequality at the disaggregated level.Furthermore, the discussion explored ways to illustratethe various drivers of the income inequality, along withimplications for growth and extreme poverty during thepast two decades.
Income and wealth inequality are growing andremain at an all-time high in the Asia-Pacific region
• Measured by the population-weighted marketincome Gini coefficient, the region’s averageinequality increased from 32.7 in the early 1990s to38.1 in the early 2010s.
• In China, India and the Russian Federation, threemajor developing countries that constitute 62 percent of the regional population, the top 10 per centof the population accounts for 47 per cent of theirnational income, on average.
Economic growth has not been inclusive, leavingmillions of people in a disadvantaged andprecarious situation
• The ratio of the average consumption of the poorest40 per cent of the population over the average
consumption for the whole population droppedfrom 50.8 per cent to 48.5 per cent between 1995and 2013.
• In many of these countries, the increase in incomeinequality has been coupled with a higherconcentration of wealth among the already rich, orthe top 10 per cent of the population.
Income and wealth inequality vary acrosssubregions and countries
• Subregions presented a more mixed picture. WithinSouth and South-West Asia, inequality increased inBangladesh, India, Nepal and Sri Lanka anddecreased in the Islamic Republic of Iran, Pakistanand Turkey. Within South-East Asia, inequalityincreased in Indonesia, Lao People’s DemocraticRepublic and Viet Nam and decreased in Cambodia,Malaysia and Thailand.
• In China, India and Indonesia the Gini coefficientincreased by about 10, 8 and 4 percentage pointsrespectively over the past decade.
The services sector is a major contributor to incomeinequality across the countries in the region
• Evidence suggests that the service sector hasaccounted for more than half of total incomeinequality.
Figure 1.13 Poverty impact of income inequality, selected Asia-Pacific countries, 1990-2014
Source: ESCAP.

21INEQUALITY IN ASIA AND THE PACIFIC
• The industrial sector’s contribution to incomeinequality has declined, while the contribution of theagricultural sector has been negligible in the pasttwo decades.
Government policies to promote productiveinvestment, particularly in the least developedcountries, help to reduce regional incomeinequality
• Domestic private consumption accounted for nearlyhalf of income inequality on average, but itsproportion is falling. In 2015, the second largestcontributor (around 37 per cent) was investment.
Globalization played a role in increasing incomeinequality in the region
• While globalization may promote economic growth,it may also cause income inequality to rise at thecountry level.
• Policymakers need to account for the economy-wideimplications of unabated globalization-relatedpolicies on trade, investment and technology.
Governments need to significantly scale-upinvestment in education and skills and inenvironmental sustainability
• Public-sector investment in human capitaldevelopment, along with health and labour-marketinstitutions are critical policy tools.
To finance the above investments, governmentsneed to mobilize significantly larger fiscal resourcesand strengthen governance frameworks
• Initially, fiscal policies may not be effective inreducing income inequality, but after a thresholdlevel, higher tax revenue may help in reducingincome inequality. The same is also true in the caseof governance issues such as political stability andregulatory quality.
Reducing income inequality can play a pivotal rolein shaping inclusive economic growth
• A 1 percentage point increase in the Gini coefficientreduces GDP per capita, on average, by US$154 forcountries in the Asia-Pacific region.
• This potential loss is huge given that severaldeveloping and least developed countries in theregion already witnessed an increasing level ofincome inequality.
High levels of income and wealth inequality inhibitpoverty reduction efforts
• The Asia-Pacific region could have lifted around 153million more people out of poverty if incomeinequality had not increased in 10 countries duringthe past decade.
ENDNOTES1 The 2030 Agenda for Sustainable Development is available online from https://sustainabledevelopment.un.org/ post2015/transformingourworld.2 United Nations System Chief Executives Board for Coordination (2017).3 See, e.g. United Nations System Chief Executives Board for Coordination (2017); IMF (2017); World Bank (2018); UNDP (2013);ADB (2012); ESCAP (2015a).4 Different researchers have used different criteria to define the middle class. ESCAP (2016, p. 40), for instance, defines themiddle class as individuals with incomes of between US$10 and US$20 per day in international dollars of 2005 (US dollars of2005 adjusted for differences in purchasing power parity across countries). The share of the Asia-Pacific population that is middleclass remains small, but it is growing quickly. In China it increased from less than 1 per cent in 1993 to 20.6 per cent in 2012(ESCAP, 2016, p. 41).5 Yoshino and Helble (2016).6 Boushey, DeLong and Steinbaum (2017).7 Basu and Das (2012).8 The founders of four of the five companies mentioned in this sentence are among the top-20 world’s billionaires, with networth ranging between US$39 billion and US$112 billion. See www.forbes.com/billionaires/ list/ (accessed 7 March 2018).9 See Isgut and Weller (2016) for an analysis of recent experiences in Latin America and Asia in developing labour marketinstitutions for both TVET and unemployment protection.10 For clarity of exposition, the Gini coefficient is normalized to the 0-100 range in this report.

INEQUALITY IN ASIA AND THE PACIFIC22
11 The usual data source for income distribution measures, such as the Gini coefficient, is household surveys, which often donot capture high-income individuals thus underestimating inequality. Recent research by Thomas Piketty and his collaboratorsis attempting to overcome the limitations of household surveys through the World Wealth and Income Database by combiningdifferent data sources, such as national accounts, survey data, fiscal data, and wealth rankings, to obtain more accurate measuresof inequality. See http://wid.world/.12 See Basu (2017).13 In 2015, the population of China, India, Indonesia and Bangladesh was 3.1 billion, compared with a population of 4.4 billionfor the whole Asia-Pacific region.14 See, e.g. Ivaschenko (2002); Slay (2009).15 For further argumentation along these lines, see ESCAP and Oxfam (2017).16 If the distribution was totally equal, the Lorenz curve would coincide with the 45-degree line and the Gini coefficient wouldbe 0. If the distribution was totally unequal, with only one individual receiving all the income or consumption and the restreceiving nothing, the Lorenz curve would coincide with the horizontal axis and join vertically the 45-degree line for the richestindividual, in which case the Gini coefficient would be 1.17 This assumption is required due to the lack of distributional data for GNI in most countries. The lack of within-countrydistributional data implies that these Lorenz curves capture only income inequality between countries.18 Available from: http://www.forbes.com/billionaires/list/.19 World Inequality Lab (2018, p. 12).20 The importance of governance and institutional factors in explaining inequality was highlighted, among others, by Stiglitz(2012); DESA (2016a); and UNESCO (2016).21 See Kuznets (1955).22 See, e.g. Piketty (2014).23 See chapter 3 for further analysis on this topic.24 Lewis (1954).25 See ESCAP (2015a).26 See Galor and Zeira (1993) and Fishman and Simhon (2002)27 See Alesina and Rodrik (1994). Similarly, Berg and Ostry (2011) find that while increased income inequality may shorten theduration of economic growth spurts, poorly designed efforts to lower inequality could distort incentives and undermine economicgrowth.28 See Gupta (1990).29 See, e.g. the studies included in Kanbur, Rhee and Zhuang (2014).30 See for instance, ESCAP (2013).31 See, e.g. Bourguignon and Dessus (2009); World Bank (2018); ESCAP, ADB and UNDP (2013; 2017).32 Wan, Lu and Chen (2006).33 ESCAP (2015b; 2017b).34 See also Banerjee and Duflo (2003).

23INEQUALITY IN ASIA AND THE PACIFIC

INEQUALITY IN ASIA AND THE PACIFIC24
Chapter 2
Addressing Inequality ofOpportunity in Asia andthe Pacific

25INEQUALITY IN ASIA AND THE PACIFIC
While the aggregate costs of inequality ofoutcome can be high, the impact ofinequality is perhaps more corrosive at the
individual or the household level. So far, research andheadlines on inequality have emphasized the mostglaring contrasts: the lavish lives of billionaires comparedwith the uncertainty, stagnant wages and exploitationthat are often experienced by the poorest people insociety. Global analysts have tended to overlook theimpact of income and wealth inequality on accessingbasic opportunities, including quality education andhealth care, meaningful work and decent livingconditions.
Inequality in access to opportunities has gone particularlyunnoticed in the fast-growing economies of the Asia-Pacific region, where many people have been able toimprove their quality of life. There are more schools andhealth clinics than ever, water supplies and treatmentworks have come on stream and electricity grids andtelecommunications systems have sprouted. TheMillennium Development Goals (MDGs) played their partin broadening access to essential services, but many ofthese achievements were not been evenly distributed.
Inclusion is at the core of the 2030 Agenda forSustainable Development, reflected in the pledge toleave no one behind and in the vision of a “just,equitable, tolerant, open and socially inclusive world inwhich the needs of the most vulnerable are met.” Thischapter goes beyond the debate of an ideal level ofincome or wealth and examines the extent to whichpeople from different circumstances and backgroundsacross the Asia-Pacific region have equal chances to fulfiltheir potential.
The chapter begins by exploring the levels of inequalityof opportunity people in Asia and the Pacific face onaggregate levels and how each of the opportunitiespresented is linked to the Agenda for SustainableDevelopment. It measures inequality of opportunityusing the dissimilarity index (D-index), which allows acomparison of inequality levels among countries as wellas a further decomposition of the observed inequalityinto those circumstances that contribute mostly to it.
The analysis then delves deeper to determine thosehouseholds and individuals that lack access toopportunities. Using an algorithm that produces country-and opportunity-specific classification trees for21 countries in the Asia-Pacific region, it reveals thecircumstances shared by those most disadvantaged andthe most advantaged groups in each country. Thechapter concludes by discussing trends and whetherpolicies have been effective in influencing access toopportunity.

INEQUALITY IN ASIA AND THE PACIFIC26
2.1 WHAT DOES INEQUALITY OFOPPORTUNITY MEAN IN THE CONTEXTOF THE 2030 AGENDA?
Inequality of opportunity is concerned with access tokey dimensions necessary for meeting aspirationsregarding quality of life. It has economic dimensions(e.g. unequal access to decent work, financial services,land ownership, etc.), social dimensions (e.g. unequalaccess to health care, education, nutrition, etc.) andenvironmental dimensions (e.g. unequal access to water,sanitation, clean fuels, electricity, access to land andnatural resources, etc.).
To gain an understanding of inequality of opportunityacross the Asia-Pacific region, 14 categories or indicatorshave been selected that encompass basic, yet criticalopportunities for individuals and households. The eightindicators of opportunities for individuals are: secondaryeducation, higher education, modern contraceptives,professional help during childbirth, decent work and(absence of) stunting, wasting and overweight amongchildren. The five indicators of opportunities forhouseholds are: access to basic drinking water, basicsanitation, electricity and clean fuels, and ownership ofa bank account. To summarize the opportunities forhouseholds, an additional indicator combines these fivecategories.
Inequality of opportunity is here defined as the gaps inaccess to each of these opportunities that depend oncircumstances beyond a person’s control. The conceptof inequality of opportunity has previously been usedto distinguish between personal responsibility andcircumstances for economic outcomes in life. Thephilosophical foundations of this approach to incomedistribution lie in the work of John Rawls and AmartyaSen. Rawls was among the first modern politicalphilosophers who articulated the importance ofbalancing personal liberties with distributive justice andfair options for all, arguing that public policy choicesshould focus on raising the welfare of the poorestpeople.1 Rawls argued that a set of primary goodsshould be made available for everyone, so that she orhe would be able to realize their life plan. Sen, later,argued that inequality could be re-examined from theperspective of human capability, looking at the meansrather than the ends of development, since withoutequal opportunity, equitable outcomes could not besecured.
Focusing on inequality of opportunity also serves asa reminder that inequality is not a static phenomenon,but rather is transmitted to children, creatingintergenerational inequality of opportunity traps thatreproduce and magnify income inequality.2 Inequality ofopportunity therefore combines issues of both equity
and efficiency. The equity argument calls for levellingthe playing field, in accordance with internationalagreements and with established human rights. Theefficiency argument motivates policymaking thatequalizes opportunities at the top level, meaning thateveryone should have access, rather than reducingaccess for those who already have it.3
Target 10.3 of SDG 10 calls for ensuring equalopportunity and reducing inequalities of outcome,including by eliminating discriminatory laws, policies andpractices and promoting appropriate legislation, policiesand action. Officially reported numbers of incidents ofdiscrimination may underestimate the real experience ofthose most marginalized. Reported data may also notreveal the daily experience of women, men and childrenwho lack access to basic opportunities because ofentrenched poverty and institutional failure.
Target 10.3, however, is not the only one in the 2030Agenda that relates to inequality of opportunity. Theindictors of opportunities presented in this chapter referto specific SDGs and most of them also directly respondto established indicators. Of them, five are examined indetail: secondary educational attainment, stuntingamong children (used as a proxy for adequate nutrition),professional help during childbirth, full-time employment(used as a proxy for decent work in developing countrycontexts) and a group of basic household services(Table 2.1). To identify the patterns of advantage ordisadvantage, we have referred to data available inDemographic and Health Surveys (DHS) and MultipleIndicator Cluster Surveys (MICS) and the latest WorldGallup Survey.
2.2 WHY INEQUALITY IN ACCESS TOOPPORTUNITIES MATTERS
Equity in opportunity can be described as a level playingfield on which all households enjoy the same access tobasic services, such as clean water, sanitation, electricityand clean fuels; where all children have adequatenutritious food and complete education; where everyonehas access to health care services when needed, ataffordable prices; and where those who want to workcan find a decent job. These rights are enshrined invarious Conventions of the United Nations, including theConvention on the Rights of the Child, the Conventionon the Rights of Persons with Disabilities and, certainly,the Universal Declaration of Human Rights. They are alsoenshrined in Constitutions and other legislation acrossthe region and are what drove leaders of 193 countriesto adopt the SDGs in 2015.
Although the Asia-Pacific region has experiencedsignificant advances in many development indicators, theplaying field is not levelled. Enrolment rates in primary

27INEQUALITY IN ASIA AND THE PACIFIC
Note: For all opportunities, except No. 8 (full-time employment) the data used are from DHS and MICS, earliest and latest surveys available (36 surveys in total), while foropportunity No. 8 the data used are from the Gallup World Poll, latest year.Note 2: In orange are those opportunities that are the focus of this chapter.Note 3:For opportunity 8, which is based on a different survey, the person’s place in the wealth distribution was not used for the analysis. Marital status (divorced, married,separated, single) was used as an additional circumstance (not as a replacement for wealth).
Table 2.1 Links between opportunities, circumstances and the SDGs
Opportunity Circumstances used to determine groups of the furthest behind/ahead Closest SDG indicator reference
Wealth: Residence: Education: Sex: Children:Age:
OpportunitySurvey Reference group
Bottom 40- Urban- No/Primary- Male- Yes-No,15-24,
Related SDG Indicatorused in survey
Top 60* Rural Secondery-Higher Female Number25-49,50-64
1 Secondary DHS/ Household Wealth Residence n/a Woman/ n/a n/a 4.1.1 Proportion of children and young people:education MICS member Man (a) in grades 2/3; (b) at the end of primary; and
aged 20-35 (c) at the end of lower secondary achieving atleast a minimum proficiency level in (i) readingand (ii) mathematics, by sex
2 Higher education DHS/ Household Wealth Residence n/a Woman/ n/a n/a 4.3.1 Participation rate of youth and adults inMICS member Man formal and non-formal education and training in
aged 25-35 the previous 12 months, by sex
3 Stunting DHS/ Child aged 0-5 Wealth Residence Mother’s Boy/Girl Number of n/a 2.2.1 Prevalence of stunting (height for age <-2MICS who has been Education children <5 standard deviation from the median of the
measured World Health Organization (WHO) Child GrowthStandards) among children under 5 years of age
4 Overweight DHS/ Child aged 0-5 Wealth Residence Mother’s Boy/Girl Number of n/a 2.2.2 Prevalence of malnutrition (weight forMICS who has been Education children <5 height >+2 or <-2 standard deviation from the
measured median of the WHO Child Growth Standards)among children under 5 years of age, by type(wasting and overweight)
5 Wasting DHS/ Child aged 0-5 Wealth Residence Mother’s Boy/Girl Number of n/a 2.2.2 Prevalence of malnutrition (weight forMICS who has been Education children <5 height >+2 or <-2 standard deviation from the
measured median of the WHO Child Growth Standards)among children under 5 years of age, by type(wasting and overweight)
6 Use of modern DHS/ Women between Wealth Residence Respondee’s n/a Number of 15-24, 3.7.1 Proportion of women aged 15-49 yearscontraceptive MICS 15-49 currently education children <5 25-49 who have their need for family planning satisfied
in union with modern methods
7 Professional help DHS/ Women between Wealth Residence Respondee’s Number of 15-24, 3.1.2 Proportion of births attended by skilledin birth MICS 15-49 ever given education children <5 25-49 health personnel
birth in the last5 years
8 Full-time Gallup All men and Marital Residence Respondee’s Woman/ Have 15-24, 8.3.1 Proportion of informal employment in non-employment World women 15-64 status education Man children 25-49, agriculture employment, by sex (proxy)
Poll who are in the (see 50-64workforce Note 3)
9 Basic drinking DHS/ All households Wealth Residence Highest Education n/a n/a n/a 6.1.1 Proportion of population using safelywater MICS in household (hh) managed* drinking water services
10 Basic sanitation DHS/ All households Wealth Residence Highest Education n/a n/a n/a 6.2.1 Proportion of population using safelyservices MICS in hh managed* sanitation services, including
a hand-washing facility with soap and water
11 Electricity DHS/ All households Wealth Residence Highest Education n/a n/a n/a 7.1.1 Proportion of population with access toMICS in hh electricity
12 Clean fuels DHS/ All households Wealth Residence Highest Education n/a n/a n/a 7.1.2 Proportion of population with primaryMICS in hh reliance on clean fuels and technology
13 Bank account DHS/ All households Wealth Residence Highest Education n/a n/a n/a 8.10.2 Proportion of adults (15 years and older)MICS in hh with an account at a bank or other financial
institution or with a mobile money-serviceprovider
14 Household DHS/ All households Wealth Residence Highest Education n/a n/a n/a 1.4.1 Proportion of population livingservices MICS in hh in households with access to basic services(Opportunities9-13 combined)
education, for example, now average around 95 percent. But this achievement has been offset by lowattendance and high dropout rates in secondaryeducation in the region’s poorer countries. Netattendance in secondary education remains below 35per cent, for example, in Afghanistan, the SolomonIslands and Vanuatu (see Figure 2.1). Poorer householdsstruggle to keep their children in school because of thecosts or the potential loss of immediate income. In ruralareas the returns of an additional year of schooling tendto be low, especially for girls.
Inequality in access to education has a significant impacton the economic, social and environmental dimensionsof sustainable development. Fewer years spent in schoolwith lower-quality education not surprisingly affectproductivity and the potential for economic growth.Lower overall educational attainment in a household isalso linked to inequality in accessing other keyopportunities including adequate nutrition for children,clean water and basic sanitation, clean fuels andelectricity.4

INEQUALITY IN ASIA AND THE PACIFIC28
Inequality in access to health care is also damaging fromboth an equity and an efficiency perspective. Yet, thereis ample evidence of persisting health-care-relatedinequalities across the Asia-Pacific region. One exampleis the proportion of births attended by skilled personnel,a critical factor for reducing neonatal and maternalmortality. The divide in skilled birth attendance betweenrich and poor segments within many countries isenormous, although there is a much lower variationamong wealthier groups between countries (Figure 2.2).The richest citizens in all countries, with the exceptionof Timor-Leste, enjoy a similarly high level of access toskilled personnel when giving birth. Conversely, thepoorest citizens have the lowest level of access to skilledpersonnel when giving birth. Armenia, Kazakhstan andUzbekistan are exceptions, where nearly all births areattended by skilled personnel.
Inequality in access to health care often has long-termhealth implications for women and children, with anegative impact on educational attainment and futurelabour force participation rates. Improvements inreproductive health services are associated with reducedfertility rates among poorer women, which, in turn, notonly increase their chances of survival, but may alsoboost their earning potential.5 Inequality in access tohealth care can also have a broader economic impact.As health-care costs and out-of-pocket health-related
expenditures are particularly high in the Asia-Pacificregion, families tend to save to guard against the riskof unexpected or unplanned needs.6 This higher savingsrate can result in lower domestic consumption andslower economic growth.
Being excluded from basic household services can exacta high cost. For example, contaminated water and poorsanitation cause diarrhoea that, if untreated, can leadto long-term cognitive and developmental impacts andeven death through dehydration. The World HealthOrganization (WHO) has estimated that, in 2012,diarrhoea resulting from a lack of clean water and poorsanitation was responsible for more than 800,000deaths globally and for 1.5 per cent of the global burdenof disease.7 A lack of sanitation costs the world anestimated US$260 billion every year in terms of lowerproductivity, sickness and loss of revenue fromunrealized investment in sectors such as tourism.8
While substantial progress has been made across theAsia-Pacific region in the past two decades, access toimproved sanitation facilities remains low in rural areasof several countries. Fewer than 20 per cent of PapuaNew Guinea’s citizens, for example, have accessto improved sanitation facilities, and the figure islower than 40 per cent in Afghanistan, India, Kiribati,Papua New Guinea, Solomon Islands and Timor-Leste(Figure 2.3).
Figure 2.1 Secondary school attendance gaps in Asia-Pacific countries, latest year
Source: ESCAP, 2017. Sustainable Social Development in Asia and the Pacific: Towards a people-centred transformation.Note: Secondary net attendance ratio data were disaggregated by wealth quintiles and location of residence. For countries in the Asia and Pacific region,the most recent data were used.
Total Urban Rural Poorest Richest
Van
uat
uSo
lom
on
Isla
nd
sA
fgh
anis
tan
Paki
stan
Lao
PD
RC
amb
od
iaTi
mo
r-Le
ste
Ban
gla
des
hIn
dia
Bh
uta
nM
yan
mar
Kir
ibat
iSa
mo
aN
epal
Phili
pp
ines
Mal
div
esN
auru
Turk
eyIn
do
nes
iaTh
aila
nd
Ton
ga
Kaz
akh
stan
Aze
rbai
jan
Geo
rgia
Tajik
ista
nC
hin
aV
iet
Nam
Arm
enia
Kyrg
yzst
anM
on
go
liaTu
rkm
enis
tan
100
90
80
70
60
50
40
30
20
10
0
Net
att
end
ance
in s
eco
nd
ary
edu
cati
on
(%)

29INEQUALITY IN ASIA AND THE PACIFIC
Figure 2.2 Births attended by skilled personnel in Asia-Pacific countries, by wealth quintile
Source: ESCAP, 2017. Sustainable Social Development in Asia and the Pacific: Towards a people-centred transformation.Note: Data refers to the most recent year between 2003 and 2014.
Shar
e o
f bir
ths
(%)
100
80
60
40
20
0Q1 (poorest) Q2 Q3 Q4 Q5 (richest)
ARM/UZB/KAZ ARM/UZB/KAZ ARM/UZB/KAZ ARM/UZB/KAZ ARM/UZB/KAZ
IND LAOVUT
TLSNPL IND
LAO
NPLIND
LAO
VUT
TLS
NPL
IND
LAO
VUT
TLS
NPL
IND
LAO
VUT
TLS
NPL
VUT
TLS
Figure 2.3 Availability of improved sanitation facilities, Asia-Pacific region
Source: ESCAP, 2017. Sustainable Social Development in Asia and the Pacific: Towards a people-centred transformation.Note: Data refers to the most recent year between 2003 and 2014.
Shar
e o
f po
pu
lati
on
(%)
100
80
60
40
20
0
Total Urban Rural
Pap
ua
New
Gu
inea
Solo
mo
n Is
lan
ds
Afg
han
ista
nIn
dia
Kir
ibat
iTi
mo
r-Le
ste
Cam
bo
dia
Nep
alB
hu
tan
Mic
ron
esia
(Fed
erat
ed S
tate
s o
f)Va
nu
atu
Mo
ng
olia
Ban
gla
des
hIn
do
nes
iaPa
kist
anLa
o P
DR
Ru
ssia
n F
eder
atio
nPh
ilip
pin
esC
hin
aM
arsh
all I
slan
ds
Vie
t N
amM
yan
mar
Dem
ocr
atic
Peo
ple
’s R
epu
blic
of K
ore
aG
eorg
iaA
zerb
aija
nA
rmen
iaIr
an (I
slam
ic R
epu
blic
of)
Ton
ga
Fiji
Sam
oa
Thai
lan
dKy
rgyz
stan
Turk
eyTa
jikis
tan
Sri L
anka
Mal
aysi
aK
azak
hst
anM
ald
ives
Niu
eA
ust
ralia
Jap
an
Inequality in access to clean energy, i.e. electricity andclean fuels, also weighs on the efficiency of an economy.Households without electricity, for example, devote lesstime to study, work or leisure, which can result in feweropportunities for career development and earningpotential. As a result, inequality in access to electricityand clean fuels can create and reinforce inequality gapsin skills and productivity. It also perpetuates disparities
in health outcomes among and within countries.Burning dirty fuels affects air quality in homes and inthe community. Globally, indoor air pollution causesmore than 4 million deaths per year, more than half ofwhich occur in China and India alone.9 Despite economicprogress and greater awareness, close to half of allpeople in Asia and the Pacific still rely on traditional andinefficient fuels for cooking and heating.10 There are still

INEQUALITY IN ASIA AND THE PACIFIC30
marked gaps in access to electricity, notably in ruralareas of Papua New Guinea, Solomon Islands, Timor-Leste and Vanuatu (Figure 2.4).
Inequalities in access to services such as an electricitysupply, clean cooking fuels, drinking water andsanitation disproportionately affect women, who bearthe brunt of household work and caretaker tasks.11 Theyalso suffer more from the health consequencesassociated with indoor air pollution, while foregoing theopportunity to earn their own income.12
2.3 WHY AVERAGE PROGRESS IS NOT ENOUGH
The evidence is clear that a rising tide has so far failedto lift all boats. The remainder of this chapter will analysedata from three types of household surveys:Demographic and Health Surveys (DHS), MultipleIndicator Cluster Surveys (MICS) and the latest WorldGallup Survey, to better understand the circumstancesof those left behind in Asia-Pacific countries.
The D-index is a useful tool for measuring thedistribution of access to a certain opportunity acrosssocieties. It is calculated for 14 individual or household-based indicators of opportunities critical for humanwellbeing (Table 2.1): 1) attainment of secondaryeducation for 20-35 year-olds; 2) attainment of highereducation for 25-35 year-olds; 3) prevalence of stunting(0-5 year-olds); 4) prevalence of wasting (0-5 year-olds);5) prevalence of overweight (0-5 year-olds); 6) women’saccess to modern contraception; 7) women’s access to
professional help during childbirth; 8) access tofull-time employment;13 and 9) household’s accessto safe drinking water; 10) household’s access tobasic sanitation; 11) household’s access to electricity;12) household’s access to clean fuels; 13) household’sownership of a bank account; and 14) household’saccess to all of the basic services opportunities forhouseholds (9-13), or “multiple deprivation”.
The D-index measures how all population groups farein terms of access to a certain opportunity. For example,two countries with identical secondary educationattainment rates may have a different D-index if thedistribution of attainment in one country excludescertain groups. Like the Gini coefficient, the D-indextakes values from 0 to 1, 0 meaning no inequality, and1 maximum inequality (Annex 2.1). Unlike the Ginicoefficient, the ideal level of a D-index is 0, wherebyeveryone has access to an opportunity.
The highest D-indices are found in South and South-West Asia, followed closely by South-East Asia(Figure 2.5). In both subregions, the opportunities thatstand out as most unequally distributed are access toclean fuels, higher and secondary education andownership of a bank account. South-East Asia also hasthe highest average D-index for access to full-timeemployment, although there is no significant variationacross subregions. In East and North-East Asia, data forthe majority of opportunities are only available forMongolia, with safe sanitation the most unequallydistributed opportunity, followed by access to clean
Figure 2.4 Access to electricity, Asia-Pacific region
Source: ESCAP based on World Bank, Sustainable Energy for All Database, SE4ALL Global Tracking Framework, 2017.
100
80
60
40
20
0
Shar
e o
f po
pu
lati
on
(%)
Pap
ua
New
Gu
inea
Van
uat
uSo
lom
on
Isla
nd
sTi
mo
r-Le
ste
Kir
ibat
iM
yan
mar
Cam
bo
dia
Ban
gla
des
hM
icro
nes
ia (F
eder
ated
Sta
tes
of)
Lao
PD
RIn
dia
Nep
alW
orl
dM
on
go
liaPh
ilip
pin
esA
fgh
anis
tan
Mar
shal
l Isl
and
sSr
i Lan
kaTo
ng
aIn
do
nes
iaPa
kist
anSa
mo
aTu
valu
Vie
t N
amIr
an (I
slam
ic R
epu
blic
of)
Kyrg
yzst
anPa
lau
Tajik
ista
nU
zbek
ista
nTu
rkm
enis
tan
Turk
eyTh
aila
nd
Sin
gap
ore
Russ
ian
Fed
erat
ion
New
Zea
lan
dN
ew C
aled
on
iaM
ald
ives
Mac
ao, C
hin
aRe
pu
blic
of K
ore
aK
azak
hst
anJa
pan
Ho
ng
Ko
ng,
Ch
ina
Fiji
Ch
ina
Bru
nei
Dar
uss
alam
Bh
uta
nA
zerb
aija
nA
ust
ralia
Arm
enia
Total Urban Rural

31INEQUALITY IN ASIA AND THE PACIFIC
Figure 2.5 D-indices for 10 basic opportunities, by subregion
Source: ESCAP calculations using data from the latest Gallup, DHS and MICS surveys for countries in Asia-Pacific.Note: The closest a country is the to centre of the graph, the higher the D-index and higher the inequality. The furthest away from the centre, the lowerthe D-index and lower the inequality.Note 2: This figure only depicts selected average subregional D-Indices (covering 10 out of 14 opportunities) for clarity.
South and South-West Asia (SSWA)
North and Central Asia (NCA)
South-East Asia (SEA)
East and North-East Asia (Mongolia)
Pacific (Vanuatu)
Electricity
Clean Fuel
Bank Account
Clean Water
Basic Sanitation
Non-Stunting
Modern Contraception
SecondaryEducation
HigherEducation
Full-timeemployment
lowerinequality
0.00
0.10
0.20
0.30
0.40
0.50
0.60
0.70
fuels. In the Pacific, data were only available forVanuatu, where access to electricity and clean fuels wereparticularly unequally distributed.
Zooming further into each individual country, thesubregional messages are repeated. The most unequalopportunities are higher educational attainment andaccess to clean fuels, followed by ownership of a bankaccount (Table 2.2). The countries where inequality inaccess is large in a wide range of opportunities are:Afghanistan, Bhutan, Lao People’s Democratic Republic,Pakistan and Timor-Leste.
Lao People’s Democratic Republic has the highestinequality of all countries in three opportunities:professional help in childbirth, secondary and highereducational attainment. Timor-Leste also tops theinequality list for three opportunities: access to cleanfuels, ownership of a bank account and access tomodern contraceptives. Afghanistan exhibits the highestinequality in terms of access to full-time employmentand in access to clean water. Pakistan experiences thehighest inequality in terms of children’s nutrition(prevalence of stunting and wasting).
On the other hand, almost all North and Central-Asiancountries have low inequality in access to opportunities,thanks to a tradition of a large state that ensuresuniversal provision of basic services. Kazakhstan has the
lowest inequality in three opportunities (basic sanitation,non-stunted children and secondary education), andbelow-average inequality in all other opportunities.Turkmenistan is in a similar category, with the lowestinequality in terms of electricity and clean fuels access,as well as professional help during childbirth.
Averaging the D-indices for individuals and householdsby country confirms the patterns described earlier, butalso highlights which countries have relatively higherinequality across all opportunities (Figure 2.6). In additionto Afghanistan, Lao People’s Democratic Republic,Pakistan and Timor-Leste, which had the highestinequality in individual opportunities, Cambodia,Myanmar and Vanuatu also appear as particularlyunequal across the board of opportunities. At the otherend of the scale, Maldives and Thailand stand out,together with several North and Central Asian countriesas having achieved a relatively equal distribution ofopportunities across various population groups for mostopportunities. In the middle of the distribution are someof the region’s most rapidly developing countries,including India, Indonesia, Philippines and Viet Nam.India, in particular, made tremendous progress over thepast few years in achieving almost universal accessto financial services for all households (see Box 4.2in chapter 4), as well as in increasing women’s accessto professional help during childbirth (see Figure 2.17).

INEQUALITY IN ASIA AND THE PACIFIC32
Source: ESCAP calculations using data from the latest DHS and MICS surveys for countries in Asia-Pacific. Additional countries from the Gallup WorldPoll are not included as D-index was available for one opportunity only, “Full-time employment.”Note: The green light is given to the values that are in the lowest third (from zero to 33th percentile), yellow to the middle third (33-67th) and red forthe highest third. The split into percentiles is done based on all opportunities together, hence most of the Asia-Pacific countries listed here belong to thelowest third for child nutrition and to the highest third for education and employment. Additionally, the best and the worst performer in each opportunityare highlighted with green/red shading.
Table 2.2 Calculated D-indices for all opportunities, Asia-Pacific countries
Calculated D-indices
Afghanistan ArmeniaBangladeshBhutanCambodiaIndiaIndonesiaKazakhstanKyrgyzstanLao PDRMaldivesMongoliaMyanmarPakistanPhilippinesTajikistanThailandTimor-LesteTurkmenistan VanuatuViet Nam
Household-based Individual-based
EnergyFinancial inclusion WASH Multiple Child Nutrition (0-5 years) Women’s Health
(15-49 years)Education Employment
Country Electricity Clean fuels
Bank account
Basic drinking
water
Basic sanitation
Multiple deprivation
Not stunted
Not wasted
Not overweight
Professional help in
childbirth
Modern con-
traception
Secondary education
Higher education
Full-time employment
Figure 2.6 Average D-indices in Asia-Pacific countries, grouped by subregion
Source: ESCAP calculations using data from the latest DHS and MICS surveys for countries in Asia-Pacific.
0.400.350.300.250.200.150.100.05
0
Ave
rage
D-in
dex
Afg
hani
stan
Bang
lad
esh
Paki
stan
Bhut
an
Ind
ia
Mal
div
es
Tim
or-L
este
Lao
PDR
Cam
bod
ia
Mya
nmar
Ind
ones
ia
Phili
pp
ines
Vie
t Nam
Thai
land
Vanu
atu
Tajik
ista
n
Arm
enia
Kyrg
yzst
an
Turk
men
ista
n
Kaza
khst
an
Mon
golia
SSWA SEA NCAPacific ENEA
2.4 WHAT DRIVES INEQUALITY OFOPPORTUNITY…
The contribution of each of the circumstances toinequality measured in terms of the D-index can beestimated using a methodology called the Shapleydecomposition (Annex 2.2). The decomposition resultsshow that different circumstances weigh differently inshaping inequality for each opportunity and country,although common threads can be found. This sectionfirst reviews the drivers of inequality in three keyopportunities: secondary educational attainment, accessto adequate nutrition among children and access to
decent work. It then takes a bird’s-eye view to spot themost important drivers of inequality across all countriesand opportunities.14 Identifying these common driversreveals not only that inequality of opportunity is tightlylinked with inequality of outcome (wealth and income),but also that it is easily transmitted across generations.
2.4.1 …in stunting
Stunting in children is associated with poorer schoolperformance and lower future earnings potential. Thecircumstances that underpin observed inequality instunting levels among children vary.15 In 9 out of 18

33INEQUALITY IN ASIA AND THE PACIFIC
countries, the child’s household wealth status is whatdetermines most of the inequality (Figure 2.7). Amongthose countries, Lao People’s Democratic Republic andPakistan stand out as the countries with the highestinequality, as measured by the D-index. The second mostimportant circumstance is a mother’s education, which
is driving most of the inequality in 5 out of the 18countries. In three countries, Armenia, Kyrgyzstan andTurkmenistan, inequality is mostly associated with thesize of the household, and less so by wealth, residence,or the child’s sex.
Figure 2.7 Inequality in adequate nutrition among children (non-stunted) and its decomposition forselected countries, grouped by the most important circumstance in shaping inequality, latest year
Source: ESCAP, using data from the latest DHS and MICS surveys for Asia-Pacific countries.
Paki
stan
Lao
PD
R
Vie
t N
am
Ban
gla
des
h
Ind
ia
Cam
bo
dia
Tajik
ista
n
Thai
lan
d
Mo
ng
olia
Van
uat
u
Tim
or-
Lest
e
Mya
nm
ar
Bh
uta
n
Mal
div
es
Kaz
akh
stan
Arm
enia
Kyrg
yzst
an
Turk
men
ista
n
Wealth Residence Child’s sex (boy) Mother’s education No. of children under the age of 5
0.14
0.12
0.10
0.08
0.06
0.04
0.02
0Dec
omp
osit
ion
of D
-ind
ex
No. of children under the age
of 5
Mother’s educationWealth Child’s sex
These results are also confirmed through country-specificlogistic regressions (Figure 2.8, Panel 1).16 A mother’seducation is prominent in determining her child’snutrition status in most South Asian countries, includingBangladesh, Bhutan and Pakistan, indicating thatwomen have a strong role in determining their children’snutrition status, despite marginalization and persistentinequalities in other aspects of social and economic life.A child whose mother has completed secondaryeducation has between 20 per cent (Timor-Leste) and110 per cent (Pakistan) higher chances of being non-stunted. Investing in the education of girls, particularlyin South Asian countries, could therefore help disruptthe cycle of intergenerational disadvantage that istransmitted across generations through inadequatenutrition.
Family (household) wealth is also startlingly importantin shaping a child’s risk of being stunted. In Pakistan,children from households in the top 60 per cent ofthe wealth distribution are half as likely to be stunted(Figure 2.8, Panel 2). In most of the remaining countries,belonging to the top 60 reduces the risk of childrenbeing stunted by between 20 and 40 per cent, asignificant impact.
2.4.2 …in education
Wealth is, in turn, a critical factor for accessingsecondary education in 12 out of 21 countries (Figure2.9). The contribution of wealth in shaping inequality isshown by the light-shaded colour in each bar. Wealthmakes up for a higher share of the D-index in countriesmarked in green, which includes very different countries:from Bangladesh and Pakistan, with higher inequality,to Armenia and Kazakhstan, with much lower inequalitylevels. The importance of an individual’s wealth level indriving inequality in education also emphasizes thevicious cycle between inequality of outcome andinequality of opportunity, whereby poorer young menand women join the labour force with less formaleducation and possibly fewer skills.
The second most prevalent circumstance is residence ina rural area, highlighting the urban-rural divide in theavailability of quality schools and opportunities in 7 outof 21 countries. In two countries, Afghanistan andTajikistan, gender matters most. A closer look at thegroups of those being left behind (Annex 2.3: Who arethe furthest behind?) confirms that in both countrieswomen are mostly excluded from secondary education.

INEQUALITY IN ASIA AND THE PACIFIC34
baseline: child in a bottom 40household
baseline: motherhas noeducation
Timor-L
este
Myanmar
Kazakhstan
Maldives
Tajikist
an
Viet Nam
Bhutan
Thailand
Turkm
enistan
BangladeshIndia
Cambodia
Mongolia
Lao PDR
Pakistan
Timor-L
este
Cambodia
Maldives
Myanmar
India
Mongolia
Bangladesh
Armenia
Bhutan
Thailand
Viet Nam
Lao PDR
Pakistan
120
100
80
60
40
20
0
Perc
enta
ge
Perc
enta
ge
0-10-20-30-40-50-60-70-80-90
-100
Figure 2.8 Impact of mother’s education and household wealth in reducing stunting among children,selected Asia-Pacific countries
Source: DHS and MICS surveys, latest data.Note: Results are based on country-specific logistic regressions. Only countries with statistically significant coefficients and odds-ratios are shown.
Panel 2: The lower odds of having a stunted child for top 60 households,compared to bottom 40 households
Panel 1: The higher odds of having a healthy (non-stunted) child for mothers with completedsecondary education, compared to mothers with no education
Figure 2.9 Inequality in secondary educational attainment among 20-35-year olds and its decomposition,countries grouped by most important circumstance, latest year
Source: ESCAP calculations, using data from DHS and MICS surveys for Asia-Pacific countries.
Lao
PD
R
Mal
div
es
Cam
bo
dia
Mya
nm
ar
Bh
uta
n
Tim
or-
Lest
e
Kyrg
yzst
an
Afg
han
ista
n
Tajik
ista
n
Ban
gla
des
h
Paki
stan
Ind
ia
Van
uat
u
Vie
t N
am
Ind
on
esia
Mo
ng
olia
Thai
lan
d
Phili
pp
ines
Turk
men
ista
n
Arm
enia
Kaz
akh
stan
Residence Gender Wealth
Residence Gender Wealth
0.400.350.300.250.200.150.100.05
0Dec
omp
osit
ion
of D
-ind
ex

35INEQUALITY IN ASIA AND THE PACIFIC
While these findings do not indicate causality (living inrural areas does not cause people to drop out ofsecondary education), the strong association indicatesan underlying relationship worth exploring. Indeed,regression analysis shows that in Afghanistan and inTajikistan women have up to a 60 per cent less chancethan men to complete secondary education (Figure 2.10,Panel 2).17 The chances of women completing secondaryeducation are also lower in the less developed South-East Asian countries and in most of South Asia. Overall,however, the gender impact is mixed. In many North andCentral Asian countries, as well as in some South-EastAsian countries (Myanmar, Philippines and Thailand),women have higher chances of completing secondaryand higher education than men, all else being equal. InMongolia, their chances are twice as high as for men.
The impact of rural residence, on the other hand, alwaysgoes in one direction, limiting the chances of individualscompleting secondary or higher education. In themajority of countries, residing in a rural area is associatedwith lower chances of obtaining a secondary educationby 50 per cent or more. In certain South-East Asiancountries, including Cambodia, Lao People’s DemocraticRepublic, Myanmar and Timor-Leste, the chances ofa rural resident completing a secondary or highereducation are up to 80 per cent lower than those of anurban resident. The impact of residence is lesspronounced in upper-middle income countries, such asThailand and Kazakhstan, but also in Indonesia, a resultthat could be attributed to decentralization andprioritization of investments in schools in rural areas inthat country.
Figure 2.10 Impact of gender and residence in completing secondary and higher education, selected Asia-Pacific countries
Source: Latest DHS and MICS surveys.Note: Results are based on country-specific logistic regressions. Only countries with statistically significant coefficients and odds-ratios are shown.
Panel 2: The lower odds of rural residents completing secondary andhigher education, compared to urban residents
Panel 1: The odds of women completing secondary and higher education,compared with men
Mongolia
Kazakhsta
n
Kyrgyzs
tan
Myanm
ar
Thailand
Philippines
Indonesia
Turkm
enistan
India
Bangladesh
Pakistan
Lao PDR
Vanuatu
Cambodia
Tajik
istan
Bhutan
Timor-L
este
Afghanist
an
150
90
120
30
60
0
-30
-60
-90
Perc
enta
ge
0
-30
-20
-10
-50
-40
-60
-70
-80
-90
Perc
enta
ge
Men’s odds are higher
Women’s odds are higher
males
urban
Secondary education Higher education
Secondary education Higher education
Thailand
India
Kazakhsta
n
Indonesia
Bangladesh
Mongolia
Viet Nam
Tajik
istan
Kyrgyzs
tan
Bhutan
Vanuatu
Pakistan
Afghanist
an
Turkm
enistan
Timor-L
este
Cambodia
Mald
ives
Myanm
ar
Lao PDR

INEQUALITY IN ASIA AND THE PACIFIC36
2.4.3 …in decent work
Beyond adequate nutrition and 12 completed years ofeducation, the most direct determinant of futureoutcomes is the opportunity to access decent work.Decent work is characterized by four main components:employment, social protection, rights at work and socialdialogue. While it is not possible to review all componentsthrough available survey data, a proxy used in thisanalysis is being a full-time employee for a company oremployer. Given the large scale of labour marketinformality and underemployment in most developingcountries in the region, access to full-time employmentis used to proxy the conditions of decent work.
Among all circumstances, gender explains the bulk ofinequality in access to full-time employment morefrequently than any other factor, including education(Figure 2.11). It is the most prominent circumstance in10 out of the 33 countries studied, including Nepal andthe Republic of Korea. The second most importantcircumstance is the level of education, followed by theage group. Age group matters most in several moreadvanced countries such as New Zealand, the RussianFederation and Singapore, but also in Cambodia, India,the Islamic Republic of Iran and Pakistan. Marital statusis generally less associated with high inequality, exceptin the cases of Australia and Kazakhstan.
Figure 2.11 Inequality in access to full-time employment and its decomposition in selected countries,grouped by the most important circumstance, latest year
Source: ESCAP calculations, prepared with the help of ILO and using data from the Gallup World Poll.Note: In more advanced countries, being in full-time employment could also reflect personal choice to work part-time. For the definition of full-timeemployment, see relevant endnote (No.13).
0.60
0.50
0.40
0.30
0.20
0.10
0Dec
omp
osit
ion
of D
-ind
ex
Afg
hani
stan
Lao
PDR
Mya
nmar
Tajik
ista
nV
iet N
amTh
aila
ndM
ongo
liaC
hina
Turk
men
ista
n
Kyrg
yzst
anA
rmen
iaG
eorg
iaA
zerb
aija
nBa
ngla
des
h
Nep
alBh
utan
Phili
pp
ines
Uzb
ekis
tan
Ind
ones
iaSr
i Lan
kaJa
pan
Mal
aysi
aTu
rkey
Rep
ublic
of K
orea
Iran
(Isl
amic
Rep
ublic
of)
Cam
bod
iaPa
kist
anIn
dia
New
Zea
land
Sing
apor
eRu
ssia
n Fe
der
atio
n
Aus
tral
iaKa
zakh
stan
Marital status
AgeGenderResidenceEducation
Gender Age Marital status Have children Education Residence
These results are confirmed through regression analysisof survey data.18 Completing higher education increasesthe odds of being a full-time employee by a staggering11 times (1,200 per cent) in Afghanistan, 9 times inArmenia and 7 in Azerbaijan. Even in countries wherethe impact is smaller, like in Indonesia, the RussianFederation and Thailand, having completed highereducation still doubles the chances of being a full-timeemployee (Figure 2.12, Panel 1). The scale of importanceof higher education in creating an advantage in the
labour market is beyond any other seen in the regressionanalyses conducted for this report.
Women are less likely than men to be in full-timeemployment in all countries studied apart from RussianFederation. In Nepal, women are almost 80 per cent lesslikely to be in full-time work than their malecounterparts, all else being equal – the largest gap inthe region – followed by Indonesia, Philippines andAfghanistan (Figure 2.12, Panel 2).

37INEQUALITY IN ASIA AND THE PACIFIC
baseline:individualswith no education
Indonesia
Russian Federa
tion
Thailand
Singapore
Turkey
Philippin
es
Uzbekist
an
Cambodia
Iran (Is
lamic Republic
of )
Kazakhsta
n
Viet Nam
China
Republic o
f Kore
a
Lao PDR
Nepal
Sri Lanka
Tajik
istan
Mongolia
Azerb
aijan
Armenia
Afghanist
an
baseline: males
Perc
enta
ge
40
20
-80
0
-20
-40
-60
-100
Nepal
Indonesia
Philippin
es
Afghanist
anJa
pan
Uzbekist
an
Sri Lanka
Bhutan
Turkey
Turkm
enistan
Thailand
Bangladesh
New Zealand
Myanm
ar
China
Viet Nam
Lao PDR
Cambodia
India
Azerb
aijan
Malaysia
Russian Federa
tion
Perc
enta
ge
1 200
1 000
200
800
600
400
0
2.4.4 Overall determinants
These decompositions point to the important linksbetween a mother’s education, children’s nutrition,school completion and employment prospects,particularly for the region’s developing countries. Thesepatterns are repeated across all opportunities studiedand sketch an image of the following four mostimportant drivers of inequality in access to opportunitiesin Asia and the Pacific:
• Education has a prominent role in shapinginequality in access to all opportunities.Education, when viewed as a “circumstance,”matters in different ways depending on theopportunity: for children’s nutrition, it is theeducation of a mother; and for securing full-timeemployment, it is the individual’s own level of
education. The highest education level in thehousehold is also important for determining accessto all basic household-level services, but mostlyassociated with ownership of a bank account.19
Given that basic literacy is necessary for accessing,understanding and operating banking services, thisassociation is not surprising.
• The rural-urban divide is behind much of theobserved inequality in access to opportunities.Together with education, the rural-urban divide isamong the most prevalent circumstances indetermining inequality in access to varioushousehold-based opportunities, particularly basicwater and sanitation, electricity and clean fuels, butalso individual-based opportunities like secondaryand higher education attainment. Interestingly,across all household-related opportunities, countries
Figure 2.12 Impact of education and gender in getting full-time employment
Source: Results are based on country-specific logistic regressions. Only countries with statistically significant coefficients and odds-ratios are shown.Analysis conducted with the help of ILO and using data from the Gallup World Poll.Note on Panel 2: In developed countries, the level of full-time employment may reflect a personal choice, rather than an access issue.
Panel 1: The higher odds for individuals with completed higher education to bein full-time employment, compared with those with no education
Panel 2: The odds of women being in full-time employment,compared with men

INEQUALITY IN ASIA AND THE PACIFIC38
with higher D-indices (hence higher inequality) arealso those where the rural-urban divide is mostimportant.
• Gender is an important determinant of inequalityin education and full-time employment. Beinga woman explains the bulk of inequality in accessto full-time employment more frequently than anyother factor, including education. The impact ofbeing a woman or a man with respect to secondaryand higher educational attainment is interestingbecause it goes both ways, depending on thecountry.
• Wealth is overall the most common driver ofinequality of opportunity in all countries. It is themost important circumstance with respect toinequality in secondary and higher educationattainment, stunting levels, but also in access tomost household-related opportunities.20 Whilebeing a proxy for many social, economic andenvironmental disadvantages, its importance indetermining inequality of opportunity is striking andconfirms the expectation and intuition thatdisadvantages are intertwined. The prominent roleof wealth in shaping these inequalities furtheremphasizes the intergenerational inequality trap,where inequality of outcome (wealth) has a directbearing on inequality of opportunity, transmittedacross generations.
2.5 WINNERS AND LOSERS – IDENTIFYINGTHOSE FURTHEST BEHIND
Knowing that inequality of opportunity is broadlyassociated with these four circumstances opens the doorto deeper exploration of the data to see exactly whichgroups are the most marginalized and which groupshave benefitted most from development. Identifyingthese two sets of groups could help policymakers betterfocus policy and programmes to tackle inequality,particularly with regards to the provision of basic services.
Using the classification tree approach, a methodologycommonly used in data mining and popular in machinelearning, this section identifies the commoncircumstances shared by those who are most likely tolack access to the selected opportunities.21 In this newmethodological approach, an algorithm splits the valuefor each variable (access rate to an opportunity) intosignificantly different population groups based on sharedpredetermined circumstances.
These circumstances vary by opportunity, followingdifferent paths for household-based opportunities andindividual-based opportunities. In each iteration, theclassification tree ascertains groups that are most and
least advantaged. The final groups could, for example,share the circumstances of belonging to the bottom40 per cent of the wealth distribution and residing ina rural area. The circumstances used for identifyingthose furthest ahead or behind for each opportunity aresummarized in Table 2.1 and are broadly the same asthose used in the decomposition analysis of key drivers(previous section).
To illustrate how the classification tree identifies themost disadvantaged or advantaged groups, the exampleof access to professional help during childbirth in LaoPeople’s Democratic Republic is used (Figure 2.13). Theclassification tree starts at the average access rate of42 per cent. The algorithm determines that the first splitinto branches should be wealth, specifically where in thewealth distribution a woman belongs: the top 60 percent or the bottom 40 per cent. Women belonging tothe top 60 per cent group have 65 per cent access rateto professional help in childbirth, compared with only17 per cent for those in the bottom 40 group.
In the same example, the algorithm determines a secondsplit for the less advantaged (bottom 40 group) aroundthe number of children a woman has had. For their firstchildbirth, one in four women in the bottom 40 groupuses professional help. That rate falls to one in nine forsubsequent childbirths or for women with more thanone child. The rate of access to professional help alsovaries for women with more than one child: only onein ten women with no education get professional help,while one in eight of those with completed primary,secondary or higher education do. Among the womenbelonging to the top 60 group, the only further split isbased on education. Half of the women with primaryor no education access professional help, compared witheight out of ten of those with secondary or highereducation.
The group with the highest access to professional helpin childbirth is women with secondary or highereducation in households belonging to the top 60 of thewealth distribution. They have an access rate of 82 percent and represent 26 per cent of Laotian women inunion who have given birth in the past five years.Conversely, only one in ten women in the bottom40 group with no education and two or more childrenunder 5 years of age use professional help duringchildbirth. The total gap between the groups withthe highest and the lowest access is a staggering72 percentage points.
The uniqueness of the classification tree approach is thatit becomes very clear where policies should, or shouldnot, be focused to reach those furthest behind.Repeating and summarizing classification tree results for21 countries is visualized in Figure 2.14. The upper lines

39INEQUALITY IN ASIA AND THE PACIFIC
Top 60Size: 51%
Access: 65%
Secondary or Higher education
None or Primary education
Population Size: 100%Access rate: 42%
Less than two children under 5
Bottom 40Size: 49%
Access: 17%
Primary, Secondary or Higher
education
Two or more children under 5
Size: 28%Access: 12%
No education
Acc
ess
to p
rofe
ssio
nal
hel
p in
ch
ildb
irth
(%)
90
80
70
60
50
40
30
20
10
0
Women with Secondary or Higher education in Top 60 households
Size: 26%Access: 82%
Women with no or Primary Education in Top 60 households
Size: 25%Access: 43%
Women with less than two children under 5 in Bottom 40 households
Size: 21%Access: 24%
Women with Primary, Secondary, or Higher education and two or more
children under 5 in Bottom 40 households
Size: 12%Access: 14%
Women with no education and two or more children under 5 in
Bottom 40 householdsSize: 16%
Access: 10%
Figure 2.13 Classification tree highlighting differences in women’s access to professional help inchildbirth in Lao People’s Democratic Republic, 2011 (15-49 years of age)
Source: ESCAP calculations, using data from the latest DHS and MICS surveys for countries in Asia-Pacific.
Figure 2.14 Access to professional help during childbirth, Asia-Pacific countries, latest year
Source: ESCAP calculations, using data from the latest DHS and MICS surveys for countries in Asia-Pacific, latest years.Note: Data for Myanmar not available for this indicator.
Armenia
Kyrgyzs
tan
Thailand
Turkm
enistan
Kazakhsta
n
Viet Nam
Cambodia
Tajik
istan
India
Philippin
es
Vanuatu
Bhutan
Pakistan
Afghanist
an
Bangladesh
Lao PDR
Timor-L
este
Mald
ives
Indonesia
Mongolia
100
80
60
40
20
0
Acc
ess
rate
(%)
Average access level Group access rate (highest) Group access rate (lowest)

INEQUALITY IN ASIA AND THE PACIFIC40
of each bar represent the access rate of the mostadvantaged groups in each country. The lower linesrepresent those with lowest access rates and the middleline shows the average access rate, by which countriesare also sorted. Countries in North and Central Asia andThailand fare the best with almost universal access andno substantial gaps between population groups. Bycontrast, Indonesia, the Maldives and Timor-Leste havethe lowest average access of below 40 per cent. Thelargest gaps are not found in the countries with thelowest access but in Lao People’s Democratic Republic(72 percentage points), Bhutan and Bangladesh(64 percentage points).
Overall, wealth and education levels strongly impactaccess to professional care during childbirth, wherewomen from the bottom 40 with lower levels ofeducation appear frequently among the mostdisadvantaged. In some countries age also matters, witholder women being less likely to obtain skilled personnelattendance during childbirth. Lastly, having morechildren also plays a role, suggesting either lack ofresources or awareness in the household of theimportance of professional attendance for all births.Annex 2.3 lists the circumstances of groups with lowestaccess rates.22
Identifying the furthest behind in all opportunities foreach of the 21 countries (33 countries for access to full-time employment) generates over 500 classification trees
(like the one in Figure 2.13). Each tree reveals anindividual, community- or country-based story, ofsuccess among urban educated elites, of catching-upamong rural communities through education, but alsoof marginalization, mostly in remote, minoritycommunities. The more nuanced, country-based storiesneed to be explored by policymakers and researchersworking in specific sectors in individual countries.
Summarizing the findings from the classification treesfor all opportunities, however, yields some generalpatterns (Table 2.3). The most common sharedcircumstance of the most disadvantaged households andindividuals is a low level of education (primary or below).The second most common circumstance is belonging tothe poorest 40 per cent of the national wealthdistribution. Households in rural areas are also morelikely to be in the most marginalized groups with loweraccess to basic services. Women are more likely to bein the furthest behind groups, as are younger peopleand those over 50 years of age.
On the contrary, the profiles of the most advantagedgroups in terms of access to basic household servicesis, expectedly, belonging to the richest 60 per cent of thedistribution, having a family member with at leastsecondary education in the household and living in urbanareas. For individuals, the most common circumstance isagain being among the wealthiest 60 per cent, havingsecondary or higher education and being male.
Table 2.3 Shared circumstances of the worst-off and best-off groups in access to opportunities
Common Circumstances: HOUSEHOLDS THAT ARE…
FURTHEST BEHIND FURTHEST AHEADCircumstances Count (times) Circumstances Count (times)
Lower and primary education 130 Top 60 80Bottom 40 107 Secondary and higher education 73Rural 43 Urban 69
Common Circumstances: INDIVIDUALS WHO ARE…
FURTHEST BEHIND FURTHEST AHEADCircumstances Count (times) Circumstances Count (times)
Bottom 40 of wealth distribution 80 Top 60 of wealth distribution 69Lower and primary education 74 Secondary and higher education 53Female 63 Male 50Living in a rural area 42 Living in an urban area 46Age 15-24 33 Age 25-49 28Male 16 Female 17Age 50-64 14 Age 15-24 9
Source: ESCAP calculations using data from the latest DHS and MICS surveys for countries in Asia-Pacific, latest years

41INEQUALITY IN ASIA AND THE PACIFIC
2.6 PROGRESS OVER TIME: WHY POLICYMATTERS
With an overall increase in access to opportunities inrecent years, the groups of households and individualsthat are furthest behind have experienced someprogress. Comparing results from earlier and latersurveys reveals that the most marginalized groupsrepresent smaller sections of society but also that theiraccess rates to most opportunities have improved.
This analysis isolates four core opportunities to reviewprogress over time: secondary educational attainment(Figure 2.15), child stunting (Figure 2.16), access toprofessional help during childbirth (Figure 2.17), and full-time employment (Figure 2.18). It finds that in somecountries, despite economic growth and improvementsin average access, sizeable groups are being excluded.Countries that increased their investment in socialprotection, particularly in education and health care,were more successful in closing the gaps compared withthose that did not.
In all countries except Kyrgyzstan, Lao People’sDemocratic Republic and Turkmenistan, averageattainment rates for secondary education increased inthe period between the two surveys (Figure 2.15).However, it is only in Kazakhstan, the Philippines andThailand that the distance of the most marginalizedgroup from the average fell. In the remaining 12countries, the gap, in percentage point (pp) differencefrom the mean, grew between the two surveys in time;revealing exclusion of certain groups from the countries’general upward trends.
In the three countries where the gaps from the meanclosed, education had been a strong policy priority. InThailand, the introduction of the 1999 NationalEducation Act guarantees nine years of compulsoryeducation (from six to 15 years of age) and 12 years offree basic education. The free education policy wasextended to 15 years in 2009. Kazakhstan’s Constitutionof 1995 also states that the citizens shall be guaranteedfree secondary education in state educationalestablishments and that secondary education isobligatory. In the Philippines, social protectionprogrammes have prioritized education, at both theprimary and secondary levels.23
Progress has been more equitably shared with respectto children’s nutrition (Figure 2.16). Average stuntingrates fell in all countries except Armenia and Thailand.Thailand also saw an increase in the average rateof overweight children, from 10 per cent in 2005 to12 per cent in 2012.24 This finding for Thailand, anupper-middle income country, suggests that ensuringchildren’s access to the right nutrition is a complexeconomic, social and cultural issue. In Bangladesh, LaoPeople’s Democratic Republic, Pakistan and Thailand thegaps of the most disadvantaged groups (the groups withthe highest prevalence of stunting) from the averageincreased, suggesting that some children were being leftbehind from overall progress.
The most successful countries in reducing stunting ratesfor all were Cambodia, Kazakhstan, Kyrgyzstan,Mongolia and Turkmenistan. In Mongolia, the universaland unconditional Child Money Programme (initially atargeted and conditional programme) is considered to
Figure 2.15 Distance between the worst-off groups and average attainment of secondary education forindividuals 20 to 35 years of age, earliest and latest
Source: ESCAP calculations, using data from the latest DHS and MICS surveys for countries in Asia-Pacific.Note: The disadvantaged groups may not have the exact same composition in both surveys. However, the most disadvantaged groups always representat least 10 per cent of the population and have at least one common circumstance.Note 2: pp stands for percentage points.
100
80
60
40
20
0
Att
ain
men
t ra
tes
(Per
cen
tag
e o
f p
op
ula
tio
n a
ges
20-
35)
2003 2014 2010 2015 2000 2014 1991 2013 2000 2011 2006 2016 2000 2013 2003 2012 2005 2012 2006 2015 2000 2013 1998 2013 1997 2012 2000 2010 2003 2015
Cambodia Afghanistan Bangladesh Pakistan Lao PDR India Viet Nam Indonesia Thailand Turkmenistan Mongolia Philippines Kyrgyzstan Armenia Kazakhstan
-5 pp
-13 pp-10 pp
-14 pp -17 pp-17 pp
-6 pp
-28 pp -22 pp
-19 pp-16 pp
-24 pp
-18 pp
-26 pp
-23 pp
-27 pp
-27 pp
-25 pp
-6 pp-8 pp
-30 pp-48 pp
-35 pp
-33 pp
-1 pp -7 pp
-9 pp-10 pp -6 pp
-5 pp
Average attainment rate Attainment rate of the worst-off group

INEQUALITY IN ASIA AND THE PACIFIC42
Figure 2.16 Distance between the worst-off groups and the average in stunting for children 0 to 5 yearsof age, earliest and latest
Source: ESCAP calculations, using data from the latest DHS and MICS surveys for countries in Asia-Pacific.Note: The disadvantaged groups may not have the exact same composition in both surveys. However, the most disadvantaged groups always representat least 10 per cent of the population and have at least one common circumstance.Note 2: pp stands for percentage points.
80
40
60
20
0
Stu
nti
ng
rat
e (P
erce
nta
ge
of c
hild
ren
)
2000 2014 2006 2016 2000 2014 2000 2011 1997 2012 2000 2013 2000 2010 2005 2012 2006 2015 2006 2015Bangladesh India Cambodia Lao PDR Kyrgyzstan Mongolia Armenia Thailand Turkmenistan Kazakhstan
8 pp
13 pp
11 pp
14 pp
8 pp
8 pp
7 pp
18 pp
15 pp
6 pp
8 pp
11 pp
13 pp 4 pp
4 pp
7 pp 4 pp 4 pp
2 pp3 pp
Average stunting rate Stunting rate of the worst-off group
Figure 2.17 Distance between the worst-off groups and the average in access to professional help duringchildbirth for women aged 15 to 49, Asia-Pacific countries, earliest and latest
Source: ESCAP calculations, using data from the latest DHS and MICS surveys for countries in Asia-Pacific.Note: The disadvantaged groups may not have the exact same composition in both surveys. However, the most disadvantaged groups always representat least 10 per cent of the population and have at least one common circumstance.Note 2: pp stands for percentage points.
2003 2015 1997 2012 2000 2010 2005 2012 2000 2013 2000 2013 1998 2013 2006 2016 2000 2014 2010 2015 1991 2013 2003 2012 2000 2011 2000 2014
Kazakhstan Kyrgyzstan Armenia Thailand Mongolia Viet Nam Philippines India Cambodia Afghanistan Pakistan Indonesia Lao PDR Bangladesh
100
40
80
60
20
0Pro
fess
ion
al h
elp
acc
ess
rate
(Per
cen
tag
e)
-0 pp -1 pp -0 pp-4 pp
-0 pp-4 pp -5 pp
-1 pp-2 pp
-1 pp
-20 pp
-30 pp
-40 pp
-32 pp
-17 pp
-35 pp
-21 pp
-19 pp-20 pp
-24 pp
-14 pp
-26 pp
-28 pp
-17 pp
-18 pp
-32 pp
-10 pp
-24 pp
Average professional help access rate Professional help access rate of the worst-off group
have had an important contribution to this development.In Cambodia, public health initiatives focusing onincreasing the interval between births and reducing useof tobacco during pregnancy have contributed to thereduction in stunting.25
Average rates of access to professional help duringchildbirth have increased in most countries (Figure 2.17).However, in most countries in South-East and South andSouth-West Asia, the distance between groups with thelowest access and the average increased. On the other
hand, Armenia, India, Kyrgyzstan, the Philippines andViet Nam saw impressive increases, both in terms ofaverage access and in closing the gaps with the mostmarginalized groups.
Viet Nam, for example, prioritized reducing maternalmortality (MDG 5) through the Strategy for Protectionand Care of the People’s Health 2001-2010, as well asthe Reproductive Health Strategy 2001-2010. In thePhilippines, the Philhealth programme introduced in1997 was designed to provide access to health care for

43INEQUALITY IN ASIA AND THE PACIFIC
the underprivileged, the sick, older persons, persons withdisabilities and women and children. The continuousexpansion and strengthening of Philhealth may havecontributed to the observed progress.26
Based on alternative data sources, access to a decentjob reveals a disconnect between overall employmentgrowth and decent job growth. Behind this disconnectis the nature of economic growth.27 As populationscontinue to expand in many countries in the region,creation of decent jobs has failed to meet the risingnumbers of new labour market entrants. With noalternative, people are forced to accept whatever jobsare available.
The extent of vulnerable employment is illustrated forthe period 2000-2015 in Figure 2.18. In countries above
the diagonal line, such as Fiji, Papua New Guinea andSri Lanka, vulnerable employment increased faster thanoverall employment. In countries below the diagonalline, but above the horizontal dotted line, which is themajority of the region’s developing countries, overallemployment increased faster than vulnerableemployment, indicating a falling share of vulnerablejobs. Nevertheless, there was still an increase in theabsolute number of vulnerable workers. In Afghanistan,Bhutan and Pakistan, for example, the overallemployment increase of 60 to 80 per cent wasaccompanied by a 50 per cent increase in vulnerableemployment. Only in a few countries, located below thedotted line, did the absolute number of vulnerableworkers fall — as in China, the Russian Federation andsome OECD members.28
Figure 2.18 Change in total employment and in vulnerable employment, 2000-2015
Source: ESCAP calculation using ILO (2017), KILM (9th edition).
Vu
lner
able
Em
plo
ymen
t G
row
th (P
erce
nta
ge)
100
40
80
60
20
0
-20
-40
Employment Growth (%)
-40 -20 0 20 40 60 80 100
BTN
CHN
FJI LAO
JPN
GEO
HKG
MMR
IDN IND
GUM
THA
KOR
PRK
WSM TUR
LKA
TLS
TON
RUS
KGZ
NZL KAZ
AUS
BGD
PYFARM
MAC
TJK
PNG
VNMBRN
TKM
NPL
NCLSLB
MYS
IRNVUT
PAK
SGP
PHLAZE
MNGKHM UZB
AFG
MDV
While not all workers in the informal economy are poor,there is a frequent overlap; trapped in hazardous, low-paid jobs without any protection or security, theseworkers have few opportunities to escape poverty.29
Meanwhile, wages in Asia-Pacific are growing fasterthan in any other region, and grew by 4 per cent in2015, suggesting a widening gap between thosebenefiting from economic growth and productivityincreases and those left behind.30
2.7 CONCLUSIONS AND RECOMMENDATIONS
Positive progress in reducing the gaps between thosefurthest behind and an average household is mostly seenin countries that have prioritized investments in thesocial sector, including through social protection. The
level of economic development, whether a country is inthe low, lower-middle or upper-middle income bracket,has a bearing on inequality of opportunity, but not asmuch as its social development policies.
The superior performance of many lower-middle incomecountries from North and Central Asia, but also Bhutan,India, Mongolia, the Philippines and Viet Nam,particularly in education and health, point to thatfinding. For household-based opportunities, prioritizationof investments in basic water and sanitation, energy andfinancial services has been stronger in upper-middleincome countries. However, certain lower-middleincome countries also stand out, including most Northand Central Asian countries, India, Viet Nam and somePacific Islands.

INEQUALITY IN ASIA AND THE PACIFIC44
These findings suggest that certain policies andinstitutions can help close the gaps in terms of accessto opportunities.
Broaden social protection coverage
• Social protection policies are key to reducinginequality, increasing prosperity, resilience andempowerment and ensuring that “no one is leftbehind”. Expanding social protection to all supportslow-income families through cash transfers, or otherincome-support mechanisms with strong multipliereffects on the economy as these groups tend tospend the extra income on domestic goods andservices. It also insures against risks such as disasters,illness and unemployment, impacts of which can belife-threatening, particularly for vulnerable groupswith no financial reserves.
Make education affordable, accessible, and relevantfor all
• A well-educated population is fundamental for allspheres of development. National education systemsshould therefore encourage and facilitate highereducation attainment and at the minimum improvesecondary completion rates for all populationgroups. This is particularly important for those livingin rural areas. The quality of education also needsto be strengthened by investing in teachers’education and training, school equipment andinfrastructure. It is finally critical that current curriculacorrespond to future labour market needs andsmoothen the school-to-work transition.
Ensure that health-care services are affordable,accessible and universal for life
• Access to affordable essential health care is centralto leading healthy lives and a key determinant ofequality. Poor access to affordable health-careservices, often combined with material deprivationand social exclusion, creates or perpetuatesinequality traps. As a core component of buildingnational social protection floors, countries need toinvest in universal access to a nationally defined setof goods and services, constituting essential healthcare, including maternity care, that meets the criteriaof availability, accessibility, affordability, acceptabilityand quality. As health challenges vary throughoutthe life cycle, services need to cater to the health-care needs of all ages and all parts of the countryincluding rural areas. Health care should also becomplemented by access to other services requiredto sustain the basic living conditions for good health,such as sufficient nutrition, clean drinking water,sanitation, electricity and clean fuels, as well as basicshelter.
Protect and promote the rights of women
• Women and girls are excluded from mainstreamdevelopment more often than men and boys. It istherefore paramount that their rights andparticipation be placed at the centre of allpolicymaking. Gender equality is not only afundamental principle of human rights, but is alsoa vital component to effectively meet future needsand challenges in Asia and the Pacific. Public policiesshould uphold and mainstream gender equality inall spheres of life.
Closing rural-urban gaps in public service delivery
• Physical access and mobility constraints compoundinequality of opportunities. For example, access tohealth care, education and decent jobs in rural areasare often constrained by a lack of infrastructure,including transport connections. Removing thesebottlenecks can also encourage labour mobility andcreate opportunities for income-generating activities.
Improve effective service delivery
• Strong political commitment, broad public supportas well as capable and accountable institutionsgoverned by transparent regulatory frameworks areprerequisites for effective service delivery. Ineffectiveadministration, weak rule of law, corruption, andlack of regulatory frameworks influence operationalcapacity to generate change and disproportionallyharm the poorest and most vulnerable segments ofsociety.31 Simply allocating more public resourceswithout reforming governing principles maytherefore not have the desired impact.
Encourage multi-sectorial and multi-stakeholdercollaboration
• To reach population groups at the highest risk ofbeing left behind, policy reforms need to beunderpinned by multisectoral and multi-stakeholderinvolvement at all stages, from development anddesign to implementation and monitoring. Given thediversity of circumstances impacting individual andhousehold decisions and opportunities, suchinvolvement and coordination are imperative forcreating opportunities and incentives for households.
Improve the quality of services and opportunitiesprovided
• An underexplored area is the importance of ensuringthe quality of services. Even when education andhealth services are publicly provided, they may notbe of adequate quality, pushing wealthier individualsto seek private options. Those who can afford to payprivately for better health-care or education serviceswill do so. Those who cannot are left with no option,

45INEQUALITY IN ASIA AND THE PACIFIC
but the publicly available service and they may haveto settle for a lower-quality job, a disadvantagedlocation for their home and the prospect of uncleanfuels and poor sanitation solutions. Inequality ofopportunity, and gaps in the quality of opportunitiesafforded, often result from income and wealthinequality and become a driving force forintergenerational inequality and for trapping peopleand communities in a vicious cycle of persistingpoverty and exclusion.
Bolster capabilities to understand inequality ofopportunity through disaggregated data analysis
• To identify those at risk of being left behind and todirect policymaking at certain population groups,national data collection needs to allow for betterdisaggregation. Additional research also needs tocapture how unequal opportunities impact individualaspirations and household possibilities and whycertain individuals and households may, for example,take their children out of school or continue usingunclean energy options, while other, sometimesneighbouring households will not. This chapter hasused innovative analytical methods to analyseavailable surveys. However, the number of countrieswith available surveys were limited and the surveysdid not provide answers to important questions,such as the quality of education or the perception
of inequality. With the availability of more and betterdata, countries will be better placed to takeadvantage of the wide array of analytical toolsavailable to them.
Inequality of opportunity and gaps in quality are notlimited to services provided by the State. It expands todaily choices around what transportation means to use,what phone device to buy and what news sources torely on. Increasingly, these services are provided by theprivate sector. As chapter 4 will show, the incredibletechnological progress that has underpinned growthover the past decades has afforded people in Asia andthe Pacific a vast choice of products and services tochoose from. Yet, what is affordable for those earningaround US$1.90 a day is not comparable with what theelites or the growing middle class across the region canenjoy.
Before exploring the interaction of technology withinequality, chapter 3 analyses in more depth inequalitiesin the quality of the environment people live in or accessto meet basic needs and generate livelihoods. Itdescribes how disadvantaged groups are oftendisproportionately exposed to the hazards ofenvironmental degradation and less able to protectthemselves and recover from various environmentalimpacts.
ENDNOTES1 See Ravallion, (2016).2 United Nations Development Programme (UNDP) (2013).3 Ravallion, (2016).4 United Nations, Economic and Social Commission for Asia and the Pacific (ESCAP) (2018a) (forthcoming).5 Canning and Schultz (2012).6 United Nations, Economic and Social Commission for Asia and the Pacific (ESCAP) (2018d) (forthcoming).7 See World Health Organization (WHO) (2018), available at: http://www.who.int/gho/phe/water_sanitation/burden_text/en/8 See World Bank (2013), available at: http://www.worldbank.org/en/news/feature/2013/08/30/whats-a-toilet-worth-infographic9 United Nations, Economic and Social Commission for Asia and the Pacific (ESCAP) (2017a).10 United Nations, Economic and Social Commission for Asia and the Pacific (ESCAP) (2017a) Available from https://www.adb.org/sectors/energy/issues/access-energy.11 Habtezion, (2013).12 Sovacool, (2013).13 Access to full-time employment is used as a proxy for decent work in this paper. Decent work is not easy to measure. Toidentify gaps in the labour force in terms of access to decent work, this analysis uses the “employed full-time for an employerindex” in the Gallup survey as a proxy. In practice, this index is a subset of the ILO’s ‘non-vulnerable’ employment classification,which includes wage and salaried workers together with employers. The ‘vulnerable,’ on the other hand, are own accountworkers and contributing family members. For more information, please see United Nations, Economic and Social Commissionfor Asia and the Pacific (ESCAP) (2018b) (forthcoming).14 The decomposition of other opportunities can be found in a series of policy papers available here: http://www.unescap.org/our-work/social-development/poverty-and-inequality/resources

INEQUALITY IN ASIA AND THE PACIFIC46
15 The D-index for stunting measures the inequality in distribution of non-stunted children among all groups of children.16 United Nations, Economic and Social Commission for Asia and the Pacific (ESCAP) (2018c) (forthcoming).17 United Nations, Economic and Social Commission for Asia and the Pacific (ESCAP) (2018a) (forthcoming).18 United Nations, Economic and Social Commission for Asia and the Pacific (ESCAP) (2018b) (forthcoming).19 Data on the D-index decomposition is available upon request.20 The wealth index, which has been used for this analysis, is a composite index reflecting a household’s cumulative livingstandard that is developed by the DHS and MICS researchers and combines a wide range of household assets and characteristics.21 A full description of the methodology and algorithm is available in the Annex of the relevant Policy Paper series, such asESCAP (2018a).22 The Annex 2.3 tables do not show the composition of the most advantage group (highest attainment rate), but thisinformation is available upon request.23 United Nations, Economic and Social Commission for Asia and the Pacific (ESCAP) (2018e) http://www.socialprotection-toolbox.org/practice/philippines-conditional-cash-transfer-families24 United Nations, Economic and Social Commission for Asia and the Pacific (ESCAP) (2018c) (forthcoming).25 Ikeda et.al (2013).26 United Nations, Economic and Social Commission for Asia and the Pacific (ESCAP) (2018e). http://www.socialprotection-toolbox.org/practice/philippines-health-care-programme27 International Labour Organization (ILO) (2009). http://www.ilo.org/wcmsp5/groups/public/@dgreports/@dcomm/documents/publication/wcms_115087.pdf28 United Nations, Economic and Social Commission for Asia and the Pacific (ESCAP) (2017b).29 International Labour Organization (ILO) http://www.ilo.org/wcmsp5/groups/public/—ed_emp/—emp_policy/documents/publication/wcms_212689.pdf30 International Labour Organization (2016).31 United Nations, Department of Economic and Social Affairs (DESA), United Nations Development Programme (UNDP), UnitedNations Educational, Scientific and Cultural Organization (UNESCO) (2012).

47INEQUALITY IN ASIA AND THE PACIFIC

INEQUALITY IN ASIA AND THE PACIFIC48
Chapter 3
Inequality of Impact:Environment and Inequality

49INEQUALITY IN ASIA AND THE PACIFIC
3.1 WHAT IS INEQUALITY OF IMPACT?
Leading on from the discussion of inequality of incomeand of opportunity, this chapter explores linkagesbetween inequality and the natural environment, ata time when a clean and healthy environment isincreasingly regarded as a human right. Firstly, theanalysis looks at where inequalities of income andopportunity appear to coincide with damage to thenatural environment. The second part is structuredaround the question of why and how human-inducedenvironmental degradation tends to worsensocioeconomic inequality by having disproportionateimpacts on poor and vulnerable groups and on low-income countries. The empirical analyses ask whetheri) air-pollution is a factor that drives up inequalitywithin countries; ii) conservation of natural capital canhelp reduce inequality within countries; and iii) climatechange and natural disasters widen income inequalitywithin countries?
Figure 3.1 illustrates the relationship between inequalityand the environment explored in this chapter. Itsummarizes the key driving mechanism of the unequalimpact of natural hazards on poor and the marginalizedcommunities. The inequality of income and opportunitiesdiscussed in chapters 1 and 2 identifies several groupsof people that are “left behind”. These groups of peopleare often confronted with the following situations: i) lowcapacity to cope with environmental hazards;ii) inadequate access to infrastructure to protectthemselves from environmental hazards; and iii) absenceor low level of prevention services to environmentalhazards.
As a result, they become highly vulnerable anddisproportionately exposed to environmental hazards.Exposure and vulnerability are two main factors of riskand therefore environmental hazards can have a biggerimpact on these groups. A degraded environmentthreatens the health, livelihoods and wellbeing ofdisadvantaged groups and this, in turn, further affectsthe inequality of opportunities and outcome- creatinga vicious cycle. To add to this complexity, conflicts arisingfrom natural-resource use and management can reversegains made on human development and mostly impactthe poor.
The question of whether higher levels of inequality areassociated with environmental damage is not a newone. For more than 20 years researchers have soughtto understand if there is a relationship between them,and, if so, what the causes might be. The conclusionshave been mixed, but a degree of empirical consensushas emerged in three broad areas:
• Several cross-country comparisons have indicated arelationship between inequality and deforestation/biodiversity loss, where more equal countries tend

INEQUALITY IN ASIA AND THE PACIFIC50
to have lower rates of deforestation and impacts onbiodiversity.1
• Some studies have found that countries with higherlevels of inequality tend to consume relatively highlevels of energy and carbon-intensive products, suchas meat, use more water and generate more waste.2
• The quality of governance seems to play a role formoderating environmental pressure and degradation.However, there is no strong agreement on whataspect of governance – such as whethera country is a formal democracy, the existence ofactive civil society organizations, or the level ofcorruption – is most important.
Inequality of impact among countries
Further studies have looked at unequal relationshipsamong countries and the implications for the naturalenvironment. Wealthier countries, with their superioreconomic status and geopolitical power, can consumemore natural resources than they have availabledomestically and outsource polluting and resource-intensive production processes to less prosperousnations.3
Inequality of impact within countries
The relationship between socioeconomic status andunequal exposure to environmental risk factors withincountries has been intensively studied, especiallyin developed country contexts. Often labelled“environmental justice”, it emerged as a scholarlydiscourse in the United States in the 1980s and has sincethen evolved into a well-established academic field.It is concerned with how different groups in societyare exposed to and harmed by pollution and otherenvironmental risk factors, especially how certainsocioeconomic or ethnic minority groups are
disproportionately exposed to and affected by suchhazards. In high-income countries, an extensive literatureconfirms the inequalities associated with environmentalhazards.4 However, despite the dire environmentalconditions in many low- and middle-income countries,systematic empirical studies on the links with inequality,including causes and effects, remain limited.5
By studying the disproportionate impact ofenvironmental hazards both between and withincountries, this chapter adds to the existing literature andderives some key environment-related policies that canhelp in reducing inequality.
3.2 UNEQUAL IMPACTS OF AIR POLLUTION
Air pollution is a growing threat to the wellbeing ofpeople in the Asia-Pacific region, especially in China,India and South-East Asia. The region’s rapidindustrialization, urbanization and rising vehicleownership is driving this upward trend.6 Some citieshave become notorious for smog and highly detrimentalhealth impacts, including premature death.7 Indoor airpollution is also a serious health issue in the region’spoorer areas, both rural and urban. In South-East Asia,62 per cent of households use wood or charcoal forcooking, while 32 per cent of households rely on highlypolluting kerosene and oil lamps.8
3.2.1 Inequality among countries
Around 92 per cent of pollution-related deaths occurin low- and middle-income countries. Asia and thePacific countries fare poorly – more than 5 million livesare lost on average across the region as a result ofpollution (including ambient and household air pollution,unsafe water and unsafe sanitation, and exposure tolead pollution).9 To evaluate the role of pollution in
Figure 3.1 Inequality and environmental impact
Source: ESCAP.
• Lower coping capacity• Lower access to
infrastructure• Lower access to
prevention services
• Inequality of opportunity
• Inequality of income
• Higher vulnerability• Higher exposure
• Disproportionate impact of environmental hazards on the poor and vulnerable groups
• Increased inequalities within and between countries
Environmental hazards:
• Pollution• Natural resource
degradation • Climate change and
natural disasters
• Conflicts
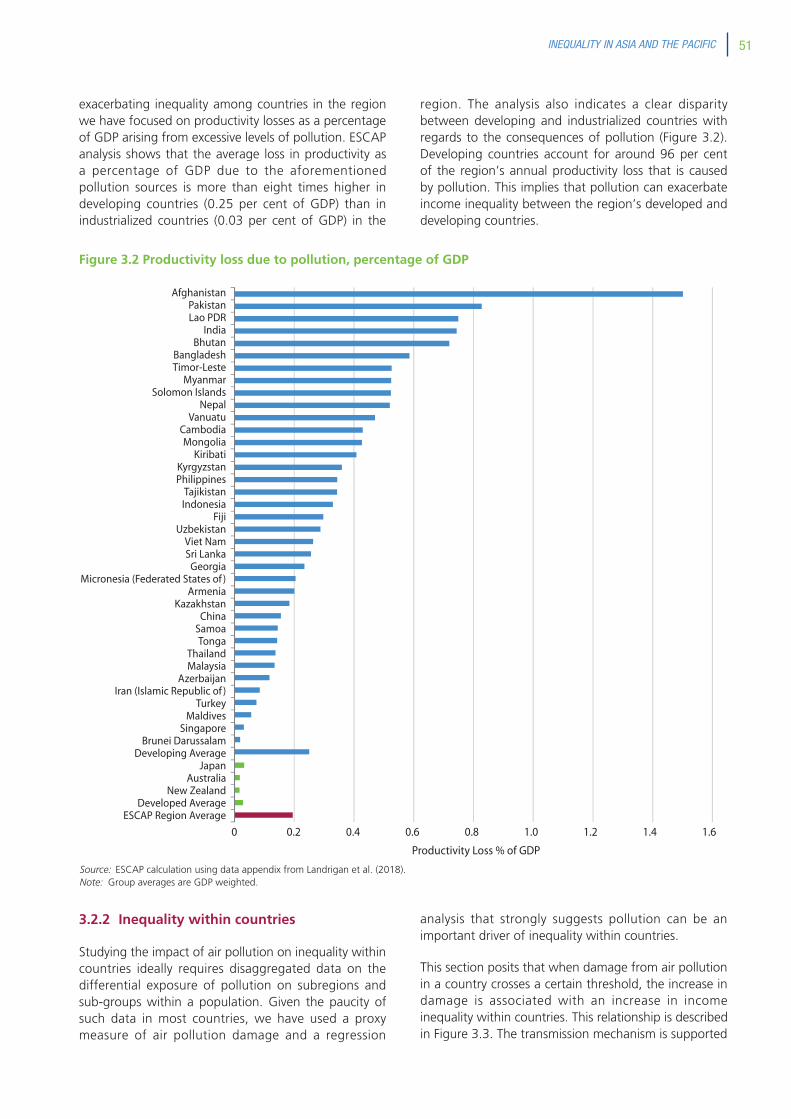
51INEQUALITY IN ASIA AND THE PACIFIC
exacerbating inequality among countries in the regionwe have focused on productivity losses as a percentageof GDP arising from excessive levels of pollution. ESCAPanalysis shows that the average loss in productivity asa percentage of GDP due to the aforementionedpollution sources is more than eight times higher indeveloping countries (0.25 per cent of GDP) than inindustrialized countries (0.03 per cent of GDP) in the
region. The analysis also indicates a clear disparitybetween developing and industrialized countries withregards to the consequences of pollution (Figure 3.2).Developing countries account for around 96 per centof the region’s annual productivity loss that is causedby pollution. This implies that pollution can exacerbateincome inequality between the region’s developed anddeveloping countries.
Figure 3.2 Productivity loss due to pollution, percentage of GDP
Source: ESCAP calculation using data appendix from Landrigan et al. (2018).Note: Group averages are GDP weighted.
3.2.2 Inequality within countries
Studying the impact of air pollution on inequality withincountries ideally requires disaggregated data on thedifferential exposure of pollution on subregions andsub-groups within a population. Given the paucity ofsuch data in most countries, we have used a proxymeasure of air pollution damage and a regression
analysis that strongly suggests pollution can be animportant driver of inequality within countries.
This section posits that when damage from air pollutionin a country crosses a certain threshold, the increase indamage is associated with an increase in incomeinequality within countries. This relationship is describedin Figure 3.3. The transmission mechanism is supported
AfghanistanPakistanLao PDR
IndiaBhutan
BangladeshTimor-Leste
MyanmarSolomon Islands
NepalVanuatu
CambodiaMongolia
KiribatiKyrgyzstanPhilippines
TajikistanIndonesia
FijiUzbekistan
Viet NamSri Lanka
GeorgiaMicronesia (Federated States of )
ArmeniaKazakhstan
ChinaSamoaTonga
ThailandMalaysia
AzerbaijanIran (Islamic Republic of )
TurkeyMaldives
SingaporeBrunei Darussalam
Developing AverageJapan
AustraliaNew Zealand
Developed AverageESCAP Region Average
0 0.2 0.4 0.6 0.8 1.0 1.2 1.4 1.6
Productivity Loss % of GDP

INEQUALITY IN ASIA AND THE PACIFIC52
by existing qualitative data from the region, whichconfirms that poor and disadvantaged people are moreexposed and vulnerable to the pernicious impact ofpollution. Because they are less able to protectthemselves from pollution, their health and productivitysuffer disproportionately.
To confirm this relationship, air pollution has beenselected as a measure of environmental impact andintroduced in the regression framework summarized inchapter 1 (see Annex Table A1). Associated with sickness
and premature death, air pollution clearly underminesproductivity and participation in the workforce. Damagefrom particulate emissions provides a good proxyvariable to measure the aggregate damage caused byair pollution. It is defined here as “damage from ultra-fine particles – particulate matter with a diameter of lessthan 2.5 microns (PM2.5)”.10 Figure 3.4 shows that theAsia-Pacific region (especially East Asia and Pacific andSouth Asia) experienced the world’s sharpest rise inpremature deaths as a result of ambient air pollution(PM2.5) between 1990 and 2015.
Figure 3.3 Mechanism of transmission of the impact of air pollution on inequality within countries
Poor are more exposed to air pollution and have fewer
means to protect themselves
Higher health impact of pollution on the poor, which
reduces their income earning potential and increases rate of
premature death
Further widening of within-country income inequality
Figure 3.4 Premature deaths from ambient air pollution (PM2.5), by region, 1990 and 2015
Source: Lange, Wodon and Carey eds. (2018).
South Asia
1 600
1 400
1 200
1 000
800
600
400
200
0
Thou
sand
s
East Asia and Pacific
Europe and Central Asia
Sub-Saharan Africa
Latin America and the
Caribbean
Middle-East and North Africa
NorthAmerica
1990 2015
The regression analysis builds on studies such as theLancet Commission on pollution and health.11 Highlevels of particulate emission damage imply that airquality has worsened beyond an acceptable threshold,indicating that air pollution is fast becoming a majorenvironmental problem within countries.12 The resultsclearly show that as air pollution exceeds certainthresholds it significantly increases levels of inequalitywithin countries.
The relationship between the two variables is illustratedin Figure 3.5. The U-shaped curve suggests that at lowerlevels of particulate emissions damages inequality fallswith a rise in pollution. However, this relationship turnsout to be positive once aggregate PM2.5 emissions crossa threshold, suggesting a sharp rise in inequality isassociated with increases in damage from particulateemissions.
Figure 3.5 Inequality and environmentaldegradation, within countries
Source: ESCAP illustration of relationship between inequality andparticulate emission damage, as shown in the regression analysis inAnnex 1.3.
70
0 5 10 15 20 25 30
60
50
40
30
20
10
0
Log (particulate emission damage) in current US$
Ineq
ualit
y (G
ini I
ndex
)

53INEQUALITY IN ASIA AND THE PACIFIC
Figure 3.6 plots the observed variations in the Ginicoefficient and particulate emission damage between1995 and 2005 and from 2005 to 2014 in the fivecountries that experienced the highest damage fromparticulate emissions in the Asia-Pacific region in 2014.As predicted by the regression results, spikes inparticulate emission damage were associated withincreases in income inequality, with the exception ofPakistan and the Russian Federation between 2005 and2014.
group due to their lack of formal residency in urbanareas) are more likely to be exposed to higher levelsof air pollution.16 This adds another dimension tothe findings of chapter 2, where access to variousopportunities was positively associated with educationalattainment in the household. It confirms thatcircumstances (such as the educational attainment ofa parent) over which one has no control often determineopportunities, as well as outcomes.
Apart from differences in exposure to pollution, thereis also a disparity in peoples’ ability to protectthemselves. Studies in China of households’ demand forface masks and air purifiers (which have become statussymbols in some places) have confirmed thesedifferences: high-income groups are much more likelyto own air purifiers, which are more expensive thanmasks and much more effective.17
The analysis underscores the need to systematically studythe impact of pollution on low-income households andto identify ways to reduce their exposure. The 2018 AsiaPacific Clean Air Partnership Joint Forum highlightedseveral solutions to improve air quality in the regionranging from technological solutions to regulatoryreforms involving diverse stakeholders.18 The findingsof this section imply that these solutions to tackleair pollution can have the co-benefit of reducinginequalities, providing additional incentives for theirimplementation.
3.3 UNEQUAL IMPACTS OF NATURALRESOURCE DEGRADATION
All societies are inextricably linked to the natural world,but the connections are deepest and most obvious forrural households, smallholders, forest-dependentcommunities and artisanal fishing villages. There isevidence that income inequality between households islower among rural households that rely on incomederived from forests and agricultural land.19 Marine andcoastal ecosystems in the Asia-Pacific region have alsotraditionally provided economic, social, environmentaland cultural value to society and played a part inmaintaining income inequality at relatively low levels.However, patterns of natural resource use are changingdrastically due to urbanization, industrialization andchanges in consumption choices. For example,calculations show that urban expansion will result ina 1.8-2.4 per cent loss of croplands by 2030, with Asiasuffering the highest absolute loss of cropland area.20
This section explores how overuse and degradation ofnatural resources can have significant implications forinequality among countries and within them.
Figure 3.6 Income inequality and particulateemission damage in selected Asia-Pacificcountries, 1995-2005 and 2005-2014
Source: ESCAP calculation using data sources described in Annex 1.3.Note: These five countries experienced the highest level of particulateemission damage in 2014, among Asia-Pacific countries for which Ginicoefficients were also available.
Particulate emission damage in US$ (in log)
21 22 23 24 25
45
40
35
30
Mar
ket G
ini c
oeff
icie
nt
1995 to 2005 2005 to 2014
Russian Federation
China
IndiaPakistan
Indonesia
Further disaggregated evidence from within countriessupports the transmission mechanism mentioned earlier;that poor and disadvantaged groups are the mostexposed to environmental degradation. A study inShanghai examined the causes of mortality in differentsocioeconomic groups and found that death fromcardiorespiratory diseases, which are closely linked withexposure to air pollution, was more likely amongresidents with low educational attainment (illiterate oronly educated to primary school level) compared withthose with high educational attainment (having attendedmiddle school or above).13 A recent review of airpollution assessments in India showed several examplesof higher levels of exposure for low-income householdscompared with those with higher median incomes.14
Studies in cities in Viet Nam found that respiratoryillnesses were twice as common in low-incomehouseholds as in high-income ones.15 A study ofChina’s Jiangsu province found that townships witha higher percentage of rural migrants (a disadvantaged

INEQUALITY IN ASIA AND THE PACIFIC54
3.3.1 Natural capital and inequality amongcountries
The “natural capital” of a country is the value of its stockof natural resources, which underpins development andsurvival. Various attempts have been made to measurenatural and human capital, which arguably providea richer account of the true wealth of nations than thatof traditional GDP. This section uses the measure ofnatural capital estimated by the World Bank,21 whichprovides an internationally comparable measureof natural capital of countries from 1995 to 2014.22
Specifically, the focus is on the renewable componentof natural capital, namely, forests, agriculture land andprotected areas. This renewable component of naturalcapital can be increased in value by measures such asincreasing the forest cover, protected areas, promotingalternate higher value of existing forests in the form ofeco-tourism, improving of crop-yield and bringing moreland into productive use.
Natural capital comprises of close to 47 per cent of theasset of low-income countries, and even in low-middleincome countries it comprises of about 27 per cent.23
How countries use their natural capital and transformit into other forms of capital such as human capital andcreated capital, and the rate at which this happensdetermines their development pathway.
Researchers have been able to more comprehensivelymap the flow of natural resources across the worldeconomy to determine the true “material footprint” ofcountries. In the Asia-Pacific region, high-incomecountries have a material footprint more than doublethe size of their low-income counterparts.24 This alludes
to the fact that the over-exploitation of natural resourcesin developing countries is often driven by consumptiondemand in richer countries. Some resource-richdeveloping countries are also forced by market pressureto use their natural capital at a much faster rate thancan be supported by their macroeconomic andinstitutional capacity.25 As a result, developing countriesoften bear the disproportionate negative externalities ofnatural resource use and over-exploitation. This can leadto conflicts related to control and management ofresources, which can further weigh on economic growthand worsen between-country inequality.
3.3.2 Natural capital and inequality withincountries
When natural resources are over-exploited, poor peoplewho depend on them for their livelihood are usuallydisproportionately affected. The loss of earnings andopportunities feeds into rising inequality withincountries, as illustrated by Figure 3.7. Overall, as thevalue of renewable natural capital available per capitadeclines it can contribute to an increase in incomeinequality within countries.
The cross-country regression model in Annex Table A.1is also used to estimate how natural resourcedegradation affects inequality. The results show that asthe availability of renewable natural capital expands incountries, income inequality seems to decrease.Conversely, income inequality rises within countries astheir natural capital is exploited.
As shown by the case study from Indonesia (Box 3.1),the ecological impacts of loss of natural capital such as
Figure 3.7 Mechanism of transmission of impact of natural resource degradation on inequality withincountries
Poor are more more dependent on natural
resources
Degraded natural resources disproportionately affect the livelihoods and the income
earning potential ofthe poor
Further wideningwithin-country income
inequality
forests can be extensive. Figure 3.8 contrasts thevariation in forest capital (a component of renewablenatural capital) in Indonesia, along with variation in theGini coefficient during 1995-2014. There weresignificant losses in renewable natural capital per capitaarising from forests in the periods from 1995 to 2005and from 2005 to 2014, with a total reductionamounting to 22 per cent of the value of forest capitalin 1995. The fall in forest capital per capita was
associated with a substantial increase in the Ginicoefficient in this period, as predicted by the regressionanalysis.
The empirical analysis underscores that in countries thatexperience a high rate of reduction of differentcomponents of natural capital, the resulting naturalresource degradation and subsequent loss of ecosystemservices can be an important mechanism that

55INEQUALITY IN ASIA AND THE PACIFIC
exacerbates inequality within countries. However, theexisting measures of natural capital management ofcountries are rather incomplete. For example, as of nowthey do not capture the value of marine/fishery resourcesor the value of numerous other ecosystem services suchas protection from natural hazards, ensuring watercycles, preserving biodiversity and ensuring carbonstorage. We do not yet have accounts of ecosystemservices that low-income rural households often dependon in practice, and there is also a scarcity of studieslooking at multidimensional poverty and ecosystemservices.26
Ample evidence supports the transmission mechanismpresented earlier in this section. The 2005 MillenniumEcosystem Assessment pointed out that resourceexploitation, such as deforestation, often has skeweddistributional effects – benefiting certain groups whileleaving the rural poor worse off. Indigenous peoples area particularly vulnerable group, as their traditional waysof life are completely entangled with their naturalenvironment. An estimated 481 to 579 million peoplein Asia and the Pacific are considered forest peoples.27
Traditional indigenous territories, which contain around80 per cent of the planet’s biodiversity, even thoughthey encompass up to 22 per cent of the world’s landsurface, are under serious threat of deforestation,agricultural and industrial expansion and uncontrolledfires.28
The unequal distribution of land further contributes tothe vulnerability of many households and communitiesacross the region. For example, around 55 per cent ofIndonesia’s farmers rely on less than half a hectare, whileless than a quarter of small-scale farmers in Cambodiahave land titles.29 In Bangladesh, around 75 per cent ofthe rural population consists of landless labourers ormarginal farmers owning less than 0.2 ha of land.30
Estimates suggest that ecosystem services and othernon-marketed goods make up between 50 and 90 percent of the total source of livelihoods among poor ruraland forest-dwelling households, which can be termedas the “GDP of the poor” (Figure 3.9). Natural resourcesand associated ecosystem services therefore havesignificant implications for the reduction of multi-dimensional poverty and inequality.31
Box 3.1 Ecological impacts of palm oil expansion in Indonesia
The expansion of palm oil cultivation in Indonesia provides a sobering example. Between 2000 and 2012 the country lost anestimated 0.84 Mha of primary forest each year, amounting to more than 6Mha, and significantly outpacing deforestationrates in Brazil; half of this forest loss has been attributed to palm oil expansion. The loss to biodiversity has been devastating,as a single hectare of rainforest harbours more than 200 species of plant, more than 60 per cent of which are endemic.Converting forests to palm oil plantations results in the loss of large amounts of carbon from biomass and from the disturbedsoil. In particular, drainage of peat swamps for oil palm establishment is associated with extremely high CO2 emissions whenorganic matter that has accumulated over millennia is allowed to decompose.
Wildfire smoke is a major source of air pollution that adversely affects human health and productivity in South-East Asia. Despiteregulations against land-clearing fires, “slash and burn” agriculture is a common occurrence in the dry season. Wildfire smokecan cause respiratory and cardiovascular disease and even death. In addition to devastating health effects, wildfires have adverseeconomic effects. Closed businesses, schools and limited transportation can bring economies to a halt, and the effects of firesspread far beyond the geographic region where they originate. Pollutants from agrochemicals associated with palm oil production(fertilizers, pesticides, and rodenticides) have harmful impacts on terrestrial and aquatic ecosystems. Palm oil mill effluent, whichis microbially digested in open ponds, often overflows into waterways during heavy rains. The use of dangerous herbicides andpesticides also directly affects the health of workers who handle these chemicals.
Source: Petrenko et al (2016)
Figure 3.8 Transition of value of natural capitalper capita (from forests) and market Gini inIndonesia, 1995-2014
Source: ESCAP calculation using data sources described in Annex 1.3.
Mar
ket i
ncom
e G
ini c
oeff
icie
nt
38
36
34
32
30
Natural capital per capita [Forests, Constant (2014 US$)]
700 800 900 1 000
1995 to 2005 2005 to 2014
Indonesia

INEQUALITY IN ASIA AND THE PACIFIC56
3.4 UNEQUAL IMPACTS OF CLIMATE CHANGEAND NATURAL DISASTERS
From shifting weather patterns that threaten foodproduction and livelihoods, to rising sea levels, theimpacts of climate change are already being felt acrossthe Asia-Pacific region. Often the poorest and mostdisadvantaged communities face the greatest impacts,which adds to the urgency of introducing policies thatdrastically reduce greenhouse gas emissions. The sectionbelow discusses the implications of climate change andnatural disasters to both inequalities between and withincountries.
3.4.1 Climate change, natural disasters andinequality among countries
The Asia-Pacific region is more exposed to the impactsof climate change than other world regions. Six of the10 countries most affected by climate change in 1996-
2015 are in Asia.32 Furthermore, in 2017 the regionaccounted for 43 per cent of all registered disasterevents and 68 per cent of all fatalities.33 The impact ofdisasters on human lives is very unevenly distributed,with mortality rates from “disaster events” four to fivetimes higher in low- and middle-income countries thanin high-income countries (Figure 3.10).
Figure 3.9 Estimates for ecosystem-servicedependence
Note: Created by GRID-Arendal, available at: http://www.grida.no/resources/8133
11% 17% 6%
75% 47% 89%
Indonesia India Brazil
Indonesia India Brazil
Indonesia India Brazil
Source: TEEB for National Policy, 2010; CIA: The World Factbook.
Share of agriculture, forestry, and fisheries in classical GDP
Ecosystem services as a percentage of “GDP of the Poor”
Rural poor population considered in GDP of the PoorTotal population(Millions)
GDP of the Poor: estimates forecosystem-service dependence
246 1 189 203
20352
99
While the estimated economic losses from climatehazards in rich countries are much higher than in poorerones in absolute numbers, the relative economic impacton low-income countries is dramatically higher – lossesrepresenting 5 per cent of GDP in low-income countriescompared with 0.2 per cent in high-income ones.34 Thisdisproportional economic damage is clearly hamperingdevelopment efforts in low-income countries, especiallyin sectors such as agriculture and marine resources.Other climate impacts, such as water scarcity, severeheat waves and increased incidence of malaria anddengue fever, also affect low- and middle-incomecountries disproportionately, worsening inequalityamong countries.
3.4.2 Climate change, natural disasters andinequality within countries
Disasters can lead to widening disparities in income.Data from 19 countries in the Asia-Pacific region pointto a positive relationship between the number ofdisasters a country has faced and its income inequalitylevels.35
Figure 3.11 shows that up to 35 per cent of thepopulation in the affected areas was likely to fall belowthe poverty line as a result of the disaster. These findingshighlight the vulnerable situation of the large numbersof people in the Asia-Pacific region categorized as “near-poor”. The powerful tropical cyclones that have
Figure 3.10 Deaths per disaster event and per100,000 inhabitants, by country income group,2000-2015
Source: ESCAP (2017g) based on data from EM-DAT database.
25
High income Middle income Low/Lower middle income
8 000
7 000
6 000
5 000
4 000
3 000
2 000
1 000
0
30
20
15
10
5
0
Number of deaths per disaster eventDeaths per 100 000

57INEQUALITY IN ASIA AND THE PACIFIC
devastated parts of the region in recent years arereminders of the challenges many vulnerablecommunities and municipal authorities face.
Insurance clearly plays a key role in enabling people,businesses and institutions to recover from naturaldisasters, but access to it varies enormously. In 2013,for example, 67 per cent of the economic losses fromnatural disasters in the United States were insured, whilethe corresponding figure for Asia was just 7.6 per cent.36
Access to services such as insurance and banking isimproving across the Asia-Pacific region, but it remainsthe privilege of wealthier citizens in many countries.
Women and children in low-income households aredisproportionately affected by disasters and by slow-onset impacts of climate change.37 Stunted children aredisproportionately found in households belonging to thepoorest 40 per cent of the population, and their mothersalmost always have lower education levels. Poor,crowded urban communities are often located onmarginal land that is vulnerable to floods and landslides.People who spend longer periods working outdoors orhave limited access to water or air conditioning areinevitably most at risk from heat waves, which arebecoming increasingly frequent in parts of the region.Malnutrition further contributes to the susceptibility oflow-income groups to heatwaves.38
3.5 ENVIRONMENTAL INEQUALITIES ANDCONFLICTS
Competition over natural resources can lead to, intensifyor sustain violent conflict, especially if resources areowned or controlled by a small group. On the one hand,a rich endowment in natural resources generatesrevenue streams that can be channeled into sustainabledevelopment, reducing income inequalities and hencealleviating the potential for conflict. On the other hand,the exploitation and mismanagement of natural
Figure 3.11 Impact of recorded disasters onpoverty rates, selected Asia-Pacific countries,2011-2016
Source: ESCAP (2017g) based on the ESCAP statistical database andcountry post-disaster damage assessments.
Pakistan2011, Floods
Philippines2013, Cyclone Haiyan
Fiji2016, Cyclone Winston
Sri Lanka2016, Floods and Landslides
Vanuatu2015, Cyclone Pam
35.6%
23.6%
14.5%
12.6%
2.3%
0% 10% 20% 30% 40%
Population that can potentially slip below poverty line
resources can deepen poverty and social inequality,exacerbating impacts of climate change and conflict.Inequality in natural resource ownership, coupled withweak political institutions, creates self-perpetuatingnegative cycles that can be very difficult to break.
In the Asia-Pacific region the following places andpractices have been identified as at risk from naturalresource-based conflict: a) The use of freshwater andfreshwater ecosystems in the Mekong, Amu Darya, SyrDarya, and Ganges river basins as well as the Aral Sea;b) Air pollution from forest fires in South-East Asia;c) Access to energy resources in the South-China Sea;d) The energy-water-food nexus in Central Asia ande) intra-State, local-level conflicts related to foreigninvestments in the mining and agro-industry.39
Globally, at least 40 per cent of all intrastate conflictsare assessed as having a link to natural resources inthe last 60 years.10 Furthermore, different types ofcommodities can correlate with conflict in differentways. For example, oil and other reserves can beassociated with a higher risk of conflict while “lootable”commodities such as gemstones can prolong conflict41
by feeding illicit financial flows and promoting practicesthat institutionalize inequality.42 Global estimates of illicitfinancial flows show that the problem is significantand widespread and poses particular problems forpoor, institutionally fragile and resource-rich countries.43
Figure 3.12 illustrates the clear connection betweenincreased dependence on natural resource rent andfragility and conflict in countries.44
Natural resources provide an important basis for rurallivelihoods. Consequently, resource scarcity coupled withpoverty, inequality, insecure land tenure and imbalancesof power all heighten the risk of conflict. Examplesinclude illegal land acquisitions that displace localcommunities, and energy developments (such as in theMekong River) that have impact on biodiversity, land-use patterns and, consequently on rural livelihoods.Indigenous peoples have also faced significant hardshipin the face of agricultural investment linked to theproduction of palm oil in South-East Asia.
These factors can, according to the environmentalchange and violent conflict theory, trigger conflicts ofdiffering types: “simple-scarcity” conflicts due todeclining levels of natural resources; “group-identity”conflicts due to large population movements caused byenvironmental stress; and “deprivation” conflicts due tosocio-economic deprivation from environmentalscarcities. While the theory does not apply to allconflicts, it is worth studying its implications in thecontext of the Asia-Pacific region in more detail.45, 46
ESCAP analysis suggests that conflict occurrence iscyclical, with variations that could be weekly or seasonal,

INEQUALITY IN ASIA AND THE PACIFIC58
and linked to anthropogenic activities that influenceweather cycles and climate patterns. Furthermore,communities in conflict-affected areas tend to be lessresilient. Worse is that among the poor, conflictsdisproportionately constrain their adaptive capacity andchoices. Similarly, community members affected bydisasters are more likely to engage in conflict. In thesecircumstances, inequality across societies can widenquickly. It has therefore become a matter of urgency torecognize that, in addition to more conventional peace-building approaches, climate adaptation and disaster riskreduction are entry points for preventing conflict. Insituations where conflict is based on competition forscarce resources, better management of naturalresources, combined with climate change adaptation,must be channeled into non-violent resolutions.
3.6 CONCLUSIONS AND RECOMMENDATIONS
The key message of this chapter is that environmentaldegradation (pollution, exploitation of natural resources,natural hazards and climate change) and related conflictsdisproportionately impact the poor and disadvantaged(as well as poorer countries) and can exacerbateinequality of opportunity and outcome both within andamong countries. The analysis specifically showed that,within countries, the damaging effects of air pollutioncan exacerbate inequalities, while conserving andexpanding natural capital is associated with reducedinequality. Therefore, it is paramount to recognize thecritical role of the environment in efforts and policiesthat tackle inequality and ensure development isinclusive.
Effective actions need to reflect national and localcircumstances, but, with that in mind, the following aresome specific policy directions to consider:
Address unequal impacts of air pollution
• While taking action to reduce pollution, makefocused efforts to protect vulnerable groups,
especially children, older persons and residents ofareas with low socioeconomic status.
• Enhance city planning and zoning to reduceexposure to pollution. Seek to separate residentialareas from polluting industries and major roads.Establish green corridors and wedges in the cityscape,and ensure that many streets are tree-lined.
• Strengthen capacity for pollution monitoring anddisclose such data in real time to the public, usingICT and other channels. Consider that pollutionlevels vary across cities, implying a need for multiplemonitoring stations to cover the full range ofneighbourhoods. Partner with local universities todevelop more comprehensive monitoring campaigns.Educate citizens about the relationship between airquality and health, including awareness of protectivemeasures.
• Map out the sources of pollution, especially in poorerneighbourhoods. Use the mapping to enforceregulations on emissions to proactively apply thepolluter-pays principle, with adequate measure toincrease compliance, reduce corruption and channelfunds generated towards resilience-building amongvulnerable groups.
• Facilitate the switch to cleaner energy sources inhouseholds in order to reduce the burden of indoor(and outdoor) air pollution. Electrification, based onrenewable sources, should be promoted whereverpossible. Subsidy schemes for the poor can facilitatethe uptake of household equipment using cleanerenergy. Regulations, awareness campaigns andsocial marketing will also be needed for enhancedeffectiveness.
• Make basic health-care services accessible andaffordable to all, as highlighted in chapter 2, andestablish regular health screenings in neighbourhoodswith low socioeconomic status, especially in schools.
Figure 3.12 Natural resources rents as percentage of GDP
Source: World Bank, World Development Indicators, accessed 2017.
40
35
30
25
20
15
10
5
01990 2000 2008 2009 2010 2011 2012 2013 2014 2015
Fragile and conflict affected countries LDCs OECD World Average

59INEQUALITY IN ASIA AND THE PACIFIC
Reduce vulnerabilities to climate changeimpacts and help improve resilience
• Channel more financial resources for climate changeadaptation directly to local communities and civil-society organizations that are rooted in local realities.Provide targeted agricultural extension services tothose relying on marginal land and other climate-sensitive lands for their livelihoods.
• Ensure that disaster preparation drills reach alsodisadvantaged communities and involve especiallyvulnerable groups, such as women, children, elderly,people with low education, and those with disabilities.Develop evacuation plans and build storm sheltersin rural areas likely to be affected by strong cyclones.
• Protect and restore coastal forests that can lessenthe combined impact of sea-level rise and storms.Seek opportunities to create green jobs by involvingrural poor in such projects.
• Prevent informal settlements in flood-prone urbanareas by creating opportunities for affordablehousing in safer locations, in line with SDG 11.1.
• Facilitate access to insurance for low-incomecommunities. One way to take action in this area isby joining and supporting the InsuResilience GlobalPartnership, which has been endorsed by G20, V20,and G7, and which was officially launched inNovember 2017 at the UN Climate ConferenceCOP23 in Bonn.
• Provide adequate assistance to the growing numberof climate migrants/refugees. Take steps towardsproviding climate migrants the same legal status andright to protection as other refugees. Internationalcooperation, including on financing and in the formof reformed rules for international resettlement, isneeded to help secure the livelihoods of these groups.
Secure access to environmental systems aslivelihood resource
• Speed up efforts to formalize land ownership, whilerespecting traditional forms of ownership and userights, such as collectively managed commons.
• Improve access to justice to help subsistence-oriented communities defend the resources they relyon for their livelihoods and continued existence.Consider establishing special courts for resolvingconflicts over land and other natural resources.
• Strengthen mechanisms for social and environmentalassessments of large-scale investments in agriculture,and involve local communities in the decision-making process.
• Reduce and reform government subsidies forlarge-scale fishing, reflecting not only sustainabilityof fish stocks but also impacts on small-scale coastalfisheries. Support the establishment of a ConservationTreaty for the High Seas.
Cross-cutting actions
• Generate disaggregated data systems and conductmore systematic research, especially in developingcountries, to deepen understanding of howenvironmental hazards impact the poor anddisadvantaged groups (as identified in chapter 2).Such research would help deconstruct inequalitiesthat exacerbate vulnerability to natural disasters andreinforce environmental degradation and its impacts.
• Policy processes and decision-making, at all levelsshould be strengthened to ensure effectiveparticipation of women. Instruments to capture sex-disaggregated data should also be in place to revealthe contribution of women to all sectors ofeconomy. Sex-disaggregated data will also be criticalin devising ways to harness women’s agency toreduce the disproportionate environmental impactson the poor and disadvantaged communities.
• Incorporate the right to a clean, safe and healthyenvironment in national constitutions. Althoughconstitutional provisions do not guarantee goodenvironmental stewardship, they provideopportunities for all citizens, regardless of socialstatus, to demand protection from environmentalhazards through the judiciary system. Ensure that allcitizens have access to justice, with special attentionto marginalized groups. Support international effortsto formally include the right to a clean, safe andhealthy environment as one of the human rights, inthe form of a legally binding treaty.
While environmental degradation aggravatesinequalities, and climate change is set to accentuate theimpact of existing inequalities, many people are lookingto technology to provide the solutions of the future thatwill help manage risks and asymmetric impacts. Thefollowing chapter reviews the impact that technologyhas had so far in shaping inequalities – and itsprospective role in reducing or further aggravatinginequalities of outcome, opportunity and impact.

INEQUALITY IN ASIA AND THE PACIFIC60
ENDNOTES1 See Koop and Tole (2001); Holland et al. (2009); Islam (2015).2 Dorling (2017).3 Clapp and Dauvergne (2011).4 See Evans and Kantrowitz (2002); Jerrett (2009); Boyce (2017).5 See Schoolman and Ma (2012); Pant et al. (2016).6 Mannucci and Franchini (2017).7 Landrigan et al. (2018).8 Word Health Organization (2016).9 Landrigan et al. (2018).10 Particulate emissions damage is the damage due to exposure of a country’s population to ambient concentrations ofparticulates measuring less than 2.5 microns in diameter (PM2.5), ambient ozone pollution, and indoor concentrations of PM2.5in households cooking with solid fuels. Damages are calculated as foregone labour income due to premature death. See moredetails on the variable: http://databank.worldbank.org/data/reports.aspx?source=2&type=metadata&series=NY.ADJ.DPEM.CD11 Landrigan et al. (2018).12 The existence of ‘threshold effects’ of environmental degradation, is well recognized in the ecological literature. See http://www.openness-project.eu/sites/default/files/SP_Thresholds.pdf13 Kan et al. (2008).14 Pant et al. (2016).15 World Bank (2006).16 Schoolman and Ma (2012).17 Zheng, Sun and Kahn (2015).18 Asia Pacific Clean Air Partnership (2018).19 Chhetri, Larsen and Smith-Hall, C. (2015).20 Bren d’Amour et al. (2016).21 Lange, Wodon and Carey eds. (2018).22 It comprises energy (oil, gas, hard and soft coal) and minerals (10 categories), agricultural land (cropland and pastureland),forests (timber and some non-timber forest products), and terrestrial protected areas. Natural capital is measured as the discountedsum of the value of the rents generated over the lifetime of these assets.23 See table ES.1, Lange and Carey eds. (2018)24 United Nations, Economic and Social Commission for Asia and the Pacific (ESCAP) (2017h)25 Lange, Wodon and Carey eds. (2018).26 Suich et al. (2015).27 Forest Peoples Programme (2012).28 World Bank (2008).29 Genetic Resources Action International (GRAIN) (2015).30 Government of Bangladesh (2008).31 Suich et al. (2015).32 Kreft et al. (2017)33 Munich RE (2018).34 United Nations, Department of Economic and Social Affairs (DESA) (2016b).35 United Nations, Economic and Social Commission for Asia and the Pacific (ESCAP) (2017g).36 Impact Forecasting 201437 Asian Development Bank (ADB) (2017).38 Intergovernmental Panel on Climate Change (IPCC) (2012).39 United Nations, Economic and Social Commission for Asia and the Pacific (ESCAP) (2017d).40 United Nations Environment Programme (UNEP) (2009).41 Ross (2004).42 Organisation for Economic Co-operation and Development (OECD) (2016c).43 Worlds Bank (2016b).44 Organisation for Economic Co-operation and Development (OECD) (2016c).45 Homer-Dixon, Thomas (1994).46 Kaplan (1994).

61INEQUALITY IN ASIA AND THE PACIFIC
INEQUALITY IN ASIA AND THE PACIFIC62
Chapter 4
Technology and Inequalities

63INEQUALITY IN ASIA AND THE PACIFIC
4.1 HOW CAN TECHNOLOGY IMPACTINEQUALITY?
The relationship between technology and inequality ismultifaceted. Technology has enhanced productivity,accelerated economic growth, enabled knowledge andinformation sharing and increased access to basicservices. However, it has also been the cause ofinequalities. This chapter examines the role oftechnology across the three facets of inequalitydiscussed in the previous chapters: inequality ofoutcome; inequality of opportunities; and inequality ofimpact, which is concerned with the impact ofenvironmental hazards on the most vulnerable.1
The chapter starts by underlining that digital connectivityis a core enabler of the emerging Fourth IndustrialRevolution – a wave of highly disruptive innovations thatwill bring new big ideas and trigger additional layers oftechnological innovations that compel a rethink of alltraditional responses, as societies, communities and evenwhat it means to be human, is challenged. These futureimpacts cannot be underestimated. While digitalinnovation and the spur of the Third IndustrialRevolution helped accelerate economic growth throughthe competitive participation of the Asia-Pacific regionin the global supply chain, a number of low-incomecountries lagged behind and did not benefit equallyfrom the digital revolution. Therefore, as frontiertechnologies go mainstream, a key policy concern giventhe speed, scale and depth of the changes ahead, is thatthe “digital divide” will amplify the “technology divide”and widen inequalities, across all three of its dimensions,and between subregions, countries and people. 2
Technology, together with the opportunities providedby trade and investment for capital accumulation andproductive transformation, has helped achieve anunprecedented level of economic growth in Asia and thePacific, enabling several countries to catch up withdeveloped nations. However, least developed countries(LDCs) and countries with special needs have not beenable to build technological capabilities and are laggingbehind.
The potential of technologies to reduce inequality inopportunities is vast but is not automatic. It largelydepends on the capabilities of the poor to access anduse technologies and solutions that respond to theirneeds. Technologies also play a critical role for reducingthe impact of environmental degradation and disasters,which disproportionately affect the poor.
Policymakers seeking to ensure that technologycontributes to, rather than undermines, equality facechallenging questions:
• What role has technology played in creating andaddressing inequality, in terms of income,

INEQUALITY IN ASIA AND THE PACIFIC64
opportunity and environmental impact in Asia andthe Pacific?
• How will future technologies potentially reshapetrends in inequalities in the region?
The rest of the chapter aims to answer these questionsand provides policymakers with recommendations toensure that technology as a means for implementing theSustainable Development Goals (SDGs) reduces ratherthan accentuates inequality. A key message is thatamong the combination of enabling factors that areneeded, public policy is key. Technologies and solutionsneed to respond to the needs of the poor, who needto be empowered to access and use such technologies.
4.2 DIGITAL DIVIDE AND INEQUALITY
As the Third Industrial Revolution has evolved,information and communications technologies (ICT)emerged as a meta infrastructure – an infrastructure thatreconfigures all other infrastructures into smart systemsthat accelerate socioeconomic development. Moreimportantly, today as the Third Industrial Revolutionmorphs into the Fourth Industrial Revolution with theInternet of Things (IoT) at its core, artificial intelligence(AI) – that is machines performing cognitive, human-likefunctions – has emerged as the next technological
frontier of sustainable development. As AI goesmainstream, its disruptive impacts are likely to be seenat an unprecedented speed and scale, which underlinesthe need for governments and stakeholders to discussand shape their collective future.
Frontier technologies are based on huge quantities ofreal-time data, which are themselves critically dependenton high-speed (broadband) Internet. The existing lackof broadband connectivity across many Asia-Pacificcountries means that the uptake, adoption anddevelopment of AI and other technologies will continueto be uneven.
Analysis of fixed (wired) broadband subscriptions acrossthe region points to a widening digital divide, with anincrease in coverage and quality in high-incomecountries (Figure 4.1). In 2016, in 18 low-incomecountries in the region, less than 2 per cent of thepopulation had access to fixed-broadband– a level thathas remained unchanged for nearly two decades.3 Thisstands in sharp contrast with fixed-broadbandsubscriptions in East and North-East Asia, where itranged between 22 and 41 per cent (Figure 4.2). Clearly,the digital revolution bypassed many countries in theregion, many of which may also be bypassed by theFourth Industrial Revolution.
Figure 4.1 Total fixed-broadband subscriptions by income group in 2000-2016, excluding China
Source: ESCAP, based on data from ITU World Telecommunication/ICT Indicators Database (accessed July 2017).
A digital divide also exists within countries – betweenurban and rural areas and between men and women –driven by the availability, affordability and reliability ofbroadband services.4
The conditions, prerequisites and drivers of AIdevelopment and uptake show a positive correlationbetween the quantity of AI on the one hand, andmarket size, capacity for technology absorption andinvestment in ICT services on the other hand.5 Thus the
return on investment in AI is likely to be significantlygreater among countries with a high capacity fortechnology absorption – a characteristic that tends toreflect inequalities accumulated in the past.
If current trends continue, AI and other frontiertechnologies may further increase income, opportunityand impact inequalities and widen developmentgaps among countries and people by providingtransformative opportunities to those with the requisite
100
80
60
40
20
0
Fixe
d-B
road
ban
d S
ub
. (M
illio
ns)
ESCAP High-income countries ESCAP Upper-middle-income excl. China PRESCAP Lower-middle-income countries ESCAP Low-income countries
2000 2001 2002 2003 2004 2005 2006 2007 2008 2009 2010 2011 2012 2013 2014 2015 2016

65INEQUALITY IN ASIA AND THE PACIFIC
infrastructure, access, investments and knowledge,while those without are left further behind. The natureof each of these dimensions is analysed in the followingthree sections.
4.3 TECHNOLOGY AND INEQUALITY OFOUTCOME
The role technology plays in income and wealthinequality is complex and contested. Technology is a keydriver of aggregate economic growth, throughproductivity improvements, but its contribution toeconomic growth varies greatly across countries.Technology can also be a driver of income and wealthinequality because of its skills-bias nature and because
innovators can capture high rents. This section exploresthese dimensions, as supplemental to the drivers ofinequality explored in previous chapters.
4.3.1 Technology as a driver of economicgrowth
Technology is considered fundamental to sustainingeconomic growth. The harnessing of water power,followed by the invention of an efficient steam enginein 1769, played vital roles in the First Industrial Revolution,which drove economic development in Europe. Theinternal combustion engine arguably sparked the SecondIndustrial Revolution, while the third has been driven bycomputers and the Internet (Figure 4.3).
Figure 4.2 Fixed-broadband subscriptions in the Asia-Pacific region (percentage), 2016
Source: ESCAP, based on data from ITU World Telecommunication/ICT Indicators Database (accessed July 2017).Note: * Countries with latest data available.
Republic of KoreaHong Kong, China
New ZealandJapan
AustraliaMacao, China
SingaporeChina
New Caledonia*Russian Federation
French PolynesiaAzerbaijan
GeorgiaKazakhstan
TurkeyCook Islands*
Iran (Islamic Republic of )ThailandArmenia
TuvaluViet Nam
Nauru*Uzbekistan
MalaysiaBrunei Darussalam
MongoliaMaldives
Palau*Philippines
Sri LankaKyrgyzstan
BhutanBangladesh
Micronesia (Federated States of )Tonga
IndonesiaGuam
Marshall IslandsVanuatu
IndiaFiji
SamoaPakistan
NepalCambodia
Lao PDRPapua New Guinea
Solomon IslandsTimor-Leste
KiribatiTurkmenistan
TajikistanMyanmar
Afghanistan
Small island developing statesLandlocked developing countries
Least developed countries
0 5 10 15 20 25 30 35 40 45
Fixed-broadband subscriptions per 100 inhabitants
41.1
35.5
32.4
31.5
30.4
30.0
25.4
22.9
21.0
19.5
19.4
18.6
15.8
13.7
13.6
13.1
11.6
10.7
10.1
10.1
9.9
9.5
9.1
8.7
8.3
7.6
7.2
5.7
5.5
4.1
4.1
3.9
3.8
3.0
2.8
1.9
1.9
1.9
1.6
1.4
1.4
1.2
0.9
0.8
0.6
0.3
0.2
0.2
0.1
0.1
0.1
0.1
0.1
0.0
5.6
2.1
0.9

INEQUALITY IN ASIA AND THE PACIFIC66
FirstIndustrial
Revolution1760s to
1840s
SecondIndustrial
Revolution1860s to
1920s
ThirdIndustrial
Revolution1970s to
2000s
FourthIndustrialRevolution2010s –
10 000
1 000
100
1550 1600 1650 1700 1750 1800 1850 1900 1950 2000
Printingpress
Firststeam
engine
Efficientsteam
engine
Mass-produced
steel
Internal combustion engine
Internet
1450 1698 1769 1855 1860 1970s Today
Esti
mat
ed g
lob
al G
DP
per
cap
ital
$U
S
Technologies and, more broadly, innovation are centralto long-term growth because of their impact onproductivity. Technological capabilities, that is acountry’s capacity to acquire, absorb, disseminate andapply modern technologies, are thus fundamental tomaintain broad economic growth.6
Quantifying the contribution of technology toproductivity or economic growth is challenging,contested and approximative at best. It is challengingbecause technology is interwoven with other drivers ofproductivity and singling out its unique role is seldomstraightforward. It is contested because multiplemethodologies are used to evaluate its impact.7 Totalfactor productivity (TFP), an aggregate measure ofproductivity first introduced by Solow (1957), has beenthe traditional measure of economy-wide technologicalchange.8 TFP is the portion of output not explained bythe amount of inputs used in production, and representshow efficiently and intensely the inputs are utilized inproduction9. Changes in TFP can be explained bothby technology changes and by non-technologicalinnovation. It is approximative at best because of thedifficulties in measuring inputs and outputs.10
The economic growth trajectories of the more advancedeconomies (including China, Japan and the Republicof Korea) have been sustained by technologicalcapabilities.11
Accelerating economic growth in the LDCs and countrieswith special needs is key to reducing income inequalitiesin the region, but most of these nations are hamperedby low technological capabilities. The extent oftechnological inequalities among countries broadlydepends on three factors: investment in technologicaldevelopment, overall national capacity to innovateand the availability of ICT infrastructure. Regardinginvestment in technological development, 16 countriesin the region (half of those surveyed) spent less than0.25 per cent of GDP on R&D in 2015 (Table 4.1).
Regarding the overall capacity to innovate, includingthrough non-technological innovation activities such asthe reorganization of production processes ororganizational improvements, among the LDCs in theAsia-Pacific region, Bhutan and Cambodia perform bestin the Global Innovation Index (GII), but their scores arestill well below the average for developing countries(Figure 4.4). Reasons for innovation weakness amongLDCs and other countries with special needs include thelow absorptive capacity of firms, weaknesses inknowledge generation (basic research capacity) anddiffusion (limited vocational and STEM education andweak linkages between academia and industry). Weakframework conditions (where governance and marketweaknesses inhibit FDI and curtail business activities),along with poor infrastructure (energy, transport andtelecommunications) also constrain the development oftechnological capabilities.12
Figure 4.3 GDP per capita growth and technology
Source: Adapted from “Disruptive technologies: Advances that will transform life, business, and the global economy,” McKinsey Global Institute, May2013, p. 24.“ The figure was derived from Angus Maddison, “Statistics on world population, GDP and per capita GDP, 1–2008 AD,” the MaddisonProject database. Data for 2008-2016 is GDP per capita (constant 2010 US$), from World Bank national accounts data (Available at: https://data.worldbank.org/indicator/NY.GDP.PCAP.KD)Note: the graph is on a log scale—the actual slope of the line after World War II is much steeper than visually depicted.

67INEQUALITY IN ASIA AND THE PACIFIC
The absence of basic technological capabilities (especiallyin terms of digital infrastructure and skills) will limit theability of these countries to access, use and developfrontier technologies. Regulatory frameworks for AI andfrontier technology also need to be in place before thedigital divide becomes unbridgeable. This is importantbecause automation may prove to be a double burdenby reducing employment in manufacturing, butopportunities to develop technological capabilities, givenalso by limiting the role of the manufacturing sector asa vehicle for technological learning.13
4.3.2 Technology and its effect on jobs andwages
The adoption of technologies can sustain competitiveness.However, technology also affects the composition andnature of jobs available as well as relative wages. Jobs
are being created and destroyed all the time and thenet effect of technology on aggregate employment isambiguous. Labour-augmenting technology cancomplement workers and increase their productivity.14
Labour-saving technology (e.g. automation) can, on theother hand, substitute workers for machines in certaintasks. It can give rise to different jobs too. Empirically,the fears of massive unemployment have provenunfounded especially in the long term. Althoughunemployment may increase in the short-to-mediumterm because of the frictions in labour markets,technological changes have empirically shown smallnegative effects on long-term employment levels, andeven positive effects in some cases.15
Regarding the effects of technology on the compositionand nature of work, automation and robotictechnologies tend to favour non-routine cognitive tasks
Table 4.1 Gross domestic expenditure on R&D in the Asia-Pacific region, 2015 or most recent yearavailable, percentage of GDP
Republic of Korea 4.23 Thailand 0.63 Mongolia 0.16Japan 3.28 Viet Nam 0.37 (2013) Philippines 0.14 (2013)Australia 2.20 (2013) Iran (Islamic Republic of) 0.33 (2012) Macao, China 0.13Singapore 2.20 (2014) Georgia 0.32 Cambodia 0.12China 2.07 Nepal 0.30 (2010) Kyrgyzstan 0.12Malaysia 1.30 Armenia 0.25 Tajikistan 0.11New Zealand 1.15 (2013) Pakistan 0.25 Sri Lanka 0.10 (2013)Russian Federation 1.13 Azerbaijan 0.22 Indonesia 0.08 (2013)Turkey 1.01 (2014) Uzbekistan 0.21 Lao PDR 0.04Hong Kong, China 0.76 Kazakhstan 0.17 Brunei Darussalam 0.04 (2004)India 0.63 Myanmar 0.16 (2002)
Source: UNESCO, Institute for Statistics Data Center (accessed January 2018).
Figure 4.4 Global Innovation Index, Asia-Pacific countries, 2016
Source: Global Innovation Index. Available from: https://www.globalinnovationindex.org/analysis-indicator (accessed January 2018).Note: Overall GII score, computed as the simple average of the Input and Output Sub-Index scores
60
50
40
30
20
10
0
Republic of K
orea
Hong Kong, China
Japan
New Zealand
Australia
China
Malaysia
Turkey
Russian Federatio
n
Thailand
Mongolia
Viet Nam
Armenia
Georgia
India
Philippines
Kazakhstan
Iran (Is
lamic Republic of
Azerbaija
n
Tajikist
an
Indonesia
Sri Lanka
Bhutan
Cambodia
Kyrgyzsta
nNepal
Pakistan
Bangladesh
57.155.7
54.5 54.2 53.150.6
43.3
39.0 38.536.5 35.7 35.4 35.1 33.9 33.6
31.8 31.530.5 29.6 29.6 29.1 28.9 27.9 27.9
26.6
23.1 22.9 22.6
LDCs average Developed countries average Developing countries averageLandlocked countries average Countries with special needs average

INEQUALITY IN ASIA AND THE PACIFIC68
while they are reducing demand for manual work.Robotics and AI tend to augment the tasks of high-skilled professionals such as engineering, customer-problem solving, management, medical diagnosis,software development, etc. New technologies also havethe capability to take over routine tasks, for examplemanufacturing assembly and back-office work, whichfall under the middle-skilled category.16 As a result,automation can create employment polarization by“hollowing out” jobs in the middle of the employmentdistribution. Evidence is extensively documented indeveloped countries, such as the United States and theEuropean countries.17 In Asia-Pacific economies, the
share of “middle-skilled” jobs in overall employment hasbeen shrinking. China is an exception due to thegrowing mechanization in agriculture, which has led toan increase of routine jobs (Figure 4.5). Most of theeconomies that experienced a fall of middle-skilled jobssaw the share of high-skilled jobs increasing. However,the rise in high-skilled jobs was only able to offset thefall in middle-skilled jobs in three countries: Bhutan,Kazakhstan and Pakistan. This unbalanced shift in thecomposition of job markets can translate into risingincome inequality as high-skilled workers will see higherwages while low-skilled workers will have to competewith displaced middle-skilled workers.
Figure 4.5 Changes in employment share by skill type, selected Asia-Pacific economies, annual average,1995-2012
Source: ESCAP’s compilation, using data from World Bank (2016).
1.5
1.0
0.5
0
-0.5
-1.0
-1.5Turkey Philippines Malaysia Republic of
KoreaNew
ZealandThailand India Australia Sri Lanka Russian
FederationBhutan Kazakhstan Mongolia Pakistan China
High-skilled occupations Middle-skilled occupations Low-skilled occupations
Looking forward, the region can expect further jobdisplacement. As labour costs in developing economiesincrease, tasks that can be automated will return todeveloped countries.18 This trend could reduce theopportunity not only to create more jobs but also forindustrialization and technological upgrading strategybased on labour-intensive manufacturing. Countriessuch as India, which aims to increase manufacturingvalue added to 25 per cent by 2020, from 16 per centin 2015, could be affected.19
Technically, the share of jobs at risk of automation ishigh (Box 4.1). However, for now, robot deploymentremains mostly confined to the manufacturing sector asautomation in Asia and the Pacific is moderated by lowerwages and slower technological adoption.20 AI isconsidered to be the most important general-purpose
technology in the new era and is expected to have thedeepest impact, permeating all industries and playing anincreasing role in daily life.21 Research on AI is advancingquickly, but its application for most developing countriesremains largely at a nascent stage.22 Nevertheless,countries need to consider policies (regulatory andothers) that would help them prepare for thistechnological change.
Empirical data on the impact of technology on incomeinequality across Asia and the Pacific is scarce. A recentstudy shows that the skills premium has been decliningor stagnant in recent years in some countries, includingIndonesia, Pakistan and the Russian Federation, andthat there is a positive relationship between the skillspremium and income inequality as measured by the Ginicoefficient (Figure 4.6).25

69INEQUALITY IN ASIA AND THE PACIFIC
Figure 4.6 Skill premium in selected Asian countries, percentage
Box 4.1 Automation and risk of job displacement
About half of all the activities people are paid to do globally, amounting to 1.2 billion workers, could potentially be automatedby adapting currently demonstrated technologies.23 The World Bank estimates that up to two-thirds of all jobs are susceptibleto automation in the developing world. In the Asia-Pacific region the risk of jobs being automated is also high: 785 millionworkers or 51.5 per cent of total employment in the region.24
The share of automatable employment varies among countries and sectors, depending on the nature of the workforce andtheir tasks. Vulnerability to automation, based on technological feasibility, is estimated to range from 55 per cent in Uzbekistanto nearly 80 per cent in Nepal.
Similarly, findings from a firm-level survey for ILO by Chang et al. (2016) suggest that automation might have a significantimpact on the job security of salaried workers in five major sectors of ASEAN economies: automotive and auto parts; electricaland electronics; textiles, clothing and footwear; business process outsourcing; and retail (from 60 per cent to 89 per cent,depending on country and sector). Additionally, based on data from MGI, 68 per cent of accommodation and food servicesjobs of major Asia-Pacific economies are technically automatable.
However, the automation effects are moderated by lower wages and slower technology adoption. UNCTAD (2017b) indicatesthat, for now, robot deployment has remained limited in manufacturing, especially in the textiles, apparel and leather sectors,which are particularly relevant to LDCs. Adjusting for adoption time lags reduces the estimates share of susceptible automationby half for Cambodia and Nepal.
Sources: Chang et al. (2016), MGI (2017), UNCTAD (2017b) and World Bank (2016).
Source: UNIDO (2016), p.114.
90
80
70
60
50
40
30
20
10
0
Kazakhstan Mongolia Tajikistan Georgia Malaysia India Thailand Bangladesh China Cambodia NepalUzbekistan
Unadjusted (technological feasibility) Adjusted (technological feasibility + adoption time lags)
Estimated share of automatable employment
Source: ESCAP’s compilation using data from World Bank (2016).
70
60
50
40
30
20
10
0
1992
1993
1994
1995
1996
1997
1998
1999
2000
2001
2002
2003
2004
2005
2006
2007
2008
2009
2010
2011
2012
Skills premium (right) Gini-coefficient
70
60
50
40
30
20
10
0
1992
1993
1994
1995
1996
1997
1998
1999
2000
2001
2002
2003
2004
2005
2006
2007
2008
2009
2010
2011
2012
Skills premium (right) Gini-coefficient
70
60
50
40
30
20
10
0
1992
1993
1994
1995
1996
1997
1998
1999
2000
2001
2002
2003
2004
2005
2006
2007
2008
2009
2010
2011
2012
Skills premium (right) Gini-coefficient
Indonesia Russian FederationPakistan

INEQUALITY IN ASIA AND THE PACIFIC70
4.3.3 Capture of technology rents impactsinequality
Increasingly, the impact of technology on inequality hasbeen associated with the generation of economic rentsand rent-seeking behaviour. The economic rent (definedas excess income such as monopoly profits or unearnedbenefits emanating from preferential regulation) is nota new phenomenon. However, it is now argued thatfinancial globalization, digitalization and the rise offrontier technologies are the enabling environments forrent-seeking that cause extreme, long-lasting anddeepening inequality.26 In the absence of globalregulatory frameworks, globalization has accentuatedthe spread of digital companies and platforms asunregulated monopolies. These powerful monopoliesinfluence the political process and tilt the rules in theirfavour, allowing them to capture a disproportionateshare of the national income. Therefore, whenever aregulatory capture is allowed to persist, (extreme)inequality is not an unexpected unfortunate economicoutcome, but rather a policy and governance failure todeal with the excesses of regulatory lobbying.27
Technology rent-seeking companies combine at leastthree types of rent sources. The first is linked toownership of intellectual property, mostly patents.28 Thesecond is an ability to “force” customers to buy bundledproducts or services together, normally linked to theexistence of monopoly power and high marketconcentration and coexisting with regulatory capture. 29
The third is network externalities, where consumersdraw value from other consumers using the sameproduct or service, such that the company that managesto get a critical mass of consumers tends to attract manymore of them. The rise of online platforms (such asAlibaba, Amazon, Facebook, Google or Baidu) areperhaps the best example of network externalities.
Credit should be given to individuals and their talent andknowledge for making the digital world possible, butthe extreme wealth based on rents should be sharedwith those who helped create it. While the knee-jerkreaction to a discussion concerning distribution is, ingeneral, to impose taxes, a host of other policies canbe effective in ensuring long-term fair solutions.Competition or anti-trust policies need to be theresponsibility of an independent public entity to preventit from capture by the vested interest groups.Furthermore, consumers might be given ownershiprights to their own data streams, while thosecontributing to the creation of intellectual property (IP)should share royalty revenues. Labour laws could berevised giving more protection to workers, not jobs, sothat they also benefit from the rents they generated.
To conclude, technology may drive income inequalitiesamong countries, given the limited technological
capabilities of LDCs, and between different types ofworkers given shifts in the nature of work, the skills-biased nature of technology and through the captureof rents.
4.4 TECHNOLOGY AND INEQUALITY OFOPPORTUNITIES
Under the right policy environment, the potential fortechnologies to reduce inequality in opportunities is vast.Technology innovation has contributed to majorbreakthroughs in providing the poorest with access tobasic services. Solar home technologies have providedaccess to electricity to millions of households inBangladesh, while providing job opportunities to140,000 people.30 Digital technologies have enlargedaccess to education and training, including to world-leading universities, through massive open onlinecourses (MOOCs). Online e-commerce platforms haveenabled small producers to sell their products worldwideand develop new markets in rural areas. In China, forexample, more than 1,300 “Taobao villages” producegoods amounting to more than US$1.5 million eachin annual trade.31 In India, a technology-based financialinclusion system has provided financial access to1.2 billion people in just six years (Box 4.2). Furthermore,technologies can support movements for democracy andsocial justice. The #metoo social media campaign againstsexual harassment and assault has given a voice towomen across the globe.
Technology offers considerable opportunities, butrewards are not guaranteed. For lower-income andother vulnerable groups to see benefits, researchsuggests that at least three conditions are necessary:
1) The availability of ICT infrastructure
ICT infrastructure is a prerequisite for knowledge-enhancing and content-rich applications, includingonline payments. Fixed-broadband Internet is requiredfor more advanced applications. Inequalities in theavailability of such infrastructure have widenedas advanced countries developed rapidly (Figures 4.1and 4.2).
2) Skills to identify and use technologies
Skills development is a second pathway to addressgrowing inequalities, particularly in universities andinstitutes of higher learning (IHL).32 Skills and knowledgeacquired at IHL should be able to help addresschallenges associated with sustainable development, byproviding applications and solutions focused on reachingthe poor in remote rural areas and delivering servicesand information that narrow various forms ofinequalities.

71INEQUALITY IN ASIA AND THE PACIFIC
Examining the leading academic programmes oftechnology and computer science/engineering in fivecountries, namely Cambodia, India, Republic of Korea,Sri Lanka and Thailand, showed that some of the leadinguniversities lacked affordable, reliable and adequateconnectivity, which is the basis of science andtechnology education and research.33 A lack ofemployment opportunities in Cambodia, for example,meant that ICT graduates were forced to work as taxidrivers. The study found that the required educationgoes beyond skills development and now encompassescross-disciplinary, problem solving and critical thinkingaspects, which are not widely available among thesurveyed programmes. The ratio of women studyingtechnology was found to be worryingly low – below35 per cent in all surveyed countries.
3) Opportunities to access technologies thataddress the needs of low-income groups
Technologies available today do not necessarily respondto the needs of low-income and vulnerable groups. Theyare often developed by profit-seeking firms and naturallyrespond to the needs of more affluent markets.Policymakers can take multiple approaches that supportthe development of technologies and innovationsolutions that respond to the needs of vulnerablegroups, for example, the adoption of mission-orientedpolicies or system-wide transformations that addresscomplex developmental challenges such as financialinclusion or renewable energy, financing social-problemresearch programmes or taking measures that promotegrassroots innovations (Table 4.2).
Table 4.2 Approaches that promote technologies addressing the needs of low-income groups
Mission-oriented policies Examples Characteristics
Set of complementary policies andmeasures aiming to address complexsociety challenges
Grand challenge competition Examples Characteristics
Seek answers to intractable, complexand priority global health anddevelopment problems throughcrowdsourcing solutions.
Social-problem research programmes Examples Characteristics
Research programmes that specificallysearch solutions to developmentproblems
Promotion of grass-roots innovations Examples Characteristics
Grassroots innovations are driven bygroups typically excluded from theinnovation process, through projectsdesigned by local communities and/orinventions designed to meet specificlocal needs
Sources: Mazzucato (2017), OECD (2015)
• Supporting financial inclusion inIndia
• Transforming fuel-based energysystems towards renewable energyin China
• Aim to change the direction oftechnological systems
• Focus on diffusion of technologies
• Seek the development of radical andincremental innovations
• Require leadership from the top, long-term investments and comprehensivepolicies
• Water abundance XPRIZE34 • Incentivizes researchers, engineers ordevelopment agents to come up withconcrete solutions
• High upfront costs
• Addressing the challenges may requireregulatory changes beyond the sphere ofinfluence of competition organizers
• Republic of Korea’s social-problemresearch programme35
• Multi-departmental research projectsdriven by demand instead of supply
• Require joint planning andimplementation across differentresearch departments
• Require sound participation of civil societyand citizens
• India’s National InnovationFoundation36
• These innovations are driven by grass-roots organizations, but governmentscan also encourage them
Innovation activities, including the commercializationand transfer of technologies, and policies promoting theadoption and diffusion of technologies are important forensuring that the poor benefit from technologies.
Market inefficiencies can, however, constrain access toexisting solutions. An absence of local suppliers or a lackof access to credit are obvious barriers to the adoptionof technologies. In agriculture, a lack of information on

INEQUALITY IN ASIA AND THE PACIFIC72
the benefits of certain farming techniques or marketfailures in land ownership – such as where lack of securityof tenure undermines investment in irrigation – can allprevent agricultural technologies from being adopted.37
Innovative business and financing models that explorechannels to reach the poor are vital. Large corporationshave sought to reach poorer market segments through“bottom of the pyramid” business strategies thatprovide large-scale, low-cost and low-margin products,but their experiences have been mixed.38
One of the traditional roles of the public sector has beento address such market inefficiencies through incentives,regulations and support programmes. In the case ofagriculture, these have included technology extension
services that reduce informational inefficiencies; marketdevelopment programmes or finance programmes thataddress the supply of credit.
It is important to recognize that the state is not onlya market fixer, it can also be a leader. Public policy actioncan support system-wide transformations that ensurethat no one is left behind. Through public investmentand procurement policies, governments can influencehow technology is developed and diffused to addresssocial challenges.39 Several countries in the Asia-Pacificregion have successfully introduced technologies thatprovide services to the poor on a large scale. India’stechnology platform based on Aadhaar biometricidentification has, for example, revolutionized access tobanking services (Box 4.2).
Box 4.2 Digital Aadhaar: financial services for 1.2 billion people in India
The world’s largest digital ID programme, Aadhaar is a unique identification number based on biometric and demographicdata issued to 99 per cent of Indian residents. It is linked to a mobile phone number and a low-cost (Jan Dhan) bank account,which facilitates the transfer of direct benefit schemes to the poorest and vulnerable in the fastest and most direct way. Toprovide incentives for people to use the Jan Dhan bank accounts, and thus for banks to eventually offer financial services to awider range of citizens, the federal government and state governments are routing certain subsidies and salary payments throughthis platform. Almost 340 million people have now received direct benefit transfers, saving the Government an estimated US$7.51billion over three years. As more people use Jan Dhan accounts, banks are piloting new digital financial services.
Key elements of the scheme’s success have included: political support at the highest level, a large-scale and systemic approach,“buy-in” from capable private-sector suppliers and planning and building a simple, open, ubiquitous digital identity infrastructure.The project has nevertheless encountered several challenges. Some have been technical glitches and the limitations of thetechnology but perhaps of more importance has been the political challenge. The legal validity of Aadhaar, for instance, hasbeen questioned on grounds of privacy and security.
Aadhar platform for financial inclusion and direct benefit transfersto the rural poor
Source: ESCAP and STEPI (2017)
National identity,Digital platform
• Gateway to access services• Tool for streamlining
government expenditure & better targeting
• Enable for transparent and accountable system of public expenditure
• Social inclusion project with a developmental focus & enabler for empowerment
As per Digital Dividends Report of World Bank 2016, once Aadhaar is applied to all social programs and welfare distribution, it is estimated that it will save USD 11 Billion per annum
“This could be the greatest poverty killer app we’ve ever seen,” (Jim Young Kim, World Bank President (April 2013)
Frontier technologies:
Reducing inequality
7 key technologies
• Artificial intelligent• Big data• Cloud Computing • Machine learning• IOT• Payment infrastructure• Mobile Internet

73INEQUALITY IN ASIA AND THE PACIFIC
Box 4.3 Tamil Nadu, India: a climate-risk hotspot
Tamil Nadu in India is exposed to various climate-related risks including cyclones, heavy rainfall, floods, droughts and landslides.The climate-risk assessments, based on high, medium, and low emission IPCC scenarios for the 2030s, 2050s, and 2080s,indicate persistent drought. Furthermore, increased rain at certain times of the year is likely to cause more intense floodingevents in areas with increasing numbers of poor and vulnerable people.
Against these scenarios, policymakers have been encouraged to incorporate comprehensive climate-risk management intodevelopment planning. This comprehensive approach consists of an innovative mix of indigenous knowledge and advances inbiotechnologies such as cultivation of drought-resistant crops.40 Such applications enable increasingly accurate calculations ofthe impact of climate change on the agriculture sector with longer lead times.41
More specifically, traditional water harvesting techniques through percolating tanks have been combined with advances inbiotechnologies that increase the tolerance of already drought tolerant crops to climate-change extremes such as increasedaverage minimum and maximum temperatures, extreme heat events, flooding and increased salinity. Marker-assisted selection(MAS) techniques have been used on crops such as chickpeas and groundnuts that are important sources of nutrition in manydrought-prone regions. With molecular breeding, a drought-tolerant chickpea variety has produced 10 to 20 per cent higheryield under increasingly variable weather conditions.42
Source: The Hindu (2016), Eisenstein (2013) and ESCAP (2015c)
4.5 TECHNOLOGY AND INEQUALITY OF IMPACT
The convergence of digital, space and othertechnologies, combined with advances in materialsciences has helped reduce environmental inequalitiesand mitigate the asymmetric impact of environmentalhazards, extreme weather events and disasters on themost vulnerable. Early warning services have provedparticularly useful in that regard. Developed countriesin the Asia-Pacific region are making great strides inharnessing frontier technologies to provide real-time,location-specific early warning information. AIinteracting with high speed digital connectivity, now hasthe power to combine huge datasets and identifyincreasingly complex patterns. This data revolutiongreatly augments human understanding of evolvingsituations and helps policymakers prioritize actions.Similarly, thanks to innovations at the intersection oftechnology and science, early warning messages can besent with ever-increasing lead times and accuracy insituations that cover both slow-onset and acute disasters.
A growing body of evidence is showing that innovativetechnologies can ease disaster-induced poverty andinequalities. Satellite-technology applications, forexample, are helping countries with fragile ecosystemsanticipate and respond to climate risks. In Mongolia,large geospatial datasets, disaggregated to district levels,are helping the authorities forecast droughts. Bycombining this information with detailed maps ofpoverty and livestock, by province and district, at a giventime, it has been possible to identify those herders athighest risk of being affected by localized drought. Thecost of mitigation actions such as additional livestockfeed can also be calculated. Availability of suchinformation has also helped mitigate the impact thatsuch recurring disasters have on rural-urban inequalities.Other technologies also help anticipate and respondto climate change risks. For instance, in Tamil Nadu,India, traditional water harvesting techniques havebeen combined with biotechnologies that increasethe tolerance of crops to the effects of climate change(Box 4.3).
The adoption of green technologies is also crucial tolimiting air pollution and, given the disproportionateimpact of air pollution on the poor (as discussed inchapter 3), to reduce inequalities of impact. For instance,China has made great strides in promoting the nationalsolar industry to reduce the impact of air pollution, torespond to its growing energy needs and to supporteconomic growth. As a result, China’s solar photovoltaic(PV) industry has experienced a tremendous expansionsince 2011, including significant growth in distributedenergy.43 By 2016, China had the largest installedphotovoltaic capacity in the world, accounting for 25 percent of the world cumulative capacity and contributing
nearly half of world additional annual capacity(Figure 4.7). Chinese companies account for around60 per cent of the world’s annual solar cellmanufacturing capacity.
The development of China’s solar PV manufacturing hascontributed to a steep reduction in the global cost ofsuch technologies (between 2008 and 2015, theaverage cost of solar PV dropped by almost 80 percent).44 China’s authorities are therefore supportinga global shift in power generation to renewable sources(including wind and hydropower), which will reduce theimpact of air pollution for everyone. Nevertheless, coal

INEQUALITY IN ASIA AND THE PACIFIC74
still accounts for 66 per cent of China’s primary energysupply.
Similarly, the Chinese Government is facing immensepressure to create jobs. While investment in renewableenergy will help, job creation has not been enough toabsorb the capacity cuts in the coal industry. In 2016 itreallocated 726,000 coal and steel workers, and in 2017it had to reallocate half a million.45 Finally, the loweringcost of PV solar technologies, has made investments inregions other than the economically poor, but energy-rich northern provinces, more attractive.46
4.6 CONCLUSIONS AND RECOMMENDATIONS
The relationship between technology and inequality ismultifaceted. Technology has brought equality dividendsby enabling productive transformation and rapideconomic growth in a number of developing countriesacross the Asia-Pacific region. Technologies, notably ICT,have brought improved access to basic services such asfinance and education, and are preventing andmitigating the environmental hazards that oftendisproportionately affect the poor. Technology has alsowidened inequality as countries differ in terms ofinvestments, policy support or technological capabilities,or because technology is skill- and capital-biased andenables rent seeking, or because certain conditions needto be in place for vulnerable populations to benefit fromtechnology, including ICT infrastructure, skills and accessto appropriate technology solutions.
Frontier technologies, such as AI, are likely to intensifyboth the divides and the dividends. New technologiescan create and reinforce inequality of outcome andopportunity with an implicit impact on the environment.
Frontier technologies are likely to intensify these impactsbecause technological capabilities are not equallydistributed across countries and people in the region.Particularly worrisome is the persistent digital divide inthe region. Reliable and resilient broadband networksare often the foundation for developing and usingfrontier technologies such as AI. However, the lack ofsuch broadband networks in many parts of the regionmeans that AI uptake is and will continue to be uneven.47
The impact of technology on inequality is country-specific. Thus, measures aiming at ensuring thattechnologies do not exacerbate inequalities will vary. Asa general guideline, more advanced countries, oftenearly-adopters of frontier technologies, are advised tofocus on managing the impact of technologicaltransitions on inequality. The priority for countries withlow levels of technological capabilities is to build theirtechnological capabilities to spur economic growth. Ascountries accumulate technological capabilities, theywould need to focus simultaneously on building strongertechnological abilities, in particular technological skills,and increasingly on ensuring that technological progressdoes not translate into increased inequality. Thefollowing are the main thrusts of such policies.
1. Investment in ICT Infrastructure development
To address technology-induced inequality in the region,ICT infrastructure, notably broadband networks, mustbe affordable, reliable and resilient. Where progress hasstagnated, such as in many LDCs and countries withspecial needs, a big investment push is needed. Withoutthis investment in infrastructure there will be nonarrowing of the existing digital divide and mitigationof the widening disparities.
Figure 4.7 Installed photovoltaic capacity, top ten countries, 2016
Source: IEA (2017), 2016 Snapshot of Global Photovoltaic Markets.
14%2%
6%
4%
3%
2%2%
13%14%
14%
26%
9%
1%1%
11%
5%
3%
2%
1%
1%
46%
20%
China Japan Germany
United States Italy United Kingdom
India France Australia
Spain Others
China United States Japan
India United Kingdom Germany
Republic of Korea Australia Philippines
Chile Others
AnnualCumulative

75INEQUALITY IN ASIA AND THE PACIFIC
2. Address persistent inequalities in technologicalcapabilities
To catch up with more advanced economies, and thusreduce income inequalities among countries, countrieswith low technological capabilities should considerstrengthening technological learning through publicpolicies that should focus on the adoption, adaptationand diffusion of existing technologies rather than oninvesting in cutting edge R&D. Policies should aim topromote greater learning from trade and FDI, increasingproductivity in existing productive sectors, andsupport the formation and growth of domestic firms,the absorptive capacity of domestic knowledge systems,productive diversification and export upgrading.
3. Promote regional and internationalcooperation to exploit technology dividends
ESCAP member States, regional and internationalpartners, including donors, could prioritize funding fortrans-border broadband infrastructure. In doing so,development can take advantage of existinginfrastructure, such as trans-regional power grids,highways and railways. By making broadbandinfrastructure available in sparsely populated areas (theso-called last mile connectivity, where the business caseis weak) the most effective use of government fundscould be made in reducing digital inequalities and itsknock-on effects on a range of inequalities.
In an effort to increase the availability of affordablebroadband connectivity for all, ESCAP has beensupporting its member States and partners in the regionfor the implementation of the Asia-Pacific InformationSuperhighway (AP-IS).
Regional cooperation platforms can also be helpful inthe exchange of expertise and knowledge services thatreduce capacity inequalities among countries. Forexample, ESCAP’s well established Regional SpaceApplications Programme (RESAP) has promoted theexchange of tools between advanced space-faringcountries and low capacity, but high disaster riskcountries.
As part of the 2030 Agenda, governments havecommitted to fostering technology development,dissemination and transfer and to the strengthening ofscientific and technological capabilities of all countriesand have agreed to put in place two global mechanisms:the United Nations Technology Facilitation Mechanismand the United Nations technology bank for LDCs. Theimplementation of such mechanisms have taken a slowstart, largely because of a lack of financial resources, andwill require further support from more advancedeconomies.
4. Anticipate the impact of technologies on jobsand wages
Technology changes may transform the composition andnature of work. Reducing income inequalities withincountries requires seeking economic growth paths thatminimize the impact of technologies on those in fragilejob situations. Policymakers need to anticipate thespecific changes that are likely to take place. Thispreparation requires, for instance, more detailed sectoralstudies on which tasks are more likely to be replacedby technology, how labour and wages will be impacted,and the nature of re-skilling that would allow displacedworkers to transition to new jobs.
There is also a need to consider the implications for theeducation sector and ensure that it is better equippedto build the skills required for current and future work.Education policies are the foundation for buildingtechnological capabilities and a fundamental element foraddressing inequalities of opportunity. However,enhancing human capital is necessary but not sufficientto make economies more inclusive. Social protectionpolicies will also be required to mitigate the impactof labour-replacing technologies (as discussed inchapters 1 and 2).
5. Address technology rents to mitigate theirimpact on extreme inequality
Taming technology rents and rent-seeking is critical toreining in inequality. However, technology per se isneither the problem nor the solution. Policymakers needto address the conditions that have allowed extremeaccumulation of wealth, including enforcing competitionlaws, strengthening intellectual property protection andbargaining power of workers and consumers.
6. Introduce more inclusive technology andinnovation policies
Inclusive technology and innovation policies can helpaddress inequalities. While the market is a keydeterminant of technology development, governmentshave influence in the direction of technology change.
Governments can lead with mission-driven policies orsystem-wide transformations to address a national socialor environmental priority. Mission-driven policiesare complex endeavours that require leadership fromthe top, long-term investments, and comprehensiveand coherent policies from the supply and demand-sidethat support the development and adoption oftechnologies. These are likely to be best suited to highand middle-income economies with solid public-sectorcapabilities.

INEQUALITY IN ASIA AND THE PACIFIC76
Governments may also introduce targeted technologyand innovation programmes that address the specificneeds of vulnerable populations, such as public researchprogrammes that specifically seek solutions todevelopment problems or the promotion of grassrootsinnovations.
The governance of technology and innovation policyprocesses matters for equality. In lower-income
countries, governments are advised to give duepriority to the building of domestic technologicalcapabilities and, accordingly, allocate the correspondingbudget funds. In more advanced economies, there isa need for governance models to integrate andcoordinate technological and innovation policieswith other economic and social policies and to givevoice to a wide range of agents throughout the policycycle.
ENDNOTES1 United Nations, Department of Economic and Social Affairs (DESA) (2015).2 The most promising and potentially the most disruptive emerging technology trends are, according to (OECD, 2016b): bigdata, the Internet of Things, artificial intelligence, additive manufacturing, nano/microsatellites, neurotechnologies, syntheticbiology, nanomaterials, advanced energy storage technologies and blockchain. All these frontier technologies are dependenton digital infrastructure.3 The 18 countries referred to are: Afghanistan, Cambodia, Fiji, India, Indonesia, Kiribati, Lao PDR, Marshall Islands, Myanmar,Nepal, Pakistan, Papua New Guinea, Samoa, Solomon Islands, Tajikistan, Timor-Leste, Turkmenistan, and Vanuatu. See UnitedNations, Economic and Social Commission for Asia and the Pacific (ESCAP) (2017e).4 See, for example, data provided by ITU (2017).5 United Nations, Economic and Social Commission for Asia and the Pacific (ESCAP) (2017e).6 Metcalfe and Ramlogan (2008)7 For a summary of methodologies see Reamer (2014)8 Violante (2016)9 Comin (2006).10 For an overview on current discussions on measuring productivity see OECD (2016a).11 See Kingston, (2001); Kozo and Yasukichi (1987); UNIDO (2016); Shi, (2010)12 See, for instance, Cirera and Maloney (2017), United Nations Conference of Trade and Development (UNCTAD) (2017a)and UNCTAD (2007).13 Rodrik (2015)14 The use of software applications in drafting a design, data analysis, accounting are some examples of technologycomplementing workers.15 See, for example, Arntz et al. (2016); Bessen (2015 and 2017); Graetz and Michaels (2015); Lawrence (2017); Ugur andMitra (2017); Vivarelli (2014).16 Jobs for high-skilled workers and low-skilled workers have still not been economically feasible to be automated in a largescale. High-skilled jobs often involve non-routine cognitive tasks (such as managerial tasks and technical specialists). Low-skilledjobs are manual tasks, many of which are non-routine (such as gardening and babysitting). Automating low-skilled tasks ina large scale has also not been economically feasible due to relatively low cost of labour in this segment.17 See, for example, Arntz et al. (2016); Bessen (2015 and 2017); Graetz and Michaels (2015); Lawrence (2017); Ugur andMitra (2017); Vivarelli (2014).18 Shih (2013).19 United Nations, Economic and Social Commission for Asia and the Pacific (ESCAP) (2018g).20 UNCTAD (2017b).21 See HBR (2017) and PWC (2018).22 See, for example, PWC (2017) and MGI (2017b).23 MGI (2017a).24 Data retrieved from https://public.tableau.com/profile/mckinsey.analytics#!/vizhome/AutomationBySector/WhereMachinesCanReplaceHumans.25 UNIDO (2016).26 Rent-seeking entails capturing wealth produced by others (rather than by generating any actual economic activity) (Krueger,1974). An example is lobbying Government to obtain a subsidy.

77INEQUALITY IN ASIA AND THE PACIFIC
27 “Over the past few years, Big Tech has quietly become the dominant political lobbying power in Washington, spendinghuge amounts of cash and exerting serious soft power in an effort to avoid regulatory disruption of its business model, whichis now the most profitable one in the private sector. According to the Center for Responsive Politics, the internet and electronicsindustry together spent a record US$181m on federal (US) lobbying in 2015 and US$178.5m in 2016, making them the second-largest corporate lobbyist, behind Big Pharma. Alphabet, Google’s parent company, is now the tenth-largest individual corporatespender in the country.” (Foroohar, 2017).28 Patents, while established to serve as an incentive for innovators to innovate, they also prevent others from innovating.Some firms use aggressive patent strategies (such as aggressive litigation, aggressive patenting, acquisition of start-ups merelyfor their patents), to maintain a monopoly situation and prevent competition.29 De Loecker and Eeckhout (2017) argue that the increase in market power (in the US) is consistent with the decline in thelabour and capital shares in income, declining wages for low skilled labour, decreases in labour force participation, flows andinter state migration rates, as well as lowering GDP growth.30 See United Nations Conference of Trade and Development (UNCTAD) (2017a) and http://www.daily-sun.com/printversion/details/198809/Bangladesh-seeks-IRENA%E2%80%99s-support-for-renewable-energy-dev31 AliResearch (2016).32 United Nations, Economic and Social Commission for Asia and the Pacific (ESCAP) (2017e).33 Ibid.34 Mitchell et al. (2014)35 ESCAP and STEPI (2017).36 United Nations, Economic and Social Commission for Asia and the Pacific (ESCAP) (2016b).37 Jack (2013).38 Simanis (2012).39 Mazzucato (2013).40 The Hindu (2016).41 United Nations, Economic and Social Commission for Asia and the Pacific (ESCAP) (2015c).42 Eisenstein (2013).43 The 12th Five-Year Plan (2011-15) already supported the development of the photovoltaic capacity.44 OECD/IEA (2016d).45 Reuters (2017).46 Zhou and Lu (2017).47 United Nations, Economic and Social Commission for Asia and the Pacific (ESCAP) (2017e).
INEQUALITY IN ASIA AND THE PACIFIC78
Chapter 5
A Policy Agenda to Addressthe Mutually ReinforcingDimensions of Inequality

79INEQUALITY IN ASIA AND THE PACIFIC
The 2030 Agenda for Sustainable Development,which was unanimously adopted by 193 MemberStates of the United Nations in September 2015,
includes strong commitments to reduce various formsof inequality. In addition to Sustainable DevelopmentGoal 10, “Reduce inequality within and amongcountries”, the Agenda includes several targets toreduce specific aspects of inequality. Examples includetargets on social protection systems for all (1.3), accessby all people to food (2.1), universal health coverage(3.8), completion of primary and secondary educationby all girls and boys (4.1), ending all forms ofdiscrimination against women and girls (5.1), anduniversal access to drinking water (6.1) and modernenergy services (7.1).1
This report has found that income and wealth inequalityhas increased in Asia and the Pacific over the last twodecades and that there are significant gaps in accessto education, health care and nutrition, waterand sanitation, clean energy, information andcommunications technology, as well as finance andcredit within countries. The report has also found thatthe impact of natural disasters and environmentalhazards, such as air pollution, is unevenly distributedamong the population, affecting more severely the poorand the most vulnerable segments of the population.The inequality trends and gaps uncovered by this reportpose a serious threat to the successful implementationof the 2030 Agenda.
5.1 INTERACTION OF DIFFERENT DIMENSIONSOF INEQUALITY
A novel aspect of this report is its focus on multipleaspects of inequality – of outcomes, opportunities andimpacts – and its special attention to the role oftechnology. While the preceding chapters haveconsidered these forms of inequality separately, theanalysis has also shown that different forms of inequalityare interdependent and mutually reinforcing. On the onehand, unequal access to opportunities exacerbatesinequality of outcomes. On the other hand, unequaloutcomes in terms of income and wealth aggravateinequalities in access to health care, education,technology and protection from natural disasters andenvironmental hazards. Such disparities perpetuatethemselves when the wealthy have disproportionateinfluence over political power and policymakingdecisions. Inequalities can also perpetuate over time andover generations if they are driven by prejudice anddiscrimination against certain groups of the population.
The interaction between inequality of outcome,opportunity and impact varies across the region’s verydiverse economies as indicated by their position in oneof the four quadrants of Figure 5.1. The figure classifies

INEQUALITY IN ASIA AND THE PACIFIC80
countries into four groups according to the values oftheir Gini coefficients and D-indices as well as countries’vulnerability to natural disasters, with green indicating
low to medium risks and red indicating high risks.2 Thefigure provides a typography of inequality, which isdescribed below.
Figure 5.1 Inequality of outcomes and opportunities, and their relation to vulnerability to natural disasters
Source: ESCAP calculations using data from the latest DHS and MICS for countries in the Asia-Pacific region.Note 1: D-index values for Azerbaijan, China, Fiji, Islamic Republic of Iran, Nepal, Papua New Guinea, Russian Federation, Sri Lanka and Turkey areinterpolated using OLS with data of access to electricity, clean water and safe sanitation in respective countries.Note 2: The quadrants are split as per average Gini (35.73) and D-index values (0.2) for countries used in the analysis. Red dots and green squares standfor World Risk Index values, with green squares for low and medium risks (0-7.35) and red dots for high risk (7.35+) of disaster.Note 3: Azerbaijan and Papua New Guinea have been rescaled to improve the graph’s clarity.
Timor-Leste
Nepal
Turkey
Pakistan
Papua New Guinea
Philippines
Russian Federation
Sri LankaTajikistan
Thailand Turkmenistan
Vanuatu
Viet Nam
Low Gini coefficient High Gini coefficient
Hig
h D
-in
dex
Low
D-i
nd
ex
Afghanistan
Armenia
Azerbaijan
BangladeshBhutan
Cambodia
ChinaFiji
India Indonesia
Kazakhstan
Kyrgyzstan
Mongolia
Lao PDR
Myanmar
Maldives Iran (Islamic Republic of )
Group 1: Low Gini, low D (lower, left quadrant)
These countries are mostly in North and Central Asia.Some of them (Kyrgyzstan and Tajikistan) are alsolow-income countries. Inequalities of opportunity amongthese countries are generally low because of historicallystrong provision of universal social protection and basicpublic services. When these countries becameindependent in the early 1990s, they suffered a severeeconomic crisis that led to negative economic growthand steep increases in income inequality. In recent years,many of these countries have managed to also reducetheir income inequalities to comparably lower levels,especially Armenia, Kazakhstan, Kyrgyzstan andTajikistan. All of these countries, with the exception ofFiji and Kyrgyzstan, are fairly resilient to natural disasters.
Group 2: High Gini, low D (lower, right quadrant)
This group consists of mostly upper-middle incomecountries, such as China, the Maldives, RussianFederation and Turkey, but also some lower-middleincome countries, such as the Islamic Republic of Iran,the Philippines and Thailand. Several of these countries,such as China, Indonesia, and Viet Nam, experiencedincreases in income inequality over past decades, while
others saw an opposite development. In general, thesecountries have prioritized investment in public servicesand as a result have seen opportunities more equallydistributed. Close to half of these countries are alsohighly vulnerable to natural disasters.
Group 3: Low Gini, high D (upper, left quadrant)
This group includes three countries from South andSouth-West Asia – Afghanistan, Bangladesh andPakistan – and two from South-East Asia – Cambodiaand Timor-Leste. Four of the five countries in this groupare least developed countries (LDCs). All these countrieshave relatively higher inequality in access toopportunities but lower, albeit often increasing, incomeinequalities. This is particularly the case for Bangladesh.Some of these countries are transitioning fromagricultural-based societies to manufacturing- andservices-driven economies. Four out of the five countriesin this group are highly vulnerable to natural disasters.
Group 4: High Gini, high D (upper, right quadrant)
This group includes five LDCs plus Papua New Guinea.These countries are transitioning from primarilyagriculture-based societies to manufacturing- and

81INEQUALITY IN ASIA AND THE PACIFIC
services-driven economies. During this transition, theymay experience large increases in income to peopleengaged in new economic activities characterized byfaster increases in labour productivity.3 At the same time,these countries are also experiencing higher levels ofinequality of opportunities because of inadequateinvestments in people. Specifically, the tax base remainsnarrow, with more reliance on indirect taxes, oftenregressive taxes, as opposed to direct and progressivetaxation. This, in turn, is adversely affecting the fiscalspace to invest in education, health care and other basicsocial services. Four of the six countries in this group arehighly vulnerable to natural disasters.
A commonality across groups is the higher vulnerabilityto natural disasters by countries with high inequality ofopportunities (Groups 3 and 4). This is worrisomebecause it implies that the most vulnerable andmarginalized people in these countries face not only ahigher risk of being affected by a disaster but also loweraccess to basic services, making inequality of impactmore severe. Given that impacts of climate change areexpected to intensify in the future, it is important toimplement policies aimed at increasing the resilience ofpoor and marginalized people in countries with highvulnerability to natural disasters.4
Likewise, it is worthwhile noting that Afghanistan,Bangladesh, Bhutan, China, India, Islamic Republic ofIran, Myanmar, Nepal, Pakistan and Tajikistan record thehighest levels to air pollution in the region. 5 While thesecountries can be found in all quadrants in Figure 5.1,the common threat from air pollution also requiresstrategies aimed at protecting the poor and thevulnerable as a means to reducing inequality of impact.
Yet another measure of rising environmental risk is therate of degradation of natural capital. Several developingcountries, such as Indonesia, showed deceleration intheir growth rates of renewable natural capital in 2010-2014 compared with 2005-2010.6 In these countries,conserving the renewable natural capital and ensuringgrowth of natural capital through policies would helpin fighting inequalities. The analyses in chapter 3 hasclearly shown that the poor are disproportionately moredependent on natural capital and destruction of naturalcapital contributes to widening within countryinequalities.
A final finding from the typography of countries isrelated to their relationship to the digital gap, measuredby the share of the population that has access to fixed-broadband internet services. In Figure 5.2, this variableis depicted as a bubble, with larger bubbles representinggreater access.7 Irrespective of countries’ inequality ofoutcomes, their access to broadband internet servicesis significantly higher if their inequality of opportunitiesis low.
Technological advances further complicate theseinteractions. For example, access to digital technologybroadens access to opportunities. Therefore, countrieswith high access to digital technology show lower levelsinequality of opportunities. However, countries with highaccess to digital technology show both low and highinequalities of outcomes.
5.2 POLICY RECOMMENDATIONS
Policies that aim to reduce inequality in all its forms needto tackle a range of areas, but also to reflect nationaland local circumstances. Detailed recommendationshave been included at the end of each of the previouschapters. With that in mind, the following are eightbroad policy directions for consideration, abstractingfrom the more detailed recommendations found inindividual chapters:
1. Strengthen social protection
Social protection policies, including access to health- careservices, are central to closing the gaps in access to mostopportunities, while also increasing prosperity, resilienceand empowerment. Expanding social protection tolow-income families through cash transfers, or otherincome-support mechanisms also tends to have strongmultiplier effects, as these groups typically spend theirextra income on domestic goods and services.
2. Prioritize education
A well-educated population is fundamental for allspheres of development. It is therefore critical fornational education systems to encourage highereducation attainment and at the minimum improvesecondary completion rates by ensuring that it isaccessible and affordable for all, including those livingin rural areas. Countries where the gap in educationalattainment has narrowed, and where overall access ishigh, should instead focus on strengthening the qualityof education by investing in teachers’ education andtraining, school equipment and infrastructure andmaking sure that current curricula correspond to futurelabour-market needs to facilitate the school-to-worktransition. High quality higher education is also criticalfor harnessing the potential of technology for inclusivedevelopment.
3. Protect the poor and disadvantaged fromdisproportionate impact of environmental hazards
Targeted policy measures that reduce exposure of thepoor and disadvantaged to environmental hazards areimportant to close inequalities within countries. Suchmeasures could include better urban planning,establishing green corridors and regular health check-ups in schools in poorer neighbourhoods. This is

INEQUALITY IN ASIA AND THE PACIFIC82
especially relevant in countries with a higher risk ofpollution, natural disasters, overexploitation of naturalcapital and natural resource-related conflicts.
4. Address the digital divide and ICT infrastructure
ICT is a development enabler and a growth sector onits own. The development, application and adaptationof frontier technologies rely largely on the availability ofICT infrastructure and access to it. Thus, addressing thedigital divide and developing affordable, resilient andreliable broadband infrastructure is a development priorityin Asia and the Pacific. If left unaddressed, inequalitycould become unbridgeable, with implications for manyother areas of development. As broadband developmentis geography-dependent, regional and subregionalcooperation is key to addressing the challenge.
5. Address persistent inequalities in technologicalcapabilities among and within countries
To catch up with more advanced economies, countrieswith low technological capabilities should considerstrengthening technological learning through public
policies that focus on the adoption, adaptation anddiffusion of existing technologies. To ensure technologydoes not further exacerbate inequalities within countries,ESCAP member States will need to anticipate the impactof technologies on jobs, wages and markets; andintroduce inclusive technology and innovation policiesthat enable low-income and vulnerable populations tobenefit from technology and to participate in innovationactivities.
6. Increase effectiveness of fiscal policies
An effective tax system enhances public revenues andfacilitates increasing investments in essential services,such as health care, education and social protection.To this end, better and effective governance will beneeded to boost overall tax compliance and improvecomposition and efficiency of public expenditure.Similarly, reforming tax structures to reduce their adverseeffects on the poor through progressive taxes onpersonal income, property and wealth can help preventexcessive concentrations of wealth and power in thehands of a few, ensuring greater equality of opportunitywithin and across generations.
Figure 5.2 Inequality of outcomes and opportunities, and the digital gap
Source: ESCAP calculations using data from the latest DHS and MICS surveys for countries in the Asia-Pacific region.Note 1: D-index values for Azerbaijan, China, Fiji, Islamic Republic of Iran, Nepal, Papua New Guinea, Russian Federation, Sri Lanka and Turkey areinterpolated using OLS with data of access to electricity, clean water and safe sanitation in respective countries.Note 2: The quadrants are split as per average Gini (35.73) and D-index values (0.2) for countries used in the analysis. Bubbles stand for the number offixed-broadband Subscription per 100 inhabitants. Values range from 0.02 per cent in Afghanistan to 22.9 per cent in China. The minimum value for avisible bubble is 1 per cent.Note 3: Azerbaijan and Papua New Guinea have been rescaled to improve the graph’s clarity.
Low Gini coefficient High Gini coefficient
Hig
h D
-in
dex
Low
D-i
nd
ex
Timor-Leste
Nepal
Turkey
Pakistan
Papua New Guinea
Philippines
Russian Federation
Sri Lanka
Tajikistan ThailandTurkmenistan
Vanuatu
Viet Nam
Afghanistan
Armenia
Azerbaijan
Bangladesh Bhutan
Cambodia
ChinaFiji
India
Indonesia
Kazakhstan
Kyrgyzstan
Mongolia
Lao PDR
Myanmar
Maldives
Iran (Islamic Republic of )

83INEQUALITY IN ASIA AND THE PACIFIC
7. Improve data collection to identify and addressinequality
To identify those at risk of being left behind and to directpolicymaking at certain population groups, national datacollection needs to allow for better disaggregation. Italso needs to capture how unequal opportunities impactindividual aspirations and household decisions and whycertain individuals, for example, take their children outof school or continue using unclean energy options,while others do not.
8. Deepen regional cooperation
Regional cooperation can be fruitful for narrowinginequalities within and among countries. Regionaleconomic cooperation and integration can help thelesser developed countries grow faster by leveraging thedynamism of more developed economies and by
ENDNOTES1 Target number in parenthesis. For full descriptions of the targets and other examples, see United Nations (2015), Transformingour world: the 2030 Agenda for Sustainable Development. https://sustainabledevelopment.un.org/post2015/transformingourworld.2 See the footnote to Figure 5.1 for details.3 An example would be when a mineral deposit is developed in a mainly agrarian country. The value of the new mineralproduction per unit of worker will greatly exceed the regular value of agricultural production per worker. As a result, incomedistribution will become skewed, with a large concentration accruing to the owners of the mine.4 United Nations, Economic and Social Commission for Asia and the Pacific (ESCAP) (2017g). Available at: http://www.unescap.org/sites/default/files/1_Disaster%20Report%202017%20Low%20res.pdf5 ESCAP calculation based on data on PM2.5 air pollution, mean annual exposure (micrograms per cubic meter), available athttps://data.worldbank.org/indicator/EN.ATM.PM25.MC.M36 ESCAP calculation using data from World Bank (2018)7 See footnote to Figure 5.2 for details.
exploiting the complementarities in a mutually beneficialmanner. Regional cooperation can also help inaddressing common challenges, such as sharedvulnerabilities to natural disasters and climate change,or in supporting common objectives, such as theextension of broadband networks, as highlighted in thereport. In addition, regional platforms for sharing goodpractices in addressing inequalities and extending socialprotection coverage can be fruitful. Member States ofESCAP have adopted a number of resolutions forstrengthening regional cooperation and integration, aswell as the Regional Roadmap for Implementing the2030 Agenda for Sustainable Development in Asia andthe Pacific, which also outlines opportunities for regionalcooperation in different thematic areas including oninequality. As their regional commission, ESCAP standsready to support the member States in implementingthe Roadmap and in strengthening regional cooperationfor addressing inequalities.

INEQUALITY IN ASIA AND THE PACIFIC84
´
ANNEXES
Annex 1.1 Dataset on the Gini coefficient
The dataset of Gini coefficients used in this report draws on data from (1) “All the Ginis” dataset asdeveloped by Branko L. Milanovic, which consists of data sets of the standardized Gini from varioussources; 1 (2) UNU- WIDER’s World Income Inequality Database (WIID), specifically WIID3.4 released in January2017;2 (3) Standardized World Income Inequality Database (SWIID) developed by Frederick Solt;3 (4) InequalityProject of the University of Texas’s Estimated Household Income Inequality Data Set (EHII);4 (5) AsianDevelopment Outlook 2012: Confronting Rising Inequality in Asia;5 and (6) ESCAP Statistical Database.6
For Asia and the Pacific, data are available for 46 countries, including the region’s developed countries(Australia, Japan and New Zealand).7
In constructing the dataset, priority was given to Gini coefficients based on market or gross income, whichexcludes transfers and taxes. In some cases, due to data limitations, Gini coefficients based on expenditureor consumption were used. Linear interpolation was used to estimate missing Gini coefficient data. Datafor the early 1990s includes average Gini coefficients for each country based on the observations availablebetween 1990 and 1994, while the early 2010s period includes average Gini coefficients for 2010-2014.For the regression analyses, the sample used includes 31 Asia-Pacific countries for which Gini coefficientsare available for at least one year within five five-year periods: 1990-1994, 1995-1999, 2000-2004,2005-2009, and 2010-2014.
Annex 1.2 Kakwani decomposition of the Gini coefficient for components of per capita GDP
When income can be expressed as the sum of various components, it is possible to decompose the Ginicoefficient into the contribution of each component following Kakwani (1977, p. 724), as
where Sk and Ck are, respectively, the share and the concentration index of the kth income component.The concentration index Ck is conceptually similar to the Gini coefficient for the kth income component,but is obtained by ordering the units for which the calculation is performed according to increasing valuesof total income instead of increasing values of the kth income component.8 Based on the decompositionabove, Wan, Wang and Zhang (2016) obtain the following equation of changes of the Gini coefficientover time:
1 www.gc.cuny.edu/Page-Elements/Academics-Research-Centers-Initiatives/Centers-and-Institutes/Stone-Center-on-Socio-Economic-Inequality/Core-Faculty,-Team,-and-Affiliated-LIS-Scholars/Branko-Milanovic/Datasets.2 www.wider.unu.edu/project/wiid-world-income-inequality-database.3 http://fsolt.org/swiid/.4 https://utip.lbj.utexas.edu/data.html.5 www.adb.org/sites/default/files/publication/29704/ado2012.pdf.6 http://data.unescap.org/escap_stat/#data/.7 See Basu (2017)8 If, for example, we are considering personal income as the sum of labour income and property income, the calculation ofconcentration indexes for labour income and property income requires sorting individuals from the lowest to the highestlevel of their personal income. The concentration indexes for labour and property income will only be equivalent to theGini coefficients for these income components if they are sorted in the same order as personal income. Kakwani (1977,p. 721) shows that -Gk ddCk dd Gk, where Gk is the Gini coefficient for the kth income component.

85INEQUALITY IN ASIA AND THE PACIFIC
The equation indicates that a change in inequality can be attributed to changes in the income sharesand changes in concentration indexes . The first component represents the impact on
inequality of structural transformation, while the second represents the impact on total inequality of changesin the inequality of its components. In the text we use this decomposition to analyse the contributions toGDP per capita inequality of both its supply-side components (agriculture, manufacturing and services) andits demand-side components (private consumption, investment, government consumption and net exports).
Annex 1.3 Regression analysis for the driving forces of income inequality
Estimations of the driving forces of income inequality were obtained through pooled cross-country, timeseries regressions:
where Gini is the Gini coefficient for country i in period t. Based on data availability, the dataset includesfive periods – 1990-1994, 1995-1999, 2000-2004, 2005-2009, and 2010-2014 – and 31 countries:Afghanistan, Armenia, Australia, Azerbaijan, Bangladesh, Bhutan, Cambodia, China, Fiji, Georgia, India,Indonesia, Islamic Republic of Iran, Japan, Kazakhstan, Kyrgyzstan, Lao People’s Democratic Republic,Malaysia, Maldives, Mongolia, Nepal, Pakistan, Papua New Guinea, Philippines, Russian Federation, Sri Lanka,Tajikistan, Thailand, Turkey, Uzbekistan and Viet Nam.
The vector Xit contains the logarithm of GDP per capita and its square, capital stock per capita, value ofthe human capital index, TFP growth, ratio of manufacturing to agriculture sector, trade openness, totaltax revenue and its square, environmental damage and its square, renewable natural capital, and fourindicators of governance and its square. µi and ϕi represent unobserved country- and year-specific effects,and is the error term. The dependent variable, income inequality, is measured as the Gini coefficient(see Annex 1.1 for details). GDP per capita and the capital stock per capita are measured in US dollars of2011 adjusted for differences in purchasing power. These variables together with the human capital index,which represents the quality of the labour force,9 and TFP growth are from the Penn World Table (PWT)version 9.0.
The ratio of the manufacturing value added over the agriculture value added and trade openness are fromthe World Bank’s World Development Indicators (WDI). Trade openness is measured as exports plus importsover the GDP. Tax revenue as a share of the GDP comes from the IMF’s World Revenue Longitudinal Dataset (WoRLD).10 Environmental damage is defined as foregone labour income, measured in current US dollars,caused by exposure of a country’s population to ambient concentrations of particulates measuring lessthan 2.5 microns in diameter (PM2.5), ambient ozone pollution and indoor concentrations of PM2.5 inhouseholds cooking with solid fuels. These data come from WDI.11 Renewable natural capital is defined asthe sum of the value of the rents generated over the lifetime of forests, agriculture land and protectedareas. It is measured in US dollars of 2014, and the data source is the World Bank Wealth Accounts database.12 Finally, the four governance indicators, that come from World Bank’s Worldwide GovernanceIndicators, are government effectiveness, rule of law, political stability and absence of violence and regulatoryquality.13
9 See www.rug.nl/ggdc/docs/human_capital_in_pwt_90.pdf for details.10 https://data.world/imf/world-revenue-longitudinal-dat.11 http://databank.worldbank.org/data/reports.aspx?source=2&type=metadata&series= NY.ADJ.DPEM.CD.12 http://databank.worldbank.org/data/reports.aspx?source=wealth-accounts#dbMetadata.13 http://info.worldbank.org/governance/wgi/#home.

INEQUALITY IN ASIA AND THE PACIFIC86
Table A.1 Driving forces of income inequality, Gini coefficient, Asia-Pacific countries
Col 1 Col 2 Col 3 Col 4log (GDP per capita) 52.952*** 50.558*** 34.768*** 41.029***
(9.033) (8.129) (9.490) (8.800)
log (GDP per capita) squared -3.379*** -3.257*** -2.304*** -2.646***(0.521) (0.479) (0.564) (0.519)
Capital stock per capita 0.185*** 0.162*** 0.144*** 0.173***(0.028) (0.023) (0.023) (0.024)
Human capital index -5.123** -6.764*** -6.238*** -7.821***(2.100) (2.318) (2.288) (2.289)
TFP growth 10.014*** 11.142*** 11.228*** 10.004***(3.786) (3.857) (4.044) (3.765)
Ratio of manufacturing to agriculture -0.732*** -0.848*** -0.793*** -0.717***(0.217) (0.255) (0.241) (0.227)
Trade openness 0.032*** 0.032*** 0.031*** 0.025***(0.007) (0.007) (0.007) (0.007)
Total revenue 0.375* 0.454** 0.588*** 0.495**(0.205) (0.215) (0.222) (0.215)
Total revenue squared -0.007* -0.008* -0.011** -0.009**(0.004) (0.004) (0.005) (0.004)
log (environment damage) -13.175*** -14.027*** -14.593*** -14.441***(2.457) (2.321) (2.281) (2.226)
log (environment damage) squared 0.446*** 0.468*** 0.464*** 0.464***(0.056) (0.054) (0.053) (0.053)
log (natural capital) -3.803** -4.597*** -3.518** -4.442***(1.523) (1.760) (1.703) (1.677)
Governance effective 0.174**(0.070)
Governance effective squared -0.001(0.001)
Governance law 0.185**(0.091)
Governance law squared -0.002(0.001)
Governance stability 0.093***(0.030)
Governance stability squared -0.001*(0.000)
Governance regulatory 0.245***(0.075)
Governance regulatory squared -0.003***(0.001)
_cons 18.013 65.278 113.285* 108.521*(58.331) (66.161) (58.594) (56.630)
Country dummy Y Y Y Y
Year dummy Y Y Y Y
N 239 239 239 239
Adj. R-square 0.924 0.921 0.922 0.922
Note: Robust standard errors in parentheses; * p < 0.1, ** p < 0.05, *** p < 0.01.
87INEQUALITY IN ASIA AND THE PACIFIC
Annex 1.4 Regression analysis for the impact of income inequality on growth
To examine the relationship between inequality and economic growth, pooled time series and cross-sectionregressions were used. The estimations are based on the following equation:
where the dependent variable is GDP per capita for country i in year t. Giniit is the Gini coefficient, and Zitincludes control variables representing technology, investment, labour, sector structure and trade openness.µi and ϕi represent unobserved country- and year-specific effects, and is the error term. With the inclusionof country-specific effects, the estimator is focused on the variation within countries. As such, the aim ofthe estimations is to test whether decreases in GDP per capita are associated with rising income inequalityacross Asia-Pacific countries.
The only additional variable is ESCAP’s Access to Physical Infrastructure Index (APII). This index includesfour dimensions of infrastructure: (1) transport, which includes access to road and railways; (2) energy,which captures electricity and power consumption; (3) information and communications technology (ICT),which includes access to Internet, mobile and fixed lines; and (4) water supply and sanitation.14
14 See ESCAP (2017c, Annex II) for details on the construction of this index.
Table A.2 Relationship between GDP per capita and income inequality, Asia-Pacific countries
Col 1 Col 2 Col 3Gini coefficient -163.571*** -157.073*** -140.100**
(49.109) (59.134) (58.744)
Capital stock per capita 0.113*** 0.106*** 0.116***(0.014) (0.015) (0.015)
Human capital index 1.258 1.881 1.039(1.853) (1.931) (1.918)
TFP 3.387*** 3.391*** 3.964***(1.076) (1.040) (1.225)
ESCAP Physical Infrastructure index 0.019*** 0.017*** 0.022***(0.004) (0.005) (0.005)
Ratio of manufacturing to agriculture 0.001 0.002 0.003(0.007) (0.007) (0.007)
Trade openness 2.048 4.268 0.068(5.291) (5.005) (5.178)
Governance effective 67.674***(14.249)
Governance law 73.530***(14.521)
Governance regulatory 25.933*(14.055)
Constant -2.0e+03 -2.9e+03 -1.5e+03(6635.262) (6893.576) (7069.753)
Country dummy Y Y Y
Year dummy Y Y Y
N 328 328 328
Adj. R-square 0.992 0.992 0.992
Note: Robust standard errors in parentheses; * p < 0.1, ** p < 0.05, *** p < 0.01

INEQUALITY IN ASIA AND THE PACIFIC88
Annex 1.5 The impact of inequality on extreme poverty
The methodology of the calculations shown in Section 1.5.2 is based on Zhang and Wan (2006), whomodified a decomposition framework proposed by Datt and Ravallion (1992). ∆P, the change in povertyindex P between period 0 and period T can be expressed as
where Y is average income or consumption and I is an indicator for income distribution or inequality, suchas the Gini coefficient. The poverty cost of rising inequality is defined as the change in poverty due toa change in inequality while holding Y constant. Let be the poverty estimate from a hypothetical distributionwith i = 0 or T, j = 0 or T and i ≠ j. The poverty cost can be computed as:
Poverty cost =
or
Poverty cost =
Table A.3 Relationship between GDP per capita and income inequality, Asia-Pacific countries,lagged variables
Col 1 Col 2 Col 3lag. Gini coefficient -135.473*** -131.755** -114.841**
(49.817) (58.591) (58.269)
lag. Capital stock per capita 0.104*** 0.097*** 0.106***(0.014) (0.015) (0.015)
lag. Human capital index 2.200 2.798 2.031(1.874) (1.922) (1.908)
lag. TFP 3.548*** 3.480*** 3.974***(1.066) (1.023) (1.235)
lag. ESCAP Physical Infrastructural index 0.018*** 0.016*** 0.021***(0.004) (0.004) (0.004)
lag. Ratio of manufacturing to agriculture 0.009 0.009 0.011(0.008) (0.007) (0.008)
lag. Trade openness 2.738 5.345 0.798(5.544) (5.210) (5.388)
lag. Governance effective 61.232***(14.012)
lag.Governance law 75.451***(14.690)
lag. Governance regulatory 30.136**(12.962)
Constant -4.6e+03 -5.5e+03 -4.4e+03(6492.959) (6664.226) (6825.543)
Country dummy Y Y Y
Year dummy Y Y Y
N 327 327 327
Adj. R-square 0.993 0.993 0.992
Note: Robust standard errors in parentheses; * p < 0.1, ** p < 0.05, *** p < 0.01.

89INEQUALITY IN ASIA AND THE PACIFIC
It is easy to see that the above two estimates may differ simply because the reference year is different.One way to obtain a single estimate is to compute average of these two estimates:
Poverty cost =
For more details, see Zhang and Wan (2006) who used the term of “distribution or inequality impact”instead of “poverty cost”.
Gini coefficients data for the early 1990s and 2010s for 24 countries in the Asia-Pacific region are basedon data as in Annex 1.1. The data on mean expenditure is from the World Bank’s PovcalNet database.

INEQUALITY IN ASIA AND THE PACIFIC90
15 Barros, Ferreira, Vega and Chanduvi (2009).16 Shorrocks (2013).
Annex 2.1 Calculating the Dissimilarity Index
The dissimilarity index, or D-index, is a measure similar to the Gini coefficient, which can be used formeasuring inequality for binary variables, such as having access to an opportunity (e.g. education) or not.15
The D-index measures how all different population groups fare in terms of accessing this opportunity. Forexample, two countries with identical secondary education attainment rates may have a very differentD-index if the distribution of attainment in one country excludes certain groups (such as rural women). Toobtain the D-index, inequalities in access among all possible population groups are calculated using thefollowing equation:
where βi is the weighted sampling proportion of group i, (sum βi of equals 1), is the average attainmentrate for secondary or higher education in the country and pi is the level of attainment of that level forpopulation group i, and takes values from 0 to 1. Unlike the Gini coefficient, where there is no ideal level,the ideal level of a D-index of 0, whereby everyone has access to an opportunity and there is no inequality.
There are n number of groups defined by using the interactions of the circumstances selected for the analysis.In the case of secondary education attainment, three circumstances are used forming 8 groups: wealth(2 groups); residence (2 groups); sex (2 groups). This produces at least n=8 groups (2x2x2), covering theentire sample population.
Annex 2.2 Shapley decomposition
The Shapley decomposition method estimates the marginal contribution each circumstance has on inequalityin access to a certain opportunity. The basic idea behind this decomposition, taken from cooperative gametheory, is to measure how much the estimated D-index would change when a circumstance was added tothe pre-existing set of circumstances. The change in inequality caused by the addition of a new circumstancewould be a reasonable indicator of its contribution to the overall inequality.16
The impact of adding a circumstance A (e.g. wealth) is given by the following formula:
Where N is the set of all n circumstances, which are different depending on the opportunity, as shown inTable 2.1; and S is the subset of N circumstances obtained after omitting the circumstance A. D(S) is theD-index estimated with the sub set of circumstances S. D(SU{A}) is the D-index calculated with set ofcircumstances S and the circumstance A.
The contribution of characteristic A to the D-index is then formula:
The critical property satisfied by the Shapley decomposition is that the sum of contributions of allcharacteristics adds up to 1 (100 per cent).

91INEQUALITY IN ASIA AND THE PACIFIC
Co
un
try/
Cir
cum
stan
ces
An
nex
2.3
Wh
o a
re t
he
furt
hes
t b
ehin
d in
all
op
po
rtu
nit
ies?
Wh
o a
re t
ho
se le
ft b
ehin
d in
ter
ms
of…
...ac
cess
to
fu
ll-ti
me
emp
loym
ent?
...se
con
dar
y ed
uca
tio
n...
hig
her
ed
uca
tio
n...
acce
ss t
o p
rofe
ssio
nal
hel
p...
acce
ss t
o c
on
trac
epti
on
?at
tain
emen
t?at
tain
emen
t?d
uri
ng
ch
ildb
irth
?
Ag
eEd
uca
-R
esi-
Mar
ital
Sex
Hav
eW
ealt
hR
esi-
Sex
Wea
lth
Res
i-Se
xW
ealt
hA
ge
Ch
ildre
nR
esi-
Edu
ca-
Wea
lth
Edu
ca-
Ag
eC
hild
ren
Res
ig
rou
pti
on
den
cest
atu
sch
ildre
nd
ence
den
ceg
rou
pu
nd
er 5
den
ceti
on
tio
ng
rou
pu
nd
er 5
den
ce
Afg
han
ista
n15
-49
Low
Sgl
MB
40R
ur
WB
40R
ur
WB
40>
251
15-2
4R
ur
Arm
enia
Ru
rSg
l or
B40
MB
40M
B40
25-3
4B
4015
-24
Sep
or
>35
Ban
gla
des
hR
ur
WB
40W
B40
WB
40Lo
w15
-24
No
Bh
uta
nW
NC
B40
Ru
rW
B40
Ru
rW
B40
2 -
415
-24
Cam
bo
dia
25-6
4Lo
wR
ur
Mar
or
WB
40R
ur
WB
40R
ur
WB
40Lo
w15
-24
No
Urb
Sep
or
>35
Ind
ia15
-24
Sgl
B40
WB
40W
B40
1Lo
w15
-24
Ind
on
esia
Low
Mar
or
WB
40R
ur
WB
40R
ur
B40
Ru
rLo
w15
-24
or
Sep
25-3
4N
o
Kaz
akh
stan
15-2
4B
40M
B40
M>
25R
ur
Low
or
15-2
4 o
rH
igh
25-3
4N
o
Kyr
gyz
stan
Sec
Ru
rN
CB
40R
ur
WB
40R
ur
M>
3515
-24
Lao
PD
R25
-49
Low
Ru
rW
B40
Ru
rW
B40
Ru
rB
40 2
- 9
Low
Low
or
Yes
Hig
h
Mal
div
esB
40R
ur
WB
40R
ur
W>
351
15-2
4o
r 25
-34
No
Mo
ng
olia
15-2
4 o
rLo
wR
ur
B40
Ru
rM
B40
Ru
rM
2 -
4Lo
wSe
c o
rN
oU
rb50
-64
Hig
h
Mya
nm
ar50
-64
WB
40R
ur
WB
40R
ur
Paki
stan
50-6
4B
40W
B40
WB
40>
35Lo
w15
-24
Phili
pp
ines
50-6
4W
B40
MB
40M
B40
Low
Low
or
No
Hig
h
Tajik
ista
n25
-49
Low
B40
WB
40R
ur
WB
4015
-24
Thai
lan
d15
-24
or
Low
Urb
Sgl o
rB
40B
40B
4025
-34
Low
or
50-6
4M
arH
igh
Tim
or-
Lest
eB
40R
ur
WB
40R
ur
WB
40>
35R
ur
Low
Low
No
Turk
men
ista
n15
-24
WN
CB
40W
B40
Ru
rW
B40
>25
15-2
4
Van
uat
uB
40R
ur
WB
40R
ur
WB
402
- 3
Low
or
15-2
4H
igh
or
>35
No
Vie
t N
amLo
w o
rR
ur
WN
CB
40W
B40
WLo
w15
-24
Sec
Au
stra
lia15
-24
Aze
rbai
jan
Ru
rSg
l or
Wo
MSe
p
Ch
ina
15-2
4 o
rLo
wW
50-6
4
Geo
rgia
Ru
rM
arW
Iran
(Is
lam
ic15
-24
or
Low
or
Rep
ub
lic o
f)50
-64
Sec
NC
Jap
anLo
w o
rU
rbM
ar o
rW
Sec
Sep
Mal
aysi
a15
-24
or
50-6
4W
Nep
al15
-24
or
50-6
4Lo
wR
ur
W
New
Zea
lan
d15
-24
Rep
ub
lic o
fSe
pK
ore
a
Ru
ssia
n15
-24
Fed
erat
ion
Sin
gap
ore
50-6
4Se
cM
ar
Sri L
anka
15-2
4 o
rLo
wM
NC
50-6
4
Turk
eyM
arW
Uzb
ekis
tan
Low
or
Ru
rM
arW
CSe
c
Sou
rce:
ESC
AP
calc
ula
tio
ns
usi
ng
dat
a fr
om
th
e la
test
DH
S an
d M
ICS
surv
eys
for
cou
ntr
ies
in A
sia-
Paci
fic
Low
= L
ow
er e
du
cati
on
(n
o o
r p
rim
ary
edu
cati
on
), S
ec =
Sec
on
dar
y ed
uca
tio
n, H
igh
= H
igh
er e
du
cati
on
, Urb
= U
rban
area
s, R
ur
= R
ura
l are
as, S
ep =
Sep
arat
e, M
ar =
Mar
ried
, Sg
l = S
ing
le, N
C =
No
Ch
ildre
n, C
= H
ave
child
ren
, M =
Men
, W =
Wo
men
, B40
= B
ott
om
40%
ho
use
ho
lds,
T60
= T
op
60%
ho
use
ho
lds.
INEQUALITY IN ASIA AND THE PACIFIC92
Wh
o a
re t
ho
se le
ft b
ehin
d in
ter
ms
of…
...ac
cess
to
ele
ctri
city
?...
acce
ss t
o c
lean
fu
els?
...ac
cess
to
mo
bile
ph
on
e?...
acce
ss t
o b
ank
acco
un
t?...
acce
ss t
o c
lean
wat
er?
...ac
cess
to
saf
e sa
nit
atio
n?
…b
asic
ho
use
ho
ld s
ervi
ces?
Wea
lth
Edu
ca-
Res
i-W
ealt
hEd
uca
-R
esi-
Wea
lth
Res
i-Ed
uca
-W
ealt
hEd
uc-
Res
i-W
ealt
hEd
uca
-R
esi-
Wea
lth
Edu
ca-
Res
i-W
ealt
hR
esi-
Edu
ca-
tio
nd
ence
tio
nd
ence
den
ceti
on
atio
nd
ence
tio
nd
ence
tio
nd
ence
den
ceti
on
Afg
han
ista
nLo
wR
ur
B40
Low
or
Ru
rB
40Lo
wB
40Lo
wB
40Lo
wB
40Lo
wR
ur
B40
Ru
rLo
w o
rse
cSe
c
Arm
enia
B40
Urb
B40
Ru
rB
40Lo
w o
rB
40Lo
w o
rB
40R
ur
B40
Ru
rB
40R
ur
Low
or
sec
sec
Sec
Ban
gla
des
hB
40Lo
wB
40R
ur
Low
B40
Low
B40
Low
B40
Low
B40
Ru
r
Bh
uta
nB
40B
40B
40Lo
wB
40Lo
wB
40Lo
wB
40Lo
wB
40R
ur
Cam
bo
dia
B40
Low
or
B40
Ru
rB
40Lo
wB
40Lo
wB
40Lo
w o
rB
40Lo
wB
40R
ur
Low
or
hig
hh
igh
Sec
Ind
iaB
40Lo
wB
40Lo
wB
40Lo
wB
40Lo
wB
40B
40Lo
wB
40R
ur
Low
Ind
on
esia
B40
Low
Ru
rB
40Lo
wR
ur
Low
B40
Low
Ru
rB
40Lo
w o
rB
40Lo
wh
igh
B40
Low
Kaz
akh
stan
B40
Low
or
B40
Low
or
Low
or
Low
or
B40
Sec
Urb
B40
Low
or
sec
sec
sec
sec
Sec
Kyr
gyz
stan
B40
Hig
hR
ur
B40
Low
or
Ru
rB
40Lo
w o
rB
40Lo
w o
rB
40Lo
w o
rT6
0U
rbB
40Lo
w o
r s
ecse
cse
cse
cSe
c
Lao
PD
RB
40Lo
wB
40R
ur
B40
Low
B40
Low
B40
Low
B40
Low
B40
Ru
rLo
w
Mal
div
esLo
w o
rB
40Lo
w o
rLo
wB
40Lo
wB
40Lo
w o
rB
40Lo
wB
40Lo
wh
igh
sec
hig
h
Mo
ng
olia
B40
Ru
rB
40R
ur
B40
Ru
rB
40R
ur
B40
Sec
Ru
rB
40B
40
Mya
nm
arB
40Lo
w
Paki
stan
B40
Low
B40
Low
Ru
rB
40Lo
wB
40Lo
wB
40Lo
wB
40Lo
wB
40R
ur
Phili
pp
ines
B40
Low
B40
Ru
rLo
wB
40Lo
wB
40Lo
w
Tajik
ista
nB
40Lo
w o
rB
40H
igh
B40
Low
or
Low
or
Urb
B40
Low
Low
or
Urb
B40
Ru
rLo
w o
r s
ec s
ecse
cSe
cSe
c
Thai
lan
dB
40Lo
w o
rB
40R
ur
B40
Low
B40
Low
B40
Low
or
Ru
rB
40U
rbB
40Lo
wh
igh
sec
Tim
or-
Lest
eB
40Lo
wT6
0Lo
wR
ur
B40
Low
B40
Low
Ru
rB
40Lo
w o
rB
40Lo
wB
40R
ur
Low
hig
h
Turk
men
ista
nH
igh
Sec
Urb
Urb
Low
or
B40
Low
or
B40
Low
or
Low
or
Urb
Ru
rLo
w s
ecse
ch
igh
Sec
or
Sec
Van
uat
uB
40R
ur
B40
Ru
rB
40R
ur
T60
Ru
rB
40
Vie
t N
amLo
wB
40Lo
w o
rLo
wB
40Lo
w o
rB
40Se
cB
40B
40Lo
w h
igh
sec
Sou
rce:
ESC
AP
calc
ula
tio
ns
usi
ng
dat
a fr
om
th
e la
test
DH
S an
d M
ICS
surv
eys
for
cou
ntr
ies
in A
sia-
Paci
fic
Low
= L
ow
er e
du
cati
on
(n
o o
r p
rim
ary
edu
cati
on
), S
ec =
Sec
on
dar
y ed
uca
tio
n, H
igh
= H
igh
er e
du
cati
on
, Urb
= U
rban
are
as, R
ur
= R
ura
l are
as, B
40 =
Bo
tto
m 4
0% h
ou
seh
old
s, T
60 =
To
p 6
0% h
ou
seh
old
s.
Co
un
try/
Cir
cum
stan
ces

93INEQUALITY IN ASIA AND THE PACIFIC
Who are those left behind in terms of…
...stunting among children? …wasting among children? …overweight among children?
Mother’sResi
Number Mother’sResi-
Number Mother’sResi-
NumberWealth educa-
dence of Sex Wealth educa-
dence of Sex Wealth educa-
denceof Sex
tion siblings tion siblings tion siblings
Afghanistan
Armenia Low Rur B40 Low 3-6 B
Bangladesh Low Rur B B40 B High
Bhutan B40 Low T60 Low or Rur B Sec sec
Cambodia B40 B40 B Urb
India B40 Low 3+ B40 B Sec or Urbhigh
Indonesia
Kazakhstan Sec 1+ T60 Sec High Urb 1
Kyrgyzstan B40 2+ B High Urb B40 1-3
Lao PDR B40 Low B40 Low or B 3-9sec
Maldives B40 2+ B40 Low Rur 3-6 Sec or 3-7high
Mongolia B40 Rur 1-2 Low or Rur 1-10 B High 1higher
Myanmar Low Low Low
Pakistan B40 Low B B40 4-10 High
Philippines
Tajikistan B40 Low T60 Rur 1-3
Thailand B40 Rur Low or B T60 Low or Rursec high
Timor-Leste B40 Rur B Low Rur B B40 4-8
Turkmenistan 2+ Rur 1 T60 2-7
Vanuatu Low B Urb G Urb B
Viet Nam B40 Low B40 Low B Urb
Source: ESCAP calculations using data from the latest DHS and MICS surveys for countries in Asia-PacificLow = Lower education (no or primary education),Sec = Secondary education, High = Higher education, Urb = Urban areas, Rur = Rural areas, B = Boys, G = Girls, B40 = Bottom 40% households, T60 = Top60% households.
Country/Circumstances

INEQUALITY IN ASIA AND THE PACIFIC94

95INEQUALITY IN ASIA AND THE PACIFIC
REFERENCES
Acemoglu, Daron (2011). Thoughts on inequality and the financial crisis. Presentation at the American EconomicAssociation Annual Meeting. Denver, Colorado, 7 January.
Alesina, Alberto, and Dani Rodrik (1994). Distribution politics and economic growth. Quarterly Journal of Economics,vol. 9, No. 2, pp. 465-490.
AliResearch (2016). New Breakthroughs of Taobao Villages Research Report on China’s Taobao Village. Jointly issuedby and Alibaba Research Center For Rural Dynamics Available at http://i.aliresearch.com/img/20170414/20170414113512.pdf
Aoyagi C. and Ganelli G. (2013). “The Path to Higher Growth: Does Revamping Japan’s Dual Labor Market Matter?,”IMF Working Paper 13/202, International Monetary Fund, Washington. Available at https://www.imf.org/en/Publications/WP/Issues/2016/12/31/The-Path-to-Higher-Growth-Does-Revamping-Japans-Dual-Labor-Market-Matter-40974
Arntz, M., Gregory, T. and Zierahn, U. (2016). The Risk of Automation for Jobs in OECD Countries: A ComparativeAnalysis, OECD Social, Employment, and Migration Working Paper No. 189, Paris: Organisation for EconomicCo-operation and Development (OECD).
Asia Pacific Clean Air Partnership (2018). Asia Pacific Clean Air Partnership Joint Forum, Event Report available at:http://cleanairweek.org/wp-content/uploads/Asia-Pacific-Clean-Air-Partnership-Joint-Forum-Event-Report.pdf
Asian Development Bank (ADB) (2012). Asian Development Outlook 2012: Confronting Rising Inequality in Asia.Manila.
Asian Development Bank (ADB) (2017). A Region at Risk: The Human Dimensions of Climate Change in Asia andthe Pacific. Manila. Available from www.adb.org/publications/region-atrisk- climate-change.
Baillergeau, Evelyne and Duyvendak, Jan Willem (2016). Social inequality and young people in Europe: their capacityto aspire. In World Social Sciences Report, 2016. Challenging Inequalities: Pathways to a Just World. UNESCOPublishing, Paris.
Balakrishnan R., Steinberg C. and Syed M. (2013). “The Elusive Quest for Inclusive Growth: Growth, Poverty, andInequality in Asia,” IMF Working Paper 13/152, International Monetary Fund, Washington. Available at: https://www.imf.org/external/pubs/ft/wp/2013/wp13152.pdf
Banerjee, Abhijit V., and Esther Duflo (2003). Inequality and growth: What can the data say? Journal of EconomicGrowth, Vol. 8, No. 3, pp. 267–299.
Barro, Robert J. (2000). Inequality and growth in a panel of countries. The Journal of Economic Growth, Vol. 5,No. 1, pp. 87-120.
Barros, Ricardo Paes de, Francisco H. G. Ferreira, José Molinas Vega and Jaime Saavedra Chanduvi (2009). MeasuringInequality of Opportunities in Latin America and the Caribbean. Washington, DC: Palgrave Macmillan andthe World Bank.
Basu, Sudip Ranjan (2017). Do data show divergence? Revisiting global income inequality trends. Asia-PacificDevelopment Journal, Vol. 24, Issue 1, pp. 23-53.
Basu, Sudip Ranjan, and Monica Das (2011). Export structure and economic performance in developing countries:evidence from nonparametric methodology. Policy Issues in International Trade and Commodities Study Series,No. 48. Geneva: United Nations Conference on Trade and Development.
Bénabou, Roland (1996). Inequality and growth. NBER Macroeconomics Annual, Vol. 11.
Bessen, J.E. (2015). Learning by Doing: The Real Connection between Innovation, Wages, and Wealth, New Haven,Yale University Press.
Bessen, J.E. (2017). “Automation and Jobs: When Technology Boosts Employment”, Law and Economics ResearchPaper No. 17-09, Boston: Boston University School of Law.
Berg, Andrew, and Jonathan David Ostry (2011). Inequality and unsustainable growth: two sides of the same coin?Staff Discussion Note, SDN 11/08. Washington, D.C.: International Monetary Fund.

INEQUALITY IN ASIA AND THE PACIFIC96
Bourguignon, François (2004). The poverty-growth-inequality triangle. Paper presented at Indian Council for Researchon International Economic Relations. New Delhi, 1-30.
Bourguignon, François F., and Sébastien Dessus (2009). Equity and development: political economy considerations.In No Growth without Equity? Inequality, Interests, and Competition in Mexico, Santiago Levy and MichaelWalton, eds. Washington, D.C.: World Bank/Palgrave MacMillan.
Boushey, Heather, J. Bradford DeLong, and Marshall Steinbaum, eds. (2017). After Piketty: The Agenda for Economicsand Inequality. Cambridge, Massachusetts: Harvard University Press.
Boyce, J.K. (2017). Inequality and the Environment: Leontief Prize Lecture. Available at: https://www.peri.umass.edu/images/BoyceInequality_and_the_Environment_-_Leontief_lecture.pdf
Bren d’Amour, C. et al. (2016). Future urban land expansion and implications for global croplands. Proceedings ofthe National Academy of Sciences of the United States of America (PNAS), Vol. 114, No. 34, pp. 8939–44,doi: 10.1073/pnas.1606036114
Canning, David and Schultz T. Paul. The Economic Consequences of Reproductive Health and Family Planning. Lancet.Vol. 380, No. 9837 (July 2012).
Chang, J.H., G. Rynhart, and P. Huynh (2016). ASEAN in transformation. How technology is changing jobs andenterprises, Bureau for Employers’ Activities, Working Paper No. 10 International Labour Office (ILO). Availableat http://www.ilo.org/wcmsp5/groups/public/—ed_dialogue/—act_emp/documents/publication/wcms_579554.pdf
Chaturvedi, M. (2017). Rent-Seeking Induced Inequality Traps, May 28, mimeo available at www.ecineq.org/ecineq_nyc17/FILESx2017/CR2/p20.pdf
Chhetri, B.B.K., Larsen, H.O., and Smith-Hall, C (2015). Environmental resources reduce income inequality and theprevalence, depth and severity of poverty in rural Nepal. Environment, Development and Sustainability,Vol. 17 (3), pp. 513-530.
Cingano, Federico (2014). Trends in income inequality and its impact on economic growth. Social, Employment andMigration Working Papers, No. 163. Paris: OECD.
Cirera, Xavier, and William F. Maloney (2017). The Innovation Paradox: Developing-Country Capabilities and theUnrealized Promise of Technological Catch-Up. Washington, DC: World Bank. Available at https://openknowledge.worldbank.org/bitstream/handle/10986/28341/9781464811609.pdf.
Clapp, J. and Dauvergne, P. (2011). Paths to a Green World: The Political Economy of the Global Environment, Secondedition. MIT Press.
Claus I., Martinez-Vazquez J. and Vulovic V. (2014). “Government fiscal policies and redistribution in Asian countries,”In: Kanbur, R., Rhee, C. and Zhuang, J. (eds), Inequality in Asia and the Pacific: Trends, Drivers and PolicyImplications, Routledge: London.
Comin D. (2006). Total Factor Productivity. New York University and NBER, August 2006. Available at http://www.people.hbs.edu/dcomin/def.pdf
Credit Suisse (2017). Corporate Insights, The bottom line: What tax reform means for your company. Q2/2017.Available at https://www.credit-suisse.com/media/assets/microsite/docs/corporate-insights/corporate-insights-q2-2017.pdf
Dabla-Norris, Era, and others (2015). Causes and consequences of income inequality: a global perspective. StaffDiscussion Note, June. Washington, D.C.: IMF.
De La Croix, David, and Matthias Doepke (2004). Public versus private education when differential fertility matters.Journal of Development Economics, Vol. 73, No. 2, pp. 607-629.
De Loecker, J. and J. Eeckhout (2017). The rise of market power and the macroeconomic implications, NBER WorkingPaper 23687 available at http://www.nber.org/papers/w23687
Department of Economic and Social Affairs (DESA) (2017). The impact of the technological revolution on labourmarkets and income distribution, Frontier Issues, 31 July 2017, United Nations.
Dorling, D. (2017). The Equality Effect: Improving life for everyone. New Internationalist Publications Ltd., Oxford.
Eisenstein, M (2013). Plant Breeding: Discovery in a Dry Spell. Nature. 501 (7468) pp. S7–S9.

97INEQUALITY IN ASIA AND THE PACIFIC
Evans, G.W. and Kantrowitz, E (2002). SOCIOECONOMIC STATUS AND HEALTH: The Potential Role of EnvironmentalRisk Exposure. Annual Review of Public Health, Vol. 23 pp. 303–31 DOI: 10.1146/annurev.publhealth.23.112001.112349
Ferracane, M.F. and Hosuk Lee-Makiyama (2018). The Geopolitics of Online Taxation in Asia-Pacific - Digitalisation,Corporate Tax Base and The Role of Governments, ECIPE Policy Briefs 2/2018, January available at http://ecipe.org/publications/the-geopolitics-of-online-taxation-in-asia-pacific/
Fishman, Arthur, and Avi Simhon (2002). The division of labor, inequality and growth. Journal of Economic Growth,Vol. 7, No. 2, pp. 117–136.
Foroohar, R. (2017). Release Big Tech Grip of Power, Financial Times, June 17. Available at https://www.ft.com/content/173a9ed8-52b0-11e7-a1f2-db19572361bb
Forest Peoples Programme (2012). Forest Peoples: Numbers across the world. Available at: http://www.forestpeoples.org/sites/fpp/files/publication/2012/05/forest-peoples-numbers-across-world-final_0.pdf
Fosu, Augustin Kwasi (2011). Growth, Inequality, And Poverty Reduction In Developing Countries: Recent GlobalEvidence, WIDER Working Paper 2011/001. Helsinki: UNU-WIDER, 2011.
Galor, Oded, and Joseph Zeira (1993). Income distribution and macroeconomics. The Review of Economic Studies,Vol. 60, No. 1, pp. 35-52.
Gaventa, John (2016). Consequences and futures of inequalities. In World Social Sciences Report, 2016. ChallengingInequalities: Pathways to a Just World. UNESCO Publishing, Paris.
Genetic Resources Action International (GRAIN) (2015). Asia’s agrarian reform in reverse: laws taking land out ofsmall farmers’ hands. Available at: https://www.grain.org/article/entries/5195-asia-s-agrarian-reform-in-reverse-laws-taking-land-out-of-small-farmers-hands
Government of Bangladesh (2008). Cyclone Sidr in Bangladesh: Damage, Loss, and Needs Assessment for DisasterRecovery and Reconstruction. Available at: https://reliefweb.int/sites/reliefweb.int/files/resources/F2FDFF067EF49C8DC12574DC00455142-Full_Report.pdf
Graetz, G. and Michaels, G. (2015). “Robots at Work”, CEP Discussion Paper No. 1335, Centre for EconomicPerformance (CEP).
Grammy, Abbas and Assane, Djeto (2006). The poverty-growth-inequality triangle hypothesis: An empiricalexamination. Journal of Policy Modeling. (November 2006).
Gupta, Dipak (1990). The Economics of Political Violence. New York: Praeger.
Harvard Business Review (2017). The business of artificial intelligences. Available online at: https://hbr.org/cover-story/2017/07/the-business-of-artificial-intelligence.
Habtezion, Sanay (2013). United Nations Development Programme (UNDP). Gender and Energy. Gender and ClimateChange: Asia and the Pacific, Policy Brief, Vol. 4.
Holland et al. (2009). A Cross-National Analysis of How Economic Inequality Predicts Biodiversity Loss. ConservationBiology, Vol. 23, No. 5, 1304–1313. http://www.diva-portal.org/smash/get/diva2:275575/FULLTEXT01.pdf
Homer-Dixon, T. (1994). Environmental Scarcities and Violent Conflict: Evidence from Cases. International Security,Vol. 19(1), pp. 5-40. doi:10.2307/2539147
IEA (2017). World Energy Outlook, 2017. Executive summary. Available at https://www.iea.org/Textbase/npsum/weo2017SUM.pdf
Ikeda, Nayu et al. (2013). Determinants of reduced child stunting in Cambodia: analysis of pooled data from threeDemographic and Health Surveys. Bulletin of the World Health Organization. Volume 91, Number 5, May2013, 313-388.
Intergovernmental Panel on Climate Change (IPCC) (2012). Managing the Risks of Extreme Events and Disasters toAdvance Climate Change Adaptation. A Special Report of Working Groups I and II of the IPCC [Field, C.B., V.Barros, T.F. Stocker, D. Qin, D.J. Dokken, K.L. Ebi, M.D. Mastrandrea, K.J. Mach, G.K. Plattner, S.K. Allen, M.Tignor, & P.M. Midgley (Eds.)]. Cambridge University Press, Cambridge, UK, and New York, NY, USA. 582pp.
International Labour Organization (ILO) (2016). ASEAN in Transformation How Technology is Changing Jobs andEnterprises. Available at: www.ilo.org/public/english/dialogue/actemp/downloads/publications/2016/asean_in_transf_2016_r1_techn.pdf

INEQUALITY IN ASIA AND THE PACIFIC98
International Labour Organization (ILO) and World Trade Organization (WTO) (2009). Globalization and Informal Jobsin Developing Countries. Geneva. Available at: http://www.ilo.org/wcmsp5/groups/public/@dgreports/@dcomm/documents/publication/wcms_115087.pdf
International Labour Organization (ILO) (2016). Global Wage Report 2016/2017. Geneva.
International Monetary Fund (IMF) (2017). Fiscal Monitor: Tackling Inequality, October. Washington, D.C.
Isgut, Alberto, and Jürgen Weller, eds. (2016). Protection and Training: Institutions for Improving Workforce Integrationin Latin American and Asia. United Nations publication, Sales No. E.16.II.G.12. Available from http://repositorio.cepal.org/bitstream/handle/11362/40661/1/S1600550_en.pdf.
Islam, S.N. (2015). Inequality and Environmental Sustainability. UNDESA Working paper No. 145. Available at: http://www.un.org/esa/desa/papers/2015/wp145_2015.pdf
ITU (2017) World Telecommunication/ICT Indicators database 2017 (21th Edition/December 2017). Available at https://www.itu.int/en/ITU-D/Statistics/Pages/publications/wtid.aspx
Ivaschenko, Oleksiy (2002). Growth and inequality: evidence from transitional economies. CESifo Working Paper Series,No. 746 (June). M¸nchen, Germany: CESifo Group Munich. Available from https://ssrn.com/abstract=322740.
Jack, B.K. (2013). Constraints on the adoption of agricultural technologies in developing countries. Literature review,Agricultural Technology Adoption Initiative, J-PAL (MIT) and CEGA (UC Berkeley).
Jain-Chandra S., Kinda T., Kochhar K., Piao S. and Schauer, J (2016). “Sharing the Growth Dividend: Analysis ofInequality in Asia”, IMF Working Paper 16/48, International Monetary Fund, Washington. Available athttps://www.imf.org/external/pubs/ft/wp/2016/wp1648.pdf
Jerrett, M. (2009). Commentary: global geographies of injustice in traffic-related air pollution exposure. EpidemiologyVol. 20 pp. 231–233.
Kakwani, Nanak (1977). Applications of Lorenz Curves in economic analysis. Econometrica, Vol. 45, pp. 719-727.
Kan et al. (2008). Season, sex, age, and education as modifiers of the effects of outdoor air pollution on daily mortalityin Shanghai, China: The Public Health and Air Pollution in Asia (PAPA) Study. Environmental Health Perspectives,Vol. 116 (9), pp. 1183-88. doi: 10.1289/ehp.10851
Kanbur, Ravi, Changyong Rhee, and Juzhong Zhuang, eds. (2014). Inequality in Asia and the Pacific: Trends, Drivers,and Policy Implications. Manila: Asian Development Bank.
Kaplan, R. (1994). The Coming Anarchy: How scarcity, crime, overpopulation, tribalism, and disease are rapidlydestroying the social fabric of our planet, The Atlantic Monthly, February; https://www.theatlantic.com/magazine/archive/1994/02/the-coming-anarchy/304670/
Kingston, J. (2001). Japan in Transformation, 1952–2000, pp. 36–44. Pearson. 2001.
Koop, G. and Tole, L. (2001) Deforestation, distribution and development. Global Environmental Change, Vol. 11,pp. 193–202.
Kozo Y. and Yasukichi Y. eds. (1987). The Political Economy of Japan, Vol. 1 – The Domestic Transformation
Kreft Sönke, David Eckstein and Inga Melchior (2017). ’Who Suffers Most from Extreme Weather Events?‘ Briefingpaper, Germanwatch.
Krueger, A.O. (1974). The political economy of the rent-seeking society. American Economic Review, 64(3), 291–303.
Kuznets, Simon (1955). Economic growth and income inequality. American Economic Review, vol. XLV, No. 1,pp. 1-28. Available from www.aeaweb.org/aer/top20/45.1.1-28.pdf.
Landrigan, Philip J. et al. (2018). “The Lancet Commission on pollution and health”. Lancet. 2018 Feb 3;391(10119),462-512.
Lange, Glenn-Marie, Wodon, Q and Carey, K eds. (2018). The Changing Wealth of Nations 2018: Buildinga Sustainable Future. Washington, DC: World Bank. doi:10.1596/978-1-4648-1046-6. License: CreativeCommons Attribution CC BY 3.0 IGO
Lawrence, R.Z. (2017). Recent US Manufacturing Employment: The Exception that Proves the Rule. Peterson Institutefor International Economics (PIIE).

99INEQUALITY IN ASIA AND THE PACIFIC
Lee K. (2016). Development of technological capabilities for building productive capacity in LDCs. CDP Policy ReviewNo.2. Committee for Development Policy, United Nations October 2016 Available at: https://www.un.org/development/desa/dpad/wp-content/uploads/sites/45/publication/CDP-review-2016-2.pdf
Lewis, W. Arthur (1954). Economic development with unlimited supplies of labour. The Manchester School, vol. 22,Issue 2 (May), pp. 139-191.
Mannucci, P.M. and Franchini, M. (2017). Health Effects of Ambient Air Pollution in Developing Countries. InternationalJournal of Environmental Research in Public Health, Vol. 14, pp. 1048; doi:10.3390/ijerph14091048
Mazzucato M. (2013). The Entrepreneurial State. Debunking Public vs. Private Sector Myths. Anthem Other CanonEconomics.
Mazzucato M. (2017). Mission-Oriented Innovation Policy: Challenges and Opportunities. Institute for Innovationand Public Purpose. University College London. IPPP Working Paper 2017-01, September 2017 Available at:https://www.ucl.ac.uk/bartlett/public-purpose/sites/public-purpose/files/moip-challenges-and-opportunities-working-paper-2017-1.pdf
McKinsey Global Institute (MGI) (2017a). Jobs lost, jobs gained: Workforce in transition in a time of automation,McKinsey Global Institute. Available at https://www.mckinsey.com/mgi/overview/2017-in-review/automation-and-the-future-of-work/jobs-lost-jobs-gained-workforce-transitions-in-a-time-of-automation
_______ (2017b). A Future that Works: Automation, Employment, and Productivity. McKinsey Global Institute. January2017 Available at https://www.mckinsey.com/~/media/McKinsey/Global%20Themes/Digital%20Disruption/Harnessing%20automation%20for%20a%20future%20that%20works/MGI-A-future-that-works_Full-report.ashx
Metcalfe, S. and Ramlogan, R. (2008). Innovation systems and the competitive process in developing economies.The Quarterly Review of Economics and Finance 48 (2), 433–446.
Mitchell, K. et al. (2014). The Craft of Incentive Prize Design. Deloitte. Available from: https://www2.deloitte.com/insights/us/en/topics/social-impact/the-craft-of-incentive-prize-design.html
Munich RE (2018). Hurricanes cause record losses in 2017 – The year in figures. Available at: https://www.munichre.com/topics-online/en/2018/01/2017-year-in-figures
Organisation for Economic Co-operation and Development (OECD) (2015). Innovation Policies for Inclusive Growth.22 May 2015. Available at http://www.oecd.org/sti/innovation-policies-for-inclusive-growth-9789264229488-en.htm
Organisation for Economic Co-operation and Development (OECD) (2016a). Compendium of Productivity Indicators.Available at http://www.oecd-ilibrary.org/industry-and-services/oecd-compendium-of-productivity-indicators-2016_pdtvy-2016-en
Organisation for Economic Co-operation and Development (OECD) (2016b). Science, Technology and InnovationOutlook. Paris. Available at: http://dx.doi.org/10.1787/sti_in_outlook-2016-en
Organisation for Economic Co-operation and Development (OECD) (2016c), States of Fragility: Understanding Violence,OECD Publishing, Paris. Available at: http://dx.doi.org/10.1787/9789264267213-en
Organisation for Economic Co-operation and Development (OECD/IEA) (2016d). Next-Generation Wind and SolarPower. From cost to value. OECD Publishing, Paris. Available at: http://www.oecd.org/publications/next-generation-wind-and-solar-power-9789264258969-en.htm
O’Neil, Siobhan, and Kato Van Broeckhoven (2018). Cradled by Conflict: Child Involvement with Armed Groups inContemporary Conflict. Helsinki, Finland: United Nations University. Available from http://collections.unu.edu/eserv/UNU:6409/Cradled_by_Conflict.pdf.
Pant, P., Guttikunda SK and Peltier RE (2016). Exposure to particulate matter in India: A synthesis of findings andfuture directions. Environmental Research, vol. 147, pp. 480–496.
Pasquier-Doumer, Laure (2016). The role of aspirations in the exclusion of Peruvian indigenous children. In WorldSocial Sciences Report, 2016. Challenging Inequalities: Pathways to a Just World. UNESCO Publishing, Paris.
Payne, Keith (2017). The Broken Ladder: How Inequality Affects the Way We Think, Live and Die. Viking, New York.
Piketty, Thomas (2014). Capital in the Twenty-First Century. Cambridge, Massachusetts: Belknap Press of HarvardUniversity Press.

INEQUALITY IN ASIA AND THE PACIFIC100
PwC (2017). Sizing the prize What’s the real value of AI for your business and how can you capitalise? Available athttps://www.pwc.com/gx/en/issues/data-and-analytics/publications/artificial-intelligence-study.html
PwC (2018). Fourth Industrial Revolution for the Earth Harnessing Artificial Intelligence for the Earth. Available at:https://www.pwc.com/gx/en/sustainability/assets/ai-for-the-earth-jan-2018.pdf
Rajan, Raghuram G. (2010). Fault Lines. Princeton, New Jersey: Princeton University Press.
Ravallion, Martin (2016). The Economics of Poverty: Oxford University Press.
Rawls, John (1971). A Theory of Justice. Harvard University Press.
Reamer A. (2014). The Impacts of Technological Invention on Economic Growth – A Review of the Literature. TheGeorge Washington Institute of Public Policy. February 28, 2014 https://gwipp.gwu.edu/files/downloads/Reamer_The_Impacts_of_Invention_on_Economic_Growth_02-28-14.pdf
Reuters. (2017). China to Reallocate 500,000 Coal and Steel Workers in 2017: Labor Minister. Available at https://www.reuters.com/article/us-china-economy-employment/china-to-reallocate-500000-coal-and-steel-workers-in-2017-labor-minister-idUSKBN1683AZ
Rodrik, D. (2015). Work and Human Development in a Deindustrializing World. Think Piece. 2015 UNDP HumanDevelopment Report Office. Available at http://hdr.undp.org/sites/default/files/rodrik_hdr_2015_final.pdf
Ross, M.L. (2004). What do we know about natural resources and civil war? Journal of Peace Research, Vol. 41(3),pp. 337-356.
Schoolman, E.D. and Ma, C. (2012). Migration, class and environmental inequality: Exposure to pollution in China’sJiangsu Province. Ecological Economics, Vol. 75, pp. 140-151.
Sen, Amartya (1999). Development As Freedom. Oxford University Press.
Shi, J. (2010). China’s Indigenous Innovation and Government Procurement. Available at https://www.ictsd.org/bridges-news/bridges/news/china%E2%80%99s-indigenous-innovation-and-government-procurement.
Shih, W. (2013). The resurgence of manufacturing in America. Inside Supply Management, pp. 30-33.
Shorrocks, A.F. (2013) Decomposition procedures for distributional analysis: a unified framework based on the Shapleyvalue. Journal of Economic Inequality, Vol. 11, Issue 1.
Simanis E. (2012). Reality Check at the Bottom of the Pyramid. Harvard Business Review. June 2012. Available athttps://hbr.org/2012/06/reality-check-at-the-bottom-of-the-pyramid
Slay, B. (2009). Poverty, inequality, and social policy reform in the former Soviet Union. UNDP Regional Bureau forEurope and CIS. Available from www.undp.org/content/dam/rbec/docs/Poverty-inequality-and-social-policy-reform-in-the-former-Soviet-Union.pdf.
Sovacool, B. (2013). Energy Access and Energy Security in Asia and the Pacific. ADB Economics Working Paper Series,Vol. 383.
Stewart, Frances (2016). Horizontal Inequalities. In World Social Sciences Report, 2016. Challenging Inequalities:Pathways to a Just World. UNESCO Publishing, Paris.
Stiglitz, Joseph E. (2012). The Price of Inequality: How Today’s Divided Society Endangers Our Future. New York:W.W. Norton & Company.
Stiglitz, Joseph E. (2017). Trends in Inequality: Social, Economic and Political Issues, mimeo, November 4, Bologna.
Suich et al. (2015). Ecosystem services and poverty alleviation: A review of the empirical links. Ecosystem Services,Vol. 12, pp. 137-147. https://doi.org/10.1016/j.ecoser.2015.02.005.
TEEB (2010). The Economics of Ecosystems and Biodiversity: Mainstreaming the Economics of Nature: A synthesis ofthe approach conclusions and recommendations of TEEB.
Tencent Penguin Intelligence and China Academy of Information and Communications Technology (CAICT) (2016).WeChat Impact Report 2016. 21 March 2016. Translated presentation by WALKTHECHAT. Available athttps://www.slideshare.net/TingyiJennyChen/wechat-impact-report-2016
The Hindu (2016). Prescription: drought-resistant crops, rabbits and quails. 29 March 2007 updated 28 September2016. Available at http://www.thehindu.com/todays-paper/tp-national/tp-tamilnadu/Prescription-drought-resistant-crops-rabbits-and-quails/article14739175.ece

101INEQUALITY IN ASIA AND THE PACIFIC
Ugur, M. and Mitra, A. (2017). “Technology Adoption and Employment in Less Developed Countries: a Mixed-methodSystematic Review”, World Development 96, pp.1-18.
United Nations (2015), Transforming our world: the 2030 Agenda for Sustainable Development. https://sustainabledevelopment.un.org/post2015/transformingourworld.
United Nations Conference of Trade and Development (UNCTAD) (2007). The Least Developed Countries Report,2007. Knowledge, technological learning and innovation for development. Available at: http://unctad.org/en/Docs/ldc2007_en.pdf
United Nations Conference of Trade and Development (UNCTAD) (2017a). The Least Developed Countries Report2017. Transformational Energy Access. Available at http://unctad.org/en/PublicationsLibrary/ldcr2017_en.pdf
United Nations Conference of Trade and Development (UNCTAD) (2017b). Trade and Development Report 2017,Beyond Austerity: Toward a global new deal, Geneva: United Nations Conference of Trade and Development.
United Nations, Department of Economic and Social Affairs (DESA), United Nations Development Programme (UNDP),United Nations Educational, Scientific and Cultural Organization (UNESCO) (2012) Governance andDevelopment, available at: http://www.un.org/millenniumgoals/pdf/Think%20Pieces/7_governance.pdf
United Nations, Department of Economic and Social Affairs (DESA) (2015). Inequality and the 2030 Agenda forSustainable Development. Development Issues No. 4. 21 October 2015 Available at https://www.un.org/development/desa/dpad/wp-content/uploads/sites/45/publication/dsp_policy_04.pdf
United Nations, Department of Economic and Social Affairs (DESA) (2016a). Leaving No One Behind: the Imperativeof Inclusive Development. Report on the World Social Situation 2016. Sales No. E.16.IV.1. Available fromwww.un.org/esa/socdev/rwss/2016/full-report.pdf.
United Nations, Department of Economic and Social Affairs (DESA) (2016b). Climate Change Resilience: an opportunityfor reducing inequalities. World Economic and Social Survey. https://wess.un.org/wp-content/uploads/2016/06/WESS_2016_Report.pdf
United Nations Development Programme (UNDP) (2013). Humanity Divided: Confronting Inequality in DevelopingCountries. New York.
United Nations Environment Programme (UNEP) (2009). From Conflict to Peacebuilding: The Role of Natural Resourcesand the Environment. Geneva.
United Nations, Economic and Social Commission for Asia and the Pacific (ESCAP) (2013). Economic and Social Surveyof Asia and the Pacific 2013: Forward-looking Macroeconomic Policies for Inclusive and SustainableDevelopment. Sales No. E.13.II.F.2.
_______ (2015a). Economic and Social Survey of Asia and the Pacific 2015: Making Growth More Inclusive forSustainable Development. Sales No. E.15.II.F.7.
_______ (2015b). Time for Equality: The Role of Social Protection in Reducing Inequalities in Asia and the Pacific.Sales No E.17.II.F.15.
_______ (2015c). Asia-Pacific Disaster Report 2015. Disasters Without Borders. ESCAP Publication Available athttp://www.unescap.org/publications/asia-pacific-disaster-report-2015-disasters-without-borders
_______ (2016a). Economic and Social Survey of Asia and the Pacific 2016: Nurturing Productivity for inclusive Growthand Sustainable Development. Sales No. E.16.II.F.10.
_______ (2016b). Harnessing Science, Technology and Innovation for Inclusive and Sustainable Developing in Asiaand the Pacific. United Nations. Bangkok. Available at http://www.unescap.org/sites/default/files/publications/STI_Theme_Study.pdf
_______ (2017a). Regional Cooperation For Sustainable Energy in Asia and the Pacific. Sales No. E.17.II.F.10.
_______ (2017b). Sustainable Social Development in Asia and the Pacific: Towards a People-Centered Transformation.Sales No. E.17.II.F.15.
_______ (2017c). Asia-Pacific Countries with Special Needs Development Report 2017: Investing in infrastructurefor an inclusive and sustainable future. Bangkok. Sales No. E.17.II.F.9
_______ (2017d), Achieving the Sustainable Development Goals in North and Central Asia. Bangkok.

INEQUALITY IN ASIA AND THE PACIFIC102
_______ (2017e). State of ICT Connectivity in Asia and the Pacific: Artificial Intelligence and Broadband Divide, 2017.Available at http://www.unescap.org/resources/artificial-intelligence-and-broadband-divide-state-ict-connectivity-asia-and-pacific-2017
_______ (2017f). Planning processes, policies and initiatives in ICTD education at institutions of higher learning (IHLs)in Asia and the Pacific. Available at http://www.unescap.org/resources/planning-processes-policies-and-initiatives-ictd-education-institutions-higher-learning
_______ (2017g). Asia-Pacific Disaster Report 2017: Leave No One Behind: Disaster Resilience for SustainableDevelopment. Bangkok. Available at: http://www.unescap.org/sites/default/files/1_Disaster%20Report%202017%20Low%20res.pdf
_______ (2017h), Analysing Resource Efficiency Transitions in Asia and the Pacific. United Nations. Bangkok. Availableat: http://www.unescap.org/publications/analysing-resource-efficiency-transitions-asia-and-pacific
_______ (2018a) Inequality of Opportunity in Asia and the Pacific: Education. Social Development Policy Papers#2018-01.
_______ (2018b) Inequality of Opportunity in Asia and the Pacific: Decent Work. Social Development Policy Papers#2018-02.
_______ (2018c) Inequality of Opportunity in Asia and the Pacific: Child Nutrition. Social Development Policy Papers#2018-04
_______ (2018d) (forthcoming). Inequality of Opportunity in Asia and the Pacific: Women’s Health. Social DevelopmentPolicy Papers #2018-05.
_______ (2018e), Social Protection Toolbox, 2018. http://socialprotection-toolbox.org
_______ (2018f). Asia-Pacific Countries with Special Needs Development Report 2018: Sustaining Development andSustaining Peace. Bangkok.
_______ (2018g) (forthcoming). Economic and Social Survey of Asia and the Pacific 2018. Bangkok.
United Nations, Economic and Social Commission for Asia and the Pacific (ESCAP), Asian Development Bank (ADB),and United Nations Development Programme (UNDP) (2013). Asia-Pacific Aspirations: Perspectives fora Post-2015 Development Agenda. Asia-Pacific Regional MDG Report 2012/13. Bangkok.
_______ (2017). Eradicating Poverty and Promotion Prosperity in a Changing Asia-Pacific. Bangkok. Available fromhttp://sdgasiapacific.net/download/AP_SDG_Thematic-Report_2017.pdf
United Nations, Economic and Social Commission for Asia and the Pacific (ESCAP) and STEPI (2017). InnovativeFinancing for Development in Asia and the Pacific. Government Policies on Impact Investment and PublicFinance for Innovation. Available at: http://www.unescap.org/publications/innovative-financing-development-asia-and-pacific
United Nations, Economic and Social Commission for Asia and the Pacific (ESCAP), and Oxfam (2017). Taxing forShared Prosperity: Policy Options for the Asia-Pacific Region. Oxford: Oxfam International; Bangkok.
United Nations Educational, Scientific and Cultural Organization (UNESCO) (2016). World Social Science Report 2016:Challenging Inequalities: Pathways to a Just World. Available from http://unesdoc.unesco.org/images/0024/002458/245825e.pdf.
United Nations Industrial Development Organization (UNIDO) (2016). Industrial Development Report Available at:https://www.unido.org/sites/default/files/2015-12/EBOOK_IDR2016_FULLREPORT_0.pdf
United Nations System Chief Executives Board for Coordination (CEB) (2017). Leaving No One Behind: Equality andNon-Discrimination at the Heart of Sustainable Development - The United Nations System Shared Frameworkfor Action. Available from: www.unsceb.org/CEBPublicFiles/CEB%20equality%20framework-A4-web-rev3.pdf.
Violante, G.L. (2016). Skill-Biased Technical Change. January 2016. New York University and CEPR (http://www.econ.nyu.edu/user/violante/Books/sbtc_january16.pdf).
Vivarelli, M. (2014). “Innovation, Employment and Skills in Advanced and Developing Countries: A Survey of EconomicLiterature”, Journal of Economic Issues 48(1), pp. 123-154.

103INEQUALITY IN ASIA AND THE PACIFIC
Wan, Guanghua, Chen Wang, and Xun Zhang (2016). Structural change and income distribution accounting forregional inequality in the People’s Republic of China and its changes during 1952-2012. ADBI Working Paper,No. 608. Tokyo: Asian Development Bank Institute. Available from www.adb.org/publications/structural-change-and-income-distribution-prc.
Wan, Guanghua, Ming Lu, and Zhao Chen (2006). The inequality-growth nexus in the short- and long-run: empiricalevidence from China. Research Paper, No. 2006/92. Helsinki, Finland: UNU-WIDER.
World Bank (2006). Poverty Environment Nexus: Sustainable Approaches to Poverty Reduction in Cambodia, LaoPDR, and Vietnam. Washington, D.C.
World Bank (2008). The Role of Indigenous Peoples in Biodiversity Conservation. The Natural but Often ForgottenPartners. Available at: http://documents.worldbank.org/curated/en/995271468177530126/pdf/443000WP0BOX321onservation01PUBLIC1.pdf
World Bank (2013). Inforgraphic: What’s a toilet worth. August 30, 2013. Available from: http://www.worldbank.org/en/news/feature/2013/08/30/whats-a-toilet-worth-infographic
World Bank (2016a). World Development Report 2016: Digital Dividends. Washington, D.C.: World Bank. doi:10.1596/978-1-4648-0671-1.
World Bank (2016b). The World Bank Group’s response to illicit financial flows: a stocktaking (English). Washington,D.C. Available at: http://documents.worldbank.org/curated/en/502341468179035132/The-World-Bank-Group-s-response-to-illicit-financial-flows-a-stocktaking
World Bank (2018). Global Economic Prospects, Broad-based Upturn, But for How Long? Washington, D.C.
World Bank (2018a). World Development Indicators. Available from: https://datacatalog.worldbank.org/
World Health Organization (2016). Burning opportunity: clean household energy for health, sustainable development,and wellbeing of women and children. Washington, D.C.
World Health Organization (2018). Mortality and burden of disease from water and sanitation. Global HealthObservatory Data. Available from: http://www.who.int/gho/phe/water_sanitation/burden_text/en/
World Inequality Lab (2018). World Inequality Report 2018. Paris. Available from http://wir2018.wid.world/files/download/wir2018-summary-english.pdf.
World Trade Organization (WTO) (2017). World Trade Report 2017: Trade, technology and jobs. Geneva.
Yoshino, Naoyuki, and Matthias Helble, eds. (2016). The Housing Challenge in Emerging Asia: Options and Solutions.Tokyo: Asian Development Bank Institute. Available from www.adb.org/sites/default/files/publication/190060/adbi-housing-challenge-emerging-asia-options-solutions.pdf.
Zhang, Yin, and Guanghua Wan (2006). The impact of growth and inequality or rural poverty in China. Journal ofComparative Economics, vol. 34, No. 4 (December), pp. 694-712.
Zheng, S., Sun, C. and Kahn, M. E. (2015). Self-protection investment exacerbates air pollution exposure inequalityin urban China, NBER Working Paper, no. w21301.
Zhou, Y. and Lu, S. (2017). China’s Renewables Curtailment and Coal Assets Risk Map. Research Findings and MapUser Guide p9. Bloomberg New Energy Finance. Available at https://data.bloomberglp.com/bnef/sites/14/2017/10/Chinas-Renewable-Curtailment-and-Coal-Assets-Risk-Map-FINAL_2.pdf
Zion Research Group (2017). Dance of Dragons – Estimating Effective Tax Rates. October 31, 2017. Available at:https://www.zionresearchgroup.com/offerings/
Zhuang J., Kanbur R. and Rhee C. (2014). “What drives Asia’s rising inequality?” In: Kanbur, R., Rhee, C. and Zhuang,J. (eds), Inequality in Asia and the Pacific: Trends, Drivers and Policy Implications, Routledge: London.


United Nations publications may be obtained from bookstores and distributors throughout the world.Please consult your bookstore or write to any of the following:
Customers in: America, Asia and the Pacific
Email: [email protected]: shop.un.orgTel: +1 703 661 1571Fax: + 1 703 996 1010
Mail Orders to:United Nations PublicationsPO Box 960Herndon, Virginia 20172United States of America
Customers in: Europe, Africa and the Middle East
United Nations Publicationsc/o Eurospan GroupEmail: [email protected]: un.org/publicationsTel: +44 (0) 1767 604972Fax: +44 (0) 1767 601640
Mail orders to:United Nations PublicationsPegasus Drive, Stratton Business ParkBigglewade, Bedfordshire SG 18 8TOUnited Kingdom
For further information on this publication, please address your enquiries to:
DirectorSocial Development Division Tel: 66 2 288-1234Economic and Social Commission for Asia and the Pacific (ESCAP) Fax: 66 2 288-1000United Nations Building, Rajadamnern Nok AvenueBangkok 10200, Thailand