Asia-Pacific Climate friendly technologies - ESCAP Repository
Upload
khangminh22Category
view
1download
0
CLIMATE CHANGE ADAPTATION for W
ater Managem
ent in a Green Econom
y
Climate change has varying impacts in the different areas of Asia and the Pacific
region. All will affect availability of and/or access to water. Some examples of such
areas in Asia and the Pacific region are as follows:
-
both coastal communities and industries may face additional threats from
saltwater intrusion. Sea level rise may also lead to an increase in environ-
mental refugees from areas that can no longer adapt to climate change.

ESCAP is the regional development arm of the United Nations and serves as the main economic and social development centre
for the United Nations in Asia and the Pacific. Its mandate is to foster cooperation between its 53 members and 9 associate
members. ESCAP provides the strategic link between global and country-level programmes and issues. It supports Governments
of the region in consolidating regional positions and advocates regional approaches to meeting the region’s unique soci-economic
challenges in a globalizing world, The ESCAP office is located in Bangkok, Thailand. Please visit our website at www.unescap.org
for further information.
The shaded areas of the map are ESCAP Members and Associate members
Cover design, layout and images: Warren FieldFront Cover image: © Dreamstime.com Back over image: © Christian Noval / Dreamstime.com
Climate Change adaptation for Water management in a green eConomy
discussion paper
Climate Change adaptation for Water management in a green economy
United nations publication Copyright United nations 2012all rights reservedmanufactured in thailand
For further information on this publication, please contact:
Mr Rae Kwon ChungDirectorEnvironment and Development Division ESCAP Rajadamnern Nok Avenue Bangkok 10200, Thailand
Tell No: +66-2288 1234Fax no: +66-2288 1048/1059email: [email protected]
All material including information, data, figures and graphic presented do not imply the expressions of any opinion whatsoever on the part of the Secretariat of the United Nations concerning the legal status of any country, territory, city or area or its authorities or concerning the delimitation of its frontiers.
References to dollars ($) denote United States dollars unless otherwise noted.
Mention of firm names and commercial products does not imply the endorsement of the United Nations.
The opinions, figures, estimates set forth in this publication are the responsibility of the consultant who was responsible for the contents of the publication and, hence, should not necessarily be considered as reflecting the views or carrying the endorsement of the United Nations.
This publication may be reproduced in whole or in part for educational non-profit purposes without special permission from the copyright holder, provided that the source is acknowledged. The ESCAP publications office would appreciate receiving a copy of any publication that uses this publication as a source.
No use may be made of the publication for resale or any other commercial purpose whatsoever without prior permission. Application for such permission, with a statement of the purpose and extent of reproduction, should be addressed to the secretary of the Publication Board, United Nations, New York.
This publication was prepared, under the guidance of Hongpeng Liu, Chief of Energy Security and Water Resources Section, by a team of writers, contributors and editors namely, Salmah Zakaria (Environment and Development Division, EDD), Felix Seebacher, Rusyan Mammit, Damien Mourey, Teresa Kersting, Emily Briggs and Helina Wright, working at various times in Energy Security and Water Resources Section.

foreword
While efforts to mitigate climate change continues by reducing greenhouse gases (ghg), the impacts of climate change has resulted in changes to the hydro-meteorological events of floods and droughts, translated in more extreme case of events. Climate Change has also increase the melting of the polar ice and the water towers of the himalaya’s hindu Kush, and threaten coastal settlements with sea-level rise. all this will have significant impact on developing countries of asia and the pacific region particularly of the least develop countries and small island states in the pacific and indian oceans.
more than 90% of impacts of climate change are related to water issues. these impacts are not only on water supply for household, industries and agriculture, but also on disasters and hazards during heavy rainfall, with flooded areas and landslides. during droughts, forest fires and haze have become the norm. the spread of poor quality water during floods and concentration of toxic water during drier months are an added health hazards. as such water security has become a truly global challenge.
eSCap in its “Low Carbon Green Growth Roadmap for Asia Pacific” publication has articulated on, “Turning resource constraints and the climate crisis into economic growth opportunities.” this current publication looks at the detail challenges of water resources management from the perspective of green economy. it complemented the works in managing the multitude of water challenges facing the vast asia and the pacific region as climate change impact is expected to further exacerbate these challenges.
this publication is prepared to provide guidance in discussions for adaptation to climate change through integrated water resources management and green growth to achieve green economy and sustainable development.
Rae Kwon Chungdirector, environment development divisioneSCap

List of Abbreviations and Acronyms
aWm agriculture Water management
ar argon
apWf asia pacific Water forum
Co Carbon monoxide
Co2 Carbon dioxide
eSCap United nations economic and Social Commission for asia and the pacific
fao food and agriculture organization
gdp gross domestic product
ghg green house gases
glof glacial lake outburst floods
gWp global Water partnership
iCimod international Centre for integrated mountain development
igSd institute of governance and Sustainable development
ipCC intergovernmental panel on Climate Change
irBm integrated river Basin management
iWmi international Water management institute
iWrm integrated Water resources management
Kg kilogram
m3 meter cube
mar managed aquifer recharge
meaB millennium ecosystem assessment Board
n2 nitrogen
n2o nitrous oxide
napa national adaptation program for action
nh4 methane
o2 oxygen
o3 ozone
peS payment for ecosystem Services
pWS payment for Watershed Services
SCp Sustainable Consumption and production
SreS Special report on emissions Scenarios
UfW Unaccounted for Water
UnCed United nations Conference on environment and development
Undp United nations development programme
Unep United nations environment programme
UnfCCC United nations framework Convention on Climate Change
UniCef United nations Children’s fund
Who World health organization

executive Summary ..............................................................................................................4
1 PURPOSEandOVERVIEW..............................................................................6
2 CLIMATECHANGEandwater........................................................................7
2.1 introduction ..............................................................................................................7
2.2 Carbon dioxide (Co2) levels and other green house gases (ghg) .............................7
2.2.1 Carbon dioxide (Co2) and green house gases (ghg)
and its effect on surface temperature .................................................................... 8
2.2.2 Carbon dioxide Co2 emissions and its regional distribution .......................... 10
2.2.3 effects of climate change ............................................................................. 10
2.3 impact of Climate Change on Water ....................................................................... 11
2.3.1 global Water Balance ................................................................................... 12
2.3.2 available freshwater resources in the region ............................................... 12
2.3.3 rising ocean levels ...................................................................................... 13
2.3.4 food Security ............................................................................................... 13
2.4 Climate Change mitigation ..................................................................................... 14
2.5 Climate Change adaptation .................................................................................... 14
3 Climatechange:howitisaffectingtheregion.........................................16
3.1 Communities in mountain Valleys ............................................................................ 16
3.1.1 impacts of climate change on glaciers ......................................................... 16
3.1.2 Socio-economic and environmental consequences .......................................18
3.2 riparian population ................................................................................................. 20
3.2.1 effects of climate change in river plains ........................................................ 20
3.2.2 Consequences for riparian societies .............................................................. 20
3.3 dwellers in coastal areas .......................................................................................... 22
3.3.1 demographics and main characteristics ........................................................ 22
3.3.2 impacts of climate change on coastal areas .................................................. 22
3.3.3 Socio-economic and environmental consequences ....................................... 23
3.4 an islander’s perspective .......................................................................................... 24
3.4.1 demographics and main characteristics ........................................................ 24
TABLE of CONTENTSTABLE of CONTENTS
3.4.2 impacts of climate change on small islands .................................................. 24
3.4.3 Socio-economic consequences ..................................................................... 25
3.4.4 health and Security across the region ........................................................... 26
3.5 asia pacific geographical Complexities ....................................................................27
4 GREENGROWTHandADAPTATION............................................................28
4.1 introduction to green growth and the ecological Based approach ..........................28
4.1.1 green growth and Water .............................................................................28
4.1.2 natural Capital .............................................................................................29
4.2 economic instruments .............................................................................................31
4.3 demand management ............................................................................................33
4.4 Sustainable Consumption and production (SCp) ......................................................34
5 ImprovedWaterGovernancetocopewithchallengesfromincreasing
uncertaintiesarisingfromclimatechange................................................36
5.1 adopting principles of integrated Water resource management (iWrm) .................36
5.2 integrated river Basin management (irBm) .............................................................38
5.3 flood management .................................................................................................39
5.4 agricultural Water management (aWm) .................................................................40
5.5 Water Supply and Sanitation ................................................................................... 43
5.6 options for increasing storage capacity ................................................................... 43
5.6.1 groundwater and aquifer management ....................................................... 43
5.6.2 reservoirs ..................................................................................................... 44
5.6.3 Small lakes, ponds and wetlands .................................................................. 44
6 PolicyOPTIONS.............................................................................................46
7 ADAPTATIONSTRATEGYexamples.............................................................48
8 References....................................................................................................52
CLIMATE CHANGE ADAPTATION for water management in a green economy4
EXECUTIVE SUMMARY
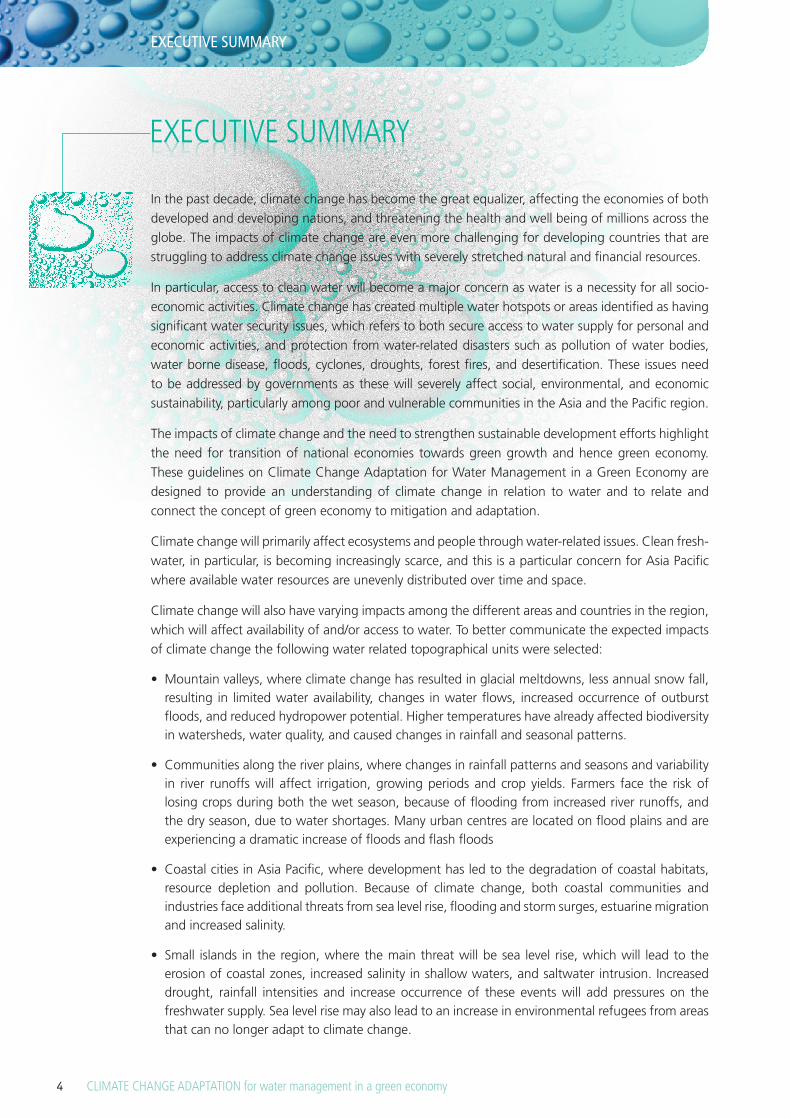
in the past decade, climate change has become the great equalizer, affecting the economies of both
developed and developing nations, and threatening the health and well being of millions across the
globe. the impacts of climate change are even more challenging for developing countries that are
struggling to address climate change issues with severely stretched natural and financial resources.
in particular, access to clean water will become a major concern as water is a necessity for all socio-
economic activities. Climate change has created multiple water hotspots or areas identified as having
significant water security issues, which refers to both secure access to water supply for personal and
economic activities, and protection from water-related disasters such as pollution of water bodies,
water borne disease, floods, cyclones, droughts, forest fires, and desertification. these issues need
to be addressed by governments as these will severely affect social, environmental, and economic
sustain ability, particularly among poor and vulnerable communities in the asia and the pacific region.
the impacts of climate change and the need to strengthen sustainable development efforts highlight
the need for transition of national economies towards green growth and hence green economy.
these guidelines on Climate Change adaptation for Water management in a green economy are
designed to provide an understanding of climate change in relation to water and to relate and
connect the concept of green economy to mitigation and adaptation.
Climate change will primarily affect ecosystems and people through water-related issues. Clean fresh-
water, in particular, is becoming increasingly scarce, and this is a particular concern for asia pacific
where available water resources are unevenly distributed over time and space.
Climate change will also have varying impacts among the different areas and countries in the region,
which will affect availability of and/or access to water. to better communicate the expected impacts
of climate change the following water related topographical units were selected:
• Mountain valleys, where climate change has resulted in glacial meltdowns, less annual snow fall, resulting in limited water availability, changes in water flows, increased occurrence of outburst floods, and reduced hydropower potential. higher temperatures have already affected biodiversity in watersheds, water quality, and caused changes in rainfall and seasonal patterns.
• Communities along the river plains, where changes in rainfall patterns and seasons and variability in river runoffs will affect irrigation, growing periods and crop yields. farmers face the risk of losing crops during both the wet season, because of flooding from increased river runoffs, and the dry season, due to water shortages. many urban centres are located on flood plains and are experiencing a dramatic increase of floods and flash floods
• Coastal cities in Asia Pacific, where development has led to the degradation of coastal habitats, resource depletion and pollution. Because of climate change, both coastal communities and industries face additional threats from sea level rise, flooding and storm surges, estuarine migration and increased salinity.
• Small islands in the region, where the main threat will be sea level rise, which will lead to the erosion of coastal zones, increased salinity in shallow waters, and saltwater intrusion. increased drought, rainfall intensities and increase occurrence of these events will add pressures on the freshwater supply. Sea level rise may also lead to an increase in environmental refugees from areas that can no longer adapt to climate change.
EXECUTIVE SUMMARY
EXECUTIVE SUMMARY

CLIMATE CHANGE ADAPTATION for water management in a green economy 5
addressing these challenges require national development plans that mainstream climate change
mitigation and adaptation strategies to strengthen local level resilience to climate change. these
plans should also consider regional issues such as transboundary migration and competition over
natural resources, particularly since a number of countries share surface and underground water
resources. encouraging countries to move towards green economy will also help foster economic
growth while addressing growing environmental pressures.
the green economy concept fosters low carbon, is a socially inclusive development, and is an ecology-
based approach to economic growth that requires an interdisciplinary approach and innovative
solutions, where the water sector is a key player. Water is not only essential for the maintenance of
ecosystems, ecosystem services and biodiversity, it is also central to the sanitation system, potable
water and industrial water supplies for social and economic activities. moving towards a green
economy requires that governments, businesses and communities are fully aware of the value of
water, the need for sound water conservation and management measures, and institutionalization of
payment schemes to ensure that water resources continue to remain safe and accessible to all.
green economy includes the development of sound water management practices to improve water
efficiency and water quality. the development of green businesses must also be supported, since
industries should move towards more resource-efficient practices that will allow both businesses to
maximize profits while reducing pressures on the environment.
increasingly difficult access to water makes it imperative for governments to place a value on natural
resources and make industries and communities understand that water is no longer a cost-free
resource. governments must work with businesses and communities to develop plans, systems
and infrastructure that will ensure that water is available for personal and economic needs. Various
economic instruments and strategies can be employed to reduce pressure on environmental and
water resources including water pricing; payments for ecosystem Services and payment for Watershed
Services; demand management; and Sustainable Consumption and production. a number of existing
water governance approaches, such as integrated Water resource management, integrated river
Basin management, and agricultural Water management, can also be re-tooled to emphasize adap-
tation measures for climate change.
it must be emphasized that implementing climate change adaptation policies for water management
is urgent given the impacts of increasing climate variability and their effects on poor and vulnerable
communities. risks from climate change will continue, and governments must mainstream medium
and long term climate change mitigation and adaptation measures in national plans. the magnitude
of the investment, system, infrastructure, and attitudinal and behavioural changes required in reducing
vulnerabilities to climate change require the cooperation of all stakeholders. Collaboration among
political leaders, decision makers, conservation organizations, scientists, academics and economists,
with media, and the general public, in all areas of planning will ensure the accessibility of safe water
resources and continued sustainable development of the countries in the eSCap region.
.
EXECUTIVE SUMMARY

6
CLIMATE CHANGE and WATER
CLIMATE CHANGE ADAPTATION for water management in a green economy CLIMATE CHANGE ADAPTATION for water management in a green economy
CLIMATE CHANGE and WATER
7
the eSCap region of asia and the pacific stretches from turkey in the west to the pacific island nation of Kiribati in the east, and from the russian federation in the north to new Zealand in the south. home to two thirds of the world’s population, it is a region with diverse levels of development and rapid urbanisation. many countries in the region are experiencing new areas of economic growth, riding on globalization resulting from a more interconnected world and benefiting from an export-led growth model. the intergovernmental panel on Climate Change fourth assessment report (ipCC, 2007) indicated that the sub-regions of asia and the pacific are among the most vulnerable to the impacts of climate change. policy frameworks and actions are required for climate change adaptation and to increase the sustainability of economic development, through transitioning towards green growth.
as water underpins all socio-economic activities, the impact of climate change is anticipated to further challenge sustainable development in asia and the pacific. this region is home to multiple water hot spots, areas identified as having significant water security issues. Water security is not only secure access to water supply for personal and economic activities, but also includes protection from water-related disasters such as pollution of water bodies, floods, cyclones, droughts, forest fires, and sand storms. Climate change is expected to dramatically impact the hydro logical cycle in the region, with changes such as increased sea levels, flooding, droughts and saline intrusion. these impacts will have devastating environmental, social and economic effects across the region, particularly impacting the most poor and vulnerable communities.
adaptation to climate change and future development should strive to be not only economically sus tainable but also environmentally sustainable. green growth, as defined by UneSCap (2012) “is an implementing strategy to achieve sustainable development that focuses on improving the eco-efficiency of production and consumption and promoting a green economy, in which economic pros perity materializes in tandem with ecological sustainability.” the concept of green growth is ecologically based. adopting ecology-based approaches in water resources management is an approach that started with the United nations Conference on environment and development (UnCed) in rio, 1992. inclusion of such approaches will result in the design of eco-efficient water infra s tructures and in the process develop local resilience to the impacts of climate change in the water sector. Such a non-structural and ecology-based approach helps address present and future challenges of adaptation in the water sector in an integrated and socially inclusive manner.
these guidelines are designed to provide an understanding of climate change in relation to water and to relate and connect the concept of green growth, to mitigation and adaptation. as such, the target audience of these guidelines includes not only political leaders, decision makers, and thought leaders but also the general public. the intention is to highlight that both green growth and building climate resilience are not only necessities, but are a natural process for sustainable development. adap tation to climate change is urgent. a window of opportunity for ecology-based development, managing both the environment and economy through green growth, presents itself as countries continue to develop economically and build their resilience to climate change. Water management must be addressed to ensure that other development progress, including the achievement of the millennium development goals, are not jeopardized by climate change.
2.1 Introductionin 1992 the United nations framework Convention on Climate Change (UnfCCC) defined climate change as “a change of climate, which is attributed directly or indirectly to human activity that alters the composition of the global atmosphere and which is in addition to natural climate variability observed over comparable time periods” (Un, 1992). from the 1970s onward, scientists in the meteoro logical and hydrological field experienced changes in hydro-meteorological patterns such as air temperature and short-term rainfall, as well an increase of extreme weather events such as droughts and floods.
The Stern Review on the Economics of Climate Change (2006/2007) highlighted the significant economic implications of climate change. the report stated that “the overall costs and risks of climate change will be equivalent to losing at least 5 per cent of global gross domestic product (gdp) each year, now and forever”, but could rise as high as 20 per cent. the report also stated that the scale of the long-term economic effects of climate change were similar to those associated with the great wars and the economic depression.
2.2 Carbon Dioxide levels (CO2) and other Green House Gases (GHG)the main constituents of the earth’s atmosphere are nitrogen (78 per cent n
2), oxygen (21 per cent
o2), and argon (0.9 per cent ar).the major drivers of climate change are gaseous natural and anthro-
pogenic emissions, generally referred to as greenhouse gases (ghg). these are the constituents of the atmosphere that absorb and re-emit infrared radiation. generally, these are carbon dioxide (Co
2),
methane (nh4), nitrous oxide (n2o), ozone (o
3), water vapour and numerous other gases, which are
present in the air in very minor amounts (e.g. chemical compounds of fluoride, ethane, methane, chloride and Co).
according to the current scientific evidence, Co2 accounts for about 20 per cent of earth’s greenhouse
effect, other long-lived greenhouse gases for about 5 per cent, and water vapour and clouds for 75 per cent. Co
2 is a very persistent constituent. it is removed from the air by natural geological-scale
processes, which take place over many years. hence, Co2 will stay in the atmosphere for decades or
even centuries.
PURPOSE and OVERVIEWPURPOSE and OVERVIEW1 CLIMATE CHANGE and WATER2
PURPOSE and OVERVIEW

CLIMATE CHANGE and WATER
CLIMATE CHANGE ADAPTATION for water management in a green economy CLIMATE CHANGE ADAPTATION for water management in a green economy
CLIMATE CHANGE and WATER
7
the eSCap region of asia and the pacific stretches from turkey in the west to the pacific island nation of Kiribati in the east, and from the russian federation in the north to new Zealand in the south. home to two thirds of the world’s population, it is a region with diverse levels of development and rapid urbanisation. many countries in the region are experiencing new areas of economic growth, riding on globalization resulting from a more interconnected world and benefiting from an export-led growth model. the intergovernmental panel on Climate Change fourth assessment report (ipCC, 2007) indicated that the sub-regions of asia and the pacific are among the most vulnerable to the impacts of climate change. policy frameworks and actions are required for climate change adaptation and to increase the sustainability of economic development, through transitioning towards green growth.
as water underpins all socio-economic activities, the impact of climate change is anticipated to further challenge sustainable development in asia and the pacific. this region is home to multiple water hot spots, areas identified as having significant water security issues. Water security is not only secure access to water supply for personal and economic activities, but also includes protection from water-related disasters such as pollution of water bodies, floods, cyclones, droughts, forest fires, and sand storms. Climate change is expected to dramatically impact the hydro logical cycle in the region, with changes such as increased sea levels, flooding, droughts and saline intrusion. these impacts will have devastating environmental, social and economic effects across the region, particularly impacting the most poor and vulnerable communities.
adaptation to climate change and future development should strive to be not only economically sus tainable but also environmentally sustainable. green growth, as defined by UneSCap (2012) “is an implementing strategy to achieve sustainable development that focuses on improving the eco-efficiency of production and consumption and promoting a green economy, in which economic pros perity materializes in tandem with ecological sustainability.” the concept of green growth is ecologically based. adopting ecology-based approaches in water resources management is an approach that started with the United nations Conference on environment and development (UnCed) in rio, 1992. inclusion of such approaches will result in the design of eco-efficient water infra s tructures and in the process develop local resilience to the impacts of climate change in the water sector. Such a non-structural and ecology-based approach helps address present and future challenges of adaptation in the water sector in an integrated and socially inclusive manner.
these guidelines are designed to provide an understanding of climate change in relation to water and to relate and connect the concept of green growth, to mitigation and adaptation. as such, the target audience of these guidelines includes not only political leaders, decision makers, and thought leaders but also the general public. the intention is to highlight that both green growth and building climate resilience are not only necessities, but are a natural process for sustainable development. adap tation to climate change is urgent. a window of opportunity for ecology-based development, managing both the environment and economy through green growth, presents itself as countries continue to develop economically and build their resilience to climate change. Water management must be addressed to ensure that other development progress, including the achievement of the millennium development goals, are not jeopardized by climate change.
2.1 Introductionin 1992 the United nations framework Convention on Climate Change (UnfCCC) defined climate change as “a change of climate, which is attributed directly or indirectly to human activity that alters the composition of the global atmosphere and which is in addition to natural climate variability observed over comparable time periods” (Un, 1992). from the 1970s onward, scientists in the meteoro logical and hydrological field experienced changes in hydro-meteorological patterns such as air temperature and short-term rainfall, as well an increase of extreme weather events such as droughts and floods.
The Stern Review on the Economics of Climate Change (2006/2007) highlighted the significant economic implications of climate change. the report stated that “the overall costs and risks of climate change will be equivalent to losing at least 5 per cent of global gross domestic product (gdp) each year, now and forever”, but could rise as high as 20 per cent. the report also stated that the scale of the long-term economic effects of climate change were similar to those associated with the great wars and the economic depression.
2.2 Carbon Dioxide levels (CO2) and other Green House Gases (GHG)the main constituents of the earth’s atmosphere are nitrogen (78 per cent n
2), oxygen (21 per cent
o2), and argon (0.9 per cent ar).the major drivers of climate change are gaseous natural and anthro-
pogenic emissions, generally referred to as greenhouse gases (ghg). these are the constituents of the atmosphere that absorb and re-emit infrared radiation. generally, these are carbon dioxide (Co
2),
methane (nh4), nitrous oxide (n2o), ozone (o
3), water vapour and numerous other gases, which are
present in the air in very minor amounts (e.g. chemical compounds of fluoride, ethane, methane, chloride and Co).
according to the current scientific evidence, Co2 accounts for about 20 per cent of earth’s greenhouse
effect, other long-lived greenhouse gases for about 5 per cent, and water vapour and clouds for 75 per cent. Co
2 is a very persistent constituent. it is removed from the air by natural geological-scale
processes, which take place over many years. hence, Co2 will stay in the atmosphere for decades or
even centuries.
PURPOSE and OVERVIEWPURPOSE and OVERVIEW1 CLIMATE CHANGE and WATER2
PURPOSE and OVERVIEW

CLIMATE CHANGE ADAPTATION for water management in a green economy8
Scientists were interested to know the historical levels of CO2 in the atmosphere. From 1993 to 1996 at the Vostok Station in Antarctica, a 3,623 m deep hole was drilled and the entire ice core, spanning 420,000 years of evolution was retrieved. In the ice core, bubbles of air are entrapped, which can be used for analysis of the atmosphere at that time. Based on the ice-core data it can be shown that the CO2 concentrations for at least the last 400,000 years were fluctuating between 180 and 300 ppm (parts-per-million = 10–6).
The baseline for evaluation and predictions forms the pre-industrial (around 1750) level of CO2 content in the atmosphere, which was approximately 280 ppm. This value is expected to double within the next 100 years to 560 ppm. The annual average for 2011 was already approximately 392 ppm. By 2015 it will reach or exceed a level of 400 ppm with a constant annual increase of approximately 1.7 ppm as measured at Mauna Loa Observatory, Scripps Institution of Oceanography, Hawaii. By volume, the CO2 content accounts only for 0.039 per cent of the earth’s atmosphere and is considered to be a trace gas. It has been shown that changes in these tiny amounts can have a significant influence on the earth’s temperature. Critics often cite these small amounts and therefore doubt the importance of CO2.
However, one can also consider the example of the proven ozone layer-depleting chlorofluorocarbons that were present in the air in parts-per-trillion (ppt = 10–12), which is six orders of magnitude less than the CO2 content in the ambient air. Their effect on the ozone layer is well documented and through the Montreal Protocol the production of these compounds has been phased out since 1989.
Today the main sources of CO2 are combustion of fossil fuels (such as coal, oil, and natural gas), industrial processes, and the use of products, which lead to a constant increase in CO2 levels.
2.2.1 Carbon Dioxide (CO2) and Green House Gases (GHG) and their effect on surface temperature
in most literature on climate change, the increase of Co2 concentrations is commonly translated into
an increase in temperature on the earth’s surface (land and water). Climatologists use energy balance (Watts per square meter at the earth’s surface) to account for solar, greenhouse, aerosol, albedo, and other effects using a single consistent set of numbers.
Simply following the well established radiation calculations and neglecting any other responses of the climate system (such as changes in water vapour, albedo or clouds), a doubling of Co
2 to 560
ppm alone would result in an increase of approximately 3.7 W m-2, or around 1° C of warming. Considering and combining all the other feedbacks in the climate system, the ipCC report (ipCC ar4, 2007) states that the average surface warming following a doubling of Co
2 is “likely to be in the
range 2°C to 4.5°C with a best estimate for about 3°C, and is very unlikely to be less than 1.5°C”. Co
2 emissions are very unevenly distributed throughout the world and also within the region. as
development increases so too do the Co2 emissions and hence surface temperature.
BOX 1
CLIMATE CHANGE and WATER

CLIMATE CHANGE ADAPTATION for water management in a green economy 9
CLIMATE CHANGE and WATER
© C
hrist
ian
Nov
al /
Drea
mst
ime.
com

CLIMATE CHANGE ADAPTATION for water management in a green economy10
Figure 2‑1: Rise of Mean Monthly and Annual Surface Temperature Anomalies (Basis: 1951‑1980)
Source: noaa and naSa data homepages (accessed 02/2012) Co2 emissions and its regional distribution
2.2.2 Carbon Dioxide CO2 emissions and its regional distribution of the world’s total Co
2 emissions of 32.1 billion tons (2008) the highest total is produced by China
with 7.03 billion tons, followed by the United States with 5.46 billion tons, and india and russia with 1.74 billion tons and 1.71 billion tons respectively. however, in terms of the emission rate per capita, the highest levels are reached in the gulf States including Qatar, Kuwait and the United arab emirates (Uae), as well as Brunei darussalam, in Southeast asia, with a range of 49.1 to 25 tons Co
2 per capita,
followed by australia, the US and Canada, which are in the range of 18.6 to 16.3 tons Co2 per capita.
China with 5.3 tons is close to the world average for 2008, which was 4.8 tons of Co2 per capita
(World Bank, databank of Co2 emissions).
asia pacific holds about 61 per cent of the world’s population and produces about 45 per cent of global Co
2 emissions. With rapid economic development across asia pacific, growing at a faster rate
than north america and europe, it is likely that the increasing demand for energy will further drive the Co
2 levels higher.
the Co2 intensity in kg per unit of gdp (US$ using 2000 prices ppp) is a good measure for efficient use
of energy. the world average in 2009 was 0.45kg per unit of gdp (2000 US$). Countries with highly developed industries, which are very energy efficient, have values for Co
2 intensity lower than 0.3 kg
Co2 per unit of gdp (e.g. germany and Japan with 0.33 and 0.32 respectively, while the US has 0.46).
China, the largest economy in asia pacific, reduced its Co2 intensity from 1.20 kg in 1990 to 0.56 kg
Co2 per unit of gdp in 2009 (iea 2011). Shifting towards green growth will ensure that resources are
used more efficiently, reducing the Co2 output with respect to gdp growth, and allowing countries
to reduce their Co2 intensity.
2.2.3 Effects of climate change Climate change has a wide and diverse range of effects on the earth’s environment. these effects are spatially variable and will be experienced in different ways in each location. global warming will lead to warming in most regions of the earth. however, some regions will most likely experience a cooling effect. the warming effect will be further manifested, for instance in the rise of the ocean’s temperature. furthermore, even if some average values, such as annual rainfall, might stay the same in large parts of the world, the spatial and seasonal distribution and the intensity of single events will change significantly. the vast majority of climate change effects are water related.
CLIMATE CHANGE and WATER

CLIMATE CHANGE ADAPTATION for water management in a green economy 11
2.3 Impact of Climate Change on Waterthe primary impacts of climate change on ecosystems and the well being of societies will be water related. Water resources, in particular freshwater, will significantly influence human development in the future through socio-economic and environmental factors (Bates, et al., ipCC, 2008). the basis for all considerations should be the water balance, from the global and continental scale, to basin and sub-basin level. less than 1 per cent of global freshwater resources are available and accessible for human use, servicing society, industry and agriculture. however, the spatial and temporal distribution of the available water varies drastically both seasonally and regionally. the following describes some of the effects of climate change.
Climate change effectsBOX 2
CLIMATE CHANGE and WATER
CLIMATE CHANGE ADAPTATION for water management in a green economy12
Water is the main component in the climate system, from the hydrosphere, cryosphere, atmosphere, to the biosphere. therefore, climate change affects water through many different inter-linked mecha-nisms. the vulnerability of communities to changes in the hydrological cycle, combined with the effects of degradation of water resources through unsustainable development, varies depending on the level of socio-economic development. a rather distressing reality is that the economic impact of climate change due to flooding and droughts is disproportionately borne by the less economically developed strata of society.
2.3.1 Global Water Balanceof the world’s total available water resources of 1.39 billion km3 (equivalent to a cube with a side length of 1,115 km), only about 2.5 per cent is considered freshwater (with a salinity of less than 500 ppm of dissolved salts). of the approximately 35 million km3 (this cube has a side length of 327 km) of fresh water about 70 per cent is frozen water bound in the polar caps, greenland, glaciers and permafrost. most of the remaining 10.6 million km3 of liquid freshwater is stored in the form of groundwater, capillary fringe and soil moisture. the amount of actually available freshwater is rather limited.
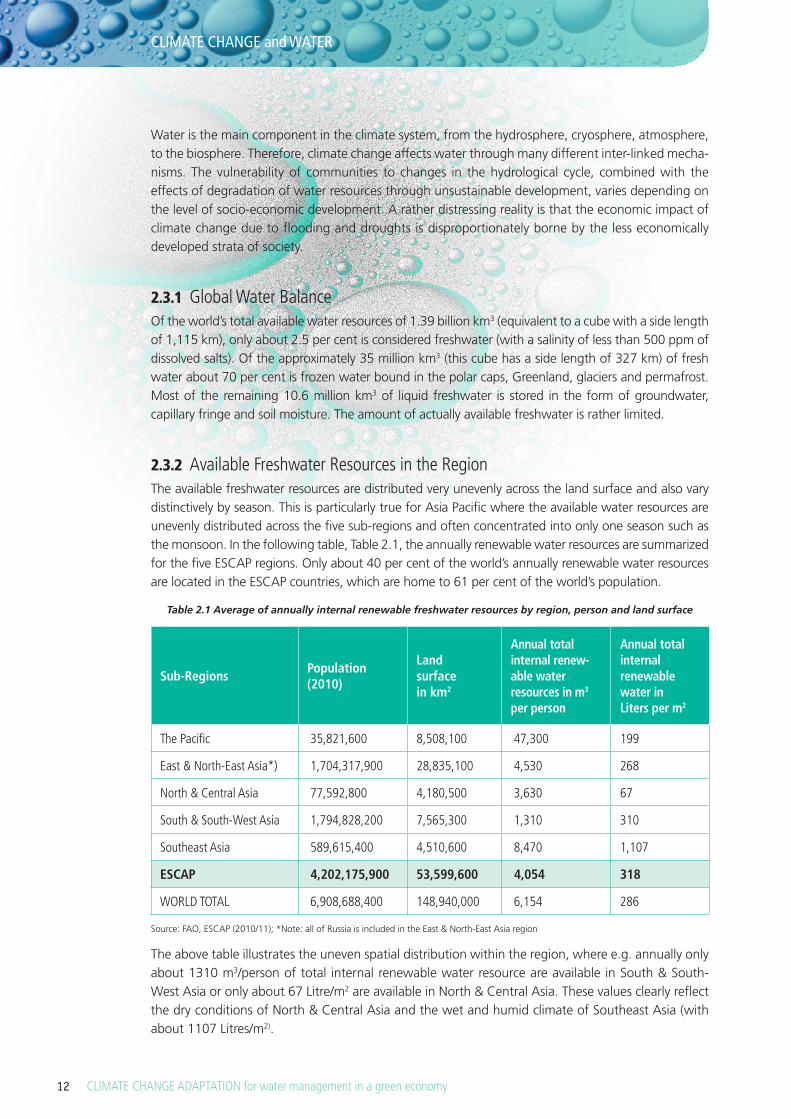
2.3.2 Available Freshwater Resources in the Regionthe available freshwater resources are distributed very unevenly across the land surface and also vary distinctively by season. this is particularly true for asia pacific where the available water resources are unevenly distributed across the five sub-regions and often concentrated into only one season such as the monsoon. in the following table, table 2.1, the annually renewable water resources are summarized for the five eSCap regions. only about 40 per cent of the world’s annually renewable water resources are located in the eSCap countries, which are home to 61 per cent of the world’s population.
Table 2.1 Average of annually internal renewable freshwater resources by region, person and land surface
Sub-RegionsPopulation (2010)
Land surface in km2
Annual total internal renew-able water resources in m3
per person
Annual total internal renewable water in Liters per m2
The Pacific 35,821,600 8,508,100 47,300 199
East & North-East Asia*) 1,704,317,900 28,835,100 4,530 268
North & Central Asia 77,592,800 4,180,500 3,630 67
South & South-West Asia 1,794,828,200 7,565,300 1,310 310
Southeast Asia 589,615,400 4,510,600 8,470 1,107
ESCAP 4,202,175,900 53,599,600 4,054 318
WORLD TOTAL 6,908,688,400 148,940,000 6,154 286
Source: fao, eSCap (2010/11); *note: all of russia is included in the east & north-east asia region
the above table illustrates the uneven spatial distribution within the region, where e.g. annually only about 1310 m3/person of total internal renewable water resource are available in South & South-West asia or only about 67 litre/m2 are available in north & Central asia. these values clearly reflect the dry conditions of north & Central asia and the wet and humid climate of Southeast asia (with about 1107 litres/m2).
CLIMATE CHANGE and WATER
CLIMATE CHANGE ADAPTATION for water management in a green economy 13
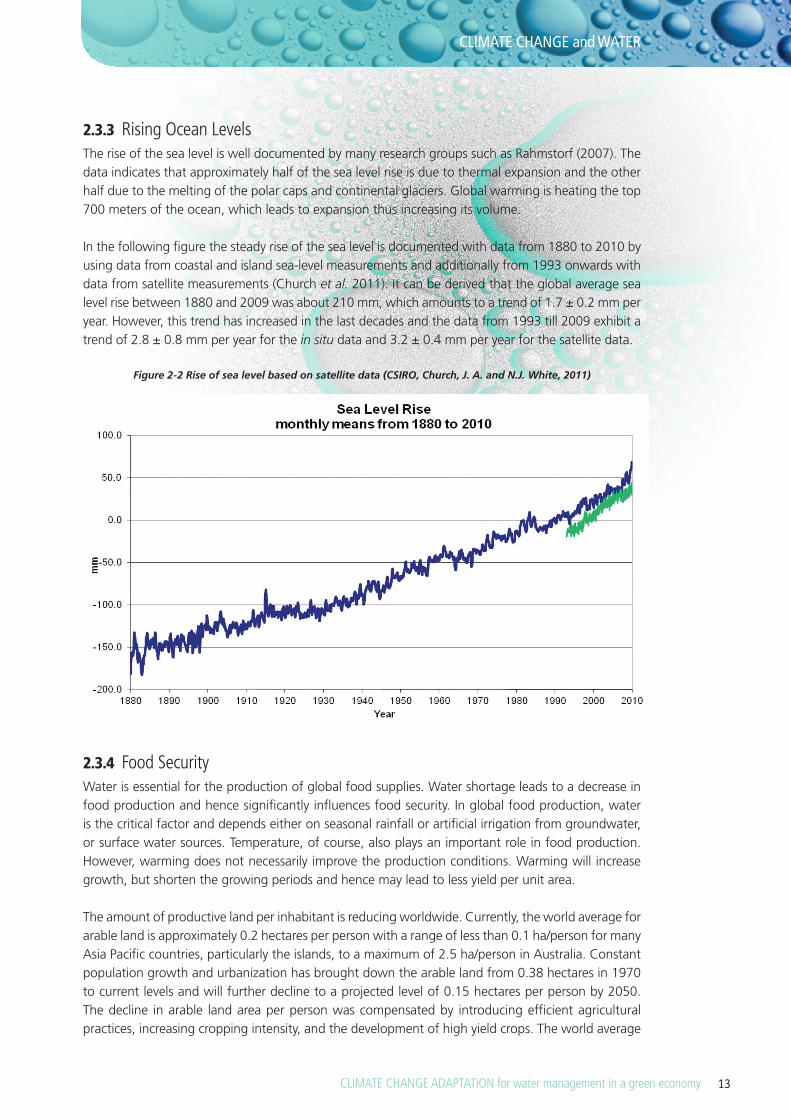
2.3.3 Rising Ocean Levelsthe rise of the sea level is well documented by many research groups such as rahmstorf (2007). the data indicates that approximately half of the sea level rise is due to thermal expansion and the other half due to the melting of the polar caps and continental glaciers. global warming is heating the top 700 meters of the ocean, which leads to expansion thus increasing its volume.
in the following figure the steady rise of the sea level is documented with data from 1880 to 2010 by using data from coastal and island sea-level measurements and additionally from 1993 onwards with data from satellite measurements (Church et al. 2011). it can be derived that the global average sea level rise between 1880 and 2009 was about 210 mm, which amounts to a trend of 1.7 ± 0.2 mm per year. however, this trend has increased in the last decades and the data from 1993 till 2009 exhibit a trend of 2.8 ± 0.8 mm per year for the in situ data and 3.2 ± 0.4 mm per year for the satellite data.
Figure 2‑2 Rise of sea level based on satellite data (CSIRO, Church, J. A. and N.J. White, 2011)
2.3.4 Food SecurityWater is essential for the production of global food supplies. Water shortage leads to a decrease in food production and hence significantly influences food security. in global food production, water is the critical factor and depends either on seasonal rainfall or artificial irrigation from groundwater, or surface water sources. temperature, of course, also plays an important role in food production. however, warming does not necessarily improve the production conditions. Warming will increase growth, but shorten the growing periods and hence may lead to less yield per unit area.
the amount of productive land per inhabitant is reducing worldwide. Currently, the world average for arable land is approximately 0.2 hectares per person with a range of less than 0.1 ha/person for many asia pacific countries, particularly the islands, to a maximum of 2.5 ha/person in australia. Constant population growth and urbanization has brought down the arable land from 0.38 hectares in 1970 to current levels and will further decline to a projected level of 0.15 hectares per person by 2050. the decline in arable land area per person was compensated by introducing efficient agricultural practices, increasing cropping intensity, and the development of high yield crops. the world average
CLIMATE CHANGE and WATER
CLIMATE CHANGE ADAPTATION for water management in a green economy14
grain yields doubled from 1.4 ton/ha in 1960 to 3 ton/ha in 2000. today, yields in the range of 4 to 5 tons/ha are not uncommon. in many parts of the world, an expansion of arable land is feasible. however, in asia pacific the utilization of arable land is already very close to the maximum available.
according to the food and agriculture organization (fao), the average minimum energy requirement per person is about 1800 kcal per person per day. the threshold value of the food energy a person must have to not be undernourished varies according to country depending on the age and sex structure of the population, and is higher where there is a growing share of adults in the population (fao, 2003). also, the composition of meals changes gradually as demand for food strengthens and lifestyles change. this is particularly true for asia pacific, where the intake of meat protein is continuously rising. according to the fao (2010) asia is experiencing the world’s highest growth rates in production and consumption of livestock products such as meat, milk and eggs. however, for the production of meat protein, significant amounts of grain and grass are required, which dramatically increases a person’s water footprint.
approximately 80 per cent of global crops are grown on predominantly rain-fed lands, which produce about 60 per cent of the global food output (fao, 2011). many countries depend heavily on irrigated agriculture. for example in Bangladesh, approximately 60 per cent of rice production comes from irrigated land. increasing demands from agriculture will exacerbate water stress in already water stressed locations, driving the prices for water and food constantly higher.
in many asia pacific countries fish protein is the deciding dietary contributor, providing at least 50 per cent of total protein intake. approximately one billion people (ird, 2010) depend on freshwater fish as their prime source of animal protein. Securing and preserving these fresh and brackish water recourses is essential for the survival of many people.
2.4 Climate Change Mitigation mitigation refers to actions to reduce the intensity of climate change, generally through reducing the emission of ghg. mitigation measures are long term actions to reduce ghg emissions, and are not an immediate cure for climate change (ipCC, 2007). one of the reasons is that the rate of change of natural systems typically takes many years. however, mitigation is the only way to finally reduce and contain the rate of climate change and therefore becomes mandatory for policymakers at all levels of responsibility. effects of mitigation will be beneficial on a global scale.
in principle, mitigation is the preferred measure over adaptation. however, as the impacts of climate change are already being felt and due to the time delay to realize the positive effects of mitigation, short to medium-term policies for adaptive measures are required. mitigation is necessary because sole reliance on adaptation could lead to magnified effects of climate change to which effective continued adap tation becomes extremely costly and will lead to more rapid environmental degradation. While mitigation may slow down climate change, it is unlikely to halt or reverse it, therefore adaptation is also essential.
2.5 Climate Change AdaptationClimate change adaptation strategies specify direct actions and activities, which were either planned or un-planned but result in adjustments to new conditions, risks, and/or hazards. adjustments should be ‘no regrets’, improving people’s resilience to climate change while enhancing development. adaptation deals with the unavoidable impacts of climate change, which the world already faces or is most likely to face in the near future. it offers the opportunity to adjust socioeconomic activities, in particular
CLIMATE CHANGE and WATER

CLIMATE CHANGE ADAPTATION for water management in a green economy 15
vulnerable sectors, and to support sustainable development. the nature and severity of the adverse impacts of climate change depend not only on the impact, but also on the vulnerability of the community. adaptation, as a form of disaster risk management, focuses on reducing the vulnerability and level of exposure of the population to these risks, which often can only be managed and not eliminated.
the array of potential adaptive responses range from purely technical (e.g. water infrastructure), through managerial (e.g. farming practices) and policy oriented (e.g. planning codes) to behavioural (e.g. choices of food to travel and recreation) (ipCC, 2007). adaptation strategies generally follow bottom-up strategies (from village to provincial level), but also need to focus on top-down strategies to ensure that implementations are compatible, not counterproductive, and follow a coherent set of rules and regulations. adap tation plan ning will require the integration of policy and economic instruments, infras-tructure and behav ioural changes, and therefore com-prise both tangibles and intan gible com ponents. adap -tation strategies can range from estab lishing a forma lized planning process, revision of water acts, better and more consistent hydro-meteorological data acqui sition, including the creation of platforms to access these data, enhanced capacity build ing to raise awareness for climate change adap tation, and estab lishing inundation and vul-nera bility maps on a basin and/or local level. Signific ant policy and invest ment changes are required for climate change adapt ation for a sustainable water future.
Based on scientific evidence and considering the topics above, an adaptation program for action has to be estab-lished on a national level, which focuses on imple men-ting com munity oriented participatory processes. proper funding for implementation should also be included in the action plan. it is essential that water management be given proper attention in any national adaptation plan.
to ensure a countrywide coordinated and coherent approach it is recommended that the national adaptation program for action (napa) has a strong emphasis on short-term actions but also identifies long-term strategies. Coordinated adaptation actions are introduced on a local to national scale and can be effective immediately after implementation. however, transboundary aspects from ground-water to pollution, to droughts and floods, should also be part of the plan.
there are of course limits to adaptation measures due to specific geographic and climate risk factors, institutional, societal, behavioural, religious and political limitations, and certainly financial constraints. it is important to realize that in many areas of the world, large groups of individuals such as minorities, urban poor, subsistence farmers and women, do not have the means to adapt to climate change. adaptation strategies are particularly effective if the most vulnerable populations and environments are targeted first.
Some of the most effective adaptation strategies will be outlined in the following chapters. the chosen topics represent a selected cross-section of various issues and are therefore by no means exhaustive. it has been recognized that integrated Water resources management provides the main tools for adaptation and will therefore be treated in some detail.
BOX 3
Principles for Climate Change Adaptation
CLIMATE CHANGE and WATER
• Mainstream adaptations within the broader development context.
• Strengthen governance and improve water management.
• Improve and share knowledge and information on climate and adaptation measures, and invest in data collection.
• Build long-term resilience through stronger institutions, and invest in infrastructure and in well functioning ecosystems.
• Invest in cost-effective and adaptive water management as well as technology transfer.
• Leverage additional funds through both increased national budgetary allocations and innovative funding mechanisms for adaptation in water management.(UnWater, 2010)

CLIMATE CHANGE ADAPTATION for water management in a green economy
CLIMATE CHANGE: How it is Affecting the Region
16
Climate change is often presented as a harbinger of multiple impacts on environment, societies, and livelihoods in the coming decades. according to the intergovernmental panel on Climate Change (ipCC) assessment report 4, the resilience of many systems – ecological, economic, and social – is likely to be exceeded over the century by an unprecedented combination of effects linked to climate change, including sea level rise, droughts, floods, and ocean acidification, among others. these effects will be exacerbated by an increased depletion of resources, and threats to food security and health.
in addition, drivers of development in asia and the pacific will have to cope with the socio-economic challenges in the region, especially the issue of urbanization. With 10 of the 20 most populated cities of the world located in asia and the highest urban growth rate in the world, the region is particularly prone to the growth impediments associated with densely populated areas in urban settings. these include unreliability of water supply in both quality and quantity, pollution, insalubrities, higher vulnerability to external shocks (namely natural disasters), and subsequent health issues.
as the threat of irreversible changes looms increasingly on fragile ecosystems, hydrological cycles and human activities, a general description of how climate change will affect populations and the environment in the asia pacific is subsequently presented. the following analysis focuses on four distinct sub-regions of asia and the pacific, chosen for their environmental and societal homogeneity reflecting the natural flow of water. reflecting the flow of water from the mountains to the valleys, then the oceans, the mountainous communities in the himalaya-hindu-Kush ranges, riparian populations in asia to the populations in coastal areas in South, east and Southeast asia, and small islands in the pacific and the indian ocean will be considered. in all of these sub-regions, growing urbanization is a recurrent phenomenon, further stressing water supply and partially fuelling the mechanics of climate change.
3.1 Communities in Mountain Valleysthe himalaya-hindu-Kush region is of crucial importance for water cycles in asia. the effects of global warming and climate change on glaciers and snow packs will have cascading repercussions on downstream communities, representing more than one billion people, who rely on seasonal meltdowns for water supply. the himalaya-hindu-Kush region represents the third largest ice-mass in the world, after the arctic and antarctic regions, with about 15,000 glaciers storing approximately 12,000 km3 of freshwater (Barnett et al, 2005 and igSd, 2010).
3.1.1 Impacts of climate change on glaciersfor the past 50 years, global warming has been particularly affecting the himalayas, with a rise in temperature approximately three times higher than the global rate, at 0.3˚ C per decade. eighty-two per cent of the glaciers on the tibetan plateau have experienced reduction since the 1960s, and in the last decade 10 per cent of its permafrost suffered degradation (Qiu, 2008). the losses are expec-ted to accelerate during this century, with two-thirds of the glaciers threatened with extinction by 2050 (Qiu, 2008).
CLIMATE CHANGE: How it is Affecting the Region3
CLIMATE CHANGE: How it is Affecting the Region

CLIMATE CHANGE ADAPTATION for water management in a green economy 17
Figure 3‑1 Variations in extreme temperature anomalies observed in Central Himalayas, 1988‑2007
(Shekhar et al, 2010)
the main consequences of glacial meltdowns are limited water availability and subsequently reduced hydropower potential in the middle run, and changes in water flows in the plains downstream. the ipCC estimates that runoffs will increase by 10 to 40 per cent in east and Southeast asia by 2050, and decrease by 10 to 30 per cent in some dry regions at mid-latitudes. for communities living in mountains, increased meltdowns and more frequent thaws will put pressure on water security and threaten existing infrastructures. already, on the northern slopes of the himalayas, scientists have recorded 20 outburst floods since the 1960s (Qiu, 2008). however, as increased runoffs in parts of the himalayan range are synonymous with a regression of glaciers, stream-flows could abruptly decrease in some years or decades following an inevitable shortage in water reserves. in Central asia, decreased runoffs have already been observed, along with an extension of drought-affected areas.
Table 3‑1 Basin‑wise loss in glacier area in Chenab, Parbati and Baspa basins (Kulkarni et al 2007)
Glacier area (sq. km) Volume (cubic km)
Basin 1962 2001-04 Loss (%) 1962 2001-04 Loss(%)
Chenab 1414 1110 21 157.6 105.03 33.3
Parbati 488 379 22 58.5 43.0 26.5
Baspa 173 140 19 19.1 14.7 23.0
Total 2077 1628 21 235.2 162.73 30.8
CLIMATE CHANGE: How it is Affecting the Region

CLIMATE CHANGE ADAPTATION for water management in a green economy18
higher temperatures will also affect the thermal and biological characteristics of watersheds in the himalayan range, with potential impacts on local biodiversity and global water quality. global warming will furthermore create a shift in rainfall patterns, with snowfalls and reserve meltdowns occurring earlier, leading to peak river runoffs earlier in the spring while demand is higher in summer and autumn. Barnett et al. (2005) noted a “regression of the maximum spring stream-flow period in the annual cycle by about 30 days and an increase in glacier melt runoff by 33-38 per cent”.
glacial meltdowns have also been observed in Central asia, as pointed in the tajikistan 2002 State of the environment report (Unep, 2002). retreats of glaciers are also a reality in the pamir and Kunlun mountain ranges, disrupting the hydrological cycle and globally decreasing the quantity of freshwater available downstream for agricultural purposes. in the pamir range of Central asia, ososkova et al. (2000) estimated that 20 per cent of the glaciers had melted between 1957 and 1980 alone, due to changes in temperatures and precipitations.
3.1.2 Socio-economic and environmental consequencesfrom an economic perspective, glacial meltdowns in the himalayas constitute a direct threat for the dams and levees involved in hydroelectric production and protection from outburst floods. transport infrastructures, such as the Qinghai-tibet railway, are also directly threatened by degradations of the permafrost (Qiu, 2008).
67%the proportion of
Himalayan glaciersthat could disappear
by 2050 (Qiu, 2008)
Why global warming in the Himalayas might accelerate
Temperature has increased at a significantly higher rate in the Himalayan
range over the past decades and this trend might accelerate in the years to come.
Scientists have provided several explanations for this particularity, one of them
being the effect of “black-carbon” emissions. This term refers to soot emissions
resulting from local human activities like cooking with traditional biofuels. Black
soot covers glaciers and snow, reducing their albedo (reflection coefficient)
and hence contributing to local heating of the soil and the air. Ramanathan
and Carmichael (2008) estimated that black carbon accounts for half of the
solar heating of the air and represents the second-largest cause of atmospheric
warming in this region after CO2 emissions.
Another factor exacerbating global warming in the Himalayas is the potential
threat of a thaw of permafrost. These soils would then release significant
quantities of stored carbon, further intensifying the warming phenomenon.
CLIMATE CHANGE: How it is Affecting the Region
*
CLIMATE CHANGE ADAPTATION for water management in a green economy 19
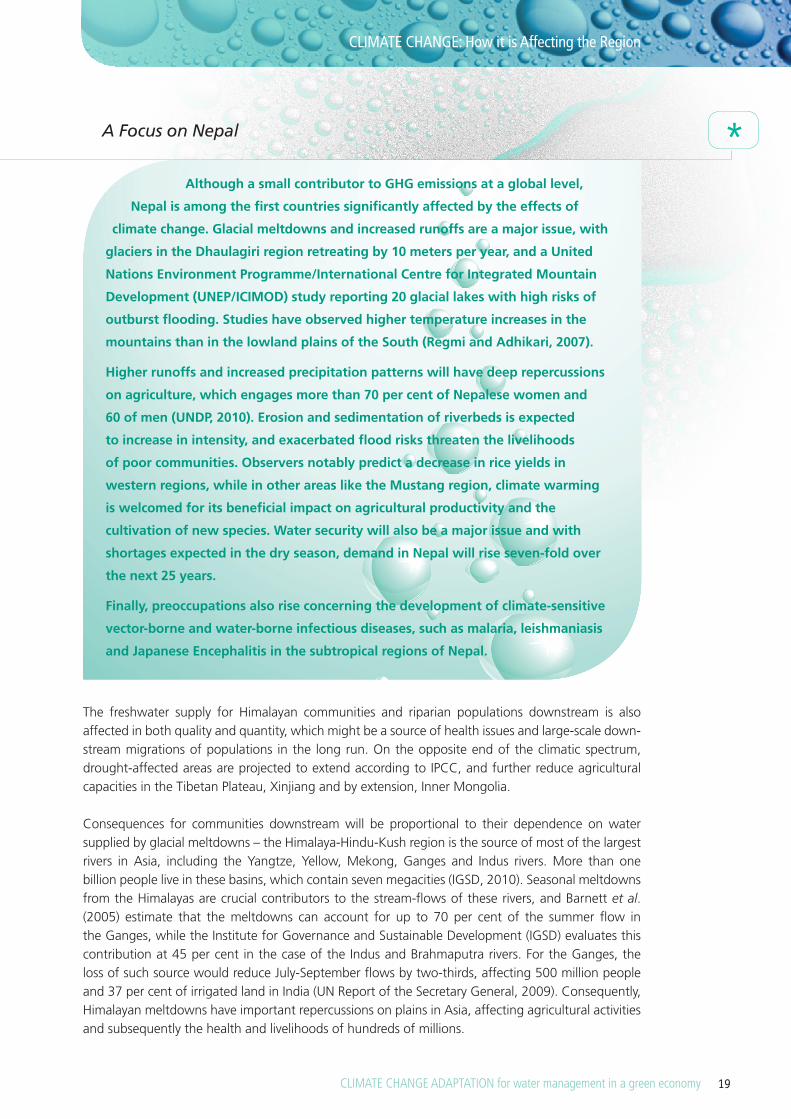
the freshwater supply for himalayan communities and riparian populations downstream is also affected in both quality and quantity, which might be a source of health issues and large-scale down-stream migrations of populations in the long run. on the opposite end of the climatic spectrum, drought-affected areas are projected to extend according to ipCC, and further reduce agricultural capa cities in the tibetan plateau, Xinjiang and by extension, inner mongolia.
Consequences for communities downstream will be proportional to their dependence on water supplied by glacial meltdowns – the himalaya-hindu-Kush region is the source of most of the largest rivers in asia, including the yangtze, yellow, mekong, ganges and indus rivers. more than one billion people live in these basins, which contain seven megacities (igSd, 2010). Seasonal meltdowns from the himalayas are crucial contributors to the stream-flows of these rivers, and Barnett et al. (2005) estimate that the meltdowns can account for up to 70 per cent of the summer flow in the ganges, while the institute for governance and Sustainable development (igSd) evaluates this contri bution at 45 per cent in the case of the indus and Brahmaputra rivers. for the ganges, the loss of such source would reduce July-September flows by two-thirds, affecting 500 million people and 37 per cent of irrigated land in india (Un report of the Secretary general, 2009). Consequently, himalayan meltdowns have important repercussions on plains in asia, affecting agricultural activities and subsequently the health and livelihoods of hundreds of millions.
A Focus on Nepal
Although a small contributor to GHG emissions at a global level,
Nepal is among the first countries significantly affected by the effects of
climate change. Glacial meltdowns and increased runoffs are a major issue, with
glaciers in the Dhaulagiri region retreating by 10 meters per year, and a United
Nations Environment Programme/International Centre for Integrated Mountain
Development (UNEP/ICIMOD) study reporting 20 glacial lakes with high risks of
outburst flooding. Studies have observed higher temperature increases in the
mountains than in the lowland plains of the South (Regmi and Adhikari, 2007).
Higher runoffs and increased precipitation patterns will have deep repercussions
on agriculture, which engages more than 70 per cent of Nepalese women and
60 of men (UNDP, 2010). Erosion and sedimentation of riverbeds is expected
to increase in intensity, and exacerbated flood risks threaten the livelihoods
of poor communities. Observers notably predict a decrease in rice yields in
western regions, while in other areas like the Mustang region, climate warming
is welcomed for its beneficial impact on agricultural productivity and the
cultivation of new species. Water security will also be a major issue and with
shortages expected in the dry season, demand in Nepal will rise seven-fold over
the next 25 years.
Finally, preoccupations also rise concerning the development of climate-sensitive
vector-borne and water-borne infectious diseases, such as malaria, leishmaniasis
and Japanese Encephalitis in the subtropical regions of Nepal.
*
CLIMATE CHANGE: How it is Affecting the Region

CLIMATE CHANGE ADAPTATION for water management in a green economy20
in Central asia, the pamir mountains host the main sources of the two rivers flowing in the aral Sea, the Syr darya and amur darya (although the latter has been diverted for irrigation purposes). glacial meltdowns upstream thus affect communities downstream, with serious impacts on the local productions of cotton and wheat.
3.2 Riparian population
3.2.1 Effects of climate change in river plainsthe impacts of climate change in river plains can be partially accounted for by the effects of global warming in mountainous regions, and the subsequent changes in river runoffs. With more than a billion people in asia depending directly or indirectly on water resources supplied by the himalaya-hindu-Kush range, disruption in seasonal cycles bear major repercussions on the livelihoods of farmers living in river plains. deep hydrological changes in the plains of Central asia should also follow glacial melt downs in the pamir and Kunlun mountain ranges. the expected increase in South and Southeast asian water flows in the short run is likely to be tempered by the increased variability of rainfalls in the region, which will modify the magnitude of seasonal effects (ipCC, 2007). ipCC predicts that by 2050 the availability of freshwater in asia should globally decrease, particularly in river basins.
the expected hydrological disruptions will be accompanied by a global rise in temperatures. ericksen et al. (2011) estimate that despite minor temperature increases in cold regions of South China that might expand local crop sustainability, the rise in temperature will have an overall negative effect on food productivity globally. according to their study, significant areas in north india, China, and the greater mekong sub-region will experience a rise in average annual maximum temperature from under to over 30˚ C during the primary growing season, this being the maximum tolerable temp-er a ture for crops such as beans. these regions will, in addition, see a reduction of more than 5 per cent in their length of growing period (lgp), which is used as an indicator for the average number of growing days per year.
3.2.2 Consequences for riparian societiesmodifications in hydrological cycles and a global elevation in temperature will have significant impacts on agriculture in South and Southeast asia. the indus river, for instance, is the source of one of the largest irrigation networks in the world, with approximately 90 per cent of pakistan’s crop production grown under irrigation coming from dams along the indus (Un report of the Secretary general, 2009). South asia is particularly exposed to the effects of climate change, with high sensitivity and low coping capacity (figure 3-2).
Figure 3‑2 Vulnerability to climate change for tropical regions (Ericksen et al., 2011)
A focus on Nepal
Although a small contributor to GHG emissions at a global level, Nepal is among the first countries significantly affected by the effects of climate change. Glacial meltdowns and increased runoffs are a major issue, with glaciers in the Dhaulagiri region retreating by 10 meters per year, and a United Nations Environment Programme/International Centre for Integrated Mountain Development (UNEP/ICIMOD) study reporting 20 glacial lakes with high risks of outburst flooding. Studies have observed higher temperature increases in the mountains than in the lowland plains of the South (Regmi and Adhikari, 2007).
Higher runoffs and increased precipitation patterns will have deep repercussions on agriculture, which engages more than 70 percent of Nepalese women and 60 of men (UNDP, 2010). Erosion and sedimentation of riverbeds is expected to increase in intensity, and exacerbated flood risks threaten the livelihoods of poor communities. Observers notably predict a decrease in rice yields in western
CLIMATE CHANGE: How it is Affecting the Region

CLIMATE CHANGE ADAPTATION for water management in a green economy 21
the United nations development programme (Undp) estimated that the rise in temperatures and additional pressures on water supplies could lead to a 30 per cent decrease in crop yields in Central and South asia by 2050 (Undp, 2006). furthermore, the institute for governance and Sustainable develop ment (igSd) associated a 1˚ C increase with a 6 to 10 per cent rise in agricultural water demand, leading them to the conclusion that cereal production in South asia would decrease by at least 4 to 10 per cent by the end of the century, accounting for increased production capacities.
farmers in asia will therefore have to face flooding risks in the short run due to increased runoffs and exacerbated rainfall patterns in the wet season, while the dry season will amplify the risks of water shortages. in the longer run, reduction in stream-flows and higher demand for water due to global increases in temperatures will increase current stresses on water supply.
Such consequences of climate change are particularly dire in a region where 70 per cent of South asians live in rural areas, which account for 75 per cent of the poor (World Bank, 2008). Communities at the bottom of the social ladder will therefore be among the first to be affected by these changes, particularly because of their low adaptive capacity and access to finance.
Vulnerability and adaptation to climate change in Bangladesh
Eighty per cent of land in Bangladesh consists of floodplains,
sustaining 75 per cent of the population relying on the Ganges, Brahmaputra
and Meghna rivers, among others, for their agrarian activities (Brouwer et al.,
2007). Floods regularly affect the country, inundating up to 60 per cent of the
territory and putting the livelihoods of millions at stake. It is anticipated that
there will be an increase in the magnitude and frequency of floods due to climate
change, therefore prevention and adaptation to these events is a crucial issue for
the population.
In a study led by Brouwer et al. in 2007, a large-scale household survey in
Southeast Bangladesh was carried out to assess the levels of preparation and
coping capacities of households without flood protection. They found out
that poorer dwellings face higher exposure to flooding risks, and that these
populations were “the least well prepared, both in terms of household-level ex
ante preparedness and community-level ex post flood relief”.
These findings raise the issue of adaptation and mitigation for countries directly
threatened by climate change. Since water and food security are also threatened,
the vulnerability of the less wealthy increases, in both urban and rural areas.
CLIMATE CHANGE: How it is Affecting the Region
*
CLIMATE CHANGE ADAPTATION for water management in a green economy22
3.3 Dwellers in coastal areas
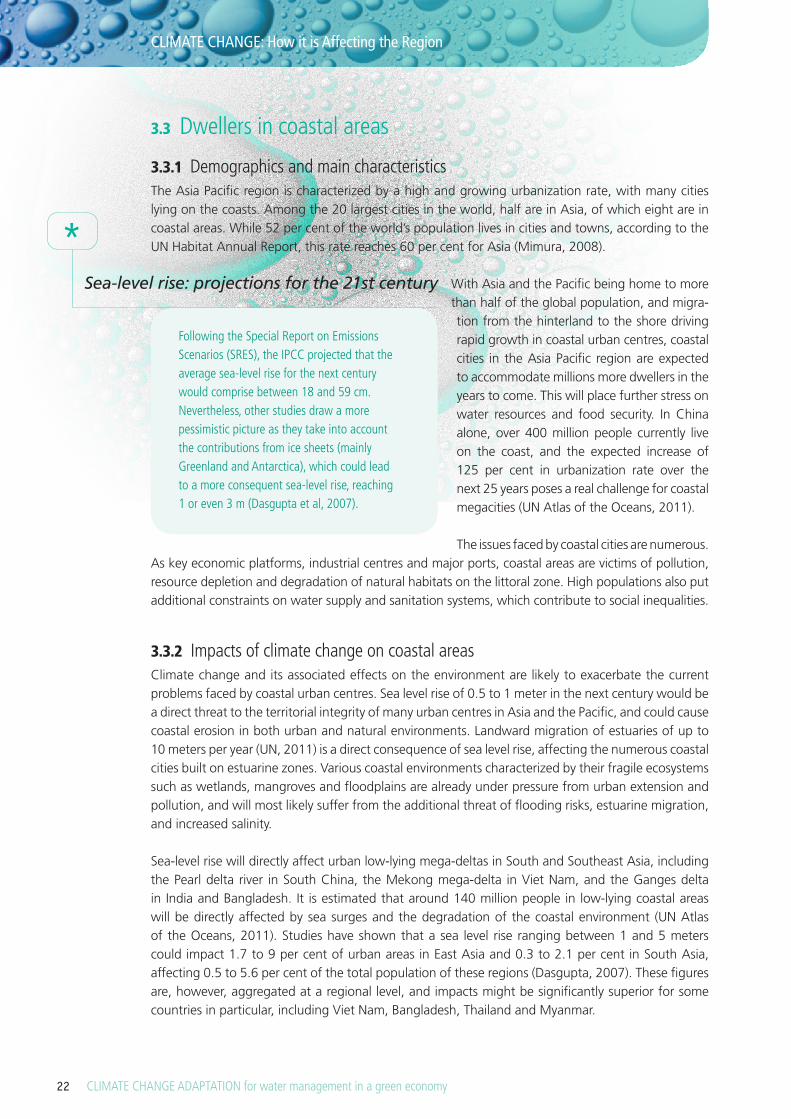
3.3.1 Demographics and main characteristicsthe asia pacific region is characterized by a high and growing urbanization rate, with many cities lying on the coasts. among the 20 largest cities in the world, half are in asia, of which eight are in coastal areas. While 52 per cent of the world’s population lives in cities and towns, according to the Un habitat annual report, this rate reaches 60 per cent for asia (mimura, 2008).
With asia and the pacific being home to more than half of the global population, and migra-tion from the hinterland to the shore driving rapid growth in coastal urban centres, coastal cities in the asia pacific region are expected to accommodate millions more dwellers in the years to come. this will place further stress on water resources and food security. in China alone, over 400 million people currently live on the coast, and the expected increase of 125 per cent in urbanization rate over the next 25 years poses a real challenge for coastal megacities (Un atlas of the oceans, 2011).
the issues faced by coastal cities are numerous. as key economic platforms, industrial centres and major ports, coastal areas are victims of pollution, resource depletion and degradation of natural habitats on the littoral zone. high populations also put additional constraints on water supply and sanitation systems, which contribute to social inequalities.
3.3.2 Impacts of climate change on coastal areasClimate change and its associated effects on the environment are likely to exacerbate the current problems faced by coastal urban centres. Sea level rise of 0.5 to 1 meter in the next century would be a direct threat to the territorial integrity of many urban centres in asia and the pacific, and could cause coastal erosion in both urban and natural environments. landward migration of estuaries of up to 10 meters per year (Un, 2011) is a direct consequence of sea level rise, affecting the numerous coastal cities built on estuarine zones. Various coastal environments characterized by their fragile ecosystems such as wetlands, mangroves and floodplains are already under pressure from urban extension and pollution, and will most likely suffer from the additional threat of flooding risks, estuarine migration, and increased salinity.
Sea-level rise will directly affect urban low-lying mega-deltas in South and Southeast asia, including the pearl delta river in South China, the mekong mega-delta in Viet nam, and the ganges delta in india and Bangladesh. it is estimated that around 140 million people in low-lying coastal areas will be directly affected by sea surges and the degradation of the coastal environment (Un atlas of the oceans, 2011). Studies have shown that a sea level rise ranging between 1 and 5 meters could impact 1.7 to 9 per cent of urban areas in east asia and 0.3 to 2.1 per cent in South asia, affecting 0.5 to 5.6 per cent of the total population of these regions (dasgupta, 2007). these figures are, however, aggregated at a regional level, and impacts might be significantly superior for some countries in particular, including Viet nam, Bangladesh, thailand and myanmar.
Following the Special Report on Emissions Scenarios (SRES), the IPCC projected that the average sea-level rise for the next century would comprise between 18 and 59 cm. Nevertheless, other studies draw a more pessimistic picture as they take into account the contributions from ice sheets (mainly Greenland and Antarctica), which could lead to a more consequent sea-level rise, reaching 1 or even 3 m (Dasgupta et al, 2007).
Sea-level rise: projections for the 21st century
CLIMATE CHANGE: How it is Affecting the Region
*

CLIMATE CHANGE ADAPTATION for water management in a green economy 23
Table 3‑2 Regional exposure for three different sea‑level rise scenarios (Anthoff, 2006)
table 3.2 shows that while Central asia is among the most territorially threatened regions of asia, the impacted population lies at a significant lower level than South or east asia, where coastal densities are more important. in terms of costs and affected population, South and east asia are particularly vulnerable.
Figure 3‑3 Country area impacted in Asia following different sea‑level rise scenarios (Dasgupta et al., 2007)
3.3.3 Socio-economic and environmental consequencesas demonstrated by the tragic aftermath of the 2004 indian ocean tsunami, the level of preparedness of coastal countries to storm surges and related natural disasters is relatively low. human development and associated constraints exacerbate the increased impacts of storms and sea surges predicted by the ipCC. this poses additional threats on the most vulnerable communities and economic activities along the coast, which intricately depend on coastal resources for their livelihood and development.
Exposure by factor and elevation according to three scenariosVolume (cubic km)
Threatened land area (103 sq.km)
Population (millions)GDP PPP
(USD billions)
West Asia 16.3 37.2 59.4 1.1 2.6 4.4 12.9 26.6 43.8
Central Asia 314.4 658.2 1112.9 0.8 2.1 3.8 5.3 13.6 25.7
South Asia 404.1 603.6 812.4 59.5 102.6 150.9 175.1 281.8 404.4
East Asia 140.1 249.2 357.2 46.1 92.2 135.3 352.7 695.0 1004.0
Australasia 135.4 197.9 267.4 2.2 2.9 3.8 43.9 58.3 77.1
CLIMATE CHANGE: How it is Affecting the Region

CLIMATE CHANGE ADAPTATION for water management in a green economy24
the main drivers of urbanization along coasts, including fisheries and tourism, will be among the first activities affected by sea level rises and storm surges. overall, protection and adaptation costs will increase, and constitute an additional financial constraint for coastal cities. negative impacts on
the survival of mangroves, marshes and other ecosystems will also affect resources and, in the longer term, agricultural activities. food security will also be in
peril due to extreme weather events such as droughts and floods as well as changes in rainfall patterns and pressures on freshwater supplies.
exposed populations in asia and the pacific will also have to be relocated, thus putting further pressure on
already constrained urban centres. While east asia should observe the greatest relative impacts within asia in terms of population affected, cities like Chennai, dhaka, Karachi or mumbai, are elevated a few meters above sea level and will
also be particularly vulnerable to climate change given their high poverty rates and low adaptive capacity.
Figure 3‑4 Population exposed in South, East and Southeast Asia
for a 5m sea‑level rise (Dasgupta et al, 2007)
3.4 An Islander’s Perspective
3.4.1 Demographics and main characteristicsthe effects of climate change are particularly observable in islands of asia and the pacific, which are among the first victims of sea level rise and increased frequency of extreme weather events. direct or indirect climatic impacts are all the more preoccupying as most small islands are characterized by low diversification of economies and limited adaptive capacity (Unep, 2007).
the following analysis will include members of the alliance of Small island States (aoSiS) in asia and the pacific, along with french polynesia, new Caledonia, northern mariana islands and timor-leste. together, these states and territories constitute the group of Small island developing States (SidS) in the asia pacific region, recognized as a distinct group of developing nations at the United nations Conference on environment and development in 1992. other islands such as the philippines, indonesia or Sri lanka, among others, are of high importance in terms of area and population but typically share most of the characteristics presented below.
Small islands in the region are characterized by low populations, with a total population of only 16 million people approximately, compared to 4.2 billion in asia and the pacific. the aggregated demographic growth rate is similar to the one in asia (1.02 per cent per year, against 1.05 per cent for asia) with significant disparities, with values ranging from -2.6 per cent per year in niue to 3.35 per cent in timor-leste (UneSCap population statistics, 2010). a majority of the population live in coastal areas with more than 50 per cent of pacific islanders living within 1.5 kilometres of the shore.
3.4.2 Impacts of climate change on small islandsa major threat for small low-lying islands is associated with sea level rise. in addition to the exacerbated erosion of coastal zones, a global rise in sea level, coupled with increased salinity in shallower tropical and subtropical waters, will be likely to constrain inland freshwater supplies through infiltrations and higher salinity. the elevated frequency of drought and heavy rainfall events will put further stress on
80%the proportion of
land in the Maldives under one meter above sea level
CLIMATE CHANGE: How it is Affecting the Region

CLIMATE CHANGE ADAPTATION for water management in a green economy 25
freshwater supply, to the point that by 2050 the water resources of some small islands might not meet predicted demand during low-rainfall seasons.
Below the surface of oceans, the acidification of shallow waters, coupled with oceanic thermal increase, is not without consequences on marine ecosystems. in the next decade, scientists expect significant loss of biodiversity in sites such as the australian great Barrier reef where, according to the ipCC, coral bleaching is a blatant illustration of this deterioration of marine biodiversity. Conversely, warmer temperatures can favour the invasion of by non-native species of both marine and terrestrial environments, exacerbating changes in local ecosystems.
With more than half of the capital cities of SidS lying at one to three meters above the sea, the situation is more than preoccupying for many small islands. in addition to the threats on populations, sea level rise will affect transportation and energy infrastructures built on the coast. Storms and associated floods also bear high damage potential, magnified by the low resilience and adaptive capacities of small islands. the limited diversification of their economies makes them particularly vulnerable, all the more as the tourism industry, on which many of them rely, might slow down because of coastal erosion and coral bleaching.
3.4.3 Socio-economic consequencesthe livelihoods of millions of island dwellers are directly threatened by coastal erosion, increased risks of inundation, and saline intrusion in underground freshwater supplies. health problems may also arise, due to warmer temperatures, which encourage the survival of pathogen agents and their associated vectors. Where coastal areas are threatened by sea surges, relocation is not always an option in small islands because of the absence of hinterland, thus opening the problem of environmental migrants.
The Carteret Islanders: world’s first environmental refugees?
Hundreds of kilometers east from Papua New Guinea, the Carteret Islands
might be home to the first environmental migrants, forced to flee their original
habitat because of uninhabitable conditions. These low-lying islands are indeed
under progressive submersion as the level of the Pacific Ocean rises inexorably,
with total submersion expected by 2015. Despite arguments pinpointing the
misuse of coastal resources and their non-protection, it is believed that sea-
level rise is the main cause of this submersion. In 2003, the Papua New Guinean
government authorized the evacuation of the whole population. A total of
approximately 1,600 inhabitants are expected to leave the atoll before 2015,
and be relocated in neighboring Bougainville.
This case might happen again in the years to come, as many low-lying islands
such as the Maldives are particularly exposed to sea surges. This phenomenon
will also affect continental coasts and low-lying deltas. In Bangladesh, Viet Nam
and China, more than a hundred million people could be directly or indirectly
affected according to the UN Atlas of the Ocean (2011).
CLIMATE CHANGE: How it is Affecting the Region
*

CLIMATE CHANGE ADAPTATION for water management in a green economy26
3.4.4 Health and Security across the regionin the 2009 report of the Un Secretary general to the general assembly, climate change was reported to have problematic repercussions on security in asia and the pacific. global warming was reported to exacerbate territorial tensions and international frictions over issues such as transboundary migration and competition over natural resources. for instance, 30 per cent of underground water resources of the Central asian region of the aral Sea are shared resources (ososkova et al., 2000).
the effects of climate change on human health are also likely to be significant, with more frequent heat waves and other extreme weather events encouraging higher prevalence of cardiovascular and respiratory illnesses. el niño, a climate pattern regularly occurring through the tropical pacific ocean and likely to be affected by climate change in terms of frequency and magnitude, has been recognized as a significant determinant of dengue and cholera epidemics that respectively affected thailand and Bangladesh from 1986 to 1992 (patz et al., 2005). Changes in air and water temperatures will also alter the reproduction and survival conditions of pathogen agents and their vector organisms, such as the ross river virus in australia (patz et al., 2005).
Figure 3‑5 World Health Organization estimated mortality (per million people) attributable to
climate change by the year 2000 (Patz, 2005)
the same study estimated that for most of asia and the pacific, climate change attributable diseases were responsible for nearly three million disability adjusted life years (dalys) and 85,000 deaths in 2000, almost all observed in South asia. the main cause of these health issues is malnutrition, linked to the absence of food and water security in areas where freshwater supply for irrigation and household consumption became insufficient to meet basic needs of households.
in Central north-eastern asia, health impacts are more moderated but still significant, with 10,000 dalys attributable to climate change in 2000 (patz et al., 2005). While for South asia the main cause of diseases was found in extended malnutrition, for Central and north-eastern asia diarrhea and floods are the quasi-exclusive causes of disease.
as far as health is concerned, sea level rise will cause saline intrusion in freshwater aquifers, thus reducing available freshwater supply, and limiting the optimal functioning of sewerage systems. Water is a key determinant of human health, and deterioration of its quality due to changes in hydrological cycles and mismanagement can be the direct cause of sickness and disease.
CLIMATE CHANGE: How it is Affecting the Region

CLIMATE CHANGE ADAPTATION for water management in a green economy 27
3.5 Asia Pacific Geographical Complexities
the diversity of the region highlights the complexity of the way changes in hydrological cycles and climate changes will affect the entire region. each ecosystem has its own uniqueness in terms of demographics, economics and environment that supports a distinct framework for the analysis of climatic disruptions. moreover, as stressed in this chapter, the issue of urbanization and demographic growth represents an essential element of the equation, as its effects, which are exacerbated by climate change and changing water security, would cause threats to water resources even without the climatic problem. Consequently, future proposals associated with climate change should not leave aside the problems associated with urbanization and constraints on water supply and disposal. an appropriate array of solutions will have to incorporate guidelines for action towards greener management of resources to reinforce climate change adaptation and reduce the global water footprint. With more than one facet to the problem, these proposals will have to be context-specific and adapted to the environmental and socio-economic characteristics of each ecosystem.
CLIMATE CHANGE: How it is Affecting the Region
© W
arre
n Fi
eld

CLIMATE CHANGE ADAPTATION for water management in a green economy
GREEN GROWTH and ADAPTATION
28
4.1 Introduction to Green Growth & the Ecological Based Approach
green growth fosters economic growth but within the limiting ecological carrying capacity. as economic growth across asia pacific is still required, however, the region must find innovative ways to reduce the environmental impacts of growth. green growth represents a strategy for making economic growth and environmental sustainability compatible, protecting the environmental base of future socio-economic activities.
the green growth concept is defined as “environmentally-sustainable economic progress that fosters low carbon, socially inclusive development” (Crawford et al., 2010). green growth, therefore, represents a policy focus that contributes to sustainable development in asia and the pacific, focusing on economic and ecological aspects of sustainable development. With this in mind, green growth is described as an ecology-based approach to economic growth. greening the economy requires an interdisciplinary approach and innovative solutions, of which the water sector is a key player. adaptation programs should be ‘no regret’ measures that deliver improvements in resilience while also having positive development outcomes. green growth strategies are an example of no regret measures, as they deliver triple bottom line improvements to social, economic and environmental sustainability.
4.4.1 Green Growth and Wateras an ecology-based approach to economic growth, green growth also aims at achieving ecological and economic sustainability in the water sector. Water is essential for the maintenance of ecosystems, ecosystem services and biodiversity. at the same time, water services, such as sanitation, potable water and industrial water supply, play a crucial role for most human and economic activities. Switching from ‘business as usual’ to a green economy means being aware of the full value that water has for the environment, society and economy. a green growth approach aims at recognizing and quantifying the real value of water so that people, businesses or the public sector can pay for it.
improving water-efficiency and water quality is key to ensuring sustainability in the water sector. examples of how to increase water efficiency include reusing and recycling water, avoiding water pollution, improving overall water resource use efficiency through better management processes, technological improvements, more stakeholder participation and capacity building (Unep, 2011). rapid economic growth has led to the contamination and exploitation of many water sources, through pollution and the uncontrolled release of untreated waste. as part of a green growth strategy, waste water treatment and disposal, for both the public and private sectors, needs to be tightly regulated.the provision of water services depends on sound management of water resources to ensure availability of fresh water. ecological sustainability in the water sector is not only relevant for the future functioning of ecosystems, but also for meeting the economic needs of future generations.
4 GREEN GROWTH and ADAPTATION
GREEN GROWTH and ADAPTATION

CLIMATE CHANGE ADAPTATION for water management in a green economy 29
Water and economic activities
In developing countries in Asia and the Pacific, with insufficient access to safe drinking water and sanitation, improvements in the provision of water services enable people to participate more in economic activities. When there is a lack of access to water, people have to spend significant parts of their income and time securing water (UNEP, 2011). This reduces the time and money available for other economic activities. Poor sanitation services often lead to water-borne diseases with high associated socio-economic costs. For example, UNEP estimates that Cambodia, Indonesia, the Philippines and Viet Nam lose approximately 2 per cent of their annual GDP due to inadequate sanitation (UNEP, 2011).
Regarding the provision of potable water and sanitation for basic human needs, further water services are also indispensable for most economic sectors. For example, water plays a key role in industrial production, agriculture, energy, forestry and fisheries. Of the total water resources dedicated to socio-economic activities, approximately 70 per cent are used in agriculture, 20 per cent by industry and power generation and 10 per cent for human consumption (UNEP, 2011).
Water is the major medium through which climate change affects are observed, through changes to the hydrological cycle, increasing extreme events of rainfall, drought and cyclones and the impact of sea level rise. therefore, focusing on sustainable management of all the water sub-sectors through frameworks such as integrated water resource management (iWrm) is recommended. iWrm is ecologically based as it considers the various interactions within the river basins and sub-basins to come up with an over-arching policy. iWrm, forms part of the implementation strategy for green growth and at the same time provides strategies to adapt to the impacts of climate change on water. these chapters explore some of the requirements within the water sector that will help in providing incentives and deterrents for ensuring that water resources are managed appropriately for all users and services.
4.1.2 Natural Capitalnatural capital represents the stock of ecosystem services within an economy, which are of utmost importance for environmental functioning, human well-being and economic activities. Such services include the earth’s capacity to provide freshwater, timber and fuel; regulate flooding, air quality and climate; and control pollution and erosion. most of these environmental services, such as erosion control and flood prevention, are relevant for adaptation to the impacts of climate change. for example, mangroves and coral reefs provide services for flood prevention. forests and vegetation absorb precipitation, recharge groundwater and stabilize soil, and therefore are effective systems to prevent soil erosion, reduce flood events and stabilize the water cycle. further examples for different ecosystem services are depicted in figure 4.1.
investment in natural capital can be described as any expenditure that leads to more sustainable manage-ment of ecosystems and the services they provide. investment in natural capital plays a crucial role for main taining the natural base of future human well-being and economic activities, as ecosystem services are already under threat by human activities. according to the millennium ecosystem assessment, 2 billion people living in dry regions already suffer from increased vulnerability due to losses of ecosystem services leading to problems such as decreased water supply (meaB, 2005). further major problems iden tified include degradation of the world’s fish stocks, nutrient pollution and the growing threat to eco systems brought on by climate change (meaB, 2005). the overall con clusion of the millennium ecosystem assessment Board (meaB) is that human activities are putting such a strain on the earth and its ecosystems, that their capacity to maintain future generations are jeopardized (meaB, 2005).
BOX 4
GREEN GROWTH and ADAPTATION
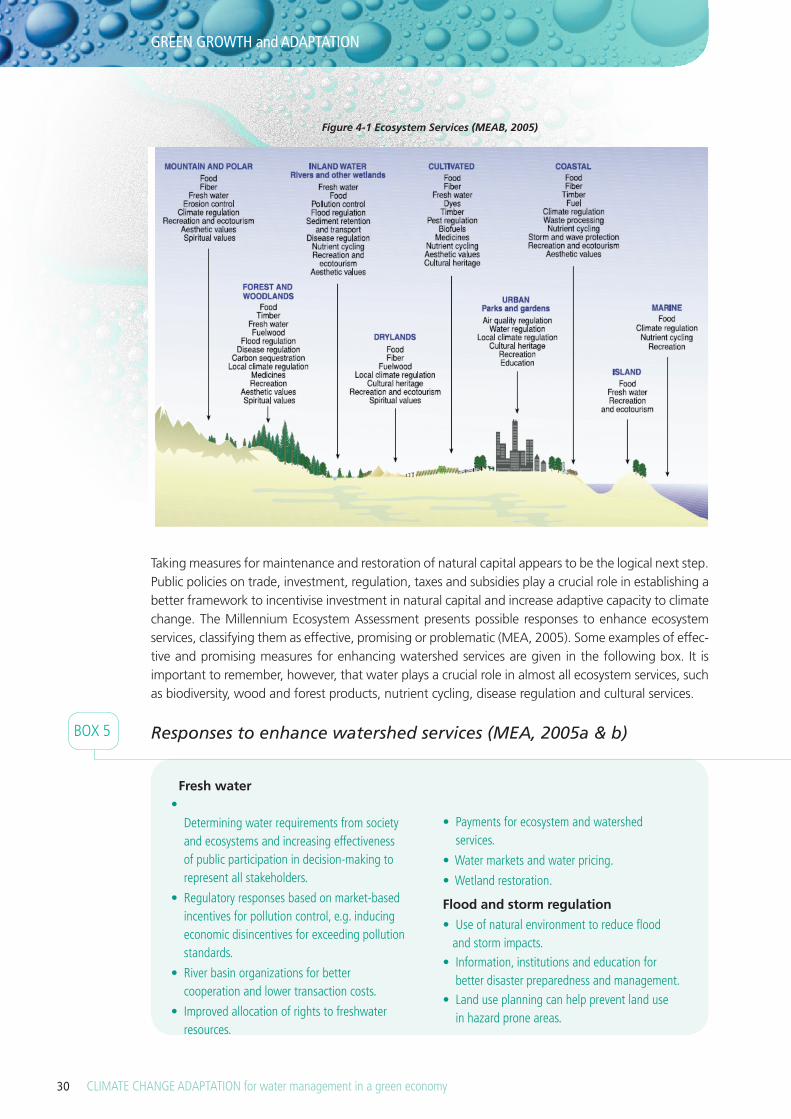
CLIMATE CHANGE ADAPTATION for water management in a green economy30
Figure 4‑1 Ecosystem Services (MEAB, 2005)
taking measures for maintenance and restoration of natural capital appears to be the logical next step. public policies on trade, investment, regulation, taxes and subsidies play a crucial role in establishing a better framework to incentivise investment in natural capital and increase adaptive capacity to climate change. the millennium ecosystem assessment presents possible responses to enhance ecosystem services, classifying them as effective, promising or problematic (mea, 2005). Some examples of effec-tive and promising measures for enhancing watershed services are given in the following box. it is important to remember, however, that water plays a crucial role in almost all ecosystem services, such as biodiversity, wood and forest products, nutrient cycling, disease regulation and cultural services.
Responses to enhance watershed services (MEA, 2005a & b)
Fresh water•
Determining water requirements from society and ecosystems and increasing effectiveness of public participation in decision-making to represent all stakeholders.
• Regulatory responses based on market-based incentives for pollution control, e.g. inducing economic disincentives for exceeding pollution standards.
• River basin organizations for better cooperation and lower transaction costs.
• Improved allocation of rights to freshwater resources.
• Payments for ecosystem and watershed services.
• Water markets and water pricing.
• Wetland restoration.
Flood and storm regulation
• Use of natural environment to reduce flood and storm impacts.
• Information, institutions and education for better disaster preparedness and management.
• Land use planning can help prevent land use in hazard prone areas.
BOX 5
GREEN GROWTH and ADAPTATION

CLIMATE CHANGE ADAPTATION for water management in a green economy 31
4.2 Economic Instruments green businesses are enterprises that consider environmental protection as an essential component of their long-term business objectives, both by using ecologically efficient business practices and providing sustainable products and services (green growth, Un eSCap, and Singg, 2011). many business enterprises already have potential to reduce costs and maximize profits by improving ecological efficiency and resource use from the “business as usual” scenario. With the introduction of green growth policies, potential cost savings and profit maximization can be further increased and thus provide a better enabling environment and stronger incentives for businesses to go green.
government and policy-makers play an important role in greening businesses as they can introduce adequate policies, legislation and incentives to encourage businesses to adopt green business practices as part of their long-term objectives. While policy-makers initially set the framework for greening the business sector, businesses have to respond to these new opportunities.
Current market prices do not capture the full environmental and social costs associated with produc-tion and consumption. environmental degradation and a decline in ecosystem services are not reflected in gdp or other growth statistics. green growth seeks to improve the quality of growth. green growth for water infrastructure means water-sensitive and low impact development, focusing on securing water resources, building resilience to flooding and drought and restoring the ecosystem. govern ments must create enabling conditions for a green economy, to bridge the gap between short term costs and long term benefits, reducing the uncertainty and risk for stakeholders.
traditionally, water has been considered as a free resource. this has provided no incentive for efficient use and has made water efficiency projects and infrastructure difficult to justify. accurately pricing water is critical. ensuring full-cost recovery of water through appropriate pricing is essential for reaching economic and ecological sustainability as desired under green growth, and is increasingly important due to climate variability. Water should be priced to cover not only the full cost of supply, but also the asso ciated waste water treatment, infrastructure maintenance and environmental costs. this pricing structure will provide an incentive for sustainable consumption and the development of water-efficient infras tructure. however, water is a basic human need and any pricing structure must give this due consideration. the pricing of water is a very difficult task and one which is socially and politically sensitive. regardless of the pricing structure, reliable metering of water consumption by the community and industry needs to be established, to account for water. this is an immense challenge, but one that must be addressed in moving towards sustainable water.
the extent to which market prices reflect the scarcity of water will determine the improve-ments in efficiency and reductions in demand in sectors such as industry, communities and agriculture. additionally, if water is priced appropriately, it will make eco-efficient investments that serve to improve efficiency and reduce environmental impact more likely to have positive returns, and hence strengthen investments in green business ventures. from an economic perspective climate change adaptation is value for money, as the long term implication and damages caused by inaction, will far outweigh the upfront costs of adaptation.
As suggested by UNESCAP (2012), a possible option is to increase block tariffs, in which the minimum basic water requirements are provided to households at a very low rate, while for subsequent consumption, the higher the use the higher the rates. Subsidies may be appropriate for low income households. Excessive consumption may be reduced by establishing a ladder of water prices, with tariffs varying based on levels of consumption.
BOX 6
Potential Strategies for Water Pricing
GREEN GROWTH and ADAPTATION
CLIMATE CHANGE ADAPTATION for water management in a green economy32
payments for ecosystem services (peS) represent one of the main tools for establishing a market for ecosystem services. it is based on payments to stakeholders whose actions can influence ecosystem services. By providing economic incentives and compensation schemes, peS aims to foster actions for increasing quantity and quality of ecosystem services. from an economic perspective, peS can correct market failures by better expressing the complete environmental value of ecosystem services in economic terms. peS and payment for watershed services (pWS) are paid voluntarily from the beneficiaries to the providers of enhanced ecosystem services. these payments can either be directly or indirectly through intermediation of responsible institutions (defra, 2010). opportunities for implementation of peS and pWS are ideal if the economic impacts of ecosystem services degradation are real, observable, immediate and local.
most firms have the potential to adopt green business practices, enhance ecological efficiency and make water resource use more sustainable (UneSCap, 2011). the overall strategy for better water resource efficiency is to reduce water and other resource use, recycle where possible and reduce pollution and waste. the first step towards a greener business is identifying potential opportunities for more sustainable resource use, in particular for reducing water resources consumption and preventing the degradation of water quality. Some tools for improving water efficiency and conservation are sector specific, however many green business practices can be modified and adopted by different types of enterprises.
Economic incentives for adopting green business practices can be implemented through a green tax, budget reform and changes in water pricing. With such reforms, adopting sustainable and eco-efficient business practices has the potential to achieve cost savings and gain competitive advantages, thus creating business opportunities. For instance, if the price for water services increases, installing water saving devices or collection of water through rainwater harvesting, provides higher potential savings. More examples for sustainable business practices are given in the following box.
Regulation and legislation on production standards, business practices and water resources, contributes to setting a framework for greening businesses. For instance, technology and performance standards can be regulated to impose decisions on business operations (De Serres, Murtin, and Nicoletti, 2010). For example, this can include tightening water pollution and discharge standards, accompanied by a strategy for monitoring and enforcement. The social impact and feasibility of regulatory and legislative changes must always be assessed carefully prior to implementation.
Raising awareness on the possibility for enterprises to gain competitiveness by adopting ecologically based business practices is one major task for governments. Enterprises need to be informed on how to achieve greater ecological efficiency and sustainability, and the potential economic opportunities this provides. As business is primarily driven by an economic bottom line, gaining support and successful implementation will be determined by businesses understanding of the potential economic benefits that exist.
Public Policies for greening the businesses
BOX 7
GREEN GROWTH and ADAPTATION
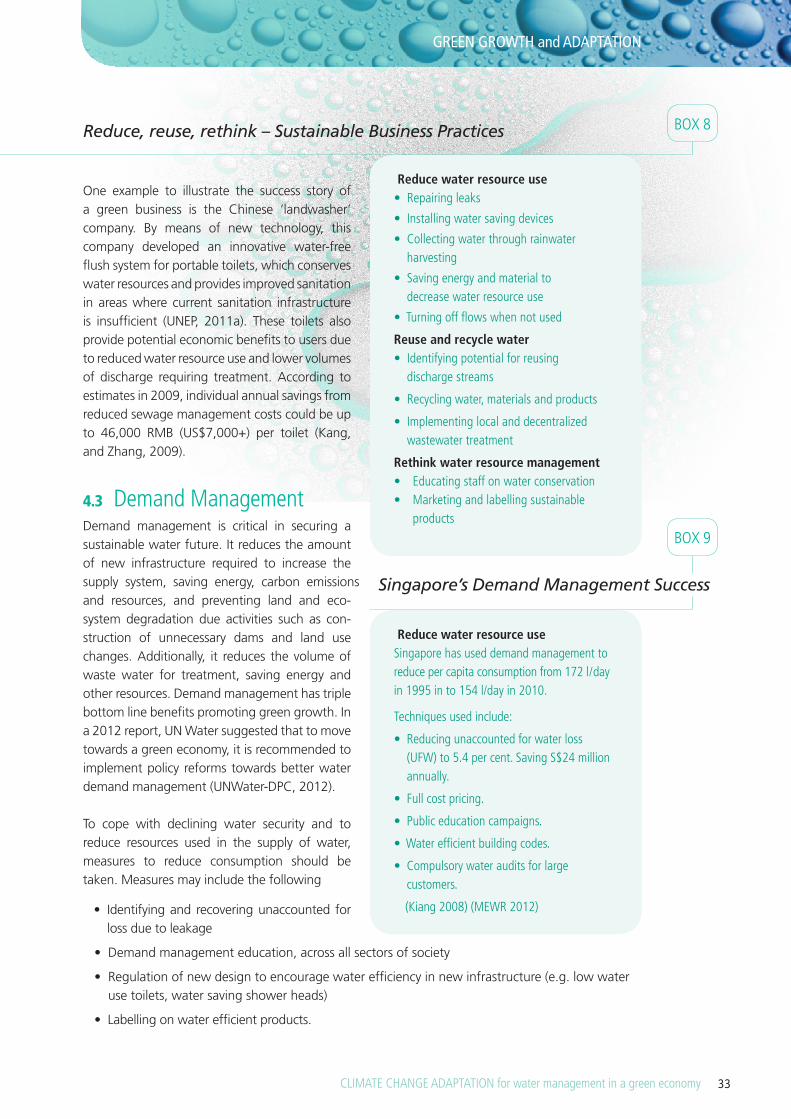
CLIMATE CHANGE ADAPTATION for water management in a green economy 33
one example to illustrate the success story of a green business is the Chinese ‘landwasher’ company. By means of new technology, this com pany developed an innovative water-free flush system for portable toilets, which conserves water resources and provides improved sanitation in areas where current sanitation infrastructure is insufficient (Unep, 2011a). these toilets also provide potential economic benefits to users due to reduced water resource use and lower volumes of discharge requiring treatment. according to estimates in 2009, individual annual savings from reduced sewage management costs could be up to 46,000 rmB (US$7,000+) per toilet (Kang, and Zhang, 2009).
4.3 Demand Managementdemand management is critical in securing a sustainable water future. it reduces the amount of new infrastructure required to increase the supply system, saving energy, carbon emissions and resources, and preventing land and eco-sys tem degradation due activities such as con-struc tion of unnecessary dams and land use changes. additionally, it reduces the volume of waste water for treatment, saving energy and other resources. demand management has triple bottom line benefits promoting green growth. in a 2012 report, Un Water suggested that to move towards a green economy, it is recommended to imple ment policy reforms towards better water demand management (UnWater-dpC, 2012).
to cope with declining water security and to reduce resources used in the supply of water, measures to reduce consumption should be taken. measures may include the following
• Identifying and recovering unaccounted for loss due to leakage
• Demand management education, across all sectors of society
• Regulation of new design to encourage water efficiency in new infrastructure (e.g. low water use toilets, water saving shower heads)
• Labelling on water efficient products.
Reduce water resource use• Repairing leaks
• Installing water saving devices
• Collecting water through rainwater harvesting
• Saving energy and material to decrease water resource use
• Turning off flows when not used
Reuse and recycle water• Identifying potential for reusing
discharge streams
• Recycling water, materials and products
• Implementing local and decentralized wastewater treatment
Rethink water resource management• Educating staff on water conservation • Marketing and labelling sustainable
products
Reduce water resource useSingapore has used demand management to reduce per capita consumption from 172 l/day in 1995 in to 154 l/day in 2010.
Techniques used include:
• Reducing unaccounted for water loss (UFW) to 5.4 per cent. Saving S$24 million annually.
• Full cost pricing.
• Public education campaigns.
• Water efficient building codes.
• Compulsory water audits for large customers.
(Kiang 2008) (MEWR 2012)
BOX 8
BOX 9
Reduce, reuse, rethink – Sustainable Business Practices
Singapore’s Demand Management Success
GREEN GROWTH and ADAPTATION

CLIMATE CHANGE ADAPTATION for water management in a green economy34
reduction in demand saves tax payer funds and protects the environment from damage through the unnecessary construction of water supply dams, water treatment and pumping works and water reticulation networks. the prevention of the potential environmental impacts caused by the building of unnecessary water supply infrastructures is an example of the triple win for the environment, savings in government funds, and use of the saved funds for other productive economic activities. demand management should be part of a country’s overall integrated water resources management strategy.
4.4 Sustainable Consumption and Production (SCP)provision of services and production of goods require material inputs such as water, energy and raw materials. during production, pollutants and emissions are released to the environment (green growth, Un eSCap, and Singg, 2011). also during consumption, emissions and pollutants are set free, and parts of the product are used up while other parts may be discarded or recycled. increasing sustainable consumption and production patterns is necessary as the earth’s capacity to carry resource extraction, pollution and emissions is limited. Sustainable consumption and production plays a key role in a green economy as it will lead to reduced resource intensity and heightened environmental awareness and expectations from consumers. it is an effective strategy for managing water demand and security for a sustainable water future.
developing more sustainable consumption and production patterns in asia and the pacific is crucial for reducing environmental degradation and contributing to more sustainable water resource manage-ment. So far, according to Unep, even though some asian countries already included SCp policies in national policies and programmes, there is still a lack of implementation (Unep, 2011b). due to the fast growth of economies, Unep identifies more sustainable water management as one of the key issues necessary to implement SCp (Unep, 2011b). Water plays a key role in many production processes and is indispensable in most industries, including energy, textiles, manufacturing, food, beverage and electronics. the conventional economic growth pattern has seen natural resources including water, oil, air and soil being overexploited, degrading the ecosystem services that they provide.
Several examples of SCp policies illustrate their potential for asia and the pacific. for instance, the phitsanulok municipality in thailand achieved an 80 per cent reduction in waste through the introduction of public private partnerships for decentralized waste management, recycling and treatment (Unep, 2011b). moreover, initiatives such as the China national Cleaner production Centre and the Viet nam Cleaner production Centre currently try to promote more sustainable production patterns in asia by offering consultancy services and training to government bodies and businesses (Unido and Unep, 2009).
A widely accepted definition for SCP, given by the Norwegian Ministry of Environment in 1994, is that it is “the production and use of goods and services that respond to basic needs and bring a better quality of life, while minimizing the use of natural resources, toxic materials and emissions of waste and pollutants over the life cycle, so as not to jeopardize the needs of future generations” (Bentley, 2008). In other words, SCP refers to achieving more efficient and profitable production to meet growing consumer needs, while decreasing material and resource use, pollution and waste (Green Growth, UN ESCAP, and SINGG, 2011).
What is sustainable Consumption and Production?BOX 10
GREEN GROWTH and ADAPTATION
CLIMATE CHANGE ADAPTATION for water management in a green economy 35
Several regulatory instruments, especially when coupled with better price signals in line with a green tax and budget reform, contribute to achieving these goals. Water efficiency regulations for industry, including building and agriculture, can be developed, and if managed and monitored can contribute to the move towards SCp. life-cycle assessment, green public procurement and demand-side management are some of the main tools for the public sector (green growth, Un eSCap, and Singg, 2011).
Tools for sustainable consumption and production
• Life-cycle assessment is a tool to assess the environmental impact of products or services, covering all stages of their life cycle. This means that the environmental impact of products from extraction of resources, production processing, packing and distribution, to consumption, disposal and recycling are included in the evaluation. Consumer choices based on life-cycle assessments represent a holistic environmental perspective.
• Green public procurement is the selection of products and services that mini¬mize environmental impacts (UN, 2008). For this purpose, organizations and companies choose products according to life-cycle assessment criteria. Public entities and companies are important consumers in some markets. By choosing environmentally-friendly products they can make a difference in environmental outcomes and influence the behaviour of consumers (UN, 2008).
• Demand-side management aims to manage and control demand for certain products and services, and represents the opposite approach of focusing only on increasing water supply. Advantages of reduced water demand includes reduced withdrawal from aquifers and streams, reduced costs of water distribution and treatment systems, and energy saving for pumping, heating and treatment (Dziegielewski, B., 1993). It often also results in a reduction of waste water requiring treatment.
• Regulation of technology and performance standards can assist in making more SCP practices mandatory. For example, setting standards for SCP by introducing minimum water efficiency standards for water appliances or fittings can prevent waste, misuse or undue consumption of water supply (GWP, 2011).
• Voluntary approaches of the private sector such as certification and labelling schemes facilitate the identification of sustainable products (UNEP, 2011b). For instance, enterprises can label sustainable products to promote their consumption.
• Public-private cooperation between government and specific industrial sectors can negotiate agreements on sustainable production to solve particular environmental issues.
GREEN GROWTH and ADAPTATION
BOX 11
CLIMATE CHANGE ADAPTATION for water management in a green economy36
IMPROVED WATER GOVERNANCE to cope with challenges from increasing uncertainties arising from climate change
5.1 Adopting Principles of Integrated Water Resource Management (IWRM)the introduction of integrated Water resources management practices is important to maintain and improve ecological and socio-economic sustainability along with economic growth. While many countries have already adopted the principles of iWrm, adaptation with respect to climate change should be urgently addressed. it had been already recognized by the ipCC (2007b) that an iWrm approach to adaptation is essential. it is stated in the report that “it can be expected that the paradigm of integrated Water resources management will be increasingly followed around the world, which will move water, as a resource and a habitat, into the centre of policy making. this is likely to decrease the vulnerability of freshwater systems to climate change.”
due to the continuous urbanization process of asia pacific with a forecast for 2020 that more than 50 per cent of the population will live in towns and cities, three water related topics have become a major concern: water supply, storm and flood water management, and protection of water resources from pollution and inadequate sanitation. the pressure on clean water resources is increasing as the population and hence, demand increases. at the same time, more pollution is penetrating the groundwater and surface water resources, making it even more difficult to maintain already stretched resources. it has been estimated that the current daily amount of untreated sewage released into the environ ment in urban areas is in the order of 150 to 200 million m3 (Seebacher and lehuu, 2012).
due to urbanization the density of water bodies is rapidly decreasing. this is also true for stagnant water bodies such as ponds, lakes and temporarily wet areas. the reduction and shortening of water courses can lead to a significant and clearly noticeable increase in urban flooding and severe hazards such as flash floods. Climate change with a tendency to more pronounced and intensified precipitation events tends to worsen the situation. Shorter rivers and the absence of wetlands, ponds and lakes, leads to a reduction of water storage capacity and hence an increase in flood water runoff. ecologically sensitive storm water management as an integral part of iWrm needs to become a part of any urban planning exercise.
iWrm can be defined as ‘a process which promotes the coordinated development and management of water, land and related resources in order to maximize the resultant economic and social welfare in an equitable manner without compromising the sustainability of vital ecosystems and the environment. integrated Water resources management is a cross-sectoral policy approach, designed to replace the traditional, fragmented sectoral approach to water resources and management that has led to poor services and unsustainable resource use’ (gWp 2012). With the ever increasing competition for water, it is essential that water policy recognizes all stakeholder needs and coordinates multiple water resources, to ensure a fair and sustainable allocation of supply and disposal. iWrm is a participatory planning and implementation process, which brings stakeholders together to determine the most environmentally and economically sustainable way to meet society’s water needs, reflecting the principles of green growth. iWrm mirrors the interconnected nature of hydrological resources and is generally considered the most effective method for water management and is being adopted across the world. in summary some of the principal components of iWrm, as defined by gWp (2012) are given below.
5
IMPROVED WATER GOVERNANCE to cope with challenges from increasing uncertainties arising from climate change

CLIMATE CHANGE ADAPTATION for water management in a green economy 37
•Managingwaterresourcesatthebasinorwatershedscale. this includes integrating land and water, upstream and downstream, groundwater, surface water, and coastal resources.
•Optimizingsupply. this involves conducting assessments of surface and groundwater sup-plies, analyzing water balances, adopting wastewater reuse, and evaluating the environmental impacts of distribution and use options.
•Managingdemand. this includes adopting cost recovery policies, utilizing water-efficient tech nologies, and establishing decentralized water management authorities.
•Providingequitableaccesstowaterresources. done through participatory and trans-parent governance and management, this may include support for effective water users’ associations, involvement of marginalized groups, and consideration of gender issues.
•Establishing improved and integrated policy, regulatory, and institutional frameworks.examples are implementation of the polluter-pays principle, water quality norms and standards, and market-based regulatory mechanisms.
• Utilizingan intersectoral approach todecisionmaking.this leads to actions where authority for managing water resources is employed responsibly and stakeholders have a share in the process.
the global Water partnership (gWp) policy Brief of 2004 outline the 13 key iWrm changed areas under three core areas of enabling environment, institutional roles and management instruments, as given below.
The 13 Key IWRM Change Areas (GWP 2004)
The enabling environment
1 Policies – setting goals for water use, protection and conservation.
2 Legislative framework – the rules to follow to achieve policies and goals.
3 Financing and incentive structures – allocating financial resources to meet water needs.
Institutional roles
4 Creating an organizational framework – focusing on forms and functions.
5 Institutional capacity building – developing human resources.
Management Instruments
6 Water resources assessment – understanding resources and needs.
7 Plans for IWRM – combining development options, resource use and human interaction.
8 Demand management – using water more efficiently.
9 Social instruments – encouraging a water-oriented civil society.
10 Conflict resolutions – managing disputes and ensuring sharing of water.
11 Regulatory instruments – developing allocation and water use limits.
12 Economic instruments – using value and price efficiency and equity.
13 Information management and exchange – improving knowledge for better water management.
BOX 12
IMPROVED WATER GOVERNANCE to cope with challenges from increasing uncertainties arising from climate change

CLIMATE CHANGE ADAPTATION for water management in a green economy38
iWrm consists of non-structural and structural measures that are executed to manage and control natural and man-made water resources systems for beneficial and sustainable uses. non-structural measures are related to governance and policies, such as administrative advisories, legislations, plan water pricing schedules, zoning laws, incentives, public relations, regulatory programs, and insurance programs to cover crop loss or flood damages. Structural components are generally man-made systems to control water flow and quality and include conveyance systems (channels, canals, and pipes), diversion structures, dams and storage facilities, treatment plants, pumping stations and hydroelectric plants, wells, and other water related infrastructure. elements of natural water resources systems include the atmosphere, river basins (drainage basins or watersheds), stream channels, wetlands, floodplains, aquifers, lakes, estuaries, seas, and the ocean. examples of non-structural measures, which do not require constructed facilities, are pricing schedules, zoning, incentives, public relations, regulatory programs, and insurance.
across the world, water related planning and upgrade of existing or implementation of new water infrastructures is continually taking place. Climate change adaptation measures should be included in all new projects. these can include simple measures associated with new housing projects such as water saving toilets, the use of grey water for flushing, and rainwater harvesting. in the case of construction along rivers or coastal areas, the infrastructure should be designed to be resilient to the impacts of climate change such as increased flooding or rising sea levels. incorporating climate change adaptation into the design for new infrastructure will prevent social and economic losses in the long term. iWrm needs to ensure collaboration and inclusion of sectors which would traditionally be considered to be outside of the water decision making sphere.
as the intensification of the global hydrological cycle continues to increase climate variability impacting on regional water resources, iWrm has a major role in finding and providing adequate adaptation measures and procedures. it is important to strengthen institutions for land and water management on all governmental levels to effectively implement iWrm principles. iWrm reflects the principles of green growth and through implementation can address climate change adaptation, while securing economic and environmental sustainability.
5.2 Integrated River Basin Management (IRBM)integrated river basin management (irBm) is a central part of iWrm, where river basins (otherwise known as watersheds or drainage basins) constitute the management unit of the iWrm processes. irBm manages the human activities in the river basin, dealing with issues such as water allocation, pollution and flood control. it is important to consider the complete basin using this integrated frame work, as activities and changes in one part of the basin can have a significant impact on stakeholders in other locations of the basin. the river basin is a logical and appropriate physical unit for the application of iWrm principles.
it is of utmost importance in dialogue and consensus building to recognize that people living in different locations of the basin, with different economic activities, may be affected in different ways. Climate change impacts, adaptations needs and building resilience, especially at local levels, are a critical additional focus area in irBm. these requirements of the different stakeholders, while needing technical analysis, should be reflected by consensus in coordinating meetings for different geographical zones, such as inundation and non-flooding areas, areas of groundwater recharge and use, urbanized, peri-urban and agricultural areas, and environmental conservation, as well as facilitating and including upstream and downstream concerns. this approach requires an under-standing of the respective adaptation needs of each zone and related problems.
IMPROVED WATER GOVERNANCE to cope with challenges from increasing uncertainties arising from climate change
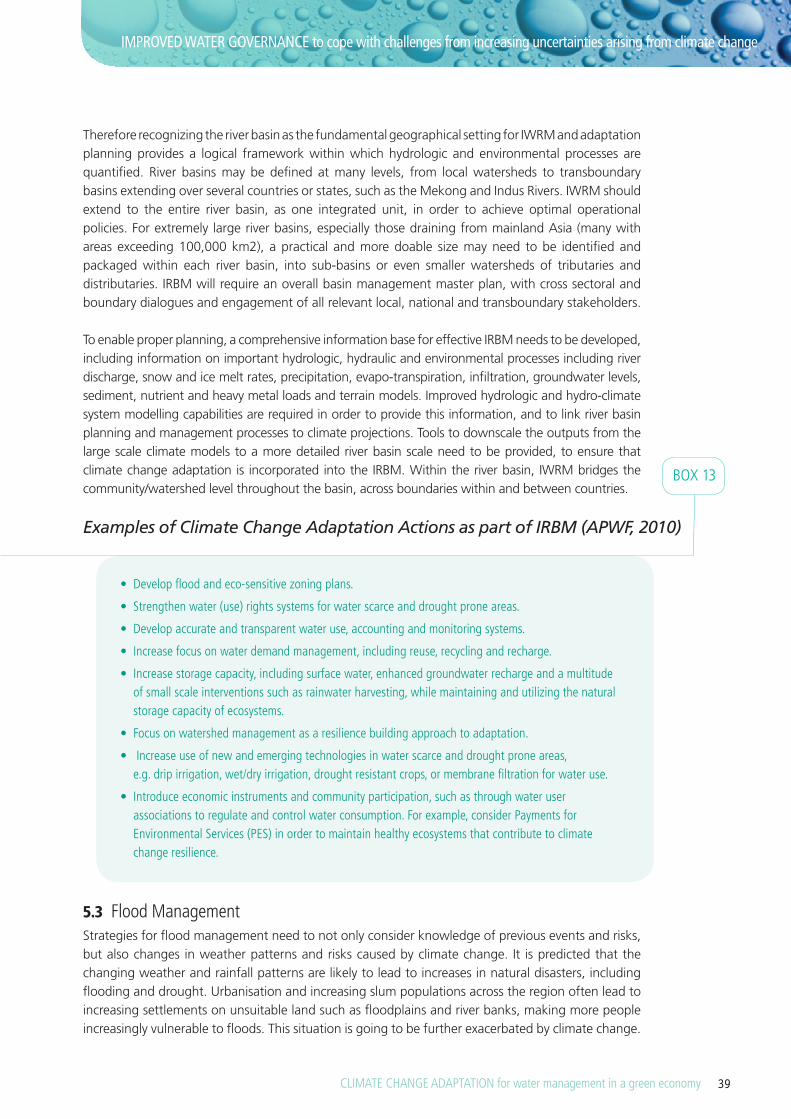
CLIMATE CHANGE ADAPTATION for water management in a green economy 39
therefore recognizing the river basin as the fundamental geographical setting for iWrm and adaptation planning provides a logical framework within which hydrologic and environmental processes are quantified. river basins may be defined at many levels, from local watersheds to transboundary basins extending over several countries or states, such as the mekong and indus rivers. iWrm should extend to the entire river basin, as one integrated unit, in order to achieve optimal operational policies. for extremely large river basins, especially those draining from mainland asia (many with areas exceeding 100,000 km2), a practical and more doable size may need to be identified and packaged within each river basin, into sub-basins or even smaller watersheds of tributaries and distributaries. irBm will require an overall basin management master plan, with cross sectoral and boundary dialogues and engagement of all relevant local, national and transboundary stakeholders.
to enable proper planning, a comprehensive information base for effective irBm needs to be developed, including information on important hydrologic, hydraulic and environmental processes including river discharge, snow and ice melt rates, precipitation, evapo-transpiration, infiltration, groundwater levels, sediment, nutrient and heavy metal loads and terrain models. improved hydrologic and hydro-climate system modelling capabilities are required in order to provide this information, and to link river basin plan ning and management processes to climate projections. tools to downscale the outputs from the large scale climate models to a more detailed river basin scale need to be provided, to ensure that climate change adaptation is incorporated into the irBm. Within the river basin, iWrm bridges the community/watershed level throughout the basin, across boundaries within and between countries.
• Develop flood and eco-sensitive zoning plans.
• Strengthen water (use) rights systems for water scarce and drought prone areas.
• Develop accurate and transparent water use, accounting and monitoring systems.
• Increase focus on water demand management, including reuse, recycling and recharge.
• Increase storage capacity, including surface water, enhanced groundwater recharge and a multitude of small scale interventions such as rainwater harvesting, while maintaining and utilizing the natural storage capacity of ecosystems.
• Focus on watershed management as a resilience building approach to adaptation.
• Increase use of new and emerging technologies in water scarce and drought prone areas, e.g. drip irrigation, wet/dry irrigation, drought resistant crops, or membrane filtration for water use.
• Introduce economic instruments and community participation, such as through water user associations to regulate and control water consumption. For example, consider Payments for Environmental Services (PES) in order to maintain healthy ecosystems that contribute to climate change resilience.
5.3 Flood ManagementStrategies for flood management need to not only consider knowledge of previous events and risks, but also changes in weather patterns and risks caused by climate change. it is predicted that the changing weather and rainfall patterns are likely to lead to increases in natural disasters, including flood ing and drought. Urbanisation and increasing slum populations across the region often lead to increasing settlements on unsuitable land such as floodplains and river banks, making more people increasingly vulnerable to floods. this situation is going to be further exacerbated by climate change.
Examples of Climate Change Adaptation Actions as part of IRBM (APWF, 2010)
BOX 13
IMPROVED WATER GOVERNANCE to cope with challenges from increasing uncertainties arising from climate change

CLIMATE CHANGE ADAPTATION for water management in a green economy40
With increasing flood frequency and impact, there is a need to establish robust and integrated flood manage ment policies. policies need to take into account climate variability and the long term impacts of climate change, and hence need to be based on scientific models of future climate patterns. Consideration should be given to the effect of increased frequency and intensity of rainfall on current flood management plans, resilience and coping capacity. an effective approach, based on the principles of iWrm, is moving away from a strategy of flood control, towards flood management. this holistic approach includes not just structural measures but also institutional frameworks and community involvement. engaging communities in flood manage-ment as part of an overall water management scheme can help to empower the community to develop their own systems and management strategies, such as hazard maps, evacuation plans and improved water retention methods that are suitable to the cultural context.
development and urbanisation should take into consideration flood management. high density urban isation increases the risk of flooding by increasing runoff and is often exacerbated by poor drain age systems. rapid urbanisation in many of the developing countries across the region has led to an increase in the size of highly vulnerable urban communities, exacerbated by poor land manage-ment and increasing informal settle ments. as populations increase and land becomes scarcer, the tendency to settle on floodplains and high risk areas increases. floodplains need to be recognised as an important part of natural flood management and these ecosystems should be protected from economic exploitation and development. dam construction and management is also critical in flood manage ment. the down and upstream implications of dams need to be considered, as there have been numerous cases of dams being built, with disastrous consequences for other river basin users.
evaluation of dam construction and design should also consider the impacts of climate change, to ensure that the structure will be suitable under future conditions.
integration of water management into urban design will encourage more resilient development. modelling tools can be used to predict possible flooding locations to improve urban design. as well as ensuring that future
development is resilient to flood, it is necessary to review existing risks and make efforts to reduce disaster risks through activities such as changes to storm water runoff systems, improved sewerage and drainage systems, increased water retention systems, and restoration of hinterlands and floodplains.
reducing vulnerability and the level of exposure to flooding should be included in iWrm planning. improving flood management and increasing resilience, reduces economic, environmental and social risk, reflecting the principles of green growth. existing flood management and urban development guidelines should be reviewed, and updated to reflect the changing risks associated with climate variability. more information on policy options for improving flood resilience can be found in the eSCap publication Developing Innovative Strategies for Flood-Resilient Cities.
5.4 Agricultural Water Management (AWM)Water for food is water for life (iWmi, 2007). agricultural production utilises the largest share of water use. additionally, agriculture provides employment and economic activities for many of the world’s poor. therefore, changes in water security threaten food production and livelihoods across
In the second half of 2011, Thailand suffered devastating floods. Around 13.6 million people were affected, hundreds of lives were lost and economic damages amounted to around US$44 billion (UNESCAP 2012).
Thailand Flood Crisis
BOX 14
IMPROVED WATER GOVERNANCE to cope with challenges from increasing uncertainties arising from climate change

CLIMATE CHANGE ADAPTATION for water management in a green economy 41
the region. Water consumption in agricultural practices can significantly influence the global water balance. Currently, a significant percentage of water used in agriculture is from non-renewable water sources. Water withdrawals are already unsustainable in many regions. as all food sources are provided and supplied through agricultural production, the sustainable use of water in agriculture becomes a critical issue in the context of food security (fao, 2011).
Climate change increases variability and intensity of rainfall in particular during the growing seasons. Comparing world wide data on agricultural practices over the last 50 years (1960 - 2009) it can be observed that the use of land for rain-fed grain production (rice, wheat, corn, and others) is unchanged at 1200 million ha, whereas irrigated land increased within this period to about 300 million ha (fao, 2011). increased climatic variability and increased droughts exert enormous stress on rain-fed agriculture and the current tendency is to find means for supplementary irrigation during dry spells in the plant’s growth period.
irrigated croplands have in general much higher yields than rain-fed croplands. future increases in irrigation to meet the growing demand on food, will have to compete for water needs of rapidly growing cities. eighty per cent of the world’s cropland that is rain-fed produces almost 65 per cent of the global harvest, while the 20 per cent that is irrigated produces more than 35 per cent. rain-fed agriculture provides, depending on the soil conditions and the provision of fertilizers, about 1000 to 2500 kg grain per hectare, whereas high yield plants on mostly irrigated land can provide 4000 to 6000 kg per hectare. rain-fed agriculture generates most of the food in the world and plays a key role in poverty reduction, since rain-fed cropland is most often owned by small scale homesteads and in many cases the range of farmland is significantly less than 5 ha per unit, but rather in the order of 1 ha. groundwater is increasingly becoming the source for irrigation water supply. already today 38 per cent of the irrigated cropland is supplied with groundwater (Siebert et al., 2010; World Bank, 2010).
Based on existing data, models and scientific evidence, an amount of sustainable groundwater withdrawal can be calculated. farming communities and stakeholders can take the responsibility to admini ster and share this amount efficiently. there are already many successful examples of commu-nity run groundwater allocation programs. this approach assists in preparing farmers for possible changing conditions associated with climate change, by having local governing bodies or institutions in place, which can facilitate the transition for adaptation. Satellite imageries from around the globe indicate significant land use change including converting grazing lands to cropland, and cutting the world’s forests and jungles. in particular, these forest lands are slowly disappearing to gain crop, cattle land and energy plants, such as oil palms, sugar-cane, and corn for production of bio-fuels as clean alternative energy. this destruction of huge tracts of forests creates susceptible monocultures in a once diverse environment, and the lands are susceptible to land-slides and increased erosion, increasing sediments in rivers. the potential for the retention of water in monoculture colonies is minimal compared to the original forest, which exacerbates flood risk.
in coastal areas rising sea levels will lead to a significant inland push of brackish groundwater. Salinity will also be a problem as often increasing irrigation will lead to more seawater intrusion and a higher salt concentration in the soils and runoff. hence, effective and efficient integrated water manage ment will be the only way to fundamentally secure and maintain the necessary global food production. high yield and more salt resistant varieties of crops are constantly explored and cultured in many different countries to cope with these new environments. however, physiological limits exist to developing stress resistant plants.
IMPROVED WATER GOVERNANCE to cope with challenges from increasing uncertainties arising from climate change
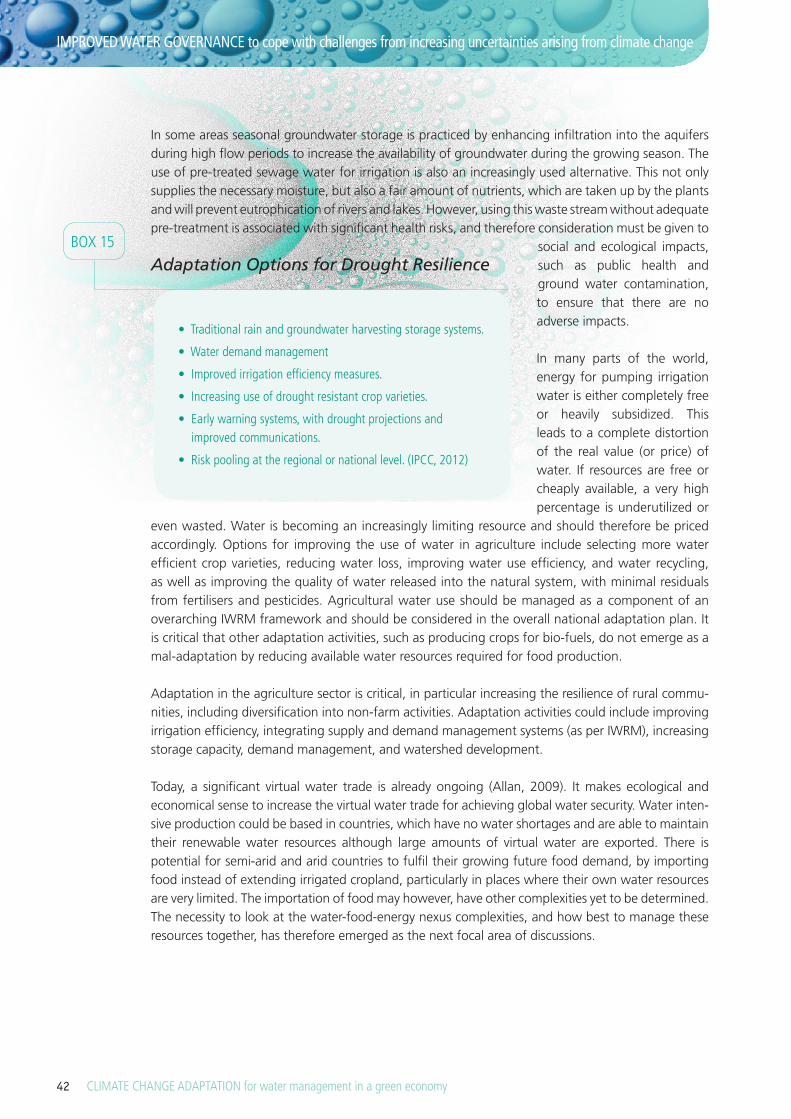
CLIMATE CHANGE ADAPTATION for water management in a green economy42
in some areas seasonal groundwater storage is practiced by enhancing infiltration into the aquifers during high flow periods to increase the availability of groundwater during the growing season. the use of pre-treated sewage water for irrigation is also an increasingly used alternative. this not only supplies the necessary moisture, but also a fair amount of nutrients, which are taken up by the plants and will prevent eutrophication of rivers and lakes. however, using this waste stream without adequate pre-treatment is associated with significant health risks, and therefore consideration must be given to
social and ecological impacts, such as public health and ground water contamination, to ensure that there are no adverse impacts. in many parts of the world, energy for pumping irrigation water is either completely free or heavily subsidized. this leads to a complete distortion of the real value (or price) of water. if resources are free or cheaply available, a very high percen tage is underutilized or
even wasted. Water is becoming an increasingly limiting resource and should therefore be priced accor dingly. options for improving the use of water in agriculture include selecting more water efficient crop varieties, reducing water loss, improving water use efficiency, and water recycling, as well as improving the quality of water released into the natural system, with minimal residuals from fertilisers and pesticides. agricultural water use should be managed as a component of an overa rching iWrm framework and should be considered in the overall national adaptation plan. it is critical that other adaptation activities, such as producing crops for bio-fuels, do not emerge as a mal-adaptation by reducing available water resources required for food production.
adaptation in the agriculture sector is critical, in particular increasing the resilience of rural commu-nities, including diversification into non-farm activities. adaptation activities could include improving irriga tion efficiency, integrating supply and demand management systems (as per iWrm), increasing storage capacity, demand management, and watershed development.
today, a significant virtual water trade is already ongoing (allan, 2009). it makes ecological and economical sense to increase the virtual water trade for achieving global water security. Water inten-sive production could be based in countries, which have no water shortages and are able to maintain their renewable water resources although large amounts of virtual water are exported. there is potential for semi-arid and arid countries to fulfil their growing future food demand, by importing food instead of extending irrigated cropland, particularly in places where their own water resources are very limited. the importation of food may however, have other complexities yet to be determined. the necessity to look at the water-food-energy nexus complexities, and how best to manage these resources together, has therefore emerged as the next focal area of discussions.
Adaptation Options for Drought ResilienceBOX 15
IMPROVED WATER GOVERNANCE to cope with challenges from increasing uncertainties arising from climate change

CLIMATE CHANGE ADAPTATION for water management in a green economy 43
5.5 Water Supply and Sanitation Climate change impacts the quantity and quality of water resources available to meet society’s needs. according to the latest data from the Joint monitoring program, about 377 million people in asia pacific still don’t have access to water, while a staggering 1.74 billion do not have access to sanitation (Who/UniCef 2010). this region represents about 50 per cent of the worlds’ population without access to clean water and 70 per cent of the total number of people without access to sanitation. indeed, if the target is achieved in asia pacific, it is achieved in 2/3 of the world.
already the region is struggling with sustainable access to water, which is going to be further exacer-bated by climate change. as climate change brings about more climate variability, environmental migration, and reduced food security, relocation of communities and increased poverty will further increase the challenges of water and sanitation. it is the region’s poor that are most vulnerable to these impacts, and without a continued focus on improving access, poverty eradication initiatives are threatened to be undermined by climate change. additionally, continued unsustainable growth is leading to pollution and overexploitation of water resources, degrading the ecosystem services that these water bodies provide to society. proper sanitation measures can preserve water resources, and prevent the waste of energy used to clean and purify contaminated water for later consumption.
Climate change threatens to introduce greater uncertainty in water supply and sanitation. the majority of existing water infrastructure was designed for different conditions and resource availability, based on pre-climate change data, so is likely to come under significant pressure due temperature changes and hydraulic loads. Both supply and waste or storm water infrastructure need to be expanded and upgraded to facilitate adaptation. for example, the increased intensity of precipitation will lead to greater runoff, further increasing stress on existing waste water treatment capacity. infrastructure must be upgraded to suit changing water quality, quantity and demand. these developments should follow the principles of eco-efficient infrastructure and green growth, utilising low cost green techno-logies, where possible. Continuing to work towards secure water and sanitation access for all, while pursuing green economic development, should remain a focus area for all countries.
5.6 Options for increasing storage capacitythe significant reduction in seasonal and inter-seasonal long-term storage, such as snow and glacier ice, has led to an increased vulnerability to droughts. therefore, discussions and scientific research has been investigating forms and mechanisms to enhance or increase storage of fresh water. in the following sections the most viable options are discussed, specifically groundwater, artificial reservoirs, and small lakes, ponds and wetlands. natural infrastructure, such as wetlands, should be evaluated as a first alternative, before considering built infrastructure such as dams and canals.
5.6.1 Groundwater and aquifer managementthe largest potential for inter-seasonal and inter-annual storage is definitely associated with ground-water and the availability of aquifer storage. groundwater and soil moisture account for almost 99 per cent of all liquid freshwater resources. due to its relatively easy accessibility, shallow groundwater resources have been over-exhausted in many areas of the world resulting in severe drawdown of the groundwater table and deterioration of water quality. in many locations, groundwater is the only source of irrigation and drinking water. in fact, more than half of the world’s population relies on groundwater for drinking (iWmi, 2007) and 38 per cent of irrigated cropland depends on ground-water (Siebert et al., 2010).
IMPROVED WATER GOVERNANCE to cope with challenges from increasing uncertainties arising from climate change

CLIMATE CHANGE ADAPTATION for water management in a green economy44
during the passage from surface water down to the aquifer, the percolating water undergoes a purifi cation process, which makes groundwater in many places a secure, clean and reliable water source. groundwater has to, if possible, replenish naturally to remain a significant water resource, but infiltration areas are being reduced on a significant scale. due to the enormous reduction of wet lands, river training, urbanization, and many other negative measures, the infiltration capacity, and thus the possibility of replenishing aquifers, has significantly decreased in the last decades. Urban develop -ment planning should optimise the retention of infiltration areas, through good design and the use of penetrable surfaces, where appropriate. there are however, a large array of artificial recharge techniques, which are commonly referred to as managed aquifer recharge (mar) (www.igrac.net, 2011) to enhance this replenishment process.
5.6.2 Reservoirsit has been frequently suggested that constructing more reservoirs can compensate for the loss of storage due to glacier melting in the himalayas. the himalayan glaciers have an ice volume of about 3,700 km3 and show signs of retreat due to warming of the atmosphere, increase of dust and soot particles, as well as an increase of debris covering the ice, which all leads to an increase of adsorption of infrared light.
all existing artificial reservoirs worldwide hold, if completely full at maximum storage capacity, approxi mately 8,000 km3 (lehner et al., 2011). this is only about 0.08 per cent of all liquid freshwater resources. the largest artificial reservoir is lake Kariba on the Zambesi river in africa, which holds at full capacity about 180 km3, and in asia the Bratsk reservoir in Siberia with a maximum capacity of 169 km3. these values illustrate that even the largest reservoirs can not contribute significantly to long-term storage or compensate for reduced storage due to snow and glacier melting.
theoretically, there is still a significant potential to develop more freshwater storage in reservoirs. however, the associated environmental damages, the problem of relocation of affected people, the loss of arable land and biodiversity in the water course, just to name a few, will make further development a less viable option. these risks must be carefully considered before undertaking any such project. in cases where there will be transboundary implications, it is important to evaluate the risks and collaborate with the transboundary stakeholders to find mutually beneficial solutions. potential to increase storage of groundwater in aquifers is the much more feasible option with a much larger capacity.
5.6.3 Small lakes, ponds and wetlandson a local and farmstead level, the creation of small lakes, community or individual ponds are alter-natives for storage and conservation of water. these small water bodies help to overcome short-term shortages and can supplement irrigation water for rain-fed agriculture during crucial growth periods. the traditional irrigation system in Sri lanka, parts of it hundreds of years old, consisting of a network of thousands of interconnected manmade small lakes and ponds, is an excellent example of a sophisticated small scale system with a very high degree of resilience to the effects of drought.
the importance of wetlands has been long ignored. Wetlands are one of the most valuable ecological habitats and exhibit the largest number of species per hectare. Wetlands also form the interface between surface and groundwater. in many places the main recharge areas for groundwater are wetlands. the restoration and preservation of wetlands should be a high priority for all countries in the region.
IMPROVED WATER GOVERNANCE to cope with challenges from increasing uncertainties arising from climate change

CLIMATE CHANGE ADAPTATION for water management in a green economy 45
© W
arre
n Fi
eld
IMPROVED WATER GOVERNANCE to cope with challenges from increasing uncertainties arising from climate change

CLIMATE CHANGE ADAPTATION for water management in a green economy
POLICY OPTIONS
46
the immediate to short term risks of climate change will continue, regardless of mitigation activities undertaken, therefore adaptation is critical. Society must adapt its water infrastructure and services to be more resilient to the changing climate and to reduce vulnerability to water hazards. as there are so many stakeholders, decision makers from all sectors must be involved in adaptation planning and implementation to ensure success. Sectors such as finance, energy, housing, agriculture, city planning and manufacturing must be engaged, as they each play a pivotal role in adaptation. Climate change adaptation requires investment, policy changes, governance shifts, and the inclusion of water concerns in all areas of planning.
due to the diversity of situations, management and culture across the region, there is no easy ‘one size fits all’ solution. Country specific plans based on risk profiles need to be developed. as water and climate change do not respect political boundaries, transboundary approaches to adaptation are essential. the following is a list of possible policy options, for water related climate change adaptation, focusing on green growth solutions.
• Mainstream climate change adaptation into all policy development and management.
• Climate change adaptation should be included in national development plans.
• Water demand management strategies should be a key component of all national
adaptation plans.
• Sustainable water management requires a shift in policies from piecemeal and sectoral
to integrated water resource management (iWrm). the management and governance of
water resources must be strengthened.
• With increasing frequency and impact, there is a need to establish robust and integrated
flood management policies. policy needs to take into account climate variability and the
long term impacts of climate change, and hence needs to be based on scientific models
of future climate patterns.
• Water management strategies should include systematic assessments of climate change
resilience for water and sanitation systems in both rural and urban settings.
• Capacity building should be encouraged for all institutions and stakeholders on holistic,
integrated water management and the role of water based climate change adaptation.
• Establish and engage in national and international knowledge sharing, modelling and
hydraulic monitoring to build the knowledge base on the risks of climate variability.
• Invest in data collection and ensure this information is transparent and readily available
to relevant stakeholders.
• Invest in eco-efficient infrastructure to build long term supply and sanitation access and
security for all.
• Invest in ecosystem restoration and maintenance, to build long term resilience.
POLICY OPTIONS6
POLICY OPTIONS
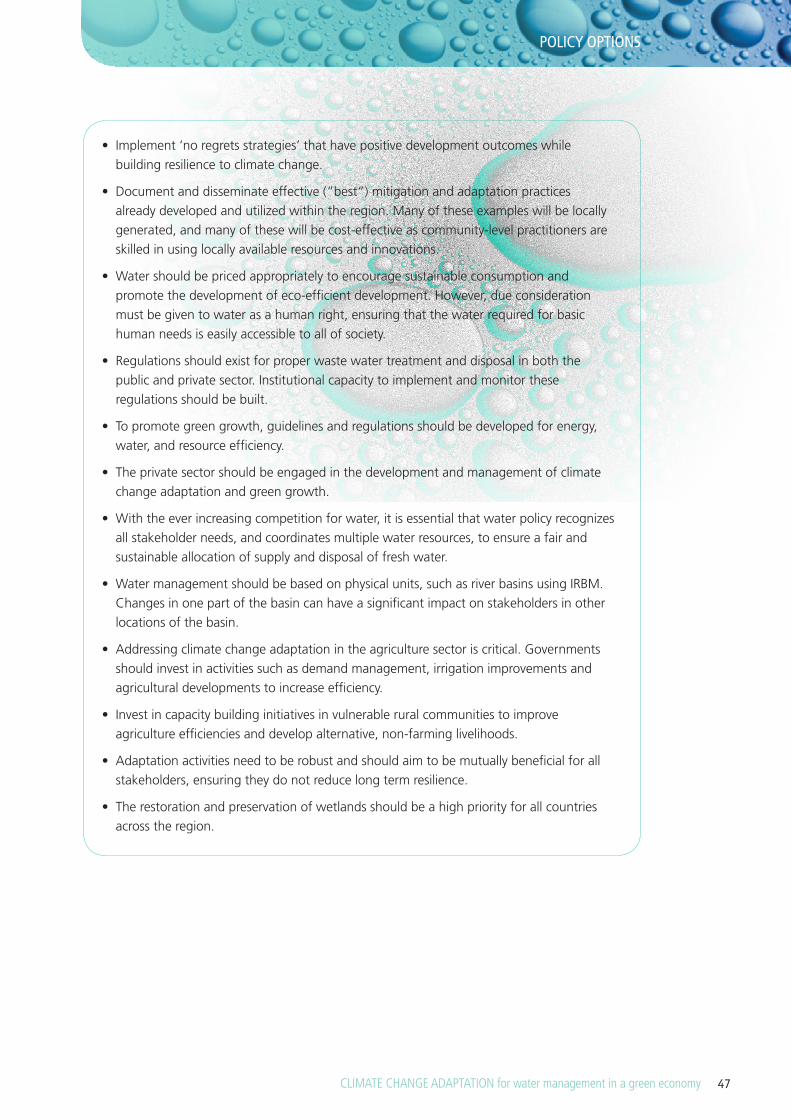
CLIMATE CHANGE ADAPTATION for water management in a green economy 47
• Implement ‘no regrets strategies’ that have positive development outcomes while
building resilience to climate change.
• Document and disseminate effective (“best”) mitigation and adaptation practices
already developed and utilized within the region. many of these examples will be locally
generated, and many of these will be cost-effective as community-level practitioners are
skilled in using locally available resources and innovations.
• Water should be priced appropriately to encourage sustainable consumption and
promote the development of eco-efficient development. however, due consideration
must be given to water as a human right, ensuring that the water required for basic
human needs is easily accessible to all of society.
• Regulations should exist for proper waste water treatment and disposal in both the
public and private sector. institutional capacity to implement and monitor these
regulations should be built.
• To promote green growth, guidelines and regulations should be developed for energy,
water, and resource efficiency.
• The private sector should be engaged in the development and management of climate
change adaptation and green growth.
• With the ever increasing competition for water, it is essential that water policy recognizes
all stakeholder needs, and coordinates multiple water resources, to ensure a fair and
sustainable allocation of supply and disposal of fresh water.
• Water management should be based on physical units, such as river basins using IRBM.
Changes in one part of the basin can have a significant impact on stakeholders in other
locations of the basin.
• Addressing climate change adaptation in the agriculture sector is critical. Governments
should invest in activities such as demand management, irrigation improvements and
agricultural developments to increase efficiency.
• Invest in capacity building initiatives in vulnerable rural communities to improve
agriculture efficiencies and develop alternative, non-farming livelihoods.
• Adaptation activities need to be robust and should aim to be mutually beneficial for all
stakeholders, ensuring they do not reduce long term resilience.
• The restoration and preservation of wetlands should be a high priority for all countries
across the region.
POLICY OPTIONS
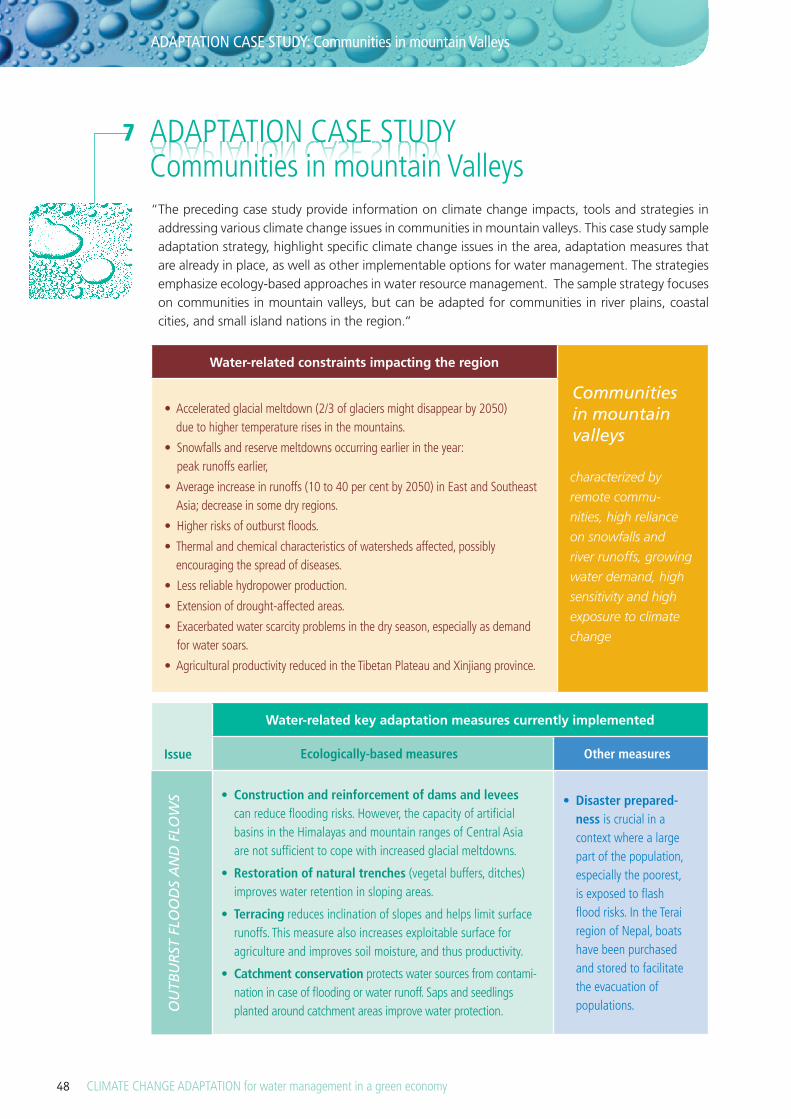
CLIMATE CHANGE ADAPTATION for water management in a green economy
ADAPTATION CASE STUDY
48
ADAPTATION CASE STUDY Communities in mountain Valleys
7
Water-related constraints impacting the region
characterized by
remote commu
nities, high reliance
on snowfalls and
river runoffs, growing
water demand, high
sensitivity and high
exposure to climate
change
• Accelerated glacial meltdown (2/3 of glaciers might disappear by 2050) due to higher temperature rises in the mountains.
• Snowfalls and reserve meltdowns occurring earlier in the year: peak runoffs earlier,
• Average increase in runoffs (10 to 40 per cent by 2050) in East and Southeast Asia; decrease in some dry regions.
• Higher risks of outburst floods.
• Thermal and chemical characteristics of watersheds affected, possibly encouraging the spread of diseases.
• Less reliable hydropower production.
• Extension of drought-affected areas.
• Exacerbated water scarcity problems in the dry season, especially as demand for water soars.
• Agricultural productivity reduced in the Tibetan Plateau and Xinjiang province.
Issue
Water-related key adaptation measures currently implemented
Ecologically-based measures Other measures
• Construction and reinforcement of dams and levees can reduce flooding risks. However, the capacity of artificial basins in the Himalayas and mountain ranges of Central Asia are not sufficient to cope with increased glacial meltdowns.
• Restoration of natural trenches (vegetal buffers, ditches) improves water retention in sloping areas.
• Terracing reduces inclination of slopes and helps limit surface runoffs. This measure also increases exploitable surface for agriculture and improves soil moisture, and thus productivity.
• Catchment conservation protects water sources from contami-nation in case of flooding or water runoff. Saps and seedlings planted around catchment areas improve water protection.
• Disaster prepared-ness is crucial in a context where a large part of the population, especially the poorest, is exposed to flash flood risks. In the Terai region of Nepal, boats have been purchased and stored to facilitate the evacuation of populations.O
UTB
UR
ST F
LOO
DS
AN
D F
LOW
S
ADAPTATION CASE STUDY: Communities in mountain Valleys
“ the preceding case study provide information on climate change impacts, tools and strategies in addressing various climate change issues in communities in mountain valleys. this case study sample adaptation strategy, highlight specific climate change issues in the area, adaptation measures that are already in place, as well as other implementable options for water management. the strategies emphasize ecology-based approaches in water resource management. the sample strategy focuses on communities in mountain valleys, but can be adapted for communities in river plains, coastal cities, and small island nations in the region.“
Communities in mountain valleys

CLIMATE CHANGE ADAPTATION for water management in a green economy 49
Issue
Water-related key adaptation measures currently implemented
Ecologically-based measures Other measures
• Roof-water harvesting systems, conser-vation ponds, surface or underground tanks greatly improve storage capacities in regions with limited supply. Such facilities can be built for limited cost and alleviate the water constraint for households and farmers.
• User-pay system can help reduce wasting by putting a higher price on water. Progressive pricing allows minimized impacts on poorer households.
• Awareness-raising through media and government campaigns helps spread the message about the importance of water conservation, especially through the voice of community associations.
• Community empowerment, especially among remote regions, is crucial for the effectiveness and sustainability of locally-based projects
• Support for poverty alleviation with increased efforts to meet the MDG targets on access to safe water and sanitation, especially when resources are scarcer and consequently less available for the poorest.
• Drip irrigation and sprinkler irrigation are two techniques for reducing water consumption for agricultural use.
• Modified cropping patterns can limit water use with the introduction of new cultivation techniques, for example the System of Rice Intensification.
• Management of irrigation canals contributes to a better allocation of water resources and contributes to limiting the depletion of underground reserves. Well-managed canal networks can also buffer the impact of floods.
• Reliance on local knowledge can help improve economies of scale by implementing context-specific projects.
HIG
HER
CO
NST
RA
INT
ON
WA
TER
SU
PPLY
EAR
LIER
PEA
K R
UN
OFF
S A
ND
A
GR
ICU
LTU
RA
L A
DA
PTA
TIO
N
ADAPTATION CASE STUDY: Communities in mountain Valleys

CLIMATE CHANGE ADAPTATION for water management in a green economy50
© W
arre
n Fi
eld
ADAPTATION CASE STUDY: Communities in mountain Valleys

CLIMATE CHANGE ADAPTATION for water management in a green economy 51
Issue
Further possibly implementable options
Ecologically-based measures Other measures
• Long-term research on climate change impacts and associated risks across sectors.
• Increased protection for hydropower facilities and other infrastructures
• Early warning system for flash floods and related disasters.
• Post flood relief with prevention of diseases and basic needs.
• Leakage control at multiple levels.
• Taxes from downstream communities to upstream users to limit overconsumption and pollution.
• Local quotas on water consumption.
• Extended research on disease spread due to water scarcity and higher temperatures, with subsequent campaigns to limit epidemics.
• Mulching helps reduce evaporation.
• Selection of low evapotranspiration species.
OU
TBU
RST
FLO
OD
S
AN
D F
LOW
SH
IGH
ER C
ON
STR
AIN
T O
N W
ATE
R S
UPP
LYA
DA
PTA
TIO
N
ADAPTATION STRATEGY EXAMPLESADAPTATION CASE STUDY: Communities in mountain Valleys
CLIMATE CHANGE ADAPTATION for water management in a green economy52
REFERENCES
allan a., (2009), Virtual water ‘trade’ and water savings, World Water Week in Stockholm, 16.- 22. august 2009.
anthoff d, nicholls rJ, tol rSJ, Vafeidis at (2006). global and regional exposure to large rises in sea-level: a sensitivity analysis. tyndall Centre for Climate Change research, Working paper 96.
asian pacific Water forum apWf (2012). framework document on Water and Climate Change adaptations.
Barnett tp, adam JC, lettenmaier dp (205). potential impacts of a warming climate on water availability in snow-dominated regions. nature, Vol.438, 2005.
Bates B.C., Kundzewicz Z.W., Wu S., and palutikof J.p., (eds.) (2008). Climate Change and water, technical paper of the intergovernmental penal on Climate Change (ipCC), geneva, 210 pp.
Bentley, m. (2008). planning for Change: guidelines for national programmes on Sustainable Consumption and production. Unep, nairobi, Kenia.
Brouwer r, akter S, Brander l, haque e (2007). Socio-economic Vulnerability and adaptation to environmental risk: a Case Study of Climate Change and flooding in Bangladesh. risk analysis, Vol.27, no.2, 2007.
Church, J. a. and n.J. White (2011). Sea-level rise from the late 19th to the early 21st Century. Surveys in geophysics, doi:10.1007/s10712-011-9119-1.
Crawford, J et al. (2010). low Carbon green growth: integrated policy approach to Climate Change for asia-pacific developing Countries. green growth, British foreign and Commonwealth office, SCphelp, UneSCap.
dasgupta S, laplante B, meisner C, Wheeler d, yan J (2007). the impact of Sea level rise on deve-loping Countries: a Comparative analysis. World Bank policy research Working paper 4136, 2007.
de Serres, a., murtin, f. & nicoletti, g. (2010). a framework for assessing green growth policies. oeCd economics department Working papers, no. 774, oeCd publishing.
department for environment food and rural affairs (defra) (2010). payments for ecosystems Services: a Short introduction. government of the United Kingdom. retrieved from http://archive.defra.gov.uk/environment/policy/natural-environ/documents/payments-ecosystem.pdf on 12 September 2011.
dziegielewski, B. (1993). management of Water demand: Unresolved issues, Water resources Update 114: 1-6, Quarterly Journal of the Universities Council on Water resources. retrieved from http://opensiuc.lib.siu.edu/cgi/viewcontent.cgi?article=1217&context=jcwre&sei-redir=1#search=%22demand%20side%20management%20water%22 on 13 September 2011.
ericksen p, thornton p, notenbaert a, Cramer l, Jones p, herrero m (2011). mapping hotspots of climate change and food insecurity in the global tropics, CCafS report no. 5 (advance Copy). Cgiar.
fao (2003). World agriculture: towards 2015/2030: an fao perspective.
fao (2010). faoStat database at: http://faostat.fao.org/
fao (2011). Climate Change, Water and food Security, rome.
REFERENCES8
REFERENCES

CLIMATE CHANGE ADAPTATION for water management in a green economy 53
global Water partnership gWp (2004). Catalyzing Change: a handbook for developing integrated water resources management (iWrm) and water efficiency strategies, global Water partnership.
gWp (2011). toolbox integrated Water resources management. retrieved from http://www.gwptoolbox.org/index.php?option=com_tool&id=36 on 14 September 2011.
gWp (2012). “What is iWrm.” retrieved 18th may, 2012, from http://www.gwp.org/the-Challenge/What-is-iWrm/.
iea, o. (2011). Co2 emissions from fuel combustion highlights. france, international energy agency.
igSd (2010), retreat of tiben plateau glaciers Caused by global Warming threatens Water Supply and food Security. http://www.igsd.org/documents/tibetanplateauglaciersnote_10august2010.pdf
ipCC (2012). managing the risks of extreme events and disasters to advance Climate Change adaptation. USa, intergovernmental panel on Climate Change.
ipCC (2007). Summary for policymakers. in: Climate Change 2007: the physical Science Basis. Contri bution of Working group i to the fourth assessment report of the intergovernmental panel on Climate Change [Solomon, S., d. Qin, m. manning, Z. Chen, m. marquis, K.B. averyt, m.tignor and h.l. miller (eds.)]. Cambridge University press, Cambridge, United Kingdom and new york, ny, USa.
ipCC (2007, b). Kundzewicz, Z.W., l.J. mata, n.W. arnell, p. döll, p. Kabat, B. Jiménez, K.a. miller, t. oki, Z. Sen and i.a. Shiklomanov, 2007: freshwater resources and their management. Climate Change 2007: impacts, adaptation and Vulnerability. Contribution of Working group ii to the fourth assessment report of the intergovernmental panel on Climate Change, m.l. parry, o.f. Canziani, J.p. palutikof, p.J. van der linden and C.e. hanson, eds., Cambridge University press, Cambridge, UK, 173-210.
ird - institut de recherche pour le développement (2010). http://www.mpl.ird.fr/suds-en-ligne/ecosys/ang_ecosys/index.htm
iWmi (2007). Water for food, Water for life, a Comprehensive assessment of Water management in agriculture.
Kang, a., & Zhang, C. (2009). turning China’s Water Crisis into investment opportunity. new Ventures, market Brief Water, august 2009.
Kiang, t. t. (2008). “Singapore’s experience in water demand management.” 13th World Water congress, iWra retrieved 24th april, 2012, from http://www.iwra.org/congress/2008/resource/authors/abs461_article.pdf.
Kulkarni, a., Bahuguna, i., rathore, B., Singh, S., randhawa, S., Sood, r., and dhar, S. (2007). glacial retreat in himalaya using indian remote Sensing satellite data. Current Science, Vol 92, no 1, 10 January 2007.
lehner B., C. reidy liermann, C. revenga, C. Vörösmarty, B. fekete, p. Crouzet, p. döll, m. endejan, K. frenken, J. magome, C. nilsson, J.C. robertson, r. rödel, n. Sindorf, d. Wisser (2011) global reservoir and dam (grand) database.
millennium ecosystem assessment (mea) (2005a). ecosystems and human Well-being: Synthesis. island press, Washington, dC.
millennium ecosystem assessment (mea) (2005b). ecosystems and human Well-being: Wetlands and Water: Synthesis. World resources institute, Washington, dC.
millennium ecosystem assessment Board (meaB) (2005). living Beyond our means: natural assets and human Well-being: Statement from the Board.
REFERENCES
REFERENCES
CLIMATE CHANGE ADAPTATION for water management in a green economy54
meWr (2012). “Key environment Statistics - Water resource management.” retrieved 11th may, 2012, from http://app.mewr.gov.sg/web/Contents/Contents.aspx?Contid=682.
mimura, n (2008). asia-pacific Coasts and their management. States of environment, Series: Coastal Systems and Continental margins (closed), Vol.11, XVi.
oeCd (2011). towards green growth. executive Summary.
ososkova t, gorelkin l, Chub V (2000). Water resources in Central asia and adaptation measures for Climate Change (2000). environmental monitoring and assessment, Vol.61, no.1, 161-166, 2000.
patz Ja, Campbell-lendrum d, holloway t, foley Ja (2005). impact of regional climate change on human health. nature, Vol.438, 2005.
Qiu J (2008). the third pole. nature, Vol.254, 2010.
rahmstorf S., Cazenave a., Church J.a., hansen J.e., Keeling r.f., parker d.e., and Somerville r.C.J. (2007). recent climatic observations compared to projections; Science Vol. 316, nr. 709
ramanathan, V., and Carmichael, g., (2008). global and regional climate changes due to black carbon, nature geoscience, Volume 1, april 2008, p221
regmi, B., and adhikari, a., (2007). human development report 2007: Climate change and human development - risk and vulnerability in a warming world, Country Case Study - nepal.
Seebacher f., lehuu t. (2012), decentralized Waste Water management for the Waste Water revolution in Urban areas to Support the engines of development in Southeast asia; in Urbanization in Southeast asia - issues & impacts, institute of Southeast asian Studies.
Shekhar, m., Chand, h., Kumar, S., Srinivasan, K., ganju, a., (2010). Climate change studies in the western himalaya, annals of glaciology, Volume 51, number 54, may 2010, pp105-112.
Siebert S., J. Burke, J. m. faures, K. frenken, J. hoogeveen, p. döll, and f. t. portmann, (2010), ground-water use for irrigation – a global inventory, hydrological earth Systems Sciences, 14, 1863–1880.
Siebert, S., p. döll, (2007), irrigation water use – a global perspective, in: global Change: enough Water for all?, Universität hamburg, germany.
Solomon S, Qin d, manning m, alley rB, Berntsen t, Bindoff nl, Chen Z, Chidthaisong a, gregory Jm, hegerl gC, heimann m, hewitson B, hoskins BJ, Joos f, Jouzel J, Kattsov V, lohmann U, matsuno t, molina m, nicholls n, overpeck J, raga g, ramaswamy V, ren J, rusticucci m, Somerville r, Stocker tf, Whetton p, Wood ra, Wratt d (2007): technical Summary. in: Climate Change 2007: the physical Science Basis. Contribution of Working group i to the fourth assessment report of the intergovernmental panel on Climate Change [Solomon S, Qin d, manning m, Chen Z, marquis m, averyt KB, tignor m and miller hl(eds.)]. Cambridge University press, Cambridge, United Kingdom and new york, ny, USa.
Stern, david i. (2003). the environmental Kuznets Curve. international Society for ecological economists – internet encyclopaedia of ecological economics.
the World Bank group (2008). Why is South asia vulnerable to climate change? South asia region, 2008.
the World Bank group (2010). Countries and economies. Washington, dC, World Bank (http://data.worldbank.org/country, accessed 27 June 2011).
the World Bank group, (2011), databank of Co2 emissions (metric tons per capita); http://data.
worldbank.org/indicator/ en.atm.Co2e.pC
Un (1992), United nations framework Convention on Climate Change, pp 25, http://unfccc.int/resource/docs/convkp/conveng.pdf
REFERENCES

CLIMATE CHANGE ADAPTATION for water management in a green economy 55
Un (2008). Sustainable development innovation briefs, issue 5, august 2008.
Un general assembly (2009). Climate change and its possible security implications. report of the Secretary-general. Sixty-fourth session.
Un (2010). Un data on population 2010. United nations Statistics division (http://data.un.org/Search.aspx?q=population, accessed 27 June 2011).
Un (2011). Un atlas of the oceans (http://www.oceansatlas.org/, accessed 28 June 2011).
Undp (2006). human development report: beyond scarcity: power, poverty and the global Water Crisis. new york, United nations development program.
Undp (2010). millennium development goals needs assessment for nepal 2010.
Un & Unep (2000). integrated environmental and economic accounting: an operational manual. Studies in methods, Series f, no. 78, handbook of national accounting, new york.
Unep (2002). tajikistan 2002 State of the environment report. Climate Change (http://enrin.grida.no/htmls/tadjik/soe2001/eng/htmls/climate/state.htm, accessed 5 July 2011).
Unep (2007). ipCC report: Climate proofing Small islands. Science daily (http://www.sciencedaily.com¬ /releases/2007/04/070410135159.htm, accessed 1 July 2011).
Unep (2009). Water Security and ecosystem Services: the Critical Connection: a Contribution to the United nations World Water assessment programme (WWap). Job no. dep/1161/na, nairobi, Kenia.
Unep (2011, a). towards a green economy: pathways to Sustainable development and poverty eradication.
Unep (2011, b). global outlook on SCp policies: taking action together.
UneSCap (2007). Sustainable infrastructure in asia – overview and proceedings: Seoul initiative policy forum on Sustainable infrastructure, Seoul, republic of Korea, 6-8 September 2006. United nations publication, Sales no. e.07.ii.f.16, Bangkok, 2007.
UneSCap (2010). energy resources development Series no. 41, 2010, low Carbon development path for asia and the pacific: Challenges and opportunities to the energy Sector, pp 177
UneSCap (2011). green growth Capacity development programme. retrieved from http://www.greengrowth.org/capacity_building/capacity.asp on 28 September 2011.
UneSCap (2012). low Carbon green growth roadmap for asia and the pacific: turning resource constraints and the climate crisis into economic growth opportunities. Bangkok, United nations.
UneSCap, & Singg (2011). green growth, green growth paths. retrieved from http://www.greengrowth.org/ggtracks.asp on 12 September 2011.
Unido & Unep (2009). Viet nam national Cleaner production Centre: Case study in good organization, management and governance practices. retrieved from http://www.unido.org/fileadmin/user_media/Services/environmental_management/Contacts/Contacts/VnCpC%20web.pdf on 13 September 2011.
UnWater-dpC (2012). Water and the green economy: Capacity development aspects a. Jaeger. germany, Un-Water decade programme on Capacity development.
UnWater (2010). Climate Change adaptation: the pivotal role of Water - policy Brief, UnWater.
Who/UniCef (2010). “Who/UniCef Joint monitoring programme (Jmp) for Water Supply and Sanitation.” retrieved 25th may, 2012, from http://www.wssinfo.org/.
World Bank (2008). http://data.worldbank.org
REFERENCES

CLIMATE CHANGE ADAPTATION for W
ater Managem
ent in a Green Econom
y
Climate change has varying impacts in the different areas of Asia and the Pacific
region. All will affect availability of and/or access to water. Some examples of such
areas in Asia and the Pacific region are as follows:
-
both coastal communities and industries may face additional threats from
saltwater intrusion. Sea level rise may also lead to an increase in environ-
mental refugees from areas that can no longer adapt to climate change.
Copyright © 2022 FDOKUMEN