REALIZING INCLUSIVE GROWTH - United Nations ESCAP
41
REALIZING INCLUSIVE GROWTH E conomic growth in the Asia-Pacific region has been quite spectacular over the last few decades as real incomes per capita on average have doubled since the early 1990s. That growth has lifted millions of people out of extreme poverty and has enabled the region as a whole to attain – before the 2015 deadline – the first target under the Millennium Development Goal of eradicating extreme poverty and hunger by halving the proportion of people whose income is less than $1 a day. Economic growth is a critical element in the development process. It creates opportunities for the enhanced well-being of people, through for example the generation of employment opportunities, which in turn contributes to the process of reducing poverty. Moreover, as employment expands and incomes increase, Governments are able to raise more resources – through such measures as taxation – for investment in additional production, which fosters further growth and development, thereby creating a virtuous circle that enables acceleration of the poverty reduction process. “Development”, however, encompasses much more than increasing the levels of income and reducing poverty. It is a multidimensional concept, as highlighted in the first Human Development Report: “The purpose of development is to offer people more options. One of their options is access to income [….] But there are other options as well, including long life, knowledge, political freedom, personal security, community participation and guaranteed human rights” (UNDP, 1990, p. iii). In this context, articulation of the Millennium Development Goals has been an important milestone in the development discourse as those Goals highlight the importance of social and economic factors through the inclusion of, for instance, health, education and gender-related dimensions. Overall, however, progress towards achieving the Goals has been uneven within as well as between countries in the region. An estimated 743 million people in the region still remain trapped in extreme poverty. In addition, gaps in development achievements have widened between rural and 3
-
Upload
khangminh22 -
Category
Documents
-
view
2 -
download
0
Transcript of REALIZING INCLUSIVE GROWTH - United Nations ESCAP
REALIZING INCLUSIVE GROWTH
Economic growth in the Asia-Pacific region has been quite spectacular over the last few decades
as real incomes per capita on average have doubled since the early 1990s. That growth has lifted millions of people out of extreme poverty and has enabled the region as a whole to attain – before the 2015 deadline – the first target under the Millennium Development Goal of eradicating extreme poverty and hunger by halving the proportion of people whose income is less than $1 a day.
Economic growth is a critical element in the development process. It creates opportunities for the enhanced well-being of people, through for example the generation of employment opportunities, which in turn contributes to the process of reducing poverty. Moreover, as employment expands and incomes increase, Governments are able to raise more resources – through such measures as taxation – for investment in additional production, which fosters further growth and development, thereby creating a virtuous circle that enables acceleration of the poverty reduction process.
“Development”, however, encompasses much more than increasing the levels of income and reducing poverty. It is a multidimensional concept, as highlighted in the first Human Development Report: “The purpose of development is to offer people more options. One of their options is access to income [….] But there are other options as well, including long life, knowledge, political freedom, personal security, community participation and guaranteed human rights” (UNDP, 1990, p. iii).
In this context, articulation of the Millennium Development Goals has been an important milestone in the development discourse as those Goals highlight the importance of social and economic factors through the inclusion of, for instance, health, education and gender-related dimensions. Overall, however, progress towards achieving the Goals has been uneven within as well as between countries in the region. An estimated 743 million people in the region still remain trapped in extreme poverty. In addition, gaps in development achievements have widened between rural and
3
Economic and Social Survey of Asia and the Pacific 2015
98
urban sectors in general, and between the “haves” and “have-nots” in particular, especially in the major developing countries in the region.
The year 2015 is a watershed in global policymaking in the pursuit of inclusive and sustainable development as it marks the deadline for achieving the Millennium Development Goals, and it is expected to be the year when the United Nations launches a set of sustainable development goals to provide a framework for the formulation of future development policies. In that context, now is an opportune time to take stock of just how inclusive economic growth has been in the Asia-Pacific region. For this purpose, the discussion in this chapter, while highlighting the region’s achievements in terms of economic growth and poverty reduction, points to trends that have taken place in individual countries. Those trends are reflected in important indicators of development other than just economic growth and poverty reduction. This is done to emphasize that social and environmental factors are also important elements that need to be considered in tandem with economic factors when determining just how inclusive such growth has been. Although noteworthy improvements have been made across countries in expanding access to health and education, significant divergence exists in the achievements made within countries on, for example, gender issues across the rural and urban sectors and between regions. Furthermore, progress that has taken place in the economic, social and environmental dimensions has often disproportionately benefited better off people.
In this chapter, it is argued that inclusiveness is essentially an unobserved multidimensional concept. In presenting a measure of inclusiveness that combines multidimensional economic, social and environmental indicators, an index is made available to enable measurement of just how inclusive growth has been in the region since the 1990s. This measurement is carried out to draw attention to the fact that a broader approach than one based on economic growth only is important when it comes to assessing people’s well-being. Moreover, based on trend analysis of the three dimensions that underpin inclusiveness (economic, social and environmental), policies are identified that have contributed to making growth more inclusive, that is, policies that would enable the benefits of economic growth to be spread more evenly within countries. In doing so, attention is drawn, for instance, to the importance of reenergizing the development of the
rural sector through rural industrialization. It is also argued that the developmental role of monetary and fiscal policy needs to be strengthened.
1. TRENDS AND PATTERNS OF INCLUSIVE GROWTH IN THE REGION
Although GDP growth in developing economies has been subdued in the Asia-Pacific region since the 2008 global financial crisis, it has been spectacular to the extent that levels of real income per capita have on average doubled since the early 1990s. In countries such as Bhutan, Cambodia and Viet Nam, real income per capita has tripled, while in China it has grown more than sevenfold since 1990. In contrast, in the economies of Brunei Darussalam, Georgia, Kyrgyzstan and Palau real per capita income has decreased by up to 14%, while in Tajikistan it has contracted by a third (annex table I).
Despite this performance, the developing Asia-Pacific region is characterized by a large degree of divergence in social and in economic development indicators. For instance, income per capita ranges from $409 per person in Nepal to almost $37,000 in Singapore, a tremendous gap that has in fact been growing since the 1990s. Economies in the region are also characterized by large differences in poverty and inequality. The question thus arises as to whether or not growth has been inclusive. Addressing this issue requires, however, a clear definition of “inclusiveness”. While a number of definitions have been applied to the concept of inclusiveness (see box 3.1), in this chapter inclusive growth is viewed as a multidimensional concept.
Thus, the terms income, income insecurity, poverty and inequality relate to an economic dimension of inclusiveness. With the current focus of the development community being on sustainable development, inclusiveness should also capture development achievements relating to social and environmental indicators. Also to be considered under the term inclusiveness should be the nature of policies for enhancing opportunities to access public goods. For instance, dimensions that should be addressed include “limited or lack of access to education and other basic services; increased morbidity and mortality from illness; homelessness and inadequate housing; unsafe environments; and social discrimination and exclusion” (United Nations,1995).

99
CHAPTER 3Realizing Inclusive Growth
Box 3.1. Defining inclusiveness
To address the issue of inclusiveness of growth, it is necessary first to identify, understand and define the concept. While the term “inclusive growth” has been widely used in recent years by Governments, international organizations and other stakeholders, consensus is still lacking on what constitutes a clear understanding of the concept. For instance, when measuring and determining the inclusiveness of growth, Anand, Mishra and Peiris (2013) considered economic growth as pro-poor as long as the extremely poor benefit.a Dollar and Kraay (2002) defined growth as being inclusive when the income of the bottom quintile does not decrease. Balakrishnan, Steinberg and Syed (2013) integrated equity and growth in a unified measure so that they could consider income growth and income distribution. In so doing, they found that growth was not inclusive in Asia. According to de Mello and Dutz (2012), “…inclusiveness goes beyond poverty and income distribution and encompasses other dimensions, such as well-being, voice in the political process and participation in social life…”. Khan (2012) argued: “Growth is inclusive if it supports high levels of employment and rising wages”.
Among the various definitions that have been used by Governments and institutions, that of the Indian Planning Commission is quite comprehensive. In its Eleventh Five Year Plan, it defined inclusive growth as “…growth that reduces poverty and creates employment opportunities, access to essential services in health and education especially for the poor, equality of opportunity, empowerment through education and skill development, employment opportunities…, environmental sustainability, recognition of women’s agency and good governance”.b By encompassing economic, social and environmental aspects of development, this definition captures the essence of the commitments that representatives of Member States agreed in the outcome documentc of the United Nations Conference on Sustainable Development, held in Rio de Janeiro, Brazil, in June 2012. In that document, entitled The future we want, the signatories clearly committed to ensuring the promotion of an economically, socially and environmentally sustainable future for the planet.
a Under the relative definition, growth is pro-poor if and only if the income of poor people grows at a faster rate than that of the population as a whole. Under the absolute definition, any increase in the income of the poorest is considered pro-poor.b See Government of India Planning Commission, Eleventh Five Year Plan (2007-2012), vol. 1 (Inclusive Growth), chap. 1, para. 1.9. Available from http://planningcommission.nic.in/plans/planrel/fiveyr/welcome.html.c See General Assembly resolution 66/288.
Overall, the concept should be sufficiently broad to capture, for instance, access to energy services and environmental goods, such as clean air and water. The inclusion of a broader range of variables would therefore contribute to a better understanding of inclusiveness that could further strengthen the sustainability of economic growth. Moreover, the concept of inclusiveness should capture output variables, as opposed to input variables, such as policies. Broadly, this chapter defines inclusiveness in terms of the following broad social objectives: (a) increasing the average standard of living of the population (captured here by average real income per capita); (b) reducing income inequality; (c) reducing levels of extreme poverty and (d) expanding and broadening equality in opportunities, such as access to public goods, including health and education services. Achievement of these social objectives should lead to an increase in people’s well-being, which is the ultimate objective of any society. In the following subsections, economic and social inclusiveness are discussed before considering the wider concept of inclusiveness with respect to environmental factors.
1.1. ECONOMIC INCLUSIVENESS
1.1.1. Inclusiveness and poverty in income
Economic growth should be broad-based and inclusive, enabling all segments of the population to benefit from such growth while incorporating the needs of the extremely poor and vulnerable. The elimination of extreme poverty should be one of the primary social objectives of all Governments, without which inclusive growth cannot be realized. In this regard, economic growth in the Asia-Pacific region has been quite successful: whereas in 1990 more than 1.6 billion people, equivalent to 51% of the region’s population, were living in extreme poverty, by 2011 the incidence of extreme poverty had dropped to about 18% of the population. As previously mentioned, when considered as a whole the region has already attained the Millennium Development Goal of reducing extreme poverty by half. Nonetheless, it should be remembered that about 743 million people in the Asia-Pacific region are still trapped in extreme poverty.

Economic and Social Survey of Asia and the Pacific 2015
100
While poverty rates are uneven across the region, the incidence of absolute poverty decreases markedly with income per capita (figure 3.1). The poverty rate exceeds 30% in only 3 countries, Bangladesh, India and the Lao People’s Democratic Republic, compared with more than 12 countries at the beginning of the 1990s. Moreover, extreme poverty has all but been eradicated in Azerbaijan, Kazakhstan, Malaysia, the Russian Federation and Thailand.
In fact, rates of extreme poverty have declined in almost all countries in the region (table 3.1). In most economies, when using the $1.25 per day poverty line, the rates of extreme poverty had already declined by half or more than half by 2010, with the notable exceptions of Bangladesh, India, the Lao People’s Democratic Republic and the Philippines. However, although extreme poverty has declined significantly in the region, poverty measured at the $2 poverty line is still very high. In India, 68.8% of the population was living below that line in 2010; in Nepal, 6 out of 10 persons were living below that line in 2010.
Despite the success achieved in reducing levels of extreme poverty in the Asia-Pacific region, large divergences exist in poverty rates within
Figure 3.1. Income levels and extreme poverty in developing Asia-Pacific economies in 2013
Source: ESCAP, based on World Bank, World Development Indicators. Available from http://data.worldbank.org/data-catalog/world-development-indicators.
countries, such as significant gender differences in poverty rates (see box 3.2). In addition, there is a large divide between rural and urban areas, with extreme poverty in rural areas usually being higher than in urban areas. For instance, the incidence of extreme poverty in urban China is almost negligible while in rural parts of the country it is quite high (figure 3.2). Thus, although China’s performance in reducing poverty is widely applauded, its impressive economic growth has to some degree bypassed the people in rural areas, as witnessed by a rural-urban poverty gap that is much wider than that in India. This may be due to the strict control of rural-to-urban migration, which has reinforced segmentation of the rural and urban sectors in China (Fan, Chen-Kang and Mukherjee, 2005). In contrast, while the rural-urban gap in India is much lower than that in China, poverty rates are higher in India than in China. Arguments that have been put forward to explain this phenomenon point to the comprehensive land reforms that took place in China after the revolution of 1949. That incident altered the asset distribution in the country, whereas in India significant land reforms involving substantial redistribution of assets did not take place to the same extent (Ghosh, 2010). Furthermore, growth rates have been significantly higher in China, where they averaged 9.7% annually between 1990
-10
0
10
20
30
40
50
$ $5 000 $10 000 $15 000 $20 000 $25 000
Pov
erty
hea
dcou
nt ra
tio, $
1.25
/day
GDP per capita, PPP (constant 2011 international dollars), 2013

101
CHAPTER 3Realizing Inclusive Growth
Table 3.1. Extreme poverty ($1.25/day PPP) rates and their changes
Source: ESCAP statistics and World Bank, World Development Indicators. Available from http://data.worldbank.org/data-catalog/world-development-indicators.
Country Poverty rate(percentage ofpopulation) in
early 1990s
Latest poverty rate(percentage of
population)
Decline inpercentage
points
Change
Armenia 17.5 2.5 15.0 -85.9%
Azerbaijan 16.3 0.4 15.8 -97.4%
Bangladesh 70.2 43.3 27.0 -38.4%
Bhutan 26.2 1.7 24.6 -93.7%
Cambodia 44.5 18.6 25.9 -58.2%
China 60.2 11.8 48.4 -80.4%
Fiji 29.2 5.9 23.3 -79.8%
Georgia 4.7 18.0 -13.3 282.0%
India 49.4 32.7 16.7 -33.8%
Indonesia 54.3 16.2 38.1 -70.1%
Iran (Islamic Republic of) 3.9 1.5 2.4 -62.3%
Kazakhstan 4.2 0.1 4.1 -97.4%
Kyrgyzstan 18.6 5.0 13.6 -73.0%Lao People’sDemocratic Republic 55.7 33.9 21.8 -39.2%
Malaysia 1.6 0.0 1.6 -100.0%
Maldives 25.6 1.5 24.1 -94.2%
Nepal 68.0 24.8 43.2 -63.5%
Pakistan 64.7 21.0 43.7 -67.5%
Philippines 30.7 18.4 12.3 -40.0%
Russian Federation 1.5 0.0 1.5 -100.0%
Sri Lanka 15.0 4.1 10.9 -72.6%
Tajikistan 49.4 6.6 42.8 -86.7%
Thailand 11.6 0.4 11.2 -96.7%
Turkey 2.1 1.3 0.8 -36.2%
Turkmenistan 63.5 24.8 38.7 -60.9%
Viet Nam 63.7 16.9 46.9 -73.6%
and 2013, than in India, where they averaged 6.4%. By contrast, in Indonesia the incidence of poverty is slightly higher in urban areas than in rural areas.
In addition to the urban-rural divide, there is also a significant gap in poverty rates across regions and ethnicities in several countries. For instance, in India, poverty at the state level differs widely; in Kerala, only 7.1% of the population are poor compared with 39.9% in Chhattisgarh. In Central Nepal, the poverty rate is less than half that in the Far-Western Development Region.
1.1.2. Inclusiveness and income inequality
Economic growth is necessary but not sufficient for realizing inclusive growth. Indeed, despite the impressive progress made in reducing extreme poverty in the region, increases in levels of real income have not always been distributed evenly within countries. On the contrary, income inequality, as measured by the Gini coefficient, has increased in many countries in the region, especially in the major developing countries. As reported in previous issues of the Survey, between the 1990s

Economic and Social Survey of Asia and the Pacific 2015
102
Box 3.2. Women and poverty
In spite of the remarkable achievements made in reducing poverty in the Asia-Pacific region, poverty among women is usually higher than among men, largely as a result of systemic vertical and horizontal discrimination in the labour market. In spite of improvements in educational attainment, women’s labour-force participation remains significantly lower than that of men. Access to economic opportunity is limited also by cultural norms, discriminatory laws and the lack of supportive infrastructure and services that would facilitate women’s labour-force participation.
As information on poverty is usually collected at the household, rather than at the individual, level, there is a dearth of sex-disaggregated data. However, for five economies that submitted information to ESCAP for the 2014 Asia-Pacific Survey on Progress in Implementation of the 12 Critical Areas of Concern of the Beijing Platform for Action, it was shown that the proportion of the female population living in extreme poverty ranged from 0.4% to 43.3% (ESCAP, forthcoming, b).
That survey also revealed that across the Asia-Pacific region the reported proportion of female populations at the national level living in poverty ranged from a low of 1.7% (Macao, China, 2012) to a high of 70% (Timor-Leste, 2013) (see figure A below). In their observations of poverty among women and girls, the respondents noted the particular vulnerability of female-headed households and of sole-parent households, the majority of which are composed of women. They further reported that greater proportions of women than of men fall within low-income brackets or within “disadvantaged populations”.
Figure A. Reported range of proportion of female population living below national poverty lines, by ESCAP subregion
Source: ESCAP (forthcoming, b).
Note: Data for the Pacific (Kiribati, Nauru, Republic of Palau and Tuvalu) from the period 2005-2012; for South-East Asia (Myanmar, Philippines, Thailand and Timor-Leste) from the period 2009-2012; for East and North-East Asia (China; Hong Kong, China; Macao, China; and Mongolia) from 2012/13; for North and Central Asia (Azerbaijan, Kazakhstan, Kyrgyzstan and the Russian Federation) from the period 2012-2014; and for South and South-West Asia (Bangladesh, Bhutan, Sri Lanka and Turkey) from the period 2009-2013.
and 2014, the population-weighted mean Gini coefficient for the entire region rose from 33.5 to 37.5. Thus, for the region as a whole, growth has not been inclusive if considered in terms of income inequality, as measured by the Gini coefficient. In a recent report, it was estimated that, if inequality had remained stable in those economies where
it actually increased between 1990 and 2010, an additional 240 million persons in the region would have been lifted out of poverty.
In some countries, the Gini coefficient of income inequality has increased considerably since the 1990s, including in the region’s larger economies,
70.0 70.0
48.5
31.527.4
11.9
1.77.8 8.0 6.5
1.7 2.60
10
20
30
40
50
60
70
80
Asia-Pacific South-EastAsia
Pacific South andSouth-West
Asia
East andNorth-East
Asia
North andCentral Asia
Pro
porti
on o
f fem
ale
popu
latio
n
Highest reported rate Lowest reported rate

103
CHAPTER 3Realizing Inclusive Growth
Figure 3.2. Poverty headcount ratio in urban and rural sectors, selected economies in Asia and the Pacific, in 2010
Source: Kakwani (2014).
namely China, India and Indonesia, whereas the Gini coefficient has decreased quite significantly in Kyrgyzstan, the Russian Federation and Thailand
(table 3.2). The Gini coefficient exceeds 40 in China, Fiji, Georgia, Malaysia, the Philippines, the Russian Federation and Turkey.
Table 3.2. Gini coefficients for selected Asia-Pacific countries, 1990-2012
Country 1990 2012 Change
Azerbaijan 35.0 33.7 -1.3
Bangladesh 27.6 32.1 4.5
Cambodia 38.3 36.0 -2.3
China 32.4 42.1 9.6
India 30.8 33.9 3.1
Indonesia 29.2 38.1 8.9
Iran (Islamic Republic of) 43.6 38.3 -5.3
Kazakhstan 32.7 29.6 -3.6
Kyrgyzstan 53.7 33.4 -20.3
Lao People’s Democratic Republic 30.4 36.7 6.3
Malaysia 47.7 46.2 -1.4
Mongolia 33.2 36.5 3.3
Pakistan 33.2 30.0 -3.2
Philippines 43.8 43.0 -0.8
Russian Federation 48.4 40.1 -8.3
Sri Lanka 32.5 36.4 3.9
Thailand 45.3 39.4 -5.9
Turkey 41.5 40.0 -1.5
Viet Nam 35.7 35.6 -0.1
Source: ESCAP statistics.
0
5
10
15
20
25
30
35
40
aisenodnIaidnIanihC
Pov
erty
hea
dcou
nt ra
tio (p
erce
ntag
e of
pop
ulat
ion)
Rural Urban

Economic and Social Survey of Asia and the Pacific 2015
104
While in almost all countries with available data, growth of per capita incomes accelerated in the last decade; however, income inequality also increased in many of them (annex table II). A widely observed phenomenon in the world is that inequality in urban areas is higher than in rural areas. This is true for both India and Indonesia. However, the opposite is the case for China where rural inequality is much higher than urban inequality (table 3.3), suggesting that the rural areas of China have been left out of the country’s otherwise very fast growth path.
The Gini coefficient is quite sensitive to changes in the middle of the income distribution, but less sensitive to changes at the extreme ends of the distribution (Atkinson, 1970). A more policy-relevant measure therefore may be to look at the income share that is held by the different population quintiles and to compare the top and bottom income quintiles.
In comparing the share of income held by the top quintile (20%) to that of the bottom quintile in countries and tracing how this ratio has evolved since 1990, a mixed picture emerges in the Asia-Pacific region. Data from 28 countries in the region show that the income share of the top quintile relative to that of the bottom quintile increased in 12 countries when comparing the 1990s with the period 2000-2012. In addition, in almost all of these 12 cases, except for Turkey and Viet Nam, the richest quintile was able to increase its share in national income, while the share of the lowest quintile declined. This pattern of a worsening of relative income shares between the top and bottom quintiles also took place in the region’s more populous economies, including Bangladesh, China, India and Indonesia. In China, the ratio has doubled since 1990; in 2009, the top quintile accounted for 10 times more income than the lowest quintile,
which placed China within the 5 countries in the region with the worst income distribution between quintiles (figure 3.3).
Nevertheless, in many countries the income distribution between the top and bottom quintiles has improved, with large declines in North and Central Asia, such as in Armenia, Kyrgyzstan, the Russian Federation and Uzbekistan. The largest decline in the income distribution ratio was observed in Maldives, where it dropped steeply from a massive 46.6 in 1998 to less than 7 in 2004.
Growth and income inequality. Overall while there is no strong evidence in the economic literature that growth affects income inequality or that income inequality affects growth, it has been generally concluded that high initial inequality is weakly associated with lower later growth. One reason for the lack of a clear relationship between growth and equality may be that growth rates are too volatile to give meaningful results; therefore, growth periods should be looked at (Pritchett, 2000). Moreover, while changing inequality – in either direction – leads to lower growth (Banerjee and Duflo, 2003), this could be because growth and inequality appear to derive from common underlying causes (Lundberg and Squire, 2003). However, recent research suggests that lower inequality may drive growth and enable societies to enjoy longer periods of economic expansion (Ostry, Berg and Tsangarides, 2014). Thus, high inequality can contribute to greater social, economic and political instability; when incomes are distributed more unevenly, the ruling classes may extend more effort in protecting their wealth and strengthening rent-seeking activities than in generating inclusive patterns of growth. Such a situation may undermine the quality of governance, but could also increase pressure for implementing inefficient, populist policies.
Table 3.3. Rural and urban inequality divide, selected countries, 2010
Source: Kakwani (2014).
Country Gini index
Rural Urban
China 40.6 35.7
India 30.0 39.3
Indonesia 31.5 38.1

105
CHAPTER 3Realizing Inclusive Growth
Figure 3.3. Ratio of income of richest to poorest quintiles, selected Asia-Pacific economies, 1990-2012
Source: ESCAP, based on World Bank, World Development Indicators. Available from http://data.worldbank.org/data-catalog/world-development-indicators.
Note: Periods compared are Armenia (1996-2010); Azerbaijan (1995-2008); Bangladesh (1992-2010); Bhutan (2003-2012); Cambodia (1994-2009); China (1990-2009); Fiji (2003-2009); Georgia (1996-2010); India (1994-2010); Indonesia (1990-2011); Islamic Republic of Iran (1990-2005); Kazakhstan (1993-2009); Kyrgyzstan (1993-2011); the Lao People’s Democratic Republic (1992-2008); Malaysia (1992-2009); Maldives (1998-2004); Mongolia (1995-2008); Nepal (1996-2010); Pakistan (1991-2008); the Philippines (1991-2009); the Russian Federation (1993-2009); Sri Lanka (1991-2010); Tajikistan (1999-2009); Thailand (1990-2010); Turkey (1994-2010); Turkmenistan (1993-1998); Uzbekistan (1999-2003); and Viet Nam (1993-2008). For those countries with only one period observed: Afghanistan (2008); Australia (1994); Hong Kong, China (1996); Japan (1993); the Republic of Korea (1998); Marshall Islands (1999); Federated States of Micronesia (2000); New Zealand (1997); Papua New Guinea (1996); and Singapore (1998).
In the past, it was assumed that the relationship between growth and inequality followed an inverted U shape, or what has come to be known as the Kuznets curve. The common interpretation was that, at low levels of income, inequality rises as people move from low-productivity agriculture to the more productive industrial sector, where average income is higher and wages are less uniform. As society matures and becomes richer, the underlying assumption is that the urban-rural gap is reduced and social transfers, including old-age pensions, unemployment benefits and the like, lower inequality (Kuznets, 1955). Thus, market forces first increase and then decrease economic inequality as an economy develops. However, the experience in the Asia-Pacific region confirms the
literature, in which it is argued that the Kuznets curve does not reflect a robust relationship: although inequality is negatively correlated with GDP per capita at the global level, this is not so when looking only at developing countries in the region (figure 3.4).
For one, it is not evident that the relevance of the Kuznets curve, which was extrapolated from cross-sectional data, is valid for time-series data. Indeed, some have argued that new international panel data with consistent time-series data for a large number of countries show no evidence of a Kuznets curve. Rather, these data show that inequality can decline in low-income countries and increase in high-income countries (Gallup, 2012).
3.44.04.24.24.64.74.74.75.05.05.35.45.65.85.95.96.26.26.36.86.86.86.97.07.07.37.78.08.38.39.59.69.710.111.312.540.270.0
0 5 10 15 20 25 30 35 40
JapanAfghanistan
PakistanKazakhstan
ArmeniaBangladesh
Republic of KoreaTajikistan
IndiaNepal
AzerbaijanKyrgyzstanCambodiaSri LankaViet Nam
Lao People’s Democratic RepublicUzbekistan
MongoliaIndonesia
New ZealandMaldives
BhutanThailandAustralia
Iran (Islamic Republic of)Russian Federation
TurkmenistanFiji
PhilippinesTurkey
GeorgiaHong Kong, China
SingaporeChina
MalaysiaPapua New Guinea
Micronesia (Federated States of)Marshall Islands
Ratio of income held by richest 20% of population to poorest 20%
Earliest year Latest year

Economic and Social Survey of Asia and the Pacific 2015
106
Figure 3.4. Income levels and inequality around the world
Source: ESCAP, based on World Bank, World Development Indicators. Available from http://data.worldbank.org/data-catalog/world-development-indicators.
For instance, Frazer (2006) found examples of low-income countries with significantly decreasing inequality, such as India until its per capita GDP passed $1,700, whereas others, such as the Republic of Korea, have achieved considerable advances in per capita GDP despite experiencing relatively small changes in inequality. Indeed, it has been argued that, while the concept underlying Kuznets’ hypothesis is correct – that inequality follows from structural change in economies – identification of this one particular structural change is too simplistic (Galbraith, 2010). For instance, during the three decades up to 1990 several economies in East Asia experienced rapid economic growth and declining inequality, a phenomenon that has been described as the “East Asian miracle”, due to the combination of fundamentally sound development policies (a stable macroeconomic environment) and systemic government intervention to foster development. This trend changed starting in the late 1980s, coinciding with the introduction of deregulation, privatization, globalization and pro-cyclical macro policies, which processes, though conferring benefits, have led to greater inequality.
1.1.3. Inclusiveness and employment
Poverty and inequality are important elements of the multidimensional concept of economic inclusiveness. Other important economic factors
include the availability of productive and decent employment, which is a decisive factor in whether a person can be lifted out of poverty and whether economic growth reduces income inequalities. Indeed, the lack of productive employment is one of the major reasons for the high incidence of poverty in many developing countries, whereas in many countries that successfully achieved both growth and equity, abundant employment opportunities had been created for the poor. Labour-intensive industrial expansion was the main vehicle for achieving this result in the Republic of Korea, for example, where light industries already produced labour-intensive goods in the 1960s and where subsequent investment in infrastructure helped to reduce unemployment substantially (Kniivilä, 2007). To reduce the risk of being trapped in a low-wage, low-productivity but labour-intensive development stage, countries need to strengthen the link between wages and productivity through appropriate wage and labour market policies.
Official unemployment rates are calculated on the basis of the number of registered unemployed people. As there is little benefit in registering in most countries (due, for instance, to the lack of unemployment insurance), formal rates of unemployment are relatively low in the region, declining to less than 10% in all of the 18 countries shown in Figure 3.5. Yet, in contrast, vulnerable
0
10
20
30
40
50
60
70
$ $10 000 $20 000 $30 000 $40 000 $50 000 $60 000 $70 000
Gin
i coe
ffici
ent (
late
st y
ear)
GDP per capita, PPP (constant 2011 international dollars), 2013
World w/o developing Asia-Pacific Developing ESCAP

107
CHAPTER 3Realizing Inclusive Growth
Figure 3.5. Unemployment and vulnerable employment in selected Asia-Pacific economies, most recent data
Source: ESCAP statistics.
employment is quite high – in most countries exceeding half the number of the persons employed.
Vulnerable employment is particlarly significant among women. For example, in East Asia, 52.7% of women that are employed are engaged in vulnerable employment, compared with 45.4% of men. In South-East Asia and the Pacific, the corresponding percentages are 65.9% and 58.5%, and in South Asia the figures are 83.8% and 75.5%, respectively. Moreover, women who choose or are compelled to combine work with childcare may find themselves in insecure jobs in the informal sector. It should also be mentioned that, in the Asia-Pacific region in 2012, 28.9% of females were engaged as contributing family workers compared with 9.2% of males (ESCAP, 2013a). Although some progress has been made, the gender wage gap persists, including in Australia, Cambodia, Mongolia, Myanmar and Sri Lanka. While the gap has narrowed over time, in 2011 it was particularly wide in Azerbaijan, Georgia and Pakistan. It is worth pointing out that the gender pay gap has narrowed in several economies, including Armenia; Azerbaijan; Georgia; Hong Kong, China; and
Thailand, while it increased or remained the same in other economies where data are available. One reason for the uneven progress that has taken place within economies is the fact that economic growth has not necessarily resulted in a commensurate rise in employment. Since the 1990s, the Asia-Pacific region has seen growth in both productivity and employment. Yet, the employment intensity of that growth, which is a numerical measure of how employment varies with economic output, was lower in the period 2008-2012 than in the 1990s in three subregions: East and North-East Asia; South and South-West Asia; and South-East Asia (table 3.4). This means that more jobs per unit of output were created in the 1990s than is currently the case. In contrast, in the Pacific subregion and in North and Central Asia, the number of jobs has increased since the 1990s.
The low employment elasticity of growth implies that economic growth is generating lower employment but more productive jobs, which is not necessarily unsatisfactory. However, in a region where large parts of the labour force are working in the informal, less
0 20 40 60 80 100
CambodiaLao People’s Democratic Republic
ThailandViet Nam
BhutanMalaysiaMongolia
Republic of KoreaIndia
BangladeshNepal
PakistanAzerbaijan
KazakhstanMaldives
IndonesiaKyrgyzstanPhilippines
Percentage
Vulnerable employment Unemployment

Economic and Social Survey of Asia and the Pacific 2015
108
Table 3.4. Average growth of output and employment, and employment intensity of growth in Asia-Pacific subregions
Source: ESCAP calculations.
Subregions GDP growth rate Total employment, Employment(percentage) change per annum intensity of growth
(percentage) (percentage)1990- 2000- 2008- 1990- 2000- 2008- 1990- 2000- 2008-1990 2007 2012 1999 2007 2012 1999 2007 2012
East and North-East Asia 3.2 4.4 3.8 1 1.1 0.5 0.31 0.25 0.13
North and Central Asia -5.1 7.5 2.5 -0.4 1.7 0.7 0.08 0.23 0.28
Pacific 3.3 3.4 2.3 1.9 2.5 1.7 0.58 0.74 0.74
South and South-West Asia 4.8 6.3 4.9 2.3 2.2 1.4 0.48 0.35 0.29
South-East Asia 5.4 5.6 4.7 2.4 1.8 2 0.44 0.32 0.43
productive sector, or where underemployment is a concern, more emphasis must be given to creating jobs.
The lower employment elasticity of growth may be the result of differences in relative performance of agriculture, industry and services that can be observed in many countries. In India, for instance, economic growth has been driven mostly by the expansion of the services sector, which grew by 9-10% per annum between 2002 and 2012, compared with agricultural growth of only about
3% per annum. Owing to differences in growth rates, the contribution of agriculture to GDP has thus declined in India from more than 50% in 1950 and about 30% in 1990 to 18.2% in 2013. Yet, agriculture still accounts for almost half of total employment in that country. Indeed, while the contribution of agriculture to GDP has almost halved in developing ESCAP countries since 1990 and currently contributes to only 10% of output, 4 out of 10 workers are still employed in this sector (figure 3.6).
Figure 3.6. Value added in GDP and percentage distribution of labour, by sector, developing ESCAP economies
Source: ESCAP statistics.
9.8
3852.2
GDP by sector in 2012
19.2
39.1
41.9
GDP by sector in 1990
5620.2
23.8
Employment by sector in 1990
39.7
24.8
35.5
Employment by sector in 2012
Agriculture Industry Services

109
CHAPTER 3Realizing Inclusive Growth
1.2. SOCIAL INCLUSIVENESS
As had been pointed out in the Survey for 1979, which widened the discussion of inequality beyond income and wealth, inequalities emerge in many other components of development (ESCAP, 1980). Indeed, “inequality in income” must be distinguished from “inequality of opportunity”, which refers to inequalities resulting from circumstances that are beyond an individual’s control. Thus, outcomes, such as “earnings” or “income”, can be determined by factors for which a person can be responsible, such as the amount of effort exerted in a job, as well as factors that are beyond a person’s control and are often dependent on family circumstances. In this context, there are multiple forms of deprivation, many of which tend to overlap and reinforce each other, which can be expressed as inequalities.
Two critical factors that are usually beyond a person’s control are the availability of education and health services. Indeed, access to health care and education are important objectives in their own right, to the extent that they are enshrined in the Universal Declaration of Human Rights. Health
and education are therefore critical social factors in identifying whether growth has been inclusive. They are also critical in the actual process of growth itself as improving health and education outcomes serves to accelerate economic growth.
1.2.1. Education
The region as a whole has made significant progress in improving access to education. One success is that most countries in the region, with the exception of Afghanistan and Pakistan, have achieved universal primary education. However, the picture is different for secondary education and even more so for tertiary education. There are still several countries where more than half the children of secondary school age are not enrolled in school. In several countries, girls’ secondary enrolment lags behind that of boys. However, some countries also face a new form of gender imbalance in education, where significantly more girls than boys receive education – in many cases because families put their boys to work. In several countries, net enrolment in secondary school among girls is relatively higher than among boys (figure 3.7).
Source: UNESCO Institute for Statistics.
Notes: a 2011 data, b 2008 data, c 2009 data, d 2006 data, e 2005 data, f 2010 data, g 2007 data.
Figure 3.7. Secondary school net enrolment of boys and girls, selected economies in the Asia-Pacific region, 2012
0 10 20 30 40 50 60 70 80 90 100
Solomon IslandsgTimor-LesteaAfghanistang
CambodiabPakistan
Lao People's Democratic RepublicBangladesh
MyanmargVanuatuf
BhutanPhilippines
NepalKiribatie
NauruMalaysia
IndonesiaSamoa
ThailandCook Islands
MongoliadFiji
TongaKyrgyzstana
ArmeniacSri Lankaa
TurkeyIran (Islamic Republic of)
GeorgiabAustralia
KazakhstanTajikistanaAzerbaijan
Brunei DarussalamRepublic of Korea
New ZealandJapan
Females Males

Economic and Social Survey of Asia and the Pacific 2015
110
Average years of education for boys and girls, by income quintile, selected countries in the Asia-Pacific region
Q1 (lowest) Q2 Q3 Q4 Q5 (highest)Girls Boys Girls Boys Girls Boys Girls Boys Girls Boys
Armenia 8.3 8.1 8.8 9.2 9.3 9.0 9.5 9.6 9.6 10.1
Azerbaijan 9.4 10.1 10.1 10.3 10.4 11.0 10.9 11.1 11.4 11.4
Bangladesh 3.5 3.8 4.5 4.8 5.6 5.6 6.6 6.8 8.1 8.0
Cambodia 2.8 4.0 3.7 4.9 4.7 5.8 5.8 6.9 7.8 8.7
Georgia 10.6 10.2 11.2 11.0 11.3 11.4 12.0 11.7 12.7 12.4
India 3.0 5.7 5.0 7.2 7.3 8.4 9.2 9.5 11.2 11.1
Indonesia 6.7 6.6 7.9 7.8 9.0 9.0 10.0 10.0 11.0 11.3
Kazakhstan 11.6 11.2 12.1 11.4 12.4 11.9 12.8 12.5 13.4 13.1
Kyrgyzstan 10.5 10.4 10.6 10.4 10.6 10.4 10.7 10.4 11.0 10.8
Lao PDR 4.5 7.4 8.6 9.0 8.3 9.0 7.6 9.0 8.2 8.0
Myanmar 3.4 3.8 4.5 4.9 5.5 5.6 6.6 6.5 7.7 7.7
Nepal 2.4 5.0 3.3 5.6 4.3 6.4 5.9 7.4 8.2 9.3
Pakistan 1.1 3.8 2.3 5.0 4.4 6.2 6.4 7.3 8.8 9.1
Philippines 7.1 5.8 8.9 7.7 9.9 9.0 10.9 9.9 11.0 11.0
Tajikistan 8.6 9.8 8.6 10.1 9.2 10.1 9.2 10.3 10.3 11.3
Turkey 5.2 7.4 7.4 9.0 8.4 9.2 7.4 8.7 8.9 9.4
Viet Nam 5.2 5.3 7.8 7.8 8.5 8.8 9.5 9.2 10.2 10.7
Source: UNESCO, Deprivation and Marginalization in Education (DME) database. Available from www.unesco.org/fileadmin/MULTIMEDIA/HQ/ED/GMR/html/dme-1.html.
It also should be noted that disparities within countries occur not only along gender lines, but also particularly between rural and urban areas and according to income group. Available data show that in general higher-income groups receive more years of schooling than lower-income groups. Moreover, while in many countries girls in lower-income quintiles receive fewer years of education, in higher-income quintiles the gap between boys and girls is significantly smaller, if one exists at all. For example, in India in the lowest-income quintile, girls receive on average half as many years of education as boys. In Pakistan, the gap is even more glaring (table 3.5). Thus, in many countries, gaps in education between boys and girls are primarily an issue of income. This is especially so in many countries where there are differences in the quality of the education received, with the poor attending mainly poorly maintained, overcrowded public schools, whereas the children of wealthier parents can attend well-funded private schools, a situation which over time aggravates intergenerational inequality.
Data from household surveys also show that there are disparities in secondary school attendance
between rural and urban areas and that gender gaps are often more pronounced in rural areas (figure 3.8). In some countries, such as India, Nepal and Viet Nam, more girls in urban areas than boys in rural areas attend school, making the rural-urban gap wider than the gender gap. In Bangladesh and Indonesia, girls’ school attendance is higher than that of boys in rural areas. Specific policies that encourage girls’ school attendance in rural areas may be the reason for this phenomenon (Khandker, Pitt and Fuwa, 2003).
While much has been achieved in increasing school enrolment in the region, there are still large disparities in the quality of education that different population strata can access. Using educational achievement as an indicator, disparities are particularly great between different income groups (see box 3.3). For example, in India in 2005, 62% of those in the lowest-income quintile were found in the bottom 20% of the distribution of years of schooling attained for the age groups 17-22 years and 23-27 years, compared with only 3% of the highest-income quintile. Moreover, in India only 20% of assessed children in the lowest-income quintile completed primary school and achieved
Table 3.5.

111
CHAPTER 3Realizing Inclusive Growth
Figure 3.8. Gender and rural/urban gaps in secondary school attendance, selected countries
Source: United States Agency for International Development, Demographic and Health Surveys, DHS Program STATcompiler. Available from www.statcompiler.com.
an international minimum learning standard in reading, compared with 55% of children in the highest-income quintile. These statistics suggest that there are large differences in the quality of education received according to income quintiles. Similarly large wealth disparities also exist in Mongolia, where 55% of the poorest population group was found in the bottom educational quintile, but only 3% of the richest were found in that quintile. By contrast, wealth disparities in educational attainment are relatively low in North and Central Asia, including in Uzbekistan, where the richest people are more likely to be found in the lowest educational quintile than the poorest people. It is also necessary to take into consideration that secondary enrolment rates are very high in North and Central Asia.
Large regional disparities also exist within countries. In India, for instance, 38% of the population between 20 and 24 years of age in the state of Bihar were in the bottom quintile of educational distribution, whereas this was the case for only 2% in Kerala. In the Philippines, 45% of the population aged 17-27 years were in the bottom 20% of the distribution of years of schooling attained, compared with only 7% for those from the National Capital Region.
1.2.2. Health
Access to health services is a further critical element in identifying whether growth has been inclusive. Better health, for instance, contributes to growth in several ways. For one, it improves the motivation and productivity of workers. It also reduces absenteeism within the workforce and can therefore contribute to strengthening growth. Better health may result in a decline in the dropout rate among school children and thus reinforce the positive impact of education on growth and equity, especially intergenerational inequality. As is the case with education, improvement in the health status of the poor is likely to increase their income-earning potential and thus reduce the prevailing disparity in distribution. Access to well-funded, high-quality health services should be available to the entire population. This can be done through the introduction of a variety of health insurance schemes. For Governments, health concerns also extend to such areas as improved sanitation and the provision of safe drinking water.
Access to health services is defined by accessibility, which is largely related to geographic location; affordability, which entails whether people can afford those services that are available; and acceptability,
0
10
20
30
40
50
60
70
80
90
100
Azer
baija
n
Bang
lade
sh
Cam
bodi
a
Indi
a
Indo
nesi
a
Nep
al
Paki
stan
Viet
Nam
Per
cent
age
Males Urban Males Rural Females Urban Females Rural

Economic and Social Survey of Asia and the Pacific 2015
112
Box 3.3. Measuring inclusiveness in schooling
To achieve inclusive growth, Governments should strive to expand opportunities and make opportunities equitable for their people. This is particularly relevant for education, as having the opportunity to attend schools that are egalitarian and well-funded is critical for the future of any society due to the importance of having a skilled workforce and an informed citizenry. Thus, if children are deprived of opportunities to attend school, then the society will have no hope of building its human capital, which is a critical requirement for inclusive growth.
An opportunity index, which takes account of both the level of opportunities and the equity of opportunities across income quintiles in terms of enrolment in primary and secondary schooling (and hence ignores quality), is presented in figure A below for seven countries in Asia and the Pacific.a The data show that Sri Lanka offers the best opportunities for children in the primary and secondary school age groups (6-11 years and 12-17 years, respectively) followed by Viet Nam, Indonesia and the Philippines. Pakistan offers the fewest opportunities, followed by Bangladesh. In all seven countries, the percentage of children attending school increases monotonically from the bottom quintile to the top quintile between the two most recently available household surveys. This means that children coming from rich households have a better opportunity to attend school than those coming from poor households.
In Sri Lanka, almost all children in the primary school age group are attending school. The percentage of such children attending school was 99.39 % so there were hardly any children who did not attend school. The value of the equity index being 100 means that all children, regardless of their economic circumstances, have the opportunity to attend primary school. The situation in Sri Lanka is in stark contrast to the one in Bangladesh and Pakistan. In Pakistan, for instance, educational opportunities available to children are very few and largely determined by the economic circumstance of parents: only 57.4% of children from lowest-income quintile attended primary school in 2007/08 compared with 93.2% of those in the top quintile. Similarly, only 34.1% of children from the lowest-income quintile attended secondary school compared with 83.2% of those from the richest quintile.
In Indonesia, government policies have resulted in an improvement in the availability of opportunities for children of both primary and secondary school age. For instance, in 2005, Indonesia launched its Education for All National Plan of Action. Its strategies to achieve education for all, particularly in the secondary education sector, included the goal of reducing the cost of schooling as far as parents and communities were concerned, building more school facilities, improving quality assurance procedures (curriculum and examination systems) and developing a professional teaching force. In order to lighten education costs for poor students and to keep students in school, the Government committed to abolishing school fees, including tuition and monthly fees, at the primary and lower secondary levels.b Thus, 87% children aged 6-11 years attended school in 2000. In other words, an estimated 3.24 million children in the primary school age group had previously been deprived of the opportunity to attend school. By 2009, 94.3% of children were attending primary school, despite the relevant cohort being larger in size, suggesting that the opportunity for children of primary school expanded over the 9-year period. Nonetheless, 1.25 million children were still being deprived of the opportunity to receive primary schooling in 2009. With regard to secondary schooling, in 2002, 6.62 million children in the secondary school age group had been deprived of the opportunity to attend school; by 2009, this number decreased to 4.92 million children.
In contrast, opportunities for children of secondary school age in the Philippines declined significantly and became less equitable between 2002 and 2008, as the opportunity index decreased by more than 5% to 74.4. Thus, when looking at secondary schooling as an indicator, the pattern of growth in the Philippines cannot be said to be inclusive.
Source: Based on Kakwani (2014).
a Kakwani (2014) developed an opportunity index, which is the product of the average opportunity available to the population and the equity of opportunity; the index informs how equitably opportunities are enjoyed by the population. The opportunities are said to be equitable (inequitable) if the equity index is greater (less) than 100. Since both equity indices are less than 100, it may be concluded that opportunities are inequitable.b See UNESCO, Secondary Education Regional Information Base: Country Profile – Indonesia (Bangkok, 2010). Available from www.uis.unesco.org/Library/Documents/Indonesia.pdf.
Figure A. Opportunity index for children in selected countries
0
10
20
30
40
50
60
70
80
90
100
Sri Lanka(2009-10)
Viet Nam(2008)
Indonesia(2009)
Philippines(2007)
Bhutan(2007)
Bangladesh(2000)
Pakistan(2007-08)
Primary school age groud Secondary school age group

113
CHAPTER 3Realizing Inclusive Growth
which relates to the question of whether people are willing to use services when they are available and possibly affordable.
Accessibility of health-care services. While most countries in the Asia-Pacific region have made efforts to establish a system for the provision of public health, there are still spatial differences which in some cases have even intensified. For example, a large number of countries in the Asia-Pacific region cited the tendency to concentrate services in urban areas as a major reason for the lack of progress in the reduction of maternal mortality and infant mortality (United Nations, 2014c). A study conducted in several states of India found that 32% of respondents in rural areas did not have access to an outpatient care facility within 5 km of their homes, while only 17% in urban areas did not have access to such a facility. In rural areas, 63% of the respondents had to travel more than 5 km to access an inpatient facility, while in urban areas, only 27% had to travel more than 5 km to the closest inpatient facility (IMS Institute for Healthcare Informatics, 2013).
In addition, while Bangladesh, where 70% of the population reside in rural areas, has a relatively extensive public health infrastructure, only 44% of the major government facilities are rural-based (Rahman, Ashaduzzaman and Rahman, 2005). Moreover, many public health centres do not have qualified and experienced health professionals, with the result that the service that they can provide is often of poor quality. Rural-urban divides are even more pronounced in archipelagos or countries where the population lives in distant mountainous areas. For example, in Papua New Guinea the doctor-to-patient ratio is lower than 1 doctor per 10,000 people. Moreover, in 2010 less than 60% of health-care facilities in rural areas had a water supply in delivery rooms (WHO and Papua New Guinea, 2012). Similarly, in the highlands of Viet Nam, lack of transport facilities is often considered to be the key barrier to accessing health-care services (Bedford and others, 2013).
Affordability of health-care services. In many cases, people may not be able to afford health-care services even when they are available. In some instances, people may be able to access health-care services but only after they have made detrimental reductions in other household expenditures to afford so-called catastrophic
payments. Indeed, in several countries, most health-care expenditure has to be borne by private households. This is reflected in the percentage of out-of-pocket payments compared with the total expenditure on health. If health-care costs have to be borne largely by the households themselves, then such expenditures are barely affordable to many of the households. Out-of-pocket payments in the Asia-Pacific region range from almost none in Kiribati and Tuvalu to almost 80% in Afghanistan and a number of other countries. In 13 countries in the region, almost 50% of all health expenditures emanate from private households, a situation that constitutes a major barrier for people to access health-care services (figure 3.9).
Surveys have shown that, particularly in lower-income quintiles, the cost of services is cited as the main barrier to using health-care services. For example, the Lao People’s Democratic Republic introduced user fees for health-care services in 1995. To date, a relatively large proportion of health-care expenditures stems from out-of-pocket payments. Thus, financial barriers are considered as a key constraint for using health-care services, particularly among the poorest households. In rural areas, households in the highest-income quintile are three times more likely to seek hospital care than households in the lowest-income quintiles (WHO and Lao People’s Democratic Republic, 2012).
However, there are also several countries in the Asia-Pacific region, among them several least developed countries, where private households bear only a small proportion of health expenditure. For example, Kiribati provides a system of free public health-care services for all its citizens, which is largely a tax-funded benefit although it is also funded by official development assistance. In that country, access to health-care services is determined largely by geography – there is less access in the outer islands – as well as by other factors, such as the limited decision-making power of women. Several other countries have achieved almost universal health-care services, whether through public service provision or through universal public health insurance, such as in Thailand. Other countries keep out-of-pocket payments low through the involvement of civil society actors in the provision of social services, such as faith-based organizations in Papua New Guinea (WHO and Papua New Guinea, 2012).

Economic and Social Survey of Asia and the Pacific 2015
114
Acceptability of health-care services. There are also instances where people refrain from using health-care services even though they are available and affordable. In some cases, this may be due to the perceived lack of good-quality care, such that those who can afford to do so visit health facilities in other countries. In other cases, the services may not be considered as socially or culturally appropriate, which is particularly the case when it comes to sexual and reproductive health services. Studies have shown that, among patriarchal-oriented societies, husbands or in-laws often decide whether women in the household should make use of health-care services (Bedford and others, 2013). For example, studies on Bangladesh contain reports of numerous examples when women were denied pre- and antenatal health-care services because male family members considered the use of such services to be inappropriate. However, studies have also shown that the use of sexual and reproductive health services as well as health-care services for children increases with the educational level of both women and husbands, and it increases for younger women. Thus, cultural norms preventing women
Out-of-pocket expenditure as a percentage of total health expenditure, selected economies in the Asia-Pacific region, 2012
Source: World Bank, World Development Indicators. Available from http://data.worldbank.org/data-catalog/world-development-indicators.
from using health-care services are more prevalent among the older generation and groups with lower education.
Studies on Viet Nam have also found that minority ethnic groups tend to use health-care services to a lower extent than majority ethnic groups. For example, indigenous communities in that country often do not make use of health services, even if their household is in close proximity to a health-care facility (Bedford and others, 2013). Yet, across income quintiles, public health facilities are relatively equitably utilized (box 3.4).
As a result of focusing on such factors as accessibility, affordability and acceptability, it can be found that the use of skilled birth attendants in many countries tends to be significantly lower in rural than in urban areas and also tends to be lower among lower-income groups than among higher-income groups. It also has to be considered that lower-income groups are also characterized by lower educational levels. Thus, in some cases, income is not the major determinant; education is.
0
10
20
30
40
50
60
70
80
Kirib
ati
Tuva
luSo
lom
on Is
land
sTi
mor
-Les
teSa
moa
Vanu
atu
Brun
ei D
arus
sala
mPa
pua
New
Gui
nea
Mic
rone
sia
(Fed
.Sts
.)Pa
lau
Tong
aM
arsh
all I
slan
dsTh
aila
ndBh
utan
Turk
ey Fiji
Rus
sian
Fed
erat
ion
Chi
naM
ongo
liaKy
rgyz
stan
Mal
aysi
aR
epub
lic o
f Kor
eaTu
rkm
enis
tan
Lao
PDR
Kaza
khst
anU
zbek
ista
nIn
done
sia
Mal
dive
sVi
et N
amN
epal
Sri L
anka
Philip
pine
sIra
n (Is
lam
ic R
epub
lic o
f)Ar
men
iaIn
dia
Sing
apor
eTa
jikis
tan
Cam
bodi
aPa
kist
anBa
ngla
desh
Geo
rgia
Azer
baija
nM
yanm
arAf
ghan
ista
n
Per
cent
age
of to
tal h
ealth
exp
endi
ture
Figure 3.9.

115
CHAPTER 3Realizing Inclusive Growth
Box 3.4. Measuring inclusiveness in access to health care in Indonesia, the Philippines and Viet Nam
The experiences of Asia and the Pacific in terms of access to health care and treatment received are quite varied. For instance, the health-care system in Indonesia is inequitable and favours the rich more than the poor. For instance, while only 18.7% of babies were delivered by qualified doctors in 2014, among the poorest 20% of the population, only 7.8% of babies were delivered by doctors compared with more than 40% for the richest 20% of the population. An equity index of only 0.76 shows that a large proportion of poor women are deprived of this very basic health service which is critical for the health of both mothers and babies.a
In terms of access to health-care facilities, the equity index for private hospitals is only 0.54, which implies that the poor do not have much opportunity to utilize private hospitals which tend to provide much higher-quality health care compared with public hospitals. Moreover, it is striking to note that the equity index for government hospitals is only 0.78, which is much less than 1, meaning that even when utilizing government hospitals the poor enjoy less opportunity than the non-poor. Since public hospitals are funded largely by the Government, it is critical to ensure that poor people can more readily access them. Currently, the richer population is utilizing more of services in both private and public hospitals.
Another basic health service is the vaccination of babies and young children, which is critical as children who have been deprived of appropriate doses of vaccination can be at risk of contracting various diseases and suffering serious health issues or even dying. Moreover, the provision of vaccination for all children is the cheapest kind of intervention that the Government can provide. Overall, using polio as an example of a highly dangerous disease, 9.3% of children had no protection in Indonesia in 2014. Yet, the equity index of 0.99 indicates that the children from both poor and non-poor households have more or less equal probability of getting a polio vaccination. Thus, family circumstances do not play a key role in protecting the children from serious diseases.
The Philippines is also characterized by serious inequity in accessing even very basic health services. For instance, in 2007 the equity index measure for seeking treatment from medical professionals was only 0.84, implying that there is a large degree of inequity in getting treatment from professional medical personnel. Yet, the equity index of 0.91 in the utilization of government hospitals suggests that the inequity is relatively smaller than that observed for Indonesia in 2014. Overall, the utilization rate was about 26.7% among the poorest 20% of the population, which increased to almost 35.8% among those belonging to the third quintile. The utilization rate among the richest 20% of the population was the lowest at about 23.2%.
In contrast, public health facilities are relatively equitably utilized in Viet Nam, such that family circumstances do not play a key role in the overall provision of access to health services. Thus, government facilities have an equity index equal to or greater than 1, with the exception of provincial hospitals and other State-owned hospitals, which are however not equitable because they are utilized largely by the urban population. Furthermore, private hospitals are located largely in urban areas and are utilized mainly by the richer population.
Source: Based on Kakwani (2014).
a Kakwani (2014) developed an opportunity index which is the product of average opportunity available to the population and equity of opportunity, which informs how equitably opportunities are enjoyed by the population. The opportunities are considered to be equitable (inequitable) if the equity index is more (less) than 100.
In some countries in the Asia-Pacific region, there are almost no differences in the presence of skilled birth attendants by income group or by rural and urban area, in spite of relatively high out-of-pocket expenditures involved with this service. This means that services are available, and there is a high awareness of the need for skilled birth attendants. This is the case in North and Central Asian economies, such as in Armenia and Kazakhstan, where initially the level of human development and the quality of human capital was much higher than in other developing countries with similar levels of income. Indeed, in the early 1990s several of these countries, including Uzbekistan, had developed a
system of social institutions at a level comparable with rich countries which offered free health care, primary, general secondary, secondary-special and higher education (Djamalov and Eshonov, 2014).
In other countries, the use of skilled birth attendants increases with income, but not proportionally, which shows that other factors in addition to affordability also play a role. For example, in Bangladesh in 2011, skilled birth attendants (doctors and other health-care staff) were present for 20.8% of births, yet there was a large degree of diversity among income groups, with the percentage of skilled birth attendants ranging between 11.5% for the lowest-

Economic and Social Survey of Asia and the Pacific 2015
116
Percentage of skilled birth attendance in three years preceding the survey, by income quintile, in selected countries in Asia and the Pacific. Most recent household data available.
income quintile to 63.7% for the highest-income quintile. The difference between the fourth and fifth income quintile was particularly high. In contrast, in Turkey, the use of skilled birth attendants increases most strongly between the lowest and the second lowest-income quintile, while close to 100% of births in the highest-income quintile are attended by skilled personnel (figure 3.10). The utilization of maternal health services, including skilled birth attendants, varies between countries due to differences in total health spending and proportion of government spending on health (Kruk and others, 2007). Moreover, utilization of skilled birth attendants across income quintiles has been found to be more equitable when higher health expenditures are accompanied by redistributive education policies (Kruk, Prescott and Galea, 2008).
1.3. INCLUSIVE DEVELOPMENT AND THE ENVIRONMENT
There is general agreement that economic growth, as measured by per capita national income, negatively affects environmental quality (Costantini and Martini, 2010). While degradation of the environment has adverse impacts on everyone,
the poor are particularly affected as they are less resilient to the negative impacts of environmental degradation. At the same time, it is important to point to the two-way relationship between the environment and inequality and poverty. In particular, inequality and poverty also contribute to environmental degradation. This is because in less developed countries and for the poor in general, the focus is less pronounced with regard to the complex issues of the environment and how the environment affects their economic future. Rather, increasing one’s income and securing one’s survival are often more relevant. Environmental degradation can therefore also be an outcome of economic inequality.
When moving up the development ladder and tackling poverty and inequality, efforts must be made to safeguard the environment and to increase the access of people to basic infrastructure, such as electricity, clean drinking water and sanitation. Indeed, access to these forms of basic infrastructure can contribute to the improvement of health conditions and to a reduction in hazardous deaths. As such, it is important to consider the inclusiveness of growth while taking environmental factors into account.
Source: United States Agency for International Development, Demographic and Health Surveys, DHS Program STATcompiler. Available from www.statcompiler.com.
0
10
20
30
40
50
60
70
80
90
100
Q1 Q2 Q3 Q4 Q5
Per
cent
age
Income quintiles
Bangladesh Cambodia India Indonesia Nepal
Pakistan Philippines Timor-Leste Turkey
Figure 3.10.

117
CHAPTER 3Realizing Inclusive Growth
1.3.1. Access to improved sanitation and water facilities
Asia-Pacific countries made important progress in increasing access to improved water sources from 1990 to 2011. In fact, in the whole region, the percentage of people without access to improved water sources dropped from about 27% to about 8% during the above-mentioned period. The percentage of the population with access to improved water sources ranges between 88% in the Pacific and 93% in North and Central Asia (figure 3.11). Despite this progress, disparities still exist between rural and urban areas. For instance, in Afghanistan, Cambodia, Mongolia, Timor-Leste and Turkmenistan, the percentage of the population having access to improved water facilities is about 50% higher in urban areas than in rural areas.
Compared with the accomplishments recorded in increasing people’s access to improved water sources, achievements in their access to improved sanitation have been relatively moderate, with only about 59% of the Asian-Pacific population having access to such facilities in 2012 compared with about 36% in 1990. The South and South-West Asian subregion is conspicuous for having
the lowest level of access to improved sanitation owing to the very low rates recorded in Afghanistan, Bhutan, India, Nepal and Pakistan. As a result, 798 million people lack access to these facilities in South and South-West Asia. In Nepal and Pakistan, this situation may be linked to increasing pressures from urbanization as the number of people living in slums in urban areas has increased significantly (figure 3.12).
Moreover, access to improved sanitation is also characterized by important disparities between rural and urban areas. The percentage of people having access to improved sanitation in urban areas of Bhutan, Cambodia, India, Pakistan and Timor-Leste was equal to more than twice that recorded in rural areas in 2012.
1.3.2. Access to energy and growth in total greenhouse gas emissions
Greenhouse gas (GHG) emissions increased considerably in the Asia-Pacific region between 1990 and 2010 on the back of the significant economic expansion recorded in many economies in the region. Such emissions jumped by an average growth rate of 4.1% between 2000 and 2010, over
Figure 3.11. Access to improved water sources and sanitation, 1990 and 2012
Source: ESCAP, Statistical Yearbook for Asia and the Pacific 2014 (ST/ESCAP/2704, Bangkok).
Access to improved water sources Access to improved sanitation
0102030405060708090
100
East
and
Nor
th-E
ast A
sia
Nor
th a
nd C
entra
l Asi
a
Paci
fic
Sout
h an
d So
uth-
Wes
t Asi
a
Sout
h-Ea
st A
sia
Per
cent
age
of p
opul
atio
n
1990 2012
0102030405060708090
100
East
and
Nor
th-E
ast A
sia
Nor
th a
nd C
entra
l Asi
a
Paci
fic
Sout
h an
d So
uth-
Wes
t Asi
a
Sout
h-Ea
st A
sia
Per
cent
age
of p
opul
atio
n
1990 2012

Economic and Social Survey of Asia and the Pacific 2015
118
Comparison between the change in percentage points and growth rate of the urban population living in slums in selected countries, between 2000 and 2010
the average growth rate of 0.9% during the 1990s (figure 3.13). The contribution of the Asia-Pacific region to total global GHG emissions was more than 50% from 1990 to 2010, with most emissions originating in East and North-East Asia; China accounts for more than 80% of the emissions.
The increase in GHG emissions, comprising a sizeable quantity of carbon dioxide (CO2), was driven mainly by the combustion of fossil fuels for electricity generation, transport and industrial uses. Even if the CO2 intensity (measured in metric tons of CO2 emissions per $1,000 of GDP) during
Source: ESCAP, based on data from the United Nations Human Settlements Programme, Department of Economic and Social Affairs, World Urbanization Prospects: The 2014 Revision (ST/ESA/SER.A/352); and United Nations, The Millennium Development Goals Report 2013 (Sales No. E.13.I.9).
Figure 3.13. Percentage of change per annum in total greenhouse gas emissions, by subregion, 1990-2010
Source: ESCAP, Statistical Yearbook for Asia and the Pacific 2014 (ST/ESCAP/2704, Bangkok).
-20
-10
0
10
20
30
40
Bang
lade
sh
Viet
Nam
Indi
a
Indo
nesi
a
Chi
na
Turk
ey
Philip
pine
s
Nep
al
Paki
stan
Per
cent
age
Change in percentage points of the proportion of urban population living in slumsChange in the absolute number of people living in slums
-4 -2 0 2 4 6 8
North and Central Asia
Pacific
World
South-East Asia
South and South-West Asia
Asia and the Pacific
East and North-East Asia
2000-2010 1990-1999
Figure 3.12.

119
CHAPTER 3Realizing Inclusive Growth
the reference period had been decreasing, it still remains quite high and was approximately 50% higher than the global average intensity in 2010. This reflects the significant use of fossil-fuel-intensive technologies in the region. In such countries as Cambodia, the Lao People’s Democratic Republic and Mongolia, the CO2 intensity was into two-digit levels in 2010, while the intensity was equal to 1.2 in the Asia-Pacific region and 0.8 at the global level.
In responding to the increasing demand for energy, the production of electricity has increased significantly since 1990. Compared with urban populations, however, rural populations in many countries still do not have access to basic energy services (figure 3.14). Thus, at least 620 million people lack access to electricity in the region and almost 1.9 billion people still rely on biomass for cooking (International Energy Agency, 2014). The use of biomass is a significant health concern due to the amount of air pollution it produces when burned indoors; more than 1 million premature deaths annually in India and China can be attributed to exposure to household air pollution (WHO, 2014).
In terms of sources of energy, renewable ones, such as biofuels, are becoming increasingly important but fossil fuels, particularly coal, remain major energy
sources used in production processes. Biofuels are produced mainly by China, India, Malaysia, the Philippines and Thailand; the coal production of China and India accounts for more than half of the global output (UNESCO, 2014). However, the use of both categories of products also poses issues of water stress because their production processes are water-intensive, and the production of biofuels increases the demand for arable land – thus leading to deforestation.
Only marginal efforts have been made to conserve forest areas in the region; as a result, the percentage of conserved forest areas has barely increased, inching up from 30.5% in 2005 to 30.6% in 2012. The scant growth is attributable mostly to the achievements recorded in China and India where more trees have been planted than in other areas. In fact, by excluding China and India from the regional analysis, a regression would have been recorded, with East and North-East Asia and South-East Asia (excluding the Philippines, Singapore and Viet Nam) being the subregions most adversely affected by deforestation. These developments affect the poorest populations as they rely heavily on forests to ensure their access to food, medicine and several other non-wood products needed to sustain life.
Access to electricity in selected Asian economies, 2012, and sources of electricity production in the region, 1990-2012
Source: ESCAP, based on data from the International Energy Agency, World Energy Outlook 2014 (Paris, OECD/IEA, 2014); and ESCAP, Statistical Yearbook for Asia and the Pacific 2014 (ST/ESCAP/2704, Bangkok).
0% 10% 20% 30% 40% 50% 60% 70% 80% 90% 100%
Democratic People's Republic of Korea
Cambodia
Myanmar
Bangladesh
Philippines
Pakistan
Indonesia
Lao People's Democratic Republic
Nepal
Mongolia
Sri Lanka
Rural electrification rate (%) Urban electrification rate (%)
0
10
20
30
40
50
60
70
80
90
100
1990 1994 1998 2002 2006 2010
Tota
l ele
ctric
ity o
utpu
t (in
per
cent
age)
Coal Oil Natural gas Nuclear Hydro
Figure 3.14.

Economic and Social Survey of Asia and the Pacific 2015
120
2. ESCAP INDEX OF INCLUSIVENESS
The foregoing discussion shows that any judgement call on whether growth has been inclusive in Asia and the Pacific becomes clouded once the multidimensional character of inclusiveness is considered. For example, while a country may have made significant advances in terms of social development, its success in accelerating poverty reduction or reducing income inequality may be less obvious. Indeed, even within each category of the three dimensions of sustainable development, that is, economic, social and environmental development, it may not be clear whether growth has been inclusive. How would one judge, for instance, the case of the region’s two most populous countries, India and China? In terms of economic inclusiveness, the rate of extreme poverty has declined in these countries by 34% and 80% respectively since 1990, yet this has happened at the cost of a large increase in income inequality, with the Gini coefficient increasing by 10% and 30% respectively.
To address this issue in a more methodological manner, this section presents a composite index for each of the three dimensions of sustainable development, comprising the indicators presented above, as well as a composite index of the three indices to gauge how growth has impacts on overall inclusiveness.
There is, of course, some controversy in creating composite indicators by adding up indicators from different fields to arrive at a total score, as reducing any multidimensional phenomenon to a simple numerical value raises technical and political issues (Atkinson and Marlier, 2010). Doing so has, for instance, raised concerns and issues regarding the substitutability between components of composite indicators to achieve higher scores (Ravillion, 2012). Keeping these caveats in mind, the creation of an aggregate performance measure is nevertheless useful when presenting an overall picture and when drawing comparisons between countries and over time. Indeed, several composite indicators that arguably capture “inclusiveness” have already been created. These include, for example, the World Bank’s Country Policy and Institutional Assessment for policies to bring about social inclusion and equity, and the Human Development Index of UNDP. The Asian Development Bank has created the Framework of Inclusive Growth Indicators (box 3.5), although it is not a composite indicator. It
should also be mentioned that the scoring methods of these indicators are not always clear, and for some indices the choice of weights is discretionary. Moreover, in some cases input variables that represent policies are mixed with output variables of inclusiveness.
2.1. The economic dimension of inclusive growth
The discussion on indicators of economic inclusiveness presented in the previous section demonstrated that country experiences, when considering different dimensions of economic inclusiveness, vary considerably. Whereas almost all countries have made significant progress in reducing rates of poverty, the levels of inequality have increased in many countries, and access to decent and productive employment, including for females, remains precarious. Creating a composite index that captures the above-mentioned elements would enable a simple comparison across countries and time. The following indicators are therefore combined into a composite indicator that gives equal weight to each of the 5 components: (a) the poverty headcount ratio at $1.25 per day in 2005 PPP (percentage of population); (b) the Gini coefficient; (c) the ratio of income shares held by the highest quintile to the share held by the lowest quintile; (d) the unemployment rate (percentage), and (e) the ratio of the female-to-male labour-force participation rate (percentage). Data availability enabled scoring for 22 countries across the periods 1990-1999 and 2000-2012 (table 3.6).
Data show that scores for economic inclusiveness increased since the 1990s in all countries except Georgia and Turkey. In Georgia, all five components of the index deteriorated, while in Turkey the decrease was driven by a decline in employment and the relative female labour-force participation rate, as well as an increase in the share of income held by the highest quintile relative to that of the lowest quintile. The largest increase in scores occurred in Armenia, Azerbaijan and Maldives.
Overall, however, it must be noted that economic inclusiveness is primarily driven by the region’s overwhelming success in reducing rates of extreme poverty. In fact, the increase in this (normalized) indicator is sufficiently large to offset the worsening in income inequality and in employment that has to a large degree characterized the region, especially in the three most populous countries, China, India and Indonesia.

121
CHAPTER 3Realizing Inclusive Growth
Box 3.5. Existing indices and inclusiveness
To help guide the allocation of International Development Association lending resources, the World Bank has since 1998 included governance and social policy indicators as part of its Country Policy and Institutional Assessment (CPIA). This mechanism is used to assess the quality of a country’s current policy and institutional framework. A total of 16 CPIA criteria are grouped into four clusters, one of which, the CPIA for Policies for Social Inclusion and Equity, is particularly relevant for measuring just how inclusive economic growth has been in a country.a This cluster represents the average score of five criteria: (a) gender equality; (b) equity of public resource use; (c) the building of human resources; (d) social protection and labour; and (e) policies and institutions for environmental sustainability. Data on this cluster, spanning the period 2004-2013, are available for 28 countries in the Asia-Pacific region.
Overall, the scoring of countries in the region ranks between 2.6 and 4.1, where countries are rated on a scale from 1 (low) to 6 (high). A rating of 1 corresponds to a very weak performance; a rating of 6, to a very strong performance. Since 2005, there have been improvements in most countries in terms of their scoring for policies for social inclusion and equity, suggesting that development has become more inclusive in those countries. Azerbaijan and Nepal have improved their scores by one full point in the human resources rating. Nepal has improved its gender equality rating score by 1 and Mongolia has improved its score by 1 for the rating on policy and institutions for environmental sustainability. Yet, scores in eight countries in the region have remained unchanged, and in five countries scores have actually deteriorated.
The human development index (HDI) of UNDP is a widely used indicator to gauge how countries are faring in terms of their development. This index was created to emphasize that people and their capabilities should be the ultimate criteria for assessing the development of a country, not economic growth and income alone. Thus, HDI represents the score of a composite statistic of life expectancy, education and income indices used to rank countries into four tiers of human development.
Similarly, the UNDP gender inequality index (GII) affords an overview that uses a “gender lens” to measure the inequality of access to labour markets and high-level positions. The multidimensional poverty index (MPI) provides information on deprivation in non-income dimensions, such as education, health and living standards. However, some shortcomings in the use of these indicators are that HDI and MPI are not integrated in one dimension, that is, MPI is based on household surveys and GII has been developed only recently.
Overall, regarding HDI, almost all the 45 economies in Asia and the Pacific with available data have seen improvements in their human development score since the 1990s. In several countries, the increase has been significant, exceeding 40% in, for instance, Afghanistan, Bangladesh, Cambodia, China, the Lao People’s Democratic Republic and Myanmar.b
The divergence of human development scores is quite significant in the region. In 2013, Singapore had the highest score in the region and ranked in the ninth position (out of 187 countries); Afghanistan ranked the lowest in the region, at a global rank of 169. Indeed, in 2013, the human development score for Afghanistan, Papua New Guinea and Solomon Islands was below that achieved by China in 1990.
Among other studies, the Asian Development Bank has developed an integrated framework of inclusive growth indicators where poverty and inequality outcomes of inclusive growth are measured by three income-related indicators and three non-income-related indicators for assessing progress on income poverty as well as non-income poverty. On the basis of this framework, McKinley (2010) derived a composite index for six countries in the region. However, the scoring method of this index is not clear and the choice of weights for each component is discretionary. Moreover, the framework presents some weaknesses as input variables that represent economic policies are mixed with output variables of inclusiveness. Sugden (2012) assessed the growth experience of 22 developing economies in the region, paying special attention to 11 economies, using a distribution-weighted measure that was used to analyse individual indicators. Anand, Mishra and Peiris (2013) estimated a unified measure of inclusive growth for emerging markets. Yet, they did so by integrating countries’ economic growth performance and income distribution outcomes using data over three decades, thereby ignoring the multidimensional aspect of inclusiveness.
a The three other clusters relate to: (a) economic management; (b) structural policies; and (c) public sector management and institutions. See World Bank (2011).b The only country which has experienced a marginal decline in its human development score is Tajikistan, where HDI contracted by 0.5% between 2013 and 1990.

Economic and Social Survey of Asia and the Pacific 2015
122
Table 3.6. Score and rank of economic inclusiveness, selected countries in Asia and the Pacific
Country Score Rank
1990-1999 2000-2012 1990-1999 2000-2012
Armenia 0.60 0.68 21 18
Azerbaijan 0.73 0.83 8 2
Bangladesh 0.69 0.70 15 15
Cambodia 0.76 0.79 4 6
China 0.74 0.75 6 10
Georgia 0.73 0.70 9 16
India 0.67 0.68 17 17
Indonesia 0.70 0.72 12 13
Iran (Islamic Republic of) 0.61 0.65 20 22
Kazakhstan 0.79 0.83 2 1Lao People’s DemocraticRepublic 0.78 0.80 3 4
Malaysia 0.69 0.74 14 12
Maldives 0.49 0.76 22 8
Nepal 0.71 0.75 10 11
Pakistan 0.61 0.67 19 21
Philippines 0.66 0.68 18 19
Russian Federation 0.74 0.79 5 7
Sri Lanka 0.70 0.71 13 14
Tajikistan 0.71 0.75 11 9
Thailand 0.79 0.81 1 3
Turkey 0.69 0.67 16 20
Viet Nam 0.74 0.80 7 5
Sources: ESCAP calculations.
Note: The index scores (columns 2 and 3) range between 0 and 1, with a higher score referring to more inclusiveness.
2.2. The social dimension of inclusive growth
Performance within and between countries in the region is mixed in terms of social opportunities that are available. To capture social inclusiveness, the following indicators were used: (a) gender parity at the secondary school level; (b) gross secondary school enrolment; (c) average years of schooling; (d) percentage of live births attended by skilled health staff; and (e) the mortality rate of children under age 5 (per 1,000 live births). Measuring the quality of education is important, though technically difficult due to the absence of indicators. Completion rates are one indicator of the quality of education, yet available data for the region are scant. However, as improvements in completion rates contribute to rising average years of schooling as younger
cohorts mature over time, it can be argued that capturing the latter implicitly captures the former. A decrease in the mortality rate of children under age 5 is one of the outcomes of a good health system. Overall, data availability enables ranking the social inclusiveness index for 23 countries across the periods 1990-1999 and 2000-2012 (table 3.7).
The scores reveal that in all countries there were improvements in terms of social inclusiveness, as captured by the composite indicator. In several countries, the improvement was quite significant, particularly in those ranked lowest in the 1990s. Thus, although their relative ranking did not change, scores increased by more than 40% in Bangladesh and Cambodia and by more than 60% in Nepal and Pakistan.

123
CHAPTER 3Realizing Inclusive Growth
Sources: ESCAP calculations.
Note: The index scores (columns 2 and 3) range between 0 and 1, with a higher score referring to more inclusiveness.
Table 3.7. Score and rank of social opportunities, selected countries in Asia and the Pacific
Country Score Rank
1990-1999 2000-2012 1990-1999 2000-2012
Bangladesh 0.35 0.50 20 20
Brunei Darussalam 0.83 0.89 4 5
Cambodia 0.34 0.49 21 21
China 0.65 0.81 13 9
Fiji 0.81 0.86 6 6
India 0.40 0.54 18 18
Indonesia 0.51 0.73 16 15
Iran (Islamic Republic of) 0.66 0.81 12 11
Kazakhstan 0.83 0.90 3 4
Malaysia 0.76 0.84 7 7
Maldives 0.64 0.72 14 16
Mongolia 0.67 0.81 11 8
Myanmar 0.46 0.58 17 17
Nepal 0.29 0.47 22 22
Pakistan 0.25 0.42 23 23
Papua New Guinea 0.39 0.50 19 19
Philippines 0.68 0.74 10 14
Russian Federation 0.88 0.93 1 1
Sri Lanka 0.81 0.92 5 2
Tajikistan 0.72 0.75 8 13
Thailand 0.71 0.81 9 10
Tonga 0.86 0.91 2 3
Turkey 0.59 0.77 15 12
2.3. The environmental dimension of inclusive growth
In this component, the indicators track changes that have occurred in the air and in forest areas and in the consumption of fossil fuels, as these aspects may relate to important damaging impacts on the environment. The indicators also measure the deprivation of people in terms of their access to basic facilities, such as improved drinking water sources and sanitation facilities. Thus, the following five indicators are used: (a) the percentage of the population with access to improved sanitation facilities; (b) the percentage of the population with access to improved water sources; (c) annual increase in total GHG emissions; (d) annual percentage change in forest area; and (e) annual
percentage change in the share of fossil-fuel energy consumption in the total consumption of energy. It is assumed that high increases in GHG and fossil-fuel energy consumption and deforestation contribute to unsustainable development.
Overall, scores for 25 countries were computed (table 3.8). They reveal that five of the six countries that saw a decline in their scores since the 1990s are located in North and Central Asia. In those economies, the increase in GHG emissions was the primary driver of the worsening of their score. In Cambodia, the one country out of the six not located in that subregion, this increase more than offset gains in the score due to improved access to sanitation facilities and improved water sources, whereas in Armenia, Georgia and Tajikistan a

Economic and Social Survey of Asia and the Pacific 2015
124
Table 3.8. Score and rank of environmental opportunities, selected countries in Asia and the Pacific
Country Score Rank
1990-1999 2000-2012 1990-1999 2000-2012
Armenia 0.75 0.69 4 13
Azerbaijan 0.63 0.66 15 17
Bangladesh 0.59 0.62 17 19
Cambodia 0.43 0.40 25 25
China 0.57 0.63 18 18Democratic People’sRepublic of Korea 0.67 0.68 13 14
Georgia 0.81 0.73 1 7
India 0.53 0.58 23 21
Indonesia 0.54 0.59 20 20
Iran (Islamic Republic of) 0.70 0.74 9 4
Kazakhstan 0.78 0.74 2 6
Malaysia 0.71 0.75 8 2
Mongolia 0.53 0.58 21 22
Myanmar 0.56 0.67 19 16
Nepal 0.45 0.57 24 23
Pakistan 0.53 0.57 22 24
Philippines 0.64 0.69 14 12
Republic of Korea 0.74 0.76 5 1
Russian Federation 0.69 0.69 11 10
Sri Lanka 0.61 0.69 16 11
Tajikistan 0.73 0.67 6 15
Thailand 0.70 0.74 10 5
Turkey 0.68 0.72 12 8
Turkmenistan 0.75 0.71 3 9
Viet Nam 0.72 0.75 7 3
significant increase in the share of fossil-fuel energy consumption in the total consumption of energy contributed further to declines in environmental sustainability. In contrast, the three economies with the most significant improvement in their environmental sustainability scores, Myanmar, Nepal and Sri Lanka, each experienced a significant decline in the per-centage of change per annum in the share of fossil-fuel energy consumption in the total consumption of energy and important improvements in access to sanitation facilities and improved water sources. Yet, as Myanmar and Nepal had very low scores in the 1990s, despite their improvement, they did not move up in the relative ranking of countries.
2.4. Inclusive growth
As detailed above, inclusiveness is a multidimensional concept. To reflect the definition of sustainable development that representatives of Member States agreed in the outcome document of the 2012 United Nations Conference on Sustainable Development, scores and rankings that capture economic, social and environmental aspects of inclusiveness have been computed as shown in table 3.9 for countries with available data. These scores can be combined to create a single score, thereby capturing all three dimensions of inclusiveness (economic, social and environmental).
Sources: ESCAP calculations.
Note: The index scores (columns 2 and 3) range between 0 and 1, with a higher score referring to more inclusiveness.

125
CHAPTER 3Realizing Inclusive Growth
Overall, data were available to compute the scores for each of the three dimensions of inclusiveness for 16 countries in the region covering the 1990s and the period 2000-2012. These 16 countries account for 92% of the region’s population and 88% of its GDP. Table 3.9 shows the ranking for the period 2000-2012 when considering the following: (a) only social and economic inclusiveness; and (b) all three dimensions of inclusiveness. The addition of environmental inclusiveness produces a negative impact on the ranking of some countries. For instance, due to a lower ranking in the environmental dimension of inclusiveness during the period 2000-2012, the overall position of Cambodia, China, Indonesia, Sri Lanka and Tajikistan decreases once all three dimensions are combined.
Table 3.10 shows the score and rank of countries for overall inclusiveness for the 16 countries with available data for each of the economic, social and environmental dimensions. Overall, growth has been the most inclusive in Kazakhstan, the Russian Federation and Thailand and the least inclusive in Bangladesh, India, Nepal and Pakistan. The data suggest that growth has been inclusive
over recent years at the macroeconomic level in the Asia-Pacific region, as indicated by the increases in index scores. Yet, some countries made more progress than others in increasing their scores. For instance, owing to the rapid increase in scores for China, the Islamic Republic of Iran and Sri Lanka that increased between the 1990s and the period 2000-2012, Tajikistan fell from fifth to eighth rank. More inclusive growth in China and the Islamic Republic of Iran also led to a decline in the ranking of the Philippines to tenth place. In addition, scores increased significantly in those economies ranked at the bottom of the table in the 1990s.
In this chapter, inclusive growth is defined in terms of broad social objectives which are not mutually exclusive: (a) increasing average standard of living of the population; (b) reducing inequality; (c) reducing extreme poverty; and (d) expanding and broadening opportunities. The sections above show that growth has been more inclusive at the country level; yet, large divergences in indicators of inclusiveness exist within countries between sexes and across the rural and urban sectors as well as between regions in countries.
Ranking of countries for the period 2000-2012, excluding and including environmental inclusiveness
Country Social and economicinclusiveness
Social, economicand environmental
inclusiveness
Change in rank byenvironment
Kazakhstan 1 1
Russian Federation 2 2
Sri Lanka 3 5
Thailand 4 3
Malaysia 5 4
China 6 7
Tajikistan 7 8
Iran (Islamic Republic of) 8 6
Indonesia 9 11
Turkey 10 9
Philippines 11 10
Cambodia 12 15
Nepal 13 13
India 14 14
Bangladesh 15 12
Pakistan 16 16
Sources: ESCAP calculations.
Table 3.9.

Economic and Social Survey of Asia and the Pacific 2015
126
Table 3.10. Scores and ranking of countries for inclusiveness of growth, 1990s and 2000-2012
Country Social, economic and environmental inclusiveness
Score Rank
1990-1999 2000-2012 1990-1999 2000-2012
Kazakhstan 0.80 0.82 1 1
Russian Federation 0.77 0.80 2 2
Thailand 0.73 0.79 3 3
Malaysia 0.72 0.78 4 4
Sri Lanka 0.71 0.77 6 5
Iran (Islamic Republic of) 0.66 0.73 8 6
China 0.65 0.73 10 7
Tajikistan 0.72 0.73 5 8
Turkey 0.65 0.72 9 9
Philippines 0.66 0.70 7 10
Indonesia 0.58 0.68 11 11
Bangladesh 0.54 0.60 12 12
Nepal 0.48 0.60 15 13
India 0.53 0.60 13 14
Cambodia 0.51 0.56 14 15
Pakistan 0.46 0.55 16 16
Sources: ESCAP calculations.
Of particular concern is that income inequalities are large and widening in many countries, as differences in access to critical public goods, such as education and health services, differ across income quintiles. With wealthier people being able to secure access to better education and better health services, thereby increasing their employment prospects, intergenerational inequities have the potential to be perpetuated unless inequalities in income are addressed.
Several reasons have been put forward to explain the widening of income inequalities. For one, market-oriented reforms that countries have embraced as they integrate more closely into the global economy have affected income distribution within countries. Thus, in many countries, real wage growth has lagged productivity growth, thereby contributing to a declining share of labour income in output and a widening of income inequality due to the more unequal distribution of capital (Zhuang, Kanbur and Rhee, 2014). Procyclical fiscal policy, increased financialization of the international economy and the privatization of State-owned enterprises that has diminished the role of the State, all have
contributed to further widening of inequalities in income (Jaumotte, Lall and Papageorgiou, 2005).
To make growth more inclusive, therefore, requires concerted efforts of both the public sector and the private sector. Indeed, while the private sector plays a critical role in making growth more inclusive (see box 3.6), doing so requires revisiting the role of the State in development and strengthening its role.
Principally, the main role of the Government is to provide basic public goods and to create an enabling environment for the private sector to act as the main engine of growth in an economy. Principally, Governments should ensure that equality of opportunities exists, such as by broadening access to education and health services and by strengthening social safety nets, through a policy framework that fosters the creation of employment. Moreover, ensuring strong legal and regulatory frameworks, improving the coordination and accountability of various institutions and ensuring macroeconomic-financial stability through prudent policies should enable the private sector to nurture a strong spirit of entrepreneurship. This should be

127
CHAPTER 3Realizing Inclusive Growth
Box 3.6. The role of the private sector in making growth more inclusive
The private sector plays a critical role in making growth more inclusive. Without a vibrant and strong private sector, tackling poverty and rising levels of inequality and creating jobs would not be possible. The private sector is the driving force behind economic growth, exports, employment and the generation of tax revenues, among other such aspects.
Thus, increased private sector participation drives economic growth through investment and business creation, innovation and knowledge transfer, and other multiplier effects from its operations and activities. As such, stronger private sector engagement can lead to increased trade, investment and financial sector linkages, which are critical to boost trade opportunities and ultimately create employment. By providing people with livelihoods and furnishing the means to lift them out of poverty, the private sector has the ability to make growth inclusive by generating decent jobs and creating income-earning opportunities for the working population. Indeed, about 90% of jobs in developing countries are created by the private sector, although only about one fourth of the working-age population in developing countries is engaged in productive and decent employment. In particular, small and medium-sized enterprises are important for generating jobs in these economies.
The private sector is also the primary source of tax revenues, providing Governments with the means to finance essential public goods and services. A stronger, more vibrant private sector is therefore able to deliver higher levels of tax revenues, thus enabling Governments to provide more and better public services, thus creating a virtuous circle.
The private sector is an important actor in terms of social development due to its role in the provision of health and education services. Furthermore, there is tremendous scope in advancing its role in managing public services, including water and sanitation services, and social funds for disability. At the same time, the private sector’s role is becoming increasingly important in terms of creating an environmentally sustainable and inclusive development trajectory. For instance, while it is increasingly involved in the provision of energy services in developing countries, the private sector is also critical in developing new technologies that may mitigate the negative impact of development on the environment.
The private sector has a critical role to play in making growth more inclusive. However, market failures can prevent it from meeting its potential to do so, thus highlighting the need for public intervention and institutional solutions. For instance, property rights in land ownership may be fragmented due to, for instance, poorly defined land rights and multiple claims on land, which can cause market failure in the land market, thereby making it impossible for investors to expand investment in developing countries (Khan, 2012). In addition, large externalities in, for instance, human capital formation, require public intervention to ensure that good-quality education is available to all. Moreover, progressive taxation and a functioning social protection system are required to ensure a minimum degree of distributional equity.
supported by risk-tolerant financial institutions and legal systems that actively encourage businesses and the development of micro, small and medium-sized enterprises, especially by women entrepreneurs.
In addition, it is important that countries do not assign to fiscal policy the role of serving as a tool for reducing government deficits or restoring macroeconomic balance alone. Rather, its role as a powerful instrument for promoting employment, and thereby inclusive growth, must be recognized. Similarly, monetary policy is not just a means for controlling inflation; rather, it should be treated as a versatile instrument through which both the price and volume of credit, for instance, can be effectively used in the pursuit of development objectives.
Given the widespread nature of vulnerable employment, greater efforts must be made to foster employment if growth is to become more inclusive. In many countries, this means giving
greater attention to the development of small and medium-sized enterprises in general, and the rural sector, especially agriculture, in particular as large proportions of the population live in this sector and as the incidence of poverty is generally higher in rural than in urban areas. Indeed, the rural non-farm sector was a major contributor to China’s remarkable growth (Mukherjee and Zhang, 2007).
Despite the importance of agriculture in terms of providing livelihoods for large proportions of the population, in most developing countries in the region the services sector and industry were the primary drivers of growth, leading to a significant decline in the contribution of agriculture to the region’s GDP (as shown previously in figure 3.6). As was argued in the Survey for 2008, addressing the neglect of agriculture is crucial for reducing poverty and inequality. One way to strengthen the role of agriculture is to diversify into high-value crops, so far limited to a few countries. In addition to focusing on quality and standards, investments

Economic and Social Survey of Asia and the Pacific 2015
128
in research and development and in human capital would significantly increase agricultural productivity (ESCAP, 2008).
However, developing the non-farm sector is just as important. Policies should therefore also emphasize development of the rural sector; ultimately, structural change in the economy should follow an agriculture-industry-service sequence rather than jumping from agriculture to services without concentrating on manufacturing. One way to do so would be by fostering rural industrialization through small-scale industries. This would require linkages between agricultural and non-agricultural sectors producing both backward-forward and production-consumption linkages within agriculture and between the agricultural and non-agricultural sectors. For instance, during the 1980s and 1990s the labour market in Bangladesh underwent significant diversification, especially in terms of access to non-farm activities, thus improving the returns to labour and wage rates in rural areas. The rising employment opportunities in the rural non-farm sector opened up new opportunities for addressing poverty dynamics in the rural areas and making growth more inclusive. The structural shift in the rural non-farm sector, especially since the 1990s, in favour of micro and small enterprises, instead of exclusive dependence on self-employ-ment activities of the earlier period, created greater scope for engaging in wage labour activities, improved productivity and enhanced wages, thus leading to accelerated inclusive growth. In Bangladesh, agroprocessing and the marketing of processed food now have the potential to emerge as new engines of inclusive growth (Mujeri, 2014).
In addition, agricultural productivity growth and consumption linkages generated by increased rural incomes would stimulate the rural economy further. For instance, the additional income generated by the ready-made garments sector, which has registered phenomenal growth and has emerged as the leading industry of Bangladesh, has provided a boost in terms of demand, especially for services and other non-tradable goods. Since the large majority of garment workers are poor women, many of whom migrated from rural areas, their spending patterns largely favour the purchase of goods and services produced by the informal non-tradable sector (Osmani and others, 2003). The rapid emergence of this sector is thus an interesting example of how a rising industrial activity can create significant spillover effects on demand for
non-tradable goods and services, creating positive impacts on poverty dynamics in both urban and rural areas and the development and diversification of small and medium-sized enterprises through backward and forward linkages.
Development of technology is also important for inclusive growth. For example, the spread of the so-called green revolution to the poorer states in India has shown its potential for reducing regional disparities in development. In addition, small-scale farmers have benefited from technology; the experience with information technology is encouraging as this technology may also offer the prospect for raising productivity in agriculture and industry.
Fostering rural development and rural indus-trialization requires an inclusive financial system that offers access to financial products and services, especially for the poor, including obtaining credit and insurance on favourable terms and conditions and accessing payment services for undertaking transactions and remittances in a secure and cost-effective manner. Financial development in general and financial inclusion in particular may affect the poor through two channels: aggregate growth and changes in the distribution of income (Beck, Demirgüç-Kunt and Levine, 2007). Better access to the financial system enables the poor to access greater opportunities to improve their lives by utilizing the money available in the formal financial system. Therefore, not only does such access help people to become better off, but it also contributes to economic growth and reduces poverty. In Indonesia, for example, financial inclusion is one of the most important factors in the development of small and medium-sized enterprises (Dartanto and Ikshan, 2014).
In practice, however, a significant share of the population, especially the poor and those in the rural sector, still remain excluded from accessing financial services offered by the formal financial sector. In Indonesia, for example, there is a strong canonical negative relationship between financial inclusion and the poverty rate at the provincial level. Provinces with a higher share of agricultural credit tend to have lower levels of inequality. This would suggest that a higher share of agricultural credit indicates an expanding agricultural sector, as agricultural credit enables farmers to invest in new technologies, such as mechanization, in addition to purchase essential inputs, such as fertilizer and

129
CHAPTER 3Realizing Inclusive Growth
seeds. A higher share of agricultural credit also enables them to expand their business, which would boost the sector and labor productivity, thereby narrowing the income gap between agricultural households and non-agricultural households (Dartanto, 2014).
In this regard, monetary policy can play an important role in fostering more inclusive growth, given its ability to affect the price and volume of credit. Financial regulation is also important for supporting a framework that encourages the development of a vibrant banking sector that caters to those currently marginalized.
Policymakers can also make growth more inclusive by targeting public expenditure to expand equality in opportunities. Indeed, econometric analysis shows that when Governments increase total public expenditure, social inclusiveness, as captured by the index presented in the section above, increases (annex table III). Such expenditure includes, for instance, increasing spending on such areas as health, education and social safety nets. It also includes attempts to make existing expenditure more efficient, more effective and more development-oriented. In some countries, such as Sri Lanka, growing inequality is explained mainly by the growing disparity in households’ access to education and infrastructure (Kelegama and Jayaweera, 2011). An important dimension may also be to focus policy on regional economic development – paying special attention to helping the most deserving and vulnerable groups in each region – in order to bridge regional disparities.
Social protection programmes have been implemented throughout the region to help address the growing inequalities within countries. Several countries have introduced direct cash transfers to the poor as a mechanism to reduce extreme poverty. There are three types of such transfers: unconditional cash transfers; conditional cash transfers; and cash for work. One of the best known cash-for-work programmes in the region is that implemented under the Mahatma Gandhi National Rural Employment Guarantee Act 2005, through which all adults in each rural household are provided with a combined 100 days of employment at the minimum wage. The programme currently costs about 0.3% of GDP and provides about 50 million households with employment. Work programmes have also been initiated elsewhere, such as in Solomon Islands where the Rapid
Employment Project has been operational since 2010; under this arrangement targeted vulnerable urban populations are assisted by increasing their incomes through the provision of short-term employment. Other conditional and unconditional cash transfer schemes that operate in the region include the Benazir Income Support Programme in Pakistan and Jamkesmas, a community health protection programme in Indonesia, which in 2013 had 86.4 million beneficiaries.
Governments need to increase the quality of their labour force in order to increase the employability and productivity of workers and to address the issue of inequality of opportunities. One way to do so is to expand investment in education. Another is to increase access to and the affordability of health-care systems. Indeed, public expenditure on health and education has a beneficial impact on social inclusiveness that is more than twice that of total public expenditure (annex table III).
Regarding expenditure on education, UNESCO has recommended that between 15% and 20% of total government expenditure be allocated to education. Yet, among the 40 Asian and Pacific countries and territories where data are available, only 14 currently meet the UNESCO target. Moreover, in terms of GDP, expenditure on education is relatively low in the region, with only two non-island-developing States, Thailand and Viet Nam, meeting the recommendation of spending at least 6% of GDP on education to ensure quality provision of learning and education.22,23 Of course, simply expanding expenditure may not be the solution to address the gaps between boys and girls that exist in education if social and cultural barriers impede female enrolment, or if gender gaps are due to differences in income, as is the case in many countries in the region.
Governments also need to increase access to and the affordability of health systems. For instance, under the Sustainable Development Solutions Network initiative of the United Nations it is proposed that “…countries make progress to allocating at least 5% of national GDP as public financing for health (with low- and middle-income countries reducing by at least half the gap between 5% of GDP and current public funding)” in order to provide universal health care (UNSDNS, 2014). Yet, apart from small island developing States, which are likely to have high levels of health expenditure due to the lack of economies of scale, no developing

Economic and Social Survey of Asia and the Pacific 2015
130
Asia-Pacific economy currently meets this goal. Universal access to health care can be provided at lower expenditure – such as is the case in Thailand, where universal health coverage is achieved by spending only 3.7% of GDP (equivalent to $136 per capita – less than the average health expenditure for lower-middle-income countries, which stood at $153) (WHO, 2010). Indeed, even a lower level of public expenditure on health equal to 3% of GDP was reached by only eight non-island developing economies in the region. In many economies, public expenditure does not even reach 1.5% of GDP, including in some of the larger economies, such as Bangladesh, India, Indonesia and Pakistan. In addition to increasing expenditure, other policies can be introduced to foster health performance. An important policy which has helped Sri Lanka, for instance, in retaining most of the qualified medical specialists and doctors in the country is the country’s policy on private practice; it allows such professionals to engage in private practice after duty hours, away from government hospitals and clinics (McNay, Keith and Penrose, 2004). In addition, compulsory posting of all newly appointed doctors to all regions in the country and transferring them on a regular basis is another policy that has been adopted by Sri Lanka to improve the availability of medical personnel throughout the country.
The Survey for 2013 demonstrated how expenditure on health, education and social security is relatively low in many economies in the Asia-Pacific region due to the fact that existing expenditure is often not sufficiently development-oriented (ESCAP, 2013a). For instance, in many economies significant spending is devoted to defence: military expenditure totalled more than $230 billion in 10 countries in the East Asian region alone; in several countries, it exceeds that spent on health and education combined. Similarly, significant resources are devoted to subsidies, especially energy subsidies. In East Asia alone, fossil-fuel consumption subsidies amounted to $76 billion in 2012. In that year, subsidies on fuel alone reached 3% of GDP in Brunei Darussalam and Indonesia; 2.6% of GDP in Thailand; 2.5% of GDP in Viet Nam; and 2.4% of GDP in Malaysia. Clearly, countries could find ways to reduce such expenditure on non-development areas. Energy subsidies are often highly regressive; moreover, they encourage wastage and result in fuel-intensive forms of production. Importantly, poorly targeted energy subsidies have had little beneficial impact on either enhancing inclusive growth or reducing extreme poverty.
While curbing increasing levels of non-development expenditure and removing or reducing harmful subsidies are politically challenging tasks, low oil prices have enabled several countries to move forward in reducing regressive subsidies and boost expenditures on education, health and social protection. These policy measures will further support their efforts to attain fiscal consolidation and to release additional financial resources for inclusive growth. For example, the Government of Indonesia reduced fuel subsidies in November 2014 and eliminated petrol subsidies in January 2015. Similarly, in Malaysia fuel subsidies were removed in December 2014.
Reducing non-development expenditure would free important resources so that they could be used to strengthen social expenditure and address the large gaps in infrastructure that are impeding development of the region, in particular those of the rural sector, where in many countries supporting infrastructure for sustained and inclusive growth is urgently needed. Rural community governments in China, for instance, have provided critical public infrastructure in the form of roads, water and irrigation systems, energy etc., to the extent that regions with better infrastructure attracted more investment into the rural manufacturing sector, which in turn led to greater employment and higher revenues (Mukherjee and Zhang, 2007). As had been noted in the Survey for 1950, land tenure systems can impede rural development (ECAFE, 1951). In Papua New Guinea, for instance, land is owned by clans and can neither be alienated nor used as collateral for business loans. Thus, the mobilization of blocks of land for rural development is constrained by the fragmentation of ownership, the difficulties of identifying the “true” owners where there are disputes, and excessive “compensation” demands (Naidu, Matadradra and Epeli, 2014).
Yet, while reducing non-development expenditure would free important resources, in the region an overall limiting factor to making public expenditure more effective is the fact that tax revenues are quite low in many countries, especially as pervasive tax avoidance and evasion are contributing to the erosion of revenues (ESCAP, 2014e). Indeed, in the Survey for 2014 it was shown that untapped tax potential is quite significant in many economies, amounting to several percentage points of GDP (ESCAP, 2014b). Indeed, raising higher levels of revenue (as a percentage of GDP) does not have a significant impact on economic inclusiveness,

131
CHAPTER 3Realizing Inclusive Growth
as measured above (annex table III). This would suggest that tax policy has not been successful in redistributing income in the region. Nonetheless, higher levels of revenue have a highly significant impact on social inclusiveness, highlighting the point that raising more revenue (in a progressive way) to finance development-oriented expenditure would increase equal opportunities in the region. However, in some countries recent taxation reforms relating to a broadening of value-added taxes (VAT) have largely failed to address income inequality but have increased the gap between the “haves” and ”have-nots”. 3. CONCLUSIONSThe phenomenal growth that has been witnessed in Asia and the Pacific over the last few decades lifted millions of people out of extreme poverty. However, there is more to well-being and development than simply increasing levels of income and reducing levels of poverty. Rather, development and human welfare comprise a multidimensional concept that encompasses economic, social and environmental aspects.
By defining inclusive growth in terms of broad social objectives that include the need to: (a) increase average standards of living of the population; (b) reduce levels of inequality; (c) reduce extreme poverty; and (d) expand and broaden opportunities, this chapter has highlighted inclusiveness across the three dimensions of sustainable development. It has shown that across countries growth overall has been inclusive. Thus, in all 22 countries with available data, social inclusiveness improved more during the period 2000-2012 than in the 1990s. Similarly, in 20 of these countries, economic inclusiveness improved, and in 19 of 25 countries with data, environmental inclusiveness improved.
However, despite these overall improvements, the gap between the “haves” and the “have nots” within countries is widening. For one, greater economic inclusiveness is largely a result of countries’ success in reducing rates of extreme poverty, masking the fact that compared with the 1990s, in most countries the richest 20% of the population are capturing a larger share of income than the poorest 20%. This is particularly true in the region’s three most populous countries, China, India and Indonesia. Moreover, in addition to wide income gaps between rural and urban sectors as well as between different regions, there has
also been a deterioration in labour markets, with fewer people in formal employment. At the same time, the analysis shows that, despite a general improvement in access to basic public services, including health and education, in all countries since the 1990s, opportunities within countries are largely determined by a person’s economic circumstance or that of his or her parents.
If such dynamics persist, they will ultimately lead to a vicious cycle in which the better off benefit more from public services, such as health care and education, which in turn would increase their employment prospects, thereby widening the gap between them and those less well off. Concerted actions of the private and public sector are therefore needed to address this issue. This will necessitate making greater efforts to achieve equality in opportunities, including more equal access to education, health-care services and stronger social safety nets. In particular, it will entail developing a policy framework that fosters the creation of employment by supporting the development of micro, small, and medium-sized enterprises and by strengthening rural development and industrialization.

Economic and Social Survey of Asia and the Pacific 2015
132
ANNEXES
(Constant 2005 United States dollars)
Table I. GDP per capita in selected Asia-Pacific economies
Country/area 1990 2013 Growth Country/area 1990 2013 Growthsince 1990 since 1990
Afghanistan 232 424 76% Micronesia (Federated States of) 1 969 2 455 25%
Armenia 1 146 2 310 101% Mongolia 846 1 796 112%
Azerbaijian 1 669 3 253 95% Nepal 233 409 75%
Bangladesh 270 625 132% Pakistan 525 806 54%
Bhutan 643 2 037 21% Palau 10 546 9 558 -9%
Brunei Darussalam 26 831 24 185 -10% Papua New Guinea 728 1 111 53%
Cambodia 242 709 193% Philippines 1 002 1 581 58%
China 483 3 583 642% Republic of Korea 8 829 23 893 171%
Fiji 2 903 3 681 27% Samoa 1 550 2 329 50%
Georgia 2 499 2 157 -14% Singapore 16 554 36 898 123%
Hong Kong, China 17 566 33 534 91% Solomon Islands 987 1 113 13%
India 403 1 165 189% Sri Lanka 710 2 004 182%
Indonesia 840 1 810 115% Tajikistan 719 481 -33%
Iran (Islamic Republic of) 1 801 3 312 74% Thailand 1 572 3 438 119%
Kazakhstan 3 073 5 425 77% Timor-Leste 438 816 87%
Kiribati 952 1 176 24% Tonga 1 853 2 662 44%
Kyrgyzstan 699 625 -10% Turkey 5 013 8 717 74%Lao People’s Democratic Republic 262 751 187% Turkmenistan 2,192 3 557 62%
Macao, China 14 494 54 092 273% Tuvela 1 782 2 648 49%
Malaysia 3 147 6 990 122% Uzbekistan 547 899 64%Maldives 2 871 4 926 72% Vanuatu 1 843 2 110 14%Marshall Islands 2 386 2 933 23% Viet Nam 301 1 029 241%
Sources: ESCAP, based on World Bank, World Development Indicators. Available from http://data.worldbank.org/data-catalog/world-development-indicators.

133
CHAPTER 3Realizing Inclusive Growth
Table II. Annual percentage change in poverty rate, GDP per capita and Gini coefficient
Trend Country Period Poverty rate GDP per Gini($1.25/day) capita coefficient
Faster decline in 2000s in inequality
Thailand 1990-20022002-2010
-15.0-16.7
3.34.0
-0.6-0.8
Decline in inequality in 2000s at a slower rate
Armenia 1996-20022002-2010
-2.6-20.2
7.87.5
-3.6-1.6
Maldivesa 1998-20042004-2013
-37.8..
9.03.2
-8.30.0
Pakistan 1991-20022002-2008
-5.2-8.5
1.13.5
-0.8-0.2
Decline in inequality in 2000s after expanding in 1990s
Azerbaijan 1995-20012001-2008
-14.6-31.9
6.616.7
0.7-1.1
Bangladesh 1996-20002000-2010
-4.4-3.0
3.34.4
0.4-0.4
Cambodiab 1994-20042004-2009
-1.6-13.2
5.26.5
1.1-2.1
China 1990-20022002-2009
-6.1-11.8
8.610.4
2.3-0.2
Iran (Islamic Republic of) 1990-19981998-2005
-13.02.0
2.23.6
0.1-2.0
Kazakhstan 1993-20022002-2009
2.3-42.3
2.46.3
0.8-2.6
Malaysia 1992-19971997-2009
-19.7-97.3
6.51.7
0.6-0.5
Nepal 1996-20032003-2010
-3.5-10.3
1.73.0
3.2-4.0
Philippines 1991-20002000-2009
-3.4-2.2
1.02.5
0.6-0.8
Sri Lanka 1991-20022002-2010
-0.7-14.2
3.75.0
2.2-1.5
Tajikistan 1999-20032003-2009
-8.0-24.5
8.24.9
3.0-0.9
Turkey 1994-20022002-2010
-0.6-4.9
1.93.5
0.4-0.8
Viet Nam 1993-20022002-2008
-5.0-13.4
5.75.8
0.6-0.9
Increase in inequality in 2000s after declining in 1990s
Indonesiac 1990-20022002-2011
-5.0-6.4
2.64.2
-0.92.8
Kyrgyzstan 1993-20022002-2011
6.9-19.1
-0.63.5
-5.70.6
Mongolia 1996-20022002-2008
..
..2.37.4
-0.21.8
Russian Federation 1993-20022002-2006
-15.8-100.0
0.27.8
-3.31.7
Faster increase in inequality in 2000s than in 1990s
Lao People’s Democratic Republic
1992-20022002-2008
-2.3-4.2
4.15.5
0.72.0
Slower increase in inequality in 2000s than in 1990s
Georgia 1996-20022002-2010
22.31.7
5.76.2
1.40.5
India 1994-20052005-2010
-1.5-4.7
4.76.9
0.70.3
Source: ESCAP, based on World Bank, World Development Indicators. Available from http://data.worldbank.org/data-catalog/world-development-indicators.
a GDP per capita covers period 2001-2004.b Gini coefficient covers period 2002-2009. c Gini coefficient covers period 1996-2002.
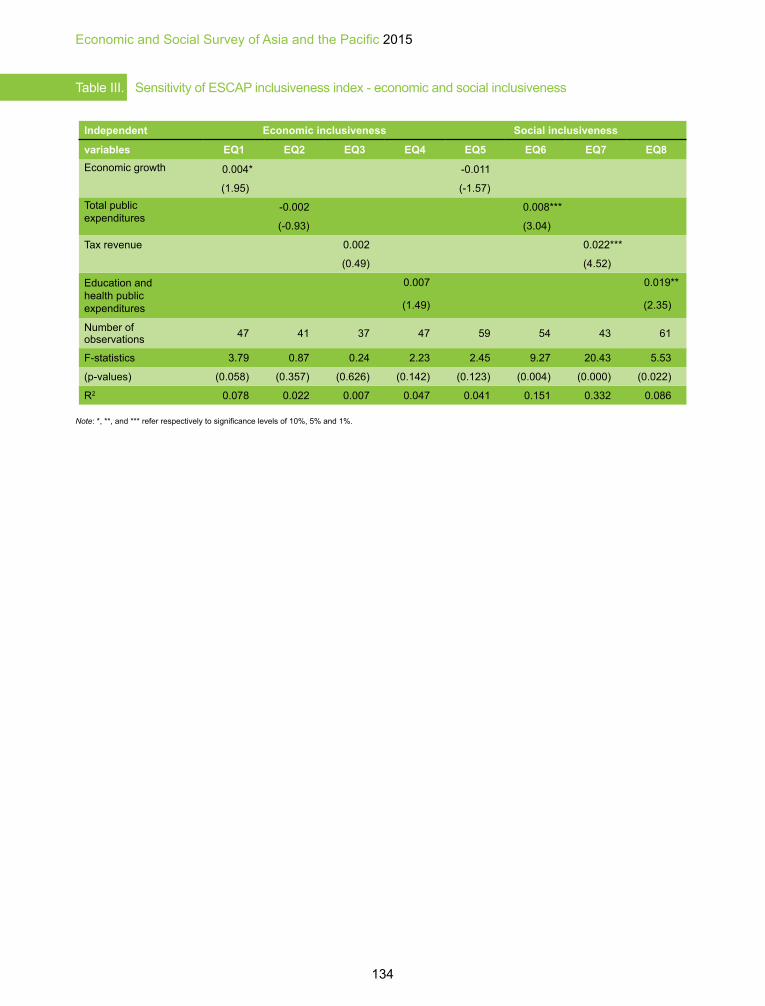
Economic and Social Survey of Asia and the Pacific 2015
134
Table III. Sensitivity of ESCAP inclusiveness index - economic and social inclusiveness
Independent Economic inclusiveness Social inclusiveness
variables EQ1 EQ2 EQ3 EQ4 EQ5 EQ6 EQ7 EQ8Economic growth 0.004* -0.011
(1.95) (-1.57)Total publicexpenditures
-0.002 0.008***
(-0.93) (3.04)
Tax revenue 0.002 0.022***
(0.49) (4.52)
Education and health publicexpenditures
0.007 0.019**
(1.49) (2.35)
Number ofobservations 47 41 37 47 59 54 43 61
F-statistics 3.79 0.87 0.24 2.23 2.45 9.27 20.43 5.53
(p-values) (0.058) (0.357) (0.626) (0.142) (0.123) (0.004) (0.000) (0.022)
R2 0.078 0.022 0.007 0.047 0.041 0.151 0.332 0.086
Note: *, **, and *** refer respectively to significance levels of 10%, 5% and 1%.

135
CHAPTER 3Realizing Inclusive Growth
Scoring of variable used for the measurement of inclusiveness
Calculating the composite indices requires scoring or rescaling all variables and aggregating variables by component (economic, social and environmental). A linear scaling from zero to one was used, as indicated in table IV. As all the components of inclusiveness are equally important, arithmetic averages are used to put all variables together by component and to aggregate the components.
Table IV. Rescaling of indicators comprising economic, social and environmental inclusiveness
Variables Min. Max. Explanation FormulaECONOMIC OPPORTUNITIES
GINI coefficient 0.01 0.99 Theoretical range boundaries are replaced by these values because they cannot be observed empirically.
S = max-actual max-min
Ratio of income shares of the highest quintile by the lowest quintile
1 25 The figure 1 corresponds to equity, and 25 is 95th percentile at the global level.
S = max-actual max-min
Poverty headcount ratio, $1.25 per day in 2005 PPP (percentage)
0 95 Based on global statistics. S = max-actual max-min
Ratio of female to male labour-force participation rate (percentage)
5 100 Based on global statistics. S = actual-min max-min
Unemployment (percentage) 0.25 40 Based on global statistics. S = max-actual max-min
ENVIRONMENTAL SUSTAINABILITYImproved sanitation facilities (percentage of population with access)
1 100 Based on global statistics. S = actual-min max-min
Improved water source (percentage of population with access)
1 100 Based on global statistics. S = actual-min max-min
Greenhouse gas emissions (percentage change per annum)
-18 40 Based on global statistics. S = max-actual max-min
Forest area (percentage change per annum)
-10 5 Based on global statistics. S = actual-min max-min
Fossil-fuel energy consumption (percentage change per annum)
-18 21 Based on global statistics (percentiles). S = max-actual
max-min
SOCIAL OPPORTUNITIESRatio of female to male secondary enrolment (percentage)
1 100 Based on global statistics. S = actual-min max-min
School enrolment, secondary (percentage gross)
5 105 Based on global statistics. S = actual-min max-min
Average years of schooling 0 13.3 UNDP, HDI method. S = actual-min max-min
Births attended by skilled health staff
4 100 S = actual-min max-min
Mortality rate, under-5 (per 1,000 live births)
1 175 Based on global statistics (95th percentile). S = max-actual
max-min
Source: ESCAP calculations.

Economic and Social Survey of Asia and the Pacific 2015
136
Endnotes1 The level of per capita income (in real terms) in Singapore was 90 times greater than that of Nepal
in 2012, compared with 71 times larger at the beginning of the 1990s.2 See, for example, Economic and Social Survey of Asia and the Pacific for 2013 and 2014.3 See Asian Development Bank (2012).4 Cobham and Sumner (2013) advocated comparing the ratio of the top 10% of a population’s share
of gross national income with that of the poorest 40% of the population’s share. Using this ratio does not change the overall picture significantly: for the latest available data, 11 of 31 developing countries in the region would find themselves in the same comparative ranking as when comparing the ratio of the top to bottom income quintiles. An additional 15 countries would find themselves ranked up to two ranks higher or lower.
5 In the Federated States of Micronesia and the Marshall Islands, this ratio is more than 40 times as large. However, this determination is based on the most recent data, which are available only for 2000 and 1999 respectively.
6 To compare, this ratio is less than or equal to 4 in Norway, which is the highest-ranked country in the UNDP Human Development Index. It is below 4 in other Nordic countries, including Denmark, Finland and Sweden. In the Asia-Pacific region, it is less than or equal to 4 only in Afghanistan and Japan.
7 These economies include: Japan; Hong Kong, China; Indonesia; Malaysia; the Republic of Korea; Singapore; Taiwan Province of China; and Thailand. See World Bank (1993).
8 Thus, there is clear evidence that a decline in budget deficits is followed by increases in inequality, even after controlling for the impacts of recessions and slowdowns (Ball and others, 2013; Woo and others, 2013). Similarly, capital account liberalization is followed by a significant and persistent increase in inequality. Furceri and Loungani (2013) showed that the Gini coefficient increases by about 1% per year after liberalization and by 2% per year after five years. They also showed that the impact of capital account liberalization on inequality holds even after the inclusion of myriad other determinants of inequality.
9 Defined by ILO as measuring the proportion of own-account workers and contributing family members in total employment.
10 Derived from estimates based on ILO (2012).11 The employment elasticity of growth is calculated as the ratio of the growth rate in employment
to the growth rate in output. While Islam and Nazara (2000) demonstrated that year-over-year employment elasticities can exhibit a great deal of instability, the intensity is calculated here using the average over several periods, thus “ironing out” the year-to-year swings. According to Article 25 of the Universal Declaration of Human Rights, “Everyone has the right to a standard of living adequate for the health and well-being of himself and of his family, including food, clothing, housing and medical care and necessary social services, and the right to security in the event of unemployment, sickness, disability, widowhood, old age or other lack of livelihood in circumstances beyond his control” (emphasis added). Under Article 26, “Everyone has the right to education. Education shall be free, at least in the elementary and fundamental stages. Elementary education shall be compulsory. Technical and professional education shall be made generally available and higher education shall be equally accessible to all on the basis of merit”.
12 According to Article 25 of the Universal Declaration of Human Rights, “Everyone has the right to a standard of living adequate for the health and well-being of himself and of his family, including food, clothing, housing and medical care and necessary social services, and the right to security in the event of unemployment, sickness, disability, widowhood, old age or other lack of livelihood in circumstances beyond his control” (emphasis added). Under Article 26, “Everyone has the right to education. Education shall be free, at least in the elementary and fundamental stages. Elementary education shall be compulsory. Technical and professional education shall be made generally available and higher education shall be equally accessible to all on the basis of merit”.

137
CHAPTER 3Realizing Inclusive Growth
13 See UNESCO World Inequality Database on Education. Available from www.education-inequalities.org.
14 Ibid.15 Several studies show the negative correlation between income inequality and environmental
sustainability, including those by Baland, Bardhan and Bowles (2007) and Mikkelson, Gonzalez and Peterson (2007).
16 See annex table IV for details on the methodology that was applied to rescale all variables and aggregate them.
17 For this line of argumentation, see Barro and Lee (2013).18 See annex for details on the methodology that was applied to rescale and aggregate all variables.19 By the mid-1990s, the ready-made garments sector in Bangladesh increased its share to about 25%
of the total value added and employed nearly 50% of the total workforce in medium and large-scale industries. Its share in total exports was barely 4% in 1983/84, but it exceeded 80% by the end of the 1990s.
20 See “Continue with NREGA, economists urge Modi”, The Hindu, 14 October 2014. Available from www.thehindu.com/news/national/economists-write-to-narendra-modi-on-nrega/article6498323.ece.
21 For details, see Oslo Declaration, which was adopted in Oslo on 18 December 2008. Available from www.unesco.org/education/Oslo_Declaration_final_17dec08.pdf.
22 Note that the eighth meeting of the high-level group on education for all, in adopting the Oslo Declaration, committed to 6% of GNP; however, as GNP data are not available for many Asia-Pacific countries, GDP is used for the purpose of analysis.
23 For details, see UNESCO and CONFINTEA VI (2009), p. 5, para. 14a. Available from www.unesco.org/fileadmin/MULTIMEDIA/INSTITUTES/UIL/confintea/pdf/working_documents/confinteavi_framework_en.pdf.
24 Data are from IEA. Available from www.iea.org/subsidy/index.html.25 Ibid.