Climate Change Mitigation and Transport in Developing Nations
27
Transport Reviews, Vol. 25, No. 6, 691–717, November 2005 0144-1647 print/1464-5327 online/05/060691-27 © 2005 Taylor & Francis DOI: 10.1080/01441640500360951 Climate Change Mitigation and Transport in Developing Nations LLOYD WRIGHT* and LEWIS FULTON** *The Bartlett School of Planning, University College London, London, UK **United Nations Environment Programme (formerly International Energy Agency), Nairobi, Kenya Taylor and Francis Ltd TTRV_A_136078.sgm (Received 15 March 2005; revised 17 June 2005; accepted 20 July 2005) 10.1080/01441640500360951 Transport Reviews 0144-1647 (print)/1464-5327 (online) Original Article 2005 Taylor & Francis 00 0000002005 LloydWright [email protected] ABSTRACT Emissions from the transport sector represent the fastest growing source of greenhouse gas emissions. There is little prospect that this situation will be resolved with a single technological fix. As developing nations quickly move to catch up with the motor- ization levels of developed nations, the sheer number of private vehicles may overwhelm any advances made by cleaner fuels. By 2030, there is projected to be more vehicles in the developing world than in developed nations. Despite the growth in developing-nation transport emissions, the sector has produced relatively few mitigation projects within the mechanisms of the Kyoto Protocol. However, a few developing cities, such as Bogota, Colombia, have demonstrated innovation in low-cost solutions to reducing emissions. This research employs scenario analysis to examine the size and cost of potential emission reduction options from the urban transport sector of developing nations. In particular, the analysis compares the cost of greenhouse gas emission reductions from fuel technology options to reductions from measures promoting mode shifting. This comparative analysis indicates that a diversified package of measures with an emphasis on mode shifting is likely to be the most cost-effective means to greenhouse gas emission reductions. Introduction The spectre of rapidly growing private vehicle ownership and usage in developing nations casts a worrying shadow over the projected course of global greenhouse gas emissions. If such nations follow the same path of automobile dependence as developed nations, there is little that technological advances can offer to offset such a monumental increase in motorization and its subsequent emissions. The result- ing emissions from millions of new vehicles will simply overwhelm the reductions achieved through improved fuel and propulsion technologies. However, most developing-nation cities still possess the basis for a more sustainable future. Public transport and non-motorized transport (walking and cycling) still command a dominant share of travel in developing cities. Unfortu- nately, the quality of these modes is often quite poor with regard to security, comfort, convenience and prestige. The sum effect of inadequate public transport Correspondence Address: Lloyd Wright, University College London, London, UK. Email: [email protected]
-
Upload
independent -
Category
Documents
-
view
7 -
download
0
Transcript of Climate Change Mitigation and Transport in Developing Nations

Transport Reviews, Vol. 25, No. 6, 691–717, November 2005
0144-1647 print/1464-5327 online/05/060691-27 © 2005 Taylor & FrancisDOI: 10.1080/01441640500360951
Climate Change Mitigation and Transport in Developing Nations
LLOYD WRIGHT* and LEWIS FULTON**
*The Bartlett School of Planning, University College London, London, UK **United Nations Environment Programme (formerly International Energy Agency), Nairobi, KenyaTaylor and Francis LtdTTRV_A_136078.sgm
(Received 15 March 2005; revised 17 June 2005; accepted 20 July 2005)10.1080/01441640500360951Transport Reviews0144-1647 (print)/1464-5327 (online)Original Article2005Taylor & [email protected]
ABSTRACT Emissions from the transport sector represent the fastest growing source ofgreenhouse gas emissions. There is little prospect that this situation will be resolved with asingle technological fix. As developing nations quickly move to catch up with the motor-ization levels of developed nations, the sheer number of private vehicles may overwhelmany advances made by cleaner fuels. By 2030, there is projected to be more vehicles in thedeveloping world than in developed nations. Despite the growth in developing-nationtransport emissions, the sector has produced relatively few mitigation projects within themechanisms of the Kyoto Protocol. However, a few developing cities, such as Bogota,Colombia, have demonstrated innovation in low-cost solutions to reducing emissions.This research employs scenario analysis to examine the size and cost of potential emissionreduction options from the urban transport sector of developing nations. In particular, theanalysis compares the cost of greenhouse gas emission reductions from fuel technologyoptions to reductions from measures promoting mode shifting. This comparative analysisindicates that a diversified package of measures with an emphasis on mode shifting islikely to be the most cost-effective means to greenhouse gas emission reductions.
Introduction
The spectre of rapidly growing private vehicle ownership and usage in developingnations casts a worrying shadow over the projected course of global greenhousegas emissions. If such nations follow the same path of automobile dependence asdeveloped nations, there is little that technological advances can offer to offset sucha monumental increase in motorization and its subsequent emissions. The result-ing emissions from millions of new vehicles will simply overwhelm the reductionsachieved through improved fuel and propulsion technologies.
However, most developing-nation cities still possess the basis for a moresustainable future. Public transport and non-motorized transport (walking andcycling) still command a dominant share of travel in developing cities. Unfortu-nately, the quality of these modes is often quite poor with regard to security,comfort, convenience and prestige. The sum effect of inadequate public transport
Correspondence Address: Lloyd Wright, University College London, London, UK. Email: [email protected]

692 L. Wright and L. Fulton
and difficult conditions for walking and cycling means that most developing-citycitizens will move to private motorized vehicles as soon as it is economicallyviable to do so. Thus, a central principle behind a more efficient and sustainabletransport future in developing cities must be the preservation of existing modeshares for public transport and non-motorized options.
This research provides a comparative analysis of the two different types ofclimate change mitigation options for developing cities. The research firstconducts a risk analysis of strategies based solely on fuel technologies. Scenarioanalysis techniques are then used to compare the size and cost of potentialbenefits from fuel-based solutions and from mode-shifting solutions. The urbantransformation of Bogota, Colombia, is used to illustrate the potential of low-cost,low-technology mechanisms to achieve dramatic improvements in urban mobil-ity and emission reductions. Finally, the research reviews the international effortsto date to mitigate developing-nation emissions from the transport sector.
Transport policy decisions made today in developing nations will haveprofound ramifications on any possible attempt to control global greenhouse gasemissions. These policies will also in part determine the extent to which other keydevelopmental objectives, such as health levels, economic efficiency and overallquality of life, are realized in developing cities. Once policies are orientatedtowards motorization, it will be difficult to return to more sustainable options. Asthe developed world has discovered, moving commuters away from cars topublic transport and non-motorized options is quite difficult and costly.
Trends in Developing-nation Transport
The planet will soon reach a milestone of being resident to over 1 billion motorizedvehicles. Virtually all trends related to motor vehicle usage remain on course forcontinued growth. The International Energy Agency (IEA) has compiled a compre-hensive set of spreadsheet analyses projecting transport trends between 2000 and2050 (IEA/SMP, 2004). This work has been undertaken in conjunction with ‘Mobil-ity 2030’ report of the World Business Council for Sustainable Development(WBCSD), which has attempted to characterize transport trends and options overthe coming decades (WBCSD, 2004).
Vehicle Ownership
The reference case from the IEA spreadsheet provides the expected business-as-usual scenario. Figure 1 shows the expected trends in vehicle ownership levels. Ithas two striking features. First, despite the existing saturation of vehicle ownershipin countries such as the USA, growth in ownership in these countries is expectedto continue through to 2050. Second, the rate of growth in developing countries issignificant, resulting in the number of developing-nation vehicles surpassing thenumber of vehicles in the Organization for Economic Co-operation and Develop-ment (OECD) by 2030. Currently, there are approximately 982 million passengervehicles worldwide; by 2050, this figure is projected to reach 2.6 billion.1Figure 1. Vehicle ownership by region. Source: IEA/SMP (2004)It may be argued that vehicle ownership is not an emissions issue. The focus ofan emission reduction strategy should be vehicle usage and not ownership.However, ownership and emission levels are in fact closely correlated for severalreasons. First, approximately one-third of a vehicle’s lifetime emissions stem fromthe upstream manufacturing process of the vehicle.2 Second, once a vehicle is

Climate Change Mitigation and Transport in Developing Nations 693
purchased, the convenience of use induces additional travel (Gilbert, 2000). Third,in the developing world, ownership has tended to arrive by way of highly pollut-ing, used vehicles. In Peru, the lifting of used vehicle import restrictions resultedin a surge of vehicle ownership, with 70% of the annual growth being realized byolder, used vehicles discarded from countries such as the USA (Zegras, 1998). Anolder vehicle fleet in conjunction with poor maintenance practices and limitedvehicle testing can mean that the impacts of motorization on developing nationsare many times worse than an equal level of motorization in a developed nation.
The growth in motorized vehicle ownership has largely followed trends inper-capita income. Dargay and Gately (1999) show that in the per-capita incomerange of US$2000–5000, vehicle purchases jump sharply. Other factors affectingvehicle ownership growth are population growth, urbanization levels, importa-tion regulations and the quality of alternative transport services. The relativelower cost of suburban versus urban housing can also increase the demand forprivate vehicles. Several major developing nations are entering the income zoneof rapid motorization.
Vehicle Usage
Figure 2 shows a projection of vehicle usage levels through to 2050 for both OECDand non-OECD nations. Like vehicle ownership, vehicle usage is expected togrow for both OECD and non-OECD countries, with the highest growth rates inthe developing world.Figure 2. Vehicle use by region (vehicle-km travelled). Source: IEA/SMP (2004)
Public Transport Usage
While private vehicle usage is reaching unprecedented heights, the samecannot be said of the state of public transport. In much of the world, publictransit usage is decreasing at a fairly steady rate. In developing cities, contin-ued penetration of motorized modes and general dissatisfaction with the qual-ity of transit services has contributed greatly to the steady mode share loss.Table 1 shows the loss of public transport mode share across several cities. In
3000
2500
2000
1500
1000
2000 2010 2020 2030 2040 2050
500
0
Year
OECD
Non-OECD
Mill
ions
of
pass
enge
r ve
hicl
es
Figure 1. Vehicle ownership by region. Source: IEA/SMP (2004)

694 L. Wright and L. Fulton
these surveyed cities, public transport is relinquishing a 0.2–1.4 mode sharepercentage annually.
A visit to any number of developing cities can quickly reveal the source ofcustomer dissatisfaction with public transport and non-motorized options(Figures 3 and 4). Poor transport services in the developing world push consum-ers to private vehicle options. If public transport is too slow, uncomfortable,unsafe, insecure and lacking in status, then the loss of mode share is almostcertain, even in seemingly captive markets. Likewise, if the pedestrian infrastruc-ture is of poor quality, then motorization can be the mode of choice even for veryshort distances, as has been the case in some Asian cities (Hook, 2000).Figures 3 and 4. The poor quality of public transport in developing cities creates great hardship for the citizenry
Greenhouse Gas Emissions
While emission control technologies have to an extent limited health-related vehi-cle emissions (e.g. particulate matter, sulphur oxides, nitrogen oxides and carbon
60 000
50 000
40 000
30 000
20 000
10 000
0
Ann
ual v
ehic
le k
m (
billi
on
km/y
r) Non-OECD
OECD
2000 2010 2020 2030 2040 2050
Year
Figure 2. Vehicle use by region (vehicle-km travelled). Source: IEA/SMP (2004)
Table 1. Trends in mode share of public transport in selected cities
City Earlier year
Public transport as a percentage of motorized trips Later year
Public transport as a percentage of motorized trips
Bangkok 1970 53 1990 39Buenos Aires 1993 49 1999 33Kuala Lumpur 1985 34 1997 19Mexico City 1984 80 1994 72Moscow 1990 87 1997 83Sao Paulo 1977 46 1997 33Seoul 1970 67 1992 61Tokyo 1970 65 1990 48Shanghai 1986 24 1995 15Warsaw 1987 80 1998 53
Source: WBCSD (2001).

Climate Change Mitigation and Transport in Developing Nations 695
monoxide), the same cannot be said of greenhouse gas emissions. Given thetrends noted in vehicle ownership and usage (Figures 1 and 2), it is not surprisingthat transport greenhouse gas emissions are projected to follow a similar patternof high growth. Figure 5 shows the projected trends for greenhouse gas emissionsfrom the transport sector for both OECD and non-OECD countries.Figure 5. Transport carbon dioxide emissions by region. Source: IEA/SMP (2004)Current estimates show that the transport sector represents approximately 24%of global greenhouse emissions from fossil fuel sources, second only to the gener-ation of electricity and heat (39%) (IEA/OECD, 2003). By all accounts, though,transport is the fastest growing source of greenhouse gas emissions, with anannual growth rate of 2.1% worldwide and an annual growth rate of 3.5% fordeveloping nations (IEA, 2002a).
‘De-coupling’ and ‘Leap-frogging’
The rise of a service economy based upon information technologies holds thepotential to decouple transport usage from economic growth. Less transport-inten-sive manufacturing should reduce the need for transport inputs into industrialprocesses. By extension, developing nations can potentially leap-frog past trans-port-intensive stages of economic growth and proceed directly into a new, lessvehicle-dependent transport paradigm.
To an extent, some evidence exists of efficiency gains leading to a reduced rela-tionship between economic growth and petroleum usage (Lovins, 2003), but the
Figures 3 and 4. The poor quality of public transport in developing cities creates great hardship for the citizenry

696 L. Wright and L. Fulton
growth of vehicle ownership and usage seems to continue irrespective of trans-port inputs to an economy (IEA/SMP, 2004). The United Nations FrameworkConvention on Climate Change (UNFCCC) conducted a survey of Member Statesin terms of quantifying the historical relationship between economic activity andtransport-sector growth. Of all the Member States, only one nation indicated adiscernible decoupling effect. During the 1990s, Finland’s economy grew signifi-cantly while simultaneously curbing growth in its transport sector (Diaz-Bone,2004). This divergence is in part credited to a ‘Nokia’ effect in which the econ-omy’s principal growth source was decidedly not transport-intensive.
However, other Scandinavian nations had similar economic characteristics with-out producing reduced transport emissions. The difference in the case of Finlandwas the simultaneous application of policies to curb vehicle ownership and usage.Otherwise, the wealth generated from Finland’s non-transport-intensive economywould likely have produced increased motorized transport, as it has elsewhere inthe world. Freight transport represents just 5.9% of worldwide vehicle-km travelled(IEA/SMP, 2004). Private individual travel still predominates in global terms. Thus,increased wealth, regardless of whether the wealth is generated by a less transport-intensive industry, seems to lead to increased use of private motorized vehicles.
As for the prospects of developing-nation leap-frogging, there is relatively littleevidence in the projected trends for anything other than continued motorization.China’s rapid adoption of the car is a prominent example. In 2004, annual growthin vehicle ownership reached 75% (The Economist, 2005). Bicycle use in China hasfallen as national policy gives favour to its burgeoning automobile industry. Mostmajor Chinese cities are actively discouraging bicycle use through prioritymeasures for automobiles and through the neglect of non-motorized infrastructure(Hook, 2002). A few Chinese cities have actually even banned bicycles fromsections of the urban area.
Preserving Mode Share in Developing-nation Cities
Despite the overwhelming movement towards motorization, virtually alldeveloping cities possess a significant advantage in terms of achieving a more
14000
12000
10000
8000
6000
4000
2000
0
2000 2010 2020 2030 2040 2050
Year
Gre
enho
use
gas
emis
sion
s (m
egat
onne
s of
CO
2)
Non-OECD
OECD
Figure 5. Transport carbon dioxide emissions by region. Source: IEA/SMP (2004)

Climate Change Mitigation and Transport in Developing Nations 697
sustainable urban form. Most developing cities already posses a high modeshare for public transit and non-motorized modes as well as a fairly high-density, mixed-use design pattern. The challenge for these cities is to improvetheir transport systems in order to preserve the market share of low-emittingmodes. Table 2 shows mode share data from a sampling of different developingcities.
Thus, finding a mechanism merely to preserve existing mode shares in devel-oping nations could be one means towards greenhouse gas stabilization.
Bogota, Colombia, and Curitiba, Brazil, are perhaps the two most notableexamples of cities that have shown the erosion of public transport mode share isnot preordained. Both cities have demonstrated innovation with high-quality bussystems and a complementary package of supporting measures, including infra-structure for non-motorized transport and car-restriction measures.
In both Bogota and Curitiba, Bus Rapid Transit (BRT) has played a prominentrole. The general idea of BRT is to create “a mass transit system using exclusiveright of way lanes that mimic the rapidity and performance of metro systems bututilises bus technology rather than rail vehicle technology” (Wright, 2004, p. 1).BRT essentially emulates the performance and amenity characteristics of amodern rail-based transit system but at a fraction of the cost. To achieve this levelof quality, BRT systems tend to focus on an array of features that enable a city totransform a standard bus service into a mass transit system. These featuresinclude the following (Wright, 2004):
● Exclusive right of way lanes.● Reformed business and institutional structures.● Rapid boarding and alighting.● Free transfers between routes.● Pre-board fare collection and fare verification.● Enclosed stations that are safe and comfortable.● Clear route maps, signage and real-time information displays.● Modal integration at stations and terminals.● Clean vehicle technologies.● Excellence in marketing and customer service.
Table 2. Mode share of urban transport in selected developing cities
Mode share (percentage of daily trips)
CityNon-motorized
transportPublic
transport
Private motorized
vehicles Other
Bamako, Mali (1984) 63 12 26 0Havana, Cuba (1998) 57 27 6 11Hanoi, Vietnam (1995) 54 4 42 0Ouagadougou, Burkina Faso (1994) 52 3 45 0Cairo, Egypt (1998) 36 47 17 0Sao Paulo, Brazil (1997) 35 33 31 1Santiago, Chile (1991) 20 56 16 9Bogota, Colombia (2000) 15 71 12 2
Sources: Vasconcellos (2001) and WBCSD (2001).

698 L. Wright and L. Fulton
Most BRT systems today are being delivered in the range of US$1–15 million/km,depending upon the capacity requirements and complexity of the project. Bycontrast, elevated rail systems and underground metro systems can cost fromUS$50 million to over US$200 million/km (Wright, 2004).
BRT gained its initial prominence with its application in Curitiba in 1974. Thesystem helped Curitiba gain an average annual ridership gain of 2.3% over twodecades (Rabinovitch and Hoehn, 1995). Likewise, under the administration ofMayor Enrique Peñalosa, Bogota launched its BRT system in December 2000. Itsubsequently experienced a gain in public transport ridership (Figures 6 and 7).The Bogota system, known as TransMilenio, included a 41-km Phase I at a cost ofUS$5.3 million/km.Figures 6 and 7. Bogota went from this to this in just 3 yearsAs of March 2005, the system features 58 km of busways and 309 km of feederroutes, moving over 800 000 passengers/day. The system functions with no oper-ating subsidies, even with each private sector operator financing Euro II or EuroIII articulated buses.
Bogota’s BRT is also complemented by new cycleways, pedestrian upgradesand car-free events. The addition of nearly 300 km of high-quality cycle ways hashelped increase bicycle mode share from 0.4 to over 3.0% in a few years. Bogotahas also gained fame for its development of car-free events. Each Sunday, 120 kmof arterial roadways are closed to private motorized vehicles (Figure 8). Bogota
Figures 6 and 7. Bogota went from this to this in just 3 years

Climate Change Mitigation and Transport in Developing Nations 699
also holds the world’s largest car-free weekday event, covering the entire expanseof the city.Figure 8. As many as 2 million of the city’s inhabitants take to the streets during Bogota’s weekly car-free SundaysBogota’s success with non-motorized and public transport modes is also due toa highly synergistic implementation of car-restriction measures. Each weekdaythe city restricts 40% of all vehicles entering the city in the morning (06.00–09.00hours) and evening (16.30–17.30 hours) peak periods. The city has also dramati-cally reformed its control on parking. On-street parking has been eliminated frommany streets. In many cases, the previous parking bays have been converted intoattractive public space. Likewise, Curitiba dramatically improved its allocation ofpublic space to pedestrians with major car-free areas in the city centre. The pedes-trian zones also act as feeder services to the BRT system by easing pedestrianmovements towards stations.
The degree to which the success of both Curitiba and Bogota can be replicatedis uncertain. Both cities benefited from highly charismatic mayors who madepublic space and transport a priority. Over 1000 city officials from approxi-mately 50 countries have visited Bogota in the past few years. In part due to theinfluence of Bogota and Curitiba, new BRT systems are already in operation inBeijing in China, Jakarta in Indonesia, Leon in Mexico, and Seoul in SouthKorea. Other cities such as Cape Town in South Africa, Dar es Salaam in Tanza-nia, Hanoi in Vietnam, Lima in Peru, Mexico City in Mexico, and Santiago inChile, have projects underway. Visits to Curitiba by US officials have evenhelped to catalyse a national BRT programme in the USA. However, none ofthese subsequent projects has reached the same level of quality or ambition asBogota or Curitiba. Without the high degree of political will exhibited in Bogotaand Curitiba, full implementation is often lacking. Further, both Bogota andCuritiba have enjoyed a continuity of transport policy across several politicaladministrations.
Figure 8. As many as 2 million of the city’s inhabitants take to the streets during Bogota’s weekly car-free Sundays
700 L. Wright and L. Fulton
Framework for Transport Emissions
The source components of transport emissions represent a myriad of opportuni-ties for reduction. Figure 9 shows a framework for identifying and evaluatingthese different components. Much of the emphasis of national and internationalemission reduction efforts has focused on just one of the over 20 subcomponentsin this equation, namely the ‘type of fuel’.
This research paper attempts to quantify the relative emission benefits ofaddressing different emission components individually as well as through a pack-age of measures. To an extent, investments in greenhouse gas reductions in thetransport sector are a zero-sum game. Investment priorities on one component(such as fuels) can mean less investment is available to address other components.Likewise, political and institutional attention on one component can be to thedetriment of others.
The first category shown in Figure 9 relates to the relative market share of aparticular mode (private vehicles, public transport, non-motorized options, etc.)and the number of passengers carried in each vehicle (load factor). Most of thesubcomponents in this category are aimed at affecting the behaviour or personalmodal choice of the consumer. Attributes such as cost, travel time, security andconvenience all play a pivotal role in the consumer’s modal choice.Figure 9. Factors affecting greenhouse gas emissions from the transport sectorThe second category relates to the distance travelled and is affected by land-useand transport network design. Transit-oriented development has become a popu-lar tool for focusing residential and commercial development around publictransport nodes, thus reducing the distances travelled. Additionally, the rise ofnew information and communications technologies (ICT) holds the possibility ofreducing the number of trips through substitution effects. Whether or not ICT isactually achieving such reductions is debatable, as telecommuters may simplyreplace work commutes with other motorized trips (Tayyaran and Khan, 2003).
The final category in Figure 9 relates to technological attributes that affect vehi-cle emissions per distance travelled. The carbon content of the particular fuel usedreceives a great deal of attention in emission reduction efforts. However, othersystem characteristics such as vehicle weight, driver behaviour and maintenancepractices are also of importance to overall vehicle emissions. For public transportsystems, the provision of priority infrastructure such as busways will also signifi-cantly improve fuel efficiency by allowing smoother, uninhibited operations.
Risk Analysis of Fuel-based Approaches
This section briefly reviews the risks associated with emission reduction strate-gies that are solely focused on fuels. These risks include: (1) uncertainty over thetiming of technology commercialization; (2) uncertainty over the size of the miti-gation effects; (3) risk due to lack of diversification; (4) risks of transport sectorgrowth outpacing fuel-based emission reductions; and (5) risks of secondaryeffects from fuel-based solutions.
National research and development budgets have heavily invested in fuel tech-nologies. By far the largest financial investment is being made in the area ofhydrogen fuel cells. In 2003, the USA launched its 5-year Hydrogen Fuel CellInitiative with a commitment of US$1.7 billion in research funding. Likewise, theEuropean Union is supporting a €2.8 billion (US$3.7 billion) public–privatepartnership in a 10-year fuel cell development programme. In 2003, Japan

Climate Change Mitigation and Transport in Developing Nations 701
Figu
re 9
.Fa
ctor
s af
fect
ing
gree
nhou
se g
as e
mis
sion
s fr
om th
e tr
ansp
ort s
ecto
r
702 L. Wright and L. Fulton
dedicated US$268 million of its government research budget to fuel cells. Like-wise, other governments such as Canada and China also have their own fuel cellprogrammes (Science, 2004). International forums for developing-nation transportoptions, such as The World Bank-led ‘Clean Air Initiative’, have placed consider-able emphasis on alternative fuels. The WBCSD’s ‘2030 Report’ likewise focusedupon fuel-based solutions.
Despite the optimism brought with these investments, the timing of the emis-sion benefits is still uncertain. The IEA (2004a) notes that there are no certaintieswhen technologies such as hydrogen fuel cells will become commercially viable.Hydrogen storage capabilities, the dependence on expensive rare-metal catalysts(e.g. platinum) and the development of appropriate infrastructure all representformidable uncertainties in the timely delivery of a commercial product. Bydepending on a technology without a known delivery date, action on transport-sector emissions can be significantly delayed:
by skewing research toward costly large-scale demonstrations of technol-ogy well before it’s ready for market, governments risk repeating a patternthat has sunk previous technologies such as synfuels in the 1980s. By focus-ing research on technologies that aren’t likely to have a measurable impactuntil the second half of the century, the current hydrogen push fails toaddress the growing threat from greenhouse gas emissions from fossil fuels.(Science, 2004, p. 958)
The timing and technological risks of a fuels-based approach are perhaps bestexemplified by the climate change policy of the USA, as presented at the 10thConference of the Parties to the UNFCCC. Specifically, this strategy containsthree key components (US Department of State, 2004):
● Commercialization of hydrogen vehicles and development of a hydrogenfuelling infrastructure.
● Development of clean-coal electricity generation with carbon sequestration.● Further development of nuclear-based electricity generation with increased
research investment in nuclear fusion.
Thus, the strategy depends upon the commercial delivery of three technologieswith major developmental issues remaining. The failure of one component tomaterialize can undermine the entire package. For example, if carbon sequestra-tion techniques prove to be technically infeasible or commercially non-viable, thehydrogen produced from coal-based electricity may well increase greenhouse gasemissions relative to today’s energy mix. A lack of diversity in an emissions strat-egy portfolio puts much pressure on the timeliness and effectiveness of specula-tive technologies.
Further, the expected size of the emission reduction benefits can also be quiteuncertain. When full life-cycle emissions are considered, other fuel processes suchas refining and delivery (‘well-to-tank’) can negate the ‘tank-to-wheel’ emissionbenefits of these fuels. For example, compressed natural gas (CNG) provides littleto no benefit in terms of greenhouse gas emissions, especially when upstreammethane losses along pipelines are considered. Some studies estimate that withthe inclusion of methane leakage, CNG will actually produce significantly moretotal greenhouse gas emissions (CVTF, 2000).

Climate Change Mitigation and Transport in Developing Nations 703
Biofuels hold the potential to deliver a product with net zero greenhouse gasemissions. The CO2 emitted by biofuels can be balanced by the CO2 absorbedduring plant growth, potentially resulting in a fixed carbon cycle. However, thereality is more complicated. Total greenhouse emissions from biofuel productionare still quite poorly understood including certain factors that could increase netgreenhouse gas emissions considerably. These factors include: (1) energy inputsinto the cultivation of crops; (2) secondary emissions that have climate changeimpacts (e.g. black soot); (3) the amount of fertilizer used and resultant emissionsof nitrous oxide (N2O); (4) the amount of pesticide used; and (5) the type of biomassbeing displaced by energy crops. In some instances, such as soy-based fuels, theresulting greenhouse gas emissions from nitrogen releases may overwhelm otherbenefits (Deluchi, 2003). Additionally, it is unclear if the amount of agriculturalland is sufficient to produce biofuels in a quantity sufficient to offset petroleumfuels dramatically (IEA, 2004b).
Hybrid-electric vehicles have gained particular attention due to the presentavailability of the technology as a commercially viable option. Both private andpublic vehicles with hybrid-electric technology are currently available at rela-tively modest cost premiums. However, even with this technology, the green-house gas benefits can vary depending on the driving duty cycle. The city ofSeattle, WA, USA, has made one of the largest investments in hybrid-electrictechnology within its bus system. However, despite manufacturer claims of fuelefficiency gains of 25% or more, the initial results in Seattle were significantly lessdue to the route choice (Hadley, 2004). If the bus duty cycle does not involve suffi-cient stop and go travel, then the efficiency gains from regenerative braking arenot realized. The additional weight of the hybrid-electric vehicle offsets the gainsfrom the on-board electricity generation. Further, like all new technologies, acertain period of adjustments and experimentation are required before optimumresults being achieved.
While hydrogen is touted as the ultimate fuel for ‘zero emissions’, muchdepends on how the hydrogen is processed. If hydrogen is derived from the elec-trolysis of water, powered by fossil-fired plants, upstream CO2 emissions couldbe similar to or even higher than for conventional diesel buses (CFCP, 2001, citedin IEA, 2002b). Hydrogen production from entirely renewably generated sourcesis far from economic viability.
Each fuel shows promise in one aspect or another. CNG and liquid petroleum gas(LPG) may well be justified in terms of reductions in other types of pollutants (partic-ulate matter, sulphur oxides, etc.), despite the lack of greenhouse gas emission bene-fits. Hybrid-electric vehicles show promise for improved fuel economy, but thereremains a learning curve. However, no fuels are currently providing near-zero emis-sions from a well-to-wheel standpoint at anywhere near a competitive price level.
The chief advantage offered by fuel-based solutions is often in terms of politicalexpediency. Fuel-based solutions allow current mode and travel practices tocontinue while avoiding seemingly difficult political and personal decisions:
While its emissions are growing very quickly, transport is perhaps themost difficult sector to regulate because of the sheer size of the vehiclefleet and its relatively slow turnover, and the complex web of institu-tional interactions among personal attitudes relating to vehicles and landuse, local politics and the marketing power of the auto-oil industry.(Rajan, 2005, pp. 4–5)

704 L. Wright and L. Fulton
Fuel-based solutions bring with them the allure of continued growth in privatevehicle usage without the necessity of lifestyle or behavioural changes. However,this attribute may also be the very weakness of a fuels-dependent path. A busi-ness-as-usual scenario in terms of motorization levels in the developing worldwill severely undermine the emission reductions from fuel-based strategies. Evenif more advanced fuels are introduced in developing cities on a wide scale duringthis period (which is unlikely), the net increase in vehicle-km travelled can easilyeclipse emission gains per vehicle.
Finally, a fuel-based strategy may also represent a missed opportunity interms of potential co-benefits. A scenario with a sole reliance on advanced fuelswill not appreciably stem the other negative impacts of motorization, such asaccident levels and congestion. Globally, an estimated 1.2 million deaths occurannually due to automobile accidents, making transport one of the leadingcauses of death worldwide. A disproportionate percentage of these deaths,approximately 90%, occur in developing nations. Of the road deaths in develop-ing nations, approximately one-half of the victims are non-motorists, but ratherpedestrians or bicycle users, thus raising serious equity questions (World HealthOrganisation, 2003). The number of persons injured from such accidents is esti-mated to be at least 15 times the mortality rate (Vasconcellos, 2001), or approxi-mately 18 million persons in 2001. Congestion is also a growing issue indeveloping-nation cities. The road infrastructure in such cities is often unable tocope with the increases in vehicle ownership and usage. Strategies that reduceprivate motorized travel, such as mode shifting or trip reduction, simulta-neously address greenhouse gas emissions, other types of emissions, noise, acci-dents and congestion. Litman (2005) developed a comparative framework forevaluating the effectiveness of particular strategies across a range of co-benefits.Fuel-based approaches may only singly address a few pollutants without anyfurther complementary benefits.
Comparative Scenario Analyses
Emissions Reduction Comparison
The IEA has conducted some initial analysis to determine the relative impacts ofmode share in comparison with different fuel and propulsion options. It exam-ined the emission impacts of shifting mode share by the capacity equivalent ofone bus with a total capacity of 120 passengers. Even with the rather modestassumption of only a 50% load factor for the bus and only 8% of the passengershaving switched from private vehicles, the resulting emission reductions weresubstantial.3 The projected reductions in hydrocarbon and carbon monoxideemissions/km were over ten times the emissions of a single bus (IEA, 2002b).The reduction/km of particulate matter, nitrogen oxides and carbon dioxide(CO2) (fuel use) ranged from two to four times the emissions of a single bus(Figure 10).Figure 10. Impacts of mode shifting to public transport. Source: IEA (2002)Remarkably, the level of emissions reduced did not change significantly withbuses of strikingly different emission standards. Buses with Euro 0, Euro II, EuroIV and fuel-cell technology all produced roughly the same reductions. This resultoccurred because the relative impact of the tailpipe standard (and thus the fueland propulsion choice) was overwhelmed by the impact from mode switching.The IEA study notes that:

Climate Change Mitigation and Transport in Developing Nations 705
Regardless of whether a bus is ‘clean’ or ‘dirty’, if it is reasonably full itcan displace anywhere from 5 to 50 other motorised vehicles …. (IEA,2002b, p. 12)
Certainly, a cleaner bus will yield lower emissions, but in this scenario,the emission reductions from technology choice are overshadowed byreductions from mode switching (and the resulting ‘subtraction’ of othervehicles). … Dramatic reductions in road space, fuel use, and most emis-sions can be achieved through displacing other vehicles with any bus,even the ‘Euro 0’ buses typically sold in the developing world. (IEA,2002b, p. 48)
The results suggest that advanced fuels alone only address a relatively smallportion of the total emission reduction potential.
Emission Reduction Costs
The potential size of the emission reduction is just one factor in mitigation invest-ments. The cost/tonne of the potential CO2 offset is also of primary importance toattracting investment. With the absence of the USA from the Kyoto Protocol, thedemand for Certified Emission Reductions (CERs) is likely to be somewhatlimited. Nevertheless, emission prices may well be in the range US$5–15/tonne ofCO2 offset. While many energy-related projects will exceed this price range, thepotential for emission credits at least partially to cover project costs may be feasi-ble. This research seeks to develop a few indicative cost figures for different emis-sion reduction scenarios.
Fuel-based scenarios. The first set of scenarios analysed focuses upon advancedfuel technologies and their potential for greenhouse gas emission reductions. Toan extent, early efforts in developing ‘Clean Development Mechanism’ (CDM)projects have already afforded a view of some emission reduction costs. InYogyakarta, Indonesia, a cost analysis of greenhouse gas emissions reductionswas conducted based on the conversion of a bus fleet from diesel fuel to LPG. Theconversion of the 200-bus fleet would generate an estimated emissions savings of
Figure 10. Impacts of mode shifting to public transport. Source: IEA (2002b)

706 L. Wright and L. Fulton
3000 tonnes of CO2 over a decade. With an assumed value of US$10/tonne ofCO2, the project would thus net US$30 000. However, the analysts calculated thetransaction costs for the emission credits to be US$40 000, producing a net US$10000 loss (Maulidia, 2004). Thus, based on these results, the project was abandonedas a CDM initiative.
Using IEA cost estimates of advanced vehicle technologies (IEA, 2002b) alongwith projections for potential fuel efficiency gains, a set of estimated emissionreduction costs has been prepared for three different fuel technologies: CNG,hybrid-electric and fuel cells. For each fuel technology, a current realistic scenariois presented along with an optimistic future scenario. In each instance, thebaseline emission comparison is with a EURO II diesel bus with an assumedoperational life of 10 years.4 Table 3 summarizes the results.
The pessimistic case for CNG assumes that no net greenhouse gas emissionreductions are achieved due to upstream methane losses. For hybrid-electricvehicles, the pessimistic case assumes only a marginal emissions benefit due toan insufficient amount of stop-and-go travel. For fuel cell vehicles, the pessimis-tic case represents the standard performance and cost figures from today’s vehi-cles, while the optimistic case represents one possible future scenario iftechnological barriers are overcome and scale-economies can be reached in vehi-cle manufacturing.
Based on these results, hybrid-electric technology represents the only technol-ogy in which a somewhat cost-competitive case could be achieved. At least from agreenhouse gas standpoint, CNG and fuel cells do not appear to be cost justified.In fact, these results in general are about an order of magnitude greater than theexpected market value of emission reduction credits. Based upon these results, itappears somewhat challenging for vehicle/fuel-based solutions by themselves tobecome competitive greenhouse gas emission reduction options.
Mode shifting scenarios. The next set of scenarios analysed focuses upon projectsthat stimulate a shift in mode share from high-emitting modes (e.g. privatemotorized vehicles) to lower-emitting modes (e.g. public transport and non-motorized vehicles).
Existing Research
Some initial analytic work has also been conducted in this area. Project teams inboth Bogota and Santiago have developed methodologies to calculate greenhousegas emission reductions from BRT projects. If such methodologies are approvedby the UNFCCC, the project developers can subsequently pursue the validationof CERs. The initial methodology put forward by Bogota was rejected, and thus itindicates some of the difficulties in establishing rigorous baselines and projec-tions when the complexities of mode shifting are involved.
As a full BRT system, TransMilenio of Bogota provides several differentsources of emission reductions, including the following:
● Increasing the share of public transport ridership by dramatically improving thequality of service (in terms of travel time, comfort, security, cleanliness, etc.).
● Constructing segregated busways that permit uninhibited bus movementswithout delays from mixed traffic.
● Using pre-board fare-collection systems that reduce dwell times.

Climate Change Mitigation and Transport in Developing Nations 707
Tab
le 3
.E
mis
sion
red
ucti
on c
osts
for
fuel
tech
nolo
gy s
cena
rios
Scen
ario
type
Fuel
/te
chni
cal t
ype
Car
bon
dio
xid
e (C
O2)
red
ucti
on (%
)In
crem
enta
l ve
hicl
e co
st (U
S$)
Incr
emen
tal
oper
atin
g co
sts
(US$
/km
)
Ref
uelli
ng
infr
astr
uctu
re
inve
stm
ent (
US$
/ve
hicl
e)In
crem
enta
l fue
l cos
tsE
stim
ated
cos
t (U
S$/
tonn
e C
O2)
Pess
imis
tic
com
pres
sed
nat
ural
gas
030
000
0.02
20 0
00eq
ual
n.a.
Opt
imis
tic
com
pres
sed
nat
ural
gas
1020
000
0.02
10 0
00eq
ual
442
Pess
imis
tic
hybr
id-e
lect
ric
510
0 00
00.
020
5% le
ss19
12O
ptim
isti
chy
brid
-ele
ctri
c20
65 0
000.
020
20%
less
148
Pess
imis
tic
fuel
cel
l30
1 00
0 00
00.
0550
000
100%
hi
gher
3570
Opt
imis
tic
fuel
cel
l75
250
000
0.03
20 0
0050
% h
ighe
r46
3
n.a.
, Not
app
licab
le.
708 L. Wright and L. Fulton
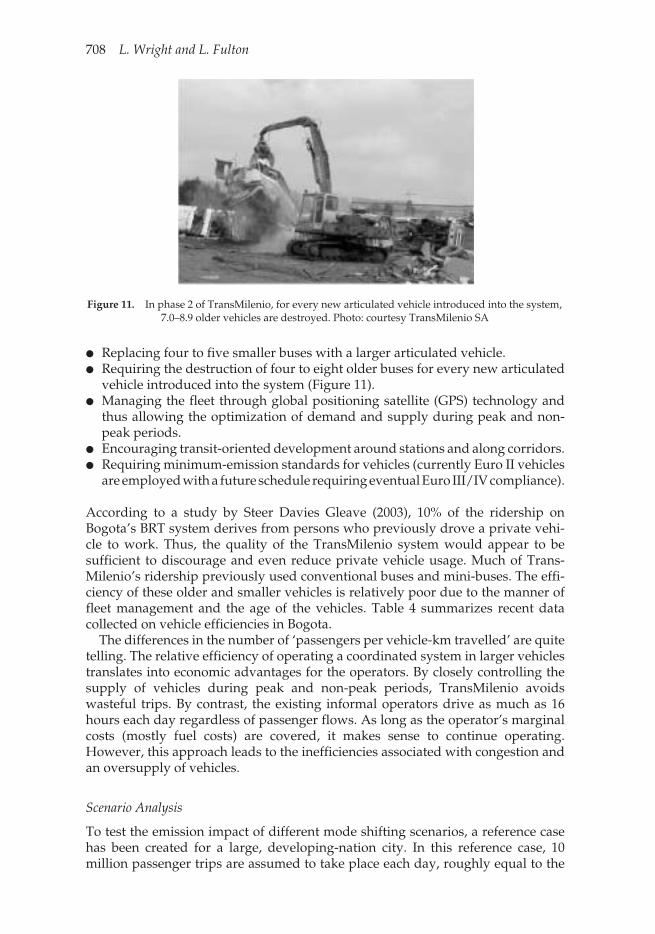
● Replacing four to five smaller buses with a larger articulated vehicle.● Requiring the destruction of four to eight older buses for every new articulated
vehicle introduced into the system (Figure 11).● Managing the fleet through global positioning satellite (GPS) technology and
thus allowing the optimization of demand and supply during peak and non-peak periods.
● Encouraging transit-oriented development around stations and along corridors.● Requiring minimum-emission standards for vehicles (currently Euro II vehicles
are employed with a future schedule requiring eventual Euro III/IV compliance).
Figure 11. In phase 2 of TransMilenio, for every new articulated vehicle introduced into the system, 7.0–8.9 older vehicles are destroyed. Photo: courtesy TransMilenio SAAccording to a study by Steer Davies Gleave (2003), 10% of the ridership onBogota’s BRT system derives from persons who previously drove a private vehi-cle to work. Thus, the quality of the TransMilenio system would appear to besufficient to discourage and even reduce private vehicle usage. Much of Trans-Milenio’s ridership previously used conventional buses and mini-buses. The effi-ciency of these older and smaller vehicles is relatively poor due to the manner offleet management and the age of the vehicles. Table 4 summarizes recent datacollected on vehicle efficiencies in Bogota.
The differences in the number of ‘passengers per vehicle-km travelled’ are quitetelling. The relative efficiency of operating a coordinated system in larger vehiclestranslates into economic advantages for the operators. By closely controlling thesupply of vehicles during peak and non-peak periods, TransMilenio avoidswasteful trips. By contrast, the existing informal operators drive as much as 16hours each day regardless of passenger flows. As long as the operator’s marginalcosts (mostly fuel costs) are covered, it makes sense to continue operating.However, this approach leads to the inefficiencies associated with congestion andan oversupply of vehicles.
Scenario Analysis
To test the emission impact of different mode shifting scenarios, a reference casehas been created for a large, developing-nation city. In this reference case, 10million passenger trips are assumed to take place each day, roughly equal to the
Figure 11. In phase 2 of TransMilenio, for every new articulated vehicle introduced into the system, 7.0–8.9 older vehicles are destroyed. Photo: courtesy TransMilenio SA

Climate Change Mitigation and Transport in Developing Nations 709
case of Bogota (7.2 million inhabitants). The average distance per non-walk trip isassumed to be 10 km. Fuel efficiency figures for private vehicles and motorcyclesare based on the IEA spreadsheet model (IEA/SMP, 2004). The fuel efficiencyfigure for BRT vehicles is based upon the TransMilenio value shown in Table 4.The fuel efficiency for conventional buses is a weighted average of the fuel effi-ciency for buses, mini-buses and micro-buses shown in Table 4. Table 5 is asummary of the reference case. The baseline calculations have been developed ina simplified manner with no assumed growth in private motorized vehicles over20 years of the analysis. Clearly, based on the IEA growth projections, this staticbaseline will not be the case. However, this assumption makes the results moreconservative since any baseline growth in private vehicle emissions will make thereductions from mode shifting even greater.
The reference case was then compared with several scenarios with differentmode shares. The cost of the mode shift was assumed to be the infrastructure costof BRT, improved footpaths and/or cycle ways. Since BRT systems, such as Trans-Milenio, function with no operational subsidy, no operational costs are included inthe subsequent cost/tonne of emissions reduced. The emission calculations for eachscenario used the same emission factors and fuel efficiency values as in the refer-ence case. The amount of the scenario’s emission reduction is simply the scenarioemission total subtracted from the emission total for the reference case. The cost ofinfrastructure is based on actual values from developing-city projects. The follow-ing infrastructure costs were used: (1) US$2.5 million/km of BRT; (2) US$150 000/km of pedestrian improvements; and (3) US$100 000/km of cycleways.
A single infrastructure value has been used for clarity when presenting theresults. However, a more representative result can be achieved by using a rangeof infrastructure costs, especially for the case of BRT, which can range from US$1million to US$15 million/km depending on local circumstances. Table 6 summa-rizes the results from the different mode shifting scenarios.
Each mode-shifting scenario resulted in relatively cost-competitive emissionreductions with no costs higher than US$70/tonne of CO2 reduced. By contrast,the lowest cost fuel-based strategy was US$148/tonne of CO2 reduced.
Ideally, an emission reduction scenario would produce both large emissionreductions as well as low-cost reductions. Each non-motorized option produced
Table 4. Comparison of vehicle efficiencies in Bogota
Vehicle typePassenger
capacity (n)Fuel consumption
(km/litre)Passengers/vehicle-
km travelled
TransMilenio articulated bus, Euro II diesel 160 1.56 5.20Private automobile 1.5 9.26 0.15Conventional bus, diesel 70–80 2.14 1.00–2.27Conventional bus, gasoline 70–80 1.53 1.00–2.27Medium-sized bus, diesel, models 1995–2004 27–45 5.02 0.90–2.24Medium-sized bus, diesel, 1980 model 27–45 3.96 0.90–2.24Medium-sized bus, gasoline, 1980 model 27–45 2.64 0.90–2.24Micro-bus, diesel 13–19 5.54 0.60–1.44Micro-bus, gasoline 13–19 3.43 0.60–1.44
Source: A. Martínez, personal communication with Aleida Martínez Palacio, Manager, Sí 99, a privateoperating company within the Bogota TransMilenio system, 2004.

710 L. Wright and L. Fulton
results under US$20/tonne of CO2 reduced. A US$60 million investment in bicy-cle infrastructure produces a projected emission reduction of 4.1 million tonnes ofCO2 over 20 years at a cost of approximately US$14/tonne.
However, the package of measures bundled together (BRT with pedestrianupgrades and cycleway investment) was the most effective combination of largeand relatively low-cost reductions. The scenario with the package of measuresproduced over 12 million tonnes of CO2 reductions at a cost of approximatelyUS$30/tonne. As an individual measure, BRT was more costly than the otherscenarios at US$66/tonne, while the non-motorized options alone did notproduce the largest reductions. This result is due to modal assignment betweenthe different options. In the case of BRT or non-motorized options working indi-vidually, each will tend to suppress the mode share of the other. For example,improved public transport (e.g. BRT) will tend to attract previously non-motor-ized users in addition to targeted trips by private vehicles. The net emissionreductions will not be as great as compared with a scenario in which public trans-port and non-motorized transport increase together. In the bundled scenario,trips by BRT, walking and cycling are all promoted and supported, and thus theloss of market share between these modes is minimized.
Finally, another interesting finding from this research has been the relative sensi-tivity of emission reductions from small changes in motorized mode share. A singlepercentage point reduction in motorized mode share and a subsequent gain byeither non-motorized options or public transport is substantial in terms of green-house gas impacts. In the context of the stated reference case, a 1% reduction inmode share of private automobiles represents over 1 million tonnes of CO2 throughthe 20-year project period. This finding implies that even shifting relatively smallpercentages of mode share to more sustainable options can be worthwhile.
It should be noted that the cost estimates generated in Tables 5 and 6 areapproximations based upon generic conditions and assumptions within project
Table 5. Reference case
Mode
Mode share (%)
Trips/day
(000s)aPassengers/vehicle-km
Distance travelled/day (km,
000s)
Fuel consump-
tion (litres/100 km)b
CO2 (kg)/litrec
CO2/day
(tonnes, 000s)
CO2 over 20 yearsd (tonnes,
000s)
Automobile 20 2000 0.150 13 333 10.80 2.42 1087.2 21 744Motorcycle 4 400 0.105 3809 2.20 2.42 63.2 1266Taxi 5 500 0.150 3333 10.80 2.42 271.8 5436Mini-bus 50 5000 1.300 3846 30.30 2.87 1043.5 20 870BRT 0 0 5.200 0 64.10 2.87 0 0Walking 20 2000 1.000 150 0 0 0 0Bicycle 1 100 1.000 100 0 0 0 0
2465.8 49 315
aBased on 10 million total trips/day.bFuel efficiency figures for private vehicles and motorcycles are based on the IEA spreadsheet model(IEA/SMP, 2004). The fuel efficiency figure for BRT vehicles is based upon the TransMilenio value inTable 5. The fuel efficiency for conventional buses is a weighted average of the fuel efficiency forbuses, mini-buses and micro-buses given in Table 5.cThe fuel for all private vehicles is assumed to be gasoline. The fuel for mini-buses and BRT vehicles isassumed to be diesel. Emissions/litre of fuel are taken from IEA spreadsheet model (IEA/SMP, 2004).dVehicle-km travelled during weekends is assumed to be one-half of weekday travel.

Climate Change Mitigation and Transport in Developing Nations 711
and baseline scenarios. The actual values will vary greatly depending on localcircumstances and a range of factors, including baseline mode shares, local infra-structure costs and cultural preferences for particular modes. The scenariospresented here also did not account for any induced travel that may occur due to
Table 6. Impact of mode shifts on carbon dioxide emission reductions
Scenario name Mode shares
Carbon dioxide (CO2) over 20 years (tonnes, 000s)
CO2 reduced from the baseline
(tonnes, 000s)Cost of infrastructure
Cost (US$)/tonne of CO2
BRT mode share increases from 0 to 5%
automobile 19%motorcycle 4%taxi 4%mini-bus 48%BRT 5%walking 19%bicycle 1%
47 409.7 1905.5 US$125 million (50 km of BRT at US$2.5 million/km)
66
BRT mode share increases from 0 to 10%
automobile 18%motorcycle 4%taxi 3%mini-bus 45%BRT 10%walking 19%bicycle 1%
45 086.8 4228.5 US$250 million (100 km of BRT at US$2.5 million/km)
59
Walking mode share increases from 20 to 25%
automobile 19%motorcycle 4%taxi 4%mini-bus 47%BRT 0%walking 25%bicycle 1%
45 888.7 3426.6 US$60 million (400 km of pedestrian upgrades at US$150 000/km)
17
Bicycle mode share increases from 1 to 5%
automobile 19%motorcycle 4%taxi 5%mini-bus 48%BRT 0%walking 19%bicycle 5%
47 393.3 1922.0 US$30 million (300 km of cycle ways at US$100 000/km)
15
Bicycle mode share increases from 1 to 10%
automobile 18%motorcycle 3%taxi 5%mini-bus 46%BRT 0%walking 18%bicycle 10%
45 154.9 4160.4 US$60 million (500 km of cycle ways at US$100 000/km, plus US$10 million promotional campaign)
14
Package: BRT, pedestrian upgrades, cycleways
automobile 15%motorcycle 3%taxi 3%mini-bus 34%BRT 10%walking 25%bicycle 10%
36 917.5 12 397.8 US$370 million (BRT US$250 million; footpaths US$60 million; cycleways US$60 million)
30
BRT, Bus Rapid Transit.

712 L. Wright and L. Fulton
the availability of road space following a shift to lower-emitting options. Further,the final total cost of attempting to convert such reductions into tradable ‘CERs’will also involve additional transaction costs as well as measurement and moni-toring costs. Nevertheless, the results of these initial scenarios for mode shiftingdo appear promising from the standpoint of cost competitiveness.
Land-use measures. The land-use impacts from the BRT systems in Bogota andCuritiba are yet to be fully quantified. In the case of Bogota, there is some initialevidence to suggest that densification around BRT stations may be occurring.Large commercial centres are being constructed along the corridors, especiallynear terminals and stations. Rodriguez and Targa (2004) determined that residen-tial property values along TransMilenio corridors are directly proportional tostation proximity. In Curitiba, zoning laws only permitted high-rise developmentalong the BRT corridors. The densification of commerce, employment and resi-dences along BRT corridors likely yields reductions in both the number of tripsundertaken as well as the average distance of each trip.
However, the challenges of projecting emissions from land-use changes aresignificant. The complex array of possible factors affecting land-use decisionscreates considerable difficulty in establishing a credible baseline. The modellingof projected land-use changes and emission reductions in Santiago hasproduced some promising results in terms of cost-effective emission reductions(under US$10/tonne of CO2) (Browne et al., 2005). However, the complexity ofthis modelling process would unlikely meet the stringent requirements of theCDM.
Policy Measures
This paper has largely addressed the comparison of technology-based solutionswith behavioural (mode-shifting) solutions. Policy measures represent anotherpotential means for achieving greenhouse gas emission reductions from the trans-port sector. Increasing vehicle performance and efficiency through mandatoryinspection and maintenance programmes as well as fuel economy standards are afew examples. Policies, particularly car-restriction policies, are quite important ascomplementary measures in supporting public transport and non-motorizedoptions. As was the case in Bogota, the scenarios summarized in Table 6 may wellnecessitate complementary car-restriction measures to encourage the intendedmode shifts. Thus, the right policy environment will ideally form another part ofa packaged approach to emission reductions.
International Response
Given the potential global impact of developing-nation motorization, the interna-tional community would be expected to be investing in mode preservationstrategies for developing cities. To an extent, international support of effective,lower-cost options has occurred. For example, the German Overseas TechnicalAgency (GTZ) has recently produced a sustainable transport sourcebook cover-ing a range of practical options, including BRT.5 Likewise, the US Agency forInternational Development (USAID), through the Institute for Transportation &Development Policy (ITDP), has supported BRT initiatives in such cities as Accrain Ghana, Cape Town, Dakar in Senegal, Delhi in India, and Jakarta. However,

Climate Change Mitigation and Transport in Developing Nations 713
compared with other sectors, the transport sector has received less investment asa means towards reductions in greenhouse gas emissions. Further, when localgovernments and international organizations have invested in transport initia-tives, the tendency has been toward fuel technologies.
International Funding Mechanisms
To date, two major international agreements have been brought forward to curbgreenhouse gas emissions. At the 1992 UN Conference on Environment andDevelopment (UNCED), member nations developed the UNFCCC. By 1994, asufficient number of countries had ratified the convention to put the documentinto force. Although the convention was essentially a non-binding agreement, theUNFCCC did include a mechanism allowing participation by developing nationsin emission-reducing projects. The mechanism, known as ‘Activities Imple-mented Jointly’ (AIJ), encouraged investment towards developing nation projectsas a means to stimulate a future emissions trading market. Remarkably, though,of the 186 AIJ projects put forward, none addressed emissions in the transportsector (Joint Implementation Quarterly, 2002).
Subsequently, in 1997, the Kyoto Protocol was drafted. The protocol calls fordeveloped nations to reduce emissions by an average of 5.2% from a 1990 base-line. Despite the absence of two major emitting nations, the USA and Australia,the agreement came into force on 16 February 2005. The Kyoto Protocol offers amechanism, known at the CDM, that allows mitigation projects in developingnations to earn CERs, which will have a monetary value. The Protocol alsoincludes a mechanism known as ‘Joint Implementation’ (JI) to promote emissionreducing projects in ‘economies-in-transition’ (i.e. Eastern Europe). Thus,although developing nations and economies-in-transition do have not reductionrequirements under the Protocol, these nations can sell credits gainedthrough CDM and JI to other nations that do have Kyoto emission reductionrequirements.
However, early indications from project proposals indicate that transport willnot be a major area of investment. CDM and JI projects are being supported bymany institutions, including the governments of Finland, Japan and the Nether-lands, as well as The World Bank through its Prototype Carbon Fund. ThroughMay 2005, a total of 126 CDM projects and 79 JI projects had been registered withthe UNFCCC. No project is transport related (Fenhann, 2005).
Apart from the UNFCCC mechanisms, the Global Environment Facility (GEF)is amongst the world’s largest grant-making facilities to fund projects alleviatingglobal environmental problems. The GEF’s resources of over US$2 billion areintended to catalyse demonstration initiatives that eventually lead to replicationglobally. The fund is managed by a central secretariat along with its implement-ing agencies, which include The World Bank, the UN Development Programme(UNDP), the UN Environment Programme (UNEP) and regional developmentbanks. However, the transport sector was one of the last sectors that the GEFclimate change programme has addressed. Further, the GEF’s operational strat-egy for transport was largely prepared by special interests from the fuel cellindustry, and thus has focused much of the early investments towards fuel andpropulsion system solutions (GEF, 2001).
Through February 2005, of the 566 registered GEF projects related to climatechange, only 13 were in the transport sector. Of these, six are focused on fuel

714 L. Wright and L. Fulton
cell technology. The fuel cell initiatives involve a US$60 million investment byUNDP to finance 46 fuel-cell buses in developing cities such as Beijing, Cairo inEgypt, Mexico City, Sao Paulo in Brazil and Shanghai in China. The actualproject cost totals US$120 million when matching funds from private sector fueland vehicle firms are included. Thus, the end result is 46 buses at a cost ofapproximately US$2.6 million per bus. However, given that in nations such asChina the hydrogen for the fuel-cell buses will likely be derived from largelycoal-based electricity, the overall greenhouse gas emissions will actually behigher than if a standard diesel vehicle was used. If instead the US$120 millioninvestment was applied towards BRT systems, then anywhere from 23 to 120km of BRT could have been financed. In response, the GEF is now movingtowards a more systems-based approach to transport initiatives. The WorldBank is currently leading GEF-financed BRT projects in Lima, Mexico City,Santiago and Hanoi, with additional projects being planned for cities in Chinaand Colombia.
Explaining the Investment Deficit
The most frequently cited reasons behind the lack of greenhouse gas mitigationprojects in the transport sector are the complexity of transport baselines and thecost-effectiveness of the projects. Projects encouraging shifts to lower-emittingmodes depend upon modelling projections that are possibly not sufficientlyrigorous to meet the standards of CERs (Sandvik, 2005). Further, the durationand timing of transport emissions may also be at odds with the CDM process.Busways and infrastructure for bicycles and pedestrians will have a lifetime of25 years or longer, and thus the initial capital costs are amortized through theemissions reduced over this period. CDM project periods only cover 7 or 10years, and thus do not permit the full emission reduction in a single reportingperiod.6 Additionally, the nature of the CDM implies the presence of a moti-vated investor with a discrete product. Private sector opportunities largelyreside in fuels and vehicles, while upgrades such as improved customer serviceeither do not have well-defined commercial opportunities or such opportunitiesare local in nature.
By contrast, fuel-switching projects do not suffer such difficulties. The average10-year life of buses coincides with permitted CDM project periods. Additionally,an emissions baseline for a fuel-switching project is far simpler without the inher-ent need of including changes in mode shares. However, as this research has indi-cated, fuel-switching projects do not appear to be cost competitive in terms ofinvestment per emission quantity reduced.
In summary, system-based approaches that promote mode shifting are costcompetitive but do not meet CDM methodological requirements. Fuel-based solu-tions meet methodological requirements but do not appear to be cost competitive.Thus, given the requirements of the CDM process, it would seem that transportwill probably not play a significant role.
However, the CDM is just one form of potential investment in emission reduc-tions. For example, GEF and bilateral agency investments do not involve emissioncredits and thus do not require the same level of baseline scrutiny, and yet trans-port has lagged as a sector here as well. To the extent transport is being addressedby either international agencies or local governments, it is often focused solely onfuel-based solutions. Although difficult to demonstrate quantitatively, there

Climate Change Mitigation and Transport in Developing Nations 715
could well be a host of informational and political barriers that account for thispredilection:
● Technological solutions (tailpipe technologies, fuels, propulsion systems) canappear to be simple black-box solutions that are intrinsically easier for publicofficials to understand than a broader systems approach.
● Higher-technology options may be perceived as being ‘modern’ by many polit-ical officials, while non-motorized transport may be perceived as counter tonational aspirations.
● It may be far more politically expedient to promote increased motorizationrather than public transport and non-motorized transport.
● BRT is a relatively new concept and there may be informational barriers to itswider application.
It is possible that simply improving the state of developing-nation footpathscould be one of the most effective long-term measures, from the perspectives ofboth cost and overall development. However, it is unlikely that any global foot-paths initiative is on the horizon anytime soon. Future research on politicalperceptions of transport modes (at the level of both international agencies andlocal governments) and the subsequent impact on investment could be helpful inunderstanding this phenomenon.
Conclusions
Emissions from the transport sector represent the fastest growing source of globalgreenhouse gas emissions. The reference case from the IEA model indicates unin-terrupted growth in motorized vehicle ownership and usage as well as green-house gas emissions. The sheer number of private vehicles being added toroadways will likely overwhelm any technological advances.
This research has produced a framework for understanding the various green-house gas emission components from the transport sector. The research has alsoconducted various scenario analyses to determine the relative size and cost-effec-tiveness of different emission reduction options. The scenario analyses indicatedthat the cost of fuel-based solutions ranged from approximately US$148 to overUS$3500/tonne of CO2. By contrast, shifting mode share from high-emittingsources (private vehicles) to lower-emitting sources (public transport and non-motorized options) produced emission reduction costs between US$14 andUS$66/tonne of CO2.
This research has thus indicated that fuel-based solutions alone will not likelyachieve cost-effective reductions in greenhouse gas emissions. The most cost-effective means to emission reductions appears to be a diverse and integratedpackage of measures that promote shifts to lower-emitting modes. By extension,these measures also produce an array of co-benefits across a range of economic,environmental and social objectives. Ideally, mode share, land use, policy andtechnology are developed as a complementary package. Additional research isrequired to understand the potential contribution from land-use changes foremission reductions.
Despite the transport sector representing the fastest growing source of green-house gas emissions worldwide, there has been relatively little project activity toaddress emissions from the sector. The number of transport projects under the

716 L. Wright and L. Fulton
mechanisms of the Kyoto Protocol and under the GEF is relatively small incomparison with other sectors.
The Kyoto process and, specifically, the CDM may not be well suited to stimu-late investment in improved transport for developing nations. Cost-competitiveoptions such as the promotion of mode shifting to public transport and non-motorized transport are not likely to meet baseline methodological requirements.Further, in the absence of the USA from the Kyoto Protocol, there are likely to belimited prospects for a highly active carbon trading market. Thus, the CDM,along with its issues of baseline calculations and additional requirements, may bemore of a distraction than a lucrative opportunity for transport investments.
While the GEF has been slow to address the transport sector, it representsperhaps the best future source of catalyst funding for mode-shifting initiatives.The World Bank’s support of BRT and non-motorized initiatives through the GEFhas already produced projects in Mexico City, Lima, Santiago and Hanoi, withother future initiatives also likely.
While the projections of increased motorization indicated in the IEA referencecase are a cause for concern, these trends are not preordained. An alternative isstill achievable for most developing nation cities. The low-cost solutions that haveemphasized public transport, bicycling and walking, and land-use changes inBogota and Curitiba are certainly possible elsewhere. Whether the political willexists elsewhere is a question to be answered.
Notes
1. ‘Passenger vehicles’ include cars, motorcycles, three-wheelers, mini-buses and buses. This valuedoes not include freight vehicles, train carriages, water transport or air transport.
2. This value is based upon vehicles in Western Europe. It is slightly less in North America, wherelife-time km travelled per vehicle are higher (Gilbert, 2000).
3. The scenario assumes that 60 new passengers switch from other modes to an articulated bus witha passenger capacity of 120. The previous modes used by the new passengers are as follows:private car (n = 5), taxi (5), paratransit (10), small diesel bus (10), three-wheeler (5), two-wheeler(10), bicycle (5) and pedestrian (10).
4. A vehicle is assumed to travel 750 000 km over a 10-year life. The baseline emission factor for aEURO II diesel bus is assumed to be 2.87 kg of CO2/litre of fuel.
5. For more information on the GTZ Sourcebook, see http://www.sutp.org6. However, the 7-year option does offer the possibility of two subsequent renewals for a total of 21
years.
References
Browne, J., Sanhueza, E., Silsbe, E., Winkelman, S. and Zegras, C. (2005) Getting on Track: Finding a Pathfor Transportation in the CDM (Winnipeg: International Institute for Sustainable Development).
California Fuel Cell Partnership (2001) Bringing Fuel Cells to Market: Scenarios and Challenges with FuelAlternatives (Sacramento: CFCP).
Cleaner Vehicles Task Force (CVTF) (2000) The Report of the Alternative Fuels Group of the CleanerVehicles Task Force: An Assessment of the Emissions Performance of Alternative and Conventional Fuels(London: UK Department of Trade and Industry).
Dargay, J. and Gately, D. (1999) Income’s effect on car and vehicle ownership, worldwide: 1960–2015,Transportation Research Part A, 33, pp. 101–138.
Deluchi, M. (2003) A Lifecycle Emissions Model (LEM): Lifecycle Emissions from Transportation Fuels, MotorVehicles, Transportation Modes, Electricity Use, Heating and Cooking Fuels, and Materials. Report No.UCD-ITS-RR-03-17 (Davis, CA: University of California).
Diaz–Bone, H. (2004) Transport and climate change in industrialized countries, paper presented at the10th Conference of the Parties to the United Nations Framework Convention on Climate Change, BuenosAires, Argentina, 6 December 2004.
Climate Change Mitigation and Transport in Developing Nations 717
The Economist (2005) Cars in China: dream machine, Economist, 2 June [electronic edn].Fenhann, J. (2005) The 109 Proposed New Methodologies Sent to the Executive Board. Report of the UNEP
Risoe Laboratory, 2 June. Available at: http://www.cd4cdm.org/Publications/CDMpipeline.pdf.Global Environment Facility (2001) Operational Program Number 11: Promoting Environmentally Sustain-
able Transport (Washington, DC: GEF).Gilbert, R. (2000) Sustainable mobility in the city, in: Proceedings of URBAN21, Global Conference on
the Urban Future, Berlin, Germany, 4–6 July 2000.Hadley, J. (2004) Hybrid buses’ fuel economy promises don’t materialize: older models have gotten
better mpg, Seattle Post-Intelligencer, 12 December.Hook, W. (2000) Improving Conditions for Non Motorized Transport in Surabya, Indonesia: A Pilot Project in
Two Neighbourhoods (Eschborn: GTZ).Hook, W. (2002) Does it make sense for China to motorize?, Sustainable Transport, 14(2), pp. 19, 29.IEA (2002a) World Energy Outlook – 2002 (Paris: IEA).IEA (2002b) Bus Systems for the Future: Achieving Sustainable Transport Worldwide (Paris: IEA).IEA (2004a) Energy Technologies for a Sustainable Future: Transport (Paris: IEA).IEA (2004b) Biofuels for Transport – An International Perspective (Paris: IEA).IEA/OECD (2003) CO2 Emissions from Fuel Combustion 1970–2001 (Paris: IEA).IEA/SMP (2004) The IEA/SMP transportation model. Available at: http://www.wbcsd.org/plugins/
DocSearch/details.asp?type=DocDet&ObjectId=MTE0Njc (accessed on 10 March 2005).Joint Implementation Quarterly (2002) AIJ pilot projects, Joint Implementation Quarterly, 8(4), p. 14.Litman, T. (2005) Efficient Vehicles Versus Efficient Transportation: Comparing Transportation Energy
Conservation Strategies (Victoria: Victoria Transport Policy Institute).Lovins, A. (2003) Energy Security Facts (Snowmass: Rocky Mountain Institute).Maulidia, M. (2004) Yogyakarta bus replacement project. Presentation at the International Seminar on
Transportation and the Clean Development Mechanism, Santiago, Chile, 25–27 August 2004.Rabinovitch, J. and Hoehn, J. (1995) A Sustainable Urban Transportation System: The ‘Surface Metro’ in
Curitiba, Brazil (Madison, WI: EPAT/MUCIA).Rajan, C. (2005) Climate change dilemma: technology, social change or both? An examination of long-
term transport policy choices in the United States, Energy Policy (forthcoming).Rodriguez, D. and Targa, F. (2004) The value of accessibility to Bogotá’s bus rapid transit system,
Transport Reviews, 24(5), pp. 587–610.Sandvik, E. (2005) Clean development mechanism as a vehicle for funding transport systems in devel-
oping countries, in: Proceedings of the Annual Meeting of the Transportation Research Board,Washington, DC, USA, January 2005.
Science (2004) The hydrogen backlash, Science, 305(13 August), pp. 958–961.Steer Davies Gleave (2003) Estimation of Private Vehicle Trips Replaced by TransMilenio: Phase II Report.
Report for the Andean Development Corporation (Caracas: CAF).Tayyaran, M. and Khan, A. (2003) The effects of telecommuting and intelligent transportation systems
on urban development, Journal of Urban Technology, 10(2), pp. 87–100.US Department of State (2004) US Climate Change Policy: The Bush Administration’s Actions on Global
Climate Change (Washington, DC: US DOS).Vasconcellos, E. (2001) Urban Transport, Environment and Equity: The Case for Developing Countries
(London: Earthscan).World Business Council for Sustainable Development (2001) Mobility 2001: Mobility at the End of the
Twentieth Century (Geneva: WBCSD).World Business Council for Sustainable Development (2004) Mobility 2030: Meeting the Challenges to
Sustainability (Geneva: WBCSD).World Health Organisation (2003) Injury Chartbook. Report (Geneva: WHO).Wright, L. (2004) Bus Rapid Transit Planning Guide (Eschborn: GTZ).Zegras, C. (1998) Used Vehicles in Perú: Effects on Motorization, Energy and Emissions (Washington, DC:
International Institute for Energy Conservation).