UNITED NATIONS NATIONS UNIES Page I. II. A. B. C.
158
UNITED NATIONS NATIONS UNIES FRAMEWORK CONVENTION ON CLIMATE CHANGE - Secretariat CONVENTION – CADRE SUR LES CHANGEMENTS CLIMATIQUES - Secrétariat FCCC/WEB/SAI/2004 3 August 2004 SYNTHESIS AND ASSESSMENT REPORT ON THE GREENHOUSE GAS INVENTORIES SUBMITTED IN 2004 Note by the secretariat CONTENTS Page I. MANDATE.................................................................................. 2 II. COMPARISON OF GHG INVENTORY INFORMATION ........... 2 A. Approach.......................................................................... 2 B. Explanatory notes to the tables. .......................................... 3 C. List of tables in Part I ........................................................ 6 D. Sectoral tables ................................................................... 13 1. General 13 2. Energy 20 3. Industrial Processes 72 4. Solvent and other product use 100 5. Agriculture 101 ` 6. Land-use change and forestry 116 7. Waste 151
-
Upload
khangminh22 -
Category
Documents
-
view
0 -
download
0
Transcript of UNITED NATIONS NATIONS UNIES Page I. II. A. B. C.

UNITED NATIONS NATIONS UNIES
FRAMEWORK CONVENTION ON CLIMATE CHANGE - Secretariat
CONVENTION – CADRE SUR LES CHANGEMENTS CLIMATIQUES - Secrétariat
FCCC/WEB/SAI/2004 3 August 2004
SYNTHESIS AND ASSESSMENT REPORT ON THE GREENHOUSE GAS INVENTORIES SUBMITTED IN 2004
Note by the secretariat
CONTENTS
Page
I. MANDATE.................................................................................. 2
II. COMPARISON OF GHG INVENTORY INFORMATION........... 2
A. Approach.......................................................................... 2
B. Explanatory notes to the tables. .......................................... 3
C. List of tables in Part I ........................................................ 6
D. Sectoral tables................................................................... 13 1. General 13 2. Energy 20 3. Industrial Processes 72 4. Solvent and other product use 100 5. Agriculture 101 ̀ 6. Land-use change and forestry 116
7. Waste 151

FCCC/WEB/SAI/2004
- 2 -
I. MANDATE
1. The Conference of the Parties (COP), by its decision 19/CP.8, adopted the revised guidelines for the technical review of greenhouse gas (GHG) inventories from Parties included in Annex I to the Convention1 (hereinafter referred to as the review guidelines) to be applied from the year 2003. It also determined that the revised reporting guidelines on annual inventories adopted by decision 18/CP.8 should be used for the inventory due by 15 April 2004.
2. As part of the inventory review process, the COP requested the secretaria t to conduct an annual synthesis and assessment of GHG inventories for all Annex I Parties. The purposes of the synthesis and assessment are to facilitate the consideration of inventory data and other information across Parties, and to identify issues for further consideration during the reviews of individual inventories (desk reviews, centralized reviews and in-country reviews). The synthesis and assessment is to be prepared in two parts. Part I is to provide information to allow comparisons across Annex I Parties, as well as descriptions of common methodological issues. Part II is to provide a preliminary analysis of individual Annex I Party inventories, in particular to identify outstanding issues requiring clarification during the individual review stage of the process.
3. In accordance with decision 19/CP.8, Part I of this present synthesis and assessment report has been sent to Parties for comment prior to publication on the UNFCCC web site. Part II will be sent to the respective Party for comments and, together with the comments from the respective Party, will be provided to the corresponding expert review team as input for the individual review; Part II will not be published on the UNFCCC web site.
II. COMPARISON OF GHG INVENTORY INFORMATION
A. Approach
4. This document contains Part I of the synthesis and assessment report, covering the national GHG inventories submitted in 2004 by those Annex I Parties that used the common reporting format (CRF) in accordance with the UNFCCC reporting guidelines (FCCC/CP/1999/7).
5. This document covers only the inventory information submitted in the CRF in 2004. It does not cover information contained in the national inventory reports, or information contained in inventory submissions from previous years. Information in this document is not intended as a judgment of whether inventory problems exist, but as an indication of potential issues that need to be considered further during the third stage of the review process (individual review) by the expert review teams.
6. The completeness of this report is limited by the fact that only 36 out of 40 Annex I Parties submitted their inventory within six weeks after the due date for submissions. Accordingly, this report covers inventories submitted by: Australia, Austria, Belarus, Belgium, Bulgaria, Canada, Croatia, Czech Republic, Denmark, Estonia, European Community, Finland, France, Germany, Greece, Hungary, Ireland, Italy, Japan, Latvia, Lithuania, Luxembourg, Monaco, Netherlands, New Zealand, Norway, Portugal, Romania, Slovakia, Slovenia, Spain, Sweden, Switzerland, Ukraine, United Kingdom, United States.
7. This synthesis and assessment report contains greenhouse gas inventory information from those Parties, compiled in tabular format. The tables provide comparisons of implied emission factors and activity data as reported in the CRF, data from international sources, emissions, information on methods used and emission factors as reported by Parties in Summary table 3 of the CRF, and other information relating to GHG inventory estimates. Where possible, this information is provided for all 36 Parties and for the base year and for the years from 1996 to 2002. For some sectors and categories, however, trend comparisons across all Parties were not possible due to the lack of data for some or all of these years.
1 The full text of the guidelines is contained in document FCCC/CP/2002/8.

FCCC/WEB/SAI/2004
- 3 -
8. The inventory data were analyzed according to the sectors, subsectors and source categories specified in the CRF, which correspond to those of the Revised 1996 IPCC Guidelines for National Greenhouse Gas Inventories (hereinafter referred to as the IPCC Guidelines).
9. To facilitate the analysis of the inventory data, the secretariat considers, for each individual Party, those source categories that are key sources in terms of their absolute level of emissions and impact on the trend, applying the tier 1 level and trend assessment as described in chapter 7 “Methodological choice and recalculations” of the IPCC Good Practice Guidance and Uncertainty Management (hereinafter referred to as the IPCC good practice guidance).2 This identification has been performed at the level of detail recommended in that guidance. The land-use change and forestry sector has not been included in the calculation of the key source assessments.3
B. Explanatory notes to the tables
10. Blank cells in a table indicate that a Party did not report information for a given source and gas in the appropriate table of the CRF. Where a Party’s value is very small compared to that of other Parties, it has been rounded to zero for this report.
11. The differences in activity data between the CRF and international data sources were calculated as percentage deviations from the activity data provided in the CRF. A positive number indicates that the data from the international data source are higher than the data reported in the CRF. Similarly, a negative number indicates that data from the international data source are lower than the data reported in the CRF.
12. References to the base year refer to 1990, except for the following Parties with economies in transition which, in accordance with decisions 9/CP.2 and 11/CP.4, use base years other than 1990: Bulgaria (1988), Hungary (average 1985–1987), Poland (1988), Romania (1989) and Slovenia (1986).
13. Key sources identified by the secretariat’s analysis are indicated by “L” for level and “T” for trend assessments in the “key source” columns. The column “Share of national total” indicates the contribution of that key source to the Party’s national total of GHG emissions in terms of CO2 equivalent, excluding emissions and removals from land-use change and forestry.
14. Tables on energy indicate whether implied emission factors given in the CRF are based on gross calorific value (GCV) or net calorific value (NCV). The difference between the NCV and the GCV for each fuel is the latent heat of vaporization of the water produced during combustion of the fuel. For coal and oil, NCV is 5 per cent less than GCV, and for most forms of natural and manufactured gas the difference is 9 to 10 per cent.
15. Where Parties used notation keys (NO, NE, NA, IE, C) these have been reproduced verbatim from the CRF tables provided by Parties. The notation keys, as described in the UNFCCC reporting guidelines (FCCC/CP/2002/8), are as follows: NO Not occurring IE Included elsewhere NE Not estimated C Confidential NA Not applicable
16. The following chemical formulae or abbreviations for greenhouse gases are used in the synthesis and assessment report:
2 For some Parties, identification of key sources at that level of detail was not possible due to insufficient reporting of disaggregated data. For these Parties, key sources have been identified at the level of category disaggregation provided in Summary table 1.A of the CRF (corresponding to summary Table 7A of the IPCC Guidelines). 3 In accordance with decision 13/CP.9, Annex I Parties should use the IPCC good practice guidance for land use, land–use change and forestry for the inventories due in 2005 and beyond.

FCCC/WEB/SAI/2004
- 4 -
C carbon CF4 perfluoromethane C2F6 perfluoroethane C3F8 perfluoropropane C4F10 perfluorobutane c-C4F8 perfluorocyclobutane C5F12 perfluoropentane C6F14 perfluorohexane CH4 methane CO2 carbon dioxide HFCs hydrofluorocarbons N2O nitrous oxide PFCs perfluorocarbons SF6 sulphur hexafluoride
17. To indicate the methods and emission factors used by Parties the following abbreviations have been used (see also footnotes to Summary table 3 of the CRF) in the synthesis and assessment report: Methods: Emission factors: D IPCC default D IPCC default RA Reference approach C CORINAIR T1 IPCC tier 1 CS Country specific T1a, T1b, T1c IPCC tier 1a, tier 1b, and PS Plant specific tier 1c, respectively M Model T2 IPCC tier 2 T3 IPCC tier 3 C CORINAIR CS Country specific M Model
18. The following units have been used in the synthesis and assessment report: kg kilogram (103 grams) t tonne (106 grams) kt kilotonne (109 grams) Mt megatonne (1012 grams) Mg megagram (106 grams) – same as tonne Gg gigagram (109 grams) TJ terajoule (1012 joules) PJ petajoule (1015 joules) Gg CO2 equ Gg of CO2 equivalent ha hectare kha thousand hectares Mha million hectares MM Bbl/yr million barrels per year m3 cubic meter bill ft3 year billion of cubic feet per year TBtu trillion British thermal units

FCCC/WEB/SAI/2004
- 5 -
19. The following other abbreviations have been used in the synthesis and assessment report: CRF common reporting format NIR national inventory report A actual emissions P potential emissions AD activity data EF emission factor IEF implied emission factor GHG greenhouse gas GWP global warming potential C carbon N nitrogen NOX nitrogen oxides NH3 ammonia NCV net calorific value GCV gross calorific value yr year dm dry matter FracFUEL fraction of livestock N excretion in excrements burned for fuel FracGRAZ fraction of livestock N excreted and deposited onto soil during grazing FracNCRBF fraction of N in non-N-fixing crop FracNCRO fraction of N in N-fixing crop FracR fraction of crop residue removed from the field as crop FracBURN fraction of crop residue burned FracGASF fraction of synthetic fertilizer N applied to soils which volatizes as NH3 and NOX FracGASM fraction of livestock N excretion that volatizes as NH3 and NOX FracLEACH fraction of N input to soils which is lost through leaching and run-off L level (key source applying the IPCC good practice guidance tier 1 level assessment) LPG liquefied petroleum gas LTO landing and take off cycle NMVOC non-methane volatile organic compounds T trend (key source applying the IPCC good practice guidance tier 1 trend assessment) FAO Food and Agriculture Organization of the United Nations IEA International Energy Agency NGL natural gas liquids

FCCC/WEB/SAI/2004
- 6 -
C. List of tables in Part I Table number Table name
G.1 Submissions used in the S&A report: Part I G.2 Key sources: inventory year 2002 Figure G.1 GHG emissions by gas: base year and 2002 (%) Figure G.2 GHG emissions by sector (without LUCF): base year and 2002 (%) G.3 Recalculation for total CO2 equivalent emissions G.4 Reported recalculations for the base year and the latest year (%) Figure 1.1 Emissions and contribution of subsectors in energy 1.1 Total CO2 emissions from the reference approach and the sectoral approach Figure 1.2 Differences in CO2 emissions from reference and sectoral approach for 1990, 1996–2002 (%) 1.2 Emissions from stationary combustion – trend information CO2 emissions (Gg) Relative change (%) 1.3 Stationary combustion: liquid fuels, CO2 (2002) 1.4 Stationary combustion: solid fuels, CO2 (2002) 1.5 Stationary combustion: gaseous fuels, CO2 (2002) 1.6 Stationary combustion: other fuels, CO2 (2002) 1.7 Stationary combustion: all fuels – trend information Fuel consumption (TJ) Relative change (%) 1.8 Stationary combustion by fuel: liquid fuels – trend information Fuel consumption (TJ) Relative change (%) 1.9 Stationary combustion by fuel: solid fuels – trend information Fuel consumption (TJ) Relative change (%) 1.10 Stationary combustion fuel: gaseous fuels – trend information Fuel consumption (TJ) Relative change (%) 1.11 Stationary combustion by fuel: biomass – trend information Fuel consumption (TJ) Relative change (%) 1.12 Stationary combustion by fuel: other fuels – trend information Fuel consumption (TJ) Relative change (%) 1.13 Contribution of fuels in total energy consumption in stationary combustion (%) 1.14 Energy industries: all fuels – trend information CO2 emissions (Gg) Relative change (%) 1.15 Energy industries: liquid fuels – trend information CO2 emissions (Gg) Relative change (%) 1.16 Energy industries: solid fuels – trend information CO2 emissions (Gg) Relative change (%) 1.17 Energy industries: gaseous fuels – trend information CO2 emissions (Gg) Relative change (%)

FCCC/WEB/SAI/2004
- 7 -
Table number Table name
1.18 Contribution of fuels in CO2 emissions from energy industries (%) 1.19 Manufacturing industries and construction: all fuels – trend information CO2 emissions (Gg) Relative change (%) 1.20 Manufacturing industries and construction: liquid fuels – trend information CO2 emissions (Gg) Relative change (%) 1.21 Manufacturing industries and construction: solid fuels – trend information CO2 emissions (Gg) Relative change (%) 1.22 Manufacturing industries and construction: gaseous fuels – trend information CO2 emissions (Gg) Relative change (%) 1.23 Contribution of fuels in CO2 emissions from Manufacturing industries and construction (%) 1.24 Other sectors (commercial/institutional, residential, agriculture/forestry/fisheries):
all fuels – trend information CO2 emissions (Gg) Relative change (%) 1.25 Other sectors (commercial/institutional, residential, agriculture/forestry/fisheries):
liquid fuels – trend information CO2 emissions (Gg) Relative change (%) 1.26 Other sectors (commercial/institutional, residential, agriculture/forestry/fisheries):
solid fuels – trend information CO2 emissions (Gg) Relative change (%) 1.27 Other sectors (commercial/institutional, residential, agriculture/forestry/fisheries): gaseous fuels – trend information CO2 emissions (Gg) Relative change (%) 1.28 Contribution of fuels in CO2 emissions from other sectors (%) 1.29 Transport: all fuels – trend information CO2 emissions (Gg) Relative change (%) N2O emissions (Gg) Relative change (%) 1.30 Road transportation, CO2, N2O (2002) 1.31 Road transportation – trend information CO2 emissions (Gg) Relative change (%) N2O emissions (Gg) Relative change (%) N2O implied emission factors for gasoline (kg/TJ) Relative change (%) N2O implied emission factors for diesel (kg/TJ) Relative change (%) 1.32 Civil aviation and navigation (domestic), CO2 (2002) 1.33 Domestic and international aviation, activity data (2002)

FCCC/WEB/SAI/2004
- 8 -
Table number Table name 1.34 Domestic and international navigation, activity data (2002) 1.35 Civil aviation (domestic) – trend information CO2 emissions (Gg) Relative change (%) 1.36 International bunkers: aviation – trend information CO2 emissions (Gg) Relative change (%) 1.37 Navigation (domestic) – trend information CO2 emissions (Gg) Relative change (%) 1.38 International bunkers: marine – trend information CO2 emissions (Gg) Relative change (%) 1.39 Fugitive emissions from fuels: coal mining and handling, CH4 (2002) 1.40 Fugitive emissions from fuels: coal mining and handling – trend information CH4 emissions (Gg) Relative change (%) 1.41 Fugitive emissions from fuels: oil and natural gas, CH4, CO2 (2002) 1.42 Fugitive emissions from fuels: oil and natural gas – trend information CO2 emissions (Gg) Relative change (%) CH4 emissions (Gg) Relative change (%) Figure 2.1 Emissions and contribution of subsectors in industrial processes 2.1 Mineral products, CO2 (2002) 2.2 Mineral products – trend information CO2 emissions (Gg) Relative change (%) 2.3 Cement production – trend information CO2 emissions (Gg) Relative change (%) CO2 implied emission factors (t/t) Relative change (%) 2.4 Chemical industry, CO2 and N2O (2002) 2.5 Chemical industry – trend information CO2 emissions (Gg) Relative change (%) N2O emissions (Gg) Relative change (%) 2.6 Chemical industry: ammonia production – trend information CO2 emissions (Gg) Relative change (%) CO2 implied emission factors (t/t) Relative change (%) 2.7 Chemical industry: nitric acid production – trend information N2O emissions (Gg) Relative change (%) N2O implied emission factors (t/t) Relative change (%)

FCCC/WEB/SAI/2004
- 9 -
Table number Table name 2.8 Chemical industry: adipic acid production – trend information N2O emissions (Gg) Relative change (%) N2O implied emission factors (t/t) Relative change (%) 2.9 Metal production, CO2 (2002) 2.10 Metal production, CO2 – trend information CO2 emissions (Gg) Relative change (%) 2.11 Metal production: iron and steel – trend information CO2 emissions (Gg) Relative change (%) CO2 implied emission factors (t/t) Relative change (%) 2.12 Metal production: aluminium – trend information CO2 emissions (Gg) Relative change (%) CO2 implied emission factors (t/t) Relative change (%) 2.13 Metal production, PFCs and SF6 (2002) 2.14 Metal production: aluminium – trend information CF4 emissions (t) Relative change (%) 2.15 Production of halocarbons and SF6 (2002) 2.16 Production of halocarbons and SF6, HFC-23 – trend information HFC-23 emissions (t) Relative change (%) 2.17 Consumption of halocarbons and SF6, HFCs (2002) 2.18 Consumption of halocarbons and SF6 – trend information HFC-134a emissions (t) Relative change (%) SF6 emissions (t) Relative change (%) 3.1 Solvent and other product use, CO2 and N2O (2002) Figure 4.1 Emissions and contribution of subsectors in agriculture 4.1 Enteric fermentation, CH4 (2002) 4.2 Enteric fermentation – trend information CH4 emissions (Gg) Relative change (%) 4.3 Enteric fermentation: diary cattle – trend information CH4 emissions (Gg) Relative change (%) CH4 implied emission factors (kg/head/yr) Relative change (%) 4.4 Enteric fermentation: non-diary cattle – trend information CH4 emissions (Gg) Relative change (%) CH4 implied emission factors (kg/head/yr) Relative change (%)

FCCC/WEB/SAI/2004
- 10 -
Table number Table name 4.5 Manure management, CH4 (2002) 4.6 Manure management, N2O (2002) 4.7 Manure management – trend information CH4 emissions (Gg) Relative change (%) N2O emissions (Gg) Relative change (%) 4.8 Agricultural soils, N2O (2002) 4.9 Agricultural soils, N2O – trend information N2O emissions (Gg) Relative change (%) 4.10 Agricultural soils: parameters used (2002) 4.11 Agricultural soils, CO2 – trend information CO2 emissions/removals Relative change (%) Figure 5.1 Emissions and removals from land use change and forestry (LUCF) 5.1 Methods and emission factors used (2002) 5.2 Net CO2 emissions/removals from changes in forest and other woody biomass stocks – trend information CO2 emissions/removals (Gg) Relative change (%) 5.3 Changes in forest and other woody biomass stocks: temperate forests (average annual growth rates and implied carbon uptake factors) (2002) 5.4 Changes in forest and other woody biomass stocks: boreal forests (average annual growth rates and implied carbon uptake factors) (2002) 5.5 Changes in forest and other woody biomass stocks: temperate forests – plantations – trend information Area of forest/biomass stocks (kha) and average annual growth rate (t dm/ha/yr) Average annual growth rate – relative change (%) Area of forest/biomass stocks – relative change (%) 5.6 Changes in forest and other woody biomass stocks: temperate forests – commercial: evergreen and deciduous – trend information Area of forest/biomass stocks (kha) and average annual growth rate (t dm/ha/yr) Average annual growth rate – relative change (%) Area of forest/biomass stocks – relative change (%) 5.7 Changes in forest and other woody biomass stocks: temperate forests – (other) – trend information Area of forest/biomass stocks (kha) and average annual growth rate (t dm/ha/yr) Area of forest/biomass stocks – relative change (%) Average annual growth rate – relative change (%) 5.8 Changes in forest and other woody biomass stocks – trend information CO2 emissions (Gg) Relative change (%) CO2 removals (Gg) Relative change (%)

FCCC/WEB/SAI/2004
- 11 -
Table number Table name 5.9 Forest/grassland conversion – trend information CO2 emissions (Gg) Relative change (%) 5.10 Forest/grassland conversion: average annual net loss of biomass (t dm/ha/yr) 5.11 Forest/grassland conversion: area converted annually (kha/yr) – trend information Temperate coniferous, on- and off-site burning (kha/yr) Relative change (%) Temperate broadleaf, on- and off-site burning (kha/yr) Relative change (%) Temperate mixed: broadleaf/coniferous, on- and off-site burning (kha/yr) Relative change (%) Grasslands, on- and off-site burning (kha/yr) Relative change (%) Boreal mixed, on- and off-site burning (kha/yr) Relative change (%) 5.12 Abandonment of managed land – trend information CO2 removals (Gg) Relative change (%) 5.13 Abandonment of managed land (2002) Annual above-ground biomass growth rate (t dm/ha/yr) and rate of biomass carbon uptake (t C/ha/yr) Abandonment of managed land: abandoned area (kha) – first 20 years Relative change (%) 5.14 CO2 emissions and removals from soils – trend information CO2 emissions and removals from soils (Gg) Relative change (%) 5.14 Cultivation of mineral soils: average annual rate of soil carbon uptake/removal (t C/ha/yr) 5.16 Cultivation of organic soils: annual loss rate (Mg C/ha/yr) (2002) 5.17 Liming of agricultural soils: C conversion factor (2002) 5.18 Cultivation of mineral soils – trend information Net CO2 emissions/removals (Gg) Relative change (%) 5.19 Cultivation of organic soils – trend information Net CO2 emissions/removals (Gg) Relative change (%) 5.20 Liming of agricultural soils – trend information Net CO2 emissions/removals (Gg) Relative change (%) 5.21 Other sources/sinks in LUCF – trend information CO2 net emission/removal and non-CO2 GHG (Gg) Relative change (%) Figure 6.1 Emissions and contribution of subsectors in waste 6.1 Solid waste disposal on land, waste-water handling and waste incineration (2002) 6.2 Solid waste disposal on land – trend information CH4 emissions (Gg) Relative change (%) Ratio: kg CH4 /capita Relative change (%)
FCCC/WEB/SAI/2004
- 12 -
Table number Table name 6.3 Waste-water handling – trend information CH4 emissions (Gg) Relative change (%) Ratio: kg CH4 /capita Relative change (%) N2O emissions (Gg) Relative change (%) Ratio: kg N2O /capita Relative change (%)

General
Table G.1Submissions used in the S&A report: Part I
Party CRF for years: Initial submission date
NIR Submission date and version used in the S&A report
Sources of data for the trend tables
Australia 1990-2002 15 April 2004 P 27 May 2004 (v.2) 1990–2001: S2004Austria 1990-2002 15 April 2004 P 7 June 2004 (v.2) 1990–2001: S2004Belarus 2002 31 March 2004 P 27 May 2004 (v.2) 1990–2001: T2004Belgium 1990-2002 15 April 2004 P 15 April 2004 (v.1) 1990–2001: S2004Bulgaria 2002 and recalculation tables for
1988, 1990-200025 April 2004
P25 April 2004 (v.1) 1990–2001: T2004
Canada 1990-2002 15 April 2004 P 27 May 2004 (v.2) 1990–2001: S2004Croatia 1990-2002 15 April 2004 P 28 May 2004 (v.2) 1990–2001: S2004Czech Republic 1992, 2002 14 April 2004
P14 April 2004 (v.1); 1992: 26 May 2004 (v.2)
1990, 1994, 1996–2001: T2004, 1992: S2004
Denmark 1990-2002 15 April 2004 P 24 May 2004 (v.2) 1990–2001: S2004Estonia 2002 15 April 2004 15 April 2004 (v.1) 1990–2001: T2004European Community 1990-2002 07 May 2004 P 7 May 2004 (v.1) 1990–2001: S2004Finland 1990-2002 01 April 2004 P 28 May 2004 (v.2) 1990–2001: S2004France 1990-2002 26 March 2004 P 26 March 2004 (v.1) 1990–2001: S2004Germany 1990-2002 30 April 2004 P 30 April 2004 (v.1) 1990–2001: S2004Greece 1990-2002 07 April 2004 P 7 April 2004 (v.1) 1990–2001: S2004Hungary 2002 13 May 2004 P 9 June 2004 (v.2) 1990–2001: S2004Ireland 1990-2002 26 April 2004 P 26 April 2004 (v.1) 1990–2001: S2004Italy 1990-2002 15 April 2004 1 June 2004 (v.2) 1990–2001: S2004Japan 1990-2002 24 May 2004 24 May 2004 (v.1) 1990–2001: S2004Latvia 1990-2002 15 April 2004 P 15 April 2004 (v.1) 1990–2001: S2004Lithuania 1990, 1998, 2001-2002 14 April 2004 1992-1997: 14 April 2004 (v.1),
1990, 1991, 1998-2002; 1 June 2004 (v.3)1990, 1998, 2001: S2004, 1992-1997: S2002
Luxembourg 1998, 2000, 2002 28 May 2004 28 May 2004 (v.1) 1998, 2000: S2004, 1999: S2001, 2001: S2003Monaco 2002 23 April 2004 P 23 April 2004 (v.1) 1990–2001: T2004Netherlands 1990-2002 01 April 2004 P 18 May 2004 (v.2) 1990–2001: S2004New Zealand 1990-2002 15 April 2004 P 28 May 2004 (v.3) 1990–2001: S2004Norway 1990, 1998-2002 15 April 2004
P1990, 1998-2002: 18 May 2004 (v.2); 1991-1997: 15 April 2004 (v.1)
1990–2001: S2004
Portugal 1990-2002 14 April 2004 28 April 2004 (v.2) 1990–2001: S2004Romania 1989, 1990-2002 14 May 2004 P 14 May 2004 (v.1) 1990–2001: S2004Slovakia 2001-2002 14 April 2004 25 May 2004 (v.2) 1990–2000: T2004, 2001: S2004Slovenia 1986, 1990-2002 15 April 2004 27 May 2004 (v.2) 1990–2001: S2004Spain 1990-2002 15 April 2004 P 15 April 2004 (v.1) 1990–2001: S2004Sweden 1990-2002 16 April 2004 P 16 April 2004 (v.1) 1990–2001: S2004Switzerland 1990-2002 14 April 2004 P 14 April 2004 (v.1) 1990–2001: S2004Ukraine 2001-2002 20 February 2004 P 20 February 2004 (v.1) 2001: S2004United Kingdom 1990-2002 15 April 2004 P 22 May 2004 (v.2) 1990–2001: S2004United States 1990-2002 12 April 2004 P 27 May 2004 (v.2) 1990–2001: S2004
Legend: v.1/2/3 - version of the CRF used in the S&A report; S200x - submission 200x; T200x - trend tables from submission 200x.
- 13 -

Table G.2
Key sources: inventory year 2002a
Source categories
Aus
tral
ia
Aus
tria
Bel
arus
Bel
gium
Bul
gari
a
Can
ada
Cro
atia
Cze
ch R
epub
lic
Den
mar
k
Est
onia
Eur
opea
n C
omm
unit
y
Fin
land
Fran
ce
Ger
man
y
Gre
ece
Hun
gary
Irel
and
Ital
y
Japa
n
Lat
via
Lit
huan
ia
Lux
embo
urg
Mon
aco
Net
herl
ands
New
Zea
land
Nor
way
Por
tuga
l
Rom
ania
Slov
akia
Slov
enia
Spai
n
Swed
en
Swit
zerl
and
Ukr
aine
Uni
ted
Kin
gdom
Uni
ted
Stat
es
EnergyStationary combustion-coal (CO2) L, T L, T L L, T L L, T L, T L L, T L L L, T L, T L, T L, T L L, T L, T L, T L, T L L, T L, T L, T L, T L, T L L, T L, T L, T L, T L L, T L, TStationary combustion-gas (CO2) L, T L, T L L, T L L, T L, T L L, T L L L, T L, T L, T L, T L L, T L, T L, T L, T L L L, T L, T L, T L, T L, T L L, T L, T L, T L, T L L, T L, TStationary combustion-oil (CO2) L L, T L L, T L L, T L, T L L, T L L L, T L, T L, T L, T L L, T L, T L, T L, T L L L, T L, T L, T L, T L, T L L, T L, T L, T L, T L L, T L, TStationnary combustion - Other Fuels (CO2) L L, T L L L, T L, T T T L, T L T L, T TStationary combustion-coal (CH4) T TStationary combustion-gas (CH4) TStationnary combustion - Biomass (CH4) T L, T L, T T TStationary combustion-coal (N2O) L L L L T TStationary combustion-gas (N2O) L T TStationary combustion-oil (N2O) L L L L, T L LStationary combustion-biomass (N2O) TMobile combustion-aircraft (C02) L, T L T L T L, T T T T L L, T L, T L, T L T L L, TMobile combustion-Road vehicles (CO2) L L, T L L, T L L, T L, T L L, T L L L, T L, T L, T L, T L L, T L, T L, T L, T L L L, T L, T L, T L, T L, T L L, T L, T L, T L, T L, T L, TMobile combustion-Road vehicles (CH4) T TMobile combustion-Road vehicles (N2O) L, T L, T T L T T L L, T L, T L, T T L T L, T L, T L, T L, T L, T L, T L, T L, T LMobile combustion-waterborne navigation (CO2) T L L L L, T L, T L, T L L T L L, T T T L L T LRailways (CO2) L, T L, T TOther Transportation (CO2) L, T L L L, T T L L T L L, TFugitive emissions: coal mining&handling (CH4) L, T L L L L T L, T L L T L L L, T T L L, T L, TFugitive emissions: oil&gas operations (CH4) L, T L L L, T L, T L L L L L, T L, T L L, T L, T T L, T L T L L, T L, TFugitive emissions: oil&gas operations (CO2) L L, T L, T T L L T L, T L, T L, T L, T L L, TOther (fugitive from solid fuels) (CH4) TOther (fugitive from solid fuels) (CO2) L, T T L, TSolid Fuel Transformation (C02) TIndustrial processesCement production (CO2) L, T L L L L L, T L L, T L L L, T L, T L L, T L L, T L, T L, T L L L L, T L, T L L L, T L, T L, T L, T L, T L, TLime production (CO2) L L L L L L L L, T L T L, TLimestone and Dolomite Use (CO2) L, T LOther (mineral products) (CO2) L, TAmmonia production (CO2) L L, T L L, T L T L, T T L L, T L, T L, T L TCarbide Production (CO2) L, TAdipic Acid production (N2O) T L L, T T L, T T T TNitric Acid production (N2O) L, T L L L, T L L, T L L, T L, T T L T T L L, T L, T L L, T L L, T L, TOther (Chemical Industry) (CH4) TOther (Chemical Industry) (N2O) T
a Source: UNFCCC secretariat key source analysis.
- 14 -

Table G.2
Source categories Aus
tral
ia
Aus
tria
Bel
arus
Bel
gium
Bul
gari
a
Can
ada
Cro
atia
Cze
ch R
epub
lic
Den
mar
k
Est
onia
Eur
opea
n C
omm
unit
y
Fin
land
Fra
nce
Ger
man
y
Gre
ece
Hun
gary
Irel
and
Ital
y
Japa
n
Lat
via
Lit
huan
ia
Lux
embo
urg
Mon
aco
Net
herl
ands
New
Zea
land
Nor
way
Por
tuga
l
Rom
ania
Slov
akia
Slov
enia
Spai
n
Swed
en
Swit
zerl
and
Ukr
aine
Uni
ted
Kin
gdom
Uni
ted
Stat
es
Industrial processesIron and Steel industry (CO2) L, T L, T L L L L L L, T L L, T L L L T L, TFerroalloys Production (CO2) L, TAluminium production (CO2) L, T L, T TAluminium production (PFC) T L, T T T T T T L, T L, T T T T TMagnesium production (SF6) T T TODS substitutes (HFCs, PFCs) T L, T L, T L, T L T L, T L, T T T L, T L, T T T L, T T L, T L, T L, T L, T L, THCFC production (HFC-23) T T L, T T T T TSemiconductor Manufacturing (F-gases) T T T
Fugitive Emissions (prod of Halocarbons and SF6) T
2. Other (Consumption of Hallocarbons and SF6) T T
Electrical equipment (SF6) T TOther sources of SF6 (SF6) T TOther (industrial processes) (CO2) L, T LSolventsSolvent and Other Product Use (CO2) L, T TAgriculatureEnteric Fermentation (CH4) L, T L, T L L, T L L L, T L L, T L L L, T L, T L L, T L L, T L, T L, T L L, T L, T L, T L, T L, T L L, T L, T L, T L, T L L, T L, TManure Management (CH4) L, T L L L L L L L L, T L L L L, T L, T L, T L, T L L, T L T L, TManure Management (N2O) L, T T L L T L L L L L L L L, T L, T T L, TDirect N2O emissions from Agricultural soils L, T L, T L L L L, T L, T L L, T L L, T L, T L L, T L L, T L, T L L L L, T L, T L, T L, T L L, T L, T L, T L, T L L LIndirect N2O from Nitrogen used in Agriculture L, T L L L L, T L L, T L, T L L, T L L, T L L, T L L L, T T L, T L, T L, T L, T L, T L, TAnimal Production (N2O) L, T L L L L, T L, T L, T T L, T L, T L, T TAgricultural soils (CO2) L, TSavanna Burning (CH4) L, TSavanna Burning (N2O) L, TOther (agricultural soils) (N2O) L, T T L LWasteSolid Waste Disposal Sites (CH4) L, T L, T L L, T L L L, T L L L L L, T L, T L, T L, T L L L, T L, T L L, T L, T L, T L, T L, T L L, T L, T L, T L, T L L, T L, TSolid Waste Disposal Sites (CO2) TWastewater handling (CH4) L T T L L, T L L, T L, T L L LWastewater handling (N2O) L TWaste Incineration (CO2) L, T T L T T L, TOther (waste) (CH4) TOtherOther (CO2) LOther (N2O) L
a Source: UNFCCC secretariat key source analysis.
Key sources: inventory year 2002a (continued)
- 15 -
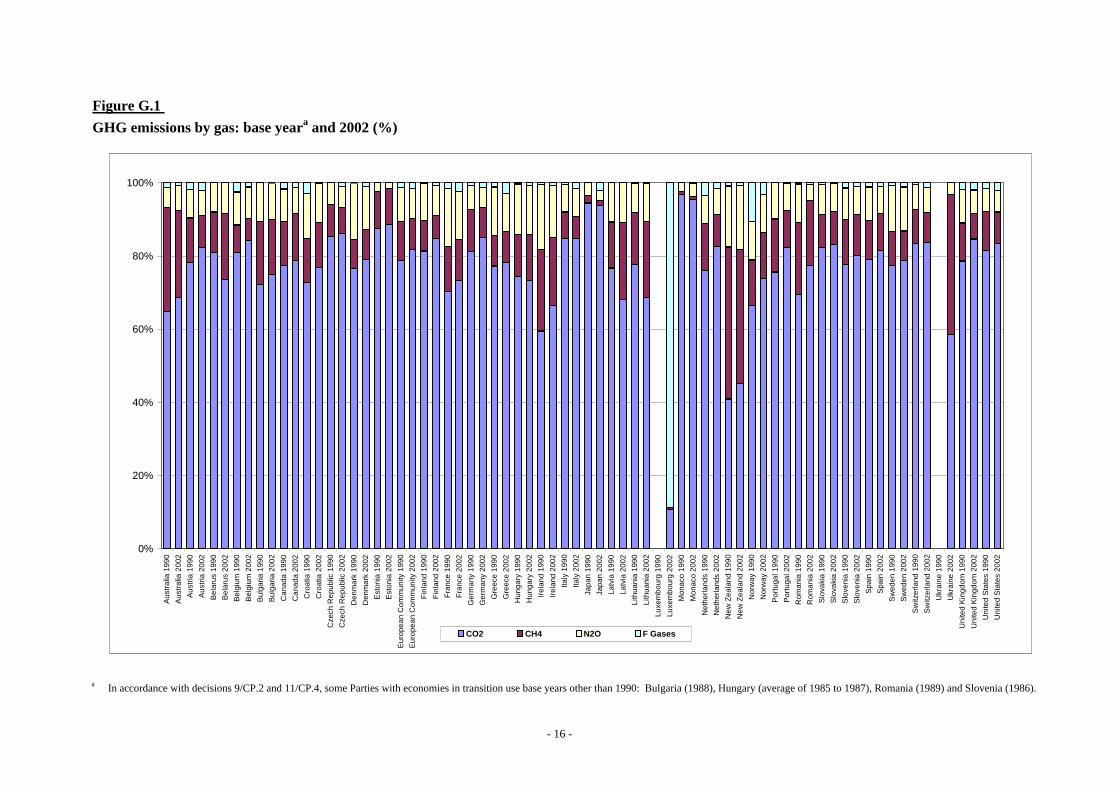
Figure G.1 GHG emissions by gas: base yeara and 2002 (%)
a In accordance with decisions 9/CP.2 and 11/CP.4, some Parties with economies in transition use base years other than 1990: Bulgaria (1988), Hungary (average of 1985 to 1987), Romania (1989) and Slovenia (1986).
0%
20%
40%
60%
80%
100%
Aus
tralia
199
0
Aus
tralia
200
2
Aus
tria
1990
Aus
tria
2002
Bel
arus
199
0
Bel
arus
200
2
Bel
gium
199
0
Bel
gium
200
2
Bul
garia
199
0
Bul
garia
200
2
Can
ada
1990
Can
ada
2002
Cro
atia
199
0
Cro
atia
200
2
Cze
ch R
epub
lic 1
990
Cze
ch R
epub
lic 2
002
Den
mar
k 19
90
Den
mar
k 20
02
Est
onia
199
0
Est
onia
200
2
Eur
opea
n C
omm
unity
199
0
Eur
opea
n C
omm
unity
200
2
Finl
and
1990
Finl
and
2002
Fran
ce 1
990
Fran
ce 2
002
Ger
man
y 19
90
Ger
man
y 20
02
Gre
ece
1990
Gre
ece
2002
Hun
gary
199
0
Hun
gary
200
2
Irela
nd 1
990
Irela
nd 2
002
Italy
199
0
Italy
200
2
Japa
n 19
90
Japa
n 20
02
Latv
ia 1
990
Latv
ia 2
002
Lith
uani
a 19
90
Lith
uani
a 20
02
Luxe
mbo
urg
1990
Luxe
mbo
urg
2002
Mon
aco
1990
Mon
aco
2002
Net
herla
nds
1990
Net
herla
nds
2002
New
Zea
land
199
0
New
Zea
land
200
2
Nor
way
199
0
Nor
way
200
2
Por
tuga
l 199
0
Por
tuga
l 200
2
Rom
ania
199
0
Rom
ania
200
2
Slo
vaki
a 19
90
Slo
vaki
a 20
02
Slo
veni
a 19
90
Slo
veni
a 20
02
Spa
in 1
990
Spa
in 2
002
Sw
eden
199
0
Sw
eden
200
2
Sw
itzer
land
199
0
Sw
itzer
land
200
2
Ukr
aine
199
0
Ukr
aine
200
2
Uni
ted
Kin
gdom
199
0
Uni
ted
Kin
gdom
200
2
Uni
ted
Sta
tes
1990
Uni
ted
Sta
tes
2002
CO2 CH4 N2O F Gases
- 16 -

Figure G.2GHG emissions by sector (without LUCF): base yeara and 2002 (%)
a In accordance with decisions 9/CP.2 and 11/CP.4, some Parties with economies in transition use base years other than 1990: Bulgaria (1988), Hungary (average of 1985 to 1987), Romania (1989) and Slovenia (1986).
Per
cent
age
0%
20%
40%
60%
80%
100%
Aus
tral
ia 1
990
Aus
tral
ia 2
002
Aus
tria
199
0A
ustr
ia 2
002
Bel
arus
199
0B
elar
us 2
002
Bel
gium
199
0B
elgi
um 2
002
Bul
garia
199
0B
ulga
ria 2
002
Can
ada
1990
Can
ada
2002
Cro
atia
199
0C
roat
ia 2
002
Cze
ch R
epub
lic 1
990
Cze
ch R
epub
lic 2
002
Den
mar
k 19
90D
enm
ark
2002
Est
onia
199
0E
ston
ia 2
002
Eur
opea
n C
omm
unity
199
0E
urop
ean
Com
mun
ity 2
002
Finl
and
1990
Finl
and
2002
Fran
ce 1
990
Fran
ce 2
002
Ger
man
y 19
90G
erm
any
2002
Gre
ece
1990
Gre
ece
2002
Hun
gary
199
0H
unga
ry 2
002
Irel
and
1990
Irel
and
2002
Italy
199
0Ita
ly 2
002
Japa
n 19
90Ja
pan
2002
Latv
ia 1
990
Latv
ia 2
002
Lith
uani
a 19
90Li
thua
nia
2002
Luxe
mbo
urg
1990
Luxe
mbo
urg
2002
Mon
aco
1990
Mon
aco
2002
Net
herla
nds
1990
Net
herla
nds
2002
New
Zea
land
199
0N
ew Z
eala
nd 2
002
Nor
way
199
0N
orw
ay 2
002
Por
tuga
l 199
0P
ortu
gal 2
002
Rom
ania
199
0R
oman
ia 2
002
Slo
vaki
a 19
90S
lova
kia
2002
Slo
veni
a 19
90S
love
nia
2002
Spa
in 1
990
Spa
in 2
002
Sw
eden
199
0S
wed
en 2
002
Sw
itzer
land
199
0S
witz
erla
nd 2
002
Ukr
aine
199
0U
krai
ne 2
002
Uni
ted
Kin
gdom
199
0U
nite
d K
ingd
om 2
002
Uni
ted
Sta
tes
1990
Uni
ted
Sta
tes
2002
Energy Industrial processes Agriculture Waste
- 17 -

Table G.3
1990a 1996 1997 1998 1999 2000 2001Australia 0.01 0.16 0.17 0.18 0.13 0.15 -0.13Austria -0.42 -2.18 -2.15 -2.17 -2.48 -1.60 -1.73BelarusBelgium 0.90 3.22 0.47 0.03 -1.44 -0.26 -0.66Bulgaria -1.41 -1.34 -1.36 -1.30 -1.37 -1.31Canada 0.18 0.43 0.10 1.59 -0.20 -0.62 5.04Croatia 0.12Czech RepublicDenmark -0.67 -0.55 -0.34 -0.18 -0.27 -0.55 -0.14EstoniaEuropean Community 0.93 1.08 0.94 0.80 0.72 0.58 0.87Finland -0.87 -0.65 -0.57 -0.55 -0.55 -0.55 -0.49France 0.70 0.43 0.33 0.08 0.04 0.03 0.16GermanyGreece 2.16 1.97 2.10 2.05 2.13 2.85 1.82HungaryIreland -0.85 0.09 0.33 0.05 0.59 1.87Italy 1.64Japan 0.01 0.60 1.40 0.38 0.35 0.28 0.22Latvia -0.90 -2.42 -1.28 -2.55 1.69 3.72 -5.53LithuaniaLuxembourgMonacoNetherlands 0.66 0.56 -1.05 -0.59 -1.74 -1.58 -1.61New Zealand -0.18 -0.95 -0.66 -0.26 -0.01 0.10 1.80Norway 0.24 -0.34 -0.33 -0.40 0.89Portugal -5.80 -4.23 -2.93 -3.28 -4.08 -5.29 -6.51Romania -0.55 -13.21 -20.15 -20.75 -19.82 -18.23 -11.35SlovakiaSloveniaSpain -1.06 -0.52 -0.61 -0.66 -0.18 -0.49 0.18Sweden -0.85 -1.92 -1.42 -1.95 -0.66 -2.10 -3.15Switzerland 0.18 -0.12 -0.19UkraineUnited Kingdom -0.21 -0.19 -0.08 -0.61 0.21 -0.22 1.21United States -0.17 -0.29 -0.27 -0.16 0.04 -0.13 -0.75
Recalculations for total CO2 equivalent emissions without land-use change and forestry: 2004 submission data (%)
a In accordance with decisions 9/CP.2 and 11/CP.4, some Parties with economies in transition use base years other than 1990: Bulgaria (1988), Hungary (average of 1985 to 1987), Romania (1989) and Slovenia (1986).
- 18 -

Table G.4
1990a2001 1990a
2001 1990a2001 1990a
2001 1990a2001 1990a
2001 1990a2001 1990a
2001 1990a2001 1990a
2001 1990a2001 1990a
2001 1990a2001 1990a
2001 1990a2001
Australia 0.00 -0.28 0.00 0.01 0.00 0.05 -0.02 0.29 15.33 12.59 -0.03 -0.05 0.00 0.00 0.00 0.00 0.00 0.00 0.04 -0.86 0.03 0.56 0.00 3.11 0.00 0.00 0.00 -0.12 0.00 -0.37Austria 14.08 9.50 33.94 62.42 2.42 -11.60 -42.91 -40.44 132.52 107.62 0.55 0.00 -45.92 -51.07 0.00 0.00 0.00 0.00 3.81 0.71 3.57 3.77 0.00 0.00 0.00 -0.38 -29.15 -36.77 108.91 186.11BelarusBelgium -0.15 -0.70 -20.27 -42.63 -21.69 10.54 11.79 -0.96 -5.95 -7.50 10.53 8.90 NE NE 100.00 100.00 0.00 0.00 0.31 0.42 17.78 5.74 18.33 100.00 -15.18 -20.08 -4.59 -25.03 -15.07 -34.37Bulgaria 0.00 0.00 -0.84 -0.62 0.00 0.00 -5.91 -4.19 0.00 0.00 0.00 0.00 0.00 0.00 0.00 0.00 0.00 0.00 0.00 0.00 -21.48 -21.00 0.00 0.00 0.00 0.00 0.00 0.00 0.00 0.00Canada 0.00 -0.37 0.00 0.46 0.00 0.02 -2.81 0.62 0.00 0.00 0.00 0.00 0.00 0.00 0.00 0.00 0.00 0.00 0.00 0.04 0.00 0.18 44.11 116.00 0.00 0.12 0.00 -4.26 0.00 0.09CroatiaCzech RepublicDenmark -0.08 0.02 1.41 -6.13 1.01 -2.11 4.55 9.34 0.00 0.00 0.00 0.00 0.00 0.00 0.00 0.00 0.00 0.00 -6.03 5.88 -12.44 -16.34 -9.17 0.23 0.00 0.00 -0.05 1.74 0.00 0.00EstoniaEuropean Community 0.28 0.40 5.44 6.85 -3.99 -4.55 -1.49 -1.53 0.46 4.28 -2.19 0.23 -4.62 -5.70 -7.61 -6.21 0.00 0.00 15.72 14.28 -3.23 -2.13 -47.35 -30.44 -12.46 -28.27 2.58 -0.87 14.23 52.04Finland 0.00 0.00 0.00 0.00 -26.94 -16.10 0.00 0.00 0.00 0.00 0.00 0.00 0.00 0.00 0.00 0.00 0.00 0.00 0.00 0.00 0.00 0.00 0.00 0.00 0.00 0.00 0.00 0.00 0.00 0.00France 0.08 0.04 8.28 5.97 -0.02 -0.23 0.99 -0.56 0.00 0.00 -0.84 0.85 0.49 -7.21 -87.23 -86.65 0.00 0.00 0.00 0.09 0.86 1.33 -43.19 -24.88 14.19 16.34 6.55 4.78 0.00 0.00GermanyGreece 0.00 0.15 16.37 0.65 -0.06 2.26 -19.63 -6.42 0.00 0.00 -0.01 -0.16 -3.51 0.18 0.00 0.00 0.00 0.00 -1.63 -1.95 46.97 43.94 2.26 -2.47 0.00 0.00 2.82 2.60 100.00 100.00HungaryIreland 0.67 8.54 0.07 0.00 0.00 -3.32 4.16 -26.03 -34.92Italy 1.33 0.98 -1.54 16.55 0.37 -14.05 -0.12 -6.43 -1.73 -1.90 -66.38 0.04 5.20Japan 0.02 0.04 0.00 -7.37 0.00 0.02 0.00 -0.19 0.00 -0.38 0.01 0.63 IE,NE,NO IE,NE,NO 0.00 0.00 NE NE 0.00 -0.12 0.00 -0.18 0.00 NE 0.00 -1.10 0.00 -0.46 0.00 -5.19Latvia 0.01 -4.31 2.09 -0.11 11.36 1.98 -30.13 -33.32 NO,NE 0.00 NO,NE 0.00 0.00 14.72 0.00 0.00 0.00 0.00 0.00 0.00 1.45 0.39 -1.30 3.29 0.00 65.61 -13.41 -18.73 NO 0.00LithuaniaLuxembourgMonacoNetherlands 0.83 -1.50 -0.01 -1.26 -10.63 -18.77 0.00 20.58 0.00 66.89 0.00 0.58 0.00 0.00 0.00 -6.06 0.00 0.00 0.00 -0.22 -1.31 -2.29 0.00 0.00 0.00 -100.00 1.75 -5.68 0.00 19.96New Zealand -0.13 1.87 -4.69 -14.66 -19.92 -16.25 0.72 2.02 0.00 3,922.27 0.00 0.00 0.00 0.00 100.00 100.00 0.00 0.00 0.00 2.01 0.00 1.22 -0.02 0.48 0.00 0.00 0.15 1.52 0.00 -1.92Norway 0.08 1.61 0.00 3.03 0.01 0.50 0.34 0.48 70.33 83.92 0.00 0.00 0.00 0.00 0.00 0.00 -100.00 -100.00 0.00 -1.83 0.60 -0.29 -2.32 -0.72 -0.17 0.00 0.34 0.00 -9.77Portugal 1.42 -1.79 10.47 26.34 2.96 -8.40 -4.64 10.92 9.13 13.86 -6.01 -3.94 -18.11 9.39 0.00 0.00 0.00 0.00 -28.98 -28.70 -29.37 -33.52 -202,034.52 -59.07 -0.34 -6.89 -10.25 -29.94 0.00 -1.45Romania -18.61 -16.86 -2.85 -0.10 -92.06 -18.58 239.77 51.91 -87.56 -2.63 129.64 73.45 0.00 0.00 0.00 0.00 0.00 0.00 22.12 -0.06 24.10 -3.39 325.27 105.30 -100.00 0.00 19.01 -36.87 0.00 0.00SlovakiaSlovenia 0.00 0.00 1.42 5.50 7.06Spain -1.40 0.24 -1.17 -0.74 -9.13 -5.34 1.29 1.76 0.00 0.00 0.00 0.00 0.00 -0.91 0.00 0.00 0.00 0.00 0.00 0.02 0.00 -0.02 -67.67 7.60 9.63 3.58 0.00 0.00 0.65 0.07Sweden -0.66 -3.39 0.43 -2.82 -1.49 -11.08 -7.00 -7.02 2.33 1.62 0.00 0.00 0.00 -0.04 0.00 94.29 IE IE 0.74 1.01 0.39 -0.19 0.00 -11.00 IE IE 0.00 2,000.00 0.00 0.00Switzerland -0.10 -0.15 0.00 0.14 0.02 0.04 0.87 0.00 -0.03 0.01 0.00 0.00 NO NO 0.00 0.00 IE IE 0.19 0.22 1.72 0.09 -59.44 -128.14 -0.59 -0.75 0.00 0.00 0.00 0.00UkraineUnited Kingdom -0.03 -0.15 -0.05 -0.56 -0.04 0.14 0.00 0.10 -0.03 -6.86 0.01 0.07 0.00 0.00 0.00 0.00 0.00 0.00 0.00 0.00 0.00 0.00 2.94 7.89 -42.01 -62.08 0.00 0.03 0.01 15.78United States -0.06 -1.13 -0.14 4.11 0.42 0.12 0.94 0.63 110.66 67.45 -11.52 -23.72 0.00 0.00 100.00 100.00 0.00 0.00 -0.15 -0.32 -1.67 -1.84 -10.71 -17.70 0.00 0.00 -0.87 -4.29 0.56 0.71
a In accordance with decisions 9/CP.2 and 11/CP.4, some Parties with economies in transition use base years other than 1990: Bulgaria (1988), Hungary (average of 1985 to 1987), Romania (1989) and Slovenia (1986).
CO2 CO2 CH4 N2ON2O CO2 CH4 N2OAgriculture LUCF Waste
CO2 CH4 N2O CO2 CH4 N2O CO2
Reported recalculations for the base year and the latest year (%)
Energy Industrial processes Solvents
- 19 -

Figure 1.1Emissions and contribution of subsectors in energya
Energy
a In accordance with decisions 9/CP.2 and 11/CP.4, some Parties with economies in transition use base years other than 1990: Bulgaria (1988), Hungary (average of 1985 to 1987), Romania (1989) and Slovenia (1986).
0
1000000
2000000
3000000
4000000
5000000
6000000
0 0 0 0 0 0 0 0 0 0 0 0 0 0 0 0 0 0 0 0 0 0 0 0 0 0 0 0 0 0 0 0 0 0 0 0 0 0 0 0 0 0 0 0 0 0 0 0 0 0 0 0 0 0 0 0 0 0 0 0 0 0 0 0 0 0 0 0 0 0 0 0
Em
issi
ons
(Gg
CO
2 equ
ival
ent)
0%
20%
40%
60%
80%
100%
Aus
tralia
199
0
Aus
tralia
200
2
Aus
tria
1990
Aus
tria
2002
Bel
arus
199
0
Bel
arus
200
2
Bel
gium
199
0
Bel
gium
200
2
Bul
garia
199
0
Bul
garia
200
2
Can
ada
1990
Can
ada
2002
Cro
atia
199
0
Cro
atia
200
2
Cze
ch R
epub
lic 1
990
Cze
ch R
epub
lic 2
002
Den
mar
k 19
90
Den
mar
k 20
02
Est
onia
199
0
Est
onia
200
2
Eur
opea
n C
omm
unity
199
0
Eur
opea
n C
omm
unity
200
2
Fin
land
199
0
Fin
land
200
2
Fra
nce
1990
Fra
nce
2002
Ger
man
y 19
90
Ger
man
y 20
02
Gre
ece
1990
Gre
ece
2002
Hun
gary
199
0
Hun
gary
200
2
Irela
nd 1
990
Irela
nd 2
002
Italy
199
0
Italy
200
2
Japa
n 19
90
Japa
n 20
02
Latv
ia 1
990
Latv
ia 2
002
Lith
uani
a 19
90
Lith
uani
a 20
02
Luxe
mbo
urg
1990
Luxe
mbo
urg
2002
Mon
aco
1990
Mon
aco
2002
Net
herla
nds
1990
Net
herla
nds
2002
New
Zea
land
199
0
New
Zea
land
200
2
Nor
way
199
0
Nor
way
200
2
Por
tuga
l 199
0
Por
tuga
l 200
2
Rom
ania
199
0
Rom
ania
200
2
Slo
vaki
a 19
90
Slo
vaki
a 20
02
Slo
veni
a 19
90
Slo
veni
a 20
02
Spa
in 1
990
Spa
in 2
002
Sw
eden
199
0
Sw
eden
200
2
Sw
itzer
land
199
0
Sw
itzer
land
200
2
Ukr
aine
199
0
Ukr
aine
200
2
Uni
ted
Kin
gdom
199
0
Uni
ted
Kin
gdom
200
2
Uni
ted
Sta
tes
1990
Uni
ted
Sta
tes
2002
Per
cent
age
stationary mobile fugitive
- 20 -

Figure 1.2
Differences in CO2 emissions from reference and sectoral approach for 1990, 1996–2002 (%)a
Note: Only Parties that provided data for three or more of the years in the selected period are included in the graph.a In accordance with decisions 9/CP.2 and 11/CP.4, some Parties with economies in transition use base years other than 1990: Bulgaria (1988), Hungary (average of 1985 to 1987), Romania (1989) and Slovenia (1986).
-15
-10
-5
0
5
10
15
20
Aus
tral
ia
Aus
tria
Bel
gium
Can
ada
Cro
atia
Den
mar
k
Eur
opea
n C
omm
unity
Fin
land
Fra
nce
Ger
man
y
Gre
ece
Irel
and
Italy
Japa
n
Latv
ia
Lith
uani
a
Net
herla
nds
New
Zea
land
Nor
way
Por
tuga
l
Rom
ania
Slo
veni
a
Spa
in
Sw
eden
Sw
itzer
land
Uni
ted
Kin
gdom
Uni
ted
Sta
tes
Per
cent
age
(%)
1990 1996 1997 1998 1999 2000 2001 2002
- 21 -

Table 1.1
Reference approach
Sectoral approach
Difference
(%)Australia 325,167 333,680 -2.55 Four main reasons there is a difference between the Reference Approach and the National Approach as displayed in the above table and Table 1A(b):
1) Partly an artefact caused by deficiencies in the design of Tables 1.A(b) and 1.A(d). The CRF does not allow for the subtraction of the energy content of the fuels whose carbon is sequestered. It only allows for the subtraction of the sequestered carbon and carbon emitted elsewhere, i.e. in other sectors. Therefore, the energy consumption reported using this method for the Reference Approach includes energy which is netted out of the national approach. The energy consumption for the Reference Approach and the National Approach will therefore never balance using the CRF tables in their current format. This explains why the extent of non-reconciliation is different for energy and for CO 2. If the energy consumption calculated by the Reference Approach is adjusted by netting out the energy content of the quantities of fuel that do not undergo combusiton for energy, as calculated in the National Approach, the extent of non-reconciliation for energy and CO 2 is almost the same for all three fuel types. 2) The large discrepancy for liquid fuels is caused by the uncertainty of the 2002 Reference Approach figure for Petroleum, which in turn derives from the crude oil density values used to convert reported indigenous production and imports in volumetric units 3) The CRF tables assume that all ethane is sourced from oil refineries, derived from crude oil. In Australia, all ethane supplied to the chemical industry is sourced from gas wells, separated from methane at gas processing plants. It is therefore classed as a gase 4) The defect described under point (1) also leads to slight discrepancies in both emission factors and oxidation factors between the two approaches for a number of individual fuel types.
Austria 61,083 61,815 -1.18 Solid fuels: Energy consumption: National approach doesn't include non-energy useCO2 emissions: CO2 emissions and fuel consumption from 2 iron & steel plants are reported by plant operators. The reported coke oven coke consumption of is not consistent with the energy balance for the year 2002 Gaseous fuels: Energy consumption: National approach doesn't include losses and non-energy-use. CO2 emissions: National aproach uses sector specific carbon contents (different from IPCC reference factor). Liquid fuels: Energy consumption: National approach doesn't include non-energy use and energy losses. CO2 emissions: Heat values and carbon contents are sector and fuel specific. The energy statistic is mass balanced only. Other fuels: The national approach considers waste as an additional fuel type (e.g. municipal solid waste and industrial fuel waste).
Belarus 50,295Belgium 111,735 115,187 -3.00
Bulgaria 45,012 43,052 4.55 The discrepancy arises from the following sources: (I) The statistical difference between "apparent consumption" used in the reference approach and actual consumption used in the sectoral approach.
(II) Not taking into account the loses during fuel transformation and the non-energy use of fuels in the sectoral approach. (III) Different emission factors applied in the sectoral approach for the different combustion technologies.
(IV) The reference approach treats the non-energy use of fuels as if they were combusted. A correction is done by the carbon stored from non-energy fuel use, which is estimated from an approximate procedure which does not identify specific processes.
Canada 545,087 521,287 4.57 For a complete discussion and reconciliation of The National and Reference Approaches, please consult the most recent copy of Canada's National Inventory Report (NIR) specifically, the section describing: Energy/Fuel Combustion/Memo Items/Reference Approach.
Croatia 18,964 18,854 0.58 The National approach is based on Sectoral approach recommended by IPCC methodology. The differences between Reference and National approach exists in energy consumption and CO2 emission from liquid and solid fuel but it is relatively small and therefore acceptable.
Czech Republic 120,956 117,426 3.01 Regarding Sectoral approach - when CO2 from 2C1 is added (2614GgCO2), the total value for the Sectoral approach is 120040 Gg CO 2 (very close to the Reference approach result). Denmark 51,795 51,922 -0.24 Non-energy use of fuels is not included in the Danish National Approach. Fuel consumption for non-energy is subtracted in Reference Approach to make
results comparable. Inclusion of these fuels in future inventories will be considered. CO2 emission from plastic part of municipal wastes is included in the Danish National Approach. CO2 emission from the plastic part of municipal wastes is added in Reference Approach. (Other fuels of sources 1A1, 1A2 and 1A4)
Estonia 15,577 16,971 -8.21 The activity data for both approches (Reference and National approch) are taken from the offical sourse: "Energy Balance 2002", Statistical Office of Estonia. Differences between two approches are caused by big differenses of activity data collected from two different sourses. The export/imports data of fuels (TPES) are collectef from the
Estonian Customs Office, but real sectoral consumption data from final consumers (so called buttom-up" method). Unfortunatelly the data from this two sourses have a big statistical difference.
European Community 3,207,564 The reference approach is not available for 2002, because the Eurostat New Cronos database does not have available the relevant data for the previous year but one before 15 April. Finland 62,801 62,211 0.95 Secondary liquid fuels with notification 'IE* are included in Other oil in Table 1.A(b). Anthracite is included in Other bituminous coal.
All biomass fuels are included in Solid biomass. The relatively high difference in liquid fuels CO2 emissions is due to statistical differences in national oil balance.
France 380,541 Anthracite is included with "other bituminous coal» Energy data relating to 2002 were not yet available with regard to the requested detail when the CRF has been elaborated.
Germany 841,387Greece 97,212 97,812 -0.61Hungary 55,377 54,583 1.46Ireland 42,237 42,621 -0.90 Liquid fuels.
Solid fuels. Gaseous fuels.
Italy 434,295 441,110 -1.54Japan 1,146,691 1,174,320 -2.35 The reason that the difference between RA and NA is over 2% is not made clear. We recognise it is necessary to examine the reason. Latvia 6,998 7,017 -0.27 Difference of the Reference approach over the National approach is due to 1) statistical differences; 2) there is inconsistency in data due to difficulties to split domestic
and international aviation and navigation. For the time period 1990-2000 is used research made by local expert and detailed information about international aviation is available since 2001. At the moment we have joint project with Danish experts to improve our inventory.
Lithuania 11,992 10,782 11.22Luxembourg 9,419Monaco 93 92 0.93 Some little differences in the net calorific values and in the carbon emission factors between both methods.
Total CO2 emissions from the reference approach and the sectoral approach (2002)
Explanation of the differences as reported in table 1.A(c) of the CRF
(Gg CO2 )
- 22 -

Reference approach
Sectoral approach
Difference
(%)
Explanation of the differences as reported in table 1.A(c) of the CRF
(Gg CO2 )Netherlands 175,616 173,025 1.50 The energy consumption in the national approach (NA) is based on the data from the national inventory.
These fuel data are not complete due to: 1) Not all CO2 emissions (from combustion) submitted by industry are accompanied by fuel data in the inventory; 2) In industry reports some of the CO2 emissions from combustion are allocated as process emissions
and thus the corresponding fuel data are not incorporated in the totals for the fuel data. 3) Industries may calculate and report actual CO 2 emissions from energy used as chemical feedstock using different overall CO2 emission factors for the amount of energy carriers converted into products
than used in the RA for estimating non-reported feedstock emissions. 4) Industry firms report more heavy fuels used as chemical feedstock than the energy statistics used in the RA.
The extent of these causes may differ from year to year, which then also causes the fluctuations in the difference between RA and NA.
In addition, the RA figures are calculated using preliminary values for the carbon content of crude oil and NGL. For more information see the National Inventory Report.
New Zealand 29,317 30,206 -2.94Norway 29,294 32,013 -8.49 Consumption figures used in the reference approach are based on annual (industry, households) and occasional (agriculture, services, construction, transport) surveys.
There are systematic deviations between the Reference Approach (RA) and Sectoral Approach (SA). The main reason is probably inaccuracies in the oil and gas production or export statistics. Due to the large production and export, small errors can amount to much CO2 compared to national total emissions. Norway has a large non-energy use of coal, coke, natural gas and liquefied petroleum gas (LPG), large oil and gas production and exports (domestic supply is the difference between the two large numbers in each case), and relatively large statistical errors, which makes the use of the reference approach inappropriate. End-user statistics from sales by energy commodity, sector and source that are used in the sectoral approach are considered to be more reliable.The energy balance data used in the CRF are the same data that Statistics Norway has reported to the IEA, but there are differences in the RA estimated by Statistics Norway and the one published by IEA. The main reason for this is that IEA distributes the statistical error between the RA and SA. The IEA estimate is furthermore based on default assumptions about carbon stored, which differs from the actual situation in Norway. IEA and Statistics Norway uses different definitions of domestic and international fuel use with respect to shipping, aviation and offshore gas combustion and flaring (offshore installations are included in the latter while excluded from the former).
Portugal 65,251 61,070 6.85 Differences between Sectoral and Reference approach (CO2 from fuel combustion): the sectoral approach CO2 estimates depends partially on combustion information from point sources, and the reference approach results from national energy balances.
Furthermore, feedstock emissions were estimated differently in the two approaches: in the sectoral approach, emissions were estimated from production activity data; in the reference approach, a global percentage of carbon stored (e.g. lubricants, naphta) was used. In the sectoral approach, emissions from lubricants may not have been totally estimated, because it is uncertain if road traffic
emission factors take into account these materials. Romania 94,662 92,775 2.03 This difference is due to the fact that national approach does not take into account the non energetic consumption of fuels.
National approach does not include non energy use of fuels. Slovakia 38,866 39,689 -2.08 National approach is based on totally independent data collection than Reference approach. The difference in fuel consumption between these two approaches can be caused by: using average NCV in RA and fuel specific NCV in NA, not full coverage of fuel
consumption in NA (not appropriate reporting by sources). Slovakia is using RA as national total emission estimate of CO2, while consistent data series since 1990 exist only for RA.
Slovenia 15,289 15,416 -0.82 Difference in Energy consumption occured due to non-energy use of natural gas. Spain 302,813 300,765 0.68Sweden 52,421 49,491 5.92 The Reference approach includes all fuel consumption in Sweden since it is not possible to separate fuels consumed in CRF 1B and 2 on this level.
The large differences between approaches are mainly due to the fact that a lot of fuel in Sweden is consumed and thus reported in CRF 1B and 2. Since this table does not take CRF 1B and 2 into account, it is not fully applicable for swedish conditions.
For more information, see chapter 3.3.6 and appendix 14 of the Swedish National Inventory Report. Switzerland 39,860 39,450 1.04 Differences in energy consumption: allocation problems:
Only bitumen production from national refineries is shown in table 1.A(d). It is a refinery product and included in the crude oil amount. In the Swiss inventories bitumen emissions (NMVOC) appear under industrial processes and not under energy use.
Gaseous fuels: gas distribution emissions (including emissions from compressor stations) are shown in table 1.B.1 and do not appear in the column "National approach" above. Liquid fuels/Solid fuels: in the national approach, petroleum coke is subsumed under solid fuels (cement industry use; there petroleum coke is treated as coal).
Ukraine 249,592 245,127 1.82A significant proportion of fuel consumption emissions occur in 1B1b Solid Fuel Transformation, 2C Metal Production, 2B1 Ammonia Production Including these sources with 1A in the comparison reduces the discrepancy to 2.4 % This discrepancy arises from three sources: (1) The statistical difference between 'apparent consumption' used in the reference inventory and actual consumption used in the sectoral inventory. This statistical difference results from losses and errors in the estimates. (2) The sectoral inventory includes emissions from the non-energy use of fuel where they can be specifically identified e.g. catalytic crackers, iron & steel, lubricants combustion and ammonia production. The reference approach implicitly treats the non-energy use of fuel as if it were combustion. A correction is then applied by deducting an estimate of carbon stored from non-energy fuel use. The carbon stored is estimated from an approximate procedure which does not identify specific processes. The result is that the reference approach is based on a higher estimate of non-energy use emissions than the sectoral inventory. (3) The reference approach uses data on primary fuels such as crude oil and natural gas liquids which are then corrected for imports, exports and stock changes of secondary fuels. Thus the estimates obtained will be highly dependent on the default carbon contents used for the primary fuels. The sectoral approach is based wholly on the consumption of secondary fuels where the carbon contents are known with greater certainty. In particular the carbon contents and calorific values of the primary liquid fuels are likely to vary more than those of secondary fuels.
In order to accommodate the differences and limitations between the Reference Approach table of the CRF and that of the U.S. Inventory, the following adaptations were made to table 1.A(b):
1) Orimulsion values refer to U.S. Inventory's "Other Liquids" which has production. The carbon stored subtracted in column P refers to "Pentanes Plus." 2) Field production of motor gasoline is included in column F with "Gasoline" Imports.
3) Naphtha values refer to "Naphtha for Petrofeed" and "Special Naphtha." 4) Refinery Feedstocks values refer to U.S. Inventory's "Other Oil for Petrofeed" and "Still Gas."
5) Other Oil values refer to U.S. Inventory's "Waxes," "Asphalt/Road Oil," "Misc. Products," and "U.S. Terr. Misc. Products." 6) Other Bit. Coal includes U.S. Inventory's "Bituminous Coal" and "Unspecified Coal."
7) U.S. Territories consumption is included in the Imports column (applies to Natural Gas Liquids, Gasoline, Other Kerosene, Gas/Diesel Oil, Residual Fuel Oil, Lubricants, Other Oil, Other Bit. Coal, and Natural Gas).
8) Other includes waste combustion and geothermal emissions. Additional notes:
9) Table 1.A(b) - The United States Reference Approach is also provided in a separate Excel spreadsheet, which is more detailed than this table allows information to be reported. Specifically, the fuel types provided in the CRF tables differ from the fuel types as defined in the U.S., and no "other" options were offered in the CRF table. The U.S. suggests revising the table to allow for additional fuel types.
10) "Other" reported above includes waste combustion, geothermal consumption, and adjustments to exclude petroleum coke for aluminum, ferroalloy, and titanium dioxide production; coking coal for iron and steel production; and natural gas for ammonia production. These fuels consumed as feedstocks are accounted for in the Industrial Processes section. Also includes CO2 exported to Canada, produced as a byproduct of coal gasification. The inclusion of emissions from waste combustion and geothermal in this table gives higher totals for energy consumption and CO 2 emissions in the CRF Reference Approach than in the U.S. Inventory Reference Approach which does not include waste combustion and geothermal energy.
United States 5,674,389 5,629,757 0.79
United Kingdom 535,852 519,159 3.22
- 23 -

Table 1.2
CO2 emissions (Gg) Relative change (%)
1990a 1996 1997 1998 1999 2000 2001 2002 1996 to 1997 1997 to 1998 1998to 1999 1999 to 2000 2000 to 2001 2001 to 2002 1990 to 2002Australia 192,933 219,212 225,383 241,106 248,877 251,639 256,197 259,593 Australia 2.8 7.0 3.2 1.1 1.8 1.3 34.6Austria 40,358 42,889 42,850 41,178 40,376 39,705 42,300 41,209 Austria -0.1 -3.9 -1.9 -1.7 6.5 -2.6 2.1Belarus 45,390 43,766 Belarus -3.6Belgium 88,805 96,019 89,440 94,649 88,859 90,114 89,629 90,210 Belgium -6.9 5.8 -6.1 1.4 -0.5 0.6 1.6Bulgaria 82,034 48235.44638 47,752 41,638 37,893 36,768 38,904 36,735 Bulgaria -1.0 -12.8 -9.0 -3.0 5.8 -5.6 -55.2Canada 275,782 295,895 300,701 306,234 315,990 337,475 332,715 340,510 Canada 1.6 1.8 3.2 6.8 -1.4 2.3 23.5Croatia 16,497 11,415 11,994 12,842 13,046 12,418 13,232 14,088 Croatia 5.1 7.1 1.6 -4.8 6.6 6.5 -14.6Czech Republic 152,805 119,620 122,534 113,707 105,485 113,310 110,185 104,998 Czech Republic 2.4 -7.2 -7.2 7.4 -2.8 -4.7 -31.3Denmark 40,831 60,544 50,742 45,886 42,634 38,456 40,005 39,622 Denmark -16.2 -9.6 -7.1 -9.8 4.0 -1.0 -3.0Estonia 34,801 19,010 18,787 16,598 15,221 15,464 14,826 14,797 Estonia -1.2 -11.7 -8.3 1.6 -4.1 -0.2 -57.5European Community 2,448,763 2,403,111 2,325,676 2,352,596 2,304,953 2,324,433 2,381,286 2,366,335 European Community -3.2 1.2 -2.0 0.8 2.4 -0.6 -3.4Finland 41,418 50,226 48,283 45,105 44,047 42,553 47,923 49,427 Finland -3.9 -6.6 -2.3 -3.4 12.6 3.1 19.3France 244,960 250,804 242,427 261,110 246,580 242,762 244,716 238,588 France -3.3 7.7 -5.6 -1.5 0.8 -2.5 -2.6Germany 826,500 723,448 690,966 679,300 646,069 652,663 672,391 665,030 Germany -4.5 -1.7 -4.9 1.0 3.0 -1.1 -19.5Greece 61,116 64,633 68,491 71,635 70,182 76,499 77,895 77,513 Greece 6.0 4.6 -2.0 9.0 1.8 -0.5 26.8Hungary 72,007 51,562 48,811 46,241 46,922 47,552 47,266 45,313 Hungary -5.3 -5.3 1.5 1.3 -0.6 -4.1 -37.1Ireland 24,617 26,563 28,052 28,939 29,868 31,124 32,285 31,390 Ireland 5.6 3.2 3.2 4.2 3.7 -2.8 27.5Italy 297,819 299,584 301,896 309,977 313,149 313,460 318,155 316,166 Italy 0.8 2.7 1.0 0.1 1.5 -0.6 6.2Japan 837,669 894,769 898,952 860,435 890,504 903,306 878,678 919,659 Japan 0.5 -4.3 3.5 1.4 -2.7 4.7 9.8Latvia 17,030 6,810 6,341 5,793 5,169 4,494 4,508 4,385 Latvia -6.9 -8.7 -10.8 -13.1 0.3 -2.7 -74.3Lithuania 30,926 10,532 7,430 7,281 Lithuania -2.0 -76.5Luxembourg 3,063 3,257 3,997 LuxembourgMonaco 31 40 35 35 40 39 37 40 Monaco -12.0 -1.3 13.5 -2.4 -3.7 8.0 31.4Netherlands 128,410 145,501 129,473 135,289 128,763 132,677 138,509 136,774 Netherlands -11.0 4.5 -4.8 3.0 4.4 -1.3 6.5New Zealand 13,618 13,620 15,423 13,823 15,196 15,127 16,733 16,307 New Zealand 13.2 -10.4 9.9 -0.5 10.6 -2.6 19.7Norway 14,717 17,936 17,890 17,683 17,066 16,979 18,519 18,688 Norway -0.3 -1.2 -3.5 -0.5 9.1 0.9 27.0Portugal 29,408 30,940 32,561 35,141 41,387 38,939 38,218 41,239 Portugal 5.2 7.9 17.8 -5.9 -1.9 7.9 40.2Romania 143,764 109,003 95,121 82,339 71,816 73,166 76,344 80,885 Romania -12.7 -13.4 -12.8 1.9 4.3 5.9 -43.7Slovakia 50,653 37,186 37,196 35,136 34,191 32,628 35,107 34,099 Slovakia 0.0 -5.5 -2.7 -4.6 7.6 -2.9 -32.7Slovenia 12,959 10,535 10,900 11,240 10,756 10,672 11,563 11,616 Slovenia 3.5 3.1 -4.3 -0.8 8.3 0.5 -10.4Spain 147,118 150,597 168,431 168,766 189,760 198,222 194,991 209,338 Spain 11.8 0.2 12.4 4.5 -1.6 7.4 42.3Sweden 32,243 36,841 32,610 33,055 30,124 27,925 28,270 29,466 Sweden -11.5 1.4 -8.9 -7.3 1.2 4.2 -8.6Switzerland 25,413 26,332 25,082 26,049 25,476 24,003 25,194 24,254 Switzerland -4.7 3.9 -2.2 -5.8 5.0 -3.7 -4.6Ukraine 229,794 232,462 Ukraine 1.2United Kingdom 440,030 421,425 397,757 401,999 392,248 398,574 412,657 396,367 United Kingdom -5.6 1.1 -2.4 1.6 3.5 -3.9 -9.9United States 3,367,371 3,722,497 3,786,992 3,784,568 3,803,561 3,941,908 3,846,916 3,865,385 United States 1.7 -0.1 0.5 3.6 -2.4 0.5 14.8
Emissions from stationary combustion – trend information
a In accordance with decisions 9/CP.2 and 11/CP.4, some Parties with economies in transition use base years other than 1990: Bulgaria (1988), Hungary (average of 1985 to 1987), Romania (1989) and Slovenia (1986).
Note: This table includes data from categories 1.A.1 Energy industries, 1.A.2 Manufacturing industries and construction, 1.A.4 Other sectors and 1.A.5 Other.
- 24 -

Table 1.3
CO2 IEF
TotalPublic electricity
and heat production
Petroleum refining
Manufacture of solid fuels and other energy
industries
Total TotalCommercial / institutional
ResidentialAgricultural /
forestry / fisheries
(%) (t/TJ)Australia L 6.7 GCV T2 CS 68.44 69.38 67.91 69.05 T2 CS 67.59 T1, T2 CS 66.37 61.37 62.68 68.84Austria L, T 17.3 NCV C CS 75.41 79.21 74.04 C CS 76.61 C CS 74.52 72.00 74.87 73.99Belarus L 12.1 NCV 76.40 73.65 70.41 74.48 62.59 73.27Belgium L, T 18.6 NCV CS CS 63.39 73.74 62.58 73.30 C C, CS 79.00 C C 73.41 73.42 73.23 74.53Bulgaria L 5.8 NCV T3 CS, D 68.89 74.47 NO 66.75 T2 CS, D 75.05 T2 CS, D 72.37 73.64 64.03 73.53Canada L, T 9.9 GCV T2 CS 65.12 71.90 63.21 NA T2 CS 72.05 T2 CS 62.74 55.42 71.44 66.82Croatia L, T 26.4 NCV T1 D 74.57 76.56 71.68 73.33 T1 D 75.55 T1 D 72.39 73.10 71.66 73.07Czech Republic L 6.4 NCV T1 D 73.71 75.64 72.47 73.33 T1 D 61.00 T1 D 68.44 71.67 62.44 73.33Denmark L, T 16.4 NCV C CS 73.00 79.12 58.68 74.00 C CS 79.35 C CS 74.04 73.99 73.94 74.16Estonia L 5.0 NCV TI/CS D 75.00 75.00 TI D 71.76 TI D 71.27 71.96 71.16 71.16European Community
L15.6 NCV C, CS, D, T1, T2,
T3C, CS, D, PS 72.82 75.71 70.24 72.43 C, CS, D, T1, T2,
T3C, CS, D, PS 75.77 C, CS, D, T1, T2,
T3C, CS, D 72.92 73.48 72.62 73.23
Finland L, T 17.2 NCV CS (T2) CS/PS/D 73.34 75.93 71.91 CS (T2) CS/PS/D 73.09 CS (T2, T1) CS/D 73.62 74.16 73.38 73.61France L, T 17.9 NCV C CS 71.37 78.00 68.73 78.24 C CS 78.22 C CS 73.36 74.21 72.92 73.33Germany L, T 12.8 NCV CS CS 70.65 76.62 69.32 75.69 CS CS 75.10 CS CS 73.67 73.72 73.63 73.83Greece L, T 20.8 NCV C C and CS 74.81 75.82 73.09 NO C C 59.32 C C 73.08 72.74 73.10 73.13Hungary L 7.6 NCV D D 75.98 75.98 D D 40.10 D D 69.40 65.60 62.44 75.99Ireland L, T 18.1 NCV T1 PS, CS 72.78 73.55 67.21 T1 PS, CS 78.63 T1 CS 73.02 73.69 72.47 73.30Italy L, T 23.5 NCV D, T2 CS 76.02 76.09 75.88 76.15 D, T2 CS 81.52 D, T2 CS 71.55 71.80 70.85 72.91Japan L, T 27.8 GCV T1, CS D, CS 66.24 70.06 54.29 90.29 T1, CS D, CS 67.96 T1, CS D, CS 66.80 67.42 64.69 68.76Latvia L, T 9.6 NCV T1 D 76.43 76.43 T1 D 74.40 T1 D 71.80 74.11 68.13 74.32Lithuania L 13.7 NCV C CS 75.50 75.40 76.00 72.50 C CS 73.70 C CS 68.56 73.70 65.00 73.70Luxembourg NCV 73.00 73.00 73.98 70.34 70.00 70.01 73.82Monaco L 29.0 NCV T1 D T1 D 73.33 73.33Netherlands L, T 1.3 NCV CS/T2 PS, CS 48.75 48.69 IE 73.58 CS/T2 PS, CS 72.93 CS/T2 CS 69.61 67.16 71.11 70.35New Zealand L, T 3.3 NCV T1 CS 73.97 68.36 74.01 NE T1 CS 68.12 T1 CS 67.84 66.75 59.84 68.85Norway L, T 11.7 NCV T2 CS 63.11 73.55 58.78 73.55 T2 CS 66.36 T2 CS 33.75 73.53 73.04 NOPortugal L, T 25.8 NCV T2 D+C 75.13 77.21 70.18 73.42 T2 D+C 72.49 T2 D+C 69.31 72.50 63.16 73.68Romania L, T 11.1 NCV D D 75.50 75.50 D D 73.29 D D 68.34 72.19 62.77 73.20Slovakia L 4.0 NCV SA D,CS 75.41 75.98 74.89 SA D,CS 68.45 SA D,CS 73.83 73.74 73.91Slovenia L, T 15.2 NCV T1 D,CS 74.23 73.43 76.08 73.30 T1 D 74.04 T1 D,CS 72.23 73.42 71.55 72.88Spain L, T 19.9 NCV CS,C PS,C 72.79 77.46 67.31 98.28 CS,C PS,C 78.17 C C 71.31 72.56 69.44 72.63Sweden L, T 27.7 NCV T2/T3 + T1, CS CS, PS, D 71.22 74.96 68.68 74.16 T2/T3 + T1 CS 71.24 T2/T3 + T1 CS 73.42 72.52 74.05 72.61Switzerland L, T 34.4 NCV RA, C RA, CS 62.15 73.46 61.65 NO C CS 73.91 C CS 73.47 73.46 73.46 73.63Ukraine L 5.2 NCV T1 D 66.10 74.14 60.19 56.91 T1 D 50.52 T1 D 69.52 68.56 69.86 69.39United Kingdom L, T 9.4 NCV T2 CS 69.49 75.53 69.05 61.62 T2 CS 72.19 T2 CS 71.88 73.80 71.08 72.54United States L, T 9.8 GCV T1 CS 75.81 75.81 IE IE T1 CS 41.92 T1 CS 66.10 67.85 65.25 IE
a Information on methods and emission factors included in this table is as reported by Parties. It may not reflect the actual method or type of emission factor used for all subcategories within the category 1.A.1 Energy Industries. b Information on methods and emission factors included in this table is as reported by Parties. It may not reflect the actual method or type of emission factor used for all subcategories within the category 1.A.2 Manufacturing industries and construction.c Information on methods and emission factors included in this table is as reported by Parties. It may not reflect the actual method or type of emission factor used for all subcategories within the category 1.A.4 Other sectors.
EF
(t/TJ)
Stationary combustion: liquid fuels, CO2 (2002)
Key source
Share of national
totalIEF in CRF
based on
Energy industries Manufacturing industries and construction Other sectors
Methods and EF useda CO2 IEF
Note: This table includes data from categories 1.A.1 Energy industries, 1.A.2 Manufacturing industries and construction, 1.A.4 Other sectors and 1.A.5 Other.
(t/TJ)
Methods and EF usedb Methods and EF usedc CO2 IEF
Methods EFMethods EF Methods
- 25 -

Table 1.4
CO2 IEF
Total
Public electricity and heat
production
Manufacture of solid fuels and other
energy industriesTotal Total
Commercial / institutional
ResidentialAgricultural /
forestry / fisheries
(%) (t/TJ)
Australia L, T 34.8 GCV T2 CS 90.87 91.21 57.48 T2 CS 81.07 T1, T2 CS 97.25 97.18 98.63 NAAustria L, T 14.0 NCV C CS 97.92 97.92 C CS 113.22 C CS 93.72 97.28 93.62 93.59Belarus L 4.1 NCV 95.49 104.13 92.77 92.77 92.76 93.90Belgium L, T 17.7 NCV CS CS 106.51 112.40 43.57 C C, CS 77.93 C C 92.84 92.70 92.85 92.71Bulgaria L 45.9 NCV T3 CS, D 106.82 107.51 65.43 T2 CS, D 94.74 T2 CS, D 100.24 98.95 100.23 104.02Canada L, T 15.1 GCV T2 CS 88.60 88.63 79.65 T2 CS 73.18 T2 CS 82.06 79.65 85.24Croatia L, T 8.2 NCV T1 D 92.65 92.65 T1 D 93.19 T1 D 82.07 96.68 75.57 46.71Czech Republic L 54.4 NCV T1 D 96.88 97.70 67.40 T1 D 96.78 T1 D 99.43 102.39 98.72 99.95Denmark L, T 24.4 NCV C CS 95.00 95.00 C CS 96.62 C CS 95.03 95.78 95.00Estonia L 63.6 NCV TI/CS D 101.24 101.24 TI D 103.16 TI D 98.03 100.62 98.00 97.92European Community
L20.7 NCV C, CS, D, T1, T2,
T3C, CS, D, PS 100.56 100.25 106.53 C, CS, D, T1, T2,
T3C, CS, D, PS 99.02 C, CS, D, T1, T2,
T3C, CS, D 93.06 92.71 93.49 95.05
Finland L, T 21.1 NCV CS (T2) CS/PS/D 91.79 92.71 39.68 CS (T2) CS/PS/D 97.71 CS (T2, T1) CS/D 92.59 92.71 92.53France L, T 9.7 NCV C CS 106.99 105.99 106.30 C CS 137.23 C CS 95.00 95.00 95.00 95.00Germany L, T 36.5 NCV CS CS 103.73 104.43 94.13 CS CS 95.31 CS CS 100.41 102.47 99.67 98.05Greece L, T 33.5 NCV C C and CS 122.14 122.14 NO C C 93.01 C C 62.48 NO 92.71 99.18Hungary L 18.8 NCV D D 98.65 98.65 D D 105.01 D D 96.65 99.09 96.38 98.41Ireland L, T 15.9 NCV T1 PS, CS 100.37 100.37 T1 PS, CS 98.67 T1 CS 98.53 98.86 98.53Italy L, T 9.6 NCV D, T2 CS 104.23 91.60 196.07 D, T2 CS 70.97 D, T2 CS 105.49 105.49 105.49 NOJapan L, T 29.3 GCV T1, CS D, CS 87.77 90.59 63.59 T1, CS D, CS 90.13 T1, CS D, CS 90.46 90.46 90.46Latvia L, T 3.5 NCV T1 D 100.83 100.83 T1 D 92.10 T1 D 92.71 92.71 92.71 92.71Lithuania L 3.4 NCV C CS 76.99 99.70 102.00 C CS 98.50 C CS 98.22 97.30 99.70 95.00Luxembourg NCV 99.46 102.02 102.02 102.02Monaco NCV T1 D T1 DNetherlands L, T 10.5 NCV CS/T2 PS, CS 93.92 93.92 NO CS/T2 PS, CS 97.89 CS/T2 CS 99.54 94.00 103.00 94.00New Zealand L, T 4.5 NCV T1 CS 89.47 89.47 NE T1 CS 89.47 T1 CS 89.47 89.47 89.47 89.47Norway L, T 4.7 NCV T2 CS 89.98 89.98 NO T2 CS 102.47 T2 CS 16,360.44 NO 104.06 NOPortugal L, T 16.2 NCV T2 D+C 92.00 92.00 T2 D+C 101.26 T2 D+CRomania L, T 22.0 NCV D D 98.12 98.12 D D 105.23 D D 96.18 99.18 95.96 103.00Slovakia L 21.7 NCV SA D,CS 93.33 93.33 SA D,CS 93.92 SA D,CS 95.71 97.11 95.42 95.21Slovenia L, T 33.7 NCV T1 D,CS 102.28 102.28 T1 D 100.35 T1 D,CS 102.99 103.01 102.99Spain L, T 21.2 NCV CS,C PS,C 98.86 99.28 69.87 CS,C PS,C 87.40 C C 65.96 63.18 67.95 NOSweden L, T 10.4 NCV T2/T3 + T1, CS CS, PS, D 135.22 141.67 75.96 T2/T3 + T1 CS 81.19 T2/T3 + T1 CS 90.70 90.70Switzerland L, T 1.2 NCV RA, C RA, CS NO NO NO C CS 94.13 C CS 94.13 NO 94.13 NOUkraine L 20.3 NCV T1 D 95.69 96.16 85.83 T1 D 56.78 T1 D 96.78 96.32 97.18 96.66United Kingdom L, T 20.4 NCV T2 CS 86.90 86.99 80.91 T2 CS 126.26 T2 CS 90.17 84.58 90.52 89.33United States L, T 28.9 GCV T1 CS 88.62 88.62 IE T1 CS 87.24 T1 CS 89.47 89.47 89.47 IE
a Information on methods and emission factors included in this table is as reported by Parties. It may not reflect the actual method or type of emission factor used for all subcategories within the category 1.A.1 Energy industries. b Information on methods and emission factors included in this table is as reported by Parties. It may not reflect the actual method or type of emission factor used for all subcategories within the category 1.A.2 Manufacturing industries and construction.c Information on methods and emission factors included in this table is as reported by Parties. It may not reflect the actual method or type of emission factor used for all subcategories within the category 1.A.4 Other sectors.
EF
(t/TJ)
Stationary combustion: solid fuels, CO2 (2002)
Key source
Share of national total IEF in CRF
based on
Energy industries Manufacturing industries and construction Other sectorsMethods and EF useda CO2 IEF
Note: This table includes data from categories 1.A.1 Energy industries, 1.A.2 Manufacturing industries and construction, 1.A.4 Other sectors and 1.A.5 Other.
(t/TJ)
Methods and EF usedb Methods and EF usedc CO2 IEF
Methods EFMethods EF Methods
- 26 -

Table 1.5
CO2 IEF
TotalPublic electricity
and heat production
Petroleum refining
Manufacture of solid fuels and other energy
industries
Total TotalCommercial / institutional
Residential
Agricultural / forestry / fisheries
(%) (t/TJ)
Australia L, T 9.3 GCV T2 CS 51.27 51.36 51.15 51.16 T2 CS 51.16 T1, T2 CS 51.20 51.19 51.20 51.15Austria L, T 16.8 NCV C CS 55.00 55.00 55.00 55.00 C CS 55.00 C CS 55.00 55.00 55.00 55.00Belarus L 46.1 NCV 56.69 57.32 55.82 55.88 55.82 55.82Belgium L, T 19.6 NCV CS CS 54.90 55.62 C C, CS 55.55 C C 55.84 55.85 55.84 55.82Bulgaria L 7.2 NCV T3 CS, D 55.82 55.82 55.82 55.82 T2 CS, D 55.82 T2 CS, D 55.82 55.82 55.82 55.82Canada L, T 22.0 GCV T2 CS 51.22 49.65 49.65 52.10 T2 CS 49.65 T2 CS 49.65 49.65 49.65 49.65Croatia L, T 15.9 NCV T1 D 55.82 55.82 55.82 55.82 T1 D 55.82 T1 D 55.82 55.82 55.82 55.82Czech Republic L 12.7 NCV T1 D 55.82 55.82 55.82 T1 D 55.82 T1 D 55.82 55.82 55.82 55.82Denmark L, T 16.2 NCV C CS 57.28 57.28 57.28 C CS 57.28 C CS 57.28 57.28 57.28 57.28Estonia L 7.1 NCV TI/CS D 55.82 55.82 TI D 55.82 TI D 55.82 55.82 55.82 55.82European Community
L18.8 NCV C, CS, D, T1,
T2, T3C, CS, D, PS 57.28 56.70 55.67 62.33 C, CS, D, T1, T2,
T3C, CS, D, PS 55.86 C, CS, D, T1,
T2, T3C, CS, D 56.56 56.49 56.59 56.16
Finland L, T 10.5 NCV CS (T2) CS/PS/D 55.82 55.82 55.82 CS (T2) CS/PS/D 54.28 CS (T2, T1) CS/D 55.82 55.83 55.82 55.82France L, T 13.9 NCV C CS 58.29 57.00 78.48 57.02 C CS 56.56 C CS 57.00 57.00 57.00 57.00Germany L, T 16.0 NCV CS CS 55.99 56.00 56.00 55.85 CS CS 56.00 CS CS 56.00 56.00 56.00 56.00Greece L, T 3.1 NCV C C and CS 55.82 55.82 NO 55.82 C C 52.52 C C 174.47 NO 55.82 NOHungary L 31.7 NCV D D 55.82 55.82 D D 54.09 D D 55.82 55.82 55.82 55.82Ireland L, T 11.5 NCV T1 PS, CS 59.02 59.02 T1 PS, CS 54.94 T1 CS 54.94 54.94 54.94Italy L, T 23.7 NCV D, T2 CS 55.46 55.46 55.46 55.46 D, T2 CS 55.46 D, T2 CS 55.46 55.46 55.46 55.46Japan L, T 12.0 GCV T1, CS D, CS 49.39 49.39 49.38 49.38 T1, CS D, CS 49.39 T1, CS D, CS 49.38 49.38 49.38Latvia L, T 28.1 NCV T1 D 55.82 55.82 T1 D 55.82 T1 D 55.82 55.82 55.82 55.82Lithuania L 25.2 NCV C CS 56.90 56.90 56.90 56.90 C CS 56.90 C CS 56.90 56.90 56.90 56.90Luxembourg NCV 56.00 56.00 55.56 55.00 55.00 55.00Monaco L 12.7 NCV T1 D 55.82 55.82 T1 D 55.82 55.82Netherlands L, T 36.0 NCV CS/T2 PS, CS 55.61 55.57 IE 56.05 CS/T2 PS, CS 55.97 CS/T2 CS 55.96 56.00 55.92 56.00New Zealand L, T 13.9 NCV T1 CS 53.06 52.02 58.94 55.42 T1 CS 30.75 T1 CS 52.13 52.13 52.13 NENorway L, T 17.1 NCV T2 CS 57.85 58.50 NO 57.85 T2 CS 58.50 T2 CS 58.50 58.50 58.50 NOPortugal L, T 8.5 NCV T2 D+C 56.10 56.10 T2 D+C 56.10 T2 D+C 56.10 56.10 56.10 56.10Romania L, T 26.2 NCV D D 59.55 59.55 D D 60.92 D D 55.82 55.82 55.82 55.82Slovakia L 25.0 NCV SA D,CS 58.63 58.63 58.63 58.63 SA D,CS 58.55 SA D,CS 58.63 58.63 58.63 58.63Slovenia L, T 8.0 NCV T1 D,CS 55.00 55.00 T1 D 55.00 T1 D,CS 55.00 55.00 55.00Spain L, T 11.1 NCV CS,C PS,C 60.72 61.64 56.24 56.00 CS,C PS,C 53.22 C C 56.00 56.00 56.00 56.00Sweden L, T 2.7 NCV T2/T3 + T1, CS CS, PS, D 56.50 56.50 56.50 T2/T3 + T1 CS 56.50 T2/T3 + T1 CS 56.50 56.50 56.50 56.50Switzerland L, T 10.9 NCV RA, C RA, CS 55.00 55.00 NO NO C CS 55.00 C CS 55.00 55.00 55.00 55.00Ukraine L 22.3 NCV T1 D 49.17 55.83 31.03 33.05 T1 D 34.40 T1 D 55.65 53.71 55.82 55.82United Kingdom L, T 32.4 NCV T2 CS 59.66 58.13 57.96 64.82 T2 CS 57.96 T2 CS 57.96 57.96 57.96 57.96United States L, T 16.7 GCV T1 CS 50.04 50.04 IE IE T1 CS 48.73 T1 CS 50.04 50.04 50.04 IE
a Information on methods and emission factors included in this table is as reported by Parties. It may not reflect the actual method or type of emission factor used for all subcategories within the category 1.A.1 Energy industries.
c Information on methods and emission factors included in this table is as reported by Parties. It may not reflect the actual method or type of emission factor used for all subcategories within the category 1.A.4 Other sectors.
Stationary combustion: gaseous fuels, CO2 (2002)
Key sourceShare of
national totalIEF in CRF
based on
Energy industries Manufacturing industries and construction Other sectors
Methods and EF useda Methods and EF usedc CO2 IEF
Methods EF
CO2 IEF Methods and EF usedb
b Information on methods and emission factors included in this table is as reported by Parties. It may not reflect the actual method or type of emission factor used for all subcategories within the category 1.A.2 Manufacturing industries and construction.
Methods EF Methods
Note: This table includes data from categories 1.A.1 Energy industries, 1.A.2 Manufacturing industries and construction, 1.A.4 Other sectors and 1.A.5 Other.
EF
(t/TJ) (t/TJ)
- 27 -

Table 1.6
CO2 IEF
TotalPublic electricity
and heat production
Total Commercial / institutional
ResidentialAgricultural /
forestry / fisheries
(%) (t/TJ)Australia GCV T2 CS NA NA T2 CS NA T1, T2 CS NA NA NA NAAustria L 0.61 NCV C CS 43.01 43.01 C CS 41.67 C CS 10.00 10.00Belarus 0.27 NCV 72.60 72.61 79.50 72.66 72.69Belgium L, T 4.33 NCV CS CS 48.88 48.88 C C, CS 68.09 C C 58.02 56.71 66.00 NOBulgaria NCV T3 CS, D NO T2 CS, D T2 CS, D NO NO NOCanada GCV T2 CS NA T2 CS T2 CS NA NA NACroatia NCV T1 D T1 D T1 DCzech Republic NCV T1 D T1 D T1 DDenmark L 0.87 NCV C CS C CS C CSEstonia 0.05 NCV TI/CS D TI D TI D 62.44 62.44 62.44 62.44European Community
L1.60 NCV C, CS, D, T1,
T2, T3C, CS, D, PS 122.82 83.05 C, CS, D, T1,
T2, T3C, CS, D, PS 105.90 C, CS, D, T1, T2,
T3C, CS, D 75.96 76.08 68.79 104.96
Finland L, T 11.55 NCV CS (T2) CS/PS/D 103.26 103.26 CS (T2) CS/PS/D 81.60 CS (T2, T1) CS/D 104.91 104.44 104.94 104.96France L, T 1.68 NCV C CS 112.23 86.77 C CS 52.50 C CS 57.00 56.96 57.00Germany T 0.10 NCV CS CS 15.03 15.00 CS CS 20.00 CS CS NE NE NEGreece NCV C C and CS NO C C C C NO NO NOHungary 0.05 NCV D D D D 3.22 D DIreland NCV T1 PS, CS T1 PS, CS T1 CSItaly T 0.31 NCV D, T2 CS 94.00 94.00 D, T2 CS 94.00 D, T2 CS 89.79 89.79 NOJapan GCV T1, CS D, CS NO T1, CS D, CS T1, CS D, CS NO NO NOLatvia NCV T1 D T1 D T1 DLithuania NCV C CS NO NO C CS NO C CS NO NO NO NOLuxembourg NCVMonaco NCV T1 D T1 DNetherlands L, T 16.21 NCV CS/T2 PS, CS 729.92 282.18 CS/T2 PS, CS 171.72 CS/T2 CS NO NO NONew Zealand NCV T1 CS NO T1 CS T1 CS NO NO NONorway 0.27 NCV T2 CS 24.05 24.05 T2 CS T2 CS NO NO NOPortugal 0.08 NCV T2 D+C T2 D+C 71.11 T2 D+CRomania NCV D D D D D DSlovakia L 15.03 NCV SA D,CS 93.36 SA D,CS 163.32 SA D,CSSlovenia 0.05 NCV T1 D,CS T1 D 70.01 T1 D,CSSpain T 0.15 NCV CS,C PS,C 36.88 36.88 CS,C PS,C 82.69 C C NO NO NOSweden L, T 1.52 NCV T2/T3 + T1, CS CS, PS, D 35.60 35.60 T2/T3 + T1 CS 58.66 T2/T3 + T1 CSSwitzerland NCV RA, C RA, CS NO NO C CS NO C CS NO NO NO NOUkraine 0.29 NCV T1 D 61.40 91.37 T1 D 85.09 T1 D 107.51 107.33 108.54 107.82United Kingdom 0.15 NCV T2 CS 30.47 30.47 T2 CS 94.25 T2 CS 30.47 30.47United States T 0.28 GCV T1 CS 7.12 7.12 T1 CS T1 CS NE NE IE
Note: This table is provided for the purpose of completeness. Parties report emissions and activity data from different fuels under other fuels in the CRF and, consequently, the CO2 IEFs may not be comparable.
a Information on methods and emission factors included in this table is as reported by Parties. It may not reflect the actual method or type of emission factor used for all subcategories within the category 1.A.1 Energy industries.
c Information on methods and emission factors included in this table is as reported by Parties. It may not reflect the actual method or type of emission factor used for all subcategories within the category 1.A.4 Other sectors.
Methods and EF useda CO2 IEF
Stationary combustion: other fuels, CO2 (2002)
Key source
Share of national total IEF in CRF
based on
1.A.1 Energy industries1.A.2 Manufacturing industries and
construction 1.A.4 Other sectors
CO2 IEF Methods and EF usedb Methods and EF usedc
(t/TJ)
Note: This table includes data from categories 1.A.1 Energy industries, 1.A.2 Manufacturing industries and construction, 1.A.4 Other sectors and 1.A.5 Other.
b Information on methods and emission factors included in this table is as reported by Parties. It may not reflect the actual method or type of emission factor used for all subcategories within the category 1.A.2 Manufacturing industries and construction.
Methods EF Methods
(t/TJ)
Methods EF TotalEF
- 28 -

Table 1.7
Fuel consumption (TJ) Relative change (%)
1990a 1996 1997 1998 1999 2000 2001 2002 1996 to 1997 1997 to 1998 1998to 1999 1999 to 2000 2000 to 2001 2001 to 2002 1990 to 2002Australia 2,684,281 3,057,300 3,161,992 3,359,610 3,484,671 3,509,555 3,556,019 3,602,155 Australia 3.4 6.2 3.7 0.7 1.3 1.3 34.2Austria 653,723 742,965 741,837 722,927 711,678 691,826 740,690 708,921 Austria -0.2 -2.5 -1.6 -2.8 7.1 -4.3 8.4Belarus 747,353 BelarusBelgium 1,203,765 1,369,897 1,277,722 1,374,243 1,308,014 1,314,017 1,323,502 1,317,193 Belgium -6.7 7.6 -4.8 0.5 0.7 -0.5 9.4Bulgaria 437,645 BulgariaCanada 4,578,041 5,030,078 5,087,974 5,168,746 5,369,335 5,687,848 5,615,076 5,863,046 Canada 1.2 1.6 3.9 5.9 -1.3 4.4 28.1Croatia 253,907 187,717 196,261 205,213 207,930 199,578 207,829 219,193 Croatia 4.6 4.6 1.3 -4.0 4.1 5.5 -13.7Czech Republic 1,293,564 Czech RepublicDenmark 541,820 808,568 706,618 653,535 624,371 578,299 603,734 605,576 Denmark -12.6 -7.5 -4.5 -7.4 4.4 0.3 11.8Estonia 182,791 EstoniaEuropean Community 33,303,594 33,328,938 33,832,346 European CommunityFinland 685,933 847,858 858,127 824,918 829,369 817,179 863,274 908,508 Finland 1.2 -3.9 0.5 -1.5 5.6 5.2 32.4France 3,633,449 3,864,108 3,707,961 3,980,405 3,789,051 3,739,512 3,810,719 3,639,428 France -4.0 7.3 -4.8 -1.3 1.9 -4.5 0.2Germany 9,878,990 9,257,880 8,905,978 8,804,300 8,423,479 8,431,195 8,738,007 8,601,780 Germany -3.8 -1.1 -4.3 0.1 3.6 -1.6 -12.9Greece 664,772 725,405 760,737 801,676 794,571 869,430 891,249 894,578 Greece 4.9 5.4 -0.9 9.4 2.5 0.4 34.6Hungary 727,579 HungaryIreland 305,636 345,568 365,466 385,470 399,881 417,047 431,910 424,150 Ireland 5.8 5.5 3.7 4.3 3.6 -1.8 38.8Italy 4,313,446 4,432,486 4,477,582 4,600,358 4,692,047 4,744,847 4,791,376 4,787,206 Italy 1.0 2.7 2.0 1.1 1.0 -0.1 11.0Japan 12,143,817 13,027,013 13,049,143 12,574,051 12,985,391 13,133,614 12,757,361 13,321,136 Japan 0.2 -3.6 3.3 1.1 -2.9 4.4 9.7Latvia 258,531 141,159 140,542 135,347 129,770 119,164 124,934 125,019 Latvia -0.4 -3.7 -4.1 -8.2 4.8 0.1 -51.6Lithuania 433,850 172,787 163,347 142,773 Lithuania -12.6 -67.1Luxembourg 48,566 71,033 86,887 LuxembourgMonaco 1,312 MonacoNetherlands 1,837,277 2,065,890 1,876,766 1,874,548 1,638,519 1,981,140 1,791,945 1,827,489 Netherlands -9.2 -0.1 -12.6 20.9 -9.5 2.0 -0.5New Zealand 291,827 310,691 329,696 302,477 336,634 343,273 362,247 364,209 New Zealand 6.1 -8.3 11.3 2.0 5.5 0.5 24.8Norway 274,893 332,609 328,072 334,306 351,967 347,909 Norway -1.4 1.9 5.3 -1.2 26.6Portugal 474,297 492,787 518,799 561,299 658,191 620,113 620,498 667,671 Portugal 5.3 8.2 17.3 -5.8 0.1 7.6 40.8Romania 2,116,801 1,713,454 1,446,254 1,272,423 1,125,623 1,135,430 1,140,839 1,208,300 Romania -15.6 -12.0 -11.5 0.9 0.5 5.9 -42.9Slovakia 472,511 440,643 Slovakia -6.7Slovenia 160,040 142,626 146,729 151,734 147,567 145,199 151,808 152,061 Slovenia 2.9 3.4 -2.7 -1.6 4.6 0.2 -5.0Spain 1,941,341 2,064,759 2,288,958 2,315,823 2,562,373 2,692,784 2,734,081 2,923,499 Spain 10.9 1.2 10.6 5.1 1.5 6.9 50.6Sweden 544,300 681,498 607,829 619,196 575,228 534,679 566,171 575,059 Sweden -10.8 1.9 -7.1 -7.0 5.9 1.6 5.7Switzerland 374,831 404,955 385,481 400,012 393,012 371,498 389,520 376,989 Switzerland -4.8 3.8 -1.8 -5.5 4.9 -3.2 0.6Ukraine 4,067,681 4,104,595 Ukraine 0.9United Kingdom 5,698,307 5,906,505 5,657,289 5,766,379 5,736,369 5,856,164 6,064,750 5,864,401 United Kingdom -4.2 1.9 -0.5 2.1 3.6 -3.3 2.9United States 54,467,524 60,818,877 61,554,483 61,277,154 61,789,038 63,757,963 61,945,864 62,258,648 United States 1.2 -0.5 0.8 3.2 -2.8 0.5 14.3
Stationary combustion: all fuels – trend information
a In accordance with decisions 9/CP.2 and 11/CP.4, some Parties with economies in transition use base years other than 1990: Bulgaria (1988), Hungary (average of 1985 to 1987), Romania (1989) and Slovenia (1986).
Note: This table includes data from categories 1.A.1 Energy industries, 1.A.2 Manufacturing industries and construction, 1.A.4 Other sectors and 1.A.5 Other.
- 29 -

Table 1.8
Fuel consumption (TJ) Relative change (%)
1990a 1996 1997 1998 1999 2000 2001 20021996 to
1997 1997 to 1998 1998to 1999 1999 to 2000 2000 to 2001 2001 to 2002 1990 to 2002Australia 415,300 501,341 480,456 490,561 481,505 504,500 507,288 521,907 Australia -4.2 2.1 -1.8 4.8 0.6 2.9 25.7Austria 212,771 231,466 234,020 236,295 218,833 198,902 215,335 194,594 Austria 1.1 1.0 -7.4 -9.1 8.3 -9.6 -8.5Belarus 113,913 BelarusBelgium 408,133 469,443 435,467 440,101 394,691 366,766 403,042 385,999 Belgium -7.2 1.1 -10.3 -7.1 9.9 -4.2 -5.4Bulgaria 49,479 Bulgaria
Canada 1,055,630 955,316 976,055 983,092 949,300 962,098 1,044,487 1,102,348 Canada 2.2 0.7 -3.4 1.3 8.6 5.5 4.4Croatia 131,072 100,267 101,280 111,205 117,581 96,500 100,587 102,881 Croatia 1.0 9.8 5.7 -17.9 4.2 2.3 -21.5Czech Republic 142,160 Czech RepublicDenmark 162,283 205,461 187,275 174,084 168,957 156,291 156,496 150,257 Denmark -8.9 -7.0 -2.9 -7.5 0.1 -4.0 -7.4Estonia 13,321 EstoniaEuropean Community 9,932,558 8,951,136 8,879,156 European CommunityFinland 203,062 206,500 196,948 199,528 194,424 186,215 190,402 192,639 Finland -4.6 1.3 -2.6 -4.2 2.2 1.2 -5.1France 1,506,119 1,552,355 1,503,601 1,555,060 1,464,946 1,399,777 1,454,921 1,336,765 France -3.1 3.4 -5.8 -4.4 3.9 -8.1 -11.2Germany 2,058,237 2,319,521 2,196,555 2,117,024 1,863,297 1,790,647 1,922,103 1,779,185 Germany -5.3 -3.6 -12.0 -3.9 7.3 -7.4 -13.6Greece 300,689 361,047 363,988 365,705 350,280 381,221 390,623 402,502 Greece 0.8 0.5 -4.2 8.8 2.5 3.0 33.9Hungary 107,645 HungaryIreland 94,664 126,891 137,453 151,437 173,501 174,003 180,912 168,131 Ireland 8.3 10.2 14.6 0.3 4.0 -7.1 77.6Italy 2,091,866 1,992,307 1,959,888 1,930,549 1,816,381 1,743,170 1,698,112 1,707,350 Italy -1.6 -1.5 -5.9 -4.0 -2.6 0.5 -18.4Japan 6,444,884 6,276,599 5,945,693 5,706,548 5,775,533 5,637,320 5,284,478 5,511,380 Japan -5.3 -4.0 1.2 -2.4 -6.3 4.3 -14.5Latvia 116,370 50,176 40,058 36,798 32,011 20,016 15,291 13,801 Latvia -20.2 -8.1 -13.0 -37.5 -23.6 -9.7 -88.1Lithuania 181,850 88,017 50,835 31,765 Lithuania -37.5 -82.5Luxembourg 19,106 35,741 35,862 LuxembourgMonaco 381 MonacoNetherlands 289,412 275,161 228,178 203,158 104,321 111,297 49,500 51,873 Netherlands -17.1 -11.0 -48.7 6.7 -55.5 4.8 -82.1New Zealand 37,008 34,267 35,759 36,156 35,902 36,092 34,947 36,472 New Zealand 4.4 1.1 -0.7 0.5 -3.2 4.4 -1.4Norway 133,502 140,206 142,216 127,950 125,803 121,749 Norway 1.4 -10.0 -1.7 -3.2 -8.8Portugal 259,254 252,776 270,072 302,939 301,142 277,671 274,338 289,479 Portugal 6.8 12.2 -0.6 -7.8 -1.2 5.5 11.7Romania 378,235 325,035 315,472 253,575 207,181 184,685 202,703 204,919 Romania -2.9 -19.6 -18.3 -10.9 9.8 1.1 -45.8Slovakia 29,248 30,510 Slovakia 4.3Slovenia 36,246 48,890 47,781 47,687 49,379 45,382 45,567 42,721 Slovenia -2.3 -0.2 3.5 -8.1 0.4 -6.2 17.9Spain 843,650 935,456 954,078 982,511 1,052,356 1,049,623 1,095,403 1,074,634 Spain 2.0 3.0 7.1 -0.3 4.4 -1.9 27.4Sweden 305,138 362,257 317,546 319,616 291,158 266,164 260,113 268,230 Sweden -12.3 0.7 -8.9 -8.6 -2.3 3.1 -12.1Switzerland 273,166 276,290 264,730 276,546 266,174 243,987 256,874 246,195 Switzerland -4.2 4.5 -3.8 -8.3 5.3 -4.2 -9.9Ukraine 400,378 395,205 Ukraine -1.3United Kingdom 1,264,630 1,154,909 1,023,793 969,628 898,268 847,832 891,073 841,655 United Kingdom -11.4 -5.3 -7.4 -5.6 5.1 -5.5 -33.4United States 12,974,523 13,271,472 13,541,494 13,592,502 13,974,079 13,839,946 14,032,547 13,681,509 United States 2.0 0.4 2.8 -1.0 1.4 -2.5 5.4
Stationary combustion by fuel: liquid fuels – trend information
Note: This table includes data from categories 1.A.1 Energy industries, 1.A.2 Manufacturing industries and construction, 1.A.4 Other sectors and 1.A.5 Other.a In accordance with decisions 9/CP.2 and 11/CP.4, some Parties with economies in transition use base years other than 1990: Bulgaria (1988), Hungary (average of 1985 to 1987), Romania (1989) and Slovenia (1986).
- 30 -

Table 1.9
Fuel consumption (TJ)
1990a 1996 1997 1998 1999 2000 2001 2002 1996 to 1997 1997 to 1998 1998to 1999 1999 to 2000 2000 to 2001 2001 to 2002 1990 to 2002Australia 1,460,816 1,657,516 1,746,199 1,892,567 1,997,630 1,966,115 1,990,362 2,008,574 Australia 5.4 8.4 5.6 -1.6 1.2 0.9 37.5Austria 140,800 114,062 119,389 101,368 99,810 114,621 124,602 114,578 Austria 4.7 -15.1 -1.5 14.8 8.7 -8.0 -18.6Belarus 29,981 BelarusBelgium 420,156 350,128 315,659 338,741 287,317 308,763 280,175 294,503 Belgium -9.8 7.3 -15.2 7.5 -9.3 5.1 -29.9Bulgaria 273,820 BulgariaCanada 969,984 1,018,462 1,091,744 1,177,288 1,180,558 1,284,192 1,265,159 1,248,437 Canada 7.2 7.8 0.3 8.8 -1.5 -1.3 28.7Croatia 31,938 6,593 10,552 10,290 9,061 19,027 20,189 24,889 Croatia 60.0 -2.5 -11.9 110.0 6.1 23.3 -22.1Czech Republic 800,533 Czech RepublicDenmark 254,836 375,387 280,011 233,355 197,985 165,921 175,451 175,727 Denmark -25.4 -16.7 -15.2 -16.2 5.7 0.2 -31.0Estonia 122,590 EstoniaEuropean Community 8,636,951 8,294,768 8,628,388 European CommunityFinland 167,071 220,974 206,643 148,994 149,933 149,177 167,656 184,758 Finland -6.5 -27.9 0.6 -0.5 12.4 10.2 10.6France 646,762 519,333 463,433 555,881 498,314 494,573 425,283 450,044 France -10.8 19.9 -10.4 -0.8 -14.0 5.8 -30.4Germany 5,520,367 3,862,927 3,699,380 3,621,925 3,462,398 3,603,147 3,599,546 3,628,241 Germany -4.2 -2.1 -4.4 4.1 -0.1 0.8 -34.3Greece 334,655 323,680 351,010 367,729 355,211 379,336 391,546 378,695 Greece 8.4 4.8 -3.4 6.8 3.2 -3.3 13.2Hungary 147,252 HungaryIreland 146,999 125,520 127,404 126,986 110,448 109,317 113,923 109,670 Ireland 1.5 -0.3 -13.0 -1.0 4.2 -3.7 -25.4Italy 620,082 473,082 465,470 487,678 489,109 514,721 550,651 569,660 Italy -1.6 4.8 0.3 5.2 7.0 3.5 -8.1Japan 3,411,531 3,898,603 4,132,243 3,844,723 4,007,101 4,174,723 4,170,989 4,390,900 Japan 6.0 -7.0 4.2 4.2 -0.1 5.3 28.7Latvia 28,758 10,732 9,277 6,773 4,955 5,101 4,901 3,924 Latvia -13.6 -27.0 -26.8 3.0 -3.9 -19.9 -86.4Lithuania 77,740 9,835 3,661 6,023 Lithuania 64.5 -92.3Luxembourg 3,673 5,075 3,379 LuxembourgMonaco MonacoNetherlands 294,521 273,464 253,873 264,047 229,984 18,597 248,411 237,877 Netherlands -7.2 4.0 -12.9 -91.9 1,235.7 -4.2 -19.2New Zealand 36,097 32,598 38,171 32,140 32,925 30,515 40,135 37,943 New Zealand 17.1 -15.8 2.4 -7.3 31.5 -5.5 5.1Norway 6,911 9,305 8,180 8,206 7,081 6,543 Norway -12.1 0.3 -13.7 -7.6 -5.3Portugal 108,813 134,386 136,013 122,054 149,438 149,956 133,296 143,075 Portugal 1.2 -10.3 22.4 0.3 -11.1 7.3 31.5Romania 445,060 373,076 305,207 252,823 234,715 259,837 281,916 302,993 Romania -18.2 -17.2 -7.2 10.7 8.5 7.5 -31.9Slovakia 135,627 120,017 Slovakia -11.5Slovenia 84,360 54,587 58,986 62,889 56,066 56,957 63,744 67,232 Slovenia 8.1 6.6 -10.8 1.6 11.9 5.5 -20.3Spain 752,579 628,596 710,970 696,406 787,143 836,778 760,890 868,034 Spain 13.1 -2.0 13.0 6.3 -9.1 14.1 15.3Sweden 77,990 78,234 63,840 63,828 54,954 53,559 56,322 60,068 Sweden -18.4 0.0 -13.9 -2.5 5.2 6.7 -23.0Switzerland 16,835 7,012 4,889 4,301 4,518 6,413 6,606 6,429 Switzerland -30.3 -12.0 5.0 41.9 3.0 -2.7 -61.8Ukraine 1,197,765 1,248,104 Ukraine 4.2United Kingdom 2,512,876 1,684,040 1,485,937 1,500,153 1,319,870 1,387,371 1,521,154 1,410,081 United Kingdom -11.8 1.0 -12.0 5.1 9.6 -7.3 -43.9United States 19,049,826 21,260,998 21,778,325 21,960,445 21,971,711 22,979,212 22,250,746 22,653,544 United States 2.4 0.8 0.1 4.6 -3.2 1.8 18.9
a In accordance with decisions 9/CP.2 and 11/CP.4, some Parties with economies in transition use base years other than 1990: Bulgaria (1988), Hungary (average of 1985 to 1987), Romania (1989) and Slovenia (1986).
Stationary combustion by fuel: solid fuels – trend information Relative change (%)
Note: This table includes data from categories 1.A.1 Energy industries, 1.A.2 Manufacturing industries and construction, 1.A.4 Other sectors and 1.A.5 Other.
- 31 -

Table 1.10
Fuel consumption (TJ)
1990a 1996 1997 1998 1999 2000 2001 2002 1996 to 1997 1997 to 1998 1998to 1999 1999 to 2000 2000 to 2001 2001 to 2002 1990 to 2002Australia 657,379 760,714 782,645 825,795 861,900 889,116 922,212 945,250 Australia 2.9 5.5 4.4 3.2 3.7 2.5 43.8Austria 197,550 271,226 261,454 265,246 266,170 255,735 263,197 258,123 Austria -3.6 1.5 0.3 -3.9 2.9 -1.9 30.7Belarus 569,260 BelarusBelgium 322,035 467,640 436,725 495,956 523,752 528,782 532,244 528,550 Belgium -6.6 13.6 5.6 1.0 0.7 -0.7 64.1Bulgaria 80,003 BulgariaCanada 2,316,119 2,785,576 2,747,867 2,711,398 2,923,310 3,123,128 3,002,649 3,173,089 Canada -1.4 -1.3 7.8 6.8 -3.9 5.7 37.0Croatia 68,282 65,382 68,333 69,578 67,810 68,884 75,422 79,662 Croatia 4.5 1.8 -2.5 1.6 9.5 5.6 16.7Czech Republic 324,646 Czech RepublicDenmark 76,099 160,599 169,726 180,202 187,959 183,757 193,450 193,610 Denmark 5.7 6.2 4.3 -2.2 5.3 0.1 154.4Estonia 24,957 EstoniaEuropean Community 12,519,324 13,018,248 13,871,889 European CommunityFinland 91,838 124,229 122,778 143,722 141,643 146,263 156,605 154,569 Finland -1.2 17.1 -1.4 3.3 7.1 -1.3 68.3France 975,732 1,241,494 1,223,659 1,328,752 1,276,415 1,303,022 1,390,133 1,349,717 France -1.4 8.6 -3.9 2.1 6.7 -2.9 38.3Germany 2,043,699 2,879,226 2,751,820 2,794,437 2,803,532 2,754,240 2,923,226 2,905,195 Germany -4.4 1.5 0.3 -1.8 6.1 -0.6 42.2Greece 6,404 2,668 7,644 30,276 51,021 70,814 69,823 74,124 Greece 186.5 296.1 68.5 38.8 -1.4 6.2 1,057.4Hungary 445,498 HungaryIreland 59,411 87,295 94,789 100,232 108,941 126,902 129,540 138,984 Ireland 8.6 5.7 8.7 16.5 2.1 7.3 133.9Italy 1,537,487 1,871,496 1,940,293 2,092,853 2,275,873 2,370,540 2,413,721 2,364,951 Italy 3.7 7.9 8.7 4.2 1.8 -2.0 53.8Japan 2,089,056 2,655,302 2,768,692 2,836,709 3,009,273 3,121,765 3,119,503 3,228,745 Japan 4.3 2.5 6.1 3.7 -0.1 3.5 54.6Latvia 100,320 35,187 43,119 42,211 40,863 44,902 52,073 53,526 Latvia 22.5 -2.1 -3.2 9.9 16.0 2.8 -46.6Lithuania 168,240 51,215 81,492 76,148 Lithuania -6.6 -54.7Luxembourg 25,073 29,503 47,209 LuxembourgMonaco 219 MonacoNetherlands 1,194,029 1,471,501 1,155,051 1,317,588 1,279,415 970,118 1,324,455 1,376,623 Netherlands -21.5 14.1 -2.9 -24.2 36.5 3.9 15.3New Zealand 191,302 209,796 226,116 202,972 236,550 246,205 256,655 251,535 New Zealand 7.8 -10.2 16.5 4.1 4.2 -2.0 31.5Norway 92,650 134,198 126,149 145,905 160,277 163,988 Norway -6.0 15.7 9.9 2.3 77.0Portugal 3,219 26,918 96,124 80,839 100,724 123,016 Portugal 736.1 257.1 -15.9 24.6 22.1Romania 1,269,363 807,947 687,450 641,584 566,471 575,496 567,135 602,111 Romania -14.9 -6.7 -11.7 1.6 -1.5 6.2 -52.6Slovakia 240,610 220,997 Slovakia -8.2Slovenia 25,591 27,022 27,555 28,538 29,220 29,800 30,512 29,820 Slovenia 2.0 3.6 2.4 2.0 2.4 -2.3 16.5Spain 184,242 347,661 460,370 471,403 554,169 636,195 707,013 808,237 Spain 32.4 2.4 17.6 14.8 11.1 14.3 338.7Sweden 22,144 30,315 29,302 29,484 29,039 27,550 31,531 33,332 Sweden -3.3 0.6 -1.5 -5.1 14.4 5.7 50.5Switzerland 67,700 98,833 95,393 98,176 101,670 101,058 105,160 103,235 Switzerland -3.5 2.9 3.6 -0.6 4.1 -1.8 52.5Ukraine 2,423,440 2,416,951 Ukraine -0.3United Kingdom 1,886,617 2,996,279 3,074,463 3,217,183 3,433,039 3,533,988 3,560,461 3,515,651 United Kingdom 2.6 4.6 6.7 2.9 0.7 -1.3 86.3United States 19,719,949 23,285,395 23,379,236 23,079,386 23,160,788 24,204,980 23,183,706 23,421,856 United States 0.4 -1.3 0.4 4.5 -4.2 1.0 18.8
a In accordance with decisions 9/CP.2 and 11/CP.4, some Parties with economies in transition use base years other than 1990: Bulgaria (1988), Hungary (average of 1985 to 1987), Romania (1989) and Slovenia (1986).
Stationary combustion by fuel: gaseous fuels – trend information Relative change (%)
Note: This table includes data from categories 1.A.1 Energy industries, 1.A.2 Manufacturing industries and construction, 1.A.4 Other sectors and 1.A.5 Other.
- 32 -

Table 1.11
Fuel consumption (TJ)
1990a 1996 1997 1998 1999 2000 2001 2002 1996 to 1997 1997 to 1998 1998to 1999 1999 to 2000 2000 to 2001 2001 to 2002 1990 to 2002Australia 179,114 199,970 219,380 221,620 217,974 223,654 211,690 203,746 Australia 9.7 1.0 -1.6 2.6 -5.3 -3.8 13.8Austria 94,376 115,490 115,709 110,187 114,616 111,659 125,274 129,160 Austria 0.2 -4.8 4.0 -2.6 12.2 3.1 36.9Belarus 31,565 BelarusBelgium 12,767 14,906 14,089 13,586 14,575 16,645 10,779 10,366 Belgium -5.5 -3.6 7.3 14.2 -35.2 -3.8 -18.8Bulgaria 34,344 BulgariaCanada 236,308 270,724 272,308 296,968 316,168 318,430 302,782 339,172 Canada 0.6 9.1 6.5 0.7 -4.9 12.0 43.5Croatia 22,680 16,140 16,700 14,660 13,927 15,640 12,240 12,394 Croatia 3.5 -12.2 -5.0 12.3 -21.7 1.3 -45.4Czech Republic 26,225 Czech RepublicDenmark 48,601 67,121 69,606 65,894 69,470 72,330 78,338 85,982 Denmark 3.7 -5.3 5.4 4.1 8.3 9.8 76.9Estonia 21,770 EstoniaEuropean Community 1,743,284 1,796,614 1,869,624 European CommunityFinland 169,787 210,949 244,134 250,617 266,829 268,697 255,535 281,491 Finland 15.7 2.7 6.5 0.7 -4.9 10.2 65.8France 439,368 472,250 439,371 459,462 454,652 442,393 445,967 408,348 France -7.0 4.6 -1.0 -2.7 0.8 -8.4 -7.1Germany 134,838 138,634 202,113 208,722 214,458 220,536 226,865 224,832 Germany 45.8 3.3 2.7 2.8 2.9 -0.9 66.7Greece 23,023 38,010 38,094 37,967 38,059 38,059 39,257 39,257 Greece 0.2 -0.3 0.2 0.0 3.1 0.0 70.5Hungary 14,592 HungaryIreland 4,564 5,862 5,820 5,945 5,652 5,862 7,536 7,365 Ireland -0.7 2.2 -4.9 3.7 28.6 -2.3 61.4Italy 59,221 85,107 102,229 80,581 100,134 104,701 115,624 126,419 Italy 20.1 -21.2 24.3 4.6 10.4 9.3 113.5Japan 198,347 196,509 202,516 186,070 193,485 199,807 182,391 190,112 Japan 3.1 -8.1 4.0 3.3 -8.7 4.2 -4.2Latvia 13,083 45,064 48,088 49,565 51,941 49,145 52,669 53,768 Latvia 6.7 3.1 4.8 -5.4 7.2 2.1 311.0Lithuania 6,020 23,720 27,359 28,837 Lithuania 5.4 379.0Luxembourg 714 714 438 LuxembourgMonaco MonacoNetherlands 16,163 17,728 18,248 18,123 18,886 25,125 28,281 33,893 Netherlands 2.9 -0.7 4.2 33.0 12.6 19.8 109.7New Zealand 27,420 34,030 29,650 31,209 31,256 30,460 30,510 38,260 New Zealand -12.9 5.3 0.2 -2.5 0.2 25.4 39.5Norway 37,657 43,701 45,727 46,129 52,188 49,048 Norway 4.6 0.9 13.1 -6.0 30.2Portugal 104,991 104,258 107,897 107,360 109,160 109,284 110,693 111,148 Portugal 3.5 -0.5 1.7 0.1 1.3 0.4 5.9Romania 24,143 207,396 138,125 124,441 117,256 115,412 89,084 98,277 Romania -33.4 -9.9 -5.8 -1.6 -22.8 10.3 307.1Slovakia 4,125 5,038 Slovakia 22.1Slovenia 13,703 12,012 12,302 12,482 12,683 12,855 11,834 12,134 Slovenia 2.4 1.5 1.6 1.4 -7.9 2.5 -11.5Spain 157,767 145,188 152,071 154,137 155,980 157,341 157,753 158,023 Spain 4.7 1.4 1.2 0.9 0.3 0.2 0.2Sweden 119,289 186,807 172,345 176,683 175,346 161,147 191,648 185,359 Sweden -7.7 2.5 -0.8 -8.1 18.9 -3.3 55.4Switzerland 17,130 22,820 20,470 20,990 20,650 20,040 20,880 21,130 Switzerland -10.3 2.5 -1.6 -3.0 4.2 1.2 23.4Ukraine 22,039 25,717 Ukraine 16.7United Kingdom 27,816 50,376 52,778 53,306 60,168 62,123 64,994 67,542 United Kingdom 4.8 1.0 12.9 3.2 4.6 3.9 142.8United States 2,311,176 2,602,597 2,478,854 2,295,187 2,346,157 2,381,002 2,128,342 2,144,077 United States -4.8 -7.4 2.2 1.5 -10.6 0.7 -7.2
a In accordance with decisions 9/CP.2 and 11/CP.4, some Parties with economies in transition use base years other than 1990: Bulgaria (1988), Hungary (average of 1985 to 1987), Romania (1989) and Slovenia (1986).
Stationary combustion by fuel: biomass – trend information Relative change (%)
Note: This table includes data from categories 1.A.1 Energy industries, 1.A.2 Manufacturing industries and construction, 1.A.4 Other sectors and 1.A.5 Other.
- 33 -

Table 1.12
Fuel consumption (TJ)
1990a 1996 1997 1998 1999 2000 2001 2002 1996 to 1997 1997 to 1998 1998to 1999 1999 to 2000 2000 to 2001 2001 to 2002 1990 to 2002Australia 0 0 0 0 0 0 0 NA AustraliaAustria 8,226 10,721 11,264 9,831 12,249 10,909 12,282 12,465 Austria 5.1 -12.7 24.6 -10.9 12.6 1.5 51.5Belarus 2,634 BelarusBelgium 40,675 67,780 75,783 85,859 87,678 93,062 97,262 97,775 Belgium 11.8 13.3 2.1 6.1 4.5 0.5 140.4Bulgaria BulgariaCanada CanadaCroatia 0 0 0 0 0 0 0 0 CroatiaCzech Republic Czech RepublicDenmark DenmarkEstonia 152 EstoniaEuropean Community 471,476 1,268,172 583,289 European CommunityFinland 54,175 85,206 87,624 82,057 76,540 66,827 93,076 95,051 Finland 2.8 -6.4 -6.7 -12.7 39.3 2.1 75.5France 65,468 78,675 77,898 81,250 94,723 99,746 94,415 94,554 France -1.0 4.3 16.6 5.3 -5.3 0.1 44.4Germany 121,849 57,572 56,109 62,192 79,795 62,625 66,267 64,328 Germany -2.5 10.8 28.3 -21.5 5.8 -2.9 -47.2Greece GreeceHungary 12,592 HungaryIreland 871 1,340 963 Ireland 53.8 -28.1Italy 4,790 10,493 9,702 8,697 10,551 11,716 13,268 18,826 Italy -7.5 -10.4 21.3 11.0 13.3 41.9 293.0Japan JapanLatvia LatviaLithuania LithuaniaLuxembourg LuxembourgMonaco 712 MonacoNetherlands 43,152 28,036 221,416 71,631 5,913 856,003 141,298 127,224 Netherlands 689.8 -67.6 -91.7 14,376.0 -83.5 -10.0 194.8New Zealand New ZealandNorway 4,174 5,199 5,801 6,116 6,618 6,582 Norway 11.6 5.4 8.2 -0.5 57.7Portugal 1,239 1,369 1,598 2,028 2,328 2,364 1,447 952 Portugal 16.8 26.9 14.8 1.6 -38.8 -34.2 -23.2Romania RomaniaSlovakia 62,901 64,080 Slovakia 1.9Slovenia 139 114 106 137 219 206 150 153 Slovenia -7.1 29.7 59.8 -5.9 -26.9 1.4 9.8Spain 3,103 7,857 11,469 11,367 12,724 12,847 13,021 14,571 Spain 46.0 -0.9 11.9 1.0 1.4 11.9 369.6
Sweden 19,739 23,885 24,797 29,585 24,731 26,259 26,557 28,070 Sweden 3.8 19.3 -16.4 6.2 1.1 5.7 42.2Switzerland NO NO NO NO NO NO NO NO SwitzerlandUkraine 24,059 18,618 Ukraine -22.6United Kingdom 6,368 20,902 20,318 26,108 25,024 24,851 27,070 29,472 United Kingdom -2.8 28.5 -4.2 -0.7 8.9 8.9 362.8United States 412,051 398,414 376,575 349,634 336,302 352,824 350,523 357,662 United States -5.5 -7.2 -3.8 4.9 -0.7 2.0 -13.2
a In accordance with decisions 9/CP.2 and 11/CP.4, some Parties with economies in transition use base years other than 1990: Bulgaria (1988), Hungary (average of 1985 to 1987), Romania (1989) and Slovenia (1986).
Stationary combustion consumption by fuel: other fuels – trend information Relative change (%)
Note: This table includes data from categories 1.A.1 Energy industries, 1.A.2 Manufacturing industries and construction, 1.A.4 Other sectors and 1.A.5 Other.
- 34 -

Table 1.13
1990a 2002 1990a 2002 1990a 2002 1990a 2002 1990a 2002
Australia 15.5 14.5 54.4 55.8 24.5 26.2 6.7 5.7Austria 32.5 27.4 21.5 16.2 30.2 36.4 14.4 18.2 1.3 1.8Belarus 15.2 4.0 76.2 4.2 0.4Belgium 33.9 29.3 34.9 22.4 26.8 40.1 1.1 0.8 3.4 7.4Bulgaria 11.3 62.6 18.3 7.8Canada 23.1 18.8 21.2 21.3 50.6 54.1 5.2 5.8Croatia 51.6 46.9 12.6 11.4 26.9 36.3 8.9 5.7Czech Republic 11.0 61.9 25.1 2.0Denmark 30.0 24.8 47.0 29.0 14.0 32.0 9.0 14.2Estonia 7.3 67.1 13.7 11.9 0.1European Community 26.2 25.5 41.0 5.5 1.7Finland 29.6 21.2 24.4 20.3 13.4 17.0 24.8 31.0 7.9 10.5France 41.5 36.7 17.8 12.4 26.9 37.1 12.1 11.2 1.8 2.6Germany 20.8 20.7 55.9 42.2 20.7 33.8 1.4 2.6 1.2 0.7Greece 45.2 45.0 50.3 42.3 1.0 8.3 3.5 4.4Hungary 14.8 20.2 61.2 2.0 1.7Ireland 31.0 39.6 48.1 25.9 19.4 32.8 1.5 1.7Italy 48.5 35.7 14.4 11.9 35.6 49.4 1.4 2.6 0.1 0.4Japan 53.1 41.4 28.1 33.0 17.2 24.2 1.6 1.4Latvia 45.0 11.0 11.1 3.1 38.8 42.8 5.1 43.0Lithuania 41.9 22.2 17.9 4.2 38.8 53.3 1.4 20.2Luxembourg 41.3 3.9 54.3 0.5Monaco 29.0 16.7 54.3Netherlands 15.8 2.8 16.0 13.0 65.0 75.3 0.9 1.9 2.3 7.0New Zealand 12.7 10.0 12.4 10.4 65.6 69.1 9.4 10.5Norway 48.6 35.0 2.5 1.9 33.7 47.1 13.7 14.1 1.5 1.9Portugal 54.7 43.4 22.9 21.4 0.0 18.4 22.1 16.6 0.3 0.1Romania 17.9 17.0 21.0 25.1 60.0 49.8 1.1 8.1Slovakia 6.9 27.2 50.2 1.1 14.5Slovenia 22.6 28.1 52.7 44.2 16.0 19.6 8.6 8.0 0.1 0.1Spain 43.5 36.8 38.8 29.7 9.5 27.6 8.1 5.4 0.2 0.5Sweden 56.1 46.6 14.3 10.4 4.1 5.8 21.9 32.2 3.6 4.9Switzerland 72.9 65.3 4.5 1.7 18.1 27.4 4.6 5.6Ukraine 9.6 30.4 58.9 0.6 0.5United Kingdom 22.2 14.4 44.1 24.0 33.1 59.9 0.5 1.2 0.1 0.5United States 23.8 22.0 35.0 36.4 36.2 37.6 4.2 3.4 0.8 0.6
Note: This table includes data from categories 1.A.1 Energy industries, 1.A.2 Manufacturing industries and construction, 1.A.4 Other sectors and 1.A.5 Other.
Contribution of fuels in total energy consumption in stationary combustion (%)
a In accordance with decisions 9/CP.2 and 11/CP.4, some Parties with economies in transition use base years other than 1990: Bulgaria (1988), Hungary (average of 1985 to 1987), Romania (1989) and Slovenia (1986).
Liquid fuel Solid fuel Gaseous fuel Biomass Other fuel
- 35 -

Table 1.14
CO2 emissions (Gg)
1990a 1996 1997 1998 1999 2000 2001 2002 1996 to 1997 1997 to 1998 1998to 1999 1999 to 2000 2000 to 2001 2001 to 2002 1990 to 2002Australia 141,806 163,335 169,403 184,779 189,112 192,391 197,224 198,871 Australia 3.7 9.1 2.3 1.7 2.5 0.8 40.2Austria 13,475 13,696 13,675 12,847 12,797 12,501 14,512 15,013 Austria -0.2 -6.1 -0.4 -2.3 16.1 3.5 11.4Belarus 33,282 33,030 Belarus -0.8Belgium 28,215 28,328 27,029 28,895 26,329 27,456 25,498 26,513 Belgium -4.6 6.9 -8.9 4.3 -7.1 4.0 -6.0Bulgaria 37,002 30,726 30,994 27,199 25,913 26,267 29,070 26,496 Bulgaria 0.9 -12.2 -4.7 1.4 10.7 -8.9 -28.4Canada 144,277 152,221 159,790 177,041 183,245 195,458 198,489 198,632 Canada 5.0 10.8 3.5 6.7 1.6 0.1 37.7Croatia 5,897 4,310 4,875 5,531 5,699 5,156 5,650 6,498 Croatia 13.1 13.5 3.0 -9.5 9.6 15.0 10.2Czech Republic 59,171 57,818 59,180 58,706 53,848 60,160 59,538 57,729 Czech Republic 2.4 -0.8 -8.3 11.7 -1.0 -3.0 -2.4Denmark 26,177 44,376 35,395 31,471 28,206 25,070 26,377 26,548 Denmark -20.2 -11.1 -10.4 -11.1 5.2 0.6 1.4Estonia 29,753 17,127 16,850 14,791 13,478 13,945 13,932 13,911 Estonia -1.6 -12.2 -8.9 3.5 -0.1 -0.1 -53.2European Community 1,139,581 1,092,270 1,055,695 1,076,931 1,054,852 1,100,865 1,114,165 1,146,183 European Community -3.3 2.0 -2.1 4.4 1.2 2.9 0.6Finland 18,517 27,509 24,673 21,395 21,029 19,815 26,762 28,947 Finland -10.3 -13.3 -1.7 -5.8 35.1 8.2 56.3France 67,686 62,799 58,890 71,415 64,481 63,646 56,931 59,416 France -6.2 21.3 -9.7 -1.3 -10.6 4.4 -12.2Germany 413,945 360,844 342,847 345,119 331,377 344,171 349,400 356,788 Germany -5.0 0.7 -4.0 3.9 1.5 2.1 -13.8Greece 43,302 44,205 47,668 50,254 50,220 55,058 55,570 55,109 Greece 7.8 5.4 -0.1 9.6 0.9 -0.8 27.3Hungary 24,807 26,610 26,537 24,161 23,614 22,403 21,247 19,680 Hungary -0.3 -9.0 -2.3 -5.1 -5.2 -7.4 -20.7Ireland 11,057 13,959 14,643 15,047 15,728 16,016 17,145 16,201 Ireland 4.9 2.8 4.5 1.8 7.0 -5.5 46.5Italy 132,812 135,343 136,575 135,774 131,210 150,055 146,748 153,151 Italy 0.9 -0.6 -3.4 14.4 -2.2 4.4 15.3Japan 338,572 353,740 347,965 334,364 351,992 362,159 350,601 379,240 Japan -1.6 -3.9 5.3 2.9 -3.2 8.2 12.0Latvia 10,186 4,367 3,795 3,503 3,109 2,678 2,601 2,467 Latvia -13.1 -7.7 -11.3 -13.8 -2.9 -5.2 -75.8Lithuania 16,352 6,808 5,345 5,086 Lithuania -4.8 -68.9Luxembourg 69 255 266 LuxembourgMonaco 1.12 0.31 0.08 0.14 0.18 0.06 0.01 0.09 Monaco -72.8 60.0 31.8 -65.5 -81.5 722.8 -91.6Netherlands 51,305 58,338 57,181 60,185 56,660 61,222 64,649 63,780 Netherlands -2.0 5.3 -5.9 8.1 5.6 -1.3 24.3New Zealand 6,036 5,259 6,877 5,201 6,530 6,154 7,623 6,725 New Zealand 30.8 -24.4 25.6 -5.8 23.9 -11.8 11.4Norway 6,634 9,171 9,450 9,152 8,583 9,452 10,625 10,882 Norway 3.0 -3.2 -6.2 10.1 12.4 2.4 64.0Portugal 16,187 15,651 16,350 18,847 24,832 21,246 21,403 24,788 Portugal 4.5 15.3 31.8 -14.4 0.7 15.8 53.1Romania 103,345 69,248 58,856 52,413 46,010 46,122 49,251 49,972 Romania -15.0 -10.9 -12.2 0.2 6.8 1.5 -51.6Slovakia 50,653 37,186 37,196 35,136 34,191 32,628 12,935 12,797 Slovakia 0.0 -5.5 -2.7 -4.6 -60.4 -1.1 -74.7Slovenia 6,701 5,284 5,680 5,919 5,213 5,487 6,233 6,402 Slovenia 7.5 4.2 -11.9 5.3 13.6 2.7 -4.5Spain 77,326 73,326 85,384 84,148 99,987 104,522 98,803 113,135 Spain 16.4 -1.4 18.8 4.5 -5.5 14.5 46.3Sweden 10,210 15,402 11,535 12,481 11,164 9,805 10,961 12,326 Sweden -25.1 8.2 -10.6 -12.2 11.8 12.4 20.7Switzerland 976 1,295 1,209 1,432 1,188 990 1,070 1,077 Switzerland -6.7 18.5 -17.0 -16.7 8.0 0.7 10.3Ukraine 86,433 104,089 Ukraine 20.4United Kingdom 228,090 197,758 183,447 188,985 180,729 190,025 199,141 194,202 United Kingdom -7.2 3.0 -4.4 5.1 4.8 -2.5 -14.9United States 1,792,382 1,992,192 2,060,469 2,148,453 2,158,748 2,261,926 2,218,175 2,240,057 United States 3.4 4.3 0.5 4.8 -1.9 1.0 25.0
Energy industries: all fuels – trend information Relative change (%)
a In accordance with decisions 9/CP.2 and 11/CP.4, some Parties with economies in transition use base years other than 1990: Bulgaria (1988), Hungary (average of 1985 to 1987), Romania (1989) and Slovenia (1986).
- 36 -

Table 1.15
CO2 emissions (Gg)
1990a 1996 1997 1998 1999 2000 2001 2002 1996 to 1997 1997 to 1998 1998to 1999 1999 to 2000 2000 to 2001 2001 to 2002 1990 to 2002Australia 8,780 10,021 8,865 9,301 9,006 9,167 9,266 9,778 Australia -11.5 4.9 -3.2 1.8 1.1 5.5 11.4Austria 3,022 3,680 3,974 4,450 4,056 3,249 3,650 2,996 Austria 8.0 12.0 -8.8 -19.9 12.3 -17.9 -0.9Belarus 5,710 BelarusBelgium 4,950 5,496 5,777 6,535 4,938 4,767 5,336 5,205 Belgium 5.1 13.1 -24.4 -3.5 11.9 -2.5 5.1Bulgaria 765 BulgariaCanada 35,451 32,273 33,766 37,679 36,008 35,455 39,290 41,205 Canada 4.6 11.6 -4.4 -1.5 10.8 4.9 16.2Croatia 3,761 2,987 3,105 3,800 4,073 2,423 2,662 2,753 Croatia 4.0 22.4 7.2 -40.5 9.9 3.4 -26.8Czech Republic 1,659 Czech RepublicDenmark 1,847 5,830 5,239 4,718 4,521 4,210 4,204 3,936 Denmark -10.1 -9.9 -4.2 -6.9 -0.1 -6.4 113.1Estonia 650 EstoniaEuropean Community 228,542 204,882 205,784 European CommunityFinland 2,607 3,145 2,608 2,844 2,871 2,502 2,934 3,100 Finland -17.1 9.0 1.0 -12.9 17.3 5.7 18.9France 20,953 21,317 21,922 24,082 22,407 22,071 20,990 20,251 France 2.8 9.9 -7.0 -1.5 -4.9 -3.5 -3.3Germany 24,972 25,606 23,472 23,665 21,956 22,223 21,962 23,072 Germany -8.3 0.8 -7.2 1.2 -1.2 5.1 -7.6Greece 7,948 9,165 8,979 8,863 8,428 9,731 9,319 9,493 Greece -2.0 -1.3 -4.9 15.5 -4.2 1.9 19.4Hungary 1,750 HungaryIreland 1,268 2,181 2,857 3,584 4,602 3,781 4,270 3,276 Ireland 31.0 25.5 28.4 -17.8 13.0 -23.3 158.5Italy 77,787 89,697 88,093 84,186 75,224 76,897 73,794 73,749 Italy -1.8 -4.4 -10.6 2.2 -4.0 -0.1 -5.2Japan 153,987 117,481 101,263 89,277 87,931 79,450 60,638 74,013 Japan -13.8 -11.8 -1.5 -9.6 -23.7 22.1 -51.9Latvia 4,768 2,702 1,713 1,654 1,404 671 421 384 Latvia -36.6 -3.4 -15.1 -52.2 -37.2 -8.8 -91.9Lithuania 8,072 4,554 2,936 1,682 Lithuania -42.7 -79.2Luxembourg 2 8 8 LuxembourgMonaco MonacoNetherlands 9,383 9,064 9,146 8,915 435 1,475 1,800 1,764 Netherlands 0.9 -2.5 -95.1 239.1 22.0 -2.0 -81.2New Zealand 226 202 153 190 218 168 180 171 New Zealand -24.4 24.0 14.9 -22.9 7.2 -5.3 -24.4Norway 1,177 1,666 1,611 1,360 1,659 1,547 Norway -3.3 -15.6 22.0 -6.7 31.5Portugal 8,345 5,265 5,584 8,147 8,303 6,898 7,635 9,086 Portugal 6.1 45.9 1.9 -16.9 10.7 19.0 8.9Romania 17,098 14,954 15,016 11,018 9,533 6,557 8,594 7,940 Romania 0.4 -26.6 -13.5 -31.2 31.1 -7.6 -53.6Slovakia 70 52 Slovakia -25.3Slovenia 309 105 105 89 38 60 106 63 Slovenia -0.8 -14.8 -57.7 60.1 75.7 -40.4 -79.6Spain 17,080 19,026 18,243 20,088 23,976 23,910 25,037 26,455 Spain -4.1 10.1 19.4 -0.3 4.7 5.7 54.9Sweden 3,444 7,853 4,919 5,403 4,567 3,687 4,149 4,745 Sweden -37.4 9.8 -15.5 -19.3 12.5 14.4 37.8Switzerland 691 932 826 1,058 818 669 722 743 Switzerland -11.4 28.1 -22.7 -18.2 7.9 3.0 7.5Ukraine 2,334 2,666 Ukraine 14.2United Kingdom 38,940 30,067 24,357 23,060 21,666 19,472 19,924 18,646 United Kingdom -19.0 -5.3 -6.0 -10.1 2.3 -6.4 -52.1United States 100,111 64,709 73,740 103,502 95,946 90,383 100,136 72,212 United States 14.0 40.4 -7.3 -5.8 10.8 -27.9 -27.9
Energy industries: liquid fuels – trend information Relative change (%)
a In accordance with decisions 9/CP.2 and 11/CP.4, some Parties with economies in transition use base years other than 1990: Bulgaria (1988), Hungary (average of 1985 to 1987), Romania (1989) and Slovenia (1986).
- 37 -

Table 1.16
CO2 emissions (Gg)
1990a 1996 1997 1998 1999 2000 2001 2002 1996 to 1997 1997 to 1998 1998to 1999 1999 to 2000 2000 to 2001 2001 to 2002 1990 to 2002Australia 119,872 137,985 144,820 158,566 161,584 163,592 167,444 168,432 Australia 5.0 9.5 1.9 1.2 2.4 0.6 40.5Austria 6,255 4,714 5,003 3,514 3,806 4,981 5,989 5,855 Austria 6.1 -29.8 8.3 30.9 20.2 -2.2 -6.4Belarus 923 BelarusBelgium 20,354 17,895 16,275 15,337 12,708 14,187 12,133 12,746 Belgium -9.1 -5.8 -17.1 11.6 -14.5 5.0 -37.4Bulgaria 23,169 BulgariaCanada 78,674 84,800 91,329 97,337 96,700 104,694 103,643 101,902 Canada 7.7 6.6 -0.7 8.3 -1.0 -1.7 29.5Croatia 702 138 544 551 501 1,381 1,500 1,901 Croatia 292.7 1.3 -9.1 175.9 8.6 26.7 171.0Czech Republic 53,718 Czech RepublicDenmark 22,462 33,931 24,983 20,863 17,567 14,552 15,579 15,798 Denmark -26.4 -16.5 -15.8 -17.2 7.1 1.4 -29.7Estonia 12,074 EstoniaEuropean Community 665,702 643,875 690,640 European CommunityFinland 9,279 13,895 12,044 8,171 8,309 8,034 10,211 11,960 Finland -13.3 -32.2 1.7 -3.3 27.1 17.1 28.9France 38,426 31,726 27,829 37,972 32,360 31,647 24,749 27,866 France -12.3 36.4 -14.8 -2.2 -21.8 12.6 -27.5Germany 365,195 307,752 293,093 293,961 281,224 294,836 298,492 304,959 Germany -4.8 0.3 -4.3 4.8 1.2 2.2 -16.5Greece 35,257 34,941 38,466 40,501 39,764 42,259 43,220 42,444 Greece 10.1 5.3 -1.8 6.3 2.3 -1.8 20.4Hungary 10,613 HungaryIreland 7,909 8,856 8,606 8,145 7,454 8,084 8,689 8,398 Ireland -2.8 -5.4 -8.5 8.5 7.5 -3.4 6.2Italy 39,100 28,659 28,125 31,522 30,360 31,436 36,204 40,397 Italy -1.9 12.1 -3.7 3.5 15.2 11.6 3.3Japan 108,096 144,683 151,744 147,362 160,299 176,277 184,189 198,001 Japan 4.9 -2.9 8.8 10.0 4.5 7.5 83.2Latvia 1,312 567 459 299 175 266 177 138 Latvia -18.9 -35.0 -41.4 51.9 -33.4 -22.2 -89.5Lithuania 295 78 48 40 Lithuania -16.8 -86.5Luxembourg LuxembourgMonaco MonacoNetherlands 25,437 26,414 23,963 26,615 22,040 2,009 24,648 21,813 Netherlands -9.3 11.1 -17.2 -90.9 1,127.1 -11.5 -14.2New Zealand 472 591 1,154 738 1,096 844 1,284 1,271 New Zealand 95.2 -36.0 48.4 -23.0 52.1 -0.9 169.2Norway 54 65 66 60 66 63 Norway 0.9 -8.5 10.0 -4.7 17.6Portugal 7,841 10,386 10,702 9,834 12,544 12,157 11,243 12,448 Portugal 3.1 -8.1 27.5 -3.1 -7.5 10.7 58.8Romania 39,906 30,729 24,673 20,645 19,908 22,696 24,916 25,337 Romania -19.7 -16.3 -3.6 14.0 9.8 1.7 -36.5Slovakia 5,945 5,847 Slovakia -1.6Slovenia 6,195 4,946 5,415 5,663 5,011 5,268 5,951 6,171 Slovenia 9.5 4.6 -11.5 5.1 13.0 3.7 -0.4Spain 59,443 52,812 61,984 61,022 72,586 76,292 69,061 79,211 Spain 17.4 -1.6 19.0 5.1 -9.5 14.7 33.3Sweden 5,737 6,124 5,231 5,594 5,170 4,775 5,334 5,890 Sweden -14.6 6.9 -7.6 -7.6 11.7 10.4 2.7Switzerland 50 NO NO NO NO NO NO NO SwitzerlandUkraine 55,125 57,915 Ukraine 5.1United Kingdom 180,801 117,122 99,703 102,650 87,366 98,626 107,887 100,855 United Kingdom -14.9 3.0 -14.9 12.9 9.4 -6.5 -44.2United States 1,515,918 1,722,178 1,767,446 1,796,584 1,802,498 1,890,453 1,828,574 1,868,432 United States 2.6 1.6 0.3 4.9 -3.3 2.2 23.3
Energy industries: solid fuels – trend information Relative change (%)
a In accordance with decisions 9/CP.2 and 11/CP.4, some Parties with economies in transition use base years other than 1990: Bulgaria (1988), Hungary (average of 1985 to 1987), Romania (1989) and Slovenia (1986).
- 38 -
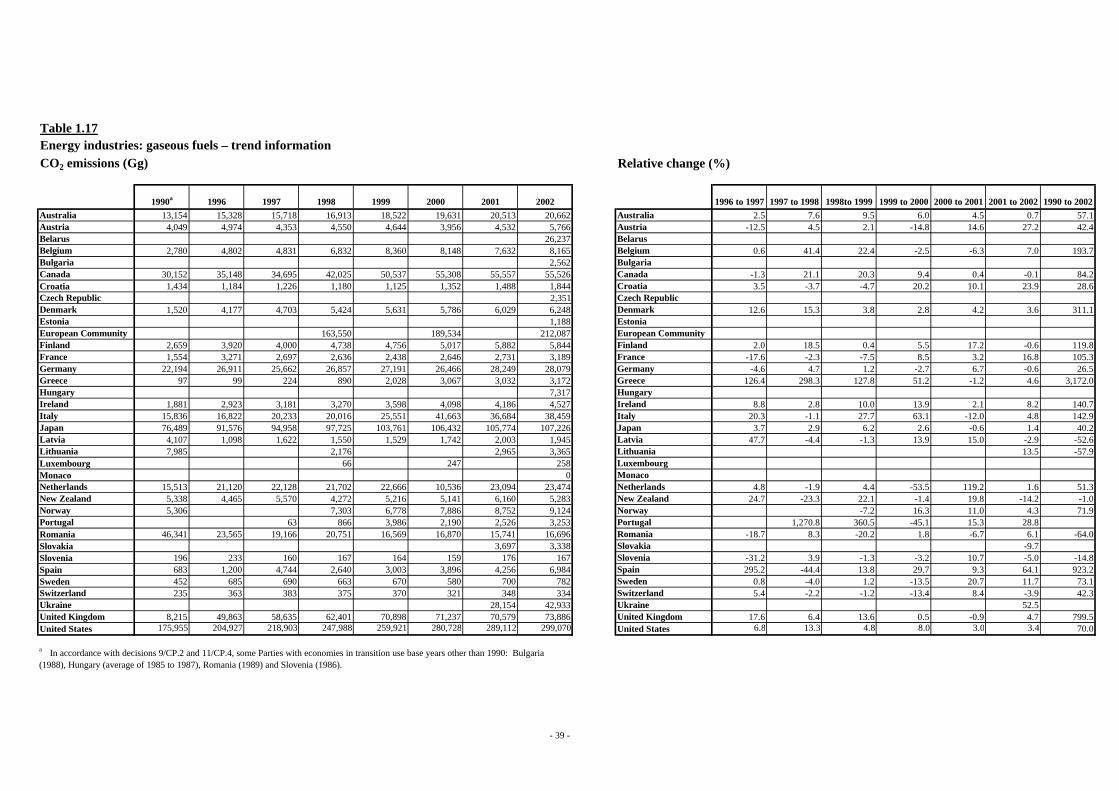
Table 1.17
CO2 emissions (Gg)
1990a 1996 1997 1998 1999 2000 2001 2002 1996 to 1997 1997 to 1998 1998to 1999 1999 to 2000 2000 to 2001 2001 to 2002 1990 to 2002Australia 13,154 15,328 15,718 16,913 18,522 19,631 20,513 20,662 Australia 2.5 7.6 9.5 6.0 4.5 0.7 57.1Austria 4,049 4,974 4,353 4,550 4,644 3,956 4,532 5,766 Austria -12.5 4.5 2.1 -14.8 14.6 27.2 42.4Belarus 26,237 BelarusBelgium 2,780 4,802 4,831 6,832 8,360 8,148 7,632 8,165 Belgium 0.6 41.4 22.4 -2.5 -6.3 7.0 193.7Bulgaria 2,562 BulgariaCanada 30,152 35,148 34,695 42,025 50,537 55,308 55,557 55,526 Canada -1.3 21.1 20.3 9.4 0.4 -0.1 84.2Croatia 1,434 1,184 1,226 1,180 1,125 1,352 1,488 1,844 Croatia 3.5 -3.7 -4.7 20.2 10.1 23.9 28.6Czech Republic 2,351 Czech RepublicDenmark 1,520 4,177 4,703 5,424 5,631 5,786 6,029 6,248 Denmark 12.6 15.3 3.8 2.8 4.2 3.6 311.1Estonia 1,188 EstoniaEuropean Community 163,550 189,534 212,087 European CommunityFinland 2,659 3,920 4,000 4,738 4,756 5,017 5,882 5,844 Finland 2.0 18.5 0.4 5.5 17.2 -0.6 119.8France 1,554 3,271 2,697 2,636 2,438 2,646 2,731 3,189 France -17.6 -2.3 -7.5 8.5 3.2 16.8 105.3Germany 22,194 26,911 25,662 26,857 27,191 26,466 28,249 28,079 Germany -4.6 4.7 1.2 -2.7 6.7 -0.6 26.5Greece 97 99 224 890 2,028 3,067 3,032 3,172 Greece 126.4 298.3 127.8 51.2 -1.2 4.6 3,172.0Hungary 7,317 HungaryIreland 1,881 2,923 3,181 3,270 3,598 4,098 4,186 4,527 Ireland 8.8 2.8 10.0 13.9 2.1 8.2 140.7Italy 15,836 16,822 20,233 20,016 25,551 41,663 36,684 38,459 Italy 20.3 -1.1 27.7 63.1 -12.0 4.8 142.9Japan 76,489 91,576 94,958 97,725 103,761 106,432 105,774 107,226 Japan 3.7 2.9 6.2 2.6 -0.6 1.4 40.2Latvia 4,107 1,098 1,622 1,550 1,529 1,742 2,003 1,945 Latvia 47.7 -4.4 -1.3 13.9 15.0 -2.9 -52.6Lithuania 7,985 2,176 2,965 3,365 Lithuania 13.5 -57.9Luxembourg 66 247 258 LuxembourgMonaco 0 MonacoNetherlands 15,513 21,120 22,128 21,702 22,666 10,536 23,094 23,474 Netherlands 4.8 -1.9 4.4 -53.5 119.2 1.6 51.3New Zealand 5,338 4,465 5,570 4,272 5,216 5,141 6,160 5,283 New Zealand 24.7 -23.3 22.1 -1.4 19.8 -14.2 -1.0Norway 5,306 7,303 6,778 7,886 8,752 9,124 Norway -7.2 16.3 11.0 4.3 71.9Portugal 63 866 3,986 2,190 2,526 3,253 Portugal 1,270.8 360.5 -45.1 15.3 28.8Romania 46,341 23,565 19,166 20,751 16,569 16,870 15,741 16,696 Romania -18.7 8.3 -20.2 1.8 -6.7 6.1 -64.0Slovakia 3,697 3,338 Slovakia -9.7Slovenia 196 233 160 167 164 159 176 167 Slovenia -31.2 3.9 -1.3 -3.2 10.7 -5.0 -14.8Spain 683 1,200 4,744 2,640 3,003 3,896 4,256 6,984 Spain 295.2 -44.4 13.8 29.7 9.3 64.1 923.2Sweden 452 685 690 663 670 580 700 782 Sweden 0.8 -4.0 1.2 -13.5 20.7 11.7 73.1Switzerland 235 363 383 375 370 321 348 334 Switzerland 5.4 -2.2 -1.2 -13.4 8.4 -3.9 42.3Ukraine 28,154 42,933 Ukraine 52.5United Kingdom 8,215 49,863 58,635 62,401 70,898 71,237 70,579 73,886 United Kingdom 17.6 6.4 13.6 0.5 -0.9 4.7 799.5United States 175,955 204,927 218,903 247,988 259,921 280,728 289,112 299,070 United States 6.8 13.3 4.8 8.0 3.0 3.4 70.0
Energy industries: gaseous fuels – trend informationRelative change (%)
a In accordance with decisions 9/CP.2 and 11/CP.4, some Parties with economies in transition use base years other than 1990: Bulgaria (1988), Hungary (average of 1985 to 1987), Romania (1989) and Slovenia (1986).
- 39 -

Table 1.18
1990a 2002 1990a 2002 1990a 2002Australia 6.2 4.9 84.5 84.7 9.3 10.4Austria 22.4 20.0 46.4 39.0 30.0 38.4Belarus 17.3 2.8 79.4Belgium 17.5 19.6 72.1 48.1 9.9 30.8Bulgaria 2.9 87.4 9.7Canada 24.6 20.7 54.5 51.3 20.9 28.0Croatia 63.8 42.4 11.9 29.3 24.3 28.4Czech Republic 2.9 93.1 4.1Denmark 7.1 14.8 85.8 59.5 5.8 23.5Estonia 4.7 86.8 8.5European Community 18.0 60.3 18.5Finland 14.1 10.7 50.1 41.3 14.4 20.2France 31.0 34.1 56.8 46.9 2.3 5.4Germany 6.0 6.5 88.2 85.5 5.4 7.9Greece 18.4 17.2 81.4 77.0 0.2 5.8Hungary 8.9 53.9 37.2Ireland 11.5 20.2 71.5 51.8 17.0 27.9Italy 58.6 48.2 29.4 26.4 11.9 25.1Japan 45.5 19.5 31.9 52.2 22.6 28.3Latvia 46.8 15.6 12.9 5.6 40.3 78.8Lithuania 49.4 33.1 1.8 0.8 48.8 66.2Luxembourg 3.1 96.9Monaco 100.0Netherlands 18.3 2.8 49.6 34.2 30.2 36.8New Zealand 3.7 2.5 7.8 18.9 88.4 78.6Norway 17.7 14.2 0.8 0.6 80.0 83.8Portugal 51.6 36.7 48.4 50.2 13.1Romania 16.5 15.9 38.6 50.7 44.8 33.4Slovakia 0.4 45.7 26.1Slovenia 4.6 1.0 92.5 96.4 2.9 2.6Spain 22.1 23.4 76.9 70.0 0.9 6.2Sweden 33.7 38.5 56.2 47.8 4.4 6.3Switzerland 70.8 69.0 5.1 24.1 31.0Ukraine 2.6 55.6 41.2United Kingdom 17.1 9.6 79.3 51.9 3.6 38.0United States 5.6 3.2 84.6 83.4 9.8 13.4
Contribution of fuels in CO2 emissions from energy industries (%)
a In accordance with decisions 9/CP.2 and 11/CP.4, some Parties with economies in transition use base years other than 1990: Bulgaria (1988), Hungary (average of 1985 to 1987), Romania (1989) and Slovenia (1986).
Liquid fuels Solid fuels Gaseous fuels
- 40 -

Table 1.19
CO2 emissions (Gg)
1990a 1996 1997 1998 1999 2000 2001 2002 1996 to 1997 1997 to 1998 1998 to 1999 1999 to 2000 2000 to 2001 2001 to 2002 1990 to 2002Australia 37,385 40,315 39,856 40,223 43,601 42,589 42,035 43,249 Australia -1.1 0.9 8.4 -2.3 -1.3 2.9 15.7Austria 13,033 13,524 15,012 14,162 13,319 13,707 12,920 12,504 Austria 11.0 -5.7 -6.0 2.9 -5.7 -3.2 -4.1Belarus 3,790 3,468 Belarus -8.5Belgium 33,194 32,048 31,007 34,044 31,817 33,385 32,994 33,976 Belgium -3.2 9.8 -6.5 4.9 -1.2 3.0 2.4Bulgaria 35,755 14,010 13,968 11,401 9,488 8,605 8,196 8,165 Bulgaria -0.3 -18.4 -16.8 -9.3 -4.8 -0.4 -77.2Canada 62,090 64,199 64,334 61,109 60,918 63,951 59,609 62,418 Canada 0.2 -5.0 -0.3 5.0 -6.8 4.7 0.5Croatia 6,546 3,763 3,714 4,008 3,729 3,805 3,903 3,836 Croatia -1.3 7.9 -7.0 2.0 2.6 -1.7 -41.4Czech Republic 59,457 43,867 43,341 35,376 34,156 36,130 34,879 30,968 Czech Republic -1.2 -18.4 -3.4 5.8 -3.5 -11.2 -47.9Denmark 5,383 6,650 6,550 5,952 5,981 5,740 5,760 5,557 Denmark -1.5 -9.1 0.5 -4.0 0.3 -3.5 3.2Estonia 2,655 730 655 666 660 483 588 422 Estonia -10.2 1.7 -1.0 -26.8 21.8 -28.3 -84.1European Community 651,908 600,646 607,208 612,676 604,009 593,411 595,042 583,070 European Community 1.1 0.9 -1.4 -1.8 0.3 -2.0 -10.6Finland 14,358 13,534 15,194 15,282 15,844 15,956 13,855 13,228 Finland 12.3 0.6 3.7 0.7 -13.2 -4.5 -7.9France 82,893 83,221 84,741 87,269 80,866 82,610 81,706 81,366 France 1.8 3.0 -7.3 2.2 -1.1 -0.4 -1.8Germany 196,315 144,167 144,166 138,562 135,441 135,612 132,869 132,033 Germany 0.0 -3.9 -2.3 0.1 -2.0 -0.6 -32.7Greece 9,792 10,412 10,570 10,772 9,552 10,415 10,436 10,143 Greece 1.5 1.9 -11.3 9.0 0.2 -2.8 3.6Hungary 22,867 6,199 4,905 8,629 9,924 10,826 10,640 10,128 Hungary -20.9 75.9 15.0 9.1 -1.7 -4.8 -55.7Ireland 3,833 3,512 3,988 3,917 4,238 4,743 4,726 4,892 Ireland 13.5 -1.8 8.2 11.9 -0.4 3.5 27.6Italy 87,846 85,721 89,077 95,107 98,686 84,514 89,865 84,943 Italy 3.9 6.8 3.8 -14.4 6.3 -5.5 -3.3Japan 335,047 359,469 371,613 339,634 348,765 349,059 336,765 346,153 Japan 3.4 -8.6 2.7 0.1 -3.5 2.8 3.3Latvia 1,663 1,196 1,447 1,290 1,125 998 872 914 Latvia 21.0 -10.9 -12.8 -11.3 -12.6 4.9 -45.0Lithuania 5,379 2,287 1,733 1,086 Lithuania 4.3 -79.8Luxembourg 1,417 1,734 2,341 LuxembourgMonaco MonacoNetherlands 42,192 43,026 35,485 39,178 38,175 36,278 36,444 35,791 Netherlands -17.5 10.4 -2.6 -5.0 0.5 -1.8 -15.2New Zealand 4,727 5,843 5,892 5,872 5,854 6,147 6,255 6,375 New Zealand 0.8 -0.3 -0.3 5.0 1.7 1.9 34.9Norway 3,497 4,166 4,265 4,443 4,283 4,143 4,111 3,735 Norway 2.4 4.2 -3.6 -3.3 -0.8 -9.1 6.8Portugal 9,158 10,211 11,040 10,689 10,412 11,178 10,562 9,971 Portugal 8.1 -3.2 -2.6 7.4 -5.5 -5.6 8.9Romania 30,234 31,406 26,310 20,047 17,777 18,752 19,264 22,638 Romania -16.2 -23.8 -11.3 5.5 2.7 17.5 -25.1Slovakia 14,796 14,233 Slovakia -4Slovenia 4,119 2,361 2,257 2,328 2,334 2,300 2,358 2,384 Slovenia -4.4 3.1 0.3 -1.5 2.5 1.1 -42.1Spain 43,839 46,972 52,639 53,504 57,094 59,661 61,332 61,903 Spain 12.1 1.6 6.7 4.5 2.8 0.9 41.2Sweden 10,677 11,482 11,962 11,653 10,580 10,119 10,117 10,380 Sweden 4.2 -2.6 -9.2 -4.4 0.0 2.6 -2.8Switzerland 5,112 4,544 4,419 4,554 5,430 5,089 5,387 5,099 Switzerland -2.7 3.1 19.2 -6.3 5.9 -5.3 -0.2Ukraine 77,133 71,695 Ukraine -7.0United Kingdom 94,138 92,757 93,402 91,169 90,219 87,762 89,805 84,044 United Kingdom 0.7 -2.4 -1.0 -2.7 2.3 -6.4 -10.7United States 966,608 1,045,925 1,058,427 1,018,063 1,001,933 999,699 970,769 955,773 United States 1.2 -3.8 -1.6 -0.2 -2.9 -1.5 -1.1
Manufacturing industries and construction: all fuels – trend information Relative change (%)
a In accordance with decisions 9/CP.2 and 11/CP.4, some Parties with economies in transition use base years other than 1990: Bulgaria (1988), Hungary (average of 1985 to 1987), Romania (1989) and Slovenia (1986).
- 41 -

Table 1.20
CO2 emissions (Gg)
1990a 1996 1997 1998 1999 2000 2001 2002 1996 to 1997 1997 to 1998 1998to 1999 1999 to 2000 2000 to 2001 2001 to 2002 1990 to 2002Australia 10,908 12,178 11,401 11,738 10,595 12,366 12,217 12,377 Australia -6.4 3.0 -9.7 16.7 -1.2 1.3 13.5Austria 3,349 3,041 3,896 3,743 2,986 3,070 2,877 2,961 Austria 28.1 -3.9 -20.2 2.8 -6.3 2.9 -11.6Belarus 314 BelarusBelgium 7,494 6,258 5,978 6,149 4,479 4,589 5,626 5,535 Belgium -4.5 2.9 -27.2 2.5 22.6 -1.6 -26.1Bulgaria 2,349 BulgariaCanada 15,451 12,735 12,367 11,793 11,290 11,621 12,837 11,326 Canada -2.9 -4.6 -4.3 2.9 10.5 -11.8 -26.7Croatia 3,023 2,057 1,932 2,195 2,150 2,151 2,220 2,215 Croatia -6.1 13.7 -2.0 0.0 3.2 -0.2 -26.7Czech Republic 5,701 Czech RepublicDenmark 2,621 2,833 2,665 2,397 2,352 2,347 2,322 2,359 Denmark -5.9 -10.1 -1.9 -0.2 -1.1 1.6 -10.0Estonia 132 EstoniaEuropean Community 183,715 163,185 162,944 European CommunityFinland 4,294 3,580 4,018 4,101 4,790 4,775 4,494 4,463 Finland 12.2 2.1 16.8 -0.3 -5.9 -0.7 3.9France 30,274 30,192 29,728 30,645 26,960 26,196 26,121 24,791 France -1.5 3.1 -12.0 -2.8 -0.3 -5.1 -18.1Germany 28,392 26,484 25,313 24,285 22,173 19,292 18,873 20,506 Germany -4.4 -4.1 -8.7 -13.0 -2.2 8.7 -27.8Greece 5,479 6,558 6,860 6,576 6,028 6,311 6,269 6,561 Greece 4.6 -4.1 -8.3 4.7 -0.7 4.7 19.7Hungary 2,355 HungaryIreland 2,007 2,288 2,761 2,382 2,540 3,132 3,189 3,016 Ireland 20.7 -13.7 6.7 23.3 1.8 -5.4 50.3Italy 36,585 28,047 29,193 30,982 29,914 25,712 27,367 28,309 Italy 4.1 6.1 -3.4 -14.0 6.4 3.4 -22.6Japan 137,614 147,128 143,370 132,744 136,767 135,991 129,627 130,249 Japan -2.6 -7.4 3.0 -0.6 -4.7 0.5 -5.4Latvia 674 662 916 744 632 489 256 231 Latvia 38.4 -18.8 -15.0 -22.7 -47.6 -9.8 -65.6Lithuania 2,919 1,539 466 310 Lithuania -33.5 -89.4Luxembourg 436 355 212 LuxembourgMonaco MonacoNetherlands 7,658 7,646 4,628 3,062 4,726 3,535 350 520 Netherlands -39.5 -33.8 54.4 -25.2 -90.1 48.4 -93.2New Zealand 728 678 681 570 537 696 659 686 New Zealand 0.5 -16.3 -5.8 29.7 -5.3 4.1 -5.7Norway 2,833 3,155 3,018 2,823 2,975 2,801 Norway -4.3 -6.5 5.4 -5.9 -1.1Portugal 6,411 7,729 8,578 8,235 7,490 6,942 6,494 6,105 Portugal 11.0 -4.0 -9.0 -7.3 -6.5 -6.0 -4.8Romania 5,759 6,534 4,689 4,244 3,709 4,681 4,603 4,900 Romania -28.2 -9.5 -12.6 26.2 -1.7 6.5 -14.9Slovakia 1,852 1,987 Slovakia 7.3Slovenia 1,557 931 739 715 746 702 611 544 Slovenia -20.6 -3.2 4.2 -5.9 -13.0 -10.9 -65.1Spain 22,962 24,827 27,998 28,301 29,006 28,137 28,683 27,201 Spain 12.8 1.1 2.5 -3.0 1.9 -5.2 18.5Sweden 7,814 8,854 9,317 9,134 8,489 7,781 7,729 8,131 Sweden 5.2 -2.0 -7.1 -8.3 -0.7 5.2 4.1Switzerland 2,294 1,882 1,907 2,042 3,332 2,769 3,003 2,787 Switzerland 1.3 7.1 63.2 -16.9 8.5 -7.2 21.5Ukraine 6,116 5,636 Ukraine -7.8United Kingdom 27,534 27,390 25,399 23,288 21,281 21,009 23,722 22,274 United Kingdom -7.3 -8.3 -8.6 -1.3 12.9 -6.1 -19.1United States 394,725 406,709 416,571 396,243 403,505 392,059 407,655 406,100 United States 2.4 -4.9 1.8 -2.8 4.0 -0.4 2.9
Manufacturing industries and construction: liquid fuels – trend information Relative change (%)
a In accordance with decisions 9/CP.2 and 11/CP.4, some Parties with economies in transition use base years other than 1990: Bulgaria (1988), Hungary (average of 1985 to 1987), Romania (1989) and Slovenia (1986).
- 42 -

Table 1.21
CO2 emissions (Gg)
1990a 1996 1997 1998 1999 2000 2001 2002 1996 to 1997 1997 to 1998 1998to 1999 1999 to 2000 2000 to 2001 2001 to 2002 1990 to 2002Australia 12,296 12,183 12,105 11,800 15,800 12,944 12,026 12,264 Australia -0.6 -2.5 33.9 -18.1 -7.1 2.0 -0.3Austria 4,848 4,430 4,845 4,303 4,250 4,611 4,361 5,156 Austria 9.4 -11.2 -1.2 8.5 -5.4 18.2 6.3Belarus 288 BelarusBelgium 15,986 12,361 11,368 12,647 12,054 12,829 12,134 12,995 Belgium -8.0 11.3 -4.7 6.4 -5.4 7.1 -18.7Bulgaria 3,994 BulgariaCanada 7,175 6,773 6,940 6,663 6,817 7,379 7,085 6,748 Canada 2.5 -4.0 2.3 8.2 -4.0 -4.8 -5.9Croatia 1,904 408 377 317 256 318 325 342 Croatia -7.5 -16.0 -19.3 24.4 2.1 5.4 -82.0Czech Republic 18,583 Czech RepublicDenmark 1,429 1,573 1,481 1,207 1,157 1,104 967 825 Denmark -5.9 -18.4 -4.2 -4.6 -12.4 -14.7 -42.3Estonia 229 EstoniaEuropean Community 174,428 170,225 156,457 European CommunityFinland 6,410 5,399 5,875 5,780 5,734 5,965 5,476 5,295 Finland 8.8 -1.6 -0.8 4.0 -8.2 -3.3 -17.4France 29,057 25,161 26,197 25,154 24,679 25,221 24,090 24,762 France 4.1 -4.0 -1.9 2.2 -4.5 2.8 -14.8Germany 120,250 68,820 70,205 65,080 62,807 66,115 63,500 61,517 Germany 2.0 -7.3 -3.5 5.3 -4.0 -3.1 -48.8Greece 4,144 3,826 3,557 3,585 2,852 3,347 3,387 2,692 Greece -7.0 0.8 -20.4 17.3 1.2 -20.5 -35.0Hungary 2,722 HungaryIreland 970 511 368 625 763 319 311 292 Ireland -27.9 69.6 22.2 -58.2 -2.5 -6.2 -69.9Italy 18,519 16,657 17,726 16,503 18,601 17,697 17,665 12,873 Italy 6.4 -6.9 12.7 -4.9 -0.2 -27.1 -30.5Japan 188,263 196,513 210,831 189,665 193,358 192,902 186,189 192,031 Japan 7.3 -10.0 1.9 -0.2 -3.5 3.1 2.0Latvia 82 33 34 37 36 24 23 23 Latvia 4.8 7.9 -2.8 -33.8 -1.8 0.4 -71.4Lithuania 1,756 369 46 226 Lithuania 397.6 -87.1Luxembourg 317 480 328 LuxembourgMonaco MonacoNetherlands 5,018 1,230 663 789 1,564 673 499 520 Netherlands -46.1 19.0 98.2 -57.0 -25.8 4.3 -89.6New Zealand 1,936 1,799 1,746 1,646 1,425 1,463 1,837 1,684 New Zealand -3.0 -5.7 -13.4 2.7 25.6 -8.3 -13.0Norway 663 909 794 848 670 586 Norway -12.6 6.8 -21.0 -12.5 -11.6Portugal 2,661 2,390 2,240 1,730 1,535 2,060 1,346 786 Portugal -6.3 -22.8 -11.3 34.2 -34.7 -41.5 -70.4Romania 1,759 5,746 5,174 4,415 3,141 2,805 2,851 4,544 Romania -9.9 -14.7 -28.9 -10.7 1.6 59.4 158.4Slovakia 5,316 4,562 Slovakia -14.2Slovenia 1,372 326 372 438 438 395 573 660 Slovenia 13.9 17.8 0.0 -9.7 44.9 15.2 -51.9Spain 12,778 7,477 7,560 5,882 5,226 5,393 5,609 5,252 Spain 1.1 -22.2 -11.2 3.2 4.0 -6.4 -58.9Sweden 2,059 1,702 1,706 1,517 1,269 1,437 1,386 1,336 Sweden 0.2 -11.1 -16.3 13.2 -3.5 -3.6 -35.1Switzerland 1,471 634 438 391 412 583 609 593 Switzerland -30.8 -10.7 5.2 41.7 4.5 -2.7 -59.7Ukraine 31,301 31,355 Ukraine 0.2United Kingdom 37,517 30,585 31,116 29,309 27,913 22,974 24,242 21,827 United Kingdom 1.7 -5.8 -4.8 -17.7 5.5 -10.0 -41.8United States 150,260 144,523 145,753 137,638 132,179 133,804 128,953 125,941 United States 0.9 -5.6 -4.0 1.2 -3.6 -2.3 -16.2
Manufacturing industries and construction: solid fuels – trend informationRelative change (%)
a In accordance with decisions 9/CP.2 and 11/CP.4, some Parties with economies in transition use base years other than 1990: Bulgaria (1988), Hungary (average of 1985 to 1987), Romania (1989) and Slovenia (1986).
- 43 -
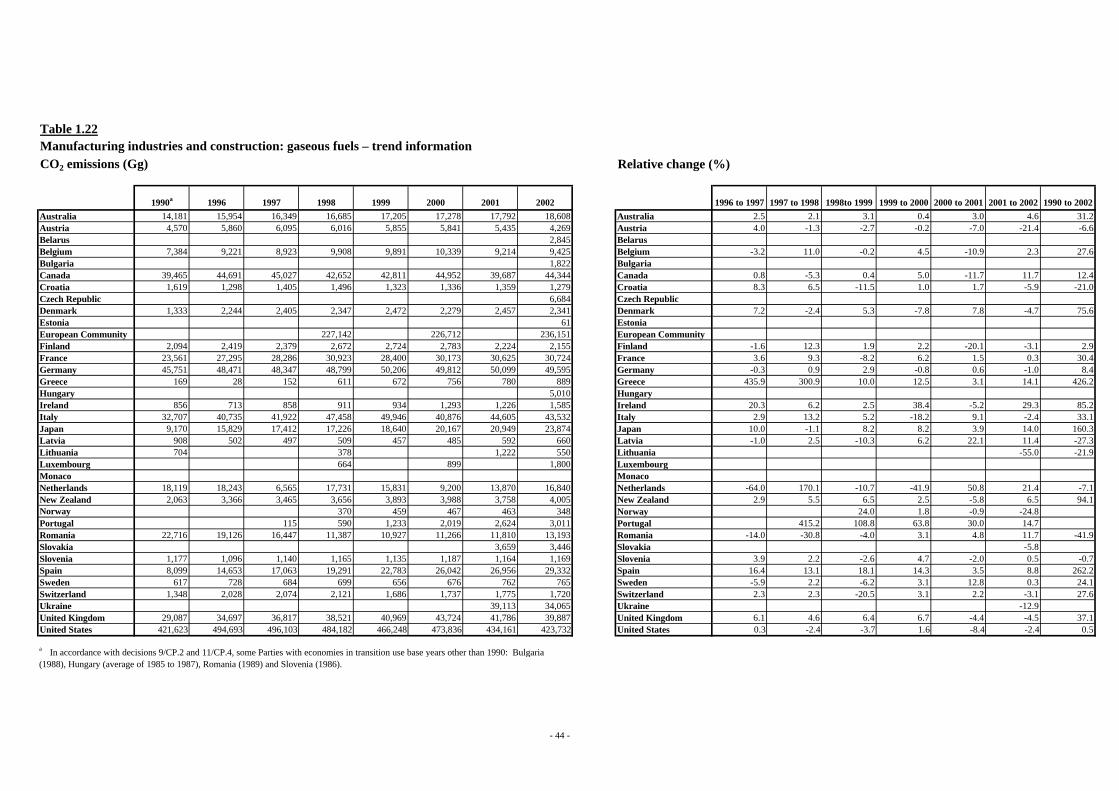
Table 1.22
CO2 emissions (Gg)
1990a 1996 1997 1998 1999 2000 2001 2002 1996 to 1997 1997 to 1998 1998to 1999 1999 to 2000 2000 to 2001 2001 to 2002 1990 to 2002Australia 14,181 15,954 16,349 16,685 17,205 17,278 17,792 18,608 Australia 2.5 2.1 3.1 0.4 3.0 4.6 31.2Austria 4,570 5,860 6,095 6,016 5,855 5,841 5,435 4,269 Austria 4.0 -1.3 -2.7 -0.2 -7.0 -21.4 -6.6Belarus 2,845 BelarusBelgium 7,384 9,221 8,923 9,908 9,891 10,339 9,214 9,425 Belgium -3.2 11.0 -0.2 4.5 -10.9 2.3 27.6Bulgaria 1,822 BulgariaCanada 39,465 44,691 45,027 42,652 42,811 44,952 39,687 44,344 Canada 0.8 -5.3 0.4 5.0 -11.7 11.7 12.4Croatia 1,619 1,298 1,405 1,496 1,323 1,336 1,359 1,279 Croatia 8.3 6.5 -11.5 1.0 1.7 -5.9 -21.0Czech Republic 6,684 Czech RepublicDenmark 1,333 2,244 2,405 2,347 2,472 2,279 2,457 2,341 Denmark 7.2 -2.4 5.3 -7.8 7.8 -4.7 75.6Estonia 61 EstoniaEuropean Community 227,142 226,712 236,151 European CommunityFinland 2,094 2,419 2,379 2,672 2,724 2,783 2,224 2,155 Finland -1.6 12.3 1.9 2.2 -20.1 -3.1 2.9France 23,561 27,295 28,286 30,923 28,400 30,173 30,625 30,724 France 3.6 9.3 -8.2 6.2 1.5 0.3 30.4Germany 45,751 48,471 48,347 48,799 50,206 49,812 50,099 49,595 Germany -0.3 0.9 2.9 -0.8 0.6 -1.0 8.4Greece 169 28 152 611 672 756 780 889 Greece 435.9 300.9 10.0 12.5 3.1 14.1 426.2Hungary 5,010 HungaryIreland 856 713 858 911 934 1,293 1,226 1,585 Ireland 20.3 6.2 2.5 38.4 -5.2 29.3 85.2Italy 32,707 40,735 41,922 47,458 49,946 40,876 44,605 43,532 Italy 2.9 13.2 5.2 -18.2 9.1 -2.4 33.1Japan 9,170 15,829 17,412 17,226 18,640 20,167 20,949 23,874 Japan 10.0 -1.1 8.2 8.2 3.9 14.0 160.3Latvia 908 502 497 509 457 485 592 660 Latvia -1.0 2.5 -10.3 6.2 22.1 11.4 -27.3Lithuania 704 378 1,222 550 Lithuania -55.0 -21.9Luxembourg 664 899 1,800 LuxembourgMonaco MonacoNetherlands 18,119 18,243 6,565 17,731 15,831 9,200 13,870 16,840 Netherlands -64.0 170.1 -10.7 -41.9 50.8 21.4 -7.1New Zealand 2,063 3,366 3,465 3,656 3,893 3,988 3,758 4,005 New Zealand 2.9 5.5 6.5 2.5 -5.8 6.5 94.1Norway 370 459 467 463 348 Norway 24.0 1.8 -0.9 -24.8Portugal 115 590 1,233 2,019 2,624 3,011 Portugal 415.2 108.8 63.8 30.0 14.7Romania 22,716 19,126 16,447 11,387 10,927 11,266 11,810 13,193 Romania -14.0 -30.8 -4.0 3.1 4.8 11.7 -41.9Slovakia 3,659 3,446 Slovakia -5.8Slovenia 1,177 1,096 1,140 1,165 1,135 1,187 1,164 1,169 Slovenia 3.9 2.2 -2.6 4.7 -2.0 0.5 -0.7Spain 8,099 14,653 17,063 19,291 22,783 26,042 26,956 29,332 Spain 16.4 13.1 18.1 14.3 3.5 8.8 262.2Sweden 617 728 684 699 656 676 762 765 Sweden -5.9 2.2 -6.2 3.1 12.8 0.3 24.1Switzerland 1,348 2,028 2,074 2,121 1,686 1,737 1,775 1,720 Switzerland 2.3 2.3 -20.5 3.1 2.2 -3.1 27.6Ukraine 39,113 34,065 Ukraine -12.9United Kingdom 29,087 34,697 36,817 38,521 40,969 43,724 41,786 39,887 United Kingdom 6.1 4.6 6.4 6.7 -4.4 -4.5 37.1United States 421,623 494,693 496,103 484,182 466,248 473,836 434,161 423,732 United States 0.3 -2.4 -3.7 1.6 -8.4 -2.4 0.5
Manufacturing industries and construction: gaseous fuels – trend information Relative change (%)
a In accordance with decisions 9/CP.2 and 11/CP.4, some Parties with economies in transition use base years other than 1990: Bulgaria (1988), Hungary (average of 1985 to 1987), Romania (1989) and Slovenia (1986).
- 44 -

Table 1.23
1990a 2002 1990a 2002 1990a 2002
Australia 29.2 28.6 32.9 28.4 37.9 43.0Austria 25.7 23.7 37.2 41.2 35.1 34.1Belarus 9.1 8.3 82.0Belgium 22.6 16.3 48.2 38.2 22.2 27.7Bulgaria 28.8 48.9 22.3Canada 24.9 18.1 11.6 10.8 63.6 71.0Croatia 46.2 57.7 29.1 8.9 24.7 33.3Czech Republic 18.4 60.0 21.6Denmark 48.7 42.4 26.5 14.8 24.8 42.1Estonia 31.2 54.4 14.3European Community 27.9 26.8 40.5Finland 29.9 33.7 44.6 40.0 14.6 16.3France 36.5 30.5 35.1 30.4 28.4 37.8Germany 14.5 15.5 61.3 46.6 23.3 37.6Greece 56.0 64.7 42.3 26.5 1.7 8.8Hungary 23.3 26.9 49.5Ireland 52.4 61.6 25.3 6.0 22.3 32.4Italy 41.6 33.3 21.1 15.2 37.2 51.2Japan 41.1 37.6 56.2 55.5 2.7 6.9Latvia 40.5 25.3 4.9 2.6 54.6 72.1Lithuania 54.3 28.5 32.6 20.8 13.1 50.6Luxembourg 9.1 14.0 76.9MonacoNetherlands 18.2 1.5 11.9 1.5 42.9 47.1New Zealand 15.4 10.8 41.0 26.4 43.7 62.8Norway 81.0 75.0 19.0 15.7 9.3Portugal 70.0 61.2 29.1 7.9 30.2Romania 19.0 21.6 5.8 20.1 75.1 58.3Slovakia 14.0 32.1 24.2Slovenia 37.8 22.8 33.3 27.7 28.6 49.1Spain 52.4 43.9 29.1 8.5 18.5 47.4Sweden 73.2 78.3 19.3 12.9 5.8 7.4Switzerland 44.9 54.6 28.8 11.6 26.4 33.7Ukraine 7.9 43.7 47.5United Kingdom 29.2 26.5 39.9 26.0 30.9 47.5United States 40.8 42.5 15.5 13.2 43.6 44.3
Contribution of fuels in CO2 emissions from Manufacturing industries and construction (%)
a In accordance with decisions 9/CP.2 and 11/CP.4, some Parties with economies in transition use base years other than 1990: Bulgaria (1988), Hungary (average of 1985 to 1987), Romania (1989) and Slovenia (1986).
Liquid fuels Solid fuels Gaseous fuels
- 45 -

Table 1.24
CO2 emissions (Gg)
1990a 1996 1997 1998 1999 2000 2001 2002 1996 to 1997 1997 to 1998 1998to 1999 1999 to 2000 2000 to 2001 2001 to 2002 1990 to 2002Australia 12,486 14,045 14,586 14,785 14,932 15,384 15,586 16,043 Australia 3.8 1.4 1.0 3.0 1.3 2.9 28.5Austria 13,815 15,630 14,126 14,127 14,219 13,452 14,825 13,651 Austria -9.6 0.0 0.6 -5.4 10.2 -7.9 -1.2Belarus 6,932 6,657 Belarus -4.0Belgium 27,230 35,552 31,306 31,615 30,617 29,178 31,040 29,624 Belgium -11.9 1.0 -3.2 -4.7 6.4 -4.6 8.8Bulgaria 7,612 3,238 2,678 2,989 2,491 1,896 1,638 2,074 Bulgaria -17.3 11.6 -16.6 -23.9 -13.6 26.6 -72.8Canada 69,415 79,476 76,576 68,085 71,827 78,066 74,616 79,460 Canada -3.6 -11.1 5.5 8.7 -4.4 6.5 14.5Croatia 3,616 3,136 3,180 3,107 3,513 3,359 3,576 3,655 Croatia 1.4 -2.3 13.1 -4.4 6.5 2.2 1.1Czech Republic 34,177 17,936 20,013 19,624 17,481 17,019 15,769 15,108 Czech Republic 11.6 -1.9 -10.9 -2.6 -7.3 -4.2 -55.8Denmark 9,152 9,342 8,626 8,259 8,265 7,535 7,771 7,428 Denmark -7.7 -4.3 0.1 -8.8 3.1 -4.4 -18.8Estonia 2,392 1,153 1,281 1,140 1,083 1,036 306 464 Estonia 11.1 -11.0 -5.0 -4.3 -70.4 51.3 -80.6European Community 636,997 698,327 651,872 653,112 637,697 622,455 665,103 630,058 European Community -6.7 0.2 -2.4 -2.4 6.9 -5.3 -1.1Finland 7,571 6,483 6,598 6,659 6,369 5,796 6,022 6,078 Finland 1.8 0.9 -4.4 -9.0 3.9 0.9 -19.7France 94,381 104,784 98,795 102,426 101,234 96,506 106,079 97,806 France -5.7 3.7 -1.2 -4.7 9.9 -7.8 3.6Germany 204,414 215,267 200,905 192,551 176,631 170,512 188,199 174,262 Germany -6.7 -4.2 -8.3 -3.5 10.4 -7.4 -14.8Greece 8,021 10,016 10,252 10,608 10,410 11,026 11,889 12,261 Greece 2.4 3.5 -1.9 5.9 7.8 3.1 52.9Hungary 23,782 18,091 16,221 13,451 13,385 13,996 15,147 15,506 Hungary -10.3 -17.1 -0.5 4.6 8.2 2.4 -34.8Ireland 9,726 9,092 9,421 9,974 9,903 10,364 10,414 10,296 Ireland 3.6 5.9 -0.7 4.7 0.5 -1.1 5.9Italy 76,121 77,342 74,712 78,060 82,146 78,085 81,188 77,759 Italy -3.4 4.5 5.2 -4.9 4.0 -4.2 2.2Japan 164,050 181,559 179,374 186,437 189,746 192,087 191,312 194,266 Japan -1.2 3.9 1.8 1.2 -0.4 1.5 18.4Latvia 5,181 1,247 1,100 1,000 935 818 1,036 1,004 Latvia -11.8 -9.1 -6.5 -12.5 26.5 -3.1 -80.6Lithuania 6,313 1,438 1,045 1,108 Lithuania 6.1 -82.4Luxembourg 1,578 1,268 1,390 LuxembourgMonaco 29 40 35 35 39 39 37 40 Monaco -11.5 -1.5 13.4 -2.1 -3.6 7.8 36.1Netherlands 34,912 44,129 36,806 35,915 33,927 35,177 37,415 37,203 Netherlands -16.6 -2.4 -5.5 3.7 6.4 -0.6 6.6New Zealand 2,855 2,519 2,655 2,751 2,812 2,826 2,855 3,206 New Zealand 5.4 3.6 2.2 0.5 1.0 12.3 12.3Norway 4,131 4,192 3,751 3,728 3,809 3,206 3,488 3,617 Norway -10.5 -0.6 2.2 -15.8 8.8 3.7 -12.4Portugal 4,055 5,078 5,172 5,606 6,143 6,516 6,253 6,481 Portugal 1.8 8.4 9.6 6.1 -4.0 3.6 59.8Romania 10,185 8,349 9,955 9,879 8,030 8,291 7,829 8,275 Romania 19.2 -0.8 -18.7 3.3 -5.6 5.7 -18.8Slovakia 5,913 5,830 Slovakia -1.4Slovenia 2,139 2,890 2,963 2,994 3,209 2,885 2,972 2,830 Slovenia 2.5 1.0 7.2 -10.1 3.0 -4.8 32.3Spain 25,953 30,300 30,408 31,113 32,678 34,040 34,856 34,300 Spain 0.4 2.3 5.0 4.2 2.4 -1.6 32.2Sweden 10,512 9,316 8,531 8,452 7,974 7,611 6,924 6,444 Sweden -8.4 -0.9 -5.7 -4.5 -9.0 -6.9 -38.7Switzerland 18,616 19,812 18,782 19,398 18,202 17,276 18,087 17,425 Switzerland -5.2 3.3 -6.2 -5.1 4.7 -3.7 -6.4Ukraine 66,229 56,678 Ukraine -14.4United Kingdom 112,538 127,121 117,296 118,664 118,164 117,885 120,802 115,076 United Kingdom -7.7 1.2 -0.4 -0.2 2.5 -4.7 2.3United States 563,740 625,914 607,739 558,339 581,568 616,372 594,155 604,289 United States -2.9 -8.1 4.2 6.0 -3.6 1.7 7.2
Other sectors (commercial / institutional, residential, agriculture / forestry / fisheries): all fuels – trend information Relative change (%)
a In accordance with decisions 9/CP.2 and 11/CP.4, some Parties with economies in transition use base years other than 1990: Bulgaria (1988), Hungary (average of 1985 to 1987), Romania (1989) and Slovenia (1986).
- 46 -

Table 1.25
CO2 emissions (Gg)
1990a 1996 1997 1998 1999 2000 2001 2002 1996 to 1997 1997 to 1998 1998to 1999 1999 to 2000 2000 to 2001 2001 to 2002 1990 to 2002Australia 5,500 5,959 6,075 6,130 6,254 6,405 6,396 6,534 Australia 1.9 0.9 2.0 2.4 -0.1 2.2 18.8Austria 8,619 9,788 8,789 8,876 8,939 8,196 9,255 8,618 Austria -10.2 1.0 0.7 -8.3 12.9 -6.9 0.0Belarus 2,339 BelarusBelgium 17,386 22,172 19,589 19,658 18,836 17,327 18,110 17,067 Belgium -11.6 0.4 -4.2 -8.0 4.5 -5.8 -1.8Bulgaria 512 BulgariaCanada 22,239 21,012 20,486 17,721 18,257 19,418 19,230 19,597 Canada -2.5 -13.5 3.0 6.4 -1.0 1.9 -11.9Croatia 2,402 1,901 1,938 1,817 2,100 2,134 2,170 2,275 Croatia 2.0 -6.3 15.6 1.6 1.7 4.8 -5.3Czech Republic 650 Czech RepublicDenmark 7,335 6,445 5,918 5,679 5,562 5,000 5,057 4,841 Denmark -8.2 -4.0 -2.1 -10.1 1.1 -4.3 -34.0Estonia 201 EstoniaEuropean Community 307,039 279,592 276,907 European CommunityFinland 7,274 5,989 6,090 6,265 5,972 5,490 5,663 5,728 Finland 1.7 2.9 -4.7 -8.1 3.1 1.1 -21.3France 59,853 62,004 58,643 59,302 58,438 54,085 59,328 53,996 France -5.4 1.1 -1.5 -7.4 9.7 -9.0 -9.8Germany 91,532 116,046 110,317 105,196 90,921 88,022 98,826 85,584 Germany -4.9 -4.6 -13.6 -3.2 12.3 -13.4 -6.5Greece 7,885 9,794 10,042 10,410 10,271 10,865 11,725 12,058 Greece 2.5 3.7 -1.3 5.8 7.9 2.8 52.9Hungary 1,796 HungaryIreland 3,670 4,829 5,000 5,235 5,840 6,247 6,274 6,189 Ireland 3.5 4.7 11.5 7.0 0.4 -1.4 68.6Italy 38,550 29,707 28,196 28,611 30,454 28,085 27,408 27,573 Italy -5.1 1.5 6.4 -7.8 -2.4 0.6 -28.5Japan 144,544 156,608 153,988 160,468 162,588 163,021 163,522 165,507 Japan -1.7 4.2 1.3 0.3 0.3 1.2 14.5Latvia 3,310 443 404 381 376 331 456 407 Latvia -8.9 -5.5 -1.4 -12.0 37.6 -10.7 -87.7Lithuania 2,663 585 327 364 Lithuania 11.1 -86.3Luxembourg 894 759 821 LuxembourgMonaco 28 MonacoNetherlands 1,352 898 666 710 685 582 559 596 Netherlands -25.9 6.6 -3.5 -15.1 -3.9 6.7 -55.9New Zealand 1,593 1,482 1,607 1,715 1,703 1,607 1,548 1,634 New Zealand 8.4 6.7 -0.7 -5.6 -3.6 5.5 2.6Norway 4,091 3,712 3,793 3,191 3,460 1,648 Norway 2.2 -15.9 8.4 -52.4 -59.7Portugal 4,055 5,078 5,169 5,552 5,969 6,190 5,753 5,844 Portugal 1.8 7.4 7.5 3.7 -7.1 1.6 44.1Romania 4,782 2,541 3,865 3,571 2,155 2,443 1,897 2,249 Romania 52.1 -7.6 -39.7 13.4 -22.3 18.5 -53.0Slovakia 35 33 Slovakia -7.1Slovenia 814 2,561 2,647 2,674 2,815 2,541 2,594 2,494 Slovenia 3.4 1.0 5.3 -9.7 2.1 -3.9 206.4Spain 22,285 25,365 25,086 25,183 26,130 27,144 27,294 25,901 Spain -1.1 0.4 3.8 3.9 0.6 -5.1 16.2Sweden 10,172 9,011 8,235 8,140 7,659 7,306 6,600 6,102 Sweden -8.6 -1.2 -5.9 -4.6 -9.7 -7.5 -40.0Switzerland 16,411 16,740 15,970 16,479 14,652 13,755 14,414 13,788 Switzerland -4.6 3.2 -11.1 -6.1 4.8 -4.3 -16.0Ukraine 16,668 16,915 Ukraine 1.5United Kingdom 20,156 21,917 20,037 19,824 17,912 16,791 16,721 15,989 United Kingdom -8.6 -1.1 -9.6 -6.3 -0.4 -4.4 -20.7United States 167,793 157,405 149,548 138,397 148,827 162,022 159,370 157,468 United States -5.0 -7.5 7.5 8.9 -1.6 -1.2 -6.2
Other sectors (commercial / institutional, residential, agriculture / forestry / fisheries): liquid fuels – trend information Relative change (%)
a In accordance with decisions 9/CP.2 and 11/CP.4, some Parties with economies in transition use base years other than 1990: Bulgaria (1988), Hungary (average of 1985 to 1987), Romania (1989) and Slovenia (1986).
- 47 -

Table 1.26
CO2 emissions (Gg)
1990a 1996 1997 1998 1999 2000 2001 2002 1996 to 1997 1997 to 1998 1998to 1999 1999 to 2000 2000 to 2001 2001 to 2002 1990 to 2002Australia 583 337 309 233 202 298 301 368 Australia -8.3 -24.4 -13.5 47.9 0.9 22.4 -36.9Austria 2,947 1,753 1,400 1,223 1,134 981 1,052 867 Austria -20.2 -12.6 -7.3 -13.5 7.3 -17.6 -70.6Belarus 1,584 BelarusBelgium 1,976 1,313 1,121 937 849 724 771 749 Belgium -14.6 -16.5 -9.4 -14.7 6.5 -2.8 -62.1Bulgaria 1,480 BulgariaCanada 191 193 179 158 151 148 144 499 Canada -7.3 -12.0 -4.2 -2.0 -2.5 246.4 160.6Croatia 536 68 59 83 77 67 43 57 Croatia -13.3 41.8 -7.7 -12.1 -35.8 32.4 -89.3Czech Republic 5,371 Czech RepublicDenmark 318 158 138 98 85 107 122 85 Denmark -13.0 -28.7 -13.8 26.2 14.1 -30.3 -73.3Estonia 109 EstoniaEuropean Community 25,274 19,231 16,732 European CommunityFinland 57 25 9 26 24 24 20 24 Finland -62.8 175.3 -5.1 -2.3 -16.1 22.8 -56.9France 4,401 2,500 1,502 1,181 1,245 1,061 1,005 870 France -39.9 -21.3 5.4 -14.7 -5.3 -13.5 -80.2Germany 67,078 14,121 11,150 7,149 6,724 5,120 4,629 4,256 Germany -21.0 -35.9 -5.9 -23.9 -9.6 -8.1 -93.7Greece 120 203 191 167 112 131 123 140 Greece -6.1 -12.5 -32.8 16.8 -5.8 13.2 16.6Hungary 1,329 HungaryIreland 5,587 3,103 3,287 3,439 2,607 2,433 2,309 2,271 Ireland 5.9 4.6 -24.2 -6.7 -5.1 -1.6 -59.4Italy 920 971 571 317 307 298 301 73 Italy -41.2 -44.5 -2.9 -3.0 1.1 -75.8 -92.1Japan 1,941 1,128 953 782 877 1,456 410 390 Japan -15.5 -18.0 12.1 66.1 -71.9 -4.8 -79.9Latvia 1,286 439 408 322 264 207 268 214 Latvia -7.2 -21.1 -18.0 -21.4 29.3 -20.3 -83.4Lithuania 2,778 493 267 327 Lithuania 22.2 -88.2Luxembourg 31 24 8 LuxembourgMonaco MonacoNetherlands 81 32 26 35 27 28 33 31 Netherlands -17.1 33.5 -24.2 3.5 18.9 -5.0 -61.9New Zealand 821 526 516 491 426 423 470 439 New Zealand -2.0 -4.7 -13.4 -0.6 11.1 -6.7 -46.6Norway 36 14 12 11 8 1,949 Norway -16.6 -7.0 -22.2 23,127.5 5,346.5Portugal PortugalRomania 2,198 546 475 70 187 165 41 153 Romania -12.9 -85.3 168.7 -12.1 -74.9 269.7 -93.0Slovakia 879 823 Slovakia -6.4Slovenia 1,291 172 100 82 86 51 40 33 Slovenia -41.6 -18.3 4.7 -40.3 -23.0 -16.3 -97.4Spain 2,300 1,371 1,350 1,258 906 545 384 442 Spain -1.5 -6.8 -28.0 -39.8 -29.7 15.4 -80.8Sweden 157 5 16 8 NO 5 5 5 Sweden 217.1 -50.0 0.0 6.3 -96.7Switzerland 64 27 23 14 14 21 12 12 Switzerland -17.2 -37.5 0.0 46.6 -41.0 0.0 -80.9Ukraine 8,236 8,767 Ukraine 6.4United Kingdom 19,445 11,642 10,520 9,406 9,498 7,750 8,579 6,911 United Kingdom -9.6 -10.6 1.0 -18.4 10.7 -19.4 -64.5United States 14,582 13,077 13,687 9,911 11,044 9,723 10,289 10,289 United States 4.7 -27.6 11.4 -12.0 5.8 0.0 -29.4
Other sectors (commercial / institutional, residential, agriculture / forestry / fisheries): solid fuels – trend information Relative change (%)
a In accordance with decisions 9/CP.2 and 11/CP.4, some Parties with economies in transition use base years other than 1990: Bulgaria (1988), Hungary (average of 1985 to 1987), Romania (1989) and Slovenia (1986).
- 48 -

Table 1.27
CO2 emissions (Gg)
1990a 1996 1997 1998 1999 2000 2001 2002 1996 to 1997 1997 to 1998 1998to 1999 1999 to 2000 2000 to 2001 2001 to 2002 1990 to 2002Australia 6,402 7,749 8,202 8,423 8,476 8,681 8,889 9,141 Australia 5.8 2.7 0.6 2.4 2.4 2.8 42.8Austria 2,247 4,084 3,932 4,022 4,140 4,268 4,509 4,162 Austria -3.7 2.3 2.9 3.1 5.6 -7.7 85.3Belarus 2,728 BelarusBelgium 7,817 11,969 10,498 10,930 10,841 11,036 12,069 11,736 Belgium -12.3 4.1 -0.8 1.8 9.4 -2.8 50.1Bulgaria 82 BulgariaCanada 46,985 58,271 55,911 50,207 53,419 58,500 55,242 59,364 Canada -4.0 -10.2 6.4 9.5 -5.6 7.5 26.3Croatia 678 1,167 1,183 1,207 1,337 1,157 1,363 1,323 Croatia 1.4 2.0 10.7 -13.4 17.8 -2.9 95.0Czech Republic 9,087 Czech RepublicDenmark 1,478 2,717 2,550 2,482 2,592 2,427 2,590 2,501 Denmark -6.1 -2.7 4.4 -6.4 6.7 -3.4 69.3Estonia 145 EstoniaEuropean Community 319,855 322,533 335,128 European CommunityFinland 99 297 322 241 260 181 215 216 Finland 8.5 -25.3 7.9 -30.4 18.9 0.6 119.7France 30,057 40,227 38,579 41,848 41,497 41,290 45,682 42,853 France -4.1 8.5 -0.8 -0.5 10.6 -6.2 42.6Germany 45,804 85,100 79,438 80,205 78,985 77,370 84,743 84,422 Germany -6.7 1.0 -1.5 -2.0 9.5 -0.4 84.3Greece 17 19 20 31 26 30 41 62 Greece 4.4 56.6 -14.7 15.0 33.8 53.5 268.1Hungary 12,380 HungaryIreland 469 1,159 1,134 1,300 1,456 1,684 1,831 1,837 Ireland -2.2 14.6 12.0 15.6 8.7 0.3 291.5Italy 36,339 46,149 45,417 48,557 50,723 48,924 52,569 49,162 Italy -1.6 6.9 4.5 -3.5 7.4 -6.5 35.3Japan 17,565 23,824 24,433 25,187 26,282 27,611 27,379 28,369 Japan 2.6 3.1 4.3 5.1 -0.8 3.6 61.5Latvia 586 364 288 297 295 280 312 383 Latvia -20.9 3.0 -0.7 -5.1 11.4 22.9 -34.5Lithuania 872 360 450 418 Lithuania -7.2 -52.1Luxembourg 652 485 561 LuxembourgMonaco 12 MonacoNetherlands 33,188 43,059 36,086 35,151 33,215 34,567 36,763 36,575 Netherlands -16.2 -2.6 -5.5 4.1 6.4 -0.5 10.2New Zealand 441 511 532 545 684 796 837 1,133 New Zealand 4.2 2.3 25.6 16.4 5.1 35.4 156.9Norway 1 3 3 17 19 Norway 106.4 6.2 439.8 10.3Portugal 3 54 174 326 501 637 Portugal 1,784.3 221.3 87.4 53.7 27.2Romania 3,206 4,977 5,615 6,238 5,688 5,684 5,890 5,873 Romania 12.8 11.1 -8.8 -0.1 3.6 -0.3 83.2Slovakia 4,999 4,975 Slovakia -0.5Slovenia 34 157 216 238 308 292 338 304 Slovenia 37.5 10.4 29.3 -5.1 15.7 -10.3 795.5Spain 1,367 3,564 3,972 4,672 5,642 6,350 7,179 7,956 Spain 11.4 17.6 20.8 12.5 13.0 10.8 482.0Sweden 184 301 281 304 314 301 319 336 Sweden -6.6 8.3 3.4 -4.3 6.1 5.4 82.8Switzerland 2,141 3,045 2,790 2,905 3,536 3,500 3,661 3,624 Switzerland -8.4 4.1 21.7 -1.0 4.6 -1.0 69.3Ukraine 41,236 30,807 Ukraine -25.3United Kingdom 72,878 93,501 86,721 89,406 90,715 93,295 95,445 92,111 United Kingdom -7.3 3.1 1.5 2.8 2.3 -3.5 26.4United States 381,365 455,431 444,503 410,031 421,698 444,627 424,496 436,532 United States -2.4 -7.8 2.8 5.4 -4.5 2.8 14.5
Other sectors (commercial / institutional, residential, agriculture / forestry / fisheries): gaseous fuels – trend information Relative change (%)
a In accordance with decisions 9/CP.2 and 11/CP.4, some Parties with economies in transition use base years other than 1990: Bulgaria (1988), Hungary (average of 1985 to 1987), Romania (1989) and Slovenia (1986).
- 49 -

Table 1.28
1990a 2002 1990a 2002 1990a 2002
Australia 44.1 40.7 4.7 2.3 51.3 57.0Austria 62.4 63.1 21.3 6.3 16.3 30.5Belarus 35.1 23.8 41.0Belgium 63.8 57.6 7.3 2.5 28.7 39.6Bulgaria 24.7 71.4 4.0Canada 32.0 24.7 0.3 0.6 67.7 74.7Croatia 66.4 62.2 14.8 1.6 18.8 36.2Czech Republic 4.3 35.6 60.1Denmark 80.1 65.2 3.5 1.1 16.1 33.7Estonia 43.3 23.4 31.2European Community 43.9 2.7 53.2Finland 96.1 94.2 0.7 0.4 1.3 3.6France 63.4 55.2 4.7 0.9 31.8 43.8Germany 44.8 49.1 32.8 2.4 22.4 48.4Greece 98.3 98.3 1.5 1.1 0.2 0.5Hungary 11.6 8.6 79.8Ireland 37.7 60.1 57.4 22.1 4.8 17.8Italy 50.6 35.5 1.2 0.1 47.7 63.2Japan 88.1 85.2 1.2 0.2 10.7 14.6Latvia 63.9 40.5 24.8 21.3 11.3 38.2Lithuania 42.2 32.8 44.0 29.5 13.8 37.7Luxembourg 59.0 0.6 40.4Monaco 69.7 0.0 30.3Netherlands 3.9 1.6 0.2 0.1 95.1 98.3New Zealand 55.8 51.0 28.8 13.7 15.4 35.3Norway 99.0 45.6 0.9 53.9 0.0 0.5Portugal 100.0 90.2 0.0 0.0 0.0 9.8Romania 46.9 27.2 21.6 1.8 31.5 71.0Slovakia 0.6 14.1 85.3Slovenia 38.0 88.1 60.4 1.2 1.6 10.7Spain 85.9 75.5 8.9 1.3 5.3 23.2Sweden 96.8 94.7 1.5 0.1 1.7 5.2Switzerland 88.2 79.1 0.3 0.1 11.5 20.8Ukraine 29.8 15.5 54.4United Kingdom 17.9 13.9 17.3 6.0 64.8 80.0United States 29.8 26.1 2.6 1.7 67.6 72.2
Contribution of fuels in CO2 emissions from Other sectors (%)
a In accordance with decisions 9/CP.2 and 11/CP.4, some Parties with economies in transition use base years other than 1990: Bulgaria (1988), Hungary (average of 1985 to 1987), Romania (1989) and Slovenia (1986).
Liquid fuels Solid fuels Gaseous fuels
- 50 -

Table 1.29
CO2 emissions (Gg) Relative change (%)
1990a 1996 1997 1998 1999 2000 2001 2002 1996 to 1997 1997 to 1998 1998to 1999 1999 to 2000 2000 to 2001 2001 to 2002 1990 to 2002Australia 59,727 67,711 69,060 69,123 69,970 72,095 72,260 74,087 Australia 2.0 0.1 1.2 3.0 0.2 2.5 24.0Austria 12,759 16,064 15,013 17,094 16,552 17,437 18,706 20,606 Austria -6.5 13.9 -3.2 5.4 7.3 10.2 61.5Belarus 5,472 6,529 Belarus 19.3Belgium 19,941 22,272 22,499 23,221 23,524 23,990 24,651 24,977 Belgium 1.0 3.2 1.3 2.0 2.8 1.3 25.3Bulgaria 12,639 6,306 5,315 6,475 6,212 5,881 6,014 6,317 Bulgaria -15.7 21.8 -4.1 -5.3 2.2 5.0 -50.0Canada 146,123 163,962 170,373 174,291 179,053 180,627 177,886 180,777 Canada 3.9 2.3 2.7 0.9 -1.5 1.6 23.7Croatia 4,046 3,668 4,013 4,163 4,394 4,396 4,459 4,766 Croatia 9.4 3.7 5.6 0.0 1.4 6.9 17.8Czech Republic 7,275 9,896 11,392 10,779 12,016 11,110 12,061 12,428 Czech Republic 15.1 -5.4 11.5 -7.5 8.6 3.0 70.8Denmark 10,415 12,029 12,160 12,191 12,253 12,120 12,149 12,300 Denmark 1.1 0.3 0.5 -1.1 0.2 1.2 18.1Estonia 2,693 1,047 1,212 1,352 1,203 1,030 1,921 2,175 Estonia 15.7 11.6 -11.0 -14.4 86.5 13.2 -19.2European Community 696,951 770,609 779,213 803,925 823,756 824,558 833,216 841,230 European Community 1.1 3.2 2.5 0.1 1.1 1.0 20.7Finland 12,475 10,994 11,531 12,299 12,734 12,379 12,569 12,784 Finland 4.9 6.7 3.5 -2.8 1.5 1.7 2.5France 119,123 130,737 132,960 135,128 138,215 137,727 140,963 141,953 France 1.7 1.6 2.3 -0.4 2.3 0.7 19.2Germany 162,360 176,661 177,159 180,427 186,067 182,349 178,224 176,388 Germany 0.3 1.8 3.1 -2.0 -2.3 -1.0 8.6Greece 15,355 17,424 18,025 19,651 20,408 19,303 19,967 20,299 Greece 3.5 9.0 3.9 -5.4 3.4 1.7 32.2Hungary 7,564 6,612 7,741 8,381 9,568 8,517 8,844 9,270 Hungary 17.1 8.3 14.2 -11.0 3.8 4.8 22.6Ireland 5,020 7,128 7,753 8,848 9,819 10,211 11,063 11,231 Ireland 8.8 14.1 11.0 4.0 8.3 1.5 123.7Italy 101,857 113,230 114,909 118,726 119,879 120,409 122,821 124,944 Italy 1.5 3.3 1.0 0.4 2.0 1.7 22.7Japan 210,663 258,603 262,061 258,464 262,053 258,060 260,345 254,661 Japan 1.3 -1.4 1.4 -1.5 0.9 -2.2 20.9Latvia 4,546 2,111 2,116 2,082 2,016 2,235 2,628 2,632 Latvia 0.3 -1.6 -3.2 10.9 17.6 0.1 -42.1Lithuania 5,791 3,846 3,377 3,502 Lithuania 3.7 -39.5Luxembourg 3,985 4,975 5,422 LuxembourgMonaco 40 48 48 46 49 51 54 52 Monaco -0.3 -2.7 5.9 3.5 6.9 -4.9 28.2Netherlands 29,399 32,626 33,062 34,154 34,996 35,212 35,506 36,251 Netherlands 1.3 3.3 2.5 0.6 0.8 2.1 23.3New Zealand 8,617 11,002 11,255 11,449 11,726 12,351 12,756 13,899 New Zealand 2.3 1.7 2.4 5.3 3.3 9.0 61.3Norway 11,099 12,717 12,963 13,305 13,902 13,028 13,336 13,326 Norway 1.9 2.6 4.5 -6.3 2.4 -0.1 20.1Portugal 10,460 14,174 14,749 16,170 17,010 18,555 19,381 19,831 Portugal 4.1 9.6 5.2 9.1 4.4 2.3 89.6Romania 7,276 11,350 11,493 10,784 8,510 9,287 10,799 11,891 Romania 1.3 -6.2 -21.1 9.1 16.3 10.1 63.4Slovakia 5,071 4,442 4,607 4,953 4,819 4,319 4,893 5,590 Slovakia 3.7 7.5 -2.7 -10.4 13.3 14.2 10.2Slovenia 1,971 4,199 4,268 3,687 3,507 3,653 3,786 3,800 Slovenia 1.6 -13.6 -4.9 4.2 3.6 0.4 92.8Spain 57,497 70,181 70,803 77,831 82,668 85,108 89,341 91,427 Spain 0.9 9.9 6.2 3.0 5.0 2.3 59.0Sweden 18,302 18,544 18,750 19,014 19,392 19,258 19,506 20,025 Sweden 1.1 1.4 2.0 -0.7 1.3 2.7 9.4Switzerland 14,187 13,865 14,452 14,680 15,292 15,587 15,298 15,195 Switzerland 4.2 1.6 4.2 1.9 -1.9 -0.7 7.1Ukraine 11,935 12,665 Ukraine 6.1United Kingdom 116,581 122,491 123,555 122,688 123,397 123,148 123,146 122,792 United Kingdom 0.9 -0.7 0.6 -0.2 0.0 -0.3 5.3United States 1,458,209 1,604,763 1,614,773 1,644,920 1,702,900 1,749,645 1,730,649 1,764,372 United States 0.6 1.9 3.5 2.7 -1.1 1.9 21.0
Transport: all fuels – trend information
a In accordance with decisions 9/CP.2 and 11/CP.4, some Parties with economies in transition use base years other than 1990: Bulgaria (1988), Hungary (average of 1985 to 1987), Romania (1989) and Slovenia (1986).
- 51 -

Table 1.29 (continued)
N2O emissions (Gg) Relative change (%)
1990a 1996 1997 1998 1999 2000 2001 2002 1996 to 1997 1997 to 1998 1998to 1999 1999 to 2000 2000 to 2001 2001 to 2002 1990 to 2002Australia 5.49 10.49 11.16 11.90 12.77 13.69 14.07 14.41 Australia 6.4 6.6 7.3 7.2 2.8 2.4 162.5Austria 1.57 2.59 2.40 2.48 2.24 2.14 2.08 2.24 Austria -7.5 3.5 -9.7 -4.5 -2.6 7.5 42.9Belarus 0.04 0.07 Belarus 75.0Belgium 1.16 1.91 2.01 2.11 2.40 2.65 2.78 2.86 Belgium 5.1 5.1 13.7 10.4 4.8 2.7 147.0Bulgaria 0.23 0.13 0.12 0.13 0.12 0.11 0.11 0.11 Bulgaria -11.8 9.4 -2.7 -9.9 -0.1 3.2 -49.9Canada 20.71 28.37 29.00 28.84 29.32 29.08 28.65 28.80 Canada 2.2 -0.6 1.7 -0.8 -1.5 0.5 39.1Croatia 0.04 0.07 0.11 0.16 0.22 0.29 0.35 0.41 Croatia 60.5 45.9 34.4 33.7 21.2 16.1 918.0Czech Republic 0.26 1.77 1.94 1.41 1.58 1.66 1.75 1.92 Czech Republic 9.5 -27.6 12.4 5.1 5.7 9.5 640.1Denmark 0.47 0.94 1.05 1.12 1.18 1.23 1.27 1.31 Denmark 11.5 6.2 5.8 3.5 3.7 3.4 177.6Estonia 0.02 0.01 0.01 0.01 0.01 0.01 0.02 0.02 Estonia 17.0 6.7 -7.0 -13.9 74.4 14.1 -20.0European Community 36.55 62.01 65.51 70.29 73.84 75.32 77.17 80.00 European Community 5.6 7.3 5.0 2.0 2.5 3.7 118.9Finland 1.19 1.29 1.39 1.77 1.65 1.60 1.79 1.90 Finland 7.8 27.7 -6.9 -2.8 11.9 6.1 60.2France 5.24 9.10 9.83 10.53 11.35 11.83 12.84 13.38 France 8.1 7.1 7.8 4.2 8.5 4.2 155.1Germany 9.93 17.93 18.13 17.98 17.65 16.57 15.65 14.80 Germany 1.1 -0.8 -1.8 -6.1 -5.5 -5.4 49.1Greece 0.63 0.99 1.08 1.17 1.20 1.23 1.41 1.54 Greece 9.0 7.7 2.9 2.0 15.1 8.9 145.0Hungary 1.25 NE NE 0.12 0.13 1.55 1.63 1.75 Hungary 9.3 1,085.2 4.9 7.0 39.1Ireland 0.28 0.71 0.86 1.03 1.26 1.21 1.33 1.28 Ireland 20.5 20.2 22.0 -4.1 10.7 -4.4 355.8Italy 5.55 7.57 8.09 9.14 9.92 10.28 10.73 11.79 Italy 6.9 13.0 8.6 3.6 4.4 9.9 112.5Japan 16.20 19.73 19.76 19.76 20.64 20.98 21.50 21.58 Japan 0.1 0.0 4.4 1.7 2.5 0.4 33.2Latvia 0.49 0.20 0.21 0.19 0.18 0.19 0.23 0.24 Latvia 7.0 -7.7 -7.0 5.0 22.5 4.0 -50.4Lithuania 0.19 0.15 0.14 0.15 Lithuania 4.3 -23.1Luxembourg 0.14 0.16 0.18 LuxembourgMonaco 0.00 0.00 0.00 0.00 0.00 0.00 0.00 0.00 Monaco 9.3 7.0 12.8 3.3 5.5 2.4 313.1Netherlands 1.00 1.70 1.71 1.73 1.72 1.65 1.63 1.63 Netherlands 0.9 0.9 0.0 -4.2 -1.4 -0.1 63.1New Zealand 0.24 0.34 0.36 0.37 0.39 0.41 0.43 0.47 New Zealand 6.0 2.5 3.6 7.0 3.2 9.7 96.8Norway 0.53 1.19 1.37 1.57 1.79 1.92 2.20 2.40 Norway 14.9 14.6 14.0 7.1 15.0 8.9 355.3Portugal 0.48 0.99 1.10 1.28 1.41 1.60 1.72 1.82 Portugal 11.2 16.3 10.3 13.8 7.6 5.9 277.2Romania 0.06 0.09 0.10 0.09 0.07 0.08 0.09 0.10 Romania 11.3 -6.1 -20.3 8.8 16.1 9.7 60.1Slovakia 0.25 0.40 0.44 0.50 0.50 0.46 0.61 0.67 Slovakia 8.9 15.3 0.3 -8.1 31.1 10.2 171.8Slovenia 0.08 0.29 0.30 0.31 0.38 0.40 0.45 0.49 Slovenia 2.1 3.1 22.4 6.6 12.5 8.5 485.0Spain 2.51 4.28 4.67 5.40 6.02 6.42 6.98 7.49 Spain 9.3 15.7 11.3 6.8 8.7 7.3 198.5Sweden 1.13 1.66 1.74 1.88 2.02 2.17 2.27 2.37 Sweden 4.5 8.2 7.5 7.3 4.8 4.1 108.7Switzerland 1.13 1.86 1.97 2.02 2.09 2.06 1.95 1.85 Switzerland 5.6 2.3 3.8 -1.4 -5.4 -5.3 63.8Ukraine 0.06 0.06 Ukraine 3.4United Kingdom 4.34 9.29 10.37 11.59 12.72 13.63 14.50 15.41 United Kingdom 11.6 11.7 9.8 7.1 6.4 6.3 255.1United States 163.39 195.71 194.49 192.23 189.09 185.12 177.47 170.66 United States -0.6 -1.2 -1.6 -2.1 -4.1 -3.8 4.4
Transport: all fuels – trend information
a In accordance with decisions 9/CP.2 and 11/CP.4, some Parties with economies in transition use base years other than 1990: Bulgaria (1988), Hungary (average of 1985 to 1987), Romania (1989) and Slovenia (1986).
- 52 -

Table 1.30
Gasoline Diesel oil Gasoline Diesel oil(%) (%)
IPCC default EFb NCV72.1 (US)
73.0 (Europe)72.1 (US)
74.0 (Europe)NCV
3-43 (US) 1-20 (Europe)
1-14 (US)3-4 (Europe)
Australia L 12.5 T1, T2 CS GCV 65.34 69.00 L, T 0.84 T1, T2 D, CS GCV 21.53 1.98Austria L, T 23.6 M, CS CS NCV 74.01 73.67 L, T 0.81 M, T1 CS NCV 18.67 2.96Belarus L 7.8 NCV 68.61 73.33 0.02 NCV 0.60 0.60Belgium L, T 16.2 C,M C,M NCV 68.61 73.33 T 0.54 C,M C,M NCV 9.65 7.11Bulgaria L 8.8 T2 C, CS, D NCV 72.16 76.14 0.05 T2 C, CS, D NCV 1.10 1.91Canada L, T 18.1 CS CS GCV 67.43 71.28 L 0.82 CS CS GCV 13.43 2.20Croatia L, T 15.9 T1 D NCV 68.61 73.33 T 0.45 T1 D NCV 11.75 0.60Czech Republic L 8.2 T1 D NCV 68.61 73.33 0.41 T2 D, PS NCV 19.44 3.00Denmark L, T 16.6 M/C CS NCV 73.00 74.00 T 0.57 M/C M/C NCV 10.80 5.23Estonia L 9.4 TI D NCV 68.61 73.33 0.02 TI D NCV 0.60 0.63European Community L 18.8 C, CS, D, M, T1, T2 C, CS, D, M NCV 71.05 72.92 L 0.57 C, CS, D, M, T1, T2, T3 C, CS, D, M NCV 0.01 0.01Finland L, T 13.6 CS (M) CS NCV 72.70 73.00 L, T 0.59 CS (M) CS/M NCV 17.70 3.26France L, T 24.0 C /CS C /M /CS NCV 72.35 75.01 L, T 0.74 C /CS C /M /CS NCV 8.93 6.59Germany L, T 16.3 CS CS NCV 72.00 74.00 L, T 0.44 CS CS NCV 9.40 3.09Greece L, T 12.6 C C NCV 68.61 73.80 T 0.32 C C NCV 6.84 3.87Hungary L 11.6 D D NCV 68.61 73.33 L 0.69 D CS NCV 8.00 18.00Ireland L, T 15.7 T1 CS NCV 69.96 73.30 T 0.54 T1 C NCV 10.54 5.57Italy L, T 20.8 D, T2 CS NCV 71.15 73.15 L, T 0.64 D, T3 D, C NCV 8.28 6.32Japan L, T 18.9 T1, CS D, CS GCV 67.08 68.66 0.48 T1, T3, CS D, CS GCV 7.16 3.03Latvia L, T 21.7 T1 D NCV 68.60 74.00 0.35 T1 D NCV 4.20 3.58Lithuania L 19.0 C CS NCV 73.00 74.00 0.25 C CS NCV 2.00 4.00Luxembourg NCV NCVMonaco L 36.6 D, T1 D NCV 74.62 72.25 1.46 D, T1 D NCV 11.99 3.81Netherlands L, T 15.3 CS/T2(Box 2) CS NCV 72.30 73.30 0.22 CS/T3(road);T1(rest) CS(road)/D(rest) NCV 4.67 2.19New Zealand L, T 16.4 T1 CS NCV 65.71 68.81 0.17 T1 D NCV 1.42 3.70Norway L, T 17.1 M, T1, CS/T2 CS NCV 71.30 73.55 L, T 1.19 CS, T2, CS/T2 CS, D, C NCV 27.36 3.38Portugal L, T 23.4 M D+C NCV 74.34 72.43 L, T 0.68 M D+C+CS NCV 8.24 6.10Romania L, T 7.1 D D NCV 68.61 73.33 0.02 T1 T1 NCV 0.60 0.60Slovakia L 10.2 M M NCV 73.01 73.83 0.29 M M NCV 8.70 5.15Slovenia L, T 18.4 T1, C D, CS NCV 73.00 73.67 L, T 0.72 T1, C D, CS NCV 10.58 6.86Spain L, T 20.9 C C NCV 71.09 72.63 L, T 0.55 C C NCV 6.55 5.93Sweden L, T 26.4 T1, T2 CS NCV 72.60 70.87 L, T 0.92 T1, T2 CS, C NCV 10.59 3.48Switzerland L, T 28.4 CS CS NCV 73.90 73.60 L, T 1.09 CS CS, D NCV 10.94 2.78Ukraine 0.3 T1 D NCV 68.60 73.33 0.00 T1 D NCV 0.60 0.60United Kingdom L, T 18.4 T2 CS NCV 70.06 72.54 L, T 0.72 T2/T3 D NCV 12.73 4.76United States L, T 20.3 T1, T2 CS GCV 66.54 67.72 L 0.72 T1, T2, M D, CS, M GCV 8.91 2.44
a Information on methods and emission factors included in this table is as reported by Parties. It may not reflect the actual method or type of emission factor used for all subcategories within the category 1.A.3 Transport. b Source of default emission factors: IPCC Guidelines, volume 3, pages 1.70–1.83. For updates on the default emission factors for N2O for US gasoline vehicles, see table 2.7, page 2.47 in the IPCC good practice guidance.
(kg/TJ)
Share of national total
Methods and EF useda N2O IEF
EFIEF in CRF
based onEFIEF in CRF
based on Methods(t/TJ)
Road transportation, CO2, N2O (2002)
CO2 emissions N2O emissions
Key source
Share of national total
Methods and EF useda CO2 IEF
Key sourceMethods
- 53 -

Table 1.31
CO2 emissions (Gg)
1990a 1996 1997 1998 1999 2000 2001 2002 1996 to 1997 1997 to 1998 1998to 1999 1999 to 2000 2000 to 2001 2001 to 2002 1990 to 2002Australia 52,763 58,684 59,814 60,766 62,147 63,656 63,329 64,887 Australia 1.9 1.6 2.3 2.4 -0.5 2.5 23.0Austria 12,278 15,565 14,502 16,459 15,701 16,581 17,893 19,939 Austria -6.8 13.5 -4.6 5.6 7.9 11.4 62.4Belarus 5,468 BelarusBelgium 19,270 21,646 21,916 22,593 22,924 23,321 23,963 24,279 Belgium 1.2 3.1 1.5 1.7 2.8 1.3 26.0Bulgaria 5,484 BulgariaCanada 102,868 114,246 119,533 120,502 124,619 125,582 127,471 131,072 Canada 4.6 0.8 3.4 0.8 1.5 2.8 27.4Croatia 3,480 3,313 3,689 3,847 4,084 4,114 4,169 4,453 Croatia 11.4 4.3 6.1 0.7 1.3 6.8 27.9Czech Republic 11,685 Czech RepublicDenmark 9,351 10,821 11,026 11,215 11,350 11,230 11,273 11,389 Denmark 1.9 1.7 1.2 -1.1 0.4 1.0 21.8Estonia 1,834 EstoniaEuropean Community 638,887 713,047 721,954 743,607 760,892 762,688 774,965 784,554 European Community 1.2 3.0 2.3 0.2 1.6 1.2 22.8Finland 11,111 10,192 10,701 10,807 10,880 10,648 10,905 11,133 Finland 5.0 1.0 0.7 -2.1 2.4 2.1 0.2France 111,403 121,884 124,078 126,008 128,833 128,462 131,969 132,672 France 1.8 1.6 2.2 -0.3 2.7 0.5 19.1Germany 150,262 165,025 165,942 169,374 174,878 171,161 167,712 166,002 Germany 0.6 2.1 3.2 -2.1 -2.0 -1.0 10.5Greece 11,873 14,509 14,851 15,561 15,845 16,031 16,421 17,071 Greece 2.4 4.8 1.8 1.2 2.4 4.0 43.8Hungary 9,061 HungaryIreland 4,680 6,609 7,205 8,264 9,121 9,544 10,300 10,833 Ireland 9.0 14.7 10.4 4.6 7.9 5.2 131.5Italy 93,994 104,545 106,103 109,395 110,270 110,316 113,022 115,125 Italy 1.5 3.1 0.8 0.0 2.5 1.9 22.5Japan 191,862 241,372 243,591 243,568 249,362 249,250 252,579 251,389 Japan 0.9 0.0 2.4 0.0 1.3 -0.5 31.0Latvia 2,668 1,753 1,732 1,751 1,733 1,938 2,319 2,306 Latvia -1.2 1.1 -1.1 11.9 19.7 -0.6 -13.6Lithuania NE 3,594 3,170 3,278 Lithuania 3.4Luxembourg 3,961 4,951 5,396 LuxembourgMonaco 35 MonacoNetherlands 25,374 29,158 29,518 30,236 31,111 31,468 31,984 32,747 Netherlands 1.2 2.4 2.9 1.1 1.6 2.4 29.1New Zealand 7,534 9,751 10,090 10,324 10,591 10,910 11,141 12,293 New Zealand 3.5 2.3 2.6 3.0 2.1 10.3 63.2Norway 7,850 9,065 9,283 8,749 9,293 9,468 Norway 2.4 -5.8 6.2 1.9 20.6Portugal 9,562 13,406 14,049 15,489 16,246 17,786 18,652 19,117 Portugal 4.8 10.2 4.9 9.5 4.9 2.5 99.9Romania 4,420 8,898 8,656 8,315 6,500 7,317 8,757 9,645 Romania -2.7 -3.9 -21.8 12.6 19.7 10.1 118.2Slovakia 4,593 5,292 Slovakia 15.2Slovenia 1,902 4,157 4,226 3,646 3,467 3,613 3,747 3,759 Slovenia 1.7 -13.7 -4.9 4.2 3.7 0.3 97.6Spain 51,390 64,251 64,879 71,387 75,304 77,315 81,072 83,418 Spain 1.0 10.0 5.5 2.7 4.9 2.9 62.3Sweden 16,592 17,132 17,225 17,390 17,673 17,588 17,855 18,406 Sweden 0.5 1.0 1.6 -0.5 1.5 3.1 10.9Switzerland 13,762 13,550 14,127 14,356 14,980 15,247 14,960 14,850 Switzerland 4.3 1.6 4.3 1.8 -1.9 -0.7 7.9Ukraine 1,473 1,500 Ukraine 1.8United Kingdom 109,039 114,770 116,198 115,468 116,438 116,286 116,747 117,026 United Kingdom 1.2 -0.6 0.8 -0.1 0.4 0.2 7.3United States 1,111,653 1,246,385 1,268,715 1,310,514 1,353,128 1,369,628 1,376,297 1,404,737 United States 1.8 3.3 3.3 1.2 0.5 2.1 26.4
Road transportation – trend information Relative change (%)
a In accordance with decisions 9/CP.2 and 11/CP.4, some Parties with economies in transition use base years other than 1990: Bulgaria (1988), Hungary (average of 1985 to 1987), Romania (1989) and Slovenia (1986).
- 54 -

Table 1.31
N2O emissions (Gg)
1990a 1996 1997 1998 1999 2000 2001 2002 1996 to 1997 1997 to 1998 1998to 1999 1999 to 2000 2000 to 2001 2001 to 2002 1990 to 2002Australia 5.30 10.23 10.90 11.66 12.55 13.44 13.82 14.15 Australia 6.5 7.0 7.6 7.1 2.8 2.4 167.0Austria 1.53 2.56 2.36 2.45 2.20 2.10 2.05 2.20 Austria -7.7 3.5 -10.0 -4.6 -2.6 7.7 43.9Belarus 0.05 BelarusBelgium 0.95 1.73 1.82 1.92 2.20 2.42 2.55 2.62 Belgium 5.5 5.2 14.7 10.0 5.3 2.9 177.0Bulgaria 0.09 BulgariaCanada 11.76 18.86 19.10 18.69 18.84 18.05 18.48 19.12 Canada 1.2 -2.2 0.8 -4.2 2.4 3.5 62.6Croatia 0.03 0.06 0.11 0.16 0.21 0.29 0.35 0.41 Croatia 65.6 47.7 35.5 34.8 21.5 16.3 1,267.7Czech Republic 1.91 Czech RepublicDenmark 0.42 0.89 1.00 1.07 1.14 1.18 1.23 1.27 Denmark 12.9 7.4 6.4 3.7 3.8 3.3 200.2Estonia 0.02 EstoniaEuropean Community 31.57 57.48 61.10 65.53 69.24 70.83 73.68 76.77 European Community 6.3 7.3 5.7 2.3 4.0 4.2 143.2Finland 0.59 0.94 1.03 1.12 1.21 1.25 1.44 1.55 Finland 9.2 8.4 8.1 3.4 15.6 7.8 164.4France 5.14 8.99 9.72 10.42 11.23 11.72 12.72 13.25 France 8.2 7.2 7.8 4.4 8.5 4.1 158.0Germany 9.46 17.50 17.73 17.59 17.26 16.19 15.29 14.45 Germany 1.3 -0.8 -1.9 -6.2 -5.5 -5.5 52.8Greece 0.46 0.86 0.95 1.00 1.03 1.09 1.27 1.40 Greece 10.1 5.8 2.7 5.6 16.6 10.7 206.6Hungary 1.73 HungaryIreland 0.18 0.55 0.68 0.85 1.05 1.00 1.10 1.19 Ireland 24.3 24.6 23.6 -5.0 10.8 8.0 558.0Italy 5.19 7.20 7.72 8.76 9.54 9.88 10.34 11.40 Italy 7.4 13.5 8.9 3.6 4.6 10.2 119.8Japan 15.23 18.68 18.67 18.71 19.61 19.95 20.49 20.58 Japan -0.1 0.2 4.8 1.7 2.7 0.4 35.1Latvia 0.07 0.06 0.07 0.07 0.08 0.09 0.12 0.12 Latvia 5.4 6.0 6.6 24.8 27.5 -0.7 77.6Lithuania NE 0.14 0.13 0.14 Lithuania 5.4Luxembourg 0.13 0.16 0.17 LuxembourgMonaco 0.005 MonacoNetherlands 0.89 1.60 1.61 1.62 1.62 1.55 1.54 1.54 Netherlands 0.8 0.3 0.2 -4.2 -1.0 -0.1 72.3New Zealand 0.21 0.31 0.33 0.34 0.35 0.37 0.38 0.42 New Zealand 5.7 3.4 3.7 5.0 2.6 11.3 104.6Norway 0.30 1.29 1.50 1.64 1.93 2.13 Norway 16.0 9.5 17.6 10.6 617.5Portugal 0.43 0.94 1.05 1.23 1.36 1.56 1.68 1.79 Portugal 12.1 17.2 10.5 14.3 8.0 6.1 315.8Romania 0.04 0.07 0.07 0.07 0.06 0.06 0.07 0.08 Romania -2.4 -3.8 -21.6 12.2 19.9 10.1 120.8Slovakia 0.43 0.49 Slovakia 14.6Slovenia 0.06 0.27 0.28 0.29 0.36 0.38 0.44 0.47 Slovenia 2.5 3.5 23.7 6.8 13.1 8.6 750.2Spain 2.17 3.96 4.35 5.08 5.66 6.05 6.58 7.09 Spain 9.8 16.8 11.5 6.9 8.7 7.8 226.5Sweden 0.82 1.36 1.44 1.56 1.71 1.85 1.97 2.06 Sweden 6.1 8.4 9.1 8.5 6.4 4.8 152.9Switzerland 1.11 1.86 1.96 2.01 2.08 2.05 1.94 1.84 Switzerland 5.6 2.3 3.8 -1.5 -5.4 -5.3 64.8Ukraine 0.01 0.01 Ukraine 6.9United Kingdom 3.32 8.30 9.50 10.72 11.90 12.83 13.76 14.79 United Kingdom 14.4 12.9 10.9 7.8 7.2 7.5 346.0United States 153.70 185.78 184.93 182.84 179.34 174.55 167.33 160.39 United States -0.5 -1.1 -1.9 -2.7 -4.1 -4.1 4.4
Road transportation – trend information (continued)Relative change (%)
a In accordance with decisions 9/CP.2 and 11/CP.4, some Parties with economies in transition use base years other than 1990: Bulgaria (1988), Hungary (average of 1985 to 1987), Romania (1989) and Slovenia (1986).
- 55 -

Table 1.31
N2O implied emission factors for gasoline (kg/TJ)
1990a 1996 1997 1998 1999 2000 2001 2002 1996 to 1997 1997 to 1998 1998to 1999 1999 to 2000 2000 to 2001 2001 to 2002 1990 to 2002Australia 8.49 16.21 17.22 18.43 19.57 20.60 21.53 21.53 Australia 6.3 7.0 6.2 5.3 4.5 0.0 153.7Austria 12.49 23.57 22.99 22.18 21.12 20.16 18.87 18.67 Austria -2.5 -3.5 -4.8 -4.5 -6.4 -1.1 49.5Belarus 0.60 BelarusBelgium 1.70 5.51 6.10 6.50 6.76 8.40 9.08 9.65 Belgium 10.9 6.5 4.0 24.2 8.2 6.3 468.4Bulgaria 1.10 BulgariaCanada 9.89 15.31 15.00 14.34 13.97 13.34 13.38 13.43 Canada -2.0 -4.4 -2.6 -4.5 0.3 0.4 35.8Croatia 0.60 1.96 3.18 4.50 5.89 8.03 10.20 11.75 Croatia 62.2 41.6 30.9 36.3 27.1 15.2 1,858.9Czech Republic 19.44 Czech RepublicDenmark 2.24 7.09 8.22 8.86 9.51 10.05 10.60 10.80 Denmark 15.9 7.8 7.3 5.7 5.5 1.8 382.3Estonia 0.60 EstoniaEuropean Community NE 0.01 0.01 NE 0.01 European CommunityFinland 3.90 9.00 10.51 11.70 12.62 13.97 16.62 17.70 Finland 16.8 11.4 7.8 10.7 19.0 6.5 354.4France 1.77 4.44 5.24 5.94 6.68 7.47 8.22 8.93 France 17.9 13.4 12.3 12.0 10.0 8.6 405.0Germany 5.40 11.20 11.37 11.14 10.71 10.32 9.89 9.40 Germany 1.4 -2.0 -3.9 -3.7 -4.1 -5.0 74.0Greece 1.79 4.09 4.46 4.61 4.70 5.04 6.33 6.84 Greece 9.1 3.2 2.0 7.4 25.5 8.0 282.6Hungary 8.00 HungaryIreland 1.92 7.44 9.10 10.50 12.44 9.50 9.95 10.54 Ireland 22.3 15.4 18.5 -23.6 4.7 5.9 447.6Italy 1.83 4.33 4.92 5.89 6.58 7.10 7.58 8.28 Italy 13.5 19.8 11.7 7.8 6.8 9.2 353.2Japan 7.00 7.08 6.97 6.93 7.05 7.15 7.16 7.16 Japan -1.5 -0.6 1.8 1.4 0.1 0.1 2.2Latvia 1.60 2.33 2.47 2.67 3.00 3.74 4.20 4.20 Latvia 6.0 8.1 12.1 25.0 12.1 0.0 162.3Lithuania NE 2.00 2.00 2.00 Lithuania 0.0Luxembourg LuxembourgMonaco 11.99 MonacoNetherlands 3.35 5.81 5.79 5.62 5.43 5.10 4.82 4.67 Netherlands -0.3 -3.0 -3.3 -6.2 -5.5 -3.0 39.5New Zealand 1.42 1.42 1.42 1.42 1.42 1.42 1.42 1.42 New Zealand 0.0 0.0 0.0 0.0 0.0 0.0 0.0Norway 2.56 15.52 18.43 21.38 24.42 27.36 Norway 18.8 16.0 14.2 12.1 968.7Portugal 1.75 5.13 5.71 6.31 6.88 7.37 7.86 8.24 Portugal 11.4 10.5 8.9 7.2 6.6 4.8 371.9Romania 0.60 0.60 0.60 0.60 0.60 0.60 0.60 0.60 Romania 0.0 0.0 0.0 0.0 0.0 0.0 0.0Slovakia 8.37 8.70 Slovakia 4.0Slovenia 1.90 5.80 5.62 6.71 8.88 8.88 9.73 10.58 Slovenia -3.1 19.3 32.5 0.0 9.5 8.7 457.8Spain 1.76 3.83 4.30 4.75 5.24 5.68 6.10 6.55 Spain 12.3 10.6 10.2 8.3 7.5 7.4 271.6Sweden 3.67 6.72 7.28 8.10 8.79 9.71 10.29 10.59 Sweden 8.4 11.2 8.6 10.5 6.0 2.8 188.6Switzerland 6.71 11.61 11.80 11.96 11.98 11.75 11.39 10.94 Switzerland 1.6 1.4 0.1 -1.9 -3.1 -4.0 63.2Ukraine 0.60 0.60 Ukraine 0.0United Kingdom 1.71 5.85 6.91 8.15 9.16 10.10 11.23 12.73 United Kingdom 18.2 18.0 12.3 10.3 11.1 13.4 642.8United States 10.51 11.61 11.43 10.93 10.40 10.04 9.56 8.91 United States -1.6 -4.4 -4.8 -3.5 -4.8 -6.9 -15.2
Road transportation – trend information (continued)Relative change (%)
a In accordance with decisions 9/CP.2 and 11/CP.4, some Parties with economies in transition use base years other than 1990: Bulgaria (1988), Hungary (average of 1985 to 1987), Romania (1989) and Slovenia (1986).
- 56 -

Table 1.31
N2O implied emission factors for diesel (kg/TJ)
1990a 1996 1997 1998 1999 2000 2001 2002 1996 to 1997 1997 to 1998 1998to 1999 1999 to 2000 2000 to 2001 2001 to 2002 1990 to 2002Australia 1.78 1.97 2.03 1.93 1.93 1.95 1.98 1.98 Australia 3.2 -5.1 0.0 1.1 1.6 0.0 11.1Austria 3.66 3.13 3.13 3.07 3.10 3.06 2.98 2.96 Austria -0.1 -1.8 0.8 -1.3 -2.5 -0.8 -19.3Belarus 0.60 BelarusBelgium 4.94 5.88 5.91 5.92 7.00 7.08 7.12 7.11 Belgium 0.5 0.1 18.4 1.1 0.5 -0.2 43.9Bulgaria 1.91 BulgariaCanada 2.22 2.16 2.16 2.18 2.18 2.19 2.19 2.20 Canada 0.0 0.8 0.0 0.4 0.3 0.3 -1.0Croatia 0.60 0.60 0.60 0.60 0.60 0.60 0.60 0.60 Croatia 0.0 0.0 0.0 0.0 0.0 0.0 0.0Czech Republic 3.00 Czech RepublicDenmark 4.54 4.67 4.69 4.71 4.81 4.96 5.00 5.23 Denmark 0.5 0.5 2.1 3.2 0.8 4.6 15.2Estonia 0.63 EstoniaEuropean Community NE 0.00 0.00 NE 0.01 European CommunityFinland 3.90 4.00 3.00 3.01 3.70 3.59 3.22 3.26 Finland -25.0 0.1 23.0 -2.9 -10.4 1.4 -16.4France 5.25 6.09 6.09 6.17 6.26 6.29 6.52 6.59 France 0.0 1.3 1.5 0.5 3.6 1.1 25.5Germany 3.09 3.04 3.03 3.01 3.02 3.04 3.06 3.09 Germany -0.4 -0.5 0.1 0.7 0.8 0.7 -0.2Greece 4.15 4.25 4.45 4.36 4.31 4.25 3.77 3.87 Greece 4.9 -2.0 -1.3 -1.4 -11.3 2.7 -6.7Hungary 18.00 HungaryIreland 4.04 4.21 4.22 4.15 4.11 5.50 5.65 5.57 Ireland 0.2 -1.7 -0.9 33.7 2.7 -1.4 37.7Italy 5.70 5.63 5.57 5.67 5.91 5.89 5.78 6.32 Italy -1.0 1.8 4.2 -0.5 -1.7 9.3 11.0Japan 3.16 2.93 2.90 2.90 2.92 2.99 3.01 3.03 Japan -1.1 -0.2 0.8 2.3 0.9 0.7 -3.9Latvia 3.42 3.37 3.48 3.53 3.53 3.54 3.58 3.58 Latvia 3.3 1.4 0.0 0.3 1.1 0.0 4.5Lithuania NE 4.00 4.00 4.00 Lithuania 0.0Luxembourg LuxembourgMonaco 3.81 MonacoNetherlands 1.45 1.58 1.70 1.82 1.92 2.05 2.16 2.19 Netherlands 7.4 6.8 5.9 6.5 5.6 1.3 51.3New Zealand 3.70 3.70 3.70 3.70 3.70 3.70 3.70 3.70 New Zealand 0.0 0.0 0.0 0.0 0.0 0.0 0.0Norway 3.08 3.44 3.40 3.38 3.38 3.38 Norway -1.3 -0.3 -0.1 0.0 9.6Portugal 4.75 5.21 5.35 5.52 5.67 5.84 5.97 6.10 Portugal 2.8 3.1 2.7 3.0 2.1 2.2 28.5Romania 0.60 0.60 0.60 0.60 0.60 0.60 0.60 0.60 Romania 0.0 0.0 0.0 0.0 0.0 0.0 0.0Slovakia 5.28 5.15 Slovakia -2.4Slovenia 2.64 2.66 3.34 4.02 4.71 5.39 6.08 6.86 Slovenia 25.7 20.5 17.0 14.5 12.7 12.9 160.4Spain 4.37 4.96 5.26 5.39 5.54 5.63 5.73 5.93 Spain 6.1 2.5 2.8 1.7 1.7 3.6 35.8Sweden 3.39 3.21 3.15 3.15 3.31 3.52 3.52 3.48 Sweden -1.9 0.2 5.1 6.2 0.0 -1.0 2.8Switzerland 2.73 2.82 2.84 2.85 2.87 2.76 2.77 2.78 Switzerland 0.5 0.6 0.5 -3.8 0.3 0.6 2.1Ukraine 0.60 0.60 Ukraine 0.0United Kingdom 3.20 4.04 4.16 4.34 4.53 4.68 4.69 4.76 United Kingdom 3.1 4.2 4.5 3.2 0.3 1.5 48.8United States 2.45 2.49 2.47 2.41 2.40 2.37 2.39 2.44 United States -0.7 -2.2 -0.7 -1.1 0.9 2.2 -0.3
Road transportation – trend information (continued)Relative change (%)
a In accordance with decisions 9/CP.2 and 11/CP.4, some Parties with economies in transition use base years other than 1990: Bulgaria (1988), Hungary (average of 1985 to 1987), Romania (1989) and Slovenia (1986).
- 57 -

Table 1.32
Jet keroseneAviation gasoline
Jet keroseneAviation gasoline
Residual oil Gas/diesel oil Residual oil Gas/diesel oil
(%) (%)IPCC default EFb NCV 72.80 72.10 72.80 72.10 77.60 73.00 77.60 75.0-77.6
Australia T1, T2 CS GCV L, T 1.11 69.00 67.32 69.00 NA T 0.30 72.86 69.00 72.86 69.00Austria M, CS CS NCV 0.09 72.74 74.14 72.74 0.08 73.67Belarus NCV 0.01 71.22 68.48 71.15Belgium C,M C,M NCV 0.01 70.94 70.79 73.00 0.31 73.30 73.36 76.59 73.33Bulgaria T2 C, CS, D NCV 0.08 70.60 70.80 70.60 NO NO NO NO 76.14Canada CS CS GCV L 1.77 68.18 69.51 68.18 L 0.71 72.71 71.28 72.71 71.28Croatia T1 D NCV T 0.41 70.79 68.61 70.79 0.40 76.59 73.33 76.59 82.56Czech Republic T1 D NCV 0.08 70.78 68.61 70.78 0.02 73.33
Denmark M/C CS NCV 0.21 72.00 73.00 72.00 73.00 L 0.81 78.00 74.00 78.00 74.00Estonia TI D NCV 0.29 70.79 105.10 0.17 75.82 73.33 75.82 75.56European Community C, CS, D, M, T1, T2 C, CS, D, M NCV L 0.56 72.03 71.09 NE NE L 0.45 77.51 74.06 NE NEFinland CS (M) CS NCV T 0.38 70.79 71.68 70.78 L, T 0.61 76.63 73.36 76.61 73.32France C /CS C /M /CS NCV L, T 1.00 71.59 71.59 L, T 0.44 78.00 75.00 78.00 75.00Germany CS CS NCV T 0.42 74.00 IE NE NE 0.07 NO 74.00 78.00 74.00Greece C C NCV T 0.86 67.34 IE 70.64 IE L, T 1.44 76.59 72.12 76.59 73.33Hungary D D NCV 70.79 0.01 68.61Ireland T1 CS NCV 0.15 71.40 71.40 69.92 0.09 76.00 73.29 76.00 73.30Italy D, T2 CS NCV T 0.48 70.74 70.74 70.74 NO L 1.10 77.36 75.84 77.36 73.81Japan T1, CS D, CS GCV 0.82 67.14 67.08 70.67 NO L 1.05 IE 68.66 NE NELatvia T1 D NCV 0.06 70.80 69.46 NO T 0.47 76.59 74.00 76.59 74.00Lithuania C CS NCV 0.01 NO 72.00 74.00 72.00 0.07 NO 74.00 78.00 74.00Luxembourg NCV 70.00Monaco D, T1 D NCV L 3.59 70.79 L 13.62 74.84Netherlands CS/T2(Box 2) CS NCV 0.11 73.00 IE 73.00 NO 0.43 NO 73.00 77.00 73.00New Zealand T1 CS NCV L, T 1.45 73.19 73.19 67.42 NE 0.48 IE 72.73 68.81Norway M, T1, CS/T2 CS NCV L, T 1.65 73.09 71.30 73.09 NO L, T 4.05 78.82 73.55 78.82 73.55Portugal M D+C NCV 0.46 70.37 70.33 70.59 70.74 T 0.28 77.84 75.80 77.84 74.51Romania D D NCV 0.09 70.79 68.61 T 0.23 76.59 72.60Slovakia M M NCV 0.06 47.23 47.93 73.05 73.60 0.24 75.01 NO 75.01Slovenia T1, C D, CS NCV 0.01 71.50 71.50 IE IE NA NASpain C C NCV L, T 1.27 72.92 72.92 72.69 L 0.58 78.89 73.38 78.89 73.38Sweden T1, T2 CS NCV L 0.86 73.10 72.30 73.10 L 0.94 76.20 73.81 76.20 73.29Switzerland CS CS NCV T 0.41 73.20 IE 73.20 IE 0.21 IE 73.79 NO NOUkraine T1 D NCV 0.04 71.15 70.79 0.09 76.59 73.33United Kingdom T2 CS NCV L 0.46 71.76 70.58 71.76 T 0.28 75.59 72.54 75.59 72.54United States T1, T2 CS GCV L, T 2.56 66.51 64.92 66.51 NE L 0.76 73.94 83.99 73.94 68.64
a Information on methods and emission factors included in this table is as reported by Parties. It may not reflect the actual method or type of emission factor used for all subcategories within the category 1.A.3 Transport. b Source of default emission factors: IPCC Guidelines, volume 3, pages 1.89, 1.91 (for gas/diesel oil: single value for internal waterways and range for sea-going ships, boats).
CO2 IEF
(t/TJ) (t/TJ) (t/TJ) (t/TJ)
CO2 IEF CO2 IEF
Key sourceShare of
national totalEF Key sourceShare of
national total
CO2 IEF
Civil aviation and navigation (domestic), CO2 (2002)
Methods and EF useda
IEF in CRF based on
Civil aviation (domestic) International aviation Navigation (domestic) International marine
Methods
- 58 -

Table 1.33
CRF IEAa Difference CRF IEAa Difference CRF IEAa Difference CRF IEAa Difference(%) (%) (%) (%)
Australia GCV 80,168 75,089 -6.3 3,684 1,971 -46.5 124,158 89,045 -28.3 208,011 166,105 -20.1Austria NCV 939 1,516 61.4 87 20,789 21,581 3.8 21,815 23,097 5.9Belarus NCV 45 11 3,448 3,504 0Belgium NCV 535 175 134 -23.1 55,200 54,176 -1.9 55,375 54,846 -1.0Bulgaria NCV 628 1,115 77.5 49 45 -8.8 5,654 5,395 -4.6 6,331 6,555 3.5Canada GCV 184,675 165,650 -10.3 3,472 3,270 -5.8 39,916 39,194 -1.8 228,063 208,114 -8.7Croatia NCV 1,631 2,229 36.7 4 45 904.7 1,389 847 -39.0 3,025 3,121 3.2Czech Republic NCV 1,524 1,427 -6.4 110 134 22.2 7,017 7,268 3.6 8,651 8,829 2.1Denmark NCV 1,927 1,382 -28.3 98 90 -8.9 28,511 29,830 4.6 30,536 31,302 2.5Estonia NCV 797 2 0 847 799 847 6.0European Community NCV 322,053 3,830 NE 325,883 0Finland NCV 4,361 6,243 43.1 53 134 153.6 14,721 15,160 3.0 19,135 21,537 12.6Franceb NCV 77,138 74,776 -3.1 1,210 204,876 207,653 1.4 282,014 283,639 0.6
Germany NCV 57,400 IE NE 57,400 0Greece NCV 17,260 16,453 -4.7 IE 32,863 32,862 0.0 50,123 49,316 -1.6Hungary NO IE 8,150 8,918 9.4 8,150 8,918 9.4Ireland NCV 1,469 1,694 15.4 NE 45 31,380 32,238 2.7 32,848 33,977 3.4Italy NCV 37,318 3,478 -90.7 527 538 2.0 97,570 138,227 41.7 135,415 142,243 5.0Japan GCV 162,440 154,592 -4.8 420 403 -4.1 299,268 301,960 0.9 462,128 456,954 -1.1Latvia NCV 91 NO 1,075 1,204 12.0 1,166 1,204 3.3Lithuania NCV NO 134 22 45 103.6 626 535 -14.5 648 714 10.1Luxembourg 0 0 0 0Monacob NCV 49 NO NO 49 0
Netherlands NCV 3,089 3,032 -1.8 IE 90 140,827 144,291 2.5 143,916 147,413 2.4New Zealand NCV 14,248 14,447 1.4 633 627 -1.0 27,617 26,575 -3.8 42,499 41,649 -2.0Norway NCV 12,322 10,479 -15.0 176 10,122 17,256 70.5 22,619 27,735 22.6Portugal NCV 5,331 6,332 18.8 27 90 233.8 28,946 25,862 -10.7 34,304 32,283 -5.9Romania NCV 935 758 90 -88.2 0 4,191 1,693 4,281 152.9Slovakia NCV 667 10 500 2,096 319.1 1,176 2,096 78.2Slovenia NCV 0 33 45 36.9 1,156 1,204 4.2 1,189 1,249 5.1Spain NCV 69,246 71,165 2.8 477 582 22.1 111,326 115,264 3.5 181,049 187,011 3.3Sweden NCV 8,168 9,408 15.2 50 179 258.8 22,045 25,148 14.1 30,263 34,736 14.8Switzerland NCV 2,898 3,835 32.3 IE 224 56,442 57,476 1.8 59,340 61,534 3.7Ukraine NCV 2,389 10 224 2,053.4 NA 13,065 2,399 13,289 453.8United Kingdom NCV 38,408 147,636 284.4 2,337 2,285 -2.2 375,216 303,431 -19.1 415,960 453,351 9.0United States GCV 2,634,988 2,645,089 0.4 35,588 41,260 15.9 889,234 715,883 -19.5 3,559,810 3,402,232 -4.4
a Source: IEA [unpublished].b IEA data for Monaco are included in the French data.
(TJ)
Domestic and international aviation, activity data (2002)
Civil aviation (domestic) International aviationTotal jet kerosene and aviation gasoline
Jet kerosene Aviation gasoline Jet keroseneActivity data in CRF
based on(TJ) (TJ) (TJ)
- 59 -

Table 1.34
CRF IEAa Difference CRF IEAa Difference CRF IEAa Difference CRF IEAa Difference CRF IEAa Difference CRF IEAa Difference
(%) (%) (%) (%) (%) (%)
Australia GCV 6,119 3,596 4,117 14.49 31,233 26,487 -15.20 3,734 3,423 -8.32 37,353 26,487 -29.09 7,330 7,540 2.87Austria NCV 0 750 347 -53.78 0 0 0 750 347 -53.78BelarusBelgium NCV 1,528 3,939 157.80 4,724 5,027 6.40 260,350 253,780 -2.52 32,656 33,150 1.51 261,878 257,719 -1.59 37,380 38,177 2.13Bulgaria NO NO NO 4,416 4,550 3.03 4,416 4,550 3.03Canada GCV 33,294 30,547 -8.25 38,350 36,963 -3.62 31,463 40,073 27.37 7,399 7,280 -1.61 64,757 70,620 9.05 45,750 44,243 -3.29Croatia NCV 293 281 -4.10 1,192 1,213 1.82 506 523 3.18 470 477 1.46 800 804 0.51 1,661 1,690 1.72Czech Republic NCV 0 361 130 -63.99 NO NO 0 361 130 -63.99Denmark NCV 2,064 2,050 -0.70 4,325 3,467 -19.84 17,547 17,363 -1.04 21,579 21,883 1.41 19,611 19,413 -1.01 25,904 25,350 -2.14Estonia NCV 4 298 173 -41.84 2,836 2,854 0.61 2,027 2,123 4.75 2,840 2,854 0.47 2,325 2,297 -1.22European Community NCV 79,817 146,971 NE NEFinland NCV 2,098 2,090 -0.38 2,510 4,420 76.10 22,518 22,347 -0.76 4,337 4,420 1.91 24,616 24,438 -0.73 6,847 8,840 29.11Franceb NCV 1,832 23,257 21,667 -6.84 85,930 86,335 0.47 16,651 22,057 32.47 87,762 86,335 -1.63 39,908 43,723 9.56
Germany NCV NO 9,967 77,818 20,578 77,818 30,545Greece NCV 11,374 11,375 0.01 14,781 14,300 -3.26 105,459 105,467 0.01 23,788 23,790 0.01 116,832 116,842 0.01 38,569 38,090 -1.24Hungary NCV NO 84 87 3.17 NA NA 84 87 3.17Ireland NCV 728 723 -0.68 53 43 -18.38 221 2,090 845.45 4,232 4,203 -0.68 949 2,814 196.32 4,285 4,247 -0.90Italy NCV 34,583 35,980 10,053 -72.06 60,196 93,570 55.44 2,127 29,640 1,293.74 94,779 93,570 -1.28 38,107 39,693 4.16Japan GCV IE 116,681 8,670 57,503 563.23 NE 184,085 NE 5,113 300,766 62,617Latvia NCV 81 80 -0.76 595 607 1.96 5,010 4,944 -1.32 3,017 3,077 1.98 5,091 5,024 -1.31 3,612 3,683 1.98Lithuania NCV NO 163 173 6.34 3,607 3,617 0.29 935 953 1.96 3,607 3,617 0.29 1,098 1,127 2.61Luxembourg NCV 0 80 80Monacob NCV NO 160 NO NO NO 160
Netherlands NCV NO 12,639 12,827 1.48 523,072 512,786 -1.97 88,888 90,220 1.50 523,072 512,786 -1.97 101,527 103,047 1.50New Zealand NCV IE 0 5,113 11,352 8,722 -23.17 3,278 4,983 52.02 8,722 3,278 10,097 208.01Norway NCV 127 121 -5.05 30,274 27,690 -8.53 11,037 9,968 -9.68 17,997 18,113 0.65 11,164 10,089 -9.63 48,270 45,803 -5.11Portugal NCV 1,045 40 -96.15 1,896 3,727 96.58 12,856 14,671 14.11 2,892 5,503 90.27 13,901 14,711 5.83 4,788 9,230 92.77Romania NCV 204 3,014 1,376.25 4,058 1,300 -67.96 0 0 204 3,014 1,376.25 4,058 1,300 -67.96Slovakia NCV 0 1,638 NO 307 0 1,945Slovenia NCV IE IE NA NASpain NCV 20,848 9,968 -52.19 9,448 49,010 418.73 245,138 245,219 0.03 40,954 41,080 0.31 265,986 255,187 -4.06 50,402 90,090 78.74Sweden NCV 1,899 1,769 -6.89 4,375 4,463 2.01 46,037 43,650 -5.19 6,276 6,327 0.81 47,937 45,418 -5.25 10,651 10,790 1.30Switzerland NCV IE 1,456 347 -76.19 NO NO 347 1,456 693 -52.38Ukraine NCV 1,083 4,592 NA NA 1,083 4,592United Kingdom NCV 1,818 1,447 -20.41 22,185 24,527 10.56 40,859 39,832 -2.51 53,355 61,880 15.98 42,677 41,278 -3.28 75,540 86,407 14.39United States GCV 369,526 603 -99.84 298,393 305,870 682,080 123.00 74,096 286,217 286.28 675,396 682,683 1.08 372,490 286,217 -23.16
a Source: IEA [unpublished].b IEA data for Monaco are included in the French data.
Domestic and international navigation, activity data (2002)
Navigation (domestic) International marine transport TotalResidual oil Gas / diesel oil Residual oil Gas / diesel oilActivity
data in CRF based
on (TJ) (TJ)
Residual oil Gas / diesel oil
(TJ) (TJ) (TJ) (TJ)
- 60 -
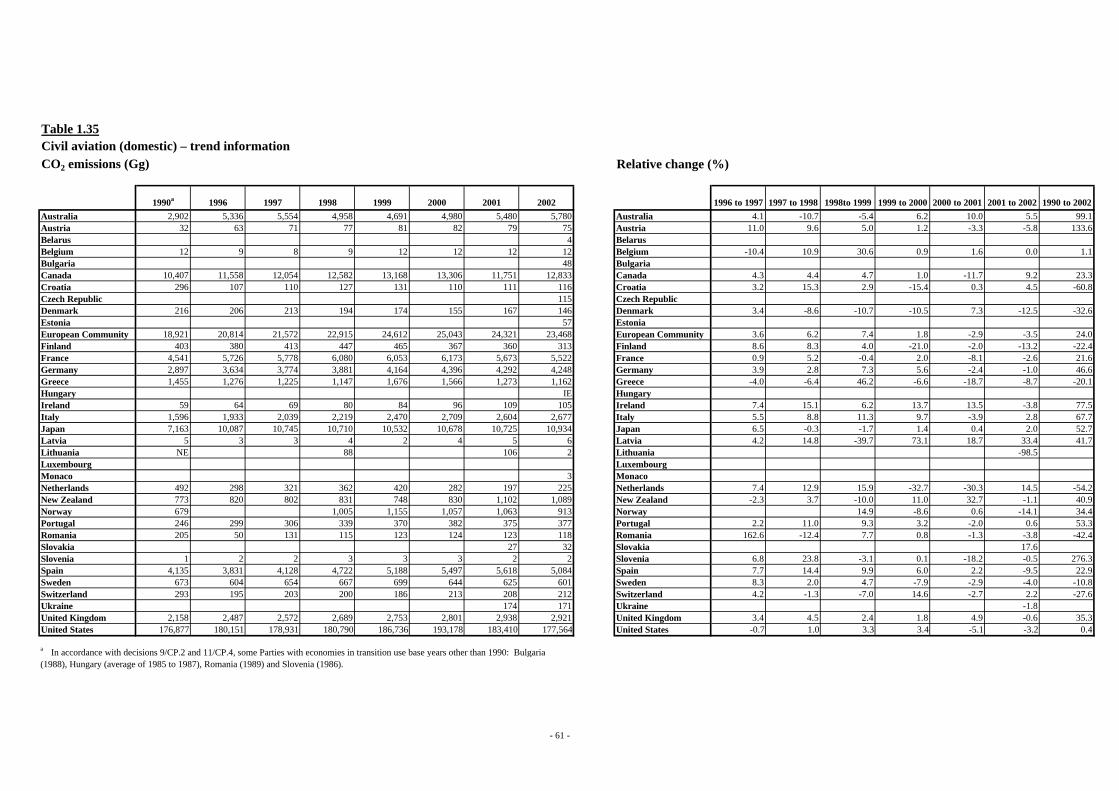
Table 1.35
CO2 emissions (Gg)
1990a 1996 1997 1998 1999 2000 2001 2002 1996 to 1997 1997 to 1998 1998to 1999 1999 to 2000 2000 to 2001 2001 to 2002 1990 to 2002Australia 2,902 5,336 5,554 4,958 4,691 4,980 5,480 5,780 Australia 4.1 -10.7 -5.4 6.2 10.0 5.5 99.1Austria 32 63 71 77 81 82 79 75 Austria 11.0 9.6 5.0 1.2 -3.3 -5.8 133.6Belarus 4 BelarusBelgium 12 9 8 9 12 12 12 12 Belgium -10.4 10.9 30.6 0.9 1.6 0.0 1.1Bulgaria 48 BulgariaCanada 10,407 11,558 12,054 12,582 13,168 13,306 11,751 12,833 Canada 4.3 4.4 4.7 1.0 -11.7 9.2 23.3Croatia 296 107 110 127 131 110 111 116 Croatia 3.2 15.3 2.9 -15.4 0.3 4.5 -60.8Czech Republic 115 Czech RepublicDenmark 216 206 213 194 174 155 167 146 Denmark 3.4 -8.6 -10.7 -10.5 7.3 -12.5 -32.6Estonia 57 EstoniaEuropean Community 18,921 20,814 21,572 22,915 24,612 25,043 24,321 23,468 European Community 3.6 6.2 7.4 1.8 -2.9 -3.5 24.0Finland 403 380 413 447 465 367 360 313 Finland 8.6 8.3 4.0 -21.0 -2.0 -13.2 -22.4France 4,541 5,726 5,778 6,080 6,053 6,173 5,673 5,522 France 0.9 5.2 -0.4 2.0 -8.1 -2.6 21.6Germany 2,897 3,634 3,774 3,881 4,164 4,396 4,292 4,248 Germany 3.9 2.8 7.3 5.6 -2.4 -1.0 46.6Greece 1,455 1,276 1,225 1,147 1,676 1,566 1,273 1,162 Greece -4.0 -6.4 46.2 -6.6 -18.7 -8.7 -20.1Hungary IE HungaryIreland 59 64 69 80 84 96 109 105 Ireland 7.4 15.1 6.2 13.7 13.5 -3.8 77.5Italy 1,596 1,933 2,039 2,219 2,470 2,709 2,604 2,677 Italy 5.5 8.8 11.3 9.7 -3.9 2.8 67.7Japan 7,163 10,087 10,745 10,710 10,532 10,678 10,725 10,934 Japan 6.5 -0.3 -1.7 1.4 0.4 2.0 52.7Latvia 5 3 3 4 2 4 5 6 Latvia 4.2 14.8 -39.7 73.1 18.7 33.4 41.7Lithuania NE 88 106 2 Lithuania -98.5Luxembourg LuxembourgMonaco 3 MonacoNetherlands 492 298 321 362 420 282 197 225 Netherlands 7.4 12.9 15.9 -32.7 -30.3 14.5 -54.2New Zealand 773 820 802 831 748 830 1,102 1,089 New Zealand -2.3 3.7 -10.0 11.0 32.7 -1.1 40.9Norway 679 1,005 1,155 1,057 1,063 913 Norway 14.9 -8.6 0.6 -14.1 34.4Portugal 246 299 306 339 370 382 375 377 Portugal 2.2 11.0 9.3 3.2 -2.0 0.6 53.3Romania 205 50 131 115 123 124 123 118 Romania 162.6 -12.4 7.7 0.8 -1.3 -3.8 -42.4Slovakia 27 32 Slovakia 17.6Slovenia 1 2 2 3 3 3 2 2 Slovenia 6.8 23.8 -3.1 0.1 -18.2 -0.5 276.3Spain 4,135 3,831 4,128 4,722 5,188 5,497 5,618 5,084 Spain 7.7 14.4 9.9 6.0 2.2 -9.5 22.9Sweden 673 604 654 667 699 644 625 601 Sweden 8.3 2.0 4.7 -7.9 -2.9 -4.0 -10.8Switzerland 293 195 203 200 186 213 208 212 Switzerland 4.2 -1.3 -7.0 14.6 -2.7 2.2 -27.6Ukraine 174 171 Ukraine -1.8United Kingdom 2,158 2,487 2,572 2,689 2,753 2,801 2,938 2,921 United Kingdom 3.4 4.5 2.4 1.8 4.9 -0.6 35.3United States 176,877 180,151 178,931 180,790 186,736 193,178 183,410 177,564 United States -0.7 1.0 3.3 3.4 -5.1 -3.2 0.4
Civil aviation (domestic) – trend information Relative change (%)
a In accordance with decisions 9/CP.2 and 11/CP.4, some Parties with economies in transition use base years other than 1990: Bulgaria (1988), Hungary (average of 1985 to 1987), Romania (1989) and Slovenia (1986).
- 61 -

Table 1.36
CO2 emissions (Gg)
1990a 1996 1997 1998 1999 2000 2001 2002 1996 to 1997 1997 to 1998 1998to 1999 1999 to 2000 2000 to 2001 2001 to 2002 1990 to 2002Australia 4,345 6,312 6,501 7,233 7,268 7,331 8,151 8,567 Australia 3.0 11.3 0.5 0.9 11.2 5.1 97.2Austria 886 1,466 1,526 1,578 1,542 1,675 1,615 1,512 Austria 4.0 3.5 -2.3 8.6 -3.6 -6.3 70.7Belarus 245 BelarusBelgium 3,096 3,340 3,601 4,068 4,534 4,661 4,219 4,219 Belgium 7.8 13.0 11.4 2.8 -9.5 0.0 36.3Bulgaria 1,037 472 428 280 319 270 393 399 Bulgaria -9.4 -34.5 14.1 -15.5 45.8 1.5 -61.5Canada 2,729 3,073 2,992 2,879 3,032 3,026 3,162 2,722 Canada -2.6 -3.8 5.3 -0.2 4.5 -13.9 -0.3Croatia 202 174 145 148 137 115 115 98 Croatia -16.6 2.4 -7.5 -16.3 -0.3 -14.1 -51.4Czech Republic 617 459 407 225 539 343 439 497 Czech Republic -11.3 -44.8 139.7 -36.3 28.0 13.2 -19.5Denmark 1,762 1,970 2,010 2,158 2,290 2,348 2,380 2,053 Denmark 2.0 7.4 6.1 2.5 1.3 -13.7 16.5Estonia EstoniaEuropean Community 60,971 82,122 86,809 93,456 100,894 107,014 104,023 102,051 European Community 5.7 7.7 8.0 6.1 -2.8 -1.9 67.4Finland 974 957 965 990 1,058 1,027 1,054 1,042 Finland 0.8 2.6 6.9 -2.9 2.6 -1.1 7.0France 8,618 11,240 11,634 12,255 13,761 14,361 14,587 14,667 France 3.5 5.3 12.3 4.4 1.6 0.6 70.2Germany 11,589 14,537 15,097 15,523 16,656 17,582 17,168 16,990 Germany 3.9 2.8 7.3 5.6 -2.4 -1.0 46.6Greece 2,448 2,498 2,416 2,536 2,262 2,498 2,322 2,322 Greece -3.3 5.0 -10.8 10.4 -7.1 0.0 -5.1Hungary 431 560 531 556 596 634 538 577 Hungary -5.1 4.6 7.3 6.3 -15.1 7.2 33.7Ireland 1,059 1,206 1,258 1,296 1,542 1,566 1,986 2,246 Ireland 4.3 3.0 19.0 1.6 26.9 13.1 112.1Italy 4,049 5,932 6,103 6,635 7,367 7,786 7,665 6,902 Italy 2.9 8.7 11.0 5.7 -1.6 -10.0 70.5Japan 13,183 18,433 19,125 19,992 18,377 16,504 18,643 21,150 Japan 3.8 4.5 -8.1 -10.2 13.0 13.4 60.4Latvia 151 95 95 85 86 75 75 75 Latvia -0.1 -10.3 1.8 -12.6 -1.0 0.0 -50.4Lithuania NE 84 104 92 Lithuania -11.6Luxembourg 903 971 1,138 LuxembourgMonaco MonacoNetherlands 4,497 8,249 8,906 9,709 10,070 10,067 9,855 10,280 Netherlands 8.0 9.0 3.7 0.0 -2.1 4.3 128.6New Zealand 1,341 1,635 1,709 1,701 1,942 1,757 1,880 1,862 New Zealand 4.5 -0.5 14.2 -9.5 7.0 -1.0 38.8Norway 619 691 771 821 942 913 835 740 Norway 11.5 6.6 14.6 -3.1 -8.5 -11.5 19.4Portugal 1,644 1,741 1,790 1,901 2,065 2,177 2,147 2,049 Portugal 2.8 6.2 8.6 5.4 -1.4 -4.6 24.6Romania NE NE NE NE NE NE NE NE RomaniaSlovakia NE 44 39 36 37 37 35 37 Slovakia -11.4 -7.8 0.9 1.7 -5.9 4.9Slovenia 97 53 56 52 62 71 80 83 Slovenia 5.5 -8.0 19.4 15.0 12.9 2.9 -15.2Spain 3,432 6,554 7,071 7,478 7,737 8,314 8,492 8,092 Spain 7.9 5.7 3.5 7.5 2.1 -4.7 135.8Sweden 1,335 1,476 1,560 1,673 1,879 1,926 1,871 1,611 Sweden 5.7 7.2 12.3 2.5 -2.9 -13.9 20.7Switzerland 3,226 3,960 4,100 4,285 4,589 4,766 4,489 4,132 Switzerland 3.5 4.5 7.1 3.9 -5.8 -8.0 28.1Ukraine UkraineUnited Kingdom 14,791 20,301 21,622 24,198 26,494 29,412 27,613 26,927 United Kingdom 6.5 11.9 9.5 11.0 -6.1 -2.5 82.1United States 46,594 52,168 55,929 57,194 58,868 60,548 59,391 59,143 United States 7.2 2.3 2.9 2.9 -1.9 -0.4 26.9
International bunkers: aviation – trend information Relative change (%)
a In accordance with decisions 9/CP.2 and 11/CP.4, some Parties with economies in transition use base years other than 1990: Bulgaria (1988), Hungary (average of 1985 to 1987), Romania (1989) and Slovenia (1986).
- 62 -

Table 1.37
CO2 emissions (Gg)
1990a 1996 1997 1998 1999 2000 2001 2002 1996 to 1997 1997 to 1998 1998to 1999 1999 to 2000 2000 to 2001 2001 to 2002 1990 to 2002Australia 2,300 2,115 2,105 1,812 1,532 1,618 1,587 1,560 Australia -0.5 -13.9 -15.5 5.6 -1.9 -1.7 -32.2Austria 52 54 62 62 63 63 64 64 Austria 14.5 1.0 0.7 0.7 0.7 0.7 23.4Belarus BelarusBelgium 340 312 324 335 367 438 450 459 Belgium 3.9 3.5 9.5 19.2 2.7 2.0 34.9Bulgaria BulgariaCanada 4,733 4,158 4,216 4,827 4,646 4,776 5,177 5,154 Canada 1.4 14.5 -3.7 2.8 8.4 -0.4 8.9Croatia 133 149 118 90 88 86 92 111 Croatia -20.7 -23.5 -3.1 -2.1 7.2 20.6 -16.7Czech Republic 26 Czech RepublicDenmark 551 702 629 534 497 507 498 554 Denmark -10.4 -15.0 -7.0 2.0 -1.8 11.3 0.6Estonia 33 EstoniaEuropean Community 19,444 18,750 18,485 19,306 19,639 18,560 19,060 18,758 European Community -1.4 4.4 1.7 -5.5 2.7 -1.6 -3.5Finland 227 258 249 257 501 481 464 503 Finland -3.4 3.0 95.4 -4.1 -3.6 8.4 121.6France 1,896 1,856 1,894 1,871 2,045 1,844 2,149 2,433 France 2.0 -1.2 9.3 -9.8 16.5 13.2 28.3Germany 2,050 1,602 1,267 1,161 946 877 846 738 Germany -20.9 -8.4 -18.5 -7.3 -3.6 -12.8 -64.0Greece 1,825 1,493 1,812 2,793 2,761 1,580 2,145 1,937 Greece 21.4 54.1 -1.2 -42.8 35.8 -9.7 6.2Hungary 6 HungaryIreland 85 104 110 116 132 122 125 59 Ireland 6.0 5.6 13.3 -7.2 2.4 -52.6 -30.4Italy 5,419 5,744 5,956 6,240 6,092 6,223 6,215 6,117 Italy 3.7 4.8 -2.4 2.1 -0.1 -1.6 12.9Japan 13,354 15,232 16,216 14,433 14,359 14,777 14,313 13,945 Japan 6.5 -11.0 -0.5 2.9 -3.1 -2.6 4.4Latvia 449 79 76 54 45 41 53 50 Latvia -3.4 -29.5 -15.6 -8.5 28.5 -5.7 -88.8Lithuania NE 14 11 12 Lithuania 13.9Luxembourg 6 6 6 LuxembourgMonaco 13 MonacoNetherlands 877 800 848 817 807 1,004 969 923 Netherlands 5.9 -3.7 -1.1 24.3 -3.4 -4.8 5.2New Zealand 233 281 208 143 215 374 325 360 New Zealand -25.9 -31.3 50.5 73.6 -13.0 10.8 54.5Norway 1,929 2,534 2,766 2,524 2,270 2,240 Norway 9.2 -8.8 -10.1 -1.3 16.1Portugal 477 313 246 204 258 254 235 225 Portugal -21.6 -17.1 26.6 -1.7 -7.2 -4.3 -52.8Romania 1,676 594 1,016 765 680 429 270 312 Romania 70.9 -24.7 -11.1 -36.9 -37.1 15.7 -81.4Slovakia 119 123 Slovakia 2.9Slovenia IE IE IE IE IE IE IE IE SloveniaSpain 1,536 1,652 1,317 1,322 1,770 1,850 2,098 2,338 Spain -20.3 0.3 33.9 4.5 13.4 11.5 52.2Sweden 643 440 504 584 652 664 664 657 Sweden 14.6 15.8 11.8 1.8 -0.1 -1.1 2.1Switzerland 101 94 96 97 99 101 104 107 Switzerland 1.9 1.9 1.9 1.8 3.2 3.1 6.0Ukraine 654 423 Ukraine -35.4United Kingdom 3,461 3,415 3,262 3,005 2,741 2,648 2,133 1,747 United Kingdom -4.5 -7.9 -8.8 -3.4 -19.4 -18.1 -49.5United States 47,950 47,756 33,351 27,086 38,058 59,136 37,196 52,384 United States -30.2 -18.8 40.5 55.4 -37.1 40.8 9.2
Navigation (domestic) – trend information Relative change (%)
a In accordance with decisions 9/CP.2 and 11/CP.4, some Parties with economies in transition use base years other than 1990: Bulgaria (1988), Hungary (average of 1985 to 1987), Romania (1989) and Slovenia (1986).
- 63 -

Table 1.38
CO2 emissions (Gg)
1990a 1996 1997 1998 1999 2000 2001 2002 1996 to 1997 1997 to 1998 1998to 1999 1999 to 2000 2000 to 2001 2001 to 2002 1990 to 2002Australia 2,056 2,719 2,519 2,240 2,485 2,769 2,474 2,533 Australia -7.3 -11.1 10.9 11.4 -10.6 2.4 23.2Austria NO NO NO NO NO NO NO NO AustriaBelarus BelarusBelgium 13,303 15,890 17,609 18,402 14,845 16,052 16,201 22,341 Belgium 10.8 4.5 -19.3 8.1 0.9 37.9 67.9Bulgaria 1,016 732 1,092 1,233 26 205 306 336 Bulgaria 49.3 12.9 -97.9 704.1 49.0 9.9 -66.9Canada 2,995 3,085 3,046 3,776 3,368 3,446 3,712 2,815 Canada -1.3 24.0 -10.8 2.3 7.7 -24.2 -6.0Croatia 109 115 74 81 66 57 89 73 Croatia -35.9 10.0 -18.9 -13.2 56.7 -18.0 -32.5Czech Republic Czech RepublicDenmark 3,087 4,803 4,403 4,414 4,155 4,279 3,605 2,966 Denmark -8.3 0.2 -5.9 3.0 -15.8 -17.7 -3.9Estonia 0 289 319 339 362 329 313 368 Estonia 10.7 6.2 6.7 -9.3 -4.8 17.7European Community 103,753 113,281 123,573 129,092 123,048 129,402 134,142 139,719 European Community 9.1 4.5 -4.7 5.2 3.7 4.2 34.7Finland 1,800 1,181 1,286 1,658 1,764 2,032 1,815 2,043 Finland 8.9 28.9 6.4 15.2 -10.7 12.6 13.5France 8,137 7,568 8,379 9,166 9,311 9,624 8,203 7,951 France 10.7 9.4 1.6 3.4 -14.8 -3.1 -2.3Germany 7,980 6,472 6,922 6,565 6,685 6,966 7,097 7,593 Germany 6.9 -5.1 1.8 4.2 1.9 7.0 -4.9Greece 8,028 9,901 9,927 11,058 9,838 11,359 11,030 9,893 Greece 0.3 11.4 -11.0 15.5 -2.9 -10.3 23.2Hungary NO NO NO NO NO NO NO NO HungaryIreland 56 497 484 503 543 477 390 327 Ireland -2.7 3.8 8.0 -12.2 -18.2 -16.1 481.2Italy 4,404 2,870 3,072 3,094 3,093 3,855 4,371 4,993 Italy 7.0 0.7 0.0 24.6 13.4 14.2 13.4Japan 17,518 12,456 16,238 17,132 15,802 16,998 14,700 15,551 Japan 30.4 5.5 -7.8 7.6 -13.5 5.8 -11.2Latvia 89 104 148 178 156 185 616 607 Latvia 42.1 19.9 -12.1 18.2 233.5 -1.5 579.1Lithuania 0 0 312 351 Lithuania 12.3Luxembourg LuxembourgMonaco MonacoNetherlands 35,267 37,196 39,530 39,822 41,143 43,429 47,721 47,124 Netherlands 6.3 0.7 3.3 5.6 9.9 -1.3 33.6New Zealand 1,033 1,061 1,110 1,072 915 746 790 1,051 New Zealand 4.6 -3.4 -14.7 -18.5 6.0 33.0 1.8Norway 1,478 2,480 3,000 2,899 2,733 2,712 2,624 2,194 Norway 21.0 -3.4 -5.7 -0.8 -3.2 -16.4 48.4Portugal 1,194 1,112 1,158 1,225 1,492 1,624 1,128 1,216 Portugal 4.2 5.8 21.8 8.9 -30.6 7.8 1.9Romania NE NE NE NE NE NE NE NE RomaniaSlovakia NE 39 23 33 7 0 21 23 Slovakia -40.4 39.8 -78.9 7.9Slovenia NA NA NA NA NA NA NA NA SloveniaSpain 11,780 15,029 18,532 19,546 19,074 19,496 21,797 22,345 Spain 23.3 5.5 -2.4 2.2 11.8 2.5 89.7Sweden 2,159 3,586 4,206 4,851 4,748 4,613 4,501 3,968 Sweden 17.3 15.3 -2.1 -2.8 -2.4 -11.8 83.8Switzerland NO NO NO NO NO NO NO NO SwitzerlandUkraine UkraineUnited Kingdom 6,559 7,213 8,064 8,788 6,357 5,597 6,284 6,959 United Kingdom 11.8 9.0 -27.7 -11.9 12.3 10.7 6.1United States 67,272 50,109 53,960 57,900 46,429 40,859 38,478 27,701 United States 7.7 7.3 -19.8 -12.0 -5.8 -28.0 -58.8
International bunkers: marine – trend informationRelative change (%)
a In accordance with decisions 9/CP.2 and 11/CP.4, some Parties with economies in transition use base years other than 1990: Bulgaria (1988), Hungary (average of 1985 to 1987), Romania (1989) and Slovenia (1986).
- 64 -

Table 1.39
IEAc
Underground minesSurface mines
Total TotalMining
activitiesPost-mining
activitiesMining
activitiesPost-mining
activities
(%) (%)IPCC default EFb 4.50 - 16.75 0.60 - 2.68 0.20 - 1.34 0 - 0.13
Australia L, T 3.35 T2 CS 91.9 244.0 335.8 341.8 1.79 5.22 0.30 1.33 NAAustria 0.01 T1 D NO 1.2 1.2 0.21BelarusBelgium C C NO NO NO NO NO NOBulgaria L 1.97 T1 D 2.9 23.2 26.0 25.9 -0.36 11.73 1.68 0.80 0.07Canada 0.14 CS CS 1.4 84.5 85.9 10.52 IE 0.38 IECroatia T1 D NO NOCzech Republic L 3.49 T3 CS 14.5 45.5 60.0 63.4 5.68 12.16 1.62 0.77 0.07Denmark D D NO NOEstonia L 1.14 TI D 6.1 6.3 12.4 12.4 0.00 1.34 0.13 0.20 0.07European Community
L0.39 C, CS, D, T1, T2,
T3C, CS, D NE NE NE NE NE NE
Finland CS CS NO NOFranced T 0.24 C CS 1.6 1.0 2.6 1.6 -38.02 38.55 0.04
Germany L, T 0.71 CS CS 26.4 177.7 204.1 12.05 0.58 0.07 NEGreece L 1.10 T1 D NO 70.5 70.5 70.5 0.00 NO NO 1.01 IEHungary L 0.66 D CS 5.5 7.6 13.0 3.64 0.54 0.21 0.01Ireland NA NAItaly 0.00 D, C D, CS 0.2 0.0 0.2 0.2 0.00 6.70Japan 0.01 T2 CS 0.7 0.6 1.3 5.41 1.64 0.77 0.07Latvia NO NO NO NO NO NO NO NOLithuania NO NO NO NO NO NOLuxembourgMonacod NO NO
Netherlands IE NO NO NO NO NO NONew Zealand T 0.47 T1 CS/D 0.9 3.6 4.5 4.5 0.00 13.74 1.60 0.77 0.07Norway 0.04 T1 CS 2.1 2.1 2.1 0.01 0.47 IE NO NOPortugal T2 D+C NO NORomania L 2.24 T1 T1 9.6 22.3 31.9 30.4 -4.72 11.73 1.56 0.77 0.06Slovakia L 0.96 T2 CS 3.4 NO 3.4 3.4 0.86 6.70 0.30 NO NOSlovenia L, T 1.29 D CS 4.7 NO 4.7 4.7 -0.01 1.83 0.85 NO NOSpain T 0.25 T1 CS 11.5 14.4 25.9 18.5 -28.66 2.95 0.91 0.18 0.03Sweden T2/T3 CS NO NOSwitzerland NO NO NO NO NO NOUkraine L 6.89 D D 81.6 0.9 82.5 18.09 1.34 0.94 0.13United Kingdom L, T 0.81 T2 CS 16.4 13.1 29.5 29.5 0.00 13.47 1.16 0.34United States L, T 0.75 T2, T3 CS 324.2 667.6 991.8 991.8 0.00 5.23 0.94 0.63 0.10
b Source of default emission factors: IPCC Guidelines, volume 3, pages 1.105–1.110 (Tier 1).c Source: IEA [unpublished].d IEA data for Monaco are included in the French data.
CH4
(Mt) (kg/t)
IEF CRF
Difference
Underground mines Surface mines
a Information on methods and emission factors included in this table is as reported by Parties. It may not reflect the actual method or type of emission factor used for all subcategories within the category 1.B.1 Solid fuels.
Fugitive emissions from fuels: coal mining and handling, CH4 (2002)
Key source
Share of national
total
Methods and EF useda
Methods EF
dataActivity
- 65 -

Table 1.40
CH4 emissions (Gg)
1990a 1996 1997 1998 1999 2000 2001 2002 1996 to 1997 1997 to 1998 1998to 1999 1999 to 2000 2000 to 2001 2001 to 2002 1990 to 2002Australia 753 847 866 955 903 935 878 831 Australia 2.2 10.3 -5.4 3.5 -6.1 -5.4 10.4Austria 1 0 0 0 0 0 0 0 Austria 2.0 0.9 -0.2 10.3 -2.0 0.0 -49.7Belarus BelarusBelgium NE NE NE NE NO NO NO NO BelgiumBulgaria 58 BulgariaCanada 91 84 78 65 51 45 47 47 Canada -7.2 -16.8 -20.7 -12.2 4.3 0.0 -48.3Croatia 2 1 1 1 0 NO NO NO Croatia -26.8 4.7 -69.9Czech Republic 237 Czech RepublicDenmark DenmarkEstonia 11 EstoniaEuropean Community 2,344 1,468 1,371 1,234 1,126 971 795 773 European Community -6.6 -10.0 -8.7 -13.8 -18.1 -2.9 -67.0Finland FinlandFrance 170 137 117 116 111 111 71 63 France -14.6 -0.6 -4.3 0.0 -36.5 -11.1 -63.0Germany 1,221 738 691 627 596 483 365 346 Germany -6.4 -9.3 -4.9 -18.9 -24.6 -5.2 -71.7Greece 52 60 59 61 62 64 67 71 Greece -1.6 3.5 1.9 3.0 3.8 6.2 35.8Hungary 24 HungaryIreland NO NO NO NO NO NO NO NO IrelandItaly 2 0 0 0 0 1 1 1 Italy -39.5 -86.6 -20.8 3,052.6 16.0 17.3 -54.5Japan 134 62 48 42 41 37 27 6 Japan -22.4 -13.3 -0.8 -11.2 -25.9 -79.2 -95.8Latvia NO NO NO NO NO NO NO NO LatviaLithuania NO NE NE NO Lithuania
Luxembourg LuxembourgMonaco MonacoNetherlands NO NO NO NO NO NO NO NO NetherlandsNew Zealand 10 20 14 17 17 16 17 17 New Zealand -31.8 22.8 0.6 -3.0 3.9 -0.7 68.6Norway 0 0 0 0 1 1 Norway 23.1 56.4 182.9 3.8 513.2Portugal 3 PortugalRomania 303 204 165 128 112 141 159 146 Romania -19.1 -22.5 -12.6 26.2 12.4 -8.0 -51.8Slovakia 24 24 Slovakia -1.4Slovenia 17 12 13 13 12 12 11 13 Slovenia 7.2 -1.2 -6.7 -1.8 -7.7 13.4 -26.5Spain 84 69 67 61 56 56 49 48 Spain -1.8 -10.1 -7.7 0.8 -12.2 -3.6 -43.4Sweden NO NO NO NO NO NO NO NO SwedenSwitzerland NO NO NO NO NO NO NO NO SwitzerlandUkraine 1,612 1,586 Ukraine -1.6United Kingdom 818 473 445 378 310 264 243 244 United Kingdom -5.9 -15.0 -17.9 -14.8 -8.2 0.5 -70.2United States 3,900 3,008 2,983 2,989 2,805 2,677 2,648 2,487 United States -0.8 0.2 -6.2 -4.5 -1.1 -6.1 -36.2
Fugitive emissions from fuels: coal mining and handling – trend informationRelative change (%)
a In accordance with decisions 9/CP.2 and 11/CP.4, some Parties with economies in transition use base years other than 1990: Bulgaria (1988), Hungary (average of 1985 to 1987), Romania (1989) and Slovenia (1986).
- 66 -

Table 1.41
CH4 IEFb CO2 IEF CH4 IEFb CO2 IEF CH4 IEFb CO2 IEF
(%) Methods EF (%) Methods EF Unit Description Unit Description Unit Description
IPCC default EFc 300 - 5,000 PJ Oil produced 745 PJ Oil tankered20 - 250 (S)
90 - 1,400 (R)PJ Oil refined
Australia L, T 1.20 T2 CS L 1.24 T2 CS 1,026 NA PJ Crude oil and ORF produced 745 NA PJ Quantity shipped 1,211 128,314 PJ Oil refined
Austria 0.35 T1, CS D 0.20 T1, CS D, CS, PS
4,444,208 89,266,738 Mt Oil throughput 31,663 Mt Oil refined (SNAP 0401)
Belarus L 3.67 2,711 (e.g. PJ of oil produced) 740 (e.g. PJ oil refined)Belgium 0.27 CS CS 0.10 CS CS NO NO NO NO NO
Bulgaria L 2.24 T1 D 2,650 NE PJ (e.g. PJ of oil produced) 745 NE PJ(e.g. PJ oil loaded in
tankers) 745 NE PJ (e.g. PJ oil refined)
Canada L, T 5.24 CS CS L, T 2.15 CS CS 6,258 760 10^3 m^3Conventional Oil, Heavy Oil and
Crude Oil Production NA NA NA Liquid Product Transport NE NE NA NA
Croatia L, T 4.62 T1 D L, T 2.38 CS CS 2,650 PJ (e.g. PJ of oil produced) 745 PJ(e.g. PJ oil loaded in
tankers) 135 PJ (e.g. PJ oil refined)
Czech Republic 0.34 T1, T3 D, CS NE 5,287 PJ (e.g. PJ of oil produced) (e.g. PJ oil loaded in
tankers) 1,150 PJ (e.g. PJ oil refined)
Denmark 0.10 C C T 0.78 C C (e.g. PJ of oil produced) (e.g. PJ oil loaded in
tankers) (e.g. PJ oil refined)
Estonia L 1.98 TI D 4,000 (e.g. PJ of oil produced) 745(e.g. PJ oil loaded in
tankers) (e.g. PJ oil refined)
European Community L 0.66
C, CS, D, T1, T2, T3
C, CS, D, PS L 0.40
C, CS, MBd, T1,
T3C, CS, D, PS NE NE (e.g. PJ of oil produced) NE NE
(e.g. PJ oil loaded in tankers) NE NE (e.g. PJ oil refined)
Finland 0.01 CS PS 0.03 CS PS (e.g. PJ of oil produced) kt kt oil loaded in tankers kt kt oil refined
France 0.34 C CS L 0.71 C CS PJ Produced PJ ProducedPJ
Loaded PJ Loaded 48 914,455PJ
Refined PJ Refined
Germany L 0.72 CS CS NE NE NE NE (e.g. PJ of oil produced) NE NE (e.g. PJ oil loaded in
tankers) 0 NE t (crude oil & products)
Greece 0.14 T1, C D, C 2,650 NE PJ Crude oil and NGL production 745 NE PJ Crude oil imports 880 NA PJRefinery input (crude oil
and NGL)
Hungary L 2.06 T1 M, CS 54,826 PJ oil produced 6 10^3 m^3 pipeline and tankers 835 PJ oil refined
Ireland 0.12 T1 CS 0.09 T1 CS (e.g. PJ of oil produced) (e.g. PJ oil loaded in
tankers) (e.g. PJ oil refined)Italy L, T 0.92 C, CS CS T 0.35 C, CS CS 236 Gg (Gg of oil produced) 24 17,303 Gg (Gg oil refined)Japan 0.04 T1 D 0.00 T1 D 1 0 10^3 l oil produced 0 0 10^3 l oil produced 91 NE PJ oil refinedLatvia
L, T1.58 CS PS NE NE (e.g. PJ of oil produced) (e.g. PJ oil loaded in
tankers) (e.g. PJ oil refined)
Lithuania L 2.45 C C 0.01 C C NE NE (e.g. PJ of oil produced) 0 NO Mg(e.g. PJ oil loaded in
tankers) NE NE Luxembourg
Monaco (e.g. PJ of oil produced) (e.g. PJ oil loaded in
tankers) (e.g. PJ oil refined)
Netherlands L, T 1.18 CS/T1 CS L, T 0.77CS/T3;>97
:T1 CS IE IE 10^6 m^3 m3 oil produced NE NE 0 603,379 PJRefinery input: Crude oil,
NGL, Other input
New Zealand 0.54 T1 CS/D L, T 0.81 T1 CS NE NE (e.g. PJ of oil produced) 1 NE TJ(e.g. PJ oil loaded in
tankers) 1 NE TJ (e.g. PJ oil refined)Norway L, T 1.15 CS CS L, T 4.83 CS CS IE IE (e.g. PJ of oil produced) PJ Oil loaded 1,349,804 PJ Oil refined
Portugal T 0.37 C+T2 D+C L, T 0.87 MBd C+PS 60,000 1,100,000
Mton crude
processed Consumption of crude 93,088 30,487,809
Mton material
inputProduction (crude and
other materials)
Romania L, T 5.78 T1 T1 NE NE 300 PJ (e.g. PJ of oil produced) 745 PJ(e.g. PJ oil loaded in
tankers) 45 PJ (e.g. PJ oil refined)
Slovakia L 1.54 T1 D,CS NA NA 2,650 NO PJ production 745 NO PJtransport of crude oil
(transfer) 745 NO PJ refining
Slovenia 0.07 T1 D 3 NE TJ (e.g. PJ of oil produced) NO NE TJ(e.g. PJ oil loaded in
tankers) NE TJ (e.g. PJ oil refined)Spain T 0.29 CS,C PS,C L 0.54 9 Mg Crude oil produced 27 Gg Transport of crude oil 1 33,344 Gg Oil refined
Sweden 0.00 T2, CS CS 0.00 CS CS (e.g. PJ oil loaded in
tankers) (e.g. PJ oil refined)Switzerland 0.48 C CS 0.18 C CS NO NO NO NO NO NO 1,042 NO PJ Crude oil usedUkraine L 21.01 D D D D 4,500 PJ oil produced 745 PJ oil 1,000 PJ oil
United Kingdom L, T 1.29 T3 CS L, T 0.87 T3 CS 532 89,087 PJ Oil and gas produced. 115 Gg Offshore loading of oil only 27 PJ Oil refinery throughput
United States L, T 2.09 M M 0.08 T2 CS 511,195 NE 10^6_bbl_per
_year (e.g. PJ of oil produced) 954 NE10^6_bbl_per_year
(e.g. PJ oil loaded in tankers) 4,930 NE
10^6_bbl_per_year (e.g. PJ oil refined)
a Information on methods and emission factors included in this table is as reported by Parties. It may not reflect the actual method or type of emission factor used for all subcategories within the category 1.B.2 Oil and natural gas. b The units of the implied emission factors (IEF) vary from Party to Party depending on the unit of the activity data used. The unit of the IEF is kg/unit of activity data.c Source of emissions factors: IPCC Guidelines, vol. 3, pages 1.119–1.121. For updated detailed emission factors on CH4 and implied emissions factors on CO2 and N2O see the IPCC good practice guidance, table 2.16, pages 2.86–2.87.d Mass balance is indicated by MB.
Value
Refining (R) / Storage (S)Activity data Activity data Activity data
Methods and EF useda
Production Transport
Value Value
Fugitive emissions from fuels: oil and natural gas, CH4, CO2 (2002)CH4 CO2 Oil
Key source
Share of national
total
Methods and EF useda Key
source
Share of national total
- 67 -

Table 1.41
CH4 IEFb CO2 IEF CH4 IEFb CO2 IEF CH4 IEFb CO2 IEF CH4 IEFb CO2 IEFUnit Description Unit Description Unit Description Unit Description
IPCC default EFc 46,000 -314,000
PJ Gas produced 57,000 -628,000
PJ Gas consumed/produced 57,000 -288,000
PJ Gas consumed/produced
0 - 384,000 PJ Gas consumed
Australia 1,088 NA PJ Gas produced 11,026 632 PJ Gas transmitted 368,537 21,349 PJ Utility sales NE NE NEAustria 46,919 10^6 m^3 Gas throughput (a) 2,900 25 km Pipelines length (km) 741 10^6 m^3 Gas Consumption
Belarus 294,253 (e.g. PJ gas produced) 118,007 (e.g. PJ gas consumed)Belgium NE NE NA NA 33,788 NA PJ consumptionBulgaria 227,000 NE PJ (e.g. PJ gas produced) 500,000 NE PJ (e.g. PJ gas consumed) 275,871 PJ (e.g. PJ gas consumed)
Canada 2,823 116 10^6 m^3
Gross New Production of Natural Gas (also
includes oil and Gas Well Drilling and Servicing) 3,230 24 km Pipeline Distance 744 NE km
Pipeline Distance - leakage
Croatia 458,000 PJ (e.g. PJ gas produced) PJ (e.g. PJ gas consumed) (e.g. PJ gas consumed) (e.g. PJ gas consumed)
Czech Republic 49,748 PJ (e.g. PJ gas produced) 3,179 PJ (e.g. PJ gas consumed) 103,842 PJ (e.g. PJ gas consumed) 49,748 PJ (e.g. PJ gas consumed)
Denmark 1 10^3 m^3 (e.g. PJ gas produced) 20 10^6 m^3Gas produced and stock
change 11 10^6 m^3 Gas distributed Incl. in transmission
Estonia 458,000 (e.g. PJ gas produced) 458,000 (e.g. PJ gas consumed)European Community NE NE (e.g. PJ gas produced) NE NE (e.g. PJ gas consumed) NE NE (e.g. PJ gas consumed) (e.g. PJ gas consumed)
Finland (e.g. PJ gas produced) PJ PJ gas consumed PJPJ gas distributed via
local networks 1,000 tt of natural gas released
from pipelines
France 672 2,675,848 PJ
Production PJ Production 57,109 PJ
Consumed PJ Consumed (e.g. PJ gas consumed) (e.g. PJ gas consumed)
Germany 62 NE TJ(natural gas from crude
oil extraction) 9 NE TJ(total amount of gas
consumed) 465 NE km (distribution net) 42 NO TJ (gas consumed)
Greece 21,000 NE PJ Natural gas production IE NE PJ Natural gas consumption 102,500 NE PJ (e.g. PJ gas consumed) NO NO NO NO
Hungary 133,233 PJ gas produced 129,411 PJ gas consumed (e.g. PJ gas consumed) (e.g. PJ gas consumed)
Ireland 10,659 2,300,689 PJ PJ of Gas produced (e.g. PJ gas consumed) 64,489 PJ PJ of gas consumed (e.g. PJ gas consumed)
Italy 176 10^6 m^3 (Mm3 gas produced) 357 10^6 m^3 (Mm3 gas transported) 7,731 10^6 m^3 (Mm3 gas transported)
Japan 4 0 10^3 m^3 gas produced 3,500 25 km Pipelines length 905 PJ
LNG & NG Consumption with
Town Gas Production NE NE
Latvia (e.g. PJ gas produced) (e.g. PJ gas consumed) (e.g. PJ gas consumed)
Lithuania NE NE (e.g. PJ gas produced) NE NE (e.g. PJ gas consumed) 218 14 TJ (e.g. PJ gas consumed) NE NE (e.g. PJ gas consumed)Luxembourg
Monaco (e.g. PJ gas produced) (e.g. PJ gas consumed) (e.g. PJ gas consumed) (e.g. PJ gas consumed)Netherlands 25,787 132,669 PJ gas produced 1,474 66 PJ gas transported 81,049 2,844 PJ gas distributed NE NE NE
New Zealand NE NE (e.g. PJ gas produced) 216 22 TJ (e.g. PJ gas consumed) NE NE (e.g. PJ gas consumed) NE NE (e.g. PJ gas consumed)
Norway IE IE (e.g. PJ gas produced) IE IE (e.g. PJ gas consumed) IE IE (e.g. PJ gas consumed) (e.g. PJ gas consumed)Portugal 100 TJ Gas consumed
Romania 288,000 PJ (e.g. PJ gas produced) 364,300 PJ (e.g. PJ gas consumed) (e.g. PJ gas consumed) (e.g. PJ gas consumed)Slovakia 67,000 NO PJ production 2,000 NO PJ transfer 2,000 NO PJ distribution 120,001 PJ consumed
Slovenia 227 NE TJ (e.g. PJ gas produced) 273 NE km (e.g. PJ gas consumed) 230 NE km (e.g. PJ gas consumed) NE (e.g. PJ gas consumed)
Spain 70,889 PJ PJ gas produced (NCV) 28,246 396 PJ PJ gas (NCV) 36,962 525 PJPJ gas consumed
(NCV) (e.g. PJ gas consumed)
Sweden 1 56,500 TJ Transfer loss (e.g. PJ gas consumed) (e.g. PJ gas consumed)
Switzerland NO NO NO NA NA See documentation box IE IE IE IE IE IEUkraine 450,000 PJ gas produced 600,000 PJ gas
United Kingdom IE (e.g. PJ gas produced) IE (e.g. PJ gas consumed) 100,946 PJ Gas consumed NE (e.g. PJ gas consumed)
United States 131,956 NE bill_ft^3_yr (e.g. PJ gas produced) 84,148 IE bill_ft^3_yr (e.g. PJ gas consumed) 62,247 NE bill_ft^3_yr (e.g. PJ gas consumed) IE IE NA (e.g. PJ gas consumed)a Information on methods and emission factors included in this table is as reported by Parties. It may not reflect the actual method or type of emission factor used for all subcategories within the category 1.B.2 Oil and natural gas. b The units of the implied emission factors (IEF) vary from Party to Party depending on the unit of the activity data used. The unit of the IEF is kg/unit of activity data.c Source of emissions factors: IPCC Guidelines, vol. 3, pages 1.119–1.121. For updated detailed emission factors on CH4 and implied emissions factors on CO2 and N2O see the IPCC good practice guidance, table 2.16, pages 2.86–2.87.
Activity dataValue Value Value Value
Fugitive emissions from fuels: oil and natural gas, CH4, CO2 (2002) (continued)
Natural GasProduction/processing Transmission Distribution Other leakage
Activity data Activity data Activity data
- 68 -

Table 1.41
CH4 IEFb CH4 IEFb CH4 IEFb CO2 IEF CH4 IEFb CH4 IEFb CO2 IEF
value unit Description value unit Description unit Description value unit Description unit Description
IPCC default EFc 1,000 -3,000 PJ Oil produced
6,000 -209,000 PJ Gas produced
6,000 -209,000 PJ Gas produced
3,000 -14,000 PJ Oil produced
3,000 -14,000 PJ
Oil and gas produced
Australia NA NA 63,859 PJ PJ gas produced NA NA IE NA NA 10,614 862,804 PJPJ gas and oil
producedAustriaBelarusBelgium NA NA NE IE NA NE
Bulgaria 2,000 PJ (e.g. PJ oil produced) 18,000 PJ (e.g. PJ gas produced) NE NE (e.g. PJ gas
consumption) NE PJ NE NE
Canada NE NA NA NE NA NA IE IE NA NA NE 10^6 m^3Net Withdrawls of Natural Gas 142 33,576 10^6 m^3
Gross New Production of Natural Gas
Croatia PJ (e.g. PJ oil produced) 18,000 PJ (e.g. PJ gas produced) (e.g. PJ gas
consumption)
Czech Republic (e.g. PJ oil produced) (e.g. PJ gas produced) (e.g. PJ gas
consumption)
Denmark (e.g. PJ oil produced) Incl. in transmission 0.2 57 GJ(e.g. PJ gas
consumption)Estonia 4,000 (e.g. PJ oil produced) 18,000 (e.g. PJ gas produced)
European Community NE (e.g. PJ oil produced) NE (e.g. PJ gas produced) NE NE (e.g. PJ gas
consumption) NE NE NE
Finland kt kt oil refined (e.g. PJ gas produced) (e.g. PJ gas
consumption)
France (e.g. PJ oil produced) (e.g. PJ oil produced) 700,441 56,387,665 PJ
Consumed PJ ConsumedGermany NE (e.g. PJ oil produced) NE (e.g. PJ gas produced) NE NE 10^3 m^3 (natural gas) NE NE NE
Greece 2,000 PJCrude oil and NGL
production NE PJ Natural gas production NE NE PJ Natural gas production NO NO NO NO NO NO NO
Hungary 2,000 (e.g. PJ oil produced) 25,247 (e.g. PJ gas produced) (e.g. PJ gas
consumption)Ireland (e.g. PJ oil produced) (e.g. PJ gas consumed) kt quantity of gas flared Italy IE Japan 1 10^3 l oil produced NE 10^3 m^3 gas produced NE NE 10^3 m^3 gas produced IE NE NE
Latvia (e.g. PJ oil produced) (e.g. PJ gas produced) (e.g. PJ gas
consumption)
Lithuania NE (e.g. PJ oil produced) NE (e.g. PJ gas produced) NE NE (e.g. PJ gas
consumption) NE NE NE Luxembourg
Monaco (e.g. PJ oil produced) (e.g. PJ gas produced) (e.g. PJ gas
consumption)
Netherlands IE (e.g. PJ oil produced) IE (e.g. PJ gas produced) IE IE (e.g. PJ gas
consumption) IE NE IE IE NE
New Zealand IE (e.g. PJ oil produced) IE (e.g. PJ gas produced) IE IE (e.g. PJ gas
consumption) IE 88 35,142 TJventing & flaring from oil & gas
Norway IE (e.g. PJ oil produced) IE (e.g. PJ gas produced) 7,084 58,060,449 PJ Gas flared 1,322 PJOil and gas produced IE IE
Portugal 7
Mton material
input Oil refined
Romania PJ (e.g. PJ oil produced) 6,000 PJ (e.g. PJ gas produced) (e.g. PJ gas
consumption) Slovakia 998 PJ production 9,996 PJ production 10,000 NO PJ consumption NO NO NO
Slovenia NE (e.g. PJ oil produced) NE (e.g. PJ gas produced) NE NE (e.g. PJ gas
consumption) NE NE NE
Spain NE (e.g. PJ oil produced) NE (e.g. PJ gas produced) 5 55,821 PJ(e.g. PJ gas
consumption)
Sweden (e.g. PJ oil produced) (e.g. PJ gas produced) (e.g. PJ gas
consumption) Switzerland IE IE IE IE NO NO NO NO NO NO NO NOUkraine
United Kingdom IE (e.g. PJ oil produced) IE (e.g. PJ gas produced) IE(e.g. PJ gas
consumption) NE 281,849 76,553,285 PJ Gas consumption
United States IE NA (e.g. PJ oil produced) IE NA (e.g. PJ gas produced) IE IE NA(e.g. PJ gas
consumption) IE NA IE 54,706,667 TBtu Flared Gas
a Information on methods and emission factors included in this table is as reported by Parties. It may not reflect the actual method or type of emission factor used for all subcategories within the category 1.B.2 Oil and natural gas. b The units of the implied emission factors (IEF) vary from Party to Party depending on the unit of the activity data used. The unit of the IEF is kg/unit of activity data.c Source of emissions factors: IPCC Guidelines, vol. 3, pages 1.119–1.121. For updated detailed emission factors on CH4 and implied emissions factors on CO2 and N2O also look at good practice guidance, table 2.16, pages 2.86–2.87.
value value
Flaringa
Activity data Activity data Activity data Activity data Activity data
Ventinga Ventinga Flaringa Ventinga
Fugitive emissions from fuels: oil and natural gas, CH4, CO2 (2002) (continued)
Venting and flaringOil Gas Combined
- 69 -

Table 1.42
CO2 emissions (Gg) Relative change (%)
1990a 1996 1997 1998 1999 2000 2001 2002 1996 to 1997 1997 to 1998 1998to 1999 1999 to 2000 2000 to 2001 2001 to 2002 1990 to 2002Australia 5,963 5,251 5,049 5,289 5,734 6,488 6,924 6,462 Australia -3.8 4.8 8.4 13.2 6.7 -6.7 8.4Austria 102 71 121 142 171 165 183 167 Austria 69.7 17.7 20.2 -3.5 11.1 -8.6 63.7Belarus BelarusBelgium 84 92 93 99 109 163 144 145 Belgium 1.1 6.5 10.1 49.5 -11.7 0.7 72.6Bulgaria NE NE NE NE NE NE NE NE BulgariaCanada 9,833 13,485 13,632 13,787 14,395 14,802 15,307 15,574 Canada 1.1 1.1 4.4 2.8 3.4 1.7 58.4Croatia 416 644 600 589 525 633 688 665 Croatia -6.9 -1.8 -10.8 20.5 8.6 -3.2 60.0Czech Republic Czech RepublicDenmark 240 400 565 422 903 593 633 535 Denmark 41.1 -25.3 113.8 -34.3 6.8 -15.5 123.1Estonia EstoniaEuropean Community 19,289 18,223 17,964 18,174 17,338 17,242 17,618 16,791 European Community -1.4 1.2 -4.6 -0.6 2.2 -4.7 -13.0Finland 42 24 26 24 24 25 23 23 Finland 11.3 -7.9 0.0 3.0 -9.8 0.0 -46.0France 4,306 4,005 4,237 4,145 3,997 4,077 4,208 3,912 France 5.8 -2.2 -3.6 2.0 3.2 -7.0 -9.1Germany NE NE NE NE NE NE NE NE GermanyGreece 0 0 0 0 0 0 0 0 GreeceHungary NO NO NO NO NO NO NO NO HungaryIreland 139 161 141 108 117 71 134 65 Ireland -12.3 -23.5 8.5 -39.5 89.2 -51.2 -52.9Italy 3,048 2,692 2,875 2,768 2,091 2,298 2,182 1,924 Italy 6.8 -3.7 -24.4 9.9 -5.0 -11.8 -36.9Japan 1 1 1 1 1 1 1 1 Japan 4.8 -5.8 -0.5 5.0 -2.0 6.9 24.6Latvia NO/NE NO/NE NO/NE NE/NO NE/NO NE/NO NE/NO NE/NO LatviaLithuania NE NE NE 1 LithuaniaLuxembourg LuxembourgMonaco 0 0 0 0 0 0 0 0 MonacoNetherlands 308 1,003 1,018 1,554 1,516 1,591 1,693 1,640 Netherlands 1.5 52.7 -2.5 5.0 6.4 -3.2 432.1New Zealand 615 632 670 651 615 579 618 610 New Zealand 5.9 -2.8 -5.6 -5.8 6.8 -1.4 -0.8Norway 2,625 2,918 2,748 2,680 3,361 3,565 3,195 2,673 Norway -5.8 -2.5 25.4 6.1 -10.4 -16.3 1.8Portugal 118 509 628 603 567 552 676 708 Portugal 23.4 -4.0 -6.0 -2.6 22.5 4.7 502.6Romania RomaniaSlovakia SlovakiaSlovenia 0 0 0 0 0 0 0 0 SloveniaSpain 1,743 1,869 1,922 2,014 1,953 2,197 2,067 2,149 Spain 2.8 4.8 -3.0 12.5 -5.9 4.0 23.3Sweden 22 26 27 19 NO 3 16 3 Sweden 5.3 -29.6 510.4 -80.7 -86.1Switzerland 75 92 89 91 93 89 93 92 Switzerland -3.2 2.4 1.9 -4.5 4.7 -1.2 22.8Ukraine UkraineUnited Kingdom 9,138 7,372 6,312 6,277 5,891 5,509 5,658 5,519 United Kingdom -14.4 -0.5 -6.2 -6.5 2.7 -2.5 -39.6United States 5,810 8,529 7,874 6,566 6,943 5,769 5,412 5,299 United States -7.7 -16.6 5.7 -16.9 -6.2 -2.1 -8.8
Fugitive emissions from fuels: oil and natural gas – trend information
a In accordance with decisions 9/CP.2 and 11/CP.4, some Parties with economies in transition use base years other than 1990: Bulgaria (1988), Hungary (average of 1985 to 1987), Romania (1989) and Slovenia (1986).
- 70 -

Table 1.42
CH4 emissions (Gg) Relative change (%)
1990a 1996 1997 1998 1999 2000 2001 2002 1996 to 1997 1997 to 1998 1998to 1999 1999 to 2000 2000 to 2001 2001 to 2002 1990 to 2002Australia 331 318 340 339 287 321 324 298 Australia 7.0 -0.3 -15.4 11.8 1.1 -8.2 -10.1Austria 13 15 15 15 15 14 15 14 Austria -0.7 -0.1 1.4 -3.0 1.2 -2.2 11.7Belarus 122 BelarusBelgium 23 22 22 21 21 20 19 19 Belgium -2.2 -1.9 -1.0 -5.5 -1.5 -1.5 -15.9Bulgaria 133 124 99 88 73 83 76 66 Bulgaria -19.9 -11.6 -17.1 13.5 -7.6 -12.9 -50.2Canada 1,247 1,785 1,787 1,774 1,776 1,822 1,842 1,809 Canada 0.1 -0.7 0.1 2.6 1.1 -1.8 45.1Croatia 56 55 58 50 51 53 59 62 Croatia 6.0 -13.0 0.3 4.7 11.7 4.1 9.0Czech Republic 32 32 35 28 29 29 23 23 Czech Republic 8.4 -19.4 2.1 0.0 -19.1 -0.5 -28.1Denmark 1 3 4 3 4 4 4 3 Denmark 16.7 -14.0 46.3 -20.3 5.4 -11.0 236.5Estonia 38 20 19 18 18 20 22 18 Estonia -2.6 -5.5 -2.6 14.8 7.5 -16.1 -51.4European Community 1,605 1,472 1,410 1,394 1,361 1,324 1,347 1,313 European Community -4.2 -1.2 -2.4 -2.7 1.7 -2.6 -18.2Finland 0 1 0 1 0 0 1 0 Finland -30.3 47.1 -41.6 5.4 144.7 -60.6 110.6France 118 92 92 92 91 91 91 90 France 0.0 -0.1 -0.5 0.1 -0.7 -0.5 -23.4Germany 403 374 362 360 355 350 357 348 Germany -3.0 -0.8 -1.2 -1.5 1.9 -2.5 -13.7Greece 2 2 2 4 6 9 9 9 Greece 33.7 111.9 41.0 37.8 -1.4 5.7 382.6Hungary 56 317 300 305 289 77 76 77 Hungary -5.6 1.8 -5.2 -73.3 -1.8 0.9 36.4Ireland 7 6 6 5 5 5 5 4 Ireland -3.4 -11.1 -2.4 -3.6 1.3 -20.3 -45.3Italy 317 268 266 266 262 260 247 243 Italy -0.7 -0.2 -1.5 -0.8 -4.9 -1.7 -23.5Japan 18 20 21 20 21 21 22 23 Japan 3.0 -0.4 1.4 3.7 0.8 5.5 29.9Latvia 13 10 9 9 9 8 8 8 Latvia -6.7 -4.1 -4.7 -7.5 -3.0 4.3 -38.5Lithuania 26 NE NE 20 Lithuania -23.2Luxembourg 2 2 3 LuxembourgMonaco 0 0 0 0 0 0 0 0 MonacoNetherlands 179 188 156 147 144 131 134 120 Netherlands -16.9 -6.3 -1.5 -9.3 2.4 -10.4 -32.8New Zealand 15 14 16 17 18 18 18 19 New Zealand 16.3 6.5 8.7 -3.3 2.8 5.0 28.0Norway 14 25 28 26 25 29 34 30 Norway 12.9 -6.9 -4.5 18.2 16.2 -11.1 119.9Portugal 2 2 2 5 12 10 12 14 Portugal 21.4 111.8 141.0 -13.8 20.6 17.5 749.1Romania 1,078 536 425 425 397 392 378 376 Romania -20.6 0.0 -6.7 -1.3 -3.6 -0.4 -65.1Slovakia 35 36 37 35 36 35 40 38 Slovakia 0.9 -4.6 3.2 -2.4 12.9 -4.7 7.9Slovenia 1 1 1 1 1 1 1 1 Slovenia 6.2 -5.3 2.2 0.4 3.2 -3.7 -46.6Spain 28 36 42 45 35 40 47 56 Spain 17.6 7.2 -23.5 14.5 19.5 17.6 99.8Sweden 0 0 0 0 0 0 0 0 Sweden 8.7 -35.4 699.2 -84.6 -85.5Switzerland 15 13 13 12 12 12 12 12 Switzerland -0.9 -0.8 -0.8 -1.0 -0.7 -0.8 -17.5Ukraine 4,746 4,838 Ukraine 1.9United Kingdom 513 464 441 433 413 396 405 389 United Kingdom -5.0 -1.8 -4.5 -4.1 2.1 -3.9 -24.2United States 7,186 7,284 7,220 7,118 6,886 7,104 7,064 6,905 United States -0.9 -1.4 -3.3 3.2 -0.6 -2.3 -3.9
Fugitive emissions from fuels: oil and natural gas – trend information (continued)
a In accordance with decisions 9/CP.2 and 11/CP.4, some Parties with economies in transition use base years other than 1990: Bulgaria (1988), Hungary (average of 1985 to 1987), Romania (1989) and Slovenia (1986).
- 71 -

Figure 2.1Emissions and contribution of subsectors in industrial processesa
Industrial processes
a In accordance with decisions 9/CP.2 and 11/CP.4, some Parties with economies in transition use base years other than 1990: Bulgaria (1988), Hungary (average of 1985 to 1987), Romania (1989) and Slovenia (1986).
0%
20%
40%
60%
80%
100%
Aus
tral
ia 1
990
Aus
tral
ia 2
002
Aus
tria
199
0A
ustr
ia 2
002
Bel
arus
199
0B
elar
us 2
002
Bel
gium
199
0B
elgi
um 2
002
Bul
gari
a 19
90B
ulga
ria
2002
Can
ada
1990
Can
ada
2002
Cro
atia
199
0C
roat
ia 2
002
Cze
ch R
epub
lic 1
990
Cze
ch R
epub
lic 2
002
Den
mar
k 19
90D
enm
ark
2002
Esto
nia
1990
Esto
nia
2002
Euro
pean
Com
mun
ity 1
990
Euro
pean
Com
mun
ity 2
002
Finl
and
1990
Finl
and
2002
Fran
ce 1
990
Fran
ce 2
002
Ger
man
y 19
90G
erm
any
2002
Gre
ece
1990
Gre
ece
2002
Hun
gary
199
0H
unga
ry 2
002
Irel
and
1990
Irel
and
2002
Ital
y 19
90It
aly
2002
Japa
n 19
90Ja
pan
2002
Latv
ia 1
990
Latv
ia 2
002
Lith
uani
a 19
90Li
thua
nia
2002
Luxe
mbo
urg
1990
Luxe
mbo
urg
2002
Mon
aco
1990
Mon
aco
2002
Net
herl
ands
199
0N
ethe
rlan
ds 2
002
New
Zea
land
199
0N
ew Z
eala
nd 2
002
Nor
way
199
0N
orw
ay 2
002
Port
ugal
199
0Po
rtug
al 2
002
Rom
ania
199
0R
oman
ia 2
002
Slov
akia
199
0Sl
ovak
ia 2
002
Slov
enia
199
0Sl
oven
ia 2
002
Spai
n 19
90Sp
ain
2002
Swed
en 1
990
Swed
en 2
002
Switz
erla
nd 1
990
Switz
erla
nd 2
002
Ukr
aine
199
0U
krai
ne 2
002
Uni
ted
Kin
gdom
199
0U
nite
d K
ingd
om 2
002
Uni
ted
Stat
es 1
990
Uni
ted
Stat
es 2
002
Mineral Products Chemical Industry Metal Production Other Production Production of F-gases comsumption of F-gases Other (please specify)
0
50,000
100,000
150,000
200,000
250,000
300,000
350,000
Aus
tral
ia 1
990
Aus
tral
ia 2
002
Aus
tria
199
0A
ustr
ia 2
002
Bel
arus
199
0B
elar
us 2
002
Bel
gium
199
0B
elgi
um 2
002
Bul
gari
a 19
90B
ulga
ria
2002
Can
ada
1990
Can
ada
2002
Cro
atia
199
0C
roat
ia 2
002
Cze
ch R
epub
lic 1
990
Cze
ch R
epub
lic 2
002
Den
mar
k 19
90D
enm
ark
2002
Esto
nia
1990
Esto
nia
2002
Euro
pean
Com
mun
ity 1
990
Euro
pean
Com
mun
ity 2
002
Finl
and
1990
Finl
and
2002
Fran
ce 1
990
Fran
ce 2
002
Ger
man
y 19
90G
erm
any
2002
Gre
ece
1990
Gre
ece
2002
Hun
gary
199
0H
unga
ry 2
002
Irel
and
1990
Irel
and
2002
Ital
y 19
90It
aly
2002
Japa
n 19
90Ja
pan
2002
Latv
ia 1
990
Latv
ia 2
002
Lith
uani
a 19
90Li
thua
nia
2002
Luxe
mbo
urg
1990
Luxe
mbo
urg
2002
Mon
aco
1990
Mon
aco
2002
Net
herl
ands
199
0N
ethe
rlan
ds 2
002
New
Zea
land
199
0N
ew Z
eala
nd 2
002
Nor
way
199
0N
orw
ay 2
002
Port
ugal
199
0Po
rtug
al 2
002
Rom
ania
199
0R
oman
ia 2
002
Slov
akia
199
0Sl
ovak
ia 2
002
Slov
enia
199
0Sl
oven
ia 2
002
Spai
n 19
90Sp
ain
2002
Swed
en 1
990
Swed
en 2
002
Switz
erla
nd 1
990
Switz
erla
nd 2
002
Ukr
aine
199
0U
krai
ne 2
002
Uni
ted
Kin
gdom
199
0U
nite
d K
ingd
om 2
002
Uni
ted
Stat
es 1
990
Uni
ted
Stat
es 2
002
- 72 -

Table 2.1
CRF UNc Differenced
(%) (%) (t/t) (%) (t/t)
IPCC default EFe 0.499 (cement)
IPCC default EFf 0.51 (clinker) 0.59-0.86
Australia T2 CS 0.6 Clinker production 6,354 7,236 13.9 0.52 0.21 0.68Austria D, CS D, CS L, T 1.9 Clinker Production [kt] 2,853 3,800 33.2 0.56 L 0.65 0.76Belarus L 1.4 (e.g. cement or clinker production) 1,889 2,171 15.0 0.51 0.63 0.79Belgium CS CS L 1.9 (e.g. cement or clinker production) 5,539 8,000 44.4 0.52 L 1.41 0.82Bulgaria D D L 1.7 Clinker production 2,031 2,173 7.0 0.52 L 1.37 0.79Canada T1 - T2 CS L 0.9 Clinker Production Data 13,036 13,081 0.3 0.52 0.23 0.76Croatia T2 D L, T 5.0 (e.g. cement or clinker production) 2,753 3,378 22.7 0.51 0.59 0.85Czech Republic T1 D L 1.1 (e.g. cement production) 3,217 3,249 1.0 0.50 0.00Denmark CS CS L, T 2.1 Production of Cement 2,698 2,698 0.0 0.54 0.18 0.26Estonia TI D L 1.2 (e.g. cement or clinker production) 466 466 0.0 0.50 0.44 0.51European Community C, CS, D, T2 C, CS, D, PS, T2 L 1.9 NE L 0.39 NEFinland D PS/D L, T 0.7 cement production 1,198 1,198 0.0 0.47 L 0.52 0.79France C CS L, T 1.6 kt of Clinker 16,479 20,244 22.8 0.53 L 0.44 0.77Germany CS CS L 1.2 (clinker production) 23,306 32,012 37.4 0.53 L 0.55 0.76Greece T1, T2 D L, T 5.1 clinker production 13,297 15,500 16.6 0.52 0.26 0.75Hungary T2 CS L 1.8 clinker production 2,687 3,510 30.6 0.53 0.37 0.79Ireland D D L, T 2.9 Clinker production 4,043 2,500 -38.2 0.50 0.26 0.75Italy D D L, T 3.0 ( clinker production) 32,235 42,050 30.4 0.51 0.34 0.90Japan D, CS D, CS
L, T2.4 Comsumption of limestone for cement
production.76,153 71,828 -5.7 0.41 0.32 0.43
Latvia D/T1/T2/C D/PS/C L 1.2 Clinker production C 0.03Lithuania T1 D L 1.8 (cement production) 606 606 0.0 0.50 0.25 0.79Luxembourg 729Monaco (e.g. cement or clinker production) NONetherlands CS/T2 (clinker) PS, CS 0.2 (e.g. cement or clinker production) 901 3,400 277.2 0.54 IENew Zealand T1 CS L 0.7 Cement production 1,177 950 -19.3 0.46 0.15 0.73Norway D CS L, T 1.6 Production quantity 1,634 1,850 13.2 0.53 0.06Portugal D D+C L, T 3.7 Total cement production 5,983 9,761 63.1 0.51Romania D D L 2.1 (cement production) 5,680 5,680 0.0 0.50 L, T 1.66 0.83Slovakia T1 D L 2.2 Clinker Production 2,260 3,141 39.0 0.51 L 1.22 0.76Slovenia T1 D L, T 2.1 Clinker produced 841 1,250 48.6 0.51 T 0.44 0.79Spain CS,C,D,T2 CS,C,D,T2 L, T 4.0 Clinker production 29,358 42,500 44.8 0.54 0.36 0.72Sweden T2, D CS, D L, T 1.8 Produced amount of clinker 2,375 2,669 12.4 0.53 L, T 0.79 0.52Switzerland C CS L, T 3.2 clinker production 3,150 4,000 27.0 0.53 0.07 0.37Ukraine T1 D 0.7 clinker production 5,316 7,157 34.6 0.66 0.62 0.77United Kingdom T2 D L, T 0.9 clinker production kt 10,834 12,000 10.8 0.50 0.13 0.44United States D,CS D,CS L, T 0.6 clinker production 81,294 89,732 10.4 0.53 0.18 0.69
e Source of default emission factors: IPCC Guidelines, volume 3, pages 2.6.f Source of default emission factors: IPCC good practice guidance, pages 3.13 and 3.22.
(kt)
Share of national total
Share of national total
CO2 IEFKey source
Descriptionb
Mineral products, CO2 (2002)
Methods and EF useda Cement production Lime production
Methods EF Key sourceCO2 IEF
Activity data (production)
c Cement production from the United Nations Industrial Commodity Production Statistics Database (as of 17 May 2004), United Nations, Department of Economic and Social Affairs, Statistics Division, United Nations, New York. Data are for the year 2002.d As the United Nations data given in this table are for cement production, they are likely to differ from the CRF data specified as clinker.
a Information on methods and emission factors is included in this table as reported by Parties. It may not reflect the actual method used or type of emission factor for all subcategories within the category 2.A Mineral products. b The CRF requests Parties to specify the activity data used (e.g. cement or clinker) for estimating the emissions from cement production. The descriptions included in this column are as reported in the CRF by Parties.
- 73 -
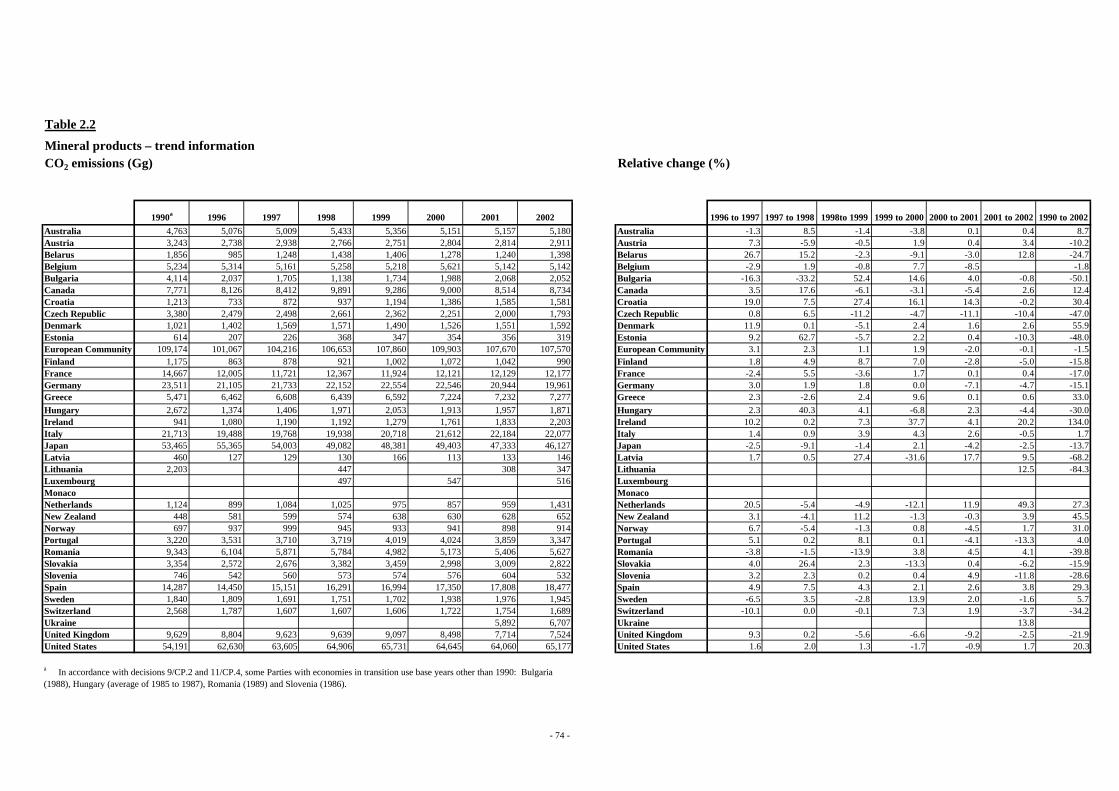
Table 2.2
Relative change (%)
1990a 1996 1997 1998 1999 2000 2001 2002 1996 to 1997 1997 to 1998 1998to 1999 1999 to 2000 2000 to 2001 2001 to 2002 1990 to 2002Australia 4,763 5,076 5,009 5,433 5,356 5,151 5,157 5,180 Australia -1.3 8.5 -1.4 -3.8 0.1 0.4 8.7Austria 3,243 2,738 2,938 2,766 2,751 2,804 2,814 2,911 Austria 7.3 -5.9 -0.5 1.9 0.4 3.4 -10.2Belarus 1,856 985 1,248 1,438 1,406 1,278 1,240 1,398 Belarus 26.7 15.2 -2.3 -9.1 -3.0 12.8 -24.7Belgium 5,234 5,314 5,161 5,258 5,218 5,621 5,142 5,142 Belgium -2.9 1.9 -0.8 7.7 -8.5 -1.8Bulgaria 4,114 2,037 1,705 1,138 1,734 1,988 2,068 2,052 Bulgaria -16.3 -33.2 52.4 14.6 4.0 -0.8 -50.1Canada 7,771 8,126 8,412 9,891 9,286 9,000 8,514 8,734 Canada 3.5 17.6 -6.1 -3.1 -5.4 2.6 12.4Croatia 1,213 733 872 937 1,194 1,386 1,585 1,581 Croatia 19.0 7.5 27.4 16.1 14.3 -0.2 30.4Czech Republic 3,380 2,479 2,498 2,661 2,362 2,251 2,000 1,793 Czech Republic 0.8 6.5 -11.2 -4.7 -11.1 -10.4 -47.0Denmark 1,021 1,402 1,569 1,571 1,490 1,526 1,551 1,592 Denmark 11.9 0.1 -5.1 2.4 1.6 2.6 55.9Estonia 614 207 226 368 347 354 356 319 Estonia 9.2 62.7 -5.7 2.2 0.4 -10.3 -48.0European Community 109,174 101,067 104,216 106,653 107,860 109,903 107,670 107,570 European Community 3.1 2.3 1.1 1.9 -2.0 -0.1 -1.5Finland 1,175 863 878 921 1,002 1,072 1,042 990 Finland 1.8 4.9 8.7 7.0 -2.8 -5.0 -15.8France 14,667 12,005 11,721 12,367 11,924 12,121 12,129 12,177 France -2.4 5.5 -3.6 1.7 0.1 0.4 -17.0Germany 23,511 21,105 21,733 22,152 22,554 22,546 20,944 19,961 Germany 3.0 1.9 1.8 0.0 -7.1 -4.7 -15.1Greece 5,471 6,462 6,608 6,439 6,592 7,224 7,232 7,277 Greece 2.3 -2.6 2.4 9.6 0.1 0.6 33.0Hungary 2,672 1,374 1,406 1,971 2,053 1,913 1,957 1,871 Hungary 2.3 40.3 4.1 -6.8 2.3 -4.4 -30.0Ireland 941 1,080 1,190 1,192 1,279 1,761 1,833 2,203 Ireland 10.2 0.2 7.3 37.7 4.1 20.2 134.0Italy 21,713 19,488 19,768 19,938 20,718 21,612 22,184 22,077 Italy 1.4 0.9 3.9 4.3 2.6 -0.5 1.7Japan 53,465 55,365 54,003 49,082 48,381 49,403 47,333 46,127 Japan -2.5 -9.1 -1.4 2.1 -4.2 -2.5 -13.7Latvia 460 127 129 130 166 113 133 146 Latvia 1.7 0.5 27.4 -31.6 17.7 9.5 -68.2Lithuania 2,203 447 308 347 Lithuania 12.5 -84.3Luxembourg 497 547 516 LuxembourgMonaco MonacoNetherlands 1,124 899 1,084 1,025 975 857 959 1,431 Netherlands 20.5 -5.4 -4.9 -12.1 11.9 49.3 27.3New Zealand 448 581 599 574 638 630 628 652 New Zealand 3.1 -4.1 11.2 -1.3 -0.3 3.9 45.5Norway 697 937 999 945 933 941 898 914 Norway 6.7 -5.4 -1.3 0.8 -4.5 1.7 31.0Portugal 3,220 3,531 3,710 3,719 4,019 4,024 3,859 3,347 Portugal 5.1 0.2 8.1 0.1 -4.1 -13.3 4.0Romania 9,343 6,104 5,871 5,784 4,982 5,173 5,406 5,627 Romania -3.8 -1.5 -13.9 3.8 4.5 4.1 -39.8Slovakia 3,354 2,572 2,676 3,382 3,459 2,998 3,009 2,822 Slovakia 4.0 26.4 2.3 -13.3 0.4 -6.2 -15.9Slovenia 746 542 560 573 574 576 604 532 Slovenia 3.2 2.3 0.2 0.4 4.9 -11.8 -28.6Spain 14,287 14,450 15,151 16,291 16,994 17,350 17,808 18,477 Spain 4.9 7.5 4.3 2.1 2.6 3.8 29.3Sweden 1,840 1,809 1,691 1,751 1,702 1,938 1,976 1,945 Sweden -6.5 3.5 -2.8 13.9 2.0 -1.6 5.7Switzerland 2,568 1,787 1,607 1,607 1,606 1,722 1,754 1,689 Switzerland -10.1 0.0 -0.1 7.3 1.9 -3.7 -34.2Ukraine 5,892 6,707 Ukraine 13.8United Kingdom 9,629 8,804 9,623 9,639 9,097 8,498 7,714 7,524 United Kingdom 9.3 0.2 -5.6 -6.6 -9.2 -2.5 -21.9United States 54,191 62,630 63,605 64,906 65,731 64,645 64,060 65,177 United States 1.6 2.0 1.3 -1.7 -0.9 1.7 20.3
Mineral products – trend information
a In accordance with decisions 9/CP.2 and 11/CP.4, some Parties with economies in transition use base years other than 1990: Bulgaria (1988), Hungary (average of 1985 to 1987), Romania (1989) and Slovenia (1986).
CO2 emissions (Gg)
- 74 -

Table 2.3
Relative change (%)
1990a 1996 1997 1998 1999 2000 2001 2002 1996 to 1997 1997 to 1998 1998to 1999 1999 to 2000 2000 to 2001 2001 to 2002 1990 to 2002Australia 3,214 3,002 2,944 3,228 3,299 3,397 3,328 3,291 Australia -1.9 9.6 2.2 2.9 -2.0 -1.1 2.4Austria 2,033 1,634 1,761 1,580 1,588 1,588 1,588 1,588 Austria 7.8 -10.3 0.5 0.0 -21.9Belarus 958 BelarusBelgium 2,824 3,009 3,162 3,175 3,113 3,270 2,908 2,908 Belgium 5.1 0.4 -1.9 5.0 -11.1 3.0Bulgaria 1,057 BulgariaCanada 5,583 6,008 6,206 6,369 6,636 6,734 6,543 6,741 Canada 3.3 2.6 4.2 1.5 -2.8 3.0 20.7Croatia 1,023 634 753 811 1,073 1,242 1,420 1,396 Croatia 18.8 7.7 32.2 15.8 14.3 -1.7 36.4Czech Republic 1,604 Czech RepublicDenmark 882 1,282 1,441 1,452 1,365 1,406 1,432 1,452 Denmark 12.4 0.8 -6.0 3.0 1.8 1.4 64.5Estonia 232 EstoniaEuropean Community 80,657 73,909 76,089 78,785 80,106 81,746 79,574 79,359 European Community 2.9 3.5 1.7 2.0 -2.7 -0.3 -1.6Finland 777 460 543 581 618 670 625 565 Finland 18.1 7.0 6.3 8.6 -6.8 -9.5 -27.3France 10,948 8,444 8,120 8,695 8,395 8,570 8,664 8,651 France -3.8 7.1 -3.5 2.1 1.1 -0.1 -21.0Germany 15,146 13,668 14,041 14,586 14,702 14,670 12,997 12,352 Germany 2.7 3.9 0.8 -0.2 -11.4 -5.0 -18.4Greece 5,189 6,139 6,158 6,136 6,200 6,854 6,876 6,920 Greece 0.3 -0.4 1.0 10.6 0.3 0.6 33.4Hungary 1,423 HungaryIreland 750 900 1,000 1,000 1,125 1,575 1,650 2,021 Ireland 11.1 0.0 12.5 40.0 4.8 22.5 169.5Italy 16,052 14,132 14,325 14,594 15,328 15,896 16,401 16,347 Italy 1.4 1.9 5.0 3.7 3.2 -0.3 1.8Japan 37,006 40,858 38,355 33,994 33,677 33,921 32,479 31,577 Japan -6.1 -11.4 -0.9 0.7 -4.3 -2.8 -14.7Latvia 346 112 114 111 146 93 116 124 Latvia 1.7 -2.8 32.0 -36.3 25.0 6.4 -64.2Lithuania 2,069 394 265 303 Lithuania 14.5 -85.4Luxembourg 457 507 460 LuxembourgMonaco 0 MonacoNetherlands 400 316 376 432 517 469 478 489 Netherlands 19.0 14.9 19.7 -9.3 1.9 2.3 22.3New Zealand 367 503 503 479 521 520 524 542 New Zealand 0.1 -4.9 8.8 -0.2 0.8 3.4 47.7Norway 653 882 876 889 838 860 Norway -0.7 1.5 -5.8 2.6 31.7Portugal 3,107 3,313 3,483 3,458 3,742 3,723 3,545 3,033 Portugal 5.1 -0.7 8.2 -0.5 -4.8 -14.4 -2.4Romania 6,094 3,468 3,267 3,279 2,782 3,020 2,825 2,831 Romania -5.8 0.4 -15.2 8.6 -6.4 0.2 -53.5Slovakia 1,188 1,144 Slovakia -3.7Slovenia 482 419 424 442 446 471 491 426 Slovenia 1.2 4.2 0.9 5.6 4.3 -13.2 -11.6Spain 12,534 12,367 13,017 14,096 14,732 15,034 15,327 15,853 Spain 5.3 8.3 4.5 2.1 1.9 3.4 26.5Sweden 1,245 1,199 1,082 1,109 1,115 1,261 1,303 1,253 Sweden -9.8 2.5 0.5 13.0 3.4 -3.8 0.6Switzerland 2,524 1,752 1,572 1,572 1,571 1,687 1,720 1,654 Switzerland -10.3 0.0 -0.1 7.4 1.9 -3.8 -34.5Ukraine 2,775 3,524 Ukraine 27.0United Kingdom 6,659 5,857 6,126 6,242 5,962 5,780 5,334 5,466 United Kingdom 4.6 1.9 -4.5 -3.0 -7.7 2.5 -17.9United States 33,278 37,079 38,323 39,218 39,991 41,190 41,357 42,898 United States 3.4 2.3 2.0 3.0 0.4 3.7 28.9
Cement production – trend information
a In accordance with decisions 9/CP.2 and 11/CP.4, some Parties with economies in transition use base years other than 1990: Bulgaria (1988), Hungary (average of 1985 to 1987), Romania (1989) and Slovenia (1986).
CO2 emissions (Gg)
- 75 -

Table 2.3
Relative change (%)
1990a 1996 1997 1998 1999 2000 2001 2002 1996 to 1997 1997 to 1998 1998to 1999 1999 to 2000 2000 to 2001 2001 to 2002 1990 to 2002Australia 0.52 0.52 0.52 0.52 0.52 0.52 0.52 0.52 AustraliaAustria 0.55 0.56 0.57 0.56 0.56 0.56 0.56 0.56 Austria 1.2 -1.7 -0.2 1.1Belarus 0.51 BelarusBelgium 0.53 0.54 0.54 0.54 0.54 0.54 0.52 0.52 Belgium 0.1 0.0 -0.1 0.1 -2.3 -1.6Bulgaria 0.52 BulgariaCanada 0.52 0.52 0.52 0.52 0.52 0.52 0.52 0.52 CanadaCroatia 0.51 0.51 0.51 0.51 0.51 0.51 0.51 0.51 CroatiaCzech Republic 0.50 Czech RepublicDenmark 0.54 0.53 0.53 0.53 0.53 0.54 0.54 0.54 Denmark -0.5 1.1 0.9 -1.2Estonia 0.50 EstoniaEuropean Community NE NE NE European CommunityFinland 0.47 0.47 0.47 0.47 0.47 0.47 0.47 0.47 FinlandFrance 0.53 0.53 0.53 0.53 0.53 0.53 0.53 0.53 France 0.0 0.0 0.0 0.0Germany 0.53 0.53 0.53 0.53 0.53 0.53 0.53 0.53 GermanyGreece 0.52 0.52 0.52 0.52 0.52 0.52 0.52 0.52 Greece 0.0 0.0 0.0 0.0 0.0 0.0Hungary 0.53 HungaryIreland 0.50 0.50 0.50 0.50 0.50 0.50 0.50 0.50 IrelandItaly 0.51 0.51 0.51 0.51 0.51 0.51 0.51 0.51 ItalyJapan 0.41 0.42 0.42 0.42 0.42 0.42 0.41 0.41 Japan 0.1 0.1 0.1 0.1 -0.5 0.1Latvia 0.53 0.53 0.53 0.53 LatviaLithuania 0.60 0.50 0.50 0.50 Lithuania -16.7Luxembourg LuxembourgMonaco MonacoNetherlands 0.43 0.54 0.54 0.54 0.54 0.54 0.54 0.54 Netherlands 0.2 0.0 0.0 -0.1 0.0 0.5 27.4New Zealand 0.51 0.51 0.49 0.49 0.49 0.49 0.48 0.46 New Zealand -3.0 -1.2 0.2 -0.2 -1.4 -4.4 -9.7Norway 0.52 0.53 0.53 0.54 0.53 0.53 Norway 0.0 3.3 -3.3 0.0 0.3Portugal 0.51 0.51 0.51 0.51 0.51 0.51 0.51 0.51 Portugal 0.0 0.0 0.0Romania 0.50 0.50 0.50 0.50 0.50 0.50 0.50 0.50 RomaniaSlovakia 0.50 0.51 Slovakia 0.9Slovenia 0.51 0.51 0.51 0.51 0.51 0.51 0.51 0.51 SloveniaSpain 0.54 0.54 0.54 0.54 0.54 0.54 0.54 0.54 Spain 0.0 0.0 0.0 0.0 0.0 0.0 0.0Sweden 0.53 0.53 0.53 0.53 0.53 0.53 0.53 0.53 Sweden -0.6 -0.3 0.0 0.4 -0.3 0.0 -0.5Switzerland 0.53 0.53 0.53 0.53 0.53 0.53 0.53 0.53 Switzerland 0.0 0.0 0.0 0.0 0.0 0.0 0.0Ukraine 0.66 0.66 UkraineUnited Kingdom 0.50 0.50 0.50 0.50 0.50 0.50 0.50 0.50 United KingdomUnited States 0.52 0.52 0.52 0.52 0.52 0.52 0.52 0.53 United States 2.0 2.0
Cement production – trend information (continued)CO2 implied emission factors (t/t)
a In accordance with decisions 9/CP.2 and 11/CP.4, some Parties with economies in transition use base years other than 1990: Bulgaria (1988), Hungary (average of 1985 to 1987), Romania (1989) and Slovenia (1986).
- 76 -

Table 2.4
CRF (2002)b CRF (2001)b UNb,c Difference CRF (2002)b CRF (2001)b UNb,c Difference
(%) (%) (t/t) (%) (%) (t/t) (%) (t/t)
IPCC default EFd 1.5 - 1.6 0.002 - 0.019 0.3Australia T1 CS,D C C 686 C T1 D C C C NOAustria PS PS L 0.5 464 448 440 -5.2 0.96 PS PS L, T 1.0 522 511 0.005Belarus 928 0.5 242 1,177 386.2 0.010Belgium CS CS L, T 1.2 C C 860 C CS CS L 2.6 1,674 1,722 0.008 NOBulgaria T1b D 0.5 369 372 0.9 0.86 D D L 1.7 C C NOCanada T1 CS L 0.9 4,501 4,297 4,501 0.0 1.39 T2-T3 CS 0.1 1,143 1,054 1,143 0.0 0.002 T 0.2 CCroatia CS D L, T 1.4 286 315 286 0.0 1.34 T1 D L, T 2.5 250 258 250 0.0 0.009Czech Republic IE 225 222 -1.4 T2 PS L 0.6 437 100 -77.1 0.007Denmark NO NO 2 L, T 1.1 334 382 0.007Estonia 13 0European Community C, CS, D, MB,
PS, T1, T1aC, CS, D, PS
L0.3 NE C, CS, D, PS, T2 C, CS, D, PS
L0.7 NE
L0.4 NE
Finland NO NO NO NO 87 D PS L, T 1.6 448 430 9 -98.0 0.009France C CS/ PS T 0.4 1,429 1,680 1,187 -17.0 1.54 C CS/ PS L, T 0.8 2,436 2,671 0.006 L, T 0.7Germany CS CS 0.2 2,653 2,603 1,028 -61.3 0.69 CS CS 0.4 2,350 2,139 0.006 T 0.3 CGreece NE NE 58 NE T1 D T 0.4 406 406 0.005 NOHungary D D 0.6 302 241 -20.1 1.50 D D L 1.1 C;Ireland D,T1a D L, T 1.2 352 451 400 13.6 2.30 D CS T 0.4 130 260 0.007Italy D D, C, CS T 0.1 334 430 391 17.0 1.50 D D, CS T 0.1 492 527 0.004 L, T 1.2 0.30Japan D CS 0.2 1,415 1,550 1,450 2.5 1.92 D CS, PS 0.1 637 603 612 -3.9 0.004 T 0.0 0Latvia NO NO NO NO NO NO NO NOLithuania T1 D L 4.1 469 659 469 0.1 1.50 L 5.2 288 266 0.010 NELuxembourgMonaco 0.0 NO NONetherlands CS/IE PS, CS C C 1,970 IE CS/T2 PS L, T 2.6 C C C NONew Zealand T1 CS 366 163 109 -70.3 IE NO NO NO NONorway D CS,D L, T 0.7 407 393 330 -18.9 0.91 CS3) PS L, T 3.5 NOPortugale MB+D D+C L, T 1.9 476 448 190 -60.1 3.21 D D+C L 0.7 253 250 0.008
Romania D D L, T 1.2 1,137 1,155 1,137 0.0 1.50 D D L, T 1.0 235 215 0.019Slovakia NO NO IE IE 326 IE T1 PS L 1.2 359 464 144 -59.9 0.006 NOSlovenia T1 D NO NO NO T1 D 0.0 0 0 0.007 NOSpain C,D C,D 0.1 521 539 415 -20.3 0.92 C CS,C L, T 0.5 896 942 481 -46.3 0.007 NOSweden D PS NE NE 4 T2, CS PS L, T 0.6 263 282 0 -100.0 0.005Switzerland C CS 33 NO C CS 0.2 65 65 0.005 NOUkraine T1 D L 1.4 4,489 4,500 4,489 0.0 1.50 T1 D 0.1 4,468 5,765 4 -99.9 0.000 0.2 0.084United Kingdom T1 CS 0.2 35 36 837 2,323.3 35.71 PS CS 0.4 1,566 1,651 0.005 T 0.1 0.01United States D D T 0.3 12,336 11,092 10,800 -12.5 1.43 D CS,PS 0.2 6,752 6,416 7,074 9.7 0.008 T 0.1 0.02
Chemical industry, CO2 and N2O (2002)
Methods and EF useda CO2Methods and EF useda N2O
2.B.1 Ammonia production 2.B.2 Nitric acid production 2.B.3 Adipic acid production
Methods EF Key sourceShare of
national total
Activity data (production)CO2 IEF
Methods EF
(kt)
Key sourceShare of
national totalN2O IEF
Key sourceShare of
national total
Activity data (production)N2O IEF
(kt)
e Mass balance is indicated by MB.
a Information on methods and emission factors is included in this table as reported by Parties. It may not reflect the actual method or type of emission factor used for all subcategories within the category 2.B Chemical industry.b As United Nations data for the year 2002 were not available for all Parties at the time of preparation of this synthesis and assessment report, for the comparisons of Unied Nations and CRF data in this table, data for the years 2002 and 2001 from the CRF are provided together with the respective United Nations data for 2002 or 2001.c Source of data: Industrial Commodity Production Statistics Database (as of 17 May 2004), Department of Economic and Social Affairs, Statistics Division, United Nations, New York. Data are for 2002, except for nitric acid data are for 2001 for the United States.d Source of default emission factors: ammonia; IPCC Guidelines, volume 3, page 2.16. nitric acid and adipic acid; IPCC good practice guidance, pages 3.34 and 3.44.
- 77 -

Table 2.5
Relative change (%)
1990a 1996 1997 1998 1999 2000 2001 2002 1996 to 1997 1997 to 1998 1998to 1999 1999 to 2000 2000 to 2001 2001 to 2002 1990 to 2002Australia C C C C C C C C AustraliaAustria 461 517 508 556 525 532 509 510 Austria -1.8 9.4 -5.5 1.4 -4.4 0.2 10.6Belarus BelarusBelgium 815 1,682 1,689 1,618 1,856 1,781 1,874 1,874 Belgium 0.5 -4.2 14.7 -4.0 5.2 129.8Bulgaria 1,246 1,063 878 474 338 570 507 325 Bulgaria -17.4 -46.0 -28.7 68.4 -11.1 -35.8 -73.9Canada 5,008 6,524 6,675 6,610 6,847 6,845 5,923 6,242 Canada 2.3 -1.0 3.6 0.0 -13.5 5.4 24.6Croatia 492 503 546 410 519 525 426 384 Croatia 8.7 -25.0 26.7 1.2 -18.9 -9.9 -21.9Czech Republic Czech RepublicDenmark 2 2 2 1 2 3 3 3 Denmark 7.4 -23.8 23.6 52.4 15.5 0.8 79.5Estonia EstoniaEuropean Community 13,434 11,856 11,996 12,499 11,211 11,629 12,111 11,394 European Community 1.2 4.2 -10.3 3.7 4.1 -5.9 -15.2Finland FinlandFrance 3,537 3,005 2,958 2,948 2,859 2,933 2,618 2,288 France -1.6 -0.3 -3.0 2.6 -10.7 -12.6 -35.3Germany 2,190 1,791 1,778 1,785 1,721 1,835 1,811 1,846 Germany -0.7 0.4 -3.6 6.6 -1.3 1.9 -15.7Greece 470 165 151 181 Greece -8.8 20.3Hungary 1,421 NE NE 10 497 666 614 452 Hungary 5,092.5 33.9 -7.8 -26.3 -68.2Ireland 989 922 1,074 1,058 943 883 1,037 810 Ireland 16.5 -1.5 -10.9 -6.3 17.4 -22.0 -18.1Italy 2,237 639 719 666 588 673 694 551 Italy 12.6 -7.4 -11.7 14.3 3.2 -20.6 -75.4Japan 3,544 3,656 3,571 3,191 3,504 3,394 3,162 2,921 Japan -2.3 -10.6 9.8 -3.1 -6.8 -7.6 -17.6Latvia NO NO NO NO NO NO NO NO LatviaLithuania NE 751 672 703 Lithuania 4.6Luxembourg LuxembourgMonaco MonacoNetherlands NetherlandsNew Zealand 152 167 158 176 177 183 187 197 New Zealand -4.8 11.3 0.5 3.2 2.3 5.5 29.7Norway 1,029 1,091 1,007 791 513 733 716 708 Norway -7.7 -21.4 -35.2 43.0 -2.3 -1.2 -31.2Portugal 633 1,056 1,510 1,892 943 1,038 1,540 1,638 Portugal 43.0 25.3 -50.1 10.0 48.4 6.4 158.9Romania 5,142 2,842 1,496 757 1,292 1,924 1,773 1,746 Romania -47.4 -49.4 70.6 48.9 -7.9 -1.5 -66.1Slovakia SlovakiaSlovenia 57 39 38 41 40 53 62 55 Slovenia -2.1 6.9 -1.6 32.6 17.4 -12.0 -3.9Spain 673 640 660 629 607 603 604 590 Spain 3.2 -4.8 -3.4 -0.7 0.2 -2.2 -12.3Sweden 69 59 58 54 54 48 47 50 Sweden -0.9 -7.5 -0.7 -11.0 -2.1 7.0 -27.3Switzerland 13 13 13 13 13 13 13 13 Switzerland -2.1 -2.1Ukraine 6,765 6,745 Ukraine -0.3United Kingdom 1,358 1,379 888 1,111 1,113 1,301 1,373 1,233 United Kingdom -35.6 25.0 0.2 16.9 5.6 -10.2 -9.2United States 23,035 24,273 24,868 26,291 24,888 23,880 20,220 22,260 United States 2.5 5.7 -5.3 -4.0 -15.3 10.1 -3.4
Chemical industry – trend informationCO2 emissions (Gg)
a In accordance with decisions 9/CP.2 and 11/CP.4, some Parties with economies in transition use base years other than 1990: Bulgaria (1988), Hungary (average of 1985 to 1987), Romania (1989) and Slovenia (1986).
- 78 -

Table 2.5
Relative change (%)
1990a 1996 1997 1998 1999 2000 2001 2002 1996 to 1997 1997 to 1998 1998to 1999 1999 to 2000 2000 to 2001 2001 to 2002 1990 to 2002Australia C C C C C C C C AustraliaAustria 2.9 2.8 2.8 2.9 3.0 3.1 2.5 2.6 Austria -1.3 4.0 3.0 3.0 -17.4 2.6 -11.5Belarus 1.1 0.9 0.9 1.0 1.0 1.0 1.0 1.2 Belarus 4.5 3.3 4.2 2.0 3.0 16.3 8.0Belgium 12.7 16.2 15.4 15.9 15.1 14.7 14.2 13.5 Belgium -5.2 3.3 -4.9 -2.7 -3.8 -4.3 6.7Bulgaria 7.8 6.3 5.2 3.1 2.4 4.2 4.2 3.5 Bulgaria -17.7 -40.0 -24.4 79.5 -1.5 -15.9 -55.0Canada 37.1 39.6 34.4 18.8 8.2 5.5 5.2 6.7 Canada -13.0 -45.3 -56.6 -33.0 -6.0 29.1 -82.1Croatia 3.0 2.5 2.6 2.0 2.3 2.8 2.3 2.2 Croatia 5.1 -24.7 18.0 17.7 -15.9 -2.9 -24.8Czech Republic 3.9 3.3 3.6 3.9 3.2 3.6 3.6 3.1 Czech Republic 8.3 7.1 -16.5 12.6 -1.1 -12.4 -19.5Denmark 3.4 2.7 2.7 2.6 3.1 3.2 2.9 2.5 Denmark 1.7 -4.9 17.8 5.6 -11.8 -12.6 -25.8Estonia EstoniaEuropean Community 334.7 318.0 311.5 235.9 163.7 160.7 158.8 141.4 European Community -2.0 -24.3 -30.6 -1.8 -1.2 -11.0 -57.8Finland 5.1 4.5 4.5 4.3 4.3 4.3 4.1 4.2 Finland 0.6 -5.8 0.3 -0.3 -4.7 4.0 -17.9France 77.9 84.8 83.9 60.1 41.6 37.0 36.9 29.1 France -1.1 -28.3 -30.8 -11.1 -0.2 -21.1 -62.6Germany 75.7 79.7 74.1 29.9 16.6 16.4 21.4 22.8 Germany -7.1 -59.7 -44.6 -1.0 30.5 6.8 -69.8Greece 2.3 2.1 1.8 1.8 1.8 1.8 1.8 1.8 Greece -12.2 -20.6Hungary 3.2 0.0 0.0 NE IE IE 2.7 2.7 Hungary -4.9 0.2 -15.9Ireland 3.3 2.6 2.6 2.6 2.6 2.6 1.9 0.9 Ireland 0.0 0.0 -28.1 -50.0 -71.8Italy 18.7 20.7 20.8 21.4 22.2 23.6 24.6 24.1 Italy 0.6 2.8 3.8 6.2 4.5 -2.1 28.5Japan 23.9 26.6 28.1 24.8 5.0 13.6 4.4 3.8 Japan 5.6 -11.8 -79.7 169.9 -67.9 -12.6 -84.0Latvia NO NO NO NO NO NO NO NO LatviaLithuania 1.4 4.9 2.7 2.9 Lithuania 8.3 105.7Luxembourg LuxembourgMonaco MonacoNetherlands 24.4 24.2 24.2 24.1 23.2 23.0 21.2 20.2 Netherlands -0.2 -0.2 -3.8 -1.0 -7.8 -4.7 -17.2New Zealand New ZealandNorway 6.7 5.2 4.8 5.4 6.1 5.6 5.5 6.2 Norway -8.6 14.0 11.2 -7.7 -2.3 12.9 -7.2Portugal 1.8 2.0 2.1 1.4 2.4 1.4 1.9 1.9 Portugal 1.4 -30.0 66.6 -41.8 33.8 1.3 4.1Romania 56.1 10.7 7.4 2.5 3.8 6.5 5.7 4.5 Romania -30.9 -66.2 52.8 71.6 -13.0 -21.5 -92.0Slovakia 1.6 2.4 2.5 2.3 2.5 2.3 2.6 2.0 Slovakia 3.6 -6.4 4.9 -7.5 13.7 -22.8 21.7Slovenia 0.0 0.0 0.0 0.0 0.0 0.0 0.0 0.0 Slovenia 26.4 -11.8 69.6Spain 9.3 7.9 7.5 7.0 7.6 7.4 6.6 6.3 Spain -5.4 -6.1 8.3 -1.7 -11.4 -4.8 -32.6Sweden 2.7 2.2 2.2 2.5 2.2 2.1 1.6 1.5 Sweden -1.2 12.3 -11.3 -4.9 -23.9 -8.0 -45.1Switzerland 0.3 0.3 0.3 0.3 0.3 0.3 0.3 0.3 SwitzerlandUkraine 6.0 5.1 Ukraine -15.3United Kingdom 94.4 65.5 67.0 59.4 18.1 20.2 17.4 9.9 United Kingdom 2.3 -11.3 -69.5 11.3 -13.9 -43.2 -89.5United States 106.6 121.8 101.7 86.7 82.6 82.7 67.2 73.0 United States -16.5 -14.8 -4.7 0.1 -18.7 8.7 -31.5
Chemical industry – trend information (continued)N2O emissions (Gg)
a In accordance with decisions 9/CP.2 and 11/CP.4, some Parties with economies in transition use base years other than 1990: Bulgaria (1988), Hungary (average of 1985 to 1987), Romania (1989) and Slovenia (1986).
- 79 -

Table 2.6
Relative change (%)
1990a 1996 1997 1998 1999 2000 2001 2002 1996 to 1997 1997 to 1998 1998to 1999 1999 to 2000 2000 to 2001 2001 to 2002 1990 to 2002Australia C C C C C C C C AustraliaAustria 396 465 457 501 472 463 442 445 Austria -1.8 9.7 -5.8 -1.9 -4.5 0.7 12.4Belarus BelarusBelgium 776 1,558 1,566 1,494 1,795 1,726 1,819 1,819 Belgium 0.5 -4.6 20.1 -3.8 5.4 134.5Bulgaria 318 BulgariaCanada 5,008 6,524 6,675 6,610 6,847 6,845 5,923 6,242 Canada 2.3 -1.0 3.6 0.0 -13.5 5.4 24.6Croatia 492 503 546 410 519 525 426 384 Croatia 8.7 -25.0 26.7 1.2 -18.9 -9.9 -21.9Czech Republic IE Czech RepublicDenmark NO NO NO NO NO NO NO NO DenmarkEstonia 0 EstoniaEuropean Community 12,395 11,214 11,367 11,844 10,640 11,057 11,545 10,842 European Community 1.4 4.2 -10.2 3.9 4.4 -6.1 -12.5Finland NO NO NO NO NO NO NO NO FinlandFrance 3,357 2,863 2,825 2,818 2,732 2,811 2,504 2,198 France -1.3 -0.3 -3.0 2.9 -10.9 -12.2 -34.5Germany 1,747 1,770 1,757 1,765 1,704 1,817 1,796 1,831 Germany -0.7 0.4 -3.4 6.6 -1.2 1.9 4.8Greece 470 165 151 181 NE NE NE NE Greece -8.8 20.3Hungary 452 HungaryIreland 989 922 1,074 1,058 943 883 1,037 810 Ireland 16.5 -1.5 -10.9 -6.3 17.4 -22.0 -18.1Italy 2,183 596 669 614 551 621 645 501 Italy 12.2 -8.3 -10.3 12.7 4.0 -22.3 -77.0Japan 3,377 3,453 3,366 2,989 3,288 3,182 2,960 2,721 Japan -2.5 -11.2 10.0 -3.2 -7.0 -8.1 -19.4Latvia NO NO NO NO NO NO NO NO LatviaLithuania NE 751 988 703 Lithuania -28.9Luxembourg LuxembourgMonaco 0 MonacoNetherlands IE IE IE IE IE IE IE IE NetherlandsNew Zealand IE IE IE IE IE IE IE IE New ZealandNorway 579 407 180 400 367 372 Norway -55.7 121.9 -8.2 1.3 -35.8Portugal 569 975 1,433 1,789 843 935 1,434 1,528 Portugal 46.9 24.9 -52.9 10.9 53.4 6.5 168.4Romania 5,006 2,762 1,427 702 1,251 1,883 1,733 1,706 Romania -48.3 -50.8 78.2 50.5 -8.0 -1.6 -65.9Slovakia IE IE SlovakiaSlovenia NO NO NO NO NO NO NO NO SloveniaSpain 550 519 546 512 487 499 494 477 Spain 5.2 -6.2 -5.0 2.6 -1.1 -3.5 -13.3Sweden NE NE NE NE NE NE NE NE SwedenSwitzerland NO NO NO NO NO NO NO NO SwitzerlandUkraine 6,750 6,734 Ukraine -0.2United Kingdom 1,358 1,379 888 1,111 1,113 1,301 1,373 1,233 United Kingdom -35.6 25.0 0.2 16.9 5.6 -10.2 -9.2United States 19,306 20,282 20,650 21,934 20,615 19,587 16,250 17,652 United States 1.8 6.2 -6.0 -5.0 -17.0 8.6 -8.6
Chemical industry: ammonia production – trend informationCO2 emissions (Gg)
a In accordance with decisions 9/CP.2 and 11/CP.4, some Parties with economies in transition use base years other than 1990: Bulgaria (1988), Hungary (average of 1985 to 1987), Romania (1989) and Slovenia (1986).
- 80 -

Table 2.6
Relative change (%)
1990a 1996 1997 1998 1999 2000 2001 2002 1996 to 1997 1997 to 1998 1998to 1999 1999 to 2000 2000 to 2001 2001 to 2002 1990 to 2002Australia C AustraliaAustria 0.86 0.96 0.95 1.03 0.96 0.96 0.99 0.96 Austria -0.7 8.6 -7.0 -0.3 2.7 -2.7 11.7Belarus BelarusBelgium C C C C C C C C BelgiumBulgaria 0.86 BulgariaCanada 1.35 1.39 1.40 1.35 1.40 1.40 1.38 1.39 Canada 0.2 -3.2 3.6 0.0 -1.6 0.6 2.7Croatia 1.43 1.35 1.36 1.36 1.34 1.33 1.35 1.34 Croatia 0.9 0.0 -1.2 -0.8 1.5 -0.6 -5.8Czech Republic Czech RepublicDenmark DenmarkEstonia EstoniaEuropean Community NE NE NE European CommunityFinland FinlandFrance 1.74 1.51 1.53 1.55 1.57 1.51 1.49 1.54 France 1.3 1.3 1.3 -3.6 -1.3 3.2 -11.7Germany 0.69 0.69 0.69 0.69 0.69 0.69 0.69 0.69 GermanyGreece 1.50 1.50 1.50 1.50 NE NE NE NE GreeceHungary 1.50 HungaryIreland 2.30 2.30 2.30 2.30 2.30 2.30 2.30 2.30 Ireland 0.0 0.0 0.0 0.0 0.0 0.0 0.0Italy 1.50 1.50 1.50 1.50 1.50 1.50 1.50 1.50 ItalyJapan 1.84 1.91 1.87 1.79 1.92 1.88 1.91 1.92 Japan -1.7 -4.6 7.5 -2.4 1.7 0.7 4.3Latvia LatviaLithuania NE 1.50 1.50 1.50 LithuaniaLuxembourg LuxembourgMonaco MonacoNetherlands IE IE IE IE IE IE IE IE NetherlandsNew Zealand IE IE IE IE IE IE IE IE New ZealandNorway NA 1.68 1.21 0.98 0.93 0.91 Norway -27.7 -19.0 -5.1 -2.2Portugal 3.08 3.14 3.20 3.23 3.10 3.13 3.20 3.21 Portugal 2.0 0.9 -3.8 0.7 2.3 0.3 4.3Romania 1.50 1.50 1.50 1.50 1.50 1.50 1.50 1.50 RomaniaSlovakia IE IE SlovakiaSlovenia NO NO NO NO NO NO NO NO SloveniaSpain 0.91 0.92 0.92 0.92 0.92 0.92 0.92 0.92 Spain -0.2 0.1 -0.2 0.0 0.1 -0.2 0.1Sweden SwedenSwitzerland NO NO NO NO NO NO SwitzerlandUkraine 1.50 1.50 UkraineUnited Kingdom 30.87 30.61 24.28 27.75 25.74 28.28 37.66 35.71 United Kingdom -20.7 14.3 -7.2 9.9 33.2 -5.2 15.7United States 1.25 1.25 1.27 1.31 1.31 1.37 1.46 1.43 United States 2.0 2.9 0.2 4.2 7.3 -2.3 14.3
Chemical industry: ammonia production – trend information (continued)CO2 implied emission factors (t/t)
a In accordance with decisions 9/CP.2 and 11/CP.4, some Parties with economies in transition use base years other than 1990: Bulgaria (1988), Hungary (average of 1985 to 1987), Romania (1989) and Slovenia (1986).
- 81 -
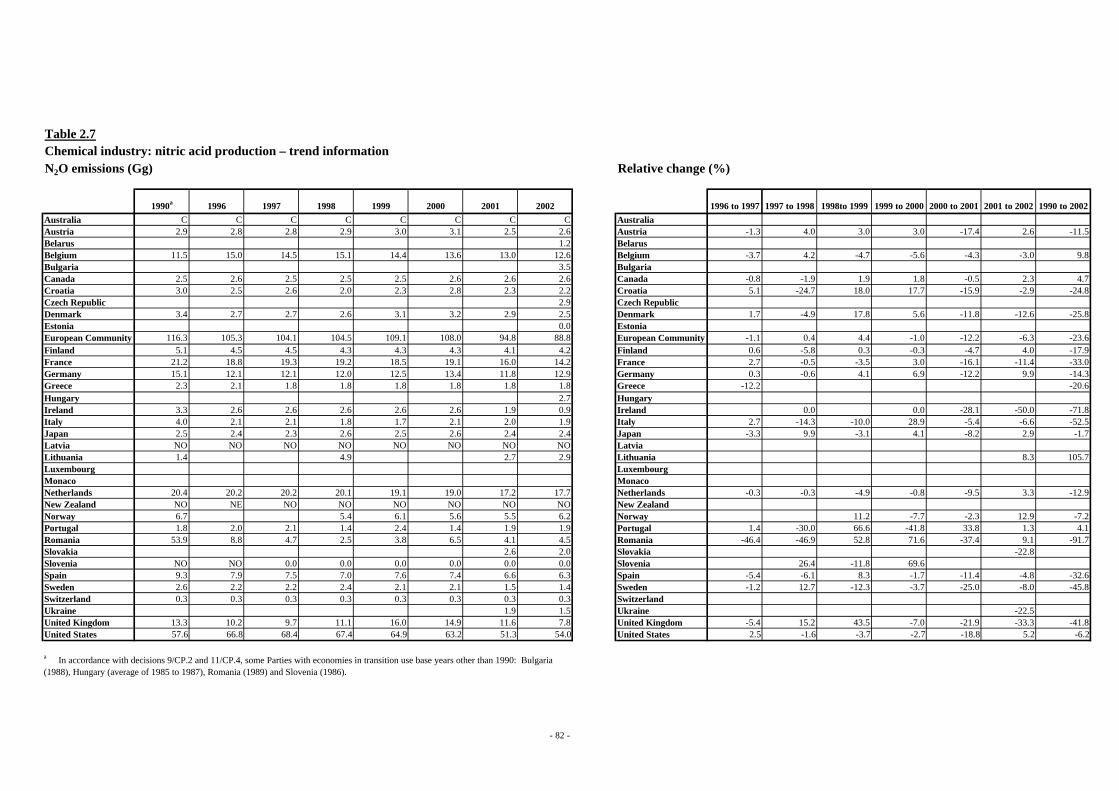
Table 2.7
Relative change (%)
1990a 1996 1997 1998 1999 2000 2001 2002 1996 to 1997 1997 to 1998 1998to 1999 1999 to 2000 2000 to 2001 2001 to 2002 1990 to 2002Australia C C C C C C C C AustraliaAustria 2.9 2.8 2.8 2.9 3.0 3.1 2.5 2.6 Austria -1.3 4.0 3.0 3.0 -17.4 2.6 -11.5Belarus 1.2 BelarusBelgium 11.5 15.0 14.5 15.1 14.4 13.6 13.0 12.6 Belgium -3.7 4.2 -4.7 -5.6 -4.3 -3.0 9.8Bulgaria 3.5 BulgariaCanada 2.5 2.6 2.5 2.5 2.5 2.6 2.6 2.6 Canada -0.8 -1.9 1.9 1.8 -0.5 2.3 4.7Croatia 3.0 2.5 2.6 2.0 2.3 2.8 2.3 2.2 Croatia 5.1 -24.7 18.0 17.7 -15.9 -2.9 -24.8Czech Republic 2.9 Czech RepublicDenmark 3.4 2.7 2.7 2.6 3.1 3.2 2.9 2.5 Denmark 1.7 -4.9 17.8 5.6 -11.8 -12.6 -25.8Estonia 0.0 EstoniaEuropean Community 116.3 105.3 104.1 104.5 109.1 108.0 94.8 88.8 European Community -1.1 0.4 4.4 -1.0 -12.2 -6.3 -23.6Finland 5.1 4.5 4.5 4.3 4.3 4.3 4.1 4.2 Finland 0.6 -5.8 0.3 -0.3 -4.7 4.0 -17.9France 21.2 18.8 19.3 19.2 18.5 19.1 16.0 14.2 France 2.7 -0.5 -3.5 3.0 -16.1 -11.4 -33.0Germany 15.1 12.1 12.1 12.0 12.5 13.4 11.8 12.9 Germany 0.3 -0.6 4.1 6.9 -12.2 9.9 -14.3Greece 2.3 2.1 1.8 1.8 1.8 1.8 1.8 1.8 Greece -12.2 -20.6Hungary 2.7 HungaryIreland 3.3 2.6 2.6 2.6 2.6 2.6 1.9 0.9 Ireland 0.0 0.0 -28.1 -50.0 -71.8Italy 4.0 2.1 2.1 1.8 1.7 2.1 2.0 1.9 Italy 2.7 -14.3 -10.0 28.9 -5.4 -6.6 -52.5Japan 2.5 2.4 2.3 2.6 2.5 2.6 2.4 2.4 Japan -3.3 9.9 -3.1 4.1 -8.2 2.9 -1.7Latvia NO NO NO NO NO NO NO NO LatviaLithuania 1.4 4.9 2.7 2.9 Lithuania 8.3 105.7Luxembourg LuxembourgMonaco MonacoNetherlands 20.4 20.2 20.2 20.1 19.1 19.0 17.2 17.7 Netherlands -0.3 -0.3 -4.9 -0.8 -9.5 3.3 -12.9New Zealand NO NE NO NO NO NO NO NO New ZealandNorway 6.7 5.4 6.1 5.6 5.5 6.2 Norway 11.2 -7.7 -2.3 12.9 -7.2Portugal 1.8 2.0 2.1 1.4 2.4 1.4 1.9 1.9 Portugal 1.4 -30.0 66.6 -41.8 33.8 1.3 4.1Romania 53.9 8.8 4.7 2.5 3.8 6.5 4.1 4.5 Romania -46.4 -46.9 52.8 71.6 -37.4 9.1 -91.7Slovakia 2.6 2.0 Slovakia -22.8Slovenia NO NO 0.0 0.0 0.0 0.0 0.0 0.0 Slovenia 26.4 -11.8 69.6Spain 9.3 7.9 7.5 7.0 7.6 7.4 6.6 6.3 Spain -5.4 -6.1 8.3 -1.7 -11.4 -4.8 -32.6Sweden 2.6 2.2 2.2 2.4 2.1 2.1 1.5 1.4 Sweden -1.2 12.7 -12.3 -3.7 -25.0 -8.0 -45.8Switzerland 0.3 0.3 0.3 0.3 0.3 0.3 0.3 0.3 SwitzerlandUkraine 1.9 1.5 Ukraine -22.5United Kingdom 13.3 10.2 9.7 11.1 16.0 14.9 11.6 7.8 United Kingdom -5.4 15.2 43.5 -7.0 -21.9 -33.3 -41.8United States 57.6 66.8 68.4 67.4 64.9 63.2 51.3 54.0 United States 2.5 -1.6 -3.7 -2.7 -18.8 5.2 -6.2
Chemical industry: nitric acid production – trend informationN2O emissions (Gg)
a In accordance with decisions 9/CP.2 and 11/CP.4, some Parties with economies in transition use base years other than 1990: Bulgaria (1988), Hungary (average of 1985 to 1987), Romania (1989) and Slovenia (1986).
- 82 -

Table 2.7
Relative change (%)
1990a 1996 1997 1998 1999 2000 2001 2002 1996 to 1997 1997 to 1998 1998to 1999 1999 to 2000 2000 to 2001 2001 to 2002 1990 to 2002Australia C AustraliaAustria 0.006 0.006 0.006 0.006 0.006 0.006 0.005 0.005 Austria 0.0 0.7 1.4 -1.0 -13.6 0.4 -10.2Belarus 0.010 BelarusBelgium 0.008 0.008 0.008 0.008 0.008 0.008 0.008 0.008 Belgium 0.1 0.1 -2.9 0.5 -1.7 -0.2 -5.8Bulgaria C BulgariaCanada 0.003 0.002 0.003 0.003 0.003 0.002 0.002 0.002 Canada 2.3 5.7 -5.3 -4.6 1.4 -5.7 -11.6Croatia 0.009 0.009 0.009 0.009 0.009 0.009 0.009 0.009 CroatiaCzech Republic 0.007 Czech RepublicDenmark 0.007 0.007 0.007 0.007 0.007 0.007 0.007 0.007 Denmark 0.0 0.0Estonia EstoniaEuropean Community NE NE NE European CommunityFinland 0.009 0.009 0.009 0.009 0.009 0.009 0.009 0.009 Finland 0.0 0.0 0.0 0.1 0.1 -0.1 0.7France 0.007 0.006 0.006 0.007 0.006 0.006 0.006 0.006 France 8.8 2.0 -2.6 -2.4 -3.7 -2.8 -12.0Germany 0.006 0.006 0.006 0.006 0.006 0.006 0.006 0.006 GermanyGreece 0.005 0.005 0.005 0.005 0.005 0.005 0.005 0.005 GreeceHungary HungaryIreland 0.010 0.010 0.010 0.010 0.010 0.010 0.007 0.007 Ireland 0.0 0.0 -28.1 -26.5Italy 0.004 0.004 0.004 0.004 0.004 0.004 0.004 0.004 ItalyJapan 0.004 0.004 0.003 0.004 0.004 0.004 0.004 0.004 Japan -4.2 18.1 -4.9 1.9 -0.3 -2.6 8.8Latvia LatviaLithuania 0.002 0.010 0.010 0.010 Lithuania 426.3Luxembourg LuxembourgMonaco MonacoNetherlands C C C C C C C C NetherlandsNew Zealand NO NE NO NO NO NO NO NO New ZealandNorway NorwayPortugal 0.008 0.008 0.008 0.008 0.008 0.008 0.008 0.008 Portugal 0.0 0.0 0.0 0.0 0.0Romania 0.019 0.019 0.019 0.019 0.019 0.019 0.019 0.019 RomaniaSlovakia 0.006 0.006 Slovakia -0.2Slovenia NO NO 0.006 0.006 0.006 0.006 0.006 0.007 Slovenia 0.0 0.0 2.8 6.7 15.4Spain 0.007 0.007 0.007 0.007 0.007 0.007 0.007 0.007 Spain 0.0 0.0 0.0 0.0Sweden 0.007 0.005 0.006 0.006 0.006 0.005 0.005 0.005 Sweden 1.4 9.9 -8.5 -13.1 12.9 -1.3 -22.9Switzerland 0.005 0.005 0.005 0.005 0.005 0.005 0.005 0.005 SwitzerlandUkraine 0.000 0.000 Ukraine 0.0United Kingdom 0.006 0.004 0.004 0.004 0.007 0.007 0.007 0.005 United Kingdom -1.7 3.8 53.6 11.8 -4.0 -29.6 -10.6United States 0.008 0.008 0.008 0.008 0.008 0.008 0.008 0.008 United States
Chemical industry: nitric acid production – trend information (continued)N2O implied emission factors (t/t)
a In accordance with decisions 9/CP.2 and 11/CP.4, some Parties with economies in transition use base years other than 1990: Bulgaria (1988), Hungary (average of 1985 to 1987), Romania (1989) and Slovenia (1986).
- 83 -

Table 2.8
Relative change (%)
1990a 1996 1997 1998 1999 2000 2001 2002 1996 to 1997 1997 to 1998 1998to 1999 1999 to 2000 2000 to 2001 2001 to 2002 1990 to 2002Australia NO NO NO NO NO NO NO NO AustraliaAustria NO NO NO NO NO NO NO NO AustriaBelarus BelarusBelgium NE NO NO NO NO NO NO NO BelgiumBulgaria NO BulgariaCanada 34.6 37.0 31.9 16.3 5.6 2.9 2.6 4.0 Canada -13.8 -48.8 -65.5 -48.6 -10.8 55.7 -88.3Croatia NO NO NO NO NO NO NO NO CroatiaCzech Republic NO Czech RepublicDenmark NO NO NO NO NO NO NO NO DenmarkEstonia 0.0 EstoniaEuropean Community 204.3 198.2 194.1 117.0 41.4 40.0 53.6 47.1 European Community -2.0 -39.7 -64.6 -3.2 33.8 -12.2 -77.0Finland NO NO NO NO NO NO NO NO FinlandFrance 47.8 56.7 56.2 31.4 14.7 10.3 15.6 12.8 France -0.9 -44.2 -53.2 -29.6 51.0 -17.8 -73.1Germany 60.7 67.6 62.0 17.8 4.0 3.0 9.6 9.9 Germany -8.4 -71.2 -77.4 -25.6 221.2 2.9 -83.7Greece NO NO NO NO NO NO NO NO GreeceHungary NO HungaryIreland NO 0.0 NO NO NO 0.0 0.0 0.0 IrelandItaly 14.8 18.6 18.6 19.5 20.5 21.4 22.6 22.2 Italy 0.3 4.8 5.1 4.4 5.4 -1.7 50.3Japan 21.5 24.2 25.8 22.3 2.6 11.0 2.0 1.4 Japan 6.5 -13.7 -88.5 329.6 -81.8 -30.8 -93.5Latvia NO NO NO NO NO NO NO NO LatviaLithuania NE NE NE NE LithuaniaLuxembourg LuxembourgMonaco MonacoNetherlands NO NO NO NO NO NO NO NO NetherlandsNew Zealand NO NE NO NO NO NO NO NO New ZealandNorway NO NO NO NO NO NO NorwayPortugal 0.0 0.0 0.0 0.0 0.0 0.0 0.0 0.0 PortugalRomania 2.2 1.9 2.7 0.0 0.0 0.0 1.6 0.0 Romania 39.7Slovakia NO NO SlovakiaSlovenia NO NO NO NO NO NO NO NO SloveniaSpain SpainSweden NO NO NO NO NO NO NO NO SwedenSwitzerland NO NO NO NO NO NO NO NO SwitzerlandUkraine 4.1 3.6 Ukraine -12.0United Kingdom 81.1 55.2 57.3 48.3 2.1 5.3 5.8 2.1 United Kingdom 3.8 -15.8 -95.6 148.0 8.8 -63.2 -97.4United States 49.0 55.0 33.3 19.3 17.7 19.5 15.9 19.0 United States -39.5 -41.9 -8.5 10.2 -18.5 19.9 -61.2
Chemical industry: adipic acid production – trend informationN2O emissions (Gg)
a In accordance with decisions 9/CP.2 and 11/CP.4, some Parties with economies in transition use base years other than 1990: Bulgaria (1988), Hungary (average of 1985 to 1987), Romania (1989) and Slovenia (1986).
- 84 -

Table 2.8
Relative change (%)
1990a 1996 1997 1998 1999 2000 2001 2002 1996 to 1997 1997 to 1998 1998to 1999 1999 to 2000 2000 to 2001 2001 to 2002 1990 to 2002Australia NO AustraliaAustria AustriaBelarus BelarusBelgium NE NO NO NO NO NO NO NO BelgiumBulgaria NO BulgariaCanada C C C C C C C C CanadaCroatia CroatiaCzech Republic Czech RepublicDenmark DenmarkEstonia EstoniaEuropean Community NE NE NE European CommunityFinland FinlandFrance FranceGermany C C C C C C C C GermanyGreece NO NO NO NO NO NO NO NO GreeceHungary HungaryIreland IrelandItaly 0.30 0.30 0.30 0.30 0.30 0.30 0.30 0.30 ItalyJapan 0.25 0.25 0.25 0.25 0.03 0.10 0.02 0.01 Japan -89.9 301.0 -81.5 -26.7 -94.5Latvia LatviaLithuania NE NE NE NE LithuaniaLuxembourg LuxembourgMonaco MonacoNetherlands NO NO NO NO NO NO NO NO NetherlandsNew Zealand NO NE NO NO NO NO NO NO New ZealandNorway NO NO NO NO NO NO NorwayPortugal PortugalRomania 0.30 0.30 0.30 0.30 RomaniaSlovakia NO NO SlovakiaSlovenia NO NO NO NO NO NO NO NO SloveniaSpain NO NO NO NO NO NO NO NO SpainSweden SwedenSwitzerland NO NO NO NO NO NO NO SwitzerlandUkraine 0.08 0.08 Ukraine 0.0United Kingdom 0.31 0.36 0.37 0.29 0.01 0.03 0.04 0.01 United Kingdom 0.9 -20.5 -94.9 111.4 23.8 -71.6 -96.4United States 0.07 0.07 0.04 0.02 0.02 0.02 0.02 0.02 United States -41.7 -41.3 -13.0 8.1 -9.7 8.7 -69.0
Chemical industry: adipic acid production – trend information (continued)N2O implied emission factors (t/t)
a In accordance with decisions 9/CP.2 and 11/CP.4, some Parties with economies in transition use base years other than 1990: Bulgaria (1988), Hungary (average of 1985 to 1987), Romania (1989) and Slovenia (1986).
- 85 -

Table 2.9
(%) (t/t) (%) (t/t) (%) (t/t) (%) (%) (t/t)IPCC default EFg
1.5 - 1.6 1.5 - 1.8Australia T2 CS L, T 2.0 NA 6,027 C 7,527 NA NA C 6,106 0.5 1,788 1,809 1,809 0.0 1.48Austria T2 CS, PS L, T 4.8 5,892 6,193 6,208 0.2 0.12 4,380 4,712 4,607 -2.2 0.71 NO NO 158Belarus 1,484Belgium CS CS L 1.2 7,623 7,626 11,316 48.4 0.12 7,669 8,510 7,992 -6.1 0.07 NOBulgaria D D L 2.1 0.91 C 1,860 C C 1,072 NA 0.0 2 2,709 131,272.9 1.65Canada T1-T2 CS L 1.0 NA 15,179 15,907 16,300 2.5 0.04 8,302 8,670 8,670 0.0 0.75 0.6 2,583 2,709 1.61Croatia T1 D 0 15Czech Republic T1 D L 1.8 6,534 2,333 -64.3 4,693 4,819 2.7 0.56 NODenmark 721.5 NO/NE 5 NO NO NO NO 31Estonia 1 0.0 0European Community C, CS, D, T1,
T2C, CS, D, PS
L0.3 NE NE 0.1 NE
Finland NO NO NA NA 4,004 NA NA 8,178 NO NO 30France C CS L, T 0.5 19,614 20,468 20,258 -1.0 0.05 11,880 13,104 12,600 -3.8 0.10 0.1 458 463 463 0.0 1.46Germany CS CS NE 44,803 45,015 10,289 -76.7 NE 29,184 29,427 29,427 0.0 NE 0.1 1,275 1,319 650 -50.7 0.68Greece T1 D 0.0 1281 1,281 1,835 43.2 0.01 NO NO NO 0.2 C C 164 CHungary T1b D 2,052 2,138 4.2 0.04 1,335 1,335 0.0 0.1 35 35 1.80Ireland NA NA 100 0 0Italy D, C D, C, CS 0.2 26,526 26,301 26,302 0.0 0.05 10,562 9,746 9,775 0.3 IE 0.1 188 190 190 0.0 1.55Japan - - IE,NA,NO NE NE 107,376 IE NE NE 80,513 IE NE NE 40 IELatvia T1 D 0.3 NE NE 520 NE NE NO NOLithuania NE NO NO NO NE NE NE NO NO NOLuxembourg 2,719 0Monaco NO NO NONetherlands CS/IE PS, CS 6,000 6155.523 6,119 -0.6 IE NE NE 5,367 IE 293 284 300 5.5 IENew Zealand T1 CS L 2.1 801 778 765 -1.7 2.01 0 0 617 IE 0.7 324 334 335 0.4 1.62Norway D, CS3) D, PS 0.5 689 NO 105 101 108 7.4 2.94 L, T 3.1 1,241 1,215 1,095 -9.9 1.42Portugal D D+C 0.0 0.15 IE IE 800 NO NO 100 0 0 18Romania D D L, T 3.8 3.10 5,490 3,243 3,979 3,964 -0.4 0.2 183 190 187 -1.6 1.50Slovakia IE L 0.9 3,752 4,103 11 -99.7 0.12 3,255 3,533 3,533 0.0 IE 0.3 110 110 112 2.0 1.50Slovenia T1 D 0.1 2 1.9966 481 23,991.0 3.60 NO NO NO L, T 0.9 36 52 88 67.7 3.56Spain C C 0.2 16,631 16,530 16,410 -0.7 0.05 C C 4,021 C 0.1 C C 380 CSweden CS, D, T1 CS, PS L 2.2 47 40 4,155 10,368.1 2.89 5,161 4,667 1,452 -68.9 0.30 0.2 102 102 101 -1.2 1.43Switzerland C CS 0.1 0.08 950 960 1,100 14.6 0.08 IE IE IE T 0.1 36 40 36 -10.4 1.60Ukraine T1 D L 4.5 33,500 34,500 34,543 0.1 26,400 27,600 27,633 0.1 0.0 121 126 112 -11.1 1.50United Kingdom T2 CS T 0.1 3,184 2,623 11,670 344.9 0.01 9,870 8,560 8,561 0.0 -0.15 0.1 341 344 340 -1.3 1.54United States D D,CS L, T 0.8 NA 42,743 46,124 94,600 105.1 0.00 5,433 3,037 40,200 1223.6 0.15 0.1 2,637 2,707 2,707 0.0 1.56
a Information on methods and emission factors is included in this table as reported by Parties. It may not reflect the actual method or type of emission factor used for all subcategories within the category 2.C Metal production.b CO2 emission estimates from sinter (2.C.1.3) were reported by only Belgium; CO2 emission estimates from coke (2.C.1.4) were reported by only Australia, Latvia, Slovenia, Ukraine, the United Kingdom and the United States.
(kt) (kt) (kt)
Methods EFKey source Key source
CRF (2002) UNd CO2 IEFCO2 IEF
Metal production, CO2 (2002)
Methods and EF used a Iron & steel b Aluminium productionSteel Pig iron
Activity data (production)
CRF (2001) c Difference
Share of national total
Activity data (production)Share of
national total CO2 IEF
CRF (2001) c CRF (2002) UNd Difference CRF (2001) c CRF (2002) UNd DifferenceCO2 IEF
Activity data (production)
g Source of default emission factors: IPCC Guidelines, Volume 3, pages 2.28 and 2.33.
c As UN data for 2002 were not available for all Parties at the time of preparation of this synthesis and assessment report, for the comparisons of UN and CRF data in this table, data for the years 2002 and 2001 from the CRF are provided along with the respective UN data for 2002 or 2001.d Source of data for crude steel: UN Industrial Commodity Production Statistics Database (as of 17 May 2004), Department of Economic and Social Affairs, Statistics Division, United Nations, New York. Data are for 2002, except for 2001 for Germany and Ireland.e Source of data for pig iron: UN Industrial Commodity Production Statistics Database (as of 17 May 2004), Department of Economic and Social Affairs, Statistics Division, United Nations, New York. Data are for 2002, except for 2001 for Luxembourg.f Source of data for aluminium: UN Industrial Commodity Production Statistics Database (as of 17 May of 2004), Department of Economic and Social Affairs, Statistics Division, United Nations, New York. Data are for 2002, except for 2001 for Austria and Portugal. Data are for primary production, except for Austria, Denmark, Finland, Hungary and Portugal where only total production data were available.
- 86 -

Table 2.10
Relative change (%)
1990a 1996 1997 1998 1999 2000 2001 2002 1996 to 1997 1997 to 1998 1998to 1999 1999 to 2000 2000 to 2001 2001 to 2002 1990 to 2002Australia 14,471 13,592 13,650 13,507 14,193 13,591 13,108 13,118 Australia 0.4 -1.0 5.1 -4.2 -3.6 0.1 -9.4Austria 3,673 3,685 4,083 3,889 3,793 4,229 4,321 4,064 Austria 10.8 -4.7 -2.5 11.5 2.2 -5.9 10.6Belarus BelarusBelgium 1,873 1,782 1,757 1,878 1,994 1,815 1,682 1,816 Belgium -1.4 6.9 6.2 -9.0 -7.3 8.0 -3.1Bulgaria 2,485 2,101 2,260 1,877 1,711 1,483 1,422 1,326 Bulgaria 7.5 -16.9 -8.9 -13.3 -4.1 -6.7 -46.6Canada 9,686 11,471 11,343 11,556 11,775 11,717 11,442 11,477 Canada -1.1 1.9 1.9 -0.5 -2.4 0.3 18.5Croatia 306 14 32 15 20 Croatia 129.5 -51.1 -97.7Czech Republic IE IE IE IE IE IE 2,524 2,614 Czech Republic 3.6Denmark 28 35 35 42 43 41 47 Denmark -0.5 20.5 2.0 -5.4 14.6Estonia EstoniaEuropean Community 21,327 19,190 19,105 18,449 19,137 19,342 19,065 18,034 European Community -0.4 -3.4 3.7 1.1 -1.4 -5.4 -15.4Finland FinlandFrance 4,559 3,415 3,946 3,824 3,402 3,008 2,923 3,335 France 15.5 -3.1 -11.0 -11.6 -2.8 14.1 -26.8Germany 1,012 787 782 837 867 880 891 893 Germany -0.7 7.0 3.6 1.6 1.2 0.2 -11.8Greece 237 207 211 232 253 257 258 260 Greece 1.7 10.1 8.9 1.9 0.0 1.1 9.9Hungary 172 174 182 171 159 111 108 116 Hungary 4.5 -6.1 -6.6 -30.2 -3.2 7.5 -32.6Ireland NE NO NO NO NE NO NO NO IrelandItaly 2,205 2,042 2,056 2,032 1,859 2,016 1,916 1,777 Italy 0.7 -1.2 -8.5 8.4 -5.0 -7.3 -19.4Japan IE,NA,NO IE,NA,NO IE,NA,NO IE,NA,NO IE,NA,NO IE,NA,NO IE,NA,NO IE,NA,NO JapanLatvia 39 25 37 34 37 50 34 31 Latvia 49.8 -8.2 9.1 33.3 -31.3 -9.8 -21.7Lithuania NE NE NE NE LithuaniaLuxembourg 137 131 270 LuxembourgMonaco MonacoNetherlands 0 3 172 Netherlands 9,270.3New Zealand 1,803 2,017 1,875 2,011 2,068 2,041 2,119 2,104 New Zealand -7.0 7.2 2.8 -1.3 3.8 -0.7 16.7Norway 4,320 4,789 4,726 5,175 5,300 5,303 5,144 4,380 Norway -1.3 9.5 2.4 0.1 -3.0 -14.9 1.4Portugal 51 67 74 75 78 81 35 8 Portugal 10.1 1.2 4.1 4.4 -57.1 -78.4 -85.2Romania 16,921 9,356 9,884 9,342 5,199 5,027 4,438 5,493 Romania 5.6 -5.5 -44.3 -3.3 -11.7 23.8 -67.5Slovakia 542 512 528 528 567 580 608 649 Slovakia 3.2 0.0 7.5 2.2 4.8 6.8 19.8Slovenia 219 208 199 150 161 171 177 252 Slovenia -4.4 -24.8 7.7 6.0 3.5 42.0 15.1Spain 1,579 1,584 1,706 1,778 1,796 1,860 1,947 1,948 Spain 7.7 4.2 1.0 3.6 4.7 0.0 23.3Sweden 2,103 2,227 2,120 2,121 1,962 1,969 2,169 2,037 Sweden -4.8 0.1 -7.5 0.4 10.2 -6.1 -3.2Switzerland 260 117 118 127 131 134 136 143 Switzerland 0.4 8.2 2.7 2.1 1.7 5.3 -45.0Ukraine 22,587 23,989 Ukraine 6.2United Kingdom 3,161 3,132 2,073 1,610 2,950 3,060 2,738 1,456 United Kingdom -33.8 -22.3 83.2 3.7 -10.5 -46.8 -54.0United States 93,708 75,857 79,523 75,249 72,268 73,135 64,516 59,871 United States 4.8 -5.4 -4.0 1.2 -11.8 -7.2 -36.1
Metal production: CO2 – trend informationCO2 emissions (Gg)
a In accordance with decisions 9/CP.2 and 11/CP.4, some Parties with economies in transition use base years other than 1990: Bulgaria (1988), Hungary (average of 1985 to 1987), Romania (1989) and Slovenia (1986).
- 87 -
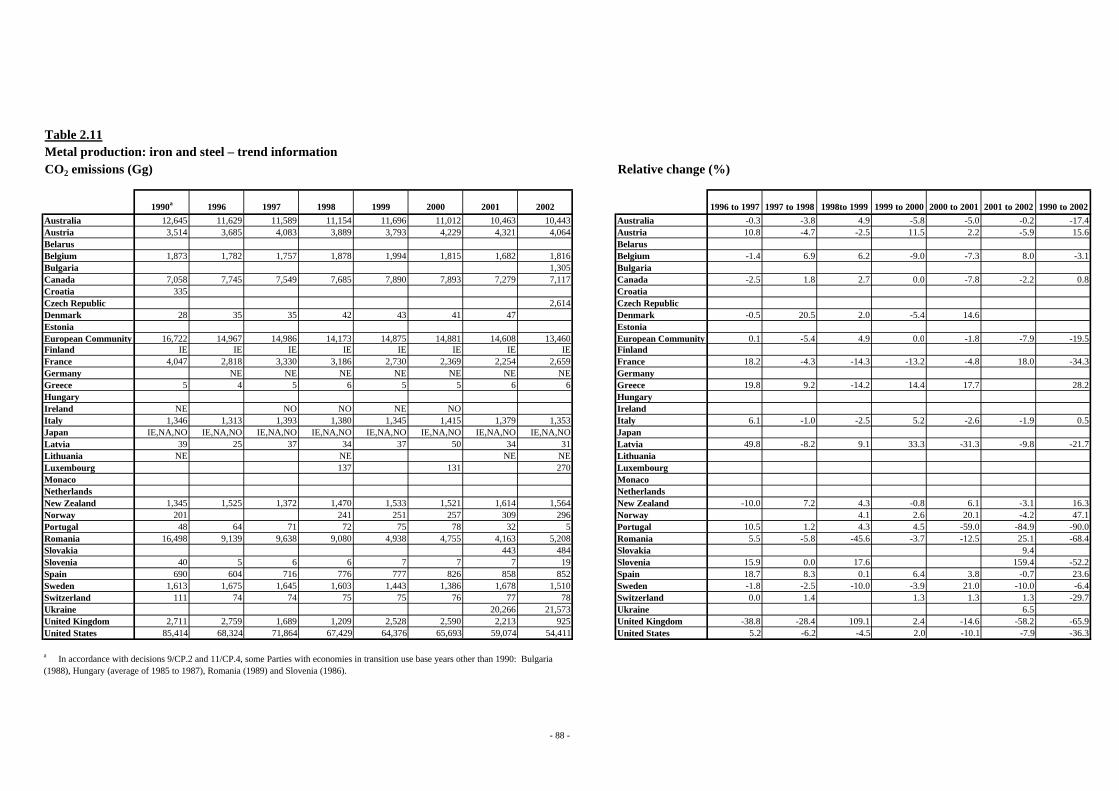
Table 2.11
Relative change (%)
1990a 1996 1997 1998 1999 2000 2001 2002 1996 to 1997 1997 to 1998 1998to 1999 1999 to 2000 2000 to 2001 2001 to 2002 1990 to 2002Australia 12,645 11,629 11,589 11,154 11,696 11,012 10,463 10,443 Australia -0.3 -3.8 4.9 -5.8 -5.0 -0.2 -17.4Austria 3,514 3,685 4,083 3,889 3,793 4,229 4,321 4,064 Austria 10.8 -4.7 -2.5 11.5 2.2 -5.9 15.6Belarus BelarusBelgium 1,873 1,782 1,757 1,878 1,994 1,815 1,682 1,816 Belgium -1.4 6.9 6.2 -9.0 -7.3 8.0 -3.1Bulgaria 1,305 BulgariaCanada 7,058 7,745 7,549 7,685 7,890 7,893 7,279 7,117 Canada -2.5 1.8 2.7 0.0 -7.8 -2.2 0.8Croatia 335 CroatiaCzech Republic 2,614 Czech RepublicDenmark 28 35 35 42 43 41 47 Denmark -0.5 20.5 2.0 -5.4 14.6Estonia EstoniaEuropean Community 16,722 14,967 14,986 14,173 14,875 14,881 14,608 13,460 European Community 0.1 -5.4 4.9 0.0 -1.8 -7.9 -19.5Finland IE IE IE IE IE IE IE IE FinlandFrance 4,047 2,818 3,330 3,186 2,730 2,369 2,254 2,659 France 18.2 -4.3 -14.3 -13.2 -4.8 18.0 -34.3Germany NE NE NE NE NE NE NE GermanyGreece 5 4 5 6 5 5 6 6 Greece 19.8 9.2 -14.2 14.4 17.7 28.2Hungary HungaryIreland NE NO NO NE NO IrelandItaly 1,346 1,313 1,393 1,380 1,345 1,415 1,379 1,353 Italy 6.1 -1.0 -2.5 5.2 -2.6 -1.9 0.5Japan IE,NA,NO IE,NA,NO IE,NA,NO IE,NA,NO IE,NA,NO IE,NA,NO IE,NA,NO IE,NA,NO JapanLatvia 39 25 37 34 37 50 34 31 Latvia 49.8 -8.2 9.1 33.3 -31.3 -9.8 -21.7Lithuania NE NE NE NE LithuaniaLuxembourg 137 131 270 LuxembourgMonaco MonacoNetherlands NetherlandsNew Zealand 1,345 1,525 1,372 1,470 1,533 1,521 1,614 1,564 New Zealand -10.0 7.2 4.3 -0.8 6.1 -3.1 16.3Norway 201 241 251 257 309 296 Norway 4.1 2.6 20.1 -4.2 47.1Portugal 48 64 71 72 75 78 32 5 Portugal 10.5 1.2 4.3 4.5 -59.0 -84.9 -90.0Romania 16,498 9,139 9,638 9,080 4,938 4,755 4,163 5,208 Romania 5.5 -5.8 -45.6 -3.7 -12.5 25.1 -68.4Slovakia 443 484 Slovakia 9.4Slovenia 40 5 6 6 7 7 7 19 Slovenia 15.9 0.0 17.6 159.4 -52.2Spain 690 604 716 776 777 826 858 852 Spain 18.7 8.3 0.1 6.4 3.8 -0.7 23.6Sweden 1,613 1,675 1,645 1,603 1,443 1,386 1,678 1,510 Sweden -1.8 -2.5 -10.0 -3.9 21.0 -10.0 -6.4Switzerland 111 74 74 75 75 76 77 78 Switzerland 0.0 1.4 1.3 1.3 1.3 -29.7Ukraine 20,266 21,573 Ukraine 6.5United Kingdom 2,711 2,759 1,689 1,209 2,528 2,590 2,213 925 United Kingdom -38.8 -28.4 109.1 2.4 -14.6 -58.2 -65.9United States 85,414 68,324 71,864 67,429 64,376 65,693 59,074 54,411 United States 5.2 -6.2 -4.5 2.0 -10.1 -7.9 -36.3
Metal production: iron and steel – trend informationCO2 emissions (Gg)
a In accordance with decisions 9/CP.2 and 11/CP.4, some Parties with economies in transition use base years other than 1990: Bulgaria (1988), Hungary (average of 1985 to 1987), Romania (1989) and Slovenia (1986).
- 88 -

Table 2.11
Relative change (%)
1990a 1996 1997 1998 1999 2000 2001 2002 1996 to 1997 1997 to 1998 1998to 1999 1999 to 2000 2000 to 2001 2001 to 2002 1990 to 2002Australia NA NA NA NA NA NA NA NA AustraliaAustria 0.12 0.12 0.12 0.12 0.11 0.12 0.11 0.12 Austria -1.1 -0.3 -1.3 0.6 -1.6 1.9 -4.9Belarus BelarusBelgium 0.12 1.70 0.12 0.12 0.12 0.12 0.12 0.12 Belgium -92.8 1.1 0.3 -1.5 0.5 0.0 -0.7Bulgaria C BulgariaCanada 0.05 0.05 0.05 0.04 0.04 0.04 0.04 0.04 Canada -5.7 -6.2 -2.5 -2.3 -8.7 3.0 -13.4Croatia CroatiaCzech Republic Czech RepublicDenmark 0.05 0.05 0.04 0.06 0.05 0.06 0.06 Denmark -12.3 31.4 -4.3 19.6 0.2Estonia EstoniaEuropean Community NE NE NE European CommunityFinland FinlandFrance 0.08 0.06 0.06 0.06 0.06 0.04 0.05 0.05 France -2.9 0.0 -2.0 -25.1 20.2 1.1 -32.9Germany NE NE NE NE NE NE NE NE GermanyGreece 0.01 0.01 0.01 0.01 0.01 0.01 0.01 0.01 GreeceHungary 0.04 HungaryIreland IrelandItaly 0.05 0.05 0.05 0.05 0.05 0.05 0.05 0.05 Italy -1.0 1.4 -2.1 -2.2 -1.0 -2.7Japan IE IE IE IE IE IE IE IE JapanLatvia LatviaLithuania NO NO NO NO LithuaniaLuxembourg LuxembourgMonaco MonacoNetherlands IE IE IE IE IE IE IE IE NetherlandsNew Zealand 1.94 1.91 1.87 1.99 2.02 2.08 2.02 2.01 New Zealand -2.1 6.0 1.7 3.2 -3.3 -0.3 3.7Norway NO NO NO NO NO NO NorwayPortugal PortugalRomania RomaniaSlovakia 0.12 0.12 Slovakia 0.0Slovenia 3.60 3.60 3.60 3.60 3.60 3.60 3.60 3.60 SloveniaSpain 0.05 0.05 0.05 0.05 0.05 0.05 0.05 0.05 Spain -0.2 -0.1 -0.1 -0.2 -0.1 -0.1 -2.1Sweden 2.89 2.89 2.89 2.89 2.89 2.89 2.89 2.89 SwedenSwitzerland 0.09 0.08 0.08 0.08 0.08 0.08 0.08 0.08 Switzerland -0.8 0.5 -1.0 0.8 0.0 0.2 -5.7Ukraine UkraineUnited Kingdom 0.01 0.01 0.01 0.01 0.01 0.01 0.01 0.01 United Kingdom 0.0 0.0 0.0 0.0 0.0United States 0.00 0.00 0.00 0.00 0.00 0.00 0.00 0.00 United States
Metal production: iron and steel – trend information (continued)CO2 implied emission factors steel (t/t)
a In accordance with decisions 9/CP.2 and 11/CP.4, some Parties with economies in transition use base years other than 1990: Bulgaria (1988), Hungary (average of 1985 to 1987), Romania (1989) and Slovenia (1986).
- 89 -

Table 2.12
Relative change (%)
1990a 1996 1997 1998 1999 2000 2001 2002 1996 to 1997 1997 to 1998 1998to 1999 1999 to 2000 2000 to 2001 2001 to 2002 1990 to 2002Australia 1,827 1,963 2,060 2,353 2,497 2,579 2,644 2,675 Australia 4.9 14.2 6.1 3.3 2.5 1.2 46.4Austria 158 NO NO NO NO NO NO NO AustriaBelarus BelarusBelgium NO NO NO NO NO NO NO NO BelgiumBulgaria 3 BulgariaCanada 2,628 3,726 3,794 3,871 3,885 3,825 4,163 4,360 Canada 1.8 2.0 0.4 -1.6 8.8 4.8 65.9Croatia 111 0 0 0 0 0 CroatiaCzech Republic NO Czech RepublicDenmark NO NO NO NO NO NO NO NO DenmarkEstonia 0 EstoniaEuropean Community 3,407 2,942 2,972 3,088 3,202 3,297 3,348 3,383 European Community 1.0 3.9 3.7 3.0 1.6 1.0 -0.7Finland NO NO NO NO NO NO NO NO FinlandFrance 512 597 616 637 672 639 668 676 France 3.2 3.5 5.5 -4.9 4.6 1.2 32.1Germany 1,012 787 782 837 867 880 891 893 Germany -0.7 7.0 3.6 1.6 1.2 0.2 -11.8Greece 232 203 206 226 248 252 251 254 Greece 1.3 10.1 9.5 1.7 -0.3 1.2 9.5Hungary 64 HungaryIreland NE 0 NO NO NE NO 0 0 IrelandItaly 359 286 291 290 290 294 291 295 Italy 1.8 -0.4 0.1 1.4 -1.2 1.5 -17.9Japan IE IE IE IE IE IE IE IE JapanLatvia NO NO NO NO NO NO NO NO LatviaLithuania NO NO NO NO LithuaniaLuxembourg LuxembourgMonaco 0 MonacoNetherlands IE IE IE IE IE IE IE IE NetherlandsNew Zealand 458 493 504 541 535 520 504 540 New Zealand 2.2 7.4 -1.2 -2.8 -3.0 7.1 18.0Norway 1,431 1,645 1,700 1,734 1,752 1,726 Norway 3.3 2.0 1.0 -1.5 20.6Portugal 0 0 0 0 0 0 0 0 PortugalRomania 423 218 246 263 261 272 275 285 Romania 13.1 6.7 -0.6 4.0 1.1 3.8 -32.6Slovakia 165 165 Slovakia -0.2Slovenia 89 127 127 126 126 127 127 187 Slovenia -0.3 -0.3 -0.3 1.1 -0.2 47.3 108.9Spain 551 560 558 558 564 567 583 589 Spain -0.5 0.2 1.0 0.5 3.0 1.0 7.0Sweden 133 137 136 139 140 195 139 146 Sweden -0.5 2.1 0.6 39.4 -28.8 5.1 9.7Switzerland 139 43 43 52 55 57 58 64 Switzerland 1.1 20.2 6.6 3.2 2.1 10.7 -53.8Ukraine 182 189 Ukraine 4.1United Kingdom 450 372 384 401 421 470 525 530 United Kingdom 3.2 4.3 5.2 11.5 11.7 1.0 17.7United States 6,315 5,580 5,621 5,792 5,895 5,723 4,114 4,223 United States 0.7 3.1 1.8 -2.9 -28.1 2.7 -33.1
Metal production: aluminium – trend informationCO2 emissions (Gg)
a In accordance with decisions 9/CP.2 and 11/CP.4, some Parties with economies in transition use base years other than 1990: Bulgaria (1988), Hungary (average of 1985 to 1987), Romania (1989) and Slovenia (1986).
- 90 -

Table 2.12
Relative change (%)
1990a 1996 1997 1998 1999 2000 2001 2002 1996 to 1997 1997 to 1998 1998to 1999 1999 to 2000 2000 to 2001 2001 to 2002 1990 to 2002Australia 1.48 1.47 1.48 1.48 1.48 1.48 1.48 1.48 Australia 0.1 0.2 0.0 -0.1 -0.1 0.0 0.0Austria 1.80 AustriaBelarus BelarusBelgium NO NO NO NO NO NO NO BelgiumBulgaria 1.65 BulgariaCanada 1.68 1.63 1.63 1.63 1.63 1.61 1.61 1.61 Canada -0.1 -0.3 -0.9 0.0 -0.1 -4.0Croatia 1.50 CroatiaCzech Republic Czech RepublicDenmark DenmarkEstonia EstoniaEuropean Community NE NE NE European CommunityFinland FinlandFrance 1.57 1.57 1.54 1.52 1.49 1.46 1.46 1.46 France -1.8 -1.8 -1.8 -1.8 0.0 0.0 -7.0Germany 0.79 0.79 0.78 0.76 0.75 0.72 0.70 0.68 Germany -1.8 -3.0 -0.2 -4.0 -3.4 -3.2 -14.4Greece C C C C C C C C GreeceHungary 1.80 HungaryIreland IrelandItaly 1.55 1.55 1.55 1.55 1.55 1.55 1.55 1.55 ItalyJapan IE IE IE IE IE IE IE IE JapanLatvia LatviaLithuania NO NO NO NO LithuaniaLuxembourg LuxembourgMonaco MonacoNetherlands IE IE IE IE IE IE IE IE NetherlandsNew Zealand 1.73 1.73 1.62 1.70 1.63 1.58 1.56 1.62 New Zealand -6.3 5.1 -4.3 -3.1 -1.5 4.1 -6.6Norway 1.65 1.58 1.45 1.37 1.41 1.42 Norway -8.0 -6.1 3.4 0.6 -14.0Portugal PortugalRomania 1.50 1.50 1.50 1.50 1.50 1.50 1.50 1.50 RomaniaSlovakia 1.50 1.50 Slovakia 0.0Slovenia 3.60 3.57 3.57 3.57 3.57 3.57 3.57 3.56 Slovenia 0.0 0.0 0.0 0.0 0.0 -0.3 -1.1Spain C C C C C 1.55 C C SpainSweden 1.38 1.39 1.38 1.44 1.41 1.93 1.36 1.43 Sweden -0.6 4.8 -2.5 36.8 -29.2 5.1 3.7Switzerland 1.60 1.60 1.57 1.60 1.60 1.60 1.60 1.60 Switzerland -1.6 1.7Ukraine 1.50 1.50 UkraineUnited Kingdom 1.55 1.55 1.55 1.55 1.55 1.54 1.54 1.54 United Kingdom -0.1 0.0 -0.1 -0.5 -0.9United States 1.56 1.56 1.56 1.56 1.56 1.56 1.56 1.56 United States
Metal production: aluminium – trend information (continued)CO2 implied emission factors (t/t)
a In accordance with decisions 9/CP.2 and 11/CP.4, some Parties with economies in transition use base years other than 1990: Bulgaria (1988), Hungary (average of 1985 to 1987), Romania (1989) and Slovenia (1986).
- 91 -

Table 2.13
Ratiof
(%) (%) (%) (t) (kg/t) (t)IPCC default EFf 0.31-1.7 0.04-0.17 1g
Australia T1c CS T 0.29 1,788 1,809 1,809 0.0 0.1083 0.0141 7.7 T2 CS SF6 consumption NE NE NEAustria NA NA NO NO 158 NA NA cast Magnesium [t] 3,600 NABelarusBelgiumBulgaria D D 0.03 0 2 2,709 131,272.9 0.0014 0.0001 10.0 NO NO NOCanada T2 CS
L, T0.67 2,583 2,709 0.0003 0.0000 14.9 T3 PS 0.37 Primary Magnesium
Production (3)70,000 0.0 112.0
Croatia 15Czech Republic NO NODenmark NO NO 31 NO NOEstoniaEuropean Community C, CS, D, PS,
T1, T2, T3a, T3bC, CS, D, PS,
T3a0.08 NE NE NE NE NE IE
Finland NO NO NO NO 30 T2, T1a NA SF6 consumption C CFrance C PS T 0.18 458 463 463 0.0 0.2832 0.0283 10.0 C CS 0.13 SF6 consumption 31 1,000.0 30.9Germany T3a T3a 0.04 653 655 650 -0.7 0.0001 0.0000 10.0 T1 T1 0.04 Mg-Production 20,000 0.0 15.9Greece T 0.07 C C 164 C C NO NO NOHungary T2 D, CS 0.26 0 35 35 0.7703 0.0773 10.0 NO NOIreland NA NA NO NA NA NOItaly D, T1, T2 CS T 0.04 188 191 190 -0.1 0.0001 0.0000 7.8 0.07 SF6 consumption 17 1.0 16.7Japan - - 0.00 7 6 40 542.0 0.3173 0.0317 10.0 - - 0.08 SF6 consumption 47 1.0 47.0Latvia NO NO NO NO NO NO NO NOLithuania NO NO NO NO NO NO NOLuxembourgMonaco NO NO 0.0Netherlands CS/T2&T3b PS T 0.49 293 284 300 5.5 0.0005 0.0000 9.9 NO NO NO NONew Zealand T2 D T 0.11 324 334 335 0.3 0.0200 0.0000 6,680.0 NO NONorway L, T 2.02 1,039 1,047 1,095 4.6 0.0002 0.0000 24.9 T 0.26 SF6 consumption 6 1.0 5.9Portugal NO NO 18Romania T1c T1c 0.38 183 190 187 -1.6 0.3730 0.0368 10.1 NE NE NESlovakia 0.02 110 110 112 2.0 0.0000 0.0000 10.0 NO NO NOSlovenia T1 D L, T 0.57 75 107 88 -17.5 0.1452 0.0161 9.0 NO NO NOSpain NO T 0.05 C C 380 C C NO NO NOSweden T2 CS T 0.41 102 102 101 -1.2 0.3695 0.0411 9.0 D D T 0.09 SF6 consumption 3 1,000.0 2.6Switzerland T 0.02 36 40 36 -10.4 0.0000 0.0000 9.0 T2 M 0.05 1.2Ukraine D D 0.00 C C 112 NA NA CUnited Kingdom T2/PS CS 0.03 341 344 340 -1.3 0.0897 T2/PS CS T 0.15 SF6 consumption 39 1,000.0 39.0United States T2, T3 PS
T0.08 2,637 2,707 2,707 0.0 0.0003 0.0000 9.4 T2 CS 0.03 Magnesium Production
and ProcessingC C 100.6
a Information on methods and emission factors is included in this table as reported by Parties. It may not reflect the actual method used or type of emission factor for PFCs for all subcategories within the category 2.C. Metal production. b Information on methods and emission factors is included in this table as reported by Parties. It may not reflect the actual method used or type of emission factor for SF6 for all subcategories within the category 2.C. Metal production.
d This column includes aluminium production data provided for CF4 and C2F6 in tables 2 (II).C,E of the CRF.
f Source of default emission factors: IPCC good practice guidance, page 3.44.g The default emission factor is 1 kg/t magnesium produced or smelted.h IPCC good practice guidance state that emissions equal consumption (IPCC good practice, page 3.48).
Metal production, PFCs and SF6 (2002)
PFCs SF6
(kt) (kg/t)
Methods EF
Activity data (Aluminium production) IEF
CRF (2001)c
Methods and EF useda 2.C.3 Aluminium production - PFCs Methods and EF used b 2.C.4.2 SF6 used in magnesium foundries
Key sourceDescription
Share of national totalMethods EF Key source CRF
(2002)c,d UNe Difference
c As United Nations data for 2002 were not available for all Parties for the comparisons of United Nations and CRF data in this table, data for the years 2001 from the CRF are provided together with the respective United Nations data for 2001.
e Source of data for aluminium: United Nations Industrial Commodity Production Statistics Database (as of 17 May 2004), Department of Economic and Social Affairs, Statistics Division, United Nations, New York. Data are for 2002, except for 2001 for Austria and Portugal. Data are for primary production, except for Austria, Denmark, Finland, Hungary and Portugal where only total production data were available.
CF4 C2F6
Actual emissions
SF6h
IEF CF4 / IEF C2F6
Activity dataShare of
national total Value SF6-IEF
- 92 -

Table 2.14
Relative change (%)
1990a 1996 1997 1998 1999 2000 2001 2002 1996 to 1997 1997 to 1998 1998to 1999 1999 to 2000 2000 to 2001 2001 to 2002 1990 to 2002Australia 511.8 156.7 136.5 181.5 127.6 143.4 202.2 195.9 Australia -12.8 33.0 -29.7 12.3 41.0 -3.1 -61.7Austria 129.5 NO NO NO NO NO NO NO AustriaBelarus BelarusBelgium NE BelgiumBulgaria 2.9 BulgariaCanada 988.0 982.7 895.5 810.7 700.5 608.8 664.0 680.9 Canada -8.9 -9.5 -13.6 -13.1 9.1 2.5 -31.1Croatia 126.0 CroatiaCzech Republic Czech RepublicDenmark NO NO NO NO NO NO NO NO DenmarkEstonia 0.0 EstoniaEuropean Community NE NE NE European CommunityFinland NO NO NO NO NO NO NO NO FinlandFrance 308.6 87.4 92.7 120.8 157.3 115.1 78.7 131.1 France 6.0 30.3 30.2 -26.8 -31.6 66.6 -57.5Germany NE 198.0 145.0 157.0 116.0 48.0 50.1 58.1 Germany -26.8 8.3 -26.1 -58.6 4.3 16.0Greece 34.7 9.7 22.3 27.5 17.8 20.0 12.3 12.0 Greece 130.2 23.4 -35.4 12.6 -38.4 -2.8 -65.5Hungary 27.2 HungaryIreland NO NO NO NO NO NO 0.0 NO IrelandItaly 198.3 18.4 18.8 18.9 18.8 25.9 30.5 25.9 Italy 1.8 0.6 -0.7 37.8 17.8 -15.2 -87.0Japan NE 8.9 8.0 6.7 3.9 2.4 2.1 2.0 Japan -9.8 -16.9 -41.1 -38.9 -11.8 -5.6Latvia NO NO NO NO NO NO NO NO LatviaLithuania NO NO NO NO LithuaniaLuxembourg LuxembourgMonaco 0.0 MonacoNetherlands 301.0 247.0 261.0 195.2 153.9 160.4 154.8 140.2 Netherlands 5.7 -25.2 -21.1 4.2 -3.5 -9.4 -53.4New Zealand 68.0 30.0 21.0 10.0 10.0 7.7 7.7 11.0 New Zealand -30.0 -52.4 -23.0 42.9 -83.8Norway 479.1 184.8 163.9 131.1 151.7 163.0 Norway -11.3 -20.0 15.7 7.4 -66.0Portugal NO NO NO NO NO NO NO NO PortugalRomania 105.2 54.1 61.2 65.3 64.9 67.5 68.3 70.9 Romania 13.1 6.7 -0.6 4.0 1.1 3.8 -32.6Slovakia 1.5 1.5 Slovakia -0.2Slovenia 37.2 32.3 26.2 20.1 14.0 14.0 14.0 15.5 Slovenia -18.8 -23.2 -30.2 10.3 -58.4Spain 114.3 103.0 105.7 99.7 91.2 50.0 24.7 26.5 Spain 2.6 -5.7 -8.5 -45.2 -50.7 7.6 -76.8Sweden 58.5 43.9 40.1 38.9 42.8 35.1 34.5 37.6 Sweden -8.6 -3.1 10.0 -17.9 -1.8 9.1 -35.7Switzerland 13.3 2.0 1.9 2.0 1.9 1.3 1.3 1.4 Switzerland -6.3 6.8 -8.7 -31.2 2.1 10.7 -89.1Ukraine 0.2 0.2 Ukraine 4.1United Kingdom 196.0 41.6 32.5 32.0 28.1 37.9 32.8 30.9 United Kingdom -21.8 -1.4 -12.3 34.9 -13.5 -5.8 -84.2United States 2,437.1 1,709.3 1,510.4 1,243.1 1,231.0 1,231.8 532.3 696.7 United States -11.6 -17.7 -1.0 0.1 -56.8 30.9 -71.4
Metal production: aluminium – trend information
a In accordance with decisions 9/CP.2 and 11/CP.4, some Parties with economies in transition use base years other than 1990: Bulgaria (1988), Hungary (average of 1985 to 1987), Romania (1989) and Slovenia (1986).
CF4 emissions (t)
- 93 -

Table 2.15
IEF
(%) (kg/t)IPCC default EFc 40Australia NA NA NO NO NA NA NA NAAustria NA NA NO NA NA NA NABelarusBelgiumBulgaria NO NOCanada NA NA NA X NO NA NA NA NACroatiaCzech Republic NO NO NODenmark NO NO NOEstoniaEuropean Community CS, D, PS, T1, T2 C, CS, D, PS, T1, T2 0.2 NE CS, PS, T2, T3 CS, PS, T3 CS, T1, T2, T3b CS, D, PS, T1Finland NO NO NO NO NO NOFrance CS CS/ PS T 0.1 X CS CS/ PSGermany T1 T1 T 30,000 X 0.00 NO NO T1 T1Greece CS CS L, T 2.4 C X C CS CSHungaryIreland NA NA NA NA NA NAItaly CS CS X CS CS CS CSJapan CS CS T 0.5 72,787 7.16 CS CS CS CSLatvia NO NO NO NO NO NO NOLithuania NO NOLuxembourgMonacoNetherlands CS/T2 PS T 0.3 C X C NO NONew Zealand NO NONorwayPortugalRomania NE NE NE NE NE NESlovakia NO NO NO NO NO NO NO NOSlovenia NO NOSpain D,CS,T2 D,PS,T2 T 0.3 C C CS,T3 PS,T3 NO NOSweden NO NO NO NO NO NO NOSwitzerlandUkraine NE NE NE NE NE NEUnited Kingdomd T2/PS CS 0.4 X T2/PS CS NO NO
United States M, T2a M, CS T 0.3 144,219 X 0.01 M, T2a M, CS NE NE
c Source of default emission factors: IPCC Guidelines, volume 3, page 2.35.
EFMethodEFMethodMethods EF Key source
(t)
PFCs SF6
Methods and EF useda By-product emissions, production of HCFC-22 Methods and EF useda Methods and EF useda
Production of halocarbons and SF6 (2002)
b An 'X' in this column indicates that an estimate of aggregated production of HCFCs for 2002 is available from the Secretariat of the Montreal Protocol. Usually HFC-23 occurs only during the production of HCFC-22.
d The United Kingdom reported aggregated HFC emissions from 2.E.1 Production and 2.E.2 Fugitive. Under that category, the activity data value was 34,851 t for 2002 and the implied emission factor was 6.64.
a Information on methods and emission factors is included in this table as reported by Parties. It may not reflect the actual method or type of emission factor used for HFCs, PFCs and SF6 for all subcategories within the category 2.E. Production of halocarbons and SF6.
Activity data (HCFC-22 production)Share of
national total CRF Internationalb HFC 23
HFCs
- 94 -

Table 2.16
Relative change (%)
1990a 1996 1997 1998 1999 2000 2001 2002 1996 to 1997 1997 to 1998 1998to 1999 1999 to 2000 2000 to 2001 2001 to 2002 1990 to 2002Australia 96 NO NO NO NO NO NO NO AustraliaAustria NO NO NO NO NO NO NO NO AustriaBelarus BelarusBelgium BelgiumBulgaria NO BulgariaCanada NO NO NO NO NO NO NO NO CanadaCroatia CroatiaCzech Republic Czech RepublicDenmark NO NO NO NO NO NO NO NO DenmarkEstonia EstoniaEuropean Community NE NE NE European CommunityFinland NO NO NO NO NO NO NO NO FinlandFrance 140 32 30 18 37 29 31 35 France -6.7 -37.9 98.7 -19.5 4.4 13.4 -75.2Germany NE 260 250 240 226 100 90 100 Germany -3.8 -4.0 -5.8 -55.8 -10.0 11.1Greece 80 320 338 320 320 320 272 273 Greece 5.7 -5.5 -15.0 0.4 241.6Hungary HungaryIreland NE NO NO NO NO NO NO IrelandItaly 30 0 0 0 0 0 0 0 ItalyJapan NE 1,333 1,256 1,178 1,205 1,060 798 521 Japan -5.8 -6.2 2.3 -12.0 -24.7 -34.7Latvia NO NO NO NO NO NO NO NO LatviaLithuania NO NO NO NO LithuaniaLuxembourg LuxembourgMonaco 0 MonacoNetherlands 379 589 573 666 294 207 38 59 Netherlands -2.6 16.1 -55.8 -29.6 -81.4 52.2 -84.6New Zealand NO NO NO NO NO NO NO NO New ZealandNorway NorwayPortugal NO NO NO NO NO NO NO NO PortugalRomania RomaniaSlovakia NO NO SlovakiaSlovenia NO NO NO NO NO NO NO NO SloveniaSpain 205 432 495 434 504 540 248 88 Spain 14.4 -12.2 16.0 7.3 -54.1 -64.6 -57.2Sweden NO NO NO NO NO NO NO NO SwedenSwitzerland SwitzerlandUkraine UkraineUnited Kingdom IE IE IE IE IE IE IE IE United KingdomUnited States 2,990 2,660 2,563 3,432 2,599 2,546 1,694 1,691 United States -3.6 33.9 -24.3 -2.0 -33.5 -0.2 -43.4
Production of halocarbons and SF6, HFC-23 – trend informationHFC-23 emissions (t)
a In accordance with decisions 9/CP.2 and 11/CP.4, some Parties with economies in transition use base years other than 1990: Bulgaria (1988), Hungary (average of 1985 to 1987), Romania (1989) and Slovenia (1986).
- 95 -

Table 2.17
2.F(p) 2.F(a) 2.F(p) 2.F(a) 2.F(p) 2.F(a) 2.F(p) 2.F(a) 2.F(p) 2.F(a) 2.F(p) 2.F(a) 2.F(p) 2.F(a)
Australia T2 CS NE NE NE NE NE NE NE NE NE 292.34 NE NE NE 2,094.24Austria CS CS 71.96 6.44 11.18 8.15 1.14 7.18 NO NO NO NO 206.75 61.33 3.37 NO NO 2,168.49 848.99 2.55BelarusBelgium 134.55 3.74 35.94 12.74 4.91 2.59 562.52 297.39 1.89 1,440.66 707.98 2.03Bulgaria T1a D 0.75 0.47 18.72 38.42Canada T2 D 1.65 1.64 1.01 0.42 0.14 2.96 39.19 118.00 0.33 1,720.42 679.53 2.53Croatia T1 D 0.06 13.29 14.32Czech Republic T1 3.57 4.03 189.28 639.86Denmark M/CS CS 15.77 5.48 2.88 325.55 135.82 2.40 556.81 364.80 1.53EstoniaEuropean Community C, CS, D, M, T1a,
T1b, T2, T2aC, CS, D, PS,
T2IE IE IE IE IE IE IE IE IE IE IE IE IE IE
Finland T2, T1a & T1b D 1.05 7.86 321.64 92.40 3.48 471.63 166.40 2.83France CS/ T2 CS 25.71 16.39 196.63 1,320.19 4,967.83Germany T2 T2 280.80 C 79.42 10.30 7.71 NO NO C C 1,574.10 964.80 1.63 NO NO 4,781.36 0.00Greece T2a D 84.32 371.25 348.42Hungary T1-2 CS 0.28 0.08 3.35 4.76 1.69 2.81 158.53 61.75 2.57 228.19 123.96 1.84Ireland T2 D, CS 9.04 2.64 3.42 32.95 1.65 20.00 697.08 64.93 10.74 541.41 89.03 6.08Italy D, T2 CS 12.99 -5.20 146.71 -0.04 803.60 1,029.60 0.78 0.11 2,960.10 1,797.38 1.65Japan CS CS 13,029.12 IE NE IE 55.83 NE NO IE NO IE IE 240.51 NE NO IE 18,722.08 6,056.40 3.09Latvia NE NE NO/NE NE NE NO/NE NE NE NO/NE NE NE NO/NE NE NE NO/NE NE NE NO/NE NE NE NO/NE NE NELithuania T1 D NE NE NE 0.20 NE NE NE NE NE NE NE NE 2.24 NE NE NE NE NE 30.16 NE NELuxembourgMonaco T1a D 0.00 0.01 0.11 0.01Netherlandsb M,CS/T2 CS 840.00 153.16 5.48 689.00 422.67 1.63
New Zealand T2 D NE NE NE NE 0.59 NE NO NO NE NO NO NE NE 54.32 NE NO NO NE NE 249.85 NENorway T2 CS 1.76 0.93 1.90 5.96 1.46 4.08 374.73 115.30 3.25 555.84 111.56 4.98Portugal D D+CS 1.44 44.73Romania NE NESlovakia D D,CS 0.49 0.46 1.06 4.17 0.78 5.34 73.67 16.13 4.57 113.47 61.63 1.84Slovenia 69.19Spain D,CS,T2 D,PS,T2 790.30 187.49 1,385.60Sweden T2, D CS, D, PS 0.94 0.94 1.00 27.50 0.30 91.38 556.44 9.76 57.04 452.97 344.96 1.31Switzerland T2 M 3.89 2.73 1.43 15.23 3.00 5.07 NO NO NA NO NO NA 327.50 81.14 4.04 NO NO NA 605.57 286.87 2.11Ukraine NE NEUnited Kingdomc T2 D/CS 14,488.19 8,126.76 1.78 IE IE IE IE IE IE
United States M, T2a M, CS 1,549.20 277.50 5.58 617.32 319.74 1.93 22,829.65 13,376.40 1.71 93,004.33 56,937.32 1.63
2.F(p) 2.F(a) 2.F(p) 2.F(a) 2.F(p) 2.F(a) 2.F(p) 2.F(a) 2.F(p) 2.F(a) 2.F(p) 2.F(a) 2.F(p) 2.F(a)
Australia NE NE NE NE NE 357.87 NE NE NE NE NE NE NE 2,744.46Austria 105.51 63.31 1.67 NO NO 202.54 51.55 3.93 11.60 0.50 23.42 NO NO NO NO 2,774.99 1,033.25 2.69BelarusBelgium 53.19 52.59 1.01 750.12 415.38 1.81 199.52 20.59 9.69 56.07 2.46 22.82 3,209.37 1,505.04 2.13Bulgaria 0.04 22.61 8.58 89.59Canada 2.57 4.39 0.59 47.18 113.67 0.42 3.10 1,814.53 917.38 1.98Croatia 21.64 49.31Czech Republic 0.55 227.47 3.43 24.19 1,092.37Denmark 1.66 1.83 0.91 400.24 164.17 2.44 1,300.03 672.10 1.93EstoniaEuropean Community IE IE IE IE IE IE IE IE IE IE IE IEFinland 19.62 0.37 53.29 435.97 136.80 3.19 1,239.88 463.44 2.68France 60.53 2,709.92 75.61 9,372.79Germany 256.62 263.03 0.98 NO NO 1,967.94 1,189.04 1.66 216.75 C C C NO NO 9,156.99 7,035.37 1.30Greece 803.99Hungary 0.11 0.11 1.00 217.23 86.10 2.52 609.11 273.70 2.23Ireland 724.18 84.32 8.59 116.00 10.36 11.20 2,120.67 252.92 8.38Italy 79.80 556.46 0.14 89.90 3,537.47 0.03 3,928.20 7,080.72 0.55Japan IE 22.22 NO IE IE IE NO 45.00 NE NO IE NO IE 44,858.00 6,844.08 6.55Latvia NO/NE NE NE NO/NE NE NE NO/NE NE NE NO/NE NE NE NO/NE NE NE NO/NE NE NE NO/NE NE NELithuania NE NE NE NE NE NE 1.90 NE NE NE NE NE NE NE NE NE NE NE 34.50 NE NELuxembourg 43.06Monaco 0.12Netherlandsb 828.40 178.26 4.65 99.00 35.90 2.76 2,456.40 789.99 3.11
New Zealand NE NE NO NO NE NE 82.08 NE NE 0.75 NE NO NO NE NO NO NE 387.59 NENorway 10.97 1.73 6.33 434.82 131.91 3.30 40.47 2.23 18.15 1,424.55 365.12 3.90Portugal 0.56 2.32 49.05RomaniaSlovakia 0.41 0.17 2.42 87.78 20.89 4.20 25.81 1.28 20.23 23.81 2.39 9.95 329.61 103.74 3.18Slovenia 69.19Spain 292.72 63.44 5.92 2,725.47Sweden 37.76 19.50 1.94 384.33 10.76 35.71 3.46 0.00 993.33 1,463.40 386.22 3.79Switzerland 28.65 3.26 8.79 NO NO NA 334.45 87.55 3.82 47.58 6.81 6.98 NO NO NA NO NO NA 1,362.87 471.36 2.89UkraineUnited Kingdomc IE IE IE IE IE IE 14,488.19 8,126.76 1.78
United States 26,953.22 12,170.77 2.21 5,888.94 2,148.31 2.74 150,842.66 85,230.03 1.77
b The Netherlands reported aggregated emissions of some HFCs. They are reported as unspecified and not as HFC-227ea.c The United Kingdom reported aggregated HFCs emissions for the industrial processes sector in the HFC-23 column.d P = potential emissionse A = Actual emissions
HFC-125 HFC-134 HFC-134a
Consumption of halocarbons and SF6, HFCs (2002)
Methods and EFa HFC-23 HFC-32 HFC-41 HFC-431-0mee
Ratio P/AP A
Ratio P/AMethod EFPd Ae P A
Ratio P/AP
(Gg CO2 equ.)
ARatio P/A
P A
(Gg CO2 equ.)
P ARatio P/A
(Gg CO2 equ.)
HFC-152a
a Information on methods and emission factors is included in this table as reported by Parties. It may not reflect the actual method or type of emission factor used for all HFCs for all subcategories within the category 2.F. Consumption of halocarbons and SF6.
(Gg CO2 equ.) (Gg CO2 equ.) (Gg CO2 equ.) (Gg CO2 equ.)
Ratio P/AP A
Ratio P/A
HFC-143 HFC-143a HFC-227ea HFC-236fa HFC-245ca Total
P ARatio P/A
P ARatio P/A
P ARatio P/A
P ARatio P/A
P AP ARatio P/A
PRatio P/A
(Gg CO2 equ.) (Gg CO2 equ.) (Gg CO2 equ.) (Gg CO2 equ.) (Gg CO2 equ.) (Gg CO2 equ.) (Gg CO2 equ.)
ARatio P/A
- 96 -

Table 2.17 (continued)
2.F(p) 2.F(a) 2.F(p) 2.F(a) 2.F(p) 2.F(a) 2.F(p) 2.F(a) 2.F(p) 2.F(a) 2.F(p) 2.F(a) 2.F(p) 2.F(a) 2.F(p) 2.F(a)
Australia NE NA NE NE NE NE NE NE NE NE NE NE NE NE NE NE NE NEAustria CS CS 117.72 9.53 12.35 81.28 15.63 5.20 NO NO NO NO NO NO NO NO NO NO 199.00 25.16 7.91BelarusBelgiumBulgariaCanada T2 D 5.46 3.12 1.75 29.49 11.75 2.51 18.88 1.67 11.32 0.12 0.00 336.63 0.00 0.07 0.01 0.15 0.08 1.85 2.23 2.42 0.92 56.34 19.12 2.95CroatiaCzech Republic T1 4.75 9.11 4.06 17.91Denmark M/CS CS 13.62 22.17 0.61 13.62 22.17 0.61Estonia NE NEEuropean Community NE NE IE IE IE IE IE IE IE IE IE IE IE IE IE IE NE 1,745.65Finland T2, T1a & T1b D 19.18 12.60 1.52 19.94 13.37 1.49France CS/ T2 CS 136.62 267.58 5.59 148.53 558.32Germany T2 T2 13.00 C 36.80 C 21.70 C NO NO C NO NO NO NO 71.50 355.00 0.20GreeceHungary T2 CS 3.41 1.45 2.35 3.41 1.45 2.35Ireland T2 D, CS 49.02 39.16 1.25 274.45 167.15 1.64 0.13 0.08 1.64 4.35 0.87 5.00 327.95 207.26 1.58Italy D, T1 CS 106.17 108.01 0.77 214.95Japan CS CS 2,866.50 IE IE IE IE IE NO IE IE IE IE IE NO IE 15,884.30 8,582.70 1.85Latvia NE NE NO/NE NE NE NO/NE NE NE NO/NE NE NE NO/NE NE NE NO/NE NE NE NO/NE NE NE NO/NE NE NE NO/NE NE NELithuania NE NE NE NE NE NE NE NE NE NE NE NE NE NE NE NE NE NE NE NE NE NE NE NELuxembourgMonaco T1a D 0.06 0.06Netherlandsb T2&T3b D 159.58 159.58
New Zealand T2 D NE NO NE NE NO NE NE 2.80 NE NO NO NE NO NO NE NO NO NE NO NO NE NE 2.80 NENorway 0.39 0.39 1.00 0.39 0.39 1.00PortugalRomania NE NESlovakia D D,CS 3.90 3.90SloveniaSpain D,CS,T2 D,PS,T2 62.34 2.91 65.24Sweden T2 CS 10.40 3.38 3.08 10.12 8.31 1.22 8.61 6.02 1.43 29.13 17.71 1.65Switzerland T2 M 10.60 6.02 1.76 25.02 15.73 1.59 0.70 3.65 0.19 NO NO NA NO NO NA NO NO NA NO NO NA 36.32 25.41 1.43Ukraine NE NEUnited Kingdomc T2 D/CS 106.88 106.88 1.00 IE IE IE IE IE IE 106.88 106.88 1.00United States M, T2a M, CS 1,216.78 1,147.67 1.06 3,208.11 2,245.68 1.43 163.60 65.44 2.50 159.50 47.85 3.33 4,747.99 3,506.64 1.35
P A2.F(p) 2.F(a)
Australia NE NA NE NEAustria CS CS 1,056.62 669.30 1.58BelarusBelgium 172.80 93.93 1.84Bulgaria D D 2.39 1.10 2.17Canada NA NACroatiaCzech Republic T1 211.80Denmark M/CS CS 33.46 21.63 1.55Estonia NO NOEuropean Community C, CS, D, M, T1,
T1a, T1b, T2, T3b, T3c
C, CS, D, PS, T1, T2
IE 6,543.03
Finland T2, T1a & T1b D 65.22 51.31 1.27France CS/ T2 CS 827.95Germany CS, T2, T1 CS, T2, T1 11,125.45 2,620.32 4.25GreeceHungary T2-3 CS 168.88 121.49 1.39Ireland T2 D, CS 110.06 71.25 1.54Italy D, T3c CS 3,680.60 360.13 10.22Japan CS CS 25,023.30 3,322.40 7.53Latvia T2 D NE 0.03 NELithuania NE NE NELuxembourg 84,128.00Monaco T1a DNetherlands T2&T3b PS/CS/D 343.59New Zealand T3/2 48.13 12.91 3.73Norway 313.77 80.63 3.89Portugal D CS 7.00Romania NE NESlovakia D D,CS 126.60 14.41 8.78Slovenia T2 D 21.03Spain CS,T2 CS,T2 238.69Sweden T2, CS CS, D, PS 347.27 32.60 10.65Switzerland T2 M NA 155.91 NAUkraine NE NEUnited Kingdom T2 CS 738.14 661.91 1.12United States T3b, CS CS 25,298.62 15,440.95 1.64
a Information on methods and emission factors is included in this table as reported by Parties. It may not reflect the actual method or type of emission factor used for all PFCs for all subcategories within the category 2.F.Consumption of halocarbons and SF6.b The Netherlads reported aggregated emissions of all PFCs for the industrial processes sector. They are reported as unspecified and not as c-C4F10.c The United Kingdom reported aggregated HFCs emissions for the industrial processes sector in the CF4 column.d P = Potential emissionse A = Actual emissions
Method and EF useda
Ratio P/AMethod EF
(Gg CO2 equ.)
SF6
Methods and EFa
Method EF
CF4
Ratio P/APd Ae
(Gg CO2 equ.)
C2F6
P ARatio P/A
(Gg CO2 equ.)
ARatio P/A
(Gg CO2 equ.) (Gg CO2 equ.)
P ARatio P/A
PRatio P/A
(Gg CO2 equ.)
ARatio P/A
P A
(Gg CO2 equ.) (Gg CO2 equ.)
P AP ARatio P/A
(Gg CO2 equ.)
Total PFCs
Consumption of halocarbons and SF6, PFCs and SF6 (2002) (continued)
Ratio P/AP
c-C4F8 C5F12 C6F14 TotalC3F8 C4F10
- 97 -

Table 2.18
Relative change (%)
1990a 1996 1997 1998 1999 2000 2001 2002 1996 to 1997 1997 to 1998 1998to 1999 1999 to 2000 2000 to 2001 2001 to 2002 1990 to 2002Australia NE 216 416 689 940 1,187 1,393 1,611 Australia 92.9 65.8 36.4 26.2 17.4 15.6Austria 1 458 509 568 602 653 653 653 Austria 11.2 11.5 6.0 8.5 48,146.9Belarus BelarusBelgium 189 270 363 408 381 403 467 545 Belgium 34.3 12.2 -6.4 5.6 15.9 16.7 188.5Bulgaria BulgariaCanada 543 406 523 523 523 523 523 Canada -25.3 28.9Croatia CroatiaCzech Republic Czech RepublicDenmark 204 172 211 227 252 269 281 Denmark -15.4 22.2 8.0 10.7 6.7 4.4Estonia NE NE NE NE NE NE NE EstoniaEuropean Community IE IE IE IE IE IE IE IE European CommunityFinland 38 89 91 127 240 203 128 Finland 136.6 1.7 39.2 90.0 -15.6 -36.9France 1,541 2,013 2,177 2,553 2,826 3,205 3,821 France 30.6 8.1 17.3 10.7 13.4 19.2Germany NE 1,735 2,033 2,318 2,375 2,691 3,549 3,374 Germany 17.2 14.0 2.4 13.3 31.9 -4.9Greece 47 70 95 132 174 217 268 Greece 46.7 36.7 38.5 31.9 25.0 23.5Hungary 95 HungaryIreland NE 10 17 31 34 44 60 68 Ireland 77.3 80.2 12.2 27.5 37.0 14.0Italy 256 391 629 817 989 1,191 1,383 Italy 52.6 60.8 30.0 21.1 20.4 16.1Japan NE 2,793 3,481 3,769 4,056 4,315 4,362 4,659 Japan 24.6 8.3 7.6 6.4 1.1 6.8Latvia NO NE NE NE NE NE NE NE LatviaLithuania NE NE NE NE LithuaniaLuxembourg LuxembourgMonaco MonacoNetherlands 389 602 696 728 633 439 325 Netherlands 55.0 15.6 4.5 -13.1 -30.5 -26.0New Zealand 72 38 114 76 105 124 192 New Zealand -47.2 201.1 -33.5 39.2 17.6 55.1Norway 38 50 61 72 86 Norway 31.5 21.6 17.6 19.5Portugal 0 1 5 9 17 26 34 Portugal 304.6 544.5 97.1 85.5 53.9 32.9Romania RomaniaSlovakia 43 47 Slovakia 10.6Slovenia 23 29 26 26 34 43 53 Slovenia 24.2 -9.8 0.4 31.2 24.8 24.1Spain 62 143 353 617 807 961 1,066 Spain 130.4 147.0 74.5 30.9 19.0 11.0Sweden 3 120 180 204 243 255 251 265 Sweden 49.7 13.2 19.6 5.0 -1.6 5.6 8,864.6Switzerland 0 96 114 154 176 182 210 221 Switzerland 18.9 35.0 13.8 3.4 15.4 5.3 1,273,295.1Ukraine UkraineUnited Kingdom United KingdomUnited States 18,870 24,136 28,202 32,491 36,888 40,512 43,798 United States 27.9 16.8 15.2 13.5 9.8 8.1
Consumption of halocarbons and SF6 – trend informationHFC-134a emissions (t)
a In accordance with decisions 9/CP.2 and 11/CP.4, some Parties with economies in transition use base years other than 1990: Bulgaria (1988), Hungary (average of 1985 to 1987), Romania (1989) and Slovenia (1986).
- 98 -

Table 2.18
Relative change (%)
1990a 1996 1997 1998 1999 2000 2001 2002 1996 to 1997 1997 to 1998 1998to 1999 1999 to 2000 2000 to 2001 2001 to 2002 1990 to 2002Australia NE NE NE NE NE NE NE NE AustraliaAustria 11 27 33 33 30 28 28 28 Austria 25.7 -1.0 -10.5 -5.4 153.1Belarus BelarusBelgium 4 4 5 5 5 5 4 4 Belgium 3.8 3.9 4.6 -9.2 -3.7 -10.3 -9.0Bulgaria 0 BulgariaCanada CanadaCroatia CroatiaCzech Republic Czech RepublicDenmark 1 2 2 2 2 2 1 1 Denmark 14.2 -27.3 13.9 -22.0 -19.8 -28.9 61.6Estonia NO NO NO NO NO NO NO EstoniaEuropean Community 247 389 395 384 302 287 274 274 European Community 1.5 -2.7 -21.3 -5.0 -4.7 10.7Finland 4 2 2 1 1 1 2 1 Finland 10.8 -32.8 25.3 -8.9 12.5 -6.7 -61.3France 44 51 47 43 38 37 35 35 France -7.0 -9.5 -11.2 -2.9 -4.0 -2.4 -21.9Germany NE 252 246 234 166 147 115 110 Germany -2.3 -4.9 -29.1 -11.3 -22.0 -6.4Greece GreeceHungary 5 HungaryIreland NE 4 6 4 3 2 3 3 Ireland 30.8 -31.4 -30.0 -18.2 28.6 6.7Italy 9 26 28 22 15 13 14 15 Italy 6.8 -19.9 -30.8 -12.8 7.5 4.3 68.7Japan NE 551 502 455 290 207 157 139 Japan -8.9 -9.4 -36.2 -28.8 -24.2 -10.9Latvia NO/NE Latvia 39.4 18.8 23.6 20.9 17.7 14.8Lithuania NE NE NE NE LithuaniaLuxembourg 3,520 3,520 3,520 LuxembourgMonaco MonacoNetherlands 9 13 14 14 13 14 15 14 Netherlands 10.4 -4.6 -3.6 5.7 6.3 -3.6 58.1New Zealand 0 1 1 1 1 1 1 1 New Zealand 0.2 130.8 8.3 -61.5 0.8 7.1 29.8Norway 2 5 5 5 5 3 Norway 2.5 2.0 1.7 -32.6 91.4Portugal 0 0 0 0 0 0 0 Portugal 3.2 3.1 9.2 8.5 7.8 7.2Romania RomaniaSlovakia 1 1 Slovakia 6.9Slovenia 0 1 1 1 1 1 1 1 Slovenia -2.2 193.3Spain 2 4 5 6 8 9 9 10 Spain 20.3 15.3 31.9 13.8 0.6 12.4 328.2Sweden 3 3 5 3 3 2 2 1 Sweden 45.0 -47.6 1.5 -38.5 41.2 -38.1 -60.9Switzerland 7 4 4 4 4 6 8 7 Switzerland -0.8 -1.3 -0.7 55.2 22.4 -13.3 -12.6Ukraine UkraineUnited Kingdom 25 35 33 33 31 29 28 28 United Kingdom -5.2 -0.8 -6.6 -4.6 -5.1 -1.0 9.6United States 1,244 1,057 954 768 741 710 684 646 United States -9.7 -19.5 -3.5 -4.2 -3.7 -5.5 -48.1
Consumption of halocarbons and SF6 – trend information (continued)SF6 emissions (t)
a In accordance with decisions 9/CP.2 and 11/CP.4, some Parties with economies in transition use base years other than 1990: Bulgaria (1988), Hungary (average of 1985 to 1987), Romania (1989) and Slovenia (1986).
- 99 -
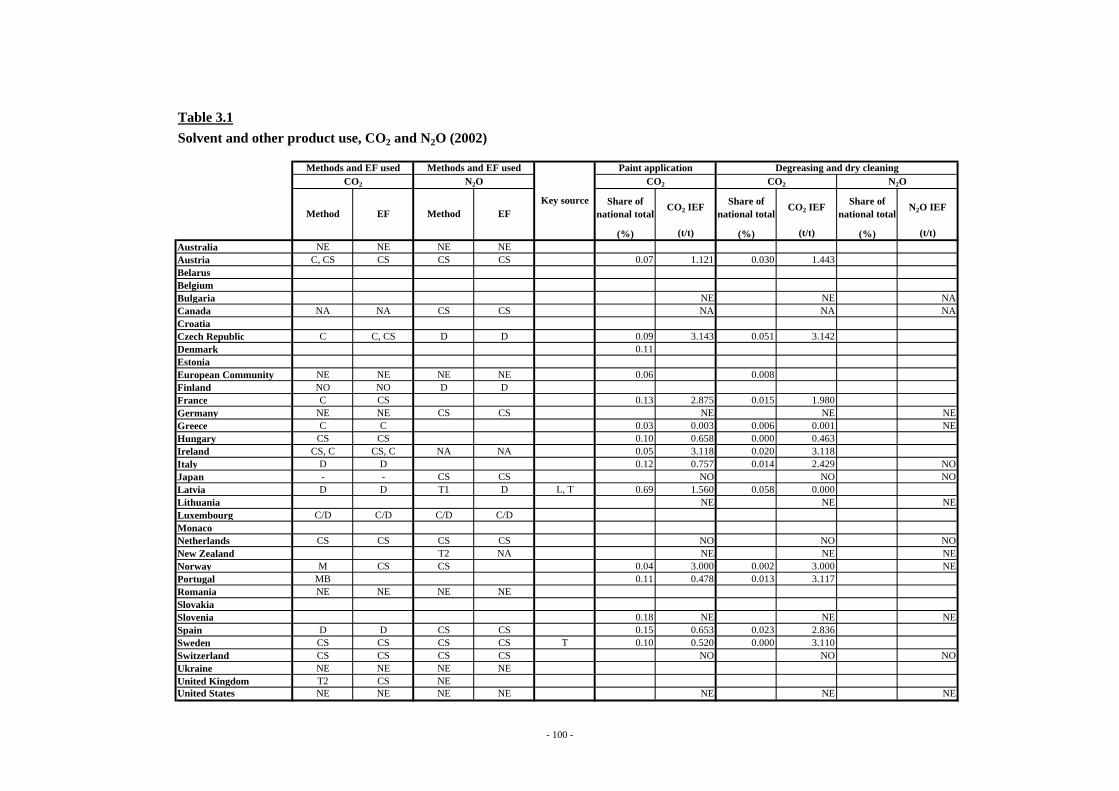
Table 3.1
(%) (t/t) (%) (t/t) (%) (t/t)Australia NE NE NE NEAustria C, CS CS CS CS 0.07 1.121 0.030 1.443BelarusBelgiumBulgaria NE NE NACanada NA NA CS CS NA NA NACroatiaCzech Republic C C, CS D D 0.09 3.143 0.051 3.142Denmark 0.11EstoniaEuropean Community NE NE NE NE 0.06 0.008Finland NO NO D DFrance C CS 0.13 2.875 0.015 1.980Germany NE NE CS CS NE NE NEGreece C C 0.03 0.003 0.006 0.001 NEHungary CS CS 0.10 0.658 0.000 0.463Ireland CS, C CS, C NA NA 0.05 3.118 0.020 3.118Italy D D 0.12 0.757 0.014 2.429 NOJapan - - CS CS NO NO NOLatvia D D T1 D L, T 0.69 1.560 0.058 0.000Lithuania NE NE NELuxembourg C/D C/D C/D C/DMonacoNetherlands CS CS CS CS NO NO NONew Zealand T2 NA NE NE NENorway M CS CS 0.04 3.000 0.002 3.000 NEPortugal MB 0.11 0.478 0.013 3.117Romania NE NE NE NESlovakiaSlovenia 0.18 NE NE NESpain D D CS CS 0.15 0.653 0.023 2.836Sweden CS CS CS CS T 0.10 0.520 0.000 3.110Switzerland CS CS CS CS NO NO NOUkraine NE NE NE NEUnited Kingdom T2 CS NEUnited States NE NE NE NE NE NE NE
Solvent and other product use, CO2 and N2O (2002)
Method EF Method EFShare of
national totalCO2 IEF Share of
national total
Paint applicationCO2
Key source
Degreasing and dry cleaningCO2 N2O
CO2 IEF Share of national total
N2O IEF
Methods and EF usedCO2
Methods and EF usedN2O
- 100 -

Figure 4.1Emissions and contribution of subsectors in agriculturea
Agriculture
a In accordance with decisions 9/CP.2 and 11/CP.4, some Parties with economies in transition use base years other than 1990: Bulgaria (1988), Hungary (average of 1985 to 1987), Romania (1989) and Slovenia (1986).
050,000
100,000150,000200,000250,000300,000350,000400,000450,000500,000
Aus
tralia
199
0A
ustra
lia 2
002
Aus
tria
1990
Aus
tria
2002
Bel
arus
199
0B
elar
us 2
002
Bel
gium
199
0B
elgi
um 2
002
Bul
garia
199
0B
ulga
ria 2
002
Can
ada
1990
Can
ada
2002
Cro
atia
199
0C
roat
ia 2
002
Cze
ch R
epub
lic 1
990
Cze
ch R
epub
lic 2
002
Den
mar
k 19
90D
enm
ark
2002
Esto
nia
1990
Esto
nia
2002
Euro
pean
Com
mun
ity 1
990
Euro
pean
Com
mun
ity 2
002
Finl
and
1990
Finl
and
2002
Fran
ce 1
990
Fran
ce 2
002
Ger
man
y 19
90G
erm
any
2002
Gre
ece
1990
Gre
ece
2002
Hun
gary
199
0H
unga
ry 2
002
Irel
and
1990
Irel
and
2002
Italy
199
0Ita
ly 2
002
Japa
n 19
90Ja
pan
2002
Latv
ia 1
990
Latv
ia 2
002
Lith
uani
a 19
90Li
thua
nia
2002
Luxe
mbo
urg
1990
Luxe
mbo
urg
2002
Mon
aco
1990
Mon
aco
2002
Net
herla
nds
1990
Net
herla
nds
2002
New
Zea
land
199
0N
ew Z
eala
nd 2
002
Nor
way
199
0N
orw
ay 2
002
Portu
gal 1
990
Portu
gal 2
002
Rom
ania
199
0R
oman
ia 2
002
Slov
akia
199
0Sl
ovak
ia 2
002
Slov
enia
199
0Sl
oven
ia 2
002
Spai
n 19
90Sp
ain
2002
Swed
en 1
990
Swed
en 2
002
Switz
erla
nd 1
990
Switz
erla
nd 2
002
Ukr
aine
199
0U
krai
ne 2
002
Uni
ted
Kin
gdom
199
0U
nite
d K
ingd
om 2
002
Uni
ted
Stat
es 1
990
Uni
ted
Stat
es 2
002
0%
20%
40%
60%
80%
100%
Aus
tralia
199
0A
ustra
lia 2
002
Aus
tria
1990
Aus
tria
2002
Bel
arus
199
0B
elar
us 2
002
Bel
gium
199
0B
elgi
um 2
002
Bul
garia
199
0B
ulga
ria 2
002
Can
ada
1990
Can
ada
2002
Cro
atia
199
0C
roat
ia 2
002
Cze
ch R
epub
lic 1
990
Cze
ch R
epub
lic 2
002
Den
mar
k 19
90D
enm
ark
2002
Esto
nia
1990
Esto
nia
2002
Euro
pean
Com
mun
ity 1
990
Euro
pean
Com
mun
ity 2
002
Finl
and
1990
Finl
and
2002
Fran
ce 1
990
Fran
ce 2
002
Ger
man
y 19
90G
erm
any
2002
Gre
ece
1990
Gre
ece
2002
Hun
gary
199
0H
unga
ry 2
002
Irel
and
1990
Irel
and
2002
Italy
199
0Ita
ly 2
002
Japa
n 19
90Ja
pan
2002
Latv
ia 1
990
Latv
ia 2
002
Lith
uani
a 19
90Li
thua
nia
2002
Luxe
mbo
urg
1990
Luxe
mbo
urg
2002
Mon
aco
1990
Mon
aco
2002
Net
herla
nds
1990
Net
herla
nds
2002
New
Zea
land
199
0N
ew Z
eala
nd 2
002
Nor
way
199
0N
orw
ay 2
002
Portu
gal 1
990
Portu
gal 2
002
Rom
ania
199
0R
oman
ia 2
002
Slov
akia
199
0Sl
ovak
ia 2
002
Slov
enia
199
0Sl
oven
ia 2
002
Spai
n 19
90Sp
ain
2002
Swed
en 1
990
Swed
en 2
002
Switz
erla
nd 1
990
Switz
erla
nd 2
002
Ukr
aine
199
0U
krai
ne 2
002
Uni
ted
Kin
gdom
199
0U
nite
d K
ingd
om 2
002
Uni
ted
Stat
es 1
990
Uni
ted
Stat
es 2
002
Enteric Fermentation Manure Management Rice Cultivation Agricultural Soils Prescribed Burning of Savannas Field Burning of Agricultural Residues Other
- 101 -

Table 4.1
CH4 IEF CH4 IEF
CRF FAOb Difference CRF FAOb Difference CRF FAOb Difference
(%) (%) (%) (%)
IPCC default EFc 56 - 118d 44 - 56d 8.0 1.5Australia L, T 12.3 CS CS 27,793 27,870 0.3 112 79 108,547 106,200 -2.2 6.9 2,844 2,940 3.4 1.4Austria L, T 3.7 T1, T2 D, CS 2,067 2,118 2.5 103 53 304 320 5.3 8.0 3,305 3,440 4.1 1.5Belarus L 8.3 4,006 4,085 2.0 81 56 73 83 13.2 8.0 3,329 3,373 1.3 1.5Belgium L, T 2.8 M CS 2,967 2,891 -2.6 105 48 150 146 -2.3 6.8 6,722 6,735 0.2 1.1Bulgaria L 2.3 T1 D 663 635 -4.3 81 56 1,650 1,571 -4.8 8.0 893 1,014 13.6 1.5Canada L 2.6 T1+CS D+CS 14,549 13,762 -5.4 118 54 656 994 51.5 8.0 14,588 14,367 -1.5 1.5Croatia L, T 2.6 T1 D 417 417 0.0 81 56 580 580 0.0 5.0 1,286 1,286 0.0 1.0Czech Republic L 1.1 T2 CS 1,466 1,520 3.7 68 24 97 96 -0.7 5.0 3,348 3,441 2.8 3.4Denmark L, T 4.1 T1/T2 CS 1,796 1,796 0.0 118 36 74 131 77.5 17.2 12,732 12,732 0.0 1.1Estonia L 1.9 TI D 254 261 2.6 81 56 30 29 -3.7 5.0 341 345 1.2 1.0European Community L 3.2 C, CS, D, M, T1, T2 C, CS, D, T1, T2 NE 80,112 NE NE NE 102,110 NE NE 122,727 NEFinland L, T 1.9 T1/T2 CS/D 1,025 1,025 0.0 115 42 96 67 -29.7 8.0 1,315 1,315 0.0 1.5France L, T 5.2 C CS 20,354 20,061 -1.4 103 52 9,372 9,339 -0.4 8.0 10,388 15,305 47.3 1.5Germany L 2.6 C/D C/D 14,603 14,227 -2.6 103 73 2,771 2,722 -1.8 8.0 25,784 25,958 0.7 1.5Greece L, T 2.2 T1 D 595 573 -3.7 81 56 9,050 9,205 1.7 8.0 967 861 -10.9 1.5Hungary L 2.1 T1 D, CS 775 783 1.0 115 48 1,133 1,136 0.3 8.0 5,094 4,822 -5.3 1.5Ireland L, T 13.8 D CS, D 6,792 6,992 2.9 100 50 6,205 4,807 -22.5 8.0 1,751 1,770 1.1 1.5Italy L, T 2.0 D, T2 D, CS 7,068 6,510 -7.9 84 49 8,138 8,138 0.0 8.0 8,333 9,166 10.0 1.5Japan 0.5 T2 D, CS 4,538 4,564 0.6 90 54 11 11 3.1 4.1 9,687 9,612 -0.8 1.1Latvia L, T 5.6 T1 D 388 388 0.0 81 56 32 32 -1.6 8.0 453 453 0.0 1.5Lithuania L 7.0 D D 779 752 -3.5 81 56 14 12 -9.6 8.0 1,061 1,011 -4.7 1.5Luxembourg 197 9 80Monaco NO 0 NO 0 NO 0Netherlands L, T 3.0 cattle 90: T2; rest: T1 cattle: CS; rest: D 3,897 3,858 -1.0 82 43 1,186 1,186 0.0 8.0 11,648 11,648 0.0 1.5New Zealand L, T 31.5 T2 CS/D 9,656 9,637 -0.2 77 56 40,284 39,546 -1.8 10.8 351 341 -2.8 1.5Norway L, T 3.1 T1 D 936 938 0.3 100 48 1,783 2,417 35.5 8.0 617 451 -26.9 1.5Portugal L, T 3.1 T1 D+CS 1,395 1,404 0.6 100 48 3,457 5,478 58.5 8.0 2,344 2,389 1.9 1.5Romania L, T 3.8 T1 T1 2,674 2,878 7.6 81 56 7,251 7,251 0.0 5.0 4,447 4,447 0.0 1.0Slovakia L 2.0 T1, T2 D, CS 608 608 0.0 100 56 316 316 0.0 8.0 1,554 1,554 0.0 1.5Slovenia L, T 3.3 T2, T1 CS,D 473 477 0.8 95 51 107 94 -12.4 8.0 656 600 -8.5 1.7Spain L, T 3.7 CS,T1,T2 T1,T2 6,522 6,478 -0.7 104 59 24,301 24,301 0.0 8.6 25,029 23,858 -4.7 1.3Sweden L, T 4.1 T1 + CS D + CS 1,638 1,638 0.0 128 57 426 427 0.2 8.0 1,881 1,882 0.0 1.7Switzerland L, T 4.7 CS CS 1,594 1,594 0.0 101 43 430 430 0.0 7.1 1,557 1,557 0.0 1.1Ukraine L 2.9 T1 D 9,108 9,421 3.4 81 56 950 967 1.8 8.0 9,204 8,370 -9.1 1.5United Kingdom L, T 2.7 T2 D/CS 10,345 10,343 0.0 121 43 35,834 35,834 0.0 4.8 5,588 5,588 0.0 1.5United States L, T 1.7 M, T1, T2 M, CS, D 78,359 96,704 23.4 99 60 6,685 6,685 0.0 8.0 59,979 59,804 -0.3 1.5
b Source of international statistics: FAO, http://apps.fao.org: follow the link "Agriculture" and then the link "Live Animals".c Source of default emission factors: IPCC Guidelines, Volume 3, Tables 4–3 and 4–4 (pages 4.10–4.11).d For dairy and non-dairy cattle, IPCC default emission factors (in kg CH4 / head/ yr) are provided by regions as shown below (see footnote c for source reference):
Oceania AsiaDairy cattle 68 56Non-dairy cattle 53 44
(thousands of head) (kg CH4/head/yr) (thousands of head) (thousands of head)
Activity data (population size) Activity data (population size)
CH4 IEF (kg CH4/ head/yr)
Dairy cattleNon-dairy
cattle
Swine
(kg CH4/ head/yr)
Activity data (population size)
Methods EF
Enteric fermentation, CH4 (2002)
Key source
Share of national
total
Methods and EF useda CattleSheep
a Information on methods and emission factors is included in this table as reported by Parties in table Summary 3 of the CRF. It may therefore not reflect the actual method or type of emission factor used for the various livestock types within the category CH4 from 4.A Enteric fermentation.
North America Western Europe Eastern Europe118 100 8147 48 56
- 102 -

Table 4.2
1990a 1996 1997 1998 1999 2000 2001 2002 1996 to 1997 1997 to 1998 1998to 1999 1999 to 2000 2000 to 2001 2001 to 2002 1990 to 2002Australia 3,214 2,983 3,007 3,011 3,049 3,063 3,082 3,059 Australia 0.8 0.1 1.2 0.5 0.6 -0.8 -4.8Austria 170 161 159 158 156 154 151 148 Austria -1.5 -0.7 -1.1 -1.4 -1.8 -2.0 -12.9Belarus 471 341 332 326 311 296 283 277 Belarus -2.7 -1.9 -4.6 -4.7 -4.4 -2.3 -41.3Belgium 214 210 206 207 204 202 203 198 Belgium -2.0 0.3 -1.1 -1.3 0.6 -2.3 -7.3Bulgaria 193 82 79 82 83 79 62 69 Bulgaria -3.5 2.9 1.5 -4.4 -21.5 10.9 -64.2Canada 762 867 875 856 849 843 896 897 Canada 1.0 -2.2 -0.8 -0.7 6.2 0.2 17.8Croatia 64 38 37 36 36 35 36 35 Croatia -1.8 -3.4 0.2 -2.2 1.4 -2.8 -45.9Czech Republic 156 98 93 86 85 81 81 76 Czech Republic -5.1 -7.6 -0.8 -4.9 -0.2 -6.6 -51.5Denmark 148 147 142 142 137 137 138 133 Denmark -3.3 0.2 -3.6 -0.4 0.8 -3.2 -9.7Estonia 52 24 23 22 19 18 18 18 Estonia -4.5 -4.7 -12.9 -5.8 2.5 -3.8 -65.9European Community 7,074 6,746 6,660 6,627 6,600 6,527 6,497 6,411 European Community -1.3 -0.5 -0.4 -1.1 -0.4 -1.3 -9.4Finland 89 78 79 77 76 75 75 74 Finland 1.0 -2.4 -1.7 -0.6 -1.0 -0.2 -16.4France 1,469 1,407 1,389 1,379 1,378 1,392 1,398 1,376 France -1.2 -0.7 -0.1 1.0 0.4 -1.6 -6.4Germany 1,633 1,353 1,320 1,300 1,291 1,264 1,276 1,276 Germany -2.5 -1.6 -0.7 -2.0 0.9 0.0 -21.9Greece 142 140 141 141 142 143 143 143 Greece 0.2 0.4 0.5 0.4 0.1 0.1 1.0Hungary 153 82 79 81 80 76 74 80 Hungary -3.7 2.8 -1.3 -5.0 -3.0 8.1 -47.9Ireland 437 464 473 483 483 473 461 454 Ireland 1.9 2.1 0.0 -2.1 -2.5 -1.6 3.7Italy 574 573 573 565 551 553 552 526 Italy -0.1 -1.4 -2.3 0.2 -0.2 -4.7 -8.3Japan 345 335 331 328 324 322 320 319 Japan -1.1 -1.0 -1.2 -0.7 -0.7 -0.1 -7.5Latvia 98 37 35 32 28 27 28 28 Latvia -6.4 -8.8 -13.1 -2.4 4.5 0.4 -71.2Lithuania 157 75 56 58 Lithuania 2.8 -63.4Luxembourg 16 16 15 LuxembourgMonaco MonacoNetherlands 402 366 353 341 334 319 322 306 Netherlands -3.6 -3.2 -2.2 -4.3 0.7 -4.9 -23.9New Zealand 1,018 1,059 1,063 1,070 1,075 1,101 1,124 1,123 New Zealand 0.4 0.7 0.5 2.4 2.1 -0.1 10.4Norway 82 85 85 85 85 84 81 80 Norway 0.2 0.9 -0.6 -1.7 -2.7 -1.1 -1.4Portugal 124 118 117 116 124 123 120 120 Portugal -0.8 -0.3 6.2 -0.5 -2.1 -0.4 -3.5Romania 547 314 307 288 280 271 255 248 Romania -2.4 -6.0 -3.0 -3.1 -5.8 -2.8 -54.7Slovakia 116 68 63 55 53 52 52 49 Slovakia -7.6 -12.1 -3.1 -1.8 0.1 -5.6 -57.5Slovenia 38 33 32 32 33 33 33 33 Slovenia -2.1 0.2 1.3 2.5 -2.5 -0.1 -13.8Spain 602 658 651 666 675 678 695 701 Spain -1.0 2.3 1.4 0.4 2.6 0.8 16.4Sweden 144 147 147 143 142 138 137 136 Sweden 0.2 -2.9 -1.1 -2.4 -0.9 -0.6 -5.6Switzerland 132 124 119 118 119 117 119 117 Switzerland -4.5 -0.6 0.6 -1.2 1.1 -1.7 -11.4Ukraine 688 667 Ukraine -3.1United Kingdom 911 907 895 895 895 865 813 806 United Kingdom -1.3 0.1 0.0 -3.4 -6.0 -0.9 -11.5United States 5,612 5,737 5,635 5,557 5,551 5,509 5,443 5,450 United States -1.8 -1.4 -0.1 -0.8 -1.2 0.1 -2.9
Enteric fermentation – trend information
a In accordance with decisions 9/CP.2 and 11/CP.4, some Parties with economies in transition use base years other than 1990: Bulgaria (1988), Hungary (average of 1985 to 1987), Romania (1989) and Slovenia (1986).
Relative change (%)CH4 emissions (Gg)
- 103 -

Table 4.3
1990a 1996 1997 1998 1999 2000 2001 2002 1996 to 1997 1997 to 1998 1998to 1999 1999 to 2000 2000 to 2001 2001 to 2002 1990 to 2002
Australia 275 310 324 345 355 360 357 356 Australia 4.3 6.4 2.9 1.5 -0.8 -0.4 29.5Austria 80 68 71 73 70 63 61 61 Austria 4.2 2.1 -3.3 -10.2 -2.8 -0.6 -24.0Belarus BelarusBelgium 95 85 84 90 86 85 87 85 Belgium -1.1 8.0 -5.2 -1.1 2.3 -2.5 -10.9Bulgaria 29 BulgariaCanada 162 150 146 144 138 134 128 127 Canada -3.1 -1.4 -3.9 -3.0 -4.6 -0.3 -21.3Croatia 40 25 25 24 24 23 23 23 Croatia -2.3 -1.3 -1.3 -3.0 -2.4 -0.7 -43.1Czech Republic 39 Czech RepublicDenmark 82 82 78 78 75 74 73 72 Denmark -4.3 0.5 -4.3 -0.7 -1.9 -1.6 -12.8Estonia 9 EstoniaEuropean Community 2,672 2,362 2,317 2,292 2,266 2,207 2,206 2,201 European Community -1.9 -1.1 -1.2 -2.6 0.0 -0.2 -17.6Finland 48 40 41 41 40 40 40 40 Finland 1.7 -1.5 -1.2 1.0 0.0 -0.9 -15.8France 531 457 447 443 440 439 440 439 France -2.0 -1.1 -0.7 -0.1 0.3 -0.4 -17.4Germany 599 513 498 482 481 465 467 467 Germany -2.9 -3.2 -0.2 -3.3 0.4 -22.0Greece 20 19 19 19 19 19 19 19 Greece 0.3 1.7 2.1 0.8 -0.3 -0.3 -3.1Hungary 40 HungaryIreland 136 126 126 126 125 123 122 121 Ireland -0.1 -0.2 -1.0 -1.3 -1.1 -1.0 -11.1Italy 234 193 190 189 181 178 182 186 Italy -1.6 -0.6 -3.9 -1.9 2.1 2.1 -20.8Japan 182 169 167 163 160 157 156 156 Japan -1.7 -1.9 -2.2 -1.6 -1.0 -0.1 -14.8
Latvia 43 22 21 20 17 17 17 17 Latvia -5.0 -8.0 -14.9 -0.7 2.2 -1.9 -61.7Lithuania 69 47 36 36 Lithuania 0.3 -47.7Luxembourg 8 8 7 LuxembourgMonaco 0 MonacoNetherlands 291 262 252 248 242 230 234 225 Netherlands -3.9 -1.7 -2.5 -4.6 1.6 -3.9 -22.6New Zealand 238 306 310 318 333 358 390 394 New Zealand 1.5 2.6 4.7 7.5 8.9 1.0 65.6Norway 34 35 35 34 33 32 Norway -0.6 -1.6 -4.0 -1.5 -5.5Portugal 40 36 36 36 36 36 34 34 Portugal -1.9 0.6 -0.6 -4.8 0.9 -15.4Romania 242 132 129 122 118 115 108 105 Romania -1.7 -5.8 -2.9 -2.9 -6.0 -2.4 -56.4Slovakia 24 23 Slovakia -5.4Slovenia 21 18 18 18 18 13 13 13 Slovenia -2.0 -0.5 0.2 -25.0 -2.5 2.4 -37.4Spain 143 130 127 129 127 121 121 123 Spain -2.1 1.0 -1.5 -4.3 -0.1 1.1 -14.1Sweden 69 58 59 56 56 54 53 53 Sweden 1.7 -4.5 0.5 -4.8 -0.7 -0.1 -23.1Switzerland 81 77 74 73 74 73 75 72 Switzerland -5.0 -0.6 1.4 -1.2 1.8 -3.0 -10.8Ukraine 398 382 Ukraine -4.1United Kingdom 296 285 281 277 282 272 264 270 United Kingdom -1.4 -1.3 1.7 -3.4 -2.9 2.3 -8.8United States 1,375 1,254 1,255 1,251 1,266 1,284 1,283 1,289 United States 0.1 -0.3 1.2 1.5 -0.1 0.5 -6.2
Enteric fermentation: dairy cattle – trend information Relative change (%)
a In accordance with decisions 9/CP.2 and 11/CP.4, some Parties with economies in transition use base years other than 1990: Bulgaria (1988), Hungary (average of 1985 to 1987), Romania (1989) and Slovenia (1986).
CH4 emissions (Gg)
- 104 -

Table 4.3
1990a 1996 1997 1998 1999 2000 2001 2002 1996 to 1997 1997 to 1998 1998to 1999 1999 to 2000 2000 to 2001 2001 to 2002 1990 to 2002Australia 107 109 110 112 113 113 113 112 Australia 0.4 1.7 0.9 0.0 0.1 -0.7 4.9Austria 89 98 99 100 101 102 103 103 Austria 0.9 0.9 0.9 0.9 0.9 0.9 16.7Belarus 81 BelarusBelgium 100 103 103 109 104 104 105 105 Belgium 0.4 5.6 -4.5 0.4 0.3 0.1 4.8Bulgaria 81 BulgariaCanada 118 118 118 118 118 118 118 118 CanadaCroatia 81 81 81 81 81 81 81 81 CroatiaCzech Republic 68 Czech RepublicDenmark 109 116 116 117 117 117 117 118 Denmark 0.1 0.7 0.0 0.0 0.0 0.6 7.7Estonia 81 EstoniaEuropean Community NE NE NE European CommunityFinland 97 103 105 106 108 111 114 115 Finland 2.0 0.5 1.6 3.3 2.6 1.1 18.6France 99 102 102 102 103 103 103 103 France 0.4 0.2 0.3 0.2 -0.2 0.6 4.6Germany 94 99 99 100 101 102 103 103 Germany 0.4 0.7 1.2 0.9 0.8 0.0 8.9Greece 83 81 81 81 81 81 81 81 Greece 0.0 0.0 0.0 0.0 0.0 0.0 -2.0Hungary 115 HungaryIreland 100 100 100 100 100 100 100 100 Ireland 0.0 0.0Italy 89 93 91 89 86 86 84 84 Italy -2.0 -2.4 -3.5 0.1 -2.1 -4.8Japan 88 89 90 90 90 90 90 90 Japan 0.3 0.5 0.3 0.1 -0.1 0.0 2.5Latvia 81 81 81 81 81 81 81 81 LatviaLithuania 81 81 81 81 LithuaniaLuxembourg LuxembourgMonaco MonacoNetherlands 81 80 80 81 81 81 81 82 Netherlands 0.0 1.1 0.4 -0.2 -0.4 1.1 1.3New Zealand 70 73 73 74 75 78 80 77 New Zealand -0.6 1.4 2.0 3.3 2.6 -3.2 10.3Norway 100 100 100 100 100 100 Norway 0.0 0.0Portugal 100 100 100 100 100 100 100 100 PortugalRomania 81 81 81 81 81 81 81 81 RomaniaSlovakia 100 100 SlovakiaSlovenia 85 86 86 86 86 95 95 95 Slovenia 0.0 0.1 0.1 9.8 0.7 -0.6 12.2Spain 89 98 98 99 104 106 106 104 Spain 0.3 0.7 4.5 1.9 0.0 -1.0 17.9Sweden 120 124 126 125 126 125 127 128 Sweden 1.2 -0.5 0.5 -0.2 1.7 0.1 6.2Switzerland 102 101 99 99 102 103 104 101 Switzerland -2.4 0.2 3.2 0.2 0.9 -2.5 -0.9Ukraine 81 81 UkraineUnited Kingdom 104 110 113 114 115 116 117 121 United Kingdom 3.0 0.9 1.0 0.9 0.7 3.4 16.7United States 97 94 96 96 97 98 99 99 United States 1.3 0.8 0.9 1.1 0.7 0.2 1.9
Enteric fermentation: dairy cattle – trend information (continued)Relative change (%)
a In accordance with decisions 9/CP.2 and 11/CP.4, some Parties with economies in transition use base years other than 1990: Bulgaria (1988), Hungary (average of 1985 to 1987), Romania (1989) and Slovenia (1986).
CH4 implied emission factors (kg/head/year)
- 105 -

Table 4.4
1990a 1996 1997 1998 1999 2000 2001 2002 1996 to 1997 1997 to 1998 1998to 1999 1999 to 2000 2000 to 2001 2001 to 2002 1990 to 2002
Australia 1,755 1,831 1,852 1,849 1,880 1,901 1,944 1,945 Australia 1.2 -0.2 1.7 1.1 2.3 0.0 10.8Austria 80 83 77 75 76 81 80 78 Austria -6.6 -3.3 1.5 6.8 -1.2 -2.8 -3.4Belarus BelarusBelgium 110 116 113 106 109 107 107 105 Belgium -2.9 -5.6 2.2 -1.4 -0.3 -2.2 -4.8Bulgaria 17 BulgariaCanada 572 684 698 679 678 675 729 730 Canada 2.0 -2.6 -0.2 -0.4 8.0 0.1 27.6Croatia 18 8 8 8 8 8 9 8 Croatia -2.0 -2.7 -0.7 -1.4 12.9 -12.0 -55.7Czech Republic 21 Czech RepublicDenmark 50 48 46 46 44 44 46 42 Denmark -3.3 -1.9 -3.5 -0.6 4.6 -7.0 -15.2Estonia 8 EstoniaEuropean Community 3,347 3,320 3,271 3,256 3,258 3,249 3,251 3,204 European Community -1.5 -0.5 0.1 -0.3 0.1 -1.4 -4.3Finland 36 31 32 31 30 29 29 29 Finland 0.2 -3.0 -1.7 -2.7 -1.8 0.0 -19.2France 820 840 832 828 831 846 851 831 France -0.9 -0.5 0.3 1.8 0.6 -2.3 1.3Germany 953 774 751 748 740 730 739 739 Germany -3.0 -0.4 -1.0 -1.4 1.2 -22.5Greece 21 20 20 20 20 20 20 20 Greece 0.1 0.9 0.4 0.7 -0.5 -0.5 -6.3Hungary 21 HungaryIreland 246 279 289 298 299 292 284 279 Ireland 3.4 3.4 0.3 -2.5 -2.8 -1.6 13.4Italy 238 256 260 252 246 249 245 241 Italy 1.5 -3.2 -2.3 1.0 -1.5 -1.9 0.9Japan 150 154 153 153 153 153 153 153 Japan -0.6 0.0 -0.2 0.2 -0.4 -0.1 2.0Latvia 51 13 12 11 10 9 10 10 Latvia -8.0 -10.3 -10.4 -5.7 8.5 4.0 -79.8Lithuania 83 24 17 19 Lithuania 8.3 -77.2Luxembourg 8 8 7 LuxembourgMonaco 0 MonacoNetherlands 75 66 63 59 57 55 54 50 Netherlands -4.7 -6.0 -3.1 -3.7 -2.9 -7.5 -33.7New Zealand 233 259 255 251 251 252 254 257 New Zealand -1.8 -1.4 0.2 0.3 0.9 0.9 10.1Norway 31 33 32 31 30 29 Norway -3.0 -3.6 -3.2 -1.8 -3.7Portugal 47 46 44 44 51 51 51 51 Portugal -2.7 -1.2 16.7 -0.5 0.7 -1.1 8.4Romania 176 96 94 89 86 84 79 77 Romania -1.8 -5.8 -2.8 -2.9 -6.0 -2.4 -56.4Slovakia 22 21 Slovakia -6.0Slovenia 15 13 12 13 13 18 17 17 Slovenia -3.6 0.3 2.5 39.8 -2.5 -3.3 13.7Spain 210 275 271 281 291 292 311 315 Spain -1.5 3.9 3.5 0.2 6.4 1.5 50.0Sweden 61 74 74 73 71 71 70 69 Sweden -0.4 -1.5 -2.1 -0.4 -1.7 -0.7 13.9Switzerland 44 41 40 39 38 38 38 38 Switzerland -3.7 -1.8 -1.2 -1.4 -0.1 0.4 -14.6Ukraine 252 246 Ukraine -2.4United Kingdom 391 404 392 389 386 377 358 349 United Kingdom -2.9 -0.9 -0.8 -2.3 -4.9 -2.6 -10.8United States 3,961 4,227 4,124 4,046 4,035 3,976 3,911 3,912 United States -2.4 -1.9 -0.3 -1.5 -1.6 0.0 -1.3
Enteric fermentation: non-dairy cattle – trend informationRelative change (%)
a In accordance with decisions 9/CP.2 and 11/CP.4, some Parties with economies in transition use base years other than 1990: Bulgaria (1988), Hungary (average of 1985 to 1987), Romania (1989) and Slovenia (1986).
CH4 emissions (Gg)
- 106 -

Table 4.4
1990a 1996 1997 1998 1999 2000 2001 2002 1996 to 1997 1997 to 1998 1998to 1999 1999 to 2000 2000 to 2001 2001 to 2002 1990 to 2002Australia 79 78 78 78 79 79 79 79 Australia 0.0 0.1 0.6 0.1 0.3 -0.2 -0.1Austria 48 52 52 52 52 53 53 53 Austria -0.5 -1.0 0.7 1.3 -0.3 -0.1 9.7Belarus 56 BelarusBelgium 48 48 48 47 48 48 48 48 Belgium 0.2 -2.0 2.1 0.0 0.6 0.0 1.3Bulgaria 56 BulgariaCanada 54 55 54 54 54 54 54 54 Canada -0.4 0.1 -0.3 -0.2 0.3 -0.1 -0.4Croatia 56 56 56 56 56 56 56 56 CroatiaCzech Republic 24 Czech RepublicDenmark 34 34 35 35 35 35 36 36 Denmark 1.0 0.0 1.3 0.6 0.4 0.6 6.2Estonia 56 EstoniaEuropean Community NE NE NE European CommunityFinland 41 42 42 42 42 42 42 42 Finland 0.4 -0.7 1.0 0.3 -0.3 0.7 3.7France 50 52 52 52 52 52 52 52 France 0.3 0.0 0.1 0.0 -0.3 -0.1 2.5Germany 73 73 74 74 73 73 73 73 Germany 0.5 0.5 -1.2 0.2 0.3 1.3Greece 59 56 56 56 56 56 56 56 Greece 0.0 0.0 0.0 0.0 0.0 0.0 -4.5Hungary 48 HungaryIreland 50 50 50 50 50 50 50 50 Ireland 0.0 0.0Italy 47 50 51 50 49 50 51 49 Italy 1.3 -1.6 -1.7 1.0 1.4 -2.3 5.9Japan 53 54 54 54 54 54 54 54 Japan 0.1 0.4 0.3 0.2 -0.2 -0.1 1.5
Latvia 56 56 56 56 56 56 56 56 LatviaLithuania 56 56 56 56 LithuaniaLuxembourg LuxembourgMonaco MonacoNetherlands 57 52 50 48 47 45 47 43 Netherlands -3.6 -3.1 -3.9 -3.5 3.8 -6.9 -23.5New Zealand 51 52 54 54 55 55 56 56 New Zealand 3.4 0.1 1.7 -0.5 2.0 0.5 10.8Norway 48 48 48 48 48 48 Norway 0.0 0.0Portugal 48 48 48 48 48 48 48 48 PortugalRomania 56 56 56 56 56 56 56 56 RomaniaSlovakia 56 56 SlovakiaSlovenia 46 49 49 50 50 51 51 51 Slovenia 0.2 1.8 0.3 1.6 0.9 -1.0 11.2Spain 61 59 59 58 58 59 59 59 Spain -1.4 -0.3 -0.4 1.4 0.8 -0.8 -2.7Sweden 53 56 56 56 56 56 56 57 Sweden 0.4 0.3 -0.1 0.2 0.1 0.3 6.6Switzerland 42 42 43 43 43 43 42 43 Switzerland 1.9 1.0 1.0 -0.2 -2.1 2.0 3.2Ukraine 56 56 UkraineUnited Kingdom 42 43 43 43 43 43 43 43 United Kingdom 0.3 0.1 0.1 -0.2 0.2 0.2 1.4United States 64 61 61 61 61 61 60 60 United States -0.6 -0.1 0.6 -0.8 -1.6 0.5 -6.0
Enteric fermentation: non-dairy cattle – trend information (continued)Relative change (%)
a In accordance with decisions 9/CP.2 and 11/CP.4, some Parties with economies in transition use base years other than 1990: Bulgaria (1988), Hungary (average of 1985 to 1987), Romania (1989) and Slovenia (1986).
CH4 implied emission factors (kg/head/year)
- 107 -

Table 4.5
Dairy cattleNon-dairy
cattle
(%)
IPCC default EFb 6 to 81 1 to 38 0.19 to 0.37 3 to 20Australia 0.4 CS CS, D 8.66 1.20 NA 22.75Austria L, T 1.0 T1, T2 D, CS 19.00 7.07 0.19 5.81Belarus 1.1 6.00 4.00 0.19 4.00Belgium L 1.7 M CS 21.52 13.51 1.40 10.08Bulgaria 0.8 T1, T2 D, CS 18.30 12.21 0.28 9.95Canada L 0.8 T1 D 36.00 1.00 0.19 10.49Croatia 0.6 T1 D 6.00 4.00 0.10 4.00Czech Republic L 0.4 T2 CS 3.29 1.01 0.23 7.87Denmark L 1.4 T2 CS 17.26 1.62 0.32 2.59Estonia 0.3 TI D 6.00 4.00 0.19 4.00European Community L 1.6 C, CS, D, M, T1, T2 C, CS, D, T1, T2 NE NE NE NEFinland 0.2 T2 CS/D 8.39 2.30 0.19 3.37France L 2.6 C D 44.00 21.38 0.28 10.00Germany L 2.7 C/D C/D 109.42 28.40 0.19 19.93Greece 0.4 TI D 19.00 13.00 0.28 7.00Hungary 0.6 T1 D, CS 6.00 4.00 0.20 3.00Ireland L, T 2.0 D CS, D 15.90 6.40 5.40Italy L 0.7 D, T1, T2 D, CS 20.05 11.03 0.22 7.92Japan 0.1 D, CS D, CS 8.69 3.23 0.28 0.92Latvia L 0.8 T1 D 6.00 4.00 0.19 4.00Lithuania 1.1 D D 6.00 4.00 0.19 4.00LuxembourgMonacoNetherlands L 0.8 CS/T2 CS (=D,corrected) 8.33 12.16 0.48 3.17New Zealand L, T 0.7 T2 CS 0.89 0.91 0.18 20.00Norway 0.6 T2 CS 14.41 8.57 0.73 1.98Portugal L, T 1.8 T2 D (CS) 3.45 1.88 0.27 26.72Romania L, T 1.2 T1 T1 19.00 13.00 0.16 7.00Slovakia 0.4 T1, T2 D, CS 4.00 3.80 0.19 4.00Slovenia L, T 0.8 T2, T1 CS,D 12.80 6.47 0.19 5.51Spain L 2.2 CS,T1,T2 T1,T2 13.92 3.77 0.23 14.03Sweden L, T 0.6 T1 + CS D + CS 16.12 5.63 0.19 3.00Switzerland 0.8 CS CS 14.16 3.44 0.14 3.39Ukraine L 1.0 T1 D 19.00 13.00 0.28 7.00United Kingdom T 0.3 T2 D/CS 13.64 4.23 0.11 3.00United States L, T 0.6 M, T1, T2 M, CS, D 56.52 1.62 0.26 14.07
cool temperate warm cool temperate warm cool temperate warmNorth America 36 54 76 1 2 3 10 14 18Western Europe 14 44 81 6 20 38 3 10 19Eastern Europe 6 19 33 4 13 23 4 7 11Oceania 31 32 33 5 6 7 20 20 20Asia 7 16 27 1 1 2 1 4 7
cool temperate warmDeveloped countries 0.19 0.28 0.37
Methods and EF useda CattleSheep Swine
Methods EF CH4 IEF(kg CH4/head/yr)
Sheep
Manure management, CH4 (2002)
a Information on methods and emission factors is included in this table as reported by Parties in table Summary 3 of the CRF. It may therefore not reflect the actual method or type of emission factor used for the various livestock types within the category CH4 from 4.B Manure management. b Source of default emission factors: IPCC Guidelines, Volume 3, tables 4–5 and 4–6 (pages 4.12 to 4.13). Default emission factors are provided according to climate regions (cool, temperate, warm), as shown in box 1.
Box 1. Default IPCC default emission factors according to climate regionsb
Dairy cattle Non-dairy cattle Swine
Key source
Share of national
total
- 108 -

Table 4.6
(%)IPCC default EF 0.001b 0.001b 0.02b 0.005c 60 to 100d 40 to 70d 16 to 20d 12 to 20d 0.6d
Australia 0.3 CS D 0.001 0.001 0.020 0.018 138 39 12 7 0.7Austria L, T 0.8 0.036 65 34 18 20 0.9Belarus 0.0 0.001 0.001 0.020 0.005 75 65 16 2 24.4Belgium 0.6 D D NO 0.001 0.020 0.005 129 53 13 10 0.6Bulgaria 0.6 D D 0.001 0.001 0.020 0.005 70 50 20 16 0.6Canada 0.6 T1 D 0.001 0.020 0.005 105 45 12 4 0.4Croatia T 0.8 0.001 0.001 0.020 0.005 70 50 20 16 0.6Czech Republic 0.3 D D 1.000 20.000 5.000 100 70 20 20 1.0Denmark L 0.9 0.001 0.020 127 38 10 17 0.6Estonia 0.1 TI D 0.001 0.020 0.005 0 0 0 0 0.0European Community L 0.4 C, CS, D, T1, T2 C, CS, D NE NE NE NE NEFinland T 0.5 D D/CS 0.001 0.020 96 35 10 16 0.2France L 0.5 C/ T2 D/ CS 0.001 0.020 0.005 100 72 20 20 0.6Germany 0.3 D D NO NE NE 116 41 11 13 0.6Greece 0.2 D D, CS NO 0.001 0.020 0.005 70 50 16 12 0.6Hungary L 1.6 D D, CS 0.001 0.020 0.005 100 70 20 20 0.6Ireland L 1.0 D CS, D 0.001 0.001 0.020 93 50 12 8 0.6Italy L 0.8 D D, CS NO 0.001 0.020 0.020 106 45 12 16 0.6Japan L 0.9 CS CS NO 0.007 0.004 0.047 80 47 16 NE 0.9Latvia L 1.2 T1 D/CS 0.001 0.001 0.020 0.005 71 51 10 6 0.9Lithuania L 1.2 D D 0.001 0.001 0.020 0.005 70 50 20 16 0.6LuxembourgMonacoNetherlands 0.1 CS CS IE IE IE 0.001 NA NA NA NA NANew Zealand 0.1 T2 CS/D 0.001 NO 0.020 0.005 114 72 16 15 0.6Norway 0.2 D D, CS NO 0.001 0.020 0.005 90 34 7 10 0.3Portugal L, T 1.3 T2 D (CS) 0.001 0.001 0.020 108 54 17 7 1.1Romania 0.1 T1 T1 0.001 0.001 0.020 0.005 70 50 20 16 0.6Slovakia 0.9 T1, T2 D, CS NO 0.001 0.020 100 60 IE 16 IESlovenia L, T 1.2 T1 D 0.001 0.001 0.020 0.001 100 70 20 20 0.6Spain T 0.4 CS,D D NO 0.001 0.020 0.005 70 33 10 10 0.4Sweden L, T 0.8 T1 + T2 D + CS NO 0.001 0.020 0.020 122 41 10 6 0.4Switzerland 0.8 CS CS NO 0.001 0.020 NO 105 16 12 0.5Ukraine 0.6 T1 DUnited Kingdom 0.2 T1 D/CS 0.001 0.020 0.005 112 49 10 7 0.7United States 0.3 M, T1, T2 D 0.001 0.001 0.021 0.013 84 45 8 4 0.4
b Source of default emission factors: IPCC good practice guidance, table 4.12, page 4.43.c Source of default emission factors: IPCC Guidelines, Volume 3, table 4-22 (page 4.104).d Source of default N excretion rates: IPCC Guidelines, Volume 3, table 4-20 page 4.99. Default values are provided by regions as shown below:
IPCC defaults:Europe Oceania Asia
Dairy cattle 70 80 60Non-dairy cattle 50 60 40Sheep 16 20 12SwinePoultry
Manure management, N2O (2002)
Methods EF N2O IEF(kg N2O-N / kg N)
Liquid systems
Solid storage and dry lot Key source
Share of national total
Methods and EF usedaN excretion rates
Anaerobic lagoons
(kg N / head / yr)
Other Sheep Poultry Dairy cattle Swine
Non-dairy Cattle
Animal waste management systems (AWMS)
a Information on methods and emission factors is included in this table as reported by Parties in table Summary 3 of the CRF. It may therefore not reflect the actual method or type of emission factor used for all subcategories within the category N2O from 4.B Manure management.
North America Western Europe
20 160.6
10070
16 20
- 109 -

Table 4.7
1990a 1996 1997 1998 1999 2000 2001 2002 1996 to 1997 1997 to 1998 1998to 1999 1999 to 2000 2000 to 2001 2001 to 2002 1990 to 2002Australia 72 81 84 88 90 91 93 96 Australia 4.2 4.8 2.4 1.2 2.3 2.4 33.0Austria 49 46 46 47 44 43 43 42 Austria 0.0 1.1 -5.3 -3.0 0.8 -3.2 -13.5Belarus 58 43 42 41 39 38 36 35 Belarus -2.5 -2.1 -4.2 -4.1 -4.7 -2.0 -39.5Belgium 122 130 130 130 131 127 123 121 Belgium -0.1 0.2 0.8 -3.3 -3.2 -1.7 -0.9Bulgaria 73 32 28 30 30 27 19 22 Bulgaria -11.6 6.1 2.2 -10.6 -28.7 16.2 -69.1Canada 219 241 236 242 243 242 261 268 Canada -2.2 2.6 0.5 -0.5 7.8 2.7 22.4Croatia 11 7 7 7 8 7 7 8 Croatia -1.9 -1.6 10.7 -7.2 0.5 1.6 -31.5Czech Republic 48 36 36 35 35 33 32 30 Czech Republic 0.7 -2.6 0.1 -7.3 -2.2 -6.9 -38.4Denmark 35 42 42 44 43 45 46 46 Denmark 1.3 4.1 -1.3 3.3 2.0 1.1 30.2Estonia 18 3 3 3 3 3 3 3 Estonia -0.8 -0.3 -12.3 -0.8 7.5 -3.0 -84.3European Community 3,410 3,170 3,215 3,192 3,183 3,164 3,183 3,161 European Community 1.4 -0.7 -0.3 -0.6 0.6 -0.7 -7.3Finland 9 10 11 10 10 10 10 10 Finland 3.7 -2.8 -2.3 -0.6 -3.5 -1.2 1.7France 707 684 677 674 672 677 683 673 France -1.0 -0.5 -0.4 0.8 0.9 -1.5 -4.8Germany 1,605 1,351 1,388 1,338 1,334 1,300 1,309 1,309 Germany 2.7 -3.6 -0.3 -2.6 0.7 0.0 -18.5Greece 24 23 23 23 23 23 23 23 Greece 0.2 0.6 0.5 0.2 0.0 0.0 -1.3Hungary 40 33 31 35 34 22 21 23 Hungary -5.6 11.9 -0.6 -37.0 -4.0 12.5 -41.3Ireland 60 66 67 69 69 68 66 66 Ireland 2.3 2.6 0.3 -1.7 -2.1 -1.1 9.4Italy 192 186 186 188 185 184 189 187 Italy 0.0 1.0 -1.5 -0.4 2.6 -1.0 -2.6Japan 51 47 46 45 45 44 44 44 Japan -1.4 -1.3 -1.4 -1.1 -0.8 -0.4 -14.5Latvia 13 5 4 4 4 4 4 4 Latvia -6.3 -6.3 -8.7 -2.7 7.1 3.0 -69.1Lithuania 23 11 9 9 Lithuania 3.8 -62.1Luxembourg 1 1 1 LuxembourgMonaco MonacoNetherlands 103 98 93 93 91 91 88 83 Netherlands -4.7 0.2 -2.4 0.0 -3.3 -5.5 -19.5New Zealand 27 27 27 27 27 26 26 26 New Zealand -1.2 -1.0 -1.0 -1.1 -0.6 -0.1 -4.4Norway 14 15 15 15 15 15 15 15 Norway 0.2 1.3 -0.9 -0.9 -2.6 -1.1 3.0Portugal 77 69 70 69 70 69 71 69 Portugal 0.9 -0.9 0.7 -0.5 1.7 -1.7 -10.4Romania 207 115 116 104 103 93 82 79 Romania 0.7 -9.9 -0.7 -10.5 -11.1 -4.3 -61.9Slovakia 18 13 12 10 10 10 10 10 Slovakia -8.2 -11.7 -3.4 2.2 -5.5 2.2 -44.5Slovenia 13 9 9 9 9 8 8 8 Slovenia -0.7 0.3 0.0 -9.3 -0.8 2.3 -37.9Spain 296 332 350 374 380 402 409 411 Spain 5.2 7.0 1.6 5.7 1.7 0.5 38.7Sweden 17 20 20 20 20 19 21 21 Sweden -2.3 -1.1 -0.5 -4.1 12.4 -0.6 22.6Switzerland 22 20 19 19 19 19 19 19 Switzerland -3.4 1.1 -0.3 0.0 0.8 -1.2 -12.1Ukraine 228 230 Ukraine 0.8United Kingdom 111 111 111 111 110 105 101 99 United Kingdom -0.1 0.7 -1.6 -4.0 -4.1 -2.0 -10.7United States 1,478 1,648 1,728 1,846 1,840 1,807 1,849 1,879 United States 4.9 6.8 -0.3 -1.8 2.3 1.6 27.1
Manure management – trend information Relative change (%)
a In accordance with decisions 9/CP.2 and 11/CP.4, some Parties with economies in transition use base years other than 1990: Bulgaria (1988), Hungary (average of 1985 to 1987), Romania (1989) and Slovenia (1986).
CH4 emissions (Gg)
- 110 -

Table 4.7
1990a 1996 1997 1998 1999 2000 2001 2002 1996 to 1997 1997 to 1998 1998to 1999 1999 to 2000 2000 to 2001 2001 to 2002 1990 to 2002Australia 1.7 3.0 3.3 3.6 4.1 4.4 4.4 4.4 Australia 10.8 8.8 13.8 6.2 0.7 0.4 160.8Austria 2.5 2.5 2.4 2.4 2.4 2.3 2.3 2.3 Austria -0.9 -0.3 -1.8 -1.9 -1.0 -2.2 -10.8Belarus 0.0 0.0 0.0 0.0 0.0 0.0 0.0 0.0 Belarus -50.0Belgium 2.9 2.9 2.9 3.0 3.0 2.9 2.9 2.9 Belgium 0.1 1.0 0.8 -1.8 0.2 -1.3 0.5Bulgaria 3.4 1.5 1.4 1.5 1.5 1.4 1.0 1.2 Bulgaria -8.5 7.0 3.3 -8.0 -25.3 14.9 -65.1Canada 11.9 13.9 14.1 13.9 13.9 14.0 14.8 14.9 Canada 1.6 -1.3 0.4 0.1 6.3 0.5 25.8Croatia 1.2 1.2 1.2 1.2 1.2 1.2 1.2 0.7 Croatia -1.0 -2.5 5.7 -2.7 0.7 -42.2 -42.4Czech Republic 2.1 1.5 1.5 1.4 1.4 1.4 1.3 1.3 Czech Republic -1.5 -5.6 0.0 -5.6 -0.8 -7.3 -41.7Denmark 2.2 2.1 2.1 2.1 2.1 2.0 2.0 2.0 Denmark 0.4 2.0 -3.3 -4.3 0.9 -2.1 -11.8Estonia 0.1 0.0 0.0 0.0 0.0 0.0 0.0 0.0 Estonia -3.8 -4.5 -12.7 -4.5 23.8 -4.4 -58.6European Community 66 61 61 61 61 60 60 59 European Community 0.1 0.5 -0.8 -1.8 1.0 -1.1 -9.4Finland 1.8 1.5 1.5 1.4 1.4 1.3 1.3 1.2 Finland 0.0 -4.3 -4.5 -1.9 -2.9 -5.7 -31.8France 9.9 9.6 9.5 9.5 9.4 9.4 9.5 9.4 France -0.7 -0.3 -0.8 0.2 0.9 -1.4 -5.6Germany 14.4 10.2 10.1 10.0 9.8 9.7 9.8 9.8 Germany -1.3 -0.8 -2.0 -1.5 1.1 -32.2Greece 1.0 0.9 0.9 0.9 0.9 0.9 0.9 0.9 Greece 0.2 1.2 1.2 0.6 -0.3 -0.3 -3.9Hungary 5.0 NE NE 1.6 1.6 2.5 2.5 3.9 Hungary -2.5 63.4 -1.5 56.3 -22.0Ireland 2.0 2.2 2.2 2.3 2.3 2.3 2.2 2.2 Ireland 2.6 2.6 0.1 -2.2 -2.4 -1.4 7.5Italy 12.4 13.0 13.1 13.3 13.3 13.0 13.7 13.4 Italy 1.2 1.6 -0.5 -1.9 5.1 -1.7 8.4Japan 43.7 40.2 39.8 39.4 39.0 38.7 38.4 38.3 Japan -1.1 -0.9 -1.0 -0.9 -0.7 -0.4 -12.4Latvia 1.0 0.5 0.5 0.5 0.4 0.4 0.4 0.4 Latvia -6.6 -8.4 -11.9 -2.8 6.1 1.7 -55.9Lithuania NE 0.9 0.7 0.7 Lithuania 3.0Luxembourg LuxembourgMonaco MonacoNetherlands 0.7 0.7 0.7 0.7 0.7 0.6 0.6 0.6 Netherlands -4.3 -3.3 -2.6 -5.0 1.6 -6.3 -10.6New Zealand 0.2 0.2 0.2 0.2 0.2 0.2 0.2 0.2 New Zealand 3.0 2.4 3.8 3.7 6.6 0.8 55.8Norway 0.4 0.4 0.4 0.4 0.4 0.4 0.4 0.3 Norway -0.4 1.0 -0.4 -1.5 -3.2 -1.3 -2.1Portugal 3.1 3.0 3.0 3.1 3.3 3.3 3.3 3.4 Portugal 1.0 3.2 4.7 0.6 0.9 0.8 9.8Romania 1.0 0.5 0.5 0.5 0.5 0.5 0.4 0.4 Romania -1.5 -7.4 -2.2 -4.7 -6.8 -2.8 -57.1Slovakia 3.5 2.2 2.0 1.8 1.7 1.6 1.6 1.6 Slovakia -8.3 -12.1 -5.3 -2.5 0.2 -4.4 -56.0Slovenia 1.4 1.1 1.1 1.1 1.1 0.8 0.8 0.8 Slovenia -0.2 0.3 0.6 -29.3 -2.2 2.3 -40.6Spain 5.3 5.1 5.1 5.2 5.2 5.2 5.2 5.3 Spain 0.3 2.0 0.1 -0.9 0.6 1.1 0.1Sweden 2.6 2.2 2.2 2.2 2.1 2.0 1.9 1.9 Sweden 3.5 -0.1 -7.0 -2.2 -5.9 0.1 -25.9Switzerland 1.4 1.4 1.4 1.4 1.3 1.4 1.3 1.3 Switzerland -1.1 -0.1 -1.6 0.8 -5.1 3.3 -8.0Ukraine 9.7 9.6 Ukraine -1.0United Kingdom 4.9 4.9 4.9 4.9 4.9 4.6 4.4 4.3 United Kingdom 0.0 0.0 1.3 -6.1 -4.2 -3.0 -11.7United States 52.2 54.8 55.8 55.9 56.0 57.3 57.9 57.6 United States 1.8 0.3 0.2 2.3 1.2 -0.7 10.3
Manure management – trend information (continued)Relative change (%)
a In accordance with decisions 9/CP.2 and 11/CP.4, some Parties with economies in transition use base years other than 1990: Bulgaria (1988), Hungary (average of 1985 to 1987), Romania (1989) and Slovenia (1986).
N2O emissions (Gg)
- 111 -

Table 4.8
Activity data
Use of synthetic fertilizers
N2O IEF Activity data N2O IEF Activity data N2O IEF
(%) (%) (%)
IPCC default EFb 5, 10 (2-15)c 0.02 (0.005-0.03)d 0.01 (0.002-0.2)e
0.025 (0.002-0.12)e
Australia CS CS L, T 1.5 1,018,248,000 0.0125 0.0180 NA NA NA L, T 0.8 0.004 0.0 IE NA NE NAAustria T1 D L, T 1.8 104,330,033 0.0125 0.0125 0.0125 0.0125 0.3 0.020 L, T 1.2 23,232,570 0.010 72,895,640 0.025Belarus L 7.8 24,890,000 0.0130 0.0130 0.0130 0.0130 5.00 0.0 0.020 0.1 247,200,000 0.010Belgium D CS L 1.8 154,400,350 0.0125 0.0125 0.0008 0.0003 5.00 0.4 0.020 0.7 55,662,929 0.010 60,692,700 0.025Bulgaria D D L 1.9 140,040,000 0.0100 0.0100 0.0003 0.0001 8.00 L 0.9 0.020 0.9 39,826,521 0.010 27,693,260 0.025Canada T1 D L, T 2.8 1,575,512,000 0.0113 0.0092 0.0016 0.0002 5.00 0.4 0.020 L 1.0 395,472,150 0.010 414,767,513 0.025Croatia L, T 3.2 110,000,000 0.0125 0.0125 0.0000 0.0000 0.00 0.6 0.020 L 2.7 120,270,740 0.002 53,541,480 0.025Czech Republic D D L 1.9 203,186,700 0.0125 0.0125 0.0125 0.0125 5.00 0.2 0.020 L 1.3 63,800,000 0.010 129,564,450 0.025Denmark CS/M CS/M L, T 4.3 206,209,610 0.0125 0.0125 0.0125 0.0125 8.00 0.4 0.020 L, T 3.6 80,800,794 0.010 167,666,667 0.025Estonia TI D 0.9 15,030,000 0.0125 0.0125 0.0007 0.0002 0.0 0.020 0.4 2,132,846 0.010 5,704,269 0.025European Community C, CS, D, M, T1, T1a,
T1b, T2C, CS, D, M
L2.3 NE NE NE NE NE NE
L0.6 NE
L1.6 NE NE NE NE
Finland D D/CS L, T 3.1 159,437,600 0.0125 0.0125 0.0125 0.0125 8.00 0.2 0.020 L, T 0.7 25,035,791 0.010 35,708,415 0.025France C/ T2 D/ CS L, T 4.6 2,104,321,050 0.0125 0.0125 0.0008 0.0001 L 1.1 0.020 L, T 3.5 628,530,260 0.010 1,349,701,990 0.025Germany C/CS C/D L 1.8 1,770,479,000 0.0125 0.0044 2.9028 NE 0.01 0.2 0.020 L 1.1 505,637,841 0.010 724,165,018 0.025Greece D, T1b D L, T 1.5 278,174,834 0.0125 0.0125 0.0006 0.0001 NE L, T 2.6 0.020 L, T 2.4 112,985,755 0.010 215,841,105 0.025Hungary T1a CS L 3.9 263,700,000 0.0125 0.0125 0.0008 0.0000 0.2 0.020 L 2.9 74,336,767 0.010 155,455,150 0.025Ireland D CS, D L, T 4.0 365,108,886 0.0125 0.0125 0.0125 0.0125 L, T 4.2 0.020 L, T 2.2 94,631,515 0.010 84,942,248 0.025Italy D D, CS L, T 1.6 751,406,653 0.0125 0.0125 0.0004 0.0001 8.00 0.3 0.020 L 1.5 414,712,710 0.010 506,366,714 0.025Japan CS CS 0.3 484,158,000 0.0092 0.0081 IE NE NE 0.0 NE 0.3 156,777,173 0.010 307,789,460 0.025Latvia T1 D L 4.3 24,840,000 0.0125 0.0125 0.0125 0.0125 8.00 0.7 0.020 L, T 2.5 9,390,207 0.010 18,225,310 0.025Lithuania D D L 2.6 59,500,000 0.0125 0.0070 NE NE NO 0.7 0.020 0.0 NE NE NE NELuxembourgMonaco NO 0.0 NO NONetherlands CS/T1b(D&I) CS L 2.0 290,300,000 0.0110 0.0200 0.0098 NE IE 0.4 0.016 NE NE NA IENew Zealand D CS/D L, T 2.8 260,744,400 0.0125 0.0125 0.0007 0.0014 8.01 L, T 9.7 0.010 L 4.4 342,395,079 0.010 129,978,338 0.025Norway D D, CS L, T 3.7 100,326,588 0.0125 0.0125 0.0125 0.0125 8.00 0.3 0.020 L 0.9 15,377,089 0.010 35,192,505 0.025Portugal D D L, T 1.5 117,000,000 0.0113 0.0106 0.0011 0.0000 T 0.6 0.019 L, T 1.4 59,025,865 0.010 68,929,008 0.025Romania D D L, T 1.8 215,100,000 0.0125 0.0125 0.0008 0.0002 0.1 0.020 T 0.9 32,868,936 0.010 85,153,404 0.025Slovakiaf T1, T2 D, CS L 3.6 79,434,000 0.0125 0.0125 0.0125 0.0125 NO 0.2 0.020 0.8 25,285,000 0.010 23,877,700 0.025
Slovenia T1 D L, T 2.5 30,073,500 0.0125 0.0125 0.0125 0.0125 NE 0.3 0.020 L, T 1.9 13,435,580 0.010 27,020,971 0.025Spain CS,D CS,D L, T 2.1 925,817,417 0.0125 0.0125 0.0125 0.0125 NO L, T 0.8 0.020 L, T 1.3 358,353,230 0.010 284,138,503 0.025Sweden D, C CS L, T 4.2 174,400,000 0.0079 0.0250 0.0006 0.0001 8.00 L, T 0.4 0.016 L, T 1.4 40,214,000 0.010 61,638,000 0.025Switzerland CS CS L, T 2.5 59,032,000 0.0125 0.0125 0.0004 0.0001 8.00 0.3 0.020 L, T 1.4 50,647,028 0.010 38,512,806 0.025Ukraine T1 D L 1.8 281,763,000 0.0125 0.0125 0.0125 0.0125 0.1 0.013 NE NEUnited Kingdom T1a/T1b D L 2.0 1,172,138,524 0.0125 0.0125 0.0007 0.0003 8.00 L, T 0.7 0.020 L, T 1.4 344,711,800 0.010 598,260,100 0.025United States T1a, T1b D L 2.5 10,021,948,539 0.0125 0.0125 0.0125 0.0125 9.22 T 0.5 0.020 L, T 1.1 2,484,225,071 0.010 5,363,108,644 0.025
(kg N/year )(kg N2O-N / kg
N)
0.0125 (0.0025 - 0.0225)b
(kg N2O-N / ha)
(kg N2O-N / kg N)
(kg N / year) (kg N2O-N / kg
N)
Share of national
totalb
Atmospheric deposition Nitrogen leaching and run-off
Methods EFN2O IEF
N2O IEF
(kg N / yr) (kg N2O-N / kg N)(kg N2O-N / kg dry
biomassc)
Key sourceb
Share of national
totalbKey sourceb
Animal wastes
applied to soils
N-fixing crops
Crop residue
Cultivation of histo
sols
Agricultural soils, N2O (2002)
Methods and EF usedaDirect soil emissions Animal production Indirect soil emissions
Key sourcebShare of
national totalb
Synthetic fertilizersPasture range and paddock
(grazing)
d Source of default emission factor: IPCC Guidelines, Volume 3, table 4-22, page 4.104 (Pasture range and paddock). See also IPCC good practice guidance, table 4.12, page 4.43. e Source of default emission factor: IPCC Guidelines, Volume 3, table 4-23, page 4.105 (default emission factors for indirect emissions). See also IPCC good practice guidance, table 4.12, page 4.43. f Slovakia reported the IEF for N-fixing crops and crop residue in the unit kg N2O-N/kg N.
a Information on methods and emission factors is included in this table as reported by Parties in table Summary 3 of the CRF. It may therefore not reflect the actual method or type of emission factor used for all subcategories within the category N2O from 4.D Agricultural soils.b Source of default emission factors: IPCC Guidelines, Volume 3; table 4-18, page 4.89. (See also IPCC good practice guidance, table 4-17, page 4.60.) It should be noted that for the sub-sources N-fixing crops and crop residue the IPCC default emission factors are not directly comparable to the N20 implied emission factors because of the use of different units; the unit of default emission factors is kg N2O-N/kg N, while in the CRF the unit relates to the amount of dry biomass (kg N2O-N/kg dry biomass).c For cultivation of histosols the two default values refer to temperate and tropical, respectively. The values in parenthesis indicate the range. It should be noted that default emission factors for histosols have been updated from 5 to 8 and from 10 to 16 for temperate and tropical, respectively (table 4.17, page 4.60 of IPCC good practice guidance).
- 112 -

Table 4.9
1990a 1996 1997 1998 1999 2000 2001 2002 1996 to 1997 1997 to 1998 1998to 1999 1999 to 2000 2000 to 2001 2001 to 2002 1990 to 2002Australia 49 49 53 55 59 61 63 63 Australia 6.6 5.4 5.9 4.8 1.8 0.4 28.6Austria 10 9 10 9 9 9 10 9 Austria 11.8 -9.0 -1.0 -0.6 3.0 -8.6 -11.8Belarus 31 17 19 20 18 19 34 17 Belarus 12.1 7.6 -12.6 5.9 81.1 -51.1 -45.9Belgium 18 18 17 18 15 14 15 15 Belgium -0.4 0.9 -15.7 -2.9 3.1 -0.1 -18.5Bulgaria 21 8 8 8 8 8 7 7 Bulgaria -3.0 -7.0 1.2 0.9 -8.1 2.9 -64.5Canada 88 104 104 105 108 109 101 97 Canada 0.1 1.5 2.5 0.7 -6.7 -4.1 10.3Croatia 8 6 7 6 6 7 6 6 Croatia 16.5 -11.7 3.0 3.0 -13.8 3.6 -23.0Czech Republic 24 19 18 16 16 15 15 16 Czech Republic -6.8 -10.1 -1.5 -2.8 1.5 0.6 -36.2Denmark 27 22 22 22 21 20 19 19 Denmark -1.2 -0.6 -6.2 -3.5 -2.3 -4.0 -30.5Estonia 3 1 1 1 1 1 1 1 Estonia 10.8 4.0 -18.2 18.5 -14.8 -16.1 -72.5European Community 677 645 650 646 643 639 629 621 European Community 0.8 -0.7 -0.4 -0.7 -1.5 -1.2 -8.2Finland 14 12 11 11 11 11 11 11 Finland -2.5 -2.4 -3.1 1.5 -1.4 -1.8 -23.3France 182 174 177 176 176 173 169 168 France 1.4 -0.2 0.0 -1.9 -2.4 -0.7 -7.7Germany 123 103 101 103 106 107 103 102 Germany -1.2 1.6 2.4 1.4 -3.3 -1.4 -17.0Greece 31 28 29 29 29 30 28 28 Greece 4.4 -1.4 -1.3 6.2 -6.2 -0.3 -9.4Hungary 30 2 2 33 33 15 16 18 Hungary -0.4 1,865.9 0.7 -54.0 6.1 9.6 -41.9Ireland 22 24 24 25 25 25 24 23 Ireland 0.3 1.3 0.8 -0.4 -3.4 -3.6 4.0Italy 61 61 65 62 63 62 63 61 Italy 5.3 -3.3 0.2 -0.9 1.7 -3.0 0.5Japan 31 27 27 26 26 26 26 26 Japan -2.1 -1.4 -0.5 -0.1 -0.2 -0.2 -16.8Latvia 8 2 3 2 2 2 3 3 Latvia 4.1 -3.1 -10.1 7.9 13.7 -3.1 -68.1Lithuania 11 2 5 2 Lithuania -60.1 -83.2Luxembourg LuxembourgMonaco MonacoNetherlands 21 26 25 25 25 23 22 21 Netherlands -1.5 -2.8 0.0 -8.1 -2.7 -2.8 0.5New Zealand 32 36 36 36 37 38 40 41 New Zealand 0.4 1.3 1.7 3.4 4.3 2.6 27.6Norway 9 9 9 9 9 9 9 9 Norway 0.5 0.4 -1.5 0.2 -2.1 -0.1 -5.2Portugal 10 10 9 10 10 9 9 9 Portugal -4.0 3.9 -0.1 -5.5 0.9 0.0 -11.9Romania 30 14 15 14 14 12 14 12 Romania 9.3 -8.7 5.9 -18.2 19.3 -12.8 -59.2Slovakia 13 8 8 8 7 7 8 8 Slovakia 1.1 -5.5 -5.0 0.6 2.8 1.6 -42.1Slovenia 3 3 3 3 3 3 3 3 Slovenia 0.4 0.7 0.4 1.4 -1.4 1.7 -10.5Spain 53 56 53 54 57 60 57 55 Spain -5.3 3.3 4.1 6.5 -6.2 -3.0 4.5Sweden 17 17 17 17 16 16 16 16 Sweden 1.0 -1.3 -5.1 -0.5 0.6 -1.7 -9.2Switzerland 8 7 7 7 7 7 7 7 Switzerland -3.8 -0.1 -0.6 0.8 -2.5 0.2 -10.8Ukraine 31 30 Ukraine -3.1United Kingdom 98 94 97 94 92 89 83 85 United Kingdom 3.1 -2.9 -2.0 -3.8 -6.4 2.4 -13.0United States 848 929 946 949 942 935 931 927 United States 1.8 0.4 -0.7 -0.8 -0.4 -0.4 9.3
Agricultural soils, N2O – trend information Relative change (%)
a In accordance with decisions 9/CP.2 and 11/CP.4, some Parties with economies in transition use base years other than 1990: Bulgaria (1988), Hungary (average of 1985 to 1987), Romania (1989) and Slovenia (1986).
N2O emissions (Gg)
- 113 -

Table 4.10
FracBURN FracFUEL FracGRAZ FracNCRBF FracNCRO FracR FracGASF FracGASM FracLEACH
IPCC defaults EF 0.1a no defaultb no defaultb 0.03a 0.015a 0.45a 0.1a 0.2a 0.3 (0.1 - 0.8)a
Australia NA NA NA NA NA NA NA NA NAAustria 0.01 0.00 0.16 0.01 0.015 0.34 0.03 0.18 0.30BelarusBelgiumBulgaria 0.10 0.00 0.46 0.03 0.015 0.10 0.10 0.20 0.10Canada 0.00 0.00 0.00 0.02 0.030 0.45 0.10 0.20 0.15Croatia 0.10 0.00 0.24 0.02 0.030 0.45 0.10 0.15 0.30Czech RepublicDenmark NO NO 0.12 NE NE NE 0.02 0.23 0.34Estonia 0.90 0.00 0.20 0.02 0.030 0.55 0.10 0.20 0.30European CommunityFinland NZ 0.00 0.22 0.01 0.042 0.43 0.01 0.31 0.15France NA NA 0.28 CS CS CS 0.10 0.20 0.30Germany 0.00 0.00 0.16 NE NE NE 0.06 0.29 0.30Greece 0.10 0.00 0.10 0.20 0.30Hungary 0.09 0.00 0.08 0.03 0.015 0.45 0.10 0.20 0.30Ireland 0.00 0.00 0.63 as GPG as GPG as GPG 0.04 0.17 0.10Italy 0.10 0.00 0.25 0.03 0.015 0.45 0.10 0.39 0.30Japan NE NE NE NE NE NE 0.10 0.20 0.30Latvia 0.10 NO 0.24 0.02 0.030 0.45 0.10 0.20 0.30LithuaniaLuxembourgMonacoNetherlands NO NO NE NE NE NE NE NE NENew Zealand 0.50 0.00 0.03 0.015 0.45 0.10 0.20 0.07Norway 0.15 NO 0.23 NE NE NE 0.01 0.18 0.18Portugal 0.10 0.00 0.27 0.01 0.023 0.80 0.10 0.16 0.27Romania 0.25 0.00 0.02 0.02 0.030 0.45 0.10 0.20 0.30Slovakia NO NO 0.06 NE NE NE 0.10 0.24 0.14Slovenia 0.00 0.00 0.11 0.03 0.015 0.72 0.10 0.20 0.30Spain NA 0.00 NA NA NA NA 0.08 0.36 0.15Sweden NO NO 0.29 0.01 0.020 0.19 0.01 0.33 0.22Switzerland 0.00 0.00 see in Table 4.B(a) see in Table 4.F see in Table 4.F see in Table 4.F 0.08 see National
Inventory Report
0.20
UkraineUnited Kingdom 0.00 0.00 0.54 0.03 0.015 0.45 0.10 0.20 0.30United States 0.11 NO 0.01, 0.04, 0.21, 0.85,
0.89, 0.920.03 0.0048, 0.0058, 0.0062, 0.0062,
0.007, 0.007, 0.0072, 0.0077, 0.0106, 0.0108, 0.023, 0.03
0.38, 0.5, 0.39, 0.43, 0.43, 0.42, 0.42, 0.45, 0.5, 0.42,
0.32, 1
0.10 0.20 0.30
Abbreviations of fractions:FracFUEL Fraction of livestock N excretion in excrements burned for fuel FracBURN Fraction of crop residue burnedFracGRAZ Fraction of livestock N excreted and deposited onto soil during grazing FracGASF Fraction of synthetic fertilizer N applied to soils which volatizes as NH3 and NoxFracNCRBF Fraction of N in non-N-fixing crop FracGASM Fraction livestock N excretion that volatizes as NH3 and NOxFracNCRO Fraction of N in N-fixing crop FracLEACH Fraction of N input to soils which is lost through leaching and runoffFracR Fraction of crop residue removed from the field as crop
a Source of IPCC default fractions: IPCC Guidelines, Volume 3, tables 4.19 and 4.24, pages 4.94 and 4.106. (See also IPCC good practice guidance, table 4.19, page 4.74).b Countries are recommended to obtain country-specific data.
(kg N/ kg of dry biomass)
Parameters (fractions) used to estimate N2O emissions in the agricultural soils category (direct and indirect emissions)
(kg N/ kg of dry biomass)
Agricultural soils: parameters used (2002)
(kg N/ kg crop-N)(NH3-N + NOx-N/ kg of synth
fert. N applied)
(NH3-N + NOx-N/ kg of N excreted)
(kg N / kg of fertilizer or manure N)
(kg N/kg crop-N)(kg N/ kg N
excreted)
- 114 -

Table 4.11
1990a 1996 1997 1998 1999 2000 2001 2002 1996 to 1997 1997 to 1998 1998to 1999 1999 to 2000 2000 to 2001 2001 to 2002 1990 to 2002Australia NA NA NA NA NA NA NA NA AustraliaAustria NA NA NA NA NA NA NA NA AustriaBelarus BelarusBelgium BelgiumBulgaria NO BulgariaCanada 7,553 2,082 1,539 1,011 475 62 -299 -531 Canada -26.1 -34.3 -53.0 -87.0 -584.0 77.9 -107.0Croatia CroatiaCzech Republic Czech RepublicDenmark DenmarkEstonia EstoniaEuropean Community 3,208 1,818 2,055 2,024 2,007 2,023 1,946 2,057 European Community 13.0 -1.5 -0.8 0.8 -3.8 5.7 -35.9Finland 3,208 1,818 2,055 2,024 2,007 2,023 1,946 2,057 Finland 13.0 -1.5 -0.8 0.8 -3.8 5.7 -35.9France FranceGermany IE IE IE IE IE IE IE IE GermanyGreece GreeceHungary HungaryIreland IE IE IE IE IE IE IE IrelandItaly ItalyJapan NE NE NE NE NE NE NE NE JapanLatvia IE/NE IE/NE IE/NE IE/NE IE/NE IE/NE IE/NE IE/NE LatviaLithuania NE NE NE NE LithuaniaLuxembourg LuxembourgMonaco MonacoNetherlands NE NE NE NE NE NE NE NE NetherlandsNew Zealand New ZealandNorway IE IE IE IE IE IE NorwayPortugal NE NE NE NE NE NE NE NE PortugalRomania RomaniaSlovakia SlovakiaSlovenia NE NE NE NE NE NE NE NE SloveniaSpain 0 0 0 0 0 0 0 0 SpainSweden IE IE IE IE IE IE IE IE SwedenSwitzerland IE IE IE IE IE IE IE IE SwitzerlandUkraine UkraineUnited Kingdom IE IE IE IE IE IE IE IE United KingdomUnited States IE IE IE IE IE IE IE IE United States
Agricultural soils, CO2 – trend information CO2 emissions/removals (Gg) Relative change (%)
a In accordance with decisions 9/CP.2 and 11/CP.4, some Parties with economies in transition use base years other than 1990: Bulgaria (1988), Hungary (average of 1985 to 1987), Romania (1989) and Slovenia (1986).
- 115 -

Land-use change and forestry
Figure 5.1Emissions and removals for land-use change and forestry (LUCF)
a In accordance with decisions 9/CP.2 and 11/CP.4, some Parties with economies in transition use base years other than 1990: Bulgaria (1988), Hungary (average of 1985 to 1987), Romania (1989) and Slovenia (1986).
-1200000
-1000000
-800000
-600000
-400000
-200000
0
200000
400000
Aus
tralia
199
0A
ustra
lia 2
002
Aus
tria
1990
Aus
tria
2002
Bel
arus
199
0B
elar
us 2
002
Bel
gium
199
0B
elgi
um 2
002
Bul
garia
199
0B
ulga
ria 2
002
Can
ada
1990
Can
ada
2002
Cro
atia
199
0C
roat
ia 2
002
Cze
ch R
epub
lic 1
990
Cze
ch R
epub
lic 2
002
Den
mar
k 19
90D
enm
ark
2002
Est
onia
199
0E
ston
ia 2
002
Eur
opea
n C
omm
unity
199
0E
urop
ean
Com
mun
ity 2
002
Fin
land
199
0F
inla
nd 2
002
Fra
nce
1990
Fra
nce
2002
Ger
man
y 19
90G
erm
any
2002
Gre
ece
1990
Gre
ece
2002
Hun
gary
199
0H
unga
ry 2
002
Irela
nd 1
990
Irela
nd 2
002
Italy
199
0Ita
ly 2
002
Japa
n 19
90Ja
pan
2002
Latv
ia 1
990
Latv
ia 2
002
Lith
uani
a 19
90Li
thua
nia
2002
Luxe
mbo
urg
1990
Luxe
mbo
urg
2002
Mon
aco
1990
Mon
aco
2002
Net
herla
nds
1990
Net
herla
nds
2002
New
Zea
land
199
0N
ew Z
eala
nd 2
002
Nor
way
199
0N
orw
ay 2
002
Por
tuga
l 199
0P
ortu
gal 2
002
Rom
ania
199
0R
oman
ia 2
002
Slo
vaki
a 19
90S
lova
kia
2002
Slo
veni
a 19
90S
love
nia
2002
Spa
in 1
990
Spa
in 2
002
Sw
eden
199
0S
wed
en 2
002
Sw
itzer
land
199
0S
witz
erla
nd 2
002
Ukr
aine
199
0U
krai
ne 2
002
Uni
ted
Kin
gdom
199
0U
nite
d K
ingd
om 2
002
Uni
ted
Sta
tes
1990
Uni
ted
Sta
tes
2002
Gg
CO
2Emissions Removals
- 116 -

Table 5.1
Methods EFProvision of activity data
in CRFMethods EF
Provision of activity data
in CRFMethods EF
Provision of activity data
in CRFMethods EF
Provision of activity data
in CRFMethods EF
Provision of activity data
in CRFAustralia CS CS CS CS CS CS CS CS CS CSAustria D CS CRF NA NA NA NA NA NA NA NABelarus CRFBelgium D CS CRF NE NE NE NE NE NE NE NEBulgaria CS CS CRFCanada CS/D CS CRF CS/D CS CRF D CS CRF CS/D CS NA NACroatia T1 D CRFCzech Republic CS CS CRF NO NO NEDenmark CRFEstonia TI D CRF TI D CRF TI D CRFEuropean Community NE NE NE NE NE NE NE NE NE NEFinland CS CS NO NO NO NO D D CRFFrance CS CS CRF CS CS CRF CS CS CS CS CRFGermany CS CS CRF NE NE NE NE CS/T2 CS CRF NO NOGreece D D CRF D D CRF D CS CRFHungary D D CRF D D D CS CRFIrelanda CS CS CRF NA NA NA NA D D CRF NA NA
Italy D, CS D, CS CRF D D CRF D D, CS CRFJapan D D, CS CRF D D, CS - - - - - -Latvia D D/CS CRF D D/CS CRF D D/CS CRF D D CRF NO NOLithuania D CS CRF CRF D D CRFLuxembourgMonacoNetherlands T1 CS CRF NE NE NE NONew Zealand CS CS CS/D CS/D CRFNorway CS D, CS CRF CS CS CRF CS CSPortugal D D+CS CRF D DRomania D D CRF D D CRF NE NE NE NESlovakia T1, CS D, CS CRF T1, CS D, CS CRF NO NO T1, T2 D, CS CRF NO NOSlovenia T1 D CRF T1 D CRF T1 D CRFSpain CS CS CRF NE NE NE NOSweden T2 CS CRF T2 CS T2 CS CS, T1 CS, D CRF NOSwitzerland CS CS CRF CS CSUkraineUnited Kingdom M M NO NO CRF NE NE D/CS/M CS/CS/CS CS CSUnited States CS CS CRF IE, NE IE, NA IE, NE IE, NA CS, D CS, D CRF CS CS
a CRF table 5.A has been modified by the Party.
Methods and emission factors used (2002)
Abandonment of lands CO2 emissions / removals from soils OthersChanges in forest and other woody
biomass stocksForest/grassland conversion
- 117 -

Table 5.2
Relative change (%)
1990a 1996 1997 1998 1999 2000 2001 2002 1996 to 1997 1997 to 1998 1998to 1999 1999 to 2000 2000 to 2001 2001 to 2002 1990 to 2002
Australia -24,598 -22,429 -22,515 -22,706 -23,298 -23,220 -22,442 -21,827 Australia 0.4 0.9 2.6 -0.3 -3.4 -2.7 -11.3Austria -9,215 -5,385 -7,633 -7,633 -7,633 -7,633 -7,633 -7,633 Austria 41.7 0.0 0.0 0.0 0.0 0.0 -17.2Belarus -35,095 -35,325 -36,000 -36,800 -38,179 -38,199 -35,795 -31,346 Belarus 1.9 2.2 3.7 0.1 -6.3 -12.4 -10.7Belgium -1,893 -1,850 -1,843 -1,836 -1,829 -1,822 -1,814 -1,814 Belgium -0.4 -0.4 -0.4 -0.4 -0.4 0.0 -4.2Bulgaria -4,657 -7,190 -5,852 -6,233 -6,608 -8,976 -9,467 -8,318 Bulgaria -18.6 6.5 6.0 35.8 5.5 -12.1 78.6Canada -180,302 -111,144 -132,379 5,670 -75,109 -99,732 -104,698 -46,767 Canada 19.1 -104.3 -1,424.7 32.8 5.0 -55.3 -74.1Croatia -6,505 -8,069 -8,069 -8,069 -8,069 -8,069 -8,069 -9,000 Croatia 0.0 0.0 0.0 0.0 0.0 11.5 38.4Czech Republic -2,128 -4,486 -4,639 -3,757 -3,401 -4,016 -4,363 -4,492 Czech Republic 3.4 -19.0 -9.5 18.1 8.6 3.0 111.1Denmark -2,832 -3,064 -3,153 -3,313 -3,311 -653 -3,539 -3,813 Denmark 2.9 5.1 -0.1 -80.3 442.0 7.7 34.6Estonia -7,463 -8,345 -7,217 -6,906 -6,493 -6,399 -5,621 -5,285 Estonia -13.5 -4.3 -6.0 -1.4 -12.2 -6.0 -29.2European Community -181,576 -202,016 -206,425 -202,747 -209,623 -198,431 -218,207 -232,181 European Community 2.2 -1.8 3.4 -5.3 10.0 6.4 27.9Finland -23,798 -21,032 -12,637 -9,713 -10,821 -11,953 -16,851 -18,010 Finland -39.9 -23.1 11.4 10.5 41.0 6.9 -24.3France -43,917 -53,452 -56,981 -56,417 -58,497 -50,753 -62,456 -67,505 France 6.6 -1.0 3.7 -13.2 23.1 8.1 53.7Germany -33,689 -33,400 -33,400 -33,400 -33,400 -25,402 -25,402 -25,402 Germany 0.0 0.0 0.0 -23.9 0.0 0.0 -24.6Greece 18 -506 -548 -1,060 -147 -185 -1,796 -1,735 Greece 8.3 93.5 -86.1 26.0 868.5 -3.4 -9,556.4Hungary -3,906 -5,421 -5,703 -6,102 -6,191 -5,772 -6,264 -6,385 Hungary 5.2 7.0 1.5 -6.8 8.5 1.9 63.4Ireland -450 -420 -498 -574 -501 -407 -1,007 -1,320 Ireland 18.5 15.2 -12.7 -18.6 147.2 31.0 193.2Italy -28,605 -27,886 -27,255 -25,745 -25,668 -25,543 -26,914 -27,583 Italy -2.3 -5.5 -0.3 -0.5 5.4 2.5 -3.6Japan -84,482 0 0 0 0 0 0 0 JapanLatvia -18,836 -15,004 -11,823 -10,152 -9,137 -8,618 -9,570 -8,328 Latvia -21.2 -14.1 -10.0 -5.7 11.0 -13.0 -55.8Lithuania -7,265 -6,249 -5,997 -5,302 Lithuania -11.6 -27.0Luxembourg -295 -295 -295 LuxembourgMonaco MonacoNetherlands -1,422 -1,398 -1,180 -1,380 -1,236 -1,413 -1,413 -1,413 Netherlands -15.5 16.9 -10.4 14.4 0.0 0.0 -0.6New Zealand -22,994 -18,478 -19,954 -21,917 -24,044 -25,760 -26,325 -26,057 New Zealand 8.0 9.8 9.7 7.1 2.2 -1.0 13.3Norway -9,765 -17,607 -16,499 -17,588 -17,767 -18,743 -18,968 -20,055 Norway -6.3 6.6 1.0 5.5 1.2 5.7 105.4Portugal 5,573 -19 -107 -1,106 -435 -1,251 -881 -1,606 Portugal 449.6 931.8 -60.7 187.8 -29.6 82.4 -128.8Romania -13,038 -17,947 -18,256 -20,117 -19,010 -18,283 -19,139 -16,570 Romania 1.7 10.2 -5.5 -3.8 4.7 -13.4 27.1Slovakia -1,753 -1,734 -975 -1,474 -1,107 -1,410 -4,761 -4,779 Slovakia -43.8 51.1 -24.9 27.4 237.5 0.4 172.7Slovenia -1,631 -4,285 -4,285 -4,285 -4,285 -4,285 -4,285 -4,285 Slovenia 0.0 0.0 0.0 0.0 0.0 0.0 162.6Spain -9,456 -18,785 -21,606 -23,871 -26,758 -31,746 -31,477 -35,301 Spain 15.0 10.5 12.1 18.6 -0.8 12.2 273.3Sweden -24,100 -26,100 -31,100 -28,100 -31,100 -31,100 -28,586 -30,306 Sweden 19.2 -9.6 10.7 0.0 -8.1 6.0 25.8Switzerland -1,887 -3,120 -3,287 -3,216 -2,869 -464 -163 -308 Switzerland 5.3 -2.2 -10.8 -83.8 -64.8 88.8 -83.7Ukraine UkraineUnited Kingdom -7,304 -8,426 -8,316 -8,184 -8,122 -8,309 -8,144 -8,444 United Kingdom -1.3 -1.6 -0.8 2.3 -2.0 3.7 15.6United States -692,648 -810,102 -733,760 -621,464 -592,114 -606,003 -603,817 -604,432 United States -9.4 -15.3 -4.7 2.3 -0.4 0.1 -12.7
Net CO2 emissions/removals from Changes in forest and other woody biomass stocks – trend information CO2 emissions/removals (Gg)
a In accordance with decisions 9/CP.2 and 11/CP.4, some Parties with economies in transition use base years other than 1990: Bulgaria (1988), Hungary (average of 1985 to 1987), Romania (1989) and Slovenia (1986).
- 118 -

Tables 5.3 and 5.4
Average annual
growth rate
Implied carbon uptake factor
Average annual
growth rate
Implied carbon uptake factor
Average annual
growth rate
Implied carbon uptake factor
Average annual
growth rate
Implied carbon uptake factor
Average annual
growth rate
Implied carbon uptake factor
(t dm/ha/yr) (t C/ha/yr) (t dm/ha/yr) (t C/ha/yr) (t dm/ha/yr) (t C/ha/yr) (t dm/ha/yr) (t C/ha/yr) (t dm/ha/yr) (t C/ha/yr)AustraliaAustria 4.91 5.15BelarusBelgium 0.00 4.75 0.00 2.48Bulgaria 2.71 1.22 2.19 0.98Canada IE IE IE IE
Commercial 1.53 0.76 1.19 0.60Croatia 4.07 2.03 2.45 1.23Czech Republic
Commercial 4.83 2.17Denmark NO NO NE NO
Conifers (before 1990) 9.00 4.50Broadleaves (bef. 1990) 5.20 2.60
Estonia 5.00 2.25European Community NE NE NE NE NE NE NE NE NE NEFinlandFrance IE IE IE
Forest as a whole 4.78 2.39Germany NO NO NO NO NO NO
Evergreen / decidous 4.27 2.13Greece NE NE
Abies spp 0.84 0.42Picea abies 5.90 2.95Pinusmspp 0.71 0.36Other Evergreen 1.26 0.63Fagus spp 1.58 0.79Quercus spp 0.27 0.14Other Deciduous 1.26 0.63Other non commercial NE NE
Hungary 4.68 2.34 4.39 2.20 NAEvergreen 3.74 1.87Deciduous 3.01 1.51
IrelandItaly
Total 2.85
Changes in forest and other woody biomass stocks: temperate and boreal forests (2002)(Average annual growth rates and implied carbon uptake factors )
Boreal forests
Species as specified by Parties
Temperate forestsPlantations Commercial evergreen Commercial deciduous Other
- 119 -

Tables 5.3 and 5.4
Average annual
growth rate
Implied carbon uptake factor
Average annual
growth rate
Implied carbon uptake factor
Average annual
growth rate
Implied carbon uptake factor
Average annual
growth rate
Implied carbon uptake factor
Average annual
growth rate
Implied carbon uptake factor
(t dm/ha/yr) (t C/ha/yr) (t dm/ha/yr) (t C/ha/yr) (t dm/ha/yr) (t C/ha/yr) (t dm/ha/yr) (t C/ha/yr) (t dm/ha/yr) (t C/ha/yr)
Changes in forest and other woody biomass stocks: temperate and boreal forests (2002)(Average annual growth rates and implied carbon uptake factors )
Boreal forests
Species as specified by Parties
Temperate forestsPlantations Commercial evergreen Commercial deciduous Other
Japan NO NO NO NO NO NO 2.06 NE NO NOOthers 0.00 NESquare parks 2.00 0.19Neighborhood parks 2.00 0.30Community parks 2.00 0.33Comprehensive parks 2.00 0.39Sport parks 2.00 0.29Large scaled parks 2.00 0.43Specific parks 2.00 0.37National government parks 2.00 0.39Buffer greenbelts 2.00 0.33Ornamental green spaces 2.00 0.33Greenways 2.00 0.60Specified community parks 2.00 0.32Green space conservation zones 2.00 1.00Intesively Managed Forest (Single Storied Forest) 4.96 NESemi-Natural Forest 1.94 NE
Latvia NE NE 4.78 2.39 5.16 2.58Bushes 1.00 0.50Clearing and rough afforestation 1.00 0.50Garden and parks 4.46 2.23
Lithuania 3.30 0.50 2.80 0.50 NO NO NOLuxembourgMonacoNetherlands NO NO NO NO NO NO NO NO NO NO
forest land coniferous 4.67 2.33forest land broadleaved 5.68 2.84
New ZealandNorway NO NO NO NO NO NO NO NO NE 1.00Portugal
Pinus pinaster 4.37 2.18other softwood 7.20 3.60Eucalyptus 6.65 3.33Quercus suber 0.29 0.14Quercus ilex 0.29 0.14other Quercus 0.29 0.14Castanea sativa 2.80 1.40other hardwood 1.65 0.83Pinus pinaster 1.24 0.62other softwood 1.00 0.50Eucalyptus 5.45 2.73Quercus suber 0.30 0.15Quercus ilex 0.30 0.15other Quercus 0.30 0.00Castanea sativa 0.00 0.00other hardwood 1.45 0.73
Romania 3.25 1.63 2.65 0.00
- 120 -
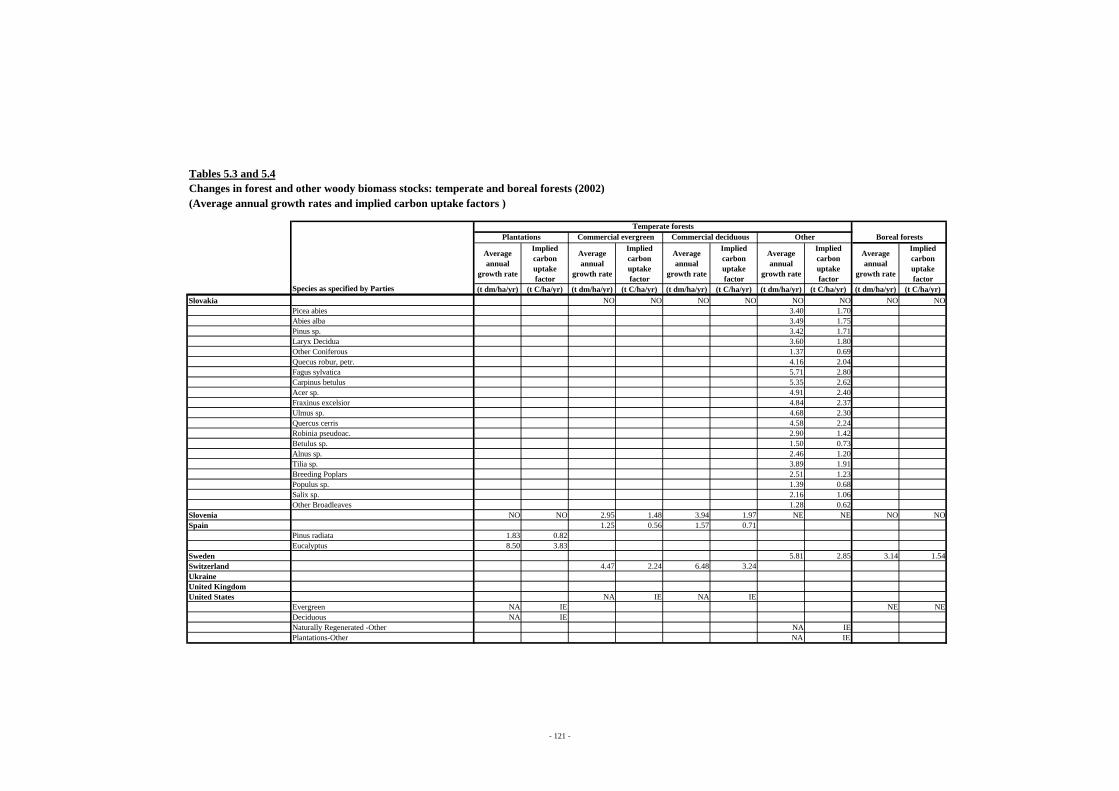
Tables 5.3 and 5.4
Average annual
growth rate
Implied carbon uptake factor
Average annual
growth rate
Implied carbon uptake factor
Average annual
growth rate
Implied carbon uptake factor
Average annual
growth rate
Implied carbon uptake factor
Average annual
growth rate
Implied carbon uptake factor
(t dm/ha/yr) (t C/ha/yr) (t dm/ha/yr) (t C/ha/yr) (t dm/ha/yr) (t C/ha/yr) (t dm/ha/yr) (t C/ha/yr) (t dm/ha/yr) (t C/ha/yr)
Changes in forest and other woody biomass stocks: temperate and boreal forests (2002)(Average annual growth rates and implied carbon uptake factors )
Boreal forests
Species as specified by Parties
Temperate forestsPlantations Commercial evergreen Commercial deciduous Other
Slovakia NO NO NO NO NO NO NO NOPicea abies 3.40 1.70Abies alba 3.49 1.75Pinus sp. 3.42 1.71Laryx Decidua 3.60 1.80Other Coniferous 1.37 0.69Quecus robur, petr. 4.16 2.04Fagus sylvatica 5.71 2.80Carpinus betulus 5.35 2.62Acer sp. 4.91 2.40Fraxinus excelsior 4.84 2.37Ulmus sp. 4.68 2.30Quercus cerris 4.58 2.24Robinia pseudoac. 2.90 1.42Betulus sp. 1.50 0.73Alnus sp. 2.46 1.20Tilia sp. 3.89 1.91Breeding Poplars 2.51 1.23Populus sp. 1.39 0.68Salix sp. 2.16 1.06Other Broadleaves 1.28 0.62
Slovenia NO NO 2.95 1.48 3.94 1.97 NE NE NO NOSpain 1.25 0.56 1.57 0.71
Pinus radiata 1.83 0.82Eucalyptus 8.50 3.83
Sweden 5.81 2.85 3.14 1.54Switzerland 4.47 2.24 6.48 3.24UkraineUnited KingdomUnited States NA IE NA IE
Evergreen NA IE NE NEDeciduous NA IENaturally Regenerated -Other NA IEPlantations-Other NA IE
- 121 -
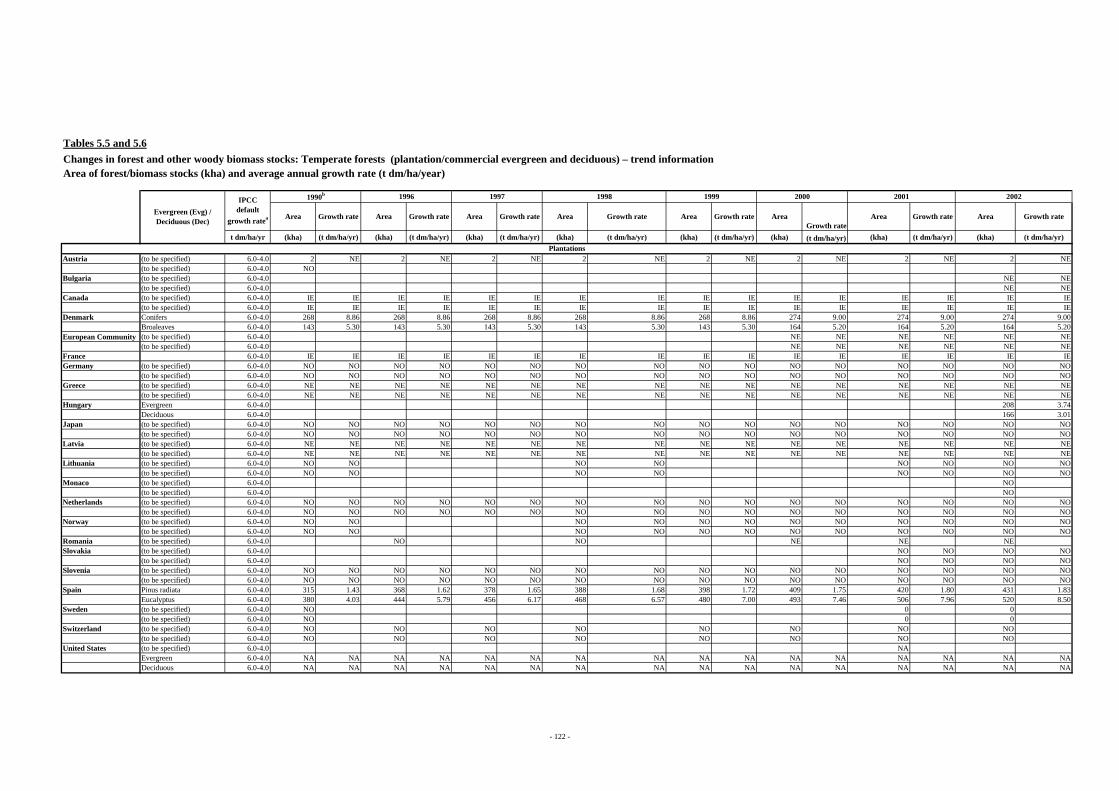
Tables 5.5 and 5.6Changes in forest and other woody biomass stocks: Temperate forests (plantation/commercial evergreen and deciduous) – trend informationArea of forest/biomass stocks (kha) and average annual growth rate (t dm/ha/year)
t dm/ha/yr (kha) (t dm/ha/yr) (kha) (t dm/ha/yr) (kha) (t dm/ha/yr) (kha) (t dm/ha/yr) (kha) (t dm/ha/yr) (kha) (t dm/ha/yr) (kha) (t dm/ha/yr) (kha) (t dm/ha/yr)
Austria (to be specified) 6.0-4.0 2 NE 2 NE 2 NE 2 NE 2 NE 2 NE 2 NE 2 NE(to be specified) 6.0-4.0 NO
Bulgaria (to be specified) 6.0-4.0 NE NE(to be specified) 6.0-4.0 NE NE
Canada (to be specified) 6.0-4.0 IE IE IE IE IE IE IE IE IE IE IE IE IE IE IE IE(to be specified) 6.0-4.0 IE IE IE IE IE IE IE IE IE IE IE IE IE IE IE IE
Denmark Conifers 6.0-4.0 268 8.86 268 8.86 268 8.86 268 8.86 268 8.86 274 9.00 274 9.00 274 9.00Broaleaves 6.0-4.0 143 5.30 143 5.30 143 5.30 143 5.30 143 5.30 164 5.20 164 5.20 164 5.20
European Community (to be specified) 6.0-4.0 NE NE NE NE NE NE(to be specified) 6.0-4.0 NE NE NE NE NE NE
France 6.0-4.0 IE IE IE IE IE IE IE IE IE IE IE IE IE IE IE IEGermany (to be specified) 6.0-4.0 NO NO NO NO NO NO NO NO NO NO NO NO NO NO NO NO
(to be specified) 6.0-4.0 NO NO NO NO NO NO NO NO NO NO NO NO NO NO NO NOGreece (to be specified) 6.0-4.0 NE NE NE NE NE NE NE NE NE NE NE NE NE NE NE NE
(to be specified) 6.0-4.0 NE NE NE NE NE NE NE NE NE NE NE NE NE NE NE NEHungary Evergreen 6.0-4.0 208 3.74
Deciduous 6.0-4.0 166 3.01Japan (to be specified) 6.0-4.0 NO NO NO NO NO NO NO NO NO NO NO NO NO NO NO NO
(to be specified) 6.0-4.0 NO NO NO NO NO NO NO NO NO NO NO NO NO NO NO NOLatvia (to be specified) 6.0-4.0 NE NE NE NE NE NE NE NE NE NE NE NE NE NE NE NE
(to be specified) 6.0-4.0 NE NE NE NE NE NE NE NE NE NE NE NE NE NE NE NELithuania (to be specified) 6.0-4.0 NO NO NO NO NO NO NO NO
(to be specified) 6.0-4.0 NO NO NO NO NO NO NO NOMonaco (to be specified) 6.0-4.0 NO
(to be specified) 6.0-4.0 NONetherlands (to be specified) 6.0-4.0 NO NO NO NO NO NO NO NO NO NO NO NO NO NO NO NO
(to be specified) 6.0-4.0 NO NO NO NO NO NO NO NO NO NO NO NO NO NO NO NONorway (to be specified) 6.0-4.0 NO NO NO NO NO NO NO NO NO NO NO NO
(to be specified) 6.0-4.0 NO NO NO NO NO NO NO NO NO NO NO NORomania (to be specified) 6.0-4.0 NO NO NE NE NESlovakia (to be specified) 6.0-4.0 NO NO NO NO
(to be specified) 6.0-4.0 NO NO NO NOSlovenia (to be specified) 6.0-4.0 NO NO NO NO NO NO NO NO NO NO NO NO NO NO NO NO
(to be specified) 6.0-4.0 NO NO NO NO NO NO NO NO NO NO NO NO NO NO NO NOSpain Pinus radiata 6.0-4.0 315 1.43 368 1.62 378 1.65 388 1.68 398 1.72 409 1.75 420 1.80 431 1.83
Eucalyptus 6.0-4.0 380 4.03 444 5.79 456 6.17 468 6.57 480 7.00 493 7.46 506 7.96 520 8.50Sweden (to be specified) 6.0-4.0 NO 0 0
(to be specified) 6.0-4.0 NO 0 0Switzerland (to be specified) 6.0-4.0 NO NO NO NO NO NO NO NO
(to be specified) 6.0-4.0 NO NO NO NO NO NO NO NOUnited States (to be specified) 6.0-4.0 NA
Evergreen 6.0-4.0 NA NA NA NA NA NA NA NA NA NA NA NA NA NA NA NADeciduous 6.0-4.0 NA NA NA NA NA NA NA NA NA NA NA NA NA NA NA NA
Growth rateGrowth rate Area Growth rate Area Growth rateArea Growth rate Area
IPCC default
growth ratea
20001996
Area
1997 19981990b
Area Growth rate
2002
Growth rate
1999
Evergreen (Evg) / Deciduous (Dec) Growth rate
Area Area
2001
Plantations
- 122 -

Tables 5.5 and 5.6 (continued)Changes in forest and other woody biomass stocks: Temperate forests (plantation/commercial evergreen and deciduous) – trend informationArea of forest/biomass stocks (kha) and average annual growth rate (t dm/ha/year)
t dm/ha/yr (kha) (t dm/ha/yr) (kha) (t dm/ha/yr) (kha) (t dm/ha/yr) (kha) (t dm/ha/yr) (kha) (t dm/ha/yr) (kha) (t dm/ha/yr) (kha) (t dm/ha/yr) (kha) (t dm/ha/yr)
Austria Evg 3 2,561 5.95 2,534 4.91 2,534 4.91 2,534 4.91 2,534 4.91 2,534 4.91 2,534 4.91 2,534 4.91Dec 2 777 6.22 818 5.15 818 5.15 818 5.15 818 5.15 818 5.15 818 5.15 818 5.15
Belgium Evg 3 240 9.49 232 9.50 230 9.50 229 9.50 228 9.50 226 9.50 225 225 0.00Dec 2 249 4.94 250 4.96 250 4.96 250 4.96 250 4.96 250 4.97 251 251 0.00
Bulgaria Evg 3 1,122 2.71Dec 2 2,367 2.19
Canada Evg 3 IE IE IE IE IE IE IE IE IE IE IE IE IE IE IE IEDec 2 IE IE IE IE IE IE IE IE IE IE IE IE IE IE IE IE
Croatia Evg 3 1,775 3.15 1,797 4.07 1,797 4.07 1,797 4.07 1,797 4.07 1,797 4.07 1,797 4.07 1,797 4.07Dec 2 286 1.92 292 2.45 292 2.45 292 2.45 292 2.45 292 2.45 292 2.45 292 2.45
Denmark Evg 3 NO NO NO NO NO NO NO NO NO NO NO NO NO NO NO NODec 2 NO NO NO NO NO NO NO NO NO NO NO NO NO NO NO NO
European Community Evg 3 NE NE NE NE NE NEDec 2 NE NE NE NE NE NE
France Evg 3 IE IE IE IE IE IE IE IE IE IE IE IE IE IE IE IEDec 2 IE IE IE IE IE IE IE IE IE IE IE IE IE IE IE IE
Germany Evergreen / decidous 3-2 10,144 4.27 10,144 4.27 10,144 4.27 10,144 4.27 10,144 4.27 10,144 4.27 10,144 4.27 10,144 4.27Hungary Evg 3 28 4.68
Dec 2 1,296 4.39Japan Evg 3 NO NO NO NO NO NO NO NO NO NO NO NO NO NO NO NO
Dec 2 NO NO NO NO NO NO NO NO NO NO NO NO NO NO NO NOLatvia Evg 3 1,567 4.73 1,614 4.81 1,615 4.81 1,607 4.83 1,558 4.99 1,618 4.81 1,615 4.82 1,630 4.78
Dec 2 1,044 5.35 1,076 5.20 1,077 5.20 1,072 5.22 1,127 4.96 1,078 5.20 1,076 5.21 1,087 5.16Lithuania Evg 3 1,064 3.30 1,146 3.30 1,161 3.30 1,160 3.30
Dec 2 733 2.80 742 2.80 777 2.80 791 2.80Monaco Evg 3 NO
Dec 2 NONetherlands Evg 3 NO NO NO NO NO NO NO NO NO NO NO NO NO NO NO NO
Dec 2 NO NO NO NO NO NO NO NO NO NO NO NO NO NO NO NONorway Evg 3 NO NO NO NO NO NO NO NO NO NO NO NO
Dec 2 NO NO NO NO NO NO NO NO NO NO NO NORomania Evg 3 1,926 3.25 1,890 3.25 1,883 3.25 1,868 3.25 1,861 3.25 1,856 3.25 1,853 3.25 1,856 3.25
Dec 2 4,323 2.65 4,350 2.65 4,353 2.65 4,359 2.65 4,365 2.65 4,367 2.65 4,372 2.65 4,383 2.65Slovakia Evg 3 NO NO NO NO
Dec 2 NO NO NO NOSlovenia Evg 3 485 2.16 456 2.95 456 2.95 456 2.95 456 2.95 456 2.95 456 2.95 456 2.95
Dec 2 520 3.10 570 3.94 570 3.94 570 3.94 570 3.94 570 3.94 570 3.94 570 3.94Spain Evg 3 6,597 0.99 7,709 1.11 7,913 1.13 8,123 1.15 8,339 1.18 8,561 1.26 8,789 1.23 9,025 1.25
Dec 2 6,613 1.01 7,727 1.24 7,931 1.28 8,142 1.33 8,358 1.38 8,581 1.48 8,810 1.45 9,046 1.57Sweden Evg 3 NO NO NO
Dec 2 NO IE (Incl. in Other) IE (Incl. in Other)Switzerland Evg 3 780 4.47 786 4.47 790 4.47 790 4.47 789 4.47 786 4.47 786 4.47 784 4.47
Dec 2 295 6.48 315 6.48 319 6.48 322 6.48 325 6.48 326 6.48 330 6.48 332 6.48United States Evg 3 NA NA NA NA NA NA NA NA NA NA NA NA NA NA NA NA
Dec 2 NA NA NA NA NA NA NA NA NA NA NA NA NA NA NA NA
Note: Only Parties reporting numerical values and/or notation keys under this category are included in the table. a Source of default emission factors: Plantations; IPCC Guidelines, volume 3, table 5.3, page 5.21, commercial evergreen and decidous; IPCC Guidelines, volume 3, table 5.2, page 5.20.b In accordance with decisions 9/CP.2 and 11/CP.4, some Parties with economies in transition use base years other than 1990: Bulgaria (1988), Hungary (average of 1985 to 1987), Romania (1989) and Slovenia (1986).
Growth rateGrowth rate
Area Growth rate AreaGrowth rate Area Growth rate Area
2000 2001 2002
Area Growth rate Area Growth rate Area Growth rate AreaEvergreen (Evg) / Deciduous (Dec)
IPCC default
growth ratea
1990b 1996 1997 1998 1999
Plantations/commercial evergreen and deciduous
- 123 -

Tables 5.5 and 5.6 (continued)Changes in forest and other woody biomass stocks: Temperate forests (plantation/commercial evergreen and deciduous) – trend informationArea of forest/biomass stocks (kha) and average annual growth rate (t dm/ha/year)
Average annual growth rate: relative change (%) Area of forest/biomass stocks: relative change (%)
1996 to 1997 1997 to 1998 1998 to 1999 1999 to 2000 2000 to 2001 2001 to 2002 1990 to 2002 1996 to 1997 1997 to 1998 1998 to 1999 1999 to 2000 2000 to 2001 2001 to 2002 1990 to 2002
Austria (to be specified) Austria 0.00 0.00 0.00 0.00 0.00 0.00 0.00(to be specified)
Bulgaria (to be specified) Bulgaria(to be specified)
Canada (to be specified) Canada(to be specified)
Denmark Conifers 0.00 0.00 0.00 1.58 0.00 0.00 1.58 Denmark 0.00 0.00 0.00 2.24 0.00 0.00 2.24Broaleaves 0.00 0.00 0.00 -1.89 0.00 0.00 -1.89 0.00 0.00 0.00 14.69 0.00 0.00 14.69
European Community (to be specified) European Community(to be specified)
France FranceGermany (to be specified) Germany
(to be specified)Greece (to be specified) Greece
(to be specified)Hungary Evergreen Hungary
DeciduousJapan (to be specified) Japan
(to be specified)Latvia (to be specified) Latvia
(to be specified)Lithuania (to be specified) Lithuania
(to be specified)Monaco (to be specified) Monaco
(to be specified)Netherlands (to be specified) Netherlands
(to be specified)Norway (to be specified) Norway
(to be specified)Romania (to be specified) RomaniaSlovakia (to be specified) Slovakia
(to be specified)Slovenia (to be specified) Slovenia
(to be specified)Spain Pinus radiata 0.02 0.02 1.90 1.88 2.85 1.78 28.24 Spain 2.65 2.65 2.66 2.66 2.67 2.68 36.80
Eucalyptus 0.06 0.07 6.57 6.64 6.70 6.76 110.93 2.65 2.65 2.66 2.66 2.67 2.68 36.80Sweden (to be specified) Sweden
(to be specified)Switzerland (to be specified) SwitzerlandSwitzerland (to be specified) SwitzerlandUnited States (to be specified) United States
EvergreenDeciduous
PlantationsPlantations
- 124 -
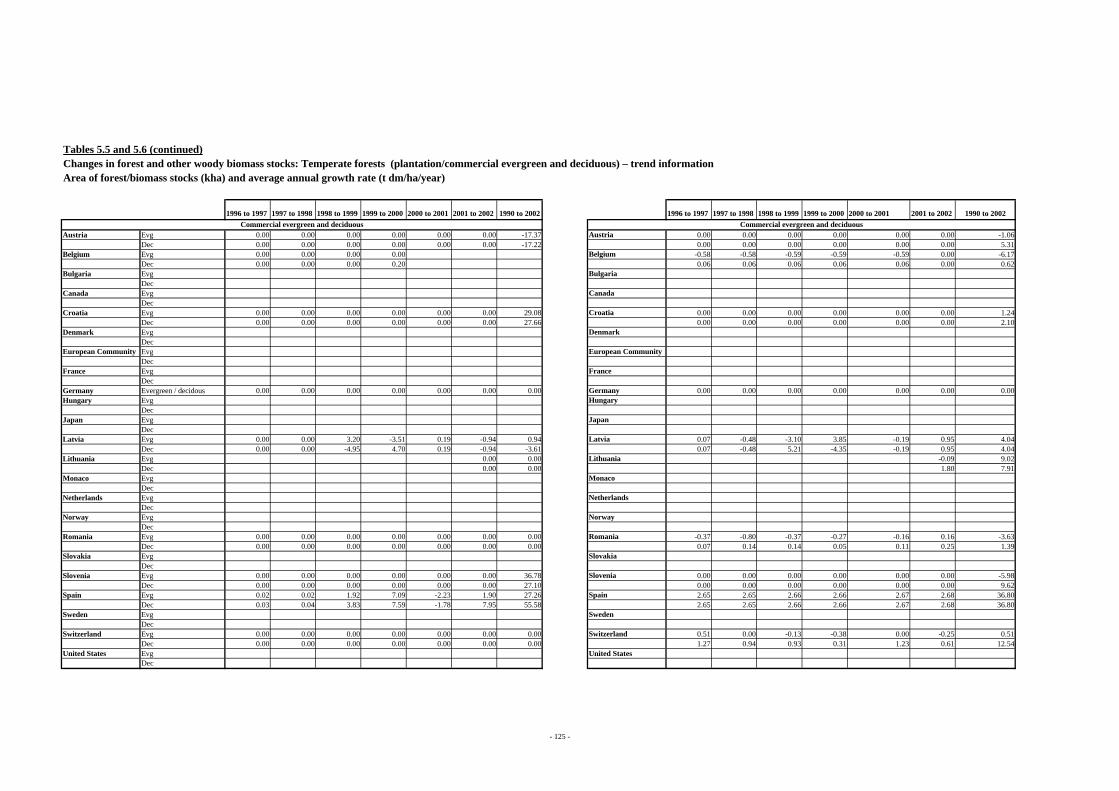
Tables 5.5 and 5.6 (continued)Changes in forest and other woody biomass stocks: Temperate forests (plantation/commercial evergreen and deciduous) – trend informationArea of forest/biomass stocks (kha) and average annual growth rate (t dm/ha/year)
1996 to 1997 1997 to 1998 1998 to 1999 1999 to 2000 2000 to 2001 2001 to 2002 1990 to 2002 1996 to 1997 1997 to 1998 1998 to 1999 1999 to 2000 2000 to 2001 2001 to 2002 1990 to 2002
Austria Evg 0.00 0.00 0.00 0.00 0.00 0.00 -17.37 Austria 0.00 0.00 0.00 0.00 0.00 0.00 -1.06Dec 0.00 0.00 0.00 0.00 0.00 0.00 -17.22 0.00 0.00 0.00 0.00 0.00 0.00 5.31
Belgium Evg 0.00 0.00 0.00 0.00 Belgium -0.58 -0.58 -0.59 -0.59 -0.59 0.00 -6.17Dec 0.00 0.00 0.00 0.20 0.06 0.06 0.06 0.06 0.06 0.00 0.62
Bulgaria Evg BulgariaDec
Canada Evg CanadaDec
Croatia Evg 0.00 0.00 0.00 0.00 0.00 0.00 29.08 Croatia 0.00 0.00 0.00 0.00 0.00 0.00 1.24Dec 0.00 0.00 0.00 0.00 0.00 0.00 27.66 0.00 0.00 0.00 0.00 0.00 0.00 2.10
Denmark Evg DenmarkDec
European Community Evg European CommunityDec
France Evg FranceDec
Germany Evergreen / decidous 0.00 0.00 0.00 0.00 0.00 0.00 0.00 Germany 0.00 0.00 0.00 0.00 0.00 0.00 0.00Hungary Evg Hungary
DecJapan Evg Japan
DecLatvia Evg 0.00 0.00 3.20 -3.51 0.19 -0.94 0.94 Latvia 0.07 -0.48 -3.10 3.85 -0.19 0.95 4.04
Dec 0.00 0.00 -4.95 4.70 0.19 -0.94 -3.61 0.07 -0.48 5.21 -4.35 -0.19 0.95 4.04Lithuania Evg 0.00 0.00 Lithuania -0.09 9.02
Dec 0.00 0.00 1.80 7.91Monaco Evg Monaco
DecNetherlands Evg Netherlands
DecNorway Evg Norway
DecRomania Evg 0.00 0.00 0.00 0.00 0.00 0.00 0.00 Romania -0.37 -0.80 -0.37 -0.27 -0.16 0.16 -3.63
Dec 0.00 0.00 0.00 0.00 0.00 0.00 0.00 0.07 0.14 0.14 0.05 0.11 0.25 1.39Slovakia Evg Slovakia
DecSlovenia Evg 0.00 0.00 0.00 0.00 0.00 0.00 36.78 Slovenia 0.00 0.00 0.00 0.00 0.00 0.00 -5.98
Dec 0.00 0.00 0.00 0.00 0.00 0.00 27.10 0.00 0.00 0.00 0.00 0.00 0.00 9.62Spain Evg 0.02 0.02 1.92 7.09 -2.23 1.90 27.26 Spain 2.65 2.65 2.66 2.66 2.67 2.68 36.80
Dec 0.03 0.04 3.83 7.59 -1.78 7.95 55.58 2.65 2.65 2.66 2.66 2.67 2.68 36.80Sweden Evg Sweden
DecSwitzerland Evg 0.00 0.00 0.00 0.00 0.00 0.00 0.00 Switzerland 0.51 0.00 -0.13 -0.38 0.00 -0.25 0.51
Dec 0.00 0.00 0.00 0.00 0.00 0.00 0.00 1.27 0.94 0.93 0.31 1.23 0.61 12.54United States Evg United States
Dec
Commercial evergreen and deciduous Commercial evergreen and deciduous
- 125 -

Table 5.7Changes in forest and other woody biomass stocks: temperate forests (Other) – trend informationArea of forest/biomass stocks (kha) and average annual growth rate (t dm/ha/year)
(k ha) (t dm/ha/yr) (k ha) (t dm/ha/yr) (k ha) (t dm/ha/yr) (k ha) (t dm/ha/yr) (k ha) (t dm/ha/yr) (k ha) (t dm/ha/yr) (k ha) (t dm/ha/yr) (k ha) (t dm/ha/yr)
Austria Other (specify) NE NE NE NE NE NE NE NECanada Commercial 52,906 1.53 49,672 1.53 49,258 1.53 48,950 1.53 48,436 1.53 47,920 1.53 47,485 1.53 47,359 1.53Czech Republic Commercial 2,560 4.83Denmark Other (specify) NE NE NE NE NE NE NE NE NE NE NE NE NE NE NE NEEuropean Community Other (specify) NE NE NE NE NE NE NE NE NE NE NE NE NE NE NE NEFrance Forest as a whole 15,195 4.78 16,564 4.68 16,741 4.65 16,797 4.71 16,797 4.76 16,835 4.71 16,870 4.75 16,894 4.78Germany Other (specify) NO NO NO NO NO NO NO NO NO NO NO NO NO NO NO NOGreece None commercial 3,154 NE 3,154 NE 3,154 NE 3,154 NE 3,154 NE 3,154 NE 3,154 NE 3,154 NEItaly Total 6,760 3.13 6,837 2.99 6,843 2.96 6,847 2.93 6,853 2.90 6,854 2.88 6,855 2.85 6,881 2.82Japan Other (specify) 25,335 2.07 NE 2.06 NE 2.06 NE 2.06 NE 2.06 NE 2.06 NE 2.06 NE 2.06
Intesively Managed Forest (Single Storied Forest) 10,327 5.03 NAV 4.96 NAV 4.96 NAV 4.96 NAV 4.96 NAV 4.96 NAV 4.96 NAV 4.96Semi-Natural Forest 13,523 2.05 NAV 1.94 NAV 1.94 NAV 1.94 NAV 1.94 NAV 1.94 NAV 1.94 NAV 1.94Others 1,415 0.00 NAV 0.00 NAV 0.00 NAV 0.00 NAV 0.00 NAV 0.00 NAV 0.00 NAV 0.00Square parks 9 2.00 10 2.00 10 2.00 11 2.00 11 2.00 11 2.00 11 2.00 12 2.00Neighborhood parks 6 2.00 8 2.00 8 2.00 8 2.00 8 2.00 8 2.00 8 2.00 9 2.00Community parks 5 2.00 6 2.00 6 2.00 6 2.00 6 2.00 7 2.00 7 2.00 7 2.00Comprehensive parks 14 2.00 18 2.00 18 2.00 19 2.00 20 2.00 21 2.00 21 2.00 22 2.00Sport parks 7 2.00 9 2.00 10 2.00 10 2.00 10 2.00 11 2.00 11 2.00 11 2.00Large scaled parks 6 2.00 9 2.00 10 2.00 10 2.00 10 2.00 11 2.00 11 2.00 12 2.00Specific parks 11 2.00 12 2.00 12 2.00 12 2.00 13 2.00 13 2.00 13 2.00 13 2.00National government parks 1 2.00 1 2.00 1 2.00 2 2.00 2 2.00 2 2.00 2 2.00 2 2.00Buffer greenbelts 1 2.00 1 2.00 1 2.00 1 2.00 1 2.00 2 2.00 2 2.00 2 2.00Ornamental green spaces 5 2.00 8 2.00 9 2.00 9 2.00 10 2.00 10 2.00 10 2.00 11 2.00Greenways 1 2.00 1 2.00 1 2.00 1 2.00 1 2.00 1 2.00 1 2.00 1 2.00Specified community parks 0 2.00 1 2.00 1 2.00 1 2.00 1 2.00 1 2.00 1 2.00 1 2.00Green space conservation zones 2 2.00 4 2.00 4 2.00 5 2.00 5 2.00 5 2.00 5 2.00 5 2.00
Latvia Bushes 111 1.00 112 1.00 127 1.00 122 1.00 124 1.00 120 1.00 117 1.00 117 1.00Clearing and rough afforestation 140 1.00 140 1.00 140 1.00 140 1.00 140 1.00 140 1.00 140 1.00 140 1.00Garden parks 20 4.46 29 4.46 30 4.46 30 4.46 29 4.46 29 4.46 29 4.46 29 4.46
Lithuania Other (specify) NO NO NO NO NO NO NO NO NO NONetherlands Other (specify) NO NO NO NO NO NO NO NO NO NO NO NO NO NO NO NO
forest land coniferous 190 5.02 195 4.66 195 4.74 195 4.74 195 4.69 196 4.67 196 4.67 196 4.67forest land broadleaved 151 5.07 157 5.59 159 5.69 161 5.72 163 5.70 164 5.68 164 5.68 164 5.68
Norway Other (specify) NO NO NO NO NO NO NO NO NO NO NO NOPortugal Pinus pinaster 1,011 4.37 931 4.37 935 4.37 939 4.37 943 4.37 947 4.37 949 4.37 951 4.37
other softwood 77 7.20 79 7.20 81 7.20 83 7.20 85 7.20 86 7.20 90 7.20 93 7.20Eucalyptus 539 6.65 648 6.65 653 6.65 657 6.65 662 6.65 666 6.65 669 6.65 671 6.65Quercus suber 679 0.29 676 0.29 675 0.29 674 0.29 673 0.29 671 0.29 672 0.29 674 0.29Quercus ilex 462 0.29 457 0.29 456 0.29 454 0.29 453 0.29 452 0.29 450 0.29 449 0.29other Quercus 123 0.29 131 0.29 130 0.29 130 0.29 129 0.29 129 0.29 129 0.29 128 0.29Castanea sativa 36 2.80 39 2.80 39 2.80 40 2.80 40 2.80 40 2.80 40 2.80 40 2.80other hardwood 87 1.65 79 1.65 79 1.65 80 1.65 81 1.65 82 1.65 85 1.65 88 1.65Pinus pinaster 58 1.24 43 1.24 37 1.24 30 1.24 27 1.24 24 1.24 22 1.24 19 1.24other softwood 27 1.00 30 1.00 31 1.00 30 1.00 34 1.00 38 1.00 39 1.00 40 1.00Eucalyptus 15 5.45 26 5.45 23 5.45 20 5.45 18 5.45 18 5.45 18 5.45 18 5.45Quercus suber 14 0.30 44 0.30 53 0.30 63 0.30 73 0.30 81 0.30 88 0.30 94 0.30Quercus ilex 0 0.30 6 0.30 10 0.30 13 0.30 16 0.30 19 0.30 23 0.30 26 0.30other Quercus 0 0.30 0 0.30 0 0.30 0 0.30 0 0.30 0 0.30 0 0.30 0 0.30Castanea sativa 1 0.00 1 0.00 1 0.00 1 0.00 1 0.00 0 0.00 0 0.00 0 0.00other hardwood 11 1.45 25 1.45 27 1.45 29 1.45 31 1.45 33 1.45 32 1.45 31 1.45
Area Growth rate Area Growth rateArea Growth rate Area Growth rateArea Growth rate Area Growth rate
2000 2001 20021990a 1996 1997 1998
Area Growth rate
Other
Evergreen / Deciduous Area Growth rate
1999
- 126 -
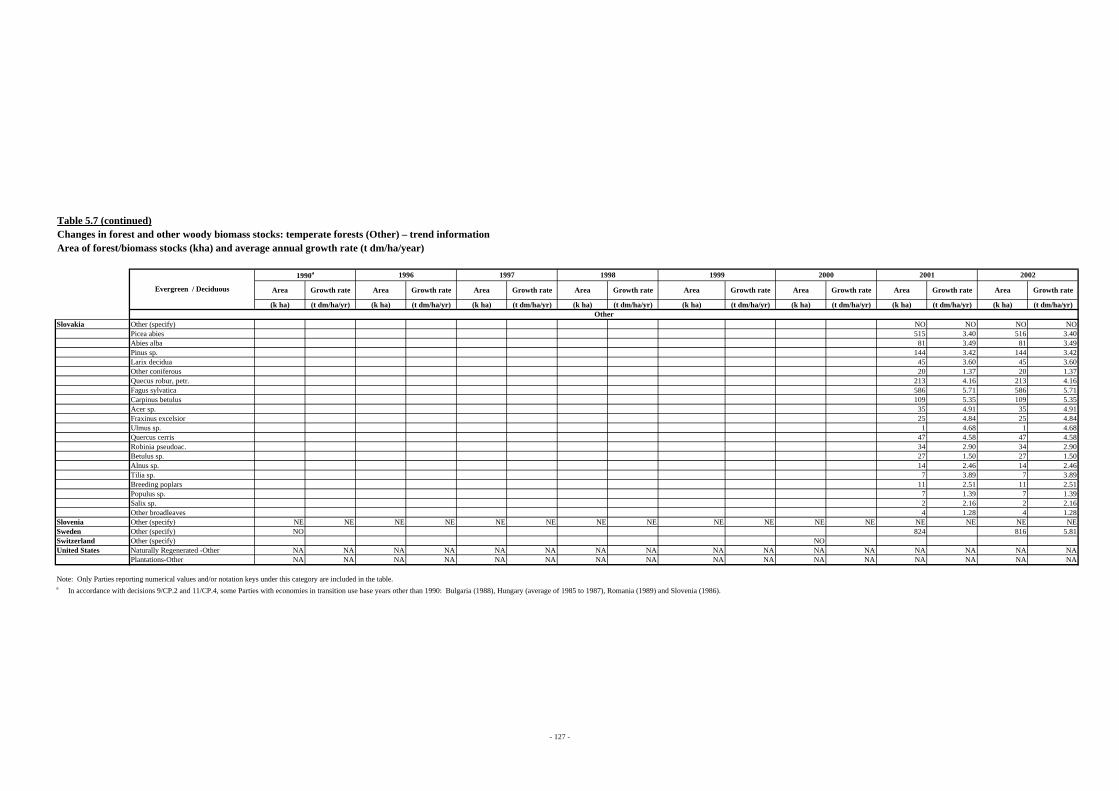
Table 5.7 (continued)Changes in forest and other woody biomass stocks: temperate forests (Other) – trend informationArea of forest/biomass stocks (kha) and average annual growth rate (t dm/ha/year)
(k ha) (t dm/ha/yr) (k ha) (t dm/ha/yr) (k ha) (t dm/ha/yr) (k ha) (t dm/ha/yr) (k ha) (t dm/ha/yr) (k ha) (t dm/ha/yr) (k ha) (t dm/ha/yr) (k ha) (t dm/ha/yr)
Slovakia Other (specify) NO NO NO NOPicea abies 515 3.40 516 3.40Abies alba 81 3.49 81 3.49Pinus sp. 144 3.42 144 3.42Larix decidua 45 3.60 45 3.60Other coniferous 20 1.37 20 1.37Quecus robur, petr. 213 4.16 213 4.16Fagus sylvatica 586 5.71 586 5.71Carpinus betulus 109 5.35 109 5.35Acer sp. 35 4.91 35 4.91Fraxinus excelsior 25 4.84 25 4.84Ulmus sp. 1 4.68 1 4.68Quercus cerris 47 4.58 47 4.58Robinia pseudoac. 34 2.90 34 2.90Betulus sp. 27 1.50 27 1.50Alnus sp. 14 2.46 14 2.46Tilia sp. 7 3.89 7 3.89Breeding poplars 11 2.51 11 2.51Populus sp. 7 1.39 7 1.39Salix sp. 2 2.16 2 2.16Other broadleaves 4 1.28 4 1.28
Slovenia Other (specify) NE NE NE NE NE NE NE NE NE NE NE NE NE NE NE NESweden Other (specify) NO 824 816 5.81Switzerland Other (specify) NOUnited States Naturally Regenerated -Other NA NA NA NA NA NA NA NA NA NA NA NA NA NA NA NA
Plantations-Other NA NA NA NA NA NA NA NA NA NA NA NA NA NA NA NA
Note: Only Parties reporting numerical values and/or notation keys under this category are included in the table. a In accordance with decisions 9/CP.2 and 11/CP.4, some Parties with economies in transition use base years other than 1990: Bulgaria (1988), Hungary (average of 1985 to 1987), Romania (1989) and Slovenia (1986).
Other
Area Growth rate Area Growth rateArea Growth rate AreaEvergreen / Deciduous
1990a 1996
Area Growth rate Area Growth rate Growth rate
1997 1998 1999
Area Growth rate Area Growth rate
2001 20022000
- 127 -

Table 5.7 (continued)Changes in forest and other woody biomass stocks: temperate forests (Other) – trend informationArea of forest/biomass stocks (kha) and average annual growth rate (t dm/ha/year)
Average annual growth rate: relative change (%) Area of forest/biomass stocks: relative change (%)
1996 to 1997 1997 to 1998 1998to 1999 1999 to 2000 2000 to 2001 2001 to 2002 1990 to 2002 1996 to 1997 1997 to 1998 1998 to 1999 1999 to 2000 2000 to 2001 2001 to 2002 1990 to 2002
Austria Other (specify) AustriaCanada Commercial 0.00 0.00 0.01 -0.03 -0.02 -0.03 -0.15 Canada -0.83 -0.62 -1.05 -1.07 -0.91 -0.27 -10.49Czech Republic Commercial Czech RepublicDenmark Other (specify) Denmark
European Community Other (specify)European Community
France Forest as a whole -0.01 0.01 1.01 -0.92 0.64 0.73 0.00 France 1.07 0.33 0.00 0.23 0.21 0.14 11.18Germany Other (specify) GermanyGreece None commercial Greece 0.00 0.00 0.00 0.00 0.00 0.00 0.00Italy Total -0.01 -0.01 -0.83 -0.87 -1.07 -0.80 -9.77 Italy 0.08 0.07 0.08 0.01 0.02 0.38 1.80Japan Other (specify) 0.00 0.00 0.00 0.00 0.00 0.00 -0.54 Japan
Intesively Managed Forest (Single Storied Forest) 0.00 0.00 0.00 0.00 0.00 0.00 -1.39Semi-Natural Forest 0.00 0.00 0.00 0.00 0.00 0.00 -5.37OthersSquare parks 0.00 0.00 0.00 0.00 0.00 0.00 0.00 2.18 2.53 2.12 2.21 2.23 1.75 34.57Neighborhood parks 0.00 0.00 0.00 0.00 0.00 0.00 0.00 1.95 2.91 2.92 1.97 1.06 2.09 36.60Community parks 0.00 0.00 0.00 0.00 0.00 0.00 0.00 2.42 3.22 2.78 2.26 2.29 2.63 37.77Comprehensive parks 0.00 0.00 0.00 0.00 0.00 0.00 0.00 1.40 3.47 6.29 2.77 3.90 2.31 53.59Sport parks 0.00 0.00 0.00 0.00 0.00 0.00 0.00 4.76 3.78 1.61 3.06 2.66 2.85 49.22Large scaled parks 0.00 0.00 0.00 0.00 0.00 0.00 0.00 6.13 5.72 -0.13 5.32 6.41 3.43 82.62Specific parks 0.00 0.00 0.00 0.00 0.00 0.00 0.00 1.09 1.77 1.11 0.54 2.58 -2.82 14.36National government parks 0.00 0.00 0.00 0.00 0.00 0.00 0.00 6.14 7.51 8.62 5.07 5.09 8.91 93.15Buffer greenbelts 0.00 0.00 0.00 0.00 0.00 0.00 0.00 0.90 0.54 1.12 3.17 1.64 0.54 22.48Ornamental green spaces 0.00 0.00 0.00 0.00 0.00 0.00 0.00 5.32 7.15 5.00 3.76 2.67 4.03 101.25Greenways 0.00 0.00 0.00 0.00 0.00 0.00 0.00 3.84 3.99 2.61 3.84 2.99 1.07 49.32Specified community parks 0.00 0.00 0.00 0.00 0.00 0.00 0.00 5.25 3.10 8.15 5.29 4.80 29.37 197.74Green space conservation zones 0.00 0.00 0.00 0.00 0.00 0.00 0.00 2.26 18.91 0.22 0.62 1.86 4.94 168.63
Latvia Bushes 0.00 0.00 0.00 0.00 0.00 0.00 0.00 Latvia 13.54 -3.91 1.89 -3.55 -2.35 -0.49 5.01Clearing and rough afforestation 0.00 0.00 0.00 0.00 0.00 0.00 0.00 0.00 0.00 0.00 0.00 0.00 0.00 0.00Garden parks 0.00 0.00 0.00 0.00 0.00 0.00 0.00 4.63 -1.34 -2.50 -1.13 0.79 0.15 45.64
Lithuania Other (specify) LithuaniaNetherlands Other (specify) Netherlands
forest land coniferous 0.02 0.00 -1.04 -0.52 0.00 0.00 -6.96 -0.20 0.09 0.10 0.56 0.00 0.00 3.16forest land broadleaved 0.02 0.01 -0.46 -0.34 0.00 0.00 11.96 1.45 1.08 1.06 0.50 0.00 0.00 8.34
Norway Other (specify) NorwayPortugal Pinus pinaster 0.00 0.00 0.00 0.00 0.00 0.00 0.00 Portugal 0.43 0.43 0.43 0.43 0.20 0.20 -5.96
other softwood 0.00 0.00 0.00 0.00 0.00 0.00 0.00 2.39 2.34 2.28 2.23 3.93 3.78 20.52Eucalyptus 0.00 0.00 0.00 0.00 0.00 0.00 0.00 0.71 0.71 0.70 0.70 0.35 0.35 24.55Quercus suber 0.00 0.00 0.00 0.00 0.00 0.00 0.00 -0.19 -0.19 -0.19 -0.19 0.15 0.22 -0.79Quercus ilex 0.00 0.00 0.00 0.00 0.00 0.00 0.00 -0.30 -0.30 -0.30 -0.31 -0.31 -0.31 -2.84other Quercus 0.00 0.00 0.00 0.00 0.00 0.00 0.00 -0.30 -0.30 -0.30 -0.30 -0.30 -0.31 4.19Castanea sativa 0.00 0.00 0.00 0.00 0.00 0.00 0.00 0.41 0.41 0.41 0.40 -0.30 -0.31 11.63other hardwood 0.00 0.00 0.00 0.00 0.00 0.00 0.00 0.85 0.84 0.83 0.83 4.29 4.11 1.74Pinus pinaster 0.00 0.00 0.00 0.00 0.00 0.00 0.00 -13.08 -19.95 -9.33 -10.29 -11.48 -12.96 -67.54other softwood 0.00 0.00 0.00 0.00 0.00 0.00 0.00 5.88 -3.39 12.62 12.06 2.22 2.17 49.96Eucalyptus 0.00 0.00 0.00 0.00 0.00 0.00 0.00 -10.88 -12.20 -13.90 0.00 0.00 0.00 15.73Quercus suber 0.00 0.00 0.00 0.00 0.00 0.00 0.00 21.95 18.70 14.43 11.32 8.51 7.29 580.52Quercus ilex 0.00 0.00 0.00 0.00 0.00 0.00 0.00 52.00 34.21 25.49 20.31 16.88 14.44other Quercus 0.00 0.00 0.00 0.00 0.00 0.00 0.00Castanea sativa 0.00 -21.10 -41.38other hardwood 0.00 0.00 0.00 0.00 0.00 0.00 0.00 5.53 6.43 7.49 6.81 -3.21 -3.31 178.26
Other Other
- 128 -

Table 5.7 (continued)Changes in forest and other woody biomass stocks: temperate forests (Other) – trend informationArea of forest/biomass stocks (kha) and average annual growth rate (t dm/ha/year)
Average annual growth rate: relative change (%) Area of forest/biomass stocks: relative change (%)
1996 to 1997 1997 to 1998 1998to 1999 1999 to 2000 2000 to 2001 2001 to 2002 1990 to 2002 1996 to 1997 1997 to 1998 1998 to 1999 1999 to 2000 2000 to 2001 2001 to 2002 1990 to 2002
Slovakia Other (specify) SlovakiaPicea abies 0.12 0.07Abies alba -0.06 0.07Pinus sp. 0.12 0.07Larix decidua 0.00 0.08Other coniferous -0.29 0.06Quecus robur, petr. 0.00 0.07Fagus sylvatica -0.04 0.07Carpinus betulus 0.07 0.07Acer sp. 0.08 0.06Fraxinus excelsior 0.00 0.08Ulmus sp. 0.00 -0.13Quercus cerris 0.09 0.07Robinia pseudoac. -0.14 0.07Betulus sp. 0.27 0.05Alnus sp. 0.12 0.07Tilia sp. 0.05 0.01Breeding poplars -0.16 0.08Populus sp. 0.29 0.08Salix sp. 0.00 -0.13Other broadleaves 0.31 0.16
Slovenia Other (specify) SloveniaSweden Other (specify) Sweden -0.93Switzerland Other (specify) SwitzerlandUnited States Naturally Regenerated -Other United States
Plantations-Other
Other Other
- 129 -

Table 5.8
Relative change (%)
1990a 1996 1997 1998 1999 2000 2001 2002 1996 to 1997 1997 to 1998 1998to 1999 1999 to 2000 2000 to 2001 2001 to 2002 1990 to 2002Australia 46,751 50,104 50,837 51,653 52,535 54,725 56,681 58,473 Australia 1.5 1.6 1.7 4.2 3.6 3.2 25.1Austria 26,679 24,423 22,175 22,175 22,175 22,175 22,175 22,175 Austria -9.2 -16.9Belarus BelarusBelgium 4,534 4,452 4,439 4,425 4,411 4,398 4,384 4,384 Belgium -0.3 -0.3 -0.3 -0.3 -0.3 -3.3Bulgaria 5,240 BulgariaCanada 184,883 220,964 198,666 335,307 247,752 219,205 211,138 267,653 Canada -10.1 68.8 -26.1 -11.5 -3.7 26.8 44.8Croatia CroatiaCzech Republic 16,378 Czech RepublicDenmark DenmarkEstonia 10,601 EstoniaEuropean Community 283,708 282,033 285,107 290,795 291,935 305,673 399,139 398,912 European Community 1.1 2.0 0.4 4.7 30.6 -0.1 40.6Finland 72,141 76,969 85,934 90,424 90,447 91,139 88,231 89,470 Finland 11.6 5.2 0.0 0.8 -3.2 1.4 24.0France 94,678 94,239 91,333 94,115 93,497 100,217 89,748 85,983 France -3.1 3.0 -0.7 7.2 -10.4 -4.2 -9.2Germany 45,686 45,975 45,975 45,975 45,975 53,973 53,973 53,973 Germany 17.4 0.0 0.0 18.1Greece 4,023 3,499 3,457 2,945 3,858 3,819 2,209 2,270 Greece -1.2 -14.8 31.0 -1.0 -42.2 2.7 -43.6Hungary 6,656 HungaryIreland 1,181 1,739 1,638 1,861 1,959 2,122 2,038 3,048 Ireland -5.8 13.6 5.3 8.3 -4.0 49.6 158.2Italy ItalyJapan 61,665 NO NO NO NO NO NO NO JapanLatvia 5,622 10,197 13,417 15,075 16,089 16,641 15,686 16,928 Latvia 31.6 12.4 6.7 3.4 -5.7 7.9 201.1Lithuania 2,935 4,494 5,016 5,775 Lithuania 15.1 96.8Luxembourg LuxembourgMonaco MonacoNetherlands -3,302 -3,574 -3,522 -3,600 -3,410 -3,593 -3,593 -3,593 Netherlands -1.4 2.2 -5.3 5.4 8.8New Zealand New ZealandNorway 19,727 15,899 16,306 15,953 16,359 15,941 Norway 2.6 -2.2 2.5 -2.6 -19.2Portugal 22,736 17,985 17,985 17,065 17,836 17,148 17,614 16,985 Portugal -5.1 4.5 -3.9 2.7 -3.6 -25.3Romania 19,413 13,997 13,661 11,739 13,258 13,965 13,115 15,756 Romania -2.4 -14.1 12.9 5.3 -6.1 20.1 -18.8Slovakia 10,230 10,221 Slovakia -0.1Slovenia 3,242 2,301 2,301 2,301 2,301 2,301 2,301 2,301 Slovenia -29.0Spain 15,543 16,321 15,566 15,529 15,058 14,239 15,398 15,385 Spain -4.6 -0.2 -3.0 -5.4 8.1 -0.1 -1.0Sweden 106,962 108,833 Sweden 1.7Switzerland 8,014 7,066 6,980 7,086 7,460 9,852 10,201 10,065 Switzerland -1.2 1.5 5.3 32.1 3.5 -1.3 25.6Ukraine UkraineUnited Kingdom United KingdomUnited States 25,098 25,098 25,098 25,098 25,098 25,098 25,098 25,098 United States
Changes in forest and other woody biomass stocks – trend information (continued)CO2 emissions (Gg)
a In accordance with decisions 9/CP.2 and 11/CP.4, some Parties with economies in transition use base years other than 1990: Bulgaria (1988), Hungary (average of 1985 to 1987), Romania (1989) and Slovenia (1986).
- 130 -

Table 5.8
Relative change (%)
1990a 1996 1997 1998 1999 2000 2001 2002 1996 to 1997 1997 to 1998 1998to 1999 1999 to 2000 2000 to 2001 2001 to 2002 1990 to 2002Australia -71,350 -72,533 -73,352 -74,359 -75,833 -77,945 -79,122 -80,300 Australia 1.1 1.4 2.0 2.8 1.5 1.5 12.5Austria -35,894 -29,808 -29,808 -29,808 -29,808 -29,808 -29,808 -29,808 Austria -17.0Belarus -31,346 BelarusBelgium -6,428 -6,303 -6,282 -6,261 -6,240 -6,219 -6,198 -6,198 Belgium -0.3 -0.3 -0.3 -0.3 -0.3 -3.6Bulgaria -13,558 BulgariaCanada -365,185 -332,108 -331,045 -329,637 -322,861 -318,938 -315,836 -314,420 Canada -0.3 -0.4 -2.1 -1.2 -1.0 -0.4 -13.9Croatia -6,505 -8,069 -8,069 -8,069 -8,069 -8,069 -8,069 -9,000 Croatia 0.0 0.0 11.5 38.4Czech Republic -20,870 Czech RepublicDenmark -2,832 -3,064 -3,153 -3,313 -3,311 -653 -3,539 -3,813 Denmark 2.9 5.1 -0.1 -80.3 442.0 7.7 34.6Estonia -15,886 EstoniaEuropean Community -465,284 -484,048 -491,532 -493,541 -501,558 -504,103 -617,346 -631,093 European Community 1.5 0.4 1.6 0.5 22.5 2.2 35.6Finland -95,939 -98,001 -98,571 -100,137 -101,268 -103,093 -105,082 -107,480 Finland 0.6 1.6 1.1 1.8 1.9 2.3 12.0France -138,595 -147,691 -148,314 -150,532 -151,994 -150,970 -152,204 -153,488 France 0.4 1.5 1.0 -0.7 0.8 0.8 10.7Germany -79,375 -79,375 -79,375 -79,375 -79,375 -79,375 -79,375 -79,375 GermanyGreece -4,005 -4,005 -4,005 -4,005 -4,005 -4,005 -4,005 -4,005 GreeceHungary 13,018 HungaryIreland -1,631 -2,159 -2,136 -2,435 -2,460 -2,530 -3,045 -4,368 Ireland -1.1 14.0 1.0 2.8 20.4 43.4 167.8Italy -28,605 -27,886 -27,255 -25,745 -25,668 -25,543 -26,914 -27,583 Italy -2.3 -5.5 -0.3 -0.5 5.4 2.5 -3.6Japan -146,147 JapanLatvia -24,458 -25,201 -25,240 -25,227 -25,226 -25,259 -25,256 -25,255 Latvia 0.2 0.0 0.0 0.1 0.0 0.0 3.3Lithuania -10,200 -10,742 -11,013 -11,077 Lithuania 0.6 8.6Luxembourg -295 -295 -295 LuxembourgMonaco MonacoNetherlands 1,881 2,176 2,342 2,220 2,175 2,180 2,180 2,180 Netherlands 7.6 -5.2 -2.0 0.2 15.9New Zealand -22,994 -18,478 -19,954 -21,917 -24,044 -25,760 -26,325 -26,057 New Zealand 8.0 9.8 9.7 7.1 2.2 -1.0 13.3Norway -29,492 -33,486 -34,074 -34,696 -35,326 -35,996 Norway 1.8 1.8 1.8 1.9 22.1Portugal -17,163 -18,004 -18,092 -18,171 -18,271 -18,399 -18,495 -18,591 Portugal 0.5 0.4 0.5 0.7 0.5 0.5 8.3Romania -32,451 -32,368 -32,341 -32,280 -32,268 -32,248 -32,254 -32,325 Romania -0.1 -0.2 0.0 -0.1 0.0 0.2 -0.4Slovakia -14,990 -15,000 Slovakia 0.1Slovenia -4,873 -6,585 -6,585 -6,585 -6,585 -6,585 -6,585 -6,585 Slovenia 35.1Spain -24,999 -35,107 -37,171 -39,400 -41,816 -45,985 -46,875 -50,686 Spain 5.9 6.0 6.1 10.0 1.9 8.1 102.8Sweden -24,100 -26,100 -31,100 -28,100 -31,100 -31,100 -135,548 -139,139 Sweden 19.2 -9.6 10.7 335.8 2.6 477.3Switzerland -9,900 -10,186 -10,267 -10,302 -10,329 -10,316 -10,364 -10,373 Switzerland 0.8 0.3 0.3 -0.1 0.5 0.1 4.8Ukraine UkraineUnited Kingdom -7,304 -8,426 -8,316 -8,184 -8,122 -8,309 -8,144 -8,444 United Kingdom -1.3 -1.6 -0.8 2.3 -2.0 3.7 15.6United States -717,746 -835,200 -758,859 -646,562 -617,212 -631,102 -628,915 -629,531 United States -9.1 -14.8 -4.5 2.3 -0.3 0.1 -12.3
Changes in forest and other woody biomass stocks – trend information (continued)CO2 removals (Gg)
a In accordance with decisions 9/CP.2 and 11/CP.4, some Parties with economies in transition use base years other than 1990: Bulgaria (1988), Hungary (average of 1985 to 1987), Romania (1989) and Slovenia (1986).
- 131 -
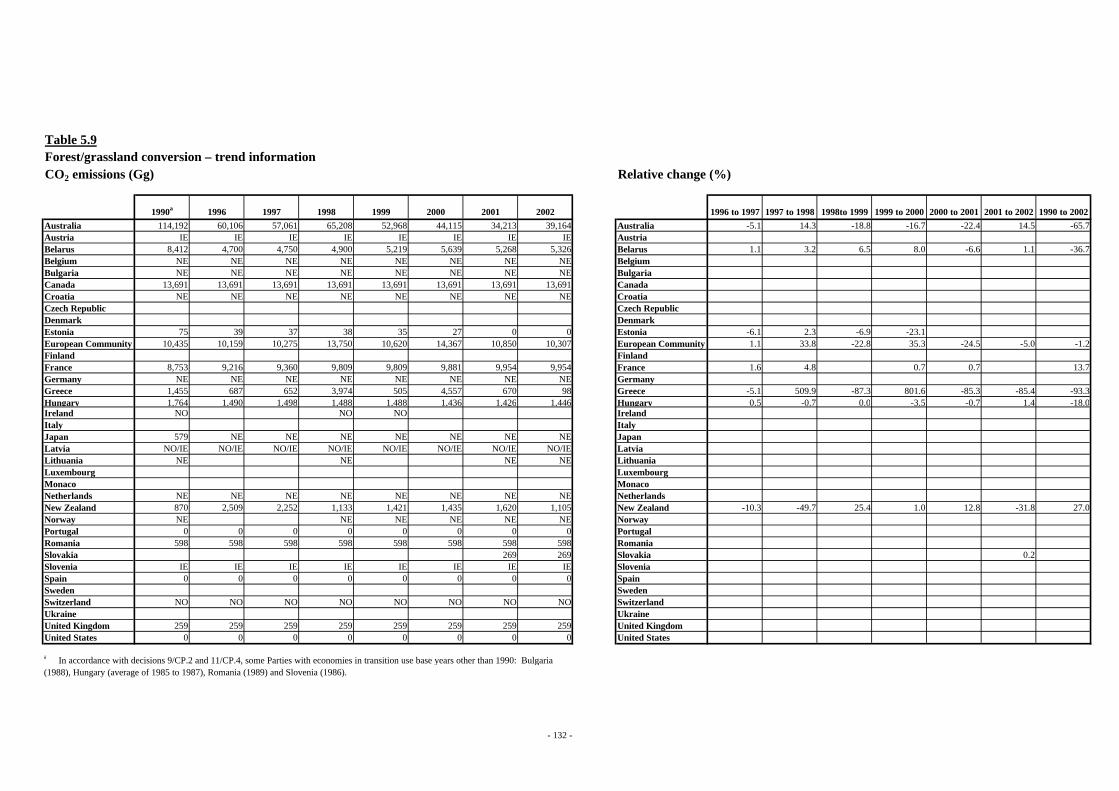
Table 5.9
Relative change (%)
1990a 1996 1997 1998 1999 2000 2001 2002 1996 to 1997 1997 to 1998 1998to 1999 1999 to 2000 2000 to 2001 2001 to 2002 1990 to 2002Australia 114,192 60,106 57,061 65,208 52,968 44,115 34,213 39,164 Australia -5.1 14.3 -18.8 -16.7 -22.4 14.5 -65.7Austria IE IE IE IE IE IE IE IE AustriaBelarus 8,412 4,700 4,750 4,900 5,219 5,639 5,268 5,326 Belarus 1.1 3.2 6.5 8.0 -6.6 1.1 -36.7Belgium NE NE NE NE NE NE NE NE BelgiumBulgaria NE NE NE NE NE NE NE NE BulgariaCanada 13,691 13,691 13,691 13,691 13,691 13,691 13,691 13,691 CanadaCroatia NE NE NE NE NE NE NE NE CroatiaCzech Republic Czech RepublicDenmark DenmarkEstonia 75 39 37 38 35 27 0 0 Estonia -6.1 2.3 -6.9 -23.1European Community 10,435 10,159 10,275 13,750 10,620 14,367 10,850 10,307 European Community 1.1 33.8 -22.8 35.3 -24.5 -5.0 -1.2Finland FinlandFrance 8,753 9,216 9,360 9,809 9,809 9,881 9,954 9,954 France 1.6 4.8 0.7 0.7 13.7Germany NE NE NE NE NE NE NE NE GermanyGreece 1,455 687 652 3,974 505 4,557 670 98 Greece -5.1 509.9 -87.3 801.6 -85.3 -85.4 -93.3Hungary 1,764 1,490 1,498 1,488 1,488 1,436 1,426 1,446 Hungary 0.5 -0.7 0.0 -3.5 -0.7 1.4 -18.0Ireland NO NO NO IrelandItaly ItalyJapan 579 NE NE NE NE NE NE NE JapanLatvia NO/IE NO/IE NO/IE NO/IE NO/IE NO/IE NO/IE NO/IE LatviaLithuania NE NE NE NE LithuaniaLuxembourg LuxembourgMonaco MonacoNetherlands NE NE NE NE NE NE NE NE NetherlandsNew Zealand 870 2,509 2,252 1,133 1,421 1,435 1,620 1,105 New Zealand -10.3 -49.7 25.4 1.0 12.8 -31.8 27.0Norway NE NE NE NE NE NE NorwayPortugal 0 0 0 0 0 0 0 0 PortugalRomania 598 598 598 598 598 598 598 598 RomaniaSlovakia 269 269 Slovakia 0.2Slovenia IE IE IE IE IE IE IE IE SloveniaSpain 0 0 0 0 0 0 0 0 SpainSweden SwedenSwitzerland NO NO NO NO NO NO NO NO SwitzerlandUkraine UkraineUnited Kingdom 259 259 259 259 259 259 259 259 United KingdomUnited States 0 0 0 0 0 0 0 0 United States
Forest/grassland conversion – trend information
a In accordance with decisions 9/CP.2 and 11/CP.4, some Parties with economies in transition use base years other than 1990: Bulgaria (1988), Hungary (average of 1985 to 1987), Romania (1989) and Slovenia (1986).
CO2 emissions (Gg)
- 132 -

Table 5.10 Forest/grassland conversion: average annual net loss of biomass (t dm/ha) (2002)
Area converted annually
Average annual net loss of biomass
Annual net loss of biomass
Average area converted
Average annual net loss of biomass
Annual net loss of biomass
(kha/yr) (t dm/ha/yr) (kt dm/yr) (kha/yr) (t dm/ha/yr) (kt dm/yr) (t dm/ha/yr)
Defaulta (225-300) (225-300)Austria NO NOBelgium NO NO NO NOCanada NO NO NO NODenmark NO NO NO NOEstonia 0.00 0.00European Community NE NE NE NEFrance 0.80 142.50 114.00 NA * NA *Germany NO NO NO NOGreece NO NO NO NOHungary NA NA NA NAIrelandJapan NO NO NO NOLatvia NO NO NO NOLithuania NO NO NO NOMonaco NONetherlands NO NO NO NONorway NO NO NO NORomania NO 0.00 0.00Slovakia NO NO NO NOSlovenia NO NO NO NOSpain NOSweden NOUnited States NE NE NE NE
Defaultb (220-295) (220-295)Austria NO IEBelgium NO NO NE NECanada IE IE NE NEDenmark NO NO NO NOEstonia 0.00 0.00European Community NE NE NE NEFrance IE IE IE IEGermany NO NO NE NEGreece 0.43 33.86 14.65 NO NOHungary IE IE IE IEIreland 0.00 0.00 0.00Japan NO NO NO NOLatvia NO NO NO NOLithuania NE NE NE NEMonaco NONetherlands NE NE NE NENorway IE IE IE IERomania 0.34 250.00 85.00 0.34 85.00 28.90Slovakia NA 847.30 0.90 63.90 57.51Slovenia IE IE IE IESpain NESweden 0.00United States NE NE NE NE
Original natural ecosystem: Tropical, wet / very moist
Original natural ecosystem: temperate / coniferous
On- and off-site burning Decay Difference in annual net loss of biomass
- 133 -

Table 5.10 (continued)Forest/grassland conversion: average annual net loss of biomass (t dm/ha) (2002)
Area converted annually
Average annual net loss of biomass
Annual net loss of biomass
Average area converted
Average annual net loss of biomass
Annual net loss of biomass
(kha/yr) (t dm/ha/yr) (kt dm/yr) (kha/yr) (t dm/ha/yr) (kt dm/yr) (t dm/ha/yr)
Defaultb (175-250) (175-250)Austria NO IEBelgium NO NO NE NECanada IE IE NE NEDenmark NO NO NO NOEstonia 0.00 0.00European Community NE NE NE NEFrance IE IE IE IEGermany NO NO NE NEGreece 0.22 19.72 4.37 NO NOHungary IE IE IE IEIreland 0.00 0.00 0.00Japan NE NE NE NAVLatvia NO NO NO NOLithuania NE NE NE NEMonaco NONetherlands NE NE NE NENorway IE IE IE IERomania 1.36 200.00 272.00 1.36 272.00 369.92Slovakia NA 1,323.36 IE IESlovenia IE IE IE IESpain NESweden 0.00United States NE NE NE NE
Defaultb (175-295) (175-295)Austria NO IEBelgium NO NO NE NECanada 45.40 101.88 4,625.25 NE NEDenmark NO NO NO NOEuropean Community NE NE NE NEFrance 58.63 86.94 5,097.10 NO NOGermany NO NO NE NEGreece 1.92 19.72 37.79 NO NOHungary NE NE NE NEIreland NE NEJapan NO NO NO NOLatvia NO NO NO NOLithuania NO NO NO NOMonaco NONetherlands NE NE NE NENorway IE IE IE IERomania NO 0.00 0.00Slovakia NA NA NA NASlovenia IE IE IE IESpain NESweden 0.00United Kingdom 1.63 240.00 392.16 NO NOUnited States NE NE NE NE
On- and off-site burning Decay Difference in annual net loss of biomass
Original natural ecosystem: temperate / broadleaf
Original natural ecosystem: temperate - mixed broadleaf / coniferous
- 134 -

Table 5.10 (continued)Forest/grassland conversion: average annual net loss of biomass (t dm/ha) (2002)
Area converted annually
Average annual net loss of biomass
Annual net loss of biomass
Average area converted
Average annual net loss of biomass
Annual net loss of biomass
(kha/yr) (t dm/ha/yr) (kt dm/yr) (kha/yr) (t dm/ha/yr) (kt dm/yr) (t dm/ha/yr)
Defaultc
Austria NO NEBelgium NO NO NE NECanada 63.42 11.81 748.87 NE NEDenmark NO NO NO NOEstonia 0.00 0.00European Community NE NE NE NEFrance NO NO NO NOGermany NO NO NE NEGreece 0.64 NE NO NOHungary NO NO NO NOIreland 0.00 0.00Japan NE NE NE NELatvia NO NO NO NOLithuania NO NO NO NOMonaco NONetherlands NE NE NE NENorway IE IE IE IERomania NO 0.00 0.00Slovakia NO NO NO NOSlovenia IE IE IE IESpain NESweden NOUnited States NE NE NE NE
Defaultb (40-87) (40-87)Austria NO NOBelgium NO NO NO NOCanada 28.65 73.07 2,093.83 NE NEDenmark NO NO NO NOEstonia 0.00 0.00 0.00 0.00European Community NE NE NE NEFrance NO NO NO NOGermany NO NO NO NOGreece NO NO NO NOHungary NA NA NA NAIreland 0.00 0.00Japan NO NO NO NOLatvia NO NO NO NOLithuania NO NO NO NOMonaco NONetherlands NO NO NO NONorway IE IE IE IERomania NO 0.00 0.00Slovakia NO NO NO NOSlovenia NO NO NO NOSpain NOSweden 0.00United States NE NE NE NE
Note: Only Parties reporting numerical values and/or notation keys under this category are included in the table. a Source of default emission factors: IPCC Guidelines, volume 3, table 5.4, page 5.26.b Source of default emission factors: IPCC Guidelines, volume 3, table 5.6, page 5.30.c No IPCC default values available.
On- and off-site burning Decay Difference in annual net loss of biomass
Original natural ecosystem: grasslands
Original natural ecosystem: boreal, mixed coniferous / broadealf
- 135 -

Table 5.11
Relative change (%)
1990a 1996 1997 1998 1999 2000 2001 2002 1996 to 1997 1997 to 1998 1998to 1999 1999 to 2000 2000 to 2001 2001 to 2002 1990 to 2002Australia AustraliaAustria NO NO NO NO NO NO NO NO AustriaBelarus BelarusBelgium NO NO NO NO NO NO NO NO BelgiumBulgaria BulgariaCanada IE IE IE IE IE IE IE IE CanadaCroatia CroatiaCzech Republic Czech RepublicDenmark NO NO NO NO NO NO NO NO DenmarkEstonia EstoniaEuropean Community NE NE NE European CommunityFinland FinlandFrance IE IE IE IE IE IE IE IE FranceGermany NO NO NO NO NO NO NO NO GermanyGreece 13.6 4.1 4.9 33.5 3.2 29.9 4.6 0.4 Greece 19.8 583.7 -90.4 835.3 -84.8 -90.5 -96.8Hungary IE HungaryIreland NE NE NE NE NE 0.0 IrelandItaly ItalyJapan NO NO NO NO NO NO NO NO JapanLatvia NO NO NO NO NO NO NO NO LatviaLithuania NE NO NO NE LithuaniaLuxembourg LuxembourgMonaco NO MonacoNetherlands NE NE NE NE NE NE NE NE NetherlandsNew Zealand New ZealandNorway IE IE IE IE IE IE NorwayPortugal PortugalRomania 0.3 0.3 0.3 0.3 0.3 0.3 0.3 0.3 RomaniaSlovakia NA NA SlovakiaSlovenia IE IE IE IE IE IE IE IE SloveniaSpain NE NE NE NE NE NE NE NE SpainSweden NO 0.0 0.0 SwedenSwitzerland SwitzerlandUkraine UkraineUnited Kingdom United KingdomUnited States NE NE NE NE NE NE NE NE United States
Forest/grassland conversion: area converted annually (kha/yr) – trend information
a In accordance with decisions 9/CP.2 and 11/CP.4, some Parties with economies in transition use base years other than 1990: Bulgaria (1988), Hungary (average of 1985 to 1987), Romania (1989) and Slovenia (1986).
Temperate coniferous, on- and off-site burning (kha/yr)
- 136 -
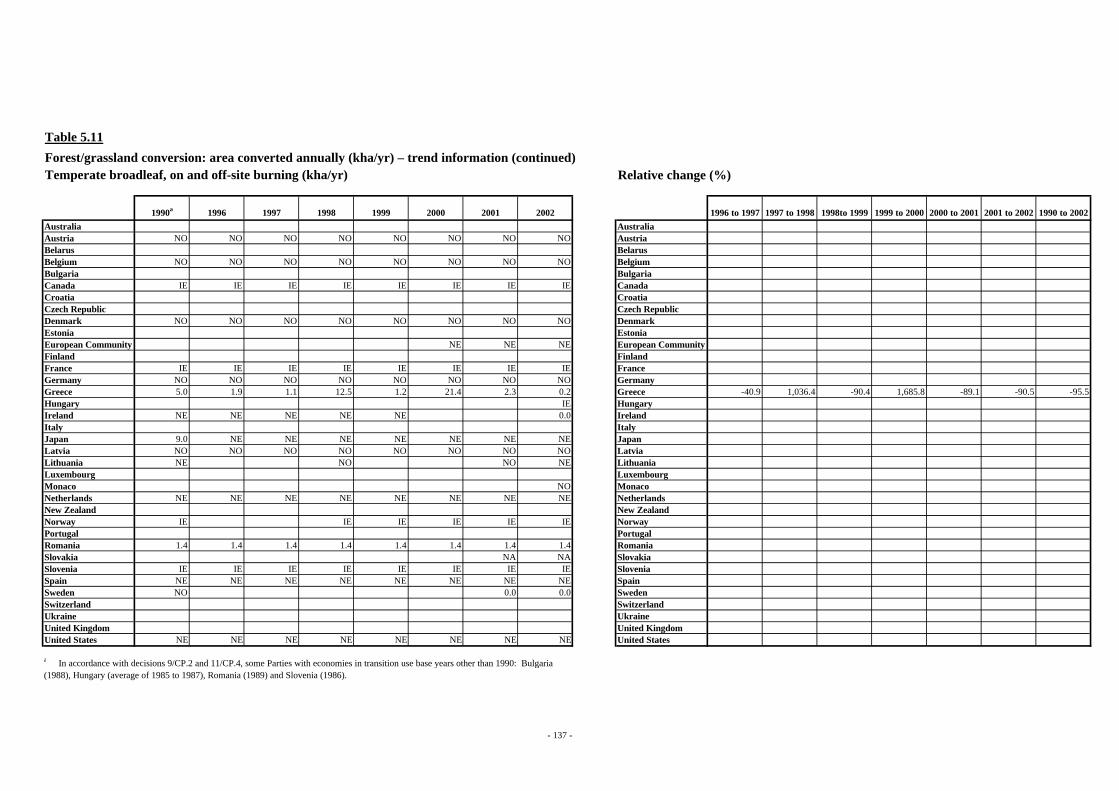
Table 5.11
Relative change (%)
1990a 1996 1997 1998 1999 2000 2001 2002 1996 to 1997 1997 to 1998 1998to 1999 1999 to 2000 2000 to 2001 2001 to 2002 1990 to 2002Australia AustraliaAustria NO NO NO NO NO NO NO NO AustriaBelarus BelarusBelgium NO NO NO NO NO NO NO NO BelgiumBulgaria BulgariaCanada IE IE IE IE IE IE IE IE CanadaCroatia CroatiaCzech Republic Czech RepublicDenmark NO NO NO NO NO NO NO NO DenmarkEstonia EstoniaEuropean Community NE NE NE European CommunityFinland FinlandFrance IE IE IE IE IE IE IE IE FranceGermany NO NO NO NO NO NO NO NO GermanyGreece 5.0 1.9 1.1 12.5 1.2 21.4 2.3 0.2 Greece -40.9 1,036.4 -90.4 1,685.8 -89.1 -90.5 -95.5Hungary IE HungaryIreland NE NE NE NE NE 0.0 IrelandItaly ItalyJapan 9.0 NE NE NE NE NE NE NE JapanLatvia NO NO NO NO NO NO NO NO LatviaLithuania NE NO NO NE LithuaniaLuxembourg LuxembourgMonaco NO MonacoNetherlands NE NE NE NE NE NE NE NE NetherlandsNew Zealand New ZealandNorway IE IE IE IE IE IE NorwayPortugal PortugalRomania 1.4 1.4 1.4 1.4 1.4 1.4 1.4 1.4 RomaniaSlovakia NA NA SlovakiaSlovenia IE IE IE IE IE IE IE IE SloveniaSpain NE NE NE NE NE NE NE NE SpainSweden NO 0.0 0.0 SwedenSwitzerland SwitzerlandUkraine UkraineUnited Kingdom United KingdomUnited States NE NE NE NE NE NE NE NE United States
Forest/grassland conversion: area converted annually (kha/yr) – trend information (continued)
a In accordance with decisions 9/CP.2 and 11/CP.4, some Parties with economies in transition use base years other than 1990: Bulgaria (1988), Hungary (average of 1985 to 1987), Romania (1989) and Slovenia (1986).
Temperate broadleaf, on and off-site burning (kha/yr)
- 137 -

Table 5.11
Relative change (%)
1990a 1996 1997 1998 1999 2000 2001 2002 1996 to 1997 1997 to 1998 1998to 1999 1999 to 2000 2000 to 2001 2001 to 2002 1990 to 2002Australia AustraliaAustria NO NO NO NO NO NO NO NO AustriaBelarus BelarusBelgium NO NO NO NO NO NO NO NO BelgiumBulgaria BulgariaCanada 45.4 45.4 45.4 45.4 45.4 45.4 45.4 45.4 CanadaCroatia CroatiaCzech Republic Czech RepublicDenmark NO NO NO NO NO NO NO NO DenmarkEstonia EstoniaEuropean Community NE NE NE European CommunityFinland FinlandFrance 58.6 58.6 58.6 58.6 58.6 58.6 58.6 58.6 FranceGermany NO NO NO NO NO NO NO NO GermanyGreece 15.5 10.5 9.0 48.5 8.4 63.7 9.4 1.9 Greece -14.4 438.9 -82.7 658.6 -85.2 -79.7 -87.6Hungary NE HungaryIreland NE NE NE NE NE NE NE NE IrelandItaly ItalyJapan NO NO NO NO NO NO NO NO JapanLatvia NO NO NO NO NO NO NO NO LatviaLithuania NE NO NO NO LithuaniaLuxembourg LuxembourgMonaco NO MonacoNetherlands NE NE NE NE NE NE NE NE NetherlandsNew Zealand New ZealandNorway IE IE IE IE IE IE NorwayPortugal PortugalRomania NO NO RomaniaSlovakia NA NA SlovakiaSlovenia IE IE IE IE IE IE IE IE SloveniaSpain NE NE NE NE NE NE NE NE SpainSweden NO 0.0 0.0 SwedenSwitzerland SwitzerlandUkraine UkraineUnited Kingdom 1.6 1.6 1.6 1.6 1.6 1.6 1.6 1.6 United KingdomUnited States NE NE NE NE NE NE NE NE United States
Forest/grassland conversion: area converted annually (kha/yr) – trend information (continued)
a In accordance with decisions 9/CP.2 and 11/CP.4, some Parties with economies in transition use base years other than 1990: Bulgaria (1988), Hungary (average of 1985 to 1987), Romania (1989) and Slovenia (1986).
Temperate mixed: broadleaf/coniferous, on- and off-site burning (kha/yr)
- 138 -

Table 5.11
Relative change (%)
1990a 1996 1997 1998 1999 2000 2001 2002 1996 to 1997 1997 to 1998 1998to 1999 1999 to 2000 2000 to 2001 2001 to 2002 1990 to 2002Australia AustraliaAustria NO NO NO NO NO NO NO NO AustriaBelarus BelarusBelgium NO NO NO NO NO NO NO NO BelgiumBulgaria BulgariaCanada 63.4 63.4 63.4 63.4 63.4 63.4 63.4 63.4 CanadaCroatia CroatiaCzech Republic Czech RepublicDenmark NO NO NO NO NO NO NO NO DenmarkEstonia EstoniaEuropean Community NE NE NE European CommunityFinland FinlandFrance NO NO NO NO NO NO NO NO FranceGermany NO NO NO NO NO NO NO NO GermanyGreece 4.9 9.3 8.3 19.8 2.4 19.2 5.5 0.6 Greece -11.0 139.3 -87.9 700.0 -71.2 -88.5 -86.8Hungary NO HungaryIreland NE NE NE NE NE IrelandItaly ItalyJapan NE NE NE NE NE NE NE NE JapanLatvia NO NO NO NO NO NO NO NO LatviaLithuania NO NO NO NO LithuaniaLuxembourg LuxembourgMonaco NO MonacoNetherlands NE NE NE NE NE NE NE NE NetherlandsNew Zealand New ZealandNorway IE IE IE IE IE IE NorwayPortugal PortugalRomania NO RomaniaSlovakia NO NO SlovakiaSlovenia IE IE IE IE IE IE IE IE SloveniaSpain NE NE NE NE NE NE NE NE SpainSweden NO NO NO SwedenSwitzerland SwitzerlandUkraine UkraineUnited Kingdom United KingdomUnited States NE NE NE NE NE NE NE NE United States
Forest/grassland conversion: area converted annually (kha/yr) – trend information (continued)Grasslands, on- and off-site burning (kha/yr)
a In accordance with decisions 9/CP.2 and 11/CP.4, some Parties with economies in transition use base years other than 1990: Bulgaria (1988), Hungary (average of 1985 to 1987), Romania (1989) and Slovenia (1986).
- 139 -

Table 5.11
Relative change (%)
1990a 1996 1997 1998 1999 2000 2001 2002 1996 to 1997 1997 to 1998 1998to 1999 1999 to 2000 2000 to 2001 2001 to 2002 1990 to 2002Australia AustraliaAustria NO NO NO NO NO NO NO NO AustriaBelarus BelarusBelgium NO NO NO NO NO NO NO NO BelgiumBulgaria BulgariaCanada 28.7 28.7 28.7 28.7 28.7 28.7 28.7 28.7 CanadaCroatia CroatiaCzech Republic Czech RepublicDenmark NO NO NO NO NO NO NO NO DenmarkEstonia 0.0 EstoniaEuropean Community NE NE NE European CommunityFinland FinlandFrance NO NO NO NO NO NO NO NO FranceGermany NO NO NO NO NO NO NO NO GermanyGreece NO NO NO NO NO NO NO NO GreeceHungary NA HungaryIreland NA NO NO NA NA IrelandItaly ItalyJapan NO NO NO NO NO NO NO NO JapanLatvia NO NO NO NO NO NO NO NO LatviaLithuania NO NE NE NO LithuaniaLuxembourg LuxembourgMonaco NO MonacoNetherlands NO NO NO NO NO NO NO NO NetherlandsNew Zealand New ZealandNorway IE IE IE IE IE IE NorwayPortugal PortugalRomania NO RomaniaSlovakia NO NO SlovakiaSlovenia NO NO NO NO NO NO NO NO SloveniaSpain NO NO NO NO NO NO NO NO SpainSweden 0.0 0.0 SwedenSwitzerland SwitzerlandUkraine UkraineUnited Kingdom United KingdomUnited States NE NE NE NE NE NE NE NE United States
Forest/grassland conversion: area converted annually (kha/yr) – trend information (continued)Boreal mixed, on- and off-site burning (kha/yr)
a In accordance with decisions 9/CP.2 and 11/CP.4, some Parties with economies in transition use base years other than 1990: Bulgaria (1988), Hungary (average of 1985 to 1987), Romania (1989) and Slovenia (1986).
- 140 -

Table 5.12
CO2 removals (Gg) Relative change (%)
1990a 1996 1997 1998 1999 2000 2001 2002 1996 to 1997 1997 to 1998 1998to 1999 1999 to 2000 2000 to 2001 2001 to 2002 1990 to 2002Australia NA NA NA NA NA NA NA NA AustraliaAustria IE IE IE IE IE IE IE IE AustriaBelarus 2,247 BelarusBelgium NE NE NE NE NE NE NE NE BelgiumBulgaria BulgariaCanada -746 -746 -746 -746 -746 -746 -746 -746 CanadaCroatia CroatiaCzech Republic Czech RepublicDenmark DenmarkEstonia -2,312 EstoniaEuropean Community -150 -199 -201 -202 -201 -199 -197 -184 European Community 1.1 0.1 0.0 -1.0 -1.3 -6.7 22.4Finland FinlandFrance -48 -48 -48 -48 -48 -48 -48 -48 FranceGermany NE NE NE NE NE NE NE NE GermanyGreece GreeceHungary HungaryIreland NO NE NE IrelandItaly -102 -151 -153 -154 -153 -151 -149 -136 Italy 1.5 0.1 0.0 -1.3 -1.7 -8.9 33.0Japan NE NE NE NE NE NE NE NE JapanLatvia NO -37 -14 -42 -51 -62 -82 -95 Latvia -62.2 204.6 21.7 20.0 32.7 16.4Lithuania -930 -1,549 -1,549 -1,609 Lithuania 3.8 72.9Luxembourg LuxembourgMonaco MonacoNetherlands NE NE NE NE NE NE NE NE NetherlandsNew Zealand New ZealandNorway NorwayPortugal PortugalRomania RomaniaSlovakia SlovakiaSlovenia -224 -216 -216 -216 -216 -216 -216 -216 Slovenia -3.3Spain SpainSweden SwedenSwitzerland IE IE IE IE IE IE IE IE SwitzerlandUkraine UkraineUnited Kingdom United KingdomUnited States United States of
America
Abandonment of managed land – trend information
a In accordance with decisions 9/CP.2 and 11/CP.4, some Parties with economies in transition use base years other than 1990: Bulgaria (1988), Hungary (average of 1985 to 1987), Romania (1989) and Slovenia (1986).
- 141 -

Table 5.13
Abandonment of managed land (2002)Annual above ground biomass growth rate (t dm/ha/yr) and rate of biomass C uptake (t C/ha/yr)
<20 yrs > 20 yrs <20 yrs > 20 yrs <20 yrs > 20 yrst dm/ha/yr t dm/ha/yr t C/ha/yr t C/ha/yr
Defaulta (2.0-3.0) (2.0-3.0)Austria IE IE IE IEBelarus 2.70 2.10 0.50 0.50Belgium NE NE NE NE NE NECanada 0.95 NE 0.50 NE 0.48 NEEuropean Community NE NE NE NE NE NEGermany NE NE NE NE NE NEGreece NE NE NE NE NE NEHungary NO NO NO NOItaly 2.00 0.50 1.00Japan NE NE NE NE NE NELatvia 1.00 NO 0.50 NO 0.50Lithuania 2.50 2.50 0.50 0.50 1.25 1.25Netherlands NE NE NE NE NE NENorway IE IE IE IE IE IESlovakia NO NO NO NO NO NOSlovenia 1.75 NE 0.50 NE 0.88 NESpain NE NEUnited States NE NE NE NE IE NE
Defaulta (2.0) (2.0)Austria IE IE IE IEBelgium NE NE NE NE NE NECanada NA NA NA NA NA NAEuropean Community NE NE NE NE NE NEGermany NE NE NE NE NE NEGreece NE NE NE NE NE NEHungary NO NO NO NOJapan NE NE NE NE NE NELatvia NO NO NO NOLithuania NO NO NO NO NO NONetherlands NE NE NE NE NE NENorway IE IE IE IE IE IESlovakia NO NO NO NO NO NOSlovenia NE NE NE NE NE NESpain NE NEUnited States NE NE NE NE IE NE
Temperate: Mixed coniferous / broadleaf
Temperate: Broadleaf
Annual rate of biomass growth C fraction of biomass Rate of biomass C uptake
- 142 -
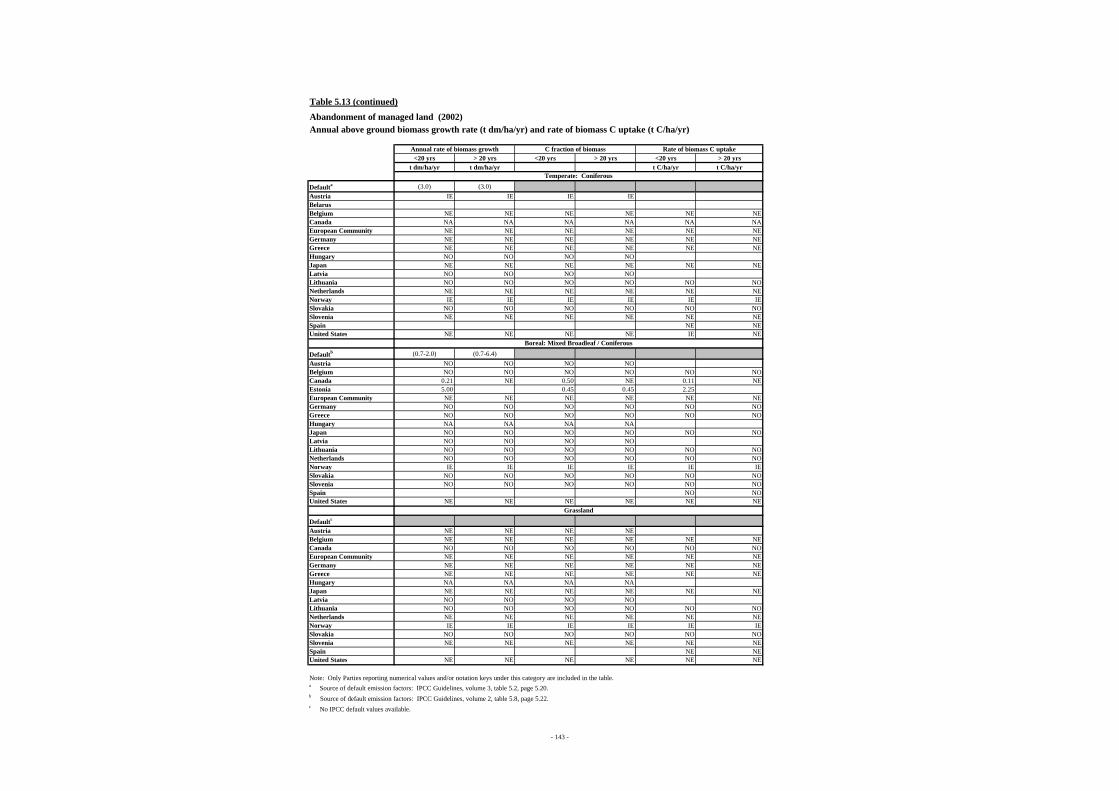
Table 5.13 (continued)
Abandonment of managed land (2002)Annual above ground biomass growth rate (t dm/ha/yr) and rate of biomass C uptake (t C/ha/yr)
<20 yrs > 20 yrs <20 yrs > 20 yrs <20 yrs > 20 yrst dm/ha/yr t dm/ha/yr t C/ha/yr t C/ha/yr
Defaulta (3.0) (3.0)Austria IE IE IE IEBelarusBelgium NE NE NE NE NE NECanada NA NA NA NA NA NAEuropean Community NE NE NE NE NE NEGermany NE NE NE NE NE NEGreece NE NE NE NE NE NEHungary NO NO NO NOJapan NE NE NE NE NE NELatvia NO NO NO NOLithuania NO NO NO NO NO NONetherlands NE NE NE NE NE NENorway IE IE IE IE IE IESlovakia NO NO NO NO NO NOSlovenia NE NE NE NE NE NESpain NE NEUnited States NE NE NE NE IE NE
Defaultb (0.7-2.0) (0.7-6.4)Austria NO NO NO NOBelgium NO NO NO NO NO NOCanada 0.21 NE 0.50 NE 0.11 NEEstonia 5.00 0.45 0.45 2.25European Community NE NE NE NE NE NEGermany NO NO NO NO NO NOGreece NO NO NO NO NO NOHungary NA NA NA NAJapan NO NO NO NO NO NOLatvia NO NO NO NOLithuania NO NO NO NO NO NONetherlands NO NO NO NO NO NONorway IE IE IE IE IE IESlovakia NO NO NO NO NO NOSlovenia NO NO NO NO NO NOSpain NO NOUnited States NE NE NE NE NE NE
Defaultc
Austria NE NE NE NEBelgium NE NE NE NE NE NECanada NO NO NO NO NO NOEuropean Community NE NE NE NE NE NEGermany NE NE NE NE NE NEGreece NE NE NE NE NE NEHungary NA NA NA NAJapan NE NE NE NE NE NELatvia NO NO NO NOLithuania NO NO NO NO NO NONetherlands NE NE NE NE NE NENorway IE IE IE IE IE IESlovakia NO NO NO NO NO NOSlovenia NE NE NE NE NE NESpain NE NEUnited States NE NE NE NE NE NE
Note: Only Parties reporting numerical values and/or notation keys under this category are included in the table. a Source of default emission factors: IPCC Guidelines, volume 3, table 5.2, page 5.20.b Source of default emission factors: IPCC Guidelines, volume 2, table 5.8, page 5.22.c No IPCC default values available.
Grassland
Temperate: Coniferous
Boreal: Mixed Broadleaf / Coniferous
Annual rate of biomass growth C fraction of biomass Rate of biomass C uptake
- 143 -

Table 5.13Abandonment of managed land (2002) (continued)Abandonment area (kha) – first 20 yearsa Relative change (%)
1990b 1996 1997 1998 1999 2000 2001 2002 1996 to 1997 1997 to 1998 1998to 1999 1999 to 2000 2000 to 2001 2001 to 2002 1990 to 2002Canada Temperate Forests : Mixed Broadleaf/Coniferous 394 394 394 394 394 394 394 394 Canada
Mixed Broadleaf/Coniferous 155 155 155 155 155 155 155 155Estonia Boreal Forests : Mixed Broadleaf/ Coniferous 280 EstoniaItaly Temperate Forests : Mixed Broadleaf/Coniferous 28 41 42 42 42 41 41 37 Italy 1.5 0.1 0.0 -1.3 -1.7 -8.9 33.0Latvia Temperate Forests : Mixed Broadleaf/Coniferous NO 20 15 23 28 34 45 52 Latvia -24.5 52.3 21.7 20.0 32.7 16.4Lithuania Temperate Forests : Mixed Broadleaf/Coniferous 3 88 138 151 Lithuania 9.4 4,933.3Slovenia Temperate Forests : Mixed Broadleaf/Coniferous 70 67 67 67 67 67 67 67 Slovenia -4.3
a Only Parties reporting numerical values under this category are included in the table.b In accordance with decisions 9/CP.2 and 11/CP.4, some Parties with economies in transition use base years other than 1990: Bulgaria (1988), Hungary (average of 1985 to 1987), Romania (1989) and Slovenia (1986).
- 144 -

Table 5.14
Net CO2 emissions/removals (Gg) Relative change (%)
1990a 1996 1997 1998 1999 2000 2001 2002 1996 to 1997 1997 to 1998 1998to 1999 1999 to 2000 2000 to 2001 2001 to 2002 1990 to 2002Australia -4,224 -4,224 -4,224 -4,224 -4,224 -4,224 -4,224 -4,224 AustraliaAustria NE NE NE NE NE NE NE NE AustriaBelarus 2,517 770 800 820 788 715 780 1,701 Belarus 3.9 2.5 -3.9 -9.3 9.2 118.0 -32.4Belgium NE NE NE NE NE NE NE NE BelgiumBulgaria NE NE NE NE NE NE NE NE BulgariaCanada 13,177 13,177 13,177 13,177 13,177 13,177 13,177 13,177 CanadaCroatia NE NE NE NE NE NE NE NE CroatiaCzech Republic Czech RepublicDenmark 0 0 0 0 0 0 0 0 DenmarkEstonia 3,053 420 -347 -42 646 463 -967 -967 Estonia -182.6 -87.8 -1,623.1 -28.4 -308.9 -131.7European Community 70,541 67,565 68,800 68,312 67,074 67,181 66,253 63,734 European Community 1.8 -0.7 -1.8 0.2 -1.4 -3.8 -9.6Finland FinlandFrance 3,567 3,043 2,859 2,809 2,669 3,007 2,692 2,734 France -6.1 -1.7 -5.0 12.6 -10.4 1.6 -23.3Germany 41,204 39,087 39,151 39,325 39,301 39,499 39,211 39,309 Germany 0.2 0.4 -0.1 0.5 -0.7 0.2 -4.6Greece -253 -508 -84 -339 -202 -169 -254 Greece 100.7 -83.4 302.2 -40.5 -16.0 50.0Hungary 794 NE NE 203 203 -41 296 2,580 Hungary -120.2 -819.2 771.5 224.9Ireland 384 416 467 413 379 360 378 342 Ireland 12.3 -11.7 -8.1 -5.0 5.1 -9.6 -11.1Italy 5,175 7,815 9,645 8,472 8,110 8,749 8,761 7,333 Italy 23.4 -12.2 -4.3 7.9 0.1 -16.3 41.7Japan NE NE NE NE NE NE NE NE JapanLatvia 134 102 113 92 93 95 91 94 Latvia 10.1 -18.2 0.9 1.7 -3.6 2.9 -30.2Lithuania 2,713 240 211 190 Lithuania -9.7 -93.0Luxembourg LuxembourgMonaco MonacoNetherlands NE NE NE NE NE NE NE NE NetherlandsNew Zealand 360 485 534 583 632 682 731 780 New Zealand 10.2 9.2 8.5 7.8 7.2 6.7 116.6Norway 217 152 149 134 129 108 113 116 Norway -1.6 -10.3 -3.3 -16.4 4.8 2.3 -46.5Portugal 0 0 0 0 0 0 0 0 PortugalRomania RomaniaSlovakia -815 -805 -547 -593 -669 -1,146 -619 -616 Slovakia -32.1 8.5 12.8 71.3 -46.0 -0.5 -24.4Slovenia -1,095 -1,061 -1,061 -1,061 -1,061 -1,061 -1,061 -1,061 Slovenia -3.2Spain 0 0 0 0 0 0 0 0 SpainSweden 3,808 3,831 3,812 3,769 3,795 3,794 3,775 3,765 Sweden -0.5 -1.1 0.7 0.0 -0.5 -0.3 -1.1Switzerland 593 593 593 593 593 593 593 593 SwitzerlandUkraine UkraineUnited Kingdom 16,404 13,626 13,374 13,607 13,160 11,973 11,604 10,506 United Kingdom -1.8 1.7 -3.3 -9.0 -3.1 -9.5 -36.0United States -239,187 -231,716 -74,337 -71,874 -72,325 -74,014 -75,717 -76,177 United States -67.9 -3.3 0.6 2.3 2.3 0.6 -68.2
CO2 emissions and removals from soils – trend information
a In accordance with decisions 9/CP.2 and 11/CP.4, some Parties with economies in transition use base years other than 1990: Bulgaria (1988), Hungary (average of 1985 to 1987), Romania (1989) and Slovenia (1986).
- 145 -
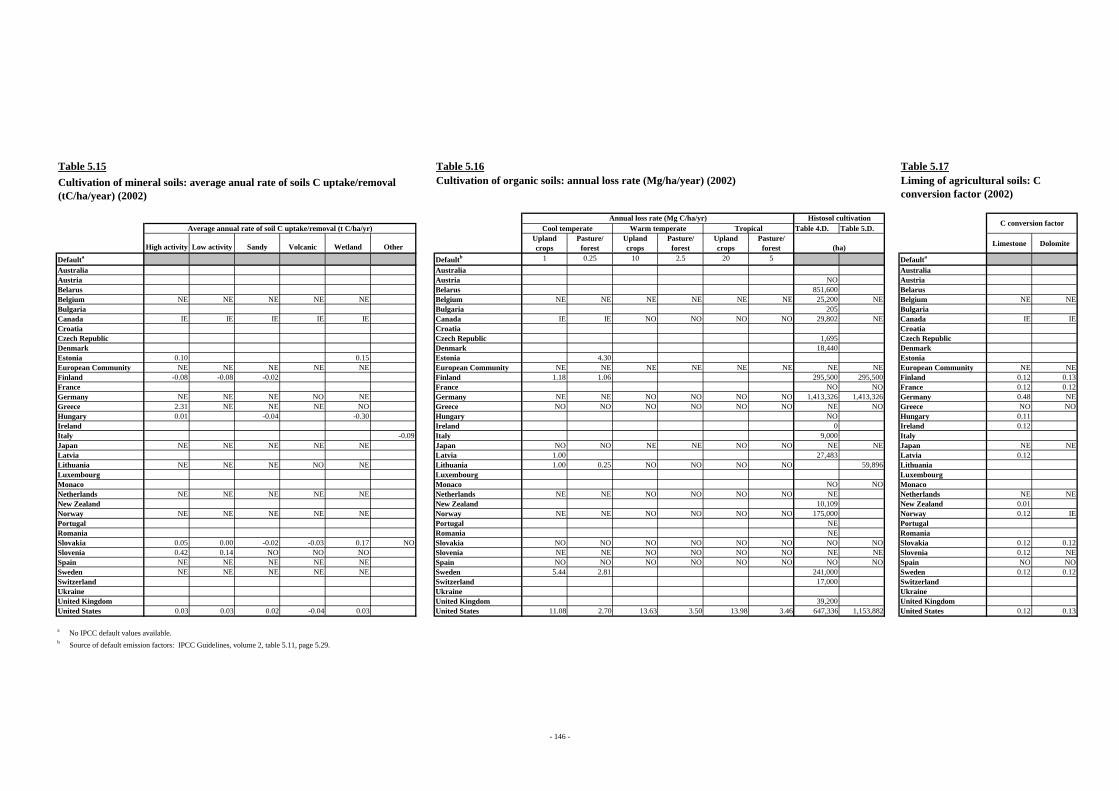
Table 5.15 Table 5.16 Table 5.17
Table 4.D. Table 5.D.
High activity Low activity Sandy Volcanic Wetland OtherUpland crops
Pasture/ forest
Upland crops
Pasture/ forest
Upland crops
Pasture/ forest Limestone Dolomite
Defaulta Defaultb 1 0.25 10 2.5 20 5 Defaulta
Australia Australia AustraliaAustria Austria NO AustriaBelarus Belarus 851,600 BelarusBelgium NE NE NE NE NE Belgium NE NE NE NE NE NE 25,200 NE Belgium NE NEBulgaria Bulgaria 205 BulgariaCanada IE IE IE IE IE Canada IE IE NO NO NO NO 29,802 NE Canada IE IECroatia Croatia CroatiaCzech Republic Czech Republic 1,695 Czech RepublicDenmark Denmark 18,440 DenmarkEstonia 0.10 0.15 Estonia 4.30 EstoniaEuropean Community NE NE NE NE NE European Community NE NE NE NE NE NE NE NE European Community NE NEFinland -0.08 -0.08 -0.02 Finland 1.18 1.06 295,500 295,500 Finland 0.12 0.13France France NO NO France 0.12 0.12Germany NE NE NE NO NE Germany NE NE NO NO NO NO 1,413,326 1,413,326 Germany 0.48 NEGreece 2.31 NE NE NE NO Greece NO NO NO NO NO NO NE NO Greece NO NOHungary 0.01 -0.04 -0.30 Hungary NO Hungary 0.11Ireland Ireland 0 Ireland 0.12Italy -0.09 Italy 9,000 ItalyJapan NE NE NE NE NE Japan NO NO NE NE NO NO NE NE Japan NE NELatvia Latvia 1.00 27,483 Latvia 0.12Lithuania NE NE NE NO NE Lithuania 1.00 0.25 NO NO NO NO 59,896 LithuaniaLuxembourg Luxembourg LuxembourgMonaco Monaco NO NO MonacoNetherlands NE NE NE NE NE Netherlands NE NE NO NO NO NO NE Netherlands NE NENew Zealand New Zealand 10,109 New Zealand 0.01Norway NE NE NE NE NE Norway NE NE NO NO NO NO 175,000 Norway 0.12 IEPortugal Portugal NE PortugalRomania Romania NE RomaniaSlovakia 0.05 0.00 -0.02 -0.03 0.17 NO Slovakia NO NO NO NO NO NO NO NO Slovakia 0.12 0.12Slovenia 0.42 0.14 NO NO NO Slovenia NE NE NO NO NO NO NE NE Slovenia 0.12 NESpain NE NE NE NE NE Spain NO NO NO NO NO NO NO NO Spain NO NOSweden NE NE NE NE NE Sweden 5.44 2.81 241,000 Sweden 0.12 0.12Switzerland Switzerland 17,000 SwitzerlandUkraine Ukraine UkraineUnited Kingdom United Kingdom 39,200 United KingdomUnited States 0.03 0.03 0.02 -0.04 0.03 United States 11.08 2.70 13.63 3.50 13.98 3.46 647,336 1,153,882 United States 0.12 0.13
a No IPCC default values available.b Source of default emission factors: IPCC Guidelines, volume 2, table 5.11, page 5.29.
Liming of agricultural soils: C conversion factor (2002)
C conversion factorHistosol cultivation
TropicalWarm temperateCool temperateAnnual loss rate (Mg C/ha/yr)
Average annual rate of soil C uptake/removal (t C/ha/yr)
(ha)
Cultivation of mineral soils: average anual rate of soils C uptake/removal (tC/ha/year) (2002)
Cultivation of organic soils: annual loss rate (Mg/ha/year) (2002)
- 146 -

Table 5.18
Relative change (%)
1990a 1996 1997 1998 1999 2000 2001 2002 1996 to 1997 1997 to 1998 1998to 1999 1999 to 2000 2000 to 2001 2001 to 2002 1990 to 2002Australia NA NA NA NA NA NA NA NE AustraliaAustria AustriaBelarus BelarusBelgium BelgiumBulgaria BulgariaCanada CanadaCroatia CroatiaCzech Republic Czech RepublicDenmark DenmarkEstonia -997 EstoniaEuropean Community 19,361 20,405 21,453 20,494 19,872 20,291 20,241 18,012 European Community 5.1 -4.5 -3.0 2.1 -0.2 -11.0 -7.0Finland FinlandFrance FranceGermany NE NE NE NE NE NE NE NE GermanyGreece -253 -508 -84 -339 -202 -169 -254 Greece 100.7 -83.4 302.2 -40.5 -16.0 50.0Hungary 2,568 HungaryIreland NE NE NE IrelandItaly 5,175 7,815 9,645 8,472 8,110 8,749 8,761 7,333 Italy 23.4 -12.2 -4.3 7.9 0.1 -16.3 41.7Japan NE NE NE NE NE NE NE NE JapanLatvia NE LatviaLithuania NE NE NE NE LithuaniaLuxembourg LuxembourgMonaco MonacoNetherlands NetherlandsNew Zealand New ZealandNorway NorwayPortugal PortugalRomania RomaniaSlovakia -620 -617 Slovakia -0.5Slovenia -1,139 -1,105 -1,105 -1,105 -1,105 -1,105 -1,105 -1,105 Slovenia -3.1Spain SpainSweden SwedenSwitzerland NE NE NE NE NE NE NE NE SwitzerlandUkraine UkraineUnited Kingdom 14,187 12,843 12,316 12,106 12,102 11,744 11,649 10,933 United Kingdom -4.1 -1.7 0.0 -3.0 -0.8 -6.2 -22.9United States -70,323 -62,653 -62,760 -61,189 -61,110 -62,533 -64,405 -64,698 United States 0.2 -2.5 -0.1 2.3 3.0 0.5 -8.0
Cultivation of mineral soils – trend information Net CO2 emission/removals (Gg)
a In accordance with decisions 9/CP.2 and 11/CP.4, some Parties with economies in transition use base years other than 1990: Bulgaria (1988), Hungary (average of 1985 to 1987), Romania (1989) and Slovenia (1986).
- 147 -

Table 5.19
Relative change (%)
1990a 1996 1997 1998 1999 2000 2001 2002 1996 to 1997 1997 to 1998 1998to 1999 1999 to 2000 2000 to 2001 2001 to 2002 1990 to 2002Australia NA NA NA NA NA NA NA NE AustraliaAustria AustriaBelarus BelarusBelgium BelgiumBulgaria BulgariaCanada CanadaCroatia CroatiaCzech Republic Czech RepublicDenmark DenmarkEstonia 30 EstoniaEuropean Community 42,199 41,068 41,068 41,030 40,993 40,993 3,638 40,993 European Community -0.1 -0.1 -91.1 1,026.7 -2.9Finland FinlandFrance FranceGermany 38,561 37,429 37,429 37,392 37,354 37,354 NE 37,354 Germany -0.1 -0.1 -3.1Greece GreeceHungary HungaryIreland NE NE NE IrelandItaly ItalyJapan NE NE NE NE NE NE NE NE JapanLatvia 130 99 111 90 91 90 91 92 Latvia 12.6 -19.1 0.8 -0.8 0.8 1.6 -28.8Lithuania NO 240 211 190 Lithuania -9.7Luxembourg LuxembourgMonaco MonacoNetherlands NetherlandsNew Zealand New ZealandNorway NorwayPortugal PortugalRomania RomaniaSlovakia SlovakiaSlovenia SloveniaSpain SpainSweden 3,638 3,638 3,638 3,638 3,638 3,638 3,638 3,638 SwedenSwitzerland 593 593 593 593 593 593 593 593 SwitzerlandUkraine UkraineUnited Kingdom United KingdomUnited States 34,313 34,721 34,721 34,721 34,721 34,721 34,721 34,721 United States 1.2
Cultivation of organic soils – trend information Net CO2 emission/removals (Gg)
a In accordance with decisions 9/CP.2 and 11/CP.4, some Parties with economies in transition use base years other than 1990: Bulgaria (1988), Hungary (average of 1985 to 1987), Romania (1989) and Slovenia (1986).
- 148 -

Table 5.20
Relative change (%)
1990a 1996 1997 1998 1999 2000 2001 2002 1996 to 1997 1997 to 1998 1998to 1999 1999 to 2000 2000 to 2001 2001 to 2002 1990 to 2002Australia NA NA NA NA NA NA NA NE AustraliaAustria AustriaBelarus BelarusBelgium BelgiumBulgaria BulgariaCanada CanadaCroatia CroatiaCzech Republic Czech RepublicDenmark DenmarkEstonia EstoniaEuropean Community 5,016 4,212 4,249 4,010 3,838 3,837 39,070 3,501 European Community 0.9 -5.6 -4.3 0.0 918.1 -91.0 -30.2Finland FinlandFrance 552 601 709 647 623 518 475 475 France 17.9 -8.7 -3.7 -17.0 -8.1 -13.8Germany 2,480 1,487 1,552 1,761 1,792 2,009 37,354 1,805 Germany 4.3 13.5 1.8 12.1 1,758.9 -95.2 -27.2Greece GreeceHungary 12 HungaryIreland 384 416 467 413 379 360 378 342 Ireland 12.3 -11.7 -8.1 -5.0 5.1 -9.6 -11.1Italy ItalyJapan NE NE NE NE NE NE NE NE JapanLatvia 5 3 1 2 2 4 0 1 Latvia -61.5 56.2 4.3 108.2 -93.1 370.4 -68.6Lithuania NE NE NE NE LithuaniaLuxembourg LuxembourgMonaco MonacoNetherlands NetherlandsNew Zealand 360 485 534 583 632 682 731 780 New Zealand 10.2 9.2 8.5 7.8 7.2 6.7 116.6Norway 217 134 129 108 113 116 Norway -3.3 -16.4 4.8 2.3 -46.5Portugal PortugalRomania RomaniaSlovakia 1 1 SlovakiaSlovenia 44 44 44 44 44 44 44 44 SloveniaSpain SpainSweden 170 193 174 131 156 156 137 127 Sweden -9.6 -24.9 19.6 -0.1 -12.3 -7.6 -25.5Switzerland NO NO NO NO NO NO NO NO SwitzerlandUkraine UkraineUnited Kingdom 1,430 1,515 1,346 1,058 887 794 725 752 United Kingdom -11.1 -21.4 -16.2 -10.5 -8.8 3.8 -47.4United States 9,490 8,882 8,702 9,593 9,064 8,797 8,966 8,800 United States -2.0 10.2 -5.5 -2.9 1.9 -1.9 -7.3
Liming of agricultural soils – trend information Net CO2 emission/removals (Gg)
a In accordance with decisions 9/CP.2 and 11/CP.4, some Parties with economies in transition use base years other than 1990: Bulgaria (1988), Hungary (average of 1985 to 1987), Romania (1989) and Slovenia (1986).
- 149 -

Table 5.21Other sources/sinks in LUCF – trend information
CO2 net emission/removal and non-CO2 GHG (Gg)a Relative change (%)
Specification Gas 1990b1996 1997 1998 1999 2000 2001 2002 1996 to 1997 1997 to 1998 1998to 1999 1999 to 2000 2000 to 2001 2001 to 2002 1990 to 2002
Belarus CO2 10,098 10,620 11,120 11,600 11,950 11,979 11,979 11,979 Belarus 4.7 4.3 3.0 0.2 18.6CH4 18 18 18 17 17 17 17 17 -0.9 -1.2 -0.6 -2.6
Belgium CH4 5 5 5 5 5 5 5 5 Belgium -0.3 -0.3 -0.2 -0.4 -0.6 -3.7N2O 1 1 1 1 1 1 1 1 -0.4 -0.9 0.3 -0.5 -0.7 -4.7
Czech Republic CO2 IE Czech RepublicCH4 3N2O 0NOx 0
CO 23European CO2 -308 -231 -285 -396 -278 -284 -245 -417 European 23.4 39.0 -29.8 2.0 -13.6 70.0 35.2Community CH4 3 -17 -21 -8 -16 -5 -12 -8 Community 19.5 -63.1 108.4 -70.2 146.7 -32.4 -387.7
N2O 1 1 1 1 1 1 1 1 1.2 9.7 -5.8 8.2 -5.5 2.9 -10.4NOx 9 4 4 7 5 7 6 7 -17.1 89.4 -30.0 59.1 -22.6 16.2 -27.8
CO 252 78 49 163 91 188 128 161 -37.2 231.4 -44.1 106.8 -32.0 25.8 -36.1France CO2 France
CH4 -31 -31 -31 -31 -31 -31 -31 -31 0.0 0.0 0.0 0.0 0.0 0.0 0.1N2O
Italy CH4 8 1 3 3 2 3 3 1 Italy 196.3 33.1 -36.2 53.4 -21.3 -55.4 -84.8N2O 0 0 0 0 0 0 0 0 196.3 33.1 -36.2 53.4 -21.3 -55.4 -84.8NOx 2 0 1 1 1 1 1 0 196.3 33.1 -36.2 53.4 -21.3 -55.4 -84.8
CO 68 8 23 30 19 29 23 10 196.3 33.1 -36.2 53.4 -21.3 -55.4 -84.8Luxembourg Other (please specify) N2O 0 0 0 LuxembourgNorway Liming of Lakes CO2 10 23 26 26 24 19 Norway 12.1 1.5 -9.9 -22.2 83.0Portugal CH4 21 8 3 15 8 18 12 17 Portugal -62.5 400.5 -45.9 121.1 -34.0 43.8 -18.1
N2O 0 0 0 0 0 0 0 0 -62.5 400.5 -45.9 121.1 -34.0 43.8 -18.1NOX 5 2 1 4 2 5 3 4 -62.5 400.5 -45.9 121.1 -34.0 43.8 -18.1
CO 184 71 26 133 72 159 105 150 -62.5 400.5 -45.9 121.1 -34.0 43.8 -18.1Spain Managed forests NOX 2 2 2 2 2 2 2 2 Spain 4.6 -2.5 0.9 1.0 1.0 -0.1 -0.5United Kingdom Changes in Crop Biomass CO2 -1,100 -1,100 -1,100 -1,100 -1,100 -1,100 -1,100 -1,100 United Kingdom
Peat Extraction CO2 792 869 815 704 822 816 855 683 -6.2 -13.7 16.8 -0.7 4.7 -20.1 -13.7United States Landfilled Yard Trimmings CO2 -26,031 -13,404 -12,857 -12,447 -11,314 -10,133 -10,213 -10,114 United States -4.1 -3.2 -9.1 -10.4 0.8 -1.0 -61.1
a Only Parties reporting numerical values under this category are included in the table.b In accordance with decisions 9/CP.2 and 11/CP.4, some Parties with economies in transition use base years other than 1990: Bulgaria (1988), Hungary (average of 1985 to 1987), Romania (1989) and Slovenia (1986).
Forest Fires
On-site burning of Cleared Forest
Managed forests for CH4, N2O, NMVOC
Forest fires
- 150 -

Figure 6.1Emissions and contribution of subsectors in wastea
Waste
a In accordance with decisions 9/CP.2 and 11/CP.4, some Parties with economies in transition use base years other than 1990: Bulgaria (1988), Hungary (average of 1985 to 1987), Romania (1989) and Slovenia (1986).
0
50,000
100,000
150,000
200,000
250,000
Aus
tralia
199
0A
ustra
lia 2
002
Aus
tria
1990
Aus
tria
2002
Bel
arus
199
0B
elar
us 2
002
Bel
gium
199
0B
elgi
um 2
002
Bul
garia
199
0B
ulga
ria 2
002
Can
ada
1990
Can
ada
2002
Cro
atia
199
0C
roat
ia 2
002
Cze
ch R
epub
lic 1
990
Cze
ch R
epub
lic 2
002
Den
mar
k 19
90D
enm
ark
2002
Est
onia
199
0E
ston
ia 2
002
Eur
opea
n C
omm
unity
199
0E
urop
ean
Com
mun
ity 2
002
Finl
and
1990
Finl
and
2002
Fran
ce 1
990
Fran
ce 2
002
Ger
man
y 19
90G
erm
any
2002
Gre
ece
1990
Gre
ece
2002
Hun
gary
199
0H
unga
ry 2
002
Irela
nd 1
990
Irela
nd 2
002
Italy
199
0Ita
ly 2
002
Japa
n 19
90Ja
pan
2002
Latv
ia 1
990
Latv
ia 2
002
Lith
uani
a 19
90Li
thua
nia
2002
Luxe
mbo
urg
1990
Luxe
mbo
urg
2002
Mon
aco
1990
Mon
aco
2002
Net
herla
nds
1990
Net
herla
nds
2002
New
Zea
land
199
0N
ew Z
eala
nd 2
002
Nor
way
199
0N
orw
ay 2
002
Por
tuga
l 199
0P
ortu
gal 2
002
Rom
ania
199
0R
oman
ia 2
002
Slo
vaki
a 19
90S
lova
kia
2002
Slo
veni
a 19
90S
love
nia
2002
Spa
in 1
990
Spa
in 2
002
Sw
eden
199
0S
wed
en 2
002
Sw
itzer
land
199
0S
witz
erla
nd 2
002
Ukr
aine
199
0U
krai
ne 2
002
Uni
ted
Kin
gdom
199
0U
nite
d K
ingd
om 2
002
Uni
ted
Sta
tes
1990
Uni
ted
Sta
tes
2002
Em
issi
ons
(thou
sand
s of
Gg
CO
2 eq
uiva
lent
)
0%
20%
40%
60%
80%
100%
Aus
tralia
199
0A
ustra
lia 2
002
Aus
tria
1990
Aus
tria
2002
Bel
arus
199
0B
elar
us 2
002
Bel
gium
199
0B
elgi
um 2
002
Bul
garia
199
0B
ulga
ria 2
002
Can
ada
1990
Can
ada
2002
Cro
atia
199
0C
roat
ia 2
002
Cze
ch R
epub
lic 1
990
Cze
ch R
epub
lic 2
002
Den
mar
k 19
90D
enm
ark
2002
Est
onia
199
0E
ston
ia 2
002
Eur
opea
n C
omm
unity
Eur
opea
n C
omm
unity
Finl
and
1990
Finl
and
2002
Fran
ce 1
990
Fran
ce 2
002
Ger
man
y 19
90G
erm
any
2002
Gre
ece
1990
Gre
ece
2002
Hun
gary
199
0H
unga
ry 2
002
Irela
nd 1
990
Irela
nd 2
002
Italy
199
0Ita
ly 2
002
Japa
n 19
90Ja
pan
2002
Latv
ia 1
990
Latv
ia 2
002
Lith
uani
a 19
90Li
thua
nia
2002
Luxe
mbo
urg
1990
Luxe
mbo
urg
2002
Mon
aco
1990
Mon
aco
2002
Net
herla
nds
1990
Net
herla
nds
2002
New
Zea
land
199
0N
ew Z
eala
nd 2
002
Nor
way
199
0N
orw
ay 2
002
Por
tuga
l 199
0P
ortu
gal 2
002
Rom
ania
199
0R
oman
ia 2
002
Slo
vaki
a 19
90S
lova
kia
2002
Slo
veni
a 19
90S
love
nia
2002
Spa
in 1
990
Spa
in 2
002
Sw
eden
199
0S
wed
en 2
002
Sw
itzer
land
199
0S
witz
erla
nd 2
002
Ukr
aine
199
0U
krai
ne 2
002
Uni
ted
Kin
gdom
199
0U
nite
d K
ingd
om 2
002
Uni
ted
Sta
tes
1990
Uni
ted
Sta
tes
2002
Solid waste disposal Watewater handling Incineration Other
- 151 -

Table 6.1
Managed Unmanaged Waste-water
Sludge Waste-water
Sludge
(%) (kg) (t/t) (t/t) (kg) (kg)
kg N2O -N/kg sewage N
(%)
IPCC default EFe 0.01
Australia 20 20 T2 M L, T 3.0 38 0.06 T2 D 0.26 3.29 NE NE NE NE 0.09 0.01 T2 CS 0.00 NAAustria 8 8 CS CS L, T 3.0 15 0.07 C CS 0.35 1.77 0.01 0.00 C CS 0.01Belarus 10 10 L 4.1 14Belgium 10 M CS L, T 0.7 5 0.02 D D,CS 0.05 0.37 NE NE 0.03 0.01 D PS L, T 0.94Bulgaria 8 8 D D,CS L 6.7 25 0.07 NE D D,CS 0.73 2.74 0.06 0.06 0.04 0.04 0.06 0.01 NOCanada 31 31 CS CS L 3.0 33 0.04 NA CS CS 0.06 0.61 NA NE NE NE 0.10 0.01 CS CS 0.04Croatia 4 4 T1 CS L, T 4.1 12 0.06 0.06 0.01Czech Republic 10 10 T1, T3 CS L 1.2 8 0.03 T2 D, CS 0.39 2.61 0.10 0.01 0.01 0.01 0.06 0.16 0.25 3,500.0Denmark See doc b 5 CS/M CS/M L 1.7 10 0.05 NE IEEstonia 1 TI D L 2.5 17 TI D L 1.29 8.84 0.12 0.12European Community C, CS, D,
M, T1, T2C, CS, D,
M, T2 L
1.9 NE NE NE NE 0.18 NE NE NE NE NE NE NE 0.11 NE
Finland 5 5 T2 D/CS L, T 3.3 25 0.05 D D/CS 0.16 1.17 0.04 0.00 0.05 0.01 NO NOFrance NA 59 CS/ T2 CS L, T 1.9 8 0.01 0.50 CS/T2 CS 0.21 0.93 0.04 0.06 C CS/ PS T 0.32Germany NE 82 T2 D/CS L, T 1.2 7 0.04 NO D D/CS T 0.01 0.08 NE NE NO NO 0.09 0.01 NO NO NOGreece 11 11 T1 D L, T 3.9 24 0.07 D D T 0.29 1.75 0.06 0.25 NE 0.11 0.01 NE NE NEHungary 10 10 D, CS CS, D L 4.7 17 0.04 D, CS CS, D L 1.36 4.97 0.25 0.25 CS CS 0.14Ireland 4 T2 CS, D L 2.5 21 0.08 NA NA 0.05 10.00 NA NAItaly 58 58 D, T2 D, CS L, T 1.7 8 0.02 D D, CS 0.23 1.04 NO NO 0.25 NO 0.06 0.01 D CS 0.05 1,141.8Japan 127 127 M, CS CS 0.3 1 0.21 NO CS CS 0.08 0.38 NE IE NE IE 0.02 NE CS CS L 1.82 426.0Latvia 2 2 T1 D L, T 8.1 18 0.06 T1 D L, T 1.81 3.93 0.16 0.07 0.07 0.01 C D 0.35Lithuania 3 3 D D L 6.3 15 NE 0.05 D D L 2.44 5.77 0.25 NE 0.25 NE NE NELuxembourg 0 5 0.50Monaco 0 0 0.0 0 D D 0.07 0.01 CS CSNetherlands 16 16 M, CS/T2 CS L, T 3.4 21 0.07 NO CS/T2 CS 0.01 0.04 IE IE NE NE NE NO (IE) IENew Zealand 4 4 T2 CS L, T 2.8 25 0.03 NE CS/D CS/D 0.23 2.05 IE 0.07 NENorway 5 5 M3) CS L, T 7.0 41 0.14 D D 0.04 0.22 0.01 0.07 D CS 0.05Portugal 10 10 T2 D+CS L, T 2.7 10 0.00 2.95 D D+CS L, T 0.97 3.69 0.13 0.16 0.00 0.11 D D+C T 0.47 1,047.8Romania 12 22 D D L, T 3.0 9 0.05 D D L, T 1.17 3.42 0.12 0.12 0.05 0.01 NE NESlovakia 5 5 D D L 2.3 11 IE IE D,CS D, CS L 1.44 6.60 0.23 0.30 0.01 0.18 NA D CS 0.28Slovenia 2 L, T 4.7 23 0.05 NE T1 D 0.51 2.52 0.00 0.10 IE NE NOSpain 41 41 T2 CS,T2 L, T 2.7 13 0.04 0.08 D CS,D L 0.61 2.83 0.00 43.20 0.03 0.02 0.09 0.01 C CS,C T 0.06Sweden 9 9 T2 D + CS L, T 2.6 10 0.07 IE IE NO NO NO NO 0.01 0.01 IE IESwitzerland 7 7 CS CS L, T 1.9 7 0.50 IE CS CS 0.06 0.22 0.01 IE IE IE CS CS L, T 4.37 IEUkraine 48 49 T1 D L 5.2 24 0.10 T1 D L 0.74 3.51 0.48 0.24 0.07 0.01 T1 D 0.03 557.3United Kingdom 59 59 M CS L, T 1.4 7 0.01 M CS 0.12 0.63 0.02 0.07 0.08 T2 CS 0.08United States 288 288 M M L, T 2.8 32 0.04 NA D D 0.41 4.73 0.10 NE 0.06 NE 0.17 0.02 CS CS IE
e Source of default emission factors: IPCC Guidelines, volume 3, page 6.28.
a Information on methods and emission factors is included in this table as reported by Parties. It may not reflect the actual method used or type of emission factor for all subcategories within the category 6.A Solid waste disposal on land. b Information on methods and emission factors is included in this table as reported by Parties. It may not reflect the actual method used or type of emission factor for all subcategories within the category 6.B Waste-water handling.
MethodsWorld Bankd Methods EF
Share of national
total
EF
CH4 IEF
c Information on methods and emission factors is included in this table as reported by Parties. It may not reflect the actual method used or type of emission factor for all subcategories within the category 6.C Waste incineration.
CH4 IEF
N2O IEF
kg / kg DC
IEF (kg/t)
Share of national total (%)Emissions
per capita (kg)
d Population data are from World Development Indicators database, http://devdata.worldbank.org/data-query/, the World Bank.
Methods and EF usedc
Key source
Population (million)
Domestic/ commercial
Industrial
CRF Methods EF
Emissions per capita
6.C Waste incinerationCH4 CH4 N2O from human sewage CO2 from non-biogenic waste
Solid waste disposal on land, waste-water handling and waste incineration (2002)
Activity data
6.A Solid waste disposal on land 6.B Wastewater handling
Methods and EF useda
Key source
Share of national
total
Emissions per capita
Methods and EF usedb
Key source
- 152 -

Table 6.2
Relative change (%)
1990a 1996 1997 1998 1999 2000 2001 2002 1996 to 1997 1997 to 1998 1998to 1999 1999 to 2000 2000 to 2001 2001 to 2002 1990 to 2002Australia 649 671 681 672 695 705 721 746 Australia 1.5 -1.3 3.4 1.5 2.3 3.4 14.9Austria 178 150 145 140 136 129 124 120 Austria -3.8 -3.2 -3.3 -4.6 -4.3 -3.2 -32.6Belarus 112 101 110 119 128 130 131 136 Belarus 8.7 8.4 7.4 1.2 0.8 4.1 21.7Belgium 125 109 108 101 86 79 57 52 Belgium -1.1 -6.1 -15.4 -7.3 -27.7 -9.0 -58.3Bulgaria 613 356 294 254 196 201 200 200 Bulgaria -17.5 -13.5 -23.0 2.8 -0.6 -0.1 -67.4Canada 882 973 996 1,021 1,059 1,085 1,050 1,047 Canada 2.4 2.5 3.7 2.4 -3.2 -0.3 18.6Croatia 38 43 45 48 51 51 53 54 Croatia 5.7 5.3 7.0 0.4 2.7 3.4 44.3Czech Republic 93 95 81 82 76 76 73 81 Czech Republic -14.9 1.3 -7.3 -3.3 9.7 -13.5Denmark 62 62 59 58 58 57 57 54 Denmark -4.8 -1.8 0.2 -1.3 -1.5 -4.8 -13.6Estonia 67 48 51 48 49 47 24 24 Estonia 5.2 -6.4 2.5 -4.6 -48.5 -1.6 -65.0European Community 5,400 4,983 4,710 4,494 4,205 3,999 3,806 3,672 European Community -5.5 -4.6 -6.4 -4.9 -4.8 -3.5 -32.0Finland 175 168 164 156 152 143 138 128 Finland -2.7 -4.6 -2.4 -6.0 -3.6 -7.5 -27.0France 534 675 585 572 546 530 505 496 France -13.3 -2.2 -4.5 -2.9 -4.7 -1.9 -7.1Germany 1,499 1,092 990 887 771 684 610 568 Germany -9.4 -10.3 -13.1 -11.2 -10.9 -6.9 -62.1Greece 134 180 187 200 215 227 240 251 Greece 4.2 6.8 7.3 6.0 5.7 4.5 87.7Hungary 188 68 68 72 102 182 199 176 Hungary 0.0 6.3 41.0 78.4 9.3 -11.8 -6.5Ireland 55 68 66 55 52 58 61 81 Ireland -2.9 -15.9 -6.6 12.8 4.6 33.3 46.8Italy 454 462 463 455 447 452 458 444 Italy 0.1 -1.7 -1.8 1.1 1.3 -3.0 -2.3Japan 193 202 200 197 192 187 182 176 Japan -1.2 -1.3 -2.3 -2.8 -2.9 -2.8 -8.4Latvia 20 32 33 36 38 40 42 41 Latvia 4.6 9.8 4.6 4.7 5.5 -2.0 105.3Lithuania 162 74 54 52 Lithuania -4.4 -53.8Luxembourg 3 3 2 LuxembourgMonaco 0 0 0 0 0 0 0 0 MonacoNetherlands 572 483 468 448 411 389 367 345 Netherlands -3.2 -4.3 -8.1 -5.4 -5.6 -6.0 -39.6New Zealand 124 106 97 98 97 95 97 98 New Zealand -8.0 0.5 -0.2 -2.2 1.3 2.0 -20.7Norway 182 191 190 188 188 189 185 184 Norway -0.6 -1.3 0.0 0.7 -1.8 -0.7 1.4Portugal 99 129 134 139 143 116 106 107 Portugal 4.2 3.5 3.2 -18.7 -9.0 0.8 7.3Romania 206 207 207 206 206 205 205 194 Romania -0.1 -0.5 -0.4 -0.5 0.0 -5.2 -5.7Slovakia 50 60 51 46 47 48 45 57 Slovakia -14.5 -10.2 1.6 3.7 -5.9 25.4 13.3Slovenia 39 49 49 49 49 48 47 46 Slovenia 1.5 -0.7 -0.7 -0.7 -2.8 -2.9 18.5Spain 257 397 423 442 458 481 499 518 Spain 6.6 4.7 3.6 5.0 3.8 3.7 101.7Sweden 122 113 111 109 102 97 94 86 Sweden -1.4 -2.2 -6.0 -5.3 -3.1 -7.9 -28.9Switzerland 59 55 55 54 53 52 50 48 Switzerland -1.0 -1.5 -2.1 -2.4 -3.3 -4.7 -20.0Ukraine 1,199 1,188 Ukraine -0.9United Kingdom 1,131 892 806 729 626 552 487 420 United Kingdom -9.7 -9.6 -14.0 -11.8 -11.8 -13.8 -62.9United States 9,998 9,942 9,685 9,360 9,419 9,491 9,202 9,192 United States -2.6 -3.4 0.6 0.8 -3.0 -0.1 -8.1
a In accordance with decisions 9/CP.2 and 11/CP.4, some Parties with economies in transition use base years other than 1990: Bulgaria (1988), Hungary (average of 1985 to 1987), Romania (1989) and Slovenia (1986).
Solid waste disposal on land – trend informationCH4 emissions (Gg)
- 153 -

Table 6.2
Relative change (%)
1990a 1996 1997 1998 1999 2000 2001 2002 1996 to 1997 1997 to 1998 1998to 1999 1999 to 2000 2000 to 2001 2001 to 2002 1990 to 2002Australia 38.0 36.6 36.7 35.8 36.6 36.8 37.2 37.9 Australia 0.3 -2.5 2.2 0.4 1.1 2.1 -0.2Austria 23.0 18.9 18.2 17.6 17.0 16.1 15.4 14.9 Austria -3.9 -3.3 -3.5 -4.9 -4.5 -3.4 -35.3Belarus 11.0 10.0 10.9 11.8 12.8 13.0 13.1 13.7 Belarus 9.1 8.9 7.7 1.6 1.1 4.6 24.9Belgium 12.6 10.7 10.6 9.9 8.4 7.7 5.6 5.1 Belgium -1.3 -6.3 -15.6 -7.5 -28.0 -9.4 -59.8Bulgaria 68.3 42.6 35.3 30.8 23.8 24.6 24.9 25.1 Bulgaria -17.1 -12.9 -22.5 3.3 1.2 0.6 -63.2Canada 31.8 32.8 33.2 33.8 34.7 35.3 33.8 33.4 Canada 1.3 1.7 2.8 1.5 -4.1 -1.2 5.1Croatia 7.9 9.5 10.2 10.8 11.6 11.5 11.8 12.2 Croatia 7.4 6.2 7.1 -0.2 2.3 3.3 54.2Czech Republic 9.0 9.2 7.8 8.0 7.4 7.4 7.2 7.9 Czech Republic -14.8 1.4 -7.1 0.1 -2.8 9.9 -12.2Denmark 12.1 11.8 11.2 11.0 10.9 10.8 10.6 10.0 Denmark -5.2 -2.2 -0.1 -1.7 -1.9 -5.1 -17.4Estonia 43.0 34.1 36.3 34.3 35.4 34.0 17.6 17.4 Estonia 6.4 -5.4 3.2 -4.2 -48.2 -1.1 -59.6European Community European CommunityFinland 35.1 32.8 31.9 30.3 29.5 27.7 26.6 24.6 Finland -3.0 -4.9 -2.6 -6.2 -3.9 -7.7 -30.0France 9.4 11.6 10.0 9.8 9.3 9.0 8.5 8.3 France -13.6 -2.5 -4.9 -3.3 -5.2 -2.4 -11.4Germany 18.9 13.3 12.1 10.8 9.4 8.3 7.4 6.9 Germany -9.6 -10.3 -13.2 -11.3 -11.0 -7.1 -63.5Greece 13.2 17.2 17.8 19.0 20.4 21.5 22.7 23.6 Greece 4.0 6.6 7.1 5.8 5.4 4.1 79.4Hungary 17.8 6.7 6.7 7.2 10.1 18.2 19.5 17.3 Hungary 0.4 6.7 41.6 79.2 7.5 -11.6 -3.1Ireland 15.7 18.6 17.9 14.9 13.7 15.2 15.7 20.7 Ireland -3.9 -16.9 -7.8 11.2 3.2 31.4 31.3Italy 8.0 8.1 8.0 7.9 7.8 7.8 7.9 7.7 Italy -0.1 -1.8 -1.9 1.0 1.3 -3.0 -3.9Japan 1.6 1.6 1.6 1.6 1.5 1.5 1.4 1.4 Japan -1.4 -1.5 -2.5 -2.9 -3.0 -2.9 -11.0Latvia 7.5 12.6 13.4 15.0 15.8 16.7 17.7 17.5 Latvia 6.3 11.6 5.4 5.5 6.1 -1.1 134.5Lithuania 43.8 20.7 15.6 15.0 Lithuania -4.0 -65.8Luxembourg 6.2 6.1 LuxembourgMonaco 0.0 0.0 0.0 0.0 0.0 0.0 0.0 MonacoNetherlands 38.3 31.1 30.0 28.5 26.0 24.4 22.9 21.4 Netherlands -3.8 -4.8 -8.8 -6.1 -6.3 -6.6 -44.1New Zealand 36.0 28.3 25.7 25.6 25.4 24.7 24.9 25.0 New Zealand -9.2 -0.4 -0.7 -2.7 0.7 0.5 -30.6Norway 42.8 43.7 43.2 42.3 42.1 42.1 41.1 40.6 Norway -1.1 -2.0 -0.7 0.0 -2.3 -1.2 -5.2Portugal 10.1 12.9 13.4 13.8 14.2 11.5 10.4 10.5 Portugal 3.8 3.1 2.8 -18.9 -9.3 0.6 4.3Romania 8.9 9.2 9.2 9.2 9.2 9.1 9.1 8.7 Romania 0.2 -0.2 -0.2 -0.4 0.1 -4.7 -2.1Slovakia 9.5 11.1 9.5 8.5 8.6 9.0 8.4 10.6 Slovakia -14.6 -10.3 1.5 3.8 -5.7 25.4 11.3Slovenia 19.5 24.5 24.9 24.8 24.5 24.3 23.8 23.3 Slovenia 1.8 -0.6 -0.9 -0.9 -2.2 -2.2 19.6Spain 6.6 10.1 10.6 11.1 11.4 11.9 12.3 12.7 Spain 5.5 4.4 2.7 4.2 3.2 3.2 91.4Sweden 14.2 12.8 12.6 12.3 11.5 10.9 10.6 9.7 Sweden -1.5 -2.2 -6.0 -5.4 -3.4 -8.2 -31.8Switzerland 8.9 7.8 7.7 7.6 7.4 7.2 6.9 6.5 Switzerland -1.2 -1.8 -2.5 -2.9 -4.0 -5.5 -26.3Ukraine 24.4 24.4 Ukraine -0.2United Kingdom 19.7 15.3 13.8 12.4 10.7 9.4 8.3 7.1 United Kingdom -9.9 -9.8 -14.2 -12.1 -12.0 -14.1 -63.9United States 40.1 37.1 35.6 34.0 33.8 33.6 32.3 31.9 United States -3.8 -4.6 -0.6 -0.5 -4.1 -1.2 -20.5
a In accordance with decisions 9/CP.2 and 11/CP.4, some Parties with economies in transition use base years other than 1990: Bulgaria (1988), Hungary (average of 1985 to 1987), Romania (1989) and Slovenia (1986).
Solid waste disposal on land – trend information (continued)Ratio: kg CH4/capita
- 154 -

Table 6.3
Relative change (%)
1990a 1996 1997 1998 1999 2000 2001 2002 1996 to 1997 1997 to 1998 1998to 1999 1999 to 2000 2000 to 2001 2001 to 2002 1990 to 2002Australia 56.19 60.29 60.98 61.61 62.32 63.07 63.92 64.67 Australia 1.1 1.0 1.1 1.2 1.4 1.2 15.1Austria 13.73 14.31 14.34 14.35 14.37 14.40 14.27 14.27 Austria 0.2 0.1 0.2 0.2 -1.0 3.9Belarus BelarusBelgium 3.85 4.02 3.95 3.92 3.93 3.98 3.91 3.87 Belgium -1.7 -0.8 0.2 1.4 -1.7 -1.0 0.6Bulgaria 44.55 46.86 39.79 34.31 34.87 28.27 22.93 21.79 Bulgaria -15.1 -13.8 1.6 -18.9 -18.9 -5.0 -51.1Canada 16.93 18.30 18.51 18.67 18.82 18.96 19.12 19.27 Canada 1.2 0.9 0.8 0.7 0.8 0.8 13.9Croatia CroatiaCzech Republic 39.31 29.02 29.64 30.77 27.43 27.52 24.84 26.64 Czech Republic 2.1 3.8 -10.8 0.3 -9.7 7.2 -32.2Denmark 0.00 0.00 0.00 0.00 0.00 0.00 0.00 0.00 DenmarkEstonia 9.14 12.68 20.32 19.82 13.34 10.41 10.37 12.00 Estonia 60.3 -2.5 -32.7 -21.9 -0.4 15.7 31.4European Community 420.83 367.77 363.66 361.17 360.17 355.61 354.57 356.02 European Community -1.1 -0.7 -0.3 -1.3 -0.3 0.4 -15.4Finland 7.29 6.76 6.77 6.62 6.40 6.26 6.19 6.10 Finland 0.1 -2.2 -3.3 -2.3 -1.1 -1.4 -16.2France 33.96 47.61 49.90 52.20 54.48 54.85 55.13 55.40 France 4.8 4.6 4.4 0.7 0.5 0.5 63.2Germany 106.01 31.62 20.97 10.31 9.32 8.32 7.33 6.33 Germany -33.7 -50.8 -9.6 -10.7 -11.9 -13.6 -94.0Greece 49.71 43.60 41.77 41.27 38.27 32.13 21.35 18.55 Greece -4.2 -1.2 -7.3 -16.0 -33.6 -13.1 -62.7Hungary 63.23 185.86 185.17 55.97 53.27 52.95 50.96 50.46 Hungary -0.4 -69.8 -4.8 -0.6 -3.8 -1.0 -20.2Ireland 0.00 0.00 0.00 0.00 0.00 0.00 0.00 0.00 IrelandItaly 59.74 58.83 59.13 59.03 58.60 59.67 60.10 60.01 Italy 0.5 -0.2 -0.7 1.8 0.7 -0.1 0.5Japan 50.94 47.97 48.23 47.70 47.84 48.15 48.25 47.92 Japan 0.5 -1.1 0.3 0.6 0.2 -0.7 -5.9Latvia 16.52 9.51 9.46 9.47 9.33 9.42 9.60 9.19 Latvia -0.5 0.2 -1.5 1.0 1.8 -4.2 -44.4Lithuania 3.70 6.55 20.03 20.03 Lithuania 0.0 32.6Luxembourg 0.21 0.22 0.22 LuxembourgMonaco 0.00 0.00 0.00 0.00 0.00 0.00 0.00 0.00 MonacoNetherlands 6.55 1.27 0.79 3.78 1.81 0.78 0.72 0.72 Netherlands -37.5 378.3 -52.1 -57.2 -7.6 -89.1New Zealand 7.46 7.66 7.69 7.72 7.76 7.79 7.82 8.08 New Zealand 0.4 0.4 0.5 0.4 0.4 3.3 8.3Norway 0.93 0.96 0.96 0.97 0.98 0.98 0.99 0.99 Norway 0.5 0.6 0.7 0.4 0.6 0.5 6.7Portugal 39.17 39.85 39.21 38.56 37.91 37.25 37.41 37.58 Portugal -1.6 -1.7 -1.7 -1.7 0.4 0.5 -4.0Romania 80.68 81.19 83.75 71.83 76.45 80.16 76.26 76.25 Romania 3.2 -14.2 6.4 4.9 -4.9 0.0 -5.5Slovakia 48.19 40.04 40.31 39.11 39.64 35.09 35.42 35.50 Slovakia 0.7 -3.0 1.4 -11.5 0.9 0.2 -26.3Slovenia 6.75 3.59 4.47 4.69 4.87 5.06 4.85 4.95 Slovenia 24.4 5.0 3.8 3.8 -4.1 2.0 -26.6Spain 72.30 89.55 95.01 99.45 103.42 106.71 110.81 115.60 Spain 6.1 4.7 4.0 3.2 3.8 4.3 59.9Sweden IE IE IE IE IE IE IE IE SwedenSwitzerland 1.35 1.51 1.52 1.53 1.53 1.54 1.55 1.57 Switzerland 1.1 0.2 0.3 0.4 0.8 1.2 16.6Ukraine 172.66 171.00 Ukraine -1.0United Kingdom 33.38 35.27 36.21 37.15 36.02 36.89 37.13 37.35 United Kingdom 2.7 2.6 -3.1 2.4 0.7 0.6 11.9United States 1,148.90 1,281.49 1,305.41 1,319.78 1,343.42 1,350.24 1,339.47 1,364.88 United States 1.9 1.1 1.8 0.5 -0.8 1.9 18.8
Waste-water handling – trend information
a In accordance with decisions 9/CP.2 and 11/CP.4, some Parties with economies in transition use base years other than 1990: Bulgaria (1988), Hungary (average of 1985 to 1987), Romania (1989) and Slovenia (1986).
CH4 emissions (Gg)
- 155 -

Table 6.3
Relative change (%)
1990a 1996 1997 1998 1999 2000 2001 2002 1996 to 1997 1997 to 1998 1998to 1999 1999 to 2000 2000 to 2001 2001 to 2002 1990 to 2002Australia 3.29 3.29 3.29 3.29 3.29 3.29 3.29 3.29 Australia -0.1 -0.1 0.0 0.1 0.1 -0.1 -0.1Austria 1.78 1.80 1.80 1.80 1.80 1.80 1.78 1.77 Austria 0.0 0.0 0.0 0.0 -1.2 -0.2 -0.2Belarus 0.00 0.00 0.00 0.00 0.00 0.00 0.00 0.00 BelarusBelgium 0.39 0.40 0.39 0.38 0.38 0.39 0.38 0.37 Belgium -1.9 -1.0 -0.1 1.2 -2.0 -1.5 -2.9Bulgaria 4.96 5.61 4.79 4.16 4.25 3.46 2.86 2.74 Bulgaria -14.6 -13.2 2.2 -18.5 -17.4 -4.3 -44.9Canada 0.61 0.62 0.62 0.62 0.62 0.62 0.62 0.61 Canada 0.1 0.0 0.0 -0.1 -0.2 -0.1 0.9Croatia 0.00 0.00 0.00 0.00 0.00 0.00 0.00 0.00 CroatiaCzech Republic 3.79 2.81 2.88 2.99 2.67 2.68 2.43 2.61 Czech Republic 2.2 3.9 -10.7 0.4 -9.3 7.4 -31.2Denmark 0.00 0.00 0.00 0.00 0.00 0.00 0.00 0.00 DenmarkEstonia 5.82 8.95 14.51 14.30 9.69 7.60 7.61 8.84 Estonia 62.1 -1.5 -32.2 -21.6 0.1 16.2 51.8European Community European CommunityFinland 1.46 1.32 1.32 1.28 1.24 1.21 1.19 1.17 Finland -0.2 -2.4 -3.5 -2.4 -1.4 -1.6 -19.7France 0.60 0.82 0.86 0.89 0.93 0.93 0.93 0.93 France 4.5 4.3 4.0 0.2 0.0 0.0 55.6Germany 1.33 0.39 0.26 0.13 0.11 0.10 0.09 0.08 Germany -33.8 -50.8 -9.6 -10.9 -12.0 -13.8 -94.3Greece 4.89 4.16 3.98 3.92 3.63 3.04 2.02 1.75 Greece -4.4 -1.4 -7.5 -16.2 -33.8 -13.4 -64.3Hungary 6.01 18.23 18.23 5.53 5.29 5.28 5.00 4.97 Hungary 0.0 -69.7 -4.4 -0.2 -5.3 -0.7 -17.3Ireland 0.00 0.00 0.00 0.00 0.00 0.00 0.00 0.00 IrelandItaly 1.05 1.03 1.03 1.03 1.02 1.03 1.04 1.04 Italy 0.3 -0.3 -0.8 1.7 0.7 -0.1 -1.2Japan 0.41 0.38 0.38 0.38 0.38 0.38 0.38 0.38 Japan 0.3 -1.3 0.1 0.5 0.1 -0.8 -8.6Latvia 6.19 3.82 3.86 3.93 3.90 3.97 4.07 3.93 Latvia 1.2 1.8 -0.7 1.8 2.4 -3.4 -36.5Lithuania 1.00 1.84 5.75 5.77 Lithuania 0.4 477.1Luxembourg 0.49 0.50 0.50 LuxembourgMonaco 0.00 0.00 0.00 0.00 0.00 0.00 0.00 MonacoNetherlands 0.44 0.08 0.05 0.24 0.11 0.05 0.04 0.04 Netherlands -37.8 375.5 -52.4 -57.5 -8.3 -0.7 -89.9New Zealand 2.16 2.05 2.03 2.02 2.02 2.02 2.01 2.05 New Zealand -0.9 -0.5 0.0 -0.2 -0.2 1.8 -5.2Norway 0.22 0.22 0.22 0.22 0.22 0.22 0.22 0.22 Norway 0.0 0.0 0.1 -0.3 0.1 -0.1 -0.3Portugal 3.96 3.99 3.91 3.83 3.75 3.68 3.68 3.69 Portugal -2.0 -2.0 -2.0 -2.0 0.2 0.3 -6.7Romania 3.48 3.59 3.71 3.19 3.40 3.57 3.40 3.42 Romania 3.4 -14.0 6.6 5.0 -4.7 0.5 -1.9Slovakia 9.12 7.45 7.49 7.25 7.35 6.51 6.59 6.60 Slovakia 0.5 -3.1 1.3 -11.4 1.2 0.2 -27.7Slovenia 3.41 1.81 2.25 2.37 2.45 2.54 2.46 2.52 Slovenia 24.7 5.2 3.7 3.7 -3.5 2.7 -26.0Spain 1.86 2.28 2.39 2.50 2.57 2.63 2.72 2.83 Spain 5.0 4.4 3.1 2.4 3.2 3.9 51.8Sweden SwedenSwitzerland 0.20 0.21 0.21 0.21 0.21 0.21 0.21 0.22 Switzerland 0.9 -0.1 -0.1 -0.2 0.1 0.4 7.3Ukraine 3.52 3.51 Ukraine -0.2United Kingdom 0.58 0.60 0.62 0.63 0.61 0.63 0.63 0.63 United Kingdom 2.5 2.4 -3.3 2.2 0.4 0.3 8.7United States 4.61 4.78 4.81 4.80 4.82 4.78 4.69 4.73 United States 0.6 -0.2 0.5 -0.8 -1.9 0.8 2.8
Ratio: kg CH4/capita
a In accordance with decisions 9/CP.2 and 11/CP.4, some Parties with economies in transition use base years other than 1990: Bulgaria (1988), Hungary (average of 1985 to 1987), Romania (1989) and Slovenia (1986).
Waste-water handling – trend information (continued)
- 156 -

Table 6.3
Relative change (%)
1990a 1996 1997 1998 1999 2000 2001 2002 1996 to 1997 1997 to 1998 1998to 1999 1999 to 2000 2000 to 2001 2001 to 2002 1990 to 2002Australia 1.56 1.67 1.69 1.71 1.73 1.75 1.77 1.79 Australia 1.1 1.0 1.1 1.2 1.4 1.2 15.1Austria 0.07 0.08 0.08 0.08 0.08 0.08 0.08 0.08 Austria -0.6 3.0 -2.4 0.2 -1.0 8.0Belarus 0.77 0.66 0.69 0.72 0.75 0.75 0.76 0.76 Belarus 4.5 4.3 4.2 1.3 -1.3Belgium 0.35 0.36 0.37 0.37 0.38 0.38 0.38 0.39 Belgium 1.2 1.2 1.2 1.0 1.2 1.0 11.0Bulgaria 0.76 0.54 0.47 0.53 0.54 0.51 0.47 0.45 Bulgaria -13.0 13.0 3.0 -6.4 -7.5 -4.4 -40.7Canada 2.80 3.00 3.03 3.05 3.08 3.10 3.14 3.17 Canada 1.1 0.9 0.9 0.8 1.2 1.0 13.4Croatia 0.45 0.27 0.27 0.26 0.28 0.27 0.29 0.29 Croatia -0.9 -4.0 10.8 -4.2 6.8 0.1 -35.7Czech Republic 0.65 0.65 0.65 0.65 0.65 0.65 0.64 0.64 Czech Republic 0.1 -0.7 -0.2 -1.0Denmark 0.00 0.00 0.00 0.00 0.00 0.00 0.00 0.00 DenmarkEstonia EstoniaEuropean Community 24.29 24.98 24.98 25.18 25.27 25.36 28.17 28.10 European Community 0.0 0.8 0.3 0.4 11.1 -0.3 15.7Finland 0.46 0.39 0.39 0.37 0.36 0.36 0.35 0.33 Finland -1.1 -4.6 -4.1 -0.2 -0.4 -6.4 -27.1France 3.65 3.68 3.57 3.46 3.47 3.51 3.53 3.54 France -3.0 -3.1 0.5 1.1 0.5 0.4 -2.8Germany 7.14 7.22 6.85 7.26 7.23 7.24 7.41 7.42 Germany -5.1 6.0 -0.4 0.1 2.3 0.1 4.0Greece 1.06 1.14 1.17 1.18 1.19 1.22 1.21 1.21 Greece 2.9 0.7 1.1 2.5 -1.0 -0.2 14.1Hungary NA NA NA NA NA NA NA HungaryIreland 0.19 0.20 0.20 0.20 0.21 0.21 0.21 0.21 Ireland 1.0 0.5 1.0 1.0 2.4 1.2 10.6Italy 3.37 3.40 3.41 3.40 3.40 3.41 3.41 3.43 Italy 0.3 -0.1 0.0 0.2 0.1 0.5 1.9Japan 4.10 5.31 5.66 5.53 5.52 5.55 5.51 5.98 Japan 6.6 -2.3 -0.1 0.5 -0.8 8.7 46.1Latvia 0.18 0.17 0.17 0.17 0.17 0.16 0.16 0.16 Latvia -0.8 -0.9 -0.8 -2.6 -0.5 -0.7 -12.1Lithuania NE NE NE NE LithuaniaLuxembourg 0.02 0.02 0.02 LuxembourgMonaco 0.00 0.00 0.00 0.00 0.00 0.00 0.00 0.00 Monaco 0.7 0.7 0.6 0.6 0.6 0.6 8.2Netherlands 0.40 0.48 0.58 0.53 0.59 0.62 0.60 0.60 Netherlands 20.4 -8.1 11.1 6.1 -3.5 48.7New Zealand 0.47 0.49 0.49 0.50 0.50 0.50 0.51 0.51 New Zealand 2.0 2.0 8.5Norway 0.29 0.36 0.38 0.38 0.39 0.35 0.36 0.33 Norway 7.8 0.2 1.1 -10.3 2.4 -7.2 12.6Portugal 1.44 1.69 1.68 1.74 1.78 1.79 1.80 1.81 Portugal -0.5 3.6 2.5 0.5 0.4 0.5 25.3Romania 1.09 1.07 1.06 1.06 1.06 1.06 1.06 1.03 Romania -0.9 -2.8 -5.5Slovakia 0.06 0.04 0.04 0.04 0.04 0.03 0.06 0.11 Slovakia -6.6 4.3 -13.8 -15.0 108.7 77.0 74.1Slovenia 0.15 0.15 0.15 0.15 0.15 0.15 0.15 0.15 SloveniaSpain 3.23 3.40 3.40 3.43 3.44 3.48 3.50 3.52 Spain -0.2 0.9 0.5 1.0 0.6 0.6 8.9Sweden 0.63 0.60 0.60 0.52 0.51 0.47 0.47 0.47 Sweden -0.3 -13.8 -0.8 -7.8 0.0 -0.3 -25.4Switzerland 0.06 0.07 0.07 0.07 0.07 0.07 0.07 0.07 Switzerland 1.1 0.2 0.3 0.4 0.8 1.2 16.6Ukraine 3.38 3.46 Ukraine 2.5United Kingdom 3.33 3.46 3.85 3.80 3.80 3.79 4.00 3.87 United Kingdom 11.2 -1.2 -0.1 -0.3 5.7 -3.2 16.2United States 41.24 45.69 46.54 47.44 48.99 49.39 49.69 50.16 United States 1.9 1.9 3.3 0.8 0.6 0.9 21.6
Waste-water handling – trend information (continued)N2O emissions (Gg)
a In accordance with decisions 9/CP.2 and 11/CP.4, some Parties with economies in transition use base years other than 1990: Bulgaria (1988), Hungary (average of 1985 to 1987), Romania (1989) and Slovenia (1986).
- 157 -

Table 6.3
Relative change (%)
1990a 1996 1997 1998 1999 2000 2001 2002 1996 to 1997 1997 to 1998 1998to 1999 1999 to 2000 2000 to 2001 2001 to 2002 1990 to 2002Australia 0.091 0.091 0.091 0.091 0.091 0.091 0.091 0.091 Australia -0.1 -0.1 0.0 0.1 0.1 -0.1 -0.1Austria 0.009 0.010 0.010 0.010 0.010 0.010 0.009 0.009 Austria -0.7 2.9 -2.6 0.0 -1.2 -0.2 3.7Belarus 0.076 0.065 0.068 0.072 0.075 0.075 0.076 0.077 Belarus 5.0 4.8 4.5 0.3 1.7 0.5 1.3Belgium 0.035 0.036 0.036 0.036 0.037 0.037 0.037 0.038 Belgium 1.0 1.0 1.0 0.7 0.9 0.6 7.1Bulgaria 0.085 0.064 0.056 0.064 0.066 0.062 0.059 0.057 Bulgaria -12.5 13.8 3.6 -5.9 -5.8 -3.8 -33.1Canada 0.101 0.101 0.101 0.101 0.101 0.101 0.101 0.101 Canada 0.0 0.0 0.0 -0.1 0.2 0.1 0.5Croatia 0.094 0.059 0.060 0.058 0.064 0.061 0.065 0.065 Croatia 0.6 -3.2 10.9 -4.8 6.5 0.1 -31.2Czech Republic 0.062 0.063 0.063 0.063 0.063 0.063 0.063 0.063 Czech Republic 0.1 0.1 0.1 0.2 -0.3 -0.1 0.5Denmark 0.000 0.000 0.000 0.000 0.000 0.000 0.000 0.000 DenmarkEstonia 0.000 0.000 0.000 0.000 0.000 0.000 0.000 0.000 EstoniaEuropean Community European CommunityFinland 0.091 0.077 0.076 0.072 0.069 0.069 0.068 0.064 Finland -1.4 -4.8 -4.4 -0.3 -0.7 -6.6 -30.1France 0.064 0.063 0.061 0.059 0.059 0.060 0.060 0.060 France -3.3 -3.4 0.1 0.6 0.0 -0.1 -7.3Germany 0.090 0.088 0.083 0.088 0.088 0.088 0.090 0.090 Germany -5.3 6.0 -0.5 0.0 2.2 -0.1 0.1Greece 0.104 0.108 0.111 0.112 0.113 0.116 0.114 0.113 Greece 2.7 0.5 0.9 2.3 -1.3 -0.6 9.1Hungary HungaryIreland 0.055 0.055 0.055 0.055 0.054 0.054 0.055 0.055 Ireland 0.0 -0.7 -0.4 -0.4 1.0 -0.2 -1.1Italy 0.059 0.059 0.059 0.059 0.059 0.059 0.059 0.059 Italy 0.1 -0.2 -0.1 0.2 0.0 0.6 0.2Japan 0.033 0.042 0.045 0.044 0.044 0.044 0.043 0.047 Japan 6.4 -2.6 -0.3 0.4 -0.9 8.6 42.0Latvia 0.069 0.069 0.070 0.070 0.070 0.069 0.069 0.069 Latvia 0.8 0.8 0.1 -1.9 0.1 0.2 0.4Lithuania LithuaniaLuxembourg 0.047 0.040 0.040 LuxembourgMonaco 0.074 0.068 0.068 0.068 0.070 0.070 0.070 Monaco 0.3 0.6 1.6 0.3 0.0 -5.3Netherlands 0.027 0.031 0.037 0.034 0.037 0.039 0.038 0.037 Netherlands 19.7 -8.6 10.3 5.3 -4.3 -0.7 37.7New Zealand 0.136 0.131 0.130 0.131 0.130 0.130 0.131 0.129 New Zealand -1.3 1.2 -0.5 -0.6 1.4 -1.5 -5.0Norway 0.069 0.081 0.087 0.087 0.087 0.077 0.079 0.073 Norway 7.2 -0.4 0.5 -11.0 1.9 -7.7 5.2Portugal 0.146 0.169 0.168 0.173 0.177 0.177 0.177 0.178 Portugal -0.9 3.2 2.2 0.2 0.1 0.3 21.8Romania 0.047 0.047 0.047 0.047 0.047 0.047 0.047 0.046 Romania -0.7 0.2 0.2 0.1 0.1 -2.4 -1.9Slovakia 0.012 0.008 0.007 0.008 0.007 0.006 0.012 0.021 Slovakia -6.8 4.2 -13.8 -14.9 109.2 77.0 71.0Slovenia 0.075 0.075 0.075 0.075 0.075 0.075 0.075 0.076 Slovenia 0.3 0.2 -0.2 -0.2 0.6 0.7 0.9Spain 0.083 0.086 0.085 0.086 0.086 0.086 0.086 0.086 Spain -1.2 0.6 -0.3 0.3 0.0 0.2 3.4Sweden 0.074 0.068 0.068 0.058 0.058 0.053 0.053 0.053 Sweden -0.4 -13.8 -0.9 -8.0 -0.3 -0.6 -28.5Switzerland 0.009 0.010 0.010 0.010 0.010 0.010 0.010 0.010 Switzerland 0.9 -0.1 -0.1 -0.2 0.1 0.4 7.3Ukraine 0.069 0.071 Ukraine 3.3United Kingdom 0.058 0.059 0.066 0.065 0.065 0.064 0.068 0.065 United Kingdom 10.9 -1.4 -0.4 -0.5 5.4 -3.5 13.0United States 0.165 0.170 0.171 0.172 0.176 0.175 0.174 0.174 United States 0.6 0.6 2.0 -0.5 -0.5 -0.1 5.2
a In accordance with decisions 9/CP.2 and 11/CP.4, some Parties with economies in transition use base years other than 1990: Bulgaria (1988), Hungary (average of 1985 to 1987), Romania (1989) and Slovenia (1986).
Waste-water handling – trend information (continued)Ratio: kg N2O/capita
- 158 -