031212BrdPckt.pdf - Auburn School District
362
AGENDA FOR BOARD OF DIRECTORS AUBURN SCHOOL DISTRICT NO. 408 Monday, March 12, 2012 I. TIME AND PLACE 1. 7 p.m. at the James P. Fugate Administration Building II. ROLL CALL 1. Roll call of board members III. PLEDGE OF ALLEGIANCE IV. AUDIENCE PARTICIPATION 1. Written communications 2. Scheduled communications a. Donna Oberg, CPPW Schools Coordinator, 401 Fifth Avenue, Suite 900, Seattle 98104-1818, will present certificates to two Auburn High School DECA students for their outstanding leadership in developing and promoting the Commit to Fit campaign throughout the Auburn School District. 3. Unscheduled communications 4. Community groups and organizations V. LEGISLATIVE UPDATE VI. STUDENT PARTICIPATION 1. Dick Scobee Elementary School art display 2. Activity/athletic report 3. Requests for travel VII. SCHOOL PROGRAMS AND STUDENT ACHIEVEMENT 1. Elementary and secondary physical education curriculum adoption 2. 2011-12 Washington Elementary School Improvement Plan 3. Approval of interdistrict agreement VIII. PERSONNEL 1. Certificated and classified personnel report IX. FINANCE 1. Vouchers 2. Comprehensive Annual Financial Report 3. Award of contract X. DIRECTORS 1. Approval of minutes 2. First reading of policies 3. Discussion 4. Executive session
-
Upload
khangminh22 -
Category
Documents
-
view
2 -
download
0
Transcript of 031212BrdPckt.pdf - Auburn School District

AGENDA FOR BOARD OF DIRECTORS AUBURN SCHOOL DISTRICT NO. 408
Monday, March 12, 2012
I. TIME AND PLACE
1. 7 p.m. at the James P. Fugate Administration Building
II. ROLL CALL
1. Roll call of board members
III. PLEDGE OF ALLEGIANCE
IV. AUDIENCE PARTICIPATION
1. Written communications
2. Scheduled communications
a. Donna Oberg, CPPW Schools Coordinator, 401 Fifth Avenue, Suite 900, Seattle 98104-1818, will present certificates to two Auburn High School DECA students for their outstanding leadership in developing and promoting the Commit to Fit campaign throughout the Auburn School District.
3. Unscheduled communications
4. Community groups and organizations
V. LEGISLATIVE UPDATE
VI. STUDENT PARTICIPATION
1. Dick Scobee Elementary School art display
2. Activity/athletic report
3. Requests for travel
VII. SCHOOL PROGRAMS AND STUDENT ACHIEVEMENT
1. Elementary and secondary physical education curriculum adoption
2. 2011-12 Washington Elementary School Improvement Plan
3. Approval of interdistrict agreement
VIII. PERSONNEL
1. Certificated and classified personnel report
IX. FINANCE
1. Vouchers
2. Comprehensive Annual Financial Report
3. Award of contract
X. DIRECTORS
1. Approval of minutes
2. First reading of policies
3. Discussion
4. Executive session

LEGISLATIVE UPDATE The board will discuss legislative items.

March 12, 2012 Page 2
STUDENT PARTICIPATION
1. Dick Scobee Elementary School Art Display
Adam Couch, Dick Scobee Elementary School principal, will introduce
Emily Heiland and Jaziah Williams, students , who will present the Dick Scobee Elementary School art display and answer questions from the board.
2. Activity/Athletic Report—Auburn Mountainview High School and Auburn
Riverside High School Fastpitch Programs Andrea McHenry, Auburn Mountainview High School as sistant principal,
will introduce Alicia Thompson, Auburn Mountainview High School coach, who will introduce Delene Colburn, Amanda Colella , and Jessica Frazier, students. Doug Aubert, Auburn Riverside High School athletics director, will introduce Chris Leverenz, Auburn Riverside High School coach, who will introduce Danielle Robinson, Breanna Clarke, and Alyssa Jarman, students. The students will report on their schools’ fastpitch programs and answer questions from the board.
3. Requests for Travel
a. Two Auburn High School students request permission to travel to Spokane, Thursday to Sunday, March 15 -18. The purpose of the trip is to compete in the State Debate Tournament. Lodging will be at the Red Lion River Inn, meals will be at local restaurant s, and travel will be by rental car. All expenses are being paid by ASB funds. Dyann Seidl, Auburn High School teacher, requests permission to accompany the students. A substitute will be needed for one day.
b. Four Virginia Cross Native Education Cent er students request
permission to travel to Washington , D.C.; New York City, New York; and Arlington, Virginia, Sunday to Sunday, March 25 – April 1. The purpose of the trip is to participate in a civics field trip in association with the Close Up Foundat ion. Lodging will be at the Crowne Plaza Hotel, meals will be at local restaurants, and travel will be by airplane and public bus. All expenses will be paid by the Muckleshoot Tribe. Brooke Broussard, Virginia Cross Native Education Center teacher, requ ests permission to accompany the students. A substitute will be needed for five days.
Joylene Simmons, Muckleshoot tribal counselor, requests permission
to accompany the students as a chaperone. c. Four Auburn High School students request permission to travel to
Santa Clara, California, Friday to Tuesday, March 30 – April 3. The purpose of the trip is to compete in the Santa Clara Speech and Debate Tournament. Lodging will be at the Garden Hotel, meals will be at local restaurants , and travel will be by airplane. All expenses are being paid by ASB funds. Dyann Seidl and Jennifer Widrig-Hodges, Auburn High School assistant c oach, request permission to accompany the students. A substitute will be needed for one day.

March 12, 2012 Page 3
d. Eight Auburn High School students request permission to travel to
Spokane, Thursday to Saturday, April 5 -7. The purpose of the trip is to compete in the Spokane FIRST Robotic Competition. Lodging will be at the Comfort Inn, meals will be at local restaurants, and travel will be by private car. Lodging and travel expenses will be paid by ASB funds and students will pay for their own meals. Chris Zawislak, Jan Erie , and Ron Cughan, Auburn High School teachers, request permission to accompany the students. No substitutes will be needed.
e. Twenty-one Auburn Riverside High School students request permission
to travel to Seattle, Thursday to Sunday, April 12 -15. The purpose of the trip is to attend the Journalism Educational Conference. Lodging will be at the Hilton and Sheraton hotels, meals will be at local restaurants, and travel will be by Shuttle Express. All expenses will be paid by ASB and CTE funds. Susan E. James and Patrick Swenson, Auburn Riverside teachers, request permission to accompany the students. Substitutes will be needed for two days.
f. Twenty-four Auburn Mountainview High School students request
permission to travel to Vancouver, Thursday to Saturday, April 26-28. The purpose of the trip is to participate in the State Sports Medicine Competition. Lodging will be at the Hilton Hotel, meals will be at local restaurants , and travel will be by school bus. All expenses will be paid by ASB funds. Krista Parsons and Amy Krause, Auburn High School teachers, and Tiffany Ostrander, Auburn Mountainview High School para-educator, request permission to accompany the students. Substitutes will be needed for two days.
Recommendation: That the above trips be approved as
requested.

March 12, 2012 Page 4
SCHOOL PROGRAMS AND STUDENT ACHIEVEMENT 1. Elementary and Secondary Physical Education Curriculum Adoption —Second
Reading
Rodney Luke, assistant superintendent of K -12 student learning, will introduce Cynthia Blansfield, director of secondary student learning, and Heidi Harris, director of elementary student learning, who will present the elementary, middle and high school physical education adoption and the associated Communities Putting Prevention to Work (CPPW) Grant deliverables for second reading and adoption.
Recommendation: That the board approve the Elementary and
Secondary Physical Education Curriculum for adoption.
2. 2011-12 Washington Elementary School Improvement Plan
Rodney Luke will introduce Pauline Thomas, Washington Elementary principal, who will introduce Christine Anderson, language arts specialist, and Dede Garci a, kindergarten teacher. The team will present the 2011 -12 Washington Elementary school improvement plan and answer questions from the board. This presentation aligns with the 2009-12 district strategic improvement plan, Goal 1: student achievement, Objective 1.b school improvement plans and the 2011 -12 stated district goals, Standard III “create conditions district wide for student and staff success.”
Recommendation: That the board approve the 2011 -12 Washington Elementary School Improvement Plan.
3. Approval of Interdistrict Agreement Providing Services to Disabled
Students—Auburn Students to other Districts/Agencies The district contracts annually with area school districts/agencies for educational programs to disabled students for which programs ar e not available in Auburn. Permission is requested to contract with the Children’s Institute for Learning Differences for Services, as needed.
Recommendation: That the superintendent/designee be authorized to sign the contract as outlined.

PHYSICAL EDUCATION ADOPTION
Communities Putting Prevention to Work
(CPPW)
Healthy Eating Active Living (HEAL)
2010-2012
AUBURN SCHOOL DISTRICT #408

CPPW GRANT CURRICULUM AND INSTRUCTION Table of Contents
Communities Putting Prevention to Work Grant ........................................................................... 1
Overview of Grant ............................................................................................................... 2
Curriculum and Instruction Deliverables ............................................................................ 2
Timeline........................................................................................................................................... 4
Committee Members ...................................................................................................................... 6
Elementary Schools ......................................................................................................................... 8
Curriculum Frameworks .................................................................................................... 40
Materials Adopted by School ............................................................................................ 68
Middle Schools .............................................................................................................................. 83
Curriculum Frameworks .................................................................................................... 84
Materials Adopted by School ...........................................................................................100
High Schools ................................................................................................................................ 104
Curriculum Frameworks .................................................................................................. 105
Materials Adopted by School .......................................................................................... 117
Budget Overview ......................................................................................................................... 118

The Communities Putting Prevention to Work (CPPW) initiative promotes policy,
systems, and environmental (PSE) change to decrease obesity and tobacco use in communities,
using funds allocated by the 2009 American Reinvestment and Recovery Act (ARRA). The
Centers for Disease Control and Prevention (CDC) awarded Public Health – Seattle & King
County (PHSKC) $25.5 million to promote healthy eating and active living and decrease tobacco
use, youth initiation of smoking, and exposure to second‐hand smoke with a particular focus on
reducing health inequities. All funds must be used within a 2 year period, March 2010 through
March 2012.
PHSKC set aside over one‐third of the CPPW funds ($9 million) for a competitive Request
for Proposals (RFP) process to fund local community organizations in various sectors (schools,
local governments, and community‐based organizations) to carry out key strategies to support
the initiative. An RFP was not required by CDC for allocating grant funding, so each site selected
its own process for funding community partners. Auburn School District Physical Education
benefited $297,079.00 from this grant. The funds have been used to align curriculum to the
new Washington physical education standards, purchase equipment, provide professional
development, and implement an online assessment tool.
1

Exhibit A – Auburn School District Scope of Work
CPPW Healthy Eating Active Living
August 19, 2010
Introduction: The Auburn School District will complete this scope of work supported by a Communities Putting Prevention to Work (CPPW) Healthy Eating Active Living (HEAL) grant from Public Health – Seattle & King County (PHSKC). The goals of CPPW HEAL are to support schools, local governments and communities to reduce overweight and obesity rates by increasing healthy eating and physical activity through policy, system and environment changes.
The policy, system or environment change(s) Auburn School District agrees to implement with the CPPW grant funding include:
• Adopt and implement a high quality physical education (PE) curriculum that aligns with state standards
• Develop and implement a training program to increase access to healthy foods in the Auburn School District through a Child Nutrition Certificate Program
• Market healthy food items and increase physical activity to students and staff by implementing a student‐led public relations media campaign
• Develop and implement a Safe Routes to Schools program at three schools Tasks: Auburn School District will conduct the following tasks and produce associated
deliverables to achieve the above outcomes. PE CURRICULUM
Project Outcome 1: By March 19, 2012, the Auburn School District has actively redesigned PE curriculum to align with state standards and employed PE student assessment and reporting software to help create a culture of fitness across the school district.
Task I: Obtain input from community, staff and students to select and adopt quality PE teaching tools and equipment that supports adopted PE curriculum aligned with state standards for Pre‐K through 12th grade district‐wide.
Deliverable: Attend 6 trainings developed by Treeswing
Deliverable: Consult with Treeswing as Auburn develops its plan and timeline for adoption and implementation of PE standards
Deliverable: Purchase quality PE software (such as the package from Fitness Gram) and other equipment as determined by PE selection review process
2

Deliverable: Contract with trainer to conduct training with Pre‐K through 12 PE teachers on aligning and implementing the new curriculum and equipment
Deliverable: Submit a report to PHSKC describing staff and student outcomes of implementing new PE curricula equipment
Completion Date: March 19, 2012
3
TIMELINE OF ACTIVITIES
4

Communities Putting Prevention to Work (CPPW) Healthy Eating Active Living (HEAL) Grant
Timeline of Events
August 12‐18, 2010 Elementary curriculum assessment and instruction design work
September 2010 CPPW HEAL Grant awarded to the Auburn School District
September 7, 2010 Initial site visit and meeting
October 22‐23, 2010 K‐12 attendance at the Annual WAHPERD Conference
October 25‐28, 2010 Total Instructional Alignment curriculum workshop by Lisa Carter offered to Auburn School District K‐12 fitness educators
November 18, 2010 Treeswing Workshop: Understanding and Applying National Standards for School Meals, Competitive Foods, and Physical Education
December 1, 2010 Secondary fitness curriculum training
December 6, 2010‐ May 6, 2011
Elementary scope and sequence and assessment design work (20 Professional Learning Community Mondays)
January 12, 2011 Secondary fitness curriculum workshop
February 16, 2011 Secondary fitness curriculum workshop
April 25, 2011 Elementary pilot of technology to support Fitnessgram began
May 2011 Secondary fitness curriculum frameworks finalized and posted on secondary SWIFT site
June 1, 2011 Secondary staff by building begin to identify equipment necessary to support teaching and learning of fitness standards identified in curriculum frameworks
June 7, 2011 Fitnessgram web‐based software becomes live
June 21, 2011 Technology Pilot Training
August 9‐28, 2011 Elementary curriculum alignment and design work
August 26, 2011 Fitnessgram/Activitygram training conducted
August 29, 2011 K‐2 PE in‐service on standards‐based curriculum
October 9, 10, 2011 Fitnessgram/Skyward Interface Training
October 21‐22, 2011 K‐12 attendance at the Annual WAHPERD Conference
September 2011 Implementation of fitness curriculum
September‐ February 2012 Elementary curriculum review, editing, and publication
February 16, 2012 Presentation of material to District Curriculum Instruction and Assessment Committee for approval
March 5, 2012 First reading to the school board
March 12, 2012 Pre‐K and Early Childhood Education Physical Education “Active Play” Training.
March 19, 2012 Second reading and recommendation for approval to the school board
5

COMMITTEE MEMBERS
6

CPPW Grant Elementary Fitness Committee Members
STAFF MEMBER BUILDING
John Ansotigue Evergreen Heights
Anne Fisher Hazelwood
Kim Goad Dick Scobee
Travis Goodlett Gildo Rey
Dee Dee Goodspeed Ilalko
Gary Greer Terminal Park
Bill Hess Lea Hill & Arthur Jacobsen
Melanie Jennings Lake View
James Main/Chris Miller Alpac
Lisa Mason Chinook
Michael McKinley Pioneer
Greg Prain Lakeland Hills
Dan St. Mary Washington
Heidi Harris Administrator
CPPW Grant
Secondary Fitness Committee Members
STAFF MEMBER BUILDING Christine Arend Cascade Middle School
Leimomi Bowles Auburn Mountainview High School
Arleen Burkhalter Mt. Baker Middle School
Christine Leverenz Auburn Riverside High School
Kay Lorrain Auburn Mountainview High School
Julie Moberg Auburn Riverside High School
Matthew Muxen Olympic Middle School
Keith Ray Cascade Middle School
Sonya Rempfer Rainier Middle School
Glen Walker Auburn Mountainview High School
Lacey Way Auburn High School
Phil Way Olympic Middle School
Cindi Blansfield Administrator
7

ELEMENTARY SCHOOLS PreK-5
Curriculum Frameworks Materials and Equipment by School
8

Auburn School District Power Standards for Physical Education
Kindergarten
Students will be able to:
1. Participate safely while moving and using equipment a. Understand and recognize general and personal space b. Move safely within general space and use equipment safely
2. Understand basic locomotor, non‐locomotor and manipulative skills a. Skip, gallop, hop, jump, run, walk, leap, and jog b. Bend, twist, stretch, pull, push, turn, swing, sway, and rock c. Roll, bounce, toss, throw, catch, strike, kick, punt, and hand/foot dribble
3. Recognize daily health and fitness habits a. Understand daily physical activity is important
First Grade
Students will be able to:
1. Participate safely while moving and using equipment a. Understand and recognize general and personal space b. Move safely within general space and use equipment safely
2. Demonstrate basic locomotor, non‐locomotor and manipulative skills a. Skip, gallop, hop, jump, run, walk, leap, and jog b. Bend, twist, stretch, pull, push, turn, swing, sway, and rock c. Roll, bounce, toss, throw, catch, strike, kick, punt, and hand/foot dribble
3. Recognize daily health and fitness habits a. Understand daily physical activity is important
9

Second Grade
Students will be able to:
1. Demonstrate safety rules and procedures in a variety of activities a. Move safely within general space and use equipment safely b. Demonstrate cooperative behaviors and positive sportsmanship
2. Apply basic locomotor, non‐locomotor and manipulative skills in a variety of activities a. Perform these movements with transitions, varying levels and speeds
3. Understand basic vocabulary and components of fitness a. Describe components of fitness, the benefits of the components and also give
examples of physical activities which incorporate one or more of the components of fitness
4. Understand daily health and fitness habits a. Explain how daily activities can influence specific components of fitness and
healthy living
Third Grade
Students will be able to:
1. Apply safety rules and procedures in a variety of activities a. Move safely within general space and use equipment safely b. Demonstrate cooperative behaviors and positive sportsmanship
2. Apply locomotor, non‐locomotor and manipulative skills in a variety of activities a. Apply movement concepts to basic game strategies b. Demonstrate manipulative skills with stationary targets and while
moving/traveling c. Develop motor skill combinations in a variety of increasingly complex movement
activities 3. Apply basic vocabulary and components of fitness
a. Classify daily activities that require each of the components b. Classify fitness assessments to corresponding components 4. Understand daily health and fitness habits
10

Fourth Grade
Students will be able to:
1. Analyze safety rules and procedures in a variety of activities a. Understand role in maintaining a safe environment b. Demonstrate cooperation and respect when working with a group
2. Apply locomotor, non‐locomotor and manipulative skills in a variety of group activities a. Demonstrate manipulative skills with stationary and moving targets in group
activities b. Integrate movement concepts in increasingly complex activities
3. Analyze components of health‐related fitness a. Describe benefits of physical activity b. Understand how the FITT principle relates to the components of fitness
Fifth Grade
Students will be able to:
1. Evaluate safety rules and procedures in a variety of physical activities a. Apply safety principles when performing activities
2. Apply locomotor, non‐locomotor and manipulative skills in sports‐related activities a. Demonstrate mature patterns and smooth transitions, skill combinations, and a
variety of balance and control skills in lead‐up games and group activities b. Demonstrate manipulative skills with stationary and moving targets, while
moving in lead‐up games and group activities 3. Understand the components of fitness and interpret information from assessments to
improve performance and overall health a. Analyze daily health and fitness habits in relation to a fitness performance
assessment b. Distinguish among lifetime activities which improve components of fitness c. Integrate FITT principle with components of fitness
11

12

13

14

15

16

17

18
19

20

21

22

23

24

25

26

27

28

29

30

31

32

33

Auburn School District Elementary PE Lesson
Lesson 1 Skill Focus: Personal Space Grade: K
Power Standards:
Lesson Objectives: • Work safely in personal and general space. • Practice pre‐established gym procedures. • Describe boundaries of personal space.
Materials: None
Safety & Tips: Discuss with students gym procedure prior to this lesson. Stress “No Touch.”
Introduction
Activities
(5 minutes)
MOVE AND FREEZE
1. Have students sit on a designated line. Briefly review gym rules, signals, and “No touch.”
2. Have students move and freeze according to signals given by the teacher.
Individual
Activities
(15-20 minutes)
PERSONAL SPACE
1. Find a space on the floor where no one else is. This space (personal space) should allow you enough room to work safely without interfering with others.
2. On the signal, begin moving about the room. When you hear “freeze,” see how quickly you can stop. Do this several times.
3. When you hear the signal, quickly return to your starting space.
4. Without moving your feet, stretch out in all directions. Stretch high, stretch low.
5. How big can you be in your personal space? How small? 6. What are some other movements you can perform
without traveling in your personal space? 7. Begin moving into general space and see how quickly you
can stop on the signal. Repeat 5 times. 8. Walk to a wall. Touch it. On the signal, return quickly,
without colliding, back to your starting spot. (standing & freezing).
34

Group
Activities
(3-4 minutes)
GAME: WALL TOUCH
On the signal, find a wall to touch with one finger and return to the starting spot (standing and freezing).
Variation: Touch something of specific color/shape, etc.
35

Auburn School District Elementary PE Lesson
Lesson 1 Skill Focus: Personal Space Grade: 1
Power Standards:
Lesson Objectives: • Work safely in personal and general space. • Practice pre‐established gym procedures. • Describe boundaries of personal space.
Materials: None
Safety & Tips: Discuss with students gym procedure prior to this lesson. Stress “No Touch.”
Introduction
Activities
(5 minutes)
MOVE AND FREEZE
1. Have students sit on a designated line. Briefly review gym rules, signals, and “No touch.”
2. Have students move and freeze according to signals given by the teacher.
Individual
Activities
(10-15 minutes)
PERSONAL SPACE
1. Find a space on the floor where no one else is. This space (personal space) should allow you enough room to work safely without interfering with others.
2. On the signal, begin moving about the room. When you hear “freeze,” see how quickly you can stop. Do this several times.
3. When you hear the signal, quickly return to your starting space.
4. Without moving your feet, stretch out in all directions. Stretch high, stretch low.
5. How big can you be in your personal space? How small? 6. What are some other movements you can perform
without traveling in your personal space? 7. Begin moving into general space and see how quickly you
can stop on the signal. Repeat 5 times. 8. Walk to a wall. Touch it. On the signal, return quickly,
without colliding, back to your starting spot. (standing & freezing).
36

Group
Activities
(10 minutes)
GAME: WALL TOUCH
On the signal, find a wall to touch with one finger and return to the starting spot (standing and freezing).
Variation: Touch something of specific color/shape, etc.
37

Auburn School District Elementary PE Lesson
Lesson 1 Skill Focus: Personal Space Grade: 2
Power Standards:
Lesson Objectives: • Work safely in personal and general space. • Practice pre‐established gym procedures. • Describe boundaries of personal space.
Materials: None
Safety & Tips: Discuss with students gym procedure prior to this lesson. Stress “No Touch.”
Introduction
Activities
(5 minutes)
MOVE AND FREEZE
1. Have students sit on a designated line. Briefly review gym rules, signals, and “No touch.”
2. Have students move and freeze according to signals given by the teacher.
Individual
Activities
(15 minutes)
PERSONAL SPACE
1. Find a space on the floor where no one else is. This space (personal space) should allow you enough room to work safely without interfering with others.
2. On the signal, begin moving about the room. When you hear “freeze,” see how quickly you can stop. Do this several times.
3. When you hear the signal, quickly return to your starting space.
4. Without moving your feet, stretch out in all directions. Stretch high, stretch low.
5. How big can you be in your personal space? How small? 6. What are some other movements you can perform
without traveling in your personal space? 7. Begin skipping into general space and see how quickly you
can stop on the signal. Repeat 5 times. 8. Walk to the farthest point in the room from your personal
space. On the signal, return quickly without colliding, back to your personal space and sit down.
38

(continued)
9. Let’s have a race. See how fast you can run and touch each corner of the room, return to your personal space, and sit down. Who was back first? How many accomplished this without bumping into someone else?
10. Discover different ways to move away from your personal space when your stomach remains in contact with the ground. Back in contact? Seat in contact?
11. Discover two ways of balancing inside your personal space.
12. With your weight placed on your hands, how high can you get your feet inside your personal space?
13. How long can you maintain this balance? Two seconds? Three?
14. Can you think of a different way to move to another person’s personal space besides walking? (ie: cartwheel, skipping, hopping, etc.)
15. On a signal, teacher will call out a number 2, 3, or 4. As soon as you hear the number, touch that many walls and return to your personal space as quickly as possible. Who was back first? How many accomplished this without touching anyone? Try again.
16. Describe or show the boundaries of personal space. Group
Activities
(10 minutes)
GAME: CORNER TOUCH
On the signal, see how fast you can run and touch the corner closest to you and return to your personal space and stand quietly. Who was back first? How many accomplished this without bumping into someone else?
Variation: On the signal touch two corners, three corners, four corners.
39

Power Standard Unit: 1. Participate safely while moving and using equipment.
Approximate Length of Unit (in hours):
Grade Level K
CBA Benchmark Target Grade 5
Planning the Learning [Understanding by Design Stage 3]
Standards (GLEs, EALRs, and/or Performance
Expectations) [Understanding by Design Stage 1]
CONTENT
Performance Task/ Assessments
[Understanding by Design Stage 2] CONTEXT
Integrating Analytical, Logical, & Creative Thinking COGNITIVE DEMAND
Vocabulary Supplies & Materials
Understand and recognize general and personal space. Move safely within general space and use equipment safely.
Maintains appropriate distance from others and objects. Demonstrates control of body. Demonstrates ability to follow start/stop signals. Uses equipment safely.
Demonstrate Demonstrate Demonstrate Demonstrate
Personal Space General Space Off Limits/Boundaries Signals
40

Power Standard Unit:
2. Develops basic locomotor, non-locomotor, and manipulative skills as developmentally appropriate.
Approximate Length of Unit (in hours):
Grade Level K
CBA Benchmark Target Grade 5
Planning the Learning [Understanding by Design Stage 3]
Standards (GLEs, EALRs, and/or Performance
Expectations) [Understanding by Design Stage 1]
CONTENT
Performance Task/ Assessments
[Understanding by Design Stage 2] CONTEXT
Integrating Analytical, Logical, & Creative Thinking COGNITIVE DEMAND
Vocabulary Supplies & Materials
Demonstrates two critical elements in locomotor skills. Demonstrates mature form in non-locomotor skills. Demonstrates two critical elements in manipulative skills.
Demonstrates basic components of: Skip, gallop, slide, hop, and jump. Demonstrates: Bend, twist, stretch, pull, push, turn, swing, sway, and rock. Demonstrates basic components of: Roll, bounce, toss, throw, catch, and kick.
Demonstrate Demonstrate Demonstrate
Opposite Skip Gallop Slide Hop Jump Bend Stretch Twist Pull Push Turn Swing Sway Rock Roll Bounce Toss Throw Catch Kick
41

Power Standard Unit: 3. Recognize daily health and fitness habits.
Approximate Length of Unit (in hours):
Grade Level K
CBA Benchmark Target Grade 5
Planning the Learning [Understanding by Design Stage 3]
Standards (GLEs, EALRs, and/or Performance
Expectations) [Understanding by Design Stage 1]
CONTENT
Performance Task/ Assessments
[Understanding by Design Stage 2] CONTEXT
Integrating Analytical, Logical, & Creative Thinking COGNITIVE DEMAND
Vocabulary Supplies & Materials
Understands basic nutrition concepts. Understands daily physical activity is important.
Identifies healthful and non-healthful foods. Recognizes healthy physical activities.
Recognize Identify
Healthy Unhealthy Physical Activity
42

Power Standard Unit: 1. Participate safely while moving and using equipment
Approximate Length of Unit (in hours):
Grade Level 1 CBA Benchmark Target Grade 5
Planning the Learning [Understanding by Design Stage 3]
Standards (GLEs, EALRs, and/or Performance
Expectations) [Understanding by Design Stage 1]
CONTENT
Performance Task/ Assessments
[Understanding by Design Stage 2] CONTEXT
Integrating Analytical, Logical, & Creative Thinking COGNITIVE DEMAND
Vocabulary Supplies & Materials
Understand and recognize general and personal space. Move safely within general space and use equipment safely.
Maintains appropriate distance from others and objects.
Demonstrates control of body at various speeds.
Demonstrates ability to follow multiple start/stop signals. Uses equipment safely.
Demonstrate Demonstrate Demonstrate Demonstrate
Personal Space General Space Off Limits/Boundaries Signals Spacing
43

Power Standard Unit:
2. Demonstrate basic locomotor, non-locomotor and manipulative skills. Approximate Length of Unit (in hours):
Grade Level 1 CBA Benchmark Target Grade 5
Planning the Learning [Understanding by Design Stage 3]
Standards (GLEs, EALRs, and/or Performance
Expectations) [Understanding by Design Stage 1]
CONTENT
Performance Task/ Assessments
[Understanding by Design Stage 2] CONTEXT
Integrating Analytical, Logical, & Creative Thinking COGNITIVE DEMAND
Vocabulary Supplies & Materials
Demonstrates mature form in locomotor skills.
Demonstrates mature form in non-locomotor skills.
Demonstrates mature form in manipulative skills.
Demonstrates: Skip, gallop, slide, hop, and jump.
Demonstrates following skills with a partner: Bend, twist, stretch, pull, push, turn, swing, sway, and rock.
Demonstrates: Roll, bounce, toss, throw, catch, kick.
Demonstrate Demonstrate Demonstrate
Opposite Skip Gallop Slide Hop Jump Bend Stretch Twist Pull Push Turn Swing Sway Rock Roll Bounce Toss Throw Catch Kick
44

Power Standard Unit: 3. Recognize daily health and fitness habits.
Approximate Length of Unit (in hours):
Grade Level 1 CBA Benchmark Target Grade 5
Planning the Learning [Understanding by Design Stage 3]
Standards (GLEs, EALRs, and/or Performance
Expectations) [Understanding by Design Stage 1]
CONTENT
Performance Task/ Assessments
[Understanding by Design Stage 2] CONTEXT
Integrating Analytical, Logical, & Creative Thinking COGNITIVE DEMAND
Vocabulary Supplies & Materials
Understands basic nutrition concepts.
Understands daily physical activity is important.
List and sort foods into appropriate food pyramid groups.
Identify healthy physical activities.
Recognize Identify
Healthy Unhealthy Physical Activity Food Pyramid Grains Vegetables Dairy Meat/Beans/Nuts Fruits Oils Sweets
45
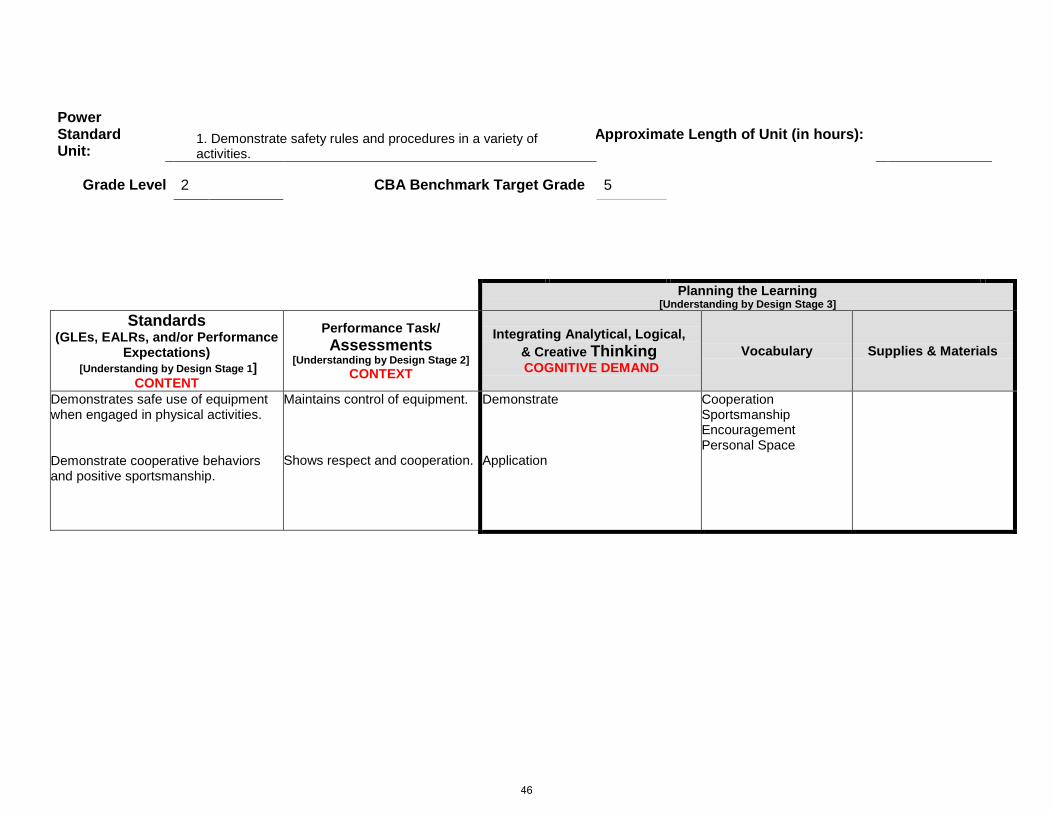
Power Standard Unit:
1. Demonstrate safety rules and procedures in a variety of activities.
Approximate Length of Unit (in hours):
Grade Level 2 CBA Benchmark Target Grade 5
Planning the Learning [Understanding by Design Stage 3]
Standards (GLEs, EALRs, and/or Performance
Expectations) [Understanding by Design Stage 1]
CONTENT
Performance Task/ Assessments
[Understanding by Design Stage 2] CONTEXT
Integrating Analytical, Logical, & Creative Thinking COGNITIVE DEMAND
Vocabulary Supplies & Materials
Demonstrates safe use of equipment when engaged in physical activities.
Demonstrate cooperative behaviors and positive sportsmanship.
Maintains control of equipment.
Shows respect and cooperation.
Demonstrate
Application
Cooperation Sportsmanship Encouragement Personal Space
46

Power Standard Unit:
2. Apply basic locomotor, non-locomotor and manipulative skills in a variety of activities.
Approximate Length of Unit (in hours):
Grade Level 2 CBA Benchmark Target Grade 5
Planning the Learning [Understanding by Design Stage 3]
Standards (GLEs, EALRs, and/or Performance
Expectations) [Understanding by Design Stage 1]
CONTENT
Performance Task/ Assessments
[Understanding by Design Stage 2] CONTEXT
Integrating Analytical, Logical, & Creative Thinking COGNITIVE DEMAND
Vocabulary Supplies & Materials
Perform locomotor movements with transitions, varying levels and speeds.
Demonstrate manipulative skills in a variety of activities.
Combines different movements in a sequence, varying levels and speeds.
Demonstrate manipulative skills using a variety of objects with stationary targets.
Application
Application
Sequence Stationary Transitions Levels
47

Power Standard Unit: 3. Understand daily health and fitness habits
Approximate Length of Unit (in hours):
Grade Level 2 CBA Benchmark Target Grade 5
Planning the Learning [Understanding by Design Stage 3]
Standards (GLEs, EALRs, and/or Performance
Expectations) [Understanding by Design Stage 1]
CONTENT
Performance Task/ Assessments
[Understanding by Design Stage 2] CONTEXT
Integrating Analytical, Logical, & Creative Thinking COGNITIVE DEMAND
Vocabulary Supplies & Materials
Understands how the body’s function and composition are affected by food consumption.
Explain how daily activities can influence specific components of fitness and healthy living.
Describes how each food group contributes to a healthy body.
List benefits of exercise.
Application
Comprehension
Food Pyramid Healthy Activity Exercise Benefit
48

Power Standard Unit: 1. Apply safety rules and procedures in a variety of activities.
Approximate Length of Unit (in hours):
Grade Level 3 CBA Benchmark Target Grade 5
Planning the Learning [Understanding by Design Stage 3]
Standards (GLEs, EALRs, and/or Performance
Expectations) [Understanding by Design Stage 1]
CONTENT
Performance Task/ Assessments
[Understanding by Design Stage 2] CONTEXT
Integrating Analytical, Logical, & Creative Thinking COGNITIVE DEMAND
Vocabulary Supplies & Materials
Move safely within general space and use equipment safely. Demonstrate cooperative behaviors, positive sportsmanship and attitude.
Demonstrates moving safely while using equipment.
Shows respect and cooperation while working with others.
Demonstrate
Demonstrate
Safety Personal Space Cooperation Sportsmanship
49

Power Standard Unit:
2. Apply locomotor, non-locomotor and manipulative skills in a variety of activities.
Approximate Length of Unit (in hours):
Grade Level 3 CBA Benchmark Target Grade 5
Planning the Learning [Understanding by Design Stage 3]
Standards (GLEs, EALRs, and/or Performance
Expectations) [Understanding by Design Stage 1]
CONTENT
Performance Task/ Assessments
[Understanding by Design Stage 2] CONTEXT
Integrating Analytical, Logical, & Creative Thinking COGNITIVE DEMAND
Vocabulary Supplies & Materials
Demonstrate manipulative skills with stationary targets and while moving/traveling. Develop motor skill combinations in a variety of increasingly complex movement activities. Apply movement concepts to basic activities.
Maintains control of an object while moving to a target.
Combine different movements in a sequence. Demonstrates appropriate spatial awareness as it relates to the activity.
Demonstrate
Application Application
Target Control Moving Space Sequence Combine
50

Power Standard Unit:
3. Understand daily health and fitness habits and can give examples of lifetime activities.
Approximate Length of Unit (in hours):
Grade Level
3
CBA Benchmark Target Grade 5
Planning the Learning [Understanding by Design Stage 3]
Standards (GLEs, EALRs, and/or Performance
Expectations) [Understanding by Design Stage 1]
CONTENT
Performance Task/ Assessments
[Understanding by Design Stage 2] CONTEXT
Integrating Analytical, Logical, & Creative Thinking COGNITIVE DEMAND
Vocabulary Supplies & Materials
Describe examples of daily health and fitness habits. Give examples of fun and healthy lifetime activities. Classifies which nutrients belong to each food group.
Explain how daily eating and exercise habits affect overall health.
Classify various activities or games that can be played for a lifetime. Identifies nutrients within each food pyramid group (ie: Calcium in Dairy Group)
Knowledge
Comprehension Application
Food Pyramid Activity Pyramid Lifetime Activities Daily Habits Calcium Nutrients Protein Carbohydrates Calorie Vitamin Composition Cholesterol
51

Power Standard Unit: 4. Apply basic vocabulary and components of fitness
Approximate Length of Unit (in hours):
Grade Level
3
CBA Benchmark Target Grade 5
Planning the Learning [Understanding by Design Stage 3]
Standards (GLEs, EALRs, and/or Performance
Expectations) [Understanding by Design Stage 1]
CONTENT
Performance Task/ Assessments
[Understanding by Design Stage 2] CONTEXT
Integrating Analytical, Logical, & Creative Thinking COGNITIVE DEMAND
Vocabulary Supplies & Materials
Classify daily activities that require each of the components. Classify fitness assessments to corresponding components.
Sort daily activities by their relation to each fitness component. Use Fitness Gram activities to understand their relationship to each fitness component.
Classify
Application
Fitness Components: Muscular Strength Muscular Endurance Flexibility Cardio Respiratory Endurance Fitness Gram Activities: Sit and reach, Curl Ups, Push Ups, Pacer, and Trunk Lift.
52
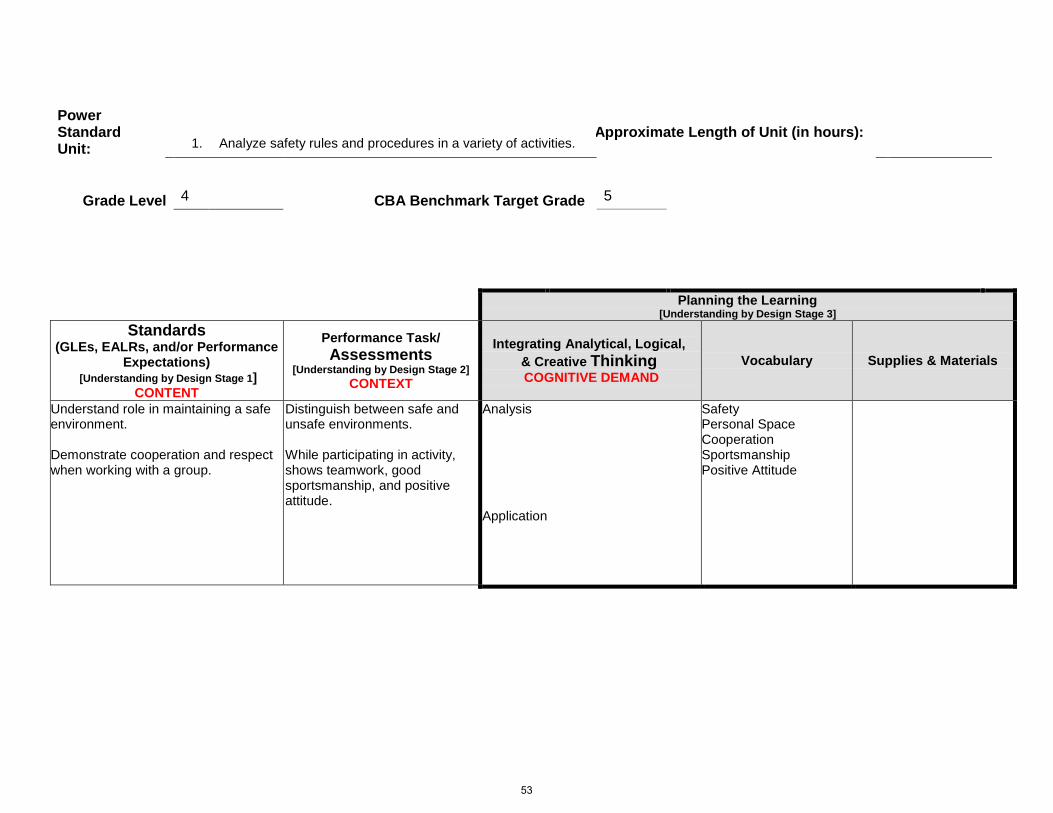
Power Standard Unit: 1. Analyze safety rules and procedures in a variety of activities.
Approximate Length of Unit (in hours):
Grade Level 4
CBA Benchmark Target Grade 5
Planning the Learning [Understanding by Design Stage 3]
Standards (GLEs, EALRs, and/or Performance
Expectations) [Understanding by Design Stage 1]
CONTENT
Performance Task/ Assessments
[Understanding by Design Stage 2] CONTEXT
Integrating Analytical, Logical, & Creative Thinking COGNITIVE DEMAND
Vocabulary Supplies & Materials
Understand role in maintaining a safe environment. Demonstrate cooperation and respect when working with a group.
Distinguish between safe and unsafe environments. While participating in activity, shows teamwork, good sportsmanship, and positive attitude.
Analysis
Application
Safety Personal Space Cooperation Sportsmanship Positive Attitude
53

Power Standard Unit:
2. Apply locomotor, non-locomotor and manipulative skills in a variety of group activities.
Approximate Length of Unit (in hours):
Grade Level 4
CBA Benchmark Target Grade 5
Planning the Learning [Understanding by Design Stage 3]
Standards (GLEs, EALRs, and/or Performance
Expectations) [Understanding by Design Stage 1]
CONTENT
Performance Task/ Assessments
[Understanding by Design Stage 2] CONTEXT
Integrating Analytical, Logical, & Creative Thinking COGNITIVE DEMAND
Vocabulary Supplies & Materials
Demonstrate manipulative skills with stationary and moving targets in group activities. Integrates movement concepts in increasingly complex activities. Analyzes movement concepts.
Maintains control of an object while moving to a target in a team game setting. Combine movements in a sequence while moving in a game setting. Demonstrates appropriate positioning strategies as it relates to a team sport.
Comprehension
Application Application
Sequence Strategy Positions
54

Power Standard Unit:
3. Understand relationships of nutrition to body composition and physical performance.
Approximate Length of Unit (in hours):
Grade Level 4
CBA Benchmark Target Grade 5
Planning the Learning [Understanding by Design Stage 3]
Standards (GLEs, EALRs, and/or Performance
Expectations) [Understanding by Design Stage 1]
CONTENT
Performance Task/ Assessments
[Understanding by Design Stage 2] CONTEXT
Integrating Analytical, Logical, & Creative Thinking COGNITIVE DEMAND
Vocabulary Supplies & Materials
Understands how the body’s function and composition are affected by food consumption. Understands information found on a food label.
Compare and contrasts food choices. Explains how serving size affects a healthy body.
Knowledge Comprehension
Calcium Nutrients Protein Carbohydrates Calorie Vitamin Composition Cholesterol
55

Power Standard Unit: 4. Analyze components of health-related fitness.
Approximate Length of Unit (in hours):
Grade Level 4
CBA Benchmark Target Grade 5
Planning the Learning [Understanding by Design Stage 3]
Standards (GLEs, EALRs, and/or Performance
Expectations) [Understanding by Design Stage 1]
CONTENT
Performance Task/ Assessments
[Understanding by Design Stage 2] CONTEXT
Integrating Analytical, Logical, & Creative Thinking COGNITIVE DEMAND
Vocabulary Supplies & Materials
Describes benefits of physical activity. Integrate the four components of fitness in group/fitness activities.
Understands that physical activity is good for heart, lungs, and muscles. Give an example of each fitness component.
Demonstrate Application
Muscle Heart Lungs Muscular Strength Cardio Vascular Endurance Flexibility Muscular Endurance
56

Power Standard Unit:
1. Evaluate safety rules and procedures in a variety of physical activities.
Approximate Length of Unit (in hours):
Grade Level 5
CBA Benchmark Target Grade 5
Planning the Learning [Understanding by Design Stage 3]
Standards (GLEs, EALRs, and/or Performance
Expectations) [Understanding by Design Stage 1]
CONTENT
Performance Task/ Assessments
[Understanding by Design Stage 2] CONTEXT
Integrating Analytical, Logical, & Creative Thinking COGNITIVE DEMAND
Vocabulary Supplies & Materials
Apply safety principles when performing activities. Demonstrate cooperation and respect when working with a group.
Participates and explains why safety rules are important while performing in activities. While participating in activity, shows teamwork, good sportsmanship, and positive attitude.
Demonstrate Analysis
Safety Sportsmanship Etiquette
57

Power Standard Unit:
2. Apply locomotor, and non-locomotor and manipulative skills in sports-related activities.
Approximate Length of Unit (in hours):
Grade Level 5
CBA Benchmark Target Grade 5
Planning the Learning [Understanding by Design Stage 3]
Standards (GLEs, EALRs, and/or Performance
Expectations) [Understanding by Design Stage 1]
CONTENT
Performance Task/ Assessments
[Understanding by Design Stage 2] CONTEXT
Integrating Analytical, Logical, & Creative Thinking COGNITIVE DEMAND
Vocabulary Supplies & Materials
In lead-up games and group activities: Demonstrate mature patterns and smooth transitions, skill combinations. Demonstrate manipulative skills with stationary and moving targets, while moving. Evaluates effective movement and/or strategy in activities.
Use proper form in two or more consecutive movements. Consistently demonstrates hitting a stationary and/or moving target. Critique the effectiveness of a movement and/or strategy in activities.
Demonstrate Application Evaluate
Target Control Movement Critique Evaluate
58

Power Standard Unit:
3. Understand relationships of nutrition to body composition and physical performance.
Approximate Length of Unit (in hours):
Grade Level 5
CBA Benchmark Target Grade 5
Planning the Learning [Understanding by Design Stage 3]
Standards (GLEs, EALRs, and/or Performance
Expectations) [Understanding by Design Stage 1]
CONTENT
Performance Task/ Assessments
[Understanding by Design Stage 2] CONTEXT
Integrating Analytical, Logical, & Creative Thinking COGNITIVE DEMAND
Vocabulary Supplies & Materials
Describe how nutrients support a healthy body. Analyze the impact of healthy eating both physical and academic performance.
Identify how a food nutrient benefits the body. Compare and contrast how eating healthy foods effect physical and academic performance.
Understanding Analysis
Nutrition Dietary Guidelines Calcium Nutrients Protein Carbohydrates Calorie Vitamin Composition Cholesterol
59

Power Standard Unit:
4. Understand the components of fitness and interpret information from assessments to improve performance and overall health.
Approximate Length of Unit (in hours):
Grade Level 5
CBA Benchmark Target Grade 5
Planning the Learning [Understanding by Design Stage 3]
Standards (GLEs, EALRs, and/or Performance
Expectations) [Understanding by Design Stage 1]
CONTENT
Performance Task/ Assessments
[Understanding by Design Stage 2] CONTEXT
Integrating Analytical, Logical, & Creative Thinking COGNITIVE DEMAND
Vocabulary Supplies & Materials
Analyze daily health and fitness habits in relation to a fitness performance assessment. Distinguish among lifetime activities which improve components of fitness.
Look at data and create a realistic fitness goal. Explain benefits of activities. Draws conclusions about personal fitness in relation to fitness assessment.
Demonstrate Analysis
Components of Fitness Fitnessgram: Muscular Strength Cardio Vascular Endurance Flexibility Muscular Endurance Aerobic Anaerobic
Fitnessgram CD
60

The student acquires the knowledge and skills necessary to maintain an active life: Movement, physical fitness, and nutrition. The student acquires the knowledge and skills necessary to maintain an active life: Movement,
Demonstrate basic locomotor skills. i.e., run, hop, skip, jump, gallop, slide, etc.
Demonstrate basic locomotor skills in lead-up games. Demonstrate balance and control in lead-up games. Use moving targets while moving. Use rhythm in increasingly complex movement patterns.
Demonstrate basic locomotor skills in a variety of activities. Demonstrate balance and control skills.
Demonstrate basic locomotor skills with transitions from skill to skill. Demonstrate balance and control skills in a variety of activities. Use stationary targets.
Demonstrate basic locomotor skills in increasingly complex movement patterns. Demonstrate balance and control in increasingly complex movement patterns. Use stationary targets while moving. Use rhythm in movement.
Demonstrate basic locomotor skills in group activities. Demonstrate balance and control in group activities. Use moving targets. Organize and demonstrate rhythm in movement.
The student acquires the knowledge and skills necessary to maintain an active life: Movement, physical fitness, and nutrition.
Develops motor skills and movement concepts as developmentally appropriate.
Demonstrates mature form in locomotor skills that contribute to movement proficiency.
Kindergarten 1st Grade 2nd Grade 3rd Grade 4th Grade 5th Grade
61

The student acquires the knowledge and skills necessary to maintain an active life: Movement, physical fitness, and nutrition. The student acquires the knowledge and skills necessary to maintain an active life: Movement,
Demonstrate basic non-locomotor skills. i.e., bend, twist, sway, turn, etc. Demonstrate static and dynamic balance skills.
Demonstrate basic non-locomotor skills while working with a partner. Demonstrate static and dynamic balance using simple sequences.
Demonstrate basic non-locomotor skills during a variety of activities. Demonstrate static and dynamic balance using a variety of sequences.
The student acquires the knowledge and skills necessary to maintain an active life: Movement, physical fitness, and nutrition.
Develops motor skills and movement concepts as developmentally appropriate.
Demonstrates mature form in non-locomotor skills that contribute to movement proficiency.
Kindergarten 1st Grade 2nd Grade 3rd Grade 4th Grade 5th Grade
62

The student acquires the knowledge and skills necessary to maintain an active life: Movement, physical fitness, and nutrition. The student acquires the knowledge and skills necessary to maintain an active life: Movement,
Deomonstrates two critical elements for a skill. i.e, steps with opposition and follows through to target for an overhand throw.
Demonstrates critical elements used in manipulative skills. i.e, sideways to target, steps with opposition, ball is back and follows through to target for an overhand throw. Demonstrates manipulative skills in a variety of activities alone/with a partner. Demonstrates manipulative skills using implements in a variety of activities.
Demonstrates mature form in manipulative skills in a variety of activities. i.e, Throws a ball in tchoukball. Demonstrates manipulative skills using implements in a variety of activities. Demonstrates manipulative skills using a variety of objects. Demonstrates manipulative skills with stationary targets.
.
The student acquires the knowledge and skills necessary to maintain an active life: Movement, physical fitness, and nutrition.
Develops motor skills and movement concepts as developmentally appropriate.
Demonstrates mature form in manipulative skills that contribute to movement proficiency.
Kindergarten 1st Grade 2nd Grade 3rd Grade 4th Grade 5th Grade
63

The student acquires the knowledge and skills necessary to maintain an active life: Movement, physical fitness, and nutrition. The student acquires the knowledge and skills necessary to maintain an active life: Movement,
Describe rules and procedures. i.e., Freeze on signal. Safe use of equipment. i.e., Maintain personal space.
Understands hydration and the importance of proper clothing for safety.
Evaluates and applies safety rules. i.e., Follows other bike riders at a safe distance. Critiques etiquette. i.e., Why roll volleyball under net. Applies knowledge of safety precautions. i.e., Warms up prior to stretching.
Understands rules and procedures. i.e., Use equipment when instructed. Describes safety rules. i.e., Watch where traveling in large group. Describes healthy choices related to hydration and proper clothing. i.e., Ties shoes.
Applies safety rules. Demonstrates safe use of equipment. i.e., Waits to throw until partner gives catching signal.
Applies rules, procedures and proper use of equipment. i.e., Keeps hockey stick below knees. Applies the knowledge of safe use of the equipment. i.e., Wears paddle safety strap.
Analyzes safety rules. Points out role in maintaining safe learning environment. i.e., The umpire wears this gear.
The student acquires the knowledge and skills necessary to maintain and active life: movement, physical fitness and nutrition.
Acquires the knowledge and skills to safely participate in a variety of developmentally appropriate physical activities.
Understands safety rules and procedures in a variety of physical activities necessary to maintain a safe learning environment.
Kindergarten 1st Grade 2nd Grade 3rd Grade 4th Grade 5th Grade
64

The student acquires the knowledge and skills necessary to maintain an active life: Movement, physical fitness, and nutrition. The student acquires the knowledge and skills necessary to maintain an active life: Movement,
Does not apply
Analyze a fitness log. Sets appropriate goals from fitness assessments. Distinguish among lifetime healthy activities. Integrates and analyzes FITT principal and uses an Activity Pyramid. Demonstrates ability to analyze the components of health related fitness by getting a 3 or above on the CBA: Concepts of Health and Fitness
Recognizes levels of healthy activity levels Recognizes cardio and muscular endurance Recognizes muscular strength, and flexibility
Describes benefits of healthy activity levels. Describes benefits of cardio and muscular endurance Describes benefits of muscular strength, and flexibility.
Classifies activities and fitness assessments by healthy activity levels, Classifies activities and fitness assessments by cardio and muscular endurance, Classifies activities and fitness assessments by muscular strength, and flexibility Demonstrates proper technique during assessments
Analyzes and distinguishes between activities by healthy activity levels Analyzes and distinguishes between activities using cardio and muscular endurance Analyzes and distinguishes between activities using muscular strength and/or flexibility. Infers FITT principals affects on health and fitness. Points out proper technique during assessments.
The student acquires the knowledge and skills necessary to maintain an active life: Movement, physical fitness, and nutrition.
Understands the components of health-related fitness and interprets information from feedback,
evaluation, and self-assessment in order to improve performance.
Recognizes basic vocabulary and components of health-related fitness.
Kindergarten 1st Grade 2nd Grade 3rd Grade 4th Grade 5th Grade
65

The student acquires the knowledge and skills necessary to maintain an active life: Movement, physical fitness, and nutrition. The student acquires the knowledge and skills necessary to maintain an active life: Movement,
Identify health and non-healthy foods. Recognize that eating breakfast is important.
Analyze how nutrients support a health body. Compare and contrast food labels. Analyze the impact of healthy eating on physical and academic performance.
Describe Food Guide Pyramid groups. Understand that food provides energy to the body.
Describe how each food group contributes to a healthy body. Explain that eating various healthy foods reduces health risk and promotes growth.
Classify which nutrients belong with each food group Understand relationship between caloric intake and expenditure. Understand importance of reading food labels. Explain how food provides nutrition and energy (carbohydrates, protein & fat).
Classify nutrients found in food groups. Explain how serving size impacts healthy body. Explain information found on food label.
The student acquires the knowledge and skills necessary to maintain an active life: Movement, physical fitness, and nutrition.
Understands relationships of nutrition and food nutrients to body composition and
physical performance.
Recognizes (K), understands (1-4) and analyzes (5) how the body’s function (K-1) and composition (2-5) is affected by food consumption.
Kindergarten 1st Grade 2nd Grade 3rd Grade 4th Grade 5th Grade
66

The student acquires the knowledge and skills necessary to maintain an active life: Movement, physical fitness, and nutrition. The student acquires the knowledge and skills necessary to maintain an active life: Movement,
Draws conclusions from a food journal for missing nutrients and selects foods to fill gaps. CBA: Mrs. Trimble’s Muffins CBA: Welcome To Our School
Summarizes the # of servings from each food group in a meal.
Classifies information in a food journal.
Analyzes a food journal for missing nutrients.
The student acquires the knowledge and skills necessary to maintain an active life: Movement, physical fitness, and nutrition.
Understands relationships of nutrition and food nutrients to body composition and
physical performance.
Recognizes (K), understands (2), and applies(3), and analyzes(4-5)information from dietary evaluation and self-assessment in order to improve performance.
Kindergarten 1st Grade 2nd Grade 3rd Grade 4th Grade 5th Grade
67

CPPW PE Grant
Elementary School Expenditures
SCHOOL VENDOR AMOUNT SPENT ITEMS PURCHASED A
LPA
C
Amazon $475.18 Helmet Camera Wireless Router
Best Buy $52.55 Microphone Cable
Dell $486.44 Netbook
Gopher $1,651.51 Balance Trainer Donuts Set Electronic Whistle Frisbee Ultimate Disc Gripper Footballs Medicine Balls (various lbs.) Reusable Cold Packs Signal Horn Softballs Volleyball Trainer Volleyballs Yoga Mats
Nasco Modesto $2,199.00 9 Ft. Play Tunnel All Purpose Goal Basketballs Beach Balls Dodge Balls Electronic Whistle Hockey Sticks Jump Ropes 7 ft., 8 ft., 9 ft., 10 ft., 16 ft. Kick Balls Nets Playground Balls Soccer Balls Tetherballs Throw Down Base Set
RadioShack Corp. $131.38 Natural Sound Microphone Wireless Microphone
Sportime $,1,349.59 Balance Board Maze Beach Balls Bocce Set Cone Covers Duck Walkers Frisbee Disc Golf Set Scooter Set Strength Cords Team Launcher The Wave Indo
68

SCHOOL VENDOR AMOUNT SPENT ITEMS PURCHASED
ART
HU
R JA
COBS
EN
Cannon Sports $269.30 Badminton Net
Fred Meyer $561.52 I‐Tune Card X‐BOX 360 with Kinect for PE Kinect Games
Gopher Sport $2,045.11 Beanbags Comet Tail Fleece Balls Floor Hockey Set Hop Along Bouncers Mini Trampoline Pedometers Soccer Balls Softball Tennis Balls Ultra ball
KCDA $390.22 Basketball Net Basketballs Cones Field Paint Field paint Jump Ropes Kick‐Off Tee Plastic Bats Playground Balls Striping Tape Striping Tape (various colors) Table Timer Tetherball Swivels
Sportime $1,178.58 Balance Boards Foam Kik Puck Juggle Bean Balls Skyline Express System Trampoline We Play Maze
US Games Sport Supply
$1,152.65 Gogo Rollers Numbered Scrimmage Vests Prism Set Scrimmage Vests Stilts
69

SCHOOL VENDOR AMOUNT SPENT ITEMS PURCHASED
CHIN
OO
K
Ace Hardware $44.09 Sets of rubber tips and hardware for stilts equipment repairs
Back to Basic Toys $451.10 Exercise Trampolines Pedal Power Whirly Wheels
BSN Sports $167.58 Flag Football Belts (various colors and sizes)
Dell $486.44 Netbook
Extex Toys $290.49 Stilts and Replacement Tips
Fred Meyer $464.93 iPod Speaker System I‐Tune Card
Gopher Sport $711.49 9’ Tunnel Bucket Stack Game Cones Curl Up Mats Hoop Jumpers Juggling Scarves Kidzladder PE Sound Track CD’s Yoga Charts Yoga Kit
KCDA $412.44 Badminton Racquets Footballs Playground Balls (various colors) Striping Tape (various colors) Volleyballs
Lakeshore Learning $113.21 Alphabet Activity Mats Let’s Get Moving Activity Mats
Sportime $1,833.22 Balance Board Maze Heavy Duty Mesh Bags Pump n’go Carts Indoor Soccer Set Nuts & Bolts PE Books Poly Bones Puzzle Roll n’ Rattle Sensory Balls Sensational Balls Stomp n’ Launch Stopwatch Tote n’ Target Fold Up Baskets Ultra Foam Rockets Whatever Game Whistles
The iStore $59.99 Wireless Remote Sport Kit
Wal‐Mart $110.27 Containers for PE Equipment
70

SCHOOL VENDOR AMOUNT SPENT ITEMS PURCHASED
DIC
K SC
OBE
E
Amazon $175.19 Wireless Router
B & H Photo‐Video $272.66 Micro Wireless Earset System
Dell $486.44 Netbook
Fred Meyer $745.42 iPod and Portable Speakers I‐Tune Card Sounddock
Gopher Sport $1,251.67 Bat Set Beanbag Scarves Curl Up Mats Fitness Skillastics Heart Rate Chart Pedal Roller Pogo Stick Vinyl Rings Volleyball Trainer
School Specialty $1,611.13 Badminton Racquets Beanbag Net Game Footballs Hockey Set Human Skeleton Puzzle Juggle Bean Balls Jump Rope Baton Playground Balls Ploy Bones Puzzle Rebounder Net Stilts
Sportime $503.56 Balloons Bean Balls Juggle Diablo Footballs Frisbees Qwiknet Stickball Set Stilts Stomp n’ Launch
US Games Sport $1,217.52 Battle Stack Game Jump Rope Exercise Set Scrimmage Vests (various colors and sizes) Soccer balls Urban Rebounder
71

SCHOOL VENDOR AMOUNT SPENT ITEMS PURCHASED
EVER
GRE
EN H
EIG
HTS
Amazon $175.19 Wireless Router
BSN Sports $742.57 Aerobic Circuit Bean Bags Blindfolds Calisthenics Station Foam Blade Covers Footballs Teamwork Trekker
Dell $486.44 Netbook
Fred Meyer $616.06 Sounddock 32G Touch
Full Compass Systems
$723.38 9 Volt Adapter Portable Digital Recorder Protective Play Case SanDisk Media Card
Gopher Sport $1,850.22 AirRanger Discs (various colors) Cage Balls Scooter Board Scooter Board Soccer Balls
Nasco Modesto $70.77 Electric Inflator/Deflator
Sportime $1,710.73 Activity Balls Balance Board Duckwalker Baseballs Dodge Balls Gym Floor Tape (various sizes and colors) Inflator Kik‐Puk Scatter Ball Skyline Express Option Pack Skyline Express System Game Softballs Sport Pinnies (various colors) Stopwatch Time Tracker Team Katcher Set Team Launcher Set Whistles
72

SCHOOL VENDOR AMOUNT SPENT ITEMS PURCHASED
GIL
DO
REY
Amazon $175.19 Wireless Router
Best Buy $1,013.82 iPod, Case and Charger Rechargeable Batteries Rechargeable Batteries 9 volt XBOX Jillian Michael Fitness XBOX Just Dance XBOX Kinect Bundle XBOX Wipeout
Dell $486.44 Netbook
Fred Meyer $100.00 I‐Tune Card
Gopher Sport $1,813.54 Indoor Scooters Juggling Cubes
Greg Larson Sports $1,183.45 Flag Belts (various colors and sizes) Flower Stick Hoop Teach Balls Juggling Blocks Megaphone Mini Soccer Ball Mr. Muscles Puzzle Playground Balls Rubber Band Ball Target Heart Rate Poster
KCDA $773.12 Basketballs Cones Hockey Pucks Hula Hoops Jump Ropes 8 ft. 9 ft. 10 ft. 14 ft. Plastic Bat w/ball Playground Balls Soccer Balls Softballs Striping Tape
School Specialty $544.46 Bean Bag Juggling Set
Wal‐Mart $218.56 XBOX
73

SCHOOL VENDOR AMOUNT SPENT ITEMS PURCHASED
HA
ZELW
OO
D
Amazon $175.19 Wireless Router
B & H Photo‐Video $272.66 Wireless Earset System
Dell $486.44 Netbook
Fred Meyer $725.27 iPod and speaker system I‐Tune Card Protective Cover
Gopher Sport $2,660.57 Balance Master Bucket stack Game Curl Up Mats Dodge Balls Fitness Skillastics Flag Belt System Heart Rate Monitors Hop Along Bouncers Medicine Ball Nutty Ball Pathway Tunnel Pogo Stick Stability Ball Station Markers Stopwatch Urban Rebounder Vinyl Rings Volleyball
KCDA $1,015.80 Basketball Basketball Net Cones Hockey Sticks Medicine Ball Playground Balls (various colors and sizes) Pogo Stick Stopwatch Volleyballs
Sportime $315.66 Fleece Light Floaters Hi Jax Medicine Ball Tactile Step n’ Stones
74

SCHOOL VENDOR AMOUNT SPENT ITEMS PURCHASED
ILA
LKO
Amazon $175.19 Wireless Router
Dell $486.44 Netbook
Fred Meyer $340.45 IPod I‐Tune Card
Gopher Sport $4,273.53 Agility Ladder Air Lite Balls Bean Bag Game Dodge Balls Double Dutch Ropes Frisbee Discs Heavy Duty Tunnel Hockey Pucks Hockey Sticks Hoppity Hops Hot Spots Hurdles Jump Ropes PE Hall of Fame Board Pedal Roller Pedal Roller Pick a Paddle Revolution Hoops Rubber Sport Ball Speaker 1 disc system Speed Ropes Utility Balls Volleyballs Water Balloon Launcher
Sportime $321.61 Footballs Stopwatch Ultrafoam Rocket
75

SCHOOL VENDOR AMOUNT SPENT ITEMS PURCHASED
LAKE
VIE
W
Amazon $175.19 Wireless Router
Dell $486.44 Netbook
Focused Fitness $903.38 Five for Life Teacher Kit Focused Fitness Curriculum
Fred Meyer $711.73 iPod Sound Dock Speaker System
Gopher Sport $2,212.47 Exercise Cards Fitness Skillastics Foam Mat Pack Inner Core Tube Abs Cart
KCDA $178.24 Hula Hoops Volleyballs
Radio Shack $32.57 USB Power Adapter
The Mac Store $32.80 Protection Case for iPod
US Games Sport Supply
$1,423.12 Foam Dice Set Neoprene Dumbbell Tennis Trainer Tuff Balls
Wal‐Mart $257.30 Camcorder with Zoom
76

SCHOOL VENDOR AMOUNT SPENT ITEMS PURCHASED
LAKE
LAN
D H
ILLS
Fred Meyer $213.91 XBOX Kinect Bundle
Gopher Sport 3,378.66 Aerobic Wavemaster II Beanbags Belt System Dodge Balls Field Marking Spray Heavy Bag Gloves Hockey Sticks Mats NCAA Game Ball Pinnies (various colors) Racquetball Slider Puck Sony Stereo Urban Rebounder Wavemaster Super X Yoga Mats
School Specialty $911.24 Asst Softi Balls Footballs Handball Heavy Mesh Bags Lanyards Pulse Bar Safety Goggles Storage Crate Volleyballs Whistles
Sportime $904.47 Combats Game DVD Easy Series Tri pack Hockey Set Kit Rebounder Angle Bounder
Target $249.85 iPod (music in gym)
77

SCHOOL VENDOR AMOUNT SPENT ITEMS PURCHASED
LEA
HIL
L
Amazon $175.19 Wireless Router
Dell $486.44 Netbook
Gopher $2,357.82 Batting Tee Beanbags Flag Belt System Folding Goal Multigame Board Quick Release Belt System Rubber Critters Scooter Set Scooter Storage Cart Soccer Balls Synthetic Gloves Tennis Balls Ultra Ball
KCDA $1,319.61 Badminton Racquet Basket Truck Bat Batting Tee Cones Field Paint Frisbees Hula Hoops Jump Ropes Molded Rubber Tire Paddle Ball Plastic Balls Playground Balls Shuttlecocks Stackhouse Game Striping Tape (various sizes and colors) Table Timer Tetherball Tetherball Swivels
NW Architectural Products
$1,264.73 Wall Mounted Back Stop w/net
US Games Sport Supply
$596.02 Funnoodles Hopper Mesh Equipment Bag Noodle Connector Rapid React Balls Volleyballs
78

SCHOOL VENDOR AMOUNT SPENT ITEMS PURCHASED
PIO
NEE
R
Amazon $175.19 Wireless Router
Dell $486.44 Netbook
Gopher Sport $3,175.06 Basketballs Fleece Balls Foam Balls Soccer Balls Stopwatch Tumbling Mat Vests (various sizes) Volleyball
Sportime $1,399.10 Bean Bag Kit Diablo Athena Juggle Lunastix Juggling Scarves Speed Stacks Kit
79

SCHOOL VENDOR AMOUNT SPENT ITEMS PURCHASED
TERM
INA
L PA
RK
Amazon $175.19 Wireless Router
Dell $486.44 Netbook
Fred Meyer $241.49 Sounddock
Gopher Sport $2,921.71 Cooperative Games Manual Curl Up Mats Cyclone Basketballs Dodge Balls Fleece Balls Foam Paddles Inflator Juggling Bean Balls Kin‐Ball Parachute w/handles Soccer Balls Volleyball
Sportime $1,314.01 Bean Bags Birdies Fleecelight Balls Footballs Pinnies (various colors) Pushball Soccer Balls Softballs Stopwatch
80

SCHOOL VENDOR AMOUNT SPENT ITEMS PURCHASED
WA
SHIN
GTO
N
Amazon $175.19 Wireless Router
Best Buy $448.81 Just Dance 3 XBOX Motion Sports Adrenaline XBOX Nintendo Wii Accessory Wii Sports Resort Game Wipeout Game XBOX
Dell $486.44 Netbook
School Specialty $562.62 Comfort Snap Daisy Disc Gymringz Safety Rotational Device Therapy Net Tippy Swing
Sportime $2,315.43 Baseball Bat Beach Balls Beanbag Frogs, Turtles, Pigs Big Box Hockey Crawl Gates Kit Pump n’ Go Cart Quiknet Scoop Ball Kit Scooter Table Tennis
The iStore $59.99 Wireless Remote
81

CLASS______________________________________________________ GRADE______
PS #2: Apply locomotor, non‐locomotor and manipulative skills in a variety of activities
Demonstrates manipulative skills with stationary targets and while moving/traveling
Develop motor skill combinations in a variety of increasingly complex movement activities
Apply movement concepts to basic game strategies
STUDENT NAME DATES
billy
jake
sally
henry
mikey
billy
jake
sally
henryhenry
mikey
billy
jake
sally
henry
mikey
billy
jake
sally
82
MIDDLE SCHOOLS
6-8 Curriculum Frameworks
Materials and Equipment by School
83

Power Standard # I
Students will understand and demonstrate safety rules and procedures in a variety of physical activities (1.2.1) Grade Level 6th
Grade Level Expectations (GLEs)
Learning Targets Underline words reference level of cognitive
demand.
Possible Assessment—how will the teacher know? Possible Units/Activity Vocabulary Supplies & Materials
• Demonstrate etiquette and
apply rules in a variety of physical activities
• Demonstrate personal space
and identify safety signals
• Retrieve and return
equipment in a safe manner
• Teacher, peer, self
observation
• Basketball • Bocce Ball • Bowling • Circus Stations • Climbing Wall • Cooperative Games • Cricket • Cup Stacking • Football • Frisbee Games • Games • Golf • Gymnastics • Hockey • Juggling • Jump Rope • Lacrosse • Racquet sports • Soccer • Softball • Tchoukball • Track & Field • Volleyball • Weight Training • Wrestling
• Etiquette • Personal space • Retrieve • Return • Sport specific
vocabulary
• Specific unit equipment –
listed under Power Standard IV (6th)
• Equipment storage facilities/containers
• Whistles/lanyards
84

Power Standard # II
Students will develop and use strategies for effective participation in physical activities (1.2.2)
Grade Level 6th
Grade Level Expectations (GLEs) Learning Targets
Underline words reference level of cognitive demand.
Possible Assessment—how will the teacher know? Possible Units/Activity Vocabulary Supplies & Materials
• Demonstrate cooperation and
sportsmanship. • Understand and apply
offense and defense.
• Teacher, peer, self
observation • Active participation in drills
and games • Written evaluation
• Basketball • Bocce Ball • Bowling • Circus Stations • Climbing Wall • Cooperative Games • Cricket • Cup Stacking • Football • Frisbee Games • Games • Golf • Gymnastics • Hockey • Juggling • Jump Rope • Lacrosse • Racquet sports • Soccer • Softball • Tchoukball • Track & Field • Volleyball • Weight Training • Wrestling
• Competition • Cooperation • Defense • Offense • Sport specific
vocabulary • Sportsmanship
• Specific unit equipment
– listed under Power Standard IV (6th)
• Written evaluation materials (paper, pencils, dry white boards and pens)
• Computer, document reader, projector, screen
85
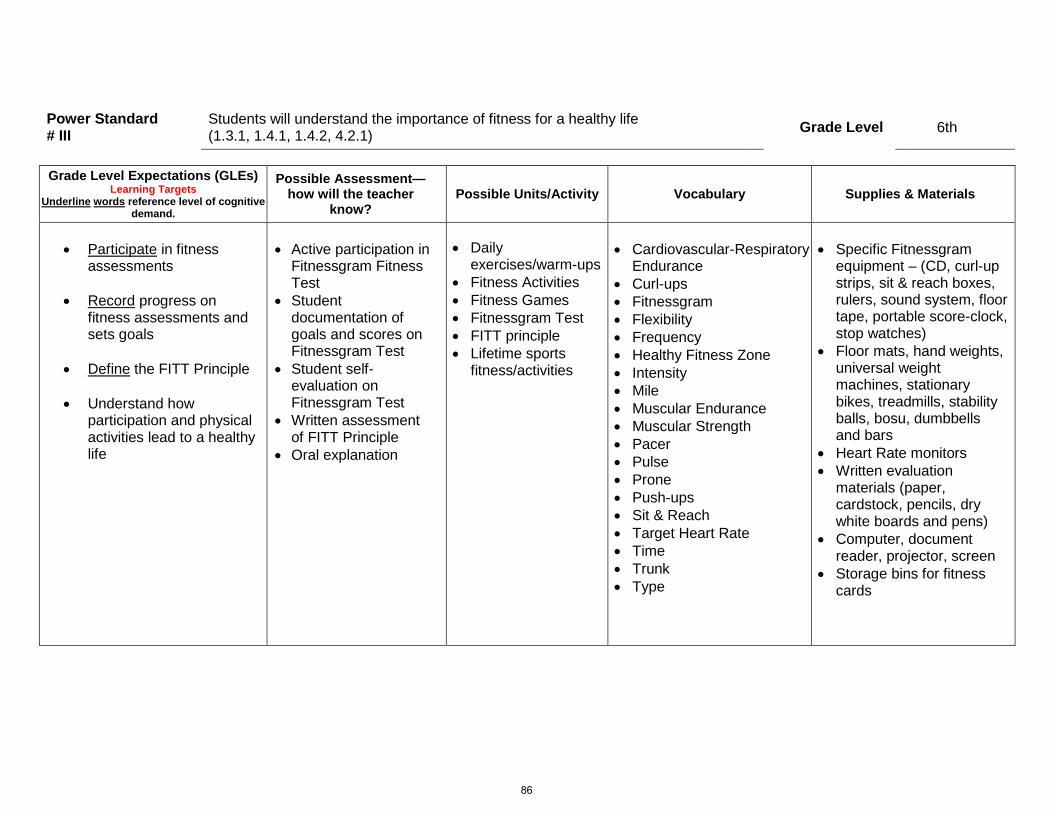
Power Standard # III
Students will understand the importance of fitness for a healthy life (1.3.1, 1.4.1, 1.4.2, 4.2.1) Grade Level 6th
Grade Level Expectations (GLEs) Learning Targets
Underline words reference level of cognitive demand.
Possible Assessment—how will the teacher
know? Possible Units/Activity Vocabulary Supplies & Materials
• Participate in fitness
assessments
• Record progress on fitness assessments and sets goals
• Define the FITT Principle
• Understand how
participation and physical activities lead to a healthy life
• Active participation in
Fitnessgram Fitness Test
• Student documentation of goals and scores on Fitnessgram Test
• Student self-evaluation on Fitnessgram Test
• Written assessment of FITT Principle
• Oral explanation
• Daily
exercises/warm-ups • Fitness Activities • Fitness Games • Fitnessgram Test • FITT principle • Lifetime sports
fitness/activities
• Cardiovascular-Respiratory
Endurance • Curl-ups • Fitnessgram • Flexibility • Frequency • Healthy Fitness Zone • Intensity • Mile • Muscular Endurance • Muscular Strength • Pacer • Pulse • Prone • Push-ups • Sit & Reach • Target Heart Rate • Time • Trunk • Type
• Specific Fitnessgram
equipment – (CD, curl-up strips, sit & reach boxes, rulers, sound system, floor tape, portable score-clock, stop watches)
• Floor mats, hand weights, universal weight machines, stationary bikes, treadmills, stability balls, bosu, dumbbells and bars
• Heart Rate monitors • Written evaluation
materials (paper, cardstock, pencils, dry white boards and pens)
• Computer, document reader, projector, screen
• Storage bins for fitness cards
86

Power Standard # IV
Students develop and demonstrate motor skills that contribute to movement proficiency (1.1.1, 1.1.5, 2.4.2) Grade Level 6th
Grade Level Expectations (GLEs) Learning Targets
Underline words reference level of cognitive demand.
Possible Assessment—how
will the teacher know? Possible Units/Activity Vocabulary Supplies & Materials
• Demonstrate proper skill
mechanics in a variety of physical activities
• Kicking a stationary and
moving ball
• Throwing a ball – stepping with opposite foot
• Catching a ball
• Teacher
observation/skill evaluation
• Skill rubric • Peer evaluation
• Basketball • Bocce Ball • Bowling • Circus
Stations/Juggling • Climbing Wall • Cooperative Games • Cricket • Cup Stacking • Football • Frisbee Games • Games • Golf • Gymnastics • Hockey • Jump Rope • Lacrosse • Racquet sports • Soccer • Softball • Tchoukball • Track & Field • Volleyball • Weight Training • Wrestling
• Opposite • Skill mechanics • Stationary • Sport/activity
specific vocabulary
• Basketballs • Bocce balls • Bowling balls/pins • Stilts, unicycles, pogo sticks, balance boards,
pedalos, juggling scarves, juggling balls, juggling bags, juggling clubs, diablos, firesticks, hacky sack, foxtails, scoops & balls, frisbees, spin jammers,
• Climbing Wall, safety mats, foot & hand holds, hula hoops
• Cones, bean bags, gator skin balls, mats, omnikin ball, scooters, medicine ball, pinnies
• No bounce balls, poly spots, flat bats, bowling pins
• Cups, mats, timers • Footballs, flags, cones • Frisbees • Golf balls, clubs, putters, irons, driving mats,
tees, putting greens, targets • Balance beam, vault, uneven bars, parallel
bars, spring board, mats, chalk, tumbling aids • Hockey sticks, hockey goals, pucks/balls,
goggles • Jump Ropes, Jump ropes storage • Lacrosse sticks, lacrosse balls, goals • Table tennis tables, nets, balls. Pickle ball
nets, paddles, whiffle balls, standards. Badminton nets, birdies, racquets.
• Soccer balls, soccer goals, shin gaurds • Softball bats, balls, bases, gloves, catchers
masks, tees • Tchoukball rebounders, pebble balls, • Batons, shot put, rake, shovel, tape measure,
87

hurdles, high jump pit, bar, standards • Volleyball standards, no-sting volleyballs,
oversize volleyballs, regulation volleyballs, nets, flip scorecards
• Hand weights, universal weight machines, stationary bikes, treadmills, stability balls, bosu, dumbbells and bars
• Mats, headgear, identification bands • Storage facilities, bins, boxes, ball carts
88

Power Standard # V Students will understand the relationship between nutrition and physical activity for a healthy life. (1.5.1, 1.5.2, 1.5.4) Grade Level 6th
Grade Level Expectations (GLEs)
Learning Targets Underline words reference level of cognitive
demand.
Possible Assessment—how will the teacher know? Possible Units/Activity Vocabulary Supplies & Materials
• Understand that
physical activity burns calories
• Recognize proper
nutrition for a healthy lifestyle.
• Written assessment • Oral explanation • Teacher observation
• Fitness/Nutrition
activities
• Balanced • Calories • Diet • Food labels • Healthy • Nutrition
• Computer,
document camera, projector, screen
• Paper, pencils
89

Power Standard # I
Students will understand the importance of fitness for a healthy life (1.3.1, 1.4.1, 1.4.2, 4.1.1, 4.2.1) Grade Level 7th
Grade Level Expectations (GLEs)
Learning Targets Underline words reference level of cognitive
demand.
Possible Assessment—how will the teacher
know? Possible Units/Activity Vocabulary Supplies & Materials
• Participate in fitness
assessments and sets goals • Record and evaluate fitness
scores in relationship to Healthy Fitness Zone
• Define and apply the FITT
principle
• Analyzes daily health and fitness habits
• Understand and state how participation in physical activities leads to a healthy life and can apply principle to self
• Give examples of activities that promote physical fitness
o Jogging=cardiovascular endurance
o Stretching=flexibility o Push-ups=muscular
strength/endurance
• Understand how participation and physical activities lead to a healthy life.
• Active participation
in Fitnessgram Fitness Test
• Student documentation of goals and scores on Fitnessgram Test
• Student self-evaluation on Fitnessgram Test
• Written assessment of FITT Principle
• Student self-evaluation on health & fitness habits
• Written assessment. • Oral explanation
• Fitnessgram Test • Daily
exercises/warm-ups • Fitness Activities • Fitness Games • FITT principle • Lifetime sports
fitness/activities
• Analyze • Cardiovascular-
Respiratory Endurance
• Curl-ups • Evaluate • Fitnessgram • Flexibility • Frequency • Healthy Fitness
Zone • Intensity • Mile • Muscular
Endurance • Muscular Strength • Pacer • Pulse • Prone • Push-ups • Sit & Reach • Target Heart Rate • Time • Trunk • Type
• Specific Fitnessgram
equipment – (CD, curl-up strips, sit & reach boxes, rulers, sound system, floor tape, portable score-clock, stop watches)
• Floor mats, hand weights, universal weight machines, stationary bikes, treadmills, stability balls, bosu, dumbbells and bars
• Heart Rate monitors • Written evaluation materials
(paper, cardstock, pencils, dry white boards and pens)
• Computer, document reader, projector, screen
• Storage bins for fitness cards
90
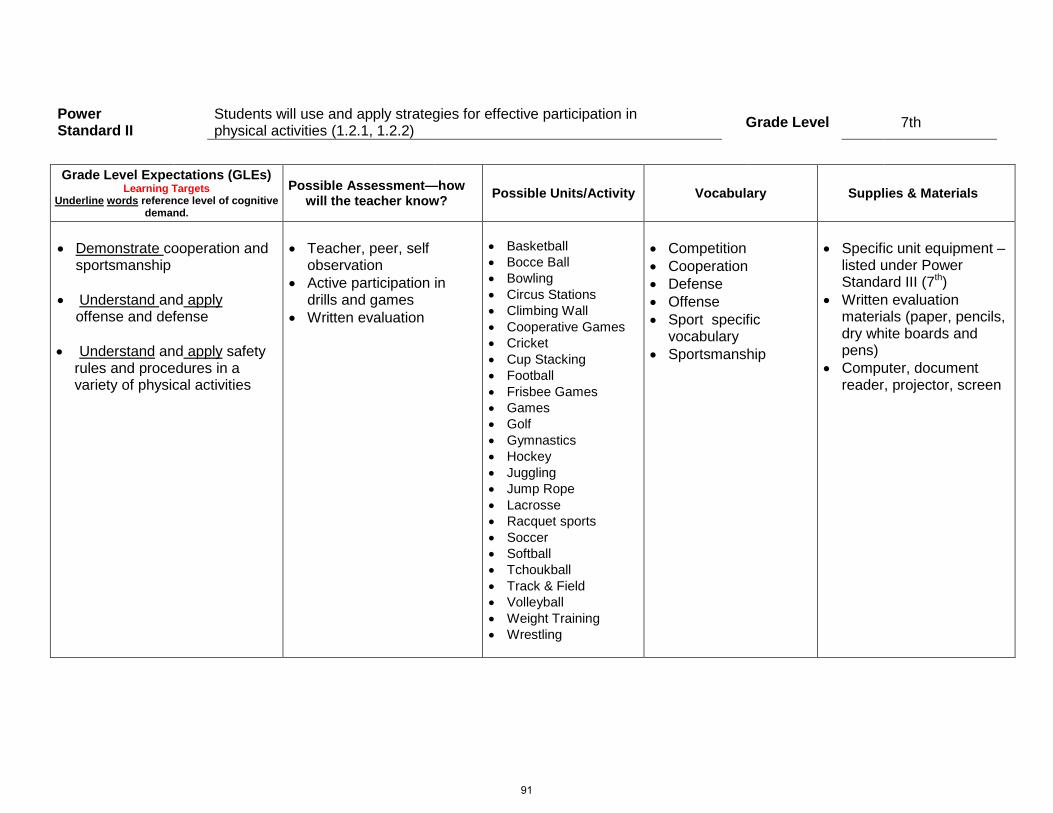
Power Standard II
Students will use and apply strategies for effective participation in physical activities (1.2.1, 1.2.2) Grade Level 7th
Grade Level Expectations (GLEs) Learning Targets
Underline words reference level of cognitive demand.
Possible Assessment—how will the teacher know? Possible Units/Activity Vocabulary Supplies & Materials
• Demonstrate cooperation and
sportsmanship • Understand and apply
offense and defense
• Understand and apply safety rules and procedures in a variety of physical activities
• Teacher, peer, self
observation • Active participation in
drills and games • Written evaluation
• Basketball • Bocce Ball • Bowling • Circus Stations • Climbing Wall • Cooperative Games • Cricket • Cup Stacking • Football • Frisbee Games • Games • Golf • Gymnastics • Hockey • Juggling • Jump Rope • Lacrosse • Racquet sports • Soccer • Softball • Tchoukball • Track & Field • Volleyball • Weight Training • Wrestling
• Competition • Cooperation • Defense • Offense • Sport specific
vocabulary • Sportsmanship
• Specific unit equipment –
listed under Power Standard III (7th)
• Written evaluation materials (paper, pencils, dry white boards and pens)
• Computer, document reader, projector, screen
91

Power Standard # III
Students will demonstrate fundamental and complex motor skills that contribute to motor proficiency. (1.1.1, 1.1.5) Grade Level 7th
Grade Level Expectations (GLEs) Learning Targets
Underline words reference level of cognitive demand.
Possible Assessment—how will
the teacher know? Possible Units/Activity Vocabulary Supplies & Materials
• Demonstrate proper skill
mechanics in a variety of physical activities
• Kicking a stationary and
moving ball with accuracy
• Throwing a ball – stepping with opposite foot
• Catching a ball – stationary
and on the move • Strike a moving object
(movement combination) • Understand the importance of
practice to improve skill level
• Teacher
observation/skill evaluation
• Peer evaluation • Skill rubrics • Written
assessments
• Basketball • Bocce Ball • Bowling • Circus Stations/Juggling • Climbing Wall • Cooperative Games • Cricket • Cup Stacking • Football • Frisbee Games • Games • Golf • Gymnastics • Hockey • Jump Rope • Lacrosse • Racquet sports • Soccer • Softball • Tchoukball • Track & Field • Volleyball • Weight Training • Wrestling
• Accuracy • Opposite • Patterns • Practice • Skill mechanics • Stationary • Strike
• Basketballs • Bocce balls • Bowling balls/pins • Stilts, unicycles, pogo sticks,
balance boards, pedalos, juggling scarves, juggling balls, juggling bags, juggling clubs, diablos, firesticks, hacky sack, foxtails, scoops & balls, frisbees, spin jammers,
• Climbing Wall, safety mats, foot & hand holds, hula hoops
• Cones, bean bags, gator skin balls, mats, omnikin ball, scooters, medicine ball, pinnies
• No bounce balls, poly spots, flat bats, bowling pins
• Cups, mats, timers • Footballs, flags, cones • Frisbees • Golf balls, clubs, putters, irons,
driving mats, tees, putting greens, targets
• Balance beam, vault, uneven bars, parallel bars, spring board, mats, chalk, tumbling aids
• Hockey sticks, hockey goals, pucks/balls, goggles
• Jump Ropes, Jump ropes storage
92

• Lacrosse sticks, lacrosse balls, goals
• Table tennis tables, nets, balls. Pickle ball nets, paddles, whiffle balls, standards. Badminton nets, birdies, racquets.
• Soccer balls, soccer goals, shin guards
• Softball bats, balls, bases, gloves, catchers masks, tees
• Tchoukball rebounders, pebble balls,
• Batons, shot put, rake, shovel, tape measure, hurdles, high jump pit, bar, standards
• Volleyball standards, no-sting volleyballs, oversize volleyballs, regulation volleyballs, nets, flip scorecards
• Hand weights, universal weight machines, stationary bikes, treadmills, stability balls, bosu, dumbbells and bars
• Mats, headgear, identification bands
• Storage facilities, bins, boxes, ball carts
93

Power Standard # IV
Students will understand the relationship between nutrition and physical activity for a healthy life. (1.5.1, 1.5.2, 1.5.4) Grade Level 7th
Grade Level Expectations (GLEs) Learning Targets
Underline words reference level of cognitive demand.
Possible Assessment—how will the teacher
know? Possible Units/Activity Vocabulary Supplies & Materials
• Understand FITT Principle –
introduction to FITT Plan for Pat
• Recognize nutritious food
choices and identify healthy and unhealthy eating patterns
• Understand and state the
relationship between caloric intake and physical activity
• Written
assessment • Oral explanation • Teacher
observation
• CBA-FITT Plan for Pat • Fitness/Nutrition
activities • FITT Principle
• Balanced • Caloric Intake • Cardio respiratory • Define • Diet • Food labels • Frequency • Healthy • Intensity • Nutritious • Recommend • Relationship • Time • Type
• Computer, document
camera, projector, screen • Paper, pencils
94

Power Standard # I
Students will understand the importance of fitness for a healthy life. (1.3.1, 1.3.2, 1.4.1, 1.4.2, 4.2.1) Grade Level 8th
Grade Level Expectations (GLEs) Learning Targets
Underline words reference level of cognitive demand.
Possible Assessment—how will
the teacher know? Possible Units/Activity Vocabulary Supplies & Materials
• Participate in Fitnessgram fitness
test and sets goals • Record and analyze fitness
scores in relationship to Healthy Fitness Zone
• Self assessment on Fitnessgram Fitness Test
• Define and apply target heart rate • Modify a fitness and nutrition plan • Complete CBA FITT Plan for Pat • Explain phases of a work-out
(warm-up, stretch, activity, cool down)
• Understand components of skill related fitness and give examples of exercises that measure the following:
o cardiovascular endurance o flexibility o muscular
strength/endurance o agility
• Understand and explain how participation in physical activities lead to a healthy life
• Active participation
in Fitnessgram Fitness Test
• CBA assessment • Oral explanation • Student
documentation • Student self-
evaluation • Teacher
observation • Written
assessment
• CBA Test • Daily
exercises/warm-ups • Fitness Activities • Fitness Games • Fitnessgram Test • FITT principle • Lifetime sports
fitness/activities
• Agility • Analyze • Cardiovascular-
Respiratory Endurance
• Curl-ups • Evaluate • Fitnessgram • Flexibility • Frequency • Healthy Fitness Zone • Intensity • Mile • Muscular Endurance • Muscular Strength • Pacer • Pulse • Prone • Push-ups • Sit & Reach • Target Heart Rate • Time • Trunk • Type
• Specific Fitnessgram
equipment – (CD, curl-up strips, sit & reach boxes, rulers, sound system, floor tape, portable score-clock, stop watches)
• Fitnessgram web based program
• Floor mats, hand weights, universal weight machines, stationary bikes, treadmills, stability balls, bosu, dumbbells and bars
• Heart Rate monitors • Measuring tapes • Written evaluation materials
(paper, cardstock, pencils, dry white boards and pens)
• Computer, document reader, projector, screen
• Storage bins for fitness cards
95

Power Standard # II
Students will understand the relationship between nutrition and physical activity for a healthy life. (1.5.1, 1.5.2, 1.5.4, 4.1.1) Grade Level 8th
Grade Level Expectations (GLEs) Learning Targets
Underline words reference level of cognitive demand.
Possible Assessment—how will the teacher know? Possible Units/Activity Vocabulary Supplies & Materials
• Complete CBA – FITT Plan
for Pat • Recognize a balanced diet
and nutritious food choices. • Predict the effects of nutrients
and calories on the body. • Analyze health and unhealthy
eating patterns. • Understand and state the
relationship between caloric intake and physical activity
• Written assessment • Oral
explanation/Discussion • Teacher Observation
• CBA-FITT Plan for Pat • Fitness/Nutrition
activities • FITT Principle
• Balanced • Caloric Intake • Cardio respiratory • Define • Diet • Food labels • Frequency • Healthy • Intensity • Nutritious • Recommendation • Relationship • Time • Type
• Computer, document
camera, projector, screen • Paper, pencils
96

Power Standard III
Students will use and apply strategies for effective participation in physical activities (1.2.1, 1.2.2) Grade Level 8th
Grade Level Expectations (GLEs) Learning Targets
Underline words reference level of cognitive demand.
Possible Assessment—how will the teacher know? Possible Units/Activity Vocabulary Supplies & Materials
• Demonstrate cooperation and
sportsmanship • Understand and apply
offensive and defensive strategies
• Organize games applying
rules and safety procedures
• Teacher, peer, self
observation • Active participation in drills
and games • Written evaluation
• Basketball • Bocce Ball • Bowling • Circus Stations • Climbing Wall • Cooperative Games • Cricket • Cup Stacking • Football • Frisbee Games • Games • Golf • Gymnastics • Hockey • Juggling • Jump Rope • Lacrosse • Racquet sports • Soccer • Softball • Tchoukball • Track & Field • Volleyball • Weight Training • Wrestling
• Competition • Cooperation • Defense • Offense • Sport specific
vocabulary • Sportsmanship
• Specific unit
equipment – listed under Power Standard IV (8th)
• Written evaluation materials (paper, pencils, dry white boards and pens)
• Computer, document reader, projector, screen
97

Power Standard # IV
Students will demonstrate fundamental and complex motor skills that contribute to motor proficiency. (1.1.1, 1.1.5) Grade Level 8th
Grade Level Expectations (GLEs) Learning Targets
Underline words reference level of cognitive demand.
Possible Assessment—how will the teacher
know? Possible Units/Activity Vocabulary Supplies & Materials
• Demonstrate proper skill
mechanics in a variety of physical activities
• Kicking a stationary and
moving ball with accuracy
• Throwing a ball – stepping with opposite foot with accuracy
• Throwing a ball to a moving target
• Catching a ball – stationary
and on the move • Strike a moving object
(movement combination)
• Understand and demonstrate ready position in a variety of sports
• Apply skill patterns to self and partner with the ability to detect and correct mechanical errors.
• Teacher
observation/skill evaluation
• Peer evaluation • Self evaluation • Skill rubrics • Written
assessments
• Basketball • Bocce Ball • Bowling • Circus
Stations/Juggling • Climbing Wall • Cooperative Games • Cricket • Cup Stacking • Football • Frisbee Games • Games • Golf • Gymnastics • Hockey • Jump Rope • Lacrosse • Racquet sports • Soccer • Softball • Tchoukball • Track & Field • Volleyball • Weight Training • Wrestling
• Accuracy • Correct • Detect • Opposite • Patterns • Practice • Skill mechanics • Stationary • Strike
• Basketballs • Bocce balls • Bowling balls/pins • Stilts, unicycles, pogo sticks,
balance boards, pedalos, juggling scarves, juggling balls, juggling bags, juggling clubs, diablos, firesticks, hacky sack, foxtails, scoops & balls, frisbees, spin jammers,
• Climbing Wall, safety mats, foot & hand holds, hula hoops
• Cones, bean bags, gator skin balls, mats, omnikin ball, scooters, medicine ball, pinnies
• No bounce balls, poly spots, flat bats, bowling pins
• Cups, mats, timers • Footballs, flags, cones • Frisbees • Golf balls, clubs, putters, irons,
driving mats, tees, putting greens, targets
• Balance beam, vault, uneven bars, parallel bars, spring board, mats, chalk, tumbling aids
• Hockey sticks, hockey goals, pucks/balls, goggles
• Jump Ropes, Jump ropes storage
98

• Lacrosse sticks, lacrosse balls, goals
• Table tennis tables, nets, balls. Pickle ball nets, paddles, whiffle balls, standards. Badminton nets, birdies, racquets.
• Soccer balls, soccer goals, shin guards
• Softball bats, balls, bases, gloves, catchers masks, tees
• Tchoukball rebounders, pebble balls,
• Batons, shot put, rake, shovel, tape measure, hurdles, high jump pit, bar, standards
• Volleyball standards, no-sting volleyballs, oversize volleyballs, regulation volleyballs, nets, flip scorecards
• Hand weights, universal weight machines, stationary bikes, treadmills, stability balls, bosu, dumbbells and bars
• Mats, headgear, identification bands
• Storage facilities, bins, boxes, ball carts
99

CPPW PE Grant
Middle School Expenditures
SCHOOL VENDOR AMOUNT SPENT ITEMS PURCHASED
CASC
AD
E
Flaghouse Inc. $1,005.45 5 lb. Balls Ab Wheels Gym Floor Tape Hockey Ball Medicine Balls (various lbs.) Mega Phone
Gopher Sport $2,705.18 Dumbbells and rack Equipment Cart Lacrosse Set Medicine Balls (various lbs. & sizes) Pop‐Up Soccer Goal
Nasco Modesto $1,035.04 Flag Football Belts Human Skeleton w/stand Impact Goggles Scrimmage Vests (various) Whistles
Sportime $535.13 Dome Wand Post Medicine Ball Rack Plastic Dome Stereo System
100

SCHOOL VENDOR AMOUNT SPENT ITEMS PURCHASED M
T. B
AKE
R Guitar Center $,1204.47 Portable PA System
Wireless Headset System 2 year Warranty on both Items
Gopher Sport $7,797.12 Agility Ladders Air dyne Exercise Bikes Folding Soccer Goal w/net Medicine Balls (various) Medicine Balls 6#, 8# Resistance Tube Pack Resistance Tubing Urban Rebounders
Sportime $744.59 Dumbbell Set
101

SCHOOL VENDOR AMOUNT SPENT ITEMS PURCHASED O
LYM
PIC
Brand Athletics $8,570.92 Badminton Cart Bocce Set Case Field Paint Dodge Balls Hacky‐Sacks Heart Rate Monitor w/stand Hex Dumbbells Incline Bench Smith Machine Softball Bats Stop Watches Vests Volley Balls Weight Plates (various)
Gopher Sport $698.72 Wireless Mic System
102

SCHOOL VENDOR AMOUNT SPENT ITEMS PURCHASED RA
INIE
R Cannon Sports $153.84 Training Volleyballs
Gopher Sport $4,685.49 7’ Slideboard Adj. Batting Tee Durabag Duffels Inflation Needle Peg Board Climber Pickle Balls Soccer Balls Stereo System s Vertical Jump Tester Volleyball System
Human Kinetics $87.47 Curl‐Up Measuring Strips
Palos Sports $1,424.54 InstaPulse Monitors Locking Ball Storage Cart
School Tech $3,125.70 Agility Ladders Dri‐Erase Marker Boards Golf Balls Golf Game No Kink Hoops Pickle Ball Paddles Playground Balls Reversible Vests Rhino Skin Softis Soak ‘em Balls Soccer Balls Volleyballs
103

HIGH SCHOOLS 9-12
Curriculum Frameworks Materials and Equipment by School
104

Power Standard: # 1
Demonstrate and apply complex motor skills and movement concepts in team games/activities. (1.1.1 & 1.1.5) Grade Level 9th
Grade Level Expectations (GLEs) Learning Targets
Underline words reference level of cognitive demand.
Possible Assessment—how will the teacher know? Possible Units/Activity Vocabulary Supplies & Materials
• Understands and applies
proper ready position and movement for various sports.
• Demonstrates ability to strike, contact or catch various objects under control
• Understands and
demonstrates the importance of practicing proper technique in improving performance.
• Integrates biomechanical principles and assesses performance.
• Teacher, self, peer
observation of ready position
• Applicable skills assessment
• Student self assessment
• Active participation in drills
• Written assessment • Oral explanation • Teacher observation
Team Game and/or Activity
• Basketball • Flag football • Games • Golf • Hockey • Racquet sports • Soccer • Softball • Volleyball • Weight training
Biomechanical Principles Sports-specific vocabulary—see individual plan
• Basketballs • Volleyballs, nets and standards • Soccer balls and goals • Racquets, nets and standards • Pickle balls • Birdies • Tennis balls • Golf clubs and balls • Hockey helmets, sticks, pucks • Footballs and flags • Weight room with equipment • Pinnies • Bats, bases, gloves and
softballs • Frisbees and cones
105

Power Standard: # 2
Demonstrates the knowledge and skills to safely participate in a variety of physical activity (1.2.1, 1.2.2) Grade Level 9th
Grade Level Expectations (GLEs) Learning Targets
Underline words reference level of cognitive demand.
Possible Assessment—how will the teacher know? Possible Units/Activity Vocabulary Supplies & Materials
• Applies and demonstrates
rules and safety while participating in a variety of physical activity
• Demonstrates appropriate
modification to personal physical strategies
• Understand and apply
concepts of teamwork and sportsmanship to engage and include all students
• Teacher and peer
observation during games
• Self assessment of teamwork and sportsmanship
• Formal and informal written assessments
Team Game and/or Activity
• Basketball • Flag football • Games • Golf • Hockey • Racquet sports • Soccer • Softball • Volleyball • Weight training
• Engage • Inclusion • Modification • Safety • Sportsmanship • Sport-specific
vocabulary • Strategies • Teamwork
• Basketballs • Volleyballs, nets and standards • Soccer balls and goals • Racquets, nets and standards • Pickle balls • Birdies • Tennis balls • Golf clubs and balls • Hockey helmets, sticks, pucks • Footballs and flags • Weight room with equipment • Pinnies • Bats, bases, gloves, catcher’s
masks and softballs • Frisbees and cones • Computer, document reader,
projector, screen
106

Power Standard:# 3
Understands assessments to evaluate and improve personal performance (1.3.1, 1.3.2) Grade Level 9th
Grade Level Expectations (GLEs) Learning Targets
Underline words reference level of cognitive demand.
Possible Assessment—how will the teacher know? Possible Units/Activity Vocabulary Supplies & Materials
• Understand and implement
FITT principle
• Participate in Fitnessgram fitness tests
• Record and monitor fitness
scores in relationship to Health Fitness Zone
• Analyzes progress of
personal fitness program • Realign health plan goals
• Integrate training principles
and draw conclusions of the effectiveness of the individual health plan
• Complete CBA: Fitness Planning
• Active participation in
Fitnessgram testing • Written goals • Written assessments • Student journals • Student evaluation of
Fitnessgram data • Teacher observation • Student created fitness
plan • Evaluation of target heart
rate
• Lifetime sports • Fitness activities • Daily warm-ups • Fitness integration
through all units • Fitnessgram tests • CBA Test
• Body Composition • Cardiovascular
endurance • Cardiovascular
strength • CBA • Fitness Planning • FITT Principle • Flexibility • Frequency • Intensity • Interval training • Muscular
Endurance • Muscular strength • Target Heart Rate • Time • Type • VO2 Max
• Bikes, treadmills, stability
balls, bosu, universal weight machine
• Computer, document reader, projector, screen, laser printer
• Curl-Up Strips • Fitness plan CBA • Fitness standard posters • Fitnessgram web based
program and kit • Flexibility boxes • Heart Rate monitors-
classroom sets • Mats • Measuring tapes • Measuring tapes • Office supplies as needed • Sound System
107

Power Standard: # 4
Understands and applies the components of skill related fitness and interprets information from feedback, evaluation, and self assessment in order to improve performance (1.4.1)
Grade Level 9th
Grade Level Expectations (GLEs) Learning Targets
Underline words reference level of cognitive demand.
Possible Assessment—how will the teacher know? Possible Units/Activity Vocabulary
Supplies & Materials
• Understands and applies the
components of skill-related fitness to physical activity or a specific sport.
• Interpret and modify skills to improve performance in a physical activity or specific sport.
• Skill related testing • Written assessments • Student journals • Self assessment • Goal Setting • Teacher, self and peer
observation
Team Game and/or Activity
• Basketball • Flag football • Games • Golf • Hockey • Racquet sports • Soccer • Softball • Volleyball • Weight training
• Agility • Balance • Coordination • Power • Reaction time • Speed
• Computer, document reader,
projector, screen, laser printer
• Sports specific equipment
108

Power Standard: # 1
Develops motor skills and movement concepts (1.1.1,1.1.5) Grade Level 10-12
Grade Level Expectations (GLEs) Learning Targets
Underline words reference level of cognitive demand.
Possible Assessment—how will the teacher know? Possible Units/Activity Vocabulary Supplies & Materials
• Applies and evaluates
complex motor skills to activities
• Application of advanced sports-specific skills
• Understands and
demomstrates the importance of practice in improving performance
• Movement demonstrates
understanding of games strategy
• Teacher, self, peer
observation of ready position
• Applicable skills assessment
• Student self assessment
• Active participation in drills
• Written Assessment • Teacher observation
Team Game and/or Activity
• Basketball • Volleyball • Soccer • Racquet sports • Hockey • Flag football • Golf • Softball • Games
• Sports specific
vocabulary
• Basketballs • Volleyballs, nets and standards • Soccer balls and goals • Racquets, nets and standards • Pickle balls • Birdies • Tennis balls • Golf clubs and balls • Hockey helmets, sticks, pucks • Footballs and flags • Weight room with equipment • Pinnies • Bats, bases, gloves and
softballs • Frisbees and cones
109

Power Standard: # 2
Acquires knowledge and skills to safely participate in activity (1.2.1,1.2.4) Grade Level 10-12
Grade Level Expectations (GLEs) Learning Targets
Underline words reference level of cognitive demand.
Possible Assessment—how will the teacher know? Possible Units/Activity Vocabulary Supplies & Materials
• Analyzes and compares the
potential risk levels in various activities
• Analyzes the training principles used for a specific task and takes corrective action when necessary
• Analyzes and demonstrates
sports specific warm up, cool down and training principles
• Apply sportsmanship and
cooperation in a variety of physical activity
• Teacher, self, peer
observation of risk analysis
• Applicable skills assessment
• Student self assessment • Active participation • Recognize and adjust to
varied risks • Written assessment • Oral explanation
Team Game and/or Activity • Basketball • Volleyball • Soccer • Racquet sports • Hockey • Flag football • Golf • Softball • Games
• Sport specific
vocabulary • Training principals
• Basketballs • Volleyballs, nets and
standards • Soccer balls and goals • Racquets, nets and
standards • Pickle balls • Birdies • Tennis balls • Golf clubs and balls • Hockey helmets, sticks,
pucks • Footballs and flags • Weight room with
equipment • Pinnies • Bats, bases, gloves and
softballs • Frisbees and cones
110

Power Standard: # 3
Understands the components of health related fitness to improve performance (1.3.1, 1.3.2) Grade Level 10-12
Grade Level Expectations (GLEs) Learning Targets
Underline words reference level of cognitive demand.
Possible Assessment—how will the teacher
know? Possible
Units/Activity Vocabulary Supplies & Materials
• Applies and evaluates the
appropriate components of health-related fitness to their specific sport
• Evaluates the progress of a personal health and fitness plan
• Teacher, self, peer
observation • Applicable skills
assessment • Student self
assessment • Active participation • Written assessment • Oral explanation
Team Game and/or Activity • Basketball • Volleyball • Soccer • Racquet sports • Hockey • Flag football • Golf • Softball • Games
• BMI • Body Composition • Cardio respiratory
Endurance • Core • Fitness Specific
Vocabulary • Fitness Standards • FITT Principle • Flexibility • HIIT (High Intensity
Interval Training) • Intervals • Muscular Endurance • Muscular Strength • Progression • Reps/Sets • Specificity • Target Heart Rate • Training Zones
• Basketballs • Volleyballs, nets and
standards • Soccer balls and goals • Racquets, nets and
standards • Pickle balls • Birdies • Tennis balls • Golf clubs and balls • Hockey helmets, sticks,
pucks • Footballs and flags • Weight room with equipment • Pinnies • Bats, bases, gloves and
softballs • Frisbees and cones • Heart Rate Monitors • Mats • Music • Pedometers • BF % machine
111

Power Standard: # 4
Understands the components of skill-related fitness and interprets information from feedback, evaluation and self-assessment in order to improve performance. (1.4.1) Grade Level 10-12
Grade Level Expectations (GLEs) Learning Targets
Underline words reference level of cognitive demand.
Possible Assessment—how will the teacher know? Possible Units/Activity Vocabulary Supplies & Materials
• Sets goals to improve
personal components of skill related fitness.
• Compares and contrasts components of skill related and health related fitness to improve performance in selected physical activity.
• Teacher, self, peer
observation of ready position
• Applicable skills assessment
• Student self assessment
• Active participation in drills
• Written assessment • Oral explanation • Teacher observation
• Basketball • Flag football • Games • Golf • Hockey • Racquet sports • Soccer • Softball • Volleyball
• Sport Specific
Vocabulary--see individual plan
• Basketballs • Volleyballs, nets and
standards • Soccer balls and goals • Racquets, nets and
standards • Pickle balls • Birdies • Tennis balls • Golf clubs and balls • Hockey helmets, sticks,
pucks • Footballs and flags • Weight room with equipment • Pinnies • Bats, bases, gloves and
softballs • Frisbees and cones
112

Power Standard: # 1
Develop movement and conditioning concepts as developmentally appropriate (1.1.1, 1.1.5) Grade Level 10-12
Grade Level Expectations (GLEs) Learning Targets
Underline words reference level of cognitive demand.
Possible Assessment—how will the teacher
know? Possible Units/Activity Vocabulary
Supplies & Materials
• Understands, demonstrates
and evaluates complex motor skills and movement concepts to activities to enhance a physically active life.
• Teacher, self, peer
observation of ready position
• Applicable skills assessment
• Student self assessment
• Active participation in drills
• Written assessment • Oral explanation • Teacher
observation
• Aerobics • Circuit training • Conditioning • Fitness Class • Pilates • Walking • Weight Training • Yoga
• BMI • Body Composition • Cardio respiratory
Endurance • Fitness Specific
Vocabulary • Fitness Standards • FITT • Flexibility • HIIT • Intervals • Muscular Endurance • Muscular Strength • Reps/Sets • Target Heart Rate
• Fitness Gram Kit • Heart Rate Monitors • Wt. Training Equipment • Plyo Boxes • Mats • Resistance Bands • Free Weights • Reebok Steps • Kettle Bells • Bosu • Exercise Balls • Sit and Reach Box • Skin Calipers • Music • Sound System • Microphones/headsets • Pedometers • Exercise Bikes • Treadmills • Ellipticals
113

Power Standard: # 2
Demonstrates knowledge and skills to safely participate in activity (1.2.1, 1.2.2) Grade Level 10-12
Grade Level Expectations (GLEs) Learning Targets
Underline words reference level of cognitive demand.
Possible Assessment—how will the teacher
know? Possible Units/Activity Vocabulary Supplies & Materials
• Analyzes and compares the
risk levels and safety issues of exercises
• Understands and applies
training principles that align with student’s specific goals
• Analyzes the importance of
fitness in the work environment.
• Teacher, self, peer
observation • Set, evaluate and
adjust personal goals • Student self
assessment • Written assessment • Oral explanation • Teacher observation • Journal • Fitness Log • Pre/Post
FitnessTesting
• Aerobics • Circuit training • Conditioning • Fitness Class • Pilates • Walking • Weight Training • Yoga
• BMI • Body Composition • Cardio respiratory
Endurance • Fitness Specific
Vocabulary • Fitness Standards • Flexibility • HIIT (High Intensity
Interval Training) • Intervals • Muscular Endurance • Muscular Strength • Reps/Sets • Safety concepts • Spotter Responsibilities • Target Heart Rate • Training Zones
• Fitness Gram Kit • Heart Rate Monitors • Wt. Training Equipment • Plyo Boxes • Mats • Resistance Bands • Free Weights • Reebok Steps • Kettle Bells • Bosu • Exercise Balls • Sit and Reach Box • Skin Calipers • Music • Sound System • Microphones/headsets • Pedometers • Exercise Bikes • Treadmills • Ellipticals
114

Power Standard: # 3
Understands the components of health related fitness and interprets information from feedback, evaluation and self assessment in order to improve performance (1.3.1, 1.3.2) Grade Level WT/A/C
Yr.2+
Grade Level Expectations (GLEs) Learning Targets
Underline words reference level of cognitive demand.
Possible Assessment—how will the teacher
know? Possible Units/Activity Vocabulary Supplies & Materials
• Evaluate, monitor and
execute a personal fitness plan
• Teacher, self,
peer observation • Active
participation • Student self
assessment • Written
assessment • Oral explanation • Journal • Fitness Log • Pre/Post
FitnessTesting
• Aerobics • Circuit training • Conditioning • Fitness Class • Pilates • Walking • Weight Training • Yoga
• BMI • Body Composition • Cardiorespiratory
Endurance • Core • Fitness Specific
Vocabulary • Fitness Standards • FITT Principle • Flexibility • HIIT (High Intensity
Interval Training) • Intervals • Muscular Endurance • Muscular Strength • Progression • Reps/Sets • Specificity • Target Heart Rate • Training Zones
• Fitness Gram Kit • Heart Rate Monitors • Wt. Training Equipment • Plyo Boxes • Mats • Resistance Bands • Free Weights • Reebok Steps • Kettle Bells • Bosu • Exercise Balls • Sit and Reach Box • Skin Calipers • Music • Sound System • Microphones/headsets • Pedometers • Exercise Bikes • Treadmills • Elliptical
115

Power Standard: # 4
Understands the components of skill related fitness and interprets information from feedback, evaluation and self assessment in order to improve performance (1.4.1) Grade Level 10-12
Grade Level Expectations (GLEs) Learning Targets
Underline words reference level of cognitive demand.
Possible Assessment—how will the teacher
know? Possible Units/Activity Vocabulary Supplies & Materials
• Sets goals to improve
personal components of skill related fitness.
• Compares and contrasts components of skill related and health related fitness to improve performance in selected physical activity.
• Teacher, self, peer
observation • Set, evaluate and
adjust skill related goals
• Student self assessment
• Written assessment
• Oral explanation • Teacher
observation • Journal • Skill assessment
Log
• Aerobics • Circuit training • Conditioning • Fitness Class • Pilates • Walking • Weight Training • Yoga
• Agility • Balance • BMI • Coordination • Fitness Standards • FITT Principle • Power • Reaction time • Reps/Sets • Skill Specific Form and
Techniques • Skill Specific
Vocabulary • Speed • Target Heart Rate • Training Zones
• Fitness Gram Kit • Heart Rate Monitors • Wt. Training Equipment • Plyo Boxes • Mats • Resistance Bands • Free Weights • Reebok Steps • Kettle Bells • Bosu • Exercise Balls • Sit and Reach Box • Skin Calipers • Music • Sound System • Microphones/headsets • Pedometers • Exercise Bikes • Treadmills • Ellipticals
116

CPPW PE Grant
High School Expenditures
SCHOOL VENDOR AMOUNT SPENT ITEMS PURCHASED
AU
BURN
HIG
H
Brand Athletics $702.21 Heart Rate Monitor
Precor Commercial Fitness
$11,344.20 2 Indoor Rowers 9 Spin Bikes
AU
BURN
MO
UN
TAIN
VIE
W Gopher Sport $1923.20 2 Training Hurdles
30 Curl Up Mats 4 Balance Trainers Agility Ladder Core Balance Discs
Precor Commercial Fitness
$9904.28 6 Spin Cycles Elliptical
AU
BURN
RIV
ERSI
DE
Precor Commercial Fitness
$11,826.00 12 Spin Cycles
117

CPPW BUDGET OVERVIEW
118

Contract #
2010-2012 Grant Year Total $297,079
2012 Budget
7/21/2010-12/31/2010
2010 Funds Expended
2010 Carryover
Amended 2 2011
Amended 2 2012
Total 2010 - 2012
Expense2011 Name or Job title
7922 27 2120 000 Salary: PE Teachers Extra Hours -$ $16,432 $3,855 $20,2877922 27 4210 000 Fringe: PE Teachers Extra Hours $2,639 $561 $3,2007922 27 2110 000 Salary: PE Tech- Substitute Teachers 11,880$ $4,150 $7,730 $9,660 4,910$ $26,4507922 27 4210 000 Fringe: PE Tech- Substitute Teachers 1,188$ $387 $801 $801 $478 $2,4677922 27 2203 000 Salary: PE Tech- PreK-2 Stipends $0 $4,000 $4,0007922 27 4210 000 Fringe: PE Tech- PreK-2 Stipends $0 $800 $8007922 27 3030 000 Salary: PE Tech- Secretarial Extra Hours $0 $1,075 $1,0757922 27 4310 000 Fringe: PE Tech- Secretarial Extra Hours $0 $120 $1207922 27 2120 000 Salary: PE Tech-K-2 Booster Sessions -$ $0 $07922 27 4210 000 Fringe: PE Tech-K-2 Booster Sessions -$ $0 $0
Consultant Costs7922 27 7450 000 ►PE Tech- Solution Tree & other Consultants 6,000$ $1,414 $4,586 $2,500 $0 $8,500
Supplies7922 27 5000 000 PE Tech-office supplies, paper, toner, tabs, tubs, etc. $500 $300 $200 $0 $1,200 $1,700
Equipment7922 27 5020 000 PE Tech-equipment purchases to implement $67,032 $56,614 $123,6467922 27 5030 & 7450 PE-Fitness Gram software package with training $39,602 $0 $39,6027922 27 5001 000 PE Tech-exercise assessment tools, heart rate, pedometers,etc. $7,283 $42,134 $49,417
Travel7922 27 8020 000 Travel expenses for WAPHERD conference $6,000 $6,000 $0 $181 $6,181
Subcontracts7922 27 7620 000 PE Tech-WHAPERD Conference Fees $1,500 $840 $660 -$660 $1,435 $2,275
OtherIT charges related to Fitnessgram software $0 $0 $0 Telephone, Internet Printing Rent, utilities Other
4 programs Subtotal 27,068$ $13,091 $13,977 $145,289 $117,363 $289,720
Overhead/Indirect cost (2.54%) 688$ $333 $355 $3,690 $2,981 $7,359
Total amount including overhead 27,756$ 13,424 $14,332 148,979$ 120,344$ 297,079$
Exhibit BAmended Budget #2
Auburn School District
2010 Budget 2011 Budget
119

Washington Elementary School Improvement Plan

Every Child By Name and Need Using building resources to meet the needs of all students

Student Demographic Data
2001-02 2005-06 2009-10
Free & Reduced 51.6% 53.8% 73% Special Education 0 14% 11.7% ELL 0 9.9% 15.5% American Indian 2.4% 3.8% 3.4% Asian/Pacific Is 8.8% 9% 13.3% Black 7.6% 8.5% 9.8% Hispanic 12.6% 18.8% 23.3% White 68.3% 59.8% 49.15

2008 2009 2010 2011 11 cells made AYP
15 cells made AYP
21 cells made AYP
21 cells made AYP
6 did not 2 did not 0 did not 2 did not
1. All –Math 2. All- Reading 3. Hispanic-
Math 4. Hispanic-
Reading 5. Low Income-
Math 6. Low Income-
Reading
1. All –Math 2. All-Reading
1. All-Reading 2. Low Income-
Reading

AYP Summary 2011
Met Proficiency Goal Met Participation Goal
Student Group Reading Math Reading Math All No Yes Yes Yes
American Indian N<Required N<Required N<Required N<Required
Asian/Pacific Islander N<Required N<Required N<Required N<Required
Black N<Required N<Required N<Required N<Required
Hispanic Yes Yes Yes Yes White Yes Yes Yes Yes Limited English Yes Yes Yes Yes
Special Education N<Required N<Required Yes Yes
Low Income No Yes Yes Yes


•Developed a needs assessment
•Research of best practices focusing on our ELL population, math instruction and best practices. •Implemented School-wide Title/SIP Plan based on data (CEE, MSP, DIBLES, MAPS, Classroom)
•Focused staff development in area of need ( Math and Reading)
Fully-Revised SIP 2009-13

District Goal(s): ASD Reading & Math Goals With district support, leadership and guidance, each student will achieve proficiency in the Washington Comprehensive Assessment Program (WCAP) and all schools will meet adequate yearly progress by meeting or exceeding the Washington State uniform bar in reading and mathematics in grades 3 through 8 and 10. School Goal(s): Washington Elementary Reading & Math Goals: Increase the percentage of students demonstrating proficiency on the Measurement of Student Progress (MSP) in Reading & Math. Grade Level S.M.A.R.T. Goals are built from school assessment data along with the grade level data and make a direct connection to the school and district improvement goals.

First Steps
Every Child By Name and Need
•Meet the needs of all students based on screening assessment and progress monitoring. •Staff will work in Professional Learning Communities to purposefully analyze reading data identifying both student needs and strengths.
•Teams will use data to plan for instruction both in reading and math

School Improvement Planning SMART Goal Worksheet
School Name: WASHINGTON ELEMENTARY SMART GOAL Subject Area: READING
Target Population: ALL STUDENTS
Our Reality: The sub cell of Hispanic and low income made AYP in reading but the ALL cell did not make AYP
Our SMART Goal:
Grade three through five will increase the percentage of students meeting standard on the Washington Reading MSP by 10% each year 2010-2013 and decrease the achievement gap by 10%.
Grade 2009 2010 2011 2012
3 59.7 69.7 79.7 89.7
4 61.3 71.3 81.3 91.3
5 57.1 67.1 77.1 87.1
In addition, all grade levels will increase the percentage of students meeting the reading benchmark as measured by DIBELS.
Strategies from the District Strategic Improvement Plan
1.a.1 Establish professional Learning Communities,1.a.3 Develop common formative assessments, 1.a.4 Implement a pyramid of interventions, 1.a.5 Establish extended learning models, 1.c.2 Use district developed power standards, 1.c.3 Monitor student learning and adjust instruction to achieve power standards.

Student Name RN
Level Reading
MSP Fall DIBELS
Wint Dibels
Math MSP
MAPS STAR
GE Star Winter
Prog Mtr
Prog Mtr
Prog Mtr
Prog Mtr
Prog Mtr
progMtr
Mock MSP
Mock MSP
4.1
354 57 70 367 1.8 2.2 43 26 61 65 61%
426 65 82 407 2.6 3.7 90 83 103 68% 70% 74% 433 66 115 391 3.7 5.3 101 105 100 84% 83% 78%
89 115 3.7 99 84% 70%
377 52 70 371 1.2 2.3 37 32 75 48 53%
367 38 50 363 2.3 1.8 34 22 62 38 63 68% 57%
479 135 143 424 5.7 6.1 132 163 126 136 68% 77% 70%
391 63 387 2 2.3 41 44 80 53 60% 27% 43%
413 96 127 415 5.5 5.3 97 100 68% 90% 57%
440 78 95 447 5 4.6 76 84% 87% 100%
426 78 79 375 3.1 3.3 74 97 70% 74%
400 83 77 375 2.5 4.2 92 73% 60%
426 136 134 436 5.7 9.5 158 140 129 164 92% 93% 100%
58 80 2.3 2.5 57 43 88 73 56% 63% 57%
405 94 92 419 3.6 4.3 101 109 84% 83% 91%
381 53 69 383 1.8 2.2
449 77 87 400 2.8 3.7 61 86 52%
377 55 77 415 4.5 3.8 75 84% 87% 78% 391 89 383 3.2 2.7 84 44% 57% 65%
426 91 84 407 4.3 85 96 64% 90% 70%
400 84 447 3 3.7 96 99 80% 70% 65%
103 1.6 1.7
371 32 43 358 1.1 1.4 28 23 22 48 30 46 33%
67 96 2.6 2.7 88 82 56% 70% 74%
405 54 66 403 1.6 3.4 56 61 54 72% 80% 40%
426 82 415 2.7 4.1 76 60% 40% 109 101 123 87% 65%
111 67%
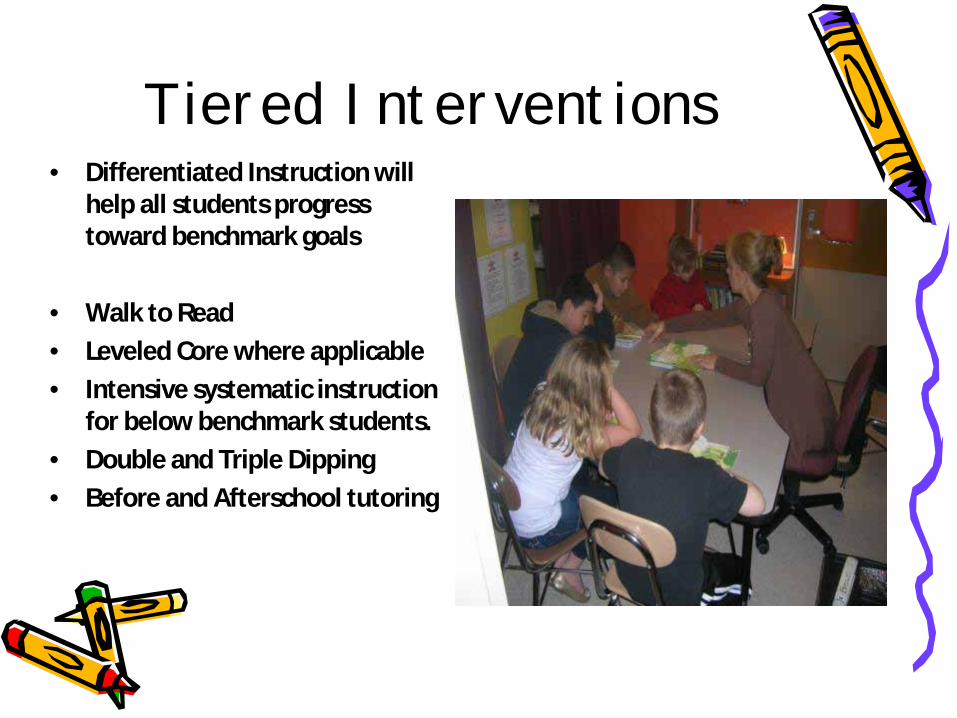
Tiered Interventions • Differentiated Instruction will
help all students progress toward benchmark goals
• Walk to Read
• Leveled Core where applicable
• Intensive systematic instruction for below benchmark students.
• Double and Triple Dipping
• Before and Afterschool tutoring

School Improvement Planning SMART Goal Worksheet
School Name: Washington Elementary SMART GOAL Subject
Area:
Target Population: All students
Our Reality: MSP 2009: 3rd Grade 47.2%, 4th Grade – 57.5%, 5th Grade – 41.3%
Our SMART Goal:
Each grade level, third through fifth, will increase the percentage of students meeting standard on the math MSP by 10% each year 2010 – 2013 and decrease the achievement gap by 10% reaching the following targets:
Grade 2010 2011 2012 3rd 57.2 67.2 87.2 4th 67.5 77.5 87.5 5th 51.3 61.3 81.3 Grade levels, kindergarten through second, will increase the percentage of students progressing toward mastery of grade level power standards as measured by Saxon Math unit assessments.
Strategies from the District Strategic
Improvement Plan
1.a.1 Establish professional Learning Communities,1.a.3 Develop common formative assessments, 1.a.4 Implement a pyramid of interventions, 1.a.5 Establish extended learning models, 1.c.2 Use district developed power standards, 1.c.3 Monitor student learning and adjust instruction to achieve power standards.

Choosing an equasion that best fits the story problem
Plot the ordered pairs
Reading the story problem- multiplication
Reading and understanding coordinates
probability (impossible, likely, certain)
Probability (likely, unlikely, certain)
Range
Probability/reducing the fraction median
Probability
Choosing an equasion that best fits the story problem
Mode
Multi-step conversion story problem
Conversion- multistep story problems
Probability
Filling in a graph Elapse Time
x x x x x x x x x x x x x x x
x x x x x x x x x x x x x x x
x x x x x x x x x x x x x
x x x x x x x x x x x x x x x
x x x x x x x x x x x x x
x x x x x x x x x x x x x
x x x x x x x x x x x x x
x x x x x x x x x x x
x x x x x x x x x x
x x x x x x x x x x x
x x x x x x x x x
x x x x x x x x
x x x x x x x x
x x x x x x x x
x x x x x x x
x x x x x x x
x x x x x x x
x x x x x x x x
x x x x x x x x
x x x x x x x
x x x x x x
x x x x x x
x x x
x x x
x x
Total correct 21 12 21 18 13 11 13 4 12 14 6 19 6 14 14 19 9
Math Data Collection

Tiered Intervention • Explicit and systematic instruction
based on District Power Standards.
• Progress monitoring helps PLCs plan for instruction and meet the needs of all students.
• Differentiated Instruction will help all students progress toward benchmark goals
• Walk to Read • Intensive systematic instruction
for below benchmark students. • Double and Triple Dipping • Before and Afterschool tutoring

Professional Development • Standard Based Teaching
and Reporting Book Study: “A Repair Kit for Grading”
• Adrian Hartness: Total Curriculum Alignment
• Auburn Teacher Leadership Academy ALTA
• Visitations to Gildo Rey and Chinook
Reading Math CoordinatedSchool Health
Anita Archer: Student Engagement
SA:XON: 1St-5th
Healthy School Index Survey
Christine Anderson:ComprehensionSkill Building
ORIGO:3rd-5th
Phonics Blast Kim Sutton:K-5
KindergartenBoot CampProfessional Development
Template & Vocabulary

Celebration Kindergarten
• 71 Students
DIBLES Intensive Strategic Benchmark Fall 20 9 35
Winter 6 16 47

Research Large numbers of children at school entry
lack the critical oral language skills necessary for them to benefit from early literacy instruction. Lucy Hart Paulson, 2001

Resources • Jump start • Extended School Day • Volunteers: CIS, High School,
Parents • Home learning Back backs • Walk to Reading groups

14 ELL DIBLES Intensive Strategic Benchmark Fall 8 4 2
Winter 1 2 11
26 Jump Start DIBLES Intensive Strategic Benchmark Fall 3 3 20
Winter 1 3 23
15 Extended Day (added 5 at Mid Winter)
DIBLES Intensive Strategic Benchmark Fall 6 3 6
Winter 0 4 11

COORDINATED SCHOOL HEALTH

School Improvement Planning SMART Goal Worksheet
School Name: Washington Elementary SMART GOAL Subject Area:
Coordinated School Health
Target Population:
ALL
Our Reality: Have an increase in the number of students who come from low income home and attend multiple schools
Our SMART Goal:
Coordinated School Health. Washington will work to address the physical and mental health of all students and staff by promoting a safe environment that encourages health, fitness, social and emotion wellness for all students.
Strategies from the District
Strategic Improvement
Plan
Goal 3: Parents/Guardians and Community Partnerships The district and schools will continue to develop partnerships to support student academic achievement and success.

PE Teacher Nurse Kitchen Manager Custodian Counselor Community/PTA Principal
Structured activities at recess
By-yearly Dental screening program
Healthy Choices at Breakfast and Lunch
Maintain a clean and safe school
Olweus Anti-Bullying Training
Walk to School Expanded Millage Club at recesses
Bike Rodeo & Bike Loan Program
Immunization Rates
Increase Breakfast participation
Green Team Champion
Kelso Choices Walk a Thon Recess before Lunch
5th grade Leadership Club
Yearly hearing and vision screening
Fully recyclable Lunch and Breakfast
Facilitate recycling school wide
Jedi Kids Club Healthy fundraisers Build schedule to include PE teacher at 3-5 recesses
After school Sports Club
Clearly communicate student health concerns with the staff
Level 1 Green School Certification
Roots of Empathy 3-classes
Fitness and Nutrition Tracking program
Encourage healthy snacks for birthday celebrations
Students will use heart monitors to check cardio levels
Calm Yoga 5-2-1-0 Ready Set Go
Coordinated School Health 2011-12 SIP Goal Revisions
Team: Nurse, Custodian, PE Teacher, Counselor, Kitchen Manager, Family/Community, Principal


Every Child By Name and Need Using building resources to meet the needs of all students

DRAFT
2010 – 2013
Washington Elementary
Strategic Improvement Plan
Strategic Plan Adopted by the Auburn School Board of Directors on board approval date here.

2009-2012
Auburn School District Strategic Improvement Plan
District Improvement Goal 1: Student Achievement
With district support, leadership, and guidance each student will achieve proficiency in the
Washington Comprehensive Assessment Program (WCAP) and all schools will meet adequate
yearly progress by meeting or exceeding the Washington State uniform bar in reading and
mathematics in grades 3 through 8 and 10.
District Improvement Goal 2: Dropout Rate and On-time Graduation
Schools will reduce dropout rates and meet additional Adequate Yearly Progress indicators as
determined by K-8 attendance and high school on-time graduation rates.
District Improvement Goal 3: Parents/Guardians and Community Partnerships
The district and schools will continue to develop partnerships to support student academic
achievement and success.
District Improvement Goal 4: Policies and Resource Management
The district will focus on improving student academic achievement and narrowing the
achievement gaps in its policy decisions and resource allocation.
2009-2010 Stated District Objectives-Student Achievement and Accountability
Superintendent implements district strategic improvement plan to establish professional learning
communities, become a standards-based district, produce power standards, develop common
formative assessments, monitor student achievement, and provide intervention for continuous
improvement for 10% more students at or above standards in reading and math.
Superintendent increases high school graduation rates to 95% and increasing high school
aggregate credits earned and decreasing failing grades in 9th grade.
Superintendent increases learning enrichment and achievement beyond standards for all students
including less represented population.

Requirements for School Improvement Plan
WAC 180-16-220
Each school in the district shall be approved annually by the school board of directors under an approval process determined by the district board of directors. “At a minimum the annual approval shall require each school to have a school improvement plan that is data driven, promotes a positive impact on student learning, and includes a continuous improvement process that shall mean the ongoing process used by a school to monitor, adjust, and update its school improvement plan”. The checklist below contains the required elements for School Improvement Plans under WAC 180-16-220. School Improvement Plans are subject to review by the Office of Superintendent of Public Instruction (OSPI).
1. Evidence and date of annual school board approval.
2. Evidence staff certification requirements were met. (Highly Qualified)
3. Evidence the plan is based on self-review and participation of required
participants (staff, students, families, parents, and community members).
4. Brief summary of use of data to establish improvement.
5. How continuous improvement in student achievement of state learning
goals and essential academic learning requirements (EALRs) is promoted.
6. Recognition of non-academic student learning, what and how. (School Climate, bullying, counselors, community resources, partnerships, student leadership; interpersonal relationship skills)
7. Plan addresses characteristics of successful schools.
8. Plan addresses educational equity (gender, race, ethnicity, culture,
language, and physical/mental ability).
9. Plan addresses use of technology to facilitate instruction.
10. Plan addresses parent, family, and community involvement. Failure to make AYP for two consecutive years will result in identification for school improvement beginning with Step 1. The consequences associated with each step are detailed at: http://www.k12.wa.us/ESEA/AdequateYearlyProgress.aspx


Step 1:
Department of Student Learning
Rod Luke Assistant Superintendent of Student Learning
Cindi Blansfield Director of Secondary Education
Heidi Harris Director of Elementary Education
Julie DeBolt Coordinator of Assessment and NCLB
Date of Completion - Step 1 Approval
Step 2:
Superintendent
Kip Herren Superintendent
Date of Completion - Step 2 Approval
Step 3:
School Board
Janice Nelson School Board President
Ray Vefik School Board Vice President
Carol Helgerson School Board Director
Lisa Connors School Board Director
Craig Schumaker
School Board Director
Date of Completion - Step 3 Approval
Auburn School District Mission
In a safe environment, all students will achieve high standards of learning in order to become ethically responsible decision makers and lifelong learners.
Auburn School District Vision
The vision of Auburn School District is to develop in students the skills and attitudes that will maximize their potential for lifelong learning and ethically responsible decision making.
Washington Elementary School Mission
The community of Washington Elementary is dedicated to providing a supportive, challenging environment where all students work towards reaching their full potential. A strong emphasis is placed on high academic standards, independent thinking, and responsible behavior .
Washington Elementary School Vision
The vision of Washington is to provide a safe environment were all students grow academically and develop responsible behavior.
Background
In fall of 2009 the SIP team met to review the following data: DIBELS, MAP, WLPTII, WASL, as well as, CEE Perceptual Data and Healthy Schools project. Over a three week period data was reviewed by all staff at weekly meetings. In addition, staff and parent members of the Healthy Schools team completed surveys and reviewed data on health and school climate. Trends were noted and areas of growth were celebrated and areas of concern were discussed. Comments and areas of concern were collated and reviewed by the teams and ranked by greatest concern. Next, a review of current research and best instructional practices in the areas of reading and math were reviewed by sub committees of classroom teachers and specialist. In addition, a Healthy Schools Summary Report was prepared by a parent, who is a member of the Pierce County Heath and Wellness department. Lastly, Smart Goals, which align with research findings in reading, math and school climate, were set and shared with staff. As plans are made for instruction and curriculum needs, Grade Level Professional Learning Communities, along with Specialist and support staff will meet to review academic data and plan for differentiated instruction and curriculum.
Throughout the process the Department of Student Learning provided support through day-long staff development, work release time, school visitation and consultant visitation. Activities included: Planning for School Improvement – Session 1, Session 2, Session 3, Reading Data and Goals, Math Data and Goals, Puget Sound ESD Reading Consultant: Data Review and Instructions Strategies with First Grade, Visitations of Professional Learning Committees in Action at White River School District, and Alpac Elementary School, Auburn. Demographic Data Washington Elementary School is located in downtown Auburn. The student body is made up of 55% males and 45 % females. 68% of Washington’s nearly five hundred students qualify for free or reduced lunch; which is a 15% increase over the past two years. Likewise, our enrollment has grown by forty students since last spring. There is a high rate of student turn over at Washington; 123 students entered or withdrew during the past school year.
The ethnicity at Washington reflects the downtown community of Auburn: 47%
white, 22% Hispanic, 24% Asian / Pacific Islander, 7% Black, 3% American or
Alaskan Native. 16% of the students are served by the Transitional Bilingual
program with our largest groups speaking Spanish, Marshallese, and Ukraine.
Special Education students make up 11% of the student body which included two
Structured Learning Classrooms and one Resource Room.
Discipline and Attendance Analysis
The 2008 Educational Effective Parent Survey, compiled by the Center for Educational Effectiveness, showed that 92% of the parents felt that the Washington Elementary has clear behavior rules and that they consistently applied to all students. Likewise, 93% of the parents agreed that Washington Elementary school is orderly and supports learning. The number of playground write-ups and office referrals continues to decline. Reports of Bullying were down. Student surveys showed that the number of

students who think adults at school try to help went up and students who were afraid of being bullied at school went down. Attendance: The unexcused absence rate the past school year was less than 1%. However, Washington Elementary has a mobility rate with 123 students enter or withdraw during the past school year. Data Analysis-DIBELS DIBELs data shows that only 20% of kindergarten students entering school in the fall were at benchmark. Most students who were “just at” benchmark” in oral reading fluency the previous spring did not maintain reading fluency over the summer and were in need of strategic intervention. Grades 4 and 5 data showed students either at benchmark and above or in need of intensive intervention. Few students were in the strategic range.
Data Analysis- MAPS
MAPS summary report supported the findings of DIBELS. Students who were at
benchmark and above on DIBELS did well on MAPS; students who were labeled at
–risk on DIBELS were at risk on MAPS. More than 45% of households in downtown
Auburn do not have access to the internet and for many of our students; Fall
MAPS testing is their first experience using the computer since school was out in
the spring.
Data Analysis- WLPTII
All regular education students taking the WLPTII showed growth over the
previous year. Students who have been in Auburn Schools for at least a year had
moved up a Level on their assessment with 52% of the students scoring at the
Advanced Level.
The majority of the ELL students taking the assessment were born in the United
States.
Data Analysis- CEE Perceptual Survey
CEE Perceptual data parent data shows that 85% of parents felt that Washington staff has high expectations and standards for students and

82% of parents felt that there was high quality curriculum, instruction and assessment at Washington, while 19% of parents showed concern over monitoring of teaching and learning. CEE Staff surveys showed 85% of all staff agree there is a clear and shared focus. Comparison data showed that Washington’s scores were above other elementary schools in supportive learning environment. While the same data showed Washington staff showed themselves below high school, middle schools and other elementary starts in the area of High standards and expectations. In the area of trust there was a perception difference between classified and certificated staff. 80% of certificated staff felt that Washington staff had the characteristics of competence, reliability and openness. Classified staff data was at least 10% lower in each of a these areas.

Achievement Washington did not make overall AYP and school is in Step 1 improvement. Washington showed growth in the number of cells meeting proficiency and participation goals. There were 11 yes cells in 2008 and 15 yes cells in 2009. This is an improvement of 64. 7% to 88.2% cells meeting proficiency and participation goals. Hispanic Students and Low Income made APY in both Reading and Math. The student group ALL did not make the proficiency goal. WASL Reading Low income, Hispanic and White students all made AYP in reading. The category all, which included other ethnic groups and special educations, students did not meet the reading goal. THIRD GRADE: 64.7% of Third graders met AYP which is above the state. This reflects a 9% increase in the number of third graders making AYP over the previous year. 3rd grade is closing the gap between district and schools scores. FOURTH GRADE: There was an 11% increase in the number of 4th graders making AYP over the previous year. The percentage of fourth grader making AYP is still below that of the state and district. The number of non low income students making AYP in 4th grade rose by 30 % over the previous year while the number of low income students rose only 1%. FIFTH GRADE: Reading continues to be an area of concern for fifth grade with only 57% of all fifth graders making AYP in Reading which is 15% below the district average. 5th grade Non low income students making AYP declined by 12% while the number of low income students making APY increased by 5%. WASL Math
47.4% of Washington’s fourth grade students met standard in math. This is higher than the district of 38.7% and state performance of 29.4% and reflects a 20% increase in the number of students meeting standard from 2008 to 2009. Low income, Hispanic and White students all made AYP in math. The category all which included other ethnic groups, as well, as special educations students did not meet the math goal. The achievement gap in third grade between low income and non low income has decrease from 43% in 2006 to 10% in 2009. While the gap at grades four and five remain stagnate over the past three years.

WASL Science Did not look closely at science data.
WASL Writing Did not look closely at writing data.
DATA Summary Statement:
Washington Elementary has increased total number of students, ethnic diversity,
new immigrants and percentage of students from low income households. While
students are enrolled at Washington their attendance is consistent but the high
turnover rate makes it imperative that there is a system in place for assessment
and appropriate instructional placement for math and reading.
Washington kindergarteners enter school without foundational readiness skills.
Two hours and forty minutes a day is not adequate to move high-risk
kindergartners toward meeting standard in reading and math. We must increase
minutes of instruction and educational opportunities for youngest learners.
Many intermediate grade students who did do not score at benchmark in reading,
as measured by DIBELs or MAPS, were able to pass WASL. Grade levels which
used test specific instructional materials for differentiated instruction and spent
increased time preparing students to meet Washington state assessment
standards had a positive impact on the number of students meeting standard.
Extended opportunities to work on reading and math have benefited low income
and Hispanic students but we must still work on closing the achievement gap for
all our students.
All grade levels will benefit from quality instructional materials and PLC time to
plan for strategic instruction and formative assessments, as well as, to review
math and reading data.

Needs Assessment Data Documents
o DIBELS Dashboard –see hard copy
o MAP Data –see hard copy
o WLPTII results- see hard copy
o CEE charts - attached
o Demographic charts-attached
o WASL- attached
o AYP-attached

Demographics 2009
Washington Elementary School Principal PAULINE THOMAS
253.391.4988 20 E ST NE AUBURN 98002 Auburn School District
Grade Span: PK-5 Updated: 9/30/2009
Select year: 2008-09
2008-09 WASL Results (Administration
Info)
Grade Level
Reading Math Writing Science
3rd
Grade 59.7% 47.2%
4th
Grade 61.3% 57.5% 30.0%
5th
Grade 57.1% 41.3% 9.5%
Student Demographics
Enrollment
October 2008 Student Count
461
May 2009 Student Count
473
Gender (October 2008)
Male 252 54.7%
Female 209 45.3%
Ethnicity (October 2008)
American Indian/Alaskan Native 17 3.7%
Asian 43 9.3%
Pacific Islander 9 2.0%
Asian/Pacific Islander 52 11.3%
Black 37 8.0%
Hispanic 114 24.7%
White 239 51.8%
Special Programs
Free or Reduced-Price Meals (May 2009) 290 61.3%
Special Education (May 2009) 52 11.0%
Transitional Bilingual (May 2009) 77 16.3%
Migrant (May 2009) 0 0.0%
Other Information (more info)
Unexcused Absence Rate (2008-09) 9 0.0%
Teacher Information (2008-09) (more info)
Classroom Teachers
31
Average Years of Teacher Experience
8.8
Teachers with at least a Master's Degree 61.3%
Total number of teachers who teach core academic classes
28
% of teachers teaching with an emergency certificate
0.0%
% of teacher teaching with a conditional certificate
3.6%
Total number of core academic classes
28
NCLB Highly Qualified Teacher Information
% of classes taught by teachers meeting NCLB highly qualified (HQ) definition
96.4%
% of classes taught by teachers who do not meet NCLB HQ
3.6%

definition
% of classes in high poverty schools taught by teachers who meet NCLB HQ definition
96.4%
% of classes in high poverty schools taught by teachers who do not meet NCLB HQ definition
3.6%
% of classes in low poverty schools taught by teachers who meet NCLB HQ definition
N/A
% of classes in low poverty schools taught by teachers who do not meet NCLB HQ definition
N/A

2009 WASL Trend Data
3rd Grade Reading
Year School
District
State
2005
-06
70.5%
66.9%
68.3%
2006
-07
62.7%
67.2%
70.9%
2007
-08
65.4%
70.4%
70.7%
2008
-09
59.7%
78.3%
71.4%
3rd Grade Math
District State
63.3% 64.2%
68.7% 69.6%
68.8% 68.6%
72.5% 66.3%

Year School
District
State
1996
-97
61.4%
51.1% 47.9
%
1997
-98
42.3%
57.6% 55.6
%
1998
-99
65.4%
60.7% 59.1
%
1999
-00
72.2%
67.4% 65.8
%
2000
-01
45.5%
66.3% 66.1
%
2001
-02
60.5%
69.6% 65.6
%
2002
-03
63.9%
64.0% 66.7
%
2003
-04
67.9%
72.4% 74.4
%
2004
-05
66.7%
78.1% 79.5
%
2005
-06
73.3%
80.9% 81.2
%
2006
-07
64.4
% 74.7%
76.6
%
2007
-08
50.0%
72.8% 72.6
%
2008
-09
61.3%
76.2% 73.6
%

4th Grade Math
Year School District State
1996-
97 25.7% 24.2% 21.4%
1997-
98 26.3% 33.6% 31.2%
1998-
99 26.9% 35.3% 37.3%
1999-
00 46.6% 37.9% 41.8%
2000-
01 21.4% 38.1% 43.4%
2001-
02 37.0% 52.1% 51.8%
2002-
03 42.6% 49.6% 55.2%
2003-
04 44.6% 57.0% 59.9%
2004-
05 50.0% 59.3% 60.8%
2005-
06 35.6% 60.2% 58.9%
2006-
07 47.9% 55.5% 58.1%
2007-
08 37.1% 53.1% 53.6%
2008-
09 57.5% 52.3% 52.3%

5th Grade Reading
Year School
District
State
2005
-06
56.1%
73.3% 76.3
%
2006
-07
66.7%
69.8% 71.9
%
2007
-08
60.9%
71.9% 75.6
%
2008
-09
57.1%
72.8% 74.0
%
5th Grade Math
Year School
District
State
2005
-06
43.9%
54.9% 55.8
%
2006
-07
37.0%
58.4% 59.5
%
2007
-08
50.7%
59.7% 61.2
%
2008
-09
41.3%
57.7% 61.9
%
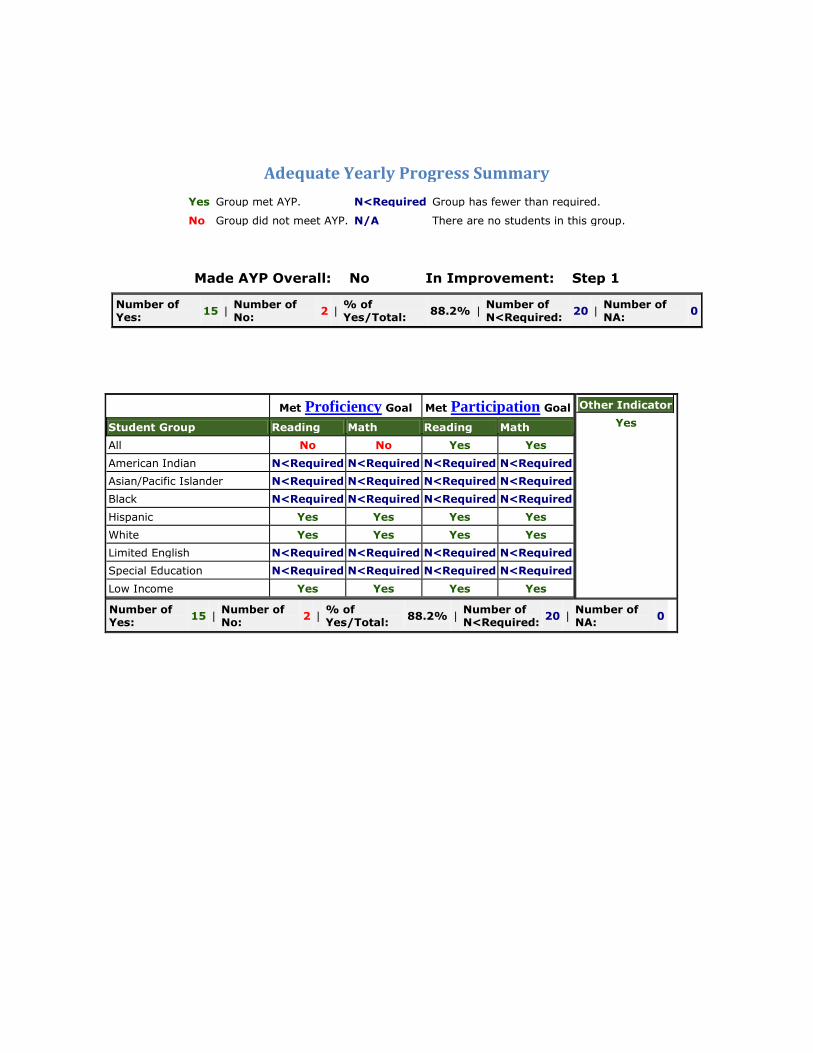
Adequate Yearly Progress Summary
Yes Group met AYP. N<Required Group has fewer than required.
No Group did not meet AYP. N/A There are no students in this group.
Made AYP Overall: No In Improvement: Step 1
Number of Yes:
15 | Number of No:
2 | % of Yes/Total:
88.2% | Number of N<Required:
20 | Number of NA:
0
Met Proficiency Goal Met Participation Goal
Student Group Reading Math Reading Math
All No No Yes Yes
American Indian N<Required N<Required N<Required N<Required
Asian/Pacific Islander N<Required N<Required N<Required N<Required
Black N<Required N<Required N<Required N<Required
Hispanic Yes Yes Yes Yes
White Yes Yes Yes Yes
Limited English N<Required N<Required N<Required N<Required
Special Education N<Required N<Required N<Required N<Required
Low Income Yes Yes Yes Yes
Other Indicator
Yes
Number of Yes:
15 | Number of No:
2 | % of Yes/Total:
88.2% | Number of N<Required:
20 | Number of NA:
0

CEE Staff Survey 2008
Comparison with CEE's Data RepositoryPercent Positive Responses (Further from the Center is MORE Positive)
0%10%20%30%40%50%60%70%80%90%
100%Readiness To Benefit
Clear & Shared Focus
High Standards & Expectations
Effective School Leadership
Collaboration & Communication
Parent & Community Involvement
Supportive Learning Environment
Frequent Monitoring of Teaching &Learning
Focused Professional Development
Curriculum, Instruction, andAssessment: Programs & Processes
Elementary Schools MS/JH Schools High Schools Washington Elem
`
Copyright © 2006 Center for Educational Effectiveness. All Rights Reserved.
CEE Data Repository Schools Your Site

CEE Parent Survey 2008
CEE Student Survey 2008
Parents' View- Nine Characteristics of High Performing Schools
53%
61%
53%
56%
54%
59%
58%
54%
27%
24%
26%
28%
25%
26%
22%
27%
11%
8%
10%
9%
12%
9%
9%
9%
2%
2%
2%
2%
3%
1%
3%
3%
1%
1%
0%
1%
1%
0%
1%
0%
6%
4%
9%
4%
6%
5%
7%
7%
0% 10% 20% 30% 40% 50% 60% 70% 80% 90% 100%
Clear & Shared Focus
High Standards & Expectations
Effective Leadership
Collaboration & Communication
Parent & Community Involvement
Supportive Learning Environment
Monitor Teaching & Learning
High Quality Curriculum, Instruction, andAssessment
Almost Always True Often True Sometimes TrueSeldom True Almost Never True Missing
Monitoring of Teaching & Learning: Summary View
51%
58%
57%
60%
40%
26%
19%
20%
12%
22%
13%
14%
11%
12%
21%
3%
2%
7%
5%
9%
2%
4%
3%
5%
4%
4%
3%
2%
5%
5%
0% 10% 20% 30% 40% 50% 60% 70% 80% 90% 100%
My teachers find other ways for me to learn thingsI find difficult
Teachers clearly tell me what is expected of meat the start of new classes.
My teachers tell me how I can improve to passtests
My teachers make learning interesting
I often see the principal or administrators visitingmy classroom.
Almost Always Often True Sometimes True Seldom True Almost Never True Missing

Improvement Goals
The building principal will work with grade levels and specialists to plan quality
math and reading instruction for all students. In addition, the principal with work
with the Healthy Schools Committee to promote a safe environment that
encourages health, fitness, social and emotional wellness for students and staff.
Parents will continue to play an important role at Washington. There will be
multiple opportunities for parents to communicate their desires for appropriate
home support, learn about their children’s educational experience and participate
in school based programs. School communication will be sent home in multiple
languages when available.
SMART Goal 1:
Math Achievement for All Students Grade levels, third through fifth, will increase the percentage of students meeting standard on the Washington State Math Assessment by 10% each year, 2010 – 2013, and decrease the achievement gap. In addition, grade levels, kindergarten through second, will increase the percentage of students meeting of grade level power standards, as measured by Saxon Math unit assessments. SMART Goal 2: Reading Achievement for All Students
Grade levels, three through five, will increase the percentage of students meeting
standard on the Washington State Reading Assessment by 10% each year 2010-
2013 and decrease the achievement gap by 10%. In addition, all grade levels with
increase the percentage of students meeting the reading benchmark as measured
by DIBELS.
SMART Goal 3:
Coordinated School Health
Washington will work to address the physical and mental health of all students by
promoting a safe environment that encourages health, fitness, social and
emotional wellness for all students and staff, as measured by the Healthy Schools
Survey.

Study Teams
Literacy Goal Group: Christine Anderson Travis Volk, Kristy Kilburg, Dede Garcia Reading Goal Group Research Materials:
Use of Researched Based Reading Instructional Practices , OSPI, 2002 Prevention and Remediation of Severe Reading Disabilities: Keeping the end in Mind,
Torgesen, Wagner & Rashotte, Scientific Studies of Reading, 1 1997
The effects of theoretically different instruction and student characteristics on skills of struggling readers, Mathes, Denton & Fletcher, Reading Research Quarterly, 40, 148-182.
Early Identification and intervention of phonological deficits in Kindergarten and early elementary children at risk of reading disability, Felton and Pepper, School Psychology Review, 24, 405-414
Assisting Students Struggling with Reading; What Works Clearinghouse, 2009
Math Goal Group: Susan Paulson, Katie Anderson, Tori Smith Math Goal Group Research Materials:
Manipulatives in K-6 Mathematics Learning and Teaching, paper presented at the annual conference of the Association for Research in Education, Howard, Perry, and Conroy. 1995
Monitoring measures in mathematics: A Review of the Literature, Foegen, Jiban, and Deno, The Journal for Special Education, 41, 121-139. 2007
Early Identification and Interventions for Students with Mathematics Difficulties, Gersten, Jordan, and Flojo, Journal of Learning Disabilities, 38, 293-304. 2005
Explicit Instruction In Mathematics Problem Solving, Dearach, Carnine, Gersten, Journal of Educational Research, 77, 351-359. 1984
Supportive Learning Environment Goal Group: Pauline Thomas, Linda Graves, Dan St Mary, Bonnie Cannon, Candi Llera, Representative from Child Nutrition , Linda Graves, parent Supportive Learning Environment Research Materials:
Action for Healthy Kids workshop
Value of Improving Nutrition and Physical Activity-David Satcher, MD PHD. The Cost of the Status Quo –Action for Healthy Kids Coordinated School Heath Guide- Pierce County Health Department.

ACTION PLANS
Instructional Program Description
Building Principal, Grade Level Teams and Specialist will meet to coordinate the use of quality of instructional materials and plan the master schedule. Principal will monitor and evaluate staffs in their use of effective methods and instructional strategies that are based on scientifically based research. Washington’s math and reading programs will be consistent with, and designed to implement our School Improvement Plan, and prepare students to meet grade level standards. Instructional strategies will address the needs of all children in the school but particularly the needs of low performing children. Title 1 funds are used for school-wide programs in both math and reading to support the School Improvement Plan Goals and Strategies. School-wide opportunities will include but are not limited to following: targeted strategic instruction groups, reduced class size during math and reading, Walk to Read and Walk to Math blocks, school-wide assessment. Title 1 staff will facilitate parent math support with math unit newsletters for grades k-2, reading newsletters for primary and intermediate grades and grade level curriculum night opportunities when funds are available.
Highly Qualified Staff
Building principal works closely with the department of Human Services to insure that all staff meets the requirements of NCLB. In addition, professional development will emphasize best practices in reading and math with a focus placed on instruction delivery and direct instruction. There are 31 classroom teachers at Washington. None have emergency credentials. 61% of the staff hold a Masters Degree. All certificated staff and instructional para-educators meet the No Child Left Behind definition of highly qualified.
Assessment Decisions
State required assessment for grades two through five will be given as directed. Auburn School District required assessments: Trimester DIBELS Reading Benchmark assessments given to all students grades K-5, Kindergarten Trimester Skills Screen, trimester MAPS testing (reading and math) for grades three through five, and grades K-5 district writing assessments.

Building based assessments: Reading: Monthly DIBELs reading progress monitoring will be given to all students that are at benchmark and below. Students that have exceeded grade-level, benchmark goals for end of year in the fall, are exempt from oral fluency progress monitoring. Grade level PLCs and specialists will use additional assessments to gather student data and make instructional decisions as needed. These assessments may include but are not limited to the following: phonics and comprehension diagnostic tools, teacher written formative assessments, STAR Reading, high frequency words, and assessments included in research based reading programs used for each Tier of reading instructions of instruction. Math: Grade level PLCs and specialists will use additional math assessments to gather student data and make instructional decisions as needed. These assessments may include but are not limited to the following: Math Facts in a Flash progress monitoring, Larsen’s math, and assessment included in research based math curriculum, math screening and diagnostic tools, teacher written formative assessments. Healthy Schools: Building and program based assessments will include but are not limited to the following: Bullying survey: both student and parent, Annual Healthy School Survey, which included nurse, counselor, custodian, counselor, food service and physical education.
Assistance to Students Experiencing Difficulty
Washington Elementary will provide targeted strategic instruction groups at all grade levels. In addition, extended learning opportunities will support students experiencing difficulty in math and reading. Quality instructional materials will be purchased to fill instructional material gaps and support Tier 2 and Tier 3 intervention in math and reading.

Timeline for Planning Process
Washington staff looked closed at building data to identify needs. This included academic areas and perception data. Staff members visited programs that were successful in other schools with like demographics. Math and Reading finding from the “What Works Clearing House” was review and Healthy school research search was reviewed to fin teams as well as Healthy schools committee review the After review data and doing a review of research In this section write a narrative about how you developed your action plans (SMART Goals). FALL
Oct 20 Washington School Improvement Team met to plan for the fully revised SIP process. Principal reviewed the plan and participants were selected. Nov 23 District SIP Training Sessions1, Data Analysis and Goal Setting Nov Healthy Schools Team met and took surveys Dec 2, 9, 16 Staff review data using Data Carousal, prioritizing process Dec 16 District SIP Training Session 2 using Data: Building Literacy in At- Risk Learners WINTER Jan 5 building SIP Team review Data Carousal and prioritizing results Jan 6 District SIP Training Session 2 using Data: Building Math Literacy in At- Risk Learners Feb Visitation “Fishbowl” Alpac PLC March Visitation “Fishbowl” While Rive School District PLC March Release Day to review research March Share research finding with staff via email SPRING March Building support with Martha Tiegan Grade 1 March SIP team sub-committee plan writing April Staff reviews Goals at PLCs April Sip Team make revision based on feed back

Planning Implementation Calendar, 2010-2011: SPRING-SUMMER May Healthy Schools PLC meet to review goals and plan for fall June Instructional materials ordered as need to support math and reading Training and review of standard aligned curriculum by PLCs Screening kindergarten enrollees PLCs meet to review end of the year assessment data PLC binders developed and in place August Jump Start program for entering at-risk kindergarteners PLCs meet to review data and plan for differentiated instruction Math standards based assessment chosen Power Standards Posters Dates for PLCs pm calendar -Building 21 Dates for Assessments on calendar Build master schedules to meets instructional needs Sept School-wide open house, Instructional Goals in multiple Languages Counselor review choices curriculum with classes Teachers have school rules and procedures in place Teachers implement school climate plan (i.e. Think Time, Community Circle) Reading and Math Plans sent home Screening of all students in math and reading Oct Differentiated Instruction groups in place for math and reading at all grades Staff training on use of DIBELS online Monthly parent communication in place for math and reading progress monitoring WINTER Jan District Assessments DIBELs, Maps, Writing Feb PLC review data adjust differentiated instruction groups as needed Ongoing PLCs plan for formative assessment, assess and review data, monitor instruction based on results. SPRING May State and District required assessments June Review student data Parent surveys sent home Plan for next school year

Current Reality Spring 2011
Math
Grade CE
Students
%CE Met Adj. Met Uniform 2012
Uniform
3 63 60.3 74.7 58 79
4 77 66.2 78.8 58 79
5 58 63.8 78.5 58 79
Reading
Grade CE
Students
%CE Met Adj. Met Uniform
Bar
3 63 73 86 88.1
4 77 61 73.9 88.1
5 58 74.1 87.5 88.1
2011-2012 Planning Implementation Calendar
Planning Implementation Calendar, 2011-2012: SPRING-SUMMER May: Healthy Schools PLC meet to review goals and plan for fall
Testing groups developed for MSP Plan for Summer School Test in-coming kindergarten students
June: Instructional materials ordered to support math and reading Training and review of standard aligned curriculum by PLCs Screening kindergarten enrollees PLCs meet to review end of the year assessment data RTI/Case Study Revision developed and in place
Aug: Staff Trained in Standards Based Report card Title 1 Summer School for students entering grades K-4 Staff meets to review data and plan for instruction
Academic Data Reviewed: MSP 2010 & 2011 Math and Reading: Grade Levels, Cells, Ethic Group, Individual Student Reports. DIBELS 2010 & 2011: Student Growth, Grade Level Growth and
Ethnic Summary Reports.

STAR 2010-2011: individual student growth MAPS Math and Reading 2010-2011: Individual student scores. Kindergarten Trimester Skills in Reading and Math: Individual student scores
AMAO 2011 reflect results of sprint WLPT testing of ELL students
Perceptual and Environment Data Reviewed: Demographics: three year trend Bullying Report for grades 3-5. Trends noted and student comments reviewed. CEE: Staff and Parent Reports Healthy School Report
Dates for Building 21 and PLCs on calendar Dates for Assessments on calendar Build master schedules built to meet instructional needs School-wide open house, Instructional Goals in multiple Languages, Saxon Parent Child Math Night
Sept: Counselor review choices curriculum with classes
Teachers have school rules and procedures in place Teachers implement school climate plan (i.e. Think Time, Community Circle) Reading and Math Plans sent home Screening of all students in math and reading Phonics Blast Training
Oct: Differentiated Instruction groups in place for math and reading at all grades
Progress monitoring reading
Nov: Grade Level Parents as Partners in Education Meetings Parent conferences scheduled and translators requested Grade levels meet after Parent conferences to adjust differentiated Instruction Groups
WINTER Jan: District Assessments DIBELs, MAPs, Writing Feb: PLC review data adjust differentiated instruction groups as needed

On Going: PLCs plan for formative assessment, assess and review data, monitor instruction based on results.
SPRING May: State and District required assessments June: Review student data
Parent surveys sent home Plan for next school year

School Improvement Planning SMART Goal Worksheet
School Name: WASHINGTON
ELEMENTARY
SMART GOAL
Subject Area: READING
Target
Population:
ALL STUDENTS
Our Reality: The sub cell of Hispanic and low income made AYP in reading but
the ALL cell did not make AYP
Our SMART
Goal:
Grade three through five will increase the percentage of students
meeting standard on the Washington Reading MSP by 10% each
year 2010-2013 and decrease the achievement gap by 10%.
Grade 2009 2010 2011 2012
3 59.7 69.7 79.7 89.7
4 61.3 71.3 81.3 91.3
5 57.1 67.1 77.1 87.1
In addition, all grade levels will increase the percentage of
students meeting the reading benchmark as measured by DIBELS.
Strategies
from the
District
Strategic
Improvement
Plan
1.a.1 Establish professional Learning Communities,1.a.3 Develop
common formative assessments, 1.a.4 Implement a pyramid of
interventions, 1.a.5 Establish extended learning models, 1.c.2 Use
district developed power standards, 1.c.3 Monitor student
learning and adjust instruction to achieve power standards.
Action Plan

Action Steps Responsibility Timeline Resources Evidence of SMART Goal Attainment
Staff will work in Professional Learning Communities to purposefully analyze reading data identifying both student needs and strengths.
Principal, Lang Arts Sp, Grade Level PLCs , Reading support staff.
Screening data Testing: Spring/Summer students entering kindergarten August, Sept., Feb., June All continuing students. Data Review: PLC meetings Spring and August to view and form groups
Reading Data may include but not limited to DIBELS, MAPS, STAR Grade level binder with Formative & Summative assessments Trimester Scope/Sequence
Grade level teams will keep a binder showing assessment data and meeting notes. MSP and DIBELs assessments will show a 10% increase in the number of students reaching benchmark
Provide differentiated instruction for all students based on current assessments.
Grade level PLCs and reading support staff.
Monthly: Formative Assessments
-Data may include but not limited to diagnostic assessments, progress monitoring passages, common grade level skills tests, skills and strategy assessments
Grade level teams will keep a binder showing assessment data and meeting notes. Both MSP and DIBELS assessments

from differentiated instruction groups -PLC time to choose assessments -Quality reading curriculum for above benchmark, benchmark, strategic and intensive level students.
will show a 10% increase in the number of students reaching benchmark
Regular Progress Monitoring of benchmark, strategic, and intensive level readers.
Instructional staff: Language Arts Specialist, Classroom Teachers, Title Paras, Principal
Monthly progress monitoring
-DIBELs Progress Monitoring passages -Staff trained to enter data into DIBELs and print reports -Assessment time decided upon by PLCs
DIBELs progress monitoring reports and summary data reports
Intensive, systematic instruction for below benchmark students.
Principal Reading support staff Classroom teachers
Fall: Begin when student screening and diagnostic assessments are complete Ongoing: as students enroll and need arises
-Building schedule that allows for 90 mins of core reading instruction in grades K-3 and 60 mins in grades 4-5 -Additional minutes of small group time for
Schedule will reflect minutes of instruction and student data will reflect students served for Tier two and materials used.

tier 2 students. -Research based instructional materials
Provide tier 3 instruction for students who show minimal progress over a reasonable amount of time.
Lang Arts Sp PLCs Principal
Ongoing as need arises
-Regular review of assessment and student progress. -Diagnostic assessment information -Quality instructional material -Highly trained reading support staff
Building data bases to record interventions

School Improvement Planning SMART Goal Worksheet
School Name: Washington Elementary SMART GOAL
Subject Area: Math
Target
Population:
All students
Our Reality: MSP 2009: 3rd Grade 47.2%, 4th Grade – 57.5%, 5th Grade – 41.3%
Our SMART
Goal:
Each grade level, third through fifth, will increase the percentage
of students meeting standard on the math MSP by 10% each year
2010 – 2013 and decrease the achievement gap by 10% reaching
the following targets: Grade 2010 2011 2012
3rd 57.2 67.2 87.2
4th 67.5 77.5 87.5
5th 51.3 61.3 81.3
Grade levels, kindergarten through second, will increase the
percentage of students progressing toward mastery of grade
level power standards as measured by Saxon Math unit
assessments.
Strategies
from the
District
Strategic
Improvement
Plan
1.a.1 Establish professional Learning Communities,1.a.3 Develop
common formative assessments, 1.a.4 Implement a pyramid of
interventions, 1.a.5 Establish extended learning models, 1.c.2 Use
district developed power standards, 1.c.3 Monitor student
learning and adjust instruction to achieve power standards.
Action Steps Responsibility Timeline Resources Evidence of SMART Goal Attainment
Staff will work in Professional Learning Communities
Principal, Grade Level PLCs instructional
Screening data Spring/Summer entering kindergarten
Data may include but not limited to both
Grade level teams will keep a binder showing

to purposefully analyze math data identifying both student needs and strengths.
support staff. students August, September, February, June All continuing students PLC meetings Spring and August to view data Continue monitoring progress on an ongoing Initially form flexible (Pop-Drop) groups based Fall Benchmark Data
summative and formative math assessments
assessment data and meeting notes. MSP will show an increase in the number of students meeting standard
Students will be screened to identify their strengths and difficulties
Math specialist Grade level PLC’s
Spring PLCs review post scores August PLCs Review data for new classes including MSP. Fall PLCs review fall assessment data
PLC time MAPs Training Grade level standards based screening tool
All students screened and at risk students identified by October first. New students during their initial week at Washington.

Explicit and systematic instruction based on district power standards.
Teacher/ Specialists Principal
Ongoing
Standards based curriculum Aligned instruction Schedule to allow for core math and differentiated instructional model. A minimum of 90 minutes of math instruction each day.
Power standards will be evident in lessons, assessments, student work, and grading. Power Standards Poster will be visible in all classrooms.
Regular progress monitoring of all students help PLCs plan for instruction and meet the instructional needs of all students.
Grade level PLC’s, Specialist, Principal
After each unit or standard taught
PLC Time Grade level common formative and summative assessments to drive instruction.
Common formative assessments given as determined by PLC’s. District problem solving assessment will be given after each unit. Grade level standards based assessment will be given three
times each year.

Differentiated instruction to meet the needs of all students based on screening assessment and progress monitoring.
Teacher/Grade level PLC’s Specialists Principal
Ongoing
PLC Time After school programs Beyond standard instructional materials Additional staff support
A decrease in the number of students receiving tier 3 interventions.
Intensive systematic instruction for below benchmark students.
Principal Math specialist teachers
Fall screening Diagnostic assessment. Ongoing assessments as determined by instructors and PLCs
Extended learning opportunities Research Based Curriculum
Schedule will reflect additional minutes of instruction. Student data will reflect students served for Tier 2 and materials used.

School Improvement Planning SMART Goal Worksheet
School
Name: Washington Elementary
SMART GOAL
Subject Area:
Coordinated
School Health
Target
Population:
ALL
Our Reality: Have an increase in the number of students who come from low
income home and attend multiple schools
Our SMART
Goal:
Coordinated School Health. Washington will work to address the
physical and mental health of all students and staff by promoting
a safe environment that encourages health, fitness, social and
emotion wellness for all students.
Strategies
from the
District
Strategic
Improvement
Plan
Goal 3: Parents/Guardians and Community Partnerships The district and schools will continue to develop partnerships to support student academic achievement and success.
Action Steps Responsibility Timeline Resources Evidence of SMART Goal Attainment
Increase the capacity to implement a coordinated school heath plan.
Consultant from School Health
Advisory: Compile survey findings and make recommendations
Winter 2010: Survey Healthy School Team
Surveys , representatives from all stakeholders, consultant from School Health Advisory
Survey completed and report summary written

Develop a coordinated School Plan and set priorities
Principal: Set
Meeting Times
Spring, 2010
Summary of findings representatives from all stakeholders, Consultant from School Health Advisory
Plan in place and presented to staff
Implement plan
Principal: Sets meeting times PE Teacher: Plans organized recess activities for 3-5th grades
Principal: Implement Recess Before lunch Principal: Enhance ‘Mileage Club’ PTA/Partnership: Encourage Healthy/Green Fundraisers
Fall Fall and Spring Fundraisers
Review Building Plan Revised Master Schedule Revised Master Schedule AmeriCorp Staff Member PTA Committee members
Stake holders document use of resources and implementation of plan Structured activities began in September Implementation of new policy Mileage Club available at all lunch recesses 5 days a week Fundraisers support healthy lifestyles

Counselor-Principal: implementation of anti-bullying and positive classroom management systems School Nurse: Implement Hand Washing Policy PE Teacher, Nurse, Kitchen Manager: Improve communication with parents promoting student participation in physical activity and healthy eating
Fall All Year All Year
Olweus, Think Time & Kelso’s Choices, Curriculum
Assemblies Training of Staff, Soap/Hand sanitizer Building Web site, News Letters, Flyers, PTA meetings, Open House, Conferences
Staff Professional Development, Think Time Assembly, Kelso’s Choices painted on Play sheet, Anti Bullying skits at assemblies, Counselor classroom lessons, Review Bully survey data, Students and staff wash hands before eating breakfast, lunch, snacks Parent’s access to health and wellness resources is increases

March 12, 2012 Page 5
PERSONNEL--CERTIFICATED AND CLASSIFIED 1. Certificated and Classified Personnel Report Attached is the personnel report, for certificated and classified
personnel, for the board’s approval. Recommendation: That the board approve the attached
report.

Monday, March 12, 2012
PERSONNEL--CERTIFICATED
Curriculum/Non-Curriculum hours
21st century grant extended day
Hill, Angela 6 hour(s) @ hourly rate of pay effective 3/30/2012
1 .
Massimino, Jay 12 hour(s) @ hourly rate of pay effective 3/30/2012
2 .
Rowe, Daniela 6 hour(s) @ hourly rate of pay effective 3/30/2012
3 .
Thornhill, Rashelle 12 hour(s) @ hourly rate of pay effective 3/30/2012
4 .
Travis, Stephanie 12 hour(s) @ hourly rate of pay effective 3/30/2012
5 .
Advisory coordinator
Erie, Janice 45 hour(s) @ hourly rate of pay effective 9/7/2011
1 .
Morrow, Jonathan 45 hour(s) @ hourly rate of pay effective 9/7/2011
2 .
CPPW grant curr adoption
Arend, Christine 2 hour(s) @ hourly rate of pay effective 2/14/2012
1 .
Moberg, Julie 1 hour(s) @ hourly rate of pay effective 2/14/2012
2 .
St. Mary, Daniel 2 hour(s) @ hourly rate of pay effective 2/14/2012
3 .
Walker, Glen 1 hour(s) @ hourly rate of pay effective 2/14/2012
4 .
Early childhood comm fair event
Locke, Roberta 6 hour(s) @ hourly rate of pay effective 1/2/2012
1 .
Early learning comm event
Huft, Joy 4 hour(s) @ hourly rate of pay effective 3/1/2012
1 .
Page 1

Monday, March 12, 2012
Peters, Dorothea 4 hour(s) @ hourly rate of pay effective 3/1/2012
2 .
Early literacy support
Gustafson, Gena 30 hour(s) @ hourly rate of pay effective 9/7/2011
1 .
EOC math refresher course
Earl, Thomas 4 hour(s) @ hourly rate of pay effective 1/1/2012
1 .
Luong, Jacob 4 hour(s) @ hourly rate of pay effective 1/1/2012
2 .
Extended day kindergarten program
Seeley, Mary Jo 10.5 hour(s) @ hourly rate of pay effective 2/27/2012
1 .
HSPE coordinator
Tapp, Nancy 30 hour(s) @ hourly rate of pay effective 3/1/2012
1 .
In-house suspension
Armstrong, Vicki As needed effective 2/15/2012 1 .Stipend $2040
Inservice prep
Cockcroft, Elsbeth 1 hour(s) @ hourly rate of pay effective 9/1/2011
1 .
Connelly, Ericka 1 hour(s) @ hourly rate of pay effective 9/1/2011
2 .
Erie, Janice 1 hour(s) @ hourly rate of pay effective 9/1/2011
3 .
Gunderson, Erik 1 hour(s) @ hourly rate of pay effective 9/1/2011
4 .
Henry, Katie 1 hour(s) @ hourly rate of pay effective 9/1/2011
5 .
Pratt, Cindy 1 hour(s) @ hourly rate of pay effective 9/1/2011
6 .
Page 2

Monday, March 12, 2012
Wasserman, Michael 1 hour(s) @ hourly rate of pay effective 9/1/2011
7 .
LAP early bird reading
Stevens, Jolie 42 hour(s) @ hourly rate of pay effective 2/14/2012
1 .
LAP math program
Stalmaster, Margaret 10.5 hour(s) @ hourly rate of pay effective 2/27/2012
1 .
LAP reading intervention support
Cavenee, Pamela 125 hour(s) @ hourly rate of pay effective 2/13/2012
1 .
Parent support early learning fair
Jacobsma, Amanda 6 hour(s) @ hourly rate of pay effective 2/13/2012
1 .
Zaldivar, Melisa 6 hour(s) @ hourly rate of pay effective 2/13/2012
2 .
Teacher leadership project
Gallinatti, Lisa 5 hour(s) @ hourly rate of pay effective 2/16/2012
1 .
James, Susan E. 5 hour(s) @ hourly rate of pay effective 2/16/2012
2 .
Medina, Frank 5 hour(s) @ hourly rate of pay effective 2/16/2012
3 .
Water polo boys coach
Van Eaton, Michael 90 hour(s) @ hourly rate of pay effective 9/1/2011
1 .
Leave
Teacher
Bachelder, Patricia effective 6/20/2012 1 .Personal2012-13 school year
New Hire
Teacher
Page 3

Monday, March 12, 2012
Brooks, Stacey effective 2/21/2012 1 .ReplacementTOSA--Native American
Laukala, Rachel effective 2/27/2012 2 .ReplacementMath specialist (.6)
Resignation/Retire
Teacher
King, Stefanie effective 6/20/2012 1 .Relocation
Luke, William Scott effective 6/20/2012 2 .Retirement
Page 4

Monday, March 12, 2012
PERSONNEL--CLASSIFIED
Rehire
Para-Educator LAP
Starr, Diane 6 hour(s) for 20 day(s) @ hourly rate of pay effective 3/7/2012
1 .
2011-12 school year
Westendorf, Linda 6 hour(s) for 20 day(s) @ hourly rate of pay effective 3/7/2012
2 .
2011-12 school year
Page 5

March 12, 2012 Page 6
FINANCE 1.
Vouchers
Vouchers will be presented. Recommendation: That these vouchers be signed. 2.
Comprehensive Annual Financial Report
Attached is the 2011 Comprehensive Annual Financial Report for the district. On page 9 in the Financial Section is the State Auditor's Opinion indicating that our financial records are in excellent shape. The financial report itself reflects that the district managed its finances prudently for fiscal year 2011.
This report has been submitted to the Association of School Business
Officials (ASBO) for consideration for a Certificate of Excellence Award. The report has also been submitted to the Municipal Securities Rulemaking Board (MSRB) through the Electronic Municipal Market Access (EMMA) data port as required by bond covenants. In addition, those financial institutions that have purchased our bonds; the bond rating agencies, Moody's Investor Service and Standard and Poor's Corporation; the credit rating agency, Dunn and Bradstreet; as well as other interested members of the financial community will be notified that the report has been posted to the Business Services section of the district’s website.
Toni Lally, executive director of business services, will highlight the
2011 Comprehensive Annual Financial Report and answer questions from the board.
3.
Award of Contract—Bid 641—Wireless Network Installations
A tabulation of the bids received for the purchase of the Wireless Network Installations is attached. It is recommended to award the contract to the low resp onsive bidder, Leverage Information Systems as shown on the attached tabulation. Total recommended award is $134,440.64.
Recommendation: That the contract be awarded to the low
responsive bidder as indicated above.

3apckp07.p AUBURN SCHOOL DISTRICT NO. 408 9:01 AM 03/08/12 04.12.02.00.00-010018 Check Summary PAGE: 1 Payments have been audited and certified by the Auditing Officer as required by RCW 42.24.080, and those expense reimbursement claims certified as required by RCW 42.24.090. Those payments have been recorded on a listing which has been made available to the board. As of March 12, 2012, the board, by a __________________________ vote, does approve for payment those checks (warrants) included in the following list and further described as follows: US Bank of Washington Check Number 404765 through 405002 in the total amount of $639,901.69. Secretary ________________________ Board Member ________________________ Board Member ________________________ Board Member ________________________ Board Member ________________________ Board Member ________________________ Check Nbr Vendor Name Check Date Check Amount 404765 911 ETC INC 03/12/2012 308.60 404766 AAGRO TREE SERVICE INC 03/12/2012 3,777.75 404767 ACHIEVEMENT PRODUCTS INC 03/12/2012 19.61 404768 AGRISHOP INC 03/12/2012 271.75 404769 AINSWORTH, ALLISON 03/12/2012 35.03 404770 ALONZO, GEORGINA 03/12/2012 6.00 404771 AMERICAN RED CROSS 03/12/2012 110.00 404772 ANDERSON, CHRIS 03/12/2012 118.51 404773 APEX LEARNING INC 03/12/2012 2,710.13 404774 ARAMARK UNIFORM SERVICES 03/12/2012 43.69 404775 AUBURN MOUNTAINVIEW H S 03/12/2012 27.38 404776 AUBURN MOUNTAINVIEW H S 03/12/2012 1,200.00 404777 AUBURN PARKS, ARTS & RECREATIO 03/12/2012 115.00 404778 AUBURN SCHOOL DIST CHILD NUTR* 03/12/2012 97.62 404779 AUBURN GYMNASTICS CENTER INC 03/12/2012 320.00 404780 BANC OF AMERICA LEASING 03/12/2012 101.23 404781 BARNES & NOBLE INC 5903315 03/12/2012 18.39

3apckp07.p AUBURN SCHOOL DISTRICT NO. 408 9:01 AM 03/08/12 04.12.02.00.00-010018 Check Summary PAGE: 2 Check Nbr Vendor Name Check Date Check Amount 404782 BEARCOM 03/12/2012 422.67 404783 BINDER PRODUCTS INC 03/12/2012 750.10 404784 BLICK ART MATERIALS 03/12/2012 682.71 404785 BLUMENTHAL UNIFORMS & EQUIPMEN 03/12/2012 724.91 404786 BOILERMASTERS INC 03/12/2012 2,461.01 404787 BROOKES PUBLISHING CO 03/12/2012 99.74 404788 BRYSON SALES & SERVICE 03/12/2012 916.19 404789 CAMP BERACHAH 03/12/2012 1,420.74 404790 CAREERSTAFF UNLIMITED INC 03/12/2012 12,420.00 404791 CARPINITO BROTHERS INC 03/12/2012 514.65 404792 CASCADE NETS INC 03/12/2012 2,969.29 404793 CASCADE BEAUTY COLLEGE 03/12/2012 735.75 404794 CHANNING BETE COMPANY INC 03/12/2012 129.16 404795 CHILDRENS BOOKSHOP 03/12/2012 119.68 404796 CHUCKALS INC 03/12/2012 74.91 404797 CITY OF AUBURN 03/12/2012 22.50 404798 CITY OF PACIFIC 03/12/2012 3,196.35 404799 CLAUSEN, VICTORIA 03/12/2012 1,128.48 404800 CLAY ART CENTER INC 03/12/2012 595.22 404801 COLWELL, LISA 03/12/2012 4.00 404802 COMCAST 03/12/2012 66.95 404803 COMMERCIAL CHEMTECH INC 03/12/2012 3,448.99 404804 CONSOLIDATED ELECTRICAL DIST I 03/12/2012 65.02 404805 CUMMINS NW LLC 03/12/2012 304.03 404806 DAIRY FRESH FARMS INC 03/12/2012 36,275.14

3apckp07.p AUBURN SCHOOL DISTRICT NO. 408 9:01 AM 03/08/12 04.12.02.00.00-010018 Check Summary PAGE: 3 Check Nbr Vendor Name Check Date Check Amount 404807 DEPT OF ENTERPRISE SERVICES 03/12/2012 350.00 404808 DEPT OF LICENSING 03/12/2012 80.00 404809 DEPT OF RETIREMENT SYSTEMS 03/12/2012 836.29 404810 DISHNETWORK 03/12/2012 24.59 404811 DWF WHOLESALE FLORIST SEA TAC 03/12/2012 295.55 404812 DYNAMIC LANGUAGE CENTER INC 03/12/2012 71.30 404813 EBS HEALTHCARE STAFFING SERVIC 03/12/2012 19,979.28 404814 EDEN ADVANCED PEST TECHNOLOGIE 03/12/2012 481.81 404815 EDWARDS, ERIN R 03/12/2012 40.00 404816 ELLIOTT, JODI 03/12/2012 103.75 404817 ERICKSON, MARILYN R 03/12/2012 6.77 404818 FLEETPRIDE 03/12/2012 111.47 404819 FOLLETT LIBRARY RESOURCES 03/12/2012 725.16 404820 FOOD SERVICES OF AMERICA 03/12/2012 103,382.59 404821 FREDERICK, ROBERTA 03/12/2012 35.00 404822 FULL COMPASS SYSTEMS LTD 03/12/2012 514.65 404823 GENSCO INC 03/12/2012 7.99 404824 GOS PRINTING CORP 03/12/2012 446.43 404825 GOSNEY MOTOR PARTS INC 03/12/2012 1,982.21 404826 GRAINGER DEPT 810392688 03/12/2012 1,189.24 404827 GUARDIAN SECURITY SYSTEMS INC 03/12/2012 1,524.00 404828 HAGGEN INC 03/12/2012 24.14 404829 HAMMOND ASHLEY VIOLINS 03/12/2012 386.07 404830 HARBOR FREIGHT TOOLS 03/12/2012 122.19 404831 HARPER BRUSH DISTRIBUTORS INC 03/12/2012 96.35

3apckp07.p AUBURN SCHOOL DISTRICT NO. 408 9:01 AM 03/08/12 04.12.02.00.00-010018 Check Summary PAGE: 4 Check Nbr Vendor Name Check Date Check Amount 404832 HEALTH VENTURE 03/12/2012 1,968.75 404833 HOLM, CYNTHIA 03/12/2012 1,391.39 404834 HOME DEPOT CREDIT SERVICES 03/12/2012 597.50 404835 IBBETSON THERAPEUTIC SERVICES 03/12/2012 11,476.00 404836 IMAGE MASTERS INC 03/12/2012 219.44 404837 INFINITI LLC 03/12/2012 201.04 404838 INGRAM LIBRARY SERVICES INC. 03/12/2012 59.44 404839 INTERWEST RECYCLE & LANDSCAPIN 03/12/2012 62.11 404840 JOHN JULIAN & SON 03/12/2012 422.65 404841 JOHNSTONE SUPPLY 03/12/2012 109.25 404842 JOSTENS INC 03/12/2012 28.55 404843 JW PEPPER & SON INC 03/12/2012 495.34 404844 K DATA SYSTEMS LLC 03/12/2012 59.97 404845 KING COUNTY DIRECTORS ASSN 03/12/2012 3,508.15 404846 LANA L. TRAYNOR LLC 03/12/2012 22,000.00 404847 LES SCHWAB TIRE CENTER 03/12/2012 1,800.33 404848 LIBRARY VIDEO CO 03/12/2012 336.44 404849 LIDS TEAM SPORTS 03/12/2012 87.80 404850 LITTLE, KAREN A 03/12/2012 110.82 404851 LOWES HIW INC 03/12/2012 1,060.07 404852 MARTIN, JEFFREY WADE 03/12/2012 15.00 404853 MCLENDON HARDWARE INC 03/12/2012 287.07 404854 MECHANICAL SALES INC 03/12/2012 1,615.13 404855 MICRO COMPUTER SYSTEMS INC 03/12/2012 1,543.19 404856 MIDAMERICA BOOKS 03/12/2012 355.30

3apckp07.p AUBURN SCHOOL DISTRICT NO. 408 9:01 AM 03/08/12 04.12.02.00.00-010018 Check Summary PAGE: 5 Check Nbr Vendor Name Check Date Check Amount 404857 MIDWEST SIGN SCREEN PRINT 03/12/2012 148.63 404858 MOUNTAINS TO SOUND GREENWAY TR 03/12/2012 400.00 404859 MURREYS DISPOSAL CO INC 03/12/2012 585.18 404860 MUSIC CENTERS INC 03/12/2012 477.03 404861 NEUROPATH LEARNING COMPANY INC 03/12/2012 4,872.00 404862 NIELSEN-HOMAN, JANET 03/12/2012 27.75 404863 NORTHWEST OPERA IN SCHOOLS 03/12/2012 600.00 404864 NW BATTERIES 03/12/2012 256.23 404865 OFFICE DEPOT INC 03/12/2012 508.45 404866 OMNITRON ELECTRONICS INC 03/12/2012 921.50 404867 ORANGE COUNTY DEPT OF EDUCATIO 03/12/2012 2,326.79 404868 ORCA PACIFIC INC 03/12/2012 239.65 404869 PACIFIC WELDING SUPPLIES 03/12/2012 26.24 404870 PARKER PAINT MFG CO INC 03/12/2012 607.52 404871 PETRO CARD 03/12/2012 34,393.09 404872 PIERCE COUNTY BUDGET & FINANCE 03/12/2012 51.96 404873 PLATT ELECTRIC 03/12/2012 363.54 404874 PROGRESSUS THERAPY INC 03/12/2012 1,133.70 404875 PUGET SOUND ENERGY ELECTRIC 03/12/2012 19.00 404876 PUGET SOUND ENERGY NAT GAS 03/12/2012 25,358.85 404877 REDCOMET 03/12/2012 500.00 404878 REFRIGERATION HARDWARE SUPPLY 03/12/2012 103.83 404879 RESCUE ROOTER ARS 03/12/2012 370.11 404880 RESILITE SPORTS PRODUCTS INC 03/12/2012 53.66 404881 RICHARDSON, KIM RENE 03/12/2012 300.00

3apckp07.p AUBURN SCHOOL DISTRICT NO. 408 9:01 AM 03/08/12 04.12.02.00.00-010018 Check Summary PAGE: 6 Check Nbr Vendor Name Check Date Check Amount 404882 ROMAINE ELECTRIC CORPORATION 03/12/2012 35.09 404883 SAFEWAY INC 03/12/2012 339.97 404884 SCHETKY NW SALES INC 03/12/2012 788.85 404885 SCHOOL SPECIALTY 03/12/2012 130.28 404886 SCOTT ENGINEERING INC 03/12/2012 11,437.00 404887 SEATTLE KING CO PUBLIC HEALTH 03/12/2012 12,598.00 404888 SHARP ELECTRONICS INC 03/12/2012 24.99 404889 SOCIAL STUDIES SCHOOL SERVICE 03/12/2012 307.68 404890 SOUND ENERGY SYSTEMS 03/12/2012 8,752.92 404891 SPANN, CECILY 03/12/2012 326.34 404892 SPECIALTY FOREST PRODUCTS INC 03/12/2012 1,093.83 404893 SPECIALTY METALS CORPORATION 03/12/2012 970.83 404894 SPEECH CONNECTIONS LLC 03/12/2012 9,690.00 404895 SPEEDY AUTO GLASS INC 03/12/2012 175.20 404896 STAPLES ADVANTAGE 03/12/2012 5,585.75 404897 SUPERIOR PLUS CONSTRUCTION PRO 03/12/2012 384.12 404898 TACOMA SCREW PRODUCTS INC 03/12/2012 177.41 404899 TACOMA SYMPHONY ORCHESTRA 03/12/2012 186.00 404900 THERMAL SUPPLY INC 03/12/2012 106.98 404901 TOP ECHELON CONTRACTING INC 03/12/2012 4,681.20 404902 TOTAL FILTRATION SERVICES, INC 03/12/2012 361.46 404903 TRANE US INC 03/12/2012 616.37 404904 TRIM FLEX VINYL 03/12/2012 68.75 404905 UNIFIRST CORPORATION 03/12/2012 408.62 404906 VAVRIK, DONNA 03/12/2012 6,480.00

3apckp07.p AUBURN SCHOOL DISTRICT NO. 408 9:01 AM 03/08/12 04.12.02.00.00-010018 Check Summary PAGE: 7 Check Nbr Vendor Name Check Date Check Amount 404907 WALMART SAMS CLUB 03/12/2012 270.09 404908 WASH ASSN FOR CAREER & TECH 03/12/2012 3,025.00 404909 WASH ASSN FOR MIDDLE LEVEL EDU 03/12/2012 1,360.00 404910 WASH RE EDUCATION ASSN INC 03/12/2012 1,591.80 404911 WEA/APA FUND - COBRA 03/12/2012 1,984.20 404912 WEST COAST PLATEN COMPANY 03/12/2012 172.05 404913 WESTERN EQUIPMENT DISTRIBUTORS 03/12/2012 146.63 404914 WESTERN MECHANICAL CONTRACTORS 03/12/2012 660.39 404915 WILBUR ELLIS COMPANY 03/12/2012 23.00 404916 WILLIAMS-RIDLEY, TRACI 03/12/2012 4.00 404917 WORLD LANGUAGE SERVICES LLC 03/12/2012 670.02 404918 WSIPC NW ESD FISCAL AGENT 03/12/2012 22,061.32 404919 XPEDX ACCT S1-500168 03/12/2012 5,593.26 404920 ARC REPROGRAPHICS NORTHWEST IN 03/12/2012 73.37 404921 BLRB ARCHITECTS 03/12/2012 6,669.28 404922 C N R INC 03/12/2012 963.60 404923 CASCADE LAND SURVEYING 03/12/2012 13,225.00 404924 EDNETICS INC 03/12/2012 657.95 404925 ELECTROCOM 03/12/2012 479.06 404926 INSLEE BEST DOEZIE & RYDER PS 03/12/2012 1,232.00 404927 KONICA MINOLTA BUSINESS SOLUTI 03/12/2012 2,706.40 404928 FAIRWEATHER SITE FURNISHINGS 03/12/2012 2,329.07 404929 LINCOLN CONSTRUCTION INC 03/12/2012 66,038.78 404930 MICRO COMPUTER SYSTEMS INC 03/12/2012 3,395.50 404931 MT VIEW LOCATING SERVICES LLC 03/12/2012 640.00

3apckp07.p AUBURN SCHOOL DISTRICT NO. 408 9:01 AM 03/08/12 04.12.02.00.00-010018 Check Summary PAGE: 8 Check Nbr Vendor Name Check Date Check Amount 404932 NOW ENVIRONMENTAL SERVICES INC 03/12/2012 2,260.00 404933 PACIFICAD INC 03/12/2012 153.30 404934 SHANNON & WILSON INC 03/12/2012 20,472.00 404935 SHOCKEY PLANNING GROUP INC 03/12/2012 1,133.59 404936 SOUTH SOUND PRINTING & TECHNOL 03/12/2012 35.59 404937 ATS SPORTS 03/12/2012 551.98 404938 AUBURN RIVERSIDE H S BAND PARE 03/12/2012 475.00 404939 AZUMANO INTERNATIONAL INC 03/12/2012 4,500.00 404940 BARNES, JOAN HARRISON 03/12/2012 40.00 404941 CENTRAL WASH UNIV 03/12/2012 375.00 404942 COCA COLA REFRESHMENTS USA INC 03/12/2012 299.59 404943 COSTCO 03/12/2012 744.55 404944 CSQUARED COFFEE LLC 03/12/2012 200.00 404945 DECARTERET DESIGNS LLC 03/12/2012 104.26 404946 DISPLAY & COSTUME SUPPLY 03/12/2012 633.77 404947 DOMINOS PIZZA-7113 03/12/2012 87.11 404948 DONUT & MUFFIN FACTORY INC 03/12/2012 82.00 404949 DWF WHOLESALE FLORIST SEA TAC 03/12/2012 17.00 404950 EK BEVERAGE COMPANY 03/12/2012 1,760.90 404951 EWEBANKS CREATIONS 03/12/2012 87.60 404952 FOOD SERVICES OF AMERICA 03/12/2012 3,377.64 404953 FULL COMPASS SYSTEMS LTD 03/12/2012 749.80 404954 GREEN RIVER MUSIC EDUCATORS AS 03/12/2012 257.00 404955 HALFON CANDY COMPANY 03/12/2012 755.63 404956 HERFF JONES YEAR BOOK PAYMENTS 03/12/2012 11,177.00

3apckp07.p AUBURN SCHOOL DISTRICT NO. 408 9:01 AM 03/08/12 04.12.02.00.00-010018 Check Summary PAGE: 9 Check Nbr Vendor Name Check Date Check Amount 404957 HORTICULTURAL SERVICES INC 03/12/2012 63.95 404958 IMAGE MASTERS INC 03/12/2012 350.35 404959 INTEGRITY PRINT RESOURCE INC 03/12/2012 192.50 404960 JAYPRO SPORTS INC 03/12/2012 678.92 404961 JOSTENS 03/12/2012 312.08 404962 JW PEPPER & SON INC 03/12/2012 129.60 404963 KRISPY KREME DOUGHNUTS 03/12/2012 325.00 404964 LIDS TEAM SPORTS 03/12/2012 550.35 404965 LOWES HIW INC 03/12/2012 1,901.16 404966 MCCONKEY COMPANY 03/12/2012 828.59 404967 MCLENDON HARDWARE INC 03/12/2012 138.61 404968 MIDWEST SIGN SCREEN PRINT 03/12/2012 462.94 404969 MUSIC THEATRE INTERNATIONAL 03/12/2012 35.00 404970 OTIS SPUNKMEYER INC 03/12/2012 530.00 404971 PACIFIC NW BASKETBALL OFFICIAL 03/12/2012 16,187.12 404972 PACIFIC NW THEATRE ASSN INC 03/12/2012 1,660.77 404973 PRAXAIR DISTRIBUTION INC 03/12/2012 34.71 404974 ROSE BRAND WIPERS INC 03/12/2012 361.25 404975 SAFEWAY INC 03/12/2012 21.96 404976 SEATTLE BOARD GIRLS GYMNASTICS 03/12/2012 328.35 404977 SEATTLE MARINERS BASEBALL CLUB 03/12/2012 8,000.00 404978 SEATTLE OFFICIALS WOMENS BASKE 03/12/2012 4,991.91 404979 STAPLES ADVANTAGE 03/12/2012 21.71 404980 STUDENT SUPPLY COMPANY 03/12/2012 118.99 404981 TAYLOR PUBLISHING COMPANY 03/12/2012 3,500.00

3apckp07.p AUBURN SCHOOL DISTRICT NO. 408 9:01 AM 03/08/12 04.12.02.00.00-010018 Check Summary PAGE: 10 Check Nbr Vendor Name Check Date Check Amount 404982 TC SPAN AMERICA 03/12/2012 216.10 404983 TEAM BUCHAN TENNIS 03/12/2012 1,730.11 404984 TH DESIGNS 03/12/2012 837.68 404985 THOUGHTBOX ILLUSTRATION 03/12/2012 100.00 404986 TOTEM FOOD PRODUCTS INC 03/12/2012 419.00 404987 WALMART SAMS CLUB 03/12/2012 387.85 404988 WASH ACTIVITY COORDINATOR ASSN 03/12/2012 755.00 404989 WASH INTERSCHOLASTIC ACTIVITY 03/12/2012 46.00 404990 WASH MUSIC EDUCATION ASSN 03/12/2012 2,142.00 404991 WHITE RIVER VALLEY MUSEUM 03/12/2012 154.00 404992 AUBURN MOUNTAINVIEW H S 03/12/2012 132.50 404993 AUBURN RIVERSIDE H S 03/12/2012 870.00 404994 AUBURN SENIOR H S 03/12/2012 1,560.00 404995 BROWN, LAUREN 03/12/2012 246.00 404996 CASCADE M S 03/12/2012 25.00 404997 COOPER, CASANDRA 03/12/2012 110.00 404998 JOHNS, IVORY 03/12/2012 15.00 404999 KROGER DBA FRED MEYER 03/12/2012 65.68 405000 LOTT, SANDRA 03/12/2012 120.08 405001 OLYMPIC M S 03/12/2012 58.00 405002 WILLIAMS, KISSEE 03/12/2012 55.00 238 Computer Check(s) For a Total of 639,901.69

3apckp07.p AUBURN SCHOOL DISTRICT NO. 408 9:01 AM 03/08/12 04.12.02.00.00-010018 Check Summary PAGE: 11 0 Manual Checks For a Total of 0.00 0 Wire Transfer Checks For a Total of 0.00 0 ACH Checks For a Total of 0.00 238 Computer Checks For a Total of 639,901.69 Total For 238 Manual, Wire Tran, ACH & Computer Checks 639,901.69 Less 0 Voided Checks For a Total of 0.00 Net Amount 639,901.69 F U N D S U M M A R Y Fund Description Balance Sheet Revenue Expense Total 10 General Fund 6,002.18 230.25 433,158.12 439,390.55 20 Capital Projects 0.00 0.00 122,464.49 122,464.49 40 ASB Fund -151.25 0.00 74,940.64 74,789.39 70 Private Purpose 0.00 0.00 3,257.26 3,257.26
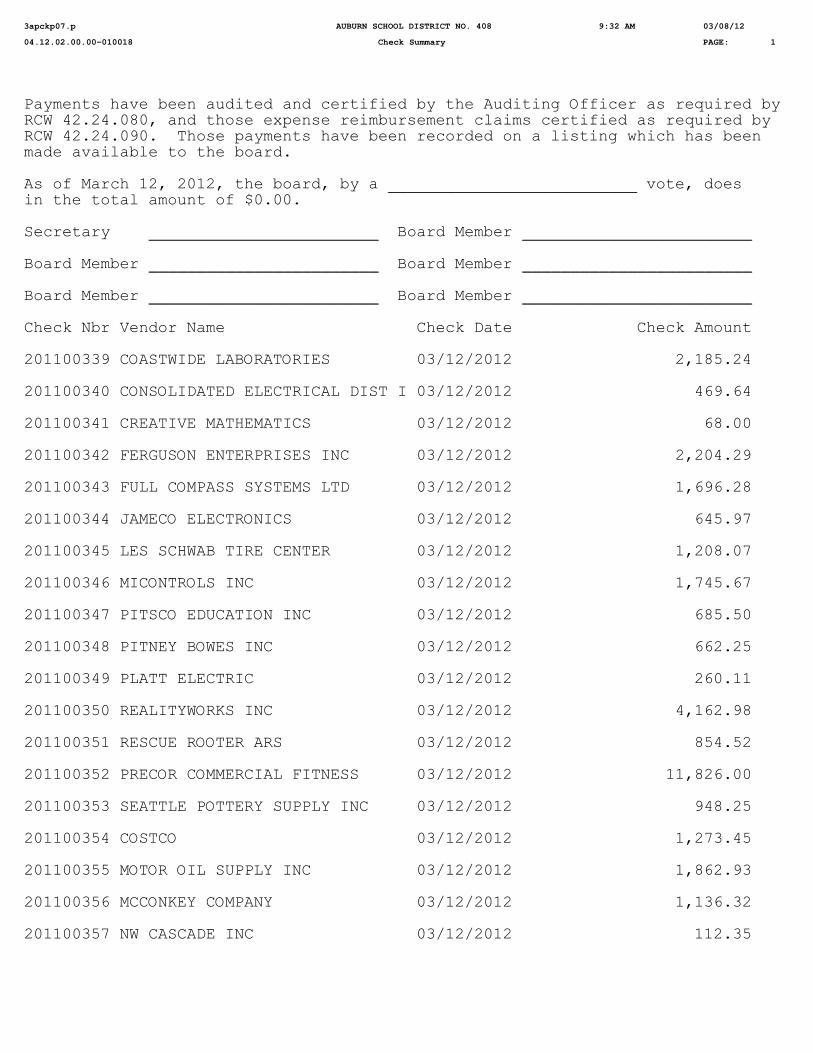
3apckp07.p AUBURN SCHOOL DISTRICT NO. 408 9:32 AM 03/08/12 04.12.02.00.00-010018 Check Summary PAGE: 1 Payments have been audited and certified by the Auditing Officer as required by RCW 42.24.080, and those expense reimbursement claims certified as required by RCW 42.24.090. Those payments have been recorded on a listing which has been made available to the board. As of March 12, 2012, the board, by a __________________________ vote, does in the total amount of $0.00. Secretary ________________________ Board Member ________________________ Board Member ________________________ Board Member ________________________ Board Member ________________________ Board Member ________________________ Check Nbr Vendor Name Check Date Check Amount 201100339 COASTWIDE LABORATORIES 03/12/2012 2,185.24 201100340 CONSOLIDATED ELECTRICAL DIST I 03/12/2012 469.64 201100341 CREATIVE MATHEMATICS 03/12/2012 68.00 201100342 FERGUSON ENTERPRISES INC 03/12/2012 2,204.29 201100343 FULL COMPASS SYSTEMS LTD 03/12/2012 1,696.28 201100344 JAMECO ELECTRONICS 03/12/2012 645.97 201100345 LES SCHWAB TIRE CENTER 03/12/2012 1,208.07 201100346 MICONTROLS INC 03/12/2012 1,745.67 201100347 PITSCO EDUCATION INC 03/12/2012 685.50 201100348 PITNEY BOWES INC 03/12/2012 662.25 201100349 PLATT ELECTRIC 03/12/2012 260.11 201100350 REALITYWORKS INC 03/12/2012 4,162.98 201100351 RESCUE ROOTER ARS 03/12/2012 854.52 201100352 PRECOR COMMERCIAL FITNESS 03/12/2012 11,826.00 201100353 SEATTLE POTTERY SUPPLY INC 03/12/2012 948.25 201100354 COSTCO 03/12/2012 1,273.45 201100355 MOTOR OIL SUPPLY INC 03/12/2012 1,862.93 201100356 MCCONKEY COMPANY 03/12/2012 1,136.32 201100357 NW CASCADE INC 03/12/2012 112.35

3apckp07.p AUBURN SCHOOL DISTRICT NO. 408 9:32 AM 03/08/12 04.12.02.00.00-010018 Check Summary PAGE: 2 Check Nbr Vendor Name Check Date Check Amount 201100358 OTIS SPUNKMEYER INC 03/12/2012 493.60 201100359 PACIFIC NORTHWEST KIWANIS DIST 03/12/2012 1,630.00 201100360 AT & T 03/12/2012 159.85 201100361 CENTURY LINK 03/12/2012 4,100.04 201100362 CENTURY LINK BUSINESS SERVICES 03/12/2012 554.59 201100363 COVINGTON WATER DIST 03/12/2012 936.74 201100364 LAKEHAVEN UTILITY DISTRICT 03/12/2012 274.76 201100365 SPRINT 03/12/2012 194.75 201100366 WASTE MANAGEMENT RECYCLE COMPA 03/12/2012 400.39 28 Wire Transfer Check(s) For a Total of 42,752.54

3apckp07.p AUBURN SCHOOL DISTRICT NO. 408 9:32 AM 03/08/12 04.12.02.00.00-010018 Check Summary PAGE: 3 0 Manual Checks For a Total of 0.00 28 Wire Transfer Checks For a Total of 42,752.54 0 ACH Checks For a Total of 0.00 0 Computer Checks For a Total of 0.00 Total For 28 Manual, Wire Tran, ACH & Computer Checks 42,752.54 Less 0 Voided Checks For a Total of 0.00 Net Amount 42,752.54 F U N D S U M M A R Y Fund Description Balance Sheet Revenue Expense Total 10 General Fund -160.40 0.00 38,267.22 38,106.82 40 ASB Fund 0.00 0.00 4,645.72 4,645.72

3apckp07.p AUBURN SCHOOL DISTRICT NO. 408 9:37 AM 03/08/12 04.12.02.00.00-010018 Check Summary PAGE: 1 Payments have been audited and certified by the Auditing Officer as required by RCW 42.24.080, and those expense reimbursement claims certified as required by RCW 42.24.090. Those payments have been recorded on a listing which has been made available to the board. As of March 12, 2012, the board, by a __________________________ vote, does approve for payment those checks (warrants) included in the following list and further described as follows: AP Direct Dep Settlement Accou Check Number 111201417 through 111201515 in the total amount of $87,297.77. Secretary ________________________ Board Member ________________________ Board Member ________________________ Board Member ________________________ Board Member ________________________ Board Member ________________________ Check Nbr Vendor Name Check Date Check Amount 111201417 ABRAHAM, JAMES MARVIN 03/12/2012 15.46 111201418 ADAMS, THOMAS W 03/12/2012 152.51 111201419 ALONZO, VICKI LEE 03/12/2012 49.95 111201420 ASHLOCK, SHERRI LYNN 03/12/2012 500.00 111201421 AUBURN SCHOOL DIST REVOLVING F 03/12/2012 666.05 111201422 BARKER, CAROL JEAN 03/12/2012 71.20 111201423 BARUCK, STEPHEN L 03/12/2012 500.00 111201424 BAYER, JAMES L 03/12/2012 57.06 111201425 BEGALKA, BONNIE ELAINE 03/12/2012 514.76 111201426 BELL, SHARON KAY 03/12/2012 31.08 111201427 BOMAR, JOHN M 03/12/2012 500.00 111201428 BURT, TIFFANY ANN 03/12/2012 58.67 111201429 CARROLL, CYNTHIA LOUISE 03/12/2012 27.38 111201430 CORDELL, KUNIKO 03/12/2012 500.00 111201431 COUCH, ADAM W 03/12/2012 152.58 111201432 COX, AMBER R 03/12/2012 24.64 111201433 DAM, MARGARET ELLEN 03/12/2012 70.00

3apckp07.p AUBURN SCHOOL DISTRICT NO. 408 9:37 AM 03/08/12 04.12.02.00.00-010018 Check Summary PAGE: 2 Check Nbr Vendor Name Check Date Check Amount 111201434 DAVIS, AMBER A 03/12/2012 1,000.00 111201435 DECKER, LOUANNE H 03/12/2012 176.66 111201436 DETWILER, KIMBERLY FLINT 03/12/2012 8.50 111201437 DODD, JANINE MARIE 03/12/2012 202.80 111201438 DONALDSON, FRED A 03/12/2012 223.03 111201439 DOZIER, ALETHEA CARLOS 03/12/2012 500.00 111201440 ECKELMAN, MONTE F 03/12/2012 13.32 111201441 ES SPEECH & LANGUAGE SERVICES 03/12/2012 3,375.00 111201442 ESCALERA, JILLYAN CRISTINA 03/12/2012 51.33 111201443 FAWVER, RICHARD ALLEN 03/12/2012 76.97 111201444 GABRIELE, SHERYL L 03/12/2012 945.00 111201445 GARY, DEBRA O 03/12/2012 9.75 111201446 GAYMAN, MARY ANNE ANNE 03/12/2012 65.82 111201447 GIBSON-MYERS, ELIZABETH ANN 03/12/2012 18.87 111201448 GRENZ, MICHAEL ALAN 03/12/2012 55.70 111201449 GRIMM, LORI LYNN 03/12/2012 82.31 111201450 HEALTH CARE AUTHORITY 03/12/2012 11,166.97 111201451 HEDGER, DUSTIN P 03/12/2012 49.96 111201452 HENRY, MILENE M 03/12/2012 10.92 111201453 HOEVET, TRACY E 03/12/2012 46.37 111201454 HOLLOMAN, LEONARD E 03/12/2012 92.35 111201455 HUFT, JOY JOANN 03/12/2012 186.59 111201456 JACKOWSKI, ERIN ANDREWS 03/12/2012 110.00 111201457 JOHNSON, DALE E 03/12/2012 500.00 111201458 JORDAN, GARY D 03/12/2012 103.45

3apckp07.p AUBURN SCHOOL DISTRICT NO. 408 9:37 AM 03/08/12 04.12.02.00.00-010018 Check Summary PAGE: 3 Check Nbr Vendor Name Check Date Check Amount 111201459 KIHARA, ALISON KAY BRANNUM 03/12/2012 455.00 111201460 KNAPP, BARBARA JEAN 03/12/2012 8.74 111201461 LALLY, TONI MARIE 03/12/2012 86.16 111201462 LAM, TAN VAN 03/12/2012 37.74 111201463 LEES, JOHN W 03/12/2012 25.17 111201464 LEITZKE, TAMARA L 03/12/2012 23.48 111201465 LEWIS, PAUL M 03/12/2012 500.00 111201466 LORENZ TSUJIKAWA, LAUREL 03/12/2012 68.27 111201467 MAY, JONNA G 03/12/2012 415.00 111201468 MCCAUSLAND, ANGELA KARON 03/12/2012 234.31 111201469 MCGARVEY, TANYA M 03/12/2012 500.00 111201470 MILLICAN, SCOTT E 03/12/2012 500.00 111201471 MULICK, PATRICK JAMES 03/12/2012 71.26 111201472 NEU, SUSAN LYNNETTE 03/12/2012 500.00 111201473 NYBO, KELLEY ANDREA 03/12/2012 63.77 111201474 RITTER, ROBIN 03/12/2012 7.33 111201475 RODRIGUEZ, JESSE ANN 03/12/2012 53.66 111201476 ROGERS, LAURA CHRISTINE 03/12/2012 500.00 111201477 ROHLFF, GERI A 03/12/2012 500.00 111201478 RUMBAUGH, WAYNE D 03/12/2012 135.00 111201479 SANDLAND, GINA M 03/12/2012 46.35 111201480 SAXON, JAN K 03/12/2012 59.50 111201481 SCOFIELD, CAROL AALAND 03/12/2012 199.00 111201482 SCOTT, ERIN FINLEY 03/12/2012 175.31 111201483 SIGURDSON, JANICE CHRISTINE 03/12/2012 445.00

3apckp07.p AUBURN SCHOOL DISTRICT NO. 408 9:37 AM 03/08/12 04.12.02.00.00-010018 Check Summary PAGE: 4 Check Nbr Vendor Name Check Date Check Amount 111201484 SINCLAIR, MIRIAM 03/12/2012 500.00 111201485 SLATER, ROBIN SHANTELLE 03/12/2012 34.99 111201486 SPEAR, HILLARY ANN 03/12/2012 365.00 111201487 STEVENSON, PAMELA V 03/12/2012 10.85 111201488 STOWE, ROBYN FRANCES 03/12/2012 26.24 111201489 STRAND, BRYCE JAMES 03/12/2012 500.00 111201490 STRAND, DEBRA MARIE 03/12/2012 720.66 111201491 SYLVAN LEARNING CENTER 03/12/2012 7,395.00 111201492 TURNER, MEGAN DENISE 03/12/2012 49.73 111201493 TYSON, BRITTANY BELL JEAN 03/12/2012 23.48 111201494 US BANK CORP PAYMENT SYSTEMS P 03/12/2012 22,544.56 111201495 US BANK CORP PAYMENT SYSTEM TR 03/12/2012 4,223.60 111201496 WASSERMAN, MICHAEL GLENN 03/12/2012 16.96 111201497 WAY, PHILLIP R 03/12/2012 100.00 111201498 WILSON, SHELLIE M 03/12/2012 37.00 111201499 WITTGOW, ERICA MARIE 03/12/2012 36.80 111201500 ZALDIVAR, MELISA K 03/12/2012 52.00 111201501 COLUMBIA STATE BANK 03/12/2012 3,159.75 111201502 US BANK CORP PAYMENT SYSTEMS P 03/12/2012 59.78 111201503 AUBURN RIVERSIDE HIGH SCHOOL I 03/12/2012 3,990.55 111201504 AUBURN SENIOR HIGH IMPREST 03/12/2012 1,910.72 111201505 DAVIDSON, JENNIFER L 03/12/2012 77.08 111201506 GASTON, SONIA LEE 03/12/2012 166.12 111201507 LOUIE, ALISA LYNN 03/12/2012 47.30 111201508 LUETTGEN, SANDRA L 03/12/2012 27.86

3apckp07.p AUBURN SCHOOL DISTRICT NO. 408 9:37 AM 03/08/12 04.12.02.00.00-010018 Check Summary PAGE: 5 Check Nbr Vendor Name Check Date Check Amount 111201509 MEINHART, DORIN JANE 03/12/2012 39.15 111201510 PIZZA TIME 03/12/2012 2,338.65 111201511 RAINIER MS IMPREST FUND 03/12/2012 564.52 111201512 RODRIGUEZ, JESSE ANN 03/12/2012 44.93 111201513 US BANK CORP PAYMENT SYSTEMS P 03/12/2012 6,510.94 111201514 US BANK CORP PAYMENT SYSTEM TR 03/12/2012 3,141.02 111201515 WINTER, SUSAN RENEE 03/12/2012 9.47 99 ACH Check(s) For a Total of 87,297.77

3apckp07.p AUBURN SCHOOL DISTRICT NO. 408 9:37 AM 03/08/12 04.12.02.00.00-010018 Check Summary PAGE: 6 0 Manual Checks For a Total of 0.00 0 Wire Transfer Checks For a Total of 0.00 99 ACH Checks For a Total of 87,297.77 0 Computer Checks For a Total of 0.00 Total For 99 Manual, Wire Tran, ACH & Computer Checks 87,297.77 Less 0 Voided Checks For a Total of 0.00 Net Amount 87,297.77 F U N D S U M M A R Y Fund Description Balance Sheet Revenue Expense Total 10 General Fund 11,603.45 0.00 53,606.48 65,209.93 20 Capital Projects 0.00 0.00 3,219.53 3,219.53 40 ASB Fund -449.00 0.00 19,317.31 18,868.31

3apckp07.p AUBURN SCHOOL DISTRICT NO. 408 9:52 AM 03/08/12 04.12.02.00.00-010018 Check Summary PAGE: 1 Payments have been audited and certified by the Auditing Officer as required by RCW 42.24.080, and those expense reimbursement claims certified as required by RCW 42.24.090. Those payments have been recorded on a listing which has been made available to the board. As of March 12, 2012, the board, by a __________________________ vote, does approve for payment those checks (warrants) included in the following list and further described as follows: AP Direct Dep Settlement Accou Check Number 111201516 through 111201518 in the total amount of $10,342.73. Secretary ________________________ Board Member ________________________ Board Member ________________________ Board Member ________________________ Board Member ________________________ Board Member ________________________ Check Nbr Vendor Name Check Date Check Amount 111201516 DEPT OF REVENUE STATE OF WASH 03/12/2012 2,518.47 111201517 DEPT OF REVENUE STATE OF WASH 03/12/2012 6,743.97 111201518 DEPT OF REVENUE STATE OF WASH 03/12/2012 1,080.29 3 ACH Check(s) For a Total of 10,342.73

3apckp07.p AUBURN SCHOOL DISTRICT NO. 408 9:52 AM 03/08/12 04.12.02.00.00-010018 Check Summary PAGE: 2 0 Manual Checks For a Total of 0.00 0 Wire Transfer Checks For a Total of 0.00 3 ACH Checks For a Total of 10,342.73 0 Computer Checks For a Total of 0.00 Total For 3 Manual, Wire Tran, ACH & Computer Checks 10,342.73 Less 0 Voided Checks For a Total of 0.00 Net Amount 10,342.73 F U N D S U M M A R Y Fund Description Balance Sheet Revenue Expense Total 10 General Fund 2,518.47 0.00 0.00 2,518.47 20 Capital Projects 6,743.97 0.00 0.00 6,743.97 40 ASB Fund 1,080.29 0.00 0.00 1,080.29

AUBURN SCHOOL DISTRICT BUSINESS SERVICES BID 641 WIRELESS NETWORK INSTALLATION
BID 641 WIRELESS NETWORK TABULATION
INSTALLATIONVENDOR NAME: VENDOR NAME: VENDOR NAME: VENDOR NAME:
BIDITEM NO. QTY. ITEM DESCRIPTION
LEA HILL ELEMENTARY SCHOOL1 LOT EQUIPMENT1 EA SUPPORT CONTRACT FOR 5 YEARS 1. EA TOTAL COSTS FOR INSTALLATION
WASHINGTON ELEMENTARY SCHOOL1 LOT EQUIPMENT1 EA SUPPORT CONTRACT FOR 5 YEARS 1. EA TOTAL COSTS FOR INSTALLATION
CHINOOK ELEMENTARY SCHOOL1 LOT EQUIPMENT1 EA SUPPORT CONTRACT FOR 5 YEARS 1. EA TOTAL COSTS FOR INSTALLATION
PIONEER ELEMENTARY SCHOOL1 LOT EQUIPMENT1 EA SUPPORT CONTRACT FOR 5 YEARS 1. EA TOTAL COSTS FOR INSTALLATION
TERMINAL PARK ELEMENTARY SCHOOL1 LOT EQUIPMENT1 EA SUPPORT CONTRACT FOR 5 YEARS 1. EA TOTAL COSTS FOR INSTALLATION
GILDO REY ELEMENTARY SCHOOL1 LOT EQUIPMENT1 EA SUPPORT CONTRACT FOR 5 YEARS 1. EA TOTAL COSTS FOR INSTALLATION
This bid considers mulitple evaluation criteria. The wireless systems under evaluation are required to A possible 500 points were A possible 500 points were A possible 500 points were A possible 500 points were meet certain performance criteria. The bids were available. This vendors available. This vendors available. This vendors available. This vendors evaluated by 5 individuals. The criteria were then evaluation score is: evaluation score is: evaluation score is: evaluation score is:weighted according to the following weights.Demonstrative 40%Experience 15%Price 45%
TOTAL FOR ALL SIX (6) SCHOOLSTOTAL EQUIPMENT SUPPORT CONTRACT FOR 5 YEARS TOTAL COSTS FOR INSTALLATION SUBTOTALWASHINGTON STATE SALES TAX
GRAND TOTAL
$160,305.27$15,229.00
$175,534.27
4,997.205,970.64
276.2
79,196.58$ 27,565.20$ 53,543.49$
4,836.0011,422.14
8,944.823,062.805,793.93
13,821.98
3,546.404,726.71
17,418.865,964.4013,505.50
14,123.40
LDG/AV LLC
PRICE
$15,064.965,158.4012,124.57
9,822.56
303.2
$14,788.94
$170,461.94
49,685.00$ $155,673.00
$134,440.64
11,249.407,800.0012,060.64
Leverage Information Systems
45,868.32$ 29,380.00$ 47,528.52$
$122,776.84$11,663.80
3,900.007,053.44
4,680.007,460.33
7,124.624,940.007,569.47
5,624.70
PRICE
$7,499.605,200.007,581.64
7,620.362,860.005,803.00
6,749.64
2,294.008,905.00
78,276.00$ 27,712.00$
2,220.008,710.00
7,419.501,406.005,465.00
12,105.50
1,628.006,160.00
15,229.502,886.0011,125.00
11,715.00
CNR
PRICE
$23,215.5017,278.009,320.00
8,591.00
55,795.00$ 41,175.08$ 54,470.00$
$151,440.08$14,386.81
$165,826.89
7,015.009,210.00
9,209.006,710.008,960.00
9,853.00
6,100.008,400.00
9,853.007,320.009,480.00
9,531.00
Integrated Media Technology
PRICE
$9,209.006,710.088,940.00
8,140.00
417.4 380.6
7,320.009,480.00

AUBURN SCHOOL DISTRICT
BID 641 WIRELESS NETWORK
INSTALLATION
BIDITEM NO. QTY. ITEM DESCRIPTION
LEA HILL ELEMENTARY SCHOOL1 LOT EQUIPMENT1 EA SUPPORT CONTRACT FOR 5 YEARS 1. EA TOTAL COSTS FOR INSTALLATION
WASHINGTON ELEMENTARY SCHOOL1 LOT EQUIPMENT1 EA SUPPORT CONTRACT FOR 5 YEARS 1. EA TOTAL COSTS FOR INSTALLATION
CHINOOK ELEMENTARY SCHOOL1 LOT EQUIPMENT1 EA SUPPORT CONTRACT FOR 5 YEARS 1. EA TOTAL COSTS FOR INSTALLATION
PIONEER ELEMENTARY SCHOOL1 LOT EQUIPMENT1 EA SUPPORT CONTRACT FOR 5 YEARS 1. EA TOTAL COSTS FOR INSTALLATION
TERMINAL PARK ELEMENTARY SCHOOL1 LOT EQUIPMENT1 EA SUPPORT CONTRACT FOR 5 YEARS 1. EA TOTAL COSTS FOR INSTALLATION
GILDO REY ELEMENTARY SCHOOL1 LOT EQUIPMENT1 EA SUPPORT CONTRACT FOR 5 YEARS 1. EA TOTAL COSTS FOR INSTALLATION
This bid considers mulitple evaluation criteria. The wireless systems under evaluation are required to meet certain performance criteria. The bids were evaluated by 5 individuals. The criteria were then weighted according to the following weights.Demonstrative 40%Experience 15%Price 45%
TOTAL FOR ALL SIX (6) SCHOOLSTOTAL EQUIPMENT SUPPORT CONTRACT FOR 5 YEARS TOTAL COSTS FOR INSTALLATION SUBTOTALWASHINGTON STATE SALES TAX
GRAND TOTAL
BID 641 TABULATION
VENDOR NAME: VENDOR NAME: VENDOR NAME: VENDOR NAME:
A possible 500 points were available. This vendors evaluation score is:
NON-RESPONSIVE NON-RESPONSIVE NON-RESPONSIVE
NON-RESPONSIVE NON-RESPONSIVE NON-RESPONSIVE
$283,700.00$26,951.50
$310,651.50
12,816.002,671.00
This bid tendered is non-responsive. Per the bid documents the contractor is required to have a,
ERATE SPIN number when the bid was submitted. Skyline Communications did not have
a SPIN Number when the bid was submitted.
207,289.00$ 51,798.00$ 24,613.00$
9,078.002,671.00
27,781.006,942.002,671.00
51,288.00
5,874.002,671.00
32,055.008,010.002,671.00
36,329.00
Skyline Communictions
PRICE
$36,329.009,078.002,671.00
23,507.00
NO BID
$163,980.72
232.0
This bid tendered is non-responsive. Per RCW 39.06 the contractor must be a licensed
contractor when the bid was submitted. Right! Systems is not a registered contractor with the
State of Washington
This bid tendered is non-responsive. Per RCW 39.06 the contractor must be a licensed
contractor when the bid was submitted. CDWG is not a registered contractor with the State of
Washington. In addition there is no bid for installation or support
NO BIDNO BID
163,980.72$ NO BIDNO BID
NO BID
NO BIDNO BID
27,330.12NO BIDNO BID
27,330.12
NO BIDNO BID
27,330.12NO BIDNO BID
27,330.12
CDWG
PRICE
$27,330.12NO BIDNO BID
27,330.1231,468.6710,500.0011,500.00
EDNETICS
PRICE
$31,468.6710,500.0011,500.00
10,500.0011,500.00
31,468.6710,500.00
31,468.6710,500.0011,500.00
31,468.67
69,000.00$ $320,812.02
11,500.00
31,468.6710,500.0011,500.00
$30,477.14
$351,289.16
Right! Systems
PRICE
$24,490.2511,200.009,976.85
6,290.25
188,812.02$ 63,000.00$
7,456.85
6,709.600.00
7,872.55
0.007,456.85
6,290.250.00
6,290.250.00
9,350.81
6,290.250.00
9,350.81
56,360.85$ 11,200.00$ 51,464.72$
$119,025.57$11,307.43
$130,333.00

AUBURN SCHOOL DISTRICT
BID 641 WIRELESS NETWORK
INSTALLATION
BIDITEM NO. QTY. ITEM DESCRIPTION
LEA HILL ELEMENTARY SCHOOL1 LOT EQUIPMENT1 EA SUPPORT CONTRACT FOR 5 YEARS 1. EA TOTAL COSTS FOR INSTALLATION
WASHINGTON ELEMENTARY SCHOOL1 LOT EQUIPMENT1 EA SUPPORT CONTRACT FOR 5 YEARS 1. EA TOTAL COSTS FOR INSTALLATION
CHINOOK ELEMENTARY SCHOOL1 LOT EQUIPMENT1 EA SUPPORT CONTRACT FOR 5 YEARS 1. EA TOTAL COSTS FOR INSTALLATION
PIONEER ELEMENTARY SCHOOL1 LOT EQUIPMENT1 EA SUPPORT CONTRACT FOR 5 YEARS 1. EA TOTAL COSTS FOR INSTALLATION
TERMINAL PARK ELEMENTARY SCHOOL1 LOT EQUIPMENT1 EA SUPPORT CONTRACT FOR 5 YEARS 1. EA TOTAL COSTS FOR INSTALLATION
GILDO REY ELEMENTARY SCHOOL1 LOT EQUIPMENT1 EA SUPPORT CONTRACT FOR 5 YEARS 1. EA TOTAL COSTS FOR INSTALLATION
This bid considers mulitple evaluation criteria. The wireless systems under evaluation are required to meet certain performance criteria. The bids were evaluated by 5 individuals. The criteria were then weighted according to the following weights.Demonstrative 40%Experience 15%Price 45%
TOTAL FOR ALL SIX (6) SCHOOLSTOTAL EQUIPMENT SUPPORT CONTRACT FOR 5 YEARS TOTAL COSTS FOR INSTALLATION SUBTOTALWASHINGTON STATE SALES TAX
GRAND TOTAL
BID 641 TABULATION
VENDOR NAME:
NON-RESPONSIVE
$8,068.15
$92,996.06
NON-RESPONSIVE
2,845.37
This bid tendered is non-responsive. Total costs added up to $92,996.06. The bid
tendered on the Signed Bid Form is for $10 million. The bid security should have been $500K (5% of the bid). But the bid security
check was only for $4,315.45. There are bid addition errors
52,468.12$ 14,597.14$ 17,862.65$ $84,927.91
2,925.36
7,780.78
2,491.11
4,954.29
3,317.72
7,088.34
2,963.46
4,573.19
NDM
PRICE
$19,839.88
3,319.63
8,231.64

March 12, 2012 Page 7
DIRECTORS 1.
Approval of Minutes
The minutes of the regular meeting of Monday, February 27, have been forwarded to the board.
Recommendation: That the minutes be approved. 2.
First Reading of Policies
The following policies are being submitted to the board for first reading: 2030 --Service Animals in Schools; 2145--Suicide Prevention; and 3412--Automated External Defibrillators (AED) . Timothy Cummings , assistant superintendent for human resources, will answer questions from the board. The policies have been reviewed by the committee of the board for policies.
Recommendation: That the above-mentioned policies be
accepted for first reading with second reading and adoption scheduled for Monday, March 26.
3.
Discussion
4.
Executive Session

Policy No. 2030 Instruction
SERVICE ANIMALS IN SCHOOLS (DRAFT 3-5-12) The Auburn Board of Directors acknowledges its responsibility to permit students and/or adults with disabilities to be accompanied by a “service animal” as required by federal laws and Washington State’s law against discrimination. This policy governs the presence of service animals in the schools, on school property, including school buses and at school activities.
A “service animal” means an animal that is trained for the purpose of assisting or accommodating a disabled person’s sensory, mental or physical disability.
The parent/guardian of a student who believes the student needs to bring a service animal to school or an employee who wishes to bring a service animal to school, must submit a written request to the building principal. The building principal, in consultation with the Section 504 coordinator or director of special services, as appropriate, will determine whether or not to permit the service animal in school.
Cross Reference: Board Policy 2029 Animals as Part of the Instructional Program Board Policy 2161 Education of Students with Disabilities Board Policy 2162 Education of Students with Disabilities
Under Section 504 Board Policy 3210 Nondiscrimination Board Policy 5010 Nondiscrimination and Affirmative Action Legal References: American Disabilities Act (ADA), Revised Title II Regulations, §35
Service animals Section 504 of the Rehabilitation Act of 1973 RCW 28A.642 Discrimination Prohibition RCW 49.60.040 Definitions WAC 162-26 Public accommodations, disability
discrimination WAC 392-145-021(3) General Operating Requirements WAC 392-172A-01035 Child with a Disability or Student eligible
for Special Education WAC 392-172A-01155 (3) Related Services WAC 392-190 Equal Educational Opportunity − unlawful
discrimination prohibited Adopted: Auburn School District Revised:

Policy No. 2145 Instruction
SUICIDE PREVENTION (DRAFT 3-5-12) The Auburn Board of Directors recognizes that suicidal behaviors are complex issues, a major cause of death among youth and should be taken seriously. While school staff may recognize potentially suicidal youth and the district can make an initial risk assessment, the district cannot provide indepth mental health counseling. Instead, the board directs school staff to refer students who exhibit suicidal behaviors to an appropriate service for further assessment and counseling.
The board also recognizes the need for youth suicide prevention procedures and will establish programs to: a) identify risk factors for youth suicide, b) intervene with such youth, c) provide referral services, d) follow-up on a completed suicide, and e) offer training for teachers, other school staff and students to provide proper assistance.
School staff who have knowledge of a suicide threat must take the proper steps to support the student and to report this information to the building principal or designee who will, in turn, notify the appropriate school officials, the student’s family and appropriate resource services.
The superintendent or designee will develop and implement procedures and a staff training schedule to achieve the board’s goals and objectives.
Cross References: Board Policy 3207 Harassment, Intimidation and Bullying Board Policy 2140 Guidance and Counseling References: RCW 28A.410.043 School Counselor Certification Management Resources: Policy News, April 2011 Youth Suicide Awareness and Prevention
Plans Adoption Date: Auburn School District Revised:

Policy No. 3412 Students
AUTOMATED EXTERNAL DEFIBRILLATORS (AED) (DRAFT 3-5-12)
The Auburn Board of Directors recognizes that by equipping schools with automated external defibrillators (AEDs) and training employees in their use, the potential to save lives in the event of a health emergency, including cardiac arrest, is increased. The board authorizes the district to place AEDs at designated school sites. Schools and district facilities with an AED on site shall train selected staff in their use according to the guidelines provided by the Washington State Department of Health.
This policy does not create any implied or express guarantee, or obligation to use an AED, nor does it create an expectation that an AED or a trained employee will be present and able to use an AED, even if a condition arose that made the use of an AED beneficial.
A person who uses an AED at the scene of an emergency and all other persons and entities providing services are immune from civil liability for any personal injury that results from any act or omission in the use of the AED in an emergency setting, unless the acts or omissions amount to gross negligence or willful or wanton misconduct.
The superintendent or designee will develop procedures for the placement, maintenance, and use of AEDs in schools.
Legal References: RCW 4.24. 300 Immunity from
liability for certain types of medical care RCW 70.54.310 Semiautomatic
external defibrillator – Duty of Acquirer-Immunity from Civil Liability
Management Resources: Policy News, April 2011 Legal Aspects of
Defibrillator Use Defined Adoption Date: Auburn School District Revised:

March 12, 2012 Page 8
INFORMATION
1. The Thursday, March 1, enrollment is included in the board background material.

ASD HEADCOUNT SUMMARY
DATE: 3/1/12 ELEM
ELEMENTARY PRE SCH Kndrgrtn Grade 1 Grade 2 Grade 3 Grade 4 Grade 5 K-5 TOTALS SCH TOTALSSCHOOLS Sec No. Sec No. Sec No. Sec No. Sec No. Sec No. Sec No. Sec No. Sec No.
Alpac -- -- REG 3.0 62 4.0 81 3.5 75 2.5 64 3.5 89 2.5 72 19.0 443 19.0 443 (ECE) 4.0 29 SPED -- -- -- -- -- -- -- -- -- -- -- -- 0.0 0Arthur Jacobsen -- -- REG 4.0 90 3.5 83 3.5 84 3.0 68 2.0 52 3.0 66 19.0 443 19.0 443
(ECE) 2.0 11 SPED -- -- -- -- -- -- -- -- -- -- -- -- 0.0 0Chinook -- -- REG 2.0 50 2.0 49 2.0 39 3.0 67 2.0 50 2.0 52 13.0 307 15.0 323 (ECE) 2.0 22 SPED * 1 * 3 * 4 1.0 3 * 3 1.0 2 2.0 16Dick Scobee -- -- REG 4.0 92 4.0 79 3.0 71 3.0 65 3.0 76 2.0 63 19.0 446 19.0 446
(ECE) 4.0 19 SPED -- -- -- -- -- -- -- -- -- -- -- -- 0.0 0Evergreen Hgts. -- -- REG 4.0 87 3.5 79 3.5 85 3.0 82 2.0 59 2.0 63 18.0 455 18.0 455 -- -- SPED -- -- -- -- -- -- -- -- -- -- -- -- 0.0 0Gildo Rey -- -- REG 3.0 82 3.0 87 3.0 71 3.0 77 2.5 68 2.5 66 17.0 451 17.0 464
(ECE) 2.0 14 SPED * 1 * 1 -- -- * 4 * 1 * 6 0.0 13Hazelwood -- -- REG 3.0 75 4.0 95 4.0 105 4.0 96 4.0 111 3.0 93 22.0 575 24.0 594
-- -- SPED * 3 * 2 1.0 3 * 3 1.0 7 * 1 2.0 19Ilalko -- -- REG 3.0 78 4.0 86 4.0 103 3.0 67 3.0 86 3.0 81 20.0 501 22.0 520 -- -- SPED * 3 * 2 1.0 6 1.0 3 * 1 * 4 2.0 19Lake View -- -- REG 2.0 43 2.0 46 3.0 68 2.0 56 2.5 60 2.5 67 14.0 340 14.0 340 (ECE) 2.0 12 SPED -- -- -- -- -- -- -- -- -- -- -- -- 0.0 0Lakeland Hills -- -- REG 4.0 104 4.5 120 4.5 121 4.0 106 3.5 93 3.5 101 24.0 645 24.0 645
-- -- SPED -- -- -- -- -- -- -- -- -- -- -- -- 0.0 0Lea Hill -- -- REG 2.0 49 2.0 52 2.5 67 2.5 48 2.0 51 3.0 70 14.0 337 14.0 337 (ECE) 3.0 29 SPED -- -- -- -- -- -- -- -- -- -- -- -- 0.0 0Pioneer -- -- REG 4.0 97 3.0 79 3.0 88 2.5 61 2.5 73 2.0 64 17.0 462 17.0 462 -- -- SPED -- -- -- -- -- -- -- -- -- -- -- -- 0.0 0Terminal Park -- -- REG 2.0 48 3.0 58 2.5 63 2.5 64 2.5 58 2.5 63 15.0 354 17.0 407
-- -- STEP -- -- -- -- -- -- -- -- 1.0 25 1.0 28 2.0 53 -- -- SPED -- -- -- -- -- -- -- -- -- -- -- -- 0.0 0
Washington -- -- REG 3.0 69 3.0 74 3.5 70 2.5 64 2.5 66 2.5 72 17.0 415 19.0 436 -- -- SPED * 3 * 3 * 3 * 4 1.0 3 1.0 5 2.0 21 Elem
ELEM TOT ECE 19.0 136 K - 5 43.0 1037 45.5 1079 47.5 1126 42.5 1002 40.5 1032 39.0 1039 250.0 6227 258.0 6315 SchoolBY GRADE HDST TOTAL 8.0 88 258.0 6315 Total
MIDDLE SCHOOLS Grd 6 Grd 7 Grd 8SCH TOTALS SR HIGH SCHOOLS Grd 9 Grd 10 Grd 11 Grd 12 SCH TOTALSCascade REG 214 199 224 637 Auburn REG 338 321 316 280 1255Middle School SPED 31 38 33 102 Senior High SPED 58 44 43 66 211
total 245 237 257 739 FTRS 0 0 16 25 41Olympic REG 196 182 204 582 total 396 365 375 371 1507Middle School SPED 32 38 32 102 Auburn Mountainview REG 405 325 310 292 1332
total 228 220 236 684 Senior High SPED 26 31 21 24 102Rainier REG 259 253 246 758 FTRS 0 0 25 33 58Middle School SPED 21 29 25 75 431 356 356 349 1492
total 280 282 271 833 Auburn Riverside REG 374 380 379 348 1481Mt. Baker REG 314 265 263 842 Senior High SPED 34 20 11 21 86Middle School SPED 25 22 27 74 FTRS 0 0 18 34 52
total 339 287 290 916 total 408 400 408 403 1619 West Auburn REG 28 44 52 103 227
TOTALS REG 983 899 937 2819 3172 Mid Senior High SPED 1 2 8 1 12BY SPED 109 127 117 353 Schl FTRS 0 0 0 0 0
GRADE all 1092 1026 1054 3172 Total total 29 46 60 104 239SR HIGH REG 1145 1070 1057 1023 4295 4857 HighTOTALS SPED 119 97 83 112 411 School
FTRS 0 0 59 92 151 TotalBY GRADE all 1264 1167 1199 1227 4857 DISTRICT TOTALS BY GRADE GROUP w/ comparisons
K - 5 6-8 9-12 TOTAL 10/1/11 6266 3221 4901 14388current 6315 3172 4857 14344
difference 49 -49 -44 -44

1sonyr01.p 35-2 CASCADE MIDDLE SCHOOL 03/01/12 Page:1
04.11.10.00.01 Course/Class Count Report 202 1:22 PM
EST NBR NBR ----TOTALS---- ---Spec ed----
COURSE DESCRIPTION LGTH SEC AVL REQ TOT FEM MAL TOT FEM MAL
ART610 ART SURVEY 6 TM 1 120 49| 49 20 29 | 1 0 1 |
33 ERIC HOWE T3 03 | 24 9 15 | 1 0 1 |
34 ERIC HOWE T4 03 | 25 11 14 | 0 0 0 |
Number of Sections: 2 Average Students Per Section: 24.50
ART710 ART SURVEY 7 TM 1 240 84| 84 42 42 | 16 7 9 |
13 ERIC HOWE T3 01 | 27 11 16 | 8 2 6 |
14 ERIC HOWE T4 01 | 19 10 9 | 4 2 2 |
23 ERIC HOWE T3 02 | 18 7 11 | 1 1 0 |
24 ERIC HOWE T4 02 | 20 14 6 | 3 2 1 |
Number of Sections: 4 Average Students Per Section: 21.00
ART810 ART SURVEY 8 TM 1 240 80| 80 35 45 | 15 7 8 |
53 ERIC HOWE T3 05 | 19 5 14 | 6 2 4 |
54 ERIC HOWE T4 05 | 13 7 6 | 2 1 1 |
63 ERIC HOWE T3 06 | 29 13 16 | 6 3 3 |
64 ERIC HOWE T4 06 | 19 10 9 | 1 1 0 |
Number of Sections: 4 Average Students Per Section: 20.00
BUS610 KEYBD SURVEY 6 TM 1 240 94| 93 39 54 | 15 7 8 |
33 DAVID L. CAMPBELL T3 03 | 30 17 13 | 4 3 1 |
34 DAVID L. CAMPBELL T4 03 | 20 8 12 | 1 0 1 |
43 DAVID L. CAMPBELL T3 04 | 24 7 17 | 5 1 4 |
44 DAVID L. CAMPBELL T4 04 | 19 7 12 | 5 3 2 |
Number of Sections: 4 Average Students Per Section: 23.25
ELL601 ELL 6 SM 1 60 6| 6 5 1 | 0 0 0 |
12 MARTHA C. ROBAYO WHITE S2 01 | 6 5 1 | 0 0 0 |
Number of Sections: 1 Average Students Per Section: 6.00
ELL801 ELL 8 SM 1 180 5| 5 4 1 | 0 0 0 |
62 MARTHA C. ROBAYO WHITE S2 06 | 5 4 1 | 0 0 0 |
Number of Sections: 1 Average Students Per Section: 5.00
GEN010 ELL MONITORING YR 1 100 58| 58 27 31 | 10 6 4 |
71 MARTHA C. ROBAYO WHITE YR 07 | 58 27 31 | 10 6 4 |
Number of Sections: 1 Average Students Per Section: 58.00
GEN100 STUDY SKILLS SM 1 11 4| 4 1 3 | 4 1 3 |
42 REBECCA A. RAMIREZ-DIL S2 04 | 1 1 0 | 1 1 0 |
52 REBECCA A. RAMIREZ-DIL S2 05 | 1 0 1 | 1 0 1 |
72 REBECCA A. RAMIREZ-DIL S2 07 | 2 0 2 | 2 0 2 |
Number of Sections: 3 Average Students Per Section: 1.33
GEN110 LEADERSHIP TM 1 360 145| 145 62 83 | 29 14 15 |
13 KENTON C. BARKER T3 01 | 23 13 10 | 6 4 2 |
14 KENTON C. BARKER T4 01 | 24 9 15 | 7 2 5 |
43 DENISE M. BAXTER T3 04 | 21 9 12 | 5 3 2 |
44 DENISE M. BAXTER T4 04 | 22 8 14 | 1 0 1 |
63 SANDRA L. LUETTGEN T3 06 | 28 10 18 | 4 3 1 |
64 SANDRA L. LUETTGEN T4 06 | 27 13 14 | 6 2 4 |
Number of Sections: 6 Average Students Per Section: 24.17
GEN610 TEACHERS AIDE 6 SM 1 5 1| 1 1 0 | 0 0 0 |
62 JULIE K. KOVASH S2 06 | 1 1 0 | 0 0 0 |
63 ISAIAH D. JOHNSON S2 06 | 0 0 0 | 0 0 0 |
Number of Sections: 2 Average Students Per Section: 0.50
GEN710 TEACHERS AIDE 7 SM 1 87 33| 33 26 7 | 3 2 1 |
001 JENNY HOMFELDT S2 02 | 1 1 0 | 0 0 0 |
002 KEVIN P. OLSON S2 02 | 1 1 0 | 0 0 0 |
003 KENTON C. BARKER S2 02 | 1 1 0 | 0 0 0 |
011 SHARON K. BELL S2 01 | 1 1 0 | 0 0 0 |
012 JULIE K. KOVASH S2 02 | 0 0 0 | 0 0 0 |
013 QUYNH N. TAYLOR S2 01 | 1 1 0 | 0 0 0 |
014 DENISE M. BAXTER S2 01 | 1 1 0 | 0 0 0 |

1sonyr01.p 35-2 CASCADE MIDDLE SCHOOL 03/01/12 Page:2
04.11.10.00.01 Course/Class Count Report 202 1:22 PM
EST NBR NBR ----TOTALS---- ---Spec ed----
COURSE DESCRIPTION LGTH SEC AVL REQ TOT FEM MAL TOT FEM MAL
020 QUYNH N. TAYLOR S2 02 | 1 1 0 | 0 0 0 |
021 SANDRA L. LUETTGEN S2 02 | 1 1 0 | 0 0 0 |
022 SHARON K. BELL S2 02 | 1 1 0 | 1 1 0 |
023 CASEY A. KILLETT S2 02 | 1 1 0 | 0 0 0 |
024 DENISE M. BAXTER S2 02 | 1 0 1 | 0 0 0 |
025 CHRISTINE S. AREND S2 02 | 1 0 1 | 0 0 0 |
026 AARON S. LEE S2 02 | 1 1 0 | 0 0 0 |
027 CORRIE L. AGNEW S2 02 | 2 2 0 | 0 0 0 |
028 STEPHANIE R. AUSTIN S2 05 | 1 1 0 | 0 0 0 |
029 STEPHANIE R. AUSTIN S2 02 | 1 1 0 | 0 0 0 |
051 NORMA F. KING S2 05 | 1 0 1 | 1 0 1 |
052 AARON S. LEE S2 05 | 1 1 0 | 0 0 0 |
053 SANDRA L. LUETTGEN S2 05 | 1 1 0 | 0 0 0 |
054 LORI KARPAN S2 05 | 1 1 0 | 0 0 0 |
055 JENNY HOMFELDT S2 05 | 1 1 0 | 0 0 0 |
061 SHARON K. BELL S2 06 | 1 1 0 | 1 1 0 |
062 LORI KARPAN S2 06 | 0 0 0 | 0 0 0 |
063 QUYNH N. TAYLOR S2 06 | 1 1 0 | 0 0 0 |
064 DENISE M. BAXTER S2 06 | 1 1 0 | 0 0 0 |
065 ROBERT A. ROBINSON S2 06 | 1 1 0 | 0 0 0 |
15 ISAIAH D. JOHNSON S2 01 | 1 0 1 | 0 0 0 |
224 LORI KARPAN S2 02 | 1 0 1 | 0 0 0 |
42 ISAIAH D. JOHNSON S2 04 | 2 0 2 | 0 0 0 |
60 ISAIAH D. JOHNSON S2 06 | 3 3 0 | 0 0 0 |
624 QUYNH N. TAYLOR S2 06 | 0 0 0 | 0 0 0 |
Number of Sections: 32 Average Students Per Section: 1.03
GEN810 TEACHERS AIDE 8 SM 1 102 53| 53 31 22 | 2 1 1 |
001 JUSTIN W. MENTINK S2 01 | 1 0 1 | 0 0 0 |
002 KANIKA L. WATKINS S2 01 | 1 1 0 | 0 0 0 |
003 AMY J. SLEETH S2 01 | 1 1 0 | 0 0 0 |
010 ROBERT K. WEBB S2 01 | 1 1 0 | 0 0 0 |
011 PAULA A. DRAGSETH S2 01 | 1 1 0 | 0 0 0 |
012 CHRISTINE S. AREND S2 01 | 2 1 1 | 0 0 0 |
013 SHAYNA E. BROWN S2 01 | 1 1 0 | 0 0 0 |
014 LORI KARPAN S2 01 | 1 1 0 | 0 0 0 |
015 ISAIAH D. JOHNSON S2 01 | 2 2 0 | 0 0 0 |
016 PAULETTE T. FONDA S2 01 | 1 1 0 | 0 0 0 |
017 SANDRA L. LUETTGEN S2 01 | 1 1 0 | 0 0 0 |
018 CHRISTINA W. THOMSEN S2 01 | 1 0 1 | 0 0 0 |
019 CHARLES R. CHEW JR S2 01 | 1 1 0 | 0 0 0 |
021 CHARLES R. CHEW JR S2 02 | 1 1 0 | 0 0 0 |
022 ISAIAH D. JOHNSON S2 02 | 2 1 1 | 0 0 0 |
031 KANIKA L. WATKINS S2 03 | 1 1 0 | 0 0 0 |
032 ISAIAH D. JOHNSON S2 03 | 2 2 0 | 0 0 0 |
033 KEITH D. RAY S2 03 | 2 1 1 | 0 0 0 |
034 AARON S. LEE S2 03 | 0 0 0 | 0 0 0 |
035 CASEY A. KILLETT S2 03 | 1 1 0 | 0 0 0 |
036 QUYNH N. TAYLOR S2 03 | 1 1 0 | 0 0 0 |
037 ALETHEA C. DOZIER S2 03 | 1 0 1 | 0 0 0 |
038 JUSTIN W. MENTINK S2 03 | 1 0 1 | 0 0 0 |
040 SHARON K. BELL S2 04 | 1 0 1 | 0 0 0 |
041 PAULA A. DRAGSETH S2 04 | 1 0 1 | 0 0 0 |
042 KEITH D. RAY S2 04 | 2 1 1 | 0 0 0 |
043 JUSTIN W. MENTINK S2 04 | 1 1 0 | 0 0 0 |
044 AARON S. LEE S2 04 | 2 1 1 | 0 0 0 |
051 KANIKA L. WATKINS S2 05 | 1 1 0 | 0 0 0 |

1sonyr01.p 35-2 CASCADE MIDDLE SCHOOL 03/01/12 Page:3
04.11.10.00.01 Course/Class Count Report 202 1:22 PM
EST NBR NBR ----TOTALS---- ---Spec ed----
COURSE DESCRIPTION LGTH SEC AVL REQ TOT FEM MAL TOT FEM MAL
052 CHRISTINE S. AREND S2 05 | 1 1 0 | 0 0 0 |
053 DANIEL A. MCNEESE S2 05 | 0 0 0 | 0 0 0 |
054 ISAIAH D. JOHNSON S2 05 | 3 3 0 | 0 0 0 |
055 MATHEW R. LUDWIGSON S2 05 | 1 1 0 | 0 0 0 |
056 KEVIN P. OLSON S2 05 | 1 0 1 | 0 0 0 |
057 DENISE M. BAXTER S2 05 | 1 0 1 | 0 0 0 |
060 ALETHEA C. DOZIER S2 06 | 3 0 3 | 0 0 0 |
061 ROBERT A. ROBINSON S2 06 | 1 1 0 | 0 0 0 |
062 AARON S. LEE S2 06 | 1 0 1 | 1 0 1 |
063 MARCUS R. DEAVER S2 06 | 1 0 1 | 0 0 0 |
064 CHRISTINE S. AREND S2 06 | 2 0 2 | 0 0 0 |
065 AMY J. SLEETH S2 06 | 1 0 1 | 0 0 0 |
40 CHRISTINA W. THOMSEN S2 04 | 1 0 1 | 0 0 0 |
58 REBECCA A. RAMIREZ-DIL S2 05 | 1 1 0 | 1 1 0 |
Number of Sections: 43 Average Students Per Section: 1.23
HOM610 HOME EC 6 TM 1 240 99| 99 46 53 | 9 3 6 |
33 VALERIE E. BRYANT T3 03 | 27 14 13 | 2 1 1 |
34 VALERIE E. BRYANT T4 03 | 24 12 12 | 1 1 0 |
43 VALERIE E. BRYANT T3 04 | 24 12 12 | 2 0 2 |
44 VALERIE E. BRYANT T4 04 | 24 8 16 | 4 1 3 |
Number of Sections: 4 Average Students Per Section: 24.75
HOM710 HOME EC 7 TM 1 240 77| 77 39 38 | 12 5 7 |
13 VALERIE E. BRYANT T3 01 | 18 9 9 | 3 1 2 |
14 VALERIE E. BRYANT T4 01 | 24 10 14 | 4 2 2 |
23 VALERIE E. BRYANT T3 02 | 22 16 6 | 3 2 1 |
24 VALERIE E. BRYANT T4 02 | 13 4 9 | 2 0 2 |
Number of Sections: 4 Average Students Per Section: 19.25
HOM810 HOME EC 8 TM 1 120 32| 32 16 16 | 2 1 1 |
53 VALERIE E. BRYANT T3 05 | 17 9 8 | 2 1 1 |
54 VALERIE E. BRYANT T4 05 | 15 7 8 | 0 0 0 |
Number of Sections: 2 Average Students Per Section: 16.00
IND610 TECH SURVEY 6 TM 1 240 0| 0 0 0 | 0 0 0 |
33 DAVID L. CAMPBELL T3 03 | 0 0 0 | 0 0 0 |
34 DAVID L. CAMPBELL T4 03 | 0 0 0 | 0 0 0 |
43 DAVID L. CAMPBELL T3 04 | 0 0 0 | 0 0 0 |
44 DAVID L. CAMPBELL T4 04 | 0 0 0 | 0 0 0 |
Number of Sections: 4 Average Students Per Section: 0.00
LAN112 YEARBOOK 2 SM 1 30 13| 13 9 4 | 0 0 0 |
12 ALETHEA C. DOZIER S2 01 | 13 9 4 | 0 0 0 |
Number of Sections: 1 Average Students Per Section: 13.00
LAN602 LAN ARTS 6 2 SM 1 151 112| 112 46 66 | 3 1 2 |
12 JULIE K. KOVASH S2 01 | 15 6 9 | 0 0 0 |
22 JULIE K. KOVASH S2 02 | 25 12 13 | 0 0 0 |
42 JULIE K. KOVASH S2 04 | 26 12 14 | 0 0 0 |
52 JULIE K. KOVASH S2 05 | 22 9 13 | 0 0 0 |
62 JULIE K. KOVASH S2 06 | 23 7 16 | 2 1 1 |
APX KANIKA L. WATKINS S2 01 | 1 0 1 | 1 0 1 |
Number of Sections: 6 Average Students Per Section: 18.67
LAN612 HON LA 6 2 SM 1 30 27| 27 12 15 | 0 0 0 |
61 LORI KARPAN S2 06 | 27 12 15 | 0 0 0 |
Number of Sections: 1 Average Students Per Section: 27.00
LAN652 LAP READING 6 2 SM 1 60 21| 21 5 16 | 0 0 0 |
11 PAULA A. DRAGSETH S2 01 | 11 2 9 | 0 0 0 |
41 PAULA A. DRAGSETH S2 04 | 10 3 7 | 0 0 0 |
Number of Sections: 2 Average Students Per Section: 10.50
LAN702 LANG ARTS 7 2 SM 6 211 157| 157 78 79 | 7 3 4 |

1sonyr01.p 35-2 CASCADE MIDDLE SCHOOL 03/01/12 Page:4
04.11.10.00.01 Course/Class Count Report 202 1:22 PM
EST NBR NBR ----TOTALS---- ---Spec ed----
COURSE DESCRIPTION LGTH SEC AVL REQ TOT FEM MAL TOT FEM MAL
11 KANIKA L. WATKINS S2 01 | 30 13 17 | 1 0 1 |
31 KANIKA L. WATKINS S2 03 | 27 10 17 | 2 1 1 |
41 KANIKA L. WATKINS S2 04 | 24 10 14 | 0 0 0 |
42 JOEL R. MACDOUGALL S2 04 | 20 12 8 | 1 1 0 |
51 KANIKA L. WATKINS S2 05 | 19 10 9 | 0 0 0 |
61 KANIKA L. WATKINS S2 06 | 17 10 7 | 1 0 1 |
62 JOEL R. MACDOUGALL S2 06 | 19 13 6 | 1 1 0 |
APX KANIKA L. WATKINS S2 03 | 1 0 1 | 1 0 1 |
Number of Sections: 8 Average Students Per Section: 19.63
LAN712 HON LA 7 2 SM 2 60 47| 47 31 16 | 0 0 0 |
11 JOEL R. MACDOUGALL S2 01 | 22 14 8 | 0 0 0 |
31 JOEL R. MACDOUGALL S2 03 | 25 17 8 | 0 0 0 |
Number of Sections: 2 Average Students Per Section: 23.50
LAN752 LAP READING 7 2 SM 1 60 22| 22 9 13 | 1 0 1 |
21 PAULA A. DRAGSETH S2 02 | 10 5 5 | 0 0 0 |
31 PAULA A. DRAGSETH S2 03 | 12 4 8 | 1 0 1 |
Number of Sections: 2 Average Students Per Section: 11.00
LAN802 LANG ARTS 8 2 SM 1 150 140| 140 57 83 | 7 3 4 |
11 AMY J. SLEETH S2 01 | 27 15 12 | 1 1 0 |
21 AMY J. SLEETH S2 02 | 22 7 15 | 1 0 1 |
31 AMY J. SLEETH S2 03 | 29 16 13 | 2 1 1 |
41 AMY J. SLEETH S2 04 | 31 13 18 | 2 1 1 |
51 AMY J. SLEETH S2 05 | 31 6 25 | 1 0 1 |
Number of Sections: 5 Average Students Per Section: 28.00
LAN812 HON LA 8 2 SM 2 60 41| 41 18 23 | 0 0 0 |
41 ALETHEA C. DOZIER S2 04 | 21 8 13 | 0 0 0 |
51 ALETHEA C. DOZIER S2 05 | 20 10 10 | 0 0 0 |
Number of Sections: 2 Average Students Per Section: 20.50
LAN816 JOURNALISM 8 TM 1 120 32| 32 15 17 | 2 2 0 |
53 JOEL R. MACDOUGALL T3 05 | 21 12 9 | 2 2 0 |
54 JOEL R. MACDOUGALL T4 05 | 11 3 8 | 0 0 0 |
Number of Sections: 2 Average Students Per Section: 16.00
LAN852 LAP READING 8 2 SM 1 30 11| 11 6 5 | 0 0 0 |
51 PAULA A. DRAGSETH S2 05 | 11 6 5 | 0 0 0 |
Number of Sections: 1 Average Students Per Section: 11.00
MAT082 MATH STRAT 1C TM 1 12 12| 12 5 7 | 1 1 0 |
23 PAULETTE T. FONDA T3 02 | 12 5 7 | 1 1 0 |
Number of Sections: 1 Average Students Per Section: 12.00
MAT083 MATH STRAT 1D TM 1 12 0| 0 0 0 | 0 0 0 |
24 PAULETTE T. FONDA T4 02 | 0 0 0 | 0 0 0 |
Number of Sections: 1 Average Students Per Section: 0.00
MAT086 MATH STRAT 2C TM 1 24 21| 21 11 10 | 0 0 0 |
33 PAULETTE T. FONDA T3 03 | 11 6 5 | 0 0 0 |
53 PAULETTE T. FONDA T3 05 | 10 5 5 | 0 0 0 |
Number of Sections: 2 Average Students Per Section: 10.50
MAT087 MATH STRAT 2D TM 1 24 0| 0 0 0 | 0 0 0 |
34 PAULETTE T. FONDA T4 03 | 0 0 0 | 0 0 0 |
54 PAULETTE T. FONDA T4 05 | 0 0 0 | 0 0 0 |
Number of Sections: 2 Average Students Per Section: 0.00
MAT090 MATH STRAT 3C TM 1 24 23| 23 7 16 | 1 0 1 |
43 PAULETTE T. FONDA T3 04 | 12 4 8 | 1 0 1 |
63 PAULETTE T. FONDA T3 06 | 11 3 8 | 0 0 0 |
Number of Sections: 2 Average Students Per Section: 11.50
MAT091 MATH STRAT 3D TM 1 24 1| 1 1 0 | 0 0 0 |
44 PAULETTE T. FONDA T4 04 | 1 1 0 | 0 0 0 |
64 PAULETTE T. FONDA T4 06 | 0 0 0 | 0 0 0 |

1sonyr01.p 35-2 CASCADE MIDDLE SCHOOL 03/01/12 Page:5
04.11.10.00.01 Course/Class Count Report 202 1:22 PM
EST NBR NBR ----TOTALS---- ---Spec ed----
COURSE DESCRIPTION LGTH SEC AVL REQ TOT FEM MAL TOT FEM MAL
Number of Sections: 2 Average Students Per Section: 0.50
MAT103 MATH FOUND 2B SM 1 150 108| 108 47 61 | 5 2 3 |
12 QUYNH N. TAYLOR S2 01 | 29 12 17 | 0 0 0 |
22 QUYNH N. TAYLOR S2 02 | 20 8 12 | 2 1 1 |
32 QUYNH N. TAYLOR S2 03 | 24 14 10 | 2 1 1 |
41 JUSTIN W. MENTINK S2 04 | 15 6 9 | 0 0 0 |
61 JUSTIN W. MENTINK S2 06 | 20 7 13 | 1 0 1 |
Number of Sections: 5 Average Students Per Section: 21.60
MAT105 MATH FOUND 3B SM 1 90 80| 80 36 44 | 8 3 5 |
32 CHARLES R. CHEW JR S2 03 | 21 6 15 | 2 0 2 |
42 CHARLES R. CHEW JR S2 04 | 30 13 17 | 2 1 1 |
62 CHARLES R. CHEW JR S2 06 | 29 17 12 | 4 2 2 |
Number of Sections: 3 Average Students Per Section: 26.67
MAT112 MATH 2 SM 1 270 214| 214 100 114 | 10 6 4 |
11 DENISE M. BAXTER S2 01 | 26 14 12 | 2 1 1 |
12 JENNY HOMFELDT S2 01 | 22 9 13 | 1 0 1 |
21 DENISE M. BAXTER S2 02 | 17 9 8 | 0 0 0 |
22 JENNY HOMFELDT S2 02 | 20 8 12 | 1 1 0 |
42 JENNY HOMFELDT S2 04 | 27 14 13 | 2 1 1 |
51 DENISE M. BAXTER S2 05 | 26 10 16 | 0 0 0 |
52 JENNY HOMFELDT S2 05 | 24 10 14 | 0 0 0 |
61 DENISE M. BAXTER S2 06 | 27 11 16 | 2 1 1 |
62 JENNY HOMFELDT S2 06 | 25 15 10 | 2 2 0 |
Number of Sections: 9 Average Students Per Section: 23.78
MAT116 PRE ALGEBRA 2 SM 1 150 61| 61 36 25 | 1 1 0 |
11 JUSTIN W. MENTINK S2 01 | 21 12 9 | 0 0 0 |
21 JUSTIN W. MENTINK S2 02 | 18 10 8 | 0 0 0 |
31 JUSTIN W. MENTINK S2 03 | 22 14 8 | 1 1 0 |
42 QUYNH N. TAYLOR S2 04 | 0 0 0 | 0 0 0 |
62 QUYNH N. TAYLOR S2 06 | 0 0 0 | 0 0 0 |
Number of Sections: 5 Average Students Per Section: 12.20
MAT121 ALGEBRA 2 SM 1 120 103| 103 47 56 | 0 0 0 |
12 CHARLES R. CHEW JR S2 01 | 24 9 15 | 0 0 0 |
22 CHARLES R. CHEW JR S2 02 | 27 11 16 | 0 0 0 |
41 SHAYNA E. BROWN S2 04 | 26 11 15 | 0 0 0 |
61 SHAYNA E. BROWN S2 06 | 26 16 10 | 0 0 0 |
Number of Sections: 4 Average Students Per Section: 25.75
MUS610 MUSIC SURVEY 6 TM 1 240 97| 97 45 52 | 3 1 2 |
33 RYAN TANAKA T3 03 | 28 13 15 | 1 1 0 |
34 RYAN TANAKA T4 03 | 23 13 10 | 0 0 0 |
43 RYAN TANAKA T3 04 | 24 8 16 | 1 0 1 |
44 RYAN TANAKA T4 04 | 22 11 11 | 1 0 1 |
Number of Sections: 4 Average Students Per Section: 24.25
MUS612 CHOIR 6 2 SM 1 45 33| 33 18 15 | 2 1 1 |
11 DAVID L. CAMPBELL S2 01 | 33 18 15 | 2 1 1 |
Number of Sections: 1 Average Students Per Section: 33.00
MUS622 BAND 6 2 SM 1 45 24| 24 11 13 | 0 0 0 |
51 DEREK V. PYLE S2 05 | 24 11 13 | 0 0 0 |
Number of Sections: 1 Average Students Per Section: 24.00
MUS632 ORCHESTRA 6 2 SM 1 45 26| 26 15 11 | 1 0 1 |
31 DAVID L. STAFFORD S2 03 | 26 15 11 | 1 0 1 |
Number of Sections: 1 Average Students Per Section: 26.00
MUS712 CHOIR 7 2 SM 1 45 33| 33 22 11 | 4 2 2 |
51 DAVID L. CAMPBELL S2 05 | 33 22 11 | 4 2 2 |
Number of Sections: 1 Average Students Per Section: 33.00
MUS722 BAND 7 2 SM 1 45 15| 15 8 7 | 0 0 0 |

1sonyr01.p 35-2 CASCADE MIDDLE SCHOOL 03/01/12 Page:6
04.11.10.00.01 Course/Class Count Report 202 1:22 PM
EST NBR NBR ----TOTALS---- ---Spec ed----
COURSE DESCRIPTION LGTH SEC AVL REQ TOT FEM MAL TOT FEM MAL
62 DEREK V. PYLE S2 06 | 15 8 7 | 0 0 0 |
Number of Sections: 1 Average Students Per Section: 15.00
MUS732 ORCHESTRA 7 2 SM 1 45 23| 23 19 4 | 1 1 0 |
22 DAVID L. STAFFORD S2 02 | 23 19 4 | 1 1 0 |
Number of Sections: 1 Average Students Per Section: 23.00
MUS812 CHOIR 8 2 SM 1 45 33| 33 23 10 | 5 5 0 |
21 DAVID L. CAMPBELL S2 02 | 33 23 10 | 5 5 0 |
Number of Sections: 1 Average Students Per Section: 33.00
MUS822 BAND 8 2 SM 1 45 26| 26 4 22 | 0 0 0 |
61 DEREK V. PYLE S2 06 | 26 4 22 | 0 0 0 |
Number of Sections: 1 Average Students Per Section: 26.00
MUS832 ORCHESTRA 8 2 SM 1 45 15| 15 9 6 | 2 0 2 |
21 DAVID L. STAFFORD S2 02 | 15 9 6 | 2 0 2 |
Number of Sections: 1 Average Students Per Section: 15.00
PHY622 HEALTH FIT 6 2 SM 1 180 157| 157 71 86 | 19 8 11 |
21 CHRISTINE S. AREND S2 02 | 29 15 14 | 3 1 2 |
22 MATHEW R. LUDWIGSON S2 02 | 31 13 18 | 9 4 5 |
31 DANIEL A. MCNEESE S2 03 | 36 10 26 | 2 0 2 |
61 CHRISTINE S. AREND S2 06 | 30 16 14 | 2 1 1 |
62 DANIEL A. MCNEESE S2 06 | 31 17 14 | 3 2 1 |
Number of Sections: 5 Average Students Per Section: 31.40
PHY701 HEALTH 7 TM 8 240 73| 73 29 44 | 10 4 6 |
13 DANIEL A. MCNEESE T3 01 | 26 11 15 | 4 2 2 |
14 DANIEL A. MCNEESE T4 01 | 19 9 10 | 4 2 2 |
23 DANIEL A. MCNEESE T3 02 | 13 4 9 | 2 0 2 |
24 DANIEL A. MCNEESE T4 02 | 15 5 10 | 0 0 0 |
Number of Sections: 4 Average Students Per Section: 18.25
PHY722 HEALTH FIT 7 2 SM 1 180 134| 134 60 74 | 22 7 15 |
21 KEITH D. RAY S2 02 | 24 7 17 | 2 0 2 |
41 KEITH D. RAY S2 04 | 30 14 16 | 7 1 6 |
51 CHRISTINE S. AREND S2 05 | 24 13 11 | 3 2 1 |
52 DANIEL A. MCNEESE S2 05 | 23 8 15 | 5 1 4 |
61 KEITH D. RAY S2 06 | 33 18 15 | 5 3 2 |
Number of Sections: 5 Average Students Per Section: 26.80
PHY801 HEALTH 8 TM 1 240 94| 94 38 56 | 10 6 4 |
53 MATHEW R. LUDWIGSON T3 05 | 21 9 12 | 0 0 0 |
54 MATHEW R. LUDWIGSON T4 05 | 17 10 7 | 2 2 0 |
63 MATHEW R. LUDWIGSON T3 06 | 31 11 20 | 5 2 3 |
64 MATHEW R. LUDWIGSON T4 06 | 25 8 17 | 3 2 1 |
Number of Sections: 4 Average Students Per Section: 23.50
PHY822 HEALTH FIT 8 2 SM 1 180 128| 127 39 88 | 15 6 9 |
11 CHRISTINE S. AREND S2 01 | 17 9 8 | 3 2 1 |
12 MATHEW R. LUDWIGSON S2 01 | 36 12 24 | 4 2 2 |
13 KEITH D. RAY S2 01 | 29 4 25 | 4 1 3 |
31 MATHEW R. LUDWIGSON S2 03 | 22 8 14 | 1 0 1 |
32 KEITH D. RAY S2 03 | 23 6 17 | 3 1 2 |
Number of Sections: 5 Average Students Per Section: 25.40
SBLA62 LANG ARTS 6 2 SM 1 120 78| 78 38 40 | 1 0 1 |
11 LORI KARPAN S2 01 | 17 8 9 | 0 0 0 |
21 LORI KARPAN S2 02 | 13 8 5 | 0 0 0 |
41 LORI KARPAN S2 04 | 30 14 16 | 0 0 0 |
51 LORI KARPAN S2 05 | 18 8 10 | 1 0 1 |
Number of Sections: 4 Average Students Per Section: 19.50
SBLA82 LANG ARTS 8 2 SM 1 60 54| 54 26 28 | 4 2 2 |
22 ALETHEA C. DOZIER S2 02 | 28 12 16 | 2 0 2 |
32 ALETHEA C. DOZIER S2 03 | 26 14 12 | 2 2 0 |

1sonyr01.p 35-2 CASCADE MIDDLE SCHOOL 03/01/12 Page:7
04.11.10.00.01 Course/Class Count Report 202 1:22 PM
EST NBR NBR ----TOTALS---- ---Spec ed----
COURSE DESCRIPTION LGTH SEC AVL REQ TOT FEM MAL TOT FEM MAL
Number of Sections: 2 Average Students Per Section: 27.00
SBMA82 MATH 8 2 SM 1 90 62| 62 22 40 | 3 1 2 |
11 SHAYNA E. BROWN S2 01 | 24 8 16 | 0 0 0 |
21 SHAYNA E. BROWN S2 02 | 22 9 13 | 1 1 0 |
31 SHAYNA E. BROWN S2 03 | 16 5 11 | 2 0 2 |
Number of Sections: 3 Average Students Per Section: 20.67
SBPA02 SB PRE ALGEB 2 SM 1 60 33| 33 22 11 | 0 0 0 |
42 QUYNH N. TAYLOR S2 04 | 20 15 5 | 0 0 0 |
62 QUYNH N. TAYLOR S2 06 | 13 7 6 | 0 0 0 |
Number of Sections: 2 Average Students Per Section: 16.50
SBSC72 SCIENCE 7 2 SM 1 120 100| 100 61 39 | 15 10 5 |
31 CASEY A. KILLETT S2 03 | 24 13 11 | 5 3 2 |
41 CASEY A. KILLETT S2 04 | 25 16 9 | 5 2 3 |
51 CASEY A. KILLETT S2 05 | 25 13 12 | 2 2 0 |
61 CASEY A. KILLETT S2 06 | 26 19 7 | 3 3 0 |
Number of Sections: 4 Average Students Per Section: 25.00
SBSC82 SCIENCE 8 2 SM 1 120 110| 110 47 63 | 13 6 7 |
21 MARCUS R. DEAVER S2 02 | 26 8 18 | 1 1 0 |
31 MARCUS R. DEAVER S2 03 | 26 10 16 | 1 1 0 |
41 MARCUS R. DEAVER S2 04 | 31 14 17 | 5 1 4 |
51 MARCUS R. DEAVER S2 05 | 27 15 12 | 6 3 3 |
Number of Sections: 4 Average Students Per Section: 27.50
SCI602 SCIENCE 6 2 SM 1 300 239| 239 107 132 | 25 11 14 |
11 STEPHANIE R. AUSTIN S2 01 | 23 10 13 | 2 1 1 |
12 CORRIE L. AGNEW S2 01 | 22 8 14 | 2 2 0 |
21 STEPHANIE R. AUSTIN S2 02 | 20 8 12 | 4 1 3 |
22 CORRIE L. AGNEW S2 02 | 19 8 11 | 2 1 1 |
31 STEPHANIE R. AUSTIN S2 03 | 31 16 15 | 1 1 0 |
32 CORRIE L. AGNEW S2 03 | 28 12 16 | 0 0 0 |
51 STEPHANIE R. AUSTIN S2 05 | 26 13 13 | 4 1 3 |
52 CORRIE L. AGNEW S2 05 | 25 16 9 | 2 2 0 |
61 STEPHANIE R. AUSTIN S2 06 | 21 8 13 | 3 1 2 |
62 CORRIE L. AGNEW S2 06 | 24 8 16 | 5 1 4 |
Number of Sections: 10 Average Students Per Section: 23.90
SCI651 ENVIRON SCI 6 TM 1 120 59| 59 25 34 | 7 3 4 |
63 MARCUS R. DEAVER T3 06 | 30 15 15 | 2 1 1 |
64 MARCUS R. DEAVER T4 06 | 29 10 19 | 5 2 3 |
Number of Sections: 2 Average Students Per Section: 29.50
SCI702 SCIENCE 7 2 SM 1 155 128| 128 60 68 | 14 3 11 |
22 JAMES M. ABRAHAM S2 02 | 26 14 12 | 0 0 0 |
32 JAMES M. ABRAHAM S2 03 | 29 9 20 | 7 1 6 |
42 JAMES M. ABRAHAM S2 04 | 21 12 9 | 0 0 0 |
52 JAMES M. ABRAHAM S2 05 | 24 13 11 | 1 1 0 |
62 JAMES M. ABRAHAM S2 06 | 24 10 14 | 4 1 3 |
APX CASEY A. KILLETT S2 06 | 3 2 1 | 1 0 1 |
AX CASEY A. KILLETT S2 05 | 1 0 1 | 1 0 1 |
Number of Sections: 7 Average Students Per Section: 18.29
SCI751 ENVIR SCIENCE 7 TM 1 155 34| 34 14 20 | 1 1 0 |
23 CASEY A. KILLETT T3 02 | 16 6 10 | 0 0 0 |
24 CASEY A. KILLETT T4 02 | 18 8 10 | 1 1 0 |
Number of Sections: 2 Average Students Per Section: 17.00
SCI802 SCIENCE 8 2 SM 1 151 140| 140 62 78 | 13 7 6 |
22 ROBERT K. WEBB S2 02 | 26 10 16 | 1 0 1 |
32 ROBERT K. WEBB S2 03 | 27 12 15 | 2 1 1 |
42 ROBERT K. WEBB S2 04 | 30 15 15 | 2 1 1 |
52 ROBERT K. WEBB S2 05 | 26 11 15 | 4 3 1 |

1sonyr01.p 35-2 CASCADE MIDDLE SCHOOL 03/01/12 Page:8
04.11.10.00.01 Course/Class Count Report 202 1:22 PM
EST NBR NBR ----TOTALS---- ---Spec ed----
COURSE DESCRIPTION LGTH SEC AVL REQ TOT FEM MAL TOT FEM MAL
62 ROBERT K. WEBB S2 06 | 30 14 16 | 4 2 2 |
APX CASEY A. KILLETT S2 04 | 1 0 1 | 0 0 0 |
Number of Sections: 6 Average Students Per Section: 23.33
SOC602 SOC STUDIES 6 2 SM 6 241 210| 210 94 116 | 25 11 14 |
11 KEVIN P. OLSON S2 01 | 25 12 13 | 1 0 1 |
12 SANDRA L. LUETTGEN S2 01 | 23 12 11 | 2 1 1 |
21 KEVIN P. OLSON S2 02 | 22 9 13 | 4 2 2 |
41 KEVIN P. OLSON S2 04 | 29 14 15 | 4 3 1 |
42 SANDRA L. LUETTGEN S2 04 | 24 14 10 | 6 3 3 |
51 KEVIN P. OLSON S2 05 | 30 11 19 | 1 0 1 |
52 SANDRA L. LUETTGEN S2 05 | 28 11 17 | 1 0 1 |
61 KEVIN P. OLSON S2 06 | 28 11 17 | 5 2 3 |
APX DARICE R. JOHNSON S2 02 | 1 0 1 | 1 0 1 |
Number of Sections: 9 Average Students Per Section: 23.33
SOC612 HON SOC STD 6 2 SM 1 30 28| 28 12 16 | 0 0 0 |
21 SANDRA L. LUETTGEN S2 02 | 28 12 16 | 0 0 0 |
Number of Sections: 1 Average Students Per Section: 28.00
SOC702 WORLD HISTORY 7 SM 1 210 182| 182 91 91 | 30 14 16 |
31 KENTON C. BARKER S2 03 | 26 16 10 | 8 5 3 |
41 KENTON C. BARKER S2 04 | 28 14 14 | 2 2 0 |
42 ROBERT A. ROBINSON S2 04 | 26 13 13 | 4 2 2 |
51 KENTON C. BARKER S2 05 | 27 11 16 | 2 0 2 |
52 ROBERT A. ROBINSON S2 05 | 25 14 11 | 1 0 1 |
61 KENTON C. BARKER S2 06 | 25 10 15 | 5 2 3 |
62 ROBERT A. ROBINSON S2 06 | 25 13 12 | 8 3 5 |
Number of Sections: 7 Average Students Per Section: 26.00
SOC712 HON WORLD HIST7 SM 2 60 47| 47 31 16 | 0 0 0 |
11 ROBERT A. ROBINSON S2 01 | 25 17 8 | 0 0 0 |
31 ROBERT A. ROBINSON S2 03 | 22 14 8 | 0 0 0 |
Number of Sections: 2 Average Students Per Section: 23.50
SOC802 US HISTORY 8 2 SM 1 240 209| 209 91 118 | 26 13 13 |
11 DEAN Y. GODFREY S2 01 | 26 13 13 | 2 1 1 |
12 STEVEN HOMFELDT S2 01 | 26 11 15 | 2 1 1 |
21 DEAN Y. GODFREY S2 02 | 21 9 12 | 1 0 1 |
22 STEVEN HOMFELDT S2 02 | 24 8 16 | 3 1 2 |
31 DEAN Y. GODFREY S2 03 | 25 12 13 | 8 5 3 |
32 STEVEN HOMFELDT S2 03 | 25 13 12 | 3 2 1 |
41 DEAN Y. GODFREY S2 04 | 32 12 20 | 1 1 0 |
51 DEAN Y. GODFREY S2 05 | 30 13 17 | 6 2 4 |
Number of Sections: 8 Average Students Per Section: 26.13
SOC812 HON US HIST 8 2 SM 2 60 41| 41 18 23 | 0 0 0 |
41 STEVEN HOMFELDT S2 04 | 20 10 10 | 0 0 0 |
51 STEVEN HOMFELDT S2 05 | 21 8 13 | 0 0 0 |
Number of Sections: 2 Average Students Per Section: 20.50
SPE012 MATH SE 2 SM 2 90 45| 45 22 23 | 43 20 23 |
22 REBECCA A. RAMIREZ-DIL S2 02 | 17 9 8 | 16 8 8 |
42 REBECCA A. RAMIREZ-DIL S2 04 | 13 6 7 | 13 6 7 |
52 REBECCA A. RAMIREZ-DIL S2 05 | 15 7 8 | 14 6 8 |
Number of Sections: 3 Average Students Per Section: 15.00
SPE042 LANG ARTS SE 2 SM 2 90 46| 46 24 22 | 43 21 22 |
12 NORMA F. KING S2 01 | 16 9 7 | 16 9 7 |
22 NORMA F. KING S2 02 | 14 6 8 | 13 5 8 |
42 NORMA F. KING S2 04 | 16 9 7 | 14 7 7 |
Number of Sections: 3 Average Students Per Section: 15.33
SPE052 ADAPTIVE PE 2 SM 1 30 17| 17 6 11 | 17 6 11 |
41 CHRISTINE S. AREND S2 04 | 17 6 11 | 17 6 11 |

1sonyr01.p 35-2 CASCADE MIDDLE SCHOOL 03/01/12 Page:9
04.11.10.00.01 Course/Class Count Report 202 1:22 PM
EST NBR NBR ----TOTALS---- ---Spec ed----
COURSE DESCRIPTION LGTH SEC AVL REQ TOT FEM MAL TOT FEM MAL
Number of Sections: 1 Average Students Per Section: 17.00
SPE102 STRUC LEARN 2 SM 1 300 94| 94 28 66 | 94 28 66 |
11 AARON S. LEE S2 01 | 9 4 5 | 9 4 5 |
12 SHARON K. BELL S2 01 | 11 3 8 | 11 3 8 |
21 AARON S. LEE S2 02 | 8 3 5 | 8 3 5 |
22 SHARON K. BELL S2 02 | 11 3 8 | 11 3 8 |
31 AARON S. LEE S2 03 | 8 2 6 | 8 2 6 |
32 SHARON K. BELL S2 03 | 9 2 7 | 9 2 7 |
51 AARON S. LEE S2 05 | 6 2 4 | 6 2 4 |
52 SHARON K. BELL S2 05 | 11 3 8 | 11 3 8 |
61 AARON S. LEE S2 06 | 11 4 7 | 11 4 7 |
62 SHARON K. BELL S2 06 | 10 2 8 | 10 2 8 |
Number of Sections: 10 Average Students Per Section: 9.40
SPE602 LAN ARTS SE 6 2 SM 1 90 33| 33 17 16 | 33 17 16 |
31 NORMA F. KING S2 03 | 14 6 8 | 14 6 8 |
32 REBECCA A. RAMIREZ-DIL S2 03 | 6 3 3 | 6 3 3 |
52 NORMA F. KING S2 05 | 13 8 5 | 13 8 5 |
Number of Sections: 3 Average Students Per Section: 11.00
SPE632 MATH SE 6 2 SM 1 60 15| 15 5 10 | 15 5 10 |
12 REBECCA A. RAMIREZ-DIL S2 01 | 15 5 10 | 15 5 10 |
32 REBECCA A. RAMIREZ-DIL S2 03 | 0 0 0 | 0 0 0 |
Number of Sections: 2 Average Students Per Section: 7.50

1sonyr01.p 35-2 CASCADE MIDDLE SCHOOL 03/01/12 Page:10
04.11.10.00.01 Course/Class Count Report Totals 1:22 PM
TITLE FOR TOTAL
TOTALS GROUP TOTAL FEMALE MALE
GRAND TOTALS 4979 2304 2675
Spec ed 680 296 384
************************ End of report ************************

1sonyr01.p 35-2 MT BAKER MIDDLE SCHOOL 03/01/12 Page:1
04.11.10.00.01 Course/Class Count Report 207 1:25 PM
EST NBR NBR ----TOTALS---- ---Spec Ed----
COURSE DESCRIPTION LGTH SEC AVL REQ TOT FEM MAL TOT FEM MAL
ART710 ART SURVEY 7 QTR 10 120 52| 51 25 26 | 4 2 2 |
133 NICOLE L. ALLEN Q3 03 | 25 12 13 | 2 2 0 |
134 NICOLE L. ALLEN Q4 03 | 26 13 13 | 2 0 2 |
Number of Sections: 2 Average Students Per Section: 25.50
ART810 ART SURVEY 8 SM 10 120 55| 55 19 36 | 9 1 8 |
112 NICOLE L. ALLEN S2 01 | 28 8 20 | 4 1 3 |
122 NICOLE L. ALLEN S2 02 | 27 11 16 | 5 0 5 |
Number of Sections: 2 Average Students Per Section: 27.50
ART815 VIS COM 8 SM 10 60 28| 28 12 16 | 4 2 2 |
112 BRUCE J. JACOBS S2 01 | 28 12 16 | 4 2 2 |
Number of Sections: 1 Average Students Per Section: 28.00
BUS610 KEYBD SURVEY 6 QTR 1 240 84| 84 34 50 | 7 1 6 |
153 JAMES J. KEMP Q3 05 | 20 6 14 | 0 0 0 |
154 JAMES J. KEMP Q4 05 | 22 10 12 | 3 0 3 |
163 JAMES J. KEMP Q3 06 | 22 8 14 | 4 1 3 |
164 JAMES J. KEMP Q4 06 | 20 10 10 | 0 0 0 |
Number of Sections: 4 Average Students Per Section: 21.00
BUS710 COMPUTER APP 7 QTR 10 240 82| 82 41 41 | 7 3 4 |
133 JAMES J. KEMP Q3 03 | 20 9 11 | 1 0 1 |
134 JAMES J. KEMP Q4 03 | 22 12 10 | 2 2 0 |
143 JAMES J. KEMP Q3 04 | 18 12 6 | 2 1 1 |
144 JAMES J. KEMP Q4 04 | 22 8 14 | 2 0 2 |
Number of Sections: 4 Average Students Per Section: 20.50
BUS810 COMPUTER APP 8 SM 10 60 30| 30 11 19 | 7 3 4 |
122 JAMES J. KEMP S2 02 | 30 11 19 | 7 3 4 |
Number of Sections: 1 Average Students Per Section: 30.00
ELL601 ELL 6 SM 3 96 28| 28 11 17 | 5 1 4 |
122 VALLERY MCCANN S2 02 | 4 2 2 | 0 0 0 |
152 VALLERY MCCANN S2 05 | 15 7 8 | 3 1 2 |
162 VALLERY MCCANN S2 06 | 9 2 7 | 2 0 2 |
Number of Sections: 3 Average Students Per Section: 9.33
ELL701 ELL 7 SM 1 64 9| 9 4 5 | 2 1 1 |
122 VALLERY MCCANN S2 02 | 0 0 0 | 0 0 0 |
132 VALLERY MCCANN S2 03 | 9 4 5 | 2 1 1 |
Number of Sections: 2 Average Students Per Section: 4.50
ELL801 ELL 8 SM 3 96 22| 22 7 15 | 8 2 6 |
112 VALLERY MCCANN S2 01 | 12 3 9 | 4 1 3 |
122 VALLERY MCCANN S2 02 | 4 0 4 | 1 0 1 |
132 VALLERY MCCANN S2 03 | 6 4 2 | 3 1 2 |
Number of Sections: 3 Average Students Per Section: 7.33
GEN010 ELL MONITORING YR 1 100 65| 65 21 44 | 17 4 13 |
01 VALLERY MCCANN YR 00 | 65 21 44 | 17 4 13 |
Number of Sections: 1 Average Students Per Section: 65.00
GEN111 LEADERSHIP 7 QTR 10 120 54| 54 30 24 | 5 4 1 |
143 ANN B. DURHAM Q3 04 | 28 14 14 | 3 2 1 |
144 ANN B. DURHAM Q4 04 | 26 16 10 | 2 2 0 |
Number of Sections: 2 Average Students Per Section: 27.00
GEN112 LEADERSHIP 6 QTR 1 200 89| 89 38 51 | 8 4 4 |
163 SHARON J. LINDGREN Q3 06 | 24 9 15 | 2 0 2 |
164 SHARON J. LINDGREN Q4 06 | 29 13 16 | 0 0 0 |
263 SUSAN R. WINTER Q3 06 | 18 8 10 | 3 2 1 |
264 SUSAN R. WINTER Q4 06 | 18 8 10 | 3 2 1 |
Number of Sections: 4 Average Students Per Section: 22.25
GEN810 TEACHERS AIDE 8 SM 1 2045 47| 47 28 19 | 2 0 2 |
02 KENNETH D. PERMAN S2 01 | 1 0 1 | 0 0 0 |
05 ARLEEN J. BURKHALTER S2 01 | 0 0 0 | 0 0 0 |

1sonyr01.p 35-2 MT BAKER MIDDLE SCHOOL 03/01/12 Page:2
04.11.10.00.01 Course/Class Count Report 207 1:25 PM
EST NBR NBR ----TOTALS---- ---Spec Ed----
COURSE DESCRIPTION LGTH SEC AVL REQ TOT FEM MAL TOT FEM MAL
11 MATTHEW L. KING S2 01 | 1 0 1 | 0 0 0 |
13 JENNIFER K. KEMP S2 01 | 0 0 0 | 0 0 0 |
15 SHARON J. LINDGREN S2 02 | 1 1 0 | 0 0 0 |
18 MELINDA A. WHARTON S2 01 | 1 1 0 | 0 0 0 |
20 SHARI M. NELSON S2 02 | 2 2 0 | 0 0 0 |
22 PENNI J. SWANSON S2 01 | 1 1 0 | 0 0 0 |
282 DEONNA J. STEFFY S2 01 | 3 1 2 | 0 0 0 |
292 DEONNA J. STEFFY S2 02 | 6 1 5 | 0 0 0 |
302 DEONNA J. STEFFY S2 03 | 2 1 1 | 0 0 0 |
312 DEONNA J. STEFFY S2 04 | 1 1 0 | 0 0 0 |
322 DEONNA J. STEFFY S2 05 | 2 2 0 | 0 0 0 |
332 DEONNA J. STEFFY S2 06 | 2 2 0 | 0 0 0 |
43 CARMELLA A. DUCA S2 01 | 1 1 0 | 0 0 0 |
44 DENNIS LUBASH S2 01 | 1 1 0 | 0 0 0 |
45 CHRISTINE A. THORINGTO S2 02 | 1 1 0 | 0 0 0 |
46 BRUCE J. JACOBS S2 01 | 1 1 0 | 0 0 0 |
47 DIXIE L. TOY S2 02 | 0 0 0 | 0 0 0 |
48 DENNIS LUBASH S2 02 | 1 0 1 | 0 0 0 |
49 ARLEEN J. BURKHALTER S2 01 | 1 1 0 | 0 0 0 |
50 VALLERY MCCANN S2 02 | 2 0 2 | 0 0 0 |
51 AARON R. COWAN S2 01 | 1 0 1 | 1 0 1 |
53 VICKI L. ARMSTRONG S2 02 | 1 1 0 | 0 0 0 |
60 STACEY K. O'ROURKE S2 02 | 1 1 0 | 0 0 0 |
61 JASON W. BROWN S2 02 | 1 0 1 | 0 0 0 |
63 DENA L. WALKER S2 02 | 1 1 0 | 0 0 0 |
64 VALLERY MCCANN S2 02 | 1 0 1 | 0 0 0 |
65 MARCIA L. DARRAH S2 02 | 1 0 1 | 1 0 1 |
66 KATRINA A. MITCHELL S2 02 | 1 1 0 | 0 0 0 |
67 MELINDA A. WHARTON S2 01 | 1 1 0 | 0 0 0 |
68 DIXIE L. TOY S2 01 | 1 0 1 | 0 0 0 |
69 KATHY LANTZ S2 02 | 1 1 0 | 0 0 0 |
70 ERIN B. CARNAHAN S2 02 | 1 0 1 | 0 0 0 |
71 SUSAN R. WINTER S2 02 | 1 1 0 | 0 0 0 |
72 NICOLE L. ALLEN S2 01 | 1 1 0 | 0 0 0 |
812 ANN B. DURHAM S2 01 | 1 1 0 | 0 0 0 |
845 LINDSEY C. HAMMOND S2 01 | 1 1 0 | 0 0 0 |
Number of Sections: 38 Average Students Per Section: 1.24
HOM610 HOME EC 6 SM 1 120 55| 55 34 21 | 2 0 2 |
152 DIXIE L. TOY S2 05 | 27 17 10 | 0 0 0 |
162 MINDY L. HAWK S2 06 | 28 17 11 | 2 0 2 |
Number of Sections: 2 Average Students Per Section: 27.50
IND610 TECH SURVEY 6 QTR 1 240 82| 82 30 52 | 8 3 5 |
153 BRUCE J. JACOBS Q3 05 | 20 9 11 | 2 0 2 |
154 BRUCE J. JACOBS Q4 05 | 22 11 11 | 2 1 1 |
163 BRUCE J. JACOBS Q3 06 | 19 5 14 | 1 1 0 |
164 BRUCE J. JACOBS Q4 06 | 21 5 16 | 3 1 2 |
Number of Sections: 4 Average Students Per Section: 20.50
IND710 TECH SURVEY 7 QTR 10 240 64| 64 26 38 | 6 4 2 |
133 BRUCE J. JACOBS Q3 03 | 21 6 15 | 1 1 0 |
134 BRUCE J. JACOBS Q4 03 | 14 4 10 | 1 0 1 |
143 BRUCE J. JACOBS Q3 04 | 15 10 5 | 0 0 0 |
144 BRUCE J. JACOBS Q4 04 | 14 6 8 | 4 3 1 |
Number of Sections: 4 Average Students Per Section: 16.00
LAN602 LAN ARTS 6 2 SM 1 300 240| 240 126 114 | 9 4 5 |
112 DENA L. WALKER S2 01 | 27 16 11 | 1 1 0 |
122 DENA L. WALKER S2 02 | 25 16 9 | 0 0 0 |

1sonyr01.p 35-2 MT BAKER MIDDLE SCHOOL 03/01/12 Page:3
04.11.10.00.01 Course/Class Count Report 207 1:25 PM
EST NBR NBR ----TOTALS---- ---Spec Ed----
COURSE DESCRIPTION LGTH SEC AVL REQ TOT FEM MAL TOT FEM MAL
132 DENA L. WALKER S2 03 | 28 13 15 | 1 0 1 |
142 DENA L. WALKER S2 04 | 26 13 13 | 1 0 1 |
232 SUSAN R. WINTER S2 03 | 30 16 14 | 2 0 2 |
242 SUSAN R. WINTER S2 04 | 26 12 14 | 1 1 0 |
312 MINDY L. HAWK S2 01 | 25 13 12 | 2 1 1 |
322 MINDY L. HAWK S2 02 | 26 14 12 | 0 0 0 |
432 KATHY LANTZ S2 03 | 27 13 14 | 1 1 0 |
512 CAROLYN M. HUBBELL S2 01 | 0 0 0 | 0 0 0 |
Number of Sections: 10 Average Students Per Section: 24.00
LAN612 HON LA 6 2 SM 3 56 59| 59 31 28 | 1 0 1 |
212 SUSAN R. WINTER S2 01 | 30 15 15 | 0 0 0 |
222 SUSAN R. WINTER S2 02 | 29 16 13 | 1 0 1 |
Number of Sections: 2 Average Students Per Section: 29.50
LAN643 READ CLINIC 6 C QTR 1 20 9| 9 5 4 | 0 0 0 |
163 DENA L. WALKER Q3 06 | 9 5 4 | 0 0 0 |
Number of Sections: 1 Average Students Per Section: 9.00
LAN644 READ CLINIC 6 D QTR 1 20 0| 0 0 0 | 0 0 0 |
164 DENA L. WALKER Q4 06 | 0 0 0 | 0 0 0 |
Number of Sections: 1 Average Students Per Section: 0.00
LAN652 LAP READING 6 2 SM 1 16 15| 15 5 10 | 2 0 2 |
162 SUSAN D. MILLANG S2 06 | 15 5 10 | 2 0 2 |
Number of Sections: 1 Average Students Per Section: 15.00
LAN660 DRAMA 6 QTR 1 120 59| 59 31 28 | 3 1 2 |
153 JAMES A. CHAR Q3 05 | 28 16 12 | 3 1 2 |
154 JAMES A. CHAR Q4 05 | 31 15 16 | 0 0 0 |
Number of Sections: 2 Average Students Per Section: 29.50
LAN700 LANG ARTS 7 1 SM 1 180 78| 78 43 35 | 3 2 1 |
412 LINDSEY C. HAMMOND S2 01 | 20 15 5 | 0 0 0 |
422 LINDSEY C. HAMMOND S2 02 | 28 13 15 | 1 1 0 |
562 LINDSEY C. HAMMOND S2 06 | 30 15 15 | 2 1 1 |
Number of Sections: 3 Average Students Per Section: 26.00
LAN702 LANG ARTS 7 2 SM 2 240 140| 140 74 66 | 2 2 0 |
152 ANN B. DURHAM S2 05 | 18 10 8 | 0 0 0 |
162 ANN B. DURHAM S2 06 | 28 14 14 | 0 0 0 |
222 CORRIE A. CARSTENS S2 02 | 25 13 12 | 0 0 0 |
252 CORRIE A. CARSTENS S2 05 | 19 9 10 | 0 0 0 |
312 SALLY J. KOENIG S2 01 | 22 13 9 | 1 1 0 |
362 SALLY J. KOENIG S2 06 | 28 15 13 | 1 1 0 |
412 LINDSEY C. HAMMOND S2 01 | 0 0 0 | 0 0 0 |
422 LINDSEY C. HAMMOND S2 02 | 0 0 0 | 0 0 0 |
Number of Sections: 8 Average Students Per Section: 17.50
LAN712 HON LA 7 2 SM 2 56 51| 51 30 21 | 0 0 0 |
112 ANN B. DURHAM S2 01 | 28 15 13 | 0 0 0 |
222 ANN B. DURHAM S2 02 | 23 15 8 | 0 0 0 |
Number of Sections: 2 Average Students Per Section: 25.50
LAN716 MEDIA 7 SM 10 120 46| 46 28 18 | 1 1 0 |
132 PETER D. WARRING S2 03 | 25 10 15 | 1 1 0 |
142 PETER D. WARRING S2 04 | 21 18 3 | 0 0 0 |
Number of Sections: 2 Average Students Per Section: 23.00
LAN743 READ CLINIC 7 C QTR 1 20 15| 15 5 10 | 6 2 4 |
143 SALLY J. KOENIG Q3 04 | 15 5 10 | 6 2 4 |
Number of Sections: 1 Average Students Per Section: 15.00
LAN744 READ CLINIC 7 D QTR 1 20 7| 7 1 6 | 6 1 5 |
144 SALLY J. KOENIG Q4 04 | 7 1 6 | 6 1 5 |
Number of Sections: 1 Average Students Per Section: 7.00
LAN752 LAP READING 7 2 SM 1 16 15| 15 8 7 | 1 1 0 |

1sonyr01.p 35-2 MT BAKER MIDDLE SCHOOL 03/01/12 Page:4
04.11.10.00.01 Course/Class Count Report 207 1:25 PM
EST NBR NBR ----TOTALS---- ---Spec Ed----
COURSE DESCRIPTION LGTH SEC AVL REQ TOT FEM MAL TOT FEM MAL
132 SUSAN D. MILLANG S2 03 | 15 8 7 | 1 1 0 |
Number of Sections: 1 Average Students Per Section: 15.00
LAN760 DRAMA 7 QTR 10 120 58| 58 32 26 | 6 4 2 |
143 JAMES A. CHAR Q3 04 | 28 13 15 | 5 3 2 |
144 JAMES A. CHAR Q4 04 | 30 19 11 | 1 1 0 |
Number of Sections: 2 Average Students Per Section: 29.00
LAN802 LANG ARTS 8 2 SM 1 270 220| 220 96 124 | 10 5 5 |
132 CAROLYN M. HUBBELL S2 03 | 29 14 15 | 2 0 2 |
142 CAROLYN M. HUBBELL S2 04 | 27 10 17 | 3 1 2 |
152 CAROLYN M. HUBBELL S2 05 | 21 9 12 | 0 0 0 |
162 CAROLYN M. HUBBELL S2 06 | 24 11 13 | 2 2 0 |
252 PETER D. WARRING S2 05 | 25 9 16 | 0 0 0 |
262 PETER D. WARRING S2 06 | 22 8 14 | 0 0 0 |
342 LINDSEY C. HAMMOND S2 04 | 27 13 14 | 2 1 1 |
352 LINDSEY C. HAMMOND S2 05 | 23 12 11 | 1 1 0 |
462 KATHY LANTZ S2 06 | 22 10 12 | 0 0 0 |
Number of Sections: 9 Average Students Per Section: 24.44
LAN812 HON LA 8 2 SM 2 56 53| 53 29 24 | 0 0 0 |
542 CORRIE A. CARSTENS S2 04 | 26 14 12 | 0 0 0 |
562 CORRIE A. CARSTENS S2 06 | 27 15 12 | 0 0 0 |
Number of Sections: 2 Average Students Per Section: 26.50
LAN823 INTRO JOURNALSM SM 10 60 29| 29 13 16 | 1 0 1 |
112 PETER D. WARRING S2 01 | 29 13 16 | 1 0 1 |
Number of Sections: 1 Average Students Per Section: 29.00
LAN843 READ CLINC 8 C SM 1 20 16| 16 2 14 | 0 0 0 |
113 CORRIE A. CARSTENS S2 01 | 16 2 14 | 0 0 0 |
Number of Sections: 1 Average Students Per Section: 16.00
LAN852 LAP READING 8 2 SM 1 16 9| 9 1 8 | 1 0 1 |
112 SUSAN D. MILLANG S2 01 | 9 1 8 | 1 0 1 |
Number of Sections: 1 Average Students Per Section: 9.00
MAT071 LAP MATH 1B SM 1 16 16| 16 7 9 | 1 0 1 |
152 SUSAN D. MILLANG S2 05 | 16 7 9 | 1 0 1 |
Number of Sections: 1 Average Students Per Section: 16.00
MAT073 LAP MATH 2B SM 1 16 14| 14 7 7 | 0 0 0 |
142 SUSAN D. MILLANG S2 04 | 14 7 7 | 0 0 0 |
Number of Sections: 1 Average Students Per Section: 14.00
MAT082 MATH STRAT 1C QTR 1 20 12| 12 6 6 | 1 1 0 |
153 DENNIS LUBASH Q3 05 | 12 6 6 | 1 1 0 |
Number of Sections: 1 Average Students Per Section: 12.00
MAT083 MATH STRAT 1D QTR 1 20 2| 2 2 0 | 0 0 0 |
154 DENNIS LUBASH Q4 05 | 2 2 0 | 0 0 0 |
Number of Sections: 1 Average Students Per Section: 2.00
MAT086 MATH STRAT 2C QTR 1 20 15| 15 9 6 | 2 1 1 |
133 PATRICE L. RADEMACHER Q3 03 | 15 9 6 | 2 1 1 |
Number of Sections: 1 Average Students Per Section: 15.00
MAT087 MATH STRAT 2D QTR 1 20 15| 15 9 6 | 2 1 1 |
134 PATRICE L. RADEMACHER Q4 03 | 15 9 6 | 2 1 1 |
Number of Sections: 1 Average Students Per Section: 15.00
MAT105 MATH FOUND 3B SM 1 45 28| 28 7 21 | 3 0 3 |
222 DAVID W. KNIGHTON S2 02 | 11 2 9 | 0 0 0 |
232 DAVID W. KNIGHTON S2 03 | 17 5 12 | 3 0 3 |
Number of Sections: 2 Average Students Per Section: 14.00
MAT112 MATH 2 SM 1 330 216| 216 118 98 | 9 2 7 |
112 DENNIS LUBASH S2 01 | 27 13 14 | 3 0 3 |
122 DENNIS LUBASH S2 02 | 26 14 12 | 0 0 0 |
132 DENNIS LUBASH S2 03 | 27 18 9 | 1 0 1 |

1sonyr01.p 35-2 MT BAKER MIDDLE SCHOOL 03/01/12 Page:5
04.11.10.00.01 Course/Class Count Report 207 1:25 PM
EST NBR NBR ----TOTALS---- ---Spec Ed----
COURSE DESCRIPTION LGTH SEC AVL REQ TOT FEM MAL TOT FEM MAL
142 DENNIS LUBASH S2 04 | 29 15 14 | 0 0 0 |
212 DIXIE L. TOY S2 01 | 28 13 15 | 2 0 2 |
222 DIXIE L. TOY S2 02 | 25 13 12 | 0 0 0 |
232 DIXIE L. TOY S2 03 | 28 17 11 | 2 2 0 |
242 DIXIE L. TOY S2 04 | 26 15 11 | 1 0 1 |
312 KATRINA A. MITCHELL S2 01 | 0 0 0 | 0 0 0 |
322 KATRINA A. MITCHELL S2 02 | 0 0 0 | 0 0 0 |
422 JEREMIAH D. CARTER S2 02 | 0 0 0 | 0 0 0 |
Number of Sections: 11 Average Students Per Section: 19.64
MAT116 PRE ALGEBRA 2 SM 2 390 336| 336 176 160 | 7 3 4 |
112 PATRICE L. RADEMACHER S2 01 | 27 14 13 | 1 1 0 |
122 PATRICE L. RADEMACHER S2 02 | 29 18 11 | 2 1 1 |
152 PATRICE L. RADEMACHER S2 05 | 29 11 18 | 1 0 1 |
162 PATRICE L. RADEMACHER S2 06 | 30 12 18 | 0 0 0 |
212 JENNIFER K. KEMP S2 01 | 28 16 12 | 0 0 0 |
222 JENNIFER K. KEMP S2 02 | 29 16 13 | 2 1 1 |
252 JENNIFER K. KEMP S2 05 | 29 17 12 | 0 0 0 |
262 JENNIFER K. KEMP S2 06 | 31 20 11 | 1 0 1 |
322 REBECCA A. MARCOTTE S2 02 | 0 0 0 | 0 0 0 |
332 REBECCA A. MARCOTTE S2 03 | 27 14 13 | 0 0 0 |
342 REBECCA A. MARCOTTE S2 04 | 25 11 14 | 0 0 0 |
452 KATRINA A. MITCHELL S2 05 | 24 15 9 | 0 0 0 |
532 JENNIFER K. KEMP S2 03 | 28 12 16 | 0 0 0 |
Number of Sections: 13 Average Students Per Section: 25.85
MAT121 ALGEBRA 2 SM 1 210 196| 196 94 102 | 1 0 1 |
132 JEREMIAH D. CARTER S2 03 | 30 14 16 | 0 0 0 |
142 DEREK S. LUDWIGSON S2 04 | 31 14 17 | 1 0 1 |
152 JEREMIAH D. CARTER S2 05 | 28 15 13 | 0 0 0 |
162 JEREMIAH D. CARTER S2 06 | 30 12 18 | 0 0 0 |
242 DAVID W. KNIGHTON S2 04 | 26 12 14 | 0 0 0 |
252 DAVID W. KNIGHTON S2 05 | 25 13 12 | 0 0 0 |
262 DAVID W. KNIGHTON S2 06 | 26 14 12 | 0 0 0 |
Number of Sections: 7 Average Students Per Section: 28.00
MAT211 GEOMETRY 2 SM 1 10 6| 6 1 5 | 0 0 0 |
132 PATRICE L. RADEMACHER S2 03 | 6 1 5 | 0 0 0 |
Number of Sections: 1 Average Students Per Section: 6.00
MAT221 MATH 1 SM 1 180 78| 78 39 39 | 1 0 1 |
312 KATRINA A. MITCHELL S2 01 | 25 13 12 | 1 0 1 |
322 KATRINA A. MITCHELL S2 02 | 27 10 17 | 0 0 0 |
422 JEREMIAH D. CARTER S2 02 | 26 16 10 | 0 0 0 |
Number of Sections: 3 Average Students Per Section: 26.00
MUS610 MUSIC SURVEY 6 QTR 1 120 51| 51 14 37 | 5 2 3 |
63 R K. PAUSTIAN Q3 06 | 26 9 17 | 2 1 1 |
64 R K. PAUSTIAN Q4 06 | 25 5 20 | 3 1 2 |
Number of Sections: 2 Average Students Per Section: 25.50
MUS612 CHOIR 6 2 SM 2 0 50| 50 41 9 | 2 1 1 |
62 JAMES A. CHAR S2 06 | 50 41 9 | 2 1 1 |
Number of Sections: 1 Average Students Per Section: 50.00
MUS622 BAND 6 2 SM 1 0 41| 41 9 32 | 5 1 4 |
52 R K. PAUSTIAN S2 05 | 41 9 32 | 5 1 4 |
Number of Sections: 1 Average Students Per Section: 41.00
MUS632 ORCHESTRA 6 2 SM 3 0 70| 70 51 19 | 0 0 0 |
52 MELINDA A. WHARTON S2 05 | 37 25 12 | 0 0 0 |
62 MELINDA A. WHARTON S2 06 | 33 26 7 | 0 0 0 |
Number of Sections: 2 Average Students Per Section: 35.00
MUS712 CHOIR 7 2 SM 2 0 50| 50 41 9 | 1 0 1 |

1sonyr01.p 35-2 MT BAKER MIDDLE SCHOOL 03/01/12 Page:6
04.11.10.00.01 Course/Class Count Report 207 1:25 PM
EST NBR NBR ----TOTALS---- ---Spec Ed----
COURSE DESCRIPTION LGTH SEC AVL REQ TOT FEM MAL TOT FEM MAL
32 JAMES A. CHAR S2 03 | 50 41 9 | 1 0 1 |
Number of Sections: 1 Average Students Per Section: 50.00
MUS722 BAND 7 2 SM 2 0 45| 45 16 29 | 4 1 3 |
42 R K. PAUSTIAN S2 04 | 45 16 29 | 4 1 3 |
Number of Sections: 1 Average Students Per Section: 45.00
MUS732 ORCHESTRA 7 2 SM 2 0 46| 46 29 17 | 0 0 0 |
42 MELINDA A. WHARTON S2 04 | 46 29 17 | 0 0 0 |
Number of Sections: 1 Average Students Per Section: 46.00
MUS812 CHOIR 8 2 SM 1 50 40| 40 28 12 | 1 1 0 |
12 JAMES A. CHAR S2 01 | 40 28 12 | 1 1 0 |
Number of Sections: 1 Average Students Per Section: 40.00
MUS822 BAND 8 2 SM 2 0 44| 44 20 24 | 0 0 0 |
22 R K. PAUSTIAN S2 02 | 44 20 24 | 0 0 0 |
Number of Sections: 1 Average Students Per Section: 44.00
MUS832 ORCHESTRA 8 2 SM 2 0 36| 36 21 15 | 0 0 0 |
22 MELINDA A. WHARTON S2 02 | 36 21 15 | 0 0 0 |
Number of Sections: 1 Average Students Per Section: 36.00
PHY601 HEALTH 6 QTR 1 240 71| 71 28 43 | 4 2 2 |
153 CARMELLA A. DUCA Q3 05 | 18 7 11 | 0 0 0 |
154 CARMELLA A. DUCA Q4 05 | 18 6 12 | 1 1 0 |
163 CARMELLA A. DUCA Q3 06 | 16 6 10 | 0 0 0 |
164 CARMELLA A. DUCA Q4 06 | 19 9 10 | 3 1 2 |
Number of Sections: 4 Average Students Per Section: 17.75
PHY611 PHYS ED 6 SM 11 360 172| 172 97 75 | 15 4 11 |
152 ARLEEN J. BURKHALTER S2 05 | 33 20 13 | 4 1 3 |
252 MATTHEW L. KING S2 05 | 34 21 13 | 2 0 2 |
262 MATTHEW L. KING S2 06 | 35 18 17 | 2 1 1 |
352 KENNETH D. PERMAN S2 05 | 36 23 13 | 4 2 2 |
362 KENNETH D. PERMAN S2 06 | 34 15 19 | 3 0 3 |
Number of Sections: 5 Average Students Per Section: 34.40
PHY701 HEALTH 7 QTR 10 120 51| 51 27 24 | 4 1 3 |
133 CARMELLA A. DUCA Q3 03 | 29 16 13 | 2 0 2 |
134 CARMELLA A. DUCA Q4 03 | 22 11 11 | 2 1 1 |
Number of Sections: 2 Average Students Per Section: 25.50
PHY711 PHYS ED 7 SM 9 360 144| 144 69 75 | 11 4 7 |
132 ARLEEN J. BURKHALTER S2 03 | 31 14 17 | 5 1 4 |
142 ARLEEN J. BURKHALTER S2 04 | 26 15 11 | 2 1 1 |
232 MATTHEW L. KING S2 03 | 29 15 14 | 3 2 1 |
242 MATTHEW L. KING S2 04 | 30 14 16 | 0 0 0 |
332 KENNETH D. PERMAN S2 03 | 28 11 17 | 1 0 1 |
Number of Sections: 5 Average Students Per Section: 28.80
PHY801 HEALTH 8 SM 10 240 78| 78 32 46 | 14 7 7 |
112 CARMELLA A. DUCA S2 01 | 16 8 8 | 5 2 3 |
122 CARMELLA A. DUCA S2 02 | 25 9 16 | 4 2 2 |
212 PENNI J. SWANSON S2 01 | 12 4 8 | 3 2 1 |
222 PENNI J. SWANSON S2 02 | 25 11 14 | 2 1 1 |
Number of Sections: 4 Average Students Per Section: 19.50
PHY811 PHYS ED 8 SM 9 360 139| 139 71 68 | 7 3 4 |
112 ARLEEN J. BURKHALTER S2 01 | 27 16 11 | 0 0 0 |
122 ARLEEN J. BURKHALTER S2 02 | 29 16 13 | 3 2 1 |
212 MATTHEW L. KING S2 01 | 26 13 13 | 0 0 0 |
312 KENNETH D. PERMAN S2 01 | 24 9 15 | 2 0 2 |
322 KENNETH D. PERMAN S2 02 | 33 17 16 | 2 1 1 |
Number of Sections: 5 Average Students Per Section: 27.80
SBLA61 LANG ARTS 6 1 SM 1 60 23| 23 14 9 | 0 0 0 |
512 CAROLYN M. HUBBELL S2 01 | 23 14 9 | 0 0 0 |

1sonyr01.p 35-2 MT BAKER MIDDLE SCHOOL 03/01/12 Page:7
04.11.10.00.01 Course/Class Count Report 207 1:25 PM
EST NBR NBR ----TOTALS---- ---Spec Ed----
COURSE DESCRIPTION LGTH SEC AVL REQ TOT FEM MAL TOT FEM MAL
Number of Sections: 1 Average Students Per Section: 23.00
SCI600 SCIENCE 6 1 SM 1 120 53| 53 32 21 | 2 1 1 |
332 KATRINA A. MITCHELL S2 03 | 24 13 11 | 0 0 0 |
342 KATRINA A. MITCHELL S2 04 | 29 19 10 | 2 1 1 |
Number of Sections: 2 Average Students Per Section: 26.50
SCI602 SCIENCE 6 2 SM 1 360 275| 275 138 137 | 17 4 13 |
112 SUSAN M. BUHR S2 01 | 30 16 14 | 0 0 0 |
122 SUSAN M. BUHR S2 02 | 28 13 15 | 1 0 1 |
132 SUSAN M. BUHR S2 03 | 26 13 13 | 1 0 1 |
142 SUSAN M. BUHR S2 04 | 28 15 13 | 1 0 1 |
212 EMILY A. BAH S2 01 | 29 13 16 | 0 0 0 |
222 EMILY A. BAH S2 02 | 29 13 16 | 6 1 5 |
232 EMILY A. BAH S2 03 | 25 13 12 | 1 0 1 |
242 EMILY A. BAH S2 04 | 28 15 13 | 3 0 3 |
332 KATRINA A. MITCHELL S2 03 | 0 0 0 | 0 0 0 |
342 KATRINA A. MITCHELL S2 04 | 0 0 0 | 0 0 0 |
432 STACEY K. O'ROURKE S2 03 | 24 12 12 | 1 1 0 |
522 AARON R. COWAN S2 02 | 28 15 13 | 3 2 1 |
Number of Sections: 12 Average Students Per Section: 22.92
SCI702 SCIENCE 7 2 SM 1 300 278| 278 150 128 | 16 7 9 |
112 STACEY K. O'ROURKE S2 01 | 29 15 14 | 0 0 0 |
122 STACEY K. O'ROURKE S2 02 | 30 17 13 | 3 2 1 |
152 STACEY K. O'ROURKE S2 05 | 27 12 15 | 4 0 4 |
162 STACEY K. O'ROURKE S2 06 | 31 18 13 | 3 2 1 |
212 SHARI M. NELSON S2 01 | 26 13 13 | 0 0 0 |
222 SHARI M. NELSON S2 02 | 29 16 13 | 1 1 0 |
262 SHARI M. NELSON S2 06 | 30 17 13 | 3 1 2 |
352 SUSAN M. BUHR S2 05 | 23 13 10 | 0 0 0 |
452 EMILY A. BAH S2 05 | 26 16 10 | 0 0 0 |
522 MICALA H. ROOT S2 02 | 27 13 14 | 2 1 1 |
Number of Sections: 10 Average Students Per Section: 27.80
SCI800 SCIENCE 8 1 SM 1 60 27| 27 14 13 | 5 1 4 |
342 JASON W. BROWN S2 03 | 27 14 13 | 5 1 4 |
Number of Sections: 1 Average Students Per Section: 27.00
SCI802 SCIENCE 8 2 SM 1 330 256| 256 113 143 | 18 8 10 |
132 AARON R. COWAN S2 03 | 28 11 17 | 4 2 2 |
142 AARON R. COWAN S2 04 | 29 10 19 | 2 0 2 |
152 AARON R. COWAN S2 05 | 25 13 12 | 0 0 0 |
162 AARON R. COWAN S2 06 | 26 8 18 | 0 0 0 |
232 MICALA H. ROOT S2 03 | 28 12 16 | 2 2 0 |
242 MICALA H. ROOT S2 04 | 28 15 13 | 3 1 2 |
252 MICALA H. ROOT S2 05 | 22 11 11 | 2 1 1 |
262 MICALA H. ROOT S2 06 | 22 11 11 | 1 0 1 |
342 JASON W. BROWN S2 04 | 0 0 0 | 0 0 0 |
432 SHARI M. NELSON S2 03 | 24 10 14 | 4 2 2 |
452 SHARI M. NELSON S2 05 | 24 12 12 | 0 0 0 |
Number of Sections: 11 Average Students Per Section: 23.27
SOC602 SOC STUDIES 6 2 SM 1 300 267| 267 139 128 | 13 3 10 |
112 DIANE K. ABRAHAM S2 01 | 25 12 13 | 0 0 0 |
122 DIANE K. ABRAHAM S2 02 | 28 15 13 | 2 0 2 |
132 DIANE K. ABRAHAM S2 03 | 26 12 14 | 0 0 0 |
142 DIANE K. ABRAHAM S2 04 | 27 14 13 | 1 0 1 |
212 KATHY LANTZ S2 01 | 26 14 12 | 0 0 0 |
222 KATHY LANTZ S2 02 | 28 15 13 | 3 1 2 |
242 KATHY LANTZ S2 04 | 27 13 14 | 2 1 1 |
342 SHARON J. LINDGREN S2 04 | 27 14 13 | 2 0 2 |

1sonyr01.p 35-2 MT BAKER MIDDLE SCHOOL 03/01/12 Page:8
04.11.10.00.01 Course/Class Count Report 207 1:25 PM
EST NBR NBR ----TOTALS---- ---Spec Ed----
COURSE DESCRIPTION LGTH SEC AVL REQ TOT FEM MAL TOT FEM MAL
512 JASON W. BROWN S2 01 | 27 17 10 | 1 0 1 |
532 JASON W. BROWN S2 04 | 26 13 13 | 2 1 1 |
Number of Sections: 10 Average Students Per Section: 26.70
SOC612 HON SOC STD 6 2 SM 2 56 58| 58 31 27 | 0 0 0 |
332 MINDY L. HAWK S2 03 | 28 18 10 | 0 0 0 |
342 MINDY L. HAWK S2 04 | 30 13 17 | 0 0 0 |
Number of Sections: 2 Average Students Per Section: 29.00
SOC702 WA ST HISTORY 7 SM 1 240 229| 229 121 108 | 19 8 11 |
112 SHARON J. LINDGREN S2 01 | 30 14 16 | 1 1 0 |
122 SHARON J. LINDGREN S2 02 | 30 16 14 | 4 0 4 |
152 SHARON J. LINDGREN S2 05 | 26 13 13 | 3 2 1 |
252 PENNI J. SWANSON S2 05 | 27 13 14 | 5 3 2 |
262 PENNI J. SWANSON S2 06 | 29 16 13 | 2 1 1 |
312 ERIN B. CARNAHAN S2 01 | 29 15 14 | 1 0 1 |
412 CHRISTINE A. THORINGTO S2 01 | 29 17 12 | 1 1 0 |
462 DIANE K. ABRAHAM S2 06 | 29 17 12 | 2 0 2 |
Number of Sections: 8 Average Students Per Section: 28.63
SOC712 HON WA ST HIST7 SM 2 56 52| 52 30 22 | 0 0 0 |
322 SALLY J. KOENIG S2 02 | 26 13 13 | 0 0 0 |
352 SALLY J. KOENIG S2 05 | 26 17 9 | 0 0 0 |
Number of Sections: 2 Average Students Per Section: 26.00
SOC802 US HIST WSH 8 2 SM 1 270 226| 226 93 133 | 20 4 16 |
142 ERIN B. CARNAHAN S2 04 | 31 14 17 | 3 1 2 |
152 ERIN B. CARNAHAN S2 05 | 26 10 16 | 2 1 1 |
162 ERIN B. CARNAHAN S2 06 | 26 13 13 | 2 0 2 |
232 CHRISTINE A. THORINGTO S2 03 | 28 12 16 | 3 1 2 |
242 CHRISTINE A. THORINGTO S2 04 | 30 12 18 | 3 1 2 |
262 CHRISTINE A. THORINGTO S2 06 | 28 10 18 | 2 0 2 |
352 JASON W. BROWN S2 05 | 29 8 21 | 4 0 4 |
362 JASON W. BROWN S2 06 | 28 14 14 | 1 0 1 |
442 PENNI J. SWANSON S2 04 | 0 0 0 | 0 0 0 |
Number of Sections: 9 Average Students Per Section: 25.11
SOC812 HON US HIST 8 2 SM 2 56 54| 54 29 25 | 0 0 0 |
132 ERIN B. CARNAHAN S2 03 | 28 16 12 | 0 0 0 |
252 CHRISTINE A. THORINGTO S2 05 | 26 13 13 | 0 0 0 |
Number of Sections: 2 Average Students Per Section: 27.00
SPE602 LAN ARTS SE 2 SM 1 14 16| 16 3 13 | 16 3 13 |
132 MARCIA L. DARRAH S2 03 | 16 3 13 | 16 3 13 |
Number of Sections: 1 Average Students Per Section: 16.00
SPE612 READING SE 6 2 SM 1 28 21| 21 6 15 | 20 6 14 |
222 DEBORAH M. CALKINS S2 02 | 12 3 9 | 11 3 8 |
242 DEBORAH M. CALKINS S2 04 | 9 3 6 | 9 3 6 |
Number of Sections: 2 Average Students Per Section: 10.50
SPE632 MATH SE 2 SM 1 14 17| 17 5 12 | 16 5 11 |
212 DEBORAH M. CALKINS S2 01 | 17 5 12 | 16 5 11 |
Number of Sections: 1 Average Students Per Section: 17.00
SPE702 LAN ARTS SE 7 2 SM 1 14 17| 17 6 11 | 17 6 11 |
112 MARCIA L. DARRAH S2 01 | 17 6 11 | 17 6 11 |
Number of Sections: 1 Average Students Per Section: 17.00
SPE712 READING SE 7 2 SM 1 14 9| 9 5 4 | 9 5 4 |
252 DEBORAH M. CALKINS S2 05 | 9 5 4 | 9 5 4 |
Number of Sections: 1 Average Students Per Section: 9.00
SPE732 MATH SE 7 2 SM 1 28 15| 15 7 8 | 15 7 8 |
322 REBECCA A. MARCOTTE S2 02 | 7 3 4 | 7 3 4 |
362 REBECCA A. MARCOTTE S2 06 | 8 4 4 | 8 4 4 |

1sonyr01.p 35-2 MT BAKER MIDDLE SCHOOL 03/01/12 Page:9
04.11.10.00.01 Course/Class Count Report 207 1:25 PM
EST NBR NBR ----TOTALS---- ---Spec Ed----
COURSE DESCRIPTION LGTH SEC AVL REQ TOT FEM MAL TOT FEM MAL
Number of Sections: 2 Average Students Per Section: 7.50
SPE802 LAN ARTS SE 8 2 SM 1 28 16| 16 4 12 | 16 4 12 |
142 MARCIA L. DARRAH S2 04 | 10 4 6 | 10 4 6 |
152 MARCIA L. DARRAH S2 05 | 6 0 6 | 6 0 6 |
Number of Sections: 2 Average Students Per Section: 8.00
SPE812 READING SE 8 2 SM 1 14 9| 9 4 5 | 9 4 5 |
262 MARCIA L. DARRAH S2 06 | 9 4 5 | 9 4 5 |
Number of Sections: 1 Average Students Per Section: 9.00
SPE832 MATH SE 8 2 SM 1 28 22| 22 9 13 | 22 9 13 |
162 DEBORAH M. CALKINS S2 06 | 10 3 7 | 10 3 7 |
352 REBECCA A. MARCOTTE S2 05 | 12 6 6 | 12 6 6 |
Number of Sections: 2 Average Students Per Section: 11.00

1sonyr01.p 35-2 MT BAKER MIDDLE SCHOOL 03/01/12 Page:10
04.11.10.00.01 Course/Class Count Report Totals 1:25 PM
TITLE FOR TOTAL
TOTALS GROUP TOTAL FEMALE MALE
GRAND TOTALS 5966 2953 3013
Spec Ed 503 178 325
************************ End of report ************************

1sonyr01.p 35-2 OLYMPIC MIDDLE SCHOOL 03/01/12 Page:1
04.11.10.00.01 Course/Class Count Report 203 1:27 PM
EST NBR NBR ----TOTALS---- ---Spec Ed----
COURSE DESCRIPTION LGTH SEC AVL REQ TOT FEM MAL TOT FEM MAL
ART402 ART SURVEY 2 SM 1 150 141| 140 54 86 | 18 5 13 |
11 WILLIAM S. LUKE S2 01 | 26 11 15 | 3 1 2 |
21 WILLIAM S. LUKE S2 02 | 27 6 21 | 4 1 3 |
31C WILLIAM S. LUKE S2 03 | 27 13 14 | 4 1 3 |
41C WILLIAM S. LUKE S2 04 | 30 7 23 | 4 1 3 |
61 WILLIAM S. LUKE S2 06 | 30 17 13 | 3 1 2 |
Number of Sections: 5 Average Students Per Section: 28.00
BUS402 COMPUTER APPS 2 SM 1 150 115| 112 56 56 | 18 9 9 |
21A KIMBERLY A. STROBEL S2 02 | 22 11 11 | 3 2 1 |
31 KIMBERLY A. STROBEL S2 03 | 28 17 11 | 4 3 1 |
41 KIMBERLY A. STROBEL S2 04 | 25 14 11 | 4 2 2 |
51 KIMBERLY A. STROBEL S2 05 | 19 6 13 | 4 1 3 |
61A KIMBERLY A. STROBEL S2 06 | 18 8 10 | 3 1 2 |
Number of Sections: 5 Average Students Per Section: 22.40
ELL402 ELL 6 7 8 B SM 1 150 50| 50 24 26 | 6 2 4 |
11 SERAPHINE M. GERBER S2 01 | 9 6 3 | 2 1 1 |
21 SERAPHINE M. GERBER S2 02 | 8 4 4 | 1 0 1 |
41 SERAPHINE M. GERBER S2 04 | 11 2 9 | 3 1 2 |
51 SERAPHINE M. GERBER S2 05 | 12 7 5 | 0 0 0 |
61 SERAPHINE M. GERBER S2 06 | 10 5 5 | 0 0 0 |
Number of Sections: 5 Average Students Per Section: 10.00
GEN010 ELL MONITORING YR 1 100 35| 35 19 16 | 11 4 7 |
10 SERAPHINE M. GERBER YR 07 | 35 19 16 | 11 4 7 |
Number of Sections: 1 Average Students Per Section: 35.00
GEN111 LEADERSHIP 2 SM 1 30 19| 18 10 8 | 1 0 1 |
11 TRACY M. SHERIN S2 01 | 18 10 8 | 1 0 1 |
Number of Sections: 1 Average Students Per Section: 18.00
LAN112 JOURNALISM 2 SM 1 30 22| 22 12 10 | 0 0 0 |
51 ROBYN R. KNUDTSON S2 05 | 22 12 10 | 0 0 0 |
Number of Sections: 1 Average Students Per Section: 22.00
LAN130 READING 1 B SM 1 75 71| 71 37 34 | 6 1 5 |
11 JILL C. BARRETT S2 01 | 16 8 8 | 0 0 0 |
31 JILL C. BARRETT S2 03 | 16 8 8 | 3 1 2 |
41 JILL C. BARRETT S2 04 | 16 9 7 | 0 0 0 |
51 JILL C. BARRETT S2 05 | 16 8 8 | 2 0 2 |
61 JILL C. BARRETT S2 06 | 7 4 3 | 1 0 1 |
Number of Sections: 5 Average Students Per Section: 14.20
LAN131 READING 2 B SM 1 75 80| 69 32 37 | 9 0 9 |
11 KARRI E. MILLICAN S2 01 | 13 7 6 | 1 0 1 |
21 KARRI E. MILLICAN S2 02 | 15 5 10 | 4 0 4 |
31 KARRI E. MILLICAN S2 03 | 15 8 7 | 1 0 1 |
51 KARRI E. MILLICAN S2 05 | 12 4 8 | 1 0 1 |
61 KARRI E. MILLICAN S2 06 | 14 8 6 | 2 0 2 |
Number of Sections: 5 Average Students Per Section: 13.80
LAN132 READING 3 B SM 1 125 113| 110 59 51 | 7 3 4 |
11 DALE A. DEVRIES S2 01 | 16 9 7 | 1 0 1 |
21 DALE A. DEVRIES S2 02 | 25 15 10 | 0 0 0 |
31 DALE A. DEVRIES S2 03 | 24 12 12 | 1 0 1 |
41 DALE A. DEVRIES S2 04 | 27 13 14 | 3 2 1 |
51 DALE A. DEVRIES S2 05 | 18 10 8 | 2 1 1 |
Number of Sections: 5 Average Students Per Section: 22.00
LAN602 LAN ARTS 6 2 SM 1 240 171| 170 87 83 | 6 0 6 |
11 SUSAN J. KINDEM S2 01 | 15 7 8 | 0 0 0 |
12 MARGARET MORGAN S2 01 | 14 6 8 | 1 0 1 |
21 MARGARET MORGAN S2 02 | 24 14 10 | 0 0 0 |
31 SUSAN J. KINDEM S2 03 | 27 17 10 | 0 0 0 |
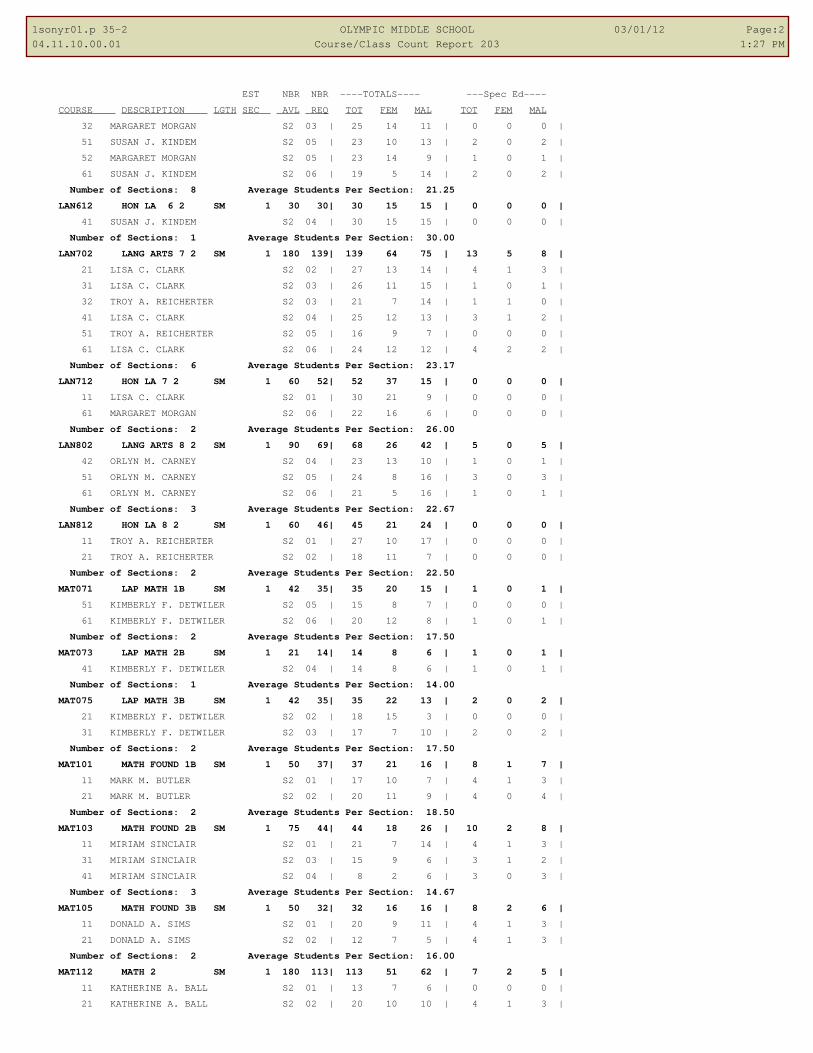
1sonyr01.p 35-2 OLYMPIC MIDDLE SCHOOL 03/01/12 Page:2
04.11.10.00.01 Course/Class Count Report 203 1:27 PM
EST NBR NBR ----TOTALS---- ---Spec Ed----
COURSE DESCRIPTION LGTH SEC AVL REQ TOT FEM MAL TOT FEM MAL
32 MARGARET MORGAN S2 03 | 25 14 11 | 0 0 0 |
51 SUSAN J. KINDEM S2 05 | 23 10 13 | 2 0 2 |
52 MARGARET MORGAN S2 05 | 23 14 9 | 1 0 1 |
61 SUSAN J. KINDEM S2 06 | 19 5 14 | 2 0 2 |
Number of Sections: 8 Average Students Per Section: 21.25
LAN612 HON LA 6 2 SM 1 30 30| 30 15 15 | 0 0 0 |
41 SUSAN J. KINDEM S2 04 | 30 15 15 | 0 0 0 |
Number of Sections: 1 Average Students Per Section: 30.00
LAN702 LANG ARTS 7 2 SM 1 180 139| 139 64 75 | 13 5 8 |
21 LISA C. CLARK S2 02 | 27 13 14 | 4 1 3 |
31 LISA C. CLARK S2 03 | 26 11 15 | 1 0 1 |
32 TROY A. REICHERTER S2 03 | 21 7 14 | 1 1 0 |
41 LISA C. CLARK S2 04 | 25 12 13 | 3 1 2 |
51 TROY A. REICHERTER S2 05 | 16 9 7 | 0 0 0 |
61 LISA C. CLARK S2 06 | 24 12 12 | 4 2 2 |
Number of Sections: 6 Average Students Per Section: 23.17
LAN712 HON LA 7 2 SM 1 60 52| 52 37 15 | 0 0 0 |
11 LISA C. CLARK S2 01 | 30 21 9 | 0 0 0 |
61 MARGARET MORGAN S2 06 | 22 16 6 | 0 0 0 |
Number of Sections: 2 Average Students Per Section: 26.00
LAN802 LANG ARTS 8 2 SM 1 90 69| 68 26 42 | 5 0 5 |
42 ORLYN M. CARNEY S2 04 | 23 13 10 | 1 0 1 |
51 ORLYN M. CARNEY S2 05 | 24 8 16 | 3 0 3 |
61 ORLYN M. CARNEY S2 06 | 21 5 16 | 1 0 1 |
Number of Sections: 3 Average Students Per Section: 22.67
LAN812 HON LA 8 2 SM 1 60 46| 45 21 24 | 0 0 0 |
11 TROY A. REICHERTER S2 01 | 27 10 17 | 0 0 0 |
21 TROY A. REICHERTER S2 02 | 18 11 7 | 0 0 0 |
Number of Sections: 2 Average Students Per Section: 22.50
MAT071 LAP MATH 1B SM 1 42 35| 35 20 15 | 1 0 1 |
51 KIMBERLY F. DETWILER S2 05 | 15 8 7 | 0 0 0 |
61 KIMBERLY F. DETWILER S2 06 | 20 12 8 | 1 0 1 |
Number of Sections: 2 Average Students Per Section: 17.50
MAT073 LAP MATH 2B SM 1 21 14| 14 8 6 | 1 0 1 |
41 KIMBERLY F. DETWILER S2 04 | 14 8 6 | 1 0 1 |
Number of Sections: 1 Average Students Per Section: 14.00
MAT075 LAP MATH 3B SM 1 42 35| 35 22 13 | 2 0 2 |
21 KIMBERLY F. DETWILER S2 02 | 18 15 3 | 0 0 0 |
31 KIMBERLY F. DETWILER S2 03 | 17 7 10 | 2 0 2 |
Number of Sections: 2 Average Students Per Section: 17.50
MAT101 MATH FOUND 1B SM 1 50 37| 37 21 16 | 8 1 7 |
11 MARK M. BUTLER S2 01 | 17 10 7 | 4 1 3 |
21 MARK M. BUTLER S2 02 | 20 11 9 | 4 0 4 |
Number of Sections: 2 Average Students Per Section: 18.50
MAT103 MATH FOUND 2B SM 1 75 44| 44 18 26 | 10 2 8 |
11 MIRIAM SINCLAIR S2 01 | 21 7 14 | 4 1 3 |
31 MIRIAM SINCLAIR S2 03 | 15 9 6 | 3 1 2 |
41 MIRIAM SINCLAIR S2 04 | 8 2 6 | 3 0 3 |
Number of Sections: 3 Average Students Per Section: 14.67
MAT105 MATH FOUND 3B SM 1 50 32| 32 16 16 | 8 2 6 |
11 DONALD A. SIMS S2 01 | 20 9 11 | 4 1 3 |
21 DONALD A. SIMS S2 02 | 12 7 5 | 4 1 3 |
Number of Sections: 2 Average Students Per Section: 16.00
MAT112 MATH 2 SM 1 180 113| 113 51 62 | 7 2 5 |
11 KATHERINE A. BALL S2 01 | 13 7 6 | 0 0 0 |
21 KATHERINE A. BALL S2 02 | 20 10 10 | 4 1 3 |

1sonyr01.p 35-2 OLYMPIC MIDDLE SCHOOL 03/01/12 Page:3
04.11.10.00.01 Course/Class Count Report 203 1:27 PM
EST NBR NBR ----TOTALS---- ---Spec Ed----
COURSE DESCRIPTION LGTH SEC AVL REQ TOT FEM MAL TOT FEM MAL
31 KATHERINE A. BALL S2 03 | 19 4 15 | 2 0 2 |
41 MARK M. BUTLER S2 04 | 23 12 11 | 0 0 0 |
51 MARK M. BUTLER S2 05 | 20 10 10 | 1 1 0 |
61 MARK M. BUTLER S2 06 | 18 8 10 | 0 0 0 |
Number of Sections: 6 Average Students Per Section: 18.83
MAT115 PRE ALGEBRA 1 SM 10 210 80| 80 48 32 | 7 4 3 |
11Z LAURA V. HOGENSON S2 01 | 29 19 10 | 2 2 0 |
21Y LAURA V. HOGENSON S2 02 | 22 12 10 | 2 0 2 |
31Y LAURA V. HOGENSON S2 03 | 29 17 12 | 3 2 1 |
Number of Sections: 3 Average Students Per Section: 26.67
MAT116 PRE ALGEBRA 2 SM 7 300 151| 150 74 76 | 4 1 3 |
21Z CHRISTY A. PRICE S2 02 | 29 12 17 | 1 1 0 |
31Z CHRISTY A. PRICE S2 03 | 31 12 19 | 1 0 1 |
41Y LAURA V. HOGENSON S2 04 | 30 18 12 | 1 0 1 |
42Z CHRISTY A. PRICE S2 04 | 30 17 13 | 1 0 1 |
61Y LAURA V. HOGENSON S2 06 | 30 15 15 | 0 0 0 |
Number of Sections: 5 Average Students Per Section: 30.00
MAT121 ALGEBRA 2 SM 1 60 60| 59 25 34 | 0 0 0 |
51 CHRISTY A. PRICE S2 05 | 29 11 18 | 0 0 0 |
61 CHRISTY A. PRICE S2 06 | 30 14 16 | 0 0 0 |
Number of Sections: 2 Average Students Per Section: 29.50
MUS402 BAND 6 7 2 SM 1 110 72| 70 23 47 | 4 1 3 |
11 ORLYN M. CARNEY S2 01 | 33 8 25 | 4 1 3 |
21 ORLYN M. CARNEY S2 02 | 37 15 22 | 0 0 0 |
Number of Sections: 2 Average Students Per Section: 35.00
MUS411 CHOIR 6 7 8 2 SM 1 110 83| 82 64 18 | 8 5 3 |
51 JANINE M. DODD S2 05 | 45 35 10 | 5 4 1 |
61 JANINE M. DODD S2 06 | 37 29 8 | 3 1 2 |
Number of Sections: 2 Average Students Per Section: 41.00
MUS632 ORCHESTRA 6 2 SM 1 50 26| 26 21 5 | 1 1 0 |
11 ELSA T. FAGER S2 01 | 26 21 5 | 1 1 0 |
Number of Sections: 1 Average Students Per Section: 26.00
MUS832 ORCHESTRA 8 2 SM 1 50 37| 37 27 10 | 1 0 1 |
21 ELSA T. FAGER S2 02 | 37 27 10 | 1 0 1 |
Number of Sections: 1 Average Students Per Section: 37.00
PHY613 PHYS ED 6 2 SM 1 210 175| 174 73 101 | 39 7 32 |
11 DEBORAH G. EYMANN S2 01 | 20 11 9 | 3 1 2 |
21 DEBORAH G. EYMANN S2 02 | 32 11 21 | 4 0 4 |
31 DEBORAH G. EYMANN S2 03 | 32 16 16 | 4 1 3 |
41 DEBORAH G. EYMANN S2 04 | 29 11 18 | 4 0 4 |
51 MATTHEW A. MUXEN S2 05 | 31 13 18 | 4 0 4 |
61S DEBORAH G. EYMANN S2 06 | 30 11 19 | 20 5 15 |
Number of Sections: 6 Average Students Per Section: 29.00
PHY713 PHYS ED 7 2 SM 1 210 150| 145 70 75 | 22 8 14 |
11 PHILLIP R. WAY S2 01 | 28 13 15 | 4 3 1 |
21 PHILLIP R. WAY S2 02 | 21 12 9 | 4 1 3 |
31 PHILLIP R. WAY S2 03 | 23 12 11 | 3 1 2 |
41 LAURA C. ROGERS S2 04 | 30 14 16 | 4 1 3 |
51 LAURA C. ROGERS S2 05 | 19 9 10 | 4 1 3 |
61 LAURA C. ROGERS S2 06 | 24 10 14 | 3 1 2 |
Number of Sections: 6 Average Students Per Section: 24.17
PHY813 PHYS ED 8 2 SM 1 210 157| 151 65 86 | 20 8 12 |
11 MATTHEW A. MUXEN S2 01 | 20 12 8 | 2 2 0 |
21 MATTHEW A. MUXEN S2 02 | 16 8 8 | 3 2 1 |
31 MATTHEW A. MUXEN S2 03 | 32 13 19 | 6 1 5 |
41 MATTHEW A. MUXEN S2 04 | 31 11 20 | 2 1 1 |

1sonyr01.p 35-2 OLYMPIC MIDDLE SCHOOL 03/01/12 Page:4
04.11.10.00.01 Course/Class Count Report 203 1:27 PM
EST NBR NBR ----TOTALS---- ---Spec Ed----
COURSE DESCRIPTION LGTH SEC AVL REQ TOT FEM MAL TOT FEM MAL
51 PHILLIP R. WAY S2 05 | 28 10 18 | 4 1 3 |
61 PHILLIP R. WAY S2 06 | 24 11 13 | 3 1 2 |
Number of Sections: 6 Average Students Per Section: 25.17
SBPA02 PRE ALGEBRA SM 1 120 111| 111 61 50 | 6 2 4 |
51A KATHERINE A. BALL S2 05 | 29 19 10 | 1 0 1 |
52B MIRIAM SINCLAIR S2 05 | 27 14 13 | 2 0 2 |
61A KATHERINE A. BALL S2 06 | 30 14 16 | 0 0 0 |
62B MIRIAM SINCLAIR S2 06 | 25 14 11 | 3 2 1 |
Number of Sections: 4 Average Students Per Section: 27.75
SBSC72 SCIENCE 7 2 SM 1 150 123| 122 62 60 | 16 5 11 |
12 BRANDY F. ENGLANDER S2 01 | 25 15 10 | 2 1 1 |
21 BRANDY F. ENGLANDER S2 02 | 19 10 9 | 4 2 2 |
31 BRANDY F. ENGLANDER S2 03 | 24 12 12 | 2 0 2 |
41 BRANDY F. ENGLANDER S2 04 | 30 15 15 | 4 1 3 |
51 BRANDY F. ENGLANDER S2 05 | 24 10 14 | 4 1 3 |
Number of Sections: 5 Average Students Per Section: 24.40
SBSS62 SOC STUDIES 6 2 SM 1 150 110| 109 52 57 | 9 2 7 |
11 JENNIFER L. WILLSON S2 01 | 16 9 7 | 0 0 0 |
21 JENNIFER L. WILLSON S2 02 | 23 10 13 | 3 0 3 |
41 JENNIFER L. WILLSON S2 04 | 25 14 11 | 0 0 0 |
51 JENNIFER L. WILLSON S2 05 | 19 9 10 | 4 2 2 |
61 JENNIFER L. WILLSON S2 06 | 26 10 16 | 2 0 2 |
Number of Sections: 5 Average Students Per Section: 21.80
SCI602 SCIENCE 6 2 SM 1 180 160| 159 82 77 | 4 2 2 |
11 DANIEL V. NOMURA S2 01 | 25 14 11 | 1 0 1 |
21 LAURA C. ROGERS S2 02 | 26 12 14 | 1 1 0 |
32 DANIEL V. NOMURA S2 03 | 28 17 11 | 1 1 0 |
42 DANIEL V. NOMURA S2 04 | 28 19 9 | 0 0 0 |
52 DANIEL V. NOMURA S2 05 | 27 10 17 | 1 0 1 |
61 DANIEL V. NOMURA S2 06 | 25 10 15 | 0 0 0 |
Number of Sections: 6 Average Students Per Section: 26.50
SCI702 SCIENCE 7 2 SM 1 90 74| 73 37 36 | 6 2 4 |
11 LAURA C. ROGERS S2 01 | 26 15 11 | 1 0 1 |
22 PAUL R. COOPER III S2 02 | 22 6 16 | 2 1 1 |
42 PAUL R. COOPER III S2 04 | 25 16 9 | 3 1 2 |
Number of Sections: 3 Average Students Per Section: 24.33
SCI802 SCIENCE 8 2 SM 1 90 84| 84 42 42 | 8 3 5 |
11 PAUL R. COOPER III S2 01 | 25 12 13 | 2 1 1 |
31 PAUL R. COOPER III S2 03 | 30 17 13 | 2 1 1 |
61 PAUL R. COOPER III S2 06 | 29 13 16 | 4 1 3 |
Number of Sections: 3 Average Students Per Section: 28.00
SOC602 SOC STUDIES 6 2 SM 1 120 82| 82 42 40 | 3 0 3 |
12 SUSAN P. WRASPIR S2 01 | 14 5 9 | 1 0 1 |
22 SUSAN P. WRASPIR S2 02 | 18 8 10 | 0 0 0 |
31 SUSAN P. WRASPIR S2 03 | 26 14 12 | 2 0 2 |
42 SUSAN P. WRASPIR S2 04 | 24 15 9 | 0 0 0 |
Number of Sections: 4 Average Students Per Section: 20.50
SOC702 WORLD HISTORY 7 SM 1 240 184| 183 89 94 | 22 5 17 |
11 MICHELLE M. COBURN S2 01 | 22 7 15 | 2 1 1 |
21 TRACY M. SHERIN S2 02 | 23 14 9 | 2 1 1 |
31 MICHELLE M. COBURN S2 03 | 25 14 11 | 2 0 2 |
41 MICHELLE M. COBURN S2 04 | 22 10 12 | 1 1 0 |
51 SUSAN P. WRASPIR S2 05 | 21 10 11 | 3 1 2 |
52 MICHELLE M. COBURN S2 05 | 24 13 11 | 4 1 3 |
61 MICHELLE M. COBURN S2 06 | 24 14 10 | 4 0 4 |
62 TRACY M. SHERIN S2 06 | 22 7 15 | 4 0 4 |

1sonyr01.p 35-2 OLYMPIC MIDDLE SCHOOL 03/01/12 Page:5
04.11.10.00.01 Course/Class Count Report 203 1:27 PM
EST NBR NBR ----TOTALS---- ---Spec Ed----
COURSE DESCRIPTION LGTH SEC AVL REQ TOT FEM MAL TOT FEM MAL
Number of Sections: 8 Average Students Per Section: 22.88
SOC802 US HISTORY 8 2 SM 1 240 196| 195 90 105 | 18 8 10 |
21 SCOTT E. MILLICAN S2 02 | 25 12 13 | 2 1 1 |
31 TRACY M. SHERIN S2 03 | 26 14 12 | 2 1 1 |
32 SCOTT E. MILLICAN S2 03 | 25 7 18 | 1 0 1 |
41 SCOTT E. MILLICAN S2 04 | 26 10 16 | 3 0 3 |
51 TRACY M. SHERIN S2 05 | 26 12 14 | 4 1 3 |
52 SCOTT E. MILLICAN S2 05 | 26 13 13 | 2 2 0 |
61 TROY A. REICHERTER S2 06 | 18 10 8 | 1 0 1 |
62 SCOTT E. MILLICAN S2 06 | 23 12 11 | 3 3 0 |
Number of Sections: 8 Average Students Per Section: 24.38
SPE012 MATH SE 2 SM 1 120 53| 53 21 32 | 51 20 31 |
31 PATRICIA A. BACHELDER S2 03 | 10 5 5 | 10 5 5 |
41 PATRICIA A. BACHELDER S2 04 | 15 6 9 | 14 5 9 |
51 PATRICIA A. BACHELDER S2 05 | 14 5 9 | 13 5 8 |
61 PATRICIA A. BACHELDER S2 06 | 14 5 9 | 14 5 9 |
Number of Sections: 4 Average Students Per Section: 13.25
SPE042 LANG ARTS SE 2 SM 1 150 59| 59 20 39 | 56 18 38 |
11 MOLLY RICHARDSON S2 01 | 14 4 10 | 14 4 10 |
21 MOLLY RICHARDSON S2 02 | 12 3 9 | 10 2 8 |
31 MOLLY RICHARDSON S2 03 | 11 5 6 | 11 5 6 |
41 MOLLY RICHARDSON S2 04 | 14 5 9 | 14 5 9 |
61 MOLLY RICHARDSON S2 06 | 8 3 5 | 7 2 5 |
Number of Sections: 5 Average Students Per Section: 11.80
SPE102 STRUC LEARN 2 SM 1 200 123| 123 31 92 | 123 31 92 |
11A SHELLEY S. WARNER S2 01 | 11 3 8 | 11 3 8 |
12B GLORIA J. SMITH-DORSEY S2 01 | 8 0 8 | 8 0 8 |
13C JAN B. GILDEN S2 01 | 8 4 4 | 8 4 4 |
21A SHELLEY S. WARNER S2 02 | 2 1 1 | 2 1 1 |
22B GLORIA J. SMITH-DORSEY S2 02 | 8 0 8 | 8 0 8 |
23C JAN B. GILDEN S2 02 | 9 5 4 | 9 5 4 |
31A SHELLEY S. WARNER S2 03 | 10 2 8 | 10 2 8 |
32B GLORIA J. SMITH-DORSEY S2 03 | 9 0 9 | 9 0 9 |
33C JAN B. GILDEN S2 03 | 10 5 5 | 10 5 5 |
41A SHELLEY S. WARNER S2 04 | 11 3 8 | 11 3 8 |
42B GLORIA J. SMITH-DORSEY S2 04 | 9 0 9 | 9 0 9 |
43C JAN B. GILDEN S2 04 | 8 4 4 | 8 4 4 |
51A SHELLEY S. WARNER S2 05 | 6 2 4 | 6 2 4 |
52B GLORIA J. SMITH-DORSEY S2 05 | 6 0 6 | 6 0 6 |
53C JAN B. GILDEN S2 05 | 3 1 2 | 3 1 2 |
61A SHELLEY S. WARNER S2 06 | 5 1 4 | 5 1 4 |
62B GLORIA J. SMITH-DORSEY S2 06 | 0 0 0 | 0 0 0 |
63C JAN B. GILDEN S2 06 | 0 0 0 | 0 0 0 |
Number of Sections: 18 Average Students Per Section: 6.83
SPE122 ADAPTVE BEHAV 2 SM 1 30 15| 15 3 12 | 15 3 12 |
12 PATRICIA A. BACHELDER S2 02 | 15 3 12 | 15 3 12 |
Number of Sections: 1 Average Students Per Section: 15.00
SPE612 READING SE 2 SM 1 150 58| 58 19 39 | 56 18 38 |
11 JUDY DENNIS S2 01 | 13 2 11 | 13 2 11 |
21 JUDY DENNIS S2 02 | 12 4 8 | 12 4 8 |
31 JUDY DENNIS S2 03 | 11 4 7 | 11 4 7 |
51 JUDY DENNIS S2 05 | 13 5 8 | 12 4 8 |
61 JUDY DENNIS S2 06 | 9 4 5 | 8 4 4 |
Number of Sections: 5 Average Students Per Section: 11.60

1sonyr01.p 35-2 OLYMPIC MIDDLE SCHOOL 03/01/12 Page:6
04.11.10.00.01 Course/Class Count Report Totals 1:27 PM
TITLE FOR TOTAL
TOTALS GROUP TOTAL FEMALE MALE
GRAND TOTALS 3841 1850 1991
Spec Ed 636 190 446
************************ End of report ************************

1sonyr01.p 35-2 RAINIER MIDDLE SCHOOL 03/01/12 Page:1
04.11.10.00.01 Course/Class Count Report 206 1:27 PM
EST NBR NBR ----TOTALS---- ---Spec Ed----
COURSE DESCRIPTION LGTH SEC AVL REQ TOT FEM MAL TOT FEM MAL
ART110 ART SM 17 240 188| 119 54 65 | 11 6 5 |
22 LUIS C. CHAVEZ S2 02 | 30 11 19 | 3 2 1 |
42 LUIS C. CHAVEZ S2 04 | 29 14 15 | 2 1 1 |
52 LUIS C. CHAVEZ S2 05 | 30 11 19 | 4 1 3 |
62 LUIS C. CHAVEZ S2 06 | 30 18 12 | 2 2 0 |
Number of Sections: 4 Average Students Per Section: 29.75
ART610 ART SURVEY 6 TM 8 120 88| 58 33 25 | 3 1 2 |
13 LUIS C. CHAVEZ T3 01 | 28 19 9 | 1 0 1 |
14 LUIS C. CHAVEZ T4 01 | 30 14 16 | 2 1 1 |
Number of Sections: 2 Average Students Per Section: 29.00
BUS110 COMPUTER APPS SM 15 60 158| 26 9 17 | 1 0 1 |
32 ERIN G. WILLIAMS S2 03 | 26 9 17 | 1 0 1 |
Number of Sections: 1 Average Students Per Section: 26.00
BUS610 COMPUTER APPS 6 TM 9 240 92| 90 53 37 | 2 0 2 |
12 ERIN G. WILLIAMS T3 01 | 21 6 15 | 0 0 0 |
13 ERIN G. WILLIAMS T4 01 | 25 17 8 | 0 0 0 |
22 ERIN G. WILLIAMS T3 02 | 27 22 5 | 2 0 2 |
23 ERIN G. WILLIAMS T4 02 | 17 8 9 | 0 0 0 |
Number of Sections: 4 Average Students Per Section: 22.50
ELL701 ELL 7 SM 1 470 47| 47 26 21 | 12 10 2 |
00 HARRIETT M. DALOS S2 00 | 12 9 3 | 9 8 1 |
12 HARRIETT M. DALOS S2 01 | 7 2 5 | 1 0 1 |
22 HARRIETT M. DALOS S2 02 | 7 3 4 | 0 0 0 |
23 HARRIETT M. DALOS S2 02 | 2 1 1 | 0 0 0 |
24 HARRIETT M. DALOS S2 02 | 0 0 0 | 0 0 0 |
32 HARRIETT M. DALOS S2 03 | 5 3 2 | 0 0 0 |
52 HARRIETT M. DALOS S2 05 | 6 2 4 | 1 1 0 |
53 HARRIETT M. DALOS S2 05 | 1 0 1 | 0 0 0 |
62 HARRIETT M. DALOS S2 06 | 7 6 1 | 1 1 0 |
Number of Sections: 9 Average Students Per Section: 5.22
GEN100 STUDY SKILLS SM 2 55 17| 17 7 10 | 0 0 0 |
52 DAVID-MICHAEL D. COX S2 05 | 17 7 10 | 0 0 0 |
Number of Sections: 1 Average Students Per Section: 17.00
GEN110 LEADERSHIP SM 12 60 131| 21 17 4 | 0 0 0 |
62 CINDY A. PRIDEMORE S2 06 | 21 17 4 | 0 0 0 |
Number of Sections: 1 Average Students Per Section: 21.00
GEN122 PEER MENTORING SM 2 60 18| 18 10 8 | 1 0 1 |
12 DEBORAH L. ALLISON S2 01 | 18 10 8 | 1 0 1 |
Number of Sections: 1 Average Students Per Section: 18.00
GEN620 TEACHR AIDE 6 2 SM 1 180 0| 0 0 0 | 0 0 0 |
11 JENNIFER G. MEREDITH S2 01 | 0 0 0 | 0 0 0 |
21 JENNIFER G. MEREDITH S2 02 | 0 0 0 | 0 0 0 |
31 JENNIFER G. MEREDITH S2 03 | 0 0 0 | 0 0 0 |
41 JENNIFER G. MEREDITH S2 04 | 0 0 0 | 0 0 0 |
51 JENNIFER G. MEREDITH S2 05 | 0 0 0 | 0 0 0 |
61 JENNIFER G. MEREDITH S2 06 | 0 0 0 | 0 0 0 |
Number of Sections: 6 Average Students Per Section: 0.00
GEN720 TEACHR AIDE 7 2 SM 1 702 14| 14 10 4 | 4 0 4 |
11 JENNIFER G. MEREDITH S2 01 | 1 1 0 | 0 0 0 |
12 JENNIFER G. MEREDITH S2 01 | 1 1 0 | 0 0 0 |
13 JENNIFER G. MEREDITH S2 01 | 1 1 0 | 0 0 0 |
14 JENNIFER G. MEREDITH S2 01 | 0 0 0 | 0 0 0 |
21 JENNIFER G. MEREDITH S2 02 | 0 0 0 | 0 0 0 |
23 JENNIFER G. MEREDITH S2 02 | 1 0 1 | 1 0 1 |
24 JENNIFER G. MEREDITH S2 02 | 1 1 0 | 0 0 0 |
30 JENNIFER G. MEREDITH S2 03 | 0 0 0 | 0 0 0 |

1sonyr01.p 35-2 RAINIER MIDDLE SCHOOL 03/01/12 Page:2
04.11.10.00.01 Course/Class Count Report 206 1:27 PM
EST NBR NBR ----TOTALS---- ---Spec Ed----
COURSE DESCRIPTION LGTH SEC AVL REQ TOT FEM MAL TOT FEM MAL
31 JENNIFER G. MEREDITH S2 03 | 0 0 0 | 0 0 0 |
32 JENNIFER G. MEREDITH S2 03 | 1 1 0 | 0 0 0 |
40 JENNIFER G. MEREDITH S2 04 | 1 1 0 | 0 0 0 |
41 JENNIFER G. MEREDITH S2 04 | 0 0 0 | 0 0 0 |
42 JENNIFER G. MEREDITH S2 04 | 0 0 0 | 0 0 0 |
43 JENNIFER G. MEREDITH S2 04 | 1 1 0 | 0 0 0 |
50 JENNIFER G. MEREDITH S2 05 | 1 1 0 | 0 0 0 |
51 JENNIFER G. MEREDITH S2 03 | 0 0 0 | 0 0 0 |
52 JENNIFER G. MEREDITH S2 05 | 0 0 0 | 0 0 0 |
53 JENNIFER G. MEREDITH S2 03 | 0 0 0 | 0 0 0 |
54 JENNIFER G. MEREDITH S2 05 | 0 0 0 | 0 0 0 |
55 JENNIFER G. MEREDITH S2 05 | 0 0 0 | 0 0 0 |
61 JENNIFER G. MEREDITH S2 06 | 0 0 0 | 0 0 0 |
62 JENNIFER G. MEREDITH S2 06 | 2 0 2 | 2 0 2 |
63 JENNIFER G. MEREDITH S2 06 | 1 1 0 | 0 0 0 |
64 JENNIFER G. MEREDITH S2 06 | 1 0 1 | 1 0 1 |
65 JENNIFER G. MEREDITH S2 06 | 1 1 0 | 0 0 0 |
Number of Sections: 25 Average Students Per Section: 0.56
GEN820 TEACHR AIDE 8 2 SM 1 922 28| 28 14 14 | 2 0 2 |
10 JENNIFER G. MEREDITH S2 01 | 1 1 0 | 0 0 0 |
11 JENNIFER G. MEREDITH S2 01 | 1 0 1 | 0 0 0 |
112 JENNIFER G. MEREDITH S2 01 | 1 1 0 | 0 0 0 |
12 JENNIFER G. MEREDITH S2 01 | 1 0 1 | 0 0 0 |
13 JENNIFER G. MEREDITH S2 00 | 0 0 0 | 0 0 0 |
14 JENNIFER G. MEREDITH S2 01 | 1 0 1 | 0 0 0 |
15 JENNIFER G. MEREDITH S2 01 | 2 2 0 | 0 0 0 |
16 JENNIFER G. MEREDITH S2 01 | 1 0 1 | 0 0 0 |
17 JENNIFER G. MEREDITH S2 01 | 1 1 0 | 0 0 0 |
18 DAVID-MICHAEL D. COX S2 01 | 0 0 0 | 0 0 0 |
21 JENNIFER G. MEREDITH S2 02 | 0 0 0 | 0 0 0 |
22 JENNIFER G. MEREDITH S2 02 | 1 0 1 | 0 0 0 |
23 JENNIFER G. MEREDITH S2 02 | 0 0 0 | 0 0 0 |
24 JENNIFER G. MEREDITH S2 02 | 1 0 1 | 0 0 0 |
25 JENNIFER G. MEREDITH S2 02 | 1 1 0 | 0 0 0 |
26 TRACY L. LASHER S2 02 | 1 1 0 | 0 0 0 |
31 JENNIFER G. MEREDITH S2 03 | 0 0 0 | 0 0 0 |
32 JENNIFER G. MEREDITH S2 03 | 0 0 0 | 0 0 0 |
33 JENNIFER G. MEREDITH S2 03 | 1 1 0 | 0 0 0 |
34 JENNIFER G. MEREDITH S2 03 | 0 0 0 | 0 0 0 |
41 JENNIFER G. MEREDITH S2 04 | 0 0 0 | 0 0 0 |
42 JENNIFER G. MEREDITH S2 04 | 0 0 0 | 0 0 0 |
43 JENNIFER G. MEREDITH S2 04 | 0 0 0 | 0 0 0 |
50 JENNIFER G. MEREDITH S2 05 | 1 0 1 | 0 0 0 |
51 JENNIFER G. MEREDITH S2 05 | 0 0 0 | 0 0 0 |
511 JENNIFER G. MEREDITH S2 05 | 2 0 2 | 2 0 2 |
52 JENNIFER G. MEREDITH S2 05 | 1 0 1 | 0 0 0 |
53 JENNIFER G. MEREDITH S2 05 | 0 0 0 | 0 0 0 |
54 JENNIFER G. MEREDITH S2 05 | 1 1 0 | 0 0 0 |
55 JENNIFER G. MEREDITH S2 05 | 0 0 0 | 0 0 0 |
56 JENNIFER G. MEREDITH S2 05 | 1 1 0 | 0 0 0 |
57 JENNIFER G. MEREDITH S2 05 | 1 0 1 | 0 0 0 |
58 JENNIFER G. MEREDITH S2 05 | 1 1 0 | 0 0 0 |
59 JENNIFER G. MEREDITH S2 05 | 0 0 0 | 0 0 0 |
61 JENNIFER G. MEREDITH S2 06 | 1 0 1 | 0 0 0 |
62 JENNIFER G. MEREDITH S2 06 | 1 1 0 | 0 0 0 |
63 JENNIFER G. MEREDITH S2 06 | 0 0 0 | 0 0 0 |

1sonyr01.p 35-2 RAINIER MIDDLE SCHOOL 03/01/12 Page:3
04.11.10.00.01 Course/Class Count Report 206 1:27 PM
EST NBR NBR ----TOTALS---- ---Spec Ed----
COURSE DESCRIPTION LGTH SEC AVL REQ TOT FEM MAL TOT FEM MAL
64 JENNIFER G. MEREDITH S2 06 | 1 1 0 | 0 0 0 |
65 JENNIFER G. MEREDITH S2 06 | 1 0 1 | 0 0 0 |
66 JENNIFER G. MEREDITH S2 06 | 1 1 0 | 0 0 0 |
67 JENNIFER G. MEREDITH S2 06 | 0 0 0 | 0 0 0 |
68 JENNIFER G. MEREDITH S2 06 | 1 0 1 | 0 0 0 |
Number of Sections: 42 Average Students Per Section: 0.67
HOM110 HOME & FAMILY SM 16 180 169| 84 36 48 | 12 4 8 |
22 CINDY A. PRIDEMORE S2 02 | 30 12 18 | 1 1 0 |
32 CINDY A. PRIDEMORE S2 03 | 24 7 17 | 7 1 6 |
52 CINDY A. PRIDEMORE S2 05 | 30 17 13 | 4 2 2 |
Number of Sections: 3 Average Students Per Section: 28.00
HOM610 HOME EC 6 TM 8 120 89| 59 29 30 | 6 1 5 |
11 CINDY A. PRIDEMORE T4 01 | 29 16 13 | 4 0 4 |
14 CINDY A. PRIDEMORE T3 01 | 30 13 17 | 2 1 1 |
Number of Sections: 2 Average Students Per Section: 29.50
IND110 IND ARTS SM 17 180 161| 74 26 48 | 11 3 8 |
12 SCOTT D. DAVIDSON S2 01 | 17 6 11 | 3 2 1 |
52 SCOTT D. DAVIDSON S2 05 | 30 15 15 | 4 0 4 |
62 SCOTT D. DAVIDSON S2 06 | 27 5 22 | 4 1 3 |
Number of Sections: 3 Average Students Per Section: 24.67
IND610 TECH SURVEY TM 7 120 91| 58 36 22 | 4 3 1 |
21 SCOTT D. DAVIDSON T4 02 | 30 25 5 | 3 3 0 |
24 SCOTT D. DAVIDSON T3 02 | 28 11 17 | 1 0 1 |
Number of Sections: 2 Average Students Per Section: 29.00
LAN110 DRAMA SM 16 180 190| 83 44 39 | 6 0 6 |
12 DAVID-MICHAEL D. COX S2 01 | 30 17 13 | 2 0 2 |
42 DAVID-MICHAEL D. COX S2 04 | 27 18 9 | 2 0 2 |
62 DAVID-MICHAEL D. COX S2 06 | 26 9 17 | 2 0 2 |
Number of Sections: 3 Average Students Per Section: 27.67
LAN112 YEARBOOK 2 SM 1 30 19| 19 16 3 | 0 0 0 |
41 SCOTT D. DAVIDSON S2 04 | 19 16 3 | 0 0 0 |
Number of Sections: 1 Average Students Per Section: 19.00
LAN602 LAN ARTS 6 2 SM 7 210 205| 205 120 85 | 5 3 2 |
11 KELLY A. PORTMANN S2 01 | 29 16 13 | 0 0 0 |
21 SHEILA R. MCCORD S2 02 | 30 15 15 | 0 0 0 |
31 SHEILA R. MCCORD S2 03 | 29 16 13 | 0 0 0 |
41 KELLY A. PORTMANN S2 04 | 32 20 12 | 1 1 0 |
51 SHEILA R. MCCORD S2 05 | 30 20 10 | 2 1 1 |
61 KELLY A. PORTMANN S2 06 | 28 17 11 | 1 0 1 |
62 SHEILA R. MCCORD S2 06 | 27 16 11 | 1 1 0 |
Number of Sections: 7 Average Students Per Section: 29.29
LAN612 HON LA 6 2 SM 2 60 59| 59 33 26 | 0 0 0 |
31 KELLY A. PORTMANN S2 03 | 29 16 13 | 0 0 0 |
51 KELLY A. PORTMANN S2 05 | 30 17 13 | 0 0 0 |
Number of Sections: 2 Average Students Per Section: 29.50
LAN652 LAP READING 6 2 SM 1 60 9| 9 3 6 | 0 0 0 |
21 MELINDA M. WENTZEL S2 02 | 5 1 4 | 0 0 0 |
51 MELINDA M. WENTZEL S2 05 | 4 2 2 | 0 0 0 |
Number of Sections: 2 Average Students Per Section: 4.50
LAN660 DRAMA 6 TM 7 120 85| 54 24 30 | 2 1 1 |
23 DAVID-MICHAEL D. COX T3 02 | 26 14 12 | 1 1 0 |
24 DAVID-MICHAEL D. COX T4 02 | 28 10 18 | 1 0 1 |
Number of Sections: 2 Average Students Per Section: 27.00
LAN702 LANG ARTS 7 2 SM 7 210 86| 86 41 45 | 2 2 0 |
11 SHEILA R. MCCORD S2 01 | 27 12 15 | 1 1 0 |
21 CHERYL SNYDER S2 02 | 0 0 0 | 0 0 0 |

1sonyr01.p 35-2 RAINIER MIDDLE SCHOOL 03/01/12 Page:4
04.11.10.00.01 Course/Class Count Report 206 1:27 PM
EST NBR NBR ----TOTALS---- ---Spec Ed----
COURSE DESCRIPTION LGTH SEC AVL REQ TOT FEM MAL TOT FEM MAL
31 TRACY L. BRENNAN S2 03 | 30 14 16 | 1 1 0 |
41 JONI L. FLORY S2 04 | 0 0 0 | 0 0 0 |
42 CHERYL SNYDER S2 04 | 0 0 0 | 0 0 0 |
51 CHERYL SNYDER S2 05 | 0 0 0 | 0 0 0 |
61 TRACY L. BRENNAN S2 06 | 29 15 14 | 0 0 0 |
Number of Sections: 7 Average Students Per Section: 12.29
LAN712 HON LA 7 2 SM 2 60 61| 61 35 26 | 1 0 1 |
12 CHERYL SNYDER S2 01 | 30 16 14 | 1 0 1 |
32 CHERYL SNYDER S2 03 | 31 19 12 | 0 0 0 |
Number of Sections: 2 Average Students Per Section: 30.50
LAN752 LAP READING 7 2 SM 1 60 10| 10 5 5 | 0 0 0 |
21 LINDA J. GERMAN S2 02 | 5 1 4 | 0 0 0 |
51 LINDA J. GERMAN S2 05 | 5 4 1 | 0 0 0 |
Number of Sections: 2 Average Students Per Section: 5.00
LAN802 LANG ARTS 8 2 SM 7 210 84| 84 36 48 | 4 2 2 |
31 ERIKA S. ASTLE S2 03 | 27 17 10 | 2 2 0 |
41 ERIKA S. ASTLE S2 04 | 27 7 20 | 2 0 2 |
51 ERIKA S. ASTLE S2 05 | 30 12 18 | 0 0 0 |
Number of Sections: 3 Average Students Per Section: 28.00
LAN812 HON LA 8 2 SM 2 60 57| 57 28 29 | 1 0 1 |
11 ERIKA S. ASTLE S2 01 | 27 12 15 | 1 0 1 |
21 ERIKA S. ASTLE S2 02 | 30 16 14 | 0 0 0 |
Number of Sections: 2 Average Students Per Section: 28.50
LAN841 READ CLINC 8 1 SM 4 120 32| 32 13 19 | 5 3 2 |
12 TRACY L. BRENNAN S2 01 | 9 3 6 | 3 1 2 |
42 TRACY L. BRENNAN S2 04 | 13 5 8 | 1 1 0 |
52 TRACY L. BRENNAN S2 05 | 10 5 5 | 1 1 0 |
Number of Sections: 3 Average Students Per Section: 10.67
LAN852 LAP READING 8 2 SM 1 60 8| 8 2 6 | 0 0 0 |
21 MONICA M. CHRISTENSEN S2 02 | 5 2 3 | 0 0 0 |
51 MONICA M. CHRISTENSEN S2 05 | 3 0 3 | 0 0 0 |
Number of Sections: 2 Average Students Per Section: 4.00
MAT070 LAP MATH 1A SM 1 180 13| 12 8 4 | 1 1 0 |
12 LINDA J. GERMAN S2 01 | 4 2 2 | 0 0 0 |
32 LINDA J. GERMAN S2 03 | 4 4 0 | 1 1 0 |
62 LINDA J. GERMAN S2 06 | 4 2 2 | 0 0 0 |
Number of Sections: 3 Average Students Per Section: 4.00
MAT072 LAP MATH 2A SM 1 210 12| 12 7 5 | 1 1 0 |
12 MONICA M. CHRISTENSEN S2 01 | 4 3 1 | 0 0 0 |
32 MONICA M. CHRISTENSEN S2 03 | 4 1 3 | 0 0 0 |
62 MONICA M. CHRISTENSEN S2 06 | 4 3 1 | 1 1 0 |
Number of Sections: 3 Average Students Per Section: 4.00
MAT073 LAP MATH 2B SM 1 210 15| 15 11 4 | 0 0 0 |
12 MELINDA M. WENTZEL S2 01 | 5 5 0 | 0 0 0 |
32 MELINDA M. WENTZEL S2 03 | 5 3 2 | 0 0 0 |
62 MELINDA M. WENTZEL S2 06 | 5 3 2 | 0 0 0 |
Number of Sections: 3 Average Students Per Section: 5.00
MAT080 MATH STRAT 1A SM 4 360 46| 46 22 24 | 10 3 7 |
12 TRACY L. LASHER S2 01 | 10 5 5 | 3 1 2 |
22 TRACY L. LASHER S2 02 | 9 6 3 | 1 1 0 |
32 KEVETTE T. SMARGIASSI S2 03 | 0 0 0 | 0 0 0 |
42 TRACY L. LASHER S2 04 | 8 3 5 | 3 1 2 |
52 TRACY L. LASHER S2 05 | 12 8 4 | 1 0 1 |
62 TRACY L. LASHER S2 06 | 7 0 7 | 2 0 2 |
Number of Sections: 6 Average Students Per Section: 7.67
MAT100 MATH FOUND 1A SM 1 60 18| 18 11 7 | 3 2 1 |

1sonyr01.p 35-2 RAINIER MIDDLE SCHOOL 03/01/12 Page:5
04.11.10.00.01 Course/Class Count Report 206 1:27 PM
EST NBR NBR ----TOTALS---- ---Spec Ed----
COURSE DESCRIPTION LGTH SEC AVL REQ TOT FEM MAL TOT FEM MAL
42 CHARLES G. THOMAS S2 04 | 18 11 7 | 3 2 1 |
Number of Sections: 1 Average Students Per Section: 18.00
MAT106 MATH FOUND 2A SM 1 70 37| 37 15 22 | 11 3 8 |
22 LYNN J. KAMOLA S2 02 | 17 7 10 | 6 2 4 |
52 LYNN J. KAMOLA S2 05 | 20 8 12 | 5 1 4 |
Number of Sections: 2 Average Students Per Section: 18.50
MAT111 MATH 1 SM 12 360 176| 176 108 68 | 4 3 1 |
12 CHARLES G. THOMAS S2 01 | 30 19 11 | 0 0 0 |
22 CHARLES G. THOMAS S2 02 | 32 20 12 | 0 0 0 |
32 CHARLES G. THOMAS S2 03 | 28 19 9 | 0 0 0 |
42 CHRISTINA N. GULLARD S2 04 | 29 18 11 | 2 2 0 |
52 CHARLES G. THOMAS S2 05 | 31 16 15 | 1 0 1 |
62 CHRISTINA N. GULLARD S2 06 | 26 16 10 | 1 1 0 |
Number of Sections: 6 Average Students Per Section: 29.33
MAT112 MATH 2 SM 4 120 60| 60 32 28 | 0 0 0 |
32 CHRISTINA N. GULLARD S2 03 | 30 17 13 | 0 0 0 |
52 CHRISTINA N. GULLARD S2 05 | 30 15 15 | 0 0 0 |
Number of Sections: 2 Average Students Per Section: 30.00
MAT115 PRE ALGEBRA 1 SM 10 330 165| 165 84 81 | 14 6 8 |
12 LYNN J. KAMOLA S2 01 | 27 16 11 | 4 1 3 |
22 MICHELE L. ROCK S2 02 | 29 19 10 | 1 1 0 |
32 MICHELE L. ROCK S2 03 | 30 11 19 | 2 0 2 |
34 LYNN J. KAMOLA S2 03 | 24 14 10 | 4 2 2 |
42 LYNN J. KAMOLA S2 04 | 28 9 19 | 2 2 0 |
62 MICHELE L. ROCK S2 06 | 27 15 12 | 1 0 1 |
Number of Sections: 6 Average Students Per Section: 27.50
MAT116 PRE ALGEBRA 2 SM 9 300 89| 89 39 50 | 2 0 2 |
12 MICHELE L. ROCK S2 01 | 0 0 0 | 0 0 0 |
32 KEVETTE T. SMARGIASSI S2 03 | 30 14 16 | 0 0 0 |
42 MICHELE L. ROCK S2 04 | 0 0 0 | 0 0 0 |
52 KEVETTE T. SMARGIASSI S2 05 | 29 12 17 | 1 0 1 |
62 KEVETTE T. SMARGIASSI S2 06 | 30 13 17 | 1 0 1 |
Number of Sections: 5 Average Students Per Section: 17.80
MAT121 ALGEBRA 2 SM 6 180 141| 141 72 69 | 1 1 0 |
11 KEVETTE T. SMARGIASSI S2 01 | 26 15 11 | 0 0 0 |
21 KIRK R. JONASSON S2 02 | 28 17 11 | 0 0 0 |
31 KIRK R. JONASSON S2 03 | 0 0 0 | 0 0 0 |
41 KEVETTE T. SMARGIASSI S2 04 | 29 12 17 | 0 0 0 |
51 KIRK R. JONASSON S2 05 | 30 15 15 | 0 0 0 |
61 KIRK R. JONASSON S2 06 | 28 13 15 | 1 1 0 |
Number of Sections: 6 Average Students Per Section: 23.50
MAT211 GEOMETRY 2 SM 1 60 46| 46 16 30 | 0 0 0 |
31 KIRK R. JONASSON S2 03 | 22 9 13 | 0 0 0 |
41 KIRK R. JONASSON S2 04 | 24 7 17 | 0 0 0 |
Number of Sections: 2 Average Students Per Section: 23.00
MUS622 BAND 2 SM 2 125 68| 68 39 29 | 1 1 0 |
11 J S. ALLEN S2 01 | 0 0 0 | 0 0 0 |
61 J S. ALLEN S2 06 | 68 39 29 | 1 1 0 |
Number of Sections: 2 Average Students Per Section: 34.00
MUS632 ORCHESTRA 2 SM 1 135 36| 36 25 11 | 1 1 0 |
11 DALE E. JOHNSON S2 01 | 5 5 0 | 1 1 0 |
41 J S. ALLEN S2 04 | 30 20 10 | 0 0 0 |
55 DALE E. JOHNSON S2 05 | 1 0 1 | 0 0 0 |
Number of Sections: 3 Average Students Per Section: 12.00
MUS722 BAND 7 2 SM 1 50 50| 50 22 28 | 1 1 0 |
21 J S. ALLEN S2 02 | 50 22 28 | 1 1 0 |

1sonyr01.p 35-2 RAINIER MIDDLE SCHOOL 03/01/12 Page:6
04.11.10.00.01 Course/Class Count Report 206 1:27 PM
EST NBR NBR ----TOTALS---- ---Spec Ed----
COURSE DESCRIPTION LGTH SEC AVL REQ TOT FEM MAL TOT FEM MAL
Number of Sections: 1 Average Students Per Section: 50.00
MUS732 ORCHESTRA 7 2 SM 1 50 25| 25 13 12 | 2 2 0 |
21 DALE E. JOHNSON S2 02 | 25 13 12 | 2 2 0 |
Number of Sections: 1 Average Students Per Section: 25.00
MUS822 BAND 8 2 SM 1 50 33| 33 14 19 | 2 0 2 |
31 J S. ALLEN S2 03 | 33 14 19 | 2 0 2 |
Number of Sections: 1 Average Students Per Section: 33.00
MUS832 ORCHESTRA 8 2 SM 1 50 12| 12 5 7 | 1 0 1 |
31 DALE E. JOHNSON S2 03 | 12 5 7 | 1 0 1 |
Number of Sections: 1 Average Students Per Section: 12.00
PHY111 PHYS ED 2 SM 8 216 198| 195 97 98 | 20 14 6 |
11 SONYA A. REMPFER S2 01 | 31 15 16 | 1 1 0 |
21 PAUL A. PRATHER S2 02 | 30 17 13 | 3 2 1 |
31 SONYA A. REMPFER S2 03 | 31 11 20 | 3 2 1 |
41 KATHY A. CARNINO S2 04 | 32 15 17 | 4 3 1 |
51 PAUL A. PRATHER S2 05 | 35 20 15 | 5 3 2 |
61 SONYA A. REMPFER S2 06 | 36 19 17 | 4 3 1 |
Number of Sections: 6 Average Students Per Section: 32.50
PHY604 HEALTH 6 TM 9 240 103| 101 62 39 | 7 2 5 |
11 PAUL A. PRATHER T3 01 | 26 14 12 | 3 0 3 |
12 PAUL A. PRATHER T4 01 | 21 5 16 | 0 0 0 |
21 RULON D. HERREN T3 02 | 25 20 5 | 2 2 0 |
22 RULON D. HERREN T4 02 | 29 23 6 | 2 0 2 |
Number of Sections: 4 Average Students Per Section: 25.25
PHY611 PHYS ED 6 1 SM 13 432 187| 187 114 73 | 15 11 4 |
12 KATHY A. CARNINO S2 01 | 36 27 9 | 4 4 0 |
22 SONYA A. REMPFER S2 02 | 35 17 18 | 2 1 1 |
32 KATHY A. CARNINO S2 03 | 27 13 14 | 1 1 0 |
42 RULON D. HERREN S2 04 | 36 21 15 | 3 2 1 |
52 KATHY A. CARNINO S2 05 | 34 26 8 | 3 3 0 |
62 RULON D. HERREN S2 06 | 19 10 9 | 2 0 2 |
Number of Sections: 6 Average Students Per Section: 31.17
PHY812 PHYS ED 8 2 SM 8 216 180| 177 71 106 | 17 4 13 |
11 RULON D. HERREN S2 01 | 33 8 25 | 3 1 2 |
21 KATHY A. CARNINO S2 02 | 24 6 18 | 2 0 2 |
31 RULON D. HERREN S2 03 | 22 8 14 | 0 0 0 |
41 PAUL A. PRATHER S2 04 | 32 15 17 | 3 1 2 |
51 SONYA A. REMPFER S2 05 | 30 13 17 | 6 1 5 |
61 PAUL A. PRATHER S2 06 | 36 21 15 | 3 1 2 |
Number of Sections: 6 Average Students Per Section: 29.50
SBLA72 LANG ARTS 7 2 SM 1 120 110| 110 54 56 | 2 1 1 |
21 CHERYL SNYDER S2 02 | 26 17 9 | 0 0 0 |
41 JONI L. FLORY S2 04 | 27 12 15 | 0 0 0 |
42 CHERYL SNYDER S2 04 | 29 14 15 | 0 0 0 |
51 CHERYL SNYDER S2 05 | 28 11 17 | 2 1 1 |
Number of Sections: 4 Average Students Per Section: 27.50
SBLA82 LANG ARTS 8 2 SM 1 120 111| 111 48 63 | 4 0 4 |
11 JONI L. FLORY S2 01 | 27 12 15 | 0 0 0 |
21 JONI L. FLORY S2 02 | 27 9 18 | 3 0 3 |
52 JONI L. FLORY S2 05 | 30 15 15 | 0 0 0 |
61 JONI L. FLORY S2 06 | 27 12 15 | 1 0 1 |
Number of Sections: 4 Average Students Per Section: 27.75
SBPA01 PRE-ALGEBRA 2 SM 1 150 0| 0 0 0 | 0 0 0 |
12 MICHELE L. ROCK S2 01 | 0 0 0 | 0 0 0 |
42 MICHELE L. ROCK S2 04 | 0 0 0 | 0 0 0 |

1sonyr01.p 35-2 RAINIER MIDDLE SCHOOL 03/01/12 Page:7
04.11.10.00.01 Course/Class Count Report 206 1:27 PM
EST NBR NBR ----TOTALS---- ---Spec Ed----
COURSE DESCRIPTION LGTH SEC AVL REQ TOT FEM MAL TOT FEM MAL
Number of Sections: 2 Average Students Per Section: 0.00
SBPA02 PRE ALGEBRA 2 SM 1 70 59| 59 25 34 | 0 0 0 |
12 MICHELE L. ROCK S2 01 | 30 11 19 | 0 0 0 |
42 MICHELE L. ROCK S2 04 | 29 14 15 | 0 0 0 |
Number of Sections: 2 Average Students Per Section: 29.50
SBSC62 SCIENCE 6 2 SM 1 120 120| 120 68 52 | 9 5 4 |
21 DEBORAH L. ALLISON S2 02 | 29 17 12 | 3 2 1 |
31 DEBORAH L. ALLISON S2 03 | 28 16 12 | 2 2 0 |
41 DEBORAH L. ALLISON S2 04 | 34 19 15 | 3 1 2 |
61 DEBORAH L. ALLISON S2 06 | 29 16 13 | 1 0 1 |
Number of Sections: 4 Average Students Per Section: 30.00
SBSC72 SCIENCE 7 2 SM 1 150 131| 131 69 62 | 11 8 3 |
11 KRISTIN J. TODD S2 01 | 26 12 14 | 3 1 2 |
22 KRISTIN J. TODD S2 02 | 26 13 13 | 3 2 1 |
32 KRISTIN J. TODD S2 03 | 23 12 11 | 2 2 0 |
42 KRISTIN J. TODD S2 04 | 26 18 8 | 1 1 0 |
62 KRISTIN J. TODD S2 06 | 30 14 16 | 2 2 0 |
Number of Sections: 5 Average Students Per Section: 26.20
SCI602 SCIENCE 6 2 SM 10 270 149| 149 90 59 | 7 6 1 |
11 WILLIAM E. DORSCHEL S2 01 | 30 18 12 | 2 2 0 |
21 DEBORAH L. ALLISON S2 02 | 0 0 0 | 0 0 0 |
31 DEBORAH L. ALLISON S2 03 | 0 0 0 | 0 0 0 |
32 WILLIAM E. DORSCHEL S2 03 | 29 18 11 | 2 2 0 |
41 DEBORAH L. ALLISON S2 04 | 0 0 0 | 0 0 0 |
42 WILLIAM E. DORSCHEL S2 04 | 30 16 14 | 1 0 1 |
51 WILLIAM E. DORSCHEL S2 05 | 30 18 12 | 0 0 0 |
61 DEBORAH L. ALLISON S2 06 | 0 0 0 | 0 0 0 |
62 WILLIAM E. DORSCHEL S2 06 | 30 20 10 | 2 2 0 |
Number of Sections: 9 Average Students Per Section: 16.56
SCI702 SCIENCE 7 2 SM 10 300 139| 138 68 70 | 12 5 7 |
12 TIMOTHY A. HELLING S2 01 | 22 11 11 | 2 1 1 |
31 TIMOTHY A. HELLING S2 03 | 30 18 12 | 2 0 2 |
41 TIMOTHY A. HELLING S2 04 | 29 11 18 | 5 2 3 |
51 TIMOTHY A. HELLING S2 05 | 30 15 15 | 2 1 1 |
61 TIMOTHY A. HELLING S2 06 | 27 13 14 | 1 1 0 |
Number of Sections: 5 Average Students Per Section: 27.60
SCI802 SCIENCE 8 2 SM 10 300 260| 260 111 149 | 21 3 18 |
11 DANIEL E. DIEFENDORF S2 01 | 21 8 13 | 1 0 1 |
12 DIANNE M. JORDAN S2 01 | 28 10 18 | 3 1 2 |
21 DANIEL E. DIEFENDORF S2 02 | 26 11 15 | 1 0 1 |
22 DIANNE M. JORDAN S2 02 | 26 9 17 | 0 0 0 |
31 DIANNE M. JORDAN S2 03 | 23 12 11 | 1 0 1 |
32 DANIEL E. DIEFENDORF S2 03 | 28 18 10 | 2 1 1 |
41 DIANNE M. JORDAN S2 04 | 23 11 12 | 2 0 2 |
42 DANIEL E. DIEFENDORF S2 04 | 30 10 20 | 4 1 3 |
51 DANIEL E. DIEFENDORF S2 05 | 29 12 17 | 2 0 2 |
61 DIANNE M. JORDAN S2 06 | 26 10 16 | 5 0 5 |
Number of Sections: 10 Average Students Per Section: 26.00
SOC602 SOC STUDIES 6 2 SM 10 300 271| 271 157 114 | 16 10 6 |
11 JULIE D. MORGAN S2 01 | 29 16 13 | 3 2 1 |
21 DAWN L. RASMUSSEN S2 02 | 30 18 12 | 2 2 0 |
31 DAWN L. RASMUSSEN S2 03 | 28 16 12 | 2 0 2 |
32 JULIE D. MORGAN S2 03 | 27 18 9 | 2 1 1 |
41 DAWN L. RASMUSSEN S2 04 | 30 15 15 | 1 0 1 |
42 JULIE D. MORGAN S2 04 | 29 18 11 | 1 1 0 |
51 DAWN L. RASMUSSEN S2 05 | 30 18 12 | 0 0 0 |

1sonyr01.p 35-2 RAINIER MIDDLE SCHOOL 03/01/12 Page:8
04.11.10.00.01 Course/Class Count Report 206 1:27 PM
EST NBR NBR ----TOTALS---- ---Spec Ed----
COURSE DESCRIPTION LGTH SEC AVL REQ TOT FEM MAL TOT FEM MAL
52 JULIE D. MORGAN S2 05 | 30 17 13 | 0 0 0 |
61 JULIE D. MORGAN S2 06 | 21 13 8 | 3 3 0 |
62 DAWN L. RASMUSSEN S2 06 | 17 8 9 | 2 1 1 |
Number of Sections: 10 Average Students Per Section: 27.10
SOC702 WA STATE HIST 7 SM 10 300 275| 275 141 134 | 24 14 10 |
11 ROBIN K. LIGHT S2 01 | 30 14 16 | 6 4 2 |
12 CHRISTINE A. LUDWIGSON S2 01 | 28 18 10 | 5 3 2 |
21 CHRISTINE A. LUDWIGSON S2 02 | 28 18 10 | 1 1 0 |
31 ROBIN K. LIGHT S2 03 | 23 10 13 | 0 0 0 |
32 CHRISTINE A. LUDWIGSON S2 03 | 25 14 11 | 0 0 0 |
41 ROBIN K. LIGHT S2 04 | 26 13 13 | 3 0 3 |
51 CHRISTINE A. LUDWIGSON S2 05 | 28 15 13 | 3 3 0 |
52 ROBIN K. LIGHT S2 05 | 30 11 19 | 1 0 1 |
61 ROBIN K. LIGHT S2 06 | 27 16 11 | 2 1 1 |
62 CHRISTINE A. LUDWIGSON S2 06 | 30 12 18 | 3 2 1 |
Number of Sections: 10 Average Students Per Section: 27.50
SOC802 US HISTORY 8 2 SM 8 240 207| 207 84 123 | 22 4 18 |
11 PAUL C. FURTH S2 01 | 27 12 15 | 5 1 4 |
21 PAUL C. FURTH S2 02 | 24 14 10 | 2 0 2 |
22 RYAN M. DUNHAM S2 02 | 25 9 16 | 2 0 2 |
32 RYAN M. DUNHAM S2 03 | 27 7 20 | 3 0 3 |
41 RYAN M. DUNHAM S2 04 | 23 13 10 | 1 0 1 |
42 PAUL C. FURTH S2 04 | 28 13 15 | 3 1 2 |
51 PAUL C. FURTH S2 05 | 27 9 18 | 3 1 2 |
61 PAUL C. FURTH S2 06 | 26 7 19 | 3 1 2 |
Number of Sections: 8 Average Students Per Section: 25.88
SOC812 HON US HIST 8 2 SM 2 60 55| 55 27 28 | 0 0 0 |
51 RYAN M. DUNHAM S2 05 | 30 17 13 | 0 0 0 |
61 RYAN M. DUNHAM S2 06 | 25 10 15 | 0 0 0 |
Number of Sections: 2 Average Students Per Section: 27.50
SPE012 MATH SE 2 SM 2 120 34| 34 18 16 | 34 18 16 |
21 JOHN W. WOODY SR S2 02 | 7 4 3 | 7 4 3 |
31 JOHN W. WOODY SR S2 03 | 13 8 5 | 13 8 5 |
41 JOHN W. WOODY SR S2 04 | 8 4 4 | 8 4 4 |
51 JOHN W. WOODY SR S2 05 | 6 2 4 | 6 2 4 |
Number of Sections: 4 Average Students Per Section: 8.50
SPE042 LANG ARTS SE 2 SM 3 240 59| 59 29 30 | 58 29 29 |
00 CYNDIA S. ULRICH S2 00 | 9 5 4 | 8 5 3 |
21 CYNDIA S. ULRICH S2 02 | 12 4 8 | 12 4 8 |
31 CYNDIA S. ULRICH S2 03 | 12 5 7 | 12 5 7 |
41 CYNDIA S. ULRICH S2 04 | 6 4 2 | 6 4 2 |
42 CYNDIA S. ULRICH S2 00 | 0 0 0 | 0 0 0 |
43 CYNDIA S. ULRICH S2 04 | 1 0 1 | 1 0 1 |
51 CYNDIA S. ULRICH S2 05 | 11 9 2 | 11 9 2 |
61 CYNDIA S. ULRICH S2 06 | 8 2 6 | 8 2 6 |
Number of Sections: 8 Average Students Per Section: 7.38
SPE062 STDY SKILL SE 2 SM 1 30 6| 6 3 3 | 6 3 3 |
61 JOHN W. WOODY SR S2 06 | 6 3 3 | 6 3 3 |
Number of Sections: 1 Average Students Per Section: 6.00
SPE122 ADAPTVE BEHAV 2 SM 1 180 42| 42 2 40 | 42 2 40 |
11 SHARI L. RUSCH-FURNSTA S2 01 | 9 2 7 | 9 2 7 |
21 SHARI L. RUSCH-FURNSTA S2 02 | 10 0 10 | 10 0 10 |
31 SHARI L. RUSCH-FURNSTA S2 03 | 6 0 6 | 6 0 6 |
41 SHARI L. RUSCH-FURNSTA S2 04 | 7 0 7 | 7 0 7 |
51 SHARI L. RUSCH-FURNSTA S2 05 | 5 0 5 | 5 0 5 |
61 SHARI L. RUSCH-FURNSTA S2 06 | 5 0 5 | 5 0 5 |

1sonyr01.p 35-2 RAINIER MIDDLE SCHOOL 03/01/12 Page:9
04.11.10.00.01 Course/Class Count Report 206 1:27 PM
EST NBR NBR ----TOTALS---- ---Spec Ed----
COURSE DESCRIPTION LGTH SEC AVL REQ TOT FEM MAL TOT FEM MAL
Number of Sections: 6 Average Students Per Section: 7.00

1sonyr01.p 35-2 RAINIER MIDDLE SCHOOL 03/01/12 Page:10
04.11.10.00.01 Course/Class Count Report Totals 1:27 PM
TITLE FOR TOTAL
TOTALS GROUP TOTAL FEMALE MALE
GRAND TOTALS 5208 2641 2567
Spec Ed 477 203 274
************************ End of report ************************

1sonyr01.p 35-2 AUBURN SENIOR HIGH SCHOOL 03/01/12 Page:1
04.11.10.00.01 Course/Class Count Report 401 1:28 PM
EST NBR NBR ----TOTALS---- ---Spec Ed----
COURSE DESCRIPTION LGTH SEC AVL REQ TOT FEM MAL TOT FEM MAL
ART108 SCULPTURE SM 5 210 59| 59 36 23 | 9 6 3 |
15 KENNY L. WHITE S2 05 | 29 20 9 | 4 2 2 |
16 KENNY L. WHITE S2 06 | 30 16 14 | 5 4 1 |
Number of Sections: 2 Average Students Per Section: 29.50
ART109 PAINTING SM 3 90 88| 88 55 33 | 12 6 6 |
02 KENNY L. WHITE S2 02 | 30 18 12 | 6 3 3 |
03 KENNY L. WHITE S2 03 | 30 17 13 | 4 1 3 |
04 KENNY L. WHITE S2 04 | 28 20 8 | 2 2 0 |
Number of Sections: 3 Average Students Per Section: 29.33
ART112 FABRIC DESIGN SM 2 29 29| 29 26 3 | 8 5 3 |
01 DIANE J. SARR S2 01 | 29 26 3 | 8 5 3 |
Number of Sections: 1 Average Students Per Section: 29.00
ART115 THEATER PROD 2 SM 1 30 18| 18 4 14 | 6 0 6 |
01 WARREN D. KERR S2 06 | 18 4 14 | 6 0 6 |
Number of Sections: 1 Average Students Per Section: 18.00
ART117 CHILD THEA 2 SM 1 30 14| 14 10 4 | 0 0 0 |
01 WARREN D. KERR S2 03 | 14 10 4 | 0 0 0 |
Number of Sections: 1 Average Students Per Section: 14.00
ART122 ACTING 2 SM 1 19 18| 18 10 8 | 0 0 0 |
01 WARREN D. KERR S2 05 | 18 10 8 | 0 0 0 |
Number of Sections: 1 Average Students Per Section: 18.00
ART124 ACTING 4 SM 1 9 8| 8 4 4 | 0 0 0 |
01 WARREN D. KERR S2 05 | 8 4 4 | 0 0 0 |
Number of Sections: 1 Average Students Per Section: 8.00
ART126 ACTING 6 SM 1 1 1| 1 0 1 | 0 0 0 |
01 WARREN D. KERR S2 05 | 1 0 1 | 0 0 0 |
Number of Sections: 1 Average Students Per Section: 1.00
ART128 ACTING 8 SM 1 2 2| 2 1 1 | 0 0 0 |
01 WARREN D. KERR S2 05 | 2 1 1 | 0 0 0 |
Number of Sections: 1 Average Students Per Section: 2.00
ART800 ART IND STUDY SM 1 2 2| 2 2 0 | 0 0 0 |
APX ROBERT A. HORLICK S2 07 | 2 2 0 | 0 0 0 |
Number of Sections: 1 Average Students Per Section: 2.00
CTE002 HORT SCIENCE 2 SM 2 60 54| 54 24 30 | 17 5 12 |
01 BRUCE J. MORRIS S2 01 | 26 11 15 | 5 1 4 |
02 BRUCE J. MORRIS S2 02 | 28 13 15 | 12 4 8 |
Number of Sections: 2 Average Students Per Section: 27.00
CTE101 ACCOUNTING 1 SM 1 31 1| 1 1 0 | 0 0 0 |
APX ROBERT A. HORLICK S2 07 | 1 1 0 | 0 0 0 |
Number of Sections: 1 Average Students Per Section: 1.00
CTE102 ACCOUNTING 2 SM 1 30 14| 14 10 4 | 0 0 0 |
01 REBECCA L. KEEFE S2 02 | 14 10 4 | 0 0 0 |
Number of Sections: 1 Average Students Per Section: 14.00
CTE105 RECORD KEEPING SM 2 61 29| 29 19 10 | 0 0 0 |
02 REBECCA L. KEEFE S2 01 | 29 19 10 | 0 0 0 |
Number of Sections: 1 Average Students Per Section: 29.00
CTE115 BUS MATH SM 2 90 24| 24 9 15 | 0 0 0 |
03 VICKI H. MUNOZ S2 05 | 24 9 15 | 0 0 0 |
Number of Sections: 1 Average Students Per Section: 24.00
CTE135 DIGITOOLS SM 2 60 46| 46 16 30 | 8 2 6 |
01 VICKI H. MUNOZ S2 01 | 21 5 16 | 4 1 3 |
02 VICKI H. MUNOZ S2 04 | 25 11 14 | 4 1 3 |
Number of Sections: 2 Average Students Per Section: 23.00
CTE142 MOS 2 SM 1 1 1| 1 1 0 | 0 0 0 |
IND VICKI H. MUNOZ S2 03 | 1 1 0 | 0 0 0 |

1sonyr01.p 35-2 AUBURN SENIOR HIGH SCHOOL 03/01/12 Page:2
04.11.10.00.01 Course/Class Count Report 401 1:28 PM
EST NBR NBR ----TOTALS---- ---Spec Ed----
COURSE DESCRIPTION LGTH SEC AVL REQ TOT FEM MAL TOT FEM MAL
Number of Sections: 1 Average Students Per Section: 1.00
CTE171 MARKETG/DECA 2 SM 2 60 39| 39 25 14 | 1 1 0 |
01 LORI D. JACOBS S2 02 | 25 16 9 | 0 0 0 |
02 LORI D. JACOBS S2 05 | 14 9 5 | 1 1 0 |
Number of Sections: 2 Average Students Per Section: 19.50
CTE176 MARKETG/DECA 4 SM 1 22 16| 16 10 6 | 0 0 0 |
01 LORI D. JACOBS S2 06 | 16 10 6 | 0 0 0 |
Number of Sections: 1 Average Students Per Section: 16.00
CTE178 SPTS & ENT MGMT SM 1 5 3| 3 0 3 | 0 0 0 |
01 LORI D. JACOBS S2 06 | 3 0 3 | 0 0 0 |
Number of Sections: 1 Average Students Per Section: 3.00
CTE181 MARKTING SPEC 2 SM 1 5 5| 5 4 1 | 0 0 0 |
01 LORI D. JACOBS S2 01 | 5 4 1 | 0 0 0 |
Number of Sections: 1 Average Students Per Section: 5.00
CTE183 STORE RETL OP 2 SM 1 20 12| 12 9 3 | 0 0 0 |
01 LORI D. JACOBS S2 04 | 12 9 3 | 0 0 0 |
Number of Sections: 1 Average Students Per Section: 12.00
CTE187 MARKTNG ENTRE 2 SM 1 15 11| 11 6 5 | 1 1 0 |
01 LORI D. JACOBS S2 01 | 11 6 5 | 1 1 0 |
Number of Sections: 1 Average Students Per Section: 11.00
CTE201 TEACHING ACAD 1 SM 2 18 2| 2 2 0 | 0 0 0 |
2 LINDA K. MORRIS S2 02 | 2 2 0 | 0 0 0 |
Number of Sections: 1 Average Students Per Section: 2.00
CTE202 TEACHING ACAD 2 SM 2 19 15| 15 13 2 | 1 1 0 |
01 LINDA K. MORRIS S2 03 | 12 10 2 | 1 1 0 |
06 LINDA K. MORRIS S2 06 | 1 1 0 | 0 0 0 |
1 LINDA K. MORRIS S2 01 | 1 1 0 | 0 0 0 |
4 LINDA K. MORRIS S2 05 | 1 1 0 | 0 0 0 |
Number of Sections: 4 Average Students Per Section: 3.75
CTE212 CAREER W/CHILD2 SM 2 33 17| 17 16 1 | 2 2 0 |
01 LINDA K. MORRIS S2 06 | 14 13 1 | 2 2 0 |
IS LINDA K. MORRIS S2 04 | 3 3 0 | 0 0 0 |
Number of Sections: 2 Average Students Per Section: 8.50
CTE213 CAREER W/CHILD3 SM 1 11 1| 1 1 0 | 0 0 0 |
4 LINDA K. MORRIS S2 06 | 1 1 0 | 0 0 0 |
Number of Sections: 1 Average Students Per Section: 1.00
CTE214 CAREER W/CHILD4 SM 1 11 4| 4 4 0 | 0 0 0 |
01 LINDA K. MORRIS S2 03 | 4 4 0 | 0 0 0 |
02 LINDA K. MORRIS S2 01 | 0 0 0 | 0 0 0 |
Number of Sections: 2 Average Students Per Section: 2.00
CTE225 FSHN APP DESGN1 SM 2 38 14| 14 13 1 | 4 4 0 |
11 LINDA K. MORRIS S2 05 | 14 13 1 | 4 4 0 |
Number of Sections: 1 Average Students Per Section: 14.00
CTE226 FSHN APP DESGN2 SM 1 10 7| 7 6 1 | 0 0 0 |
01 LINDA K. MORRIS S2 05 | 7 6 1 | 0 0 0 |
Number of Sections: 1 Average Students Per Section: 7.00
CTE250 NUTRTN WELLNESS SM 1 60 49| 49 24 25 | 16 6 10 |
01 LINDA K. MORRIS S2 01 | 19 10 9 | 8 4 4 |
02 LINDA K. MORRIS S2 02 | 30 14 16 | 8 2 6 |
Number of Sections: 2 Average Students Per Section: 24.50
CTE266 COSMETOLOGY 2 SM 1 5 0| 0 0 0 | 0 0 0 |
01 REBECCA L. KEEFE S2 03 | 0 0 0 | 0 0 0 |
Number of Sections: 1 Average Students Per Section: 0.00
CTE303 HEALTH CTE SM 1 300 136| 136 71 65 | 12 7 5 |
11 CINDY L. PRATT S2 01 | 28 14 14 | 3 0 3 |
12 CINDY L. PRATT S2 02 | 23 9 14 | 1 1 0 |

1sonyr01.p 35-2 AUBURN SENIOR HIGH SCHOOL 03/01/12 Page:3
04.11.10.00.01 Course/Class Count Report 401 1:28 PM
EST NBR NBR ----TOTALS---- ---Spec Ed----
COURSE DESCRIPTION LGTH SEC AVL REQ TOT FEM MAL TOT FEM MAL
14 CINDY L. PRATT S2 04 | 29 16 13 | 2 2 0 |
15 CINDY L. PRATT S2 05 | 27 15 12 | 4 3 1 |
16 CINDY L. PRATT S2 06 | 29 17 12 | 2 1 1 |
Number of Sections: 5 Average Students Per Section: 27.20
CTE304 PREVENTIVE MED SM 2 60 25| 25 16 9 | 3 2 1 |
02 KRISTA R. PARSONS S2 02 | 25 16 9 | 3 2 1 |
Number of Sections: 1 Average Students Per Section: 25.00
CTE306 ANATOMY/PHYS 2 SM 2 60 46| 46 36 10 | 2 2 0 |
01 KRISTA R. PARSONS S2 03 | 25 17 8 | 1 1 0 |
02 KRISTA R. PARSONS S2 04 | 21 19 2 | 1 1 0 |
Number of Sections: 2 Average Students Per Section: 23.00
CTE308 SPORTS MED 2 SM 1 20 16| 16 15 1 | 1 1 0 |
01 KRISTA R. PARSONS S2 06 | 16 15 1 | 1 1 0 |
Number of Sections: 1 Average Students Per Section: 16.00
CTE312 ADVSPORTS MED 2 SM 2 12 8| 8 7 1 | 0 0 0 |
01 KRISTA R. PARSONS S2 06 | 8 7 1 | 0 0 0 |
Number of Sections: 1 Average Students Per Section: 8.00
CTE332 CULINARY ARTS SM 4 118 109| 109 51 58 | 20 7 13 |
01 MARCI J. KILLIAN S2 01 | 22 13 9 | 6 4 2 |
02 MARCI J. KILLIAN S2 02 | 26 13 13 | 2 1 1 |
03 MARCI J. KILLIAN S2 03 | 24 12 12 | 4 1 3 |
04 MARCI J. KILLIAN S2 04 | 14 6 8 | 0 0 0 |
05 MARCI J. KILLIAN S2 05 | 22 6 16 | 8 1 7 |
CS MARCI J. KILLIAN S2 08 | 1 1 0 | 0 0 0 |
Number of Sections: 6 Average Students Per Section: 18.17
CTE334 ADV CULNY ART 2 SM 4 23 14| 14 4 10 | 2 1 1 |
01 MARCI J. KILLIAN S2 01 | 3 0 3 | 1 0 1 |
02 MARCI J. KILLIAN S2 02 | 4 1 3 | 1 1 0 |
03 MARCI J. KILLIAN S2 03 | 5 2 3 | 0 0 0 |
04 MARCI J. KILLIAN S2 04 | 1 0 1 | 0 0 0 |
05 MARCI J. KILLIAN S2 01 | 1 1 0 | 0 0 0 |
Number of Sections: 5 Average Students Per Section: 2.80
CTE336 CULNY ARTS CS 2 SM 1 7 3| 3 1 2 | 0 0 0 |
01 MARCI J. KILLIAN S2 01 | 0 0 0 | 0 0 0 |
02 MARCI J. KILLIAN S2 02 | 0 0 0 | 0 0 0 |
08 MARCI J. KILLIAN S2 08 | 3 1 2 | 0 0 0 |
Number of Sections: 3 Average Students Per Section: 1.00
CTE351 JEWELRY 1 SM 6 221 82| 82 41 41 | 12 3 9 |
05 CHRISTOPHER G. TELFORD S2 03 | 28 17 11 | 5 3 2 |
06 CHRISTOPHER G. TELFORD S2 05 | 28 13 15 | 5 0 5 |
07 CHRISTOPHER G. TELFORD S2 06 | 26 11 15 | 2 0 2 |
Number of Sections: 3 Average Students Per Section: 27.33
CTE352 JEWELRY 2 SM 2 56 23| 23 10 13 | 0 0 0 |
02 CHRISTOPHER G. TELFORD S2 01 | 13 6 7 | 0 0 0 |
03 CHRISTOPHER G. TELFORD S2 02 | 10 4 6 | 0 0 0 |
Number of Sections: 2 Average Students Per Section: 11.50
CTE355 JEWELRY CS SM 4 11 4| 4 2 2 | 1 1 0 |
12 CHRISTOPHER G. TELFORD S2 02 | 3 1 2 | 1 1 0 |
13 CHRISTOPHER G. TELFORD S2 03 | 0 0 0 | 0 0 0 |
14 CHRISTOPHER G. TELFORD S2 02 | 1 1 0 | 0 0 0 |
Number of Sections: 3 Average Students Per Section: 1.33
CTE361 VIS COM 1 SM 4 136 41| 41 22 19 | 3 2 1 |
06 CHARLES M. FITZGERALD S2 01 | 21 12 9 | 2 1 1 |
14 CHARLES M. FITZGERALD S2 04 | 20 10 10 | 1 1 0 |
Number of Sections: 2 Average Students Per Section: 20.50
CTE362 VIS COM 2 SM 2 45 29| 29 10 19 | 5 0 5 |

1sonyr01.p 35-2 AUBURN SENIOR HIGH SCHOOL 03/01/12 Page:4
04.11.10.00.01 Course/Class Count Report 401 1:28 PM
EST NBR NBR ----TOTALS---- ---Spec Ed----
COURSE DESCRIPTION LGTH SEC AVL REQ TOT FEM MAL TOT FEM MAL
01 CHARLES M. FITZGERALD S2 02 | 16 5 11 | 4 0 4 |
02 CHARLES M. FITZGERALD S2 03 | 13 5 8 | 1 0 1 |
Number of Sections: 2 Average Students Per Section: 14.50
CTE366 VIS COM CS 2 SM 5 12 6| 6 2 4 | 0 0 0 |
01 CHARLES M. FITZGERALD S2 01 | 0 0 0 | 0 0 0 |
02 CHARLES M. FITZGERALD S2 03 | 1 1 0 | 0 0 0 |
03 CHARLES M. FITZGERALD S2 04 | 3 0 3 | 0 0 0 |
04 CHARLES M. FITZGERALD S2 02 | 2 1 1 | 0 0 0 |
Number of Sections: 4 Average Students Per Section: 1.50
CTE371 DRAWING 1 SM 4 140 25| 25 14 11 | 3 3 0 |
15 CHARLES M. FITZGERALD S2 05 | 25 14 11 | 3 3 0 |
Number of Sections: 1 Average Students Per Section: 25.00
CTE372 DRAWING 2 SM 3 45 32| 32 15 17 | 6 5 1 |
01 DIANE J. SARR S2 02 | 15 10 5 | 5 5 0 |
02 DIANE J. SARR S2 03 | 17 5 12 | 1 0 1 |
Number of Sections: 2 Average Students Per Section: 16.00
CTE376 GRAPHIC DES 2 SM 1 10 8| 8 4 4 | 1 0 1 |
01 DIANE J. SARR S2 03 | 8 4 4 | 1 0 1 |
Number of Sections: 1 Average Students Per Section: 8.00
CTE382 ELECTRONICS 2 SM 2 77 47| 47 1 46 | 6 0 6 |
01 CHRISTOPHER E. ZAWISLA S2 01 | 16 1 15 | 1 0 1 |
02 CHRISTOPHER E. ZAWISLA S2 03 | 18 0 18 | 3 0 3 |
03 CHRISTOPHER E. ZAWISLA S2 04 | 13 0 13 | 2 0 2 |
Number of Sections: 3 Average Students Per Section: 15.67
CTE384 ELECTRONICS 4 SM 2 24 16| 16 0 16 | 1 0 1 |
01 CHRISTOPHER E. ZAWISLA S2 05 | 16 0 16 | 1 0 1 |
Number of Sections: 1 Average Students Per Section: 16.00
CTE402 DRAFTING 2 SM 1 20 11| 11 2 9 | 0 0 0 |
01 RONALD L. CUGHAN S2 03 | 11 2 9 | 0 0 0 |
Number of Sections: 1 Average Students Per Section: 11.00
CTE406 DRFT ENG TECH 2 SM 1 4 3| 3 0 3 | 0 0 0 |
01 RONALD L. CUGHAN S2 03 | 3 0 3 | 0 0 0 |
Number of Sections: 1 Average Students Per Section: 3.00
CTE408 DRFT ENG TECH 4 SM 3 3 3| 3 0 3 | 0 0 0 |
01 RONALD L. CUGHAN S2 03 | 3 0 3 | 0 0 0 |
Number of Sections: 1 Average Students Per Section: 3.00
CTE412 COMP SYS ENG 2 SM 1 24 18| 18 1 17 | 0 0 0 |
01 CHRISTOPHER E. ZAWISLA S2 06 | 18 1 17 | 0 0 0 |
Number of Sections: 1 Average Students Per Section: 18.00
CTE422 SMALL GAS ENG 2 SM 3 43 34| 34 1 33 | 12 0 12 |
01 FRED A. DONALDSON S2 04 | 13 0 13 | 1 0 1 |
02 FRED A. DONALDSON S2 03 | 21 1 20 | 11 0 11 |
Number of Sections: 2 Average Students Per Section: 17.00
CTE426 AUTO TECH 2 SM 2 52 36| 36 3 33 | 9 2 7 |
01 FRED A. DONALDSON S2 01 | 21 2 19 | 3 1 2 |
05 FRED A. DONALDSON S2 05 | 12 0 12 | 3 0 3 |
SE1 FRED A. DONALDSON S2 01 | 0 0 0 | 0 0 0 |
SE5 FRED A. DONALDSON S2 05 | 3 1 2 | 3 1 2 |
Number of Sections: 4 Average Students Per Section: 9.00
CTE428 ADV AUTO TECH 2 SM 2 6 6| 6 0 6 | 0 0 0 |
01 FRED A. DONALDSON S2 04 | 6 0 6 | 0 0 0 |
Number of Sections: 1 Average Students Per Section: 6.00
CTE430 ADV AUTO TECH 4 SM 1 12 1| 1 0 1 | 1 0 1 |
01 FRED A. DONALDSON S2 04 | 0 0 0 | 0 0 0 |
02 FRED A. DONALDSON S2 05 | 0 0 0 | 0 0 0 |
03 FRED A. DONALDSON S2 06 | 1 0 1 | 1 0 1 |

1sonyr01.p 35-2 AUBURN SENIOR HIGH SCHOOL 03/01/12 Page:5
04.11.10.00.01 Course/Class Count Report 401 1:28 PM
EST NBR NBR ----TOTALS---- ---Spec Ed----
COURSE DESCRIPTION LGTH SEC AVL REQ TOT FEM MAL TOT FEM MAL
Number of Sections: 3 Average Students Per Section: 0.33
CTE444 WELDING 2 SM 2 32 13| 13 1 12 | 1 0 1 |
01 RONALD L. CUGHAN S2 01 | 7 0 7 | 0 0 0 |
02 RONALD L. CUGHAN S2 02 | 6 1 5 | 1 0 1 |
Number of Sections: 2 Average Students Per Section: 6.50
CTE446 MACHNST TRNG 2 SM 1 10 8| 8 0 8 | 0 0 0 |
01 RONALD L. CUGHAN S2 01 | 8 0 8 | 0 0 0 |
Number of Sections: 1 Average Students Per Section: 8.00
CTE455 WOODWRK DESGN 1 SM 5 106 23| 23 1 22 | 4 0 4 |
05 LEWIS J. KELIHER S2 06 | 23 1 22 | 4 0 4 |
Number of Sections: 1 Average Students Per Section: 23.00
CTE456 WOODWRK DESGN 2 SM 3 61 54| 54 12 42 | 7 0 7 |
01 LEWIS J. KELIHER S2 01 | 19 4 15 | 1 0 1 |
02 LEWIS J. KELIHER S2 03 | 21 4 17 | 4 0 4 |
03 LEWIS J. KELIHER S2 04 | 14 4 10 | 2 0 2 |
Number of Sections: 3 Average Students Per Section: 18.00
CTE458 WOODWRK DESGN 4 SM 1 24 19| 19 1 18 | 2 0 2 |
01 LEWIS J. KELIHER S2 05 | 19 1 18 | 2 0 2 |
Number of Sections: 1 Average Students Per Section: 19.00
CTE462 WOODWRK DESGN 6 SM 2 18 18| 18 1 17 | 0 0 0 |
01 LEWIS J. KELIHER S2 01 | 6 0 6 | 0 0 0 |
02 LEWIS J. KELIHER S2 03 | 5 0 5 | 0 0 0 |
03 LEWIS J. KELIHER S2 04 | 6 1 5 | 0 0 0 |
IND LEWIS J. KELIHER S2 06 | 1 0 1 | 0 0 0 |
Number of Sections: 4 Average Students Per Section: 4.50
CTE470 WBL GENERIC SM 1 200 0| 0 0 0 | 0 0 0 |
14 REBECCA L. KEEFE S2 07 | 0 0 0 | 0 0 0 |
Number of Sections: 1 Average Students Per Section: 0.00
CTE471 WBL AMER SIGN SM 1 60 0| 0 0 0 | 0 0 0 |
14 REBECCA L. KEEFE S2 07 | 0 0 0 | 0 0 0 |
Number of Sections: 1 Average Students Per Section: 0.00
CTE472 WBL AUTOMOTIVE SM 1 60 3| 3 0 3 | 0 0 0 |
14 REBECCA L. KEEFE S2 07 | 3 0 3 | 0 0 0 |
Number of Sections: 1 Average Students Per Section: 3.00
CTE473 WBL BUS ED SM 1 60 2| 2 2 0 | 0 0 0 |
14 REBECCA L. KEEFE S2 07 | 2 2 0 | 0 0 0 |
Number of Sections: 1 Average Students Per Section: 2.00
CTE474 WBL CAREERS ED SM 1 40 1| 1 1 0 | 0 0 0 |
02 REBECCA L. KEEFE S2 07 | 1 1 0 | 0 0 0 |
Number of Sections: 1 Average Students Per Section: 1.00
CTE476 WBL CONSTR MANU SM 1 60 0| 0 0 0 | 0 0 0 |
02 REBECCA L. KEEFE S2 07 | 0 0 0 | 0 0 0 |
Number of Sections: 1 Average Students Per Section: 0.00
CTE477 WBL CULNY ARTS SM 1 60 2| 2 2 0 | 0 0 0 |
02 REBECCA L. KEEFE S2 07 | 2 2 0 | 0 0 0 |
Number of Sections: 1 Average Students Per Section: 2.00
CTE478 WBL DRAFT ENGIN SM 1 31 0| 0 0 0 | 0 0 0 |
02 REBECCA L. KEEFE S2 07 | 0 0 0 | 0 0 0 |
Number of Sections: 1 Average Students Per Section: 0.00
CTE480 WBL FAM CONS SC SM 1 61 1| 1 1 0 | 0 0 0 |
02 REBECCA L. KEEFE S2 07 | 1 1 0 | 0 0 0 |
03 REBECCA L. KEEFE S2 07 | 0 0 0 | 0 0 0 |
Number of Sections: 2 Average Students Per Section: 0.50
CTE484 WBL MARKETING SM 1 60 4| 4 4 0 | 0 0 0 |
14 REBECCA L. KEEFE S2 08 | 4 4 0 | 0 0 0 |

1sonyr01.p 35-2 AUBURN SENIOR HIGH SCHOOL 03/01/12 Page:6
04.11.10.00.01 Course/Class Count Report 401 1:28 PM
EST NBR NBR ----TOTALS---- ---Spec Ed----
COURSE DESCRIPTION LGTH SEC AVL REQ TOT FEM MAL TOT FEM MAL
Number of Sections: 1 Average Students Per Section: 4.00
CTE485 WBL METALS MFG SM 1 60 0| 0 0 0 | 0 0 0 |
14 REBECCA L. KEEFE S2 07 | 0 0 0 | 0 0 0 |
Number of Sections: 1 Average Students Per Section: 0.00
CTE487 WBL SPORTS MED SM 1 10 0| 0 0 0 | 0 0 0 |
02 REBECCA L. KEEFE S2 07 | 0 0 0 | 0 0 0 |
Number of Sections: 1 Average Students Per Section: 0.00
CTE490 WBL CAR CHOICES SM 1 45 8| 8 8 0 | 0 0 0 |
02 REBECCA L. KEEFE S2 07 | 8 8 0 | 0 0 0 |
Number of Sections: 1 Average Students Per Section: 8.00
ELL102 ELL LAN ART 1B SM 1 5 4| 4 1 3 | 0 0 0 |
01 NUKA NURZHANOV S2 01 | 4 1 3 | 0 0 0 |
Number of Sections: 1 Average Students Per Section: 4.00
ELL121 ELL STDY SKILL2 SM 1 60 29| 29 13 16 | 0 0 0 |
01 NUKA NURZHANOV S2 04 | 18 7 11 | 0 0 0 |
02 KUNIKO CORDELL S2 06 | 11 6 5 | 0 0 0 |
Number of Sections: 2 Average Students Per Section: 14.50
ELL202 ELL LAN ART 2B SM 1 24 22| 22 7 15 | 0 0 0 |
01 NUKA NURZHANOV S2 01 | 10 4 6 | 0 0 0 |
02 NUKA NURZHANOV S2 02 | 12 3 9 | 0 0 0 |
Number of Sections: 2 Average Students Per Section: 11.00
ELL302 ELL LAN ART 3B SM 1 60 26| 26 15 11 | 0 0 0 |
01 NUKA NURZHANOV S2 03 | 13 6 7 | 0 0 0 |
02 NUKA NURZHANOV S2 06 | 13 9 4 | 0 0 0 |
Number of Sections: 2 Average Students Per Section: 13.00
FOR202 FRENCH 2 SM 4 90 82| 82 60 22 | 2 2 0 |
01 GREGORY S. ISHAM S2 01 | 28 23 5 | 0 0 0 |
02 GREGORY S. ISHAM S2 05 | 29 19 10 | 1 1 0 |
03 CARMEN Z. REINHARDT S2 06 | 25 18 7 | 1 1 0 |
Number of Sections: 3 Average Students Per Section: 27.33
FOR204 FRENCH 4 SM 3 61 54| 54 28 26 | 0 0 0 |
01 GREGORY S. ISHAM S2 03 | 27 15 12 | 0 0 0 |
02 GREGORY S. ISHAM S2 04 | 26 12 14 | 0 0 0 |
03 GREGORY S. ISHAM S2 01 | 1 1 0 | 0 0 0 |
Number of Sections: 3 Average Students Per Section: 18.00
FOR206 FRENCH 6 SM 1 10 4| 4 3 1 | 0 0 0 |
01 GREGORY S. ISHAM S2 02 | 4 3 1 | 0 0 0 |
Number of Sections: 1 Average Students Per Section: 4.00
FOR210 AP FRENCH 2 SM 1 25 18| 18 9 9 | 0 0 0 |
01 GREGORY S. ISHAM S2 02 | 18 9 9 | 0 0 0 |
Number of Sections: 1 Average Students Per Section: 18.00
FOR402 JAPANESE 2 SM 1 53 20| 20 7 13 | 1 0 1 |
01 KUNIKO CORDELL S2 02 | 13 5 8 | 0 0 0 |
02 KUNIKO CORDELL S2 05 | 7 2 5 | 1 0 1 |
Number of Sections: 2 Average Students Per Section: 10.00
FOR404 JAPANESE 4 SM 1 30 18| 18 8 10 | 2 0 2 |
01 KUNIKO CORDELL S2 03 | 18 8 10 | 2 0 2 |
Number of Sections: 1 Average Students Per Section: 18.00
FOR406 JAPANESE 6 SM 1 13 10| 10 3 7 | 0 0 0 |
01 KUNIKO CORDELL S2 04 | 10 3 7 | 0 0 0 |
Number of Sections: 1 Average Students Per Section: 10.00
FOR408 JAPANESE 8 SM 2 5 2| 2 2 0 | 0 0 0 |
01 KUNIKO CORDELL S2 04 | 2 2 0 | 0 0 0 |
Number of Sections: 1 Average Students Per Section: 2.00
FOR602 SPANISH 2 SM 6 180 123| 123 73 50 | 2 1 1 |
01 AMBER A. DAVIS S2 01 | 14 8 6 | 0 0 0 |

1sonyr01.p 35-2 AUBURN SENIOR HIGH SCHOOL 03/01/12 Page:7
04.11.10.00.01 Course/Class Count Report 401 1:28 PM
EST NBR NBR ----TOTALS---- ---Spec Ed----
COURSE DESCRIPTION LGTH SEC AVL REQ TOT FEM MAL TOT FEM MAL
02 AMBER A. DAVIS S2 02 | 27 16 11 | 1 1 0 |
03 CARMEN Z. REINHARDT S2 03 | 26 17 9 | 0 0 0 |
04 CARMEN Z. REINHARDT S2 04 | 19 9 10 | 1 0 1 |
05 AMBER A. DAVIS S2 05 | 20 14 6 | 0 0 0 |
06 AMBER A. DAVIS S2 06 | 17 9 8 | 0 0 0 |
Number of Sections: 6 Average Students Per Section: 20.50
FOR604 SPANISH 4 SM 4 140 126| 126 65 61 | 1 0 1 |
01 BRIAN M. KELLER S2 01 | 24 15 9 | 0 0 0 |
02 BRIAN M. KELLER S2 02 | 30 11 19 | 0 0 0 |
03 BRIAN M. KELLER S2 05 | 29 16 13 | 0 0 0 |
04 BRIAN M. KELLER S2 06 | 27 17 10 | 0 0 0 |
SS CARMEN Z. REINHARDT S2 02 | 16 6 10 | 1 0 1 |
Number of Sections: 5 Average Students Per Section: 25.20
FOR606 SPANISH 6 SM 2 56 34| 34 22 12 | 0 0 0 |
02 BRIAN M. KELLER S2 03 | 10 7 3 | 0 0 0 |
04 AMBER A. DAVIS S2 04 | 16 8 8 | 0 0 0 |
IND BRIAN M. KELLER S2 02 | 1 1 0 | 0 0 0 |
SS CARMEN Z. REINHARDT S2 02 | 7 6 1 | 0 0 0 |
Number of Sections: 4 Average Students Per Section: 8.50
FOR608 SPANISH 8 SM 1 5 3| 3 2 1 | 0 0 0 |
03 BRIAN M. KELLER S2 03 | 3 2 1 | 0 0 0 |
Number of Sections: 1 Average Students Per Section: 3.00
GEN101 ORIENTATION SM 1 404 199| 199 101 98 | 16 7 9 |
11 CRYSTAL A. WISNESS S2 01 | 30 14 16 | 2 1 1 |
12 VICKI H. MUNOZ S2 02 | 30 16 14 | 2 1 1 |
13 REBECCA L. KEEFE S2 03 | 30 12 18 | 2 1 1 |
14 REBECCA L. KEEFE S2 04 | 30 18 12 | 2 0 2 |
15C RONALD L. CUGHAN S2 05 | 26 16 10 | 0 0 0 |
16C RONALD L. CUGHAN S2 06 | 25 12 13 | 2 1 1 |
16M VICKI H. MUNOZ S2 06 | 28 13 15 | 6 3 3 |
Number of Sections: 7 Average Students Per Section: 28.43
GEN200 ADVISORY 9-12 YR 2 431 191| 191 95 96 | 132 59 73 |
01 CAMI M. SCHULTZ YR 09 | 9 6 3 | 9 6 3 |
02 ELAINE M. HOGG YR 09 | 10 4 6 | 10 4 6 |
03 BARBARA J. KNAPP YR 09 | 9 4 5 | 9 4 5 |
04 MARCELA FIGUEROA YR 09 | 9 4 5 | 9 4 5 |
05 KYLE B. JONES YR 09 | 9 2 7 | 9 2 7 |
06 TERESA A. MCLUEN YR 09 | 13 9 4 | 13 9 4 |
07 ANGELA D. STUBBLEFIELD YR 09 | 13 2 11 | 13 2 11 |
08 BRANDI N. COLE YR 09 | 12 4 8 | 12 4 8 |
09 JUDITH E. LUTTON YR 09 | 19 9 10 | 0 0 0 |
10 DANIEL B. BORDEN YR 09 | 17 11 6 | 0 0 0 |
11 MICHAELA M. HERRERA YR 09 | 11 8 3 | 0 0 0 |
12 LESLIE L. KIILSGAARD YR 09 | 12 8 4 | 0 0 0 |
13 SARAH C. SHAW YR 09 | 10 6 4 | 10 6 4 |
14 JUDITH E. LUTTON YR 09 | 0 0 0 | 0 0 0 |
15 ALETA L. JOHNSON YR 09 | 8 4 4 | 8 4 4 |
16 LISA M. WOODY YR 09 | 10 4 6 | 10 4 6 |
17 MEGAN D. ORR YR 09 | 7 4 3 | 7 4 3 |
18 JAYNE CRIDDLE YR 09 | 13 6 7 | 13 6 7 |
Number of Sections: 18 Average Students Per Section: 10.61
GEN212 ADVISORY 2012 YR 1 540 268| 268 133 135 | 3 1 2 |
01 ADAM L. LADAGE YR 09 | 15 10 5 | 0 0 0 |
02 SUSAN M. BOWERS YR 09 | 19 11 8 | 1 1 0 |
03 ANTHONY E. CALLERO YR 09 | 18 3 15 | 0 0 0 |
04 JASON L. CAPPS YR 09 | 19 11 8 | 0 0 0 |

1sonyr01.p 35-2 AUBURN SENIOR HIGH SCHOOL 03/01/12 Page:8
04.11.10.00.01 Course/Class Count Report 401 1:28 PM
EST NBR NBR ----TOTALS---- ---Spec Ed----
COURSE DESCRIPTION LGTH SEC AVL REQ TOT FEM MAL TOT FEM MAL
05 RONALD L. CUGHAN YR 09 | 14 4 10 | 0 0 0 |
06 GORDON A. ELLIOTT YR 09 | 12 6 6 | 0 0 0 |
07 JANICE M. ERIE YR 09 | 12 6 6 | 0 0 0 |
08 CHARLES M. FITZGERALD YR 09 | 14 9 5 | 0 0 0 |
09 MICHAEL G. WASSERMAN YR 09 | 13 8 5 | 0 0 0 |
10 GREGORY S. ISHAM YR 09 | 14 9 5 | 0 0 0 |
11 KATIE E. HENRY YR 09 | 15 9 6 | 0 0 0 |
12 LEWIS J. KELIHER YR 09 | 14 6 8 | 0 0 0 |
13 BRIAN M. KELLER YR 09 | 17 9 8 | 1 0 1 |
14 PATRICK W. MARTIN YR 09 | 14 9 5 | 0 0 0 |
15 SCOTT J. MCLAUGHLIN YR 09 | 16 8 8 | 0 0 0 |
16 BRUCE J. MORRIS YR 09 | 12 3 9 | 0 0 0 |
17 NUKA NURZHANOV YR 09 | 16 6 10 | 0 0 0 |
18 DONNA L. BOWLER YR 09 | 14 6 8 | 1 0 1 |
Number of Sections: 18 Average Students Per Section: 14.89
GEN213 ADVISORY 2013 YR 1 570 318| 318 152 166 | 11 2 9 |
01 ABIJAH G. ALASTRA YR 09 | 17 9 8 | 1 0 1 |
02 EDWARD M. BENDER YR 09 | 17 10 7 | 0 0 0 |
03 WILLIAM E. BONNELL YR 09 | 16 10 6 | 1 1 0 |
04 DOUGLAS B. BURT YR 09 | 19 3 16 | 2 0 2 |
05 ELSBETH C. COCKCROFT YR 09 | 16 7 9 | 1 0 1 |
06 KANDY R. GILBERT YR 09 | 13 7 6 | 0 0 0 |
07 ERIK G. GUNDERSON YR 09 | 19 4 15 | 0 0 0 |
08 THOMAS J. KAUP YR 09 | 15 7 8 | 1 0 1 |
09 WARREN D. KERR YR 09 | 19 10 9 | 2 1 1 |
10 PHILIP N. SMETHERAM YR 09 | 21 14 7 | 0 0 0 |
11 THOMAS J. MCDERMOTT YR 09 | 10 5 5 | 0 0 0 |
12 ERIC R. MOHLER YR 09 | 16 4 12 | 1 0 1 |
13 VICKI H. MUNOZ YR 09 | 18 9 9 | 0 0 0 |
14 REBECCA L. KEEFE YR 09 | 18 13 5 | 0 0 0 |
15 BESS E. OWENS YR 09 | 14 6 8 | 1 0 1 |
16 KJEL P. KIILSGAARD YR 09 | 17 6 11 | 0 0 0 |
17 CHRISTOPHER G. TELFORD YR 09 | 17 10 7 | 0 0 0 |
18 KENNY L. WHITE YR 09 | 18 7 11 | 1 0 1 |
19 CHRISTOPHER E. ZAWISLA YR 09 | 18 11 7 | 0 0 0 |
Number of Sections: 19 Average Students Per Section: 16.74
GEN214 ADVISORY 2014 YR 1 510 340| 340 169 171 | 20 3 17 |
01 TERESA M. ANDERSON YR 09 | 19 9 10 | 1 0 1 |
02 DIANE J. SARR YR 09 | 22 9 13 | 2 0 2 |
03 SHERRI L. ASHLOCK YR 09 | 21 15 6 | 0 0 0 |
04 DENISE L. CARROLL YR 09 | 23 12 11 | 1 0 1 |
05 ERICKA A. CONNELLY YR 09 | 22 12 10 | 0 0 0 |
06 KUNIKO CORDELL YR 09 | 15 9 6 | 2 1 1 |
07 CARMEN Z. REINHARDT YR 09 | 17 6 11 | 2 0 2 |
08 MARCI J. KILLIAN YR 09 | 18 8 10 | 0 0 0 |
09 JESSICA L. HANSEN YR 09 | 21 10 11 | 0 0 0 |
10 SHERYL L. HARMON YR 09 | 21 13 8 | 1 1 0 |
11 ERIC D. WAKEFIELD YR 09 | 19 8 11 | 2 1 1 |
12 ROBERT A. HORLICK YR 09 | 21 8 13 | 4 0 4 |
13 LINDA K. MORRIS YR 09 | 20 12 8 | 1 0 1 |
14 RICK D. NELSON YR 09 | 19 8 11 | 2 0 2 |
15 KRISTA R. PARSONS YR 09 | 18 9 9 | 0 0 0 |
16 KEITH B. RODMAN YR 09 | 21 12 9 | 2 0 2 |
17 KENT D. RODSETH YR 09 | 23 9 14 | 0 0 0 |
Number of Sections: 17 Average Students Per Section: 20.00
GEN215 ADVISORY 2015 YR 1 450 379| 379 190 189 | 45 20 25 |
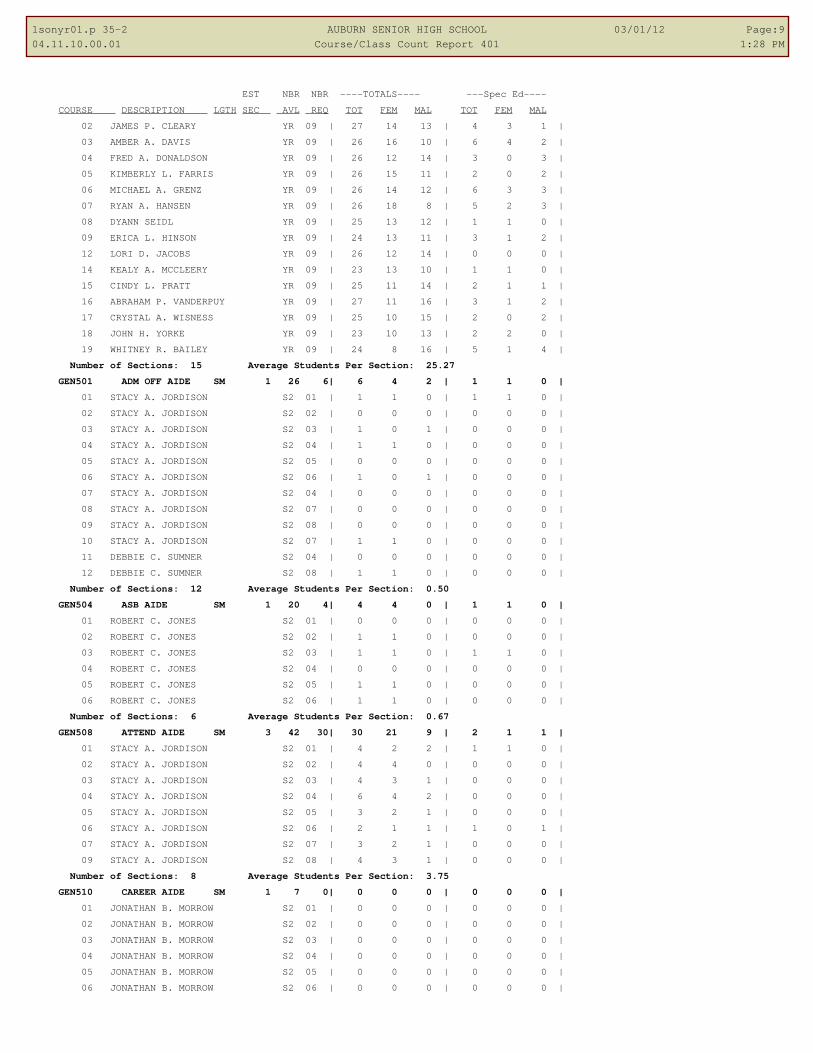
1sonyr01.p 35-2 AUBURN SENIOR HIGH SCHOOL 03/01/12 Page:9
04.11.10.00.01 Course/Class Count Report 401 1:28 PM
EST NBR NBR ----TOTALS---- ---Spec Ed----
COURSE DESCRIPTION LGTH SEC AVL REQ TOT FEM MAL TOT FEM MAL
02 JAMES P. CLEARY YR 09 | 27 14 13 | 4 3 1 |
03 AMBER A. DAVIS YR 09 | 26 16 10 | 6 4 2 |
04 FRED A. DONALDSON YR 09 | 26 12 14 | 3 0 3 |
05 KIMBERLY L. FARRIS YR 09 | 26 15 11 | 2 0 2 |
06 MICHAEL A. GRENZ YR 09 | 26 14 12 | 6 3 3 |
07 RYAN A. HANSEN YR 09 | 26 18 8 | 5 2 3 |
08 DYANN SEIDL YR 09 | 25 13 12 | 1 1 0 |
09 ERICA L. HINSON YR 09 | 24 13 11 | 3 1 2 |
12 LORI D. JACOBS YR 09 | 26 12 14 | 0 0 0 |
14 KEALY A. MCCLEERY YR 09 | 23 13 10 | 1 1 0 |
15 CINDY L. PRATT YR 09 | 25 11 14 | 2 1 1 |
16 ABRAHAM P. VANDERPUY YR 09 | 27 11 16 | 3 1 2 |
17 CRYSTAL A. WISNESS YR 09 | 25 10 15 | 2 0 2 |
18 JOHN H. YORKE YR 09 | 23 10 13 | 2 2 0 |
19 WHITNEY R. BAILEY YR 09 | 24 8 16 | 5 1 4 |
Number of Sections: 15 Average Students Per Section: 25.27
GEN501 ADM OFF AIDE SM 1 26 6| 6 4 2 | 1 1 0 |
01 STACY A. JORDISON S2 01 | 1 1 0 | 1 1 0 |
02 STACY A. JORDISON S2 02 | 0 0 0 | 0 0 0 |
03 STACY A. JORDISON S2 03 | 1 0 1 | 0 0 0 |
04 STACY A. JORDISON S2 04 | 1 1 0 | 0 0 0 |
05 STACY A. JORDISON S2 05 | 0 0 0 | 0 0 0 |
06 STACY A. JORDISON S2 06 | 1 0 1 | 0 0 0 |
07 STACY A. JORDISON S2 04 | 0 0 0 | 0 0 0 |
08 STACY A. JORDISON S2 07 | 0 0 0 | 0 0 0 |
09 STACY A. JORDISON S2 08 | 0 0 0 | 0 0 0 |
10 STACY A. JORDISON S2 07 | 1 1 0 | 0 0 0 |
11 DEBBIE C. SUMNER S2 04 | 0 0 0 | 0 0 0 |
12 DEBBIE C. SUMNER S2 08 | 1 1 0 | 0 0 0 |
Number of Sections: 12 Average Students Per Section: 0.50
GEN504 ASB AIDE SM 1 20 4| 4 4 0 | 1 1 0 |
01 ROBERT C. JONES S2 01 | 0 0 0 | 0 0 0 |
02 ROBERT C. JONES S2 02 | 1 1 0 | 0 0 0 |
03 ROBERT C. JONES S2 03 | 1 1 0 | 1 1 0 |
04 ROBERT C. JONES S2 04 | 0 0 0 | 0 0 0 |
05 ROBERT C. JONES S2 05 | 1 1 0 | 0 0 0 |
06 ROBERT C. JONES S2 06 | 1 1 0 | 0 0 0 |
Number of Sections: 6 Average Students Per Section: 0.67
GEN508 ATTEND AIDE SM 3 42 30| 30 21 9 | 2 1 1 |
01 STACY A. JORDISON S2 01 | 4 2 2 | 1 1 0 |
02 STACY A. JORDISON S2 02 | 4 4 0 | 0 0 0 |
03 STACY A. JORDISON S2 03 | 4 3 1 | 0 0 0 |
04 STACY A. JORDISON S2 04 | 6 4 2 | 0 0 0 |
05 STACY A. JORDISON S2 05 | 3 2 1 | 0 0 0 |
06 STACY A. JORDISON S2 06 | 2 1 1 | 1 0 1 |
07 STACY A. JORDISON S2 07 | 3 2 1 | 0 0 0 |
09 STACY A. JORDISON S2 08 | 4 3 1 | 0 0 0 |
Number of Sections: 8 Average Students Per Section: 3.75
GEN510 CAREER AIDE SM 1 7 0| 0 0 0 | 0 0 0 |
01 JONATHAN B. MORROW S2 01 | 0 0 0 | 0 0 0 |
02 JONATHAN B. MORROW S2 02 | 0 0 0 | 0 0 0 |
03 JONATHAN B. MORROW S2 03 | 0 0 0 | 0 0 0 |
04 JONATHAN B. MORROW S2 04 | 0 0 0 | 0 0 0 |
05 JONATHAN B. MORROW S2 05 | 0 0 0 | 0 0 0 |
06 JONATHAN B. MORROW S2 06 | 0 0 0 | 0 0 0 |

1sonyr01.p 35-2 AUBURN SENIOR HIGH SCHOOL 03/01/12 Page:10
04.11.10.00.01 Course/Class Count Report 401 1:28 PM
EST NBR NBR ----TOTALS---- ---Spec Ed----
COURSE DESCRIPTION LGTH SEC AVL REQ TOT FEM MAL TOT FEM MAL
Number of Sections: 6 Average Students Per Section: 0.00
GEN512 GUID OFF AIDE SM 2 15 11| 11 6 5 | 2 1 1 |
01 JUDITH E. LUTTON S2 01 | 2 0 2 | 1 0 1 |
02 JUDITH E. LUTTON S2 02 | 2 2 0 | 0 0 0 |
03 JUDITH E. LUTTON S2 03 | 2 1 1 | 0 0 0 |
04 JUDITH E. LUTTON S2 04 | 1 1 0 | 1 1 0 |
05 JUDITH E. LUTTON S2 05 | 3 2 1 | 0 0 0 |
06 JUDITH E. LUTTON S2 06 | 1 0 1 | 0 0 0 |
09 JUDITH E. LUTTON S2 08 | 0 0 0 | 0 0 0 |
Number of Sections: 7 Average Students Per Section: 1.57
GEN514 LIBRARY AIDE SM 2 20 11| 11 9 2 | 2 2 0 |
01 SHERRI L. ASHLOCK S2 01 | 0 0 0 | 0 0 0 |
02 SHERRI L. ASHLOCK S2 02 | 2 2 0 | 0 0 0 |
03 SHERRI L. ASHLOCK S2 03 | 2 2 0 | 1 1 0 |
04 SHERRI L. ASHLOCK S2 04 | 1 1 0 | 0 0 0 |
05 SHERRI L. ASHLOCK S2 05 | 1 0 1 | 0 0 0 |
06 SHERRI L. ASHLOCK S2 06 | 1 1 0 | 1 1 0 |
07 SHERRI L. ASHLOCK S2 07 | 2 1 1 | 0 0 0 |
09 SHERRI L. ASHLOCK S2 08 | 2 2 0 | 0 0 0 |
Number of Sections: 8 Average Students Per Section: 1.38
GEN516 NURSE AIDE SM 1 6 1| 1 1 0 | 0 0 0 |
01 JANET D. SCHNEIDER S2 01 | 0 0 0 | 0 0 0 |
02 JANET D. SCHNEIDER S2 02 | 0 0 0 | 0 0 0 |
03 JANET D. SCHNEIDER S2 03 | 0 0 0 | 0 0 0 |
04 JANET D. SCHNEIDER S2 04 | 0 0 0 | 0 0 0 |
05 JANET D. SCHNEIDER S2 05 | 0 0 0 | 0 0 0 |
06 JANET D. SCHNEIDER S2 06 | 1 1 0 | 0 0 0 |
Number of Sections: 6 Average Students Per Section: 0.17
GEN601 TEACHER AIDE SM 1 34 30| 30 21 9 | 4 3 1 |
01 JOHN H. YORKE S2 04 | 0 0 0 | 0 0 0 |
02 EDWARD M. BENDER S2 02 | 1 0 1 | 0 0 0 |
03 MICHAEL A. GRENZ S2 06 | 1 0 1 | 0 0 0 |
04 CRYSTAL A. WISNESS S2 06 | 1 1 0 | 0 0 0 |
05 THOMAS J. KAUP S2 05 | 1 0 1 | 0 0 0 |
06 GREGORY S. ISHAM S2 05 | 1 0 1 | 0 0 0 |
07 MICHAEL A. GRENZ S2 04 | 1 1 0 | 0 0 0 |
08 CRYSTAL A. WISNESS S2 05 | 1 1 0 | 0 0 0 |
09 WILLIAM E. BONNELL S2 04 | 1 1 0 | 0 0 0 |
10 TERESA M. ANDERSON S2 04 | 0 0 0 | 0 0 0 |
11 ERIC D. WAKEFIELD S2 03 | 1 1 0 | 0 0 0 |
12 PHILIP N. SMETHERAM S2 02 | 1 1 0 | 0 0 0 |
13 ERIK G. GUNDERSON S2 03 | 1 0 1 | 0 0 0 |
14 JANICE M. ERIE S2 01 | 1 1 0 | 0 0 0 |
15 BRANDI N. COLE S2 02 | 1 0 1 | 1 0 1 |
16 JOHN H. YORKE S2 03 | 1 1 0 | 0 0 0 |
17 BESS E. OWENS S2 07 | 1 1 0 | 1 1 0 |
18 JOHN H. YORKE S2 04 | 1 1 0 | 0 0 0 |
19 GORDON A. ELLIOTT S2 03 | 1 1 0 | 0 0 0 |
20 WILLIAM E. BONNELL S2 05 | 1 0 1 | 0 0 0 |
21 KEITH B. RODMAN S2 02 | 1 0 1 | 0 0 0 |
22 LINDA K. MORRIS S2 01 | 1 1 0 | 0 0 0 |
23 KEALY A. MCCLEERY S2 02 | 1 1 0 | 0 0 0 |
24 LEWIS J. KELIHER S2 04 | 1 0 1 | 0 0 0 |
25 AMBER A. DAVIS S2 05 | 1 1 0 | 0 0 0 |
26 GREGORY S. ISHAM S2 04 | 1 1 0 | 0 0 0 |
27 EDWARD M. BENDER S2 06 | 1 1 0 | 0 0 0 |

1sonyr01.p 35-2 AUBURN SENIOR HIGH SCHOOL 03/01/12 Page:11
04.11.10.00.01 Course/Class Count Report 401 1:28 PM
EST NBR NBR ----TOTALS---- ---Spec Ed----
COURSE DESCRIPTION LGTH SEC AVL REQ TOT FEM MAL TOT FEM MAL
28 LACEY A. WAY S2 06 | 0 0 0 | 0 0 0 |
29 GREGORY S. ISHAM S2 01 | 1 1 0 | 0 0 0 |
30 ADAM L. LADAGE S2 01 | 1 1 0 | 1 1 0 |
32 ERIC D. WAKEFIELD S2 02 | 1 1 0 | 0 0 0 |
34 BRANDI N. COLE S2 04 | 1 1 0 | 1 1 0 |
35 RICK D. NELSON S2 01 | 1 1 0 | 0 0 0 |
4 MICHAEL A. GRENZ S2 05 | 0 0 0 | 0 0 0 |
Number of Sections: 34 Average Students Per Section: 0.88
GEN607 PEER TUTOR SM 3 21 16| 16 10 6 | 0 0 0 |
01 ALETA L. JOHNSON S2 01 | 0 0 0 | 0 0 0 |
02 KYLE B. JONES S2 03 | 1 1 0 | 0 0 0 |
03 KJEL P. KIILSGAARD S2 03 | 3 3 0 | 0 0 0 |
04 KEITH B. RODMAN S2 02 | 1 1 0 | 0 0 0 |
05 KYLE B. JONES S2 01 | 1 1 0 | 0 0 0 |
06 KRISTA R. PARSONS S2 03 | 1 0 1 | 0 0 0 |
07 JASON L. CAPPS S2 01 | 1 1 0 | 0 0 0 |
08 DONNA L. BOWLER S2 05 | 1 0 1 | 0 0 0 |
09 KRISTA R. PARSONS S2 02 | 1 1 0 | 0 0 0 |
10 KRISTA R. PARSONS S2 04 | 1 1 0 | 0 0 0 |
11 CHRISTOPHER E. ZAWISLA S2 04 | 1 0 1 | 0 0 0 |
12 ERIC D. WAKEFIELD S2 03 | 1 0 1 | 0 0 0 |
13 ERICKA A. CONNELLY S2 04 | 0 0 0 | 0 0 0 |
14 CAMI M. SCHULTZ S2 05 | 1 1 0 | 0 0 0 |
15 MARCELA FIGUEROA S2 08 | 0 0 0 | 0 0 0 |
16 ERICKA A. CONNELLY S2 04 | 1 0 1 | 0 0 0 |
17 DOUGLAS B. BURT S2 02 | 1 0 1 | 0 0 0 |
6 ALETA L. JOHNSON S2 03 | 0 0 0 | 0 0 0 |
Number of Sections: 18 Average Students Per Section: 0.89
GEN700 RELEASE TIME SM 1 450 82| 82 44 38 | 26 8 18 |
01B RICHARD A. ZIMMERMAN S2 01 | 27 16 11 | 7 3 4 |
02B RICHARD A. ZIMMERMAN S2 02 | 8 4 4 | 3 1 2 |
03B RICHARD A. ZIMMERMAN S2 03 | 4 2 2 | 2 0 2 |
04B RICHARD A. ZIMMERMAN S2 04 | 7 3 4 | 3 0 3 |
05B RICHARD A. ZIMMERMAN S2 05 | 12 5 7 | 5 1 4 |
06B RICHARD A. ZIMMERMAN S2 06 | 24 14 10 | 6 3 3 |
Number of Sections: 6 Average Students Per Section: 13.67
GEN701 REL-SEMINARY YR 1 90 13| 13 8 5 | 2 2 0 |
01 RICHARD A. ZIMMERMAN YR 01 | 1 1 0 | 1 1 0 |
04 RICHARD A. ZIMMERMAN YR 04 | 6 4 2 | 1 1 0 |
05 RICHARD A. ZIMMERMAN YR 05 | 6 3 3 | 0 0 0 |
Number of Sections: 3 Average Students Per Section: 4.33
GEN708 APEX SM 1 275 108| 108 51 57 | 12 5 7 |
13 ROBERT A. HORLICK S2 03 | 27 10 17 | 1 0 1 |
14 ROBERT A. HORLICK S2 04 | 29 14 15 | 4 1 3 |
16 ROBERT A. HORLICK S2 06 | 23 10 13 | 3 2 1 |
17 ROBERT A. HORLICK S2 07 | 25 15 10 | 4 2 2 |
IN2 ROBERT A. HORLICK S2 09 | 4 2 2 | 0 0 0 |
Number of Sections: 5 Average Students Per Section: 21.60
GEN710 RUNNING START SM 1 1610 355| 355 203 152 | 0 0 0 |
01B DANIEL B. BORDEN S2 01 | 41 29 12 | 0 0 0 |
02B DANIEL B. BORDEN S2 02 | 59 32 27 | 0 0 0 |
03B DANIEL B. BORDEN S2 03 | 62 34 28 | 0 0 0 |
04B DANIEL B. BORDEN S2 04 | 65 36 29 | 0 0 0 |
05B DANIEL B. BORDEN S2 05 | 64 36 28 | 0 0 0 |
06B DANIEL B. BORDEN S2 06 | 63 35 28 | 0 0 0 |
07B DANIEL B. BORDEN S2 07 | 1 1 0 | 0 0 0 |

1sonyr01.p 35-2 AUBURN SENIOR HIGH SCHOOL 03/01/12 Page:12
04.11.10.00.01 Course/Class Count Report 401 1:28 PM
EST NBR NBR ----TOTALS---- ---Spec Ed----
COURSE DESCRIPTION LGTH SEC AVL REQ TOT FEM MAL TOT FEM MAL
Number of Sections: 7 Average Students Per Section: 50.71
GEN755 PS SKILLS CNTR SM 1 18 0| 0 0 0 | 0 0 0 |
11 RICHARD A. ZIMMERMAN S2 01 | 0 0 0 | 0 0 0 |
12 RICHARD A. ZIMMERMAN S2 02 | 0 0 0 | 0 0 0 |
13 RICHARD A. ZIMMERMAN S2 03 | 0 0 0 | 0 0 0 |
Number of Sections: 3 Average Students Per Section: 0.00
GEN805 LEADERSHIP SM 1 60 12| 12 10 2 | 0 0 0 |
16 KATIE E. HENRY S2 06 | 12 10 2 | 0 0 0 |
Number of Sections: 1 Average Students Per Section: 12.00
GEN806 ADV LEADERSHIP SM 1 60 28| 28 19 9 | 1 1 0 |
14 KATIE E. HENRY S2 04 | 28 19 9 | 1 1 0 |
Number of Sections: 1 Average Students Per Section: 28.00
GEN811 MS STUDENT YR 1 180 9| 9 5 4 | 0 0 0 |
06 RICHARD A. ZIMMERMAN YR 06 | 2 1 1 | 0 0 0 |
1 RICHARD A. ZIMMERMAN YR 01 | 0 0 0 | 0 0 0 |
2 RICHARD A. ZIMMERMAN YR 02 | 2 1 1 | 0 0 0 |
3 RICHARD A. ZIMMERMAN YR 03 | 2 1 1 | 0 0 0 |
4 RICHARD A. ZIMMERMAN YR 04 | 2 1 1 | 0 0 0 |
5 RICHARD A. ZIMMERMAN YR 05 | 1 1 0 | 0 0 0 |
Number of Sections: 6 Average Students Per Section: 1.50
LAN102 LA 9 INTERVEN 2 SM 1 60 40| 40 16 24 | 2 0 2 |
01 DONNA L. BOWLER S2 05 | 16 10 6 | 1 0 1 |
02 THOMAS J. KAUP S2 04 | 14 3 11 | 1 0 1 |
LA! JANICE M. ERIE S2 03 | 10 3 7 | 0 0 0 |
Number of Sections: 3 Average Students Per Section: 13.33
LAN120 LA 9 1 SM 12 360 1| 1 1 0 | 0 0 0 |
AX2 ROBERT A. HORLICK S2 07 | 1 1 0 | 0 0 0 |
Number of Sections: 1 Average Students Per Section: 1.00
LAN121 LA 9 2 SM 12 390 273| 273 128 145 | 5 2 3 |
01 ERICKA A. CONNELLY S2 04 | 25 11 14 | 2 1 1 |
02 ERICKA A. CONNELLY S2 05 | 21 9 12 | 0 0 0 |
03 JANICE M. ERIE S2 01 | 24 12 12 | 0 0 0 |
04 JANICE M. ERIE S2 05 | 21 8 13 | 0 0 0 |
05 SHERYL L. HARMON S2 02 | 26 14 12 | 0 0 0 |
06 SHERYL L. HARMON S2 03 | 22 14 8 | 0 0 0 |
07 DONNA L. BOWLER S2 03 | 24 12 12 | 1 0 1 |
08 DONNA L. BOWLER S2 04 | 26 15 11 | 1 1 0 |
09 THOMAS J. KAUP S2 06 | 30 10 20 | 1 0 1 |
10 THOMAS J. KAUP S2 01 | 26 9 17 | 0 0 0 |
11 DONNA L. BOWLER S2 02 | 28 14 14 | 0 0 0 |
Number of Sections: 11 Average Students Per Section: 24.82
LAN131 LA 9 HONORS 2 SM 3 90 61| 61 42 19 | 0 0 0 |
01 JANICE M. ERIE S2 02 | 20 14 6 | 0 0 0 |
02 JANICE M. ERIE S2 06 | 22 15 7 | 0 0 0 |
03 SHERYL L. HARMON S2 01 | 19 13 6 | 0 0 0 |
Number of Sections: 3 Average Students Per Section: 20.33
LAN220 LA 10 1 SM 10 305 0| 0 0 0 | 0 0 0 |
AX2 ROBERT A. HORLICK S2 07 | 0 0 0 | 0 0 0 |
Number of Sections: 1 Average Students Per Section: 0.00
LAN221 LA 10 2 SM 10 330 252| 252 115 137 | 5 1 4 |
01 ABIJAH G. ALASTRA S2 01 | 29 9 20 | 2 0 2 |
02 ABIJAH G. ALASTRA S2 02 | 24 8 16 | 0 0 0 |
03 ABIJAH G. ALASTRA S2 03 | 30 13 17 | 1 0 1 |
04 ANTHONY E. CALLERO S2 01 | 30 17 13 | 0 0 0 |
05 ANTHONY E. CALLERO S2 04 | 30 16 14 | 1 0 1 |
06 ANTHONY E. CALLERO S2 05 | 30 13 17 | 0 0 0 |

1sonyr01.p 35-2 AUBURN SENIOR HIGH SCHOOL 03/01/12 Page:13
04.11.10.00.01 Course/Class Count Report 401 1:28 PM
EST NBR NBR ----TOTALS---- ---Spec Ed----
COURSE DESCRIPTION LGTH SEC AVL REQ TOT FEM MAL TOT FEM MAL
07 JAMES P. CLEARY S2 04 | 29 10 19 | 0 0 0 |
08 JAMES P. CLEARY S2 06 | 25 14 11 | 0 0 0 |
09 DONNA L. BOWLER S2 06 | 25 15 10 | 1 1 0 |
Number of Sections: 9 Average Students Per Section: 28.00
LAN231 LA 10 HONORS 2 SM 3 90 64| 64 46 18 | 0 0 0 |
01 THOMAS J. KAUP S2 02 | 29 20 9 | 0 0 0 |
02 THOMAS J. MCDERMOTT S2 05 | 18 14 4 | 0 0 0 |
03 THOMAS J. MCDERMOTT S2 06 | 17 12 5 | 0 0 0 |
Number of Sections: 3 Average Students Per Section: 21.33
LAN302 LA INTERVEN 2 SM 1 37 29| 29 17 12 | 4 2 2 |
01 THOMAS J. KAUP S2 03 | 9 6 3 | 0 0 0 |
COE ABIJAH G. ALASTRA S2 05 | 20 11 9 | 4 2 2 |
Number of Sections: 2 Average Students Per Section: 14.50
LAN321 AMER LIT 2 SM 12 331 228| 228 103 125 | 5 2 3 |
01 WILLIAM E. BONNELL S2 01 | 23 8 15 | 0 0 0 |
02 WILLIAM E. BONNELL S2 02 | 21 12 9 | 0 0 0 |
03 WILLIAM E. BONNELL S2 05 | 19 12 7 | 0 0 0 |
04 WILLIAM E. BONNELL S2 06 | 23 6 17 | 0 0 0 |
05 TERRY J. O'CONNOR S2 04 | 23 10 13 | 2 1 1 |
06 STEPHANIE M. SCHLEICHE S2 04 | 21 11 10 | 1 1 0 |
07 STEPHANIE M. SCHLEICHE S2 06 | 24 11 13 | 0 0 0 |
08 MICHAEL G. WASSERMAN S2 01 | 25 12 13 | 0 0 0 |
09 MICHAEL G. WASSERMAN S2 03 | 27 9 18 | 1 0 1 |
10 MICHAEL G. WASSERMAN S2 05 | 22 12 10 | 1 0 1 |
Number of Sections: 10 Average Students Per Section: 22.80
LAN331 AP LAN/COMP 2 SM 3 90 58| 58 37 21 | 0 0 0 |
01 JAMES P. CLEARY S2 02 | 15 7 8 | 0 0 0 |
02 JAMES P. CLEARY S2 03 | 20 13 7 | 0 0 0 |
03 STEPHANIE M. SCHLEICHE S2 05 | 23 17 6 | 0 0 0 |
Number of Sections: 3 Average Students Per Section: 19.33
LAN410 COMMUN ARTS SM 2 60 22| 22 13 9 | 0 0 0 |
02 JAMES P. CLEARY S2 05 | 22 13 9 | 0 0 0 |
Number of Sections: 1 Average Students Per Section: 22.00
LAN415 SPORTS LIT SM 2 54 26| 26 5 21 | 2 0 2 |
11 ANTHONY E. CALLERO S2 03 | 26 5 21 | 2 0 2 |
Number of Sections: 1 Average Students Per Section: 26.00
LAN416 CREATIVE WRIT SM 2 50 23| 23 17 6 | 0 0 0 |
02 WILLIAM E. BONNELL S2 04 | 23 17 6 | 0 0 0 |
Number of Sections: 1 Average Students Per Section: 23.00
LAN417 COLLEGE WRITING SM 2 50 18| 18 6 12 | 0 0 0 |
02 MICHAEL G. WASSERMAN S2 06 | 18 6 12 | 0 0 0 |
Number of Sections: 1 Average Students Per Section: 18.00
LAN418 POETRY SM 1 30 10| 10 6 4 | 0 0 0 |
01 THOMAS J. MCDERMOTT S2 01 | 10 6 4 | 0 0 0 |
Number of Sections: 1 Average Students Per Section: 10.00
LAN421 HUMANITIES 1 SM 3 96 1| 1 1 0 | 0 0 0 |
AP2 ROBERT A. HORLICK S2 07 | 1 1 0 | 0 0 0 |
Number of Sections: 1 Average Students Per Section: 1.00
LAN422 HUMANITIES 2 SM 2 90 79| 79 33 46 | 1 0 1 |
01 ERICKA A. CONNELLY S2 01 | 22 9 13 | 0 0 0 |
02 ERICKA A. CONNELLY S2 02 | 28 11 17 | 0 0 0 |
06 ERICKA A. CONNELLY S2 06 | 29 13 16 | 1 0 1 |
Number of Sections: 3 Average Students Per Section: 26.33
LAN431 AP LIT/COMP 2 SM 3 90 61| 61 37 24 | 0 0 0 |
01 THOMAS J. MCDERMOTT S2 02 | 15 8 7 | 0 0 0 |
02 THOMAS J. MCDERMOTT S2 03 | 20 12 8 | 0 0 0 |

1sonyr01.p 35-2 AUBURN SENIOR HIGH SCHOOL 03/01/12 Page:14
04.11.10.00.01 Course/Class Count Report 401 1:28 PM
EST NBR NBR ----TOTALS---- ---Spec Ed----
COURSE DESCRIPTION LGTH SEC AVL REQ TOT FEM MAL TOT FEM MAL
03 TERRY J. O'CONNOR S2 05 | 26 17 9 | 0 0 0 |
Number of Sections: 3 Average Students Per Section: 20.33
LAN512 YEARBOOK 2 SM 1 30 15| 15 11 4 | 0 0 0 |
01 ROBERT A. HORLICK S2 05 | 15 11 4 | 0 0 0 |
Number of Sections: 1 Average Students Per Section: 15.00
LAN513 JOURNALISTIC WR SM 2 30 8| 8 5 3 | 0 0 0 |
02 MICHAEL G. WASSERMAN S2 04 | 8 5 3 | 0 0 0 |
Number of Sections: 1 Average Students Per Section: 8.00
LAN515 NEWSPAPER 2 SM 1 10 6| 6 3 3 | 1 0 1 |
01 MICHAEL G. WASSERMAN S2 04 | 6 3 3 | 1 0 1 |
Number of Sections: 1 Average Students Per Section: 6.00
LAN518 DEBATE SM 1 30 8| 8 5 3 | 0 0 0 |
01 DYANN SEIDL S2 06 | 8 5 3 | 0 0 0 |
Number of Sections: 1 Average Students Per Section: 8.00
LAN532 WRITING LAB SM 1 100 32| 32 11 21 | 3 0 3 |
11 ABIJAH G. ALASTRA S2 04 | 19 6 13 | 2 0 2 |
12 ANTHONY E. CALLERO S2 06 | 13 5 8 | 1 0 1 |
Number of Sections: 2 Average Students Per Section: 16.00
MAT101 MATH INTERVTN 2 SM 1 81 55| 55 30 25 | 1 1 0 |
02 SCOTT J. MCLAUGHLIN S2 02 | 15 8 7 | 0 0 0 |
03 RICK D. NELSON S2 03 | 10 6 4 | 0 0 0 |
04 JASON L. CAPPS S2 04 | 14 6 8 | 0 0 0 |
05 ERIK G. GUNDERSON S2 05 | 16 10 6 | 1 1 0 |
Number of Sections: 4 Average Students Per Section: 13.75
MAT121 ALGEBRA 2 SM 13 441 274| 274 134 140 | 4 2 2 |
01 JASON L. CAPPS S2 05 | 22 11 11 | 0 0 0 |
02 JASON L. CAPPS S2 06 | 25 7 18 | 1 0 1 |
03 KIMBERLY L. FARRIS S2 03 | 22 11 11 | 0 0 0 |
04 KIMBERLY L. FARRIS S2 05 | 21 13 8 | 2 1 1 |
05 KIMBERLY L. FARRIS S2 06 | 21 9 12 | 0 0 0 |
06 ERIK G. GUNDERSON S2 03 | 27 16 11 | 1 1 0 |
07 ERIK G. GUNDERSON S2 04 | 25 15 10 | 0 0 0 |
08 SCOTT J. MCLAUGHLIN S2 03 | 27 11 16 | 0 0 0 |
09 SCOTT J. MCLAUGHLIN S2 04 | 22 13 9 | 0 0 0 |
10 RICK D. NELSON S2 01 | 19 6 13 | 0 0 0 |
11 RICK D. NELSON S2 02 | 15 9 6 | 0 0 0 |
12 DYANN SEIDL S2 01 | 14 7 7 | 0 0 0 |
13 DYANN SEIDL S2 02 | 14 6 8 | 0 0 0 |
Number of Sections: 13 Average Students Per Section: 21.08
MAT210 GEOMETRY 1 SM 13 420 0| 0 0 0 | 0 0 0 |
AX2 ROBERT A. HORLICK S2 07 | 0 0 0 | 0 0 0 |
Number of Sections: 1 Average Students Per Section: 0.00
MAT211 GEOMETRY 2 SM 12 421 330| 330 164 166 | 6 1 5 |
01 TERESA M. ANDERSON S2 01 | 28 14 14 | 1 0 1 |
02 TERESA M. ANDERSON S2 05 | 30 13 17 | 0 0 0 |
03 SUSAN M. BOWERS S2 02 | 28 13 15 | 0 0 0 |
04 SUSAN M. BOWERS S2 03 | 28 17 11 | 0 0 0 |
05 SUSAN M. BOWERS S2 06 | 26 14 12 | 0 0 0 |
06 RICK D. NELSON S2 05 | 24 10 14 | 0 0 0 |
07 RICK D. NELSON S2 06 | 30 14 16 | 1 0 1 |
08 KEITH B. RODMAN S2 01 | 29 9 20 | 0 0 0 |
09 KEITH B. RODMAN S2 02 | 29 14 15 | 1 0 1 |
10 KEITH B. RODMAN S2 04 | 27 16 11 | 1 0 1 |
11 DYANN SEIDL S2 03 | 24 13 11 | 2 1 1 |
12 DYANN SEIDL S2 04 | 26 17 9 | 0 0 0 |
AX2 ROBERT A. HORLICK S2 07 | 1 0 1 | 0 0 0 |

1sonyr01.p 35-2 AUBURN SENIOR HIGH SCHOOL 03/01/12 Page:15
04.11.10.00.01 Course/Class Count Report 401 1:28 PM
EST NBR NBR ----TOTALS---- ---Spec Ed----
COURSE DESCRIPTION LGTH SEC AVL REQ TOT FEM MAL TOT FEM MAL
Number of Sections: 13 Average Students Per Section: 25.38
MAT311 ADV ALG/TRIG 2 SM 11 336 263| 263 143 120 | 2 1 1 |
01 SUSAN M. BOWERS S2 04 | 24 14 10 | 0 0 0 |
02 SUSAN M. BOWERS S2 05 | 19 8 11 | 0 0 0 |
03 KIMBERLY L. FARRIS S2 01 | 27 19 8 | 0 0 0 |
04 KIMBERLY L. FARRIS S2 02 | 29 22 7 | 0 0 0 |
05 SCOTT J. MCLAUGHLIN S2 01 | 24 8 16 | 1 0 1 |
06 SCOTT J. MCLAUGHLIN S2 05 | 19 9 10 | 0 0 0 |
07 ERIC R. MOHLER S2 02 | 31 16 15 | 0 0 0 |
08 ERIC R. MOHLER S2 04 | 30 15 15 | 1 1 0 |
09 ERIC R. MOHLER S2 06 | 23 9 14 | 0 0 0 |
10 KEITH B. RODMAN S2 03 | 25 19 6 | 0 0 0 |
11 KEITH B. RODMAN S2 06 | 12 4 8 | 0 0 0 |
Number of Sections: 11 Average Students Per Section: 23.91
MAT411 BYND ADV ALG 2 SM 2 60 52| 52 28 24 | 0 0 0 |
01 ERIK G. GUNDERSON S2 01 | 27 14 13 | 0 0 0 |
02 ERIK G. GUNDERSON S2 06 | 25 14 11 | 0 0 0 |
Number of Sections: 2 Average Students Per Section: 26.00
MAT413 PRE CALCULUS 2 SM 5 150 123| 123 63 60 | 0 0 0 |
01 JASON L. CAPPS S2 01 | 30 16 14 | 0 0 0 |
02 TERESA M. ANDERSON S2 02 | 21 11 10 | 0 0 0 |
03 JASON L. CAPPS S2 03 | 26 13 13 | 0 0 0 |
04 TERESA M. ANDERSON S2 04 | 25 11 14 | 0 0 0 |
05 TERESA M. ANDERSON S2 06 | 21 12 9 | 0 0 0 |
Number of Sections: 5 Average Students Per Section: 24.60
MAT415 AP CALCULUS 2 SM 2 60 36| 36 13 23 | 0 0 0 |
01 ERIC R. MOHLER S2 01 | 21 8 13 | 0 0 0 |
02 ERIC R. MOHLER S2 05 | 15 5 10 | 0 0 0 |
Number of Sections: 2 Average Students Per Section: 18.00
MAT418 AP CALC BC 1 SM 1 30 11| 11 4 7 | 0 0 0 |
01 ERIC R. MOHLER S2 08 | 11 4 7 | 0 0 0 |
Number of Sections: 1 Average Students Per Section: 11.00
MUS101 BAND SM 1 18 18| 18 10 8 | 18 10 8 |
SE STEPHEN R. ANDERSON S2 03 | 18 10 8 | 18 10 8 |
Number of Sections: 1 Average Students Per Section: 18.00
MUS116 WIND ENSEMBLE SM 1 40 10| 10 5 5 | 1 0 1 |
01 STEPHEN R. ANDERSON S2 04 | 10 5 5 | 1 0 1 |
Number of Sections: 1 Average Students Per Section: 10.00
MUS121 PERCUSSION SM 1 30 3| 3 0 3 | 2 0 2 |
01 STEPHEN R. ANDERSON S2 02 | 3 0 3 | 2 0 2 |
Number of Sections: 1 Average Students Per Section: 3.00
MUS123 ADV PERCUSSION SM 1 30 4| 4 0 4 | 0 0 0 |
01 STEPHEN R. ANDERSON S2 02 | 4 0 4 | 0 0 0 |
Number of Sections: 1 Average Students Per Section: 4.00
MUS126 SYMPHONC BAND SM 1 40 8| 8 5 3 | 1 1 0 |
01 STEPHEN R. ANDERSON S2 04 | 8 5 3 | 1 1 0 |
Number of Sections: 1 Average Students Per Section: 8.00
MUS131 JAZZ ENSEMBLE SM 1 40 12| 12 3 9 | 0 0 0 |
01 STEPHEN R. ANDERSON S2 08 | 12 3 9 | 0 0 0 |
Number of Sections: 1 Average Students Per Section: 12.00
MUS201 CHOIR ENSMBLE SM 1 19 14| 14 14 0 | 0 0 0 |
01 KANDY R. GILBERT S2 02 | 14 14 0 | 0 0 0 |
Number of Sections: 1 Average Students Per Section: 14.00
MUS211 CHOIR-CONCERT SM 1 40 29| 29 29 0 | 5 5 0 |
01 KANDY R. GILBERT S2 01 | 29 29 0 | 5 5 0 |

1sonyr01.p 35-2 AUBURN SENIOR HIGH SCHOOL 03/01/12 Page:16
04.11.10.00.01 Course/Class Count Report 401 1:28 PM
EST NBR NBR ----TOTALS---- ---Spec Ed----
COURSE DESCRIPTION LGTH SEC AVL REQ TOT FEM MAL TOT FEM MAL
Number of Sections: 1 Average Students Per Section: 29.00
MUS216 CHOIR-SHOW SM 1 16 13| 13 7 6 | 0 0 0 |
01 KANDY R. GILBERT S2 04 | 13 7 6 | 0 0 0 |
Number of Sections: 1 Average Students Per Section: 13.00
MUS221 CHOIR-CHAMBER SM 1 45 42| 42 29 13 | 6 3 3 |
01 KANDY R. GILBERT S2 03 | 42 29 13 | 6 3 3 |
Number of Sections: 1 Average Students Per Section: 42.00
MUS231 CHOIR-JAZZ EN SM 1 23 20| 20 13 7 | 2 1 1 |
01 KANDY R. GILBERT S2 08 | 20 13 7 | 2 1 1 |
Number of Sections: 1 Average Students Per Section: 20.00
MUS301 ORCHESTRA SM 1 40 20| 20 13 7 | 0 0 0 |
01 DALE E. JOHNSON S2 05 | 20 13 7 | 0 0 0 |
Number of Sections: 1 Average Students Per Section: 20.00
MUS303 ORCHEST-CHMBR SM 1 40 21| 21 15 6 | 0 0 0 |
01 DALE E. JOHNSON S2 06 | 21 15 6 | 0 0 0 |
Number of Sections: 1 Average Students Per Section: 21.00
MUS401 GUITAR SM 3 60 6| 5 1 4 | 0 0 0 |
03 STEPHEN R. ANDERSON S2 05 | 5 1 4 | 0 0 0 |
Number of Sections: 1 Average Students Per Section: 5.00
MUS402 ADV GUITAR SM 2 20 8| 8 1 7 | 0 0 0 |
01 STEPHEN R. ANDERSON S2 05 | 8 1 7 | 0 0 0 |
Number of Sections: 1 Average Students Per Section: 8.00
PHY002 ADAPTIVE PE SM 1 52 47| 47 21 26 | 47 21 26 |
SE2 DOUGLAS B. BURT S2 02 | 12 6 6 | 12 6 6 |
SE3 KJEL P. KIILSGAARD S2 03 | 18 8 10 | 18 8 10 |
SE5 RYAN A. HANSEN S2 05 | 17 7 10 | 17 7 10 |
Number of Sections: 3 Average Students Per Section: 15.67
PHY100 HEALTH SM 17 122 55| 55 23 32 | 6 1 5 |
12 KATIE E. HENRY S2 02 | 27 11 16 | 4 1 3 |
13 KATIE E. HENRY S2 03 | 27 12 15 | 2 0 2 |
ax KATIE E. HENRY S2 07 | 1 0 1 | 0 0 0 |
Number of Sections: 3 Average Students Per Section: 18.33
PHY101 INTRO PE SM 13 432 148| 147 77 70 | 17 7 10 |
11 DOUGLAS B. BURT S2 01 | 17 10 7 | 3 1 2 |
12 KJEL P. KIILSGAARD S2 02 | 25 14 11 | 2 1 1 |
13 ERICA L. HINSON S2 03 | 17 8 9 | 2 1 1 |
14 KENT D. RODSETH S2 04 | 25 13 12 | 5 2 3 |
15 JESSICA L. HANSEN S2 05 | 32 14 18 | 3 2 1 |
16 RYAN A. HANSEN S2 06 | 31 18 13 | 2 0 2 |
Number of Sections: 6 Average Students Per Section: 24.50
PHY204 AEROBIC/WALK SM 1 36 30| 28 23 5 | 5 3 2 |
01 JESSICA L. HANSEN S2 02 | 28 23 5 | 5 3 2 |
Number of Sections: 1 Average Students Per Section: 28.00
PHY206 AEROBICS SM 1 36 13| 13 12 1 | 0 0 0 |
01 JESSICA L. HANSEN S2 01 | 13 12 1 | 0 0 0 |
Number of Sections: 1 Average Students Per Section: 13.00
PHY208 BASKETBALL SM 1 72 44| 44 1 43 | 4 0 4 |
01 RYAN A. HANSEN S2 01 | 27 0 27 | 3 0 3 |
02 KENT D. RODSETH S2 03 | 17 1 16 | 1 0 1 |
Number of Sections: 2 Average Students Per Section: 22.00
PHY214 FIELD SPORTS SM 1 36 14| 14 2 12 | 2 0 2 |
01 DOUGLAS B. BURT S2 04 | 14 2 12 | 2 0 2 |
Number of Sections: 1 Average Students Per Section: 14.00
PHY218 HOCKEY/SOC SM 1 56 27| 26 6 20 | 4 0 4 |
01 DOUGLAS B. BURT S2 03 | 18 5 13 | 3 0 3 |
02 RYAN A. HANSEN S2 04 | 8 1 7 | 1 0 1 |

1sonyr01.p 35-2 AUBURN SENIOR HIGH SCHOOL 03/01/12 Page:17
04.11.10.00.01 Course/Class Count Report 401 1:28 PM
EST NBR NBR ----TOTALS---- ---Spec Ed----
COURSE DESCRIPTION LGTH SEC AVL REQ TOT FEM MAL TOT FEM MAL
Number of Sections: 2 Average Students Per Section: 13.00
PHY220 RACQT SPORTS SM 1 36 30| 28 11 17 | 3 1 2 |
01 ERICA L. HINSON S2 05 | 28 11 17 | 3 1 2 |
Number of Sections: 1 Average Students Per Section: 28.00
PHY224 VOLLEYBALL SM 2 144 121| 121 65 56 | 11 5 6 |
01 KJEL P. KIILSGAARD S2 01 | 21 12 9 | 2 1 1 |
02 ERICA L. HINSON S2 02 | 33 15 18 | 2 0 2 |
03 KJEL P. KIILSGAARD S2 04 | 33 18 15 | 1 0 1 |
04 ERICA L. HINSON S2 06 | 34 20 14 | 6 4 2 |
Number of Sections: 4 Average Students Per Section: 30.25
PHY228 WATER SPORTS SM 1 20 12| 12 4 8 | 10 4 6 |
01 KJEL P. KIILSGAARD S2 05 | 12 4 8 | 10 4 6 |
Number of Sections: 1 Average Students Per Section: 12.00
PHY230 BEG WT TRNG SM 4 180 176| 175 36 139 | 22 1 21 |
01 ERICA L. HINSON S2 01 | 35 4 31 | 8 0 8 |
02 KENT D. RODSETH S2 02 | 35 5 30 | 2 0 2 |
03 RYAN A. HANSEN S2 03 | 35 9 26 | 4 1 3 |
04 JESSICA L. HANSEN S2 04 | 34 9 25 | 3 0 3 |
99 DOUGLAS B. BURT S2 08 | 36 9 27 | 5 0 5 |
Number of Sections: 5 Average Students Per Section: 35.00
PHY304 ADV VLYBALL SM 2 36 37| 36 21 15 | 0 0 0 |
01 JESSICA L. HANSEN S2 06 | 36 21 15 | 0 0 0 |
Number of Sections: 1 Average Students Per Section: 36.00
PHY306 ADV WT TRNG SM 1 64 54| 54 8 46 | 5 0 5 |
01 KENT D. RODSETH S2 06 | 27 4 23 | 4 0 4 |
05 KENT D. RODSETH S2 05 | 27 4 23 | 1 0 1 |
Number of Sections: 2 Average Students Per Section: 27.00
PHY502 HUMAN SURVIVAL SM 2 61 34| 30 16 14 | 6 3 3 |
15 KATIE E. HENRY S2 05 | 30 16 14 | 6 3 3 |
Number of Sections: 1 Average Students Per Section: 30.00
SCI101 SCIENCE LINKS SM 13 360 144| 144 80 64 | 23 10 13 |
11 WHITNEY R. BAILEY S2 03 | 29 18 11 | 6 4 2 |
12 WHITNEY R. BAILEY S2 04 | 30 17 13 | 3 2 1 |
13 WHITNEY R. BAILEY S2 05 | 28 10 18 | 7 1 6 |
14 WARREN D. KERR S2 01 | 29 16 13 | 3 1 2 |
15 KEALY A. MCCLEERY S2 06 | 28 19 9 | 4 2 2 |
Number of Sections: 5 Average Students Per Section: 28.80
SCI203 BIOLOGY 2 SM 15 450 379| 379 169 210 | 31 9 22 |
01 WHITNEY R. BAILEY S2 01 | 27 12 15 | 1 0 1 |
02 WHITNEY R. BAILEY S2 06 | 21 10 11 | 4 1 3 |
03 BRUCE J. MORRIS S2 04 | 27 14 13 | 2 1 1 |
04 BRUCE J. MORRIS S2 05 | 28 12 16 | 3 1 2 |
05 BRUCE J. MORRIS S2 06 | 22 9 13 | 1 0 1 |
06 KEALY A. MCCLEERY S2 01 | 24 11 13 | 1 0 1 |
07 KEALY A. MCCLEERY S2 02 | 19 8 11 | 1 0 1 |
08 KEALY A. MCCLEERY S2 03 | 28 11 17 | 2 0 2 |
09 KEALY A. MCCLEERY S2 04 | 23 9 14 | 2 1 1 |
10 BESS E. OWENS S2 02 | 30 9 21 | 2 0 2 |
11 BESS E. OWENS S2 03 | 30 11 19 | 2 0 2 |
12 BESS E. OWENS S2 04 | 21 10 11 | 3 1 2 |
13 BESS E. OWENS S2 05 | 23 14 9 | 2 2 0 |
14 BESS E. OWENS S2 06 | 29 16 13 | 4 2 2 |
15 ERIC D. WAKEFIELD S2 01 | 27 13 14 | 1 0 1 |
Number of Sections: 15 Average Students Per Section: 25.27
SCI301 CHEMISTRY 2 SM 9 270 183| 183 113 70 | 0 0 0 |
01 DENISE L. CARROLL S2 01 | 25 18 7 | 0 0 0 |

1sonyr01.p 35-2 AUBURN SENIOR HIGH SCHOOL 03/01/12 Page:18
04.11.10.00.01 Course/Class Count Report 401 1:28 PM
EST NBR NBR ----TOTALS---- ---Spec Ed----
COURSE DESCRIPTION LGTH SEC AVL REQ TOT FEM MAL TOT FEM MAL
02 DENISE L. CARROLL S2 02 | 24 13 11 | 0 0 0 |
03 DENISE L. CARROLL S2 03 | 27 21 6 | 0 0 0 |
04 DENISE L. CARROLL S2 04 | 23 12 11 | 0 0 0 |
05 DENISE L. CARROLL S2 05 | 18 12 6 | 0 0 0 |
06 ELSBETH C. COCKCROFT S2 01 | 23 14 9 | 0 0 0 |
07 ELSBETH C. COCKCROFT S2 02 | 13 9 4 | 0 0 0 |
08 ELSBETH C. COCKCROFT S2 05 | 10 4 6 | 0 0 0 |
09 ELSBETH C. COCKCROFT S2 06 | 20 10 10 | 0 0 0 |
Number of Sections: 9 Average Students Per Section: 20.33
SCI303 ADV CHEM 2 SM 1 30 15| 15 7 8 | 0 0 0 |
01 ELSBETH C. COCKCROFT S2 04 | 15 7 8 | 0 0 0 |
Number of Sections: 1 Average Students Per Section: 15.00
SCI401 PHYSICS 2 SM 4 112 81| 80 31 49 | 0 0 0 |
01 ERIC D. WAKEFIELD S2 02 | 17 3 14 | 0 0 0 |
02 ERIC D. WAKEFIELD S2 03 | 24 12 12 | 0 0 0 |
03 ERIC D. WAKEFIELD S2 05 | 19 8 11 | 0 0 0 |
04 ERIC D. WAKEFIELD S2 06 | 20 8 12 | 0 0 0 |
Number of Sections: 4 Average Students Per Section: 20.00
SCI504 GEOLOGY SM 6 32 2| 2 1 1 | 1 1 0 |
Ax1 ROBERT A. HORLICK S2 07 | 2 1 1 | 1 1 0 |
Number of Sections: 1 Average Students Per Section: 2.00
SCI505 ASTRONOMY SM 1 30 30| 25 12 13 | 2 2 0 |
02 WARREN D. KERR S2 02 | 25 12 13 | 2 2 0 |
Number of Sections: 1 Average Students Per Section: 25.00
SOC101 WORLD STUDIES SM 13 420 164| 161 78 83 | 22 11 11 |
11 ABRAHAM P. VANDERPUY S2 01 | 25 17 8 | 3 1 2 |
12 ABRAHAM P. VANDERPUY S2 02 | 28 8 20 | 5 1 4 |
13 ABRAHAM P. VANDERPUY S2 03 | 27 15 12 | 5 3 2 |
14 ABRAHAM P. VANDERPUY S2 04 | 24 13 11 | 2 1 1 |
15 PHILIP N. SMETHERAM S2 05 | 30 14 16 | 3 1 2 |
16 ABRAHAM P. VANDERPUY S2 06 | 27 11 16 | 4 4 0 |
AX2 ROBERT A. HORLICK S2 07 | 0 0 0 | 0 0 0 |
Number of Sections: 7 Average Students Per Section: 23.00
SOC103 HON WRLD STU 2 SM 2 60 52| 52 32 20 | 0 0 0 |
01 MICHAEL A. GRENZ S2 02 | 22 9 13 | 0 0 0 |
02 MICHAEL A. GRENZ S2 03 | 30 23 7 | 0 0 0 |
Number of Sections: 2 Average Students Per Section: 26.00
SOC203 US HISTORY 2 SM 11 391 322| 322 149 173 | 35 9 26 |
01 EDWARD M. BENDER S2 05 | 28 12 16 | 3 0 3 |
02 EDWARD M. BENDER S2 06 | 30 11 19 | 2 0 2 |
03 PHILIP N. SMETHERAM S2 01 | 28 15 13 | 4 1 3 |
04 PHILIP N. SMETHERAM S2 02 | 29 10 19 | 3 1 2 |
05 PHILIP N. SMETHERAM S2 03 | 30 15 15 | 1 1 0 |
06 PHILIP N. SMETHERAM S2 06 | 30 14 16 | 4 0 4 |
07 JOHN H. YORKE S2 01 | 28 11 17 | 6 4 2 |
08 JOHN H. YORKE S2 03 | 30 17 13 | 0 0 0 |
09 JOHN H. YORKE S2 04 | 29 18 11 | 4 2 2 |
10 JOHN H. YORKE S2 05 | 30 17 13 | 4 0 4 |
11 EDWARD M. BENDER S2 04 | 30 9 21 | 4 0 4 |
Number of Sections: 11 Average Students Per Section: 29.27
SOC205 AP EUROPEAN 2 SM 3 90 77| 77 45 32 | 0 0 0 |
01 MICHAEL A. GRENZ S2 04 | 26 15 11 | 0 0 0 |
02 MICHAEL A. GRENZ S2 05 | 30 15 15 | 0 0 0 |
03 MICHAEL A. GRENZ S2 06 | 21 15 6 | 0 0 0 |
Number of Sections: 3 Average Students Per Section: 25.67
SOC300 CIVICS SM 12 420 140| 140 65 75 | 11 4 7 |

1sonyr01.p 35-2 AUBURN SENIOR HIGH SCHOOL 03/01/12 Page:19
04.11.10.00.01 Course/Class Count Report 401 1:28 PM
EST NBR NBR ----TOTALS---- ---Spec Ed----
COURSE DESCRIPTION LGTH SEC AVL REQ TOT FEM MAL TOT FEM MAL
11 ADAM L. LADAGE S2 01 | 19 10 9 | 0 0 0 |
12 ADAM L. LADAGE S2 02 | 25 13 12 | 2 1 1 |
13 GORDON A. ELLIOTT S2 03 | 27 12 15 | 2 1 1 |
14 GORDON A. ELLIOTT S2 04 | 25 10 15 | 2 0 2 |
15 GORDON A. ELLIOTT S2 05 | 22 8 14 | 0 0 0 |
16 PATRICK W. MARTIN S2 06 | 22 12 10 | 5 2 3 |
Number of Sections: 6 Average Students Per Section: 23.33
SOC302 AP US HISTORY 2 SM 3 60 51| 51 29 22 | 0 0 0 |
01 EDWARD M. BENDER S2 01 | 30 17 13 | 0 0 0 |
02 EDWARD M. BENDER S2 02 | 21 12 9 | 0 0 0 |
Number of Sections: 2 Average Students Per Section: 25.50
SOC400 GLOBAL ISSUES SM 11 332 119| 118 60 58 | 9 4 5 |
11 PATRICK W. MARTIN S2 01 | 20 10 10 | 0 0 0 |
12 JOHN H. YORKE S2 02 | 30 17 13 | 5 3 2 |
13 PATRICK W. MARTIN S2 03 | 19 7 12 | 1 0 1 |
14 PATRICK W. MARTIN S2 04 | 19 9 10 | 2 0 2 |
15 PATRICK W. MARTIN S2 05 | 28 15 13 | 1 1 0 |
AX2 ROBERT A. HORLICK S2 07 | 2 2 0 | 0 0 0 |
Number of Sections: 6 Average Students Per Section: 19.67
SOC402 AP US POL&GOV 2 SM 2 60 49| 49 28 21 | 0 0 0 |
01 GORDON A. ELLIOTT S2 01 | 24 12 12 | 0 0 0 |
02 GORDON A. ELLIOTT S2 02 | 25 16 9 | 0 0 0 |
Number of Sections: 2 Average Students Per Section: 24.50
SOC500 PSYCHOLOGY 1 SM 5 152 61| 59 33 26 | 1 0 1 |
13 CRYSTAL A. WISNESS S2 03 | 27 14 13 | 1 0 1 |
14 CRYSTAL A. WISNESS S2 04 | 30 17 13 | 0 0 0 |
APX ROBERT A. HORLICK S2 07 | 2 2 0 | 0 0 0 |
Number of Sections: 3 Average Students Per Section: 19.67
SOC501 PSYCHOLOGY 2 SM 2 60 58| 58 35 23 | 1 1 0 |
01 CRYSTAL A. WISNESS S2 05 | 29 18 11 | 1 1 0 |
02 CRYSTAL A. WISNESS S2 06 | 29 17 12 | 0 0 0 |
Number of Sections: 2 Average Students Per Section: 29.00
SOC504 SOCIOLOGY 1 SM 2 60 24| 23 9 14 | 1 0 1 |
02 ADAM L. LADAGE S2 06 | 23 9 14 | 1 0 1 |
Number of Sections: 1 Average Students Per Section: 23.00
SOC508 WASH STATE HIST SM 3 120 38| 36 13 23 | 5 2 3 |
13 ADAM L. LADAGE S2 03 | 22 10 12 | 2 1 1 |
15 ADAM L. LADAGE S2 05 | 14 3 11 | 3 1 2 |
Number of Sections: 2 Average Students Per Section: 18.00
SPE101 STRUCTRD LEARN SM 23 478 339| 339 159 180 | 339 159 180 |
01 ELAINE M. HOGG S2 01 | 17 9 8 | 17 9 8 |
02 ELAINE M. HOGG S2 02 | 9 5 4 | 9 5 4 |
03 ELAINE M. HOGG S2 03 | 9 5 4 | 9 5 4 |
04 ELAINE M. HOGG S2 04 | 11 4 7 | 11 4 7 |
05 ELAINE M. HOGG S2 05 | 6 3 3 | 6 3 3 |
06 ELAINE M. HOGG S2 06 | 10 3 7 | 10 3 7 |
21 MARCELA FIGUEROA S2 01 | 9 4 5 | 9 4 5 |
22 MARCELA FIGUEROA S2 02 | 9 4 5 | 9 4 5 |
23 MARCELA FIGUEROA S2 03 | 3 1 2 | 3 1 2 |
24 MARCELA FIGUEROA S2 04 | 9 4 5 | 9 4 5 |
26 MARCELA FIGUEROA S2 06 | 8 3 5 | 8 3 5 |
31 CAMI M. SCHULTZ S2 01 | 8 4 4 | 8 4 4 |
32 CAMI M. SCHULTZ S2 02 | 5 4 1 | 5 4 1 |
34 CAMI M. SCHULTZ S2 04 | 8 4 4 | 8 4 4 |
35 CAMI M. SCHULTZ S2 05 | 4 1 3 | 4 1 3 |
36 CAMI M. SCHULTZ S2 06 | 9 5 4 | 9 5 4 |

1sonyr01.p 35-2 AUBURN SENIOR HIGH SCHOOL 03/01/12 Page:20
04.11.10.00.01 Course/Class Count Report 401 1:28 PM
EST NBR NBR ----TOTALS---- ---Spec Ed----
COURSE DESCRIPTION LGTH SEC AVL REQ TOT FEM MAL TOT FEM MAL
41 KYLE B. JONES S2 01 | 9 2 7 | 9 2 7 |
42 KYLE B. JONES S2 02 | 9 1 8 | 9 1 8 |
43 KYLE B. JONES S2 03 | 4 2 2 | 4 2 2 |
44 KYLE B. JONES S2 04 | 10 2 8 | 10 2 8 |
46 KYLE B. JONES S2 06 | 9 2 7 | 9 2 7 |
51 SARAH C. SHAW S2 01 | 9 6 3 | 9 6 3 |
52 SARAH C. SHAW S2 02 | 9 5 4 | 9 5 4 |
54 SARAH C. SHAW S2 04 | 9 6 3 | 9 6 3 |
55 SARAH C. SHAW S2 05 | 9 5 4 | 9 5 4 |
56 SARAH C. SHAW S2 06 | 9 6 3 | 9 6 3 |
61 ALETA L. JOHNSON S2 01 | 6 3 3 | 6 3 3 |
63 ALETA L. JOHNSON S2 03 | 11 5 6 | 11 5 6 |
64 ALETA L. JOHNSON S2 04 | 8 5 3 | 8 5 3 |
65 ALETA L. JOHNSON S2 05 | 6 4 2 | 6 4 2 |
66 ALETA L. JOHNSON S2 06 | 7 4 3 | 7 4 3 |
71 LISA M. WOODY S2 01 | 10 4 6 | 10 4 6 |
72 LISA M. WOODY S2 02 | 7 2 5 | 7 2 5 |
74 LISA M. WOODY S2 04 | 9 4 5 | 9 4 5 |
75 LISA M. WOODY S2 05 | 9 4 5 | 9 4 5 |
76 LISA M. WOODY S2 06 | 10 4 6 | 10 4 6 |
82 MEGAN D. ORR S2 02 | 4 4 0 | 4 4 0 |
83 MEGAN D. ORR S2 03 | 8 4 4 | 8 4 4 |
84 MEGAN D. ORR S2 04 | 8 4 4 | 8 4 4 |
85 MEGAN D. ORR S2 05 | 8 4 4 | 8 4 4 |
86 MEGAN D. ORR S2 06 | 8 4 4 | 8 4 4 |
Number of Sections: 41 Average Students Per Section: 8.27
SPE204 LANG ARTS 2 SM 1 14 9| 9 5 4 | 9 5 4 |
01 TERESA A. MCLUEN S2 02 | 9 5 4 | 9 5 4 |
Number of Sections: 1 Average Students Per Section: 9.00
SPE205 LANG ARTS 3 SM 1 28 14| 14 4 10 | 14 4 10 |
11 TERESA A. MCLUEN S2 01 | 14 4 10 | 14 4 10 |
Number of Sections: 1 Average Students Per Section: 14.00
SPE206 LANG ARTS 3 SM 1 28 11| 11 5 6 | 11 5 6 |
11 JAYNE CRIDDLE S2 04 | 11 5 6 | 11 5 6 |
Number of Sections: 1 Average Students Per Section: 11.00
SPE207 LANG ARTS 4 SM 3 28 11| 11 5 6 | 11 5 6 |
04 JAYNE CRIDDLE S2 01 | 11 5 6 | 11 5 6 |
Number of Sections: 1 Average Students Per Section: 11.00
SPE208 LANG ARTS 4 SM 3 56 26| 26 12 14 | 26 12 14 |
03 JAYNE CRIDDLE S2 02 | 12 3 9 | 12 3 9 |
04 JAYNE CRIDDLE S2 03 | 14 9 5 | 14 9 5 |
Number of Sections: 2 Average Students Per Section: 13.00
SPE209 LANG ARTS 5 SM 3 32 16| 16 4 12 | 16 4 12 |
3W1 TERESA A. MCLUEN S2 05 | 16 4 12 | 16 4 12 |
Number of Sections: 1 Average Students Per Section: 16.00
SPE210 LANG ARTS 5 SM 2 84 33| 33 14 19 | 33 14 19 |
5W2 TERESA A. MCLUEN S2 03 | 12 5 7 | 12 5 7 |
6W2 TERESA A. MCLUEN S2 04 | 12 6 6 | 12 6 6 |
7W2 JAYNE CRIDDLE S2 06 | 9 3 6 | 9 3 6 |
Number of Sections: 3 Average Students Per Section: 11.00
SPE304 MATH 2 SM 2 28 21| 21 10 11 | 21 10 11 |
01 ANGELA D. STUBBLEFIELD S2 04 | 8 4 4 | 8 4 4 |
02 BRANDI N. COLE S2 06 | 13 6 7 | 13 6 7 |
Number of Sections: 2 Average Students Per Section: 10.50
SPE306 MATH 3 SM 3 56 43| 43 11 32 | 43 11 32 |
01 ANGELA D. STUBBLEFIELD S2 01 | 8 2 6 | 8 2 6 |

1sonyr01.p 35-2 AUBURN SENIOR HIGH SCHOOL 03/01/12 Page:21
04.11.10.00.01 Course/Class Count Report 401 1:28 PM
EST NBR NBR ----TOTALS---- ---Spec Ed----
COURSE DESCRIPTION LGTH SEC AVL REQ TOT FEM MAL TOT FEM MAL
02 ANGELA D. STUBBLEFIELD S2 02 | 10 2 8 | 10 2 8 |
03 BRANDI N. COLE S2 04 | 13 3 10 | 13 3 10 |
04 BRANDI N. COLE S2 05 | 12 4 8 | 12 4 8 |
Number of Sections: 4 Average Students Per Section: 10.75
SPE308 MATH 4 SM 2 56 48| 48 21 27 | 47 21 26 |
01 ANGELA D. STUBBLEFIELD S2 05 | 9 5 4 | 9 5 4 |
02 ANGELA D. STUBBLEFIELD S2 06 | 12 4 8 | 12 4 8 |
03 BRANDI N. COLE S2 02 | 14 5 9 | 14 5 9 |
04 BRANDI N. COLE S2 03 | 13 7 6 | 12 7 5 |
Number of Sections: 4 Average Students Per Section: 12.00
SPE601 COMM LAB SM 1 122 22| 22 8 14 | 22 8 14 |
01 KAREN SHU-MINUTOLI S2 01 | 9 2 7 | 9 2 7 |
04 KAREN SHU-MINUTOLI S2 04 | 11 5 6 | 11 5 6 |
06 KAREN SHU-MINUTOLI S2 06 | 0 0 0 | 0 0 0 |
07 KAREN SHU-MINUTOLI S2 07 | 2 1 1 | 2 1 1 |
08 KAREN SHU-MINUTOLI S2 08 | 0 0 0 | 0 0 0 |
Number of Sections: 5 Average Students Per Section: 4.40

1sonyr01.p 35-2 AUBURN SENIOR HIGH SCHOOL 03/01/12 Page:22
04.11.10.00.01 Course/Class Count Report Totals 1:28 PM
TITLE FOR TOTAL
TOTALS GROUP TOTAL FEMALE MALE
GRAND TOTALS 10610 5253 5357
Spec Ed 1439 584 855
************************ End of report ************************

1sonyr01.p 35-2 AUBURN MOUNTAINVIEW H. S. 03/01/12 Page:1
04.11.10.00.01 Course/Class Count Report 405 1:30 PM
EST NBR NBR ----TOTALS---- ---Spec Ed----
COURSE DESCRIPTION LGTH SEC AVL REQ TOT FEM MAL TOT FEM MAL
ART104 ADV ART 2 SM 1 13 13| 13 11 2 | 2 1 1 |
31 AMY L. MILLS GOLDBERG S2 03 | 13 11 2 | 2 1 1 |
Number of Sections: 1 Average Students Per Section: 13.00
ART106 ADV ART 4 SM 1 5 5| 5 2 3 | 0 0 0 |
31 AMY L. MILLS GOLDBERG S2 03 | 5 2 3 | 0 0 0 |
Number of Sections: 1 Average Students Per Section: 5.00
ART109 PAINTING SM 3 38 36| 28 23 5 | 0 0 0 |
26 AMY L. MILLS GOLDBERG S2 02 | 20 15 5 | 0 0 0 |
36 AMY L. MILLS GOLDBERG S2 03 | 8 8 0 | 0 0 0 |
Number of Sections: 2 Average Students Per Section: 14.00
ART111 ADV CERAMICS SM 1 30 26| 26 16 10 | 4 1 3 |
16 AMY L. MILLS GOLDBERG S2 01 | 26 16 10 | 4 1 3 |
Number of Sections: 1 Average Students Per Section: 26.00
ART112 FABRIC DESIGN SM 1 8 8| 8 8 0 | 0 0 0 |
36 AMY L. MILLS GOLDBERG S2 03 | 8 8 0 | 0 0 0 |
Number of Sections: 1 Average Students Per Section: 8.00
ART114 THEATER PROD 1 SM 1 61 32| 31 11 20 | 7 0 7 |
46 PAUL H. FOUHY S2 04 | 1 1 0 | 0 0 0 |
66 PAUL H. FOUHY S2 06 | 30 10 20 | 7 0 7 |
Number of Sections: 2 Average Students Per Section: 15.50
ART116 CHILD THEA 1 SM 1 30 26| 26 10 16 | 4 1 3 |
36 PAUL H. FOUHY S2 03 | 26 10 16 | 4 1 3 |
Number of Sections: 1 Average Students Per Section: 26.00
ART121 ACTING 1 SM 3 37 12| 12 8 4 | 2 1 1 |
56 PAUL H. FOUHY S2 05 | 12 8 4 | 2 1 1 |
Number of Sections: 1 Average Students Per Section: 12.00
ART122 ACTING 2 SM 2 16 15| 15 10 5 | 2 1 1 |
56 PAUL H. FOUHY S2 05 | 15 10 5 | 2 1 1 |
Number of Sections: 1 Average Students Per Section: 15.00
ART124 ACTING 4 SM 1 2 2| 2 2 0 | 2 2 0 |
56 PAUL H. FOUHY S2 05 | 2 2 0 | 2 2 0 |
Number of Sections: 1 Average Students Per Section: 2.00
ART125 ACTING 5 SM 1 2 1| 1 1 0 | 0 0 0 |
56 PAUL H. FOUHY S2 05 | 1 1 0 | 0 0 0 |
Number of Sections: 1 Average Students Per Section: 1.00
ART126 ACTING 6 SM 1 0 0| 0 0 0 | 0 0 0 |
56 PAUL H. FOUHY S2 05 | 0 0 0 | 0 0 0 |
Number of Sections: 1 Average Students Per Section: 0.00
ART128 ACTING 8 SM 1 0 0| 0 0 0 | 0 0 0 |
56 PAUL H. FOUHY S2 05 | 0 0 0 | 0 0 0 |
Number of Sections: 1 Average Students Per Section: 0.00
CTE002 HORT SCIENCE 2 SM 1 60 56| 56 25 31 | 14 5 9 |
51 REGINA K. GRUBB S2 05 | 27 13 14 | 7 2 5 |
61 REGINA K. GRUBB S2 06 | 29 12 17 | 7 3 4 |
Number of Sections: 2 Average Students Per Section: 28.00
CTE004 ENVIRON HORT 2 SM 1 21 21| 21 4 17 | 5 0 5 |
46 REGINA K. GRUBB S2 04 | 21 4 17 | 5 0 5 |
Number of Sections: 1 Average Students Per Section: 21.00
CTE006 ENVIRON HORT 4 SM 1 0 0| 0 0 0 | 0 0 0 |
46 REGINA K. GRUBB S2 04 | 0 0 0 | 0 0 0 |
Number of Sections: 1 Average Students Per Section: 0.00
CTE008 FLORAL DES MKT2 SM 1 9 9| 9 8 1 | 0 0 0 |
46 REGINA K. GRUBB S2 04 | 9 8 1 | 0 0 0 |
Number of Sections: 1 Average Students Per Section: 9.00
CTE102 ACCOUNTING 2 SM 1 30 29| 29 14 15 | 1 0 1 |
21 PATRICIA E. ECKELMAN S2 02 | 29 14 15 | 1 0 1 |

1sonyr01.p 35-2 AUBURN MOUNTAINVIEW H. S. 03/01/12 Page:2
04.11.10.00.01 Course/Class Count Report 405 1:30 PM
EST NBR NBR ----TOTALS---- ---Spec Ed----
COURSE DESCRIPTION LGTH SEC AVL REQ TOT FEM MAL TOT FEM MAL
Number of Sections: 1 Average Students Per Section: 29.00
CTE115 BUS MATH SM 1 28 28| 28 17 11 | 1 1 0 |
36 PATRICIA E. ECKELMAN S2 03 | 28 17 11 | 1 1 0 |
Number of Sections: 1 Average Students Per Section: 28.00
CTE135 DIGITOOLS SM 2 27 28| 27 10 17 | 2 0 2 |
46 PATRICIA E. ECKELMAN S2 04 | 27 10 17 | 2 0 2 |
Number of Sections: 1 Average Students Per Section: 27.00
CTE142 MOS 2 SM 1 35 5| 5 0 5 | 0 0 0 |
36 PATRICIA E. ECKELMAN S2 03 | 2 0 2 | 0 0 0 |
46 PATRICIA E. ECKELMAN S2 04 | 3 0 3 | 0 0 0 |
Number of Sections: 2 Average Students Per Section: 2.50
CTE171 MARKETG/DECA 2 SM 5 90 90| 89 44 45 | 6 3 3 |
11 DEREK E. ENZ S2 01 | 30 20 10 | 2 2 0 |
12 JANA D. THOMAS S2 01 | 29 11 18 | 1 0 1 |
31 DEREK E. ENZ S2 03 | 30 13 17 | 3 1 2 |
Number of Sections: 3 Average Students Per Section: 29.67
CTE176 MARKETG/DECA 4 SM 1 30 29| 28 15 13 | 1 1 0 |
51 DEREK E. ENZ S2 05 | 28 15 13 | 1 1 0 |
Number of Sections: 1 Average Students Per Section: 28.00
CTE181 MARKTING SPEC 2 SM 1 6 5| 5 3 2 | 0 0 0 |
56 DEREK E. ENZ S2 05 | 1 1 0 | 0 0 0 |
61 DEREK E. ENZ S2 06 | 4 2 2 | 0 0 0 |
Number of Sections: 2 Average Students Per Section: 2.50
CTE183 STORE RETL OP 2 SM 2 24 26| 26 13 13 | 1 1 0 |
41 DEREK E. ENZ S2 04 | 26 13 13 | 1 1 0 |
Number of Sections: 1 Average Students Per Section: 26.00
CTE185 STOR OP SM BSN2 SM 1 6 7| 7 3 4 | 0 0 0 |
41 DEREK E. ENZ S2 04 | 7 3 4 | 0 0 0 |
Number of Sections: 1 Average Students Per Section: 7.00
CTE187 MARKTNG ENTRE 2 SM 2 26 16| 16 8 8 | 1 0 1 |
16 DEREK E. ENZ S2 01 | 0 0 0 | 0 0 0 |
61 DEREK E. ENZ S2 06 | 16 8 8 | 1 0 1 |
Number of Sections: 2 Average Students Per Section: 8.00
CTE212 CAREER W/CHILD2 SM 1 30 23| 23 19 4 | 2 2 0 |
26 VIVIAN G. BAGLIEN S2 02 | 23 19 4 | 2 2 0 |
Number of Sections: 1 Average Students Per Section: 23.00
CTE225 FSHN APP DESGN1 SM 2 30 27| 27 26 1 | 3 3 0 |
16 VIVIAN G. BAGLIEN S2 01 | 27 26 1 | 3 3 0 |
Number of Sections: 1 Average Students Per Section: 27.00
CTE232 FOOD NUTR&SCI 2 SM 1 30 26| 26 15 11 | 3 2 1 |
51 VIVIAN G. BAGLIEN S2 05 | 26 15 11 | 3 2 1 |
Number of Sections: 1 Average Students Per Section: 26.00
CTE240 INDEP LIVING SM 1 30 28| 28 17 11 | 4 1 3 |
66 VIVIAN G. BAGLIEN S2 06 | 28 17 11 | 4 1 3 |
Number of Sections: 1 Average Students Per Section: 28.00
CTE250 NUTRTN WELLNESS SM 2 60 31| 29 20 9 | 3 2 1 |
36 VIVIAN G. BAGLIEN S2 03 | 29 20 9 | 3 2 1 |
Number of Sections: 1 Average Students Per Section: 29.00
CTE304 PREVENTIVE MED SM 4 120 58| 57 41 16 | 3 2 1 |
36 STEVEN I. CALHOUN S2 03 | 28 18 10 | 2 1 1 |
46 STEVEN I. CALHOUN S2 04 | 29 23 6 | 1 1 0 |
Number of Sections: 2 Average Students Per Section: 28.50
CTE306 ANATOMY/PHYS 2 SM 3 60 59| 59 43 16 | 1 0 1 |
11 STEVEN I. CALHOUN S2 01 | 30 25 5 | 0 0 0 |
21 STEVEN I. CALHOUN S2 02 | 29 18 11 | 1 0 1 |

1sonyr01.p 35-2 AUBURN MOUNTAINVIEW H. S. 03/01/12 Page:3
04.11.10.00.01 Course/Class Count Report 405 1:30 PM
EST NBR NBR ----TOTALS---- ---Spec Ed----
COURSE DESCRIPTION LGTH SEC AVL REQ TOT FEM MAL TOT FEM MAL
Number of Sections: 2 Average Students Per Section: 29.50
CTE308 SPORTS MED 2 SM 2 21 19| 19 15 4 | 0 0 0 |
61 STEVEN I. CALHOUN S2 06 | 19 15 4 | 0 0 0 |
Number of Sections: 1 Average Students Per Section: 19.00
CTE312 ADVSPORTS MED 2 SM 1 9 9| 9 5 4 | 0 0 0 |
61 STEVEN I. CALHOUN S2 06 | 9 5 4 | 0 0 0 |
Number of Sections: 1 Average Students Per Section: 9.00
CTE331 CULINARY ARTS SM 7 281 117| 116 44 72 | 25 9 16 |
16 ROBERTA J. LOCKE S2 01 | 29 12 17 | 8 3 5 |
26 ROBERTA J. LOCKE S2 02 | 30 12 18 | 9 5 4 |
36 ROBERTA J. LOCKE S2 03 | 29 6 23 | 6 1 5 |
96 ROBERTA J. LOCKE S2 00 | 28 14 14 | 2 0 2 |
Number of Sections: 4 Average Students Per Section: 29.00
CTE332 CULINARY ARTS SM 6 37 41| 41 22 19 | 7 3 4 |
46 ROBERTA J. LOCKE S2 04 | 25 13 12 | 5 2 3 |
56 ROBERTA J. LOCKE S2 05 | 16 9 7 | 2 1 1 |
Number of Sections: 2 Average Students Per Section: 20.50
CTE334 ADV CULNY ART 2 SM 2 19 17| 17 8 9 | 0 0 0 |
46 ROBERTA J. LOCKE S2 04 | 8 2 6 | 0 0 0 |
51 ROBERTA J. LOCKE S2 05 | 9 6 3 | 0 0 0 |
Number of Sections: 2 Average Students Per Section: 8.50
CTE351 JEWELRY 1 SM 5 202 66| 66 39 27 | 4 2 2 |
16 DORIN J. MEINHART S2 01 | 25 17 8 | 0 0 0 |
46 DORIN J. MEINHART S2 04 | 1 0 1 | 0 0 0 |
56 DORIN J. MEINHART S2 05 | 15 8 7 | 0 0 0 |
66 DORIN J. MEINHART S2 06 | 25 14 11 | 4 2 2 |
Number of Sections: 4 Average Students Per Section: 16.50
CTE352 JEWELRY 2 SM 5 67 65| 64 42 22 | 9 5 4 |
16 DORIN J. MEINHART S2 01 | 2 1 1 | 0 0 0 |
26 DORIN J. MEINHART S2 02 | 1 0 1 | 0 0 0 |
36 DORIN J. MEINHART S2 03 | 27 15 12 | 5 2 3 |
46 DORIN J. MEINHART S2 04 | 26 19 7 | 2 1 1 |
56 DORIN J. MEINHART S2 05 | 5 5 0 | 2 2 0 |
66 DORIN J. MEINHART S2 06 | 3 2 1 | 0 0 0 |
Number of Sections: 6 Average Students Per Section: 10.67
CTE353 JEWELRY 3 SM 3 7 7| 7 3 4 | 2 1 1 |
36 DORIN J. MEINHART S2 03 | 1 0 1 | 0 0 0 |
46 DORIN J. MEINHART S2 04 | 1 0 1 | 0 0 0 |
56 DORIN J. MEINHART S2 05 | 5 3 2 | 2 1 1 |
Number of Sections: 3 Average Students Per Section: 2.33
CTE354 JEWELRY 4 SM 1 4 4| 4 3 1 | 0 0 0 |
16 DORIN J. MEINHART S2 01 | 1 0 1 | 0 0 0 |
56 DORIN J. MEINHART S2 05 | 3 3 0 | 0 0 0 |
Number of Sections: 2 Average Students Per Section: 2.00
CTE361 VIS COM 1 SM 5 170 89| 87 43 44 | 12 4 8 |
16 CARY W. DAVIDSON S2 01 | 31 17 14 | 5 2 3 |
26 CARY W. DAVIDSON S2 02 | 28 15 13 | 3 0 3 |
56 CARY W. DAVIDSON S2 05 | 28 11 17 | 4 2 2 |
Number of Sections: 3 Average Students Per Section: 29.00
CTE362 VIS COM 2 SM 3 40 29| 26 13 13 | 2 2 0 |
36 CARY W. DAVIDSON S2 03 | 26 13 13 | 2 2 0 |
Number of Sections: 1 Average Students Per Section: 26.00
CTE365 VIS COM CS 1 SM 2 5 2| 2 1 1 | 0 0 0 |
36 CARY W. DAVIDSON S2 03 | 2 1 1 | 0 0 0 |
Number of Sections: 1 Average Students Per Section: 2.00
CTE366 VIS COM CS 2 SM 1 32 2| 2 0 2 | 0 0 0 |

1sonyr01.p 35-2 AUBURN MOUNTAINVIEW H. S. 03/01/12 Page:4
04.11.10.00.01 Course/Class Count Report 405 1:30 PM
EST NBR NBR ----TOTALS---- ---Spec Ed----
COURSE DESCRIPTION LGTH SEC AVL REQ TOT FEM MAL TOT FEM MAL
46 CARY W. DAVIDSON S2 04 | 1 0 1 | 0 0 0 |
56 CARY W. DAVIDSON S2 05 | 1 0 1 | 0 0 0 |
Number of Sections: 2 Average Students Per Section: 1.00
CTE371 DRAWING 1 SM 5 90 31| 31 10 21 | 2 0 2 |
46 CARY W. DAVIDSON S2 04 | 31 10 21 | 2 0 2 |
Number of Sections: 1 Average Students Per Section: 31.00
CTE372 DRAWING 2 SM 2 60 59| 59 33 26 | 7 3 4 |
26 LONNIE J. CHAVEZ S2 02 | 30 18 12 | 4 2 2 |
46 LONNIE J. CHAVEZ S2 04 | 29 15 14 | 3 1 2 |
Number of Sections: 2 Average Students Per Section: 29.50
CTE376 GRAPHIC DES 2 SM 1 30 20| 20 12 8 | 2 2 0 |
61 LONNIE J. CHAVEZ S2 06 | 20 12 8 | 2 2 0 |
Number of Sections: 1 Average Students Per Section: 20.00
CTE378 GRAPHC DES CS 2 SM 1 5 4| 4 2 2 | 0 0 0 |
56 LONNIE J. CHAVEZ S2 05 | 1 1 0 | 0 0 0 |
66 LONNIE J. CHAVEZ S2 06 | 3 1 2 | 0 0 0 |
Number of Sections: 2 Average Students Per Section: 2.00
CTE382 ELECTRONICS 2 SM 3 42 34| 34 2 32 | 2 0 2 |
26 MICHAEL R. FAWCETT S2 02 | 21 1 20 | 2 0 2 |
36 MICHAEL R. FAWCETT S2 03 | 13 1 12 | 0 0 0 |
Number of Sections: 2 Average Students Per Section: 17.00
CTE384 ELECTRONICS 4 SM 1 6 4| 4 0 4 | 0 0 0 |
36 MICHAEL R. FAWCETT S2 03 | 4 0 4 | 0 0 0 |
Number of Sections: 1 Average Students Per Section: 4.00
CTE390 ROBOTICS TECH 2 SM 1 16 15| 15 1 14 | 0 0 0 |
61 MICHAEL R. FAWCETT S2 06 | 15 1 14 | 0 0 0 |
Number of Sections: 1 Average Students Per Section: 15.00
CTE391 WEB PUBLISH 1 SM 1 12 2| 2 1 1 | 0 0 0 |
46 MICHAEL R. FAWCETT S2 04 | 1 0 1 | 0 0 0 |
66 MICHAEL R. FAWCETT S2 06 | 1 1 0 | 0 0 0 |
Number of Sections: 2 Average Students Per Section: 1.00
CTE392 WEB PUBLISH 2 SM 1 8 8| 8 2 6 | 0 0 0 |
36 MICHAEL R. FAWCETT S2 03 | 1 0 1 | 0 0 0 |
66 MICHAEL R. FAWCETT S2 06 | 7 2 5 | 0 0 0 |
Number of Sections: 2 Average Students Per Section: 4.00
CTE394 WEB PUBLISH 4 SM 2 1 1| 1 0 1 | 0 0 0 |
31 MICHAEL R. FAWCETT S2 03 | 1 0 1 | 0 0 0 |
66 MICHAEL R. FAWCETT S2 06 | 0 0 0 | 0 0 0 |
Number of Sections: 2 Average Students Per Section: 0.50
CTE401 DRAFTING 1 SM 4 56 24| 24 2 22 | 2 0 2 |
36 TIMOTHY M. SCOTT S2 03 | 24 2 22 | 2 0 2 |
Number of Sections: 1 Average Students Per Section: 24.00
CTE402 DRAFTING 2 SM 2 32 24| 24 3 21 | 0 0 0 |
46 TIMOTHY M. SCOTT S2 04 | 23 3 20 | 0 0 0 |
56 TIMOTHY M. SCOTT S2 05 | 1 0 1 | 0 0 0 |
Number of Sections: 2 Average Students Per Section: 12.00
CTE406 DRFT ENG TECH 2 SM 1 11 11| 11 0 11 | 0 0 0 |
56 TIMOTHY M. SCOTT S2 05 | 11 0 11 | 0 0 0 |
Number of Sections: 1 Average Students Per Section: 11.00
CTE407 DRFT ENG TECH 3 SM 2 7 1| 1 0 1 | 0 0 0 |
16 TIMOTHY M. SCOTT S2 01 | 1 0 1 | 0 0 0 |
Number of Sections: 1 Average Students Per Section: 1.00
CTE408 DRFT ENG TECH 4 SM 1 5 5| 5 0 5 | 0 0 0 |
56 TIMOTHY M. SCOTT S2 05 | 5 0 5 | 0 0 0 |
Number of Sections: 1 Average Students Per Section: 5.00
CTE412 COMP SYS ENG 2 SM 2 43 29| 29 2 27 | 1 0 1 |
1sonyr01.p 35-2 AUBURN MOUNTAINVIEW H. S. 03/01/12 Page:5
04.11.10.00.01 Course/Class Count Report 405 1:30 PM
EST NBR NBR ----TOTALS---- ---Spec Ed----
COURSE DESCRIPTION LGTH SEC AVL REQ TOT FEM MAL TOT FEM MAL
41 MICHAEL R. FAWCETT S2 04 | 16 1 15 | 0 0 0 |
51 MICHAEL R. FAWCETT S2 05 | 13 1 12 | 1 0 1 |
Number of Sections: 2 Average Students Per Section: 14.50
CTE414 COMP SYS ENG 4 SM 1 6 5| 5 0 5 | 0 0 0 |
31 MICHAEL R. FAWCETT S2 03 | 1 0 1 | 0 0 0 |
51 MICHAEL R. FAWCETT S2 05 | 3 0 3 | 0 0 0 |
61 MICHAEL R. FAWCETT S2 06 | 1 0 1 | 0 0 0 |
Number of Sections: 3 Average Students Per Section: 1.67
CTE420 COMP TECH CS 2 SM 1 2 1| 1 0 1 | 0 0 0 |
31 MICHAEL R. FAWCETT S2 03 | 0 0 0 | 0 0 0 |
51 MICHAEL R. FAWCETT S2 05 | 1 0 1 | 0 0 0 |
Number of Sections: 2 Average Students Per Section: 0.50
CTE456 WOODWRK DESGN 2 SM 2 44 38| 38 8 30 | 3 2 1 |
16 TIMOTHY M. SCOTT S2 01 | 16 3 13 | 2 1 1 |
26 TIMOTHY M. SCOTT S2 02 | 22 5 17 | 1 1 0 |
Number of Sections: 2 Average Students Per Section: 19.00
CTE458 WOODWRK DESGN 4 SM 1 6 4| 4 0 4 | 0 0 0 |
16 TIMOTHY M. SCOTT S2 01 | 4 0 4 | 0 0 0 |
Number of Sections: 1 Average Students Per Section: 4.00
CTE462 WOODWRK DESGN 6 SM 1 5 4| 4 0 4 | 2 0 2 |
16 TIMOTHY M. SCOTT S2 01 | 4 0 4 | 2 0 2 |
Number of Sections: 1 Average Students Per Section: 4.00
CTE466 YEARBOOK 2 SM 1 25 24| 24 15 9 | 0 0 0 |
61 STEPHANIE E. KEAGLE S2 06 | 24 15 9 | 0 0 0 |
Number of Sections: 1 Average Students Per Section: 24.00
CTE470 WBL GENERIC SM 1 60 0| 0 0 0 | 0 0 0 |
76 PATRICIA E. ECKELMAN S2 07 | 0 0 0 | 0 0 0 |
Number of Sections: 1 Average Students Per Section: 0.00
CTE472 WBL AUTOMOTIVE SM 1 60 1| 1 0 1 | 0 0 0 |
76 PATRICIA E. ECKELMAN S2 07 | 1 0 1 | 0 0 0 |
Number of Sections: 1 Average Students Per Section: 1.00
CTE473 WBL BUS ED SM 1 60 3| 3 0 3 | 0 0 0 |
76 PATRICIA E. ECKELMAN S2 07 | 3 0 3 | 0 0 0 |
Number of Sections: 1 Average Students Per Section: 3.00
CTE477 WBL CULNY ARTS SM 1 60 2| 2 1 1 | 0 0 0 |
76 PATRICIA E. ECKELMAN S2 07 | 2 1 1 | 0 0 0 |
Number of Sections: 1 Average Students Per Section: 2.00
CTE478 WBL DRAFT ENGIN SM 1 60 0| 0 0 0 | 0 0 0 |
76 PATRICIA E. ECKELMAN S2 07 | 0 0 0 | 0 0 0 |
Number of Sections: 1 Average Students Per Section: 0.00
CTE480 WBL FAM CONS SC SM 1 60 7| 7 7 0 | 1 1 0 |
76 PATRICIA E. ECKELMAN S2 07 | 7 7 0 | 1 1 0 |
Number of Sections: 1 Average Students Per Section: 7.00
CTE483 WBL JEWELRY MFG SM 1 60 2| 2 1 1 | 0 0 0 |
76 PATRICIA E. ECKELMAN S2 07 | 2 1 1 | 0 0 0 |
Number of Sections: 1 Average Students Per Section: 2.00
CTE484 WBL MARKETING SM 1 60 4| 4 3 1 | 0 0 0 |
76 PATRICIA E. ECKELMAN S2 07 | 4 3 1 | 0 0 0 |
Number of Sections: 1 Average Students Per Section: 4.00
CTE487 WBL SPORTS MED SM 1 60 3| 3 3 0 | 0 0 0 |
76 PATRICIA E. ECKELMAN S2 07 | 3 3 0 | 0 0 0 |
Number of Sections: 1 Average Students Per Section: 3.00
CTE488 WBL VIS COM SM 1 60 4| 4 3 1 | 0 0 0 |
76 PATRICIA E. ECKELMAN S2 07 | 4 3 1 | 0 0 0 |
Number of Sections: 1 Average Students Per Section: 4.00
CTE515 NEWSPAPER 2 SM 1 25 27| 26 20 6 | 0 0 0 |

1sonyr01.p 35-2 AUBURN MOUNTAINVIEW H. S. 03/01/12 Page:6
04.11.10.00.01 Course/Class Count Report 405 1:30 PM
EST NBR NBR ----TOTALS---- ---Spec Ed----
COURSE DESCRIPTION LGTH SEC AVL REQ TOT FEM MAL TOT FEM MAL
41 STEPHANIE E. KEAGLE S2 04 | 26 20 6 | 0 0 0 |
Number of Sections: 1 Average Students Per Section: 26.00
ELL102 ELL LAN ART 1B SM 1 16 4| 4 2 2 | 0 0 0 |
31 CHANTAL F. BALDACCI S2 03 | 3 1 2 | 0 0 0 |
61 CHANTAL F. BALDACCI S2 06 | 1 1 0 | 0 0 0 |
Number of Sections: 2 Average Students Per Section: 2.00
ELL121 ELL STDY SKILL2 SM 1 30 21| 21 10 11 | 3 3 0 |
51 CHANTAL F. BALDACCI S2 05 | 21 10 11 | 3 3 0 |
Number of Sections: 1 Average Students Per Section: 21.00
ELL202 ELL LAN ART 2B SM 1 15 10| 10 1 9 | 0 0 0 |
31 CHANTAL F. BALDACCI S2 03 | 10 1 9 | 0 0 0 |
Number of Sections: 1 Average Students Per Section: 10.00
ELL302 ELL LAN ART 3B SM 1 30 14| 14 6 8 | 1 1 0 |
61 CHANTAL F. BALDACCI S2 06 | 14 6 8 | 1 1 0 |
Number of Sections: 1 Average Students Per Section: 14.00
ELL810 ELL MONITORING YR 1 50 44| 44 21 23 | 12 8 4 |
71 CHANTAL F. BALDACCI YR 07 | 44 21 23 | 12 8 4 |
Number of Sections: 1 Average Students Per Section: 44.00
FOR202 FRENCH 2 SM 11 60 55| 55 37 18 | 2 2 0 |
21 CHANTAL F. BALDACCI S2 02 | 24 16 8 | 1 1 0 |
41 KYE S. CEZENNE S2 04 | 31 21 10 | 1 1 0 |
Number of Sections: 2 Average Students Per Section: 27.50
FOR204 FRENCH 4 SM 7 90 80| 80 45 35 | 2 1 1 |
11 KYE S. CEZENNE S2 01 | 28 20 8 | 1 1 0 |
31 KYE S. CEZENNE S2 03 | 26 12 14 | 0 0 0 |
61 KYE S. CEZENNE S2 06 | 26 13 13 | 1 0 1 |
Number of Sections: 3 Average Students Per Section: 26.67
FOR206 FRENCH 6 SM 1 19 16| 16 12 4 | 0 0 0 |
51 KYE S. CEZENNE S2 05 | 16 12 4 | 0 0 0 |
Number of Sections: 1 Average Students Per Section: 16.00
FOR208 FRENCH 8 SM 1 10 4| 4 4 0 | 0 0 0 |
51 KYE S. CEZENNE S2 05 | 4 4 0 | 0 0 0 |
Number of Sections: 1 Average Students Per Section: 4.00
FOR210 AP FRENCH 2 SM 1 11 8| 8 6 2 | 0 0 0 |
51 KYE S. CEZENNE S2 05 | 8 6 2 | 0 0 0 |
Number of Sections: 1 Average Students Per Section: 8.00
FOR402 JAPANESE 2 SM 6 60 52| 52 24 28 | 1 1 0 |
41 JESSICA C. LEE S2 04 | 25 10 15 | 1 1 0 |
61 JESSICA C. LEE S2 06 | 27 14 13 | 0 0 0 |
Number of Sections: 2 Average Students Per Section: 26.00
FOR404 JAPANESE 4 SM 1 30 17| 17 8 9 | 0 0 0 |
51 JESSICA C. LEE S2 05 | 17 8 9 | 0 0 0 |
Number of Sections: 1 Average Students Per Section: 17.00
FOR406 JAPANESE 6 SM 1 16 10| 10 5 5 | 0 0 0 |
31 JESSICA C. LEE S2 03 | 10 5 5 | 0 0 0 |
Number of Sections: 1 Average Students Per Section: 10.00
FOR410 AP JAPANESE 2 SM 1 14 12| 12 3 9 | 0 0 0 |
31 JESSICA C. LEE S2 03 | 12 3 9 | 0 0 0 |
Number of Sections: 1 Average Students Per Section: 12.00
FOR502 LATIN 2 SM 2 60 42| 42 21 21 | 1 0 1 |
21 RAY S. DALLY S2 02 | 16 10 6 | 0 0 0 |
41 RAY S. DALLY S2 04 | 26 11 15 | 1 0 1 |
Number of Sections: 2 Average Students Per Section: 21.00
FOR504 LATIN 4 SM 2 30 19| 19 14 5 | 0 0 0 |
31 RAY S. DALLY S2 03 | 19 14 5 | 0 0 0 |

1sonyr01.p 35-2 AUBURN MOUNTAINVIEW H. S. 03/01/12 Page:7
04.11.10.00.01 Course/Class Count Report 405 1:30 PM
EST NBR NBR ----TOTALS---- ---Spec Ed----
COURSE DESCRIPTION LGTH SEC AVL REQ TOT FEM MAL TOT FEM MAL
Number of Sections: 1 Average Students Per Section: 19.00
FOR506 LATIN 6 SM 1 10 7| 7 4 3 | 0 0 0 |
31 RAY S. DALLY S2 03 | 7 4 3 | 0 0 0 |
Number of Sections: 1 Average Students Per Section: 7.00
FOR508 LATIN 8 SM 1 5 0| 0 0 0 | 0 0 0 |
31 RAY S. DALLY S2 03 | 0 0 0 | 0 0 0 |
Number of Sections: 1 Average Students Per Section: 0.00
FOR602 SPANISH 2 SM 12 150 147| 147 83 64 | 5 3 2 |
11 DUSTIN P. HEDGER S2 01 | 29 16 13 | 1 1 0 |
31 NORMA I. VEGA COLON S2 03 | 30 14 16 | 1 0 1 |
41 DUSTIN P. HEDGER S2 04 | 30 19 11 | 1 1 0 |
51 NORMA I. VEGA COLON S2 05 | 28 16 12 | 0 0 0 |
61 NORMA I. VEGA COLON S2 06 | 30 18 12 | 2 1 1 |
Number of Sections: 5 Average Students Per Section: 29.40
FOR604 SPANISH 4 SM 8 120 113| 113 61 52 | 0 0 0 |
11 EVA D. MEANS S2 01 | 28 18 10 | 0 0 0 |
21 EVA D. MEANS S2 02 | 25 13 12 | 0 0 0 |
31 DUSTIN P. HEDGER S2 03 | 29 13 16 | 0 0 0 |
51 DUSTIN P. HEDGER S2 05 | 31 17 14 | 0 0 0 |
Number of Sections: 4 Average Students Per Section: 28.25
FOR606 SPANISH 6 SM 2 45 43| 43 25 18 | 1 0 1 |
21 DUSTIN P. HEDGER S2 02 | 24 14 10 | 0 0 0 |
31 EVA D. MEANS S2 03 | 19 11 8 | 1 0 1 |
Number of Sections: 2 Average Students Per Section: 21.50
FOR608 SPANISH 8 SM 1 15 12| 12 7 5 | 0 0 0 |
31 EVA D. MEANS S2 03 | 12 7 5 | 0 0 0 |
Number of Sections: 1 Average Students Per Section: 12.00
FOR616 NAT SPEAK SPAN2 SM 1 30 28| 28 16 12 | 2 1 1 |
41 NORMA I. VEGA COLON S2 04 | 28 16 12 | 2 1 1 |
Number of Sections: 1 Average Students Per Section: 28.00
GEN101 ORIENTATION SM 15 450 199| 199 102 97 | 9 5 4 |
16 JESSICA C. LEE S2 01 | 29 11 18 | 3 0 3 |
17 LONNIE J. CHAVEZ S2 01 | 29 18 11 | 1 1 0 |
18 JARED D. GERVAIS S2 01 | 29 13 16 | 0 0 0 |
19 PATRICIA E. ECKELMAN S2 01 | 30 17 13 | 2 1 1 |
26 JESSICA C. LEE S2 02 | 24 12 12 | 1 1 0 |
36 JARED D. GERVAIS S2 03 | 29 16 13 | 1 1 0 |
37 LONNIE J. CHAVEZ S2 03 | 29 15 14 | 1 1 0 |
Number of Sections: 7 Average Students Per Section: 28.43
GEN212 ADVISORY 2012 YR 70 454 332| 332 155 177 | 20 7 13 |
01 TORI T. AMMONS YR 08 | 6 3 3 | 0 0 0 |
02 ERIC D. ARNOLD YR 08 | 5 3 2 | 0 0 0 |
03 VIVIAN G. BAGLIEN YR 08 | 5 4 1 | 0 0 0 |
04 CHANTAL F. BALDACCI YR 08 | 6 3 3 | 0 0 0 |
05 PATRIA R. BAUMSTARK YR 08 | 5 2 3 | 0 0 0 |
06 HEIDI K. BENDT YR 08 | 6 2 4 | 0 0 0 |
07 JERRY P. BENTLER YR 08 | 5 1 4 | 1 0 1 |
08 LEIMOMI M. BOWLES YR 08 | 5 2 3 | 0 0 0 |
09 KRISTINE A. BROWN YR 08 | 3 1 2 | 0 0 0 |
10 JENNIE M. BUETOW YR 08 | 5 2 3 | 0 0 0 |
11 STEVEN I. CALHOUN YR 08 | 4 3 1 | 0 0 0 |
12 CHRISTOPHER J. CARR YR 08 | 5 4 1 | 0 0 0 |
13 LONNIE J. CHAVEZ YR 08 | 5 3 2 | 0 0 0 |
14 KYE S. CEZENNE YR 08 | 5 5 0 | 0 0 0 |
15 JANET H. CHU YR 08 | 5 3 2 | 0 0 0 |
16 MICHAEL J. CLANCY YR 08 | 4 3 1 | 0 0 0 |
1sonyr01.p 35-2 AUBURN MOUNTAINVIEW H. S. 03/01/12 Page:8
04.11.10.00.01 Course/Class Count Report 405 1:30 PM
EST NBR NBR ----TOTALS---- ---Spec Ed----
COURSE DESCRIPTION LGTH SEC AVL REQ TOT FEM MAL TOT FEM MAL
17 KENNETH N. COLBURN YR 08 | 4 1 3 | 1 0 1 |
18 GREGG R. COLLETTE YR 08 | 5 3 2 | 0 0 0 |
19 RAY S. DALLY YR 08 | 3 1 2 | 0 0 0 |
20 CARY W. DAVIDSON YR 08 | 5 4 1 | 1 1 0 |
21 PATRICIA E. ECKELMAN YR 08 | 6 1 5 | 0 0 0 |
22 DEREK E. ENZ YR 08 | 4 1 3 | 1 0 1 |
23 MICHAEL R. FAWCETT YR 08 | 4 2 2 | 0 0 0 |
24 PAUL H. FOUHY YR 08 | 3 2 1 | 0 0 0 |
25 ADAM C. FRANCE YR 08 | 4 2 2 | 0 0 0 |
26 KAREN M. FRERICHS YR 08 | 5 3 2 | 0 0 0 |
27 TARA N. FULTON YR 08 | 5 1 4 | 0 0 0 |
28 JARED D. GERVAIS YR 08 | 6 1 5 | 0 0 0 |
29 DOUGLAS S. GONZALES YR 08 | 6 1 5 | 1 0 1 |
30 KIRSTEN A. GRAVNING YR 08 | 4 1 3 | 0 0 0 |
31 ANECIA D. GRIGSBY YR 08 | 4 1 3 | 0 0 0 |
32 REGINA K. GRUBB YR 08 | 0 0 0 | 0 0 0 |
33 SAMIA P. HALLAK YR 08 | 5 3 2 | 1 0 1 |
34 EVELYN I. HAMMER YR 08 | 3 3 0 | 0 0 0 |
35 ROBIN K. HAMMER YR 08 | 4 2 2 | 0 0 0 |
36 THERESA A. HAYNES YR 08 | 3 1 2 | 0 0 0 |
37 DUSTIN P. HEDGER YR 08 | 5 4 1 | 0 0 0 |
38 JAYME L. HOSTETTER YR 08 | 4 2 2 | 0 0 0 |
39 STEPHANIE E. KEAGLE YR 08 | 5 1 4 | 0 0 0 |
40 JESSICA C. LEE YR 08 | 4 2 2 | 0 0 0 |
41 NATHAN R. LEMANSKI YR 08 | 5 0 5 | 0 0 0 |
42 ROBERTA J. LOCKE YR 08 | 5 1 4 | 0 0 0 |
43 KAY M. LORRAIN YR 08 | 5 5 0 | 0 0 0 |
44 BRIAN E. LOVEJOY YR 08 | 3 2 1 | 0 0 0 |
45 EVA D. MEANS YR 08 | 5 2 3 | 1 0 1 |
46 DORIN J. MEINHART YR 08 | 5 0 5 | 0 0 0 |
47 AMY L. MILLS GOLDBERG YR 08 | 5 3 2 | 1 1 0 |
48 LEAHMARIE O'BRIEN YR 08 | 3 1 2 | 0 0 0 |
49 NORENE L. OSBORNE YR 08 | 4 1 3 | 0 0 0 |
51 DAVID A. PRESTON YR 08 | 4 3 1 | 0 0 0 |
52 JON W. PRICE YR 08 | 4 2 2 | 1 0 1 |
53 DEREK V. PYLE YR 08 | 3 3 0 | 0 0 0 |
54 WAYNE D. RUMBAUGH YR 08 | 4 2 2 | 1 0 1 |
55 TIMOTHY M. SCOTT YR 08 | 4 2 2 | 0 0 0 |
56 MAUREEN A. SERNA YR 08 | 4 2 2 | 0 0 0 |
57 KARL F. STEFFIN YR 08 | 5 4 1 | 0 0 0 |
58 JULIANNE R. STRICHERZ YR 08 | 2 0 2 | 0 0 0 |
59 LESLIE J. TAUZER YR 08 | 5 2 3 | 0 0 0 |
60 JANA D. THOMAS YR 08 | 4 1 3 | 0 0 0 |
61 ALICIA J. THOMPSON YR 08 | 0 0 0 | 0 0 0 |
62 BRIAN K. TINSLEY YR 08 | 5 3 2 | 1 0 1 |
63 NORMA I. VEGA COLON YR 08 | 5 1 4 | 0 0 0 |
64 GLEN W. WALKER YR 08 | 5 0 5 | 0 0 0 |
65 JOHN P. TOMASI YR 08 | 7 4 3 | 0 0 0 |
66 DEBRA J. LANDIS YR 08 | 7 3 4 | 1 0 1 |
67 KAREN L. BROWN YR 08 | 6 2 4 | 0 0 0 |
68 KAREN M. AINSWORTH YR 08 | 9 3 6 | 2 1 1 |
69 CAROL L. HANSON YR 08 | 6 3 3 | 0 0 0 |
70 MONTE F. ECKELMAN YR 08 | 5 2 3 | 0 0 0 |
71 TERRI A. HERREN YR 08 | 6 4 2 | 0 0 0 |
72 STEVEN R. DUBAY YR 08 | 5 2 3 | 0 0 0 |
73 ANDREA MCHENRY YR 08 | 1 1 0 | 0 0 0 |

1sonyr01.p 35-2 AUBURN MOUNTAINVIEW H. S. 03/01/12 Page:9
04.11.10.00.01 Course/Class Count Report 405 1:30 PM
EST NBR NBR ----TOTALS---- ---Spec Ed----
COURSE DESCRIPTION LGTH SEC AVL REQ TOT FEM MAL TOT FEM MAL
74 NANCY E. TAPP YR 08 | 0 0 0 | 0 0 0 |
75 ANGELA K. MCCAUSLAND YR 08 | 6 4 2 | 6 4 2 |
Number of Sections: 74 Average Students Per Section: 4.49
GEN400 AMHS CORE SM 106 3710 572| 572 232 340 | 67 24 43 |
02 TORI T. AMMONS S2 09 | 13 5 8 | 1 1 0 |
04 ERIC D. ARNOLD S2 09 | 12 4 8 | 0 0 0 |
06 VIVIAN G. BAGLIEN S2 09 | 1 0 1 | 0 0 0 |
08 CHANTAL F. BALDACCI S2 09 | 8 3 5 | 0 0 0 |
10 PATRIA R. BAUMSTARK S2 09 | 13 2 11 | 0 0 0 |
100 HEIDI K. BENDT S2 09 | 12 3 9 | 0 0 0 |
102 JERRY P. BENTLER S2 09 | 15 6 9 | 1 0 1 |
104 LEIMOMI M. BOWLES S2 09 | 0 0 0 | 0 0 0 |
106 FRANK G. BOYKO S2 09 | 22 8 14 | 1 0 1 |
109 JENNIE M. BUETOW S2 09 | 15 4 11 | 2 0 2 |
111 STEVEN I. CALHOUN S2 09 | 2 1 1 | 0 0 0 |
113 CHRISTOPHER J. CARR S2 09 | 18 9 9 | 5 3 2 |
115 KYE S. CEZENNE S2 09 | 5 1 4 | 0 0 0 |
117 LONNIE J. CHAVEZ S2 09 | 3 2 1 | 0 0 0 |
12 JANET H. CHU S2 09 | 16 3 13 | 0 0 0 |
124 BRIAN K. TINSLEY S2 09 | 4 0 4 | 4 0 4 |
125 NORMA I. VEGA COLON S2 09 | 2 1 1 | 0 0 0 |
126 GLEN W. WALKER S2 09 | 0 0 0 | 0 0 0 |
127 JARED D. GERVAIS S2 09 | 17 11 6 | 2 1 1 |
14 MICHAEL J. CLANCY S2 09 | 20 10 10 | 1 0 1 |
16 KENNETH N. COLBURN S2 09 | 4 1 3 | 0 0 0 |
18 GREGG R. COLLETTE S2 09 | 9 2 7 | 0 0 0 |
20 RAY S. DALLY S2 09 | 15 10 5 | 1 1 0 |
22 CARY W. DAVIDSON S2 09 | 0 0 0 | 0 0 0 |
24 PATRICIA E. ECKELMAN S2 09 | 0 0 0 | 0 0 0 |
26 DEREK E. ENZ S2 09 | 1 1 0 | 0 0 0 |
28 MICHAEL R. FAWCETT S2 09 | 6 0 6 | 0 0 0 |
30 PAUL H. FOUHY S2 09 | 3 1 2 | 0 0 0 |
32 ADAM C. FRANCE S2 09 | 14 5 9 | 0 0 0 |
34 KAREN M. FRERICHS S2 09 | 0 0 0 | 0 0 0 |
36 TARA N. FULTON S2 09 | 11 5 6 | 10 5 5 |
38 DOUGLAS S. GONZALES S2 09 | 17 8 9 | 3 0 3 |
40 KIRSTEN A. GRAVNING S2 09 | 16 4 12 | 1 0 1 |
42 ANECIA D. GRIGSBY S2 09 | 14 4 10 | 13 4 9 |
44 SAMIA P. HALLAK S2 09 | 25 7 18 | 1 0 1 |
46 EVELYN I. HAMMER S2 09 | 7 3 4 | 0 0 0 |
48 ROBIN K. HAMMER S2 09 | 12 5 7 | 1 0 1 |
50 THERESA A. HAYNES S2 09 | 2 1 1 | 0 0 0 |
52 DUSTIN P. HEDGER S2 09 | 4 3 1 | 0 0 0 |
54 JAYME L. HOSTETTER S2 09 | 3 1 2 | 1 0 1 |
56 STEPHANIE E. KEAGLE S2 09 | 7 3 4 | 0 0 0 |
58 JESSICA C. LEE S2 09 | 5 1 4 | 0 0 0 |
60 NATHAN R. LEMANSKI S2 09 | 15 5 10 | 4 1 3 |
62 ROBERTA J. LOCKE S2 09 | 0 0 0 | 0 0 0 |
64 AMY K. LORRAIN S2 09 | 0 0 0 | 0 0 0 |
66 BRIAN E. LOVEJOY S2 09 | 21 10 11 | 0 0 0 |
68 ANGELA K. MCCAUSLAND S2 09 | 10 7 3 | 9 6 3 |
70 EVA D. MEANS S2 09 | 4 2 2 | 0 0 0 |
72 DORIN J. MEINHART S2 00 | 0 0 0 | 0 0 0 |
74 AMY L. MILLS GOLDBERG S2 09 | 1 0 1 | 0 0 0 |
76 LEAHMARIE O'BRIEN S2 09 | 21 8 13 | 2 1 1 |
78 NORENE L. OSBORNE S2 09 | 5 1 4 | 0 0 0 |

1sonyr01.p 35-2 AUBURN MOUNTAINVIEW H. S. 03/01/12 Page:10
04.11.10.00.01 Course/Class Count Report 405 1:30 PM
EST NBR NBR ----TOTALS---- ---Spec Ed----
COURSE DESCRIPTION LGTH SEC AVL REQ TOT FEM MAL TOT FEM MAL
80 DAVID A. PRESTON S2 09 | 23 9 14 | 0 0 0 |
82 JON W. PRICE S2 09 | 15 10 5 | 3 1 2 |
84 DEREK V. PYLE S2 09 | 0 0 0 | 0 0 0 |
86 WAYNE D. RUMBAUGH S2 09 | 19 9 10 | 0 0 0 |
88 TIMOTHY M. SCOTT S2 09 | 0 0 0 | 0 0 0 |
90 MAUREEN A. SERNA S2 09 | 14 4 10 | 0 0 0 |
92 KARL F. STEFFIN S2 09 | 11 3 8 | 0 0 0 |
94 JULIANNE R. STRICHERZ S2 09 | 18 12 6 | 1 0 1 |
96 LESLIE J. TAUZER S2 09 | 21 14 7 | 0 0 0 |
98 JANA D. THOMAS S2 09 | 1 0 1 | 0 0 0 |
Number of Sections: 62 Average Students Per Section: 9.23
GEN501 ADM OFF AIDE SM 1 11 9| 9 3 6 | 1 0 1 |
16 ANDREA MCHENRY S2 01 | 1 1 0 | 0 0 0 |
26 ANDREA MCHENRY S2 02 | 1 0 1 | 1 0 1 |
36 ANDREA MCHENRY S2 03 | 1 1 0 | 0 0 0 |
46 ANDREA MCHENRY S2 04 | 2 0 2 | 0 0 0 |
56 ANDREA MCHENRY S2 05 | 1 0 1 | 0 0 0 |
66 ANDREA MCHENRY S2 06 | 1 0 1 | 0 0 0 |
76 ANDREA MCHENRY S2 07 | 1 1 0 | 0 0 0 |
96 ANDREA MCHENRY S2 09 | 1 0 1 | 0 0 0 |
Number of Sections: 8 Average Students Per Section: 1.13
GEN508 ATTEND AIDE SM 1 27 26| 26 17 9 | 6 4 2 |
16 MICHAEL J. CLANCY S2 01 | 3 3 0 | 2 2 0 |
26 MICHAEL J. CLANCY S2 02 | 3 2 1 | 1 1 0 |
36 MICHAEL J. CLANCY S2 03 | 3 2 1 | 0 0 0 |
46 MICHAEL J. CLANCY S2 04 | 4 1 3 | 1 0 1 |
56 MICHAEL J. CLANCY S2 05 | 3 2 1 | 0 0 0 |
66 MICHAEL J. CLANCY S2 06 | 4 3 1 | 2 1 1 |
76 MICHAEL J. CLANCY S2 07 | 5 3 2 | 0 0 0 |
96 MICHAEL J. CLANCY S2 09 | 1 1 0 | 0 0 0 |
Number of Sections: 8 Average Students Per Section: 3.25
GEN510 CAREER AIDE SM 1 8 3| 3 2 1 | 0 0 0 |
16 CAROL L. HANSON S2 01 | 2 1 1 | 0 0 0 |
26 CAROL L. HANSON S2 02 | 0 0 0 | 0 0 0 |
36 CAROL L. HANSON S2 03 | 0 0 0 | 0 0 0 |
46 CAROL L. HANSON S2 04 | 1 1 0 | 0 0 0 |
56 CAROL L. HANSON S2 05 | 0 0 0 | 0 0 0 |
66 CAROL L. HANSON S2 06 | 0 0 0 | 0 0 0 |
Number of Sections: 6 Average Students Per Section: 0.50
GEN512 GUID OFF AIDE SM 1 19 17| 17 11 6 | 2 2 0 |
16 DEANNE M. BASSEN S2 01 | 2 2 0 | 1 1 0 |
26 DEANNE M. BASSEN S2 02 | 2 2 0 | 1 1 0 |
36 KAREN L. BROWN S2 03 | 3 2 1 | 0 0 0 |
46 DEANNE M. BASSEN S2 04 | 4 3 1 | 0 0 0 |
56 DEANNE M. BASSEN S2 05 | 2 1 1 | 0 0 0 |
66 DEANNE M. BASSEN S2 06 | 3 0 3 | 0 0 0 |
76 DEANNE M. BASSEN S2 07 | 1 1 0 | 0 0 0 |
Number of Sections: 7 Average Students Per Section: 2.43
GEN514 LIBRARY AIDE SM 2 14 8| 8 5 3 | 1 1 0 |
16 NANCY E. TAPP S2 01 | 2 1 1 | 0 0 0 |
26 NANCY E. TAPP S2 02 | 1 1 0 | 1 1 0 |
36 NANCY E. TAPP S2 03 | 0 0 0 | 0 0 0 |
46 NANCY E. TAPP S2 04 | 2 1 1 | 0 0 0 |
56 NANCY E. TAPP S2 05 | 1 0 1 | 0 0 0 |
66 NANCY E. TAPP S2 06 | 1 1 0 | 0 0 0 |
96 NANCY E. TAPP S2 09 | 1 1 0 | 0 0 0 |

1sonyr01.p 35-2 AUBURN MOUNTAINVIEW H. S. 03/01/12 Page:11
04.11.10.00.01 Course/Class Count Report 405 1:30 PM
EST NBR NBR ----TOTALS---- ---Spec Ed----
COURSE DESCRIPTION LGTH SEC AVL REQ TOT FEM MAL TOT FEM MAL
Number of Sections: 7 Average Students Per Section: 1.14
GEN515 NURSE AIDE SM 1 1 1| 1 1 0 | 0 0 0 |
46 KELLY L. LIBADIA S2 04 | 1 1 0 | 0 0 0 |
Number of Sections: 1 Average Students Per Section: 1.00
GEN601 TEACHER AIDE SM 1 62 51| 51 34 17 | 1 1 0 |
13 DEREK E. ENZ S2 01 | 1 1 0 | 0 0 0 |
15 KAREN M. FRERICHS S2 01 | 1 0 1 | 0 0 0 |
16 DORIN J. MEINHART S2 01 | 0 0 0 | 0 0 0 |
17 CHANTAL F. BALDACCI S2 01 | 1 1 0 | 0 0 0 |
18 DUSTIN P. HEDGER S2 01 | 1 0 1 | 0 0 0 |
19 KYE S. CEZENNE S2 01 | 1 0 1 | 0 0 0 |
26 HEIDI K. BENDT S2 02 | 1 1 0 | 0 0 0 |
27 ANECIA D. GRIGSBY S2 02 | 0 0 0 | 0 0 0 |
28 CHANTAL F. BALDACCI S2 02 | 1 0 1 | 0 0 0 |
29 GLEN W. WALKER S2 02 | 1 0 1 | 0 0 0 |
2P JON W. PRICE S2 03 | 0 0 0 | 0 0 0 |
30 KARL F. STEFFIN S2 03 | 1 1 0 | 0 0 0 |
31 DEREK E. ENZ S2 03 | 1 1 0 | 0 0 0 |
32 JULIANNE R. STRICHERZ S2 03 | 1 1 0 | 0 0 0 |
33 PATRICIA E. ECKELMAN S2 03 | 1 0 1 | 0 0 0 |
34 HEIDI K. BENDT S2 03 | 0 0 0 | 0 0 0 |
35 STEPHANIE E. KEAGLE S2 03 | 2 1 1 | 0 0 0 |
36 PAUL H. FOUHY S2 03 | 1 1 0 | 0 0 0 |
37 STEVEN I. CALHOUN S2 03 | 1 0 1 | 0 0 0 |
38 VIVIAN G. BAGLIEN S2 03 | 1 1 0 | 0 0 0 |
39 NORENE L. OSBORNE S2 03 | 1 1 0 | 0 0 0 |
3E PATRICIA E. ECKELMAN S2 03 | 1 1 0 | 0 0 0 |
3G ANECIA D. GRIGSBY S2 03 | 1 1 0 | 1 1 0 |
40 DEREK E. ENZ S2 04 | 1 0 1 | 0 0 0 |
41 NORMA I. VEGA COLON S2 04 | 1 1 0 | 0 0 0 |
42 JESSICA C. LEE S2 04 | 0 0 0 | 0 0 0 |
43 JON W. PRICE S2 04 | 1 1 0 | 0 0 0 |
44 KENNETH N. COLBURN S2 04 | 1 0 1 | 0 0 0 |
45 KIMBERLY M. STENSON S2 04 | 1 0 1 | 0 0 0 |
46 DORIN J. MEINHART S2 04 | 1 0 1 | 0 0 0 |
46C JANET H. CHU S2 04 | 1 1 0 | 0 0 0 |
47 JENNIE M. BUETOW S2 04 | 1 1 0 | 0 0 0 |
48 BRIAN E. LOVEJOY S2 04 | 1 1 0 | 0 0 0 |
49 HEIDI K. BENDT S2 04 | 1 1 0 | 0 0 0 |
4B JERRY P. BENTLER S2 04 | 1 0 1 | 0 0 0 |
4C KYE S. CEZENNE S2 04 | 1 1 0 | 0 0 0 |
4CH LONNIE J. CHAVEZ S2 04 | 1 0 1 | 0 0 0 |
4d CARY W. DAVIDSON S2 04 | 1 0 1 | 0 0 0 |
4G JARED D. GERVAIS S2 04 | 0 0 0 | 0 0 0 |
50 KAREN M. FRERICHS S2 05 | 1 1 0 | 0 0 0 |
51 EVELYN I. HAMMER S2 05 | 0 0 0 | 0 0 0 |
52 CHANTAL F. BALDACCI S2 05 | 1 1 0 | 0 0 0 |
53 TORI T. AMMONS S2 05 | 1 1 0 | 0 0 0 |
56 LONNIE J. CHAVEZ S2 05 | 0 0 0 | 0 0 0 |
57 LEIMOMI M. BOWLES S2 05 | 1 1 0 | 0 0 0 |
58 JON W. PRICE S2 05 | 1 1 0 | 0 0 0 |
59 LONNIE J. CHAVEZ S2 05 | 1 1 0 | 0 0 0 |
5B JENNIE M. BUETOW S2 05 | 1 1 0 | 0 0 0 |
5G VIVIAN G. BAGLIEN S2 05 | 1 1 0 | 0 0 0 |
63 GLEN W. WALKER S2 06 | 1 1 0 | 0 0 0 |
64 REGINA K. GRUBB S2 06 | 1 1 0 | 0 0 0 |

1sonyr01.p 35-2 AUBURN MOUNTAINVIEW H. S. 03/01/12 Page:12
04.11.10.00.01 Course/Class Count Report 405 1:30 PM
EST NBR NBR ----TOTALS---- ---Spec Ed----
COURSE DESCRIPTION LGTH SEC AVL REQ TOT FEM MAL TOT FEM MAL
65 LEIMOMI M. BOWLES S2 06 | 1 1 0 | 0 0 0 |
66 JANA D. THOMAS S2 06 | 1 1 0 | 0 0 0 |
66B HEIDI K. BENDT S2 06 | 1 1 0 | 0 0 0 |
66F PAUL H. FOUHY S2 06 | 1 1 0 | 0 0 0 |
67 CHANTAL F. BALDACCI S2 06 | 0 0 0 | 0 0 0 |
67B STEVEN I. CALHOUN S2 06 | 0 0 0 | 0 0 0 |
68 JARED D. GERVAIS S2 06 | 1 0 1 | 0 0 0 |
68B NATHAN R. LEMANSKI S2 06 | 1 0 1 | 0 0 0 |
69 CHANTAL F. BALDACCI S2 06 | 1 1 0 | 0 0 0 |
6C LONNIE J. CHAVEZ S2 06 | 0 0 0 | 0 0 0 |
Number of Sections: 61 Average Students Per Section: 0.84
GEN700 RELEASE TIME SM 2 370 74| 73 29 44 | 4 2 2 |
16 ANDREA MCHENRY S2 01 | 20 8 12 | 1 0 1 |
26 ANDREA MCHENRY S2 02 | 9 4 5 | 1 0 1 |
36 ANDREA MCHENRY S2 03 | 5 1 4 | 0 0 0 |
46 ANDREA MCHENRY S2 04 | 7 2 5 | 0 0 0 |
56 ANDREA MCHENRY S2 05 | 9 4 5 | 0 0 0 |
66 ANDREA MCHENRY S2 06 | 23 10 13 | 2 2 0 |
Number of Sections: 6 Average Students Per Section: 12.17
GEN701 REL-SEMINARY YR 2 120 28| 28 16 12 | 3 3 0 |
11 ANDREA MCHENRY YR 01 | 14 7 7 | 0 0 0 |
41 ANDREA MCHENRY YR 04 | 1 1 0 | 0 0 0 |
61 ANDREA MCHENRY YR 06 | 13 8 5 | 3 3 0 |
91 ANDREA MCHENRY YR 09 | 0 0 0 | 0 0 0 |
Number of Sections: 4 Average Students Per Section: 7.00
GEN705 COACH MONITOR YR 1 175 70| 70 0 70 | 0 0 0 |
SOC CARY W. DAVIDSON YR 07 | 70 0 70 | 0 0 0 |
VB1 LEIMOMI M. BOWLES YR 07 | 0 0 0 | 0 0 0 |
VB2 LEIMOMI M. BOWLES YR 09 | 0 0 0 | 0 0 0 |
Number of Sections: 3 Average Students Per Section: 23.33
GEN706 C L MONITORING YR 1 160 88| 88 36 52 | 87 35 52 |
71 ANECIA D. GRIGSBY YR 07 | 28 11 17 | 27 10 17 |
72 TARA N. FULTON YR 07 | 28 10 18 | 28 10 18 |
73 ANGELA K. MCCAUSLAND YR 07 | 17 11 6 | 17 11 6 |
74 AMBER R. COX YR 07 | 11 4 7 | 11 4 7 |
75 BRIAN K. TINSLEY YR 07 | 4 0 4 | 4 0 4 |
Number of Sections: 5 Average Students Per Section: 17.60
GEN708 APEX SM 1 62 27| 27 12 15 | 0 0 0 |
66 SAMIA P. HALLAK S2 06 | 27 12 15 | 0 0 0 |
Number of Sections: 1 Average Students Per Section: 27.00
GEN710 RUNNING START SM 13 1550 561| 560 277 283 | 0 0 0 |
16 KAREN L. BROWN S2 01 | 91 45 46 | 0 0 0 |
26 KAREN L. BROWN S2 02 | 95 45 50 | 0 0 0 |
36 KAREN L. BROWN S2 03 | 102 49 53 | 0 0 0 |
46 KAREN L. BROWN S2 04 | 101 49 52 | 0 0 0 |
56 KAREN L. BROWN S2 05 | 91 47 44 | 0 0 0 |
66 KAREN L. BROWN S2 06 | 79 41 38 | 0 0 0 |
76 KAREN L. BROWN S2 07 | 1 1 0 | 0 0 0 |
Number of Sections: 7 Average Students Per Section: 80.00
GEN800 INDEP STUDY SM 1 2 1| 1 1 0 | 0 0 0 |
66 JESSICA C. LEE S2 06 | 1 1 0 | 0 0 0 |
Number of Sections: 1 Average Students Per Section: 1.00
GEN805 LEADERSHIP SM 2 60 21| 21 7 14 | 1 0 1 |
36 JANA D. THOMAS S2 03 | 21 7 14 | 1 0 1 |
Number of Sections: 1 Average Students Per Section: 21.00
GEN806 ADV LEADERSHIP SM 1 60 28| 28 17 11 | 0 0 0 |

1sonyr01.p 35-2 AUBURN MOUNTAINVIEW H. S. 03/01/12 Page:13
04.11.10.00.01 Course/Class Count Report 405 1:30 PM
EST NBR NBR ----TOTALS---- ---Spec Ed----
COURSE DESCRIPTION LGTH SEC AVL REQ TOT FEM MAL TOT FEM MAL
26 JANA D. THOMAS S2 02 | 28 17 11 | 0 0 0 |
Number of Sections: 1 Average Students Per Section: 28.00
GEN809 SERV LEARN SM 1 30 20| 20 14 6 | 1 1 0 |
66 HEIDI K. BENDT S2 06 | 20 14 6 | 1 1 0 |
Number of Sections: 1 Average Students Per Section: 20.00
GEN814 AHS AUTO TECH YR 2 10 5| 5 0 5 | 0 0 0 |
11 STEVEN R. DUBAY YR 01 | 5 0 5 | 0 0 0 |
Number of Sections: 1 Average Students Per Section: 5.00
GEN816 AHS WELDING YR 1 8 2| 2 0 2 | 0 0 0 |
11 STEVEN R. DUBAY YR 01 | 1 0 1 | 0 0 0 |
21 STEVEN R. DUBAY YR 02 | 1 0 1 | 0 0 0 |
31 STEVEN R. DUBAY YR 03 | 0 0 0 | 0 0 0 |
Number of Sections: 3 Average Students Per Section: 0.67
GEN817 AHS MACH TRNG YR 1 30 1| 1 0 1 | 0 0 0 |
01 STEVEN R. DUBAY YR 01 | 1 0 1 | 0 0 0 |
Number of Sections: 1 Average Students Per Section: 1.00
GEN823 WAHS STUDENT YR 1 2 2| 2 2 0 | 0 0 0 |
11 MONTE F. ECKELMAN YR 00 | 2 2 0 | 0 0 0 |
Number of Sections: 1 Average Students Per Section: 2.00
GEN825 HOME SCHOOL YR 2 180 28| 28 11 17 | 0 0 0 |
11 ANDREA MCHENRY YR 01 | 6 2 4 | 0 0 0 |
21 ANDREA MCHENRY YR 02 | 4 2 2 | 0 0 0 |
31 ANDREA MCHENRY YR 03 | 4 2 2 | 0 0 0 |
41 ANDREA MCHENRY YR 04 | 3 1 2 | 0 0 0 |
51 ANDREA MCHENRY YR 05 | 2 1 1 | 0 0 0 |
61 ANDREA MCHENRY YR 06 | 9 3 6 | 0 0 0 |
Number of Sections: 6 Average Students Per Section: 4.67
LAN102 LA 9 INTERVEN 2 SM 1 30 25| 25 8 17 | 0 0 0 |
11 SAMIA P. HALLAK S2 01 | 10 2 8 | 0 0 0 |
41 NATHAN R. LEMANSKI S2 04 | 15 6 9 | 0 0 0 |
Number of Sections: 2 Average Students Per Section: 12.50
LAN121 LA 9 2 SM 14 300 276| 276 123 153 | 4 1 3 |
11 HEIDI K. BENDT S2 01 | 28 8 20 | 1 0 1 |
12 MAUREEN A. SERNA S2 01 | 27 11 16 | 0 0 0 |
21 JANET H. CHU S2 02 | 28 12 16 | 0 0 0 |
22 SAMIA P. HALLAK S2 02 | 28 13 15 | 0 0 0 |
31 HEIDI K. BENDT S2 03 | 27 13 14 | 1 0 1 |
32 JANET H. CHU S2 03 | 27 13 14 | 0 0 0 |
33 MAUREEN A. SERNA S2 03 | 0 0 0 | 0 0 0 |
41 MAUREEN A. SERNA S2 04 | 28 13 15 | 1 1 0 |
42 SAMIA P. HALLAK S2 04 | 28 14 14 | 0 0 0 |
51 HEIDI K. BENDT S2 05 | 28 11 17 | 1 0 1 |
52 SAMIA P. HALLAK S2 05 | 27 15 12 | 0 0 0 |
Number of Sections: 11 Average Students Per Section: 25.09
LAN131 LA 9 HONORS 2 SM 4 120 120| 120 71 49 | 0 0 0 |
21 GREGG R. COLLETTE S2 02 | 30 20 10 | 0 0 0 |
31 GREGG R. COLLETTE S2 03 | 30 18 12 | 0 0 0 |
41 GREGG R. COLLETTE S2 04 | 29 17 12 | 0 0 0 |
51 GREGG R. COLLETTE S2 05 | 31 16 15 | 0 0 0 |
Number of Sections: 4 Average Students Per Section: 30.00
LAN221 LA 10 2 SM 8 210 217| 217 110 107 | 11 4 7 |
11 STEPHANIE E. KEAGLE S2 01 | 31 16 15 | 3 2 1 |
21 MAUREEN A. SERNA S2 02 | 30 21 9 | 1 0 1 |
22 STEPHANIE E. KEAGLE S2 02 | 31 14 17 | 0 0 0 |
31 NATHAN R. LEMANSKI S2 03 | 30 14 16 | 0 0 0 |
41 KRISTINE A. BROWN S2 04 | 32 14 18 | 1 0 1 |

1sonyr01.p 35-2 AUBURN MOUNTAINVIEW H. S. 03/01/12 Page:14
04.11.10.00.01 Course/Class Count Report 405 1:30 PM
EST NBR NBR ----TOTALS---- ---Spec Ed----
COURSE DESCRIPTION LGTH SEC AVL REQ TOT FEM MAL TOT FEM MAL
51 NATHAN R. LEMANSKI S2 05 | 32 14 18 | 5 2 3 |
61 MAUREEN A. SERNA S2 06 | 31 17 14 | 1 0 1 |
Number of Sections: 7 Average Students Per Section: 31.00
LAN231 LA 10 HONORS 2 SM 5 120 109| 109 80 29 | 1 1 0 |
11 EVELYN I. HAMMER S2 01 | 25 18 7 | 0 0 0 |
12 NATHAN R. LEMANSKI S2 01 | 25 17 8 | 0 0 0 |
21 EVELYN I. HAMMER S2 02 | 29 25 4 | 1 1 0 |
51 EVELYN I. HAMMER S2 05 | 30 20 10 | 0 0 0 |
Number of Sections: 4 Average Students Per Section: 27.25
LAN302 LA INTERVEN 2 SM 1 30 24| 24 11 13 | 2 0 2 |
46 EVELYN I. HAMMER S2 04 | 13 8 5 | 1 0 1 |
LP1 HEIDI K. BENDT S2 02 | 11 3 8 | 1 0 1 |
Number of Sections: 2 Average Students Per Section: 12.00
LAN321 AMER LIT 2 SM 11 240 225| 225 99 126 | 13 7 6 |
11 ADAM C. FRANCE S2 01 | 29 15 14 | 1 0 1 |
12 PAUL H. FOUHY S2 01 | 30 15 15 | 1 1 0 |
22 ADAM C. FRANCE S2 02 | 32 12 20 | 0 0 0 |
31 ADAM C. FRANCE S2 03 | 29 13 16 | 0 0 0 |
41 JANET H. CHU S2 04 | 29 8 21 | 4 2 2 |
51 JANET H. CHU S2 05 | 30 15 15 | 5 3 2 |
61 JANET H. CHU S2 06 | 25 10 15 | 2 1 1 |
62 ADAM C. FRANCE S2 06 | 21 11 10 | 0 0 0 |
Number of Sections: 8 Average Students Per Section: 28.13
LAN331 AP LAN/COMP 2 SM 3 60 64| 64 35 29 | 0 0 0 |
51 KRISTINE A. BROWN S2 05 | 31 20 11 | 0 0 0 |
61 KRISTINE A. BROWN S2 06 | 33 15 18 | 0 0 0 |
Number of Sections: 2 Average Students Per Section: 32.00
LAN410 COMMUN ARTS SM 2 60 33| 32 9 23 | 3 0 3 |
26 PAUL H. FOUHY S2 02 | 32 9 23 | 3 0 3 |
Number of Sections: 1 Average Students Per Section: 32.00
LAN413 INDIV LIT 1 SM 2 90 83| 82 40 42 | 5 1 4 |
16 ROBIN K. HAMMER S2 01 | 27 10 17 | 3 1 2 |
36 MAUREEN A. SERNA S2 03 | 26 14 12 | 1 0 1 |
56 STEPHANIE E. KEAGLE S2 05 | 29 16 13 | 1 0 1 |
Number of Sections: 3 Average Students Per Section: 27.33
LAN415 SPORTS LIT SM 1 30 29| 29 7 22 | 2 0 2 |
56 ADAM C. FRANCE S2 05 | 29 7 22 | 2 0 2 |
Number of Sections: 1 Average Students Per Section: 29.00
LAN416 CREATIVE WRIT SM 3 50 25| 25 17 8 | 0 0 0 |
66 NATHAN R. LEMANSKI S2 06 | 25 17 8 | 0 0 0 |
Number of Sections: 1 Average Students Per Section: 25.00
LAN418 POETRY SM 2 60 29| 29 15 14 | 1 0 1 |
66 EVELYN I. HAMMER S2 06 | 29 15 14 | 1 0 1 |
Number of Sections: 1 Average Students Per Section: 29.00
LAN431 AP LIT/COMP 2 SM 3 90 77| 77 42 35 | 0 0 0 |
11 GREGG R. COLLETTE S2 01 | 22 13 9 | 0 0 0 |
21 ROBIN K. HAMMER S2 02 | 25 14 11 | 0 0 0 |
31 ROBIN K. HAMMER S2 03 | 30 15 15 | 0 0 0 |
Number of Sections: 3 Average Students Per Section: 25.67
MAT101 MATH INTERVTN 2 SM 1 30 23| 23 10 13 | 5 3 2 |
LP1 LEAHMARIE O'BRIEN S2 01 | 11 6 5 | 2 1 1 |
LP2 LEAHMARIE O'BRIEN S2 02 | 12 4 8 | 3 2 1 |
Number of Sections: 2 Average Students Per Section: 11.50
MAT111 FOUND ALG/GEO 2 SM 3 81 58| 58 24 34 | 12 6 6 |
11 JULIANNE R. STRICHERZ S2 01 | 13 5 8 | 2 0 2 |
31 JERRY P. BENTLER S2 03 | 18 6 12 | 3 2 1 |

1sonyr01.p 35-2 AUBURN MOUNTAINVIEW H. S. 03/01/12 Page:15
04.11.10.00.01 Course/Class Count Report 405 1:30 PM
EST NBR NBR ----TOTALS---- ---Spec Ed----
COURSE DESCRIPTION LGTH SEC AVL REQ TOT FEM MAL TOT FEM MAL
61 KIRSTEN A. GRAVNING S2 06 | 27 13 14 | 7 4 3 |
Number of Sections: 3 Average Students Per Section: 19.33
MAT113 FOUND ALG/GEO 4 SM 1 0 0| 0 0 0 | 0 0 0 |
21 BRIAN E. LOVEJOY S2 02 | 0 0 0 | 0 0 0 |
Number of Sections: 1 Average Students Per Section: 0.00
MAT120 ALGEBRA 1 SM 13 390 61| 61 26 35 | 5 2 3 |
16 LESLIE J. TAUZER S2 01 | 31 12 19 | 3 1 2 |
36 LESLIE J. TAUZER S2 03 | 30 14 16 | 2 1 1 |
Number of Sections: 2 Average Students Per Section: 30.50
MAT121 ALGEBRA 2 SM 13 294 241| 241 108 133 | 10 0 10 |
12 FRANK G. BOYKO S2 01 | 29 9 20 | 2 0 2 |
21 FRANK G. BOYKO S2 02 | 26 9 17 | 1 0 1 |
22 DAVID A. PRESTON S2 02 | 20 7 13 | 0 0 0 |
41 DAVID A. PRESTON S2 04 | 29 13 16 | 0 0 0 |
42 ALICIA J. THOMPSON S2 04 | 28 18 10 | 0 0 0 |
51 ALICIA J. THOMPSON S2 05 | 28 14 14 | 1 0 1 |
61 FRANK G. BOYKO S2 06 | 31 11 20 | 3 0 3 |
62 ALICIA J. THOMPSON S2 06 | 30 17 13 | 1 0 1 |
FD4 BRIAN E. LOVEJOY S2 02 | 20 10 10 | 2 0 2 |
Number of Sections: 9 Average Students Per Section: 26.78
MAT210 GEOMETRY 1 SM 14 385 49| 49 20 29 | 4 0 4 |
56 LEAHMARIE O'BRIEN S2 05 | 25 14 11 | 3 0 3 |
66 LEAHMARIE O'BRIEN S2 06 | 24 6 18 | 1 0 1 |
Number of Sections: 2 Average Students Per Section: 24.50
MAT211 GEOMETRY 2 SM 15 360 311| 311 167 144 | 4 3 1 |
11 MICHAEL J. CLANCY S2 01 | 30 17 13 | 1 0 1 |
21 MICHAEL J. CLANCY S2 02 | 28 11 17 | 0 0 0 |
22 JULIANNE R. STRICHERZ S2 02 | 28 15 13 | 0 0 0 |
31 MICHAEL J. CLANCY S2 03 | 26 16 10 | 0 0 0 |
32 JULIANNE R. STRICHERZ S2 03 | 30 17 13 | 0 0 0 |
33 FRANK G. BOYKO S2 03 | 22 13 9 | 1 1 0 |
34 BRIAN E. LOVEJOY S2 03 | 27 12 15 | 1 1 0 |
41 BRIAN E. LOVEJOY S2 04 | 30 15 15 | 0 0 0 |
52 BRIAN E. LOVEJOY S2 05 | 30 16 14 | 0 0 0 |
53 FRANK G. BOYKO S2 05 | 29 17 12 | 0 0 0 |
62 BRIAN E. LOVEJOY S2 06 | 31 18 13 | 1 1 0 |
Number of Sections: 11 Average Students Per Section: 28.27
MAT311 ADV ALG/TRIG 2 SM 9 270 257| 256 160 96 | 3 1 2 |
11 BRIAN E. LOVEJOY S2 01 | 30 18 12 | 1 1 0 |
21 JERRY P. BENTLER S2 02 | 30 15 15 | 0 0 0 |
31 KIRSTEN A. GRAVNING S2 03 | 28 15 13 | 2 0 2 |
41 JULIANNE R. STRICHERZ S2 04 | 32 20 12 | 0 0 0 |
51 KIRSTEN A. GRAVNING S2 05 | 30 18 12 | 0 0 0 |
52 DAVID A. PRESTON S2 05 | 20 14 6 | 0 0 0 |
61 JERRY P. BENTLER S2 06 | 28 19 9 | 0 0 0 |
62 JULIANNE R. STRICHERZ S2 06 | 28 19 9 | 0 0 0 |
63 LESLIE J. TAUZER S2 06 | 30 22 8 | 0 0 0 |
Number of Sections: 9 Average Students Per Section: 28.44
MAT411 BYND ADV ALG 2 SM 2 60 38| 38 19 19 | 0 0 0 |
11 JERRY P. BENTLER S2 01 | 20 8 12 | 0 0 0 |
51 JERRY P. BENTLER S2 05 | 18 11 7 | 0 0 0 |
Number of Sections: 2 Average Students Per Section: 19.00
MAT413 PRE CALCULUS 2 SM 5 120 116| 116 57 59 | 0 0 0 |
11 DAVID A. PRESTON S2 01 | 22 11 11 | 0 0 0 |
21 LESLIE J. TAUZER S2 02 | 35 18 17 | 0 0 0 |
41 LESLIE J. TAUZER S2 04 | 31 17 14 | 0 0 0 |
1sonyr01.p 35-2 AUBURN MOUNTAINVIEW H. S. 03/01/12 Page:16
04.11.10.00.01 Course/Class Count Report 405 1:30 PM
EST NBR NBR ----TOTALS---- ---Spec Ed----
COURSE DESCRIPTION LGTH SEC AVL REQ TOT FEM MAL TOT FEM MAL
61 DAVID A. PRESTON S2 06 | 28 11 17 | 0 0 0 |
Number of Sections: 4 Average Students Per Section: 29.00
MAT415 AP CALCULUS 2 SM 3 60 56| 55 23 32 | 0 0 0 |
11 KIRSTEN A. GRAVNING S2 01 | 24 10 14 | 0 0 0 |
41 KIRSTEN A. GRAVNING S2 04 | 31 13 18 | 0 0 0 |
Number of Sections: 2 Average Students Per Section: 27.50
MAT417 AP STATS 2 SM 1 30 18| 18 10 8 | 0 0 0 |
41 LEAHMARIE O'BRIEN S2 04 | 18 10 8 | 0 0 0 |
Number of Sections: 1 Average Students Per Section: 18.00
MAT419 AP CALC BC 2 SM 2 35 4| 4 0 4 | 0 0 0 |
11 KIRSTEN A. GRAVNING S2 01 | 1 0 1 | 0 0 0 |
41 KIRSTEN A. GRAVNING S2 04 | 3 0 3 | 0 0 0 |
Number of Sections: 2 Average Students Per Section: 2.00
MUS106 CONCERT BAND SM 1 22 21| 21 10 11 | 1 0 1 |
21 DEREK V. PYLE S2 02 | 21 10 11 | 1 0 1 |
Number of Sections: 1 Average Students Per Section: 21.00
MUS116 WIND ENSEMBLE SM 1 40 33| 33 12 21 | 1 0 1 |
11 DEREK V. PYLE S2 01 | 33 12 21 | 1 0 1 |
Number of Sections: 1 Average Students Per Section: 33.00
MUS121 PERCUSSION SM 1 15 3| 3 0 3 | 0 0 0 |
21 DEREK V. PYLE S2 02 | 3 0 3 | 0 0 0 |
Number of Sections: 1 Average Students Per Section: 3.00
MUS126 SYMPHONC BAND SM 1 3 1| 1 1 0 | 0 0 0 |
21 DEREK V. PYLE S2 02 | 1 1 0 | 0 0 0 |
Number of Sections: 1 Average Students Per Section: 1.00
MUS131 JAZZ ENSEMBLE SM 1 40 21| 21 1 20 | 0 0 0 |
91 DEREK V. PYLE S2 09 | 21 1 20 | 0 0 0 |
Number of Sections: 1 Average Students Per Section: 21.00
MUS211 CHOIR-CONCERT SM 1 40 24| 24 15 9 | 8 3 5 |
31 KAREN M. FRERICHS S2 03 | 24 15 9 | 8 3 5 |
Number of Sections: 1 Average Students Per Section: 24.00
MUS221 CHOIR-CHAMBER SM 1 30 21| 21 13 8 | 4 4 0 |
26 KAREN M. FRERICHS S2 02 | 21 13 8 | 4 4 0 |
Number of Sections: 1 Average Students Per Section: 21.00
MUS226 ADV CHORUS SM 1 40 38| 38 28 10 | 2 2 0 |
11 KAREN M. FRERICHS S2 01 | 38 28 10 | 2 2 0 |
Number of Sections: 1 Average Students Per Section: 38.00
MUS231 CHOIR-JAZZ EN SM 1 10 6| 5 4 1 | 0 0 0 |
26 KAREN M. FRERICHS S2 02 | 5 4 1 | 0 0 0 |
Number of Sections: 1 Average Students Per Section: 5.00
MUS301 ORCHESTRA SM 2 35 28| 28 23 5 | 1 1 0 |
56 DAVID L. STAFFORD S2 05 | 28 23 5 | 1 1 0 |
Number of Sections: 1 Average Students Per Section: 28.00
MUS303 ORCHEST-CHMBR SM 1 25 24| 24 19 5 | 0 0 0 |
41 DAVID L. STAFFORD S2 04 | 24 19 5 | 0 0 0 |
Number of Sections: 1 Average Students Per Section: 24.00
MUS401 GUITAR SM 2 80 27| 27 4 23 | 0 0 0 |
56 KAREN M. FRERICHS S2 05 | 27 4 23 | 0 0 0 |
Number of Sections: 1 Average Students Per Section: 27.00
MUS402 ADV GUITAR SM 2 30 28| 28 4 24 | 3 0 3 |
66 KAREN M. FRERICHS S2 06 | 28 4 24 | 3 0 3 |
Number of Sections: 1 Average Students Per Section: 28.00
PHY100 HEALTH SM 14 450 213| 213 103 110 | 18 7 11 |
16 LEIMOMI M. BOWLES S2 01 | 30 14 16 | 1 1 0 |
26 THERESA A. HAYNES S2 02 | 30 14 16 | 1 0 1 |
36 THERESA A. HAYNES S2 03 | 30 14 16 | 2 0 2 |
1sonyr01.p 35-2 AUBURN MOUNTAINVIEW H. S. 03/01/12 Page:17
04.11.10.00.01 Course/Class Count Report 405 1:30 PM
EST NBR NBR ----TOTALS---- ---Spec Ed----
COURSE DESCRIPTION LGTH SEC AVL REQ TOT FEM MAL TOT FEM MAL
37 KAY M. LORRAIN S2 03 | 30 14 16 | 2 1 1 |
46 THERESA A. HAYNES S2 04 | 31 15 16 | 10 5 5 |
56 THERESA A. HAYNES S2 05 | 30 15 15 | 0 0 0 |
66 THERESA A. HAYNES S2 06 | 30 17 13 | 0 0 0 |
AB1 BRIAN K. TINSLEY S2 01 | 1 0 1 | 1 0 1 |
BD2 BRIAN K. TINSLEY S2 04 | 1 0 1 | 1 0 1 |
Number of Sections: 9 Average Students Per Section: 23.67
PHY101 INTRO PE SM 4 216 126| 125 37 88 | 4 2 2 |
26 KAY M. LORRAIN S2 02 | 29 9 20 | 1 0 1 |
36 GLEN W. WALKER S2 03 | 22 5 17 | 0 0 0 |
46 KENNETH N. COLBURN S2 04 | 37 8 29 | 3 2 1 |
66 KENNETH N. COLBURN S2 06 | 37 15 22 | 0 0 0 |
Number of Sections: 4 Average Students Per Section: 31.25
PHY207 BASKETBALL SM 3 72 38| 36 4 32 | 2 1 1 |
26 GLEN W. WALKER S2 02 | 36 4 32 | 2 1 1 |
Number of Sections: 1 Average Students Per Section: 36.00
PHY208 BASKETBALL SM 2 36 29| 29 2 27 | 4 0 4 |
16 GLEN W. WALKER S2 01 | 29 2 27 | 4 0 4 |
Number of Sections: 1 Average Students Per Section: 29.00
PHY219 RACQT SPORTS SM 2 72 36| 36 25 11 | 3 2 1 |
56 KAY M. LORRAIN S2 05 | 36 25 11 | 3 2 1 |
Number of Sections: 1 Average Students Per Section: 36.00
PHY224 VOLLEYBALL SM 2 72 73| 72 42 30 | 12 6 6 |
26 LEIMOMI M. BOWLES S2 02 | 36 21 15 | 5 2 3 |
46 LEIMOMI M. BOWLES S2 04 | 36 21 15 | 7 4 3 |
Number of Sections: 2 Average Students Per Section: 36.00
PHY229 BEG WT TRNG SM 4 144 36| 36 12 24 | 2 0 2 |
16 KAY M. LORRAIN S2 01 | 36 12 24 | 2 0 2 |
Number of Sections: 1 Average Students Per Section: 36.00
PHY230 BEG WT TRNG SM 2 36 38| 37 10 27 | 7 2 5 |
46 KAY M. LORRAIN S2 04 | 37 10 27 | 7 2 5 |
Number of Sections: 1 Average Students Per Section: 37.00
PHY304 ADV VLYBALL SM 2 72 69| 69 28 41 | 2 1 1 |
56 LEIMOMI M. BOWLES S2 05 | 34 16 18 | 1 1 0 |
66 LEIMOMI M. BOWLES S2 06 | 35 12 23 | 1 0 1 |
Number of Sections: 2 Average Students Per Section: 34.50
PHY305 ADV WT TRNG SM 2 72 33| 33 6 27 | 3 0 3 |
66 GLEN W. WALKER S2 06 | 33 6 27 | 3 0 3 |
Number of Sections: 1 Average Students Per Section: 33.00
PHY306 ADV WT TRNG SM 1 36 38| 37 6 31 | 4 0 4 |
56 GLEN W. WALKER S2 05 | 37 6 31 | 4 0 4 |
Number of Sections: 1 Average Students Per Section: 37.00
PHY502 HUMAN SURVIVAL SM 2 30 3| 3 3 0 | 0 0 0 |
56 THERESA A. HAYNES S2 05 | 3 3 0 | 0 0 0 |
Number of Sections: 1 Average Students Per Section: 3.00
PHY510 SPORTS OFFCTG SM 1 30 30| 30 14 16 | 1 0 1 |
66 KARL F. STEFFIN S2 06 | 30 14 16 | 1 0 1 |
Number of Sections: 1 Average Students Per Section: 30.00
SBBIO1 SB BIOLOGY TEST SM 1 30 0| 0 0 0 | 0 0 0 |
01 RAY S. DALLY S2 01 | 0 0 0 | 0 0 0 |
Number of Sections: 1 Average Students Per Section: 0.00
SBLATI SB LATIN TEST SM 1 30 0| 0 0 0 | 0 0 0 |
01 RAY S. DALLY S2 01 | 0 0 0 | 0 0 0 |
Number of Sections: 1 Average Students Per Section: 0.00
SCI101 SCIENCE LINKS SM 10 300 138| 138 65 73 | 10 3 7 |
26 KENNETH N. COLBURN S2 02 | 26 15 11 | 2 0 2 |

1sonyr01.p 35-2 AUBURN MOUNTAINVIEW H. S. 03/01/12 Page:18
04.11.10.00.01 Course/Class Count Report 405 1:30 PM
EST NBR NBR ----TOTALS---- ---Spec Ed----
COURSE DESCRIPTION LGTH SEC AVL REQ TOT FEM MAL TOT FEM MAL
36 PATRIA R. BAUMSTARK S2 03 | 22 11 11 | 1 1 0 |
56 JARED D. GERVAIS S2 05 | 30 10 20 | 3 0 3 |
57 PATRIA R. BAUMSTARK S2 05 | 30 15 15 | 2 1 1 |
66 JARED D. GERVAIS S2 06 | 30 14 16 | 2 1 1 |
Number of Sections: 5 Average Students Per Section: 27.60
SCI203 BIOLOGY 2 SM 12 330 343| 343 183 160 | 9 5 4 |
12 KENNETH N. COLBURN S2 01 | 35 16 19 | 1 1 0 |
21 PATRIA R. BAUMSTARK S2 02 | 30 22 8 | 0 0 0 |
31 JENNIE M. BUETOW S2 03 | 30 16 14 | 3 1 2 |
32 KENNETH N. COLBURN S2 03 | 30 16 14 | 1 0 1 |
41 PATRIA R. BAUMSTARK S2 04 | 30 20 10 | 1 1 0 |
42 JARED D. GERVAIS S2 04 | 30 17 13 | 0 0 0 |
51 JENNIE M. BUETOW S2 05 | 31 11 20 | 1 0 1 |
53 RAY S. DALLY S2 05 | 31 15 16 | 1 1 0 |
61 PATRIA R. BAUMSTARK S2 06 | 31 14 17 | 0 0 0 |
62 JENNIE M. BUETOW S2 06 | 33 17 16 | 1 1 0 |
63 RAY S. DALLY S2 06 | 32 19 13 | 0 0 0 |
Number of Sections: 11 Average Students Per Section: 31.18
SCI205 AP BIOLOGY 2 SM 1 30 14| 14 11 3 | 0 0 0 |
11 JENNIE M. BUETOW S2 01 | 14 11 3 | 0 0 0 |
Number of Sections: 1 Average Students Per Section: 14.00
SCI301 CHEMISTRY 2 SM 8 180 179| 179 102 77 | 1 0 1 |
11 KARL F. STEFFIN S2 01 | 31 17 14 | 0 0 0 |
21 KARL F. STEFFIN S2 02 | 32 14 18 | 1 0 1 |
31 JAYME L. HOSTETTER S2 03 | 26 17 9 | 0 0 0 |
41 JAYME L. HOSTETTER S2 04 | 31 20 11 | 0 0 0 |
51 JAYME L. HOSTETTER S2 05 | 30 14 16 | 0 0 0 |
61 JAYME L. HOSTETTER S2 06 | 29 20 9 | 0 0 0 |
Number of Sections: 6 Average Students Per Section: 29.83
SCI401 PHYSICS 2 SM 3 60 48| 48 14 34 | 0 0 0 |
21 JAYME L. HOSTETTER S2 02 | 19 6 13 | 0 0 0 |
51 KARL F. STEFFIN S2 05 | 29 8 21 | 0 0 0 |
Number of Sections: 2 Average Students Per Section: 24.00
SCI503 ENVIRON BIOLOGY SM 1 60 32| 32 10 22 | 9 3 6 |
46 JENNIE M. BUETOW S2 04 | 32 10 22 | 9 3 6 |
Number of Sections: 1 Average Students Per Section: 32.00
SCI505 ASTRONOMY SM 3 60 24| 23 8 15 | 1 0 1 |
36 KARL F. STEFFIN S2 03 | 23 8 15 | 1 0 1 |
Number of Sections: 1 Average Students Per Section: 23.00
SOC101 WORLD STUDIES SM 10 300 154| 154 70 84 | 15 7 8 |
16 TORI T. AMMONS S2 01 | 30 13 17 | 2 0 2 |
26 JON W. PRICE S2 02 | 30 14 16 | 1 1 0 |
56 CHRISTOPHER J. CARR S2 05 | 31 13 18 | 5 2 3 |
57 WAYNE D. RUMBAUGH S2 05 | 31 13 18 | 3 1 2 |
66 NORENE L. OSBORNE S2 06 | 32 17 15 | 4 3 1 |
Number of Sections: 5 Average Students Per Section: 30.80
SOC102 HON WRLD STU 1 SM 4 120 62| 62 36 26 | 0 0 0 |
36 TORI T. AMMONS S2 03 | 29 19 10 | 0 0 0 |
46 TORI T. AMMONS S2 04 | 33 17 16 | 0 0 0 |
Number of Sections: 2 Average Students Per Section: 31.00
SOC203 US HISTORY 2 SM 11 331 330| 330 192 138 | 32 16 16 |
11 WAYNE D. RUMBAUGH S2 01 | 30 19 11 | 2 2 0 |
21 CHRISTOPHER J. CARR S2 02 | 31 18 13 | 4 1 3 |
22 WAYNE D. RUMBAUGH S2 02 | 29 13 16 | 6 4 2 |
31 JON W. PRICE S2 03 | 30 15 15 | 5 3 2 |
32 DOUGLAS S. GONZALES S2 03 | 30 18 12 | 4 0 4 |

1sonyr01.p 35-2 AUBURN MOUNTAINVIEW H. S. 03/01/12 Page:19
04.11.10.00.01 Course/Class Count Report 405 1:30 PM
EST NBR NBR ----TOTALS---- ---Spec Ed----
COURSE DESCRIPTION LGTH SEC AVL REQ TOT FEM MAL TOT FEM MAL
33 CHRISTOPHER J. CARR S2 03 | 30 22 8 | 3 2 1 |
41 CHRISTOPHER J. CARR S2 04 | 29 18 11 | 0 0 0 |
42 WAYNE D. RUMBAUGH S2 04 | 31 19 12 | 1 0 1 |
51 ERIC D. ARNOLD S2 05 | 30 16 14 | 1 1 0 |
52 JON W. PRICE S2 05 | 29 17 12 | 4 2 2 |
61 JON W. PRICE S2 06 | 31 17 14 | 2 1 1 |
BD1 BRIAN K. TINSLEY S2 03 | 0 0 0 | 0 0 0 |
Number of Sections: 12 Average Students Per Section: 27.50
SOC205 AP EUROPEAN 2 SM 3 90 68| 68 39 29 | 0 0 0 |
21 ERIC D. ARNOLD S2 02 | 20 14 6 | 0 0 0 |
31 ERIC D. ARNOLD S2 03 | 22 10 12 | 0 0 0 |
61 ERIC D. ARNOLD S2 06 | 26 15 11 | 0 0 0 |
Number of Sections: 3 Average Students Per Section: 22.67
SOC300 CIVICS SM 11 360 147| 147 68 79 | 11 6 5 |
16 CHRISTOPHER J. CARR S2 01 | 30 13 17 | 2 1 1 |
36 NORENE L. OSBORNE S2 03 | 30 13 17 | 3 2 1 |
46 NORENE L. OSBORNE S2 04 | 30 18 12 | 1 1 0 |
47 JON W. PRICE S2 04 | 30 13 17 | 3 1 2 |
66 CHRISTOPHER J. CARR S2 06 | 27 11 16 | 2 1 1 |
Number of Sections: 5 Average Students Per Section: 29.40
SOC302 AP US HISTORY 2 SM 2 30 32| 32 11 21 | 0 0 0 |
41 ERIC D. ARNOLD S2 04 | 32 11 21 | 0 0 0 |
Number of Sections: 1 Average Students Per Section: 32.00
SOC400 GLOBAL ISSUES SM 8 180 108| 108 58 50 | 9 6 3 |
16 DOUGLAS S. GONZALES S2 01 | 39 19 20 | 5 4 1 |
26 DOUGLAS S. GONZALES S2 02 | 39 22 17 | 3 2 1 |
66 WAYNE D. RUMBAUGH S2 06 | 30 17 13 | 1 0 1 |
Number of Sections: 3 Average Students Per Section: 36.00
SOC402 AP US POL&GOV 2 SM 2 60 54| 54 27 27 | 0 0 0 |
21 NORENE L. OSBORNE S2 02 | 24 11 13 | 0 0 0 |
51 NORENE L. OSBORNE S2 05 | 30 16 14 | 0 0 0 |
Number of Sections: 2 Average Students Per Section: 27.00
SOC500 PSYCHOLOGY 1 SM 4 90 34| 31 23 8 | 1 1 0 |
46 DOUGLAS S. GONZALES S2 04 | 31 23 8 | 1 1 0 |
Number of Sections: 1 Average Students Per Section: 31.00
SOC501 PSYCHOLOGY 2 SM 1 30 29| 29 10 19 | 1 1 0 |
66 DOUGLAS S. GONZALES S2 06 | 29 10 19 | 1 1 0 |
Number of Sections: 1 Average Students Per Section: 29.00
SOC504 SOCIOLOGY 1 SM 4 90 30| 30 19 11 | 3 1 2 |
26 TORI T. AMMONS S2 02 | 30 19 11 | 3 1 2 |
Number of Sections: 1 Average Students Per Section: 30.00
SOC508 WASH STATE HIST SM 2 61 54| 52 19 33 | 8 3 5 |
26 BRIAN K. TINSLEY S2 02 | 1 0 1 | 1 0 1 |
56 TORI T. AMMONS S2 05 | 29 11 18 | 5 2 3 |
E16 CHANTAL F. BALDACCI S2 01 | 22 8 14 | 2 1 1 |
Number of Sections: 3 Average Students Per Section: 17.33
SPE210 LANG ARTS 5 SM 1 38 16| 16 8 8 | 15 8 7 |
31 BRIAN K. TINSLEY S2 03 | 0 0 0 | 0 0 0 |
41 ANECIA D. GRIGSBY S2 04 | 7 3 4 | 7 3 4 |
51 ANECIA D. GRIGSBY S2 05 | 9 5 4 | 8 5 3 |
52 BRIAN K. TINSLEY S2 05 | 0 0 0 | 0 0 0 |
Number of Sections: 4 Average Students Per Section: 4.00
SPE212 READ/WR LAN 1 SM 1 29 13| 13 5 8 | 10 4 6 |
11 TARA N. FULTON S2 01 | 13 5 8 | 10 4 6 |
51 TARA N. FULTON S2 05 | 0 0 0 | 0 0 0 |
52 BRIAN K. TINSLEY S2 05 | 0 0 0 | 0 0 0 |

1sonyr01.p 35-2 AUBURN MOUNTAINVIEW H. S. 03/01/12 Page:20
04.11.10.00.01 Course/Class Count Report 405 1:30 PM
EST NBR NBR ----TOTALS---- ---Spec Ed----
COURSE DESCRIPTION LGTH SEC AVL REQ TOT FEM MAL TOT FEM MAL
Number of Sections: 3 Average Students Per Section: 4.33
SPE216 READ/WR LAN 3 SM 2 42 40| 40 19 21 | 38 19 19 |
21 ANECIA D. GRIGSBY S2 02 | 14 6 8 | 13 6 7 |
31 TARA N. FULTON S2 03 | 12 4 8 | 12 4 8 |
41 TARA N. FULTON S2 04 | 14 9 5 | 13 9 4 |
Number of Sections: 3 Average Students Per Section: 13.33
SPE218 READ/WR LAN 4 SM 1 5 0| 0 0 0 | 0 0 0 |
21 BRIAN K. TINSLEY S2 02 | 0 0 0 | 0 0 0 |
Number of Sections: 1 Average Students Per Section: 0.00
SPE302 MATH 1 SM 1 14 10| 10 3 7 | 8 3 5 |
11 ANGELA K. MCCAUSLAND S2 01 | 10 3 7 | 8 3 5 |
Number of Sections: 1 Average Students Per Section: 10.00
SPE304 MATH 2 SM 1 15 14| 14 7 7 | 13 6 7 |
21 ANGELA K. MCCAUSLAND S2 02 | 13 6 7 | 12 5 7 |
36 BRIAN K. TINSLEY S2 03 | 1 1 0 | 1 1 0 |
Number of Sections: 2 Average Students Per Section: 7.00
SPE306 MATH 3 SM 3 56 42| 42 24 18 | 40 24 16 |
31 ANECIA D. GRIGSBY S2 03 | 9 7 2 | 9 7 2 |
51 TARA N. FULTON S2 05 | 11 3 8 | 10 3 7 |
61 ANECIA D. GRIGSBY S2 06 | 10 7 3 | 9 7 2 |
62 TARA N. FULTON S2 06 | 12 7 5 | 12 7 5 |
Number of Sections: 4 Average Students Per Section: 10.50
SPE308 MATH 4 SM 1 24 0| 0 0 0 | 0 0 0 |
11 BRIAN K. TINSLEY S2 01 | 0 0 0 | 0 0 0 |
31 BRIAN K. TINSLEY S2 03 | 0 0 0 | 0 0 0 |
61 TARA N. FULTON S2 06 | 0 0 0 | 0 0 0 |
Number of Sections: 3 Average Students Per Section: 0.00
SPE401 SOCIAL SKILLS 2 SM 1 56 8| 8 0 8 | 8 0 8 |
46 BRIAN K. TINSLEY S2 04 | 2 0 2 | 2 0 2 |
56 BRIAN K. TINSLEY S2 05 | 1 0 1 | 1 0 1 |
66 BRIAN K. TINSLEY S2 06 | 5 0 5 | 5 0 5 |
67 ANECIA D. GRIGSBY S2 06 | 0 0 0 | 0 0 0 |
Number of Sections: 4 Average Students Per Section: 2.00
SPE601 COMM LAB SM 1 17 5| 5 0 5 | 5 0 5 |
46 LESLEY C. MOENTER S2 04 | 1 0 1 | 1 0 1 |
56 LESLEY C. MOENTER S2 05 | 1 0 1 | 1 0 1 |
66 LESLEY C. MOENTER S2 06 | 1 0 1 | 1 0 1 |
76 LESLEY C. MOENTER S2 07 | 1 0 1 | 1 0 1 |
96 LESLEY C. MOENTER S2 09 | 1 0 1 | 1 0 1 |
Number of Sections: 5 Average Students Per Section: 1.00

1sonyr01.p 35-2 AUBURN MOUNTAINVIEW H. S. 03/01/12 Page:21
04.11.10.00.01 Course/Class Count Report Totals 1:30 PM
TITLE FOR TOTAL
TOTALS GROUP TOTAL FEMALE MALE
GRAND TOTALS 10168 4963 5205
Spec Ed 804 345 459
************************ End of report ************************

1sonyr01.p 35-2 AUBURN RIVERSIDE HIGH SCHOOL 03/01/12 Page:1
04.11.10.00.01 Course/Class Count Report 408 1:31 PM
EST NBR NBR ----TOTALS---- ---Spec Ed----
COURSE DESCRIPTION LGTH SEC AVL REQ TOT FEM MAL TOT FEM MAL
ART104 ADV ART 2 SM 1 11 10| 10 7 3 | 0 0 0 |
66 KATHY K. LOBDELL S2 06 | 10 7 3 | 0 0 0 |
Number of Sections: 1 Average Students Per Section: 10.00
ART106 ADV ART 4 SM 1 1 0| 0 0 0 | 0 0 0 |
66 KATHY K. LOBDELL S2 06 | 0 0 0 | 0 0 0 |
Number of Sections: 1 Average Students Per Section: 0.00
ART107 2-D ART SM 2 56 26| 26 17 9 | 3 2 1 |
46 PAUL M. LEWIS S2 04 | 26 17 9 | 3 2 1 |
Number of Sections: 1 Average Students Per Section: 26.00
ART110 CERAMICS SM 4 99 48| 48 29 19 | 4 1 3 |
56 PAUL M. LEWIS S2 05 | 25 15 10 | 1 0 1 |
66 PAUL M. LEWIS S2 06 | 23 14 9 | 3 1 2 |
Number of Sections: 2 Average Students Per Section: 24.00
ART111 ADV CERAMICS SM 4 21 12| 12 7 5 | 0 0 0 |
56 PAUL M. LEWIS S2 05 | 5 2 3 | 0 0 0 |
66 PAUL M. LEWIS S2 06 | 7 5 2 | 0 0 0 |
Number of Sections: 2 Average Students Per Section: 6.00
ART121 ACTING 1 SM 2 60 29| 29 13 16 | 3 2 1 |
56 KARLA K. SEMAN S2 05 | 29 13 16 | 3 2 1 |
Number of Sections: 1 Average Students Per Section: 29.00
ART122 ACTING 2 SM 2 39 14| 14 6 8 | 2 1 1 |
36 KARLA K. SEMAN S2 03 | 14 6 8 | 2 1 1 |
Number of Sections: 1 Average Students Per Section: 14.00
ART381 AP STUDIO ART 2 SM 1 12 10| 10 8 2 | 1 1 0 |
66 KATHY K. LOBDELL S2 06 | 10 8 2 | 1 1 0 |
Number of Sections: 1 Average Students Per Section: 10.00
CTE171 MARKETG/DECA 2 SM 2 60 44| 44 24 20 | 2 0 2 |
26 DOUGLAS J. AUBERT S2 02 | 14 9 5 | 1 0 1 |
36 DOUGLAS J. AUBERT S2 03 | 30 15 15 | 1 0 1 |
Number of Sections: 2 Average Students Per Section: 22.00
CTE176 MARKETG/DECA 4 SM 1 8 8| 8 5 3 | 0 0 0 |
46 DOUGLAS J. AUBERT S2 04 | 8 5 3 | 0 0 0 |
Number of Sections: 1 Average Students Per Section: 8.00
CTE178 SPTS & ENT MGMT SM 1 1 0| 0 0 0 | 0 0 0 |
46 DOUGLAS J. AUBERT S2 04 | 0 0 0 | 0 0 0 |
Number of Sections: 1 Average Students Per Section: 0.00
CTE183 STORE RETL OP 2 SM 1 21 21| 21 17 4 | 0 0 0 |
36 DOUGLAS J. AUBERT S2 03 | 1 1 0 | 0 0 0 |
46 DOUGLAS J. AUBERT S2 04 | 20 16 4 | 0 0 0 |
Number of Sections: 2 Average Students Per Section: 10.50
CTE185 STOR OP SM BSN2 SM 1 1 1| 1 1 0 | 0 0 0 |
46 DOUGLAS J. AUBERT S2 04 | 1 1 0 | 0 0 0 |
Number of Sections: 1 Average Students Per Section: 1.00
CTE187 MARKTNG ENTRE 2 SM 1 2 2| 2 1 1 | 0 0 0 |
46 DOUGLAS J. AUBERT S2 04 | 2 1 1 | 0 0 0 |
Number of Sections: 1 Average Students Per Section: 2.00
CTE211 CAREER W/CHILD1 SM 1 34 4| 4 4 0 | 1 1 0 |
26 KELLY A. JENSEN S2 02 | 4 4 0 | 1 1 0 |
Number of Sections: 1 Average Students Per Section: 4.00
CTE212 CAREER W/CHILD2 SM 1 26 5| 5 4 1 | 0 0 0 |
26 KELLY A. JENSEN S2 02 | 5 4 1 | 0 0 0 |
Number of Sections: 1 Average Students Per Section: 5.00
CTE213 CAREER W/CHILD3 SM 1 10 1| 1 1 0 | 0 0 0 |
26 KELLY A. JENSEN S2 02 | 1 1 0 | 0 0 0 |
Number of Sections: 1 Average Students Per Section: 1.00
CTE214 CAREER W/CHILD4 SM 1 5 2| 2 2 0 | 0 0 0 |

1sonyr01.p 35-2 AUBURN RIVERSIDE HIGH SCHOOL 03/01/12 Page:2
04.11.10.00.01 Course/Class Count Report 408 1:31 PM
EST NBR NBR ----TOTALS---- ---Spec Ed----
COURSE DESCRIPTION LGTH SEC AVL REQ TOT FEM MAL TOT FEM MAL
26 KELLY A. JENSEN S2 02 | 2 2 0 | 0 0 0 |
Number of Sections: 1 Average Students Per Section: 2.00
CTE232 FOOD NUTR&SCI 2 SM 3 96 72| 72 32 40 | 14 5 9 |
16 ROBYN F. STOWE S2 01 | 19 10 9 | 3 2 1 |
26 ROBYN F. STOWE S2 02 | 11 8 3 | 1 0 1 |
36 ROBYN F. STOWE S2 03 | 20 7 13 | 6 2 4 |
46 ROBYN F. STOWE S2 04 | 22 7 15 | 4 1 3 |
Number of Sections: 4 Average Students Per Section: 18.00
CTE240 INDEP LIVING SM 2 60 22| 22 18 4 | 1 1 0 |
36 KELLY A. JENSEN S2 03 | 22 18 4 | 1 1 0 |
Number of Sections: 1 Average Students Per Section: 22.00
CTE245 INTERIOR DESIGN SM 1 30 24| 24 23 1 | 0 0 0 |
46 KELLY A. JENSEN S2 04 | 24 23 1 | 0 0 0 |
Number of Sections: 1 Average Students Per Section: 24.00
CTE250 NUTRTN WELLNESS SM 4 96 49| 48 31 17 | 4 1 3 |
56 KELLY A. JENSEN S2 05 | 24 16 8 | 3 0 3 |
66 KELLY A. JENSEN S2 06 | 24 15 9 | 1 1 0 |
Number of Sections: 2 Average Students Per Section: 24.00
CTE266 COSMETOLOGY 2 SM 1 2 2| 2 2 0 | 0 0 0 |
36 JAMES C. WICKENS S2 03 | 2 2 0 | 0 0 0 |
Number of Sections: 1 Average Students Per Section: 2.00
CTE282 AM SIGN LANG 2 SM 2 60 52| 52 40 12 | 2 1 1 |
26 CINDY L. ANDERSON S2 02 | 23 16 7 | 1 0 1 |
56 CINDY L. ANDERSON S2 05 | 29 24 5 | 1 1 0 |
Number of Sections: 2 Average Students Per Section: 26.00
CTE284 AM SIGN LANG 4 SM 2 60 43| 43 33 10 | 0 0 0 |
16 CINDY L. ANDERSON S2 01 | 19 14 5 | 0 0 0 |
66 CINDY L. ANDERSON S2 06 | 24 19 5 | 0 0 0 |
Number of Sections: 2 Average Students Per Section: 21.50
CTE286 AM SIGN LANG 6 SM 1 30 17| 17 17 0 | 0 0 0 |
46 CINDY L. ANDERSON S2 04 | 17 17 0 | 0 0 0 |
Number of Sections: 1 Average Students Per Section: 17.00
CTE303 HEALTH CTE SM 1 60 30| 30 15 15 | 2 0 2 |
66 ROBYN F. STOWE S2 06 | 30 15 15 | 2 0 2 |
Number of Sections: 1 Average Students Per Section: 30.00
CTE304 PREVENTIVE MED SM 2 60 31| 30 23 7 | 2 1 1 |
56 CHRISTOPHER T. TUCKER S2 05 | 30 23 7 | 2 1 1 |
Number of Sections: 1 Average Students Per Section: 30.00
CTE306 ANATOMY/PHYS 2 SM 3 90 74| 74 51 23 | 0 0 0 |
26 CHRISTOPHER T. TUCKER S2 02 | 18 9 9 | 0 0 0 |
36 CHRISTOPHER T. TUCKER S2 03 | 28 20 8 | 0 0 0 |
46 CHRISTOPHER T. TUCKER S2 04 | 28 22 6 | 0 0 0 |
Number of Sections: 3 Average Students Per Section: 24.67
CTE308 SPORTS MED 2 SM 1 25 25| 25 14 11 | 0 0 0 |
66 CHRISTOPHER T. TUCKER S2 06 | 25 14 11 | 0 0 0 |
Number of Sections: 1 Average Students Per Section: 25.00
CTE312 ADVSPORTS MED 2 SM 1 5 9| 9 6 3 | 0 0 0 |
66 CHRISTOPHER T. TUCKER S2 06 | 9 6 3 | 0 0 0 |
Number of Sections: 1 Average Students Per Section: 9.00
CTE332 CULINARY ARTS SM 1 113 106| 106 54 52 | 17 6 11 |
09 WAYNE M. SHELTON S2 09 | 3 3 0 | 0 0 0 |
16 WAYNE M. SHELTON S2 01 | 23 11 12 | 2 0 2 |
26 WAYNE M. SHELTON S2 02 | 24 15 9 | 3 1 2 |
36 WAYNE M. SHELTON S2 03 | 23 11 12 | 6 3 3 |
46 WAYNE M. SHELTON S2 04 | 26 13 13 | 5 2 3 |
56 WAYNE M. SHELTON S2 05 | 7 1 6 | 1 0 1 |

1sonyr01.p 35-2 AUBURN RIVERSIDE HIGH SCHOOL 03/01/12 Page:3
04.11.10.00.01 Course/Class Count Report 408 1:31 PM
EST NBR NBR ----TOTALS---- ---Spec Ed----
COURSE DESCRIPTION LGTH SEC AVL REQ TOT FEM MAL TOT FEM MAL
Number of Sections: 6 Average Students Per Section: 17.67
CTE334 ADV CULNY ART 2 SM 1 7 8| 8 3 5 | 3 1 2 |
16 WAYNE M. SHELTON S2 01 | 5 2 3 | 1 0 1 |
36 WAYNE M. SHELTON S2 03 | 3 1 2 | 2 1 1 |
Number of Sections: 2 Average Students Per Section: 4.00
CTE336 CULNY ARTS CS 2 SM 1 1 1| 1 0 1 | 1 0 1 |
46 WAYNE M. SHELTON S2 04 | 1 0 1 | 1 0 1 |
Number of Sections: 1 Average Students Per Section: 1.00
CTE351 JEWELRY 1 SM 6 165 80| 80 51 29 | 5 1 4 |
46 WENDY S. WOLDENBERG S2 04 | 26 18 8 | 0 0 0 |
56 WENDY S. WOLDENBERG S2 05 | 27 15 12 | 2 0 2 |
66 WENDY S. WOLDENBERG S2 06 | 27 18 9 | 3 1 2 |
Number of Sections: 3 Average Students Per Section: 26.67
CTE352 JEWELRY 2 SM 3 80 36| 36 25 11 | 1 1 0 |
26 WENDY S. WOLDENBERG S2 02 | 20 15 5 | 0 0 0 |
36 WENDY S. WOLDENBERG S2 03 | 16 10 6 | 1 1 0 |
Number of Sections: 2 Average Students Per Section: 18.00
CTE353 JEWELRY 3 SM 1 22 10| 10 6 4 | 2 1 1 |
26 WENDY S. WOLDENBERG S2 02 | 5 3 2 | 1 0 1 |
36 WENDY S. WOLDENBERG S2 03 | 4 3 1 | 1 1 0 |
56A WENDY S. WOLDENBERG S2 05 | 1 0 1 | 0 0 0 |
Number of Sections: 3 Average Students Per Section: 3.33
CTE354 JEWELRY 4 SM 1 10 9| 9 4 5 | 1 0 1 |
26 WENDY S. WOLDENBERG S2 02 | 3 2 1 | 0 0 0 |
36 WENDY S. WOLDENBERG S2 03 | 5 1 4 | 1 0 1 |
56A WENDY S. WOLDENBERG S2 05 | 1 1 0 | 0 0 0 |
Number of Sections: 3 Average Students Per Section: 3.00
CTE355 JEWELRY CS SM 1 4 1| 1 1 0 | 0 0 0 |
66 WENDY S. WOLDENBERG S2 06 | 1 1 0 | 0 0 0 |
Number of Sections: 1 Average Students Per Section: 1.00
CTE361 VIS COM 1 SM 6 162 53| 53 26 27 | 2 1 1 |
26 GINA M. SANDLAND S2 02 | 13 7 6 | 1 1 0 |
56 GINA M. SANDLAND S2 05 | 23 11 12 | 0 0 0 |
66 GINA M. SANDLAND S2 06 | 17 8 9 | 1 0 1 |
Number of Sections: 3 Average Students Per Section: 17.67
CTE362 VIS COM 2 SM 3 67 53| 53 27 26 | 2 2 0 |
16 GINA M. SANDLAND S2 01 | 20 9 11 | 1 1 0 |
26 GINA M. SANDLAND S2 02 | 12 5 7 | 0 0 0 |
36 GINA M. SANDLAND S2 03 | 15 9 6 | 1 1 0 |
56A GINA M. SANDLAND S2 05 | 1 0 1 | 0 0 0 |
66 GINA M. SANDLAND S2 06 | 5 4 1 | 0 0 0 |
Number of Sections: 5 Average Students Per Section: 10.60
CTE365 VIS COM CS 1 SM 1 12 0| 0 0 0 | 0 0 0 |
16 GINA M. SANDLAND S2 01 | 0 0 0 | 0 0 0 |
26 GINA M. SANDLAND S2 02 | 0 0 0 | 0 0 0 |
56 GINA M. SANDLAND S2 05 | 0 0 0 | 0 0 0 |
66 GINA M. SANDLAND S2 06 | 0 0 0 | 0 0 0 |
Number of Sections: 4 Average Students Per Section: 0.00
CTE366 VIS COM CS 2 SM 1 10 3| 3 1 2 | 0 0 0 |
16 GINA M. SANDLAND S2 01 | 0 0 0 | 0 0 0 |
26 GINA M. SANDLAND S2 02 | 0 0 0 | 0 0 0 |
36 GINA M. SANDLAND S2 03 | 1 1 0 | 0 0 0 |
46A GINA M. SANDLAND S2 04 | 1 0 1 | 0 0 0 |
56 GINA M. SANDLAND S2 05 | 1 0 1 | 0 0 0 |
66 GINA M. SANDLAND S2 06 | 0 0 0 | 0 0 0 |

1sonyr01.p 35-2 AUBURN RIVERSIDE HIGH SCHOOL 03/01/12 Page:4
04.11.10.00.01 Course/Class Count Report 408 1:31 PM
EST NBR NBR ----TOTALS---- ---Spec Ed----
COURSE DESCRIPTION LGTH SEC AVL REQ TOT FEM MAL TOT FEM MAL
Number of Sections: 6 Average Students Per Section: 0.50
CTE371 DRAWING 1 SM 5 140 53| 53 35 18 | 2 2 0 |
16 KATHY K. LOBDELL S2 01 | 26 15 11 | 2 2 0 |
26 KATHY K. LOBDELL S2 02 | 27 20 7 | 0 0 0 |
Number of Sections: 2 Average Students Per Section: 26.50
CTE372 DRAWING 2 SM 2 60 33| 33 19 14 | 0 0 0 |
36 KATHY K. LOBDELL S2 03 | 20 12 8 | 0 0 0 |
56 KATHY K. LOBDELL S2 05 | 13 7 6 | 0 0 0 |
Number of Sections: 2 Average Students Per Section: 16.50
CTE376 GRAPHIC DES 2 SM 1 11 8| 8 5 3 | 0 0 0 |
56 KATHY K. LOBDELL S2 05 | 8 5 3 | 0 0 0 |
Number of Sections: 1 Average Students Per Section: 8.00
CTE382 ELECTRONICS 2 SM 2 60 51| 51 6 45 | 2 0 2 |
16 FRANK MEDINA S2 01 | 14 3 11 | 0 0 0 |
26 FRANK MEDINA S2 02 | 20 1 19 | 0 0 0 |
36 FRANK MEDINA S2 03 | 17 2 15 | 2 0 2 |
Number of Sections: 3 Average Students Per Section: 17.00
CTE383 ELECTRONICS 3 SM 1 22 2| 1 0 1 | 0 0 0 |
56 FRANK MEDINA S2 05 | 1 0 1 | 0 0 0 |
Number of Sections: 1 Average Students Per Section: 1.00
CTE384 ELECTRONICS 4 SM 1 19 17| 17 0 17 | 2 0 2 |
16 FRANK MEDINA S2 01 | 4 0 4 | 0 0 0 |
26 FRANK MEDINA S2 02 | 4 0 4 | 0 0 0 |
36 FRANK MEDINA S2 03 | 4 0 4 | 1 0 1 |
56 FRANK MEDINA S2 05 | 5 0 5 | 1 0 1 |
Number of Sections: 4 Average Students Per Section: 4.25
CTE391 WEB PUBLISH 1 SM 1 13 5| 5 1 4 | 0 0 0 |
56 FRANK MEDINA S2 05 | 4 1 3 | 0 0 0 |
66 FRANK MEDINA S2 06 | 1 0 1 | 0 0 0 |
Number of Sections: 2 Average Students Per Section: 2.50
CTE392 WEB PUBLISH 2 SM 1 9 6| 6 0 6 | 0 0 0 |
56 FRANK MEDINA S2 05 | 6 0 6 | 0 0 0 |
Number of Sections: 1 Average Students Per Section: 6.00
CTE401 DRAFTING 1 SM 3 70 24| 24 1 23 | 3 0 3 |
46 GEORGE W. SUMNER S2 04 | 24 1 23 | 3 0 3 |
Number of Sections: 1 Average Students Per Section: 24.00
CTE402 DRAFTING 2 SM 1 26 24| 24 4 20 | 0 0 0 |
16 GEORGE W. SUMNER S2 01 | 24 4 20 | 0 0 0 |
Number of Sections: 1 Average Students Per Section: 24.00
CTE406 DRFT ENG TECH 2 SM 1 9 8| 8 0 8 | 1 0 1 |
26 GEORGE W. SUMNER S2 02 | 8 0 8 | 1 0 1 |
Number of Sections: 1 Average Students Per Section: 8.00
CTE408 DRFT ENG TECH 4 SM 1 9 7| 7 1 6 | 0 0 0 |
26 GEORGE W. SUMNER S2 02 | 7 1 6 | 0 0 0 |
Number of Sections: 1 Average Students Per Section: 7.00
CTE410 DRAFT ENG CS 2 SM 1 2 2| 2 0 2 | 1 0 1 |
26 GEORGE W. SUMNER S2 02 | 2 0 2 | 1 0 1 |
Number of Sections: 1 Average Students Per Section: 2.00
CTE412 COMP SYS ENG 2 SM 1 24 21| 21 0 21 | 1 0 1 |
66 FRANK MEDINA S2 06 | 21 0 21 | 1 0 1 |
Number of Sections: 1 Average Students Per Section: 21.00
CTE414 COMP SYS ENG 4 SM 1 7 7| 7 0 7 | 0 0 0 |
56 FRANK MEDINA S2 05 | 7 0 7 | 0 0 0 |
Number of Sections: 1 Average Students Per Section: 7.00
CTE450 POWER/ENERGY SM 2 72 24| 24 14 10 | 1 0 1 |
36 GEORGE W. SUMNER S2 03 | 24 14 10 | 1 0 1 |
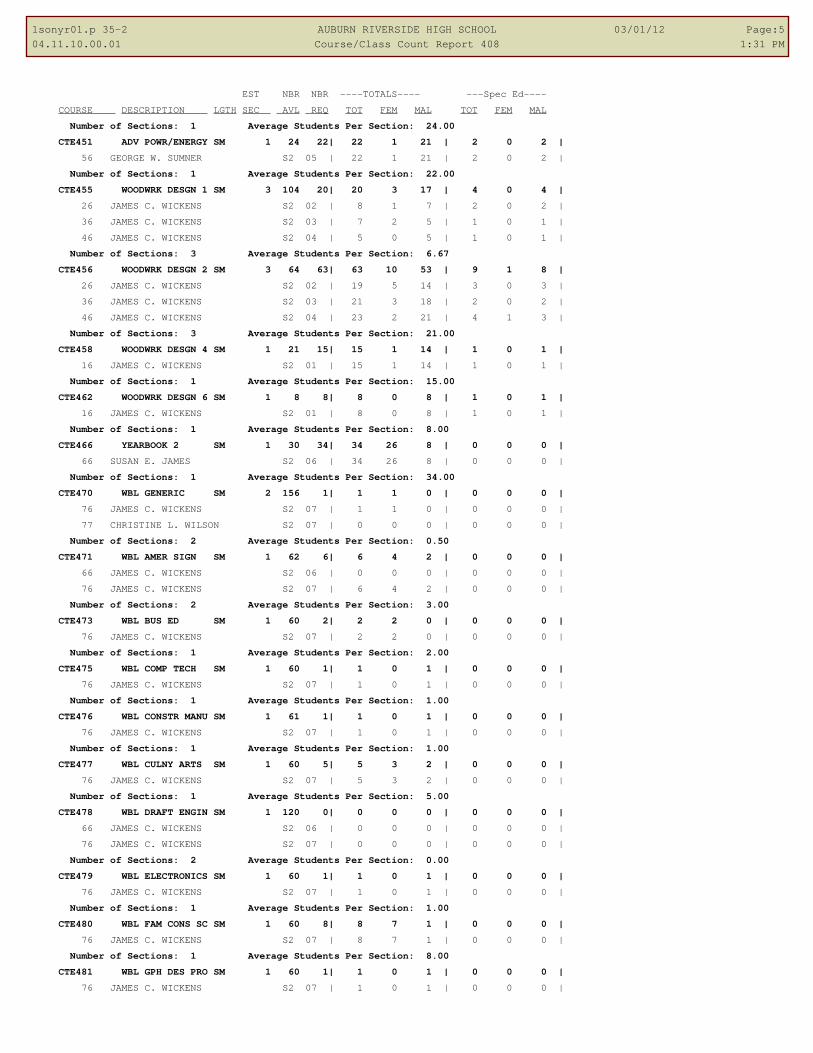
1sonyr01.p 35-2 AUBURN RIVERSIDE HIGH SCHOOL 03/01/12 Page:5
04.11.10.00.01 Course/Class Count Report 408 1:31 PM
EST NBR NBR ----TOTALS---- ---Spec Ed----
COURSE DESCRIPTION LGTH SEC AVL REQ TOT FEM MAL TOT FEM MAL
Number of Sections: 1 Average Students Per Section: 24.00
CTE451 ADV POWR/ENERGY SM 1 24 22| 22 1 21 | 2 0 2 |
56 GEORGE W. SUMNER S2 05 | 22 1 21 | 2 0 2 |
Number of Sections: 1 Average Students Per Section: 22.00
CTE455 WOODWRK DESGN 1 SM 3 104 20| 20 3 17 | 4 0 4 |
26 JAMES C. WICKENS S2 02 | 8 1 7 | 2 0 2 |
36 JAMES C. WICKENS S2 03 | 7 2 5 | 1 0 1 |
46 JAMES C. WICKENS S2 04 | 5 0 5 | 1 0 1 |
Number of Sections: 3 Average Students Per Section: 6.67
CTE456 WOODWRK DESGN 2 SM 3 64 63| 63 10 53 | 9 1 8 |
26 JAMES C. WICKENS S2 02 | 19 5 14 | 3 0 3 |
36 JAMES C. WICKENS S2 03 | 21 3 18 | 2 0 2 |
46 JAMES C. WICKENS S2 04 | 23 2 21 | 4 1 3 |
Number of Sections: 3 Average Students Per Section: 21.00
CTE458 WOODWRK DESGN 4 SM 1 21 15| 15 1 14 | 1 0 1 |
16 JAMES C. WICKENS S2 01 | 15 1 14 | 1 0 1 |
Number of Sections: 1 Average Students Per Section: 15.00
CTE462 WOODWRK DESGN 6 SM 1 8 8| 8 0 8 | 1 0 1 |
16 JAMES C. WICKENS S2 01 | 8 0 8 | 1 0 1 |
Number of Sections: 1 Average Students Per Section: 8.00
CTE466 YEARBOOK 2 SM 1 30 34| 34 26 8 | 0 0 0 |
66 SUSAN E. JAMES S2 06 | 34 26 8 | 0 0 0 |
Number of Sections: 1 Average Students Per Section: 34.00
CTE470 WBL GENERIC SM 2 156 1| 1 1 0 | 0 0 0 |
76 JAMES C. WICKENS S2 07 | 1 1 0 | 0 0 0 |
77 CHRISTINE L. WILSON S2 07 | 0 0 0 | 0 0 0 |
Number of Sections: 2 Average Students Per Section: 0.50
CTE471 WBL AMER SIGN SM 1 62 6| 6 4 2 | 0 0 0 |
66 JAMES C. WICKENS S2 06 | 0 0 0 | 0 0 0 |
76 JAMES C. WICKENS S2 07 | 6 4 2 | 0 0 0 |
Number of Sections: 2 Average Students Per Section: 3.00
CTE473 WBL BUS ED SM 1 60 2| 2 2 0 | 0 0 0 |
76 JAMES C. WICKENS S2 07 | 2 2 0 | 0 0 0 |
Number of Sections: 1 Average Students Per Section: 2.00
CTE475 WBL COMP TECH SM 1 60 1| 1 0 1 | 0 0 0 |
76 JAMES C. WICKENS S2 07 | 1 0 1 | 0 0 0 |
Number of Sections: 1 Average Students Per Section: 1.00
CTE476 WBL CONSTR MANU SM 1 61 1| 1 0 1 | 0 0 0 |
76 JAMES C. WICKENS S2 07 | 1 0 1 | 0 0 0 |
Number of Sections: 1 Average Students Per Section: 1.00
CTE477 WBL CULNY ARTS SM 1 60 5| 5 3 2 | 0 0 0 |
76 JAMES C. WICKENS S2 07 | 5 3 2 | 0 0 0 |
Number of Sections: 1 Average Students Per Section: 5.00
CTE478 WBL DRAFT ENGIN SM 1 120 0| 0 0 0 | 0 0 0 |
66 JAMES C. WICKENS S2 06 | 0 0 0 | 0 0 0 |
76 JAMES C. WICKENS S2 07 | 0 0 0 | 0 0 0 |
Number of Sections: 2 Average Students Per Section: 0.00
CTE479 WBL ELECTRONICS SM 1 60 1| 1 0 1 | 0 0 0 |
76 JAMES C. WICKENS S2 07 | 1 0 1 | 0 0 0 |
Number of Sections: 1 Average Students Per Section: 1.00
CTE480 WBL FAM CONS SC SM 1 60 8| 8 7 1 | 0 0 0 |
76 JAMES C. WICKENS S2 07 | 8 7 1 | 0 0 0 |
Number of Sections: 1 Average Students Per Section: 8.00
CTE481 WBL GPH DES PRO SM 1 60 1| 1 0 1 | 0 0 0 |
76 JAMES C. WICKENS S2 07 | 1 0 1 | 0 0 0 |

1sonyr01.p 35-2 AUBURN RIVERSIDE HIGH SCHOOL 03/01/12 Page:6
04.11.10.00.01 Course/Class Count Report 408 1:31 PM
EST NBR NBR ----TOTALS---- ---Spec Ed----
COURSE DESCRIPTION LGTH SEC AVL REQ TOT FEM MAL TOT FEM MAL
Number of Sections: 1 Average Students Per Section: 1.00
CTE482 WBL HORTICULTUR SM 1 20 0| 0 0 0 | 0 0 0 |
76 JAMES C. WICKENS S2 07 | 0 0 0 | 0 0 0 |
Number of Sections: 1 Average Students Per Section: 0.00
CTE483 WBL JEWELRY MFG SM 1 62 0| 0 0 0 | 0 0 0 |
66 JAMES C. WICKENS S2 06 | 0 0 0 | 0 0 0 |
76 JAMES C. WICKENS S2 07 | 0 0 0 | 0 0 0 |
Number of Sections: 2 Average Students Per Section: 0.00
CTE484 WBL MARKETING SM 1 60 5| 5 3 2 | 0 0 0 |
76 JAMES C. WICKENS S2 07 | 5 3 2 | 0 0 0 |
Number of Sections: 1 Average Students Per Section: 5.00
CTE487 WBL SPORTS MED SM 1 4 0| 0 0 0 | 0 0 0 |
66 JAMES C. WICKENS S2 06 | 0 0 0 | 0 0 0 |
Number of Sections: 1 Average Students Per Section: 0.00
CTE488 WBL VIS COM SM 1 60 1| 1 1 0 | 0 0 0 |
76 JAMES C. WICKENS S2 07 | 1 1 0 | 0 0 0 |
Number of Sections: 1 Average Students Per Section: 1.00
CTE489 WBL WEB PUBLISH SM 1 40 1| 1 1 0 | 0 0 0 |
09A JAMES C. WICKENS S2 09 | 1 1 0 | 0 0 0 |
Number of Sections: 1 Average Students Per Section: 1.00
ELL102 ELL LAN ART 1B SM 1 12 3| 3 1 2 | 0 0 0 |
26 JACQUELINE G. DE HAVEN S2 02 | 3 1 2 | 0 0 0 |
Number of Sections: 1 Average Students Per Section: 3.00
ELL121 ELL STDY SKILL2 SM 1 15 14| 14 8 6 | 2 2 0 |
46 JACQUELINE G. DE HAVEN S2 04 | 14 8 6 | 2 2 0 |
Number of Sections: 1 Average Students Per Section: 14.00
ELL202 ELL LAN ART 2B SM 1 12 5| 5 1 4 | 0 0 0 |
26 JACQUELINE G. DE HAVEN S2 02 | 5 1 4 | 0 0 0 |
Number of Sections: 1 Average Students Per Section: 5.00
ELL302 ELL LAN ART 3B SM 1 27 19| 19 5 14 | 0 0 0 |
16 JACQUELINE G. DE HAVEN S2 01 | 10 4 6 | 0 0 0 |
36 JACQUELINE G. DE HAVEN S2 03 | 9 1 8 | 0 0 0 |
Number of Sections: 2 Average Students Per Section: 9.50
ELL810 ELL MONITORING YR 1 37 22| 22 9 13 | 4 1 3 |
61 JACQUELINE G. DE HAVEN YR 06 | 0 0 0 | 0 0 0 |
71 JACQUELINE G. DE HAVEN YR 07 | 22 9 13 | 4 1 3 |
Number of Sections: 2 Average Students Per Section: 11.00
FOR202 FRENCH 2 SM 2 60 46| 46 30 16 | 0 0 0 |
16 KIMBERLEE I. POLLEY S2 01 | 24 16 8 | 0 0 0 |
26 KIMBERLEE I. POLLEY S2 02 | 22 14 8 | 0 0 0 |
Number of Sections: 2 Average Students Per Section: 23.00
FOR204 FRENCH 4 SM 2 60 40| 40 24 16 | 1 0 1 |
36 KIMBERLEE I. POLLEY S2 03 | 22 13 9 | 0 0 0 |
46 KIMBERLEE I. POLLEY S2 04 | 18 11 7 | 1 0 1 |
Number of Sections: 2 Average Students Per Section: 20.00
FOR206 FRENCH 6 SM 1 25 10| 10 7 3 | 0 0 0 |
36 KAISA SWENDDAL-WHITE S2 03 | 10 7 3 | 0 0 0 |
Number of Sections: 1 Average Students Per Section: 10.00
FOR208 FRENCH 8 SM 1 30 4| 4 4 0 | 0 0 0 |
36 KAISA SWENDDAL-WHITE S2 03 | 4 4 0 | 0 0 0 |
Number of Sections: 1 Average Students Per Section: 4.00
FOR302 GERMAN 2 SM 2 30 30| 30 12 18 | 1 0 1 |
56 STACY A. BARDSLEY S2 05 | 30 12 18 | 1 0 1 |
Number of Sections: 1 Average Students Per Section: 30.00
FOR304 GERMAN 4 SM 2 60 49| 49 16 33 | 0 0 0 |
26 STACY A. BARDSLEY S2 02 | 27 9 18 | 0 0 0 |

1sonyr01.p 35-2 AUBURN RIVERSIDE HIGH SCHOOL 03/01/12 Page:7
04.11.10.00.01 Course/Class Count Report 408 1:31 PM
EST NBR NBR ----TOTALS---- ---Spec Ed----
COURSE DESCRIPTION LGTH SEC AVL REQ TOT FEM MAL TOT FEM MAL
36 STACY A. BARDSLEY S2 03 | 22 7 15 | 0 0 0 |
Number of Sections: 2 Average Students Per Section: 24.50
FOR306 GERMAN 6 SM 1 19 15| 15 9 6 | 0 0 0 |
46 STACY A. BARDSLEY S2 04 | 15 9 6 | 0 0 0 |
Number of Sections: 1 Average Students Per Section: 15.00
FOR307 GERMAN 7 SM 1 8 1| 1 0 1 | 0 0 0 |
46A STACY A. BARDSLEY S2 04 | 1 0 1 | 0 0 0 |
Number of Sections: 1 Average Students Per Section: 1.00
FOR308 GERMAN 8 SM 1 6 1| 1 0 1 | 0 0 0 |
46 STACY A. BARDSLEY S2 04 | 1 0 1 | 0 0 0 |
Number of Sections: 1 Average Students Per Section: 1.00
FOR402 JAPANESE 2 SM 2 30 28| 28 16 12 | 1 1 0 |
36 CHAD M. GUISINGER S2 03 | 28 16 12 | 1 1 0 |
Number of Sections: 1 Average Students Per Section: 28.00
FOR404 JAPANESE 4 SM 2 47 34| 34 13 21 | 0 0 0 |
56 CHAD M. GUISINGER S2 05 | 17 7 10 | 0 0 0 |
66 CHAD M. GUISINGER S2 06 | 17 6 11 | 0 0 0 |
Number of Sections: 2 Average Students Per Section: 17.00
FOR406 JAPANESE 6 SM 1 22 21| 21 11 10 | 0 0 0 |
46 CHAD M. GUISINGER S2 04 | 21 11 10 | 0 0 0 |
Number of Sections: 1 Average Students Per Section: 21.00
FOR408 JAPANESE 8 SM 1 8 9| 9 2 7 | 0 0 0 |
46 CHAD M. GUISINGER S2 04 | 9 2 7 | 0 0 0 |
Number of Sections: 1 Average Students Per Section: 9.00
FOR602 SPANISH 2 SM 5 150 136| 135 69 66 | 4 2 2 |
16 JUAN F. NUNEZ S2 01 | 30 16 14 | 1 1 0 |
17 KAISA SWENDDAL-WHITE S2 01 | 24 15 9 | 0 0 0 |
26 KAISA SWENDDAL-WHITE S2 02 | 29 14 15 | 1 0 1 |
27 JUAN F. NUNEZ S2 02 | 22 10 12 | 1 0 1 |
56 KAISA SWENDDAL-WHITE S2 05 | 30 14 16 | 1 1 0 |
Number of Sections: 5 Average Students Per Section: 27.00
FOR604 SPANISH 4 SM 6 150 139| 139 54 85 | 0 0 0 |
16 BRYCE J. STRAND S2 01 | 28 8 20 | 0 0 0 |
36 CAROL A. BARNETT S2 03 | 30 13 17 | 0 0 0 |
46 BRYCE J. STRAND S2 04 | 23 6 17 | 0 0 0 |
56 CAROL A. BARNETT S2 05 | 29 18 11 | 0 0 0 |
66 CAROL A. BARNETT S2 06 | 29 9 20 | 0 0 0 |
Number of Sections: 5 Average Students Per Section: 27.80
FOR606 SPANISH 6 SM 4 120 87| 87 44 43 | 1 1 0 |
16 CAROL A. BARNETT S2 01 | 27 18 9 | 0 0 0 |
26 CAROL A. BARNETT S2 02 | 22 8 14 | 1 1 0 |
36 JUAN F. NUNEZ S2 03 | 15 6 9 | 0 0 0 |
66 JUAN F. NUNEZ S2 06 | 23 12 11 | 0 0 0 |
Number of Sections: 4 Average Students Per Section: 21.75
FOR608 SPANISH 8 SM 1 30 17| 17 9 8 | 0 0 0 |
46 KAISA SWENDDAL-WHITE S2 04 | 17 9 8 | 0 0 0 |
Number of Sections: 1 Average Students Per Section: 17.00
FOR616 NAT SPEAK SPAN2 SM 1 30 23| 23 16 7 | 1 1 0 |
46 JUAN F. NUNEZ S2 04 | 23 16 7 | 1 1 0 |
Number of Sections: 1 Average Students Per Section: 23.00
GEN101 ORIENTATION SM 14 389 182| 182 100 82 | 16 5 11 |
16 DAVID R. GOETHALS S2 01 | 30 17 13 | 2 0 2 |
26 DAVID R. GOETHALS S2 02 | 28 14 14 | 1 0 1 |
27 PAUL M. LEWIS S2 02 | 22 12 10 | 2 0 2 |
36 PAUL M. LEWIS S2 03 | 27 17 10 | 1 1 0 |
46 JACQUELINE G. DE HAVEN S2 04 | 14 8 6 | 2 2 0 |

1sonyr01.p 35-2 AUBURN RIVERSIDE HIGH SCHOOL 03/01/12 Page:8
04.11.10.00.01 Course/Class Count Report 408 1:31 PM
EST NBR NBR ----TOTALS---- ---Spec Ed----
COURSE DESCRIPTION LGTH SEC AVL REQ TOT FEM MAL TOT FEM MAL
56 JON D. AARSTAD S2 05 | 31 16 15 | 5 1 4 |
66 JONATHAN M. STENSON S2 06 | 30 16 14 | 3 1 2 |
Number of Sections: 7 Average Students Per Section: 26.00
GEN200 ADVISORY 9-12 YR 1 2030 417| 417 217 200 | 21 9 12 |
001 STACY A. BARDSLEY YR 10 | 13 6 7 | 0 0 0 |
002 JACQUELINE G. DE HAVEN YR 10 | 8 2 6 | 0 0 0 |
003 CHAD M. GUISINGER YR 10 | 12 3 9 | 0 0 0 |
004 CRYSTAL L. CONANT YR 10 | 14 8 6 | 1 0 1 |
005 JAN B. GILDEN YR 10 | 0 0 0 | 0 0 0 |
006 MARK S. DAVIS YR 10 | 13 9 4 | 0 0 0 |
008 BRUCE D. DIEHL YR 10 | 11 6 5 | 1 0 1 |
010 THOMAS S. EARL YR 10 | 12 6 6 | 1 0 1 |
011 MEGAN ELLIS SUMNER YR 10 | 12 9 3 | 0 0 0 |
012 JOHN A. ERICKSON YR 10 | 10 4 6 | 1 0 1 |
013 JENNIFER W. GARCIA YR 10 | 13 8 5 | 0 0 0 |
014 ELAINE M. HETTERLY YR 10 | 11 6 5 | 9 5 4 |
015 SCOTT A. HUSAR YR 10 | 12 5 7 | 1 1 0 |
016 CRYSTAL L. JILBERT YR 10 | 13 9 4 | 1 1 0 |
018 JANALYN R. MCKEEHAN YR 10 | 0 0 0 | 0 0 0 |
019 CHRISTINE M. LEVERENZ YR 10 | 14 6 8 | 1 0 1 |
020 KATHY K. LOBDELL YR 10 | 13 10 3 | 1 1 0 |
021 PATRICK M. MCKEEHAN II YR 10 | 12 7 5 | 0 0 0 |
022 JANALYN R. MCKEEHAN YR 10 | 0 0 0 | 0 0 0 |
023 ROBERT L. MORGAN YR 10 | 12 6 6 | 0 0 0 |
025 PHILIP J. MYKA YR 10 | 12 6 6 | 0 0 0 |
029 KARYN L. WILLIAMSON YR 10 | 13 8 5 | 1 0 1 |
031 GERI A. ROHLFF YR 10 | 14 7 7 | 0 0 0 |
032 ROBYN N. SAARENAS YR 10 | 13 5 8 | 0 0 0 |
033 GINA M. SANDLAND YR 10 | 12 9 3 | 0 0 0 |
035 JUDITH J. SHAW YR 10 | 12 9 3 | 0 0 0 |
037 BRYCE J. STRAND YR 10 | 13 4 9 | 0 0 0 |
038 GEORGE W. SUMNER YR 10 | 13 3 10 | 0 0 0 |
042 CHRISTOPHER T. TUCKER YR 10 | 12 11 1 | 0 0 0 |
043 MICHAEL VAN EATON YR 10 | 14 4 10 | 1 0 1 |
044 MEGHAN E. WAGNER YR 10 | 13 8 5 | 1 1 0 |
045 JAMES C. WICKENS YR 10 | 12 2 10 | 1 0 1 |
049 ERNEST E. ZEIGER YR 10 | 13 5 8 | 0 0 0 |
10a THOMAS W. ADAMS YR 10 | 0 0 0 | 0 0 0 |
10b CINDY L. ANDERSON YR 10 | 0 0 0 | 0 0 0 |
10c STEPHANIE SWIFT YR 10 | 0 0 0 | 0 0 0 |
10e DOUGLAS J. AUBERT YR 10 | 0 0 0 | 0 0 0 |
10f TERRANCE Z. JOHNSON YR 10 | 0 0 0 | 0 0 0 |
10g ARTHUR BENARD III YR 10 | 0 0 0 | 0 0 0 |
10h LISA M. GALLINATTI YR 10 | 46 26 20 | 0 0 0 |
10i CHRISTOPHER K. GARRISO YR 10 | 0 0 0 | 0 0 0 |
10k MICHAEL T. HUYLAR YR 10 | 0 0 0 | 0 0 0 |
10l SUSAN E. JAMES YR 10 | 0 0 0 | 0 0 0 |
10m CORIN G. MALONE YR 10 | 0 0 0 | 0 0 0 |
10n ANDREW D. MONSEN YR 10 | 0 0 0 | 0 0 0 |
10o KIMBERLEE I. POLLEY YR 10 | 0 0 0 | 0 0 0 |
10p SCOTT J. ROWE YR 10 | 0 0 0 | 0 0 0 |
10q WAYNE M. SHELTON YR 10 | 0 0 0 | 0 0 0 |
10s JONATHAN M. STENSON YR 10 | 0 0 0 | 0 0 0 |
10t EDWARD K. ROSIN YR 10 | 0 0 0 | 0 0 0 |
11b CAROL A. BARNETT YR 10 | 0 0 0 | 0 0 0 |
11c RALPH L. CUBIT YR 10 | 0 0 0 | 0 0 0 |

1sonyr01.p 35-2 AUBURN RIVERSIDE HIGH SCHOOL 03/01/12 Page:9
04.11.10.00.01 Course/Class Count Report 408 1:31 PM
EST NBR NBR ----TOTALS---- ---Spec Ed----
COURSE DESCRIPTION LGTH SEC AVL REQ TOT FEM MAL TOT FEM MAL
11d TERRANCE Z. JOHNSON YR 10 | 0 0 0 | 0 0 0 |
11e SHAWN P. KILGALLON YR 10 | 0 0 0 | 0 0 0 |
11g LAINE M. LENIHAN YR 10 | 0 0 0 | 0 0 0 |
11h FRANK MEDINA YR 10 | 0 0 0 | 0 0 0 |
11i CHERYL C. MOYD YR 10 | 0 0 0 | 0 0 0 |
11j SUSAN L. NEU YR 10 | 0 0 0 | 0 0 0 |
11k JUAN F. NUNEZ YR 10 | 0 0 0 | 0 0 0 |
11l KARLA K. SEMAN YR 10 | 0 0 0 | 0 0 0 |
11m KAISA SWENDDAL-WHITE YR 10 | 0 0 0 | 0 0 0 |
11n PATRICK J. SWENSON YR 10 | 0 0 0 | 0 0 0 |
11o CHRISTINE L. WILSON YR 10 | 0 0 0 | 0 0 0 |
11p WENDY S. WOLDENBERG YR 10 | 0 0 0 | 0 0 0 |
11q TIMOTHY A. WRIGHT YR 10 | 0 0 0 | 0 0 0 |
Number of Sections: 65 Average Students Per Section: 6.42
GEN300 STUDY SKILLS SM 10 486 170| 169 71 98 | 13 2 11 |
10 SHAWN A. MARTINSON S2 10 | 63 35 28 | 1 0 1 |
26 CHERYL C. MOYD S2 02 | 26 13 13 | 1 0 1 |
27 GEORGE W. SUMNER S2 02 | 6 1 5 | 1 0 1 |
36 JON D. AARSTAD S2 03 | 15 3 12 | 4 1 3 |
37 KAISA SWENDDAL-WHITE S2 03 | 3 0 3 | 0 0 0 |
46 STACY A. BARDSLEY S2 04 | 6 2 4 | 1 0 1 |
56 CHAD M. GUISINGER S2 05 | 14 1 13 | 0 0 0 |
57 THOMAS W. ADAMS S2 05 | 27 12 15 | 3 0 3 |
66 GERI A. ROHLFF S2 06 | 0 0 0 | 0 0 0 |
67 CHAD M. GUISINGER S2 06 | 9 4 5 | 2 1 1 |
Number of Sections: 10 Average Students Per Section: 16.90
GEN301 STUDY SKILLS SM 2 102 105| 105 38 67 | 19 6 13 |
16 STACY A. BARDSLEY S2 01 | 24 11 13 | 3 0 3 |
17 ROBYN N. SAARENAS S2 01 | 6 0 6 | 0 0 0 |
46 JON D. AARSTAD S2 04 | 24 5 19 | 7 2 5 |
66 GERI A. ROHLFF S2 06 | 23 8 15 | 3 2 1 |
67 THOMAS W. ADAMS S2 06 | 27 14 13 | 5 2 3 |
68 ANGELA K. MCCAUSLAND S2 06 | 1 0 1 | 1 0 1 |
Number of Sections: 6 Average Students Per Section: 17.50
GEN500 ADM OFF AIDE SM 1 16 5| 5 3 2 | 0 0 0 |
16 JANET K. OKE S2 01 | 0 0 0 | 0 0 0 |
26 JANET K. OKE S2 02 | 1 1 0 | 0 0 0 |
36 JANET K. OKE S2 03 | 1 1 0 | 0 0 0 |
46 JANET K. OKE S2 04 | 0 0 0 | 0 0 0 |
56 JANET K. OKE S2 05 | 1 1 0 | 0 0 0 |
66 JANET K. OKE S2 06 | 1 0 1 | 0 0 0 |
96 JANET K. OKE S2 09 | 1 0 1 | 0 0 0 |
Number of Sections: 7 Average Students Per Section: 0.71
GEN501 ADM OFF AIDE SM 1 3 2| 2 0 2 | 0 0 0 |
16 JANET K. OKE S2 01 | 1 0 1 | 0 0 0 |
46D JANET K. OKE S2 04 | 0 0 0 | 0 0 0 |
76 JANET K. OKE S2 07 | 1 0 1 | 0 0 0 |
Number of Sections: 3 Average Students Per Section: 0.67
GEN504 ASB AIDE SM 1 8 3| 3 3 0 | 0 0 0 |
16 MERI M. BENEDICT S2 01 | 1 1 0 | 0 0 0 |
26 MERI M. BENEDICT S2 02 | 0 0 0 | 0 0 0 |
36 MERI M. BENEDICT S2 03 | 1 1 0 | 0 0 0 |
46 MERI M. BENEDICT S2 04 | 1 1 0 | 0 0 0 |
56 MERI M. BENEDICT S2 05 | 0 0 0 | 0 0 0 |
66 MERI M. BENEDICT S2 06 | 0 0 0 | 0 0 0 |
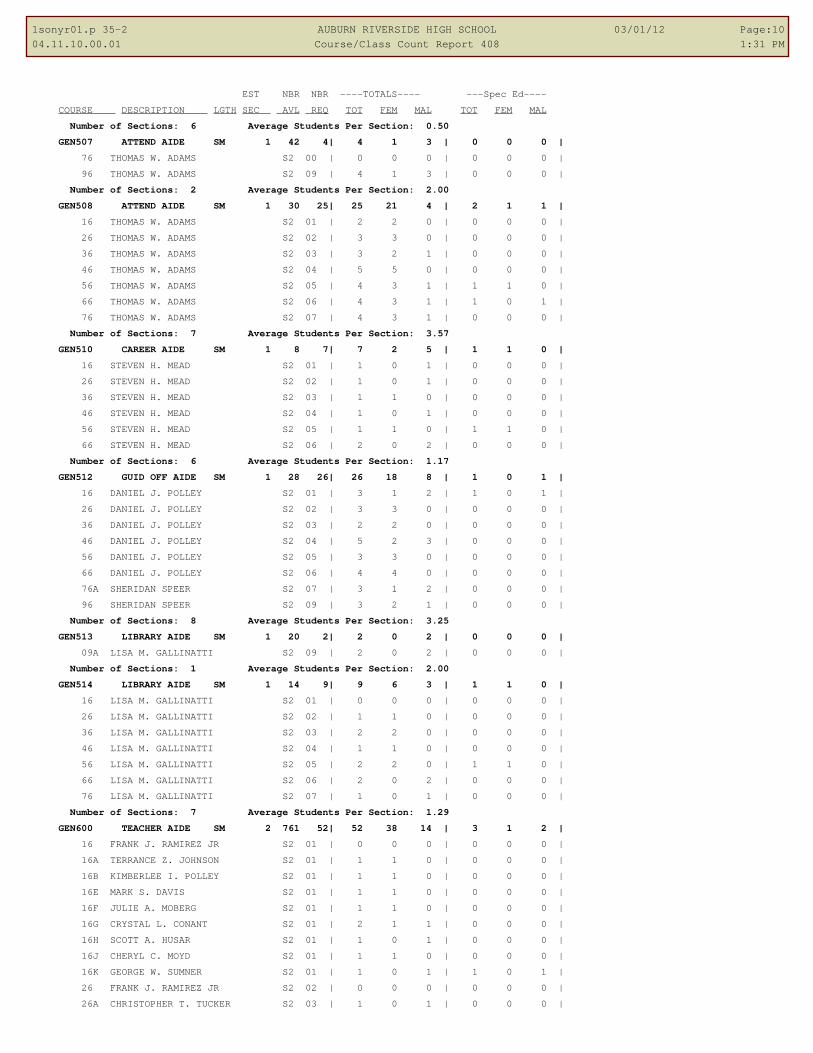
1sonyr01.p 35-2 AUBURN RIVERSIDE HIGH SCHOOL 03/01/12 Page:10
04.11.10.00.01 Course/Class Count Report 408 1:31 PM
EST NBR NBR ----TOTALS---- ---Spec Ed----
COURSE DESCRIPTION LGTH SEC AVL REQ TOT FEM MAL TOT FEM MAL
Number of Sections: 6 Average Students Per Section: 0.50
GEN507 ATTEND AIDE SM 1 42 4| 4 1 3 | 0 0 0 |
76 THOMAS W. ADAMS S2 00 | 0 0 0 | 0 0 0 |
96 THOMAS W. ADAMS S2 09 | 4 1 3 | 0 0 0 |
Number of Sections: 2 Average Students Per Section: 2.00
GEN508 ATTEND AIDE SM 1 30 25| 25 21 4 | 2 1 1 |
16 THOMAS W. ADAMS S2 01 | 2 2 0 | 0 0 0 |
26 THOMAS W. ADAMS S2 02 | 3 3 0 | 0 0 0 |
36 THOMAS W. ADAMS S2 03 | 3 2 1 | 0 0 0 |
46 THOMAS W. ADAMS S2 04 | 5 5 0 | 0 0 0 |
56 THOMAS W. ADAMS S2 05 | 4 3 1 | 1 1 0 |
66 THOMAS W. ADAMS S2 06 | 4 3 1 | 1 0 1 |
76 THOMAS W. ADAMS S2 07 | 4 3 1 | 0 0 0 |
Number of Sections: 7 Average Students Per Section: 3.57
GEN510 CAREER AIDE SM 1 8 7| 7 2 5 | 1 1 0 |
16 STEVEN H. MEAD S2 01 | 1 0 1 | 0 0 0 |
26 STEVEN H. MEAD S2 02 | 1 0 1 | 0 0 0 |
36 STEVEN H. MEAD S2 03 | 1 1 0 | 0 0 0 |
46 STEVEN H. MEAD S2 04 | 1 0 1 | 0 0 0 |
56 STEVEN H. MEAD S2 05 | 1 1 0 | 1 1 0 |
66 STEVEN H. MEAD S2 06 | 2 0 2 | 0 0 0 |
Number of Sections: 6 Average Students Per Section: 1.17
GEN512 GUID OFF AIDE SM 1 28 26| 26 18 8 | 1 0 1 |
16 DANIEL J. POLLEY S2 01 | 3 1 2 | 1 0 1 |
26 DANIEL J. POLLEY S2 02 | 3 3 0 | 0 0 0 |
36 DANIEL J. POLLEY S2 03 | 2 2 0 | 0 0 0 |
46 DANIEL J. POLLEY S2 04 | 5 2 3 | 0 0 0 |
56 DANIEL J. POLLEY S2 05 | 3 3 0 | 0 0 0 |
66 DANIEL J. POLLEY S2 06 | 4 4 0 | 0 0 0 |
76A SHERIDAN SPEER S2 07 | 3 1 2 | 0 0 0 |
96 SHERIDAN SPEER S2 09 | 3 2 1 | 0 0 0 |
Number of Sections: 8 Average Students Per Section: 3.25
GEN513 LIBRARY AIDE SM 1 20 2| 2 0 2 | 0 0 0 |
09A LISA M. GALLINATTI S2 09 | 2 0 2 | 0 0 0 |
Number of Sections: 1 Average Students Per Section: 2.00
GEN514 LIBRARY AIDE SM 1 14 9| 9 6 3 | 1 1 0 |
16 LISA M. GALLINATTI S2 01 | 0 0 0 | 0 0 0 |
26 LISA M. GALLINATTI S2 02 | 1 1 0 | 0 0 0 |
36 LISA M. GALLINATTI S2 03 | 2 2 0 | 0 0 0 |
46 LISA M. GALLINATTI S2 04 | 1 1 0 | 0 0 0 |
56 LISA M. GALLINATTI S2 05 | 2 2 0 | 1 1 0 |
66 LISA M. GALLINATTI S2 06 | 2 0 2 | 0 0 0 |
76 LISA M. GALLINATTI S2 07 | 1 0 1 | 0 0 0 |
Number of Sections: 7 Average Students Per Section: 1.29
GEN600 TEACHER AIDE SM 2 761 52| 52 38 14 | 3 1 2 |
16 FRANK J. RAMIREZ JR S2 01 | 0 0 0 | 0 0 0 |
16A TERRANCE Z. JOHNSON S2 01 | 1 1 0 | 0 0 0 |
16B KIMBERLEE I. POLLEY S2 01 | 1 1 0 | 0 0 0 |
16E MARK S. DAVIS S2 01 | 1 1 0 | 0 0 0 |
16F JULIE A. MOBERG S2 01 | 1 1 0 | 0 0 0 |
16G CRYSTAL L. CONANT S2 01 | 2 1 1 | 0 0 0 |
16H SCOTT A. HUSAR S2 01 | 1 0 1 | 0 0 0 |
16J CHERYL C. MOYD S2 01 | 1 1 0 | 0 0 0 |
16K GEORGE W. SUMNER S2 01 | 1 0 1 | 1 0 1 |
26 FRANK J. RAMIREZ JR S2 02 | 0 0 0 | 0 0 0 |
26A CHRISTOPHER T. TUCKER S2 03 | 1 0 1 | 0 0 0 |

1sonyr01.p 35-2 AUBURN RIVERSIDE HIGH SCHOOL 03/01/12 Page:11
04.11.10.00.01 Course/Class Count Report 408 1:31 PM
EST NBR NBR ----TOTALS---- ---Spec Ed----
COURSE DESCRIPTION LGTH SEC AVL REQ TOT FEM MAL TOT FEM MAL
26B JUAN F. NUNEZ S2 03 | 0 0 0 | 0 0 0 |
26J JANALYN R. MCKEEHAN S2 02 | 1 1 0 | 0 0 0 |
27B KIMBERLEE I. POLLEY S2 02 | 0 0 0 | 0 0 0 |
27C JOHN A. ERICKSON S2 02 | 1 1 0 | 0 0 0 |
27D PHILIP J. MYKA S2 02 | 0 0 0 | 0 0 0 |
27E ARTHUR BENARD III S2 02 | 1 0 1 | 0 0 0 |
27F MARK S. DAVIS S2 02 | 1 1 0 | 0 0 0 |
27G KATHY K. LOBDELL S2 02 | 1 1 0 | 0 0 0 |
36 FRANK J. RAMIREZ JR S2 03 | 0 0 0 | 0 0 0 |
36A JANALYN R. MCKEEHAN S2 03 | 1 1 0 | 0 0 0 |
36B MICHAEL T. HUYLAR S2 03 | 1 1 0 | 0 0 0 |
36C CHRISTOPHER T. TUCKER S2 03 | 2 2 0 | 0 0 0 |
36D ERNEST E. ZEIGER S2 03 | 1 1 0 | 0 0 0 |
36E MARK S. DAVIS S2 03 | 1 0 1 | 0 0 0 |
36F THOMAS S. EARL S2 03 | 1 1 0 | 0 0 0 |
36G GEORGE W. SUMNER S2 03 | 1 1 0 | 0 0 0 |
46 FRANK J. RAMIREZ JR S2 04 | 0 0 0 | 0 0 0 |
46A CINDY L. ANDERSON S2 04 | 2 2 0 | 0 0 0 |
46B BRYCE J. STRAND S2 04 | 1 0 1 | 0 0 0 |
46C JUAN F. NUNEZ S2 04 | 0 0 0 | 0 0 0 |
46D STACY A. BARDSLEY S2 04 | 1 1 0 | 0 0 0 |
46E BRUCE D. DIEHL S2 04 | 1 1 0 | 0 0 0 |
46F CHRISTINE M. LEVERENZ S2 04 | 1 1 0 | 0 0 0 |
46G JULIE A. MOBERG S2 04 | 1 0 1 | 0 0 0 |
46H PHILIP J. MYKA S2 04 | 2 2 0 | 0 0 0 |
46I SCOTT J. ROWE S2 04 | 1 1 0 | 0 0 0 |
56 FRANK J. RAMIREZ JR S2 05 | 0 0 0 | 0 0 0 |
56A PAUL M. LEWIS S2 05 | 1 1 0 | 0 0 0 |
56C GINA M. SANDLAND S2 05 | 1 1 0 | 0 0 0 |
56D ANGELA 0. RIGLEY BERG S2 05 | 0 0 0 | 0 0 0 |
56E CINDY L. ANDERSON S2 05 | 1 1 0 | 0 0 0 |
56F DAVID R. GOETHALS S2 05 | 0 0 0 | 0 0 0 |
56G CHRISTINE M. LEVERENZ S2 05 | 1 0 1 | 0 0 0 |
56H MARK S. DAVIS S2 05 | 1 1 0 | 0 0 0 |
56I JULIE A. MOBERG S2 05 | 0 0 0 | 0 0 0 |
56J JOHN A. ERICKSON S2 05 | 0 0 0 | 0 0 0 |
56K SHAWN A. MARTINSON S2 05 | 1 1 0 | 0 0 0 |
56L JOHN A. ERICKSON S2 05 | 1 1 0 | 0 0 0 |
56M JON D. AARSTAD S2 05 | 1 1 0 | 0 0 0 |
56N PATRICK M. MCKEEHAN II S2 05 | 1 0 1 | 0 0 0 |
66 FRANK J. RAMIREZ JR S2 06 | 0 0 0 | 0 0 0 |
66A CINDY L. ANDERSON S2 06 | 1 1 0 | 0 0 0 |
66B SHAWN P. KILGALLON S2 06 | 1 1 0 | 0 0 0 |
66C PHILIP J. MYKA S2 06 | 0 0 0 | 0 0 0 |
66D CRYSTAL L. JILBERT S2 06 | 0 0 0 | 0 0 0 |
66F FRANK MEDINA S2 06 | 2 0 2 | 1 0 1 |
66G DAVID R. GOETHALS S2 06 | 0 0 0 | 0 0 0 |
66H KELLY A. JENSEN S2 06 | 1 1 0 | 1 1 0 |
66J ANGELA 0. RIGLEY BERG S2 06 | 1 1 0 | 0 0 0 |
66K ELAINE M. HETTERLY S2 06 | 0 0 0 | 0 0 0 |
66M CHRISTOPHER K. GARRISO S2 06 | 1 1 0 | 0 0 0 |
66n WENDY S. WOLDENBERG S2 06 | 1 1 0 | 0 0 0 |
66O ELSA T. FAGER S2 06 | 1 0 1 | 0 0 0 |
66Q GERI A. ROHLFF S2 06 | 1 0 1 | 0 0 0 |
Number of Sections: 65 Average Students Per Section: 0.80
GEN601 TEACHER AIDE SM 1 166 38| 38 25 13 | 1 0 1 |

1sonyr01.p 35-2 AUBURN RIVERSIDE HIGH SCHOOL 03/01/12 Page:12
04.11.10.00.01 Course/Class Count Report 408 1:31 PM
EST NBR NBR ----TOTALS---- ---Spec Ed----
COURSE DESCRIPTION LGTH SEC AVL REQ TOT FEM MAL TOT FEM MAL
11 KARLA K. SEMAN S2 01 | 1 0 1 | 0 0 0 |
11c JONATHAN M. STENSON S2 01 | 1 1 0 | 0 0 0 |
14 CHRISTOPHER K. GARRISO S2 01 | 1 0 1 | 0 0 0 |
16 FRANK J. RAMIREZ JR S2 01 | 0 0 0 | 0 0 0 |
16B CAROL A. BARNETT S2 01 | 1 1 0 | 0 0 0 |
16C KELLY A. JENSEN S2 01 | 0 0 0 | 0 0 0 |
16G MICHAEL VAN EATON S2 01 | 1 0 1 | 1 0 1 |
19 CAROL A. BARNETT S2 01 | 1 1 0 | 0 0 0 |
23 SCOTT A. HUSAR S2 02 | 1 0 1 | 0 0 0 |
24 GINA M. SANDLAND S2 02 | 1 1 0 | 0 0 0 |
26 FRANK J. RAMIREZ JR S2 02 | 0 0 0 | 0 0 0 |
33 WENDY S. WOLDENBERG S2 03 | 1 0 1 | 0 0 0 |
33A CHRISTINE M. LEVERENZ S2 03 | 1 1 0 | 0 0 0 |
34 PATRICK M. MCKEEHAN II S2 03 | 1 1 0 | 0 0 0 |
36 FRANK J. RAMIREZ JR S2 03 | 0 0 0 | 0 0 0 |
36A ANGELA 0. RIGLEY BERG S2 03 | 1 1 0 | 0 0 0 |
36B CAROL A. BARNETT S2 03 | 1 1 0 | 0 0 0 |
36C TERRANCE Z. JOHNSON S2 03 | 1 1 0 | 0 0 0 |
36D PATRICK M. MCKEEHAN II S2 03 | 1 0 1 | 0 0 0 |
36F CHRISTOPHER K. GARRISO S2 03 | 1 0 1 | 0 0 0 |
36W PHILIP J. MYKA S2 03 | 1 0 1 | 0 0 0 |
36Y EDWARD K. ROSIN S2 03 | 1 1 0 | 0 0 0 |
37 MARK S. DAVIS S2 03 | 1 1 0 | 0 0 0 |
44 SUSAN E. JAMES S2 04 | 1 1 0 | 0 0 0 |
46 FRANK J. RAMIREZ JR S2 04 | 0 0 0 | 0 0 0 |
46A SHAWN P. KILGALLON S2 04 | 1 0 1 | 0 0 0 |
46B PAUL M. LEWIS S2 04 | 1 1 0 | 0 0 0 |
46C THOMAS S. EARL S2 04 | 1 1 0 | 0 0 0 |
47 WENDY S. WOLDENBERG S2 04 | 1 1 0 | 0 0 0 |
48 KIMBERLEE I. POLLEY S2 04 | 1 1 0 | 0 0 0 |
53 FRANK MEDINA S2 05 | 1 0 1 | 0 0 0 |
55 MICHAEL T. HUYLAR S2 05 | 1 1 0 | 0 0 0 |
56 FRANK J. RAMIREZ JR S2 05 | 0 0 0 | 0 0 0 |
56A ROBYN F. STOWE S2 05 | 1 1 0 | 0 0 0 |
56B PATRICK J. SWENSON S2 05 | 1 0 1 | 0 0 0 |
56C KAISA SWENDDAL-WHITE S2 05 | 1 1 0 | 0 0 0 |
56H DAVID R. GOETHALS S2 05 | 0 0 0 | 0 0 0 |
56L CHRISTINE M. LEVERENZ S2 05 | 1 0 1 | 0 0 0 |
56Y CRYSTAL L. CONANT S2 05 | 1 1 0 | 0 0 0 |
57 WENDY S. WOLDENBERG S2 05 | 1 1 0 | 0 0 0 |
66 FRANK J. RAMIREZ JR S2 06 | 0 0 0 | 0 0 0 |
66A JACOB LUONG S2 06 | 1 0 1 | 0 0 0 |
66B THOMAS W. ADAMS S2 06 | 1 1 0 | 0 0 0 |
66C MARK S. DAVIS S2 06 | 1 1 0 | 0 0 0 |
66D ERNEST E. ZEIGER S2 06 | 1 1 0 | 0 0 0 |
67 KATHY K. LOBDELL S2 06 | 0 0 0 | 0 0 0 |
68 MICHAEL VAN EATON S2 06 | 1 1 0 | 0 0 0 |
Number of Sections: 47 Average Students Per Section: 0.81
GEN603 TA SCI DEPT SM 1 1 1| 1 1 0 | 0 0 0 |
46 JUDITH J. SHAW S2 04 | 1 1 0 | 0 0 0 |
Number of Sections: 1 Average Students Per Section: 1.00
GEN700 RELEASE TIME SM 1 292 59| 59 39 20 | 16 4 12 |
16 DAVID L. HALFORD JR S2 01 | 14 10 4 | 2 1 1 |
26 DAVID L. HALFORD JR S2 02 | 7 6 1 | 1 1 0 |
36 DAVID L. HALFORD JR S2 03 | 5 3 2 | 2 1 1 |
46 DAVID L. HALFORD JR S2 04 | 8 5 3 | 4 1 3 |

1sonyr01.p 35-2 AUBURN RIVERSIDE HIGH SCHOOL 03/01/12 Page:13
04.11.10.00.01 Course/Class Count Report 408 1:31 PM
EST NBR NBR ----TOTALS---- ---Spec Ed----
COURSE DESCRIPTION LGTH SEC AVL REQ TOT FEM MAL TOT FEM MAL
56 DAVID L. HALFORD JR S2 05 | 9 6 3 | 3 0 3 |
66 DAVID L. HALFORD JR S2 06 | 16 9 7 | 4 0 4 |
Number of Sections: 6 Average Students Per Section: 9.83
GEN701 REL-SEMINARY YR 1 91 16| 16 12 4 | 0 0 0 |
11 FRANK J. RAMIREZ JR YR 01 | 5 3 2 | 0 0 0 |
41 FRANK J. RAMIREZ JR YR 04 | 2 2 0 | 0 0 0 |
61 FRANK J. RAMIREZ JR YR 06 | 9 7 2 | 0 0 0 |
71 FRANK J. RAMIREZ JR YR 07 | 0 0 0 | 0 0 0 |
Number of Sections: 4 Average Students Per Section: 4.00
GEN706 C L MONITORING YR 1 155 86| 86 29 57 | 84 27 57 |
86 RALPH L. CUBIT YR 08 | 30 10 20 | 29 9 20 |
87 ANGELA K. MCCAUSLAND YR 08 | 17 4 13 | 17 4 13 |
88 JON D. AARSTAD YR 08 | 12 2 10 | 12 2 10 |
89A ELAINE M. HETTERLY YR 08 | 20 8 12 | 20 8 12 |
89B AMBER R. COX YR 08 | 7 5 2 | 6 4 2 |
Number of Sections: 5 Average Students Per Section: 17.20
GEN708 APEX SM 1 60 7| 7 4 3 | 1 1 0 |
76 THOMAS W. ADAMS S2 07 | 7 4 3 | 1 1 0 |
Number of Sections: 1 Average Students Per Section: 7.00
GEN710 RUNNING START SM 25 970 432| 432 273 159 | 0 0 0 |
16 DANIEL J. POLLEY S2 01 | 71 42 29 | 0 0 0 |
26 DANIEL J. POLLEY S2 02 | 76 48 28 | 0 0 0 |
36 DANIEL J. POLLEY S2 03 | 75 48 27 | 0 0 0 |
46 DANIEL J. POLLEY S2 04 | 74 47 27 | 0 0 0 |
56 DANIEL J. POLLEY S2 05 | 67 44 23 | 0 0 0 |
66 DANIEL J. POLLEY S2 06 | 68 44 24 | 0 0 0 |
76 DANIEL J. POLLEY S2 07 | 1 0 1 | 0 0 0 |
Number of Sections: 7 Average Students Per Section: 61.71
GEN740 RS-PART TIME SM 1 80 30| 29 19 10 | 0 0 0 |
96 DANIEL J. POLLEY S2 09 | 29 19 10 | 0 0 0 |
Number of Sections: 1 Average Students Per Section: 29.00
GEN741 RS-FULL TIME SM 2 80 50| 49 28 21 | 0 0 0 |
96 DANIEL J. POLLEY S2 09 | 49 28 21 | 0 0 0 |
Number of Sections: 1 Average Students Per Section: 49.00
GEN814 AHS AUTO TECH YR 1 16 4| 4 0 4 | 0 0 0 |
11 FRANK J. RAMIREZ JR YR 01 | 3 0 3 | 0 0 0 |
51 FRANK J. RAMIREZ JR YR 05 | 1 0 1 | 0 0 0 |
Number of Sections: 2 Average Students Per Section: 2.00
GEN815 AHS ADV AUTOTEC YR 1 1 0| 0 0 0 | 0 0 0 |
41 FRANK J. RAMIREZ JR YR 04 | 0 0 0 | 0 0 0 |
Number of Sections: 1 Average Students Per Section: 0.00
GEN820 AHS STUDENT YR 1 3 0| 0 0 0 | 0 0 0 |
11 FRANK J. RAMIREZ JR YR 01 | 0 0 0 | 0 0 0 |
21 FRANK J. RAMIREZ JR YR 02 | 0 0 0 | 0 0 0 |
31 FRANK J. RAMIREZ JR YR 03 | 0 0 0 | 0 0 0 |
Number of Sections: 3 Average Students Per Section: 0.00
GEN821 AMHS STUDENT YR 1 60 0| 0 0 0 | 0 0 0 |
11 FRANK J. RAMIREZ JR YR 01 | 0 0 0 | 0 0 0 |
21 FRANK J. RAMIREZ JR YR 02 | 0 0 0 | 0 0 0 |
Number of Sections: 2 Average Students Per Section: 0.00
GEN823 WAHS STUDENT YR 1 180 0| 0 0 0 | 0 0 0 |
11 FRANK J. RAMIREZ JR YR 01 | 0 0 0 | 0 0 0 |
21 FRANK J. RAMIREZ JR YR 02 | 0 0 0 | 0 0 0 |
31 FRANK J. RAMIREZ JR YR 03 | 0 0 0 | 0 0 0 |
41 FRANK J. RAMIREZ JR YR 04 | 0 0 0 | 0 0 0 |
51 FRANK J. RAMIREZ JR YR 05 | 0 0 0 | 0 0 0 |

1sonyr01.p 35-2 AUBURN RIVERSIDE HIGH SCHOOL 03/01/12 Page:14
04.11.10.00.01 Course/Class Count Report 408 1:31 PM
EST NBR NBR ----TOTALS---- ---Spec Ed----
COURSE DESCRIPTION LGTH SEC AVL REQ TOT FEM MAL TOT FEM MAL
61 FRANK J. RAMIREZ JR YR 06 | 0 0 0 | 0 0 0 |
Number of Sections: 6 Average Students Per Section: 0.00
GEN825 HOME SCHOOL YR 1 30 2| 2 1 1 | 0 0 0 |
11 FRANK J. RAMIREZ JR YR 09 | 2 1 1 | 0 0 0 |
Number of Sections: 1 Average Students Per Section: 2.00
GEN830 EARLY GRAD SM 1 30 1| 1 1 0 | 1 1 0 |
16 FRANK J. RAMIREZ JR S2 01 | 1 1 0 | 1 1 0 |
Number of Sections: 1 Average Students Per Section: 1.00
GEN834 AFTR SCHL PRG 1 SM 1 93 33| 33 10 23 | 4 1 3 |
76 GERI A. ROHLFF S2 07 | 33 10 23 | 4 1 3 |
Number of Sections: 1 Average Students Per Section: 33.00
GEN835 AFTR SCHL PRG 2 SM 1 60 2| 2 0 2 | 0 0 0 |
76 GERI A. ROHLFF S2 07 | 2 0 2 | 0 0 0 |
Number of Sections: 1 Average Students Per Section: 2.00
GEN999 SEE COUNSELOR SM 3 326 0| 0 0 0 | 0 0 0 |
16 DANIEL J. POLLEY S2 01 | 0 0 0 | 0 0 0 |
911 DANIEL J. POLLEY S2 02 | 0 0 0 | 0 0 0 |
Number of Sections: 2 Average Students Per Section: 0.00
LAN121 LA 9 2 SM 8 180 240| 240 113 127 | 9 4 5 |
16 JENNIFER W. GARCIA S2 01 | 30 13 17 | 1 1 0 |
18 JOHN A. ERICKSON S2 01 | 63 35 28 | 1 0 1 |
26 KARYN L. WILLIAMSON S2 02 | 30 12 18 | 2 2 0 |
36 KARYN L. WILLIAMSON S2 03 | 26 15 11 | 1 0 1 |
46 JENNIFER M. CZARNOWSKI S2 04 | 30 13 17 | 1 0 1 |
56 JENNIFER M. CZARNOWSKI S2 05 | 30 15 15 | 0 0 0 |
66 JENNIFER W. GARCIA S2 06 | 31 10 21 | 3 1 2 |
Number of Sections: 7 Average Students Per Section: 34.29
LAN131 LA 9 HONORS 2 SM 5 150 129| 129 97 32 | 0 0 0 |
16 KARLA K. SEMAN S2 01 | 24 17 7 | 0 0 0 |
26 KARLA K. SEMAN S2 02 | 20 16 4 | 0 0 0 |
46 KARYN L. WILLIAMSON S2 04 | 27 22 5 | 0 0 0 |
56 KARYN L. WILLIAMSON S2 05 | 28 19 9 | 0 0 0 |
66 KARYN L. WILLIAMSON S2 06 | 30 23 7 | 0 0 0 |
Number of Sections: 5 Average Students Per Section: 25.80
LAN211 LA 10 BASIC 2 SM 1 20 17| 17 6 11 | 1 0 1 |
46 SHAWN P. KILGALLON S2 04 | 17 6 11 | 1 0 1 |
Number of Sections: 1 Average Students Per Section: 17.00
LAN221 LA 10 2 SM 8 270 217| 217 88 129 | 4 2 2 |
16 JENNIFER M. CZARNOWSKI S2 01 | 27 10 17 | 0 0 0 |
26 JENNIFER M. CZARNOWSKI S2 02 | 15 6 9 | 1 0 1 |
27 ANGELA 0. RIGLEY BERG S2 02 | 16 5 11 | 0 0 0 |
36 JENNIFER W. GARCIA S2 03 | 17 4 13 | 1 1 0 |
37 ANGELA 0. RIGLEY BERG S2 03 | 19 6 13 | 0 0 0 |
46 JENNIFER W. GARCIA S2 04 | 27 12 15 | 1 0 1 |
47 ANGELA 0. RIGLEY BERG S2 04 | 24 12 12 | 1 1 0 |
56 JENNIFER W. GARCIA S2 05 | 24 12 12 | 0 0 0 |
66 JENNIFER M. CZARNOWSKI S2 06 | 24 9 15 | 0 0 0 |
67 ANGELA 0. RIGLEY BERG S2 06 | 24 12 12 | 0 0 0 |
Number of Sections: 10 Average Students Per Section: 21.70
LAN231 LA 10 HONORS 2 SM 5 150 139| 139 79 60 | 0 0 0 |
16 ANGELA 0. RIGLEY BERG S2 01 | 30 20 10 | 0 0 0 |
36 CRYSTAL L. CONANT S2 03 | 30 16 14 | 0 0 0 |
46 CRYSTAL L. CONANT S2 04 | 30 17 13 | 0 0 0 |
56 PATRICK J. SWENSON S2 05 | 19 10 9 | 0 0 0 |
66 PATRICK J. SWENSON S2 06 | 30 16 14 | 0 0 0 |

1sonyr01.p 35-2 AUBURN RIVERSIDE HIGH SCHOOL 03/01/12 Page:15
04.11.10.00.01 Course/Class Count Report 408 1:31 PM
EST NBR NBR ----TOTALS---- ---Spec Ed----
COURSE DESCRIPTION LGTH SEC AVL REQ TOT FEM MAL TOT FEM MAL
Number of Sections: 5 Average Students Per Section: 27.80
LAN302 LA INTERVEN 2 SM 1 30 15| 15 3 12 | 2 1 1 |
26 SUSAN E. JAMES S2 02 | 15 3 12 | 2 1 1 |
Number of Sections: 1 Average Students Per Section: 15.00
LAN311 AM LIT BASIC 2 SM 1 20 19| 19 3 16 | 2 0 2 |
36 TIMOTHY A. WRIGHT S2 03 | 19 3 16 | 2 0 2 |
Number of Sections: 1 Average Students Per Section: 19.00
LAN321 AMER LIT 2 SM 9 270 241| 241 116 125 | 2 0 2 |
16 SUSAN L. NEU S2 01 | 26 8 18 | 0 0 0 |
17 SUSAN E. JAMES S2 01 | 29 10 19 | 0 0 0 |
26 SUSAN L. NEU S2 02 | 27 10 17 | 0 0 0 |
27 CRYSTAL L. CONANT S2 02 | 29 19 10 | 0 0 0 |
37 SUSAN L. NEU S2 03 | 29 17 12 | 1 0 1 |
47 SUSAN E. JAMES S2 04 | 30 18 12 | 0 0 0 |
56 CRYSTAL L. CONANT S2 05 | 26 13 13 | 1 0 1 |
57 SHAWN P. KILGALLON S2 05 | 24 15 9 | 0 0 0 |
66 SHAWN P. KILGALLON S2 06 | 21 6 15 | 0 0 0 |
Number of Sections: 9 Average Students Per Section: 26.78
LAN331 AP LAN/COMP 2 SM 4 120 99| 99 71 28 | 0 0 0 |
16 TIMOTHY A. WRIGHT S2 01 | 25 22 3 | 0 0 0 |
26 TIMOTHY A. WRIGHT S2 02 | 28 19 9 | 0 0 0 |
46 SUSAN L. NEU S2 04 | 17 9 8 | 0 0 0 |
66 TIMOTHY A. WRIGHT S2 06 | 29 21 8 | 0 0 0 |
Number of Sections: 4 Average Students Per Section: 24.75
LAN410 COMMUN ARTS SM 2 61 30| 30 13 17 | 1 1 0 |
36 SUSAN E. JAMES S2 03 | 30 13 17 | 1 1 0 |
Number of Sections: 1 Average Students Per Section: 30.00
LAN411 SHAKESPEARE SM 1 30 22| 22 9 13 | 1 1 0 |
66 KARLA K. SEMAN S2 06 | 22 9 13 | 1 1 0 |
Number of Sections: 1 Average Students Per Section: 22.00
LAN412 SOC OF FUTURE SM 2 60 28| 28 7 21 | 1 0 1 |
16 PATRICK J. SWENSON S2 01 | 28 7 21 | 1 0 1 |
Number of Sections: 1 Average Students Per Section: 28.00
LAN413 INDIV LIT 1 SM 3 61 29| 29 15 14 | 2 0 2 |
36 GERI A. ROHLFF S2 03 | 29 15 14 | 2 0 2 |
Number of Sections: 1 Average Students Per Section: 29.00
LAN414 INDIV LIT 2 SM 1 30 26| 26 12 14 | 2 1 1 |
46 GERI A. ROHLFF S2 04 | 26 12 14 | 2 1 1 |
Number of Sections: 1 Average Students Per Section: 26.00
LAN415 SPORTS LIT SM 2 60 30| 29 12 17 | 0 0 0 |
16 CRYSTAL L. CONANT S2 01 | 29 12 17 | 0 0 0 |
Number of Sections: 1 Average Students Per Section: 29.00
LAN416 CREATIVE WRIT SM 6 175 89| 89 51 38 | 2 2 0 |
16 SHAWN P. KILGALLON S2 01 | 22 11 11 | 0 0 0 |
26 SHAWN P. KILGALLON S2 02 | 25 11 14 | 0 0 0 |
47 PATRICK J. SWENSON S2 04 | 20 11 9 | 1 1 0 |
56 JOHN A. ERICKSON S2 05 | 22 18 4 | 1 1 0 |
Number of Sections: 4 Average Students Per Section: 22.25
LAN417 COLLEGE WRITING SM 9 250 76| 76 41 35 | 1 1 0 |
16 GERI A. ROHLFF S2 01 | 14 5 9 | 0 0 0 |
26 GERI A. ROHLFF S2 02 | 22 15 7 | 0 0 0 |
56 TIMOTHY A. WRIGHT S2 05 | 25 13 12 | 1 1 0 |
66 JOHN A. ERICKSON S2 06 | 15 8 7 | 0 0 0 |
Number of Sections: 4 Average Students Per Section: 19.00
LAN431 AP LIT/COMP 2 SM 1 31 20| 20 14 6 | 0 0 0 |
26 PATRICK J. SWENSON S2 02 | 19 13 6 | 0 0 0 |

1sonyr01.p 35-2 AUBURN RIVERSIDE HIGH SCHOOL 03/01/12 Page:16
04.11.10.00.01 Course/Class Count Report 408 1:31 PM
EST NBR NBR ----TOTALS---- ---Spec Ed----
COURSE DESCRIPTION LGTH SEC AVL REQ TOT FEM MAL TOT FEM MAL
56C PATRICK J. SWENSON S2 05 | 1 1 0 | 0 0 0 |
Number of Sections: 2 Average Students Per Section: 10.00
LAN513 JOURNALISTIC WR SM 1 23 0| 0 0 0 | 0 0 0 |
46 PATRICK J. SWENSON S2 04 | 0 0 0 | 0 0 0 |
Number of Sections: 1 Average Students Per Section: 0.00
LAN515 NEWSPAPER 2 SM 1 12 12| 12 8 4 | 0 0 0 |
46 PATRICK J. SWENSON S2 04 | 11 8 3 | 0 0 0 |
76 PATRICK J. SWENSON S2 07 | 1 0 1 | 0 0 0 |
Number of Sections: 2 Average Students Per Section: 6.00
MAT111 FOUND ALG/GEO 2 SM 1 1 1| 1 0 1 | 1 0 1 |
16 JON D. AARSTAD S2 01 | 1 0 1 | 1 0 1 |
Number of Sections: 1 Average Students Per Section: 1.00
MAT117 APPLIED MATH 2 SM 1 0 0| 0 0 0 | 0 0 0 |
36 GEORGE W. SUMNER S2 03 | 0 0 0 | 0 0 0 |
Number of Sections: 1 Average Students Per Section: 0.00
MAT120 ALGEBRA 1 SM 8 323 46| 46 17 29 | 2 0 2 |
16 JACOB LUONG S2 01 | 17 7 10 | 2 0 2 |
26 JACOB LUONG S2 02 | 9 3 6 | 0 0 0 |
66 JACOB LUONG S2 06 | 20 7 13 | 0 0 0 |
Number of Sections: 3 Average Students Per Section: 15.33
MAT121 ALGEBRA 2 SM 8 180 236| 236 127 109 | 10 3 7 |
17 MICHAEL T. HUYLAR S2 01 | 29 12 17 | 3 0 3 |
18 ROBERT L. MORGAN S2 01 | 27 11 16 | 2 1 1 |
27 ROBERT L. MORGAN S2 02 | 28 17 11 | 1 1 0 |
28 SCOTT A. HUSAR S2 02 | 63 35 28 | 1 0 1 |
36 MICHAEL T. HUYLAR S2 03 | 30 18 12 | 2 0 2 |
46 MICHAEL T. HUYLAR S2 04 | 30 18 12 | 1 1 0 |
67 ROBERT L. MORGAN S2 06 | 29 16 13 | 0 0 0 |
Number of Sections: 7 Average Students Per Section: 33.71
MAT210 GEOMETRY 1 SM 16 489 36| 35 11 24 | 1 0 1 |
56 SCOTT J. ROWE S2 05 | 20 4 16 | 1 0 1 |
66 SCOTT J. ROWE S2 06 | 15 7 8 | 0 0 0 |
Number of Sections: 2 Average Students Per Section: 17.50
MAT211 GEOMETRY 2 SM 16 360 345| 345 189 156 | 4 3 1 |
16 ERIC LAPLANTE S2 01 | 27 16 11 | 3 2 1 |
26 ROBYN N. SAARENAS S2 02 | 28 16 12 | 0 0 0 |
36 THOMAS S. EARL S2 03 | 26 17 9 | 0 0 0 |
37 EDWARD K. ROSIN S2 03 | 30 15 15 | 1 1 0 |
46 EDWARD K. ROSIN S2 04 | 30 16 14 | 0 0 0 |
47 ROBYN N. SAARENAS S2 04 | 30 11 19 | 0 0 0 |
56 EDWARD K. ROSIN S2 05 | 30 19 11 | 0 0 0 |
58 ROBYN N. SAARENAS S2 05 | 30 19 11 | 0 0 0 |
59 ERIC LAPLANTE S2 05 | 26 11 15 | 0 0 0 |
67 EDWARD K. ROSIN S2 06 | 30 16 14 | 0 0 0 |
68 ERIC LAPLANTE S2 06 | 28 14 14 | 0 0 0 |
69a ROBYN N. SAARENAS S2 06 | 30 19 11 | 0 0 0 |
Number of Sections: 12 Average Students Per Section: 28.75
MAT311 ADV ALG/TRIG 2 SM 13 360 330| 330 159 171 | 3 1 2 |
16 EDWARD K. ROSIN S2 01 | 30 18 12 | 0 0 0 |
17 THOMAS S. EARL S2 01 | 30 18 12 | 0 0 0 |
26 ERIC LAPLANTE S2 02 | 25 13 12 | 0 0 0 |
28 EDWARD K. ROSIN S2 02 | 27 15 12 | 0 0 0 |
36 ERIC LAPLANTE S2 03 | 24 11 13 | 0 0 0 |
37 ROBERT L. MORGAN S2 03 | 30 11 19 | 0 0 0 |
46 THOMAS S. EARL S2 04 | 28 14 14 | 1 0 1 |
47 ROBERT L. MORGAN S2 04 | 20 6 14 | 0 0 0 |

1sonyr01.p 35-2 AUBURN RIVERSIDE HIGH SCHOOL 03/01/12 Page:17
04.11.10.00.01 Course/Class Count Report 408 1:31 PM
EST NBR NBR ----TOTALS---- ---Spec Ed----
COURSE DESCRIPTION LGTH SEC AVL REQ TOT FEM MAL TOT FEM MAL
56 SCOTT A. HUSAR S2 05 | 30 17 13 | 0 0 0 |
57 ROBERT L. MORGAN S2 05 | 26 9 17 | 1 1 0 |
67 SCOTT A. HUSAR S2 06 | 30 15 15 | 1 0 1 |
68 THOMAS S. EARL S2 06 | 30 12 18 | 0 0 0 |
Number of Sections: 12 Average Students Per Section: 27.50
MAT411 BYND ADV ALG 2 SM 3 60 61| 61 39 22 | 2 0 2 |
26 SCOTT J. ROWE S2 02 | 33 19 14 | 1 0 1 |
46 SCOTT J. ROWE S2 04 | 28 20 8 | 1 0 1 |
Number of Sections: 2 Average Students Per Section: 30.50
MAT413 PRE CALCULUS 2 SM 9 240 216| 216 122 94 | 0 0 0 |
16 SCOTT J. ROWE S2 01 | 30 24 6 | 0 0 0 |
26 MICHAEL T. HUYLAR S2 02 | 26 15 11 | 0 0 0 |
36 JACOB LUONG S2 03 | 23 10 13 | 0 0 0 |
37 SCOTT J. ROWE S2 03 | 30 19 11 | 0 0 0 |
46 JACOB LUONG S2 04 | 20 3 17 | 0 0 0 |
56 THOMAS S. EARL S2 05 | 30 20 10 | 0 0 0 |
57 MICHAEL T. HUYLAR S2 05 | 28 13 15 | 0 0 0 |
66 MICHAEL T. HUYLAR S2 06 | 29 18 11 | 0 0 0 |
Number of Sections: 8 Average Students Per Section: 27.00
MAT415 AP CALCULUS 2 SM 4 90 82| 82 37 45 | 0 0 0 |
16 ERNEST E. ZEIGER S2 01 | 30 15 15 | 0 0 0 |
26 ERNEST E. ZEIGER S2 02 | 22 9 13 | 0 0 0 |
36 ROBYN N. SAARENAS S2 03 | 30 13 17 | 0 0 0 |
Number of Sections: 3 Average Students Per Section: 27.33
MAT417 AP STATS 2 SM 1 30 26| 26 19 7 | 0 0 0 |
36 ERNEST E. ZEIGER S2 03 | 26 19 7 | 0 0 0 |
Number of Sections: 1 Average Students Per Section: 26.00
MUS106 CONCERT BAND SM 1 30 26| 26 18 8 | 0 0 0 |
46 MEGHAN E. WAGNER S2 04 | 26 18 8 | 0 0 0 |
Number of Sections: 1 Average Students Per Section: 26.00
MUS116 WIND ENSEMBLE SM 2 40 36| 36 19 17 | 1 1 0 |
56 MEGHAN E. WAGNER S2 05 | 36 19 17 | 1 1 0 |
Number of Sections: 1 Average Students Per Section: 36.00
MUS121 PERCUSSION SM 1 19 18| 18 8 10 | 0 0 0 |
26 MEGHAN E. WAGNER S2 02 | 18 8 10 | 0 0 0 |
Number of Sections: 1 Average Students Per Section: 18.00
MUS126 SYMPHONC BAND SM 1 40 24| 24 10 14 | 0 0 0 |
36 MEGHAN E. WAGNER S2 03 | 24 10 14 | 0 0 0 |
Number of Sections: 1 Average Students Per Section: 24.00
MUS131 JAZZ ENSEMBLE SM 1 40 24| 24 9 15 | 0 0 0 |
96 MEGHAN E. WAGNER S2 09 | 24 9 15 | 0 0 0 |
Number of Sections: 1 Average Students Per Section: 24.00
MUS206 CHORUS SM 2 40 42| 42 28 14 | 4 3 1 |
46 JONATHAN M. STENSON S2 04 | 42 28 14 | 4 3 1 |
Number of Sections: 1 Average Students Per Section: 42.00
MUS211 CHOIR-CONCERT SM 1 40 35| 35 24 11 | 1 0 1 |
36 JONATHAN M. STENSON S2 03 | 35 24 11 | 1 0 1 |
Number of Sections: 1 Average Students Per Section: 35.00
MUS226 ADV CHORUS SM 1 40 36| 36 36 0 | 1 1 0 |
16 JONATHAN M. STENSON S2 01 | 36 36 0 | 1 1 0 |
Number of Sections: 1 Average Students Per Section: 36.00
MUS231 CHOIR-JAZZ EN SM 1 40 24| 24 10 14 | 0 0 0 |
26 JONATHAN M. STENSON S2 02 | 24 10 14 | 0 0 0 |
Number of Sections: 1 Average Students Per Section: 24.00
MUS301 ORCHESTRA SM 1 41 28| 28 16 12 | 0 0 0 |
66 ELSA T. FAGER S2 06 | 27 15 12 | 0 0 0 |

1sonyr01.p 35-2 AUBURN RIVERSIDE HIGH SCHOOL 03/01/12 Page:18
04.11.10.00.01 Course/Class Count Report 408 1:31 PM
EST NBR NBR ----TOTALS---- ---Spec Ed----
COURSE DESCRIPTION LGTH SEC AVL REQ TOT FEM MAL TOT FEM MAL
76 ELSA T. FAGER S2 07 | 1 1 0 | 0 0 0 |
Number of Sections: 2 Average Students Per Section: 14.00
MUS303 ORCHEST-CHMBR SM 2 40 40| 40 27 13 | 0 0 0 |
56 ELSA T. FAGER S2 05 | 40 27 13 | 0 0 0 |
Number of Sections: 1 Average Students Per Section: 40.00
MUS401 GUITAR SM 2 45 5| 5 3 2 | 1 0 1 |
26 MEGHAN E. WAGNER S2 02 | 5 3 2 | 1 0 1 |
Number of Sections: 1 Average Students Per Section: 5.00
MUS402 ADV GUITAR SM 1 16 1| 1 0 1 | 0 0 0 |
26 MEGHAN E. WAGNER S2 02 | 1 0 1 | 0 0 0 |
Number of Sections: 1 Average Students Per Section: 1.00
PHY100 HEALTH SM 14 330 175| 175 86 89 | 16 6 10 |
16 MERI M. BENEDICT S2 01 | 30 17 13 | 3 0 3 |
26 MERI M. BENEDICT S2 02 | 27 20 7 | 4 4 0 |
37 MERI M. BENEDICT S2 03 | 29 10 19 | 3 1 2 |
46 CHRISTOPHER K. GARRISO S2 04 | 31 12 19 | 4 0 4 |
56 JULIE A. MOBERG S2 05 | 30 12 18 | 0 0 0 |
66 CHRISTOPHER K. GARRISO S2 06 | 28 15 13 | 2 1 1 |
Number of Sections: 6 Average Students Per Section: 29.17
PHY200 COED PE SM 12 360 175| 175 84 91 | 15 4 11 |
16 JULIE A. MOBERG S2 01 | 35 15 20 | 5 2 3 |
26 JULIE A. MOBERG S2 02 | 35 17 18 | 2 1 1 |
36 CHRISTINE M. LEVERENZ S2 03 | 33 18 15 | 3 0 3 |
46 CHRISTINE M. LEVERENZ S2 04 | 36 17 19 | 3 1 2 |
56 ARTHUR BENARD III S2 05 | 36 17 19 | 2 0 2 |
Number of Sections: 5 Average Students Per Section: 35.00
PHY205 AEROBICS SM 3 72 35| 35 34 1 | 1 1 0 |
16 CHRISTINE M. LEVERENZ S2 01 | 35 34 1 | 1 1 0 |
Number of Sections: 1 Average Students Per Section: 35.00
PHY207 BASKETBALL SM 3 72 37| 36 5 31 | 2 0 2 |
26 ARTHUR BENARD III S2 02 | 36 5 31 | 2 0 2 |
Number of Sections: 1 Average Students Per Section: 36.00
PHY213 FIELD SPORTS SM 3 72 31| 31 5 26 | 2 0 2 |
46 JULIE A. MOBERG S2 04 | 31 5 26 | 2 0 2 |
Number of Sections: 1 Average Students Per Section: 31.00
PHY220 RACQT SPORTS SM 2 36 34| 34 8 26 | 3 0 3 |
36 ARTHUR BENARD III S2 03 | 34 8 26 | 3 0 3 |
Number of Sections: 1 Average Students Per Section: 34.00
PHY229 BEG WT TRNG SM 8 211 100| 100 14 86 | 11 0 11 |
16 ARTHUR BENARD III S2 01 | 20 0 20 | 4 0 4 |
26 CHRISTINE M. LEVERENZ S2 02 | 18 5 13 | 2 0 2 |
46 DAVID R. GOETHALS S2 04 | 18 2 16 | 2 0 2 |
56 DAVID R. GOETHALS S2 05 | 23 3 20 | 2 0 2 |
66 DAVID R. GOETHALS S2 06 | 21 4 17 | 1 0 1 |
Number of Sections: 5 Average Students Per Section: 20.00
PHY240 OUTDOOR REC SM 3 72 34| 34 10 24 | 1 1 0 |
66 JULIE A. MOBERG S2 06 | 34 10 24 | 1 1 0 |
Number of Sections: 1 Average Students Per Section: 34.00
PHY301 ADV BSKETBALL SM 2 36 36| 36 3 33 | 0 0 0 |
66 ARTHUR BENARD III S2 06 | 36 3 33 | 0 0 0 |
Number of Sections: 1 Average Students Per Section: 36.00
PHY303 ADV VLYBALL SM 1 36 36| 36 21 15 | 0 0 0 |
56 CHRISTINE M. LEVERENZ S2 05 | 36 21 15 | 0 0 0 |
Number of Sections: 1 Average Students Per Section: 36.00
PHY305 ADV WT TRNG SM 4 113 60| 60 9 51 | 3 0 3 |
16 ARTHUR BENARD III S2 01 | 10 0 10 | 0 0 0 |

1sonyr01.p 35-2 AUBURN RIVERSIDE HIGH SCHOOL 03/01/12 Page:19
04.11.10.00.01 Course/Class Count Report 408 1:31 PM
EST NBR NBR ----TOTALS---- ---Spec Ed----
COURSE DESCRIPTION LGTH SEC AVL REQ TOT FEM MAL TOT FEM MAL
26 CHRISTINE M. LEVERENZ S2 02 | 7 1 6 | 0 0 0 |
46 DAVID R. GOETHALS S2 04 | 17 3 14 | 2 0 2 |
56 DAVID R. GOETHALS S2 05 | 13 1 12 | 0 0 0 |
66 DAVID R. GOETHALS S2 06 | 13 4 9 | 1 0 1 |
Number of Sections: 5 Average Students Per Section: 12.00
PHY502 HUMAN SURVIVAL SM 6 180 89| 89 52 37 | 3 0 3 |
16 CHRISTOPHER K. GARRISO S2 01 | 30 19 11 | 1 0 1 |
26 CHRISTOPHER K. GARRISO S2 02 | 30 19 11 | 1 0 1 |
36 CHRISTOPHER K. GARRISO S2 03 | 29 14 15 | 1 0 1 |
Number of Sections: 3 Average Students Per Section: 29.67
SBSEP1 MATH 3 SM 1 60 10| 10 4 6 | 8 2 6 |
26 JON D. AARSTAD S2 02 | 10 4 6 | 8 2 6 |
Number of Sections: 1 Average Students Per Section: 10.00
SBSEP2 MATH 4 SM 1 60 3| 3 1 2 | 3 1 2 |
26 JON D. AARSTAD S2 02 | 3 1 2 | 3 1 2 |
Number of Sections: 1 Average Students Per Section: 3.00
SCI101 SCIENCE LINKS SM 12 330 156| 155 83 72 | 14 4 10 |
26 EDMUND M. VALENTIN S2 02 | 30 13 17 | 1 0 1 |
37 ELAINE M. HETTERLY S2 03 | 31 17 14 | 5 2 3 |
47 ELAINE M. HETTERLY S2 04 | 30 12 18 | 4 0 4 |
56 EDMUND M. VALENTIN S2 05 | 32 21 11 | 2 2 0 |
66 EDMUND M. VALENTIN S2 06 | 32 20 12 | 2 0 2 |
Number of Sections: 5 Average Students Per Section: 31.00
SCI201 BIOLOGY BASIC 2 SM 1 22 21| 21 7 14 | 3 1 2 |
36 CORIN G. MALONE S2 03 | 21 7 14 | 3 1 2 |
Number of Sections: 1 Average Students Per Section: 21.00
SCI203 BIOLOGY 2 SM 12 360 328| 328 172 156 | 5 2 3 |
16 PHILIP J. MYKA S2 01 | 29 13 16 | 0 0 0 |
17 CORIN G. MALONE S2 01 | 29 12 17 | 1 0 1 |
26 CORIN G. MALONE S2 02 | 19 12 7 | 0 0 0 |
27 PHILIP J. MYKA S2 02 | 30 14 16 | 0 0 0 |
28 JUDITH J. SHAW S2 02 | 17 10 7 | 0 0 0 |
36 PHILIP J. MYKA S2 03 | 30 17 13 | 1 1 0 |
37 JUDITH J. SHAW S2 03 | 26 20 6 | 1 0 1 |
46 PHILIP J. MYKA S2 04 | 30 14 16 | 0 0 0 |
47 JUDITH J. SHAW S2 04 | 29 13 16 | 0 0 0 |
56 CORIN G. MALONE S2 05 | 30 16 14 | 1 0 1 |
66 CORIN G. MALONE S2 06 | 30 15 15 | 0 0 0 |
68 JUDITH J. SHAW S2 06 | 29 16 13 | 1 1 0 |
Number of Sections: 12 Average Students Per Section: 27.33
SCI205 AP BIOLOGY 2 SM 2 30 24| 24 11 13 | 0 0 0 |
16 JUDITH J. SHAW S2 01 | 24 11 13 | 0 0 0 |
Number of Sections: 1 Average Students Per Section: 24.00
SCI301 CHEMISTRY 2 SM 11 300 123| 123 72 51 | 0 0 0 |
16 EDMUND M. VALENTIN S2 01 | 27 19 8 | 0 0 0 |
26 MARK S. DAVIS S2 02 | 27 16 11 | 0 0 0 |
46 EDMUND M. VALENTIN S2 04 | 22 12 10 | 0 0 0 |
56 MARK S. DAVIS S2 05 | 28 14 14 | 0 0 0 |
66 MARK S. DAVIS S2 06 | 19 11 8 | 0 0 0 |
Number of Sections: 5 Average Students Per Section: 24.60
SCI305 AP CHEMISTRY 2 SM 1 30 27| 27 18 9 | 0 0 0 |
16 MARK S. DAVIS S2 01 | 27 18 9 | 0 0 0 |
Number of Sections: 1 Average Students Per Section: 27.00
SCI307 CHEMISTRY 2 SM 1 150 141| 141 72 69 | 1 0 1 |
27 MICHAEL VAN EATON S2 02 | 26 15 11 | 0 0 0 |
36 MICHAEL VAN EATON S2 03 | 28 11 17 | 0 0 0 |

1sonyr01.p 35-2 AUBURN RIVERSIDE HIGH SCHOOL 03/01/12 Page:20
04.11.10.00.01 Course/Class Count Report 408 1:31 PM
EST NBR NBR ----TOTALS---- ---Spec Ed----
COURSE DESCRIPTION LGTH SEC AVL REQ TOT FEM MAL TOT FEM MAL
47 MICHAEL VAN EATON S2 04 | 28 12 16 | 0 0 0 |
57 MICHAEL VAN EATON S2 05 | 29 14 15 | 1 0 1 |
67 MICHAEL VAN EATON S2 06 | 30 20 10 | 0 0 0 |
Number of Sections: 5 Average Students Per Section: 28.20
SCI308 BIOLOGY 2 SM 1 30 19| 19 12 7 | 0 0 0 |
26 CORIN G. MALONE S2 02 | 19 12 7 | 0 0 0 |
Number of Sections: 1 Average Students Per Section: 19.00
SCI401 PHYSICS 2 SM 3 60 58| 57 30 27 | 0 0 0 |
56 ERNEST E. ZEIGER S2 05 | 30 12 18 | 0 0 0 |
66 ERNEST E. ZEIGER S2 06 | 27 18 9 | 0 0 0 |
Number of Sections: 2 Average Students Per Section: 28.50
SCI502 MARINE BIOLOGY SM 3 60 29| 29 18 11 | 0 0 0 |
56 PHILIP J. MYKA S2 05 | 29 18 11 | 0 0 0 |
Number of Sections: 1 Average Students Per Section: 29.00
SCI503 ENVIRON BIOLOGY SM 1 30 20| 19 8 11 | 0 0 0 |
46 CORIN G. MALONE S2 04 | 19 8 11 | 0 0 0 |
Number of Sections: 1 Average Students Per Section: 19.00
SCI505 ASTRONOMY SM 2 60 59| 59 23 36 | 0 0 0 |
36 MARK S. DAVIS S2 03 | 29 10 19 | 0 0 0 |
46 MARK S. DAVIS S2 04 | 30 13 17 | 0 0 0 |
Number of Sections: 2 Average Students Per Section: 29.50
SCI507 COMPUTER SCI 2 SM 1 15 11| 11 0 11 | 0 0 0 |
16 ROBYN N. SAARENAS S2 01 | 11 0 11 | 0 0 0 |
Number of Sections: 1 Average Students Per Section: 11.00
SCI509 AP COMP SCI 2 SM 1 5 2| 2 0 2 | 0 0 0 |
16 ROBYN N. SAARENAS S2 01 | 2 0 2 | 0 0 0 |
Number of Sections: 1 Average Students Per Section: 2.00
SCI521 AP PHYSICS B 2 SM 1 30 18| 18 4 14 | 0 0 0 |
16 MICHAEL VAN EATON S2 01 | 18 4 14 | 0 0 0 |
Number of Sections: 1 Average Students Per Section: 18.00
SOC101 WORLD STUDIES SM 10 240 180| 179 88 91 | 17 6 11 |
16 TERRANCE Z. JOHNSON S2 01 | 31 15 16 | 4 3 1 |
36 BRYCE J. STRAND S2 03 | 24 10 14 | 5 0 5 |
38 SHAWN A. MARTINSON S2 03 | 63 35 28 | 1 0 1 |
56 BRYCE J. STRAND S2 05 | 31 13 18 | 2 1 1 |
67 BRYCE J. STRAND S2 06 | 30 15 15 | 5 2 3 |
Number of Sections: 5 Average Students Per Section: 35.80
SOC102 HON WRLD STU 1 SM 4 120 56| 56 41 15 | 0 0 0 |
36 JANALYN R. MCKEEHAN S2 03 | 26 19 7 | 0 0 0 |
46 JANALYN R. MCKEEHAN S2 04 | 30 22 8 | 0 0 0 |
Number of Sections: 2 Average Students Per Section: 28.00
SOC201 US HIST BASIC 2 SM 1 21 20| 20 3 17 | 11 3 8 |
26 JANALYN R. MCKEEHAN S2 02 | 20 3 17 | 11 3 8 |
Number of Sections: 1 Average Students Per Section: 20.00
SOC203 US HISTORY 2 SM 11 330 329| 329 153 176 | 12 6 6 |
16 BRUCE D. DIEHL S2 01 | 30 12 18 | 0 0 0 |
26 ANDREW D. MONSEN S2 02 | 30 15 15 | 2 1 1 |
27 PATRICK M. MCKEEHAN II S2 02 | 30 10 20 | 0 0 0 |
36 BRUCE D. DIEHL S2 03 | 30 15 15 | 0 0 0 |
37 PATRICK M. MCKEEHAN II S2 03 | 30 18 12 | 0 0 0 |
46 PATRICK M. MCKEEHAN II S2 04 | 30 15 15 | 1 0 1 |
56 JANALYN R. MCKEEHAN S2 05 | 30 14 16 | 0 0 0 |
57 ANDREW D. MONSEN S2 05 | 29 12 17 | 2 1 1 |
66 MEGAN ELLIS SUMNER S2 06 | 30 16 14 | 2 2 0 |
67 PATRICK M. MCKEEHAN II S2 06 | 30 12 18 | 3 1 2 |
68 JANALYN R. MCKEEHAN S2 06 | 30 14 16 | 2 1 1 |

1sonyr01.p 35-2 AUBURN RIVERSIDE HIGH SCHOOL 03/01/12 Page:21
04.11.10.00.01 Course/Class Count Report 408 1:31 PM
EST NBR NBR ----TOTALS---- ---Spec Ed----
COURSE DESCRIPTION LGTH SEC AVL REQ TOT FEM MAL TOT FEM MAL
Number of Sections: 11 Average Students Per Section: 29.91
SOC205 AP EUROPEAN 2 SM 5 120 113| 113 57 56 | 0 0 0 |
16 MEGAN ELLIS SUMNER S2 01 | 25 14 11 | 0 0 0 |
26 MEGAN ELLIS SUMNER S2 02 | 28 18 10 | 0 0 0 |
46 MEGAN ELLIS SUMNER S2 04 | 30 10 20 | 0 0 0 |
56 MEGAN ELLIS SUMNER S2 05 | 30 15 15 | 0 0 0 |
Number of Sections: 4 Average Students Per Section: 28.25
SOC300 CIVICS SM 10 300 121| 121 70 51 | 5 1 4 |
26 TERRANCE Z. JOHNSON S2 02 | 21 14 7 | 1 0 1 |
36 CHERYL C. MOYD S2 03 | 22 12 10 | 1 1 0 |
46 TERRANCE Z. JOHNSON S2 04 | 27 13 14 | 1 0 1 |
66 CHERYL C. MOYD S2 06 | 21 13 8 | 0 0 0 |
67 TERRANCE Z. JOHNSON S2 06 | 30 18 12 | 2 0 2 |
Number of Sections: 5 Average Students Per Section: 24.20
SOC302 AP US HISTORY 2 SM 3 90 70| 70 43 27 | 0 0 0 |
36 TERRANCE Z. JOHNSON S2 03 | 20 13 7 | 0 0 0 |
46 BRUCE D. DIEHL S2 04 | 28 17 11 | 0 0 0 |
56 BRUCE D. DIEHL S2 05 | 22 13 9 | 0 0 0 |
Number of Sections: 3 Average Students Per Section: 23.33
SOC400 GLOBAL ISSUES SM 10 300 141| 141 66 75 | 9 5 4 |
16 ANDREW D. MONSEN S2 01 | 30 17 13 | 0 0 0 |
26 CRYSTAL L. JILBERT S2 02 | 23 17 6 | 4 3 1 |
46 CRYSTAL L. JILBERT S2 04 | 29 14 15 | 2 2 0 |
56 SHAWN A. MARTINSON S2 05 | 29 11 18 | 2 0 2 |
66 SHAWN A. MARTINSON S2 06 | 30 7 23 | 1 0 1 |
Number of Sections: 5 Average Students Per Section: 28.20
SOC402 AP US POL&GOV 2 SM 4 120 99| 99 50 49 | 0 0 0 |
16 PATRICK M. MCKEEHAN II S2 01 | 18 10 8 | 0 0 0 |
36 ANDREW D. MONSEN S2 03 | 26 14 12 | 0 0 0 |
46 ANDREW D. MONSEN S2 04 | 28 13 15 | 0 0 0 |
56 PATRICK M. MCKEEHAN II S2 05 | 27 13 14 | 0 0 0 |
Number of Sections: 4 Average Students Per Section: 24.75
SOC501 PSYCHOLOGY 2 SM 3 78 74| 74 49 25 | 2 2 0 |
16 CHERYL C. MOYD S2 01 | 30 18 12 | 0 0 0 |
46 CHERYL C. MOYD S2 04 | 30 21 9 | 2 2 0 |
66 CRYSTAL L. JILBERT S2 06 | 14 10 4 | 0 0 0 |
Number of Sections: 3 Average Students Per Section: 24.67
SOC503 AP PSYCH 2 SM 1 12 9| 9 6 3 | 0 0 0 |
66 CRYSTAL L. JILBERT S2 06 | 9 6 3 | 0 0 0 |
Number of Sections: 1 Average Students Per Section: 9.00
SOC504 SOCIOLOGY 1 SM 2 60 28| 28 13 15 | 2 1 1 |
66 ANDREW D. MONSEN S2 06 | 28 13 15 | 2 1 1 |
Number of Sections: 1 Average Students Per Section: 28.00
SOC506 ECONOMICS SM 1 30 20| 20 9 11 | 0 0 0 |
26 BRUCE D. DIEHL S2 02 | 20 9 11 | 0 0 0 |
Number of Sections: 1 Average Students Per Section: 20.00
SOC508 WASH STATE HIST SM 1 30 26| 26 14 12 | 3 1 2 |
56 CRYSTAL L. JILBERT S2 05 | 26 14 12 | 3 1 2 |
Number of Sections: 1 Average Students Per Section: 26.00
SPE116 READING LAB SM 1 20 13| 13 4 9 | 13 4 9 |
56 ELAINE M. HETTERLY S2 05 | 8 3 5 | 8 3 5 |
57 RALPH L. CUBIT S2 05 | 5 1 4 | 5 1 4 |
Number of Sections: 2 Average Students Per Section: 6.50
SPE212 READ/WR LAN 1 SM 1 17 16| 16 3 13 | 16 3 13 |
56 ANGELA K. MCCAUSLAND S2 05 | 9 2 7 | 9 2 7 |
66 ANGELA K. MCCAUSLAND S2 06 | 7 1 6 | 7 1 6 |

1sonyr01.p 35-2 AUBURN RIVERSIDE HIGH SCHOOL 03/01/12 Page:22
04.11.10.00.01 Course/Class Count Report 408 1:31 PM
EST NBR NBR ----TOTALS---- ---Spec Ed----
COURSE DESCRIPTION LGTH SEC AVL REQ TOT FEM MAL TOT FEM MAL
Number of Sections: 2 Average Students Per Section: 8.00
SPE214 READ/WR LAN 2 SM 1 18 12| 12 6 6 | 12 6 6 |
56 ANGELA K. MCCAUSLAND S2 05 | 5 3 2 | 5 3 2 |
66 ANGELA K. MCCAUSLAND S2 06 | 7 3 4 | 7 3 4 |
Number of Sections: 2 Average Students Per Section: 6.00
SPE216 READ/WR LAN 3 SM 1 11 8| 8 2 6 | 8 2 6 |
16 ELAINE M. HETTERLY S2 01 | 5 2 3 | 5 2 3 |
66 ELAINE M. HETTERLY S2 06 | 3 0 3 | 3 0 3 |
Number of Sections: 2 Average Students Per Section: 4.00
SPE218 READ/WR LAN 4 SM 1 10 6| 6 1 5 | 6 1 5 |
16 ELAINE M. HETTERLY S2 01 | 4 1 3 | 4 1 3 |
66 ELAINE M. HETTERLY S2 06 | 2 0 2 | 2 0 2 |
Number of Sections: 2 Average Students Per Section: 3.00
SPE302 MATH 1 SM 1 14 7| 7 1 6 | 7 1 6 |
16 RALPH L. CUBIT S2 01 | 7 1 6 | 7 1 6 |
Number of Sections: 1 Average Students Per Section: 7.00
SPE304 MATH 2 SM 1 27 16| 16 7 9 | 16 7 9 |
26 RALPH L. CUBIT S2 02 | 9 4 5 | 9 4 5 |
36 RALPH L. CUBIT S2 03 | 7 3 4 | 7 3 4 |
Number of Sections: 2 Average Students Per Section: 8.00
SPE306 MATH 3 SM 1 24 5| 5 2 3 | 5 2 3 |
46 RALPH L. CUBIT S2 04 | 5 2 3 | 5 2 3 |
Number of Sections: 1 Average Students Per Section: 5.00
SPE308 MATH 4 SM 1 21 1| 1 0 1 | 1 0 1 |
26 JON D. AARSTAD S2 02 | 0 0 0 | 0 0 0 |
46 RALPH L. CUBIT S2 04 | 1 0 1 | 1 0 1 |
Number of Sections: 2 Average Students Per Section: 0.50
SPE321 PRE ALGEBRA 2 SM 1 17 15| 15 7 8 | 15 7 8 |
16 JON D. AARSTAD S2 01 | 13 6 7 | 13 6 7 |
36 JON D. AARSTAD S2 03 | 2 1 1 | 2 1 1 |
Number of Sections: 2 Average Students Per Section: 7.50
SPE601 COMM LAB SM 1 29 9| 9 3 6 | 9 3 6 |
46 LESLEY C. MOENTER S2 04 | 3 1 2 | 3 1 2 |
56 LESLEY C. MOENTER S2 05 | 3 1 2 | 3 1 2 |
66 LESLEY C. MOENTER S2 06 | 3 1 2 | 3 1 2 |
76 LESLEY C. MOENTER S2 07 | 0 0 0 | 0 0 0 |
86 LESLEY C. MOENTER S2 08 | 0 0 0 | 0 0 0 |
Number of Sections: 5 Average Students Per Section: 1.80

1sonyr01.p 35-2 AUBURN RIVERSIDE HIGH SCHOOL 03/01/12 Page:23
04.11.10.00.01 Course/Class Count Report Totals 1:31 PM
TITLE FOR TOTAL
TOTALS GROUP TOTAL FEMALE MALE
GRAND TOTALS 10524 5368 5156
Spec Ed 625 209 416
************************ End of report ************************

1sonyr01.p 35-2 WEST AUBURN SENIOR HIGH SCHOOL 03/01/12 Page:1
04.11.10.00.01 Course/Class Count Report 504 1:32 PM
EST NBR NBR ----TOTALS---- ---Spec Ed----
COURSE DESCRIPTION LGTH SEC AVL REQ TOT FEM MAL TOT FEM MAL
ART102 DRAWING 2 SM 1 50 42| 42 17 25 | 2 0 2 |
04 KENNETH G. WATSON S2 04 | 18 5 13 | 1 0 1 |
05 KENNETH G. WATSON S2 05 | 24 12 12 | 1 0 1 |
Number of Sections: 2 Average Students Per Section: 21.00
ART104 ADV ART 2 SM 1 25 0| 0 0 0 | 0 0 0 |
04 KENNETH G. WATSON S2 04 | 0 0 0 | 0 0 0 |
Number of Sections: 1 Average Students Per Section: 0.00
ART201 IND ARTS 2 SM 1 20 16| 16 2 14 | 1 1 0 |
04 DON A. WILSON S2 04 | 16 2 14 | 1 1 0 |
Number of Sections: 1 Average Students Per Section: 16.00
ART352 JEWELRY 2 SM 1 20 17| 17 7 10 | 0 0 0 |
02 DON A. WILSON S2 02 | 17 7 10 | 0 0 0 |
Number of Sections: 1 Average Students Per Section: 17.00
ART800 ART IND STUDY SM 1 50 11| 11 7 4 | 0 0 0 |
71 BROOKE BROUSSARD S2 06 | 11 7 4 | 0 0 0 |
Number of Sections: 1 Average Students Per Section: 11.00
CTE102 ACCOUNTING 2 SM 2 25 17| 17 9 8 | 0 0 0 |
02 STEVEN J. PAYNE S2 02 | 17 9 8 | 0 0 0 |
Number of Sections: 1 Average Students Per Section: 17.00
CTE103 ACCOUNTING 3 SM 1 45 0| 0 0 0 | 0 0 0 |
23 STEVEN J. PAYNE S2 03 | 0 0 0 | 0 0 0 |
Number of Sections: 1 Average Students Per Section: 0.00
CTE104 ACCOUNTING 4 SM 1 50 0| 0 0 0 | 0 0 0 |
23 STEVEN J. PAYNE S2 03 | 0 0 0 | 0 0 0 |
24 STEVEN J. PAYNE S2 04 | 0 0 0 | 0 0 0 |
Number of Sections: 2 Average Students Per Section: 0.00
CTE112 BUS ENGLISH 2 SM 1 55 9| 9 4 5 | 0 0 0 |
05 STEVEN J. PAYNE S2 05 | 9 4 5 | 0 0 0 |
Number of Sections: 1 Average Students Per Section: 9.00
CTE115 BUS MATH SM 1 50 14| 14 5 9 | 0 0 0 |
27 STEVEN J. PAYNE S2 07 | 14 5 9 | 0 0 0 |
Number of Sections: 1 Average Students Per Section: 14.00
CTE120 BUS PERS FIN SM 1 50 0| 0 0 0 | 0 0 0 |
22 STEVEN J. PAYNE S2 02 | 0 0 0 | 0 0 0 |
Number of Sections: 1 Average Students Per Section: 0.00
CTE125 CAREER CHOICES SM 1 150 53| 53 30 23 | 2 0 2 |
21 COLLEEN S. RAYBURN S2 01 | 18 8 10 | 0 0 0 |
22 COLLEEN S. RAYBURN S2 02 | 13 6 7 | 0 0 0 |
24 COLLEEN S. RAYBURN S2 04 | 22 16 6 | 2 0 2 |
Number of Sections: 3 Average Students Per Section: 17.67
CTE135 DIGITOOLS SM 5 32 0| 0 0 0 | 0 0 0 |
24 STEVEN J. PAYNE S2 04 | 0 0 0 | 0 0 0 |
Number of Sections: 1 Average Students Per Section: 0.00
CTE141 MOS 1 SM 1 170 0| 0 0 0 | 0 0 0 |
21 STEVEN J. PAYNE S2 01 | 0 0 0 | 0 0 0 |
24 STEVEN J. PAYNE S2 04 | 0 0 0 | 0 0 0 |
25 STEVEN J. PAYNE S2 05 | 0 0 0 | 0 0 0 |
26 STEVEN J. PAYNE S2 06 | 0 0 0 | 0 0 0 |
Number of Sections: 4 Average Students Per Section: 0.00
CTE142 MOS 2 SM 1 50 0| 0 0 0 | 0 0 0 |
02 STEVEN J. PAYNE S2 02 | 0 0 0 | 0 0 0 |
06 STEVEN J. PAYNE S2 06 | 0 0 0 | 0 0 0 |
Number of Sections: 2 Average Students Per Section: 0.00
CTE232 FOOD NUTR&SCI 2 SM 1 25 0| 0 0 0 | 0 0 0 |
04 NOREEN A. KEBBA S2 04 | 0 0 0 | 0 0 0 |

1sonyr01.p 35-2 WEST AUBURN SENIOR HIGH SCHOOL 03/01/12 Page:2
04.11.10.00.01 Course/Class Count Report 504 1:32 PM
EST NBR NBR ----TOTALS---- ---Spec Ed----
COURSE DESCRIPTION LGTH SEC AVL REQ TOT FEM MAL TOT FEM MAL
Number of Sections: 1 Average Students Per Section: 0.00
CTE250 NUTRTN WELLNESS SM 1 50 18| 18 16 2 | 3 3 0 |
24 NOREEN A. KEBBA S2 04 | 18 16 2 | 3 3 0 |
Number of Sections: 1 Average Students Per Section: 18.00
CTE300 TEEN PARENTNG 1 SM 1 50 0| 0 0 0 | 0 0 0 |
25 NOREEN A. KEBBA S2 05 | 0 0 0 | 0 0 0 |
Number of Sections: 1 Average Students Per Section: 0.00
CTE303 HEALTH CTE SM 1 150 59| 59 27 32 | 3 2 1 |
21 NOREEN A. KEBBA S2 01 | 15 6 9 | 0 0 0 |
22 NOREEN A. KEBBA S2 02 | 20 7 13 | 0 0 0 |
25 NOREEN A. KEBBA S2 05 | 24 14 10 | 3 2 1 |
Number of Sections: 3 Average Students Per Section: 19.67
CTE304 PREVENTIVE MED SM 1 75 0| 0 0 0 | 0 0 0 |
01 NOREEN A. KEBBA S2 01 | 0 0 0 | 0 0 0 |
02 NOREEN A. KEBBA S2 02 | 0 0 0 | 0 0 0 |
05 NOREEN A. KEBBA S2 05 | 0 0 0 | 0 0 0 |
Number of Sections: 3 Average Students Per Section: 0.00
CTE466 YEARBOOK 2 SM 1 25 18| 18 12 6 | 0 0 0 |
06 STEVEN J. PAYNE S2 06 | 18 12 6 | 0 0 0 |
Number of Sections: 1 Average Students Per Section: 18.00
CTE470 WBL GENERIC SM 1 100 8| 8 5 3 | 0 0 0 |
26 COLLEEN S. RAYBURN S2 06 | 8 5 3 | 0 0 0 |
27 COLLEEN S. RAYBURN S2 07 | 0 0 0 | 0 0 0 |
Number of Sections: 2 Average Students Per Section: 4.00
CTE473 WBL BUS ED SM 1 50 0| 0 0 0 | 0 0 0 |
26 COLLEEN S. RAYBURN S2 06 | 0 0 0 | 0 0 0 |
Number of Sections: 1 Average Students Per Section: 0.00
CTE480 WBL FAM CONS SC SM 1 50 0| 0 0 0 | 0 0 0 |
26 COLLEEN S. RAYBURN S2 06 | 0 0 0 | 0 0 0 |
Number of Sections: 1 Average Students Per Section: 0.00
CTE490 WBL CAR CHOICES SM 1 180 3| 3 3 0 | 0 0 0 |
25 COLLEEN S. RAYBURN S2 05 | 0 0 0 | 0 0 0 |
26 COLLEEN S. RAYBURN S2 06 | 1 1 0 | 0 0 0 |
27 COLLEEN S. RAYBURN S2 07 | 1 1 0 | 0 0 0 |
28 COLLEEN S. RAYBURN S2 08 | 1 1 0 | 0 0 0 |
Number of Sections: 4 Average Students Per Section: 0.75
CTE515 NEWSPAPER 2 SM 1 25 0| 0 0 0 | 0 0 0 |
06 STEVEN J. PAYNE S2 06 | 0 0 0 | 0 0 0 |
Number of Sections: 1 Average Students Per Section: 0.00
GEN301 STUDY SKILLS SM 1 25 0| 0 0 0 | 0 0 0 |
06 MICHAEL H. BOSCH S2 06 | 0 0 0 | 0 0 0 |
Number of Sections: 1 Average Students Per Section: 0.00
GEN501 ADM OFF AIDE SM 1 3 0| 0 0 0 | 0 0 0 |
05 LEONARD E. HOLLOMAN S2 05 | 0 0 0 | 0 0 0 |
06 LEONARD E. HOLLOMAN S2 06 | 0 0 0 | 0 0 0 |
07 LEONARD E. HOLLOMAN S2 07 | 0 0 0 | 0 0 0 |
Number of Sections: 3 Average Students Per Section: 0.00
GEN513 LIBRARY AIDE SM 1 1 0| 0 0 0 | 0 0 0 |
21 LEONARD E. HOLLOMAN S2 01 | 0 0 0 | 0 0 0 |
Number of Sections: 1 Average Students Per Section: 0.00
GEN710 RUNNING START SM 1 160 0| 0 0 0 | 0 0 0 |
21 FRANCINE A. SULLIVAN S2 01 | 0 0 0 | 0 0 0 |
22 FRANCINE A. SULLIVAN S2 02 | 0 0 0 | 0 0 0 |
23 FRANCINE A. SULLIVAN S2 03 | 0 0 0 | 0 0 0 |
24 FRANCINE A. SULLIVAN S2 04 | 0 0 0 | 0 0 0 |
25 FRANCINE A. SULLIVAN S2 05 | 0 0 0 | 0 0 0 |

1sonyr01.p 35-2 WEST AUBURN SENIOR HIGH SCHOOL 03/01/12 Page:3
04.11.10.00.01 Course/Class Count Report 504 1:32 PM
EST NBR NBR ----TOTALS---- ---Spec Ed----
COURSE DESCRIPTION LGTH SEC AVL REQ TOT FEM MAL TOT FEM MAL
26 FRANCINE A. SULLIVAN S2 06 | 0 0 0 | 0 0 0 |
27 FRANCINE A. SULLIVAN S2 07 | 0 0 0 | 0 0 0 |
28 FRANCINE A. SULLIVAN S2 08 | 0 0 0 | 0 0 0 |
Number of Sections: 8 Average Students Per Section: 0.00
GEN800 INDEP STUDY SM 1 50 0| 0 0 0 | 0 0 0 |
71 BROOKE BROUSSARD S2 04 | 0 0 0 | 0 0 0 |
Number of Sections: 1 Average Students Per Section: 0.00
GEN801 WSLP SM 1 475 141| 140 92 48 | 1 1 0 |
24 MICHAEL H. BOSCH S2 04 | 0 0 0 | 0 0 0 |
25 MICHAEL H. BOSCH S2 05 | 15 13 2 | 0 0 0 |
26 MICHAEL H. BOSCH S2 06 | 25 18 7 | 1 1 0 |
27 MICHAEL H. BOSCH S2 07 | 4 4 0 | 0 0 0 |
45 DORNFORD W. STOLIKER J S2 05 | 24 17 7 | 0 0 0 |
60 BONNIE E. BEGALKA S2 08 | 10 6 4 | 0 0 0 |
61 BONNIE E. BEGALKA S2 09 | 12 8 4 | 0 0 0 |
64 CATHERINE M. PETER S2 02 | 13 8 5 | 0 0 0 |
65 CATHERINE M. PETER S2 05 | 12 5 7 | 0 0 0 |
66 CATHERINE M. PETER S2 03 | 13 8 5 | 0 0 0 |
67 CATHERINE M. PETER S2 06 | 12 5 7 | 0 0 0 |
Number of Sections: 11 Average Students Per Section: 12.73
GEN804 PERSONAL GROWTH SM 1 625 145| 145 63 82 | 12 6 6 |
31 ROBERT T. FASSO S2 03 | 22 7 15 | 4 2 2 |
32 NOREEN A. KEBBA S2 03 | 12 4 8 | 1 0 1 |
33 LARRY D. LAUSH JR S2 03 | 20 8 12 | 0 0 0 |
34 THOMAS J. PARSONS S2 03 | 8 4 4 | 1 0 1 |
35 STEVEN J. PAYNE S2 03 | 21 8 13 | 4 2 2 |
36 COLLEEN S. RAYBURN S2 03 | 18 7 11 | 1 1 0 |
37 BRADLEY J. COMSTOCK S2 03 | 0 0 0 | 0 0 0 |
38 DORNFORD W. STOLIKER J S2 03 | 18 8 10 | 0 0 0 |
39 SANDRA L. VANNICE S2 03 | 16 10 6 | 0 0 0 |
40 KENNETH G. WATSON S2 03 | 0 0 0 | 0 0 0 |
41 DON A. WILSON S2 03 | 8 5 3 | 1 1 0 |
94 MICHAEL H. BOSCH S2 03 | 2 2 0 | 0 0 0 |
Number of Sections: 12 Average Students Per Section: 12.08
GEN821 AMHS STUDENT YR 1 30 0| 0 0 0 | 0 0 0 |
01 LEONARD E. HOLLOMAN YR 01 | 0 0 0 | 0 0 0 |
02 LEONARD E. HOLLOMAN YR 02 | 0 0 0 | 0 0 0 |
03 LEONARD E. HOLLOMAN YR 03 | 0 0 0 | 0 0 0 |
04 LEONARD E. HOLLOMAN YR 04 | 0 0 0 | 0 0 0 |
05 LEONARD E. HOLLOMAN YR 05 | 0 0 0 | 0 0 0 |
06 LEONARD E. HOLLOMAN YR 06 | 0 0 0 | 0 0 0 |
Number of Sections: 6 Average Students Per Section: 0.00
GEN827 AHS PE SM 1 2 0| 0 0 0 | 0 0 0 |
28 LEONARD E. HOLLOMAN S2 08 | 0 0 0 | 0 0 0 |
Number of Sections: 1 Average Students Per Section: 0.00
GEN830 EARLY GRAD SM 1 300 0| 0 0 0 | 0 0 0 |
21 LEONARD E. HOLLOMAN S2 01 | 0 0 0 | 0 0 0 |
22 LEONARD E. HOLLOMAN S2 02 | 0 0 0 | 0 0 0 |
23 LEONARD E. HOLLOMAN S2 03 | 0 0 0 | 0 0 0 |
24 LEONARD E. HOLLOMAN S2 04 | 0 0 0 | 0 0 0 |
25 LEONARD E. HOLLOMAN S2 05 | 0 0 0 | 0 0 0 |
26 LEONARD E. HOLLOMAN S2 06 | 0 0 0 | 0 0 0 |
Number of Sections: 6 Average Students Per Section: 0.00
GEN888 SEAT COUNT YR 1 175 0| 0 0 0 | 0 0 0 |
21 LARRY D. LAUSH JR YR 01 | 0 0 0 | 0 0 0 |
25 LARRY D. LAUSH JR YR 05 | 0 0 0 | 0 0 0 |

1sonyr01.p 35-2 WEST AUBURN SENIOR HIGH SCHOOL 03/01/12 Page:4
04.11.10.00.01 Course/Class Count Report 504 1:32 PM
EST NBR NBR ----TOTALS---- ---Spec Ed----
COURSE DESCRIPTION LGTH SEC AVL REQ TOT FEM MAL TOT FEM MAL
26 LARRY D. LAUSH JR YR 06 | 0 0 0 | 0 0 0 |
42 DORNFORD W. STOLIKER J YR 02 | 0 0 0 | 0 0 0 |
44 KENNETH G. WATSON YR 06 | 0 0 0 | 0 0 0 |
45 DORNFORD W. STOLIKER J YR 05 | 0 0 0 | 0 0 0 |
46 DORNFORD W. STOLIKER J YR 06 | 0 0 0 | 0 0 0 |
Number of Sections: 7 Average Students Per Section: 0.00
LAN121 LA 9 2 SM 5 25 23| 23 8 15 | 0 0 0 |
2A ROBERT A. HORLICK S2 02 | 23 8 15 | 0 0 0 |
Number of Sections: 1 Average Students Per Section: 23.00
LAN221 LA 10 2 SM 1 50 24| 24 6 18 | 1 1 0 |
01 ROBERT A. HORLICK S2 01 | 24 6 18 | 1 1 0 |
06 MATTHEW J. ROY S2 06 | 0 0 0 | 0 0 0 |
Number of Sections: 2 Average Students Per Section: 12.00
LAN302 LA INTERVEN 2 SM 1 55 6| 6 3 3 | 0 0 0 |
02 ROBERT T. FASSO S2 02 | 6 3 3 | 0 0 0 |
05 ROBERT T. FASSO S2 05 | 0 0 0 | 0 0 0 |
Number of Sections: 2 Average Students Per Section: 3.00
LAN321 AMER LIT 2 SM 11 50 28| 28 12 16 | 2 1 1 |
04 ROBERT T. FASSO S2 04 | 19 8 11 | 0 0 0 |
05 ROBERT T. FASSO S2 05 | 9 4 5 | 2 1 1 |
Number of Sections: 2 Average Students Per Section: 14.00
LAN416 CREATIVE WRIT SM 3 25 0| 0 0 0 | 0 0 0 |
25 MICHAEL H. BOSCH S2 05 | 0 0 0 | 0 0 0 |
Number of Sections: 1 Average Students Per Section: 0.00
LAN422 HUMANITIES 2 SM 1 25 0| 0 0 0 | 0 0 0 |
02 MICHAEL H. BOSCH S2 02 | 0 0 0 | 0 0 0 |
Number of Sections: 1 Average Students Per Section: 0.00
LAN424 READING LAB 2 SM 1 30 12| 12 3 9 | 1 0 1 |
02 ROBERT T. FASSO S2 02 | 0 0 0 | 0 0 0 |
06 ROBERT T. FASSO S2 06 | 12 3 9 | 1 0 1 |
Number of Sections: 2 Average Students Per Section: 6.00
LAN532 WRITING LAB SM 1 40 0| 0 0 0 | 0 0 0 |
25 MICHAEL H. BOSCH S2 05 | 0 0 0 | 0 0 0 |
Number of Sections: 1 Average Students Per Section: 0.00
LAN800 LAN IND STDY SM 1 112 31| 31 16 15 | 0 0 0 |
02 KENNETH G. WATSON S2 02 | 1 1 0 | 0 0 0 |
04 KENNETH G. WATSON S2 04 | 0 0 0 | 0 0 0 |
05 KENNETH G. WATSON S2 05 | 1 0 1 | 0 0 0 |
26 LARRY D. LAUSH JR S2 06 | 18 8 10 | 0 0 0 |
71 BROOKE BROUSSARD S2 03 | 11 7 4 | 0 0 0 |
Number of Sections: 5 Average Students Per Section: 6.20
LAN801 WSLP SM 1 123 0| 0 0 0 | 0 0 0 |
64 CATHERINE M. PETER S2 02 | 0 0 0 | 0 0 0 |
65 CATHERINE M. PETER S2 05 | 0 0 0 | 0 0 0 |
94 MICHAEL H. BOSCH S2 04 | 0 0 0 | 0 0 0 |
Number of Sections: 3 Average Students Per Section: 0.00
MAT110 FOUND ALG/GEO 1 SM 4 456 0| 0 0 0 | 0 0 0 |
21 LARRY D. LAUSH JR S2 01 | 0 0 0 | 0 0 0 |
24 LARRY D. LAUSH JR S2 04 | 0 0 0 | 0 0 0 |
42 DORNFORD W. STOLIKER J S2 02 | 0 0 0 | 0 0 0 |
45 DORNFORD W. STOLIKER J S2 05 | 0 0 0 | 0 0 0 |
46 DORNFORD W. STOLIKER J S2 06 | 0 0 0 | 0 0 0 |
60 BONNIE E. BEGALKA S2 08 | 0 0 0 | 0 0 0 |
61 BONNIE E. BEGALKA S2 09 | 0 0 0 | 0 0 0 |
64 CATHERINE M. PETER S2 02 | 0 0 0 | 0 0 0 |
65 CATHERINE M. PETER S2 05 | 0 0 0 | 0 0 0 |

1sonyr01.p 35-2 WEST AUBURN SENIOR HIGH SCHOOL 03/01/12 Page:5
04.11.10.00.01 Course/Class Count Report 504 1:32 PM
EST NBR NBR ----TOTALS---- ---Spec Ed----
COURSE DESCRIPTION LGTH SEC AVL REQ TOT FEM MAL TOT FEM MAL
66 KATHLEEN L. LEE S2 03 | 0 0 0 | 0 0 0 |
67 CATHERINE M. PETER S2 06 | 0 0 0 | 0 0 0 |
71 BROOKE BROUSSARD S2 04 | 0 0 0 | 0 0 0 |
Number of Sections: 12 Average Students Per Section: 0.00
MAT111 FOUND ALG/GEO 2 SM 4 419 0| 0 0 0 | 0 0 0 |
21 LARRY D. LAUSH JR S2 01 | 0 0 0 | 0 0 0 |
42 DORNFORD W. STOLIKER J S2 02 | 0 0 0 | 0 0 0 |
45 DORNFORD W. STOLIKER J S2 05 | 0 0 0 | 0 0 0 |
46 DORNFORD W. STOLIKER J S2 06 | 0 0 0 | 0 0 0 |
60 BONNIE E. BEGALKA S2 08 | 0 0 0 | 0 0 0 |
61 BONNIE E. BEGALKA S2 09 | 0 0 0 | 0 0 0 |
64 CATHERINE M. PETER S2 02 | 0 0 0 | 0 0 0 |
65 CATHERINE M. PETER S2 05 | 0 0 0 | 0 0 0 |
66 CATHERINE M. PETER S2 03 | 0 0 0 | 0 0 0 |
67 CATHERINE M. PETER S2 06 | 0 0 0 | 0 0 0 |
71 BROOKE BROUSSARD S2 04 | 0 0 0 | 0 0 0 |
Number of Sections: 11 Average Students Per Section: 0.00
MAT112 FOUND ALG/GEO 3 SM 2 456 0| 0 0 0 | 0 0 0 |
21 LARRY D. LAUSH JR S2 01 | 0 0 0 | 0 0 0 |
24 LARRY D. LAUSH JR S2 04 | 0 0 0 | 0 0 0 |
42 DORNFORD W. STOLIKER J S2 02 | 0 0 0 | 0 0 0 |
45 DORNFORD W. STOLIKER J S2 05 | 0 0 0 | 0 0 0 |
46 DORNFORD W. STOLIKER J S2 06 | 0 0 0 | 0 0 0 |
60 BONNIE E. BEGALKA S2 08 | 0 0 0 | 0 0 0 |
61 BONNIE E. BEGALKA S2 09 | 0 0 0 | 0 0 0 |
64 CATHERINE M. PETER S2 02 | 0 0 0 | 0 0 0 |
65 CATHERINE M. PETER S2 05 | 0 0 0 | 0 0 0 |
66 CATHERINE M. PETER S2 03 | 0 0 0 | 0 0 0 |
67 CATHERINE M. PETER S2 06 | 0 0 0 | 0 0 0 |
71 BROOKE BROUSSARD S2 04 | 0 0 0 | 0 0 0 |
Number of Sections: 12 Average Students Per Section: 0.00
MAT113 FOUND ALG/GEO 4 SM 2 506 0| 0 0 0 | 0 0 0 |
21 LARRY D. LAUSH JR S2 01 | 0 0 0 | 0 0 0 |
25 LARRY D. LAUSH JR S2 05 | 0 0 0 | 0 0 0 |
26 LARRY D. LAUSH JR S2 06 | 0 0 0 | 0 0 0 |
42 DORNFORD W. STOLIKER J S2 02 | 0 0 0 | 0 0 0 |
45 DORNFORD W. STOLIKER J S2 05 | 0 0 0 | 0 0 0 |
46 DORNFORD W. STOLIKER J S2 06 | 0 0 0 | 0 0 0 |
60 BONNIE E. BEGALKA S2 08 | 0 0 0 | 0 0 0 |
61 BONNIE E. BEGALKA S2 09 | 0 0 0 | 0 0 0 |
64 CATHERINE M. PETER S2 02 | 0 0 0 | 0 0 0 |
65 CATHERINE M. PETER S2 05 | 0 0 0 | 0 0 0 |
66 CATHERINE M. PETER S2 03 | 0 0 0 | 0 0 0 |
67 CATHERINE M. PETER S2 06 | 0 0 0 | 0 0 0 |
71 BROOKE BROUSSARD S2 04 | 0 0 0 | 0 0 0 |
Number of Sections: 13 Average Students Per Section: 0.00
MAT120 ALGEBRA 1 SM 11 556 3| 3 2 1 | 0 0 0 |
21 LARRY D. LAUSH JR S2 01 | 0 0 0 | 0 0 0 |
24 LARRY D. LAUSH JR S2 04 | 3 2 1 | 0 0 0 |
26 LARRY D. LAUSH JR S2 06 | 0 0 0 | 0 0 0 |
41 DORNFORD W. STOLIKER J S2 01 | 0 0 0 | 0 0 0 |
42 DORNFORD W. STOLIKER J S2 02 | 0 0 0 | 0 0 0 |
45 DORNFORD W. STOLIKER J S2 05 | 0 0 0 | 0 0 0 |
46 DORNFORD W. STOLIKER J S2 06 | 0 0 0 | 0 0 0 |
60 BONNIE E. BEGALKA S2 08 | 0 0 0 | 0 0 0 |
61 BONNIE E. BEGALKA S2 09 | 0 0 0 | 0 0 0 |

1sonyr01.p 35-2 WEST AUBURN SENIOR HIGH SCHOOL 03/01/12 Page:6
04.11.10.00.01 Course/Class Count Report 504 1:32 PM
EST NBR NBR ----TOTALS---- ---Spec Ed----
COURSE DESCRIPTION LGTH SEC AVL REQ TOT FEM MAL TOT FEM MAL
64 CATHERINE M. PETER S2 02 | 0 0 0 | 0 0 0 |
65 CATHERINE M. PETER S2 05 | 0 0 0 | 0 0 0 |
66 CATHERINE M. PETER S2 03 | 0 0 0 | 0 0 0 |
67 CATHERINE M. PETER S2 06 | 0 0 0 | 0 0 0 |
71 BROOKE BROUSSARD S2 04 | 0 0 0 | 0 0 0 |
Number of Sections: 14 Average Students Per Section: 0.21
MAT121 ALGEBRA 2 SM 11 556 22| 22 11 11 | 0 0 0 |
21 LARRY D. LAUSH JR S2 01 | 0 0 0 | 0 0 0 |
24 LARRY D. LAUSH JR S2 04 | 0 0 0 | 0 0 0 |
26 LARRY D. LAUSH JR S2 06 | 0 0 0 | 0 0 0 |
31 DORNFORD W. STOLIKER J S2 01 | 22 11 11 | 0 0 0 |
41 DORNFORD W. STOLIKER J S2 01 | 0 0 0 | 0 0 0 |
42 DORNFORD W. STOLIKER J S2 02 | 0 0 0 | 0 0 0 |
45 DORNFORD W. STOLIKER J S2 05 | 0 0 0 | 0 0 0 |
46 DORNFORD W. STOLIKER J S2 06 | 0 0 0 | 0 0 0 |
60 BONNIE E. BEGALKA S2 08 | 0 0 0 | 0 0 0 |
61 BONNIE E. BEGALKA S2 09 | 0 0 0 | 0 0 0 |
64 CATHERINE M. PETER S2 02 | 0 0 0 | 0 0 0 |
65 CATHERINE M. PETER S2 05 | 0 0 0 | 0 0 0 |
66 CATHERINE M. PETER S2 03 | 0 0 0 | 0 0 0 |
67 CATHERINE M. PETER S2 06 | 0 0 0 | 0 0 0 |
71 BROOKE BROUSSARD S2 04 | 0 0 0 | 0 0 0 |
Number of Sections: 15 Average Students Per Section: 1.47
MAT210 GEOMETRY 1 SM 13 506 5| 5 1 4 | 0 0 0 |
21 LARRY D. LAUSH JR S2 01 | 0 0 0 | 0 0 0 |
24 LARRY D. LAUSH JR S2 04 | 0 0 0 | 0 0 0 |
25 LARRY D. LAUSH JR S2 05 | 5 1 4 | 0 0 0 |
42 DORNFORD W. STOLIKER J S2 02 | 0 0 0 | 0 0 0 |
45 DORNFORD W. STOLIKER J S2 05 | 0 0 0 | 0 0 0 |
46 DORNFORD W. STOLIKER J S2 06 | 0 0 0 | 0 0 0 |
60 BONNIE E. BEGALKA S2 08 | 0 0 0 | 0 0 0 |
61 BONNIE E. BEGALKA S2 09 | 0 0 0 | 0 0 0 |
64 CATHERINE M. PETER S2 02 | 0 0 0 | 0 0 0 |
65 CATHERINE M. PETER S2 05 | 0 0 0 | 0 0 0 |
66 CATHERINE M. PETER S2 03 | 0 0 0 | 0 0 0 |
67 CATHERINE M. PETER S2 06 | 0 0 0 | 0 0 0 |
71 BROOKE BROUSSARD S2 04 | 0 0 0 | 0 0 0 |
Number of Sections: 13 Average Students Per Section: 0.38
MAT211 GEOMETRY 2 SM 13 506 10| 10 3 7 | 0 0 0 |
21 LARRY D. LAUSH JR S2 01 | 0 0 0 | 0 0 0 |
24 LARRY D. LAUSH JR S2 04 | 0 0 0 | 0 0 0 |
25 LARRY D. LAUSH JR S2 05 | 10 3 7 | 0 0 0 |
42 DORNFORD W. STOLIKER J S2 02 | 0 0 0 | 0 0 0 |
45 DORNFORD W. STOLIKER J S2 05 | 0 0 0 | 0 0 0 |
46 DORNFORD W. STOLIKER J S2 06 | 0 0 0 | 0 0 0 |
60 BONNIE E. BEGALKA S2 08 | 0 0 0 | 0 0 0 |
61 BONNIE E. BEGALKA S2 09 | 0 0 0 | 0 0 0 |
64 CATHERINE M. PETER S2 02 | 0 0 0 | 0 0 0 |
65 CATHERINE M. PETER S2 05 | 0 0 0 | 0 0 0 |
66 CATHERINE M. PETER S2 03 | 0 0 0 | 0 0 0 |
67 CATHERINE M. PETER S2 06 | 0 0 0 | 0 0 0 |
71 BROOKE BROUSSARD S2 04 | 0 0 0 | 0 0 0 |
Number of Sections: 13 Average Students Per Section: 0.77
MAT310 ADV ALG/TRIG 1 SM 1 456 1| 1 0 1 | 0 0 0 |
21 LARRY D. LAUSH JR S2 01 | 0 0 0 | 0 0 0 |
24 LARRY D. LAUSH JR S2 04 | 1 0 1 | 0 0 0 |

1sonyr01.p 35-2 WEST AUBURN SENIOR HIGH SCHOOL 03/01/12 Page:7
04.11.10.00.01 Course/Class Count Report 504 1:32 PM
EST NBR NBR ----TOTALS---- ---Spec Ed----
COURSE DESCRIPTION LGTH SEC AVL REQ TOT FEM MAL TOT FEM MAL
42 DORNFORD W. STOLIKER J S2 02 | 0 0 0 | 0 0 0 |
45 DORNFORD W. STOLIKER J S2 05 | 0 0 0 | 0 0 0 |
46 DORNFORD W. STOLIKER J S2 06 | 0 0 0 | 0 0 0 |
60 BONNIE E. BEGALKA S2 08 | 0 0 0 | 0 0 0 |
61 BONNIE E. BEGALKA S2 09 | 0 0 0 | 0 0 0 |
64 CATHERINE M. PETER S2 02 | 0 0 0 | 0 0 0 |
65 CATHERINE M. PETER S2 05 | 0 0 0 | 0 0 0 |
66 CATHERINE M. PETER S2 03 | 0 0 0 | 0 0 0 |
67 CATHERINE M. PETER S2 06 | 0 0 0 | 0 0 0 |
71 BROOKE BROUSSARD S2 04 | 0 0 0 | 0 0 0 |
Number of Sections: 12 Average Students Per Section: 0.08
MAT311 ADV ALG/TRIG 2 SM 1 456 0| 0 0 0 | 0 0 0 |
21 LARRY D. LAUSH JR S2 01 | 0 0 0 | 0 0 0 |
24 LARRY D. LAUSH JR S2 04 | 0 0 0 | 0 0 0 |
42 DORNFORD W. STOLIKER J S2 02 | 0 0 0 | 0 0 0 |
45 DORNFORD W. STOLIKER J S2 05 | 0 0 0 | 0 0 0 |
46 DORNFORD W. STOLIKER J S2 06 | 0 0 0 | 0 0 0 |
60 BONNIE E. BEGALKA S2 08 | 0 0 0 | 0 0 0 |
61 BONNIE E. BEGALKA S2 09 | 0 0 0 | 0 0 0 |
64 CATHERINE M. PETER S2 02 | 0 0 0 | 0 0 0 |
65 CATHERINE M. PETER S2 05 | 0 0 0 | 0 0 0 |
66 CATHERINE M. PETER S2 03 | 0 0 0 | 0 0 0 |
67 CATHERINE M. PETER S2 06 | 0 0 0 | 0 0 0 |
71 BROOKE BROUSSARD S2 04 | 0 0 0 | 0 0 0 |
Number of Sections: 12 Average Students Per Section: 0.00
MAT800 MATH IND STDY SM 1 347 87| 87 40 47 | 3 2 1 |
21 LARRY D. LAUSH JR S2 01 | 20 9 11 | 0 0 0 |
24 LARRY D. LAUSH JR S2 04 | 16 7 9 | 0 0 0 |
25 LARRY D. LAUSH JR S2 05 | 0 0 0 | 0 0 0 |
26 LARRY D. LAUSH JR S2 06 | 1 1 0 | 0 0 0 |
42 DORNFORD W. STOLIKER J S2 02 | 16 8 8 | 1 0 1 |
46 DORNFORD W. STOLIKER J S2 06 | 23 8 15 | 2 2 0 |
71 BROOKE BROUSSARD S2 04 | 11 7 4 | 0 0 0 |
Number of Sections: 7 Average Students Per Section: 12.43
MAT801 WSLP SM 1 130 0| 0 0 0 | 0 0 0 |
64 CATHERINE M. PETER S2 03 | 0 0 0 | 0 0 0 |
65 CATHERINE M. PETER S2 06 | 0 0 0 | 0 0 0 |
91 LARRY D. LAUSH JR S2 04 | 0 0 0 | 0 0 0 |
Number of Sections: 3 Average Students Per Section: 0.00
PHY100 HEALTH SM 1 0 0| 0 0 0 | 0 0 0 |
21 NOREEN A. KEBBA S2 01 | 0 0 0 | 0 0 0 |
22 NOREEN A. KEBBA S2 02 | 0 0 0 | 0 0 0 |
23 NOREEN A. KEBBA S2 03 | 0 0 0 | 0 0 0 |
25 NOREEN A. KEBBA S2 05 | 0 0 0 | 0 0 0 |
26 NOREEN A. KEBBA S2 06 | 0 0 0 | 0 0 0 |
Number of Sections: 5 Average Students Per Section: 0.00
PHY201 COED PE SM 1 50 49| 49 11 38 | 3 0 3 |
05 DON A. WILSON S2 05 | 24 6 18 | 1 0 1 |
06 DON A. WILSON S2 06 | 25 5 20 | 2 0 2 |
Number of Sections: 2 Average Students Per Section: 24.50
PHY206 AEROBICS SM 1 25 0| 0 0 0 | 0 0 0 |
04 NOREEN A. KEBBA S2 04 | 0 0 0 | 0 0 0 |
Number of Sections: 1 Average Students Per Section: 0.00
PHY800 PE IND STUDY SM 1 50 11| 11 7 4 | 0 0 0 |
71 BROOKE BROUSSARD S2 07 | 11 7 4 | 0 0 0 |

1sonyr01.p 35-2 WEST AUBURN SENIOR HIGH SCHOOL 03/01/12 Page:8
04.11.10.00.01 Course/Class Count Report 504 1:32 PM
EST NBR NBR ----TOTALS---- ---Spec Ed----
COURSE DESCRIPTION LGTH SEC AVL REQ TOT FEM MAL TOT FEM MAL
Number of Sections: 1 Average Students Per Section: 11.00
SCI203 BIOLOGY 2 SM 1 50 24| 24 15 9 | 5 3 2 |
05 SANDRA L. VANNICE S2 05 | 12 8 4 | 2 1 1 |
06 SANDRA L. VANNICE S2 06 | 12 7 5 | 3 2 1 |
Number of Sections: 2 Average Students Per Section: 12.00
SCI510 HORTICULTURE SM 1 50 0| 0 0 0 | 0 0 0 |
24 DON A. WILSON S2 04 | 0 0 0 | 0 0 0 |
Number of Sections: 1 Average Students Per Section: 0.00
SCI515 EARTH SCIENCE SM 1 50 45| 45 18 27 | 1 1 0 |
24 SANDRA L. VANNICE S2 04 | 22 5 17 | 0 0 0 |
27 SANDRA L. VANNICE S2 07 | 23 13 10 | 1 1 0 |
Number of Sections: 2 Average Students Per Section: 22.50
SCI800 SCI IND STUDY SM 1 35 0| 0 0 0 | 0 0 0 |
45 DORNFORD W. STOLIKER J S2 05 | 0 0 0 | 0 0 0 |
Number of Sections: 1 Average Students Per Section: 0.00
SCI801 WSLP SM 1 50 0| 0 0 0 | 0 0 0 |
92 DORNFORD W. STOLIKER J S2 02 | 0 0 0 | 0 0 0 |
Number of Sections: 1 Average Students Per Section: 0.00
SOC101 WORLD STUDIES SM 1 100 23| 23 10 13 | 0 0 0 |
22 KENNETH G. WATSON S2 02 | 11 3 8 | 0 0 0 |
26 KENNETH G. WATSON S2 06 | 12 7 5 | 0 0 0 |
Number of Sections: 2 Average Students Per Section: 11.50
SOC203 US HISTORY 2 SM 1 130 42| 42 17 25 | 8 4 4 |
04 THOMAS J. PARSONS S2 04 | 18 8 10 | 5 2 3 |
05 THOMAS J. PARSONS S2 05 | 21 7 14 | 3 2 1 |
06 KENNETH G. WATSON S2 06 | 3 2 1 | 0 0 0 |
Number of Sections: 3 Average Students Per Section: 14.00
SOC300 CIVICS SM 1 50 12| 12 6 6 | 1 0 1 |
22 THOMAS J. PARSONS S2 02 | 12 6 6 | 1 0 1 |
Number of Sections: 1 Average Students Per Section: 12.00
SOC400 GLOBAL ISSUES SM 1 50 21| 21 11 10 | 1 1 0 |
21 THOMAS J. PARSONS S2 01 | 21 11 10 | 1 1 0 |
Number of Sections: 1 Average Students Per Section: 21.00
SOC501 PSYCHOLOGY 2 SM 1 25 0| 0 0 0 | 0 0 0 |
07 MICHAEL H. BOSCH S2 07 | 0 0 0 | 0 0 0 |
Number of Sections: 1 Average Students Per Section: 0.00
SOC508 WASH STATE HIST SM 1 50 10| 9 4 5 | 1 0 1 |
26 KENNETH G. WATSON S2 06 | 9 4 5 | 1 0 1 |
Number of Sections: 1 Average Students Per Section: 9.00
SOC800 SOC IND STDY SM 1 50 11| 11 7 4 | 0 0 0 |
71 BROOKE BROUSSARD S2 05 | 11 7 4 | 0 0 0 |
Number of Sections: 1 Average Students Per Section: 11.00
SPE201 LANG ARTS 1 SM 1 85 10| 10 4 6 | 10 4 6 |
21 BRADLEY J. COMSTOCK S2 01 | 10 4 6 | 10 4 6 |
Number of Sections: 1 Average Students Per Section: 10.00
SPE202 LANG ARTS 1 SM 1 55 0| 0 0 0 | 0 0 0 |
21 BRADLEY J. COMSTOCK S2 01 | 0 0 0 | 0 0 0 |
Number of Sections: 1 Average Students Per Section: 0.00
SPE203 LANG ARTS 2 SM 1 55 0| 0 0 0 | 0 0 0 |
21 BRADLEY J. COMSTOCK S2 01 | 0 0 0 | 0 0 0 |
Number of Sections: 1 Average Students Per Section: 0.00
SPE204 LANG ARTS 2 SM 1 55 0| 0 0 0 | 0 0 0 |
21 BRADLEY J. COMSTOCK S2 01 | 0 0 0 | 0 0 0 |
Number of Sections: 1 Average Students Per Section: 0.00
SPE205 LANG ARTS 3 SM 1 55 0| 0 0 0 | 0 0 0 |
21 BRADLEY J. COMSTOCK S2 01 | 0 0 0 | 0 0 0 |

1sonyr01.p 35-2 WEST AUBURN SENIOR HIGH SCHOOL 03/01/12 Page:9
04.11.10.00.01 Course/Class Count Report 504 1:32 PM
EST NBR NBR ----TOTALS---- ---Spec Ed----
COURSE DESCRIPTION LGTH SEC AVL REQ TOT FEM MAL TOT FEM MAL
Number of Sections: 1 Average Students Per Section: 0.00
SPE206 LANG ARTS 3 SM 1 55 0| 0 0 0 | 0 0 0 |
21 BRADLEY J. COMSTOCK S2 01 | 0 0 0 | 0 0 0 |
Number of Sections: 1 Average Students Per Section: 0.00
SPE207 LANG ARTS 4 SM 1 55 0| 0 0 0 | 0 0 0 |
21 BRADLEY J. COMSTOCK S2 01 | 0 0 0 | 0 0 0 |
Number of Sections: 1 Average Students Per Section: 0.00
SPE208 LANG ARTS 4 SM 1 55 0| 0 0 0 | 0 0 0 |
21 BRADLEY J. COMSTOCK S2 01 | 0 0 0 | 0 0 0 |
Number of Sections: 1 Average Students Per Section: 0.00
SPE209 LANG ARTS 5 SM 1 55 0| 0 0 0 | 0 0 0 |
21 BRADLEY J. COMSTOCK S2 01 | 0 0 0 | 0 0 0 |
Number of Sections: 1 Average Students Per Section: 0.00
SPE210 LANG ARTS 5 SM 1 55 1| 1 0 1 | 0 0 0 |
21 BRADLEY J. COMSTOCK S2 01 | 1 0 1 | 0 0 0 |
Number of Sections: 1 Average Students Per Section: 1.00
SPE301 MATH 1 SM 1 85 9| 9 6 3 | 9 6 3 |
22 BRADLEY J. COMSTOCK S2 02 | 9 6 3 | 9 6 3 |
Number of Sections: 1 Average Students Per Section: 9.00
SPE302 MATH 1 SM 1 55 0| 0 0 0 | 0 0 0 |
22 BRADLEY J. COMSTOCK S2 02 | 0 0 0 | 0 0 0 |
Number of Sections: 1 Average Students Per Section: 0.00
SPE303 MATH 2 SM 1 85 1| 1 0 1 | 1 0 1 |
22 BRADLEY J. COMSTOCK S2 02 | 1 0 1 | 1 0 1 |
Number of Sections: 1 Average Students Per Section: 1.00
SPE304 MATH 2 SM 1 55 0| 0 0 0 | 0 0 0 |
22 BRADLEY J. COMSTOCK S2 02 | 0 0 0 | 0 0 0 |
Number of Sections: 1 Average Students Per Section: 0.00
SPE305 MATH 3 SM 1 55 0| 0 0 0 | 0 0 0 |
22 BRADLEY J. COMSTOCK S2 02 | 0 0 0 | 0 0 0 |
Number of Sections: 1 Average Students Per Section: 0.00
SPE306 MATH 3 SM 1 55 0| 0 0 0 | 0 0 0 |
22 BRADLEY J. COMSTOCK S2 02 | 0 0 0 | 0 0 0 |
Number of Sections: 1 Average Students Per Section: 0.00
SPE307 MATH 4 SM 1 85 0| 0 0 0 | 0 0 0 |
22 BRADLEY J. COMSTOCK S2 02 | 0 0 0 | 0 0 0 |
Number of Sections: 1 Average Students Per Section: 0.00
SPE308 MATH 4 SM 1 55 1| 1 0 1 | 0 0 0 |
22 BRADLEY J. COMSTOCK S2 02 | 1 0 1 | 0 0 0 |
Number of Sections: 1 Average Students Per Section: 1.00

1sonyr01.p 35-2 WEST AUBURN SENIOR HIGH SCHOOL 03/01/12 Page:10
04.11.10.00.01 Course/Class Count Report Totals 1:32 PM
TITLE FOR TOTAL
TOTALS GROUP TOTAL FEMALE MALE
GRAND TOTALS 1091 520 571
Spec Ed 71 36 35
************************ End of report ************************