00annual e
34
Transcript of 00annual e


Since our establishment in 1917, Nikon Corporation has been a leading pioneer in optical glass
manufacturing technology in Japan. In addition to our distinctive lineup of single lens reflex (SLR)
cameras, Nikon manufactures a wide range of industrial instruments, including steppers and
other semiconductor manufacturing-related equipment, microscopes and measuring instruments.
In response to the rapidly changing environment, Nikon established Vision Nikon 21, with an
emphasis on “trustworthiness and creativity” as well as concrete objectives to realize this
corporate vision, while further strengthening our brand identity.
The ultimate goal is to maximize returns to vested individuals--namely CUSTOMERS,
SHAREHOLDERS, EMPLOYEES and all other STAKEHOLDERS. Integrating
the core competencies of the entire Nikon Group, we will strive to meet the diverse needs of
people and industries around the world.
FOCUSING ON HELPING PEOPLE ENVISION THE WORLD
nikon first 00.9.5 8:52 PM ページ 1

1
CONTENTSFinancial Highlights 1To Our Shareholders 2Review of Operations 4Board of Directors 8Five—Year Summary 9Management s Discussion and Analyisis of Operations 9Consolidated Balance Sheets 12Consolidated Statements of Operations 14Consolidated Statements of Shareholders Equity 15Consolidated Statements of Cash Flows 16Notes to Consolidated Financial Statements 17Independent Auditors Report 28Corporate Directory 29Investor Information 31
Nikon Corporation and Consolidated Subsidiaries
Years ended March 31, 2000 and 1999
Millions of
Millions of Yen U.S.Dollars %
2000 1999 2000 Increase
For the yearNet sales ¥ 371,801 ¥ 305,765 $ 3,503 21.6%Operating income (loss) 18,434 ( 8,741) 174Net income (loss) 7,770 (18,233) 73Per share of common stock (Yen and U.S. dollars); Net income (loss) ¥ 21.01 ¥ (49.29) $ 0.20 Cash dividends applicable to the year 5.00 3.00 0.05 66.7% At year-endTotal assets ¥ 502,175 ¥ 474,965 $ 4,731 5.7%Shareholders' equity 166,495 160,991 1,568 3.4%
Notes; 1.Per share of common stock is computed based on the weighted average number of shares outstanding during the year.
2.U.S. dollar figures are translated for reference only at ¥106.15 to U.S. $1.00, the exchange rate at March 31, 2000.
FINANCIAL HIGHLIGHTS

2
BUSINESS CONDITIONS AND RESULTS
In the fiscal year ended March 31, 2000, the consolidated net sales of the Nikon Group recovered strongly, rising 21.6% to ¥371.8 billion (US$3,503 million). In consumer products, buoyant sales of digital cameras both in Japan and in overseas markets helped overcome the effects of stalled consumer spending in Japan and the strong appreciation of the yen, as demonstrated by a solid growth in recorded revenues. In industrial instruments, a general recovery in the semiconductor market contributed to a sharp rise in sales of semiconductor-related equipment. In addition, the effects of the various measures enacted across the Nikon Group to increase earnings began to impact the bottom line. As a result, a positive operating income of ¥18,434 million (US$174 million) was recorded, and net income amounted to ¥7,770 million (US$73 million).
In line with a change in accounting policy, we decided to amortize unfunded pension and severance payment liabilities totaling approximately ¥27 billion* (US$ 255 million) over a three-year period, starting in the fiscal year ended March 31, 2001.
BOOSTING EARNINGS POTENTIAL AND OPERATIONAL RESPONSE SPEED
Despite our return to profit during the year, we believe there is still considerable room for improvement in profit performance. Since October 1999, we have introduced an in-house company system designed to make all the companies within the Nikon Group individually responsible for sales and profit performance. The new system puts companies on an equal footing with a clear delegation of responsibilities. To support companies in achieving their sales and profit targets, we are also making greater use of information technology to reform our business management practices. The introduction of a new performance evaluation system supports these moves, making the entire process more efficient and results-oriented.
During the year, we implemented several specific organizational measures to improve the performance of the Nikon Group. First, we established our surveying instrument business as an independent company. Second, we merged our ophthalmic lens business in a joint venture with Essilor International S.A. of France.
The full benefits of the implementation of the in-house company system are expected to become evident in fiscal year 2001. From this year, we plan to begin managing the Nikon Group with the various companies forming their own separate business segments.
TO OUR SHAREHOLDERS
Shoichiro Yoshida, President (left), Shigeo Ono, Chairman (right)
* Approximate amount as of March 31, 2000

3
Shigeo OnoChairman
WORKING WITH NEW VISION
In March 2000, we formulated a new vision statement and management plan for the Nikon Group. Vision Nikon 21 contains a revised corporate philosophy, in which the keywords are “trustworthiness and creativity,” as well as concrete goals that we must achieve collectively as a company. It is the leading concept of our policies, and sets out the actions that we need to take as individual employees and group firms to realize both the spirit and foundation of our corporate vision.
Our two major business domains are focused within the visual imaging field, chiefly cameras, and high-tech industry related fields, mainly steppers. Vision Nikon 21 sets out the direction we must take in both these domains to foster the creation of new business over the coming decades.
REEVALUATION OF THE VALUE CHAIN
To further strengthen the Nikon brand and enhance profitability, we are currently in the process of reevaluating and reconstructing the entire value chain of our research and product development, manufacturing, sales, logistics and customer service. By adopting a consistent, comprehensive, value-oriented philosophy, we are working to establish a business model within each stage of this process to enhance profitability as well as to make Nikon more resilient to today's harsh and fast-changing business environment.
FOCUSING MANAGEMENT RESOURCES ON GROWTH AREAS
In addition to the various measures outlined above, we are focusing our efforts in the areas that have the greatest potential. In practical terms, this means concentrating our management resources and investing selectively in existing businesses that show the greatest potential. At the same time, we also plan to invest in new business areas to augment sales growth.
In the visual imaging field, we see significant potential in the development of digital cameras as portable IT devices. We intend to make this business a key contributor to Nikon Group revenues. Within high-tech industry related fields, we plan to build on our core competencies and create fresh business opportunities in stepper-related fields.
We also plan to move into the field of optical disk stampers, which constitute a fast-growing market.
BUSINESS OUTLOOK
Foreign exchange market trends continue to pose a potential threat to our sales in overseas markets. Although fragility of a recovery in consumer spending gives little cause for optimism in the consumer products sector in Japan, the markets for digital cameras are expected to expand worldwide. Private-sector capital investment in Japan, on the other hand, appears to be at the beginning of an upturn, and the semiconductor market is projected to stage a sharp recovery. The prospects for our industrial instruments business therefore appear comparatively positive.
Refreshed by a strengthened corporate vision and inspired with fresh motivation, we are working hard to reconstruct our various business and management systems. These efforts will make us more market-responsive as a company, raise profit margins, and further strengthen the power of the Nikon brand. We ask all our shareholders for their continued support and understanding as we forge ahead with these tasks.
Shoichiro YoshidaPresident
JULY 2000

BUSINESS RESULTS
In the fiscal year ended March 31, 2000, divisional sales rose 8.0% to ¥150,288 million, producing operating income of ¥8,912 million.
IMAGING PRODUCTS
In single-lens reflex (SLR) cameras, sales of the F100 camera for advanced amateur photographers in Japan and overseas rose on the back of the model's growing popularity. The easy-to-use F60 series (N60 in the United States), which is specifically designed for beginners, also sold well in overseas markets. Sales of interchangeable lenses benefited from the introduction of a range of high-performance models with built-in silent-wave motors. In compact cameras, the division launched new products such as the compact, lightweight Advanced Photo System Nuvis 200/300 models. Towards the end of the year, we introduced the shell-type Nuvis S 2000, which combines excellent performance with sleek, fashionable styling. Nevertheless, due to the negative effects of the strong yen on sales in overseas markets and the intensity of sales competition, sales in these product segments actually fell below the level of the previous year.
In contrast, the market for digital cameras continued to expand rapidly. Nikon followed up the success of the COOLPIX 950, which features a 3.0X zoom lens, with the launch of the COOLPIX 800. This model, which is fitted with a 2.0X zoom lens, further strengthened the Nikon model lineup. The division also launched the D1, an SLR digital camera reminiscent of the flagship F5. Delivering high performance at a considerably lower price than other models, the D1 established itself as a popular choice with commercial and professional photographers. As a result, sales of digital cameras more than quadrupled, and, accordingly, the segment proved profitable.
REVIEW OF OPERATIONS: CONSUMER PRODUCTS
Nikon D1
4
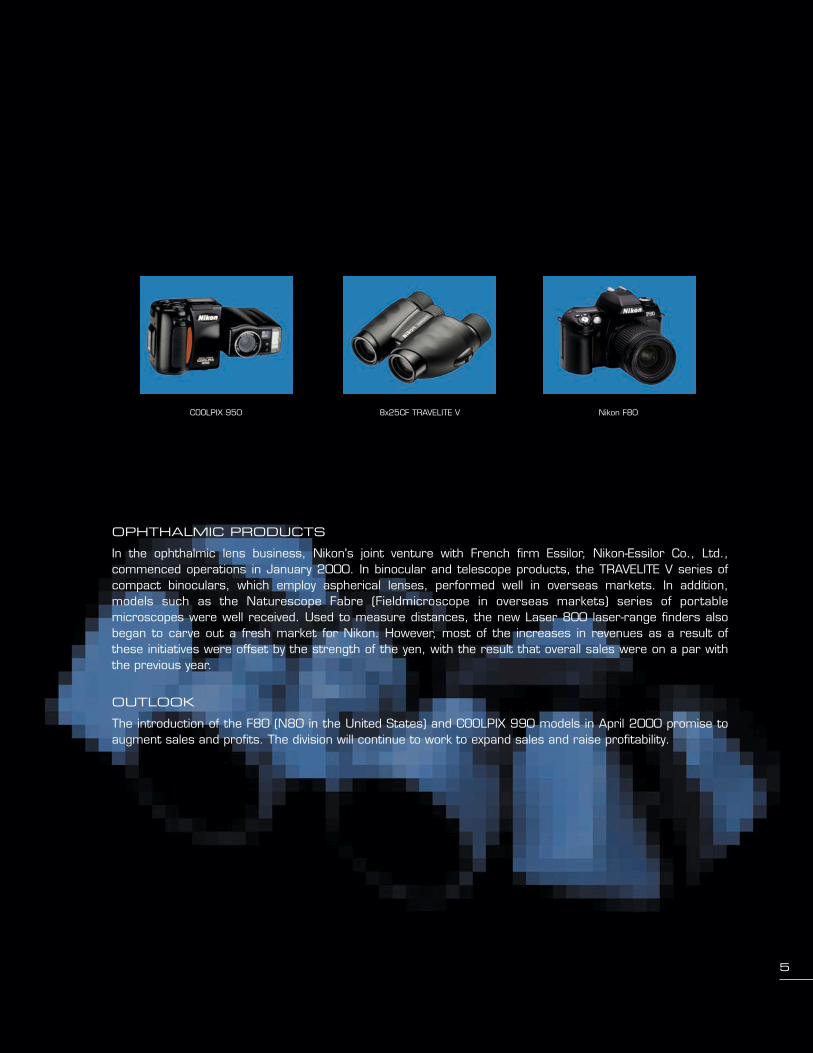
OPHTHALMIC PRODUCTS
In the ophthalmic lens business, Nikon's joint venture with French firm Essilor, Nikon-Essilor Co., Ltd., commenced operations in January 2000. In binocular and telescope products, the TRAVELITE V series of compact binoculars, which employ aspherical lenses, performed well in overseas markets. In addition, models such as the Naturescope Fabre (Fieldmicroscope in overseas markets) series of portable microscopes were well received. Used to measure distances, the new Laser 800 laser-range finders also began to carve out a fresh market for Nikon. However, most of the increases in revenues as a result of these initiatives were offset by the strength of the yen, with the result that overall sales were on a par with the previous year.
OUTLOOK
The introduction of the F80 (N80 in the United States) and COOLPIX 990 models in April 2000 promise to augment sales and profits. The division will continue to work to expand sales and raise profitability.
Nikon F80 8x25CF TRAVELITE VCOOLPIX 950
5

BUSINESS RESULTS
In the fiscal year ended March 31, 2000, healthy sales of steppers contributed to a 33.0% rise in divisional sales to ¥221,513 million. This produced operating income of ¥9,522 million.
SEMICONDUCTOR MANUFACTURING-RELATED EQUIPMENT
Surging demand for semiconductors used in mobile telephones and advanced video game consoles helped the semiconductor market stage a sharp recovery in the second half of the year. All the major semiconductor manufacturers quickly raised capital investment levels to increase their production capacity for both the latest and next-generation integrated circuits (ICs). In response, Nikon also boosted production capacity in relation to steppers.
The division worked to expand sales of main stepper models, such as the NSR-S203B and NSR-S204B Step-and-Repeat KrF Excimer Scanning Systems. These are superior to earlier generations in their ability to mass manufacture ICs with ultra-high-precision circuitry–specifically, sub-0.18µm minimum-pattern linewidth. In tandem, Nikon promoted the NSR-S302A Step-and-Repeat ArF Excimer Scanning Systems, which are able to produce ICs with finer patterns for R&D applications. The division also began taking orders for the newly developed NSR-SF100 i-line stepper. Used in combination with excimer steppers, this machine can contribute to higher overall manufacturing productivity.
In flat-panel display exposure systems, Nikon adapted our products to handle a broader variety of LCD panels and larger panel sizes. Sales in this segment increased as a result of continued strong capital investment by overseas LCD panel manufacturers.
A rationalization of the product lineup reduced sales of IC inspection systems. However, Nikon also started taking orders for the NRM-1000 model, which combines inspection functions with the ability to monitor and manage lithographic precision with the latest IC devices. This advanced capability results in higher precision and throughput for chip manufacturers.
REVIEW OF OPERATIONS: INDUSTRIAL INSTRUMENTS
6

MICROSCOPES AND MEASURING INSTRUMENTS
Sales of biological microscopes faltered both in Japan and the United States, despite the launch of new models of the ECLIPSE series, which uses CFI60 infinity optics. In industrial microscopes, the recovery in semiconductor-related demand helped boost demand for stereoscopic microscopes, particularly in Asian markets. The year saw the launch of the NEXIV VMH-300N computerized numerical control video measuring instruments, which boasts the highest measuring precision of any machine in its class. However, overall sales of measuring instruments fell below the level of the previous year in view of slumping demand in Western markets.
In October 1999, Nikon spun off surveying instruments operations as an independent company, Nikon Geotecs Co., Ltd. This move was designed to improve management efficiency, raise the market responsiveness of operations, and thereby improve earnings.
OUTLOOK
The Nikon Group is responding to rising stepper demand by boosting production capacity–for example, cleanroom facilities have been expanded at both the Kumagaya Plant and at Tochigi Nikon Corporation. In addition, to support higher sales and service the projected increased in demand for steppers in the fast-growing Southeast Asian market, Nikon established a local sales and customer service support company, Nikon Precision Singapore Pte Ltd in May 2000.
NRM-1000 ECLIPSE E200NSR-S204B
7

8
CHAIRMAN
Shigeo Ono
PRESIDENT
Shoichiro Yoshida
EXECUTIVE VICE PRESIDENTS
Tadao Tsuruta
Technology in General
Kenji Enya
Finance, Administration and Marketing in General
MANAGING DIRECTORS
Yuji Obana
Chief Officer of Business Administration Center
Toyohisa Kuramoto
Chief Officer of Business Development Center
Yasujiro Hara
Chief Officer of Corporate Strategy Center
Teruo Shimamura
President of Precision Equipment Company
Hideo Ikeda
Chief Officer of Core Technology Center
DIRECTORS
Akinori Kiribuchi
General Manager of Sales & Marketing Headquarters of
Precision Equipment Company
Michio Kariya
President of Imaging Company
Shinya Sasayama
General Manager of IC Equipment Division of Precision
Equipment Company
Yosuke Takahashi
Assistant Chief Officer of Core Technology Center and
Assistant Chief Officer of Business Development Center
Kazumasa Tokoi
Assistant Chief Officer of Corporate Strategy Center
Masami Kurosawa
Assistant Chief Officer of Corporate Strategy Center
Yoichi Nishida
President of Nikon-Essilor Co., Ltd.
Takashi Tamori
President of Instruments Company
Motosuke Otsuka
Assistant Chief Officer of Business Administration Center
ADVISORY DIRECTORS
Haruo Takeda
Counsellor,
The Tokio Marine and Fire Insurance Co., Ltd.
Terumichi Tsuchida
Senior Corporate Advisor,
Meiji Life Insurance Company
STANDING CORPORATE AUDITORS
Yoshiro Imagawa
Tomochika Nakano
CORPORATE AUDITORS
Takuji Shidachi
Mitsutake Okano
BOARD OF DIRECTORS
9
OPERATING ENVIRONMENTIn fiscal 2000, the financial year ended March 31, 2000, economic conditions remained somewhat mixed. The U.S. economy contin-ued to grow strongly, boosted by buoyant consumer spending and supported by high levels of capital investment. In Europe, exportsrecovered on the back of the weakness of the euro, and conditions were generally favorable. In Asia, rising exports helped to supporthigher levels of manufacturing activity, and many economies in the region staged a firm recovery.
In Japan, however, overall business conditions remained harsh. The effects of stalled consumer spending resulting from incomestagnation and persistent worries on the part of workers over job security continued to be compounded by lackluster private-sectorcapital investment. Even so, signs of a recovery in the latter emerged during the second half of the year, and there were indications ofgradual improvement in the economy.
The Nikon Group’s business was not unduly affected by the adverse conditions in Japan. While sales of consumer products in Japansuffered amid the ongoing downturn in consumer spending, sales in overseas markets prospered despite the strength of the yen.Worldwide sales of industrial instruments rose appreciably, benefiting from a sharp recovery in the market for semiconductor-relatedequipment.
Net Sales by Industry SegmentFor the years ended March 31, 2000 and 1999
(Millions of Yen, %)2000 1999
Consumer products ¥150,288 ¥139,204Share of net sales 40.4 % 45.5 %
Industrial instruments 221,513 166,561Share of net sales 59.6 54.5
Total ¥371,801 ¥305,765
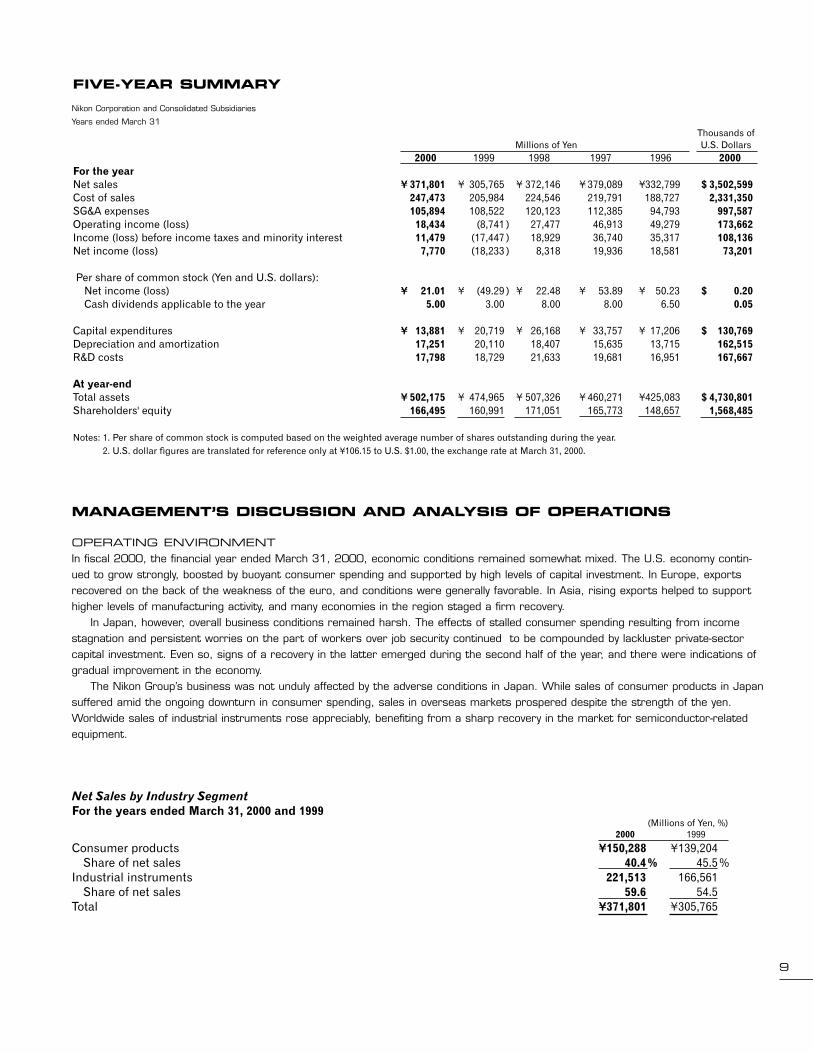
Thousands of Millions of Yen U.S. Dollars
2000 1999 1998 1997 1996 2000For the yearNet sales ¥ 371,801 ¥ 305,765 ¥ 372,146 ¥ 379,089 ¥332,799 $ 3,502,599Cost of sales 247,473 205,984 224,546 219,791 188,727 2,331,350SG&A expenses 105,894 108,522 120,123 112,385 94,793 997,587Operating income (loss) 18,434 (8,741 ) 27,477 46,913 49,279 173,662Income (loss) before income taxes and minority interest 11,479 (17,447 ) 18,929 36,740 35,317 108,136Net income (loss) 7,770 (18,233 ) 8,318 19,936 18,581 73,201
Per share of common stock (Yen and U.S. dollars):Net income (loss) ¥ 21.01 ¥ (49.29 ) ¥ 22.48 ¥ 53.89 ¥ 50.23 $ 0.20Cash dividends applicable to the year 5.00 3.00 8.00 8.00 6.50 0.05
Capital expenditures ¥ 13,881 ¥ 20,719 ¥ 26,168 ¥ 33,757 ¥ 17,206 $ 130,769Depreciation and amortization 17,251 20,110 18,407 15,635 13,715 162,515R&D costs 17,798 18,729 21,633 19,681 16,951 167,667
At year-endTotal assets ¥ 502,175 ¥ 474,965 ¥ 507,326 ¥ 460,271 ¥425,083 $ 4,730,801Shareholders' equity 166,495 160,991 171,051 165,773 148,657 1,568,485
Notes: 1. Per share of common stock is computed based on the weighted average number of shares outstanding during the year. 2. U.S. dollar figures are translated for reference only at ¥106.15 to U.S. $1.00, the exchange rate at March 31, 2000.
FIVE-YEAR SUMMARY
MANAGEMENT’S DISCUSSION AND ANALYSIS OF OPERATIONS
Nikon Corporation and Consolidated Subsidiaries
Years ended March 31

OPERATIONAL REVIEW AND ANALYSISNikon implemented a number of initiatives during the year designed to boost consolidated earnings. The introduction of an in-housecompany system made individual firms within the Nikon Group more accountable for financial performance by delegating managementresponsibilities. The company’s surveying instruments operations-development, production and sales functions-were unified and incorpo-rated as a separate company. In addition, the ophthalmic lens business was merged into an international joint venture to aid its expan-sion and development. Nikon developed and launched a number of new products designed to appeal to market trends. Resources werealso reallocated to shift management focus to prioritized areas.
Net consolidated sales in fiscal 2000 rose 21.6%, or ¥66.0 billion, to ¥371.8 billion. Net income recovered from a loss in fiscal1999 to reach ¥7.8 billion.
In terms of performance by industry segment, net sales of consumer products increased 8.0% to ¥150.3 billion, largely as aresult of buoyant sales of digital cameras. Operating income rose sharply, to ¥8.9 billion. With sales of steppers recovering strongly,consolidated net sales of industrial instruments rose 33.0% to ¥221.5 billion, producing operating income of ¥9.5 billion.
Splitting out the performance by region, sales in Japan were boosted by a swift recovery in the market for semiconductor-relatedequipment. Domestic revenues surged 21.4% to ¥333.3 billion, producing operating income of ¥9.4 billion. Overseas, sales of con-sumer products-especially digital cameras-and steppers and other industrial equipment advanced both in the United States and inEurope. Sales in the United States rose 20.3% to ¥97.0 billion, resulting in operating income of ¥6.0 billion. Sales in Europe soared35.1% to ¥49.0 billion, leading to operating income of ¥0.3 billion. In Asia, principally due to continued price erosion in the consumerproducts sector, sales dipped 4.2% to ¥10.9 billion, producing operating income of ¥1.6 billion.
10
Income AnalysisFor the years ended March 31, 2000 and 1999
(% of Net Sales)2000 1999
Net sales 100.0% 100.0%Cost of sales (66.6) (67.4)Gross profit 33.4 32.6SG&A expenses (28.5) (35.5)Operating income (loss) 4.9 (2.9)Net interest expense and dividend income (1.1) (1.4)Net other income (expenses) (0.7) (1.4)Income (loss) before income taxes and minority interest 3.1 (5.7)Income taxes (1.0) (0.3)Minority interest (0.0) 0.0Net income (loss) 2.1 (6.0)
Note: All expenses and subtractive amounts are in parentheses.
Balance Sheet AnalysisAt March 31, 2000 and 1999
(% of Total Assets)2000 1999
Total assets 100.0% 100.0%Total current assets 66.2 65.0
Inventories 30.6 31.7Property, plant and equipment 17.8 21.4Investments and other assets 16.0 13.6Total current liabilities 47.4 44.1
Short-term borrowings 17.0 22.5Long-term debt, less current portion 19.1 21.7Shareholders’ equity 33.2 33.9
11
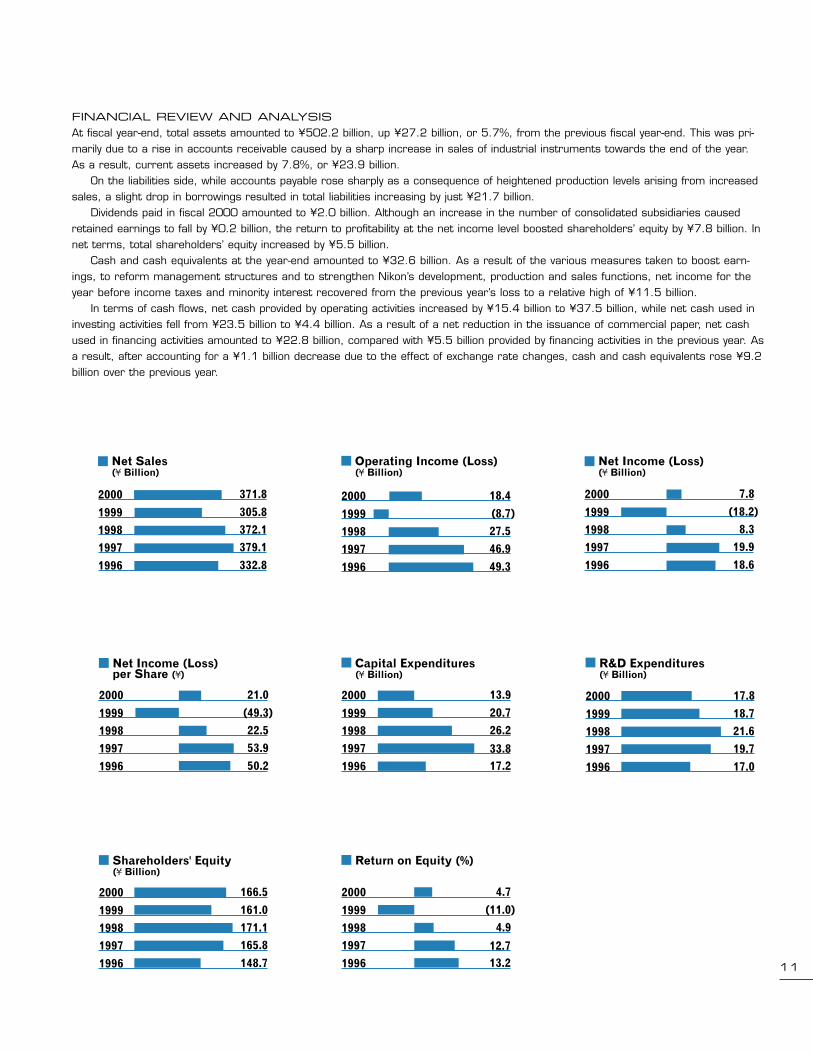
FINANCIAL REVIEW AND ANALYSISAt fiscal year-end, total assets amounted to ¥502.2 billion, up ¥27.2 billion, or 5.7%, from the previous fiscal year-end. This was pri-marily due to a rise in accounts receivable caused by a sharp increase in sales of industrial instruments towards the end of the year.As a result, current assets increased by 7.8%, or ¥23.9 billion.
On the liabilities side, while accounts payable rose sharply as a consequence of heightened production levels arising from increasedsales, a slight drop in borrowings resulted in total liabilities increasing by just ¥21.7 billion.
Dividends paid in fiscal 2000 amounted to ¥2.0 billion. Although an increase in the number of consolidated subsidiaries causedretained earnings to fall by ¥0.2 billion, the return to profitability at the net income level boosted shareholders’ equity by ¥7.8 billion. Innet terms, total shareholders’ equity increased by ¥5.5 billion.
Cash and cash equivalents at the year-end amounted to ¥32.6 billion. As a result of the various measures taken to boost earn-ings, to reform management structures and to strengthen Nikon’s development, production and sales functions, net income for theyear before income taxes and minority interest recovered from the previous year’s loss to a relative high of ¥11.5 billion.
In terms of cash flows, net cash provided by operating activities increased by ¥15.4 billion to ¥37.5 billion, while net cash used ininvesting activities fell from ¥23.5 billion to ¥4.4 billion. As a result of a net reduction in the issuance of commercial paper, net cashused in financing activities amounted to ¥22.8 billion, compared with ¥5.5 billion provided by financing activities in the previous year. Asa result, after accounting for a ¥1.1 billion decrease due to the effect of exchange rate changes, cash and cash equivalents rose ¥9.2billion over the previous year.
2000 17.8
R&D Expenditures (¥ Billion)
1999 18.71998 21.61997 19.7
1996 17.0
2000 166.5
Shareholders' Equity(¥ Billion)
1999 161.01998 171.11997 165.8
1996 148.7
2000 4.7
Return on Equity (%)
1999 (11.0)1998 4.91997 12.71996 13.2
2000 371.8
Net Sales(¥ Billion)
1999 305.81998 372.11997 379.1
1996 332.8
2000 18.4
Operating Income (Loss)(¥ Billion)
1999 (8.7)1998 27.51997 46.9
1996 49.3
2000 7.8
Net Income (Loss) (¥ Billion)
1999 (18.2)1998 8.31997 19.9
1996 18.6
2000 21.0
Net Income (Loss) per Share (¥)
1999 (49.3)1998 22.51997 53.9
1996 50.2
2000 13.9
Capital Expenditures (¥ Billion)
1999 20.71998 26.21997 33.81996 17.2

12
CONSOLIDATED BALANCE SHEETS
Thousands ofU.S. Dollars
Millions of Yen (Note 1)
2000 1999 2000
ASSETS
Current assets
Cash and cash equivalents ¥ 32,574 ¥ 23,419 $ 306,864
Marketable securities (Notes 3 and 5) 12 14,380 110
Notes and accounts receivable — trade (Note 5):
Customers 122,285 99,335 1,151,998
Unconsolidated subsidiaries and associated companies 680 1,502 6,401
Allowance for doubtful receivables (2,116) (2,603) (19,937)
Inventories (Note 4) 153,847 150,577 1,449,340
Deferred tax assets (Note 7) 12,521 10,066 117,959
Other current assets 12,502 11,707 117,787
Total current assets 332,305 308,383 3,130,522
Property, plant and equipment
Land 13,736 15,171 129,404
Buildings and structures 81,999 88,021 772,481
Machinery and equipment 148,692 158,947 1,400,773
Construction in progress 6,243 4,139 58,810
Total 250,670 266,278 2,361,468
Accumulated depreciation (161,245) (164,412) (1,519,030)
Net property, plant and equipment 89,425 101,866 842,438
Investments and other assets
Investments in securities (Notes 3 and 5) 49,368 36,579 465,082
Investments in unconsolidated subsidiaries and associated companies 5,643 2,695 53,159
Long-term loans:
Employees and other 808 979 7,610
Unconsolidated subsidiaries and associated companies 78 122 730
Allowance for doubtful receivables (48) (44) (452)
Deferred tax assets (Note 7) 4,141 5,728 39,007
Deposit and long-term prepaid expenses 5,900 6,674 55,581
Foreign currency translation adjustments 7,107 2,963 66,952
Other 7,448 9,020 70,172
Total investments and other assets 80,445 64,716 757,841
Total ¥502,175 ¥474,965 $4,730,801
See Notes to Consolidated Financial Statements.
Nikon Corporation and Consolidated Subsidiaries
March 31, 2000 and 1999

13
Thousands ofU.S. Dollars
Millions of Yen (Note 1)
2000 1999 2000
LIABILITIES AND SHAREHOLDERS’ EQUITY
Current liabilities
Short-term borrowings (Note 5) ¥ 85,558 ¥106,666 $ 806,007
Current portion of long-term debt (Note 5) 15,439 12,510 145,442
Notes and accounts payable — trade:
Suppliers 86,685 53,229 816,630
Unconsolidated subsidiaries and associated companies 1,103 684 10,393
Income taxes payable 3,175 915 29,910
Accrued expenses 30,194 25,756 284,442
Other current liabilities (Note 5) 16,083 9,644 151,518
Total current liabilities 238,237 209,404 2,244,342
Long-term liabilities
Long-term debt (Note 5) 95,728 103,091 901,817
Liability for severance indemnities 1,349 1,265 12,711
Other long-term liabilities 355 200 3,339
Total long-term liabilities 97,432 104,556 917,867
Minority interest 11 14 107
Commitments and Contingent liabilities (Notes 9,10 and 11)
Shareholders’ equity
Common stock (Note 6):
¥50 par value per share
Authorized — 1,000,000,000 shares
Issued and outstanding — 369,927,584 shares in 2000 and 1999 36,661 36,661 345,369
Additional paid-in capital (Note 6) 51,910 51,910 489,022
Retained earnings (Notes 6 and 12) 77,950 72,424 734,335
166,521 160,995 1,568,726
Treasury stock, at cost :
6,658 shares in 2000 and 2,407 shares in 1999 (26) (4) (241)
Total shareholders’ equity 166,495 160,991 1,568,485
Total ¥502,175 ¥474,965 $4,730,801

14
CONSOLIDATED STATEMENTS OF OPERATIONS
Thousands ofU.S. Dollars
Millions of Yen (Note 1)
2000 1999 2000
Net sales ¥371,801 ¥305,765 $3,502,599
Cost of sales 247,473 205,984 2,331,350
Gross profit 124,328 99,781 1,171,249
Selling, general and administrative expenses 105,894 108,522 997,587
Operating income (loss) 18,434 (8,741) 173,662
Other income (expenses):
Interest and dividend income 1,062 1,151 10,008
Interest expense (5,216) (5,642) (49,134)
Write-down of inventories (2,460) (1,288) (23,176)
Loss on disposals of inventories (2,534) (3,714) (23,868)
Cash discount (1,962) (1,997) (18,482)
Equity in earnings of unconsolidated subsidiaries
and associated companies 174 96 1,637
Other-net 3,981 2,688 37,489
(6,955) (8,706) (65,526)
Income (loss) before income taxes and minority interest 11,479 (17,447) 108,136
Income taxes (Note 7):
Current 4,740 1,499 44,651
Deferred (1,032) (710) (9,725)
Minority interest 1 (3) 9
Net income (loss) ¥ 7,770 ¥ (18,233) $ 73,201
U.S. DollarsYen (Note 1)
Per share of common stock (Note 2 (m)):
Net income (loss) ¥ 21.01 ¥ (49.29) $ 0.20
Cash dividends applicable to the year 5.00 3.00 0.05
See Notes to Consolidated Financial Statements.
Nikon Corporation and Consolidated Subsidiaries
Years ended March 31, 2000 and 1999

15
CONSOLIDATED STATEMENTS OF SHAREHOLDERS’ EQUITY
Thousands Millions of Yen
OutstandingNumber of AdditionalShares of Common Paid-in Retained Treasury
Common Stock Stock Capital Earnings Stock
BALANCE, APRIL 1, 1998 369,928 ¥ 36,661 ¥ 51,910 ¥ 82,485 ¥ (4)
Adjustment of retained earnings for
newly applied accounting for tax allocation (Note 2 (h)) 8,725
Net loss (18,233)
Cash dividends, ¥4 per share (1,479)
Bonuses to directors and corporate auditors (20)
Adjustment of retained earnings for newly consolidated subsidiaries 946
BALANCE, MARCH 31, 1999 369,928 ¥ 36,661 ¥ 51,910 ¥ 72,424 ¥ (4)
Net income 7,770
Cash dividends, ¥5.5 per share (2,034)
Adjustment of retained earnings for newly consolidated subsidiaries (229)
Adjustment of retained earnings
for additional application of equity method 19
Increase in treasury stock (22)
BALANCE, MARCH 31, 2000 369,928 ¥ 36,661 ¥ 51,910 ¥ 77,950 ¥ (26)
Thousands of U.S. Dollars (Note 1)Additional
Common Paid-in Retained TreasuryStock Capital Earnings Stock
BALANCE, MARCH 31, 1999 $345,369 $ 489,022 $682,279 $ (34)
Net income 73,201
Cash dividends, U.S.$ 0.05 per share (19,167)
Adjustment of retained earnings for newly consolidated subsidiaries (2,161)
Adjustment of retained earnings
for additional application of equity method 183
Increase in treasury stock (207)
BALANCE, MARCH 31, 2000 $345,369 $ 489,022 $734,335 $ (241)
See Notes to Consolidated Financial Statements.
Nikon Corporation and Consolidated Subsidiaries
Years ended March 31, 2000 and 1999

16
CONSOLIDATED STATEMENTS OF CASH FLOWS
Thousands ofU.S. Dollars
Millions of Yen (Note 1)
2000 1999 2000
Operating activities:Income (loss) before income taxes and minority interest ¥ 11,479 ¥ (17,447) $ 108,136Adjustments for:
Income taxes-paid (2,561) (4,721) (24,130)Depreciation and amortization 17,251 20,110 162,515Reversal of doubtful receivables (352) (877) (3,315)Loss on sales or disposal of property, plant and equipment 1,004 1,003 9,454Equity in earnings of non-consolidated subsidiaries and associated companies (174) (96) (1,637)Other-net 398 (4,163) 3,748Change in assets and liabilities:
Decrease (increase) in notes and accounts receivable — trade (27,372) 39,751 (257,865)Decrease (increase) in inventories (7,311) 3,075 (68,869)Increase (decrease) in notes and accounts payable — trade 38,874 (17,865) 366,218Other-net 6,248 3,318 58,867
Total adjustments 26,005 39,535 244,986Net cash provided by operating activities 37,484 22,088 353,122
Investing activities:Capital expenditures (11,161) (25,636) (105,144)Proceeds from sales of property, plant and equipment 2,682 2,592 25,264Purchases of investments in securities (5,630) (4,775) (53,034)Proceeds from sales of investments in securities 1,282 707 12,076Proceeds from sales of investments in consolidated subsidiaries 3,079 29,005Net decrease (increase) in loans receivable (3,961) 1,670 (37,318)Proceeds from transfer of business 2,401 22,620Other-net 6,882 1,946 64,833
Net cash used in investing activities (4,426) (23,496) (41,698)
Financing activities:Proceeds from long-term debt 10,629 17,933 100,133Repayments of long-term debt (12,340) (13,590) (116,251)Net increase (decrease) in short-term borrowings (19,033) 2,616 (179,304)Dividends paid (2,037) (1,480) (19,188)Other-net (28) (264)
Net cash provided by (used in) financing activities (22,809) 5,479 (214,874)
Foreign currency translation adjustments on cash and cash equivalents (1,081) (758) (10,188)Net increase in cash and cash equivalents 9,168 3,313 86,362Cash and cash equivalents of newly consolidated subsidiaries
at beginning of year 39 646 366Cash and cash equivalents of exclusive consolidated subsidiaries
at end of year (52) (494)Cash and cash equivalents at beginning of year 23,419 19,460 220,630Cash and cash equivalents at end of year ¥ 32,574 ¥ 23,419 $ 306,864
Non-cash investing and financing activitiesAssets increased by consolidation of subsidiary previously unconsolidated ¥ 159 ¥ 647 $ 1,494Liabilities increased by consolidation of subsidiary previosly unconsolidated 62 124 581
See Notes to Consolidated Financial Statements.
Nikon Corporation and Consolidated Subsidiaries
Years ended March 31, 2000 and 1999
17
1. BASIS OF PRESENTING CONSOLIDATED FINANCIAL STATEMENTSNikon Corporation ( the “Company” ), its domestic subsidiaries and affiliates maintain their records and prepare their financial statements in
accordance with the provisions set forth in the Japanese Commercial Code ( the “Code” ), the related accounting regulations, and in conformi-
ty with accounting principles and practices generally accepted in Japan. The foreign consolidated subsidiaries maintain and prepare their
financial statements in accordance with accounting principles generally accepted in the countries where such subsidiaries are established.
The consolidated financial statements have been prepared in accordance with the provisions set forth in the Securities and Exchange Law
of Japan ( the “Securities Law” ) and its related accounting regulations, and in conformity with accounting principles and practices generally
accepted in Japan, which are different in certain respects as to application and disclosure requirements of International Accounting
Standards. The consolidated financial statements are not intended to present the financial position, results of operations and cash flows in
accordance with accounting principles and practices generally accepted in countries and jurisdictions other than Japan.
In preparing these consolidated financial statements, certain reclassifications and rearrangements have been made to the consolidated
financial statements issued domestically in order to present them in a form which is more familiar to readers outside Japan.
Effective April 1, 1999, consolidated statements of cash flows are required to be prepared under Japanese accounting standards, and those
for the years, ended March 31, 2000 and 1999 are presented herein.
The consolidated financial statements are stated in Japanese yen, the currency of the country in which the Company is incorporated and
operates. The translations of Japanese yen amounts into U.S. dollar amounts are included solely for the convenience of readers outside Japan
and have been made at the rate of ¥106.15 to U.S.$1, the rate of exchange at March 31, 2000. Such translations should not be
construed as representations that the Japanese yen amounts could be converted into U.S. dollars at that or any other rate.
Certain reclassifications have been made in 1999 financial statements to conform to classification used in 2000.
2. SUMMARY OF SIGNIFICANT ACCOUNTING POLICIES(a) Consolidation
The consolidated financial statements as of March 31, 2000, include the accounts of the Company and its 33 (33 in 1999) significant sub-
sidiaries (collectively the “companies”). Investments in 3 (3 in 1999) unconsolidated subsidiaries and 1 associated company are accounted for
by the equity method.
The differences between the cost and the underlying net equity of investments in consolidated subsidiaries, unconsolidated subsidiaries
and an associated company accounted for by the equity method at acquisition (“Goodwill”) are insignificant and are charged to income when
incurred.
Investments in the remaining unconsolidated subsidiaries and associated companies are stated at cost as they are immaterial to the con-
solidated financial statements.
In the ophthalmic lenses business, the Company entered into a joint venture agreement with Essilor International S.A. on October 29, 1999,
and started a joint venture company named “Nikon-Essilor Co., Ltd.” in January, 2000.
All significant intercompany balances and transactions have been eliminated in consolidations. All material unrealized profit included in
assets resulting from transactions within the companies is eliminated.
(b) Cash and Cash Equivalents
Cash equivalents are short-term investments that are readily convertible into cash and that are exposed to insignificant risk of changes in value.
Cash equivalents include time deposits, certificate of deposits, commercial paper and mutual funds investing in bonds that represent
short-term investments, all of the date of acquisition.
The scope of cash and cash equivalents at beginning and end of year 1999 were changed from ¥40,142 million and ¥42,596 million to
¥19,460 million and ¥23,419 million, respectively, to conform with the presentation in 2000.
(c) Marketable Securities and Investments in Securities
Marketable securities and investments in securities are stated principally at cost as determined using the moving-average method.
See Note 3 for reclassification in 2000.
(d) Inventories
Inventories of the Company and its domestic subsidiaries are stated at cost as determined principally using the average method, except for
work in process which is determined by the specific identification method. Inventories of foreign subsidiaries are stated at the lower of cost or
market as determined principally using the first-in, first-out method.
NOTES TO CONSOLIDATED FINANCIAL STATEMENTSNikon Corporation and Consolidated Subsidiaries
Years ended March 31, 2000 and 1999

(e) Property, Plant and Equipment
Property, plant and equipment are stated at cost. Depreciation of the Company and domestic subsidiaries is computed using the declining-
balance method, while the straight-line method is applied to buildings (excluding facilities incidental to buildings) of the Company and domes-
tic subsidiaries and the property, plant and equipment of foreign subsidiaries at rates based on the estimated useful lives of the assets.
Accounting Change - Effective April 1, 1999, the Company and domestic subsidiaries adopted the straight-line method of depreciation for
the buildings (excluding facilities incidental to buildings), which, previously, had been depreciated by the declining-balance method. This
change was made to more accurately allocate the cost of the buildings in light of the operations of the Companies.
The effect of this change was to decrease depreciation expenses by ¥520 million ($4,907 thousand) and to increase income before income
taxes by ¥388 million ($3,659 thousand) for the year ended March 31, 2000.
(f) Retirement Benefits
The Company and major domestic subsidiaries have non-contributory funded pension plans covering substantially all of their employees of the
Company and such subsidiaries. Foreign subsidiaries have principally contributory pension plans.
Other domestic subsidiaries have unfunded severance payment plans and have established a liability for severance indemnities at 40% of
the amount which would be required if all employees voluntarily terminated their employment at each balance sheet date.
(g) Leases
All leases are accounted for as operating leases by the Company and its domestic subsidiaries. Under Japanese accounting standards for
leases, finance leases that deem to transfer ownership of the leased property to the lessee are to be capitalized, while other finance leases are
permitted to be accounted for as operating lease transactions if certain “as if capitalized” information is disclosed in the notes to the lessee’s
financial statements.
(h) Income Taxes
Effective April 1, 1998, the Comapany and consolidated subsidiaries adopted accounting for allocation of income taxes based on the asset and
liability method. The cumulative effect of the application of interperiod tax allocation in prior years in the amount of ¥8,725 million was includ-
ed as an adjustment to retained earnings as of April 1, 1998.
Deferred income taxes are recorded to reflect the impact of temporary differences between assets and liabilities recognized for financial
reporting purposes and such amounts recognized for tax purposes together with the tax effect of loss carryforwards. These deferred taxes are
measured by applying currently enacted tax laws to the temporary differences.
(i) Research and Development Costs
The companies are active in research and development and such costs are charged to income as incurred.
(j) Appropriations of Retained Earnings
Appropriations of retained earnings at each year end are reflected in the consolidated financial statements in the following year upon sharehold-
ers’ approval.
(k) Foreign Currency Transactions
Balances denominated in foreign currencies, except for those hedged by forward exchange contracts, are translated into Japanese yen at the
current exchange rates in effect at each balance sheet date for monetary current assets and liabilities, and at historical rates for non-current
assets and liabilities. Foreign currency balances hedged by forward exchange contracts are translated into Japanese yen at the contracted
rates. Exchange and translation gains or losses are credited or charged to income as incurred.
(l) Foreign Currency Financial Statements
The balance sheet accounts and revenue and expense accounts of the foreign subsidiaries are translated into Japanese yen at the current
exchange rates except for shareholders’ equity, which is translated at the historical exchange rates. The differences resulting from such
translations are reflected in the consolidated balance sheets as investments and other assets.
(m) Per Share Information
Net income per share is computed based on the weighted average number of shares of common stock outstanding during each year. The aver-
age number of common shares used in the computation was 369,918,890 shares for 2000 and 369,925,009 shares for 1999.
Cash dividends per share shown in the consolidated statements of operations are presented on an accrual basis and include interim
dividends paid and year ended dividends to be approved after the balance sheet date.
18

19
3. MARKETABLE SECURITIES AND INVESTMENTS IN SECURITIESMarketable securities at March 31, 2000 and 1999 were as follows:
Thousands ofMillions of Yen U.S. Dollars
2000 1999 2000
Marketable equity securities ¥ 2 ¥13,663 $ 16
Bank debentures and other 10 717 94
¥ 12 ¥14,380 $ 110
Investments in securities at March 31, 2000 and 1999 were principally equity securities with market quotations as follows:Thousands of
Millions of Yen U.S. Dollars2000 1999 2000
Equity securities ¥49,266 ¥36,522 $464,121
Trust bonds, debentures and other 102 57 961
¥49,368 ¥36,579 $465,082
The carrying amounts and market values of marketable securities (current) and investments in securities (non-current) at March 31, 2000
and 1999 were as follows:Thousands of
Millions of Yen U.S. Dollars2000 1999 2000
Current (market value available):
Carrying amount ¥ 2 ¥14,243 $ 16
Aggregate market value 3 21,839 31
Net unrealized gains ¥ 1 ¥ 7,596 $ 15
Non-current (market value available):
Carrying amount ¥44,856 ¥32,230 $422,568
Aggregate market value 58,975 43,435 555,581
Net unrealized gains ¥14,119 ¥11,205 $133,013
The difference between the above carrying amounts and the amounts shown in the accompanying balance sheets principally consists of
non-marketable securities for which there is no readily-available market from which to obtain or calculate the market value thereof.
Due to the change in the Companies’ investment policy during the year ended March 31, 2000, the Company reclassified corporate shares
in the aggregate amount of ¥12,636 million ($119,048 thousand) from “Marketable securities” to “Investments in securities”.
4. INVENTORIESInventories at March 31, 2000 and 1999 consisted of the following:
Thousands ofMillions of Yen U.S. Dollars
2000 1999 2000
Finished and semi–finished products ¥ 55,072 ¥ 62,401 $ 518,817
Work in process 85,213 72,354 802,760
Raw materials and supplies 13,562 15,822 127,763
¥153,847 ¥150,577 $1,449,340

20
5. SHORT-TERM BORROWINGS AND LONG-TERM DEBT Short-term borrowings at March 31, 2000 and 1999 consisted of the following:
Thousands of Millions of Yen U.S. Dollars
2000 1999 2000
Short-term loans, principally from banks:
2000: 0.4402%-7.3840%
1999: 0.4937%-8.0000% ¥ 71,558 ¥ 74,666 $ 674,118
Commercial paper:
2000: 0.0709%- 0.1235%
1999: 0.4500%-0.9050% 14,000 32,000 131,889
¥ 85,558 ¥106,666 $ 806,007
Long-term debt at March 31, 2000 and 1999 consisted of the following:
Thousands ofMillions of Yen U.S. Dollars
2000 1999 2000
Loans, principally from banks and insurance companies:
2000: 1.18%-9.185% due 2000-2006
1999: 1.13%-9.185% due 2000-2006 ¥ 21,167 ¥ 25,601 $ 199,405
Bonds 90,000 90,000 847,854
111,167 115,601 1,047,259
Less: Current portion (15,439) (12,510) (145,442)
Long-term debt, less current portion ¥ 95,728 ¥103,091 $ 901,817
The following is a summary of the terms of bonds which the Company may at any time purchase at any price in
the open market or otherwise.
The bonds purchased or otherwise acquired by the Company may be held or resold or, at the discretion of the Company, may be canceled
(together with any unmatured coupons attached thereto or purchased therewith).Thousands of
Millions of Yen U.S. DollarsIssued in To be redeemed in 2000 1999 2000
6.2% Euro-Yen Unsecured Bonds July 1992 October 1999 10,000
4.85% Euro-Yen Unsecured Bonds September 1994 December 2001 10,000 10,000 94,206
4.4% Yen Unsecured Bonds January 1995 January 2001 10,000 10,000 94,206
2.95% Yen Unsecured Bonds February 1996 February 2003 10,000 10,000 94,206
2.7% Yen Unsecured Bonds February 1996 February 2002 10,000 10,000 94,206
2.45% Yen Unsecured Bonds March 1997 March 2004 10,000 10,000 94,206
2.7% Yen Unsecured Bonds June 1997 June 2003 10,000 10,000 94,206
2.5% Yen Unsecured Bonds November 1997 November 2007 10,000 10,000 94,206
2.575% Yen Unsecured Bonds April 1998 April 2005 10,000 10,000 94,206
1.76% Yen Unsecured Bonds August 1999 August 2004 10,000 94,206
Long-term debt, less current portion ¥ 90,000 ¥ 90,000 $ 847,854
21
The aggregate annual maturities of long-term debt for the years following March 31, 2000 are as follows:
Year Ending Thousands of March 31 Millions of Yen U.S. Dollars
2001 ¥ 15,439 $ 145,442
2002 24,154 227,546
2003 15,752 148,393
2004 21,836 205,709
2005 11,843 111,567
Thereafter 22,143 208,602
¥111,167 $1,047,259
At March 31, 2000, the following assets were pledged as collateral for the short-term borrowings, long-term debt and other liabilities.
Thousands of Millions of Yen U.S. Dollars
Notes and accounts receivable–trade ¥ 11,213 $ 105,632
Marketable securities and investments in securities 10,594 99,807
¥ 21,807 $ 205,439
Liabilities secured by the above assets were as follows:Thousands of
Millions of Yen U.S. Dollars
Short-term borrowings ¥ 2,266 $ 21,348
Other current liabilities 188 1,771
Long-term debt, including current portion 3,880 36,554
¥ 6,334 $ 59,673
As is customary in Japan, the Company maintains substantial deposit balances with banks with which it has borrowings. Such deposit bal-
ances are not legally or contractually restricted as to withdrawal.
General agreements with respective banks provide, as is customary in Japan, that additional collateral must be provided under certain cir-
cumstances if requested by such banks and that certain banks have the right to offset cash deposited with them against any long-term or
short-term debt or obligation that becomes due and, in case of default and certain other specified events, against all other debts payable to the
banks. The Company has never been requested to provide any additional collateral.
22
6. SHAREHOLDERS’ EQUITY
The Code requires at least 50% of the issue price of new shares, with a minimum of the par value thereof, to be designated as stated capital as
determined by resolution of the Board of Directors. Proceeds in excess of amounts designated as stated capital are credited to additional
paid-in capital.
The Code also requires companies to appropriate from retained earnings to legal reserve an amount equal to at least 10% of all cash
payments which are made as an appropriation of retained earnings until such reserve equals 25% of stated capital.
The Company may transfer portions of additional paid-in capital and legal reserve to stated capital by resolution of the Board of Directors.
The Company may also transfer portions of unappropriated retained earnings, available for dividends, to stated capital by resolution of the
shareholders.
Under the Code, the Company may issue new shares of common stock to existing shareholders without consideration as a stock split
pursuant to resolution of the Board of Directors. The Company may make such a stock split to the extent that the aggregate par value of the
shares outstanding after the stock split does not exceed the stated capital. However, the amount calculated by dividing the total amount of
shareholders’ equity by the number of outstanding shares after the stock split shall not be less than ¥ 50.
Dividends are approved by the shareholders at a meeting held subsequent to the fiscal year to which the dividends are applicable. Interim
dividends may also be paid upon resolution of the Board of Directors, subject to certain limitations imposed by the Code.
Under the Code, the Company may resolve to repurchase its treasury stock for retirement and related reduction of retained earnings
pursuant to resolution of the Board of Directors, subject to approval by the shareholders.
At the general shareholders’ meeting held on June 29, 1999, the Company’s shareholders approved that the Company is authorized to
repurchase, at management’s discretion, up to 35 million shares of Company’s stock for the purpose of canceling the shares by charging
repurchased amounts to retained earnings.
Under the Code, the amount available for dividends is based on retained earnings as recorded on the Company’s books. At March 31, 2000,
retained earnings as recorded on the Company’s books were ¥55,850 million ($526,142 thousand), which is available for future dividends
subject to the approval of the shareholders and legal reserve requirements.
7. INCOME TAXESThe Company and its domestic subsidiaries are subject to Japanese national and local income taxes which, in the aggregate, resulted in a nor-
mal effective statutory tax rates of approximately 42% and 48% for the years ended March 31, 2000, and 1999, respectively.
The tax effects of significant temporary differences and loss carryforwards which result in deferred tax assets and liabilities at March 31,
2000 and 1999 were as follows:Thousands of
Millions of Yen U.S. Dollars
2000 1999 2000Deferred tax assets:
Devaluation of inventories ¥ 4,649 ¥ 5,082 $ 43,800
Allowance for doubtful receivables 3,256 515 30,669
Depreciation and amortization 6,118 5,117 57,637
Tax loss carryforwards 249 5,759 2,346
Other 4,882 2,346 45,996
¥19,154 ¥ 18,819 $180,448
Valuation allowance of ¥3,451 million ($32,518 thousand) in 2000 and ¥4,000 million in 1999 were deducted from the amounts calculated
above.
Deferred tax liabilities :
Deferred profits on sales of property to be replaced 2,141 2,073 20,167
Other 494 952 4,660
¥ 2,635 3,025 $ 24,827
Net deferred tax assets ¥16,519 15,794 $155,621
23
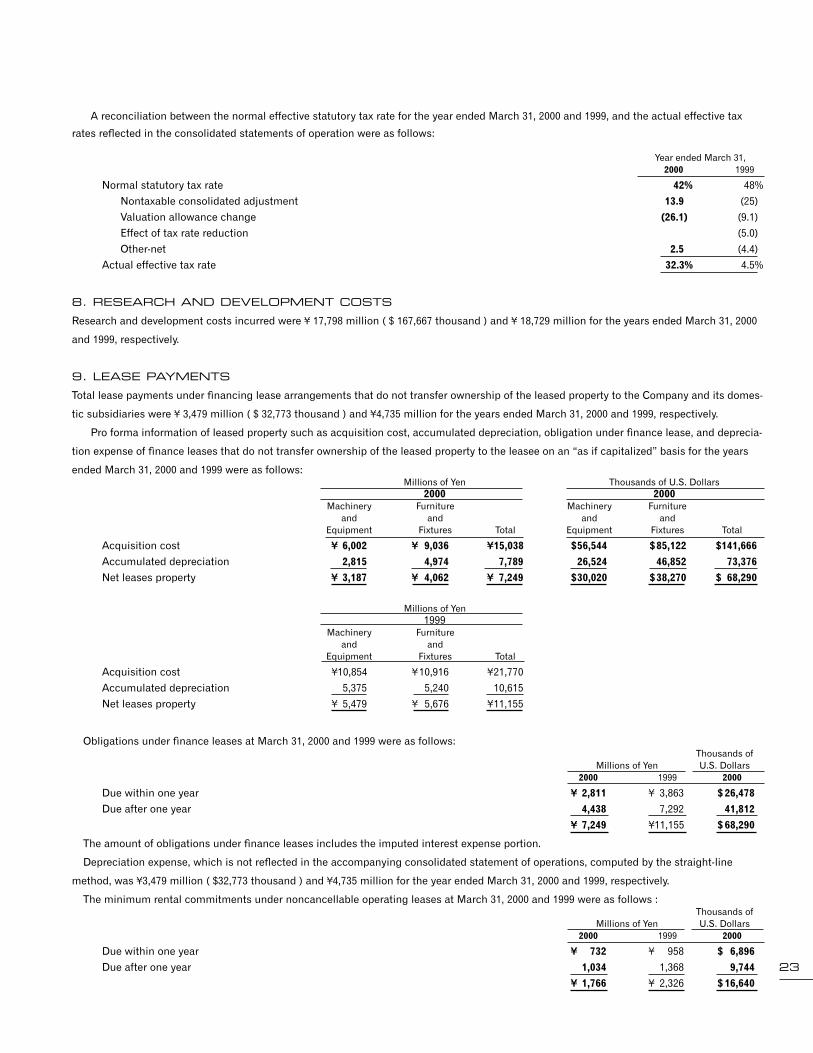
A reconciliation between the normal effective statutory tax rate for the year ended March 31, 2000 and 1999, and the actual effective tax
rates reflected in the consolidated statements of operation were as follows:
Year ended March 31,2000 1999
Normal statutory tax rate 42% 48%Nontaxable consolidated adjustment 13.9 (25)Valuation allowance change (26.1) (9.1)Effect of tax rate reduction (5.0)Other-net 2.5 (4.4)
Actual effective tax rate 32.3% 4.5%
8. RESEARCH AND DEVELOPMENT COSTS
Research and development costs incurred were ¥ 17,798 million ( $ 167,667 thousand ) and ¥ 18,729 million for the years ended March 31, 2000
and 1999, respectively.
9. LEASE PAYMENTS
Total lease payments under financing lease arrangements that do not transfer ownership of the leased property to the Company and its domes-
tic subsidiaries were ¥ 3,479 million ( $ 32,773 thousand ) and ¥4,735 million for the years ended March 31, 2000 and 1999, respectively.
Pro forma information of leased property such as acquisition cost, accumulated depreciation, obligation under finance lease, and deprecia-
tion expense of finance leases that do not transfer ownership of the leased property to the leasee on an “as if capitalized” basis for the years
ended March 31, 2000 and 1999 were as follows:Millions of Yen Thousands of U.S. Dollars
2000 2000Machinery Furniture Machinery Furniture
and and and andEquipment Fixtures Total Equipment Fixtures Total
Acquisition cost ¥ 6,002 ¥ 9,036 ¥15,038 $56,544 $85,122 $141,666Accumulated depreciation 2,815 4,974 7,789 26,524 46,852 73,376Net leases property ¥ 3,187 ¥ 4,062 ¥ 7,249 $30,020 $38,270 $ 68,290
Millions of Yen1999
Machinery Furnitureand and
Equipment Fixtures Total
Acquisition cost ¥10,854 ¥10,916 ¥21,770Accumulated depreciation 5,375 5,240 10,615Net leases property ¥ 5,479 ¥ 5,676 ¥11,155
Obligations under finance leases at March 31, 2000 and 1999 were as follows:Thousands of
Millions of Yen U.S. Dollars2000 1999 2000
Due within one year ¥ 2,811 ¥ 3,863 $ 26,478Due after one year 4,438 7,292 41,812
¥ 7,249 ¥11,155 $ 68,290
The amount of obligations under finance leases includes the imputed interest expense portion.
Depreciation expense, which is not reflected in the accompanying consolidated statement of operations, computed by the straight-line
method, was ¥3,479 million ( $32,773 thousand ) and ¥4,735 million for the year ended March 31, 2000 and 1999, respectively.
The minimum rental commitments under noncancellable operating leases at March 31, 2000 and 1999 were as follows :Thousands of
Millions of Yen U.S. Dollars2000 1999 2000
Due within one year ¥ 732 ¥ 958 $ 6,896Due after one year 1,034 1,368 9,744
¥ 1,766 ¥ 2,326 $ 16,640

24
10. DERIVATIVESThe Company and consolidated subsidiaries enter into derivative financial instruments (“derivatives”), including foreign exchange forward con-
tracts, currency option contracts and interest rate swap contracts to hedge foreign exchange risk and interest rate exposures.
The Company and consolidated subsidiaries do not hold or issue derivatives for trading purposes.
Derivatives are subject to market risk and credit risk. Market risk is the exposure created by potential fluctuations in market conditions,
including interest or foreign exchange rates. Credit risk is the possibility that a loss may result from a counterparty’s failure to perform accord-
ing to the terms and conditions of the contract.
Because the counterparties to those derivatives are limited to major international financial institutions, the Company and consolidated
subsidiaries do not anticipate any losses arising from credit risk.
Derivative transactions entered into by the Company and consolidated subsidiaries have been made in accordance with internal policies
which regulate the authorization and credit limit amount.
Derivatives contracts outstanding at March 31, 2000 were as follows:Thousands of
Millions of Yen U.S. Dollars 2000 2000
Contract or Net Contract or NetNotional Unrealized Notional UnrealizedAmount Gain (Loss) Amount Gain (Loss)
Forward Exchange Contracts:
Selling U.S.$ ¥ 5,252 ¥ 70 $ 49,480 $ 662
Selling EUR 6,016 266 56,673 2,508
Buying YEN ¥15,733 ¥ 682 $148,214 $ 6,429
Buying EUR 3,691 (165) 34,767 (1,558)
Currency Option Contracts:
Selling Call U.S.$ ¥ 1,073 $ 10,111
Option premiums 24 ¥ 9 222 $ 81
Buying Put U.S.$ 1,035 9,750
Option premiums 24 (4) 222 (41)
Interest Rate Swaps:
(fixed rate receipt, floating rate payment) ¥40,000 ¥ 1,490 $376,825 $ 14,034
(fixed rate payment, floating rate receipt) 20,000 (460) 188,413 (4,333)
¥60,000 ¥ 1,030 $565,238 $ 9,701
Forward exchange contracted amounts which are assigned to associated assets or liabilities and are reflected on the balance sheet at year
end are not subject to the disclosure of market value information.
11. CONTINGENT LIABILITIESContingent liabilities at March 31, 2000 were as follows:
Thousands ofMillions of Yen U.S. Dollars
As the endorser of trade notes receivable discounted with banks ¥ 926 $ 8,725
As the guarantor of bank loans and indebtedness, principally of employees,
unconsolidated subsidiaries and associated companies 13,315 125,438
¥ 14,241 $134,163

25
12. SUBSEQUENT EVENTOn June 29, 2000, the Company’s shareholders approved appropriations of retained earnings as follows:
Thousands of
Millions of Yen U.S. Dollars
Cash dividends ¥ 925 $ 8,712
Bonuses to directors and corporate auditors 30 283
¥ 955 $ 8,995
13. SEGMENT INFORMATION(a) Industry Segments
Millions of YenConsumer Industrial Total (Eliminations) Consolidatedproducts instruments or corporate
For the year ended March 31, 2000
Net sales ¥ 150,288 ¥ 221,513 ¥ 371,801 ¥ 371,801
Operating expenses 141,376 211,991 353,367 353,367
Operating income ¥ 8,912 ¥ 9,522 ¥ 18,434 ¥ 18,434
Assets ¥ 103,695 ¥ 314,356 ¥ 418,051 ¥ 84,124 ¥ 502,175
Depreciation and amortization 4,703 12,548 17,251 17,251
Capital expenditures 3,519 10,362 13,881 13,881
For the year ended March 31, 1999
Net sales ¥ 139,204 ¥ 166,561 ¥ 305,765 ¥ 305,765
Operating expenses 136,683 177,823 314,506 314,506
Operating income (loss) ¥ 2,521 ¥ (11,262) ¥ (8,741) ¥ (8,741)
Assets ¥ 112,838 ¥ 287,680 ¥ 400,518 ¥ 74,447 ¥ 474,965
Depreciation and amortization 6,871 13,239 20,110 20,110
Capital expenditures 6,088 14,631 20,719 20,719
Thousands of U.S. Dollars
For the year ended March 31, 2000
Net sales $1,415,807 $2,086,792 $3,502,599 $3,502,599
Operating expenses 1,331,851 1,997,086 3,328,937 3,328,937
Operating income $ 83,956 $ 89,706 $ 173,662 $ 173,662
Assets $ 976,872 $2,961,430 $3,938,302 $792,499 $4,730,801
Depreciation and amortization 44,302 118,213 162,515 162,515
Capital expenditures 33,156 97,613 130,769 130,769

26
(b) Geographic SegmentsMillions of Yen
(Eliminations)Japan North America Europe Asia Total or corporate Consolidated
For the year ended March 31, 2000
Net sales
Outside customers ¥ 219,188 ¥ 96,699 ¥ 48,926 ¥ 6,988 ¥ 371,801 ¥ ¥ 371,801
Intersegment sales 114,093 322 104 3,879 118,398 (118,398)
Total 333,281 97,021 49,030 10,867 490,199 (118,398) 371,801
Operating expenses 323,878 91,002 48,702 9,261 472,843 (119,476) 353,367
Operating income ¥ 9,403 ¥ 6,019 ¥ 328 ¥ 1,606 ¥ 17,356 ¥ 1,078 ¥ 18,434
Assets ¥ 357,750 ¥ 58,158 ¥ 29,249 ¥ 8,848 ¥ 454,005 ¥ 48,170 ¥ 502,175
For the year ended March 31, 1999
Net sales
Outside customers ¥ 183,725 ¥ 80,366 ¥ 36,129 ¥ 5,545 ¥ 305,765 ¥ ¥ 305,765
Intersegment sales 90,731 281 172 5,801 96,985 (96,985)
Total 274,456 80,647 36,301 11,346 402,750 (96,985) 305,765
Operating expenses 285,427 77,965 36,524 10,051 409,967 (95,461) 314,506
Operating income (loss) ¥ (10,971) ¥ 2,682 ¥ (223) ¥ 1,295 ¥ (7,217) ¥ (1,524) ¥ (8,741)
Assets ¥ 339,740 ¥ 57,255 ¥ 27,423 ¥ 7,946 ¥ 432,364 ¥ 42,601 ¥ 474,965
Thousands of U.S. Dollars(Eliminations)
Japan North America Europe Asia Total or corporate Consolidated
For the year ended March 31, 2000
Net sales
Outside customers $ 2,064,891 $ 910,970 $ 460,909 $ 65,829 $ 3,502,599 $ $ 3,502,599
Intersegment sales 1,074,826 3,030 987 36,544 1,115,387 (1,115,387)
Total 3,139,717 914,000 461,896 102,373 4,617,986 (1,115,387) 3,502,599
Operating expenses 3,051,131 857,298 458,808 87,245 4,454,482 (1,125,545) 3,328,937
Operating income $ 88,586 $ 56,702 $ 3,088 $ 15,128 $ 163,504 $ 10,158 $ 173,662
Assets $ 3,370,231 $ 547,882 $ 275,545 $ 83,358 $ 4,277,016 $ 453,785 $ 4,730,801
27
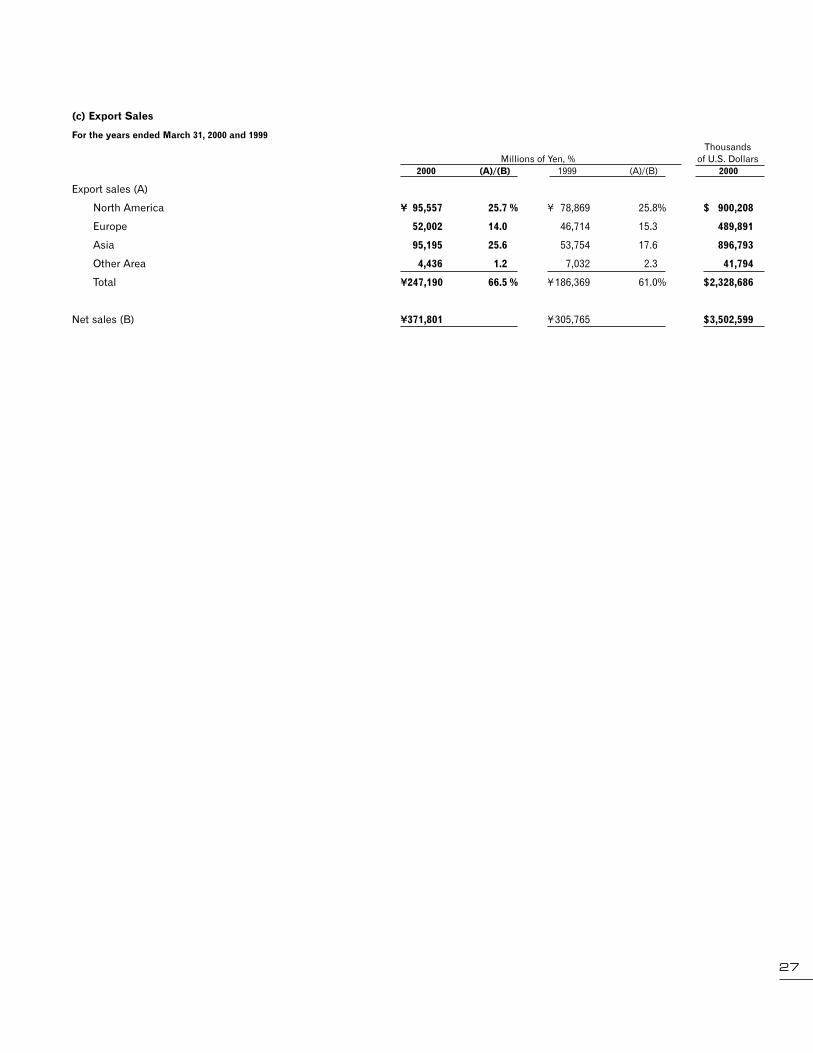
(c) Export Sales
For the years ended March 31, 2000 and 1999 Thousands
Millions of Yen, % of U.S. Dollars2000 (A)/(B) 1999 (A)/(B) 2000
Export sales (A)
North America ¥ 95,557 25.7 % ¥ 78,869 25.8% $ 900,208
Europe 52,002 14.0 46,714 15.3 489,891
Asia 95,195 25.6 53,754 17.6 896,793
Other Area 4,436 1.2 7,032 2.3 41,794
Total ¥247,190 66.5 % ¥ 186,369 61.0% $2,328,686
Net sales (B) ¥371,801 ¥ 305,765 $3,502,599

28

29
HEAD OFFICEFuji Bldg., 2-3, Marunouchi 3-chome,Chiyoda-ku, Tokyo 100-8331, JapanTel: 03-3214-5311
DOMESTIC OFFICEOsaka
DOMESTIC PLANTSOhi plant6-3, Nishiohi 1-chome,Shinagawa-ku, Tokyo 140-8601Tel: 03-3773-1111
Yokohama Plant471, Nagaodai-machi, Sakae-ku, Yokohama, Kanagawa 244-8533Tel: 045-852-2111
Sagamihara Plant10-1, Asamizodai 1-chome,Sagamihara, Kanagawa 228-0828Tel: 042-740-6300
Kumagaya Plant201-9, Oaza-miizugahara, Kumagaya, Saitama 360-8559Tel: 0485-33-2111
Mito Plant276-6, Motoishikawa-cho,Mito, Ibaraki 310-0843Tel: 029-240-1111
MAJOR DOMESTIC SUBSIDIARIESTochigi Nikon Corporation770, Midori Otawara,Tochigi 324-8625Tel: 0287-28-1111
Mito Nikon Corporation4500, Sugaya, Naka-machi, Naka-gun, Ibaraki 311-0194Tel: 029-298-8111
Sendai Nikon Corporation277, Aza-hara, Tako, Natori, Miyagi 981-1221Tel: 022-384-0011
Zao Nikon Co., Ltd.20, Aza-shinoyoke, Miya, Zao-cho, Katta-gun,Miyagi 989-0701Tel: 0224-32-2336
Kurobane Nikon Co., Ltd.1434, Oaza-kurobanemuko-machi,Kurobane-machi, Nasu-gun,Tochigi 324-0241Tel: 0287-53-1111
Sagami Optical Co., Ltd.3330-1, Tana, Sagamihara,Kanagawa 229-1124Tel: 042-763-1291
Nikon Photo Products Inc.23-1, Azumabashi 1-chome,Sumida-ku, Tokyo 130-8677Tel: 03-5608-5500
Nikon Instech Co., Ltd.4-25, Koraku 1-chome,Bunkyo-ku, Tokyo 112-0004Tel: 03-5802-0211
Nikon Geotecs Co., Ltd.16-2, Minamikamata 2-chome,Ota-ku, Tokyo 144-0035Tel: 03-5710-2580
Nikon Eyewear Co., Ltd.10-8, Ryogoku 2-chome,Sumida-ku, Tokyo 130-0026Tel: 03-5600-2471
Kogaku Co., Ltd.8-2, Meishinguchi 3-chome,Toyonaka, Osaka 561-0841Tel: 06-6333-3191
Nikon Tec Corporation5-21, Katsushima 1-chome,Shinagawa-ku, Tokyo 140-0012Tel: 03-5762-8911
Nikon Systems Inc.3-3, Minatomirai 2-chome,Nishi-ku, Yokohama,Kanagawa 220-6116Tel: 045-682-0120
Nikon Life Co., Ltd.*4-25, Nishiohi 1-chome, Shinagawa-ku, Tokyo 140-0015Tel: 03-3773-2122
Nikon Sales–Promotion Co., Ltd.*4-25, Nishiohi 1-chome, Shinagawa-ku, Tokyo 140-0015Tel: 03-5709-8281
Nikon Logistics Corporation*13-17, Nishiohi 4-chome,Shinagawa-ku, Tokyo 140-0014Tel: 03-3773-0351
CORPORATE DIRECTORY

30
MAJOR OVERSEAS SUBSIDIARIESNikon Inc.1300 Walt Whitman Road,Melville, NY 11747-3064, U.S.A.Tel: (1) 631-547-4200
Nikon Canada Inc.1366 Aerowood Drive,Mississauga, Ontario,Canada L4W 1C1Tel: (1) 905-625-9910
Nikon Europe B.V.Schipholweg 321,1171 PL Badhoevedorp,The NetherlandsTel: (31) 20-4496 222
Nikon AGKaspar-Fenner-Strasse 6,8700 Küsnacht/ZH, SwitzerlandTel: (41) 1-913-61-11
Nikon Svenska ABAnton Tamms väg 3, Box 84 S 194 22,Upplands-Väsby, SwedenTel: (46) 8-594 109 00
Nikon GmbHTiefenbroicher Weg 25,40472 Düsseldorf, GermanyTel: (49) 211-9414-0
Nikon U.K. Ltd.380 Richmond Road,Kingston-Upon-Thames,Surrey KT2 5PR, U.K.Tel: (44) 181-541-4440
Nikon France S.A.191, rue du Marché Rollay,94504 Champigny sur Marne,Cedex, FranceTel: (33) 1-45-16-45-16
Nikon Instruments S.p.A.Via Tevere 54,50019 Sesto Fiorentino,Firenze, ItalyTel: (39) 055-3009601
Nikon Kft.*H-1134 Budapest,Dévai, útca 26-28,HungaryTel: (36) 1-350-5525
Nikon s.r.o.*Kodanska 46,100 10 Praha 10,The Czech RepublicTel: (420) 2-67154560
Nikon Singapore Pte Ltd150 Beach Road #30-01/04,The Gateway West,Singapore 189720Tel: (65) 2978123
Nikon Hong Kong Ltd.Suite 1001, 10/F City Plaza One,1111 King's Road, Taikoo Shing,Hong KongTel: (852) 2882-3936
Beijing Nikon OphthalmicProducts Co., Ltd.*9 Xiagongfu Street,Dongcheng District,Beijing 100006, ChinaTel: (86) 10-6512-2557
Nikon Precision Inc.1399 Shoreway Road, Belmont, CA 94002-4107, U.S.A.Tel: (1) 650-508-4674
Nikon Precision Europe GmbHPaul-Ehrlich-Strasse 3-5,63225 Langen, GermanyTel: (49) 6103-973-0
Nikon Precision Korea Ltd.17-24 Shingal-ri, Kihung-eup,Yongin-si, Kyungki-do,South KoreaTel: (82) 331-285-4320
Nikon Precision Taiwan Ltd.10th Floor, No. 55,Tung Kuang Road,Hsinchu, TaiwanTel: (886) 3 573 3622
Nikon Precision Singapore Pte Ltd*29 Woodlands Industrial Park E1,#04-11/12 Northtech Building,Singapore 757716Tel:(65) 367-4020
Nikon Research Corporation ofAmerica*1399 Shoreway Road, Belmont, CA 94002-4107, U.S.A.Tel: (1) 650-508-4674
Nikon (Thailand) Co., Ltd.1/42 Moo 5, Rojana Industrial Park,Rojana Road, Tambol Kanham,Amphur U-Thai, Ayutthaya 13210,ThailandTel: (66) 35-330-152
Nanjing Nikon Jiangnan OpticalInstrument Co., Ltd.48 Shizi Street, Hongshan Road, Nanjing,ChinaTel: (86) 25-542-0012
*Unconsolidated(As of March 31, 2000)

31
Stock Exchange ListingsTokyo, Osaka, Kyoto, Fukuoka, Sapporo
Transfer Agent and RegistrarThe Mitsubishi Trust and Banking Corporation11-1, Nagatacho 2-chome, Chiyoda-ku,Tokyo 100-8212, JapanTel: 03-3212-1211
(As of March 31, 2000)
For further information or additional copies of this annual report,
please contact the Corporate Communications Department.
Price Range of Common Stock (¥)
4,4004,2004,0003,8003,6003,4003,2003,0002,8002,6002,4002,2002,0001,8001,6001,4001,2001,000
800600
1st 2nd 3rd 4th 1st 2nd 3rd 4th
FY1999 FY2000
INVESTOR INFORMATION
Major ShareholdersNumber of Percentage ofshares held total shares(thousands) issued
Meiji Life Insurance Company 23,550 6.37 %The Mitsubishi Trust and Banking Corporation 17,186 4.65The Bank of Tokyo-Mitsubishi, Ltd. 16,996 4.59The Chase Manhattan Bank, N.A. London Secs Lending Omnibus Account 13,751 3.72The Tokio Marine and Fire Insurance Co., Ltd. 10,567 2.86The Asahi Bank, Ltd. 9,013 2.44The Sumitomo Trust & Banking Co., Ltd. (Trust Account) 8,792 2.38State Street Bank and Trust Company 8,769 2.37Boston Safe Deposit BSDT Treaty Clients Omnibus 8,766 2.37Nippon Life Insurance Company 7,994 2.16
Nikon CorporationFuji Bldg., 2-3, Marunouchi 3-chome,Chiyoda-ku, Tokyo 100-8331, JapanTel: 03-3214-5311Fax: 03-3201-5856
Date of EstablishmentJuly 25, 1917
Number of Employees11,946
Common StockAuthorized: 1,000,000,000 sharesIssued: 369,927,584 shares
¥36,661 million
Number of Shareholders18,100