0000306.pdf - Deep Blue Repositories
29
Solute Concentration in the Kidney- I. A Model of the Renal Medulla and Its limit Cases* JOHN A. JACQUEZ, DAVID FOSTER AND EUGENE DANIELS The Department of Physiology, The Medical School, The Unioersity of Michigan, Ann Arbor, Michigan 48109 ABSTRACT We develop a general model of the renal medulla that is similar m geometry to the models reported by others. Two solutes are assumed to be present, one to play the role of salt and the other that of urea and similarly handled compounds. The equations fr’om irreversible thermodynamics are used to describe simultaneous solvent and solute flow across tubular membranes and a salt pump, saturable in the cis concentration and inhibited by trans concentrations is included in the AHL. We examine the input limit cases of the model, i.e., those for zero and infinite inflows in vasa rectae, Henle loop and collecting ducts. High inflow to vasa rectae washes out the gradients. For inflow to DHL there is an optimal value for building up the concentration gradients: for zero inflow, no concentration gradients are developed and as inflow increases above the optimal value, the concentration gradients decrease and all concentrations in DHL, AHL and inter- stitium tend towards those in the inflow to DHL. A central core model, the limit case for zero inflow in vasa rectae. is then described. KEY WORDS Kidney, medulla, concentration gradient, model, limit case, central core. I. INTRODUCTION The countercurrent multiplier theory of the operation of the renal medulla is often attributed to Kuhn and Ryffel [l]. However, this theory was stated more explicitly by Hargitay and Kuhn [2] who proposed a model *This work was supported in part by grants AM 16635 and GM 00110 from the National Institutes of Health, DHEW. MATHEMATICAL BIOSCIENCES 32, 307-335 (1976) 0 American Elsevier Publishing Company, Inc., 1976 307
-
Upload
khangminh22 -
Category
Documents
-
view
0 -
download
0
Transcript of 0000306.pdf - Deep Blue Repositories

Solute Concentration in the Kidney- I. A Model of the Renal Medulla and Its limit Cases*
JOHN A. JACQUEZ, DAVID FOSTER
AND
EUGENE DANIELS
The Department of Physiology, The Medical School, The Unioersity of Michigan,
Ann Arbor, Michigan 48109
ABSTRACT
We develop a general model of the renal medulla that is similar m geometry to the
models reported by others. Two solutes are assumed to be present, one to play the role of
salt and the other that of urea and similarly handled compounds. The equations fr’om
irreversible thermodynamics are used to describe simultaneous solvent and solute flow
across tubular membranes and a salt pump, saturable in the cis concentration and
inhibited by trans concentrations is included in the AHL. We examine the input limit
cases of the model, i.e., those for zero and infinite inflows in vasa rectae, Henle loop and
collecting ducts. High inflow to vasa rectae washes out the gradients. For inflow to DHL
there is an optimal value for building up the concentration gradients: for zero inflow, no
concentration gradients are developed and as inflow increases above the optimal value,
the concentration gradients decrease and all concentrations in DHL, AHL and inter-
stitium tend towards those in the inflow to DHL. A central core model, the limit case for
zero inflow in vasa rectae. is then described.
KEY WORDS
Kidney, medulla, concentration gradient, model, limit case, central core.
I. INTRODUCTION
The countercurrent multiplier theory of the operation of the renal
medulla is often attributed to Kuhn and Ryffel [l]. However, this theory
was stated more explicitly by Hargitay and Kuhn [2] who proposed a model
*This work was supported in part by grants AM 16635 and GM 00110 from the
National Institutes of Health, DHEW.
MATHEMATICAL BIOSCIENCES 32, 307-335 (1976)
0 American Elsevier Publishing Company, Inc., 1976
307

308 .I. A. JACQUEZ, D. FOSTER AND E. DANIELS
for the operation of the system utilizing hydrostatic pressure as the driving
force although they acknowledged that the known pressure differences in
the kidney were too small to account for the total force required. Now,
however, the evidence is overwhelming in favor of the driving force being
the active extrusion of salt from the ascending limb of Henle, although
there is disagreement as to whether the ion being pumped is sodium or
chloride, and whether or not there is pump activity in the thin portion of
that limb [3-91.
The countercurrent hypothesis states that the loops of Henle, acting as a
countercurrent multiplier system, establish an osmotic gradient along the
renal pyramids with the tips of the pyramids having a higher osmotic
pressure than the bases. This theory was supported by the experimental
findings of Wirz, Hargitay, and Kuhn [3] who, from their measurements on
the melting points of slices of the medulla, reported that the osmolality of
the medulla increased from the corticomedullary border to the tips of the
papillae. They also reported that all structures at any one level have the
same osmolality, a fact we now know to be incorrect since the fluid leaving
the ascending limb of Henle is hypotonic. The micropuncture work of
Gottschalk and coworkers [lo] showed that when the hamster, the kangaroo
rat, and the Psammomys were in an antidiuretic state, the fluid in the loops
of Henle and the blood in the vasa rectae near the tips of the papillae had
the same osmolality as the fluid in the collecting ducts at that level, and that
these fluids were hyperosmotic. These findings have established the counter-
current hypothesis as a viable theory, and since the early 1960’s all of the
experimental evidence has been consistent with its general features.
As the evidence in support of the countercurrent mechanism has in-
creased, there has been a concomitant increase in the effort to develop more
detailed models of the medulla. The early attempts were hampered by the
fact that although the geometry of the medulla was fairly well worked out,
the bulk of the evidence supporting the countercurrent hypothesis provided
little insight into the details of how the various tubular segments functioned.
In the early part of this decade, however, there were two significant
developments which have had a major impact on the development of
models of the medulla.
The first of these was that techniques to measure the electrical and
permeability properties of isolated tubular segments were perfected [ll].
The in vitro data so obtained gave, for the first time, direct evidence as to
how these segments probably functioned in vivo thereby allowing refine-
ments to be made to the countercurrent hypothesis.
The second of these deals with the vasa rectae. If the assumption is made
that the vasa rectae are highly permeable to nonprotein solutes and in
equilibrium with the medullary interstitium at any given level in the

A MODEL OF THE RENAL MEDULLA 309
medulla, then it is possible to merge them with the interstitium to form a
larger fluid filled space. The advantage to using this assumption is that it
simplifies the geometry of the medulla considerably while leaving the
concentrating mechanism intact. This assumption was first used by Kokko
and Rector [6] and Stephenson [ 121. Kokko and Rector formulated a model
of the inner medulla to examine the countercurrent multiplication system
without active transport and used this assumption to simplify the calcula-
tions. Subsequent computer simulations based upon this model were carried
out by Stewart et al. [13,14] although it should be pointed out that they
used an ad hoc assumption on water movement to force volume balance.
Stephenson used it because under the assumptions of the central core model
the functional role of the vasculature is retained but the model is greatly
simplified. Initially, he analyzed the general properties of the central core
model and calculated the energy requirements for the concentration of
urine [12,15,16]. Later, he reported some concentration profiles in the
medulla in a normalized form [ 171.
In this paper, we will derive the equations describing two concentrating
engines, the geometry and structure of which are motivated by our knowl-
edge of the structure and function of the medulla. The first, called the full
model of the medulla, includes provisions for all of the tubular segments
which are present in this region, specifically the two limbs of Henle, the two
limbs of the vasa rectae and the associated capillary plexus, and the
collecting duct. The geometry of this model represents a first approximation
to what we know about the anatomy and tubular function in the medulla.
Even so, it leads to tremendous difficulties. Indeed, from the mathematical
point of view it is a difficult two point boundary value problem, and from
the physiological point of view, some of the input values and parameters are
yet unknown.
If we examine the full model closely we are led to the conclusion that the
source of most of the mathematical problems lies with the inclusion of the
vasa rectae in the model. Thus we are led in a natural way to seek
circumstances under which the vasa rectae might be disregarded. Here the
second significant development on the modeling of medullary function
comes into play, and at this point we introduce the second model, namely
the central core model. We point out that this version of the central core
model is the same in general though differing in details from that given by
Stephenson [ 121.
In the next paper, we will use the central core model for our simulations.
The question arises why we did not start with it and proceed directly to the
simulations. The answer is twofold. One is that we wanted to spell out very
carefully the mathematical and physiological consequences in passing from
what we know of the medulla to the central core model. Indeed the

310 J. A. JACQUEZ, D. FOSTER AND E. DANIELS
implications as to medullary function which we may deduce from the
simulations can only be understood if one understands the basic assump-
tions of the central core model. The other reason is that the necessity of
having to pass from the full model to the central core mode1 points out the
fact that much of the experimental data needed to solve the equations of the
full model are missing and the mathematics is difficult. It is our hope that
these deficiencies will stimulate interest in both directions.
II. THE FULL MODEL OF THE MEDULLA
The full model of the medulla which we give in this section is designed in
accord with the general evidence for the countercurrent mechanism dis-
cussed in the introduction. Therefore, it should be regarded as a model of a
countercurrent concentrating engine, and the implications of the mode1 with
respect to the medulla itself must be tempered by the underlying assump-
tions. These assumptions can best be explained in terms of the schematic in
Fig. 1. Geometrically we note that this schematic is similar to that used by a
number of other authors in modeling renal medullary function.
EORTEX
GL
I
I
LOOP OF HENLE
VASA COLLECTING RECTA
DUCTS
FIG. I. Schematic diagram of model of renal medulla. l--descending limb of Henle;
2-ascending limb of Henle; 3-collecting ducts; 4-interstitium; Sdescending vasa
rectae; bascending vasa rectae; 7 -capillary nets connecting descending and ascending
vasa rectae.

A MODEL OF THE RENAL MEDULLA 311
GEOMETRY
Tubes 1 and 2 represent the descending (DHL) and ascending (AHL)
loops of Henle, respectively. Notice that we have not included the end of
the proximal tubule which penetrates into the medulla as it empties into the
top of the descending limb. Tube 3 represents the collecting duct (CD). No
provision has been made to allow for the highly branched nature of this
tube, a feature of the model which we will discuss later. Since the inter-
stitium itself can be regarded as a tube in which all of the other tubes lie, we
have labeled it as tube 4. The descending (DVR) and ascending (AVR) vasa
rectae are represented by tubes 5 and 6; tubes 7 represent the capillary
meshwork connecting the two.
The transition between the outer and inner medulla occurs at the
junction of the thin AHL with the thick. We have diagrammed this as a
linear transition beginning at L,, and ending at L,,. The reason for this is
that even though the thick limbs are the same length to within a few
percent, the transitions are not abrupt. We would like to point out that this
linear transition has an important mathematical consequence. If this transi-
tion were abrupt, then there could be discontinuities in certain parameters
used in the equations at. this point resulting in difficulties in the numerical
solutions. For example, urea permeability in the thin AHL is quite high,
whereas it is virtually zero in the thick part. With an abrupt transition, the
differential equations describing urea movemeat across the tubular walls
would have a discontinuity at this point resulting in oscillations in the
numerical solutions. To alleviate this problem, all changes in parameter
values between the inner and outer zones have been accomplished by
inserting a linear gradient across the transition from L,, to L,,.
LOOPS OF HENLE
The total amount of material which can exchange across the walls of the
DHL and AHL at any given level in the medulla depends in part upon the
total surface area per unit length and the total flow rate in the respective
tubules at that level. At the corticomedullary border, the total flow into the
DHL is determined by the total number of deep nephrons, the deep
nephron glomerular filtration rate (GFR), and the percentage of water
which is reabsorbed along the proximal convoluted tubule. The total surface
area of the AHL and DHL at this point is determined by the total number
of deep nephrons together with their respective radii. From species to
species, there is a difference not only in the percentage of nephrons that are
long looped, but in the number of these nephrons that actually extend to the
tips of the papillae. This implies that in any cross section of the medulla the
number of tubules can decrease as one goes from the corticomedullary
border to the papillae. The result of this is a decrease both in surface area
per unit length and in flow rate at deeper levels of the medulla.

312 J. A. JACQUEZ, D. FOSTER AND E. DANIELS
COLLECTING DUCTS
As indicated in Fig. 1, we regard the collecting ducts as tubes passing
through the interstitium, and have assumed a constant surface area per unit
length throughout the medulla. Thus we neglect the highly branched nature
of these tubes and the fact that the confluence of these structures probably
leads to a situation where the flow velocity stays relatively constant along
the lengths of the ducts. Because of the complicated geometry of these
tubes, it is difficult to estimate the changes in total surface area per unit
length since the total number of collecting ducts decreases as one ap-
proaches the papillae whereas their radii increase. In our initial model we
assumed that all loops have the same length and have constant surface area
per unit length. However, in programming the central core model, provision
for a changing surface area per unit length as a function of distance was
incorporated in the program.
VASA RECTA
The vasa rectae descend as parallel bundles from the corticomedullary
border to form the capillary plexuses at different levels in the medulla [14].
We have lumped these plexuses into a series of tubes cross-connecting the
DVR with the AVR. Since the vasa rectae do not enter into the computa-
tional model, we will not enumerate the difficulties these simplifications
present except to point out that the flow in the cross-connecting tubes is
perpendicular to the DVR and AVR (see Fig. 2).
INTERSTITIUM
The interstitium is assumed to be well-mixed at any one level x from the
corticomedullary border. As indicated by the schematic, the tubules interact
indirectly via solute and solvent exchange with the interstitium. This ne-
I I I
t X j, (x,2)
f&J)--
r-7
z
FIG. 2. Schematic diagram showing notation for capillary bed connecting DVR and
AVR.

A MODEL OF THE RENAL MEDULLA 313
glects the anatomic evidence [18] which suggests that the tubules are not
randomly distributed, and that there may be some direct exchange between
tubules such as the DHL and AVR.
TUBULAR FLUIDS
The fluid in each tube is assumed to contain two solutes, one to play the
role of salt and the other urea. In addition, the vasa rectae and their
associated capillary plexuses are assumed to contain another solute to play
the role of the plasma proteins. No attempt has been made to deal with the
ions separately so it is immaterial to the model whether it is sodium or
chloride which is actually transported. What is included is the effect of the
net movement of salt and the resulting osmotic effect.
PHYSICAL PROCESSES TO BE MODELED
The basic relations required to describe the processes in each tube are:
(1) equations of conservation for solutes and solvent, (2) equations of
motion that give the flow rates as functions of the pressure gradients and
tube geometry, and (3) equations of state to describe the dependence of the
tube diameter on pressure differences across the walls of the tubes. Since we
treat fluids as incompressible, we do not require the equations of state for
the fluids. Moreover, from the work which has been done on perfused
isolated tubules [15] we are led to believe that the tubes are of relatively
constant diameter over their length. Thus we treat them as rigid tubes
thereby eliminating the equations of state for tube diameters. Furthermore,
we believe that the pressure gradient and pressure filtration effects are small
for all tubules except the vasa rectae which means that the equations of
motion must be included only for the vasa rectae and their capillary
networks. However, one must then make some assumptions about the
pressure in the interstitium in order to obtain the pressure differences across
the walls of the tubules 5, 6 and 7. Our conclusion, therefore, is that a
reasonable first model of the countercurrent concentrating engine as it
might apply to the medulla must include the conservation equations for all
solutes and solvents for all tubes, and the equations of motion for at least
tubes 5, 6 and 7.
SYMBOLS AND NOTATZON
In Table 1, we present a list of symbols together with their respective
units which we will use. Except where it is essential for clarity, the
independent variable x will not be exhibited. The tube numberings refer to
those given in Fig. 1. Thus, the concentration of the kth solute in tube 5 at a
distance x from the corticomedullary border is Cam which we will write
csk. A schematic showing the notation for the capillary bed at a depth x is
given in Fig. 2.

314 J. A. JACQUEZ, D. FOSTER AND E. DANIELS
TABLE 1
List of Symbols Used
Symbol Dimension Meaning
L
4 L2
4,
L 22
4
x
k
s,
S,(x)
F,*
Ftk
c,k
J 1*
Jik
z
f,(x,z)
fkcx+-)
.L(x.z)
jk(x3r)
L P
Oik
@,k
cm
cm
cm
cm
cm
cm
cm
cm*/cm
cm2/cm
cm3/min
mmoles/min
mmole/cm’
cm3/cm2.min
mmole/cm2. min
cm
cm3/cm2.min
mmole/min
cm3/cm2.min
mmole/cm2. min
cm’/dyne.min
mmole/dyne.min
Total width of the medulla
Total width of the outer medulla
Total width of the inner medulla
Beginning of linear transition from
outer to inner medulla
End of the linear transition from the
outer to inner medulla
Mean length of capillary bed between
vasa rectae
Independent variable-distance into
medulla from corticomedullary
border
Solutes: k= 1 is salt: k=2 is urea
Surface area per unit length of tube i,
i= 1,2,3,5,6
Surface area per unit length of
capillary bed at depth x
Volume flow rate in tube i Flow rate of solute k in tube i
Concentration of kth solute in tube i
Volume flux across wall of tube i,
positive outwards
Flux of solute k across tube i
Independent variable--distance down
capillary bed
Density of volume flow in capillaries
at depth x at a distance z down the
bed
Density of flow of solute k at the
same point
Density of volume flux across
capillary bed at the same point
Density of flux of solute across
capillary bed at the same point
Filtration coefficient for the wall of
tube i
Reflection coefficient of solute k for
tube i
Permeability coefficient of solute k
across the wall of tube i

A MODEL OF THE RENAL MEDULLA
TABLE I (cont’d)
Svmbol Dimension Meaning
31s
W dyne/cm2
dyne/cm’
Hydrostatic pressure difference across
the wall of tube i, Pa- P,
Osmotic pressure difference across
the wall of tube i due to impermeable
solutes. 774 - 77,
cm3/cm2.min
Function describing active transport
for solute /( across the wall of tube i
Bulk flow into the capillaries from the
DVR to the AVR; b,(x)=j,(x,O)
mmole/cm3
mmole/cm3
mmole/cm3
Protein concentration in the vasa
rectae at depth x
Protein concentration in the cap-
illaries at depth x and at distances I
along the capillaries
Concentration of solute k in
capillaries at depth x in the medulla
and at distance z along the capillary
connecting DVR and AVR
III. THE EQUATIONS FOR THE FULL MODEL
THE CONSERVATION EQUATIONS
The conservation equations for all tubules but the interstitium can be
written:
dF,, __ = - S,J,k. dx
The axial flow of solute k is
where the first term in the equation is the bulk flow contribution and the
second is the contribution of axial diffusion. Here A, is the cross-sectional
area of tube i and Dk is the diffusion coefficient of solute k. For the renal
medulla, we believe that the axial diffusion term is small in comparison with
the bulk flow term, so we neglect it in what follows. Mathematically, we are
seeking the zero-th order solution of a singular perturbation problem.

316 J. A. JACQUEZ, D. FOSTER AND E. DANIELS
THE EQUATIONS FOR WATER AND SOLUTE MOVEMENT
In Eqs. (1) and (2) J,, is the total flux of water across tube i and Jlk is the
total flux of the solute k across tube i. The equations describing these
should include expressions accounting for each mechanism by which such
movement can occur. These include filtration and diffusion across the walls,
active transport where applicable, and, in the vasa rectae, bulk flow out into
the capillaries. For filtration and diffusion across the tubular walls, we will
use the equations for simultaneous volume and solute flow from irreversible
thermodynamics [20]. Thus
J,,=-L,,(AP,-A~,)+L,,RTCu,(c,,-c,)+b,, k
(4)
and
Jik = ( 1 - utk> (Clk + Cik)
2 J;,-w~~RT(c~~-c,~)+ T,,+b,cik. (9
It follows from the discussion in the previous section that b, is zero except
for tubes 5 and 6, and that AP, is zero except for tubes 5, 6 and 7. Note that
we have used the arithmetic mean concentration in Eq. (5) instead of
(cik- c,,)/ln(c,,/c,,) [20]. This is a good approximation so long as the
concentration difference between interstitium and tubule is not large.
THE PUMP TERM
As we stated earlier, we will neglect the ionic nature of the salt and
assume a solute is transported that gives the osmotic effect of the ion that is
actually transported, i.e., it does not matter for this model whether it is
sodium or chloride which is pumped.
The equation for the pump term is:
T,= cc,,
A, + Gil + B;Ca, .
The arguments for this form of the transport function have been given in
[21]. Notice that this expression is saturating in the cis concentration c,,, and
that the flux is inhibited by increasing trans concentration cd,. Notice also
that this expression differs from that used by Stephenson [ 171 because of the
presence of B,c,,.
In our model we assume that salt is the only transported solute. This
neglects the possibility of urea transport in the collecting duct, a possibility
which has been mentioned by Schmidt-Nielsen [22].

A MODEL OF THE RENAL MEDULLA 317
INTERSTITIUM
For the interstitium, we can write the conservation equations for volume
flow and solute flux as
and
Notice that F,,(L) is the volume flow rate leaving the collecting ducts,
which we take as the urine flow rate.
VASA RECTAE
The vasa rectae are the only tubules for which the bi are nonzero. By
definition. we have
65(x)=L(x,O), (9)
&j(X) = -f, (x,&h (10)
For these tubules we also require the equations of motion. In the case of
streamline flow in tubes where exchange is occurring across the tubular
walls, the velocity profiles are no longer parabolic [23-251. The volume flow
rate, however, is still proportional to the pressure gradient even though the
coefficient is no longer the same as in Poiseuille’s equation. Thus, if K, is
the constant of proportionality,
F,,= -K,$$
and
Fee= -K,z
(11)
(12)
Flow in the vasa rectae is further complicated by the presence of proteins
which are responsible for the colloid osmotic pressure. As a result, we must
include the conservation equations for proteins. Assuming these proteins do
not cross the walls of the vasa rectae but have free access to the capillary

318 J. A. JACQLJEZ, D. FOSTER AND E. DANIELS
beds, we can write the equations
~50~~~~5,~~~=~50~~~~5,~~~+~5 Xc50(E)fv(uw~, I
(13) 0
clo(O)F,,(O)=c,,(x)F,“(x)+~,l‘~c,o(5)11(5,L,)d5. (14) 0
Finally, in the capillary bed, equations similar to those for the DVR and
AVR can be written. Since the arguments are essentially the same, we
simply exhibit these equations.
df, (x>z) ___ = - SCjL(X,Z),
dz (15)
;,(x,z)= - Lp,,~APc-A~~,l+Lp,RT~ G(C,A -cc/J, (17) k
(18)
(19)
BOUNDARY CONDITIONS
The equations which we wish to solve are Eqs. (1) for tubes 1 through 6
and (2) for the two solutes for tubes 1 through 6. This gives us 18 equations.
In addition, Eqs. (11) and (12) give us two more. Thus, to solve these
equations, we need 20 boundary values. These values consist of known
values such as concentrations and initial flow rates in tubes 1, 3. and 5, and
matching conditions at x = L. The boundary conditions which are obvious
from physical considerations are listed in Table 2. This list contains only 18
values, so we must find two more. These can be demonstrated for the lower
boundary x= L, but we will defer consideration of this until we have
obtained the central core approximation.
There is another problem with respect to the boundary conditions, and
this is that Eqs. (15) (16) and (19) must be solved at each level X. This then
makes the problem an accessory two point boundary value problem, and
demonstrates clearly the theoretical difficulties presented by the inclusion of
the vasa rectae in the computational model.

A MODEL OF THE RENAL MEDULLA 319
TABLE 2
Boundary Conditions for Full Model
Known values Matching conditions
F,,(O)* F,,(L)= -F,,(L)*
F&3* F,,(L)= - F,,(L)
F,,(O) c,k(L)=cx(L)*
c&9* c,,(L) = %k(L) I k= 1.2
C3k to)*
c5k(o) I
k= 1,2 P,(L)= P,(L)
P,(O)
F,,(L)=O*
*The boundary values marked with an asterisk (*) are those
remaining in the central core model.
IV. THE LIMIT CASES FOR THE FULL MODEL
In order to solve the equations which describe the model, we must have
in addition to the boundary conditions numerical values for the parameters
and inputs listed in Table 2. From a mathematical point of view, each of
these parameters and inputs has a maximal interval containing all of the
possible values it can assume. For example, the reflection coefficients all lie
in the unit interval from zero to one. On the other hand, the inflow rate into
the DHL has a minimum possible value of zero but there is no upper limit
to the value it can assume. We stress the fact that these are the mathemati-
cal limits as they apply to this model; the values for these parameters and
inputs which are physiological are invariably more restricted and rarely
extend to their mathematical limits.
Suppose that among the parameters and inputs for the model we choose
an arbitrary subset and allow each of the parameters and inputs in this
subset to assume or approach one of its extreme values. This maneuver will
change some of the Eqs. (l)-(20). and we can study the nature of the
solutions of this new set of equations as the remaining parameters and
inputs are varied. This is an example of a limit case for the model. Indeed,
the limit cases for a model are those in which each parameter or input value
is assigned or allowed to approach one of its extreme values either one at a
time or in various combinations. By studying limit cases, one hopes to
derive realistic simplifications of the model and to study the behavior of the
full model as these cases are approached.
For the model which we are considering there is a large number of
possible limit cases, most of which are of little interest. Those cases in which
we are interested and which we will consider in this and the next section
involve the volume inflow rates into the DHL, the DVR and the CD, and

320 J. A. JACQUEZ, D. FOSTER AND E. DANIELS
the solute permeabilities in the vasa rectae and their capillary plexuses. We
wish to point out again that each of these is an input to the model and can
be varied independently of the others. Of course it may well be that not all
of the parameters can be varied independently in the renal medulla.
INFLOW INTO THE DVR
The minimum value which this inflow rate can assume is zero, i.e.,
F,,(O)=O. In this case, the vasa rectae and their associated capillary
plexuses disappear from the model simplifying it considerably. To see this,
note that the two terms on the right of Eq. (13) are nonnegative. Hence if
F,,(O)=O, either c,,(x)=0 or F,,(x)=0 or both. We argue on physical
grounds that both must be zero. Recall that the equations we have set up
are for the steady state. But consider the transients after F,,(O) is set to
zero, assuming the system retains its properties otherwise. The osmotic
pressure of the plasma proteins would pull interstitial fluid into the vasa
rectae to generate a flow that would flush out the plasma proteins so that in
the steady state cso(x)= c6e(x)~0. Thus AT, tends to zero and so does AP,
because there is no pressure gradient at x =0 and because of the high
permeabilities of urea, salt and water the concentration differences across
the walls of the vessels must tend to zero. In effect the contents of the
vessels equilibrate with the interstitium. Thus we argue that J,, goes to zero
in the steady state. As a result FSL.(x) must be a constant but since
F,,(O)=O, F,,(x)=O.
The other extreme occurs when F,,(O)~cc. In the limit, because flow is
continuous, it is easy to see that F,, and Fe0 become infinite throughout the
system whence Fsk and Fbk also become infinite. Moreover, in this case, the
fluid entering the DVR is identical in composition with that leaving the
AVR, so c,,(O) = csk(x) = csk(x) for all x. What is the effect of this upon the
model? If we approach this limit in such a way that the derivatives in (1)
and (2) tend to zero, then from (5) we see that we must have cdk(x)
approach c,,(O) as a limit assuming of course that the solutes are highly
permeable. The physiological implications of this limit case are obvious. If
we assume that the vasa rectae are highly permeable to salt and urea, then
as F,,(O) increases, the initial concentrations csk(0) will be propagated
further and further down the DVR, and the high permeability will promote
equilibration between the interstitium and the vasa rectae. The net effect
will be to wash out whatever gradients might have existed in the inter-
stitium, almost completely.
INFLOW INTO THE DHL
As with the DVR, the minimum value which this inflow rate can assume
is zero, i.e., F,“(O)=O. In this case, there may be transient movement of
fluid and solute into and out from various portions of the DHL and AHL
A MODEL OF THE RENAL MEDULLA 321
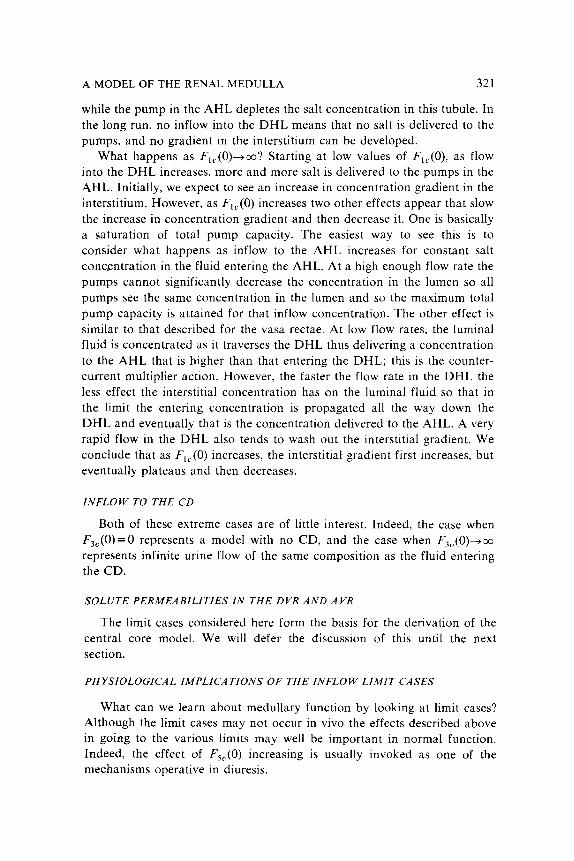
while the pump in the AHL depletes the salt concentration in this tubule. In
the long run, no inflow into the DHL means that no salt is delivered to the
pumps, and no gradient in the interstitium can be developed.
What happens as F,,(O)-+cc? Starting at low values of F,,(O), as flow
into the DHL increases, more and more salt is delivered to the pumps in the
AHL. Initially, we expect to see an increase in concentration gradient in the
interstitium. However, as F,,(O) increases two other effects appear that slow
the increase in concentration gradient and then decrease it. One is basically
a saturation of total pump capacity. The easiest way to see this is to
consider what happens as inflow to the AHL increases for constant salt
concentration in the fluid entering the AHL. At a high enough flow rate the
pumps cannot significantly decrease the concentration in the lumen so all
pumps see the same concentration in the lumen and so the maximum total
pump capacity is attained for that inflow concentration. The other effect is
similar to that described for the vasa rectae. At low flow rates, the luminal
fluid is concentrated as it traverses the DHL thus delivering a concentration
to the AHL that is higher than that entering the DHL; this is the counter-
current multiplier action. However, the faster the flow rate in the DHL the
less effect the interstitial concentration has on the luminal fluid so that in
the limit the entering concentration is propagated all the way down the
DHL and eventually that is the concentration delivered to the AHL. A very
rapid flow in the DHL also tends to wash out the interstitial gradient. We
conclude that as F,,(O) increases, the interstitial gradient first increases, but
eventually plateaus and then decreases.
INFLOW TO THE CD
Both of these extreme cases are of little interest. Indeed, the case when
FsO(0)=O represents a model with no CD, and the case when F30(0)+oo
represents infinite urine flow of the same composition as the fluid entering
the CD.
SOLUTE PERMEABILITIES IN THE DVR AND AVR
The limit cases considered here form the basis for the derivation of the
central core model. We will defer the discussion of this until the next
section.
PHYSIOLOGICAL IMPLICATIONS OF THE INFLOW LIMIT CASES
What can we learn about medullary function by looking at limit cases?
Although the limit cases may not occur in vivo the effects described above
in going to the various limits may well be important in normal function.
Indeed, the effect of F,,(O) increasing is usually invoked as one of the
mechanisms operative in diuresis.

322 J. A. JACQUEZ, D. FOSTER AND E. DANIELS
What determines the inflow rates into the DHL, the DVR, and the CD,
i.e., F,,(O), F,,(O), and FsL’(0)? First, it is obvious that they are not
independent in the real situation, so the question then becomes a question
of their interdependence and how this fits in with the limit cases. In what
follows in this section we argue on physiological and physical grounds; the
limit cases have not actually been approached in simulations on a full
model containing vasa rectae.
We know that the blood supplying each nephron arrives via the afferent
arteriole into Bowman’s capsule, and leaves the capsule via the efferent
arteriole. The efferent arteriole gives rise to the peritubular capillaries, and
the vasa rectae and its capillary plexus. Thus the fluid arriving at Bowman’s
capsule is divided into two parts, that which becomes the glomerular filtrate
and that which leaves in the efferent arteriole.
The first control point for the blood supply to the nephron then is the
smooth muscle surrounding the afferent arteriole. When these muscles
constrict, the total flow into the nephron is decreased over what it was
before. and in the extreme would correspond to the case when F,,(O)+0
and F,,(O)-+O. As we have seen, this would be equivalent to removing this
nephron as a functional unit. In this case we can say that this unit
contributes little to F,“(O), but, as there are other factors involved in F,,(O),
we can make no overall conclusion about this flow rate. We can think of
this particular situation occurring when there is a redistribution of blood
flow within the kidney.
The next control point would be the smooth muscles surrounding the
efferent arteriole. Indeed, for any given inflow rate in the afferent arteriole
and blood composition, the distribution between GFR and flow rate in the
efferent arteriole can be controlled by constricting or relaxing these
muscles. However, these flow rates are not the flow rates for the fluids
entering the DHL and DVR because of the fact that there is reabsorption of
water and solutes by the peritubular capillaries along the proximal con-
voluted tubule. Thus F,,(O) is determined by the GFR along with this
reabsorption and F,,(O) is determined by the initial flow in the efferent
arteriole along with this reabsorption where we must also take into account
the possibility that not all of the capillaries lead into the DVR.
With these facts in mind, let us consider the inflow into the DHL, DVR,
and CD for a gicen flow rate and blood composition in the afferent arteriole.
As F,,(O)+0 we must have F,,(O) increasing although we cannot say by
how much. The contribution of this nephron to flow in the CD would
become negligible. A situation such as this could arise in the event that the
nephron was damaged. In this case. the effect of F,,(O) would be to
decrease the medullary gradient, and we would expect in the extreme an
isotomc urine. It is also possible to conceive of the situation in which inflow

A MODEL OF THE RENAL MEDULLA 323
to the DHL becomes small with a concomitant rise in F,,(O) as the transient
behavior of the kidney in passing to a more diuretic state.
On the other hand, as the inflow into the DHL becomes large we would
expect a drop in the inflow into the DVR. The initial result would be an
increased delivery of salt to the pumps in the AHL. As F,,(O) decreases, the
effect that the vasa rectae has on the concentration gradient in the medulla
is decreased, the establishment of the gradient depending primarily on the
action of the loops of Henle. Thus again we would expect to see an optimal
flow rate for F,,(O) where the maximal gradient is established followed by a
decrease in the gradient.
Finally, the flow into the CD is partly coupled to that leaving the AHL
so FJO) cannot be varied entirely independently of F,,(O). For species that
have only long Henle loops all of which go into the medulla. F3JO) must be
determined almost entirely by FzO(0) and the subsequent action of the distal
tubules on this fluid. However, for many species only a portion of the Henle
loops are in the medulla; most of the cortical nephrons have short Henle
loops that just get into the outer medulla. For such kidneys F3”(0) must be
determined more by what goes on in the cortical nephrons than by the
outflow from the AHL of the juxtamedullary nephrons.
V. THE CENTRAL CORE MODEL
In the previous section we saw that in the limit case when F,,(O)=0 the
vasa rectae and their associated capillary plexuses dropped out of the
model. In this section we will consider another limit case, specifically that in
which these vessels are infinitely permeable to salt, urea, and other small
solutes, and show that it leads to the same conclusion. Stephenson [12] was
the first to consider the consequences of such an assumption, and at almost
the same time, Kokko and Rector [6] pointed out that this assumption
greatly simplified their calculations for mass balance in the inner medulla.
The assumption that Stephenson made was that the reflection
coefficients in the vasa rectae and their capillaries for NaCl, urea, and other
small solutes were close to zero, i.e., that these solutes were highly perme-
able. This meant that these tubules could be merged functionally with the
interstitium into a single fluid-filled space called the central core. Thus, this
leaves the machinery of the concentrating mechanism intact, implicitly
retains the functional effect of the vasa rectae in this limit case but greatly
simplifies the model.
THE CENTRAL CORE ASSUMPTION
With the above information in mind, we will sketch the derivation of the
central core model.

324
Let us write
J. A. JACQUEZ, D. FOSTER AND E. DANIELS
for the combined volume flow rates at level x in the interstitium and vasa rectae. Then, from (7) we obtain upon differentiating
dF 3 dF, -=- dx c- dx '
j=l
(21)
Differentiating (8) and rearranging terms, we have
d(F,,c,, + FskC5k + F6kCd 3 d(F;,C,k) =-
dx c dx (22) j=l
If the vasa rectae are highly permeable to the solutes in both limbs and in the capillary beds so that u5k, usk, and uck are approximately zero, then we may assume cdk = c5k = cdk = c,,, and Eq. (22) may be simplified
d (FCa) 3 d(&jk) -=- dx c dx ’ (23)
j=l
This equation tells us that if this assumption is true, then the details of the vasa rectae and their capillary beds may be ignored as far as the concentrat- ing process is concerned, and they can be lumped with the interstitium into an enlarged functional unit. Note that in reaching this conclusion, we have assumed that the loops of Henle and the collecting ducts interact with the vasa rectae only via the interstitium.
Thus the complicated model shown in Fig. 1 reduces to the simpler one shown in Fig. 3. The central core, i.e., the interstitium and the vasa rectae, is labeled with the subscript 4. This makes our notation the same as that used by Stephenson [ 12,171 and should facilitate comparison of his work and ours.
THE EQUATIONS OF THE CENTRAL CORE
The equations for the central core model may be obtained directly from (1) and (2) for the loop of Henle and the collecting duct, and Eqs. (21) and

A MODEL OF THE RENAL MEDULLA 325
FIG. 3. Schematic diagram of central core model.
(23) for the interstitium. They are:
d4, dx - - SiJm,
J,,= L,RT~~,,(c,cc,,)~
dF,, - = - S,J,,, dx
(27)
Notice that this gives us 12 equations. The solution of these equations gives
us FiFio(x) and F,k(x). From (3) ignoring the axial diffusion term, we may
solve for c,~(x), i.e.,
& (xl c,/,(x)= -.
F,, (x> (28)
BOUNDARY VALUES FOR THE CENTRAL CORE MODEL
There are 10 boundary values listed in Table 2 which apply to the central
core model. Since we have 12 equations we need two more. We will derive
these now.
From (28) when x# L, we have c,,(x)F,,(x)= Fhk(x). One of the
boundary conditions imposed on our model is F,,(L)= 0. Assuming that
cdk( L) is finite, it follows because of the continuity of cdk(x) that Fdk(L) = 0. Thus (28) is not defined when x = L. At this point, however, we may invoke

326 J. A. JACQUEZ, D. FOSTER AND E. DANIELS
I’Hopital’s rule. If dF,,/dx does not vanish when x= L, 1’Hopital’s rule
states that
dFddx c4k(L)= :?“, dF,,.dx ’
Substituting (24) and (26) into this expression gives
i s,J,k
j=l
Cam= lim -.
(29)
(30)
J=I
This provides two nonlinear relations between cJ, and c42 and the other
concentrations at the lower boundary x = L. In any numerical solution of
(24) (25) (21), and (23) these can be used as added constraints thus giving a
full set of 12 boundary conditions.
THE SIGNIFICANCE OF THE CENTRAL CORE MODEL
We have just seen that the central core assumption, that is, the limit case
in which the reflection coefficients for salt and urea in the vasa rectae and
their capillary meshwork are close to zero which means that c4/, = cjk = chk =
c,~ results in the disappearance of the vasa rectae from the model. This
implies that the details of the action of the vasa rectae have no influence on
the rest of the model. Thus, within the range of blood flows for which this
assumption is a good approximation, changing the blood flow to the
medulla cannot affect the gradient except possibly in an indirect fashion
through an effect on the GFR of the juxtamedullary glomeruli and a
consequent change in inflow into the DHL. It is clear that there must be
situations in which this is a fairly good approximation; the problem is that
we do not know whether these situations overlap the physiologically realiz-
able states of the medulla. Nonetheless, as a model of a concentrating
engine, it should provide some insight into the operation of the full model.
VI. PARAMETERS AND INPUT VALUES
FOR THE CENTRAL CORE MODEL
The parameters and input values required for the central core model are
of the following types: the geometric parameters, the thermodynamic
parameters of the tubules, those which characterize the action of the salt
pumps, and the composition and flow rates of the fluid entering the tubules.
Recall that the notation for each is listed in Table 1.

A MODEL OF THE RENAL MEDULLA 327
GEOMETRIC PARAMETERS
The geometric parameters which have been directly measured and r.:-
ported in the literature are summarized in Table 3, arranged in order of
increasing maximum urine concentration attainable. The reference for each
entry is given in square brackets.
Of course what is required for the model is the surface area per unit
length for the various tubules. For the ascending and descending limbs of
Henle, these have been computed from a knowledge of the luminal diame-
ters, and are summarized in Table 4. Notice that we have sufficient
information to calculate or make reasonable estimates only for the rabbit,
rat. hamster and man.
The major problem was obtaining estimates for the collecting ducts. The
numbers for the collecting ducts in man were calculated from C:iver’s data
[27]. According to Oliver. there are about 350 collecting trees in the human
kidney, each tree being formed by 8 or 9 successive dichotomous branch-
ings of a papillary duct, and resulting in an estimated 90,000 to 180,000
collecting ducts at or near the corticomedullary border. Since the mean
number of ducts decreases as one moves from the corticomedullary border
into the medulla, we have used the smaller number, 90,000. From the data
in Table 3, we estimated an average diameter for the collecting duct as
double that of the limbs of Henle. Using these figures, we obtain a surface
area per unit length in the human kidney which is just about the same as
that estimated for the loops of Henle. If the ratio of the collecting ducts to
long LOOPS of Henle remains the same in the other species and if the average
diameters of the collecting ducts is double that of the loops of Henle the
surface area per unit length of the collecting duct is approximately the same
as for the loops of Henle. These figures are also summarized in Table 4 with
the figures for the nonhuman cases being put in parenthesis to stress their
hypothetical nature.
THERMODYNAMIC PARAMETERS
Almost all of the measurements of the reflection coefficients, permeabil-
ity coefficients, and filtration coefficients have been obtained for the rat
and rabbit. As we mentioned in the introduction, the data on the rabbit
tubules come from experiments on isolated tubules whereas the rat data
come from estimates based upon micropuncture studies. Table 5 presents
our summary of the data available in the literature. It is interesting to note
that in many cases there are sizable differences in the permeability proper-
ties of the same tubular segment between the rat and the rabbit.
TRANSPORT PARA METERS
The equation for the pump, Eq. (6) has three independent parameters.
This form has the advantage that, as for the Michaelis-Menten equation, the

Nep
hron
s pe
r
kidn
ey
x 10
’
TA
BL
E
3
Geo
met
ric
Para
met
ers
of t
he
Kid
neys
of
a N
umbe
r of
Spe
cies
Bea
ver
Man
R
abbi
t D
og
Rat
H
amst
er
Psam
mom
ys
ltSl2
.5[2
6]
2.05
[27,
28]
4.08
[45]
.3
08[3
0]
0.6.
0.7[
28]
11[4
5]
2.12
[29]
.3
8[31
] 2.
07[4
5]
.02
juxt
amed
.[28]
Pe
rcen
t of
321
long
lo
oped
ne
phro
ns
Thi
ckne
ss
7[33
,34]
of c
orte
x-m
m
Thi
ckne
ss
14[3
3,34
]
oute
r m
edul
la-m
m
Thi
ckne
ss
0[33
,34]
in
ner
med
ulla
Dia
met
er
desc
endi
ng
limb
Hen
le
p D
iam
eter
thin
as
cend
ing
limb
p
14[3
2]
44~3
21
48[3
3]
49[3
3]
34[3
3]
5[34
,3
1]
9%10
[33]
10[3
4,35
]
1422
[26]
27
[39]
14-2
2[26
] 27
[7]
Lum
inal
di
amet
er
2&50
[26]
24
.5[8
] th
ick
asce
ndin
g lim
b p
Num
ber
of
0.9%
1.8(
27]
colle
ctin
g tu
bule
s x
IO5
Lum
inal
di
amet
er
22-2
5140
1 co
llect
ing
duct
s p
20[4
1 ]
Max
imum
ur
ine
600[
34]
1500
[34]
co
ncen
trat
ion
mO
sm
1900
[9]
100[
32]
28[3
2,33
] 10
0[32
]
7[35
] 2.
9[33
]
1.5[
18]
6[35
] 2.
6[33
]
1.85
[18]
11[2
9]
5.4[
33]
3.8[
18]
16[4
2]
I.51
351
2.1[
35,3
8]
1.6[
35]
2.4[
35,3
8]
4.1[
35]
11.5
[35,
38]
11.9
[53,
36]
11.6
[37]
17.7
[36]
16.8
[53]
20.8
(37]
19[4
2]
32[4
2]
2000
[43]
26
00[3
2]
2600
[32]
3000
[443
50
00[3
4]
6000
[38]
‘Tak
en
from
fi
gure
in
[7
].

A MODEL OF THE RENAL MEDULLA 329
TABLE 4
Lengths and Surface Areas of Tubules
Man Rabbit Dog Rat
L, (cm) 1 .O? 0.5 0.6 0.25
L, (cm) 1.0 1 .o 1.1 0.50
Diameter Thm and thick Henle ( p) 22 27 22 18
S--cm2/cm 1200 800 2800 50
Descending and thin
and thick ascending
S--cm*/cm 1200 (800) (2800) (50) Collecting ducts
net flux is saturable in the cis concentration; it has the added advantage of
being inhibited by an increase in the trans concentration. As pointed out by
Jacquez et al. [21], Eq. (6) describes the experimental data on transport
across renal tubules fairly well, and values for the parameters have been
given for the proximal and distal tubules of the rat in [21]. We defer
presenting the values which we will use in our simulations until the next
paper.
TUBULAR FLUID COMPOSITION AND FL0 W RATES
For input into the model we must have the flow rate and composition of
the fluids entering the DHL and CD at the corticomedullary border. Since
the model predicts the flow rate and composition of the fluids leaving the
top of the AHL and the bottom of the CD, we must also have the
experimentally determined values for these to serve as the basis for com-
parison.
The urine flow rate and composition has been measured in several
species. Thus it is an easy matter to compare the predicted values with the
observed values. Moreover, micropuncture studies have given us values for
the fluid composition in various tubular segments, but unfortunately these
are available only for certain species of rodents. The remaining values that
are required must be estimated from our knowledge of GFR and tubular
reabsorption and secretion.
We will defer until the next paper our table of input concentrations and
flow rates, and summarize here only our values for urine concentration and
flow rates. Table 6 lists the excretion rates for rat, rabbit, dog and man
which we have taken from one of the biological handbooks [58], and Table
7 gives urine concentrations under conditions of hydropenia and water
diuresis.

330 J. A. JACQUEZ, D. FOSTER AND E. DANIELS
TABLE 5
Thermodynamic Parameters
Descending limb of Henle Rabbit Rat
k Na (cm.min-‘x 10b3)
ONa
k “X.2
(cm.min-‘X 10v3)
O”,,, RTL,T=37”
(
cm3 cm3 ~.- cm2. min mmole
0.966[39]
0.96[39] 0.36[6]
0.90[46] No ADH: 7.8[42]
ADH: 12.0 0.95[46] 0.44[6]
0.247[46] 0.06599[42]
Ascending limb of Henle
THIN: 15.3[7]
THICK: 3.76[8]
Thin: 70.2[7]
THICK: 0.636[8]
THIN: 4.02[7]
THICK: 0.516[47]
THIN: 0.00142[7]
THICK: 0.000183[8] O.OOOOO764[48]
THIN: l[6]
THIN: 1[6]
No ADH: 8.4[42]
ADH: 9.6[42]
THIN: 0.3[6]
0.0050[42]
Collecting duct
k N.9 No ADH: 0.036[49]
UNa
%I
k urea
~urea RTL,
No ADH
1[50,51]
l[50,51]
No ADH: 0:18[50]
0.63[41] 0.096[52]
0.055[ 161
ADH: 0.12[50]
0.732[41]
0.090[52] 0.058[ 111
1[51,52]
0.000652[40]
0.00785[41]
0.00278[54]
RTL,
ADH present
0.0202[40]
0.0264[41]
0.0135[54]
7.56(corrected for
active transport[50])
I1591
l[591 No ADH: 12.0[11]
8.28[55]
ADH: 18.0[11]
l2.12[55]
0.4[ 171
0.00478[42]
0.00467[55]
0.00580[55]
Antidiuresis: 0.00488[56]
0.00539[57] 0.0341[42]
0.0239[55]
0.0228[55]

A MODEL OF THE RENAL MEDULLA 331
TABLE 6
Excretion Rates
Units Rat Rabbit Dog Man
Volume ml/kgm-day 15-30 50-75 20-100 9-29
Sodium mEq/kgm-day 4.5( 1.7-7.3) 1.9(0.0413) 2.6(1.14.1)
Chloride mEq/kgm-day 3.4(0.9-8.2) 0.5(0.1-1.4) 2.0(&10.3) 2.8(1.13-5.0) Urea mmoles/kgm-day 16.7-26.7 20-25 5.s8.3 3.3-8.3 Creatinine mmoles/kgm-day 0.21-0.35 0.18-0.44 0.27-0.7 1 0.2(0.13-0.27)
TABLE 7
Concentration in Urine
(mEa/L or mmoles/L)
Rat Rabbit Doe Man
Sodium
Chloride
Urea
90 60 74(2- 189) 114(35%167)
96 41(3.4-94) 76(&289) 110(49%2 10)
111
VI. SUMMARY AND CONCLUSIONS
In this paper we have developed two models for concentrating engines
which can be viewed as first approximations to the concentrating
mechanism in the medulla. Although from the point of view of mimicking
medullary function the full model is probably a better approximation, we
found that it presented insurmountable theoretical and experimental diffi-
culties. Hence we were led to the central core model.
How do these models fit into the overall picture of the modeling of
medullary function? The model of Hargitay and Kuhn assumed that the
movement of water across the walls of the loops of Henle was due to
pressure filtration although they acknowledged that the known pressure
differences in the kidney were too small to account for the total force
required [2]. Kuhn and Ramel [4] changed this to the active extrusion of
sodium as the driving force of the system and at the same time omitted the
vasa rectae and the flow of water across the tubular walls. These omissions
along with the omission of nontransported solutes such as urea makes such
a model unrealistic. Pinter and Shohet [.59] were the first to try to include
the vasa rectae in such a model but they did not allow the water to move
across the walls of the tubules. Stephenson [60] showed that such a model
could not concentrate solute and Kelman et al. [61] showed that the
concentration profile was nonmonotonic.
Jacquez et al. [21] formulated a model of both the medulla and cortex
that included the movement of a transported solute, a nontransported

332 J. A. JACQUEZ, D. FOSTER AND E. DANIELS
solute, and water. The model of the medulla included the vasa rectae, the
loops of Henle, and the collecting ducts; the geometry was essentially the
same as Fig. 1. The equations used to describe the model consisted of
equations for the conservation of water, of transported solute, and of
nontransported solute, but the equations of motion of volume flow down
the tubules were omitted. No solutions of the equations were presented.
Marumo et al. [62] published the same type of model and included the
equations of motion for flow in the tubules but used a sodium pump that
was linear in the sodium concentration in the ascending limb of Henle.
They publish graphs that show a concentration effect. Furukawa et al. [63]
also worked on the same type of model except for the nature of the
transport function and the fact that they tapered the medulla towards the
papillae.
Lieberstein [64] returned to the original model of Hargitay and Kuhn in
that his driving force was pressure filtration; active transport of solute as
the driving force was specifically excluded. In view of the evidence for
active transport, this model would appear to be incorrect.
Koushanpour et al. [65] in their simulation of the medulla used only the
conservation equations. They also assumed known linear gradients in the
transported and nontransported solutes. These assumptions simplify the
mathematics considerably since they uncouple the equations for solute and
solvent movement in each tubule from those in the other tubules, but this
approach is really an evasion of the basic problem which is to see if and
how such a model develops a concentration gradient in the medulla.
Kokko and Rector [6], as we have pointed out previously, presented a
model for the countercurrent multiplication system in which there was no
active transport in the inner medulla. This model focuses on the action of
the loops of Henle and the collecting ducts in the medulla. Some of the
mathematical analysis of this model was done by Stewart et al. [13].
Palatt and Saidel [66] tried to incorporate some of the anatomical
interrelations described by Kriz [I81 into a model in which the descending
vasa rectae exchange solutes and water with the ascending loop of Henle,
and the ascending vasa rectae exchange with the descending loop of Henle;
the capillary plexus exchanges with the ascending loop of Henle and the
collecting ducts. The model does not include equations of motion for the
vasa rectae or the capillary bed, and the equations for water movement
across the tubular walls do not include the filtration terms.
As we have stated, the central core model was originally introduced by
Stephenson [12]. It will serve as the basis for our simulations which we
present in the next paper.
The authors thank Dr. James A. Schafer and Dr. John Stephenson for their
critical review of this and the succeeding paper.

A MODEL OF THE RENAL MEDULLA 333
REFERENCES
I
2
3
4
5
6
7
8
9
IO
II
12
13
14
15
16
17
18
19
20
21
W. Kuhn, and K. Ryffel, Herstellung konzentrierter Losungen aus verdunnten durch
blosse Membran-wirkung, Ein Modellversuch zur Function der Ntere, Zischr. Physiol.
Chem 276, 145-178 (1942).
B. Hargitay, and W. Kuhn, Das Multiplikationsprinzip als Grundlage der Harnkon-
zentration in der Niere, Z. Elektrochem. 55, 539-558 (1951).
H. Wirz, B. Hargitay and W. Kuhn, Lokalisation des Konzentrierungs prozesses in
der Niere durch direkte Kryoskopie. He/o. Physiol. el Pharmacol. Acra 9, 196-207
(1951).
W. Kuhn, and A. Ramel, Aktiver Salztransport als moglicher (und wahrschemlicher).
Einzeleffekt bei der Harnkonzentrierung in der Niere, Helc. Chim. Acta 42, 628-660
(1959).
R. L. Jamison. Countercurrent systems, MTP intern. rev. science, Kidney and Urinary
Tract Physiol., K. Thurau, ed., Butterworths, London, 1974, Vol. 6, pp. 199-245.
J. P. Kokko, and F. C. Rector, Jr., Countercurrent multiplication system without
active transport in inner medulla, Kidney Internal. 2, 214223 (1972).
M. Imai, and J. P. Kokko, Sodium chloride, urea, and water transport in the thin
ascending limb of Henle, J. Clin. Inoest. 53, 393407 (1974).
A. S. Rocha, and J. P. Kokko, Sodium chloride and water transport in the medullary
thick ascending limb of Henle: Evidence for active chloride transport, J. Clin. Inoest.
52, 612-613 (1974).
D. J. Marsh, Solute and water flow m thin limb of Henle’s loop in the hamster
kidney, Am. J. Physiol. 218. 824-831 (1970).
C. W. Gottschalk, Micropuncture studies of tubular function in the mammalian
kidney, Physiologist 4, 35-55 (1961).
M. B. Burg, and J. Orloff, Perfusion of isolated renal tubules, Renal physiology,
Handbook of Physiology, J. Orloff and R. W. Berliner. eds., Am. Physiol. Sot..
Washington, DC, 1973, Chapt. 7, Sect. 8.
J. L. Stephenson, Concentration of urine in a central core model of the renal
counterflow system, Kidney Intern&. 2, 85-94 (1972).
J. Stewart, M. E. Luggen and H. Valtin, A computer model of the renal countercur-
rent system, Kidney Internat. 2, 253-263 (1972).
J. Stewart, and H. Valtin, Computer simulation of osmottc gradient without active
transport in renal inner medulla, Kidney Internat. 2, 264-270 (1972).
J. L. Stephenson, Concentrating engines and the kidney-I. Central core model of the
renal medulla, Biophys. J. 13, 512-545 (1973).
J. L. Stephenson, Concentrating engines and the kidney--II. Multisolute central core
systems, Biophys. J. 13, 546-567 (1973).
J. L. Stephenson, R. P. Tewarson and R. Mejia, Quantitative analysis of mass and
energy balance in non-ideal models of the renal counterflow system, Proc. Not. Acad.
Sci. USA 71, 1618 (1974).
W. Kriz, Der architektonische and funktionelle Aufbau der Rattenniere, Z.
ZelIforsch. Mikroskip. Anat. 82, 495-535 (1961).
L. W. Welling, and D. J. Welling, Pressure-flow-diameter relattonships in isolated
perfused thm limb of Henle, Am. J. Physiol. 229, l-7 (1975).
A. Katchalsky, and P. F. Curran, Nonequilibrium Thermodynamics in Biophysics,
Harvard Univ. Press, Cambridge, Mass., 1965.
J. A. Jacquez, B. Carnahan and P. Abbrecht, A model of the renal cortex and
medulla, Math. Biosci. 1, 2277261 (1967).

334 J. A. JACQUEZ, D. FOSTER AND E. DANIELS
22
23
24
25
26
27
28
29
30
31
32
33
34
35
36
37
38
39
40
41
42
43
44
45
B. Schmidt-Nielsen, Urea excretion in mammals, Phys. Reu. 38, 139-168 (1958).
A. S. Berman, Laminar flow in channels with porous walls, J. Appl. Physics 24,
1232-1235 (1953).
S. W. Yuan. and A. B. Finkelstem. Laminar pipe flow with injection and suction
through a porous wall, Trans. Am. Sot. Mech. Eng. 78, 719-724 (1956).
R. 1. Macey. Pressure flow patterns in a cylinder wtth reabsorbing walls. Bull. Math.
Biophysics 25. 1-9 (1963).
R. G. Pitt& Physiology of the Kidney and Body Fluids, Year Book Medical Publishers,
Chicago, 1974.
J. Oliver, Nephrons and Kidneys, Harper and Row, New York. 1968.
E. M. Renkin. and J. P. Gilmore, Glomerular filtration, Renal physiology, Handbook
of Physiology, J. Orloff and R. W. Berliner, eds., Am. Physiol. Sot., Washington, DC,
1973. Chapt. 9, Sect. 8.
B. J. Nelson, The number of glomeruli in the kidney of the adult rabbit, Amt. Rec.
23, 355-361 (1922).
E. E. Windhager. Micropuncture Techniques and Nephron Function, Appleton-
Century-Crofts. New York, 1968.
L. J. Barrat, J. D. Wallin. F. C. Rector, Jr., and D. W. Seldin, Influence of volume
expansion on single-nephron filtration rate and plasma flow in the rat. Am. J. Physiol.
224, 643-650 (1973).
B. Schmidt-Nielsen, and R. O’Dell, Structure and concentrating mechanism in the
mammalian kidney, Am. J. Physrol. 200, 1119-l 124 (1961).
1. Sperber, Studies on the mammalian kidney, Zoo/. Bidrag. fran Uppsala 22, 249
(1944).
R. O’Dell, and B. Schmidt-Nielsen, Concentrating ability and kidney structure, Fed.
Proc. 19, 366 (1960).
S. E. Dicker, Mechanisms of Urine Concentration and Dilution in Mammals, Williams
and Wilkins Co., Baltimore, 1970.
D. J. Marsh. and S. Solomon, Analysis of electrolyte movement in thin Henle’s loop
of hamster papilla, Am. J. Physiol. 208, 1 119-l 128 (1965).
K. Thurau, and G. Henne, Dynamik des Harnstromes in den Henleschen Schleife,
Arch. Ges. Physiol. 278, 45-46 (1963).
B. Schmidt-Nielsen, and L. Rabinowitz, Methylurea and acetamide: Active reabsorp
tion by elasmobranch renal tubules, Science 146, 158771588 (1964).
J. P. Kokko, Sodium chloride and water transport in the descending limb of Henle, J.
Clin. Invest. 49, 1838-1846 (1970).
.I. Schafer, and T. E. Andreoli, Cellular constraints to diffusion, The effect of
antidiuretic hormone on water flows in isolated mammalian tubules, J. Clin. Inuest.
51, 12641278 (1972). J. J. Grantham, and M. B. Burg, Effect of vasopressin and cyclic AMP on permeabil-
ity of isolated collecting tubules, Am. J. Physiol. 211, 255-259 (1966).
T. Morgan, and R. W. Berliner, Permeability of the loop of Henle, vasa rectae, and
collecting duct to water, urea, and sodium, Am. J. Physiol. 215. 108-l 15 (1968).
S. E. Bradley, J. H. Laragh, H. 0. Wheeler, M. MacDowell and J. Oliver, Correlation
of structure and function in the handling of glucose by the nephrons of the canine
kidney. J. C/in. Incest. 40, 1113-1131 (1961).
F. Morel, and M. Guinnebault, Les mechanismes de concentration et de dilution de
I’urine, J. Physiol. (Paris) 53, 75-130 (1961).
H. W. Smith, The Kidney: Siructure and Function in Health and Disease, Oxford
University Press, New York, 1951.

A MODEL OF THE RENAL MEDULLA 335
46
41
48
49
50
51
52
53
54
55
56
57
58
59
60
61
62
63
64
65
66
J. P. Kokko, Urea transport in the proximal tubule and the descending limb of Henle,
J. Clin. Invest. 51. 1999-2008 (1972).
J. P. Kokko, Membrane characteristics governing salt and water transport in the loop
of Henle, Fed. Proc. 33, 25-30 (1974).
M. B. Burg, and N. Green, Function of the thick ascending limb of Henle’s loop, Am.
J. Physiol. 224, 659-668 (1973).
G. Frindt, and M. B. Burg. Effect of vasopressin on sodium transport in renal cortical
collecting tubules, Kidney Internat. 1, 224-23 1 (1972).
J. A. Schafer, and T. E. Andreoli, The effect of antidiuretic hormone on solute flows
in mammalian collecting tubules, J. C/in. Invest. 51, 1279-1286 (1972).
J. A. Schafer, and T. E. Andreoli, Vasopressin-dependent reflection coefficients in
isolated collecting tubules, Physiologisr 13, 302 (1970).
M. B. Burg, Urea and the Kidney, B. Schmidt-Nielsen and D. W. S. Kerr, eds.,
Excerpta Med. Found., Amsterdam, 1970.
M. Steinhousen, In viva-Beobachtungen und der Nierenpapille von Goldhamstern
nach intravenoser Lissamingrun-Injektion, Arch. Ges. Physiol. 279, 195-213 (1964).
J. J. Grantham, and J. Orloff, Effect of protaglandin E, on the permeability response
of the isolated collecting tubule to vasopressin, J. Clin. Inoest. 47, I1541 161 (1968).
T. Morgan, F. Sakai and R. W. Berliner, In vitro permeability of medullary collectmg
ducts to water and urea, Am. J. Physiol. 214, 574-581 (1968).
K. J. Ullrich, G. Rumrich and G. Fuchs, Wasser permeabilitat und transtubularer
Wasserfluss corticaler Nephronabschnitte bei verschiedenen Diuresezustanden, Arch.
Ges. Physiol. 280, 99-l 19 (1964).
H. Stolte, J. P. Brecht, M. Wiederholt and K. Hierholzer, Einfluss von Adrenalekto-
mie und Glucocorticoiden auf die Wasserepermeabilitat corticaler Nephronabschnitte
der Rattenniere, Arch. Ges. Physiol. 299. 99-127 (1968).
P. L. Altman and D. S. Dittmer, eds.. Blood and Other Body Fluids, Biological
Handbook, Fed. Am. Sot. for Exptl. Biology, Washington, DC, 1961.
G. G. Pinter and J. L. Shohet, Origin of sodium concentration profile m the renal
medulla, Nature 200, 955-958 (1963).
J. L. Stephenson. Ability of counterflow systems to concentrate. Nature 206,
1215-1219 (1965).
R. B. Kelman, D. J. Marsh and H. C. Howard, Nonmonotonicity of solutions of
linear differential equations occurring in the theory of urine formation. SIAM Rec. 8,
463478 (1966).
F. Marumo. Y. Yoshikawa and S. Koshikawa, A study on the concentration
mechanism of the renal medulla by mathematical model, Jap. Circul. J. 31, 1309-l 3 17
(1967).
T. Furukawa, S. Takasugi, M. Inoue, H. Inada, F. Kajiya and H. Abe, A digital
computer model of the renal medullary countercurrent system-I. Comput. Blamed.
Res. 7, 213-229 (1974).
H. M. Lieberstein, The significance of viscous flow properties in the theory of
operation of a nephron, Math. Biosci. 4, 49-102 (1969).
E. Koushanpour, R. R. Tarica and W. F. Stevens, Mathematical simulation of
normal nephron function in rat and man, J. Theor. Biol. 31. 177-214 (1971).
P. J. Palatt, and G. M. Saidel, Countercurrent exchange in the inner renal medulla:
Vasa recta-descending limb system, BUN. Ma/h. Biol. 35, 431447 (1973).