
0 ro Tot 1 - Coalfield Geology Council
291
Edited by G.H. McNally & C. R. Ward 0 ro Tot 1 Minirtg Proceedings of a Symposium held at the University of New South Wales, Sydney November 1996 COALFIELD GEOLOGY COUNCIL OF NEW SOUTH WALES
-
Upload
khangminh22 -
Category
Documents
-
view
6 -
download
0
Transcript of 0 ro Tot 1 - Coalfield Geology Council

Edited by G.H. McNally & C. R. Ward
0 ro Tot 1 Minirtg
Proceedings of a Symposium held at the
University of New South Wales, Sydney
November 1996
COALFIELD GEOLOGY COUNCIL OF NEW SOUTH WALES

GEOLOGY IN LONGWALL MINING

Coalfield Geology Council of New South Wales
Chairman: Harry Bowman, NSW Coal Compensation Board Secretary: Michael Armstrong, NSW Department of Mineral Resources
Longwall Mining Committee
Colin Ward, University of New South Wales (Convener) Bulent Agrali, Bellambi Coal Pty Limited
Harry Bowman, NSW Coal Compensation Board Cohn Coxhead, Maitland Main Collieries Pty Limited
Michael Creech, Powercoal Technical Services John Edwards, Coal Operations Australia Limited
Rod Doyle, Dartbrook Coal Pty Limited Malcolm Ives, Powercoal Technical Services
Greg McNally, University of New South Wales Brad Mullard, NSW Department of Mineral Resources
Ian Poppitt, Oakbridge Pty Limited
Postal Address
The Secretary Coalfield Geology Council of New South Wales
New South Wales Department of Mineral Resources PO Box 536
St Leonards NSW 2065 Australia
LIST OF SPONSORS
The organising committee wishes to thank the following sponsors for support of the symposium:
ECS International Pty Limited
New South Wales Department of Mineral Resources
Coal Operations Australia Limited
ISS Pacific Pty Limited
Mincom Pty Limited
Velseis Processing Pty Limited
Dartbrook Coal Pty Limited

COALFIELD GEOLOGY COUNCIL OF NEW SOUTH WALES
GEOLOGY IN LONGWALL MINING
Proceedings of a symposium held at the University of New South Wales 12-13 November 1996
Edited by G. H. McNally and C. R. Ward Department of Applied Geology
School of Mines University of New South Wales
ORGANISED BY THE COALFIELD GEOLOGY COUNCIL OF NEW SOUTH WALES
in conjunction with
New South Wales Department of Mineral Resources University of New South Wales
Key Centre for Mines Geological Society of Australia Environmental, Engineering and Hydrogeology Specialist Group
Geological Society of Australia Coal Geology Group Sydney Basin Coal Geologists Group
c Copyright Coalfield Geology Council of New South Wales, 1996.
Copyright compilation and editing G. H. McNally and C. R. Ward, 1996.
c Copyright of individual papers remains with the Authors.
All rights reserved. No part of this publication may be reproduced, stored in a retrieval system or transmitted in any form or by any means, electronic, mechanical, photocopying, facsimile, recording or otherwise, without the prior written permission of the Editors.
First published in 1996 for the Coalfield Geology Council of New South Wales by
Conference Publications P.O. Box 107 Springwood NSW 2777 Australia.
National Library of Australia Cataloguing-in-Publication data:
Geology in longwall mining : proceedings of a symposium held at the University of New South Wales, 12-13 November, 1996.
Bibliography. ISBN 0 947333 90 8.
I. Mining geology — Congresses. 2. Coal mines and mining — Congresses. 3. Longwall mining —Congresses. I. McNally, G. H. II. Ward, C. R.
553.2
Cover photograph: roof fall, Longwall 5, Newstan Colliery NSW (courtesy M. Creech).
Typeset by Conference Publications.
Printed in Australia by Centatime Pty Ltd, 18 Primrose Avenue, Rosebery (Sydney) NSW 2018.
iv

Preface
The symposium on Geology in Longwall Mining comes at an important time for the Australian coal mining industry. On the one hand it provides a timely opportunity to review the geological lessons from thirty years of mechanised longwall production, during which longwall methods have recovered from a difficult start to reach the point where underground productivity is now challenging that of surface mining. Over the next decade there is likely to be further expansion of longwall mines into structurally-complex areas of the Hunter Valley and the Bowen Basin which have not previously experienced longwall technology, together with the development of increasingly larger longwall blocks and even more productive faces. On the other hand, it highlights the disturbing fact that many existing longwall mines appear to be operating uneconomically, due to factors such as the high capital cost of longwall installations and-the-diminishing-extent of accessible-and-geologically-amenable resources. Some mines have also experienced strata control problems reminiscent of those which retarded the first Australian longwall faces in the New South Wales Southern Coalfield during the 1960s.
It is often forgotten that hand-worked longwalls operated in Australia from the early years of the 20th Century, notably at Mount Mulligan in Queensland and the Sydney Harbour Colliery in New South Wales. The introduction of mechanised longwall faces on the post-war British pattern was delayed in Australia by the success of pillar extraction using continuous miners in the 1950s and, for a time, by the use of shortwall chocks. Nonetheless, progressively deeper workings and the demands for increasing output meant that longwall methods became the logical next step. When British longwall equipment was installed at Coal Cliff Colliery in 1963 and at South Bulli in 1965, however, it proved to be unequal to the task of controlling the massive sandstone roof strata involved. Successful control was only really achieved at Angus Place and West Cliff Collieries in 1979-82, when supports with two to three times the load capacity of the 1960s chocks were employed. From this point, however, the industry never looked back.
The two decades of development between the first and second generations of Australian longwall faces highlights the relevance of geology to this particular method of mining. Whereas bord-and-pillar mining is essentially a "suck it and see" process, profitable longwall mining imposes a firmer scientific discipline. Not only must the hydraulic supports be matched to the geomechanical properties of the roof, but the geological conditions ahead of the face must also be known in great detail. Where a bord-and-pillar face stoppage due to difficult roof conditions may be a nuisance that can possibly be overcome in a new heading, a longwall face stoppage means an almost complete halt to mine production — at a loss of perhaps several hundred thousand dollars per day. It is no wonder, then, that successful longwalling demands (and repays) large amounts of geological investigation, both on the surface prior to mining and in the underground roadways during development.
The Coalfield Geology Council of New South Wales is a body set up under the aegis of the Minister for Mineral Resources, with the object of bringing together geological knowledge from government, private and academic groups, as well as appropriate individuals, to assist the New South Wales coal industry. The Council's Longwall Mining Committee, recognising the increasing importance of longwall mining and the associated
need for better geological input in longwall development, put forward a proposal in mid-1995 that led to the present symposium. As well as providing a forum for oral presentation of papers, the function was intended as the basis for compiling a collection of written papers on longwall geology into a reference volume, for use as a manual after the function by geologists and others involved with longwall mining projects. Contributions to the symposium therefore cover the full range of geological input to longwall planning and operation, including:
• Definition and measurement of resources, and resource preservation in the face of public indifference or hostility to mining;
• Detailed geological and geophysical exploration methods for greenfields sites, and methods for seam structure mapping and geotechnical monitoring in development roadways;
• Investigation of the effects of overburden lithology, structure and sedimentology on caving behaviour and stress redistribution;
• Prediction of horizontal stress magnitudes and directions, and stress-field perturbations caused by major geological structures;
• Prediction of gas emissions in terms of gas quantity and composition, and in-seam gas control by drainage;
• Prediction of geological hazards and impediments to mining, such as faults, outbursts, igneous intrusions and spontaneous combustion; and
• Prediction and limitation of surface subsidence effects, including groundwater leakage from overlying aquifers.
In addition, the papers discuss several new developments in geophysics and geomechanics as applied to longwall mining. These include micro seismic monitoring of roof falls, surface, in-hole and in-seam seismic reflection, and new methods of predicting in-situ stress from bore core samples.
As editors of the volume we would like to thank the many people who have contributed to bringing about the symposium and compiling the papers presented. First the authors, most of whom had to write their papers under heavy pressure of other work. Despite these responsibilities, many still managed to meet the required deadlines. Secondly we would like to thank the Coalfield Geology Council for identifying the need for such a function, and the members of the Council's Longwall Mining Committee for organising the function itself. Thanks are also expressed to the Geological Society of Australia's Environmental, Engineering and Hydrogeology Group and Coal Geology Group, and to the Sydney Basin Coal Geologists Group, for assistance in distribution of the circulars, and to staff of the UNSW Department of Applied Geology and the Key Centre for Mines, especially Kim Russell, Iris Cheung, Rosi Benninghaus and Jaala Clifford, for on-site organisation and support. Finally, we extend thanks to the publisher of the volume (and former UNSW School of Mines colleague) Dr Ross Blackwood of Conference Publications, for bringing the papers together in a very professional form.
Greg McNally
Colin Ward
Volume Editors
vi

Contents
Page
Preface
Future longwall resources in New South Wales H N Bowman and B. W. Mullard 1
Longwall mining — is there a future? B. W. Mullard and H. N Bowman 11
The effect of geology on longwall mining — a twenty-five year case history I M Galvin 15
Geological aspects of longwall mine planning. Dartbrook Mine — a case study
R. P. Doyle ... 17
Sedimentological analysis of goafmg interval for longwall mining at Goonyella Mine, Bowen basin
Esterle and C. R. Fielding
Application of gas content test data to the evaluation of gas emission and hazards during longwall development and extraction
R. J. Williams
The influence of coal composition on gas emission rates and some implications on mining in the southern Sydney Basin
M M Faiz, N I. Aziz and A. C. Hutton
... 27
35
... 41
Geological factors influencing longwall gas emissions at Appin Colliery A. N Ogden and J. Wood ... 47
The occurrence and impact of hydrogen sulphide on longwall mining at Southern Colliery, German Creek, Queensland
C. Ko Ko and B. Ward 55
Estimation of the geomechanical properties of coal measures rock for numerical modelling
G. H. McNally ... 63
The mechanical behaviour of coal measures rocks from NSW collieries under load K H. R. Moelle, G. L. Dean-Jones and G. Li ... 73
vii

Impact of igneous intrusions, roof and floor irregularities and injection features on longwall mining
B. Agrali ... 81
Application of deep transient electromagnetic sounding methods to mapping of coal seams in the Appin area
Z. Lin, K. Vozoff, G. H. Smith and 0. G. Engels ... 109
... 137
... 143
... 153
Directional drivage influences and the application of mechanistic mapping techniques
M W Fabjanczyk
The role of horizontal stress in longwall design — a case history at Dartbrook Colliery
Enever and R. Doyle
New understanding of longwall caving processes: microseismic monitoring and initial computational modelling at Gordonstone Mine
M Kelly, W. Gale, P. Hat herly, R. Balusu and X Luo
Application of acoustic emission techniques in estimating in-situ vertical stress from borehole core samples
D. K Nag, M. Seto and V. S. Vutukuri ... 179
Frictional ignition associated with underground coal mines C. R. Ward and A. Crouch ... 91
Geostatistical analysis of gas data in advance of gate road development J. H. Duke amd R. Phillips ... 99
Mine mapping: an important component of integrated mine characterisation L. K. Rixon ... 119
Geotechnical mapping methods for longwall layout design J. Shepherd ... 127
Low cost seismic methods assist longwall mine planning B. J. Evans, M Urosevic and J. Cocker ... 163
Stress orientation from drill core — does it work? P. W. Schmidt ... 173
Geological issues relating to coal pillar design W. J. Gale 185
viii

Issues affecting longwall chain pillar design B. K Hebblewhite and J. M. Galvin ... 193
Aeromagnetics as an exploration tool for regional and mine planning studies in the upper Hunter Valley
J. Moloney and R. Doyle ... 199
The application of drilling and survey technology in Australian coal mining F. Hungeiford and S. Thompson ... 207
Surface exploration for longwall mining at Moranbah North, Queensland F. Bos and A. Laws ... 213
In-seam seismic and longwall mining: a review of the current status J. F. Doyle and A. R.—Newland ... 223
A design method to assess massive strata for longwall face and subsidence behaviour
R. Seedsman and A. Stewart
From development to changeout: geology in the longwall mining cycle at Clarence Colliery
G. Noon
... 227
... 233
Microseismic monitoring, windblasts and longwall mining under massive strata at Newstan Colliery
M Creech ... 239
Application of tunnel boring machines to Australian mining operations G. Dean-Jones, K H. R. Moelle and K Kaneko ... 251
Geological factors influencing longwall-induced subsidence G. H. McNally, P. L. Willey and M Creech ... 257
A review of the hydrogeological aspects of Australian longwalls R. Seedsman ... 269
Effect of mining on permeability of rock strata in the Southern Coalfield P. Reid ... 273
ix


Symposium on Geology in Longwall Mining, 12-13 November 1996, eds G. H. McNally and C. R. Ward, pp 1-10.
Future longwall resources in New South Wales
H. N. BOWMAN' AND B. W. MULLARD2
NSW Coal Compensation Board. 2NSW Department of Mineral Resources.
What is the potential for longwall mines in New South Wales? The State already has 20 longwall mines in operation — where and when will they be developed in the future? Crystal ball gazing along these lines has been undertaken for the past eleven years by the Coal Compensation Board of NSW. The NSW Department of Mineral Resources has been conducting drilling programs and evaluations of the State's resources with a view to the release of tender areas. The present paper is an attempt to put these investigations together and to speculate on the future of longwall mining in New South Wales.
ANALYSIS OF EXISTING PITS production levels over 1.5 Mtpa and preferably over 2 Mtpa.
It is informative to examine the existing longwall mines in the State before considering the potential for future developments. Such an analysis shows some interesting predictors of success.
Depth of mining
Perhaps one of the best predictors of success of a mine is the depth at which mining occurs. Figure 1, which is a plot of 1995 raw production per employee per year versus working depth, shows a strong inverse cor-relation with depth. Mines shallower than 200 m can have very high output per employee.
Below 200 m the curve is flatter, although some pits can still show acceptable productivities. The NSW curve flattens at a shallower depth than a similar plot for the world, which flattens at 600 m (Figure 2). This could be because of more severe stress regimes at depth in NSW coalfields, although this has yet to be proved. Another reason for the lower productivity at depth could be the presence of increased gas levels below 200 m.
Seams which are stratigraphically low in the sequence tend to have more structural problems, simply because the rocks are older and more deformed. Thus in some cases quite shallow mines can have severe stress problems. Plots of pithead cost per tonne against depth of mining (Figure 3) show a good correlation of between cost and depth. Thus shallow mines are likely to have lower mining costs than deeper ones.
Annual production
Plotting annual production against profit (Figure 4) appears to show that no pits with production levels below about 1 Mtpa make money. On the other hand, while some pits with outputs above 1 Mtpa also lose money, most are profitable. Longwall mines of the future will therefore need to be planned with annual
Seam thickness
A plot of seam thickness vs annual production for longwalls in NSW shows an interesting result (Figure 5). Although the scatter is wide, the line of best fit indicates that annual production peaks with a seam thickness of about 3.25 m. Such a thickness probably represents a good compromise between the increased efficiency of bigger equipment and the need to maintain underground openings at a manageable height.
Other factors
Surprisingly, there is little correlation between longwall width and profitability. However, if one assumes that new pits are developed in the rational order of their profitability, factors such as the value of the product (coking vs thermal), the distance to market and the quality of the coal are significant. An examination of pits that have failed further suggests that the resource needs to be structurally undisturbed, to have a dip less than 100, and to have good roof and floor conditions.
A GOOD RESOURCE
An analysis of the foregoing suggests these character-istics of a favourable resource for longwall mining: • A shallow mining depth, preferably less tan 200 m. • A resource capable of sustaining a production rate of
about 2 Mtpa over the life of the mine, which needs to be about 20 years to recover capital costs. Thus the minimum resource needs to be at least 40 Mt of recoverable coal. As experience suggests that only about half a well-explored seam will be recoverable, the in situ resource needs to be at least 80 Mt.
• A seam with around 3 m of workable thickness.

•
•
• •
•
• • •
• • •
• • •
• •
Ra
w P
rod
uct
ion
per
ma
n y
ea
r (t
onn
es)
16000
14000
12000
10000
8000
6000
4000
2000
• Raw Tonnes
—Power (Raw Tonnes)
2 H. N. BOWMAN AND B. W. MULLARD
100 200 300
Depth (m)
400 500 600
Figure 1 Relationship between ROM production per man-year and depth of coal mining in NSW.
7,500 -
2,500 -
0
0 200 400 600 800 1,000 1200,
Depth (m)
Figure 2 Relationship between productivity (in tonnes per man-shift per year) and mining depth, world-wide (after Hessling, 1990).

FOB
Pro
fit
($/t
on
ne)
• Seriesl
—Log. (Series1)1
FUTURE LONGWALL RESOURCES IN NEW SOUTH WALES 3
45
40 •
35 — • •
30
25 • • • Seriesl
20 • • • (Seriesl)
15 •
10
5.-
0 0 100 200 300 400 500 600
Depth (m)
Figure 3 Relationship between pithead cost /tonne and depth of mining in NSW.
RO
M P
ith
ead
Co
st (
$ /to
nn
e)
Total Saleable Production (Mt)
Figure 4 Relationship between annual saleable production and FOB profit per tonne.

4 H. N. BOWMAN AND B. W. MULLARD
3
2.5 —
• Baal Bone • Cordeaux
• Ulan
2
1.5 — Newstan •
Tot
al S
alea
ble
Pro
duct
ion (
Mt)
Tahmoor •
0.5
• Clarence
• Appin
• West Wal!send
VVyee Wambo *Angus Place
• Tower
Appin •
• South Bulli Saxonvale/Bulga
est Cliff • Gretley
• Metropolitan • Springvale
• Cumnock
• Series1 —Poly. (Series1)
•
• Pelton/Ellalong
0.5 1 1.5 2 2.5
Seam Thickness (m)
3 3.5 4 4.5
Figure 5 Relationship between seam working thickness and saleable production (Mtpa) in NSW longwall mines.
• A deposit amenable to longwall mining — that is, not structurally disturbed, with a dip less than 100, good roof and floor, and coal of a high enough quality.
POTENTIAL LONGWALL RESOURCES
The locations of existing longwall mines and areas for potential longwall mines have been plotted on plans for each coalfield (Figures 6-10). Potential mine sites have been divided into near-term (present to 2014), intermediate-term (2015 to 2040) and long-term (post 2040).
Southern Coalfield
Coal areas considered in this study are shown on Figure 6. This diagram also shows National Park boundaries, the 600 m cover line and the limit of economic development for the Bulli seam. Although there are several existing longwall mines, there are no new mines likely to be developed in the near future. There are, however, several possible areas for intermediate and long-term consideration.
The intermediate-term mines will be developed in the resources that are just below 600 m depth. The longer term mines will be developed deeper still in poor-quality Bulli seam areas, and in the Wongawilli seam resources which become lower in quality to the south.
The Southern Coalfield hard coking coal resources are best developed in the Camden-Campbelltown-Picton area. To date, mining has progressed from the shallow
coal in the south of the coalfield towards deeper reserves in the north. However, urban developments, high gas contents, significant structures and flood-prone areas may constrain development of these remaining coal resources.
Figure 6 also indicates the possibility of longwall mining under Sydney in the long-term. Although it is possible to envisage situations where this might occur, such a scenario is speculative. However, if coal mining has a long-term future and quality resources exist under Sydney, it could be argued that there will eventually be mining beneath the Sydney urban area.
Gunnedah Coalfield
There are immense coal resources with underground mining potential in the Gunnedah Coalfield (Figure 7). However, it is questionable as to how much of this resource will be amenable to longwall mining. There are significant hurdles to the development of these resources, of which distance from markets is but one. Other possible problems include disrupted surface drainage due to subsidence of the black soil plains and the effeats of large igneous intrusions. These will need to be resolved before mining development can proceed.
Consequently the authors do not see any longwall mines being developed in the near future in the Gunnedah Coalfield. The better coal resources in the east of the field may be developed in the intermediate term.

OPOUTAN
AL CLIFF
CURRENTIONGWALL MINES 2015-2040
2041 ONWARDS
N.S.W. COAL COMPENSATION BOARD
SOU ERN CO FIELD
4 4 4 4 4 4 4 4 4 4
4 4 4
Ksjai
MIFACOIRED BY WESTERN COALFIELD MAP
FUTURE LONGWALL RESOURCES IN NEW SOUTH WALES 5
Figure 6 Southern Coalfield, NSW: current longwall mines and future longwall prospect areas.

*Imo /7
MM. COAL COMPENSATION BOARD GN
\ \ \
\ \ \ \ \ \ \ \ \ \
\ \ \ \ \ \ \ \ \ \
\ \ \ \
\ \ \ \ \ \
\ \ \ \ \ \ \ \ \ \ \ \ \
\ \ \ \ \ \ \ \ \ \ \ 1 \ \ \ \ \ \ \ \ \ \ \ \ \ \ \ \ \ \ \ \ \ \ \ \ \ \ \ \
PENA
TROUGH \ \ \ \ \ \ \ N \ \ \ \ \ \ \ \ \ \ \ \ \ \ \ \ \ \ \ \ \ \ \ \ \ \\\ \\\\ \ \ \ \ \ \ \ \ \ \ \ \ \ \ \ \ \ \ \ \ \ \\ \\\\ \\ \ NYI \ \ \ \
LEY
HOS1 INSEAM >NI CO
NAIIONALPARI
OUTSIDE BASIN
2015-2040
1041 OW
311
abaraJi an
;i,
%
//
(
6 H. N. BOWMAN AND B. W. MULLARD
Figure 7 Gunnedah Coalfield, NSW: future longwall prospect areas.

Goislbam Ever
GN
eSandy Hollow
KEY NOm COVER LINE
\ (after DMR POTENTIAL COAL • DEVELOPMENT AREAS)
ABEAM= THE SEAMS NEAR BASE OF ILIAWARRACM NAHONAL PARKS
O 0 C
O 0 C CURRENT LONGWAIL MINES
PRESENT- 201 4
2041 ONWARDS
Nit COAL COMPENSATION BO
WES1TRN COALFIELD
44 44 44
444 4 44444 44444
44444 44
Ar 45 ..rz A A A
.".
j. q""
4"445 44 4 A 4 44
4"75 4" 44" 45
q'4"7'41
(?"?"q"
4 44 4 444 4444 44
4444 44 494 44 444 4444
4"4"1 944
• 44 44 44 • 45 q41 45
44 44449 41 44 45 AREACOVEREDBY 44 4444444 44 4444444
44444444444 4444 44444
44444 44444 444444444 4444444444
• 5 ';“5 45(1 )
• 44444 444 '.4444
CAMW-4444 444
4444 .7.4
445 45 45 45 45
444444 4419 4
4'q"11)
444
SOUTHERN COALFIELD MAP
II Ill
\\I
?1,94 A , „1.AW1
AWR,W
fit PI 6 ,
dso
SPR1NGWOOD COALARFA
KM
FUTURE LONGWALL RESOURCES IN NEW SOUTH WALES 7
Figure 8 Western Coalfield, NSW: current longwall mines and future longwall prospect areas.

8 H. N. BOWMAN AND B. W. MULLARD
'IMAGO CPA
, ,sfIWPsf
5f5f li,C5eX5t1t 'XXV •ont
X5t5t1214V5tVWX5fleg X5252527t5CXXXVW52X1rg
5nelOilt5t5tY5t5tX52.7t1t5tV 5t7t5t5f525tW72.X.Stit5f5t51
5t5tX5t5000[50t5l.." XXV5elt5t5tX5e12500025C14.5412
51.5tV5e125e5tXXXIM•ItSt•X5r, XXVX5e5t5t5fItX12X.50271.5<•g'
• XXXVX5t7i7t5ein<X5C' 5f521t5f5tVX5212 5000252.XXXV52
X5C7f52.X.SeStXX5t XV5t5tX5t1t5(1Ct 5:5t5t5i5t5t5f12V1{
XV5(1411•50C5rfeltSt 54.952St5t525f5t5t52525e5t
5nnek•XICXXXV Avseststsootsrust ICSCXXX5C,MIC
RX5f5t5i 55X"
54"52.g5CV102525tXX 5("X% 'X'Se'Vk
WY'
5e5C 71VVI1 RItV
NEWVA1E
weastile
• THRUST BLOCK WITH WITIINGHAM
• °MOP OF COAL HAS=
ARUM GM °RIMEL DEPTH OF COVER
NATIONAL PARE IUNDARY P VIODSLY OR CONTD111011SLY MINF,D AREA
No.2
L4912 TUGGER
ce q' 1 0 10 20
GOSFORD COAL AREA KM
TX5t124 5e1t5k.5e V125C.A. 5212.52V
II CURRENT LONGWAIL
PRESENT- 224 WATER
AL AREA 2041 ONWARDS ih.
O 0
O 0
Figure 9 Newcastle Coalfield, NSW: current longwall mines and future longwall prospect areas.

0 0
OUTCROP OF GRETA CM IN CENTRAL AREA tic OUTSIDE BASIN 156?"?)45 45 q)
5(155 45 q) (7)q"45 (?"?) > 800m DEPTH OF COVER IN 'WEST 5 '41*(c`15 4.6ee'e
NATIONAL PARK BOUNDARY 44.444444
N.S.W. COAL COMPENSATION BOARD 5 ct (?)4,445
A168 çAUD
MOUNT ARMUR MEM
RAVENSSO (NARDELL)
RAVENSWORTH 3
BUNKERS CROSSIN 4,4,
4 4 44444444 44444444 44 ,44444 444444444 ,4 (444, 44444444 40.4444444444 444444444444 444.444444444
ets".. ,611 4 4 4 4 44 444, 4444 44 44444444 444 4444444 4444444,44444 4444444444444
4 44 A 4, .0 !." I t.
1111111
HUFEc CO FIELD A450
BULGA STET
Figure 10 Hunter Coalfield, NSW: current longwall mines and future longwall prospect areas.
FUTURE LONG WALL RESOURCES IN NEW SOUTH WALES 9

10 H. N. BOWMAN AND B. W. MULLARD
Western Coalfield
Present and future longwall developments in the Western Coalfield are shown on Figure 8. Mining is constrained here by National Parks to the east and by the crop line of the coal measures to the west. New pits may be expected in the southern and northern parts of the coalfield, in both cases near existing operations. Longer term longwall mines could be developed to the north around Ulan, and in the Springwood and Kurrajong areas. The coal in these areas is of surprisingly good quality, but at a depth that diminishes its attractiveness.
There are opportunities in the Rylstone area for the CONCLUSION development of longwall operations. However, shallow cover and a. high number of intrusions may result in this resource being mined by open cut and by non-longwall underground methods.
Newcastle Coalfield
Development of longwalls could occur within the next 10-20 years in the Wyong area (Figure 9), but in the longer term the deep coal around Gosford may also be exploited. There is, however, little potential elsewhere in the coalfield for further development because of space constraints caused by past and present workings.
ACKNOWLEDGMENTS
day open cut operations should consider this aspect when pit mapping is undertaken. As well, management should be made aware of the need to prepare for future longwall mining.
The complex geology of the Hunter Coalfield and the likelihood of high gas contents in shallow coalbeds will provide major challenges to the development of longwall mines. However with dwindling options in the other coalfields, the large underground resources of the Hunter Valley represent the future of the coal mining industry in NSW.
New South Wales has considerable potential for the extraction of coal by longwall methods. In the near term, however, there may not be many such mines developed. Cheaper open cut mines are more likely to provide for the coal market. This is because the shallow longwall resources which are cheapest to develop are either in areas of open cut potential, or lie beneath operating pits which need to be worked out before underground mining can start. In the longer term there could be many new longwall mines, provided of course that coal is still being mined in New South Wales.
Hunter Coalfield
There is great potential for longwall mines in the Hunter Valley (Figure 10). Unfortunately, some of the best areas lie below or in association with existing open cuts and are unlikely to be developed until such pits are approaching the end of their lives. Present economics ensure that it is more profitable to fully exploit a shallow deposit as a surface mine rather than extract part of it underground. Unless this situation changes, the only longwalls in the near term will be those where the resource is not amenable to open cut mining.
Of course, future longwall mines below well-mapped open cuts should be able to avoid many of the geotechnical problems and geological hazards encountered in present workings. Geologists in present-
Data for this paper were collected and analysed by officers of the Coal Compensation Board. The authors gratefully acknowledge their contribution.
REFERENCES
HESSELING M. 1990. Comparative mine productivity in major coalfields of the western world. TEA Coal Research, London (draft report) 110p.
JOINT COAL BOARD 1996. Longwall mines survey 1995. Supplement to Australia's Mining Monthly.
NSW DEPARTMENT OF MINERAL RESOURCES 1995. 1996 New South Wales Coal Industry Profile. Coal and Petroleum Branch (DMR) and Joint Coal Board.
WRIGHT A. 1995. Economics Report. Method for estimating FOB costs for potential mines. Report RCB 1995 / 714.

Symposium on Geology in Longwall Mining, 12-13 November 1996, eds G. H. McNally and C. R. Ward, pp 11-14.
Longwall mining is there a future?
B. W. MULLARD I AND H. N. BOWMAN2
NSW Department of Mineral Resources. 2Coal Compensation Board of New South Wales.
INTRODUCTION
The Australian Bureau of Agriculture and Resource Economics (ABARE) has predicted that world seaborne trade in thermal coal will increase by 43% over the next five years (ABARE, 1996). Australia, with its proximity to the growing economies of Asia, is well positioned to take advantage of this growth. Japan has dommated Australian coal exports for the past twenty years, but other Asian countries including Korea, Taiwan, India and China have established themselves as important customers in recent times.
While the outlook for thermal coal remains bullish, the ability of Australia and in particular NSW to maintain or increase its market share will depend on its ability to develop new, highly productive, internation-ally competitive mines. Nevertheless, opportunities for new mine development, and in particular for open cut development, are becoming limited as the coal industry increasingly becomes subject to diminishing returns.
Coal was discovered south of Newcastle in 1791 (Martin et al., 1993), only three years after the first white settlement in New South Wales. Coal mining commenced in the Newcastle area in about 1800, and by 1861 Newcastle was heavily dependent on the coal industry, with 900 miners and 5000 associated workers. Substantial mining activity commenced at Cessnock in the early 1900s, and as coal mining continued to expand the industry moved further up the Hunter Valley to the Singleton and Muswellbrook areas. The early 1970s and 1980s were a period of virtually uninterrupted growth for the NSW coal industry. Low-cost open cut mines in the Singleton district led this growth, and today the Hunter Coalfield is the state's largest coal-producing region.
The easy access to shallow, low-cost coal resources over the past 200 years has given rise to a commonly-held belief that New South Wales contains vast coal reserves, sufficient to meet any foreseeable demand. While the state has large remaining coal resources, most of the lower-cost seams, such as those close to the coast or under shallow cover, have already been allocated or exploited. The industry will need to develop more difficult and potentially higher-cost resources to meet the expected future growth in coal demand.
Increasingly, the coal industry is turning to longwall mining for lower operating costs and higher produc-tivity. Longwalls promise the holy grail of underground milling: low comparative costs, high productivity and
safe operating conditions. This quest has seen the number of longwall faces increase from 12 in 1984-85 to 24 in 1994-95. Longwall raw coal production increased from 8.5 million tonnes to just over 31 million tonnes over the same period (NSW Dept Mineral Resources, 1995).
Despite these impressive statistics, many longwall mines have experienced major problems, and most are achieving nowhere near their potential production rates. In an attempt to address this shortfall, a great deal of effort has been expended to optimise the mining technology and human resource issues associated with longwall mining.
However, as longwall blocks increase in width and length, and expectations rise, it is becoming apparent that geological constraints will be critical to future longwall productivity. Despite recent improved longwall performance at mines such as South Bulga and Wambo (Roberts, 1996), doubt still remains as to whether longwall mining will be able to cope with the geological conditions expected in the next generation of underground mines.
THE FUTURE OF COAL MINING IN NSW
Today in the Newcastle, Western and Southern Coalfields, constraints on development and limited remaining resources of high quality coal restrict opportunities for new mine development. In these coalfields, production is expected to remain static or decline (Coal Resources Development Committee, 1994).
The key to future growth in the coal industry is the Hunter and Gunnedah Coalfields. Production from the Hunter is expected to almost double, to around 100 million tonnes per annum, over the next ten to twenty years. The Hunter Coalfield has been the fastest-growing area of coal production in the State over the last decade. There has been an enormous expansion of mining operations, particularly open cut, in the Singleton and Muswellbrook area. There are several major open cut coal projects in various stages of development near Muswellbrook, namely Bengalla, Mt Arthur North and Mt Pleasant. They represent what is considered to be the last major open-cut coal develop-ment opportunities available in the State. Virtually all other areas have only underground mining potential (Coal Resources Development Committee, 1994).

12 B. W. MULLARD AND H. N. BOWMAN
Million Tonnes (31
West Cliff
Newstan
Teralbap.
E oue
Tahmoor
Cordeaux ii:!
South Bullb
Brimston%
Tower
I ooranbong
Clarence
Wet Wallsend
Appin
Gretley
Baal Bone
' gus Place
Wyee
Oakdale
Ulan
Wambo =
Pel n/Ellalong
Figure 1 Changes in raw coal production per year, 1993-95, from selected New South Wales underground mines.

LONGWALL MINING — IS THERE A FUTURE? 13
Table 1 Raw coal production (Mt) for selected NSW longwall mines. (From NSW Coal Industry Profile, NSW Department of Mineral Resources).
Mine 1992-93 1993-94 1994-95
Tahmoor 1.57 1.36 1.10 West Cliff 2.90 2.21 1.09 South Bulli 1.66 1.31 1.21 Ellalong 2.02 1.62 1.40 Wambo 1.97 1.28 2.26
Increasingly, New South Wales will become dependent on underground resources in the Hunter Coalfield. However, the Hunter Coalfield is a geologically com-plex area; for example, gas is likely to be encountered at shallower depths-in-the-Hunter-than in-other-coalfields. Already, a number of underground mines here are experiencing problems with gas. In addition, the coal seams were deposited in very dynamic geological environment adjacent to the New England Fold Belt, which has resulted in rapid and structurally complex variations in coal seam character. As a consequence, the development of underground mines in the Hunter Coalfield will need to address significant geological problems, and this will require a revolution in the way geologists explore and interrelate with the planning and operation of underground mines. From a geological perspective, the two key requirements are: • The ability to assess the geology of a deposit, to
determine its suitability for longwall mining; and • The ability to predict geological hazards and
variations ahead of mining, in order to minimise production disruptions through appropriate planning.
Longwall mines are capital intensive; in order to justify spending of hundreds of millions of dollars on longwall equipment and associated infrastructure, it is becoming imperative that companies commit to exploration programs which will result in a high degree of confidence concerning the nature of the coal deposit. From a Departmental perspective, and with the benefit of hindsight, many longwall mines suffer from a lack of knowledge of the deposit, resulting principally from inadequate exploration.
Over the past few years there has been a litany of disasters affecting some of the state's more productive longwall mines. Gas outbursts and high gas emissions have resulted in slow development and precautionary delays; unexpected intrusions and fault zones have not only resulted in poor productivity but, in some cases, in loss of life. The high capital cost of longwall mines demands that equipment perform at or near its peak capability year in and year out. A major delay to long-wall operation can very quickly bring a productive mine to its knees and destroy the most carefully estimated Net Present Value calculation.
An examination of the production record of selected longwall mines shows what in most cases would be
considered to be unacceptable variations in their pro-duction. Last year appears to have been a particularly bad year (see Table 1). Figure 1 shows the change in raw prediction for New South Wales coal mines from the 1993-94 to the 1994-95 financial years. The major and unexpected feature of the graph is the enormous variation that can occur in production over one year. This variation equates directly to risk.
An examination of the descriptive statistics for this graph shows that, at the 95% confidence level, the expected variation over one year is around 215,000 tonnes. Based on the average raw production for New South Wales longwall mines of 1.7 million tonnes in 1994-95, this represents a variation of 13% over one year. Given the low average profitability of the coal industry, an outside investor could conclude with considerable justification that the returns are not worth the risk.
Engineers at times appear to have watched too many episodes of Star Trek and iaginthemselveto be Scotty boldly going where no man has gone before. When a geological problem is encountered, it is put down as an Act of God about which nothing could be done. It is 'clearly not their fault'. In these circumstances, geological problems become an excuse for poor performance. After all, geological problems are unpredictable!
THE SOLUTION
The longwall mining environment demands a different approach. Longwalls are less flexible and hence far more sensitive to geological conditions than other forms of mining. In many cases, once a longwall has been purchased and the main headings committed, it is too late to decide that some additional exploration is needed. A change of direction can easily lose twelve months of longwall production. Exploration needs to be done well before the commitment is made to a longwall mine. In most cases, an adequate program could involve a doubling or tripling of current exploration budgets.
Geologists should forget the old rule of thumb that drilling a deposit to 1 km spacing provides a Measured Reserve on which to plan a mine. This may have been adequate for bord and pillar mining in simple geological environments. However, longwall mining requires careful assessment of the geological variability com-mensurate with the risk the company is prepared to accept. Based on the amount of exploration work companies were previously prepared to undertake, one can only conclude that they were prepared to accept (either knowingly or not) very high levels of risk. However, this risk can be reduced and managed.
Low-risk longwall mining demands close-spaced drilling, high resolution magnetic surveys, advanced seismic surveys (including 3D and borehole to borehole in-seam investigations), and the latest in imaging and processing software. All this technology should not blind one, however, to the most important factor of all — a good basic understanding of the geology of the deposit. Careful attention should be given to the
14 B. W. MULLARD AND H. N. BOWMAN
regional geology, including the structure of the area. Ultimately, the most attractive longwall deposits in the Hunter Valley may lie under the current generation of open cut mines. Knowledge of the structure and other geological aspects should be at high level in these areas, allowing companies to plan longwall layouts and anticipate problems well in advance. This raises an interesting question: is the current mapping of geological structures and their variation in open cuts sufficient for the planning of future longwall operations?
CONCLUSION
The title of this paper is Longwall Mining — is there a future? The answer to this question is not clear-cut. If longwall mines continue to under-achieve, or to have highly variable production (record output one year — disaster the next), then there may not be a future.
It must be recognised that not all deposits are suitable for longwall mining. Historically, the coal industry has limited its use of exploration, particularly prior to the commencement of mining. Exploration has tended to be used only when major geological problems have become apparent. This approach did not matter in the days when mining was based on flexible continuous mining equipment. However, as mining has become
more capital-intensive and its equipment less flexible, this is a recipe for disaster.
With greater exploration effort and the appropriate application of new technology, the authors believe that longwall mining will have a future in New South Wales. Ultimately, the answer to the question does longwall mining have a future? will be determined by the geologists associated with the coal industry.
REFERENCES
AUSTRALIAN BUREAU OF AGRICULTURAL AND RESOURCE EcoNomics 1996. Outlook 96: Proceedings of the National Agricultural and Resources Outlook Conference, Canberra, February 1996, Vol 3. Minerals and Energy, ABARE, Canberra.
COAL RESOURCES DEVELOPMENT COMMITTEE 1994. Effects of Land Use on Coal Resources. Report prepared for NSW Department of Mineral Resources (unpublished).
MARTIN C. H., HARGRAVES A. J., KININMONTH R. J. & SAYWELL S. M. C. 1993. History of Coal Mining in Australia. Australasian Institute of Mining and Metal-lurgy, Monograph Series 21.
NSW DEPARTMENT OF MINERAL RESOURCES 1995. 1996 New South Wales Coal Industry Profile, Department of Mineral Resources, Sydney.
ROBERTS R. 1996. Australia's longwalls II. Australian Mining Monthly, August 1996, 8-21.
Symposium on Geology in Longwall Mining, 12-13 November 1996, eds G. H. McNally and C. R. Ward, p. 15.
The effect of geology on longwall mining — a twenty-five year case history
J. M. GALVIN
The University of New South Wales, Department of Mining Engineering.
The productivity potential of mechanised longwall mining was proven for the first time in Australia at Angus Place Colliery in 1979. Today the colliery is extracting its nineteenth longwall block. In the intervening years the depth of mining has increased from 50 metres to now approach 400 metres. Longwall mining of blocks 1 to 7 occurred in some of the best geological conditions in the Australian coal industry. However, since Longwall 8 , these conditions have progressively deteriorated to the point where the colliery now is noted for some of the worst, if not the worst, geological conditions in New South Wales. These include extensive zones of strike-slip faulting and horizontal-to vertical stress ratios up to 3:1.
Angus Place Colliery has been a pioneer and an innovator in dealing with these conditions. Productivity has almost trebled in the last decade. This paper reviews the 25 years of mining experience at the colliery and illustrates aspects of the learning curve that the Australian coal mining industry has been through in recognising how critical geology is to the success of longwall mining.


Symposium on Geology in Longwall Mining, 12-13 November 1996, eds G. H. McNally and C. R. Ward, pp 17-25.
Geological aspects of longwall mine planning. Dartbrook Mine — a case study
R. P. DOYLE
Dartbrook Coal Pty Ltd.
This paper examines the geological planning process, using Dartbrook Mine as a case study. The role of geology and geotechnical practice associated with longwall mining has recently taken on greater significance. This is a response to the desire of Australian operators to become more reliable suppliers, by minimising risks related to geology. While considerable geological mine planning goes into any project prior to its development, it is fundamental that this planning becomes an on-going function at any mine. Reducing geological risks through the communication and application of knowledge makes mining more productive.
INTRODUCTION
Exploration provides the fundamental geological and geotechnical parameters required for longwall mine planning. This paper highlights the areas of major importance in this process and demonstrates their impact on mine design. Geological mine planning requires detailed consideration of numerous aspects, including:
Social/governmental —Meeting the requirements of regulatory authorities in regard to the environment, lease boundaries, subsidence control, landowner compensation, community consultation, Aboriginal land claims, heritage site preservation and so on.
Geological/ geo technical — Evaluating depth of cover, seam thickness, seam structure, in situ stress, gas content, coal quality, washability, pillar design, strata control, selection of longwall equipment and so on.
The aim of longwalling in Australia, as anywhere, is to make profits from coal mining. Therefore the fundamental question in all coal mining projects is 'Can an adequate return on the capital investment be made?' To confidently answer this question requires a study of the geological and geotechnical parameters of the deposit, together with an assessment of their likely impact on future operations. The more capital expended on exploration, the more confident the response must be. Finding areas of concern during exploration allows time to address any 'challenges' posed by them.
Dartbrook Mine, which is used as an example throughout this paper, had cost some $300M prior to the longwall face being commissioned. To make this an attractive investment for its shareholders, the mine will need to operate profitably. This necessitates knowing about any potential impediments to mining and developing contingency plans to counteract their impact.
The importance of having accurate geodata available to allow informed and timely decisions should be self evident. Many mines have suffered from significant delays of one kind or another, for example, unexpected
silling, spontaneous combustion, etc. Geologists need to obtain as much information as is economically feasible and physically possible, to ensure that decision making has a high degree of accuracy. In obtaining data the geologist must utilise every appropriate technique at their disposal.
A longwall mine in Australia today needs to be both safe and economic. Without safety, a mine is constantly 'behind the 8-ball', Figure 1 shows a comparison safe and productive mines. Currently, there are 23 longwall mines in NSW, with five more in Queensland (Joint Coal Board Statistics). Less than half of these were originally commissioned as longwall operations. These mines are also the more recently built, designed from the ground down for longvvalling.
DARTBROOK MINE
Located in the upper Hunter Valley of NSW, Dartbrook Mine is some 10 km north of Muswellbrook and 140 km from the port of Newcastle. Figure 2 shows the location of the mine site. Originally, exploration at Dartbrook Mine targeted potential open-cut reserves of the Whittingham Coal Measures. The most attractive coal resource was deep, which swayed the economic decision to go underground. The planners targeted the Wynn Seam and proposed to export 3.5 Mtpa as a ROM product (Doyle, 1993). With a workforce of only 175 people, and three continuous miners and one longwall face, the mine is lean in manning and equipment.
The product is thermal coal, low in ash, low in sulphur and 'bursting with energy'. Trace elements are low, on both an Australian and worldwide basis, making the coal 'environmentally friendly'. Moderate levels of CaO in the ash have caused a rethink of the mine's commitment to provide the highest possible quality to its customers; a washery is currently being built to ensure that this commitment is met. Bound for the Asian market, the coal will meet the rising demand for electricity generation there.

Mine there is currently a restriction on extraction beneath the Hunter River alluvial gravels. The mine has, however, developed a coal haulage corridor called the Hunter Tunnel, beneath the Hunter River flood plain (Doyle and Lohe, 1996).
Infrastructure such as railways, bridges and buildings, and also lake foreshores (those around Lake Macquarie, in particular) can have mining restrictions, such as a large angles of draw, placed on them. Generally the restrictions are imposed so that subsidence will not adversely affect these surface features. A land use and infrastructure study will identify possible constraints.
Lease boundaries
A fundamental constraint to mine design and layout is the actual lease within which a mine operates. These boundaries generally have a degree of flexibility, but some boundaries can require the mine to have a specific layout which can control the orientation of the longwall blocks and affect its overall productivity. Maximising recovery of the resource requires careful consideration of the lease boundaries.
The longwall application process
The Coal Mines Regulation Act (1994) requires that a pillar extraction approval be obtained for longwalls. The Department of Mineral Resources (DMR) publish a helpful guide (McKensey, 1993) on how this approval is to be secured. An audit by the DMR covers all the relevant topics prior to submission. The DMR are also active in ensuring that all lease and licence requirements are met.
GEOLOGICAL AND GEOTECHNICAL ASPECTS
The key decisions in mine planning and for successful Iongwall operations are ones of mine layout. The longwall panels should, for example, be oriented in the most favourable direction in relation to the horizontal stress field (see Enever and Doyle, 1996, this volume). Ultimately the mine layout will be a compromise, in an effort to satisfy many design requirements. Some of these aspects are described below.
Exploration
Initial phases of exploration should identify the seams of most interest, highlighting the broad nature of the geological environment. A significant proportion of information about a target seam comes from early exploration. This initial phase of exploration should target holes at a wide spacings, to outline the resource and to identify potential geological and geotechnical impacts on mining. In an area of uncertain geology it is prudent to fully core some holes, using them as focal points of information. This will assist more detailed
18 R. P. DOYLE
GOVERNMENT AND SOCIAL ASPECTS
Clearly, mines have an effect on employment both on and off the minesite. Mines also affect nearby landowners to varying degrees, in both their real and imaginary cocerns. Appropriately, there are legal requirements to ensure the interests of the community are satisfactorily addressed. Successful mine planning addresses these varied issues, carefully fulfilling the respective requirements. The following notes highlight some of the issues that need to reviewed during development of a mine.
Statutory and socio-political constraints
These aspects of the planning process include consideration of Aboriginal land claims, community and local government liaison, and statutory requirements for heritage and environmental protection. Any of these aspects can complicate the mine planning process, and hence need early attention and review. For example, noise pollution can irritate landowners and violate approval conditions. Strict conditions are placed on water discharge; at Dartbrook a zero discharge policy operates. The Mabo decision imposes uncertainty about Aboriginal ownership and makes the renewal of exploration licenses more complicated than it needs to be. Heritage buildings or artefacts may need protection or restoration. At Dartbrook Mine, a unique cemetery dating back to 1831 contains convicts buried alongside settlers.
In today's era of stringent environmental controls, which are likely to become even stricter, coal properties such as high sulphur content, NO, emissions, and toxic trace elements will hecome even more important. If a coal handling plant is to built on site, environmental and practical issues require consideration of waste disposal.
In some instances it is necessary to acquire land. Dartbrook Mine has adopted a policy of trying to work in with landowners, rather than purchasing land. This policy requires a good relationship between the miner and the landowners. At any mining site, community liaison needs to effectively relate its activities to the needs of the neighbours.
Surface constraints
Surface constraints such as dams, rivers and infrastructure affect many mines. Water storages overlie mines in the Southern Coalfield, at South Bulli and Elouera to name two. The Dams Safety Committee has a responsibility to protect the dam structures and the integrity of their reservoirs. They achieve this goal by approving extraction from the affected mines. Restrictions have also been placed upon mining adjacent to the Hunter River, although the Hunter Valley Mine is successfully operating an open cut alongside the river under rigorous conditions (J. ICrajewski, pers. comm.), which may lead to further mines being given similar opportunities. At Dartbrook

uepiodoilen
!ling i.nnos
6uolellTuolled
.18M01 Co a)
Joowyei 0
IseM
eIBPNBO rill
vouwno
elen6upds
u!ddy
new sn6uv
eJnoe
Buoquemoo
eeAm
egg*
12118AU000'N
0 80U81810 75.
xneepioo
puesnem isem i—
uelsmeN Eli >Imo Axeo
Aenelp
euolsuoplop
wengnos
uelfl
euos pug
Num
lenueo
seine Limos
11
1=
1%
of T
otal
RO
M Ton
nes
GEOLOGICAL ASPECTS OF LONGWALL MINE PLANNING — DARTBROOK MINE 19
(ssiuno Jo4) Aouenbau 0 0 0 0 0 0 0 LC) 0 CD 0 .2) '7 C,) CO CV CV
8 0
0 0 CV
(001. Aq pamp s! ucgonpoid Ism) (suLunloo Jol) seuuoi
Figure 1 Comparison of safety, production and employee parameters for Australian longwall mines, 1995. Upper curve is number of employees, lower curve is time lost through injuries. Grey indicate tonnes/employee/year; black columns are ROM tonnes/year.

MUSWELLBROOK
20 R. P. DOYLE
Figure 2 Location of Dartbrook Mine within Mining Lease 386 and adjacent coal exploration areas, in the upper Hunter Valley.
follow-up investigations to focus on the issues most relevant to longwall mining. The Singleton Coal Measures are geologically complex, with numerous coal seams and abundant seam splitting, in contrast to the simple layer cake stratigraphy of the Southern Coalfield.
At Dartbrook early drilling by the DMR and other organisations identified the presence of abundant coal
resources. Further drilling detailed the potential open-cut reserves. Prior to the commitment to longwall at Dartbrook, some four bores intersected the Wynn Seam in every square kilometre. The Wynn Seam does not outcrop anywhere, nor has it been mined previously. All information about the seam came from boreholes or remote sensing. With Shell's decision to commit to mining in April 1993, further exploration included
GEOLOGICAL ASPECTS OF LONGWALL MINE PLANNING — DARTBROOK MINE 21
24 extra holes. These holes were drilled during 1993/94 over the first four longwall blocks and emphasised the need to learn more about the mining environment. Drilling across the mining lease and adjacent exploration areas still continues, to better identify the risks associated with mining. Currently, the mine has a coverage of 18 bores per square kilometre, being composed of 94 open holes and 86 cored holes.
In situ stress
The design of a mine layout should involve an investigation into the stress field and a determination of its importance at the site. Experience throughout Australia has demonstrated the impact of stress on gateroads, not only during development but more particularly during longwall retreat (Gale et al., 1989). Typically, a high level of horizontal stress exists in NSW underground mines, often 2-3 times the vertical stress (for example, at Tahmoor and Tower Collieries). High stress conditions lead to deformation of roadways during normal drivage, with deformation increasing with geological anomalies and defects. Magnification of the in-situ stress by 1.5 to 2 times occurs during extraction.
By orienting gateroads near-parallel to the maximum principal stress, they are likely to suffer less deformation. This implies that careful selection of gateroad orientation will not only improve development rates, but also extraction conditions and safety (Gale et al., 1989). Dartbrook Coal placed a high priority on stress determination for these very reasons, especially when initial investigations suggested much variation in horizontal stresses. The Bayswater seam, the immediate roof of the Wynn seam, was the target for follow-up stress measurements. This work highlighted the relatively benign stress environment enveloping the target longwall coal (Enever and Doyle, 1996). Ultimately, this meant that insitu stress was not a critical factor determining the Dartbrook mine layout.
Structural geology
Timely identification and location of geological structures is critical in mine planning. Depending on their thickness, hardness and consistency, igneous intrusions, for example, can severely impede longwall mining. Recently, Tahmoor and Metropolitan Collieries have experienced delays caused by major in-seam intrusions. Identification of these structures during the exploration stage, allows mine operators the opportunity to plan for them, rather than having to deal with them as emergencies.
Techniques such as surface and aeromagnetic surveys have a proven track record of accurately locating structures (Moloney and Doyle, 1996, this volume). At Dartbrook several surface and aeromagnetic surveys found the intrusive anomalies to strike northeast. Further investigations, involving bulldozer trenching, helped to prove up these structures. Intersecting dykes
near-parallel to a longwall face could cause difficulties with extraction. Intrusions trending at an oblique angle to the faceline will minimise longwall delays. This focuses the difficult mining zone over a relative short strike length along the face line; although the structure will be along the face for longer, the impact of it should be quite manageable.
In much the same way, faulting or steep seam grades can impede longwall mining. They represent obstructions to development and to extraction. To accurately predict faulting in an area, it is sensible to use a combination of exploration tools. These exploration techniques can be used on the surface or underground aspects, and are may include drilling, seismics, radio imaging and magnetic surveys. Local knowledge from adjacent mines or a more generalised pattern associated with regional structures can also provide an overview. It is unlikely that a precise fault pattern will emerge. A geologist needs to be confident about potential-faulting before assessing its effect on mine design.
Dartbrook Mine has a nominal borehole spacing of 250m. Uncertainty surrounding possible faulting (at the time) resulted in limited input into the mine design. Clearly, faulting could cause difficulties with mining. However, the extensive coal overlying and underlying the mining horizon would minimise these difficulties. The issue here becomes one of coal quality, rather than structural constraint associated with mines with stone roof and floor.
High resolution seismic and mini-sosie work has had mixed results at this site, some excellent results contrasting with areas of poor data. This contrast is due in part to extensive coal seams overlying the target seam, together with an 8m thick tuffaceous horizon (the Greenleak Claystone), all affecting the transmission of sound waves (Stasinowsky, 1995; Urosevic and Evans, 1994). Mining experience of the Wynn Seam indicates that it is capable of withstanding some large scale folding rather than faulting. The flexible nature of the seam may reflect its great thickness.
At Appin Colliery (Hanes and Maddocks, 1990) a high resolution seismic survey was so successful that it greatly assisted design of the longwall layout. At Tower (Ron Wilson, pers. comm.) a high resolution survey defined a major fault, and assisted in locating the upcast and downcast shafts and surface infrastructure. Current 3-D seismic practice in the Southern Coalfield is successfully defining structures (G. Poole, pers. comm.).
Extensive jointing was identified in some drill core from Dartbrook and determining its orientation became an exploration priority. The RaaX drillhole wall photography method accurately achieved this. The jointing is ubiquitous and trends relatively consistently at 110; individual joints are calcite infilled, which tends to cement them together. Underground measurements in the first workings confirmed the exploration data. With the thick seam and this jointing in mind, design of the longwall supports incorporated face spags (flippers). The flippers hold the top of the seam in place to reduce spalling.

and Fabjanczyk, 1985). Roof support design can cater for all types of roof rocks and conditions during development and extraction. It was first thought that Wynn seam roof at Dartbrook would require much support due to the prominent jointing. Upon exposure, the seam exhibited very good roadway conditions due in part to the use of Voest Alpine ABM20's, which bolt at the face and cut a single pass roadway.
To maintain good roof stability requires adequate support levels. For Australian mines the main consideration is to keep the mine safe and and open, using in-place bolting systems. In the USA, with place changing the primary focus appears to be one of development rates. The advent of roadheading machines such as the Joy sump miner and the ABM20, that allow for bolting during the cutting and loading process has led to increases in development rates in Australia.
Australian longwall panel design typically has a two-heading gateroad system. An assessment of the two types of development rates shows that place-changing causes a major improvement in development rates. However, the Americans generally three gateroads rather than two, which reduces the impact of this advancement.
Peng et al. (1988), describe the loading characteristics of different roof strata on longwall supports. In general, estimating overall loading and caving capabilities of the roof rocks will assist in deciding the size of longwall chocks. In particular, massive sandstones can bridge over large distances and exert high loads on the longwall face supports (Fallcner, 1993). At Dartbrook Mine the typical roof comprises about 14 m of inferior coal. At this stage the bulking factors are uncertain, but with a mining height of up to 4.5 m the immediate roof will remain in coal. While loading from the upper roof strata is unlikely, a 'no surprises' policy has selected longwall shields rated at 914 tonnes yield.
Mining issues associated with floor rocks include: floor heave, pillar deformation, machinery digging into a soft floor, and stone rolls. The Mine Technik Australia (MTA) longwall face supports at Dartbrook have a toe lifting capacity, to assist in keeping the face on the appropriate mining horizon. Installation of support into the floor to make it secure despite severe levels of deformation is rare.
Gas emissions
Ascertaining appropriate gas information from an exploration programme has developed into a routine operation in Australia. The presence of gas, its content and composition could have a dramatic impact on mine operations, influencing possible development and cutting rates, ventilation requirements and any decision to implement gas drainage (Hargraves, 1986).
Prior to the commitment to mine at Dartbrook, the gas data obtained indicated a necessity for pre-drainage, despite a lack of `Q3' results. Further exploration work used the Australian Standards. The coal has a high level of carbon dioxide present. A variation between the surface exploration standard and the underground
22 R. P. DOYLE
Coal quality
Coal quality is the single most important factor in defining a new longwall prospect. The fundamental distinction in coal quality assessent is whether the product will be thermal or coking. Current market prices are greater for coking coal then for thermal. For the thermal coal operator this price differential makes it all the more difficult to be economic. Ward (1984) comprehensively describes coal quality parameters. The operator must thoroughly examine the product and be aware of both its strengths and weaknesses. A good knowledge of how the customer is going to use product is also worthwhile.
Open cut mines generally have several areas within the pit to extract coal from and blend to the customer's taste. Longwall mines have no such product flexibility. It may be that ash content, sulphur or phosphorous levels, etc. have an impact on the initial mine planning, but they are unlikely to ever affect panels extraction. Hence the initial mine design should take into account the optimum coal quality areas and aim to exploit them within the context of all the other design criteria.
At Dartbrook the Western Mains run down the length of the southern lease boundary. These roadways experience relatively higher ash levels and lower seam height areas, to facilitate the longwall extracting higher quality coal. Figure 3 shows the Dartbrook Mine layout and structure, together with ash contours at 4.2 m mining height.
Roof and floor rocks
Immediate roof lithologies can vary dramatically from coal (such as in the Wongawilli, Ulan and Wynn seams) to shales, laminites, sandstones and conglomerates. The strength of the roof rocks varies significantly, literally from 5-100 MPa. The geotechnical investigation should carefully review the nature of the core, noting any structures that are likely to affect on the behaviour of the roof. Classifications systems such as that of McMahon et al. (1975) assist in defining rock parameters. An interpretation of these features assists the design of roof support patterns.
It is important to obtain a general assessment of mining conditions from exploration borecore. This assessment of both roof and floor rocks should include geotechnical logging, physical testing, and the interpretation of geophysical logs. If available, examining conditions at other mines extracting the same seams will assist in formulating support strategies. Computer modelling techniques can confirm this assessment. In-situ testing of the installed support and monitoring of conditions using tell-tales and extensometers assists the process of review. General underground mapping can also assist in monitoring the performance of roadways and the support systems in place.
The design of support systems for Australian development roadways minimises movement and maintains the solid beam approach to roof control (Gale

- A 3
282000E 284000E 283000E 2 8 5 0 0 0 E 2 8 6 0 0 0 E
LEGEND
Igneous Pipe
Dykes
Faults
./ , s , ,
• , ri•
•
12
c, Sandy Creek Explorat 'pan Area
• •
t .. ... . • e
; ee • ..... e— • •• — • ee ee le
-- • • ..":7A- 7- • •
GEOLOGICAL ASPECTS OF LONGWALL MINE PLANNING — DARTBROOK MINE 23
Figure 3 Dartbrook Mine — layout of main entries and initial longwall panels.
'quick crush' technique gave a discrepancy of 1-2 m3/t. Absorption of CO2 into the acidified brine caused this error. To make a more satisfactory comparison between the exploration and the underground data, the mine employs the quick crush technique in current exploration work.
Pillar design
Typically, there are three main pillar types within a
mine: gateroad, longwall abutment and mains development pillars. The mains pillars facilitate transport of persons and materials, give sufficient pit space, and allow separation of intakes and return airways. Mains pillars need to be there for the life of a mine and thus are of very sturdy construction. The gateroad (chain) pillars have a relatively short life, that of their current panel and the next one, a period of 2 to 3 years. Longwall abutment pillars isolate and thereby protect the mains from abutment effects caused by panel extraction.

24 R. P. DOYLE
In seams prone to spontaneous combustion, pillars have an extra role in ensuring that stoppings maintain contact without suffering deformation. Maintenance of the pressure differential across these stoppings reduces leakage, limiting the danger of spontaneous combustion. The stoppings also keep the goaf atmosphere constrained.
There are numerous models, both empirical and numerical, that can be used to determine pillar sizes. Some mines, in particular those of North America, operate with a yielding pillar design. This yielding pillar system will operate at Moranbah North Mine. Many modem mines utilise rib bolting, to reinforce pillars and enlarge their stable core. An updated Australian data base would be a worthy research activity and could simplify pillar design.
Dartbrook has an average overburden density of only 2.2 t / m3, due to the abundance of overlying coalbeds. This is significantly less than the assumed value of 2.5 t/m3 used in some pillar design models. Exploration programmes can target coal strength parameters, including the UCS and Triaxial, as well as shear strength parameters. Geophysical logs can also be of use in estimating strength and deformation moduli values for overburden (McNally, 1987).
Ineffectual pillar design can have an adverse effects ranging from catastrophic, e.g. Cranbrook in South Africa, to less severe situations of floor heave, pillar deformation, requirements for extra support, broken ribs, and possible spontaneous combustion. It therefore becomes essential to adequately design pillars so that the mine can operate without fear of undue delays associated with pillar deformation. The reason why you do not have excessively wide pillars is that they take too long to drive and you lose reserves. Optimising pillar size maximises coal recovery. This issue hi blights the two aspects, of safety and economics, a balance that needs careful review.
Mining heights
Most mines extract coal between a stone roof and floor. At Dartbrook, with coal of economic quality up to 6.0m thick in places, the mining height on development became a fimction of the machinery selected to mine the seam. Dartbrook typically mines 3.9 to 4.0m on development and undertakes most of its ancillary work (hanging pipes etc) out of Eimco baskets. Cutting this extra height clearly takes longer and has a minor impact on development rates. Another aspect associated with mining height is equipment design, and what equipment you have to fit into the opening that you make. Manoeuvring some of the largest longwall equipment in the world through these roadways means that adequate clearance is essential.
Hydrology
Water can have a significant impact on mining in general. On development water can cause difficulties
with transport of materials, shuttle car travel and general mining conditions. This is particularly true if the general trend of development is downdip. Time lost to pumping and maintenance of the pumps is also an issue. Overall an investigation of the seam moisture will indicate the need for major pumping from longwall extraction.
CONCLUSION
Various issues affect the success of a longwall mine. Geological mine planning requires that initial broad brush exploration be undertaken to examine the lease and determine areas of most importance, particularly in the first 5 to 10 years of mine life. This initial treatment will highlight the main issues that follow-up work must target. Exploration is vital to mine planning. When used prudently it will provide excellent information to help develop resources in a manner that is economic and safe.
Government and social considerations play an important part in any mine development and a good working relationship with external bodies is essential to successful mining. This paper has briefly described the geological and geotechnical parameters needing review, with particular reference to the recent development of Dartbrook Mine. All these aspects have influenced the mine layout design and will contribute to its economic success.
ACKNOWLEDGMENTS
People from numerous organisations have conducted considerable field and office work in developing the on-going geological mine plan at Dartbrook. The author has been fortunate to have worked with them and the mine is indebted to them. In particular, I would like to emphasise the role of the personnel from McElroy Bryan Geological Services.
The permission of the Shell Coal Australia Limited Company is gratefully acknowledged in presenting this paper. Particular thanks go to Richard Holland for reviewing the paper.
REFERENCES
DOYLE R. 1993. Dartbrook Mine — Australia's newest. New Developments in Coal Geology Symposium, Beeston J. W. ed. Brisbane, November.
Dovu R. & LOHE E. 1996. Dartbrook Mine's Hunter Tunnel — a geological cross-section across the upper Hunter Valley. Proceedings of the 30th Newcastle Symposium on Advances in the Study of the Sydney Basin, The University of Newcastle.
ENEVER J. & DOYLE R. 1996. The role of horizontal stress in longwall design — a case study at Dartbrook Mine, NSW. Geology in Longwall Mining Symposium (this volume), 143-151.
FALKNER A. 1993. Sedimentological studies in the German Creek Coal Measures and their relevance to longwall

GEOLOGICAL ASPECTS OF LONGWALL MINE PLANNING — DARTBROOK MINE 25
mining. New Developments In Coal Geology Symposium, Beeston J. W. ed. Brisbane, November.
GALE W. J. & FABJANCZYK M. W. 1985. In-situ measurement to determine roof stability and bolt performance and its implication to the stability of mine roadways. Proceedings of the 21st International Conference on Safety in Mines, Green A. R. ed. A.A. Balkema.
GALE W. J., FABJANCZYK M. W. & MATTHEWS S. M. 1989. Strata reinforcement and strata control methods. Longwalling In The '90s, AC1RL Seminar Sydney.
HANES J. & MADDOCKS P. 1990. Application of high resolution seismic predictions to mining — a case history. Proceedings of the 24th Newcastle Symposium on Advances in the Study of the Sydney Basin, The University of Newcastle.
HARGRAVES A. J. 1986. Seam gas and seam gas drainage. In Australasian Coal Mining Practice, C. H. Martin ed. Australasian Institute of Mining and Metallurgy Monograph No 12, ch. 25.
McICENsEv B. 1994. Guidance notes for approval to extract coal. Department of Mineral Resources NSW.
McMAHoN B. K., DOUGLAS D. J. & BURGESS P. J. 1975. Engineering classification of sedimentary rocks in the Sydney area. Australian Geomechanics Journal, 51-53.
MCNALLY G. H. 1987. Estimation of coal measures rock strength using sonic and neutron logs. Geoexploration 24, 381-395.
MOLONEY J. & DO Y L E R. 1996. Aeromagnetics as an exploration tool for regional and mine planning studies in the upper Hunter Valley. Geology in Longwall Mining Symposium (this volume), 199-205.
PENG S. S., HSIUNG S. M. & JIANG J. M. 1988 (Originally Oct 1987). Method of determining the rational load capacity of shield supports at longwall faces. Longwall Mining Seminar, Wollongong, April 1988.
STASINOWSKY W. 1995. Dartbrook Mine trial seismic survey — interpretation. Company Report.
UROSEVIC M. & EVANS B. J. 1994. Seismic acquisition, processing and interpretation of a trial seismic survey at Dartbrook Mine, NSW. Company Report.
WARD C. R. 1984. Coal Geology and Coal Technology. Blackwell Scientific Publications.


Symposium on Geology in Longwall Mining, 12-13 November 1996, eds G. H. McNally and C. R. Ward, pp 27-34.
Sedimentological analysis of goafing interval for longvvall mining at Goonyella Mine, Bowen Basin
J. S. ESTERLE1 AND C. R. FIELD1NG2
CSIRO Division of Exploration and Mining. University of Queensland, Department of Earth Sciences.
A sedimentological analysis was conducted for the goafing interval above the Middle Goonyella seam, in order to characterise the lithologies which affect roof conditions during underground mining. Major sandstone, tuff and coal units were identified, coded and correlated in geophysical records to produce a three-dimensional sedimentological model. Sandstones occur as two types of channels: broad (>3 kin), thick (>30 m) low-sinuosity channels trending SSW; and narrow (<500 m), thick (>25 m) ribbon-shaped channels which are oblique to the main channel system_Sandstones_also_occur as broad, thin (1-5 m)_irregularly,shaped sheets, and as thin interbeds in the finer-grained rocks. The distribution of sandstones and fine-grained lithologies is interpreted as representing a channel! splay/ floodplain complex. Variability in roof conditions is high on the outer bend of the channel due to overbanking. The facies distributions can be used to construct zones of similar overburden character for mine design and planning.
INTRODUCTION
This paper describes a study intended to identify and correlate the major rock units within the overburden of the Goonyella Middle (GM1) seam, which might influence goafing behaviour. A new underground mine was proposed east of the southern open-cut pits on the Goonyella-Riverside mine lease (Figure 1); the rock units and their degree of lateral variability were expected to impact upon the mining conditions encountered in the roof of the GM! seam. Sedimentary facies analysis is an effective means of characterising overburden strata. When combined with geotechnical and structural information, the sedimentological model from such analysis can provide a useful framework for mine planning and engineering studies.
BACKGROUND
Three main coal seams (Goonyella Lower (GL1), Middle (GM!) and Upper (GU!), five minor seams and the "P" Tuff marker (GP4) are present in the proposed underground mine area (Figure 2). These beds provide marker horizons across the property. Seam and interseam isopach maps were generated from the model to provide general information about the orientation of the depositional system controlling lithofacies variation in the mine area. Highwall exposures provided an excellent opportunity to observe facies relationships and the transition between units expected to be encountered in the underground mine.
The general stratigraphy of the Goonyella Mine area was established by Godfrey (1979). Sedimentological models were developed from the mapping of high wall exposures of the GM! to "P" Tuff interval (Godfrey, 1979 and undated; Johnson, 1984; Falkner and Fielding,
1993). They interpreted the Moranbah Coal Measures in this area to have formed in a low relief terrain from the interplay between belts of low-sinuosity trunk river channels (sheet sandstones), low to high-sinuosity secondary channels (ribbon sandstones), and floodbasin deposits. Differential compaction during dewatering and lithification of the sand, mud and peat-dominated facies has resulted in a pinching and swelling relationship between the GM1 seam and the "P" Tuff.
Regional studies suggest that the Moranbah Coal Measures formed in an extensive upper delta plain environment that was occasionally subjected to tidal inundation (Falkner and Fielding, 1993). Trunk distributary channels flowed southward as components of axial drainage networks established in the Bowen Basin. The volcanolithic mineralogy of the sandstones suggests derivation from resurgent volcanic activity to the east of the basin (Falkner and Fielding, 1993). The objective of the present study was to examine the mine-scale variability in rock units arising from the sedimentology, and identify elements that could affect goafmg behaviour during longwall mining.
METHODOLOGY
A total of 270 geophysically-logged boreholes (Figure 1) was used to identify and correlate the coal seams and major sandstone units. The "P" Tuff horizon provides a stratigraphic marker across the study area, which can also be traced through the Goonyella-Riverside open-cut mining area. Lithologies represented by the different geophysical signatures were identified from logging of available core (30 roof and floor cores and six continuous cores). In addition to the boreholes, highwall exposures from Ramp 0 to Ramp 3 were examined to obtain palaeocurrent information, and to

w 1 w --E --.... E 0 0 0 . i 8 N0 er . • 0
CO ' •
• • CO
(1 1F 0 co
-75880 n Ram D3
Ramp 2
I
Ramp 1
' \Ramp 0 I 7584000mN
• • • • Moo 0
• • • - • • •:•00
bo
knns SCALE
borehole
• •••• •
• • • •
• • • •
• •
. .
▪ ...... • . •041. •
• • • • 000 •
• .....
•
5 ..550,0 •
0000
0000 ••••••
• . • • • O0 e.• .
• •
• •••• • • •• •• •
• • •• • •
• 0.41 000
OW.. •
• • • • .
•
I.
28 J. S. ESTERLE AND C. R. FIELDING
Figure 1 Location map of the proposed Goonyella underground mine, showing borehole locations and highwall ramps. Inset shows the location of Goonyella in the Bowen Basin.
characterise sedimentary facies and the degree of lateral variability which might be encountered in the underground mine.
Facies were categorised into a simplified rock unit scheme based on the work of Fallcner and Fielding (1993), and used to interpret the geophysical borelog data. A series of cross-sections was constructed, and
7
—7582000 N
major sandstone units were manually correlated and isopached. Geophysical records were also sorted into groups with similar vertical sequences in the interval covering approximately 50 m immediately above the GM1 seam, to provide general zones for goafing character. Although not shown, the areal distribution of these zones also provides a hazard map for the area.

SEDIMENTOLOGICAL ANALYSIS OF GOAFING INTERVAL AT GOONYELLA 29
UPPER SEAM — - - ..... UU4() — - - - - - — - - - - — - — — - - - - - — - - - - - - - - - - - -
- - - - - - - - - - - • • • • • • • - - - - - 2- — — - - - - - - -
I - - - - —
.• . .• .• .• .• .• - - - - - - - - - - - - - - - — - - - - - - - - - - - - -
- - - - - - - - - - - -
• • • • • .• .- 11L.
..::_'. PU40 INIPN
.. - - - - - - - - - - - - - - - PU20-• • ,
—...- - — — - - - - - - uu
. . . . . . • •• .• .• • • • GP5 zone
. •• •• .• .•
. • • • •
GP 4 zone . ... ... ... MN
=I NM I=
PU20
'.. '... •.:. :.• ..• ... .
. ..
.•
•• .• .• .•
• • 'MM..' .•• .•• .•• • ..• ..• ..• ..' _ • .• .• .• • • • • . . •
13111;b.._ ':•. MP20 ' •
.........am329,•:. masuouncompb...:. whom,,,,:...... :tam
MIDDLE SEAM tu:
rrrentrrio =SE= maillIZEMPaismint.MINIWPR =mann • LM20
ZONE 1 ZONE 2 ZONE 3 ZONE 4 ZONE 5 ZONE 6
Figure 2 Schematic east-west cross section through the study area, showing relationship between coal seams and major rock units in goafing zones described in the text.
ps
ROCK UNIT CLASSIFICATION
The lithofacies associations were grouped into five major rock unit types: massive sandstone; interbedded to interlaminated siltstone and sandstone; tuffaceous claystone and siltstone; carbonaceous mudrock; and coal. Besides having significant geotechnical differ-ences, these gross units could be easily identified in the geophysical logs, and correlated and coded for isopach maps and computer modelling.
evident in places, and many channel fills display a fming-upward or interbedded upper part, indicative of progressive abandonment. Channel fill sandstones are pervasively trough cross-bedded, with lesser flat lamination and ripple cross-lamination. Coalified log compressions are abundant, with occasional upright, in-situ tree trunks encased in basal channel sediments. Palaeocurrent data measured in the channels in high wall sections indicate predominantly southward sediment dispersal.
Rock unit Type 1 —Massive to thickly bedded sandstone
Two varieties of thick channel bodies can be distinguished:
• Very thick (>30 m), wide (>3 km), laterally accreted sandstone bodies; and
• Variably thick (10 to 30 m), narrow (250 to 500 m), apparently vertically-accreted sandstone bodies.
A third type is evident in the highwalls, consisting of laterally accreted, interbedded sandstone/ siltstone bodies, but these were difficult to distinguish on geo-physical records. Channel bodies are typically incised into fmer-grained lithologies of rock unit type 2 (see below).
Both main channel varieties are composed of quartz-lithic sandstone with subordinate siltstone partings. Large-scale, dipping surfaces interpreted as the product of lateral accretion are common. Steep cutbanks are
Rock unit Type 2— Interbedded to interlaminated siltstone and sandstone
Thinly interbedded and interlaminated siltstone/ sandstone strata are abundant within the succession; they are interpreted as being of lake and floodbasin origin. The sediment bodies consist of variable proportions of the two lithologies, with tabular quartz-lithic to quartzose sandstone beds typically up to 0.3m thick. Siltstones are generally medium grey in colour and laminated (0.1 to 0.3 m thick). They are often cemented by ferroan dolomite (Godfrey, 1979). Small-scale sedimentary structures are abundant; they include trough cross-bedding, current and wave-modified current ripple cross-lamination, and interlamination structures (lenticular bedding, flame structures, ball and pillow, and soft sediment deformation). Palaeocurrent data indicate sediment transport from both the north and south, probably from overbanking of the trunk and subsidiary channels. Some intervals are penetrated by plant rootlets.

30 J. S. ESTERLE AND C. R. FIELDING
Rock unit Type 3— Tuff
Beds of diagenetically altered, crudely bedded volcaniclastic material occur sporadically through the studied succession. One bed (the "P" Tuff) is continuous across the entire area, and is used here as a stratigraphic datum. The tuffs consist of mixtures of vitric debris, quartz and feldspar crystals, and fine-grained, recrystallised material interpreted as fine ash. Organic debris is common, ranging from small particles to large tree trunks and in-situ roots/rootlets. Crude flat bedding is typical. Minor cross-bedding is evident, along with abundant soft-sediment deformation of units into series of small-scale antiforms and synforms.
The tuffs are interpreted as altered volcanic fallout deposits that fell into shallow standing water, were reworked by current and wave processes, and colonised by plants. Soft-sediment deformation is interpreted as arising from hydration reactions involving the smectitic clays that are abundant in these rocks. No palaeocurrent data are available from this facies.
Rock unit Type 4 — Carbonaceous mudrock
Beds of dark grey to black carbonaceous mudrock (siltstone, claystone) occur at intervals, particularly in the immediate floor and roof of the coal seams. These rocks are typically laminated, rich in detrital plant debris and vitrain lenses, and are commonly root-penetrated. They form lenses and extensive, thin sheets within the studied interval. The carbonaceous mudrocks are interpreted as the deposits of stagnant, shallow lakes and ponds, genetically associated with wetland environments that gave rise to peats (see below).
Rock unit Type 5 — Coal
Beds of banded bituminous coal up to 7 m thick occur throughout the studied interval. The thickest and most extensive of these is the Goonyella Middle seam (GM1), which is the target mining unit for this study. GM1 can be divided into four major plies, which form an overall dulling-upward sequence. Thin tuffaceous mudrock partings (stone bands) occur at intervals throughout this and other coal seams. The coals are interpreted as the product of peat accumulation in extensive mires.
DISTRIBUTION OF ROCK UNITS
An overview of the general stratigraphy and the relationships between the different lithologies is presented schematically in Figure 2. The stratigraphy was subdivided into packages, or intervals bounded by coal seams. These intervals vary laterally in thickness and, in general, the proportion of sandstone to mudstone increases with increasing interval thickness. Exceptions to this generalisation occur, and are expected to influence roof behaviour in the goafing interval above
GM1. Thickness distributions are vertically offset in successive intervals, i.e. where interval GM1—GP4 is thin, GP4—GP5 is thick.
Lower goafing interval — GM1 to GP4
The interval from the GM1 seam to the "P" Tuff (GP4) varies from 4 to 52 m thick and trends in a NE-SW arcuate belt (Figure 3a). The interval thins to the south-east, as GP4 approaches the roof of the seam. This transition occurs over a distance of less than 250 m, little more than a panel width, and coincides with the loss of thick Type 1 massive channel sandstone from the overburden section. An erratic decrease in interval thickness occurs to the north-west along the highwall exposures, and on the outer margin of the belt.
The immediate few metres of stone roof above the GM1 seam can be characterised variably as Type 2 interbedded fme-grained rocks. It persistently consists of a thinly (2-10mm) laminated siltstone which varies in thickness from 1 to 4m, the thickest area occurring in a NE striking belt in the centre of the property. This unit exhibits sparse root penetration, but small fossil tree stumps have been observed in highwalls emanating from the roof of the GM1 seam. The thickness and character of this unit are expected to influence roof control.
The laminated siltstone is overlain by a hard, medium-bedded (0.1 to 0.3 m) quartzose tabular sandstone (coded as MP20), which varies in thickness from 1 to 4 m (Figure 3b). Where thick, the MP20 unit occurs as irregular to linear lobes of variable strike, and is possibly eroded into the underlying siltstones. Where thin, it has possibly been eroded by the overlying massive sandstone channel (MP42).
Whereas the transition from GM1 to MP20 is laterally persistent across the mining area, the overlying rock units are variable in thickness relative to the total distribution of the GM1 to GP4 interval. MP20 is overlain by thinly-laminated to interbedded dark to light grey mudstones and siltstones, with variable proportions of thin (50 to 100 mm) sandstone interbeds (Type 2). Although generally thin (1 to 5 m), the laminated siltstone attains a thickness up to 20 m to the south-west. It is traversed by a N-S striking, narrow ribbon channel where the GM1 to GP4 interval tapers off in thickness. The fine grained unit is overlain and/or eroded by thick, broad massive Type 1 channel sandstones, coded as MP42 and MP41. These units are separated by 1 to 3m of dark grey to carbonaceous mudstone (Type 4). Where merged, the individual bodies are difficult to differentiate. Their distributions are presented in Figure 3c and 3d. The lower sandstone, MP42, occurs as a broad (>2 km) arcuate sheet (Figure 3c). To the south-east it thins to less than lm and passes into interbedded Type 2 rock types; these grade into root-penetrated and carbonaceous Type 4 rocks as the "P" Tuff approaches the seam. To the south the sandstone tapers over 10 to 15 m of Type 2 siltstones. To the west, MP42 also tapers. It is observed to pinch out into Type 2 rocks in

SEDIMENTOLOGICAL ANALYSIS OF GOAF1NG INTERVAL AT GOONYELLA 31
1 * I 1 t i ‘.
......._.... 4._—(, . ' t t I% I ''--- — i
- ,_„ ‘)
/
.....
5
A I I
I
\ .. _._
k
I .• A — • ___
-- - -,----o- ••••
if yr
0
.... — —
/ / /
.
,,,, . ",
- * it 417.1177 . e •,,-., ..., .. .... i
T" - c •
#
t-., • A.
I,.4* ,t, 4
e
*4. 1
GM1 to GP4 INTERVAL 00,,,,. 0, I "' * > 40 m
24-40m 8 to 24 m < 8 m
'I
(r.:::::------ 1 / 20m
GM1-GP4 ' /
;. .
1 contour_
. '.4'..4
.
t t n•
,
7•
'-' 1 . \I
,--c-1 - , •1 . '4 ...,...
•
30
30"
t
•
t \
• , ....,. , . • ,
...- io • 2
v
I ,
CAt
......
143<ei%
.../ .‘ . . . e° k •
i
/ , / '
/ /
/ /
I /
// / ,
, / - . . - . - . •—•
scaLE ,
4'
I a
MP42 SANDSTONE m >20 m 111 10-20m
,— r fr-"-,...
\ I ‘
i _...,
/
.,.... N ,1
k \ ‘ N I N,
I
I I 1 t
i i i /
..
r t I
f ' I I
, . J I I I I I I
I ...
.....
I i i /
/1
.
. .
.-
/ .
......
/
/ / / /
.1......— -.—T—
sou
1 --
MP20 SANDSTONE 0. 1 f u m II m >3 El 1-3 m EiS <1m
/f / ----_—, // ., :
\I si/ •---77.\___3)1 . % \ I\
I I
i
I -•—•-,..
I I I
r I I
I
• • i
r L
.
I I
‘,........ I
J
10 .
• 2 . . ,
.....
o z- 4) 4, 4/
// / 1 -, 1
• / I
A :1
1 { I . I
I 4-------
• / • / • I
I
M P41 SANDSTONE 0 1 2 kms 1 . . •
4
>10m
0.10m
Figure 3 Maps showing thickness of the GM1 to GP4 interval and of major sandstones within that interval. Figure 3(a) GM1 to GP4; 3(b) MP20; 3(c) MP42; 3(d) MP41.

sandstones. In core these may be carbonaceous and root-penetrated in places. However, the distribution of different facies within the fine-grained lithologies could not be determined from geophysical logs. This fine-grained unit often coarsens upward into a thin (<1 m to 4 m), sheet to irregularly lobate sandstone (PP40).
This part of the sequence is capped by GP5, a coaly to carbonaceous mudstone which increases in thickness from 1 m to 4 m to the south-east over the thick GP4—GP5 interval. Its geophysical signature is that of a coal doublet to triplet, which becomes dominated by carbonaceous mudstone as it thickens.
LITHOFACIES DISTRIBUTION IN THE GOAFING INTERVAL
Vertical sequences in the stratigraphy between the GM1 and GP5 horizons allowed the borehole records to be grouped and mapped into zones within the study area. The character of these zones is shown schematically in Figure 2. The interval immediately overlying the GM1 seam is similar in all zones, consisting of a thin mudstone which coarsens up into the thin (0.5 to 4 m) MP20 sandstone. Hence, the zones generally describe the variation occurring in the overlying lithofacies. Although not shown, the areal distribution of these zones can be roughly used as a hazard map for roof conditions occurring in the goafing interval in the mine area. Of note are the rapid lateral transitions between coarse and fme-grained zones.
In Zone 1, the goafing interval is dominated by the sheet sandstones coded as MP42 and MP41. The two sandstones are indistinguishable in this area, and the zone occurs as an arcuate belt trending north-east. This zone would be expected to form a heavy roof.
The goafing interval in Zone 2 is also dominated by MP42 and MP41, but the two units are clearly separated by the root penetrated carbonaceous mudstone. The separation occurs approximately 20 to 25 m above the GM1 seam. This zone would probably form a heavy roof, with potential for cyclic loading from the carbonaceous parting.
In Zone 3, the goafing interval consists of a thick (15 to 25 m) MP42 sandstone overlain by a thinner GP4 to GP5 interval. The GP4 to GP5 interval is dominated by laminated to interbedded mudstones and sandstones. The MP20 sandstone immediately overlying the GM1 seam in Zone 3 may be up to 4 m thick, and sit within a metre of the coal roof. Again, heavy roof with potential cyclic loading due to the coal and tuff horizons between heavy sandstones would be expected to characterise this zone.
The goafing interval in Zone 4 is dominated by 10 to 20 m of laminated siltstone overlain by 15 to 20 m of sandstone (MP42). Narrow ribbon-shaped channels incised into the finer grained rocks occur near the transition to Zone 5. The position of the thick competent sandstone presents a potential bridging problem over weak roof during goafing. The ribbon channel may influence control in an otherwise fme-grained roof rock.
Zone 5 is dominated by laminated to interbedded
32 J. S. ESTERLE AND C. R. FIELDING
Ramp 0. The upper sandstone, MP41, also occurs as an arcuate sheet, but is located northwestward from the underlying MP42 sandstone (Figure 3d). It emanates from the dark grey, carbonaceous mudstone which underlies the "P" Tuff horizon.
A series of later generation sandstones occurs in the highwalls mapped in Ramps 1 to 3, with a different geometry to that of the Type 1 trunk sandstones. These beds represent the other two varieties of Type 1 sandstone, the thick vertically accreted, narrow ribbon shaped channels and the interbedded, laterally accreted channels. They are incised into and interfinger with the finer-grained Type 2 rock units. Data from these channels show variable palaeocurrent directions, suggesting a combination of secondary channels emanating from the trunk sheet channel belts and independent meandering channels flowing in a southward direction. The exact timing and relationship of these channels has not yet been resolved.
The channel sandstone units fine upward, and are capped by a fine grained carbonaceous mudstone which grades into the coal GPO beneath the "P" Tuff bed. The carbonaceous mudstone varies in thickness from 2 to 6m and is, in places, the lateral equivalent of the fine-grained interval which splits MP41 and MP42. The "P" Tuff is underlain and overlain by thin (<1 m) coals (GPO and GPI, respectively). All three units are thickest in a belt oriented NE-SW and offset eastward above the MP41 sandstone channel. This suggests contempor-aneous accumulation in the protected inner bend as the channel belts migrated to the north-west.
Upper goafing interval — GP4 to GP5
The thickness of the next major overburden interval, GP4 to GP5, varies inversely with that of the underlying GM1 to GP4 interval. The GP4 to GP5 interval is thickest (up to 40m) to the south-east, and thins rapidly to the west-north-west. The variation in lithologies is shown in Figure 2.
It is important to note that, when this interval is thick, it is not necessarily also sandstone-dominated. Geophysical logs and highwall observations show that the sandstones can occur both as Type 1 and Type 2 varieties. Two laterally persistent sandstones were mapped: PP20 and PP40. The lower sandstone (PP20) can be subdivided into two types of sandstone: a lower interbedded sandstone (PP22) and an upper, more massive sandstone (PP21).
The lower sandstone (PP22) has a restricted dis-tribution on the southern edge of the study area. It varies from <2 m to >5 m in thickness, and is narrowly lobate. The upper sandstone (PP21) is a Type 1 rock unit; it occurs as a thick arcuate sandstone which roughly follows the course of the underlying MP42 sandstone. The distribution of this competent, potentially bridging sandstone is important to roof or goafing conditions where the underlying "P" Tuff is within 8 m of the GM1 seam.
The PP22 and PP21 sandstones are overlain by dark grey laminated to interbedded mudstones and

SEDIMENTOLOGICAL ANALYSIS OF GOAFING INTERVAL AT GOONYELLA 33
siltstones, tuff and coals. The zone is narrow (<500 m wide), reflecting the abrupt lateral decrease in thickness of the GM1 to GP4 interval. As the GM1 to GP4 interval thins, the overlying GP4 to GP5 interval thickens; it is sandstone-dominated where the PP21 channel occurs. The overburden in this zone is weak and thin to thickly laminated.
Zone 6 occurs in the south-eastern corner of the mine area, where the "P" tuff is within 4 to 12 m of the GM1 seam. The interval is dominated by root-penetrated and carbonaceous to laminated mudstones, which may contain fossilised tree stumps up to lm in diameter. The GP4 to GP5 interval is thick, but not necessarily sandstone-dominated in this zone. The localised distribution of the PP21 sandstone channel has the potential to create bridging problems during goafmg.
SEDEVIENTOLOGICAL INTERPRETATION
The stratigraphy of the overburden interval can be summarised as a pattern of offset thickening patterns up-section from the GM1 seam. Although the grainsize of the lithofacies within the intervals generally decreases as thickness declines, the distribution of sandstone bodies changes up-section.
Peat accumulation in the GM1 seam was terminated by gradual flooding, as suggested by the increased frequency of thin stone partings in the upper part of the seam and by the laminated mudstones in the immediate stone roof. Increased flooding, and the development of irregularly lobate to linear splay-type sandstones and small channels, is shown by the distribution of the MP20 sandstone.
Sediment influx continued as a result of subsidence, possibly caused by differential compaction of the underlying peat and of sands and muds beneath the peat floor. Subsidence rates were unevenly distributed; thick (10 to 15 m) laminated mudstones occur above the MP20 sandstone in the south-west and west of the mine area, but not to the north. The laminated nature of this mudstone with its rare, thin stringers of sandstone, the lack of root penetration and the well-preserved condition of the rare plant and leaf fossils suggest deposition in a quiescent ponded environment, possibly an interdistributary lake (Johnson, 1984; Falkner and Fielding, 1993).
The invasion of this system is heralded by the establishment of the thick sandstone channels in the GM1 to GP4 interval. The sandstone channels within the mining area occur as sheets (MP42 and MP41). They correspond to the broad, low-sinuosity, southward-flowing channels described by Johnson (1984) and Falkner and Fielding (1993). Channel depths are estimated to be up to 8m from bedding and small sets. It appears from the distribution of the MP42 and MP41 sandstones that the arcuate trunk channel system shifted northwestward with time. The outer bend experienced persistent overbank flooding whereas lateral migration left the inside of the meander belt free of sediment influx, allowing vertical accretion of the fine-grained laminated to root-penetrated sediments
observed in Zones 5 and 6. The narrow, ribbon-shaped channels that occur within
this interval in the highwalls from Ramps 2 to 3 are secondary or later-generation channels, which either emanated from the trunk sheet channels as crevasse channels or existed as smaller meandering drainage tributaries into the larger system. Initial palaeocurrent studies have identified both.
Slowing of sediment supply and subsidence, or avulsion of the trunk channel system out of the mining area, is shown by the thick root-penetrated and coaly carbonaceous mudstone which forms the floor to the thin GPO coal seam. Peat development for this seam was thickest to the east of the trunk channel system, and may have been partly contemporaneous with sluggish channel accumulation of sandstone to the .west.
The "P" Tuff blanketed this mire and channel system. The thickness distribution of the tuff suggests that narrow, shallow channel systems still operated in the western area of the property where the tuff is thickest (-2m) and overlies thick GM1 to GP4 interval. The underlying GPO seam is thin or nonexistent in this area. To the east, where the "P" Tuff is closest to the GM1 seam, the tuff contains large fossilised tree stumps which continue into the overlying GP1 coal seam. Common root penetration of the tuff in all areas suggests that it was deposited on a relatively flat landscape. The peat mire which formed the GP1 seam blanketed this landscape.
Subsidence and sediment influx was rejuvenated, and laminated to interbedded clays, silts and sands ac-cumulated above the GP1 seam. Greater sediment influx in the form of splays and channels is suggested by the irregular lobe of interbedded sandstone (PP22), which occurs in the southern panels, and the planar cross-bedded channel sandstones (PP21). The PP21 channel rims the proposed mine area, following the distribution of the underlying MP42 and MP41 sandstones to the west but cutting across the southern edge of the panels in the south. Abandonment of this system is again indicated by thick fine-grained laminated and inter-bedded sediments which overly the channel sandstones. These sediments coarsen upward into the irregularly lobate sheet sandstones of the PP40 unit, which probably formed as flood-derived overbank deposits. Again, the sediment influx into the area was shut off and the interval capped by fine-grained mudstones which formed the floor of the GP5 coal seam.
Using the time horizon before the deposition of the "P" Tuff, the distribution of interburden thickness and rock types can be described in the context of a channel system, with main channels, overbank and floodplain, and peat swamp environments. The distribution of thick sandstones and coals can be explained by a southerly flowing, low-sinuosity channel belt system, which became progressively more confined up-section.
CONCLUSIONS
Sedimentological analysis of the distribution of major rock types occurring with the overburden of coal seams

34 J. S. ESTERLE AND C. R. FIELDING
can provide a framework in which to examine and characterise the geotechnical and geomechanical behaviour of the goafing interval. Data are easily obtained from routine exploration drilling, and only require diligent correlation and mapping of units important to goafing behaviour. These units and maps of their distribution can be correlated and drawn by hand, or they can be coded and modelled in any of the available geological and mining software packages. Sedimentological analysis provides a tool from which to back-analyse geological disturbances and potentially predict rock mass failures.
ACKNOWLEDGMENTS
The authors thank BHP Coal for permission to publish these results, and acknowledge Mark Manners, Dennis McManus and Ian Price from BHPAC-EFO for assistance in the field and for acquisition of all drill hole
information. A number of useful discussions were also held with them and Rick Bowem regarding the work.
REFERENCES
FALKNER A. & FIELDING C., 1993. Quantitative facies analysis of coal-bearing sequences in the Bowen Basin, Australia: applications to reservoir description. Special Publication, International Association of Sedimen-tologists , 15, 81-98.
GODFREY N. H .H. 1979. A revised Permian stratigraphy at the Goonyella Mine. Utah Development Company Technical Services, Internal Report.
GODFREY N. H. H. Undated (1980?). Clay and lithology studies at Goonyella for pitwall instability research. Utah Development Company Technical Services, Internal Report.
JOHNSON D. P., 1984. Development of Permian fluvial coal measures, Goonyella, Australia. Special Publication, International Association of Sedimentologists 7, 149-162.

Symposium on Geology in Longwall Mining, 12-13 November 1996, eds G. H. McNally and C. R. Ward, pp 35-40.
Application of gas content test data to the evaluation of gas emission and hazards during longwall development and extraction
R. J. WILLIAMS
GeoGAS Systems Pty. Ltd.
This paper compares aspects of fast and slow gas desorption methods using coal seam bore core, and attempts to provide guidelines for their application together with associated sampling strategies. The importance of determining Total Desorbable Gas Content (Q1 + Q2 + Q3), as opposed to Desorbable Gas Content (Q1 + Q2), is highlighted. The former involves partial destruction of the bore core, but provides considerably more accurate data. It is also more amenable for use in gas reservoir simulation modelling.
Fast desorption techniques are shown to have considerable advantages over slow desorption. These are: greater accuracy in gas composition assessment; the potential to rationalise sampling; fast turnaround involving fewer resources; finalisation of geological logs; and early application of the data. Q3 can still be differentiated. A more sensitive indicator of gas desorption rate is incorporated into GeoGAS's fast desorption method .(GeoGAS Desorption Rate Index).
Determination of gas reservoir size is facilitated by a sampling strategy in which relationships are defined between gas content, gas composition, depth and mineral matter. This enables indirect estimation of gas content and assignment of relevant values for strata not directly tested. The importance of testing or assigning gas content values for inferior coaly horizons is indicated.
The results of gas content testing are a basic input to any mining application. An overview is privided of their application to modelling gas emission. Statistical analysis of such data enables modelling inputs and outputs to be expressed in terms of relevant means and probability distributions.
INTRODUCTION
Testing of gas content has become a routine part of most surface borehole exploration programs for underground coal mining. Test data on gas content are a basic input to costed approaches for control of gas, ventilation and spontaneous combustion problems.
The development, over the past three years, of fast desorption methods for gas content testing has provided the exploration geologist with additional choices of method and sampling strategy. This paper compares aspects of fast and slow desorption methods, and attempts to provide guidelines for their application and associated sampling strategies. The most important determinant of methodology is how the data will be used. Its application to longwall development and extraction is broadly covered in the present discussion.
GAS CONTENT TESTING
Terminology
The following terminology is used in this paper and would generally be accepted across the industry:
• Total Desorbable Gas Content (TDGC) — the sum of Lost Gas (Q1), Desorbed Gas (Q2) and Residual Gas (Q3).
• Lost Gas (Q1)— the gas lost from the sample between coring and sealing in a gas canister.
• Desorbed Gas — the gas desorbed (per unit mass)
from an uncrushed coal sample in the time between lost gas testing and crushing of the coal. The term is applied to fast desorption testing and is not the same as Q2.
• Q2 — the gas desorbed (per unit mass) from an uncrushed coal sample held within a seam gas atmosphere, to the point in time where the partial pressure of the gases in the gas bomb is in equilibrium with the remaining gas in the core. The ambient pressure is approximately 1 atmosphere.
GeoGAS's fast desorption method determines Q2 by difference through subtracting the separately determined Q3 value from the initial desorbed gas, plus the gas on crushing: Q2 = (desorbed gas + gas on crushing) — Q3.
• Gas on Crushing — that gas released during crushing of the coal sample, at ambient pressure. Applies to fast desorption testing. The defmition is not the same as Q3.
• Residual Gas (Q3) —the volume of gas per unit mass desorbed at atmospheric pressure from the crushed coal sample, after it has been allowed to desorb to its equilibrium gas content level in a seam gas atmosphere.
• Desorbable Gas Content —the sum of Q1 and Q2. • GeoGAS DRI — a measure of the gas desorption rate
during crushing of the coal sample, corrected to the TDGC of the sample. It is the gas volume generated after 30 seconds of crushing a 200 g sample corrected from the 'Gas on Crushing' value to the TDGC value.

36 R. W. WILLIAMS
While AS 3980-1991 specifies reporting results to STP (0°C, 101.3 kPa), it is common practice in the industry to report results to 20°C and 101.3 kPa.
A comparison of fast and slow desorption methods
Australian Standard 3980-1991, Guide to the determi-nation of the desorbable gas content of coal seams, was developed to provide a more uniform approach to gas content testing. A number of limitations and defi-ciencies have been identified since this was published and a new Standard, incorporating fast desorption techniques, is currently being drawn up.
Testing of gas content has traditionally been undertaken by the slow desorption method (USBM), with testing being mainly confined to Desorbable Gas Content (Q1 + Q2) determinations. With the emergence of the fast desorption methods and the associated review of these and slow desorption methods (such as by Working Group MN/1/5/3 of Standards Australia), their limitations have been more clearly recognised.
The comments and comparisons that follow refer only to the GeoGAS method of fast desorption testing, and to experience in its application. For a more complete view, the interested reader should also contact other organi-sations that have developed fast desorption methods (ACIRL, BHP, CSIRO, KCC, Lunagas).
The fast and slow desorption methods differ in a number of ways, the most important being destruction of the bore core during the test, the time taken to achieve a result and the accuracy of the result obtained (Table 1). The main advantage of the slow desorption method (Q1 + Q2 only) is that it can be used where the core needs to be kept intact for other analyses (such as washability testing), and where there are no alternative sampling schemes. In the author's view, however, there is an unacceptable penalty on the accuracy of the results.
Stopping the test after determining Q1 + Q2 without proceeding to Q3 can result in underestimation of the gas content by between 1 and 4 m3/ t. The Q3 com-ponent is important in mining and gas extraction.
The problem with measuring Q1 + Q2 only is that the test result is very much influenced by the equipment used, in particular the void space in the gas bombs. Gas will stop desorbing in the canister when the partial pressure of the gas surrounding the core is in equi-librium with the sorbed gas concentration remaining in the core. Finishing a test after determining Q2 alone normally gives high scatter and potentially misleading results because of this effect. The time chosen to terminate the test can also be somewhat arbitrary.
In fast desorption testing, Q1+ Q2+ Q3 is determined in one operation. It is useful to know the Q3 value, and hence a small-scale 'slow desorption' test has been added to the GeoGAS fast desorption method for its direct determination. A sub-sample (approx 600 g) is taken for Q3 determination during the fast desorption test and sealed in a small glass jar bomb. The sub-sample is left on line for a sufficiently long period for gas desorption to cease. The bomb is packed full of
coal, so that by the end of the test the equilibrium end-point for the desorption is one where the gas surrounding the coal pieces is near pure seam gas (unless the gas content is very low). This material is then crushed, and the gas evolved calculated as Q3.
Gas composition is more accurately determined with the fast desorption method. Gas samples from explor-ation cores are routinely analysed for CO2, CH4, N2 and 02. Slow desorption techniques do not adequately address CO2 (which is readily lost even in acid brine baths), and are ambiguous regarding the question of whethwer N2 is a real component of the seam gas. With the fast desorption method, there is little time available for solution of CO2 in water, or for 02 to react with the core to produce excess N2.
Fast desorption testing allows quick turnaround; a result may be available in as little as two hours after the sample reaches the laboratory. This means that equipment needs are minimised. Fast turnaround of results also frees up the core for other tests, and allows finalisation of the geological logs and application of the borehole data. Importantly, gas content data can be evaluated as the drilling program progresses, so that decisions regarding sampling can be made in response to the evolving data set.
Gas content is a static measure; in as far as desorption rate is affected by gas content, it implies a rate of gas desorption. However, other factors significantly affect the rate of desorption, namely the gas composition, the inherent structural characteristics of the coal, and the moisture content.
It is important to quantify the rate of gas desorption. The rate can be quantified from the following para-meters: • The initial rate of gas desorption, measured as part of
the Q1 determination. This is common to fast and slow desorption testing.
• The rate of gas desorption (desorption history curve), determined as part of the slow desorption test.
• The rate of gas desorption during coal crushing, determined as part of the fast desorption test.
Of these three options, the author has found the rate of gas desorption during coal crushing (GeoGAS DRI) to be highly sensitive. It differentiates the effects of gas content, gas composition and the inherent structural characteristics of the coal. From a database of over 3000 DRI determinations, the desorption rate of a particular coal is readily characterised, along with associated gas responses during mining, especially in relation to outburst phenomena.
SAMPLING AND TESTING STRATEGY
A generic aim for most gas testing programs is to define the stratigraphic and lateral distribution of gas content and its composition. The extent of sampling required is ideally determined by statistical assessment of the data, with sufficient being undertaken when the mean and probability distribution of the results are unaffected (to say within 2%) by further sampling.

GAS CONTENT DATA AND EVALUATION OF GAS EMISSION AND HAZARDS 37
Table 1 Comparison of slow and fast desorption.
Slow Desorption Ql+Q2
Slow Desorption with Q3
GeoGAS Fast Desorption
Q1 + Q2 + Q3
Fast Desorption with Q3
Core left intact Yes No No No (additional (2 x 200 g crushed) (2 x 200 g crushed) 2 x 200 g crushed)
Result timing 30 days + 30 days + <I day 30 days +
Accuracy re gas quantity Rough Potentially good when added to Q1 +Q2
Good (±0.5 m3 / t to 95% confidence)
Good
Accuracy re gas composition Rough unless Rough unless Good. Defines Good. Defines pure CH4 pure CH4 CO2 and N2 CO2 and N2
Accuracy re desorption rate Rough N/A Good (GeoGAS DR Index) N/A
Resources Requires lots of gas Requires lots of gas Minimum with quick Uses glassjars, bombs / space bombs / space reuse of equipment. but as many as
with slow method.
Adjust sampling strategy Not possible Not possible Yes Yes "on the fly"
Effect of slow leak in system High High Slight Slight
Number of tests required to define reservoir
Maximum Maximum Minimum Minimum
In an assessment of the effect of gas on mining, all gassy material (i.e., any carbonaceous matter) will need to be assigned values for gas content and composition, mostly indirectly. It is not practical to test every piece of coal or carbonaceous material. The key is to define relationships between gas content and other parameters that will enable indirect assignment of gas content to those lithologies not tested. The main relationships are: gas content and depth, gas content and mineral matter, and gas composition and depth.
Lateral changes in these parameters need to be defined and controls also identified (e.g., faulting can influence the distribution of carbon dioxide). The extent to which these relationships are defined determines the amount of sampling required.
Regardless of how good or bad the relationship ends up being, any particular value assigned to a gas-bearing rock should have a probability distribution associated with that value. GeoGAS modelling of gas emission uses a statistical modelling package called @RISK, where uncertain inputs are defined in terms of proba-bility distributions. The model presents outputs as means and probability distributions, and a sensitivity ranking of the contribution of each input to the output distribution.
The point is more about knowing how the spread of gas content data affect the final calculation (i.e., input into a mine feasibility or pre-feasibility study), and how important gas is to the particular circumstance. If gas content value uncertainty is shown to be a major
contributor to assessment uncertainty, then the next stage of drilling can be more focused to overcome these deficiencies.
With slow desorption tests, assumptions need to be made about the gas content variability and a rigid sampling program put in place. By the time the results are available, it would generally be too late to make any adjustments to the sampling strategy, at least in the current drilling phase.
Fast desorption testing opens up the possibility of rationalising the sampling program during the current drilling campaign. For example, boreholes for gas content testing could be drilled on a wide spacing (say 4 km) and depth/gas content gradients for each borehole compared. The results could then influence the pattern of fill-in drilling for gas content testing.
A more common approach is to limit the extent of sampling according to the budgetary constraints. With fast desorption testing and an 'on the fly' sampling strategy, the opportunity is created to define the gas content and composition distribution with the smallest number of samples.
Note that slow desorption testing (Q1+ Q2 only), is inappropriate due to scatter and error in the results. The author believes that compromising gas content testing by testing only Q1+ Q2, because of the need to keep the core intact, is not acceptable.
All other forms of testing to define Q1+ Q2+ Q3 result in partial core destruction. Options to get around this limitation are to:

38 R. W. WILLIAMS
• Test the non-economic coal horizons for gas content and composition, and leave the economic horizons for coal quality testing. This option only applies if there are sufficient minor coal seams in the sequence.
• Dedicate some boreholes to gas content testing, or wedge off to obtain a separate coal-quality core.
The second option is clearly preferable. While wedg-ing off is more costly, in the end the better data should represent value for money. If sample rationalisation strategies can be made to work, then the overall cost to define the gas content and composition distribution should be reasonable.
DEFINITION OF THE GAS RESERVOIR SIZE
For longwall mining, quantification is required of gas sources between 200 m above and 60 m below the working seam. Any carbonaceous material can generate gas, so gas content values need to be assigned to all the potentially gas-bearing materials present.
In using gas content data for gas reservoir defmition, the effect of mineral matter must be taken into account. Gas content test results are normally expressed in units of m3/t (m3 of gas per tonne of substance). If the material is always pure coal the gas content results can be used directly, but this almost never occurs.
With variable proportions of mineral matter, expressing the results in m3 /t becomes meaningless (m3 of gas per tonne of what?). It is important that each gas content determination have an associated rock density measurement. This facilitates conversion of the gas content data from m3/t to m3/m3 (m3 of gas per m3 of material). In this form it is usable: for example, a shaly coal unit with a gas content of 5.0 m3 /t and a relative density of 1.6 g/cm3 will have a gas content in m3/m3 of 5 x 1.6 = 8.0 m3/m3.
In most studies, good quality coal is targeted for testing. This is satisfactory, provided inferior coals
make up only a small proportion of the total sequence. Where inferior coals are significant (such as in the Wongawilli seam), it is important to test a range of lithologies (carbonaceous shale, coaly shale, shaly coal, coal) and define a gas content/mineral matter relation-ship.
This type of analysis is facilitated by 'bombing' relatively uniform samples, e.g., intervals that are all coaly shale or all carbonaceous shale. Mixtures are sometimes unavoidable and can be accommodated. However, they also require more extensive laboratory tests, which involve: • Defining and weighing each petrographic type; • Sub-sampling and crushing samples of each type; and • Calculating weighted average gas contents and
densities for the combined material.
It is also essential to exclude any material that does not contribute gas, such as claystone bands.
For situations where only coal has been subjected to gas content testing, these can be estimated for associated carbonaceous strata by measuring their density and calculating the gas content.
Consider, for example, a coal with a gas content of 5.0 m3 /t and a density of 1.35 g/cm3, and an untested carbonaceous shale unit with a density of 1.9 g/ cm3. The density for zero gas content is (say) 2.4 m3 /t (GeoGAS has recorded from 2.2 to 2.6 g/cm3). The gas content of the carbonaceous shale can be calculated as a point on the straight line defined by the coal gas content and density (xl, yl), and the point at zero gas content and 2.4 g/cm3 density (x2, y2). The estimated carbon-aceous shale gas content thus becomes 2.4 m3 /t.
In calculating the gas reservoir size, data on the gas content gradient with depth and gas content in relation to mineral matter are required. These are combined with stratigraphic logs to assign gas contents for all potentially gassy materials, complete with probability distributions reflecting the level of uncertainty in the data.
Take, for example, the following sequence:
Lithology Directly measured
Depth base (m)
Thickness (m)
Q1 +Q2 +Q3 (m3/t)
Ql +Q2 +Q3 (m3 /m3 )
Ql +Q2 +Q3 (113/ m2)
i.e. /stratum
Carb. Shale No 190.0 2.6 N/A 2.4 6.24
Coal Yes 192.6 0.5 5.0 6.75 3.38
Claystone No 192.7 0.1 N/A 0 0
Coal Yes 193.7 1.0 4.7 6.34 6.34
Sandstone No 205.0 11.3 N/A N/A (1)
(1) Defined in m3/ m2 units according to porosity and gas pressure.
A more detailed account of this approach is given by Williams and Maddocks (1993).

GAS CONTENT DATA AND EVALUATION OF GAS EMISSION AND HAZARDS 39
APPLICATION TO MINING
The gas desorption rate has direct application in situations where the coal has become detached from the rock mass, as in instantaneous outbursts and in gas emission from coal blocks in the goat'. The GeoGAS DRI is an important indicator of outburst susceptibility, enabling risk assessments to be carried out in the pre-mining stage. For low permeability environments (say, <5 millidarcies), a GeoGAS DRI of >900 indicates an outburst-prone zone. The reader is referred to Williams and Weissman (1995) for details on how desorption rate affects outburst risk.
To estimate the rate of gas desorption from goaf, GeoGAS has developed a crushing test. This measures the rate of gas desorption of coal core under conditions of complete exposure to air, exposure to air and seam gas, saturated moist, and dry conditions. These data are then used to model the effect of different goaf block sizes (in collaboration with Dr. A. Saghafi, CSIRO Division of Coal and Energy Technology).
With more emphasis being placed on spontaneous combustion control, the rate of gas desorption is becoming more important in gauging the time taken for the gas in a newly-sealed goaf to pass into and out of the explosive range. Too low a gas content could result in a goaf gas mixture that remains in the explosive range for an unacceptably long period (Andrew Self, Australian Coal Mining Consultants Pty. Ltd., pers. comm.).
Longwall gas emission is a highly complex process, and models that describe the emission process rely heavily on empirical data. GeoGAS uses three approaches to this problem:
• For greenfield sites with no mine access: Longwall-specific emission is initially calculated. This model is an advance on traditional European methods, in that the zone of degassing considers desorption pressures and varying longwall geometries. Nonetheless, this static value has then to be related to production by coefficients derived from past longwall panels, which ideally have similar features to the one being evaluated. The approach and its limitations are described by Williams, Maddocks and Gale (1992). Its accuracy is poor, so results are given in terms of probability distributions utilising @RISK modelling.
• For accessible mines with no previous longwalling: A longwall emission model is essentially custom-built, taking into account the various gas sources that make up the total picture. At this level, more accurate definition is given of gas quantities and concentrations at different positions around the longwall. This includes differentiating intake gas, gas from different sources within the goaf, and gas emitted during cutting. The accuracy should be good, but has not been tested as yet. Extensive use is made of probability distributions using @RISK modelling.
• For mines with previous longwall experience: Provided a high standard of gas emission monitoring
has been undertaken, empirical relationships are readily established. These link return gas con-centration to the main variables of production rate, ventilating air and gas capture, as described by Williams, Maddocks and Gale, (1992). Provided there are no significant geological changes (and such a situation frequently occurs), the results can be highly accurate (e.g., for Tahmoor Colliery, as described by Williams, 1991). Again, probability distributions using @RISK modelling are relevant.
Basic to all these models are detailed assessments of the gas reservoir size along the longwall panel. Marked changes can occur in stratigraphy, gas content and composition, resulting in conditions at the start of a longwall being very different to those at the end.
Gas reservoir simulators that model the fundamental characteristics of migration through coal are directly applicable to assessment of rib emissions and design of gas drainage. Apart from gas content and composition data, model input includes permeability, relative gas/ water permeability curves and gas sorption pressures (Meany et al., 1995). Permeability and relative permeability can be derived from surface borehole well tests, with relative permeability determined from curve-matching well test data using a gas reservoir simulator (eg SIMED II) or laboratory testing (Meany and Paterson, 1996).
Water has an enormous effect on the rate of gas flow from a reservoir. The relative permeability curves enable modelling of this effect. Nonetheless, for a greenfield site, a high level of uncertainty remains. Measurements from within operating coal mines frequently show a high variability in gas flow and residual gas contents, reflecting changes in permeability and relative permeability (apart from more direct causes such as partially collapsed boreholes).
For gas drainage and ventilation design an approach used by GeoGAS involves: • Drilling wide (say 100 m) spaced in-seam boreholes,
and taking a profile of cores for gas content determination along their length. The rib should be old enough that the gas content profile reflects its state of degassing. Tests can be carried out in orthogonal boreholes, to measure the effect of directional permeability due to cleating or stress effects.
• Measuring the gas flow history from the test bore holes.
• Defining the history of rib emission (ideally measured prior to drilling the test borehole).
• Modelling the measured gas content profile using curve matching in SIMED II.
• Validating the model by using it to define the gas flow rates from the borehole and the rib emission rates. If the measured and simulated results differ, changes to the permeability and relative permeability flows are required until all three independent sets of data can be modelled.
Having developed the model, runs can then be made assessing the effect of different hole spacings and

40 R. W. WILLIAMS
drainage times on the remaining gas content. For an operating mine requiring gas drainage, it is
necessary to balance borehole spacings with the drainage time allowed by the mine plan, in an environ-ment where gas content and composition may be changing laterally. Most mine layouts do not allow for these changes; drillholes are at a set spacings, regardless of the drainage time available or changes in gas content.
GeoGAS use another program called GASTOT, primarily as a planning aid for gas drainage, extraction plant design and gas utilisation. This program draws on a database, built mainly from SIMED II simulation data, of all the possible combinations of gas content, gas composition and hole spacing applying to the deposit. On entering the mining and drilling schedule on a panel by panel basis, the model is run, a process involving 'drilling' every borehole over what could be the life of the mine and totaling the gas drained. Results are given in terms of gas quantity and quality to the gas extraction plant, and remaining gas content in the coal. Areas where the remaining gas content is still too high can be flagged, and the mine plan adjusted accordingly.
Gas content data used in SIMED II models use Total Desorbable Gas Content (Q1 + Q2+ Q3) recalculated to zero absolute pressure (i.e., Q1 + Q2+ Q3+ Q4) with the aid of gas sorption isotherms, where Q4 is that com-ponent of gas content between 1 bar and 0 bar absolute. The importance of determining Total Desorbable Gas Content, rather than just Desorbable Gas Content (Q1 + Q2), is reinforced in this application.
CONCLUSIONS
Assessment of gas reservoir size and distribution is another aspect of resource definition that can be well overseen by the coal exploration or mine geologist. Geological training provides a sound basis for under-standing the controls on gas distribution, and for designing sampling and testing strategies to suit the particular situation.
Conflicting requirements for coal drill core testing may cause the geologist to cut the gas content testing short, either through shortened desorption or by not
measuring residual gas content (Q3). The author em-phasises that testing only for Desorbable Gas Content (Q1+ Q2) may compromise later use of the data. With the increasing importance of gas in mining, such testing (Q1+ Q2) would rarely be acceptable. With appropriate sampling strategies, there should be sufficient material for bore core testing and determination of Total Desorbable Gas Content.
Fast desorption methods are clearly preferable. The advantages over slow desorption are: greater accuracy in gas composition assessment; the potential to rationalise sampling; faster turnaround involving less equipment; finalisation of geological logs; and earlier availability of the data. Q3 can still be differentiated. A more sensitive indicator of gas desorption rate (the Desorption Rate Index, or DRI) is incorporated in GeoGAS's fast desorption method.
REFERENCES
MEANY K. & PATERSON L. 1996. Relative permeability in coal. 1996 SPE Asia Pacific Oil and Gas Conference, Adelaide.
MEANY K., PATERSON L., STEVENSON M. D. & PINCZEWSICI W. V. 1995. Advance in coal seam reservoir simulation for mine gas drainage. International Symposium cum Workshop on Management and Control of High Gas Emissions and Outbursts, Wollongong.
WILLIAMS R. J. 1991. Carbon dioxide and methane emission at Tahmoor Colliery. Symposium on Gas in Australian Coals, eds Bamberry W. J. & Depers A. M. , University of New South Wales, 4-5 February, 1991. Geological Society of Australia Symposium Proceedings 2,141-155.
WILLIAMS R. J. & MADDOCKS P. I. 1993. On gas content testing and data reduction. Symposium on New Develop-ments in Coal Geology, Geological Society of Australia Coal Geology Group, Brisbane.
WILLIAMS R. J., MADDOCKS P. I. and GALE W. J. 1992. Longwall gas emission modelling. Symposium on Coal Bed Methane Research and Development in Australia, Townsville. •
WILLIAMS R. J. & WEISSMAN J. J. 1995. Gas emission and outburst assessment in mixed CO, and CH, environ-ments. ACIRL Underground Mining Seminar, Brisbane, September 1995.

Symposium on Geology in Longwall Mining, 12-13 November 1996, eds G. H. McNally and C. R. Ward, pp 41-46.
The influence of coal composition on gas emission rates and some implications on mining in the southern Sydney Basin
M. M. FAIZ1, N. I. AZIZ2 AND A. C. HUTTON2
CSIRO Petroleum /Australian Petroleum Co-operative Research Centre. University of Wollongong.
Methane and carbon dioxide emission rates were determined for 11 coal chip samples from the Bowen and Sydney Basins. The'results indicate that gas emission rates are directly proportional to the initial gas content, ash yield and vitrinite content of the coal. Coals rich in mineral matter have a high gas emission rate because they are rich in macro-pores. Vitrinite-rich coals have a high emission rate due to the presence of more interconnected fractures than in inertinite-rich coals. These variations in coal and gas compositions are likely to have marked influence on the gas drainage rates in coal mines.
INTRODUCTION
Longwall mining problems are influenced by many factors, including stress, roof and floor lithologies, geological structure and the presence of gas. High gas emission in coal seams has been one of the most detrimental factors to longwall mining in Australia. Many underground mines contain a mixture of methane and carbon dioxide in the coal seams. Methane in the coals of the Bowen and Sydney Basins was formed as a by-product of coalification, and by the bacterial alteration of carbon dioxide and higher hydrocarbons since the Late Cretaceous (Smith and Pallasser, 1996; Faiz, 1996). Where carbon dioxide is a significant component of the seam gas (>10%), it is associated with post-Jurassic igneous activity (Smith et al., 1984; Faiz and Hutton, 1995).
The two main mining problems caused by the presence of high gas contents are the increased ventilation requirements and the risk of outbursts. In many cases the rate of gas release from coal largely determines the intensity of the outburst. The rate of gas released depends on the its pressure, gas content, coal type and micro-structure. A clear understanding of these factors is required for the implementation of cost-efficient ventilation and gas drainage systems. This paper discusses the results of laboratory gas desorption tests conducted on a suite of Bowen and Sydney Basin coals, and compares these results with gas emission rates from exploratory boreholes in the southern Sydney Basin.
GAS STORAGE IN COAL
More than 90% of the gas in coal is stored as sorbed molecules on the micro-pore (diameter <2 nm) surfaces. A small proportion occurs as free gas within the macro-pores and fractures. The amount of gas sorbed in coal generally increases with pressure and
decreases with temperature. The sorption capacity of coal also depends on the type of gas. In general, coal can sorb 2 to 3 times more carbon dioxide than methane (Figure 1; Faiz et al., 1992). The influence of maceral composition of coal on the gas contents has been extensively discussed in the literature (Ettinger et al., 1966; Faiz and Cook, 1991; Beamish and O'Donnell, 1992; Faiz et al., 1992; Lamberson and Bustin, 1993; Crosdale and Beamish, 1995), although the conclusions of these works are in disagreement.
In general, laboratory experiments indicate that vitrinite sorbs more gas than inertinite for coals in most regions. In contrast, borehole desorption data do not indicate any strong correlation between the desorbable gas content and the maceral composition of the coal (Faiz, 1993). Both laboratory sorption and borehole desorption data show that the amount of gas stored in coal is inversely proportional to the mineral matter content (Faiz and Cook, 1991; Faiz et al., 1992).
EXPERIMENTAL METHODS
Methane and carbon dioxide sorption and desorption for 11 coal samples, comprising six samples from the southern Sydney Basin and five samples from Bowen Basin mines, were investigated using a high-pressure gravimetric method as described by Lama (1982). The sample locations and their petrographic composition are listed in Table 1. The experiments were conducted at 25°C using samples under equilibrium moisture conditions. Samples of approximately 150 g, with particle sizes of 2.5 mm to 4.5 mm, were used for the experiments.
Initially the samples were placed in aluminium containers and evacuated for one week. They were then pressurized with gas up to 4100 kPa. When the samples had equilibrated at the required pressure, the gas was released from the bombs and the weight changes were recorded automatically to determine the volume of gas

101
• 24 A
.18.2 • N 9,
.7.3
▪ 8.2
16.2 a • 10.6 12.21 9.6 • 4 . 8
42 M. M. FAIZ ETAL.
30
IF) 25 T-2
E 20
-Cs (o 15 4:2 0 co 10 CO C9 5
1000 2000 3000 4000 5000 0
Pressure (kPa) 0 500 1000 1500 2000 2500 Time (s)
(Thousands)
-.- CO2 1 -0- CH4 s,
T-2
Figure 1 Methane and carbon dioxide sorption curves at 25°C for sample T-2.
desorbed. Examples of methane and carbon dioxide desorption curves are illustrated in Figure 2.
GAS DESORPTION RATES
The movement and subsequent release of gas through coal can be modelled using two distinct stages:
• Diffusion through the micro-pore network; and
• Free flow through macro-pores, including fractures.
Initially, gas sorbed within the coal diffuses through the micro-pore system until it reaches macro-pores; it subsequently flows freely along these macro-pores down a pressure gradient. Diffusive flow of gas through coal is described by Fick's Law (Mahajan and Walker, 1978). It is a very slow process compared to free flow along macro-pores, which is described by Darcy's Law.
Airey (1968) developed an empirical equation, based on Darcy' s Law and incorporating a mathematical model which included a fracture system, to describe desorption during extended periods:
Vt = V, [l—exp(-(t / T)n)1
where t = time Vt = the volume of gas desorbed from coal
at time t, Ve = total gas content, and
n, T = emission constants.
When t is small the emission equation can be simplified to the following form:
Vt = V, (t / T)n, or
InVt = ln(Ve / Tn)" + nlnt
A plot of InV, against Int gives a straight line. The value of T, which is related to the rate of gas desorption, can be calculated from the gradient and intercept. In order to determine the initial gas desorption rates from
T-2
1000 1500 2000 2500 3000 3500 Time (s)
(Thousands)
Figure 2 Methane and carbon dioxide desorption curves for sample T-2.
•
• •
• •
• •
10 20 30 Ash yield (% weight)
Figure 3 Relationship between gas emission rates and ash yield.
8 10 12 14 16 18
Initial gas content (cnhg)
Figure 4 Relationship between gas emission rates and gas content (ash yields for the samples shown adjacent to marker).
25
20
15
o 10
5
0 500
0.4
04
CO
, 0.3
0.2CO CO

THE INFLUENCE OF COAL COMPOSITION ON GAS EMISSION RATES IN THE SYDNEY BASIN 43
Table 1 Petrographic and proximate analysis data for the samples.
Sample Number
Basin V Rvmax IM Ash VM FC
T-2 Sydney 33.4 57.6 0.5 8.5 1.11 1.0 16.2 21.7 60.8 CD-1 Sydney 23.9 70.8 tr. 5.3 1.27 1.0 8.2 20.0 70.8 MP-1 Sydney 21.6 70.5 tr. 7.9 1.35 1 12.2 18.4 68.4 MP-2 Sydney 40.2 54.4 tr. 5.3 1.38 1.0 9.6 19.6 69.8 TH-1 Sydney 40.8 53.4 2.1 3.7 1.044 1.3 7.3 26.1 65.3 W-1 Sydney 57.8 27.7 tr. 14.5 1.27 1.0 24.4 18.9 52.7 CK-1 Bowen 74.5 14.5 1.7 9.3 1.04 1.6 10.6 30.0 57.8 G-1 Bowen 53.0 23.9 2.9 20.2 0.93 1.4 18.2 27.4 53.0 GK-1 Bowen 80.7 16.1 tr. 3.3 1.42 0.9 4.8 22.2 72.1 NP-1 Bowen 82.8 11.1 tr. 6.1 1.67 1.1 10.1 16.6 72.2 PD-1 Bowen 55.1 37.1 0.2 7.6 1.32 1.2 9.7 22.9 66.2
V - vitrinite, I - inertinite, L - Liptinite, M - minerals, IM - inherent moisture, A - ash yield VM - volatile matter, FC - fixed carbon, Rvmax - mean maximum reflectance of vitrinite, tr. - traces NOTE Proximate analyses data on air-dried basis.
Table 2 Emission constant (Tk) for early desorption.
Sample Number Methane
Tk (hours) Carbon dioxide
MP-2 14.0 CD-1 65.7 4.5 GK-1 16.0 3.6 W-1 6.9 4.1 MP-1 20.0 TH-1 32.5 4.7 G-1 17.0 CK-1 13.1 NP-1 10.0 T-2 12.9 3.3 PD-1 19.7
NOTE Initial pressure for CH4 desorption from samples CD-1 and GK-1 was 3100 kPa, and for the other samples it was 4100 kPa.
coal, the value of T was calculated for the first hour of desorption (Tk). In this study the value of the emission constant Tk was used to compare the desorption times of coals and then relationships to coal composition.
At an initial pressure of 4100 kPa, the value of Tk for methane with the coal samples tested ranged between 6.9 hours and 32.5 hours; for carbon dioxide it was between 3.3 hours and 4.7 hours (Table 2). It therefore appears, at a given pressure, that early gas desorption rates are significantly higher when the coal is saturated with carbon dioxide rather than with methane.
Variations in gas desorption rates for coal are dependent on particle size, temperature, pressure, gas content and the nature of the atmosphere into which the gas is released (Nandi and Walker, 1975; Creedy, 1985). The experiments in the present study were
conducted under conditions of constant temperature, initial pressure and particle size, and the gas was released to the atmosphere. Therefore, the variations in desorption rates should primarily be controlled by the coal properties and the gas content.
Plots of the inverse square root of the emission constant (1/ 'VTk), which reflects the early emission rate, against the ash yield and initial gas content (Figures 3 and 4) show that the emission rate is generally high for coals with a high ash yield and initial gas content. Figure 5 clearly indicates that the gas emission rate is directly proportional to the telovitrinite content and inversely proportional to the semifusinite content. The coals examined in this study were generally low in fusinite and liptinite, and the effect of these macerals on the gas emission rates is not clear. Creedy (1985), however, has indicated that, for British coals, the gas desorption rate increases with increasing fusinite content.
The multivariate regression between the standardized variables of gas emission rates and the coal composition is shown in Equation 1.
(1 Mk) = 0.929Q + 0.277V + 1.21A ... (1)
where n = 11 R2 = 90.4%
= initial gas content; V = vitrinite; A = ash yield.
Equation 1 indicates that the gas emission rate increases with mineral matter (ash yield), gas and vitrinite contents. The influence of mineral matter appears to be considerably higher than that of gas and vitrinite contents.
Larger emission rates in coals with high mineral content can be attributed to the occurrence of high volumes of macro-pores (Faiz et al., 1992) which

•
•
• •
•
Bulli seam
30
66 20
5. a.
•9"
0 20 40 60
Mean Median
3.1days 2.4 days
0.4
0.4
0.3 -
0.2 -
0.1 -
•
C's4 UI •
•
60 20 40
Semifusinite (% volume) 2 3 4 5 6 7 8 9 10 11 12 Tic (days)
44 M. M. FAIZ ET AL.
40
4 5 6 7 it 9 10 11 12
Telovitrinite (% volume) lk (days)
Figure 5 Relationship between methane emission rates (1 / Tk)", and maceral composition.
Figure 6 Frequency distribution histograms of gas emission constant (Tk) for Bulli and Wongawilli Coal core samples.
• facilitate gas movement. The difference in the gas desorption rates between vitrinite and inertinite is largely related to the fracture properties of these macerals. The higher desorption rates in vitrinite-rich coals are primarily due to a high frequency of interconnected fractures in vitrinite compared with inertinite (Faiz, 1993). Furthermore, of the vitrinite subgroups, telovitrinite imposes the greatest influence on gas emission rates. The telovitrinite usually occurs as distinct homogeneous bodies, or as weak layers which contain extensive networks of interconnected fractures relative to detrovitrinite.
Crosdale and Beamish (1995), who studied the maceral effects on methane diffusivity of some Bowen Basin (Central Colliery) and southern Sydney Basin (South Bulli Colliery) coal samples, report contradictory results. In the Bowen Basin coals methane diffusivity was higher in inertinite-rich coals compared to vitrinite-rich coals. This was attributed to the presence of larger proportions of open cell lumens in the inertinite maceral compared with vitrinite. In contrast, Crosdale and Beamish (1995) reported that the southern Sydney Basin coals have no significant differences in the diffusivity between the vitrinite and inertinite groups.
GAS DESORPTION RATES FOR COAL BOREHOLE CORES
Gas emission rates were calculated for 101 cores from exploration boreholes through the Bulli and Wongawilli seams in the southern Sydney Basin (Figure 6). The Tk values for these samples were highly variable, ranging from about 200 minutes to 11 days. The emission rates of Bulli and Wongawilli coals were not greatly different, although the mean Tk value for the Wongawilli seam samples was fractionally lower than for the Bulli seam samples. Wongawilli seam coal contains considerably more vitrinite and mineral matter than Bulli seam coal. Therefore, for equivalent gas contents, the gas emission rate for coal from the Wongawilli seam is expected to be higher than that for Bulli seam coal. In many parts of the southern Sydney Basin, the carbon dioxide content of the Bulli seam is higher than that of the Wongawilli seam, and as a result the total gas content of the Bulli seam is also higher. In such areas, as a result of the higher gas contents, the gas emission rate for the Bulli seam may be greater than that for the Wongawilli seam.

THE INFLUENCE OF COAL COMPOSITION ON GAS EMISSION RATES IN THE SYDNEY BASIN 45
GAS EMISSION RATES AND THE LOST GAS DURING GAS CONTENT MEASUREMENTS
Gas content determination of coal samples from boreholes involves one estimated and two measured components. These are: • Lost gas (Q1), • Desorbable gas (Q2) and • Residual gas (Q3).
Q1 is the volume of gas lost from the sample between the time it is drilled and when it is enclosed in a canister for measurement of Q2. Q1 is estimated by extrapo-lating the initial part of the desorption curve, obtained during the measurement of Q2, to zero time. For coal from the southern Sydney Basin, Q1 varies from <1% up to 60% of the total gas, with a mean value of about 13% (Faiz, 1993).
Errors in the determination of Q1 can significantly affect the accuracy of the measured total gas content. The value of Q1 is primarily influenced by the time elapsed between removing the sample from its in situ position and enclosing it in the canister, and by the gas emission rate of the coal. Therefore, for a given length of time, Q1 is likely to be greater for samples high in vitrinite and mineral matter than for those high in inertinite and low in mineral matter. Highly fractured coals, such as those from near faults, can also have high Q1 values irrespective of the coal's composition.
COAL COMPOSITION AND GAS DRAINAGE EFFICIENCY
Drainage of gas from coal seams prior to mining is common practice in coal mines. The efficiency of gas drainage is largely dependent on the gas desorption rate. Highly banded seams such as the Bulli seam can have large inter-ply variations in gas drainage rates. According to Lama (personal communication, 1996) drainage of gas from the topmost plies of the Bulli seam in the West Cliff mine is much more difficult compared to drainage from the lower plies. A possible explanation for this variation is that, in most parts of the southern Sydney Basin, the topmost plies of the Bulli seam are enriched in inertinite compared to the lower plies, which are vitrinite-rich. The gas emission rates for inertinite-rich coals as observed in laboratory experiments are low, and therefore draining gas from the upper plies of the • Bulli seam can be a very slow process.
Spatial variations in maceral composition along the seam can also affect the gas drainage rates for various sections of a mine. In the southern Sydney Basin, the Bulli coal is relatively high in inertinite over structural highs (for example the Bulli, Kemira and Woronora Anticlines) compared with structural lows (Cook and Johnson, 1975). Therefore, draining of gas from the Bulli seam in anticlines (for example the north-eastern part of West Cliff mine, which approaches the Woronora Anticline) can be considerably more demanding than in the synclines.
CONCLUSIONS
The gas emission rate of coal is significantly influenced by its composition. At a given pressure and gas content, coals rich in vitrinite and mineral matter generally emit gas at higher rates than those rich in inertinite. These differences can influence the value of Q1 and the accuracy of total gas content determinations. Due to variations in maceral composition in coals of the southern Sydney Basin, drainage of gas from the uppermost plies of the Bulli seam and from structural highs is likely to be a very slow process.
ACKNOWLEDGMENTS
Borehole gas desorption data used for the calculation of emission rates were provided by Kembla Coal and Coke Ltd. Coal samples used for laboratory experiments were obtained-from-Cordeaux, Kemira, Metropolitan, West Cliff and Tahmoor mines in the Syndey Basin and from Cook, German Creek, Norwich Park and Peak Downs mines in the Bowen Basin. We thank the management and geologists of these companies and mines for their assistance. Dr. Neil Sherwood is thanked for his useful comments and for critically reviewing the manuscript.
REFERENCES
AIREY E. M. 1968. Gas emission from broken coal, an experimental and theoretical investigation. International Journal of Rock Mechanics and Mining Sciences 5, 475-494.
BEAMISH B. B. & O'DONNELL G. 1992. Microbalance appli-cations to sorption testing of coal. Symposium on Coalbed Methane Research and Development in Australia 4, James Cook University, Townsville, 31-44.
COOK A. C. & JOHNSON K. R. 1975. Seam thickness, quality and structure variation in the Bulli Coal, Sydney Basin NSW. Australasian Institute of Mining and Metallurgy,
. South Australia Conference 1975, 537-550. CREEDY D. P. 1985. The origin and distribution of firedamp in
some British coalfields. Ph.D. Thesis, University College, Cardiff:
CROSDALE P. J. & BEAMISH B. B. 1995. Methane diffusivity at South Bulli (NSW) and Central (Old) Collieries in relation to coal maceral composition. In Lama R. D. ed. Proceedings of the International Symposium-cum-work-shop on Management and Control of High Gas Emissions and Outbursts in Underground Coal Mines, Wollongong NSW, 363-367.
ETTINGER I., EREMIN I., ZIMAKOV B. & YANOVSKAYA M. 1966. Natural factors influencing coal sorption properties: 1 — Petrography and sorption properties of coals. Fuel 45, 267-275.
FAIZ M. M. 1993. Geological controls on the distribution of coal seam gases in the southern Sydney Basin. PhD thesis, University of Wollongong, 326pp.
FAIZ M. M. 1996. Gaseous hydrocarbons in the southern Sydney Basin. Proceedings of the 30th Newcastle Sym-posium, University of Newcastle NSW, 175-182.
FAIZ M. M. & CooK, A. C. 1991. Influence of coal type, rank and depth on the gas retention capacity of coals in the Southern Coalfield, NSW. In Bamberry W. J. and

46 M. M. FA1Z ET AL.
Depers A. M. eds. Gas in Australian Coals. Geological Society of Australia Symposium Proceedings 2, 19-29.
PAIZ, M. M. & HUTTON, A. C. 1995. Geological controls on the distribution of CH4 and CO2 in coal seam gas of the Southern Coalfield NSW Australia. In Lama R. D. ed. Proceedings of the International Symposium-cum-workshop on Management and Control of High Gas Emissions and Outbursts in Underground Coal Mines, Wollongong NSW, 375-383.
PAIZ, M. M., AZIZ N. I., HUTTON A. C. & JONES B. 1992. Porosity and gas sorption capacity of some eastern Aus-tralian coals. Symposium on Coalbed Methane Research and Development in Australia 4, James Cook University, Townsville, 9-20.
LAMA R. D. 1982. Adsorption and desorption of mixed gases on coal and their implications in mine ventilation. Proceeding of the 4th International Mine Ventilation Congress, Brisbane, 161-174.
LAMBERSON M. N. & BUSTIN R. M. 1993. Coalbed methane characteristiscs of Gates Formation coals, northeastern British Columbia: effect of maceral composition. American Association of Petroleum Geologists Bulletin 77, 2062-2076.
MAHAJAN 0. P. & WALKER P. L. 1978. Porosity of coal and coal products. In Karr C. ed. Analytical Methods for Coal and Coal Products I. Academic Press, New York, 125-162.
NANDI S. P. & WALKER P. L. 1975. Activated diffusion of methane from coals at elevated pressure. Fuel 54, 81-86.
Small J. W. & PALLASSER R. 1996. Microbial origin of coalbed methane. American Association of Petroleum Geologists Bulletin 80 (6), 891-897.
Smrrx J. W. BOTZ R. W., GOULD K. W., HART G. H., HUNT J. W. & RIGBY D. 1984. Outburst and gas drainage investigations. National Energy Research Development and Demonstration Program, Final Report 321.

Figure 1 Location of Appin Colliery and adjacent BHP colliery holdings, southern Sydney Basin.
Symposium on Geology in Longwall Mining, 12-13 November 1996, eds G. H. McNally and C. R. Ward, pp 47-53.
Geological factors influencing longwall gas emissions at Appin Colliery
A. N. OGDEN AND J. WOOD
Technical Services Department, Collieries Division, BHP Australia Coal.
Efficient gas management is the key to successful longwall production of the Bulli seam at Appin Colliery. In the past, up to 20% of the total time available for longwall extraction was lost due to cross-measure gas emissions. The processes involved in triggering the sudden release of gas onto a longwall face and those controlling gas migration are poorly understood. However, stratigraphic and geological variations are considered to be an integral part of these processes. Carbon isotope ratios have fingerprinted the Wongawilli seam, and possibly the Tongarra seam, as the major source of gas emissions causing longwall delays.
To date, cross-measure drainage at Appin Colliery has therefore targeted the Wongawilli seam. Borehole integrity and drainage efficiency have been hampered by blockage horizons, intersecting faults, minor seam flexures, disturbed zones, stress loci and low permeability. Greater geological control, improved drilling techniques and an understanding of the prevailing stratigraphic, structural and geomechanical environment have increased gas capture from cross-measure drainage holes. These have enabled drilling patterns to be tailored towards maximum gas drainage and the most efficient use of drilling resources.
Continued improvements are expected to effectively reduce the gas reservoir response to mining, especially in the Wongawilli seam, and to reduce the 'down time' attributed to longwall gas emissions, resulting in improved rates of production.
INTRODUCTION
The problem of excessive gas emissions resulting in longwall production delays is not new to the mining industry, and is the primary focus of Appin Colliery's Gas Emission Study. Since 1994, the Collieries Division has investigated various aspects of gas emissions in terms of ventilation, gas drainage, geological and geomechanical mechanisms, in order to reduce the risk associated with methane gas during longwall extraction and to improve gas drainage efficiency. This paper will discuss the geological factors influencing longwall gas emissions at Appin Colliery.
Gas emissions are geologically controlled, and are indirectly influenced by the gas composition and modifications to the gas reservoir in response to mining. The penetrative nature and geometry of pre-existing structure and the effect of goaf formation are integral to predicting likely sites for gas emission. It is now possible to target areas for maximum drainage effort.
BACKGROUND
Appin Colliery is located 37 km north-west of Wollongong and is one of four longwall mines owned and operated by BHP Australia Coal, Collieries Division, in the NSW Southern Coalfield, as shown in Figure 1. The longwall panels at Appin are typically 200 m wide by either 2 km or 1 km, and extract a 2.3 m thick Bulli seam section at depths to 500 m. The Bulli seam in a pre-mined state typically contains 13 m3 of gas per tonne of coal. This is predominantly methane, although in some localised and structurally-controlled

48 A. N. OGDEN AND J. WOOD
GROUP FORMA-DON AND MEMBER lay THICK GRAPHIC
WIANAMATTA GROUP 0-5
WAYKESBURY
SANDSTONE 1E15
Newport Formation 11 Gone Formation 3 .
Bold Hill Cloystone 22
BuIgo Sandstone 175 NARRABEEN
GROUP
Stonwell Park Claystone 1
Scarborough Sandstone 39
Wombarra Claystone 40
Coaleliff Sandstone 10
ULU COAL 2 Unnamed Member 1 7
ILLAWARRA
BALGOWNIE COAL MEMBER 1 • • • • • ::::: :::::: :— — — .
Lawrence Sandstone 15 CAPE HORN COAL MEMBER'
1
0.3 Unnamed Member 2 3 __—
Ai HARGRAVE COAL MEMBER Q1 COAL Unnamed Member 3
MEASURES WONGAWILLI COAL 10 Nlimmi
Kemblo Sandstone 10 Mans Creek Formation 11 ....N. .e-- . Appin Formation 33 "•••.. — 1OFIGARRA COAL 1 . ..
'TIE'larakigitws. Imninni aCreol was penetrated Appin
Vali: occurred. — — — --------:
Figure 2 Generalised stratigraphic column for the Appin Colliery area.
areas up to 70% carbon dioxide has been encountered. In-seam drainage prior to longwall extraction reduces this gas content to less than 4 m3/t in most cases.
The Appin colliery holding is transected by minor seam folding and numerous strike-slip faults trending southeast to northwest. A generalised stratigraphic column is shown in Figure 2. The stratigraphy varies throughout the holding, with the Wongawilli seam varying from 20 m to 30 m below the Bulli seam over the length of a single longwall panel.
LONGWALL GAS EMISSIONS
The management at Appin Colliery is committed to maintaining gas concentrations in the mine airways below legal limits, and to limiting potential ignition sources on and around the longwall face, as outlined in the colliery's Longwall Management Plan. Prior to LW26 panel, up to one-fifth of the time available for extraction was lost due to gas emissions on the longwall face or in return airways exceeding the statutory limits. Cross-measure drainage has now greatly reduced the ventilation impact of these gas emissions.
Methane concentrations are monitored at various
locations in the gateroads and on the longwall chocks. In accordance with the Collieries Longwall Manage-ment Plan, production ceases on a 'precautionary delay' when methane concentrations reach 0.9% on the face and/or 1.9% in the return airway. If this exceeds 1.25% on the face and/or 2% in the return prior to isolating power to the face, then a 'gas out' is recorded. No delays have been caused by carbon dioxide so far. Effective management can also significantly reduce the risk of ignition and is achieving less than 1% of gas delays in the 'gas out' category.
GAS DRAINAGE
Cross-measure drainage drill sites are located in the maingate approximately 50 m apart and target the Wongawilli seam. Each site contains a set of 5 to 10 drainage holes, drilled in a fan-shaped pattern prior to longwall extraction. Maddocks (1991) reports that uncased boreholes became blocked off in the Balgownie to Cape Horn seam interval. Since then, various casing types have been trialed by the Gas Drainage Department at Appin Colliery. A machine-tightened, part-perforated type strong steel casing has proved to be efficient and increases in gas drainage of 65% have been recorded.
Various studies have been undertaken to determine the most effective drilling declinations and azimuths. Current patterns use a declination between -20° and -30°, at azimuths between 015 and 325 from the gateroads. Boreholes drilled between azimuths 335 and 345 had an 80% success rate, as opposed to only 60% on all other bearings, irrespective of declination (Ogden, 1996). This preferred drilling azimuth was noted by Maddocks (1991) on longwall panel 18 and is thought to be a function of the geological environment.
A geological prediction of the expected flow rates for drainage sites in longwall 27 proved accurate in 90% of cases, when compared with the actual rates. It was found that drainage holes intersecting joint planes or the axes of minor flexures in the strata flowed well. At the time of a gas-induced production delay, drainage holes 50-100 m behind the longwall face which intersected joint planes during drilling produced gas. These joints, when extrapolated along strike, intersected the longwall face toward the tailgate and have been associated with gas issuing from floor blowers.
Gray (1987) suggests that coal cleat is important in controlling the principal direction of permeability, and that permeability increases with gas drainage. However, drainage holes intersecting structures associated with mylonite or drilled outside the recommended azimuths at Appin did not flow well. Faults were found to provide localised areas of low permeability and mylonite may retard gas migration into the borehole. Boreholes expected to intersect mylonite at depth recorded low gas flows with borehole integrity intact.
Minor seam flexures also appear to modify gas drainage. Creedy (1989) suggests that gas formation in British coals was contemporaneous with folding and that gas migration is structurally controlled.
No
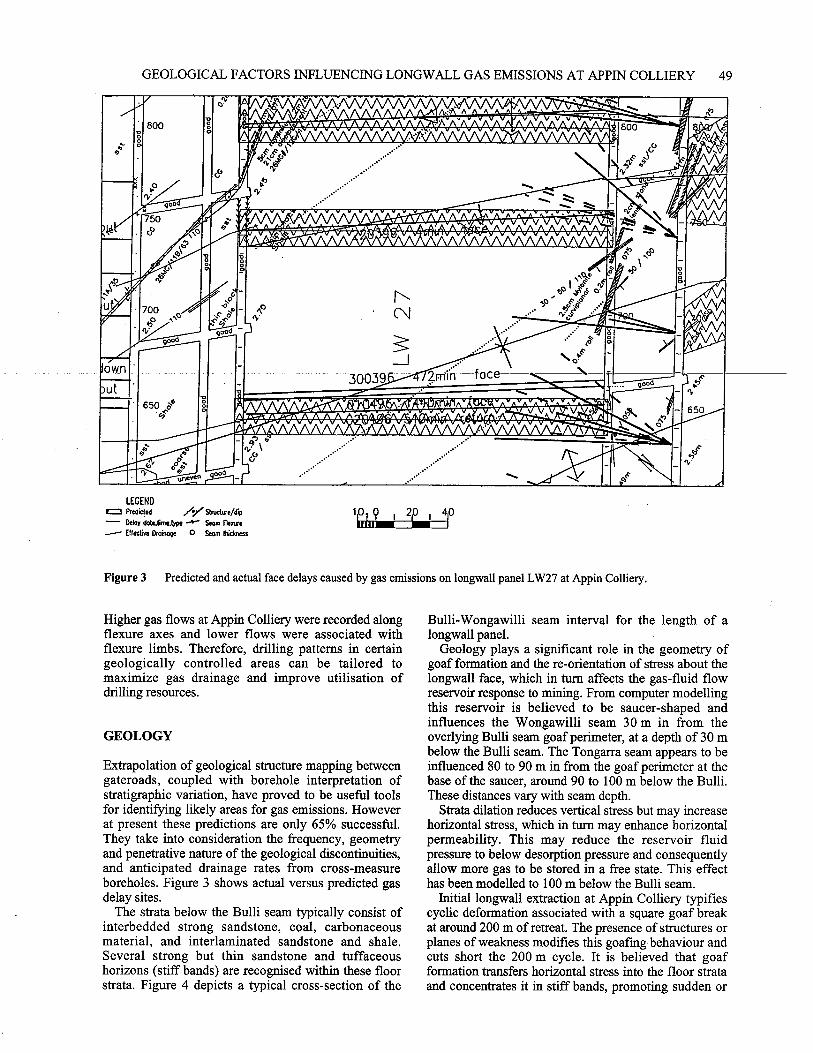
ft- ju,u/4AL:IMAINANYWOkkikkkiiktiAAAL A le•v•v•v•irtr•111 .Z. • • • • • •
IV/ VICYVVVVVVIIP
• •
....•••••• ••••• • •
• - V V ••••••
_ Akit
EAM=IIVVVY-A—AAA' VA820-A-AWW•••••••••••••••A
800
750
K'° )
700 •<,
4.; goad
2min face
V v v 1.417
#‘440‘ e r" V VAMV3V wf• ••••A A _• . • el • • • Alrae..— ..L.7411
0 111 liglAKtili WAIT \ e
0
c\I
I own
put 650 t
.c•
30039 -
ood /
411/4 650
•
A irjoy
• la
4W
800
GEOLOGICAL FACTORS INFLUENCING LONGWALL GAS EMISSIONS AT APPIN COLLIERY 49
LEGEND CI Predicted /1./ Structure/dip — Delos dote.lirne.type Scorn Flexure ---- Effective Drainage 0 Seam thickness
1p9 20 40
Figure 3 Predicted and actual face delays caused by gas emissions on longwall panel LW27 at Appin Colliery.
Higher gas flows at Appin Colliery were recorded along flexure axes and lower flows were associated with flexure limbs. Therefore, drilling patterns in certain geologically controlled areas can be tailored to maximize gas drainage and improve utilisation of drilling resources.
GEOLOGY
Extrapolation of geological structure mapping between gateroads, coupled with borehole interpretation of stratigraphic variation, have proved to be useful tools for identifying likely areas for gas emissions. However at present these predictions are only 65% successful. They take into consideration the frequency, geometry and penetrative nature of the geological discontinuities, and anticipated drainage rates from cross-measure boreholes. Figure 3 shows actual versus predicted gas delay sites.
The strata below the Bulli seam typically consist of interbedded strong sandstone, coal, carbonaceous material, and interlaminated sandstone and shale. Several strong but thin sandstone and tuffaceous horizons (stiff bands) are recognised within these floor strata. Figure 4 depicts a typical cross-section of the
Bulli-Wongawilli seam interval for the length of a longwall panel.
Geology plays a significant role in the geometry of goaf formation and the re-orientation of stress about the longwall face, which in turn affects the gas-fluid flow reservoir response to mining. From computer modelling this reservoir is believed to be saucer-shaped and influences the Wongawilli seam 30 m in from the overlying Bulli seam goaf perimeter, at a depth of 30 m below the Bulli seam. The Tongarra seam appears to be influenced 80 to 90 m in from the goaf perimeter at the base of the saucer, around 90 to 100 m below the Bulli. These distances vary with seam depth.
Strata dilation reduces vertical stress but may increase horizontal stress, which in turn may enhance horizontal permeability. This may reduce the reservoir fluid pressure to below desorption pressure and consequently allow more gas to be stored in a free state. This effect has been modelled to 100 m below the Bulli seam.
Initial longwall extraction at Appin Colliery typifies cyclic deformation associated with a square goaf break at around 200 m of retreat. The presence of structures or planes of weakness modifies this goafing behaviour and cuts short the 200 m cycle. It is believed that goaf formation transfers horizontal stress into the floor strata and concentrates it in stiff bands, promoting sudden or
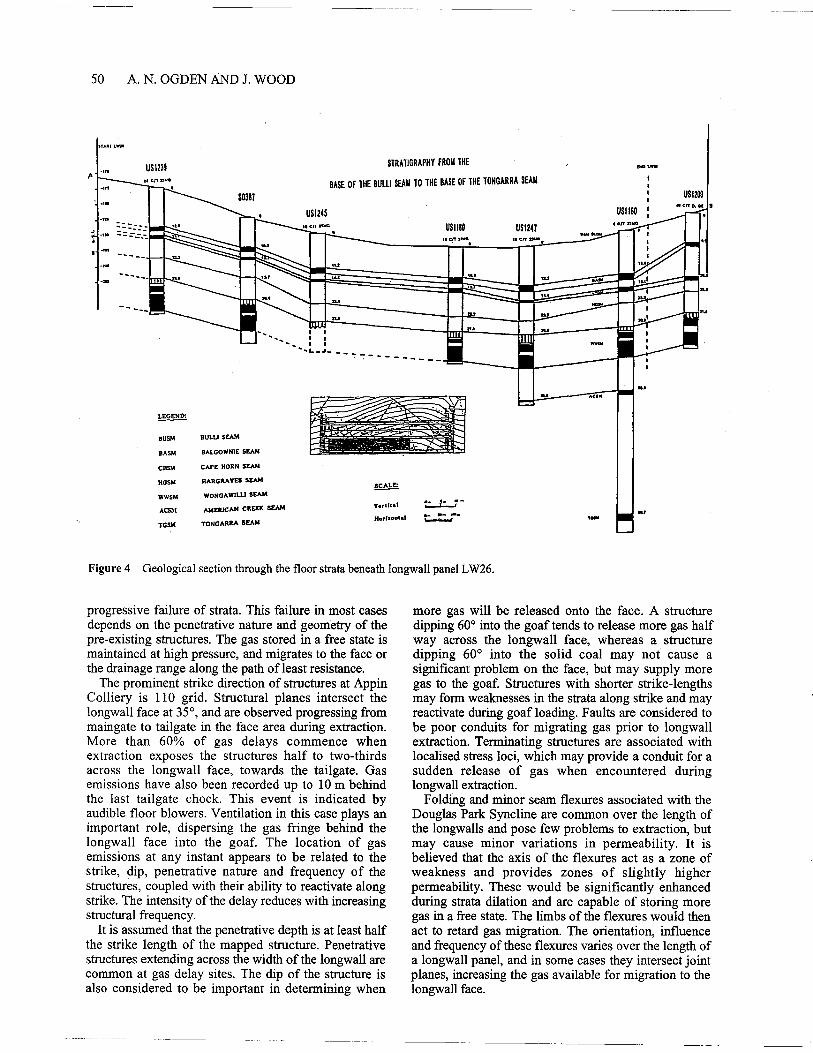
PO tan.
50 A. N. OGDEN AND J. WOOD
STRATIGRAPHY FROM THE
BASE OF THE NW SEAM TO THE BASE OF THE IONGARRA SEAM
LEGEND: 4117., 0,.- —....1.20A----..._ -0•1 -NOM
Orri,"':—.0 --.....1...111.
BUSM BULIJ SEAM
BASM BALGOWNIE SEAM
CHSM CAPE HORN SEAM
HGSM HARGRAVES SEAM SCALC
WWSM WONGAWILLI SEAM
ACSSI
TOM
AMERICAN CREEK SEAM
TONGARRA SEAM
Vortical
Hort s. 1•-• Imme,•••••1
Figure 4 Geological section through the floor strata beneath longwall panel LW26.
progressive failure of strata. This failure in most cases depends on the penetrative nature and geometry of the pre-existing structures. The gas stored in a free state is maintained at high pressure, and migrates to the face or the drainage range along the path of least resistance.
The prominent strike direction of structures at Appin Colliery is 110 grid. Structural planes intersect the longwall face at 35°, and are observed progressing from maingate to tailgate in the face area during extraction. More than 60% of gas delays commence when extraction exposes the structures half to two-thirds across the longwall face, towards the tailgate. Gas emissions have also been recorded up to 10 m behind the last tailgate chock. This event is indicated by audible floor blowers. Ventilation in this case plays an important role, dispersing the gas fringe behind the longwall face into the goaf. The location of gas emissions at any instant appears to be related to the strike, dip, penetrative nature and frequency of the structures, coupled with their ability to reactivate along strike. The intensity of the delay reduces with increasing structural frequency.
It is assumed that the penetrative depth is at least half the strike length of the mapped structure. Penetrative structures extending across the width of the longwall are common at gas delay sites. The dip of the structure is also considered to be important in determining when
more gas will be released onto the face. A structure dipping 60° into the goaf tends to release more gas half way across the longwall face, whereas a structure dipping 60° into the solid coal may not cause a significant problem on the face, but may supply more gas to the goaf. Structures with shorter strike-lengths may form weaknesses in the strata along strike and may reactivate during goaf loading. Faults are considered to be poor conduits for migrating gas prior to longwall extraction. Terminating structures are associated with localised stress loci, which may provide a conduit for a sudden release of gas when encountered during longwall extraction.
Folding and minor seam flexures associated with the Douglas Park Syncline are common over the length of the longwalls and pose few problems to extraction, but may cause minor variations in permeability. It is believed that the axis of the flexures act as a zone of weakness and provides zones of slightly higher permeability. These would be significantly enhanced during strata dilation and are capable of storing more gas in a free state. The limbs of the flexures would then act to retard gas migration. The orientation, influence and frequency of these flexures varies over the length of a longwall panel, and in some cases they intersect joint planes, increasing the gas available for migration to the longwall face.

-44 b 6b 70 96 - 100 33
-46
A ,-
•
. . , . ,.
-
,...Gaaout / Hh Flow borehole . . -
.
Rain blowers / low flow boreholes
-58
• Balgownie
"rape Horn
Wongawilli
• Tongarra
-56
GEOLOGICAL FACTORS INFLUENCING LONGWALL GAS EMISSIONS AT APPIN COLLIERY 51
Desorbed Volume (% of Total)
Figure 5 Carbon isotope 'signatures' for seam gas from coalbeds within the floor of the Bulli seam.
GAS SOURCE
In the current area of longwall extraction gas contents are in the order of 13 to 14 m3 per tonne of coal for all seams below the Bulli Coal. Its composition is generally consistent, with little vertical variation between seams for less than 20 % CO2. Wood (1992) suggests that the amount of carbon dioxide in migrating gas is dependent on the pH and concentration of other ionic species in seam water. A localised area of greater than 20% carbon dioxide in the Bulli Coal was encountered close to the start of recent longwall blocks. It proved to be of low permeability, with poor drainage performance; subsequently the faces achieved high coal extraction rates and few gas delays.
Gas-bearing strata within the Bulli seam roof and floor strata include the Bulgo Sandstone, Balgownie seam, Cape Horn seam, Hargrave seam, Wongawilli seam, American Creek and Tongarra seams. The Bulgo Sandstone is located more than 50 m above the Bulli seam and is not considered to be a major contributor to gas emissions. Gas from the Bulgo Sandstone has a distinct isotopic signature and odour which has not been detected on the longwall. The gas released from the Balgownie, Cape Horn and Hargrave seams continually migrates to the face and goaf, where it is adequately diluted by the ventilation system.
Carbon isotope fingerprinting was carried out on gas recovered during desorption of cross-measure seam cores, and on gas collected from drainage holes and floor breaks. In addition, samples were collected on the
face under normal mining conditions and during gas delays. The isotopic signatures confirm that samples collected from high-flowing holes and floor breaks during gas delays are from a Wongawilli or lower seam source, whereas those collected from low-flowing holes and floor breaks during normal mining conditions were primarily from a Balgownie and/or Cape Horn seam source. Wood (1992) suggests that the ratio of floor gas depends on the degree of desorption and pressure at the source of the floor gas. Gas must also migrate through seam water, which is subject to gas partial pressure and differs from equilibrium prior to extraction. Figure 5 shows the variation in isotopic signatures for the coal seams with desorption. Gas reservoir modelling conducted for the Appin Gas Emission Study indicated that 100% of desorbable gas from the Balgownie and Cape Horn seams, along with 80% partial desorption of the Wongawilli and Tongarra seams were required to balance the amount of gas contained in the methane drainage and ventilation systems. Table 1 outlines coal seam characteristics.
CURRENT RESEARCH
As part of the Gas Emission Study at Appin Colliery, information has been collected on stratigraphic variation, gas content and composition of the coal seams. Pressure cells installed in the Wongawilli seam have proved useful in recording changes in fluid pressure during longwall extraction. BHP Research is

52 A. N. OGDEN AND J. WOOD
Table 1 Coal seam gas reservoir characteristics at Appin Colliery.
Seam Bulli Balgownie Wongawilli Upper
Wongawilli Lower
Tongarra
Total gas content (m3/t) 12.56 15.14 12.5 12.72 12.11 (@20 deg C, 101.3 kPa)
Reservoir Pressure (kPa) 3499 3480 3672 3781 4150
Desorption Pressure (kPa) 3500 3100 3600 3600 3800
Permeability (mD) 1.78-1.91 0.13-0.22 0.01-0.03 0.07-0.1 1.31-1.55
% Seam Gas Released 100 100 80 80 80
developing a geomechanical and coal gas model on the ABAQUS system. The 3D computer model aims to simulate the mechanisms which induce gas delay conditions. Other research has been conducted by ACIRL and Strata Control Technology (SCT). ACIRL has measured a reduction in the average convergence rate of the powered supports prior to a gas delay, whereas SCT have recorded a stress change from stress cells installed in the interburden above the Wongawilli seam at the time of a gas delay on the face.
Recently, two surface bore holes were utilised by CSIRO to conduct an experimental mini-hydrofrac of the Bulli, Balgownie, and Wongawilli seams near current workings. The information collected is designed to clarify the assumptions used in the fluid flow model.
Future research will include microseisraic monitoring from a vertical array of geophones, coupled with chock monitoring, and is planned for longwall 28A. This will allow a real time measurement of the location and magnitude of stress redistribution associated with longwall extraction.
CONCLUSIONS
Since the introduction of the Longwall Management Plan and subsequent Gas Emission Study at Appin Colliery, significant improvements in longwall gas management techniques have been implemented. Long-wall gas emissions at Appin Colliery appear to be the result of gas migration from reservoirs below the Bulli seam.
Generally, floor deformation is progressive and allows gas to be dispersed gradually into the ventilation system without incident. However, greater than 60% of emissions causing production delays occur along zones of joints or weakened floor strata. The presence of these structures and their ability to reactivate along strike modify the expected cyclic goafing behaviour. The amount of gas released is dependent on the insitu seam content and its composition, as well as the frequency, geometry and penetrative nature of the structures. Pre-existing parameters such as permeability, fluid pressure and the availability of gas in a free state can be partially
or permanently modified by both effective cross-measure drainage and longwall extraction.
Production delays are common when an overall increase of gas-make is recorded in the drainage system. This has been attributed to an increased flow rate in drainage holes intersecting penetrative structures 50 to 100 m past the longwall face. At the same time cross-measure drainage performance adjacent to the longwall face is poor. The presence of mylonite in boreholes may also retard gas migration. Isotopic signatures have identified the gas liberated during a longwall gas delay to be from a Wongawilli or lower seam source. The effects can be reduced by effective gas drainage.
Goafing characteristics and the influence of strata dilation modified by geological factors are integral to this dynamic system. Current and future research will provide an understanding of the geological environment and of the factors influencing gas emissions. Thus, it will be possible to identify more accurately areas of poor gas drainage and those areas prone to production delays. Effective gas management is therefore the key to reducing the risks of longwall mining in this geological environment.
ACKNOWLEDGMENTS
The authors would like to thank staff at Appin Colliery and the Gas Emission Study Team, who provided information for this paper. Australian Coal Mining Consultants carried out a literature search for the project and Andrew Gurba performed the gas reservoir model-ling. The paper is published with the permission of BHP Australia Coal, Collieries Division.
REFERENCES
APPIN COLLIERY 1996. Appin Colliery longwall management plan. BHP Australia Coal. Unpublished internal report.
CREEDY D. P. 1989. Geological controls on the formation and distribution of gas in British coal measure strata. International Journal of Coal Geology.
GRAY I. 1987. Reservoir engineering in coal seams: Part 2 — the physical process of gas storage and movement in coal

GEOLOGICAL FACTORS INFLUENCING LONGWALL GAS EMISSIONS AT APPIN COLLIERY 53
seams. SPE Reservoir Engineering, February. MADDOCKS P. I. 1991. Appin Colliery Longwall 18 — cross
measure bore deformation. In Bamberry W. J. and Deepers A. M. eds. Gas in Australian Coals. Geological Society of Australia Symposium Proceedings 2. University of New South Wales, 4-5th February 1991, 94-104.
OGDEN A. N. 1996. Geological assessment of cross-measures
drainage holes and gas delays for Longwall 27 at Appin Colliery. Technical Services Department, Collieries Division, BHP Australia Coal. Unpublished company document.
WOOD J. 1992. Gas fingerprinting of lower seam gas at Appin Colliery. Technical and Engineering Services Dept., Collieries Division, BHP Steel. Unpublished company report.

- -

Symposium on Geology in Longwall Mining, 12-13 November 1996, eds G. H. McNally and C. R. Ward, pp 55-62.
The occurrence and impact of hydrogen sulphide on longwall mining at Southern Colliery, German Creek, Queensland
CHIT KO KO AND BARRY WARD
Capricorn Coal Management Ply Ltd.
Hydrogen sulphide (H2S) gas has been reported in opencut excavations and shallow underground mine workiings in the German Creek seam. A very high concentration (50 litre/tonne) of H2S was detected during recent exploration drilling in 701 longwall panel at Southern Colliery. This could result in release of gas in lethal concentrations during conventional longwall mining.
A surface and in-seam underground drilling investigation was carried out and a large number of samples were tested for H2S content to delineate the zone of gas concentration. A hydrofracturing and infusion trial was conducted to evaluate the potential for de-gassing the seam prior to mining. The results of the trial indicated no significant reduction in H2S levels by these methods.
Risk analyses were made and appropriate procedures for longwall extraction through the high concentration zone were drawn up. Due to unforeseen circumstances regarding the performance of the longwall equipment, the decision to mine through the H2S zone was abandoned.
INTRODUCTION
Southern Colliery is one of two undG6 erground mines operated by Capricorn Coal Management (Capcoal) Pty Ltd, and is situated in the Bowen Basin about 200 km northeast of Rockhampton Old, as shown on Figure 1. The colliery mines the German Creek seam, which is the lowest economic seam of the Permian-age German Creek Formation.
Hydrogen sulphide gas was initially encountered in the German Creek seam open cut, where the Southern Colliery portal is located. Underground development and longwall extraction in 601 Panel proceeded through the zone, which had a measured maximum concen-tration of 10 litres/tonne. Exploration drilling sub-sequently indicated pockets of H2S concentration in the 700s block. Known occurrences of H2S are shown in Figure 2. The exploration and evaluation of the high concentration of H2S in 701 Panel is the subject of this paper.
Various strategies were developed for safe extraction of coal through the zone of high H2S concentration, involving mine ventilation and the use of sodium hypochlorite to remove the liberated H2S from the mine environment. However, due to teething problems with the new longwall equipment due to which continuous advance could not be guaranteed, it was decided to avoid the H2S affected zone by relocating the longwall face.
OCCURRENCE OF HYDROGEN SULPHIDE
A study of the sulphur isotope ratio (S"/ S32) by Smith and Phillips (1990) suggests that the H2S is the result of biological reduction of sulphate mineral, precipitated from a marine transgression in a low-iron environment, which was not converted to pyrite. This allowed large
quantities of H2S to react with the coal's organic matter and to be trapped within the seam during maturation. The occurrence of H2S in Europe, according to a review by Moelle (1987), was associated with sapropelic muds containing the remains of the plant families Neuropteris, Lonchopteris and Sphenopteris of Carboniferous age (Phillips et al., 1990).
H2S has also been encountered in association with deposits of rock salt, anhydrite, sulphur, gypsum, lead (galena), petroleum and natural gas. It is found in active volcanic regions in fumaroles, and occurs naturally in some mineral waters, geothermal waters, hot pools and geyser fluids. Large quantities of H2S occur in the natural gas deposits of France and Canada. The occurrence of fossil H2S gas in coal measure strata has been noted in France, Canada, China, Russia and Australia (Moelle, 1987; Barrett, 1988).
H2S usually occurs in small quantities and at shallow levels, particularly in high-sulphur coal, but its occurrence in Australian coal is comparatively rare. However, quantities of 112S have been reported in the Bowen Basin, with occurrences at Collinsville, Gregory open cut mine, Crinum and Oaky Creek No. 1, as well as in Southern Colliery.
The location of known H2S concentrations in the German Creek seam at Southern Colliery is shown in Figure 2. There are, in addition, occurrences of H2S in some of the overlying seams, such as the Corvus and Tieri, and in the seams of the Fairhill Formation. All of these occurrences are at relatively shallow depths, comparable to those in the German Creek seam.
CHARACTERISTICS AND TOXICITY OF HYDROGEN SULPHIDE
Hydrogen sulphide is mostly formed by decomposition

MACKAY DBCT
Goonyella North Mine Riverside Mine
Goonyella Mine
Moranbah North
Moranbah
Peak Dqwns Mine
Sara ji Mine
Blair Athol
Blair Athol •
GERMAN 0 CREEK
MINES
Locatio
n of the G
erman C
reek Mines, including Southern C
olliery, central Q
ueensland.
0 • so
• kilometres Gooe
ry
HAMPTON
Emerald
BlaoRwater,5 Mine
Fairbairn Reservoir
rc?* Cook f‘ Colliery
GLADSTONE •5‘ South Blaokwater
Mine

7458000 mN
............................„ 7457000 rnN
7455000 rnN
7455000 nIN
7454030 rnN
GERMAN CREEK
OAK)' CREEK
GERMAN CREEK SOUTH
MLA 70047 7453000 mN
7452000 'TIN
HYDROGEN SULPHIDE AT SOUTHERN COLLIERY, GERMAN CREEK 57
Figure 2 Locations of known concentrations of hydrogen sulphide gas within Southern Colliery. These are close to the mine portal (and in 601 panel), and within 701, 702 and 703 panels.

58 CHIT KO KO AND BARRY WARD
EXPLANATION
PRI
DM0
OL
uro4L
IN-SEMI BOREHOLE PILED BY PRO RAM)
IN-SEAM BOREHOLE (DRILLED BY DIAMEC 260)
SURFACE BOREHOLE
1425 CONTOUR IN LITREPON
FAULT(THROV)
Figure 3 Part of 701 panel showing exploratory (surface) drillholes, hydrogen sulphide contents, and underground drillholes (PR 1-5 and DM 01-03) associated with gas investigations and de-gassing trials.
of organic materials and the reduction of sulphates by bacterial action. Mine or strata gases with a significant proportion of H2S are referred to variously as `stinkdamp' (UK), `sulphuretted hydrogen' or 'sour gas' (USA).
1-12S is slightly denser than air (1.19 relative density) and colourless. It has a sweetish taste, and its presence can easily be detected by a powerful odour resembling that of rotten eggs. The human nose can detect concentrations as low as 0.02 ppm, however increasing exposure de-sensitises the olfactory organ and concentration levels above 50 ppm can no longer be smelt. The residence time of H2S in the atmosphere is fairly short, as it is readily oxidized to H2SO4 and is highly soluble in water. It forms a flammable mixture in air in the range of 4.5 to 45% (Shell Safety Committee, 1986; Capcoal, 1994).
H2S is very highly toxic and its hazardous effects with concentration are summarised below:
• Over 20 ppm (0.002%) — eye irritation; • Over 50 ppm (0.005%) — irritation of the upper
respiratory tract, painful conjunctivitis, disturbance of vision, nausea, coughing, dizziness and headache;
• Over 100 ppm (0.01%) — increasing risk of pulmonary oedema (fluid accumulation on the lungs), loss of sense and balance;
• Over 500 ppm (0.05%) — affects the nervous system, rapid loss of consciousness and early death (victims need prompt artificial ventilation and cardiopulmonary resuscitation); and
• Over 1000 ppm (0.1%) — immediate collapse and death without effective first aid (the gas is an acute neurotoxin at these levels) (Proctor, 1978; Shell Safety Comittee, 1986; Glance and Bofinger, 1995; O'Beirne and O'Mally, 1995).
The maximum allowable concentration of H2S in the mine atmosphere permitted by the Queensland Coal Mining Act General Rules for Underground Coal Mines is 10 ppm (0.001%).
DRILLING INVESTIGATION OF H2S BEARING ZONE IN 701 PANEL
Surface exploration drilling and in-seam underground drilling programmes, covering an area of approximately 400 m x 250 m within 701 panel, were carried out at various stages between February and December 1995. Figure 3 shows the location of the drill holes. Some 185 samples were taken and tested, initially for their H2S content only. Subsequently other tests necessary for a seam infusion trial were performed. These included

HYDROGEN SULPHIDE AT SOUTHERN COLLIERY, GERMAN CREEK 59
permeability and chemical reaction, H2S absorption and desorption isotherms, electron microscopy and H2S gas analysis with zinc chloride injection.
Surface drilling was done by conventional wireline methods, with HQ core (61mm in diameter) recovered over the full section of the German Creek seam. In general the full seam section was tested for H2S content at 200 mm intervals, to establish the vertical distribution of the gas.
In-seam drilling was carried out in two stages between September and December, 1995; N size core (46 mm diameter) was taken. It was originally intended to recover samples at regular intervals, but in practice the sample interval was affected by borehole wander and fracture spacing. Shorter holes were drilled along the panel using a Pro Ram drill (PR1 to PR5), while longer holes were drilled from the cut-through stub using a Diamec 260 rig (DM01 to DM03). The five Pro Ram holes were drilled in the first stage to obtain samples, and were oriented so as to intercept the highest number of cleats for the infusion trial. As a result the core tended to be highly fractured, reducing the potential for intact test samples. Core samples were taken initially at a depth of 10 m to 15 m, and at 20 m intervals thereafter. Continuous coring was done where necessary to obtain samples.
Only two holes, PR1 and PR2, achieved the design depth of 60 m. The other three holes (PR3 to PR5) had to be terminated after hitting the seam floor at 42.5 m, 36.5 m and 23.5 m respectively. It was apparent that horizon control in the unguided Pro Ram holes was difficult to maintain, hence rendering them unsuitable for anything other than short in-seam drill holes.
The six Diamec 260 holes varied in length from 70 m to 250 m, and were directionally guided towards the target area by surveying as drilling progressed. Samples of coal core were normally taken at 25 m intervals, but coring was continuous in borehole DMO1C from 156 m onwards. A total of 108 silver nitrate tests and 56 drum tumble tests were done on the samples retrieved.
SAMPLING AND TESTING
Core samples were put into plastic bags, tightly rolled and sealed on site as soon as possible after drilling. They were then wrapped in bubble-pack and placed into cardboard cylinder tubes, which were themselves wrapped in bubble-pack and inserted into larger card-board cylinders to ensure there was no sample breakage or loss of H2S during transit. Samples were dispatched to the testing laboratory within 24 hours of drilling.
The samples were tested by Carbon Consulting International (CCI) at Gladstone Qld. An arrangement was subsequently made to perform the drum tumble testing on site as soon as possible after the samples were taken, to reduce the risk of sample breakage and liberation of H2S while in transit. Most of the core samples taken from the Diamec and surface boreholes were tested in this manner.
The drum tumble test and the silver nitrate test are the two methods used to determine H2S concentration.
Since the H2S gas is released only through comminution of the coal, the drum tumble test gives the concentration of H2S liberated upon breaking. The silver nitrate test gives the total H2S content, as the procedure requires the sample to be ground finely, thus increasing its surface area. Hence the silver nitrate gave consistently higher values, around four times the drum tumble results. The tests are described below.
Silver nitrate test
The silver nitrate test method attempts to quantify the amount of H2S present by first reacting it with excess silver nitrate to form silver sulphide. The unreacted silver nitrate is back-titrated against sodium thiocyanate. The value obtained is then adjusted by subtracting the quantity of Ag2S formed from a 'blank' purged, duplicate sample. The formula to calculate the amount of H2S in the sample is as follows:
H2S (litre/tonne) (V1 x 0.0282)—(V2 x 0.0250) x 22.4 x 1000
2 x W Where:
V1= total volume of silver nitrate V2= titration volume W= weight of the sample
Final H2S = H2S in test sample — H2S sample in blank sample
It is possible (and often happens) that the blank sample has a larger calculated gas content than the test speci-men. In such cases a H2S level of zero is recorded.
Drum tumble test
This test is used to analyse the quantity of H2S gas liberated during comminution of the coal. It was developed in the late 1980s while mining through an H2S zone near the Southern Colliery mine entries. The test gives a prediction of the volume of H2S released into the atmosphere during mining, by comparing gas levels measured during mining with drum tumble results from samples taken from the mining face (Phillips et al., 1990).
The test is carried out by cutting a 300g sub-sample from a 200 mm long core stick and then placing it into a specially lined, dry, clean 200L drum and sealing immediately. The drum is rotated 25 times and the H2S content within it is then measured by inserting a Draeger pump and tube (for later tests Draeger tube was replaced by electrochemical measurements). This procedure is repeated at intervals, with the Draeger readings being recorded at 25, 50, 75 and 100 tumbles. The H2S liberated, in litres per tonne of coal, is calculated by the formula:
H2S (litre/tonne)
Volume of drum (200L) x Draeger tube reading (ppm) Mass of sample analysed

-- --
—
----------
- - - DD300 — • — • 0D307
DD310
— — — DD313
80 60 100 120 0
0 20 40
4-.
3.5 —
---- --------
• --------
...........
------
-------
---- --
Borehole ID
3—
.. ? 2.5 — 8 2 u_
S.
2 — 2 UI
rts
1 —
0 5
.e 1 5
60 CHIT KO KO AND BARRY WARD
Volume of H2S (lit)
Figure 4 Vertical distribution of hydrogen sulphide content within the German Creek seam in 701 longwall panel.
SITE INVESTIGATION
A two-stage drilling investigation was carried out in an attempt to delineate the high-H2S zone within the 700s longwall block at Southern Colliery, and to conduct an assessment on the infusion trial. The first stage included eight vertical boreholes, taking samples of the whole German Creek seam, with H2S values being determined at 200mm intervals by drum tumble tests. The second stage comprised 11 in-seam boreholes, plus another 6 vertical boreholes. A total of 181 silver nitrate tests and 230 drum tumble tests were performed. An equal number of size analyses were carried out to supplement the drum tumble tests.
The test results indicate that the in-situ H2S content could be as high as 276 L/t, recorded by in-seam drill hole DMO1C at 160.7 m to 161.3 m. The maximum value recorded by drum tumbling was 88.6 L/t, after 100 revolutions. However the drum tumble test result is directly related to degree of breakage, and hence size analyses must be taken into account.
It was concluded that the amount of H2S likely to be released during mining can be estimated from the H2S values determined using the drum tumble test results for 100 tumbles. This is generally one quarter of the total H2S content determined by silver nitrate tests. The estimated H2S concentration contours are shown in Figure 3. The test only gives an indication of H2S levels, and the results shown in Figure 3 are based on seam average values from vertical holes. According to Harvey (1995) the accuracy of H2S values is estimated to be plus or minus 30%.
The H2S levels vary considerably in the vertical
direction, as shown in Figure 4; the lateral variation is more gradual. Some of the vertical variation may, however, be due to differences in the degree of sample breakage during testing. It is predicted that up to 50 L of H2S per tonne of coal would be liberated in 701 panel during mining.
PREVIOUS STUDIES OF H2S EMISSION CONTROL
Very little research has been done on suppressing H2S gas emissions from coal, apart from a few studies carried out in China and Russia. In the Wuda Coal Mining Area in China, two years of underground testing and three years of laboratory experiments were carried out during the late 1980s. The investigators concluded that concentrations of H25 could be reduced 50%-70% by injection of chemical adsorbent into the coal seam. The study also noted that chemical sprays at the workface resulted in a 77% reduction in emissions. It was suggested that a covering of foam on the coal cuttings could lessen H2S discharge by 41% to 48%.
During the early 1980s a number of gas control strategies were investigated in the Karaganda Basin coal mines of Russia. These comprised dilution by ventilation, neutralisation by calcined soda mixtures with a wetting agent, covering of cut coal with foam, creation of water screens and other methods; none produced positive results. It was claimed, however, that successful suppression of H25 gas was achieved by force-pumping refrigerant and pouring liquid nitrogen into a borehole drilled parallel to and ahead of the face.

HYDROGEN SULPHIDE AT SOUTHERN COLLIERY, GERMAN CREEK 61
INFUSION TRIAL
Chemical scavengers have been used in petroleum drilling fluids for controlling H2S for many years. These can be categorised into three main groups:
• Iron oxide compounds, especially Fe304 (magnetite);
• Zinc compounds, such as zinc oxide (ZnO) and zinc carbonate (ZnCO3); and
• Zinc chelates: organic compounds where the zinc cation is loosely bound to organic molecules (Garrett et al., 1979; Scott, 1994; Hennig, 1995; Glance and Bofinger, 1995).
These sulphide scavengers, though used in drilling fluids and oil production fields, are not necessarily applicable for in-situ treatment of hydrogen sulphide gas in coal. Therefore a series of qualitative bench tests were carried out by CSIRO (Petroleum Division), using zinc chloride and iron chloride to find an ideal reagent for in-situ treatment. The reagent was required to be fast-acting; to irreversibly remove hydrogen sulphide; to ensure maximum penetration into coal; and to be non-toxic and safe to handle (Hennig, 1995).
Zinc chloride was considered to be the most suitable reagent, and an infusion trial was carried out during October 1995 by the APCRC (Australian Petroleum Cooperative Research Centre). Hydraulic fracturing of the German Creek coal seam was conducted in borehole DD312, with treatment by injecting ZnC12 solution. Seam characterization tests (well test, step rate and stress tests) were performed in borehole DD310. A total volume of 31,500 L of ZnC12 solution was injected over 5.5 hrs (105 L /min average total injection rate) to test the effectiveness of the chemical and the operational method of degassing.
The ZnC12 used was supplied in liquid form (50% ZnC12 by weight, pH of 1). The pH of the solution was raised to 5.5 during the injection process by mixing with water, to minimise corrosion to the chemical pump and injection string. Fluorescein tracer dye was also added to the mixed-in water after pumping half the total volume.
Jeffrey et al. (1996) indicate that the ZnC12 treatment was likely to have been dispersed over a rectangular volume of coal about 25 m by 10 m in plan. Two boreholes, 7 m east and 10 m north-east of DD312, were drilled and the cored samples tested for H2S and ZnC12 content. Two in-seam boreholes were targeted to pass through the treated area; continuous coring was done on DMO1C from depths of 156 m to 191.5 m, and H2S values were determined.
The results from the surface and underground drill holes revealed no significant reduction in H2S concentration, and zinc was not detected in any of the coal core samples predicted to have been treated by ZnC12 solution. No fluorescein was detected in the samples or in any of the water from these drill holes.
MINING STRATEGY AND OPERATIONAL PROCEDURE
The immediate concern with excessive H2S levels is occupational safety, as the quantities released during longwall extraction could be lethal. Longwall extraction in 601 panel found concentrations of between 5 to 10 L/t. The zone was successfully mined through with little impact, a result achieved by thorough ventilation and by slowing the production rate intermittently to allow excess gas to disperse.
In the case of 701 panel, however, H2S gas levels were predicted to be as high as 50 L/t. At this high gas content, conventional shearer cutting rates (5 to 10 m/min) were expected to produce an excessive amount of H2S, many times greater than the statutory limit of 10 ppm. Taking this into account, the following basic guidelines were developed to mine the high-H2S zone (O'Beirne and O'Mally, 1995):
• Reduce the cutting rate to 3 shears per shift, cutting unidirectionally. This should hold emissions to 200 ppm or less in the main return airway.
• Keep the belt section in return air by partitioning, as well as having a conventional maingate return. Airflow will split, 80% into the main return and 20% into the belt partition.
• Automate the face operation with the shearer cutting from maingate to tailgate. The operators will remain at the maingate end of the face and only proceed onto the face for emergencies.
• Educate and train the operators, implementing appropriate safety guidelines, provide protective equipment and breathing apparatus, and continu-ously monitor H2S emission by electronic devices.
According to McNamara (1990), the advantages of unidirectional cutting are that:
• By cutting with the tailgate drum, the major source of H2S liberation is confined to the return side of the shearer. The shearer operator is on the intake side of the cutting drum at all times.
• Supports advance during the maingate to tailgate cycle. Operators are on the intake side of the shearer.
• Conveyor advance during the tailgate to maingate flit may be performed using remote control from the intake side of the shearer.
• The depth of the coal bed on the AFC is reduced. This will increase the effectiveness of any water applied to suppress the H2S.
• Unidirectional cutting allows use of the shearer clearing sprays to wet coal on the AFC.
Utilisation of chemical scavengers has also been considered, and is subject to on-going research. The options include control of H2S by chemical additives in the water spray, and scavenging of H2S liberated into the atmosphere by passing through a sodium hypochlorite spray curtain.

62 CHIT KO KO AND BARRY WARD
A second major factor in mining through high-H2S zones is the extremely corrosive nature of the gas. This can result in damage to bronze components such as chock legs and certain hose fittings. Corrosion tests with sulphur gases and copper alloys by Franey (1988) revealed that pure copper has the highest corrosion rate, which is 50 to 100 times higher than for brass. Hydrogen sulphide was also found to be four orders of magnitude more corrosive than sulphur dioxide.
Not only is the H2S itself corrosive, but the most effective scavenger, sodium hypochlorite, is also highly corrosive. As such it cannot be passed through the shearer sprays and would have to be applied as a spray curtain in the maingate. Investigations for 701 panel extraction indicated that the suggested solution of sodium hypochlorite and caustic soda was too corrosive, and that sodium hypochlorite with a buffer of sodium carbonate and sodium bicarbonate would more acceptable. Even so, this alternative is still aggressive to stainless steel in concentrated solutions.
It was originally intended, using the procedures outlined above, to mine through the zone of high H2S concentration. Once mining in the panel commenced, however, unforeseen factors regarding the operational performance of the longwall equipment became apparent, which meant that uninterrupted advance could not be guaranteed. In these circumstances there would have been an unacceptably high risk of excessive exposure to personnel working on the face, so the decision was made to pull the face off and relocate it on the outbye side of the H2S zone.
CONCLUSIONS
Hydrogen sulphide occurs in isolated pockets in the German Creek seam at depths less than 175m, with a maximum estimated concentration of up to 50 L/t in 701 panel.
A combination of surface and in-seam drilling investigations enabled the zone of H2S concentration in 701 panel to be delineated. It was found to extend over an approximate 190 m length of the panel. The Pro Ram drill was only suitable for short in-seam holes, as it proved unable to maintain horizon.
The drum tumble test over 100 cycles appears to give a good approximation of the actual emission expected during mining. The silver nitrate test gives an indication of total H2S content, with values about four times those from the drum tumble test.
Downhole infusion of the coal seam using zinc chloride did not appear to have any significant effect in reducing in situ H2S levels. The H2S is tightly bound to the coal and is only released from fresh surfaces formed during mining-induced comminution.
Suppressants such as sodium hypochlorite solution
can be used in curtain sprays to remove emitted H2S from the mine atmosphere, but are highly corrosive. These chemicals are therefore not suitable for passing through normal dust-suppression sprayers on the shearer.
REFERENCES
BARRETT A. L. 1988. The occurrence, characteristics and control of hydrogen sulphide in mines. Headquarters Technical Department, British Coal. Capcoal Internal Report.
CAPCOAL 1994. Coal mine gases. Booklet prepared for persons employed by Capcoal in underground coal mining occupations. Capricorn Coal Management Pty Ltd.
FRANEY J. 1988. Degradation of copper and copper alloys by atmospheric sulfur. In Degradation of Metals in the Atmosphere, S. W. Dean & T. S. Lee (eds), ASTM STP 965. American Society for Testing and Materials, Philadelphia, 306-315.
GARRETT R. L., CLARK R. K., CARNEY L. L. & GRANTHAM C. K. 1979. Chemical scavengers for sulfides in water-base drilling fluids. Journal of Petroleum Technology, June, 787-796.
GLANCE F. & BOFINGER C. 1995. Hydrogen sulphide in coal mines. SIMTARS 31, December, 10-11.
HARVEY T. 1995. HAZOP H2S — 701 Panel Southern Colliery. Capcoal Internal Report.
HENNIG A. 1995. Investigation into the potential use of chemi- cal reagents for in-situ treatment of hydrogen sulphide gas in coal. CSIRO Petroleum. Capcoal Internal Report.
JEFFREY R. G., FERGUSON T. G., HENNIG A. & BRIDE J. 1996. • Trial treatment of hydrogen sulfide in the German
Creek seam by injection of a zinc chloride solution: DD312 and 310 at Southern Colliery. Australian Petroleum Cooperative Research Centre, CSIRO Petroleum Resources. APCRC Confidential Report No. 165, February 1996 (Capcoal Internal Report).
MCNAMARA P. 1990. Hydrogen sulphide (H2S) in Southern Colliery. Capcoal Internal Report.
MOELLE K. H. R 1987. Some notes on the occurrence of H2S in coal measure strata. Capcoal Internal Report.
O'BEIRNE T. and O'MALLY A. 1995. Risk review of mining through the H2S zone at Capcoal Southern. Capcoal Internal Report.
PHILLIPS R., SMITH J. W. & BYRNES R. 1990. Hydrogen sulphide gas occurrence at Southern Colliery. Proceedings of Bowen Basin Geologists Group Symposium, Mackay, Queensland, 91-97.
PROCTOR N. H. and HUGHES J. P. 1978. Chemical Hazards of the Workplace. J. B. Lippincott Co., 293-294.
SCOTT P. 1994. Drilling fluids with scavengers help control H2S. Oil and Gas Journal, May 23,72-75.
SHELL SAFETY COMMITTEE 1986. Hydrogen sulphide hazards and precautions. Shell Safety Committee Publication, December 1986.
SMITH J. W. & PHILLIPS R. 1990. Isotopic study of coal-associated hydrogen sulphide. American Chemical Society, Series No. 429, Ch. 28,569-571.

Symposium on Geology in Longwall Mining, 12-13 November 1996, eds G. H. McNally and C. R. Ward, pp 63-72.
Estimation of the geomechanical properties of coal measures rock for numerical modelling
G. H. McNALLY
The University of New South Wales, Department of Applied Geology.
Much design for underground coal mine structures such as chain pillars and roof supports is now based on numerical modelling. This paper describes how geotechnical input may be devised for such models, and points out some of the sampling and testing problems involved. Chief among these are the lack of reliable methods for measuring true tensile strength in rock, and for scaling down geomechanical test results from small laboratory specimens to provide realistic model input. Even where careful drill core sampling and testing is possible, much of the input still has to be estimated empirically. The use of one empirical technique, the Hoek-Brown failure criterion for constructing Mohr envelopes, is emphasised. 'Rules of thumb' for estimating tensile strength, elastic modulus and the Hoek-Brown factors m and s are presented in the text.
INTRODUCTION
This paper examines the problems of preparing realistic input data for numerical models of coal mine structures such as chain pillars, roadway intersections, roadway roof support and longwall faces. It also aims to: • Point out the shortcomings of geomechanical test
results, which arise even where the sampling and testing are carried out to 'best practice' standards; and
• Outline techniques for converting raw test results for small intact rock specimens into rock mass properties (strength and deformability) for model cells, which may be 103 times larger than the test specimen.
This intuitive or empirical approach to rock mechanics, as exemplified by Farmer (1968), has lost support over the past thirty years to a more analytical approach based on the principles of mechanics and elastic theory. One notable exception to this trend has been the work of Professor Evert Hoek (Hoek and Brown, 1980a, b; Hoek, 1983), whose method for estimating the triaxial strength of rock (the Hoek-Brown Criterion) will be later referred to in some detail.
The computing methods employed in these mining simulations include finite-element (FE), finite-difference (FD), boundary-element (BE), distinct-element (DE) and displacement-discontinuity (DD). In addition, a number of composite codes combine the simulation of elastic behaviour through FE with block movement through DE, mainly to predict caving and subsidence. Models may be either two-dimensional or three-dimensional, though the former are usually preferred because they are easier to construct and faster to run.
The implicit assumptions, complexity and capabilities of these numerical methods will not be addressed here, except in relation to their geotechnical input require-ments. The model output consists of slices through the mine structures and the surrounding rock mass,
essentially showing the stress redistribution induced by mining and the consequent strains (see Figures 1-3). Hence the effects of altering cavity dimensions and shape, and of adding or reducing roof or rib support can be assessed. In addition, the model can be re—run any number of times with different rock properties to try and fit the input, which inevitably involves much uncertainty, to checkable output such as roadway convergence measurements.
These computer simulations of rock mass behaviour are powerful design tools, which have become much more user-friendly and accessible as PC computing power has increased. Nevertheless, their limitations should be clearly understood. First, as many users (especially geologists!) are not well equipped with programming skills, the assumptions of the code designer and the inherent quirks of the method itself are often forgotten. Second, the model will work only as well as the input data allow, and this is an area where there have been no recent advances comparable to the growth of computing capacity. It should be remembered that these computer-based methods grew out of elastic analysis of metal structures, where the properties of the materials used were well known and consistent — quite the opposite to excavations in rock.
GEOTECHNICAL INPUT FOR NUMERICAL MODELS
The geotechnical input requirements for numerical models vary greatly with the type of program and even between individual codes. FE input has the most detailed requirements, which concentrate on the strength and deformation characteristics of the rock substance. BE models are much less complex — averaged elastic properties for a few large elements are the main input requirements. DE models emphasise the geomechanical properties of discontinuities rather than those of the intervening rock substance.

131t
Floor 10 10
t
•._ heave
ler
9 1012 t t
4, 4. 4 4 4 4
4 4 4 4 4 4
',t 4 4
st 4' 4
19 19 19 1 /7 16 a)
Roof sag 13 1
0 14
64 G. H. McNALLY
Failed element
/Guttering
0
0
0 0
CL
Roadway
0 a 2m
Failed element
Rib spall
0
°
Yielded element
4m
4-
4-
g' r
a. ar. a.
"
Roadway
CL
Figure 1 Finite element model of a mine roadway subjected to side abutment stresses, showing the centres of failed and yielded elements. For simplicity of presentation the FE mesh boundaries are not shown, nor is the left-hand half of the roadway (which is assumed to be symmetrically loaded).
xxk x k k
x
\ kk c
k
1r A- +
ii + +
I f f + +
+ +
+ +
/ I-
X )4
X X X X X X
XXXXXX
XX X X X X
0 2m 4m 0 40MPa
Dimensions Stress
Figure 2 The same model, showing maximum and minimum stress magnitudes and directions for each element in the mesh, after loading.
Figure 3 The same model again, showing induced strain magnitudes and directions. The imposed loading has caused guttering at the right hand edge of the roadway roof and failure in the upper part of the coal rib. The amount of convergence assumes that the roadway was excavated in an instant — measured values would be less.
FE models resemble masonry walls made up of angular, tight-fitting blocks which become larger with distance from the mine opening. The whole is referred to as a mesh and individual blocks are known as cells or elements. Cells which are close to the mine opening are made smaller, because it is here that the greatest amount of detail is required and here that failure or gross deformation is most likely. DE models more closely simulate the arrangement of joint blocks in a rock mass, with blocks being much the same size and shape along the layer. BE models are simple layer cakes with holes for roadways and pillars. Carter (1996) gives a useful summary of the applications of numerical modelling in geotechnical engineering.
In general terms the geotechnical requirements for modelling are made up of:
(1) A simplified geological cross-section though the rock mass being investigated. Each layer is presumed to be more or less homogeneous in its properties, and may or may not correspond to stratigraphic units. The layers are defined using lithological and downhole geophysical logs.
(2) Bulk geomechanical properties based on, but scaled down and otherwise modified from, the results of rock specimen tests. Much of this input data is unknown or unmeasurable, and therefore has to be devised by 'educated guessing'.
Low stress indicates ,
I yielded zones

GEOMECHANICAL PROPERTIES OF COAL MEASURES ROCK FOR NUMERICAL MODELLING 65
Table 1 Geomechanical input requirements for numerical modelling of coal seams and overburden rock masses.
INTACT ROCK STRENGTH (MOHR ENVELOPE) made up of: Uniaxial tensile strength (UTS or crt) Uniaxial compressive strength (UCS or cyc) Triaxial compressive strength at 3 confining pressures
UCS is measured, UTS estimated from Brazilian or flexural tests. Mohr envelope constructed from these results, or (more often) by the Hoek-Brown method.
STRENGTH ANISOTROPY
The variation of strength (and elastic parameters) with the direction of loading is generally estimated from point load strength tests, perpendicular and parallel to bedding. Horizontal UCS and E values are typically 60-80% those of vertically-loaded specimens.
ELASTIC PROPERTIES Youngs modulus (E) Shear modulus (G) Bulk modulus (K) Poissons ratio
The Young's modulus is required prior to yielding (from actual test results); post-yield, but pre-failure (estimated); post-failure (estimated); and in the residual, or thoroughly fragmented state (estimated).
(3) The pre-mining (in situ) stress state, usually in terms of the magnitude and orientation of the over-burden stress av and the maximum and minimum horizontal stress components (ail and oh). These vectors may be either measured or, much more commonly, estimated on the basis of local experience.
(4) The strength and stiffness of the principal discontinuities (master joints, faults, bedding and dykes) intersecting the rock mass. These 'discrete joints' are modelled as mesh elements; the smaller and more numerous 'intrinsic joints' are allowed for in the scaling factors.
(5) The shape and dimensions of the proposed mine openings (roadways, intersections, pillars) and artificial support to be supplied.
This paper will concentrate on the geomechanical input properties of rock mass strength and deformabi-lity, especially in relation to FE model cells. The essentials are summarised on Table 1.
ROCK SAMPLING AND TESTING FOR MODEL INPUT
Sampling limitations
There are three main problems at the sampling stage of geomechanical testing: the small specimen size, the bias towards stronger rock and the condition of the core. The specimens used in rock mechanics testing are generally pieces of drill core, 50-60 mm in diameter and 30-150 mm long. As such, they are between 1% and 0.1% of the size of a typical FE model cell. They are therefore likely to be considerably stronger and stiffer
than the element which they are supposed to represent. Larger samples, especially blocks of coal (see Medhurst and Brown, 1996), are occasionally tested, but these would rarely exceed 0.2 m to 0.3 m in maximum dimension. The reasons for such small specimens are the high cost of cutting large blocks and the incapacity of compression testing machines to bring them to failure.
The second major limitation in the sampling process is the tendency to select the strongest core sticks in a tray for testing. This is not entirely due to human nature — core segments at least 120 mm long, and ideally 200 mm (to allow for trimming), are required for compression tests. Sticks of that length are uncommon, even rare, in core boxes. This is because the drilling process induces torsional fractures along bedding planes, wrongly described as joints on many logs. Hence sandstone tends to be over-represented in most test results, while weak lithologies such as siltstone and mudstone are correspondingly under-represented.
The problem is most acute with coal, whose geo-mechanical properties are most critical to the success of modelling. Here the sampling bias is towards strong, dull coals like those in the Ulan, Fassifern and Bayswater seams. Weak, highly cleated bright coals fail to survive the drilling, handling and sample preparation processes. Furthermore, geomechanical testing is often performed as an afterthought, when the coal has already been removed from core boxes for analysis!
To some extent this bias can be overcome by selecting samples with a sonic or neutron log in hand. These geophysical logs will immediately flag the strongest and weakest sections of the core, and

66 G. H. McNALLY
give valuable supplementary information for model specification as well. Indeed, sonic logs are most sensitive to strength variations at the low end of the range, and are especially valuable in estimating the physical properties of coal (McNally, 1987a, b). Hence an effort can be made to select low to intermediate strength rock for testing. Another palliative is to accept squat specimens (with a length/diameter or L/D ratio of 2.0 or less) of coal and mudstone for compression testing, and allow for the result being a little high. There is no such problem with indirect tensile tests, for which an L/D ratio of 0.5 is standard and which require no end-preparation.
The third problem area in sampling relates to the condition of the drill core at the time of testing. This usually means in an air-dried state, after several weeks in core boxes. Sandstone and conglomerate core, especially where the sandy matrix is coarse, becomes stronger with drying (wet strengths are typically 70% to 80% of dry values). On the other hand, many mudstones and shales exhibit hairline cracks on drying, and even complete slaking in some cases, making them untestable. Highly stressed core from deep boreholes undergoes microfracturing, becoming progressively weaker and less stiff with time. Hence test results may spuriously indicate that the drill core samples are either stronger or weaker than the in situ rock.
The effects of drying can be minimised by wrapping the core in plastic film, but this will be a nuisance if the trays are to be subsequently photographed (which is very desirable), and adds to the cost of sampling and testing. Significantly de-stressed core can sometimes be detected where the laboratory sonic velocity is well below that on the downhole sonic log. However, note that compressional wave velocity Vp is stress-dependent, so some diminution from in-hole to laboratory values is normal. Another stress relief indicator is where the tested elastic modulus is anomalously low relative to the compressive strength (i.e., it has a low modulus ratio), or relative to the apparent hardness of the rock. The general remedy is to keep the core as moist as possible, to handle it carefully and to test it as soon as possible after drilling.
Two final points need emphasis in relation to sampling. Firstly, the effects of mining on stress redistribution drop off rapidly with distance away from the mine excavation. Therefore the most valuable test results are those from a zone 2-3 diameters above and below the opening; in other words, immediate roof specimens are more important than those from upper roof strata. Secondly, the most important rock in modelling is the coal itself. Coal has unusual geomechanical properties — it has has relatively high tensile strength and is relatively dilatant (high Poisson's ratio), for example. It may be massive or highly cleated, and very anisotropic due to variations in ply composition. Much more investigation of the bulk properties of coal has been carried than for any other rocktype for these reasons. It is also quite variable in strength — UCS values for Australian coals range from about 6 to 60 MPa.
Testing limitations
Commercial rock mechanics testing lacks the degree of standardization found in aggregate or soil testing laboratories. This arises for a number of good reasons: there is not the same volume or continuity of work; to meet higher standards would be expensive; and, most important, this rock does not have to meet any specification criteria. Testing procedures such as those proposed by the ISRM (Brown, 1981) represent the ideal rather than standard practice. For example, the ISRM method for compression testing suggests a length/diameter ratio of 2.5 to 3.0. This is difficult to achieve with weak coal measures rock, which is exactly what most needs to be tested. It may require a 200mm stick of HQ core (62 nun diameter) when allowance is made for end-preparation. In practice, L/D ratios of 2 or even less have to be accepted, especially for lower strength specimens.
The reference standard in all rock mechanics testing is the unconfined or uniaxial compressive strength (UCS) test, to which all other strength indices, elastic properties and even rock cuttability are compared. However, the UCS of a particular rock layer is not an intrinsic or constant property. It varies with specimen size, specimen shape, moisture content, loading rate and other factors. The values obtained using a modem 'stiff' (servo-controlled) testing machine are likely to be higher than those from a conventional machine, in which the failure process is less controlled, even explosive.
Furthermore, even under the most strictly specified test conditions the UCS value will vary between apparently identical specimens, and between horizon-tally and vertically-loaded specimens. In other words, rock is inhomogeneous as well as anisotropic in its geomechanical properties. Note that the standard deviation for UCS tests is typically 35-45% of the mean (lower deviations usually mean that all samples were cut from the same block, rather than being different core segments!)
Nevertheless, compressive strength results for rock materials are more consistent than their tensile strengths. The determination of uniaxial tensile strength (UTS) is, after the estimation of rock mass properties, the most difficult problem in rock mechanics testing. Such measurements are, nonetheless, important because rock, being a brittle material, is much weaker in tension than in compression. However, no practical direct (extension) tensile test for rock specimens has yet been devised because of problems with end effects, so indirect (splitting and bending) methods have to be used instead.
The most widely accepted indirect tensile test (ITS) is the Brazilian (splitting) method. However, on theoretical grounds (Fairhurst, 1964) this test con-siderably underestimates UTS, the 'true' value being about 1.5 times ITS. Flexural (bending) tests, such as the USBM modulus of rupture test, simulate actual rock mass stress conditions better, with results that are typically 1.2 to 1.5 times ITS. However this method requires a core stick even longer (130 mm) than

TEI1S1011
UtlIAXIAL TENSION
CONPRESSICH
TRIAXIAL c't COMPRESSION
0-3
-
Sh
ear S
tress
UNIAXIAL COMPRESSION
GEOMECHANICAL PROPERTIES OF COAL MEASURES ROCK FOR NUMERICAL MODELLING 67
Table 3 Table 2 Typical compressive/tensile strength relations for coal measures rock.
UCS/ITS UCS/UTS
Typical elastic properties.
MODULUS RATIO, E/UCS
500(+) Exceptionally brittle cherty claystone 20 14 Strong sandstone and conglomerate 300 Strong, massive sandstone and conglomerate 20 14 Strong coal 200 Most coal measures rocictypes, especially sandstone 15 10 Sedimentary rock generally 200 Strong, uncleated coal, UCS > 30MPa 15 10 Medium to low strength coal 150 Medium to low strength coal 12 8 Shale, siltstone, mudstone 100 Weak mudstone, shale, non-silicified claystone 10 7 Weak shale, siltstone, mudstone
POISSON'S RATIO (of horizontal to vertical strains induced by loading):
that for a UCS specimen, which rules out the weaker lithologies. Suggested empirical relationships between UCS, ITS and UTS for coal measures rocktypes are given in Table 2.
The point load test is an even more widely_performed indirect tensile test, although it is best known as a means of estimating UCS. In sedimentary rocks, UCS can be anywhere between 10 and 45 times point load strength index (PLSI) (Read et al., 1980), rather than the 24 times which is generally quoted. Furthermore, the point load test is only valid where a definite tensile break occurs — which is usually not the case with weak, clay-rich rocks. Hence its use for estimating compressive (or tensile) strength of coal measures rock is not recommended, with the possible exception of some very strong and brittle sandstones. It has some value as a means of quantifying the relative strength of hard drill core, but even here it is less sensitive than sonic logging. Its main use in numerical modelling input preparation is for evaluating strength anisotropy (V/H, PLSIaxial / PLSIradia)) in core specimens.
BIAXIAL TENSION (Indirect Tensile Test)
Figure 4 The Mohr envelope construction for rock, made up of an ITS, UCS and three triaxial test results. Note that the ITS result (crb) is significantly less than the estimated uniaxial tensile strength (at).
0.35 Stronger coals 0.30 Weaker coals 0.30 Stronger sandstones 0.25 Most coal measures lithologies
Values above 0.40 or below 0.20 generally indicate strain gauge malfunction.
The main practical problem with triaxial testing of rock materials lies in the fact that 5 specimens are required for a complete Mohr envelope (UCS, ITS and compressive strength at three or more confining pressures, see Figure 4). In coal measures drill core, which is typically close-fractured, these specimens might be spread over 1-2 m of vertical interval, and even then low L/D test cylinders may have to be accepted. Multi-stage triaxial testing eliminates this problem, but requires more sophisticated equipment. The best indication that the five test results are consistent is the fit of the Mohr envelope to the data. A coefficient of determination (r2) between 0.95 and 1.00 is desirable; examples of good and bad data fits are illustrated on Figure 5.
The elastic properties of intact rock comprise its Young's modulus (E), Poisson's ratio (PR), shear modulus (G) and bulk modulus (K). In practice, only the first two parameters are measured, using strain gauges attached to UCS test cylinders. Shear and bulk moduli are estimated from E and PR, using elastic theory formulae. The Young's modulus generally used in modelling is the slope of the straight middle portion of the stress/strain curve (i.e., the tangent modulus, Et50 ).
However, a family of modulus values is required to simulate the progressive failure of a rock mass. A series of such curves governing the stress/strain behaviour of a numerical model, known as its 'constitutive law', is illustrated by Figure 6. These curves describe, in idealised form, the initial elastic deformation, yielding at close to peak strength, post-peak deformation and, finally, gradual crushing. Figure 6 is based on the complete stress/strain failure envelope generated by a servo-controlled 'stiff' compression machine. This apparatus represents the present state of the art in rock testing equipment, but such results are still uncommon.
In sedimentary rocks there is an approximate
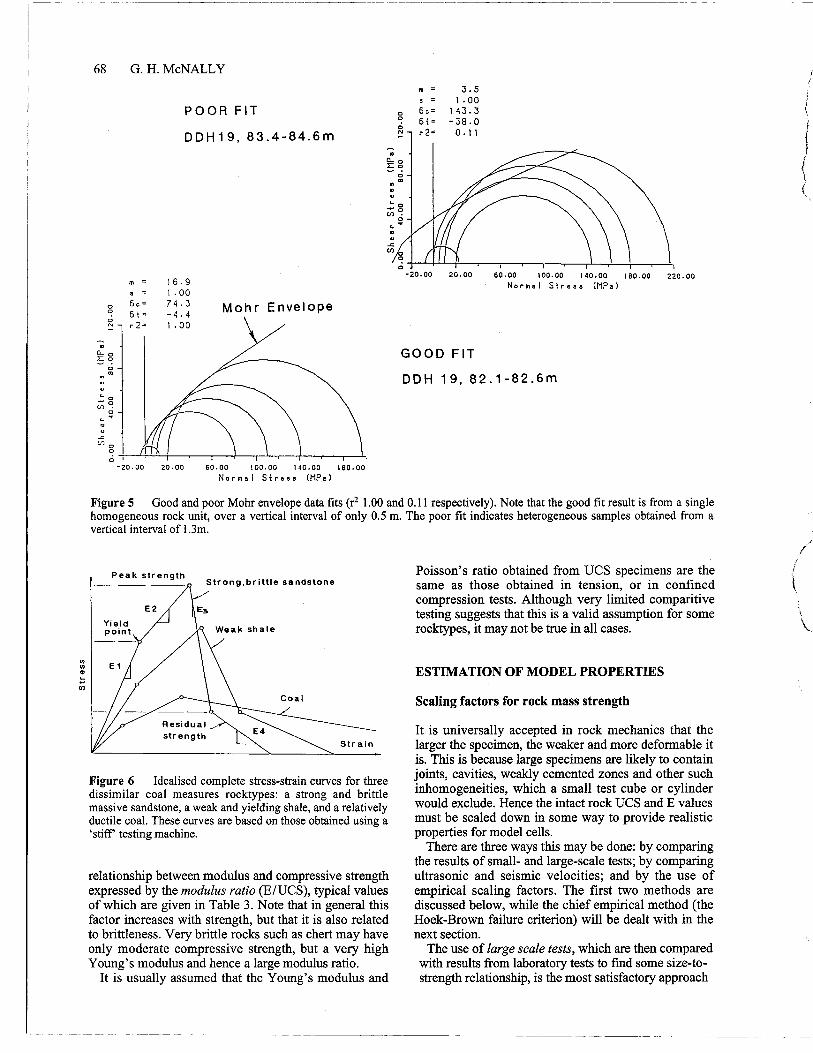
68 G. H. McNALLY
POOR FIT
DDH19, 83.4-84.6m
Mohr Envelope
16.9 1.00 74.3 —4.4 1.00
20.00 60.00 100.00 140.00 180.00
Normal Stre33 (MPa)
0
C.r)
-C (.n
8 -20.00
= 3.5 5 = 1.00 60= 143.3 6t= —38.0 r2. 0.11
-20.00 20.00 60.00 100.00 140.00 180.00 220.00
Normal Stre33 CMPa)
Yield point Weak shale
Peak strength Strong,brittle sandstone
Es
Coal
Strain
C7)
GOOD FIT
DDH 19, 82.1-82.6m
Figure 5 Good and poor Mohr envelope data fits (r2 1.00 and 0.11 respectively). Note that the good fit result is from a single homogeneous rock unit, over a vertical interval of only 0.5 m. The poor fit indicates heterogeneous samples obtained from a vertical interval of 1.3m.
Figure 6 Idealised complete stress-strain curves for three dissimilar coal measures rocktypes: a strong and brittle massive sandstone, a weak and yielding shale, and a relatively ductile coal. These curves are based on those obtained using a 'stiff' testing machine.
relationship between modulus and compressive strength expressed by the modulus ratio (E/UCS), typical values of which are given in Table 3. Note that in general this factor increases with strength, but that it is also related to brittleness. Very brittle rocks such as chert may have only moderate compressive strength, but a very high Young's modulus and hence a large modulus ratio.
It is usually assumed that the Young's modulus and
Poisson's ratio obtained from UCS specimens are the same as those obtained in tension, or in confined compression tests. Although very limited comparitive testing suggests that this is a valid assumption for some rocktypes, it may not be true in all cases.
ESTIMATION OF MODEL PROPERTIES
Scaling factors for rock mass strength
It is universally accepted in rock mechanics that the larger the specimen, the weaker and more deformable it is. This is because large specimens are likely to contain joints, cavities, weakly cemented zones and other such inhomogeneities, which a small test cube or cylinder would exclude. Hence the intact rock UCS and E values must be scaled down in some way to provide realistic properties for model cells.
There are three ways this may be done: by comparing the results of small- and large-scale tests; by comparing ultrasonic and seismic velocities; and by the use of empirical scaling factors. The first two methods are discussed below, while the chief empirical method (the Hoek-Brown failure criterion) will be dealt with in the next section.
The use of large scale tests, which are then compared with results from laboratory tests to find some size-to-strength relationship, is the most satisfactory approach

GEOMECHANICAL PROPERTIES OF COAL MEASURES ROCK FOR NUMERICAL MODELLING 69
Hoelt&Brown Curve (hard rock)
Coal Measures rock (proposed)
Singh Curve (coal)
0. .50 540 'SOO Specimen Diameter
Figure 7 Specimen size versus compressive strength curves for hard rock, coal measures sedimentary rock and coal. Note the considerable decrease in strength between that of a laboratory test sample (diameter 50mm) and that of an in situ joint block (diameter 1-2 m).
from a scientific viewpoint. Unfortunately, it is also the most expensive, and for this reason is rarely undertaken unless the matter is critical. Nevertheless, Hoek and Brown (1980a) have gathered together published results from a number of such compression tests, and have presented them as an exponential curve (Figure 7). This curve indicates, for example, that the UCS for a 1 m cube is likely to be about 60% of that for an intact 50 mm diameter test cylinder, while a 10 m cube (roughly the size of a large FE cell) is about half the laboratory strength.
Note, however, that the Hoek and Brown curve is based largely on tests in strong rock such as granite and for specimens no larger than 200 mm diameter. At the opposite extreme, Singh (1981) has compiled a similar curve for coal, which is also plotted on Figure 7. Assuming coal measures rocks to be about midway in geomechanical properties between granite and coal, an empirical strength/ size relationship is therefore given by:
ae = UCS (50/ d)"
where ac is the scaled-down compressive strength for a rock mass block of maximum dimension d mm.
The use of the velocity ratio, comparing ultrasonic Vp for laboratory UCS specimens with seismic Vp for rock masses was first proposed by Onodera (1963). Its appeal lies in being able to compare the same physical property, and one that is closely related to strength and elastic modulus, at two quite different scales. However, suitable seismic velocity measurements using uphole (VSP) methods are rarely performed in coal exploration boreholes.
Long-spaced in-hole sonic logs (0.6 m transit distance) provide a cheaper, though less satisfactory, means of estimating rock mass V. It must be remembered that log velocities are often considerably faster than laboratory values because of the influence of in situ stress (rather than slower, as the scaling factor
approach would predict). In fact this disparity is one way of detecting high in situ stress, and hence it is necessary to re-load the laboratory specimen back to the in situ value before making a comparison. This is therefore not a very practical procedure.
Hoek-Brown failure criterion
The state of stress in a brittle material at the point of failure can be expressed graphically by the Mohr envelope construction shown in Figure 4. The envelope for intact rock is typically a parabolic curve, with a small negative intercept on the x-axis representing its tensile strength. To simplify presentation, only semi-circles and a half-parabola are usually plotted. Within the compressive stress field the Mohr envelope is defined by a series of tangents to the semi-circles. These points of tangency represent the combination of stresses at the point of failure. In contrast to the -Mohr-Coulomb envelope for soils, the internal angle of friction for rock (4)) diminishes as stress increases. Note also that cr1 and 02 correspond to the axial and lateral (confining) stresses at failure in the triaxial test.
Failure may occur by rupture along a single shear plane at low confining pressures, or by excessive microfracturing and cylindrical bulging at high pressures. It is assumed that the intermediate principal stress cr2 plays no part in the failure process (in fact the all-round confining pressure in a triaxial test means that a2 = cs3 in this case). A more comprehensive discussion of the failure process in coal measures rocks can be found in Farmer (1983).
As mentioned previously, the exeierimental data used in the construction of the Mohr envelope are obtained from UCS, ITS and triaxial compression tests performed on apparently identical rock cylinder samples from the same layer. Some care is needed to ensure that the confining stresses are low enough to replicate conditions in coal measures strata, since much of the published literature relates to experiments carried out at stresses far beyond these values; cr3 = 5, 10 and 20 MPa is recommended. The steepness of the envelope (expressed, as discussed later, by the parameter m) is a measure of the strength increase with confinement.
Construction of a Mohr envelope using experimental data is expensive, yet may not truly represent the strength of the rock layer being modelled. This is because the triaxial specimens are often not identical (see Figure 5), and since tensile strength controls the steepness of the curve at low stresses this parameter should be chosen carefully. Furthermore, as the distance from the mine opening to the layer being modelled increases, and failure of an element within this layer becomes correspondingly unlikely, the precise shape of the Mohr envelope becomes less critical. Nonetheless, a Mohr envelope is required to define the strength characteristics of each cell in an FE model, so if no experimentally-derived curve is available it must be estimated.
This is the purpose of the Hoek-Brown failure criterion (Hoek and Brown, 1980a, b; Hoek, 1983). It

70 G. H. McNALLY
Table 4 Suggested values of Hoek-Brown brittleness factor (n).
m Rock Description
20 Very brittle rocks, such as silicified claystone 15 Very strong sandstone and sideritic mudstone,
UCS>120 MPa 12 Strong and brittle or closely cleated coal,
UCS>30 MPa 10 Most coal, UCS <30 MPa 10 Strong sandstone, UCS around 100 MPa 8 Massive conglomerate and sandstone, UCS<100 MPa 6 Interbedded and interlaminated sandstone, siltstone
and mudstone 4 Very weak shale, mudstone subject to plastic
deformation
NOTE: Intact rock specimens only; all rocktypes presumed to be unweathered.
Table 5 Suggested values of Hoek-Brown fracturing factor (s).
s Rock Description
0.80 Massive sandstone and conglomerate, joint spacing > FE cell dimensions
0.60 Same, but joint spacing < cell dimensions 0.50 Thick-bedded sandstone 0.40 Medium to thin-bedded sandstone; interbedded
sandstone, siltstone and mudstone 0.30 Most coal, weak mudstone 0.20 Highly cleated coal 0.10 Closely jointed rock, any lithology
provides an empirically-based method for constructing Mohr envelopes using only readily-available com-pressive and tensile strength data. It has the general form of a parabolic curve given by:
= a-3 (maea3 + sa3 2 )0.5
where a , and 03 are the maximum and minimum principal stresses at failure, a c is the compressive strength, and m and s are empirical constants which govern the shape of the Mohr curve. The Hoek-Brown criterion applies to all rocks, including jointed rock masses and lithologies much stronger than those found in Australian coal measures. One of the chief aims of this paper is to present values of m and s which are more relevant to coal measures rock than those given by Hoek and Brown. A modified form of the Hoek-Brown criterion for estimating the bulk strength of coal has been derived by Medhurst and Brown (1996).
In FE modelling the state of increased stress around a mine opening at the instant of its excavation is first simulated, in effect by transforming the cavity into an
element with the properties of air. The program then calculates the direction and magnitude of the principal stresses within each perimetral element through a series of iterations, until stability is achieved (see Figures 1-3). If the semi-circle defined by these stress combinations intersects the cell's Mohr envelope, that element is deemed to have failed. If failure does not occur — which is the more usual result — the element will nevertheless be subjected to increased stress and its centre will be displaced slightly towards the void. The nett result of all this is a series of plots showing: the extent of failed elements (and whether by shear or tensile failure) (Figure 1); the extent of partly-failed (yielded) elements; the new magnitude and direction of al and a3 in each unfailed element (Figure 2); and strain vectors for each element (Figure 3).
Estimation of parameters m and s
Although Hoek (1983) disclaims any fundamental relationship between his dimensionless empirical parameters m and s, they are analogous to the angle of friction (0) and the cohesion intercept (c) on a conventional Mohr-Coulomb soil envelope. Both parameters influence the shape of the Mohr envelope for rock materials, with s dominating in the tensile and low-compressive stress fields, and m being the more significant at higher compressive stresses. Estimating realistic values for both parameters is essential to the operation of the Hoek-Brown failure criterion in numerical modelling. For convenience these parameters are referred to here, though not by Hoek and Brown, as the brittleness factor (m) and the fracturing factor (s).
The brittleness factor (m) is numerically equal to the ratio of uniaxial compressive to tensile strength (ac/ at) for either the intact rock or a rock mass, as defined by its Mohr envelope. It is therefore approximately equivalent to the UCS /ITS ratio, the disparity being due to the averaging effect of the envelope and the shortcomings of the Brazilian ITS. Hoek and Brown (1980) suggest m-values of up to 25 for very strong and brittle igneous rock such as granite, and 10-15 for shales and sandstones. For Australian coal measures rocks, intact m-values are slightly lower, typically 6-12 (Table 4).
Hoek and Brown suggest reducing these intact rock m-values by half for 'very good' quality rock masses (RMR about 85), and to one-tenth for 'good' quality (RMR about 65). They admit that these scaling factors err on the side of safety by underestimating rock mass strength, and the author's experience with Sydney Basin rock certainly upholds this view. Since the brittleness factor m is the ratio a,/ a„ these scaling factors imply that rock mass compressive strength diminishes relative to its tensile strength. The opposite is much more plausible — that as the size of the rock specimen increases, its tensile strength will diminish faster than compressive strength. Hence it is suggested that for estimating purposes no such reduction factor be applied, and even that the intact m-value be slightly increased to obtain rock mass strength.

GEOMECHANICAL PROPERTIES OF COAL MEASURES ROCK FOR NUMERICAL MODELLING 71
The principal consequence of increasing m is the same as increasing the internal friction angle — it means that a small amount of confinement greatly increases the load-carrying capacity of a FE mesh element. This is especially important in pillar design and is a fortuitous consequence of high m-values (i.e., high brittleness) for coal. Bieniawski and Bauer (1982) suggest m = 20-27 for US coals, which are about twice the suggested Australian coal values (Table 4), but may be due to the American samples being not truly intact. Hoek and Brown do not give m-values for coal, but Medhurst and Brown (1996) suggest values as low as 3 for Moura coal masses.
The bulk strength of a rock mass is also controlled by the Hoek-Brown fracturing factor (s), which has values between 1.00 for intact specimens and zero for closely jointed rock masses with no tensile strength. Hoek and Brown give little guidance for estimating s-values, though they suggest s = 0.1 for 'very good quality' rock masses and s = 0.004 for 'good quality'. However they do indicate a 'maximum possible' value of 0.65 for hard, very tightly jointed rock masses. This has proved to be a much more realistic upper bound s-value for modelling Australian coal measures strata. In fact with models of extremely wide-jointed rock masses, such as the Newcastle Coal Measures conglomerates, where FE cells are similar in dimensions to actual joint blocks, s-values of 0.8 or even 0.9 may be appropriate. Suggested typical s-values for a variety of coal measures lithologies are given on Table 5.
CONCLUSIONS
(1) The formulation of geotechnical input specifications for numerical models requires careful evaluation of the available geological data (primarily that from lithological logs and downhole geophysics) and geomechanical test results. However, even the best results have to be modified and scaled down to represent actual rock mass conditions. Much of the input data have to be obtained from 'educated guessing' and a range of rules of thumb are presented here for this purpose.
(2) A common dilemma in testing is that the weakest rock, which is most likely to fail and therefore of most geotechnical interest, is also likely to be the most fractured (even fragmented) in drill core. When sampling drill core for testing it is necessary to avoid taking only the strongest segments, even at the risk of having to perform UCS tests on specimens with L/D ratios of 2 or less. Sonic logs are useful in selecting such low strength samples.
(3) Drill core may become stronger on drying due to increased suction (especially with sandstone), or weaker due to destressing and slaking (especially in mudrocks). Closely-spaced bedding plane fractures are common in coal measures drill core because of this, and because of drilling-induced torsional stresses. Such fractures are often mis-logged as bedding plane joints. It is advisable that testing be carried out as soon as possible after coring.
(4) There is no satisfactory test for the uniaxial tensile strength of rock, despite rock being much more likely to fail in tension than compression. The Brazilian indirect tensile test is widely used, because it is convenient, but underestimates UTS by about one-third. Flexural tests give a truer measure, but require much longer (hence impractical) test specimens. The point load test is of very limited value in coal measures rocks.
(5) Strength (and elastic modulus) reduction factors are necessary to scale down geomechanical test results for model input. Two approaches are recommended: an exponential curve based on comparison of UCS tests on large and small specimens, and the Hoek-Brown fracturing factor (s). Values for this factor in coal measures rock masses are suggested in the text (Table 5), but note that these are considerably higher than those previously suggested by Hoek and Brown.
(6) The Hoek-Brown failure criterion is recom-mended as a means of constructing Mohr envelopes for FE models. However, more specific values of the brittleness factor (m) than those proposed by Hoek and Brown are presented here for eastern Australian coal measures rocks. In addition, no reduction in m between intact specimens and rock masses is recommended, since this would imply that compressive strength in rock masses diminishes relative to tensile strength; the opposite is more likely.
ACKNOWLEDGEMENTS
Much of the experience related in this paper was gained while the author was employed by Australian Coal Industry Research Laboratories (ACIRL) Ltd between 1981 and 1987. The empirical factors and rules of thumb included here were developed from about 2,000 geomechanical test results obtained at twenty underground coal mine sites in the Sydney and Bowen Basins. I would like to thank all my former colleagues at ACIRL, but in particular Dr Peter Mikula, who helped to develop many of these ideas and gently guided me towards a vague understanding of the black art of numerical modelling.
REFERENCES
BIENIAWSKI Z. T. & BAUER J. 1982. Discussion on empirical strength criterion for rock masses. Journal ASCE Geotechnical Division 108 (GT4), 670-673.
BROWN E. T. (ed.) 1981. Rock characterization, testing and monitoring — ISRM suggested methods. ISRM/ Pergamon, London.
CARTER J. P. 1996. Numerical methods in geotechnical enginering — from research to practice. Proceedings of the 7th ANZ Geomechanics Conference, Adelaide, 441-470.
FAIRHURST C. 1964. On the validity of the Brazilian test for brittle materials. International Journal of Rock mechanics and mining Science 1,535-5346.
FARMER I. W. 1968. Engineering properties of rock. Spon, London.
FARMER I. W. 1983. Engineering behaviour of rocks — second edition. Chapman and Hall, London.

72 G. H. McNALLY
HOEK E. 1983. Strength of jointed rock masses. Geotechnique 33 (3), 187-223.
HOEK E. & BROWN E. T. 1980a. Underground excavations in rock. Institute of Mining and Metallurgy, London.
HOEK E. & BROWN E. T. 1980b. Empirical strength criterion for rock masses. Journal ASCE Geotechnical Division 106 (GT9), 1013-1035.
MCNALLY G. H. 1987a. Estimation of coal measures rock strength using sonic and neutron logs. GeoExploration 24 (4-5), 381-395.
MCNALLY G. H. 1987b. Geotechnical applications and interpretation of downhole geophysical logs. Australian Coal Industry Research Laboratories (A GIRL). Published
Report 87-7, November. MEDHURST T. P. & BROWN E. T. 1996. Large scale laboratory
testing of coal. Proceedings of the 7th ANZ Geomechanics Conference, Adelaide, 203-208.
ONODERA T. F. 1963. Dynamic investigations of foundation rocks in situ. Proceedings of the 5th US Rock Mechanics Symposium. Pergamon, New York, 517-533.
READ J. R. L., THORNTON P. N. & REGAN W. M. 1980. A rational approach to the point load test. Proceedings of the 3rd ANZ Geomechanics Conference, Wellington NZ, Volume 2,35-39.
SINGH M. M. 1981. Physical properties of rocks and minerals. McGraw-Hill, New York.

Symposium on Geology in Longwall Mining, 12-13 November 1996, eds G. H. McNally and C. R. Ward, pp 73-80.
The mechanical behaviour of coal measures rocks from NSW collieries under load
K. H. R. MOELLE, G. L. DEAN-JONES AND G. LI
Institute of Coal Research, The University of Newcastle.
Results of experimental investigations into the load responses and geomechanical behaviour patterns of several coal measures rocktypes from the Sydney and Bowen Basins have allowed characterisation of failure precursors and failure modes. In many cases failure can be predicted through analysis of stress-strain relationships and acoustic emission recording. Force-axial displacement results demonstrate that failure mode can be categorised as stable, where residual deformation takes place, and unstable where the load capacity of the rock is rapidly lost. Experimental results suggest that rocks with UCS values <20 MPa fail in a stable manner and those with UCS values >55 MPa fail in an unstable manner. Rock fabric features play an important role in the failure process.
INTRODUCTION
The test programme reported here aimed to identify the mechanics of sudden uncontrolled roof failures in underground coal mines. Geomechanical tests have been conducted on a wide range of rock types sampled from the floor and roof strata of collieries in the Sydney Basin, and to a lesser extent in the Bowen Basin. The large number of data (approximately 1,000 UCS tests) has allowed a statistically valid categorisation of the mechanical response of these rocks to directional loading.
The rock samples tested cover a wide range of rocks, including igneous dykes, likely to be encountered during underground mining operations in the Sydney-Bowen Basin. Samples have been taken from the Newcastle, Greta, Southern and Western Coalfields in NSW, and from the German Creek-Moranbah Coal Measures.
Correlations have been made between failure modes and the contributions made to failure by a variety of geological factors. Understanding the processes and mechanics of roof failure is an essential prerequisite to any attempts to 'control' the response of roof strata to mining-induced disturbances, and hence to eliminate sudden roof failures. These laboratory-based investigations were designed to provide a systematic approach to the categorisation of failure modes and the identification of the principal contributing factors. The geomechanical behaviour of laminites has been particularly emphasised, as that rock type is frequently associated with immediate roof instability problems.
TESTING METHODS
The tested rock types have been categorised into the following groups according to grainsize and fabric configuration:
• Coals;
• Claystones and mudstones; • Shales and laminated siltstones • Sandstones and conglomerates; and • Dolerite and cindered coals.
Uniaxial compressive strength (UCS) tests using circumferential displacement and axial displacement control have been used to provide data on the precursors to, and characteristics of rock failure.
Specimen—testing machine interactions
Interactions between the UCS specimen and the testing device play an important role in determining the post-peak failure characteristics of a rock sample. Whether or not a specimen fractures in an unstable fashion after its peak load capacity is exceeded depends on the relative stiffnesses of the specimen and that of the testing device. Rock failure characteristics observed in the post-peak deformation phase are, to some extent, artefacts of the test procedure, and are not an intrinsic property. 'Specimen-machine' interactions do, never-theless, simulate the behaviour of rockmass stability under mining conditions in a way that older 'soft' testing machines did not.
Experimental procedures
A closed-loop servo-controlled MTS 810 load frame was used in this investigation. This 'stiff' testing apparatus allows experimental variables, such as a force, axial displacement, circumferential displacement, or a strain component to be programmed to change in a predetermined manner. The measured and programmed values are compared electronically at a speed of 3 kHz, and a servo valve adjusts the pressure within the actuator to produce the desired equivalence between the measured and the programmed values. Both circum-ferential-displacement and axial-displacement testing

74 K. H. R. MOELLE ET AL.
were used to study precursory phenomena and the characteristics of rock failure in these UCS tests.
Circumferential-displacement control testing
Loading under a constant rate of circumferential displacement allows the specimen to dilate uniformly. Fractures, which are the direct cause of this dilatancy, are only allowed to develop at a certain speed. Consequently, the specimen will not fail violently. This is an excellent method to derive the stress-volumetric strain relationship from a rock sample, as a direct manifestation of fracture development in the specimen. The stress-volumetric strain relationships have been used in this investigation to characterise the precursory phenomena of rock failures. The rates of the circumferential-displacement used in controlling the tests varied from 0.020 to 0.030 mm/minute.
Axial-displacement control testing
As axial displacement is much less sensitive to the development of fractures in the specimen than cir-cumferential displacement, such a test will involve specimen-machine interactions, even under servo-controlled conditions. Testing of brittle rock specimens under axial displacement control allows characteristics of unstable failures in the post peak phase to be observed.
The bulk of the specimens studied in this programme were tested under axial displacement control. The loading conditions for the samples were identical, with the axial displacement increased monotonically at a speed of 1 mm/minute.
PRECURSORY PHENOMENA OF ROCK FAILURES
Under uniaxial compressive loading, the stress-volumetric strain relationship portrays the fracture development in a test specimen. An inflection point on the stress-volumetric strain curve defines Long Term Strength where, under a constant stress lower than the UCS value, fractures will continue to develop until the specimen fails (Figure 1). The point of Long Term Strength signifies a change in the deformation process of a specimen. Up to this stage, reduction of a specimen's volume is the primary deformation response; beyond it fracturing dominates, with significantly increased acoustic emissions.
Experiments using circumferential displacement control have identified three different stress-strain patterns:
(1) A stress-volumetric strain curve (Figure 1) characterised by pronounced non-linearity and smooth change with increasing stress levels, indicating progressive and pervasive microcracking in the speci-men. The progressive nature of such brittle deformation, and, in particular, the exceeding of Long Term Strength,
would provide ample warning of imminent failure through use of appropriate instrumentation, such as strain extensometers or acoustic emission transducers.
(2) A stress-volumetric strain curve (Figure 2) which is virtually linear up to a sudden inflection point. This inflection point coincides with the strength failure of the specimen. The linearity of the stress-volumetric strain curve indicates a lack of microcracking. This acoustically-quiet period is terminated by major fracture development at the inflection point, without any transition period. Such a sudden change makes it extremely difficult to predict failures in rocks of this type, even under laboratory conditions.
(3) A stress-volumetric strain curve (Figure 3) showing multiple drops in stress level before the peak is reached. These fluctuations are caused by highly unstable but localised fracture events, resulting from stress concentrations in the vicinity of rock fabric defects. The fractures propagate only far enough to relieve excess stress concentrations and subsequently remain in equilibrium. Such multiple fractures occur on a scale much larger than the pervasive microcracks displayed in Figure 1, but smaller than the major fracture event depicted in Figure 2. These multiple fractures produce an audible signal which can be detected without the aid of acoustic emission equipment, and they are frequently heard in coal and fme-grained coal measure rocks such as shales and siltstones.
The timing of the initiation of such fractures varies significantly. Fracture events in the same rock have been recorded at well below half of the UCS values, or shortly before the final failure event. This type of precursory phenomenon requires further study.
ROCK FAILURE MODES
Under axial displacement control a rock specimen may fail in an unstable fashion in the post-peak period. This provides an opportunity to study the characteristics of unstable rock failures, and to assess the factors that affect roof stability. A laboratory study of rock failure behaviour under unstable loading conditions may help predict such violent failure events (rockbursts) under mining conditions.
Rock failure can be divided into four stages, according to the stability of the failure development.
Stage I. Stable deformation
A stable deformation period prevails before the peak is reached. Precursory phenomena of rock failure, observed during this stage, are discussed above.
Stage H. Peak load to failure initiation
This transitional stage commences at the curve peak and terminates when the failure begins. Stable fracture development in this stage accelerates. Stage II can be further classified by the shape of the force-axial

Str
ess
(M
Pa)
Sudden Change in Volumetric Strain Fracture Development UCS
\A
Circumferential Strain / Axial Strain
-0.002 0.006 0.004
50
40 -
30 -
20 -
10 -
-0.004 -0.000 0.002 Strains
-0.002
Figure 3 Fracture behaviour patterns as precursors to rock failure. Stress-strain curves showing multiple fracture events preceding failure in dull coal.
12
10
8 - • \-'4).Y1
UCS Stress Drops
\
)
Before Failure
2 -
/ Volumetric Strain /
NA /
// Axial Strain
0
-0.000 0.002
Strains
70
60 -
50 -
al a. 40 -
u) 30- U)
65 20 -
10 -
THE MECHANICAL BEHAVIOUR OF COAL MEASURES ROCKS 75
./rN'
/ ,
Axial Strain
UCS Strain \y, Strain Circumferential Volumetric
Long Term Strength
•
k p. p.
1
Region D:
-0.004 -0.002 -0.000 0.002 0.004 0.006
Strains Figure 1 Fracture behaviour patterns as precursors to rock failure. Stress-strain relationship in laminated siltstone, demonstrating progressive failure.
Figure 2 Fracture behaviour patterns as precursors to rock failure. Stress-strain relationship in a laminated siltstone specimen containing a pre-existing frac-ture. Note sudden failure.

0 0.2 0.4 0.6 0.8 1 1.2
Figure 4 Rock failure modes. Force-axial displacement curve with yielding and stable failure.
80
60 -
V'r • Commencement of unstable failure
20 -
0
200 -
150 -
F
Strafing Point of Unstable Failure
a) 2 100 - 0 u_
50 -
0
76 K. H. R. MOELLE ET AL.
0.0 0.4 0.8 1.2 1.6 2.0
Axial Displacement (mm)
Axial Displacement (mm)
Figure 5 Rock failure modes. Force-axial displacement curve showing pre-peak cracking, yielding and unstable failure.
0 0.2 0.4 0.6 0.8 1 1.2 1.4
Axial Displacement (mm)
Figure 6 Rock failure modes. Force-axial displacement curve with a sharply inflected peak load, folowed by sudden and unstable failure.

200
2 100 - o u_
50 -
THE MECHANICAL BEHAVIOUR OF COAL MEASURES ROCKS 77
Figure 7 failure.
0 0.2 0.4 0.6 0.8 1 1.2 1.4
Axial Displacement (mm)
Rock failure modes. Force-axial displacement curve exhibiting multiple force relaxation events prior to unstable
displacement curve in the peak region. Figures 4-7 demonstrate the three basic types identified.
The curve in Figures 4 and 5 display a broad peak and gradual yielding. The final failure can be either stable (Figure 4) or unstable (Figure 5), depending on lithology. If the failure is unstable, it will occur well after the peak has been reached.
The Figure 6 force-axial displacement curve shows a sharply inflected peak, where the slope of the curve changes abruptly. A highly unstable failure can be expected immediately or shortly after the maximum load is exceeded. The curve in Figure 6 was obtained from a UCS test performed under axial displacement control. The same rock, when tested under circum-ferential displacement control, may yield either a gradual (Figure 1) or a sudden (Figure 2) change in its stress-volumetric strain curve, depending on the defect configuration in the specimen. This point will be discussed later.
In Figure 7 the force-axial displacement curve exhibits multiple force relaxation events, each drop signifying a highly unstable but localised fracture event. The specimen regains stability after each fracturing event, in a process similar to that depicted in Figure 3.
Stage III. Failure
Failure can be either stable (Figure 4) or unstable (Figures 5-7). Unstable failure is often marked by a loud cracking sound. It is frequently observed that the sooner an unstable failure occurs after the peak, the more violent this event will be, and the fewer the precursors recorded. Rocks which fail unstably can be further categorised by the starting point of Stage
• Highly unstable, characterised by failure immediately or shortly after the peak; or
• Moderately unstable.
Stage IV. Residual deformation
The failure process at this stage reverts to a stable pattern, called here residual deformation. Unstable failures usually result in the complete collapse of the specimen, due to the violent release of stored strain energy. As a result, the load-carrying capacity of the sample is totally destroyed and no residual deformation can observed.
FACTORS AFFECTING THE FAILURE MODES
Rock strength
In the following discussion, test results from coal, cindered coal and dyke materials are excluded, because the strength characteristics of these materials are different from those of other coal measures rocks.
As discussed above, rock specimens loaded under axial displacement control can exhibit stable or unstable failure in the post-peak region (Stage III). Figures 8 and 9 illustrate the frequency distribution of the UCS results from these two groups. An analysis of this UCS data shows the following trends:
(1) Failure of rocks with a UCS value between 20 and 55 MPa can be either stable or unstable. No unique relationship exists between the rock strength and the failure stability, indicating that the instability criterion of a rock failure is independent of the strength of the rock.
(2) Under experimental conditions, rocks with UCS values outside the range 20-55 MPa, fail either stably, when their UCS is <20 MPa, or unstably when >55 MPa. This apparent relationship between failure stability and the UCS ranges is a reflection of the stiffness characteristics of the specimen-testing machine system discussed above. If a testing frame much stiffer than the present MTS machine is used, the failure of a rock with a UCS >55 MPa may still be stable in the post-peak region.

50 60 10 20 30 40
(MPa)
Figure 8 Frequency distribution of UCS results derived from rocks which failed in a stable manner.
78 K. H. R. MOELLE ET AL.
16
14
12
10
8
6
4
2
0 o
20 30 40 50 60 70 80 90 100
(M Pa)
Figure 9 Frequency distribution of UCS results derived from rocks which failed in an unstable manner.
The dependence of failure stability on the stiffness characteristics of the system, rather than on the intrinsic strength of the rock, is an important consideration for mine design. A mine layout offering high overall stiffness will be less likely to incur unstable and violent failures, even when the rockmass surrounding the excavations may have exceeded its strength values.
Heterogeneities and lithology
Heterogeneities in brittle materials play an important role in the occurrence and the magnitude of precursory phenomena, and in unstable failures in the post-peak region. In homogeneous materials such as glass, failure occurs suddenly and highly unstably. Conversely, in heterogeneous materials such as most coal measure rocks, the precursory phenomena and failure stability are strongly dependent on the nature and orientation with respect to loading of inherent heterogeneities.
The heterogeneities in coal measure sediments are primarily determined by their porosity, mineralogy, degree of alteration, fabric and the physical interaction between clasts, matrix and cement. Boundaries between the individual components in these rocks are non-crystalline and are thus weak, unless they are bonded by siliceous or carbonate secondary cements. The presence of mechanical heterogeneities promotes microcracking
or sliding at low stress levels, and their pervasive distribution significantly reduces the possibilities for high stress concentrations.
Consequently, a typical heterogeneous rock, such as a porous sandstone with an argillaceous matrix/ cement, always deforms progressively under loads. It gradually yields near the peak of its force-axial displacement curve, before it fails unstably (Figure 5). The stress levels recorded at the commencement of microcracking in such rocks were only 10% or less of their UCS values.
Mudstones and claystones, on the other hand, often deform in a 'ductile' manner without unstable failures (as exemplified by Figure 4), due to their weak argillaceous constituents and the dispersed void space in their fabric. Shales, being more lithified, tend to be more brittle in their deformation behaviour.
In the studied elastic rocks, heterogeneities diminish as the grain size and pore volume decrease, and as the amount of siliceous or carbonate cement increases. This restricts microcracking, and increases the required stress levels for the commencement of microcracking to 30%-70% of the rocks' UCS values. Failure patterns become more linear, exhibit fewer precursors before the peak, and specimens fail more violently. In the present investigation, rocks classified as highly unstable were mainly laminated siltstones (when loaded normal to bedding), and sandstones and conglomerates with a substantial amount of siliceous or carbonate cement.
Moisture content
Moisture content has a strong influence on the failure modes of rocks by activating weak mechanical hetero-geneities. Consequently, a wet rock sample develops more pronounced non-linearity under test conditions and it usually fails in a more stable manner compared to its dry counterpart. The effects of moisture, however, become less significant for rocks with a densely compacted fabric and a siliceous or carbonate cement.
Fabric defects
The fracture geometry is a key factor controlling the stability of rock failures. A complex fracture system created under loading will consume strain energy provided by the system evenly within the rock fabric. Consequently, the failure process is unlikely to be sudden or violent. In contrast, if a rock fails along a few dominant fractures, the potential energy created by mining in the 'roof-seam-floor' system, can become excessive. The fractures become highly unstable and the failure mechanism is violent.
The effects of fabric defects on failure development are demonstrated by the following results:
(1) Tests conducted on a highly anisotropic coal with two cleat sets. The fractures generated by the tests were forced into new orientations, or to branch, when they met the boundaries of the discontinuities. The fracture system was complex, and included re-activated
14
12
10
8
6
4
2
0 10

THE MECHANICAL BEHAVIOUR OF COAL MEASURES ROCKS 79
0.5 1 1.5 2 2.5
Axial Displacement (mm)
Figure 10 Fabric defects as failure precursors. Force-axial displacement curve for a cleated coal with a highly anisotropic fabric.
0 0.5 1 1.5 2
Axial Displacement (mm)
Figure 11 Fabric defects as failure precursors. Force-axial displacement plot for a tuffaceous rock specimen containing a smooth, unhealed pre-existing fracture.
discontinuities of different sizes, shapes and orien-tations. Such intensive interactions between the propagating fractures and existing structural defects have important implicatons for the rapidity of rock failures. Figure 10 shows the 'ductile' deformation characteristic of this coal sample. Coal measure rocks with a similar defect network fail in the same way.
(2) Tests on rock samples with penetrative pre-existing fractures oriented at approximately 20-30° to the core axis. This orientation coincides with a favourable spatial attitude for stress-induced fracturing under UCS loading conditions. The test-induced fractures were confined by pre-existing fractures, as they followed exactly the geometry of existing fractures, and had very limited interactions with the bulk of the rock fabric. Tests conducted on rocks with this type of defect configuration have produced two different results, illustrated by Figures 2 and 11.
Figure 11 shows a force-axial displacement curve obtained from a tuffaceous rock with a smooth, unhealed pre-existing fracture. At less than half peak load the curve begins to undulate, indicating movement or cracking within the sample. The specimen eventually failed by fracturing along the penetrative defect. Post-test examination of the fracture surfaces revealed that sliding was the primary cause of the pre-failure movements, as well as for the stable failure behaviour.
The stress-strain patterns displayed in Figure 2 were obtained from laminated siltstone with a prominent pre-existing fracture set inclined to the sample axis. Although the geometrical configuration of the defect was very similar to that portrayed in Figure 11, the test results were completely different. The siltstone failed without any warning, through sudden unlocking along the discontinuities at a stress level below the UCS value of the same rock without defects.

80 K. H. R. MOELLE ET AL.
UVIPLICATIONS FOR STRATA CONTROL
Three typical failure patterns which are considered important for strata control purposes can therefore be defined:
1. PROGRESSIVE FAILURE
This is characterised by non-linear and stable failure development throughout (Figure 4). Such behaviour is characteristic of weak rocks with UCS values less than 20-30 MPa, including mudstones, claystones, some shales, and coals with well-developed cleat. Higher-UCS clastic rocks containing a substantial amount of argillaceous matrix sometimes exhibit a similar failure pattern when tested in a wet condition. Rocks in this category deform readily under load, and the UCS is not the most critical design parameter. Rather, the mechanical weakness and the 'allowable' deformation of these rocks are the controlling factors for mine design and ground support.
and highly unstable failure which results in complete collapse of the rock sample (Figure 6). Warning signals of this type of failure can be detected under laboratory conditions by noting the coincidence of Long Term Strength with an increase in acoustic emissions. Rocks showing this failure pattern are mechanically strong and their occurrence in the immediate roof strata can impede goafing, because of their tendency to cantilever behind the supports and fail unpredictably.
3. SUDDEN UNCONTROLLED FAILURE UNDER LOW STRESSES
The stress-strain pattern displayed in Figure 2 illustrates this failure mode. Fine-grained and strongly cemented rocks with prominent discontinuities oriented un-favourably in the existing stress field tend to fail violently without any warning. The failure is caused by the sudden release of 'locking' mechanisms along the discontinuities, which may occur under low stresses. The presence of this defect configuration, and the associated rapid failure, will invariably create strata control problems. The potential for this failure mode to cause mining problems can be predicted through a careful assessment of the location, orientation and surface condition of faults, erosional surfaces and joints contained in stronger rock units in the roof strata.
2. SUDDEN UNCONTROLLED FAILURE UNDER HIGH STRESSES
This failure pattern is characterised by a virtually linear force-axial displacement curve, to the point of sudden

Symposium on Geology in Longwall Mining, 12-13 November 1996, eds G. H. McNally and C. R. Ward, pp 81-89.
Impact of igneous intrusions, roof and floor irregularities and injection features on longwall mining
B. AGRALI
BelIambi Collieries Pty. Ltd.
Geological features presumed to be minor may seriously hamper development and extraction in areas earmarked for longwall mining. These features may be undetected by early surface exploration, or even by later in-seam detection techniques, or be detected but misinterpreted due to the limitations of the techniques used. Problems thus faced may range from minor production delays to major revisions of the mining layout, extraction schedule and coal preparation strategy.
In the Southern Coalfield of the Sydney Basin such features comprise washouts, floor and roof rolls, sedimentary dykes, minor faulting, narrow drainage channels, localised anomalies in the floor strata, and magmatic intrusions with associated cindering. In gassy seams, some of the above features may constitute outburst triggers by generating pockets of highly comminuted coal, or by forming seals between domains with low and high gas contents.
A complete re-appraisal of surface drilling results at seam level may be needed following a late realisation that such features are, or may be, present in a given area. Detailed mine mapping from the early stages of development, in addition to information from neighbouring areas, could provide clues as to the possible occurrence of adverse structures in a new mining area. Statistical assessment of numerical and directional data could provide guidance for mine planning, scheduling and budgeting. Geophysical techniques and in-seam drilling may help detect some roof and floor irregularities in developed longwall blocks and ahead of current workings.
INTRODUCTION
Exploration, in all its forms, aims to define the geological setting of a mining prospect, rather than to solve mining problems caused by an imperfect or inadequate knowledge of the site geology. It is widely accepted that a perfect knowledge of this setting may not be possible until, or even after, mining is completed.
Surface exploration over a new area, however detailed, can seldom provide a full insight on all aspects of the geology. The cost factor alone is often a powerful enough deterrent in deciding what level of detail and precision would be satisfactory. In addition, only some aspects of proposed exploration and some categories of exploration data may be relevant to mining. Another important point is that the interpretation of exploration results always has room for human error, sometimes leading to serious mistakes.
The occurrence of mining problems is often either expected, or suspected, depending on the interpretation of exploration results and/or experience. On-line or stop-gap exploration, run either as part of an established routine or as a local check during mining, may confirm the presence of suspected features, or detect unsuspected ones in time for a contingency plan to be worked out without interrupting normal extraction schedule.
This paper deals with some geological features that escape both the initial exploration and later on-line or stop-gap exploration, thus creating mining problems not covered by any contingency planning. The effects of such problems may vary from short or lengthy delays to substantial losses of production and reserves, more so in
longwall extraction than in bord-and-pillar mining. Some features, while not causing any noticeable delays, nor requiring remedial extraction planning, may affect the composition of the ROM product to a degree that may condemn an otherwise profitable operation.
In the Southern Coalfield, floor and roof rolls, clay dykes, in-seam drainage channels, thick stone bands, wash-outs and wash-ins are the common sedimento-logical nuisances. Soft dykes and sills, cindered coal, some hard dykes, small plugs and pipes constitute the igneous impediments to mining. Low-angle thrusts, minor normal faults, leaners or 'greasy backs' and zones of intensified jointing are common sources of mining trouble that may escape scrutiny during exploration.
IGNEOUS INTRUSIONS
Igneous intrusions occur widely in the Sydney Basin. Features known in the Southern Coalfield include diatremes of various dimensions, wide areas of sills and cinder, and swarms of dykes following some preferred directions. All these are found in mine workings at various states of alteration, the end product being a plastic clay.
Whereas unaltered intrusions have a fair chance of being detected by geophysical methods, fully or partly altered igneous rock often escapes positive identi-fication, except by fortuitous borehole intersection or in the rare instances of intrusions reaching the surface. Such features may have a better chance of being identified by cross-hole seismics, provided there is a reason for suspecting their presence.

f t 'Sill ? ODiatreme ? / Sill ?
Magnetic anomalies Likely dyke ---Possible dyke
,,,,-'// .......
, • . '
; / ..... --s
),
CY ( /-- , ......... /
......""-- /
0 '
j • /s - -7-//
Features known prior to survey
-------Dyke Sill/Cinder
/ / / /
• Diatreme
82 B. AGRALI
Features encountered in new workings
..... Dykes ElDiatreme (Post-survey)
Limits of working
E Before survey ECurrent
Colliery Boundary
Figure 1 Southwest District of the South Bulli Colliery (200 Series longwalls) showing magnetic anomalies detected by aerial survey prior to longwall extraction, and igneous intrusions intersected in workings. Major anomalies revealed by aerial magnetics were further checked by in-seam seismics as development proceeded westwards.
Approach to igneous features that escaped scrutiny by drilling or by various surface and in-seam geophysical techniques is usually through a joint zone, though most joint zones are either un-intruded, or only partly intruded. Cinder and sills may occur only a few metres before the main feature is reached, but even when the width of cinder reaches tens of metres it is still too late for immediate remedial measures.
Ground magnetic surveys are notoriously unreliable for detecting dykes at depth and most aeromagnetic surveys run prior to 1990s are known to have merely added to the number of existing question marks. The same should be said of the study of lineaments. All such question marks have to be checked by in-seam detection techniques including geophysics and drilling. Figure 1 shows an area where features revealed by mining disagreed sharply with indications from an early aeromagnetic survey.
In-seam longhole drilling is useful in delineating the extent of known or suspected features, but thin, soft dykes are often either missed ('hole-in-the-wall' syndrome) or misinterpreted by the drillers as very thick sills, due to the colouring of the returns. By contrast, drilling through a really thick sill/cinder area may be an exercise in futility. Our experience in the Southern Coalfield shows that even thick, hard dykes may be missed by in-seam techniques at distances of less than 400 metres, and misinterpreted at distances of less than 200 metres. It goes without saying that the same features were initially missed by the aeromagnetic survey. Subsequent angle drilling showed that these features did not extend to the surface, where joints zones were likely to be their surface expressions. They were also not detectable by an array of surface geophysical techniques.
The reasons for this undetectability are not obvious,

•-, N
0 0
0
0
/ iffe..; 40.4k te, 414 rf I Aim 4 4:"
0
/
201.3\ 600 ,q9/
c, • --
iF • / • ---- • • .• - N
-o-• 'N.
1000 nc
Dyke known in old workings (soft and < lm in width)
IMPACT OF IGNEOUS INTRUSIONS, IRREGULARITIES AND INJECTION FEATURES 83
----Dykes interpreted by aerial magnetics Dykes " in-seam seismics
Dyke as intersected in new workings (soft) Dyke as intersected in new workings (hard)
ID Plug (and sill?) interpreted by aerial magnetics
Sill (and cinder?) CC CC
0 Surface boreholes used for cross-hole seismics
Boundary of plug (and sill?) as interpreted by in-seam drilling
Sill (soft)/cinder area intersected in new workings or by in-seam holes
Old goaf Colliery boundary
Figure 2 Cataract District of the South Bulli Colliery (500 Series longwalls) showing magnetic anomalies detected by aerial survey prior to longwall extraction, and igneous intrusions intersected in workings. In-seam seismics and in-seam longhole drilling were also used to confirm the indications of the magnetic survey and to investigate the continuity and extent of features known in workings. Cross-hole seismics, despite limitations imposed by inter-hole distances, were nevertheless useful in detecting discontinuities.

ROOF
ROOF ROLL CLAY DYKE-.
I FLOOR ROLLS
(a)
FLOOR ROLLS \
F LOOR
(b)
84 B. AGRALI
but one result is that long face delays can occur, caused by having to blast instead of shearing. In addition, production is lost by abandonment of areas originally earmarked for longwall extraction) and some potentially good coal reserves are also lost, due to necessary modifications to the mine layout. Further effects of this unforeseen occurrence are likely to be reduced yields (caused by clay in ROM) and lower quality (hence a reduced coking coal fraction).
Figure 2 shows such an area in South Bulli Colliery where some well-tried means of detection failed. Of the anomalies detected by aeromagnetics arid interpreted as 'possible dykes' (with medium to low confidence), only D14 and D16 and maybe D18 could be considered as broadly defining the main zone of intrusion. The lineaments D6, D17, and D25-27 did not correspond to structures at seam level, while D19 and D23 did not agree with the actual extent of features known in old workings. Of the weak reflectors detected by in-seam seismics (c-h), none indicated the existence of a 3 m thick hard dyke running parallel to the survey line; some, sub-parallel to this feature, were probably stone-rolls. Reflectors c-d and h were later interpreted as jointed zones.
Action
• Mining through intruded zones may be a very costly and time-consuming exercise, especially when the characteristics of the zone are not well known beforehand. The risks are such that all available techniques should be used at various stages of surface and underground exploration. Late exploration, including in-seam geophysics run during development work, may provide clues. Seam quality changes may also be good indicators if sampling and coal analysis go hand-in-hand with development.
• Systematic drilling ahead of standing faces and exploratory longhole drilling across planned long-wall blocks could provide the first clues about the presence of igneous bodies, and even successfully delineate the whole feature in some cases.
• Some new radiometric techniques are becoming commercially available and these may indicate the proximity of an igneous intrusion or cinder zone.
• It is prudent to assume that some igneous material and cinder will be present in all future longwalls when formulating long-term forecasts, by adopting the average of past longwalls. This avoids making too optimistic an assessment of coal quality, especial-ly if mine profitability is marginal.
• Indications from surface exploration should always be checked by further means as mining approaches the suspect area, even if a number of previous investigations have proved unfruitful.
• It is often assumed, when seams are mined in succession, that intrusion pattern observed in one seam will be repeated. Though basically correct, this assumption does not cover the extent of silling and cindering.
Figure 3 Floor- and roof rolls in part of G.505 Panel, Cataract District, South Bulli Colliery (a) plan view, (b) cross-section X- X through centre-line of cut-through No. 2. Verical scale exaggerated x 10.
INJECTION FEATURES
Most roof and floor rolls, clay dykes and some in-seam bands in the Bulli seam have been shown to be injection features (rheotropic structures) originating in the floor (Agrali, 1987, 1990), though some may have had a sedimentary origin (Diessel, 1970). A permafrost origin has also been suggested (Conaghan, 1984). Much work is yet to be done on the Bulli stone-rolls, as their geographical distribution appears to be much wider than suggested earlier (Noone, 1995), while the study of rolls in the Wongawilli Coal has remained at an elementary level during the last 25 years.
It appears that injection features are largely

IMPACT OF IGNEOUS INTRUSIONS, IRREGULARITIES AND INJECTION FEATURES 85
unreported, although their impact on mining and coal processing is more widespread than that of faulting in some colliery holdings. This lack of reporting reinforces the established feeling that these features have a strictly local character. Overseas terminology of rolls includes roof channels and compaction features, and is not directly applicable to the Sydney Basin. Sandstone dykes, known in the Balgownie seam at South Bulli Colliery, have a curiosity value only. They are also rheotropic structures, but originate in roof rocks.
Figure 3 includes a simplified sketch of injection features, showing floor rolls as ridges and roof rolls as injected cushions of floor shale in contact with roof strata. Floor and roof rolls, where they occur together, are linked by a clay dyke filling a low-angle joint plane. Edges of rolls are seldom smooth and bedding planes in coal may contain injected floor shale material directly linked to the main body of the roll.
Stone-rolls may be totally missing across some mine areas, whereas their frequency (ridge-to-ridge interval) may be as close as 11 metres in parts of the South Bulli Colliery (and averaging 18 m). With such a frequency, and heights varying between 0.3 m and 2.1 m (average 0.9 m), one would expect these features to be encountered and recognised in some drill holes. The fact is that only one hole, out of 74 drilled in the area, intersected a substantial part of a stone-roll (1.05 m). Even this intersection was only recognised as such in a deflection hole. Under normal circumstances the intersection would have been reported as a fault. Six other intersections were interpreted as parts of stone-rolls, based on: reduced seam thickness; an increased number of sideritic and carbonaceous bands near base; and siderite accumulation in the floor. In all cases the interpretations were based on prior knowledge of stone-roll occurrences in the general area, and may well be erroneous.
Stone-rolls are not recognised as such by in-seam geophysical surveys. Only very large ones show as faint reflectors, which are then interpreted as possible joint zones, minor faulting, or soft dykes. Their identification as rolls is up to the local geologist, though only two or three will act as faint reflectors out of a total population of 50 in a typical longwall block.
It is important to make the right assessment of their occurrence and frequency, as the following problems are usually linked to the presence of stone-rolls: heavy wear to machinery; lower ROM yields; some outbursts in gassy seam areas; floor heave following excessive brushing; and poor roof conditions and unstable ribs due to differential compaction. It is also a common occurrence that crews stop mining when faced with very large rolls, as a localised fracture line, caused by differential compaction, simulates a tectonic fault following the roll axis. Faults of this type are known to have throws of up to 0.8 m in the Southern Coalfield.
Stone-rolls are also a major nuisance to in-seam longhole drilling, as their drilling characteristics are similar to those of the seam floor. Combined with slope changes in seam structure, a stone-roll intersection may lead to erroneous interpretations by drillers.
Action
• Rolls cannot be identified in bore cores unless they are known to exist in the general area, so that their sporadic occurrence in a new district should lead to a re-appraisal of seam section descriptions on bore logs.
• The continuity, size and frequency of rolls in a new area should be assumed to be similar to those observed in old workings or in neighbouring collieries, unless a clear directional trend emerges.
• As there is no way to avoid mining stone-rolls, it is important that the highest values known in the general area for size, continuity, frequency, and hardness be considered in assessing likely dilution (hence washery yield). This should also be taken into account when predicting roof conditions and machine wear, especially if the perceived mine profitability is only marginal.
IN-SEAM DRAINAGE CHANNELS
This term, in coal mining, may cover a number of features of different origin and age, the practical result being that the coal seam contains either a single thick band or a number of relatively thin silty/ shaley/ sandy bands alternating with coal. These may extend tens or hundreds of metres laterally, and be hundreds to thousands of metres in length with meandering axes. Their effects on mining and coal processing may be drastic.
Such a zone, 1100 m long and up to 150 m wide, was not detected by early exploratory drilling and was crossed in parts of South Bulli Colliery, affecting some development panels and the middle part of one longwall block. Another zone, intersected by two holes during early drilling but not interpreted as such, was finally — though very broadly — delineated by further drilling and interpreted as the link between similar zones in neighbouring lease areas (Figure 4). The first channel was a minor one, both in extent and thickness, and had only a marginal effect on overall plant yield. The western channel is likely to impede mining over a very restricted area near the western boundary; a reduction of the extracted thickness is likely for the remainder of the area.
Action
• In areas affected by floor and roof rolls, drainage channels may not be readily recognised in drill hole intersections, despite differences in lithology and appearance. These include a layered structure and much coarser sediments in channel deposits, compared to a lack of structure other than com-paction features in stone-rolls.
• Modifications to the proposed mining layout may be warranted, depending on the size and nature of the channel, and its potential to affect product specifications.
• It is doubtful that in-seam geophysical techniques

0 0 0
0 0 o 0
0 0
0 I 'Q...." ......." ..:.>""..-,
...". ,......." ,I 0
1
....." ''... ..4-7- ------.7- ,......../ ....., _ „....
7, ......, ;7;7- --iv/ ---
(N,...--,,. ,.... _.--- ,... ,..---------
i. 0 7 ..., ' ../ „, , <,...- ,.. ...-- ,....- , /0 , "•"" 7 -..*.. <7 ----- . ...1
0
0
Claystone -• — • - - - - - - • - -Shale / Siltstone sequence
=
86 B. AGRALI
._.... _... _\-.-.. __<.,Z,.... .
../..... ..7' 7- '..:7'
Channel 0 Early boreholes
Figure 4 Western portion of the South Bulli Colliery Holding showing in-seam drainage channels detected in development panels (east), and by drilling (west).
Figure 5 A relatively minor occurrence of 'false bottoms' in W-Main panel, South Bulli Colliery. The alternation of brittle coaly / carbonaceous strata with plastic claystone bands and layers caused the brushing of the floor through the whole section.
0 500 1000 1500m 0
• Recent boreholes ----Colliery boundary
and in-seam drilling can provide reliable data regarding the extent and continuity of channels encountered during development work. Interpretation based on CM intersections is often the only way to help in decision making, and would require a sound knowledge of the regional geology and mining experience in neighbouring areas.
FALSE BOTTOMS
In the Southern Coalfield the term 'false bottoms' is applied to the shaley coal / coaly shale sequence at the base of the Bulli seam, which is often separated from
the usual working section by a stone band thick and resistant enough to serve as a mining floor. This sequence also contains numerous coal bands and laminae and, occasionally, soft claystone layers and lenses. Further plastic claystone layers may occur below the false bottoms. Though technically part of the coal seam, the extraction of this sequence actually causes the seam's washability characteristics to deteriorate and, very often, has adverse effects on mining operations.
The immediate floor of the Bulli Coal is formed by a relatively brittle shale/ siltstone/ laminite sequence overlying a massive sandstone body that extends downwards to form the roof of the Balgownie seam. The known thickness of this brittle sequence varies

IMPACT OF IGNEOUS INTRUSIONS, IRREGULARITIES AND INJECTION FEATURES 87
between a few centimetres and 4 metres. It appears that thicker (i.e. >2 m) parts of the sequence occur within 300 to 500 m wide troughs extending in a NW—SW direction, separated by ridges of thinner material. This direction is structurally meaningful, as it is parallel to the main fold axes in the area (Agrali, 1995). Known occurrences of false bottoms in mined-out areas indicate that some of these line up along axes of troughs, but exceptions are numerous. Figure 5 illustrates an ex-ample of false bottoms containing plastic clay layers, as detected by drilling.
Mining of false bottoms is often performed to increase the height of roadways for various purposes, as mining the floor is easier than mining the roof, providing better horizon control under normal circum-stances. Unfortunately this may bring the continuous miner (CM) in direct contact with incompetent (i.e. brittle or soft and plastic) strata. Occurrences are known where a floor brushing operation, started with the intent of increasing the roadway height by 0.2 or 0.3 m, caused the CM to sink more than 1 metre, creating considerable delays in development work. Mining of the floor, including the false bottoms, also acts as a trigger for floor heave in particular areas.
Action
• False Bottoms may be identified as such in bore cores from exploration holes, if their occurrence is known in the general area. However surface drilling alone is unlikely to provide reliable data about their areal distribution and thickness variations. Systematic drilling of floor strata in development headings is often helpful.
• Cutting profiles for longwall faces should be carefully worked out by the geologist, as tilting of chocks in soft floor areas may cause unpredictable delays and production losses.
• Brushing of the floor should be avoided in sensitive areas. Careful consideration should be given to the selection of cutting and supporting equipment for longwalls, when brittle or plastic strata occur as immediate floor or at a short distance below this (Diessel, 1964).
WASHOUTS
Over very large portions of the Southern Coalfield, the original shale roof of the Bulli Coal has been eroded by a Triassic river system (Diessel, 1967). Erosion has removed the top coal ply to varying depths and, in South Bulli Colliery, this depth exceeds 1 m in some locations. In one instance seam thickness in a whole longwall block was reduced by more than 0.5 m. This made development work extremely difficult, due to the necessity for cutting sandstone layers with a UCS of over 100 MPa. Eventually, a whole area had to be abandoned, partly due to its uneconomical seam thickness.
The problem in this particular case was that early
drilling did not give an indication of any major washout. Even the mining of the previous longwall block, where some deep potholes existed between areas affected by minor erosion, did not provide an adequate warning of what lay ahead. As for the actual development work, it was hoped, on the basis of mining experience in contiguous areas, that washouts would be local, elongated in shape and of limited extent.
The main reason, of course, was that drilling density in the longwall area was adequate for quality assess-ment, but too low for the assessment of seam-level sedimentary features. Further drilling was deemed superfluous, as existing holes revealed no immediate cause for alarm. This decision was quite justified, as the question 'What density is the right one to solve ALL possible problems ?' never has a satisfactory answer, especially in areas under a thick overburden.
Seam sections from boreholes are difficult to interpret for the assessment of thickness variations as, in the Southern Coalfield, this may be affected by: • The presence and proximity of floor or roof rolls; • The presence or absence of the so-called 'false
bottoms'; • Erosion of top coal plies where the immediate roof is
a sandstone; and • Local and regional seam thinning/thickening trends.
Figure 6 shows a wide area (approximately 27 km2) of the South Bulli Colliery holding, comparing the anticipated and actual distributions of sandstone channels in the immediate roof of the Bulli Coal. The original interpretation was based on thickness variations of the shale sequence underlying the channel sandstone, on flow directions measured in workings, and on thin sections from oriented cores. The actual channel distribution is that revealed by subsequent mining. This is a good example to illustrate the difficulty of predicting the occurrence and extent of washouts based on drill hole results.
Action
RIM surveys around a fully-developed longwall block may detect a localised washout not intersected in development headings. RIM-2 surveys between in-seam longholes are likely to provide a reliable picture of thickness trends for the next longwall block. In both cases, however, it is usually too late by this stage to change the layout or extraction schedule.
MINOR FAULTING
A 3 m throw normal or reverse fault at a depth of 450 m has little chance of being detected or interpreted by surface geophysical techniques, let alone a 'half seam thickness' fault that could seriously hamper longwall development. A similar fault could be neither detected or interpreted by surface drilling alone, unless intersected in a seam section or in specific, well-documented intervals. Geologists' interpretations, based

0 0
0
V
z 0
0
1000 m
0
0
L__
0
CO-R. DEAU jJ
Extent of sandstone roof area as interpreted from exploration boreholes ( 0 )
0
88 B. AGRALI
alimt Actual extent of sandstone roof area (channels) in mine workings
Area mined out (27 longwall blocks) ------ Colliery boundary
Figure 6 Western District of the South Bulli Colliery showing the anticipated extent of sandstone channels in the roof, as interpreted from drill hole intersections prior to mining, and the actual distribution of the immediate sandstone roof in workings. The sandstone/ coal contact is erosional, and the depth of coal eroded and replaced by sandstone varies between less than 0.1 m and more than 0.5 m. The small washout at the extreme north exceeded 1.0 m and interfered with the development plan. The longwall block mentioned in the text is the north-western one.
IMPACT OF IGNEOUS INTRUSIONS, IRREGULARITIES AND INJECTION FEATURES 89
on structural oddities but not supported by hard evidence (bore cores and/or geophysical survey results), may be completely out of step with real situations. Examples abound of 10 m interpreted faults not materialising, and of 25 m faults appearing in areas where a simple structural explanation worked satisfac-torily until the seam went missing in the last drill hole!
Surface geological techniques keep improving and becoming more reliable. Areas where surface seismics suggested swarms of faults 25 years ago have since been re-surveyed with much higher resolutions techniques. The result is less question marks in general, and more precision where it counts. Some particular methods, though, still have a reputation of having only a 50% rate of success.
Occasionally in-seam techniques may be successful, depending on the relative bearing of the feature and its distance to the sensors. As for low-angle thrust faults with less than half-seam throws, their chances of being detected as such by surface or in-seam geophysical techniques are practically nil (Doyle, 1991). In-seam drilling, if practiced on a routine basis and at close intervals, could give some indications in gassy seam areas (high gas pressure and/or thick fault gouge along fault planes).
Action
• Considering their direct effect on mine geometry, it is of paramount importance that major faulting be detected before the layout of a prospective longwall district is finalised.
• Smaller faults intersected or suspected in develop-ment panels should be investigated to ascertain their presence, continuity and throw. The means include drilling, in-seam geophysics, and changes in gas content, composition and pressure . A detailed study and geotechnical assessment of immediate floor and roof rocks should be part of this investigation, as brittle or plastic layers in floor and roof strata might be exposed by brushing while retreating through a fault zone. Examples abound of longwalls slowing to a complete halt while going across a so-called minor fault, and becoming literally bogged down.
• Records of routine in-seam drill holes must be scrutinized for soft spots and relatively high gas pressures (fault gouge?), as a way to detect possible thrust faults. These may be localised in the upper part of the seam. Unsurveyed holes may easily lead the geologist into error, as angular deviations may be very significant, especially for small-diameter holes.
CONCLUSIONS
There is always room for surprises in mine geology, as unexpected features and structures come to light during mining, having somehow escaped detection during the various stages of exploration. Such features may simply have a curiosity value, but they often adversely affect mining operations — by their nature, their frequency, or
simply by the uncertainty they generate. It is therefore important for a mine geologist to accept
a priori that unknown features and structures may occur, whatever the extent of the initial exploration may have been. However, ways and means exist to alleviate the surprises effect by allowing further exploration ahead of, or during, mining. It must be remembered that the cost of seemingly useless exploration is much lower than that of unforeseen stoppages, production losses, reserve losses and mid-stream layout and schedule changes caused by situations that could have been avoided or minimised.
The best exploration tool during mining is 'mine mapping'. Routine detailed mapping is likely to pick up the first clues to unexpected geological structures. This should then motivate further exploration by other means, such as surface and in-seam geophysics and drilling.
Longwall mining often requires tight planning and scheduling. Whereas-other--extraction methods could - turn around an unforeseen feature or structure, last-minute surprises may prove very costly to longwall operators. The mining characteristics of the next longwall block and of the next longwall district must be constantly reconsidered by the mine geologist, who must also try to fill any perceived gaps in the structural and coal quality data bases likely to affect extraction or product specifications.
REFERENCES
AGRALI B. 1987. Stone-rolls in the Bulli seam — new facts versus theories. In Diessel C. ed. Advances in the study of the Sydney Basin, Proceedings of the 21st Newcastle Symposium, University of Newcastle, 37-44.
AGRALI B. 1990. Floor and roof rolls and associated features in the Bulli seam, South Bulli Colliery. In Hutton A. et al. eds. Southern and western coalfields of the Sydney Basin, Workshop Proceedings, University of Wollongong, 81-92.
AGRALI B. 1995. Geological aspects of floor control at South Bulli Colliery. Internal report to Bellambi Collieries (unpublished).
CONAGHAN P. J. 1984. Aapamire (string-bog) origin for stone-roll swarms and associated fluvio-deltaic coals in the Late Permian Illawarra Coal Measures of the southern Sydney Basin: climatic, geomorphic, and tectonic implications. Abstracts, 7th Australian Geological Convention, Sydney. Geological Society of Australia, Abstracts 12, 106-109.
DIESSEL C. F. K. 1964. Report on borehole SB 4. Internal report to Bellambi Coal Company (unpublished).
DIESSEL C. F. K., DRIVER R. C. & MOELLE K. H. R. 1967. Some geological investigations into a fossil river system in the roof strata of the Bulli seam. Proceedings, Austra-lasian Institute of Mining and Metallurgy 221, 19-37.
DIESSEL C. F. K. & MOELLE K. H. R. 1970. On the occurrence and origin of stone-rolls in the Bulli seam of the Southern Coalfield in New South Wales, Australia. Proceedings of the 6th International Congress on Carboniferous Stratigraphy and Geology, Sheffield 1967, Volume 2, 619-630.
DOYLE J. 1991. In-seam seismic reflection survey at W11 and W12 panels, South Bulli Colliery. BHP Engineering Report 1309 (unpublished).
NOONE G. 1995. Personal communication.


Symposium on Geology in Longwall Mining, 12-13 November 1996, eds G. H. McNally and C. R. Ward, pp 91-97.
Frictional ignition associated with underground coal mines
COLIN R. WARD AND ANTON CROUCH
The University of New South Wales, Department of Applied Geology.
Ignition of methane in underground coal mines, including longwall operations, may be initiated by the heat produced from frictional contacts between moving cutter picks and incendive rock types. Another possibility arises from frictional contact between incendive rock types, or between incendive rocks and other materials, in movements associated with roof falls. Test procedures to establish the relative incendivity of individual rock samples include pressing of rock, pick or metal samples against a rotating rock wheel under controlled conditions in a gas chamber, and generation of sliding contacts between two rock samples in a methane-bearing atmosphere. Temperatures of up to 1550°C may be developed very quickly at such contacts in rock-on-rock situations.
Rotating-wheel tests indicate that the relative incendivity of rocks in Australian coal mines depends on the percentage of hard framework particles such as quartz, feldspar and rock fragments. Silicified coal within a seam may also cause ignition problems. Pyrite in otherwise non-incendive rocks may give rise to methane ignition through oxidation or burning associated with frictional processes. Frictional incendivity declines, however, with increased abundance of carbonates in rocks, and to a lesser extent with increased proportions of mica and clay minerals. Such relationships should be taken into account by mine geologists in areas where gas emissions are expected to be present. Engineering controls such as adequate ventilation, lower cutting speeds, well-directed water sprays, replacement of worn picks and, possibly, use of improved pick materials should also be considered in areas where frictional incendivity is likely to be a problem.
INTRODUCTION
Methane is ignitable in air under normal conditions at concentrations of between 5 and 15%. Ignition of methane-air mixtures, while in itself potentially dangerous, may also act as the trigger for even more violent coal dust explosions. Over the years these have resulted in an unfortunate number of fatal incidents, both in Australia and overseas.
One of the objects of mine ventilation systems is therefore to provide sufficient air to keep the methane concentration in the workings below this ignitable limit. Even so, local areas with ignitable concentrations may still occur, especially in the immediate vicinity of individual gas seepages. For that reason every effort is made in modem mines to control the different ignition sources, which include naked flames, shotfiring, electrical arcs and other mechanisms. These efforts on the whole have been very successful, especially in Australian collieries. Frictional processes still remain, however, and now constitute the most common cause of methane ignition in modem underground coal mines.
Frictional ignitions in coal mines, including longwall operations, may arise from metal-on-rock interactions, including the impact of shearer or continuous miner picks on hard non-coal strata. Several incidents have also been reported which suggest the possibility of gas ignition from rock-on-rock friction associated with roof falls. As gas accumulates not only in coal mines, the risk of frictional ignition occurs in some civil engineering projects, such as tunnels above coal measures in the Sydney region, as well as above landfills and in several types of industrial installations.
A special case of metal-on-metal ignition is the
interaction of aluminium and rusty iron. When struck together these materials give rise to a sharp exothermic chemical reaction, the thermite reaction, that can ignite methane if the appropriate concentration is present. For this reason aluminium articles are generally prohibited from underground colliery workings. The present paper, however, is concerned only with ignition from friction involving rocks, and perhaps similar substances such as concrete or certain ceramic materials.
Summaries of investigations into frictional ignition phenomena associated with coal mining, both in Australia and overseas, are given by Ward et al. (1990; 1991a, b), Powell (1991, 1992) and Phillips (1995). Among those relevant to mine geology are a number of experimental studies aimed at categorising rock materials in terms of their frictional incendivity. These are described in papers by Burgess and Wheeler (1928), Wynn (1952), Nagy and Kawenski (1960), Datey (1963), Rae (1961, 1964a, b), Ramsey et al. (1965), Blickensderfer et al. (1974), and Powell and Billinge (1975). The work described by Powell and Billinge (1975) forms the basis for a mineralogical categorisation of frictional ignition potential for rocks based mainly on quartz content (National Coal Board, 1984). This has since been used by default in many countries (including, until recently, Australia) to identify rock materials associated with high ignition risks.
The fatal explosion at Moura Colliery in 1986, although ultimately ascribed to different causes (Lynn et al., 1987), focussed attention in Australian mines on frictional ignition processes. Research on frictional ignition hazards dealing specifically with Australian rocks was subsequently carried out by Ward et al.

92 COLIN R. WARD AND ANTON CROUCH
(1990) and Golledge et al. (1991), and has since been further refined by Ward et al. (1996). The results of these studies are discussed separately elsewhere in this paper.
ignition appears to have been a siliceous horizon within the seam, in which extensive replacement of cell structures by quartz took place in the peat before compaction. Although difficult to test, the silicified coal from this site was subsequently found to have very high frictional incendivity characteristics. Such horizons have since been identified as lenticles and similar bodies occur widely within the seam (P. Wiseman, pers. comm.).
The remaining seven ignitions reported by the Department of Mineral Resources were ascribed to a variety of causes. These included metal-on-metal friction associated with drilling for roof bolts (two incidents); rock pressed against a rotating metal shaft in a mining machine (one incident); sparks falling into a shaft from welding operations (1); and electric arcing from cable damage associated with rib collapse in pillar extraction (1). The remaining two ignitions appear to represent rock-on-rock interactions, associated with either shaft infilling or with an apparent goaf fall.
OCCURRENCE OF FRICTIONAL IGNITIONS IN COAL MINES
New South Wales
Although ignitions due to naked flames and shotfiring have been relatively common since the early years of colliery development, the first recorded occurrence of methane ignition by friction in a New South Wales coal mine seems to have been at Redhead Colliery in 1926. There is, however, some uncertainty about this occurrence, since the actual ignition was ascribed at the time to either a naked flame or a roof fall. Friction was not reported again as a cause of ignition until 1950 (Ward et al., 1990), and only since about 1971 has friction regularly been reported among the causes of methane ignitions in New South Wales coal mines.
A comprehensive report dealing with the location and cause of 23 separate frictional ignitions of methane in New South Wales collieries between July, 1987 and December, 1993 was prepared by the New South Wales Department of Mineral Resources and circulated to the industry in July, 1994 (NSW Department of Mineral Resources, 1994). Of the incidents reported, 12 (52%) were associated with continuous miner drum picks and four (17%) with longwall shearer drum picks. Other causes were more diverse, and these are discussed more fully below.
Of the 23 ignitions covered by the Mineral Resources report, 16 (or 70%) involved picks of shearers or continuous miners interacting with rock material above, below or within the coal seam. Seven ignitions involved the interaction of picks with the lithic conglomerates of the Newcastle Coal Measures, and one involved interaction between picks and sandstone in the same general sequence of roof strata. Conglomerate from this area, tested by Ward et al. (1990), appears to be a highly incendive rock material. Extraction should clearly proceed with caution where methane emissions are likely in association with these particular strata.
The next most common type of ignition arises from interaction between miner picks and siliceous nodules or bands within the actual coal seam. Other types of intra-seam material, described by the Department of Mineral Resources (1994) as 'conglomerate' in one instance and a 'stone intrusion' in another, are also involved in two of the ignitions reported. Such intra-seam incendive materials are inherently more difficult to identify and predict than more persistent and easily recognisable beds in the roof strata. They are also more widespread, having produced ignitions both in the Southern and the Hunter Coalfields during the period under review.
An occurrence of this type at South Bulga Colliery in November 1993 is discussed more fully by Ward et al. (1996). The material responsible for that particular
South Africa
Phillips (1995) provides data on 51 ignitions and explosions that took place in South African collieries between 1984 and 1993. These were responsible for a total of 136 deaths and 59 injuries. Friction was cited as the cause for 32.5% of all occurrences, and for 68% of the ignitions and explosions for which any cause could be established. Most occurrences were in bord and pillar workings (55%) or pillar extraction goaf areas (8%), but significant proportions were in longwall development areas (6%), on longwall faces (5%)and in longwall goaf areas (1.5%). The remainder were in non-face situations (8%) or in unknown types of locations.
South African coals are significantly harder than average (Phillips, 1995), requiring powerful machines operating at relatively high drum rotation speeds to achieve acceptable production levels. No information is available on the relative incendivity of the rocks with which the different ignitions were associated. Never-theless, due to their common Gondwanaland heritage there may be some similarities to Australian coal-measures rocks.
Other countries
Powell (1991) indicates that there were more than 370 reported frictional ignitions of firedamp (methane) in United Kingdom coal mines between 1960 and 1989, most of which were attributed to machine picks cutting into rock. Peak occurrence levels are represented by 24 pick-on-rock ignitions in 1981 and 15 in 1986. Despite a subsequent reduction in the number of operating mines, there were still 11 pick-related ignitions in British collieries during 1989.
A high rate of frictional ignition occurrence has also been reported in US coal mines since the 1960s (Cheng et al., 1987), with a peak of 87 ignitions by machine picks occurring in 1979 (Powell, 1991).

Friction Force Normal Force
Side Thrust
5 • 5
o 4-4.5
• 3-3.5
O 2-2.5
• 1
IGCAT Zones
2
4-5
IGCAT Zones
Carbonate LOI
FRICTIONAL IGNITION ASSOCIATED WITH UNDERGROUND COAL MINES 93
Figure 1 Schematic diagram of rotating-wheel frictional ignition test rig, equipped with dynamometer and pyrometer accessories for acquisition of force and temperature data (from Ward et al., 1996).
Quartz • Rock Fragments • Ignition
a Feldspar Category
Clay • Mica Carbonate
Ignition Category
Ignition
Yes .4:14r
Yes/No
No .
Velocity (m/sec)
2.2 3.7 5.1
5 444r. 3,-tr 44,tr
4 0
414ir )iti'r 3 • 'a
4441,r.
2 • • .ti
1 • • •
QXRD
Figure 3 Ternary plots showing ignition categorisation (IGCAT) in relation to other rock properties (Ward et al., 1990, 1991a,b). Plot (a) is based on petrographic data from point counting on thin sections. Plot (b) is based on chemical and X-ray diffraction data.
Figure 2 Ignition categorisation (IGCAT) system, based on rock-on-rock ignition at different speeds, as developed by Ward et al. (1990, 1991a,b).
Seventy-five percent of the 298 ignitions reported in the USA between 1971 and 1976 were classed as friction induced (Courtney, 1981). Frictional effects are also reported as the largest single cause (38.7%) of methane ignitions in the (former) USSR by Bobov and Petchenko (1981, quoted by Powell, 1991).
RELATIVE INCENDIVITY OF DIFFERENT ROCK MATERIALS
Ignition categorisation
Ward et al. (1990, 1991a, b) carried out a series of investigations into the geological factors associated with frictional ignition, concentrating on the relative
incendivity of rock materials found in Australian underground coal mines. This work made use of a specially-constructed test rig in which a rock specimen was pressed, with a measured force, against a 150 mm diameter wheel of the same material, rotating at a controlled speed in a methane-air atmosphere within an enclosed gas chamber. The most recent version of this equipment, with additional instrumentation for force and temperature measurement (discussed more fully below), is illustrated in Figure 1. A five-point incendivity categorisation scale was developed (Figure 2), based on the relative ease of igniting a 7% methane! air mixture by rock-on-rock friction at three different contact speeds.
The categorisation (IGCAT value) was found to be related to the relative proportions of hard framework particles (quartz, rock fragments, feldspar), clay matrix and carbonate minerals as determined by petrographic analysis (Figure 3a). Alternatively, the relative pro-portions of quartz (measured by X-ray diffraction), carbonate (by acid solution) and volatile constituents
94 couN R. WARD AND ANTON CROUCH
(loss on ignition) were determined by geochemical and mineralogical analysis (Figure 3b). Plotting procedures in both cases require that the parameters at each corner of the respective triangular diagram are the only ones considered, and that they be normalised for each plot so that the total adds up to 100%.
The results of this work suggest that hard framework grains such as quartz, rock fragments and to a lesser extent feldspar are associated with heat development. Softer materials, such as mica, carbonate and clay minerals, produce less heat from a given frictional input and act to suppress the ignition process. Carbonate minerals, although often associated with high strength in the rocks in which they occur, appear to suppress ignition development to an even greater extent than clay minerals or micas in the same rock sample.
Provided allowance is made for any pyrite present (see separate discussion below), assessment of rocks using one of the petrographic or geochemical categor-isations in Figure 3 provides a useful aid to the mine geologist in identifying potentially incendive rock types for mine design and development The relationships developed from those diagrams can also help in extrapolating any results of incendivity tests on particular samples to other parts of the mine workings.
Frictional ignition process
The actual ignition process may be most simply explained by considering the rate of physical work done (power, equal to energy input per unit time) in moving the frictional force associated with the contact (equal to normal force x coefficient of friction) through the distance over which the contact itself is dragged. This work is either expended in breaking, wearing away or cutting one or both of the materials involved, or is converted to other forms of energy such as sound and heat. Heat generation is the dominant output where no significant cutting or breakage is developed, and this builds up the temperature at the contact point. The low thermal conductivity of rock means that in geological situations the heat generated is not readily dissipated. Very high contact temperatures may therefore be developed with continued friction in such circumstances, limited only by melting of one of the materials involved.
The development of high heating rates where cutting does not occur means that worn cutting picks produce higher heating rates at frictional contacts than well-sharpened picks, and therefore give rise, when passed against an incendive rock, to greater ignition risks. This is especially the case when softer non-cutting shank material is exposed on the worn pick behind the cutting tip. It also means that slow cutting speeds, or low-speed rock-on-rock contacts, are less likely to produce ignition, all else being equal, than high-speed frictional effects.
Analysis of video records shows that methane ignition almost always originates from the hot-spot at the frictional contact, and not from incandescent particles ("sparks") thrown off by frictional effects. The source
of the ignition, moreover, is usually slightly behind the hot-spot developed in a rotating wheel apparatus or the hot-spot formed by picks drawn across stationery rock samples in similar laboratory experiments. This is generally explained by a delay between the times of reaching the critical temperature at the contact and actually igniting the gas in development of the ignition reaction.
Pyrite, although relatively rare in Australian coal mine rocks, behaves in a different way. Like other sulphides it interacts with oxygen when heated, and effectively burns rather than simply emits radiant heat as a result of frictional energy input. The burning material may nevertheless ignite methane if the gas concentration is in the appropriate range.
The hot-spot and incandescent particles associated with pyritic rocks in laboratory ignition tests is more orange in colour as a result, and a characteristic odour of sulphurous gases is usually detected on opening the UNSW ignition test rig. Because of this different behaviour, concentrations of pyritic material, especially if associated with otherwise relatively incendive rock types (e.g. pyrite-impregnated sandstones), should be regarded until proved otherwise as having a potentially higher incendivity than equivalent rocks with no pyrite present.
A similar situation prevails with iron, hot particles of which oxidise or burn as they move through that air when liberated by the frictional process.
Recent work by Golledge et al. (1991) has shown that ignition of methane-bearing natural gas can be achieved by single grazing impacts between two rock samples (100 mm cubes) from Australian coal mines, as well as by rotating-wheel experiments. Such incendive contacts are individually of less than 20 ms duration. They may occur at relative velocities of 7 to 8 m s-1, corresponding to velocities expected from drops of 2.5 m to 3.5 m in a colliery roof fall. Although the energy released in the individual contacts was also monitored, and a certain minimum energy exchange was required to generate an ignition, no correlation between rock properties and relative incendivity was identified in this particular study.
Temperatures and friction coefficients
The work of Ward et al. (1990, 1991a, b) has recently been extended by development of comprehensive instrumentation (Ward et al., 1996), allowing contin-uous acquisition of data on the forces and temperatures developed in the course of an individual frictional ignition test (Figure 1). A specially-designed cone sensing-shell dynamometer was installed to measure the three forces (normal force, shear or frictional force and lateral or sideways thrust) associated with friction of either a pick or another rock against the wheel. A non-contacting infra-red pyrometer was also used to monitor the temperature at the contact point. Output from the dynamometer and pyrometer was processed by a dedicated computer system (Figure 4), and used in conjunction with synchronised video records to

temperature (°C)
100 200 300 400
1200.000-
1000.000-
800.000 - 677.957
0 I I I
500 600 700 800 900 1000 1100 1200 1300
Frame Number
82.064=
60.000-
40.000-
20.000-
-2.617= 37.056-
30.000-
20.000-
10.000-
-0.161 - -28.188
-30.000-
-32.000-
-34.452-1474.278-
-
76229/06 700 rpm
FRICTIONAL IGNITION ASSOCIATED WITH UNDERGROUND COAL MINES 95
Figure 4 Output from computer screen of an instrumented rock-on-rock ignition test, showing normal force (top panel), shear (frictional) force (second from top) and temperature (bottom panel). Lateral (transverse) force (third from top) was not recorded in this experiment.
determine aspects such as the maximum and average temperatures reached and the coefficient of dynamic friction developed.
Temperatures of between 11000 and 1550°C were typically measured at the hot-spot in rock-on-rock studies using this facility. These temperatures were developed quickly (<1 second after contact) in the course of individual ignition tests. Similar temperatures have been noted by Boland et al. (1994), using output from thermocouples embedded in a cutter-pick apparatus. The temperatures in both cases are well above the values normally required to ignite a methane-air mixture in laboratory conditions.
Average friction coefficients of between 0.48 and 0.75 were also noted. Maxima were considerably higher, but these were typically due to transient effects such as surface irregularities and wheel jams. It should
be noted that these values represent dynamic rather than static friction coefficients; it is not necessarily advisable to apply static values from (say) triaxial compressive tests to frictional heating situations.
Although only limited data have so far been obtained, broad positive correlations are tentatively suggested between the rock ignition category (IGCAT value) and mean friction coefficient and mean hot-spot tem-perature. These correlations, however, need to be further tested, particularly with low IGCAT materials, before reliable conclusions can be drawn. Tentative correlations between friction coefficient or hot-spot temperature and IGCAT-related rock composition parameters such as quartz, rock fragment and feldspar content are also suggested, but these have a large degree of scatter and require further investigation for any reliability to be established.

96 COLIN R. WARD AND ANTON CROUCH
Ignition tests with unmatched wheels and sliders
It is not always possible to obtain a rock sample, especially a sample free of mechanical discontinuities, sufficiently large to prepare a 150 mm diameter wheel for use in the UNSW ignition test rig. This is par-ticularly the case with the typically brittle and heavily fractured siliceous coals associated with at least some ignitions in New South Wales mines.
Fractured or brittle materials have been successfully tested, or at least graded against other rocks with known frictional ignition (IGCAT) characteristics, by placing sliders of the rock and a range of other rock samples against a wheel of an independent rock type. Although not giving the same IGCAT value in all cases as conventional procedures, the results to date have successfully separated highly incendive from less incendive materials. Tests against wheels of a different rock type therefore appear to offer a viable alternative means of rock incendivity assessment in cases where insufficient material is available for 150 mm wheel production.
DESIGN OF MINING EQUIPMENT
In addition to rock characterisation, a considerable body of research on frictional ignition has been concentrated on engineering factors such as the improvement of mining equipment, rather than on geological factors such as rock characterisation. A comprehensive review of this research, particularly the processes associated with ignitions from picks attached to different types of mining equipment, is given in a series of two papers by Powell (1991, 1992). As well as providing a valuable historical account of the development of frictional ignition studies, this review incorporates a discussion of the measures which have the potential to minimise ignitions from pick sources in underground coal mining operations. These can be summarised as follows:
• Provision of good general ventilation, augmented by local ventilation at the machine itself. Even though flammable mixtures of methane/ air may still develop, good ventilation will reduce the extent of flame propagation, and hence the overall danger, from any ignition source.
• Incorporation of low cutting speeds (1.5 and preferably 1 m s-') in mining machine design and operation. This also implies, however, a general reduction in coal production rates.
• Use of material harder than tungsten carbide, such as poly-crystalline diamond, at the cutting edge of miner picks. Poly-crystalline diamond (pcd) picks, however, must also be designed to protect the tungsten carbide and steel also used in the pick from rubbing against the rock and developing heat that may destroy the pcd itself in the process.
• Provision of water sprays behind the pick, to quench any hot-spot development that might otherwise lead to methane ignition. Water sprays behind the pick are considered by Powell (1992) to be just as
effective for dust suppression as water sprays in front of the pick, and as a by-product are more effective in ignition suppression.
Studies of this type relevant to Australian mines include the work of Lama et al. (1990) and Boland et al. (1994). Such investigations are useful in further identifying the processes associated with ignition by pick-on-rock effects, and offer scope for reduction of ignition risk through improvements in equipment design and operating practice. They are an essential complement to the work of the mine geologist, which should aim in the first instance to identify the frictional incendivity characteristics of the different rocks expected in the underground mine situation.
ACKNOWLEDGMENTS
Work on frictional ignition at the University of New South Wales has been funded by the National Energy Research Developemnt and Demonstration Program and by the Joint Coal Board Health and Safety Trust. The assistance and co-operation of numerous colliery companies and personnel, as well as CSIRO, SIMTARS and other research organisations, is also gratefully acknowledged. David Cohen, Drago Panich, Chris Fowler, Prodip Dufta, Peter Christie and Igor Pluzhnik, among others, contributed at different times to the UNSW work program.
REFERENCES
BLICICENSDERFER R., KELLEY J. E., DEARDORF D. K. & COPELAND, M. I. 1974. Incendivity of some coal cutter materials by impact-abrasion in air-methane. US Bureau of Mines Report of Investigations 7930.
BOBOV A. I. & PETCHENKO N. G. 1981. Causes of methane-air ignitions in mines. Ugol 3, 48-49.
BOLAND J., SPEIGHT H., GURGENCI H. & FORSTER J. 1994. Frictional heating in drag tools during cutting. CSIRO Exploration and Mining Research News 2 (September, 1994), 13-14.
BURGESS M. J. & WHEELER R. V. 1928. The ignition of firedamp by the heat of impact of rocks. Safety in Mines Research Board Paper 46.
CHENG L. et al. 1987. Reduction of frictional ignition due to conical cutting bits. US Bureau of Mines Report of Investigations 9134.
COURTNEY W. G. 1981. Preventing frictional ignitions. Coal Mining and Processing, 18 (1), 48-58.
DATEY U. W. 1963. A study of the incendivity of frictional sparks from rubbing contact between rock and steel. Unpublished MSc thesis, University of Birmingham.
GOLLEDGE P., GRAY I., STORY R. & DAVIS R. 1991. Frictional and impact ignitions of methane — coal dust mixtures. End of Grant Report, Project 1222, National Energy Research Development and Demonstration Program. Department of Primary Industries and Energy, Canberra, 122pp.
LAMA R. D., Liu Y., MACDONALD G. R. & SCHRODER R. 1990. Diamond-tipped cutter picks to prevent frictional ignitions in coal mines. End of Grant Report, Project

FRICTIONAL IGNITION ASSOCIATED WITH UNDERGROUND COAL MINES 97
954, National Energy Research Development and Demonstration Program. Department of Primary Industries and Energy, Canberra, 205pp.
LYNN K. P., MAITLAND J., JONES H., Ross K. & KATHAGE B. A. 1987. Report on an accident at Moura No. 4 underground mine on Wednesday, 16th July, 1986. Report of Warden's Inquiry, Queensland.
NAGY J. & KAWENSKI E. M. 1960. Frictional ignition of gas during a roof fall. U.S. Bureau of Mines, Report of Investigations 5548, 1 1pp.
NATIONAL COAL BOARD 1984. Ignition risk from quartz or pyrites. Mining Department Instruction PI/1984/4, 7pp.
NEW SOUTH WALES DEPARTMENT OF MINERAL RESOURCES 1994. Review of reportable frictional ignitions of methane in NSW underground coal mines, 1987-1993. Report SR94 / 1, Coal Mining and Engineering Inspectorate Branch, lOpp.
PHILLIPS H. 1995. Coal mine explosions: the South African experience. Proceedings of the 26th International Conference of Safety in Mines Research Institutes. Central Mining Institute, Katowice, Poland, 2, 89-102.
POWELL F. 1991. Ignitions of firedamp by machine picks: a review (Part 1). Colliery Guardian, November, 241-253.
POWELL F. 1992. Ignitions of firedamp by machine picks: a review (Part 2). Colliery Guardian, January, 21-30.
POWELL F. & BILLINGE K. 1975. The frictional ignition hazard associated with colliery rocks. The Mining Engineer, July, 527-533.
RAE D. 1961. A measurement of the temperature of some frictional sparks. Combustion and Flame 5 (4), 341-347.
RAE D. 1964a. The role of quartz in the ignition of methane by the friction of rocks. Safety in Mines Research Establishment Research Report 223.
RAE D. 1964b. The size and temperature of a hot square in a cold plane surface necessary for the ignition of methane. Safety in Mines Research Establishment Research Report 224.
RAMSAY H. T., WASS C. A. A. & HARTWELL F. J. 1965. A summary of the manner and the frequency of ignitions of firedamp in British coal mines. The Mining Engineer, September, 728-744.
WARD C. R., COHEN D. R., PANICH D., CROUCH A., SCHALLER S. & DUTTA P. 1990. Assessment of methane ignition potential by frictional processes from Australian coal mine rocks. End of Grant Report, Project 1083, National Energy Research Development and Demonstrat-ion Program. Department of Primary Industry and Energy, Canberra, 216pp.
WARD C. R., COHEN D. R., PANICH D., CROUCH A., • SCHALLER S. & DUTTA P. 1991a. Assessment of methane ignition potential by frictional processes from rocks in Australian coal mines. Mining Science and Technology 13, 183-206.
WARD C. R., COHEN D. R., PANICH D., CROUCH A., SCHALLER S. & DUTTA P. 1991b. Assessment of gas ignition potential by frictional processes from rocks in Australian coal mines. Proceedings of Symposium on Gas in Australian Coals, Bamberry W. J. and Depers A. M. eds, Sydney. Geological Society of Australia Symposium Proceedings 2, 121-130.
WARD C. R., CROUCH A., COHEN D. R., FOWLER, J. C. W. & PANICH D. 1996. Categorisation of rock strata in Australian coal mines with respect to potential for methane ignition by frictional effects. End of Grant Report, Joint Coal Board Health and Safety Trust, 99pp.
WYNN A. H. A. 1952. The ignition of firedamp by friction. Safety in Mines Research Establishment Report 42.


Symposium on Geology in Longwall Mining, 12-13 November 1996, eds G. H. McNally and C. R. Ward, pp 99-108.
Geostatistical analysis of gas data in advance of gate road development
J. H. DUKE' AND R. PHILLIPS2
Engineering Computer Services Pty Ltd. 2Technical Services, Bellambi Collieries.
Geostatistical analysis and modelling of gas sampling data has been used to determine optimum gas sample spacing, and to predict gas behaviour ahead of gate road development at South Bulli Colliery. It is proposed that these relatively simple geostatistical techniques are applicable to most in-seam gas sampling data, provided that geological conditions are not highly variable.
INTRODUCTION
This paper is based on work undertaken for Bellambi Collieries underground operation at South Bulli mine, in the Southern Coalfield of the Sydney Basin. The work was carried out to determine the density of sampling that is required to reliably predict gas behaviour, and to meet the requirements of the Depart-ment of Mineral Resources Outburst Management Plan Guide.
Bellambi Colliery mines the Bulli Seam, which in the area being studied averages 2.55 m in thickness and dips approximately 3° to the southwest. The current working area is shown on Figure 1. The Bulli Seam here is cut by narrow basalt dykes trending ESE, roughly parallel to Longwall 507, and cross-cutting dyke sets trending NE to ENE. A basalt sill and/ or vent structure has been identified in the north of the longwall area shown on Figure 1.
Gas sampling techniques
Bellambi Collieries currently collect cores for gas determination on a 200 m x 70 m staggered grid. The core samples, measuring some 0.7 m to 1.5 m long, are taken from horizontal drillholes. These samples are analysed for gas content (expressed as cubic metres/tonne), gas composition (recorded as a ratio of methane to carbon dioxide) and ash content. Gas sampling is carried out on an ongoing basis as mine development proceeds.
ANALYSIS AND MODELLING OF GAS CONTENT SAMPLING DATA
Criteria for exclusion of samples
Of the total number of gas samples collected at Bellambi Colliery, some 35 have been eliminated from the current study because of clustering (i.e., too close)
with other samples, or because the sample core length was insufficient. The remaining 205 sample values represent the latest reliable set of gas at Bellambi Colliery and form the basis of this current study.
Statistics and discussion
As with an earlier data set of 158 gas samples, these gas content values form a somewhat negatively skewed normal population, as shown on Figure 2. This has an average gas content of 6.75 m3 / t and a standard deviation of 1.86, compared to 7.0 m3/ t in previous data set.
The probability plot (see Figure 3) shows a single straight line population between 4 and 10 m3/ t, with a small number (approximately 1.0% of values) above 10.0 m3/ t. The population of values below 4.0 m3 / t (approximately 7.0% of the total) shows a distinct absence of gas contents between 3.5 and 4.0 m3 / t.
Variography and discussion
Variograms for the gas content values have been generated for each major joint direction, as well as for all directions. In general the variograms are transitional. The omnidirectional variogram for gas content can be modelled either with a single exponential curve, or with a nested spherical model (see Figure 4). This shows a range of approximately 300 metres. The E/W and ESE/WNW variograms (see Figures 5 and 6) in the direction of the longwall panels show a range of 240 — 275 metres.
Contour map of gas content variogram values
The contour map of gas content variogram values (Figure 7) shows a more complete picture of the variography than do individual variograms. The con-centric pattern of closely spaced contours at the centre

100 J. H. DUKE AND R. PHILLIPS
2 8 2 0 0 0 E 28 30 0 0 E 2 8 4 0 0 0 E
2 8 2 0 0 0 E 2 8 3 0 0 0 E 2 8 4 0 0 0 E
Figure 1 Location of worked-out longwall panels (hatched), current panel 507 and future blocks north of 507. Gas sample boreholes shown by circles.

10.0 12.0
-0.213 2.838
: 205
1 10 30 50 70
Probability (cumulative 7)
90 99
GEOSTATISTICAL ANALYSIS OF GAS DATA IN ADVANCE OF GATE ROAD DEVELOPMENT 101
20-
— 90
— 80
- 7(s'
10-
— 30
— 20
— 10
0.0 2 . 0 4 . 0 6.0 .
Average 6.756 Stand.Dev. 1.859 Skewness Median 8.890 Variance 3.456 Kurtosis Minimum 2.230 7. Coeff.var: 27.516 No. Values Maximum 11.110
Figure2 Histogram of gas content values, in cubic metres per tonne of coal.
Fre
qu
ency
%
No. points: 205 Minimum: 2.230 Maximum: 11.110 Mean: 6.756 Std.Dev.: 1.859 Variance: 3.456 Median: 6.890 Skewness: —0.213 Kurtosis: 2.638
Figure 3 Probability plot for gas contents below a specific value. Gas content on y-axis (m3 /0 and probability on x-axis.
12.00
11.00
10.00
9.00
8.00
7.00
5.00
5.00 0
r/3 44 4.00
3.00
2.00
1.00
0.00
4.

1.6 - LA
0.8
0.0 1100 0
102 J. H. DUKE AND R. PHILLIPS
All Directions 4.0 -
0.0 41-00 500
3.2 -
VA
RIO
GR
AM
2.4 -
1.6 LLI (f)
0.8
100 200 300 DISTANCE
Di rCovarionce
5 3.13 58 204 320 423 493
Population
542 549 651 634 650
Figure 4 All-directions variogram, based on 205 gas content values. Spherical nested model: nugget = 0.0; sill 1 = 2.10, range = 125 m; sill 2 = 2.95, range = 300 m.
4.0 100 Azimuth
3.2-
VA
RIO
GR
AM
2.4 -
200 300 41-00 500 DISTANCE
Di rCovoriance
3.31 22 71 101 102 144
Population
138 179 169 184 199
Figure 5 East/west direction variogram for same data as Figure 4. Spherical model: nugget = 0.0; si 1= 2.75, range = 240 m.

VA
RIO
GR
AM
3.D -
2.5-
2.0-
1.0 -
GEOSTATISTICAL ANALYSIS OF GAS DATA IN ADVANCE OF GATE ROAD DEVELOPMENT 103
4.0-
3.5-
0.5- 4(
0.0 0 100 200 300
DISTANCE
No. Covor Population
3 3.28 17 66 96 106 147 119 166 183 194 195
Figure 6 ESE/WNW direction variogram for same data as Figure 4. Spherical model: nugget = 0.0; sill = 2.85, range = 275 m.
10 degree azim.
400 500
North- south
separation distance
500W 400W
i
300W 2000 1000 OE 1000 2000 3000 400E 5000
§ C • h '-a"'..•-•-....
i s
Mi.
1
. • i a
i
t
.
a . "
Z 0
..4P111V4PII ((0 . . • a . .
275 metre
6,---- :7 /
z o
•..
ran
. /) 1
1 . .8 ,„ •Dop
1 5000 400W 300W 200W 100W
, ---....---- OE
- 100E
----) 2005
cm
300E 400E 500E
?
i
ESE direction
East-west separation distance (metres)
Figure 7 Contour map of the gas variogram values for all directions, in 100 increments. Contour values are gas contents, in m3/ t.

104 J. H. DUKE AND R. PHILLIPS
20- -100
— 90
— 80
- 7cr —41
60>
1 0- 50
3 4CL)
— 30
— 20
— 10
0. S. 10. 1 5 . 20. 2 5 .
Average
Median
Minimum
Maximum
12.34 Sim nd.Dev. :
9.30 Variance
1.56 % Coat .vor:
25.00
8.44 Skewness 0.45
71.24 Kurtosis 1.66
68.41 Na. Values : 159
Figure 8 Histogram of gas composition, in terms of methane/carbon dioxide ratio.
Fre
que
ncy
%
Y;ME4.
25.00
20.00
15.00
5.00
0.00
4. 4-
4.
+
-t .4.
+ 1
1 .4
+
1- .1. 4.
4
I 4"
,t4
ft 4.* /:
4- 4 +
ii +
1
No. points: 203
Minimum: 1.560
Maximum: 25.000
Mean: 12.338
Std.Dev.: 8.441
Variance: 71.244
Median: 9.300
Skewness: 0.447
Kurtosis: 1.660
1 10 30 50 70 90 99
Probability (cumulative %)
Figure 9 Probability plot for gas composition below a specific CH4/ CO2 ratio. Composition on y-axis and probability on x-axis.

•er
GEOSTATISTICAL ANALYSIS OF GAS DATA IN ADVANCE OF GATE ROAD DEVELOPMENT 105
2 8 2 0 0 0 E 283000 E 2 8 4 0 0 0 E
2 8 2 0 0 0 E 2 8 3 0 0 E 2 8 4 0 0 0 E
Figure 10 Gas content in Bulli Seam at South Bulli Colliery, in cubic metres per tonne. Current longwall panels shown. Kriged model, contour interval 1 niVt.

106 J.H. DUKE AND R. PHILLIPS
2 8 2 0 0 0 E 2 8 3 0 0 E 284000E
2 8 2 0 0 0 E 2 8 3 0 0 0 E 2 8 4 000 E
Figure 11 Gas composition in Bulli Seam at South Bulli Colliery, in terms of CH4/CO2 ratios. Current longwall panels shown. Kriged model, contour interval 2.5. Note very high proportion of methane in the south, reducing to less than ten times carbon dioxide in the north.

GEOSTATISTICAL ANALYSIS OF GAS DATA IN ADVANCE OF GATE ROAD DEVELOPMENT 107
25.0-
20.0-
11)
0 o 15.0-
-n0 0 i0.0- >
5.0- • :
. . . •
0.0 2.0 4.0 6.0 8.0 10.0 12.0
Variable: GASCON
Figure 12 Scattergram of gas content (x-axis) versus gas composition (y-axis).
of the cross lines show the steep part of each variogram from the origin to the sill value at approximately 2.8 m3/t. This concentric pattern of contours clearly shows the N/S anisotropic direction and the reason why Figures 5 and 6 vary in range from 240 to 275 metres.
Kriged model of gas content data
The gas content values have been modelled using kriging with the omnidirectional variogram model. Parameters for the 2D gridded model are:
X Origin 281500E Y Origin 1202500N X Extent 2500 Y Extent 3000 X Mesh 10m Y Mesh 10m Scan Distance 500m
Variogram Model: Exponential Nugget: 0.20, Sill: 3.05, Range: 325.0
The model contour plan (see colour Figure 10) indicates that the higher gas content values occur in an ESE-trending zone, which is sub-parallel to the main dyke system and to the longwall panels. The area north of Longwell 508 (approximately 1204000N) appears to be generally low in gas content, although the sample support for this part of the model is somewhat sparse.
ANALYSIS AND MODELLING OF GAS COMPOSITION DATA
The gas composition values from the 205 sample gas data set are ratios of methane to carbon dioxide gas, and range in raw values from 1.56 to 150. After advice from geologists at Bellambi Colliery, all values above 25 have been cut to that value for purposes of this study.
Statistics and discussion
The histogram of gas composition ratios (see Figure 8) indicates a number of populations, as does the probability plot (see Figure 9). There are a number of gaps in the samples values as shown on the probability plot, but a straight line population can be seen between about 7 and 23. The correlation scatterplot (see Figure 12) shows no recognisable correlation between gas content and gas composition values.
Modelling of gas composition data
A 2D gridded model of the gas composition ratios has been created using the inverse distance squared estimation method, with the following modelling parameters:
X Origin 281500E Y Origin 1202500N

108 J. H. DUKE AND R. PHILLIPS
X Extent 2500 Y Extent 3000 X Mesh 50m Y Mesh 50m Scan Distance 500m Estimation Method: Inverse Distance Squared
The model contour plans (see Figure 11) show a marked high gradient zone trending ESE, which separates an area of higher gas composition values (relatively lower CO2 values) to the south from an area of lower gas composition ratios (higher CO2 values) to the north. The only zone of >30% CO2 values is restricted to an area at the extreme eastern end of Longwall 507. There is some indication that ratios north of 1204500N are increasing, although this part of the model is supported by only two samples.
CONCLUSIONS
There are two sets of conclusions that apply — those that are specific to the study of in-seam gas sampling data at Bellambi Colliery, and those that may apply generally to in-seam sampling data in many other coal mines.
Conclusions that are specific to the study of in-seam gas sampling data at the Bellambi Colliery are:
• Variography shows gas content continuity over a 240 — 300 metre range, with the longer (>300 m) range in the N/ S direction (010 azimuth — perpendictilar to the longwall panel centreliness) and the shorter range (240 metres) in the E/W direction (100 azimuth — parallel to the longwalls).
• Most high gas content values (>8.00 m3/0 are restricted to an irregular zone perhaps vaguely related to the ESE trending dyke zone in the area of Longwall 507.
• There appears to be no clear correlation between gas content and gas composition values.
• Modelling of gas composition values shows an ESE-trending high gradient zone, separating an area of
higher CH4: CO2 ratios in the south from an area of lower ratios (i.e., higher CO2 values) in the north. However 30% or greater CO2 values are restricted to a small area at the extreme end of Longwall 507.
• Based on the analysis of current gas sampling data indicating continuity of gas content values over a 240 m — 300 m range, the proposal by Bellambi Colliery to widen the gas hole spacing from 70 m x 200 m to 170 m x 200 m appears to be justified.
• In areas which are free of geological structure, the gas is composed of less than 30% CO2 and seam gas content is not closer than 1 m3/ t to the predetermined threshold value.
Conclusions that may apply generally to in-seam sampling data in many coal mines are:
• Geostatistical analysis of in-seam gas sampling data can be used to determine optimum gas sample spacing in advance of gate road development, provided geological conditions are not highly variable.
• Geostatistical modelling of both gas content and gas composition values can be used effectively to predict in-seam gas behaviour in unmined areas — again provided geological mapping indicates no real changes in the geology, such as faults or dyke structures.
ACKNOWLEDGMENTS
The authors wish to thank the management of Bellambi Collieries for permission to present this paper. Thanks also go to Dr Bulent Agrali, Senior Geologist at Bellambi Colliery, for his technical contributions.
REFERENCE
ISAAKS E. H. & SRIVASTAVA R. M. 1989. An introduction to applied geostatistics, 150-152.

Symposium on Geology in Longwall Mining, 12-13 November 1996, eds G. H. McNally and C. R. Ward, pp 109-117.
Application of deep transient electromagnetic sounding methods to mapping of coal seams in the Appin area
Z. UN' , K. VOZOFF2, G. H. SMITH3 AND 0. G. ENGELS4
CRCAMET, School of Earth Sciences, Macquarie University. 2HarbourDom Ply Limited, Sydney.
3Mathematics Department, University of Technology, Sydney.
4HarbourDom GmbH, Cologne, Germany.
The longvvall method of mining is very efficient in uniform seams, but coalbed anomalies can make the method unprofitable and unsafe. For this reason there has been growing use of geophysics in advance of mining, to predict seam continuity and to map disruptions. A deep transient electromagnetic sounding technique has been used to map electrical properties within coal seams and geological disturbances in the sedimentary sequence at Appiri NSW. Two feasibility model studies were conducted, based on the reduced geoelectric section from well logs. The first was a model study to map the electrical properties of coal seams, which are closely related to stress and saturation problems at West Cliff Colliery. The second was aimed at locating the boundary between a basalt intrusion and virgin coal at Cordeaux Colliery. The results of the field survey at West Cliff are also presented. Both model studies and the field survey results have shown that the deep transient electromagnetic sounding technique is very useful for mapping geological disturbances in thin, highly resistive coal seams at great depth. The main limitations of the method are that the structure and stratigraphy must be specified in advance. The technique should be used interactively, with models constrained by geological information.
INTRODUCTION
Longwall mining is an efficient method for extracting coal from deep underground. However if unexpected geological disturbances, such as basalt intrusions or faults disrupt the seam, a substantial loss of production may occur. In addition, high gradients in stress and fluid pressures, including concentrations of explosive methane, can arise during mining (Vozoff et al., 1993). Any one of these occurrences can pose a hazard to men and machinery, and can also disrupt mining operations. To move a longwall takes time, leading to many millions of dollars worth of lost production, but losses can be minimised if the location and nature of geological anomalies are known in advance and preparations have been made to reduce their potential impact.
To avoid such problems, a number of geophysical methods have been employed to try to sense these zones. These include high resolution seismic, geological radar and the radio imagining method. The present paper describes an application of a deep transient electromagnetic (TEM) sounding technique to explor-ation problems in the Australian coal mining industry.
The deep TEM sounding technique is a particular type of transient electromagnetic sounding system, characterised by a large scale and deep exploration capability as compared with most EM sounding systems. The method originated in the former Soviet Union and has been used for deep exploration of hydrocarbon deposits, geothermal resources and crustal studies in the USA, Australia, Germany and South Africa for the past two and half decades (Keller et al.,
1984; Strack et al., 1989; Engels, 1992). Recent advances of the technique have been mainly
made in field instrumentation, data acquisition and data processing techniques at the University of Cologne, Germany (Stack, 1992). Commercial equipment is now available for an exploration depth range from several tens of metres to several kilometres. The method has shown itself to be very promising in hydrocarbon exploration, particularly where the task is to define variations in porosity and sandstone percentage within a sedimentary section (Vozoff, 1990).
The geological structure of the Appin area, located in the southern Sydney Basin, is characterised by horizon-tal strata consisting of sandstones, shales and mudstones. The major coalbeds in this area are the Bulli, Balgownie and Wongawilli seams, which have thicknesses of 2 to 5 m and occur at depths of 400 m to 700 m. Typically, the electrical resistivity of un-disturbed coal in this area is more than 104 cm, which is much higher than for the other geological units in the section. This large contrast in electrical properties between coals and their host sediments provides the physical basis of the electromagnetic measurements.
Furthermore, laboratory measurements on samples show that electrical properties of coal are strongly affected by local water saturation and stress (Yu, 1992), suggesting that these conditions might be mappable remotely. In this paper the deep transient electro-magnetic sounding technique is briefly described, and results from two model studies and one field survey are used to show how the method can be used to detect geological disturbances and map electrical properties within coal seams in the Appin area.

1110. time
+ ++ T+++
+++++++++ +++++÷+++ ++÷++ +++
+
+ ++++ + + ++++++++ ++++++++ + +
110 Z. LIN ET AL.
TRANSMITTER CURRENT WAVE FORM
V ++ •
+++ ++
+++ + RECEIVER TRANSIENT
SIGNAL
++
if--
V v,Iv'ZVVVy'l,VTV"y""rilIVYV wyyVyVIVYVVW viyVylITVVyVV VVVVV.VVYVV.VVVVY V Y V V. VVVV.;,,,yVyV!!VVVV.;vyllyV-yY VylIV V
YV y
Y yV
VYY y
Y VI
YVy? VV Y
rV VYYVTY Y y
.Y.Y YYYYV vYyY V Y V YVVYVY'We'.YVVYVVY "Tv .W.YV Y yvyyyV vvv y v elfyyyyViryv
y v eVy lr y. , TV VV. yY YY YVV• VV yY YY T Y Y V y V V - •Y y V
+ ++
++++++++ ++++++÷ ++++++++
Figure 1 Typical field survey configuration for the deep transient electromagnetic sounding method (after Strack, 1992).
THE DEEP TRANSIENT ELECTROMAGNETIC SOUNDING METHOD
The deep TEM method is sometimes called LOTEM (long-offset TEM) sounding when large transmitter-receiver separations are used. Figure 1 shows a typical LOTEM field setup. A grounded-wire transmitter injects a square wave electric current, which is provided by a large generator, into the ground. This alternating current induces both galvanic and eddy currents in the subsurface. Each current step induces a new system of currents and magnetic fields in the subsurface, which causes transients in the magnetic fields and a step response in the electric fields to be seen at the receivers. The receiving system was designed to operate with a very large number of channels, although only two receivers (four channels) were available for these preliminary trials. Later measurements at Appin and in France used 35-40 channels, resulting in very high data rates and large overlap between measurements.
Information on subsurface resistivity distribution is deduced from the amplitude and shape of the electric and magnetic field signals. The receivers are mobile.
A multi-turn loop is used to measure the time derivative of the vertical magnetic field (H). The electric field (E) is measured with a wire grounded at both ends, through non-polarizing copper electrodes. Ideal electric and magnetic transients are shown in the lower right of Figure 1.
Detailed descriptions of LOTEM theory for a horizontally layered earth are given by Kaufman and Keller (1983) and Strack (1992). An important aspect of LOTEM is that the E component is very sensitive to the presence of resistive features in the geological section, while H is not (Lin, 1996). The interpretation of LOTEM data is initially based on a one-dimensional (1D) horizontally layered earth model. This strategy has been responsible for many successful interpretations, since 1D inversion can be used in several different ways to obtain an objective estimate of the subsurface resis-tivity. However, in more complicated environments, forcing layered-earth models to fit the responses of two-dimensional (2D) and three-dimensional (3D) structures is a dangerous proposition, because parts of the layering will not reflect the actual resistivity distribution in the earth (Gunderson et al., 1986).

APPLICATION OF DEEP TEM SOUNDING TO MAPPING OF COAL SEAMS IN THE APPIN AREA 111
10W'
1 km ,
Tx V I
Rx spread I
I t
180m 180 ohm-m
14 m 80 ohm-m
30m 25 ohm-m
262 m (1) 1E+6 ohm-m (2) 100 ohm-m 45 ohm-m
2.5 m \ 1 1E+4 ohm-m <
38 m 45 ohm-m
9 m 1E+3 ohm-m
Rx POSITION: 2200M FROM Tx
.........................
ORIGINAL COAL WATER-INFUSED COAL DRAINED COAL
0 -'• ......„ , e -3 10 .2 10'1 ie
TIME (S)
1 . 5 ..„ BASEMENT 25 ohm-m
Figure 2 Transmitter and receiver configuration, and 2D geoelectrical cross-section used to model EM responses. The geoelectric parameters were derived from well logs. The anomaly consists of a 500 m wide water-infused seam (100 Dm) or drained seam (106 Dm). The transmitter (Tx) is set across the geoelectric strike and located 1250 m from the central line (dashed). The receivers are aligned along the receiver (Rx) line.
Hoerdt et al. (1992) presented one of the first efforts to interpret LOTEM data from 3D structures quantita-tively, by using three different modelling routines. Furthermore, 2D automatic inversion of LOTEM data has since been made possible (Petrat and Hoerdt, 1996; Lin, 1996). The programs used in this paper are MODALL (1D) (Strack, 1992), EMSUNA and EMSUNI (2D) (Smith et al., 1992; Lin, 1996). The LOTEM data processing and 1D interpretation were based on the programs LOPS and EMUPLUS (Strack and Engels, 1990).
MODEL STUDY CASES
Model 1: Mapping stress and saturation in coal seams at West Cliff
According to available well logs, the geological section at West Cliff Colliery is characterised by at least 560 m of sandstone, shale, mudstone and a conductive base-ment. The major formations and lithologies, as well as a reduced geoelectric section, are outlined in Table 1. The thickness of the Bulli seam is about 2.5 m, and is generally constant in the survey area. Typically, the undisturbed electrical resistivity of the Bulli Coal at West Cliff is more than 104 Skil. This is more than two orders of magnitude greater than that of any other geological unit in the section. However, the resistivity
DRAINED COAL WATER-INFUSED COAL
0. 5 10 -3 10 .2 10 " 1 TIME (S)
Figure 3 Electric field (Ex) responses for partly drained and water-infused coal seams of the model shown in Figure 2. The solid line represents responses without the anomaly. The lower curves are the ratios of responses with and without the target.
value in the coal seam is changed from time to time by mining activity — by the release of gases and water from the seam after the roadways have been driven, or by the injection of water into the seam in order to suppress the dust. The objective of the West Cliff modelling was to determine whether the resistivity change caused by stress and water saturation in the Bulli seam can be measured and monitored at the surface by the LOTEM system.
In order to simulate the EM responses for a practical situation, a 2D geoelectric cross section was constructed (Figure 2). The anomalous region consists of a 500 m width of water-infused seam (100 S2m) or drained seam (106 5-2m). The resistivity of the original coal was taken as 104 0m. The configuration of the transmitter (Tx) and receiver (Rx) is shown on the top of the figure. The Tx was set across the strike and located 1250 m from the central line (dashed). Receivers were aligned along the Rx spread line.
Figure 3 shows typical in-line Ex responses and their ratios of 2D (with anomaly) and 1D (without anomaly). The solid line represents responses without the anoma-ly. The difference is clear. The maximum ratio is about 30% for drained coal and 25% for wet coal, which is
10
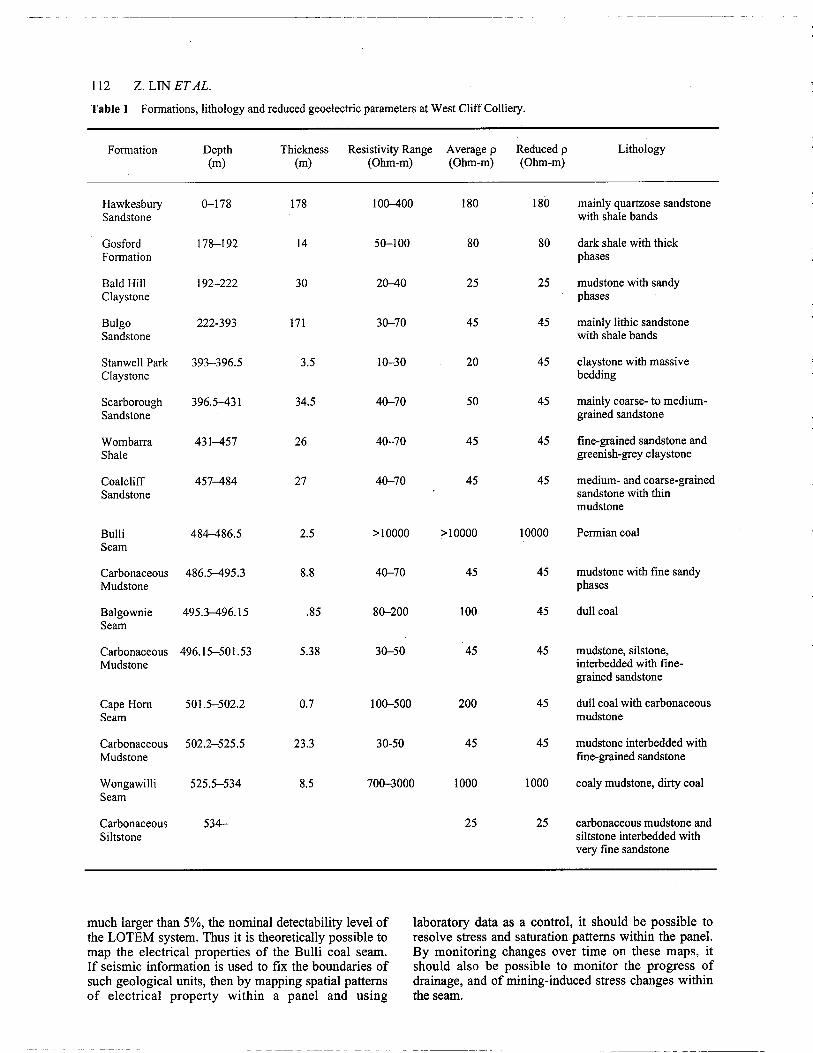
112 Z. LIN ET AL.
Table 1 Formations, lithology and reduced geoelectric parameters at West Cliff Colliery.
Formation Depth (m)
Thickness (m)
Resistivity Range (Ohm-m)
Average p (Ohm-m)
Reduced p (Ohm-m)
Hawkesbury 0-178 178 100-400 180 180 Sandstone
Gosford 178-192 14 50-100 80 80 Formation
Bald Hill 192-222 30 20-40 25 25 Claystone
Bulgo 222-393 171 30-70 45 45 Sandstone
Stanwell Park 393-396.5 3.5 10-30 20 45 Claystone
Scarborough 396.5-431 34.5 40-70 50 45 Sandstone
Wombarra 431-457 26 40-70 45 45 Shale
Coalcliff 457-484 27 40-70 45 45 Sandstone
Bulli 484-486.5 2.5 >10000 >10000 10000 Seam
Carbonaceous 486.5-495.3 8.8 40-70 45 45 Mudstone
Balgownie 495.3-496.15 .85 80-200 100 45 Seam
Carbonaceous 496.15-501.53 5.38 30-50 45 45 Mudstone
Cape Horn 501.5-502.2 0.7 100-500 200 45 Seam
Carbonaceous 502.2-525.5 23.3 30-50 45 45 Mudstone
Wongawilli 525.5-534 8.5 700-3000 1000 1000 Seam
Carbonaceous 534— 25 25 Siltstone
Lithology
mainly quartzose sandstone with shale bands
dark shale with thick phases
mudstone with sandy phases
mainly lithic sandstone with shale bands
claystone with massive bedding
mainly coarse- to medium-grained sandstone
fine-grained sandstone and greenish-grey claystone
medium- and coarse-grained sandstone with thin mudstone
Permian coal
mudstone with fine sandy phases
dull coal
mudstone, silstone, interbedded with fine-grained sandstone
dull coal with carbonaceous mudstone
mudstone interbedded with fine-grained sandstone
coaly mudstone, dirty coal
carbonaceous mudstone and siltstone interbedded with very fine sandstone
much larger than 5%, the nominal detectability level of the LOTEM system. Thus it is theoretically possible to map the electrical properties of the Bulli coal seam. If seismic information is used to fix the boundaries of such geological units, then by mapping spatial patterns of electrical property within a panel and using
laboratory data as a control, it should be possible to resolve stress and saturation patterns within the panel. By monitoring changes over time on these maps, it should also be possible to monitor the progress of drainage, and of mining-induced stress changes within the seam.

= BuIli =
;
BuIli
Model 2: Locating a geological boundary at Cordeaux
Model 2 was aimed at understanding whether the geological boundary between a basalt-intruded coal and virgin coal at Cordeaux Colliery could be mapped by the deep TEM sounding method. Well logs show that there is a basalt intrusion in this area. Figure 4 shows parts of two resistivity well logs (No. 1161 and No. 1163), which are about 1300 m apart. It is evident that there is a thin conductor at 423 m depth, with a thin
No.1161 No.1163
Resistivity in ohm—m Resistivity in ohm—m
420
430
440
5
1 0
Rx POSITION: 2200M FROM Tx
........................
.........
A (Tx on the left) Without intruoion (ID) B (Tx on the right)
le -1e
1 0 -2 1 0 1 1 0 TIME (S)
2. 0
...................... ^
A (Tx on the left) B (Tx on the right)
0.5 „ 10 10 2 1 0 1
TIME (S) 10
i.e
APPLICATION OF DEEP TEM SOUNDING TO MAPPING OF COAL SEAMS 1N THE APPIN AREA 113
Figure 4 Parts of well logs (Nos. 1161 and 1163) in western area of Cordeaux Colliery.
Tx Rx A:
B: V
i km
No. 1163 No. 1161
180 m 300 ohm-m 300 ohm-m
20 m 40 ohm-m 40 ohm-m
110 m 90 ohm-m I 90 ohm-m
113 m 60 ohm-m 60 ohm-m
2 m 5000 ohm-m am
3m
9m
60 ohm-m
60 ohm-m
2E+4 ahm-m
60 ohm-m
23 m 200 ohm-m i 200 ohm-m
BASEMENT 25 ohm-m 25 ohm-m
Figure 5 Two-dimensional geoelectrical section and two sets of transmitter-receiver configurations used in the Cordeaux modelling study. The left side shows the geoelectrical parameters without an intrusion, and the right side the same parameters with an intrusion.
but highly resistive sill unit just below it at site 1161. Only natural coal exists at site 1163, and the resistivity of the Bulli seam is approximately 5000 cm. Using these well logs, a 2D geoelectric section and two sets of transmitter-receiver configurations (A and B) were constructed, as shown in Figure 5. For configuration A, the transmitter (Tx) was set on the side without the intrusion and 1000 m from the boundary, and the receiver (Rx) was on the other side and 2200 m from the boundary. Configuration B is the opposite of con-figuration A. The electric dipole transmitter was set across the geoelectric strike for both configurations.
In order to make the comparison convenient, both 2D responses (with intrusion) and 1D responses (without intrusion) were calculated. Figure 6 shows the electric field (Ex) response curves and their ratio curves between the 2D and 1D responses. It can be seen from these plots that the difference between the 2D and 1D responses is significant for both sets of Tx-Rx con-figurations. However, the response for A (Tx on the left) is more than twice that of B (Tx on the right).
Figure 6 Electric field (Ex) responses for two different transmitter-receiver configurations shown in Figure 5. The solid line represents responses without an intrusion. The lower curves are the ratios of responses with and without an intrusion.

114 Z. LIN ET AL.
Figure 7 Transmitter and receiver sites are shown in the survey area. Traverse lines are for seismic survey. The grounded electric dipole transmitter (Tx) was set on the south of the map. Six receiver stations were set from south to north along a road.
Further modelling studies show that the maximum ratio amounts to 2.5 (Lin, 1996). This is much higher than the detectability level of the LOTEM system.
2D model simulations show that the deep TEM sounding method can produce truly significant changes in the detected electric field when the measurements are taken over coal with and without intrusions. This means
that the boundary between basalt-intruded coal and unaffected coal should be easily measured and located by using the electric field component of LOTEM system. Sufficient spatial resolution could be expected from the measurements. The modelling results suggest that it is better to set the transmitter on the non-intruded side and the receiver on the other side.

—2.16
0.12 —0.19
Ca E--a
TIME (SEC) 0.83
-2.20
0.03 -0.19
VI •
—1 0 • >
TIME (SEC) 0.03
-2 10
I.
6 , 10 _3
10 -1 0
10 10 -2
10
TIME (SEC)
la, 3 Orel -,1
14 a n
80 4 Olim-n
J88
23 4 OM- r1
21 a ?I
4 El 2 0141-n
2 1 ri 18882 I aHn-n
10I @ n
43 0 akin-pi
9 1
teez I pin -n I
24 9 amn-n
ERROR 2 62% 10 1
APPLICATION OF DEEP TEM SOUNDING TO MAPPING OF COAL SEAMS IN THE APPIN AREA 115
cF19anEx cr 19oEX
Figure 8 Typical raw transient of Ex signal recorded in the field (left), and transient signal after data processing (right).
cF- 11APEx Eota TH ■baft.
Figure 9 One-dimensional (1D) inversion results obtained for station 10 / 11 with structural parameters fixed.
FIELD SURVEY AND RESULTS
LOTEM surveys were carried out at West Cliff Colliery in October, 1992. Figure 7 shows the survey location and transmitter-receiver setup. A 500m long transmitter dipole was set along the N-S direction in the south. Six contiguous receiver stations along a road crossed from virgin coal in the south, through mined coal interrupted by a fault, across current mining and a drained panel and then back into virgin coal in the north. This provided a very good profile to test the method, since resistivities were changing from south to north.
Based on forward modelling, only the electric field signals were recorded. The electric fields were measured by grounded copper/copper sulphate non-polarizable electrodes, both 100 m and 50 m apart. A total of 24 soundings at six different receiver locations
along the road were recorded, with 64 transients for each sounding.
LOTEM data processing techniques are similar to those used in seismic data processing. The processing is usually divided into three sections: pre-stack processing, stacking and post-stack processing (Strack et al., 1989). The details of data processing are given by Lin et al. (1996). On the left of Figure 8 is a typical raw transient recorded in field. The transient can be seen to be contaminated with noise. The noise was successfully removed after data processing (on the right of Figure 8). The data were then normalised by the survey parameters for later inversion.
The 1D interpretation of the LOTEM measurements was carried out site by site. The results for each site were then combined to form a profile. The 1D inversion was based on a generalised linear inversion routine with

116 Z. LIN ET AL.
statistical analysis of layered earth models (Jupp and Vozoff, 1975; Raiche etal., 1985). Since the geological structure in the survey area was well established from seismic data and well logs, it was possible to calculate the thickness of each geological unit at each survey site and to identify the major resistivity features. This helped to set up a starting model for the inversion. In addition, the electric field can only resolve the product of thickness and resistivity, not thickness or resistivity individually. Hence fixing thickness can increase the resolution of resistivity parameter. Figure 9 shows an inversion result for station 10/11 with all thicknesses fixed during the inversion. The solid lines through the observed data points represent the theoretical curve derived from the layered earth model on the right. The model data fit the field data within an error of 2.62%.
1 km
Tx Rx spread V V V VV V V
180 m 180 ohm-m
14 m 80 ohm-m
30 m 25 ohm-m
262 m 45 ohm-m
2.5 m 2 3 4 5 1E+4 ohm-m
38 m 45 ohm-m
9m 1E+3 ohm-m
BASEMENT 25 ohm-m
Figure 10 Two-dimensional (2D) inversion model configura-tion. The section of interest in the Bulli seam was divided into six blocks. Each block is 500 m wide and was assigned a single parameter.
20/21
14/15
10/11 12/13
*-..-,.2D INVERSION X), X 1D INVERSION
1000 5100 2000 2500 3000 3500 I I
DISTANCE(m)
Figure 11 ID and 2D inversion results. For the ID inversion the structural parameters were fixed to get the resistivity of each geological unit. For the 2D inversion both the structural parameters and the resistivities of the background geology were fixed, in order to obtain the resistivity distribution of the Bulli seam. The initial parameters were taken from approximate results of ID inversion.
12/13
14/15
18/17 18/1
20/21
0.0 1000 1600 2000 2500 3000
DISTANCE (M)
Figure 12 Saturation changes in the Bulli seam along the survey profile.
For 2D interpretation, all data from six sites were put into one data set and a 2D geoelectric model con-structed, as shown in Figure 10. The interesting region of the Bulli seam was divided into 6 blocks, each with 500 m width; the aim of inversion was to get a resistivity value for each block. Structural parameters and resistivities of the host strata were fixed during the inversion. Results from ID inversion were taken as starting parameters; that is, patching the results made by fitting layered models separately at each site as the initial 2D resistivity section. Both 1D and 2D inversion results are shown in Figure 11. It was found that the resistivity values did not change much from the 1D results for all blocks. 2D inversion confirms the validity of ID interpretation in this case.
One objective of the survey was to derive water saturation information for the Bulli coal seam. Hence, a correlation had to be established between resistivity and water saturation. Assuming that water resistivity and formation porosity are constant, the resistivity of a water-bearing rock is inversely related to the square of the fraction of the pore volume occupied by formation water, or saturation (Archie, 1942). Using this calibration allowed transformation of resistivity variations to water saturation. Figure 12 shows the result of transforming the resistivity section of Figure 11 to water saturation. The relative fraction of water in the mining area (i.e. stations 14/15, 16/17 and 18/19), was lower than that of original coal at stations such as 10/11 and 12/13, due to the release of gases and water during mining. Station 20/21 was on the original coal, but the inversion result gave a larger resistivity value. This might have been influenced by mining activity. In summary, the results match the known geological conditions very well.
CONCLUSIONS
The deep transient electromagnetic sounding technique can produce detectable responses to highly resistive units at large depth, which may be related to coal conditions. This is because the electric field of the
10
0
›- E— 10: > E—
Cr4
10 '
3560
APPLICATION OF DEEP TEM SOUNDING TO MAPPING OF COAL SEAMS IN THE APPIN AREA 117
grounded source is sensitive to a horizontal resistive body.
Model 1 shows that the technique can be used to map electrical properties in coal seams at West Cliff Col-liery. Since the electrical properties are closely related to stress as well as water saturation in coal seams within a sedimentary pile, quantitative relationships between the changes in stress or water saturation and electrical properties can therefore be established.
Model 2 indicates that LOTEM can be used to map geological disturbances between basalt-intruded and virgin coal in a sedimentary sequence from the surface at Cordeaux Colliery. Sufficient spatial resolution could be expected from the measurement. According to modelling results, it is better to set the transmitter on non-intrusion side and the receiver on the other side.
The West Cliff survey case study shows that the deep TEM sounding technique can successfully be used to map resistivity distribution within the coal seam with assistance from seismic and well logs. If laboratory data are available for control, resistivity can be converted directly to saturation and stress in coal seams. By monitoring changes in these maps with time, it should also be possible to monitor the progress of drainage, and of stress changes during mining.
ACKNOWLEDGMENTS
This study was assisted by the CRC for Australian Mineral Exploration Technologies, by Australian Coal Industry Research Laboratories (ACIRL), and by the German Academic Exchange Committee (DAAD) and the University of Cologne. We would like to express our thanks to HarbourDom GmbH of Cologne, which provided data processing software and the opportunity to use it whilst in Germany.
REFERENCES
ARGHE G. E. 1942. The electrical resistivity log as an aid in determining some reservoir characteristics. Petroleum Technology 5.
ENGELS 0. G. 1992. A multichannel processing system for LOTEM and field tests in South Africa. Diploma thesis, Institute of Geophysics and Meteorology, University of Cologne, Germany.
GUNDERSON B. M., NEWMAN G. A. & HOHMANN, G. W. 1986. Three-dimensional transient electromagnetic res-ponses for a grounded source. Geophysics 51, 2117-2130.
HOERDT A., DRUSIUN V. L., KNIZHNERMAN L. A. & STRACK, K.-M. 1992. Interpretation of 3-D effects in long-offset transient electromagnetic (LOTEM) soundings in the Munsterland area, Germany. Geophysics 57 (9), 1127-1137.
JUPP D. L. B. & VOZOFF K. 1975. Stable iterative methods for the inversion of geophysical data. Geophysical Journal Royal Astronomical Society 42, 957-976.
KAuFmAN A. A. & ICELLER G. V. 1983. Frequency and Transient Sounding. Elsevier, Amsterdam.
KELLER G. V., PRITCHARD J. I. & HARTHILL N. 1984. Megasource time-domain electromagnetic sounding methods. Geophysics 49, 993-1009.
LIN Z. 1996. 2.5D modelling and inversion of deep transient electromagnetic sounding with a grounded source. Ph.D thesis, Macquarie University.
LIN Z., VOZOFF K., SMITH G., HATHERLY P. & ENGELS 0. G. 1996. Joint application of seismic and electromagnetic methods to coal characterisation at West Cliff. Accepted for publication by Exploration Geophysics.
PET'RAT L. & HOERDT A. 1996. 2D Inversion of long-offset TEM data. 58th EAEG Conference, Amsterdam, Extended Abstracts, Vol. 1.
RAICHE A. P., JUPP D. L. B., Ru-rrER H. & VOZOFF K. 1985. The joint use of coincident loop transient electromagnetic and Schlumberger sounding to resolve layered structures. Geophysics 50, 1618-1627.
SMITH G. H., WILLIAMSON P. R. & VOZOFF K. 1990. The application of nested dissection to the solution of a 2.5D electromagnetic problem. The Applied Computational Electromagrietics Society Journal 5 (2), 87-106.
STRACK K.-M. 1992. Exploration with Deep Transient Electromagnetics. Elsevier, Amsterdam.
STRACK K.-M. & ENGELS 0. G. 1990. LOTEM processing system: user's reference guide, Vol 2.5. HarbourDom Consulting GmbH, Germany.
STRACK K.-M., HANSTEIN T., LEBROCQ K., Moss D. C., VOZOFF K. & WOLFGRAM P. A. 1989. Case histories of long-offset transient electromagnetic (LOTEM) in hydrocarbon prospective areas. First Break 7, 467-477.
VOZOFF K. 1990. A deep transient electromagnetic technique for petroleum exploration. Centre for Geophysical Exploration Research, Macquarie University.
VOZOFT K., SMITH G. H., HATHERLY P. J. & THOMSON, S. 1993. An overview of the Radio Imaging Method in Australian coal mining. First Break 10 (1).
Yu G. 1992. Electrical property measurements of some Permian coals. Centre for Geophysical Exploration Research, Macquarie University.

-

Symposium on Geology in Longwall Mining, 12-13 November 1996, eds G. H. McNally and C. R. Ward, pp 119-125.
Mine mapping: an important component of integrated mine characterisation
L. K. RIXON
Strata Control Technology Pty Ltd.
Mine mapping is an exploration and monitoring tool which embodies systematic recording of those aspects of geology, mine stability and geotechnical data that are amenable to simple observation or inference. It helps to close the design loop by providing feedback on mine performance and plays a significant role in balanced interpretation of detailed monitoring. The observations (data) may be presented on two sorts of map. One map summarises the type and amount of artificial support, mining machine and driveage directions. A roadway condition map shows the position, shape and important dimensions of roof falls, rib spall and floor heave, as well as geological observations such as fault types and lithology changes. The data can be used for qualitative evaluation of mine design, definition of mining environment, hazard identification, maintenance planning and mine planning. Mine mapping should be undertaken by personnel who are experienced in a wide variety of mining environments and are aware of the needs of the end users, and who are capable of filtering out the 'noise' in the information that confronts the underground observer. If it assists recollection of past events, or highlights a particular relationship that contributes to efficient mining or improved safety, then it has served its purpose.
MINE MAPPING — WHAT IS IT?
Mine mapping is an exploration and monitoring technique which embodies systematic -recording of those relevant aspects of mine geology, mine roadway stability and geotechnical conditions that are amenable to simple observation or •inference. 'Simple observation' in this context refers to qualitative estimates of roadway closure, support deformation and the sketching of geological and roadway deformational features. It also includes recording of measurements from simple displacement and dilation measuring instruments such as roof and rib extensometers, convergence pins, and spatial data on geological structures. It also extends to leg pressure and/or closure data from longwall face supports.
WHY DO IT?
Few would doubt the value of exploring and characterising a resource before attempting to mine it. Characterisation in this context refers to an assessment of the underground mining environment in terms of geological, geotechnical and hydrological observations. If there was perfect knowledge of the deposit and the initial pre-mining design procedures were immaculate there would be no need for further exploration, design or monitoring during the life of a mine. Since neither has been attained, current good practice is to continuously close design loops by observation and measurement of mine geology and geomechanical performance, which can then be compared with the initial information and design assumptions.
THE ROLE OF MAPPING
In a new mine the mapping is a first record of its geotechnical performance. In established mines it can assist with assessment of support and design parameters, and can be a basis for prediction of problem areas during extraction or in development of nearby unmined areas. As a mine develops, mineability becomes apparent as mining conditions are observed and mine statistics are generated. Performance data for the mining operation is regularly and systematically gathered, and in some mines the trend is now to do likewise with geotechnical performance (mine stability) data. Geotechnically this involves underground stress measurements, displacement monitoring of the land surface and of underground openings, and measure-ments of support performance directly and indirectly.
Detailed strata monitoring results are sometimes summarised on maps, but regardless of the form of presentation the results can be misleading if they are not placed in the general mine context. For example, strata monitoring instruments are often sited on discontinuities which are not recorded during installation. Subsequent anomalous in displacements may cause unfounded concern for the general health of a particular section of the mine or the support. A major role of geotechnical mapping is to provide the overview for balanced interpretation of the detailed information.
MAPPING TECHNIQUES AND PRESENTATION
A trained observer in the mine will note whether the face conditions are good or bad; whether the place is wet or dusty; comment on the condition of the roof,

120 L. K. RIXON
SUPPORT PATTERN CODE
SUPPORT PATTERN CODE - 64, 0.5, M. 5.0
64 = 6 BOLTS IN FIRST ROW, 4 BOLTS IN SECOND ROW
0.5 = SPACING BETWEEN ROWS (m)
SMB = STRAPS, MESH or BUTTERFLIES
5.0 = ROADWAY WIDTH (m)
SUPPORT DENSITY
ROADWAY SHADING INDICATES SUPPORT DENSITY (BOLTS PER m2)
2.0 - 2.4 4.2, 0.5, Irt, 5.0
1.0- 1.4
CENTRE SHADING INDICATES BOLT LENGTH
2.1m
Figure 1 Typical roadway support map, showing type and distribution of roof support measures.

MINE MAPPING: AN IMPORTANT COMPONENT OF INTEGRATED MINE CHARACTERISATION 121
floor and ribs; and check if the roof support is easy to install. He or she will notice if the outbye areas are in a similar condition to the face areas, or whether they are beginning to deteriorate.
Anyone with training in strata control will be asking themselves, as they map, questions such as: is any deformation related to minor geological structures, or is it of a more pervasive nature? Do systematic differences exist in the locus of failure in weaker areas and what inferences can therefore be made about the stress field? Has the initial design work been validated? These initial observations can be made more permanent and accessible by noting them on a plan.
The observations (data) may be presented on two types of map. A support map (Figure 1) summarises the type and amount of artificial support that is actually placed in the mine roadways. This information is sometimes available from the mine support rules and a summary map it is not always seen as useful by mine personnel. However, additional information relating to driveage directions, change points in the support type and its density, and the type of mining machine used are required for geotechnical assessment. These details are usually plotted on the support map.
A roadway condition map (Figure 2) shows the position, shape and important dimensions of any roof falls, rib spall and floor heave which may be present. If intact rock failure has occurred, horizontal stress directions are plotted. These can be inferred by experienced personnel from differential roadway performance and from shear failure planes within the strata. The condition map is also the appropriate place to plot any geological structure, particularly faults and any significant rock type changes.
Maps that were once hand drawn by the geologist or strata control engineer are now usually prepared by transferring the information into one of the CAD packages. This still requires manual redrawing of the map by mouse rather than pencil. The benefits are ease of editing and of reproduction.
to improved operational procedures or equipment investigations.
The results of underground mapping can be integrated into extraction operations in the form of general hazard maps for extraction areas (Figure 4). Day to day management of strata control can also be assisted by timely mapping of prominent joint zones, faults or strata changes. Hazards for pillar extraction crews are highlighted on day to day production plans. Similarly, secondary support requirements can be assessed on a shift by shift basis for critical areas of the mine, such as wide longwall installation roads (Figure 5). Forewarning of soft roof areas and faults can assist decision making for planned downtime. How many miners would want to stop a longwall in a local area of weak strata if they had the option of continuing on to nearby sound roof?
Map information can be used to assess the suitability of longwall takeoff areas, and also as a guide to the selection and placement of secondary support. This is particularly so in mines with strata types and strengths that are relatively predictable from the exploration drilling, but which contain geological structures that are not detectable by drilling. The structures that intersect the roadways are found and mapped during development, and then appropriately supported before extraction reaches them. For those structures not intersecting the roadways, the use of new exploration tools such as the borehole optical or acoustic imaging systems may prove to be helpful.
For mines where structures are few, and the local rock type distribution is complex and essentially un-predictable, the condition map serves to highlight and record areas of deterioration. This is of considerable use in the estimation of stress directions and of their relative magnitudes. The design of primary roadway support, however, is necessarily conservative under these conditions. Any secondary support design must be likewise unless systematic strata sampling and roadway displacement monitoring is implemented.
APPLICATION OF MAPPING RESULTS
The answers to three of the four mining environment questions posed above in the mapping techniques section can be found by overlaying the four data sets (that is support, roadway condition, geology and stress), to highlight the operating factors. Qualitative answers to the question of the validity of the initial design can also be found on the plan. For example, if the initial roadway modelling indicated that roof dilation was expected to be 10 to 15 mm and visible roof sag is mapped, then clearly the magnitude of the dilation is 5 to 10 times the design value.
It is often appropriate to have maps available which link known underground conditions to relevant geotechnical and geological data. For example, the relation between roof falls and certain rock types or structure may be shown succinctly on a map (Figure 3). Conversely, a lack of correlation between roof conditions and geotechnical factors may point the way
WHO SHOULD DO IT?
Mapping should be done by experienced personnel who possess a good knowledge of geology, geomechanics, mining practice and mine design skills. These personnel would have experience of a wide range of underground mining conditions, making them able to filter the important information from the large amount of 'noise' that confronts an unskilled observer. If mine staff do not have the relevant skills, consultants are sometimes contracted to do mapping. The opportunity then exists to train suitable mine staff in the mapping techniques, although it may take some time to develop the subjective skills required.
CONCLUSIONS
Underground mapping in its broadest sense is the collation of pertinent observations, for the purpose of

122 L. K. RIXON
N
LEGEND
GUTTER OR FALL <1.0m HIGH
ROOF FALL 1.0m HIGH
MINOR ROOF SAG
MAJOR ROOF SAG
JOINT
ROOF SAG AXIS
DIRECTION OF DRIVEAGE
Figure 2 Typical roadway roof condition map.
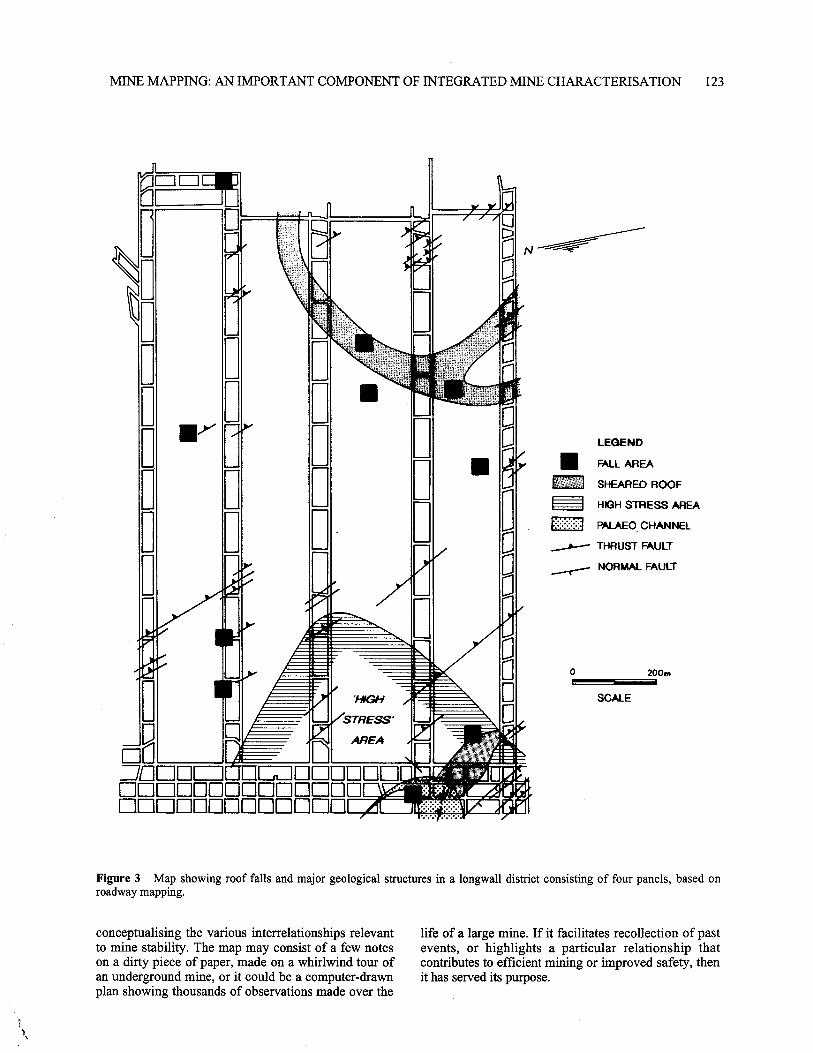
LEGEND
FALL AREA
SHEARED ROOF
HIGH STRESS AREA
PALAEO. CHANNEL
,sh-- THRUST FAULT
NORMAL FAULT
0 200m
'HIGH
STRESS'
r -\ AREA
=01 • 01_,10 =El OEICIOMMEEIDEIDEI ElEIEMODODEID
SCALE
MINE MAPPING: AN IMPORTANT COMPONENT OF INTEGRATED MINE CHARACTERISATION 123
Figure 3 Map showing roof falls and major geological structures in a longwall district consisting of four panels, based on roadway mapping.
conceptualising the various interrelationships relevant to mine stability. The map may consist of a few notes on a dirty piece of paper, made on a whirlwind tour of an underground mine, or it could be a computer-drawn plan showing thousands of observations made over the
life of a large mine. If it facilitates recollection of past events, or highlights a particular relationship that contributes to efficient mining or improved safety, then it has served its purpose.

MAINGATE GUTTERING
STRESS DAMAGE ON FLEXURE
SOFT ROOF (Zone of
thrust faults) mAINGATE ez FACEONE FALLS
— u-r-rERI..
„,,a„
cv • °pc-
4//v p
N<I44‘9 ‘9MAINGATE GUTTERING
I I
124 L. K. RIXON
8
14
12
10
Figure 4 Geological hazards within the immediate roof of a longwall panel, based on interpretation of roadway mapping.
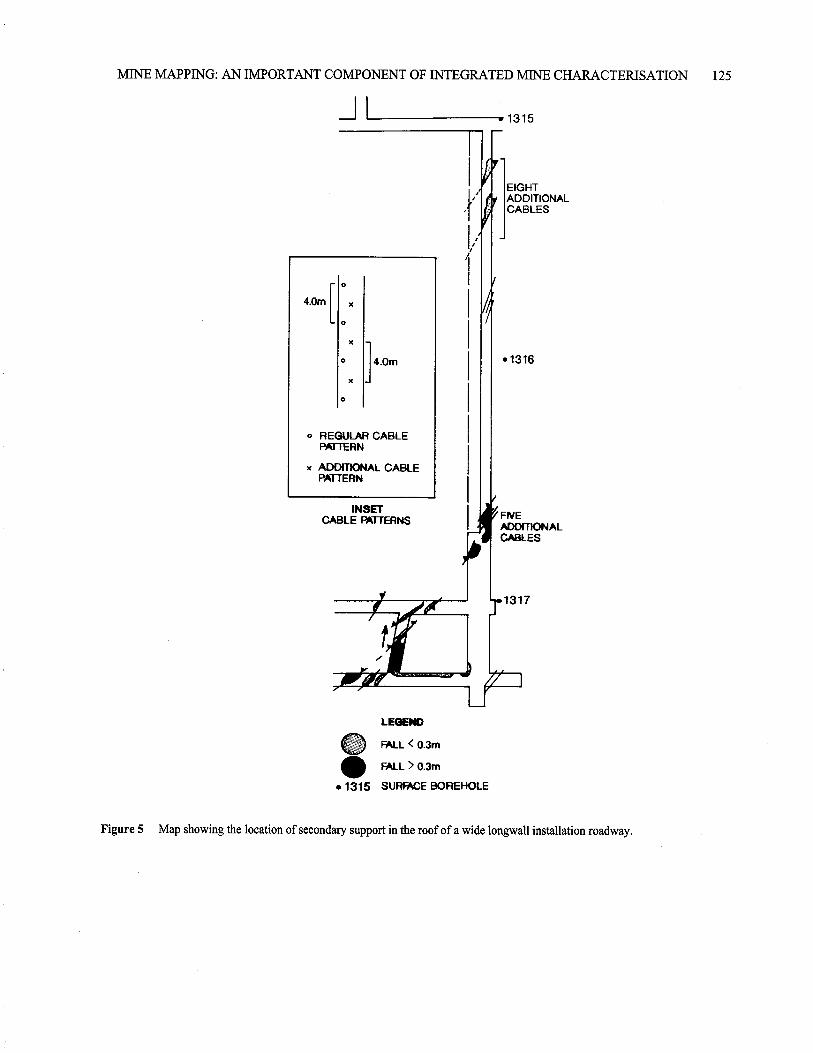
ii • 1315
EIGHT ADDITIONAL CABLES
INSET CABLE PATTERNS
• 1316
FIVE ADDITIONAL CABLES
1317
4.0m [
o
o
* REGULAR CABLE PATTERN
x ADDMONAL CABLE PATTERN
o
o
MINE MAPPING: AN IMPORTANT COMPONENT OF INTEGRATED MINE CHARACTERISATION 125
LEGEND
FALL
• FALL > 0.3m
• 1315 SURFACE BOREHOLE
Figure 5 Map showing the location of secondary support in the roof of a wide longwall installation roadway.

-- - - -

Symposium on Geology in Longwall Mining, 12-13 November 1996, eds G. H. McNally and C. R. Ward, pp 127-135.
Geotechnical mapping methods for longwall layout design
J. SHEPHERD
Shepherd Mining Geotechnics Pty Ltd.
A range of underground mapping methods and their uses are presented here as a basis for geotechnical assessment of longwall panel layout designs. Underground measurements of structures such as faults, joints, swilleys and induced roof shear zones can quantify fault segment lengths, displacement gradients, joint zones, swilley geometry, coal cleat patterns and lateral stress directions. Airphoto lineament analysis is useful in some coalfields for the identification of bedrock joints, dykes (not discussed here) and major faulted zones. This information can be used for a planning map framework that defines the main constraints on panel layout. The use of a triangular grid diagram is proposed to assist in reaching a best fit direction for longwall blocks using fault, stress and joint information.
INTRODUCTION
Mine planning engineers and geologists have at their disposal a range of techniques for determining the nature of a coal resource at the pre-mine development phase of investigations. Drilling, down-hole geophysics, surface geophysical methods and borehole rock stress determinations are all used. Despite these techniques, there is no substitute for systematic geotechnical mapping in the seam when entries are first driven, and during the life of the mine. Underground mapping is a form of risk reduction and a means of providing information to see how geological factors will impact on longwall extraction (Elliott, 1974).
This paper outlines a range of mapping techniques for obtaining information on coal seam geological features, mainly in the mine roof, and for interpreting roof deformation in roadway developments. The behaviour of the mine roof in gateroads and across longwall faces is a result of rock types, stresses, seam dip variations and various types of fractures. The nature of mining-induced fracturing on longwall faces is not dealt with here, neither is roof or floor stratigraphy. To avoid confusion, face width is defined as the distance between the gateroads and longwall block length is the retreat distance.
UNDERGROUND MAPPING
The basis of underground mapping is to record features on mine plans, preferably at scales of 1:2000 or larger, in conjunction with a suitable notebook or work-sheet type data format (see, for example, Proctor (1971) and Shepherd et al., 1989). Observational data must be objective, rigorously collected and reproducible to meet engineering design requirements. Generally, statistical quantities of data are needed for sound interpretations, although at times this may not be possible if features are isolated.
JOINT, CLEAT, FAULT AND SWILLEY MAPPING
The main parameters of seam, roof and floor fracture systems are summarised in Figure 1. A fundamental characteristic of fractures is that they are segmented (Walsh and Watterson, 1988; Peacock and Sanderson, 1991 and 1994; and Shepherd, 1995). Segments can offset either way (left or right), or one way when termed en echelon. The length and spacing of segments is very important for mine roadway stability forecasting. The true length of faults truncated by mine workings is difficult to obtain, so distance/displace-ment (d-x) graphs are important for extrapolating (Walsh and Watterson, 1990; Peacock and Sanderson, 1991; Cowie and Scholz 1992).
Mapping roof joints
Orientations (Figure 1) can be readily measured and defmed using a compass. If the roof is strong dips may not be easily measured, but where roof cavities occur they can be measured with a Coda compass. Joint spacings in roofs affected by recurrent joints can be measured by scan-line surveys, using a 50 m tape measure along the roof and measuring the distance between adjacent joints, as shown on Figure 2 (Shepherd et al., 1981a). Alternatively, counts per metre or 5 m intervals are also useful. Statistical treatments of such data are described fully by Shepherd et al., 1981a. Joint spacings decrease in the vicinity of strike-slip faults and dykes (Shepherd and Creasey, 1979). Sustained increases in the numbers of joints can be used with caution for short-range forecasting at advancing development gateroad faces.
Mapping cleats
Few underground operations regularly record cleat

128 J. SHEPHERD
FAULT ZONE
,NET SLIP (Slickenlines) ,
0 PITCH
090° SET
PATTERN (Non random) random)
ORIENTATION COMPRISES NUMBER OF SETS
Figure 1 Principal parameters of a fault pattern (in plan). Some of these features are common to joints. L is segment length, S is spacing, D is dip, R is relay ramp and overlap, 0 is offset (stepover) and T is tip (end point).
directions. There are two procedures available: a rapid or 'SLIME' method (Shepherd and Fisher, 1981) and a more detailed method. The first is useful for making long traverses quickly in several kilometres of roadways or gateroads. The median value of 5 readings is taken at sites along chain pillar ribs and these are linked together (Figure 3) to form a SLIME (Selected LIinked MEdian) plot.
If more information is needed for rib control or longwall face investigations then a detailed method involves circuits of one or more pillars. Statistical bias can occur depending upon orientations of sets. Data are then plotted as a 'bristle diagram' (a rose diagram is not preferred because it places arbitrary class intervals on the data grouping) and a lower hemisphere pole stereoplot (shown on Figure 3). These enable analysis and site to site comparisons, especially for obtaining orientation data for pillar rib assessments.
Mapping faults
Unpredicted faults pose a significant threat to successful longwall extraction. The elements of fault zones are now much better understood (see for example, Peacock and Sanderson 1991).
A fundamental characteristic of normal and strike-slip fault zones (data on thrusts is sparse) is that segments have a displacement gradient, which can be represented as a d-x graph (Figure 4). A Greta Seam fault was mapped as shown in Figure 5 and analysed into three segments, S1-3 on Figure 4. The rapid growth of S3 to 9 m shortened the next longwall panel (see Figure 5). Faults such as these are characterised by oblique-slip, where high displacement gradients occur. The photo-
graphic example (Figure 6) is from the Bulli Seam. Strata bending and interbed slip at the seam roof produce areas of roof marked by striations (slicken-lines). These can sometimes be found before the fault plane is mined into.
A comparison of normal faults from three different coalfields shows that Bowen Basin faults have the highest displacement gradients (Figure 7). The risk from such faults is summarised in Figure 8, where a vertical displacement of 1.5 m is used to indicate the practical effects of faults on a longwall face. Large numbers of faults have displacement gradients of —10 mm/m and at that rate of growth a fault will cut off a longwall face from a gateroad in about 150 m, that is considerably less than the face width of most longwall blocks.
It is important to search for signs of strike slip displacements across joints or other minor faults, because even millimetre scale slip can be indicative of more extensive fault zones and a deterioration of roof conditions (Figure 9). Detailed mapping is needed, but it need not be tedious to produce results that unravel the fault system (Shepherd et al., 1981b).
Mapping swilleys
Most coal seams 'roll' and are not truly planar, but they generally dip at low angles of <50. Some seams are affected by linear depressions and highs that do not appear to be folding (Figure 10) and are known as swilleys (Elliott, 1965). They can occur in groups with a preferred orientation, as illustrated by Figure 11. The spatial frequency of joints, as measured in scanline surveys, is related to swilleys (Figure 12). This is known to have geomechanical implications for roof

GEOTECHNICAL MAPPING METHODS FOR LONGWALL LAYOUT DESIGN 129
Figure 2 Mapped joints in a Bulli Seam roof, shown by arrows. The w-strap (0.2 m wide) gives the approximate scale.
control (Butcher, 1987), especially for roof instability on longwall faces and for oversize 4-way intersections in main headings.
The origin of swilleys probably relates to stream channels aligned along pre-existing localised downwarping zones influenced by the basement. The Lithgow/Lidsdale seam in the Western Coalfield has an abundance of these features.
STRESS MAPPING
Rock mechanics stress measurements in mines at relatively shallow depths, as in eastern Australia, have shown that in numerous localities the principal lateral compressive stress (a , or OH) in the coal measure sequences considerably exceeds the vertical stress (see for example, Jamison and Cook, 1980).
As gateroads are driven out into virgin coal the mine roof and floor deforms ('softens') and fails by shearing.
Sometimes both a l and 02 are horizontal, becoming aH and ah respectively, and are both of high magnitude. This roof failure process is well documented (Shepherd and Gale, 1980; Gale and Blackwood, 1987; Gale et al., 1992; Shepherd et al., 1987). Hence mapping the roof deformation is a powerful adjunct to in-situ rock stress determinations. Axes of shearing in the roof, as illustrated photographically in Figure 13, generally lie along the 02 direction and are thus perpendicular to al (see details in Shepherd et al., 1987, Figure 1).
Complications arise in multi-heading developments, depending upon the drivage sequence, the timing of the shearing at the development faces or behind them, and the reactivation of roof shearing by the forward abutment as the face retreats and stress 'notches' either the maingate or tailgate. (This paper does not examine these various complications.) If the gateroad roofs shear during development, then the orientation of a l along them can be estimated to within about 5° accuracy and mapped. Local variations in a l direction can be
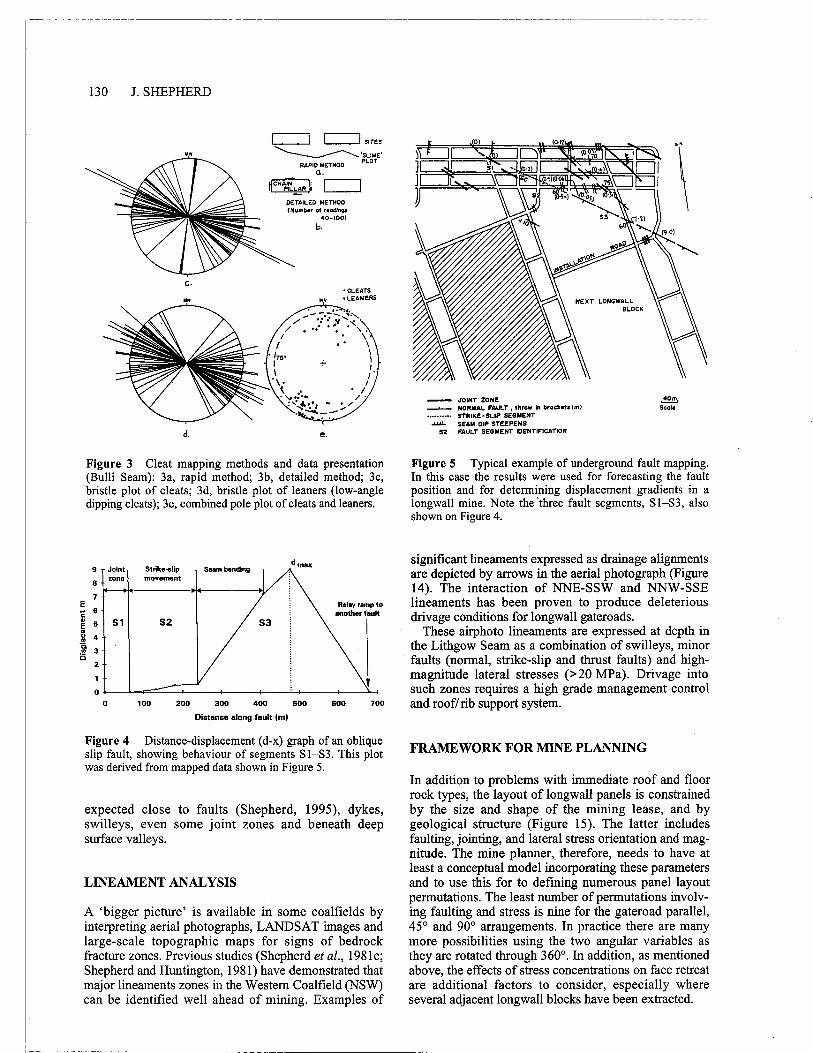
I I 1
d. e.
SITES
SLIME PLOT
RAPID METHOD
II I CHAPNLLAR
DETAILED METHOD (Numbor of matins
40-1001
b.
C. • CLEATS • LEANERS
• \\• \
1
• / • ••• •••••• / •
:•:.„4, • • , •• • .•••
175.
NEXT LONGWALL BLOCK
0 100 200 300 400 500 800 700
Strike-slip Seam bending movement
9 Joint zone
8
Taw
Relay ramp to another fault
7
••
E 5
4
.7'. 3
2
130 J. SHEPHERD
JOINT ZONE NORMAL FAULT, throw In brackets On)
STRIKE-SLIP SEGMENT AUL. SEAM DIP STEEPENS
52 FAULT SEGMENT IDENTIFICATION
Figure 3 Cleat mapping methods and data presentation (Bulli Seam): 3a, rapid method; 3b, detailed method; 3c, bristle plot of cleats; 3d, bristle plot of leaners (low-angle dipping cleats); 3e, combined pole plot of cleats and leaners.
Distance along fault (m)
Figure 4 Distance-displacement (d-x) graph of an oblique slip fault, showing behaviour of segments S1—S3. This plot was derived from mapped data shown in Figure 5.
expected close to faults (Shepherd, 1995), dykes, swilleys, even some joint zones and beneath deep surface valleys.
LINEAMENT ANALYSIS
A 'bigger picture' is available in some coalfields by interpreting aerial photographs, LANDSAT images and large-scale topographic maps for signs of bedrock fracture zones. Previous studies (Shepherd et al., 1981c; Shepherd and Huntington, 1981) have demonstrated that major lineaments zones in the Western Coalfield (NSW) can be identified well ahead of mining. Examples of
Figure 5 Typical example of underground fault mapping. In this case the results were used for forecasting the fault position and for determining displacement gradients in a longwall mine. Note the 'three fault segments, S1—S3, also shown on Figure 4.
significant lineaments expressed as drainage alignments are depicted by arrows in the aerial photograph (Figure 14). The interaction of NNE-SSW and NNW-SSE lineaments has been proven to produce deleterious drivage conditions for longwall gateroads.
These airphoto lineaments are expressed at depth in the Lithgow Seam as a combination of swilleys, minor faults (normal, strike-slip and thrust faults) and high-magnitude lateral stresses (>20 MPa). Drivage into such zones requires a high grade management control and roof/rib support system.
FRAMEWORK FOR MINE PLANNING
In addition to problems with immediate roof and floor rock types, the layout of longwall panels is constrained by the size and shape of the mining lease, and by geological structure (Figure 15). The latter includes faulting, jointing, and lateral stress orientation and mag-nitude. The mine planner, therefore, needs to have at least a conceptual model incorporating these parameters and to use this for to defining numerous panel layout permutations. The least number of permutations involv-ing faulting and stress is nine for the gateroad parallel, 45° and 90° arrangements. In practice there are many more possibilities using the two angular variables as they are rotated through 360°. In addition, as mentioned above, the effects of stress concentrations on face retreat are additional factors to consider, especially where several adjacent longwall blocks have been extracted.

11. NEWCASTLE 0 SOUTHERN 0 QUEENSLAND
20
0-10 10-20 20-30 30-40 40-50 50-60 50-70 70-60 90-90 90-100
• 3.0
2.5
2.0
t5
VE
RT
ICA
L D
ISP
LA
CE
ME
NT
(m
etr
os
)
0 -
t
LONGWALL FACE
"STOPS"
05. -
• to
50 100 150 200 250
FACE WIDTH (m e )
1
, LONGWALL FACE DISRUPTED
300 0
GEOTECHNICAL MAPPING METHODS FOR LONG WALL LAYOUT DESIGN 131
Figure 6 Photograph of a high displacement gradient, oblique slip, normal fault plane in the Bulli Seam. Arrows highlight oblique slip striations on the fault plane and sub-horizontal striations at the seam/roof parting. Geological pick (left centre) gives scale.
DISPLACEMENT GRADIENT I nun /m)
Figure 7 Frequency distribution plot of displacement gradients from normal faults in the Newcastle, Southern and Bowen Basin Coalfields.
LAYOUT DESIGN PROCEDURE
It is generally preferable to consider three variables rather than two; that is, faulting, stress and jointing. These variables can be plotted onto a triangular design grid, as in Figure 16. Mining experience has demons-trated that 6 fields are important on this diagram and that it can be used as a first pass classification scheme for panel layout. It is not the intention here to fully explore the pros and cons of face versus gateroad align-ment, but to highlight some of the important factors.
Figure 8 Effect of fault displacement gradients across longwall blocks of varying face widths. Zero displacement represents the tip (end) point of a fault.
A number of points can be made about layout design: • Gateroads should be at an angle of <35-40° to al; • Gateroads and faces should, ideally, not cross faults

Floor REGIONAL DIP
WAVELENGTH (A)
(a) ••••••
JOINT CLUSTER-1
FLAT BOTTOM SYMMETRICAL
C) SWILLEYS AND JOINTS
JOINT CLUSTER
132 J. SHEPHERD
7
lOmm
(a)
(c) INSET
Figure 9 Illustration of typical minor strike slip fault displacements in a mine roof: 9a, dextral movement; 9b, sinistral; 9c, occurrence of gouge in Figure 9b. Care has to be exercised to record the correct movement sense when viewed in a mine roof from below.
VARIABLE STEEPNESS IN DIP
COAL SEAM
SEAM DIP INFLEXION SWILLEY AXIS NORMAL FAULT ((Ow ongle<45.1
SOin
Figure 11 Mapped occurrence of swilleys and small-displacement normal faults in the Lithgow/Lidsdale seam roof, Western Coalfield.
NORMAL FAULT
a) MONOCLINAL INFLEXION
Note: (a) AMPLITUDE
b) SWILLEY PARAMETERS (variable profiles)
Sca.rdine
111111111111111111111IIIIIIIIIM11111111111111111 1 I—SWILLEY-1 50m.
Schematic Plan Along Mine Root
2 -5*—
I 4.5.
SWILLEY PROFILE (Angles exaggerated x 3)
Figure 12 Scanline survey results across a typical swilley in the Lithgow/Lidsdale seam, Western Coalfield. Note the higher density ofjoints in the swilley.
and certainly not do so at low angles; and • Gateroads and faces should not be parallel to, or at
low angles to major joint sets.
Therefore in Figure 16, fields 1-4 indicate favourable conditions, fields 1 and 3 being close to ideal. Fields 5 and 6 will produce sheared gateroad roofs, and field 6 should be avoided at all costs.
In practice, a common problem is that joints can be parallel to faults. Sometimes a, is aligned along the regional joint set and this can produce roof instability problems, if gateroads are also aligned close to a I and
(b)
/ I a 1 / \ \ GOUGE / \ /
/
Roof
d/ SEAM 'HIGH'
Figure 10 Diagrammatic summary showing how swilley parameters and associated features are defined. Joint dist-ributions and fault relationships are also shown.

GEOTECHNICAL MAPPING METHODS FOR LONGWALL LAYOUT DESIGN 133
Figure 13 Photograph of a typical mudstone roof shearing axis, caused by lateral stress. Arrows indicate the o2 stress direction, which coincides with the shear axis. The safety lamp gives scale.
Figure 14 Major lineaments identified in an airphoto on the Newnes Plateau, Western Coalfield. Arrows indicate the drainage alignments; note the right angle bends.
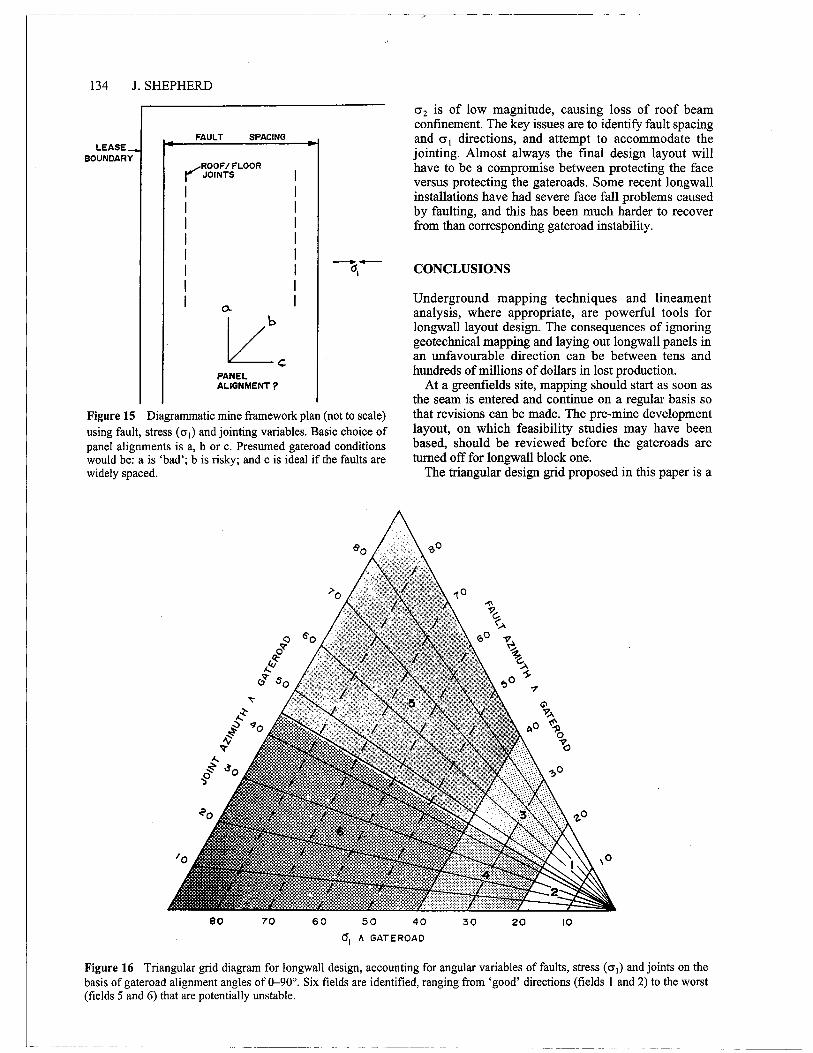
FAULT SPACING
ROOF/ FLOOR r- JOINTS
0-
PANEL ALIGNMENT?
134 J. SHEPHERD
LEASE BOUNDARY
Figure 15 Diagrammatic mine framework plan (not to scale) using fault, stress (al ) and jointing variables. Basic choice of panel alignments is a, b or c. Presumed gateroad conditions would be: a is 'bad'; b is risky; and c is ideal if the faults are widely spaced.
a2 is of low magnitude, causing loss of roof beam confmement. The key issues are to identify fault spacing and a l directions, and attempt to accommodate the jointing. Almost always the final design layout will have to be a compromise between protecting the face versus protecting the gateroads. Some recent longwall installations have had severe face fall problems caused by faulting, and this has been much harder to recover from than corresponding gateroad instability.
CONCLUSIONS
Underground mapping techniques and lineament analysis, where appropriate, are powerful tools for longwall layout design. The consequences of ignoring geotechnical mapping and laying out longwall panels in an unfavourable direction can be between tens and hundreds of millions of dollars in lost production.
At a greenfields site, mapping should start as soon as the seam is entered and continue on a regular basis so that revisions can be made. The pre-mine development layout, on which feasibility studies may have been based, should be reviewed before the gateroads are turned off for longwall block one.
The triangular design grid proposed in this paper is a
GO 70 6 0 50 40 30 20 10
61 A GAT EROAD
Figure 16 Triangular grid diagram for longwall design, accounting for angular variables of faults, stress (a1) and joints on the basis of gateroad alignment angles of 0-900. Six fields are identified, ranging from 'good' directions (fields 1 and 2) to the worst (fields 5 and 6) that are potentially unstable.

GEOTECHNICAL MAPPING METHODS FOR LONGWALL LAYOUT DESIGN 135
starting point to optimize design layouts. If the risk of closely-spaced recurrent faults exists, especially those with high displacement gradients, and there are high lateral stresses, then it may be wise to adopt bord-and-pillar mining for at least some blocks of virgin coal. The presence of massive sandstones in the seam roof might also influence this choice.
ACKNOWLEDGMENTS
The support and encouragement of numerous colliery managements is gratefully acknowledged, particularly for the opportunities to investigate 'tough' underground mining problems. ACA and ACARP supported ACIRL Ltd on fault forecasting technique development between 1988 and 1993. Many colleagues have been an inspiration to work with, especially Bob Butcher, John Creasey, Keith Rixon, Kathy Walton, Nick Gordon, Bruce Hebblewhite, Russell Frith, Richard Walsh and David Peacock (UK).
REFERENCES
BUTCHER R. K. 1987. Fall recovery procedure for a longwall face. The Coal Journal 16, 49-51.
COWIE P. A. & SCHOLZ C. H. 1992. Displacement-length scaling relationship for faults: data synthesis and discussion. Journal of Structural Geology 14, 1149-1156.
Entorr R. E. 1974. The mine geologist and risk reduction. The Mining Engineer 135, 173-184.
Eworr R. E. 1965. Swilleys in the coal measures of Nottinghamshire interpreted as palaeo-river courses. Mercian Geologist 1, 133-145.
GALE W. J. & BLACKWOOD R. L. 1987. Stress distributions and rock failure around coal mine roadways. International Journal of Rock Mechanics, Mining Science & Geomechanics Abstracts 24 (3), 165-173.
GALE W. J., FABJANCZYK M. W., TARRANT G. C. & GUY R. J. 1992. Optimisation of reinforcement design of coalmine roadways. In Aziz N. I. and Peng S. S. eds. Proceedings of the I 1 th International Conference on Ground Control in Mining, Wollongong NSW, Australasian Institute of Mining and Metallurgy, 272-279.
JAMISON D. B. & COOK N. G. W. 1980. Note on measured values for the state of stress in the earth's crust. Journal of Geophysical Research 85 (B4), 1833-1838.
PEACOCK D. C. P. & SANDERsoN D. J. 1991. Displacements, segment linkages and relay ramps in normal fault zones. Journal of Structural Geology 13 (6), 721-733.
PEACOCK D. C. P. & SANDERSON D. J. 1994. Geometry and development of relay ramps in normal fault systems. The American Association of Petroleum Geologists Bulletin 78
(2), 147-165. POPPITT I. L. 1992. Wrench faulting in the Western Coalfield
NSW. Proceedings of the 26th Newcastle Symposium on Advances in the Study of the Sydney Basin, University of Newcastle.
PROCTOR R. J. 1971. Mapping geological conditions in tunnels. Bulletin of the Association of Engineering Geologists 8 (1), 1-43.
SHEPHERD J. 1995. The structure of fault zones in relation to outburst proneness. In Lama R. D. ed. International Symposium-cum-Workshop on Management and Control of High Gas Emissions and Outbursts in Underground Coal Mines, Australian Coal Association and Kembla Coal & Coke Pty Ltd, Wollongong NSW, 85-92.
SHEPHERD J. & CREASEY J. W. 1979. Forewarning of faults and outbursts of coal and gas at West Cliff Colliery Australia. Colliery Guardian Coal International 227 (4), 13-22.
SHEPHERD J., CREASEY J. W. & FISHER N. I. 1981. Statistical analysis of spacings between geological discontinuities in coal mines, with applications to short-range forecasting of mining conditions. Australian Coal Geology 3 (2) 71-80.
SHEPHERD J., CREASEY J. W. & HUNTINGTON J. F. 1981. Geometric and dynamic analysis of some faults in the Western Coalfield of NSW. Proceedings, Australasian Institute of Mining and Metallurgy No. 279, 19-32.
SHEPHERD J. & FISHER N. I. 1981. Rapid method of mapping fracture trends in collieries. Mining Engineering (NY) 270, 1931-1932.
SHEPHERD J. & GALE W. J. 1982. Colliery roof stability and the role of geology: a review. The Australian Journal of Coal Mine Technology and Research 1, 47-67.
SHEPHERD J. & HUNTINGTON J. F. 1981. Geological fracture mapping in coalfields and the stress fields of the Sydney Basin. Journal of the Geological Society of Australia 28, 299-309.
SHEPHERD J., HUNTINGTON J. F. & CREASEY J. W. 1981. Surface and underground geological prediction of bad roof conditions in collieries of the Western Coalfield of NSW. Transactions of the Institution of Mining and Metallurgy (Section B: Applied Earth Science) 90, BI-B14.
SHEPHERD J., RIXON L. K. & FISHER N. I. 1989. Develop and improve methods of forecasting faults to assist underground mining. Australian Coal Association Project End of Grant Report (August), ACIRL Ltd Sydney.
SHEPHERD J., RIXON L. K., WALTON K. P., HUMPHREYS D. & O'BEIRNE T. 1987. Geotechnical methods for the evaluation of underground roadway conditions and support requirement. Australian Coal Industry Research Laboratories Ltd Published Report 87-2, Sydney NSW.
WALSH J. J. & WATTERSON J. 1988. Analysis of the relationship between displacements and dimensions of faults. Journal of Structural Geology 10 (3) 239-247.
WALSH J. J. & WATTERSON J. 1990. New methods of fault projection for coalmine planning. Proceedings of the Yorkshire Geological Society 48 (2), 209-219.

-

RANGE OF BEHAVIOUR EXPECTED
INC
REA
SE
D D
EF
OR
MA
TIO
N
Symposium on Geology in Longwall Mining, 12-13 November 1996, eds G. H. McNally and C. R. Ward, pp 137-142.
Directional drivage influences and the application of mechanistic mapping techniques
M. W. FABJANCZYK
Strata Control Technology.
INTRODUCTION
The fact that roadway stability can be strongly influenced by the direction of the drivage has been realised for many years. Historically this has been attributed to various factors, such as cleat in the coal and rock strata 'fabric'. The aims of this paper are to provide a framework for understanding the influence of drivage direction on roadway conditions, and to illustrate how mapping techniques can enhance this understanding.
INCREASED STRESS LEVELS
Figure 1 Hypothetical relationship between in-situ stress and the degree of mine roadway roof deformation resulting from this stress field.
RELATIONSHIP BETWEEN STRESS AND ROOF DISPLACEMENT
For a given roadway shape and lithology, the amount of peripheral displacement is proportional to the stresses acting. These stresses are the result of various tectonic factors and the weight of the superincumbent rock. Figure 1 shows a typical relationship between the total roof displacement occurring over a range of stresses (Gale et al., 1992), which will vary with factors such as:
• Changes in lithology which result in different intact and residual strength properties;
• Changes in the vertical stress acting, due to increased depth or other mining-induced factors;
• Changes in the properties of discontinuities such as bedding planes;
• Changes in roadway shape and dimensions, particularly width; and
• Changes in the amount and timing of the roof support installed.
In general there is a clearly defined relationship between the stress acting on the roadway and the displacement produced, which can be determined using field measurements or computer simulation. Alterna-tively, as will be discussed later in the paper, systematic mapping can provide a qualitative method of deter-mining this relationship. This stress/ strain relationship will not be unique, but will cover a range of behaviour as indicated in Figure 1.
BASICS OF DIRECTIONAL DRIVAGE CHARACTERISTICS
A typical stress field acting on a roadway within a colliery will consist of a vertical stress related to the weight of the overburden and two principal horizontal stresses (by definition, at right angles to each other). The ratio of the magnitude of the two principal horizontal stresses will vary with the geological environment and depth, but usually one will be significantly higher than the other. Unless the stresses acting are modified by varying conditions, the major principal horizontal stress will act in one direction, as shown in Figure 2. The result of this is that roadways driven at different orientations relative to the stresses will show different geomechanical behaviour (Gale and Blackwood, 1987).
Figure 3 is a simplistic representation of the effects of directional drivage factors. It illustrates three different types of roof deformation behaviour, depending on the orientation of the drivage axis with respect to the major horizontal principal stress (cyl) direction.
• When roadways are driven in line with al the stress concentrations at the face of the roadway are minimised and roadway stability will be highest (see Figure 3a).

138 M. W. FABJANCZYK
V
• 11.111.1111.0" Hi
VR
FORCES ACTING ON ROCK AT DEPTH
✓ Weight at rock above P41 and H2 g• Crustal movements and frozen in stresses
VA Reaction counteracting weight of rock above
Figure 2 Virgin stress field acting on a rock element at depth prior to mining.
• When the roadways are driven perpendicular to al, stress concentrations at the face are maximized and distributed across the full heading width. Under these conditions roadway stability is lowest, as shown on Figure 3b.
• When the roadways are driven at an angle to al, stresses are concentrated at one corner of the roadway. Under these conditions biased failure of the roadway can occur; if stresses are high enough guttering may be evident. This situation is depicted by Figures 3c and 3d.
These roadway deformation characteristics and their relationship to the stress field are fundamental to the assessment of stability in mine roadways, and have been used to set guidelines for reinforcement requirements (Nicholls and Stone, 1986). However, the observable effects in any mine will vary significantly. To understand this variability, consider the likely range of stresses acting on a roadway and how they are likely to be manifest in a given mine (Cole and Fabjanczyk, 1993). In the simplest case, three stress levels acting on the roadway are important:
amm The smallest stress acting on the roadway, which is typically driven in line with a ,. In this case 02 (the minor horizontal principal stress) is the one concentrated at the face of the heading.
a„„„ The stress acting when the roadway is driven perpendicular to a,. The full magnitude of a, is concentrated at the face of the heading.
awn The largest stress acting when additional stress concentration is occurring. Such a situation might develop where front abutment pressures are added to in-situ stresses in roadways immediately ahead of a longwall face. Gale et al. (1996) describe stress concentrations which can be twice a, in magnitude.
These three stress values can then be plotted on the stress/displacement curve shown in Figure 1 to give an indication of the range of conditions to be encountered. To demonstrate this concept, three cases are considered in Figures 4 to 6:
• In low stress conditions (Figure 4) it can be seen that with both the am,„ and amax stresses the expected roadway stability would be good, with little roof movement. Even when front abutment stress concentrations are acting, only low levels of roof displacement would be expected.
• In medium stress conditions (Figure 5) it can be seen that with am,„ acting on the roadway low levels of displacement can be expected, compared with road-ways subjected to amax. Where a is acting very high displacements can occur. In this situation large roadway roof deformations may be experienced ahead of the longwall face.
• In the high in-situ stress conditions shown in Figure 6, significant roadway deformations can be expected in all drivage directions.
This variability in behaviour within a given geological environment but with different stress levels acting is significant, and often greater than the variability within differing lithologies with the same stresses acting. The establishment of a system to assess this relationship, in either a new mine or new area of an existing mine, is critical in determining the viability of proposed mining layouts and reinforcement strategies.
INFLUENCE OF LITHOLOGY
The influence of lithology on roadway stability is not a linear relationship with strength. In low stress conditions the immediate roof lithology can change from massive sandstones to weak mudstones with little change in the stability achieved. If, however, the stresses acting are sufficient to initiate failure in weaker material, then lithology changes can be significant. This is again reflected in the relative levels of displacement with roadways driven at different angles to a,.
The relativity of the stability levels achieved in high and low strength strata is further complicated by the stiffness of the materials involved. In nearly all environments the horizontal stress developed in a given layer of material is proportional to its stiffness. Weak rocks are therefore lightly stressed compared with stronger and stiffer adjacent beds (their horizontal load is said to be 'thrown' onto the higher-modulus layers above and below). This will lessen the impact of the weaker lithology on the level of stability.
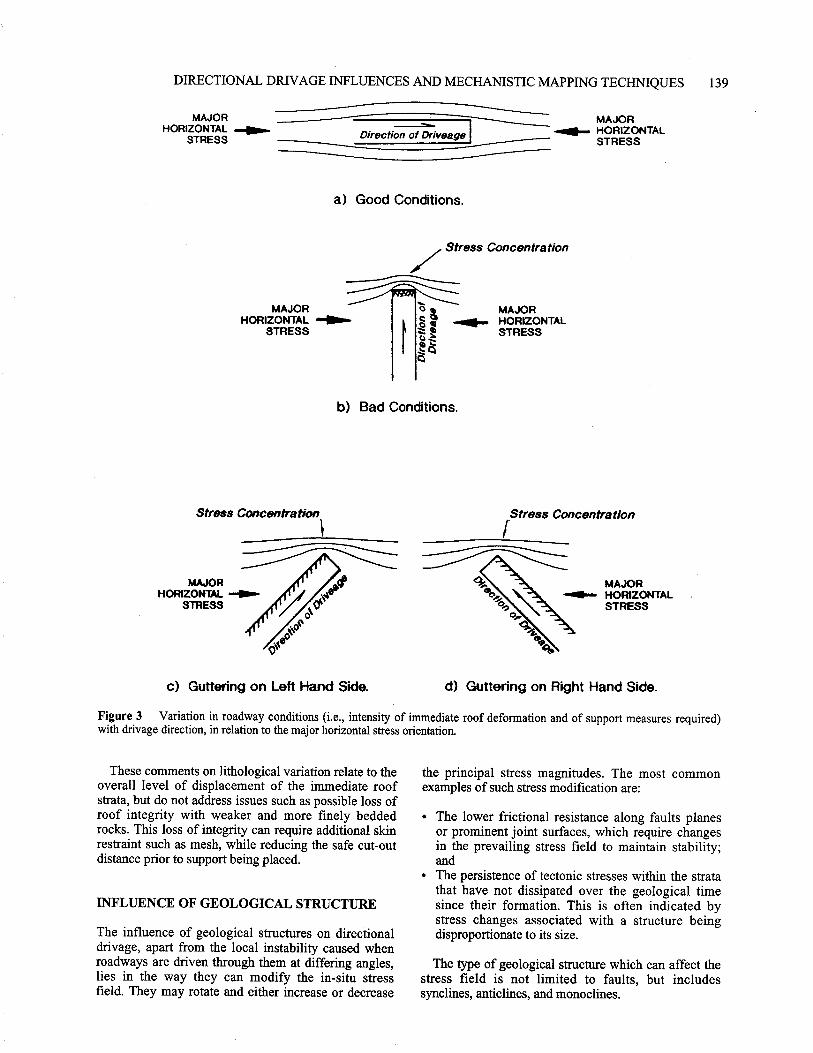
MAJOR HORIZONTAL
STRESS
MAJOR -041111••• HORIZONTAL
STRESS
DIRECTIONAL DRIVAGE INFLUENCES AND MECHANISTIC MAPPING TECHNIQUES 139
MAJOR HORIZONTAL
STRESS Direction of Driveage MAJOR HORIZONTAL STRESS
a) Good Conditions.
Stress Concentration
HORIZONTAL ..q10.- s2t it -.40..... HORIZONTAL STRESS
MAJOR 0 p) MAJOR ii
STRESS
b) Bad Conditions.
Stress Concentrationi
Stress Concentration
c) Guttering on Left Hand Side. d) Guttering on Right Hand Side.
Figure 3 Variation in roadway conditions (i.e., intensity of immediate roof deformation and of support measures required) with drivage direction, in relation to the major horizontal stress orientation.
These comments on lithological variation relate to the overall level of displacement of the immediate roof strata, but do not address issues such as possible loss of roof integrity with weaker and more finely bedded rocks. This loss of integrity can require additional skin restraint such as mesh, while reducing the safe cut-out distance prior to support being placed.
INFLUENCE OF GEOLOGICAL STRUCTURE
The influence of geological structures on directional drivage, apart from the local instability caused when roadways are driven through them at differing angles, lies in the way they can modify the in-situ stress field. They may rotate and either increase or decrease
the principal stress magnitudes. The most common examples of such stress modification are:
• The lower frictional resistance along faults planes or prominent joint surfaces, which require changes in the prevailing stress field to maintain stability; and
• The persistence of tectonic stresses within the strata that have not dissipated over the geological time since their formation. This is often indicated by stress changes associated with a structure being disproportionate to its size.
The type of geological structure which can affect the stress field is not limited to faults, but includes synclines, anticlines, and monoclines.

140 M. W. FABJANCZYK
INC
RE
AS
ED
DE
RANGE OF BEHAVIOUR EXPECTED 0
INCREASED STRESS LEVELS
Figure 4 Influence of maximum, minimum and concentrated stresses on roadway roof deformation in a low in-situ stress environment.
RANGE OF BEHAVIOUR EXPECTED
INCREASED STRESS LEVELS
Figure 5 As for Figure 4, in a medium stress field.
b /8)
RANGE OF BEHAAOUR EXPECTED
INC
RE
AS
ED
DE
FO
RM
ATIO
N
INCREASED STRESS LEVELS
Figure 6 As for Figure 4, in a high stress field.
Gutter Gutter Left Hand Side Central Shearing Right Hand Side
a) Representation of Shear.
Roof Sag Flaking
b) Representation of Additional Deformation Modes.
Figure 7 Symbols used in roadway roof deformation mapping.
MECHANISTIC MAPPING TECHNIQUES
Mine geologists use a wide range of mapping techniques to describe roadway conditions. This section of the paper outlines a simple method which concentrates on recording the mechanism and intensity of roof failure. The procedure can also be extended to cover rib and floor deformation
Roof strata deformation is related to the failure of intact rock units and of discontinuities within the rock mass, such as bedding. This failure is evidenced in the roadway through the development of shear failure of the strata, which when of sufficient intensity can be easily assessed and mapped. This shearing is concentrated at different positions in the roadway, as discussed previously, depending on the orientation of al . Some of the symbols used in mapping roof shear are illustrated on Figure 7a.
Additional deformation modes associated with roof displacement include flaking (irregular but systematic breakup of immediate roof strata) and sag (bowing of the immediate roof, commonly associated with shearing of units above). These mapping symbols are shown in Figure 7b.
In order to describe the intensity of the deformation, a qualitative scale summarised in Table 1 is used. As with all qualitative techniques, it is difficult to remove

I
R4
R2
R4
FALL
R3
R5
R4
\ Potential stress I orientation from
cut-through I 2En*
•
ROOF SAG
T
\• I \
LIGHT GUTTER
280.
DIRECTIONAL DRIVAGE INFLUENCES AND MECHANISTIC MAPPING TECHNIQUES 141
LEGEND
—ONE— MAPPED PRINCIPAL HORIZONTAL STRESS DIRECTION
JOINT
0 FALL
Figure 8 Example of a typical roof map for longwall gateroads. Note that the principal horizontal stress directions have been inferred from shear orientations. This map would normally be presented in colour, using the system shown in Table 1.
individual bias and to maintain consistency between mapping sites. The aim of the qualitative system of roof deformation rating is to minimise these problems. The use of a colour scheme, which smooths the intensity values, further reduces the subjectivity. Figure 8 shows, in half-tone, a section of longwall panel where this mapping technique has been used.
A \
1% 280- Potential stress •• orientation from heading i Cut-through same
conditions as heading
( 44;44;• \‘;
Cut-through and Heading experience Guttering
NOTE: REARMS SHOWN ARE IN DEGREES RELATIVE TO NORTH
Cut-through Sagged. Heading Lightly Guttered
Figure 9 Use of roadway roof failure and deformation criteria for estimating principal horizontal stress directions.
INITIAL DETERMINATION OF STRESS ORIENTATIONS
During the mapping procedure outlined above, observation of shear fracture orientations provides a good indicator of the stress direction. The technique described in Nicholls and Stone (1986) and Gale and Stone (1993) correlates well with in-situ stress measure-ments.
In environments where the shear fracture orientation is poorly defmed or absent because of the nature of the immediate roof lithology (for example, where coal tops are left), the roadway deformation characteristics themselves can be used to give an indication of a orientation. Figure 9 illustrates how different com-binations of cut-through and heading condition can indicate this direction, based entirely on the relative intensity and style of deformation.
Allowable quadrant. given potential stress direction from heading and cut-through

142 M. W. FABJANCZYK
Table 1 Qualitative system of roof deformation intensity guidelines.
Intensity Value Colour Definition
RO Green No visible deterioration
R1 Green Slight scaling or slabbing
R2 Yellow Visible shearing or guttering
R3 Yellow Clearly defined shearing or guttering
R4 Orange Clearly defined extensive shearing or guttering
R5 Orange Shearing or guttering associated with cantilevering or strata sagging
R6 (+) Red Values of 6 and above are used if required in areas of extreme deformation
Both the above methods provide a means of analysing the variability in orientation and magnitude within a stress field, and of predicting its effect on roadway stability.
CORRELATION WITH GEOLOGY AND STRUCTURE
The roadway condition maps prepared in this fashion can be used as overlays onto a range of mine plans, including lithology, geological and seam structures. Analysis of these plans can indicate the principal factors which are controlling both the stress directions and roadway behaviour, and improve understanding of the mine geotechnical environment. Once correlated with the geological factors, the maps can become both predictive tools on roadway condition and indicators of where additional information is needed.
REFERENCES
GALE W. J. & BLACKWOOD R. L. 1987. Stress distribution and rock failure around coal mine roadways. International Journal of Rock Mechanics, Mining Science & Geomechanics Abstracts 24 (3), 165-173.
GALE W. J. & FABJANCZYK M. W. 1993. Design approach to assess coal mine roadway stability and support requirements. Proceedings of the 8th Australian Tunnelling Conference, Sydney.
GALE W. J., FABJANCZYK M. W., TARRANT G. C. & GUY R. J. 1992. Optimisation of reinforcement design of coal mine roadways. In Aziz N. I. and Peng S. S. eds. Proceedings of the I 1 th International Conference on Ground Control in Mining, Wollongong, Australasian Institute of Mining and Metallurgy, 272-279.
NICHOLLS B. & STONE I. J. 1986. Development of strata control at Tahmoor Mine. Proceedings, Conference on Ground Movement and Control Related to Coal Mining„ Wollongong, Australasian Institute of Mining and Metallurgy.

Symposium on Geology in Longwall Mining, 12-13 November 1996, eds G. H. McNally and C. R. Ward, pp 143-151.
The role of horizontal stress in longwall design — a case history at Dartbrook Colliery, NSW
J. ENEVERI AND R. DOYLE2
CSIRO Division of Petroleum Resources. 2Dartbrook Coal Ply Ltd.
The results of a comprehensive program of in-situ stress measurement conducted in coal and overlying sediments at Dartbrook Colliery are presented. Results obtained from the surface by hydraulic fracturing and anelastic strain measurements, and from underground by overcoring showed good agreement in magnitude and orientation. The overall picture is of a relatively low stress field magnitude, with horizontal components roughly balanced. The implications of this for longwall layout design are discussed.
INTRODUCTION
The in-situ stress field is generally considered to be important in longwall planning in relation to gateroad stability, face conditions and caving behaviour. The major problem facing longwall operations in Australia at present is the ability to develop stable gateroads at a rate that can keep ahead of longwall extraction. In-situ stress has a major impact on the ability to achieve acceptable rates of roadway advance by influencing stability. Problems such as roof sag, guttering, rib spalling and excessive support requirements are all related to the in-situ stress state.
This paper discusses in-situ stress in the context of planning for longwall operations at Dartbrook Colliery, located adjacent to the village of Kayuga NSW, some 4 km west of Aberdeen and 140 km north-west of Newcastle (Figure 1). The mine is a joint venture between The Shell Company of Australia, the Marubeni Corporation, Sang Yong Corporation and Showa Coal; Shell Coal Australia is the operator.
Geologically, the mine is located within the northern extremity of the Sydney Basin, in proximity to the Hunter and Aberdeen Thrust Fault Zones and to a number of igneous intrusions, as shown on Figure 2. Economic seams occur within the Foybrook Formation of the Wittingham Coal Measures (Figure 3). The prime seam of interest for underground mining is the Upper Wynn, which in the Dartbrook area converges with the Broonie and Bayswater Coals to form a so-called `megaseam' 24 m thick. The Upper Wynn seam had not been extracted prior to commencement of mining activities at Dartbrook, precluding reliance on prior experience to guide planning. The closest underground mining experience has been at Muswellbrook Colliery, about 10 km to the south-east, in very different seams.
At the outset of planning, the major issues of concern at Dartbrook were considered to be:
• Delineation of seam structure, faulting, jointing and igneous intrusions;
• Determination of the horizontal stress field (in orientation and magnitude);
• Specification of controls on coal quality in light of horizon control and steep grades;
• Definition of the gas regime (content and com-position); and
• Defmition of the groundwater regime.
The primary focus of the geotechnical investigation was to obtain data for optimising gateroad support design. The horizontal stress field was considered to be of major importance, particularly because early stress measurements indicated possible high magnitudes in the area.
INVESTIGATION PROGRAM
General
An extensive program of stress measurement was undertaken, in recognition of the perceived high lateral pressures. Two techniques were employed successfully from the surface during the exploration program:
• Hydraulic fracturing within boreholes, and • Anelastic strain measurements on core specimens.
Results from these measurements were supplemented by underground overcoring during initial mine develop-ment.
Because the proposed extraction plan involved leaving a substantial thickness of coal above the mining horizon, emphasis was placed on determining the horizontal stress field within the megaseam. Stress measurements were also conducted in the overlying and underlying strata. Successful stress measurements in coal are few and far between in the literature, but the massive nature of this seam suggested that existing techniques might be applicable.

144 J. ENEVER AND R. DOYLE
MUSWELLBROOK Figure 1 Location plan for Dartbrook Mine, within ML 386 at Kayuga NSW.
HUNTER THRUST
SYDNEY BAS BASIN
CHPP I f' —
i Pipe
Dyke
SANDY CREEK' 1EL4575
LEGEND
o Igneous
V Igneous
\Fault
NEW ENGLAND FOLD BELT
ABERDEEN THRUST
DART BROOK NINE
280000E 282500E 285000E 287500E 290000E 292500E 295000E
Figure 2 Geological structures in the vicinity of Dartbrook Mine. Note entries and initial panel development within the south-eastern corner of the mining lease.

Mt Arthur Seam Kayuga Seam
Burnamwood Formation
Piercefield Seam
Vaux Seam
Broonie Seam
• Bayswater Seam A S Archerfield/Bulga Fm. E Wynn Seam A
• Foybrook Formation
Edderton Seam
Test fluid injection
"0" ring seal
Coal sample
Fracture
Pre-drilled hole
Spherical seats
HORIZONTAL STRESS IN LONGWALL DESIGN — DARTBROOK COLLIERY 145
Alluviutn/Colluvium
Warkworth Seam Mt Thorley Formation
Fairford Formation
Figure 3 Typical stratigraphic column through the Broonie-Bayswater-Wynn `megaseam' and roof strata at Dartbrook.
Axial load
Figure 4 Laboratory test procedure for hydraulic fracturing
Hydraulic fracturing
The hydraulic fracturing technique (Enever and Walton, 1995) was used to measure the in-situ stress field in the coal and overlying/underlying strata in six drillholes. The technique was applied in coal in essentially the same way as that developed for testing in rock (Enever, 1993). The apparently low matrix permeability of this coal suggested that fluid leak-off would not cause a problem for data interpretation, if specific fracture zones in the seam were avoided.
At the outset of testing in the coal, two attributes of the test records were considered to be essential for a valid stress determination: • That the test pressure record exhibit clear crack
initiation and imply a fracture strength (crack initiation minus crack re-opening pressure) consistent with formation of a new fracture; and
• That the impression record be consistent with hydraulic fracture development (i.e., there should be diametrically-opposed traces on the drillhole wall).
0
30
60
90
120
150
180
210
240
270
300 -

146 J. ENEVER AND R. DOYLE
10 TIME (mins.) 30 26
Range of pressure at fracture in* iation
Range of fracture stregth Lab.
?strength
7.0
Re-opening pressure hut-in
pressure acker pressure
Test section pressure
Figure 5 Typical pressure record fom hydraulic fracturing test in coal seam. Packer pressure is shown by the thin line and hydraulic pressure within the test section (between the packers) by the thick line.
Before commencing the field testing, a laboratory program was undertaken on core recovered from the test holes to measure the intact fracture strength of the coal. This was used to assess if the in-situ test records were consistent with fracture initiation. The laboratory test procedure employed is summarized in Figure 4. The samples were pressurised with water internally at a rate typical of field testing, until fracture initiation occurred. The pressure of crack initiation was used to assess the fracture strength.
In most of the exploration holes, tests were conducted in both the coal and roof strata. The field testing was undertaken by Strata Tek Pty Ltd, using the procedure developed by CSIRO (Enever, 1993). The only specific adaptation to the general test procedure introduced for the coal tests was to keep the pressure differential between packers and test section as small as possible, in deference to the relatively low fracture strength of coal. Otherwise the test procedure was as used for testing in rock.
Figure 5 illustrates a typical pressure record, annotated to show test stages and the method for estimating fracture strength. Figure 6 shows a borehole wall impression record obtained from similar coal seam tests, indicating crack length and orientation. In most cases, the pressure difference between packers and test section at crack initiation was such as to result in a range of estimated fracture strengths, overlapping those obtained from laboratory testing. Note that fracture initiation can occur either within walls of the test section or under either packer. These results made it difficult to use the fracture initiation criteria outlined above, placing major reliance on the form of the impression as the primary check on test validity. In some cases, the pressure records quite clearly indicated that new fracture initiation was highly unlikely, based on comparison with the laboratory results.
In total, 14 tests were considered to be valid stress determinations in the coal. A further 23 tests were considered as valid representations of the stress field in the overlying rocks, based on a similar validation process to that described above for the coal tests. All the tests considered valid showed evidence of vertical or near-vertical new fracture development. From these the horizontal stress field was determined from the
conventional theory of hydraulic fracturing (Enever, 1993), as follows: • The orientation of the major horizontal secondary
principal stress component (cm) was estimated directly from the fracture azimuth;
• The magnitude of the minor horizontal secondary principal stress component (ah) was estimated directly by the shut-in pressure;
• The magnitude of the major horizontal secondary principal stress component (aH) was estimated from the expression:
= 3 ah — Pr Po
where Pr is the crack re-opening pressure, and Po is the ambient pore pressure, estimated from the standing water level in the hole.
The methods used to select these values from the pressure record are illustrated on Figure 5.
Tests were conducted throughout the megaseam. Figure 7 summarises a typical profile of horizontal stress field magnitude measured through the coal sequence, with the magnitude generally being least in the middle.
Anelastic strain measurements
This technique of measuring rock core ellipticity and relating it to the orientation of the horizontal stress field at the drilling site has been pioneered by CSIRO (Schmidt and Lackie, 1995). By combining the orientation of the ellipticity with the orientation of the core based on its paleomagnetic signature, the orientation of the horizontal stress field can be estimated (see Schmidt, 1996, this volume). At Dartbrook, the technique was applied to core from five holes, with most emphasis on one borehole in which hydraulic fracture stress measurement had also been made. Most test samples exhibited measurable ellipticity, allowing the stress prediction methods to be compared.
At Dartbrook the technique produced very variable results. Table 1 summarises the results obtained from
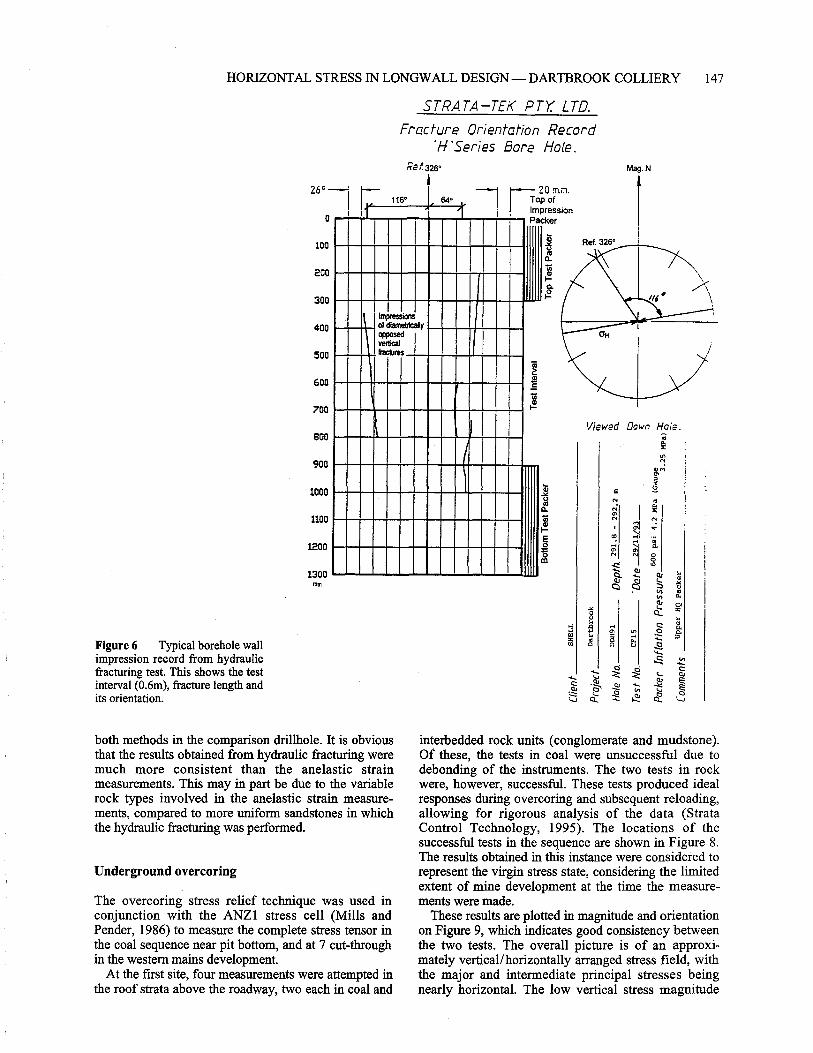
Dart b
roo k
Upp
er
HQ
Pac
ke
r
Infla
tio
n P
ress
ure
C.
0 m.M. p of pression cker
0.
Viewed
Bot
tom
Te
st P
ac k
er
• --,
Ref. 326°
HORIZONTAL STRESS IN LONGWALL DESIGN— DARTBROOK COLLIERY 147
STRATA—TEK PTY LTD.
Fracture Orientation Record "H 'Series Bore Hole.
Re f 326 Mag. N
Figure 6 Typical borehole wall impression record from hydraulic fracturing test. This shows the test interval (0.6m), fracture length and its orientation.
260
20
30
40
50
60
70
80
900
1000
110
1200
1300 ran
1 100
—....! r—i 116° 64° Tc
Im 1- Pa
I
I
, of Impressions
diametrically
Te s
t In
terv
al
I
°Posed vertical fractures 1
both methods in the comparison drillhole. It is obvious that the results obtained from hydraulic fracturing were much more consistent than the anelastic strain measurements. This may in part be due to the variable rock types involved in the anelastic strain measure-ments, compared to more uniform sandstones in which the hydraulic fracturing was performed.
Underground overcoring
The overcoring stress relief technique was used in conjunction with the ANZ1 stress cell (Mills and Pender, 1986) to measure the complete stress tensor in the coal sequence near pit bottom, and at 7 cut-through in the western mains development.
At the first site, four measurements were attempted in the roof strata above the roadway, two each in coal and
interbedded rock units (conglomerate and mudstone). Of these, the tests in coal were unsuccessful due to debonding of the instruments. The two tests in rock were, however, successful. These tests produced ideal responses during overcoring and subsequent reloading, allowing for rigorous analysis of the data (Strata Control Technology, 1995). The locations of the successful tests in the sequence are shown in Figure 8. The results obtained in this instance were considered to represent the virgin stress state, considering the limited extent of mine development at the time the measure-ments were made.
These results are plotted in magnitude and orientation on Figure 9, which indicates good consistency between the two tests. The overall picture is of an approxi-mately vertical/horizontally arranged stress field, with the major and intermediate principal stresses being nearly horizontal. The low vertical stress magnitude

0 Stress (UPI)
250 -
260
270 .
Estimate of vertical stress based on depth of cover
280. A 0
290 _ Wynn & Broonie • 4° Bayswat at 'Megasearre as)
300
A an
310 . 0 etH
320
GN
148 J. ENEVER AND R. DOYLE
Table 1 Summary of horizontal stress field orientation in sediments from anelastic strain measurements and hydraulic fracturing in one hole.
Hydraulic Fracturing Anelastic Strain
Depth (m) Orientation of afi
(Mag.)
Depth (m) Orientation of aH
(Mag.)
121 1090 115 960 ±400 126 107° 123 26° ± 19° 148 128° 133 1410 ± 15° 146 121° 145 45° ± 5° 150 121° 157 38° ± 18° 158 110° 162 113° ± 18° 180 100° 178 113° ± 16° 232 1110 209 86° ± 50°
222 30° ± 18° 228 144° ± 16° 232 23° ± 9°
12m
Location of Overcoring Tests
Working Section
Om
All tests performed in rock strata above Wynn + Bayswater + Figure 8 Location of successful overcoring tests in immediate roof, in relation to the megaseam working section. Broonie Megaseam'.
Figure 7 Typical profile of horizontal stress field magni-tude (symbols) throughout megaseam, compared to estimated vertical stress. Note similar magnitudes of maximum and minimum horizontal stress components, and the fact that they are less than the vertical stress (which is itself slightly lower than might be predicted from strata deadweight).
Figure 9 Results of overcoring in rock from pit bottom test site. Horizontal stress components shown by circles and and triangles, vertical components by rectangles.

DDH91
DDH68
DDH8
DDH79
I DDH71
HORIZONTAL STRESS IN LONGWALL DESIGN— DARTBROOK COLLIERY 149
DDH91
DDH8 >04(
DDH79 >i<
DDH120 DDH71 •
DDH120 -›*<-
Average orientation >e<
- Major Horizontal Secondary Principal Stress in Coal Seams
(g)
Figure 10 Average stress field orientation in coal from hydraulic fracturing tests.
Average orientation - Major Horizontal Secondary )00‹ Principal Stress in Rock
(%)
Figure 11 Average stress field orientation in overburden rock from hydraulic fracturing tests.
(2.6 and 2.9 MPa), relative to the test depth (about 300 m), has been attributed to the low overburden density deriving from the high proportion of coal in the roof sequence.
At a second site, a series of measurements were conducted vertically above the roadway to defme the stress field changes caused by its excavation. These results are not reported here, since they do not represent the virgin stress field. Two further tests were attempted in coal in a hole angled up over the rib-side of the roadway to measure the virgin stress state. These tests were unsuccessful for the same reason as the coal tests at the first site.
SUMMARY
The results of the hydraulic fracturing program, in terms of the average measured horizontal stress field orientation from hole to hole, are summarised in Figure 10 for the coal and Figure 11 for the overlying rocks. These suggest a consistent, approximately E-W maximum horizontal stress in the coal, and a somewhat more variable horizontal stress field orientation in the roof strata. The reason for the difference between the stress fields in the coal and rock is open to speculation, but may be a reflection of the greater impact of geological structure in the stiffer rock units.
The range of horizontal stress field magnitudes measured in the coal and rock by hydraulic fracturing is summarised in Table 2, which suggests a number of features: • A systematically higher stress field magnitude in the
roof rocks (excluding the very shallow measure-ments), relative to that measured in the coal seam; and
• A more variable and anisotropic stress field in the rock compared to the coal.
Figure 12 summarises the results of the hydraulic fracturing in coal, for those tests where both orientation and magnitude were determined. It indicates a spread of orientation, but with maximum horizontal stress clustering around an approximately E-W direction. Figure 12 also suggests a consistent horizontal stress field magnitude from test to test, when normalised by dividing by the corresponding overburden pressure.
Superimposed on Figure 12 are the results obtained from the underground overcoring in the coal sequence. In this case the measured near horizontal principal stress components can be considered to represent the horizontal stress field for purposes of comparison. The overcoring results have been normalised by the same process to facilitate comparison with the hydraulic fracturing results. Figure 12 indicates acceptable agreement between hydraulic fracturing and overcoring,

A a h 0 0 hydrofrac
A a h • a
H }overawe
•
0 •
• A 0 i) A A
A 2 A
0
150 J. ENEVER AND R. DOYLE
Table 2 Summary of stress field magnitudes in coal and rock from hydraulic fracturing.
Coal Rock
Hole cYh Depth c7H Depth (MPa) (MPa) Range (MPa) (MPa) Range
(m) (m)
71 4.6*_ 11.2 7.2* - 20.3 121-232 68 7.6- 8.6 11.2-11.6 168-207 79 2.1 -2.9 2.4-3.6 182 - 194 3.8- 4.5 5.9 - 10.4 156- 158 81 2.3-5.9 4.0 - 9.2 276 - 293 22.1 - 24.8 243 - 249 91 3.5 -4.3 3.7 - 7.0 281 -296 6.9- 9.6 9.1 - 16.0 260 - 268
120 4.5 - 6.2 5.3 - 8.6 354-367 1.0* - 19.0 1.3* - 33.4 60 - 334
* Low values correspond to relatively shallow measurements.
0
2
relatively low magnitude horizontal stress regime. In addition, the components of this field are nearly balanced (i.e., ail is only a little greater than ah). This implies that stress will not adversely affect gateroad performance, despite the thick coal seam isolating the workings from the rock strata. As a result, the selection of gateroad orientation can be flexible. This allows the mine layout to focus on other issues, such as geological structure and optimum reserve exploitation.
As the current depth of working exceeds 250 m, the impact of the vertical stress has been observed in underground workings. Minor deformation occurs at the roof/rib interface on one side of the headings, and the lower rib on the other side. Generally, however, roadway conditions have been good. One interesting feature has been upward deformations observed at roof extensometer locations. This has been attributed to coal shrinkage due to removal of gas and water, rather than to any stress-related mechanism.
20 40 80 80 100 120 140
OrienL of ccH
(Deg.) CONCLUSIONS
Figure 12 Summary of stress field orientations and ratios of component magnitudes, from hydraulic fracturing and overcoring.
considering the likely impact of the difference in stiffness between coal and the interbedded rock units.
IMPLICATIONS FOR LONGWALL PLANNING
Experience throughout Australia has demonstrated the impact of stress on gateroads during development and subsequent longwall retreat. Generally, gateroads have been found to suffer less deformation if they are orientated near-parallel to the maximum horizontal secondary principal stress (crH). Stress measurements within the megaseam at Dartbrook clearly indicate a
In-situ stress measurements were successfully con-ducted in coal by hydraulic fracturing, and in interbedded rock units within the coal sequence by overcoring.
The measured horizontal stress field in the coal sequence exhibited a very consistent orientation across the area of investigation and a generally low magnitude, less than the corresponding overburden pressure.
The measured horizontal stress field in the coal seam appears to be relatively balanced, with the average ratio of the two horizontal stress components being 1: 1.25.
In recognition of the above, the impact of stress on gateroad orientation at Dartbrook Colliery is not considered to be critical, even though these roadways are located in a very thick coal sequence.
To date, roadway performance has been satisfactory and has matched expectations based on the results of the stress measurement program.
HORIZONTAL STRESS IN LONGWALL DESIGN — DARTBROOK COLLIERY 151
ACKNOWLEDGMENTS
The authors would like to acknowledge the staff of Dartbrook Coal, Strata Tek Pty. Ltd. and Strata Control Technology for their major contributions to the testing program. The support of Dartbrook Coal throughout is gratefully acknowledged.
REFERENCES
ENEVER J. R. & WALTON R. J. 1995. Assessment of ground stresses. In Kryzszton, D. ed. Geomechanical Criteria for underground coal mines design. International Bureau of Strata Mechanics, Central Mining Institute, Katowice, Poland, 7-34.
ENEVER J. R. 1993. Case studies of hydraulic fracture stress measurement in Australia. In Hudson J. A. ed. Comprehensive rock engineering, Volume 3 , Chapter 20 — Rock Testing and Site Characterization. Pergamon Press.
SCHMIDT P. W. & LACKIE M. 1995. Determination of stress relaxation axes in drill core using laser micrometry and palaeomagnetism. Proceedings of the 29th Newcastle Symposium, 273-279.
MILLS K. W. 1996. A soft inclusion instrument for in-situ stress measurement in coal. Proceedings of the International Symposium on Rock Stress and Rock Stress Measurement. Centek Publishers, Lulea, Sweden, 247-251.
STRATA CONTROL TECHNOLOGY 1995. Report to Dartbrook Coal on in-situ stress measurements. Internal report.

-

Symposium on Geology in Longwall Mining, 12-13 November 1996, eds G. H. McNally and C. R. Ward, pp 153-161.
New understanding of longwall caving processes: results of microseismic monitoring and initial computational
modelling at Gordonstone Mine
MICHAEL KELLY,' WINTON GALE,2 PETER HATHERLY,3 RAO BALUSU3 AND XUN LUO3
CSIRO Division of Geology and Mining. 2Strata Control Technology.
3CSIRO Division of Geology and Mining.
A microseismic monitoring study at Gordonstone Mine, originally aimed at determining height of fracturing for water leakage from overlying aquifers, has provided a new understanding of longwall caving processes. When used in conjunction with numerical modelling, the results from the microseismic study have helped to develop key caving and stress change parameters for the overburden strata at Gordonstone. The interdependence of these parameters is described, and details are given of further developments from a current broader program.
INTRODUCTION
Longwall caving is one of the most widely practised methods in underground coal mining. The characterisa-tion and understanding of longwall caving behaviour are very important for strata control at the face, and for gas emission estimation and control. Many organisations and researchers have contributed to the understanding of strata behaviour on longwall faces, but there are considerable variations in both the approaches taken and the assumptions underlying them. Attempts have been made to analyse the caving mechanism using numerical models, empirical models, physical models and various forms of field measurement techniques.
A review of these studies indicates that most researchers link the vertical extent of fracturing to extraction thickness, and a number of relationships have been proposed to predict fracturing extent. Knowledge of actual fractures zones and failure mechanisms ahead of the face and in the floor is, however, limited. Most studies suggest that there is vertical fracturing due to tensile failure ahead of the face, because the peak front abutment stress is thought to be very close to the face. However, such models are contradicted by time domain reflectometry (TDR) studies, which suggest shear rather than tensile failure. This conclusion also indicates a different type of stress distribution around a longwall face.
It would therefore seem that there is no clear under-standing of the stress distribution and failure mechanism ahead of the face, and that more comprehensive and thorough investigations are necessary to achieve such an understanding. Field data obtained using stress cells, extensometers and convergence measurements often refer to the region very close to the face, but are insufficient to understand the rock mass behaviour further ahead of the face. Investigations involving surface boreholes and extensometers, such as camera surveys of borehole walls before and after mining,
give some idea of the vertical extent of fracture zones. However, they are difficult to undertake, time-consuming and expensive. In addition, the amount of data that can be obtained from such field studies, including TDR monitoring, is limited and is insufficient to characterise the complete caving process.
In spite of the central role of goaf formation to the success and safety of longwall mining, there is not yet a comprehensive quantitative understanding of the dynamic process involved. Fortunately, through the application of new technology, the situation is changing. Investigations by Styles et al. (1992) in Britain and by Hatherly et al. (1995a, 1995b) at Gordonstone Mine show that microseismic monitoring can provide large sets of three-dimensional and dynamic data on stresses and failure mechanisms at minimal cost. Such data provide validation for numerical simulations, which can now be produced with increasing sophistication and accuracy. The present paper describes new insights into the longwall caving process, on the basis of the microseismic monitoring at Gordonstone and sub-sequent numerical modelling.
REVIEW OF LONGWALL GEOMECHANICAL BEHAVIOUR
Early studies by Wilson (1964, 1975, 1983) postulated that the height of caving in the goaf depends on extraction thickness and is governed by the bulking factor of the strata. Wilson estimated that the distance required for the goaf to return to cover load was typically 0.3 times the seam depth, and that this was equal to the width of the pressure arch. He suggested that mining-induced stress starts increasing about 100 m ahead of the longwall face and gradually rises, until it peaks at about four times the cover load a few metres in front of the face.
Peng and Chiang (1984) similarly indicate that the
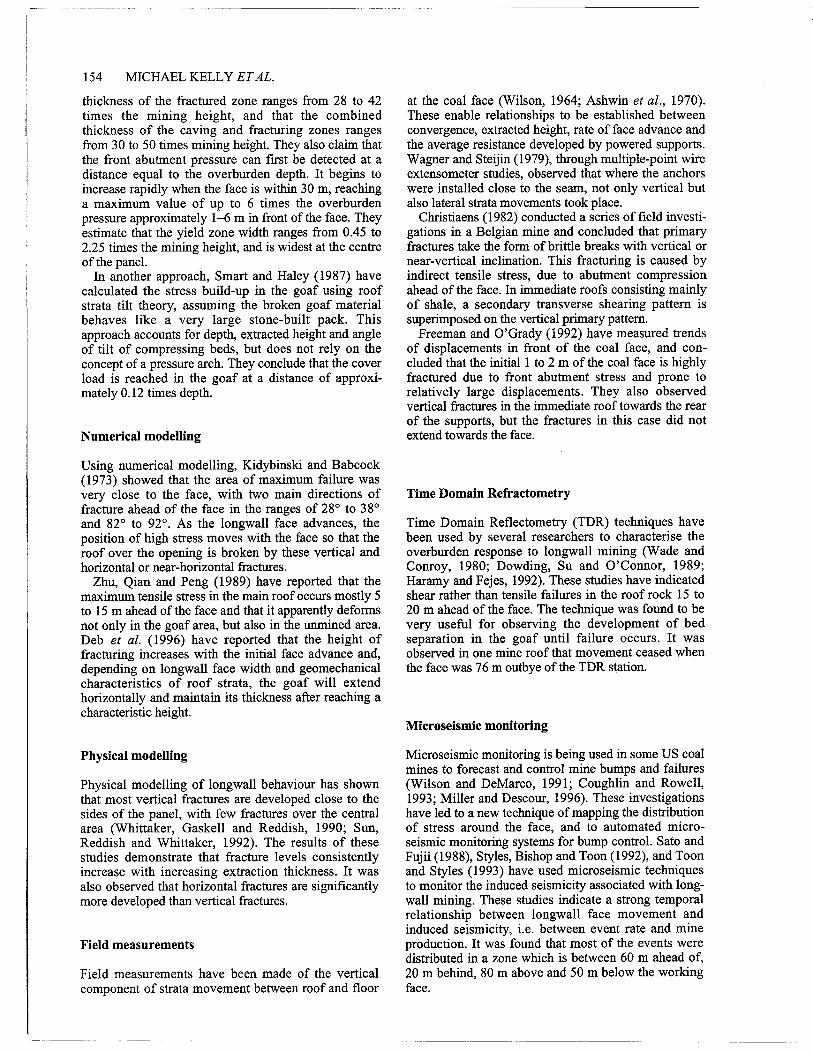
154 MICHAEL KELLY ET AL.
at the coal face (Wilson, 1964; Ashwin et al., 1970). These enable relationships to be established between convergence, extracted height, rate of face advance and the average resistance developed by powered supports. Wagner and Steijin (1979), through multiple-point wire extensometer studies, observed that where the anchors were installed close to the seam, not only vertical but also lateral strata movements took place.
Christiaens (1982) conducted a series of field investi-gations in a Belgian mine and concluded that primary fractures take the form of brittle breaks with vertical or near-vertical inclination. This fracturing is caused by indirect tensile stress, due to abutment compression ahead of the face. In immediate roofs consisting mainly of shale, a secondary transverse shearing pattern is superimposed on the vertical primary pattern.
Freeman and O'Grady (1992) have measured trends of displacements in front of the coal face, and con-cluded that the initial 1 to 2 m of the coal face is highly fractured due to front abutment stress and prone to relatively large displacements. They also observed vertical fractures in the immediate roof towards the rear of the supports, but the fractures in this case did not extend towards the face.
Time Domain Refractometry
Time Domain Reflectometry (TDR) techniques have been used by several researchers to characterise the overburden response to longwall mining (Wade and Conroy, 1980; Dowding, Su and O'Connor, 1989; Haramy and Fejes, 1992). These studies have indicated shear rather than tensile failures in the roof rock 15 to 20 m ahead of the face. The technique was found to be very useful for observing the development of bed separation in the goaf until failure occurs. It was observed in one mine roof that movement ceased when the face was 76 m outbye of the TDR station.
Microseismic monitoring
Microseismic monitoring is being used in some US coal mines to forecast and control mine bumps and failures (Wilson and DeMarco, 1991; Coughlin and Rowell, 1993; Miller and Descour, 1996). These investigations have led to a new technique of mapping the distribution of stress around the face, and to automated micro-seismic monitoring systems for bump control. Sato and Fujii (1988), Styles, Bishop and Toon (1992), and Toon and Styles (1993) have used microseismic techniques to monitor the induced seismicity associated with long-wall mining. These studies indicate a strong temporal relationship between longwall face movement and induced seismicity, i.e. between event rate and mine production. It was found that most of the events were distributed in a zone which is between 60 m ahead of, 20 m behind, 80 m above and 50 m below the working face.
thickness of the fractured zone ranges from 28 to 42 times the mining height, and that the combined thickness of the caving and fracturing zones ranges from 30 to 50 times mining height. They also claim that the front abutment pressure can first be detected at a distance equal to the overburden depth. It begins to increase rapidly when the face is within 30 m, reaching a maximum value of up to 6 times the overburden pressure approximately 1-6 m in front of the face. They estimate that the yield zone width ranges from 0.45 to 2.25 times the mining height, and is widest at the centre of the panel.
In another approach, Smart and Haley (1987) have calculated the stress build-up in the goaf using roof strata tilt theory, assuming the broken goaf material behaves like a very large stone-built pack. This approach accounts for depth, extracted height and angle of tilt of compressing beds, but does not rely on the concept of a pressure arch. They conclude that the cover load is reached in the goaf at a distance of approxi-mately 0.12 times depth.
Numerical modelling
Using numerical modelling, Kidybinski and Babcock (1973) showed that the area of maximum failure was very close to the face, with two main directions of fracture ahead of the face in the ranges of 28° to 38° and 82° to 92°. As the longwall face advances, the position of high stress moves with the face so that the roof over the opening is broken by these vertical and horizontal or near-horizontal fractures.
Zhu, Qian and Peng (1989) have reported that the maximum tensile stress in the main roof occurs mostly 5 to 15 m ahead of the face and that it apparently deforms not only in the goaf area, but also in the unmined area. Deb et al. (1996) have reported that the height of fracturing increases with the initial face advance and, depending on longwall face width and geomechanical characteristics of roof strata, the goaf will extend horizontally and maintain its thickness after reaching a characteristic height.
Physical modelling
Physical modelling of longwall behaviour has shown that most vertical fractures are developed close to the sides of the panel, with few fractures over the central area (Whittaker, Gaskell and Reddish, 1990; Sun, Reddish and Whittaker, 1992). The results of these studies demonstrate that fracture levels consistently increase with increasing extraction thickness. It was also observed that horizontal fractures are significantly more developed than vertical fractures.
Field measurements
Field measurements have been made of the vertical component of strata movement between roof and floor

NEW UNDERSTANDING OF LONGWALL CAVING PROCESSES 155
MICROSEISMIC MONITORING AT GORDONSTONE MINE
Most microseismic monitoring around the world is undertaken for the control of rockbursts in deep metal-liferous mines (Young, 1993). This is an important application, but represents only one aspect of its geo-technical use. The potential of microseismic monitoring in Australian coal mining has been, until recently, largely unexplored.
In 1995, CSIRO commenced a microseismic moni-toring study at the Gordonstone Mine in central Queens-land. Its main objective was to determine whether caving from longwall mining extended into overlying unconsolidated Tertiary sediments and volcanics, which are significant aquifers. The project also allowed a more general assessment of the role of microseismic monitoring to be undertaken.
The geology at Gordonstone Mine is described by Kelly et a/.(1994). In the area of the study the 3 m thick German Creek Seam is being mined at a depth of about 235 m. Mining is by the longwall method, with a face width of 250 m. The immediate roof and floor are particularly weak, with UCS values of only 5-15 MPa. Stronger bands (UCS about 50 MPa) occur above the Corvus Seam, some 25 metres above the worked seam. The dominant horizontal stress direction is NNE, parallel to the panel centreline and sub-parallel to the dominant coal cleat and roof strata joint directions. The thickness of the Tertiary sediments and volcanics is about 70 m.
The microseismic study has been reported in detail by Hatherly et al. (1995a, 1995b). The approach taken was to grout arrays of three-component geophones down boreholes drilled from the surface to the German Creek seam, and to monitor the microseismic activity con-tinuously as mining progressed. Three boreholes were drilled, and nine triaxial geophones were installed in each. All but the shallowest were below the Tertiary/ Permian unconformity. Piezometer readings to sup-plement the microseismic data were made at depths of 205 m, 170 m and 125 m, from a hole drilled in the centre of the longwall panel and within the micro-seismic array.
Microseismic activity was monitored during September and October, 1994. The activity was closely correlated with mining, and in all 1200 events were detected. Of these, 629 events with sharp P-wave onsets were located. The remaining bumps were of lesser magnitude, with indistinct onsets; these are thought to have been from within the goaf and to have occurred after initial failure.
The locations of the microseismic events, summarised in Figures 1 to 4, are estimated to have an accuracy gen-erally better than 5 m within the microseismic network and 10 m outside. Confirmation of this was obtained from two seismic shots fired within deep boreholes, which were located with accuracies of 2 m and 6 m.
In plan view (Figure 1) it is apparent that the majority of the events occurred within and above the panel (LW103) which was being mined. There is a tendency for events to occur on the sides of the panel, and in
cross section (Figure 2) it can be seen that they generally lie within an envelope at some 15 degrees from the vertical above the gateroads.
Figure 2 also shows that the events extend to a height of about 120 m above the German Creek seam, and to a depth of about 30 m into the floor. None of this activity reaches up to the base of the Tertiary. There is a relatively aseismic zone about 35 m above the German Creek seam that appears to be related to a stronger band between the Corvus and Tieri II seams.
Figures 3 and 4 show the locations of the events relative to a fixed face position. These figures show that the events tend to occur within an arcuate zone, up to 70 m ahead of the face and extending back behind it at the gateroads. This seismically-active zone extends upwards at an angle of about 500 from the horizontal.
As shown in Figure 5, it has been possible to deter-mine source mechanisms for a number of the events. The nodal planes are approximately parallel to the longwall face, and a compressive shear fracture pattern is indicated with fault planes dipping at an angle of approximately 50010.
The piezometer data (Figure 6) confirm these results. In the upper piezometers, increases in pore pressures occurred up to 170 m ahead of the face and varied according to mining activity. The piezometer cables were also sheared progressively up the hole at distances of 73 m, 53 m, and 25 m ahead of the face respectively. As shown in Figure 3, these distances coincide with the onset of the microseismic activity.
LONGWALL SIMULATION MODEL OF GORDONSTONE MINE
The aim of computer simulation is to assess the mechanisms of caving and the distribution of rock frac-ture in the central area of a longwall face. The program FLAC was used as the basic code, but supplemented with SCT-developed rock failure and goaf consolidation routines. The rock failure routines developed define the orientation and properties of fractures created in the rock mass from various failure models. These are: • shear fracture through intact rock; • shear failure along bedding; • tensile fracture of intact rock; and • tensile breakage along bedding planes.
In addition, the orientation of pre-existing joints and the failure planes generated are analysed to assess stability under conditions of tension and shear, as the ground moves backwards into the extracted void. The goaf consolidation routine assesses stiffness of the caved material as a function of load and void space. The type of fracture and its orientation are displayed in the output.
The model is two-dimensional, simulating a zone down the centre of the longwall face. Although it is recognised that the full problem is three-dimensional, the first step is to undertake 2-D simulations of the central zone where the 'out-of-plane' third dimension has least effect.

500
500
LW103 b
metres
LW104 LW102
• • time
• t •.P • „;..
p.r 7/
.; • 4965(C) •••:* • • • ....m,"•• Q
/
1000. -1000
kon '71
#964(13
4966N •• eposCion 29/14
500
-500
metres •oo
LW102 /770 LW103 LW104
r_7LI 1000
500
15965(C) 0
1000
a)
In
In In
156 MICHAEL KELLY ET AL.
Figure 1 Plan view showing locations of microseismic events between 16 September and 29 October, 1994. The geophones were located in the boreholes 964, 965 and 966.
-200 -150 -100 -50 0 50 100 150 200 250 300 350
-300 - - -300 10-20 m above seam
-250 - - -250
-200 - Tailgate Maingate - -200
-150 - - -150
- -100
- -50
0
- 50
- 100
- 150
- 200
250 - 250
300 - - 300
350 - - 350
-200 -150 -100 -50 0 50 100 150 200 250 300 350 Distance (m)
-E. -100 -
O -50-
• 50 - 0
2 150- 0II
200 -
100 -
o - LW face _ _ _
11 gateroads
• I • • ..*4.11 !.•
.% • „ "400 • e• •• •
d•.• • • es I
• I. • • • i
LW103
gateroads
-150
150
cu 100 1/1 CU
O 50 - .0 as
0 09
•a", -50
-100 -50 50 100 150 200 250 300 350
150
- 100
- 50
0
- -50
-150 -100 -50 0 50 100 150 200 250 300 350 Distance (m)
Figure 2 Microseismic event locations for part of the panel from Figure 1, viewed in cross section. The coal seams are the German Creek seam (GC), Corvus seam (CO), Tieri I and II seams (T1 and T2), Aquila seam (AQ) and Pleiades seam (PL). The base of the Tertiary is at an elevation of about 145 m.
Events in panel centre
350 300 250 200 150 100 50 0 -50 -100 -150 -200-250
• srlsmIr e•rol X she., of piezomeler
" M. X • AQ
---.---:;.•—: 12 CO
• . .4.%-.11• GC
• ho Coal In o Coal extracted • • I.
1,W face
350 300 250 200 150 100 50 0 -50 -100 -150 -200 -250 Distance from longwall face (m)
Figure 3 Distribution of events in the centre third of the panel relative to a fixed face position viewed from the side of the panel. Crosses show the points at which the three piezometers failed.
Figure 4 Distribution of events in plan view relative to a fixed face position and for heights of 10 to 20 m above the German Creek seam.
Figure 5 Source solutions on lower hemisphere for 14 events. The shaded areas are under tension and the open areas are under compression.
The approach used is to excavate an approximately one metre wide 'web' (shearer slice), allow the model to undertake a suitable number of calculation steps, and then to repeat the process. Consideration is given to the depth and panel width geometry. The Gordonstone model (Figure 7) is large, and extends from the seam to the surface and to at least 500m below the seam.
LW102 LW103 LW104 Mined Being mined In development
e. PC •;.„, • . AQ
. .AL• ,, •• •.e . • • . . • •;• Ti : 1r#1,k- • . .1 • ii• . • it T2
_ • „ • ". Ai A .: • • . _ •• i • • -.- CO .•
• _ ••• ! GC ••• • .
110
if • •
gateroads •
•
2 it gateroads
C
150 E
100
• 50 .c
nit .4a1 • 0
• -50

position of lonowall
• #2, 170.5 m, Tied 1 Seam
7 600
500
+400
•
posi
tion
of lo
ngw
all
(m)
kPa
varia
tion •
• • a II • IN 111
• #3, 125.6 m, Pleiades Seam
+, 300
8
;C. date 17
/10/
9 4 12
:00
4-
13/1
0/9
4 12
: 00
+
11/1
0/9
4 12
:00 +
9/10
/ 94
12:0
0 +
5/10
/94
12:0
0 +
1/10
/94 12
: 00
I-
15/1
0/94
12:0
0 4-
3/10
/94
12:0
0
29/0
9/94
12:
0 0 +
25/0
9/94
12:
27/0
9/9 4
12: 0
800 —
700 1-
600
I • • 500 t
400 -I-
300 -I-
200 1-
100 I-
-100 +
-200 0 0 esi
0 0.1
• • piezo hole
r © 223 m
200
NEW UNDERSTANDING OF LONGWALL CAVING PROCESSES 157
Figure 6 Hydrostatic pressures from borehole piezometers versus face position from recovery roadway.
The results of simulated longwall mining at Gordon-stone are presented in Figure 8. A number of key features are indicated:
• Failure of roof strata occurs at a substantial distance in front of the face. The model indicates that this takes place at least 10m-15m ahead of the face, and that it extends up to the Corvus Seam. The fractures are pervasive but have no pattern. The expected microseismic characteristics would therefore be many low intensity energy releases, rather than a (periodic) high energy release of lesser frequency.
• Failure of the immediate floor strata occurs at regular intervals.
• The nature of rock failure ahead of the face is shear fracture through intact material, and bedding plane shear.
Unlike current models, this simulation did not have coupled fluid pressure as part of the rock failure process. As a result, it is probable that shear fractures form even further ahead of the face than indicated from this study.
Validation of the models can be based on subsidence characteristics, extensometer results, stress measure-ments, microseismic locations and other suitable criteria. At Gordonstone the outcomes of subsidence, stress measurement and microseismic data are all consistent with the results of the simulation.
IMPLICATIONS OF 1VIICROSEISMIC AND MODELLING RESULTS
As related earlier, previous studies (Wilson, 1964, 1975, 1983; Peng and Chiang, 1984), while recognising that front abutment stresses can be detected at significant distances, predict that they peak close to the longwall face. They further predict that these abutments are 4 to 6 times the overburden pressure. Most studies also predict either explicitly (Zhu et al., 1989; Christiaens, 1982) or implicitly that the failure mechanism is tensile. This tensile mechanism is caused by indirect tensile stress, due to an essentially unconfined abutment load close to the face. In contrast, the TDR studies have indicated shear rather than tensile failure is the predominant mechanism, and that failure occurs 15 m to 20 m ahead of the face.
Caving-induced microseismic events, located to an accuracy of about 5 m, define an arcuate zone (in plan) of initial failure that is concentrated near the gateroads. The events on the centre third of the face extend up to 70 m ahead of the longwall. The dominant breakage mechanism of all events is by shear, with a failure plane inclined at an average angle of 50° to the horizontal thrusting above the goaf. This mechanism is further validated by piezometric evidence. Forward abutment pressure is first indicated 170 m ahead of the face, with shearing of the cables occurring consistently with initial microseismic event locations.

-.500
-1.000
-1.590
-2.000
-2.500
158 KELLY ET AL.
(*10^2)
.000 200 .400 .600 .800 1.000 ("1 0^2)
Geological Units Modelled NOTE: A small section modelled.
Figure 7 A section of the geological model used in the study.
Modelling for the present study has also indicated that the initial failure occurs a substantial distance ahead of the face, with the dominant failure mechanism being shear through intact rock with some bedding plane shear. The main difference between the model and actual field microseismic measurements is not the mode of failure, but the predicted distance ahead of the face where failure occurred. This forward distance is 15 m for the model and averages 30 m —40 m from the field measurements. The model, however, represents only the
centre third of the longwall, and does not attempt to describe roof failure around the gateroad ends of the face.
The roof rocks at Gordonstone have a high moisture content, but this was not modelled as part of the failure criteria. It is postulated that pore water pressure has an influence on intact rock failure by reducing the effective stress. This will cause failure to be initiated at lower stress levels, and may explain the differences between the model and field measurements. Before the TDR
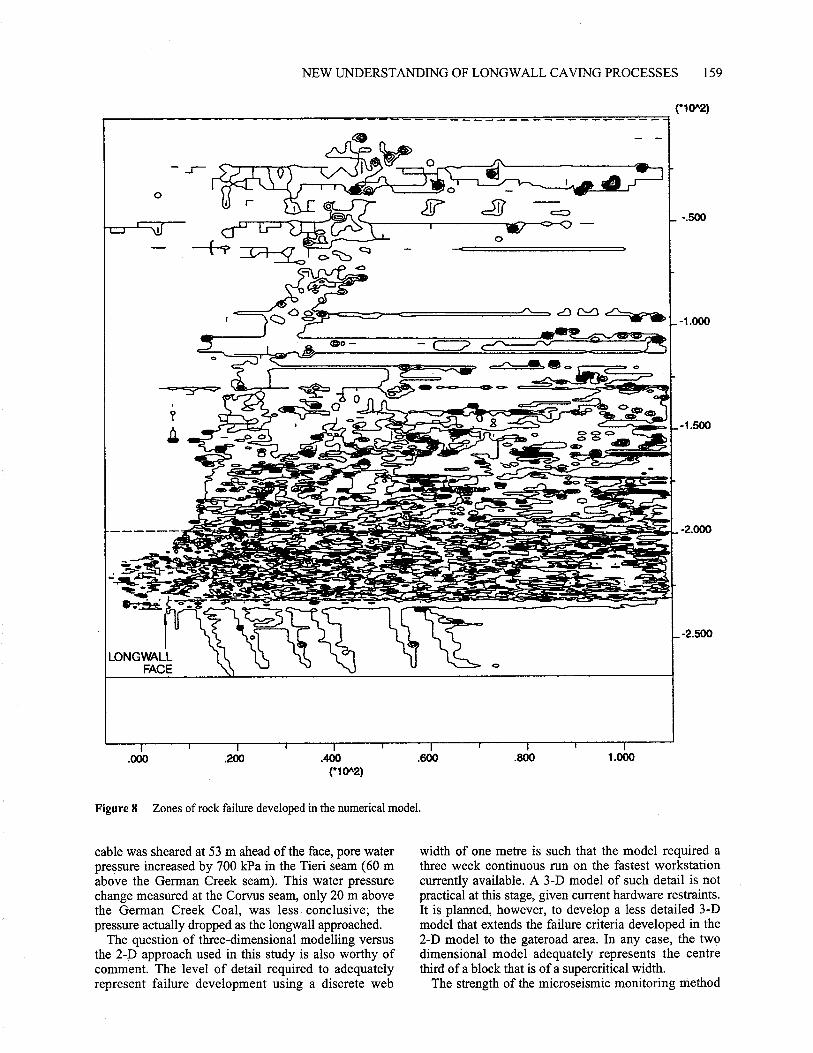
NEW UNDERSTANDING OF LONGWALL CAVING PROCESSES
(10A2)
159
.600 .800 1.000
LONGVVALL FACE
Figure 8 Zones of rock failure developed in the numerical model.
cable was sheared at 53 m ahead of the face, pore water pressure increased by 700 kPa in the Tieri seam (60 m above the German Creek seam). This water pressure change measured at the Corvus seam, only 20 m above the German Creek Coal, was less conclusive; the pressure actually dropped as the longwall approached.
The question of three-dimensional modelling versus the 2-D approach used in this study is also worthy of comment. The level of detail required to adequately represent failure development using a discrete web
width of one metre is such that the model required a three week continuous run on the fastest workstation currently available. A 3-D model of such detail is not practical at this stage, given current hardware restraints. It is planned, however, to develop a less detailed 3-D model that extends the failure criteria developed in the 2-D model to the gateroad area. In any case, the two dimensional model adequately represents the centre third of a block that is of a supercritical width.
The strength of the microseismic monitoring method

160 KELLY ET AL.
is its detection of failure points around the face area. Secondary failure, relaxation and consolidation in the goaf are not as well represented. Not only are these events of lesser magnitude, but high microseismic absorption might also be expected within the goaf material. Other evidence (Lawrence, undated) has confirmed that failure around the face is the primary rock breakage mechanism. Subsequent events are more related to flexure and reconsolidation.
The study by Lawrence was based on Gordonstone's first longwall panel, obtaining data from eight extensometers and ten boreholes drilled through the goaf after the face had passed. The boreholes showed that there was no water loss above the longwall panel until within 110 m of the seam. Seven of the ten holes did not record water loss until within 35 m of the seam. This compares with the 120 m maximum height above the seam of microseismic activity. The extensometers recorded significant delamination up to 90 m above the seam, which occurred within 40 m of the face passing. Reconsolidation occurred within 200 m of the face passage.
70 80
NOTE: 'YIELD ZONE INFLUENCED BY FRACTURE OF ROOF OVER RIBLINE
12
8 - •
COVER LOAD AT 230m
10 20 30 40 50 60
DISTANCE FROM GOAF EDGE (m/
VE
RT
ICA
L S
TRE
SS
(A1
PaI
Figure 9 Vertical abutment stress relative to the goaf edge developed in the model.
The vertical stress profile developed from the simu-lation (Figure 9), shows that the maximum abutment load is only twice the overburden stress, and occurs about 10 metres ahead of the face. This contrasts with 4 to 6 times the overburden load traditional approaches would suggest. The difference arises from two main causes: firstly Gordonstone has a high horizontal stress regime, with the major principal stress being horizontal, approximately parallel to the gateroads and about 2.4 times the overburden stress. The horizontal relief into the goaf is quite significant, and through lateral relaxation will have a decreasing influence on the vertical stress. Secondly, shearing through intact rock and along bedding will reduce the load-carrying capacity of the rock adjacent to the longwall zone. This will effectively transfer the abutment peak away from the longwall and reduce its magnitude.
CONCLUSIONS
The power of combining accurate microseismic moni-toring and detailed numerical simulation has been demonstrated in this study. The study has shown that, in the circumstances at Gordonstone, traditional models with tensile failure mechanisms and abutment loads of 4 to 6 times the overburden pressure are not applicable. The effects of shear failure, reduction of horizontal stresses and perhaps pore fluid pressure have resulted in a much lower abutment load, which peaks further away from the longwall face than traditional models indicate. This has major implications for understanding longwall geomechanics generally, and will influence issues of face control, gateroad stability and fluid flow (both gas and water).
Based on the significance of the results, a new project has been initiated by CSIRO and SCT to apply these methods to at least three other sites. These sites have a wide range of geometry, geology and geotechnical properties. Face and goaf monitoring will also be undertaken to provide additional validation. The results from the project will either demonstrate that shear failure is the dominant failure mechanism ahead of a longwall face, or that this mechanism is limited to certain geotechnical regimes.
ACKNOWLEDGMENTS
The microseismic monitoring work described in this paper was undertaken with the financial support of ACARP, BHP Australia Coal and Gordonstone Coal Management. The ongoing project, which includes the simulation, is being undertaken with support from ACARP, BHP Australia Coal, The Shell Company of Australia, North Goonyella Coal Mines Ltd, Macquarie Coal Joint Venture and Cyprus Australia Coal Company.
REFERENCES
Asirwm D. P., CAMPBELL S. G., KIBBLE J. D., HASKAYNE J. D., MOORE J. F. A. & SHEPHERD R. 1970. Some fundamental aspects of face powered support design. Mining Engineering 129, 659-671.
CHRISTIAENS P. 1982. Proposed calculation model for powered supports on a longwall face. Proeedings, 7th International Strata Control Conference, Liege, Belgium, September, 139-155.
COUGHLIN J. P. & ROWELL G. A. 1993. Patterns of microseis-mic activity prior to a mountain bump. International Journal of Rock Mechanics, Mining Sciences and Geomechanics Abstracts 30 (7), 917-923.
DEB D., PARK D. W., NOVAK T. & JIANG Y. M. 1996. Effect of geomechanical behaviour of the methane emission zone on methane production in longwall mining. Society for Mining, Metallurgy, and Exploration, Inc. Preprint No 96-121,8pp.
DOWDING C. H., Su M. B. & O'CONNOR K. 1989. Measure-ment of rock mass deformation with grouted coaxial antenna cables. Rock Mechanics and Rock Engineering 22, 1-23.

NEW UNDERSTANDING OF LONGWALL CAVING PROCESSES 161
FREEMAN P. N. & O'GRADY P. 1992. In-situ performance analysis of immediate forward support (IFS) systems in thin-medium seam sections in the United Kingdom. Proeedings, 11th International Conference on Ground Control in Mining, University of Wollongong, July, 117-130.
HARAMY K. Y. & FEJES A. J. 1992. Characterization of overburden response to longwall mining in the western United States. Proeedings of the 1 I th International Conference on Ground Control in Mining, University of Wollongong, July, 334-344.
HATHERLY P. J., Luo X., DIXON R., McKAvANAGH B., BARRY M., JECNY Z. & BUGDEN C. 1995. Roof and goaf monitoring for strata control in longwall mining. Final report on ACARP Project C3067 (unpublished).
HATHERLY P., Luo X., MCKAVANAGH B., DIXON. R. & DEVEY D. 1995. Microseismic monitoring for mapping of longwall caving at Gordonstone Mine. Proceedings, Bowen Basin Symposium 1995. Geological Society of Australia, Mackay Qld, October 1995,117-126.
KELLY M., LAWRENCE B. & DEVEY D. 1994. Roof control at Gordonstone leads to Australian records. The Australasian Institute of Mining and Metallurgy Bulletin 6, December.
KIDYBINSIU A. & BABCOCK, C. 0. 1973. Stress distribution and rock fracture zones in the roof of longwall face in a coal mine. Rock Mechanics 5, 1-19.
LAWRENCE B. (undated). Intel,nal report on goafing characteristics, Longwall 101, Gordonstone Mine.
MILLER R. J. & DESCOUR J. M. 1996. Avoiding disastrous ground failures during longwall mining. Society for Mining, Metallurgy and Exploration, Inc, Preprint No. 96-53,10 pp.
PENG S. S. and CHIANG H. S. 1984. Longwall Mining. John Wiley and Sons, New York.
SATO K. & FUJH Y. 1988. Induced microseismicity associated with longwall coal mining. International Journal of Rock Mechanics, Mining sciences and Geomechanics Abstracts 25 (5), 253-262.
SMART B. G. D. & HALEY, S. M. 1987. Further development of the roof strata tilt concept for pack design and the estimation of stress development in a caved waste. Mining Science and Technology 5, 121-130.
STYLES P., BISHOP I. & TooN S. 1992. Surface and borehole microseismic monitoring of longwall faces: their
potential for three-dimensional fracture imaging and the geomechanical implications. Proceedings of the 11th International Conference on Ground Control in Mining, University of Wollongong, July, 177-192.
SUN G. X., REDDISH D. J. & WHITTAICER B. N. 1992. Image analysis technique for rock fracture pattern studies around longwall excavations. Transactions Institution of Mining and Metallurgy (Section A, Mining Industry) 101, September-December, A159-A165.
TOON S. M. & STYLES P. 1993. Microseismic event location around longwall coal faces using borehole in-seam seismology. Proceedings of the 3rd International Symposium on Rockbursts and Microseismicity in Mines, Young R. P. (ed.). Queen's University, Canada, 441-443.
WADE L. V. & CONROY P. J. 1980. Rock mechanics study of a longwall panel. Mining Engineering, December, 1728-1734.
WAGNER H. & STEIJN J. J. 1979. Effect of local strata conditions on the support requirements on longwall faces. Proceedings of the 4th Congress, International Society for Rock Mechanics (ISRM). Vol. I, 557-564.
WHITTAKER B. N., GASKELL P. & REDDISH D. J. 1990. Sub-surface ground strain and fracture development associated with longwall mining. Mining Science and Technology 10, 71-80.
WILSON A. H. 1964. Conclusions from recent strata control measurements made by the mining research establishment. Mining Engineer 123, 367-380.
WILSON A. H. 1975. Support load requirements on longwall faces. Mining Engineer 134, 479-491.
WILSON A. H. 1983. The stability of underground workings in the soft rocks of the coal measures. International Journal of Mining Engineering 1, 91-187.
WILSON P. E. & DEMARCO M. J. 1991. In-mine microseismic monitoring for improved coal mine bump control. Proceedings of the 1st International Symposium on Mine Mechanisation and Automation, USA, 5:17-5:24.
YOUNG R. P. (ed.) 1993. Rockbursts and microseismicity in mines. Balkema, Rotterdam.
Diu D., QIAN, M. & PENG S. S. 1989. A study of displacement field of main roof in longwall mining and its application. Proceedings of the 30th US Symposium on Rock Mechanics. Balkema, Rotterdam, 149-156.

Symposium on Geology in Longwall Mining, 12-13 November 1996, eds G. H. McNally and C. R. Ward, pp 163-171.
Low cost seismic methods assist longwall mine planning
B. J. EVANS, M. UROSEVIC AND J. COCKER
Curtin University, Department of Exploration Geophysics.
Over the last ten years, surface and borehole seismic methods have been used as an aid in longwall mine planning. While conventional two dimensional (2-D) seismic reflection methods are used to understand seam dislocations, the use of inexpensive reversed vertical seismic profiling (RVSP) and three dimensional (3-D) methods have evolved. These obtain a better image of complex subsurface geology at a relatively low cost compared with exploration drilling. In addition, new 2-D three component (3-C) data are providing, for the first time, an indication of the presence of open fractures and their orientation.
The RVSP method allows receivers to be positioned along the surface and charges to be detonated up existing open boreholes, to produce an image of both sides of the borehole. The 3-D seismic method requires a grid of lines to be recorded, to produce data which can be viewed in perspective, such that small throw faults and fractures can be interpreted. A 3-D volume can be recorded for a year's planned production, so that complex geology can be investigated well before mining commences. The recent 3-C technology advance provides a new method to sense the presence of fractures and their orientation, as well as any associated variations in gas content.
This paper discusses the applications of seismic reflection methods to longwall mine planning, with case histories from Tower, South Blackwater, and Wambo collieries. The paper also compares the economics of using seismic methods for seam exploration with those of conventional drilling.
INTRODUCTION
Surface and borehole seismic methods have been used commonly over the last 15 years for coal exploration in Australia. Since the development of the 2-D surface seismic method (Figure 1), geologists and engineers have used it when seam faulting or structure have been indicated by drilling. BHP Collieries Division relies heavily on the results of seismic to guide their longwall mining operation, and they have operated their own seismic crew at Appin and Tower collieries for the last five years.
Seismic exploration methods are, nevertheless, rarely used in longwall planning elsewhere in Australia because they are: • Considered to be more expensive than drilling; • Thought to be less reliable than drilling; and • Not understood by geologists and engineers.
Over the years, the Curtin University research group has been developing ways to reduce the cost of seismic methods, while making their interpretation more reliable. In 2-D seismic, for example, deep sub-weathering shot holes are now often unnecessary. They can be replaced by less expensive shallow drill holes while collecting equally good data. A case history from Wambo Colliery illustrating this development will be discussed in this paper, together with a case history of using 2-D seismic at South Blackwater mine.
New imaging methods are also being developed using existing boreholes. For example, the Vertical Seismic Profiling (VSP) method has been used by the oil industry to image faults away from the oil well. This method has been reversed (RVSP) and adapted for the coal mining industry to image geology away from
existing boreholes (Figure 2). The method has also been used to investigate geology between two boreholes, to obtain an image similar to a computer tomograph (CT) scan (Figure 3). These methods are discussed below with a case history from Wards Well (Queensland).
At Tower Colliery, the 3-D method was used to map scissor faulting at a fraction of the cost of exploration drilling. In this case, 2-D seismic did not provide the complete structural explanation, whereas the 3-D data did. The images resulted in modifications to the mine plan in order to avoid the faulted zone. This case history is discussed further below.
Finally, the need to have more knowledge of faults and fractures is ever present. Three component (3-C) seismic recording provides a new dimension to understanding such structures, since it is possible using such methods to determine their location and orientation. In this paper, the results of recording 3-C data at Tower Colliery are reviewed, and they show how 3-C data was used in fracture studies.
Wambo 2-D
In 1992, Wambo Mining Corporation was planning an underground longwall operation in the Whybrow seam, with an anticipated life of some 25 years. Borehole data (on a 250-500 m grid) indicated that no faulting was present in this new area. Previous and current mining experience area also indicated that faulting was not likely in the area. However, a newly commissioned open cut some 2 km to the north-east encountered several faults, which appeared to be trending towards the proposed underground mining area.
In December 1993, an experimental RVSP survey

Depth slice
2-D section
3-D volume
Reflection
Seismic section
Overlapping seismic section
164 B. J. EVANS ET AL.
Figure 1 Comparison of the 2-D and 3-D seismic reflection methods. The 3-D method produces a volume of seismic data, which can be cut vertically to generate a geological section, or horizontally as a depth slice through a seam.
V V VT VT V V V V V
earn
Figure 2 The RSVP method produces a 2-D seismic section away from the existing borehole, which acts as a shotpoint.
Borehole 1 Borehole 2
Figure 3 Overlapping RSVPs produce an image of the geology between two existing boreholes.

:41
2 Km
nitln
4 hi
i* 01110 I
.,r...11Or 2 74-ii or--. 1160 ON eir" ,21":10>t'1=1" II 41N1 1110, 4 ' ^Xle AG' 4.0•!1* -1r4- 40,1, 41, :‘,11,ito"." • '1 •irikujg. 44fid
.r. 4iit.a• 041.. .wr ritt
,
300
..
400
LOW COST SEISMIC METHODS ASSIST LONGWALL MINE PLANNING 165
100
Ire
Depth (m) 200
Figure 4 Seismic depth section with a number of interpreted faults at the Wambo mine site. These faults were later proven by drilling, with throws of 2-3 m, to a spatial accuracy of 2 m.
was recorded, followed by a short seismic line. The aim was to test if there was an adequate seismic response to image seams to depths of 300 m and to detect the presence of faults. These tests indicated that a small, shallow charge would provide sufficient energy to image the seams, where the conventional approach would have been to use deep shot-holes and large charges (costing about $40 per hole). The trials showed that in valleys a single shotgun cartridge fired into a water-filled hole would be adequate. In more hilly areas, a 6 m deep hole with a single 175 g primer ($8 per hole) gave a satisfactory result.
An experimental program commenced during 1994, further defining the parameters for recording 2-D seismic lines across faults. A two kilometre section along one line is illustrated on Figure 4. This clearly shows zones of intense faulting through the Whybrow seam. The original mining plan was to drive panels sub-parallel to these fault clusters, which appear to have throws of 2-3 m at depths below 100 m. This seismic line was expected to cross no more than six faults, but the results indicated seventeen. Subsequent drilling con-firmed the presence of groups of closely-spaced faults, and further assessment indicated more than thirty faults.
Conclusion — The proposed mine plan had to be totally revised as a result of this 2-D seismic survey; there was new respect for the site geologist from the mine engineering staff; and further seismic exploration is planned to assist future mine plRnning.
South Blackwater 2-D
Several longwall mining areas are being developed at South Blackwater mine, one of these being the Kenmare site. This is typical of other mine sites in the Bowen Basin, with 40 m of Tertiary alluvium overlying
the Rewan Formation (interbedded siltstones and sand-stones). The Rangal Coal Measures extend from 160 m to 220 m, within which the most economic coalbeds are the Aries and Pollux seams at 180-214 m. These seams are known to be locally disrupted by complex faulting.
An initial RVSP test was was performed to establish optimum seismic parameters and this demonstrated that strong reflections could be expected from depths of 89 m to 193 m. The shot-hole depth was set at 12 m, with 800 g of explosive required in each hole. Where the ground surface was very hard due to outcropping silcrete bands, geophone spike-holes had to be predrilled. Eddyseis geophones were used to determine if the frequency content of the seismic reflections could be improved. Under normal conditions, deeper shot-holes and larger charges would have been used. However, the aim was to obtain high frequency data using relatively small, but adequately energetic, charges and geophones drilled into the ground.
Figure 5 shows a stacked depth section of the 580 m long trial seismic line. There appears to be a complex structure present, with a strong reflection at 180 m (the top of the Aries Coal). Figure 6 is an interpretation of this structure, after tying-in with three drill-holes along the line. This seismic profile was recorded along an existing drill-hole line, which was oblique to the planned underground workings. Subsequent infill drilling and observations in mine workings projected to the line have shown that a faulted structure is potentially present, as shown in the interpretation. However, the precise details of the structure will not be determined until mining takes place.
In addition to the major faulting, a low-throw fault (about 3 m) or a seam roll of similar displacement was postulated at the location shown on Figure 6. A seam roll of amplitude one metre has since been observed in mine workings.

166 B. J. EVANS ET AL.
480m
.N- 'V Vegi 4 1 . , . •,'llq/.1414ANg4'.'•NA:sf...7 ..1.,0,...1.,-1
444.191 r94;44 (411444 4/ qlikf,14 CIN'V ti,j0.111 V.Iii 4 '5,7.0:41NIS'i If Ire 4, , 0. ilk 4 4 $ 41 4414 44°,4 I As̀ 4. '.P 4 4 44 0.11A 44)4 ,.')4 Vi. f l'4,P,Atk
''d 14:0 '.1.4v ,...44e444 i4( it.4.4—'11:Kkre,1":4' 0, IV, 0 ' Ili1 !' i 0,, i'''..ecof '60 10).,t,u;,a.?".:...4.1ril . 4Velli s 4,,, iJA, 4.• •i4A1.1Y +.4,2,...f,a.,,4, 4 ,4A 41 N61 :42k,,,,Asn:( , r„„,trill , ;4v-0 pm' )44 q4,;<c4ttr,"" 1,4 I, 117,1 d 4 - '4.̀--Icli lie14.rig If Tid‘d ' '111,'" 01 Isl. i'
VI / 1,4.6d.,,,,, , i. . • 1.. V 4 il 11 /4 tit I ' ' 1 t ,14,::111:‘"1:"fl'':'
.N. t il ‘1 1̀,441J/A 414i)5 ir'lit.ti?e--4601''," i"k g ;4% *1 4••." 'Y, \ALIO/4 i '11)s:19,11
illifiKn "41/91141K.V4011
ii
%Pe Fta:46C,411s4 Y1110111 l(itisili;lf,14g1( Depth ,“ 6,1(1441u;',,,,emi,„4 591.41ifigi ,MiliAle10.7"‘P'"d400rMlliffiri, 9 IOC jC rii
1'71 1 M4(4'0,1/100 ,,iir,,(011d114c44',/iP( fti' ( ;7'4.wV /.., 4',(F e4,(11(1 V(' ( 1 'i yON114 1̀14'40 ,e, (m)
-, \ s ..,9.4 •#., '4,6A s .„ ) 1 ,•,*. Y4140,), a C..-0110{eks'6 4,.(40/Ntt ".ii•i'IP'• P "iifi,KaKwerri, , , wog/4; 1 , j,,1(;'(?4,4) , ,4 ,,,) 44ff 4/44 , ' •- ' %NAM fi I., '''' ' JI . ' -
200 qi,,,,—„ 01)qt,,,, T A ‘71;̀Ii?ir 4treNgQ.if qk(4. "1)7M ni• VT: '.1.1 1 'I I sql_idi II [ 441 Ill AV ),,, ,IL , - . 4 1111 ed4 ds i.,,,,u,,„ f i i .:.l.pti,eir. , , „, 41 11 t 1 4=1.'04% ,
t11 u,q ,rfe '4 I ti" 1,9 1 i 9' 1 taiknt , 4
i 11 i 1, , 4 ,t , 4 4,,, ,,,, —dd.+, ,PARit. h , ii,, , ii. ILA,. ,,,i,... ,eizr,, ,„,,e, 1 11 11 ii'llt.Nli' 1J14''?(°t.V4‘ si"''''' 1 fit''' M134012./(1kt ' grl'it!' ll
ill
If ' \'4),< i $ hrly i ,ZNAVIGtiq llg trIlerVill 1;.1,e ",';1114igiiti,',,I,j14ggit,A6L1,4iiv; Tii14
4 IY6911 t1,111iitiP5111)121MOWTM41 i I lirteV a gIVIVII fkl4((l04‘i‘:,))111,1`"IVI J i ii/A I 1 ‘,0 )) 1, ,te ;1 . I .V.hil d j . 1 ly".,44 ,I I •4. , ,t ., I I, r‘mii ‘4,1„, ,f •A A : 1,;(‘„, .) 1
V6 'PI thliiiiiqtaarlfiltiiII4iviltiilnolifiOlItCrii:i44:11,ei?litviziiiiiii.!
1,131; ;11 ; r k .11121N1 t ii t i f: f g P ?Nati Mrh)1111i 0 Milidlittiititail lit IdIld -1, 'Ail,
; 1 l' 4144111.1flilli il CII1ir1 ii ISHIMPAlkS1244:N egigNitjaitr!,11
'cintflifinifelir(i Willq141)1* 44(1 i rillo ziii ifi4i(igzeltatkoAlotiolvkatt ,„ , „,, ,,,,„ , ,i3ograilli'quomilli., 12),,fm,,,i,I 4 rAilliilifill 1113iiT114, 11 I) ilMalifteiT'd'ib,(14
1,
1 ,
, 1 , • 1,
0 ,,I.,,, il II 1 r 1 i ,
ato;I: 1 il i
i i. i i De:
r:01,1 .,,, if r
,
Figure 5 South Blackwater 2-D surface seismic section, as processed.
..
..[ i4,-,. .• 4:4,':(.... , 41 ); '4 ;44.4 !-A9,1':.: 4i411, 7,:?4 " ' ' : - 4 44: 194,:10,44714444 m1,11944.,',414iig14)13%.":4,444A. 1.1- ATtlitmk oil 4„1 4,0 f 414 ,4$;',
th,vrotro•40.,,,,,,,,f/4.,,, ,,404, . 4 A #14401 4;141"?4,1 1 1411,1111V..61 Y,4'ilLiii,iiii;'',,k131.7:s'(<iiii.s.lf. 4 .,,,ev.,.;„1 ,1,01:4 6. , 71, 4.0r;:ii,,,' Vet,,I)K1 7 . , loycid,11,01-.,,t; •,-; ;•,, 4
q 11'9,1.4 iti,i«,heit,d411X,41?,,,, ,( i %J csilkr I,144'Yi#ifi, t'4 ,' IV t,1 44;0$4
lAtt.1,11,',(' .°1 '4111"S‘71K rirl 4/1 '4‘ 4) P t t•I' ,'q,:'` i
't1 lire NI sod!4‹:',//„Ai.411 .4 i Al 4 i Nicililinf,..44.1(' il'il?'. 4i'ifilillsis1.41
4 4k , , NS
1 ‘. g rill'1111q;) '1. Vte l'441, 4.ei41, it ,414 ' 1.., 4 i q ii, fib/ if , CI 4.1 i(.41 ,,,,,,.„,,„ 311[rt., in JO ,,,(y4„. ,,,voi 4 ,;'' 1W q '14 Pk: - '"Ae4.:01..1.4(.4,6":i',',f,',,
.41tor• 4 !kl+ g r, ‘',14'• VA(' kw All 44 ' ' ``'. !:6U(1,/,, 94, ifill,Ytiki,ii0 411ligi'r 6 ,sq,10 ,i
iii,,,r•- i'lvoo,,,, ,, ,,,‘,0,-,,A11,#zieoe,<(<4,(,,,Ir4q,N, ,iJ,!,.1,1k.ii..p4'0,(to,.•4,i,, ,e,e,„. q i, J(4frit,4e'h,
0.2<a4,4,110.1 hi .' 'II wi kai . , ,,, ,,, -, -' , ,•...'1'. I ' ' ` 'eon "iez.---,,,,,,.,„, . 1,,V4AA7.0.;411,
r.)1..." jr t,itt '1,1 711f11,1. ,,,crgiVoc lin N,e,' *qfAy/. . - -.—"°•A'Ideifq-vdejliti,§Prr ,4 A) ,0141. i '44V14(444? 7,1)111":)11,invill.,,piliiiiiii; Nr,4,t,,, 11/i ip igi,4'4.ffil4'1`,° llit0 4 1 ../.. t, ill IJ,.. 1.: 1 . h ,'` , '+ 1.''X , '..I ,.`.T<Y,11),„: 0,,,{ 4/ 4,,,I miA,Tr.ftg,,,, ;.1,,,,,„4T,I., , ..,14114k(rfkilliql,fyil,104411t,1A.R,,q., 04 ,. ,i IrkV4,4*44 Vkliql0' ,, AV& f' III, PSI) Avig; 111/14, 11 '11. 6 ,,, y. .0,6A 4Witaillkilliq't'"'"c7111,,16.11414 Ilitf11 ,13Pt1 (Ili' '01'1A'i r''''11114iir:Iiiita h4iii,41.A4Antil AtilSVIVOrr111'"f47f).'P*4. brj'12'`7,\.',"1" 4 .4 ,,, s
lif ,i „ Oil lidtri'dliViglIRR .41,J;), 6 N,lf.tililt!iiiNfaiiliZt;i1V,iillijb2f..qii.,,111)
li P: Wilir ilttij&I'll1141k1Sil iiTli IiiT V(,iiiiti llfiti4tIq1014(i'lllmit agnfTlit rtl'A a t . 1 1,t, , , t .1 r4 , I., . ri 1, ,̀ 1111:iki tAlilierl "I 4 Id j's,!:, 'Od IPS 12Dild tidg4fINVItIPJ,1114 241
1! 'f 1k71144 ;till' , 11
talIT goismilni, i mitiiiall,Aaog,04,01x491_i) ,,,,11, t ;atom:4Q ,Fir lim 11. it ‘ilYkti, II tiliiiivirsivi" IiiirelIN t. ), 4 iiTilmoompole,41 , ' ,.'t" " ..,A '1 'I I ,i I " ' 'I I
Figure 6 South Blackwater interpreted section, showing faults and a seam roll later confirmed by drilling and underground development.
• 3
44
130

LOW COST SEISMIC METHODS ASSIST LONGWALL MINE PLANNING 167
F. le 4 4 41 ( 01 1' 414/1 2 'I i4 I . 114 r !J4 II' 1 41 4 4
',1#44 kill Al Plill t 01. k IA ifitt 1 4 )4414i 4114/ ).440 '4-0:1;43 '4',1011 m1 444114o hi'10:',,,lit ,4 141,
/ !soliVIAP NITilt 41 i q4.41)1Jfk',4 li ,1111"401 i'11144mt 1 i Ifi ,pxlific (14 4 10P/ ;p4,), 14fi){, 1,i 0,4 ,,,110,014 1,1 , ik , 1 yi ifot ,, 4*,,f 4 1 44 el 1 l'ij 11 f 4 i 411 (A14 .4 eit 404 li ic
y 4r1,14v4 \sliii) 4 1 . 1 441 , 1.1 is 01 4 14 4‘ / 4 i& Ip144 (4 , /I t (Ik
4 ,(4.,.., , „, ' d ° 0 I 0 .1.-4114 401 v , 4 .1 ...,4. 14 1 4 0 04 • ix. 1,4,1,0 <
'-'" PA. •<,,,; 41'441; I' I 4 falle .4 ell!. til l 1 '1,e a f • .1
.4J°i<s,4v4fi'414 11:44 f4(. 1..k'44k4k-li:;414 V41)1S17J .64 \4%14.4 144404111/4011q(111;(4'?fi 1:44:44.11/4 4-ot Altr-i,t5,414rp, ,,,‘ , 4.11<1 4'74444 44 1 1 1 '140 1" 1 ?{ t'04 4 4.4r~(•` '4,Q(417;o10 4 kg' Al f 11/1 I) ll'f qis'il 04 4i, 4q1 °1)4 hi 1 4 14 l444V(4<( kTIIIPI /4 Ill 41kk444 "4 co') .il , ocv c 1.,4 i , 401, )1 ' ,/,, 1 , j\iii,,,,,,,,co, i ./ Af,N) '• 'VA r ,, 44,404414,b,N1 i` (JAlolcVk4,./!-,/,',./e 41,<,r<c*(,, , v Iii i t4 v/efilk*k
Prf r41'4044 I ' e'* i
Ø !
4t(i.," )',,,, ' ,k‘v"h liv s'041 <444"ii4 Aiqi uliii k„i ,1', ,11"ii's fr\l'i's',PiP/ yedMit „. 4 4, kA.,,,c ,, 4 )1 r + Ot4 i 4'41 IP 14011, ,11/ )illl i,614,‘ 44)/044 , 4 4t/)1 ts(i mi N4,1 /4 4/i-fss II 41 1 1 .1 14 , ill h 4 4 fil ' 04 41 P 1 41 4 i tiftl 4 1 1/1 14 I 44 i i ' .,101;&/1 ,) 4, 4Pi 14 1. if Jet(' 4No lio,i) 0 *fe1 /441 44 I 4 141,110d014 $11\1,1, 44,filylii 4 11+4tIciii ii0t) ) 0°4t- iii 1 N ))1,to ? 4 4e4vi ,,o i g 1 (4 f& ilk p 1-t 1 1 41 tk1•401 I I f 0 ;444.4 it 4440 ) ii 1 1'0? 11441 )
I 't 1 440 It 4 )', I 1( P4if(4/4„1 i ,.4 1)4 1449
"fifi41°114110411f(104.14t/4S414f1(414ill 1t4k4 1,g
, l
i() 4'Ll
if1iFoti
,ifk;11
s1,i
jo
itit1
4 gg '1i6,k/ \it 1 VI:.#911 ? N 4?4/1•1 t VI 4 / i r 111 " Ilri" 11 /4" I() 4 )414 444<\ 4i AtidAl f Of A10.1 4,11i 4 11 I , 1 %A 11. 4,4 1 Y i
Figure 7 Wards Well conventional seismic line, showing poorly-imaged seams at 300 m depth under 110 m of basalts.
Jill
i,lf1,111,441))01;-1,41;4,1j511,1iiliii:141?!4!441).4i):4,!3114:‘17!41‘1:1;:111,;1:1)111 ::1:1;Ill".
1 11 1 ii li 1
• i /11,krtIKA4Q ii d Awl •
4
:1
,,,,(
:;
.4,,
t 1 :
4 ti, 0,44.6,„,..
44...,
rke,..4.1 0) 1 :t4.0.4,4; i
lik 1
;-;'' ;444A)t(Itlls4' 6
40( 'Pl11,';r„,(4 4--,-(,4u444wii 1/ii,;/14kiAt,14)411110'1,/o. <-11):,,00 Vk''.)&,-(e4 It` )1,A,A.;4QA(V.<1.4./4 /4,4**K41041i 1 V k,s, .;`'• ', -. 0 i 4 ' ;
4-44' Ar)414;;‘"C<4.4k Vil) .1' `•"- ; 14 0 _. . , i(0 (-,,,..„ 4-011(1.?(:<\4‘ ..., -: ..., :4.4,c,\A :trictee(40e44,4:444,44:410044; ,'• )
444). :.1,i; -
1
,:
d
..
,
'-47i::1
,
11
)
(4; •44z4,4\kgiq<cti'41(<4.,V.V•444.V.444( :,'I'jt)411,V14,,4*. 444/(e4:4,4e/it; Zeik,<0( fee 4̀4i4P1140114°̀ , 494410<oisM00,0441;040 ,.)44,1eife"<40,e
(,14,1;11,41 4
(44,44.‘41:4,)1,4,140,J4!,lAkipdvil!
jf,44
%?(4%eis:,,r,
4,04%*.4,1,4t 4C44 0•4; 04 4)41 ' k'410 “-1?4,i04414(r tmo ,`
1 0'4 ‘d ie,- tt•-1-,0411.) 1,11).0i Ili 4f /4 4"eiAl k((r41)-1.2011 J ' 'ill - i 4 1,k11, c•$' 4 4 14 i` Pt 411,6 I )4 1 441 ei) 'I 414 4 ' 44 .(0d til 11 4 ) 4 e{.P1t41 401 i '1 0 %Ali 444'e Tig-zoe (ci,•, 44:44,(40,/,147, Itioll'41,04.47kft
'0,41444461:441Zr<444; /V74,4N1,11414‘4%1M ' *) '41*1 1 I 0 404iI4 W 'Pf"#41 4441 'Op 44' 0)
1.1144 4 A 0 4k e 401" 10 1 I, "4 4) Ati, q,.(0, t? 4 144114h4AliedilitjA14 t(:14*qts,s' 41111.i, i4hifiii:dV 4
Figure 8 The same line at Wards Well, but using overlapping RSVP. This image is an improvement over that in Figure 7, showing continuous Goonyella Middle seam reflections at 300 m depth.
Conclusions — Provided a 12 m shot-hole was used, with geophones drilled into the ground over silcrete areas, good quality seismic data could be obtained to guide future longwall panel planning. Since a normal shot-hole would previously have been 40 m or more deep, a cost saving of some 30 m of drilling per shot-hole (at spacings of 15 m) was achieved, amounting to a saving of 1000 m of drilling per line kilometre. These seismic costs are now comparable with stratigraphic drilling, since a seismic sample every 7.5 m can replace a drill-hole every 200 m. By this measure, seismic reflection may be a more economic seam exploration method than infill drilling, and potentially more reliable in defining structure.
Wards Well 2-D/RVSP
The Wards Well (Queensland) site was chosen because faulting beneath a 70 m thick continuous basalt layer had been indicated by boreholes spaced 157 m apart. Previous seismic data recorded at an adjacent site had also indicated that reflections could be obtained using long-offset recording methods (Evans and Urosevic, 1995). It had been expected that the seismic data quality would not be very good due to the dispersive nature of the thick basalt layer. Therefore, the intention was to trial the RVSP method of recording between three
existing bore-holes, to see if a better image could be obtained by firing the source at different levels beneath the basalt.
The BHP Australia Coal seismic recording instru-ments were linked to the Curtin seismic instruments to form a 288-channel device. Both vertical and radial shear-geophones were used, with a shot-hole every 15 m and receiver stations every 7.5 m. Two RVSPs were recorded in two of the bore-holes, by firing up the bore-holes while recording the surface data.
Figure 7 shows 480 m of the surface seismic section, in which the image of the coal seams at 300 m is not well defined. The RVSP method was then used, firing 400 g explosives up the boreholes into the surface seismic receivers, so that the receiver spreads from adjacent boreholes overlapped. The data recorded from shots beneath the basalts were then transformed as conventional walk-away RVSP data at each bore-hole, and mapped into the common mid-point (CMP) domain. The mapping of RVSP shots fired beneath the seam causes the jagged appearance of data shallower than 100 m. The data were then spliced together to produce the stacked section of Figure 8, and Goonyella Middle Coal continuity is apparent at 300 m. Clearly there is a great improvement in reflection quality in the RVSP data, and an interpretation suggests three faults between the outer two boreholes. This interpretation is to be tested during the next round of drilling in 1997.

168 B. J. EVANS ET AL.
Perspective direction
Figure 9 Depth slice through Bulli Coal. The lighter grey indicates the seam at depth 475 m, while the darkest grey shows it at 500 m. The perspective view direction for Figure 10 is also indicated.
Figure 10 Low oblique perspective view of scissor fault affecting the Bulli seam at Tower Colliery NSW.
Conclusions — Where thick basalt layers exist in the overburden, a new seismic method known as 'overlapping RVSP' has been tested and shown to produce better quality reflections than those produced by the surface seismic method. While there is still some way to go in the development of the method, it has strong potential as a replacement for surface seismic in areas of extensive basalt cover. Instead of using expensive surface shot-holes, this method uses existing drillholes, so no further surface sources are required. It has potential for use where environmental concerns are paramount, such as mining in national parks. Since there is no longer a need to drill and record shot-hole seismic lines, the cost benefits are large.
Tower 3-D
BHP Collieries Division conducts longwall mining of the Bulli Coal at their Tower Colliery near Appin, NSW. Conventional 12-fold 2-D seismic surveys had indicated an area of poor seismic response with potential complex faulting of the Bulli seam at a depth of 500 m. A number of alternative interpretations resulted and it became apparent that the fault was sufficiently complex to merit a test 8-fold 3-D seismic survey (Lambourne et al., 1989).
During 1988, a 3-D seismic survey was conducted over the anomalous region, using conventional 12 m shot-hole depths (to weathering base) and single

LOW COST SEISMIC METHODS ASSIST LONGWALL MINE PLANNING 169
3-C line B
3-C line A
fast
Fracture
Fracture zone
Figure 11 Shear waves split into slow and faster-moving components when they pass through a fracture. With this fracture geometry, line B transverse shear waves will arrive later than those of line A.
component 100 hz geophones. The 3-D survey (Figure 1) could be considered as equivalent to a series of parallel, closely spaced 2-D lines, which confine a volume of seismic data. In this case, the surface area measured 500 m by 920 m, and represented the approximate dimensions of a longwall panel which would take a year to extract.
The seismic data were tied-in with down-hole logs and processed to produce a volume of seismic data, which could be sectioned vertically to produce a seismic line in any required direction or cut horizontally through the Bulli seam. Figure 9 shows a depth slice at the Bulli seam level; the darker areas represent it at depths greater than 490 m, while the lighter areas show the seam at depths of 470 m to 490 m. The seam is shown to contain a linear feature running across the panel, with another feature running diagonally.
The data were then interpreted and gridded to produce the perspective view shown in Figure 10. The vertical scale has been increased by 25% in this figure to exaggerate the faulting. It is clear from this perspective view that the linear feature is a fault with a throw of about 10 m, while the diagonal feature is a fault-bounded seam ramp. Fault tips of as little as 0.2 m throw have been imaged to a positional accuracy of some 2 m at the seam level of 470 m.
Conclusions — The 3-D image led to a change in the longwall mining plan and provided, for the first time, an interpretation of the Bulli Coal structure in a complex zone. The 3-D seismic data were used to image a complex structure which would be very difficult to evaluate using any form of drilling, either horizontal or vertical. The major drawback of the method is that clear access is required to the whole of the surface above the area being investigated. The surface in this instance was open paddocks, which made equipment movement very easy. There was a temporary disruption to the local environment, which was fully restored after the survey.
Tower 3-C
During 1994, a two line 3-C seismic survey was conducted by BHP Collieries in the Cataract area of Tower Colliery. The area displayed seismic velocity anomalies on existing seismic data recorded by BHP, and it was speculated that these anomalies may have resulted from the presence of small gas accumulations associated with rock fractures in the Bulgo and Hawkesbury Sandstones.
The intention of this survey was to record two orthogonal 3-C seismic lines over the possible anomaly. BHP aeromagnetic data and ACIRL seismic fault finder software were also used to determine if 3-C recording methods with conventional explosive sources could be used to sense the presence of fractures and their orientation. Apart from the use of shear-wave geophones, there were no special features in the recording process.
Seismic waves propagate in the form of com-pressional (P-) and shear (S-) waves. When a P-wave meets a fracture, it passes across with minimal change to its propagation parameters. However, when an S-wave meets a fracture, it splits into two separate shear-waves, one which propagates along the fracture face at a fast S-wave velocity and one which propagates across the fracture with a slower velocity (Figure 11). The mechanism of this rapid change in shear parameters is referred to as 'birefringence', and can be observed as 5-wave reflections arriving at the surface at different times. If such birefringence can be detected at the surface, then a knowledge of the location and orientation of the fractures can be obtained.
Recognition of shear-wave splitting is of great impor-tance, particularly in this instance where uncontrolled shear-waves were generated by the explosive source. Initial field tests indicated that the shear-wave arrivals occurred 200 to 500 m from the shot requiring 1.6 kg of
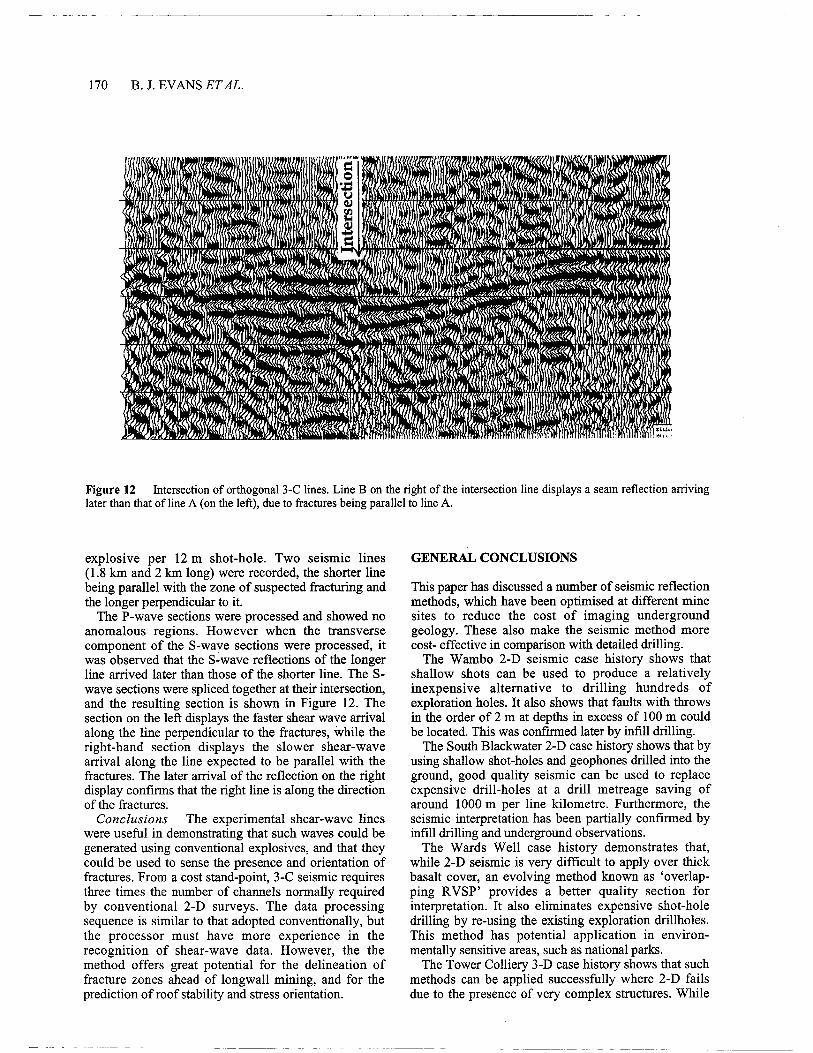
170 B. J. EVANS ET AL.
({ ) ic qi(oci 104 4)' 4 lk dO 0 / 414i itii, #:,) it irM11 til fl i ili.),:ltIllo'll fic)t<,<Iiitit)0 44144(Allid<liitd rfiiitiii(410111011 ti'iiiti t4101:e<<1;11$40411ccee 4)1i
,
millt wril ) qi 74 1 4) lit 41T < Cce <C, IfNO A 0 1(00i (ck(tE 'e lel<IY{0 i ( i r (
i io'ci %Vol 41 / o oo 4 _
0 iif e\iji! vorli
44
?4/
1)(41(,)1<
ei4),o
s i.,,k‘‘ ce,ls
0 1 d 40) <I <Oi) ji) I) i a 4 Vaq 14 e <44 h /I 41 s 0 4m1r 119 1 40,000 4ve qp 0 ‹e " rl, ,,,,tcc e <e Alc% li) ! i0 / ? 4 II <41 \\ 1 f- ' < < 1 4 (() q << ‘ ‹i Olt 4e 0 <0Oi ‹ 0 i !k 4 ‘4 4 #tkf4 0
$ 1) kii ee ooi illg IlioP ego / i 4‹ t ° (41 ff, 1 iil 11(4 4 e< 1# 41fIlr?
i, i 4
N 1 4vit V cO' s qi,e4 A i<g (1( 1 lo)(<4SP oii#004 < 04 0 i 644 (dila i fr ' ier T Mo/ft ?I‘44(// A \ 110 1 111A NJ 4iAilif { 11(li<A44A t gio ci <4) 00%4 i'ok 40161 P 0! 404 4)/ it At OA )„ filti i)
i i °OIP dl" 1 40 VII) e /al& IVA 'i i idd eel, ) i (41 I A { \ d
co Ow 44 ilu V1 1 11 1 i 0, Ni) ) i 11) 11 !4‹ IN 1 Nil 411040 4))) %WI); ,0<icOf i 11 il eqm IfiN q( 0) 1 c 001 v 1 4
.rd% )10),Oitel S 11 ( e A c0 1 ' .sc
Figure 12 Intersection of orthogonal 3-C lines. Line B on the right of the intersection line displays a seam reflection arriving later than that of line A (on the left), due to fractures being parallel to line A.
t '
explosive per 12 m shot-hole. Two seismic lines (1.8 km and 2 km long) were recorded, the shorter line being parallel with the zone of suspected fracturing and the longer perpendicular to it.
The P-wave sections were processed and showed no anomalous regions. However when the transverse component of the S-wave sections were processed, it was observed that the S-wave reflections of the longer line arrived later than those of the shorter line. The 5-wave sections were spliced together at their intersection, and the resulting section is shown in Figure 12. The section on the left displays the faster shear wave arrival along the line perpendicular to the fractures, while the right-hand section displays the slower shear-wave arrival along the line expected to be parallel with the fractures. The later arrival of the reflection on the right display confirms that the right line is along the direction of the fractures.
Conclusions — The experimental shear-wave lines were useful in demonstrating that such waves could be generated using conventional explosives, and that they could be used to sense the presence and orientation of fractures. From a cost stand-point, 3-C seismic requires three times the number of channels normally required by conventional 2-D surveys. The data processing sequence is similar to that adopted conventionally, but the processor must have more experience in the recognition of shear-wave data. However, the the method offers great potential for the delineation of fracture zones ahead of longwall mining, and for the prediction of roof stability and stress orientation.
GENERAL CONCLUSIONS
This paper has discussed a number of seismic reflection methods, which have been optimised at different mine sites to reduce the cost of imaging underground geology. These also make the seismic method more cost- effective in comparison with detailed drilling.
The Wambo 2-D seismic case history shows that shallow shots can be used to produce a relatively inexpensive alternative to drilling hundreds of exploration holes. It also shows that faults with throws in the order of 2 m at depths in excess of 100 m could be located. This was confirmed later by infill drilling.
The South Blackwater 2-D case history shows that by using shallow shot-holes and geophones drilled into the ground, good quality seismic can be used to replace expensive drill-holes at a drill metreage saving of around 1000 m per line kilometre. Furthermore, the seismic interpretation has been partially confirmed by infill drilling and underground observations.
The Wards Well case history demonstrates that, while 2-D seismic is very difficult to apply over thick basalt cover, an evolving method known as 'overlap-ping RVSP' provides a better quality section for interpretation. It also eliminates expensive shot-hole drilling by re-using the existing exploration drillholes. This method has potential application in environ-mentally sensitive areas, such as national parks.
The Tower Colliery 3-D case history shows that such methods can be applied successfully where 2-D fails due to the presence of very complex structures. While
LOW COST SEISMIC METHODS ASSIST LONGWALL MINE PLANNING 171
the cost of 3-D acquisition is greater than that of 2-D seismic, it does provide far better quality. The Tower 3-C case history demonstrates that conventional seismic methods using 3-C receivers can be used to locate fractures and map their orientation. The 3-C method also offers potential for predicting other rock properties.
Particular thanks go to Bryan Atkins, Atilla Kovago, Greg Poole, Jeff Wood, Ken O'Reilly and Nick Gordon for their foresight in supporting our research ideas and review of this paper. We also thank the reviewers of this paper for their comments.
ACKNOWLEDGMENTS
The authors wish to acknowledge the ACARP supported Seismic Syndicate members, including Wambo Mining Corporation, South Blackwater Mine, BHP Australia Coal, BHP Collieries Division and ISCOR. We also acknowledge the release of data for this paper by Wambo Colliery, South Blackwater Colliery, BHP Collieries Division and BHPAC.
REFERENCES
EVANS B. J. & UROSEVIC M. 1995. The potential of surface and down-hole seismic in multi-layer basalts. Proceedings of the Bowen Basin Symposium 1995, Mackay. Geological Society of Australia (Queensland Division), 55-64.
LAMBOURNE A. N., EVANS B. J. and HATHERLY P. J. 1989. The application of the 3D seismic surveying technique to coal seam imaging — case histories from the Arckaringa and Sydney Basins. Exploration Geophysics 20, 137-141.


Symposium on Geology in Longwall Mining, 12-13 November 1996, eds G. H. McNally and C. R. Ward, pp 173-178.
Stress orientation from drill core — does it work?
P. W. SCHIVIIDT
CSIRO Division of Exploration and Mining.
Prediction of in-situ stress orientation from drill core relaxation and palaeomagnetism is a concept being tested under ACARP project C3069. Drill core dilation monitored using a laser micrometer within a few hours of drilling has exhibited real-time stress relaxation. For vertical drill holes and horizontal strata, and in the absence of any obvious anisotropy, the axis of greatest strain presumably corresponds to the major principal horizontal stress direction (ahi). Measurement of remanent magnetisation in the core allows it to be oriented, since such directions in Sydney Basin sediments have been established through palaeomagnetic studies. The method may break down when any of the following conditions apply: the rock is too weakly magnetised for a consistent direction to be determined; the stress anisotropy is too low to produce significantly oval-shaped drill core cross-sections; or if the drill core is taken too close to the surface.
Two case studies, from Ulan and Oakdale collieries in the Sydney Basin, are discussed. The am observed in most drill holes at Ulan appear to be N—S, although this is modified near intrusions and faults. In particular, ahi appears to be deflected E—W between the Echidna Sill and the Spring Gully Fault, and near the Cliffdale Fault. Otherwise, to the north of Echidna Sill am seems to be fairly consistently oriented N—S. At Oakdale, there is a consistent relationship between am) above and below the coal seam to the west of an inferred fault. Below the seam these axes are mostly E—W, while above it they swing around to the SE—NW.
These case studies generate a good deal of confidence in the method. With carefully selected samples, and when all the assumptions in the method are met, systematic relationships suggest that the underlying concepts are sound.
INTRODUCTION
ACARP project C3069, which began in 1994, was designed to investigate the feasibility of using the cross-sectional shape of vertical drill core samples as a proxy for the horizontal component of underground stress. If this procedure proved to be valid then palaeomagnetic orientation of the drill core (ACARP project C1615) provides a method to determine the stress axes in geographical coordinates. This method is complemen-tary to, rather than an alternative to other methods. However, it is appealing in several respects. It is simple, non-destructive, can be applied to old core, and it is not expensive.
While the concepts are under investigation, the results are experimental and have to be treated with caution. Cross-checking the stress relaxation concept with other accepted techniques has not been easy since other techniques are accompanied with their own vaguaries and finding appropriate drill core samples has been difficult. However, the orientation procedure itself has proved to be very reliable where the opportunity has arisen to cross-check it against other methods (Pattison et al., 1995).
TECHNIQUES
Laser micrometer
To measure the diameter of drill core with adequate precision and to systematically rotate and translate core samples, a laser micrometer (ZYGO Model 1104 Laser Dimension Sensor) has been adapted. A chuck-
mounting system has been designed and built which is controlled by stepping motors and interfaced to a PC. The PC also performs the task of data logging. The method is further described by Schmidt and Lackie (1994).
The output consists of a cluster of plots (Figure 1). The uppermost plot displays the diameter variation as a function of angle (from 00 to 180°) every 5 mm to 20 mm along the core stick length. The next plot down is a record of the absolute diameters; for HQ core this is about 61 mm. The absolute diameters are only used indirectly, but can indicate drilling-induced problems or when samples have become deformed after drilling. This latter problem is common with shales and other clay-rich samples.
The lowermost two stereoplots indicate the long axes of the oval-shaped core cross-sections. The stereoplot on the left is plotted with respect to an arbitrary reference line, while that on the right has been oriented according to the natural remanent magnetisation (NRM). The axes represent the phase and amplitude of the fundamental term as determined from a Fourier analysis of each cross-section. The significance of the phase is self-evident, but the amplitude is also useful since it reflects how closely sinusoidal the signal is. The amplitudes are proportional to the lengths of the axes after normalisation to the stereoplot radii. For a perfect sinusoid the axis would extend from the centre to the perimeter of the stereoplot.
The right hand oriented stereoplot is arrived at by rotating the reference so the NRM direction (in this case 1610) is aligned with True North. The principles behind the palaeomagnetic orientation have been described

174 P. W. SCHMIDT
30
20 1, 0
150 175 100 R`SM
0.0400 0.0450 0.01 0.0200 0.0100
Wan coal d,15 214.51-214.65 Core Diameter (slices 25 diff 77.2 y m )
Core Diameter for 25 slices
60.9742-
60.9692-
60.9642
60.9592-
60.9542-
Core Depth (a) start 214.53 incorrected Relaxation Direction! (slices 25)
Palaeo Corrected Directions WM 161 Core Cr•l_ftSER\1L15
Principal Relaxation Direction is 1.6
Maxima difference in diameter is 77.2 y
Mean to 25)
179.2 t 1.61
Mean (n 25)
18.2 it 1.6
-1. -2,
Figure 1 Output from the laser micrometer. The uppermost plot displays the diameter variation, while the next plot down is a record of the absolute diameters. Lowermost are two stereoplots indicating the inferred stress axes, with respect to an arbitrary reference line (left) and following orientation (right).
-10-
UnCorrected Relaxation Directions (slices 5) r Core Cts.TC•LASER,,CAIA
Mean (n 4)
150.3 t 2.75
125 hrt 175
Principal Relaxation Direction is 150.2t 2.7
Madam difference in di/ratter is 53.3
Figure 2 Real-time relaxation data showing how the circular core sample slowly becomes elliptical in cross-section over an 18-hr period. The diameter difference increased from 19µm to 29µm, 47µm, 50pm and finally to 51µm.
Cor• Cliwater (slices 5 cliff 53.3 y a
18 hrs

STRESS ORIENTATION FROM DRILL CORE — DOES IT WORK?
elsewhere (Schmidt, 1991; Schmidt and Anderson, 1991) and will not be repeated here.
Some caveats
When dealing with axes it is worth remembering that they are defined with a range of 1800. Therefore modes may appear to be more significant than they really are. To put this another way, the scatter of axes may appear to be less significant than it really is. It should also be noted that this method may fail when any of the following conditions apply:
• The sediment is too weakly magnetised for a consistent remanence direction to be determined;
• The stress anisotropy is too low to produce significant oval-shaped drill core cross-sections; or
• The drill core was taken too close to the surface and stress differences that may exist at depth are compensated for by surface accommodation.
RESULTS
Real-time relaxation
During the course of the project several opportunities have arisen to observe the real-time relaxation of a drill core sample. Several drilling programs have been conducted close enough to the CSIRO Rock Magnetism Laboratory at North Ryde for samples to be transported and monitored within a few hours of their extraction from the ground. These have included Pacific Power's Eveleigh deep hole and programs at Tahmoor and Ulan. The example shown in Figure 2 is from Ulan's 1994 drilling program. This is a compilation of real-time relaxation data for sample C448, which was collected on site at Ulan on 14th January 1994 and immediately taken to North Ryde.
That evening and throughout the following day the sample was continuously monitored. The plot shows how the sample slowly becomes oval shaped over an 18-hour period. It is noteworthy that even by 7:25 PM (0 hr) the sample had a measurable oval shape, whose long axis remained fairly constant throughout the observation period. The diameter difference increased from 19p,m to 29p,m, 47µm, 50p.m and finally 51p,m. Other results from the Sydney Basin suggest that final values of 40um to 801..tm are normal.
Some noise sources
As mentioned previously, the diameters of clay-rich g core sticks often vary dramatically along the length of
the sample. In addition, these samples often have odd shaped cross-sections dominated by higher harmonic terms. That is, the amplitude of the fundamental term in the Fourier analysis is weak. It is difficult to attribute these observations to simple stress relaxation and they seem more likely to reflect the instability of the clay
175
Figure 3 Photograph of a drill core sample showing core catcher grooves (locations highlighted by barbs).
minerals in humid air and post-drilling stresses. Fine sandstone consistently gives superior results to shale and has therefore become the preferred lithology for this application.
Other sources of noise are drilling induced. While drilling irregularities such as a wobbling drill bit usually damage the core irretrievably, other drilling effects can be dealt with. A photo of a drill core sample with core catcher grooves is shown in Figure 3 and the resulting signal is plotted in Figure 4. Despite the deep grooving (about 40pm) the signal can be readily retrieved, although the amplitude of the fundamental from the Fourier analysis is somewhat diminished (shown by the axes only extending part way to the perimeter of the stereonet).
Ulan Colliery
A sketch map of the sampling sites in relation to the Ulan Mine area is given in Figure 5. Also indicated are drill holes that have been tested, along with inferred
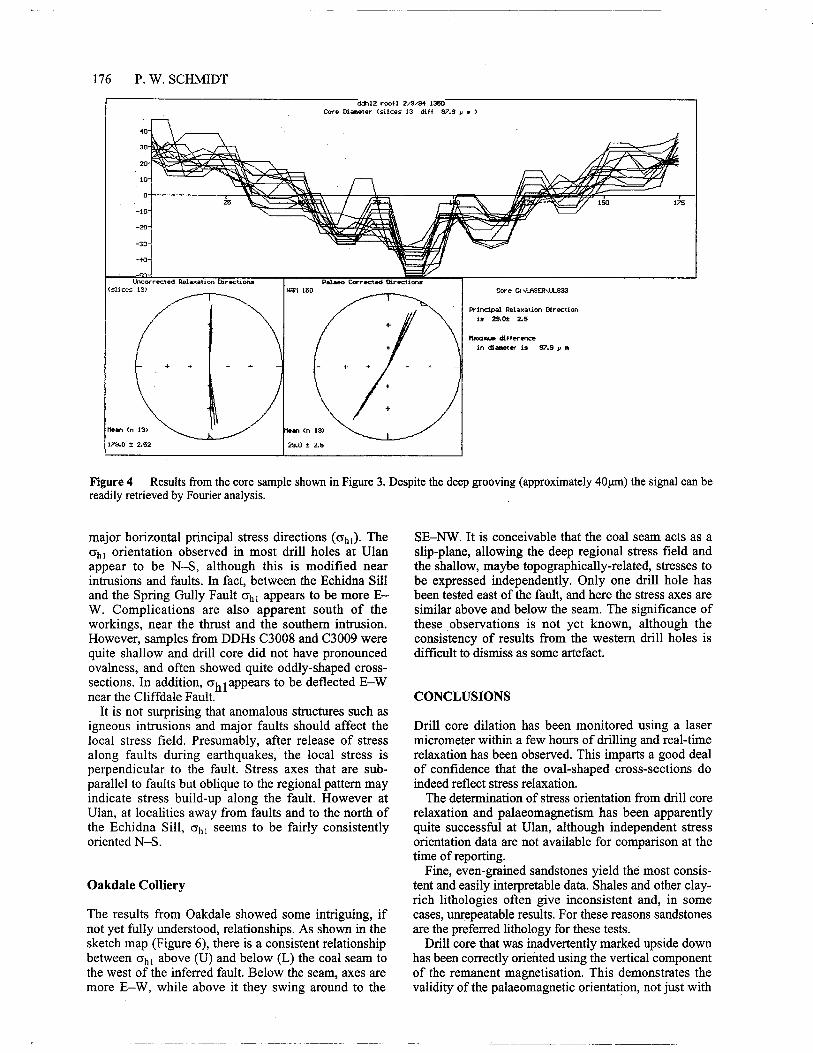
176 P. W. SCHMIDT
Figure 4 Results from the core sample shown in Figure 3. Despite the deep grooving (approximately 40µm) the signal can be readily retrieved by Fourier analysis.
major horizontal principal stress directions (ahi). The ah, orientation observed in most drill holes at Ulan appear to be N—S, although this is modified near intrusions and faults. In fact, between the Echidna Sill and the Spring Gully Fault crh, appears to be more E—W. Complications are also apparent south of the workings, near the thrust and the southern intrusion. However, samples from DDHs C3008 and C3009 were quite shallow and drill core did not have pronounced ovalness, and often showed quite oddly-shaped cross-sections. In addition, ah appears to be deflected E—W near the Cliffdale Fault.
It is not surprising that anomalous structures such as igneous intrusions and major faults should affect the local stress field. Presumably, after release of stress along faults during earthquakes, the local stress is perpendicular to the fault. Stress axes that are sub-parallel to faults but oblique to the regional pattern may indicate stress build-up along the fault. However at Ulan, at localities away from faults and to the north of the Echidna Sill, al,, seems to be fairly consistently oriented N—S.
Oakdale Colliery
The results from Oakdale showed some intriguing, if not yet fully understood, relationships. As shown in the sketch map (Figure 6), there is a consistent relationship between am above (U) and below (L) the coal seam to the west of the inferred fault. Below the seam, axes are more E—W, while above it they swing around to the
SE—NW. It is conceivable that the coal seam acts as a slip-plane, allowing the deep regional stress field and the shallow, maybe topographically-related, stresses to be expressed independently. Only one drill hole has been tested east of the fault, and here the stress axes are similar above and below the seam. The significance of these observations is not yet known, although the consistency of results from the western drill holes is difficult to dismiss as some artefact.
CONCLUSIONS
Drill core dilation has been monitored using a laser micrometer within a few hours of drilling and real-time relaxation has been observed. This imparts a good deal of confidence that the oval-shaped cross-sections do indeed reflect stress relaxation.
The determination of stress orientation from drill core relaxation and palaeomagnetism has been apparently quite successful at Ulan, although independent stress orientation data are not available for comparison at the time of reporting.
Fine, even-grained sandstones yield the most consis-tent and easily interpretable data. Shales and other clay-rich lithologies often give inconsistent and, in some cases, unrepeatable results. For these reasons sandstones are the preferred lithology for these tests.
Drill core that was inadvertently marked upside down has been correctly oriented using the vertical component of the remanent magnetisation. This demonstrates the validity of the palaeomagnetic orientation, not just with

364000E 360000E •
360000E * 1 1 11=====1
kilometres
372000E 376000E
clifeej=s -.,
I ••••
ULAN COAL MINE
f ettle25
Wombat Sill
elik$4 Ake
...'"I'' ' ' .• ir4...
v
date
1
STRESS ORIENTATION FROM DRILL CORE—DOES IT WORK? 177
Figure 5 A sketch map of the Ulan Colliery area showing drill holes that have been tested, along with inferred major horizontal principal stress axes (ah1). The ahl direction observed in most drill holes at Ulan appears to be N—S.

OAKDALE
0.5 1.0 0
1218000
BG156
.U4111.cu
ldfolioed=
BG157
L
II
178 P. W. SCHMIDT
Figure 6 A sketch map of Oakdale Colliery showing drill holes that have been tested, along with inferred major horizontal principal stress axes (ah1). The consistency of results from DDHs BG157, BG158 and BG160A, although not understood, is difficult to dismiss as some artefact.
respect to geographic north but also with respect to the horizontal. Core-catcher grooves on samples have been detected by the laser micrometer and the relaxation signal is still clearly discernible, showing that the method is robust to this kind of noise.
REFERENCES
PATTISON C. I., FIELDING C. R., MCWATTERS R. H. & HAMILTON L. H. 1995. Nature and origin of fractures in permian (sic.) coals from the Bowen Basin and the relationship with in situ reservoir permeability. Proceedings of the Bowen Basin Symposium 1995,
Geological Society of Australia (Queensland Division), Mackay, 217-234.
SCHMIDT P. W. 1991. Remanent magnetisation and orientation of drill core. Proceedings of Underground Coal Mining Exploration Techniques, Australian Coal Association, Brisbane, 1991.
SCHMIDT P. W. & ANDERSON J. C. 1991. Orientation of drill core using palaeomagnetism in coal exploration. Twenty -fifth Newcastle Symposium on Advances in the Study of the Sydney Basin. University of Newcastle Publication 413,118-121.
SCHMIDT P. W. & LACKIE M. A. 1994. Determination of stress relaxation axes in drill core using laser micrometry and palaeomagnetism. Twenty-eighth Newcastle Sym-posium on Advances in the Study of the Sydney Basin. University of Newcastle Publication 606, 273-279.

Symposium on Geology in Longwall Mining, 12-13 November 1996, eds G. H. McNally and C. R. Ward, pp 179-184.
Application of acoustic emission techniques in estimating in-situ vertical stress from borehole core samples
D. K. NAG', M. SET02 AND V. S. VUTUICURI3
Monash University.
3The University of New South Wales, Department of Mining Engineering.
A laboratory investigation was conducted to investigate the Kaiser effect in coal and the possibility of estimating of its in-situ stress by this means. The Kaiser effect is a phenomenon whereby acoustic emissions (AE) in a rock sample sharply increase when it is loaded beyond the previous maximum stress experienced. AE signals were measured by two piezoelectric transducers in different frequency ranges, 50-200 kHz and 200-1200 kHz. Coal specimens exhibited an obvious Kaiser effect in both low and high frequency ranges. The time interval between sampling and testing, up to 20 days, did not strongly influence the AE response. The vertical in-situ stress determined from coal core samples coincided well with that estimated from overburden pressure at the sampling depth.
2National Institute for Resources and Environment, Tsukuba, Japan.
INTRODUCTION
information on in-situ stress is valuable in numerous disciplines such as mining engineering, engineering geology and especially in rock mechanics. Adequate and accurate stress measurement is extremely important in evaluating the stability of rock masses and coal seams in underground excavations. A variety of methods has been developed and used to determine the in-situ stresses; currently the most popular are borehole overcoring and hydraulic fracturing. Both have certain limitations, being costly, time consuming and producing results which are difficult to interpret. Consequently, the use of these methods is not extensive. In addition, coal is fragile and fractured in nature, so most of the established techniques have not been successfully applied in this material. An alternative method, using an acoustic emission (AE) recording technique on rock drillcore to determine in-situ stress has heen proposed by researchers in the recent past.
Acoustic emissions are bursts of high frequency elastic waves caused by microcracking or pore collapse in stressed rock. AE is detected only when the previous maximum applied stress state is exceeded. This is the so-called 'Kaiser effect', which suggests that previous maximum stress levels might be estimated by loading a sample to the point where there is a substantial increase in AE activity.
Stress investigation techniques relying on the Kaiser effect have been tried by various researchers in the past. These include Kanagawa et al., 1976; Kurita and Fujii, 1979; Houghton and Crawford, 1987; Seto et al., 1989a, b, 1992a, b, 1996; Holocomb 1993; and Utagawa et al., 1995. The technique is workable, and the rapid and economical determination of in-situ stress in rock is possible. Little research, however, has been conducted
with the Kaiser effect in coal. In the present study a series of laboratory experiments was conducted to investigate the Kaiser effect in coal, and to estimate in-situ vertical stresses from cored coal specimens taken from deep boreholes.
EXPERIMENTAL PROCEDURES
Coal and rock specimens
In the preparation of test specimens, all cutting, sanding and grinding were done in a dry condition to prevent moisture entry. Cubic specimens were prepared with dimensions of 110 mm in height and approxi-mately 105 mm x 105 mm in cross-section. Parallelism between the top and bottom faces of each cube was achieved to within 0.02 mm. Coal specimens were taken from a depth of 356 m in a borehole drilled 45 days before the test. These had dimensions of 61 mm diameter and 144.5 mm length. Rock cores taken from a 315 m deep vertical exploration borehole in the Hunter Valley NSW were also used in the laboratory tests. This borehole was drilled 7 days before the tests. In order to evaluate the time dependency of stress imprinting, rock cores from another 400 m borehole drilled at Newcastle nearly two years previously were include in the test program.
Testing Procedure
In the experiments, the initial stress was imprinted on a coal specimen by five cycles of uniaxial loading up to nearly 5 MPa. The loading was performed under a constant displacement rate of 100 microns/minute, by means of a Schenk TREBEL servo-controlled testing

180 D. K. NAG ET AL.
Previous stress
100 200 300 400 500 600
AE increase point
9
8
7
co 6
2_ 5 ,„0 4
C7) 3
14000 1.4
12000 0
w 10000
12 8000
-3 6000
4000
2000
2
1
0
0 16000
100 200 300 400
Time, sec 500 600
Figure 1 A typical example of the Kaiser effect in a coal specimen.
Figure 2 Acoustic emission (AE) signature in the second loading of a previously stressed coal.
machine. After this initial loading, specimens were kept at room temperature until reloadings for 5 minutes, 1 day, 2 days, 6 days and 20 days. During reloading of the specimen, each loading/unloading cycle was repeated four times while AE signals were measured.
The MISTRAS-2001 AE system was employed in the tests. This is a computerised device that performs AE signal measurements and stores, displays and analyses the resulting data. AE signals were enhanced by a pre-amplifier (Gain: 40 dB; frequency filter: 50— 1200 kHz)
Num
ber
of
AE
Cou
nt R
ate
and a post-amplifier inside the system (Gain: 20 dB). Each AE signal was described in terms of its counts, energy, amplitude rise time and duration. Two different types of piezoelectric transducer, PAC nano-30 (sensor-1) and NF AE-901S (sensor-2), were employed. The resonant frequencies of sensor-1 and sensor-2 are 500 kHz and 120 kHz respectively. In general, piezoelectric transducers cannot have a flat frequency response over a wide band of frequencies; they have multiple sensitivity peaks. These peaks were accentuated through the use of active band filters to create narrow windows through which acoustic emissions were monitored. A statistical comparison of the emission event rate monitored through a lower frequency window to that simultaneously detected through a higher frequency window was made. Lower frequency emissions were monitored by sensor-2 at 50 to 200 kHz, and higher frequency emissions by sensor-1 at 200 to 1200 kHz. Two of these transducers were cemented to the specimen with wax. In these experiments the two transducers were placed adjacent to each other, to minimise the difference in propagation paths from emission sources to the transducers.
RESULTS AND DISCUSSION
The Kaiser effect in coal
Figure 1 shows a typical test result that demonstrates the existence of the Kaiser effect in a coal specimen. Data for a specimen tested 5 minutes after the previous loading (to 5.5 MPa) are shown. The take-off point of AE activity coincides with the maximum previous stress, which was within the elastic range. In all such experiments conducted within a short time of the initial loading the existence of the Kaiser effect in coal specimens could be clearly observed, and the estimated stress from the take-off point of the AE signature was within 7% of the pre-load. Although the cumulative number of AEs reduced in the second reloading, Figure 2 shows a clear indication of AE increase at the previous stress level. Similar observations were reported on various types of rock specimens by Seto et al. (1989a, b; 1992a, b; 1996).
Effect of delay time on Kaiser effect
One question arising from this research is: how long can the stress memory be retained in a coal specimen? Since coal has a more complicated microfracture system than rock, the recovery process of the hysteresis due to delay time is important for stress estimation. If the recovery time is short, the memorised stress would represent only a recent loading, whereas if it is long enough, the highest stress experienced in the past could be estimated through a test.
In the previous section, the results reported were when the time interval between loading and reloading was quite short. Further experiments were conducted similar to those described in the previous section, but

200 400 600 800 1000 1200 200 400 600 800 1000 1200
1000 1200 1000 1200 200 400 600 800 Time, sec
200 400 600 800 Time, sec
6 18 0.5
4 60 3 2
7
8
Acc
um
ula
ted
AE
Counts
40000
35000
30000
25000
20000
15000
10000
5000
A: 40-50 dB
Estimated stress point
Previous stress
Previous Stress:5.0 MPa
40000
36000
30000 0 Qw 25000
7, 20000
3 15000
El 10000
5000
0
120000
1,4 100000
Q 80000 Si <C •I5 60000
08
40000
<C 20000
25000 LUU
.0 20000
• 15000
eas 200 400 600 1000 1200
40000
35000
O 30000
10000
5000
40000
35000
30000
25000
20000
15000
10000
5000
13t
Ac
cu
mu
late
d A
E C
ou
nts
C: 60-80 dB
Previous stress Estimated stress pan
AE(L) COAL11
200 400 600 800
AE(H) COAL11
AE-onset
1000 1200
ACOUSTIC EMISSION TECHNIQUES IN ESTIMATING IN-SITU VERTICAL STRESS 181
Figure 3 Time histories of low and high frequency cumulative AE counts during first reloading. Delay time 20 days, amplitude 50-100 dB.
Figure 4 Time histories of higher frequency cumulative AE counts during the first reloading. Delay time 20 days, amplitudes as shown.
with intervals between the loadings of 1, 2, 6 and 20 days. The previous stress level was chosen within the elastic range.
Figure 3 shows the AE signatures in the first reloading of AE(L) and AE(H) in the amplitude range from 50 to 100 dB. Previous stress is indicated by an arrow. In the AE signature of sample AE(H), many emissions were generated below the previous stress level and these obscured the Kaiser effect. In contrast to this, the signature of sample AE(L) clearly shows the Kaiser effect.
Figure 4 shows the signatures of AE(H) at the first reloading in the amplitude ranges of 40-50 dB, 50-60 dB and 60-80 dB. AE increase at the previous stress can be more easily identified at the highest amplitude range than in the two lower ranges. Figure 5 illustrates the first reloading signatures of AE(L) in the amplitude ranges 40-50 dB and 50-60 dB. In this case also, AE increase can be more easily identified in the higher amplitude range.
As the delay time was increased, the Kaiser effect in coal was obscured by higher frequency and lower amplitude emissions produced below the previous stress level. Thus in the case of a long delay time, the Kaiser
effect can be clearly identified by the AE signature of higher amplitude and lower frequency emissions. The estimation accuracy remained within 10% up to 20 days. From these experiments, it was confirmed that no recovery of Kaiser effect in coal is observed up to 20 days after testing under room temperature conditions.
Estimation of in-situ stress from coal and rock specimens
Cored coal specimens were taken from a 400 m deep exploratory borehole drilled in the Newcastle area of NSW. The estimation of in-situ stress was conducted under uniaxial compression 45 days after drilling. The specimens were loaded four times at a constant displacement rate of 100 microns/minute.
Figure 6 shows the AE signatures of coal specimens after the first and second loadings up to 15.7 MPa. In both the first and second loadings, the AE increase can be recognised clearly at the same stress level. However in the second loading the emissions below this stress were significantly less, and the take-off point can be identified more easily. The estimated stress from these

182 D. K. NAG ET AL.
100 a)
4c—c) f:4 80
C.) 60 T•13
40 0
20
Time(sec)
5 000
4000
3000
2000
1000
A: The First Loading
Estimated Stress Point
Num
ber
of
AE
Cou
nt R
a te
0
Num
ber
of
AE
Cou
nt R
a te
500
400
300
200
100
5000
4000
3000
2000
1000 Num
ber
of
AE
Cou
nt R
ate
B: The Second Loading
Estimated Stress Point
Time(sec) Time (sec) 40
Figure 5 Time histories of lower frequency AE event Figure 6 AE signatures of coal core specimens during first rate during first reloading. Delay time 20 days, amplitude A and second loading. Elapsed time 45 days. 40-50 dB, B 50-60 dB.
signatures was 9.2 MPa, which is very close to the overburden pressure (8.5 MPa) estimated for the actual sample depth of 356 m. This confirms that even 45 days after drilling, the in-situ vertical stress remains imprinted in a coal sample.
Figure 7 shows an AE signature from the repeated loading-unloading of a rock core specimen taken at a depth of 300 m, 44 days before the test. The maximum previous stress is recognisable by a sharp increase in emissions, which is indicated by the arrow. The stress estimated from the AE pattern coincides well with the overburden pressure. Figure 8 shows the acoustic signatures of rock cores taken from a depth of 310 m nearly two years before the test. Although the take-off point is not clear in the first loading, the previous vertical stress is more easily estimated from the AE signature of the second loading. This estimated stress was also consistent with the calculated overburden pressure. A time lag of two years did not inhibit the evaluation of in-situ stress within about 10%.
The delay time effect on stress memory is interpreted as follows. In the elastic range stress memory would be retained through the microcrack system, which grows to an equilibrium configuration corresponding to the
previous stress (Seto et al., 1995). After unloading, tensile cracks close while shear cracks open and slide. This is the healing process of the crack configuration corresponding to the previous stress. In the healing process other microcracks are generated and the existing cracks rearrange themselves (Seto et al., 1993). This is responsible for the noise emissions (at higher frequency and lower amplitude) produced below the previous stress level in the first reloading. Since the first reloading allows the newly formed and rearranged cracks to reach an equilibrium state corresponding to the applied stress of cyclic reloadings, the emissions due to healing cracks are not significant in subsequent reloadings. In these reloadings, the growth of preloading cracks is alone responsible for the acoustic emission. Consequently, the AE increase is more pronounced in the second reloading than in the first.
CONCLUSIONS
The Kaiser effect was investigated to explore the applicability of AE techniques to in-situ stress measure-ment in coal seams. The conclusions obtained from this
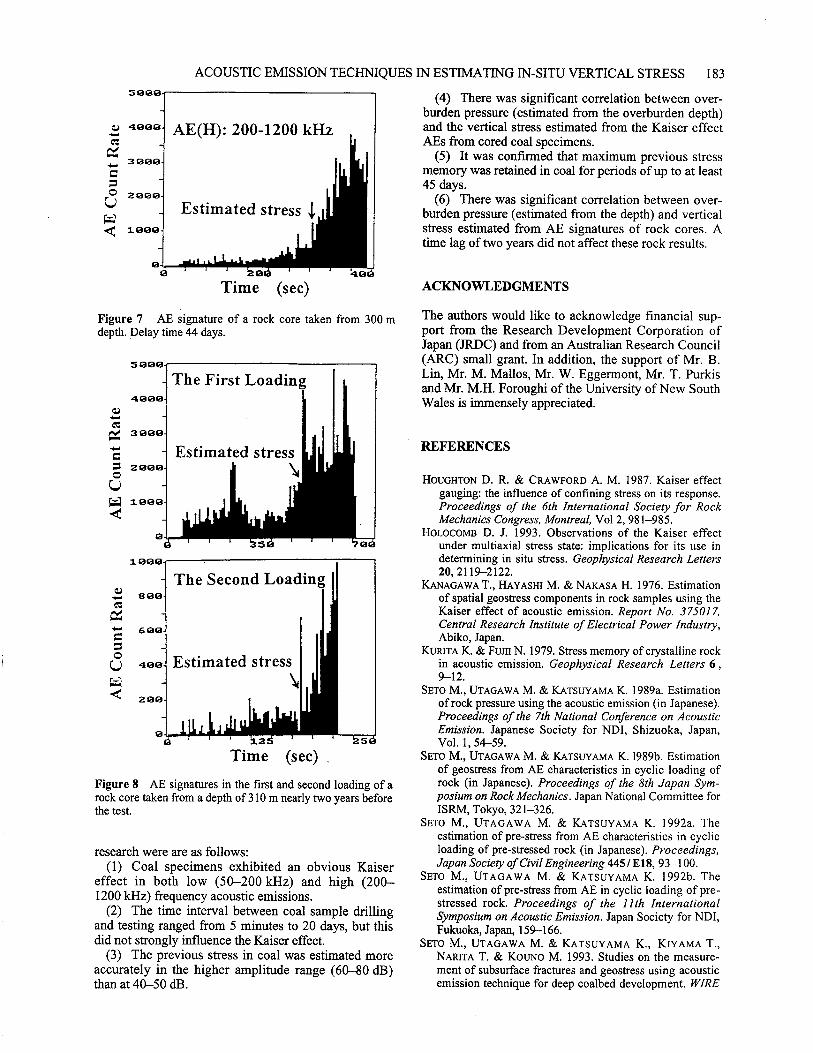
AE(H): 200-1200 kHz
Estimated stress 4,
0 40
3000
2000 (4,4)
1000
4000
5'3
5000
4000
3000
2000
1000
1000
800
600
400
200
AE
Cou
nt
Ra
te
AE
Co
un
t R
ate
ACOUSTIC EMISSION TECHNIQUES IN ESTIMATING IN-SITU VERTICAL STRESS 183
(4) There was significant correlation between over-burden pressure (estimated from the overburden depth) and the vertical stress estimated from the Kaiser effect AEs from cored coal specimens.
(5) It was confirmed that maximum previous stress memory was retained in coal for periods of up to at least 45 days.
(6) There was significant correlation between over-burden pressure (estimated from the depth) and vertical stress estimated from AE signatures of rock cores. A time lag of two years did not affect these rock results.
Time (sec)
Figure 7 AE signature of a rock core taken from 300 m depth. Delay time 44 days.
Figure 8 AE signatures in the first and second loading of a rock core taken from a depth of 310 m nearly two years before the test.
research were are as follows: (1) Coal specimens exhibited an obvious Kaiser
effect in both low (50-200 kHz) and high (200-1200 kHz) frequency acoustic emissions.
(2) The time interval between coal sample drilling and testing ranged from 5 minutes to 20 days, but this did not strongly influence the Kaiser effect.
(3) The previous stress in coal was estimated more accurately in the higher amplitude range (60-80 dB) than at 40-50 dB.
ACKNOWLEDGMENTS
The authors would like to acknowledge financial sup-port from the Research Development Corporation of Japan (JRDC) and from an Australian Research Council (ARC) small grant. In addition, the support of Mr. B. Lin, Mr. M. Mallos, Mr. W. Eggermont, Mr. T. Purkis and Mr. M.H. Foroughi of the University of New South Wales is immensely appreciated.
REFERENCES
HOUGHTON D. R. & CRAWFORD A. M. 1987. Kaiser effect gauging: the influence of confining stress on its response. Proceedings of the 6th International Society for Rock Mechanics Congress, Montreal, Vol 2,981-985.
HOLOCOMB D. J. 1993. Observations of the Kaiser effect under multiaxial stress state: implications for its use in determining in situ stress. Geophysical Research Letters 20,2119-2122.
KANAGAWA T., HAYASHI M. & NAKASA H. 1976. Estimation of spatial geostress components in rock samples using the Kaiser effect of acoustic emission. Report No. 375017, Central Research Institute of Electrical Power Industry, Abiko, Japan.
KURITA K. & Rim N. 1979. Stress memory of crystalline rock in acoustic emission. Geophysical Research Letters 6, 9-12.
SETO M., UTAGAWA M. & KATSUYAMA K. 1989a. Estimation of rock pressure using the acoustic emission (in Japanese). Proceedings of the 7th National Conference on Acoustic Emission. Japanese Society for NDI, Shizuoka, Japan, Vol. 1,54-59.
SETO M., UTAGAWA M. & KATSUYAMA K. 1989b. Estimation of geostress from AE characteristics in cyclic loading of rock (in Japanese). Proceedings of the 8th Japan Sym-posium on Rock Mechanics. Japan National Committee for ISRM, Tokyo, 321-326.
SETO M., UTAGAWA M. & KATSUYAMA K. 1992a. The estimation of pre-stress from AE characteristics in cyclic loading of pre-stressed rock (in Japanese). Proceedings, Japan Society of Civil Engineering 445/ E18, 93-100.
SETO M., UTAGAWA M. & KATSUYAMA K. 1992b. The estimation of pre-stress from AE in cyclic loading of pre-stressed rock. Proceedings of the 1 1 th International Symposium on Acoustic Emission. Japan Society for NDI, Fukuoka, Japan, 159-166.
SETO M., UTAGAWA M. & KATSUYAMA K., KIYAMA T., NARrrA T. & KOUNO M. 1993. Studies on the measure-ment of subsurface fractures and geostress using acoustic emission technique for deep coalbed development. WIRE

184 D. K. NAG ET AL.
Report No.7, National Institute for Resources and Environment, Tsukuba, Japan.
SETO M., UTAGAWA M. & KATSUYAMA K. 1995. The relation between the variation of AE hypocentres and the Kaiser effect of Shirahama sandstone. Proceedings of the 8th ISRM Congress, Tokyo, Vol. 1,201-205.
SETO M., NAG D. K. & VUTUKURI V. S. 1996. Experimental
verification of the Kaiser effect in rock under different environment conditions. Proceeding, EUROCK '96.
UTAGAWA M., SETO.M. & KATSUYAMA K. 1995. Application of acoustic emission technique to determination of in-situ stresses in mines. Proceedings of the 26th International Conference on Safety in Mines. Central Mining Institute, Katowice, Poland, Vol. 4,95-109.
Symposium on Geology in Longwall Mining, 12-13 November 1996, eds G. H. McNally and C. R. Ward, pp 185-191.
Geological issues relating to coal pillar design
WINTON J. GALE
Strata Control Technology.
INTRODUCTION
The strength characteristics of coal pillars have been studied by many workers and the subject is well discussed in the literature (for example, Salamon and Monro, 1967; Wilson, 1972; Hustrulid, 1976). A range of strength relationships have been derived from four main sources: • Laboratory strength measurements on different-sized
coal block specimens; • Empirical relationships from observations of failed
and unfailed pillars; • A theoretical fit of statistical data and observations;
and • Theoretical extrapolation of the vertical stress
buildup from the ribside toward the pillar centre, to defme the load capacity of a pillar.
These relationships provide a relatively wide range of potential strengths for the same pillar geometry. In practice, it has been found that various formulae are favoured (or modified) by users, depending on past experience in their application to certain mining districts or countries.
In general, the application of empirically and statistically based formulae has been restricted to the mining method and geological environment for which they were developed, and they often relate to specific pillar geometries. Such relationships have usually been developed for relatively small pillars having width-to-height (W/H) ratios less than 5, and can only be used with confidence in these situations. The development of stress measurement and detailed rock deformation recording tools over the last 10-15 years has allowed much more quantification of actual pillar stresses and deformations. Little of this data were available when many of the pillar strength relationships were originally defined. Similarly, the development of computer simulation methods has allowed detailed back analysis of the mechanics of strata-coal interaction within formed-up pillars.
Strata Control Technology (SCT) has conducted numerous monitoring and stress measurement programs to assess roadway stability and pillar design requirements in Australia, UK, Japan, USA, Indonesia and Mexico. The results of these investigations, and others reported in the literature, have demonstrated that the mechanical response of the coal and surrounding strata defines the pillar strength, which can vary widely depending on geology and stress environment. The application of a pillar strength formulae to assess the
strength of a system which is controlled by the interaction of geology, stress and associated rock failure is commonly an over-simplification.
MECHANICS OF THE PILLAR-COAL SYSTEM
The strength of a pillar is basically determined by the magnitude of vertical stress which can be sustained within the strata/ coal sequence forming and bounding it. The vertical stress developed through this sequence can be limited by failure of one or more of the units which make up the pillar system. This failure may occur in the coal, roof or floor strata forming the system, but usually involves the coal in some manner. The failure modes include shear fracture of intact material, lateral shear along bedding or tectonic structures, and buckling of cleat-bounded ribsides.
In pillar system geologies having a strong roof and floor, the pillar coal is the limiting factor. In coal seams surrounded by weak beds, a complex interaction of strata and coal failure will occur and this will determine the pillar strength. The strength achievable in the various elements is largely dependent on the confining stresses developed, as illustrated by Figure 1. This indi-cates that, as confinement is developed in a pillar, the axial strength of the material will increase significantly, thereby increasing the actual strength of the pillar well above its unconfmed value.
The strength of the coal is enhanced as confining stress increases toward the pillar centre. This increased strength is often related to the width/height ratio, whereby the larger this ratio the greater the confmement generated within the pillar. Hence squat pillars (high W/ H) have greater strength potential than slender ones (of low Will).
The basic concepts related to coal pillars were developed by Wilson (1972) and with the growing availability of measured data these general mechanics are widely accepted. However, confining stress can be reduced by roadway deformations such as floor heave, bedding plane slip and other failure mechanisms. These mechanisms are described below.
Roadway development phase
Prior to mining, the rock and coal units will have in-situ horizontal and vertical stresses which form a balanced initial stress state in the ground. As an opening (roadway) is created in a coal seam, there is a natural

STRONG ROOF
FAILED
/Confinement 4-
FAILED
!Axial Strength
186 WINTON J. GALE
A
INTACT
I Axial Strength
Confinement 4- INTACT no slip
STRONG FLOOR
ST
RE
NG
TH
UCS
CONFINEMENT
Figure 1 Effect of confining stress on compressive strengths of intact and fractured rocks (note that 'failed' should read `fractured').
tendency for the coal and rock to move laterally and vertically into the roadway. In this situation, the horizontal stress acting across the pillar will form the confining stress within that pillar. If this lateral displacement is resisted by sufficient friction, cohesion and shear stiffness of the immediate roof and floor layers, then most of the lateral confining stress is maintained within the pillar. Consequently, the depth of 'failure' (yield) into the pillar ribside is small. On the other hand, if the coal and rock layers are free to move into the roadways by slippage along bedding planes or by shear deformation of soft bands, then this confming stress will be reduced. Hence the depth of failure into the pillar ribside may be significantly greater.
The geometry of failure in the system and the residual strength properties of the failure planes will, therefore, determine the nature of confming stress adjacent to the ribsides and that extending across the pillars. This mechanism determines the depth of failure into the pillar and the extent of ribside displacement during roadway drivage.
Pffiar loading by abutment stresses
Roadways are subjected to an additional phase of loading during longwall panel extraction, as front and then side abutment pressures are added to the previous (and generally much smaller) stress changes induced by roadway excavation. These abutment stresses are
DISTANCE INTO PILLAR Yielded I Solid I Yielded Ribside Coal ' Ribside
Figure 2 Rapid buildup of vertical stress bearing capacity within a well-confined coal pillar. Note that horizontal rib dowels provide extra confinement, additional to that generated by high coal /rock friction.
DISTANCE INTO PILLAR
Figure 3 Low bearing capacity of coal pillar with weak (low shear strength) coal / rock interfaces. Note that horizontal slippage also causes roadway roof and floor failure, in addition to rib spall.
predominantly vertical in orientation, but can generate additional horizontal (confining) stresses if there is sufficient lateral restraint from the surrounding roof and floor. Conversely, if the ground is free to move into the roadway then this increased horizontal stress is not well developed, and increased rib squeeze is manifest instead.
This concept is presented in Figure 2, where with strongly cohesive coal/rock interfaces the confining stress in the pillar increases rapidly inwards from the ribsides, allowing high vertical stresses to be sustained by the pillar. The opposite case, of low shear strength (i.e., slippery) coal/rock contact surfaces, is presented in Figure 3. In this situation confinement cannot be maintained sufficiently, hence the allowable vertical stress would be significantly less than in Figure 2. The diagram shows that the pillar has failed due its inability to sustain the imposed vertical abutment stresses.

a. APPLIED STRESS Average Pillar
(LOAD) Stress_ _
APPLIED STRESS (LOAD)
Average Pillar Stress
16 20
W
0 4
Small
241 8 12
WIDTH/HEIGHT RATIO OF PtLLAR Large
Figure 5 Range of potential pillar strengths relative to width-to-height (W/H) ratios and degree of lateral confinement.
GEOLOGICAL ISSUES RELATING TO COAL PILLAR DESIGN 187
STRESS IN PILLAR = LOAD STABLE
a) Strong System.
STRESS IN PILLAR = 0.5 LOAD FAILED
b) Weak System.
Figure 4 Pillar bearing capacities for strong and weak geologies. 'Geology' in this context means the immediate roof + coal pillar + immediate floor strata system. In this example the strong system is stable, but the weak system has failed.
In addition, lateral movement has caused floor heave and severe immediate roof shearing.
The implications of this for the strength of an isolated pillar are presented in Figure 4, where the load carried by the pillar is the mean of the vertical stress across it. If this mean stress is equal to the average 'applied load' to be carried by the pillar, then the pillar is stable (Figure 4a). If the applied load is greater, then the pillar is said to fail (Figure 4b) and the deficit stress must be redistributed (or 'thrown') onto nearby pillars.
One of the problems faced is that under certain stress conditions, the pillar can exhibit no failure of the coal or rock and display potentially high loading capabilities. However, at increased stress levels, certain rocks or structures in the system fail and allow lateral movement, which then reduces the confinement and subsequently the strength of the pillar. A similar situation arises if the roof or floor geology change along a panel. This could allow failure of certain rock types in one area and not in another, despite constant stress conditions.
Conceptually, pillar strength behaviour should fall between the two end members of: • Lateral slip occurring totally unresisted, so that pillar
strength is limited to its unconfined value; and • Lateral slip being resisted by system cohesion and
stiffness, such that pillar strength is significantly above its unconfined value due to confinement.
A range of potential pillar strengths associated with these two end members, relative to W/H ratio, is presented in Figure 5. It is assumed that the rock mass
50 -
\Area of Potential Strength based on
Geological Variation
A
NO CONFINEMENT GENERATED
0

A • A A
• •
ST
RE
NG
TH
(AV
ER
AG
E S
TR
ES
S) (M
Pa)
50 'STRONG/ NORMAL' GEOLOGY
40-
30 -
20 - WEAK or FAILURE in SYSTEM
10-
188 WINTON J. GALE
40 -
30 -
20 -
ST
RE
NG
TH
(AV
ER
AG
E STR
ES
S) (
MP
a )
10 -
50 -
•
NO CONFINEMENT GENERATED •
0 4 8 12 16 20 24 0
WIDTH/HEIGHT RATIO OF PILLAR
A DATA GENERATED FROM MARK at al (1988)
• DATA FROM US (PAALEKI 1992)
• STRATA CONTROL TECHNOLOGY DATA
NO CONFINEMENT GENERATED
Figure 6 Measured pillar strengths in relation to W/H. This is the field data on which Figures 5 and 7 are based.
8 12 16
WIDTH/HEIGHT RATIO OF PILLAR
Figure 7 Generalised grouping of data points from Figure 6, indicat-ing strong to normal and weak geologies.
0
0 20 24

STRESS MEASUREMENT LOCATIONS
GEOLOGICAL ISSUES RELATING TO COAL PILLAR DESIGN 189
or field strength of the coal is 6.5 MPa, or about one-quarter of the average UCS of intact NSW coal in 50 mm diameter core specimens, and that the coal is significantly involved in the failure process. This range of pillar strengths is representative of most rock failure combinations, except in rare cases where small stiff pillars may punch into soft clay-rich strata at loading levels below the field UCS of the coal. In the punching situations, pillar strength may be lower than that depicted, but the variation would generally be confined to pillars having small width/height ratios.
A comparison of these 'end member' situations with a range of pillar strengths determined from actual measurement programs conducted in Australia and the UK by SCT, and from USA (Mark et al., 1988) is presented in Figure 6. The comparison indicates that a wide range of pillar strengths have been measured for the same geometry (in terms of W/H), and that the data appear to span the full interval between the end members. However, two groupings can be discerned and are shaded in Figure 7:
• The 'strong-normal' geologies, where pillar strength appears to be close to the upper bound.
• The structured or weak geologies, where the strength is closer to the lower bound and where it is apparent that strength of the system is significantly limited.
It should be noted that these two groupings are arbitrary and possibly due to a limitation of data. With more data points the grouping may become less obvious.
METHODS USED TO ASSESS STRENGTH CHARACTERISTICS
It should now be apparent that pillar design for long-term strength must take into account the geology of the immediate roof/coal pillar/immediate floor system, its failure geometry, its material strengths and the mining-induced stress changes. Methods to take such variables into account on a site- specific basis are limited, but exclude empirical and formula-based approaches. Back analysis of existing data is useful, but is often limited by the number of pillars having a suitable range of loading, and by the pillar geometries available.
The main approaches to assess the potential strength of a coal/rock sequence are are by field measure-ments of the stresses actually carried by pillars, and by computer simulations validated against field measure-ments. There are two approaches to field stress measurements:
• Monitoring stress and strain distributions above or within pillars during mining, using stress cells and rib extensometers. These measurements provide the vertical stress (load) distribution and the extent of failure into the pillar for various loads imposed during mining. Typically chain pillars are monitored, since these are heavily loaded.
• Measurement of the stress across a pillar or into a
DEPTH INTO RIB 10-40m
a) Typical Stress Measurement Locations. (Not to scale).
25 -
20 -
15 -
10 -
5 -
0
DISTANCE INTO RIB (m)
• MEASURED
EXTRAPOLATED STRESS DISTRIBUTION IN A 20m PILLAR
b) Stress Distribution in Pillar from Measurements.
Figure 8 Measurement of vertical stresses within and above a coal pillar, and stress profile through the pillar.
ribside, to determine the stress increase geometry. This technique utilises measurements to determine the vertical stress increase from the rib toward the pillar centre. The information is used to calculate the potential load distribution in different sized pillars and their ultimate strength under the geological conditions present. The general layout of measurements and the distribution measured is presented in Figure 8.
Computer simulation routines, together with detailed rock testing programs, can now be confidently applied to defining the potential strength characteristics of various strata systems. Field stress measurements have been used to confirm these results, or to assess the in-situ properties of certain units unable to be tested by normal laboratory methods.
VE
RT
ICA
L S
TR
ES
S (M
Pa
)
5 10 15 20

30 /1/ BIENIAWSKI (4.0MPa coal)
///
SALAMON and MONROE (7.2MPa coal) 20 /
50
SQUAT PILLAR (7.2MPa coal)
BIENIAWSKI (6.5MPa coal)
/ •
LOWER LIMIT
8 12 16
WIDTH/HEIGHT RATIO OF PILLAR
Figure 9 Range of pillar strengths, based on various formulae and on degree of confinement.
20 24
)0
190 WINTON J. GALE
EFFECT OF GEOLOGY
The impact of coal strength and width/height ratio on pillar strength is presented in Figure 9. This diagram shows the upper and lower bound average strengths from Figures 6 and 7, plus pillar strengths based on empirical formulae. It is clear that a wide range of pillar strengths are possible, and that these are not only related to coal rock mass strength and width/height ratio. Geological factors have a major impact on the strength achievable under the various pillar geometries.
Unfortunately, there is no simple formula which we can apply to various geological environments or mine geometries to get a satisfactory result. However some broad generalisations can be made:
• Strong immediate roof and floor layers and good coal-to-rock contacts provide a general relationship similar to the upper bound pillar strength in Figure 5.
• Weak, clay-rich and sheared contacts adjacent to the mining section can reduce pillar strength.
• Soft strata in the immediate roof and floor, which fail under the mining-induced stresses, will weaken pillars.
• Cleat and other vertical defects may weaken smaller-sized pillars, but are unlikely to reduce the effective strength of larger pillars if adequate rib reinforcement is used.
• Tectonic deformation of coal in disturbed geological environments will reduce pillar strength, though the extent is dependent on geometry and shear strength of the discontinuities.
• The occurrence of water in failed ground often reduces strength.
UPPER LIMITS (high confinement)
Obviously, combinations of these various factors will have a compounding effect. For example, structurally disturbed, weak and wet roof strata may greatly reduce pillar confinement and, consequently, pillar bearing capacity.
AN APPROACH TO PILLAR DESIGN
Field studies suggest that a range of strengths are possible ranging, within upper and lower bounds. If we make use of these relationships as 'first pass estimates', to be reviewed by more detailed analysis later, then a number of options are available. In known or suspected 'weak geologies' the initial design may utilise the lower bound curve of the weak geology band in Figure 7. In good or normal geologies, the Bieniawsld or squat pillar formulae may be suitable for initial designs.
Two obvious problems with this approach are that:
• Estimates of pillar size can vary greatly, depending of the geological environment assumed.
• The pillar size versus strength data set used (Figure 6) is limited, and the groupings may be arbitrary rather than real.
This is why such formulae or relationships are con-sidered as first pass estimates only, to be significantly improved later by more rigorous site-specific design studies, utilising measurements and computer simu-lation.
Design based on measurement requires that pillars be available for monitoring. It is most useful to measure the vertical stress rise into the pillar under a high
STR
EN
GT
H (
WE
RA
GE
ST
RE
SS
) (M
Pa )

GEOLOGICAL ISSUES RELATING TO COAL PILLAR DESIGN 191
loading condition, or for the expected 'working loads' to include higher loading. The stress measurement profiles are used to determine the potential load distributions in pillars of varying dimensions, andhence to develop a pillar strength relationship suitable for that geological site.
Computer modeling methods have been developed to simulate the behaviour of the strata sections under various stress fields and mining geometries. Where possible, such simulations need to be validated against actual ground behaviour and stress measurements. This provides confidence that sufficient geological investigation has been undertaken, and that the strength properties and deformation mechanisms are being simulated accurately. Where computer modeling is used in association with validation measurements, the limitations noted in the measurement method are largely overcome.
One major benefit of computer modeling is that the behaviour of roadways adjacent to the pillars can be simulated. In this way the design of a pillar will not only reflect the stress distribution within it, but also its impact on roadway stability. In many mining situations, the pillar geometry is influenced more by optimising roadway conditions and controlling ground movements than by the nominal pillar strength. Yield pillars and chain pillars are obvious examples of this application. Similarly, models also assess the geometry of other pillars and virgin coal areas in determining the impact of a particular load within a pillar, and the ability of the overburden to span over a yielded pillar and safely redistribute the excess stress to adjacent ground.
Computer simulation methods are used by SCT for the design of key layouts which require an assessment of geological variations, pillar size and stress field changes to optimise the mining operation. This approach also provides an expected roadway or pillar response, which can be monitored to determine if the ground is behaving as expected.
CONCLUSIONS
There are many factors which affect the strength of a coal pillar, some of which have been briefly discussed in this paper. There are a number of points to be made when considering a pillar size:
• The impact of geological factors, stress magnitude and rock failure mode on the load-carrying ability of mine pillars;
• Pillar strength formulae can only be used in a general sense. They are more relevant to large areas of standing pillars, as previously utilised in shallow bord and pillar operations, than to longwall operations.
• For pillar design, the effects of geological and geotechnical parameters together with the overall mining layout need to be addressed. In many cases, ground conditions and stress variations determine pillar size, not its nominal strength.
• Field measurements and computer simulations do address many of the design issues, if undertaken in a rigorous and validated manner.
REFERENCES
HusTituup W. A. 1976. Review of coal strength formulae. Rock Mechanics 8.
MARK C. 1987. Analysis of longwall pillar stability. Ph.D. Thesis, Pennsylvania State University.
MARK C., LISTAK J. & BlENIAWSKI Z. T. 1988. Yielding coal pillars — field measurements and analysis of design methods. Proceedings of the 29th US Symposium on Rock Mechanics. AIME, New York.
SALAMON M. D. G. & MUNRO A. H. 1967. A study of the strength of coal pillars. Journal of South African Institute of Mining and Metallurgy 68, November.
WILSON A. H. 1972. An hypothesis concerning pillar stability. Mining Engineering 141, June.

-
Symposium on Geology in Longwall Mining, 12-13 November 1996, eds G. H. McNally and C. R. Ward, pp 193-197.
Issues affecting longwall chain pillar design
B. K. HEBBLEWHITE AND J. M. GALVIN
The University of New South Wales, Department of Mining Engineering
This paper discusses the various design approaches currently adopted in Australia and elsewhere for chain pillars between adjacent longwall panels. In reviewing the various approaches taken, it seeks to clarify a number of misconceptions about chain pillar design which may be leading to inappropriately designed pillars.
The paper reviews the various, often quite different, roles that chain pillars are expected to fulfil. These include providing a separation between adjacent goaf areas, adequately separating gateroads from adjacent abutment stresses, providing local and / or regional strata stability (short and long-term), and providing a stable location for explosion-resistant stoppings in cut-throughs between adjacent panels. Effects of differing geology can further complicate the performance of the chain pillar in all of these situations.
In addition to reviewing the roles and appropriate design approaches for chain pillars, the paper discusses several variations of chain pillar configuration, and identifies the relevant design constraints which must be considered if these variations are to be implemented.
INTRODUCTION
Australian longwall operations have achieved some impressive individual production performances over recent years. However, the industry average continues to lag well behind the best figures, particularly when long-term averages are taken into account. It is also a disturbing fact that over 50% of the current 29 Australian longwall operations are performing below the industry average productivity.
Apart from the effects of development rate shortfalls, the most common causes for these unacceptably low averages relate to geomechanics problems. Over the past 18 months, more than 50% of Australian longwall faces have experienced significant production disruptions due to strata control related issues, be they focussed on face, gateroad, subsidence or pillar performance.
Problems have included: • face roof falls and associated development of roof
cavities; • fracturing ahead of the face (often associated with
periodic weighting linked to the caving process), leading to face falls, roof and face cavities, etc. as the face retreats under such zones;
• roof instability, requiring excessive support in gateroads;
• pillar and ribside deterioration in chain pillars; • goaf hang-up and caving disruption under massive
roof strata, leading to windblast problems, regional load transfers ("creep") and other effects of excessive abutment loading in gateroads; and
• unpredictable floor failure behind longwall faces, leading to major gas inrushes to the goaf and face areas.
Many geotechnical problems on Australian longwall faces have been investigated in the past. Changes have been made to various aspects of the "longwall design",
which have improved the situation but not necessarily eliminated the problems.
One possible reason for the limited nature of the success is that the investigations have been restricted to the local or micro scale, rather than looking at the bigger, regional picture. The potential inter-relationships between factors such as face length, nature of caving, weighting effects on face and supports, gateroad roof conditions, chain pillar geometries and performance, and roof/floor geology are only now being realised.
Previously, for instance, poor gateroad roof con-ditions have too often been blamed totally on local high stress concentrations and immediate roof geological abnormalities, without recognising that the width of the adjacent chain pillar, or even the width of the adjacent longwall panel and the nature of caving within that panel, may be the determining and driving factor causing the roof problem. Similarly, subsidence data and underground observations of conditions often bear out the fact that the loading mechanisms involved in and around longwall excavations can act over many hundreds of metres. It is often the case that the full strata control effects of mining are only experienced after two, three or even four adjacent panels are extracted. Once again, an appreciation of the inter-related roles of panel widths, chain pillar widths, overburden depth and strata stiffness is critical to understanding the regional geotechnical mechanisms involved and, hence, enabling potential strata control problems to be engineered out of the system.
It is clearly apparent that chain pillar design and chain pillar performance are integral components in either the success or failure of a longwall operation. This paper discusses some of the key geotechnical issues affecting chain pillar design, in the context of overall regional stability and structural integrity of the mine. The paper also discusses some of the chain pillar design alternatives being considered by the industry.

194 B. K. HEBBLEWHITE AND J. M. GALVIN
ROLE OF CHAIN PILLARS
There are a number of misconceptions and potential sources of error in the prevailing industry practice, both in Australia and overseas, with regard to chain pillar design. These can lead to pitfalls in design if adopted by operators who do not recognise some of the assumptions or limitations of particular design approaches. An important starting point in addressing these misconceptions is to clarify the role or, in many cases, roles played by chain pillars in a mining layout. These can include the following:
(a) provide a stable, load-bearing pillar for local overburden support for the duration of the two adjacent longwall panels;
(b) provide a stable, load-bearing pillar for regional overburden support over the longer term (e.g. for subsidence control due to surface constraints, overlying aquifers, etc.);
(c) provide stability as in (a) but designed to crush out once second longwall has passed, in order to maintain continuity of goaf formation across panels;
(d) provide separation between adjacent gateroads to ensure adequate protection from goaf side abutment pressures on gateroad roof, rib and floor conditions;
(e) provide a barrier between adjacent goaf areas for control of spontaneous combustion or other ventilation or gas-related management issues.
There are undoubtedly other specific roles for which chain pillars may be designed or used, as well as numerous instances of combinations of the above roles. The important point to be recognised is that the design procedure adopted must take account of the appropriate roles at the outset. Having recognised the role and hence the design approach to be adopted, the other issues to be considered are: • the life expectancy of the pillar, i.e. for how long
must the pillar fulfil its role(s); and • the consequences of a failure in pillar performance
with respect to its role(s).
Once these factors have been considered, the design process can proceed and the outcome can be determined on the basis of a pre-determined acceptable level of risk.
DESIGN APPROACHES
There is no single correct design method for longwall chain pillars, particularly when their roles in the mine layout may be quite diverse. Several methods are discussed briefly below, highlighting their areas of application and limitations.
UNSW Pillar Design Procedure
The UNSW Pillar Design Procedure (Galvin and Hebblewhite, 1995) was the outcome of a considerable research program aimed at developing an Australian pillar performance database. Such a database was developed and included a large number of both failed
and unfailed pillar systems. It enabled the development of: • a statistically sound analytical method for determi-
ning pillar strength, based on Australian case studies; • an assignment of levels of probability of failure,
based on the above statistical database; and • a risk-based design methodology for coal pillars.
The database used in this work consisted primarily of first workings and pillar extraction case studies. There were no longwall chain pillars in the study although there were inter-panel pillars between adjacent goaf areas.
The question to be asked, therefore, is: "How does the UNSW Pillar Design Procedure apply to longwall chain pillars?" The answer is simple. In terms of pillar strength, within the geometric and geological limitations already defined for the UNSW Procedure in general, the strength determination is as equally applicable to chain pillars as any other pillars. Similarly, the database of probabilities with respect to pillar stability! instability (if that is a design criterion) are equally applicable.
The design step which requires further elaboration (and is probably the most difficult for any design procedure) is determination of load. This may be done empirically (by assumption of caving angles, and hence weight of incumbent overburden strata to be carried by the chain Pillar), it may be done numerically, or it may be done through interpretation of field monitoring data. All of these approaches have their merits and difficulties.
Once pillar load is determined, the UNSW Pillar Design Procedure can be applied to chain pillars. A note of caution is then raised with respect to use of Factor of Safety values. If designing for pillar stability (roles (a), (b) and (e) above), it is essential to recognise that the chain pillar is subjected to a multiple loading duty cycle during its lifetime. Not only will its load-bearing capacity vary, but it is likely that its design Factor of Safety requirement will vary also, in accordance with the designer's determination of an "acceptable level of risk".
The load duty cycle is likely to include the following steps:
(a) primary development load, on formation of gateroads;
(b) side abutment load, as the first longwall face approaches and is adjacent to the pillar;
(c) side abutment load once the first longwall face is past the chain pillar;
(d) side abutment load as the second face approaches and is adjacent to the chain pillar;
(e) side abutment load as the second face is past the chain pillar (i.e. goaf is on both sides).
Although pillar strength will be a single calculation, pillar load must be determined for each of these steps. For each step, or pillar performance scenario, the designer must then consider the consequences of failure with respect to the pillar roles at that step, and determine an acceptable Factor of Safety. The Factor of Safety (FOS) may be extremely variable. For instance, it may be that for all steps (a) to (e), no pillar instability

ISSUES AFFECTING LONGWALL CHAIN PILLAR DESIGN 195
can be tolerated and the pillars must continue to play a regional load-bearing role for 5 to 10 years or more (e.g. role (b)) and so an FOS value of 1.8, or even 2.0 or 2.2, is assigned for all loading stages, representing less than 1 in 1,000,000 probability of failure (in the case of 2.2).
On the other hand, if the pillar stability issue is not of concern once the second face passes it, and, in fact, it is desirable that the pillar crushes out, the designer may accept a 3 in 1,000 risk (FOS = 1.6) for load steps (a), (b) and (c), with a 1 in 10 risk (FOS = 1.25) for load step (d) (second face approaching and adjacent) and less than 1 in 2 (FOS <1.0) for step (e) once the face has passed.
Similarly, if the role of the pillars is to provide a spontaneous combustion barrier (i.e. prevent oxygen migration through the pillar under ventilation pressure differentials) for 5 years or more, then the requirement is to minimise pillar fracturing and crush zone development, not only through the main body of the pillar but around potential seal sites in the ribs of cut-throughs. A design methodology to achieve this is to ensure the pillar is relatively lightly loaded with respect to its strength by choosing a higher value of FOS, e.g. 1.8 or greater, for all steps in the load cycle.
The point of these examples is not to nominate pre-determined design FOS values, but to illustrate the need to identify: • differing pillar roles; • life expectancies of pillars; • variable load cycles; • consequences of failure; • acceptable levels of risk; and hence, • appropriate "design" Factors of Safety.
Much of the above discussion has been based around the UNSW Pillar Design Procedure. However, it is equally applicable to other design approaches, provided the probability figures are modified accordingly.
USBM ALPS method
The ALPS method (Analysis of Longwall Pillar Stability) was developed by Mark (1990, 1992) at the US Bureau of Mines. Essentially, it primarily uses a linear form of the pillar strength calculation based on the work of Bieniawski (1984), and then estimates load based on simplified geometric assumptions of angle of break (or caving angle), as referred to in the discussion of the UNSW procedure above.
This analysis is backed up by a database of US coal pillar performance monitoring. The ALPS method recommends initial use of Factor of Safety values (or Stability Factors) in the range of 1.0 to 1.3 until local experience determines otherwise.
The ALPS approach is fundamentally sound and is quite widely used. However, there are certain aspects of it that should be treated with caution. These include the following:
(a) the linear geometric assumptions of caving angles and goaf formation may be somewhat too simplistic in some strata conditions, such as in massive immediate
roof where a shallow but curved angle of break is often observed (e.g. conglomerate roof); or where a more massive bed exists in the overburden, resulting in strata bridging across the goaf and adding additional load to chain pillars (especially with narrower face lengths);
(b) ALPS does not assign any levels of probability or measure of risk associated with its final design "Stability Factors". Given the variability of parameters involved in the calculation, this is an aspect that would benefit from inclusion in the method;
(c) the major area of concern relates to the fact that the design process, the determination of stability factor and the recommended values for usage are all based on a database of failed and unfailed pillars, where failure includes unacceptable adjacent gateroad conditions. In fact, while the actual coal pillar itself may be quite stable and capable of accepting additional loading, it can be deemed to have failed because the adjacent gateroad has suffered excessive side abutment pressure.
The shortcoming identified in (c) above is the result of combining two independent (albeit related) functions with respect to chain pillar design: • the pillar as a load-bearing structure (roles (a) and (b)
under "role of chain pillars"); and • the pillar as a partition between adjacent gateroads to
minimise adverse side abutment effects on gateroads (role (d) in the same discussion).
The ALPS database does not distinguish between these two different functions, and as a result includes some very large pillars as "failed" when clearly they are not failed in the sense of pillar stability but are simply too narrow with respect to the prevailing abutment stress distribution.
Any application of ALPS should bear in mind this issue, particularly with regard to adoption of ALPS recommended "Stability Factors" which are based on this "hybrid" database.
It is a strong recommendation of the authors that future development of ALPS or similar methods for Australian conditions must isolate these two different issues into separate design components. In many cases, the question of chain pillars providing adequate separation to protect adjacent gateroads is the dominant issue, and is far more significant than the question of actual pillar stability (whether using an ALPS approach, UNSW or other for the latter determination).
Other methods
Two other generic approaches are included here briefly, as they are used in Australia, at least as part of the design process. These are: • numerical modelling; and • in situ monitoring.
These can both play a significant and very useful role in the pillar design process, provided their limitations are recognised. They have been widely documented elsewhere and will not be elaborated on significantly here, apart from the following brief summary-

196 B. K. HEBBLEWHITE AND J. M. GALVIN
NUMERICAL MODELLING
• ideally suited to complex geological and/ or geomet-ric conditions, especially where unusual or extreme conditions exist (e.g. very soft or weak material);
• difficult to represent geological structure adequately; • must have representative material property data, and
be using a model which incorporates appropriate material constitutive equations and failure criteria;
• needs calibration with actual performance data from mine (preferably quantitative) if any absolute design parameters are to be determined.
IN-SITU MONITORING
• instrumentation layout must be determined to suit objectives;
• reliability and precision of instruments must be taken into account;
• instrumentation site must be representative (geo-logically and geotechnically), and extent of variations elsewhere must be incorporated in the interpretation;
• can provide useful record of typical loading profiles and magnitudes across pillars, once a sufficient database is established;
• cannot assume that if loads decrease, pillar must have failed.
ALTERNATIVE CONFIGURATIONS
There is some level of interest in Australia in various alternative chain pillar configurations, beyond the conventional two-heading, "stable pillar" layout. Such alternatives include the use of conventional three-heading layouts, and the use of "yield pillar" systems.
These have been adopted in the United States for various reasons, including:
(a) minimising coal sterilised by mandatory (MSHA imposed) three heading layouts;
(b) providing optimum three heading geometries for place-changer mining of gateroads;
(c) providing some degree of stress relief in adjacent gateroad roof and floor conditions;
(d) eliminating (or minimising) the occurrence of dynamic (and often violent) coal bumps, usually experienced at depths of more than 600 m.
Some of these reasons are valid factors in Australia. Use of yield pillars to improve roof conditions (and hence the productivity, cost and safety of gateroad development) by minimising abutment effects is of particular interest.
At the present time, function (c) is addressed in Australian mines by choosing chain pillar widths which are sufficiently large to ensure that the pillars retain a competent, confined, central core of load-bearing material. This central core is sufficiently wide that the increased abutment stress (load) induced by mining adjacent to the pillars (both in development and longwall extraction) dissipates sufficiently across the width of the pillar that the gateroad on the opposite side
does not suffer excessively from the effects of increased induced stress concentrations. Under some strata and loading conditions it is extremely difficult to minimise the effects of this induced stress, even with quite wide pillars. This is increasingly becoming the case as shallow coal deposits are depleted and as operators take advantage of new technology to extract coal from deeper and weaker regimes.
Progressive reductions in the width of chain pillars (which are major load-bearing structures) results in ever-increasing stress concentrations in the roof, ribs and floor of each of the adjacent gateroads, as the induced stress concentrations from either side of the pillar begin to interact. This again creates adverse strata conditions, particularly in the roof and ribs, with corresponding increases in the hazard to personnel operating in such roadways as well as a severe impact on the mining operation as a whole.
The concept of yield pillars utilises the extreme lower end of the range of chain pillar widths. It is postulated that if the pillar widths are sufficiently narrow, the coal pillars will actually fail (having been loaded beyond their peak strength capacity) and then yield in a controlled manner to a level of reduced, residual strength. This yielding results in a reduced pillar stiffness relative to the stiffness of the surrounding roof and floor strata.
The desired outcomes are that the yielded pillars carry only a very localised load from the immediate roof strata, and that the level of excessive induced stress concentration in the gateroad roof strata (particularly shear and bending stresses) is reduced, thereby improving the strata conditions in the gateroad. The penalty for poor design, however, is severe in the form of sudden and unpredictable collapse which unfortunately has claimed lives overseas.
An improved understanding of the mechanics of post-failure behaviour of coal is an essential pre-requisite to introducing the method into Australia. This understanding is complex and needs to be based on physical, mechanical and material behaviour principles.
The concept of yield pillars is not a new one. Although the mechanics were not understood at the time and the resultant application did not eventuate, it was put forward as a concept to deal with high stress environments in coal mines by Alder, Potts and Walker (1949). It later found widespread application in the Canadian potash mines (not longwall), as reported by Serata (1968), Serata and Schultz (1972) and many others.
Potts and Hebblewhite (1976) and Hebblewhite (1977) reviewed the Canadian experience with a view to its application in UK potash mining, and identified some of the critical parameters and limitations with respect to mining geometry and the properties and strengths of the surrounding strata.
More recently there has been some experience with narrow pillars used in underground coal mining in the USA. Although referred to as yield pillars, many of these are, in fact, "stable", load-bearing pillars of very low height (relative to Australian conditions), with quite benign roof strata conditions.
ISSUES AFFECTING LONGWALL CHAIN PILLAR DESIGN 197
Some US coal pillar systems are a hybrid of a single narrow "yield" pillar adjacent to a very wide "con-ventional" pillar, as documented in the USBM ALPS database (Mark, 1992). Kneisley (1995) and DeMarco (1994) describe some of the empirical approaches and design issues for narrow pillars in US coal mines. US coal experience is closest to the starting point of understanding the evaluation of yield pillar applications in Australia. The major differences between US experience and Australian conditions are: • lower height pillars in general in the US; hence the
critical width/height ratios are higher, more akin to conventional pillars;
• generally (not exclusively) more benign roof strata conditions in the US;
• adoption of hybrid chain pillar systems in the US with unclear load-bearing behaviour;
• possible differences in inherent post-failure material properties of the coal seams.
An extreme variation of the yield pillar concept has previously attracted some interest in Australia, but mining technology and cost limitations have prevented its progressing. This is the concept of mining a wide single entry, and forming up an artifical "yield pillar" using some form of cementitious material and con-tinuous slip formwork behind the face. Such a process would create two headings in close proximity, in a potentially destressed environment. An adjacent third heading could still be mined with a "conventional width" stable pillar between, if required. Such a system presents considerable geotechnical and mining diffi-culties. However, in the right circumstances, it may be a solution in the future.
CONCLUSIONS
This paper has canvassed many of the issues pertaining to longwall chain pillar design in Australia. It has attempted to highlight the need to consider the role of the chain pillar, in both the local and regional context of the mine, throughout its lifetime, recognising that the role and the consequent risks and hence, design approaches, may change during that pillar life.
Key factors identified are the quite distinct issues of
pillar stability and pillar width (as a means of protecting adjacent gateroads from abutment stresses). In any reliable design methodology, these issues should be addressed separately, as they are different and may yield different results.
Alternative pillar layouts incorporating narrower "yield pillars" may be adopted in the future, with significant gains in productivity and resource recovery. However, these yield pillar concepts must be fully evaluated geotechnically, as the margin for error in such designs is signficantly lower than with "conventional" width stable pillars.
REFERENCES
ALDER H., POTTS E. L. J. & WALKER A. 1949. Yield-pillar technique in deep coal mining. Engineering.
BIENIAWSKI Z. T. 1984. Rock Mechanics Design in Mining and Tunnelling. A A Balkema.
DEMARCO M. J. 1994. Yielding pillar gateroad design considerations for longwall mining. Proceedings of the US Bureau of Mines Seminar on New Technology for Longwall Ground Control, Washington.
GALVIN J. M. & HEBBLEWHITE B. K. 1995. UNSW pillar design procedure. Research Release No. I (RR001), School of Mines, University of New South Wales.
HEBBLEWHITE B. K. 1977. Underground potash mine design based on rock mechanics principles and measurements. Ph.D Thesis, Unversity of Newcastle-on-Tyne.
Kneisley R. 0. 1995. Yield pillar sizing: an empirical approach. US Bureau of Mines, Report of Investigations RI9593.
MARK C. 1990. Pillar design methods for longwall mining. US Bureau of Mines, Information Circular IC9247.
MARK C. 1992. Analysis of longwall pillar stability (ALPS): an update. US Bureau of Mines, Information Circular IC9315 (Proceedings of Workshop on Coal Pillar Mechanics and Design, Santa Fe, USA, June 1992.)
Purrs E. L. J. & HEBBLEWHITE B. K. 1995. Potash mines in Saskatchewan, Canada. University of Newcastle-on-Tyne, Report No. 52-1076 to Cleveland Potash Ltd (unpublished).
SERATA S. 1968. Application of continuum mechanics to design of deep potash mines in Canada. International Journal of Rock Mechanics and Mining Sciences 5.
SERATA S. & SCHULTZ W. G. 1972. Application of stress control in deep potash mines. Mining Congress Journal.

.-
1
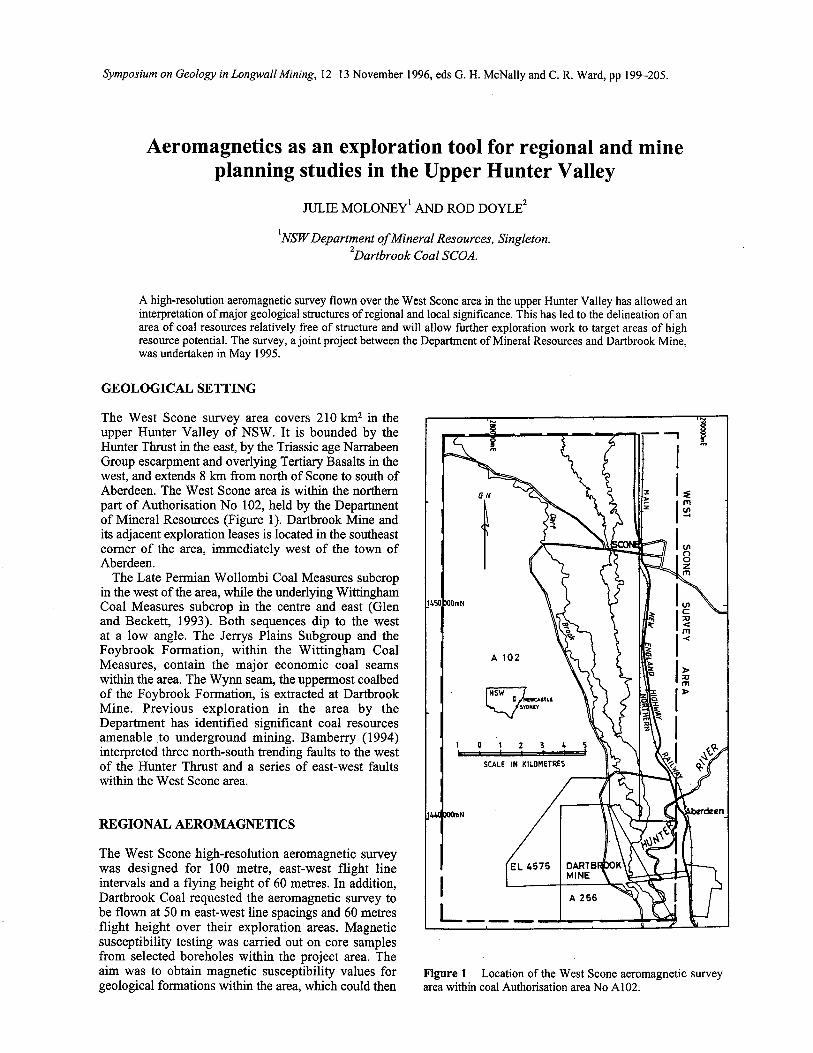
SCALE IN KILOMETRES
Symposium on Geology in Longwall Mining, 12-13 November 1996, eds G. H. McNally and C. R. Ward, pp 199-205.
Aeromagnetics as an exploration tool for regional and mine planning studies in the Upper Hunter Valley
JULIE MOLONEY' AND ROD DOYLE2
NSW Department of Mineral Resources, Singleton. 2Dartbrook Coal SC0,4.
A high-resolution aeromagnetic survey flown over the West Scone area in the upper Hunter Valley has allowed an interpretation of major geological structures of regional and local significance. This has led to the delineation of an area of coal resources relatively free of structure and will allow further exploration work to target areas of high resource potential. The survey, a joint project between the Department of Mineral Resources and Dartbrook Mine, was undertaken in May 1995.
GEOLOGICAL SETTING
The West Scone survey area covers 210 km' in the upper Hunter Valley of NSW. It is bounded by the Hunter Thrust in the east, by the Triassic age Narrabeen Group escarpment and overlying Tertiary Basalts in the west, and extends 8 km from north of Scone to south of Aberdeen. The West Scone area is within the northern part of Authorisation No 102, held by the Department of Mineral Resources (Figure 1). Dartbrook Mine and its adjacent exploration leases is located in the southeast corner of the area, immediately west of the town of Aberdeen.
The Late Permian Wollombi Coal Measures subcrop in the west of the area, while the underlying Wittingham Coal Measures subcrop in the centre and east (Glen and Beckett, 1993). Both sequences dip to the west at a low angle. The Jerrys Plains Subgroup and the Foybrook Formation, within the Wittingham Coal Measures, contain the major economic coal seams within the area. The Wynn seam, the uppermost coalbed of the Foybrook Formation, is extracted at Dartbrook Mine. Previous exploration in the area by the Department has identified significant coal resources amenable to underground mining. Bamberry (1994) interpreted three north-south trending faults to the west of the Hunter Thrust and a series of east-west faults within the West Scone area.
REGIONAL AEROMAGNETICS
The West Scone high-resolution aeromagnetic survey was designed for 100 metre, east-west flight line intervals and a flying height of 60 metres. In addition, Dartbrook Coal requested the aeromagnetic survey to be flown at 50 m east-west line spacings and 60 metres flight height over their exploration areas. Magnetic susceptibility testing was carried out on core samples from selected boreholes within the project area. The aim was to obtain magnetic susceptibility values for geological formations within the area, which could then
Figure 1 Location of the West Scone aeromagnetic survey area within coal Authorisation area No A102.

200 JULIE MOLONEY AND ROD DOYLE
be used to interpret the results of the aeromagnetic survey (Moloney, 1994).
The West Scone total magnetic intensity plan, Figure 2 summarises the survey results. The 3D total magnetic intensity plan, Figure 3, shows the magnetic highs and lows in isometric projection. The total magnetic intensity plan can be divided into three regions — a western, central and eastern domain — on the basis of magnetic response.
The western magnetic domain is dominated by the response of the Tertiary Basalts. The high magnetic response (red) overlies low magnetic response (purple), which has been interpreted as a magnetic reversal in the earlier flows of the Tertiary Basalts. The aeromagnetic survey result suggests that the Tertiary Basalts are more extensive than previously mapped (Glen and Beckett, 1993). The underlying Narrabeen Group, of Triassic age, is characterised by low magnetic response.
The central domain is characterised by a generally low magnetic response (blues and greens), suggesting no major igneous activity. The higher amplitude response within the northern part of the central domain is interpreted as being due to thick sills at varying depths, probably superimposed on weaker basement anomalies (Cowan, 1995). Sills in the West Scone area have been dated as Jurassic by Martin (1985). In the south of the central domain the north-east to south-west trending Dartbrook dyke can be clearly seen.
The eastern domain is characterised by the high magnetic response of the Hunter Thrust and New England Fold Belt rocks, consisting predominantly of sandstone, conglomerate and volcanogenic rocks. The aeromagnetic data suggest that this domain is complex, with a strong magnetic response close to the thrust. This may be. either an edge effect, as the magnetic response changes sharply from low to high, or it may indicate intrusions close to the thrust. Indications of smaller intrusions offset from the main thrust zone suggest imbricated structures (Cowan, 1995).
The coal measures are contained within the central magnetic domain. The most prospective seams are the Vaux, upper and lower Piercefield, Mount Arthur, and upper and lower Whybrow. The total resource within these coalbeds is more than 1,500 Mt of Inferred Class 1 (Bamberry, 1994).
RESOURCES AND STRUCTURE
The high-resolution aeromagnetic survey has confirmed the presence of major geological structures, illustrated on Figure 3, which disrupt the continuity of seams within the West Scone Area. The Hunter Thrust is a curvilinear feature clearly seen on the total magnetic intensity plan. A second curvilinear feature sub-parallel to the Hunter Thrust is interpreted as the northern extension of the Aberdeen Thrust. The third and most westerly fault, the Dartbrook Thrust, is more linear and orientated NNW. The southern extension of the Dartbrook Thrust swings to an easterly direction and joins the Aberdeen Thrust.
Displacement along the Aberdeen Thrust, which
forms the eastern limit of coal seam development, is 500 to 700 m in the south of the area (J. Rogis., pers. comm.). Displacement along the Dartbrook Thrust is approximately 120 metres in the north, but probably decreases southward as it joins the Aberdeen Thrust (J. Beckett 1996, pers. comm.)
Within the central magnetic domain a series of northeast-trending faults has been interpreted in the north-west corner of the West Scone Area (Figure 4). These correspond to lineaments identified as faults by Bamberry (1994), who suggested that displace-ment along these structures was 40-60 metres. Two northwest-trending faults, also shown in the top left corner of Figure 4, have been interpreted from the total magnetic intensity plan (Figure 3).
PREVIOUS AEROMAGNETIC SURVEYS
This survey has delineated a large area of relatively structure-free coal resources, encouraging further exploration work and targeting areas of interest. It also highlights local features pertinent to an operating colliery such as Dartbrook Mine.
Atkins (1989) studied the igneous intrusions in the drilling records from the Dartbrook area and recommended an aeromagnetic survey to cover a portion of the area. Dartbrook Coal undertook such a survey in 1990, with the aim of identifying igneous intrusions over the whole of its mining lease. The field data collected by Geoterrex Pty Ltd had line spacing of 100m and a specified terrain clearance of 35m. However during the aeromagnetic survey the operator experienced difficulties and raised the flying height to 60m. BHP Engineering (1990), Hungerford (1990), and Stasinowsky (1994) provide interpretations of this survey data, which identified alluvial gravel deposits, faulting, dykes and silling.
Dartbrook Coal sought to collaborate with the Depart-ment of Mineral Resources' West Scone aeromagnetic survey, primarily to better define the igneous bodies within its mining and exploration areas. The new survey incorporated the Sandy Creek, Kayuga, and West Kayuga areas, and offered a better data capture system and a closer line spacing than previously used. It was expected that newer technology and more definitive techniques would achieve a clearer resolution of the igneous intrusions.
The use of airborne magnetometry in this regional application has distinct advantages. The method can quickly cover a large area, collecting reliable data and providing detailed definition of local, mine-scale structures. It is, however, costly and requires expert analysis and interpretation. Why then is it worth the expense?
EFFECTS OF INTRUSIONS ON MINING
The presence of igneous intrusions in a mine affects safety, productivity, continuity of supply, customer satisfaction, product quality, insurance and economic

rn rn
AEROMAGNETICS IN THE UPPER HUNTER VALLEY 201
i34fX10C1014
6455000N
6450001314
6445000N
6440000N
6435003N
0 1 2 3 mirmit=si
Kikunateas
Figure 2 Total magnetic intensity of the West Scone area (colour). The main interpreted geological structures are shown on Figure 4 and are described in the text.

202 JULIE MOLONEY AND ROD DOYLE
Figure 3 Three-dimensional total magnetic intensity image (colour). This low-oblique view is from south-west (lower left) to north-east (upper right).
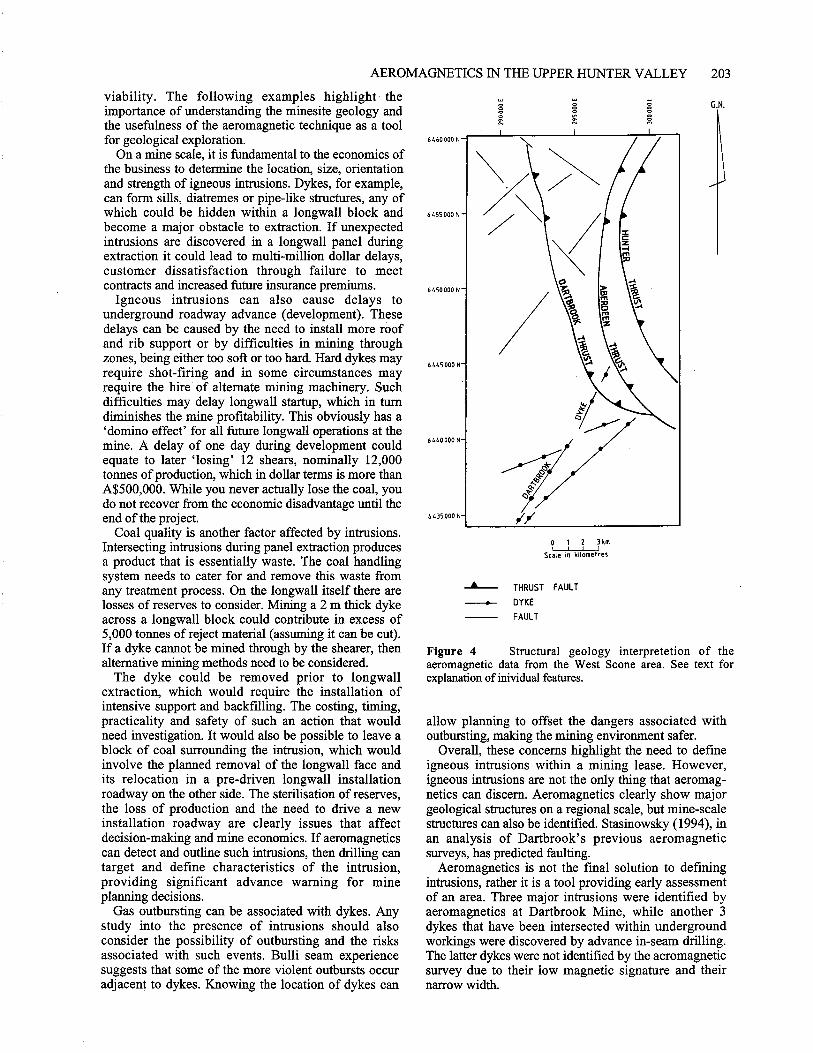
AEROMAGNETICS IN THE UPPER HUNTER VALLEY 203
viability. The following examples highlight the importance of understanding the minesite geology and the usefulness of the aeromagnetic technique as a tool for geological exploration.
On a mine scale, it is fundamental to the economics of the business to determine the location, size, orientation and strength of igneous intrusions. Dykes, for example, can form sills, diatremes or pipe-like structures, any of which could be hidden within a longwall block and become a major obstacle to extraction. If unexpected intrusions are discovered in a longwall panel during extraction it could lead to multi-million dollar delays, customer dissatisfaction through failure to meet contracts and increased future insurance premiums.
Igneous intrusions can also cause delays to underground roadway advance (development). These delays can be caused by the need to install more roof and rib support or by difficulties in mining through zones, being either too soft or too hard. Hard dykes may require shot-firing and in some circumstances may require the hire of alternate mining machinery. Such difficulties may delay longwall startup, which in turn diminishes the mine profitability. This obviously has a 'domino effect' for all future longwall operations at the mine. A delay of one day during development could equate to later 'losing' 12 shears, nominally 12,000 tonnes of production, which in dollar terms is more than A$500,000. While you never actually lose the coal, you do not recover from the economic disadvantage until the end of the project.
Coal quality is another factor affected by intrusions. Intersecting intrusions during panel extraction produces a product that is essentially waste. The coal handling system needs to cater for and remove this waste from any treatment process. On the longwall itself there are losses of reserves to consider. Mining a 2 m thick dyke across a longwall block could contribute in excess of 5,000 tonnes of reject material (assuming it can be cut). If a dyke cannot be mined through by the shearer, then alternative mining methods need to be considered.
The dyke could be removed prior to longwall extraction, which would require the installation of intensive support and backfilling. The costing, timing, practicality and safety of such an action that would need investigation. It would also be possible to leave a block of coal surrounding the intrusion, which would involve the planned removal of the longwall face and its relocation in a pre-driven longwall installation roadway on the other side. The sterilisation of reserves, the loss of production and the need to drive a new installation roadway are clearly issues that affect decision-making and mine economics. If aeromagnetics can detect and outline such intrusions, then drilling can target and define characteristics of the intrusion, providing significant advance warning for mine planning decisions.
Gas outbursting can be associated with dykes. Any study into the presence of intrusions should also consider the possibility of outbursting and the risks associated with such events. Bulli seam experience suggests that some of the more violent outbursts occur adjacent to dykes. Knowing the location of dykes can
9 1 Pcm Scale in kilometres
-A- THRUST FAULT
--•.- DYKE
FAULT
Figure 4 Structural geology interpretetion aeromagnetic data from the West Scone area. See explanation of inividual features.
allow planning to offset the dangers associated with outbursting, making the mining environment safer.
Overall, these concerns highlight the need to define igneous intrusions within a mining lease. However, igneous intrusions are not the only thing that aeromag-netics can discern. Aeromagnetics clearly show major geological structures on a regional scale, but mine-scale structures can also be identified. Stasinowsky (1994), in an analysis of Dartbrook's previous aeromagnetic surveys, has predicted faulting.
Aeromagnetics is not the final solution to defining intrusions, rather it is a tool providing early assessment of an area. Three major intrusions were identified by aeromagnetics at Dartbrook Mine, while another 3 dykes that have been intersected within underground workings were discovered by advance in-seam drilling. The latter dykes were not identified by the aeromagnetic survey due to their low magnetic signature and their narrow width.
G.N.
of the text for

204 JULIE MOLONEY AND ROD DOYLE
Surface magnetometer surveys have also been conducted over areas within the Datbrook mining lease to pinpoint anomalies previously indicated by the aeromagnetic surveys. Howland-Rose (1990), Schwartz and Wilkie-Snow (1993), Clark (1994) and McClelland (1995) report on surface magnetometer surveys which have directly assisted in proving up aeromagnetic anomalies.
DARTBROOK MINE IGNEOUS INTRUSIONS
Several types of intrusions have been intersected, indicating a complex history of igneous activity in the Dartbrook area. To date no age determinations have been undertaken, but evidence suggests a range of ages for the intrusions.
The aeromagnetic survey highlighted the presence of major dykes (possibly up to 20 m in thickness). The dyke rocks are highly magnetic (Emerson 1996), relatively fresh, green-grey, predominantly north-east trending, and have both faulting and silling associated with them. In general, these dykes are basaltic in origin and have been moderately altered. Doyle and Lohe (1996) note the likelihood of these dykes intruding into older structures and cross cutting existing intrusions.
MacDonald (1981) suggested that the Strathem Anticline dominated the structure in the area and was responsible for a broad magnetic high in the area. It was also postulated that the Gyarran Volcanics (basement rocks) could be closer to the surface than previously thought. Aeromagnetic interpretations by both Stasinowsky (1994) and Cowan (1996) suggest that the broad magnetic high is due to an intrusion between at 500 to 1000 m depth. This deep intrusion could be responsible for the seam structure, in particular the irregular gradients and the abundant calcite-infilled jointing. The intrusion is believed to have introduced carbonate-enriched waters and carbon dioxide gas to the overlying coal seams, infilling joints with calcium carbonate. Subsequent to these events, thrust faulting occurred leaving 'open' fault planes. Unfortunately, none of this seems to have improved the rank of the coal.
Three other types of dykes are present, all altered, all minor and all distinctly different. One type is very fine grained, clayey, white to grey, highly altered and relatively soft. Another intrusion is dark and coarse-grained, exhibiting vesicular fragments, highly altered phenocrystic dykes, and again is relatively soft. The latter intrusion is believed to be derived from a different magma source than the other dykes. To date both types of intrusion have been found to reach a maxi-mum thickness of about 2 m. The third type is a thin (<0.05 m) clastic dyke, dark grey-brown, hard, composed largely of calcite and siderite. These dykes show chevron folding along their axis, indicating their early intrusion into the 'seam' during compaction and diagenesis.
The aeromagnetic evidence suggests the presence of pipes and further sill activity on the mining lease, some of which has been proved up with drilling.
Finally, Tertiary Basalts (Glen & Beckett, 1996) overlie the Permian strata to the west of Dartbrook Mine. These are likely to have been fed from some of the intrusions in the local area.
CONCLUSIONS
The West Scone Aeromagnetic Survey has provided high resolution data which have enabled a detailed structural interpretation of the area to be prepared, and has identified areas which contain extensive igneous intrusions. As a result of this work an area containing containing substantial coal resources has been identified to the north-west of Dartbrook Mine. The area is bounded to the north by major faulting and igneous intrusions; to the east by the Dartbrook Thrust, to the south by Dartbrook Mine and its exploration areas, and to the west by the Triassic escarpment. Coal resources within this prime area appear to be undisturbed by major structural elements and apparently contains no large igneous intrusions.
The West Scone aeromagnetic survey has been a successful collaborative venture between government and industry. The survey has led to a fundamental re-evaluation of geological structures across the upper Hunter Valley, while fine-tuning their definition at a mine scale. In an area of such complex structural and igneous activity, aeromagnetics is a fundamental tool for understanding both regional and mine-scale geology.
REFERENCES
ATKINS B. T. 1989. Igneous intrusive study. Joint Coal Board Geology Report SNR 89 / 3.
BANIBERRY W. J. 1994. Geology and coal resources of the West Scone Area, Authorisation No 102, Hunter Coalfield NSW. Department of Mineral Resources, Coal and Petroleum Geology Branch Report CGB 1994/002 (unpublished).
BHP ENGINEERING 1990. Interpretation of aeromagnetic data over the Aberdeen area, Hunter Coalfield NSW. BHPE Report No G90 /09.
CLARK P. 1994. Magnetometer survey, Dartbrook Mine. Company report.
COWAN D. R. 1995. Scone-Gunnedah surveys: aeromagnetic and radiometric interpretation. Unpublished report for NSW Department of Mineral Resources.
COWAN D. R. 1996. West Scone survey, Dartbrook Mine Area. Company report.
DOYLE R. & LOHE E. 1996. Dartbrook Mine's Hunter Tunnel — a geological cross-section across the upper Hunter River Valley. Proceedings of the 30th Newcastle Symposium, Advances in the Study of the Sydney Basin.
EMERSON D. W. 1996. Report on petrophysical tests, Dartbrook Mine samples. Project No 9637, Sydney University Dept. of Geology and Geophysics, for Dartbrook Mine.
GLEN R. A. & BECKETT J. 1996. Hunter Coalfield regional geology 1:100,000 sheet. Department of Mineral Resources.
HUNGERFORD N. 1990. Aeromagnetic Review. Shell Balton Report CR 2294.
AEROMAGNETICS IN THE UPPER HUNTER VALLEY 205
HOWLAND-ROSE A. W. 1990. A report on ground magnetometer field surveys over the Aberdeen area near Muswellbrook NSW. NSW Department of Mineral Resources, unpublished report.
MACDONALD I. 1981. Denman-Scone coal drilling programme, Stage 3D. Basic data report. NSW Deparment of Mineral Resources, unpublished report GS1981/ 039.
MARTIN D. J. 1985. A small layered tholeiitic intrusion emplaced at shallow level at Scone NSW. In Sutherland F. L., Franklin B. J. and Waltho A. E. eds. Volcanism in Eastern Australia. Geological Society of Australia, NSW Division Publication No 1, 107-140.
MCCLELLAND P. 1995. Ground magnetic survey Dartbrook Coal. Unpublished company report.
MOLONEY J. 1994. Magnetic susceptibility of selected boreholes in the Narrabri and Caroona Areas in the Gunnedah Coalfield and the West Scone Area in the Hunter Coalfield. NSW Department of Mineral Resources, Coal and Petroleum Geology Branch. Unpublished report CGB 1996/016.
STASINOWSKY W. 1994. 1987 to 1994 aeromagnetic and ground magnetic surveys — a reinterpretation. Dartbrook Mine report (unpublished).
SCHWARTZ T. & WILKIE- SNOW, J. 1993. Magnetometer survey, Dartbrook Mine. Company report (unpublished).


Symposium on Geology in Longwall Mining, 12-13 November 1996, eds G. H. McNally and C. R. Ward, pp 207-212.
The application of drilling and survey technology to Australian coal mining
F. HUNGERFORD AND S. THOMSON
Advanced Mining Technologies Ply Ltd.
In-seam drilling for gas drainage and exploration is now an integral part of Australian underground coal mining. With increased production levels, the demand for gas drainage has resulted in the rapid improvement of drilling techniques and survey instrumentation. Down-hole motor drilling now predominates over rotary drilling. Increasingly, electronic in-hole survey tools are being applied to improve drillhole target accuracy. Directional drilling with a down-hole motor to depths in excess of 1500m has now been achieved in Australia. Electronic in-hole survey instruments such as the DDM MECCA have increased drilling productivity and improved accuracy in reaching a predetermined target.
INTRODUCTION
Production levels in Australian underground coal mines have increased greatly over the past 15-20 years, while face conditions have become increasingly gassy. Consequently, in-seam drilling for gas drainage and exploration has become an integral part of the mining process. Initially the equipment and technology for drilling had been borrowed from activities outside the coal mining industry, such as surface drilling and underground hard rock mining. Today, leading Australian coal mining operators and service companies are committed to improved design and development of drilling equipment and technology to be used in their specific applications.
Borehole surveying has become more critical in recent years. The equipment used in the earlier drilling is. still quite functional in most situations, although the pressure for improved drilling rates and increased borehole depths has focused attention on development of electronic in-hole survey instruments. The leading electronic survey system in current use is Advanced Mining Technologies' (AMT's) DDM (Directional Drill Monitor) MECCA (Modular Electrically Connected Cable Assembly).
AN OVERVIEW OF DRILLING TECHNOLOGIES IN UNDERGROUND COAL MINING
Initially, in-seam drilling was limited by the equipment and technology that were available (and approved) for underground use. Improvements in underground drilling technology have usually been driven by the production side of the industry, to overcome particular conditions or situations. This has been achieved through modifying technology which was already being used in other activities, through in-house or research grant funding. As the industry has become more experienced with drilling, and more familiar with local conditions and requirements, research and
development effort has increasingly been applied to improve existing technologies.
Design considerations
The coal mining environment imposes severe restrictions on the design of drilling equipment. The main concern is the presence of coal dust and methane in confined spaces, and the potential for a spark-initiated explosion. As a consequence, all components have to be Mines Department approved for safe under-ground operation. Statutory requirements include a flameproof electric motor and starter (control box), no exposed aluminium components, a methane monitor and automatic shut-off, fire resistant anti-static components, fire resistant hydraulic oil, and an approved survey instrument. These necessary modifications result in a safe drilling machine, but one which is heavier and more expensive than an equivalent rig utilised in surface or hard rock operations.
Current status
Over the past 10 years, most Australian coal mines involved in in-seam drilling have become more involved in the design and development of drill rigs and support equipment. They are ordering machines which suit their specific needs in terms of thrust capacities, rod sizes, down-hole motor capabilities, mobility and physical size. Local suppliers are working to meet these specifications, while providing a drill which is market-able to the rest of the mining industry. A sample of the current specification for an underground gas drainage drill rig would be:
• 75 kW, 1000V hydraulic power unit to power the rig and the water pump;
• 250 L /min at 10 MPa high pressure pump; • Automatic rod handling; • 135 IcN thrust and pull; • 1500 to 2000 Nm torque, NQ capacity rotation unit;

208 F. HUNGERFORD AND S. THOMSON
• Track-mounted, compact enough to operate in a roadway and allow vehicles to pass.
Although rotary open-hole drilling has in the past predominated, down-hole motor drilling has become the major form of in-seam drilling in recent years. In-seam exploration drilling has also become more common, with a need to better identify and define structures which could adversely affect the high level of longwall production. This has created a need for longer directionally controlled boreholes, with the increased use of down-hole-motors. Longer boreholes have required higher strength rods, improved surveying techniques and more powerful rigs.
Rotary drilling across block for gas drainage is being used at Appin, Metropolitan and Tahmoor collieries. Parallel or fan drilling patterns are used with borehole depths of 250-350 m. Monitoring of the lateral deviations of boreholes has established general trends which have been allowed for in the drilling pattern design. In instances where rotary drilling cannot achieve the desired coverage, down-hole motor drilling or a combination of both has been used. Cross-measure drilling under longwall blocks for post-drainage is generally done with rotary drilling.
In an effort to improve the accuracy of rotary drilling, research is currently underway in water jet drilling (Dunn, 1996). Some success has been achieved in trials to date for cross-panel drainage (200-250 m borehole length). However, holes still need to be surveyed post drilling and maintaining trajectory is still causing some problems.
Down-hole motor drilling
The main advantage that down-hole motor drilling has over rotary drilling is directional control, both in the vertical and lateral sense. For long-holes the seam profile can be defined with regular seam roof inter-sections. Instead of a stone intersection causing the termination of a borehole, it is continued with branching. Faulting in the seam can be identified and defmed with numerous branching runs.
Penetration rates can be low with down-hole motor drilling and metreage rates are further reduced by the need to survey regularly for directional control. This can be balanced by fewer boreholes having to be drilled to achieve the desired gas drainage coverage. Most Australian coal mines involved in gas drainage are using down-hole motors for all or most of their in-seam drilling.
Several mines are employing in-seam down-hole motor drilling for exploration. Borehole depths have generally been restricted to 500-900 m by limited drill capacities and in-hole problems. However, these problems are being overcome with improving tech-nology and borehole depths beyond 1000 m are now regularly achieved. The longest underground in-seam borehole completed to date in Australia was drilled to 1533 m at North Cliff Colliery.
The three down-hole motors in common use are the 73 mm high-torque Slimdril, the 60.3 mm Drilex and the 74.6 mm Accu-Dril. The ability to steer such motors is provided by a combination of the size of the bent housing on the motor and the diameter of the drill bit. To control the drilling, this combination must provide the ability to climb. The accepted combination for the NQ size motors is a 1 degree bend with an 89 mm bit. In softer conditions, where the bit cuts a bigger hole and reduces the climbing ability, a 1.25 degree bend is used.
The ability to drill long holes is controlled primarily by the stability of the strata being drilled. Very long holes can only be drilled in stable geological conditions, where borehole collapse causing rod jamming is not a factor. The equipment and operational requirements for very long hole drilling are:
THE ARGUMENT FOR DOWN HOLE MOTOR VERSUS ROTARY DRILLING
The decision whether to use conventional rotary drilling or down-hole motor drilling has been influenced by the past performance of rotary drilling in the local con-ditions. In recent times, there has been an increased importance placed on positioning boreholes to achieve optimum drainage effect and on surveying to ensure that they are in the desired location. Inaccurate drilling and uneven gas drainage have proved a major occupational health and safety issue in Australian coal mining.
With normal rotary drilling the quality rating (hole achieving objectives) in the Bulli seam is estimated to be around 50% with a penetration rate of 40 m/ hour, whilst down-hole motor drilling has a 98% quality rating with a 25 m/ hour penetration rate (Dunn, 1996). It can therefore be said that the major problem with rotary drilling is getting the hole to go where it is planned, while with directional drilling it is achieving a sufficient rate of penetration to keep gas drainage ahead of mining. Efforts are being made in Australian R & D to improve the accuracy of rotary drilling (Dunn, 1996). In addition, down-hole motor drilling with the DDM MECCA survey system is now approaching rotary drilling penetration rates (Baker, 1996).
Rotary drilling
The big benefit of rotary drilling in most cases is the very high rate of advance, with 250-300 metres possible per shift. This is achievable with penetration rates of 2-3 metres/min in coal, in conditions where the boreholes follow a particular section of the seam or the bit deflects off low angle intersections with the harder roof or floor strata.
The position of the boreholes has been assumed in the past, relying on known trends of lateral deviation. With changing drilling conditions creating variable and increased lateral deviations and the emphasis on correct seam drainage coverage, mines are now looking to improve the straightness of the boreholes and carry out post-drilling surveying with multi-shot survey instruments.

Ver
tical Dev
iati
on (m
)
APPLICATION OF DRILLING AND SURVEY TECHNOLOGY TO AUSTRALIAN COAL MINING 209
0 200 400 600 800 1000 1200 1400 1600
Borehole Depth (m)
Figure 1 Example of multiple branching in a coal seam longhole. Note that the vertical scale is exaggerated forty-fold and that the seam profile is indicated by the dotted lines.
• Optimum bit size and configuration; • High down-hole motor torque; • Optimum rod diameter and bent housing size; • Adequate strength and stiffness of the drill string.
The drill rig must then provide the thrust required to overcome the in-hole friction in longer holes, which is higher in directional drilling than rotary drilling. Rig thrust must be higher in pulling rods from the hole than in the push mode.
Down-hole motor drilling enables multiple branching to be achieved, in order to establish seam dip trends and investigate structure. An example of multiple branches in a long hole is presented in Figure 1 (note the exaggerated vertical scale).
Borehole depths with down-hole motor drilling has been restricted by surging as the depth increases. For long-hole exploration, the bit diameter has increased from 89 mm to 96 mm, with an increase in the size of the bend from 1 to 1.25 degree to maintain the ability to climb. With the increased clearance, surging has been reduced and borehole depths in excess of 1500 m are possible.
Lateral control can also be adversely affected by geological conditions. Strong cleating, fractured zones and some high stress areas in the coalbed can divert the drill bit off line. Continual drilling against the trend, drilling back on line beyond the problem area and diverting around the area are methods used to negotiate these areas.
BOREHOLE SURVEYING TECHNIQUES — STATUS
Surveying applications
Whether boreholes are surveyed or not has, in the past, depended on the application. Some of the first rotary gas drillholes required progressive surveying with an Eastman photographic single-shot survey instrument on wire-line. Routine gas drainage boreholes were not surveyed if the drilling conditions had been consistent and their positions could be detected by subsequent mining. If boreholes were not found to be where predicted, tedious post-drilling surveys were performed out with the single-shot instrument to identify any unexpected directional trends. Most rotary gas drainage drilling programs now require that all boreholes be surveyed on completion to ensure correct positioning. This has created a need for a multi-shot device which satisfies approval conditions. The two post drilling multi-shot instruments being used at present are the 'Peewee' photographic instrument and the Surtron 'Champ' electronic instrument.
Progressive surveying of down-hole motor drilling is required to maintain control of borehole trajectory and azimuth. The increased use of down-hole motors for gas drainage drilling has also created a need to improve survey technology. Cable-less down-hole monitors have been imported to reduce surveying time and improve accuracy. These instruments are installed in the drill

210 F. HUNGERFORD AND S. THOMSON
60
50 —
Eastman Wire-line 40 —
30— E
20 —
10 —
0 -r 0 200 400 600 800
AMT DDM-MECCA
1000 1200 1400 —r
Borehole Depth (m)
Figure 2 Comparison of the time required for longhole surveying in relation to hole length. Note that wireline single-shot methods suffer from greatly increased delays, in relation to in-hole electronic systems such as DDM-MECCA, as the borehole lengthens.
string behind the down-hole motor and are used to measure borehole trajectory, and to transmit that information to the borehole collar via the drill string or a cable. Various instruments have been tried, with some being rejected and some developed to suit the local conditions. All units are suited to NQ size or larger rods.
Surveying problems
All forms of borehole surveying suffer from some sources of inaccuracy and operational problems. The sources of inaccuracy include:
• Rated accuracy and calibration of the instrument; • Errors in azimuth caused by the influence of steel in
the down-hole-motor and the drill rods; • Multiple changes in trajectory and azimuth over the
extended distance between survey points; • Conversion errors between the magnetic azimuth
readings and the grid bearings used by the mine surveyors.
To reduce these inaccuracies, before each new project and at stages during projects, the survey system should be calibrated against the mine grid system.
Wire-line single-shot surveying, which has in the past been the main means of surveying, suffers from delays to drilling with increasing depth (Figure 2). Extending the distance between survey points to improve drilling
rates increases the chances of errors in borehole positioning and control. The introduction of electronic in-hole survey systems, such as the DDM MECCA, has a direct impact on drilling productivity (Figure 3).
AMT's DDM MECCA surveying instrument
AMT have developed the Directional Drill Monitor (DDM) in two distinct forms, the DDM—MECCA (Figure 4) and the DDM Upgrade. The DDM Upgrade is activated by rotating the drill string and transmits the information along the drill string by varying the frequency of a carrier signal. It measures the borehole trajectory and azimuth and down-hole motor orien-tation. Although the depth capacity of the DDM upgrade is 700 to 1000 m, this system still suffers signal transmission problems from in-hole noise at depth and after drilling through "sticky" ground or stone.
To overcome this problem, AMT have developed the MECCA communication system. This has a cable installed in each drill rod and provides automatic connection to the DDM with each rod added to the drill string. All outside influences on activation and signal transmission have been eliminated. With DDM MECCA the survey instrument is not the limiting factor on the depth drilled beyond 1000 m. The MECCA system enables a survey shot to be taken within 4 seconds regardless of borehole depth. This system has now been fully tested on a number of occasions beyond 1500 m in-seam. From the user's perspective,
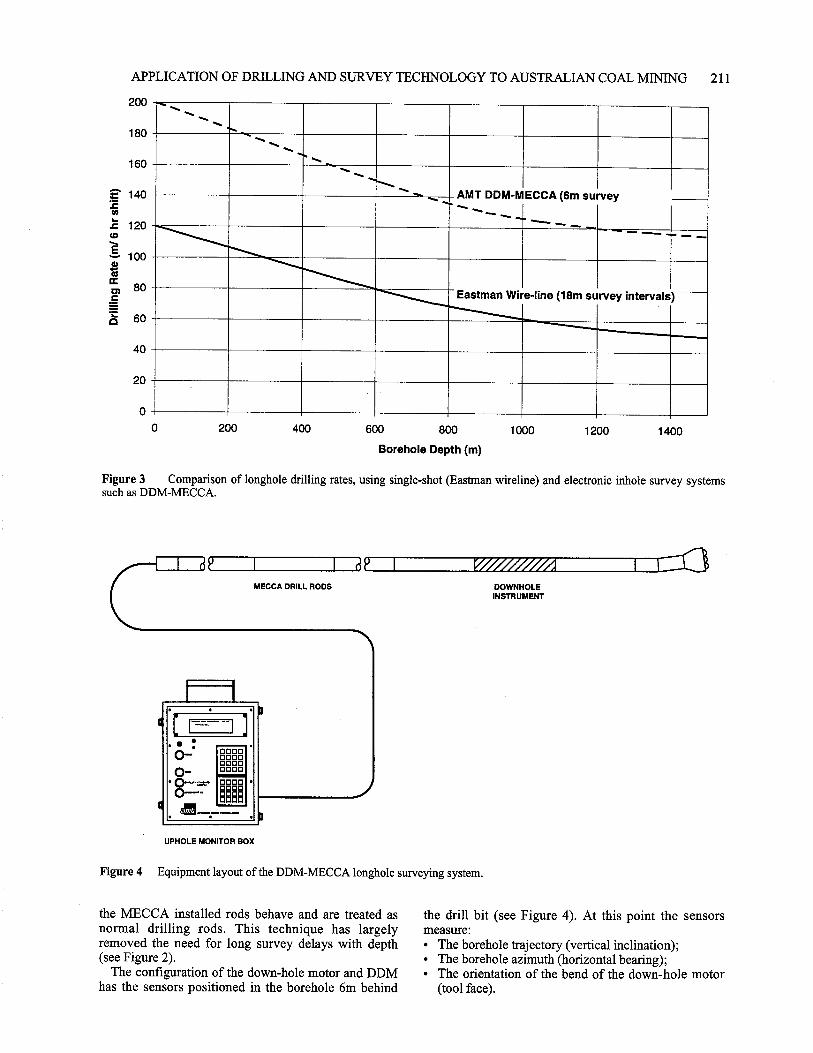
........ -..........,
-.. ...
... , AMT DDM-MECCA (6m survey
— _
-, -. -. ,
-line (18m survey intervals) Eastman Wire
200
180
160
g 140
1C . 120 co
100
cc 80
60
40
20
0
APPLICATION OF DULLING AND SURVEY TECHNOLOGY TO AUSTRALIAN COAL MINING 211
0 200 400 600 800 1000 1200 1400
Borehole Depth (m)
Figure 3 Comparison of longhole drilling rates, using single-shot (Eastman wireline) and electronic inhole survey systems such as DDM-MECCA.
MECCA DRILL RODS
poop moo 0000 0000
UPHOLE MONITOR BOX
Figure 4 Equipment layout of the DDM-MECCA longhole surveying system.
DOWNHOLE INSTRUMENT
the MECCA installed rods behave and are treated as normal drilling rods. This technique has largely removed the need for long survey delays with depth (see Figure 2).
The configuration of the down-hole motor and DDM has the sensors positioned in the borehole 6m behind
the drill bit (see Figure 4). At this point the sensors measure: • The borehole trajectory (vertical inclination); • The borehole azimuth (horizontal bearing); • The orientation of the bend of the down-hole motor
(tool face).

212 F. HUNGERFORD AND S. THOMSON
The orientation is recorded to allow the down-hole motor to be steered along the desired path and also to establish response behaviours in both the horizontal and vertical planes. The trajectory and azimuth are values used in trigonometric calculations in the control box to provide three-dimensional co-ordinates for each survey position along the borehole. The RL and forward displacement (down track) are initially calculated relative to the collar of the borehole, with lateral deviation being calculated relative to the target direction defined at the start of the hole. This information can then be down-loaded and converted to tie in with the mine co-ordinate system.
The rated accuracy of the sensors in the DDM instru-ment is ±0.1 degree in both trajectory and azimuth. Additional inaccuracies can occur in the following circumstances:
• If the instrument does not lie exactly parallel to the hole wall, due to curvature in the hole itself;
• If magnetic influences are caused by the steel in the motor and the rods;
• If calibration with the mine site grid is imprecise; • By assuming a consistent curve between survey
points, when in fact this may vary between points.
The sum of these factors affects the system accuracy. Experience suggests that the system performs to an accuracy of ±0.2 to 0.5 degrees, which is equivalent to ± 0.35 m to 0.90 mover 100 m.
FUTURE DIRECTIONS
Australian gas drainage and exploration drilling is likely to continue down the path of specialised equipment for local applications, with rig design and survey equipment development undertaken in close collaboration with mine operators. Likely future trends include:
• Increased use of down-hole motor drilling in preference to rotary;
• Wider acceptance and application of electronic in-hole survey technologies;
• The addition of geophysical sensors and true "measure whilst drilling" capabilities;
• Faster down-hole motor penetration rates; • The metreage of directional drilling continuing to
grow at more than 10% per year.
ACKNOWLEDGMENTS
The Australian underground coal drilling fraternity is characterised by a ready interchange of ideas between drill operators, developers and mine personnel. In particular, the support of gas drainage engineers, production planners, geologists and drill crews has been of vital importance in the development of DDM MECCA, and in the growing acceptance and knowledge of directional drilling. The authors would like to thank the mine staff who have readily shared ideas in the past and contributed to future R & D directions.
REFERENCES
BAKER P. 1996. Appin Colliery guided drilling. Guided Drilling Seminar, Centre for Mining Technology and Equipment, Brisbane, June.
CERVICK J., FIELDS H. H. & Atm G. N. 1975. Drilling holes in coalbeds for degasification. U.S. Bureau of Mines Report of Investigations, RI 8097, 21pp.
DUNN P. 1996. Waterjet assisted drilling. Guided Drilling Seminar, Centre for Mining Technology and Equipment, Brisbane, June.
HUNGERFORD F. 1995. Status of underground drilling technology. Keynote Address, International Symposium cum Workshop on Management & Control of High Gas Emission & Outbursts, Wollongong 20-24 March.
HUNGERFORD F., KELLY M., SAGHAFI A. & WILLIAMS R. 1988. Long-hole drilling for gas emission control at Appin Colliery, NSW Australia. Proceedings of the Fourth International Mine Ventilation Congress, Brisbane. The Australasian Institute of Mining and Metallurgy, July.
KELLY M. 1983. Practical in-seam drainage at Appin Colliery. Seminar No.3, Alleviation of Coal and Gas Outburst in Coal Mines. Co-ordinating Committee on Outburst Research.
WALSH R. & HUNGERFORD F. 1993. Exploring longwall domains using directional longhole drilling. Longwalling in Australia — Continuous Improvement or Crisis. ACIRL Underground Mining Seminar, November.

Symposium on Geology in Longwall Mining, 12-13 November 1996, eds G. H. McNally and C. R. Ward, pp 213-221.
Surface exploration for longwall mining at Moranbah North, Queensland
F. BOS AND A. J. LAWS
Shell Coal Australia Limited.
The Moranbah North deposit has been extensively explored in preparation for longwall mining since Shell Coal Australia Limited acquired the exploration rights to the area in 1990. Four exploration campaigns were conducted which largely consisted of drilling, but also included down-the-hole techniques and surface geophysical methods. This paper describes the exploration activities to date and evaluates the geological control achieved for the variables important in longwall mining. Development of a new underground mine commenced early in 1996, and the accuracy of the geological predictions will become known during the next few years.
INTRODUCTION
The Moranbah North coal deposit is situated 150 km south-west of Mackay, between the township of Moranbah and the Goonyella Mining Lease (Figure 1). The area was first explored by the Utah Development Company (now BHP Coal) and the Queensland Department of Minerals and Energy in the 1960s and 1970s. In 1990 the exploration rights were made available for competitive tender. Shell won this tender and was awarded Exploration Permit for Coal 506. Over the following five years Shell completed four exploration campaigns: • Stage 1, leading to a pre-feasibility study (Shell
Company of Australia Limited, 1992); • Stage 2, in preparation for a feasibility study (Shell
Company of Australia, 1995; Laws and Bos, 1995); • Stage 3, required for detailed mine design; and • Stage 4, which is currently being undertaken as part
of the production planning process. Work to date has confirmed and enhanced the original expectations of a high quality coking coal deposit suitable for extraction by the longwall method (Laws, 1995).
A Mining Lease was granted in December 1995 and site construction started in April this year. Underground development will start early 1997 and longwall extraction is expected to commence two years later.
GEOLOGY
The productive formation in the area is the 250 to 300 m thick Moranbah Coal Measures of Permian age, which contains 12 coal seams (Figure 3). The Goonyella Middle (GM) seam is the most prospective of these, and has been extensively worked in the adjacent Goonyella mine. This seam maintains an average thickness of 5 to 6 m over the area, with an overall trend of thinning to the south. The upper 0.4 m to 0.9 m of the seam is transitional, composed of variable proportions of stone and high-ash coal, which will be left as the working
roof. Mining will concentrate on extracting the remaining 'ideal section' of high-yield and low-ash coal. Towards the southern boundary of the area the GM seam deteriorates, and the saleable coal proportion falls below economic levels.
The strata dip uniformly at approximately 3° from subcrop in the west to a depth of about 400 m on the eastern boundary. The coal measures are unconformably overlain by an irregular cover of Tertiary sediments and basalts, ranging in thickness from 6 m to 146 m. Weathering of the coal measures strata beneath the unconformity surface extends to a maximum depth of 40 m,. but is generally 5 m to 10 m deep. Widespread Tertiary volcanism produced extensive basalt flows, which partly fill the major depressions in the palaeosurface along the southern and western boundaries of the area.
EXPLORATION APPROACH
The information available to Shell before the granting of exploration rights comprised logs of about 100 holes drilled by Utah, of which 22 were partly cored (Figure 2). In combination with the eight holes subsequently drilled by the Queensland Department of Minerals and Energy, it was possible to make a broad assessment of the underground potential of the deposit. This was sufficiently encouraging for the company to apply for the area when it was offered for tender in 1990.
Stage 1 of the exploration programme, which began in 1991, aimed to prove a large resource of prime coking coal suitable for extraction by longwall mining. Based on the pre-existing data, together with results from the 29 holes drilled during the first year's programme, the GM seam in the northern half of the area was identified as having favourable coal quality and mining conditions. All other seams were found to be sub-economic, due to seam thickness and/ or quality limitations.
A pre-feasibility study in 1991, based on an underground entry at the northern boundary, confirmed

214 F. BOS AND A. J. LAWS
the economic attractiveness of the northern area. This was followed by Stage 2 exploration activities during 1992 and 1993, including the drilling of 84 boreholes (Figure 2), a magnetometer survey and a trial seismic survey. Full details of the exploration activities conducted during the first two stages are given by Bos and Knight (1993).
A detailed feasibility study in 1994 proposed a 'herringbone' layout, with the mine entrance about 2 km south of the northern boundary. Exploration over the next two years was concentrated on the area to be mined during the first twenty years of production, although there were also a number of holes drilled outside this area. These Stage 3 exploration activities (Figure 2) are summarised as follows: • 80 non-cored holes, to improve structural control,
improve the interpretation of the base of weathering and for hydrogeological tests;
• 9 partly-cored holes, to enlarge the area containing Measured Resources in the south and east;
• 7 large diameter cored holes, to provide sufficient coal for detailed washability tests and samples of roof and floor strata for geotechnical tests;
• 20 partly cored holes along the lines of the proposed underground access drifts, to investigate strata conditions.
As in previous company programmes, all holes were geophysically logged. Although the pre-Shell holes were useful, especially during the early stages of the programme, many of these drillholes were not used in the geological models, due to uncertain locations and unreliable seam levels in non-cored holes. A total of 242 holes were therefore used for modelling the deposit.
Following detailed design studies and commissioning of the project in late 1995, concerns were raised about the stability of the roof strata overlying the shallowest workings. To address this problem a fourth stage exploration campaign was mounted. Six partly-cored geotechnical holes were drilled in the initial mining area, and detailed geomechanical tests were conducted on the roof cores. Following the realignment of one of the access drifts, a further 10 geotechnical holes were drilled on the line of the new drift. Additional drilling and investigation may be required as problems arise during mine construction and development.
The Stage 4 activities are mentioned here to indicate that the investigations are continuing. Strictly speaking, these recent and near future investigations have to be regarded as pre-production studies rather than as exploration; 'exploration' normally describes activities leading to the actual development decision.
EVALUATION OF GEOLOGICAL CONTROL ACHIEVED
The first aim of exploration is to identify a potentially viable coal deposit. Once this has been confirmed by pre-feasibility studies, exploration and investigations
are continued to reduce the risk of the project to a level acceptable to the investor. Successful longwall mining requires large blocks of relatively undisturbed coal, with suitable roof and floor strata behaviour during and after mining. Surface investigations, drilling, wireline logging, down-the-hole tests, and analysis of borecore samples are used to evaluate all geological variables important to the longwall process. These evaluations, combined with experience gained elsewhere, then form the basis for the investment decision and the design of the mine. As is well known from other recently developed longwall mines in the Bowen Basin, there is always some element of risk, no matter how much work is undertaken prior to mine development.
In order to evaluate the overall geological control achieved by exploration, it is necessary to assess each variable separately; the type and density of information required are different for each. The measure of control achieved for each of the geological variables important for longwall mining at Moranbah North is discussed below.
Seam consistency
The target GM seam was known to occur over most of the area since the exploration by Utah in the 1960s. Departmental drilling in the 1970s confirmed the existence of a thick, high-quality seam in the north-east, but also indicated its deterioration towards the southern boundary of the exploration area.
The first year of drilling by Shell established the consistency of the GM seam, with stone bands and coal plies recognisable throughout the area (Figure 4). Although sandstones are present in the roof sediments of the GM seam, the risk of intersecting washouts in the initial mining area is regarded as small because the rider seam is unaffected by erosion in all holes located in the study area.
The coal quality deterioration in the south is caused by thickening of the stone bands, thinning of the coal plies and a general increase in inherent ash of the coal. The extent of this deterioration was initially interpreted as covering a large wedge-shaped area in the south. However, the size of this poor-quality area was reduced when it was realised, during 1991, that the overlying P seam in some Utah holes had been mistaken for the GM seam. A similar miscorrelation in a 1992 Shell drillhole on the northern side of the poor-quality zone was rectified in 1994, when the hole was deepened and a good quality GM seam was found. Further drilling in this previously written-off area established that the poor-quality zone was much smaller than originally thought. Total in-situ Measured and Indicated Resources in the area north of the poor-quality zone are 339 Mt, sufficient for the establishment of a longwall mine.
Subdivision of the seam into five plies (Figure 4), adopted during the first year and retained in subsequent years, facilitated interpretation of the variations in coal quality parameters. Float! sink tests were carried out for all five plies, so that cumulative yields and ash

kilometres
DBCT oy Point
RIVERSIDE BHP COAL
100
I GOONYELLA BHP COAL
0 5 10
kilometres
MORANBAH NORTH SHELL
coo 11.9„zz,
HAY pohyr RAILWAY
GROSVENOR SHELL
EPC 552
L_
PEAK DOWNS k, BHP COAL ,>
MORANBAH SOUTH ISCOR
EPC 548
SURFACE EXPLORATION FOR LONGWALL MINING AT MORANBAH NORTH 215
Figure 1 Location of the Moranbah North coal deposit, in the Bowen Basin central Queensland.

Kay to Boreholos
c Utah partly cored hole
Utah open hole
X Government cored hole
• BHP cored hole
• Party cored hole. Stage 1 & 2
o Open hole. Stage 1 & 2
• Party cored hole. Stage 3
O Open hole. Stage .3
Large diameter cored hole
0 Geotechnical hole partly cored. Stage 4
7 570 000 r00
• c•
• •••••••• 11•M•1••• 1•11 1111111•MINNI
•
MDL166 x
216 F. BOS AND A.J. LAWS
Figure 2 Borehole locations and exploration stages in the Moranbah North area. Note GM seam subcrop and provisional layout of longwall panels, indicated by chevron pattern.

A'
Ut 3 ••• TOPOGRAPHY
A
100 250metres
H:V = 1:5
30
20
10
0
GM GML
For location see FIGURE 7
metres 50
40
SURFACE EXPLORATION FOR LONG WALL MINING AT MORANBAH NORTH 217
Figure 3 Geological cross-section from west to east through the western part of the study area (dip direction is towards the east). For location of section line see Figure 7. GM indicates Goonyella Middle seam.
percentages could be calculated for different mining heights. Figure 5 illustrates the yield percentage at F1.45 for the ideal seam section. Apart from some refinements near the subcrop, and adjustments due to the miscorrelations in the south, the present yield distribution differs very little from the interpretations made in 1991.
Washed coal characteristics were determined for the ideal section, in most instances based on a product with about 8.5% ash. As the coal type distribution in the seam is uniform throughout the area, the coal rank determines the variation in most other characteristics. Coal rank, expressed as mean maximum reflectance of vitrinite (Figure 6), increases gradually towards the east. Other rank-dependent parameters, such as volatile matter, ultimate analysis, fluidity and dilatation, follow the same trend. The patterns now established in these parameters also differ very little from those interpreted in 1991.
The above-demonstrated consistencies in seam composition, float/sink characteristics and coal quality trends are believed to be adequate for the purpose of committing to a longwall mine. This means that analysis of about 70 partly cored holes, on which these interpretations were based, would have been adequate for deposit evaluation. The existence of wireline logs for more than 100 non-cored holes, showing the same seam composition as nearby cored holes is reassuring,
but not absolutely necessary for the purpose of establishing seam consistency.
Structure
Identifying faults before the start of longwall mining presents the most important challenge to the exploration effort. Even the closest spaced drilling cannot locate small faults, but seismic surveys can sometimes prove seam continuity between boreholes. A trial seismic survey was conducted for this purpose in the northern part of the area, where the coal measures are covered by about 70 m of Tertiary sediments. Although this trial was reasonably successful, it was decided not to rely on seismic methods in the initial mining area because the presence of thick basalt in the Tertiary strata hampered the resolution of the technique.
Other tools available to assist in structural interp-retations were descriptions of joints and fractures in cores, analyses of wireline logs, cross sections and isopach maps of overlying strata (to find suspected fault zones), in-situ stress measurements, palaeomagnetic orientation of cores to establish the direction of jointing, and highwall mapping in the nearby Goonyella open-cut mine. These tools have been used in addition to seam levels in boreholes, which provide the most important information for structural interpretations.

....
27
00
0.0
00
- 26000.0
00
1 - 2
100
0.0
00
BED RESOLUTION DENSITY
GM1
GM2
4.0m
GM3
GM4
GM5
218 F. BUS AND A. J. LAWS
DDH1A
un GMR 327
328
329
330
GM 331
332
333
334
GM SEAM GEOLOGICAL SECTION
GM Seam Wed section (GMO
1600
0.0
00
Figure 4 Coal plies (quality sampling horizons) identified in the Goonyella Middle seam, possible working section and typical bed resolution density (gamma-gamma) profile.
Recognising the importance of seam structure, the majority of holes drilled during the third exploration stage were non-cored. Attention was concentrated on the initial mining area. The borehole spacing along the planned gateroads was first reduced to 250 m and later to 125 m.
Figure 7 illustrates the dilemma the geologist faced in interpreting seam structure. This, of necessity, was based primarily on seam level anomalies in boreholes. The map indicates the possibility of a number of northwesterly striking faults, with throws between 3 m and 5 m, in the area to be mined during the first 20 years. Faults with larger throws have been deduced in
the less-intensively explored areas. However, the smaller irregularities could just as easily be explained by seam rolls, as seen in the Goonyella mine.
Noting that the structural interpretations hardly changed when the distance between holes in the shallow area was reduced from 250 m to 125 m, it has been concluded that delineation of small seam displacements or rolls by drilling is unlikely to be cost-effective. Considering that there is a low frequency of such disturbances in the open-cut mines to the north, the risk of intersecting small undefmed structural irregularities has to be accepted as unavoidable. Once the first longwall block has been developed, it will be possible

Contour Interval 20m
A—A' see X—section Fig 2
SURFACE EXPLORATION FOR LONGWALL MINING AT MORANBAH NORTH 219
Figure 5 Product yield percentages at F1.45 from the ideal working seam section.
Figure 7 Structure contours, Goonyella Middle seam floor.
Figure 6 Mean maximum vitrinite reflectance (vitrinite A Figure 8 Desorbable gas content (m3 / t), Goonyella + vitrinite B) for composite Goonyella Middle seam section. Middle seam. Note steady increase with seam depth.

220 F. BOS AND A. J. LAWS
to explore further with in-seam boreholes, mapping and geophysical techniques.
Igneous intrusions
Apart from suspected igneous rock in one of the deep Departmental holes, there has been no evidence of igneous intrusions in any of the more than 300 boreholes drilled in the Moranbah North area. However, as some thin dykes are present in the Goonyella mine, the risk of finding similar dykes at Moranbah North cannot be entirely excluded. A ground magnetic survey carried out over the initial mining area proved useful for locating Tertiary basalt flows. No linear features were indicated by the magnetic survey in the areas without Tertiary basalt, which may reflect an absence of dykes in the Permian strata. However, due to the thickness of the Tertiary sediments in the initial mining area, the usefulness of magnetic surveys to locate igneous intrusions has to be regarded as limited.
As further drilling and magnetic surveys are unlikely to improve the interpretations, some risk of igneous intrusions into the seam has to be accepted. As with faulting, once the first longwall block has been developed, the presence of intrusions can be investi-gated by in-seam drilling and geophysical techniques.
Water ingress
The possibility exists that water from the surrounding Permian and overlying Tertiary strata will flow into the workings once longwall extraction starts. The Tertiary cover of the initial mining area is between 20 m and 80 m thick. This cover comprises poorly lithified sediments, with basalt flows filling pre-Tertiary valleys on the western side. The locations of the basalt flows have been accurately delineated by a ground magnetic survey combined with borehole information. The hydrologeological properties characteristics of the Tertiary flows and sediments have been investigated by pump-out tests in some holes, and by piezometer water levels in other representative boreholes. Vesicular horizons in the basalt constitute minor aquifers of limited extent. Hydrogeological tests have demonstrated that these aquifers can be dewatered by pumping prior to mining.
It is believed that the available information is of sufficient density for the workings west of the Isaac River. Once initial mining experience has been gained, the effects of subsidence on the overlying Tertiary strata will be more fully understood and extraction under the Isaac River can be reconsidered. Any further exploration at this stage is not expected to improve the predictions relating to subsidence and water inflow.
Washability
Detailed washability tests were performed on large-
diameter core samples taken from five sites. These sites were chosen to ensure full coverage of the range of washabilities anticipated during the first ten years of coal production.
Float/ sink data from slim cores demonstrate a relative uniformity over the initial mining area from which the large diameter cores were taken (Figure 5). It is believed, therefore, that the approach of using coal from five representative sites in the early mining area is adequate for the design of a washery at Moranbah North. Nearly all coal from the deeper parts of the mine area has better float/sink results than that from the shallower area, which means that a washery designed for the shallow coal will also be able to cope with the deeper coal in the deposit.
Coal seam gas
Gas desorption tests have been performed on cores from 35 boreholes. These tests indicate that the GM seam contains very little gas at depths of less than 180 m, and that the gas content rises to about 12 m3/t at about 360 m. Methane is the predominant gas in all samples.
The regular pattern of gas content related to seam depth and the predominance of methane indicate a good understanding of this variable (Figure 8). The fact that there is little gas at shallow depths supports the view that gas will not present a major problem during the early years of mining. Although vigilance should remain during mining, further exploration of coal seam gas does not appear to be required at this stage.
GM seam roof and floor
The immediate roof and floor of the GM seam have been described in detail for all holes with bore cores, and the rock types have been interpreted from the wireline logs for the non-cored holes. Four different roof types have been distinguished in the area of the first 20 years' workings. The floor has been mapped in similar detail and areas with weak floor have been delineated.
Rock strength tests were performed on a large number of representative roof rock samples, and a correlation was established between the UCS and the sonic log results. Applying this correlation to three horizons at fixed distances above the seam, and plotting the calculated values, resulted in a conclusion that the roof strength deteriorates towards the subcrop. Based on these findings is was decided to develop the first longwall block beneath at least 30 m of unweathered Permian strata. Additional drilling of six geotechnical core holes in 1996 and specialised testing of the samples confirmed the weakness of the shallow roof strata.
Geological mapping and geomechanical testing have been concentrated in the area of early workings, for the obvious reason that the roof and floor behaviour in this area needs to be understood before any interpretations can be made for the longer-term mining areas. Apart

SURFACE EXPLORATION FOR LONG WALL MINING AT MORANBAH NORTH 221
from some additional geotechnical holes planned for the pit-bottom area, the available information is regarded as sufficient to describe the expected variations in roof and floor strata. However, the behaviour of roof and floor can only be fully understood after gaining mining experience.
CONCLUSIONS
Exploration of the Moranbah North deposit has identified large reserves of a thick, good-quality seam suitable for extraction by longwall mining. Washability characteristics and coal-seam gas are also well under-stood, and require no further surface exploration. The incidence of disturbances such as dykes and faults is believed to be minor, but cannot be totally excluded. Additional surface exploration is not considered to be cost-effective for improving the prediction of any such disturbances. The geotechnical and hydrogeological characteristics of the strata have been reasonably established. However, further understanding of these charac-teristics requires underground investigations and experience during mining.
The exploration effort now completed is regarded as having included all possible investigations that could reasonably be done in preparation for a longwall mine development decision. Some risks still remain, but these would only marginally be reduced by any further surface exploration. It is now up to the miners to prove that the project is as attractive as indicated by the results of exploration.
ACKNOWLEDGMENTS
Exploration of the Moranbah North deposit and the evaluations leading to the development of the mine required contributions from drillers, wireline loggers, geophysicists, surveyors, chemists, environmentalists and geologists. These contributions are hereby acknowledged. The fact that the mine is now being developed is a visible recognition of their efforts.
REFERENCES
Bos F. & KNIGHT A. S. 1993. Exploration in preparation for longwall mining at Moranbah North, Queensland. Proceedings of the Symposium on New Developments in Coal Geology Beeston J. W. ed., Coal Geology Group, Geological Society of Australia, Brisbane, 13-24.
LAWS A. 1995. Moranbah North coal deposit. Proceedings of the 1995 Bowen Basin Symposium, Follington I. L., Beeston J. W. and Hamilton L. H. eds, Bowen Basin Geologists Group and Coal Geology Group, Geological Society of Australia, Mackay Qld, 343-350.
LAWS A. & Bos F. 1995. Moranbah North coal project, resource description, 1995 Supplement. Unpublished Shell Company Report .
THE SHELL COMPANY OF AUSTRALIA LIMITED 1992. Moranbah North Underground Coal Mine Project, Pre-Feasibility Study, Volume 1, Resource Description. Unpublished Shell Company Report.
THE SHELL COMPANY OF AUSTRALIA LIMITED 1995. Moranbah North Coal Project, Feasibility Study, Volume 2, Resource Geology. Unpublished Shell Company Report.


Symposium on Geology in Longwall Mining, 12-13 November 1996, eds G. H. McNally and C. R. Ward, pp 223-225.
Inseam seismic and longwall mining: a review of the current status
J. DOYLE AND A. R. NEWLAND
BHP Engineering
INTRODUCTION
Inseam seismic (ISS) has been applied in Australian mines for over ten years and has developed into a mature technology. The Australian experience has been developed as a result of research by a number of academic and industrial groups during the 1980s and early 1990s. Inseam seismic was first offered commercially in the late 1980s by BHP Engineering and ACIRL. BHP Engineering, however, is now the sole supplier ISS services in Australia.
THE BHP EXPERIENCE
Inseam seismic was introduced into Australia by a demonstration of the technique in 1981 by the then British Coal. A series of demonstration surveys, using the reflection method on known targets, showed the viability of the method in the Southern Coalfield of NSW. Faults and dykes were individually resolved, as well as faults behind dykes. As a result of this demonstration, BHP decided to develop hardware and software specifically to record and process inseam surveys. A total of $7.5M was invested by BHP and NERDDC (the predecessor to ACARP) between 1981 and 1988 to bring the technology to commercial reality.
Inseam seismic was applied to BHP longwall mines during the 1980s and was offered to the general industry from 1987, when this technology was transferred to BHP Engineering. ISS has been applied in numerous Australian mines, as well as generating a significant revenue from operations in the USA and South Africa.
INSEAM SEISMIC TODAY
Inseam seismic initially was conducted as reflection surveys along the access roads of longwall panels, in keeping with European practice and to provide structural geology information prior to extraction. The depth of interrogation is typically from 100 m to 500 m into the solid coal area. Faults, dykes and fracture zones have been resolved routinely in such surveys. The positioning of an anomaly is a function of velocity control, but in sites where good transmission data or where survey results are available, location accuracy is
5 to 10% of the transmission path length. The technique has not been used to any great extent
to explore developed longwall blocks, other than for investigating site-specific geological or geotechnical problems. In these situations ISS tomography has found an application, particularly for the determination of geotechnical properties and the detection of stress. As a generalisation, the geology of an Australian longwall block is known once it is fully circled by mine workings, in contrast to European and US experience where significant localised structures can remain undetected. Consequently, it is generally inappropriate to apply reflection ISS to formed-up longwall blocks. More recently, the emphasis on reflection surveys has greatly diminished, as longhole drilling technology has developed and mines carry out extensive gas drainage operations ahead of their development for safety and statutory reasons.
Inseam transmission involves the propagation of channel waves within and about the coal seam from one point, such as a borehole or mine workings, to another similar site in the coal seam. Channel waves have been detected after travelling inseam for kilometres. However, useable information for detecting geological anomalies becomes improbable when transmission paths are much longer than 500 m. The quality of the signal is degraded by the more rapid attenuation of the high frequency components of the channel wave, which are necessary for the detection of geological anomalies. ISS surveys in Australia have been conducted along transmission paths in excess of 1000 m long, producing the expected poor but sometimes useable result.
ISS transmission surveys now form virtually all of the ISS work in Australia. Many hundreds of surveys have been conducted over the last two years, compared with the relatively few conducted previously. Geological faults and dykes remain the targets for ISS here, although the detection of abandoned workings is the dominant business for ISS in the USA.
ISS is usually applied late in the exploration phase, at the time of detailed mine planning. Commonly drill spacing is being closed down to 500 or 250 m and some suspicion of adverse geology is driving the decision for ISS surveying.
Low cost inseam seismic detectors may be grouted into the seam when the drill hole is abandoned. Some detectors have been in place for over ten years and remain operational. Geophones have been successfully placed to depths of more than 700 m and the current

224 J. DOYLE AND A. R. NEWLAND
(6)
177 Bore
Three component geophone in Bulli Coal
WEST CLIFF EAST SEISMIC SURVEY
12/3/94
178 Bore
27m to BuIli Cool SCALE
0
Figure 1 Plan view showing dual tunnels being driven between Westcliff and Northcliff Collieries, NSW.
177 Bore
102m 221m I 78 Bore
WEST CLIFF EAST
MODE CONVERSION SURVEY
SCHEMATIC INTERPRETED SECTION
Figure 2 Vertical section through area shown on Figure 1, showing tunnel (201 Drive), coal seams and interpreted faults between the two mine workings.

INSEAM SEISMIC AND LONG WALL MINING: CURRENT STATUS 225
design is rated to considerably over 1000 m of water head. Alternatively, a clamping geophone suspended from a logging cable may be used where a number of open holes are available.
EXAMPLE: WESTCLIFF COLLIERY
At the time of this ISS survey Westcliff Colliery was excavating a stone drive from its neighbour Northcliff Colliery to link the two mines (Figure 1). Geophysical investigations were needed to determine the location of a fault east of Bore 177 that had been inferred from surface seismic mine mapping. It was decided to attempt to generate channel waves on the fault plane, using shots fired from the stone drive. Data were collected in a grouted three component geophone previously placed in exploration bore hole 177.
Ten shot holes were prepared in the two stone drivages (s1-10 on Figure 1). They were located from the tunnel faces to about 100 m behind. Shots were initiated using a shot exploder which was clock-synchronised with a seismograph located above the exploration bore hole. Data was processed as follows: • Pick first arrivals and determine P wave velocity
through the rock. • Analyse each shot for Love wave energy. As
expected, none was detected, since the shots were located well away from the coal seam.
• Using hologram analysis, locate dispersed SH energy arriving faster than an unimpeded Love wave.
Three packets of energy displaying SH dispersed
energy were ultimately identified. Of these, two were identified with confidence, these data being reproduc-ible in the majority of the shots. The fault may be located in a number of simple ways, based on the calculation of travel time in the rock strata and the constant Love wave travel time from the discontinuity (and channel wave source) to the detector. The interpretation of this survey was as follows: • A fault is located 221 m from 177 Bore, approxi-
mately 10 m ahead of the tunnel face. • A second fault is located 102 m from 177 Bore,
approximately 120 m ahead of the tunnel face. Displacement of this fault is not much larger than seam displacement, since channel waves from the first fault passed through this feature.
• A third, low confidence feature could not be reliably located between 177 Bore and the fault at 102 m. The feature was considered to be small-displacement faulting.
Figure 2 depicts schematically the interpreted structure ahead of one of the tunnels, 201 Drive. Subsequent longhole drilling and mining have verified the results achieved in this survey. The speed of the survey method and its relatively small effect on the mining cycle were significant in the selection of this technique.
This Westcliff exercise also demonstrated the applicability of ISS mode conversion as a geophysical tool. ISS mode conversion requires the acquisition of the high frequency component of the seismic signal for accurate interpretation. Subsequent surveys have been conducted in other mines with similar success.

-
-
Symposium on Geology in Longwall Mining, 12-13 November 1996, eds G. H. McNally and C. R. Ward, pp 227-231.
A design method to assess massive strata for longwall face and subsidence behaviour
ROSS SEEDSMAN AND ALEX STEWART
Coffey andPartners International Pty Limited, Unanderra NSW.
The paper briefly reviews the literature on the relationship between the presence of massive units in the overburden and mining performance, such as surface subsidence and longwall face conditions. A brief review of some of the empirical and analytical techniques to assess massive units is presented, and a new technique using linear arch concepts that recognises the role of joints introduced. A number of steps in a design method using the new technique are discussed, including ways of identifying massive units, predicting stable spans, and their relation to face conditions and surface subsidence.
MINING IMPACT OF MASSIVE UNITS
The presence of massive units has been implicated in a number of examples of atypical mining behaviour. Examples include surface subsidence in the Newcastle Coalfield, mining under massive dolerites in South Africa, and the mining of Longwall 5 at Newstan Colliery in the Newcastle area. In many cases the behaviour has been analysed empirically, and incorporated into design procedures that work well in the local area for which they were developed but cannot be readily applied to other coalfields. If the empirical techniques are incorrectly applied, the result can be an extreme degradation of face conditions, unplanned surface subsidence or unnecessarily conservative mine layout.
Subsidence
The empirical subsidence prediction curves for the Newcastle Coalfield (Holla, 1987) demonstrate the impact of massive units in limiting the level of surface subsidence, at least for shallow panels. By comparing the subsidence prediction curves for the Newcastle and Southern Coalfields it can be seen that for a vertical subsidence/ seam depth ratio of 0.25, a panel that is 60% wider is possible in the Newcastle Coalfield compared to the Southern Coalfield. This behaviour has been ascribed to the presence of massive conglomerates in the Newcastle Coal Measures (the Teralba and/or Charlestown Conglomerates), although it is important to recognise that part of this effect may be the shallower depths and narrower panel widths in the Newcastle data base. Creech (1995) updated the data base on Newcastle Coalfield subsidence behaviour, and assessed that the presence of massive strata does play a significant role. Creech proposed an empirical subsidence prediction method similar to that of Holla, but with the percentage of conglomerate in the overburden being an additional input parameter.
Galvin (1983) reported on the behaviour of massive
dolerite sills in South Africa and their role in modifying surface subsidence. Galvin developed an semi-empirical model based on the buckling of thin elastic plates. Other South African workers (van der Merwe, 1992) found that the Galvin approach did not apply to other coalfields, and developed an alternative approach based on shear along vertical joints.
Face loadings
Over the last 4 years Newstan Colliery has retreated a number of longwalls under a massive conglomerate (up to 60 m thick) that lies immediately above the Young Wallsend seam. The face conditions have been reported by Simpson etal. (1996). In summary, periodic extreme face loading conditions developed, and as a result the extraction of Longwall 5 (225 m wide) required 157 days longer than planned. Subsequent longwalls have been extracted successfully at narrower panel widths (100 m to 135 m) without the extreme face loadings, although air blasts have occurred. The adjacent West Wallsend Colliery is in a similar geological environ-ment, and face widths were reduced from 200 m to 135 m as the conglomerate was approached.
In 1990, Churcha Colliery in India commenced longwall extraction under a massive dolerite sill. A 155 m-wide panel had retreated about 116 m when heavy face weightings began, and at 198 m of retreat the whole face was lost (Gupta and Ghose, 1992). Subsequent investigations suggested that a layer of dolerite between 19 m and 30 m may have separated from the base of a massive dolerite sill and caused the face weightings.
DESIGN REQUIREMENTS
If the coal industry is to optimise longwall panel layouts against surface subsidence and productivity constraints, it will need to develop geotechnical design tools that allow better recognition of the hazards provided by

228 ROSS SEEDSMAN AND ALEX STEWART
massive units. Whilst it can be argued that empirical methods are adequate and have served the industry well, the recent history in the Newcastle Coalfield alone suggests that improvements are required. As with all rock mechanics, empiricism will always be necessary. However, this paper presents a number of ideas that can be used in a more analytical approach to the problem.
From a geotechnical perspective, the first main requirement is being able to establish that a massive unit is indeed present. It is assumed that the subsidence and face conditions are somehow related to thickly bedded units, involving either sedimentary bedding or layering within basalt/ dolerite units.
The second requirement is for simple and validated analytical tools. The tools need to be relatively simple so that the focus of the design engineer remains on the issue of major risk, the variability of the geology. The designer needs simple tools that are quick and inexpensive to run, so that sensitivities of panel layout to varying geology can be assessed. The analytical tools will be simplifications of the complex stress and strength fields that are operating above a longwall panel, so it is essential that some validation is conducted. At the very least the tools need to be able to explain the successes of any of the empirical design approaches.
BRIEF LITERATURE REVIEW
South African dolerites
Galvin (1983) used a combination of elastic thin plate theory and empirical calibration to develop an equation to calculate the panel dimensions required to induce dolerite sill failure. The dolerites in question have unconfined compressive strengths in the order of 300 MPa. The equation was found to be a poor predictor of behaviour when the dolerite occurs at shallow depths (van der Merwe, 1992), and an alternative model was developed on the basis of vertical shear at abutments. Neither of the models allow consideration of the different material properties; i.e. the input parameters are only geometrical.
Wilson's 1986 model
Wilson (1986) used elastic beam theory to determine the bridging capability of massive beams. In his approach he superimposed horizontal stresses on to the bending stresses of an elastic beam, producing some simple equations to assess stable roof spans as a function of thickness depending on whether tensile failure (shallow depth) or compressive failure (greater depth) develops. Using typical values for the input parameters, this approach suggests that tensile failures dominate and that the stable span is in the range of 2.5 to 3 times the strata thickness. As will be shown, the assumption of tensile failure is conservative, and a linear arch may develop after tensile failure.
ACIRL empirical method
Australian Coal Industry Research Laboratories (1992) recognised the role of fracturing ahead of a longwall face, and developed a model for periodic face weighting depending on the position of the face line with respect to vertical fractures in massive beams. ACIRL invoked a cantilevering tensile failure of a massive beam to explain the location of the fracturing. A cross plot of the height of a massive unit above the seam against the cantilever index (I[unconfined compressive strength] multiplied by massive unit thickness) defined zones of variable and periodic weightings. One problem with this model from a mechanistic view, however, is that it fails to recognise the fact that rock masses have zero tensile strength as a result of jointing.
Role of joints and a new caving model
The role of joints has been largely ignored in recent underground coal geotechnical research, although it has been well established in the British longwall literature that there is an empirical relationship between face conditions and the orientation of the face to the dominant joint or cleat sets. In a stress field characterised by high horizontal stresses, vertical joints are of lesser importance than horizontal defects (e.g. bedding), but may still have a significant contribution especially when considering post-failure deformations. Linear arch concepts have been used to analyse the behaviour of jointed rock beams in civil engineering and underground metalliferous mining.
Coal measures are typically characterised by two vertical joint sets: a dominant set and a lesser set often oriented at about 90° to the dominant set. Joints are typically discontinuous and often do not penetrate through different lithologies. There is a trend for wider joint spacing in thicker units, with the trend being strongly developed in units less than about 2 m thick.
Linear arch theory recognises that, when an intact beam is subjected to compressive stress, it will tend to develop tensile failures at the abutments and at the centreline. However, the onset of these failures does not mean that the beam fails as a load-carrying member. For the beam to fail, the blocks of rock defined by the tensile failure zones will need to fall out. As the blocks move they tend to rotate, and hence result in the generation of compressive stresses. Depending on the aspect ratio of the beam and the magnitude of the imposed stresses, the beam ultimately fails by compression, vertical shear or buckling. Work reported by Brady and Brown (1985) suggests that the failure stresses of laboratory scale beam can be in the order of 10 times those indicated by an analysis of the onset of tensile failures. Linear arch theory can also be applied for beams with pre-existing joints.
Linear arch theories can be implemented on hand-held programmable calculators, and there are a number of different algorithms that can account for imposed horizontal stress, rock strength, surcharge etc.
Linear arch theories consider two dimensions, whilst

50 - 46 - 40 - 35 - 30 - 25 20 16 10 - 5-0 100 150 200 260 300
DESIGN METHOD TO ASSESS MASSIVE STRATA FOR LONGWALL FACE AND SUBSIDENCE 229
it could be argued that the longwall face problem is three-dimensional. There is a three-dimensional plate solution available, but closer consideration of the nature of the operational problem suggests that a two-dimensional model can be used. The goaf above a longwall consists of a very large volume of broken and de-stressed rock. Horizontal stresses in the strata ahead of face line can be expected to relieve into the goaf. It is argued that this de-stressing allows the rock mass near the face line to behave as isolated beams defined by natural joints, hence permitting the use of two-dimensional models.
It is important to note that the model considers jointing in the massive unit as the driving force for subsequent face loadings. If the massive unit is not developed at the extracted seam roof level, then care needs to be used in relating the orientation of what might be mining induced fracturing with natural joints in the massive horizon.
DESIGN FOR MASSIVE UNITS
Identifying massive units
The first step in the design is the recognition of the key geological variable, the thickness of the massive unit. Layer thickness is the key variable in assessing strata behaviour; the range of thicknesses for coal measure strata is from millimetres to tens of metres (four orders of magnitude).
Other factors are unconfined compressive strength, elastic modulus, density, and surcharge thickness. The first three can be determined from geophysical and/or geotechnical logs, but the range of variation is usually less than one order of magnitude. The surcharge thickness comes from an examination of the logs, and may be the depth in burial or the interburden to the next massive unit.
Sedimentology
The depositional environment can give an indication of the potential of massive units in the overburden sequence. The key environments are those of high energy that allow the formation of thick units, or that involve reworking of the sediments so that bedding/ banding is destroyed. Geotechnically massive units have been found in reworked marine sediments (10 to 15 m thick), fluvial channel conglomerates (up to 50 m thick), barrier sands (up to 6 m thick), and fluvial sandstones (10 to 15 m thick). The important point is that the effective geotechnical thickness is often less than the logged or geological thickness.
Other geologies that have been found to produce massive units are basalt flows and dolerite intrusions.
Geotechnical and geophysical logs
There is no substitute for a comprehensive geotechnical log, prepared to recognised standards, to identify massive units. Logging of defects (breaks in core that are assessed not to be handling breaks) is essential, and should be supplemented with an assessment of bedding thicknesses. RQD logging is necessary but not sufficient.
Geophysical logs, especially the sonic log, can be used to assess the massiveness of coal measure strata. The use of the sonic log to provide an index to unconfmed compressive strength is well established and forms an integral part of most modern exploration programmes. By comparing defect logs with the sonic logs, Coffey Partners have noticed that intervals of massive core are matched by segments of sonic logs with low-amplitude variations in the trace. Through trial and error Coffey has developed a simple technique to process sonic LAS files to produce a massiveness index log.
Layer thickness (m)
surcharge (m)
- • Om - - • - -20m — A— 100m
Longwall panel width (m)
Figure 1 Layer thickness required to span typical longwall panel widths for a number of surcharges.

PREDICTING SUBSIDENCE
The linear arch approach can be used to identify panel geometries that will result in sub-critical subsidence behaviour, say less than about 300 mm of surface subsidence. It is postulated that, at this level of deformation, massive beams somewhere in the overburden will still be behaving as linear arches, and hence remaining intact across a panel. Greater subsidence indicates that the linear arch may have failed. In such cases the subsidence is controlled to a large degree by the compaction properties of the goaf.
Coffey Partners have developed a simple beam/column finite element model for predicting centreline deformations of linear arches. Initial use of the model has shown it to be a good predictor of surface subsidence in the case of surcharged massive conglomerates. The results are also compatible with those indicated by the linear arch models.
CONCLUSIONS
The key benefits of the design method lie in its recognition of key properties of rock masses (bedding and joints) and its analytical simplicity. The simplicity allows sensitivity studies to be conducted so that the key geological uncertainties can be assessed.
Coffey Partners have used the design methods on a number of recent consulting jobs in both New South Wales and Queensland. It has been noted that there is little if any need to change strength and deformation values from those measured in the laboratory. In many ways this is to be expected, as the analytical methods explicitly address the variables (rock mass defects) that are used to justify strength reduction factors in other techniques.
Factors of safety used by Coffey have been in the range of 1.0, which is very encouraging. However, more case studies are required before recommendations can be made on appropriate values for routine design.
REFERENCES
AUSTRALIAN COAL INDUSTRY RESEARCH LABORATORIES 1993. Optimisation of powered support performance in relation to strata loading and engineering criteria. Final Report to ACARP, Report No OMU 0382.
BRADY B. H. G. & BROWN E. T., 1985. Rock Mechanics for Underground Mining. George Allen and Unwin, 527pp.
CREECH M. 1995. A review of subsidence data from the Newcastle Coalfield and a new subsidence prediction method. Mine Subsidence Technological Society, 3rd Triennial Conference Proceedings, February.
GALVIN J. 1983. The development of the theory of dolerite sill behaviour. Proceedings of the Fifth International Congress of the International Society of Rock Mechanics E127—E132.
GUPTA R. N. & GHOSE A. K. 1992. Strata-support interaction on a powered support longwall face under a massive dolerite sill — a study. Proceedings of the I I th International Conference on Ground Control in Mining,
230 ROSS SEEDSMAN AND ALEX STEWART
Predicting spans
Linear arch concepts are used to predict stable and unstable spans. These concepts are well estab-lished in the literature, and a number of analytical techniques are available that can be implemented on programmable calculators or in simple spreadsheets. The input parameters are bedding thickness, unconfined compressive strength, elastic modulus, defect shear strength, density, horizontal stress, and surcharge. Implicit in linear arch concepts is the acceptance of subvertical joints. It is noted that linear arch concepts often produce stable arches of significantly lower thickness than those indicated from simple elastic beam calculations.
Figure 1 presents typical results showing the range of layer thickness required to span typical longwall panel widths for a number of surcharges.
PREDICTING FACE CONDITIONS
In a linear arch/joint model the periodicity of the loadings is controlled by joint spacing, which may be related to bed thickness. Intuitively thicker units have wider joints. Certainly this pattern is present in units up to about 1 to 2 m thick (Nan and Suppe, 1991), but the literature suggests that other factors may act for thicker units (Ladeira and Price, 1981). On the basis of our recent investigations it would appear that periodicity lof adverse face loadings is similar to the beam thickness, i.e. master joint spacing may be equal to beam thickness.
The severity of the loadings is controlled by the thickness of the unit and the orientation to the joints. Faces aligned parallel to joint directions may suffer adverse conditions along the most of the face length; orientation at an angle to the joint sets may reduce the length of the face affected by weightings.
A factor of safety of 1 against spanning may not automatically mean that adverse face conditions will develop. One the one hand, there is a need to calibrate the design procedure whilst on the other there is a need to account for the dynamics of the retreating longwall face. It is known that conditions deteriorate when a face stands for several days.
At this stage of development the design tool can be used to supplement the empirical data base of ACIRL. We assess that adverse loadings only develop if the massive unit is within 40 m of the seam and that the loading is independent of the position within this interval. Secondly, the major determinant is the thickness of the unit, as there is little variation in the unconfined compressive strength of most coal measure strata. The linear arch approach can be used to specify panel width for a given massive unit, so that it can span across the panel; if the unit can Ispan completely then it will not load the face. Note that in many cases the required panel widths may not be compatible with the necessary face productivity.
DESIGN METHOD TO ASSESS MASSIVE STRATA FOR LONGWALL FACE AND SUBSIDENCE 231
Wollongong, 7-10 July. HOLLA L. 1987. Surface subsidence prediction in the
Newcastle Coalfield. Mining Subsidence in New South Wales, Series 2, NSW Department of Mineral Resources.
LADIERA F. L. & PRICE N. J., 1981. Relationship between fracture spacing and bed thickness. Journal of Structural Geology 3(2), 179-183.
NARR W. & SUPPE J. 1991. Joint spacing in sedimentary rocks. Journal of Structural Geology 13 ( 9), 1037-1048.
SIMPSON J., BERGIN P. & FRITH R. 1996. When wider faces are not always better. The Effects of Development and
Longwalls on Production Continuity. Australasian Institute of Mining and Metallurgy and NSW Coal Mine Managers Association, 8th March.
VAN DER MERWE J. N. 1992. The prediction of subsidence in the Secunda and Sasolburg areas. COMA: Symposium on Construction over Mined Areas, Pretoria, 81-85.
WILSON A. H. 1986. The problems of strong roof beds and water bearing strata in the control of longwall faces. Ground Movement and Control Related to Mining. Australasian Institute of Mining and Metallurgy, 1-8.

Symposium on Geology in Longwall Mining, 12-13 November 1996, eds G. H. McNally and C. R. Ward, pp 233-237.
From development to changeout: geology in the longwall mining cycle at Clarence Colliery
GRAHAM NOON
Oakbridge Pty Ltd, Clarence Colliery.
INTRODUCTION
Clarence Colliery is situated in the Blue Mountains, 10 km north of Lithgow NSW, near the western edge of the Sydney Basin (Figure 1). Four seams are present in the Clarence lease. In descending order these are the Katoomba, Middle River, Wolgan and Lithgow Seams. At present, the Katoomba Seam is the only economically mineable seam and is up to 5 m thick within the lease. The Illawarra Coal Measures are in the order of 100 m thick in the area.
The roof of the Katoomba seam marks the upper boundary of the Illawarra Coal Measures with the overlying coal-barren Triassic sediments of the Narrabeen Group. Narrabeen Group rocks in the area are represented by the Grose Sub-Group, which is divided into three formations. These are, in descending order:
• The Banks Wall Sandstone, containing quartzose sandstones, which is up to 150 m thick.
• The Mt York Claystone, containing red-brown shales and claystones, which is up to 15 m thick. This unit contains several splits.
• The Burra-Moko Head Sandstone containing quartzose and pebbly sandstones, with minor shales (up to 60 m thick).
Below the Grose Sub-Group to the roof of the Katoomba Seam is the Caley Formation, containing interbedded shales, claystones, siltstones and sand-stones. The Caley Formation is up to 80 m thick within the Clarence Lease (Table 1). The topography of the lease is broadly a plateau that has been dissected and deeply incised into the Narrabeen Group overburden.
The floor of the Katoomba Seam is the Burragorang Claystone Member of the Farmers Creek Formation, and consists of carbonaceous shale, shale, claystone and minor sandstone. A more complete account of the Illawaara coal Measures stratigraphy in this area can be found in Bembrick (1983), and is summarised on Table 2.
NEW LONGWALL PANEL DISTRICTS
Clarence Colliery has been extracting coal by the longwall method since 1993, and prior to this by the Bord and Pillar method since 1982. With the change to
longwall extraction came the need to define coal blocks of sufficient length and free of wall-stopping geological surprises that could halt production for extended periods.
Prior to the development of a longwall district at Clarence, the area had been explored by drilling to as close centres as possible, within budgetary and topographical constraints. The aim of this exploration was to generate maps showing roof structure contours, seam thickness, ash floats and yield distributions. This allowed informed decisions to be made by mine management for planning purposes. The current drill hole spacing standard for Cyprus/ Oakbridge mines is at 500 m centres, wherever possible, to increase the density of exploration data points.
An interpretation of the Katoomba Seam roof at 10m contour intervals, is made and in conjunction with the strikes of known faulting, ensures that to the best of our knowledge any wall-stopping faults that exist in the area are identified prior to the mining layout being finalised. Faulting identified or inferred during exploration is plotted on the structure contour map and distributed to mine management.
NEW LONGWALL PANEL DEVELOPMENT
Prior to development of a new longwall panel, information from any adjacent workings is summarised in a report and forwarded to mine management. This includes estimates of distances inbye to any expected structures, such as faults or sedimentary floor injections. These expected structures are also plotted on the surveyor's panel sequence plan, which is updated weekly as they are approached, for the benefit of operations personnel.
During gate road development, regular mapping of any roof and seam structures such as faults, sedimentary floor injections, roof jointing (density and trends), roof water ingress, swillies and crests is undertaken.
Areas of concern or potential concern are 'projected onto the longwall plan as numbered hazard zones (see Figure 2). Thus a picture is built up, before longwall extraction commences, of the roof-seam structure and any areas where caution should be exercised.
On completion of development, a RIM survey is routinely undertaken to confirm the likely extent into the block of any faulting intersected in the gateroads. This also provides some insurance against undetected

LITHGOW
\ 10 DATNURST
CLARENCE COLLIERY
ROAD
-,\'BELL RICHMOND
TO PARFtAMATTA
TO JENOLAN CAVES
PENRITH KATOOMBA
TO SYDNEY
234 GRAHAM NOON
Figure 1 Clarence Colliery, location plan.
Table 1 Stratigraphic units within the Narrabeen Group in the Western Coalfield.
..: Suli-Croun • ,
Forinatit;n:::. ., .,, hile-mbei Litho. logy
Burrolow Formation Red-brown and grey shale; minor quartz sandstone
Grose
Sub-Group
Banks Walls Sandstone
Quartzosc sandstone;
minor red-brown and grey shale Wentworth Falls Clay-Stone Member
Mt. York Claystone Red-brown shale to claystone
Burra Moko Head Sandstone Quartzosc sandstone, pebbly in part; minor red-brown and grey shale
Coley
Formation
Hartley Vale Claystone Member Grey shale to claystone
Govelts Leap Sandstone Member Quartz-lithie sandstone
Victoria Pass Claystone Member Grey shale to claystone
Clwydd Sandstone Member Quartz-lithic sandstone
Beauchamp Falls Shale Member Grey shale; minor quartz-lithic sandstone
in-block faulting with no expression in the gates. Areas of excessive seam thinning across the block are also identified. As the Katoomba Seam has proven quite receptive to the RIM signal, this has been successful.
Coal quality information, additional to that from exploration drillholes, is obtained from strip samples at 90m intervals up each gateroad as development proceeds. A comprehensive picture of the expected coal quality of the longwall block is thus built up, from which optimum shearer cutting heights can be ascertained.
The gateroad development roof and floor conditions are very good at Clarence, due to the strength and rigidity of the immediate roof strata coupled with a low in-situ stress field. This is the case even in faulted and closely-jointed roof areas. Historically, poor roof in the longwall panels has been associated with periodic weighting events of the face and supports by the immediate roof. This causes the face to heavily spall and embay, excessive convergence of some supports, and loss of control of the canopy tip to face roof span.

FROM DEVELOPMENT TO CHANGEOUT: GEOLOGY AT CLARENCE COLLIERY 235
Table 2 Stratigraphic units within the Illawarra Coal Measures in the Western Coalfield.
iiii 'ro :: .;.:j Ièiu, ..;iiudiiiiiti oiii:ii'iill ----
:,.::::::, . .• . :ii:::iii,:•iii:;:i: i:::::E::•:••:-.. •-::::,:fx::.:
- - - ------ ' . : ,.
•:i ;•::::, i,:::•::•: '
F6rmatjo
.
ii':
..
i$i;;i:1:;.. .....:.:' •
, ••::E:-. t::::•:--;
Thickness at Clarence
Aa_t)Pr)
Wallerawang
Sub-
Group
Farmers
Creek
Formation
Katoomba Coal Mbr.
Shale, clay-
30 m Burragorang Claystone Member .
stone and
coal; minor
Middlc River Coal Member
sandstone
The Gap Sandstone
sandstone 8 m
Charbon
Sub-
Group
State Mine Creek Formation
Moolarben Coal Member
Shale, mudstone and coal
3 m
Angus Place Sandstone
Ivanhoe Sandstone Mbr.
Sandstone 5 m
Baal Bone Formation
Shale, some inter-laminated sandstone 20 m
Glen Davis Formation
Coal, oil shale, minor shale and sandstone
20 m Newnes Formation
Shale and sandstone
Irondale Coal Coal, minor shale 1 m
Long Swamp Formation
Bunnyong Sandstone Mbr.
Shale, silstone and mudstone, minor interlaminated sandstone
35 m
Cullen
Bullen
Sub-
Group
Lidsdale Coal Coal, minor shale
not recognised
,
Blackrnans Flat Conglomerate
Conglomerate, sandstone
Lithgow Coal Coal, shale, sandstone not recognised
Marrangaroo Conglomerate
Conglomerate and sandstone
12 m
Gundanoaroo Formation
Shale, sandstone, minor coal
15 m
Nile
Sub-
Group
Corrangooba Creek Sandstone Sandstone not
determined
Mt Marsden Claystone
Claystone, limestone nodules

...
r 7" ,,,A '. ..— ,.......
....
L9r4 G WALL
...........-.....—.
4 , ...4 ...d.
. ,..r . r or. ." .4
.4'.. '.... 1 4.. , 7 —7, r
'‘.,
tIggi
"...„,
alr. Ismom•A
g .,.. in,„ ,1•11111.11111. M“W Is.. . .•.....cti,
,...
OM g g.g. lograi' g
_Lair - Cf/
,
V. -.F.A, . /JO WEI ...MOM,
413 PANEL",...1."-"`" ....... 111•11,M1 M.71,....haj '. IIIM•Mig. !In moon. An
" 01.0.00.04 OUTM CAL 1011 t" 0
MY I. 3el 412 Mit 01110111
VIM
.........
loom
/ . Li
!iiy
-,....., ..1 ••••••• DOC - 260m
300m 400m 500m 600 me°°. 700m 800m 90
0 I I
0
' CC42
C -
a a. Ce.r1
EF
474, • ,......
• 1 oi . to Nr.
o....s.
LONGWALL 5 PANEL
rli .141=g4g.....
E.1
,....
.1 lii
DOC I
I ..
..."' I i
5.. \ 8 ....-•=a,
............... 0,• 12
10_1. 13 14 15 .1... 17
19 I 23
I .1 ...... o . 411.••••••1 le Mom gell MI 41.0 • re bat.* Y..*
00
/1.- I 1111.1••• .... tar= — 412 PANEL ....
•
Om 100m 2 m
11.•• g. 'Ige \ ;
e CW'
•••••• ggg, NO..
• > II
O.> ao
SCALE 04, eh% 1
KEY
I HEAVY ROOF JOINT 100m 200m OAKBRIDGE PTY LTD
I MEDIUM ROOF JOINT ra HAZARD ZONES - STRUCTURE CONTROLLED
1
--IL-N.\ CREEK I LIGHT ROOF JOINT CC44
BOREHOLE WITH KATOOMBA SEAM D.O.C. - DEPTH
LONGWALL 5 FACE CHAINAGE
OF OVERBURDEN COVER CLARENCE COLLIERY PTY LTD
SEDIMENTARY FLOOR INJECTION I KATOOMBA SEAM CAVERN I Cip ROOF LEVEL AND TRACE
LONGWALL 5 HAZARD MAP 1.3m I- DO
---\\-........ 791.5
NORMAL FAULT WITH THROW -- SEAM ROOF CONTOURS KATOOMBA SEAM
I SCALE 1:2000
DIP AND DOWN—THROW DIRECTION CLAY INFILL CCLW5HAZ.DW2 DRAWN: G. NOON 27-5-96

FROM DEVELOPMENT TO CHANGEOUT: GEOLOGY AT CLARENCE COLLIERY 237
The occurrence of any poor roof during longwall extraction is plotted onto a copy of the panel hazard map. This information is obtained from personal face inspections and from daily shift deputies reports. Plotting of the lateral extent and width of any poor roof, and the height of falls, allows back analysis of longwall width, orientation, structures and the spacing of any poor roof events.
At Clarence Colliery an array of four micro-seismic geophones cemented at depth into strategically-placed boreholes is monitored daily. The monitoring equipment is remotely powered by solar-charged batteries and the data sent by radio-link back to the mine site. The equipment was installed by ISS Pacific and JRD communications, in conjunction with mine personnel. This equipment has enabled mining-induced roof strata breakages occurring ahead of the retreating face to be located. Advance warning can then be given to mine management and face crews to keep cutting coal and re-schedule non-essential maintenance if possible, and to avoid prolonged face stoppages until this zone has been retreated through.
Compilation and review of information derived from the above sources allows some firm conclusions to be drawn on what is a stable longwall face width at Clarence Colliery. The height of goaf caving and the mechanism of goaf formation are also being character-ised for longwall panels of various widths. This has been investigated by the installation of a single down-hole multi-wire extensometer above Longwall 4 panel, along with three similar units at the same chainage above the current Longwall 5 panel. The extensometers were sited along a subsidence monitoring line common to both longwall panels. Anchor points for the extensometers were determined from geophysical logs of the non-cored drillholes that terminated 10m above the seam roof.
These extensometers were installed by John Lakeland of Geotechnical Systems Australia, and the data were analysed and reported by Dr Ken Mills of Strata Control Technology, Wollongong. The Longwall 4 panel extensometer remained open and functional even as the Longwall 5 panel face approached and passed. As a result, the behaviour of the roof strata both ahead and behind the face is now beginning to be understood for longwalls of various widths and, ultimately, of varying orientation.
LONGWALL FACE RECOVERY
The potential recovery area for each longwall panel is carefully mapped prior to extraction. Strikes of any roof joints that occur are important for the final 12 shears of the rundown phase, prior to support removal. A pattern of 6 m cable bolts, 4 m flexibolts, 1.8 m steel roof bolts,
straps, steel mesh and tensile mesh is used to support the recovery roadway. Cable bolts and flexibolts are installed so as to intersect the maximum number of roof joint planes. The inclination and bearing of the cables and flexibolts, especially the ones adjacent to the face coal/roof intersection, are vital. If the angle is too steep and the dominant sub-vertical roof joints are not intersected, or if only a few are intersected, excessive movement may occur along these planes. This can result in possible roof falls. Roof extensometers are also emplaced along the face in the mid-face area and are regularly monitored.
However it is best to install the roof support properly in the first place, rather than when the roof conditions deteriorate, as this uses up valuable support recovery time. In addition, this may allow conditions to rapidly deteriorate further while remedial roof support measures are taken.
It is also vital to maintain stability of the face coal, and avoid possible loss of control of the canopy tip-to-face roof interval, by restricting face spalling. Roof failure has, at times in the past, had its genesis by guttering here once the face coal had spalled away heavily. To repair such conditions, PUR expanding foam has been injected into the face from holes drilled at right angles to the main face cleat, so as to maximize the number of cleats and fractures filled in the coal face. This has been augmented by installation of fibreglass dowels grouted into the face and holding tensile mesh to bind the face coal together.
For the current longwall recovery face, PUR foam will not be injected and shell-anchored steel bolts 1.8m in length with a high pattern density, will be installed instead. Particular attention will be paid to the mid-seam and face/roof intersection areas. It is envisaged that this method, in conjunction with a much greater area of tensile mesh used, will bind the face in a more cohesive unit and minimise face spalling.
In conclusion, it can be seen that at Clarence Colliery geology plays a vital but at times a behind-the-scenes role. This is true from exploration of future longwall districts, through panel development, extraction and finally face recovery. The role of the Mine Geologist overlaps and complements other disciplines, ranging from environmental procedures and protocols during exploration to liasing with the Mining Engineer during development and recovery.
REFERENCE
BEMBRICK C. S. 1983. Stratigraphy ansd sedimentation of the Late Permian Illawarra Coal Measures in the Western Coalfield. Journal and Proceedings of the Royal Society of NSW 116, 105-117.

- -

Symposium on Geology in Longwall Mining, 12-13 November 1996, eds G. H. McNally and C. R. Ward, pp 239-249.
Microseismic monitoring, windblasts and longwall mining under massive strata at Newstan Colliery
M. CREECH
Powercoal Central Coast Technical Services.
Longwall 5 at Newstan Colliery was extracted during 1994-95 under massive conglomerate strata. The colliery experienced aggressive periodic weighting in the process, with a dozen major mid-face roof falls. Individual falls required 3 to 30 days to recover and in total represented a loss of 40% of production days. On two occasions such high convergence rates were experienced that an ironbound longwall appeared to be a possible consequence.
In the light of this experience the subsequent panel was split longitudinally. The two sub-panels were then extracted in less than half the time of Longwall 5, with no periodic weighting effects. The need for increased development rates due to this use of narrower panels, however, meant that some means of identifying the optimum panel width was required other than by trial by error. In the absence of any guidance as to goaf behaviour from monitoring of the narrower face, microseismic monitoring was used to locate where the massive strata were breaking in relation to the coal face.
Although the use of a narrow panel had successfully avoided periodic weighting, windblast became a hazard where the massive strata bridged the goaf and the roof septum was less than twice the extraction height. These conditions created a 1.5 to 2 metre gap above and behind the chocks, exposing the face to air displacements following any major roof falls. Seismic monitoring successfully warned of impending windblasts, and the geological aspects of this work are discussed here. To the best of the author's knowledge, the research undertaken into this phenomenon on a longwall face is unique.
BACKGROUND
Longwall 5 at Newstan Colliery commenced extraction on the 26th April 1994, under a massive sandstone/ conglomerate channel that was up to 50 metres thick and 5 to 25 metres above the worked seam. The longwall panel was 225 metres in width, and located at a depth of approximately 200 metres. Extraction height was 3.2 metres, the face working the West Borehole seam at the base of the Newcastle Coal Measures (Figure 1). Recognition of the potential caving problems under these massive strata led to a co-operative approach by Powercoal and Oceanic Coal; the latter company's West Wallsend Colliery was shortly to undertake extraction under similar geological conditions.
The co-operation included funding and interpretation of an extensive up-hole drilling programme (with the aim of delineating channel geometry), together with an ACARP-sponsored project of full-time chock monitoring (Frith, 1996). This work was a flow-on from a previous ACARP project (Frith, 1993), which found that normal longwall geomechanics involved strata breakage ahead of the face in an arcuate pattern (Figure 2). This was subsequently confirmed using seismic monitoring (Hatherly et al., 1995) at Gordonstone Mine in Queensland (Figure 3). However, periodic weighting was found to occur when the immediate strata are massive and break ahead of the face. Good mining conditions may prevail when the strata are capable of bridging the goaf, as they were prior to the major series of falls at Newstan in Longwall 5.
The most effective means of avoiding another
Longwall 5 scenario at Newstan was postulated to be narrowing the width of extraction to induce shortwall caving, as shown on Figure 2. Under these conditions the massive strata were expected either to bridge the goaf, or to fail well behind the face. High convergence rates were expected where the breakage line was very close to the face, representing a transition between these two goafmg mechanisms.
The extraction of Longwall 5 resulted in a total of 12 major roof falls (Figure 4), together with a total of 160 days of lost production and considerable expense to recover the face at each occurrence. The final indignity was a fall within 15 metres of the recovery road, delaying the successful recovery of the longwall equipment. The most aggressive conditions were experienced in an area where the channel was thinning ahead of the face. The channel was 25 to 45 m thick, with its base up to 25 m above the working horizon. Between 835 metres and 625 metres of retreat (August 30 to December 21) the colliery experienced five roof falls, representing an aggregate loss of 80 production days. Each event was approximately 45 m apart, and was preceded by audible goaf activity above and ahead of the face.
Chock monitoring revealed heavy weighting for several shears prior to encountering the poor roof, coinciding with face spalling and high convergence rates. This activity was presumed to be a result of the channel breaking ahead of the face, and rotating down and back into the goaf (Figure 5). The intervening strata (immediate roof), when subsequently exposed a further 4 to 6 m ahead of the chocks, exhibited numerous subvertical mining-induced shear planes hading back

216.00
BHL
N1738 36.23
Fb
sPo 1pa2
mPb fpb2
jpc
_pgiPd2 •= Pe2
Pe3
HHo
]IiHb
jAa
244AbAC
HcIVHb
A A AA AAA
A A A A
—VTU
O 0
O 0
O 0
O 0
O 0
O 0
O 0
230.00
240 M. CREECH
N1738 36.23
WEST BOREHOLE SEAM
YU
YM
YL
Standard Working Section (up to 4.3m)
BHU
Figure 1 Standard working section of the West Borehole seam (left) and seam overburden (right) at Newstan colliery.
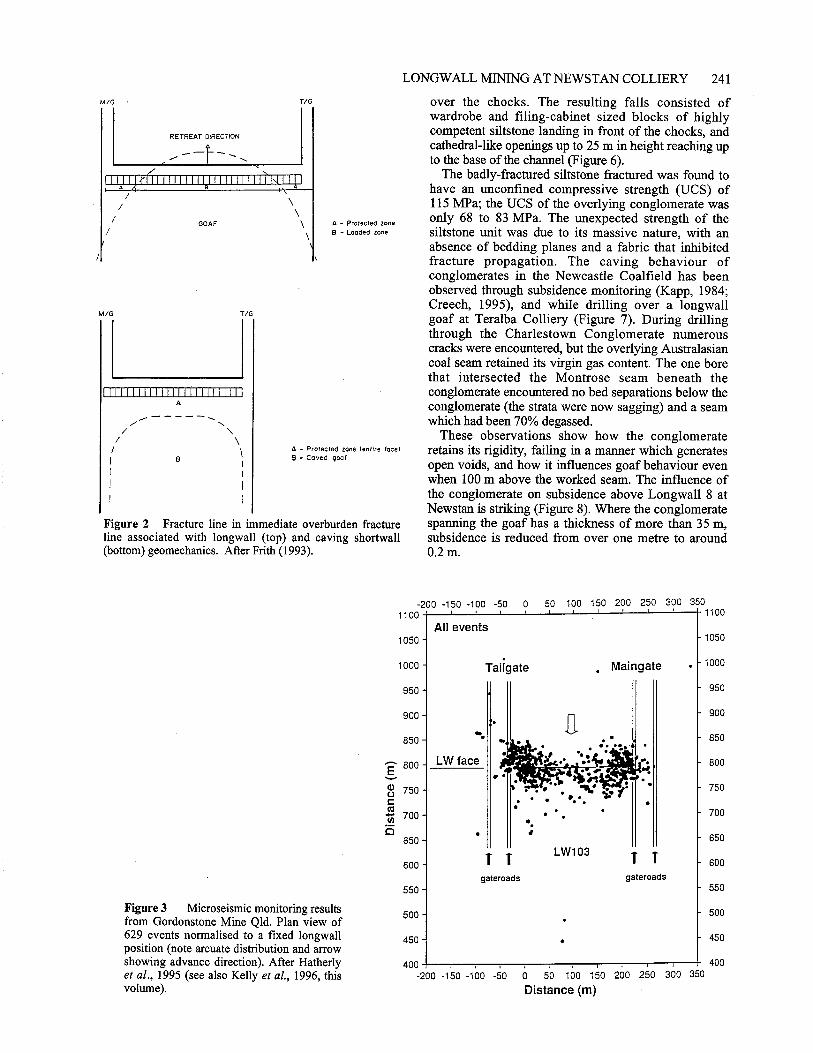
-200 -150 -100 -50 1100
50 100 150 200 250 300 350
1050 -
1000 -
950 -
900 -
850
800 -
0CD 750 - c
17) 700
i3 650
600 -
550 -
1100
- 1050
- 1000
- 950
- 900
850
800
750
700
650
600
550
LONGWALL MINING AT NEWSTAN COLLIERY 241
/G • /G
RETREAT DIRECTiON
...•••••• ---
GOAF A - Protected zone B - Loaded zone
M/G /G
111111H1111111111111111 A
Figure 2 Fracture line in immediate overburden fracture line associated with longwall (top) and caving shortwall (bottom) geomechanics. After Frith (1993).
over the chocks. The resulting falls consisted of wardrobe and filing-cabinet sized blocks of highly competent siltstone landing in front of the chocks, and cathedral-like openings up to 25 m in height reaching up to the base of the channel (Figure 6).
The badly-fractured siltstone fractured was found to have an unconfined compressive strength (UCS) of 115 MPa; the UCS of the overlying conglomerate was only 68 to 83 MPa. The unexpected strength of the siltstone unit was due to its massive nature, with an absence of bedding planes and a fabric that inhibited fracture propagation. The caving behaviour of conglomerates in the Newcastle Coalfield has been observed through subsidence monitoring (Kapp, 1984; Creech, 1995), and while drilling over a longwall goaf at Teralba Colliery (Figure 7). During drilling through the Charlestown Conglomerate numerous cracks were encountered, but the overlying Australasian coal seam retained its virgin gas content. The one bore that intersected the Montrose seam beneath the conglomerate encountered no bed separations below the conglomerate (the strata were now sagging) and a seam which had been 70% degassed.
These observations show how the conglomerate retains its rigidity, failing in a manner which generates open voids, and how it influences goaf behaviour even when 100 m above the worked seam. The influence of the conglomerate on subsidence above Longwall 8 at Newstan is striking (Figure 8). Where the conglomerate spanning the goaf has a thickness of more than 35 m, subsidence is reduced from over one metre to around 0.2m.
A - Protected zone (entire face) - Caved goal
Figure 3 Microseismic monitoring results 500 500 - from Gordonstone Mine Qld. Plan view of 629 events normalised to a fixed longwall 450 - 450 position (note arcuate distribution and arrow showing advance direction). After Hatherly 400 400 et al., 1995 (see also Kelly et al., 1996, this -200 -150 -100 -50 0 50 100 150 200 250 300 350
volume). Distance (m)

352000E 352000E 351500E 351000E 350500E
242 M. CREECH
oz 350500E
Lc)
U 351000E 351500E
N)
0
Conglo
1348
50
0N
012.5
Conglomerate splits
Figure 4 Channel thickness (contours in metres) and location of roof falls in Longwall 5, Newstan Colliery.
Chock monitoring during the extraction of Longwall 5 helped to predict imminent roof falls, enabling face management plans to be implemented and scheduled stoppages to be synchronised with goaf behaviour. However the severity of the conditions
experienced was, in the opinion of those who saw them, insurmountable with the technology in use. It was therefore decided to split the next panel longitudinally into two sub-panels, each 90 m wide. These sub-panels (Longwalls 6 and 7) were extracted in seven months,

V
Cantilever Rotation Horizontal Tension
Towards Goaf
Laminated Interburden
'
Vertical Stress Distribution Under Cantilever
Massive Cantilever
LONGWALL MINING AT NEWSTAN COLLIERY 243
Figure 5 Schematic illustration of relationship between failing cantilever rotation and sub-vertical shear fracture formation. After Frith (1996).
and did not experience periodic weighting. Surface subsidence generally did not exceed 100 mm, indicating that the channel was bridging across both goafs.
MICROSEISMIC MONITORING
Due to the pressure placed on gateroad development with the narrower faces, a method was required to identifying largest practical width that could be extracted under these conditions. Unfortunately, when the channel failed at these narrow widths, it would do so well behind the face and neither visual or mechanical monitoring of the face could indicate how far back such failure was occurring. It was assumed that, as panel widths were increased, the channel would fail at increasing thicknesses and the breakline would approach the face. Microseismic monitoring was seen as potentially the best method for locating brealdines.
A Kelunji seismograph, supplied by the University of Central Queensland, was positioned on the surface to monitor caving above Newstan Longwalls 6 and 7, together with Longwall 11 at West Wallsend Colliery. This programme provided useful background data, indicating excellent conditions for such a style of monitoring. Longwall 11 at West Wallsend was
narrowed from 200 m to 130 m at a point where the overlying channel thickened to greater than 15 m. Seismic monitoring indicated that, at 130 m panel width, the channel started bridging where its thickness exceeded 25 m. To enable both collieries to better define extraction widths, however, the locations of channel strata failures in relation to the working face were required.
A microseismic monitoring package supplied by ISS Australia (through Mindata) was installed above Longwall 8 at Newstan and above Longwall 12 West Wallsend Colliery. Unfortunately, at the time of writing, data collected for Newstan were still being processed and those from West Wallsend were still being collected. Nonetheless, Longwall panel 8 at Newstan was successfully extracted at a width of 130 m and experienced no periodic weighting effects. Subsidence data indicate that the channel failed for 50% of the length of the wall (Figure 8); this failure must have occurred behind the face, as no weighting was experienced.
WINDBLAST ACTIVITY
Although no periodic weighting was experienced during

1 to 2 m
spalling approx 33 m
WORKED SEAM
A PPROX 200m
PARTIAL WATER LOSS
250m
VIRGIN GAS CONTENT-100%
AUSTRALASIAN SEAM
TOTAL WATER LOSS GAS EMISSIONS s To to cm BED SEPERATIONS • °• o
CHARLESTOWN CONGLOMERATE o 20-25m THICK
DRILLSTRING JAMMED EQUIPMENT LOST
MONTROSE SEAM Figure 7 Influence of Charles-town Conglomerate on goaf behaviour above Longwall 9,
/////////// Teralba Colliery.
VIRGIN GAS CONTENT-I00%
GAS CONTENT -30%
250m approx. 120m
PARTIAL WATER RECOVERY GAS EMISSIONS SUBSIDE
WATER RETURN LOST GAS EMISSIONS
244 M. CREECH
I
a. ----- °
( 10 to 15m High Fall
Figure 6 Cross section of roof fall, Longwall 5, Newstan Colliery, 22 June, 1994. See also cover photograph of this volume.
extraction of Longwalls 6 to 8 at Newstan Colliery, severe windblast was experienced as a consequence of the strata bridging the goaf at such a close proximity to the seam. A total of 13 men were injured by being knocked over and/ or peppered with dust while standing in the maingate near the face. Windblast velocities of up to 140 km/ hr have been recorded using underground equipment supplied by the University of New South Wales (Fowler 1996); an event of up to 80 km/ hr is shown in Figure 9.
In order to minimise such risks the colliery management initiated several procedures, including the installation of a safety harness system in the maingate. Only two men were to be in the maingate at any one time and the crew donned full-face motocross helmets. Seismic activity was used to warn of impending windblasts, and to allow any work in the maingate or tailgate to be performed between expected occurrences.
Windblast activity at Newstan was found to occur exclusively where the channel was thick enough to bridge the goaf, and where it occurred within 7 metres of the working roof or twice the extraction height (Figure 10). Experience from longwalling under dolerite sills in South Africa has indicated that an interval as much as four to five times seam height is potentially dangerous (Salamon and Oravecz, 1972), although little research has been undertaken to fine-tune this estimate. Caving of the immediate roof at Newstan creates a gap, generally 1.5 to 2 m high, between the base of the channel and the goafed material, as illustrated by Figure 11. This gap connects the face to a large area of potential roof falls behind the chocks.
This observation was made after extraction of Longwall 6, and as a result it was planned to monitor seismic activity 24 hours per day during extraction of Longwalls 7 and 8 under these hazardous conditions. This monitoring has unfortunately involved a steep learning curve, and as a result trigger mechanisms have been the subject of ongoing modification.
Base of Sandstone Channel About this Height
0.0
Competent Sandstone, Siltstone and Shales, somen
yebbly layers

a 2 4
Elapsed Time (seconds)
LONGWALL MINING AT NEWSTAN COLLIERY 245
C'J g CD 03 0 CM <1. CO CD 0 DJ NI' CD • 0) 0) 01 • 4:1) r U) Is- • .11 0 0 0 04 DJ DI DI 03 el V' LO CO CO CO CO CO CO CO D) CO CO 0) CO CO CI) CO CO CO CO CO U) CO CO CO CO -I -I -I -I -I -I _I _I _I -4 -4 - -J X J - J - -I -J J -4 -4 -I -I -I
Figure 8 Longitudinal subsidence profile (diamond symbols), channel thickness (squares) and location of windblasts (crosses), Longvvall 8, Newstan Colliery. See also McNally etal., 1996, this volume.
20
80 KM/HR WINDBLAST
2 SECONDS DURATION
1 0
SUCKBACK -90 KM/HR
.20 —
Wind
Ve
locity (m
etr
es/s
ec)
Figure 9 Windblast event as recorded at Newstan Colliery, 9th November, 1995. After Fowler etal., 1996.
0
-1
2
60
50
CH
AN
NE
L T
HIC
KN
ES
S IN
ME
TR
ES
40
30
20
10
0.2
-0.2
-0.4
-1.4
-1.6
-1.8
•
• •
•
•
STARTLINE-LS06-1100m FINISHLINE-LS49
......
•
++ 4 4 + WINDBLASTS

35200(4 0 0 0
351500E 6 350500E
te,
134
90
00
N
0 0 ,r)
0 0 Ul
•sr- fe)
352000E 351500E 351000E 350500E
cr)
mon.. o9 /
/
0 0 0 a)
246 M. CREECH
Figure 10 Height of channel above seam (indicated by numbers beside oen circle; add 2 m for working horizon). Location of windblasts shown by faceline chainages. Barbed lines indicate areas where channel is less than 7 m above seam.

0 0
0
0 0
0 0 0
,.... .
____3 _-...) I I TO 2 METRESC- -- *-- L,.-- r-•
II
<7 METRES
E3.6 TO 4.2 METRES
e"\ r-
▪ 0 "N. __,
(-- 2-1 (•-• •••-• r, e•—•
n e.\ (") ,-N r• ' e-N r's r"..
e... , -I /-% ,..-, ..--,
C r. (---) m Es-
,— rc ..,---,c% e., ('- ,-- •--, r• ,-- •-t
L - , /----- _-
0
souRcE r6v 0
e t.-- rs
NU
MB
ER
OF
EV
EN
TS
300
250
200
150
100
50
0
NO GOAF FALL DETECTED
WINDBLASTS
LONGWALL MINING AT NEWSTAN COLLIERY 247
SANDSTONE / CONGLOMERATE CHANNEL 0 THICK ENOUGH TO SPAN GOAF
Figure 11 Windblast mechanism model for Newstan Colliery, based on large block caving above goaf.
11/5/960:00 16/5/96 0:00 21/5/96 0:00 26/5/96 0:00 31/5/96 0:00 5/6/96 0:00 10/6/96 0:00 15/6/96 0:00
Figure 12 Seismic events recorded at PC36 geophone station, May-June 1996 (vertical lines are five-day intervals), during extraction of Longwall 8 at Newstan Colliery. Note steepening of cumulative event profile coinciding with windblasts.
The seismic trigger determined for Longwall 7 involved a period of quiescence prior to a windblast. This was assumed to reflect some kind of periodic failure as the face retreated, an assumption which in hindsight appears to have been wrong. Monitoring during extraction of Longwall 8 relied on cumulative energy recorded by individual geophones, and source locations and magnitudes were not utilised due to lack
of data. This resulted in many false alarms due to small-magnitude events close to geophones being recorded as high energy events. However before seismic monitoring was used as a warning system on Longwall 8 there were two large windblasts, which injured three men. Two further large windblasts occurred after monitoring was established, and the face crews were successfully evacuated prior to each event.

\\. ®
" 11
/ 4/9
6 21
:42
507m
17/4
/96
18:4
0 46
5m
,..
la A \ 4 g
-
12/6
/96
13: 2
9 12
8m i
16/6
/96
13:5
5 12
2m
GEOPHONE PC33A
\
m II m e4 *
N so 1:
im m
e.;
NNE1, a ki m
;
AREA OF CIIA CONVERGENC
248 M. CREECH
GEOPHONE PC36
500m 400m 300m 200m 100m
(NOT MONITORED - SYSTEM FAILURE)
WINBLAST SOURCE APPROX
300m AWAY FROM PC36
Figure 13 Face locations at time of of windblast events, Longwall 5, Newstan Colliery.
Table 1 Large seismic events recorded by PC 36, associated with windblasts.
P WAVE VELOCITIES ADJUSTED TO 6000 mls (refer to calibration blast) AVERAGE VVINDBLAST SOURCE LOCATION - DISTANCE FROM PC36 3di " H :, METRES::
4111196 2t42 FACE 210m BEHIND 513M621 37 80m AHEAD
EVENT NO TIME MAGNITUDE DISTANCE EVENT NO TIME MAGNITUDE DISTANCE 609 20:45 -1.00 304 258 20:36 0.60 290 612 20:46 -1.10 243 267 20:40 -0.30 133 618 20:50 -0.90 283 279 20:55 -0.80 418
: 622 # mv. 20:52 -0.90 370 287 21:06 -0.20 754 637 21:10 -0.90 205 290 21:10 -0.30 171 655 21:27 -0.90 226 292 21:10 -0.80 224 656 21:30 4.80 692 294 21:11 0.20 219 657 21:30 4.80 194 304 21:17 -0.20 491
66040E 21:30 -0.80 308 309 21:25 0.10 198 661 2131 4.80 311 AVERAGE DISTANCE ti:':!: :14 663 21:35 -0.70 201 670 21:39 4.50 435 i!611219613:i29 FACE 140m AHEAD 675 21:42 -0.70 518 EVENT NO TIME MAGNITUDE DISTANCE 676 21:42 -0.60 337 7 2:31 -0.80 383 678 21:42 1.20 ? 28 9:51 -0.80 398 682 21:47 -0.80 335 36 12:40 -0.50 231 686 21:51 -0.40 344 38 12:42 -0.50 242
AVERAGE DISTANCE :::-354: 53 1317 -o.so 129 55 13:25 -0.60 160
412 81961555 FACE 80m BEHIND 86 1431 -0.60 214
EVENT NO. TIME MAGNITUDE DISTANCE AVERAGE W 201 31 13:10 -0.70 232 ao 1326 0.20 422 81161961355 FACE 150m AHEAD 62 15:45 -1.00 364 EVENT NO. TIME MAGNITUDE DISTANCE 66 15:46 -0.70 350 2 0:06 -0.50 267 70 15:51 0.30 310 8 0:30 -0.40 267 74 15:55 -0.20 245 62 11:01 -0.50 380 76 16:00 -0.40 150 72 13:01 -0.80 151
AVERAGE DISTANCE p .s296 , 101 13:36 -1.00 310 111 13:46 -0.50 267
&18196756::F ACE 20m AHEAD 116 13:52 1.30 444 EVENT NO. TIME MAGNITUDE DISTANCE 117 13:52 -0.50 255
9 0:16 -0.80 195 142 14:15 0.20 444 21 0:50 -0.60 427 145 14:15 -1.00 255 42 2:26 -0.40 599 154 14:31 -0.90 84 55 7:56 -1.00 181 158 14:31 -0.60 365 59 7:56 -0.30 296 174 14:57 -0.60 456 64 8:06 -0.40 242 AVERAGE DISTANCE rBOok: 1 65 8:06 -0.60 267
AVERAGE DISTANCE :..N :i315 #":wiTHINIotaipr BEQPBOBE PC33A:4

LONGWALL MINING AT NEWSTAN COLLIERY 249
On the negative side, there were a total of 133 warnings given over a 55-day period. These caused delays averaging 2 hours and totalling 275 hours, representing a 30% loss of production time. With the incorporation of seismic event location and magnitude data, many of these false alarms should be avoided. This was confirmed by the fact that large magnitude events (M> 1.0) preceded each windblast (Figure 12). However the source location was soon recognised as the important information required to assist in seismic monitoring and warning of these events.
It was noted that the roof falls responsible for the windblasts were often not heard by the face crew, even when the mining equipment was idle. In the windblast at 255 m on Longwall 7, for example, the crew preparing the Longwall 8 installation roadway (some 800 m from the Longwall 7 face) heard the goaf fall, whereas the face crew only felt a slight pressure change seconds before the fall. The volume of air displaced by several of these windblasts was estimated (C. Fowler, pers. comm.) to be 3,000 to 4,000 m3. Assuming a 1.5 to 2 m space behind the chocks, the surface area of the rock which had fallen would be up to 2,000 ni.2. A fall of this magnitude should be audible some distance away.
These observations suggest that the source of the windblast could be some considerable distance behind the face. The most likely location for such a large piece of strata to fall would be back where the conglomerate channel started to converge with the seam, particularly since this edge may be ragged, and where surface subsidence has indicated altered caving behaviour and potential instability.
Such a proposition was confirmed when the locations of large-magnitude events averaged 324 m away from geophone PC36, located in the conglomerate (Table 1). This location was reasonably consistent for the six windblasts recorded on Figure 13, even though the geophone was located between 200 m ahead of and 150 m behind the face. Such a location logically could not be ahead of the face, nor beyond the sides of the wall. It must lie behind the face, an area that coincides with the convergence between the seam and the conglomerate channel. In contrast, the numerous smaller seismic events follow the face position, and are considered to be caused by the failure of the septum material immediately above and behind the face. The occurrence of numerous large seismic events prior to and often following a windblast indicate that instability within the channel is the cause. The actual block of material falling is likely to be a basal piece from of this unit.
Seismic monitoring will continue for Longwalls 9 and 10 at Newstan. If it is used in conjunction with detailed geological information, it is hoped that Newstan and West Wallsend Collieries will be able to efficiently extract coal under massive strata with minimal risk to mine employees.
ACKNOWLEDGMENTS
The author would like to thank Powercoal and Oceanic Coal for permission to publish these data, though the opinions and interpretations expressed in this paper may not necessarily be those of either company. He would also like to thank B. McKavanagh (University of Central Queensland), C. Fowler (University of New South Wales), and V. Brink and T. Siggins of ISS for their assistance and advice.
REFERENCES
CREECH M. 1995. A review of subsidence data from the Newcastle Coalfield and a new subsidence prediction method. Mine Subsidence Technology Society, 3rd Triennial Conference Proceedings, February.
num R. 1993. Optimisation of powered support performance in relation to strata loading and engineering criteria. ACARP Project Report No. 1445, November.
FRrm R. 1996. Development and demonstration of a longwall monitoring system for operating decision making. ACARP Project Report No. C4017 (still to be published).
FRrrx R. & CREECH M. 1997. Face width optimisation in both longwall and shortwall caving environments. ACARP Project No. C5015 (still to be published).
FOWLER J. C. W., TORABI S. R. & DALY C. R. 1996. Field investigations into windblasts resulting from large falls of roof in Australian underground coal mines. International Symposium on Mining Science and Technology, Xuzhou, Jiangsu, China, October.
HATHERLY P., Luo X., DIXON R., McKAvANAGH B., BARRY M., JECNY Z. & BUGDEN C. 1995. Roof and goaf monitoring for strata control in longwall mining. ACARP Project Report No. C3067.
KAPP W. A. 1984. Mine subsidence and strata control in the Newcastle District of the Northern Coalfield, NSW. Unpublished PhD Thesis, Department of Civil and Mining Engineering, University of Wollongong.
SALAMON M. D. G. & ORAVECZ K. I. 1972. Rock mechanics problems associated with longwall trials in South Africa. Proceedingas of the 5th International Strata Control Conference, London, August, 1972. Chamber of Mines of South Africa Project No. CM/801 /66, Research Report No. 6/72, January, 1972.


Symposium on Geology in Longwall Mining, 12-13 November 1996, eds G. H. McNally and C. R. Ward, pp 251-255.
Application of tunnel boring machines to Australian coal mining operations
G. DEAN-JONES,' K. H. R. MOELLE1 AND K. ICANEK02
Institute of Coal Research, The University of Newcastle. 2Kumamoto University.
Longwall coal mining will in future contribute a greater proportion of Australian coal output. Improvements in the performance of conventional continuous miner roadheading systems are unlikely to reach a stage where the rate of gateroad development matches the potential rate of longwall extraction. Shielded tunnel boring machines (STBMs) for roadway development have potential for application in the Australian coal mining industry, especially for planned large-dimension longwall panels. The advantages of STBM technology are: rapid advance rates achieved through a separation of cutting and roof support activities; improved safety; and the potential for a high degree of automation. Operational success of this roadway development concept will require a close integration of cutting, roof support, coal clearance and panel services. In addition, geological conditions will need to be suitable and well understood prior to mining, with the main emphasis being on seam continuity.
INTRODUCTION
Longwall mining operations have gained wide acceptance in Australia, with demonstrated advantages of productivity and worker safety over other underground coal mining methods. At present there are 28 mines in Australia using longwall extraction technology, all located in the Sydney and Bowen Basins. The majority of these mines are in the established underground mining areas of the Sydney Basin, with five operations in Queensland. Six new longwall mines are either committed or under development, shared equally between Queensland and NSW. There is potential for approximately twenty new mines, with the majority likely to be established in Queensland. Present and proposed longwall mines are all single face operations with the exception of Gordonstone, which has two sets of longwall equipment but generally operates only one face at any time.
The prime operational aim in longwall mining is to optimise the cost of coal production through maximising extraction and minimising roadway development. The trend is thus to delineate larger panels and to increase the ratio of longwall to development-produced tonnes.
The choice of face width is determined by a variety of factors, including the capacities of available equipment, as well as strata control and subsidence considerations. Current Australian practice is to establish face widths of approximately 200 m, except where constrained by special conditions (such as beneath stored water or in difficult geological conditions). Some newer operations (Springvale, Ulan, Southern Colliery, Gordonstone and North Goonyella) are trending toward 250 m under favourable conditions, and the present widest face is 270 m at Crinum. Wider faces are not an automatic key to either higher production or productivity, but have generally been implemented by the newer mines which
are gaining experience with their particular geological conditions.
In a move against the general industry trend for widening longwall faces, two mines in the Newcastle Coalfield have narrowed face widths to minimise the periodic weighting effects of massive conglomerate/ sandstone units in their roof sequences. Shortening the face to utilise the inherent bridging characteristics of the roof strata serves to stiffen this system and thus prevent face centre failures. There is an obvious economic limit to face shortening if the advantages of longwall extraction are to be optimised, hence short faces can usually only be sustained if there is a thick working section. The main motivation for developing wider panels is the simple fact that larger volumes of coal in a single longwall block takes some pressure off development rates.
Panel lengths are variable and relate mainly to geological continuity of the coal block. A trend towards increasing this dimension is driven by the same economic arguments that apply to panel width. Current Australian Iongwall panels are generally approximately 2 km in length, but range up to 3.2 km. Presently there are only two Australian mines operating panels in the 3,000 m range (South Bulga and Gordonstone), five between 2,250-2,500 m and the remainder at around 2,000 m or less.
The trend toward increased panel sizes given good geological conditions is exemplified by the Cyprus-Amax Twenty Mile mine in Colorado. This operation is developing a longwall district with planned 300 m x 6,000 m panels, each containing about 6 Mt coal. There is some question as to whether such dimensions are optimal, given the technical difficulties of maintaining services in such long gateroads and the rock mechanics requirements.
Twenty years ago longwall mining in Australia had not yet achieved a consistently high level of

252 G. DEAN-JONES ET AL.
productivity, matched against the required high capital investment, to compete with continuous miner operations. A generation later, production levels have exceeded those possible in pillar extraction panels using continuous miners. Nevertheless, many longwall mines are economically marginal, largely because of the declining real price of coal in international markets. The pressure to increase the efficiency of longwall operations is as great as ever.
DELAYS IN LONGWALL OPERATIONS
Installed longwall production capacity in Australia varies between 1,000 and 3,000 tonnes/hr. On a sustained basis, no longwall operation comes close to exploiting the full potential of the system, and only a few mines exceed 50% of rated capacity. The reasons vary from geological problems in roadways and at the face to mechanical and electrical problems with face and outbye equipment. In spite of this, most development systems cannot keep pace with longwall extraction rates.
Gateroad development in Australian mines generally consists of driving two or more maingate and tailgate headings on 30 to 45 m centres, with chain pillars approximately 100 m long. Total drivage for a typical 200 m by 2,000 m longwall panel with a dual gateroad configuration is in the order of 10,000 m. The industry requirement for roadway drivage to match the potential of longwall extraction is estimated to be in the order of a sustainable 50-60 m/ shift. Although modern continuous miners can achieve this target in terms of cutting performance, sustained rates generally fall below half this level due to delays arising through strata control and coal clearance.
Lama and Misra (1991) indicate that conventional continuous miners (excluding machines which are capable of simultaneous cutting and bolting) operating with shuttle cars should be capable of a sustained 40 m advance per day, even under difficult conditions requiring a high density of roof support. A recent survey of Australian gate road development rates (Cram, 1996) indicates, however, a current average rate of approximately 23 m/ day.
Success in gateroad development is best measured by the rate of sustainable panel advance regardless of the number of headings. In general, roadway drivage rates in Australia fall short of the best US practice, where the highest productivity underground operations can achieve roadway development rates which are better matched to longwall capacity, while using familiar and proven development equipment.
In the US, a typical high efficiency development operation may consist of three-heading gateroads advanced using a place change system (two continuous miners, one track-mounted bolter and short pillars). Development rates of 50 m per shift are frequently achieved by the best operations.
In a three-heading development panel, 50 m of roadway advance per shift equates to about 13 m of panel advance per shift. To achieve the same level of
panel advance in Australia under a two heading system would require about 30 m/ shift. This is about double the average currently achieved by the best Australian operators.
Place change development
Much of the relative success with gateroad development in the USA has been achieved using place change technology. This technique has achieved significant, though limited success in Australia, in underground operations beneath relatively massive and stiff roof strata. In these conditions, long stand-up times allow a sufficient delay between cutting and bolting procedures. In the Sydney and Bowen Basins, however, more than half of the immediate roof strata are laminated rocks. The presence of these weak layers, combined with high horizontal stresses, is not consistent with efficient place change operations. This situation has been echoed by the performance of continuous miner-based highwall mining operations in the Bowen Basin, which have encountered significant problems advancing under unsupported roof.
There is great potential for change and improvement of a wide variety of coal mining operational aspects through benchmarking against overseas mines. None-theless, direct implementation of mining techniques proven under different geological conditions has not always been successful in Australian underground coal mines.
ROADHEADING EQUIPMENT — STATE OF THE ART
There are two potential and overlapping paths to the solution of the 'delay in development' problem: more efficient utilisation of conventional equipment, and the introduction of innovative equipment and concepts. The general tendency has been to stay with conventional equipment and, by a process of incremental change to work practices and equipment, to gradually improve operational efficiency. This approach has been exploited to great advantage in a number of US mines, which achieve high development rates with relatively simple equipment and management structures which encourage accountability, communication and teamwork. This development equipment comprises high capacity continuous miners (e.g., Joy 12CM series) and separate bolters, both modified for efficient flitting moves in place change operations.
On the Australian scene, a number of advances on the continuous miner/shuttle car concept have been introduced recently and some have achieved wide acceptance. A particularly successful machine concept is the Voest Alpine ABM20, which provides a degree of continuous operation by allowing simultaneous cutting and roof/rib bolting. This is achieved through an undercarriage arrangement which provides a stable bolting platform separated from the cutter head. Experience has shown that this type of machine can

TUNNEL BORING MACHINES INAUSTRALIAN COAL MINING 253
outperform conventional continuous miners, including those fitted with onboard bolters, by approximately 50% in terms of supported metres driven.
Emphasis has also been placed on outbye coal handling systems, in the form of cableless battery-powered shuttle cars and track-mounted development tail end equipment (Phillips and Gallagher, 1996). The Joy Sump Shearer (JSS) and monorail-mounted flexible conveyor train recently trialed at Capcoal Southern Colliery represent an integrated cutting-coal clearance-ventilation system. An advantage of the JSS machine is the ability to cut a variety of profiles ranging from rectangular to semi-arch, full arch and rib arch.
In spite of these achievements, the continuous miner concept has not advanced significantly since the first machines were introduced by Joy in 1948. Coal cutting operations are inherently discontinuous, due to the time required for bolting and delays in coal clearance and extension of services.
Improvements in outbye systems have provided some relief, but the slow improvement in roadheading rates leads to the inescapable conclusion that conventional continuous miners cannot advance fast enough to match the capabilities of longwall mining systems. Hence new roadway development technology has to be considered. In this context, advances made in tunnel-boring machine technology have produced design concepts which may be readily and profitably transferred to the coal mining industry.
POTENTIAL OF TUNNEL BORING MACHINES IN COAL MINTING
Developments in coal roadheading machines and shielded tunnel boring machines for civil engineering works and hard rock mining have, up to recently, followed largely separate paths. The main reasons for this, from a coal mining perspective, are probably that:
• Shielded tunnel boring machines (STBMs) are mainly used to cut an opening of fixed cross-sectional area between two defined points, without being confined to a particular geological mining horizon.
• The usual circular tunnel profile is inconsistent with the requirements of coal mining in a stratiform deposit.
• STBM systems lack the flexibility of conventional continuous miners, where a single machine can be used to drive headings and cut-throughs, and extract pillars.
There are, however, many similarities between the tunnels which are normally driven by shielded tunnel boring machines and the gateroad requirements for longwall mines. These include the length and cross-sectional area of the excavation, as well as the geomechanical properties of the material to be excavated. There is a strong probability that STBM technology would represent a cost-effective solution to the problem of rapid roadway development.
STBM MACHINE CONCEPT FOR COAL MINING
A reusable shielded tunnel boring machine represents a significant departure from conventional coal mining practice. The fundamental design requirements of a STBM system appropriate for gateroad development are:
• Continuous excavation capability, to achieve high development rates. This can be best achieved by a total separation of the cutting and bolting! supporting actions.
• A shielded body providing continuous support to the opening and preventing bed separation until bolting is completed.
• An outbye coal clearance, materials supply and ventilation system which allows for continuity of the mining operation.
• A tunnel profile consistent with ventilation, coal clearance and materials supply requirements during development and longwall extraction.
• A modular design allowing for speedy disassembly and relocation, and for in-situ maintenance.
• A high degree of automation, minimal manning and excellent operator safety.
The initial design challenge is to select a cutting profile and to define machine weights and dimensions which are compatible with underground mining practice. The vast majority of tunnel boring machines cut a circular opening, which combines the advantages of maximum stability, machine design simplicity, and suitability for a wide variety of civil engineering purposes. Conventional tunnel boring technology generally focuses on the dimensions and characteristics of the created opening, rather than on how this tunnel may relate to the variety of underground engineering elements of an operating coal mine. Circular openings do have some applications in underground coal mining (such as for ventilation or drainage), but are not the ideal geometry for the main mine roadways or development headings.
A profile more consistent with existing coal mining practice combines a flat floor and roof with curved ribs. This profile offers improved geomechanical stability relative to a rectangular opening, and can be cut a STBM which uses two or three circular cutting heads arranged side-by-side. While more complex than a single circular cutter, such machines represent proven technology and have demonstrated rapid tunnelling performance — up to 25 m/hr, including ground support. Relatively simple engineering solutions exist for the removal of the roof and floor septa produced by circular cutters which have only a small overlap.
The size and weight of a TBM capable of driving at roadway-sized dimensions will greatly exceed those of continuous miners. The TBM Weight is likely to be double that of modem bolter-miners, about 150 tonnes, taking into account the enveloping shield. Machine length will be of the same order as a continuous miner

254 G. DEAN-JONES ET AL.
but height will be greater, as provision for significant shrinking would compromise the integrity of the surface shield. Relocation of the machine to a new heading may require partial dismantling into modular components, due to the difficulties of reversing an essentially unidirectional machine.
It is assumed that strata control in roadways formed by a STBM will be by conventional roof and rib bolting, well-proven under Australian mining conditions, without resorting to arches. The key to successful strata control in laminated roof sequences is to provide immediate support to the opening. Immediate and continuous support to the excavation up to the point of bolting can prevent the initiation of delamination, shearing and sagging. A STBM can provide this, as well as the complete separation of cutting and bolting by performing these operations at opposite ends of the shield.
The effective performance of any cutting/bolting system is only as good as the weakest element in the mining cycle. Commitment to a STBM requires the implementation of an integrated systems approach to cutting, strata control, coal clearance and service extension, using matched components of high capacity and reliability. Outbye sSTstems such as development tail ends (Dartbrook Colliery) and flexible conveyor trains (Capcoal Southern Colliery) are a preview of engi-neering solutions which may eliminate delays in this area. The predicted cutting rate of a shielded STBM under Australian conditions is more than 10 m/br, which places considerable pressure on the capacity and performance of all outbye systems.
STBM technology would not mean the elimination of conventional continuous miners from development work. Their flexibility of operation would make them essential for short headings, cut-throughs and the driving of stub headings required at the beginning of a STBM-driven roadway.
STABILITY OF EXCAVATIONS DRIVEN BY STBM
The excavation produced by a STBM will have a different profile to the rectangular openings produced by a conventional drum-type continuous miner, and hence different deformation properties. It has been suggested that the STBM configuration most suitable for coal mining will cut a flat roof and floor and curved ribs. An Equivalent Volume Defect Method (EVDM) (Kaneko and Shiba, 1990) has been used to compare rock deformation behaviour around underground entries with rectangular and curved rib profiles.
The EVDM can be used to predict the elastic behaviour of rocks containing mechanically significant discontinuities, such as joints and bedding planes. The method takes into account the density, orientation, and aperture of these discontinuities, and is combined with the Finite Element Method to model stress and deformation in discontinuous rock masses.
GEOLOGICAL CONSTRAINTS TO STBM IMPLEMENTATION IN COAL MINES
Shielded TBM technology may not be the solution to roadway development under all mining conditions. In general terms however, geological conditions conducive to longwall extraction are also likely to be favourable for roadway development by STBM. A combination of relatively high capital cost, fixed cutting height and low manoeuvrability means that the geology of a coal deposit must be known with some certainty and be appropriate for the application of a STBM. A full evaluation of geological and geotechnical properties of the roof-seam-floor system would be required before STBM technology was committed to underground roadway development. Some of the geological and geotechnical conditions which may have a significant influence on TBM operations in coal mines are outlined below.
Coal seam continuity — faults and seam rolls
The operator of a full-face STBM is unsighted and would steer the machine along a profile determined mainly by the geological model, taking into account changes in seam attitude. This factor marks a significant difference between civil engineering tunnelling and coal mining roadway development, where the aim is to stay within a predetermined working section. Automatic horizon control could be effected by sensors picking up emitted gamma ray contrasts in roof and floor strata, or by ground probing radar.
Compared to a continuous miner, tunnel boring machines have very limited manoeuvrability with a turning radius (horizontal and vertical) exceeding 100m. Significant seam displacements on faults would have to be defmed well before they were reached, so that an appropriate vertical steering correction could be initiated. Seam rolls of large amplitude or sharp flexure would need to be defmed and traversed in the same way as faults. In cases where a maingate or tailgate driven by a TBM diverges from true seam floor or roof, the longwall will have to cut outside the preferred working section to maintain contact with the gateroads. Zones of broken ground associated with faults and shears should not, however, pose any particular problems to TBM cutting or to support behind the shield.
Sedimentary structures and igneous intrusions
Materials intersected in a roadway with geomechanical and cuttability characteristics markedly different to coal will affect the progress of any cutting machine. Sedimentary structures which may have a deleterious effect include differential compaction features, floor stone rolls and roof channels. In the case of stone rolls similar to those present in the floor of the Bulli Seam in the NSW Southern Coalfield, their magnitude, frequency and trend in relation to the heading would become important considerations. Wants, if not defined

TUNNEL BORING MACHINES INAUSTRALIAN COAL MINING 255
accurately, may appear to the machine operator as similar to a large displacement fault.
Igneous features such as dykes, sills and cinder zones which cannot be readily cut by a TBM designed primarily for drivage in coal present a similar problem. The general configuration of a shielded TBM means that access to the face to carry out conventional drill and blast excavation activities is difficult or impossible, and any worker doing so would be operating under largely unsupported roof. One possible solution may be to use cutting elements such as polycrystalline diamond, which are capable of milling the hardest materials, and to make provision for access to the cutting head for maintenance purposes.
Gas emissions
Potential high advance rates may promote rapid gas desorption from gassy seams, which could cause outbursts. Outburst occurrences may be better handled by a full-face TBM than by a continuous miner, as the TBM fills the opening and its bulkhead provides a measure of ground pressure balance.
CONCLUSIONS
Conversion from conventional continuous miners to shielded tunnel boring machines for driving gate roadways would constitute a major change in Australian coal mining practice. It would be comparable to the introduction of continuous miners in the late 1940s and early 1950s. Whereas the continuous miners provided a significant improvement in productivity and safety, the use of a STBM will further improve these areas. In particular, face personnel will be largely isolated from the rockmass by the bulkhead and the shield itself.
However, the biggest change will be the in the rate of drivage likely to be achieved by the STBM. Projected advance rates of 10 m/hour will require major modifications in mine logistics and planning. The STBM represents a large step towards continuity of roadheading operations, by separating the cutting
operation totally from the support installation. A key to the success of STBM technology will be the integration of the cutting, bolting, coal clearance and panel services components in a reliable, high capacity system.
The function of the shield is primarily to prevent bed separation in the immediate roof strata and thus delay their deterioration. A STBM can be designed and manufactured with variable dimensions and profile geometries suitable for particular deposits and mining conditions. In particular, the engineering difficulties of operating in thick seams will be markedly reduced. There is even potential for producing two gateroads in a single pass, by driving a sufficiently wide single entry which could then be subdivided by a septum.
Shielded tunnel boring machines present an attractive solution to the problems faced in matching gateroad development and longwall extraction rates under most Australian mining conditions. Successful implemen-tation of this technology, however, relies on the existence of suitable mining conditions. The veracity of the geological and geotechnical models thus becomes a key element in deciding if this technology should be applied to a particular deposit.
REFERENCES
CRAM K. 1996. Australian longwall gate road development benchmark survey. Australia's Longwalls II, August 1996.
ICANEK0 K. & SHIBA T. 1990. Equivalent volume defect model for estimation of deformation behaviour of jointed rock. In Rossmanith H. P. ed. Mechanics of jointed and faulted rock Proceedings of the International Conference, Technical University of Vienna, 277-284
LAMA R. D. & MISRA A. 1991. Development rates using conventional continuous miner technology in deep underground mines in Australia. In Hargraves A. J. ed. International Conference on Reliability. Production and Control in Coal Mines. Illawarra Branch, Australasian Institute of Mining and Metallurgy, 148-154.
PHILLIPS R. & GALLAGHER R. J. 1996. Options for development equipment selection at South Bulli Colliery. In The Effects of Development and Longwalls on Production Continuity. Illawarra Branch, Australasian Institute of Mining and Metallurgy.


Symposium on Geology in Longwall Mining, 12-13 November 1996, eds G. H. McNally and C. R. Ward, pp 257-267.
Geological factors influencing longwall-induced subsidence
G. H. McNALLY,I P. L. WiLLEY2 AND M. CREECH3
The University of New South Wales, Department of Applied Geology. 2Formerly ACIRL Pty Ltd.
3Powercoal Central Coast Technical Services.
Geology is an important factor in subsidence prediction, but its effects are poorly understood and complicated by those of mining depth, partial extraction, and uneven surface topography. The main lithological factor is the proportion of massive sandstone and conglomerate present within the overburden. These beds need not be of high intact strength, as measured by laboratory UCS tests. If UCS is low, caving-induced subsidence occurs mainly through the rock substance; if high, these fractures follow and extend joints. Massive strata reduce the subsidence factor, transfer abutment loads to pillars, reduce the angle of draw and may concentrate ground strain along a few widely-spaced master joints. Their variable thickness creates subsidence prediction difficulties above subcritical panels, especially at high W/ H ratios, say 0.6-0.8. At shallow depths the stiffness of the immediate roof, pillar coal and immediate floor system may be even more important at sub-critical W/ Hs.
High tensile strains, compression mounds and stepped subsidence profiles may develop where a longwall face crosses a fault or dyke. Wide-spaced master joints have similar effects, while closely-spaced joints increase vertical movement. Steep topography can severely affect subsidence; large tensile strains develop along ridge lines and high compressive strains are common in valley bottoms. Conversely, thick soils and unconsolidated sediments reduce ground strains, but increase the angle of draw. Subsiding ground tends to 'flow' as a highly viscous mass towards low ground, cliff lines and adjacent goafs.
INTRODUCTION
Depth of cover, mining layout, pillar dimensions, topography and overburden geology are the main factors controlling surface movements above longwall extraction panels. However, because the overburden factors are difficult to quantify, geological explanations of subsidence phenomena are often sought only when empirical or numerical modelling predictions fail to match actual measurements. The main purpose in studying the geology and geomechanical properties of overburden strata is therefore: • To fine-tune empirical predictions by comparing local
with regional geology and suggesting where, and how, conditions at a particular site differ from those used in the construction of the empirical model; and
• To devise the most appropriate input data for numerical models of subsidence behaviour, taking into account the geological uncertainties and the limitations of numerical methods.
It is also important to note that while geology may have little effect on vertical movement — the subsidence parameter most commonly recorded — it can have a great influence on the more structurally damaging parameters: lateral movements, horizontal strains, ground curvature and tilt.
The geological factors influencing ground response to mining-induced caving include: • Gross lithology, particularly the presence or absence
of massive sandstone or conglomerate beds, and hence the overall stiffness and tensile strength of the overburden.
• Geological structure of the rock mass, primarily the intensity of joints and bedding, and their geomechanical properties (shearing resistance, persistence, spacing).
• Faults and dykes. These features have a specific influence on the character of surface subsidence, in that they concentrate strain and differential movement along their line of-outcrop.
• The depth and type of soils and surficial deposits overlying the coal measures strata. These influence the surface movements, ground strains and the spread of the subsidence trough.
• Surface topography. This may cause tensile strains to increase along ridge lines and close to cliffs, and cause compressive strains to increase in valleys.
CAVING AND SUBSIDENCE MECHANISMS
Coal extraction, whether by longwall or bord-and-pillar methods, removes support from the overlying strata, and thereby generates an arch-shaped or trapezoidal zone of tensile stress above the seam cavity. Rock being weak in tension, the immediate roof layers soon fracture and fall as the mined-out width increases. This caved zone (Figure 1), filled with a chaotic pile of thoroughly fragmented rock blocks, is usually all that can be seen behind the longwall chocks. However, this is quite unrepresentative of rock mass conditions further up in the overburden.
For a start, this rock debris bulks up to 120-130% of its in-situ volume; were this to continue upwards, the mining void would quickly become choked and there
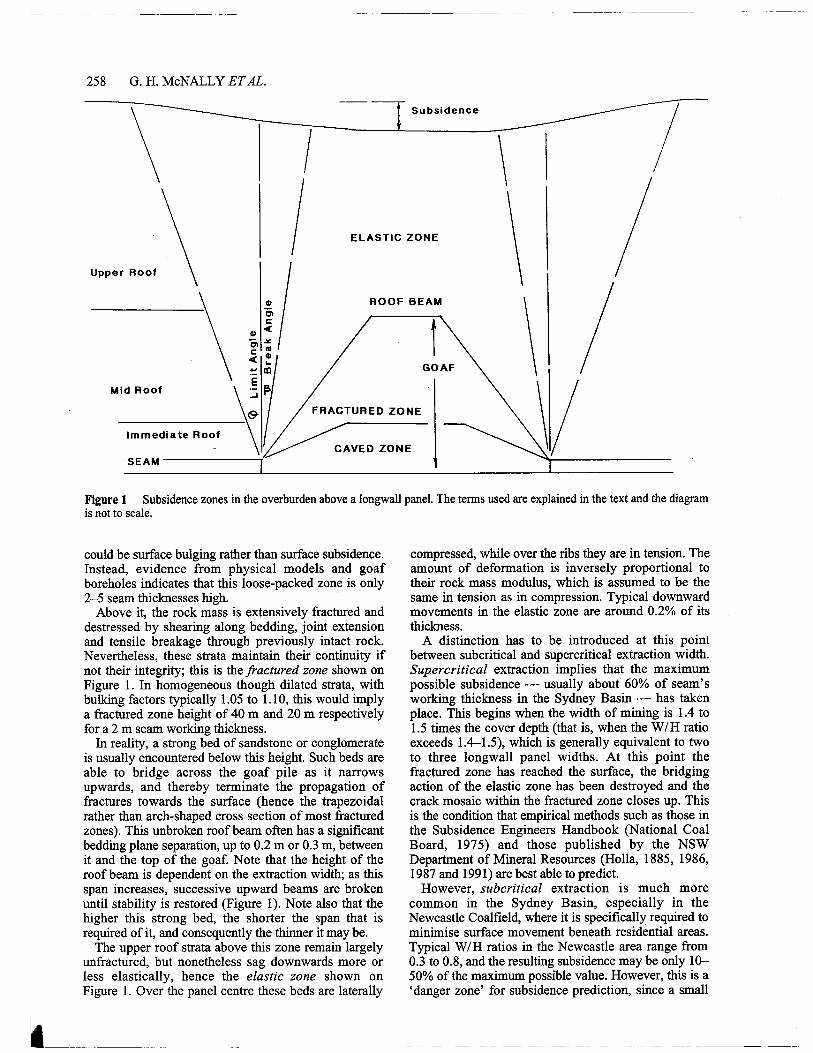
Upper Roof
Mid Roof
Immediate Roof
SEAM
ELASTIC ZONE
ROOF BEAM
GOAF
FRACTURED ZONE
CAVED ZONE
Subsidence
258 G. H. McNALLY ET AL.
Figure 1 Subsidence zones in the overburden above a longwall panel. The terms used are explained in the text and the diagram is not to scale.
could be surface bulging rather than surface subsidence. Instead, evidence from physical models and goaf boreholes indicates that this loose-packed zone is only 2-5 seam thicknesses high.
Above it, the rock mass is extensively fractured and destressed by shearing along bedding, joint extension and tensile breakage through previously intact rock. Nevertheless, these strata maintain their continuity if not their integrity; this is the fractured zone shown on Figure 1. In homogeneous though dilated strata, with bulking factors typically 1.05 to 1.10, this would imply a fractured zone height of 40 m and 20 m respectively for a 2 m seam working thickness.
In reality, a strong bed of sandstone or conglomerate is usually encountered below this height. Such beds are able to bridge across the goaf pile as it narrows upwards, and thereby terminate the propagation of fractures towards the surface (hence the trapezoidal rather than arch-shaped cross section of most fractured zones). This unbroken roof beam often has a significant bedding plane separation, up to 0.2 m or 0.3 m, between it and the top of the goaf. Note that the height of the roof beam is dependent on the extraction width; as this span increases, successive upward beams are broken until stability is restored (Figure 1). Note also that the higher this strong bed, the shorter the span that is required of it, and consequently the thinner it may be.
The upper roof strata above this zone remain largely unfractured, but nonetheless sag downwards more or less elastically, hence the elastic zone shown on Figure 1. Over the panel centre these beds are laterally
compressed, while over the ribs they are in tension. The amount of deformation is inversely proportional to their rock mass modulus, which is assumed to be the same in tension as in compression. Typical downward movements in the elastic zone are around 0.2% of its thickness.
A distinction has to be introduced at this point between subcritical and supercritical extraction width. Supercritical extraction implies that the maximum possible subsidence — usually about 60% of seam's working thickness in the Sydney Basin — has taken place. This begins when the width of mining is 1.4 to 1.5 times the cover depth (that is, when the W/H ratio exceeds 1A-1.5), which is generally equivalent to two to three longwall panel widths. At this point the fractured zone has reached the surface, the bridging action of the elastic zone has been destroyed and the crack mosaic within the fractured zone closes up. This is the condition that empirical methods such as those in the Subsidence Engineers Handbook (National Coal Board, 1975) and those published by the NSW Department of Mineral Resources (Holla, 1885, 1986, 1987 and 1991) are best able to predict.
However, subcritical extraction is much more common in the Sydney Basin, especially in the Newcastle Coalfield, where it is specifically required to minimise surface movement beneath residential areas. Typical W/H ratios in the Newcastle area range from 0.3 to 0.8, and the resulting subsidence may be only 10-50% of the maximum possible value. However, this is a 'danger zone' for subsidence prediction, since a small

Supercritical Panels
• 0
Subcritical
0 20 40 60%
GEOLOGICAL FACTORS INFLUENCING LONGWALL-INDUCED SUBSIDENCE 259
increase in W/H above about 0.6, or the thinning of a bridging conglomerate, can cause subsidence to increase greatly. Subsidence mechanisms in this situation are poorly understood, but vertical movement is probably controlled partly by the elastic properties of the overburden, partly by its fracturing behaviour and, perhaps most of all, by the stiffness of the coal pillars.
A comprehensive account of subsidence mechanisms in the Sydney Basin, emphasizing subcritical panel and pillar mining in the southern part of the Newcastle Coalfield, is given by Galvin (1987a and b, 1988). Kapp (1985) summarises the results of earlier longwall mining further north on this coalfield, while Holla and Hughson (1987) describe one of the few examples of supercritical longwall extraction in the Newcastle region (Ellalong Colliery, panels LW1-3).
GEOLOGICAL FACTORS
Lithology
The effects of overburden lithology on subsidence behaviour are generally discussed in terms of the proportion of 'massive' strata occurring within this sequence. Typical subsidence parameters for predomi-nantly massive and thin-bedded overburdens are compared on Table 1. For the purposes of this paper, massive strata are assumed to be more than 2m thick. They may nonetheless be 30-60 m thick, and even up to 100 m in a single layer (Kapp, 1985). The most common massive lithologies are sandstone and conglomerate in the Sydney Basin, but elsewhere limestone (in the USA and England) and thick dolerite sills (in South Africa and Tasmania) have similar effects on subsidence. These effects are: • To reduce the subsidence factor (the ratio of the
surface subsidence to the seam working height). In the Sydney Basin this results in vertical movement being 30% to 60% of the thickness mined (Holla, 1986), compared to 45% to 90% above UK longwall panels (Whittaker and Breeds, 1977).
• To reduce the limit angle, and thus increase the maximum tilt and maximum tensile strain above the panel edges and faceline.
• To produce `hangups' (wide roof spans) behind the advancing longwall face, cyclic (intermittent) caving, periodic weighting on supports, and 'roof bumps' (small—magnitude seismic events due to strain energy release from roof beam tensile failures).
The effects of massive overburden layers on subsidence above sixteen Appalachian longwalls were studied by Tandanand and Powell (1982), and a relationship between these beds and the subsidence factor was suggested (see Figure 2). Whittaker and Breeds (1977) on the other hand found that overburden lithology had little effect on the measured limit angle and subsidence factor in the UK, but that massive Bunter Sandstone (similar to the Hawkesbury Sandstone) gave rise to large and irregular tensile strains.
Table 1 Typical subsidence parameters in relation to lithology.
Predominantly massive
overburden
Predominantly thin-bedded overburden
Overall subsidence factor, at super-critical width
50-60% He Up to 90% He
Limit angle, to 12° 30° 50 mm subsidence
Break angle 50-60° 70-80°
Bulking factor, in caved zone
1.30-1.50 1.20-1.30
Bulking factor, in fractured zone
1.05-1.10 1.05
Caved zone height 1-2He 3-5H,
NOTE: He = height of extraction, or seam working height.
0 . 8
0.6
Su
bsid
en
ce F
acto
r
0.4
0.2
Percentage Massive Beds
Figure 2 Relationship between subsidence factor (= working height /surface subsidence) and proportion of beds thicker than 2 m in the overburden, according to Tandanand and Powell (1982). Note the much reduced subsidence factors for subcritical extraction widths.
Australian experience of deep longwall mining beneath massive sandstone is of very low subsidence factors (30% of extracted thickness at Appin Colliery

/NCB (UK) Curve
Subcritical Supercritical Extraction
Southern Coalfield
Newcastle Coalfield
o 0.6 c.)
LL
60
Subsidence
Cha
nn
el
Thic
kn
ess (m
)
Channel Thickness
20
40-
20-
260 G. H. McNALLY ET AL.
0.8
0.2
0.5 1.0 1.5 2.0 2.5
Width/depth (W/H)
Figure 3 Subsidence development curves compared for UK and Sydney Basin longwall mines. British data from the National Coal Board (1975); Australian curves from Holla (1985, 1986 and 1987).
Panel Retreat 1100m
Figure 4 Subsidence retarded by a thick channel sandstone in the roof strata of Newstan Colliery panel LW8. Section along the centreline, direction of retreat from left to right.
and 26% at Ellalong, for example) and very small maximum tensile and compressive strains (0.5 and 1.2 mm/m), compared with those predicted for similar UK mining geometries (Kapp, 1982a). These very thick and strong overburden units are such that supercritical extraction widths can only be achieved after several adjacent longwall panels have been mined out.
Nevertheless, there are significant differences in caving behaviour between the Southern and Newcastle Coalfields. Chief among these is that rapid subsidence in the Newcastle Coalfield does not begin until a W/H of about 0.6 is exceeded (Figure 3), whereas the equivalent width to depth ratio in the south is only 0.3.
Clearly, the conglomerate bodies within the Newcastle Coal Measures are more effective at bridging across goafs than the sandstone formations overlying the Illawarra Coal Measures, though there is no great difference between the intact UCS values for the two groups of rocks. The bridging effects of a massive sandstone above panel LW8 at Newstan Colliery are illustrated on Figure 4. This shows subsidence decreasing to about one-tenth of its maximum value as the face passes beneath the thickest portion of a channel sandstone. One important difference between the two coalfields, however, is the depth of cover — generally less than 200 m in the Newcastle field, 200-500 m in the south. As pointed out by Galvin (1987b), this causes much greater elastic deformation of the bridging strata (ie, more sag) at great depth, even at the same W/H ratio. Furthermore, the Bulli Coal (UCS 15-20 MPa) is also much less stiff than the Great Northern (UCS 30 Mpa) and Fassifern (UCS 40 MPa) seams. It appears likely, therefore, that future subsidence profiles above deeper panels in the Newcastle seams will more closely resemble those from mines in the Southern Coalfield.
In contrast, caving of thinly bedded overburden produces small, slabby fragments which accumulate in a loose heap at their angle of rest (40° to 50°) on the floor of the mined-out seam. These fragments can rotate independently as they fall, so they pile up to create a goaf with much greater initial void space than that created by massive roof strata. Caving continues upwards at a steep break angle, typically 70-80°, until a stable arch forms, or until the goaf pile bulks

GEOLOGICAL FACTORS INFLUENCING LONGWALL-INDUCED SUBSIDENCE 261
sufficiently to support the sagging upper roof strata. The bulking factor for this type of overburden is believed to be initially 1.20 to 1.30, corresponding to caving heights of 3 to 5 times the extracted seam thicknesses. It does, however, diminishes upwards. Because of the high proportion of initial void space, such a goaf pile can undergo considerable compaction. Excavations through old goafs suggest that their porosity may diminish with time, from about 25% to perhaps 5-10%. This would imply not only void closure but also plastic deformation of the rock fragments themselves.
Other rock types that can influence subsidence behaviour are weak mudstones and claystones, which are highly deformable when dry and may swell on wetting. Claystone beds, largely composed of volcanic ash, occur widely as immediate roof and floor units in the Newcastle Coal Measures. These vary greatly in thickness and in geomechanical properties, ranging from a dense but expansive clay to a hard but exceptionally brittle rock. Their compressive strengths probably range between 2 MPa and 200 MPa, and their stiffnesses are even more variable, ranging from about 100 times to 1000 times their UCS value. Claystones are subject to pillar punching where present as immediate roof or floor strata (especially beneath the Great Northern Coal). They also cave readily as immediate roof units (the Awaba Tuff above the Fassifern seam, for example). Their strength and deformability both decrease with time, raising questions as to the long-term stability of coal pillars above or below claystone beds. Another characteristic relevant to subsidence is their impermeability — even a relatively thin soft claystone within the fractured zone is likely to prevent water movement downwards from the surface or from aquifers overlying caved panels.
Joints and fractures
Within the caved zone above total extraction panels, rock breakage has been observed to occur partly along joints and bedding, and partly through intact rock (that is, along natural and mining-induced fractures respectively). Higher still, in the fractured zone, it is postulated that most vertical and horizontal movement takes place along joints and bedding. Such breakage of intact rock as does occur in this zone results from crack extension between impersistent joints and edge damage to joint-bounded blocks.
Hence the geomechanical properties controlling subsidence behaviour are largely those of the overbur-den rock mass, rather than those of its intact rock. Empirical methods of prediction simply average out these properties for the overburden in a particular coalfield, but numerical modelling techniques — especially discrete element (or 'blocky') models — may require that they be specified as part of the model input data. Depending on the type of model, the discontinuity properties required include shear strength and deforma-bility (stiffness), joint spacing, set orientation and so on.
The shearing resistance of joints is expressed in terms of effective angle of friction, which is governed by
small scale roughness and large scale waviness, and also by cohesion. Frictional resistance is scale-dependent; the angle diminishes with the length of the joint, as roughness becomes less significant, from about 350 down to 250. Joint cohesion is normally assumed to be zero, because it cannot easily be measured. This is a conservative assumption, but one which errs on the side of safety.
Most of the required joint information is unmeasurable, or at best can only be extrapolated from tests on small samples. Where parameters — such as joint persistence — might be measurable, little . systematic research has been carried out. However, observations on cliff faces in the Sydney Basin suggest a number of empirical 'joint rules' such that: • Joint spacing is roughly proportional to bed
thickness, with the widest-spaced joints (30 m or more apart) occurring in massive sandstone and conglomerate bodies. Joints commonly occur in clusters from the same set, with wide gaps between clusters. In these situations the average joint spacing tends to understate the most common block sizes.
• The great majority of joints are vertical or near-vertical, and occur in well-defined sets with one dominant orientation (which is often, unsurprisingly, parallel to the regional trend for faults and dykes). The secondary set tends to be more or less perpendicular (orthogonal) to this and less persistent.
• The primary and secondary joint directions are reflected in the coal cleat direction (as face cleat and butt cleat respectively). The orientations of the main joint trends do not appear to vary much between the different overburden strata, but their intensity — the joint area per unit volume — does vary. Finer-grained rocks, being more closely-jointed, have much more joint surface area per cubic metre than sandstones or conglomerates (hence they fragment more thoroughly during caving).
• Joints below the base of weathering tend to be wider spaced, more persistent and rougher. They may or may not be tighter, but they are usually cleaner and therefore more permeable (at least in the loosened zone immediately below the base of weathering).
• Joints (particularly wide-spaced master joints) tend to have a vertical persistence roughly equal to bed thickness, but to be laterally offset between beds. This creates a large-scale 'brick wall' effect, but with the dimensions of the 'bricks' being proportional to bed thickness.
• The horizontal persistence of joints is even more difficult to estimate than their vertical extent. It could be up to 100 m in the case of single master joints in massive sandstone, and several hundred metres where closely spaced joints form en-echelon clusters. Even in shale units, joint traces 10-20 m long can sometimes be seen.
Subsidence cracks are usually the surface expression of dilated overburden joints. Above longwall panels these fractures typically open by up to 10 or 20 mm during the tensile phase of the subsidence wave, and close again during compression. Where the panel is laid

262 G. H. McNALLY ET AL.
.4
11
CHAIN PILLARS
LONGWALL 4
.-----%-.
t
\\
1 4V RII) 1 •
,-- •
_
CHAIN PILLARS
LONGWALL 3 -, ‘
Figure 5 Chain-link pattern of curved subsidence fractures above Cook Colliery longwall panel LW4. From Willey et al., 1993).
out parallel to the main joint direction, tensile strains and dilation may increase vertical movement at subcritical W/H ratios. In other words, closely-spaced joints facilitate subsidence (Creech, 1995) and increase the subsidence ratio.
Much wider cracks form above the goaf edge of shallow panels and these may remain open long after mining has ceased. Spectacular open fissures up to 200 mm wide, 10 m deep and 300 m long have been observed where tensile strains have been intensified by very shallow (10-20 m) mining, or by mining beneath steep topography (see below, and also Dunrud 1976, 1984; Kapp, 1982b).
Surface crack propagation above longwall panels appears to make use of existing joints where these occur within plus or minus 30° of the face or rib alignment. These cracks often step from one favourably-oriented joint to the next (Dunrud, 1984). Curved fractures are common above panel corners. At Cook Colliery Qld, for example, a chain-link pattern of circular fractures was observed at 50-100 m intervals (Willey et al., 1993, and Figure 5). These fractures corresponded to sites of cyclic caving in a massive sandstone, and to 0.2-0.4 m amplitude humps in the subsidence profile. In this case, however, the fracture pattern is thought to indicate breakage primarily through intact rock rather than along joints.
There is some evidence (as, for example, above Baal Bone Colliery NSW) that intact rock breakage is prevalent in massive but weak overburden. In harder rock masses joint extension is the rule, but where new fractures are generated in relatively strong and massive
strata, such as the Newcastle conglomerates, consider-able strain energy will be released. Should such breakage occur close to the surface, building damage may result.
Willey et al. (1993) also report regular linear humps, typically 50-100 mm high and up to several hundred metres in length, crossing subsidence profiles on level ground. Some of these humps correspond to the posi-tions of chain pillars, faults and dykes, but most cannot be related to any geological or mining structure. They are conspicuous above thick Hawkesbury Sandstone overburden at Appin and Tahmoor Collieries. Their regular spacing suggests that they may be caused by compressive strain concentrations over widely-spaced master joints.
Bedding
The geomechanical properties of bedding planes differ from those of joints in being more persistent, much stronger and stiffer. Exceptions to this generalisation occur where coaly, micaceous or graphitic partings occur along bedding surfaces. Bedding plane shears (horizontal faults) of low strength and stiffness also occur within coal measures rocks, but are rarely recognisable as such except where they offset vertical dykes.
Subsurface horizontal crack development appears to exploit block shearing along bedding planes, but this is generally only obvious when surface boreholes close off or their steel casing is bent. Large-diameter water wells

GEOLOGICAL FACTORS INFLUENCING LONGWALL-INDUCED SUBSIDENCE 263
and shafts are less affected than slimholes, with horizontal displacements being in the order of 50 mm. Bedding plane shearing at Cook Colliery occurred at vertical intervals of 5-40 m within the overburden and up to 20 m ahead of a longwall face (Willey et al., 1993). This horizontal movement was recognisable because extensometer anchors were cut off and caliper logs recorded indicated partial borehole closures of about 50 mm. Similar shearing was observed at Angus Place, Wyee Colliery and the former Ulan No. 2 Colliery. In most cases the amount of translation at depth can only be guessed at, but is most prevalent along coal/rock interfaces.
Faults and dykes
In contrast to joints, faults and dykes are through-going discontinuities. Deep-seated movements can be transmitted to the surface along these planes, little dimi-nished by the dilational effects of joint block movement within the roof strata. This process often results in pronounced steps in the subsidence profile where there is little or no soil cover, or monocline-like mounds where thick soil drapes across the fault-line trace. Buildings located above faults are therefore especially vulnerable; unfortunately, the presence of the fault is usually unsuspected prior to the damage occurring.
The reason for this is that faults with throws greater than half the seam thickness would rarely be crossed by a longwall face. Instead, the supports would be dismantled and the panel re-started on the opposite side of the fault. Hence those faults which are mined through are relatively inconspicuous at seam level. Even where the presence of such a discontinuity is noted, it is difficult to predict where (and if) it will break surface, especially in the case of low angle thrust faults. Creech (1995) reports increased subsidence on the footwall side of a reverse fault dipping at 20°-25° at Teralba Colliery. The direction of mining was from the hanging wall side towards the footwall. The main risk of movement on major faults occurs when a panel is terminated close enough to the fault for the limit angle to intersect it, in which case stepping occurs.
The effects of faults on subsidence were investigated by Lee (1966), and have been reviewed by Hellewell (1988). While acknowledging the complexity of the process, these authors found that: • Stepping becomes more likely as the W/H ratio
increases, and where the fault is sub-parallel to the panel edge rather than to the faceline.
• Stepping is also more likely to develop with multi-seam mining, usually where an old goaf is under-mined and remobilised.
• The highest risk of stepping occurs over near-vertical normal faults; this risk is much reduced with low angle normal or reverse faults.
• The amount of vertical movement along the fault tends to be roughly the same across a panel, except at the edges where it reduces to zero.
• Very high strains and tilts are experienced at the ground surface in the vicinity of faults.
A case study of longwall extraction close to a major dyke has been reported by Holla and Thompson (1988). The first Fassifern seam longwall panel at Wyee State Mine produced abnormally high maximum tensile strains of 8.1 mm/m above the (northern) ribside closest — within about 50 m — to the dyke. Two years after mining, surface cracks here had opened to a maximum of 100 mm, and could be traced horizontally for about 200 m. No cracks were observed on the southern panel side opposite the dyke, adjacent to the second longwall panel, and it is assumed that these closed up during a compressive phase. In another instance, a dyke between longwall panels at Ellalong Colliery NSW, reduced maximum subsidence from 0.9 m to 0.6 m (that is, from supercritical to subcritical) and left a 0.3 m high linear hump between the panels (Willey, 1992).
Soils and surficial deposits
The influence of soil type and thickness on surface subsidence has received little comment in technical papers. Much of this has been concerned with pseudo-subsidence effects due to soil shrinkage, swelling and downslope creep. However, it appears that: • Soil cover has little effect on the amount of vertical
movement on level terrain, but may distort both vertical and horizontal displacements on steep slopes.
• Thick soil cover can greatly reduce surface strains on level ground, particularly maximum tensile strains.
• Saturated granular alluvium overlying coal measures overburden can cause the subsidence trough to spread widely, increasing the limit angle but decreasing strain and tilt.
• Dewatering effects due to bedrock cracking may cause swampy ground to drain (at least temporarily) and induce shrinkage of peat deposits.
In addition, the adhesion properties of the surface soil determine the extent to which ground strains are transformed into structural strains within overlying buildings (structural strains would normally be less than ground strains). Peak shearing resistance along the soil/ foundation interface is only generated after 15-40 mm of ground displacement (Geddes, 1977). Shorter peak displacements are characteristic of clay soils. Sand foundation layers are therefore preferred for reducing strain transfer, since the amount of horizontal move-ment experienced may be less than that required to mobilise peak shearing resistance along the soil! foundation interface.
Large magnitude surface strains in extremely weathered shale saprolite in the former Liddell State Mine have been described by McNally (1991). Maximum tensile strains of +30 mm/m produced transient cracks up to 200 mm wide, which largely closed up during the compression phase. However, such large strains in soil-like materials are atypical. They were caused by a high working face (3.1 m) at shallow depth (80 m), and were exacerbated by a ridge top monitoring site. Compressive strains large enough to generate ground heave of about 0.8 m in highly

• • Chain pillar
• k
\
264 G. H. McNALLY ET AL.
Goaf
LONGWALL 4 Retreat
() c0
0 20
Strain mm/m
Figure 6 'Flowage' pattern of surface movement above one corner of the LW4 goaf at Liddell Colliery, as indicated by strain vectors. These strains are predominantly tensile (indicated by barbs), but become compressive in the lower right of the monitoring grid. The size of the grid is about 130m x 60m. From Willey et al., 1993.
weathered shale were observed near the western portal of the Tickhole railway tunnel (Newcastle) above shallow abandoned bord-and-pillar workings (Dr D. F. Branagan, pers. comm.)
The effect of longwall undermining of unconsolidated and saturated alluvial soils has been reported by Whittaker and Reddish (1989) for the River Trent in the UK, and by Kapp (1985) for the vicinity of the now-defunct John Darling Colliery near Newcastle. In both cases the limit angle was increased, to 45° and 50° respectively, apparently due to lateral flow of the soft sediments. Reduced vertical movement at the centre of the trough, and diminished surface strains and tilt, were also noted.
The regolith above Sydney Basin coal measures rocks typically consists of a relatively thin residual soil developed on deeply weathered (10-30 m) sandstone
and shale. On steeper slopes this is mantled by a bouldery clay talus. Across plateau surfaces where the residual soil is thin, or where bare sandstone outcrops, subsidence effects are concentrated along widely spaced joints. Where the soil is thick these strains are much reduced. This is due to the much greater deformability of soil materials compared with even very weak rock, which allows mining-induced strains to dissipate rather than concentrate along discontinuities.
Finally, earth embankments may be weakened by subsidence, either through cyclic loading due to dis-continuous caving, or because of differential settlement. One consequence of this is the creation of small subgrade cracks and cavities (0.1-0.2 m across) beneath stiffer bridging pavement courses, followed later by collapse and stepping of the road surfaces. The problem is caused by internal erosion of poorly compacted subgrades by piping of surface runoff through pavement cracks. Many sinkholes above shallow abandoned workings in the Newcastle area have a similar origin; dispersive B-horizon clays in residual soil profiles are eroded by infiltration, and eventually collapse.
Topography
It was formerly assumed when using empirical subsidence prediction techniques that ground slope has little or no effect on the result. In flat or undulating terrain this is the case, but in high relief areas (such as the southern and western parts of the Sydney Basin) topography may severely modify the subsidence profile. Mines in these areas are commonly worked beneath steeply dissected plateaus, so that depth of cover is variable and downslope movements are superimposed on vertical and horizontal displacements. On slopes steeper than about 20° the horizontal component often exceeds the vertical, while gaping fractures up to one metre wide may open up on very steep slopes (generally close to panel edges, and on their upslope side).
It is now apparent that overburden rock masses which have been fractured and loosened by mining-induced caving not only subside, but also 'flow' as a highly-viscous mass towards low ground — be it the seam void behind the face (Figure 6), or an adjacent cliff or gully. This has been demonstrated many times since it became easier to monitor ground movement in three dimensions using EDM theodolites. Previously, pegs on subsi-dence survey lines would have only been levelled. Furthermore, steep and heavily-vegetated slopes where deformations are greatest can also now be surveyed more easily.
In fact some degree of horizontal movement appears to be the rule rather than the exception. Even on relatively flat ground, it is common for the point of maximum subsidence to be offset from the panel centreline. At Liddell State Mine this flowage was towards the adjacent open cut highwall, while at other minesites (Cook Colliery, for example) it has been observed moving towards the previous panel goaf. These lateral movements are typically only 50-100 mm, though over 2 m has been measured on very steep

Panel Advance.-
20
Ext
en
sio
n
0 mm/m
20
Co
ntr
ac
tion
GEOLOGICAL FACTORS INFLUENCING LONGWALL-INDUCED SUBSIDENCE 265
slopes in the US. The movement may be reversed as the ground surface passes from the tensile to the com-pressive phase. Part-rotation of survey pegs and U-turns are common at panel corners.
The effects of topography on subsidence can be summarised as follows: • Although vertical movement is affected (ridgelines
subside more than gullies), the increases in ground strains and horizontal movement are much greater and much more damaging.
• An asymmetrical subsidence profile develops, with the point of maximum subsidence and maximum compressive strain displaced downhill. The broader upslope tensile zone causes joints to open, and their aperture may be increased by downslope creep.
• Slopes mantled by colluvial soils may be further weakened by mining-induced cracks and by ingress of surface water.
• Vertically-jointed rock faces may be subjected to toppling failure where tensile stresses generated by undermining cause rock bridges to break and fractures to extend.
In the Sydney Basin the most conspicuous subsidence features associated with steep topography are a number of major rock falls, which have occurred along sandstone clifflines on the Western and Southern Coalfields (Pells et al., 1987). The largest of these, at Nattai North Colliery, is 800 m long and about 14 million cubic metres of sandstone escarpment appear to have slipped over a period of more than 20 years. Behind other cliffs large tension cracks have opened along joints without resulting in major rockfalls. One of these, at Kemira Colliery, was about 300 m long and horizontally stepped in places along orthogonal joints; its maximum width was 600 mm and depth about 9 m (Kapp, 1973, 1982b).
A major study of subsidence-induced cliff falls above longwall panels at Baal Bone Colliery on the Western Coalfield has been summarised by Kay and Carter (1992). In all, 67 falls were investigated, representing about 16% of the 3.8 km length of sandstone cliffline undermined. The cliffs are 5-60 m high, about 200 m above the mine workings and sub-parallel to the face line. Although there was no factor common to all falls, they tended to occur where horizontal displacements were greatest and at about 0.2 to 0.5 times cover depth behind the face. Unlike other reported subsidence-induced rockfalls, failure generally took place through the intact rock rather than along pre-mining joints, and was parallel to the panel edges. One possible reason for this anomalous behaviour is that the cliff-forming Banks Wall Sandstone at Baal Bone is distinctly weaker than other Sydney Basin sandstones.
A study of longwall mining at York Canyon Mine, New Mexico, by staff from the Colorado School of Mines (CSM, 1981; Gentry and Abel, 1978) provides another well-documented case history of the effects of surface topography on subsidence. Some of these effects are illustrated by Figure 7, which is based on data from York Canyon. This investigation demonstrated that:
• Vertical movements were up to one-third larger beneath hilltops than under adjacent valleys (where the depths of cover were about 125 m and 75 m respectively). The reason for this appears to be that joint blocks and the overlying regolith 'piled up' in the lower ground.
• Horizontal movements were up to 2.4 m more than the vertical movement at stations on the steepest slopes (30° or 1V: 1.7H), and were were greatest in the direction of face advance. The maximum movement on reverse slopes (ie, those inclined away from the face advance direction) was only about one-quarter of that on forward slopes.
• Tensile strains at points along the centreline remote from the panel edges (i.e., outside the usual ribside tensile zone) were up +35 mm/m, while compressive strains ranged up to -34 mm/m beneath adjacent valley floors. In other words, tensile strains were concentrated along ridge lines perpendicular to the panel centre line, while overburden tended to bulge up in gullies.
The development of compression bulges in gullies above longwall panels at Appin and Tahmoor Collieries has been reported by Willey et al. (1993). At Appin, shearing and crushing of sandstone beds was also observed. Another interesting example of surface compression on almost level ground occurred above LW3 panel at Wyee State Mine in 1988. Here a conveyor located close to the centreline was compressed by about lm in each of several 30 m bay lengths. However, the most spectacular example of mining-induced compression damage in Australia to date was probably the failure of the Stanwell Park railway viaduct in 1985 (Hilleard, 1988; 1993). Although this brick structure was was located outside the then-accepted angle of draw from Bulli Coal workings, situated about 150 m below and 130 m distant from the viaduct footings, it underwent about 0.2 m of shortening
LW
Figure 7 Effect of topography on subsidence parameters along a panel centreline at York Canyon Mine, Colorado. Horizontal scale equals vertical in topographic section. Note that only a small proportion of the vertical and horizontal movements (arrowed) are shown for the sake of clarity, but these are typical.

266 G. H. McNALLY ET AL.
(equivalent to a compressive strain of -1.6 mm/m). This was sufficient to cause shear failure of the central arch, which had to be replaced. It appears that lateral stresses at foundation level were greatly magnified by the steep V-shaped gorge of Stanwell Creek and by the presence of at least one fault.
CONCLUSIONS
The influence of geology on mining-induced subsidence in Australian coal basins is at present poorly known, and is complicated by the effects of shallow mining, partial extraction and uneven surface topography. However, a number of conclusions may be drawn:
(1) The main geological factor influencing surface movements due to coal extraction is the proportion of massive sandstone and conglomerate beds present in the overburden. These dominate the Sydney Basin overburden sequence and limit subsidence to 30% to 60% of the seam's worked height. They also transfer abutment loads to permanent pillars, reduce the angle of draw, and may concentrate ground strains along a few widely spaced joints. In subcritical and partial extraction layouts, esfiecially those shallower than 200 m, the bridging effect of these massive strata greatly reduces surface subsidence and strains.
(2) Subsidence prediction at high subcritical W/H ratios, say 0.6 to 0.8, is especially difficult where this bridging occurs. Vertical movement may be reduced by 90% where a thick channel sandstone or conglomerate is present in the roof strata, but may rapidly increase as the massive stratum thins and/or the extraction width increases.
(3) Shale, mudstone, siltstone and claystone are less prevalent in Sydney Basin roof strata than they are in the UK and Bowen Basin coal measures. Hence caving and surface subsidence mechanisms differ from those on which British empirical subsidence prediction methods are based. However the distinction between subcritical and supercritical extraction is still valid, and the transition between the two takes place at a width to depth (W/H) ratio of about 1.4. Australian mining depths are in general shallower than in the UK, and up until recently supercritical extraction widths and multi-seam mining were less common, though this is changing.
(4) At relatively shallow mining depths the stiffness of the pillar coal, and of the immediate roof and floor, has a substantial influence on subsidence, and may be the most important factor in partial extraction panels. Punching of stiff pillars into soft, wet claystone floors becomes more likely as the width of partial extraction areas expands under stiff sandstone and conglomerate roofs.
(5) High tensile strains, linear compression mounds, stepped subsidence and steep ground tilts are associated with longwall mining through, or close to, faults and dykes. Faults and dykes may also provide conduits for gas, surface waters and groundwater to enter mine workings. Widely spaced master joints cause similar effects, though of lesser magnitude, while closely
spaced joints may increase vertical movement. (6) Large tensile strains are developed along ridge
lines, behind cliff faces and on steep slopes, particularly where the slope faces in the direction of panel advance. High compressive strains and reduced vertical movement are experienced in adjacent valley floors, due to large horizontal displacements and the 'piling-up' effect of regolith.
(7) Thick residual soils and weathering profiles appear to have little effect on vertical movement due to longwall mining, but may cause ground strains to be diminished. Soft and/or saturated soils extend the subsidence trough laterally, reducing surface strain and maximum subsidence but greatly increasing the limit angle.
(8) The effects of topography on subsidence parameters can be severe, but have not in the past been given sufficient consideration. This has been remedied as three-dimensional survey monitoring has sup-plemented levelling. It is now apparent that horizontal movements can exceed vertical movements on moderate slopes, and that very large ground strains can occur on slopes steeper than about 30°. Pronounced asymmetry is common in cross-panel subsidence profiles, and horizontal movement vectors reveal a definite tendency for overburden 'flow' towards lower or less confmed ground.
REFERENCES
COLORADO SCHOOL OF MINES 1981. Rock mechanics instrumentation program for longwall supports at York Canyon Mine, New Mexico. US Dept of Energy, Report No.DOE/ ET/ 12530-1, May.
CREECH M. 1995. A review of subsidence data from the Newcastle coalfield and a new subsidence prediction method. Proceedings of the 3rd Conference on Buildings and Structures Subject to Ground Movements, Newcastle. IE Aust/MSTS, 199-208.
DUNRUD C. R. 1976. Some engineering geological factors controlling coal mining subsidence in Utah and Colorado. US Geological Survey, Professional Paper 969.
DUNRUD C. R. 1984. Coal mine subsidence— western United States. In Reviews in engineering geology, volume VI. Geological Society of America, 151-194.
EDWARDS J. L. and others 1993a. Mine design considerations for surface subsidence control. Proceedings of the 12th International Conference on Ground Control in Mining, Morgantown WV, USA, 385-396.
EDWARDS J. L. and others 1993b. Optimal mine design to accomodate surface subsidence restrictions. NERDDP End of project report No 1311.
FARMER I. W. 1986. Coal mine structures. Chapman and Hall, London.
FORSTER I. & ENEVER J. 1992. Hydrogeological response of overburden strata to underground mining, central coast NSW. NSW Office of Energy.
GALVIN J. M. 1987a. Surface subsidence mechanisms — theory and practice. Part I — Theory. The Coal Journal 16.
GALVIN J. M. 1987b. Surface subsidence mechanisms — theory and practice. Part II— Subsidence mechanisms in practice. The Coal Journal 17.
GALVIN J. M. 1988. Surface subsidence mechanisms —

GEOLOGICAL FACTORS INFLUENCING LONGWALL-INDUCED SUBSIDENCE 267
theory and practice, Part III - Mine design for stability and subsidence control. The Coal Journal 19.
GEDDES J. D. 1977. The effect of horizontal ground movements on structures. In Geddes J. D. ed. Large ground movements and structures. Cardiff, July 1977, Pentech Press.
GENTRY D. W. & ABEL J.F. 1978. Rock mass response to mining longwall panel 4N, York Canyon Mine. Mining Engineering (SME) 30 (3), March, 273-280.
HELLEWELL E. G. 1988. The influence of faulting on ground movement due to coalmining. The Mining Engineer 316, 334-337.
HILLEARD P. R. 1988. Damage to the Stanwell Park railway viaduct. Proceedings of the Conference on Buildings and Structures Subject to Mine Subsidence, Maitland. Institution of Engineers Australia, Newcastle Division.
HILLEARD P. R. 1993. Bedrock movements and the failure of the Stanwell Park railway viaduct. In McNally G. H., Knight M. and Smith R. eds. Collected case studies in engineering geology, hydrogeology and environmental geology, second series. EEHSG/ Geological Society of Australia-and-Butterfly-Books, 1-27.
HOLLA L. 1985. Surface subsidence prediction in the Southern Coalfield. NSW Dept. of Mineral Resources.
HOLLA L. 1986. Evaluation of the surface subsidence characteristics in the Newcastle Coalfield of NSW. The Coal Journal 11, 11-22.
HOLLA L. 1987. Surface subsidence prediction in the Newcastle Coalfield. NSW Dept. of Mineral Resources.
HOLLA L. 1991. Surface subsidence prediction in the Western Coalfield. NSW Dept. of Mineral Resources.
HOLLA L. & ARMSTRONG M. 1986. Measurement of sub-surface movement by multi-wire borehole instrumentation. Proceedings Australasian IMM 291, 65-72.
HOLLA L. & HUGHSON, R. 1987. Strata movements associated with longwall mining. Proceedings of the 6th Australian Tunnelling Conference, Melbourne, Australasian Institute of Mining & Metallurgy, 211-216.
HOLLA L. & THOMPSON K. J. 1988. Ground movement in multi-seam mining. Transactions Institution of Engineers Australia CE 30 (5), 299-305.
KAPP W. A. 1973. Subsidence, Kemira Colliery NSW. Subsidence in Mines Symposium, Australasian Institute of Mining & Metallurgy Illawarra Branch, Wollongong. AusIMM Symposium Series No. 2.
ICAPP W. A. 1982a. Subsidence from deep longwall mining of coal overlain by massive sandstone. Proceedings Australasian IMM 281, 23-36.
KAPP W. A. 1982b. A review of subsidence experience in the Southern Coalfield of New South Wales. In Chugh Y. P. and Karmis M. eds. State of the art of ground control in
longwall mining and mining subsidence. SME of AIME, New York, 167-182.
KAPP W. A. 1985. Mine subsidence in the Newcastle district, New South Wales. Transactions Institution of Engineers Australia CE27 (4), 331-340.
KAY D. & CARTER J. P. 1992. Effects of subsidence on steep topography and clifflines. Proceedings of the I 1 th International Conference on Ground Control in Mining, Wollongong NSW, 483-490.
LEE A. J. 1966. The effect of faulting on mining subsidence. The Mining Engineer 71, 735-743.
MCNALLY G. H. 1991. Surface strain monitoring above subsiding longwall panels at Wyee and Liddell State Mines NSW. Proceedings of the 2nd Conference on Buildings and Structures Subject to Mine Subsidence, Maitland. Institution of Engineers Australia/ MSTS, 196-207.
NATIONAL COAL BOARD 1975. Subsidence engineers handbook (second edition). NCB, London.
PELLS P. J. N. 1991. A note on escarpment instability associated with mining subsidence. Proceedings of the 2nd
Conference on Buildings and-Structures Subject to Mine Subsidence, Maitland. Institution of Engineers Australia/ MSTS, 66-73.
PELLS P. J. N. and others 1987. Cliffline collapse associated with mining activities. In Walker B. F. and Fell R. eds. Slope instability and stabilization. Balkema, Rotterdam, 359-385.
TANDANAND S. & POWELL L. R. 1982. Consideration of overburden lithology for subsidence prediction. US Bureau of Mines Report of Investigations RI 8630.
TRAVES D. M. & ICnvG D. eds 1975. Economic geology of Australia and Papua New Guinea - Coal. Australasian IMM Monograph No. 6.
WHIaltLD L. M. 1984. Ground movements from coal extraction in the vicinity of dams in NSW. In Geddes J. D. ed. Ground movements and structures. Cardiff, July 1984, Pentech Press.
WHITTAKER B. N. & BREEDS C. D. 1977. The influence of surface geology on the character of mining subsidence. Geotechnics of structurally complex formations AGI-IAEG Capri, 1977,459-468.
WHITTAKER B. N. & REDDISH D. J. 1989. Subsidence - occurrence, prediction and control. Elsevier, Amsterdam.
WILLEY P. L. 1992. Geological aspects of mining-induced subsidence. Abstracts, SUCOGG Symposium on Engineering and Environmental Geology, University of New Slouth Wales, Dept of Applied Geology, November.
WILLEY P. L. and others 1993. Improved methods of subsidence engineering. NERDDP End of project report No 1311, ACIRL North Ryde NSW.

I4

Symposium on Geology in Longwall Mining, 12-13 November 1996, eds G. H. McNally and C. R. Ward, pp 269-272.
A review of the hydrogeological aspects of Australian longwalls
ROSS SEEDSMAN
Coffey andPartners International Pty Limited, Unanderra NSW.
This paper presents a review of hydrogeological issues related to Australian longwalls. The paper draws on recent experience in consulting and research projects conducted in both New South Wales and Queensland. It is not intended to be a comprehensive review, but aims to present a number of issues that have recently impacted on Australian longwall mines. Water inflows from the coal seam, the overburden, and from geological structures are discussed, along with the important issue of in-mine management of water.
INTRODUCTION
Production and environmental impacts
The presence of excess or unexpected water in an underground coal mine can have a major impact on longwall productivity. For example, in early 1996, one longwall mine in Central Queensland lost over two months' production due to inundation of its face equipment as a result of a tropical rain storm that passed overhead. A more insidious effect may be found in lost production due to poor trafficability of wet roads: low morale, slow travelling speeds, lost-time injuries.
There is a large amount of literature presenting case studies on inrushes. The industry's understanding of such risks is well demonstrated in the mining regulations that require barriers greater than 45 m in thickness between roadways and any known body of water. For lesser inflows, there appears to be an acceptance in many mines that water is a fact of life in mining, and that it does not warrant management attention. This paper suggests that a more sophisticated approach to water management is required to support the drive to ever higher production rates.
Some longwall mines face less than optimum reserve recovery through the need to adopt very conservative layouts under stored waters. In the Newcastle Coal Measures these requirements are based on the prevention of inrushes of water from Lake Macquarie and/or the Pacific Ocean. In the Southern Coalfield the issue is related to the integrity of the water supply reservoirs of Sydney Water.
Typical hydrogeological conditions
In common with other rock masses, water flow in coal measure rocks is dominantly via defects — cleats, joints, bedding, faults. Typically, in the Permian coal measures of New South Wales and Queensland, the coal seams are the major aquifers. Hydraulic conductivities for coal are in the range of 1 m/ day, with specific yields of about 2%, and elastic storage of 0.0002. The actual values depend on the nature of
cleating and also the in-situ stress conditions. Fine grained units (mudstones, shales) are aquicludes. The Tertiary sequence in the Bowen Basin contains sandstone/conglomerate units and vesicular basalts, both of which are aquifers. The hydrogeological conditions that faced the underground mines in the Collie coalfield (Western Australia) are dissimilar to those seen on the east coast.
INFLOWS FROM THE COAL SEAM
Coal seams are typically the major aquifers in the coal measure sequence, and hence underground coal mining should be anticipated to be wet to some degree. However, many mines do not report a problem with water; in fact many mines are nett consumers of water. This apparent contradiction is perhaps related to the major source of water within the coal being release from storage. The implications of this are that shadowing effects are present; the first roadways driven into virgin coal are wetter than subsequent roadways. Similarly the first panels are wetter than subsequent panels. Thicker coal seams typically result in greater inflows.
Supporting evidence for this comes from the reports of water conditions in new longwall mines. For example, several of the new Bowen Basin longwalls have been characterised by wetter mining conditions than associated with deeper mines in New South Wales. These reports are before longwall caving has occurred.
Depending on seam thickness and storativity, whole mine flows in excess of 25 to 30 1/s could be possible when developing a 2-3 km panel in virgin coal. Note that water is removed from a coal mine not only via the pumping network but also via the conveyor belts and the ventilation circuit.
INFLOWS FROM CAVING
Fracturing above longwall panels
In all but the extreme conditions of massive strata and

270 ROSS SEEDSMAN
narrow faces, longwall extraction results in the collapse of the overlying strata. Terminology is not precise, but four zones are typically identified:
• a chaotic caving zone where the strata are broken and disrupted (about five times the extraction thickness);
• a fractured zone where the horizontal layering of the strata is relatively intact, but vertical fracturing has developed and jointing has opened up (probably about 20 times the extraction thickness); • an elastic zone where the strata are intact but sag to
some minor degree over the panel, and • a surface zone which undergoes minor tensile
fracturing (less than 15 m thick).
The quoted thicknesses for the various zones are indicative only, and are site-specific. The relationships are empirical only, as the height of caving and fracturing are a function of the overburden lithologies as well as the void left by mining. Bai and Elsworth (1990) give some empirical relationships for the heights of caving and fracturing for strong, medium strong, weak and weathered weak strata.
From a hydrogeological viewpoint, it is the fracturing that is associated with the chaotic and fractured zones that controls mine inflows. Whittaker and Reddish (1989) have defmed two zones (Zones A & B) which have proved useful in understanding water inflows to longwall panels in the Bowen Basin. Zone A is that zone above the extracted longwall panel in which cracking is continuous, whilst Zone B is where there is discontinuous cracking. Whittaker and Reddish (1989) published a nomogram to predict the height of Zones A and B based on some physical models, while Colwell (1993) used surface drilling to calibrate Zone A for conditions at Oaky Creek No. 1 Colliery in the Bowen Basin.
The definition of the height of Zone B is consistent with the empirical knowledge implicit in the National Coal Board (NCB) direction regarding mining under the North Sea — 10 mm/m of strain at the rock head and the Wardell Guidelines requiring a minimum tensile strain of 7.5 mm/m beneath tidal waters.
The permeability of fractured strata should be anticipated to be orders of magnitude greater than that of the in-situ strata. Thus, if fracturing intersects aquifers, water will flow to the mine at a rate controlled by the hydraulic conductivity and storativity of the aquifer. It has been argued that claystone horizons between the workings and the aquifer or the surface may restrict inflows. Such a mechanism requires the claystones to be dispersion/ slake prone. There is no method to assess the minimum thickness of such claystone material.
The Whittaker and Reddish concepts have proved useful. However, there are limitations, especially given their use of predicted tensile strains in cases where Tertiary strata are present. There is no data base on strain prediction where there is a large thickness of sands/ gravels, massive basalts, and thick clay units, as will be the case in several of the new Bowen Basin longwalls. Even when such a data base is developed, there will be questions regarding the ability of the
unconformity to transfer stress. It may be that the unconformity will need to be taken as "rock head", as in the NCB direction.
Association with face falls
Numerous authors have reported that inflow events have been associated with severe face weightings (Xiao et al., 1991) The concept here is that bed separation develops ahead of mining, and this provides a temporary reservoir for water from adjacent aquifers. Caving/ goafing develops ahead of the face and taps into the reservoirs. It is assessed that the reported relationship between face loadings and water flows at Wistow Colliery (Bigby, 1988) is related to the intersection of overlying aquifers (see further discussion below).
Surface cracking
Little attention has been paid to the onset of surface cracking, which may impact on the local hydro-geological regime by increasing drainage rates to the groundwater table. The effect probably will be localised to areas where rock is exposed in the floor of ephemeral streams. If the surface cracks are deep enough, they may interact with pre-existing permeability zones and hence produce a major pathway for water. Surface cracking is well known in the shallow longwall mines of the Bowen Basin, where cracks in excess of 100 mm are often reported.
Surface cracking can be considered as tensile failure in response to the permanent and travelling subsidence fronts. Tensile failure strains are not well established for coal measure rocks, but are assessed to be in the range of 0.3%. Using the New South Wales empirical relationships as a guideline and recognising that the predicted strains are usually on a bay length of 20 to 40 m, such tensile strain values can be exceeded for longwall panels extracted at depths of up to 600 m.
The depth of surface cracking has not been studied in detail. Comments are made in the literature that surface cracking extends some 15m in depth. It is anticipated that the depth of the cracks is related to the crack width, and simple fracture mechanics concepts suggest that the crack depth is somewhere between 100 to 500 times the crack width.
In deeply dissected topography mine induced subsidence may induce localised shear fractures at the base of cliff lines as a result of the interaction of the subsidence with shallow horizontal stresses. Such a mechanism may also produce pathways for surface water to recharge the groundwater table.
INFLOW FROM STRUCTURES
Geological structures such as joints, dykes, and faults provide pre-existing pathways for water inflows to longwall mines. The pathways may have sufficient

HYDROGEOLOGICAL ASPECTS OF AUSTRALIAN LONGWALLS 271
hydraulic conductivity prior to mining, or they may have their hydraulic conductivity enhanced by the mining process.
Joints
Coffey Partners Pty Limited have developed a conceptual model to explain the continuing increase in pump-out volumes at one of the underground mines in the Western Coalfield, New South Wales. At this mine there has been an underlying increase in pumping requirements as the area of pillar extraction has increased, although the yearly figures show the impact of management procedures. Such a trend is not consistent with release of water from storage in aquifers. Coffey Partners have proposed that the very prominent joint sets that can be seen in surface imagery provide conduits for surface water to recharge aquifers intersected by caving.
The possible presence of open joints beneath an unconformity surface is one reason why an appropriate degree of conservativism should be applied when planning longwalls in such geological environments. In the Bowen Basin it may be necessary to locate shallow longwall panels at least 50 to 60 m distant from the mapped Tertiary unconformity surface, to limit possible water inflow rates. Such a distance should allow for errors in the definition of the unconformity, weathering below the unconformity, and the possibility of open joint zones.
Dykes and sffis
At a mine in the Southern Coalfield, dykes were identified as the source of nuisance water on roadways. In this case the goafs of the adjacent mine had been flooded and an appropriate barrier pillar left. However, the permeability and thickness of a dyke was sufficient to cause nuisance water to enter the mine. The roadways were developed on a coal floor, and poor attention to in-mine water management resulted in very poor trafficability (see further discussion below).
Dykes were also implicated in the water makes in Bulli and Wongawilli Colliery reported by Whitfield (1988). Klenowski and Phillips (1988) discuss water make from the Tieri Sill at Central Colliery, Queensland.
Faults
Examples of serious water inflows from faults have not been reported in the Australian industry in recent times. However, it is anticipated that increased flows will be routinely encountered during gateroad development.
IN-MINE WATER MANAGEMENT
Once a significant amount of water has entered a mine,
the management response needs to be twofold. Firstly, the water must be removed from the mine with or without temporary storage in goafs. Failure to do this adequately can lead, in extreme cases, to loss of production due to flooding of working areas. Secondly, and perhaps equally important, is the need to keep water off roadway pavements so that travelling speeds and comfort can be maintained.
In-mine storage
Depending on the volumes involved and assuming that the mine retreats up-dip, water can be stored, either temporarily or permanently, in goafs. It is important that monitoring of the stored volumes is possible if the goafs are to be used as emergency storage in case of flooding. The available volume within the seam horizon can be taken as 20 to 25% of the extraction thickness. Leakage of water under seals and via dykes or open joints should be anticipated.
Trafficability
The key to maintaining good trafficability in underground coal mines is to keep water off the roadway pavements. It is important to recognise that almost all sedimentary strata will give bad floors when water is present. This is because there are two mechanisms of breakdown involved (Logan and Seedsman, 1995). Firstly there is the softening of low strength material in water; the slake durability test is often used to identify these cases. Secondly, and perhaps more widespread, there is the failure of strong but bedded strata by a "pumping" mechanism, similar to the breakdown of concrete roadway pavements. In ACARP research conducted by Coffey Partners, bad floors were found in environments of wet coal, wet bedded strata, and wet slake-prone materials (i.e. all materials if and only if water is present). All materials gave good pavements when they were dry.
The general principle is to keep water off the critical roads. If this is not possible then water should be actively encouraged to drain away from the pavement by installing a cross fall to an engineered gutter/ drainage network and installing sub-floor drainage. When coal is present in the floor this can often give enough horizontal permeability to enable a small pump, installed in an auger hole at the rib, to drain the pavement subgrade. However, such pumps may serve no purpose if the permeability is low, and options of enhancing permeability may need to be considered.
REFERENCES
BAI M. & ELS WORTH D. 1990. Some aspects of mining under aquifers in China. Mining Science and Technology 10, 81-91.
BIGBY D.N., 1988. Surface monitoring of weighting conditions on United Kingdom longwall faces.
272 ROSS SEEDSMAN
COLWELL M. & HARMAN J. A., 1993. Water inflow investi-gation for a longwall operation. Recent Developments in Underground Coal Mining in the Bowen Basin. Australasian Institute of Mining and Metallurgy, Central Queensland Branch, Emerald.
KLENowsm G. & PHILLIPS R. N. 1988. Determination of groundwater inflow rates for longwall mining, German Creek, Bowen Basin, Queensland. Third International Mine Water Congress, Melbourne, October.
LOGAN A. S. & SEEDSMAN R. W. 1995. Construction and maintenance of underground mine roads. Underground Operators Conference, Kalgoorlie, 1995. Australasian
Institute of Mining and Metallurgy. WHITFIELD L. 1988. The effect of coal mining on the
hydrological regime of the Southern Coalfield New South Wales. 5th Australia-New Zealand Conference on Geomechanics, Sydney.
WiirrrAKER B. N. & REDDISH D. J. 1989. Subsidence Occurrence, Prediction, and Control. Developments in Geotechnical Engineering, Volume 56, Elsevier Science. 558 pp.
XiA0 G. C., IRviN R. A. & FARMER I. W. 1991. Water inflows into longwall workings in the proximity of aquifer rocks. Mining Engineer, July.

Symposium on Geology in Longwall Mining, 12-13 November 1996, eds G. H. McNally and C. R. Ward, pp 273-280.
Effect of mining on permeability of rock strata in the Southern Coalfield
PETER REID
NSW Dams Safety Committee.
The Lugeon test is commonly used for investigating the permeability of strata above mine workings in the Southern Coalfield of NSW. Although it does not provide an accurate measure of this parameter, the test is well suited to this area because the rocks are of low permeability and mining is deep. The results can be used to estimate the impact of mining-induced fracturing on overburden permeability. Results from 246 Lugeon tests in the coalfield have been tabulated to give an indication of the typical horizontal permeabilities of the major rock units. In addition, results from mined and unmined areas have been compared to illustrate the impact of mining on the overlying strata.
INTRODUCTION
There has been a conflict between underground coal mining and water supply land uses in the NSW Southern Coalfield for many years. The basis of this conflict has been the fear that mining beneath stored waters, especially total extraction methods, could lead to serious water losses and possible mine flooding as well. A major enquiry into the problem was chaired by Mr Justice Reynolds in 1974-77 (Reynolds, 1977). Since the early 1970s a number of groundwater investigations have been conducted, some of which were specifically designed to determine the effect of coal mining on the groundwater regime in the mine overburden layers.
The NSW Dams Safety Committee (DSC) has been involved in determining the extent and type of mining to be allowed adjacent to dams and their stored waters since 1978. During this time the DSC has undertaken groundwater investigations on its own, and has received data from investigations undertaken both by collieries and dam owners. A common tool used in these investigations is the Lugeon water pressure test, or packer test.
The purpose of this paper is to present some results of Lugeon tests undertaken in the Southern Coalfield. These indicate the typical range of permeability results from various rock units, and can be used to assess how mining has affected the permeability of the strata. The currently preferred DSC method of conducting and interpreting Lugeon tests is described in the Appendix.
THE LUGEON WATER TEST
The Lugeon test is a method of estimating the permeability of rock by pumping water under pressure into the walls of a vertical section within a borehole. A Lugeon unit (Lu) is defined as a water take of 1 litre per metre of borehole length per minute, at a pressure of
1,000 kPa. The test originated in the dam construction industry, where it is used to determine the extent of foundation grouting needed to reduce seepage beneath dams.
Estimates of rock mass permeability obtained from Lugeon tests are not accurate. The test only provides an indication of the permeability of a small volume of rock immediately adjacent to the borehole, and because of this the result are particularly sensitive to 'skin effects'. Positive or negative skin effects can result from the gouging action of drill bits or rods, or from residues of drilling fluid left on the wall of the borehole. In general these effects tend to reduce the water take by partially or completely sealing the borehole wall, but they can also increase the water take due to fracturing induced by drilling (Faust and Mercer, 1984).
Calculating permeabilities from measured water takes assumes that the test section is of uniform permeability and/ or is uniformly cracked, which are usually un-realistic assumptions. Permeabilities so calculated will be strongly influenced by any high flow zones or fracture zones. In a vertical borehole in horizontally layered strata (which is typical for the Southern Coalfield), the measured permeability is predominantly that of horizontal discontinuities. However when assessing the impact of mining, it is the vertical per-meability that is critical.
Nevertheless, Lugeon tests are by far the most common method of assessing permeability in the Southern Coalfield (and in fractured rock masses generally), as shown on Table 1. For many projects, it is the only method by which permeability has been assessed. The reasons for the popularity of the method are that: • Strata in the Southern Coalfield are generally of low
permeability so that more sophisticated and accurate pump-out type tests are not appropriate;
• The time taken to conduct a Lugeon test is short compared to that required for other tests;
• The equipment required is readily available and relatively inexpensive;
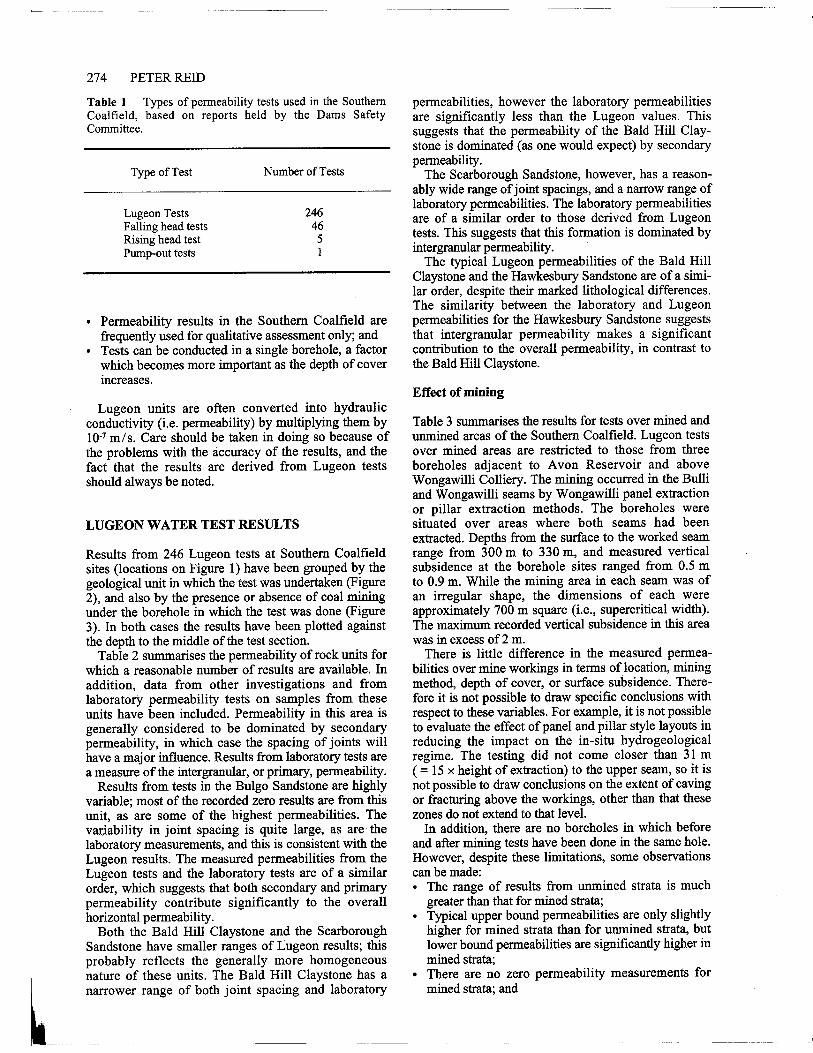
274 PETER REID
Table 1 Types of permeability tests used in the Southern Coalfield, based on reports held by the Dams Safety Committee.
Type of Test Number of Tests
Lugeon Tests 246 Falling head tests 46 Rising head test 5 Pump-out tests 1
• Permeability results in the Southern Coalfield are frequently used for qualitative assessment only; and
• Tests can be conducted in a single borehole, a factor which becomes more important as the depth of cover increases.
Lugeon units are often converted into hydraulic conductivity (i.e. permeability) by multiplying them by 10-7 m/s. Care should be taken in doing so because of the problems with the accuracy of the results, and the fact that the results are derived from Lugeon tests should always be noted.
LUGEON WATER TEST RESULTS
Results from 246 Lugeon tests at Southern Coalfield sites (locations on Figure 1) have been grouped by the geological unit in which the test was undertaken (Figure 2), and also by the presence or absence of coal mining under the borehole in which the test was done (Figure 3). In both cases the results have been plotted against the depth to the middle of the test section.
Table 2 summarises the permeability of rock units for which a reasonable number of results are available. In addition, data from other investigations and from laboratory permeability tests on samples from these units have been included. Permeability in this area is generally considered to be dominated by secondary permeability, in which case the spacing of joints will have a major influence. Results from laboratory tests are a measure of the intergranular, or primary, permeability.
Results from tests in the Bulgo Sandstone are highly variable; most of the recorded zero results are from this unit, as are some of the highest permeabilities. The variability in joint spacing is quite large, as are the laboratory measurements, and this is consistent with the Lugeon results. The measured permeabilities from the Lugeon tests and the laboratory tests are of a similar order, which suggests that both secondary and primary permeability contribute significantly to the overall horizontal permeability.
Both the Bald Hill Claystone and the Scarborough Sandstone have smaller ranges of Lugeon results; this probably reflects the generally more homogeneous nature of these units. The Bald Hill Claystone has a narrower range of both joint spacing and laboratory
permeabilities, however the laboratory permeabilities are significantly less than the Lugeon values. This suggests that the permeability of the Bald Hill Clay-stone is dominated (as one would expect) by secondary permeability.
The Scarborough Sandstone, however, has a reason-ably wide range of joint spacings, and a narrow range of laboratory permeabilities. The laboratory permeabilities are of a similar order to those derived from Lugeon tests. This suggests that this formation is dominated by intergranular permeability.
The typical Lugeon permeabilities of the Bald Hill Claystone and the Hawkesbury Sandstone are of a simi-lar order, despite their marked lithological differences. The similarity between the laboratory and Lugeon permeabilities for the Hawkesbury Sandstone suggests that intergranular permeability makes a significant contribution to the overall permeability, in contrast to the Bald Hill Claystone.
Effect of mining
Table 3 summarises the results for tests over mined and unmined areas of the Southern Coalfield. Lugeon tests over mined areas are restricted to those from three boreholes adjacent to Avon Reservoir and above Wongawilli Colliery. The mining occurred in the Bulli and Wongawilli seams by Wongawilli panel extraction or pillar extraction methods. The boreholes were situated over areas where both seams had been extracted. Depths from the surface to the worked seam range from 300 m to 330 m, and measured vertical subsidence at the borehole sites ranged from 0.5 m to 0.9 m. While the mining area in each seam was of an irregular shape, the dimensions of each were approximately 700 m square (i.e., supercritical width). The maximum recorded vertical subsidence in this area was in excess of 2 m.
There is little difference in the measured permea-bilities over mine workings in terms of location, mining method, depth of cover, or surface subsidence. There-fore it is not possible to draw specific conclusions with respect to these variables. For example, it is not possible to evaluate the effect of panel and pillar style layouts in reducing the impact on the in-situ hydrogeological regime. The testing did not come closer than 31 m ( = 15 x height of extraction) to the upper seam, so it is not possible to draw conclusions on the extent of caving or fracturing above the workings, other than that these zones do not extend to that level.
In addition, there are no boreholes in which before and after mining tests have been done in the same hole. However, despite these limitations, some observations can be made: • The range of results from unmined strata is much
greater than that for mined strata; • Typical upper bound permeabilities are only slightly
higher for mined strata than for unmined strata, but lower bound permeabilities are significantly higher in mined strata;
• There are no zero permeability measurements for mined strata; and

EFFECT OF MINING ON PERMEABILITY OF ROCK STRATA IN THE SOUTHERN COALFIELD 275
moos
Wernernbe
Bull Colliery
'I South Bulli Colliery
Huntley Colliery
I.
stay
Cordeaux Da km
10-7 10-6 10-6
=Pas
I
r
' _
—
*
0 0
a I
! *
0 •
* .
S .
: +*
0 *
+ +t + *4
* 00 0 * ** ir ** ., 7
*, _ ; .** **
e .
. .
it
+
• *
*
• *
* *+
+. b.
+ -
•f • * * ** 4* i.
.* * :+
. . e e
.
.
. . C . ft
. *
ft.
+ ' .."' +Is ,.. r. . 8.
. ...P.
*.
*
. P. ••
.
p .
ft. I* . * '
S. 1 I. ft
D. .
P. I/.
s . '.. ..... ft.
P. S.
°....
e e M
e Fe
::.
IP
* .
.
b. EB
ED
8
ES
ao
tea
250
354
teepoe
Figure 1 Test sites, Southern Coalfield.
0
E
C. a)
200
tsa
Typical stratigraphic column.
Legend + Bald Hill ft Bulgo * Hawkeebury a Scarborough
Wongawilli Colliery
Permeability, mis on. Wilson tess
Figure 2 Depth vs permeability, by rock unit.

.
, .
* v. i
:
• v • • , • • •
•
• •
i
Am
, + •+.- +
+.+4+ • ti.
--. bt r 1
;
•
•
•
•
•
. • • • • .
•
•—v--• f * + , • + .
+
w•
+
V + + , +
+ • + 1
+ + + 4+ .,
r
r
•
•
v___ •
T
•
•
•
• + +
+
+I- + +
+ + t
+ + + -H- +
1+ + +
-I- +t
• ;
•
•
le ,
V . T • •
e v•
•
•
+
-H- + + + +1-+
+ + +I+
+ +1
,
I _
••
•
s •
1
•
• +++ + +
+ + +
•
•
• •
•
•
.
•
. .
•
.
•
0 104
10 104
104
104
so
100
250
300
350
150
Typical stratigraphic column.
• No mining + Mining
Stanwall Park Cs
Scarborough Ss
Wornbarra Sh
276 PETER REID
Permeability, m/s mom Lupon
Figure 3 Permeability vs depth, by mining.
Table 2 Permeability results from Southern Coalfield.
Unit Results from Lugeon tests Results from Laboratory Tests Vertical Joint Spacing (total horizontal permeability) (primary permeability) (1) (m) (2)
Lugeons Approx. Number Range Mean Number Range Mean m/s of tests m/s of tests
Hawkesbury Sandstone 0.1 -21 l0410.6 68 0-10-5 10-6 31 3-40 7-15 Bald Hill Claystone 0.1 -23 104-10-6 35 0-10-9 1010 12 0.3-3 1 Bulgo Sandstone 0-24 0-10-6 108 10-9-10-6 10-7 53 0.5-10 1-3
0.2 (shale) Scarborough Sandstone 0.1-10 104-10-6 11 10-9-10-7 104 60 1-35 20
(1) These results combined from Stuntz, 1973 and Jensen 1975. (2) These results taken from McElroy, 1976 and Regan, 1980.
Table 3 Effect of mining on permeability of Southern Coalfield strata.
Typical Range Number of Tests Lugeons Approximate ru/ s
Mining 1 -24 10-7- 10-6 110 No mining 0-20 10-H - 10-6 136
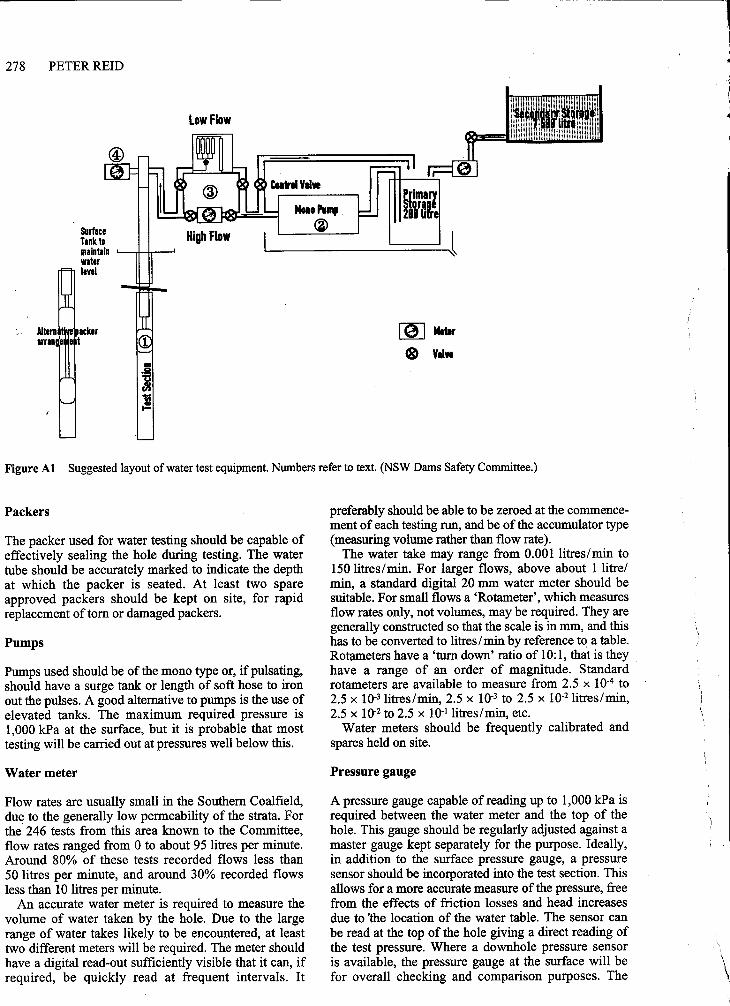
0 1)
Low Flow
CoaIrol Volvo Primary
High Flow Surface Tank to maintain , water
— level
Koos Pomp
Now
e valve
Morn arrant
acker
278 PETER REID
Figure Al Suggested layout of water test equipment. Numbers refer to text. (NSW Dams Safety Committee.)
Packers
The packer used for water testing should be capable of effectively sealing the hole during testing. The water tube should be accurately marked to indicate the depth at which the packer is seated. At least two spare approved packers should be kept on site, for rapid replacement of torn or damaged packers.
Pumps
Pumps used should be of the mono type or, if pulsating, should have a surge tank or length of soft hose to iron out the pulses. A good alternative to pumps is the use of elevated tanks. The maximum required pressure is 1,000 kPa at the surface, but it is probable that most testing will be carried out at pressures well below this.
Water meter
Flow rates are usually small in the Southern Coalfield, due to the generally low permeability of the strata. For the 246 tests from this area known to the Committee, flow rates ranged from 0 to about 95 litres per minute. Around 80% of these tests recorded flows less than 50 litres per minute, and around 30% recorded flows less than 10 litres per minute.
An accurate water meter is required to measure the volume of water taken by the hole. Due to the large range of water takes likely to be encountered, at least two different meters will be required. The meter should have a digital read-out sufficiently visible that it can, if required, be quickly read at frequent intervals. It
preferably should be able to be zeroed at the commence-ment of each testing run, and be of the accumulator type (measuring volume rather than flow rate).
The water take may range from 0.001 litres/min to 150 litres/min. For larger flows, above about 1 litre/ min, a standard digital 20 mm water meter should be suitable. For small flows a `Rotameter', which measures flow rates only, not volumes, may be required. They are generally constructed so that the scale is in mm, and this has to be converted to litres/min by reference to a table. Rotameters have a 'turn down' ratio of 10:1, that is they have a range of an order of magnitude. Standard rotameters are available to measure from 2.5 x 10⁻⁴ to 2.5 x 10⁻³ litres /min, 2.5 x 10⁻³ to 2.5 x 10⁻² litres/min, 2.5 x 10⁻² to 2.5 x 10⁻¹ litres/min, etc.
Water meters should be frequently calibrated and spares held on site.
Pressure gauge
A pressure gauge capable of reading up to 1,000 kPa is required between the water meter and the top of the hole. This gauge should be regularly adjusted against a master gauge kept separately for the purpose. Ideally, in addition to the surface pressure gauge, a pressure sensor should be incorporated into the test section. This allows for a more accurate measure of the pressure, free from the effects of friction losses and head increases due to The location of the water table. The sensor can be read at the top of the hole giving a direct reading of the test pressure. Where a downhole pressure sensor is available, the pressure gauge at the surface will be for overall checking and comparison purposes. The

EFFECT OF MINING ON PERMEABILITY OF ROCK STRATA IN THE SOUTHERN COALFIELD 277
• Both mined and unmined strata have relatively low permeabilities (generally less than 3 x 10⁻⁶ m/ s).
It can be concluded from these observations that mining tends to increase the (horizontal) permeability of the overlying strata over the full height of the over-burden. Despite this general increase, typical horizontal permeabilities from strata over areas of extensive mining remain relatively low.
These results do not fully address the issue of the impact of mining on the hydrogeological regime, and in particular the issue of mining under stored water. Other factors, such as the effect on vertical permeability, the presence of low permeability layers, and the response of faults, dykes and joint zones to mining, need to be considered as well. What these results do indicate is that underground coal mining in the Southern Coalfield does not result in catastrophic damage to the hydrogeological environment, and that there is potential for controlled mining to be carried out in sensitive areas such as near or underneath important water storages.
CONCLUSIONS
The Lugeon test is a useful tool for making qualitative estimates of the permeability of strata in the southern Coalfield.
Typical permeability results confirm that the Southern Coalfield rocks can be generally classified as having low permeability.
The current database of results does not cover a wide range of mining types, depth of cover, surface impacts (subsidence), or locations, and so it is not possible to
correlate these variables with the impact on the permeability.
In general terms underground coal mining in the Southern Coalfield does not result in catastrophic damage to the hydrogeological environment. There is potential for controlled mining to be carried out in sensitive areas such as near or underneath important water storages.
The Appendix provides details of the currently preferred DSC method of conducting and interpreting these tests.
REFERENCES
FAUST C. R. & MERCER J. W. 1984. Evaluation of slug test in wells containing a finite-thickness skin. Water Resources Research 20 (4), April, 504-506.
JENSEN N. V. 1975. Cordeaux Dam, results of drilling and regional mapping. Metropolitan Water Sewerage and Drainage Board unpublished report, April.
McELRoY C. T. & PROBERT D. H. 1976. Jointing in rocks in relation to the Southern Catchment Areas, NSW. Unpub-lished report prepared for the Department of Mines by Clifford McElroy and Associates, February.
REGAN W. 1980. Report on the nature of the defects in the Narrabeen Group rocks in the Southern Coalfield Water Catchment Area. Unpublished report by Coffey and Partners Pty Ltd for the NSW Dams Safety Committee, December.
REYNOLDS R. G. 1977. Coal mining under stored water. Report of Royal Commission, NSW Government Printer, 118pp.
S'TUNTZ J. 1974. Southern Sydney Basin intergranular porosity and permeability. NSW Department of Mines unpublished report, November.
APPENDIX — CONDUCTING LUGEON TESTS AND INTERPRETING THE RESULTS
The original specifications for the testing equipment were developed by the NSW Dams Safety Committee's Borehole Advisory Subcommittee between 1978 and 1982. The analysis procedure is a modified version of that developed by the former Water Conservation and Irrigation Commission (now the NSW Department of Land and Water Conservation) for use on dam investigation sites.
SUGGESTED TESTING EQUIPMENT
The method described here has been designed with the Southern Coalfield geological and mining environment in mind, and is considered to be appropriate for the generally low permeability strata and deep boreholes which are common in this area. However, the reader should be aware that there are several other accepted methods. Figure Al summarises the equipment layout.
The testing equipment should be constructed so that
all water losses can be measured. Sources of errors can then be identified if required. Water should be pumped into the test section through a bypass-controlled closed section with limited primary storage of about 200 litres in a tall tank. Measurement of water level in this tank can supplement meter readings. A minimum secondary storage of 7,500 litres is required and the water should be clean. Water flow from this storage into the primary storage should be metered.
Drilling procedures
Drilling mud, or any other material capable of clogging aquifers, should not be used if at all possible. Drilling can be carried out through a header tank to keep The hole full of water. This will reduce deterioration of the borehole wall and therefore reduce the need for drilling mud. Pulling of the inner tube should be carried out slowly, to avoid pressure drops on the formation.

EFFECT OF MINING ON PERMEABILITY OF ROCK STRATA IN THE SOUTHERN COALFIELD 279
Characteristics Calculated Lugeon values Test (Pressure)
All 5 figures are about the same. 1st As a linear relationship between (Low) pressure and water loss is 2nd assumed, the reading at the (Mod) highest pressure increment will be the most accurate. 3rd
(High) 4th
(Mod) 5th
(Low)
Take the value from the highest pressure.
If the figures generally decrease ist (indicating initial filling of finite (Low) voids) a figure is chosen from those 2nd after the variation has settled down. This situation can be avoided if the (Med) rock is fully saturated before the 3rd test (High)
4th (Mod)
5th (Low)
Take a representative value from after the values have settled down.
If the first few values generally increase (indicating washing out of voids) a figure is chosen from those after the variation has settled down. If all 5 figures increase then it is probable that the test was not continued for long enough. If a repeat is not possible, then the last figure is used.
1st (Low) 2nd
(Mod) 3rd
(High) 4th
(Mod) 5th
(Low)
Take a representative value from after the values have settled down.
If there is a sudden large increase in water loss it suggests that the rock mass has dilated due to the pressure of the test This invalidates the test as the resulting permeability no longer represents the in-situ state. A figure is chosen from the remaining tests.
1st (Low) 2nd
(Mod) 3rd
(High) 4th
(Mod)
5th (Low)
If the figures vary without any pattern there may be a problem with the testing. If re-testing is not possible a representative figure is selected, with a bias towards the figure obtained at the highest pressure.
If water emerged from the top of the hole during testing (indicating faulty seating or by-passing of a packer) the test is regarded as invalid.
If a test is beyond pump capacity (cannot acheive required pressure) the permeability is regarded as greater than 100 Lugeons.
Figure A2 Interpreting Lugeon values.
Table A2: Recommended pressures
Depth to bottom of stage
Low Medium High
metres kPa kPa kPa
5 50 75 100 10 75 140 250 15 100 200 300 20 160 300 450 25 250 400 550 30 275 450 675 35 275 500 775 40 275 625 900
• 45 275 700 1000 Beyond 45 275 700 1000
Take a representative value from before the increase.

280 PETER REID
pressure will be adjusted at the control valve to achieve the desired pressures.
Hoses connecting components of the water testing system should be high pressure hoses fitted with high pressure couplings.
TESTING PROCEDURES
Testing is preferably carried out downstage with a single packer. Other methods, such as using double packers (where the lower packer could leak without detection and thus invalidate the tests) are also used, but not recommended.
Stage lengths vary between about 10 m and 20 m, so as to coincide with drill runs and with distinct changes in rock type (some geological features will require separate testing). They should also allow for grouting as a remedy for lost drill water, and for very high or very low flow rates. When the take exceeds the pump capacity at low or moderate pressures in a normal stage, the packer is reseated half-way down the stage and the lower half of the stage is separately re-tested.
In unstable materials the test stages may be extended to 30 m. In the Southern Coalfield the Stanwell Park Claystone is difficult to test, as the process causes caving of the hole. Where possible, the stage top and bottom are set to coincide with geological boundaries, as this tends to simplify interpretation.
The testing sequence involves:
• Drilling the stage to the required length, then flushing through the drill rods as they are slowly withdrawn, to ensure that all turbid water is removed;
• Fitting the packer at the required depth and connect-ing water test equipment to the top;
• Applying water to the test section in the sequence: low-medium-high-medium-low pressure.
The recommended test pressures depend on the depth, as indicated in the Appendix Figure A2. At each pressure, water takes should be recorded until losses over consecutive 5-minute periods differ by less than 10%. Test results are recorded on a suitable form. On completion of the test the packer is removed and drilling resumes into the next stage. This is followed by repetition of the above process until the bottom of the hole is reached.
If any of the 5-minute periods take so much water that the supply cannot cope, the test is recorded as 'beyond pump capacity'. The actual pressure and take are recorded if possible. If this happens at low or medium pressures, further testing of the stage is then dis-continued, although the lower half of the stage may be re-tested. If it happens at high pressure, the test is
continued at the subsequent medium and low pressures.
Corrections
If pressure is not measured within the test section, (i.e. only at the top of the borehole), then the measured pressure will differ from the actual value. This is because of the head loss between the surface gauge and the test section due to friction, and the head gain due to gravity as a result of the elevation difference between the gauge and the water table. Testing in the Southern Coalfield usually involves relatively low flow rates, so that head losses due to friction are usually small.
The standing water level is frequently not measured before testing, due to the time needed for it to stabilise, so it is frequently impossible to correct for the additional head due to gravity. Given that friction losses will decrease the actual pressure in the test section and that gravity will increase it, these two influences tend to cancel each other. Taking into account the low precision of the method, it is reasonable to ignore both of these corrections and take the gauge pressure as the actual pressure in the test section.
Analysis procedures
The Lugeon value for each reading taken is calculated using the formula:
Lugeon value =
[woo x water loss per metre of test interval (1/min/m)1 [Pressure (kPa)]
This formula assumes a linear relationship between the pressure and the water take.
Water loss is normally taken over a 10-minute interval, which means that two 5-minute intervals are combined, usually the last two if the procedure for testing outlined above is followed. Therefore, there will be five Lugeon values calculated for each stage (one for each pressure increment). The five values for each stage are then inspected as a group and a representative lugeon value chosen. The method of inspection is summarised in Figure A2.
REFERENCES
HOULSBY A. C. 1975. Notes on water testing in foundation rock. Water Conservation and Irrigation Commission, unpublished report, 1975.
HOULSBY A. C. 1976. Routine interpretation of the Lugeon water-test. Quarterly Journal of Engineering Geology 9, 303-313.