तारापुर Tarapur Tarapur - Maharashtra Pollution Control Board
81
Action Plan for Ind Action Plan for Ind Action Plan for Ind Action Plan for Ind in Severely Poll in Severely Poll in Severely Poll in Severely Poll Monitoring, sampling, analysi Quality, Surface Water, Groun ताराप ु र Ta February, 2019 dustrial Cluster dustrial Cluster dustrial Cluster dustrial Cluster luted Areas luted Areas luted Areas luted Areas is of Stack, Ambient Air nd Water, Waste Water arapur
-
Upload
khangminh22 -
Category
Documents
-
view
0 -
download
0
Transcript of तारापुर Tarapur Tarapur - Maharashtra Pollution Control Board
Action Plan for Industrial Cluster Action Plan for Industrial Cluster Action Plan for Industrial Cluster Action Plan for Industrial Cluster
in Severely Polluted Areasin Severely Polluted Areasin Severely Polluted Areasin Severely Polluted Areas
Monitoring, sampling, analysi
Quality, Surface Water, Ground Water, Waste Water
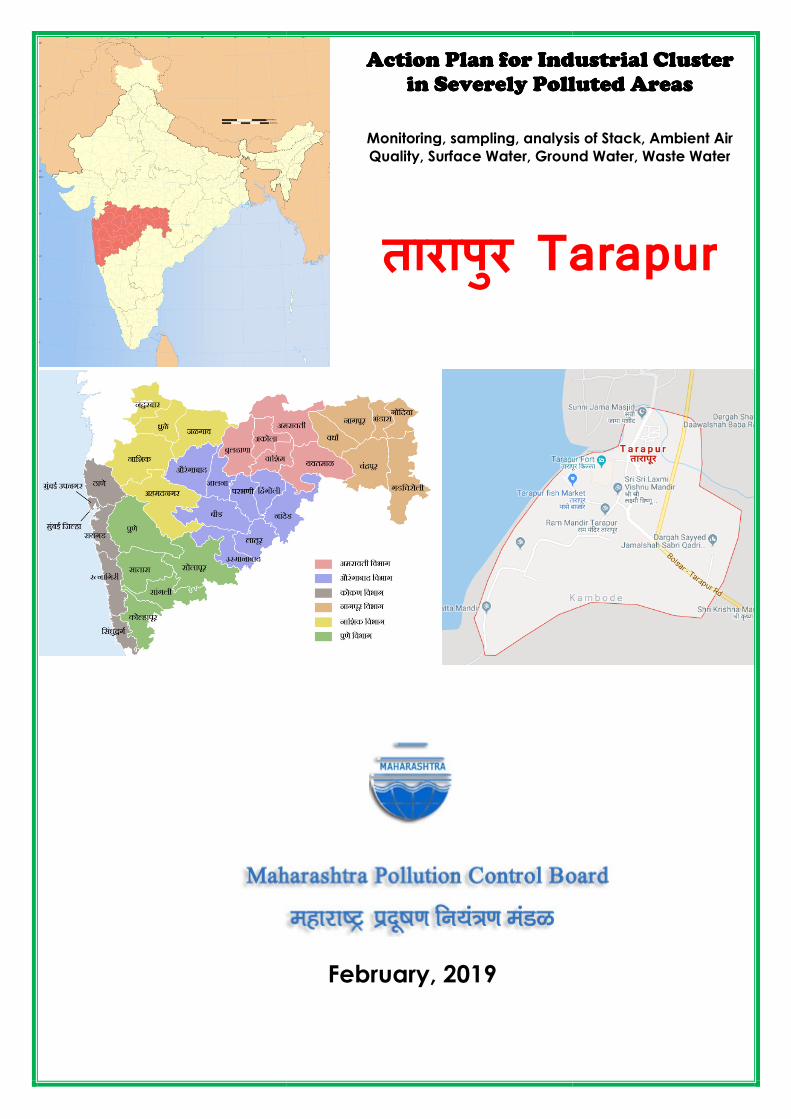
तारापुर Tarapur
February, 2019
Action Plan for Industrial Cluster Action Plan for Industrial Cluster Action Plan for Industrial Cluster Action Plan for Industrial Cluster
in Severely Polluted Areasin Severely Polluted Areasin Severely Polluted Areasin Severely Polluted Areas
Monitoring, sampling, analysis of Stack, Ambient Air
Quality, Surface Water, Ground Water, Waste Water
Tarapur

Critically Polluted Areas: Monitoring, sampling, analysis of Stack, Ambient Air Quality, Surface Water, Ground Water, Waste Water
Tarapur 2
INDEX
Acknowledgement ............................................................................................ 3
Abbreviations:................................................................................................... 4
1. Introduction: ............................................................................................. 5
2. Scope of Work ............................................................................................ 6
2.1 Stack Emission Parameters .................................................................... 6
2.2 Ambient Air Quality Parameters .............................................................. 7
2.3 Water/Waste Water Parameters ............................................................. 7
2.4 Methodology followed in Sampling and Analysis ...................................... 10
3. Results of Analysis ................................................................................... 10
3.1 Stack Emission Monitoring: .................................................................. 10
3.2 Ambient Air Quality: ........................................................................... 13
3.3 Water/Waste Water: ........................................................................... 17
3.4 Ground Water Analysis Results: ............................................................ 30
4 Summary of the Results ........................................................................... 41
4.1 Stack Emission Monitoring: .................................................................. 41
4.2 Ambient Air Monitoring: ...................................................................... 41
4.3 Waste Water Quality: .......................................................................... 41
4.4 Ground Water Quality: ........................................................................ 42
5 CEPI Score: .............................................................................................. 43
5.1 Comparison of CEPI scores: ................................................................. 45
6 Conclusions .............................................................................................. 48
7 Efforts Taken For the Abatement and Control of Pollution ....................... 49
8 Photographs ............................................................................................ 50
9 References ............................................................................................... 57
10 Annexures................................................................................................ 58
Annexure I Health related data in impact on humans ........................................ 58
Annexure II: Stack Emission Sampling and Analysis Methodology ....................... 59
Annexure III: Ambient Air Sampling and Analysis Methodology .......................... 61
Annexure IV: Water/Wastewater Sampling and Analysis Methodology ................. 63
Annexure V: National Ambient Air Quality Standards, 2009 ................................ 67
Annexure VI: General Standards for Discharge of Environmental Pollutants,
Part A: Effluents (The Environment (Protection) Rules, 1986, Schedule VI) .......... 68
Annexure VII: Drinking Water Specification-IS 10500:2012 ............................... 72
Annexure VIII: CPCB Water Quality Criteria: .................................................... 76
Annexure IX: Water Quality Parameters Requirements and Classification ............. 77
Critically Polluted Areas: Monitoring, sampling, analysis of Stack, Ambient Air Quality, Surface Water, Ground Water, Waste Water
Tarapur 3
Acknowledgement
We gratefully acknowledge E. Ravendiran, Member Secretary, Maharashtra Pollution
Control Board, for entrusting this very important and prestigious project to us.
Our special thanks are to Regional and Sub Regional Officer of the concerned areas, for
guidance during the sampling. The contribution of Shri V. M Motghare (Joint director
APC) and Mr. Sameer Hundlekar (Field officer) is appreciated.
We would also like to extend our thanks to the concerned staff of Regional Hospitals,
who has provided us the health data, which is the most important component of this
revised concept of CEPI.
By undertaking this project and completing in schedule time, we consider ourselves
very lucky since we have helped the mankind by giving the data on pollution load and
further action by the Board, to bring down the pollution level.
We also thank our associates for working on this project for making the write up,
making graphs and feeding the data on computer.
This acknowledgement will be incomplete if we do not thank our laboratory analysts
and others who made this project a success by timely analysing the samples.
We also thank our sampling team members for conducting the sampling in this vast
area.
Critically Polluted Areas: Monitoring, sampling, analysis of Stack, Ambient Air Quality, Surface Water, Ground Water, Waste Water
Tarapur 4
Abbreviations:
APHA American Public Health Association
BDL Below Detection Limit
BOD Biochemical Oxygen Demand
CEPI Comprehensive Environmental Pollution Index
CETP Common Effluent Treatment Plant
COD Chemical Oxygen Demand
CPA Critically Polluted Areas
SPA Severely Polluted Areas
DO Dissolved Oxygen
ETP Effluent Treatment Plant
MIBK Methyl Isobutyl Ketone
MPCB Maharashtra Pollution Control Board
NAAQS National Ambient Air Quality Standards
NOx Oxides of Nitrogen
ND Not Detected
PAH Poly Aromatic Hydrocarbons
PCB Poly Chlorinated Biphenyls
PCT Poly Chlorinated Terphenyls
PM10 Particulate Matter (size less than 10 µm)
PM2.5 Particulate Matter (size less than 2.5 µm)
SO2 Sulphur Dioxide
STAP Short Term Action Plan
WHO World Health Organization
Critically Polluted Areas: Monitoring, sampling, analysis of Stack, Ambient Air Quality, Surface Water, Ground Water, Waste Water
Tarapur 5
1. Introduction:
Although industries contribute significantly to India’s economic growth and development,
the increase in pollution of land, water, air, noise and resulting degradation of
environment that they have caused, cannot be overlooked. Industries are responsible for
four types of pollution: a) Air b) water c) land d) noise. Rapid industrialization carries
with it the seeds of environmental damage. Pollution of natural environment not only
affects people but also have adverse impact on economic growth in the long run.
Analysis of pollution load shows that there are few industries in the country which
contribute to more than 90percent of the pollution. Hence, scientists are exploring the
quantum of pollution load as well as to device certain strategies and technologies so that
our sustainable development would not be jeopardized otherwise our long cherished
dream of establishing eco-socialism on this watery planet could not come true.
Industrial pollution takes on many faces. It contaminates many sources of drinking
water, releases unwanted toxins into the air and reduces the quality of soil all over the
world. Every litre of waste water discharged by our industries pollute eight times the
quantity of fresh water. The extent of pollution varies with the size of the industry, the
nature of the industry, the type of products used and produced etc. In view of this,
Central Pollution Control Board (CPCB) has evolved the concept of Comprehensive
Environmental Pollution Index (CEPI) during 2009-10 as a tool for comprehensive
environmental assessment of prominent industrial clusters and formulation of remedial
Action Plans for the identified critically polluted areas. Later-on proposals were received
from the SPCBs, State Governments, and Industrial Associations and concerned Stake-
holders for revisiting the criteria of assessment under CEPI concept. After careful
examination and consideration of the suggestions of concerned stake-holders, it was
decided to prepare the revised concept of CEPI by eliminating the subjective factors but
retaining the factors which can be measured precisely. Hence, revised concept came into
existence, which is termed as Revised CEPI Version 2016.
The present report is also based on the revised CEPI version 2016. The results of the
application of the Comprehensive Environmental Pollution Index (CEPI) to selected
industrial clusters or areas are presented in this report. The main objective of the study
is to identify polluted industrial clusters or areas in order to take concerted action and to
centrally monitor them at the national level to improve the current status of their
environmental components such as air and water quality data, ecological damage, and
visual environmental conditions. A total of 88 industrial areas or clusters have been
selected by the Central Pollution Control Board (CPCB) in consultation with the Ministry
of Environment & Forests Government of India for the study. The index captures the
various dimensions of environment including air, water and land. Comprehensive
Environmental Pollution Index (CEPI), which is a rational number to characterize the
environmental quality at a given location following the algorithm of source, pathway and
receptor have been developed.
In this report, CEPI study includes Tarapur industrial area of Maharashtra state. It is one
of the best industrial area situated near Mumbai, Thane and adjacent to Gujarat state on
Mumbai - Ahmedabad Express Highway. The industrial part of this place has a number of
factories manufacturing dyes, paints and industrial / agricultural chemicals. Heavy metal
factories manufacturing a wide variety of equipment are also based in this region. A few
nationally prominent industrial establishments have their manufacturing plants in
Tarapur. This city accommodates bulk drug manufacturing units, speciality chemical
manufacturing units, steel plants and some textile plants. Government of Maharashtra
has established Industrial Estate at Boisar, Tarapur in the year 1972. This estate is
known as MIDC Tarapur. This is one of the largest chemical industrial estates in the
State of Maharashtra.
Critically Polluted Areas: Monitoring, sampling, analysis of Stack, Ambient Air Quality, Surface Water, Ground Water, Waste Water
Tarapur 6
2. Scope of Work
The Scope of Work consisted of the following:
Monitoring, Sampling, Analysis for Stack, Ambient Air Quality, Surface Water, Waste
Water, and Ground Water Quality for identified five Critically Polluted areas (CPAs) in
Maharashtra i.e. Chandrapur, Dombivli, Aurangabad, Navi Mumbai and Tarapur
and 3 Severely Polluted areas (SPAs) in Maharashtra i.e. Chembur, Pimpri-
Chinchwad and Nashik as per standard methods.
• At each of the 5 CPAs and 3 SPAs, 24 hourly ambient air quality monitoring to be
carried out.
• Representative samples for surface water quality, waste water quality and Ground
Water quality to be collected from prominent surface and Ground Water bodies
located in and around the clusters/areas.
• Submission of complete monitoring, sampling and analysis reports including the
summary of the parameters exceeding the prescribed standards/norms for all the 5
CPAs and 3 SPAs.
• Submission of 3 copies of final report with photographs at prominent locations and
the CD (soft copy) on completion of the project for every critically polluted and
severely polluted area separately.
Monitoring, Sampling, Analysis for Stack, Ambient Air Quality, Surface Water,
Waste Water and Ground Water Quality for Tarapur:
• The sampling was carried out in 6 days at various locations i.e. from 30th January, to
04th February, 2019.
• In Tarapur, a total of 7 Stack Monitoring Samples, 6 Ambient Air Quality Monitoring
Samples, 2 Volatile Organic Carbon samples 7 Waste Water Samples and 5 Ground
Water Samples were collected and analyzed.
2.1 Stack Emission Parameters
The Stack Emissions were analyzed with the following parameters:
1. Acid Mist
2. Ammonia
3. Carbon Monoxide
4. Chlorine
5. Fluoride(gaseous)
6. Fluoride (particulate)
7. Hydrogen Chloride
8. Hydrogen Sulphide
9. Oxides of Nitrogen
10. Oxygen
11. Polyaromatic Hydrocarbons (Particulate)

Critically Polluted Areas: Monitoring, sampling, analysis of Stack, Ambient Air Quality, Surface Water, Ground Water, Waste Water
Tarapur 7
12. Suspended Particulate Matter
13. Sulphur Dioxide
14. Benzene
15. Toluene
16. Xylene
17. Volatile Organic Compounds (VOCs)
2.2 Ambient Air Quality Parameters
The Ambient Air Quality was analyzed with the following parameters:
1. Sulphur Dioxide (SO2)
2. Nitrogen Dioxide (NO2)
3. Particulate Matter (PM10)
4. Particulate Matter (PM2.5)
5. Ozone (O3)
6. Lead (Pb)
7. Carbon Monoxide (CO)
8. Ammonia (NH3)
9. Benzene (C6H6)
10. Benzo (a) Pyrene (BaP) (Particulate Phase Only)
11. Arsenic (As)
12. Nickel (Ni)
2.3 Water/Waste Water Parameters
The Water/Waste Water was analyzed with the following parameters:
a. Prominent Surface Water bodies such as outfalls of CETPs, ETPs, treated effluent
drainage, river, canal, ponds, lakes and other such water supply resources flowing
through the area or flowing adjoining the CPA.
b. Ground Water Quality data of prominent ground water resources such as observation
wells of Central Ground Water Board, drinking water wells, hand pumps, bore wells,
hand pumps, bore wells and other such water supply resources located in the
industrial cluster/area under consideration or in the peripheral areas.

Critically Polluted Areas: Monitoring, sampling, analysis of Stack, Ambient Air Quality, Surface Water, Ground Water, Waste Water
Tarapur 8
Basic water quality parameters for surface water and ground water both are
as follows:
i. Simple Parameters:
1. Sanitary Survey
2. General Appearance
3. Colour
4. Smell
5. Transparency
6. Ecological(Presence of animals like fish, insects) (Applicable to only surface water)
ii. Regular Monitoring Parameters:
7. pH
8. Oil & Grease
9. Suspended Solids
10. Dissolved Oxygen (% saturation) (Not applicable for ground waters)
11. Chemical Oxygen Demand
12. Biochemical Oxygen Demand
13. Electrical Conductivity
14. Nitrite-Nitrogen
15. Nitrate-Nitrogen
16. (NO2 + NO3)-Nitrogen
17. Free Ammonia
18. Total Residual Chlorine
19. Cyanide
20. Fluoride
21. Sulphide
Critically Polluted Areas: Monitoring, sampling, analysis of Stack, Ambient Air Quality, Surface Water, Ground Water, Waste Water
Tarapur 9
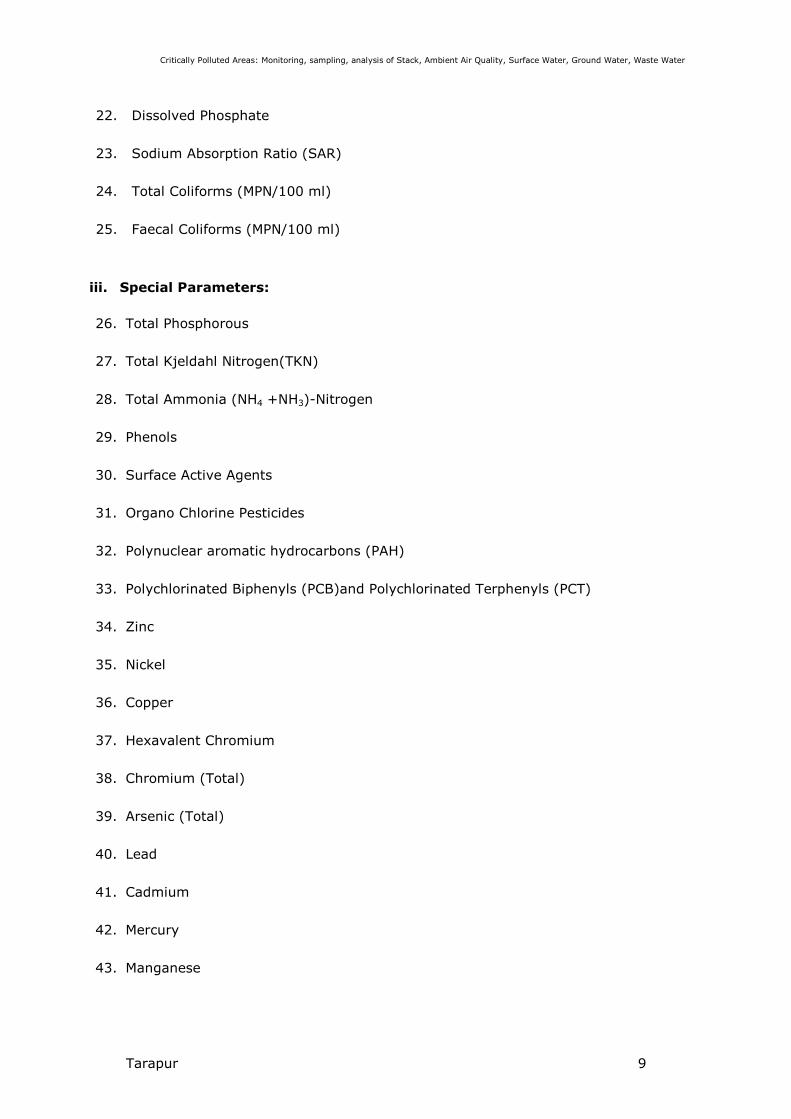
22. Dissolved Phosphate
23. Sodium Absorption Ratio (SAR)
24. Total Coliforms (MPN/100 ml)
25. Faecal Coliforms (MPN/100 ml)
iii. Special Parameters:
26. Total Phosphorous
27. Total Kjeldahl Nitrogen(TKN)
28. Total Ammonia (NH4 +NH3)-Nitrogen
29. Phenols
30. Surface Active Agents
31. Organo Chlorine Pesticides
32. Polynuclear aromatic hydrocarbons (PAH)
33. Polychlorinated Biphenyls (PCB)and Polychlorinated Terphenyls (PCT)
34. Zinc
35. Nickel
36. Copper
37. Hexavalent Chromium
38. Chromium (Total)
39. Arsenic (Total)
40. Lead
41. Cadmium
42. Mercury
43. Manganese
Critically Polluted Areas: Monitoring, sampling, analysis of Stack, Ambient Air Quality, Surface Water, Ground Water, Waste Water
Tarapur 10
44. Iron
45. Vanadium
46. Selenium
47. Boron
iv. Bioassay (Zebra Fish) Test: For specified samples only.
2.4 Methodology followed in Sampling and Analysis
Industries, places and locations that have been chosen for the sampling are
representative of the city/area. Sampling has been done at the potential polluted areas
so as to arrive at the CEPI. This will further help the authorities to monitor the areas in
order to improve the current status of their environmental components such as air and
water quality data, ecological damage and visual environmental conditions.
Methodology for sampling, preservation and analysis have been done according to the
references incorporated. Methodology of various types of parameters is presented
under following annexure:
1. Stack Emission Sampling and Analysis Methodology – Annexure II
2. Ambient Air Sampling and Analysis Methodology - Annexure III
3. Water/Wastewater Sampling and Analysis Methodology - Annexure IV
3. Results of Analysis
Results of Analysis are tabulated below for Stack Emission Monitoring, Ambient Air
Quality Monitoring, Waste Water Analysis and Water Analysis. These are followed by
their respective graphical representation.
Kindly note:
• NA specifies the sample is not analysed for the specific parameter.
• ND specifies that even though the sample was analysed for the parameter, it was
not detected.
• BDL specifies that the result obtained is below detection limit.
Please Note: Industrial clusters observed with below detection limit parameters
are NOT included into the graphs
3.1 Stack Emission Monitoring:
Stack Emission Monitoring Results are compared against The Environment (Protection)
Rules, 1986 General Emission Standard - Part D. The limits are represented on the
graphical representation. Graph of Volatile Organic Carbon (VOCs) could not be prepared
as their concentration was found either very less or not detected.

Critically Polluted Areas: Monitoring, sampling, analysis of Stack, Ambient Air Quality, Surface Water, Ground Water, Waste Water
Tarapur 11
Sr. Name of Industry Included in
1. Mandhana Industrial Ltd. (Dyeing Unit- II) Table No. I
2. Siyaram Silk Mills Ltd. Table No. I
3. IVP Ltd. Table No. I
4. Sarex Overseas Table No. II
5. Lupin Ltd. Table No. II
6. Dicitex Furnishing Table No. II
Table No. I:
Name of Industry
Mandhana
Industrial
Ltd. (Dyeing
Unit- II)
Siyaram
Silk Mills
Ltd.
IVP Ltd.
Date of Sampling 30.01.19 30.01.19 31.01.19
Stack ID Boiler Boiler Boiler
Sr. Parameters Unit Result
1 Particulate Matter mg/Nm3 20 36 35
Std. Limit mg/Nm3 150 150 150
2 Sulphur Dioxide (SO2)
mg/Nm3 8.57 5.71 8.57
kg/d 6.35 1.38 3.02
Std. Limit mg/Nm3 - - -
3 Nitrogen Dioxide (NO2) mg/Nm3 13 16.3 13.1
Critically Polluted Areas: Monitoring, sampling, analysis of Stack, Ambient Air Quality, Surface Water, Ground Water, Waste Water
Tarapur 12
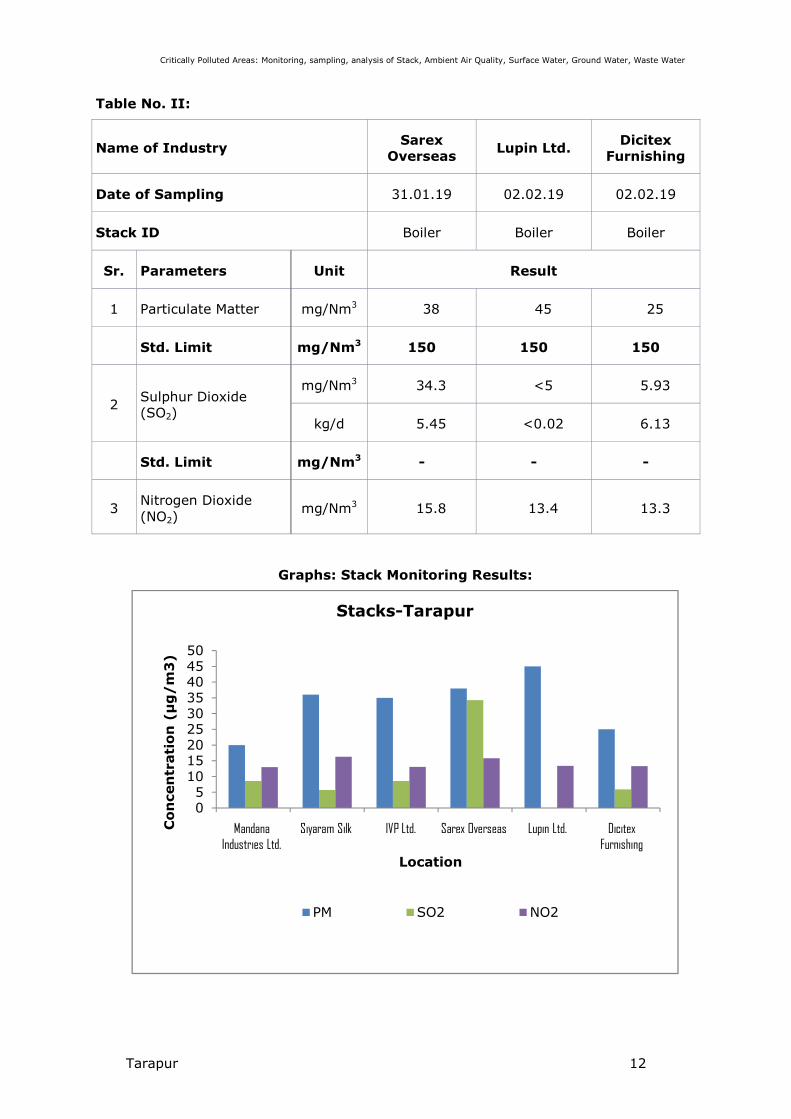
Table No. II:
Name of Industry Sarex
Overseas Lupin Ltd.
Dicitex
Furnishing
Date of Sampling 31.01.19 02.02.19 02.02.19
Stack ID Boiler Boiler Boiler
Sr. Parameters Unit Result
1 Particulate Matter mg/Nm3 38 45 25
Std. Limit mg/Nm3 150 150 150
2 Sulphur Dioxide
(SO2)
mg/Nm3 34.3 <5 5.93
kg/d 5.45 <0.02 6.13
Std. Limit mg/Nm3 - - -
3 Nitrogen Dioxide
(NO2) mg/Nm3 15.8 13.4 13.3
Graphs: Stack Monitoring Results:
05
101520253035404550
Mandana Industries Ltd.
Siyaram Silk IVP Ltd. Sarex Overseas Lupin Ltd. Dicitex Furnishing
Co
ncen
trati
on
(µ
g/
m3
)
Location
Stacks-Tarapur
PM SO2 NO2
Critically Polluted Areas: Monitoring, sampling, analysis of Stack, Ambient Air Quality, Surface Water, Ground Water, Waste Water
Tarapur 13
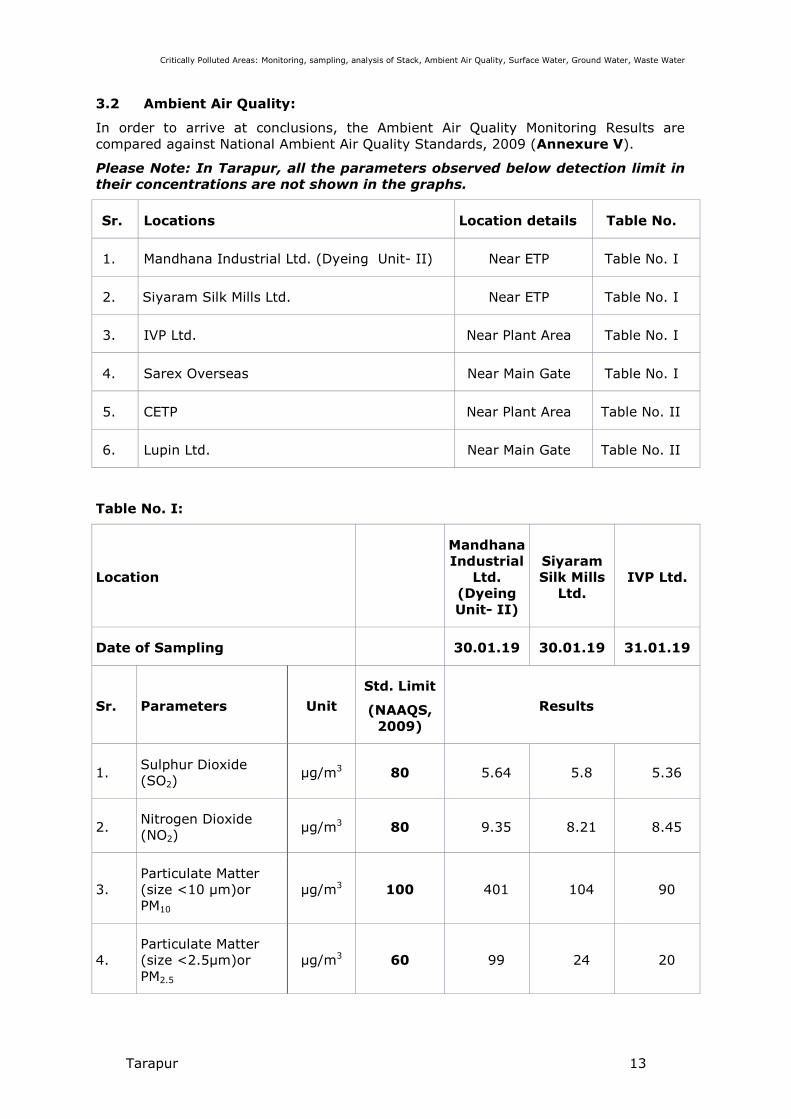
3.2 Ambient Air Quality:
In order to arrive at conclusions, the Ambient Air Quality Monitoring Results are
compared against National Ambient Air Quality Standards, 2009 (Annexure V).
Please Note: In Tarapur, all the parameters observed below detection limit in
their concentrations are not shown in the graphs.
Sr. Locations Location details Table No.
1. Mandhana Industrial Ltd. (Dyeing Unit- II) Near ETP Table No. I
2. Siyaram Silk Mills Ltd. Near ETP Table No. I
3. IVP Ltd. Near Plant Area Table No. I
4. Sarex Overseas Near Main Gate Table No. I
5. CETP Near Plant Area Table No. II
6. Lupin Ltd. Near Main Gate Table No. II
Table No. I:
Location
Mandhana
Industrial
Ltd.
(Dyeing
Unit- II)
Siyaram
Silk Mills
Ltd.
IVP Ltd.
Date of Sampling 30.01.19 30.01.19 31.01.19
Sr. Parameters Unit
Std. Limit
(NAAQS,
2009)
Results
1. Sulphur Dioxide
(SO2) µg/m3 80 5.64 5.8 5.36
2. Nitrogen Dioxide
(NO2) µg/m3 80 9.35 8.21 8.45
3.
Particulate Matter
(size <10 µm)or
PM10
µg/m3 100 401 104 90
4.
Particulate Matter
(size <2.5µm)or
PM2.5
µg/m3 60 99 24 20
Critically Polluted Areas: Monitoring, sampling, analysis of Stack, Ambient Air Quality, Surface Water, Ground Water, Waste Water
Tarapur 14
Location
Mandhana
Industrial
Ltd.
(Dyeing
Unit- II)
Siyaram
Silk Mills
Ltd.
IVP Ltd.
Date of Sampling 30.01.19 30.01.19 31.01.19
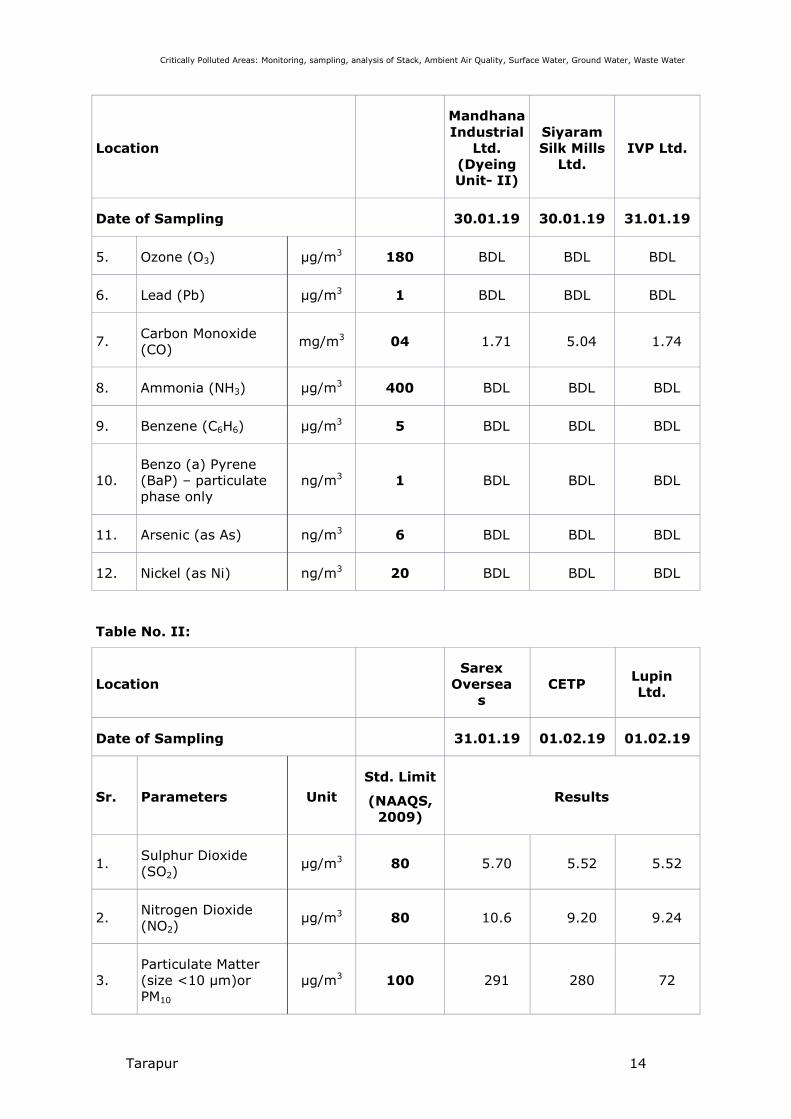
5. Ozone (O3) µg/m3 180 BDL BDL BDL
6. Lead (Pb) µg/m3 1 BDL BDL BDL
7. Carbon Monoxide
(CO) mg/m3 04 1.71 5.04 1.74
8. Ammonia (NH3) µg/m3 400 BDL BDL BDL
9. Benzene (C6H6) µg/m3 5 BDL BDL BDL
10.
Benzo (a) Pyrene
(BaP) – particulate
phase only
ng/m3 1 BDL BDL BDL
11. Arsenic (as As) ng/m3 6 BDL BDL BDL
12. Nickel (as Ni) ng/m3 20 BDL BDL BDL
Table No. II:
Location
Sarex
Oversea
s
CETP Lupin
Ltd.
Date of Sampling 31.01.19 01.02.19 01.02.19
Sr. Parameters Unit
Std. Limit
(NAAQS,
2009)
Results
1. Sulphur Dioxide
(SO2) µg/m3 80 5.70 5.52 5.52
2. Nitrogen Dioxide
(NO2) µg/m3 80 10.6 9.20 9.24
3.
Particulate Matter
(size <10 µm)or
PM10
µg/m3 100 291 280 72

Critically Polluted Areas: Monitoring, sampling, analysis of Stack, Ambient Air Quality, Surface Water, Ground Water, Waste Water
Tarapur 15
Location
Sarex
Oversea
s
CETP Lupin
Ltd.
Date of Sampling 31.01.19 01.02.19 01.02.19
4.
Particulate Matter
(size <2.5µm)or
PM2.5
µg/m3 60 70 68 16
5. Ozone (O3) µg/m3 180 BDL BDL BDL
6. Lead (Pb) µg/m3 1 BDL BDL BDL
7. Carbon Monoxide
(CO) mg/m3 04 2.41 3.98 4.61
8. Ammonia (NH3) µg/m3 400 BDL BDL BDL
9. Benzene (C6H6) µg/m3 5 BDL BDL BDL
10.
Benzo (a) Pyrene
(BaP) – particulate
phase only
ng/m3 1 BDL BDL BDL
11. Arsenic (as As) ng/m3 6 BDL BDL BDL
12. Nickel (as Ni) ng/m3 20 BDL BDL BDL

Critically Polluted Areas: Monitoring, sampling, analysis of Stack, Ambient Air Quality, Surface Water, Ground Water, Waste Water
Tarapur 16
Graphs: Ambient Air Monitoring Results:
0
50
100
150
200
250
300
350
400
450
Mandhana Industries Ltd.
Siyaram Silk Mills Ltd.
IVP Ltd. Sarex Overseas CETP Lupin Ltd.
Co
ncen
trati
on
(µ
g/
m3
)
Location
Tarapur
SO2 NO2 PM10 PM2.5
0
1
2
3
4
5
6
Mandhana Industries Ltd.
Siyaram Silk Mills Ltd.
IVP Ltd. Sarex Overseas CETP Lupin Ltd.
Co
ncen
trati
on
(µ
g/
m3
)
Tarapur
CO
Critically Polluted Areas: Monitoring, sampling, analysis of Stack, Ambient Air Quality, Surface Water, Ground Water, Waste Water
Tarapur 17
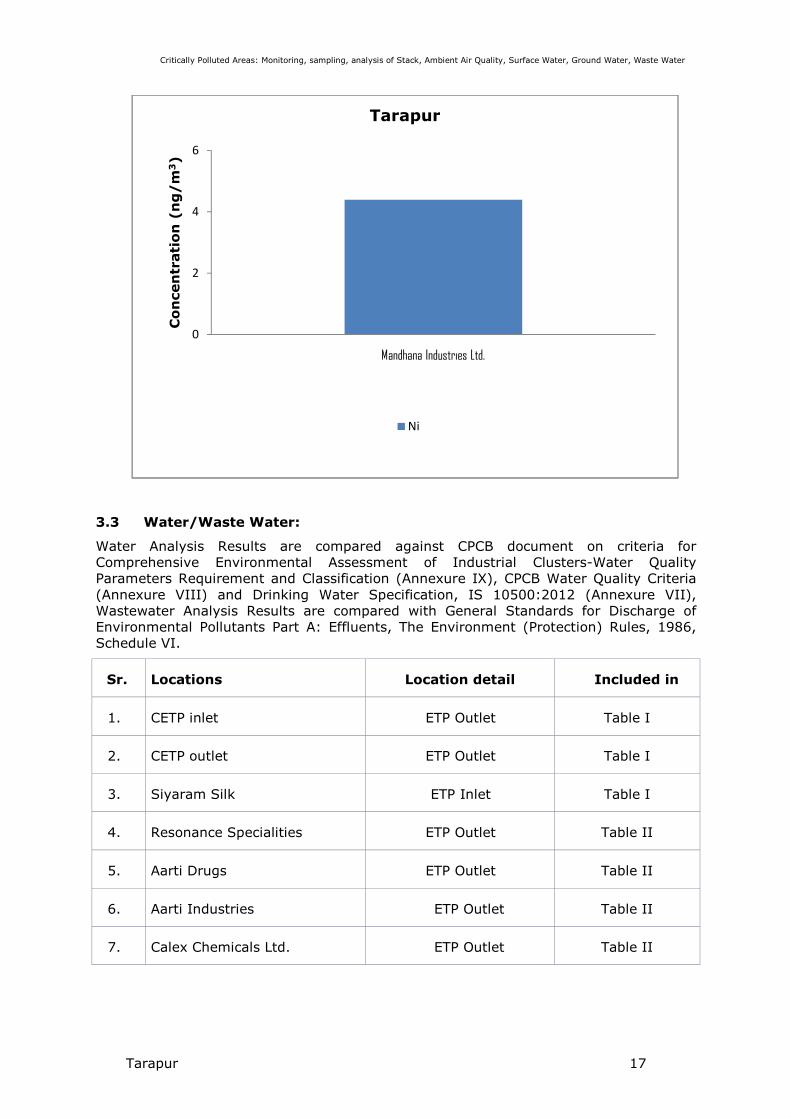
3.3 Water/Waste Water:
Water Analysis Results are compared against CPCB document on criteria for
Comprehensive Environmental Assessment of Industrial Clusters-Water Quality
Parameters Requirement and Classification (Annexure IX), CPCB Water Quality Criteria
(Annexure VIII) and Drinking Water Specification, IS 10500:2012 (Annexure VII),
Wastewater Analysis Results are compared with General Standards for Discharge of
Environmental Pollutants Part A: Effluents, The Environment (Protection) Rules, 1986,
Schedule VI.
Sr. Locations Location detail Included in
1. CETP inlet ETP Outlet Table I
2. CETP outlet ETP Outlet Table I
3. Siyaram Silk ETP Inlet Table I
4. Resonance Specialities ETP Outlet Table II
5. Aarti Drugs ETP Outlet Table II
6. Aarti Industries ETP Outlet Table II
7. Calex Chemicals Ltd. ETP Outlet Table II
0
2
4
6
Mandhana Industries Ltd.
Co
ncen
trati
on
(n
g/
m3)
Tarapur
Ni
Critically Polluted Areas: Monitoring, sampling, analysis of Stack, Ambient Air Quality, Surface Water, Ground Water, Waste Water
Tarapur 18
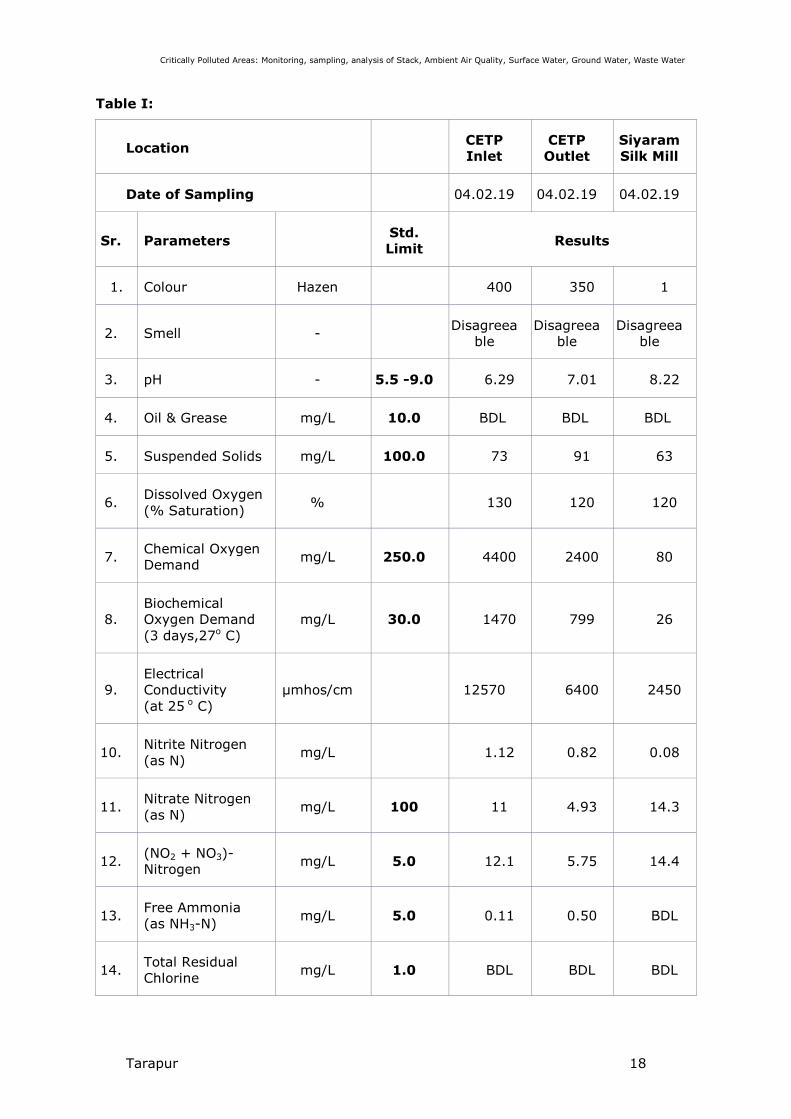
Table I:
Location CETP
Inlet
CETP
Outlet
Siyaram
Silk Mill
Date of Sampling 04.02.19 04.02.19 04.02.19
Sr. Parameters Std.
Limit Results
1. Colour Hazen 400 350 1
2. Smell - Disagreea
ble
Disagreea
ble
Disagreea
ble
3. pH - 5.5 -9.0 6.29 7.01 8.22
4. Oil & Grease mg/L 10.0 BDL BDL BDL
5. Suspended Solids mg/L 100.0 73 91 63
6. Dissolved Oxygen
(% Saturation) % 130 120 120
7. Chemical Oxygen
Demand mg/L 250.0 4400 2400 80
8.
Biochemical
Oxygen Demand
(3 days,27o C)
mg/L 30.0 1470 799 26
9.
Electrical
Conductivity
(at 25 o C)
µmhos/cm 12570 6400 2450
10. Nitrite Nitrogen
(as N) mg/L 1.12 0.82 0.08
11. Nitrate Nitrogen
(as N) mg/L 100 11 4.93 14.3
12. (NO2 + NO3)-
Nitrogen mg/L 5.0 12.1 5.75 14.4
13. Free Ammonia
(as NH3-N) mg/L 5.0 0.11 0.50 BDL
14. Total Residual
Chlorine mg/L 1.0 BDL BDL BDL
Critically Polluted Areas: Monitoring, sampling, analysis of Stack, Ambient Air Quality, Surface Water, Ground Water, Waste Water
Tarapur 19
Location CETP
Inlet
CETP
Outlet
Siyaram
Silk Mill
Date of Sampling 04.02.19 04.02.19 04.02.19
Sr. Parameters Std.
Limit Results
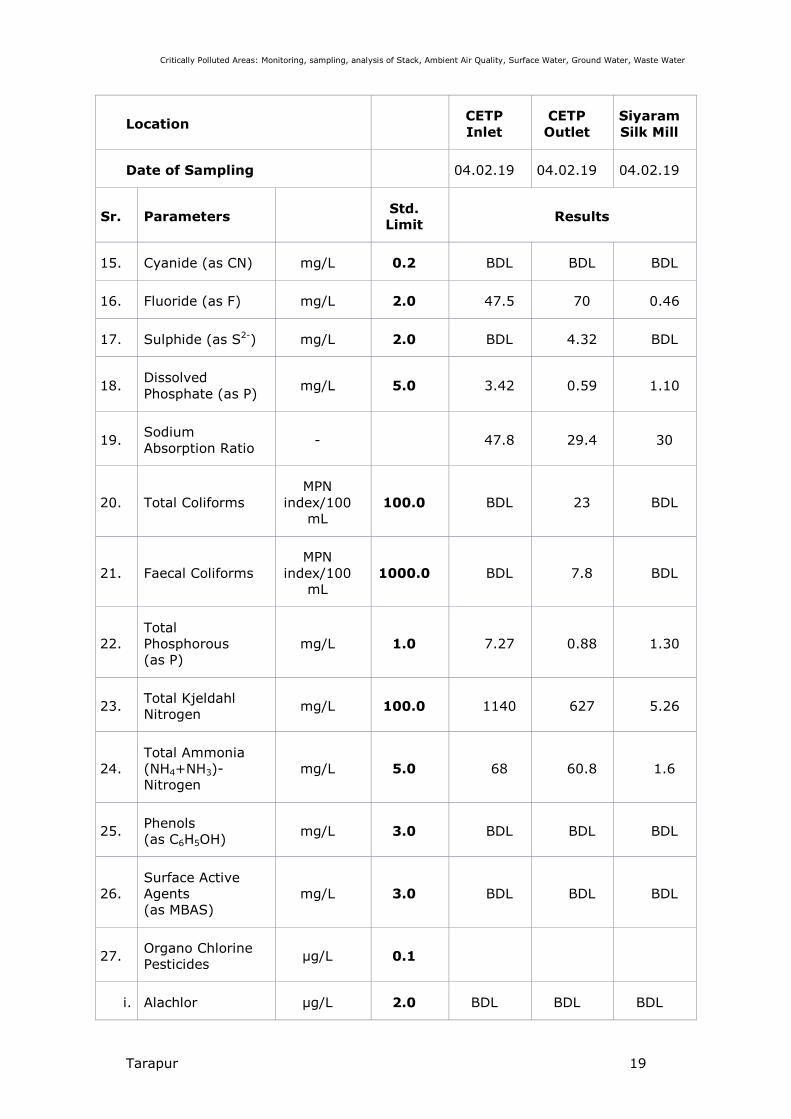
15. Cyanide (as CN) mg/L 0.2 BDL BDL BDL
16. Fluoride (as F) mg/L 2.0 47.5 70 0.46
17. Sulphide (as S2-) mg/L 2.0 BDL 4.32 BDL
18. Dissolved
Phosphate (as P) mg/L 5.0 3.42 0.59 1.10
19. Sodium
Absorption Ratio - 47.8 29.4 30
20. Total Coliforms
MPN
index/100
mL
100.0 BDL 23 BDL
21. Faecal Coliforms
MPN
index/100
mL
1000.0 BDL 7.8 BDL
22.
Total
Phosphorous
(as P)
mg/L 1.0 7.27 0.88 1.30
23. Total Kjeldahl
Nitrogen mg/L 100.0 1140 627 5.26
24.
Total Ammonia
(NH4+NH3)-
Nitrogen
mg/L 5.0 68 60.8 1.6
25. Phenols
(as C6H5OH) mg/L 3.0 BDL BDL BDL
26.
Surface Active
Agents
(as MBAS)
mg/L 3.0 BDL BDL BDL
27. Organo Chlorine
Pesticides µg/L 0.1
i. Alachlor µg/L 2.0 BDL BDL BDL
Critically Polluted Areas: Monitoring, sampling, analysis of Stack, Ambient Air Quality, Surface Water, Ground Water, Waste Water
Tarapur 20
Location CETP
Inlet
CETP
Outlet
Siyaram
Silk Mill
Date of Sampling 04.02.19 04.02.19 04.02.19
Sr. Parameters Std.
Limit Results
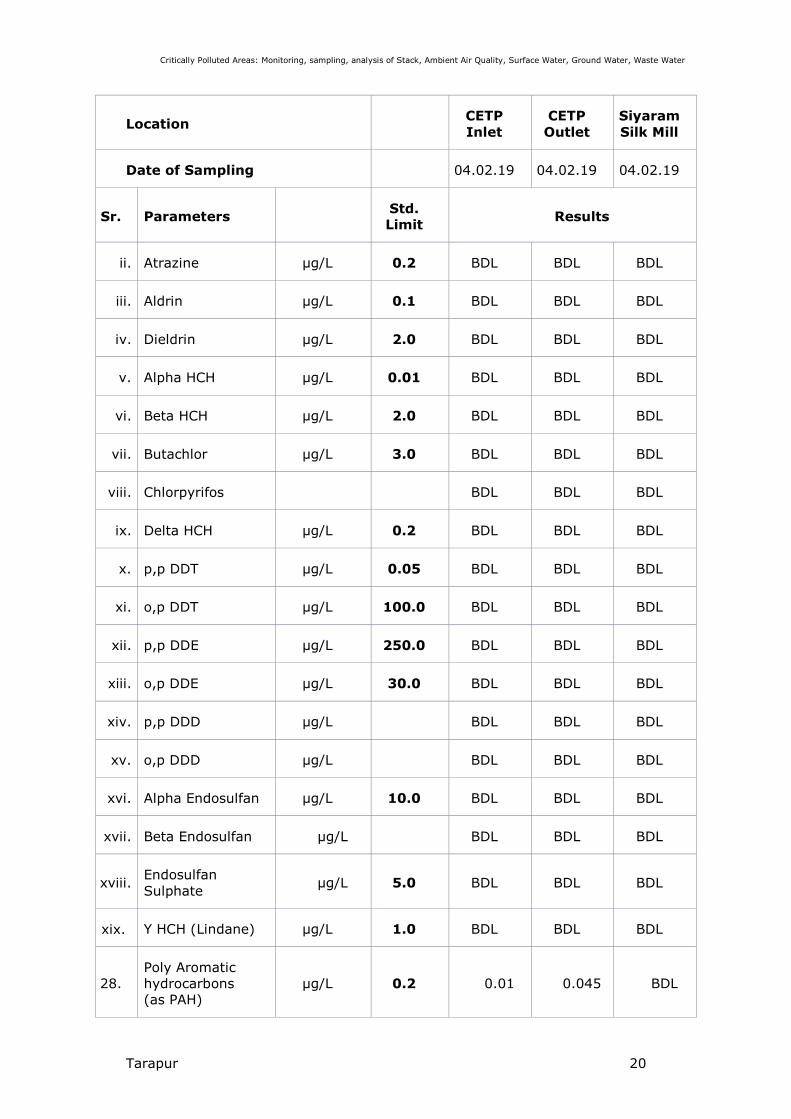
ii. Atrazine µg/L 0.2 BDL BDL BDL
iii. Aldrin µg/L 0.1 BDL BDL BDL
iv. Dieldrin µg/L 2.0 BDL BDL BDL
v. Alpha HCH µg/L 0.01 BDL BDL BDL
vi. Beta HCH µg/L 2.0 BDL BDL BDL
vii. Butachlor µg/L 3.0 BDL BDL BDL
viii. Chlorpyrifos BDL BDL BDL
ix. Delta HCH µg/L 0.2 BDL BDL BDL
x. p,p DDT µg/L 0.05 BDL BDL BDL
xi. o,p DDT µg/L 100.0 BDL BDL BDL
xii. p,p DDE µg/L 250.0 BDL BDL BDL
xiii. o,p DDE µg/L 30.0 BDL BDL BDL
xiv. p,p DDD µg/L BDL BDL BDL
xv. o,p DDD µg/L BDL BDL BDL
xvi. Alpha Endosulfan µg/L 10.0 BDL BDL BDL
xvii. Beta Endosulfan µg/L BDL BDL BDL
xviii. Endosulfan
Sulphate µg/L 5.0 BDL BDL BDL
xix. Y HCH (Lindane) µg/L 1.0 BDL BDL BDL
28.
Poly Aromatic
hydrocarbons
(as PAH)
µg/L 0.2 0.01 0.045 BDL
Critically Polluted Areas: Monitoring, sampling, analysis of Stack, Ambient Air Quality, Surface Water, Ground Water, Waste Water
Tarapur 21
Location CETP
Inlet
CETP
Outlet
Siyaram
Silk Mill
Date of Sampling 04.02.19 04.02.19 04.02.19
Sr. Parameters Std.
Limit Results
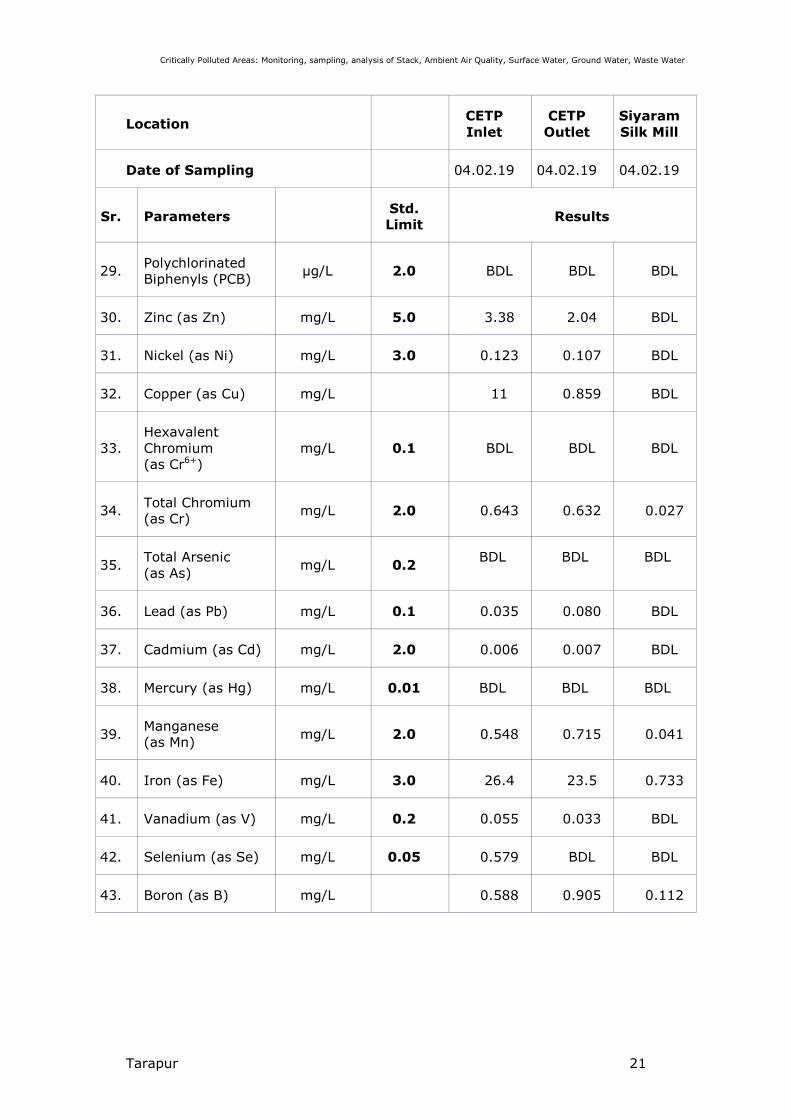
29. Polychlorinated
Biphenyls (PCB) µg/L 2.0 BDL BDL BDL
30. Zinc (as Zn) mg/L 5.0 3.38 2.04 BDL
31. Nickel (as Ni) mg/L 3.0 0.123 0.107 BDL
32. Copper (as Cu) mg/L 11 0.859 BDL
33.
Hexavalent
Chromium
(as Cr6+)
mg/L 0.1 BDL BDL BDL
34. Total Chromium
(as Cr) mg/L 2.0 0.643 0.632 0.027
35. Total Arsenic
(as As) mg/L 0.2
BDL BDL BDL
36. Lead (as Pb) mg/L 0.1 0.035 0.080 BDL
37. Cadmium (as Cd) mg/L 2.0 0.006 0.007 BDL
38. Mercury (as Hg) mg/L 0.01 BDL BDL BDL
39. Manganese
(as Mn) mg/L 2.0 0.548 0.715 0.041
40. Iron (as Fe) mg/L 3.0 26.4 23.5 0.733
41. Vanadium (as V) mg/L 0.2 0.055 0.033 BDL
42. Selenium (as Se) mg/L 0.05 0.579 BDL BDL
43. Boron (as B) mg/L 0.588 0.905 0.112
Critically Polluted Areas: Monitoring, sampling, analysis of Stack, Ambient Air Quality, Surface Water, Ground Water, Waste Water
Tarapur 22
Location CETP
Inlet
CETP
Outlet
Siyaram
Silk Mill
Date of Sampling 04.02.19 04.02.19 04.02.19
Sr. Parameters Std.
Limit Results
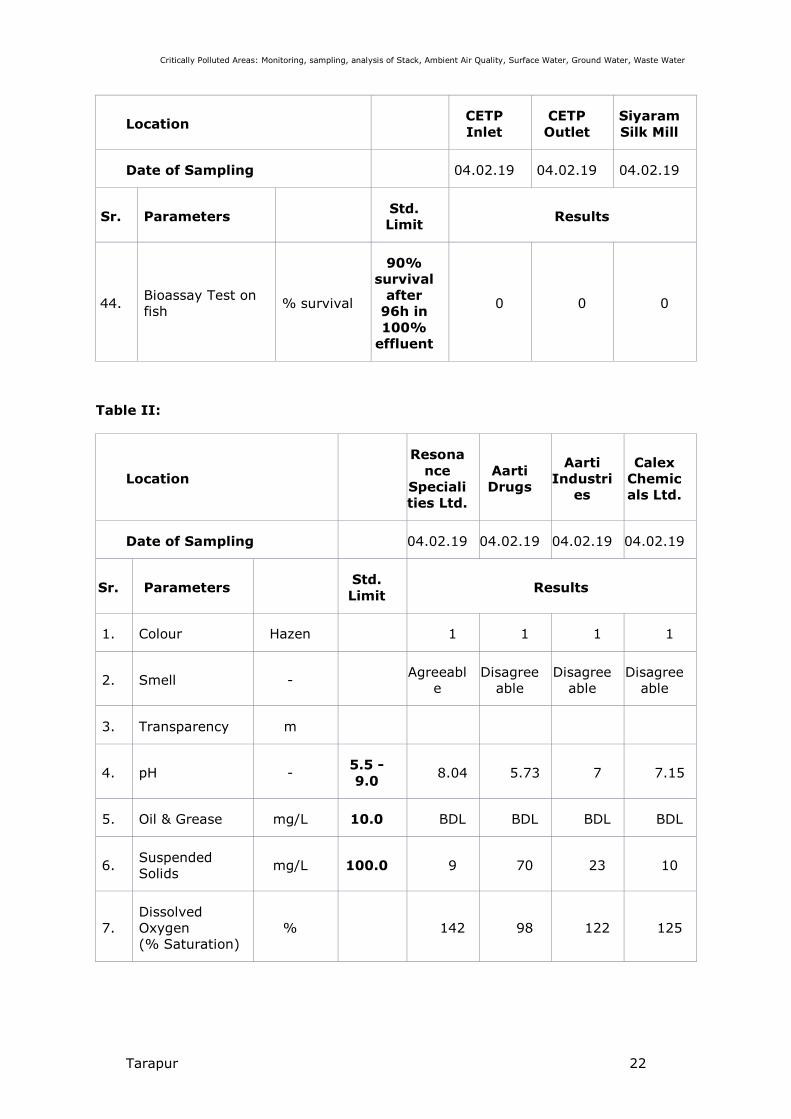
44. Bioassay Test on
fish % survival
90%
survival
after
96h in
100%
effluent
0 0 0
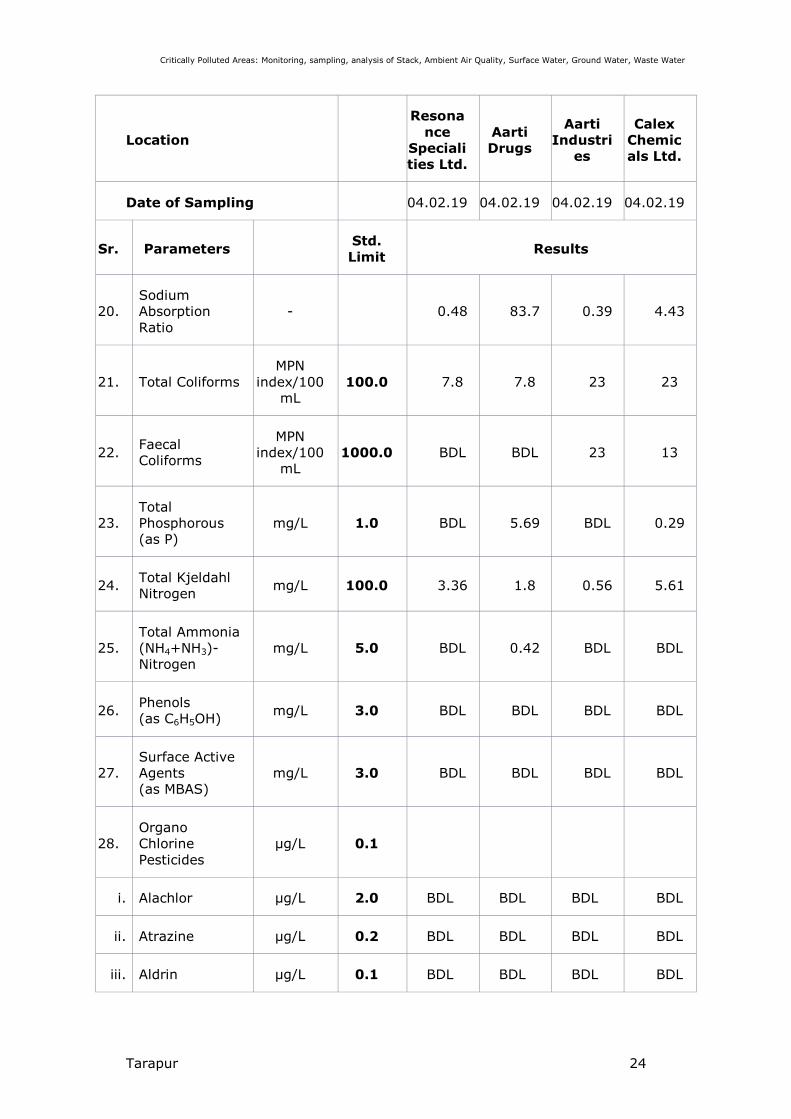
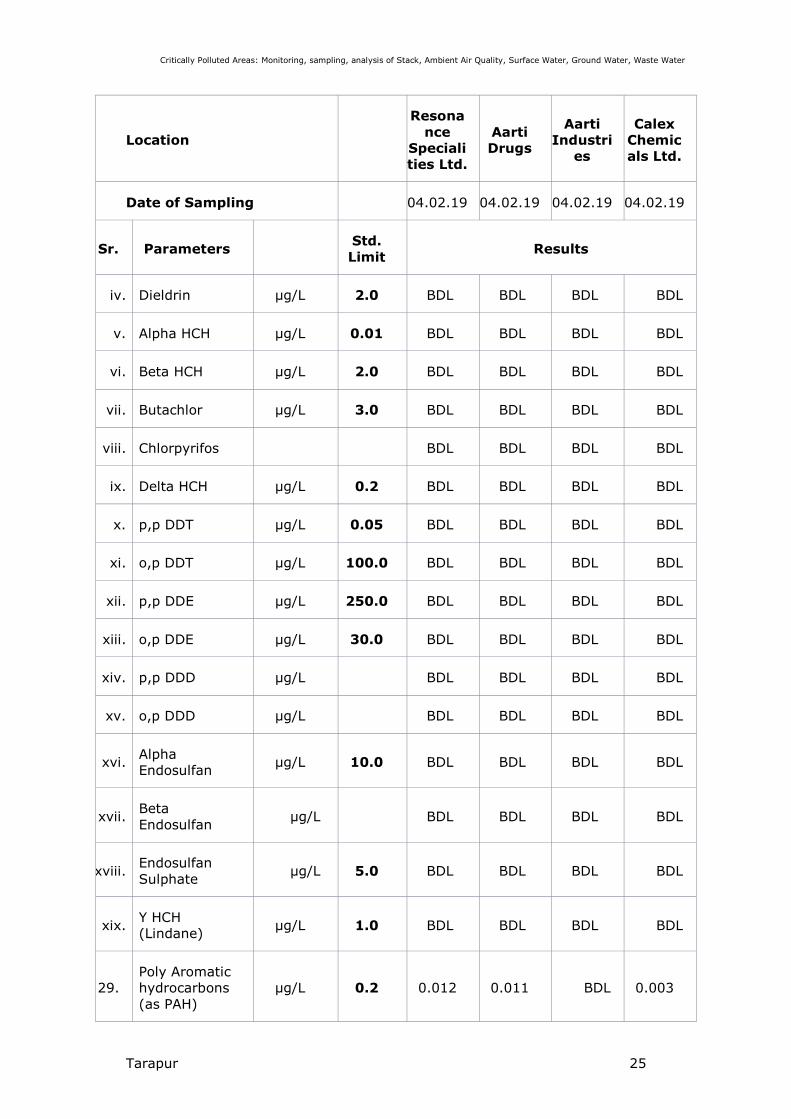
Table II:
Location
Resona
nce
Speciali
ties Ltd.
Aarti
Drugs
Aarti
Industri
es
Calex
Chemic
als Ltd.
Date of Sampling 04.02.19 04.02.19 04.02.19 04.02.19
Sr. Parameters Std.
Limit Results
1. Colour Hazen 1 1 1 1
2. Smell - Agreeabl
e
Disagree
able
Disagree
able
Disagree
able
3. Transparency m
4. pH - 5.5 -
9.0 8.04 5.73 7 7.15
5. Oil & Grease mg/L 10.0 BDL BDL BDL BDL
6. Suspended
Solids mg/L 100.0 9 70 23 10
7.
Dissolved
Oxygen
(% Saturation)
% 142 98 122 125
Critically Polluted Areas: Monitoring, sampling, analysis of Stack, Ambient Air Quality, Surface Water, Ground Water, Waste Water
Tarapur 23
Location
Resona
nce
Speciali
ties Ltd.
Aarti
Drugs
Aarti
Industri
es
Calex
Chemic
als Ltd.
Date of Sampling 04.02.19 04.02.19 04.02.19 04.02.19
Sr. Parameters Std.
Limit Results
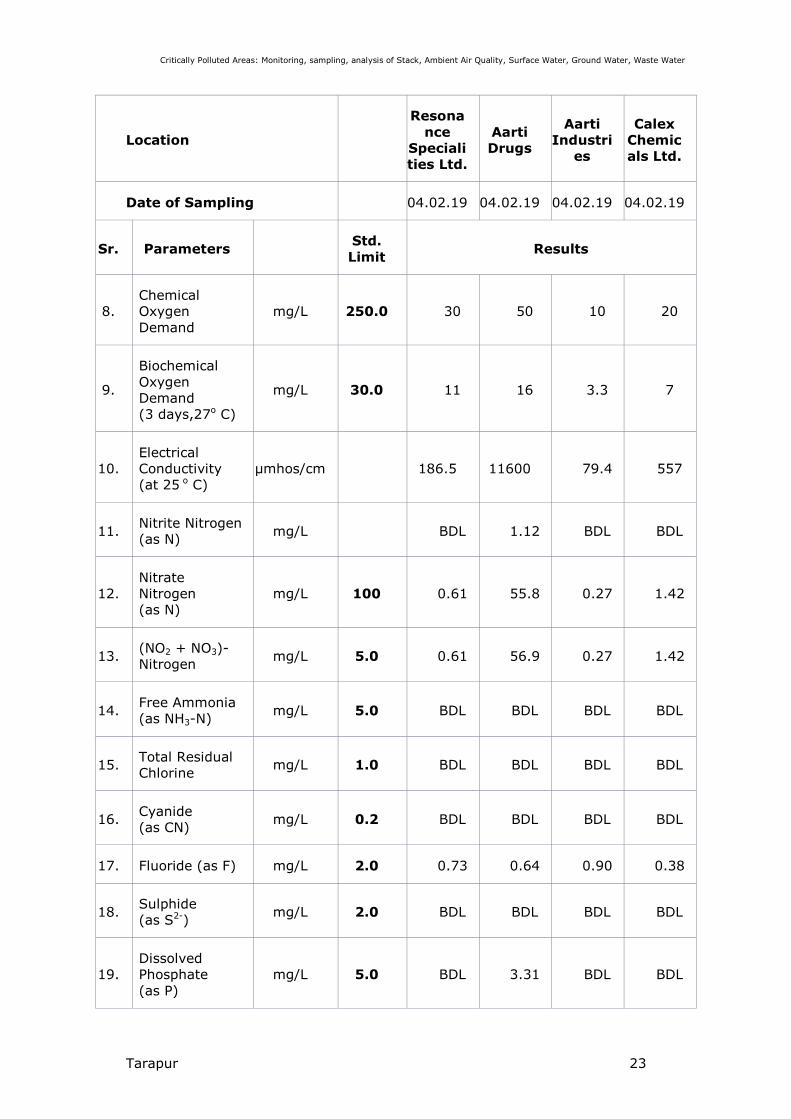
8.
Chemical
Oxygen
Demand
mg/L 250.0 30 50 10 20
9.
Biochemical
Oxygen
Demand
(3 days,27o C)
mg/L 30.0 11 16 3.3 7
10.
Electrical
Conductivity
(at 25 o C)
µmhos/cm 186.5 11600 79.4 557
11. Nitrite Nitrogen
(as N) mg/L BDL 1.12 BDL BDL
12.
Nitrate
Nitrogen
(as N)
mg/L 100 0.61 55.8 0.27 1.42
13. (NO2 + NO3)-
Nitrogen mg/L 5.0 0.61 56.9 0.27 1.42
14. Free Ammonia
(as NH3-N) mg/L 5.0 BDL BDL BDL BDL
15. Total Residual
Chlorine mg/L 1.0 BDL BDL BDL BDL
16. Cyanide
(as CN) mg/L 0.2 BDL BDL BDL BDL
17. Fluoride (as F) mg/L 2.0 0.73 0.64 0.90 0.38
18. Sulphide
(as S2-) mg/L 2.0 BDL BDL BDL BDL
19.
Dissolved
Phosphate
(as P)
mg/L 5.0 BDL 3.31 BDL BDL
Critically Polluted Areas: Monitoring, sampling, analysis of Stack, Ambient Air Quality, Surface Water, Ground Water, Waste Water
Tarapur 24
Location
Resona
nce
Speciali
ties Ltd.
Aarti
Drugs
Aarti
Industri
es
Calex
Chemic
als Ltd.
Date of Sampling 04.02.19 04.02.19 04.02.19 04.02.19
Sr. Parameters Std.
Limit Results
20.
Sodium
Absorption
Ratio
- 0.48 83.7 0.39 4.43
21. Total Coliforms
MPN
index/100
mL
100.0 7.8 7.8 23 23
22. Faecal
Coliforms
MPN
index/100
mL
1000.0 BDL BDL 23 13
23.
Total
Phosphorous
(as P)
mg/L 1.0 BDL 5.69 BDL 0.29
24. Total Kjeldahl
Nitrogen mg/L 100.0 3.36 1.8 0.56 5.61
25.
Total Ammonia
(NH4+NH3)-
Nitrogen
mg/L 5.0 BDL 0.42 BDL BDL
26. Phenols
(as C6H5OH) mg/L 3.0 BDL BDL BDL BDL
27.
Surface Active
Agents
(as MBAS)
mg/L 3.0 BDL BDL BDL BDL
28.
Organo
Chlorine
Pesticides
µg/L 0.1
i. Alachlor µg/L 2.0 BDL BDL BDL BDL
ii. Atrazine µg/L 0.2 BDL BDL BDL BDL
iii. Aldrin µg/L 0.1 BDL BDL BDL BDL
Critically Polluted Areas: Monitoring, sampling, analysis of Stack, Ambient Air Quality, Surface Water, Ground Water, Waste Water
Tarapur 25
Location
Resona
nce
Speciali
ties Ltd.
Aarti
Drugs
Aarti
Industri
es
Calex
Chemic
als Ltd.
Date of Sampling 04.02.19 04.02.19 04.02.19 04.02.19
Sr. Parameters Std.
Limit Results
iv. Dieldrin µg/L 2.0 BDL BDL BDL BDL
v. Alpha HCH µg/L 0.01 BDL BDL BDL BDL
vi. Beta HCH µg/L 2.0 BDL BDL BDL BDL
vii. Butachlor µg/L 3.0 BDL BDL BDL BDL
viii. Chlorpyrifos BDL BDL BDL BDL
ix. Delta HCH µg/L 0.2 BDL BDL BDL BDL
x. p,p DDT µg/L 0.05 BDL BDL BDL BDL
xi. o,p DDT µg/L 100.0 BDL BDL BDL BDL
xii. p,p DDE µg/L 250.0 BDL BDL BDL BDL
xiii. o,p DDE µg/L 30.0 BDL BDL BDL BDL
xiv. p,p DDD µg/L BDL BDL BDL BDL
xv. o,p DDD µg/L BDL BDL BDL BDL
xvi. Alpha
Endosulfan µg/L 10.0 BDL BDL BDL BDL
xvii. Beta
Endosulfan µg/L BDL BDL BDL BDL
xviii. Endosulfan
Sulphate µg/L 5.0 BDL BDL BDL BDL
xix. Y HCH
(Lindane) µg/L 1.0 BDL BDL BDL BDL
29.
Poly Aromatic
hydrocarbons
(as PAH)
µg/L 0.2 0.012 0.011 BDL 0.003

Critically Polluted Areas: Monitoring, sampling, analysis of Stack, Ambient Air Quality, Surface Water, Ground Water, Waste Water
Tarapur 26
Location
Resona
nce
Speciali
ties Ltd.
Aarti
Drugs
Aarti
Industri
es
Calex
Chemic
als Ltd.
Date of Sampling 04.02.19 04.02.19 04.02.19 04.02.19
Sr. Parameters Std.
Limit Results
30.
Polychlorinated
Biphenyls
(PCB)
µg/L 2.0 BDL BDL BDL BDL
31. Zinc (as Zn) mg/L 5.0 BDL 0.741 BDL BDL
32. Nickel (as Ni) mg/L 3.0 BDL 0.042 BDL BDL
33. Copper (as Cu) mg/L BDL BDL BDL BDL
34.
Hexavalent
Chromium
(as Cr6+)
mg/L 0.1 BDL BDL BDL BDL
35.
Total
Chromium
(as Cr)
mg/L 2.0 BDL BDL BDL BDL
36. Total Arsenic
(as As) mg/L 0.2 BDL BDL BDL BDL
37. Lead (as Pb) mg/L 0.1 BDL BDL BDL BDL
38. Cadmium
(as Cd) mg/L 2.0 BDL BDL BDL 0.016
39. Mercury
(as Hg) mg/L 0.01 BDL BDL BDL BDL
40. Manganese
(as Mn) mg/L 2.0 BDL 0.269 BDL BDL
41. Iron (as Fe) mg/L 3.0 0.193 5.28 0.366 0.234
42. Vanadium
(as V) mg/L 0.2 BDL BDL BDL BDL
43. Selenium
(as Se) mg/L 0.05 BDL BDL BDL BDL
Critically Polluted Areas: Monitoring, sampling, analysis of Stack, Ambient Air Quality, Surface Water, Ground Water, Waste Water
Tarapur 27
Location
Resona
nce
Speciali
ties Ltd.
Aarti
Drugs
Aarti
Industri
es
Calex
Chemic
als Ltd.
Date of Sampling 04.02.19 04.02.19 04.02.19 04.02.19
Sr. Parameters Std.
Limit Results
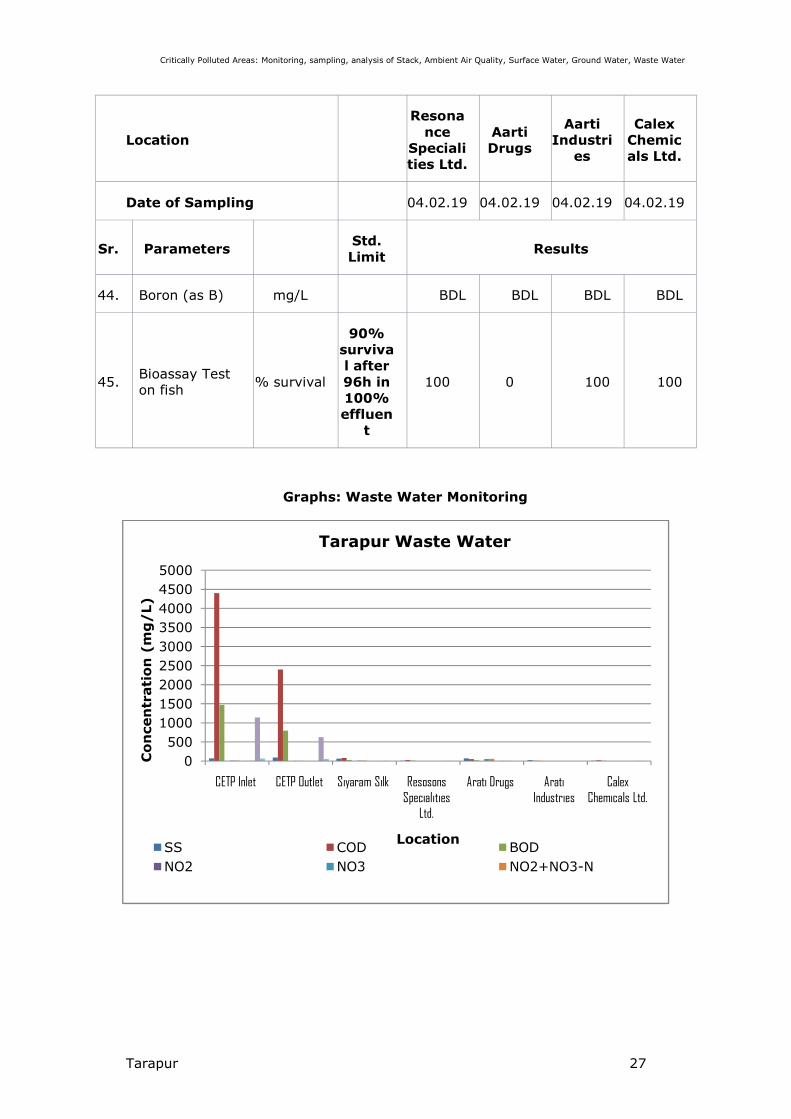
44. Boron (as B) mg/L BDL BDL BDL BDL
45. Bioassay Test
on fish % survival
90%
surviva
l after
96h in
100%
effluen
t
100 0 100 100
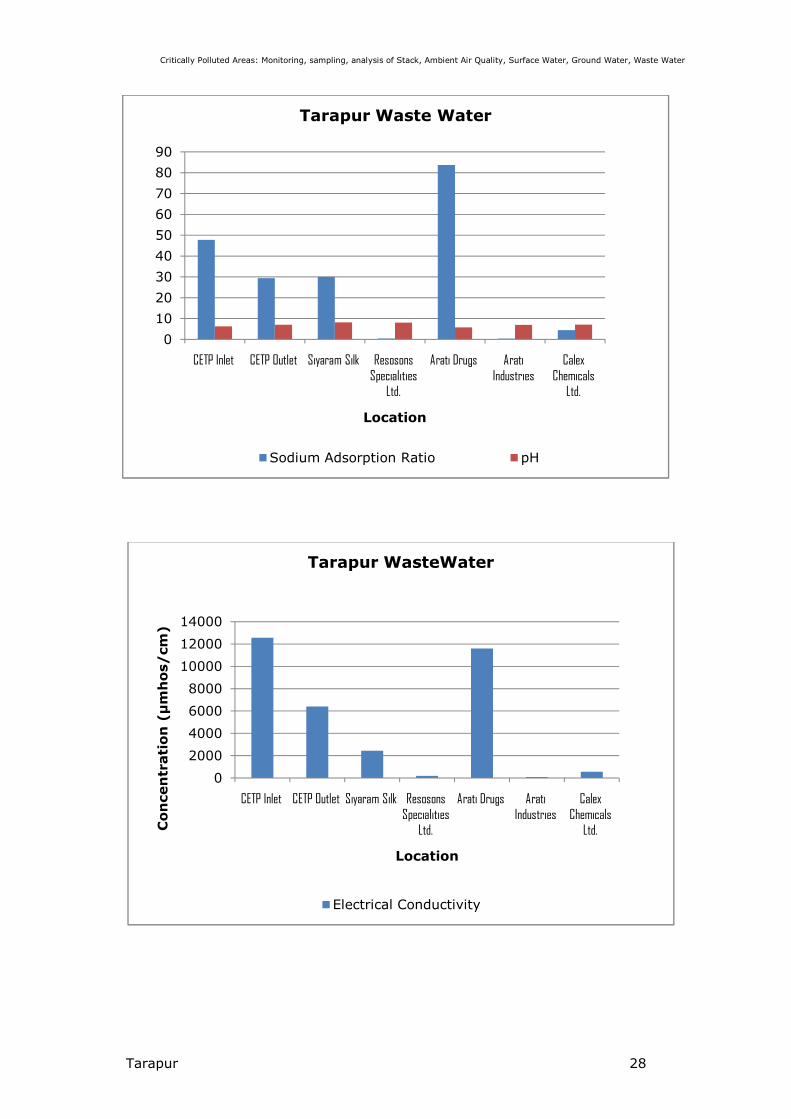
Graphs: Waste Water Monitoring
0
500
1000
1500
2000
2500
3000
3500
4000
4500
5000
CETP Inlet CETP Outlet Siyaram Silk Resosons Specialities
Ltd.
Arati Drugs Arati Industries
Calex Chemicals Ltd.
Co
ncen
trati
on
(m
g/
L)
Location
Tarapur Waste Water
SS COD BOD
NO2 NO3 NO2+NO3-N
Critically Polluted Areas: Monitoring, sampling, analysis of Stack, Ambient Air Quality, Surface Water, Ground Water, Waste Water
Tarapur 28
0
10
20
30
40
50
60
70
80
90
CETP Inlet CETP Outlet Siyaram Silk Resosons Specialities
Ltd.
Arati Drugs Arati Industries
Calex Chemicals
Ltd.
Location
Tarapur Waste Water
Sodium Adsorption Ratio pH
0
2000
4000
6000
8000
10000
12000
14000
CETP Inlet CETP Outlet Siyaram Silk Resosons Specialities
Ltd.
Arati Drugs Arati Industries
Calex Chemicals
Ltd. Co
ncen
trati
on
(µ
mh
os/
cm
)
Location
Tarapur WasteWater
Electrical Conductivity

Critically Polluted Areas: Monitoring, sampling, analysis of Stack, Ambient Air Quality, Surface Water, Ground Water, Waste Water
Tarapur 29
0
5
10
15
20
25
CETP Outlet Resosons Specialities Ltd.
Arati Drugs Arati Industries Calex Chemicals Ltd.
MP
N I
nd
ex/
10
0m
l
Location
Tarapur Waste Water
Total Coliforms Faecal Coliforms
0
20
40
60
80
100
120
Resosons Specialities Ltd. Arati Industries Calex Chemicals Ltd.
% s
urviv
al
Location
Tarapur WasteWater
Bioassay Test on Fish
Critically Polluted Areas: Monitoring, sampling, analysis of Stack, Ambient Air Quality, Surface Water, Ground Water, Waste Water
Tarapur 30
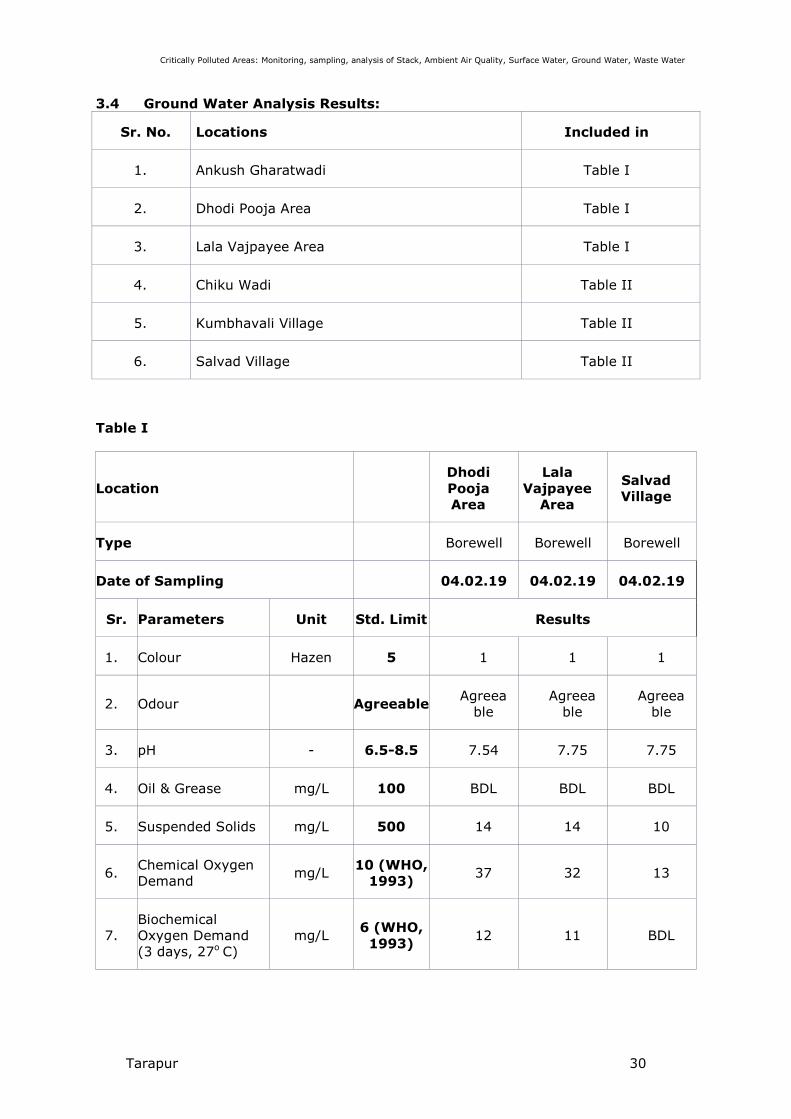
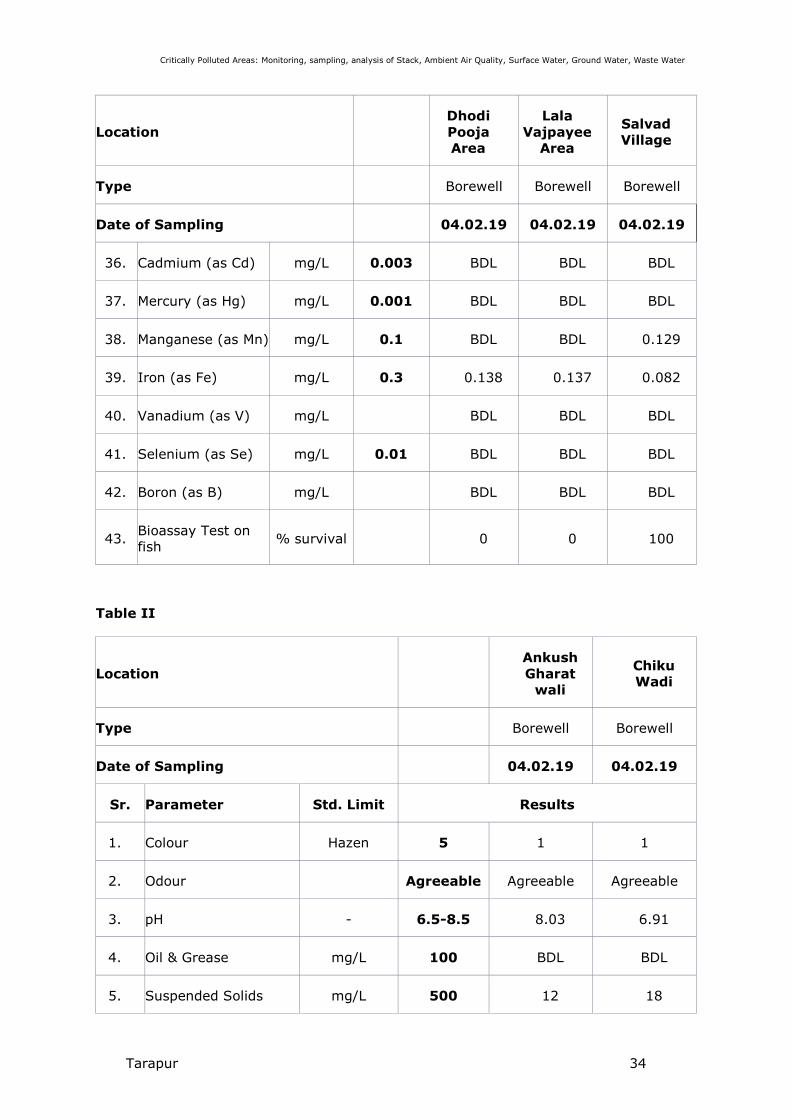
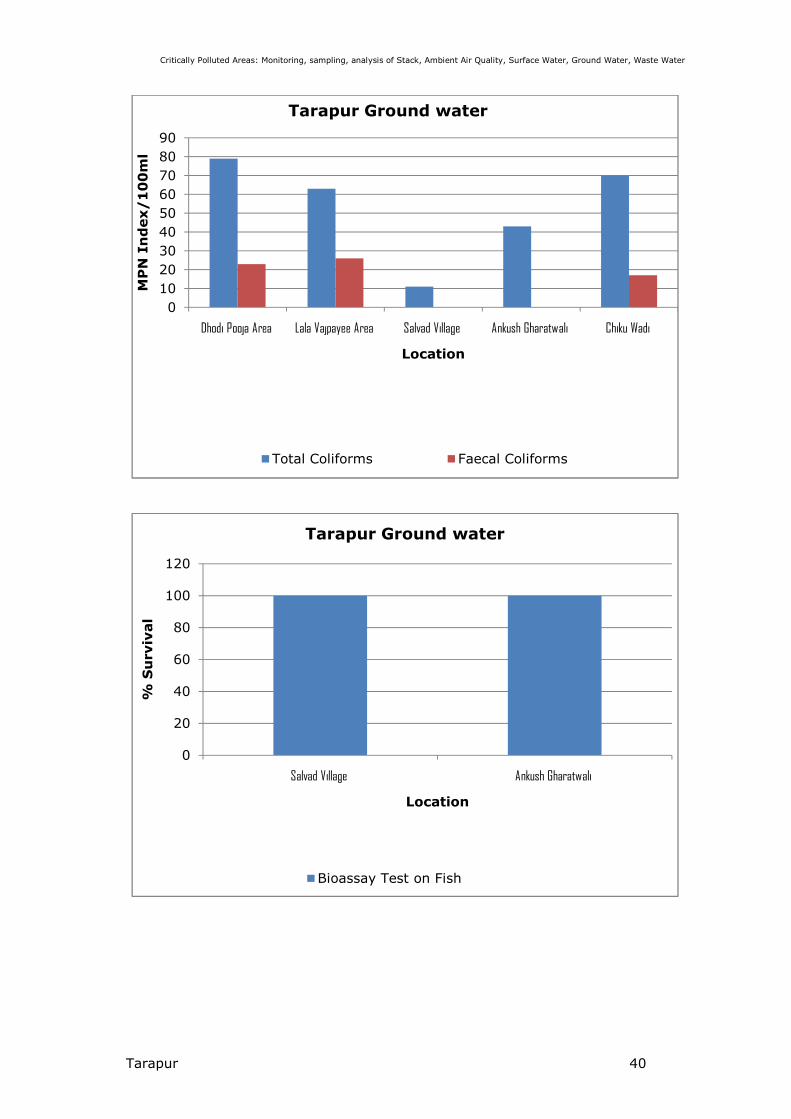
3.4 Ground Water Analysis Results:
Sr. No. Locations Included in
1. Ankush Gharatwadi Table I
2. Dhodi Pooja Area Table I
3. Lala Vajpayee Area Table I
4. Chiku Wadi Table II
5. Kumbhavali Village Table II
6. Salvad Village Table II
Table I
Location
Dhodi
Pooja
Area
Lala
Vajpayee
Area
Salvad
Village
Type Borewell Borewell Borewell
Date of Sampling 04.02.19 04.02.19 04.02.19
Sr. Parameters Unit Std. Limit Results
1. Colour Hazen 5 1 1 1
2. Odour Agreeable Agreea
ble
Agreea
ble
Agreea
ble
3. pH - 6.5-8.5 7.54 7.75 7.75
4. Oil & Grease mg/L 100 BDL BDL BDL
5. Suspended Solids mg/L 500 14 14 10
6. Chemical Oxygen
Demand mg/L
10 (WHO,
1993) 37 32 13
7.
Biochemical
Oxygen Demand
(3 days, 27o C)
mg/L 6 (WHO,
1993) 12 11 BDL
Critically Polluted Areas: Monitoring, sampling, analysis of Stack, Ambient Air Quality, Surface Water, Ground Water, Waste Water
Tarapur 31
Location
Dhodi
Pooja
Area
Lala
Vajpayee
Area
Salvad
Village
Type Borewell Borewell Borewell
Date of Sampling 04.02.19 04.02.19 04.02.19
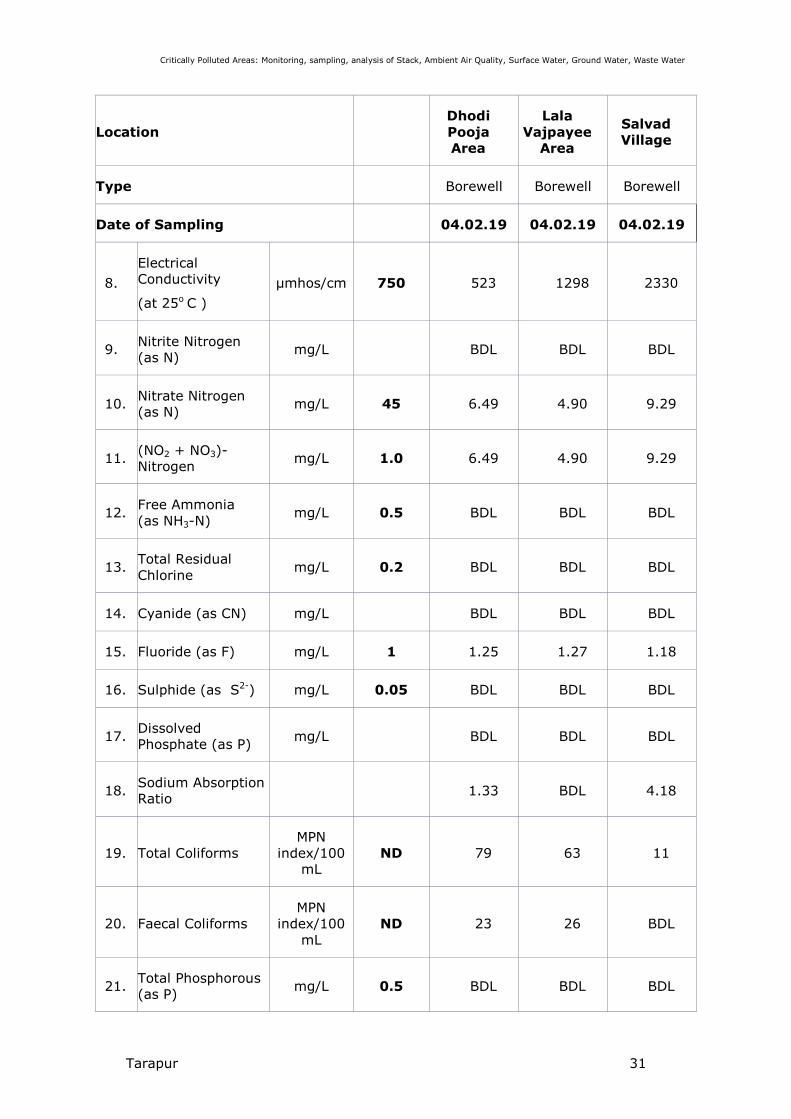
8.
Electrical
Conductivity
(at 25o C )
µmhos/cm 750 523 1298 2330
9. Nitrite Nitrogen
(as N) mg/L BDL BDL BDL
10. Nitrate Nitrogen
(as N) mg/L 45 6.49 4.90 9.29
11. (NO2 + NO3)-
Nitrogen mg/L 1.0 6.49 4.90 9.29
12. Free Ammonia
(as NH3-N) mg/L 0.5 BDL BDL BDL
13. Total Residual
Chlorine mg/L 0.2 BDL BDL BDL
14. Cyanide (as CN) mg/L BDL BDL BDL
15. Fluoride (as F) mg/L 1 1.25 1.27 1.18
16. Sulphide (as S2-) mg/L 0.05 BDL BDL BDL
17. Dissolved
Phosphate (as P) mg/L BDL BDL BDL
18. Sodium Absorption
Ratio 1.33 BDL 4.18
19. Total Coliforms
MPN
index/100
mL
ND 79 63 11
20. Faecal Coliforms
MPN
index/100
mL
ND 23 26 BDL
21. Total Phosphorous
(as P) mg/L 0.5 BDL BDL BDL
Critically Polluted Areas: Monitoring, sampling, analysis of Stack, Ambient Air Quality, Surface Water, Ground Water, Waste Water
Tarapur 32
Location
Dhodi
Pooja
Area
Lala
Vajpayee
Area
Salvad
Village
Type Borewell Borewell Borewell
Date of Sampling 04.02.19 04.02.19 04.02.19
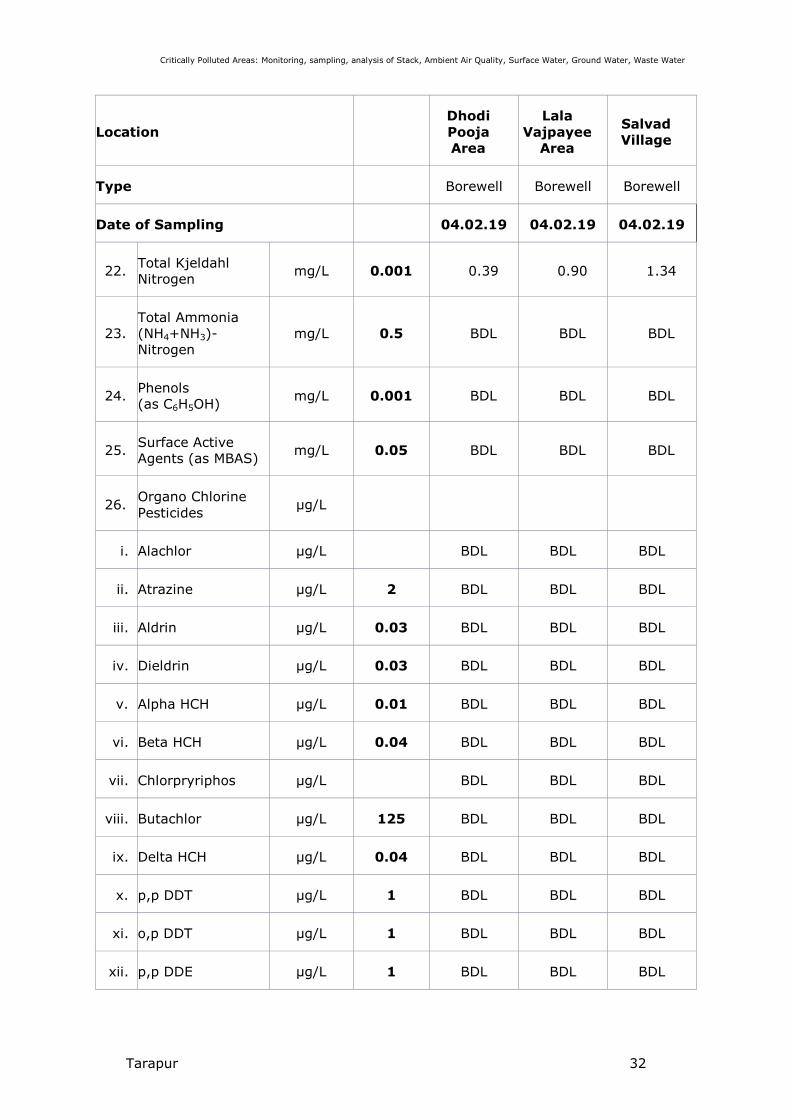
22. Total Kjeldahl
Nitrogen mg/L 0.001 0.39 0.90 1.34
23. Total Ammonia
(NH4+NH3)-
Nitrogen
mg/L 0.5 BDL BDL BDL
24. Phenols
(as C6H5OH) mg/L 0.001 BDL BDL BDL
25. Surface Active
Agents (as MBAS) mg/L 0.05 BDL BDL BDL
26. Organo Chlorine
Pesticides µg/L
i. Alachlor µg/L BDL BDL BDL
ii. Atrazine µg/L 2 BDL BDL BDL
iii. Aldrin µg/L 0.03 BDL BDL BDL
iv. Dieldrin µg/L 0.03 BDL BDL BDL
v. Alpha HCH µg/L 0.01 BDL BDL BDL
vi. Beta HCH µg/L 0.04 BDL BDL BDL
vii. Chlorpryriphos µg/L BDL BDL BDL
viii. Butachlor µg/L 125 BDL BDL BDL
ix. Delta HCH µg/L 0.04 BDL BDL BDL
x. p,p DDT µg/L 1 BDL BDL BDL
xi. o,p DDT µg/L 1 BDL BDL BDL
xii. p,p DDE µg/L 1 BDL BDL BDL
Critically Polluted Areas: Monitoring, sampling, analysis of Stack, Ambient Air Quality, Surface Water, Ground Water, Waste Water
Tarapur 33
Location
Dhodi
Pooja
Area
Lala
Vajpayee
Area
Salvad
Village
Type Borewell Borewell Borewell
Date of Sampling 04.02.19 04.02.19 04.02.19
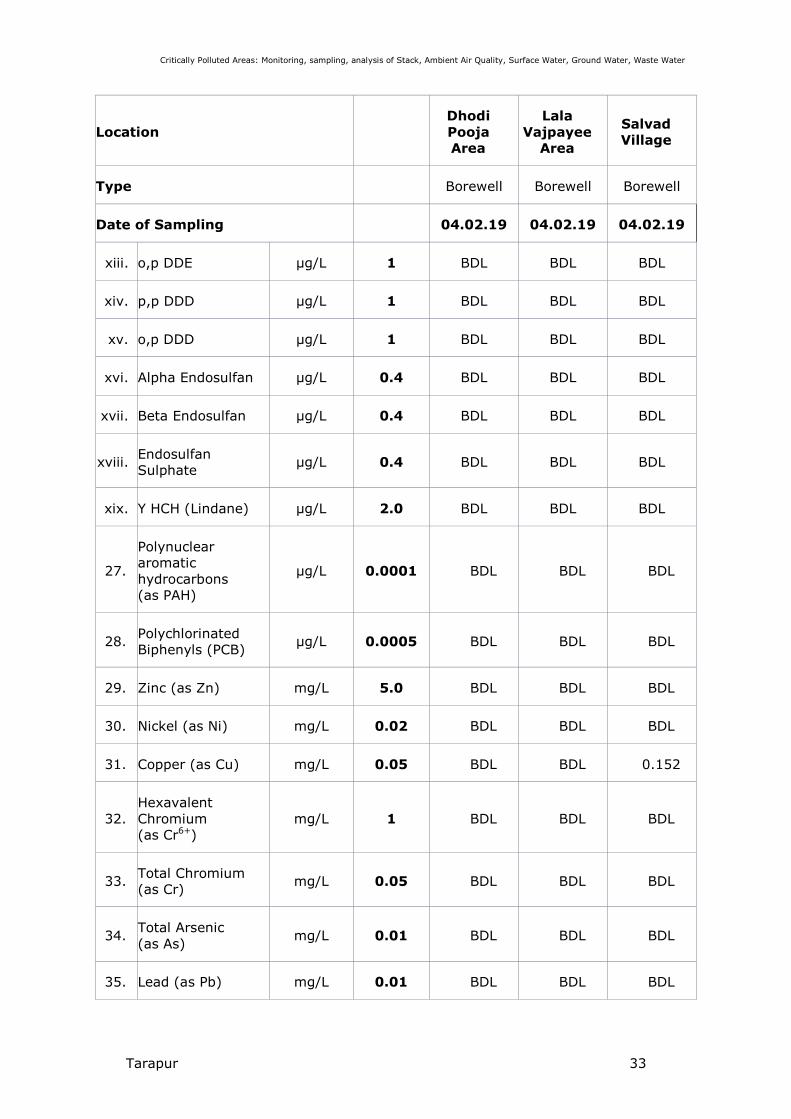
xiii. o,p DDE µg/L 1 BDL BDL BDL
xiv. p,p DDD µg/L 1 BDL BDL BDL
xv. o,p DDD µg/L 1 BDL BDL BDL
xvi. Alpha Endosulfan µg/L 0.4 BDL BDL BDL
xvii. Beta Endosulfan µg/L 0.4 BDL BDL BDL
xviii. Endosulfan
Sulphate µg/L 0.4 BDL BDL BDL
xix. Y HCH (Lindane) µg/L 2.0 BDL BDL BDL
27.
Polynuclear
aromatic
hydrocarbons
(as PAH)
µg/L 0.0001 BDL BDL BDL
28. Polychlorinated
Biphenyls (PCB) µg/L 0.0005 BDL BDL BDL
29. Zinc (as Zn) mg/L 5.0 BDL BDL BDL
30. Nickel (as Ni) mg/L 0.02 BDL BDL BDL
31. Copper (as Cu) mg/L 0.05 BDL BDL 0.152
32. Hexavalent
Chromium
(as Cr6+)
mg/L 1 BDL BDL BDL
33. Total Chromium
(as Cr) mg/L 0.05 BDL BDL BDL
34. Total Arsenic
(as As) mg/L 0.01 BDL BDL BDL
35. Lead (as Pb) mg/L 0.01 BDL BDL BDL
Critically Polluted Areas: Monitoring, sampling, analysis of Stack, Ambient Air Quality, Surface Water, Ground Water, Waste Water
Tarapur 34
Location
Dhodi
Pooja
Area
Lala
Vajpayee
Area
Salvad
Village
Type Borewell Borewell Borewell
Date of Sampling 04.02.19 04.02.19 04.02.19
36. Cadmium (as Cd) mg/L 0.003 BDL BDL BDL
37. Mercury (as Hg) mg/L 0.001 BDL BDL BDL
38. Manganese (as Mn) mg/L 0.1 BDL BDL 0.129
39. Iron (as Fe) mg/L 0.3 0.138 0.137 0.082
40. Vanadium (as V) mg/L BDL BDL BDL
41. Selenium (as Se) mg/L 0.01 BDL BDL BDL
42. Boron (as B) mg/L BDL BDL BDL
43. Bioassay Test on
fish % survival 0 0 100
Table II
Location
Ankush
Gharat
wali
Chiku
Wadi
Type Borewell Borewell
Date of Sampling 04.02.19 04.02.19
Sr. Parameter Std. Limit Results
1. Colour Hazen 5 1 1
2. Odour Agreeable Agreeable Agreeable
3. pH - 6.5-8.5 8.03 6.91
4. Oil & Grease mg/L 100 BDL BDL
5. Suspended Solids mg/L 500 12 18

Critically Polluted Areas: Monitoring, sampling, analysis of Stack, Ambient Air Quality, Surface Water, Ground Water, Waste Water
Tarapur 35
Location
Ankush
Gharat
wali
Chiku
Wadi
Type Borewell Borewell
Date of Sampling 04.02.19 04.02.19
6. Chemical Oxygen
Demand mg/L
10 (WHO,
1993) BDL 31
7.
Biochemical Oxygen
Demand (3 days, 27o
C)
mg/L 6 (WHO,
1993) BDL 10.3
8. Electrical Conductivity
(at 25o C ) µmhos/cm 1000 745 5570
9. Nitrite Nitrogen
(as N) mg/L BDL BDL
10. Nitrate Nitrogen (as N) mg/L 45 4.22 19.1
11. (NO2 + NO3)-Nitrogen mg/L 1.0 4.22 19.1
12. Free Ammonia
(as NH3-N) mg/L 0.5 BDL BDL
13. Total Residual Chlorine mg/L 0.2 BDL BDL
14. Cyanide (as CN) mg/L BDL BDL
15. Fluoride (as F) mg/L 1 0.63 0.75
16. Sulphide (as S2-) mg/L 0.05 BDL BDL
17. Dissolved Phosphate
(as P) mg/L BDL BDL
18. Sodium Absorption
Ratio 0.58 1.34
19. Total Coliforms MPN
index/100 mL ND 43 70
20. Faecal Coliforms MPN
index/100 mL ND BDL 17
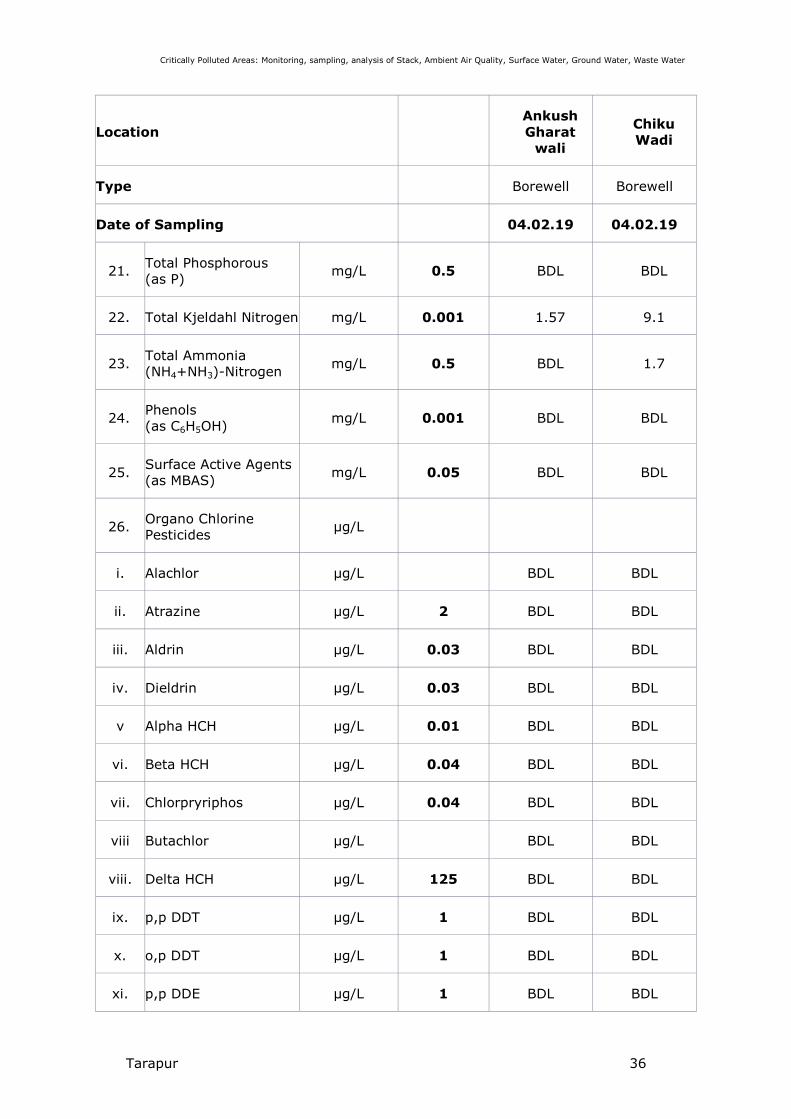
Critically Polluted Areas: Monitoring, sampling, analysis of Stack, Ambient Air Quality, Surface Water, Ground Water, Waste Water
Tarapur 36
Location
Ankush
Gharat
wali
Chiku
Wadi
Type Borewell Borewell
Date of Sampling 04.02.19 04.02.19
21. Total Phosphorous
(as P) mg/L 0.5 BDL BDL
22. Total Kjeldahl Nitrogen mg/L 0.001 1.57 9.1
23. Total Ammonia
(NH4+NH3)-Nitrogen mg/L 0.5 BDL 1.7
24. Phenols
(as C6H5OH) mg/L 0.001 BDL BDL
25. Surface Active Agents
(as MBAS) mg/L 0.05 BDL BDL
26. Organo Chlorine
Pesticides µg/L
i. Alachlor µg/L BDL BDL
ii. Atrazine µg/L 2 BDL BDL
iii. Aldrin µg/L 0.03 BDL BDL
iv. Dieldrin µg/L 0.03 BDL BDL
v Alpha HCH µg/L 0.01 BDL BDL
vi. Beta HCH µg/L 0.04 BDL BDL
vii. Chlorpryriphos µg/L 0.04 BDL BDL
viii Butachlor µg/L BDL BDL
viii. Delta HCH µg/L 125 BDL BDL
ix. p,p DDT µg/L 1 BDL BDL
x. o,p DDT µg/L 1 BDL BDL
xi. p,p DDE µg/L 1 BDL BDL
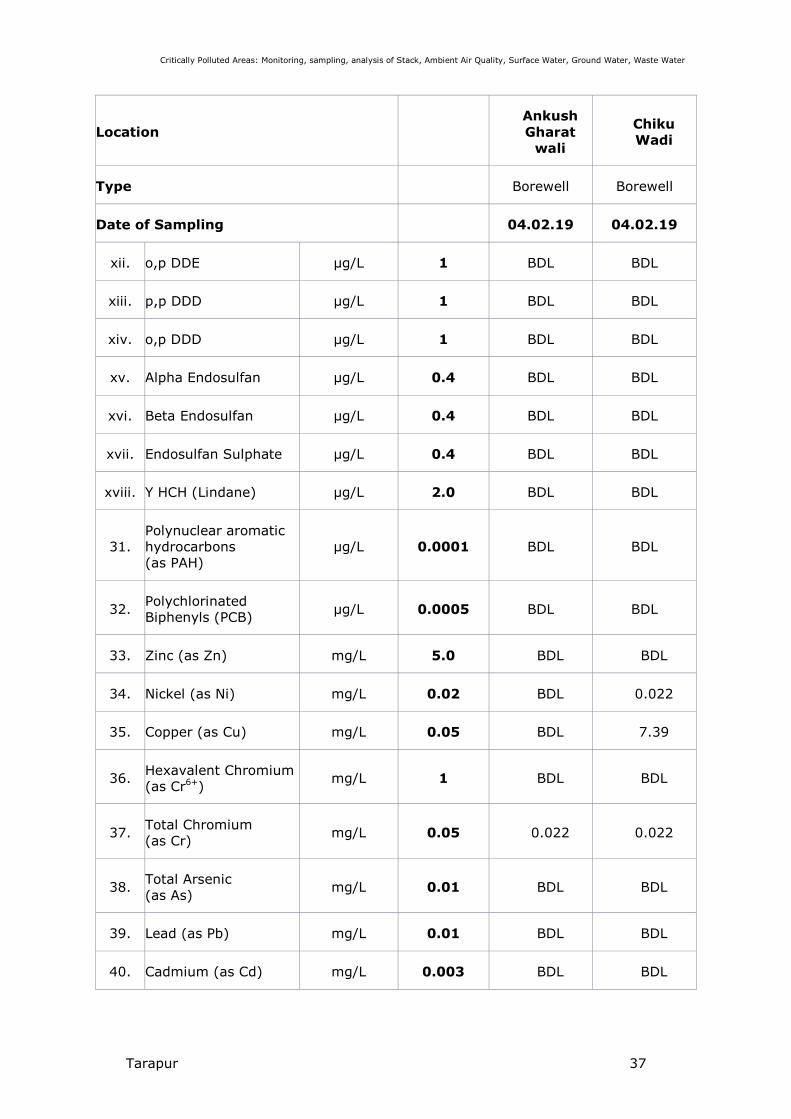
Critically Polluted Areas: Monitoring, sampling, analysis of Stack, Ambient Air Quality, Surface Water, Ground Water, Waste Water
Tarapur 37
Location
Ankush
Gharat
wali
Chiku
Wadi
Type Borewell Borewell
Date of Sampling 04.02.19 04.02.19
xii. o,p DDE µg/L 1 BDL BDL
xiii. p,p DDD µg/L 1 BDL BDL
xiv. o,p DDD µg/L 1 BDL BDL
xv. Alpha Endosulfan µg/L 0.4 BDL BDL
xvi. Beta Endosulfan µg/L 0.4 BDL BDL
xvii. Endosulfan Sulphate µg/L 0.4 BDL BDL
xviii. Y HCH (Lindane) µg/L 2.0 BDL BDL
31.
Polynuclear aromatic
hydrocarbons
(as PAH)
µg/L 0.0001 BDL BDL
32. Polychlorinated
Biphenyls (PCB) µg/L 0.0005 BDL BDL
33. Zinc (as Zn) mg/L 5.0 BDL BDL
34. Nickel (as Ni) mg/L 0.02 BDL 0.022
35. Copper (as Cu) mg/L 0.05 BDL 7.39
36. Hexavalent Chromium
(as Cr6+) mg/L 1 BDL BDL
37. Total Chromium
(as Cr) mg/L 0.05 0.022 0.022
38. Total Arsenic
(as As) mg/L 0.01 BDL BDL
39. Lead (as Pb) mg/L 0.01 BDL BDL
40. Cadmium (as Cd) mg/L 0.003 BDL BDL
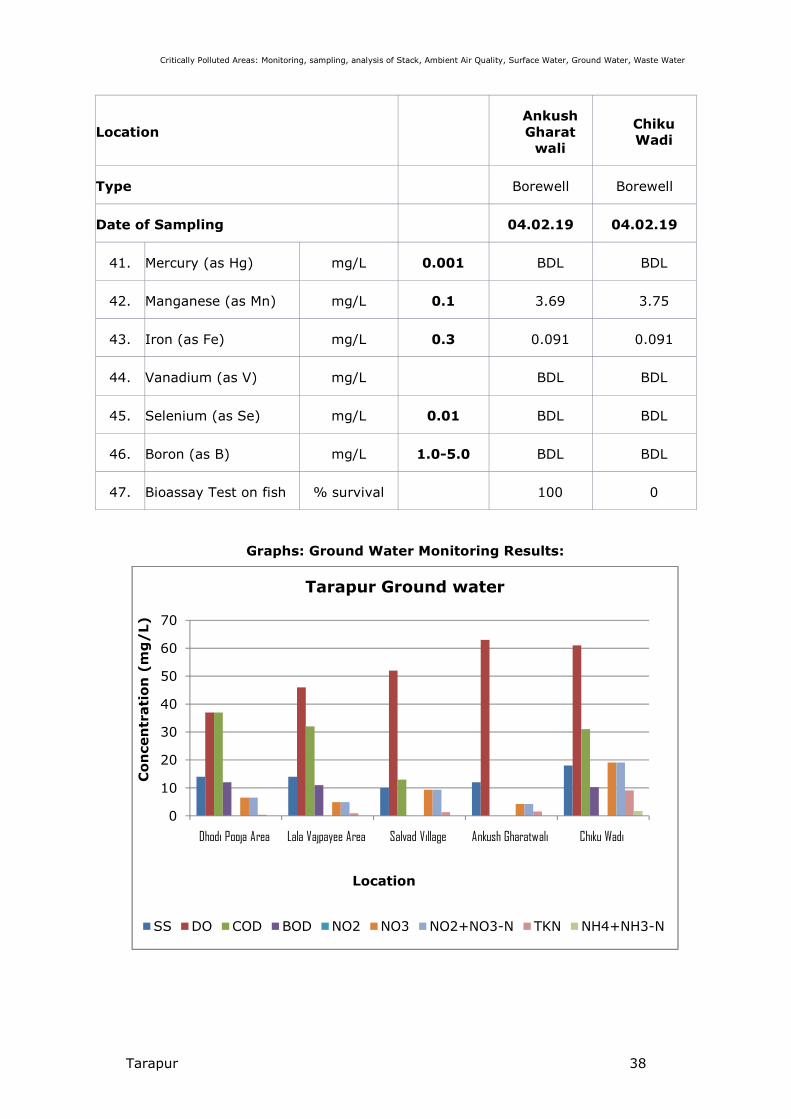
Critically Polluted Areas: Monitoring, sampling, analysis of Stack, Ambient Air Quality, Surface Water, Ground Water, Waste Water
Tarapur 38
Location
Ankush
Gharat
wali
Chiku
Wadi
Type Borewell Borewell
Date of Sampling 04.02.19 04.02.19
41. Mercury (as Hg) mg/L 0.001 BDL BDL
42. Manganese (as Mn) mg/L 0.1 3.69 3.75
43. Iron (as Fe) mg/L 0.3 0.091 0.091
44. Vanadium (as V) mg/L BDL BDL
45. Selenium (as Se) mg/L 0.01 BDL BDL
46. Boron (as B) mg/L 1.0-5.0 BDL BDL
47. Bioassay Test on fish % survival 100 0
Graphs: Ground Water Monitoring Results:
0
10
20
30
40
50
60
70
Dhodi Pooja Area Lala Vajpayee Area Salvad Village Ankush Gharatwali Chiku Wadi
Co
ncen
trati
on
(m
g/
L)
Location
Tarapur Ground water
SS DO COD BOD NO2 NO3 NO2+NO3-N TKN NH4+NH3-N

Critically Polluted Areas: Monitoring, sampling, analysis of Stack, Ambient Air Quality, Surface Water, Ground Water, Waste Water
Tarapur 39
0
1
2
3
4
5
6
7
8
9
Dhodi Pooja Area Lala Vajpayee Area Salvad Village Ankush Gharatwali Chiku Wadi
Location
Tarapur Ground water
Sodium Adsorption Ratio pH
0
1000
2000
3000
4000
5000
6000
Dhodi Pooja Area Lala Vajpayee Area Salvad Village Ankush Gharatwali Chiku Wadi Co
ncen
trati
on
(µ
mh
os/
cm
)
Location
Tarapur Ground water
Electrical Conductivity
Critically Polluted Areas: Monitoring, sampling, analysis of Stack, Ambient Air Quality, Surface Water, Ground Water, Waste Water
Tarapur 40
0
10
20
30
40
50
60
70
80
90
Dhodi Pooja Area Lala Vajpayee Area Salvad Village Ankush Gharatwali Chiku Wadi
MP
N I
nd
ex/
10
0m
l
Location
Tarapur Ground water
Total Coliforms Faecal Coliforms
0
20
40
60
80
100
120
Salvad Village Ankush Gharatwali
% S
urviv
al
Location
Tarapur Ground water
Bioassay Test on Fish
Critically Polluted Areas: Monitoring, sampling, analysis of Stack, Ambient Air Quality, Surface Water, Ground Water, Waste Water
Tarapur 41
4 Summary of the Results
Based on the study done, the results are summarised and concluded as follows:
4.1 Stack Emission Monitoring:
In Tarapur, six different stacks were monitored at Mandana Industries Ltd., Siyaram
Silk, IVP Ltd., Sarex Overseas, Lupin Ltd. and Dicitex Furnishing. Results show that
concentration of all the parameters, particulate matter, nitrogen dioxide and sulphur
dioxide, are below the standard limits. Particulate matter is observed in the range of 25
to 45 mg/Nm3 and sulphur dioxide in the range of Below Detection Limit (BDL i.e.<5) to
34.3 mg/Nm3. However, the nitrogen dioxide is observed is observed with the range of
13.1 mg/Nm3 – 16.3mg/Nm3.
4.2 Ambient Air Monitoring:
At Tarapur, ambient air quality was monitored at six locations namely: Mandana
Industries Ltd., Siyaram Silk, IVP Ltd., Sarex Overseas, CETP and Lupin Ltd. At all these
places 12 parameters of ambient air quality standards were monitored.
1. Suphur dioxide (SO2): All the results for SO2 are observed lower than the
standard limit of 80 µg/m3. It is observed in the range of 5.36 to 5.80 µg/m3.
2. Nitrogen Dioxide (NOx): All the results for SO2 are observed lower than the
standard limit of 80 µg/m3. It is observed in the range of 8.21 to 10.6 µg/m3.
3. Particulate Matter (PM10): It is the most critical parameter as its higher
concentration in the air affects ecosystem health a lot. However, 50% of all the
locations are observed with above the standard limit of 100 µg/m3 of PM10.
Minimum of 72µg/m3 is observed at Lupin Ltd. and maximum of 401 µg/m3 at
Mandhana Industries Ltd.
4. Particulate Matter (PM2.5): Concentration of PM2.5 also followed the similar trend
as PM10 is observed. It is observed in the range of 16 to 99 µg/m3.
5. Ozone (O3): All values of O3 recorded below the detection limit i.e.19.8µg/m3.
6. Lead (Pb): Lead is categorised as known human carcinogen by CPCB. In our
results, concentration of Lead is found below the standard limit.
7. Carbon Monoxide (CO): Values of Carbon Monoxide are also observed below
standard limit at all the studied locations. It is observed minimum of 1.71 mg/m3
at Mandhana Industries Ltd. and maximum (5.04mg/m3) at Siyaram Silks.
8. Ammonia (NH3): All values of O3 recorded below the detection limit.
9. Benzene: Benzene falls under group C category, which includes known
carcinogens. All values are recorded below the standard limit of 5µg/m3.
10. Benzo (a) Pyrene (BaP): All values recorded below the detection limit i.e.
<0.2ng/m3.
11. Arsenic: Arsenic values are also observed well below the detection limit i.e. BDL.
12. Nickel: All the values are observed below the standard limit of 20 ng/m3.
4.3 Waste Water Quality:
Seven samples of ETP outlet and inlet were collected from different industries in Tarapur
region. The quality of waste water was determined by determining various parameters
as per standards and corresponding results are discussed below:
1. pH: At all the locations, pH of water samples is found well within the range
prescribed by CPCB. It is ranged from 5.73 to 8.22.
2. Oil and Grease: All values within the acceptable range.

Critically Polluted Areas: Monitoring, sampling, analysis of Stack, Ambient Air Quality, Surface Water, Ground Water, Waste Water
Tarapur 42
3. Suspended Solids: All the samples of different locations are found within the
acceptable limits.
4. Chemical Oxygen Demand: Chemical Oxygen Demand is found above the
standards of 250 mg/L in two water samples namely CETP inlet (4400 mg/L) and
CETP Outlet (2400 mg/L).
5. Biochemical Oxygen Demand: Biochemical Oxygen demand also exhibits the
same picture as COD. This is recorded highest (1470 mg/L) at CETP inlet and
minimum at CETP Outlet (799 mg/L).
6. Total Kjeldahl Nitrogen: It is also observed beyond permissible limit at two
locations namely CETP inlet (1140 mg/L) and CETP Outlet (627 mg/L).
7. Total Ammonia: Out of all values of minimum is observed as BDL at three
locations and maximum is observed as 68 mg/L at CETP Inlet.
8. Metals: All metals like Arsenic, Nickel, Copper, Hexavalent Chromium (Cr6+) are
observed either below detection limit or below their standard limits. However
water sample of CETP Inlet is observed with above permissible limits of metals
also.
9. Fish Bioassay: Fish bioassay exhibits 0-100% survival.
10. Parameters like Total Residual Chlorine, Cyanide, Fluoride, Sulphide, Dissolved
Phosphate, Total Ammonical Nitrogen and Phenolic compounds, also meet the
criteria as prescribed by CPCB.
4.4 Ground Water Quality:
Five Borewell samples were collected from different locations namely: (i) Dhodi Pooja
Area (ii) Lala Vajpayee (iii) Salvad Village (iv) Ankush Gharatwadi (v) Chiku Wadi
1. Colour (Hazen Units): Colour units are below the acceptable standard.
2. Odour of the sample is agreeable.
3. pH: At all the locations, pH of water samples is found well within the range
prescribed by CPCB. It is ranged from 6.91 to 8.03.
4. Chemical Oxygen Demand: Except Ankush Ghratwadi water sample (<5mg/L),
all other samples were detected above the standard limit of 10 mg/L set by WHO.
It is ranged from <5 to 37 mg/L.
5. Biological Oxygen Demand: Except Ankush Ghratwadi and Salvad village water
samples, all other samples were detected above the standard limit of 6 mg/L set
by WHO. It is ranged from <1 to 12 mg/L.
Following are the parameters which are compared with 10500:2012 Drinking water
specifications.
1. Nitrite: Values of Nitrite are at below detection level.
2. Nitrate: Nitrate value ranged between 4.22mg/L and 19.1mg/L. Nitrate
concentrations are below the acceptable standards of IS 10500:2012.
3. Residual Free Chlorine: Values are below the acceptable standards.
4. Total Ammonia: observed within the acceptable range.
5. Cyanide: Concentration of cyanide in all the bore well water is very much below
the standard.
6. Fluoride: out of five, three samples are observed above standard limit. It is
observed in the range of 0.63 to 1.27 mg/L.
7. Sulphide: Analytical values are below the detection limits and below the
standards.
Critically Polluted Areas: Monitoring, sampling, analysis of Stack, Ambient Air Quality, Surface Water, Ground Water, Waste Water
Tarapur 43
8. Sodium Absorption Ratio: These values fit within range of water quality criteria
of CPCB.
9. Electrical Conductivity: As per the water quality criteria of CPCB, water samples
exceed the limit of electrical conductivity.
10. Metals: Metals like Copper, Total Chromium, Lead, Arsenic, Cadmium and
Mercury are well within the acceptable limits of drinking water standards.
11. PAH & PCB are also below the acceptable limits.
12. Fish Bioassay: Fish bioassay exhibits 0-100% survival
5 CEPI Score:
Comprehensive Environmental Pollution Index (CEPI) is intended to act as early warning
tool which helps in categorization of industrial clusters/areas in terms of priority of
needing attention.
CPCB had evolved certain methodology to calculate CEPI, in which a score has been
fixed for different environmental components based on the level of pollution. The scoring
system involves an algorithm that takes into account the basic selection criteria. This
approach is based on the basic hazard assessment logic that can be summarized as
below.
Hazard = pollutant source, pathways, and receptor
CPCB has calculated CEPI for the identified critically polluted industrial clusters. It is
calculated separately for air, water, and land. The basic framework and scoring system
of the CEPI – based on three factors namely pollutant, pathway, and receptor – has been
described further under this section.
To overcome the subjectivity, revised concept is proposed by eliminating the subjective
factors as described in the previous section but retaining the factors which can be
measured precisely.
I. Revised concept is prepared by eliminating the debatable factors but retaining
the factors which can be measured precisely.
II. It is decided to develop the Comprehensive Environmental Pollution Index
(CEPI) retaining the existing algorithm of Source, Pathway and Receptor.
III. Health component was also retained in the revised concept in line with the
suggestions of Secretary, MoEFCC during the meeting held in MoEF.
Outlines of revised CEPI 2016 criteria
The outlines of the revised CEPI criteria are as follows:
1. It is proposed to develop the Comprehensive Environmental Pollution Index
(CEPI) based on Sources of pollution, real time observed values of the pollutants
in the ambient air, surface water and ground water in & around the industrial
cluster and health related statistics.
2. For assessment of the environmental quality of the area i.e. CEPI score, the
concept of SNLF i.e. a surrogate number which represents the level of exposure
(a function of percentage sample Exceedance & Exceedance Factor) shall be used.
3. Health component to be evaluated based on the health data available from major
hospitals in the area was also retained in the revised concept.
The evaluation criterion of the revised CEPI version 2016 is described in the flowchart
given below:

Critically Polluted Areas: Monitoring, sampling, analysis of Stack, Ambient Air Quality, Surface Water, Ground Water, Waste Water
Tarapur 44
Here, health data collected for Receptor Score C is included in Annexure I
Based on Sub-Index Score (score of individual environmental component like air, water
etc.):
Score more than 63: A Critical Level of Pollution in the respective level of
environmental component
Score between 51-63: Severe to critical level of pollution with reference to
respective environmental component
Cut-off Score
Score 50: Severely Polluted Industrial Clusters/areas
Score 60: Critically Polluted Industrial Clusters/areas
Based on Aggregated CEPI Score (score includes sub-index score of all individual
environmental components together):
Aggregated CEPI score >70: Critically polluted areas
Aggregated CEPI score between 60-70: Severely polluted areas
Since the inception of the programme, MPCB has also formulated Action Plans to
mitigate the environmental pollution problems for each of the 8 Critically Polluted Areas
(CPAs) in Maharashtra. Based on available information, parameters selected and
monitored in continuation with this, CEPI has been calculated and Short-Term Action
Plan (STAP) as well as Long Term Action Plan (LTAP) was prepared in 2010.
Subsequently NAAQS 2009 came in force. List of parameters to be considered increased
and expanded including more critical and hazardous pollutants like benzene, BaP, Metals,
Critically Polluted Areas: Monitoring, sampling, analysis of Stack, Ambient Air Quality, Surface Water, Ground Water, Waste Water
Tarapur 45
etc. existing in the environment. There was revision of standards (limiting values) as
well. In this present report of 2016 prepared by MPCB, CEPI is calculated considering all
these revised standards’ limiting values, list of parameters and complete scope of
monitoring.
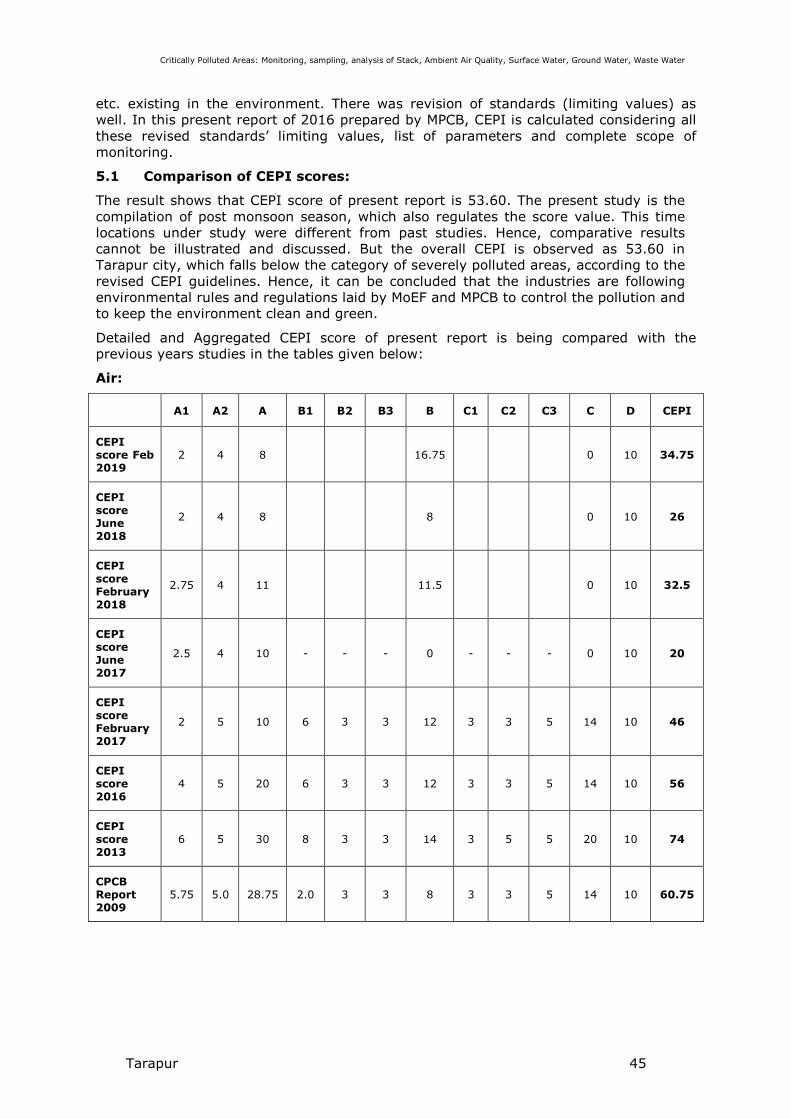
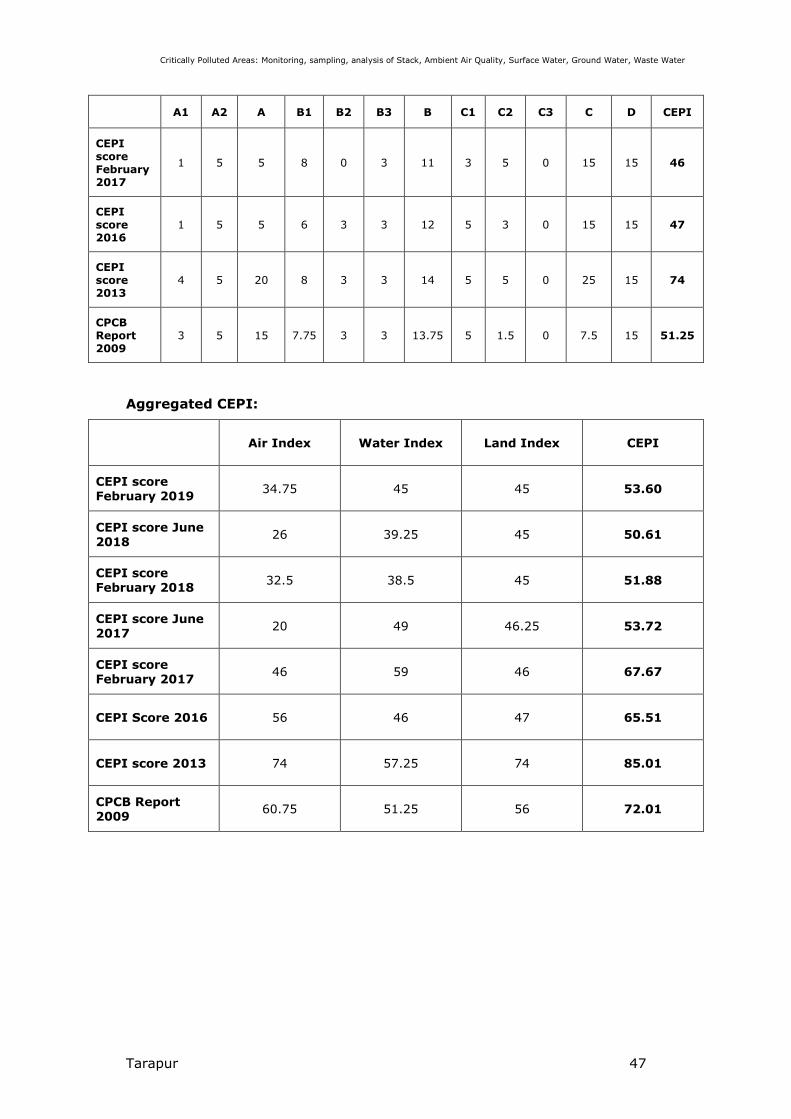
5.1 Comparison of CEPI scores:
The result shows that CEPI score of present report is 53.60. The present study is the
compilation of post monsoon season, which also regulates the score value. This time
locations under study were different from past studies. Hence, comparative results
cannot be illustrated and discussed. But the overall CEPI is observed as 53.60 in
Tarapur city, which falls below the category of severely polluted areas, according to the
revised CEPI guidelines. Hence, it can be concluded that the industries are following
environmental rules and regulations laid by MoEF and MPCB to control the pollution and
to keep the environment clean and green.
Detailed and Aggregated CEPI score of present report is being compared with the
previous years studies in the tables given below:
Air:
A1 A2 A B1 B2 B3 B C1 C2 C3 C D CEPI
CEPI score Feb 2019
2 4 8
16.75
0 10 34.75
CEPI score June 2018
2 4 8
8
0 10 26
CEPI score February 2018
2.75 4 11
11.5
0 10 32.5
CEPI score June 2017
2.5 4 10 - - - 0 - - - 0 10 20
CEPI score February 2017
2 5 10 6 3 3 12 3 3 5 14 10 46
CEPI score 2016
4 5 20 6 3 3 12 3 3 5 14 10 56
CEPI score 2013
6 5 30 8 3 3 14 3 5 5 20 10 74
CPCB Report 2009
5.75 5.0 28.75 2.0 3 3 8 3 3 5 14 10 60.75

Critically Polluted Areas: Monitoring, sampling, analysis of Stack, Ambient Air Quality, Surface Water, Ground Water, Waste Water
Tarapur 46
Water:
A1 A2 A B1 B2 B3 B C1 C2 C3 C D CEPI
CEPI score Feb 2019
2.5 4 10
20
0 15 45
CEPI score June 2018
2.5 4. 10
14.25
0 15 39.25
CEPI score February 2018
2.5 4 14
13.5
0 15 38.5
CEPI score June 2017
3.5 4 14 - - - 20 - - - 0 15 49
CEPI score February 2017
1 5 5 8 3 3 14 5 5 0 25 15 59
CEPI score 2016
1 5 5 8 0 3 11 3 5 0 15 15 46
CEPI score 2013
4 5 20 8 0 3 11 3 3.75 0 11.25 15 57.25
CPCB Report 2009
3 5 15 8 0 3 11 3 5 0 15 15 56
Land:
A1 A2 A B1 B2 B3 B C1 C2 C3 C D CEPI
CEPI score Feb 2019
2.5 4 10
20
0 15 45
CEPI score June 2018
2.5 4 10
20
0 15 45
CEPI
score February 2018
2.5 4 10
20
0 15 45
CEPI score June 2017
3.5 4 14 - - - 17.25 - - - 0 15 46.25
Critically Polluted Areas: Monitoring, sampling, analysis of Stack, Ambient Air Quality, Surface Water, Ground Water, Waste Water
Tarapur 47
A1 A2 A B1 B2 B3 B C1 C2 C3 C D CEPI
CEPI score February 2017
1 5 5 8 0 3 11 3 5 0 15 15 46
CEPI score 2016
1 5 5 6 3 3 12 5 3 0 15 15 47
CEPI score 2013
4 5 20 8 3 3 14 5 5 0 25 15 74
CPCB Report 2009
3 5 15 7.75 3 3 13.75 5 1.5 0 7.5 15 51.25
Aggregated CEPI:
Air Index Water Index Land Index CEPI
CEPI score February 2019
34.75 45 45 53.60
CEPI score June 2018
26 39.25 45 50.61
CEPI score February 2018
32.5 38.5 45 51.88
CEPI score June 2017
20 49 46.25 53.72
CEPI score February 2017
46 59 46 67.67
CEPI Score 2016 56 46 47 65.51
CEPI score 2013 74 57.25 74 85.01
CPCB Report 2009
60.75 51.25 56 72.01

Critically Polluted Areas: Monitoring, sampling, analysis of Stack, Ambient Air Quality, Surface Water, Ground Water, Waste Water
Tarapur 48
6 Conclusions
This is an attempt to check the characteristics and status of environment among the
different industrial clusters of Tarapur city. Revised CEPI version 2016 includes 2 major
modifications in terms of evaluation of data: (1) It includes Contribution of primary as
well as secondary pollutants under Factor B (Max Value 50) and (2) Exhaustive
collection of health data of people residing in the vicinity of industrial clusters under
study, Factor C (Max Value 10). This has changed the entire criteria of calculating CEPI
as compared to the previous CEPI version and hence affected the overall CEPI score
also. It shows that the concentration of pollutants in air, ground water and surface water
is lowered down as compared to past studies, as most of the results are observed below
their standards with an exception of one or two parameters.
Parameters of air sampling are observed within the standard limit all the sampling
locations. Among waste water samples, BOD and COD of CETP Inlet, CETP outlet
samples are found beyond standard limit. All the ground water samples are found within
the limits except BOD and COD of few the water samples, which are observed above
standard limits at one location.
Moreover, the lower value (53.60) of Comprehensive Environmental Pollution Index
(CEPI) in the present study as compared to past few years study also reveals the fact
that the environmental pollution in this city is substantially decreased over the period of
times. To achieve this target, improvement in conventional practice and procedures
adopted by the industries coupled with initiatives taken by Maharashtra Pollution Control
Board played a major role. Although, a decrease in environmental pollution is observed,
but still there is lot of scope to improve the environmental quality of the city, for which
continuous efforts, strategies, planning and actions are required. Overall CEPI figures
are comprised in the table below:
A1 A2 A B C D CEPI
Air Index 2 4 8 16.75 0 10 34.75
Water Index 2.5 4 10 20 0 15 45
Land Index 2.5 4 10 20 0 15 45
Aggregated CEPI 53.60

Critically Polluted Areas: Monitoring, sampling, analysis of Stack, Ambient Air Quality, Surface Water, Ground Water, Waste Water
Tarapur 49
7 Efforts Taken For the Abatement and Control of Pollution
The regional office of Maharashtra pollution control board has taken various initiatives
in reducing the CEPI Score of 67.67 of June to 53.60. Below mentioned are some of
the efforts:
a) Expansion of TEPS-CETP from existing 25 MLD to 37 MLD
b) Due to various measures taken by the industries solvent recovery improved. And
following industries has taken measures
• M/s. Arti Drugs Ltd, Plot No. N-198, MIDC Tarapur, Tal. Palghar. This industry
has developed new technology for the recovery of ammonium sulphate 2000
Mt/month by unit operation like evaporation, crystallization. Earlier the same
was treated in their ETP.
• M/s Camlin Fine Chemicals. Ltd., Plot No. D, MIDC Tarapur has segregated of
high COD stream.
• M/s. Aarti Industries Ltd., Plot No E-50, has installed zero discharge plant such
as incineration high COD.
• M/s Lupin Limited Plt No. T-142 MIDC, Tarapur has provided Anaerobic Digestor
for segregated effluents.
c) Board has informed CHWTSDF to increase the frequency of collecting of HW and its
transportation.
d) MIDC is carrying out massive tree plantation program on empty/ reserved plots,
and on boundary of MIDC. 4500 nos of trees have been distributed by MIDC to
TIMA.
e) Replacement of RCC drainage by HDPE within MIDC area.
f) Five nos of industries has started and recycling 50 % of their treated effluent i.e
1604.5 CMD
g) 7 No. of Textile industries has provided zero discharge system and recycling about
2434 CMD
Critically Polluted Areas: Monitoring, sampling, analysis of Stack, Ambient Air Quality, Surface Water, Ground Water, Waste Water
Tarapur 50
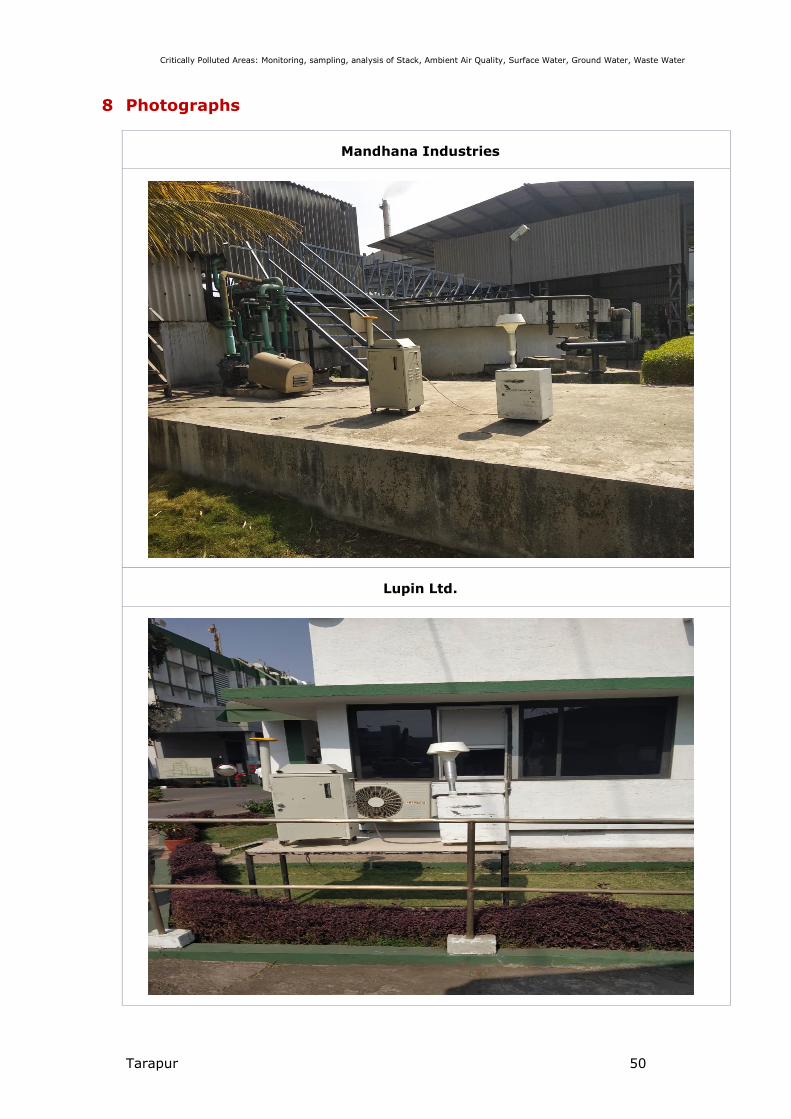
8 Photographs
Mandhana Industries
Lupin Ltd.

Critically Polluted Areas: Monitoring, sampling, analysis of Stack, Ambient Air Quality, Surface Water, Ground Water, Waste Water
Tarapur 51
Sarex Overseas
Siyaram Silk Mills

Critically Polluted Areas: Monitoring, sampling, analysis of Stack, Ambient Air Quality, Surface Water, Ground Water, Waste Water
Tarapur 52
IVP Ltd.
CETP
Critically Polluted Areas: Monitoring, sampling, analysis of Stack, Ambient Air Quality, Surface Water, Ground Water, Waste Water
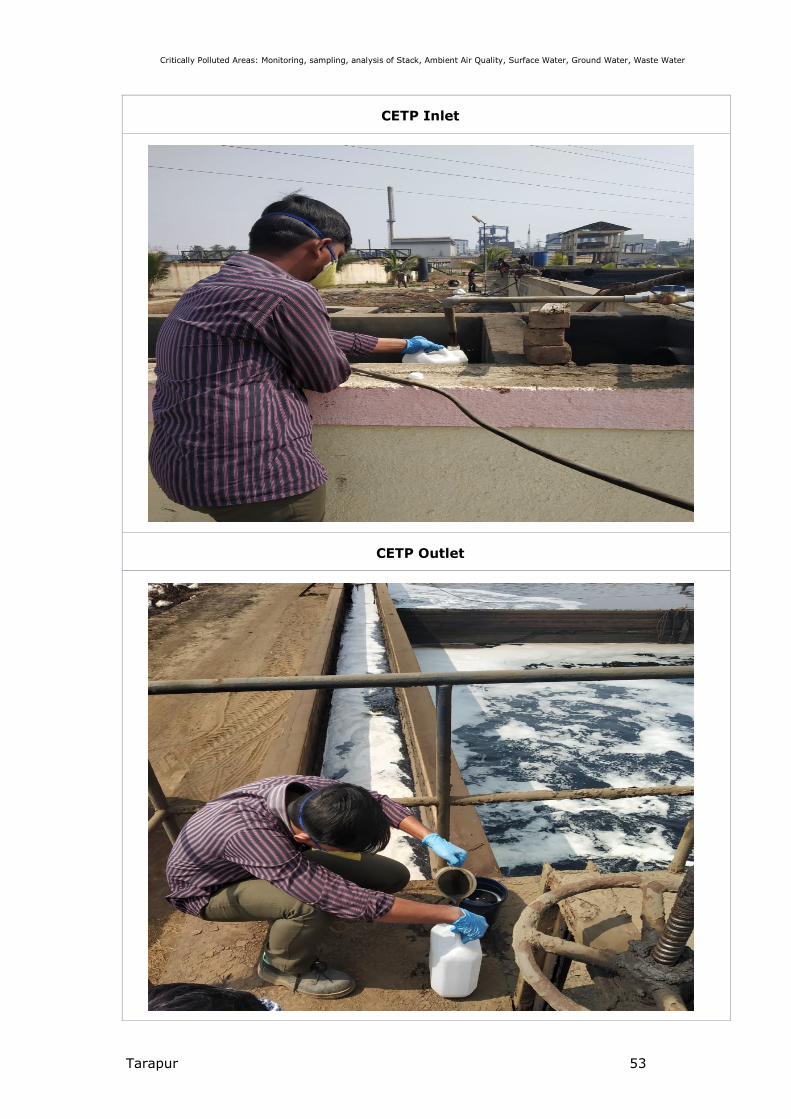
Tarapur 53
CETP Inlet
CETP Outlet
Critically Polluted Areas: Monitoring, sampling, analysis of Stack, Ambient Air Quality, Surface Water, Ground Water, Waste Water
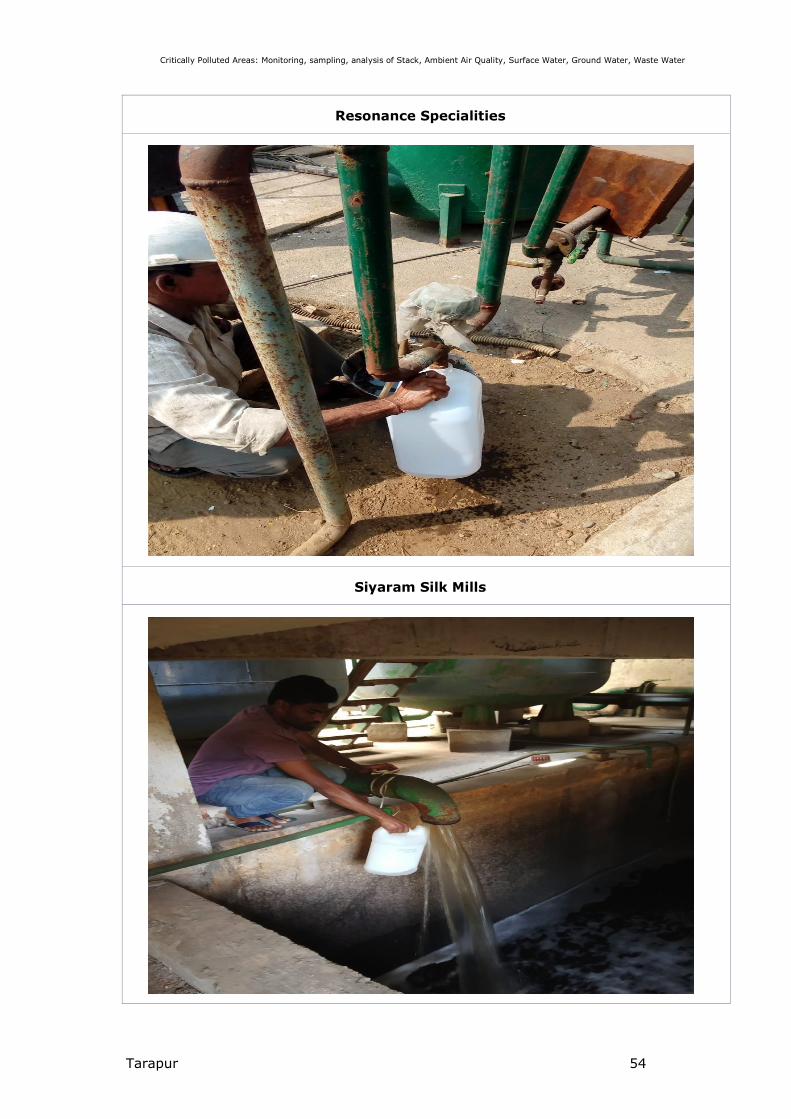
Tarapur 54
Resonance Specialities
Siyaram Silk Mills

Critically Polluted Areas: Monitoring, sampling, analysis of Stack, Ambient Air Quality, Surface Water, Ground Water, Waste Water
Tarapur 55
Chikuwadi borewell
Dhodi Pooja borewell
Critically Polluted Areas: Monitoring, sampling, analysis of Stack, Ambient Air Quality, Surface Water, Ground Water, Waste Water
Tarapur 56
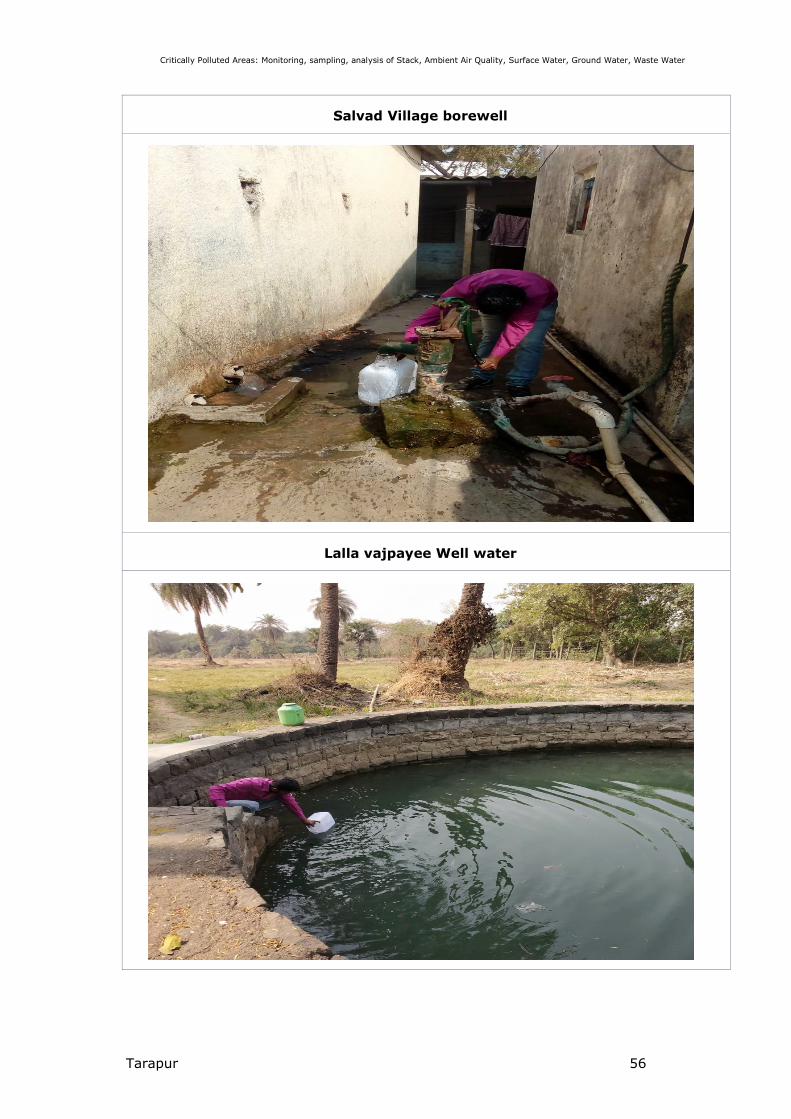
Salvad Village borewell
Lalla vajpayee Well water
Critically Polluted Areas: Monitoring, sampling, analysis of Stack, Ambient Air Quality, Surface Water, Ground Water, Waste Water
Tarapur 57
9 References
1. Criteria for Comprehensive Environmental Assessment of Industrial Clusters,
December 2009, CPCB, EIAS/4/2009-10
2. Comprehensive Environmental Assessment of Industrial Clusters, December
2009,CPCB, EIAS/5/2009-10
3. Action Plan for Industrial Cluster: Chandrapur, November 2010, MPCB
4. Action Plan for Industrial Cluster: Dombivli, November 2010, MPCB
5. Action Plan for Industrial Cluster: Aurangabad, November 2010, MPCB
6. Action Plan for Industrial Cluster: Navi Mumbai, November 2010, MPCB
7. Action Plan for Industrial Cluster: Navi Mumbai, November 2010, MPCB
8. Standard Methods for the Examination of Water and Waste Water, American Public
Health Association, 22nd Edition, 2012.
9. IS 3025 (various parts)
10. www.mpcb.gov.in
11. www.cpcb.gov.in
Critically Polluted Areas: Monitoring, sampling, analysis of Stack, Ambient Air Quality, Surface Water, Ground Water, Waste Water
Tarapur 58
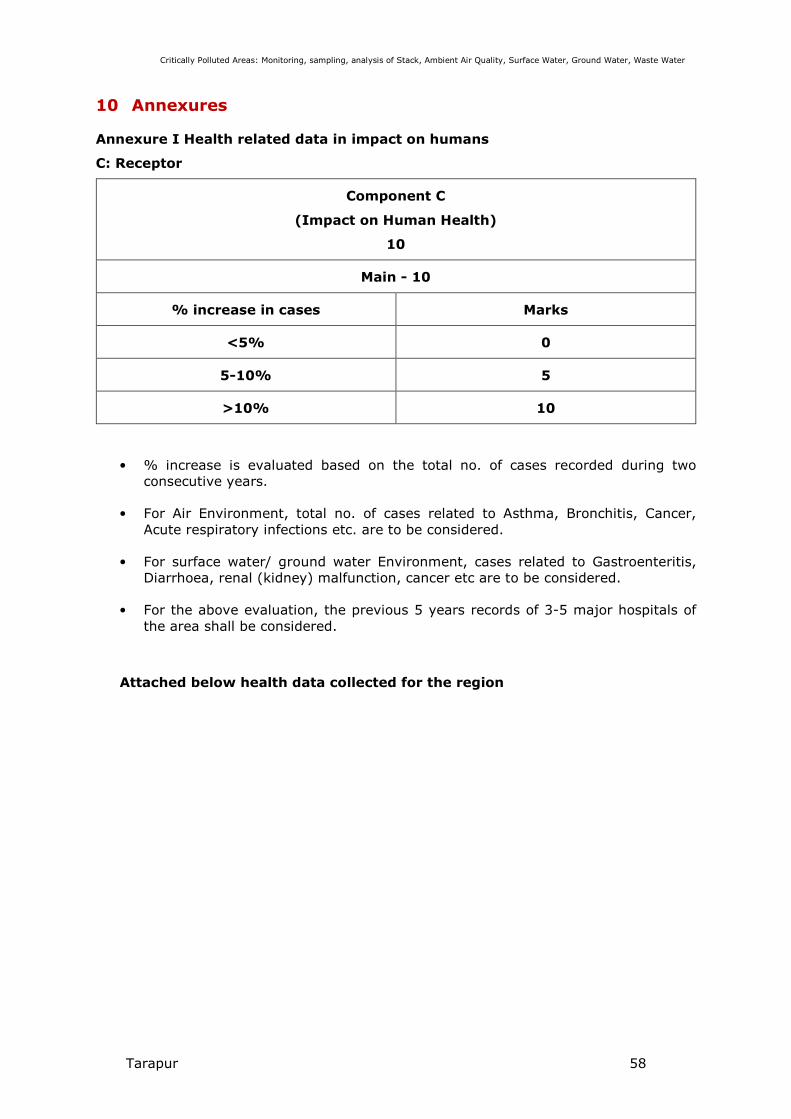
10 Annexures
Annexure I Health related data in impact on humans
C: Receptor
Component C
(Impact on Human Health)
10
Main - 10
% increase in cases Marks
<5% 0
5-10% 5
>10% 10
• % increase is evaluated based on the total no. of cases recorded during two
consecutive years.
• For Air Environment, total no. of cases related to Asthma, Bronchitis, Cancer,
Acute respiratory infections etc. are to be considered.
• For surface water/ ground water Environment, cases related to Gastroenteritis,
Diarrhoea, renal (kidney) malfunction, cancer etc are to be considered.
• For the above evaluation, the previous 5 years records of 3-5 major hospitals of
the area shall be considered.
Attached below health data collected for the region

ANNEXURE B
INFORMATION ON HEALTH STATISTICS IN PIA
1. Name of the Polluted Industrial Area (PIA): Tarapur
2. Name of the major health centre/ organization: Thunga Hospital
3. Name and designation of the contact person:
4. Address: AM-32,Tarapur M.I.D.C., Boisar, Maharashtra 401506
5. Year of Establishment:
Sl No.
Diseases
No. of patients reported for the years
2018-2017 2017-2016 2016-2015 2015-2014 2014-2013
Air Borne Diseases
1. Asthma 21 53
2. Acute Respiratory Infection
58 184
3. Bronchitis 26 43
4. Cancer 2 6
Water Borne Diseases
5. Gastroenteritis 50 101
6. Diarrhea 154 133
7. Renal diseases 0 0
8. Cancer 0 0
Signature of the Hospital Head/ Superintend
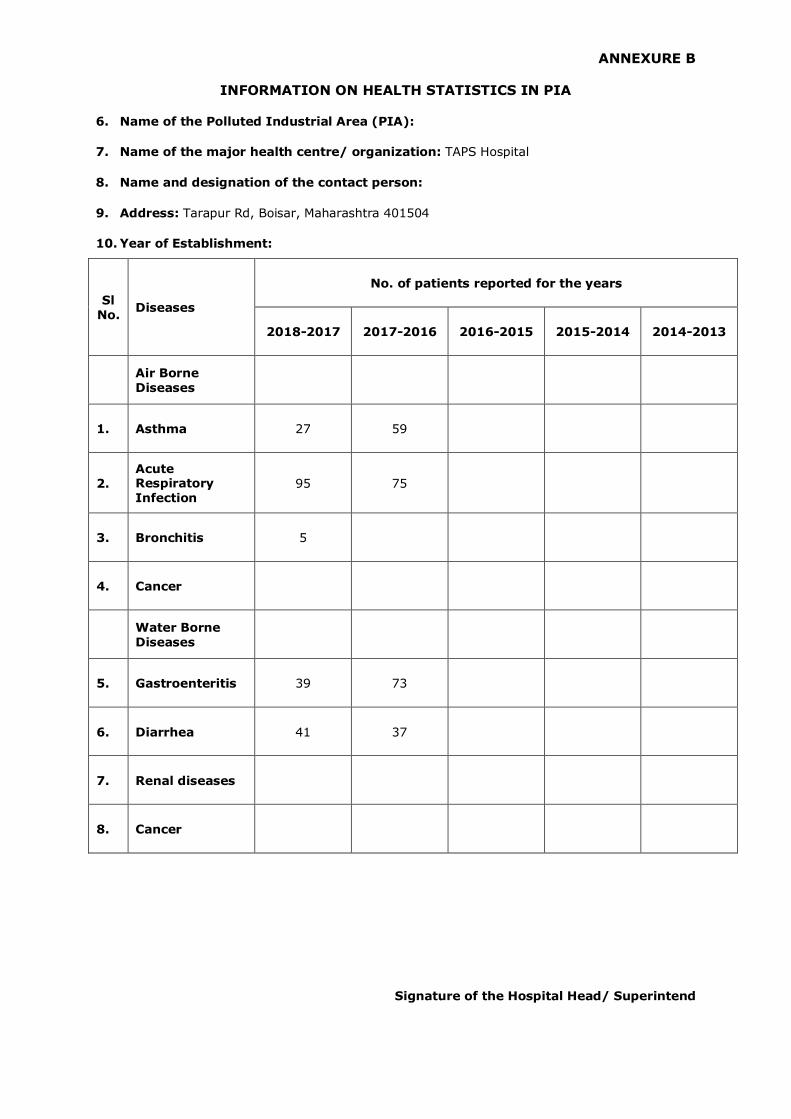
ANNEXURE B
INFORMATION ON HEALTH STATISTICS IN PIA
6. Name of the Polluted Industrial Area (PIA):
7. Name of the major health centre/ organization: TAPS Hospital
8. Name and designation of the contact person:
9. Address: Tarapur Rd, Boisar, Maharashtra 401504
10. Year of Establishment:
Sl No.
Diseases
No. of patients reported for the years
2018-2017 2017-2016 2016-2015 2015-2014 2014-2013
Air Borne Diseases
1. Asthma 27 59
2. Acute Respiratory Infection
95 75
3. Bronchitis 5
4. Cancer
Water Borne Diseases
5. Gastroenteritis 39 73
6. Diarrhea 41 37
7. Renal diseases
8. Cancer
Signature of the Hospital Head/ Superintend
Critically Polluted Areas: Monitoring, sampling, analysis of Stack, Ambient Air Quality, Surface Water, Ground Water, Waste Water
Tarapur 59
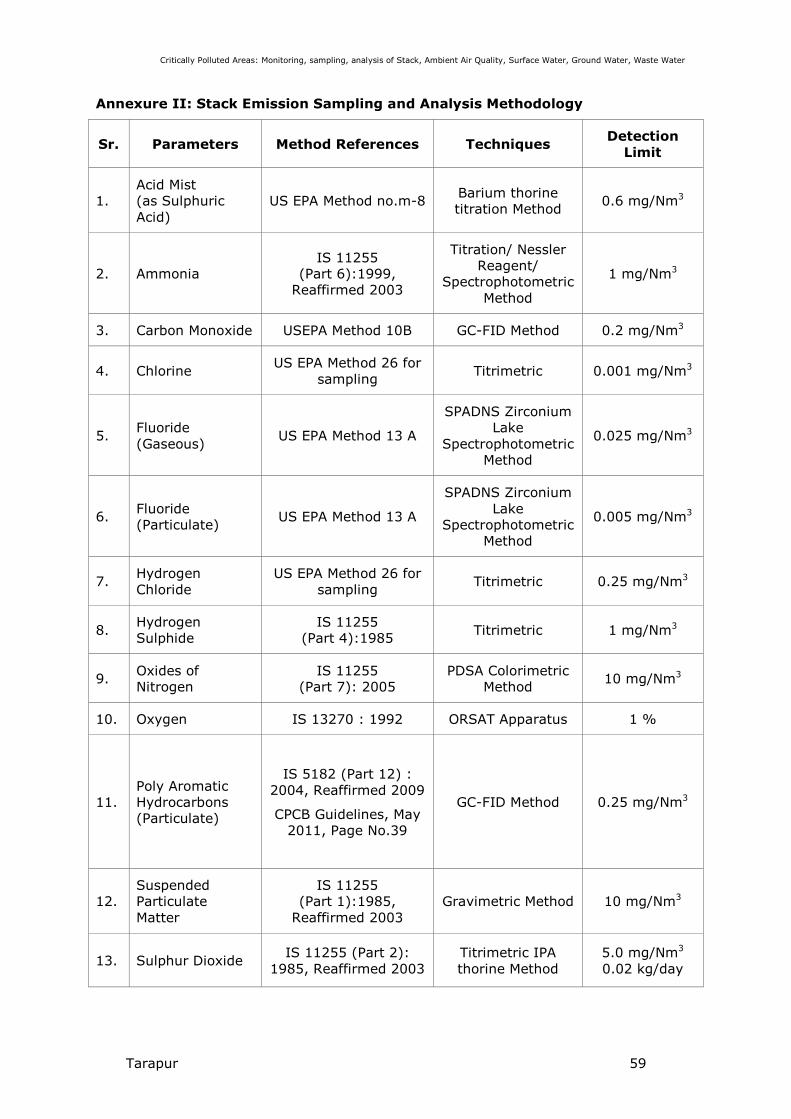
Annexure II: Stack Emission Sampling and Analysis Methodology
Sr. Parameters Method References Techniques Detection
Limit
1.
Acid Mist
(as Sulphuric
Acid)
US EPA Method no.m-8 Barium thorine
titration Method 0.6 mg/Nm3
2. Ammonia
IS 11255
(Part 6):1999,
Reaffirmed 2003
Titration/ Nessler
Reagent/
Spectrophotometric
Method
1 mg/Nm3
3. Carbon Monoxide USEPA Method 10B GC-FID Method 0.2 mg/Nm3
4. Chlorine US EPA Method 26 for
sampling Titrimetric 0.001 mg/Nm3
5. Fluoride
(Gaseous) US EPA Method 13 A
SPADNS Zirconium
Lake
Spectrophotometric
Method
0.025 mg/Nm3
6. Fluoride
(Particulate) US EPA Method 13 A
SPADNS Zirconium
Lake
Spectrophotometric
Method
0.005 mg/Nm3
7. Hydrogen
Chloride
US EPA Method 26 for
sampling Titrimetric 0.25 mg/Nm3
8. Hydrogen
Sulphide
IS 11255
(Part 4):1985 Titrimetric 1 mg/Nm3
9. Oxides of
Nitrogen
IS 11255
(Part 7): 2005
PDSA Colorimetric
Method 10 mg/Nm3
10. Oxygen IS 13270 : 1992 ORSAT Apparatus 1 %
11.
Poly Aromatic
Hydrocarbons
(Particulate)
IS 5182 (Part 12) :
2004, Reaffirmed 2009
CPCB Guidelines, May
2011, Page No.39
GC-FID Method 0.25 mg/Nm3
12.
Suspended
Particulate
Matter
IS 11255
(Part 1):1985,
Reaffirmed 2003
Gravimetric Method 10 mg/Nm3
13. Sulphur Dioxide IS 11255 (Part 2):
1985, Reaffirmed 2003
Titrimetric IPA
thorine Method
5.0 mg/Nm3
0.02 kg/day
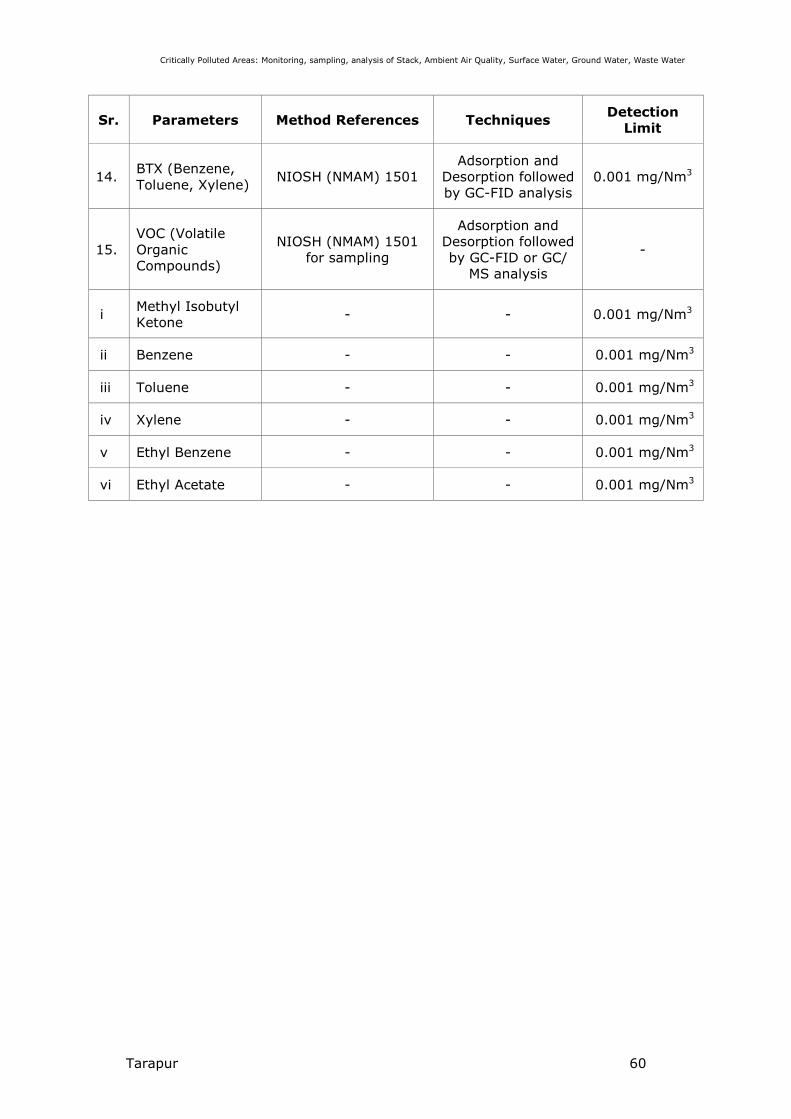
Critically Polluted Areas: Monitoring, sampling, analysis of Stack, Ambient Air Quality, Surface Water, Ground Water, Waste Water
Tarapur 60
Sr. Parameters Method References Techniques Detection
Limit
14. BTX (Benzene,
Toluene, Xylene) NIOSH (NMAM) 1501
Adsorption and
Desorption followed
by GC-FID analysis
0.001 mg/Nm3
15.
VOC (Volatile
Organic
Compounds)
NIOSH (NMAM) 1501
for sampling
Adsorption and
Desorption followed
by GC-FID or GC/
MS analysis
-
i Methyl Isobutyl
Ketone - - 0.001 mg/Nm3
ii Benzene - - 0.001 mg/Nm3
iii Toluene - - 0.001 mg/Nm3
iv Xylene - - 0.001 mg/Nm3
v Ethyl Benzene - - 0.001 mg/Nm3
vi Ethyl Acetate - - 0.001 mg/Nm3
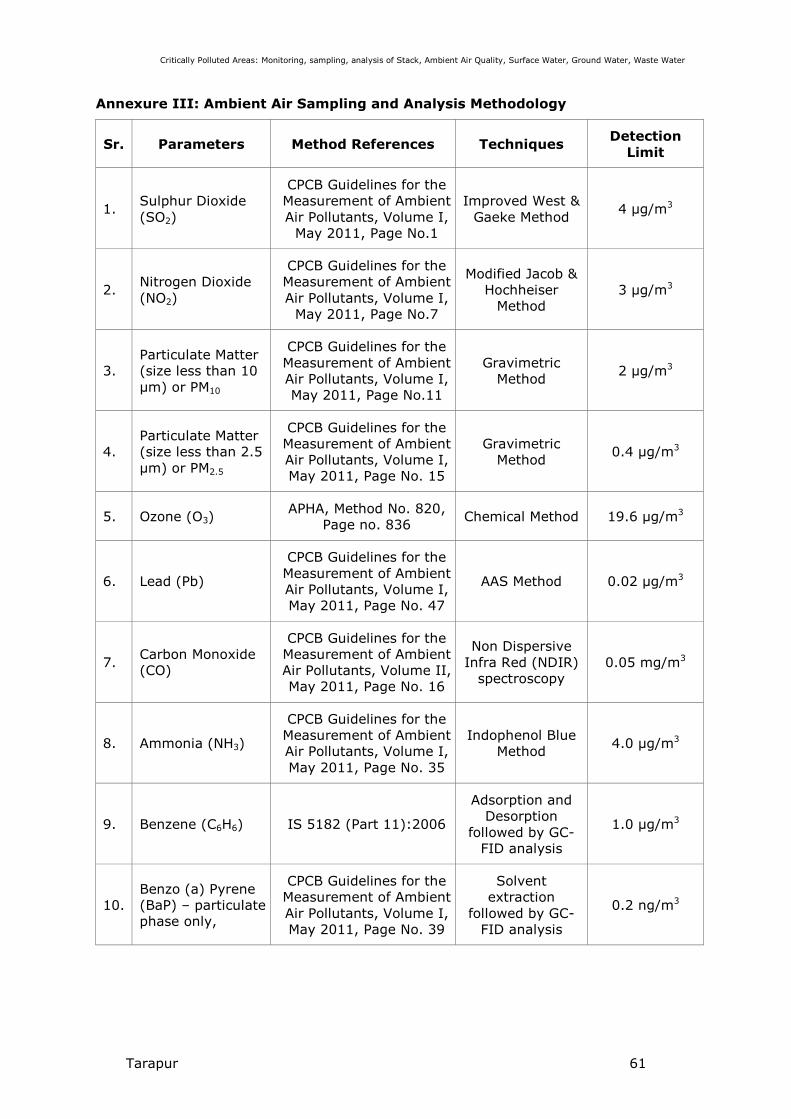
Critically Polluted Areas: Monitoring, sampling, analysis of Stack, Ambient Air Quality, Surface Water, Ground Water, Waste Water
Tarapur 61
Annexure III: Ambient Air Sampling and Analysis Methodology
Sr. Parameters Method References Techniques Detection
Limit
1. Sulphur Dioxide
(SO2)
CPCB Guidelines for the
Measurement of Ambient
Air Pollutants, Volume I,
May 2011, Page No.1
Improved West &
Gaeke Method 4 µg/m3
2. Nitrogen Dioxide
(NO2)
CPCB Guidelines for the
Measurement of Ambient
Air Pollutants, Volume I,
May 2011, Page No.7
Modified Jacob &
Hochheiser
Method
3 µg/m3
3.
Particulate Matter
(size less than 10
µm) or PM10
CPCB Guidelines for the
Measurement of Ambient
Air Pollutants, Volume I,
May 2011, Page No.11
Gravimetric
Method 2 µg/m3
4.
Particulate Matter
(size less than 2.5
µm) or PM2.5
CPCB Guidelines for the
Measurement of Ambient
Air Pollutants, Volume I,
May 2011, Page No. 15
Gravimetric
Method 0.4 µg/m3
5. Ozone (O3) APHA, Method No. 820,
Page no. 836 Chemical Method 19.6 µg/m3
6. Lead (Pb)
CPCB Guidelines for the
Measurement of Ambient
Air Pollutants, Volume I,
May 2011, Page No. 47
AAS Method 0.02 µg/m3
7. Carbon Monoxide
(CO)
CPCB Guidelines for the
Measurement of Ambient
Air Pollutants, Volume II,
May 2011, Page No. 16
Non Dispersive
Infra Red (NDIR)
spectroscopy
0.05 mg/m3
8. Ammonia (NH3)
CPCB Guidelines for the
Measurement of Ambient
Air Pollutants, Volume I,
May 2011, Page No. 35
Indophenol Blue
Method 4.0 µg/m3
9. Benzene (C6H6) IS 5182 (Part 11):2006
Adsorption and
Desorption
followed by GC-
FID analysis
1.0 µg/m3
10.
Benzo (a) Pyrene
(BaP) – particulate
phase only,
CPCB Guidelines for the
Measurement of Ambient
Air Pollutants, Volume I,
May 2011, Page No. 39
Solvent
extraction
followed by GC-
FID analysis
0.2 ng/m3

Critically Polluted Areas: Monitoring, sampling, analysis of Stack, Ambient Air Quality, Surface Water, Ground Water, Waste Water
Tarapur 62
Sr. Parameters Method References Techniques Detection
Limit
11. Arsenic (As)
CPCB Guidelines for the
Measurement of Ambient
Air Pollutants, Volume I,
May 2011, Page No. 47
AAS Method 0.3 ng/m3
12. Nickel (Ni)
CPCB Guidelines for the
Measurement of Ambient
Air Pollutants, Volume I,
May 2011, Page No. 47
AAS Method 3.0 ng/m3
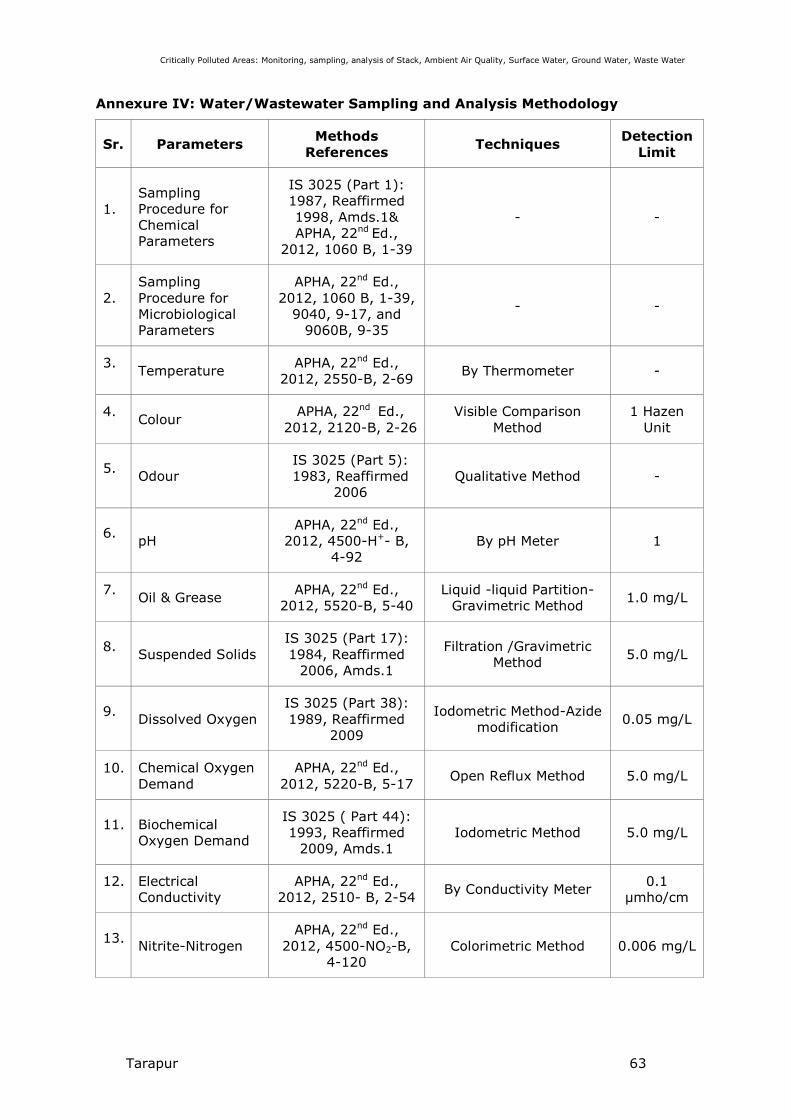
Critically Polluted Areas: Monitoring, sampling, analysis of Stack, Ambient Air Quality, Surface Water, Ground Water, Waste Water
Tarapur 63
Annexure IV: Water/Wastewater Sampling and Analysis Methodology
Sr. Parameters Methods
References Techniques
Detection
Limit
1.
Sampling
Procedure for
Chemical
Parameters
IS 3025 (Part 1):
1987, Reaffirmed
1998, Amds.1&
APHA, 22nd Ed.,
2012, 1060 B, 1-39
- -
2.
Sampling
Procedure for
Microbiological
Parameters
APHA, 22nd Ed.,
2012, 1060 B, 1-39,
9040, 9-17, and
9060B, 9-35
- -
3. Temperature
APHA, 22nd Ed.,
2012, 2550-B, 2-69 By Thermometer -
4. Colour
APHA, 22nd Ed.,
2012, 2120-B, 2-26
Visible Comparison
Method
1 Hazen
Unit
5. Odour
IS 3025 (Part 5):
1983, Reaffirmed
2006
Qualitative Method -
6. pH
APHA, 22nd Ed.,
2012, 4500-H+- B,
4-92
By pH Meter 1
7. Oil & Grease
APHA, 22nd Ed.,
2012, 5520-B, 5-40
Liquid -liquid Partition-
Gravimetric Method 1.0 mg/L
8. Suspended Solids
IS 3025 (Part 17):
1984, Reaffirmed
2006, Amds.1
Filtration /Gravimetric
Method 5.0 mg/L
9. Dissolved Oxygen
IS 3025 (Part 38):
1989, Reaffirmed
2009
Iodometric Method-Azide
modification 0.05 mg/L
10. Chemical Oxygen
Demand
APHA, 22nd Ed.,
2012, 5220-B, 5-17 Open Reflux Method 5.0 mg/L
11. Biochemical
Oxygen Demand
IS 3025 ( Part 44):
1993, Reaffirmed
2009, Amds.1
Iodometric Method 5.0 mg/L
12. Electrical
Conductivity
APHA, 22nd Ed.,
2012, 2510- B, 2-54 By Conductivity Meter
0.1
µmho/cm
13. Nitrite-Nitrogen
APHA, 22nd Ed.,
2012, 4500-NO2-B,
4-120
Colorimetric Method 0.006 mg/L
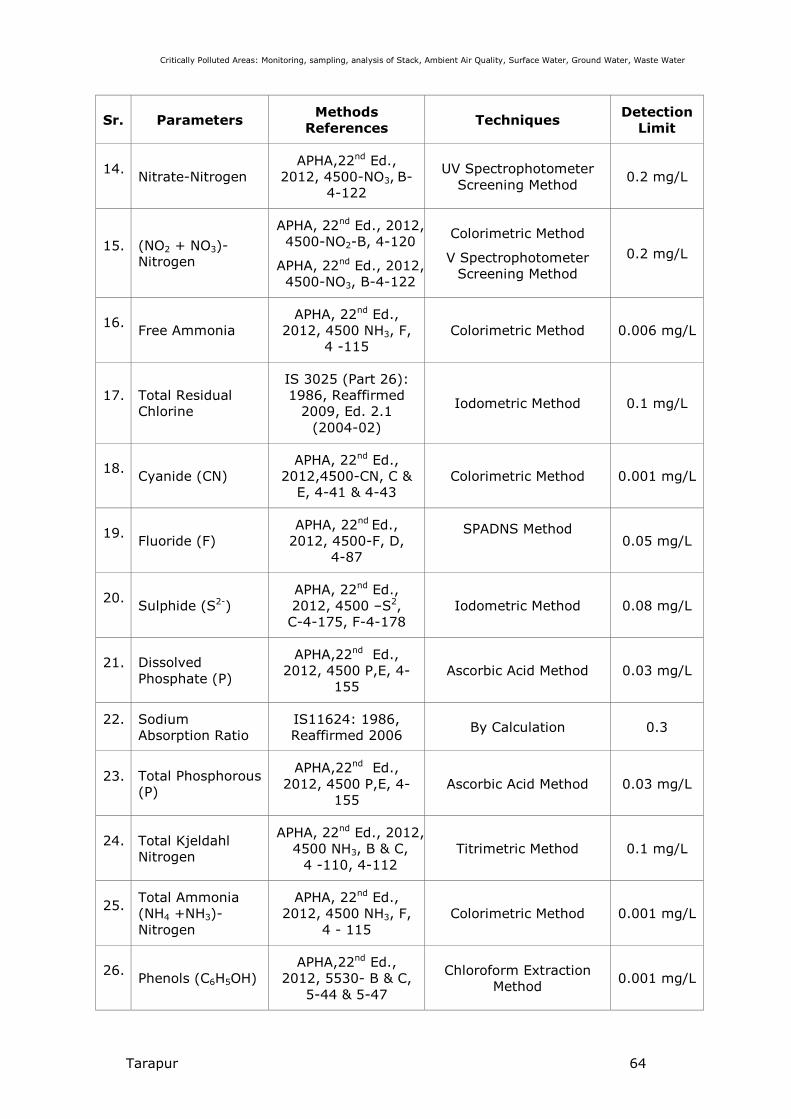
Critically Polluted Areas: Monitoring, sampling, analysis of Stack, Ambient Air Quality, Surface Water, Ground Water, Waste Water
Tarapur 64
Sr. Parameters Methods
References Techniques
Detection
Limit
14. Nitrate-Nitrogen
APHA,22nd Ed.,
2012, 4500-NO3, B-
4-122
UV Spectrophotometer
Screening Method 0.2 mg/L
15. (NO2 + NO3)-
Nitrogen
APHA, 22nd Ed., 2012,
4500-NO2-B, 4-120
APHA, 22nd Ed., 2012,
4500-NO3, B-4-122
Colorimetric Method
V Spectrophotometer
Screening Method
0.2 mg/L
16. Free Ammonia
APHA, 22nd Ed.,
2012, 4500 NH3, F,
4 -115
Colorimetric Method 0.006 mg/L
17. Total Residual
Chlorine
IS 3025 (Part 26):
1986, Reaffirmed
2009, Ed. 2.1
(2004-02)
Iodometric Method 0.1 mg/L
18. Cyanide (CN)
APHA, 22nd Ed.,
2012,4500-CN, C &
E, 4-41 & 4-43
Colorimetric Method 0.001 mg/L
19. Fluoride (F)
APHA, 22nd Ed.,
2012, 4500-F, D,
4-87
SPADNS Method
0.05 mg/L
20. Sulphide (S2-)
APHA, 22nd Ed.,
2012, 4500 –S2,
C-4-175, F-4-178
Iodometric Method 0.08 mg/L
21. Dissolved
Phosphate (P)
APHA,22nd Ed.,
2012, 4500 P,E, 4-
155
Ascorbic Acid Method 0.03 mg/L
22. Sodium
Absorption Ratio
IS11624: 1986,
Reaffirmed 2006 By Calculation 0.3
23. Total Phosphorous
(P)
APHA,22nd Ed.,
2012, 4500 P,E, 4-
155
Ascorbic Acid Method 0.03 mg/L
24. Total Kjeldahl
Nitrogen
APHA, 22nd Ed., 2012,
4500 NH3, B & C,
4 -110, 4-112
Titrimetric Method 0.1 mg/L
25. Total Ammonia
(NH4 +NH3)-
Nitrogen
APHA, 22nd Ed.,
2012, 4500 NH3, F,
4 - 115
Colorimetric Method 0.001 mg/L
26. Phenols (C6H5OH)
APHA,22nd Ed.,
2012, 5530- B & C,
5-44 & 5-47
Chloroform Extraction
Method 0.001 mg/L
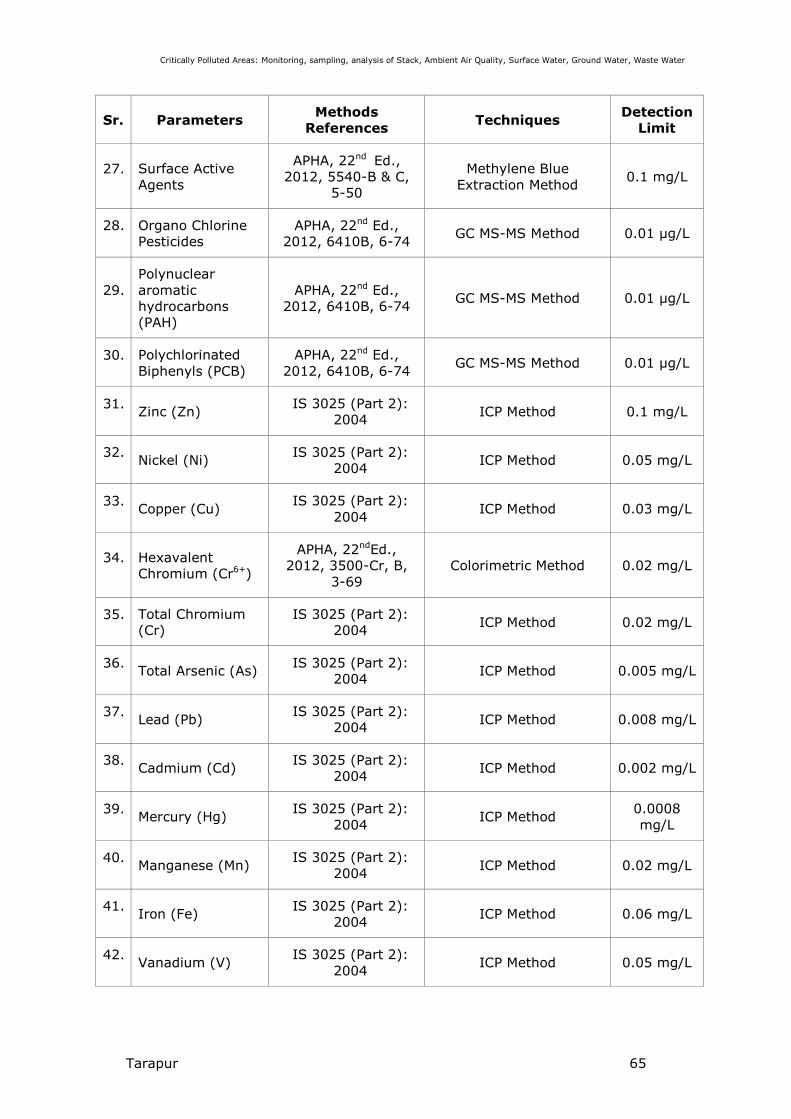
Critically Polluted Areas: Monitoring, sampling, analysis of Stack, Ambient Air Quality, Surface Water, Ground Water, Waste Water
Tarapur 65
Sr. Parameters Methods
References Techniques
Detection
Limit
27. Surface Active
Agents
APHA, 22nd Ed.,
2012, 5540-B & C,
5-50
Methylene Blue
Extraction Method 0.1 mg/L
28. Organo Chlorine
Pesticides
APHA, 22nd Ed.,
2012, 6410B, 6-74 GC MS-MS Method 0.01 µg/L
29. Polynuclear
aromatic
hydrocarbons
(PAH)
APHA, 22nd Ed.,
2012, 6410B, 6-74 GC MS-MS Method 0.01 µg/L
30. Polychlorinated
Biphenyls (PCB)
APHA, 22nd Ed.,
2012, 6410B, 6-74 GC MS-MS Method 0.01 µg/L
31. Zinc (Zn)
IS 3025 (Part 2):
2004 ICP Method 0.1 mg/L
32. Nickel (Ni)
IS 3025 (Part 2):
2004 ICP Method 0.05 mg/L
33. Copper (Cu)
IS 3025 (Part 2):
2004 ICP Method 0.03 mg/L
34. Hexavalent
Chromium (Cr6+)
APHA, 22ndEd.,
2012, 3500-Cr, B,
3-69
Colorimetric Method 0.02 mg/L
35. Total Chromium
(Cr)
IS 3025 (Part 2):
2004 ICP Method 0.02 mg/L
36. Total Arsenic (As)
IS 3025 (Part 2):
2004 ICP Method 0.005 mg/L
37. Lead (Pb)
IS 3025 (Part 2):
2004 ICP Method 0.008 mg/L
38. Cadmium (Cd)
IS 3025 (Part 2):
2004 ICP Method 0.002 mg/L
39. Mercury (Hg)
IS 3025 (Part 2):
2004 ICP Method
0.0008
mg/L
40. Manganese (Mn)
IS 3025 (Part 2):
2004 ICP Method 0.02 mg/L
41. Iron (Fe)
IS 3025 (Part 2):
2004 ICP Method 0.06 mg/L
42. Vanadium (V)
IS 3025 (Part 2):
2004 ICP Method 0.05 mg/L
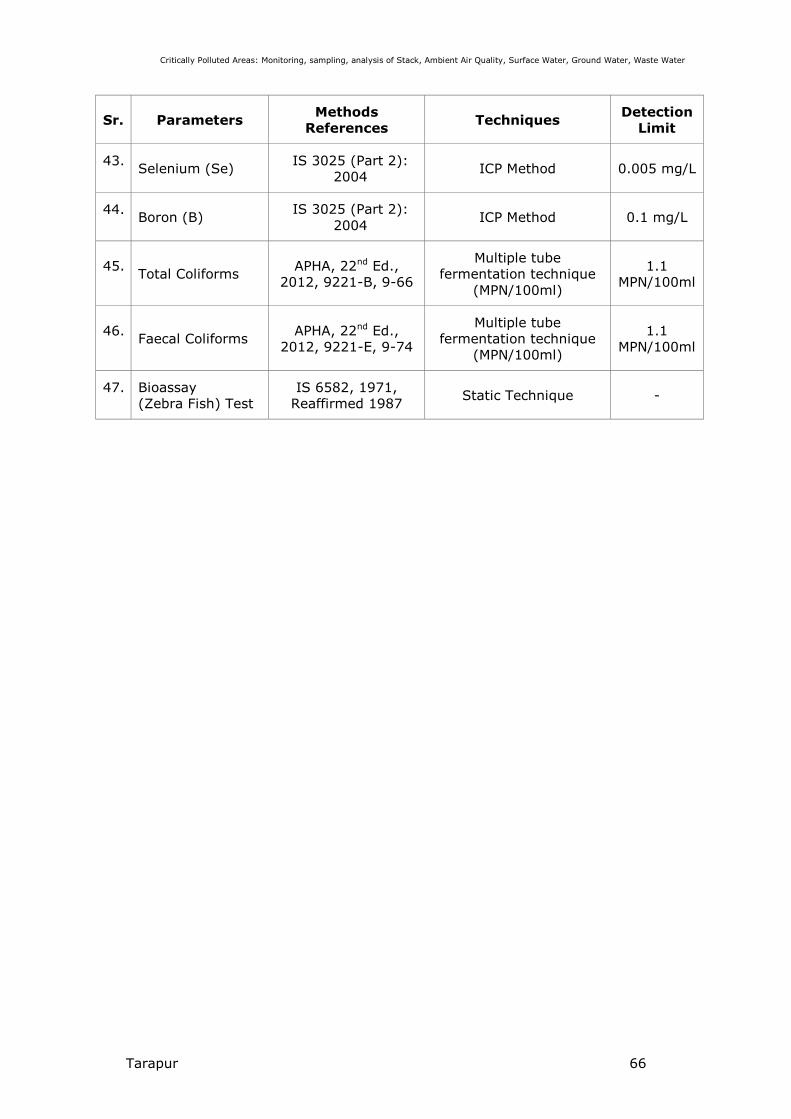
Critically Polluted Areas: Monitoring, sampling, analysis of Stack, Ambient Air Quality, Surface Water, Ground Water, Waste Water
Tarapur 66
Sr. Parameters Methods
References Techniques
Detection
Limit
43. Selenium (Se)
IS 3025 (Part 2):
2004 ICP Method 0.005 mg/L
44. Boron (B)
IS 3025 (Part 2):
2004 ICP Method 0.1 mg/L
45. Total Coliforms
APHA, 22nd Ed.,
2012, 9221-B, 9-66
Multiple tube
fermentation technique
(MPN/100ml)
1.1
MPN/100ml
46. Faecal Coliforms
APHA, 22nd Ed.,
2012, 9221-E, 9-74
Multiple tube
fermentation technique
(MPN/100ml)
1.1
MPN/100ml
47. Bioassay
(Zebra Fish) Test
IS 6582, 1971,
Reaffirmed 1987 Static Technique -
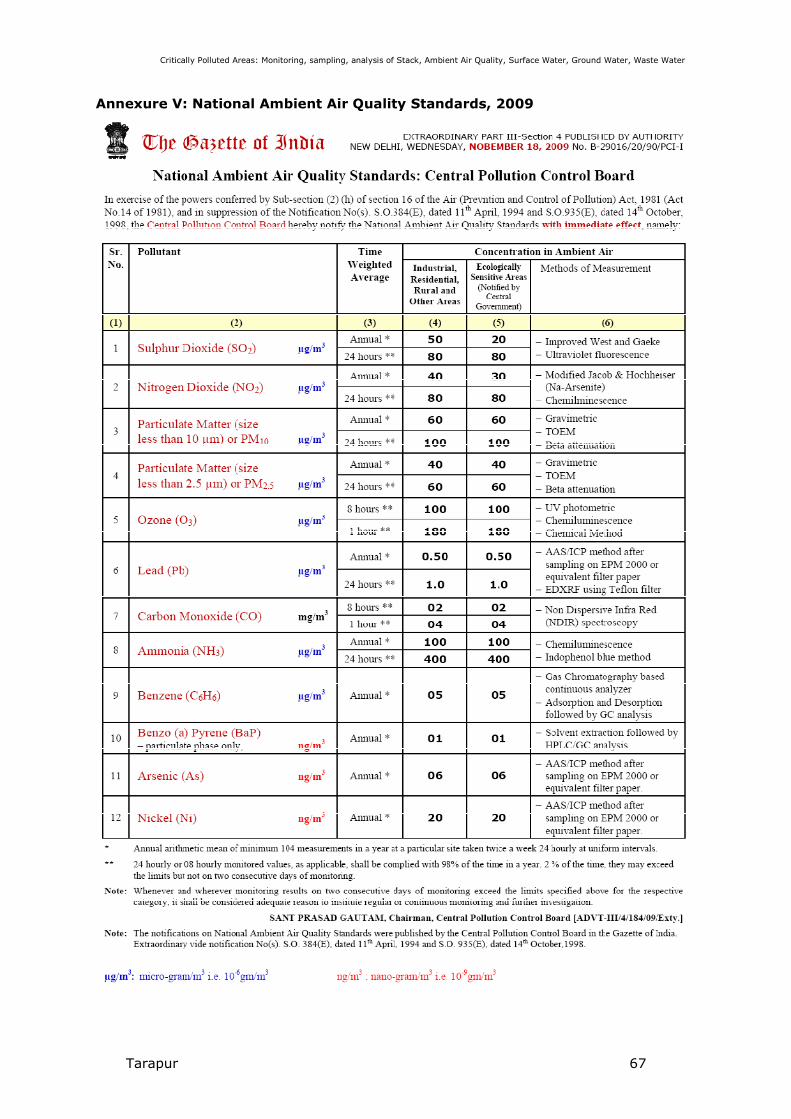
Critically Polluted Areas: Monitoring, sampling, analysis of Stack, Ambient Air Quality, Surface Water, Ground Water, Waste Water
Tarapur 67
Annexure V: National Ambient Air Quality Standards, 2009
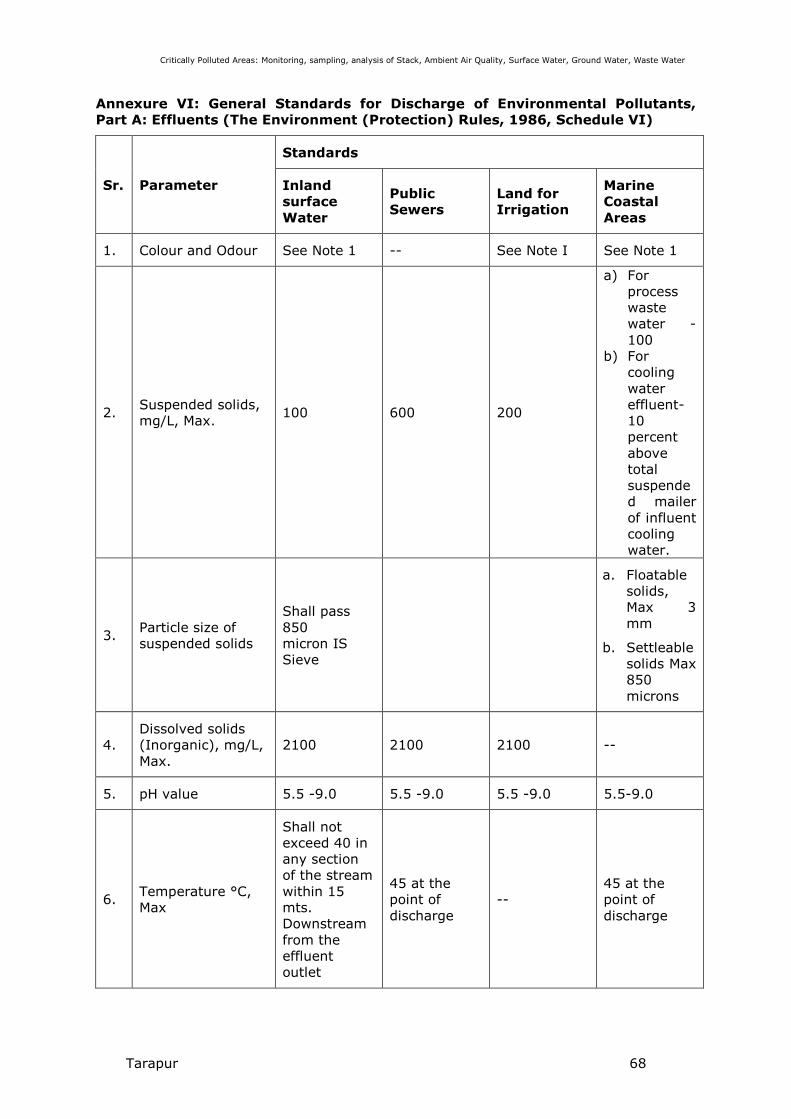
Critically Polluted Areas: Monitoring, sampling, analysis of Stack, Ambient Air Quality, Surface Water, Ground Water, Waste Water
Tarapur 68
Annexure VI: General Standards for Discharge of Environmental Pollutants,
Part A: Effluents (The Environment (Protection) Rules, 1986, Schedule VI)
Sr. Parameter
Standards
Inland
surface
Water
Public
Sewers
Land for
Irrigation
Marine
Coastal
Areas
1. Colour and Odour See Note 1 -- See Note I See Note 1
2. Suspended solids,
mg/L, Max. 100 600 200
a) For
process
waste
water -
100
b) For
cooling
water
effluent-
10
percent
above
total
suspende
d mailer
of influent
cooling
water.
3. Particle size of
suspended solids
Shall pass
850
micron IS
Sieve
a. Floatable
solids,
Max 3
mm
b. Settleable
solids Max
850
microns
4.
Dissolved solids
(Inorganic), mg/L,
Max.
2100 2100 2100 --
5. pH value 5.5 -9.0 5.5 -9.0 5.5 -9.0 5.5-9.0
6. Temperature °C,
Max
Shall not
exceed 40 in
any section
of the stream
within 15
mts.
Downstream
from the
effluent
outlet
45 at the
point of
discharge
--
45 at the
point of
discharge
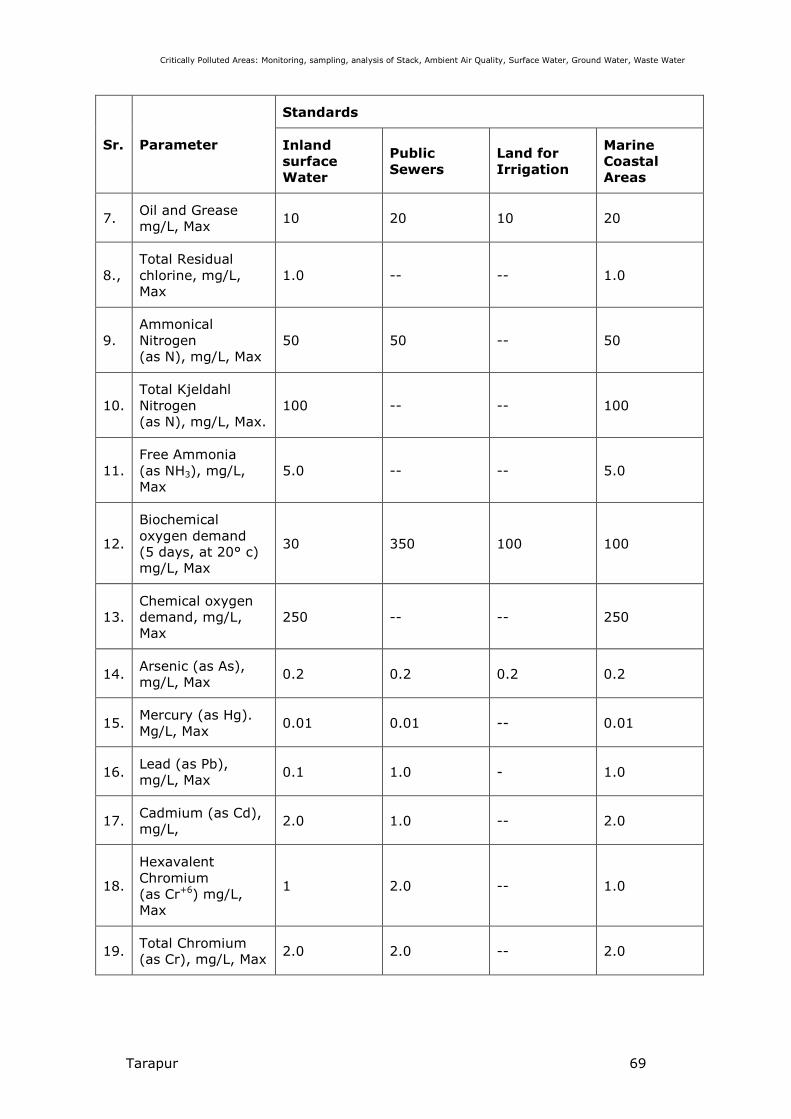
Critically Polluted Areas: Monitoring, sampling, analysis of Stack, Ambient Air Quality, Surface Water, Ground Water, Waste Water
Tarapur 69
Sr. Parameter
Standards
Inland
surface
Water
Public
Sewers
Land for
Irrigation
Marine
Coastal
Areas
7. Oil and Grease
mg/L, Max 10 20 10 20
8.,
Total Residual
chlorine, mg/L,
Max
1.0 -- -- 1.0
9.
Ammonical
Nitrogen
(as N), mg/L, Max
50 50 -- 50
10.
Total Kjeldahl
Nitrogen
(as N), mg/L, Max.
100 -- -- 100
11.
Free Ammonia
(as NH3), mg/L,
Max
5.0 -- -- 5.0
12.
Biochemical
oxygen demand
(5 days, at 20° c)
mg/L, Max
30 350 100 100
13.
Chemical oxygen
demand, mg/L,
Max
250 -- -- 250
14. Arsenic (as As),
mg/L, Max 0.2 0.2 0.2 0.2
15. Mercury (as Hg).
Mg/L, Max 0.01 0.01 -- 0.01
16. Lead (as Pb),
mg/L, Max 0.1 1.0 - 1.0
17. Cadmium (as Cd),
mg/L, 2.0 1.0 -- 2.0
18.
Hexavalent
Chromium
(as Cr+6) mg/L,
Max
1 2.0 -- 1.0
19. Total Chromium
(as Cr), mg/L, Max 2.0 2.0 -- 2.0
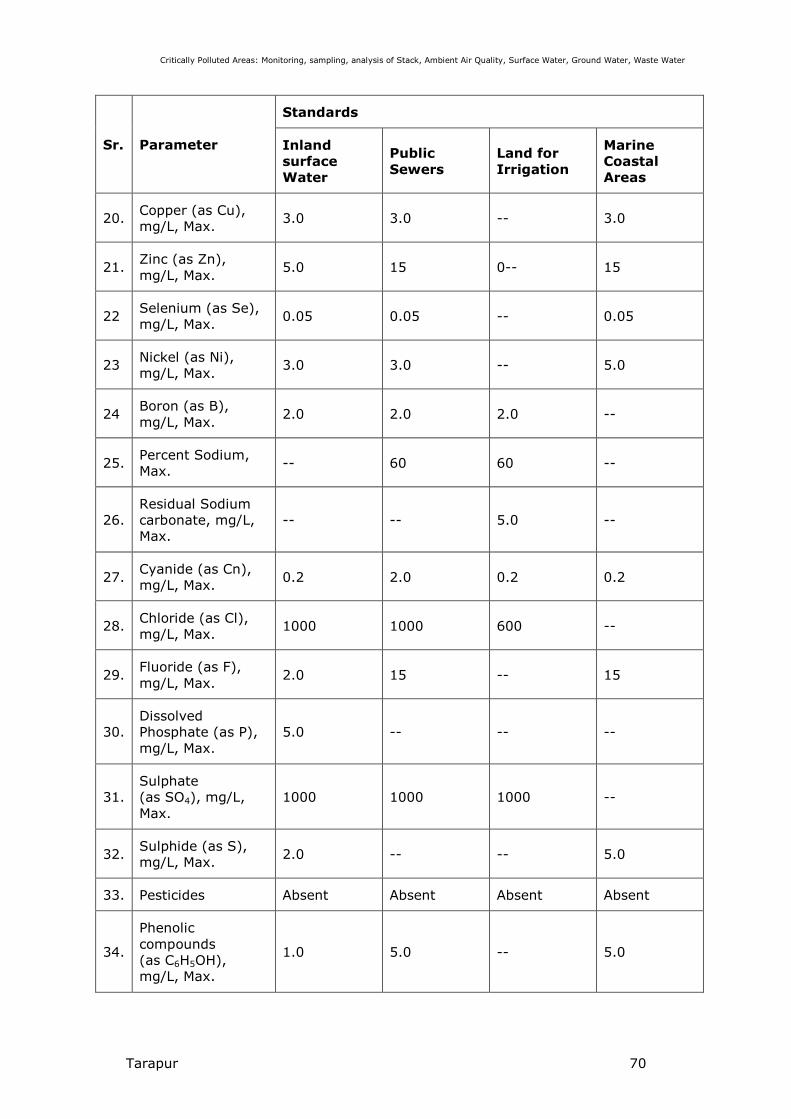
Critically Polluted Areas: Monitoring, sampling, analysis of Stack, Ambient Air Quality, Surface Water, Ground Water, Waste Water
Tarapur 70
Sr. Parameter
Standards
Inland
surface
Water
Public
Sewers
Land for
Irrigation
Marine
Coastal
Areas
20. Copper (as Cu),
mg/L, Max. 3.0 3.0 -- 3.0
21. Zinc (as Zn),
mg/L, Max. 5.0 15 0-- 15
22 Selenium (as Se),
mg/L, Max. 0.05 0.05 -- 0.05
23 Nickel (as Ni),
mg/L, Max. 3.0 3.0 -- 5.0
24 Boron (as B),
mg/L, Max. 2.0 2.0 2.0 --
25. Percent Sodium,
Max. -- 60 60 --
26.
Residual Sodium
carbonate, mg/L,
Max.
-- -- 5.0 --
27. Cyanide (as Cn),
mg/L, Max. 0.2 2.0 0.2 0.2
28. Chloride (as Cl),
mg/L, Max. 1000 1000 600 --
29. Fluoride (as F),
mg/L, Max. 2.0 15 -- 15
30.
Dissolved
Phosphate (as P),
mg/L, Max.
5.0 -- -- --
31.
Sulphate
(as SO4), mg/L,
Max.
1000 1000 1000 --
32. Sulphide (as S),
mg/L, Max. 2.0 -- -- 5.0
33. Pesticides Absent Absent Absent Absent
34.
Phenolic
compounds
(as C6H5OH),
mg/L, Max.
1.0 5.0 -- 5.0
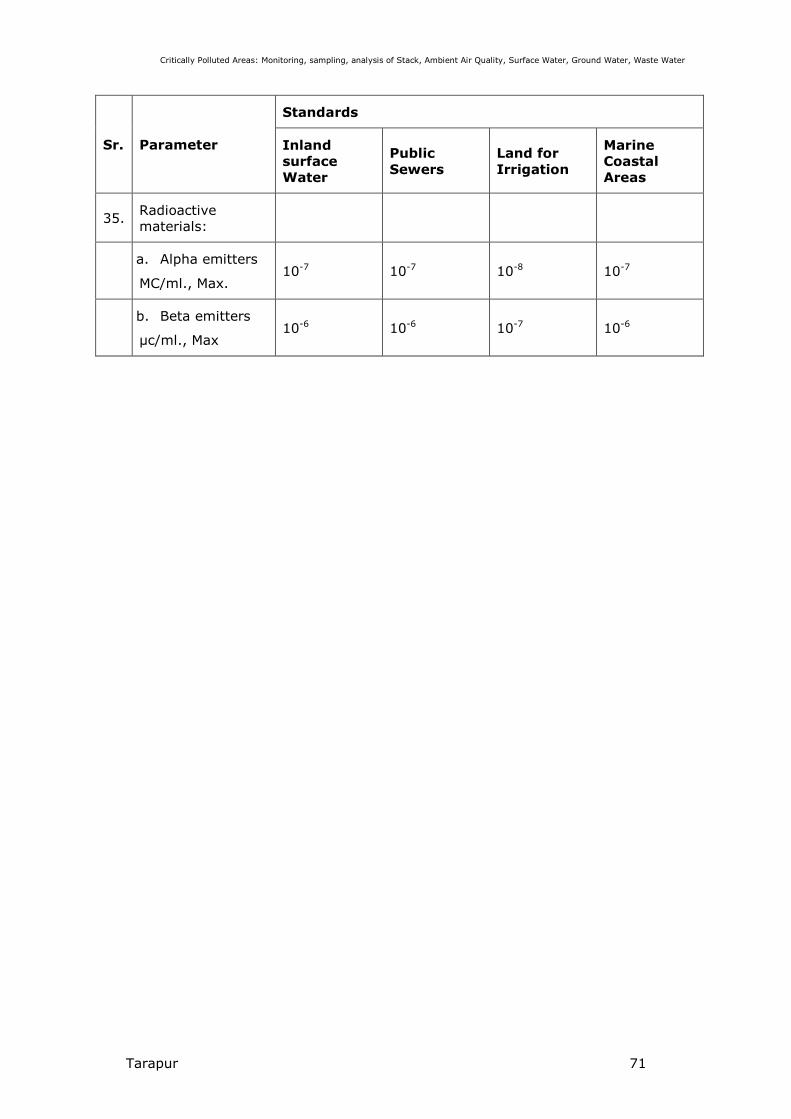
Critically Polluted Areas: Monitoring, sampling, analysis of Stack, Ambient Air Quality, Surface Water, Ground Water, Waste Water
Tarapur 71
Sr. Parameter
Standards
Inland
surface
Water
Public
Sewers
Land for
Irrigation
Marine
Coastal
Areas
35. Radioactive
materials:
a. Alpha emitters
MC/ml., Max. 10-7 10-7 10-8 10-7
b. Beta emitters
µc/ml., Max 10-6 10-6 10-7 10-6
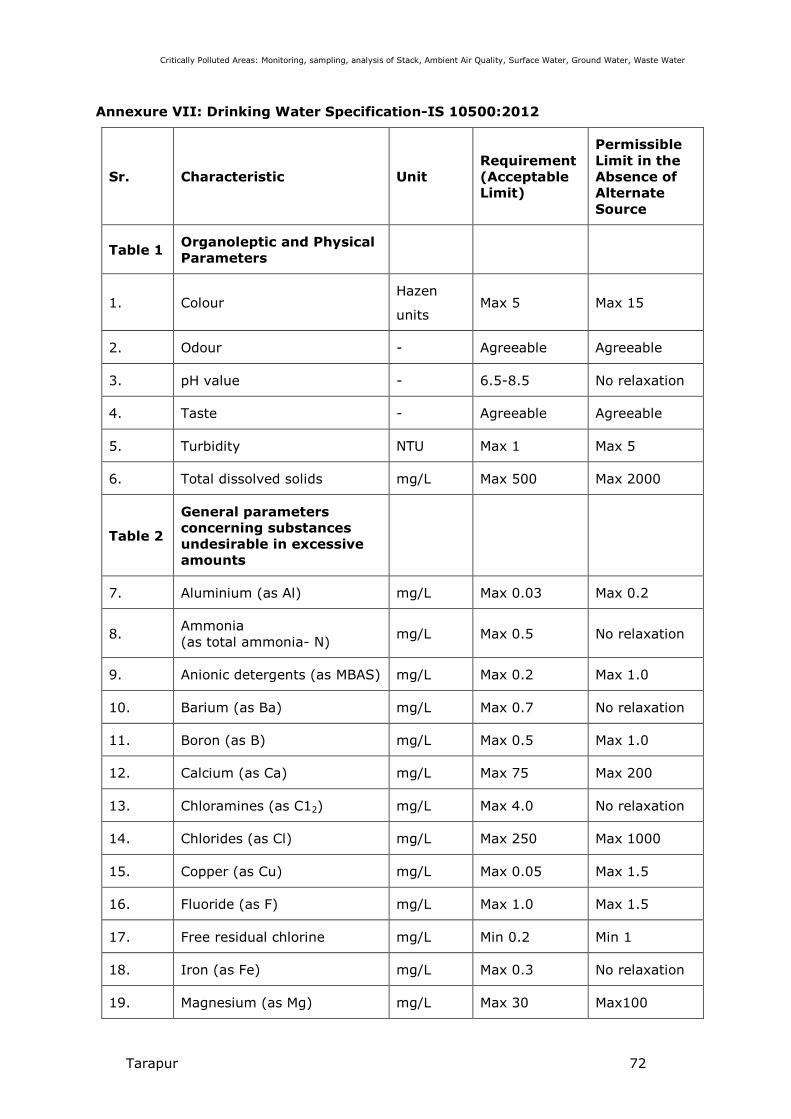
Critically Polluted Areas: Monitoring, sampling, analysis of Stack, Ambient Air Quality, Surface Water, Ground Water, Waste Water
Tarapur 72
Annexure VII: Drinking Water Specification-IS 10500:2012
Sr. Characteristic Unit
Requirement
(Acceptable
Limit)
Permissible
Limit in the
Absence of
Alternate
Source
Table 1 Organoleptic and Physical
Parameters
1. Colour Hazen
units Max 5 Max 15
2. Odour - Agreeable Agreeable
3. pH value - 6.5-8.5 No relaxation
4. Taste - Agreeable Agreeable
5. Turbidity NTU Max 1 Max 5
6. Total dissolved solids mg/L Max 500 Max 2000
Table 2
General parameters
concerning substances
undesirable in excessive
amounts
7. Aluminium (as Al) mg/L Max 0.03 Max 0.2
8. Ammonia
(as total ammonia- N) mg/L Max 0.5 No relaxation
9. Anionic detergents (as MBAS) mg/L Max 0.2 Max 1.0
10. Barium (as Ba) mg/L Max 0.7 No relaxation
11. Boron (as B) mg/L Max 0.5 Max 1.0
12. Calcium (as Ca) mg/L Max 75 Max 200
13. Chloramines (as C12) mg/L Max 4.0 No relaxation
14. Chlorides (as Cl) mg/L Max 250 Max 1000
15. Copper (as Cu) mg/L Max 0.05 Max 1.5
16. Fluoride (as F) mg/L Max 1.0 Max 1.5
17. Free residual chlorine mg/L Min 0.2 Min 1
18. Iron (as Fe) mg/L Max 0.3 No relaxation
19. Magnesium (as Mg) mg/L Max 30 Max100

Critically Polluted Areas: Monitoring, sampling, analysis of Stack, Ambient Air Quality, Surface Water, Ground Water, Waste Water
Tarapur 73
Sr. Characteristic Unit
Requirement
(Acceptable
Limit)
Permissible
Limit in the
Absence of
Alternate
Source
20. Manganese (as Mn) mg/L Max 0.1 Max 0.3
21. Mineral Oil mg/L Max 0.5 No relaxation
22. Nitrate (as NO3) mg/L Max 45 No relaxation
23. Phenolic compounds
(as C6H5OH) mg/L Max 0.001 Max 0.002
24. Selenium (as Se) mg/L Max 0.01 No relaxation
25. Silver (as Ag) mg/L Max 0.1 No relaxation
26. Sulphate (as SO4) mg/L Max 200 Max 400
27. Sulphide (as H2S) mg/L Max 0.05 No relaxation
28. Total Alkalinity as calcium
carbonate mg/L Max 200 Max600
29. Total hardness (as CaCO3) mg/L Max 200 Max 600
30. Zinc (as Zn) mg/L Max 5 Max15
Table 3 Parameters Concerning
Toxic Substances
31. Cadmium (as Cd) mg/L Max 0.003 No relaxation
32. Cyanide (as CN) mg/L Max 0.05 No relaxation
33. Lead (as Pb) mg/L Max 0.01 No relaxation
34. Mercury (as Hg) mg/L Max 0.001 No relaxation
35. Molybdenum (as Mo) mg/L Max 0.07 No relaxation
36. Nickel (as Ni) mg/L Max 0.02 No relaxation
37. Pesticides mg/L See Table 5 No relaxation
38. Polychlorinatedbiphenyls mg/L Max 0.0005 No relaxation
39. Poly nuclear aromatic
Hydrocarbons (as PAH) mg/L Max 0.0001 No relaxation
40. Total Arsenic(as As) mg/L Max 0.01 Max0.05
41. Total Chromium (as Cr) mg/L Max 0.05 No relaxation
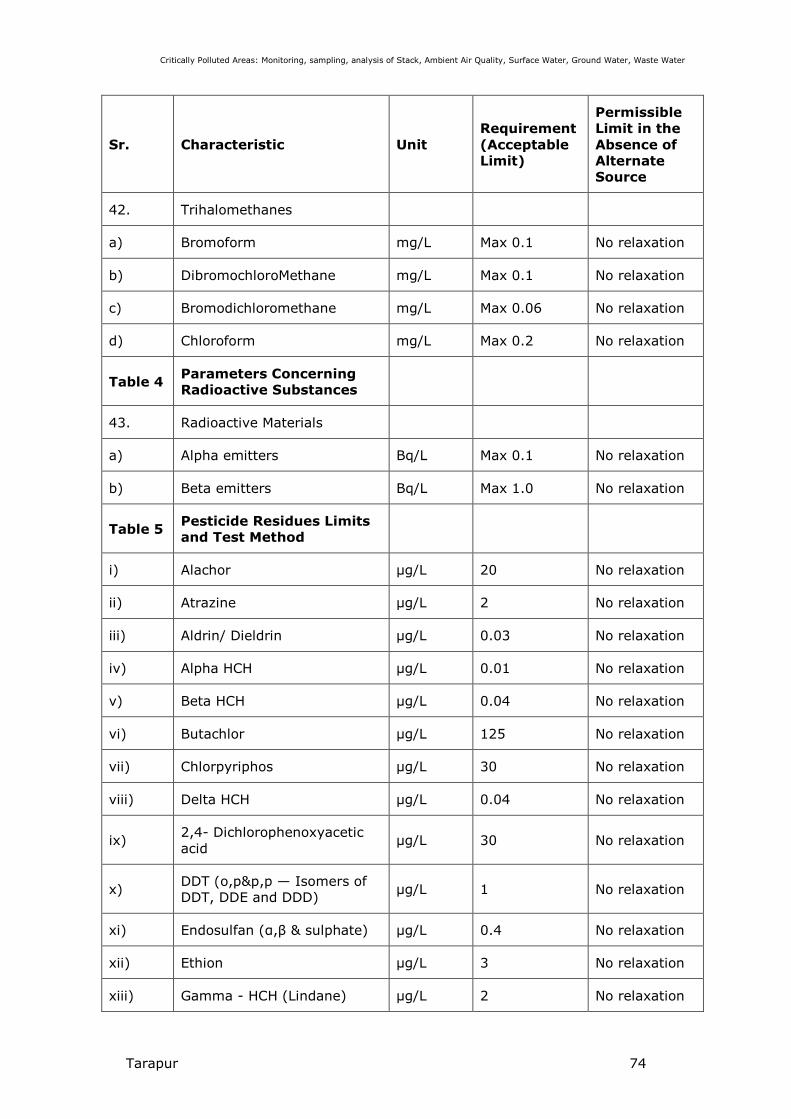
Critically Polluted Areas: Monitoring, sampling, analysis of Stack, Ambient Air Quality, Surface Water, Ground Water, Waste Water
Tarapur 74
Sr. Characteristic Unit
Requirement
(Acceptable
Limit)
Permissible
Limit in the
Absence of
Alternate
Source
42. Trihalomethanes
a) Bromoform mg/L Max 0.1 No relaxation
b) DibromochloroMethane mg/L Max 0.1 No relaxation
c) Bromodichloromethane mg/L Max 0.06 No relaxation
d) Chloroform mg/L Max 0.2 No relaxation
Table 4 Parameters Concerning
Radioactive Substances
43. Radioactive Materials
a) Alpha emitters Bq/L Max 0.1 No relaxation
b) Beta emitters Bq/L Max 1.0 No relaxation
Table 5 Pesticide Residues Limits
and Test Method
i) Alachor µg/L 20 No relaxation
ii) Atrazine µg/L 2 No relaxation
iii) Aldrin/ Dieldrin µg/L 0.03 No relaxation
iv) Alpha HCH µg/L 0.01 No relaxation
v) Beta HCH µg/L 0.04 No relaxation
vi) Butachlor µg/L 125 No relaxation
vii) Chlorpyriphos µg/L 30 No relaxation
viii) Delta HCH µg/L 0.04 No relaxation
ix) 2,4- Dichlorophenoxyacetic
acid µg/L 30 No relaxation
x) DDT (o,p&p,p — Isomers of
DDT, DDE and DDD) µg/L 1 No relaxation
xi) Endosulfan (α,β & sulphate) µg/L 0.4 No relaxation
xii) Ethion µg/L 3 No relaxation
xiii) Gamma - HCH (Lindane) µg/L 2 No relaxation

Critically Polluted Areas: Monitoring, sampling, analysis of Stack, Ambient Air Quality, Surface Water, Ground Water, Waste Water
Tarapur 75
Sr. Characteristic Unit
Requirement
(Acceptable
Limit)
Permissible
Limit in the
Absence of
Alternate
Source
xiv) Isoproturon µg/L 9 No relaxation
xv) Malathion µg/L 190 No relaxation
xvi) Methyl parathion µg/L 0.3 No relaxation
xvii) Monocrotophos µg/L 1 No relaxation
xviii) Phorate µg/L 2 No relaxation
Table 6 Bacteriological Quality of
Drinking Water
44. E.coli or thermotolerant
coliform bacteria /100 Not detectable -
45. Total coliform bacteria /100 mL Not detectable -
Virological Requirements
46. MS2 phage /1 L Absent -
Biological Requirements
47. Cryptosporidium /10 L Absent -
48. Giardia /10 L Absent -
49.
Microscopic organisms such
as algae, zooplanktons,
flagellates, parasites and
toxin producing organisms
Free from
microscopic
organisms
-
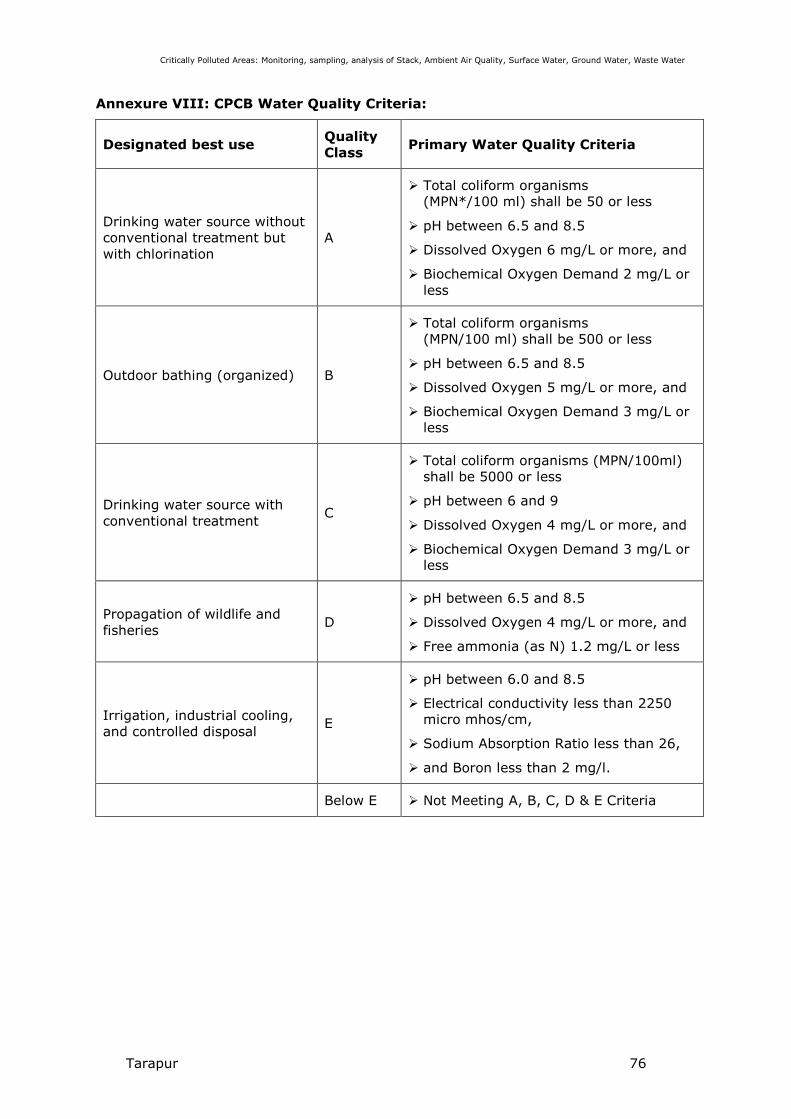
Critically Polluted Areas: Monitoring, sampling, analysis of Stack, Ambient Air Quality, Surface Water, Ground Water, Waste Water
Tarapur 76
Annexure VIII: CPCB Water Quality Criteria:
Designated best use Quality
Class Primary Water Quality Criteria
Drinking water source without
conventional treatment but
with chlorination
A
� Total coliform organisms
(MPN*/100 ml) shall be 50 or less
� pH between 6.5 and 8.5
� Dissolved Oxygen 6 mg/L or more, and
� Biochemical Oxygen Demand 2 mg/L or
less
Outdoor bathing (organized) B
� Total coliform organisms
(MPN/100 ml) shall be 500 or less
� pH between 6.5 and 8.5
� Dissolved Oxygen 5 mg/L or more, and
� Biochemical Oxygen Demand 3 mg/L or
less
Drinking water source with
conventional treatment C
� Total coliform organisms (MPN/100ml)
shall be 5000 or less
� pH between 6 and 9
� Dissolved Oxygen 4 mg/L or more, and
� Biochemical Oxygen Demand 3 mg/L or
less
Propagation of wildlife and
fisheries D
� pH between 6.5 and 8.5
� Dissolved Oxygen 4 mg/L or more, and
� Free ammonia (as N) 1.2 mg/L or less
Irrigation, industrial cooling,
and controlled disposal E
� pH between 6.0 and 8.5
� Electrical conductivity less than 2250
micro mhos/cm,
� Sodium Absorption Ratio less than 26,
� and Boron less than 2 mg/l.
Below E � Not Meeting A, B, C, D & E Criteria
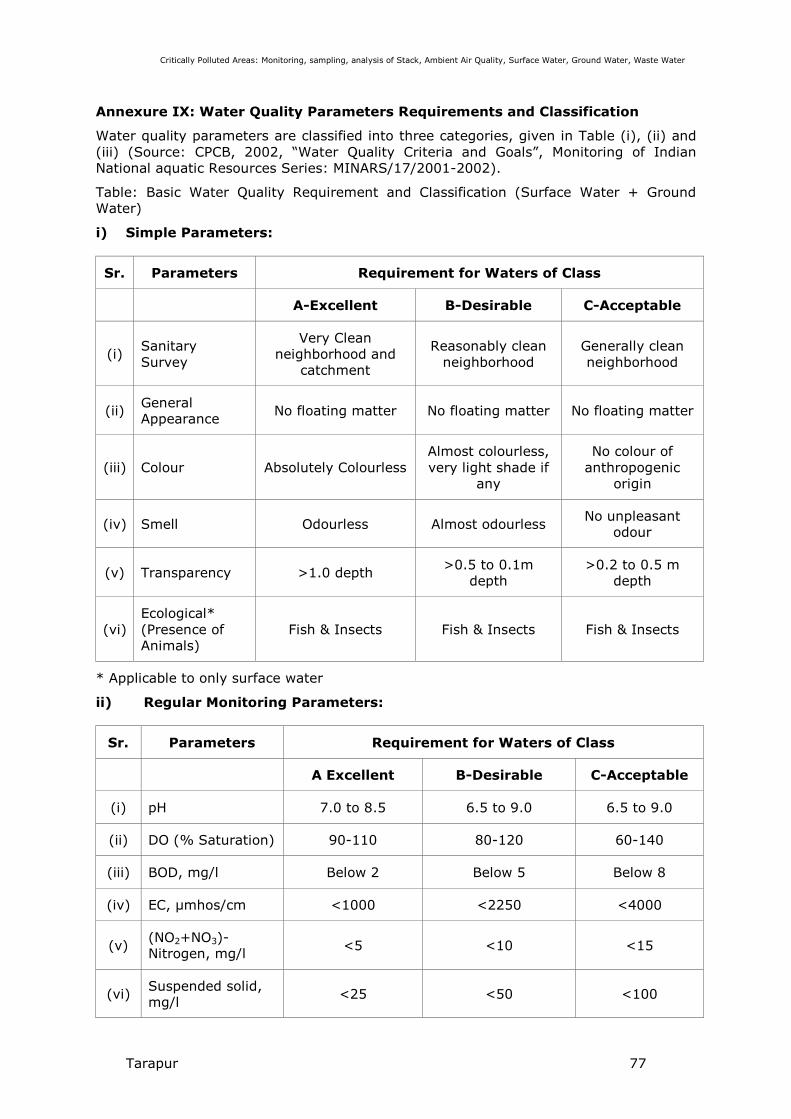
Critically Polluted Areas: Monitoring, sampling, analysis of Stack, Ambient Air Quality, Surface Water, Ground Water, Waste Water
Tarapur 77
Annexure IX: Water Quality Parameters Requirements and Classification
Water quality parameters are classified into three categories, given in Table (i), (ii) and
(iii) (Source: CPCB, 2002, “Water Quality Criteria and Goals”, Monitoring of Indian
National aquatic Resources Series: MINARS/17/2001-2002).
Table: Basic Water Quality Requirement and Classification (Surface Water + Ground
Water)
i) Simple Parameters:
Sr. Parameters Requirement for Waters of Class
A-Excellent B-Desirable C-Acceptable
(i) Sanitary
Survey
Very Clean
neighborhood and
catchment
Reasonably clean
neighborhood
Generally clean
neighborhood
(ii) General
Appearance No floating matter No floating matter No floating matter
(iii) Colour Absolutely Colourless
Almost colourless,
very light shade if
any
No colour of
anthropogenic
origin
(iv) Smell Odourless Almost odourless No unpleasant
odour
(v) Transparency >1.0 depth >0.5 to 0.1m
depth
>0.2 to 0.5 m
depth
(vi)
Ecological*
(Presence of
Animals)
Fish & Insects Fish & Insects Fish & Insects
* Applicable to only surface water
ii) Regular Monitoring Parameters:
Sr. Parameters Requirement for Waters of Class
A Excellent B-Desirable C-Acceptable
(i) pH 7.0 to 8.5 6.5 to 9.0 6.5 to 9.0
(ii) DO (% Saturation) 90-110 80-120 60-140
(iii) BOD, mg/l Below 2 Below 5 Below 8
(iv) EC, µmhos/cm <1000 <2250 <4000
(v) (NO2+NO3)-
Nitrogen, mg/l <5 <10 <15
(vi) Suspended solid,
mg/l <25 <50 <100

Critically Polluted Areas: Monitoring, sampling, analysis of Stack, Ambient Air Quality, Surface Water, Ground Water, Waste Water
Tarapur 78
Sr. Parameters Requirement for Waters of Class
A Excellent B-Desirable C-Acceptable
(vii) Fecal Coliform,
MPN/ 100 ml <20 per 100 ml <200 per 100 ml
<2000 per 100
ml
(viii) Bio-assay
(Zebra Fish)
No death in 5
days No death in 3 days
No death in 2
days
Note:
1. Dissolved Oxygen (DO) not applicable for ground waters.
2. Dissolved Oxygen in eutrophicated waters should include measurement for
diurnal variation.
3. Suspended solid limit is applicable only during non-monsoon period.
4. Faecal Coliform values should meet for 90% times.
5. Static Bio-Assay method may be adopted.
iii) Specific Parameters: (Only in case of need/apprehensions)
Sr. Parameters Requirement for Waters of Class
A- Excellent B-Desirable C-Acceptable
(i) Total Phosphorous <0.1 mg/l <0.2 mg/l <0.3 mg/l
(ii) T.K.N <1.0 mg/l <2.0 mg/l <3.0 mg/l
(iii)
Total Ammonia
(NH4 + NH3)-
Nitrogen
<0.5 mg/l <1.0 mg/l <1.5 mg/l
(iv) Phenols <2 µg/l <5 µg/l <10 µg/l
(v) Surface Active
Agents <20 µg/l <100 µg/l <200 µg/l
(vi) Organo Chlorine
Pesticides <0.05 µg/l <0.1 µg/l <0.2 µg/l
(vii) PAH <0.05 µg/l <0.1 µg/l <0.2 µg/l
(viii) PCB and PCT <0.01 µg/l <0.01 µg/l <0.02 µg/l
(ix) Zinc <100 µg/l <200 µg/l <300 µg/l
(x) Nickel <50 µg/l <100 µg/l <200 µg/l
(xi) Copper <20 µg/l <50 µg/l <100 µg/l
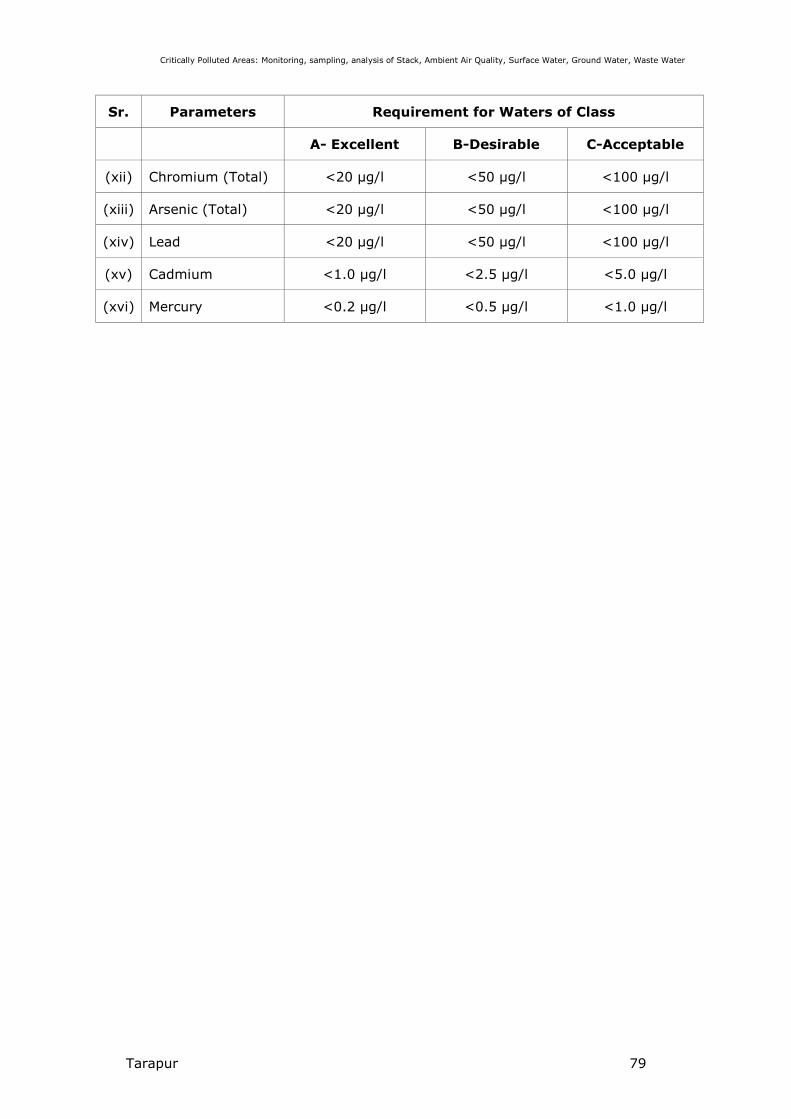
Critically Polluted Areas: Monitoring, sampling, analysis of Stack, Ambient Air Quality, Surface Water, Ground Water, Waste Water
Tarapur 79
Sr. Parameters Requirement for Waters of Class
A- Excellent B-Desirable C-Acceptable
(xii) Chromium (Total) <20 µg/l <50 µg/l <100 µg/l
(xiii) Arsenic (Total) <20 µg/l <50 µg/l <100 µg/l
(xiv) Lead <20 µg/l <50 µg/l <100 µg/l
(xv) Cadmium <1.0 µg/l <2.5 µg/l <5.0 µg/l
(xvi) Mercury <0.2 µg/l <0.5 µg/l <1.0 µg/l