قائمـة الجـداول Tables List الجدول Table Banking Statistics ...
68
Tables List جـداولئمـة ال قاTable جدول الBanking Statistics ءات المصرفيةحصا اMoney & Banking لمصارف النقود واCentral Bank of Bahrain - Assets/Liabilities 1 ن المركزي مصرف البحري- الموجودات/ مطلوبات الCurrency 2 النقدMoney Supply 3 عرض النقدMonetary Survey 4 المسح النقديFactors Affecting Changes in Money Supply 5 المؤثرة في عرض النقدعوامل الBD Exchange Rates Against Selected Currencies 6 لمختارةت ا بعض العمني مقابلر البحريلدينار صرف ا أسعاConventional Retail Banks - BD Interest Rates on Deposits and Loans 7 تقليديةع التجزئة ال مصارف قطا- نير البحريلقروض بالديناى الودائع وافائدة علر ال أسعاConventional Retail Banks - Highest and Lowest Interest Rates offered on BD Loans 8 تقليديةع التجزئة ال مصارف قطا- نير البحريلقروض بالدينائدة على الى وأدنى أسعار فا أعConventional Retail Banks - BD Interest Rates on Personal & Business Loans by Banks 9 تقليديةع التجزئة ال مصارف قطا- لمصارفل حسب اعماع الشخصية وقروض قطاى القروض افائدة علر ال أسعاGovernment of Bahrain Treasury Bills 10 ة لحكومة البحرينت الخزان أذوناPublic Debt Instruments 11 لعام أدوات الدين اAggregated Balance Sheet of the Banking System: Retail Banks & Wholesale Banks 12 ز المصرفيلجها الموحدة ل الميزانية: جملةع اللتجزئة ومصارف قطاع ا مصارف قطاRetail Banks ع التجزئة مصارف قطاAggregated Balance Sheet - Assets 13 الموحدة الميزانية- الموجوداتAggregated Balance Sheet - Liabilities 14 الموحدة الميزانية- مطلوبات الForeign Assets and Liabilities 15 جنبيةت امطلوبا الموجودات والAssets by Currency 16 ت الموجودات حسب العمLiabilities by Currency 17 تت حسب العممطلوبا الDeposit Liabilities to Non-Banks 18 لمصارف الودائع من غير اOutstanding Loans and Advances to Non-Bank Residents by Economic Sector 19 دية المقيمةقتصات القطاعات حسب ا القروض والتسهيع إجمالي توزي( لمصارفء ا باستثنا) Outstanding Loans and Advances to Non-Bank Residents-Banks and Financing Companies 20 لمصارفت لغير ا القروض والتسهيع إجمالي توزي- تمويلت اللمصارف وشركا اGeographical Classification of Assets and Liabilities 21 الجغرافي حسب التصنيفمطلوبات الموجودات والClassification of Assets and Liabilities by Major Currencies 22 ت العمات حسب أهممطلوب الموجودات والSelected Banking Indicators 23 مختارة مؤشرات مصرفيةConventional Retail Banks: Aggregated Balance Sheet of Islamic Windows - Assets 24 تقليديةع التجزئة ال مصارف قطا: ميةسلنوافذ ا الموحدة ل الميزانية- الموجوداتConventional Retail Banks: Aggregated Balance Sheet of Islamic Windows - Liabilities 25 تقليديةع التجزئة ال مصارف قطا: ميةسلنوافذ ا الموحدة ل الميزانية- مطلوبات الWholesale Banks جملةع ال مصارف قطاAggregated Balance Sheet - Assets 26 الموحدة الميزانية- الموجوداتAggregated Balance Sheet - Liabilities 27 الموحدة الميزانية- مطلوبات الGeographical Classification of Assets and Liabilities 28 الجغرافي حسب التصنيفمطلوبات الموجودات والClassification of Assets and Liabilities by Major Currencies 29 ت العمات حسب أهممطلوب الموجودات وال
-
Upload
khangminh22 -
Category
Documents
-
view
1 -
download
0
Transcript of قائمـة الجـداول Tables List الجدول Table Banking Statistics ...

Tables List قائمـة الجـداول
Table الجدول
Banking Statistics اإلحصاءات المصرفية
Money & Banking النقود والمصارف
Central Bank of Bahrain - Assets/Liabilities 1 المطلوبات/الموجودات- مصرف البحرين المركزي
Currency 2 النقد
Money Supply 3 عرض النقد
Monetary Survey 4 المسح النقدي
Factors Affecting Changes in Money Supply 5 العوامل المؤثرة في عرض النقد
BD Exchange Rates Against Selected Currencies 6 أسعار صرف الدينار البحريني مقابل بعض العمالت المختارة
Conventional Retail Banks - BD Interest Rates on Deposits and Loans 7 أسعار الفائدة على الودائع والقروض بالدينار البحريني- مصارف قطاع التجزئة التقليدية
Conventional Retail Banks - Highest and Lowest Interest Rates offered on BD Loans 8 أعلى وأدنى أسعار فائدة على القروض بالدينار البحريني- مصارف قطاع التجزئة التقليدية
Conventional Retail Banks - BD Interest Rates on Personal & Business Loans by Banks 9 أسعار الفائدة على القروض الشخصية وقروض قطاع األعمال حسب المصارف- مصارف قطاع التجزئة التقليدية
Government of Bahrain Treasury Bills 10 أذونات الخزانة لحكومة البحرين
Public Debt Instruments 11 أدوات الدين العام
Aggregated Balance Sheet of the Banking System: Retail Banks & Wholesale Banks 12 مصارف قطاع التجزئة ومصارف قطاع الجملة: الميزانية الموحدة للجهاز المصرفي
Retail Banks مصارف قطاع التجزئة
Aggregated Balance Sheet - Assets 13 الموجودات- الميزانية الموحدة
Aggregated Balance Sheet - Liabilities 14 المطلوبات- الميزانية الموحدة
Foreign Assets and Liabilities 15 الموجودات والمطلوبات األجنبية
Assets by Currency 16 الموجودات حسب العمالت
Liabilities by Currency 17 المطلوبات حسب العمالت
Deposit Liabilities to Non-Banks 18 الودائع من غير المصارف
Outstanding Loans and Advances to Non-Bank Residents by Economic Sector 19 (باستثناء المصارف)توزيع إجمالي القروض والتسهيالت حسب القطاعات االقتصادية المقيمة
Outstanding Loans and Advances to Non-Bank Residents-Banks and Financing Companies 20 المصارف وشركات التمويل-توزيع إجمالي القروض والتسهيالت لغير المصارف
Geographical Classification of Assets and Liabilities 21 الموجودات والمطلوبات حسب التصنيف الجغرافي
Classification of Assets and Liabilities by Major Currencies 22 الموجودات والمطلوبات حسب أهم العمالت
Selected Banking Indicators 23 مؤشرات مصرفية مختارة
Conventional Retail Banks: Aggregated Balance Sheet of Islamic Windows - Assets 24 الموجودات- الميزانية الموحدة للنوافذ اإلسالمية : مصارف قطاع التجزئة التقليدية
Conventional Retail Banks: Aggregated Balance Sheet of Islamic Windows - Liabilities 25 المطلوبات- الميزانية الموحدة للنوافذ اإلسالمية : مصارف قطاع التجزئة التقليدية
Wholesale Banks مصارف قطاع الجملة
Aggregated Balance Sheet - Assets 26 الموجودات- الميزانية الموحدة
Aggregated Balance Sheet - Liabilities 27 المطلوبات- الميزانية الموحدة
Geographical Classification of Assets and Liabilities 28 الموجودات والمطلوبات حسب التصنيف الجغرافي
Classification of Assets and Liabilities by Major Currencies 29 الموجودات والمطلوبات حسب أهم العمالت

Tables List قائمـة الجـداول
Table الجدول
Islamic Banks المصارف اإلسالمية
Aggregated Balance Sheet - Assets 30 الموجودات- الميزانية الموحدة
Aggregated Balance Sheet - Liabilities 31 المطلوبات- الميزانية الموحدة
Geographical Classification of Assets and Liabilities 32 الموجودات والمطلوبات حسب التصنيف الجغرافي
Classification of Assets and Liabilities by Major Currencies 33 الموجودات والمطلوبات حسب أهم العمالت
Classification of Restricted & Unrestricted account for Islamic Banks (Consolidated) 34 (مجمعة)الحسابات المقيدة وغير المقيدة للمصارف اإلسالمية
Financial Soundness Indicators مؤشرا ت السالمة المالية للقطاع المصرفي
Financial Soundness Indicators - Entire Banking Sector 35 مؤشرا ت السالمة المالية للقطاع المصرفي
Financial Soundness Indicators - Conventional Banks 36 المصارف التقليدية- مؤشرا ت السالمة المالية للقطاع المصرفي
Financial Soundness Indicators - Islamic Banks 37 المصارف اإلسالمية- مؤشرا ت السالمة المالية للقطاع المصرفي
Investment Business Firms 38 شركات أعمال استثمارية
Money Changers: Aggregated Balance Sheet 39 الميزانية الموحدة لمكاتب الصرافة
Payment Systems 40 أنظمة المدفوعات
Bahrain Cheque Truncation System (BCTS) - Returned Cheques 41 الشيكات المرتجعة- نظام البحرين لمقاصة الشيكات اإللكتروني
Point of Sales Transactions عمليات نقاط البيع
Point of Sales Transactions 42 عمليات نقاط البيع
Points of Sales Transactions by Sectors - Credit Cards issued in Bahrain 43 بطاقات االئتمان المصدرة في البحرين- عمليات نقاط البيع حسب القطاعات
Points of Sales Transactions by Sectors - Credit Cards issued Outside Bahrain 44 بطاقات االئتمان المصدرة خارج البحرين- عمليات نقاط البيع حسب القطاعات
Points of Sales Transactions by Sectors - Debit Cards issued in Bahrain 45 بطاقات الخصم المصدرة في البحرين- عمليات نقاط البيع حسب القطاعات
Points of Sales Transactions by Sectors - Debit Cards issued Outside Bahrain 46 بطاقات الخصم المصدرة خارج البحرين- عمليات نقاط البيع حسب القطاعات
Number of POS Transactions by Geographical Classification of Card-Issuer Country 47 عدد عمليات نقاط البيع حسب التصنيف الجغرافي للدول المصدرة للبطاقة
Value of POS Transactions by Geographical Classification of Card-Issuer Country 48 قيمة عمليات نقاط البيع حسب التصنيف الجغرافي للدول المصدرة للبطاقة
Economic Statistics اإلحصاءات االقتصادية
Population 49 عدد السكان
Number of Employees in the Financial Sector 50 عدد العاملين في القطاع المالي
Balance of Payments 51 ميزان المدفوعات
International Investment Position 52 وضع االستثمار الدولي
Bahrain Bourse بورصة البحرين
Market Indicators of Listed Companies 53 مؤشرات التداول للشركات المساهمة العامة
Value of Shares Traded by Sector (1) 54 (1) قيمة األسهم المتداولة حسب القطاعات
Value of Shares Traded by Sector (2) 55 (2) قيمة األسهم المتداولة حسب القطاعات
Bahrain Index by Sector (1) 56 (1) مؤشر األسعار حسب القطاعات
Bahrain Index by Sector (2) 57 (2) مؤشر األسعار حسب القطاعات
Trading value of investors' participation and % of shares ownership in listed companies 58 قيمة تعامالت المستثمرين في السوق ونسب التملك في أسهم الشركات المساهمة العامة المسجلة
Mutual Funds 59 صناديق االستثمار

Purpose of the study
General description of data
Classification System
Statistical Population
Data Users
Reference Area
Residency
Sector Coverage
Time Coverage
Concept Periodicity Tables Currency Scale
Money Supply Monthly 3 BD Million
Monetary Survey Monthly 4 BD Million
Interest Rates on Deposits and
LoansMonthly 7-9 NA % Per Annum
Public Debt Instruments Monthly 10-11 BD Million
• Public Debt is measured in terms of treasury bills and securities.
• Conventional instruments include development bonds and treasury bills with a maturity of 91 days,
182 days, 12 months.
• Islamic instruments includes Islamic Leasing securities and Al Salam securities. Sukuk or Islamic
securities can be issued in BD or USD, and an exchange rate of 0.376 is used when evaluating USD
government securities in BD.
Historical data on the average interest on Deposits and Loans with a sectoral breakdown is provided.
The data is also provided by banks.
The subject of the study of the statistical bulletin are CBB licensees. This includes all banks, retail and wholesale, conventional and Islamic. Also, other non-banking
financial institutions are included.
Public institutions and organizations such as: Ministry of Finance and National Economy (MOFNE), Ministry of Trade and Industry, Bahrain Economic Development Board
(EDB), international organizations such as International Monetary Fund (IMF), The Arab Monetary Fund (AMF), Rating Agencies, financial institutions, and other users.
Bahrain
• For many entries on the returns, it is necessary to classify customers or counter-parties as “residents” or “non-residents” of Bahrain. Residents are entities that are
physically located in Bahrain, whether or not associated with an institution that is located outside Bahrain, and irrespective of nationality of the underlying ownership.
Conversely, non-residents are entities located outside Bahrain, whether or not owned--wholly or in part--by entities inside Bahrain. With regard to individuals, persons who
are long-term residents, or have their “economic center of interest” in Bahrain are to be classified as residents, irrespective of nationality.
• Assets and Liabilities of the reporting bank are to be broken down by the “bank” or “non-bank” character of the counter-party, the country of its residence and currency.
•In the BOP and IIP, only retail banks and locally incorporated wholesale banks licensed by the CBB are treated as residents.
General Government (includes Central Government and Social Insurance), Central Bank, banks, other sectors (other financial and nonfinancial corporations).
Data are compiled by the Central Bank of Bahrain since 2001, and are available on monthly basis.
Statistical Concepts and Definitions
Description
Monetary Statistics
• Money supply is the total value of money in an economy.
• This table shows M0,M1,M2,M3. M0 describes the monetary base of the economy (Currency in
circulation + Bank deposits in the Central Bank of Bahrain).
• M1 is a narrow measure of money supply that consists of the most liquid portions of money
(Currency in Circulation + Demand deposits).
• M2 is a broader measure of money supply than M1 (M1 + Time and Saving deposits).
• M3 is the broadest definition of money supply and it includes the least liquid portions of money (M2
+ General Government Deposits).
• It displays the components of M3 in terms of net foreign assets and domestic assets.
• Domestic Assets include Claims on General Government and Claims on Private Sector, in addition
to other net assets.
Based on international Standards set forth in The Special Data Dissemination Standard (SDDS) by the International Monetary Fund.
Statistical Bulletin Metadata
I. Coverage Characteristics
To disseminate financial and monetary data for our statistical bulletin publication that is reliable and comparable based on international standards to policy makers and
other data users.
The statistical bulletin gathers financial, monetary statistics from the Central Bank of Bahrain and other entities that is systematically recorded and divided by sector.

Concept Periodicity Tables Currency Scale
Balance Sheet of The Central
Bank of Bahrain Monthly 1 BD Million
Aggregated Balance Sheet of the
Banking SystemMonthly 12 USD Million
Aggregated Balance Sheet of
Retail BanksMonthly 13-25 BD Million
Aggregated Balance Sheet of
Wholesale BanksMonthly 26-29 USD Million
Aggregated Balance Sheet of
Islamic BanksMonthly 30-34 USD Million
Investment Business Firms Quarterly 38 BD Million
Aggregated Balance Sheet of
Money ChangersQuarterly 39 BD Thousand
Payment Systems Monthly 40-41 BD Million
Point of Sales Transactions Monthly 42-48 BD Million
Description
Banking Statistics
• Assets are divided into foreign and domestic. Foreign Assets include Foreign Exchange Reserves
and Gold. A fixed value of 2.5 is recorded for monetary gold.
• Domestic Assets are presented in terms of claims on government, claims on banks and others.
• Liabilities include Foreign Liabilities and Domestic Liabilities such as Currency in Circulation,
Liabilities to Banks and Non-Banks, Central Government Deposits, Capital Reserves and others.
• The aggregate balance sheet covers all the banking system excluding the balance sheet of The
Central Bank of Bahrain.
• Balance sheets are also provided by sector; Retail, wholesale, and Islamic. Each sectoral balance
sheet is divided into two tables of Assets and Liabilities.
• Domestic Assets include Cash, Central Bank, Banks, Non Banks, and General Government.
• In the Retail Sector, Net Foreign Assets are calculated, as well as the deposit liabilities.
• A table is also provided to segment loans provided to non-bank residents by industrial sector,
personal sector, and general government, excluding securities.
• A classification of the balance sheet is also provided by currency and geographical locations.
• In the wholesale Sector, Assets and Liabilities are divided into two table, in addition to the currency
and geographical classification tables.
• In the Islamic Sector, both retail and wholesale banks are included.
• Separate tables are provided for Assets and Liabilities, along with currency and geographical
classification.
• Further classification by restricted and unrestricted investment accounts, resident and non-resident,
is also provided.
• Investment Business Firms Assets are divided by the three categories.
• Assets include Balance Sheet Assets and Assets Under Management, resident and non-resident.
• Domestic Assets include Cash, Deposits from Banks, Due from others, and other assets.
• Domestic Liabilities include Loans from Banks, Due to Others, Reserves and Equity, and other
liabilities.
Four payment systems are available to conduct transactions:
• Real Time Gross Settlement for customer and inter-bank transactions, which is divided by customer
transactions and interbank transactions.
• Electronic Funds Transfer System (EFTS)
• ATM Withdrawal Transactions
• Electronic Bill Payment and Presentment (EBPP)
Bahrain Cheque Truncation System (BCTS); Returned Cheques are also provided by volume and
value along with the reasons (Technical or Financial Reasons).
• In this section, the number of transaction and their values are displayed for both debit and credit
cards issued inside and outside Bahrain.
• Classification of POS transactions is provided by sector.
• Volume and value of Point of Sales Transactions by Geographical Classification of Card-Issuer
Country (Excluding Bahrain).

Concept Periodicity Tables Currency Scale
Population Yearly 49 NA Number of Individuals
Number of Employees in the
Financial SectorYearly 50 NA Number of Individuals
Balance of Payments Quarterly 51 BD Million
International Investment Position Quarterly 52 BD Million
Bahrain Bourse Monthly/
Quarterly53-58 BD Thousand
Mutual Funds Quarterly 59 USD Thousand
Financial Soundness Indicators Quarterly 35-37 NA %
Description
Financial Soundness Indicators are calculated for the overall banking sector and the following
banking segments: Conventional Retail and Conventional Wholesale, Islamic Retail and Islamic
Wholesale. The Data covers the following core indicators:
• Capital Adequacy Ratio (CAR)
• Tier 1 Capital Adequacy Ratio (Tier 1 CAR)
• Non-Performing Loans Ratio (NPL)
• Specific Provisioning
• Return on Assets (ROA)
• Return on Equity (ROE)
• Liquidity Ratio (LR)
• Loan/deposit Ratio
According to the IGA, the scope used to measure the population is the De Jure Population, which
accounts for all usual residents residing in Bahrain for 6 months or more.
Current Account: It covers all the imported and exported goods and services, primary and
secondary income accounts in the balance of payments.
• Primary Income includes all the investment income, direct investment, portfolio investment, and
others. Whereas, Secondary Income cover workers’ remittances.
• In current account, when credits exceed the debits, in other words, when the difference is positive
the result is called as current account surplus.
• In contrast, the result is called a deficit when the debits exceed the credits. when the debits exceed
the credits, in other words, when the difference is negative the result is called as current account
deficit.
Capital Account: It covers capital transfers.
Financial Account: It covers the changes in external financial assets and liabilities of a country and
the corresponding records of these changes, it calculates the nets of the direct investment, portfolio
investment, other investment, and reserve assets.
On the assets side of the different items of the financial account, a negative sign means an
increase in foreign assets compared with the previous period, while a positive sign means a decrease
in foreign assets.
On the liabilities side of the different items of the financial account, a negative sign means a
decrease in foreign liabilities, while a positive sign means an increase in foreign liabilities.
The International Investment Position (IIP) is covered in terms of Foreign Assets and Foreign
Liabilities.
• This section covers the stock market regulated by Bahrain Bourse.
• It provides the number of companies along with the volume and value of shares traded. It also
classifies the value of shares traded according to sector.
• In addition, it covers market indicators like the capitalization and the turnover rate.
• It also provides the trading value of investors' participation and percentage of shares ownership in
listed companies on quarterly basis.
Mutual funds are professionally managed investment funds that are segmented in terms of type of
bank or type of investor, whether an individual investor or an institution.
Financial Statistics
Includes the total number of employees under the banking and financial sector classified by sub-
sectors, Bahraini and non-Bahraini, and by gender.
Economic And Capital Market Statistics

Revisions
Access by The Public
Responsibility for collecting,
processing, and disseminating
statistics
Confidentiality of individual
reporters' data
Impartiality of statistics
Data Sources
Commenting on erroneous
interpretation and misuse of
statistics
IV. Quality
V. Additional Notes
Central Bank of Bahrain (CBB), Ministry of Finance and National Economy (MOFNE), Bahrain Bourse, Information and e-Government Authority (IGA).
The CBB issues a press release that highlights important information in a way to avoid misinterpretation. However, in case of misinterpretation or misuse of data, the CBB
responds on a case by case basis by addressing each incident with corrected data and interpretation.
The data is explained in this metadata Section. All statistics in the same data set are consistent internally. Methodological Soundness is highly valued and the overall
structure of data is internationally comparable.
Last Updated: February 27th, 2022
Data is revised and updated on the official website whenever needed.
The data is published simultaneously every end of a month and are available on the CBB website (https://www.cbb.gov.bh/publications) along with a press release
(https://www.cbb.gov.bh/media-center). In addition, the CBB Media Team sends a press release prepared by the Statistics Unit to public newspapers. The level of detail of
the statistics is adapted to the need of the intended audience and any further detailed or partial statistics can be made available upon an official written request. All users
must be given equal treatment and equal access to statistical information.
III. Integrity
The Financial Stability Directorate has the ability to gather information based on the power of the Central Bank to collect information given in articles (111), (112), and (113)
of the CBB Law. The Statistical Research Division in the Financial Stability Directorate (FSD) is responsible for collecting and compiling the monthly statistical returns to
generate the financial and monetary statistics. Some data is collected from other internal directorates and external entities. However, other employees have no access to
the data prior to publication. In case of any technical issues, technical support by the Information Technology Directorate is provided.
According to the CBB, the data is published for statistical purposes on an aggregate level and personal and private information of any licensed institution or private body
shall not be disclosed.
The data reflected in the tables is obtained from related internal directorates within the CBB and other reliable and credible independent entities and are checked in
coordination for necessary amendments.
II. Periodicity and Access
Periodicity
Frequency of data collection: Monthly
Frequency of dissemination: Monthly
TimelinessAverage production time for each release of data: 21 days
Time lag: 30 days

المؤشرات المصرفية والنقدية والماليةBanking, Financial and Monetary Indicators
2020 2021
الفصل الفصل الفصل الفصل الفصل
الرابع األول الثاني الثالث الرابعQ4 Q1 Q2 Q3 Q4
Central Bank of Bahrain (B.D. Million) (مليون دينار)مصرف البحرين المركزي
Total Assets/Liabilities 3,023.8 3,852.5 3,919.1 4,349.6 4,129.6 المطلوبات/ إجمالي الموجودات
Money Supply (B.D. Million) (مليون دينار)عرض النقد
M1 2,921.1 2,986.8 3,072.3 3,139.8 3,224.7 1ن
Growth Rate % 1.8 2.3 2.9 2.2 2.7 %معدل النمو M2 12,840.0 12,946.6 13,475.9 13,433.0 13,465.4 2ن
Growth Rate % 0.2 0.8 4.1 -0.3 0.2 %معدل النمو As % of GDP 98.3 99.2 103.2 102.9 103.1 كنسبة من الناتج المحلي اإلجمالي
M3 14,151.3 14,185.8 14,756.2 14,747.5 14,884.2 3ن
Growth Rate % 1.0 0.2 4.0 -0.1 0.9 %معدل النمو
Banking System الجهاز المصرفي
Aggregated Balance Sheet of Banking System (USD Million) 207,353.5 208,377.3 213,200.0 211,667.7 217,501.6 )مليون دوالر(الميزانية الموحدة للجهاز المصرفي
As % of GDP 597.2 600.1 614.0 609.6 626.4 كنسبة من الناتج المحلي اإلجمالي
Aggregated Balance Sheet of Retail Banks (USD Million) 94,274.7 93,923.1 97,258.0 96,728.2 99,398.9 )مليون دوالر(الميزانية الموحدة لمصارف قطاع التجزئة
As % of GDP 271.5 270.5 280.1 278.6 286.3 كنسبة من الناتج المحلي اإلجمالي
Aggregated Balance Sheet of Wholesale Banks (USD Million) 113,078.8 114,454.2 115,942.0 114,939.5 118,102.7 )مليون دوالر(الميزانية الموحدة لمصارف قطاع الجملة
As % of GDP 325.7 329.6 333.9 331.0 340.1 كنسبة من الناتج المحلي اإلجمالي
Aggregated Balance Sheet of Islamic Banks (USD Million) 31,611.4 31,458.5 32,613.0 32,881.0 34,554.8 )مليون دوالر(الميزانية الموحدة للمصارف اإلسالمية
As % of GDP 91.0 90.6 93.9 94.7 99.5 كنسبة من الناتج المحلي اإلجمالي
Total Domestic Assets of the Banking System (USD Million) 71,511.8 73,683.3 75,163.1 75,355.6 76,078.6 )مليون دوالر(إجمالي الموجودات المحلية للجهاز المصرفي
As % of GDP 205.9 212.2 216.5 217.0 219.1 كنسبة من الناتج المحلي اإلجمالي
Total Foreign Liabilities of the Banking System (USD Million) 142,476.4 142,224.8 146,183.2 145,378.0 149,140.9 )مليون دوالر(إجمالي المطلوبات األجنبية للجهاز المصرفي
As % of Total Liabilities 68.7 68.3 68.6 68.7 68.6 كنسبة من مجموع مطلوبات الجهاز المصرفي
As % of GDP 410.3 409.6 421.0 418.7 429.5 كنسبة من الناتج المحلي اإلجمالي
Total Equity of the Banking System (USD Million) 28,780.8 27,342.8 27,975.8 28,109.9 29,131.0 )مليون دوالر(مجموع حقوق الملكية للجهاز المصرفي
As % Total Liabilities 13.9 13.1 13.1 13.3 13.4 كنسبة من إجمالي المطلوبات
Retail Banks (FCB) مصارف قطاع التجزئة
Net Foreign Assets (B.D. Million) -1,329.1 -1,626.5 -1,493.0 -1,894.0 -1,494.0 )مليون دينار(صافي الموجودات األجنبية
Total Local Deposits (B.D. Million) * 13,553.4 13,588.6 14,138.5 14,162.1 14,122.7 *)مليون دينار(مجموع الودائع المحلية
As % of GDP 103.8 104.1 108.3 108.5 108.2 كنسبة من الناتج المحلي اإلجمالي
Total Outstanding Loans to Residents (B.D. Million) 10,413.8 10,556.7 10,719.0 10,730.6 10,906.3 )مليون دينار(الرصيد القائم للقروض المقدمة للقطاعات المقيمة
As % of GDP 79.8 80.9 82.1 82.2 83.5 كنسبة من الناتج المحلي اإلجمالي
* Includes BD & FC deposits. .تشمل الودائع بالدينار البحريني والعمالت األجنبية*
SECTORSالقطاعات

المؤشرات المصرفية والنقدية والماليةBanking, Financial and Monetary Indicators
2020 2021
الفصل الفصل الفصل الفصل الفصل
الرابع األول الثاني الثالث الرابعQ4 Q1 Q2 Q3 Q4
Interest Rates أسعار الفائدة
Average Interest Rate on Personal Loans 4.78 4.83 5.03 4.54 4.26 متوسط نسبة الفائدة على القروض الشخصية
Average Interest Rate on Business Loans (Excludes Overdraft Approvals) 2.40 1.89 4.76 4.34 4.14 )ال يشمل السحب على المكشوف(متوسط نسبة الفائدة على قروض قطاع األعمال
Average Interest Rate on Deposits (3-12 Months) 1.20 0.69 0.73 0.68 0.63 ) شهر12-3(متوسط نسبة الفائدة على الودائع
Money Market Rate/Inter- Bank Rate % * *%أسعار الفائدة في األسواق المالية والتعامالت بين المصارف
Average Interest Rate - 3 Months 0.22 0.20 0.16 0.14 0.16 ثالثة شهور- متوسط أسعار الفائدة
Average Interest Rate - 6 Months 0.25 0.21 0.18 0.16 0.33 ستة شهور- متوسط أسعار الفائدة
Repos 2.25 2.25 2.25 2.25 2.25 متوسط أسعار الفائدة لعقود إعادة الشراء
Yield on Short-Term Treasury Bills % %أذونات الخزانة قصيرة األجل
Average Interest Rate - 3 Months 2.22 1.74 1.53 1.44 1.44 ثالثة شهور- متوسط أسعار الفائدة
Average Interest Rate - 6 Months 2.58 1.78 1.67 1.48 1.58 ستة شهور- متوسط أسعار الفائدة
Average Interest Rate - 12 Months 2.80 2.11 1.67 1.71 1.68 أثنى عشر شهرا- متوسط أسعار الفائدة
Average of Return on Short-Term Islamic Al-Salam Securities 2.22 1.88 1.50 1.46 1.43 متوسط سعر العائد على صكوك السلم اإلسالمية قصيرة األجل
Average of Return on Short-Term Islamic Leasing Securities 2.60 2.21 1.57 1.53 1.50 متوسط سعر العائد على صكوك التأجير اإلسالمية قصيرة األجل
Average of Return on Local and International Long-Term Islamic Leasing
Securities 3.28 2.53 3.28 2.53 3.28 متوسط سعر العائد على صكوك التأجير اإلسالمية طويلة األجل المحلية والدولية
Yield on Long-Term Government Development Bond % %سندات التنمية الحكومية طويلة األجل
Average Interest Rate on Local and International Long-Term Government
Bond 3.01 2.79 3.01 2.79 2.75 متوسط أسعار الفائدة على السندات الحكومية طويلة األجل المحلية والدولية
Manpower العمالة
Number of Employees in the Financial Sector 13737 13697 عدد العاملين في القطاع المالي
Bahranisation in the Financial Sector % 67.8 68.6 نسبة البحرنة في القطاع المالي
Licenses التراخيص
Number of Banks and Financial Institutions 370 369 366 365 360 عدد المصارف والمؤسسات المالية
New Licenses 3 1 0 1 2 التراخيص الجديدة
Mutual Funds صناديق االستثمار
Number of Mutual Funds 2004 1729 1766 1693 1696 عدد صناديق االستثمار
New Mutual Funds 38 11 15 54 39 صناديق االستثمار الجديدة
Total Investment in Mutual Funds (USD Million) 8,093.0 9,682.7 10,122.1 10,337.8 10,644.5 )مليون دوالر(إجمالي المبالغ المستثمرة في صناديق االستثمار
Public Debt Instruments (B.D. Million) (مليون دينار)أدوات الدين العام
Public Debt Instruments 13,079.4 13,314.8 13,464.8 13,464.8 14,416.8 أدوات الدين العام
Public Debt Instruments as % of GDP 100.2 102.0 103.1 103.1 110.4 أدوات الدين العام كنسبة من الناتج المحلي اإلجمالي
Government Development Bonds 7,621.6 7,957.0 8,107.0 8,107.0 9,059.0 سندات التنمية الحكومية
Treasury Bonds 2,110.0 2,110.0 2,110.0 2,110.0 2,110.0 أذونات الخزانة
Al-Salam Islamic Securities 129.0 129.0 129.0 129.0 129.0 صكوك السلم اإلسالمية
Islamic Leasing Securities 3,218.8 3,118.8 3,118.8 3,118.8 3,118.8 صكوك التأجير اإلسالمية
* Interest rates on US Dollar. .أسعار الفائدة على الدوالر األمريكي*
SECTORS القطاعات
المؤشرات المصرفية والنقدية والماليةBanking, Financial and Monetary Indicators
2020 2021
الفصل الفصل الفصل الفصل الفصل
الرابع األول الثاني الثالث الرابعQ4 Q1 Q2 Q3 Q4
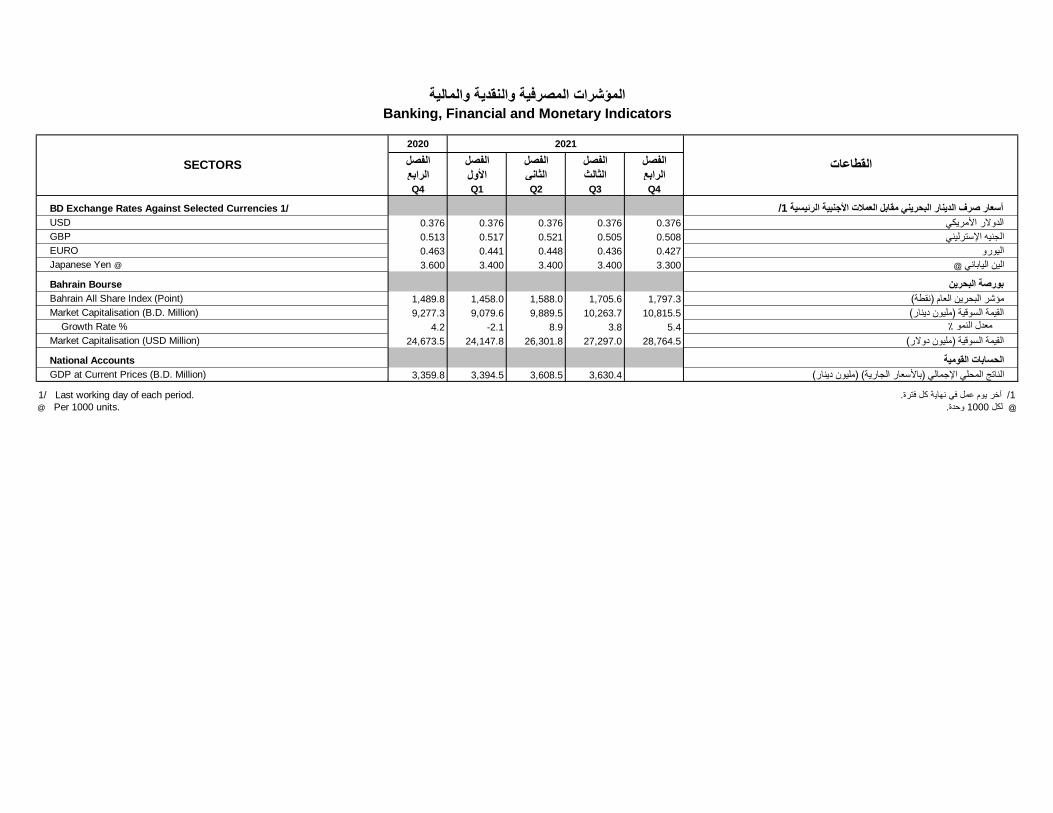
BD Exchange Rates Against Selected Currencies 1/ /1أسعار صرف الدينار البحريني مقابل العمالت األجنبية الرئيسية
USD 0.376 0.376 0.376 0.376 0.376 الدوالر األمريكي
GBP 0.513 0.517 0.521 0.505 0.508 الجنيه اإلسترليني
EURO 0.463 0.441 0.448 0.436 0.427 اليورو
Japanese Yen @ 3.600 3.400 3.400 3.400 3.300 @الين الياباني
Bahrain Bourse بورصة البحرين
Bahrain All Share Index (Point) 1,489.8 1,458.0 1,588.0 1,705.6 1,797.3 )نقطة(مؤشر البحرين العام
Market Capitalisation (B.D. Million) 9,277.3 9,079.6 9,889.5 10,263.7 10,815.5 )مليون دينار(القيمة السوقية
Growth Rate % 4.2 -2.1 8.9 3.8 5.4 %معدل النمو Market Capitalisation (USD Million) 24,673.5 24,147.8 26,301.8 27,297.0 28,764.5 )مليون دوالر(القيمة السوقية
National Accounts الحسابات القومية
GDP at Current Prices (B.D. Million) 3,359.8 3,394.5 3,608.5 3,630.4 )مليون دينار( )باألسعار الجارية(الناتج المحلي اإلجمالي
1/ Last working day of each period. .آخر يوم عمل في نهاية كل فترة/ 1
@ Per 1000 units. . وحدة1000لكل @
SECTORS القطاعات

Table No. (1) جدول رقم
مصرف البحرين المركزي
Central Bank of Bahrain
المطلوبات/ الموجودات
Assets / LiabilitiesB.D. Million مليون دينار
Assets الموجودات Liabilities المطلوبات
األجنبية Domestic المحلية Domestic المحلية
نهاية الفترة Foreign مطالب على مطالب على المجموع النقد مطلوبات ودائع مطلوبات رأس المال
End of Period ذهب عمالت أجنبية المصارف المحلية الحكومة أخرى Total األجنبية المتداول للمصارف المحلية الحكومة لغير المصارف أخرى واالحتياطي
Gold Foreign Claims on Claims on Other Foreign Currency in Liab. to Central Liab. to Other Capital &
Exchange Banks Govt. Circulation Banks Gov. Dep. Non-banks Reserves
2012 2.5 1,841.5 586.4 0.0 92.1 2,522.5 0.0 522.5 1,339.5 2.3 63.2 89.9 505.1
2013 2.5 1,894.2 569.9 0.0 13.1 2,479.7 0.0 578.0 1,259.4 85.4 0.0 114.2 442.7
2014 2.5 2,164.8 532.5 0.0 12.9 2,712.7 0.0 610.5 1,546.2 0.6 0.0 110.6 444.8
2015 2.5 1,168.9 380.2 496.7 442.6 2,490.9 0.0 650.1 1,267.6 0.6 0.0 112.9 459.7
2016 2.5 815.9 365.3 990.6 484.8 2,659.1 0.0 670.6 1,086.8 5.1 0.0 389.6 507.0
2017 2.5 880.6 252.6 1,024.0 549.5 2,709.2 0.0 662.7 1,218.8 10.7 0.0 321.1 495.9
2018 2.5 699.8 130.9 1,005.6 617.7 2,456.5 0.0 681.7 1,028.7 5.9 0.0 199.1 541.1
2019 2.5 1,276.1 415.0 1,085.9 418.3 3,197.8 0.0 687.1 1,603.1 4.2 0.0 317.4 586.0
2020 2.5 732.0 162.1 1,778.8 348.4 3,023.8 0.0 745.1 1,408.5 4.9 0.0 269.7 595.6
2021 2.5 1,468.6 421.7 1,797.8 439.0 4,129.6 0.0 704.0 2,335.1 203.5 0.0 282.3 604.7
2020 Q1 2.5 614.6 584.3 1,698.0 369.0 3,268.4 0.0 726.1 1,708.5 1.4 0.0 236.9 595.5
Q2 2.5 595.7 413.5 1,834.0 393.2 3,238.9 0.0 781.6 1,630.8 2.0 0.0 226.1 598.4
Q3 2.5 708.1 210.2 1,555.1 383.3 2,859.2 0.0 761.2 1,269.5 5.7 0.0 223.7 599.1
Q4 2.5 732.0 162.1 1,778.8 348.4 3,023.8 0.0 745.1 1,408.5 4.9 0.0 269.7 595.6
2021 Q1 2.5 1,219.0 408.8 1,984.4 237.8 3,852.5 0.0 728.6 2,195.3 9.4 0.0 320.5 598.7
Q2 2.5 1,439.6 226.8 1,983.8 266.4 3,919.1 0.0 735.9 2,300.7 17.6 0.0 269.0 595.9
Q3 2.5 1,323.8 200.2 2,465.8 357.3 4,349.6 0.0 712.9 2,776.8 7.4 0.0 254.9 597.6
Q4 2.5 1,468.6 421.7 1,797.8 439.0 4,129.6 0.0 704.0 2,335.1 203.5 0.0 282.3 604.7
2021 Feb. 2.5 1,327.1 277.9 1,685.2 274.1 3,566.8 0.0 724.6 1,943.6 9.0 0.0 292.3 597.3
Mar. 2.5 1,219.0 408.8 1,984.4 237.8 3,852.5 0.0 728.6 2,195.3 9.4 0.0 320.5 598.7
Apr. 2.5 1,315.4 309.3 2,124.0 250.8 4,002.0 0.0 756.5 2,345.9 33.6 0.0 267.5 598.5
May 2.5 1,226.3 255.8 2,312.0 248.3 4,044.9 0.0 745.1 2,439.8 19.5 0.0 242.2 598.3
Jun. 2.5 1,439.6 226.8 1,983.8 266.4 3,919.1 0.0 735.9 2,300.7 17.6 0.0 269.0 595.9
Jul. 2.5 1,580.2 151.4 2,170.6 268.4 4,173.1 0.0 735.0 2,574.0 19.9 0.0 248.7 595.5
Aug. 2.5 1,410.8 201.8 2,232.3 279.5 4,126.9 0.0 727.5 2,535.1 25.4 0.0 244.6 594.3
Sep. 2.5 1,323.8 200.2 2,465.8 357.3 4,349.6 0.0 712.9 2,776.8 7.4 0.0 254.9 597.6
Oct. 2.5 1,439.0 175.8 2,615.6 367.0 4,599.9 0.0 704.9 2,849.9 202.2 0.0 241.6 601.3
Nov. 2.5 1,608.7 489.4 1,910.2 420.0 4,430.8 0.0 716.1 2,650.3 206.1 0.0 254.5 603.8
Dec. 2.5 1,468.6 421.7 1,797.8 439.0 4,129.6 0.0 704.0 2,335.1 203.5 0.0 282.3 604.7
2022 Jan. 2.5 1,494.4 387.8 2,012.5 441.0 4,338.2 0.0 697.1 2,567.2 201.1 0.0 269.2 603.6
Feb. 2.5 1,616.8 331.4 2,073.5 511.8 4,536.0 0.0 696.1 2,779.2 200.8 0.0 255.3 604.6
- 1 -

Table No. (2) جدول رقم
النقد
CurrencyB.D. Million مليون دينار
Currency in Circulation 1/ النقد المتداول
Notes, by denomination أوراق النقد حسب الفئات النقد لدى النقد المتداول
نهاية الفترة مجموع المسكوكات المجموع المصارف خارج المصارف
End of Period عشرون دينار عشرة دنانير خمسة دنانير دينار واحد نصف دينار أوراق النقد Coins Total Currency Currency
BD 20 BD 10 BD 5 BD 1 BD 1/2 Total held by Outside
Notes banks Banks
2012 411.6 55.8 15.7 18.9 5.4 507.4 15.1 522.5 101.1 421.4
2013 457.5 59.0 17.2 21.0 6.9 561.6 16.4 578.0 116.9 461.1
2014 483.9 60.3 18.1 22.7 8.0 593.0 17.5 610.5 117.3 493.2
2015 512.4 66.1 19.6 25.1 8.3 631.5 18.6 650.1 124.9 525.2
2016 529.3 69.7 20.6 23.2 8.0 650.8 19.8 670.6 135.3 535.3
2017 517.6 71.1 21.8 23.4 8.2 642.1 20.6 662.7 135.9 526.8
2018 522.3 79.4 24.4 24.9 9.2 660.2 21.5 681.7 153.6 528.1
2019 521.5 81.0 28.2 24.9 9.1 664.7 22.4 687.1 152.0 535.1
2020 575.9 82.1 29.8 24.5 9.8 722.1 23.0 745.1 152.1 593.0
2021 539.7 76.6 31.4 24.6 8.9 681.2 22.8 704.0 146.0 558.0
2020 Q1 560.5 81.4 28.3 24.6 8.8 703.6 22.5 726.1 152.9 573.2
Q2 603.3 87.6 30.9 26.8 10.1 758.7 22.9 781.6 150.8 630.8
Q3 587.4 83.3 30.8 26.5 10.2 738.2 23.0 761.2 151.1 610.1
Q4 575.9 82.1 29.8 24.5 9.8 722.1 23.0 745.1 152.1 593.0
2021 Q1 561.6 80.1 30.3 24.3 9.3 705.6 23.0 728.6 140.8 587.8
Q2 566.4 79.1 31.0 25.9 10.2 712.6 23.3 735.9 135.8 600.1
Q3 546.6 78.1 29.6 25.5 10.0 689.8 23.1 712.9 134.9 578.0
Q4 539.7 76.6 31.4 24.6 8.9 681.2 22.8 704.0 146.0 558.0
2021 Feb. 558.5 79.7 30.1 23.9 9.4 701.6 23.0 724.6 138.0 586.6
Mar. 561.6 80.1 30.3 24.3 9.3 705.6 23.0 728.6 140.8 587.8
Apr. 581.2 83.4 32.1 26.5 10.0 733.2 23.3 756.5 159.3 597.2
May 570.8 81.4 32.2 27.0 10.4 721.8 23.3 745.1 144.4 600.7
Jun. 566.4 79.1 31.0 25.9 10.2 712.6 23.3 735.9 135.8 600.1
Jul. 560.8 81.3 31.6 27.2 10.8 711.7 23.3 735.0 139.4 595.6
Aug. 557.6 79.4 30.6 26.1 10.5 704.2 23.3 727.5 148.9 578.6
Sep. 546.6 78.1 29.6 25.5 10.0 689.8 23.1 712.9 134.9 578.0
Oct. 540.8 77.5 29.0 25.1 9.6 682.0 22.9 704.9 135.2 569.7
Nov. 551.2 76.9 31.1 24.8 9.2 693.2 22.9 716.1 151.3 564.8
Dec. 539.7 76.6 31.4 24.6 8.9 681.2 22.8 704.0 146.0 558.0
2022 Jan. 532.8 76.7 31.5 24.5 8.8 674.3 22.8 697.1 142.2 554.9
Feb. 531.7 76.3 32.2 24.4 8.7 673.3 22.8 696.1 135.8 560.3
1/ Notes and coins outside Central Bank of Bahrain. .أوراق النقد والمسكوكات خارج مصرف البحرين المركزي/ 1
- 2 -

Table No. (3) جدول رقم
عرض النقدMoney Supply
B.D. Million مليون دينار
Deposits 1/ الودائع عرض النقد
النقد المتداول Private Sector عرض النقد القطاع الخاص عرض النقد بمفهومه الواسع القاعدة النقدية
نهاية الفترة خارج المصارف األجل والتوفير الحكومة بمفهومه الضيق بمفهومه الواسع ودائع الحكومة+ Monetary
End of Period Currency Time and General Narrow Money Broad Money Broad Money Base
Outside Banks دينار بحريني عمالت أجنبية Savings Government 2/ + Gov. Deposits
BD FC M1 M2 M3 M0
1 2 3 4 5 6 = (1+2) 7 = (3+4+6) 8 = (5+7) 3/
2012 421.4 1,569.1 620.6 5,853.7 1,970.3 1,990.5 8,464.8 10,435.1 1,862.0
2013 461.1 1,799.8 534.9 6,363.3 2,060.6 2,260.9 9,159.1 11,219.7 1,837.4
2014 493.2 1,975.6 626.3 6,660.4 1,879.7 2,468.8 9,755.5 11,635.2 2,156.7
2015 525.2 2,110.4 658.8 6,748.5 1,852.3 2,635.6 10,042.9 11,895.2 1,917.7
2016 535.3 2,138.2 642.4 6,852.0 1,853.9 2,673.5 10,167.9 12,021.8 1,757.4
2017 526.8 2,134.9 693.2 7,239.6 1,926.8 2,661.7 10,594.5 12,521.3 1,881.5
2018 528.1 2,134.0 759.9 7,423.3 1,776.8 2,662.1 10,845.3 12,622.1 1,710.4
2019 535.1 2,091.8 886.7 8,538.6 1,619.7 2,626.9 12,052.2 13,671.9 2,290.2
2020 593.0 2,328.1 959.9 8,959.0 1,311.3 2,921.1 12,840.0 14,151.3 2,153.6
2021 558.0 2,666.7 1,285.3 8,955.4 1,418.8 3,224.7 13,465.5 14,884.2 3,039.1
2020 Q1 573.2 2,146.0 1,006.1 8,604.0 1,642.6 2,719.2 12,329.3 13,971.9 2,434.6
Q2 630.8 2,346.9 986.8 8,928.8 1,285.9 2,977.7 12,893.3 14,179.2 2,412.4
Q3 610.1 2,260.5 1,074.7 8,875.0 1,194.3 2,870.6 12,820.2 14,014.6 2,030.7
Q4 593.0 2,328.1 959.9 8,959.0 1,311.3 2,921.1 12,840.0 14,151.3 2,153.6
2021 Q1 587.8 2,399.0 912.3 9,047.5 1,239.2 2,986.8 12,946.7 14,185.8 2,923.9
Q2 600.1 2,472.2 1,453.2 8,950.4 1,280.3 3,072.3 13,475.8 14,756.2 3,036.6
Q3 578.0 2,561.8 1,268.0 9,025.2 1,314.5 3,139.8 13,433.0 14,747.5 3,489.7
Q4 558.0 2,666.7 1,285.3 8,955.4 1,418.8 3,224.7 13,465.5 14,884.2 3,039.1
2021 Feb. 586.6 2,377.1 971.6 9,013.6 1,220.6 2,963.7 12,948.9 14,169.5 2,668.2
Mar. 587.8 2,399.0 912.3 9,047.5 1,239.2 2,986.8 12,946.6 14,185.8 2,923.9
Apr. 597.2 2,446.7 1,082.7 9,026.5 1,241.5 3,043.9 13,153.1 14,394.6 3,102.4
May 600.7 2,470.0 1,322.6 8,989.5 1,275.6 3,070.7 13,382.8 14,658.4 3,184.9
Jun. 600.1 2,472.2 1,453.2 8,950.4 1,280.3 3,072.3 13,475.9 14,756.2 3,036.6
Jul. 595.6 2,550.8 1,261.1 8,870.8 1,395.2 3,146.4 13,278.3 14,673.5 3,309.0
Aug. 578.6 2,539.3 1,276.7 8,931.3 1,311.0 3,117.9 13,325.9 14,636.9 3,262.6
Sep. 578.0 2,561.8 1,268.0 9,025.2 1,314.5 3,139.8 13,433.0 14,747.5 3,489.7
Oct. 569.7 2,599.3 1,223.0 9,009.8 1,545.3 3,169.0 13,401.8 14,947.1 3,554.8
Nov. 564.8 2,606.1 1,144.2 9,046.5 1,485.4 3,170.9 13,361.6 14,847.0 3,366.4
Dec. 558.0 2,666.7 1,285.3 8,955.4 1,418.8 3,224.7 13,465.4 14,884.2 3,039.1
2022 Jan. 554.9 2,677.2 1,201.1 9,021.0 1,419.9 3,232.1 13,454.2 14,874.1 3,264.3
Feb. 560.3 2,745.9 1,306.5 8,910.5 1,399.3 3,306.2 13,523.2 14,922.5 3,475.3
1/ BD and FC deposits of resident non-banks at Central Bank of Bahrain and Retail Banks. . الودائع بالدينار البحريني والعمالت األجنبية لغير المصارف لدى مصرف البحرين المركزي ومصارف قطاع التجزئة/ 1
2/ Central Government and the Social Insurance System. .الحكومة المركزية ونظام التأمينات االجتماعية/ 2
3/ Monetary Base = Currency in Circulation + Banks Deposits with Central Bank ودائع المصارف لدى المصرف المركزي+ النقد المتداول = القاعدة النقدية / 3
- 3 -
تحت الطلب
Demand

Table No. (4) جدول رقم
المسح النقدي
Monetary Survey
B.D. Million مليون دينار
صافي الموجودات األجنبية الموجودات المحلية عرض النقد
Net Foreign Assets Domestic Assets بمفهومه الواسع
نهاية الفترة مصرف البحرين مصارف المطالب على المطالب على صافي الموجودات ودائع الحكومة+
End of Period المركزي قطاع التجزئة المجموع الحكومة القطاع الخاص األخرى المجموع Broad Money
Central Bank Retail Claims on Claims on Other +of Bahrain Banks Total Government Private Sector Assets (Net) Total Gov. Deposits
M3
2012 1,844.0 -181.9 1,662.1 2,360.8 7,994.2 -1,582.0 8,773.0 10,435.1
2013 1,896.7 -354.6 1,542.1 3,189.5 8,519.2 -2,031.1 9,677.6 11,219.7
2014 2,167.3 122.4 2,289.7 3,465.8 8,019.2 -2,139.5 9,345.5 11,635.2
2015 1,171.4 -371.5 799.9 4,398.6 8,627.4 -1,930.7 11,095.3 11,895.2
2016 818.4 -588.3 230.1 5,626.8 8,755.6 -2,590.7 11,791.7 12,021.8
2017 883.1 -921.5 -38.4 6,094.4 8,970.2 -2,504.9 12,559.7 12,521.3
2018 702.3 -1,106.9 -404.6 6,057.6 9,860.5 -2,891.4 13,026.7 12,622.1
2019 1,278.6 -979.0 299.6 6,622.5 9,966.8 -3,217.0 13,372.3 13,671.9
2020 734.5 -1,329.1 -594.6 7,789.5 10,644.3 -3,687.9 14,745.9 14,151.3
2021 1,471.1 -1,494.0 -22.9 8,077.2 11,111.1 -4,281.2 14,907.1 14,884.2
2020 Q1 617.1 -1,568.1 -951.0 7,445.8 10,301.1 -2,824.0 14,922.9 13,971.9
Q2 598.2 -1,126.8 -528.6 7,588.3 10,441.2 -3,321.7 14,707.8 14,179.2
Q3 710.6 -1,315.7 -605.1 7,398.4 10,486.0 -3,264.7 14,619.7 14,014.6
Q4 734.5 -1,329.1 -594.6 7,789.5 10,644.3 -3,687.9 14,745.9 14,151.3
2021 Q1 1,221.5 -1,626.5 -405.0 7,769.6 10,628.1 -3,806.9 14,590.8 14,185.8
Q2 1,442.1 -1,493.0 -50.9 7,994.0 10,848.3 -4,035.1 14,807.2 14,756.2
Q3 1,326.3 -1,894.0 -567.7 8,309.8 10,959.8 -3,954.4 15,315.2 14,747.5
Q4 1,471.1 -1,494.0 -22.9 8,077.2 11,111.1 -4,281.2 14,907.1 14,884.2
2021 Feb. 1,329.6 -1,587.8 -258.2 7,648.5 10,607.1 -3,827.9 14,427.7 14,169.5
Mar. 1,221.5 -1,626.5 -405.0 7,769.6 10,628.1 -3,806.9 14,590.8 14,185.8
Apr. 1,317.9 -1,659.8 -341.9 7,894.2 10,683.3 -3,841.0 14,736.5 14,394.6
May 1,228.8 -1,596.4 -367.6 8,147.0 10,770.9 -3,891.9 15,026.0 14,658.4
Jun. 1,442.1 -1,493.0 -50.9 7,994.0 10,848.3 -4,035.1 14,807.2 14,756.2
Jul. 1,582.7 -1,991.5 -408.8 8,163.8 10,800.3 -3,881.8 15,082.3 14,673.5
Aug. 1,413.3 -1,904.9 -491.6 8,106.2 10,908.1 -3,885.8 15,128.5 14,636.9
Sep. 1,326.3 -1,894.0 -567.7 8,309.8 10,959.8 -3,954.4 15,315.2 14,747.5
Oct. 1,441.5 -2,004.7 -563.2 8,626.5 10,996.4 -4,112.6 15,510.3 14,947.1
Nov. 1,611.2 -2,144.8 -533.6 8,154.0 11,132.4 -3,905.8 15,380.6 14,847.0
Dec. 1,471.1 -1,494.0 -22.9 8,077.2 11,111.1 -4,281.2 14,907.1 14,884.2
2022 Jan. 1,496.9 -1,897.5 -400.6 8,276.2 11,122.1 -4,123.6 15,274.7 14,874.1
Feb. 1,619.3 -2,255.4 -636.1 8,330.4 11,193.5 -3,965.3 15,558.6 14,922.5
- 4 -

Table No. (5) جدول رقم
العـوامل المؤثرة في عرض النقد
Factors Affecting Changes in Money SupplyB.D. Million مليون دينار
العوامل المؤثرة في عرض النقد
عرض النقد Factors Affecting Change in Money Supply
M3 التغيرات في صافي الموجودات األجنبية التغيرات في الموجودات المحلية
نهاية الفترة Change in Net Foreign Assets Change in Domestic Assets
End of Period مصرف البحرين مصارف
المجموع التغير المركزي قطاع التجزئة المجموع الحكومة القطاع الخاص (صافي)أخرى المجموع
Total Change Central Bank Retail Total General Private Sector Other (Net) Total
of Bahrain Banks Government
2012 10,435.1 441.1 247.8 -183.8 64.0 246.6 468.7 -338.1 377.2
2013 11,219.7 784.6 52.7 -172.7 -120.0 828.7 525.0 -449.1 904.6
2014 11,635.2 415.6 270.6 477.0 747.6 276.3 -500.0 -108.4 -332.1
2015 11,895.2 260.0 -995.9 -493.9 -1,489.8 932.8 608.2 208.8 1,749.8
2016 12,021.8 126.6 -353.0 -216.8 -569.8 1,228.2 128.2 -660.0 696.4
2017 12,521.3 499.5 64.7 -333.2 -268.5 467.6 214.6 85.8 768.0
2018 12,622.1 100.8 -180.8 -185.4 -366.2 -36.8 890.3 -386.5 467.0
2019 13,671.9 1,049.8 576.3 127.9 704.2 564.9 106.3 -325.6 345.6
2020 14,151.3 479.4 -544.1 -350.1 -894.2 1,167.0 677.5 -470.9 1,373.6
2021 14,884.2 732.9 736.6 -164.9 571.7 287.7 466.8 -593.3 161.2
2020 Q1 13,971.9 300.0 -661.5 -589.1 -1,250.6 823.3 334.3 393.0 1,550.6
Q2 14,179.2 207.3 -18.9 441.3 422.4 142.5 140.1 -497.7 -215.1
Q3 14,014.6 -164.6 112.4 -188.9 -76.5 -189.9 44.8 57.0 -88.1
Q4 14,151.3 136.7 23.9 -13.4 10.5 391.1 158.3 -423.2 126.2
2021 Q1 14,185.8 34.5 487.0 -297.4 189.6 -19.9 -16.2 -119.0 -155.1
Q2 14,756.2 570.4 220.6 133.5 354.1 224.4 220.2 -228.2 216.4
Q3 14,747.5 -8.7 -115.8 -401.0 -516.8 315.8 111.5 80.7 508.0
Q4 14,884.2 136.7 144.8 400.0 544.8 -232.6 151.3 -326.8 -408.1
2021 Feb. 14,169.5 134.7 268.5 -130.6 137.9 -24.5 -14.5 35.8 -3.2
Mar. 14,185.8 16.3 -108.1 -38.7 -146.8 121.1 21.0 21.0 163.1
Apr. 14,394.6 208.8 96.4 -33.3 63.1 124.6 55.2 -34.1 145.7
May 14,658.4 263.8 -89.1 63.4 -25.7 252.8 87.6 -50.9 289.5
Jun. 14,756.2 97.8 213.3 103.4 316.7 -153.0 77.4 -143.3 -218.9
Jul. 14,673.5 -82.7 140.6 -498.5 -357.9 169.8 -48.0 153.3 275.1
Aug. 14,636.9 -36.6 -169.4 86.6 -82.8 -57.6 107.8 -4.0 46.2
Sep. 14,747.5 110.6 -87.0 10.9 -76.1 203.6 51.7 -68.6 186.7
Oct. 14,947.1 199.5 115.2 -110.7 4.5 316.7 36.6 -158.2 195.1
Nov. 14,847.0 -100.1 169.7 -140.1 29.6 -472.5 136.0 206.8 -129.7
Dec. 14,884.2 37.2 -140.1 650.8 510.7 -76.8 -21.3 -375.4 -473.5
2022 Jan. 14,874.1 -10.1 25.8 -403.5 -377.7 199.0 11.0 157.6 367.6
Feb. 14,922.5 48.4 122.4 -357.9 -235.5 54.2 71.4 158.3 283.9
- 5 -

Table No. (6) جدول رقم
/1أسعار صرف الدينار البحريني مقابل بعض العمالت المختارة
BD Exchange Rates Against Selected Currencies 1/BD Per Unit of Foreign Currency دينار بحريني لكل وحدة عملة أجنبية
GCC Currencies 2/ Major Currencies عمالت دول مجلس التعاون الخليجي العمالت الرئيسية
نهاية الفترة لاير سعودي دينار كويتي درهم إماراتي لاير عماني لاير قطري دوالرأمريكي جنيه إسترليني اليورو ين ياباني فرنك سويسري
End of PeriodSaudi Riyal
Kuwaiti
DinarUAE Dirham Omani Riyal Qatari Riyal U.S. Dollar
Pound
SterlingEuro
Japanese
Yen 3/Swiss Franc
2012 0.1006 1.3371 0.1024 0.9818 0.1033 0.376 0.6077 0.4973 4.400 0.4119
2013 0.1006 1.3314 0.1024 0.9818 0.1033 0.376 0.6202 0.5191 3.600 0.4237
2014 0.1006 1.2848 0.1024 0.9818 0.1033 0.376 0.5852 0.4572 3.100 0.3803
2015 0.1006 1.2384 0.1024 0.9818 0.1033 0.376 0.5571 0.4112 3.100 0.3805
2016 0.1006 1.2302 0.1024 0.9818 0.1033 0.376 0.4646 0.3956 3.200 0.3686
2017 0.1006 1.2470 0.1024 0.9818 0.1033 0.376 0.5084 0.4514 3.300 0.3859
2018 0.1006 1.2387 0.1024 0.9818 0.1033 0.376 0.4771 0.4304 3.400 0.3823
2019 0.1006 1.2410 0.1024 0.9818 0.1033 0.376 0.4932 0.4214 3.500 0.3882
2020 0.1006 1.2402 0.1024 0.9818 0.1033 0.376 0.5132 0.4629 3.600 0.4269
2021 0.1006 1.2428 0.1024 0.9818 0.1033 0.376 0.5076 0.4269 3.300 0.4113
2020 Q1 0.1006 1.2199 0.1024 0.9818 0.1033 0.376 0.4654 0.4148 3.500 0.3918
Q2 0.1006 1.2222 0.1024 0.9818 0.1033 0.376 0.4630 0.4230 3.500 0.3954
Q3 0.1006 1.2282 0.1024 0.9818 0.1033 0.376 0.4838 0.4417 3.600 0.4090
Q4 0.1006 1.2402 0.1024 0.9818 0.1033 0.376 0.5132 0.4629 3.600 0.4269
2021 Q1 0.1006 1.2445 0.1024 0.9818 0.1033 0.376 0.5169 0.4409 3.400 0.3993
Q2 0.1006 1.2492 0.1024 0.9818 0.1033 0.376 0.5205 0.4475 3.400 0.4083
Q3 0.1006 1.2480 0.1024 0.9818 0.1033 0.376 0.5049 0.4363 3.400 0.4025
Q4 0.1006 1.2428 0.1024 0.9818 0.1033 0.376 0.5076 0.4269 3.300 0.4113
2021 Feb. 0.1006 1.2459 0.1024 0.9818 0.1033 0.376 0.5240 0.4541 3.500 0.4140
Mar. 0.1006 1.2445 0.1024 0.9818 0.1033 0.376 0.5169 0.4409 3.400 0.3993
Apr. 0.1006 1.2490 0.1024 0.9818 0.1033 0.376 0.5248 0.4564 3.500 0.4137
May 0.1006 1.2496 0.1024 0.9818 0.1033 0.376 0.5333 0.4584 3.400 0.4178
Jun. 0.1006 1.2492 0.1024 0.9818 0.1033 0.376 0.5205 0.4475 3.400 0.4083
Jul. 0.1006 1.2511 0.1024 0.9818 0.1033 0.376 0.5230 0.4455 3.400 0.4133
Aug. 0.1006 1.2505 0.1024 0.9818 0.1033 0.376 0.5175 0.4437 3.400 0.4100
Sep. 0.1006 1.2480 0.1024 0.9818 0.1033 0.376 0.5049 0.4363 3.400 0.4025
Oct. 0.1006 1.2467 0.1024 0.9818 0.1033 0.376 0.5146 0.4347 3.300 0.4105
Nov. 0.1006 1.2428 0.1024 0.9818 0.1033 0.376 0.5009 0.4245 3.300 0.4073
Dec. 0.1006 1.2428 0.1024 0.9818 0.1033 0.376 0.5076 0.4269 3.300 0.4113
2022 Jan. 0.1006 1.2424 0.1024 0.9818 0.1033 0.376 0.5040 0.4192 3.300 0.4038
Feb. 0.1006 1.2424 0.1024 0.9818 0.1033 0.376 0.5028 0.4205 3.300 0.4059
1/ Last working day of each period. .آخر يوم عمل في نهاية كل فترة/ 1
2/ GCC currencies exchange rates are as per official peg except Kuwaiti Dinar as per market prices. .أسعار صرف عمالت دول مجلس التعاون الخليجي متوافقة مع سعر الربط الرسمي باستثناء الدينار الكويتي وفقا ألسعار السوق/ 2
3/ Per 1000 Units. . وحدة1000لكل / 3
- 6 -

Table No. (7) جدول رقم
/1أسعار الفائدة على الودائع والقروض بالدينار البحريني - مصارف قطاع التجزئة التقليدية
Conventional Retail Banks - Interest Rates on BD Deposits & Loans 1/Percent Per Annum النسبة السنوية
Deposits الودائع Business Loans قروض قطاع األعمال Personal Loans القروض الشخصية
Time 2/ المجموع ألجل المجموع Secured بضمان
التوفير 3أقل من
شهوراإلنشاء والتعمير شهر12-3 الصناعة التجارة أخرى
ال يشمل السحب )
(على المكشوف
يشمل السحب على )
(المكشوفالعقار المركبة الراتب الودائع أخرى المجموع بطاقات االئتمان
End of Period
Savings
Less
than 3
months
3-12
months
Construction
and Real
Estate
Manufacturing Trade Other 3/
Total
(Excludes
overdraft
approvals)
Total
(Includes
overdraft
approvals)
by
Mortgages
Vehicle
Title
by
Deposits
Salary
AssignmentOther Total 4/ Credit Cards
2012 0.22 0.63 1.00 5.24 3.45 5.00 4.96 4.94 5.67 6.48 7.34 4.82 5.89 10.47 5.96 20.65
2013 0.25 0.57 1.08 5.47 2.74 5.61 4.63 5.08 5.22 6.01 6.07 6.53 5.86 8.59 5.90 18.76
2014 0.25 0.62 0.95 5.15 5.19 4.62 6.03 5.02 5.16 5.31 7.31 2.78 4.97 9.07 5.39 18.50
2015 0.23 0.65 1.09 5.61 3.63 5.35 6.43 5.03 5.02 5.84 5.28 3.82 5.01 21.97 5.09 19.98
2016 0.22 0.76 1.28 7.49 5.76 4.48 6.83 5.40 4.91 5.46 5.30 3.04 4.80 21.98 4.83 19.71
2017 0.21 1.12 1.59 6.28 6.41 5.64 5.95 5.99 5.36 5.27 5.55 3.52 4.96 21.78 5.01 19.62
2018 0.21 1.81 2.37 6.96 4.98 6.55 7.00 6.50 6.39 5.93 6.08 4.62 5.10 20.03 5.19 20.22
2019 0.23 1.31 1.61 6.19 3.67 5.78 6.24 4.87 4.97 5.38 6.27 4.50 4.83 20.13 4.91 21.06
2020 0.18 0.94 1.20 6.58 0.74 5.82 4.96 2.40 3.89 5.00 6.48 3.67 4.65 21.02 4.78 21.03
2021 0.15 0.47 0.63 3.71 3.13 4.84 4.82 4.14 4.31 4.77 4.71 2.88 4.12 21.16 4.26 20.99
2020 Q1 0.23 1.04 0.98 5.33 3.08 4.76 4.68 4.16 4.59 5.06 6.18 3.53 4.72 19.80 4.79 21.02
Q2 0.22 1.17 1.29 6.31 5.46 4.60 5.76 4.99 5.18 5.14 6.30 4.29 4.57 20.15 4.73 21.01
Q3 0.22 0.96 1.35 6.53 2.56 5.86 6.26 3.76 4.54 5.14 6.73 2.72 4.51 19.73 4.67 21.13
Q4 0.18 0.94 1.20 6.58 0.74 5.82 4.96 2.40 3.89 5.00 6.48 3.67 4.65 21.02 4.78 21.03
2021 Q1 0.17 0.52 0.69 6.11 0.67 5.25 4.96 1.89 2.80 5.08 6.44 3.40 4.63 21.24 4.83 21.00
Q2 0.17 0.59 0.73 6.99 2.12 4.91 5.83 4.76 4.89 5.06 5.26 3.20 4.99 20.81 5.03 20.95
Q3 0.15 0.50 0.68 5.14 2.75 5.04 3.56 4.34 4.65 5.08 5.29 1.84 4.20 21.26 4.54 20.96
Q4 0.15 0.47 0.63 3.71 3.13 4.84 4.82 4.14 4.31 4.77 4.71 2.88 4.12 21.16 4.26 20.99
2021 Feb. 0.17 0.63 0.91 5.77 4.21 5.96 5.23 5.53 4.79 5.04 6.52 3.12 4.80 20.80 4.92 20.99
Mar. 0.17 0.52 0.69 6.11 0.67 5.25 4.96 1.89 2.80 5.08 6.44 3.40 4.63 21.24 4.83 21.00
Apr. 0.17 0.60 0.76 5.39 6.08 4.90 4.70 5.12 4.94 5.10 4.89 3.38 4.82 21.26 4.93 20.94
May 0.17 0.58 0.72 6.98 2.16 4.92 5.83 4.78 4.90 5.06 5.27 3.19 5.00 20.82 5.04 20.96
Jun. 0.17 0.59 0.73 6.99 2.12 4.91 5.83 4.76 4.89 5.06 5.26 3.20 4.99 20.81 5.03 20.95
Jul. 0.15 0.57 0.71 4.62 3.46 5.54 4.33 4.93 4.92 4.82 5.09 3.01 4.29 21.24 4.46 21.03
Aug. 0.15 0.50 0.69 4.65 2.25 5.07 4.98 4.42 4.64 5.05 5.31 1.76 4.25 21.48 4.53 21.14
Sep. 0.15 0.50 0.68 5.14 2.75 5.04 3.56 4.34 4.65 5.08 5.29 1.84 4.20 21.26 4.54 20.96
Oct. 0.15 0.49 0.63 5.75 2.25 5.14 3.72 4.50 4.77 5.03 5.12 2.98 4.25 21.13 4.56 21.01
Nov. 0.15 0.49 0.64 4.27 3.15 4.93 2.80 3.25 3.83 5.10 5.15 2.43 3.94 21.43 4.28 20.99
Dec. 0.15 0.47 0.63 3.71 3.13 4.84 4.82 4.14 4.31 4.77 4.71 2.88 4.12 21.16 4.26 20.99
2022 Jan. 0.15 0.48 0.63 3.02 2.92 4.60 4.60 4.00 4.37 4.86 4.43 0.75 4.17 21.23 4.32 20.95
Feb. 0.14 0.51 0.75 6.04 3.19 4.42 4.39 4.36 4.07 4.96 4.68 2.31 4.22 21.23 4.44 20.94
1/ Weighted average rates derived from Conventional Retail Banks returns. The present survey asks for deposit rates offered, 1 /ويعنى المسح بأسعار الفائدة على الودائع والقروض . أسعار الفائدة مشتقة من استمارات مصارف قطاع التجزئة التقليدية
and loan rates charged on loans extended, during the last month of each quarter. . خالل آخر شهر من كل فصل
2/ Deposits in the BD 10,000-50,000 range, for period indicated, begining with June, 1998. .1998 دينار بحريني للفترة المذكورة ، اعتباراً من يونيو 50,000 الى 10,000الودائع من / 2
3/ Includes non-banks financial and other services. .والخدمات األخرى (غير المصرفي)يشمل القطاع المالي / 3
4/ Includes other types of personal loans not shown separately. .يشمل القروض الشخصية األخرى/ 4
- 7 -
نهاية الفترة

Table No. (8) جدول رقم
/1 - 2022أعلى وأدنى أسعار فائدة مقدمة على القروض بالدينار البحريني لشهر فبراير - مصارف قطاع التجزئة التقليدية
Conventional Retail Banks - Highest and Lowest Interest Rates Offered on BD Loans - February 2022 - 1/
Percent Per Annum النسبة السنوية
Business Loans قروض قطاع األعمال Personal Loans القروض الشخصية
Secured بضمان
العقار المركبة الراتب الودائع
Construction
and Real EstateManufacturing Trade
by
Mortgages Vehicle Title by Deposits
Salary
Assignment
Highest 6.08 6.52 4.98 5.66 8.55 3.02 16.08 أعلى
Lowest 5.95 0.61 1.47 2.50 3.46 0.50 3.54 أدنى
Average 6.04 3.19 4.42 4.96 4.68 2.31 4.22 المتوسط المرجح
1/ Weighted Average. .متوسط مرجح/ 1
- 8 -
اإلنشاء والتعمير الصناعة التجارة

Table No. (9) جدول رقم
/1 - 2022فبراير -أسعار الفائدة على القروض الشخصية وقروض قطاع األعمال حسب المصارف - مصارف قطاع التجزئة التقليدية
Conventional Retail Banks - Interest Rates on Personal and Business Loans by Banks - February 2022 - 1/Percent Per Annum النسبة السنوية
Business Loans قروض قطاع األعمال Personal Loans القروض الشخصية
Secured بضمان
اإلنشاء والتعمير الصناعة التجارة أخرى المجموعالسحب على
المكشوفالعقار المركبة الراتب الودائع أخرى المجموع
بطاقات
االئتمان
Construction
and Real
Estate
Manufacturing Trade Other 2/ Total 3/Overdraft
Approvals
by
Mortgages
Vehicle
Title
by
Deposits
Salary
AssignmentOther Total 4/
Credit
Cards
Arab Bank N/A N/A N/A N/A N/A N/A 5.66 5.45 N/A 6.54 N/A 6.06 19.50 البنك العربي
Ahli United Bank 6.08 6.52 4.98 5.62 5.16 4.36 5.34 5.12 0.50 5.83 N/A 5.63 22.00 البنك األهلي المتحد
Bank of Bahrain & Kuwait N/A N/A 4.01 4.37 4.35 N/A 5.14 3.89 N/A 3.61 N/A 4.05 N/A بنك البحرين والكويت
HSBC Bank Middle East N/A 4.50 4.50 4.86 4.81 N/A 4.50 5.75 N/A 5.52 N/A 5.52 20.50 بنك إتش إس بي سي الشرق األوسط
Future Bank N/A N/A N/A N/A N/A N/A N/A N/A N/A N/A N/A N/A N/A بنك المستقبل
Citibank N/A N/A N/A N/A N/A N/A N/A N/A N/A 16.08 21.28 17.83 22.00 سيتي بنك
The Housing Bank for Trade
& Finance N/A N/A N/A N/A N/A N/A N/A N/A N/A N/A N/A N/A N/A بنك اإلسكان للتجارة والتمويل
Habib Bank Limited N/A N/A N/A N/A N/A N/A N/A N/A N/A N/A N/A N/A N/A حبيب بنك المحدود
National Bank of Bahrain 5.95 5.29 4.50 4.49 4.55 3.83 4.83 3.46 3.02 3.54 N/A 3.95 20.61 بنك البحرين الوطني
BNP Paribas N/A N/A N/A N/A N/A 3.50 N/A N/A N/A N/A N/A N/A N/A بي إن بي باريبا
Standard Chartered Bank N/A N/A 1.47 N/A 1.47 N/A N/A 8.55 N/A 5.54 N/A 5.59 22.00 ستاندرد تشارترد بنك
National Bank of Kuwait N/A N/A N/A N/A N/A N/A N/A N/A N/A N/A N/A N/A 11.91 بنك الكويت الوطني
State Bank of India N/A N/A N/A N/A N/A N/A N/A 6.50 2.50 6.50 N/A 3.58 N/A ستيت بنك أوف إنديا
United Bank Limitied N/A N/A N/A N/A N/A N/A N/A N/A N/A N/A N/A N/A N/A يونايتد بنك ليمتد
ICICI Bank Limitied N/A N/A N/A N/A N/A N/A N/A N/A N/A N/A N/A N/A N/A آي سي آي سي آي بنك ليمتد
Credit Libanais N/A N/A N/A 9.50 9.50 N/A N/A 4.56 N/A 4.50 0.50 3.01 17.50 بنك االعتماد اللبناني
Eskan Bank N/A N/A N/A N/A N/A N/A 2.50 N/A N/A N/A N/A 2.50 N/A بنك اإلسكان
National Bank of Abu Dhabi N/A N/A N/A N/A N/A N/A N/A N/A N/A N/A N/A N/A N/A بنك أبوظبي الوطني
Mashreq Bank N/A 1.87 2.30 N/A 1.95 N/A N/A N/A N/A N/A N/A N/A N/A بنك المشرق
Gulf International Bank N/A N/A N/A N/A N/A N/A N/A N/A N/A N/A N/A N/A N/A بنك الخليج الدولي
Arab Banking Corporation N/A N/A N/A N/A N/A N/A N/A N/A N/A N/A N/A N/A 22.00 المؤسسة العربية المصرفية
Bahrain Development Bank N/A 0.61 2.57 1.30 1.90 N/A N/A N/A N/A N/A N/A N/A N/A بنك البحرين للتنمية
Average 6.04 3.19 4.42 4.39 4.36 3.84 4.96 4.68 2.31 4.22 21.23 4.44 20.94 المعدل
1/ Weighted average rates derived from Conventional Retail Banks returns. The present survey asks for deposit rates offered, 1 /ويعني المسح بأسعار الفائدة على الودائع والقروض . أسعار الفائدة مشتقة من استمارات مصارف قطاع التجزئة التقليدية
and loan rates charged on loans extended, during month. . خالل آخر شهر
2/ Includes loans to non-banks financial and other services' companies. .وشركات الخدمات األخرى (غير المصرفي)يشمل القروض الممنوحة للقطاع المالي / 2
3/ Does not includes overdraft approvals. .ال يشمل السحب على المكشوف/ 3
4/ Includes other types of personal loans not shown separately. .يشمل القروض الشخصية األخرى/ 4
- 9 -
Banks المصارف

Table No. (10) جـدول رقـم
أذونات الخزانة لحكومة البحرين
Government of Bahrain Treasury Bills
مجموع العروض أذونات الخزانة متوسط سـعر متوسط سعر أسعار الفائدة
المقـدمة المخصصة األذونات الفائـدة على السائدة على الودائع
التاريخ (بماليين الدنانير) (بماليين الدنانير) (بالنسبة المئوية) األذونات المخصصة لثالثة إلى ستة أشهـر
Date of Total Treasury Average Average Int. Inter-bank Market
Issue Tenders Bills Price of Rate of BD 3 to 6 Month
Received Allotted Bills Allotted Allotted Bills Offered Rate
(BD Million) (BD Million) (%) (% p.a.) (% p.a.)
03.03.2021 210.70 70.00 99.637 1.44 0.19
10.03.2021 135.00 70.00 99.672 1.30 0.19
24.03.2021 146.00 70.00 99.694 1.22 0.20
25.03.2021 457.11 100.00 98.454 1.55 0.28
28.03.2021 106.65 35.00 99.352 1.29 0.21
31.03.2021 71.91 70.00 99.721 1.11 0.20
07.04.2021 70.00 70.00 99.697 1.20 0.20
21.04.2021 87.14 70.00 99.671 1.31 0.19
22.04.2021 154.71 100.00 98.406 1.60 0.29
28.04.2021 80.31 70.00 99.623 1.50 0.18
05.05.2021 114.88 70.00 99.584 1.65 0.18
09.05.2021 73.98 35.00 99.127 1.74 0.21
12.05.2021 94.33 70.00 99.575 1.69 0.16
26.05.2021 200.97 70.00 99.576 1.68 0.15
27.05.2021 306.01 100.00 98.272 1.74 0.26
30.05.2021 126.58 35.00 99.162 1.67 0.18
02.06.2021 143.71 70.00 99.586 1.64 0.13
09.06.2021 161.52 70.00 99.598 1.60 0.13
23.06.2021 125.63 70.00 99.610 1.55 0.13
24.06.2021 171.66 100.00 98.337 1.67 0.25
27.06.2021 87.04 35.00 99.205 1.59 0.16
30.06.2021 127.92 70.00 99.619 1.51 0.15
07.07.2021 190.59 70.00 99.635 1.45 0.14
21.07.2021 83.19 70.00 99.658 1.36 0.13
22.07.2021 100.00 100.00 98.258 1.75 0.24
28.07.2021 79.04 70.00 99.658 1.36 0.13
01.08.2021 82.89 35.00 99.242 1.51 0.16
04.08.2021 78.59 70.00 99.633 1.46 0.12
11.08.2021 112.37 70.00 99.623 1.50 0.24
25.08.2021 100.35 70.00 99.625 1.49 0.13
26.08.2021 151.98 100.00 98.296 1.71 0.24
29.08.2021 97.25 35.00 99.254 1.49 0.16
01.09.2021 104.36 70.00 99.626 1.48 0.12
08.09.2021 174.67 70.00 99.642 1.42 0.12
22.09.2021 95.65 70.00 99.642 1.42 0.12
23.09.2021 171.00 100.00 98.352 1.66 0.23
26.09.2021 44.83 35.00 99.282 1.43 0.15
29.09.2021 70.00 70.00 99.638 1.44 0.13
06.10.2021 151.35 70.00 99.647 1.40 0.13
20.10.2021 89.68 70.00 99.641 1.42 0.13
21.10.2021 109.77 100.00 98.356 1.65 0.30
27.10.2021 93.65 70.00 99.646 1.40 0.12
03.11.2021 100.99 70.00 99.646 1.40 0.13
07.11.2021 40.03 35.00 99.271 1.45 0.22
10.11.2021 80.38 70.00 99.636 1.44 0.14
24.11.2021 70.38 70.00 99.627 1.48 0.16
25.11.2021 108.80 100.00 98.346 1.66 0.43
28.11.2021 35.00 35.00 99.185 1.63 0.45
01.12.2021 80.66 70.00 99.627 1.48 0.18
08.12.2021 73.85 70.00 99.631 1.46 0.19
22.12.2021 82.66 70.00 99.630 1.47 0.21
23.12.2021 100.00 100.00 98.295 1.72 0.53
26.12.2021 35.00 35.00 99.164 1.67 0.33
29.12.2021 126.27 70.00 99.635 1.45 0.22
05.01.2022 160.51 70.00 99.651 1.39 0.21
19.01.2022 139.75 70.00 99.660 1.35 0.24
20.01.2022 163.70 100.00 98.242 1.77 0.77
26.01.2022 129.25 70.00 99.665 1.33 0.26
30.01.2022 81.42 35.00 99.236 1.52 0.45
02.02.2022 81.14 70.00 99.670 1.31 0.32
09.02.2022 80.00 70.00 99.660 1.35 0.34
23.02.2022 80.00 70.00 99.629 1.47 0.48
24.02.2022 100.57 100.00 97.749 2.28 1.26
27.02.2022 35.00 35.00 99.021 1.96 0.78
- 1
0 -

Table No. (11) جدول رقم
أدوات الدين العام
Public Debt InstrumentsB.D. Million مليون دينار
Conventional Instruments األدوات التقليدية Islamic Instruments 1/ األدوات اإلسالمية
سندات التنمية الحكومية أذونات الخزانة صكوك التأجير اإلسالمية صكوك السلم اإلسالمية
نهاية الفترة Development Bonds Treasury Bills 2/ الرصيد القائم Islamic Leasing Securities Al Salam Islamic Securities 3/ الرصيد القائم المجموع
End of Period المستحق إصدار جديد الرصيد المستحق إصدار جديد الرصيد Outstanding المستحق إصدار جديد الرصيد المستحق إصدار جديد الرصيد Outstanding Grand Total
Matured New Issue Balance Matured New Issue BalanceBalance
Matured New Issue Balance Matured New Issue BalanceBalance
2012 0.0 749.0 1669.0 2110.0 2160.0 930.0 2,599.0 500.0 400.0 1215.5 216.0 216.0 54.0 1269.5 3,868.5
2013 50.0 1,064.0 2,683.0 2,190.0 2,390.0 1,130.0 3,813.0 371.6 340.0 1,183.9 234.0 288.0 108.0 1,291.9 5,104.9
2014 0.0 470.0 3,153.0 2,705.0 2,805.0 1,230.0 4,383.0 562.0 240.0 861.9 432.0 432.0 108.0 969.9 5,352.9
2015 200.0 914.0 3,867.0 3,405.0 3,885.0 1,710.0 5,777.0 358.0 844.0 1,347.9 474.0 495.0 129.0 1,476.9 7,053.9
2016 150.0 1,386.6 5,103.6 4,020.0 4,095.0 1,785.0 6,888.6 512.0 851.9 1,687.8 516.0 516.0 129.0 1,816.8 8,705.4
2017 300.0 1,622.0 6,425.6 4,130.0 4,405.0 2,060.0 8,485.6 472.0 756.6 1,972.4 516.0 516.0 129.0 2,101.4 10,587.0
2018 100.0 638.0 6,963.6 4,370.0 4,420.0 2,110.0 9,073.6 694.0 976.0 2,254.4 516.0 516.0 129.0 2,383.4 11,457.0
2019 485.0 861.0 7,339.6 4,420.0 4,420.0 2,110.0 9,449.6 475.6 688.0 2,466.8 516.0 516.0 129.0 2,595.8 12,045.4
2020 920.0 1202.0 7,621.6 4,110.0 4,110.0 2,110.0 9,731.6 286.0 1038.0 3,218.8 473.0 473.0 129.0 3,347.8 13,079.4
2021 866.6 2304.0 9,059.0 4,420.0 4,420.0 2,110.0 11,169.0 600.0 500.0 3,118.8 516.0 516.0 129.0 3,247.8 14,416.8
2020 Q1 470.0 0.0 6,869.6 1,105.0 1,105.0 2,110.0 8,979.6 78.0 78.0 2,466.8 129.0 129.0 129.0 2,595.8 11,575.4
Q2 300.0 676.0 7,245.6 725.0 725.0 2,110.0 9,355.6 52.0 428.0 2,842.8 86.0 86.0 129.0 2,971.8 12,327.4
Q3 150.0 526.0 7,621.6 1,175.0 1,175.0 2,110.0 9,731.6 78.0 454.0 3,218.8 129.0 129.0 129.0 3,347.8 13,079.4
Q4 0.0 0.0 7,621.6 1,105.0 1,105.0 2,110.0 9,731.6 78.0 78.0 3,218.8 129.0 129.0 129.0 3,347.8 13,079.4
2021 Q1 716.6 1052.0 7,957.0 1,105.0 1,105.0 2,110.0 10,067.0 178.0 78.0 3,118.8 129.0 129.0 129.0 3,247.8 13,314.8
Q2 0.0 150.0 8,107.0 1,105.0 1,105.0 2,110.0 10,217.0 78.0 78.0 3,118.8 129.0 129.0 129.0 3,247.8 13,464.8
Q3 150.0 150.0 8,107.0 1,105.0 1,105.0 2,110.0 10,217.0 266.0 266.0 3,118.8 129.0 129.0 129.0 3,247.8 13,464.8
Q4 0.0 952.0 9,059.0 1,105.0 1,105.0 2,110.0 11,169.0 78.0 78.0 3,118.8 129.0 129.0 129.0 3,247.8 14,416.8
2021 Feb. 0.0 0.0 8,107.0 345.0 345.0 2,110.0 10,217.0 26.0 26.0 3,118.8 43.0 43.0 129.0 3,247.8 13,464.8
Mar. 350.0 200.0 7,957.0 415.0 415.0 2,110.0 10,067.0 26.0 26.0 3,118.8 43.0 43.0 129.0 3,247.8 13,314.8
Apr. 0.0 0.0 7,957.0 310.0 310.0 2,110.0 10,067.0 26.0 26.0 3,118.8 43.0 43.0 129.0 3,247.8 13,314.8
May 0.0 0.0 7,957.0 380.0 380.0 2,110.0 10,067.0 26.0 26.0 3,118.8 43.0 43.0 129.0 3,247.8 13,314.8
Jun. 0.0 150.0 8,107.0 415.0 415.0 2,110.0 10,217.0 26.0 26.0 3,118.8 43.0 43.0 129.0 3,247.8 13,464.8
Jul. 0.0 0.0 8,107.0 310.0 310.0 2,110.0 10,217.0 26.0 26.0 3,118.8 43.0 43.0 129.0 3,247.8 13,464.8
Aug. 150.0 150.0 8,107.0 380.0 380.0 2,110.0 10,217.0 26.0 26.0 3,118.8 43.0 43.0 129.0 3,247.8 13,464.8
Sep. 0.0 0.0 8,107.0 415.0 415.0 2,110.0 10,217.0 214.0 214.0 3,118.8 43.0 43.0 129.0 3,247.8 13,464.8
Oct. 0.0 200.0 8,307.0 310.0 310.0 2,110.0 10,417.0 26.0 26.0 3,118.8 43.0 43.0 129.0 3,247.8 13,664.8
Nov. 0.0 752.0 9,059.0 380.0 380.0 2,110.0 11,169.0 26.0 26.0 3,118.8 43.0 43.0 129.0 3,247.8 14,416.8
Dec. 0.0 0.0 9,059.0 415.0 415.0 2,110.0 11,169.0 26.0 26.0 3,118.8 43.0 43.0 129.0 3,247.8 14,416.8
2022 Jan. 0.0 0.0 9,059.0 345.0 345.0 2,110.0 11,169.0 26.0 26.0 3,118.8 43.0 43.0 129.0 3,247.8 14,416.8
Feb. 0.0 0.0 9,059.0 345.0 345.0 2,110.0 11,169.0 26.0 26.0 3,118.8 43.0 43.0 129.0 3,247.8 14,416.8
1/ Islamic Instruments are issued in BD & US Dollar. .األدوات اإلسالمية تصدر بالدينار البحريني وبالدوالر األمريكي/ 1
2/ Treasury bills have a maturity of 91 days, 182 days & 12 Months. . شهرا12ً يوم و182 و91أذونات الخزانة تستحق بعد / 2
3/ Al Salam Islamic securities have a maturity of 91 days. . يوم91صكوك السلم اإلسالمية تستحق بعد / 3
* Based on Ministry of Finance instructions, an exchange rate of 0.376 will be used وذلك لجميع إصدارات الوزارة 0.376بناء على تعليمات وزارة المالية سيتم استخدام سعر صرف الدوالر األمريكي *
when evaluating the USD Government Issues in BD. . بالدوالر األمريكي عند تقييمها بالدينار البحريني
- 11 -

Table No. (12) جدول رقم
مصارف قطاع التجزئة ومصارف قطاع الجملة: الميزانية الموحدة للجهاز المصرفي
Aggregated Balance Sheet of the Banking System: Retail Banks and Wholesale Banks
(ال يشمل مصرف البحرين المركزي)
(Excluding Central Bank of Bahrain)U.S. Dollar Million مليون دوالر أمريكي
Assets الموجودات Liabilities المطلوبات
Domestic المحلية Domestic المحلية
القطاع الخاص األجنبية المجموع القطاع الخاص األجنبية
المصارف (غير المصارف) الحكومة أخرى المجموع Total المصارف (غير المصارف) الحكومة أخرى المجموع
Banks 2/ Private General Other Total Foreign Banks 2/ Private General Other Total Foreign
Non-Banks Government 1/ Non-Banks Government 1/
2012 15,134.7 23,213.2 6,476.6 3,428.2 48,252.7 138,069.7 186,322.4 11,819.3 22,080.8 6,194.2 11,153.8 51,248.1 135,074.3
2013 11,650.5 24,941.4 8,735.9 3,396.0 48,723.9 143,275.4 191,999.3 8,485.9 23,961.6 6,290.4 11,759.9 50,497.8 141,501.5
2014 12,623.8 23,308.6 9,520.7 3,805.1 49,258.2 140,034.9 189,293.1 8,681.4 25,367.6 5,952.0 11,871.4 51,872.4 137,420.7
2015 12,338.2 25,189.6 10,935.2 4,125.1 52,588.0 138,412.8 191,000.8 8,449.2 25,911.1 5,750.5 12,448.8 52,559.6 138,441.2
2016 13,322.6 25,399.3 13,391.1 3,648.0 55,761.0 130,289.5 186,050.5 9,792.0 26,376.9 5,814.9 12,842.7 54,826.5 131,224.0
2017 13,224.9 26,108.7 14,770.0 3,679.4 57,783.0 129,660.9 187,443.9 8,373.8 27,783.3 6,107.4 13,633.1 55,897.6 131,546.3
2018 13,700.1 29,500.5 15,268.8 3,979.0 62,448.4 130,201.0 192,649.4 8,922.1 28,640.9 5,962.3 14,372.3 57,897.6 134,751.8
2019 15,457.6 30,750.6 17,357.3 4,950.0 68,515.5 136,391.3 204,906.8 9,232.6 31,529.1 6,046.7 15,501.6 62,310.0 142,596.8
2020 14,825.1 33,581.6 18,403.0 4,702.1 71,511.8 135,841.7 207,353.5 9,652.1 33,673.1 5,098.2 16,453.7 64,877.1 142,476.4
2021 17,858.8 34,209.7 19,696.3 4,313.8 76,078.6 141,423.0 217,501.6 11,893.6 35,389.6 4,808.0 16,269.5 68,360.7 149,140.9
2020 Q1 16,419.2 31,801.9 18,212.0 5,886.9 72,320.0 138,509.7 210,829.7 10,812.0 32,305.8 6,174.7 15,290.3 64,582.8 146,246.9
Q2 15,960.1 32,362.1 17,767.4 5,639.0 71,728.6 138,982.6 210,711.2 10,247.5 33,569.5 5,281.0 15,997.2 65,095.2 145,616.0
Q3 14,613.1 32,816.1 18,197.1 5,022.2 70,648.5 136,396.2 207,044.7 9,800.6 33,497.8 4,735.9 15,970.1 64,004.4 143,040.3
Q4 14,825.1 33,581.6 18,403.0 4,702.1 71,511.8 135,841.7 207,353.5 9,652.1 33,673.1 5,098.2 16,453.7 64,877.1 142,476.4
2021 Q1 17,415.6 33,298.7 18,324.1 4,644.9 73,683.3 134,694.0 208,377.3 10,913.8 34,216.5 4,858.4 16,163.8 66,152.5 142,224.8
Q2 18,079.7 33,888.3 18,704.5 4,490.7 75,163.1 138,036.9 213,200.0 11,028.9 35,131.8 4,867.3 15,988.7 67,016.8 146,183.2
Q3 18,719.1 33,912.2 18,205.9 4,518.4 75,355.6 136,312.1 211,667.7 10,091.4 35,179.5 5,115.2 15,903.6 66,289.7 145,378.0
Q4 17,858.8 34,209.7 19,696.3 4,313.8 76,078.6 141,423.0 217,501.6 11,893.6 35,389.6 4,808.0 16,269.5 68,360.7 149,140.9
2021 Feb. 16,589.2 33,191.6 18,676.9 4,582.8 73,040.5 137,394.0 210,434.5 10,385.1 34,030.5 4,778.7 15,922.8 65,117.1 145,317.4
Mar. 17,415.6 33,298.7 18,324.1 4,644.9 73,683.3 134,694.0 208,377.3 10,913.8 34,216.5 4,858.4 16,163.8 66,152.5 142,224.8
Apr. 17,878.4 33,565.0 18,412.6 4,573.0 74,429.0 134,128.6 208,557.6 10,691.5 34,309.0 4,811.3 15,966.2 65,778.0 142,779.6
May 19,117.9 33,693.5 18,188.2 4,513.3 75,512.9 137,297.2 212,810.1 11,388.0 34,870.2 4,885.0 15,901.6 67,044.8 145,765.3
Jun. 18,079.7 33,888.3 18,704.5 4,490.7 75,163.1 138,036.9 213,200.0 11,028.9 35,131.8 4,867.3 15,988.7 67,016.8 146,183.2
Jul. 18,854.0 33,858.4 18,798.2 4,995.5 76,506.1 134,957.7 211,463.8 10,167.6 34,688.4 5,253.7 16,319.0 66,428.7 145,035.1
Aug. 18,532.8 34,029.5 18,353.3 4,464.2 75,379.8 133,482.0 208,861.8 10,291.7 34,715.5 5,035.9 16,172.7 66,215.8 142,646.0
Sep. 18,719.1 33,912.2 18,205.9 4,518.4 75,355.6 136,312.1 211,667.7 10,091.4 35,179.5 5,115.2 15,903.6 66,289.7 145,378.0
Oct. 19,540.3 34,076.6 18,932.4 4,450.8 77,000.1 133,118.3 210,118.4 10,370.4 35,105.5 5,140.8 16,253.9 66,870.6 143,247.8
Nov. 18,434.3 34,486.9 19,506.9 4,396.1 76,824.2 135,221.6 212,045.8 10,329.1 35,129.7 5,046.4 16,434.2 66,939.4 145,106.4
Dec. 17,858.8 34,209.7 19,696.3 4,313.8 76,078.6 141,423.0 217,501.6 11,893.6 35,389.6 4,808.0 16,269.5 68,360.7 149,140.9
2022 Jan. 19,186.6 34,239.8 19,528.5 4,336.6 77,291.5 139,218.4 216,509.9 11,590.5 35,351.3 4,796.2 16,274.4 68,012.4 148,497.5
Feb. 19,461.8 34,654.5 19,583.1 4,261.9 77,961.3 140,737.1 218,698.4 12,119.0 35,824.7 4,753.2 16,765.5 69,462.4 149,236.0
1/ Central Government and the Social Insurance System. .الحكومة المركزية ونظام التأمينات االجتماعية/ 1
2/ Includes Central Monetary Authorities. .يشمل السلطات النقدية المركزية/ 2
- 12 -
End of Period
نهاية الفترة

Table No. (13) جدول رقم
الميزانية الموحدة لمصارف قطاع التجزئة
Retail Banks - Aggregated Balance Sheet
الموجودات
AssetsB.D. Million مليون دينار
Domestic Assets الموجودات المحلية الشراء ألجل
مصرف البحرين القطاع الخاص الحكومة الموجودات مجموع للعمالت
نهاية الفترة نقداً المركزي المصارف (غير المصارف) General Government أخرى المجموع األجنبية الموجودات memo:
End of PeriodCash Banks
Private
Non-Banksالقروض السندات Other Total
Foreign
Assets
Total
Assets
Forward
Currency
1/ 2/ Loans Securities Purchased
2012 101.1 1,299.8 2,677.2 7,994.2 198.0 2,162.8 747.1 15,180.2 11,783.4 26,963.6 6,801.7
2013 116.9 1,268.5 1,632.7 8,519.2 174.8 3,014.7 776.9 15,503.7 12,814.2 28,317.9 5,679.1
2014 117.3 1,575.8 1,511.2 8,019.2 185.1 3,280.7 888.4 15,577.7 14,505.5 30,083.2 4,991.6
2015 124.9 1,183.7 1,767.9 8,627.4 297.1 3,604.8 917.8 16,523.6 14,378.7 30,902.3 3,549.5
2016 135.3 1,018.7 2,070.7 8,755.6 293.4 4,342.8 732.5 17,349.0 13,864.5 31,213.5 4,043.2
2017 135.9 1,130.2 1,860.5 8,970.2 333.2 4,737.2 857.8 18,025.0 13,364.0 31,389.0 5,461.3
2018 153.6 889.0 2,070.6 9,860.5 261.1 4,790.9 913.6 18,939.3 13,629.7 32,569.0 6,068.7
2019 152.0 1,443.5 1,956.5 9,966.8 301.6 5,235.0 891.2 19,946.6 15,423.2 35,369.8 6,799.8
2020 152.1 1,343.9 1,815.9 10,644.3 369.6 5,641.1 972.8 20,939.7 14,507.6 35,447.3 7,079.0
2021 146.0 1,748.0 1,919.9 11,111.1 454.4 5,825.0 921.8 22,126.2 15,247.8 37,374.0 7,469.5
2020 Q1 152.9 1,356.0 2,068.4 10,301.1 441.5 5,306.3 1,059.4 20,685.6 15,066.7 35,752.3 9,006.8
Q2 150.8 1,290.2 1,996.2 10,441.2 328.9 5,425.4 989.4 20,622.1 15,183.4 35,805.5 8,824.0
Q3 151.1 1,088.6 1,997.0 10,486.0 297.0 5,546.3 991.1 20,557.1 14,864.3 35,421.4 7,279.8
Q4 152.1 1,343.9 1,815.9 10,644.3 369.6 5,641.1 972.8 20,939.7 14,507.6 35,447.3 7,079.0
2021 Q1 140.8 1,985.3 2,013.3 10,628.1 468.4 5,316.8 1,011.0 21,563.7 13,751.4 35,315.1 7,805.9
Q2 135.8 2,067.3 2,002.7 10,848.3 450.2 5,560.0 952.7 22,017.0 14,552.0 36,569.0 6,475.3
Q3 134.9 2,449.5 2,019.4 10,959.8 371.5 5,472.5 960.5 22,368.1 14,001.7 36,369.8 7,281.4
Q4 146.0 1,748.0 1,919.9 11,111.1 454.4 5,825.0 921.8 22,126.2 15,247.8 37,374.0 7,469.5
2021 Feb. 138.0 1,843.4 1,808.6 10,607.1 474.5 5,488.8 961.3 21,321.7 14,632.4 35,954.1 8,568.3
Mar. 140.8 1,985.3 2,013.3 10,628.1 468.4 5,316.8 1,011.0 21,563.7 13,751.4 35,315.1 7,805.9
Apr. 159.3 2,194.6 1,869.6 10,683.3 444.9 5,325.3 1,003.6 21,680.6 14,064.8 35,745.4 7,535.5
May 144.4 2,271.5 1,995.6 10,770.9 449.7 5,385.3 973.7 21,991.1 14,457.2 36,448.3 7,745.8
Jun. 135.8 2,067.3 2,002.7 10,848.3 450.2 5,560.0 952.7 22,017.0 14,552.0 36,569.0 6,475.3
Jul. 139.4 2,436.6 2,023.3 10,800.3 488.8 5,504.4 972.9 22,365.7 13,817.6 36,183.3 7,502.3
Aug. 148.9 2,414.8 1,907.0 10,908.1 428.3 5,445.6 951.9 22,204.6 13,870.2 36,074.8 6,689.1
Sep. 134.9 2,449.5 2,019.4 10,959.8 371.5 5,472.5 960.5 22,368.1 14,001.7 36,369.8 7,281.4
Oct. 135.2 2,526.5 1,999.5 10,996.4 391.2 5,619.7 969.5 22,638.0 13,750.6 36,388.6 7,817.4
Nov. 151.3 2,277.7 1,894.5 11,132.4 436.3 5,807.5 962.1 22,661.8 14,203.4 36,865.2 8,007.8
Dec. 146.0 1,748.0 1,919.9 11,111.1 454.4 5,825.0 921.8 22,126.2 15,247.8 37,374.0 7,469.5
2022 Jan. 142.2 2,138.5 1,957.5 11,122.1 470.6 5,793.1 931.8 22,555.8 14,729.7 37,285.5 8,100.6
Feb. 135.8 2,397.5 2,025.5 11,193.5 481.8 5,775.1 946.7 22,955.9 15,262.2 38,218.1 8,521.4
1/ Includes Head Offices and Affiliates. . يشمل المكاتب الرئيسية والشركات الزميلة/ 1
2/ Loans and Holdings of Securities. .القروض والسندات/ 2
- 13 -
Central
Bank of
Bahrain

Table No. (14) جدول رقم
الميزانية الموحدة لمصارف قطاع التجزئة
Retail Banks - Aggregated Balance Sheet
المطلوبات
Liabilities مملكة مملكة
B.D. Million مليون دينار
Domestic Liabilities المطلوبات المحلية البيع ألجل
نهاية الفترة مصرف البحرين القطاع الخاص رأس المال المطلوبات مجموع للعمالت
End of Period المركزي المصارف الحكومة (غير المصارف) أخرى واإلحتياطي المجموع األجنبية المطلوبات memo:
Central Bank
of BahrainBanks
Private
Non-Banks 2/
General
Government 2/Other
Capital &
ReservesTotal
Foreign
Liabilities 1/
Total
Liabilities
Forward
Currency Sold
2012 241.4 2,181.3 8,001.6 2,161.7 379.3 2,033.0 14,998.3 11,965.3 26,963.6 6,800.8
2013 219.0 1,395.5 8,724.9 2,209.2 384.1 2,216.4 15,149.1 13,168.8 28,317.9 5,678.4
2014 204.4 1,134.5 9,303.8 2,131.8 477.9 2,447.7 15,700.1 14,383.1 30,083.2 4,993.2
2015 272.5 1,111.1 9,563.3 2,090.7 526.5 2,588.0 16,152.1 14,750.2 30,902.3 3,544.8
2016 244.2 1,380.0 9,684.2 2,122.3 508.0 2,822.0 16,760.7 14,452.8 31,213.5 4,032.9
2017 149.3 1,109.8 10,118.5 2,220.5 565.7 2,939.7 17,103.5 14,285.5 31,389.0 5,369.0
2018 51.9 1,462.2 10,347.0 2,204.7 707.4 3,059.2 17,832.4 14,736.6 32,569.0 6,022.3
2019 182.1 1,197.9 11,551.4 2,126.8 692.6 3,216.8 18,967.6 16,402.2 35,369.8 6,812.3
2020 134.2 1,135.2 12,275.3 1,829.3 1,021.5 3,215.1 19,610.6 15,836.7 35,447.3 7,090.1
2021 129.4 1,542.6 12,938.1 1,704.4 738.1 3,579.6 20,632.2 16,741.8 37,374.0 7,487.7
2020 Q1 149.8 1,335.1 11,787.0 2,164.7 970.7 2,710.2 19,117.5 16,634.8 35,752.3 9,023.1
Q2 257.2 1,166.4 12,299.3 1,800.8 1,111.1 2,860.5 19,495.3 16,310.2 35,805.5 8,815.1
Q3 137.3 1,074.9 12,252.2 1,721.0 1,114.7 2,941.3 19,241.4 16,180.0 35,421.4 7,250.4
Q4 134.2 1,135.2 12,275.3 1,829.3 1,021.5 3,215.1 19,610.6 15,836.7 35,447.3 7,090.1
2021 Q1 187.7 1,394.2 12,390.0 1,701.6 1,023.9 3,239.8 19,937.2 15,377.9 35,315.1 7,819.2
Q2 96.3 1,619.2 12,906.2 1,730.7 840.3 3,331.3 20,524.0 16,045.0 36,569.0 6,486.2
Q3 97.5 1,479.2 12,888.2 1,803.6 817.7 3,387.9 20,474.1 15,895.7 36,369.8 7,303.1
Q4 129.4 1,542.6 12,938.1 1,704.4 738.1 3,579.6 20,632.2 16,741.8 37,374.0 7,487.7
2021 Feb. 150.1 1,279.7 12,393.6 1,707.0 916.1 3,287.4 19,733.9 16,220.2 35,954.1 8,584.1
Mar. 187.7 1,394.2 12,390.0 1,701.6 1,023.9 3,239.8 19,937.2 15,377.9 35,315.1 7,819.2
Apr. 145.5 1,427.3 12,585.7 1,681.1 964.2 3,217.0 20,020.8 15,724.6 35,745.4 7,552.2
May 100.2 1,609.2 12,812.0 1,733.1 886.7 3,253.5 20,394.7 16,053.6 36,448.3 7,759.3
Jun. 96.3 1,619.2 12,906.2 1,730.7 840.3 3,331.3 20,524.0 16,045.0 36,569.0 6,486.2
Jul. 58.6 1,489.6 12,712.3 1,864.1 932.0 3,317.6 20,374.2 15,809.1 36,183.3 7,516.3
Aug. 63.8 1,483.8 12,778.0 1,771.9 857.2 3,345.0 20,299.7 15,775.1 36,074.8 6,705.8
Sep. 97.5 1,479.2 12,888.2 1,803.6 817.7 3,387.9 20,474.1 15,895.7 36,369.8 7,303.1
Oct. 101.5 1,518.4 12,864.5 1,834.2 856.2 3,458.5 20,633.3 15,755.3 36,388.6 7,834.5
Nov. 177.7 1,379.0 12,830.5 1,772.6 850.5 3,506.7 20,517.0 16,348.2 36,865.2 8,031.8
Dec. 129.4 1,542.6 12,938.1 1,704.4 738.1 3,579.6 20,632.2 16,741.8 37,374.0 7,487.7
2022 Jan. 170.5 1,551.5 12,935.5 1,714.0 711.7 3,575.1 20,658.3 16,627.2 37,285.5 7,900.5
Feb. 190.0 1,447.1 13,012.0 1,698.3 770.9 3,582.2 20,700.5 17,517.6 38,218.1 8,543.7
1/ Includes Capital and Reserves. .يشمل رأس المال واإلحتياطي/ 1
2/ Includes some non-deposit (non-monetary) liabilities. .(غير الودائع)يشمل بعض المطلوبات / 2
- 14 -

Table No. (15) جدول رقم
الموجودات والمطلوبات األجنبية- مصارف قطاع التجزئة
Retail Banks - Foreign Assets and LiabilitiesB.D. Million مليون دينار
Assets الموجودات Liabilities المطلوبات صافي الموجودات
نهاية الفترة المصارف غير المصارف المجموع ومنه السندات المصارف غير المصارف المجموع األجنبية
End of PeriodBanks Non-Banks Total
of which
SecuritiesBanks Non-Banks Total
Net Foreign
Assets
2012 5,837.8 5,945.6 11,783.4 2,200.2 6,919.6 5,045.7 11,965.3 -181.9
2013 4,794.5 8,019.7 12,814.2 3,287.7 7,286.5 5,882.3 13,168.8 -354.6
2014 5,845.5 8,660.0 14,505.5 3,629.1 8,283.8 6,099.3 14,383.1 122.4
2015 5,407.8 8,970.9 14,378.7 3,527.4 8,180.3 6,569.9 14,750.2 -371.5
2016 4,748.7 9,115.8 13,864.5 3,738.7 8,007.7 6,445.1 14,452.8 -588.3
2017 4,557.0 8,807.0 13,364.0 3,797.6 7,910.5 6,375.0 14,285.5 -921.5
2018 4,516.2 9,113.5 13,629.7 4,534.8 7,614.9 7,121.7 14,736.6 -1,106.9
2019 5,655.9 9,767.3 15,423.2 5,506.9 10,248.7 6,153.5 16,402.2 -979.0
2020 4,774.8 9,732.8 14,507.6 5,937.5 10,990.1 4,846.6 15,836.7 -1,329.1
2021 6,002.3 9,245.5 15,247.8 5,234.8 10,279.6 6,462.2 16,741.8 -1,494.0
2020 Q1 5,403.1 9,663.6 15,066.7 5,469.8 11,252.4 5,382.4 16,634.8 -1,568.1
Q2 4,929.9 10,253.5 15,183.4 6,067.4 10,968.6 5,341.6 16,310.2 -1,126.8
Q3 4,665.2 10,199.1 14,864.3 6,027.5 10,909.4 5,270.6 16,180.0 -1,315.7
Q4 4,774.8 9,732.8 14,507.6 5,937.5 10,990.1 4,846.6 15,836.7 -1,329.1
2021 Q1 4,357.5 9,393.9 13,751.4 5,570.9 10,887.7 4,490.2 15,377.9 -1,626.5
Q2 5,234.4 9,317.7 14,552.0 5,517.1 10,856.6 5,188.3 16,045.0 -1,493.0
Q3 4,970.6 9,031.1 14,001.7 5,348.4 10,478.9 5,416.8 15,895.7 -1,894.0
Q4 6,002.3 9,245.5 15,247.8 5,234.8 10,279.6 6,462.2 16,741.8 -1,494.0
2021 Feb. 5,323.9 9,308.5 14,632.4 5,695.8 11,080.7 5,139.5 16,220.2 -1,587.8
Mar. 4,357.5 9,393.9 13,751.4 5,570.9 10,887.7 4,490.2 15,377.9 -1,626.5
Apr. 4,897.4 9,167.4 14,064.8 5,544.1 10,929.3 4,795.3 15,724.6 -1,659.8
May 5,159.4 9,297.8 14,457.2 5,573.8 10,945.0 5,108.6 16,053.6 -1,596.4
Jun. 5,234.4 9,317.7 14,552.0 5,517.1 10,856.6 5,188.3 16,045.0 -1,493.0
Jul. 4,543.3 9,274.3 13,817.6 5,458.1 10,620.4 5,188.7 15,809.1 -1,991.5
Aug. 4,649.0 9,221.2 13,870.2 5,423.8 10,672.9 5,102.2 15,775.1 -1,904.9
Sep. 4,970.6 9,031.1 14,001.7 5,348.4 10,478.9 5,416.8 15,895.7 -1,894.0
Oct. 4,769.2 8,981.4 13,750.6 5,291.8 10,396.3 5,359.0 15,755.3 -2,004.7
Nov. 5,119.5 9,083.9 14,203.4 5,251.8 10,672.3 5,675.9 16,348.2 -2,144.8
Dec. 6,002.3 9,245.5 15,247.8 5,234.8 10,279.6 6,462.2 16,741.8 -1,494.0
2022 Jan. 5,591.9 9,137.8 14,729.7 5,144.2 10,400.5 6,226.7 16,627.2 -1,897.5
Feb. 6,188.8 9,073.4 15,262.2 4,993.0 10,339.2 7,178.4 17,517.6 -2,255.4
- 15 -

Table No. (16) جدول رقم
الميزانية الموحدة لمصارف قطاع التجزئة
Retail Banks - Aggregated Balance Sheet
الموجودات حسب العمالت
Assets by Currencyمملكة مملكة
B.D. Million مليون دينار
Domestic Assets الموجودات المحلية
المصارف (غير المصارف)القطاع الخاص الحكومة أخرى
نهاية الفترة Banks Private Non-Banks General Government Other
End of Period دينار بحريني عمالت أجنبية دينار بحريني عمالت أجنبية دينار بحريني عمالت أجنبية دينار بحريني عمالت أجنبية دينار بحريني عمالت أجنبية دينار بحريني عمالت أجنبية
BD FC BD FC BD FC BD FC BD FC BD FC
2012 2,933.2 1,144.9 5,790.3 2,203.9 1,909.7 451.1 569.2 177.9 294.7 11,488.7 11,497.1 15,466.5
2013 2,119.4 898.7 6,133.8 2,385.4 2,633.1 556.4 551.8 225.1 304.7 12,509.5 11,742.8 16,575.1
2014 2,359.5 844.8 6,576.6 1,442.6 2,825.6 640.2 590.0 298.4 428.0 14,077.5 12,779.7 17,303.5
2015 1,960.9 1,115.6 7,002.3 1,625.1 3,100.6 801.3 647.5 270.3 429.7 13,949.0 13,141.0 17,761.3
2016 2,241.9 982.8 7,220.6 1,535.0 3,603.1 1,033.1 422.7 309.8 359.4 13,505.1 13,847.7 17,365.8
2017 1,805.4 1,321.2 7,406.1 1,564.1 3,680.9 1,389.5 647.5 210.3 400.3 12,963.7 13,940.2 17,448.8 2018 1,729.0 1,384.2 7,880.2 1,980.3 3,785.5 1,266.5 665.4 248.2 402.7 13,227.0 14,462.8 18,106.2
2019 2,180.6 1,371.4 7,967.3 1,999.5 4,110.6 1,426.0 657.8 233.4 408.3 15,014.9 15,324.6 20,045.2
2020 2,086.1 1,225.8 8,647.3 1,997.0 4,204.9 1,805.8 643.9 328.9 314.3 14,193.3 15,896.5 19,550.8
2021 2,581.1 1,232.8 9,112.3 1,998.8 4,177.9 2,101.5 672.1 249.7 235.7 15,012.1 16,779.1 20,594.9
2020 Q1 2,271.4 1,305.9 8,153.1 2,148.0 4,160.9 1,586.9 758.8 300.6 355.9 14,710.8 15,700.1 20,052.2
Q2 2,160.1 1,277.1 8,328.2 2,113.0 4,140.7 1,613.6 685.5 303.9 262.1 14,921.3 15,576.6 20,228.9
Q3 1,951.2 1,285.5 8,405.5 2,080.5 4,120.5 1,722.8 662.5 328.6 268.8 14,595.5 15,408.5 20,012.9
Q4 2,086.1 1,225.8 8,647.3 1,997.0 4,204.9 1,805.8 643.9 328.9 314.3 14,193.3 15,896.5 19,550.8
2021 Q1 2,780.9 1,358.5 8,622.8 2,005.3 3,955.4 1,829.8 699.2 311.8 230.1 13,521.3 16,288.4 19,026.7
Q2 2,874.8 1,331.0 8,732.7 2,115.6 4,202.6 1,807.6 674.0 278.7 244.5 14,307.5 16,728.6 19,840.4
Q3 3,276.8 1,327.0 8,876.6 2,083.2 4,003.2 1,840.8 700.4 260.1 241.6 13,760.1 17,098.6 19,271.2
Q4 2,581.1 1,232.8 9,112.3 1,998.8 4,177.9 2,101.5 672.1 249.7 235.7 15,012.1 16,779.1 20,594.9
2021 Feb. 2,543.4 1,246.6 8,614.7 1,992.4 4,120.4 1,842.9 653.1 308.2 244.9 14,387.5 16,176.5 19,777.6
Mar. 2,780.9 1,358.5 8,622.8 2,005.3 3,955.4 1,829.8 699.2 311.8 230.1 13,521.3 16,288.4 19,026.7
Apr. 2,940.8 1,282.7 8,687.2 1,996.1 3,904.7 1,865.5 712.2 291.4 215.4 13,849.4 16,460.3 19,285.1
May 3,011.5 1,400.0 8,680.8 2,090.1 3,941.8 1,893.2 694.0 279.7 251.1 14,206.1 16,579.2 19,869.1
Jun. 2,874.8 1,331.0 8,732.7 2,115.6 4,202.6 1,807.6 674.0 278.7 244.5 14,307.5 16,728.6 19,840.4
Jul. 3,265.9 1,333.4 8,750.1 2,050.2 4,061.2 1,932.0 677.7 295.2 235.4 13,582.2 16,990.3 19,193.0
Aug. 3,191.8 1,278.9 8,787.2 2,120.9 3,996.7 1,877.2 681.8 270.1 260.3 13,609.9 16,917.8 19,157.0
Sep. 3,276.8 1,327.0 8,876.6 2,083.2 4,003.2 1,840.8 700.4 260.1 241.6 13,760.1 17,098.6 19,271.2
Oct. 3,411.4 1,249.8 8,989.9 2,006.5 4,162.7 1,848.2 681.8 287.7 241.4 13,509.2 17,487.2 18,901.4
Nov. 3,075.2 1,248.3 9,068.4 2,064.0 4,186.4 2,057.4 669.3 292.8 250.5 13,952.9 17,249.8 19,615.4
Dec. 2,581.1 1,232.8 9,112.3 1,998.8 4,177.9 2,101.5 672.1 249.7 235.7 15,012.1 16,779.1 20,594.9
2022 Jan. 2,977.2 1,261.0 9,143.1 1,979.0 4,165.9 2,097.8 693.8 238.0 252.4 14,477.3 17,232.4 20,053.1
Feb. 3,307.0 1,251.8 9,218.8 1,974.7 4,139.0 2,117.9 687.5 259.2 244.8 15,017.4 17,597.1 20,621.0
- 16 -
الموجودات األجنبية
Foreign Assets
مجموع الموجودات
Total Assets

Table No. (17) جدول رقم
الميزانية الموحدة لمصارف قطاع التجزئة
Retail Banks - Aggregated Balance Sheet
المطلوبات حسب العمالت
Liabilities by Currency
B.D. Million مليون دينار
Domestic Liabilities المطلوبات المحلية
المصارف (غير المصارف)القطاع الخاص الحكومة أخرى
نهاية الفترة Banks Private Non-Banks General Government Other
End of Period دينار بحريني عمالت أجنبية دينار بحريني عمالت أجنبية دينار بحريني عمالت أجنبية دينار بحريني عمالت أجنبية دينار بحريني عمالت أجنبية دينار بحريني عمالت أجنبية
BD FC BD FC BD FC BD FC BD FC BD FC
2012 1,321.6 1,101.1 6,101.2 1,900.4 1,991.6 170.1 1,713.7 698.6 1,408.4 10,556.9 12,536.5 14,427.1
2013 555.3 1,059.2 6,785.4 1,939.5 2,043.8 165.4 1,906.2 694.3 1,366.6 11,802.2 12,657.3 15,660.6
2014 447.5 891.4 7,361.2 1,942.6 1,966.9 164.9 2,156.8 768.8 1,408.2 12,974.9 13,340.6 16,742.6
2015 411.5 972.1 7,486.6 2,076.7 1,911.4 179.3 2,305.7 808.8 1,397.0 13,353.2 13,512.2 17,390.1
2016 579.9 1,044.3 7,443.1 2,241.1 1,822.4 299.9 2,571.4 758.6 1,308.5 13,144.3 13,725.3 17,488.2
2017 504.6 754.5 7,541.9 2,576.6 1,962.9 257.6 2,669.4 836.0 1,063.9 13,221.6 13,742.7 17,646.3
2018 533.8 980.3 7,543.6 2,803.4 1,914.2 290.5 2,847.8 918.8 1,112.6 13,624.0 13,952.0 18,617.0
2019 453.1 926.9 8,469.8 3,081.6 1,768.5 358.3 3,010.7 898.7 1,245.8 15,156.4 14,947.9 20,421.9
2020 627.2 642.2 9,386.6 2,888.7 1,604.9 224.4 3,161.4 1,075.2 1,492.2 14,344.5 16,272.3 19,175.0
2021 816.4 855.6 9,801.2 3,136.9 1,530.7 173.7 3,469.4 848.3 1,670.9 15,070.9 17,288.6 20,085.4
2020 Q1 697.3 787.6 8,583.8 3,203.2 1,877.4 287.3 2,729.1 951.8 1,371.1 15,263.7 15,258.7 20,493.6
Q2 689.6 734.0 9,098.7 3,200.6 1,534.2 266.6 3,000.0 971.6 1,238.8 15,071.4 15,561.3 20,244.2
Q3 493.3 718.9 9,242.0 3,010.2 1,462.5 258.5 3,054.1 1,001.9 1,323.3 14,856.7 15,575.2 19,846.2
Q4 627.2 642.2 9,386.6 2,888.7 1,604.9 224.4 3,161.4 1,075.2 1,492.2 14,344.5 16,272.3 19,175.0
2021 Q1 823.5 758.4 9,514.9 2,875.1 1,500.8 200.8 3,217.6 1,046.1 1,504.5 13,873.4 16,561.3 18,753.8
Q2 956.5 759.0 9,599.3 3,306.9 1,518.0 212.7 3,244.0 927.5 1,612.8 14,432.2 16,930.6 19,638.4
Q3 952.0 624.7 9,632.7 3,255.5 1,585.1 218.5 3,311.3 894.3 1,725.9 14,169.8 17,207.0 19,162.8
Q4 816.4 855.6 9,801.2 3,136.9 1,530.7 173.7 3,469.4 848.3 1,670.9 15,070.9 17,288.6 20,085.4
2021 Feb. 781.8 648.0 9,550.7 2,842.9 1,508.1 198.9 3,160.4 1,043.1 1,454.6 14,765.6 16,455.6 19,498.5
Mar. 823.5 758.4 9,514.9 2,875.1 1,500.8 200.8 3,217.6 1,046.1 1,504.5 13,873.4 16,561.3 18,753.8
Apr. 908.8 664.0 9,512.0 3,073.7 1,479.7 201.4 3,255.8 925.4 1,608.9 14,115.7 16,765.2 18,980.2
May 1,028.6 680.8 9,576.4 3,235.6 1,517.8 215.3 3,215.4 924.8 1,599.7 14,453.9 16,937.9 19,510.4
Jun. 956.5 759.0 9,599.3 3,306.9 1,518.0 212.7 3,244.0 927.5 1,612.8 14,432.2 16,930.6 19,638.4
Jul. 961.2 587.0 9,579.1 3,133.2 1,600.6 263.5 3,319.8 929.8 1,744.8 14,064.3 17,205.5 18,977.8
Aug. 954.2 593.4 9,593.8 3,184.2 1,568.3 203.6 3,265.3 936.9 1,790.6 13,984.5 17,172.2 18,902.6
Sep. 952.0 624.7 9,632.7 3,255.5 1,585.1 218.5 3,311.3 894.3 1,725.9 14,169.8 17,207.0 19,162.8
Oct. 961.8 658.1 9,676.3 3,188.2 1,602.4 231.8 3,415.8 898.9 1,818.8 13,936.5 17,475.1 18,913.5
Nov. 847.7 709.0 9,756.0 3,074.5 1,553.8 218.8 3,459.9 897.3 1,708.8 14,639.4 17,326.2 19,539.0
Dec. 816.4 855.6 9,801.2 3,136.9 1,530.7 173.7 3,469.4 848.3 1,670.9 15,070.9 17,288.6 20,085.4
2022 Jan. 949.9 772.1 9,855.6 3,079.9 1,547.3 166.7 3,450.5 836.3 1,735.1 14,892.1 17,538.4 19,747.1
Feb. 922.1 715.0 9,931.2 3,080.8 1,552.7 145.6 3,464.1 889.0 1,815.2 15,702.4 17,685.3 20,532.8
- 17 -
المطلوبات األجنبية
Foreign Liabilities
مجموع المطلوبات
Total Liabilities

Table No. (18) جدول رقم
الميزانية الموحدة لمصارف قطاع التجزئة
Retail Banks - Aggregated Balance Sheet
الودائع من غير المصارف
Deposit Liabilities to Non-BanksB.D. Million مليون دينار
Domestic Deposits الودائع المحلية
الحكومة Private Sector القطاع الخاص المجموع الودائع األجنبية مجموع الودائع
نهاية الفترة General Government تحت الطلب التوفير األجل Total Foreign Deposits Total Deposits
End of Period Demand Savings Time 1/
دينار بحريني عمالت أجنبية دينار بحريني عمالت أجنبية دينار بحريني عمالت أجنبية دينار بحريني عمالت أجنبية دينار بحريني عمالت أجنبية دينار بحريني عمالت أجنبية دينار بحريني عمالت أجنبية المجموع
BD FC BD FC BD FC BD FC BD FC BD FC BD FC Total
2012 1,797.9 170.1 1,569.1 620.6 1,619.7 111.1 2,895.4 1,164.3 7,882.1 2,066.1 188.6 2,816.8 8,070.7 4,882.9 12,953.6
2013 1,809.8 165.4 1,799.8 534.9 1,834.7 117.9 3,129.1 1,281.6 8,573.4 2,099.8 190.0 4,065.6 8,763.4 6,165.4 14,928.8
2014 1,714.2 164.9 1,975.6 626.3 2,095.4 146.1 3,253.4 1,165.5 9,038.6 2,102.8 213.5 4,243.2 9,252.1 6,346.0 15,598.1
2015 1,672.3 179.4 2,110.4 658.8 2,355.7 157.2 2,979.8 1,255.8 9,118.2 2,251.2 152.7 4,829.9 9,270.9 7,081.1 16,352.0
2016 1,548.9 299.9 2,138.2 642.4 2,443.2 183.9 2,815.1 1,409.8 8,945.4 2,536.0 158.0 4,928.6 9,103.4 7,464.6 16,568.0
2017 1,658.5 257.6 2,134.9 693.2 2,741.7 229.3 2,619.5 1,649.1 9,154.6 2,829.2 172.3 4,827.5 9,326.9 7,656.7 16,983.6
2018 1,480.3 290.6 2,134.0 759.9 2,696.7 195.0 2,688.2 1,843.4 8,999.2 3,088.8 199.8 5,565.8 9,199.0 8,654.7 17,853.7
2019 1,257.1 358.4 2,091.8 886.7 3,048.3 191.0 3,302.8 1,996.5 9,700.0 3,432.6 210.4 4,621.4 9,910.4 8,054.0 17,964.4
2020 1,082.0 224.4 2,328.1 959.9 3,507.5 231.7 3,528.4 1,691.4 10,446.0 3,107.4 331.6 3,023.3 10,777.6 6,130.7 16,908.3
2021 1,041.5 173.8 2,666.7 1,285.3 3,610.3 259.3 3,499.3 1,586.5 10,817.8 3,304.9 391.0 4,190.5 11,208.8 7,495.4 18,704.2
2020 Q1 1,353.8 287.4 2,146.0 1,006.1 3,123.1 226.0 3,291.2 1,963.7 9,914.1 3,483.2 209.1 3,824.0 10,123.2 7,307.2 17,430.4
Q2 1,017.3 266.6 2,346.9 986.8 3,400.0 221.9 3,322.6 1,984.3 10,086.8 3,459.6 205.8 3,692.7 10,292.6 7,152.3 17,444.9
Q3 930.1 258.5 2,260.5 1,074.7 3,486.0 225.0 3,461.0 1,703.0 10,137.6 3,261.2 245.0 3,645.6 10,382.6 6,906.8 17,289.4
Q4 1,082.0 224.4 2,328.1 959.9 3,507.5 231.7 3,528.4 1,691.4 10,446.0 3,107.4 331.6 3,023.3 10,777.6 6,130.7 16,908.3
2021 Q1 1,029.0 200.8 2,399.0 912.3 3,513.1 249.0 3,579.2 1,706.2 10,520.3 3,068.3 401.4 2,631.5 10,921.7 5,699.8 16,621.5
Q2 1,050.0 212.7 2,472.2 1,453.2 3,609.6 252.1 3,494.7 1,594.0 10,626.5 3,512.0 425.4 3,237.5 11,051.9 6,749.5 17,801.4
Q3 1,088.6 218.5 2,561.8 1,268.0 3,596.2 244.4 3,449.2 1,735.4 10,695.8 3,466.3 425.4 3,137.5 11,121.2 6,603.8 17,725.0
Q4 1,041.5 173.8 2,666.7 1,285.3 3,610.3 259.3 3,499.3 1,586.5 10,817.8 3,304.9 391.0 4,190.5 11,208.8 7,495.4 18,704.2
2021 Feb. 1,012.7 198.9 2,377.1 971.6 3,585.3 234.0 3,564.5 1,629.8 10,539.6 3,034.3 394.8 3,261.9 10,934.4 6,296.2 17,230.6
Mar. 1,029.0 200.8 2,399.0 912.3 3,513.1 249.0 3,579.2 1,706.2 10,520.3 3,068.3 401.4 2,631.5 10,921.7 5,699.8 16,621.5
Apr. 1,006.5 201.4 2,446.7 1,082.7 3,543.6 247.1 3,499.6 1,736.2 10,496.4 3,267.4 421.5 2,905.1 10,917.9 6,172.5 17,090.4
May 1,040.8 215.3 2,470.0 1,322.6 3,556.8 247.5 3,527.3 1,657.9 10,594.9 3,443.3 409.5 3,192.5 11,004.4 6,635.8 17,640.2
Jun. 1,050.0 212.7 2,472.2 1,453.2 3,609.6 252.1 3,494.7 1,594.0 10,626.5 3,512.0 425.4 3,237.5 11,051.9 6,749.5 17,801.4
Jul. 1,111.8 263.5 2,550.8 1,261.1 3,583.8 249.8 3,422.6 1,614.6 10,669.0 3,389.0 430.6 3,208.0 11,099.6 6,597.0 17,696.6
Aug. 1,082.0 203.6 2,539.3 1,276.7 3,584.0 251.4 3,447.4 1,648.5 10,652.7 3,380.2 427.4 3,090.7 11,080.1 6,470.9 17,551.0
Sep. 1,088.6 218.5 2,561.8 1,268.0 3,596.2 244.4 3,449.2 1,735.4 10,695.8 3,466.3 425.4 3,137.5 11,121.2 6,603.8 17,725.0
Oct. 1,111.2 231.9 2,599.3 1,223.0 3,589.9 256.2 3,462.3 1,701.4 10,762.7 3,412.5 427.7 3,055.2 11,190.4 6,467.7 17,658.1
Nov. 1,060.5 218.8 2,606.1 1,144.2 3,602.0 261.2 3,521.7 1,661.6 10,790.3 3,285.8 416.6 3,399.7 11,206.9 6,685.5 17,892.4
Dec. 1,041.5 173.8 2,666.7 1,285.3 3,610.3 259.3 3,499.3 1,586.5 10,817.8 3,304.9 391.0 4,190.5 11,208.8 7,495.4 18,704.2
2022 Jan. 1,052.1 166.7 2,677.2 1,201.1 3,633.2 255.8 3,516.6 1,615.4 10,879.1 3,239.0 394.1 3,898.3 11,273.2 7,137.3 18,410.5
Feb. 1,052.9 145.6 2,745.9 1,306.5 3,682.6 252.8 3,461.2 1,513.9 10,942.6 3,218.8 371.8 4,877.8 11,314.4 8,096.6 19,411.0
1/ Includes Certificates of Deposit. .يشمل شهادات اإليداع/ 1
- 18 -

Table No. (19) جدول رقم
الميزانية الموحدة لمصارف قطاع التجزئة
Retail Banks - Aggregated Balance Sheet
/1 (باستثناء المصارف)توزيع إجمالي القروض والتسهيالت حسب القطاعات االقتصادية المقيمة
Outstanding Loans and Advances to Non-Bank Residents by Economic Sector 1/B.D. Million مليون دينار
Business Sector Personal Sector قطاع األعمال قطاع األشخاص
of which Secured ومنها بضمان
الصناعةالمناجم
والمحاجر
الزراعة وصيد
األسماك واأللباناإلنشاء والتعمير التجارة
القطاع المالي
غير )
(المصارف
قطاعات
أخرى
النقل
واالتصاالت
الفنادق
والمطاعمالمجموع قطاع الحكومة العقار المركبة الراتب الودائع بطاقات االئتمان أخرى المجموع المجموع
End of Period
MFGMining &
Quarrying
Agriclture,
Fishing &
Dairy
Construction
& Real
Estate
Trade
Non-
Bank
Financial
Other
Sectors
Trans. &
Comm.
Hotels
& Rest.Total
General
Gov.
by
Mortgages
Vehicle
Title
by
Deposits
Salary
Assignment
Credit Card
ReceivablesOther Total
Grand
Total
2012 537.5 8.9 11.5 1,641.7 960.0 327.9 795.2 248.7 143.8 4,282.7 197.9 713.1 98.2 25.8 1,028.2 73.8 429.0 2,368.1 6,848.7
2013 631.1 8.4 10.4 1,566.1 1,144.4 180.4 761.1 219.9 132.3 4,301.9 174.8 867.9 108.0 68.6 1,034.5 61.6 553.2 2,693.8 7,170.5
2014 529.4 11.4 11.0 1,363.7 1,001.0 271.9 781.4 210.8 128.3 3,969.8 185.1 982.0 119.4 68.2 1,117.9 67.9 606.1 2,961.5 7,116.4
2015 630.4 4.2 6.4 1,343.7 1,114.3 274.3 786.1 195.3 138.9 4,159.4 297.1 1,058.3 124.4 54.0 1,230.4 69.0 853.1 3,389.2 7,845.7
2016 553.3 13.2 6.1 1,372.9 1,106.3 309.7 800.1 178.5 163.8 4,161.6 293.4 1,512.4 124.9 47.5 1,211.6 80.6 630.7 3,607.7 8,062.7
2017 717.8 59.7 8.1 1,698.3 1,125.4 222.2 799.1 97.2 172.4 4,630.6 333.2 1,613.6 114.9 52.9 1,278.3 86.1 589.5 3,735.3 8,699.1
2018 916.3 96.5 2.3 1,866.8 1,132.1 228.1 854.3 143.4 177.3 5,096.4 261.1 1,796.7 103.0 134.1 1,325.1 72.5 731.0 4,162.4 9,519.9
2019 1,068.1 86.7 6.7 1,841.4 1,071.0 251.8 812.9 127.2 151.6 5,138.6 301.6 1,953.2 123.0 140.1 1,577.4 104.0 398.5 4,296.2 9,736.4
2020 1,173.8 150.8 12.1 1,932.0 934.4 227.5 896.3 209.0 188.1 5,326.9 369.6 2,197.9 118.1 187.6 1,700.4 92.2 421.1 4,717.3 10,413.8
2021 1,292.3 74.7 13.2 2,009.6 903.9 169.5 878.0 147.5 196.1 5,341.2 454.4 2,261.5 109.2 133.7 1,933.0 99.5 573.8 5,110.7 10,906.3
2020 Q1 1,211.1 107.2 6.1 1,842.8 1,047.6 254.6 807.1 119.2 171.3 5,276.5 441.5 1,999.3 118.6 159.3 1,637.8 100.2 392.4 4,407.6 10,125.6
Q2 1,264.6 105.3 7.4 1,889.0 1,019.0 241.2 859.9 158.2 167.8 5,386.4 328.9 2,058.2 121.2 155.2 1,657.3 95.5 379.0 4,466.4 10,181.7
Q3 1,171.9 156.8 6.5 1,892.9 972.8 227.6 874.5 195.0 177.2 5,303.0 297.0 2,121.9 120.0 209.6 1,661.2 95.9 388.1 4,596.7 10,196.7
Q4 1,173.8 150.8 12.1 1,932.0 934.4 227.5 896.3 209.0 188.1 5,326.9 369.6 2,197.9 118.1 187.6 1,700.4 92.2 421.1 4,717.3 10,413.8
2021 Q1 1,181.9 126.6 12.1 1,917.6 920.9 216.9 910.8 211.4 190.8 5,286.8 468.4 2,269.4 112.9 163.8 1,757.7 89.8 407.9 4,801.5 10,556.7
Q2 1,307.6 126.2 12.6 1,991.0 898.6 199.6 924.0 207.3 197.8 5,459.6 450.2 2,134.2 111.6 138.3 1,828.6 83.0 513.5 4,809.2 10,719.0
Q3 1,339.0 75.3 11.9 2,004.8 882.1 186.1 912.1 198.0 193.5 5,411.3 371.5 2,206.2 108.1 124.0 1,891.1 95.7 522.7 4,947.8 10,730.6
Q4 1,292.3 74.7 13.2 2,009.6 903.9 169.5 878.0 147.5 196.1 5,341.2 454.4 2,261.5 109.2 133.7 1,933.0 99.5 573.8 5,110.7 10,906.3
2021 Feb. 1,200.5 122.9 12.3 1,913.8 908.0 216.3 906.9 207.2 189.6 5,280.7 474.5 2,217.6 114.9 167.0 1,745.5 93.6 398.6 4,737.2 10,492.4
Mar. 1,181.9 126.6 12.1 1,917.6 920.9 216.9 910.8 211.4 190.8 5,286.8 468.4 2,269.4 112.9 163.8 1,757.7 89.8 407.9 4,801.5 10,556.7
Apr. 1,187.1 121.2 11.8 1,946.5 926.3 207.7 914.5 211.8 196.3 5,315.1 444.9 2,252.2 113.0 145.2 1,779.4 89.6 413.4 4,792.8 10,552.8
May 1,258.6 125.8 12.3 1,974.9 920.9 198.4 913.0 209.8 197.2 5,403.9 449.7 2,116.6 112.7 146.9 1,828.3 77.6 512.5 4,794.6 10,648.2
Jun. 1,307.6 126.2 12.6 1,991.0 898.6 199.6 924.0 207.3 197.8 5,459.6 450.2 2,134.2 111.6 138.3 1,828.6 83.0 513.5 4,809.2 10,719.0
Jul. 1,286.1 70.1 12.8 1,975.5 902.0 195.7 934.6 214.8 196.7 5,376.8 488.8 2,156.1 110.3 133.6 1,839.6 89.9 518.1 4,847.6 10,713.2
Aug. 1,337.7 71.0 12.3 1,981.0 910.7 202.2 929.3 208.4 198.1 5,444.2 428.3 2,183.2 110.0 128.3 1,852.5 89.5 524.9 4,888.4 10,760.9
Sep. 1,339.0 75.3 11.9 2,004.8 882.1 186.1 912.1 198.0 193.5 5,411.3 371.5 2,206.2 108.1 124.0 1,891.1 95.7 522.7 4,947.8 10,730.6
Oct. 1,270.4 74.7 12.3 1,997.7 871.6 177.5 919.4 197.3 192.9 5,323.6 391.2 2,234.9 108.0 119.6 1,898.2 95.1 539.0 4,994.8 10,709.6
Nov. 1,327.3 75.2 13.0 2,001.2 900.1 178.2 921.6 197.9 197.4 5,416.6 436.3 2,244.1 108.6 124.2 1,921.6 98.8 556.3 5,053.6 10,906.5
Dec. 1,292.3 74.7 13.2 2,009.6 903.9 169.5 878.0 147.5 196.1 5,341.2 454.4 2,261.5 109.2 133.7 1,933.0 99.5 573.8 5,110.7 10,906.3
2022 Jan. 1,287.4 77.1 13.5 2,020.4 890.6 164.9 853.8 149.1 173.7 5,307.7 470.6 2,259.8 107.7 127.0 1,947.8 96.6 610.8 5,149.7 10,928.0
Feb. 1,262.0 77.3 13.2 1,720.4 886.1 170.3 893.7 156.9 173.6 5,023.0 481.8 2,607.7 105.4 128.9 1,962.2 96.9 592.6 5,493.7 10,998.5
1/ Excludes Securities. . ال يشمل السندات/ 1
- 19 -
نهاية الفترة

Table No. (20) جدول رقم
توزيع إجمالي القروض والتسهيالت لغير المصارف
المصارف وشركات التمويل
Outstanding Loans and Advances to Non-Bank Residents
Banks and Financing CompaniesB.D. Million مليون دينار
نهاية الفترة المصارف شركات التمويل المجموع
End of Period Banks Financing Companies 1/ Total
2014 Q1 7,041.1 333.3 7,374.4
Q2 7,114.9 353.1 7,468.0
Q3 7,260.6 346.6 7,607.2
Q4 7,116.4 347.4 7,463.8
2015 Q1 7,429.1 365.1 7,794.2
Q2 7,661.2 368.2 8,029.4
Q3 7,745.3 385.3 8,130.6
Q4 7,845.7 407.4 8,253.1
2016 Q1 7,944.2 386.8 8,331.0
Q2 7,998.3 410.1 8,408.4
Q3 8,050.1 425.2 8,475.3
Q4 8,062.7 438.1 8,500.8
2017 Q1 8,178.5 435.9 8,614.4
Q2 8,252.5 431.8 8,684.3
Q3 8,437.0 455.4 8,892.4
Q4 8,699.1 435.5 9,134.6
2018 Q1 8,986.8 455.5 9,442.3
Q2 9,202.3 463.5 9,665.8
Q3 9,783.7 474.1 10,257.9
Q4 9,519.9 480.4 10,000.3
2019 Q1 9,623.2 471.3 10,094.5
Q2 9,887.3 469.3 10,356.6
Q3 9,783.7 505.8 10,289.5
Q4 9,736.4 508.6 10,245.0
2020 Q1 10,125.6 451.0 10,576.6
Q2 10,181.7 420.4 10,602.1
Q3 10,196.7 426.1 10,622.8
Q4 10,413.8 413.1 10,826.9
2021 Q1 10,556.7 394.0 10,950.7
Q2 10,719.0 382.3 11,101.3
Q3 10,730.6 382.3 11,113.0
Q4 10,906.3 386.8 11,293.1
- 20 -

Table No. (21) جدول رقم
/1الموجودات والمطلوبات حسب التصنيف الجغرافي : مصارف قطاع التجزئة
Retail Banks: Geographical Classification of Assets and Liabilities 1/B.D. Million مليون دينار
Assets الموجودات Liabilities المطلوبات
مملكة دول مجلس الدول العربية أوروبا مملكة دول مجلس الدول العربية أوروبا
نهاية الفترة البحرين التعاون األخرى الدول األمريكية الغربية آسيا أخرى المجموع البحرين التعاون األخرى الدول األمريكية الغربية آسيا أخرى
End of Period Kingdom of GCC Other Arab Americas Western Asia Other Total Kingdom of GCC Other Arab Americas Western Asia Other
Bahrain Countries 2/ Europe Bahrain Countries 2/ Europe
2012 15,180.2 5,105.8 771.6 1,375.7 1,883.8 2,236.1 410.4 26,963.6 14,998.3 6,789.2 573.8 486.3 1,979.4 2,019.6 117.0
2013 15,503.7 5,456.5 751.0 1,523.2 1,969.5 2,672.3 441.7 28,317.9 15,149.1 7,981.0 536.1 571.3 1,303.0 2,670.2 107.2
2014 15,577.7 6,785.9 836.3 1,377.7 1,847.1 3,175.5 483.0 30,083.2 15,700.1 8,541.0 731.3 881.9 1,397.6 2,753.9 77.4
2015 16,523.6 6,352.9 846.2 1,879.7 1,688.9 3,138.2 472.8 30,902.3 16,152.1 9,237.2 669.4 834.2 1,281.5 2,647.7 80.2
2016 17,349.0 7,043.1 944.1 1,225.8 1,590.6 2,673.1 387.8 31,213.5 16,760.7 9,543.7 747.7 786.8 1,180.9 2,091.9 101.8
2017 18,025.0 7,074.1 957.0 1,133.3 1,672.1 2,198.7 328.8 31,389.0 17,103.5 9,704.7 863.4 805.9 1,268.9 1,541.6 101.0
2018 18,939.3 7,948.3 991.9 1,186.1 1,382.4 1,817.9 303.1 32,569.0 17,832.4 10,275.9 880.2 484.6 1,411.8 1,636.2 47.9
2019 19,946.6 8,684.5 1,024.9 1,651.2 1,726.4 2,041.8 294.4 35,369.8 18,967.6 10,994.8 1,205.9 349.5 2,404.5 1,382.7 64.8
2020 20,939.7 8,514.0 898.8 1,324.4 1,515.1 1,964.2 291.1 35,447.3 19,610.6 9,347.6 1,438.2 632.6 2,642.0 1,537.3 239.0
2021 22,126.2 8,841.7 1,049.9 1,549.5 1,560.6 1,910.2 335.9 37,374.0 20,632.2 10,438.9 1,204.0 1,035.9 2,432.2 1,328.0 302.8
2020 Q1 20,685.6 8,793.3 936.4 1,375.4 1,774.4 1,854.9 332.3 35,752.3 19,117.5 10,225.8 1,194.7 493.0 2,769.1 1,769.0 183.2
Q2 20,622.1 8,878.9 889.8 1,486.4 1,678.9 1,964.6 284.8 35,805.5 19,495.3 9,886.1 1,133.3 654.8 2,816.1 1,596.9 223.0
Q3 20,557.1 8,778.2 882.7 1,475.1 1,610.2 1,838.6 279.5 35,421.4 19,241.4 9,631.0 1,323.7 549.5 2,787.1 1,744.5 144.2
Q4 20,939.7 8,514.0 898.8 1,324.4 1,515.1 1,964.2 291.1 35,447.3 19,610.6 9,347.6 1,438.2 632.6 2,642.0 1,537.3 239.0
2021 Q1 21,563.7 8,360.0 960.1 1,008.3 1,429.3 1,685.4 308.3 35,315.1 19,937.2 8,838.7 1,183.9 918.5 2,689.6 1,536.1 211.1
Q2 22,017.0 8,841.0 954.9 1,424.2 1,433.3 1,597.3 301.3 36,569.0 20,524.0 9,193.4 1,346.2 1,114.1 2,596.0 1,561.2 234.0
Q3 22,368.1 8,437.0 919.5 1,382.3 1,490.3 1,453.5 319.1 36,369.8 20,474.1 9,268.2 1,199.3 989.8 2,608.6 1,543.5 286.3
Q4 22,126.2 8,841.7 1,049.9 1,549.5 1,560.6 1,910.2 335.9 37,374.0 20,632.2 10,438.9 1,204.0 1,035.9 2,432.2 1,328.0 302.8
2021 Feb. 21,321.7 8,336.3 936.6 1,476.4 1,908.9 1,656.1 318.1 35,954.1 19,733.9 9,544.0 1,220.0 976.0 2,791.9 1,484.0 204.3
Mar. 21,563.7 8,360.0 960.1 1,008.3 1,429.3 1,685.4 308.3 35,315.1 19,937.2 8,838.7 1,183.9 918.5 2,689.6 1,536.1 211.1
Apr. 21,680.6 8,158.3 970.8 1,311.2 1,734.6 1,585.7 304.2 35,745.4 20,020.8 8,924.2 1,305.1 1,052.3 2,636.2 1,595.2 211.6
May 21,991.1 8,698.6 1,017.9 1,331.8 1,516.4 1,592.4 300.1 36,448.3 20,394.7 9,279.8 1,288.0 976.7 2,666.7 1,615.0 227.4
Jun. 22,017.0 8,841.0 954.9 1,424.2 1,433.3 1,597.3 301.3 36,569.0 20,524.0 9,193.4 1,346.2 1,114.1 2,596.0 1,561.2 234.0
Jul. 22,365.7 8,411.8 954.4 1,255.6 1,507.6 1,383.2 305.0 36,183.3 20,374.2 9,359.6 1,226.7 799.8 2,617.6 1,562.8 242.6
Aug. 22,204.6 8,423.6 947.3 1,330.9 1,547.3 1,321.0 300.1 36,074.8 20,299.7 9,480.0 1,221.8 756.1 2,603.3 1,466.6 247.3
Sep. 22,368.1 8,437.0 919.5 1,382.3 1,490.3 1,453.5 319.1 36,369.8 20,474.1 9,268.2 1,199.3 989.8 2,608.6 1,543.5 286.3
Oct. 22,638.0 8,270.4 922.7 1,323.7 1,441.2 1,447.5 345.1 36,388.6 20,633.3 9,392.3 1,094.2 984.5 2,559.8 1,432.8 291.7
Nov. 22,661.8 8,403.9 980.2 1,254.9 1,555.9 1,666.0 342.5 36,865.2 20,517.0 10,075.2 1,123.0 980.7 2,474.8 1,404.7 289.8
Dec. 22,126.2 8,841.7 1,049.9 1,549.5 1,560.6 1,910.2 335.9 37,374.0 20,632.2 10,438.9 1,204.0 1,035.9 2,432.2 1,328.0 302.8
2022 Jan. 22,555.8 8,660.5 1,033.1 1,432.8 1,767.5 1,502.8 333.0 37,285.5 20,658.4 10,510.1 1,084.9 936.1 2,419.2 1,352.8 324.0
Feb. 22,955.9 8,525.3 937.5 1,914.2 2,028.3 1,522.9 334.0 38,218.1 20,700.5 11,353.3 960.1 1,111.3 2,405.2 1,366.7 321.0
1/ Includes Islamic Banks. .يشمل المصارف اإلسالمية/ 1
2/ Includes Argentina, Bahamas, Brazil, British Virgin Islands, Canada, Cayman Islands, Mexico, 2 / ،تشمل األرجنتين، البهاما، البرازيل، الجزر العذراء البريطانية، كندا، جزر كايمان، المكسيك، األنتيل الهولندية
Netherlands Antilles, Panama, Puerto Rico, United States, Venezuela and Others. . بنما، بورتو ريكو، الواليات المتحدة، فنزويال وأخرى
- 21 -

Table No. (22) جدول رقم
/1الموجودات والمطلوبات حسب أهم العمالت : مصارف قطاع التجزئة
Retail Banks: Classification of Assets and Liabilities by Major Currencies 1/B.D. Million مليون دينار
Assets الموجودات Liabilities المطلوبات
الدينار عمالت دول الدوالر الجنيه الين الدينار عمالت دول الدوالر الجنيه الين
نهاية الفترة البحريني مجلس التعاون األمريكي اإلسترليني اليورو الياباني أخرى المجموع البحريني مجلس التعاون األمريكي اإلسترليني اليورو الياباني أخرى
End of Period Bahraini GCC U.S. Pound Euro Japanese Other Total Bahraini GCC U.S. Pound Euro Japanese Other
Dinar Currencies Dollar Sterling Yen Dinar Currencies Dollar Sterling Yen
2012 11,497.1 1,721.0 11,643.1 465.5 836.0 81.6 719.3 26,963.6 12,536.5 1,671.3 11,105.0 291.6 1,075.4 63.5 220.3
2013 11,742.8 1,476.1 12,869.5 432.8 1,004.9 101.7 690.1 28,317.9 12,657.3 1,329.6 12,835.4 227.9 1,056.5 60.0 151.2
2014 12,779.7 2,227.9 13,244.2 388.3 694.5 80.3 668.3 30,083.2 13,340.6 1,955.6 13,513.7 221.1 692.2 77.5 282.5
2015 13,141.0 1,778.1 14,018.9 545.6 726.8 136.8 555.1 30,902.3 13,512.2 1,720.1 14,124.4 342.7 831.9 123.8 247.2
2016 13,847.7 2,582.1 13,061.5 608.8 588.0 29.2 496.2 31,213.5 13,725.3 2,064.1 14,217.4 368.4 553.2 29.6 255.5
2017 13,940.2 2,907.5 12,788.4 552.4 849.3 27.1 324.1 31,389.0 13,742.7 2,376.7 14,405.8 243.9 486.4 24.3 109.2
2018 14,462.8 2,586.6 13,769.9 571.3 815.7 15.4 347.3 32,569.0 13,952.0 2,532.6 14,701.1 347.7 886.5 13.5 135.6
2019 15,324.6 2,658.0 15,520.5 546.4 907.9 34.2 378.2 35,369.8 14,947.9 3,168.3 15,458.7 443.7 1,220.1 33.5 97.6
2020 15,896.5 2,321.0 15,243.6 594.2 1,050.0 18.0 324.0 35,447.3 16,272.3 2,600.4 14,958.5 499.0 1,006.5 21.3 89.3
2021 16,779.1 2,282.2 16,484.9 597.9 806.8 5.6 417.5 37,374.0 17,288.6 2,622.0 16,083.7 537.5 799.2 5.6 37.4
2020 Q1 15,700.1 2,723.0 15,251.1 697.8 988.1 26.4 365.8 35,752.3 15,258.7 3,464.1 15,260.0 410.8 1,210.7 24.7 123.3
Q2 15,576.6 2,357.9 16,129.5 555.6 884.1 19.5 282.3 35,805.5 15,561.3 2,821.7 15,373.3 433.2 1,478.5 31.2 106.3
Q3 15,408.5 2,306.8 15,799.1 576.3 1,019.1 14.2 297.4 35,421.4 15,575.2 2,682.4 15,087.2 468.2 1,477.8 33.1 97.5
Q4 15,896.5 2,321.0 15,243.6 594.2 1,050.0 18.0 324.0 35,447.3 16,272.3 2,600.4 14,958.5 499.0 1,006.5 21.3 89.3
2021 Q1 16,288.4 2,207.1 14,983.1 561.2 918.8 17.9 338.6 35,315.1 16,561.3 2,395.4 14,941.1 343.4 987.2 23.3 63.4
Q2 16,728.6 2,266.2 15,733.6 538.9 905.8 6.7 389.2 36,569.0 16,930.6 2,612.6 15,430.0 426.1 1,101.3 7.8 60.6
Q3 17,098.6 2,162.4 15,311.6 472.5 882.6 18.4 423.7 36,369.8 17,207.0 2,626.6 15,033.4 465.0 969.4 19.2 49.2
Q4 16,779.1 2,282.2 16,484.9 597.9 806.8 5.6 417.5 37,374.0 17,288.6 2,622.0 16,083.7 537.5 799.2 5.6 37.4
2021 Feb. 16,176.5 2,273.0 15,543.3 600.3 989.1 20.0 351.9 35,954.1 16,455.6 2,588.3 15,457.7 413.9 935.2 24.9 78.5
Mar. 16,288.4 2,207.1 14,983.1 561.2 918.8 17.9 338.6 35,315.1 16,561.3 2,395.4 14,941.1 343.4 987.2 23.3 63.4
Apr. 16,460.3 2,139.9 15,058.3 536.5 1,136.3 10.6 403.5 35,745.4 16,765.2 2,424.2 14,822.2 503.1 1,159.3 15.7 55.7
May 16,579.2 2,200.6 15,678.2 543.5 1,048.0 9.5 389.3 36,448.3 16,937.9 2,532.8 15,114.3 553.2 1,238.5 14.8 56.8
Jun. 16,728.6 2,266.2 15,733.6 538.9 905.8 6.7 389.2 36,569.0 16,930.6 2,612.6 15,430.0 426.1 1,101.3 7.8 60.6
Jul. 16,990.3 2,113.8 15,159.3 538.4 975.1 11.0 395.4 36,183.3 17,205.5 2,453.0 14,916.9 459.5 1,076.7 10.4 61.3
Aug. 16,917.8 2,141.5 15,216.8 473.0 897.4 13.2 415.1 36,074.8 17,172.2 2,562.4 14,776.0 471.2 1,017.4 12.1 63.5
Sep. 17,098.6 2,162.4 15,311.6 472.5 882.6 18.4 423.7 36,369.8 17,207.0 2,626.6 15,033.4 465.0 969.4 19.2 49.2
Oct. 17,487.2 2,094.3 15,103.8 459.1 803.6 21.4 419.2 36,388.6 17,475.1 2,512.3 14,978.3 469.6 893.9 20.6 38.8
Nov. 17,249.8 2,072.1 15,840.0 483.2 791.4 12.0 416.7 36,865.2 17,326.2 2,489.9 15,612.8 554.3 820.7 11.9 49.4
Dec. 16,779.1 2,282.2 16,484.9 597.9 806.8 5.6 417.5 37,374.0 17,288.6 2,622.0 16,083.7 537.5 799.2 5.6 37.4
2022 Jan. 17,232.4 2,144.5 16,267.2 505.5 730.9 5.3 399.7 37,285.5 17,538.4 2,409.0 16,070.0 555.2 643.0 6.4 63.5
Feb. 17,597.1 2,177.5 16,770.0 567.8 782.9 4.8 318.0 38,218.1 17,685.3 2,342.5 16,790.4 595.4 753.0 4.4 47.1
1/ Includes Islamic Banks. .يشمل المصارف اإلسالمية/ 1
- 22 -

Table No. (23) جدول رقم
الميزانية الموحدة لمصارف قطاع التجزئة
Retail Banks - Aggregated Balance Sheet
مؤشرات مصرفية مختارة
Selected Banking Indicatorsالنسبة المئوية
نهاية الفترة
القروض لغير
مجموع / المصارف
الموجودات
القروض للقطاع
/ (غير المصارف)الخاص
مجموع الموجودات
القروض لغير
مجموع / المصارف
الودائع
/ الموجودات األجنبية
مجموع الموجودات
/ المطلوبات األجنبية
مجموع المطلوبات
/ مجموع الودائع
مجموع المطلوبات
الودائع بالدينار
مجموع / البحريني
الودائع
/ ودائع القطاع الخاص
مجموع الودائع
ودائع القطاع الخاص تحت
مجموع الودائع/ الطلب
End of Period Loans to Non-
Banks / Total
Assets
Loans to Private
Non-Banks / Total
Assets
Loans to Non-
Banks / Total
Deposits
Foreign
Assets / Total
Assets
Foreign
Liabilities /
Total Liabilities
Total Deposits /
Total Liabilities
BD Deposits /
Total Deposits
Private Sector
Deposits / Total
Deposits
Private Sector
Demand Deposits /
Total Deposits
2012 25.4 24.7 52.9 43.7 44.4 48.0 62.3 61.6 16.9
2013 25.3 24.7 48.0 45.3 46.5 52.7 58.7 58.3 15.6
2014 23.7 23.0 45.6 48.2 47.8 51.8 59.3 59.4 16.7
2015 25.4 24.4 48.0 46.5 47.7 52.9 56.7 58.2 16.9
2016 25.8 24.9 48.7 44.4 46.3 53.1 54.9 58.1 16.8
2017 27.7 26.7 51.2 42.6 45.5 54.1 54.9 59.3 16.7
2018 29.2 28.4 53.3 41.8 45.2 54.8 51.5 57.8 16.2
2019 27.5 26.7 54.2 43.6 46.4 50.8 55.2 64.1 16.6
2020 29.4 28.3 61.6 40.9 44.7 47.7 63.7 72.4 19.4
2021 29.2 28.0 58.3 40.8 44.8 50.0 59.9 69.0 21.1
2020 Q1 28.3 27.1 58.1 42.1 46.5 48.8 58.1 67.4 18.1
Q2 28.4 27.5 58.4 42.4 45.6 48.7 59.0 70.3 19.1
Q3 28.8 27.9 59.0 42.0 45.7 48.8 60.1 70.6 19.3
Q4 29.4 28.3 61.6 40.9 44.7 47.7 63.7 72.4 19.4
2021 Q1 29.9 28.6 63.5 38.9 43.5 47.1 65.7 74.4 19.9
Q2 29.3 28.1 60.2 39.8 43.9 48.7 62.1 72.3 22.1
Q3 29.5 28.5 60.5 38.5 43.7 48.7 62.7 72.5 21.6
Q4 29.2 28.0 58.3 40.8 44.8 50.0 59.9 69.0 21.1
2021 Feb. 29.2 27.9 60.9 40.7 45.1 47.9 63.5 71.7 19.4
Mar. 29.9 28.6 63.5 38.9 43.5 47.1 65.7 74.4 19.9
Apr. 29.5 28.3 61.7 39.3 44.0 47.8 63.9 73.5 20.7
May 29.2 28.0 60.4 39.7 44.0 48.4 62.4 72.5 21.5
Jun. 29.3 28.1 60.2 39.8 43.9 48.7 62.1 72.3 22.1
Jul. 29.6 28.3 60.5 38.2 43.7 48.9 62.7 71.7 21.5
Aug. 29.8 28.6 61.3 38.4 43.7 48.7 63.1 72.6 21.7
Sep. 29.5 28.5 60.5 38.5 43.7 48.7 62.7 72.5 21.6
Oct. 29.4 28.4 60.7 37.8 43.3 48.5 63.4 72.7 21.6
Nov. 29.6 28.4 61.0 38.5 44.3 48.5 62.6 71.5 21.0
Dec. 29.2 28.0 58.3 40.8 44.8 50.0 59.9 69.0 21.1
2022 Jan. 29.3 28.0 59.4 39.5 44.6 49.4 61.2 70.1 21.1
Feb. 28.8 27.5 56.7 39.9 45.8 50.8 58.3 66.8 20.9
- 23 -
Percentage

Table No. (24) جدول رقم
الميزانية الموحدة للنوافذ اإلسالمية: مصارف قطاع التجزئة التقليدية
Conventional Retail Banks: Aggregated Balance Sheet of Islamic Windows
*الموجودات
Assets *B.D. Million مليون دينار
Domestic Assets Foreign Assets الموجودات المحلية الموجودات األجنبية
نهاية الفترة استثمار مع استثمار مع استثمار مع استثمار مع استثمار مع المكاتب الرئيسية مجموع البنود خارج
End of Period ً نقدا المصارف غير المصارف الحكومة أخرى المجموع المصارف غير المصارف السندات والشركات الزميلة أخرى المجموع الموجودات الميزانية
Cash Invest. Invest. Invest. Others Total Invest. Invest. Securities H.O. & Others Total Total Off
with Banks with Private with Govt. with Banks with Private Affiliates Assets Balance
2/ Non-banks Non-banks 1/ Sheet 3/
2013 0.6 927.6 422.4 92.4 7.3 1,450.3 61.3 355.4 38.2 -- -- 454.9 1,905.2 0.5
2014 4.6 261.4 632.9 81.0 9.6 989.5 48.9 420.4 45.7 -- -- 515.0 1,504.5 0.0
2015 6.9 212.7 787.1 78.9 13.2 1,098.8 105.1 362.4 37.2 -- 0.4 505.1 1,603.9 0.0
2016 6.4 197.2 755.7 80.6 22.4 1,062.3 180.1 384.5 26.5 -- 4.5 595.6 1,657.9 8.9
2017 0.7 105.1 733.1 46.4 8.7 894.0 88.1 421.2 10.1 -- 3.5 522.9 1,416.9 0.0
2018 0.8 98.9 720.3 62.4 4.0 886.4 90.3 412.4 53.8 -- 3.8 560.3 1,446.7 0.0
2019 0.9 106.2 767.1 54.1 7.2 935.5 43.6 388.4 101.8 -- 9.2 543.0 1,478.5 0.0
2020 0.9 90.7 935.9 90.1 9.3 1,126.9 25.5 232.9 165.5 -- 22.4 446.3 1,573.2 0.0
2021 0.9 65.1 968.1 102.6 15.4 1,152.1 48.7 242.9 108.6 -- 6.4 406.6 1,558.7 0.0
2020 Q1 0.8 80.4 807.6 53.8 9.6 952.2 93.8 354.2 147.5 -- 25.0 620.5 1,572.7 0.0
Q2 0.7 82.6 920.7 110.8 11.0 1,125.8 40.8 356.0 152.2 -- 28.6 577.6 1,703.4 0.0
Q3 0.9 92.9 930.7 93.7 11.0 1,129.2 42.7 242.3 158.0 -- 26.3 469.3 1,598.5 0.0
Q4 0.9 90.7 935.9 90.1 9.3 1,126.9 25.5 232.9 165.5 -- 22.4 446.3 1,573.2 0.0
2021 Q1 0.8 70.0 941.4 232.2 7.2 1,251.6 41.1 266.8 109.6 -- 10.6 428.1 1,679.7 0.0
Q2 1.0 71.5 961.6 226.5 9.0 1,269.6 23.8 265.5 111.5 -- 10.3 411.1 1,680.7 0.0
Q3 0.8 128.0 966.9 221.9 3.3 1,320.9 24.2 244.2 109.4 -- 11.8 389.6 1,710.5 0.0
Q4 0.9 65.1 968.1 102.6 15.4 1,152.1 48.7 242.9 108.6 -- 6.4 406.6 1,558.7 0.0
2021 Feb. 0.7 65.4 964.1 240.7 5.1 1,276.0 62.7 236.3 121.0 -- 15.9 435.9 1,711.9 0.0
Mar. 0.8 70.0 941.4 232.2 7.2 1,251.6 41.1 266.8 109.6 -- 10.6 428.1 1,679.7 0.0
Apr. 1.0 64.6 940.8 230.8 11.3 1,248.5 23.9 266.4 110.0 -- 12.0 412.3 1,660.8 0.0
May 0.8 64.6 948.5 222.2 13.7 1,249.8 80.0 265.0 110.5 -- 12.6 468.1 1,717.9 0.0
Jun. 1.0 71.5 961.6 226.5 9.0 1,269.6 23.8 265.5 111.5 -- 10.3 411.1 1,680.7 0.0
Jul. 0.9 64.2 960.2 228.4 3.9 1,257.6 23.9 266.6 112.2 -- 11.9 414.6 1,672.2 0.0
Aug. 0.9 61.7 959.2 230.6 4.3 1,256.7 23.8 265.6 111.9 -- 11.2 412.5 1,669.2 0.0
Sep. 0.8 128.0 966.9 221.9 3.3 1,320.9 24.2 244.2 109.4 -- 11.8 389.6 1,710.5 0.0
Oct. 1.0 82.4 967.9 215.4 11.6 1,278.3 32.7 245.4 108.9 -- 7.2 394.2 1,672.5 0.0
Nov. 0.8 62.1 963.1 108.7 9.9 1,144.6 25.0 244.6 109.3 -- 7.4 386.3 1,530.9 0.0
Dec. 0.9 65.1 968.1 102.6 15.4 1,152.1 48.7 242.9 108.6 -- 6.4 406.6 1,558.7 0.0
2022 Jan. 0.8 54.0 974.7 102.8 7.3 1,139.6 84.3 241.3 106.8 -- 4.2 436.6 1,576.2 0.0
Feb. 0.8 55.7 976.4 91.5 7.1 1,131.5 65.5 237.3 106.2 -- 3.7 412.7 1,544.2 0.0
1/ Includes Unrestricted Investment Accounts. .يشمل حسابات اإلستثمار المطلقة/ 1
2/ Includes Head Offices and Affiliates. 2 /يشمل المكاتب الرئيسية والشركات الزميلة.
3/ Includes Restricted Investment Accounts. .يشمل حسابات االستثمار المقيدة/ 3
* Islamic Windows' Assets and Liabilities may not be equal due to the presence of conventional transactions. .موجودات ومطلوبات النوافذ اإلسالمية قد ال تتطابق نظرا لوجود معامالت تقليدية*
- 24 -

Table No. (25) جدول رقم
الميزانية الموحدة للنوافذ اإلسالمية: مصارف قطاع التجزئة التقليدية
Conventional Retail Banks: Aggregated Balance Sheet of Islamic Windows
*المطلوبات
Liabilities *B.D. Million مليون دينار
Domestic Liabilities المطلوبات المحلية Foreign Liabilities المطلوبات األجنبية
نهاية الفترة القطاع الخاص رأس المال المكاتب الرئيسية رأس المال مجموع البنود خارج
End of Period المصارف (غير المصارف) الحكومة أخرى واالحتياطي المجموع المصارف غير المصارف والشركات الزميلة أخرى واالحتياطي المجموع المطلوبات الميزانية
Private General Capital & H.O. & Capital & Total Off
Banks Non-Banks Government Reserves Other Total Banks Non-Banks Affiliates Reserves Other Total Liabilities Balance
2/ 1/ Sheet 3/
2013 828.2 83.3 128.3 86.6 14.9 1,141.3 458.6 214.1 0.0 4.3 0.0 677.0 1,818.3 0.5
2014 177.7 256.3 169.7 35.8 49.9 689.4 417.2 374.3 0.0 2.6 0.0 794.1 1,483.5 0.0
2015 228.9 286.2 221.9 89.4 45.8 872.2 448.9 140.7 0.0 5.4 4.4 599.4 1,471.6 0.0
2016 621.6 210.9 242.2 135.7 60.5 1,270.9 230.0 29.9 0.0 8.3 1.0 269.2 1,540.1 8.9
2017 502.5 65.5 258.1 79.7 29.0 934.8 329.6 25.2 0.0 3.0 1.7 359.5 1,294.3 0.0
2018 519.9 53.6 222.6 96.2 14.4 906.7 398.9 42.6 0.0 4.6 5.2 451.3 1,358.0 0.0
2019 378.9 92.7 211.3 129.9 32.5 845.3 418.7 141.7 0.0 3.9 5.4 569.7 1,415.0 0.0
2020 228.1 148.5 8.4 339.1 13.3 737.4 354.9 342.6 0.0 2.8 3.7 704.0 1,441.4 0.0
2021 278.0 117.6 6.4 324.4 10.6 737.0 416.8 236.9 0.0 6.3 0.9 660.9 1,397.9 0.0
2020 Q1 262.8 47.0 216.5 132.6 18.8 677.7 476.0 342.4 0.0 5.0 5.5 828.9 1,506.6 0.0
Q2 445.4 69.0 211.2 141.6 23.1 890.3 463.1 206.8 0.0 4.9 4.2 679.0 1,569.3 0.0
Q3 294.2 126.9 192.6 148.5 11.8 774.0 471.9 216.5 0.0 2.1 4.7 695.2 1,469.2 0.0
Q4 228.1 148.5 8.4 339.1 13.3 737.4 354.9 342.6 0.0 2.8 3.7 704.0 1,441.4 0.0
2021 Q1 310.7 138.0 133.2 322.5 11.2 915.6 278.1 299.6 0.0 4.0 3.7 585.4 1,501.0 0.0
Q2 377.0 112.0 8.3 327.6 8.0 832.9 197.7 370.2 0.0 4.9 0.3 573.1 1,406.0 0.0
Q3 198.0 115.3 7.9 333.4 5.8 660.4 429.3 337.8 0.0 5.7 8.7 781.5 1,441.9 0.0
Q4 278.0 117.6 6.4 324.4 10.6 737.0 416.8 236.9 0.0 6.3 0.9 660.9 1,397.9 0.0
2021 Feb. 198.6 136.4 140.9 343.7 15.3 834.9 321.7 351.0 0.0 3.1 4.5 680.3 1,515.2 0.0
Mar. 310.7 138.0 133.2 322.5 11.2 915.6 278.1 299.6 0.0 4.0 3.7 585.4 1,501.0 0.0
Apr. 273.8 143.4 8.8 319.1 8.4 753.5 245.4 364.8 0.0 4.4 2.8 617.4 1,370.9 0.0
May 333.2 134.4 8.6 322.4 10.1 808.7 235.2 386.8 0.0 4.7 3.2 629.9 1,438.6 0.0
Jun. 377.0 112.0 8.3 327.6 8.0 832.9 197.7 370.2 0.0 4.9 0.3 573.1 1,406.0 0.0
Jul. 350.1 104.1 8.4 332.4 6.9 801.9 198.0 393.8 0.0 5.2 0.1 597.1 1,399.0 0.0
Aug. 336.4 106.0 8.2 337.9 6.5 795.0 237.3 353.1 0.0 5.5 0.2 596.1 1,391.1 0.0
Sep. 198.0 115.3 7.9 333.4 5.8 660.4 429.3 337.8 0.0 5.7 8.7 781.5 1,441.9 0.0
Oct. 188.5 127.6 7.9 340.8 6.1 670.9 410.3 307.8 0.0 6.0 9.0 733.1 1,404.0 0.0
Nov. 182.8 122.4 7.6 345.8 9.8 668.4 425.0 264.7 0.0 6.2 0.6 696.5 1,364.9 0.0
Dec. 278.0 117.6 6.4 324.4 10.6 737.0 416.8 236.9 0.0 6.3 0.9 660.9 1,397.9 0.0
2022 Jan. 288.9 83.4 31.2 328.7 13.1 745.3 498.0 205.0 0.0 6.9 4.7 714.6 1,459.9 0.0
Feb. 280.1 83.5 31.6 331.3 14.5 741.0 423.5 249.5 0.0 7.3 6.0 686.3 1,427.3 0.0
1/ Includes Unrestricted Investment Accounts. .يشمل حسابات اإلستثمار المطلقة/ 1
2/ Includes Head Offices and Affiliates. 2 /يشمل المكاتب الرئيسية والشركات الزميلة.
3/ Includes Restricted Investment Accounts. .يشمل حسابات االستثمار المقيدة/ 3
* Islamic Windows' Assets and Liabilities may not be equal due to the presence of conventional transactions. .موجودات ومطلوبات النوافذ اإلسالمية قد ال تتطابق نظرا لوجود معامالت تقليدية*
- 25 -

Table No. (26) جدول رقم
الميزانية الموحدة لمصارف قطاع الجملة
Wholesale Banks - Aggregated Balance Sheet
الموجودات
AssetsU.S. Dollar Million مليون دوالر أمريكي
Domestic Assets الموجودات المحلية Foreign Assets الموجودات األجنبية الشراء ألجل
القطاع الخاص المكاتب الرئيسية مجموع للعمالت
نهاية الفترة المصارف (غير المصارف) الحكومة أخرى المجموع المصارف غير المصارف السندات والشركات الزميلة أخرى المجموع الموجودات memo:
End of Period Private General H.O. & Total Forward
Banks Non-Banks Government Other Total Banks Non-Banks Securities Affiliates Other Total Assets Currency
1/ 2/ 2/ Purchased
2012 4,288.9 1,951.9 197.8 1,441.3 7,879.9 12,467.5 29,090.8 25,939.9 30,739.4 8,493.2 106,730.8 114,610.7 30,953.9
2013 3,623.7 2,283.8 253.3 1,329.7 7,490.5 13,433.3 30,054.3 26,234.2 30,765.1 8,708.3 109,195.2 116,685.7 32,893.6
2014 4,101.8 1,980.9 303.2 1,442.2 7,828.1 17,026.0 30,187.9 20,134.6 24,388.5 9,719.4 101,456.4 109,284.5 43,113.1
2015 4,155.9 2,244.3 557.9 1,684.3 8,642.4 14,400.4 32,826.8 18,610.4 23,066.8 11,267.0 100,171.4 108,813.8 40,392.1
2016 4,746.2 2,113.2 1,060.8 1,699.9 9,620.1 13,303.9 31,391.6 18,279.3 22,184.5 8,256.5 93,415.8 103,035.9 46,535.7
2017 4,909.6 2,251.7 1,285.0 1,397.9 9,844.2 13,291.0 34,360.0 17,660.1 20,740.9 8,066.3 94,118.3 103,962.5 36,194.0
2018 5,420.3 3,275.8 1,832.6 1,549.2 12,077.9 7,324.4 37,132.8 17,785.3 23,146.8 8,562.5 93,951.8 106,029.7 31,236.4
2019 6,010.7 4,243.2 2,632.4 2,579.8 15,466.1 8,727.5 41,918.5 17,399.6 21,102.8 6,223.7 95,372.1 110,838.2 22,654.5
2020 6,016.8 5,272.3 2,417.0 2,115.0 15,821.1 7,108.5 42,558.2 17,840.5 23,333.3 6,417.2 97,257.7 113,078.8 17,910.9
2021 7,715.4 4,658.8 2,995.7 1,862.4 17,232.3 9,475.2 41,373.6 18,324.1 26,048.8 5,648.7 100,870.4 118,102.7 19,771.2
2020 Q1 6,905.1 4,405.3 2,925.5 3,069.3 17,305.2 9,595.8 43,764.9 16,138.2 22,802.9 6,136.8 98,438.6 115,743.8 22,292.0
Q2 6,818.5 4,593.0 2,463.4 3,007.7 16,882.6 8,342.8 42,178.3 17,357.7 24,722.0 6,000.4 98,601.2 115,483.8 18,342.0
Q3 6,004.8 4,927.9 2,656.3 2,386.4 15,975.4 7,235.8 42,811.5 16,995.2 23,987.0 5,833.9 96,863.4 112,838.8 17,007.9
Q4 6,016.8 5,272.3 2,417.0 2,115.0 15,821.1 7,108.5 42,558.2 17,840.5 23,333.3 6,417.2 97,257.7 113,078.8 17,910.9
2021 Q1 6,406.6 5,032.5 2,937.9 1,956.0 16,333.0 8,239.3 41,978.1 17,094.3 24,796.7 6,012.8 98,121.2 114,454.2 17,228.6
Q2 6,894.2 5,036.3 2,719.9 1,956.8 16,607.2 8,891.3 42,008.7 17,762.0 24,692.0 5,980.8 99,334.8 115,942.0 16,737.2
Q3 6,474.9 4,763.7 2,663.4 1,964.0 15,866.0 8,888.3 41,731.4 18,845.6 23,719.2 5,889.0 99,073.5 114,939.5 18,751.4
Q4 7,715.4 4,658.8 2,995.7 1,862.4 17,232.3 9,475.2 41,373.6 18,324.1 26,048.8 5,648.7 100,870.4 118,102.7 19,771.2
2021 Feb. 6,509.5 4,981.2 2,817.0 2,026.2 16,333.9 7,383.6 42,090.1 17,825.7 25,018.6 6,160.0 98,478.0 114,811.9 17,955.2
Mar. 6,406.6 5,032.5 2,937.9 1,956.0 16,333.0 8,239.3 41,978.1 17,094.3 24,796.7 6,012.8 98,121.2 114,454.2 17,228.6
Apr. 6,645.6 5,152.1 3,066.3 1,903.8 16,767.8 7,944.4 41,953.3 16,700.2 24,091.3 6,033.1 96,722.3 113,490.1 18,349.2
May 7,385.1 5,047.6 2,669.6 1,923.6 17,025.9 7,285.5 42,874.9 17,385.4 25,258.4 6,043.0 98,847.2 115,873.1 17,835.9
Jun. 6,894.2 5,036.3 2,719.9 1,956.8 16,607.2 8,891.3 42,008.7 17,762.0 24,692.0 5,980.8 99,334.8 115,942.0 16,737.2
Jul. 6,621.8 5,134.3 2,858.7 2,408.0 17,022.8 7,807.3 42,129.2 17,646.8 24,659.1 5,966.4 98,208.8 115,231.6 19,071.0
Aug. 6,642.5 5,018.5 2,731.4 1,932.6 16,325.0 8,263.3 41,962.6 17,354.4 23,285.8 5,727.1 96,593.2 112,918.2 18,665.5
Sep. 6,474.9 4,763.7 2,663.4 1,964.0 15,866.0 8,888.3 41,731.4 18,845.6 23,719.2 5,889.0 99,073.5 114,939.5 18,751.4
Oct. 7,143.6 4,830.9 2,946.0 1,872.2 16,792.7 7,899.4 41,477.2 18,529.3 22,910.0 5,731.6 96,547.5 113,340.2 17,755.6
Nov. 6,935.4 4,879.4 2,901.2 1,837.5 16,553.5 7,299.0 40,937.8 18,297.6 25,182.5 5,729.7 97,446.6 114,000.1 17,426.2
Dec. 7,715.4 4,658.8 2,995.7 1,862.4 17,232.3 9,475.2 41,373.6 18,324.1 26,048.8 5,648.7 100,870.4 118,102.7 19,771.2
2022 Jan. 7,914.8 4,659.7 2,869.8 1,858.3 17,302.6 7,996.3 41,441.8 18,025.5 26,895.1 5,685.0 100,043.7 117,346.3 18,156.4
Feb. 7,337.3 4,884.7 2,942.4 1,744.0 16,908.4 7,377.0 41,718.6 18,388.5 26,504.0 6,158.0 100,146.1 117,054.5 17,300.6
1/ Includes Head Offices and Affiliates. 1 /يشمل المكاتب الرئيسية والشركات الزميلة.
2/ Includes Securities. .يشمل السندات/ 2
- 26 -

Table No. (27) جدول رقم
الميزانية الموحدة لمصارف قطاع الجملة
Wholesale Banks - Aggregated Balance Sheet
المطلوبات
LiabilitiesU.S. Dollar Million مليون دوالر أمريكي
Domestic Liabilities المطلوبات المحلية Foreign Liabilities المطلوبات األجنبية البيع ألجل
القطاع الخاص المكاتب الرئيسية مجموع للعمالت
نهاية الفترة المصارف (غير المصارف) الحكومة أخرى المجموع المصارف غير المصارف السندات والشركات الزميلة أخرى المجموع المطلوبات memo:
End of Period Private General H.O. & Total Forward
Banks Non-Banks Government Other Total Banks Non-Banks Securities Affiliates Other Total Liabilities Currency
1/ 2/ 2/ Sold
2012 5,376.1 799.9 445.0 4,738.0 11,359.0 29,390.6 20,955.9 2,899.7 30,468.3 19,537.2 103,251.7 114,610.7 31,123.5
2013 4,192.1 757.0 414.9 4,843.7 10,207.7 30,308.7 27,625.4 2,453.7 28,210.5 17,879.7 106,478.0 116,685.7 33,859.7
2014 5,120.4 623.3 282.3 4,090.7 10,116.7 31,623.1 25,282.5 2,138.0 21,281.8 18,842.4 99,167.8 109,284.5 41,794.1
2015 4,769.4 476.8 190.1 4,165.6 9,601.9 34,277.3 23,872.1 1,768.0 19,988.5 19,306.0 99,211.9 108,813.8 38,417.9
2016 5,472.4 621.1 170.4 3,986.3 10,250.2 29,376.0 22,801.0 889.5 23,243.0 16,476.2 92,785.7 103,035.9 45,198.8
2017 5,025.1 872.5 201.9 4,310.0 10,409.5 27,334.2 22,452.8 537.0 26,363.6 16,865.4 93,553.0 103,962.5 35,096.3
2018 4,895.4 1,122.4 98.6 4,354.7 10,471.1 28,238.4 21,561.6 3.1 28,716.6 17,038.9 95,558.6 106,029.7 29,736.5
2019 5,562.5 807.2 390.2 5,104.3 11,864.2 30,443.5 22,182.7 538.6 30,907.9 14,901.3 98,974.0 110,838.2 21,905.8
2020 6,276.1 1,025.9 233.0 5,186.2 12,721.2 27,354.2 20,540.8 1,039.4 35,455.6 15,967.6 100,357.6 113,078.8 19,623.4
2021 7,446.8 979.9 275.0 4,786.1 13,487.8 33,274.9 21,472.5 512.2 35,091.9 14,263.4 104,614.9 118,102.7 20,835.0
2020 Q1 6,862.7 957.4 417.5 5,500.8 13,738.4 29,896.9 22,795.1 537.2 34,237.4 14,538.8 102,005.4 115,743.8 22,043.7
Q2 6,461.4 858.6 491.6 5,434.4 13,246.0 30,245.1 22,627.5 538.0 33,789.8 15,037.4 102,237.8 115,483.8 18,841.3
Q3 6,576.6 912.1 158.8 5,182.9 12,830.4 28,365.9 21,637.1 1,038.4 34,031.0 14,936.0 100,008.4 112,838.8 18,616.3
Q4 6,276.1 1,025.9 233.0 5,186.2 12,721.2 27,354.2 20,540.8 1,039.4 35,455.6 15,967.6 100,357.6 113,078.8 19,623.4
2021 Q1 6,706.7 1,264.5 332.8 4,824.0 13,128.0 27,754.3 21,684.4 1,040.7 36,694.0 14,152.8 101,326.2 114,454.2 20,141.6
Q2 6,466.4 806.8 264.3 4,894.2 12,431.7 28,390.9 21,922.3 500.4 38,109.1 14,587.7 103,510.4 115,942.0 17,815.0
Q3 5,898.0 902.5 318.4 4,718.4 11,837.3 30,904.8 21,314.1 508.2 36,351.9 14,023.2 103,102.2 114,939.5 19,728.7
Q4 7,446.8 979.9 275.0 4,786.1 13,487.8 33,274.9 21,472.5 512.2 35,091.9 14,263.4 104,614.9 118,102.7 20,835.0
2021 Feb. 6,582.4 1,068.7 238.8 4,743.4 12,633.3 27,436.6 21,719.9 1,041.4 37,438.3 14,542.4 102,178.6 114,811.9 21,597.4
Mar. 6,706.7 1,264.5 332.8 4,824.0 13,128.0 27,754.3 21,684.4 1,040.7 36,694.0 14,152.8 101,326.2 114,454.2 20,141.6
Apr. 6,508.6 836.5 340.2 4,845.9 12,531.2 27,861.3 21,970.3 510.5 36,304.1 14,312.7 100,958.9 113,490.1 19,819.2
May 6,841.8 795.7 275.7 4,890.4 12,803.6 28,402.1 22,427.7 511.6 37,120.3 14,607.8 103,069.5 115,873.1 18,792.4
Jun. 6,466.4 806.8 264.3 4,894.2 12,431.7 28,390.9 21,922.3 500.4 38,109.1 14,587.7 103,510.4 115,942.0 17,815.0
Jul. 6,050.0 879.1 296.1 5,016.8 12,242.0 29,257.5 22,222.6 512.1 36,661.5 14,335.9 102,989.6 115,231.6 20,364.6
Aug. 6,175.8 731.5 323.3 4,996.6 12,227.2 29,165.1 20,930.2 513.5 35,871.8 14,210.4 100,691.0 112,918.2 19,709.2
Sep. 5,898.0 902.5 318.4 4,718.4 11,837.3 30,904.8 21,314.1 508.2 36,351.9 14,023.2 103,102.2 114,939.5 19,728.7
Oct. 6,062.2 891.4 262.6 4,778.6 11,994.8 31,978.9 19,957.1 509.2 34,636.1 14,264.1 101,345.4 113,340.2 19,267.1
Nov. 6,188.8 1,006.1 332.1 4,845.9 12,372.9 32,469.6 20,519.7 516.5 33,803.4 14,318.0 101,627.2 114,000.1 19,007.3
Dec. 7,446.8 979.9 275.0 4,786.1 13,487.8 33,274.9 21,472.5 512.2 35,091.9 14,263.4 104,614.9 118,102.7 20,835.0
2022 Jan. 7,010.8 948.5 237.6 4,873.2 13,070.1 33,138.2 21,906.1 512.5 36,081.8 12,637.6 104,276.2 117,346.3 19,452.6
Feb. 7,764.9 1,218.4 236.5 5,188.1 14,407.9 32,266.4 21,226.3 4.8 35,662.7 13,486.4 102,646.6 117,054.5 18,405.6
1/ Includes Head Offices and Affiliates. 1 /يشمل المكاتب الرئيسية والشركات الزميلة.
2/ Includes Capital & Reserves. .يشمل رأس المال واإلحتياطي/ 2
- 27 -

Table No. (28) جدول رقم
/1الموجودات والمطلوبات حسب التصنيف الجغرافي : مصارف قطاع الجملة
Wholesale Banks: Geographical Classification of Assets and Liabilities 1/U.S. Dollar Million مليون دوالر أمريكي
Assets الموجودات Liabilities المطلوبات
مملكة دول مجلس الدول العربية أوروبا مملكة دول مجلس الدول العربية أوروبا
نهاية الفترة البحرين التعاون األخرى الدول األمريكية الغربية آسيا أخرى المجموع البحرين التعاون األخرى الدول األمريكية الغربية آسيا أخرى
End of Period Kingdom of GCC Other Arab Americas Western Asia Other Total Kingdom of GCC Other Arab Americas Western Asia Other
Bahrain Countries 2/ Europe Bahrain Countries 2/ Europe
2012 7,879.9 30,741.8 3,674.7 16,719.6 45,840.2 8,520.9 1,233.6 114,610.7 11,359.0 41,786.6 10,807.6 5,006.6 38,238.9 6,304.7 1,107.3
2013 7,490.4 34,258.7 4,316.8 13,924.8 45,009.1 10,115.1 1,570.8 116,685.7 10,207.7 44,924.8 11,449.6 4,025.4 34,717.3 9,028.9 2,331.8
2014 7,828.1 35,057.9 4,237.4 8,711.3 40,269.8 11,205.4 1,974.6 109,284.5 10,116.7 41,327.1 12,400.0 3,535.8 30,656.3 8,844.0 2,404.6
2015 8,642.4 35,667.5 3,865.0 9,099.4 37,693.4 11,763.4 2,082.7 108,813.8 9,601.9 37,848.5 13,272.0 4,882.6 30,541.4 10,384.6 2,282.8
2016 9,620.1 35,628.4 3,800.7 10,678.9 32,260.0 9,304.9 1,742.9 103,035.9 10,250.2 35,519.3 14,444.6 4,743.1 28,554.8 7,840.0 1,683.9
2017 9,844.2 33,126.3 4,168.2 10,569.6 34,810.0 9,587.2 1,857.0 103,962.5 10,409.5 35,759.5 13,628.7 5,112.8 29,573.4 7,491.4 1,987.2
2018 12,077.9 31,562.8 4,773.8 10,533.2 36,343.6 8,910.7 1,827.7 106,029.7 10,471.1 37,836.4 14,681.5 3,868.1 30,757.4 6,888.9 1,526.3
2019 15,466.1 34,604.6 5,815.1 11,262.1 32,793.3 9,170.0 1,727.0 110,838.2 11,864.2 39,835.6 16,254.1 3,950.1 28,910.5 8,583.7 1,440.0
2020 15,821.1 35,403.5 6,665.1 10,614.7 35,090.8 8,309.1 1,174.5 113,078.8 12,721.2 38,636.6 15,979.6 3,449.8 29,667.5 11,204.8 1,419.3
2021 17,232.3 37,816.9 6,597.2 13,146.7 33,407.5 8,571.3 1,330.8 118,102.7 13,487.8 42,140.5 16,020.5 3,488.9 28,115.2 13,617.1 1,232.7
2020 Q1 17,305.2 35,679.2 6,489.4 11,538.2 34,150.3 9,019.4 1,562.1 115,743.8 13,738.4 42,134.6 15,309.7 3,923.8 29,476.9 9,525.2 1,635.2
Q2 16,882.6 36,535.8 6,298.7 10,599.5 35,227.6 8,097.9 1,841.7 115,483.8 13,246.0 43,734.1 15,854.1 3,694.2 27,646.3 9,502.1 1,807.0
Q3 15,975.4 36,198.8 6,614.7 10,138.3 34,812.9 7,819.7 1,279.0 112,838.8 12,830.4 40,471.9 15,798.1 3,401.3 27,828.3 10,968.0 1,540.8
Q4 15,821.1 35,403.5 6,665.1 10,614.7 35,090.8 8,309.1 1,174.5 113,078.8 12,721.2 38,636.6 15,979.6 3,449.8 29,667.5 11,204.8 1,419.3
2021 Q1 16,333.0 35,596.2 6,235.2 10,111.5 36,243.9 8,686.7 1,247.7 114,454.2 13,128.0 40,177.5 15,359.7 3,477.1 28,889.5 12,034.7 1,387.7
Q2 16,607.2 34,183.8 6,270.7 10,874.2 37,631.9 9,233.6 1,140.6 115,942.0 12,431.7 40,084.2 15,507.2 4,080.3 29,023.2 13,405.8 1,409.6
Q3 15,866.0 34,327.9 5,952.3 12,679.2 36,679.4 8,279.0 1,155.7 114,939.5 11,837.3 40,065.2 15,143.6 4,044.3 29,037.0 13,295.3 1,516.8
Q4 17,232.3 37,816.9 6,597.2 13,146.7 33,407.5 8,571.3 1,330.8 118,102.7 13,487.8 42,140.5 16,020.5 3,488.9 28,115.2 13,617.1 1,232.7
2021 Feb. 16,333.9 34,490.4 6,181.8 10,315.5 38,079.8 8,097.7 1,312.8 114,811.9 12,633.3 40,462.7 15,704.2 3,394.0 29,086.8 12,182.4 1,348.5
Mar. 16,333.0 35,596.2 6,235.2 10,111.5 36,243.9 8,686.7 1,247.7 114,454.2 13,128.0 40,177.5 15,359.7 3,477.1 28,889.5 12,034.7 1,387.7
Apr. 16,767.8 34,268.3 6,217.2 10,443.2 35,518.0 9,036.3 1,239.3 113,490.1 12,531.2 39,519.5 15,759.7 3,488.3 28,477.1 12,186.5 1,527.8
May 17,025.9 33,877.3 6,325.7 10,797.7 37,503.5 9,122.4 1,220.6 115,873.1 12,803.6 40,314.7 15,969.2 3,656.9 29,237.8 12,338.7 1,552.2
Jun. 16,607.2 34,183.8 6,270.7 10,874.2 37,631.9 9,233.6 1,140.6 115,942.0 12,431.7 40,084.2 15,507.2 4,080.3 29,023.2 13,405.8 1,409.6
Jul. 17,022.8 33,905.5 6,209.2 10,334.0 37,121.4 9,437.8 1,200.9 115,231.6 12,242.0 39,467.7 15,852.2 3,848.9 28,915.4 13,571.3 1,334.1
Aug. 16,325.0 33,667.0 6,027.3 10,225.5 36,555.8 8,960.0 1,157.6 112,918.2 12,227.2 37,168.3 15,787.4 3,751.2 28,821.2 13,725.6 1,437.3
Sep. 15,866.0 34,327.9 5,952.3 12,679.2 36,679.4 8,279.0 1,155.7 114,939.5 11,837.3 40,065.2 15,143.6 4,044.3 29,037.0 13,295.3 1,516.8
Oct. 16,792.7 33,645.5 5,911.7 12,766.5 35,139.8 7,919.6 1,164.4 113,340.2 11,994.8 39,290.4 15,309.2 4,167.1 28,524.8 12,763.7 1,290.2
Nov. 16,553.5 35,864.5 6,433.8 11,320.7 34,384.7 8,263.1 1,179.8 114,000.1 12,372.9 40,370.5 15,400.1 3,788.6 27,810.9 12,846.8 1,410.3
Dec. 17,232.3 37,816.9 6,597.2 13,146.7 33,407.5 8,571.3 1,330.8 118,102.7 13,487.8 42,140.5 16,020.5 3,488.9 28,115.2 13,617.1 1,232.7
2022 Jan. 17,302.6 36,296.6 6,638.2 11,847.3 35,370.8 8,621.3 1,269.5 117,346.3 13,070.1 43,005.8 15,137.3 3,506.2 26,943.7 14,285.5 1,397.7
Feb. 16,908.4 36,833.6 7,223.8 12,133.1 34,013.4 8,492.4 1,449.8 117,054.5 14,407.9 42,449.9 15,063.5 3,322.9 26,608.2 13,797.2 1,404.9
1/ Includes Islamic Banks. .يشمل المصارف اإلسالمية/ 1
2/ Includes Argentina, Bahamas, Brazil, British Virgin Islands, Canada, Cayman Islands, Mexico, 2 / ،تشمل األرجنتين، البهاما، البرازيل، الجزر العذراء البريطانية، كندا، جزر كايمان، المكسيك، األنتيل الهولندية
Netherlands Antilles, Panama, Puerto Rico, United States, Venezuela and Others. . بنما، بورتو ريكو، الواليات المتحدة، فنزويال وأخرى
- 28 -

Table No. (29) جدول رقم
/1الموجودات والمطلوبات حسب أهم العمالت : مصارف قطاع الجملة
Wholesale Banks: Classification of Assets and Liabilities by Major Currencies 1/U.S. Dollar Million مليون دوالر أمريكي
Assets الموجودات Liabilities المطلوبات
الدينار عمالت دول الدوالر الجنيه الين الدينار عمالت دول الدوالر الجنيه الين
نهاية الفترة البحريني مجلس التعاون األمريكي اإلسترليني اليورو الياباني أخرى المجموع البحريني مجلس التعاون األمريكي اإلسترليني اليورو الياباني أخرى
End of Period Bahraini GCC U.S. Pound Euro Japanese Other Total Bahraini GCC U.S. Pound Euro Japanese Other
Dinar Currencies Dollar Sterling Yen Dinar Currencies Dollar Sterling Yen
2012 1,256.8 13,556.6 75,040.8 2,979.8 11,542.4 1,271.4 8,962.9 114,610.7 723.4 9,638.4 84,153.4 2,181.5 9,564.6 1,022.1 7,327.3
2013 1,219.9 13,447.5 76,382.3 3,163.8 11,107.9 213.4 11,150.8 116,685.7 781.0 9,070.9 86,337.3 2,498.5 10,776.3 188.8 7,032.8
2014 1,123.4 14,286.4 72,375.6 2,831.8 7,882.4 302.4 10,482.5 109,284.5 482.5 8,520.8 84,459.1 1,860.1 7,247.8 200.4 6,513.8
2015 1,634.8 13,329.4 74,085.8 2,516.8 8,273.0 265.1 8,708.9 108,813.8 768.4 9,358.2 85,126.2 1,557.8 8,007.6 140.2 3,855.4
2016 1,541.1 11,851.7 71,479.3 3,490.6 7,471.0 378.0 6,824.2 103,035.9 688.7 8,356.4 81,330.6 1,547.5 7,545.0 148.5 3,419.2
2017 1,176.9 9,769.3 72,636.0 2,798.1 10,753.0 294.2 6,535.0 103,962.5 626.5 7,636.3 80,778.0 1,658.2 10,205.3 98.5 2,959.7
2018 1,880.0 10,171.9 72,941.9 2,231.0 11,644.7 370.9 6,789.3 106,029.7 749.5 7,498.8 82,983.6 1,055.0 9,677.0 183.6 3,882.2
2019 1,980.5 11,259.5 76,435.1 2,945.7 12,447.9 711.2 5,058.3 110,838.2 471.2 11,447.4 84,033.8 824.4 10,415.8 193.3 3,452.3
2020 2,154.2 13,066.4 77,571.3 2,307.6 12,488.7 203.3 5,287.3 113,078.8 566.8 12,448.4 85,622.4 1,465.4 9,777.8 33.2 3,164.8
2021 2,953.2 12,239.2 83,569.4 2,389.0 13,862.8 432.5 2,656.6 118,102.7 1,010.5 9,419.6 93,480.2 1,017.8 9,820.7 16.4 3,337.5
2020 Q1 2,438.9 12,757.3 82,287.1 1,616.5 11,999.4 335.8 4,308.8 115,743.8 633.8 12,266.6 88,467.1 705.9 9,672.7 196.2 3,801.5
Q2 2,065.5 12,840.3 83,589.2 1,654.3 11,737.0 152.6 3,444.9 115,483.8 522.0 12,390.9 87,467.3 816.0 9,781.2 100.3 4,406.1
Q3 2,090.0 12,567.5 80,258.7 1,720.1 11,925.2 194.7 4,082.6 112,838.8 531.2 11,745.2 86,854.3 883.0 9,567.7 27.8 3,229.6
Q4 2,154.2 13,066.4 77,571.3 2,307.6 12,488.7 203.3 5,287.3 113,078.8 566.8 12,448.4 85,622.4 1,465.4 9,777.8 33.2 3,164.8
2021 Q1 2,907.2 12,334.9 81,383.6 2,331.9 11,822.4 78.4 3,595.8 114,454.2 927.8 11,694.9 86,543.1 1,446.5 10,092.2 6.9 3,742.8
Q2 2,769.0 10,943.5 83,718.9 2,310.4 12,537.7 75.9 3,586.6 115,942.0 823.8 10,628.2 88,514.3 1,445.3 10,884.0 14.7 3,631.7
Q3 3,137.3 10,704.1 80,314.0 2,489.3 14,620.7 175.0 3,499.1 114,939.5 1,130.7 8,409.3 89,786.6 1,014.3 10,354.6 14.5 4,229.5
Q4 2,953.2 12,239.2 83,569.4 2,389.0 13,862.8 432.5 2,656.6 118,102.7 1,010.5 9,419.6 93,480.2 1,017.8 9,820.7 16.4 3,337.5
2021 Feb. 2,911.4 12,597.5 80,681.9 2,263.2 12,439.5 90.8 3,827.6 114,811.9 802.2 12,075.6 85,980.0 1,386.7 10,455.7 20.1 4,091.6
Mar. 2,907.2 12,334.9 81,383.6 2,331.9 11,822.4 78.4 3,595.8 114,454.2 927.8 11,694.9 86,543.1 1,446.5 10,092.2 6.9 3,742.8
Apr. 2,998.7 12,720.7 80,365.7 2,122.7 11,736.5 76.7 3,469.1 113,490.1 719.9 11,841.6 85,835.3 1,258.5 10,015.2 14.6 3,805.0
May 3,225.8 11,815.8 82,071.7 2,076.5 12,857.2 76.2 3,749.9 115,873.1 878.1 11,528.3 86,938.7 1,313.7 11,195.9 14.3 4,004.1
Jun. 2,769.0 10,943.5 83,718.9 2,310.4 12,537.7 75.9 3,586.6 115,942.0 823.8 10,628.2 88,514.3 1,445.3 10,884.0 14.7 3,631.7
Jul. 3,114.1 10,223.5 82,327.3 2,091.7 13,682.2 77.9 3,714.9 115,231.6 924.4 9,806.5 88,884.4 1,197.9 10,667.6 15.5 3,735.3
Aug. 3,078.6 9,900.4 79,049.9 2,667.4 14,594.4 183.3 3,444.2 112,918.2 959.5 9,557.3 86,480.3 1,211.1 10,548.4 12.6 4,149.0
Sep. 3,137.3 10,704.1 80,314.0 2,489.3 14,620.7 175.0 3,499.1 114,939.5 1,130.7 8,409.3 89,786.6 1,014.3 10,354.6 14.5 4,229.5
Oct. 3,353.4 10,054.3 79,952.1 2,511.8 13,805.2 410.1 3,253.3 113,340.2 1,179.1 7,863.7 89,024.9 978.6 10,238.7 23.1 4,032.1
Nov. 3,140.6 10,391.0 82,053.9 2,521.1 12,466.3 410.3 3,016.9 114,000.1 1,108.9 8,097.3 90,483.8 1,005.7 9,670.4 14.8 3,619.2
Dec. 2,953.2 12,239.2 83,569.4 2,389.0 13,862.8 432.5 2,656.6 118,102.7 1,010.5 9,419.6 93,480.2 1,017.8 9,820.7 16.4 3,337.5
2022 Jan. 3,370.1 10,378.9 84,127.3 2,640.8 14,073.3 141.3 2,614.6 117,346.3 1,109.3 7,709.2 93,651.1 1,058.1 9,705.3 13.6 4,099.7
Feb. 3,643.8 11,253.3 82,965.8 2,513.4 13,819.2 128.1 2,730.9 117,054.5 1,202.2 10,887.9 91,075.7 999.3 9,644.5 11.4 3,233.5
1/ Includes Islamic Banks. .يشمل المصارف اإلسالمية/ 1
- 29 -

Table No. (30) جدول رقم
مصارف قطاع التجزئة ومصارف قطاع الجملة: الميزانية الموحدة للمصارف اإلسالمية
Aggregated Balance Sheet of the Islamic Banks: Retail Banks and Wholesale Banks
الموجودات
AssetsU.S. Dollar Million مليون دوالر أمريكي
Domestic Assets Foreign Assets الموجودات المحلية الموجودات األجنبية
نهاية الفترة استثمار مع استثمار مع استثمار مع استثمار مع استثمار مع المكاتب الرئيسية مجموع البنود خارج
End of Period نقداً المصارف غير المصارف الحكومة أخرى المجموع المصارف غير المصارف السندات والشركات الزميلة أخرى المجموع الموجودات الميزانية
Cash Invest. Invest. Invest. Others Total Invest. Invest. Securities H.O. & Others Total Total Off
with Banks with Private with Govt. with Banks with Private Affiliates Assets Balance
2/ Non-banks Non-banks 1/ Sheet 3/
2012 94.3 3,515.4 6,684.1 673.9 1,855.8 12,823.5 1,390.0 1,777.1 2,539.4 6,105.0 927.0 12,738.5 25,562.0 N/A
2013 108.2 3,708.6 7,307.0 635.2 1,723.7 13,482.7 1,654.3 1,712.8 2,530.6 2,970.1 948.3 9,816.1 23,298.8 N/A
2014 115.2 3,890.9 7,786.1 754.7 1,870.2 14,417.1 1,641.0 2,112.1 2,777.3 3,077.4 870.1 10,477.9 24,895.0 N/A
2015 135.2 3,240.4 8,634.8 1,398.2 2,319.2 15,727.8 1,624.6 2,158.1 2,372.0 2,762.1 697.9 9,614.7 25,342.5 N/A
2016 120.2 4,105.3 9,137.1 1,934.1 1,619.2 16,915.9 1,651.4 1,860.8 2,585.2 2,694.8 582.4 9,374.6 26,290.5 N/A
2017 156.3 4,330.6 9,625.5 2,385.9 1,934.4 18,432.7 1,636.5 1,447.6 2,014.7 2,331.2 882.8 8,312.8 26,745.5 N/A
2018 163.3 4,793.4 10,732.2 2,854.9 1,849.3 20,393.1 1,445.0 1,541.1 2,061.4 1,776.4 711.2 7,535.1 27,928.2 N/A
2019 158.6 5,171.8 11,687.6 4,001.1 2,533.2 23,552.3 1,666.4 1,863.6 2,624.2 1,666.2 709.9 8,530.3 32,082.6 N/A
2020 165.4 4,406.4 12,459.3 4,910.5 1,659.5 23,601.1 1,309.4 1,854.6 2,626.2 1,733.3 486.8 8,010.3 31,611.4 N/A
2021 148.5 5,907.0 13,144.0 5,520.0 1,753.9 26,473.4 1,318.9 1,444.4 3,472.9 909.6 935.6 8,081.4 34,554.8 N/A
2020 Q1 148.2 5,210.9 11,836.5 4,267.0 2,594.4 24,057.0 1,538.7 1,727.6 2,818.9 1,702.1 691.5 8,478.8 32,535.8 N/A
Q2 156.3 5,226.7 12,082.9 4,355.6 2,472.8 24,294.3 1,258.9 1,570.3 2,893.7 1,857.2 624.3 8,204.4 32,498.7 N/A
Q3 168.9 4,999.9 12,223.3 4,857.5 1,743.1 23,992.7 1,001.3 1,704.7 2,601.4 1,437.5 662.9 7,407.8 31,400.5 N/A
Q4 165.4 4,406.4 12,459.3 4,910.5 1,659.5 23,601.1 1,309.4 1,854.6 2,626.2 1,733.3 486.8 8,010.3 31,611.4 N/A
2021 Q1 153.2 5,147.4 12,495.7 4,858.3 1,873.3 24,527.9 1,415.9 1,620.4 2,542.0 919.4 432.9 6,930.6 31,458.5 N/A
Q2 151.6 5,389.1 12,768.6 5,035.5 1,841.8 25,186.6 1,512.2 1,697.9 2,715.1 925.9 575.3 7,426.4 32,613.0 N/A
Q3 134.0 5,252.4 12,725.2 4,824.3 1,863.2 24,799.1 1,188.8 1,399.1 3,760.0 925.1 808.9 8,081.9 32,881.0 N/A
Q4 148.5 5,907.0 13,144.0 5,520.0 1,753.9 26,473.4 1,318.9 1,444.4 3,472.9 909.6 935.6 8,081.4 34,554.8 N/A
2021 Feb. 150.0 4,796.8 12,471.1 4,871.6 1,663.7 23,953.2 1,413.9 1,811.1 2,594.8 912.1 447.4 7,179.3 31,132.5 N/A
Mar. 153.2 5,147.4 12,495.7 4,858.3 1,873.3 24,527.9 1,415.9 1,620.4 2,542.0 919.4 432.9 6,930.6 31,458.5 N/A
Apr. 167.9 5,018.8 12,700.2 5,031.2 1,948.3 24,866.4 1,417.5 1,644.6 2,488.7 925.6 472.0 6,948.4 31,814.8 N/A
May 153.4 5,168.2 12,617.4 5,017.7 1,905.5 24,862.2 1,328.0 1,732.0 2,445.8 1,006.8 484.6 6,997.2 31,859.4 N/A
Jun. 151.6 5,389.1 12,768.6 5,035.5 1,841.8 25,186.6 1,512.2 1,697.9 2,715.1 925.9 575.3 7,426.4 32,613.0 N/A
Jul. 144.9 5,278.0 12,738.3 4,991.0 1,827.2 24,979.4 1,128.7 1,708.3 2,710.8 1,045.0 485.6 7,078.4 32,057.8 N/A
Aug. 150.0 5,218.5 12,728.5 4,784.0 1,747.1 24,628.1 1,321.6 1,500.3 2,522.1 916.7 424.5 6,685.2 31,313.3 N/A
Sep. 134.0 5,252.4 12,725.2 4,824.3 1,863.2 24,799.1 1,188.8 1,399.1 3,760.0 925.1 808.9 8,081.9 32,881.0 N/A
Oct. 147.5 5,300.0 12,896.9 4,966.6 1,827.4 25,138.4 1,185.9 1,343.2 3,489.7 926.7 799.1 7,744.6 32,883.0 N/A
Nov. 153.8 5,266.9 12,959.6 5,483.6 1,866.7 25,730.6 1,099.1 1,381.1 3,439.6 1,027.1 881.7 7,828.6 33,559.2 N/A
Dec. 148.5 5,907.0 13,144.0 5,520.0 1,753.9 26,473.4 1,318.9 1,444.4 3,472.9 909.6 935.6 8,081.4 34,554.8 N/A
2022 Jan. 152.9 5,680.3 13,179.0 5,348.1 1,760.9 26,121.2 1,321.8 1,488.2 3,452.6 825.5 970.6 8,058.7 34,179.9 N/A
Feb. 144.1 5,234.2 13,544.5 5,358.3 1,783.2 26,064.3 1,291.1 1,505.9 3,782.7 894.1 1,396.8 8,870.6 34,934.9 N/A
1/ Includes Unrestricted Investment Accounts. .يشمل حسابات اإلستثمار المطلقة/ 1
2/ Includes Head Offices and Affiliates. 2 /يشمل المكاتب الرئيسية والشركات الزميلة.
3/ Includes Restricted Investment Accounts. .يشمل حسابات االستثمار المقيدة/ 3
- 30 -

Table No. (31) جدول رقم
مصارف قطاع التجزئة ومصارف قطاع الجملة: الميزانية الموحدة للمصارف اإلسالمية
Aggregated Balance Sheet of the Islamic Banks: Retail Banks and Wholesale Banks
المطلوبات
LiabilitiesU.S. Dollar Million مليون دوالر أمريكي
Domestic Liabilities المطلوبات المحلية Foreign Liabilities المطلوبات األجنبية
نهاية الفترة القطاع الخاص رأس المال المكاتب الرئيسية رأس المال مجموع البنود خارج
End of Period المصارف (غير المصارف) الحكومة أخرى واالحتياطي المجموع المصارف غير المصارف والشركات الزميلة أخرى واالحتياطي المجموع المطلوبات الميزانية
Private General Capital & H.O. & Capital & Total Off
Banks Non-Banks Government Reserves Other Total Banks Non-Banks Affiliates Reserves Other Total Liabilities Balance
2/ 1/ Sheet 3/
2012 2,447.0 7,237.2 640.1 2,781.6 556.5 13,662.4 3,875.0 1,907.8 979.0 5,097.3 40.5 11,899.6 25,562.0 N/A
2013 2,043.0 8,147.5 840.2 2,821.7 411.2 14,263.6 2,423.3 1,092.6 1,060.3 4,330.7 128.3 9,035.2 23,298.8 N/A
2014 2,277.4 8,963.2 973.8 3,496.9 184.7 15,896.0 2,374.2 1,106.2 788.8 4,613.2 116.6 8,999.0 24,895.0 N/A
2015 2,493.2 9,095.1 1,022.4 3,275.1 748.4 16,634.2 2,266.8 1,084.1 768.7 4,407.5 181.2 8,708.3 25,342.5 N/A
2016 2,808.1 9,658.0 1,543.3 3,124.2 650.7 17,784.3 2,170.7 1,316.9 754.6 3,946.7 317.3 8,506.2 26,290.5 N/A
2017 2,782.5 10,523.7 1,449.2 3,422.9 684.4 18,862.7 2,189.6 1,567.0 408.7 3,433.0 284.5 7,882.8 26,745.5 N/A
2018 3,298.4 10,658.3 1,457.9 3,287.6 917.5 19,619.7 2,411.7 1,877.0 368.5 3,356.4 294.9 8,308.5 27,928.2 N/A
2019 2,648.1 12,215.4 1,465.5 3,528.6 1,091.1 20,948.7 5,246.9 1,981.7 472.0 3,197.5 235.7 11,133.9 32,082.6 N/A
2020 2,816.7 13,113.6 1,172.7 2,941.6 1,308.1 21,352.7 4,024.0 2,604.4 604.9 2,718.1 307.3 10,258.7 31,611.4 N/A
2021 3,245.8 14,533.7 1,087.0 2,737.9 1,018.1 22,622.5 5,826.2 3,314.4 734.9 1,837.1 219.7 11,932.3 34,554.8 N/A
2020 Q1 2,668.2 12,341.8 1,462.4 3,322.0 1,305.1 21,099.5 5,232.5 2,421.8 504.7 3,071.4 205.9 11,436.3 32,535.8 N/A
Q2 2,934.8 12,885.0 1,181.8 3,024.2 1,529.5 21,555.3 4,927.2 2,213.4 622.7 2,880.0 300.1 10,943.4 32,498.7 N/A
Q3 2,769.7 12,841.8 1,172.2 2,852.6 1,499.7 21,136.0 4,440.9 2,301.6 476.9 2,742.0 303.1 10,264.5 31,400.5 N/A
Q4 2,816.7 13,113.6 1,172.7 2,941.6 1,308.1 21,352.7 4,024.0 2,604.4 604.9 2,718.1 307.3 10,258.7 31,611.4 N/A
2021 Q1 2,690.4 13,402.3 1,084.6 2,846.5 1,315.6 21,339.4 4,204.7 2,824.1 582.2 2,175.1 333.0 10,119.1 31,458.5 N/A
Q2 2,553.2 14,076.7 1,180.7 2,919.6 1,158.1 21,888.3 4,297.2 3,388.9 592.2 2,149.0 297.4 10,724.7 32,613.0 N/A
Q3 2,378.3 14,315.0 1,135.1 2,558.0 957.8 21,344.2 5,669.1 3,135.9 620.6 1,808.5 302.7 11,536.8 32,881.0 N/A
Q4 3,245.8 14,533.7 1,087.0 2,737.9 1,018.1 22,622.5 5,826.2 3,314.4 734.9 1,837.1 219.7 11,932.3 34,554.8 N/A
2021 Feb. 2,591.7 13,463.9 1,102.0 2,849.1 1,172.1 21,178.8 4,011.8 2,795.3 628.6 2,174.3 343.7 9,953.7 31,132.5 N/A
Mar. 2,690.4 13,402.3 1,084.6 2,846.5 1,315.6 21,339.4 4,204.7 2,824.1 582.2 2,175.1 333.0 10,119.1 31,458.5 N/A
Apr. 2,465.5 13,404.1 1,122.6 2,716.3 1,432.6 21,141.1 4,329.6 3,203.0 668.3 2,141.0 331.8 10,673.7 31,814.8 N/A
May 2,461.5 13,693.9 1,186.2 2,750.9 1,263.7 21,356.2 4,232.1 3,177.3 634.5 2,147.2 312.1 10,503.2 31,859.4 N/A
Jun. 2,553.2 14,076.7 1,180.7 2,919.6 1,158.1 21,888.3 4,297.2 3,388.9 592.2 2,149.0 297.4 10,724.7 32,613.0 N/A
Jul. 2,392.5 13,810.9 1,278.9 2,859.4 1,139.2 21,480.9 4,222.4 3,261.6 642.3 2,151.1 299.5 10,576.9 32,057.8 N/A
Aug. 2,287.0 14,086.5 1,255.8 2,837.5 1,081.8 21,548.6 4,126.0 2,904.8 625.3 1,810.7 297.9 9,764.7 31,313.3 N/A
Sep. 2,378.3 14,315.0 1,135.1 2,558.0 957.8 21,344.2 5,669.1 3,135.9 620.6 1,808.5 302.7 11,536.8 32,881.0 N/A
Oct. 2,289.1 14,261.8 1,109.1 2,720.9 970.1 21,351.0 5,465.0 3,252.7 691.6 1,826.3 296.4 11,532.0 32,883.0 N/A
Nov. 2,448.8 14,462.4 1,087.3 2,779.1 1,104.3 21,881.9 5,627.4 3,257.3 741.1 1,831.6 219.9 11,677.3 33,559.2 N/A
Dec. 3,245.8 14,533.7 1,087.0 2,737.9 1,018.1 22,622.5 5,826.2 3,314.4 734.9 1,837.1 219.7 11,932.3 34,554.8 N/A
2022 Jan. 3,101.3 14,482.0 1,072.1 2,755.4 1,020.7 22,431.5 5,922.3 2,783.7 963.7 1,842.9 235.8 11,748.4 34,179.9 N/A
Feb. 3,820.0 14,840.0 998.9 3,048.2 1,165.8 23,872.9 4,905.3 3,297.4 815.5 1,848.1 195.7 11,062.0 34,934.9 N/A
1/ Includes Unrestricted Investment Accounts. .يشمل حسابات اإلستثمار المطلقة/ 1
2/ Includes Head Offices and Affiliates. 2 /يشمل المكاتب الرئيسية والشركات الزميلة.
3/ Includes Restricted Investment Accounts. .يشمل حسابات االستثمار المقيدة/ 3
- 31 -

Table No. (32) جدول رقم
الموجودات والمطلوبات حسب التصنيف الجغرافي: المصارف اإلسالمية
Islamic Banks: Geographical Classification of Assets and LiabilitiesU.S. Dollar Million مليون دوالر أمريكي
Assets الموجودات Liabilities المطلوبات
مملكة دول مجلس الدول العربية أوروبا مملكة دول مجلس الدول العربية أوروبا
نهاية الفترة البحرين التعاون األخرى الدول األمريكية الغربية آسيا أخرى المجموع البحرين التعاون األخرى الدول األمريكية الغربية آسيا أخرى
End of Period Kingdom of GCC Other Arab Americas Western Asia Other Total Kingdom of GCC Other Arab Americas Western Asia Other
Bahrain Countries 1/ Europe Bahrain Countries 1/ Europe
2012 12,823.5 3,561.9 1,120.1 4,702.7 2,488.1 678.5 187.2 25,562.0 13,662.4 7,252.9 754.6 1,152.9 1,885.8 808.8 44.6
2013 13,482.7 3,704.3 1,126.7 1,318.0 2,760.4 678.3 228.3 23,298.8 14,263.7 6,845.8 805.0 165.9 593.0 612.7 12.5
2014 14,417.1 3,933.5 1,408.6 1,383.4 2,785.9 680.0 286.5 24,895.0 15,896.0 6,410.8 977.3 267.6 765.5 520.8 57.0
2015 15,727.8 3,684.9 1,289.5 1,357.9 2,368.5 676.9 237.0 25,342.5 16,634.2 6,093.1 987.8 252.8 811.7 504.1 58.8
2016 16,915.9 3,738.7 1,290.8 1,341.8 2,122.2 612.9 268.2 26,290.5 17,784.3 5,862.6 949.4 256.3 870.1 515.5 52.3
2017 18,432.7 2,865.6 1,809.5 932.2 1,955.2 612.3 138.0 26,745.5 18,862.7 5,044.0 1,112.3 383.6 778.5 550.2 14.2
2018 20,393.1 2,884.2 1,666.8 855.9 1,379.7 588.7 159.8 27,928.2 19,619.7 4,756.3 1,257.5 357.4 1,319.0 601.2 17.1
2019 23,552.3 3,110.7 1,623.5 1,709.0 1,369.9 617.3 99.9 32,082.6 20,948.7 6,089.9 1,543.1 646.3 1,947.0 873.5 34.1
2020 23,601.1 2,730.1 1,506.6 1,565.0 1,421.0 648.7 138.9 31,611.4 21,352.7 5,715.9 1,602.8 533.2 1,425.4 898.3 83.1
2021 26,473.4 3,258.6 862.0 2,488.9 1,062.5 286.5 122.9 34,554.8 22,622.5 6,612.2 960.2 781.7 2,849.5 620.2 108.5
2020 Q1 24,057.0 2,785.8 1,651.0 1,779.7 1,549.5 617.6 95.2 32,535.8 21,099.5 6,376.6 1,662.9 604.3 1,881.2 879.0 32.3
Q2 24,294.3 2,451.7 1,559.8 1,829.5 1,563.9 709.7 89.8 32,498.7 21,555.3 5,746.7 1,574.7 769.7 1,943.1 885.4 23.8
Q3 23,992.7 2,310.1 1,573.7 1,530.2 1,265.8 637.1 90.9 31,400.5 21,136.0 5,886.7 1,585.6 513.0 1,345.2 892.1 41.9
Q4 23,601.1 2,730.1 1,506.6 1,565.0 1,421.0 648.7 138.9 31,611.4 21,352.7 5,715.9 1,602.8 533.2 1,425.4 898.3 83.1
2021 Q1 24,527.9 2,315.9 1,082.7 1,437.1 1,321.8 628.3 144.8 31,458.5 21,339.4 5,763.3 1,198.4 454.8 1,687.9 910.9 103.8
Q2 25,186.6 2,684.5 1,038.2 1,728.0 1,257.7 601.9 116.1 32,613.0 21,888.3 5,862.7 1,217.7 634.7 1,995.2 907.4 107.0
Q3 24,799.1 2,213.8 722.1 3,606.7 1,094.9 312.0 132.4 32,881.0 21,344.2 6,791.8 722.3 934.3 2,342.3 628.1 118.0
Q4 26,473.4 3,258.6 862.0 2,488.9 1,062.5 286.5 122.9 34,554.8 22,622.5 6,612.2 960.2 781.7 2,849.5 620.2 108.5
2021 Feb. 23,953.2 2,536.1 1,093.5 1,499.9 1,249.9 656.5 143.4 31,132.5 21,178.8 5,664.5 1,178.9 433.5 1,669.8 912.8 94.2
Mar. 24,527.9 2,315.9 1,082.7 1,437.1 1,321.8 628.3 144.8 31,458.5 21,339.4 5,763.3 1,198.4 454.8 1,687.9 910.9 103.8
Apr. 24,866.4 2,103.8 1,112.8 1,697.0 1,298.0 626.7 110.1 31,814.8 21,141.1 5,815.7 1,260.2 468.7 2,115.3 912.4 101.4
May 24,862.2 2,199.9 1,128.3 1,608.0 1,337.3 616.9 106.8 31,859.4 21,356.2 5,670.8 1,235.9 497.6 2,085.8 914.2 98.9
Jun. 25,186.6 2,684.5 1,038.2 1,728.0 1,257.7 601.9 116.1 32,613.0 21,888.3 5,862.7 1,217.7 634.7 1,995.2 907.4 107.0
Jul. 24,979.4 2,238.8 1,037.6 1,788.2 1,286.0 601.7 126.1 32,057.8 21,480.9 5,825.2 1,141.0 586.3 2,003.3 905.8 115.3
Aug. 24,628.1 2,144.7 897.5 1,786.7 1,149.7 586.2 120.4 31,313.3 21,548.6 5,498.1 1,115.6 501.9 1,632.5 904.1 112.5
Sep. 24,799.1 2,213.8 722.1 3,606.7 1,094.9 312.0 132.4 32,881.0 21,344.2 6,791.8 722.3 934.3 2,342.3 628.1 118.0
Oct. 25,138.4 1,894.1 780.4 3,536.9 1,092.2 309.4 131.6 32,883.0 21,351.0 6,404.6 763.1 928.4 2,695.0 624.8 116.1
Nov. 25,730.6 2,922.2 856.5 2,442.0 1,181.2 291.9 134.8 33,559.2 21,881.9 6,507.6 820.9 744.7 2,858.4 626.8 118.9
Dec. 26,473.4 3,258.6 862.0 2,488.9 1,062.5 286.5 122.9 34,554.8 22,622.5 6,612.2 960.2 781.7 2,849.5 620.2 108.5
2022 Jan. 26,121.2 3,134.3 747.6 2,741.5 1,024.7 288.2 122.4 34,179.9 22,431.5 6,854.7 930.9 789.2 2,444.5 616.3 112.8
Feb. 26,064.3 3,666.2 1,071.0 2,370.4 1,352.7 287.0 123.3 34,934.9 23,872.9 6,698.5 1,020.6 568.2 1,961.9 703.2 109.6
1/ Includes Argentina, Bahamas, Brazil, British Virgin Islands, Canada, Cayman Islands, Mexico, 1 / ،تشمل األرجنتين، البهاما، البرازيل، الجزر العذراء البريطانية، كندا، جزر كايمان، المكسيك، األنتيل الهولندية
Netherlands Antilles, Panama, Puerto Rico, United States, Venezuela and Others. . بنما، بورتو ريكو، الواليات المتحدة، فنزويال وأخرى
- 32 -

Table No. (33) جدول رقم
الموجودات والمطلوبات حسب أهم العمالت: المصارف اإلسالمية
Islamic Banks: Classification of Assets and Liabilities by Major CurrenciesU.S. Dollar Million مليون دوالر أمريكي
Assets الموجودات Liabilities المطلوبات
الدينار عمالت دول الدوالر الجنيه الين الدينار عمالت دول الدوالر الجنيه الين
نهاية الفترة البحريني مجلس التعاون األمريكي اإلسترليني اليورو الياباني أخرى المجموع البحريني مجلس التعاون األمريكي اإلسترليني اليورو الياباني أخرى
End of Period Bahraini GCC U.S. Pound Euro Japanese Other Total Bahraini GCC U.S. Pound Euro Japanese Other
Dinar Currencies Dollar Sterling Yen Dinar Currencies Dollar Sterling Yen
2012 8,936.8 929.7 13,421.5 309.8 469.3 2.1 1,492.8 25,562.0 9,230.9 563.5 14,343.1 195.8 731.6 1.1 496.0
2013 9,562.9 1,015.6 10,369.8 211.8 657.1 2.8 1,478.8 23,298.8 10,237.6 707.2 11,157.2 203.1 690.3 0.2 303.3
2014 10,488.2 1,179.1 10,617.5 145.8 561.4 4.3 1,898.7 24,895.0 11,159.9 829.9 11,727.3 116.4 653.1 0.1 408.3
2015 11,498.6 1,118.2 10,180.1 152.5 505.4 0.0 1,887.7 25,342.5 11,770.1 691.2 11,856.1 140.2 580.4 0.1 304.4
2016 12,221.8 988.9 10,733.1 163.8 371.7 0.6 1,810.6 26,290.5 12,058.9 664.1 12,560.1 167.0 509.4 0.6 330.4
2017 12,417.7 1,297.9 11,046.5 114.3 548.7 0.8 1,319.6 26,745.5 12,123.2 1,353.7 12,607.6 87.3 568.8 0.7 4.2
2018 12,973.9 1,667.7 11,036.4 208.9 701.8 0.7 1,338.8 27,928.2 12,157.2 1,534.7 13,328.1 194.0 707.0 0.7 6.5
2019 14,241.5 1,563.0 13,641.6 151.7 1,203.0 0.6 1,281.2 32,082.6 13,054.8 4,581.8 13,204.4 134.7 1,104.8 0.6 1.5
2020 14,844.3 1,366.9 13,407.0 74.3 726.2 0.7 1,192.0 31,611.4 14,137.3 4,775.9 11,972.3 73.8 630.1 0.7 21.3
2021 16,211.6 853.2 15,948.0 66.6 704.8 0.9 769.7 34,554.8 15,344.8 2,470.2 15,150.6 65.0 735.9 0.9 787.4
2020 Q1 14,490.9 1,423.8 14,050.4 85.3 1,205.8 0.6 1,279.0 32,535.8 13,283.4 5,046.7 13,032.5 77.9 1,085.7 0.6 9.0
Q2 14,443.9 1,322.6 14,601.2 69.1 802.7 0.6 1,258.6 32,498.7 13,899.5 4,539.9 13,304.6 66.4 678.4 0.6 9.3
Q3 14,916.1 1,374.2 13,094.1 71.7 708.0 0.7 1,235.7 31,400.5 13,988.4 4,504.5 12,236.2 73.1 581.8 0.7 15.8
Q4 14,844.3 1,366.9 13,407.0 74.3 726.2 0.7 1,192.0 31,611.4 14,137.3 4,775.9 11,972.3 73.8 630.1 0.7 21.3
2021 Q1 15,125.4 1,225.8 13,570.2 67.4 763.7 0.7 705.3 31,458.5 14,423.1 4,818.1 11,397.9 68.1 697.2 0.7 53.4
Q2 15,320.2 1,029.2 14,501.1 85.4 737.1 164.4 775.6 32,613.0 14,707.3 4,948.9 12,149.2 68.2 700.2 0.8 38.4
Q3 15,730.7 643.4 14,772.8 44.7 700.4 0.8 988.2 32,881.0 14,922.9 2,385.2 13,986.1 46.5 642.8 0.8 896.7
Q4 16,211.6 853.2 15,948.0 66.6 704.8 0.9 769.7 34,554.8 15,344.8 2,470.2 15,150.6 65.0 735.9 0.9 787.4
2021 Feb. 14,732.5 1,279.6 13,556.2 88.0 750.2 0.7 725.3 31,132.5 14,183.1 4,787.3 11,386.7 85.0 655.0 0.7 34.7
Mar. 15,125.4 1,225.8 13,570.2 67.4 763.7 0.7 705.3 31,458.5 14,423.1 4,818.1 11,397.9 68.1 697.2 0.7 53.4
Apr. 15,195.4 1,157.3 13,866.5 68.5 743.5 0.8 782.8 31,814.8 14,614.5 4,724.8 11,674.0 67.2 709.5 0.8 24.0
May 15,194.7 1,291.0 13,803.7 67.2 779.4 0.8 722.6 31,859.4 14,462.9 4,682.1 11,872.6 65.9 746.9 0.8 28.2
Jun. 15,320.2 1,029.2 14,501.1 85.4 737.1 164.4 775.6 32,613.0 14,707.3 4,948.9 12,149.2 68.2 700.2 0.8 38.4
Jul. 15,338.3 1,175.6 13,987.9 67.5 748.5 1.0 739.0 32,057.8 14,762.2 4,669.3 11,825.9 58.7 700.0 0.9 40.8
Aug. 15,370.4 1,156.9 13,223.5 71.3 705.8 0.8 784.6 31,313.3 14,889.7 4,683.9 10,986.7 58.1 655.2 0.8 38.9
Sep. 15,730.7 643.4 14,772.8 44.7 700.4 0.8 988.2 32,881.0 14,922.9 2,385.2 13,986.1 46.5 642.8 0.8 896.7
Oct. 16,040.3 597.6 14,569.5 52.0 705.0 0.8 917.8 32,883.0 15,026.5 2,268.4 14,026.6 49.7 667.0 0.8 844.0
Nov. 16,208.3 579.6 15,233.2 60.1 703.5 0.9 773.6 33,559.2 15,334.9 2,296.1 14,396.0 61.3 679.2 0.9 790.8
Dec. 16,211.6 853.2 15,948.0 66.6 704.8 0.9 769.7 34,554.8 15,344.8 2,470.2 15,150.6 65.0 735.9 0.9 787.4
2022 Jan. 16,195.8 676.6 15,809.1 49.9 686.4 0.8 761.3 34,179.9 15,513.1 2,067.9 14,941.3 55.4 721.9 0.8 879.5
Feb. 16,562.1 948.3 15,648.0 56.8 769.3 0.8 949.6 34,934.9 15,603.6 4,675.6 13,888.0 56.2 672.0 0.8 38.7
- 33 -

Table No. (34) جدول رقم
2022فبراير (مجمعة)الحسابات المقيدة وغير المقيدة للمصارف اإلسالمية
Classification of Restricted & Unrestricted account for Islamic Banks (Consolidated) February 2022
الموجودات
Assets
U.S. Dollar Million مليون دوالر أمريكي
حسابات االستثمار المقيدة حسابات االستثمار غير المقيدة أموال المصرف- تمويل ذاتي
المقيمة غير المقيمة المقيمة غير المقيمة المقيمة غير المقيمةResidents Non-Residents Residents Non-Residents Residents Non-Residents
دينار بحريني عمالت أخرى دينار بحريني عمالت أخرى دينار بحريني عمالت أخرى دينار بحريني عمالت أخرى دينار بحريني عمالت أخرى دينار بحريني عمالت أخرى
BD OC BD OC BD OC BD OC BD OC BD OC
Total 411.9 771.3 0.0 436.8 1,620.0 8,979.6 3,302.9 37.3 3,639.8 15,959.6 6,898.1 5,712.1 24.2 5,983.8 18,618.2 36,197.8 المجموع
Short-term investment and
treasury securities 0.0 0.0 0.0 0.0 0.0 371.1 217.8 0.0 232.4 821.3 154.4 78.8 0.0 95.9 329.1 1,150.4
استثمارات قصيرة األجل وسندات
الخزينة
Long-term investments 0.0 0.0 0.0 0.0 0.0 290.9 870.8 0.0 840.8 2,002.5 748.5 2,193.5 0.0 1,796.8 4,738.8 6,741.3 استثمارات طويلة األجل
Murabaha 367.4 310.1 0.0 246.2 923.7 3,890.0 372.0 11.6 1,301.6 5,575.2 1,529.9 1,703.5 0.3 211.5 3,445.2 9,944.1 المرابحة
Ijara 0.0 0.0 0.0 9.0 9.0 3,410.9 287.4 9.0 4.4 3,711.7 785.9 102.8 0.6 14.7 904.0 4,624.7 اإلجارة
Ijara installment receivables 0.0 0.0 0.0 0.0 0.0 0.0 0.0 0.0 0.0 0.0 0.0 0.0 0.0 0.0 0.0 0.0 أقساط اإلجارة المستحقة
Mudaraba 13.0 29.2 0.0 135.8 178.0 663.1 358.3 0.9 17.9 1,040.2 163.8 79.6 0.0 38.5 281.9 1,500.1 المضاربة
Musharaka 0.0 0.0 0.0 2.4 2.4 159.9 0.0 15.8 0.0 175.7 131.7 0.0 0.0 0.0 131.7 309.8 المشاركة
Salam 0.0 0.0 0.0 0.0 0.0 0.0 0.0 0.0 0.0 0.0 0.0 0.0 0.0 0.0 0.0 0.0 السلم
Real Estate 0.0 110.6 0.0 16.3 126.9 0.0 0.0 0.0 0.0 0.0 667.0 19.4 0.0 0.0 686.4 813.3 عقارات
Securities 31.5 321.4 0.0 10.9 363.8 1.2 758.3 0.0 569.8 1,329.3 202.1 62.4 0.0 276.1 540.6 2,233.7 سندات
Istisna'a 0.0 0.0 0.0 0.0 0.0 0.0 0.0 0.0 453.0 453.0 0.0 0.0 0.0 0.7 0.7 453.7 االستصناع
Istisna'a receivables 0.0 0.0 0.0 0.0 0.0 0.0 0.0 0.0 0.0 0.0 0.0 0.0 0.0 0.0 0.0 0.0 دين مستحق على االستصناع
Qard Hasan 0.0 0.0 0.0 0.0 0.0 0.0 0.0 0.0 0.0 0.0 1.9 0.0 0.0 0.0 1.9 1.9 Investment inقرض حسن
Unconsolidated Subsidiaries
and Associates 0.0 0.0 0.0 16.2 16.2 4.8 403.3 0.0 23.9 432.0 308.3 1,131.9 5.0 1,521.6 2,966.8 3,415.0
استثمارات في شركات شقيقة وتابعة
غير مدمجة
Property, plant, and
equipments (PPE) 168.5 20.1 0.0 0.0 188.6 188.6 العقارات، المصانع والمعدات
Balances at banks 472.7 43.3 0.0 380.6 896.6 896.6 أرصدة المصرف
Other 0.0 0.0 0.0 0.0 0.0 187.7 35.0 0.0 196.0 418.7 1,563.4 276.8 18.3 1,647.4 3,505.9 3,924.6 أخرى
- 34 -
Classification
المجموع
الكليالتصنيف
Restricted Investment Account Unrestricted Investment Account Self Finance - Own Fund
المجموع المجموع المجموع Grand
TotalTotal Total Total

Table No. (35) جدول رقم
مؤشرات السالمة المالية للقطاع المصرفيFinancial Soundness Indicators
النسبة المئوية
نهاية الفترة
End of Period نسبة رأس المال التنظيمي
إلى األصول المرجحة
بالمخاطر
نسبة رأس المال األساسي التنظيمي
إلى األصول المرجحة بالمخاطر
نسبة القروض المتعثرة
إلى مجموع القروض
اإلجمالية
نسبة مخصصات القروض
المتعثرة إلى إجمالي
القروض المتعثرة
معدل العائد على األصولنسبة العائد على حقوق
الملكية
نسبة األصول السائلة
إلى مجموع األصولنسبة القروض إلى الودائع
Total Capital
Adequacy Ratio
Tier 1 Capital Adequacy
Ratio
Non-Performing
Loans Ratio (%
of Gross Loans)
Specific Provisions Return on AssetsReturn on Equity
1/
Liquid Assets
Ratio
Loans/Deposit
Ratio
2012 19.2 16.0 7.2 57.3 0.6 5.1 19.8 69.6
2013 21.2 18.2 6.2 59.9 1.3 7.7 22.4 69.6
2014 20.3 17.9 5.6 62.8 1.0 6.2 22.1 67.5
2015 19.0 17.4 5.3 59.2 0.8 4.6 23.0 68.1
2016 19.3 17.9 5.9 56.6 1.0 6.8 21.9 66.6
2017 19.5 18.2 5.6 52.8 1.1 7.1 24.0 71.0
2018 18.9 17.6 5.5 61.2 1.0 6.7 24.1 72.1
2019 19.4 18.1 4.8 62.0 1.1 7.9 25.5 71.5
2020 18.6 17.3 4.2 68.6 0.7 2.6 24.4 70.9
2021 18.6 17.1 3.2 70.0 1.1 7.8 26.5 69.9
2018 Q1 18.8 17.4 5.6 52.0 0.3 2.5 25.5 72.7
Q2 19.2 17.8 5.6 58.2 0.6 4.0 24.1 73.2
Q3 19.4 18.0 5.5 61.2 0.7 5.3 24.5 71.1
Q4 18.9 17.6 5.5 61.2 1.0 6.7 24.1 72.1
2019 Q1 18.4 17.1 5.5 61.4 0.3 2.5 25.0 70.8
Q2 19.2 17.9 5.3 64.7 0.6 4.8 25.2 70.2
Q3 19.2 17.8 5.2 64.9 0.8 6.5 24.6 71.5
Q4 19.4 18.1 4.8 62.0 1.1 7.9 25.5 71.5
2020 Q1 17.7 16.3 4.4 63.2 0.2 0.5 25.4 71.1
Q2 18.5 17.1 4.5 64.8 0.4 1.5 24.6 69.5
Q3 18.6 17.3 4.6 66.8 0.7 2.8 24.0 70.9
Q4 18.6 17.3 4.2 68.6 0.7 2.6 24.4 70.9
2021 Q1 18.5 17.3 4.0 67.2 0.2 2.2 25.2 68.4
Q2 18.8 17.5 3.8 68.9 0.6 3.9 26.4 70.1
Q3 18.3 16.9 3.6 69.6 0.8 6.1 26.2 69.1
Q4* 18.6 17.1 3.2 70.0 1.1 7.8 26.5 69.9
1/ For Locally Incorporated Banks only للمصارف المدرجة محلياً /1
* Provisional data. .بيانات أولية *
- 35 -
Capital Adequacy 1/ Asset Quality Profitability Liquidity
القطاع المصرفي Entire Banking Sector
Percentage
رأس المال جودة األصول الربحية السيولة

Table No. (36) جدول رقم
مؤشرات السالمة المالية للقطاع المصرفيFinancial Soundness Indicators
النسبة المئوية
نهاية الفترة
End of Period
مصارف التجزئة مصارف الجملة مصارف التجزئة مصارف الجملة مصارف التجزئة مصارف الجملة مصارف التجزئة مصارف الجملة مصارف التجزئة مصارف الجملة مصارف التجزئة مصارف الجملة مصارف التجزئة مصارف الجملة مصارف التجزئة مصارف الجملة
Retail Wholesale Retail Wholesale Retail Wholesale Retail Wholesale Retail Wholesale Retail Wholesale Retail Wholesale Retail Wholesale
2012 19.3 23.6 15.8 19.9 4.2 8.1 51.8 79.5 1.3 0.4 11.5 4.6 24.5 17.2 67.1 64.1
2013 19.2 22.2 15.0 19.0 4.1 6.9 53.5 65.6 1.8 1.3 17.2 8.1 27.0 21.0 68.9 62.6
2014 18.3 21.4 15.6 18.6 3.7 5.9 56.0 73.0 1.5 0.9 13.2 5.5 25.7 21.2 64.8 72.4
2015 18.6 19.8 16.7 18.2 3.9 5.2 54.3 67.0 1.4 0.8 13.3 4.3 25.5 24.2 72.4 66.0
2016 20.1 19.4 18.4 18.1 5.3 5.7 49.9 65.7 1.5 0.7 13.3 3.7 24.1 23.2 71.3 64.0
2017 21.0 19.2 19.4 18.3 5.5 5.4 50.6 59.0 1.5 0.9 13.0 3.8 34.1 19.6 71.3 66.4
2018 20.9 18.1 19.4 17.3 5.5 5.7 63.8 67.9 1.5 0.7 14.3 0.8 32.9 23.0 69.6 64.2
2019 21.1 18.6 19.7 17.7 4.9 4.5 66.1 74.3 1.8 0.9 14.2 4.8 36.0 21.3 65.8 68.5
2020 20.0 17.8 18.7 17.0 4.7 4.1 69.9 74.3 1.0 0.8 9.6 -5.3 34.4 21.6 66.3 71.1
2021 20.6 17.1 19.2 15.6 3.9 2.9 71.9 72.7 1.3 1.2 10.9 3.5 34.4 24.7 69.3 68.7
2018 Q1 19.6 18.6 18.1 17.6 5.9 5.3 47.8 59.9 0.4 0.3 4.1 2.1 33.6 23.2 73.4 69.2
Q2 20.0 18.4 18.4 17.4 5.8 5.3 54.3 66.6 0.8 0.4 8.0 1.7 33.9 21.9 69.6 65.8
Q3 20.4 18.6 18.9 17.7 5.8 5.5 59.1 67.5 1.1 0.4 11.1 1.2 32.8 23.4 70.2 60.3
Q4 20.9 18.1 19.4 17.3 5.5 5.7 63.8 67.9 1.5 0.7 14.3 0.8 32.9 23.0 69.6 64.2
2019 Q1 19.6 17.8 18.1 16.9 5.5 5.6 63.3 69.3 0.2 0.4 4.3 2.5 34.9 22.5 68.0 64.3
Q2 19.8 19.4 18.5 18.5 5.5 5.3 66.0 74.3 0.9 0.6 8.0 4.1 35.9 20.9 67.9 63.4
Q3 20.5 18.4 19.1 17.4 5.4 5.1 67.8 74.6 1.3 0.6 11.3 3.9 34.3 21.1 67.7 65.4
Q4 21.1 18.6 19.7 17.7 4.9 4.5 66.1 74.3 1.8 0.9 14.2 4.8 36.0 21.3 65.8 68.5
2020 Q1 17.6 17.3 16.3 16.0 4.7 4.2 62.5 73.6 0.4 0.2 4.0 -1.9 33.4 22.5 65.2 70.3
Q2 18.8 17.9 18.2 17.0 4.6 4.7 66.2 72.3 0.6 0.4 6.0 -2.3 32.8 22.2 66.4 67.1
Q3 19.5 17.8 18.2 16.9 4.6 5.0 67.3 74.1 0.8 0.8 8.3 -3.1 32.7 21.6 66.9 69.5
Q4 20.0 17.8 18.7 17.0 4.7 4.1 69.9 74.3 1.0 0.8 9.6 -5.3 34.4 21.6 66.3 71.1
2021 Q1 19.7 17.9 18.3 17.0 4.6 3.7 69.5 71.4 0.3 0.2 3.3 0.8 35.0 21.6 67.8 63.9
Q2 20.4 17.6 18.9 16.7 4.3 3.6 69.6 73.9 0.7 0.6 5.8 1.7 34.1 24.5 67.2 69.4
Q3 20.3 16.8 18.9 15.3 4.3 3.6 69.9 74.4 1.0 0.8 8.5 2.8 34.2 23.8 68.2 67.1
Q4* 20.6 17.1 19.2 15.6 3.9 2.9 71.9 72.7 1.3 1.2 10.9 3.5 34.4 24.7 69.3 68.7
1/ For Locally Incorporated Banks only للمصارف المدرجة محلياً /1
* Provisional data. .بيانات أولية*
- 36 -
المصارف التقليديةConventional Banks
Percentageرأس المال جودة األصول الربحية السيولة
Capital Adequacy 1/ Asset Quality Profitability Liquidity
نسبة رأس المال التنظيمي إلى
األصول المرجحة بالمخاطر
نسبة رأس المال األساسي التنظيمي
إلى األصول المرجحة بالمخاطر
نسبة القروض المتعثرة إلى مجموع
القروض اإلجمالية
نسبة مخصصات القروض المتعثرة
إلى إجمالي القروض المتعثرةنسبة العائد على األصول نسبة العائد على حقوق الملكية
نسبة األصول السائلة إلى مجموع
األصولنسبة القروض إلى الودائع
Return on Equity 1/ Liquid Assets Ratio Loans/Deposit RatioTotal Capital Adequacy
Ratio
Tier 1 Capital Adequacy
Ratio
Non-Performing Loans
Ratio (% of Gross Loans)Specific Provisions Return on Assets

Table No. (37) جدول رقم
مؤشرات السالمة المالية للقطاع المصرفيFinancial Soundness Indicators
النسبة المئوية
نهاية الفترة
End of Period
مصارف التجزئة مصارف الجملة مصارف التجزئة مصارف الجملة مصارف التجزئة مصارف الجملة مصارف التجزئة مصارف الجملة مصارف التجزئة مصارف الجملة مصارف التجزئة مصارف الجملة مصارف التجزئة مصارف الجملة مصارف التجزئة مصارف الجملة
Retail Wholesale Retail Wholesale Retail Wholesale Retail Wholesale Retail Wholesale Retail Wholesale Retail Wholesale Retail Wholesale
2012 18.5 9.4 15.4 7.7 15.0 6.2 40.0 52.8 -0.3 0.3 -2.7 7.1 11.8 23.1 78.7 69.8
2013 17.3 25.8 14.8 24.8 12.1 5.2 41.5 73.4 0.0 0.8 0.4 5.1 13.2 23.4 77.2 67.2
2014 16.9 24.0 14.6 22.9 12.5 4.6 39.2 75.3 0.5 0.5 4.7 3.2 13.3 22.2 79.9 65.6
2015 15.9 20.7 13.7 20.1 12.0 4.6 39.6 81.2 0.2 -0.5 1.4 -3.4 9.9 20.8 78.0 61.8
2016 17.2 19.2 15.2 18.6 11.4 3.7 40.1 81.4 0.4 1.1 3.2 7.2 13.6 17.7 78.7 59.5
2017 18.6 18.3 15.5 17.7 10.0 2.6 35.9 86.5 0.6 0.9 6.1 6.2 12.0 22.4 89.8 60.4
2018 17.8 17.9 14.9 16.9 9.5 1.3 39.4 79.6 0.6 0.9 6.7 6.9 14.1 12.6 94.8 75.1
2019 18.3 18.2 15.7 17.1 10.4 1.1 36.7 93.8 0.4 0.7 4.7 6.4 17.5 17.9 92.5 69.9
2020 20.3 16.4 17.9 15.0 6.5 1.6 42.9 87.6 0.2 0.3 2.1 3.1 17.8 14.6 79.7 63.2
2021 21.2 15.8 19.7 14.4 5.1 0.7 55.3 99.9 0.6 0.8 7.0 10.0 19.9 18.0 74.1 63.0
2018 Q1 18.0 18.5 14.8 17.4 10.0 1.4 41.3 75.7 0.2 0.3 1.5 2.0 14.5 21.0 94.4 67.9
Q2 18.1 20.2 15.1 19.0 10.4 1.8 43.5 85.3 0.3 0.6 2.5 3.9 14.5 13.4 92.1 80.4
Q3 18.2 20.0 15.3 18.9 8.9 1.7 44.4 92.5 0.4 0.8 3.5 5.6 13.9 14.9 97.9 80.5
Q4 17.8 17.9 14.9 16.9 9.5 1.3 39.4 79.6 0.6 0.9 6.7 6.9 14.1 12.6 94.8 75.1
2019 Q1 17.0 18.5 14.1 17.4 9.9 1.2 37.8 90.4 0.1 0.2 1.9 1.2 16.5 14.5 ########### 66.7
Q2 17.3 18.7 14.5 17.6 9.5 1.1 38.0 91.7 0.3 0.4 3.9 3.0 17.7 17.4 95.9 68.7
Q3 18.5 18.5 15.8 17.4 9.7 1.2 36.8 84.6 0.5 0.7 5.4 5.7 16.5 17.4 95.1 71.6
Q4 18.3 18.2 15.7 17.1 10.4 1.1 36.7 93.8 0.4 0.7 4.7 6.4 17.5 17.9 92.5 69.9
2020 Q1 18.5 17.9 15.9 16.7 8.5 1.4 40.8 75.1 0.1 -0.2 1.1 -1.9 18.5 18.6 82.7 68.9
Q2 20.6 17.6 17.8 16.2 7.5 1.4 40.7 78.6 0.2 0.0 2.1 -0.5 17.3 16.5 79.1 65.6
Q3 20.8 17.0 18.2 15.5 7.1 1.7 44.4 72.6 0.2 0.2 2.6 2.4 16.4 14.7 80.6 65.1
Q4 20.3 16.4 17.9 15.0 6.5 1.6 42.9 87.6 0.2 0.3 2.1 3.1 17.8 14.6 79.7 63.2
2021 Q1 20.0 16.2 17.9 14.9 6.0 1.8 48.8 78.6 0.2 0.3 2.2 2.7 16.2 19.3 79.0 66.3
Q2 21.6 16.4 19.6 15.2 5.5 1.8 51.8 78.6 0.3 0.4 3.6 4.7 19.2 18.8 76.2 64.0
Q3 21.4 15.5 19.6 14.2 5.4 0.7 53.5 93.7 0.4 0.7 5.1 8.3 18.6 20.3 76.3 61.9
Q4* 21.2 15.8 19.7 14.4 5.1 0.7 55.3 99.9 0.6 0.8 7.0 10.0 19.9 18.0 74.1 63.0
1/ For Locally Incorporated Banks only للمصارف المدرجة محلياً /1
* Provisional data. .بيانات أولية*
- 37 -
المصارف اإلسالميةIslamic Banks
Percentageرأس المال جودة األصول الربحية السيولة
Capital Adequacy 1/ Asset Quality Profitability Liquidity
نسبة رأس المال التنظيمي إلى
األصول المرجحة بالمخاطر
نسبة رأس المال األساسي التنظيمي
إلى األصول المرجحة بالمخاطر
نسبة القروض المتعثرة إلى مجموع
القروض اإلجمالية
نسبة مخصصات القروض المتعثرة
إلى إجمالي القروض المتعثرةنسبة العائد على األصول نسبة العائد على حقوق الملكية
نسبة األصول السائلة إلى مجموع
األصولنسبة القروض إلى الودائع
Return on Equity 1/ Liquid Assets Ratio Loans/Deposit RatioTotal Capital Adequacy
Ratio
Tier 1 Capital Adequacy
Ratio
Non-Performing Loans
Ratio (% of Gross Loans)Specific Provisions Return on Assets

Table No. (38) جدول رقم
شركات أعمال استثمارية
Investment Business FirmsB. D. Million مليون دينار
الفئة (1) الفئة (2) الفئة (3) مجموع الفئات
Category (1) Category (2) Category (3) Total IB
مجموع الموجودات المدارة لصالح العمالء مجموع موجودات الميزانية مجموع الموجودات المدارة لصالح العمالء
Balance Sheet Total Assets Total Assets Under Management Total Assets Under Management
المجموع
مجموع : ويتضمن
الموجودات
المستثمرة لصالح
الشركات االستثمارية
المقيمة غير المقيمة المجموع المقيمة غير المقيمة المجموع
Total (a)
of which:
Total
Investment
as Principal
ResidentsNon-
ResidentsTotal (b) Residents
Non-
ResidentsTotal (e)
2014 Q1 467.1 118.0 3,648.8 693.3 4,342.1 4,809.2 23.7 936.2 905.8 1,842.0 1,865.7 9.1 6,684.0
Q2 499.9 110.0 3,747.7 727.1 4,474.8 4,974.7 27.7 1,320.6 951.9 2,272.5 2,300.2 9.1 7,284.0Q3 464.8 112.0 3,767.7 707.2 4,474.9 4,939.7 26.4 1,401.7 886.8 2,288.5 2,314.9 9.4 7,264.0Q4 597.9 144.4 4,294.8 859.8 5,154.6 5,752.5 27.7 1,320.4 778.0 2,098.4 2,126.1 11.3 7,889.9
2015 Q1 542.5 136.1 4,317.8 842.4 5,160.2 5,702.7 28.3 1,406.6 793.7 2,200.3 2,228.6 11.4 7,942.7
Q2 581.1 124.8 4,340.1 979.2 5,319.3 5,900.4 36.3 1,391.5 797.9 2,189.4 2,225.7 11.4 8,137.5Q3 450.7 62.7 3,756.5 898.0 4,654.5 5,105.2 30.3 1,375.1 731.9 2,107.0 2,137.3 9.7 7,252.2Q4 318.9 45.6 3,770.7 890.3 4,661.0 4,979.9 42.0 1,368.9 699.7 2,068.6 2,110.6 10.1 7,100.6
2016 Q1 286.6 46.1 3,648.4 856.8 4,505.2 4,791.8 42.6 1,338.3 669.6 2,007.9 2,050.5 7.9 6,850.2
Q2 277.8 49.0 3,634.0 912.2 4,546.2 4,824.0 36.1 1,367.5 609.1 1,976.6 2,012.7 8.9 6,845.6Q3 268.9 44.5 3,653.8 924.9 4,578.7 4,847.6 47.7 1,462.4 624.3 2,086.7 2,134.4 8.7 6,990.7Q4 286.2 50.3 3,656.7 947.9 4,604.6 4,890.8 30.6 1,631.1 667.5 2,298.6 2,329.2 9.7 7,229.7
2017 Q1 290.9 54.8 3,724.5 922.4 4,646.9 4,937.8 32.7 1,734.0 677.2 2,411.2 2,443.9 9.2 7,390.9
Q2 289.3 57.9 3,781.3 959.2 4,740.6 5,029.8 35.1 1,809.6 694.7 2,504.3 2,539.4 8.6 7,577.8Q3 291.5 58.6 3,821.9 986.1 4,808.0 5,099.5 38.3 1,797.2 742.9 2,540.0 2,578.3 8.3 7,686.1Q4 291.1 51.6 3,855.0 942.2 4,794.2 5,085.3 36.7 1,767.5 730.4 2,497.8 2,534.5 8.7 7,628.5
2018 Q1 281.0 60.0 3,894.7 902.8 4,797.4 5,078.4 39.5 1,869.0 746.7 2,615.7 2,655.2 8.4 7,742.1
Q2 286.1 57.8 3,877.8 928.9 4,806.7 5,092.7 37.6 1,899.8 734.6 2,634.5 2,672.1 7.5 7,772.3
Q3 291.9 67.7 3,900.4 909.3 4,809.7 5,101.5 43.3 1,967.4 739.7 2,707.7 2,751.0 7.4 7,859.9
Q4 266.3 68.2 3,841.6 900.2 4,741.8 5,008.1 40.1 2,058.7 624.4 2,683.1 2,723.2 7.6 7,738.8
2019 Q1 254.2 109.6 4,029.7 874.4 4,904.1 5,158.3 41.9 1,917.8 1,109.7 3,027.5 3,069.4 7.4 8,235.1
Q2 289.3 121.3 3,897.6 857.4 4,755.0 5,044.3 40.3 1,985.7 1,266.2 3,251.9 3,292.2 7.4 8,343.9Q3 386.3 111.5 3,960.4 3,316.2 7,276.6 7,662.9 47.9 2,037.8 1,235.1 3,272.9 3,320.8 6.0 10,989.7
Q4 252.3 134.3 4,087.9 886.9 4,974.8 5,227.1 39.8 2,533.6 849.8 3,383.4 3,423.2 7.9 8,658.2
2020 Q1 368.2 175.3 3,700.8 3,130.0 6,830.8 7,199.0 43.4 2,256.5 628.3 2,884.8 2,928.2 8.3 10,135.5
Q2 364.4 162.6 3,580.2 3,129.7 6,709.9 7,074.3 35.7 1,949.7 1,189.8 3,139.5 3,175.2 10.1 10,259.6Q3 333.0 150.6 3,674.0 3,000.4 6,671.4 7,004.4 40.0 2,502.4 899.6 3,389.7 3,429.7 8.0 10,442.1Q4 400.1 201.6 4,136.0 3,074.0 7,210.0 7,610.1 39.2 3,030.8 592.1 3,622.9 3,662.1 8.2 11,280.3
2021 Q1 395.1 193.2 4,015.9 3,095.9 7,111.9 7,507.0 41.1 2,203.0 1,456.3 3,659.3 3,700.4 8.4 11,215.7Q2 404.2 191.0 4,078.9 3,259.9 7,338.7 7,742.9 41.1 2,328.7 1,512.8 3,841.5 3,882.6 7.2 11,632.7Q3 414.9 141.1 4,069.7 3,425.0 7,494.7 7,909.6 44.1 2,701.3 1,087.2 3,788.5 3,832.6 9.0 11,751.2Q4 367.1 139.9 4,101.0 3,314.7 7,415.7 7,782.8 45.8 2,430.5 1,473.9 3,904.4 3,950.2 8.7 11,741.7
- 38 -
Total Assets
(Cat 1,2,3)
(h) = (c+f+g)
نهاية الفترة
مجموع
الموجودات
مجموع موجودات
الميزانية
مجموع
الموجودات
مجموع موجودات
الميزانيةالمجموع الكلي
End of Period
Total Assets
(c) = (a+b)
Balance
Sheet Total
Assets (d)
Total Assets
(f) = (d+e)
Balance
Sheet Total
Assets (g)

Table No. (39) جدول رقم
الميزانية الموحدة لمكاتب الصرافة
Money Changers: Aggregated Balance SheetBD Thousand ألف دينار
Assets الموجودات Liabilities المطلوبات
Domestic المحلية Domestic المحلية
ودائع لدى مستحق من موجودات موجودات المجموع قروض من مستحق الى مطلوبات رأس المال مطلوبات
النقد المصارف الغير أخرى المجموع أجنبية Total المصارف الغير أخرى واإلحتياطي المجموع أجنبية
Cash Deposits in Due from Other Total Foreign Loans from Due to Other Equity & Total Foreign
Banks Others 1/ Assets Assets Banks Others 1/ Liabilities Reserves Liabilities
2014 Q1 59,077.1 1,138.1 403.2 18,199.2 78,817.6 27,828.1 106,645.7 7,821.0 483.2 20,503.9 50,452.0 79,260.1 27,385.6
Q2 66,559.0 1,140.7 1,452.0 11,909.4 81,061.1 32,541.7 113,602.8 4,674.3 282.5 17,205.2 49,423.8 71,585.8 42,017.0
Q3 68,306.3 1,143.4 527.9 19,475.7 89,453.3 25,179.7 114,633.0 7,853.7 1,586.3 18,368.3 52,014.0 79,822.3 34,810.7
Q4 36,080.4 1,142.9 1,152.6 14,899.5 53,275.4 21,034.2 74,309.6 626.5 685.7 12,384.1 54,681.3 68,377.6 5,932.0
2015 Q1 38,111.4 1,143.0 1,979.0 14,776.4 56,009.8 29,652.6 85,662.4 3,045.7 72.7 18,023.4 57,117.3 78,259.1 7,403.3
Q2 58,410.3 2,536.3 1,141.0 15,182.3 77,269.9 20,239.3 97,509.2 8,009.9 107.4 21,511.8 58,541.2 88,170.3 9,338.9
Q3 59,419.7 1,548.7 1,662.5 13,437.6 76,068.4 43,361.4 119,429.8 4,324.5 101.0 33,308.9 60,185.1 97,919.5 21,510.3
Q4 37,927.0 1,424.5 386.8 19,504.4 59,242.7 30,046.0 89,288.7 554.0 40.2 18,401.9 62,169.8 81,165.8 8,122.9
2016 Q1 40,168.4 1,448.7 1,645.1 18,038.3 61,300.5 40,835.3 102,135.8 5,725.1 77.9 22,859.6 64,965.7 93,628.2 8,507.6
Q2 41,297.1 1,428.3 3,413.7 27,025.6 73,164.7 48,324.8 121,489.5 1,912.2 82.5 45,148.2 63,390.7 110,533.6 10,955.9
Q3 66,464.6 1,183.9 861.2 28,073.6 96,583.2 30,106.1 126,689.3 815.6 76.0 40,872.3 64,604.2 106,368.1 20,321.2
Q4 50,429.7 1,087.8 557.7 26,818.2 78,893.4 45,225.0 124,118.4 25,906.2 64.9 17,167.5 64,603.8 107,742.5 16,375.9
2017 Q1 48,566.3 4,923.9 1,338.8 27,137.9 81,966.9 38,733.6 120,700.5 30,327.9 175.6 11,563.8 65,158.5 107,225.9 13,474.6
Q2 57,826.7 4,823.0 1,755.9 27,842.0 92,247.6 40,646.9 132,894.5 38,837.9 76.7 12,300.8 68,781.8 119,997.2 12,897.3
Q3 76,983.1 4,830.2 6,438.7 28,938.7 117,190.7 28,773.8 145,964.5 34,033.0 73.0 12,888.2 70,575.6 117,569.8 28,394.7
Q4 53,188.8 4,831.3 1,000.3 17,667.0 76,687.4 42,744.8 119,432.2 31,256.0 128.4 9,825.7 60,881.5 102,091.6 17,340.6
2018 Q1 80,019.1 4,987.4 1,170.9 37,002.2 123,179.5 34,930.5 158,110.0 27,599.5 228.5 31,583.1 61,994.5 121,405.6 36,704.4
Q2 128,775.8 6,487.5 1,563.7 24,741.3 161,568.2 13,749.8 175,318.0 36,712.9 313.1 14,747.8 62,915.5 114,689.3 60,628.7
Q3 78,879.8 6,629.5 926.7 20,621.8 107,057.8 50,565.3 157,623.1 29,280.9 98.7 13,715.1 63,494.8 106,589.5 51,033.6
Q4 37,234.0 5,298.0 175.7 20,049.6 62,757.3 46,658.3 109,415.6 26,595.3 37.4 11,424.9 61,724.7 99,782.3 9,633.3
2019 Q1 67,398.9 5,699.8 45.4 19,400.0 92,544.1 62,113.0 154,657.0 19,312.7 107.5 15,787.0 62,900.5 98,107.7 56,549.4
Q2 79,993.7 4,638.3 125.2 21,813.6 106,570.8 28,523.7 135,094.5 22,733.8 76.1 15,172.3 59,526.5 97,508.7 37,585.8
Q3 50,552.4 4,629.3 18.1 20,682.1 75,881.9 38,591.3 114,473.2 23,146.1 387.9 12,666.9 57,861.9 94,062.9 20,410.4
Q4 51,415.0 4,519.7 303.7 18,653.6 74,892.1 26,850.6 101,742.7 21,199.2 197.9 7,749.8 56,869.6 86,016.5 15,726.2
2020 Q1 60,043.7 6,276.2 38.5 23,805.6 90,164.0 17,132.5 107,296.5 21,634.9 110.4 13,959.0 63,492.9 99,197.2 8,099.3
Q2 65,015.8 8,352.1 85.3 19,793.2 93,246.4 11,835.8 105,082.3 17,132.2 102.2 16,433.5 54,939.9 88,607.8 16,474.4
Q3 62,704.0 10,006.6 598.1 21,265.1 94,573.7 15,385.3 109,959.1 16,693.8 125.2 16,153.6 59,388.4 92,361.0 17,598.0
Q4 40,913.8 13,467.0 268.3 18,949.8 73,598.9 19,767.7 93,366.7 15,360.9 25.0 12,091.1 58,771.8 86,248.9 7,117.8
2021 Q1 51,432.0 12,164.9 174.9 21,330.6 85,102.3 16,453.0 101,555.3 15,293.2 207.5 15,752.0 59,720.4 90,973.1 10,582.2
Q2 81,209.5 12,316.7 65.3 20,780.4 114,371.8 11,847.9 126,219.7 12,684.3 60.7 20,515.5 61,676.4 94,937.0 31,282.8
Q3 62,901.1 12,370.9 250.5 20,157.6 95,680.1 23,510.8 119,190.9 12,911.5 40.6 19,396.5 63,606.9 95,955.5 23,235.4
Q4 55,767.0 12,365.6 76.7 20,782.2 88,991.6 19,386.9 108,378.5 12,703.0 47.3 16,962.8 65,851.5 95,564.6 12,813.9
1/ includes other money changers and travellers' cheque companies. .يشمل على مكاتب الصرافة األخرى وشركات إصدار الشيكات السياحية\ 1
- 39 -
نهاية الفترة
End of Period

Table No. (40) جدول رقم
أنظمة المدفوعات
Payment Systems
B.D. Million مليون دينار
العدد القيمة العدد القيمة العدد القيمة العدد القيمة
Volume Value Volume Value Volume Value Volume Value
9,691.1 39,452.5 6,825.1 5,367,978 511.9 10,455.8 48,340.6 9,076.5 6,469,271 631.7 12,433.9 50,934.6 10,136.7 8,029,462 786.5 15,074.7 53,503.8 10,479.3 9,271,985 909.2 4,881 1.4 179,326 633.1 - 0.0
2016 11,144.8 64,772.2 10,087.7 11,524,588 1,105.8 131,548 35.7 2,589,591 7,286.6 102,758 12.5 9,134.1 78,021.1 10,058.5 15,158,643 1,429.7 371,841 87.6 4,981,026 9,630.8 1,244,287 79.0
2018 9,232.9 81,718.9 9,472.0 17,811,102 1,651.9 962,740 174.7 5,831,526 11,159.1 1,665,110 133.1 2019 9,372.9 85,142.4 8,737.8 19,731,651 1,746.6 6,322,911 542.9 7,110,816 12,671.9 1,995,920 291.5 2020 10,593.5 68,026.2 7,266.4 18,741,958 1,555.7 47,247,358 2,237.8 8,702,806 13,458.7 4,199,985 465.0 2021 9,673.9 83,922.6 7,254.8 15,758,177 1,419.6 141,835,256 4,462.5 9,681,631 15,378.3 9,140,103 685.4
2020 Q1 2,559.8 21,878.3 2,113.3 5,104,104 431.3 4,584,502 304.6 2,129,704 3,406.0 571,863 115.1 Q2 2,843.5 16,386.7 1,653.3 4,358,401 368.4 8,974,578 506.5 2,151,686 3,470.0 690,174 105.9 Q3 2,662.0 13,685.6 1,712.1 4,647,141 376.9 13,896,169 641.1 2,157,866 3,158.5 1,280,802 118.7 Q4 2,528.2 16,075.6 1,787.7 4,632,312 379.2 19,792,109 785.6 2,263,550 3,424.2 1,657,146 125.3
2021 Q1 2,633.9 20,380.2 1,812.1 4,224,205 363.7 25,552,775 920.1 2,296,439 3,635.9 1,907,069 164.0 Q2 2,435.3 21,612.6 1,766.8 3,798,507 345.8 31,037,798 1,051.4 2,367,030 3,725.4 2,209,563 144.2 Q3 2,303.7 20,808.5 1,779.7 3,812,110 348.7 38,937,387 1,174.1 2,453,191 3,814.2 2,457,854 163.7 Q4 2,301.0 21,121.3 1,896.2 3,923,355 361.3 46,307,296 1,316.9 2,564,971 4,202.7 2,565,617 213.5
2021 Feb. 787.0 6,371.4 549.7 1,300,377 112.2 7,682,812 278.8 694,159 1,059.1 586,616 41.7 Mar. 993.9 7,751.4 655.4 1,453,323 129.4 9,833,945 350.8 781,583 1,334.5 700,288 72.0 Apr. 743.2 7,202.6 588.4 1,290,816 117.3 9,565,290 332.7 885,795 1,252.4 676,286 48.4 May 806.7 5,495.8 566.4 1,302,545 116.4 10,833,976 360.8 760,632 1,180.2 809,842 51.3 Jun. 885.4 8,914.2 612.1 1,205,146 112.1 10,638,532 357.9 720,603 1,292.8 723,435 44.4 Jul. 657.9 5,810.3 571.5 1,317,553 120.1 13,006,538 398.3 861,072 1,167.6 760,696 48.6 Aug. 783.9 7,135.7 593.2 1,241,441 113.2 12,638,251 386.5 801,586 1,266.6 854,978 60.1 Sep. 861.9 7,862.5 615.0 1,253,116 115.4 13,292,598 389.3 790,533 1,380.0 842,180 55.0 Oct. 742.1 7,094.5 593.3 1,312,556 120.7 14,719,767 419.3 906,828 1,290.5 868,324 102.3 Nov. 703.7 6,205.5 650.1 1,241,855 115.4 15,153,414 430.4 817,960 1,357.1 847,851 54.5 Dec. 855.3 7,821.4 652.8 1,368,944 125.2 16,434,115 467.2 840,183 1,555.1 849,442 56.7
2022 Jan. 774.5 7,481.1 590.6 1,187,060 112.1 16,585,948 444.0 931,740 1,386.7 904,646 75.5
Feb. 733.8 6,023.9 589.5 1,108,148 106.4 16,067,475 432.3 791,026 1,282.1 829,383 65.3
1/ The Real Time Gross Settlement (RTGS) System went live on 14th June 2007 2007 يونيو 14بدأ عمل النظام اآلني للتسويات اإلجمالية في / 1
2/ The Bahrain Cheque Truncation System (BCTS) went live on 13th May, 2012 2012 مايو 13بدأ عمل نظام البحرين لمقاصة الشيكات اإللكتروني في / 2
3/ Local Debit Cards Only بطاقات الخصم المحلية فقط/ 3
4/ The Electronic Fund Transfer System (EFTS) went live on 5th November 2015 (only with Fawri+ and Fawri) 2015 نوفمبر 5في (فقط+ فوري و فوري)بدأ عمل نظام التحويالت المالية اإللكتروني / 4
5/ The Electronic Bill Presentment and Payment (EBPP) System i.e. Fawateer went live officially on 1st
February, 2016 (Direct Debit Service) 5 / (خدمة الدفع المباشر)2016 أكتوبر 3و (خدمة االستقطاع المباشر) 2016 فبراير 1بشكل رسمي في بدأ عمل نظام عرض ودفع الفواتير اإللكترونية
and on 3rd October, 2016 (Direct Credit Service)
- 40 -
Real Time Gross Settlement (RTGS)
System 1/
2012
2013
فوري
FawriFawri +
Interbank
Transactions
+فوري
عمليات السحب من أجهزة الصراف اآللينظام التحويالت المالية اإللكتروني
Electronic Funds Transfer System (EFTS) and Electronic Bill Payment and Presentment (EBPP) 4/
ATM Withdrawal Transactions 3/فواتير
Fawateer 5/
During the Period
2017
تحويالت الزبائنالتحويالت المصرفية بين
المصارف التجارية Bahrain Cheque
Truncation
System (BCTS)
نظام البحرين لمقاصة
الشيكات اإللكتروني
Customer
Transactions
2014
2015
النظام اآلني للتسويات اإلجمالية

العددالقيمة
(مليون دينار)العدد
كنسبة من إجمالي عدد
الشيكات الصادرة
القيمة
(مليون دينار)
كنسبة من إجمالي قيمة
الشيكات الصادرةالعدد
القيمة
(مليون دينار)العدد
القيمة
(مليون دينار)
VolumeValue
(B.D. Million)Volume
% of Total
Cheques Issued
Value
(B.D. Million)
% of Total
Cheques IssuedVolume
Value
(B.D. Million)Volume
Value
(B.D. Million)
2013 3,249,487 9,076.5 87,145 2.7% 207.1 2.3% 17,869 66.8 69,276 140.3
2014 3,382,447 10,136.7 83,681 2.5% 236.5 2.3% 17,403 67.7 66,278 168.8
2015 3,372,471 10,479.3 84,944 2.5% 254.0 2.4% 17,080 74.2 67,864 179.8
2016 3,303,295 10,087.7 88,416 2.7% 294.9 2.9% 16,257 76.9 72,159 218.0
2017 3,300,941 10,058.5 105,111 3.2% 369.8 3.7% 21,042 139.2 84,069 230.6
2018 3,166,987 9,472.1 99,961 3.2% 318.4 3.4% 20,836 66.7 79,125 251.7
2019 2,964,508 8,737.8 92,571 3.1% 252.5 2.9% 19,039 59.9 73,532 192.2
2020 2,331,423 7,266.4 63,668 2.7% 195.5 2.7% 13,509 53.0 50,159 142.5
2021 2,175,075 7,254.8 56,047 2.7% 242.2 2.7% 11,426 93.6 44,621 148.7
2020 Q1 696,858 2,113.3 20,452 2.9% 69.7 3.3% 4,372 17.4 16,080 52.4
Q2 509,524 1,653.3 13,523 2.7% 37.3 2.3% 3,042 12.8 10,481 24.5
Q3 544,921 1,712.1 13,467 2.5% 38.6 2.3% 2,972 11.3 10,495 27.2
Q4 580,120 1,787.7 16,226 2.8% 49.9 2.8% 3,123 11.5 13,103 38.4
2021 Q1 557,107 1,812.0 13,993 2.5% 56.4 3.1% 2,603 11.1 11,390 45.4
Q2 527,748 1,766.8 13,711 2.6% 52.6 3.0% 2,534 12.0 11,177 40.6
Q3 535,986 1,779.7 14,605 2.7% 89.1 5.0% 3,315 57.3 11,290 31.8
Q4 554,234 1,896.2 13,738 2.5% 44.1 2.3% 2,974 13.2 10,764 30.9
2021 Feb. 172,579 549.7 4,385 2.5% 9.9 1.8% 837 2.4 3,548 7.5
Mar. 201,349 655.4 4,681 2.3% 15.4 2.3% 874 4.5 3,807 11.0
Apr. 173,339 588.4 4,086 2.4% 13.2 2.2% 719 3.8 3,367 9.4
May 174,898 566.4 4,999 2.9% 20.5 3.6% 848 4.9 4,151 15.7
Jun. 179,511 612.1 4,626 2.6% 18.9 3.1% 967 3.3 3,659 15.6
Jul. 160,510 571.5 5,028 3.1% 62.7 11.0% 1,600 49.6 3,428 13.1
Aug. 189,777 593.2 5,108 2.7% 14.2 2.4% 855 3.9 4,253 10.3
Sep. 185,699 615.0 4,469 2.4% 12.2 2.0% 860 3.8 3,609 8.4
Oct. 182,302 593.3 4,638 2.5% 17.5 2.9% 913 2.8 3,725 14.7
Nov. 188,687 650.1 4,503 2.4% 13.7 2.1% 984 4.6 3,519 9.1
Dec. 183,245 652.8 4,597 2.5% 13.0 2.0% 1,077 5.9 3,520 7.1
2022 Jan. 180,714 590.6 4,914 2.7% 14.1 2.4% 840 4.5 4,074 9.6
Feb. 168,062 589.5 4,522 2.7% 13.1 2.2% 791 2.6 3,731 10.5
1/ The Bahrain Cheque Truncation System (BCTS) went live on Sunday, 13th May, 2012. .2012 مايو 13بدأ عمل نظام البحرين لمقاصة الشيكات اإللكتروني بتاريخ األحد، / 1
- 41 -
Returned Cheques for Technical
Reasons
Returned Cheques for Financial
Reasons
Table No. (41) جدول رقم
الشيكات المرتجعة- نظام البحرين لمقاصة الشيكات اإللكتروني
Bahrain Cheque Truncation System (BCTS) - Returned Cheques
During the Period
إجمالي الشيكات الصادرة اجمالي الشيكات المرتجعة الشيكات المرتجعة ألسباب تقنية الشيكات المرتجعة ألسباب مالية
Total Cheques Issued Total Returned Cheques

Table No. (42) جدول رقم
عمليات نقاط البيع والتجارة اإللكترونية
Points of Sales and E-Commerce Transactions
Of which: E-Commerce Trans.
البطاقات المصدرة في
البحرين
البطاقات المصدرة خارج
البحرينالمجموع
ومنه البطاقات
الالتالمسية
البطاقات المصدرة في
البحرين
البطاقات المصدرة خارج
البحرينالمجموع
ومنه البطاقات
الالتالمسيةعدد العمليات (دينار)قيمة العمليات
Cards issued in
Bahrain
Cards issued
outside BahrainTotal
of which
Contactless
Cards
Cards issued in
Bahrain
Cards issued
outside BahrainTotal
of which
Contactless
Cards
Number of
transactions
Value of
transactions
(BD)
2018 49,048,695 15,425,030 64,473,725 N/A 1,524,054,553 453,159,703 1,977,214,256 N/A N/A N/A 35,010
2019 58,433,552 15,246,093 73,679,645 N/A 1,877,177,353 557,218,330 2,434,395,681 N/A N/A N/A 40,262
2020 77,347,515 6,438,295 83,785,810 31,863,198 2,124,921,776 216,993,593 2,341,915,369 438,734,453 N/A N/A 24,702
2021 109,539,142 16,009,386 125,548,528 82,397,936 2,707,223,375 443,993,621 3,151,216,996 1,252,676,799 11,470,238 988,113,898 32,742
2020 Q1 17,208,015 3,403,237 20,611,252 7,232,947 502,314,582 111,827,796 614,142,378 101,414,385 N/A N/A 42,768
Q2 15,874,738 772,294 16,647,032 5,632,961 447,251,147 25,008,665 472,259,812 75,960,199 N/A N/A 43,538
Q3 20,504,199 907,432 21,411,631 8,062,483 554,864,878 33,249,383 588,114,260 108,290,222 N/A N/A 22,587
Q4 23,760,563 1,355,332 25,115,895 10,934,807 620,491,169 46,907,750 667,398,919 153,069,648 N/A N/A 24,702
2021 Q1 25,207,125 1,620,229 26,827,354 15,301,960 639,417,616 53,619,453 693,037,069 228,768,206 2,604,591 220,154,223 27,800
Q2 24,884,685 1,810,883 26,695,568 17,079,841 615,312,730 58,961,685 674,274,415 255,496,096 2,835,759 239,510,052 29,394
Q3 29,079,182 4,897,285 33,976,467 23,118,851 698,432,809 138,429,500 836,862,309 352,077,213 2,624,711 250,201,365 30,775
Q4 30,368,150 7,680,989 38,049,139 26,897,284 754,060,220 192,982,983 947,043,202 416,335,285 3,405,177 278,248,258 32,742
2021 Feb. 7,617,141 466,910 8,084,051 4,588,941 194,919,840 16,156,149 211,075,989 67,822,561 858,330 72,945,324 27,074
Mar. 9,023,335 616,518 9,639,853 5,947,095 230,997,175 20,426,160 251,423,335 93,507,253 972,159 80,198,973 27,800
Apr. 8,241,607 584,293 8,825,900 5,745,585 215,280,129 20,359,130 235,639,259 90,832,179 885,378 79,981,641 28,287
May 8,888,683 763,309 9,651,992 6,281,754 212,613,728 25,363,618 237,977,346 97,325,301 960,672 75,262,252 29,013
Jun. 7,754,395 463,281 8,217,676 5,052,502 187,418,872 13,238,938 200,657,810 67,338,616 989,709 84,266,159 29,394
Jul. 9,875,340 1,271,093 11,146,433 7,548,210 235,673,376 37,506,988 273,180,364 116,695,737 887,482 80,800,089 29,931
Aug. 9,464,619 1,856,737 11,321,356 7,614,346 228,263,219 51,375,562 279,638,781 115,885,859 884,233 83,073,081 30,329
Sep. 9,739,223 1,769,455 11,508,678 7,956,295 234,496,214 49,546,950 284,043,164 119,495,618 852,996 86,328,194 30,775
Oct. 10,344,295 2,274,366 12,618,661 8,861,166 245,209,272 57,493,648 302,702,920 130,485,590 983,468 91,616,736 31,264
Nov. 9,927,970 2,563,534 12,491,504 8,855,504 247,996,084 69,109,208 317,105,292 139,489,652 1,242,379 88,736,867 32,048
Dec. 10,095,885 2,843,089 12,938,974 9,180,614 260,854,864 66,380,127 327,234,991 146,360,043 1,179,330 97,894,655 32,742
2022 Jan. 9,761,895 2,796,592 12,558,487 8,886,747 232,312,131 58,182,383 290,494,514 128,707,808 1,130,328 93,432,371 33,347
Feb. 9,073,097 2,328,794 11,401,891 8,170,875 221,378,337 50,693,669 272,072,008 118,744,903 1,313,169 95,373,548 33,894
- 42 -
الفترة
Period
عدد أجهزة نقاط البيع
(نهاية الفترة)
No. of POS
terminals
(end of period)
عدد العمليات
Number of transactions
(دينار)قيمة العمليات
Value of transactions (BD) عمليات التجارة اإللكترونية: ومنها

Table No. (43) جدول رقم
بطاقات االئتمان المصدرة في البحرين- عمليات نقاط البيع والتجارة اإللكترونية حسب القطاعات
Points of Sales and E-Commerce Transactions by Sectors - Credit Cards issued in Bahrain
Value of Transactions in B.D. قيمة المعامالت بالدينار البحريني
2021 2022
عدد العمليات القيمة عدد العمليات القيمة عدد العمليات القيمة عدد العمليات القيمة عدد العمليات القيمة عدد العمليات القيمة عدد العمليات القيمة
No. of trans. Value No. of trans. Value No. of trans. Value No. of trans. Value No. of trans. Value No. of trans. Value No. of trans. Value
1 Education التعليم 3,056,628 5,857 3,294,442 5,021 1,751,111 4,539 2,017,831 5,377 1,801,504 5,050 3,613,162 7,713 2,214,305 4,293
2 Lodging - Hotels, Motels, Resorts الفنادق والمنتجعات- اإلقامة 1,183,294 12,692 1,854,821 13,872 1,074,934 14,901 947,406 14,149 1,086,626 16,109 1,052,818 13,914 1,388,527 16,017
3 Restaurants المطاعم 5,362,448 681,403 5,807,762 735,692 5,838,320 746,475 5,598,990 726,899 6,129,889 785,720 5,589,820 730,469 5,537,354 717,972
4 Health الصحة 4,063,510 178,530 4,290,043 186,534 4,234,720 174,497 4,323,102 173,150 4,314,924 175,168 4,529,502 171,870 4,308,683 161,834
5 Government Services الخدمات الحكومية 62,618,413 233,627 63,846,389 250,951 65,586,610 273,844 59,210,379 261,557 60,143,562 251,545 58,871,151 254,890 55,400,006 232,674
6
Construction - Contractors, Building
Materials and Maintenance & Related
Services 40,645 2,647,606 43,729 2,882,947 49,856 3,223,272 51,080 3,424,059 53,505 4,459,518 48,345 2,797,293 45,636 2,859,962
المقاولون ، مواد البناء والصيانة والخدمات ذات - البناء
الصلة
7 Supermarket أسواق السوبرماركت 7,887,490 536,596 8,483,978 580,994 8,264,584 576,347 8,173,245 569,178 8,341,842 581,010 8,273,803 562,950 7,409,793 509,212
8 Jewelry Stores متاجر المجوهرات 3,037,007 7,716 2,920,232 8,000 6,652,195 14,742 10,369,044 14,853 4,159,527 9,972 3,227,756 8,489 3,743,831 8,995
9 Department Store المتاجر 2,225,256 92,132 2,190,316 97,987 2,905,350 112,170 2,518,860 103,388 2,601,863 110,180 2,378,266 102,245 2,680,094 112,419
10 Clothing and Footwear المالبس واألحذية 2,057,311 67,757 2,513,836 89,302 3,466,176 114,217 3,309,873 108,342 2,785,906 98,241 2,609,391 97,384 2,759,653 102,734
11 Electronic and Digital Goods مبيعات األجهزة اإللكترونية والرقمية 1,886,361 24,364 1,948,368 26,472 2,918,493 31,867 2,624,328 30,669 2,434,394 29,331 2,129,372 27,853 2,496,559 28,340
12 Insurance 12,169 1,258,246 12,891 1,364,177 13,430 1,427,827 13,736 1,442,390 15,274 1,681,385 12,524 1,322,920 12,497 1,279,711 التأمين
13 Telecommunication االتصاالت 4,121,898 137,824 4,427,588 151,524 4,967,124 152,769 4,816,743 149,092 4,723,517 158,423 4,512,836 151,569 4,565,311 151,236
14 Transportation وسائل النقل 298,440 4,616 310,106 4,776 346,683 5,940 309,873 5,743 278,471 5,127 272,248 4,821 295,973 4,901
15
Automobile and Truck Dealers - Sales,
Service, Repairs, Parts and Leasing تجار السيارات والشاحنات 6,043,509 70,263 6,041,266 74,769 9,372,700 82,646 7,331,736 83,242 7,600,300 87,281 7,628,254 83,414 7,828,355 79,010
16 Travel السفر 1,281,141 4,155 1,365,320 4,128 1,580,928 5,286 1,572,598 5,222 1,434,378 5,063 1,301,956 4,507 1,585,898 4,550
17 Family Entertainment & Tourism الترفيه العائلي والسياحة 939,387 42,560 783,834 39,473 1,123,171 55,579 876,876 42,575 996,437 53,202 811,623 38,016 776,959 38,879
18
Equipment, Furniture & Home Furnishings
Stores (except appliances) متاجر األثاث 1,623,097 19,532 1,781,060 20,248 2,975,054 27,147 2,210,274 21,296 2,157,338 23,059 1,993,992 23,748 1,991,017 23,845
19 Book Stores & Stationary متاجر الكتب والقرطاسية 141,552 6,655 146,394 6,630 198,986 7,733 171,852 7,597 216,958 8,362 228,433 10,033 182,257 7,108
20 Miscellaneous Goods & Services سلع وخدمات غير مصنفة أعاله 3,825,240 101,048 4,352,294 116,460 5,504,752 133,738 5,312,086 122,796 4,629,115 121,026 4,727,932 117,532 4,507,264 113,363
Total المجموع 115,791,654 2,285,460 120,478,263 2,473,702 134,902,795 2,603,216 126,561,547 2,509,941 120,487,650 2,587,155 117,999,438 2,468,037 113,577,691 2,370,196
Government Services includes: Court Costs including Alimony and Child Support, Fines, Bail and Bond Payments, Tax Payments, تكاليف المحكمة بما في ذلك النفقة ودعم الطفل، الغرامات، دفع الكفالة والسندات، المدفوعات الضريبية، : تشمل الخدمات الحكومية
Government Services not elsewhere classified, Government Postal Services, and Intra-Government Purchases .الخدمات الحكومية غير المصنفة في مكان آخر، الخدمات البريدية الحكومية، والمشتريات الحكومية
- 43 -
Sector القطاعAugust September October November December January February

Table No. (44) جدول رقم
بطاقات االئتمان المصدرة خارج البحرين- عمليات نقاط البيع والتجارة اإللكترونية حسب القطاعات
Points of Salesand E-Commerce Transactions by Sectors - Credit Cards issued Outside Bahrain
Value of Transactions in B.D. قيمة المعامالت بالدينار البحريني
2021 2022
عدد العمليات القيمة عدد العمليات القيمة عدد العمليات القيمة عدد العمليات القيمة عدد العمليات القيمة عدد العمليات القيمة عدد العمليات القيمة
No. of trans. Value No. of trans. Value No. of trans. Value No. of trans. Value No. of trans. Value No. of trans. Value No. of trans. Value
1 Education التعليم 348,572 1,028 292,548 891 233,076 1,006 313,231 1,288 242,850 878 350,885 1,074 300,480 775
2 Lodging - Hotels, Motels, Resorts الفنادق والمنتجعات- اإلقامة 6,426,049 69,579 6,815,324 84,032 7,946,347 91,544 8,356,338 91,634 7,603,739 89,765 7,173,306 79,883 7,733,109 86,970
3 Restaurants المطاعم 7,303,185 711,739 8,884,409 816,057 8,062,442 778,039 7,585,632 700,423 6,573,517 533,772 5,291,322 373,266 5,473,254 385,488
4 Health الصحة 1,194,168 67,494 1,266,419 62,236 1,262,436 58,100 1,106,787 50,385 992,585 41,176 841,676 31,394 811,591 30,058
5 Government Services الخدمات الحكومية 1,227,448 37,451 1,395,787 52,332 1,558,265 62,044 1,518,301 57,310 1,982,613 46,683 1,896,772 47,688 1,799,170 61,612
6
Construction - Contractors, Building
Materials and Maintenance & Related
Services 11,632 497,028 10,954 469,930 13,099 524,899 13,593 453,876 15,331 559,614 14,049 488,344 11,025 446,019
المقاولون ، مواد البناء والصيانة والخدمات ذات - البناء
الصلة
7 Supermarket أسواق السوبرماركت 1,914,689 139,793 2,332,805 175,383 2,232,753 170,891 2,023,960 153,976 1,795,078 130,270 1,453,035 95,172 1,367,675 93,623
8 Jewelry Stores متاجر المجوهرات 2,655,142 4,854 2,452,910 5,226 4,437,486 8,637 9,596,224 9,544 3,080,296 6,749 2,805,121 5,222 3,001,472 5,565
9 Department Store المتاجر 1,607,600 50,552 1,837,842 65,115 2,219,754 73,077 2,123,504 69,623 1,889,777 61,748 1,492,505 40,790 1,599,428 44,907
10 Clothing and Footwear المالبس واألحذية 2,306,857 47,931 3,475,357 81,134 4,273,492 90,968 3,783,471 79,124 3,131,676 68,507 2,453,686 48,180 2,678,525 55,250
11 Electronic and Digital Goods مبيعات األجهزة اإللكترونية والرقمية 474,834 8,047 512,879 10,520 795,959 13,759 645,303 11,459 606,782 10,973 444,702 7,382 456,170 7,949
12 Insurance 48,044 182,897 51,507 192,620 62,612 218,440 65,122 271,505 73,755 314,633 68,516 310,452 27,723 187,725 التأمين
13 Telecommunication االتصاالت 968,885 55,206 963,168 57,073 912,058 48,444 756,316 42,984 548,531 30,588 303,528 18,102 323,098 18,579
14 Transportation وسائل النقل 43,390 3,997 54,824 4,876 54,903 5,261 94,627 5,316 61,846 3,951 90,744 2,711 71,940 2,619
15
Automobile and Truck Dealers - Sales,
Service, Repairs, Parts and Leasing تجار السيارات والشاحنات 1,196,038 24,033 1,296,015 32,057 1,947,691 34,373 1,292,940 29,371 1,453,496 23,500 1,056,393 15,926 1,004,420 14,911
16 Travel السفر 273,266 1,717 249,813 1,578 356,670 2,262 408,132 2,452 334,915 2,184 309,176 1,773 261,908 1,707
17 Family Entertainment & Tourism الترفيه العائلي والسياحة 682,814 27,785 663,461 36,670 842,338 42,596 700,499 35,760 702,583 39,881 439,084 24,809 451,319 28,053
18
Equipment, Furniture & Home
Furnishings Stores (except appliances) متاجر األثاث 454,595 6,573 608,326 8,850 642,869 9,809 604,383 8,613 511,066 7,484 456,657 5,932 455,800 6,239
19 Book Stores & Stationary متاجر الكتب والقرطاسية 108,411 2,676 114,705 3,266 114,362 3,714 120,409 3,351 126,922 3,386 118,096 2,460 127,832 2,766
20 Miscellaneous Goods & Services سلع وخدمات غير مصنفة أعاله 3,467,647 78,548 3,083,918 96,854 3,488,060 103,105 3,237,747 86,702 2,808,768 75,959 2,386,802 57,178 2,343,758 57,091
Total المجموع 33,287,335 1,377,751 37,099,308 1,676,715 42,255,206 1,686,715 44,993,183 1,518,030 35,190,379 1,253,165 30,026,041 921,403 30,940,874 963,838
Government Services includes: Court Costs including Alimony and Child Support, Fines, Bail and Bond Payments, Tax Payments, تكاليف المحكمة بما في ذلك النفقة ودعم الطفل، الغرامات، دفع الكفالة والسندات، المدفوعات الضريبية، : تشمل الخدمات الحكومية
Government Services not elsewhere classified, Government Postal Services, and Intra-Government Purchases .الخدمات الحكومية غير المصنفة في مكان آخر، الخدمات البريدية الحكومية، والمشتريات الحكومية
- 44 -
Sector Augustالقطاع September October November December January February

Table No. (45) جدول رقم
بطاقات الخصم المصدرة في البحرين- عمليات نقاط البيع والتجارة اإللكترونية حسب القطاعات
Points of Salesand E-Commerce Transactions by Sectors - Debit Cards issued in Bahrain
Value of Transactions in B.D. قيمة المعامالت بالدينار البحريني
2021 2022
عدد العمليات القيمة عدد العمليات القيمة عدد العمليات القيمة عدد العمليات القيمة عدد العمليات القيمة عدد العمليات القيمة عدد العمليات القيمة
No. of trans. Value No. of trans. Value No. of trans. Value No. of trans. Value No. of trans. Value No. of trans. Value No. of trans. Value
1 Education التعليم 971,049 6,368 860,580 4,848 910,557 5,581 1,028,311 7,381 983,839 8,343 3,416,080 30,555 998,725 13,712
2 Lodging - Hotels, Motels, Resorts الفنادق والمنتجعات- اإلقامة 1,020,171 40,061 1,208,618 41,591 1,148,632 42,862 1,067,291 43,411 1,296,683 49,807 1,103,135 41,349 1,358,984 43,226
3 Restaurants المطاعم 12,630,914 2,108,960 13,934,788 2,280,886 13,809,115 2,352,606 13,545,443 2,345,205 14,866,743 2,508,008 13,452,292 2,320,017 13,559,340 2,293,420
4 Health الصحة 8,487,594 591,194 9,061,952 623,205 9,061,223 560,376 9,248,410 565,125 9,350,276 579,681 9,408,723 548,453 9,333,397 534,022
5 Government Services الخدمات الحكومية 12,428,092 302,148 12,890,303 332,829 13,403,083 345,872 13,202,920 324,752 13,406,415 316,568 13,193,735 322,286 12,505,551 302,064
6
Construction - Contractors, Building
Materials and Maintenance & Related
Services 149,357 3,061,498 153,741 3,125,422 177,872 3,628,376 176,132 3,814,141 185,552 4,271,528 179,488 3,282,185 170,798 3,151,536
المقاولون ، مواد البناء والصيانة والخدمات ذات - البناء
الصلة
7 Supermarket أسواق السوبرماركت 19,348,082 1,893,171 20,127,596 1,974,678 19,193,096 1,928,339 19,718,309 1,968,318 21,236,748 2,057,731 20,541,893 1,939,331 18,954,669 1,793,891
8 Jewelry Stores متاجر المجوهرات 2,117,439 15,407 2,426,255 16,045 5,131,466 28,010 4,811,250 24,738 3,060,243 21,418 2,403,524 17,899 2,596,894 17,854
9 Department Store المتاجر 4,511,022 324,491 4,945,527 359,469 5,775,690 385,823 5,463,350 371,372 5,509,992 391,454 5,155,975 365,503 5,709,571 381,464
10 Clothing and Footwear المالبس واألحذية 4,540,360 231,127 5,543,611 297,239 7,127,974 357,942 7,062,177 349,157 6,065,530 324,977 5,771,791 313,469 5,954,008 322,307
11 Electronic and Digital Goods مبيعات األجهزة اإللكترونية والرقمية 2,128,977 67,433 2,167,290 71,682 3,079,633 78,942 3,183,936 80,665 3,079,776 78,642 2,697,203 73,562 2,819,695 72,549
12 Insurance 26,160 1,613,901 28,190 1,672,452 28,601 1,682,184 29,183 1,702,005 31,790 1,935,860 26,743 1,521,062 27,239 1,511,600 التأمين
13 Telecommunication االتصاالت 3,097,437 146,241 3,416,739 161,878 3,453,206 161,673 3,516,780 156,105 3,412,398 158,753 3,205,701 153,263 3,404,432 163,498
14 Transportation وسائل النقل 398,592 10,556 478,935 12,504 599,524 15,134 510,805 14,637 429,472 12,380 407,857 11,240 448,961 11,735
15
Automobile and Truck Dealers - Sales,
Service, Repairs, Parts and Leasing تجار السيارات والشاحنات 3,689,468 240,872 3,805,326 252,051 4,416,793 267,507 4,311,640 274,326 4,407,084 296,205 4,347,092 272,606 4,242,386 263,492
16 Travel السفر 514,732 4,540 575,395 8,750 788,951 12,309 757,790 11,354 727,043 11,424 673,525 11,982 834,513 17,400
17 Family Entertainment & Tourism الترفيه العائلي والسياحة 1,444,366 103,815 1,197,578 100,523 1,649,342 118,061 1,427,405 106,132 1,782,462 136,477 1,468,578 110,987 1,555,336 122,066
18
Equipment, Furniture & Home Furnishings
Stores (except appliances) متاجر األثاث 1,966,347 53,212 1,941,073 51,317 2,869,258 64,626 2,430,625 54,654 2,398,988 60,909 2,333,491 63,408 2,424,672 60,312
19 Book Stores & Stationary متاجر الكتب والقرطاسية 243,937 24,354 244,685 23,251 274,742 24,862 286,804 26,647 316,274 29,421 375,898 34,232 287,447 23,139
20 Miscellaneous Goods & Services سلع وخدمات غير مصنفة أعاله 21,384,969 425,650 22,204,372 469,216 27,052,394 524,802 24,345,145 488,735 27,081,097 508,469 21,742,409 459,113 23,021,550 482,755
Total المجموع 105,586,684 6,787,637 111,833,868 7,288,193 125,952,068 7,492,669 121,434,537 7,418,029 124,721,621 7,757,140 116,496,775 7,271,186 114,685,529 7,094,423
Government Services includes: Court Costs including Alimony and Child Support, Fines, Bail and Bond Payments, Tax Payments, تكاليف المحكمة بما في ذلك النفقة ودعم الطفل، الغرامات، دفع الكفالة والسندات، المدفوعات الضريبية، : تشمل الخدمات الحكومية
Government Services not elsewhere classified, Government Postal Services, and Intra-Government Purchases .الخدمات الحكومية غير المصنفة في مكان آخر، الخدمات البريدية الحكومية، والمشتريات الحكومية
- 45 -
Sector القطاعAugust September October November December January February

Table No. (46) جدول رقم
بطاقات الخصم المصدرة خارج البحرين- عمليات نقاط البيع والتجارة اإللكترونية حسب القطاعات
Points of Sales and E-Commerce Transactions by Sectors - Debit Cards issued Outside Bahrain
Value of Transactions in B.D. قيمة المعامالت بالدينار البحريني
2021 2022
عدد العمليات القيمة عدد العمليات القيمة عدد العمليات القيمة عدد العمليات القيمة عدد العمليات القيمة عدد العمليات القيمة عدد العمليات القيمة
No. of trans. Value No. of trans. Value No. of trans. Value No. of trans. Value No. of trans. Value No. of trans. Value No. of trans. Value
1 Education التعليم 78,506 399 90,944 331 64,544 368 72,143 385 82,054 321 171,465 512 87,086 367
2 Lodging - Hotels, Motels, Resorts الفنادق والمنتجعات- اإلقامة 3,126,065 78,164 4,118,633 104,281 4,212,320 106,580 4,174,626 105,744 4,593,752 120,482 4,082,227 105,000 4,309,233 107,621
3 Restaurants المطاعم 3,503,747 312,117 4,399,916 346,235 4,383,500 357,131 4,009,587 327,750 4,156,441 307,383 3,662,841 250,709 3,892,106 267,171
4 Health الصحة 992,792 66,232 963,601 51,767 970,912 47,376 889,070 41,170 853,603 37,527 795,410 32,175 710,727 30,676
5 Government Services الخدمات الحكومية 347,254 57,452 525,962 110,073 719,723 113,733 537,279 98,348 528,143 99,584 686,383 93,665 644,116 99,659
6
Construction - Contractors, Building
Materials and Maintenance & Related
Services 27,280 609,548 26,096 574,670 32,142 692,550 30,819 708,240 36,345 814,818 35,436 745,616 25,407 555,728
المقاولون ، مواد البناء والصيانة والخدمات ذات - البناء
الصلة
7 Supermarket أسواق السوبرماركت 1,679,433 156,169 1,911,129 169,593 1,855,899 166,748 1,648,806 148,712 1,592,486 138,653 1,357,394 114,797 1,331,659 116,020
8 Jewelry Stores متاجر المجوهرات 1,405,009 3,612 1,396,572 4,166 2,714,958 6,794 4,248,623 6,774 2,260,779 5,540 1,687,309 4,025 1,960,637 4,435
9 Department Store المتاجر 808,829 38,227 988,025 45,416 1,181,805 49,627 1,127,061 43,843 1,061,258 42,480 898,435 32,464 1,010,283 37,673
10 Clothing and Footwear المالبس واألحذية 1,396,067 39,856 2,002,209 57,113 2,484,640 64,092 2,328,062 57,879 2,161,787 53,592 1,729,319 41,148 2,106,115 51,241
11 Electronic and Digital Goods مبيعات األجهزة اإللكترونية والرقمية 245,785 6,222 267,634 7,422 413,371 9,335 338,782 8,391 350,616 8,099 307,308 6,301 280,829 6,572
12 Insurance 29,048 115,493 29,523 115,918 35,751 132,559 33,180 131,905 36,747 145,219 41,673 166,943 43,111 167,248 التأمين
13 Telecommunication االتصاالت 124,151 5,087 139,025 5,912 138,434 5,947 141,119 5,647 163,477 6,891 120,503 6,880 131,025 6,989
14 Transportation وسائل النقل 27,224 1,431 35,809 1,827 37,110 2,160 35,167 2,092 33,136 1,630 24,245 980 22,762 934
15
Automobile and Truck Dealers - Sales,
Service, Repairs, Parts and Leasing تجار السيارات والشاحنات 573,458 25,218 569,505 29,551 618,204 30,771 556,749 26,648 567,900 24,214 544,475 18,760 467,624 16,988
16 Travel السفر 86,096 1,374 81,372 1,525 121,976 2,083 116,678 1,961 109,413 1,936 130,301 1,953 153,191 1,853
17 Family Entertainment & Tourism الترفيه العائلي والسياحة 307,943 20,669 346,811 23,053 386,416 25,157 327,433 22,058 354,782 24,156 301,728 17,516 308,802 19,570
18
Equipment, Furniture & Home Furnishings
Stores (except appliances) متاجر األثاث 277,850 5,955 296,953 6,656 363,170 8,031 338,227 6,934 326,914 6,694 295,460 5,468 282,387 5,577
19 Book Stores & Stationary متاجر الكتب والقرطاسية 37,539 3,132 41,023 3,222 60,140 3,936 51,731 3,516 58,060 3,547 55,360 2,899 59,946 3,008
20 Miscellaneous Goods & Services سلع وخدمات غير مصنفة أعاله 1,665,611 61,209 1,995,394 74,625 2,437,763 83,413 2,334,736 73,653 2,223,557 70,579 1,980,158 57,181 1,951,118 60,217
Total المجموع 17,406,335 951,043 21,083,075 1,119,877 24,124,921 1,156,374 24,116,024 1,045,504 22,303,269 1,021,201 19,520,909 848,052 20,434,687 892,899
Government Services includes: Court Costs including Alimony and Child Support, Fines, Bail and Bond Payments, Tax Payments, تكاليف المحكمة بما في ذلك النفقة ودعم الطفل، الغرامات، دفع الكفالة والسندات، المدفوعات الضريبية، : تشمل الخدمات الحكومية
Government Services not elsewhere classified, Government Postal Services, and Intra-Government Purchases .الخدمات الحكومية غير المصنفة في مكان آخر، الخدمات البريدية الحكومية، والمشتريات الحكومية
- 46 -
Sector Augustالقطاع September October November December January February

Table No. (47) جدول رقم
عدد عمليات نقاط البيع حسب التصنيف الجغرافي للدول المصدرة للبطاقة
(باستثناء البحرين)
Number of Point of Sales Transactions by Geographical Classification of Card-Issuer Country
(Excluding Bahrain)
أوروبا شمال أفريقياأفريقيا جنوب الصحراء
الكبرىأمريكا الشمالية والوسطى
شمال األطلسي ومنطقة
البحر الكاريبيأمريكا الجنوبية *دول الخليج العربي
اقتصادات أخرى في
الشرق األدنى واألوسطوسط وجنوب آسيا شرق آسيا أوقيانوسيا المجموع
Europe North AfricaSub-Saharan
Africa
North and
Central America
North Atlantic
and CaribbeanSouth America
Countries of
Arabian Gulf*
Other Near and
Middle East
Economies
Central and
South AsiaEast Asia Oceania TOTAL
2020 472,912 29,867 15,852 2,128,224 1,720 4,899 3,584,185 28,898 119,144 33,035 19,559 6,438,295
2021 1,283,421 75,883 70,352 4,722,007 4,551 93,863 8,636,813 38,308 950,863 99,955 33,393 16,009,409
2020 Q1 201,304 10,804 6,261 538,278 619 1,710 2,559,874 13,779 50,366 11,768 8,474 3,403,237
Q2 60,167 4,297 2,297 400,388 353 541 272,643 4,926 18,754 5,040 2,888 772,294
Q3 62,995 6,161 2,824 504,256 283 745 294,778 4,319 21,714 6,218 3,139 907,432
Q4 148,446 8,605 4,470 685,302 465 1,903 456,890 5,874 28,310 10,009 5,058 1,355,332
2021 Q1 220,708 12,664 10,538 714,533 778 2,652 598,669 7,440 35,696 11,672 4,879 1,620,229
Q2 168,713 17,570 10,723 710,151 676 4,327 830,109 6,754 40,777 14,490 6,593 1,810,883
Q3 240,076 32,040 21,401 1,208,784 858 16,153 3,265,122 6,936 56,063 36,665 13,210 4,897,308
Q4 653,924 13,609 27,690 2,088,539 2,239 70,731 3,942,913 17,178 818,327 37,128 8,711 7,680,989
2021 Feb. 62,101 3,240 3,670 204,682 258 841 174,767 2,241 10,466 3,169 1,475 466,910
Mar. 87,700 5,981 4,124 258,591 242 964 235,492 2,839 14,063 4,740 1,782 616,518
Apr. 64,467 6,651 3,571 245,605 291 1,135 237,563 3,225 14,826 5,101 1,858 584,293
May 67,149 7,092 4,052 269,528 245 2,170 385,188 2,322 16,946 5,728 2,889 763,309
Jun. 37,097 3,827 3,100 195,018 140 1,022 207,358 1,207 9,005 3,661 1,846 463,281
Jul. 64,945 6,218 5,427 333,271 266 7,784 818,620 1,784 14,646 9,699 8,433 1,271,093
Aug. 83,815 16,210 8,181 423,287 248 4,081 1,282,112 2,002 20,399 14,051 2,374 1,856,760
Sep. 91,316 9,612 7,793 452,226 344 4,288 1,164,390 3,150 21,018 12,915 2,403 1,769,455
Oct. 139,640 4,145 9,512 634,886 400 19,148 1,298,003 4,696 145,745 15,333 2,858 2,274,366
Nov. 277,395 4,401 8,681 607,936 627 17,161 1,274,790 6,413 353,136 10,022 2,972 2,563,534
Dec. 236,889 5,063 9,497 845,717 1,212 34,422 1,370,120 6,069 319,446 11,773 2,881 2,843,089
2022 Jan. 236,322 3,991 11,210 876,383 1,702 36,887 1,256,559 5,289 356,224 9,737 2,288 2,796,592
Feb. 179,292 4,295 11,419 799,424 665 31,428 930,340 6,506 349,833 12,786 2,806 2,328,794
* Excluding cards issued in Bahrain. .باستثناء البطاقات المصدرة في البحرين*
الفترة
Period
- 47 -

Table No. (48) جدول رقم
قيمة عمليات نقاط البيع حسب التصنيف الجغرافي للدول المصدرة للبطاقة
(باستثناء البحرين)
Value of Point of Sales Transactions by Geographical Classification of Card-Issuer Country
(Excluding Bahrain)
Bahraini Dinar دينار بحريني
أوروبا شمال أفريقياأفريقيا جنوب الصحراء
الكبرى
أمريكا الشمالية
والوسطى
شمال األطلسي ومنطقة
البحر الكاريبيأمريكا الجنوبية *دول الخليج العربي
اقتصادات أخرى في
الشرق األدنى واألوسطوسط وجنوب آسيا شرق آسيا أوقيانوسيا المجموع
Europe North AfricaSub-Saharan
Africa
North and
Central America
North Atlantic
and CaribbeanSouth America
Countries of
Arabian Gulf*
Other Near and
Middle East
Economies
Central and
South AsiaEast Asia Oceania TOTAL
2020 16,522,479 935,109 388,002 65,669,048 38,802 128,196 125,728,147 1,012,636 4,644,650 1,150,684 775,837 216,993,590
2021 41,910,884 2,008,915 1,566,620 118,002,840 101,950 1,925,207 259,908,217 1,242,248 13,577,370 2,657,222 1,092,817 443,994,290
2020 Q1 7,062,219 341,629 159,959 17,628,672 13,121 47,295 83,294,075 551,989 2,026,364 447,074 255,398 111,827,796
Q2 1,829,023 109,750 39,033 11,633,104 8,060 15,095 10,632,615 138,432 338,041 168,346 97,164 25,008,664
Q3 2,081,464 194,570 73,022 16,227,369 8,228 18,365 12,605,369 137,400 1,522,296 197,997 183,301 33,249,381
Q4 5,549,773 289,160 115,987 20,179,902 9,393 47,440 19,196,088 184,815 757,949 337,267 239,974 46,907,749
2021 Q1 8,290,460 410,680 295,107 20,068,270 17,837 58,908 22,342,272 245,838 1,370,214 359,407 160,461 53,619,453
Q2 6,493,805 468,848 230,262 20,619,380 16,461 97,378 28,885,122 215,735 1,265,131 435,591 233,972 58,961,685
Q3 8,752,807 709,893 473,297 32,079,356 24,337 346,005 93,025,801 200,329 1,578,400 858,638 381,307 138,430,169
Q4 18,373,812 419,495 567,953 45,235,834 43,315 1,422,917 115,655,022 580,345 9,363,625 1,003,586 317,078 192,982,982
2021 Feb. 2,422,142 88,146 110,251 5,914,425 6,883 16,056 6,586,869 60,704 793,562 109,116 47,994 16,156,149
Mar. 3,307,731 211,657 92,641 7,537,232 5,677 28,752 8,624,648 95,025 312,988 152,322 57,487 20,426,161
Apr. 2,713,762 186,619 87,939 7,427,650 8,607 25,245 9,188,459 100,198 388,312 160,159 72,179 20,359,130
May 2,571,989 191,221 85,584 7,924,416 4,780 53,962 13,546,712 80,402 626,071 172,481 106,000 25,363,618
Jun. 1,208,053 91,008 56,739 5,267,314 3,074 18,171 6,149,951 35,135 250,747 102,952 55,793 13,238,938
Jul. 2,180,685 135,081 119,049 9,089,684 11,035 197,450 24,930,843 40,551 391,369 227,355 183,888 37,506,988
Aug. 3,150,528 328,415 176,893 11,182,476 5,030 75,649 35,390,135 59,932 579,643 330,856 96,675 51,376,232
Sep. 3,421,595 246,397 177,355 11,807,196 8,272 72,906 32,704,823 99,847 607,388 300,427 100,743 49,546,949
Oct. 4,779,443 116,936 194,221 14,005,032 8,303 308,885 35,670,499 152,888 1,800,378 336,945 120,117 57,493,648
Nov. 7,366,830 148,421 180,265 14,271,993 12,152 332,042 42,169,190 237,530 3,985,052 304,442 101,290 69,109,207
Dec. 6,227,540 154,137 193,467 16,958,809 22,860 781,990 37,815,332 189,927 3,578,195 362,199 95,670 66,380,126
2022 Jan. 5,435,361 95,682 216,219 15,742,079 31,276 694,007 31,615,843 184,290 3,837,043 266,133 64,450 58,182,383
Feb. 4,816,403 139,283 208,644 14,214,839 11,648 650,599 26,743,430 169,129 3,338,922 321,094 79,677 50,693,670
* Excluding cards issued in Bahrain. .باستثناء البطاقات المصدرة في البحرين*
الفترة
Period
- 48 -

Table No. (49) جدول رقم
عدد السكان
Population
Nationality / Sex النوع/ الجنسية
السنة Bahraini بحريني Non-Bahraini غير بحريني Total المجموع
Yearذكور إناث المجموع ذكور إناث المجموع ذكور إناث المجموع
Males Females Total Males Females Total Males Females Total
2007 266,420 261,013 527,433 365,654 146,209 511,864 632,074 407,223 1,039,297
2008 273,612 267,975 541,587 402,978 158,931 561,909 676,590 426,906 1,103,496
2009 282,011 276,000 558,011 449,986 170,418 620,404 731,997 446,418 1,178,415
2010 288,452 282,235 570,687 475,905 181,951 657,856 764,357 464,186 1,228,543
2011 295,878 288,810 584,688 445,605 164,727 610,332 741,483 453,537 1,195,020
2012 305,354 294,275 599,629 455,095 154,240 609,335 760,449 448,515 1,208,964
2013 312,945 301,885 614,830 475,436 162,925 638,361 788,381 464,810 1,253,191
2014 320,839 309,905 630,744 485,648 198,170 683,818 806,487 508,075 1,314,562
2015 328,887 318,948 647,835 517,478 205,009 722,487 846,365 523,957 1,370,322
2016 336,834 327,873 664,707 551,555 207,464 759,019 888,389 535,337 1,423,726
2017 343,340 334,166 677,506 607,972 215,638 823,610 951,312 549,804 1,501,116
2018 349,661 340,053 689,714 597,203 216,174 813,377 946,864 556,227 1,503,091
2019 355,633 346,194 701,827 564,931 216,998 781,929 920,564 563,192 1,483,756
2020 361,979 351,284 713,263 563,057 195,884 758,941 925,036 547,168 1,472,204
2021 364,891 354,442 719,333 560,856 224,176 785,032 925,747 578,618 1,504,365
Source: Central Informatics Organisation. . الجهـاز المركزي للمعلومات: المصدر
- 49 -

Table No. (50) جدول رقم
عدد العاملين في القطاع المالي
Number of Employees in the Financial Sector
ذكور إناث المجموع ذكور إناث المجموع ذكور إناث المجموع ذكور إناث المجموع
Male Female Total Male Female Total Male Female Total Male Female Total
Banking Sector 3206 2179 5385 3172 2128 5300 1347 257 1604 1304 261 1565 6989 6865 القطاع المصرفي
Retail Banks 2614 1705 4319 2650 1681 4331 646 151 797 611 146 757 5116 5088 مصارف قطاع التجزئة
Wholesale Banks 588 473 1061 520 445 965 694 102 796 677 108 785 1857 1750 مصارف قطاع الجملة
Representative Offices 4 1 5 2 2 4 7 4 11 16 7 23 16 27 المكاتب التمثيلية
Non-Bank Financial Sector 2209 1284 3493 2282 1380 3662 2110 656 2766 2058 629 2687 6259 6349 القطاع المالي غير المصرفي
Locally Incorporated
Insurance Firms 623 395 1018 610 398 1008 330 96 426 307 105 412 1444 1420
شركات التأمين الوطنية وشركات
إعادة التأمين
Insurance Related Activities
Firms 214 166 380 206 177 383 288 144 432 284 129 413 812 796شركات األنشطة المتعلقة بالتأمين
Specialised Licensees * 1077 555 1632 1088 584 1672 1217 356 1573 1223 333 1556 3205 3228 *األنشطة المتخصصة Of which: :ومنها
Money Changers محالت الصرافة
Financing Companies
and Microfinance
Institutions 472 298 770 446 281 727 114 31 145 106 30 136 915 863
شركات التمويل ومؤسسات
التمويل متناهية الصغر
Capital Markets ** 56 33 89 147 104 251 2 1 3 24 7 31 92 282 **أسواق رأس المال
Investment Business Firms 239 135 374 231 117 348 273 59 332 220 55 275 706 623 شركات أعمال استثمارية
Supporting Institutions *** 208 230 438 208 232 440 38 13 51 34 9 43 489 483 ***المؤسسات الداعمة
Total 5623 3693 9316 5662 3740 9402 3495 926 4421 3396 899 4295 13737 13697 المجموع
- 50 -
Sector
*** Includes Central Bank of Bahrain, and Bahrain Institute of Banking and Finance.
تشمل محالت الصرافة، شركات التمويل، مؤسسات التمويل متناهية الصغر، خدمات الدعم للقطاع المالي، أمناء العهد المالية، مسجلو األسهم ومسجلو الخدمات *
.اإلدارية للمحافظ االستثمارية وهيئة مهنية مسجلة
تشمل األسواق المالية المرخص لها للتداول في األوراق واألدوات المالية، مؤسسات وغرف التسوية والتقاص واإليداع والحفظ المركزي المرخص لها، **
وسطاء األوراق المالية العاملون لصالح حساباتهم وحسابات عمالئهم، وسطاء التسوية والتقاص واإليداع المركزي، خدمات الداللة في األوراق المالية ووحدات
.األصول المشفرة
.تشمل مصرف البحرين المركزي ومعهد البحرين للدراسات المصرفية والمالية***
2021
241 1034194 72 266 214 92
القطاع
* Includes Money Changers, Financing Companies, Microfinance Institutions, Ancillary Service Provider, Trust
Service Provider, Registered Administrators, Fund Administrators and Registrar License.
2020
** Includes Licensed Exchanges, Licensed Clearing (Settlement and Central), Licensed Securities Broker-
Dealer, Licensed Securities Clearing Member, and Licensed Securities Broker, Licensed Securities Discount
Broker and Crypto-Asset Services.
1329 1340824 239 1063 793306
Bahraini بحريني Non-Bahraini غير بحريني
2020
2020
المجموع
2021 Total2021

Table No. (51) جدول رقم
ميزان المدفوعات
Balance of PaymentsB.D. Million مليون دينار
2020 2021*
الفصل األول الفصل الثاني الفصل الثالث الفصل الرابع الفصل األول الفصل الثاني الفصل الثالث الفصل الرابع
Q1 Q2 Q3 Q4 Q1 Q2 Q3 Q4
Current Account (a+b+c+d) (د+ج+ب+أ) الحساب الجاري 427.4 477.5 181.8 108.2- 249.5- 268.4- 570.3- 131.8- 978.5 1,220.0-
a. Goods السلع- أ 622.4 651.5 436.3 134.1 31.2 65.5 189.6- 45.1 1,844.3 47.8-
Exports (fob) (فوب)الصادرات 2,489.8 2,344.5 1,899.8 1,676.8 1,338.4 1,411.3 1,015.0 1,524.0 8,410.9 5,288.7
- Oil النفطية - 1,142.6 995.8 792.0 807.3 582.6 599.5 332.3 718.4 3,737.7 2,232.8
- Non-Oil غيرالنفطية - 1,347.2 1,348.7 1,107.8 869.5 755.8 811.8 682.7 805.6 4,673.2 3,055.9
Imports (fob) (فوب)الواردات 1,867.4- 1,693.0- 1,463.5- 1,542.7- 1,307.2- 1,345.8- 1,204.6- 1,478.9- 6,566.6- 5,336.5-
- Oil النفطية - 602.1- 478.6- 339.5- 362.2- 235.3- 295.9- 153.6- 359.1- 1,782.4- 1,043.9-
- Non-Oil غيرالنفطية - 1,265.3- 1,214.4- 1,124.0- 1,180.5- 1,071.9- 1,049.9- 1,051.0- 1,119.8- 4,784.2- 4,292.6-
b. Services (net) (صافي)الخدمات - ب 295.6 310.7 226.3 202.2 184.0 178.6 149.3 270.0 1,034.8 781.9
Credit دائن 1,310.5 1,305.6 1,125.6 1,095.6 1,081.3 1,074.1 934.4 1,115.2 4,837.3 4,205.0
Debit مدين 1,014.9- 994.9- 899.3- 893.4- 897.3- 895.5- 785.1- 845.2- 3,802.5- 3,423.1-
- Maintenance 161.8 157.3 46.2 38.2 39.3 38.1 39.6 38.5 39.1 40.1 - الصيانة
- Transportation النقل - 201.6- 185.3- 171.6- 180.1- 178.3- 175.0- 181.2- 184.1- 738.6- 718.6-
- Travel السفر - 261.1 255.5 156.1 141.9 122.6 115.4 100.4 202.2 814.6 540.6
- Construction اإلنشاء - 1.0 1.1 1.1 1.0 1.1 1.0 1.1 1.3 4.2 4.5
- Insurance 365.8 340.5 98.2 88.3 90.1 89.2 87.2 88.1 86.0 79.2 - التأمين
- Financial Services خدمات مالية - 10.3 10.2 10.1 9.9 9.8 9.6 8.9 10.5 40.5 38.8
- Communication services خدمات االتصاالت - 85.5 84.5 83.9 83.7 82.3 79.9 76.5 77.2 337.6 315.9
- Other Business Services خدمات أخرى - 20.0 19.6 20.1 19.0 19.2 18.3 17.1 18.2 78.7 72.8
c. Primary Income (net) (صافي)الدخل األساسي - ج 247.9- 239.6- 232.0- 231.0- 229.6- 235.2- 234.8- 225.0- 950.5- 924.6-
Credit دائن 244.7 240.4 244.8 240.1 244.6 237.3 235.7 228.8 970.0 946.4
Debit مدين 492.6- 480.0- 476.8- 471.1- 474.2- 472.5- 470.5- 453.8- 1,920.5- 1,871.0-
Investment Income دخل االستثمار 247.9- 239.6- 232.0- 231.0- 229.6- 235.2- 234.8- 225.0- 950.5- 924.6-
- Direct Investment Income االستثمار المباشر - 80.4- 79.1- 78.6- 79.4- 80.1- 81.6- 80.2- 79.2- 317.5- 321.1-
- Portfolio Income استثمارات الحافظة - 160.2- 153.6- 148.3- 147.1- 145.2- 149.2- 150.8- 142.6- 609.2- 587.8-
- Other Investment Income استثمارات أخرى - 7.3- 6.9- 5.1- 4.5- 4.3- 4.4- 3.8- 3.2- 23.8- 15.7-
d. Secondary income (Current Transfers) (net) (صافي) (التحويالت الجارية )الدخل الثانوي - د 242.7- 245.1- 248.8- 213.5- 235.1- 277.3- 295.2- 221.9- 950.1- 1,029.5-
- Workers' Remittances تحويالت العاملين - 242.7- 245.1- 248.8- 213.5- 235.1- 277.3- 295.2- 221.9- 950.1- 1,029.5-
Capital and Financial Account (net) (a+b) (ب+أ) (صافي) الحساب الرأسمالي والمالي 858.6- 288.8- 142.2 368.5 300.3 361.1 291.4 788.5 636.7- 1,741.3
a. Capital Account (net) الحساب الرأسمالي - أ 0.0 0.0 0.0 0.0 293.1 0.0 0.0 0.0 0.0 293.1
- Capital Transfers التحويالت الرأسمالية - 0.0 0.0 0.0 0.0 293.1 0.0 0.0 0.0 0.0 293.1
b. Financial Account 1/ /1الحساب المالي - ب 858.6- 288.8- 142.2 368.5 7.2 361.1 291.4 788.5 636.7- 1,448.2
Direct Investment االستثمار المباشر 52.1 46.1 201.0 338.2 2.1 5.7 266.8- 720.1 637.4 461.1
- Abroad في الخارج - 2.9- 13.0- 5.2- 3.1- 2.2- 9.8- 44.4 44.7 24.2- 77.1
- In Bahrain في البحرين - 55.0 59.1 206.2 341.3 4.3 15.5 311.2- 675.4 661.6 384.0
Portfolio Investment (net) (صافي)استثمارات الحافظة 62.9 999.9- 163.5- 675.5 68.5- 1,089.3 271.3 474.8- 425.0- 817.3
- Assets األصول - 316.4- 1,229.1- 61.5- 290.6 74.0- 147.3 480.6- 64.9- 1,316.4- 472.2-
- Liabilities الخصوم - 379.3 229.2 102.0- 384.9 5.5 942.0 751.9 409.9- 891.4 1,289.5
Other Investment (net) (صافي)استثمارات أخرى 828.8- 753.6 330.6 158.2- 97.5 621.5- 266.6 120.6- 97.2 378.0-
- Assets األصول - 740.4- 607.3 476.7- 212.5 122.9- 229.9 303.0 830.9- 397.3- 420.9-
- Liabilities الخصوم - 88.4- 146.3 807.3 370.7- 220.4 851.4- 36.4- 710.3 494.5 42.9
Reserve Assets (net) (صافي)االصول االحتياطية 144.8- 88.6- 225.9- 487.0- 23.9- 112.4- 20.3 663.8 946.3- 547.8
Errors and Omissions السهو والخطأ 431.2 188.7- 324.0- 260.3- 50.8- 92.7- 278.9 656.7- 341.8- 521.3-
1/ A negative sign means net outflows/increases in external assets. .اإلشارة السالبة تعني تدفق للخارج أو زيادة في الموجودات األجنبية/ 1
* Provisional data. . بيانات أولية*
- 51 -
2020Items *2021البيان

Table No. (52) جدول رقم
وضع االستثمار الدولي
International Investment PositionB. D. Million مليون دينار
2021*
الفصل األول الفصل الثاني الفصل الثالث الفصل الرابع الفصل األول الفصل الثاني الفصل الثالث الفصل الرابع
Q1 Q2 Q3 Q4 Q1 Q2 Q3 Q4
IIP, net 8,176.3 8,813.0 8,836.0 8,544.6 8,183.5 8,176.3 7,807.8 7,665.6 7,954.4 8,813.0 (صافي)وضع االستثمار الدولي
Foreign Assets 50,809.9 53,494.1 50,729.0 50,841.9 50,586.9 50,809.9 50,796.9 51,566.2 52,289.6 53,494.1 األصول األجنبية
Direct Investment Abroad 7,122.3 7,146.5 7,154.7 7,110.3 7,120.1 7,122.3 7,125.4 7,130.6 7,143.6 7,146.5 االستثمار المباشر في الخارج
Portfolio Investment 16,632.5 17,948.9 16,225.2 16,705.8 16,558.5 16,632.5 16,341.9 16,403.4 17,632.5 17,948.9 استثمارات الحافظة
Other Investment 26,216.2 26,613.5 26,626.2 26,323.2 26,093.3 26,216.2 26,003.7 26,480.4 25,873.1 26,613.5 استثمارات أخرى
Reserve Assets 838.9 1,785.2 722.9 702.6 815.0 838.9 1,325.9 1,551.8 1,640.4 1,785.2 األصول االحتياطية
Foreign Liabilities 42,633.6 44,681.1 41,893.0 42,297.3 42,403.4 42,633.6 42,989.1 43,900.6 44,335.2 44,681.1 الخصوم األجنبية
Direct Investment in Bahrain 11,921.1 12,582.7 12,212.5 11,901.3 11,916.8 11,921.1 12,262.4 12,468.6 12,527.7 12,582.7 االستثمار المباشر في البحرين
Portfolio Investment 7,979.8 8,871.2 6,280.4 7,032.3 7,974.3 7,979.8 8,364.7 8,262.7 8,491.9 8,871.2 استثمارات الحافظة
Other Investment 22,732.7 23,227.2 23,400.1 23,363.7 22,512.3 22,732.7 22,362.0 23,169.3 23,315.6 23,227.2 استثمارات أخرى
* Provisional Data. .بيانات أولية*
- 52 -
Itemsالبيان
2020
2020 2021*

Table No. (53) جدول رقم
مؤشرات التداول للشركات المساهمة العامة- بورصة البحرين Bahrain Bourse - Market Indicators of Listed Companies
عدد الشركات كمية األسهم المتداولة قيمة األسهم عدد المؤشر العام مؤشر البحرين العام القيمة السوقية نسبة األرباح الموزعة
المدرجة (الف) (ألف دينار )المتداولة الصفقات (نقطة) (نقطة) (مليون دينار) معدل الدوران العائد على السهم الى السعر
الفترة Number of Volume of Value of Number of Bahrain Bahrain All Market Shares Dividend
Period Listed Shares Traded Shares Traded 1/ Transactions Index Share Index Capitalisation 2/ Turnover 3/ P/E Yield %
Companies (Thousand) (B.D. Thousand) (Point) (Point) (B.D. Million) (%)
2012 47 627,708 110,244 10,168 -- 1,065.61 5,855.64 1.74 7.58 5.40
2013 47 1,867,761 225,868 14,197 -- 1,248.86 6,962.95 3.04 10.07 3.67
2014 47 1,127,448 269,333 16,217 -- 1,426.57 8.327.07 3.23 10.41 4.26
2015 46 515,561 109,975 11,248 -- 1,215.89 7,199.91 1.53 8.85 5.16
2016 44 734,392 124,454 10,592 -- 1,220.45 7,248.45 1.72 8.99 4.11
2017 43 1,129,827 211,339 19,440 -- 1,331.71 8,146.33 2.58 9.43 4.82
2018 44 1,441,082 321,919 19,225 -- 1,337.26 8,198.53 3.88 9.69 5.22
2019 44 397,719 56,461 4,209 -- 1,610.18 10,134.62 2.82 11.27 4.10
2020 43 1,063,072 193,309 18,074 -- 1,489.78 9,277.25 2.18 11.29 5.07
2021 42 1,018,299 195,678 21,001 -- 1,797.25 10,815.45 1.70 20.35 1.89
2020 Q1 44 290,920 63,583 5,145 -- 1,350.62 8,504.60 0.65 9.90 5.32
Q2 43 149,901 31,312 2,457 -- 1,277.61 7,928.36 0.63 9.31 5.71
Q3 43 351,723 49,536 5,222 -- 1,434.49 8,901.92 0.56 10.85 5.02
Q4 43 270,528 48,878 5,250 -- 1,489.78 9,277.25 0.53 11.29 5.07
2021 Q1 43 323,075 60,365 5,498 -- 1,458.03 9,079.57 0.60 16.04 2.35
Q2 43 269,102 42,274 4,532 -- 1,587.97 9,889.49 0.43 17.82 2.09
Q3 43 204,445 49,889 5,387 -- 1,705.56 10,263.68 0.46 19.31 2.07
Q4 42 221,677 43,150 5,584 -- 1,797.25 10,815.45 0.40 20.35 1.89
2021 Feb. 43 87,679 17,789 2,129 -- 1,466.43 9,131.81 0.19 15.65 2.42
Mar. 43 112,728 25,998 1,682 -- 1,458.03 9,079.57 0.23 16.04 2.35
Apr. 43 39,131 8,818 1,293 -- 1,484.85 9,247.29 0.10 16.43 2.33
May 43 51,247 11,364 1,582 -- 1,527.62 9,513.61 0.12 16.99 2.27
Jun. 43 178,724 22,092 1,657 -- 1,587.97 9,889.49 0.22 17.82 2.18
Jul. 43 42,002 10,389 1,292 -- 1,597.00 9,610.35 0.11 18.01 2.22
Aug. 43 85,171 20,969 2,101 -- 1,645.41 9,901.68 0.21 18.54 2.15
Sep. 43 77,272 18,531 1,994 -- 1,705.56 10,263.68 0.18 19.31 2.07
Oct. 42 97,054 17,389 2,093 -- 1,743.06 10,489.34 0.17 19.75 2.03
Nov. 42 79,617 16,447 2,073 -- 1,729.60 10,408.35 0.16 19.49 2.05
Dec. 42 45,006 9,314 1,418 -- 1,797.25 10,815.45 0.09 20.35 1.97
2022 Jan. 42 39,678 12,508 1,277 -- 1,809.82 10,891.06 0.11 20.49 1.96
Feb. 42 52,277 16,934 1,933 -- 1,963.62 11,816.62 0.14 10.13 3.68
1/ Includes Shares Traded by Preferred, Closed & Non-Bahraini Stock. .تشمل تداول األسهم الممتازة والمقفلة وغير البحرينية/ 1
2/ End of Period - Doesn't Include Preferred, Closed & Non-Bahraini Stock. .ال تشمل األسهم الممتازة والمقفلة وغير البحرينية- نهاية الفترة / 2
3/ Shares Turnover = (Value of Shares Traded / Market Capitalisation) X 100. .100 ا X (القيمة السوقية / قيمة األسهم المتداولة )= معدل الدوران / 3
* The total value of shares are not inclusive of shares traded in the IPO market (IPO)قيمة األسهم المتداولة ال تشمل األسهم المتداولة في السوق األكتتابات األولية *
Source: Bahrain Bourse. .بورصة البحرين: المصدر
- 53 -

Table No. (54) جدول رقم
قيمة األسهم المتداولة حسب القطاعات - بورصة البحرين
Bahrain Bourse - Value of Shares Traded by SectorB.D. Thousand الف دينار
الشركات
الفترة المصارف التجارية االستثمار التأمين الخدمات الصناعة الفنادق والسياحة الشركات المقفلة المجموع األسهم الممتازة غير البحرينية
Period Commercial Investment Insurance Services Industrial Hotel & Closed Non- Preferred Total
Banks Tourism Companies Bahraini Shares
2011 50,004 20,347 1,164 20,008 9,236 1,187 0 0 3,020 104,966
2012 68,519 9,266 812 15,791 7,121 645 52 0 8,039 110,245
2013 153,620 31,925 774 19,735 5,583 324 156 0 13,751 225,868
2014 190,427 40,557 371 22,157 11,830 3,677 120 194 0 269,333
2015 68,512 11,343 4,365 18,727 5,852 1,176 0 0 0 109,975
2016 65,270 17,772 11,556 24,648 2,643 2,565 0 0 0 124,454
2017 98,303 44,893 4,130 31,214 29,607 2,323 869 0 0 211,339
2018 168,523 98,890 1,412 29,289 19,169 730 3,906 0 0 321,919
2019 38,875 7,144 656 8,411 968 253 154 0 0 56,461
2020 79,398 34,282 925 55,109 15,301 122 8,171 0 0 193,309
2019 Q3 10,327 1,901 68 3,541 533 80 109 0 0 16,559
Q4 28,548 5,243 588 4,870 435 173 45 0 0 39,902
2020 Q1 27,927 8,342 419 14,433 4,363 101 7,998 0 0 63,583
Q2 19,945 4,539 163 5,934 731 0 0 0 0 31,312
Q3 15,994 13,326 88 15,180 4,929 16 3 0 0 49,536
Q4 15,532 8,075 256 19,562 5,278 5 170 0 0 48,878
2021 Q1 16,075 9,391 1,218 23,307 4,701 197 5,476 0 0 60,365
Q2 20,992 3,583 197 10,726 6,692 84 0 0 0 42,274
2020 Jun. 3,846 3,737 160 4,246 569 0 0 0 0 12,558
Jul. 4,195 4,652 21 3,199 221 1 0 0 0 12,289
Aug. 5,040 3,012 66 4,160 3,369 3 0 0 0 15,650
Sep. 6,759 5,662 1 7,821 1,339 12 3 0 0 21,597
Oct. 5,835 2,966 104 10,348 555 1 170 0 0 19,979
Nov. 4,258 2,599 132 5,778 2,139 3 0 0 0 14,909
Dec. 5,439 2,510 20 3,436 2,584 1 0 0 0 13,990
2021 Jan. 4,492 4,137 137 7,144 668 0 0 0 0 16,578
Feb. 5,863 3,700 33 6,247 1,940 6 0 0 0 17,789
Mar. 5,720 1,554 1,048 9,916 2,093 191 5,476 0 0 25,998
Apr. 3,172 981 22 2,277 2,350 16 0 0 0 8,818
May 4,228 1,208 22 3,671 2,234 1 0 0 0 11,364
Jun. 13,592 1,394 153 4,778 2,108 67 0 0 0 22,092
* The total value of shares are not inclusive of shares traded in the IPO market (IPO)قيمة األسهم المتداولة ال تشمل األسهم المتداولة في السوق األكتتابات األولية *
Note: The market sectors were reclassified by Bahrain Bourse effective 11th July 2021. 2021 يوليو 11تم إعادة تصنيف قطاعات السوق من قبل بورصة البحرين اعتباراً من : مالحظة.
The new classification are in next table (Table 52). .(52جدول )التصنيف الجديد في الجدول التالي
Source: Bahrain Bourse. .بورصة البحرين: المصدر
- 54 -

Table No. (55) جدول رقم
قيمة األسهم المتداولة حسب القطاعات - بورصة البحرين
Bahrain Bourse - Value of Shares Traded by SectorB.D. Thousand الف دينار
السلع االستهالكية السلع االستهالكية الشركات
الفترة المواد االساسية الصناعات الكمالية االساسية المال االتصاالت العقارات الشركات المقفلة المجموع األسهم الممتازة غير البحرينية
Period Materials Industrials Consumer Consumer Financials Communications Real Closed Non- Preferred Total
Discretionary Staples Services Estate Companies Bahraini Shares
2021 31,978 11,171 6,485 3,022 105,831 27,275 3,642 6,274 0 0 195,678
2021 Q3 11,936 2,017 825 554 26,917 6,284 558 798 0 0 49,889
Q4 8,711 1,985 681 210 27,457 3,668 438 0 0 0 43,150
2021 Jul. 2,241 1,027 167 27 5,071 1,659 197 0 0 0 10,389
Aug. 3,192 398 426 74 13,235 2,665 181 798 0 0 20,969
Sep. 6,503 592 232 453 8,611 1,960 180 0 0 0 18,531
Oct. 3,490 1,026 206 30 11,042 1,478 117 0 0 0 17,389
Nov. 3,384 825 422 123 10,351 1,181 161 0 0 0 16,447
Dec. 1,837 134 53 57 6,064 1,009 160 0 0 0 9,314
2022 Jan. 4,451 535 78 28 6,213 1,038 165 0 0 0 12,508
Feb. 7,060 372 200 34 7,153 1,987 128 0 0 0 16,934
* The total value of shares are not inclusive of shares traded in the IPO market (IPO)قيمة األسهم المتداولة ال تشمل األسهم المتداولة في السوق األكتتابات األولية *
Note: The market sectors were reclassified by Bahrain Bourse effective 11th July 2021. 2021 يوليو 11تم إعادة تصنيف قطاعات السوق من قبل بورصة البحرين اعتباراً من : مالحظة.
The old classification are in prevous table (Table 51). .(51جدول )التصنيف القديم في الجدول السابق
Source: Bahrain Bourse. .بورصة البحرين: المصدر
- 55 -

Table No. (56) جدول رقم
مؤشر األسعار حسب القطاعات - بورصة البحرين
Bahrain Bourse - Bahrain Index by Sector
(1989 - 1990 = 100)Point نقطة
مؤشر
نهاية الفترة البحرين العام المصارف التجارية االستثمار التأمين الخدمات الصناعة الفنادق والسياحة
End of Period Bahrain All Commercial Investment Insurance Services Industrial Hotel &
Share Index Banks Tourism
2011 1,143.69 1,814.05 697.30 1,852.03 1,148.99 1,055.17 3,573.71
2012 1,065.61 1,792.20 646.20 1,718.03 1,242.75 696.26 3,468.87
2013 1,248.86 2,456.44 650.69 1,876.33 1,206.77 824.47 3.279.94
2014 1,426.57 2,721.17 842.14 1,844.71 1,385.97 830.93 3,687.62
2015 1,215.89 2,461.82 613.84 1,653.62 1,361.73 606.13 3,779.18
2016 1,220.45 2,481.78 686.24 1,585.63 1,248.89 524.33 3,237.54
2017 1,331.71 2,772.59 680.22 1,645.81 1,078.63 986.54 2,940.32
2018 1,337.26 2,769.81 669.88 1,619.89 1,216.27 960.84 2,677.69
2019 1,610.18 3,947.61 703.64 1,458.28 1,439.63 674.05 2,336.09
2020 1,489.78 3,363.00 585.22 1,654.47 1,806.78 823.13 1,958.10
2019 Q3 1,516.53 3,537.67 702.48 1,385.94 1,425.62 706.87 2,378.12
Q4 1,610.18 3,947.61 703.64 1,458.28 1,439.63 674.05 2,336.09
2020 Q1 1,350.62 3,103.75 626.26 1,545.39 1,340.85 597.01 2,188.75
Q2 1,277.61 2,913.79 584.33 1,445.49 1,358.68 535.66 2,188.75
Q3 1,434.49 3,405.14 585.99 1,454.60 1,546.76 642.48 1,998.46
Q4 1,489.78 3,363.00 585.22 1,654.47 1,806.78 823.13 1,958.10
2021 Q1 1,458.03 3,300.99 580.00 1,820.19 1,682.89 828.02 1,889.71
Q2 1,587.97 3,654.39 600.46 1,857.69 1,748.89 1,026.88 1,708.08
2020 Jun. 1,277.61 2,913.79 584.33 1,445.49 1,358.68 535.66 2,188.75
Jul. 1,290.57 2,955.41 584.93 1,471.21 1,394.17 518.38 2,188.75
Aug. 1,380.89 3,253.39 585.88 1,454.60 1,432.64 618.92 2,180.09
Sep. 1,434.49 3,405.14 585.99 1,454.60 1,546.76 642.48 1,998.46
Oct. 1,427.18 3,332.51 578.09 1,550.19 1,645.97 629.91 1,998.46
Nov. 1,477.51 3,357.98 580.28 1,598.65 1,799.95 776.00 1,958.10
Dec. 1,489.78 3,363.00 585.22 1,654.47 1,806.78 823.13 1,958.10
2021 Jan. 1,462.61 3,278.09 586.98 1,717.73 1,763.01 802.71 1,958.10
Feb. 1,466.43 3,317.45 586.18 1,795.06 1,694.46 829.59 1,897.56
Mar. 1,458.03 3,300.99 580.00 1,820.19 1,682.89 828.02 1,889.71
Apr. 1,484.85 3,327.67 578.94 1,786.70 1,728.90 936.23 1,829.17
May 1,527.62 3,421.12 586.17 1,806.75 1,757.53 1,025.77 1,829.17
Jun. 1,587.97 3,654.39 600.46 1,857.69 1,748.89 1,026.88 1,708.08Note: The market sectors were reclassified by Bahrain Bourse effective 11th July 2021. 2021 يوليو 11تم إعادة تصنيف قطاعات السوق من قبل بورصة البحرين اعتباراً من : مالحظة.
The new classification are in next table (Table 54). .(54جدول )التصنيف الجديد في الجدول التالي
Source: Bahrain Bourse. .بورصة البحرين: المصدر
- 56 -

Table No. (57) جدول رقم
مؤشر األسعار حسب القطاعات - بورصة البحرين
Bahrain Bourse - Bahrain Index by Sector
(1989 - 1990 = 100)Point نقطة
مؤشر السلع االستهالكية السلع االستهالكية
نهاية الفترة البحرين العام المواد االساسية الصناعات الكمالية االساسية المال االتصاالت العقارات
End of Period Bahrain All Materials Industrials Consumer Consumer Financials Communications Real
Share Index Discretionary Staples Services Estate
2021 1,797.25 3,675.35 3,042.22 3,035.81 3,010.64 2,957.86 3,190.20
2021 Q3 1,705.56 3,215.93 3,024.92 3,087.95 3,025.12 6,059.63 3,003.87 3,214.33
Q4 1,797.25 3,675.35 3,042.22 3,035.81 3,010.64 6,402.47 2,957.86 3,190.20
2021 Jul. 1,597.00 3,046.00 3,028.00 3,017.00 3,070.00 5,561.00 3,087.00 3,106.00
Aug. 1,645.41 3,101.07 3,009.84 3,045.17 3,070.23 5,839.89 2,872.61 3,141.03
Sep. 1,705.56 3,215.93 3,024.92 3,087.95 3,025.12 6,059.63 3,003.87 3,214.33
Oct. 1,743.06 3,381.32 2,969.01 3,068.95 3,040.16 6,196.69 3,015.76 3,254.10
Nov. 1,729.60 3,675.35 2,976.25 3,013.02 2,978.35 6,110.81 2,865.41 3,136.63
Dec. 1,797.25 3,675.35 3,042.22 3,035.81 3,010.64 6,402.47 2,957.86 3,190.20
2022 Jan. 1,809.82 4,019.91 3,000.86 3,005.84 2,987.32 6,395.61 2,921.02 3,070.88
Feb. 1,963.62 5,742.73 2,898.32 3,085.63 3,000.82 6,717.65 2,880.13 3,163.68
Note: The market sectors were reclassified by Bahrain Bourse effective 11th July 2021. 2021 يوليو 11تم إعادة تصنيف قطاعات السوق من قبل بورصة البحرين اعتباراً من : مالحظة.
The old classification are in prevous table (Table 53). .(53جدول )التصنيف القديم في الجدول السابق
Source: Bahrain Bourse. .بورصة البحرين: المصدر
- 57 -

Table No. (58) جدول رقم
قيمة تعامالت المستثمرين في السوق ونسب التملك في أسهم الشركات المساهمة العامة المسجلة- بورصة البحرين
Bahrain Bourse - Trading Value of Investors' Participation and Percentage of Shares Ownership in Listed Companies
(ألف دينار )قيمة تعامالت المستثمرين نسبة توزيع ملكية األسهم مجموع عدد األسهم
الفترة Trading Value of Investors' Participation (BD Thousand) 1/ % of Shares Ownership الصادرة والمدفوعة
Period البحرين دول مجلس التعاون الدول األخرى المجموع البحرين دول مجلس التعاون الدول األخرى ( Thousandألف )
Total Shares
Outstanding
2010 150,118 38,770 27,934 216,822 54.28 36.17 9.55 26,369,253
2011 117,728 63,185 29,020 209,932 52.44 37.41 10.16 26,170,836
2012 85,683 72,704 62,100 220,487 33.44 48.89 17.67 26,981,522
2013 303,721 128,687 19,328 451,736 67.23 28.49 4.28 N/A
2014 347,180 121,701 69,792 538,674 N/A N/A N/A N/A
2015 146,411 59,530 14,009 219,949 N/A N/A N/A N/A
2016 173,465 45,516 29,927 248,908 N/A N//A N/A N/A
2017 288,357 94,549 39,771 422,677 N/A N//A N/A N/A
2018 357,427 185,371 104,867 647,666 N/A N/A N/A N/A
2019 345,309 151,875 75,628 572,812 N/A N/A N/A N/A
2020 318,290 80,420 26,889 425,599 N/A N/A N/A N/A
2021 293,389 72,012 26,015 391,416 N/A N/A N/A N/A
2018 Q1 106,259 39,661 14,362 160,282 N/A N/A N/A N/A
Q2 61,928 25,064 8,479 95,471 N/A N/A N/A N/A
Q3 75,527 40,031 32,926 148,484 N/A N/A N/A N/A
Q4 113,713 80,615 49,101 243,429 N/A N/A N/A N/A
2019 Q1 78,817 54,324 45,459 178,600 N/A N/A N/A N/A
Q2 107,392 47,702 13,521 168,615 N/A N/A N/A N/A
Q3 76,287 26,453 9,681 112,421 N/A N/A N/A N/A
Q4 82,813 23,396 6,967 113,176 N/A N/A N/A N/A
2020 Q1 96,525 19,356 11,285 127,166 N/A N/A N/A N/A
Q2 59,805 37,119 4,682 101,606 N/A N/A N/A N/A
Q3 80,760 11,703 6,609 99,072 N/A N/A N/A N/A
Q4 81,200 12,242 4,313 97,755 N/A N/A N/A N/A
2021 Q1 93,802 22,231 4,705 120,738 N/A N/A N/A N/A
Q2 61,131 18,972 4,496 84,600 N/A N/A N/A N/A
Q3 72,286 17,664 9,827 99,778 N/A N/A N/A N/A
Q4 66,170 13,145 6,986 86,301 N/A N/A N/A N/A
1/ Presents buying and selling sides. .تمثل جانبي البيع والشراء/ 1
Note: figures may vary fom the published bulletins due to the settlement dates. .توجد فروقات بين تعامالت المستثمرين في هذا الجدول وبين مطبوعات السوق وذلك بسبب تواريخ التسوية: مالحظة
Source: Bahrain Bourse. .بورصة البحرين: المصدر
- 58 -
OthersBahraini GCC Others Total Bahraini GCC

Table No. (59) جدول رقم
إجمالي االستثمارات القائمة- صناديق االستثمار
Mutual Funds - Total Outstanding InvestmentsU.S. Dollar Thousand ألف دوالر أمريكي
Investors المستثمرون إجمالي المبالغ
مؤسسات أفراد
إجمالي المبالغ المستثمرة في
صناديق االستثمار
End of Period Type of Bank Institutions Individuals Total Amount
Invested in the
Funds
2019 Q4 Retail Banks 412,733.0 766,249.0 1,178,982.0
Wholesale Banks 88,887.0 26,718.0 115,605.0
Other Institutions 4,387,171.0 1,518,630.0 5,905,801.0
Grand Total 4,888,791.0 2,311,597.0 7,200,388.0
2020 Q1 Retail Banks 453,867.0 717,188.0 1,171,055.0
Wholesale Banks 77,520.0 26,001.0 103,521.0
Other Institutions 4,201,700.0 1,480,682.0 5,682,382.0
Grand Total 4,733,087.0 2,223,871.0 6,956,958.0
2020 Q2 Retail Banks 410,579.0 593,559.0 1,004,138.0
Wholesale Banks 77,778.0 20,805.0 98,583.0
Other Institutions 4,131,684.0 1,526,736.0 5,658,420.0
Grand Total 4,620,041.0 2,141,100.0 6,761,141.0
2020 Q3 Retail Banks 425,953.0 670,262.0 1,096,215.0
Wholesale Banks 69,262.0 21,175.0 90,437.0
Other Institutions 4,258,679.0 1,602,292.0 5,860,971.0
Grand Total 4,753,894.0 2,293,729.0 7,047,623.0
2020 Q4 Retail Banks 421,494.0 599,914.0 1,021,408.0
Wholesale Banks 75,989.0 22,040.0 98,029.0
Other Institutions 5,268,039.0 1,705,505.0 6,973,544.0
Grand Total 5,765,522.0 2,327,459.0 8,092,981.0
2021 Q1 Retail Banks 285,208.0 517,577.0 802,785.0
Wholesale Banks 84,922.0 22,544.0 107,466.0
Other Institutions 6,862,079.0 1,910,322.0 8,772,401.0
Grand Total 7,232,209.0 2,450,443.0 9,682,652.0
2021 Q2 Retail Banks 192,431.0 633,869.0 826,300.0
Wholesale Banks 97,506.0 21,309.0 118,815.0
Other Institutions 7,300,540.0 1,876,446.0 9,176,986.0
Grand Total 7,590,477.0 2,531,624.0 10,122,101.0
2021 Q3 Retail Banks 189,664.0 605,645.0 795,309.0
Wholesale Banks 80,081.0 13,908.0 93,989.0
Other Institutions 7,641,021.0 1,807,505.0 9,448,526.0
Grand Total 7,910,766.0 2,427,058.0 10,337,824.0
2021 Q4 Retail Banks 177,467.0 625,554.0 803,021.0
Wholesale Banks 103,977.0 23,963.0 127,940.0
Other Institutions 7,933,506.0 1,780,064.0 9,713,570.0
Grand Total 8,214,950.0 2,429,581.0 10,644,531.0
نهاية الفترة نوع المصرف
- 5
9 -