T.hidrologi After Mid - Hidrograf HS
29
Hidrograf Satuan Program Studi Teknik Sipil Fakultas Teknik Universitas Atma Jaya Yogyakarta 2013/2014
description
Langkah perhitungan hidrograf satuan
Transcript of T.hidrologi After Mid - Hidrograf HS
Hidrograf SatuanProgram Studi Teknik Sipil
Fakultas Teknik
Universitas Atma Jaya Yogyakarta
2013/2014
Perbedaan Hidrograf dgn Hidrograf Satuan
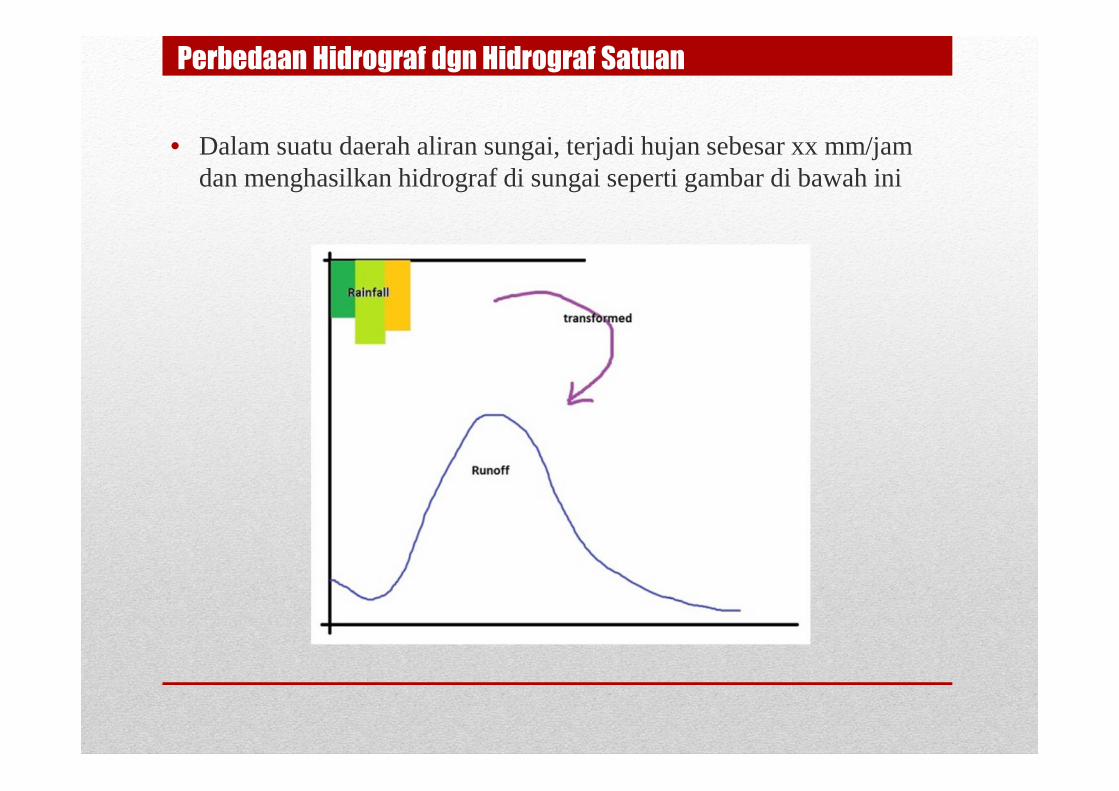
• Dalam suatu daerah aliran sungai, terjadi hujan sebesar xx mm/jamdan menghasilkan hidrograf di sungai seperti gambar di bawah ini
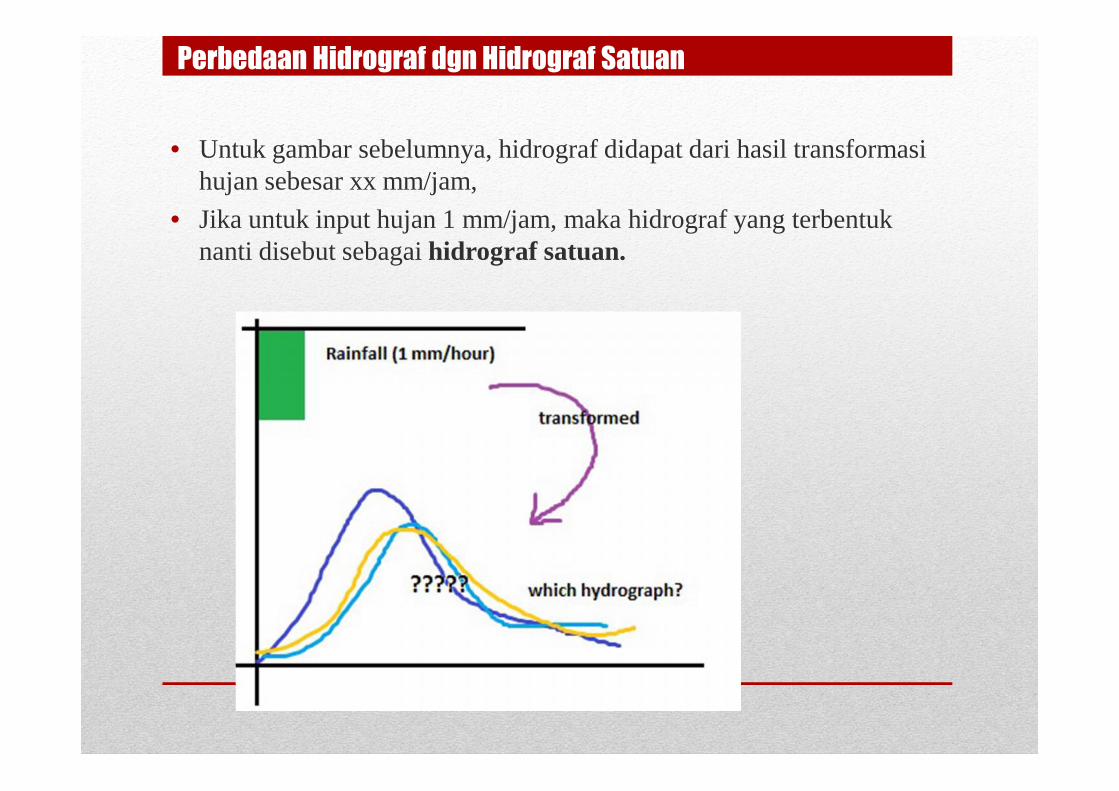
• Untuk gambar sebelumnya, hidrograf didapat dari hasil transformasihujan sebesar xx mm/jam,
• Jika untuk input hujan 1 mm/jam, maka hidrograf yang terbentuknanti disebut sebagai hidrograf satuan.
Perbedaan Hidrograf dgn Hidrograf Satuan
• Konsep hidrograf satuan pertama kali dikenalkan oleh L.K. Shermanpada tahun 1932.
• Hidrograf Satuan adalah hidrograf limpasan langsung (tanpabaseflow/aliran dasar) yang tercatat di ujung hilir DAS yangditimbulkan oleh hujan efektif sebesar 1 mm yang terjadi secaramerata di permukaan DAS dengan intensitas tetap dalam suatu durasitertentu.
• Hujan efektif atau hujan lebihan (excess rainfall) adalah bagian darihujan yang menjadi aliran langsung di sungai.
Hujan efektif = hujan total yg jatuh di permukaan tanah –kehilangan air.
• Kehilangan air dihitung dengan metode Φ indeks
Pengertian Hidrograf Satuan
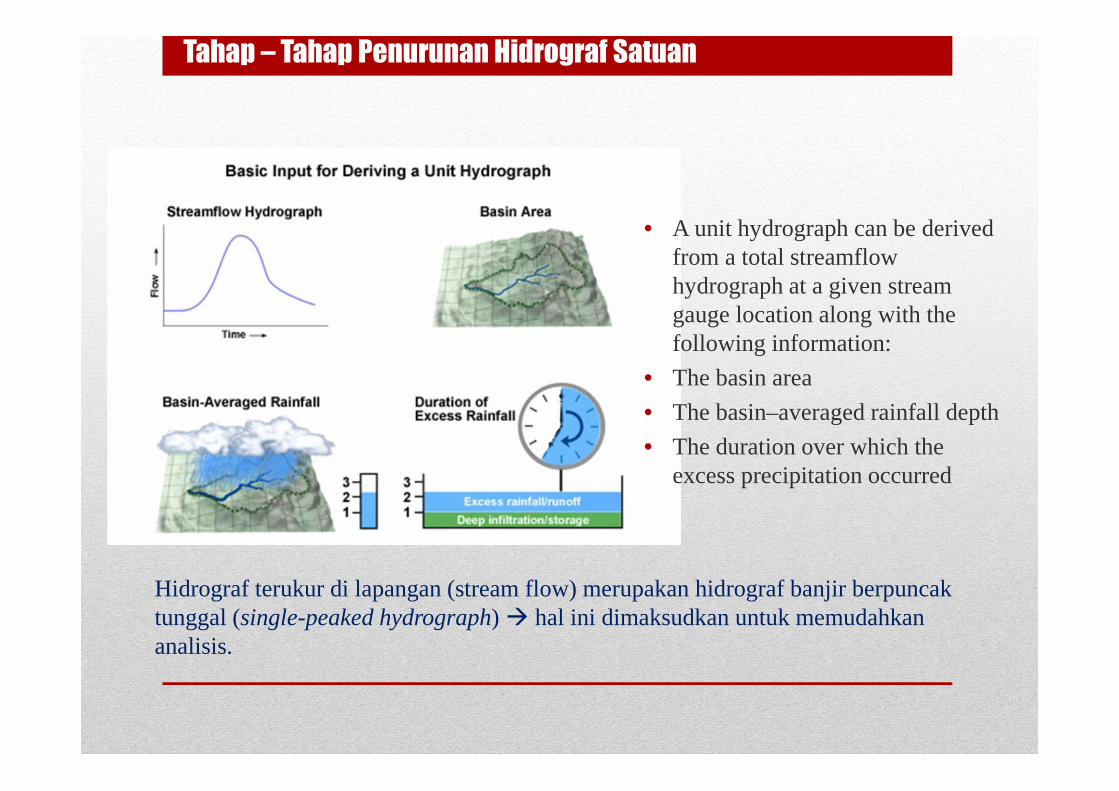
Tahap – Tahap Penurunan Hidrograf Satuan
• A unit hydrograph can be derivedfrom a total streamflowhydrograph at a given streamgauge location along with thefollowing information:
• The basin area
• The basin–averaged rainfall depth
• The duration over which theexcess precipitation occurred
Hidrograf terukur di lapangan (stream flow) merupakan hidrograf banjir berpuncaktunggal (single-peaked hydrograph) hal ini dimaksudkan untuk memudahkananalisis.
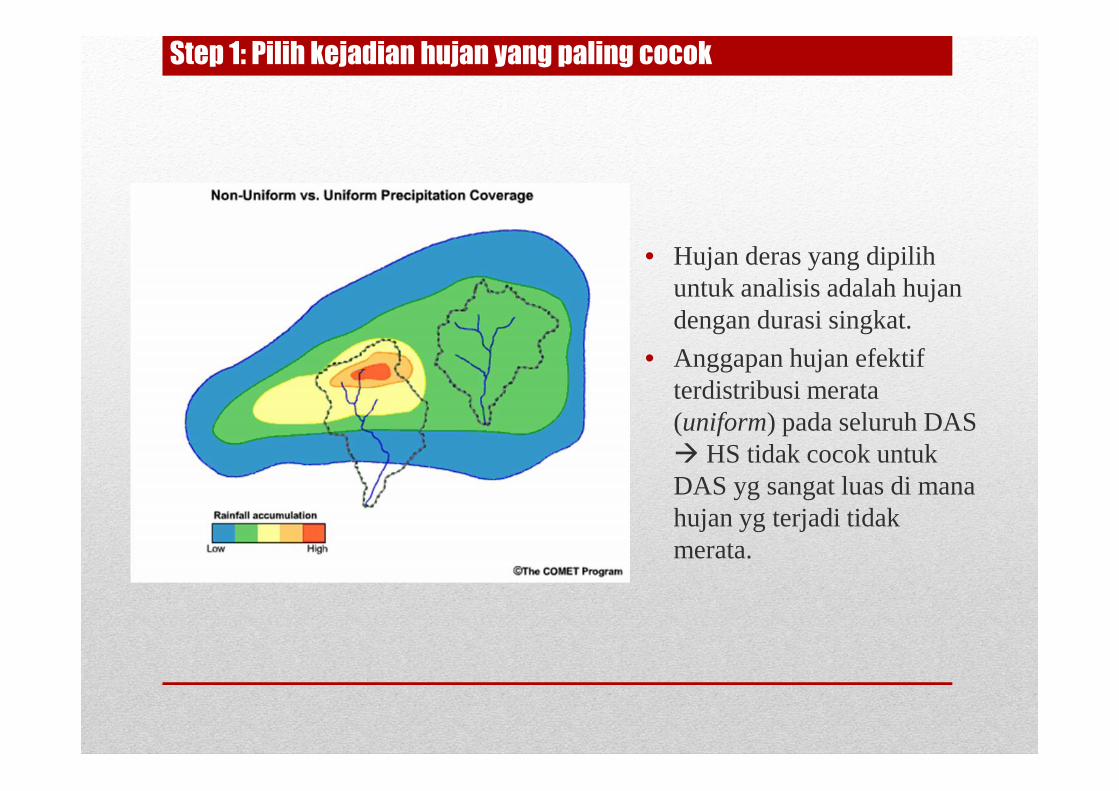
Step 1: Pilih kejadian hujan yang paling cocok
• Hujan deras yang dipilihuntuk analisis adalah hujandengan durasi singkat.
• Anggapan hujan efektifterdistribusi merata(uniform) pada seluruh DAS HS tidak cocok untukDAS yg sangat luas di manahujan yg terjadi tidakmerata.
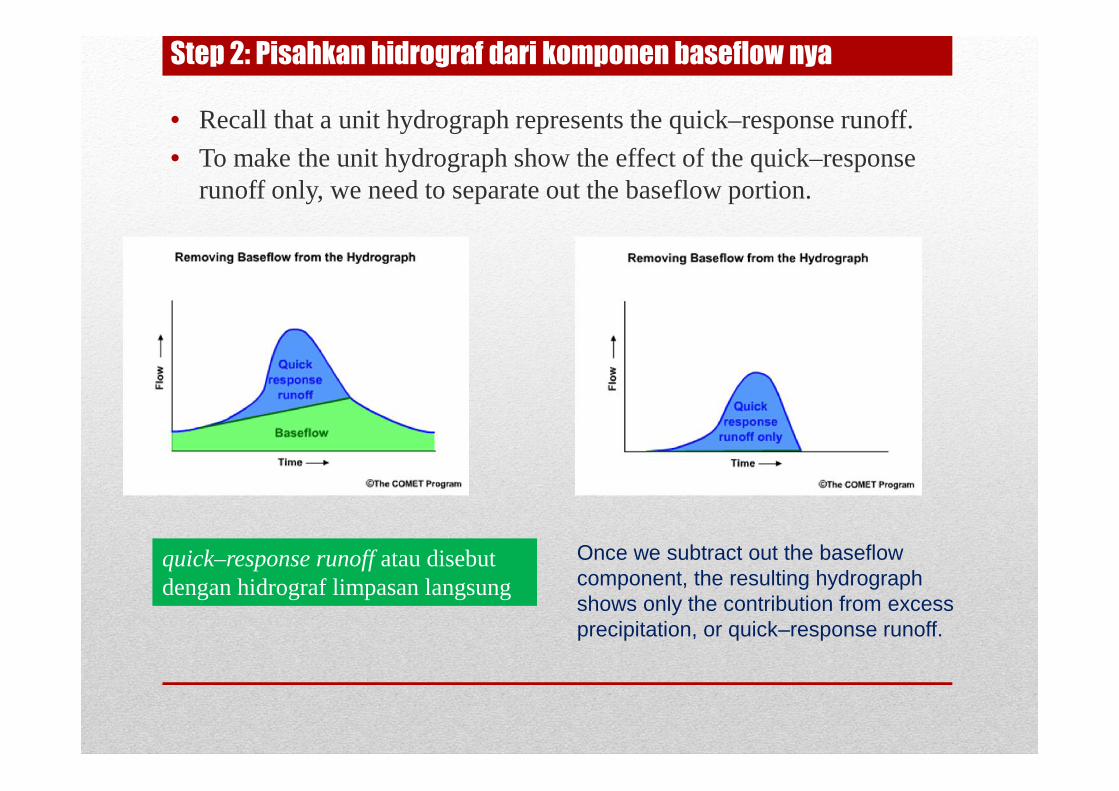
Step 2: Pisahkan hidrograf dari komponen baseflow nya
• Recall that a unit hydrograph represents the quick–response runoff.
• To make the unit hydrograph show the effect of the quick–responserunoff only, we need to separate out the baseflow portion.
Once we subtract out the baseflowcomponent, the resulting hydrographshows only the contribution from excessprecipitation, or quick–response runoff.
quick–response runoff atau disebutdengan hidrograf limpasan langsung
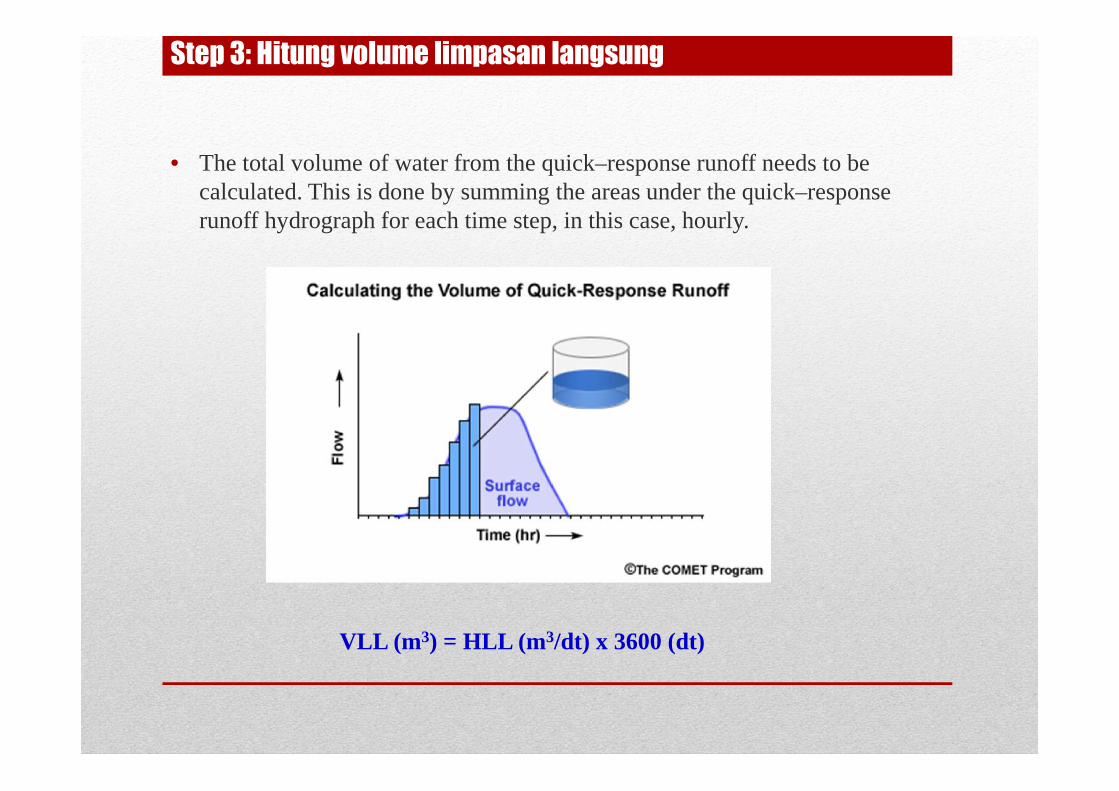
Step 3: Hitung volume limpasan langsung
• The total volume of water from the quick–response runoff needs to becalculated. This is done by summing the areas under the quick–responserunoff hydrograph for each time step, in this case, hourly.
VLL (m3) = HLL (m3/dt) x 3600 (dt)
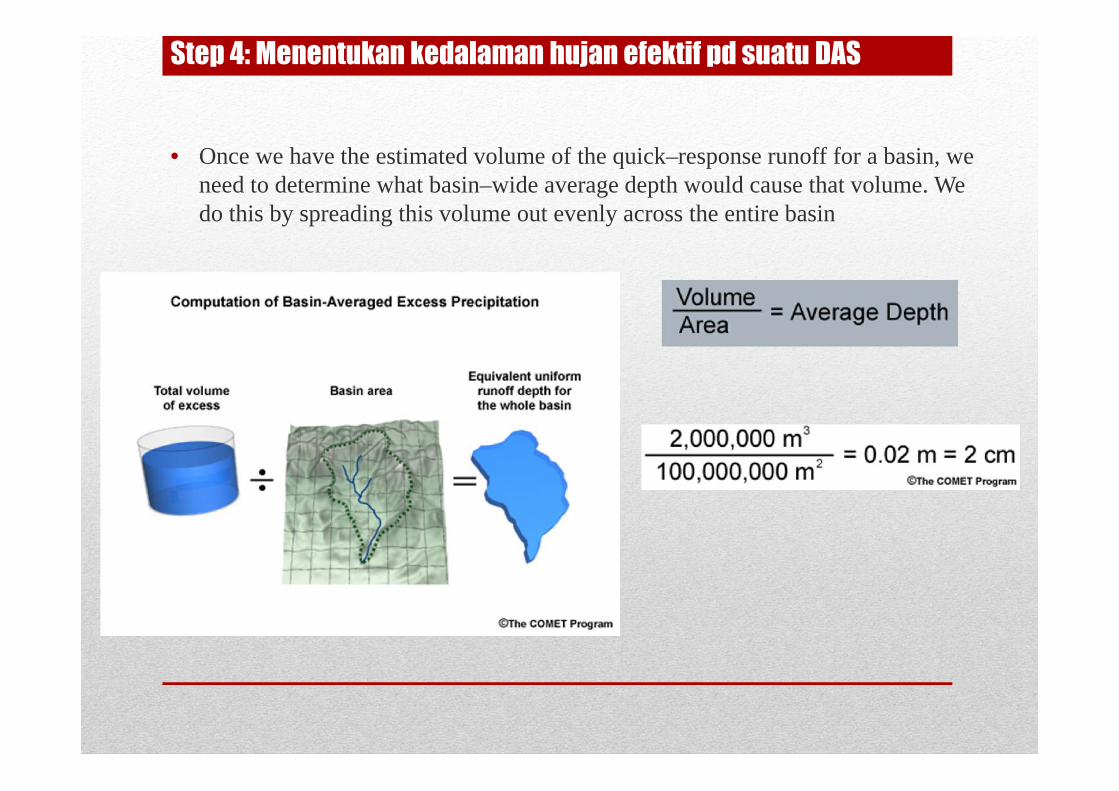
Step 4: Menentukan kedalaman hujan efektif pd suatu DAS
• Once we have the estimated volume of the quick–response runoff for a basin, weneed to determine what basin–wide average depth would cause that volume. Wedo this by spreading this volume out evenly across the entire basin
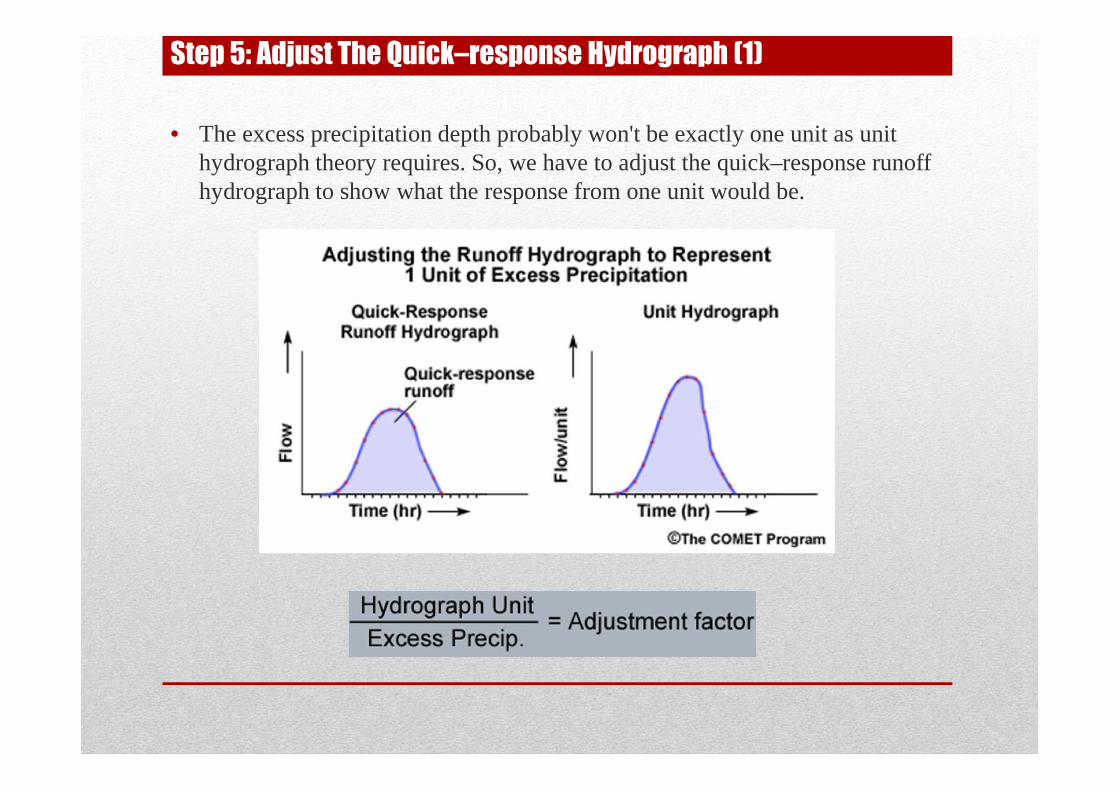
Step 5: Adjust The Quick–response Hydrograph (1)
• The excess precipitation depth probably won't be exactly one unit as unithydrograph theory requires. So, we have to adjust the quick–response runoffhydrograph to show what the response from one unit would be.
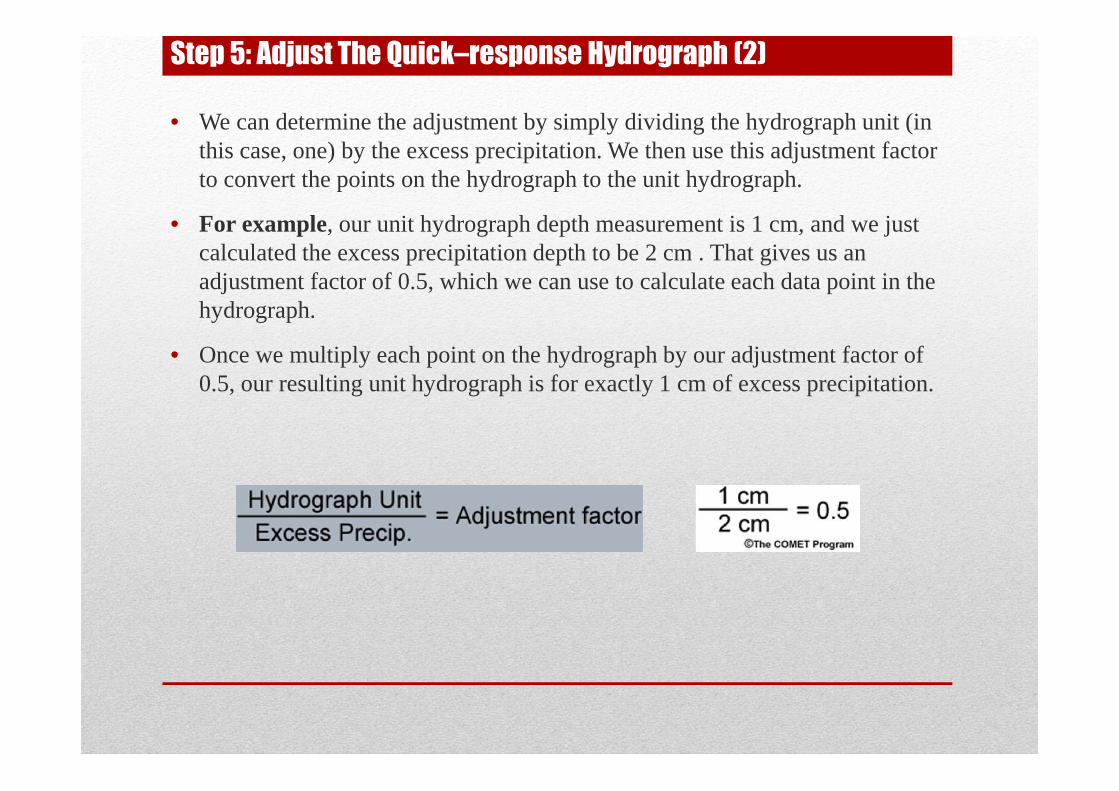
Step 5: Adjust The Quick–response Hydrograph (2)
• We can determine the adjustment by simply dividing the hydrograph unit (inthis case, one) by the excess precipitation. We then use this adjustment factorto convert the points on the hydrograph to the unit hydrograph.
• For example, our unit hydrograph depth measurement is 1 cm, and we justcalculated the excess precipitation depth to be 2 cm . That gives us anadjustment factor of 0.5, which we can use to calculate each data point in thehydrograph.
• Once we multiply each point on the hydrograph by our adjustment factor of0.5, our resulting unit hydrograph is for exactly 1 cm of excess precipitation.
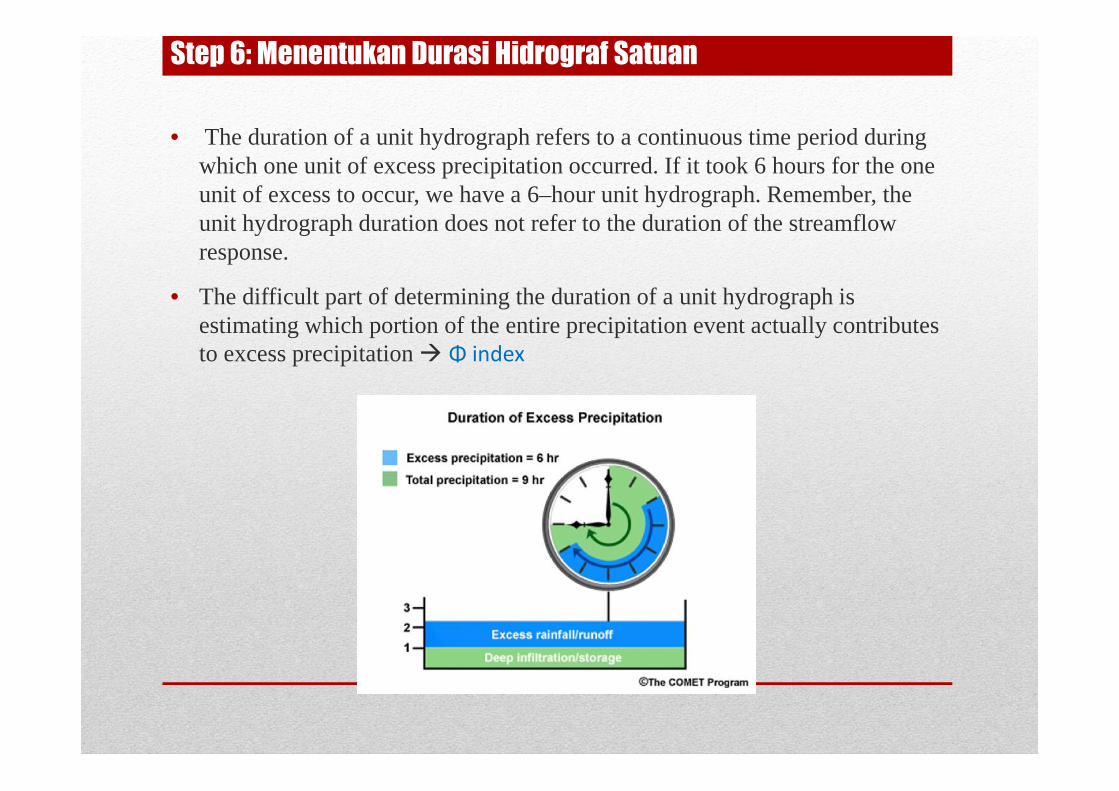
Step 6: Menentukan Durasi Hidrograf Satuan
• The duration of a unit hydrograph refers to a continuous time period duringwhich one unit of excess precipitation occurred. If it took 6 hours for the oneunit of excess to occur, we have a 6–hour unit hydrograph. Remember, theunit hydrograph duration does not refer to the duration of the streamflowresponse.
• The difficult part of determining the duration of a unit hydrograph isestimating which portion of the entire precipitation event actually contributesto excess precipitation Φ index
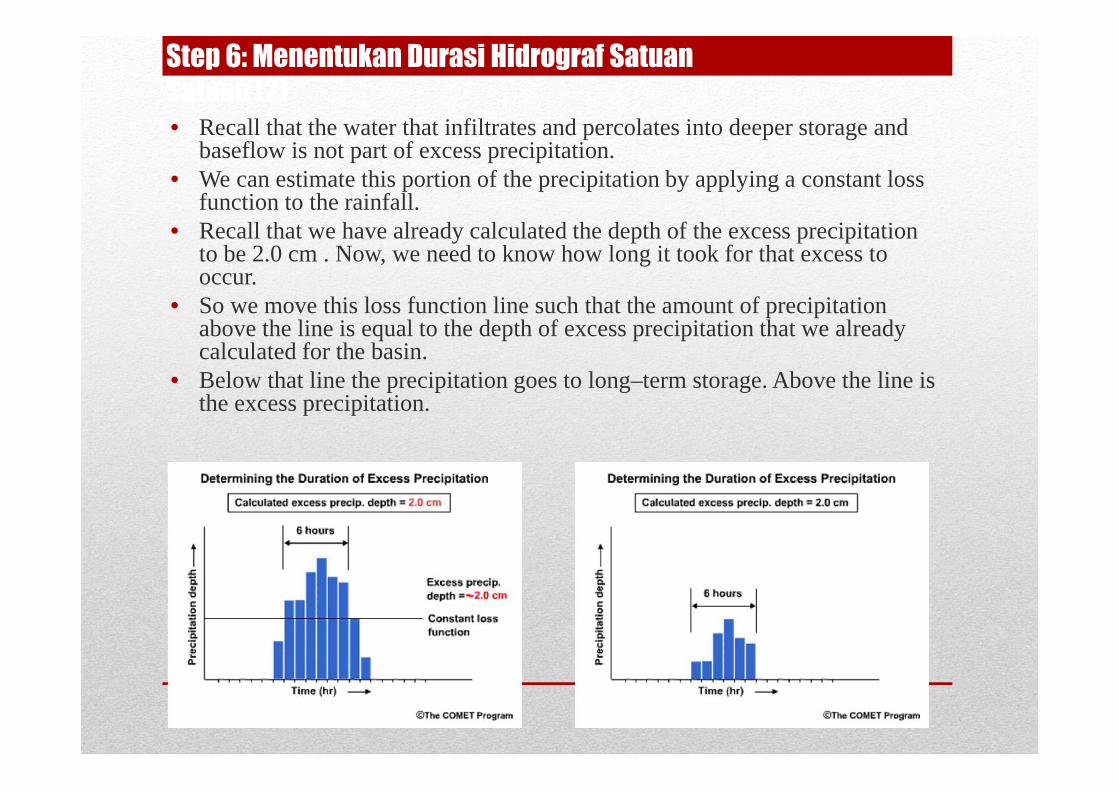
• Recall that the water that infiltrates and percolates into deeper storage andbaseflow is not part of excess precipitation.
• We can estimate this portion of the precipitation by applying a constant lossfunction to the rainfall.
• Recall that we have already calculated the depth of the excess precipitationto be 2.0 cm . Now, we need to know how long it took for that excess tooccur.
• So we move this loss function line such that the amount of precipitationabove the line is equal to the depth of excess precipitation that we alreadycalculated for the basin.
• Below that line the precipitation goes to long–term storage. Above the line isthe excess precipitation.
Step 6: Menentukan Durasi Hidrograf SatuanSatuan (2)
Hasil Akhir Hidrograf Satuan
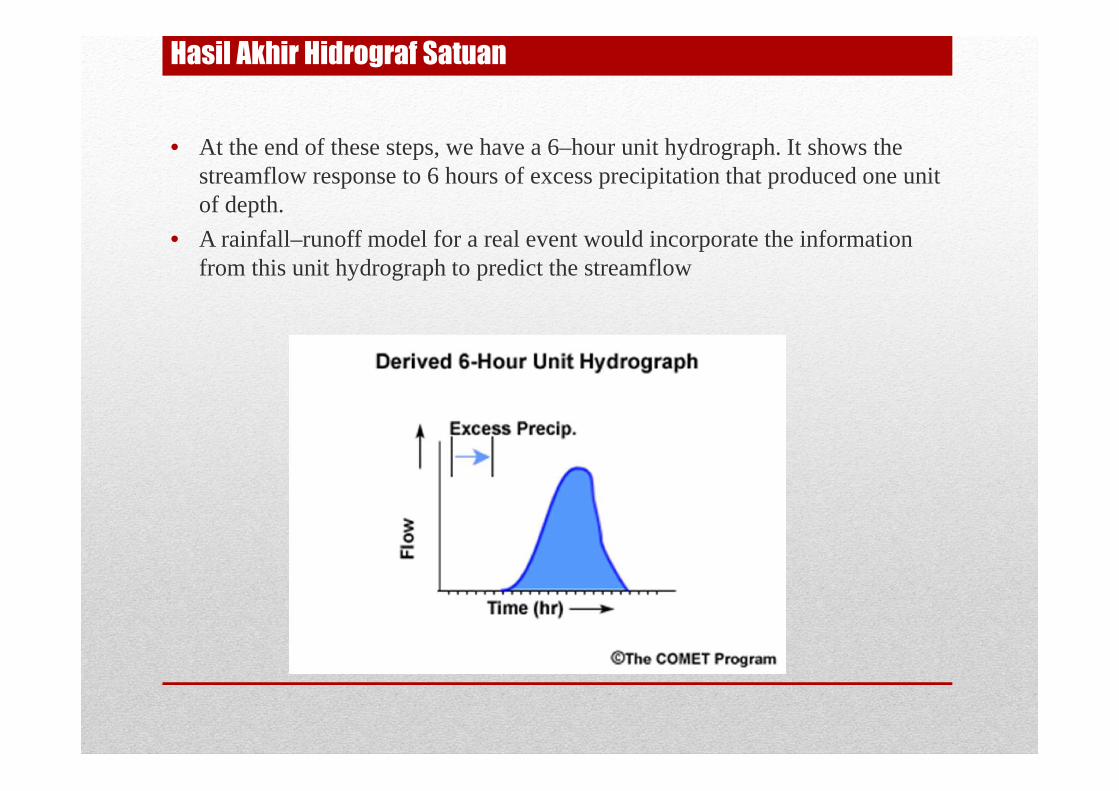
• At the end of these steps, we have a 6–hour unit hydrograph. It shows thestreamflow response to 6 hours of excess precipitation that produced one unitof depth.
• A rainfall–runoff model for a real event would incorporate the informationfrom this unit hydrograph to predict the streamflow
Konsep dasar Hidrograf Satuan
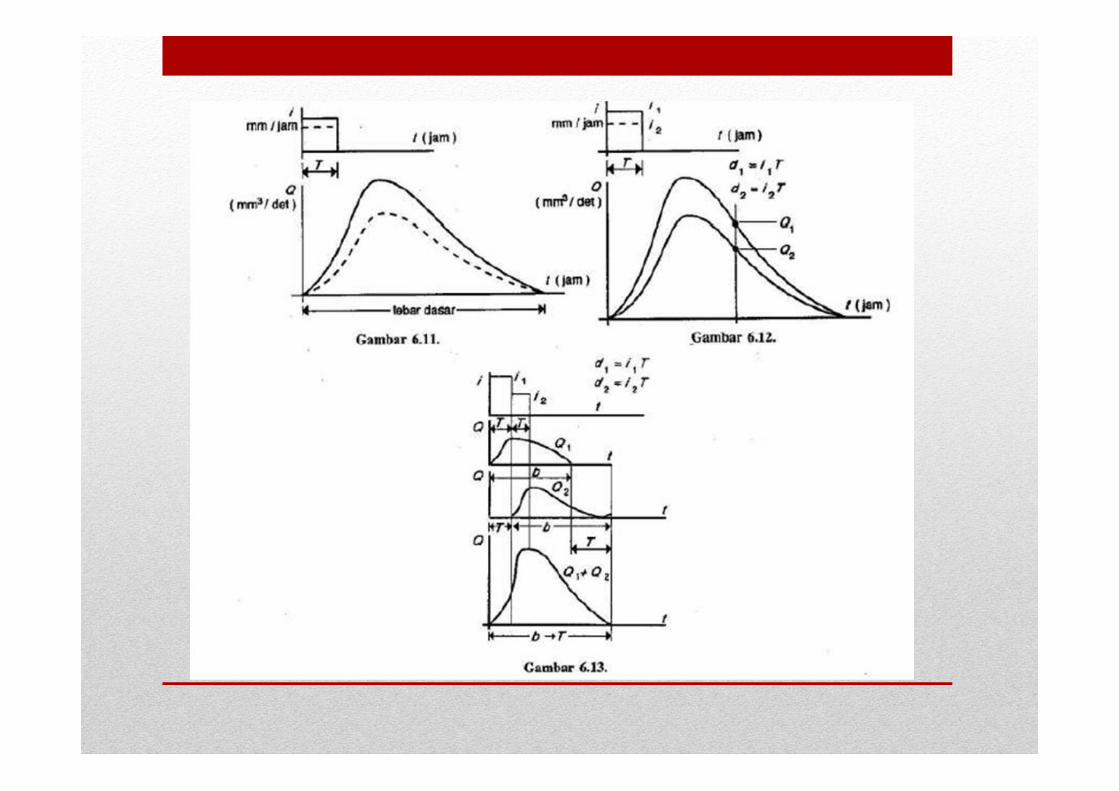
• Sifat DAS tidak berubah dari hujan yg satu dgn hujan yg lain, makahidrograf yg dihasilkan oleh hujan dgn durasi dan pola yg serupamemberikan bentuk dan waktu dasar yg serupa pula Konsep Superposisi.
• Apabila terjadi hujan efektif sebesar 2 mm dgn satuan waktu tertentu,hidrograf yg terjadi akan mempunyai bentuk yg sama dgn hidrograf dgnhujan efektif 1 mm dgn durasi hujan yg sama, kecuali jika ordinatnya adalahdua kali lebih besar (misal: dua satuan hujan efektif 1 mm)
• Apabila hujan efektif 1 mm terjadi dalam dua satuan durasi yg berurutan,hidrograf yg dihasilkan adalah jumlah dari dua hidrograf 1 mm, denganhidrograf kedua mulai dgn keterlambatan satu satuan waktu.
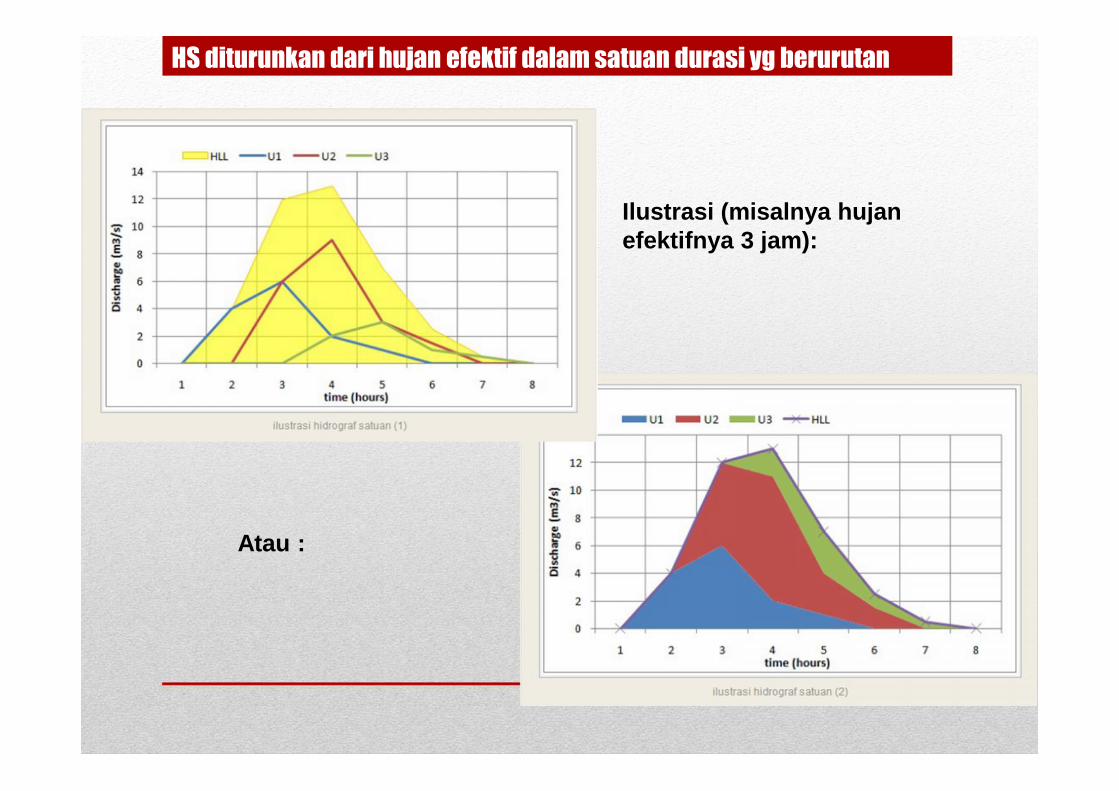
HS diturunkan dari hujan efektif dalam satuan durasi yg berurutan
Ilustrasi (misalnya hujanefektifnya 3 jam):
Atau :
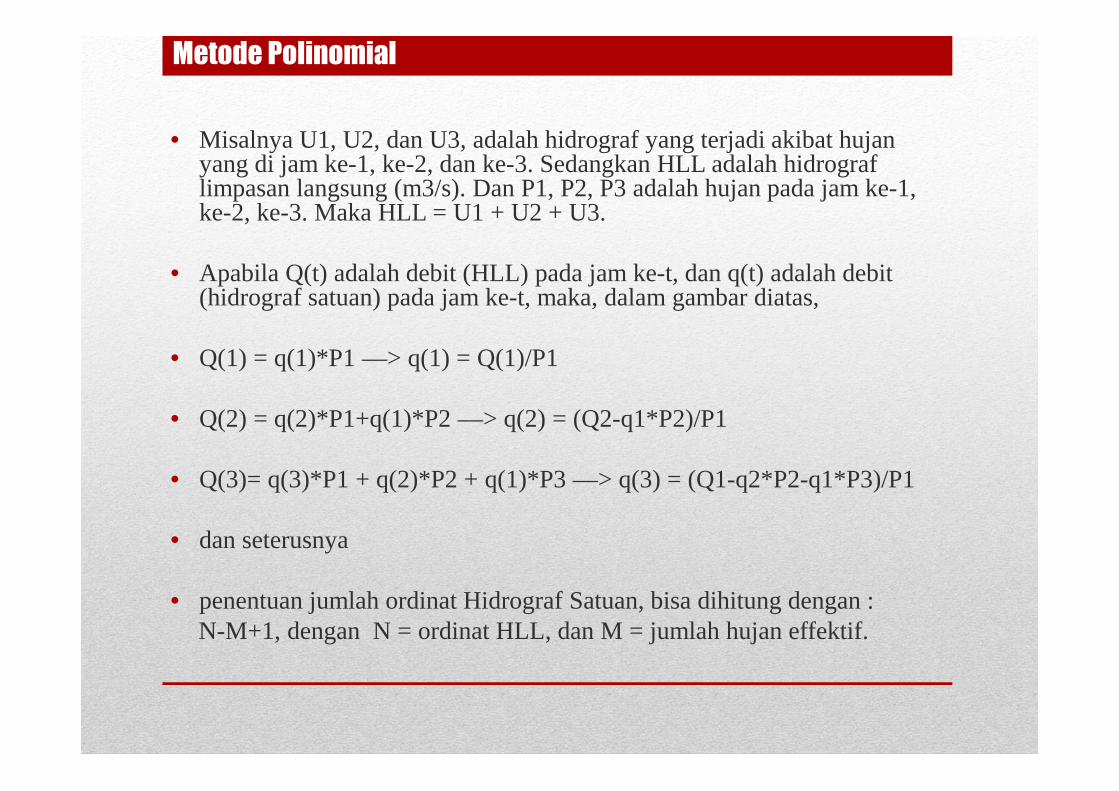
• Misalnya U1, U2, dan U3, adalah hidrograf yang terjadi akibat hujanyang di jam ke-1, ke-2, dan ke-3. Sedangkan HLL adalah hidrograflimpasan langsung (m3/s). Dan P1, P2, P3 adalah hujan pada jam ke-1,ke-2, ke-3. Maka HLL = U1 + U2 + U3.
• Apabila Q(t) adalah debit (HLL) pada jam ke-t, dan q(t) adalah debit(hidrograf satuan) pada jam ke-t, maka, dalam gambar diatas,
• Q(1) = q(1)*P1 —> q(1) = Q(1)/P1
• Q(2) = q(2)*P1+q(1)*P2 —> q(2) = (Q2-q1*P2)/P1
• Q(3)= q(3)*P1 + q(2)*P2 + q(1)*P3 —> q(3) = (Q1-q2*P2-q1*P3)/P1
• dan seterusnya
• penentuan jumlah ordinat Hidrograf Satuan, bisa dihitung dengan :N-M+1, dengan N = ordinat HLL, dan M = jumlah hujan effektif.
Metode Polinomial
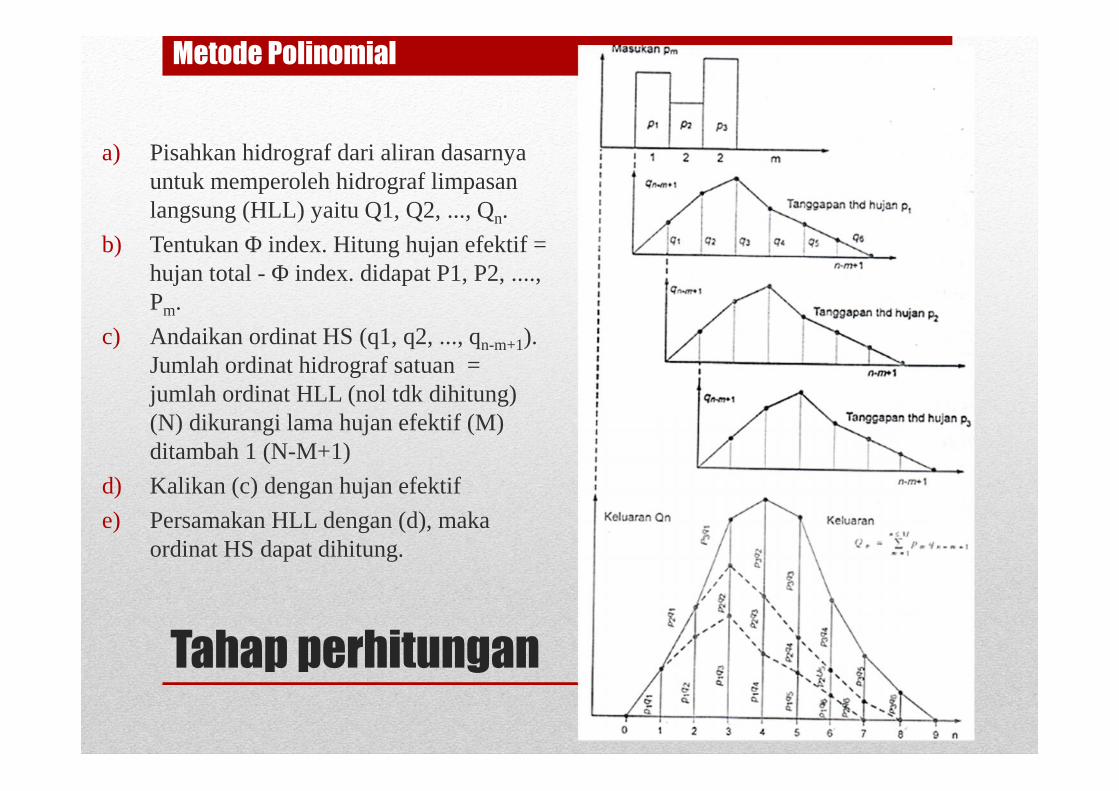
Tahap perhitungan
a) Pisahkan hidrograf dari aliran dasarnyauntuk memperoleh hidrograf limpasanlangsung (HLL) yaitu Q1, Q2, ..., Qn.
b) Tentukan Φ index. Hitung hujan efektif =hujan total - Φ index. didapat P1, P2, ....,Pm.
c) Andaikan ordinat HS (q1, q2, ..., qn-m+1).Jumlah ordinat hidrograf satuan =jumlah ordinat HLL (nol tdk dihitung)(N) dikurangi lama hujan efektif (M)ditambah 1 (N-M+1)
d) Kalikan (c) dengan hujan efektif
e) Persamakan HLL dengan (d), makaordinat HS dapat dihitung.
Metode Polinomial
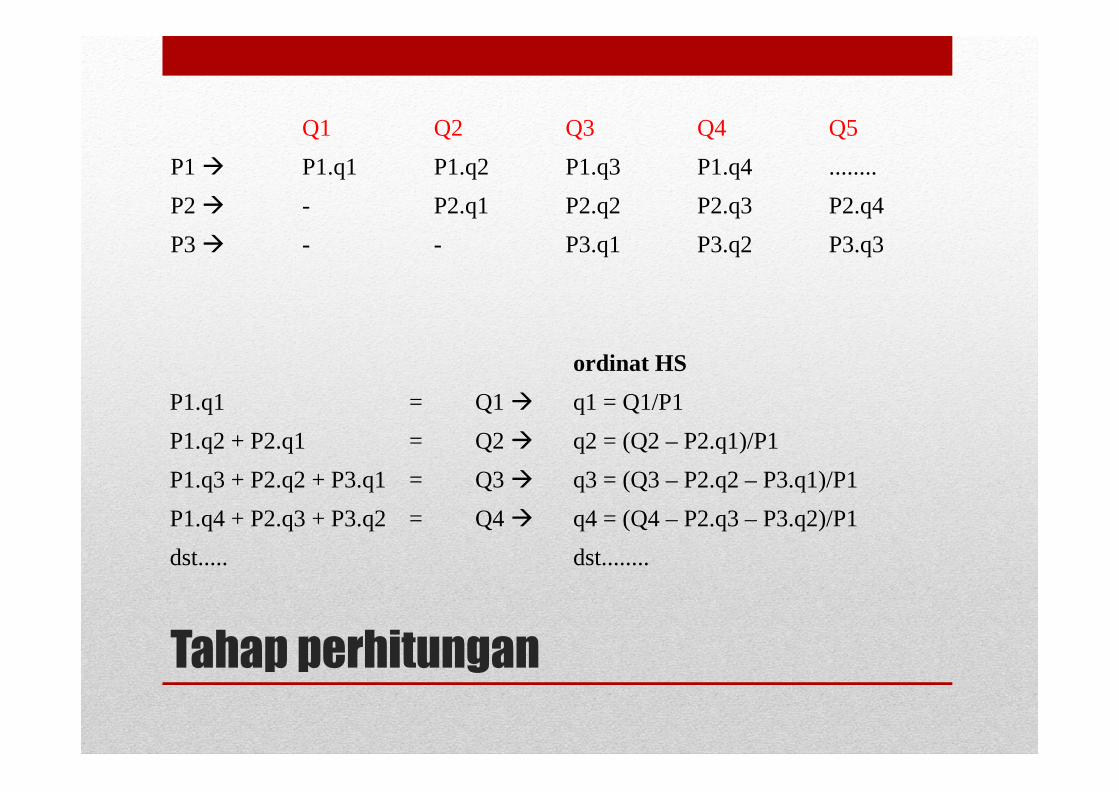
Tahap perhitungan
Q1 Q2 Q3 Q4 Q5
P1 P1.q1 P1.q2 P1.q3 P1.q4 ........
P2 - P2.q1 P2.q2 P2.q3 P2.q4
P3 - - P3.q1 P3.q2 P3.q3
ordinat HS
P1.q1 = Q1 q1 = Q1/P1
P1.q2 + P2.q1 = Q2 q2 = (Q2 – P2.q1)/P1
P1.q3 + P2.q2 + P3.q1 = Q3 q3 = (Q3 – P2.q2 – P3.q1)/P1
P1.q4 + P2.q3 + P3.q2 = Q4 q4 = (Q4 – P2.q3 – P3.q2)/P1
dst..... dst........
Contoh Soal :
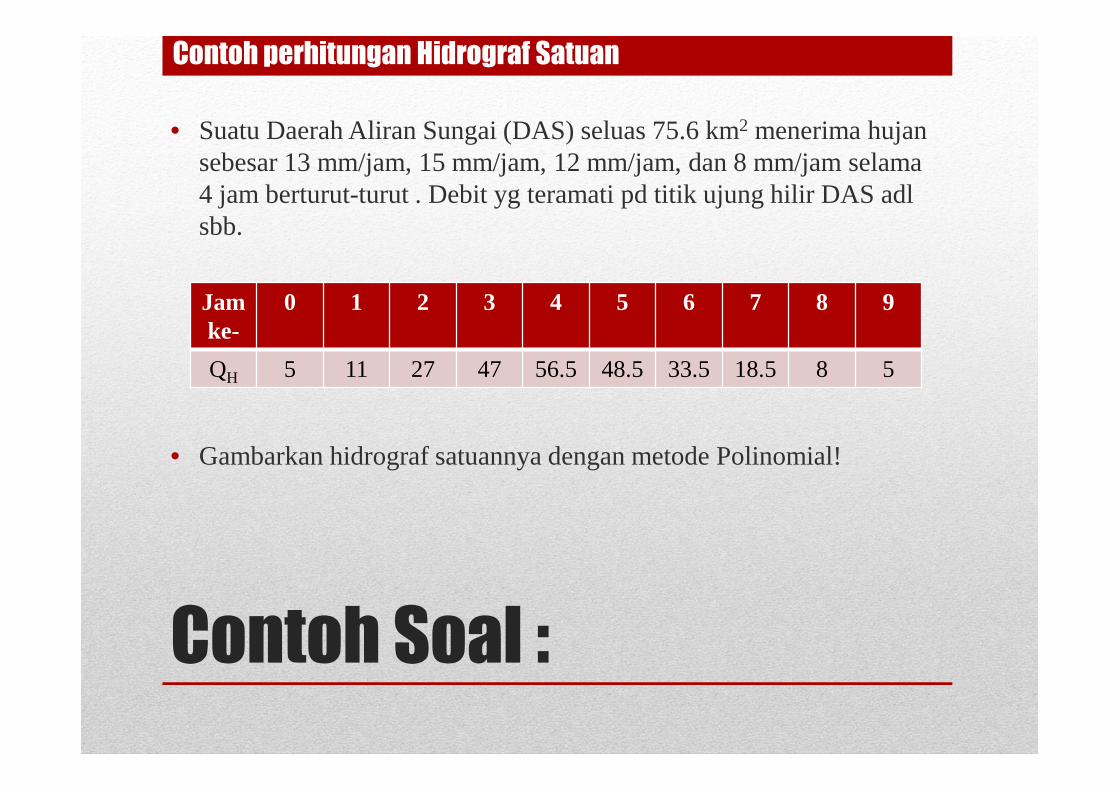
• Suatu Daerah Aliran Sungai (DAS) seluas 75.6 km2 menerima hujansebesar 13 mm/jam, 15 mm/jam, 12 mm/jam, dan 8 mm/jam selama4 jam berturut-turut . Debit yg teramati pd titik ujung hilir DAS adlsbb.
• Gambarkan hidrograf satuannya dengan metode Polinomial!
Jamke-
0 1 2 3 4 5 6 7 8 9
QH 5 11 27 47 56.5 48.5 33.5 18.5 8 5
Contoh perhitungan Hidrograf Satuan
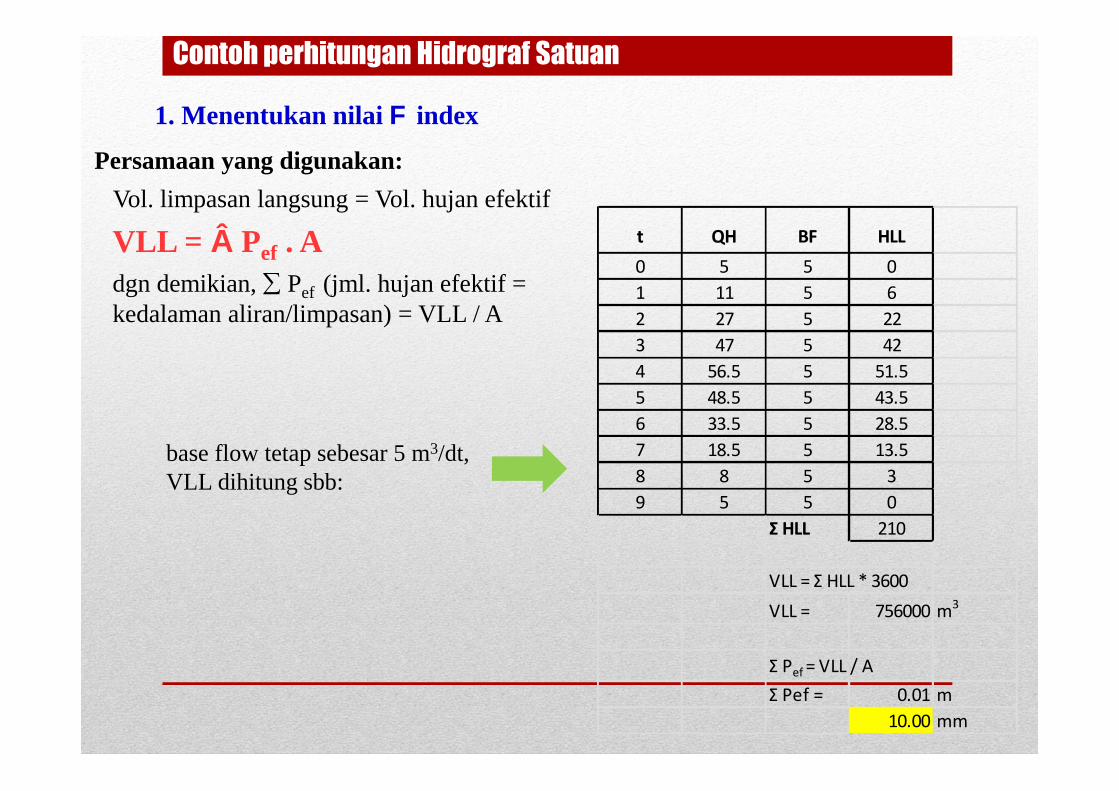
Persamaan yang digunakan:
Vol. limpasan langsung = Vol. hujan efektif
VLL = Pef . Adgn demikian, Pef (jml. hujan efektif =kedalaman aliran/limpasan) = VLL / A
1. Menentukan nilai index
base flow tetap sebesar 5 m3/dt,VLL dihitung sbb:
Contoh perhitungan Hidrograf Satuan
t QH BF HLL0 5 5 01 11 5 62 27 5 223 47 5 424 56.5 5 51.55 48.5 5 43.56 33.5 5 28.57 18.5 5 13.58 8 5 39 5 5 0
Σ HLL 210
VLL = Σ HLL * 3600VLL = 756000 m3
Σ Pef = VLL / AΣ Pef = 0.01 m
10.00 mm
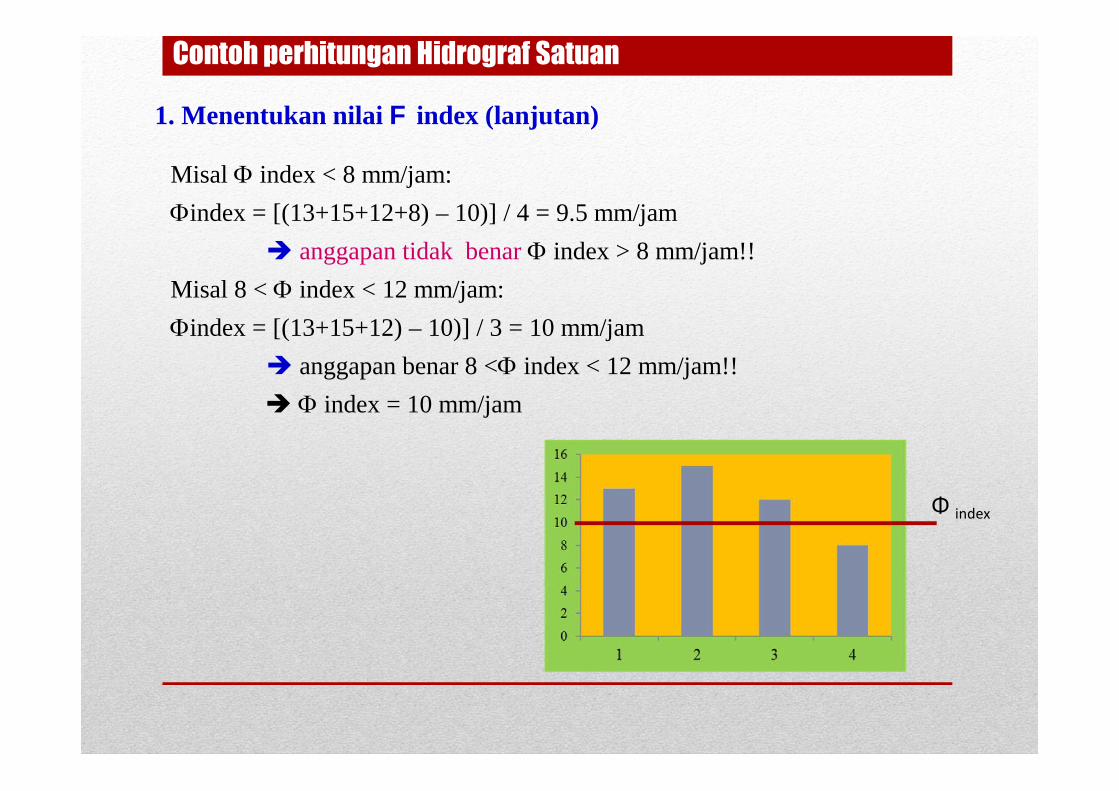
Misal index < 8 mm/jam:
index = [(13+15+12+8) – 10)] / 4 = 9.5 mm/jam
anggapan tidak benar index > 8 mm/jam!!
Misal 8 < index < 12 mm/jam:
index = [(13+15+12) – 10)] / 3 = 10 mm/jam
anggapan benar 8 < index < 12 mm/jam!!
index = 10 mm/jam
Φ index
1. Menentukan nilai index (lanjutan)
Contoh perhitungan Hidrograf Satuan
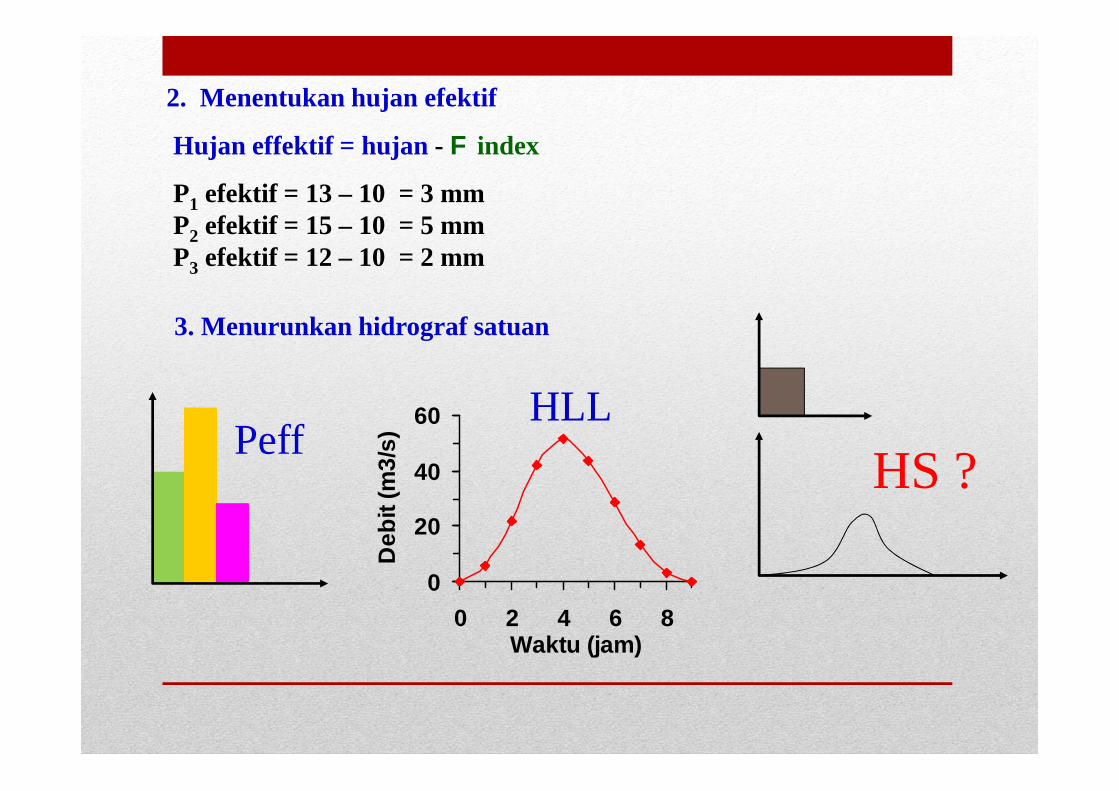
2. Menentukan hujan efektif
Hujan effektif = hujan - index
P1 efektif = 13 – 10 = 3 mmP2 efektif = 15 – 10 = 5 mmP3 efektif = 12 – 10 = 2 mm
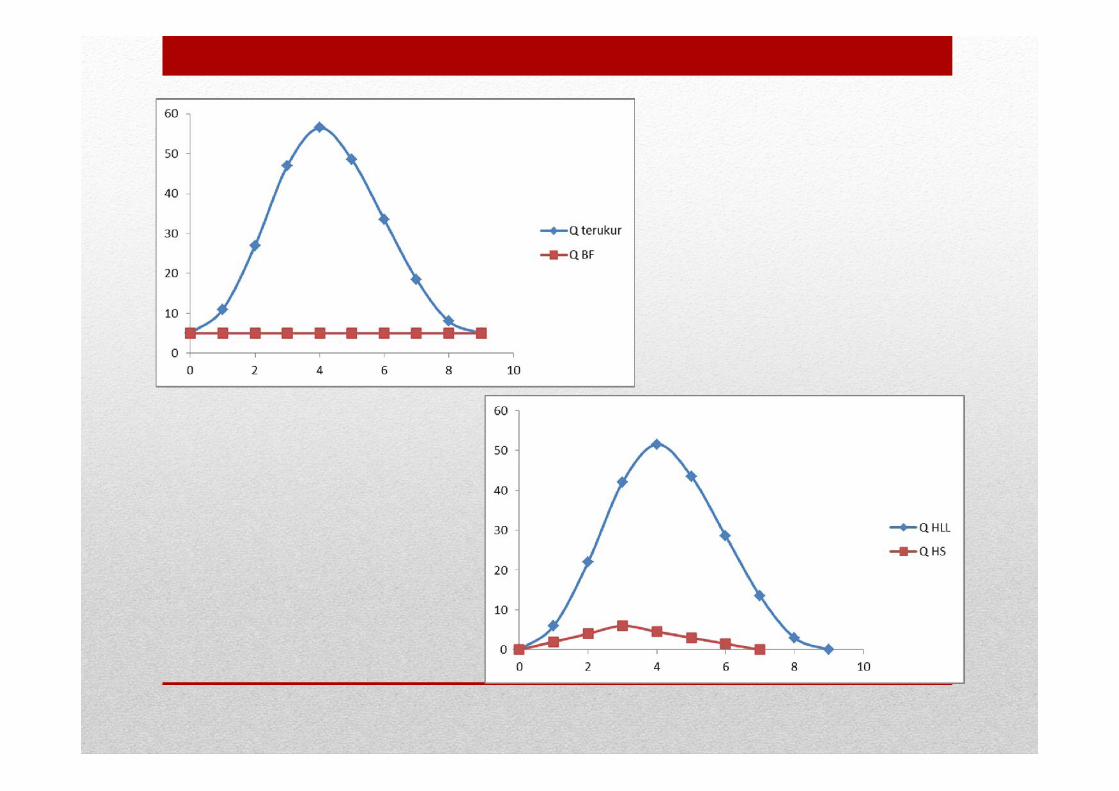
3. Menurunkan hidrograf satuan
0
20
40
60
0 2 4 6 8Waktu (jam)
Deb
it (m
3/s)
HS ?Peff
HLL
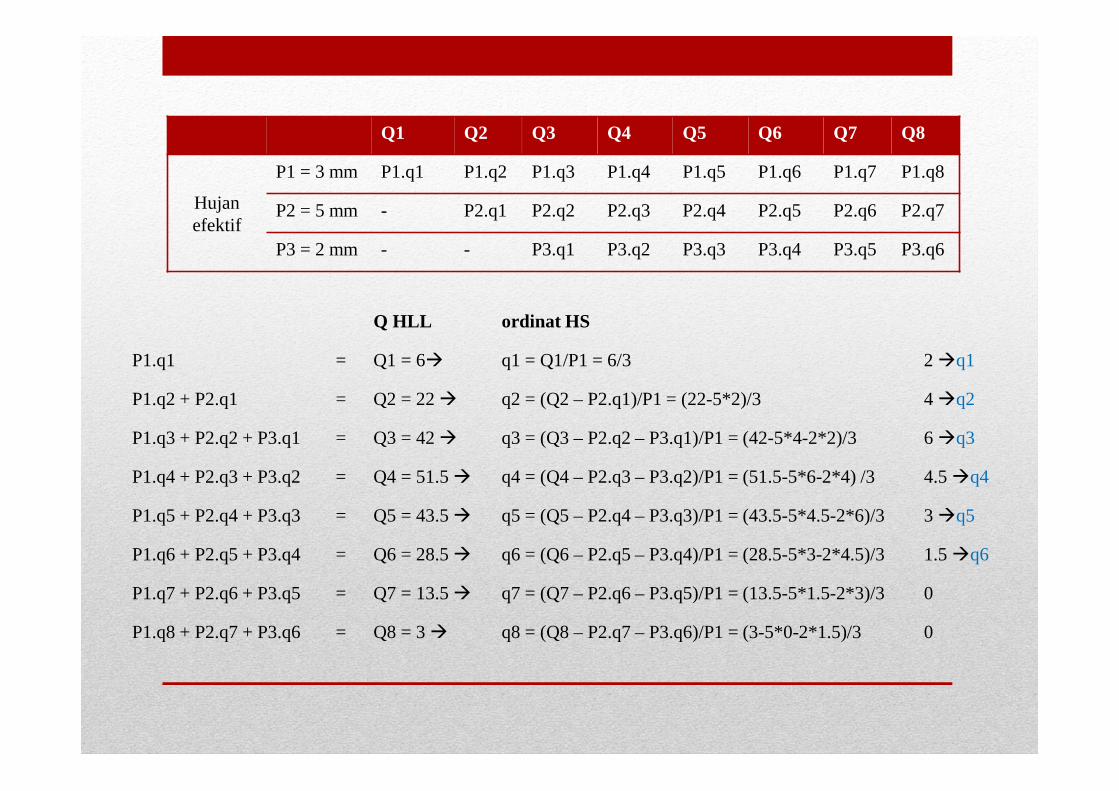
Q1 Q2 Q3 Q4 Q5 Q6 Q7 Q8
Hujanefektif
P1 = 3 mm P1.q1 P1.q2 P1.q3 P1.q4 P1.q5 P1.q6 P1.q7 P1.q8
P2 = 5 mm - P2.q1 P2.q2 P2.q3 P2.q4 P2.q5 P2.q6 P2.q7
P3 = 2 mm - - P3.q1 P3.q2 P3.q3 P3.q4 P3.q5 P3.q6
Q HLL ordinat HS
P1.q1 = Q1 = 6 q1 = Q1/P1 = 6/3 2q1
P1.q2 + P2.q1 = Q2 = 22 q2 = (Q2 – P2.q1)/P1 = (22-5*2)/3 4q2
P1.q3 + P2.q2 + P3.q1 = Q3 = 42 q3 = (Q3 – P2.q2 – P3.q1)/P1 = (42-5*4-2*2)/3 6q3
P1.q4 + P2.q3 + P3.q2 = Q4 = 51.5 q4 = (Q4 – P2.q3 – P3.q2)/P1 = (51.5-5*6-2*4) /3 4.5q4
P1.q5 + P2.q4 + P3.q3 = Q5 = 43.5 q5 = (Q5 – P2.q4 – P3.q3)/P1 = (43.5-5*4.5-2*6)/3 3q5
P1.q6 + P2.q5 + P3.q4 = Q6 = 28.5 q6 = (Q6 – P2.q5 – P3.q4)/P1 = (28.5-5*3-2*4.5)/3 1.5q6
P1.q7 + P2.q6 + P3.q5 = Q7 = 13.5 q7 = (Q7 – P2.q6 – P3.q5)/P1 = (13.5-5*1.5-2*3)/3 0
P1.q8 + P2.q7 + P3.q6 = Q8 = 3 q8 = (Q8 – P2.q7 – P3.q6)/P1 = (3-5*0-2*1.5)/3 0
t QH BF QHLL U3(t) U5(t-1) U2(t-2) UH=U1(t)
0123456789
5.011.027.047.056.548.533.518.58.05.0
5.05.05.05.05.05.05.05.05.05.0
0.06.0
22.042.051.543.528.513.53.00.0
0.06.012.018.013.59.04.50.0
-0.010.020.030.022.515.07.50.0
--
0.04.08.012.09.06.03.00.0
0.06.0/3.0=2.0
12.0/3.0=4.06.04.53.01.50.0
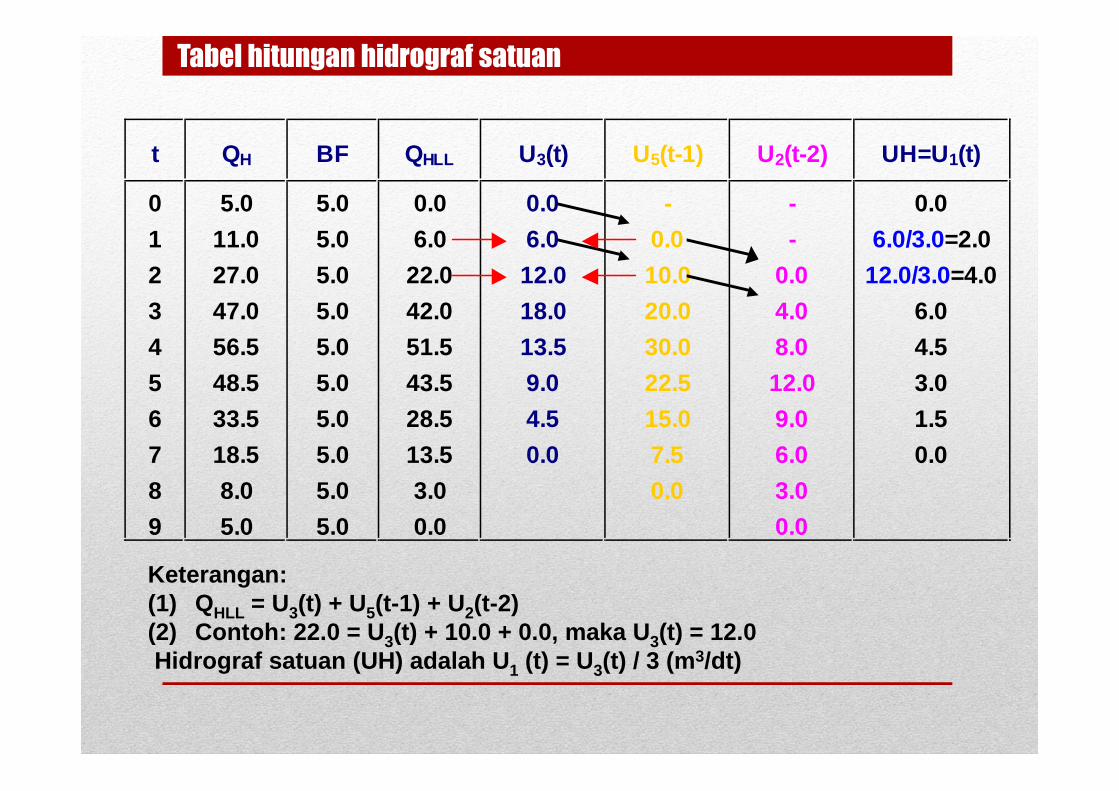
Tabel hitungan hidrograf satuan
Keterangan:(1) QHLL = U3(t) + U5(t-1) + U2(t-2)(2) Contoh: 22.0 = U3(t) + 10.0 + 0.0, maka U3(t) = 12.0Hidrograf satuan (UH) adalah U1 (t) = U3(t) / 3 (m3/dt)
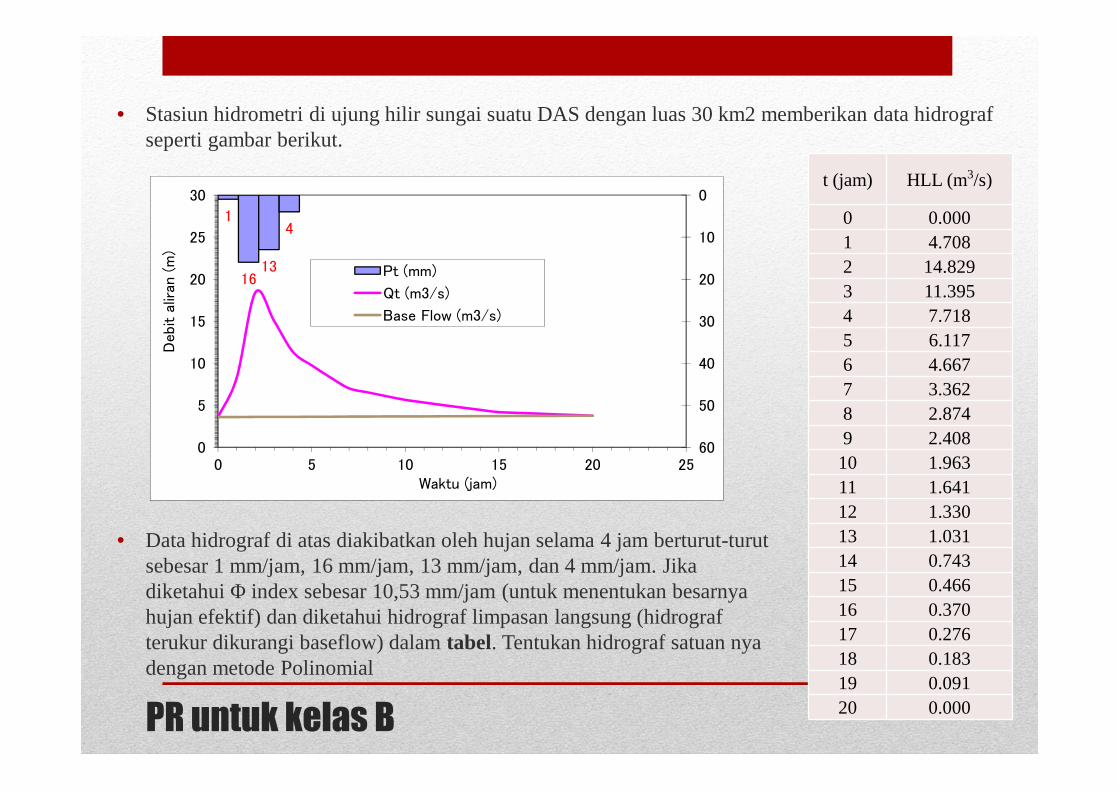
PR untuk kelas B
• Stasiun hidrometri di ujung hilir sungai suatu DAS dengan luas 30 km2 memberikan data hidrografseperti gambar berikut.
1
1613
4
0
10
20
30
40
50
600
5
10
15
20
25
30
0 5 10 15 20 25
Debit a
liran
(m
)
Waktu (jam)
Pt (mm)
Qt (m3/s)
Base Flow (m3/s)
• Data hidrograf di atas diakibatkan oleh hujan selama 4 jam berturut-turutsebesar 1 mm/jam, 16 mm/jam, 13 mm/jam, dan 4 mm/jam. Jikadiketahui Φ index sebesar 10,53 mm/jam (untuk menentukan besarnyahujan efektif) dan diketahui hidrograf limpasan langsung (hidrografterukur dikurangi baseflow) dalam tabel. Tentukan hidrograf satuan nyadengan metode Polinomial
t (jam) HLL (m3/s)
0 0.0001 4.7082 14.8293 11.3954 7.7185 6.1176 4.6677 3.3628 2.8749 2.408
10 1.96311 1.64112 1.33013 1.03114 0.74315 0.46616 0.37017 0.27618 0.18319 0.09120 0.000
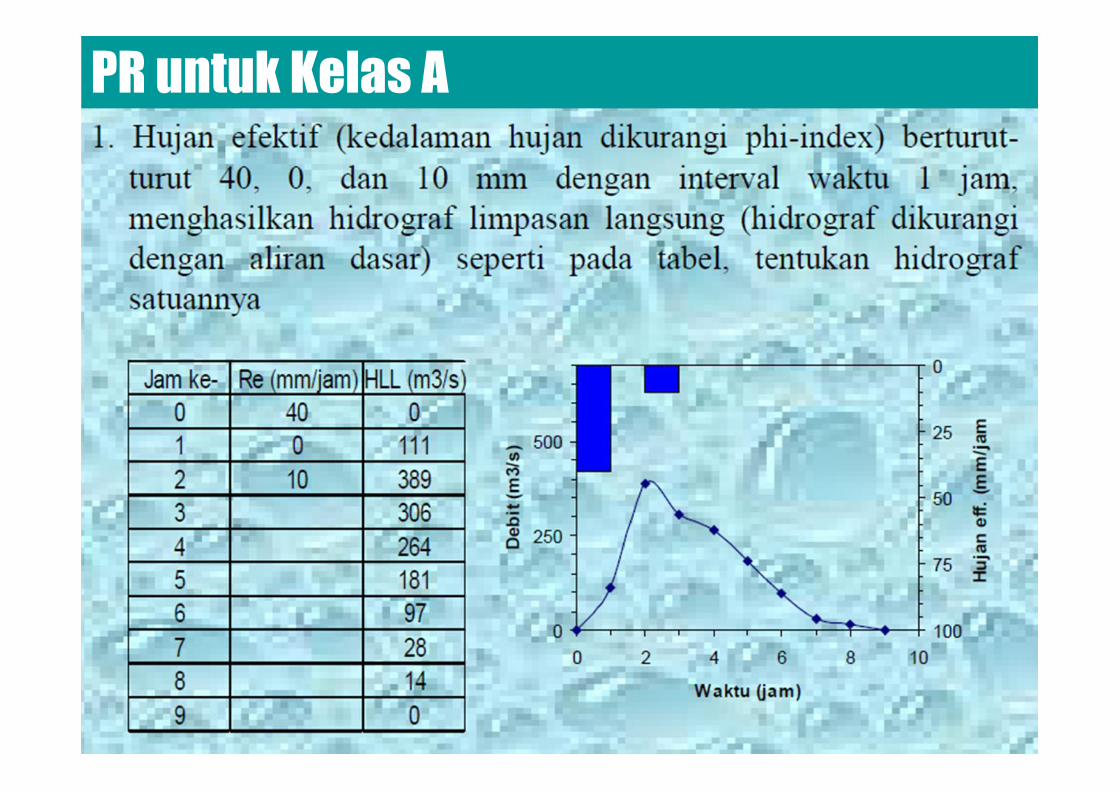
PR untuk Kelas A