Prilaku biaya
31
Analisis Perilaku Biaya
Transcript of Prilaku biaya
Analisis Perilaku
Biaya

To accompany Cost Accounting 12e, by Horngren/Datar/Foster. Copyright © 2006 by Pearson Education. All rights reserved. 10-2
Pengklasifikasian biaya berdasar
perilaku biaya:
1. Biaya Tetap (Fixed cost)
biaya yang tidak berubah secara total dalam
hubungan dengan beberapa aktivitas atau output
yang dipilih
2. Biaya Variabel (Variable cost)
biaya yang berubah secara total dalam hubungan
dengan beberapa aktivitas atau output yang dipilih
3. Biaya Semivariabel (Semivariable cost)
biaya yang memiliki baik komponen tetap dan
variabel

To accompany Cost Accounting 12e, by Horngren/Datar/Foster. Copyright © 2006 by Pearson Education. All rights reserved. 10-3
Fixed CostsA cost that stays the
same as output
changes is a fixed
cost.

To accompany Cost Accounting 12e, by Horngren/Datar/Foster. Copyright © 2006 by Pearson Education. All rights reserved. 10-4
Lease of
Machine
s
Number
of Units
$60,000 0 N/A
60,000 60,000 $1.00
60,000 120,000 0.50
60,000 180,000 0.33
60,000 240,000 0.25
Units
Cost
Fixed Costs
Total Fixed Cost GraphTota
l C
osts
$120,000
$100,000
$80,000
$60,000
$40,000
$20,000
601201802400
Units Produced (000)
F =
$60,000

To accompany Cost Accounting 12e, by Horngren/Datar/Foster. Copyright © 2006 by Pearson Education. All rights reserved. 10-5
Variable Cost
A variable cost is a cost
that, in total, varies in
direct proportion to
changes in output.
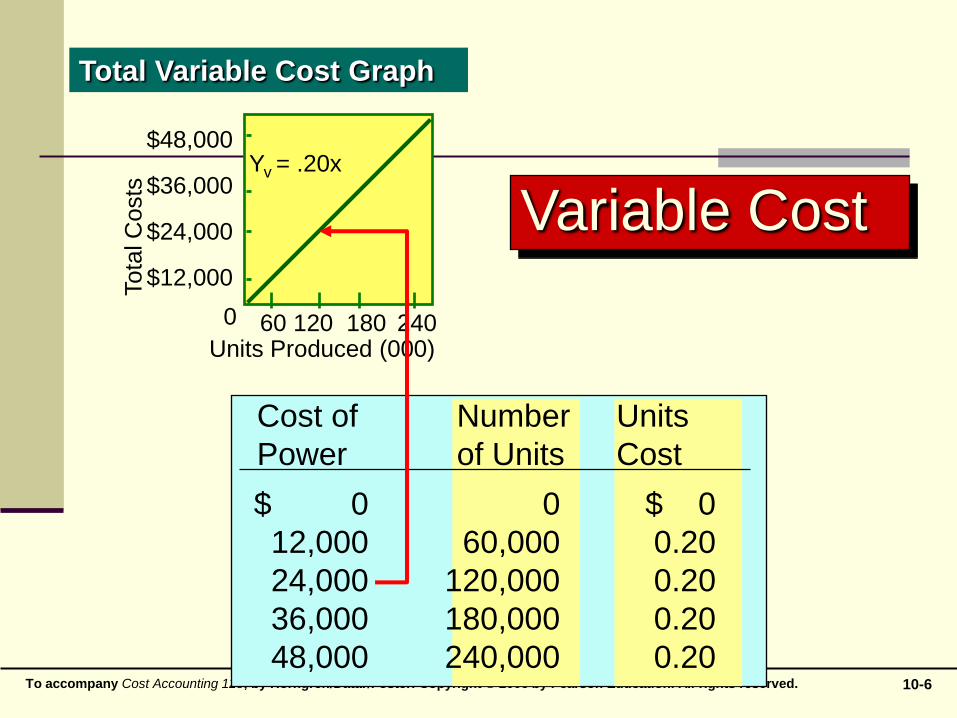
To accompany Cost Accounting 12e, by Horngren/Datar/Foster. Copyright © 2006 by Pearson Education. All rights reserved. 10-6
Total Variable Cost Graph
Cost of
Power
Number
of Units
$ 0 0 $ 0
12,000 60,000 0.20
24,000 120,000 0.20
36,000 180,000 0.20
48,000 240,000 0.20
Units
Cost
Tota
l C
osts
0
Units Produced (000)
$48,000
$36,000
$24,000
$12,000
60 120 180 240
Variable CostYv = .20x
To accompany Cost Accounting 12e, by Horngren/Datar/Foster. Copyright © 2006 by Pearson Education. All rights reserved. 10-7
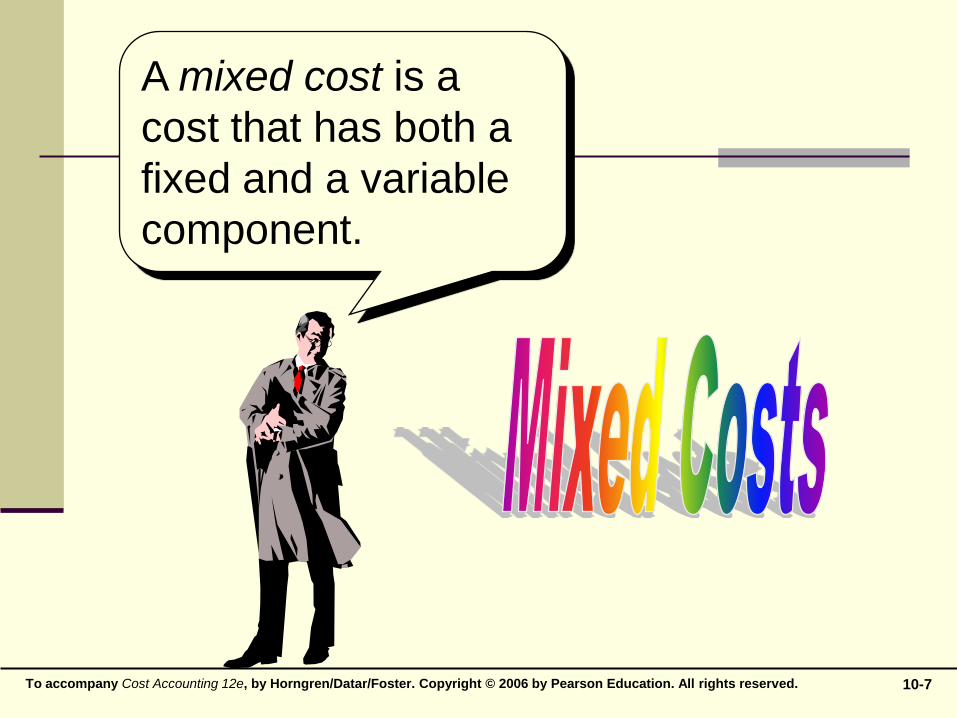
A mixed cost is a
cost that has both a
fixed and a variable
component.

To accompany Cost Accounting 12e, by Horngren/Datar/Foster. Copyright © 2006 by Pearson Education. All rights reserved. 10-8
Inserts
Sold
Variable
Cost of
Selling
40,000 $ 20,000 $30,000 $ 50,000 $1.25
80,000 40,000 30,000 70,000 0.86
120,000 60,000 30,000 90,000 0.75
160,000 80,000 30,000 110,000 0.69
200,000 100,000 30,000 130,000 0.65
Total
Selling
Cost
Fixed
Cost of
Selling
Selling
Cost per
Unit
Mixed Cost BehaviorTota
l C
osts
0
Units Sold (000)
$130,000
$110,000
$90,000
$70,000
$50,000
$30,000
40 80 120 160 180
200
To accompany Cost Accounting 12e, by Horngren/Datar/Foster. Copyright © 2006 by Pearson Education. All rights reserved. 10-9
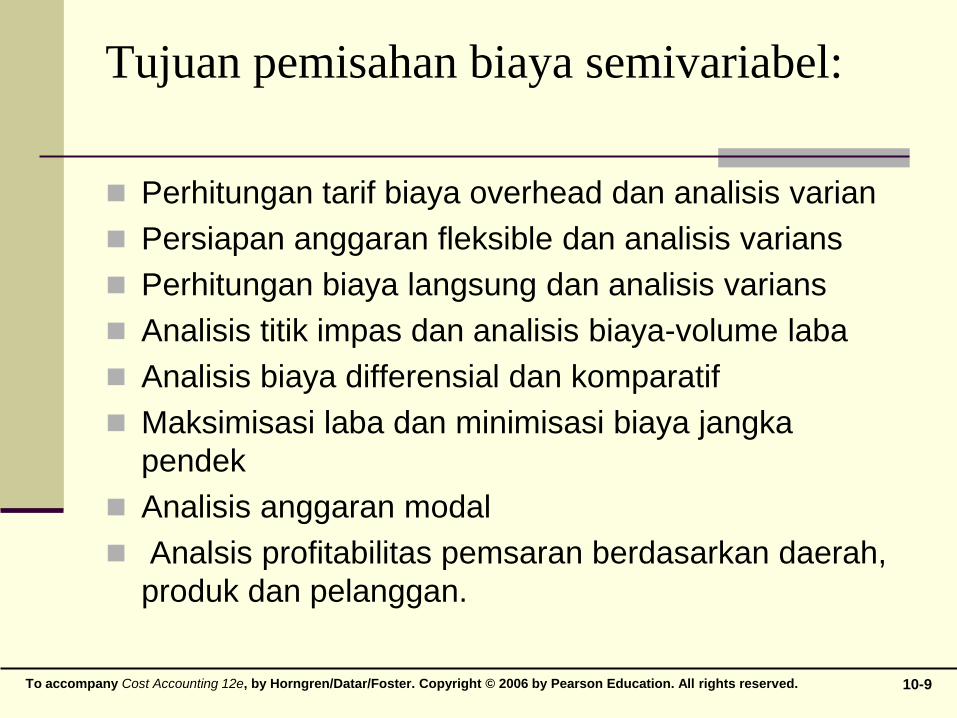
Tujuan pemisahan biaya semivariabel:
Perhitungan tarif biaya overhead dan analisis varian
Persiapan anggaran fleksible dan analisis varians
Perhitungan biaya langsung dan analisis varians
Analisis titik impas dan analisis biaya-volume laba
Analisis biaya differensial dan komparatif
Maksimisasi laba dan minimisasi biaya jangka
pendek
Analisis anggaran modal
Analsis profitabilitas pemsaran berdasarkan daerah,
produk dan pelanggan.

To accompany Cost Accounting 12e, by Horngren/Datar/Foster. Copyright © 2006 by Pearson Education. All rights reserved. 10-10
Asumsi-asumsi Fungsi Biaya
1. Perilaku biaya diperkirakan dengan fungsi
biaya linear dalam rentang yang relevan
Secara grafis, biaya total versus tingkat suatu
aktivitas tunggal yang berhubungan dengan
biaya itu adalah suatu garis lurus dalam
rentang yang relevan
To accompany Cost Accounting 12e, by Horngren/Datar/Foster. Copyright © 2006 by Pearson Education. All rights reserved. 10-11
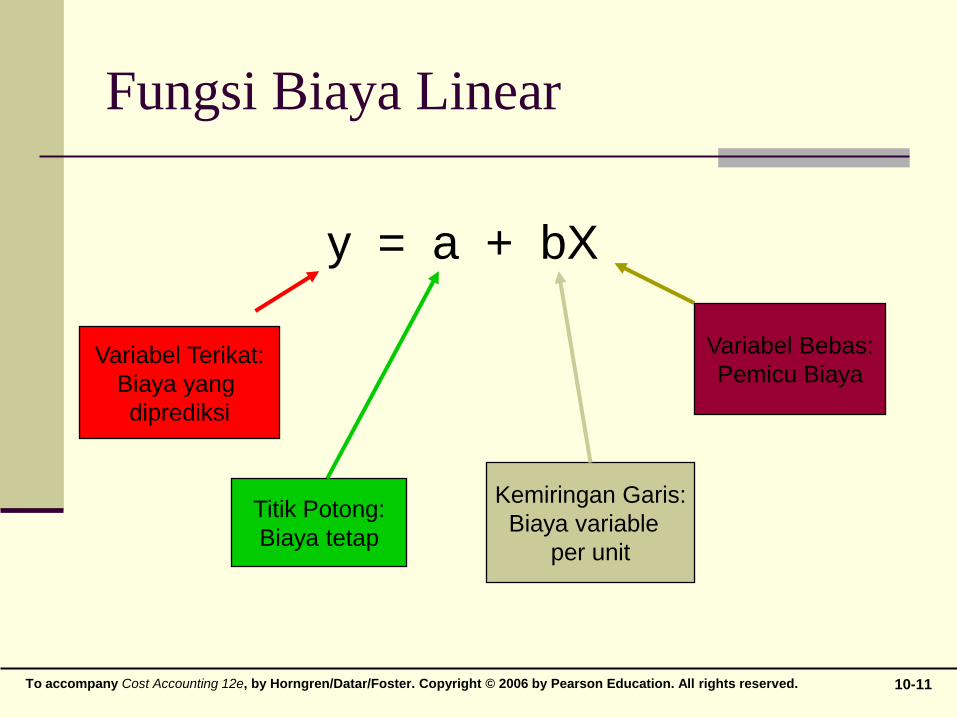
Fungsi Biaya Linear
y = a + bX
Variabel Terikat:
Biaya yang
diprediksi
Variabel Bebas:
Pemicu Biaya
Titik Potong:
Biaya tetap
Kemiringan Garis:
Biaya variable
per unit

To accompany Cost Accounting 12e, by Horngren/Datar/Foster. Copyright © 2006 by Pearson Education. All rights reserved. 10-1212
Perilaku Biaya Campuran
(Mixed-Cost Behaviour)
Total Biaya
Biaya
Kuantitas Produk
Biaya Tetap
Biaya Variabel
Asumsi Linearitas
Total Biaya = Biaya Tetap + Total Biaya Variabel
To accompany Cost Accounting 12e, by Horngren/Datar/Foster. Copyright © 2006 by Pearson Education. All rights reserved. 10-13
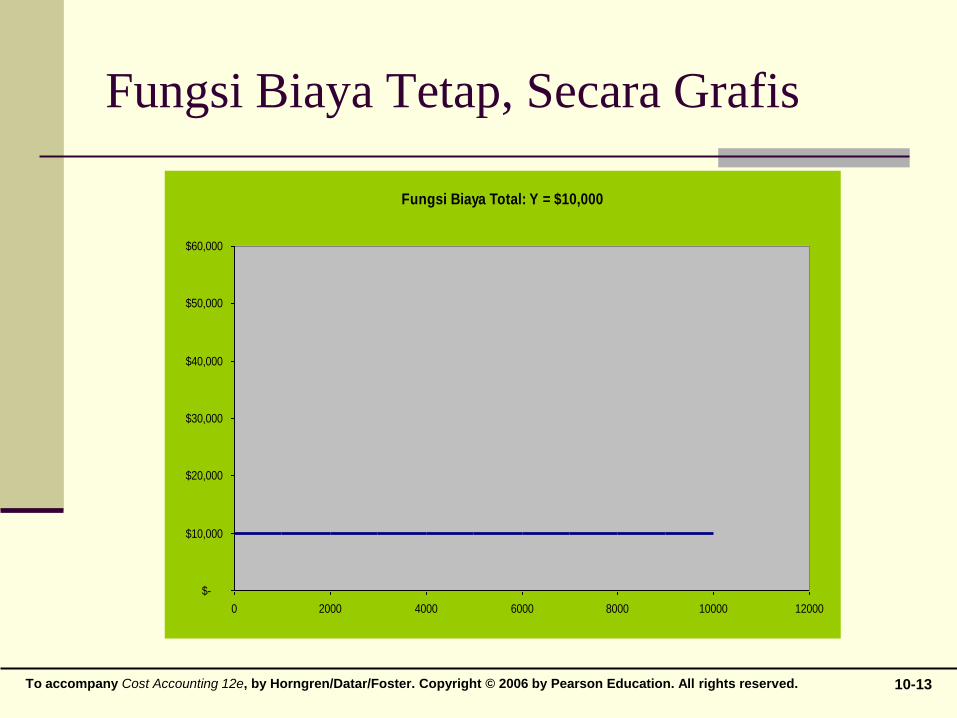
Fungsi Biaya Tetap, Secara Grafis
Fungsi Biaya Total: Y = $10,000
$-
$10,000
$20,000
$30,000
$40,000
$50,000
$60,000
0 2000 4000 6000 8000 10000 12000

To accompany Cost Accounting 12e, by Horngren/Datar/Foster. Copyright © 2006 by Pearson Education. All rights reserved. 10-14
Fungsi Biaya Variabel, secara Grafis
Fungsi Biaya Total : Y = $5X
$-
$10,000
$20,000
$30,000
$40,000
$50,000
$60,000
0 2000 4000 6000 8000 10000 12000
To accompany Cost Accounting 12e, by Horngren/Datar/Foster. Copyright © 2006 by Pearson Education. All rights reserved. 10-15
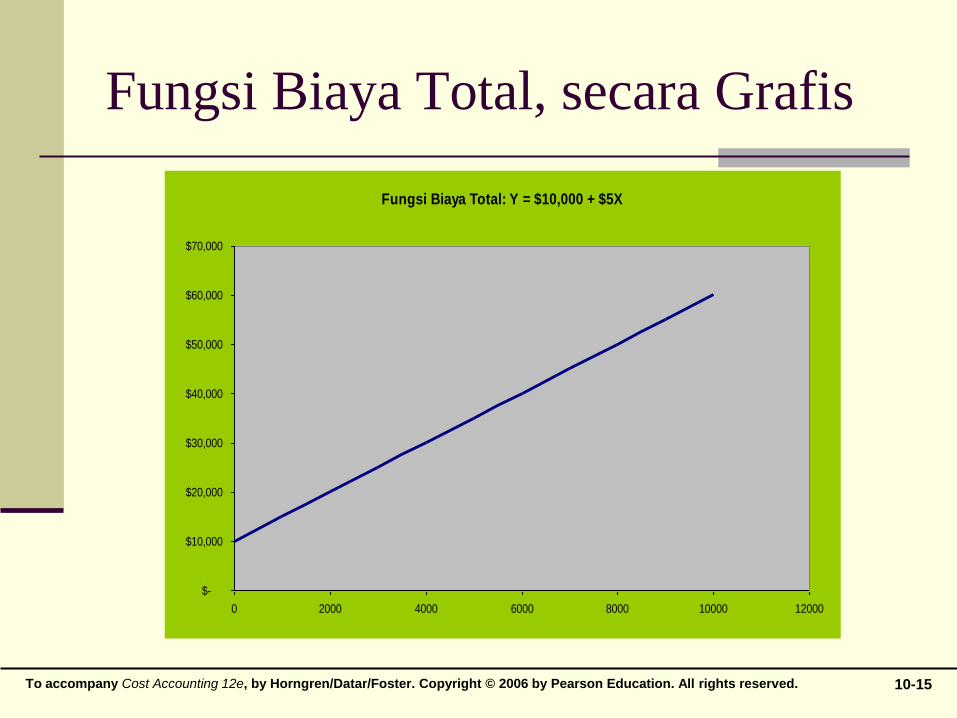
Fungsi Biaya Total, secara Grafis
Fungsi Biaya Total: Y = $10,000 + $5X
$-
$10,000
$20,000
$30,000
$40,000
$50,000
$60,000
$70,000
0 2000 4000 6000 8000 10000 12000
To accompany Cost Accounting 12e, by Horngren/Datar/Foster. Copyright © 2006 by Pearson Education. All rights reserved. 10-16
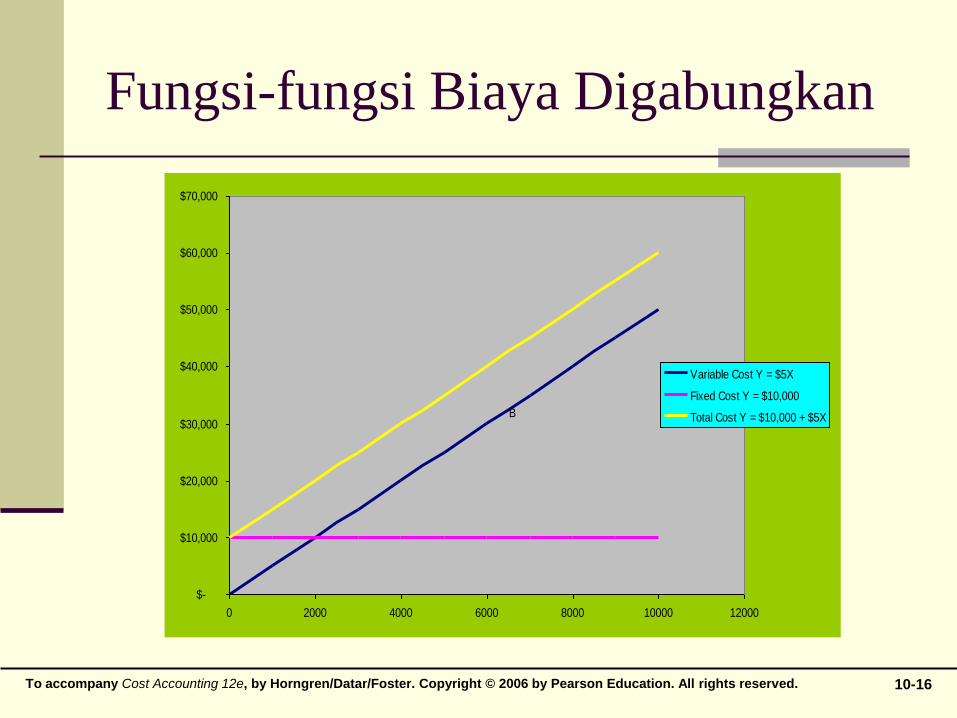
Fungsi-fungsi Biaya Digabungkan
$-
$10,000
$20,000
$30,000
$40,000
$50,000
$60,000
$70,000
0 2000 4000 6000 8000 10000 12000
Variable Cost Y = $5X
Fixed Cost Y = $10,000
Total Cost Y = $10,000 + $5XB

To accompany Cost Accounting 12e, by Horngren/Datar/Foster. Copyright © 2006 by Pearson Education. All rights reserved. 10-17
Metode Pemisahan Biaya
Semivariabel:
1. Metode Titik tertinggi dan terendah
2. Metode Scattergraph
3. Metode Least Square

To accompany Cost Accounting 12e, by Horngren/Datar/Foster. Copyright © 2006 by Pearson Education. All rights reserved. 10-18
Metode Tinggi-Rendah
Metode analisis kuantitatif paling sederhana
Menggunakan hanya nilai-nilai teramati yang
tertinggi dan terendah
To accompany Cost Accounting 12e, by Horngren/Datar/Foster. Copyright © 2006 by Pearson Education. All rights reserved. 10-19
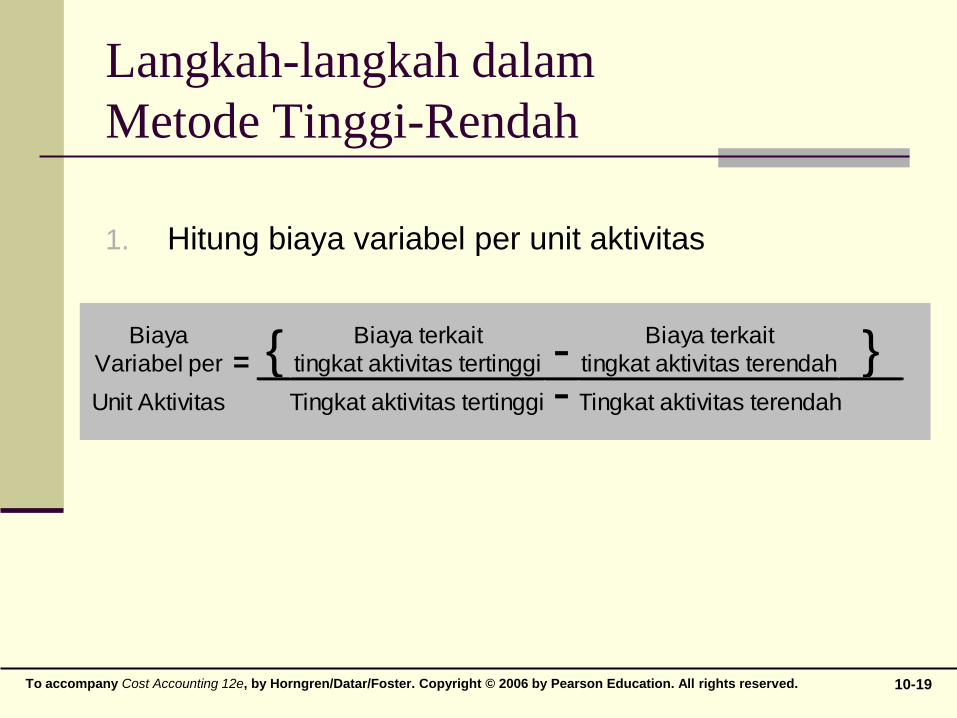
Langkah-langkah dalam
Metode Tinggi-Rendah
1. Hitung biaya variabel per unit aktivitas
Biaya Biaya terkait Biaya terkait
Variabel per = tingkat aktivitas tertinggi tingkat aktivitas terendah
Unit Aktivitas Tingkat aktivitas tertinggi - Tingkat aktivitas terendah
{ - }

To accompany Cost Accounting 12e, by Horngren/Datar/Foster. Copyright © 2006 by Pearson Education. All rights reserved. 10-20
Langkah-langkah dalam
Metode Tinggi-Rendah
2. Hitung Biaya Tetap Total
3. Buat ringkas dengan menuliskan persamaan linear
Biaya Total dari tingkat aktivitas tertinggi atau terendah
– (Biaya Variabel per unit aktivitas X Aktivitas terkait dengan biaya total di atas)
Biaya Tetap
Y = Biaya Tetap + ( Biaya variabel per unit Aktivitas * Aktivitas )
Y = FC + (VCu * X)
To accompany Cost Accounting 12e, by Horngren/Datar/Foster. Copyright © 2006 by Pearson Education. All rights reserved. 10-21
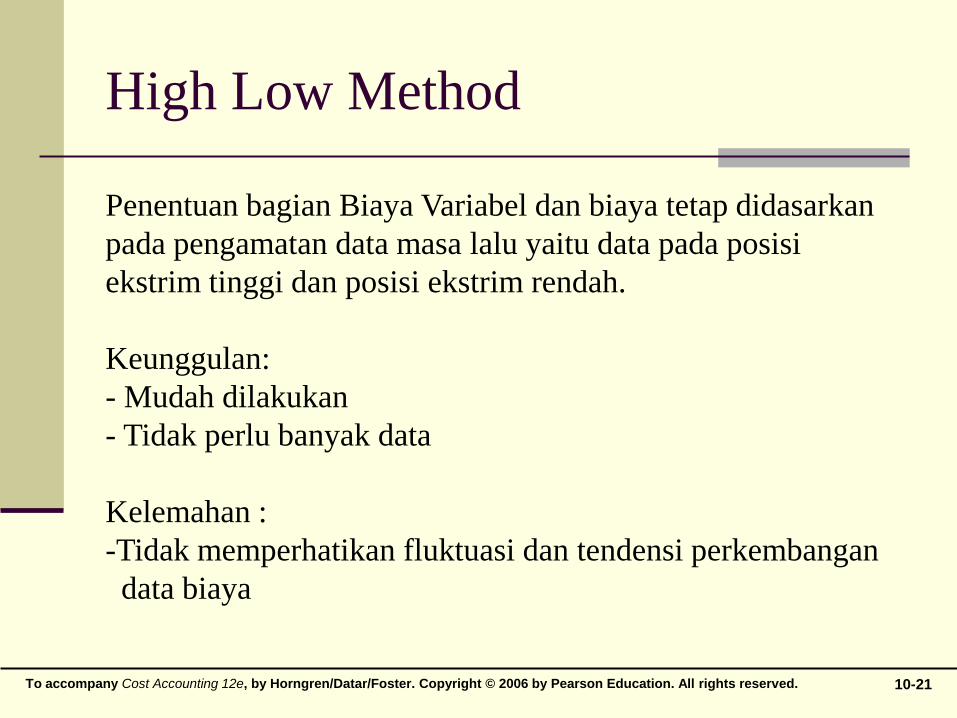
High Low Method
Penentuan bagian Biaya Variabel dan biaya tetap didasarkan
pada pengamatan data masa lalu yaitu data pada posisi
ekstrim tinggi dan posisi ekstrim rendah.
Keunggulan:
- Mudah dilakukan
- Tidak perlu banyak data
Kelemahan :
-Tidak memperhatikan fluktuasi dan tendensi perkembangan
data biaya
To accompany Cost Accounting 12e, by Horngren/Datar/Foster. Copyright © 2006 by Pearson Education. All rights reserved. 10-22
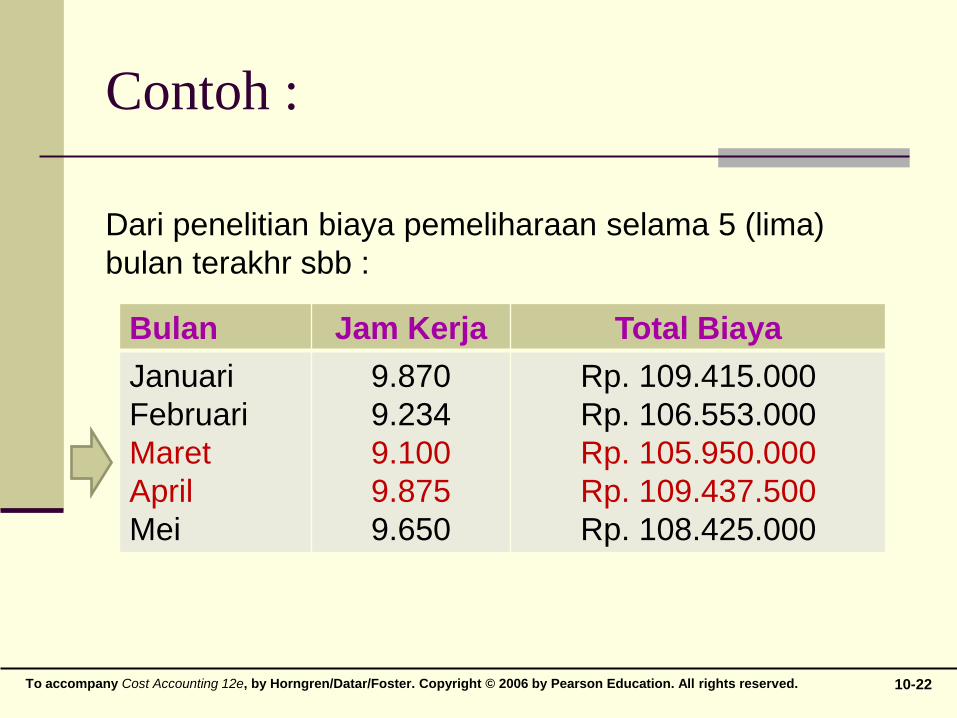
Contoh :
Dari penelitian biaya pemeliharaan selama 5 (lima)
bulan terakhr sbb :
Bulan Jam Kerja Total Biaya
Januari
Februari
Maret
April
Mei
9.870
9.234
9.100
9.875
9.650
Rp. 109.415.000
Rp. 106.553.000
Rp. 105.950.000
Rp. 109.437.500
Rp. 108.425.000

To accompany Cost Accounting 12e, by Horngren/Datar/Foster. Copyright © 2006 by Pearson Education. All rights reserved. 10-23
Pemisahan biaya……
Tertinggi 9.875 Rp. 109.437.500
Terrendah 9.100 Rp. 105.950.000
Perubahan 775 Rp. 3.487.500
3.487.500
Biaya Variabel = --------------------- = Rp. 4.500/jam kerja
775
Total Biaya Bulan Maret Rp. 105.950.000
Biaya Variabel 9.100 X 4.500 Rp. 40.950.000
Komponen Biaya Tetap Rp. 65.000.000
To accompany Cost Accounting 12e, by Horngren/Datar/Foster. Copyright © 2006 by Pearson Education. All rights reserved. 10-24

To accompany Cost Accounting 12e, by Horngren/Datar/Foster. Copyright © 2006 by Pearson Education. All rights reserved. 10-25
Metode Scattergraph:
Langkah-langkahnya:
1. Buat grafik
2. Buat titik-titik di grafik
3. Tarik garis lurus dengan melewati titik-titik
4. Hitung biaya variabel dan biaya tetap
seperti dalam metode titik tertinggi dan
terendah

To accompany Cost Accounting 12e, by Horngren/Datar/Foster. Copyright © 2006 by Pearson Education. All rights reserved. 10-26
Metode Stand By Cost
Metode ini diterapkan apabila ada
kesempatan perusahaan dihentikan
semetara.
Padasaat perusahaan dihentikan maka biaya
yang tetap harus dikeluarkan disebut dengan
Stand by Cost yang dianggp setara dengan
Fixed Cost.
To accompany Cost Accounting 12e, by Horngren/Datar/Foster. Copyright © 2006 by Pearson Education. All rights reserved. 10-27
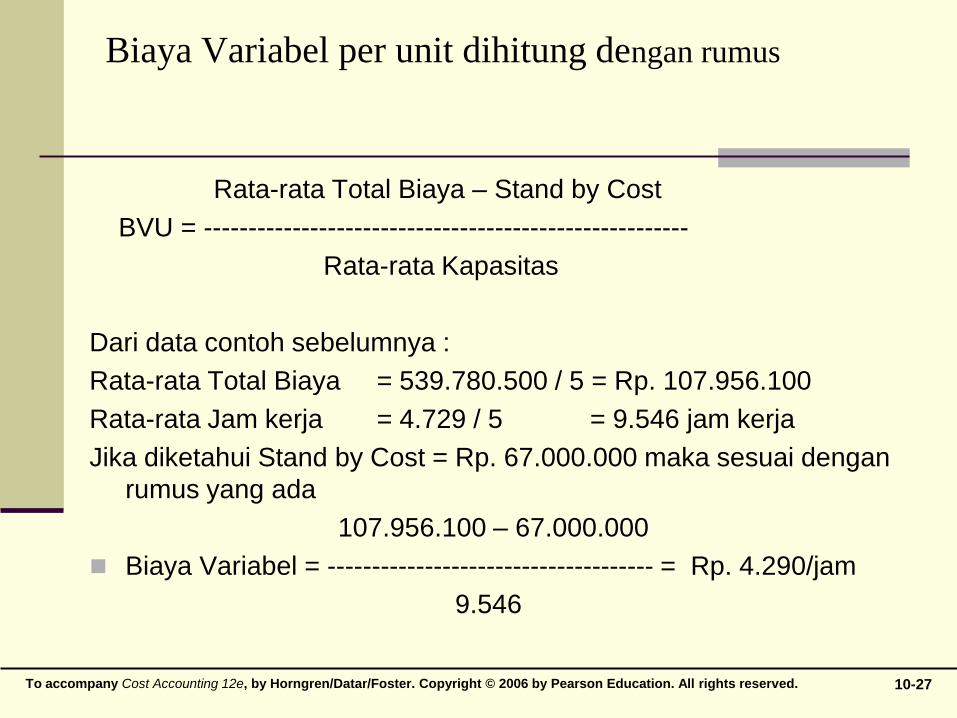
Biaya Variabel per unit dihitung dengan rumus
Rata-rata Total Biaya – Stand by Cost
BVU = -------------------------------------------------------
Rata-rata Kapasitas
Dari data contoh sebelumnya :
Rata-rata Total Biaya = 539.780.500 / 5 = Rp. 107.956.100
Rata-rata Jam kerja = 4.729 / 5 = 9.546 jam kerja
Jika diketahui Stand by Cost = Rp. 67.000.000 maka sesuai dengan
rumus yang ada
107.956.100 – 67.000.000
Biaya Variabel = ------------------------------------- = Rp. 4.290/jam
9.546

To accompany Cost Accounting 12e, by Horngren/Datar/Foster. Copyright © 2006 by Pearson Education. All rights reserved. 10-28
Analisis Regresi / Least Square
Analisis Regresi adalah metode statistik yang
mengukur jumlah rata-rata perubahan dalam variabel
dependen yang terkait dengan suatu unit perubahan
dalam salah satu atau lebih variabel independen
Lebih akurat dari metode Tinggi-Rendah karena
persamaan regresi mengestimasi biaya menggunakan
informasi dari semua pengamatan; metode Tinggi-
Rendah menggunakan hanya dua pengamatan
To accompany Cost Accounting 12e, by Horngren/Datar/Foster. Copyright © 2006 by Pearson Education. All rights reserved. 10-29
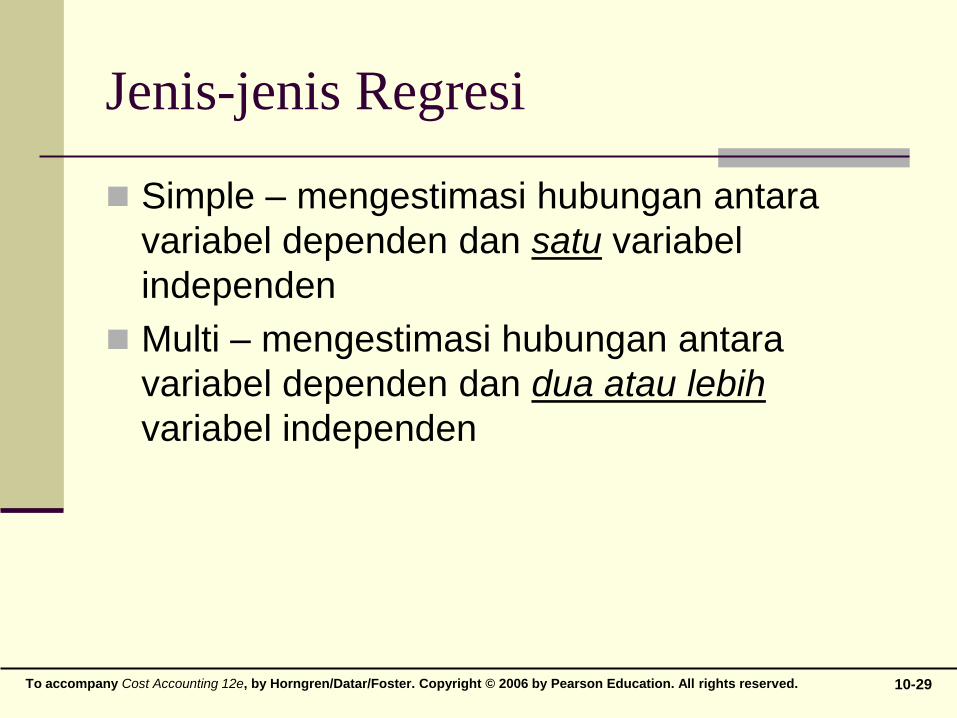
Jenis-jenis Regresi
Simple – mengestimasi hubungan antara
variabel dependen dan satu variabel
independen
Multi – mengestimasi hubungan antara
variabel dependen dan dua atau lebih
variabel independen
To accompany Cost Accounting 12e, by Horngren/Datar/Foster. Copyright © 2006 by Pearson Education. All rights reserved. 10-30
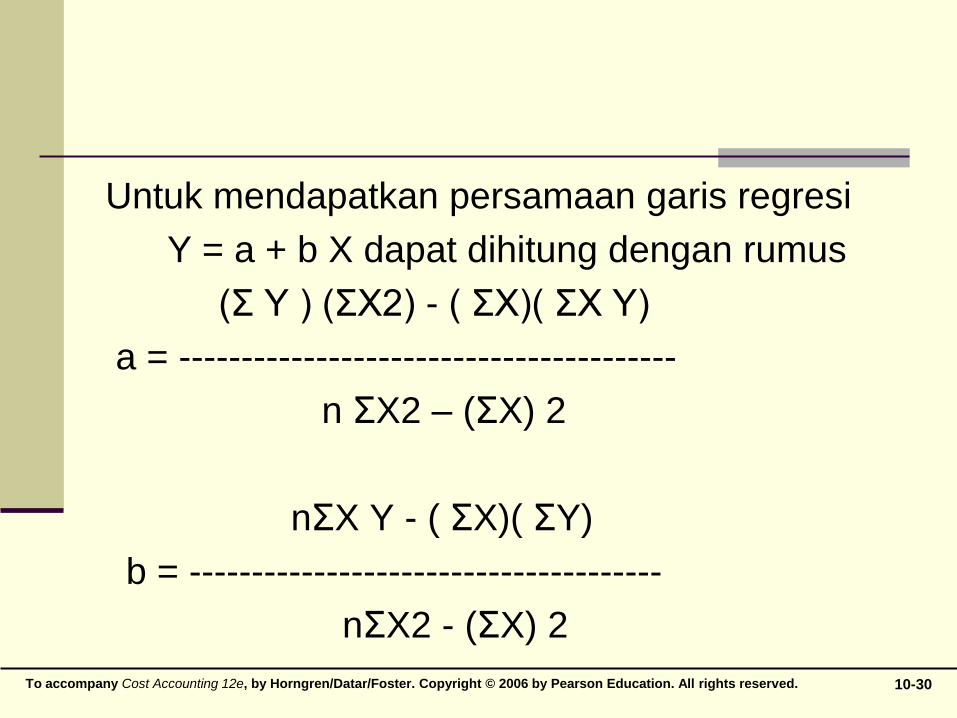
Untuk mendapatkan persamaan garis regresi
Y = a + b X dapat dihitung dengan rumus
(Σ Y ) (ΣX2) - ( ΣX)( ΣX Y)
a = ----------------------------------------
n ΣX2 – (ΣX) 2
nΣX Y - ( ΣX)( ΣY)
b = --------------------------------------
nΣX2 - (ΣX) 2

To accompany Cost Accounting 12e, by Horngren/Datar/Foster. Copyright © 2006 by Pearson Education. All rights reserved. 10-31
n X Y X.Y X2
1 9.870 109,4 1.079.778 97.416.900
2 9.234 106,5 983.421 85.266.756
3 9.100 105,9 963.690 82.810.000
4 9.875 109,4 1.080.325 97.515.625
5 9.650 108,4 1.046.060 93.122.500
47.729 539,6 5.153.274 456.131.781
Persamaan garis projeksi menurut metode
least square :
Y = 64.615.260 + 4.537 X