
Human Capital - Prodi Ekonomi Pembangunan · •Entail an initial cost that one ... of one’s...
54
-
Upload
phungduong -
Category
Documents
-
view
220 -
download
0
Transcript of Human Capital - Prodi Ekonomi Pembangunan · •Entail an initial cost that one ... of one’s...

2
Chinese Proverb
Give a man a fish and you
feed him for one day
Teach a man to fish and you
feed him for a lifetime
3
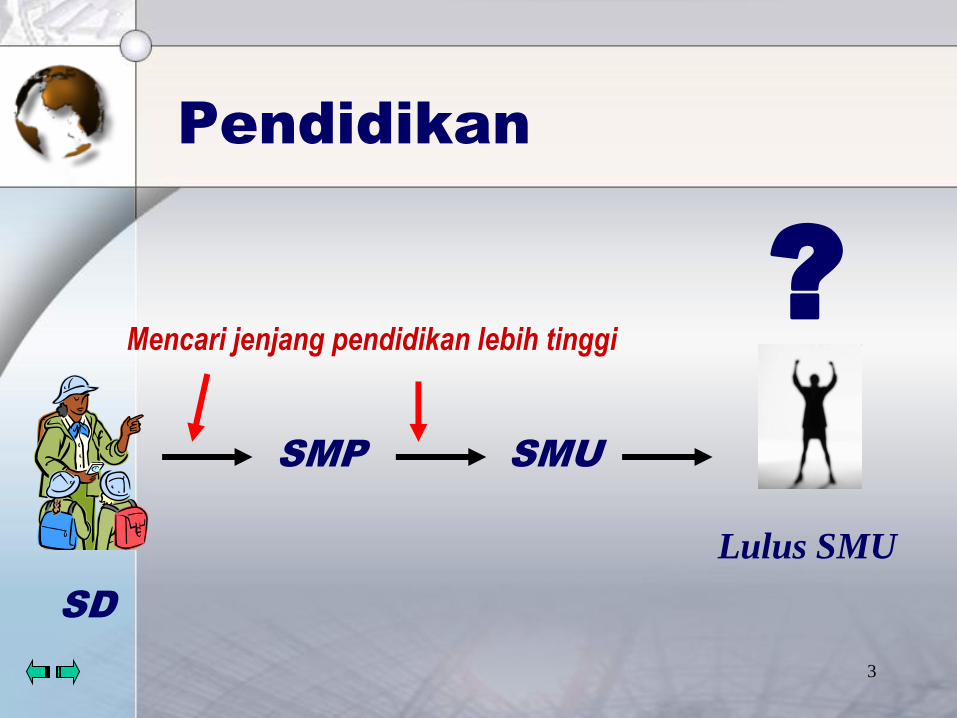
Pendidikan
Lulus SMU
SD
SMP SMU
?Mencari jenjang pendidikan lebih tinggi
4
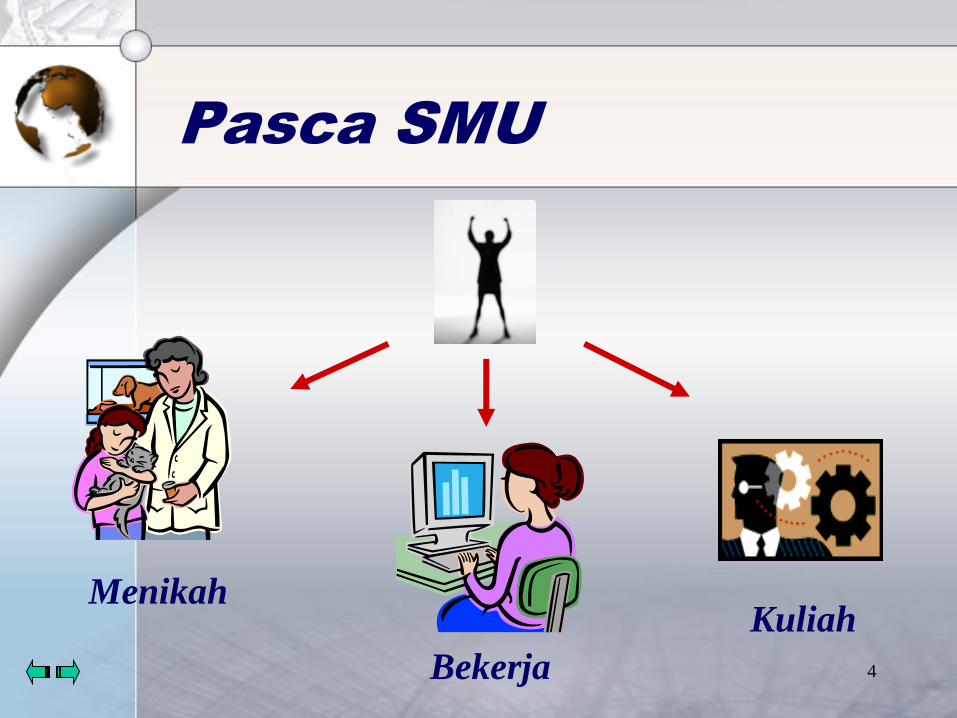
Pasca SMU
Menikah
Bekerja
Kuliah
5
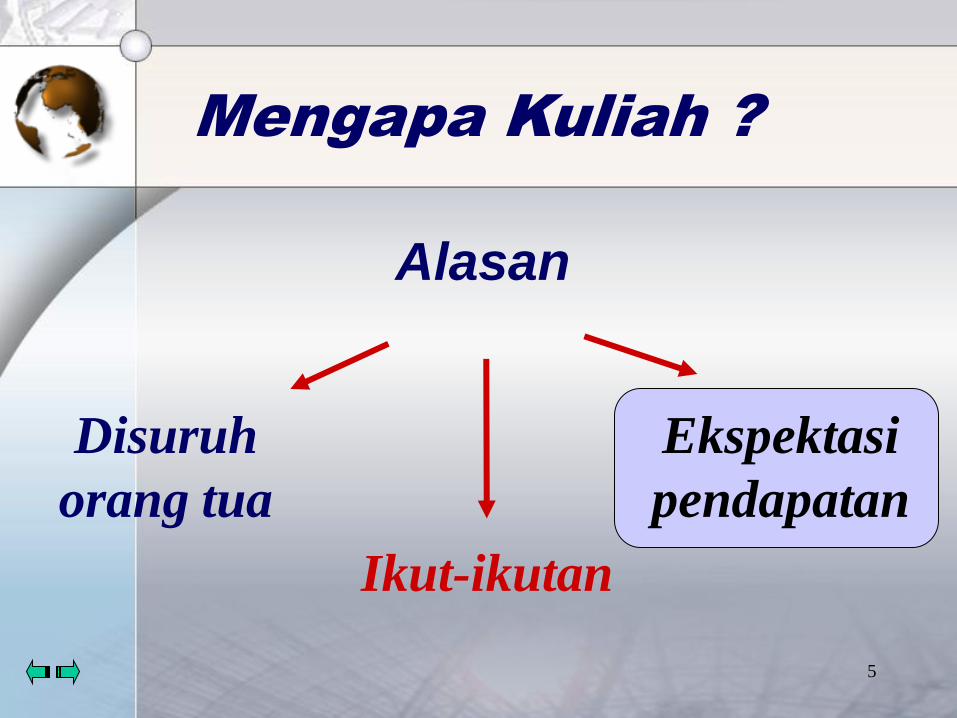
Mengapa Kuliah ?
Disuruh
orang tua
Alasan
Ekspektasi
pendapatan
Ikut-ikutan

6
Basic Concept

7
Human Capital
Definition
acquired skills to entering labor
market.
• Unique set of abilities and
acquired skills
Assumption• Maximizes the present value of
lifetime earnings
8
Investment
Ehrenberg &Smith :
• Entail an initial cost that one
hopes to recoup over some
periode of time

9
Three Major kinds of Labor Market Investment
Ehrenberg &Smith :
1. Education and Training
2. Migration
3. Search for the new jobs

10
Three Major kinds of Labor Market Investment
All three investment involve an initial cost, and all three are made in the hope and expectation that the investment will pay off well into the future

11
Three Major kinds of Labor Market Investment
The Knowledge and Skills a worker has generate a certain stock of productive capital

12
Three Major kinds of Labor Market Investment
Job search and Migration are activities that incerase the value of one’s human capital by increasing the price (wage) received for a given stock of skills

13
Three Stages of Human Capital Investment
A. Early Childhood
The acquisition of human capital is largerly determined by decisions of others :
• Parental resources and guidances
• Cultural environment
• Early schooling experiences

14
Three Stages of Human Capital Investment
B. Teenagers and young adult
• Full time students in a high school, college or vocational training program
15
Three Stages of Human Capital Investment
C. Entering labor market
• On-the-job training
• Formal traning program
16
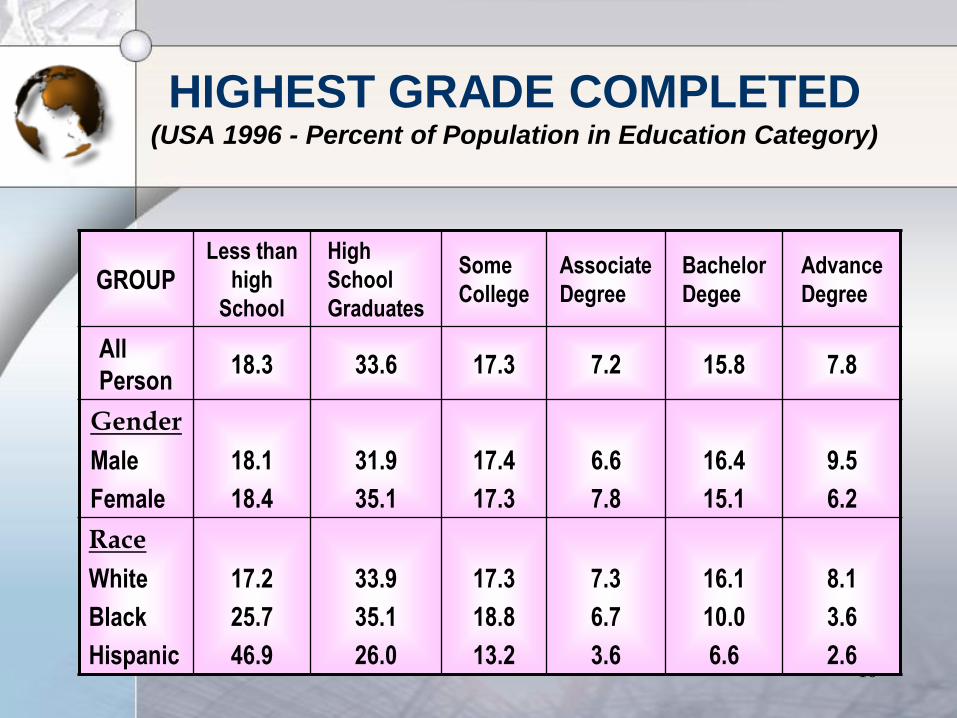
HIGHEST GRADE COMPLETED(USA 1996 - Percent of Population in Education Category)
GROUPLess than
high
School
High
School
Graduates
Some
College
Associate
Degree
Bachelor
Degee
Advance
Degree
All
Person18.3 33.6 17.3 7.2 15.8 7.8
Gender
Male
Female
18.1
18.4
31.9
35.1
17.4
17.3
6.6
7.8
16.4
15.1
9.5
6.2
Race
White
Black
Hispanic
17.2
25.7
46.9
33.9
35.1
26.0
17.3
18.8
13.2
7.3
6.7
3.6
16.1
10.0
6.6
8.1
3.6
2.6
17
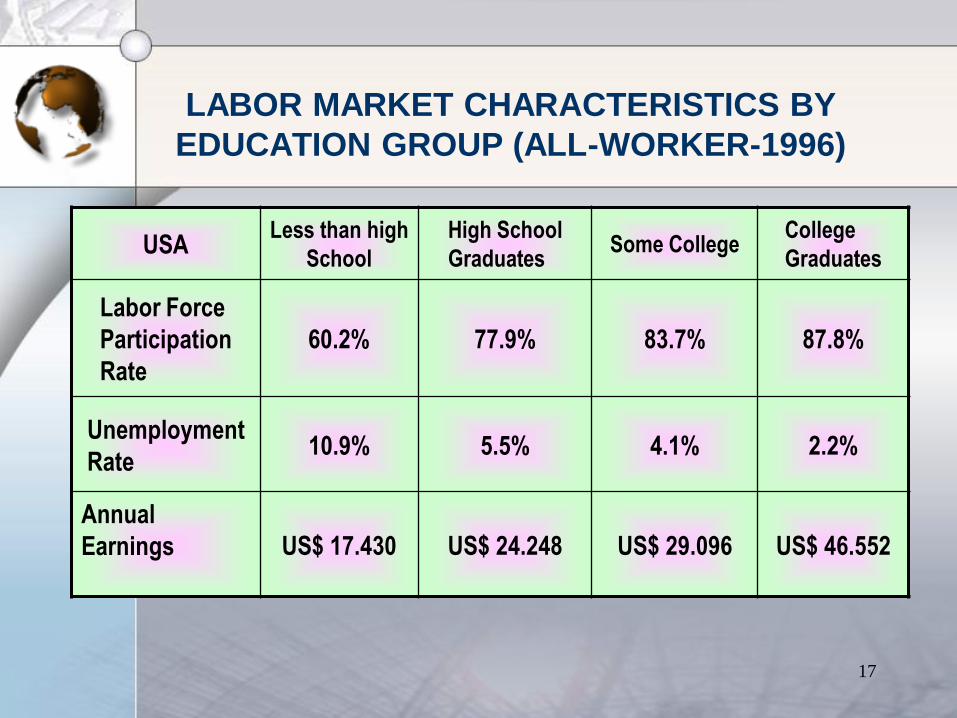
LABOR MARKET CHARACTERISTICS BY
EDUCATION GROUP (ALL-WORKER-1996)
USALess than high
School
High School
GraduatesSome College
College
Graduates
Labor Force
Participation
Rate
60.2% 77.9% 83.7% 87.8%
Unemployment
Rate10.9% 5.5% 4.1% 2.2%
Annual
Earnings US$ 17.430 US$ 24.248 US$ 29.096 US$ 46.552
18
Investment : Present Value
• Keputusan Investasi : Gain antara
“Current Cost” dan “Future Returns”
• Fakta : terdapat perbedaan nilai
antara saat ini dengan yang akan
datang
19
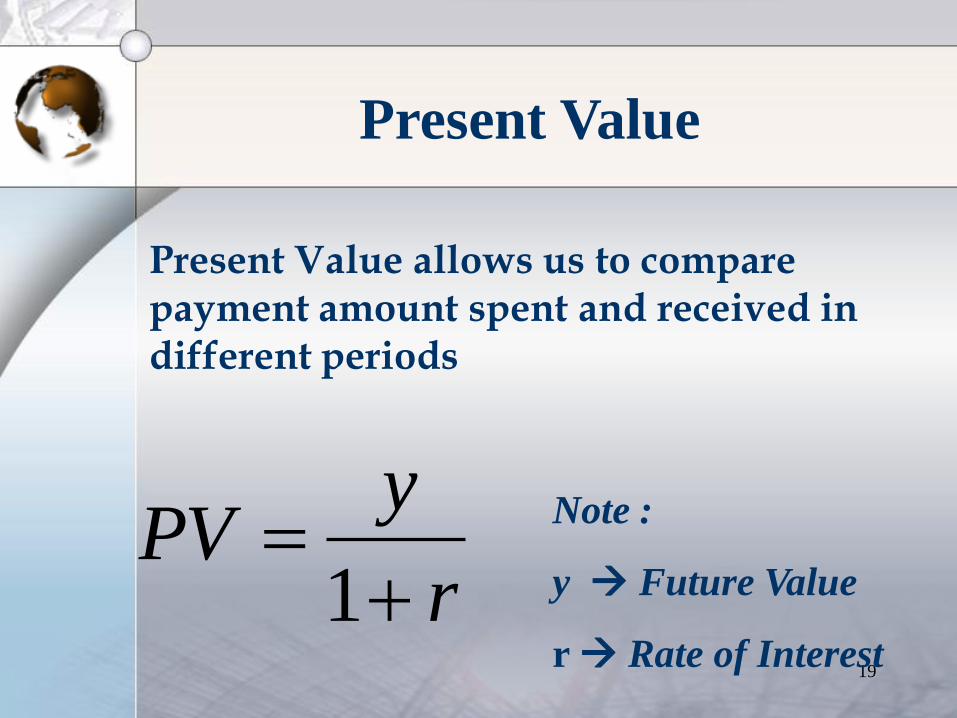
Present Value
Present Value allows us to compare payment amount spent and received in different periods
r
yPV
1
Note :
y Future Value
r Rate of Interest

20
Present Value
The quantity Present Value (PV) tells us how much needs to be invested today in order have y dollars next year
Period 0 1 2 3 4 5
Value 100.000 110.000 121.000 133.100 146.410 161.051

21
Schooling Model
22
• Workers acquire the skill level that
maximizes the present value of
lifetime earnings
Schooling Model
• Education and other forms of
training, therefor, are valued only
because they increased earnings
Maximizes Utility
23
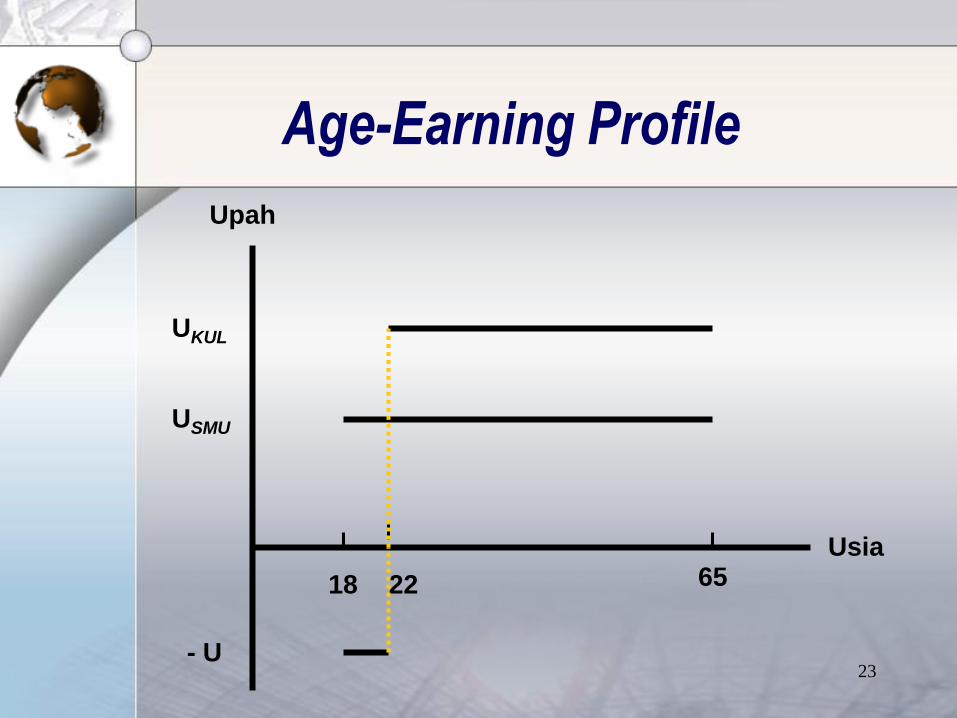
Age-Earning Profile
Upah
Usia
18 65
USMU
22
- U
UKUL
24
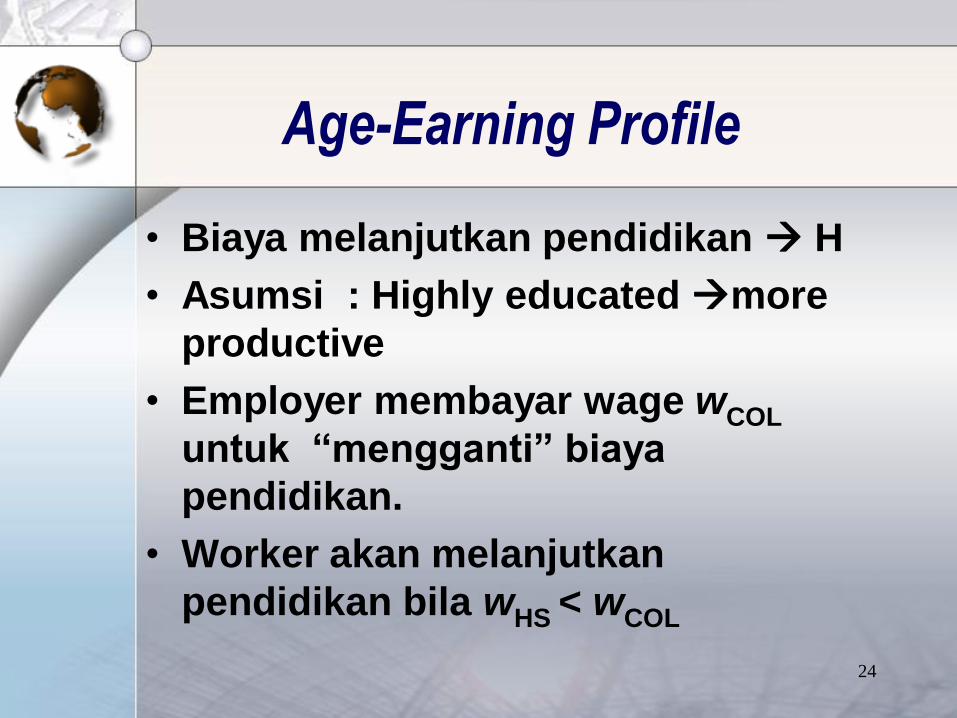
• Biaya melanjutkan pendidikan H
• Asumsi : Highly educated more
productive
• Employer membayar wage wCOL
untuk “mengganti” biaya
pendidikan.
• Worker akan melanjutkan
pendidikan bila wHS < wCOL
Age-Earning Profile
25
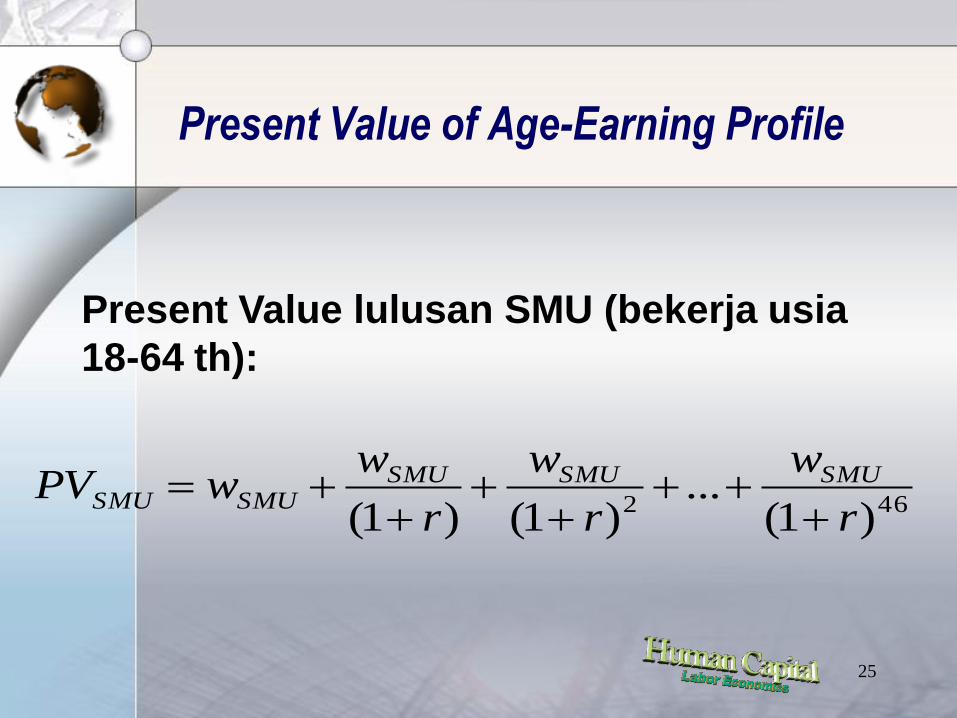
Present Value of Age-Earning Profile
Present Value lulusan SMU (bekerja usia
18-64 th):
462 )1(...
)1()1( r
w
r
w
r
wwPV SMUSMUSMU
SMUSMU
26
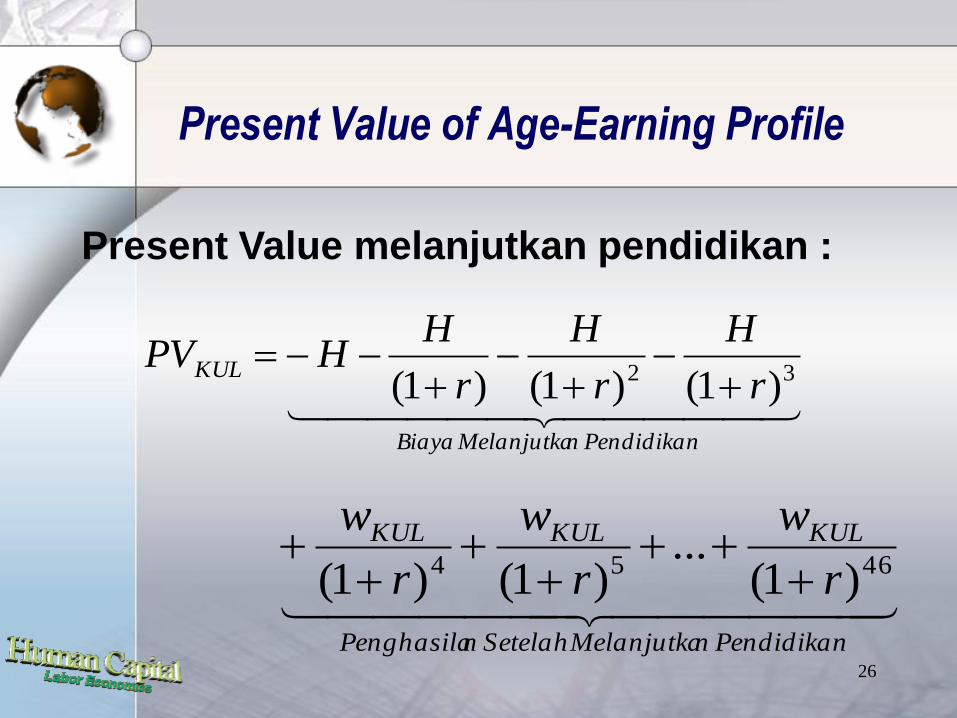
Present Value of Age-Earning Profile
Present Value melanjutkan pendidikan :
PendidikannMelanjutkaBiaya
KULr
H
r
H
r
HHPV
32 )1()1()1(
PendidikannMelanjutkaSetelahnPenghasila
KULKULKUL
r
w
r
w
r
w4654 )1(
...)1()1(

27
Present Value of Age-Earning Profile
Contoh :
• Asumsi : worker hanya bekerja selama 2
tahun
• Earning lulusan SMU : Rp 100.000
rPVSMU
1
000.100000.100
28
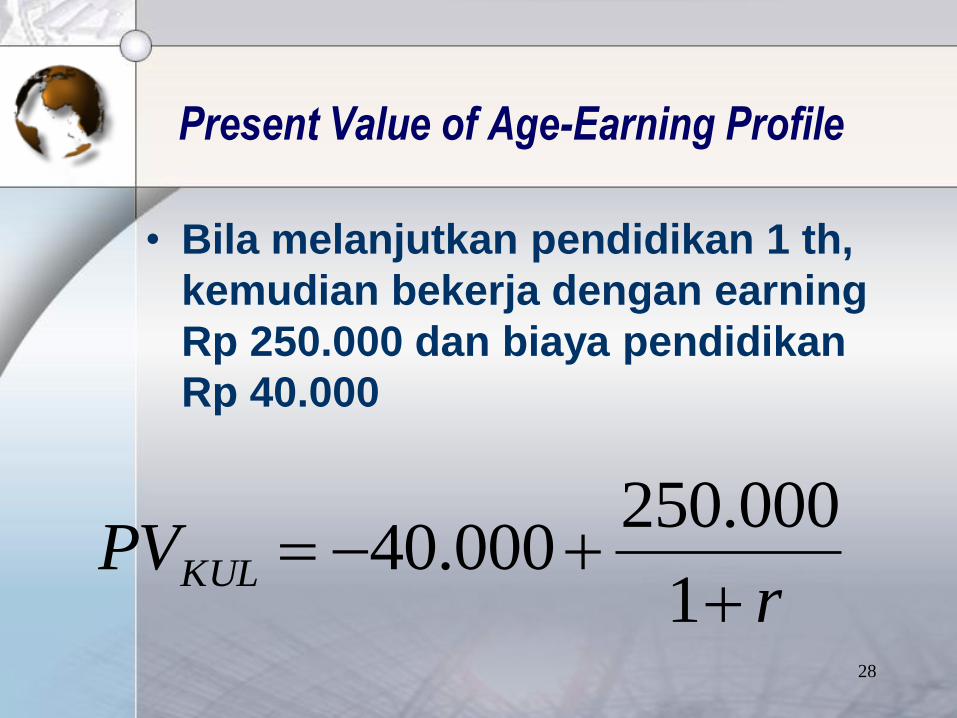
• Bila melanjutkan pendidikan 1 th,
kemudian bekerja dengan earning
Rp 250.000 dan biaya pendidikan
Rp 40.000
Present Value of Age-Earning Profile
rPVKUL
1
000.250000.40
29
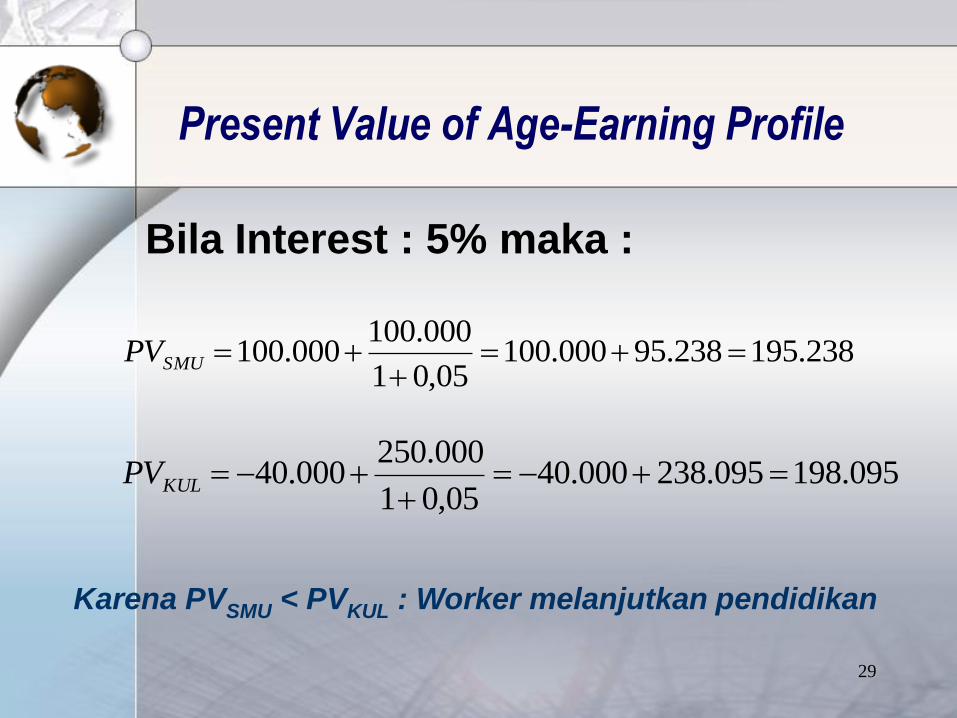
Bila Interest : 5% maka :
Present Value of Age-Earning Profile
238.195238.95000.10005,01
000.100000.100
SMUPV
095.198095.238000.4005,01
000.250000.40
KULPV
Karena PVSMU < PVKUL : Worker melanjutkan pendidikan

30
Bila Interest : 10% maka :
Present Value of Age-Earning Profile
Karena PVSMU > PVKUL : Worker tidak melanjutkan pendidikan
909.190909.90000.1001,01
000.100000.100
SMUPV
273.187273.227000.401,01
000.250000.40
KULPV

31
• Rate of Interest (rate of discount) berpengaruh terhadap keinginan melanjutkan pendidikan, dapat berupa market rate of interest.
• Rate of Discount also depends on how we feel about giving up some of today’s consumption in return for future rewards.
• Present Oriented Worker higher rate of discount
Present Value of Age-Earning Profile
32
The Wage-Schooling Locus
• Wage-Schooling Locus
menggambarkan tingkat upah
yang dibayarkan employer untuk
tingkat pendidikan tertentu.
• Ditentukan oleh juga equilibrium
pasar (Supply & Demand)

33
The Wage-Schooling Locus
Dollars
Years of
Schooling12 13 14
20.000
23.000
25.000
18
28.000
34
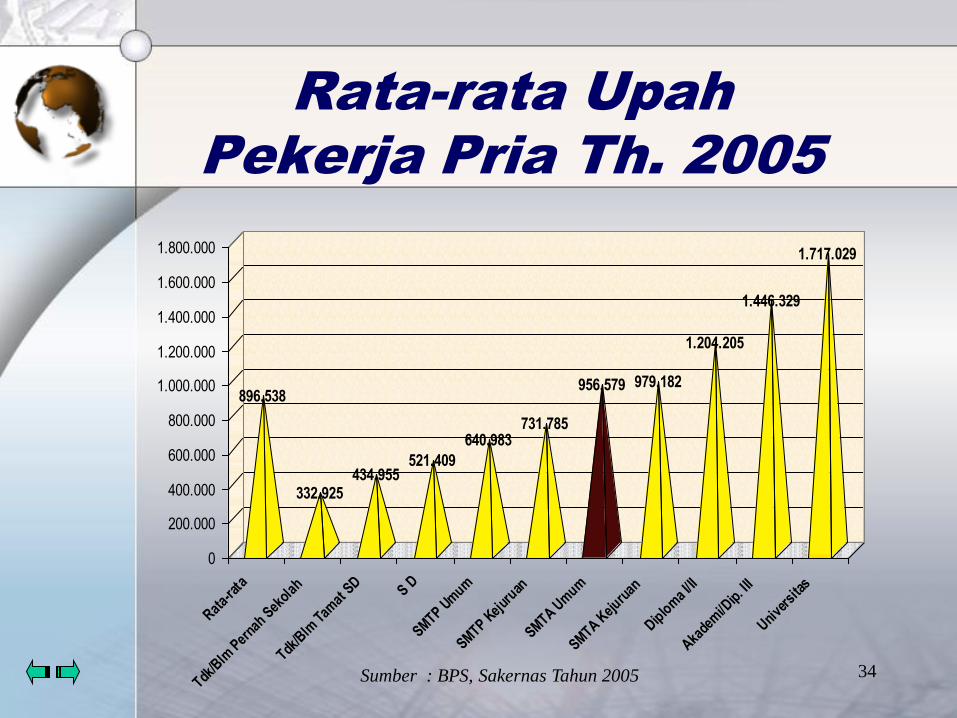
Rata-rata Upah
Pekerja Pria Th. 2005
896.538
332.925434.955
521.409
640.983731.785
956.579 979.182
1.204.205
1.446.329
1.717.029
0
200.000
400.000
600.000
800.000
1.000.000
1.200.000
1.400.000
1.600.000
1.800.000
Rata-
rata
Tdk/B
lm P
erna
h Sek
olah
Tdk/B
lm T
amat
SD
S D
SMTP U
mum
SMTP K
ejur
uan
SMTA U
mum
SMTA K
ejuru
an
Diplo
ma
I/II
Akade
mi/D
ip. I
II
Unive
rsita
s
Sumber : BPS, Sakernas Tahun 2005
35
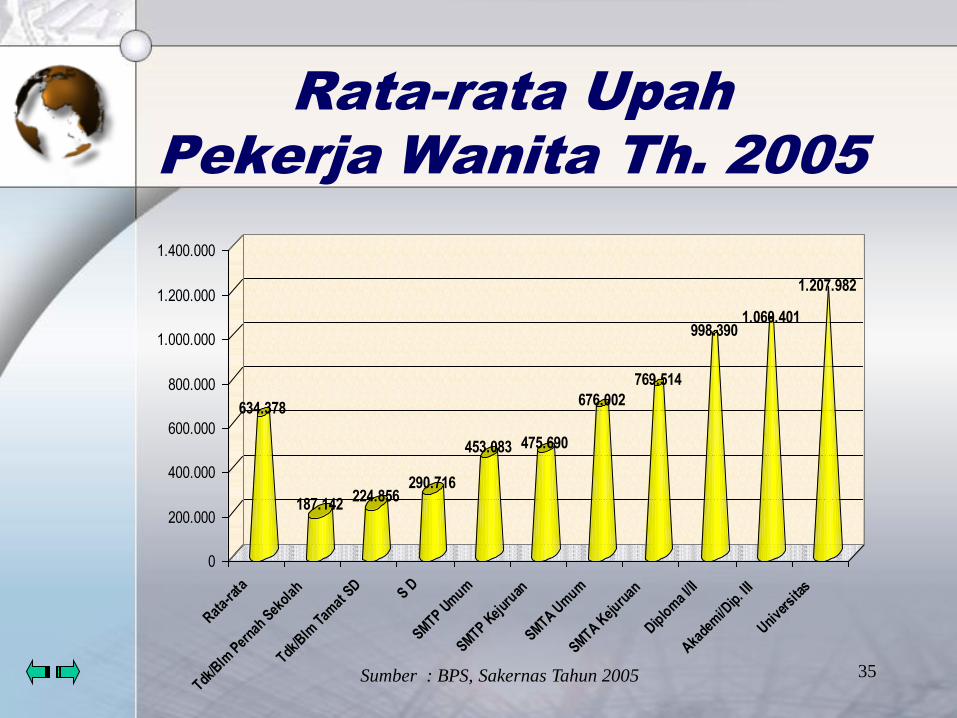
Rata-rata Upah
Pekerja Wanita Th. 2005
634.378
187.142224.856
290.716
453.083 475.690
676.002
769.514
998.3901.060.401
1.207.982
0
200.000
400.000
600.000
800.000
1.000.000
1.200.000
1.400.000
Rata-
rata
Tdk/B
lm P
erna
h Sek
olah
Tdk/B
lm T
amat
SD
S D
SMTP U
mum
SMTP K
ejur
uan
SMTA U
mum
SMTA K
ejuru
an
Diplo
ma
I/II
Akade
mi/D
ip. I
II
Unive
rsita
s
Sumber : BPS, Sakernas Tahun 2005
36
The Marginal Rate of Return to School
• Slope of the wage-schooling locus
(w / s) menyatakan peningkatan
earnings yang diterima apabila
melanjutkan pendidikan.
• Menyatakan persentase peningkatan
earnings untuk setiap peningkatan
educational investment.
37
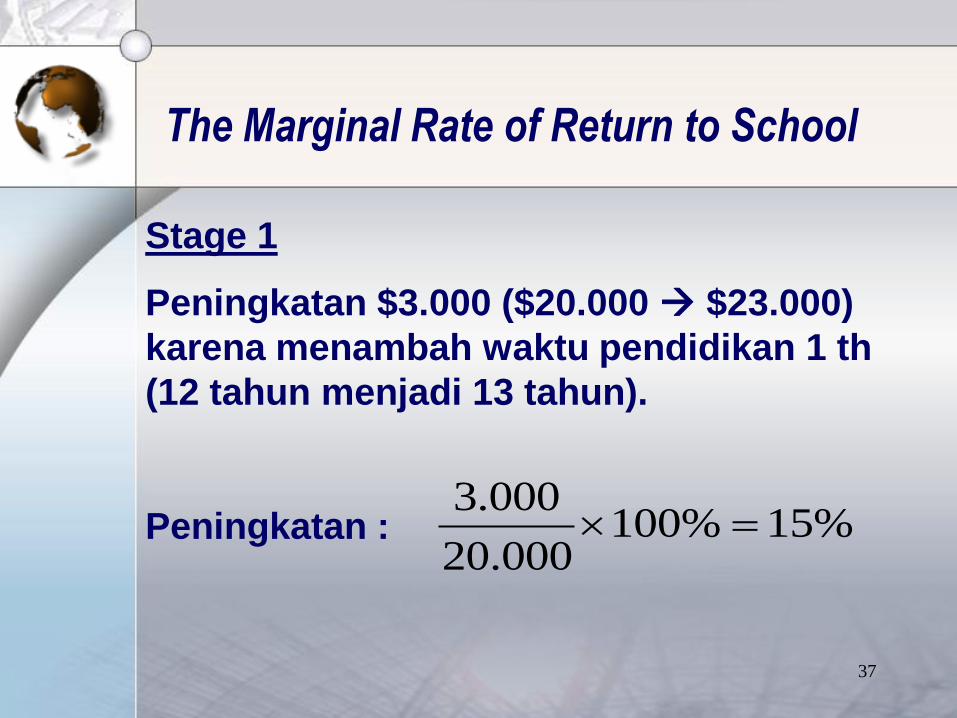
The Marginal Rate of Return to School
Stage 1
Peningkatan $3.000 ($20.000 $23.000)
karena menambah waktu pendidikan 1 th
(12 tahun menjadi 13 tahun).
Peningkatan : %15%100000.20
000.3
38
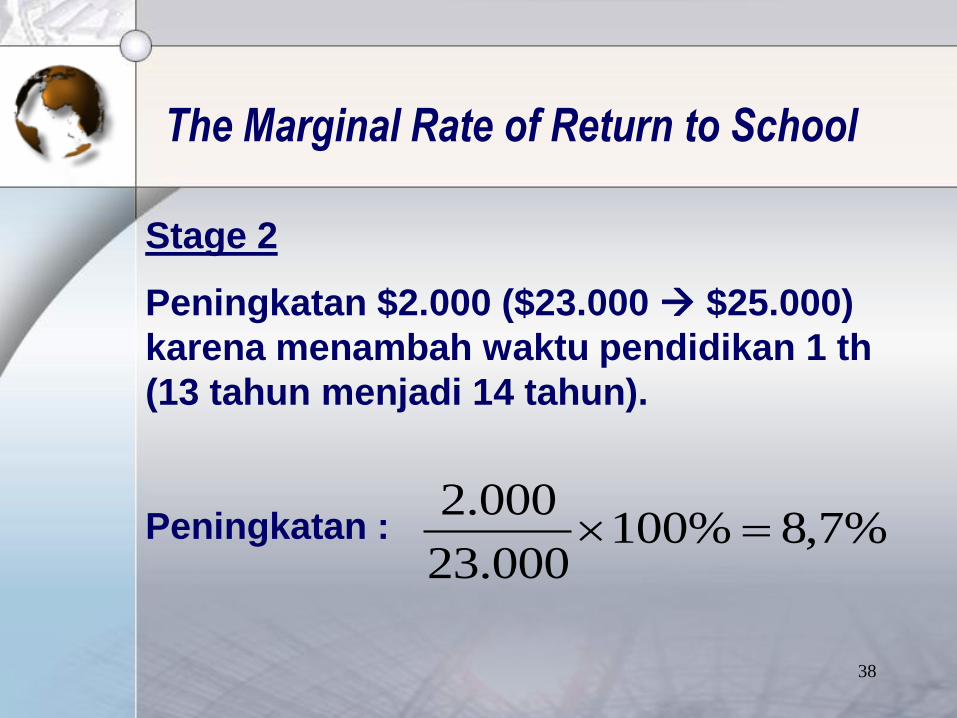
The Marginal Rate of Return to School
Stage 2
Peningkatan $2.000 ($23.000 $25.000)
karena menambah waktu pendidikan 1 th
(13 tahun menjadi 14 tahun).
Peningkatan : %7,8%100000.23
000.2
39
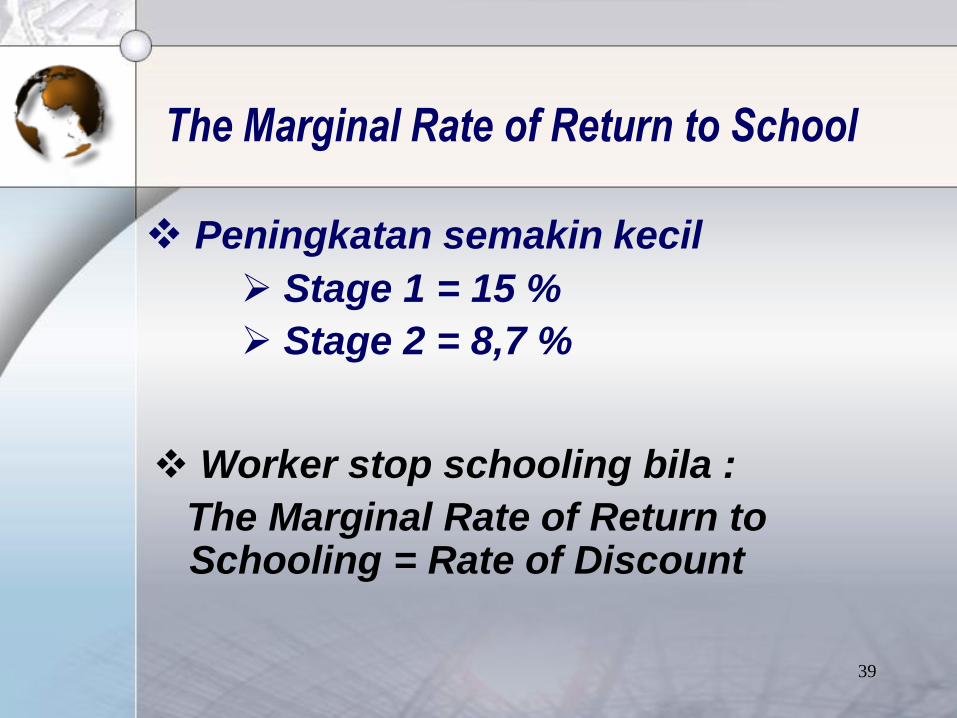
Peningkatan semakin kecil
Stage 1 = 15 %
Stage 2 = 8,7 %
The Marginal Rate of Return to School
Worker stop schooling bila :
The Marginal Rate of Return to Schooling = Rate of Discount
40
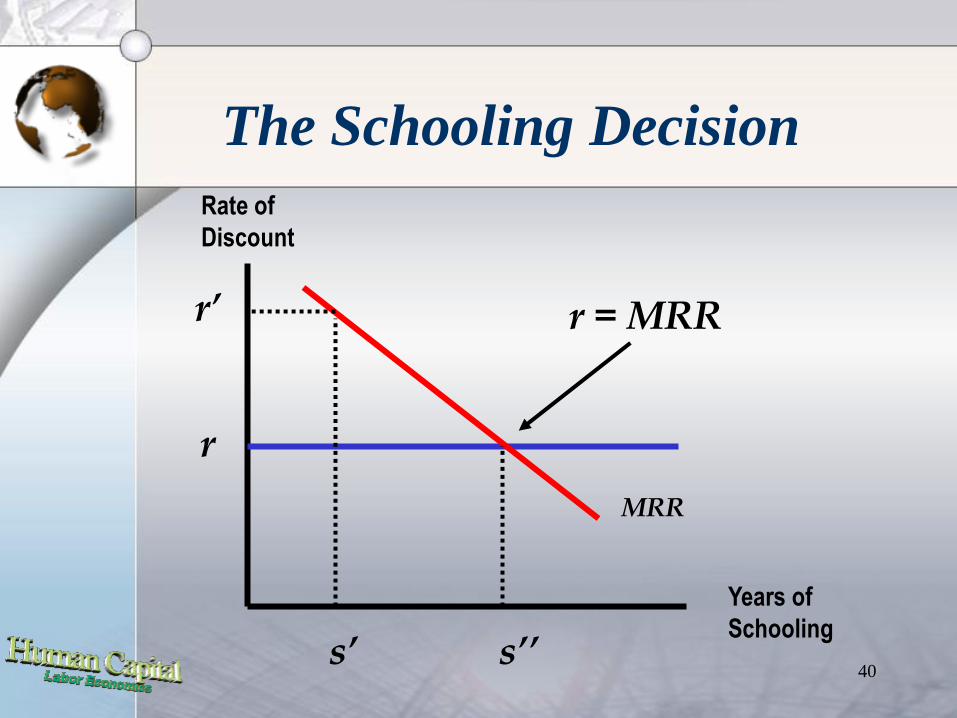
The Schooling Decision
Rate of
Discount
Years of
Schooling
r
MRR
s’
r’
s’’
r = MRR

41
On The Job Training

42
On-the-job training merupakan salah satu aspek penting dalam worker’s human capital stock.
Jacob Mincer : OJT memberikan kontribusi hingga separuh dalam proses pembentukan human capital.
On-The-Job Training

43
On-The-Job Training
Worker bekerja untuk 2 periode maka
profit-maximizing (tanpa training) :
r
VMPVMP
r
TCTC
11
21
21
TC Total Labor Cost

44
On-The-Job Training
Apabila rekruitment dilakukan dengan
On-The-Job Training maka :
r
VMPVMP
r
wwH
11
21
21
H Biaya training
45
On-The-Job Training
GENERAL TRAINING
Skill & knowledge dapat digunakan
di firm lain.
Training period : w1 = VMP1 - H
Posttraining : w2 = VMP2

46
On-The-Job Training
GENERAL TRAINING
Firms provide general training, therefor, only if they don’t pay any of the costs.
Wage masa training rendah karena untuk H
Mempertahankan worker : w1 < w2
47
On-The-Job Training
SPECIFIC TRAINING
Skill & knowledge tidak dapat/tidak mudah digunakan di firm lain (not portable).
merupakan alternative wage (other firms)
w
48
On-The-Job Training
SPECIFIC TRAINING
Firm akan mendapat gain : w2 < VMP2 , namun beresiko worker keluar firm menginginkan jaminan worker tidak keluar dari firm
Bila worker “pays” for the spesific training w1 rendah menginginkan jaminan tidak dikeluarkan dari firm karena skill dari spesific training tidak portable.
49
On-The-Job Training
SOLUTION FOR SPECIFIC TRAINING
w < w2 < VMP2
Firm dan worker share the return from spesific training.

50
Penduduk usia 15 tahun yang mencari kerja
di Surabaya Th.2003
106910
131859
6927673968
87014 85404
0
20.000
40.000
60.000
80.000
100.000
120.000
140.000
1998 1999 2000 2001 2002 2003
51
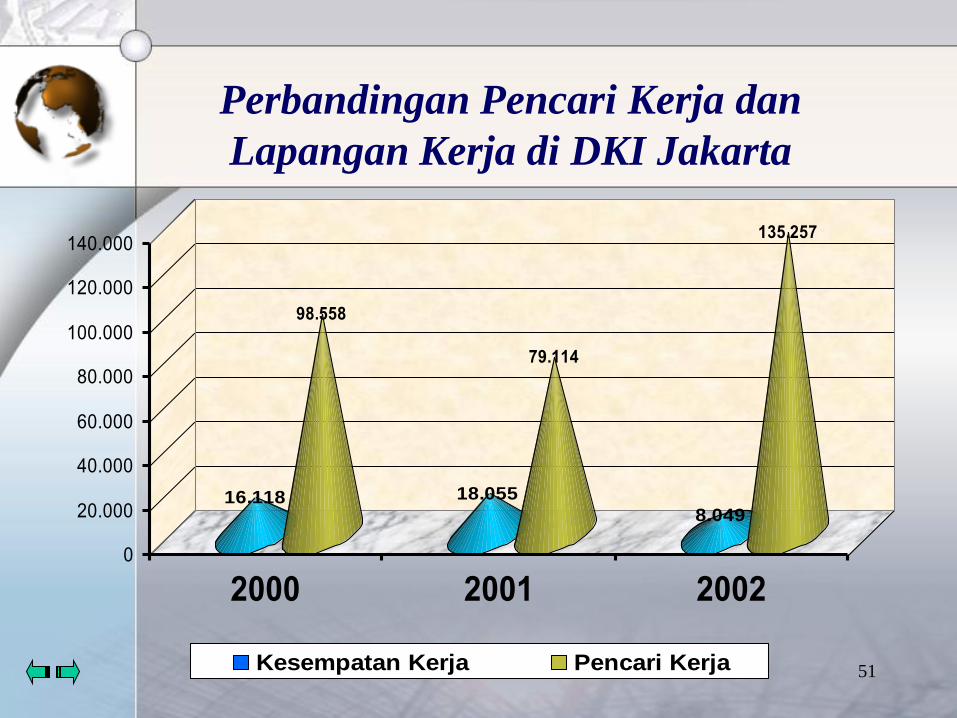
16.118
98.558
18.055
79.114
8.049
135.257
0
20.000
40.000
60.000
80.000
100.000
120.000
140.000
2000 2001 2002
Kesempatan Kerja Pencari Kerja
Perbandingan Pencari Kerja dan
Lapangan Kerja di DKI Jakarta

STANDAR KOMPETENSI KERJA
NASIONAL INDONESIA
52
http://binalattas.depakertrans.go.id/datin/reportskkni
53
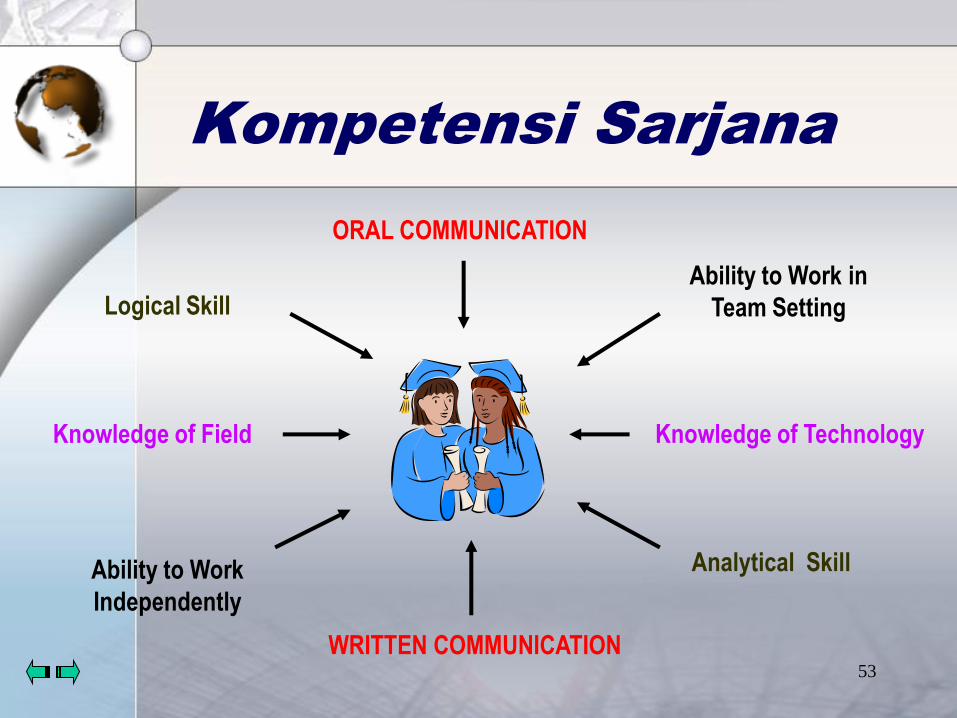
Kompetensi Sarjana
ORAL COMMUNICATION
WRITTEN COMMUNICATION
Knowledge of Field Knowledge of Technology
Ability to Work
Independently
Ability to Work in
Team SettingLogical Skill
Analytical Skill

54
See you next time…