How Congested Jakarta is? Perception of Jakarta’s Citizen...
11
Economics and Finance in Indonesia Vol. 62 No. 3, December 2016 : 141–151 p-ISSN 0126-155X; e-ISSN 2442-9260 141 How Congested Jakarta is? Perception of Jakarta’s Citizen on Traffic Congestion Muhammad H. Yudhistira a,* , Decky Priambodo K. b , Sonny H.B. Harmadi c , Andhika Putra Pratama d a Visiting Fellow, The Australian National University b Department of Public Work, DKI Jakarta c Department of Economics, Faculty of Economics and Business, Universitas Indonesia d Lembaga Penyelidikan Ekonomi dan Masyarakat, Fakultas Ekonomi dan Bisnis, Universitas Indonesia Abstract This paper aims to reveal the behavior and perception of Jakarta’s citizens on traffic congestion in Jakarta. Although this approach is somewhat well-developed in behavioral science, its utilization in urban economics study, is still limited. Detecting the traffic congestion and its cause mainly relies on physical (engineering) methods, i.e V/C ratio. Here, we define the traffic congestion through two variables; ordinal traffic congestion perception and proportion of expected travel time to perceived travel time. Using a non-probabilistic sampling survey held in one of densest business district in Jakarta called Sudirman-Thamrin Golden Triangle Area; the estimation results show that travel behavior plays a major role in affecting travel time perceptions. Keywords: Traffic Congestion; Travel Time; Travel Behavior; Perception Abstrak Studi ini bertujuan untuk melihat tingkah laku masyarakat Jakarta terhadap kemacetan di Jakarta. Pendekatan yang digunakan dalam studi ini telah banyak dikembangkan dalam studi behavioral science, namun penggunaanya dalam studi ekonomi perkotaan masih terbatas. Mendeteksi tingkat kemacetan serta penyebabnya umumnya mengandalkan metode fisik seperti V/C ratio. Studi ini mendefinisikan tingkat kemacetan ke dalam dua variabel, persepsi tingkat kemacetan ordinasl serta proporsi dari ekspektasi waktu perjalanan terhadap waktu perjalanan actual. Dengan menggunakan survey non-probabilitic sampling di Sudirman-Tharim Golden Triangle Area, hasil estimasi menunjukkan bahwa perilaku perjalanan (travel behavior) berperan utama dalam mempengaruhi persepsi waktu perjalanan. Kata kunci: Tingkat Kemacetan; Waktu Perjalanan; Perilaku Perjalanan; Persepsi JEL classifications: R40; R41 1. Introduction As the largest and densest urbanized areas in In- donesia, Jakarta experienced severe traffic con- gestion for a quite long time. Along with flooding, massive urbanization, and urban slum, traffic con- gestion is categorized as biggest challenges in Jakarta. The congestion level in Jakarta has in- creased twofold during 1985–2000 causing poten- * Corresponding Address: Indonesia Project – The Arndt- Corden Department of Economics – Crawford School of Pub- lic Policy – The Australian National University, Canberra ACT 0200, Australia. E-mail : [email protected] / mhyudhistira@ lpem-feui.org. tial loss as much as 65 trillion rupiahs in 2020 (Har- madi 2006). This calculation is based on two param- eters, loss due to vehicle operational costs (28.1 trillion rupiahs) and the cost of longer travel time (36.9 trillion rupiahs). The calculation does not ac- count cost of environmental deterioration (i.e. air and noise pollution), cancelled transaction, lower productivity and competitive advantage relative to other major big cities (McFadden 2007; Boarnet, Kim, & Parkany 1998). Hence, potentially, the num- ber of potential losses due to traffic congestion in Jakarta is higher than predicted. Transportation Planning of DKI Jakarta (2007) sug- gests that there are four main problems as the Economics and Finance in Indonesia Vol. 62 No. 3, December 2016
Transcript of How Congested Jakarta is? Perception of Jakarta’s Citizen...

Economics and Finance in IndonesiaVol. 62 No. 3, December 2016 : 141–151p-ISSN 0126-155X; e-ISSN 2442-9260 141
How Congested Jakarta is? Perception of Jakarta’s Citizen on TrafficCongestion
Muhammad H. Yudhistiraa,∗, Decky Priambodo K.b, Sonny H.B. Harmadic, Andhika Putra Pratamad
aVisiting Fellow, The Australian National UniversitybDepartment of Public Work, DKI Jakarta
cDepartment of Economics, Faculty of Economics and Business, Universitas IndonesiadLembaga Penyelidikan Ekonomi dan Masyarakat, Fakultas Ekonomi dan Bisnis, Universitas Indonesia
Abstract
This paper aims to reveal the behavior and perception of Jakarta’s citizens on traffic congestion in Jakarta.Although this approach is somewhat well-developed in behavioral science, its utilization in urban economicsstudy, is still limited. Detecting the traffic congestion and its cause mainly relies on physical (engineering)methods, i.e V/C ratio. Here, we define the traffic congestion through two variables; ordinal traffic congestionperception and proportion of expected travel time to perceived travel time. Using a non-probabilistic samplingsurvey held in one of densest business district in Jakarta called Sudirman-Thamrin Golden Triangle Area; theestimation results show that travel behavior plays a major role in affecting travel time perceptions.Keywords: Traffic Congestion; Travel Time; Travel Behavior; Perception
AbstrakStudi ini bertujuan untuk melihat tingkah laku masyarakat Jakarta terhadap kemacetan di Jakarta.Pendekatan yang digunakan dalam studi ini telah banyak dikembangkan dalam studi behavioral science,namun penggunaanya dalam studi ekonomi perkotaan masih terbatas. Mendeteksi tingkat kemacetanserta penyebabnya umumnya mengandalkan metode fisik seperti V/C ratio. Studi ini mendefinisikan tingkatkemacetan ke dalam dua variabel, persepsi tingkat kemacetan ordinasl serta proporsi dari ekspektasi waktuperjalanan terhadap waktu perjalanan actual. Dengan menggunakan survey non-probabilitic sampling diSudirman-Tharim Golden Triangle Area, hasil estimasi menunjukkan bahwa perilaku perjalanan (travelbehavior) berperan utama dalam mempengaruhi persepsi waktu perjalanan.Kata kunci: Tingkat Kemacetan; Waktu Perjalanan; Perilaku Perjalanan; Persepsi
JEL classifications: R40; R41
1. Introduction
As the largest and densest urbanized areas in In-donesia, Jakarta experienced severe traffic con-gestion for a quite long time. Along with flooding,massive urbanization, and urban slum, traffic con-gestion is categorized as biggest challenges inJakarta. The congestion level in Jakarta has in-creased twofold during 1985–2000 causing poten-
∗Corresponding Address: Indonesia Project – The Arndt-Corden Department of Economics – Crawford School of Pub-lic Policy – The Australian National University, Canberra ACT0200, Australia. E-mail : [email protected] / [email protected].
tial loss as much as 65 trillion rupiahs in 2020 (Har-madi 2006). This calculation is based on two param-eters, loss due to vehicle operational costs (28.1trillion rupiahs) and the cost of longer travel time(36.9 trillion rupiahs). The calculation does not ac-count cost of environmental deterioration (i.e. airand noise pollution), cancelled transaction, lowerproductivity and competitive advantage relative toother major big cities (McFadden 2007; Boarnet,Kim, & Parkany 1998). Hence, potentially, the num-ber of potential losses due to traffic congestion inJakarta is higher than predicted.
Transportation Planning of DKI Jakarta (2007) sug-gests that there are four main problems as the
Economics and Finance in Indonesia Vol. 62 No. 3, December 2016

YUDHISTIRA, M.H. ET AL./HOW CONGESTED JAKARTA IS? ...142
source of traffic congestion. It consists of roadinterconnection problem, roadway misuse due toof user’s discipline, lack of additional road infras-tructure, and high growth of private transportationmodes. In order to provide a better traffic in Jakarta,it is believed that the government should managethose challenges as well as providing a better ser-vice in transport infrastructure.
Among those barriers, lack of additional road infras-tructure and high growth of private transportationmodes believed as the main causes of traffic con-gestion. The number of private vehicles users inJakarta has grown faster than roadway and rail-way growth. During 1999–2003, private vehiclesusers has grown 6.3% annually, reaching its peakwith average growth almost 10% in 2003. On thesame period, motorcycle had experienced its high-est growth, as high as 7.9% annually on average,and reached its peak around 14.3% in 2003. Inthe other hand, during 2000–2003, Jakarta road-way has only grown 2.09% or less than one per-cent annually. Bearing those condition in mind, an-other transport data also shows that, by the year of2002, most of transportation mode used by peoplein Jakarta is private vehicles (54%), where 40.3%of them is using private car and the rest using mo-torcycle. (Jakarta Metropolitan Area Police Office,Traffic Division Unit 2004).
A persistent unbalanced growth of transportationsupply and demand leads to longer travel timein almost all roadways in Jakarta, especially inthe rush hours (morning and evening). Continu-ous growing in suburban area of Jakarta, namelyBodetabek, generates unbalanced urban structurewhich creates excessive commuting inflow in themorning and outflow in the evening toward centralof Jakarta. Some studies attempt to measure thelevel of the traffic congestion by various metrics, i.e.lower speed at rush hours (Mochtar & Hino 2006)and V/C ratio (Anindia, Verhaeghe, & Zondag 2007).So far, those metrics are mainly dominated by en-gineering approaches which examine the conges-tion problem in macro context. They measure thelevel of congestion by using a certain unit of areaor road as unit analysis. On contrary, behavioralapproaches using individual or household as unitanalysis are still underutilized.
This paper attempts to investigate the relation be-tween trip behavior and perception of Jakarta’s andits suburban areas’ citizen toward traffic congestion.
Using a trip survey held in the central of Jakarta,we measured the congestion level by asking therespondents to evaluate how severe the conges-tion level as well as the perceived ideal travel timecompared to the actual travel time. We show thatJakarta’s congestion level is perceived at severelevel using both measurements and the perceptionis associated with the frequency of being caughtin congestion, trip purpose, and transport cost. Wealso find socio-economic variables also affect theperception.
This paper is structured as follows. The first sec-tion contains the introduction and literature work,including previous study in measuring congestion inJakarta and the neighboring areas, the second partexplains the methodology and survey, and the lastsection is analysis and concluding remarks, thenfollowed by recommendations.
2. Literature Review
Urban traffic congestion has been a major problemin big cities in the world, particularly for those whichhave vast emerging suburban areas. Congestioncan be defined as a situation in which demand forroad space exceeds supply, making the impedancevehicles impose on each other, due to the speed-flow relationship, in conditions where the use of atransport system approaches capacity (TransportResearch Centre 2004). Severe traffic congestiongenerates many externalities, taking form of increas-ing travel time, pollution (air, noise, etc.), excess fuelconsumption, and traffic accidents.
One of the most criticizing externality producedby congestion is the increasing travel time. It cre-ates lower speed of goods, services, peoples, in-formation, and in turn, hampers regional economicgrowth. Because of this externality, basic transporta-tion economics theory believes that urban conges-tion level tends to below its optimum level. Thenature of roadway is not pure public goods whichstill characterizes as rivalry goods in some level.Additional road user will directly cost other roadusers by increasing their travel time or opportunitycost (O’Sullivan 2006). This process exists as longas the users do not necessarily incur the cost theycause and will end until the roadway nearly reachesits capacity.
Economics and Finance in Indonesia Vol. 62 No. 3, December 2016

YUDHISTIRA, M.H. ET AL./HOW CONGESTED JAKARTA IS? ... 143
Considering huge impact of urban traffic congestion,there are abundant studies about the nature of con-gestion in transportation engineering. They haveproduced many measurements to understand thelevel of traffic congestion of a certain area. Somecommon basic measurements include: (1) trafficdensity, (2) average travel speed, (3) maximum ser-vice flow rate, (4) a ratio of traffic volume to roadcapacity (V/C), (5) average daily traffic volume, and(6) daily vehicle miles of travel (Laetz 1990). Severalstudies developed much more complicated conges-tion indexes, which are locally acceptable, i.e. TexasTransportation Index’s Roadway Congestion Index(Schrank & Lomax 1997), ACCESS index (Boarnet,Kim, & Parkany 1998), hydrodynamic models offluid and turbulent flow (McFadden 2007), and ur-ban Mobility Index (Wilbur Smith Associates 2008).Transportation engineering approach in measuringurban congestion as part of consumer behaviorcan be seen as a "macro" approach; it calculatesthe level of congestion using roadway or area asthe unit analysis. This ’macro’ model somewhatneglects the human existence as subject and ob-ject of congestion and its policy. It cannot catchthe rationality behind the behavior of the peoplewho travel in a particular roadway or area whichthe transportation economics model does. How-ever, as emphasized by (McFadden 2007) level ofmodeling of behavior depends on the nature of theproblem. He suggests physical analogies for ag-gregate, long-term forecasting, economic optimiz-ing models while economic models of behavior intransportation. Study by Li (2003) introduced travelenvironments and individuals’ expectancy as a partof determinants in understanding travel behavior.Later in this study, we use those variables to under-standing travel behavior in Jakarta.
Several studies trying to investigates travel behaviorhas been conducted to capture individuals’ prefer-ence on travel behavior. Study by Venezia (2009),focus on finding the right determinants of demandfor public transport, by understanding individuals’preferences toward using bus. This study helps infinding area to improve in order to move people’spreference from using private cars, to bus transit.
Prior studies predicting individuals travel behaviorusing perceived time travel has been introducedby Saw, Katti, & Joshi (2016) in Surat, India. It isfound that most of socio-economic variables usedin study, such as age, gender and education, didnot have significant result in understanding individ-
uals travel behavior. Meanwhile, only intensity ofenvironmental disturbance along the route who issignificantly correlated with travel time behavior. Onanother study, Poon & Stopher (2011), also pointsout that habitual travellers who makes the samejourney multiple times, are likely to have successfulprediction towards travel-related condition.
3. Method
3.1. Questionnaire Design
This study heavily relies on primary data miningand use questionnaires to collect the data. Thisstudy takes several steps to finalize the question-naire. Early step defines all important variables andconduct a pre-test survey to validate the question-naire and to gather inputs from respondents. Alongwith the pretest survey, interview with urban andtransportation experts are undertaken to ask theiropinion about the draft of questionnaire. The pre-test survey result and the interview input are incor-porated to finalize the survey.
3.2. Model Estimation
This study observes the relationship between timeinefficiency, as a proxy of preference towards con-gestion and the transportation behavior using twoapproaches. Firstly, we use the explicit evaluationusing an ordinal scale answer, where "1" is con-sidered as normal congestion and "5" as a verysevere congestion. Congestion function for the firstapproach is written as,
Congestion = α+ β1Cost + β2Freq + β3Income
+ β4Sex + β5Educ + β6Purpose
+β6Distance+β7Modes+β8Age+µ
(1)
The second approach is measuring the efficiencylevel of commuting time by using the proportion ofexpected travel time divided by actual perceivedtime. The function for second approach can be writ-
Economics and Finance in Indonesia Vol. 62 No. 3, December 2016

YUDHISTIRA, M.H. ET AL./HOW CONGESTED JAKARTA IS? ...144
ten as,
CongestionRatio = α+ β1Cost + β2Freq
+ β3Income + β4Sex + β5Educ
+ β6Purpose + β6Distance
+ β7Modes + β8Age + µ
(2)
We use similar explanatory variables for both ap-proaches in understanding individual behavior to-ward congestion. In general, our explanatory vari-ables consist of two types of variables. The firstone is transport-related variables, including Cost,Freq, Purposes, Distance and Modes, and socio-economic variables such as Income, Sex, Educ,and Age.
Cost is defined as the rupiahs we spent during ourtravel from origin to the destination. Cost denotesin ten thousand rupiahs per kilometer, and consistsof several components, including fuel and toll feesfor private transport, and fees for public transportusers. Private transport user may avoid some trafficcongestions through toll way while public transportuser can benefit from better but more expensivethan other public transports. In that way, travel costfor private transport is higher and, in our hypothe-sis, will lead to negative relationship with perceivedcongestion.
Freq captures how frequent the individual experi-ences the congestion on daily trip. It measures notonly the occurrence of congestion in one-way trip,but also how many days in a week, respondentsexperience with the congestion. For that purpose,respondents were asked to evaluate their experi-ence with the congestion when performe their maintrip. We provide the responses in questionnaires us-ing an ordinal approach, from "1" to "5", where "1" isconsidered as never experienced congestion, and"5" as always experienced congestions. Purposeis defined as individual reason to travel during thetime survey was conducted. We divide the answerbetween working purposes and other purposes.
We define Travel distance as distance traveled byrespondents from their starting point (origin) to theirdestination and measured in kilometers. Travel dis-tance is assumed to increase the perceived conges-tion burden. Longer distance enables the respon-dent to face more traffic jams. Explanatory variablesAge is used as additional socio-economic variables
to enrich our estimation in understanding individ-uals travel behavior. However, there is no strongtheory about how one gender would perceived abetter or worse travel time as another.
Transportation mode variables reflects medium oftransportation that the respondents choose to travel.We choose several modes of transportation such as,private cars, motorcycle, bus, and train. All thosemodes have their own advantages regarding to thecharacteristics of origin-destination of the respon-dent. For example, regarding to poor connectionof Jakarta’s public transport, private transports aremore likely. However, those are not reliable enoughto deal with the congestion. On contrary, other trans-portation modes offer a better travel time, such astrain, who are less likely to deal with congestion.
On socio-economic variables, we define Incomeas a respondent average monthly disposable in-come in general, including their basic salary and al-lowances. We expect that people with high incomereveals higher perceived congestion rather thanlower income people, since they face higher oppor-tunity cost. They tend to expect shorter travel timeto go to their destination. We also include dummyvariable Sex to distinguish perceived congestion be-tween male and female. We assign 1 for male and 0otherwise. We also use explanatory variables Educto reflect the level of education that the respondenthas achieved. The level of education is expected tohave positive relationship, since educated people isbelieved to be patient and have better understand-ing about the cause of congestion.
3.3. Data and Source of Data
The survey was conducted to collect informationfrom people in Golden Triangle Area, both whocommute using private cars or public transporta-tion. During the period of study, the transportationinfrastructure around to Golden Triangle Area con-sists of train, bus, mini-bus, and taxi. This surveyis conducted in 2008, consists of three blocks ofquestions. The first block aims to collect generalinformation on respondents’ travel behavior. Thesecond block aims to gain people perception ontravel behavior when several conditions applied.The third block is aims to collect general profileof the respondents, including their background andfinancial capacity.
Economics and Finance in Indonesia Vol. 62 No. 3, December 2016
YUDHISTIRA, M.H. ET AL./HOW CONGESTED JAKARTA IS? ... 145
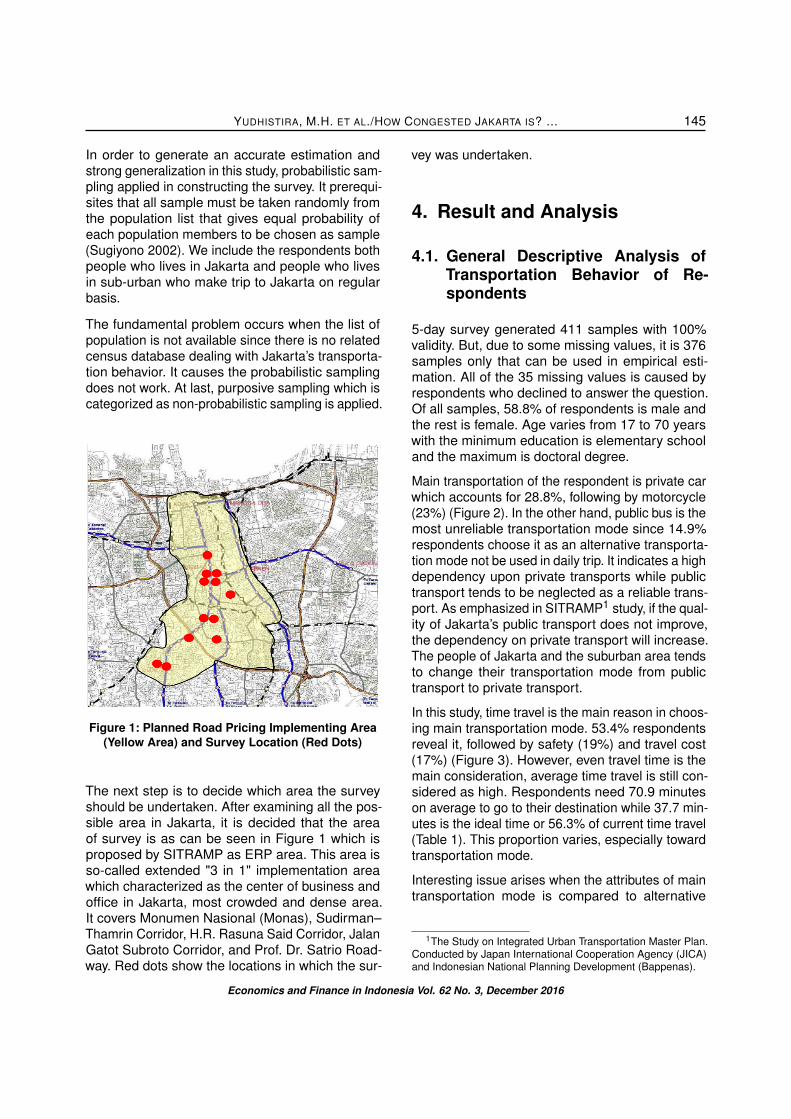
In order to generate an accurate estimation andstrong generalization in this study, probabilistic sam-pling applied in constructing the survey. It prerequi-sites that all sample must be taken randomly fromthe population list that gives equal probability ofeach population members to be chosen as sample(Sugiyono 2002). We include the respondents bothpeople who lives in Jakarta and people who livesin sub-urban who make trip to Jakarta on regularbasis.
The fundamental problem occurs when the list ofpopulation is not available since there is no relatedcensus database dealing with Jakarta’s transporta-tion behavior. It causes the probabilistic samplingdoes not work. At last, purposive sampling which iscategorized as non-probabilistic sampling is applied.
Figure 1: Planned Road Pricing Implementing Area(Yellow Area) and Survey Location (Red Dots)
The next step is to decide which area the surveyshould be undertaken. After examining all the pos-sible area in Jakarta, it is decided that the areaof survey is as can be seen in Figure 1 which isproposed by SITRAMP as ERP area. This area isso-called extended "3 in 1" implementation areawhich characterized as the center of business andoffice in Jakarta, most crowded and dense area.It covers Monumen Nasional (Monas), Sudirman–Thamrin Corridor, H.R. Rasuna Said Corridor, JalanGatot Subroto Corridor, and Prof. Dr. Satrio Road-way. Red dots show the locations in which the sur-
vey was undertaken.
4. Result and Analysis
4.1. General Descriptive Analysis ofTransportation Behavior of Re-spondents
5-day survey generated 411 samples with 100%validity. But, due to some missing values, it is 376samples only that can be used in empirical esti-mation. All of the 35 missing values is caused byrespondents who declined to answer the question.Of all samples, 58.8% of respondents is male andthe rest is female. Age varies from 17 to 70 yearswith the minimum education is elementary schooland the maximum is doctoral degree.
Main transportation of the respondent is private carwhich accounts for 28.8%, following by motorcycle(23%) (Figure 2). In the other hand, public bus is themost unreliable transportation mode since 14.9%respondents choose it as an alternative transporta-tion mode not be used in daily trip. It indicates a highdependency upon private transports while publictransport tends to be neglected as a reliable trans-port. As emphasized in SITRAMP1 study, if the qual-ity of Jakarta’s public transport does not improve,the dependency on private transport will increase.The people of Jakarta and the suburban area tendsto change their transportation mode from publictransport to private transport.
In this study, time travel is the main reason in choos-ing main transportation mode. 53.4% respondentsreveal it, followed by safety (19%) and travel cost(17%) (Figure 3). However, even travel time is themain consideration, average time travel is still con-sidered as high. Respondents need 70.9 minuteson average to go to their destination while 37.7 min-utes is the ideal time or 56.3% of current time travel(Table 1). This proportion varies, especially towardtransportation mode.
Interesting issue arises when the attributes of maintransportation mode is compared to alternative
1The Study on Integrated Urban Transportation Master Plan.Conducted by Japan International Cooperation Agency (JICA)and Indonesian National Planning Development (Bappenas).
Economics and Finance in Indonesia Vol. 62 No. 3, December 2016

YUDHISTIRA, M.H. ET AL./HOW CONGESTED JAKARTA IS? ...146
Figure 2: Main Transportation ModeSource: Survey result
Table 1: Proportion of Ideal Travel Time Divided byPreceived Time
Characteristics Average SamplePurposeWorking 0.567 378Not working 0.509 33OriginJakarta 0.574 227Bodetabek 0.548 184Transportation ModeCar 0.508 100Motor cycle 0.614 116Bus 0.538 157Train 0.651 38Total Respondent 0.563 411
Source: Survey result
Figure 3: Main Reason in Choosing TransportationMode
Source: Survey result
mode (Figure 4). In this survey, there are 4 main at-tributes defined, which are connectivity, travel cost,safety, and time travel. We define connectivity ashow many times respondents need to change theirtransport modes during its travel from their origin totheir destination. Time travel is defined as the timespent by respondents from their origin to the desti-nation. We also measure safety as how safe peoplefeel during its travel from their origin to their destina-tion. Lastly, we define travel cost as the rupiah beingspent by respondents to reach their destination onone way trip from their respective origin.
Respondents are asked to evaluate both, maintransportation and alternative modes in respect tothose attributes in cardinal scale. 1 refers to badand 4 for excellent. Apparently, even time travelis the main reason in choosing mode, there is nosignificant difference in time travel between thosetwo. Instead, connectivity and travel cost shows asignificant difference. It does not rule out the factthat time travel is the most important. A severe con-gestion in Jakarta drives all type of transportationsmove slower and, in turn drive the time travel isquite similar among transport modes even some re-spondents perceive quite significant difference. Butnow, people cannot rather than relies on time travelonly, they start to extensively incorporate other at-tributes, especially connectivity and travel cost. Forexample, private transport offers higher connectiv-
Economics and Finance in Indonesia Vol. 62 No. 3, December 2016

YUDHISTIRA, M.H. ET AL./HOW CONGESTED JAKARTA IS? ... 147
Figure 4: Comparison Among Attributes BetweenMain Mode and Alternative Mode
Source: Survey result
ity than mass transport does, since people did notneed to change their mode of transportation whenusing private transport.
Another interesting figure is when transportationmode is cross-tabulated with travel distance. Ac-cording to the basic transportation theory, furthertravel distance leads people to change their trans-portation choice into longer haul characterizedtransportation. In this case, public transport, es-pecially railway and bus is more reliable than anyprivate transport in serving longer distance. Surveyresult shows a similar pattern (Table 2).
4.2. Empirical Results
Empirical result for Equation (1) is presented inTable 3 and 4, respectively. The Table 3 presentsthe estimation result for perception toward conges-tion, while the Table 4 shows the result for Propor-tion of ideal travel time divided by actual perceivedtime. For both results, low R2 value indicates weakexplanatory level of estimated model. However, F-statistics for overall model and t-statistics for manyvariables are significant. It provides enough reasonto employ the result for further analysis.
In the Table 3, among explanatory variables onlyfrequency in experiencing congestion and incomeare significant. Other variables have no clear rela-tionship in affecting the perception since all of themdo not statistically differ from zero.
The coefficient of the frequency in experiencing con-gestion is positive and significant at 10% level. Itcan be explained as more frequent people experi-ence congestion when traveling generates worseperception of congestion. As noted earlier, thehigher frequency not only refers to more congestionspot met in single trip, but implicitly reflects moredays in a week the individual experiences conges-tion in daily trip as well.
The estimation result also reports that the coeffi-cient of income is positive and significant at 5%level. This result confirms our previous hypothesis,that people with higher income experienced moresevere congestion. Understandably, they are bur-dened with higher opportunity cost and demandmuch better traffic congestion than lower incomepeople. It brings a consequence that for a samelevel of congestion, higher income people leads tovote worst congestion.
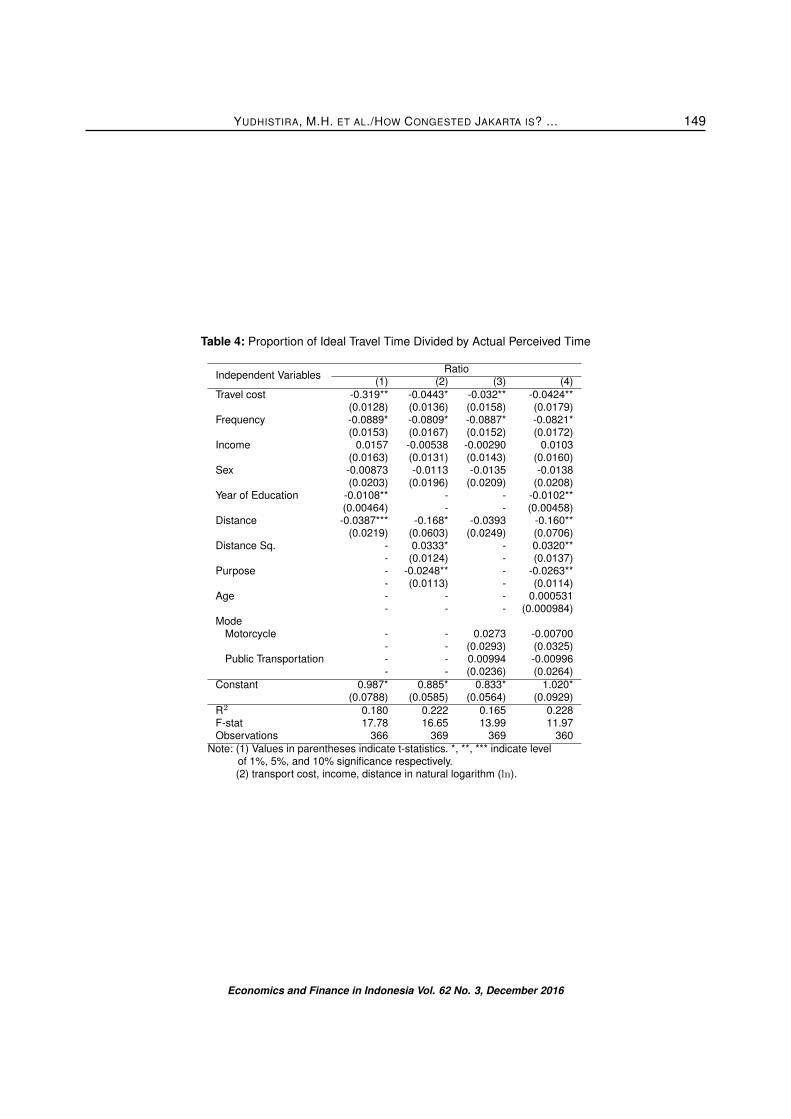
Table 4 employs the proportion of ideal travel timedivided by actual perceived time as dependent vari-able provides richer result since there are moresignificant variables in the estimation result. Thisstudy uses ordinary least squares (OLS) as methodof estimation. Our previous hypothesis expects thecoefficient for travel cost is positive if we use theproportion of ideal time as dependent variable. Itmeans that higher travel cost should indicates bettertransportation modes, and generates better traveltime. However, the estimation is showing differentresult. It shows a negative and significant correla-tion between travel time and ratio of ideal time toperceived time. A possible explanation of this re-sults is that the congestion in Jakarta has reachedthe worst condition, where changing transportationmode from the first best mode into the second bestdoes not provide a significant improvement in traveltime. This explanation confirms the fact presentedin Figure 3. Respondents asked to evaluate theattributes of their main transportation mode and al-ternative mode. The result is that there is not muchdifference between both modes. Another possibleexplanation is that higher travel cost for better trans-portation mode generates higher expectation forbetter travel time. Since the traffic did not changemuch, the expectation of better travel time did notmeet the perceived time.
The frequency variable coefficient has significantnegative sign. The result is similar with our hypoth-esis and the estimation using ordered logit. An in-
Economics and Finance in Indonesia Vol. 62 No. 3, December 2016

YUDHISTIRA, M.H. ET AL./HOW CONGESTED JAKARTA IS? ...148
Table 2: Proportion of Transportation Mode Based on Travel Distance
Transportation Mode Totalcar motor cycle train bus othersTravel Distance (km) < 1 0.2 1.5 0.0 1.9 0.0 3.6
1–3 1.0 2.2 0.0 2.4 0.0 5.63–5 0.5 2.9 0.0 1.9 1.0 6.35–10 2.2 4.4 0.2 5.6 0.0 12.410–15 5.8 3.4 0.2 5.8 1.0 16.315–25 8.5 7.8 1.7 9.2 0.7 28.0> 25 5.1 5.6 6.8 8.3 1.9 27.7
Total 23.4 27.7 9.0 35.3 4.6 100.0Source: Survey result
Table 3: Perception Toward Congestion: Logit Estimates
Independent VariablesPerception toward congestion0=normal, 1=worse, 2=worstI II III IV
Transport cost per km -0.104 - -0.0354 -0.0446(0.0932) - (0.168) (0.162)
Frequency 0.741* 0.756* 0.714* 0.756*(0.137) (0.135) (0.138) (0.142)
Income 0.423** 0.352** 0.375** 0.493**(0.180) (0.143) (0.178) (0.195)
Sex -0.0329 -0.0555 -0.0482 0.0541(0.212) (0.208) (0.220) (0.233)
Year of education -0.00424 - - -0.0140(0.0512) - - (0.0532)
Purpose - -0.0674 - -0.0542- (0.150) - (0.170)
Distance - - 0.102 0.131- - (0.180) (0.184)
Age - - - -0,0289*- - - (0.0111)
ModeMotorcycle - - 0.00428 -0.147
- - (0.338) (0.354)Bus - - -0.109 -0.270
- - (0.287) (0.302)Cut-off 1 2.756* 2.338* 2.656* 1.695Constant (0.897) (0.505) (0.633) -1.085Cut-off 2 3.737* 3.343* 3.642* 2.702**Constant (0.898) (0.510) (0.636) -1.085Pseudo R2 0.0513 0.0506 0.0520 0.0654Loglikelihood -370.5 -380.9 -373.5 -359.6Observations 370 379 373 364
Note: (1) Values in parentheses indicate t-statistics. *, **, *** indicate levelof 1%, 5%, and 10% significance respectively.(2) transport cost, income, distance in natural logarithm (ln).
Economics and Finance in Indonesia Vol. 62 No. 3, December 2016
YUDHISTIRA, M.H. ET AL./HOW CONGESTED JAKARTA IS? ... 149
Table 4: Proportion of Ideal Travel Time Divided by Actual Perceived Time
Independent Variables Ratio(1) (2) (3) (4)
Travel cost -0.319** -0.0443* -0.032** -0.0424**(0.0128) (0.0136) (0.0158) (0.0179)
Frequency -0.0889* -0.0809* -0.0887* -0.0821*(0.0153) (0.0167) (0.0152) (0.0172)
Income 0.0157 -0.00538 -0.00290 0.0103(0.0163) (0.0131) (0.0143) (0.0160)
Sex -0.00873 -0.0113 -0.0135 -0.0138(0.0203) (0.0196) (0.0209) (0.0208)
Year of Education -0.0108** - - -0.0102**(0.00464) - - (0.00458)
Distance -0.0387*** -0.168* -0.0393 -0.160**(0.0219) (0.0603) (0.0249) (0.0706)
Distance Sq. - 0.0333* - 0.0320**- (0.0124) - (0.0137)
Purpose - -0.0248** - -0.0263**- (0.0113) - (0.0114)
Age - - - 0.000531- - - (0.000984)
ModeMotorcycle - - 0.0273 -0.00700
- - (0.0293) (0.0325)Public Transportation - - 0.00994 -0.00996
- - (0.0236) (0.0264)Constant 0.987* 0.885* 0.833* 1.020*
(0.0788) (0.0585) (0.0564) (0.0929)R2 0.180 0.222 0.165 0.228F-stat 17.78 16.65 13.99 11.97Observations 366 369 369 360
Note: (1) Values in parentheses indicate t-statistics. *, **, *** indicate levelof 1%, 5%, and 10% significance respectively.(2) transport cost, income, distance in natural logarithm (ln).
Economics and Finance in Indonesia Vol. 62 No. 3, December 2016

YUDHISTIRA, M.H. ET AL./HOW CONGESTED JAKARTA IS? ...150
crease in frequency experiencing congestion wouldincrease the perception. In this case, it will reducethe perceived proportion of travel time. As empha-sized earlier in first model, higher frequency in expe-riencing congestion would directly lower their travelspeed. Hence, the gap between current travel timeand expected ideal travel time gets wider.
The coefficient of the trip purpose dummy variablehas negative significant sign suggesting that re-spondents who travel for working perceive bettertraveling time rather than those whose purpose isother than working. The possible explanation ofthis condition is that people who daily commutewith working purposes are possibly more realistictoward current condition of Jakarta transportationsystem. This leads to lower expectation on theirexpected travel time.
In terms of distance, it suggests that the furtherpeople travels, the worse their travel time expec-tation. One of the possible explanation for this re-sults is that the longer people travels, the higherpossibility of traffic jam occurred (for those whoused road-based transportation), or the higher pos-sibility of train-related disturbance, such as signalinterference, station queuing (for those who usedrail-based transportation). The quadratic results fordistance interpreted as even though people couldexpect a higher possibility of traffic jam when theytravel at a longer distance, at one point, the trafficwill lessen as the distance shortened.
The choice of main transportation modes also playsa significant role in perceiving the congestion. Thisstudy use private car as basis. The estimation re-sults for both motorcycle and public transportationcould not explain whether using motorcycle or pub-lic transportation is resulting better perception ontravel time.
Among socio-economic variables, education playsa significant role in forming expectation toward con-gestion. The coefficient for years of education isnegative and significant at 5% level. This result iscontrast with our previous hypothesis. It seems thateducated people are more optimistic about theirexpected travel time. They believe that their traveltime can be much improved if the congestion is wellmanaged.
5. Conclusion
This paper tries to investigate the behavior ofperception toward traffic congestion in Jakarta.In order to do so, we analyze a simple non-probabilistic individual-level survey undertaken inJakarta’s Golden Triangle Area at 2008. To measurethe perception, we employ two variables; (1) the ex-plicit evaluation measured by ordinal scale, and (2)efficiency level of travel time measured as propor-tion of expected travel time divided by perceivedactual time.
We found several interesting transport behavior vari-ables that play a significant role in forming the per-ception. Many congestion spots in Jakarta whichgenerates higher frequency in experiencing trafficcongestion in daily trip go hand on hand with higherperception. The result also points out that the effi-ciency level is getting worst as the travel distanceincreases due to inadequate transport infrastruc-ture.
Taking all the results into consideration, this studypoints out that there is a growing urge to improvethe transport infrastructure in Jakarta to reduce traf-fic congestion in Jakarta metropolitan areas. Byimproving the transport infrastructure, we believethat the individuals perception towards congestionwould be better as well as its expected travel time.We also believe that the traffic congestion can alsobe reduced by providing better option at public trans-port infrastructure.
References
[1] Anindia, I, Verhaeghe, RJ, & Zondag, B 2007, IntegratedSpace-transport Modelling for a Strategic Analysis of Con-gestion in a Strongly Developing Region, Paper presentedin International Conference on Regional and Urban Mod-elling, 1–2 June 2007, Free University of Brussels, Brussels,viewed 15 June 2010, <https://ecomod.net/sites/default/files/document-conference/ecomod2007-rum/111.pdf>.
[2] Boarnet, M, Kim, E, & Parkany, E 1998, ’Measuring trafficcongestion’, Transportation Research Record: Journal ofthe Transportation Research Board, vol. 1634, pp.93–99.doi: https://doi.org/10.3141/1634-12.
[3] Harmadi, SH 2006, Megapolitan in Economic Perspective:Megapolitan in Multi Perspective, Faculty of Social andPolitical Science, Universitas Indonesia.
[4] Jakarta Metropolitan Area Police Office, Traffic Division Unit2004, Number of registration vehicles in Jakarta Metropoli-tan Area, Jakarta.
Economics and Finance in Indonesia Vol. 62 No. 3, December 2016

YUDHISTIRA, M.H. ET AL./HOW CONGESTED JAKARTA IS? ... 151
[5] JICA & Bappenas 2004, The Study on Integrated Trans-portation Master Plan for Jabotabek (Phase II), Pacific Con-sultants International Almec Corporation – Japan Interna-tional Cooperation Agency (JICA) & National DevelopmentPlanning Agency (BAPPENAS) Republic of Indonesia.
[6] Laetz, TJ 1990, ’Predictions and perceptions: Definingthe traffic congestion problem’, Technological Forecast-ing and Social Change, vol. 38, no. 3, pp. 287–292. doi:https://doi.org/10.1016/0040-1625(90)90074-6.
[7] Li, YW 2003, ’Evaluating the urban commute experience: Atime perception approach’, Journal of Public Transportation,vol. 6, no. 4, pp. 41–67. doi: http://dx.doi.org/10.5038/2375-0901.6.4.3.
[8] McFadden, D 2007, ’The behavioral science of transporta-tion’, Transport Policy, vol. 14, no. 4, pp. 269–274. doi:https://doi.org/10.1016/j.tranpol.2007.07.001.
[9] Mochtar, MZ & Hino, Y 2006, ’Principal Issues to Improvethe Urban Transport Problems in Jakarta’, Mem. Fac. Eng.,Osaka City Univ., vol. 47, pp. 31–38.
[10] O’Sullivan, A 2006, Urban Economics, [Sixth Edition,McGraw-Hill Irwin, New York.
[11] Poon, JF & Stopher, PR 2011, Investigating the Effects ofDifferent Types of Travel Information on Travellers’ Learn-ing in a Public Transport Setting using An ExperimentalApproach, Conference paper delivered at the 34th Aus-tralasian Transport Research Forum (ATRF) Proceedingsheld on 28–30 September 2011 in Adelaide, Australia.
[12] Saw, K, Katti, BK, & Joshi, GJ 2016, ’Impact of Socio-Economic Variables and Travel Environment on Perceptionof Travel Time: A Case Study of Surat, India’, InternationalJournal for Traffic and Transport Engineering, vol. 6, no. 4,pp. 444–452. doi: 10.7708/ijtte.2016.6(4).07.
[13] Schrank, DL, & Lomax, TJ 1997, Urban Roadway Conges-tion - 1982 to 1994 Volume 2: Methodology and UrbanizedArea Data, Texas Transportation Institute, Austin.
[14] Sugiyono 2002, Metode Penelitian Bisnis, CV Alfa Beta,Bandung.
[15] Transport Research Centre 2004, Managing Urban TrafficCongestion, Summary Document, European Conferenceof Ministers of Transport (ECMT) – Organisation for Eco-nomic Co-operation and Development (OECD), viewed15 June 2010, <https://www.itf-oecd.org/sites/default/files/docs/07congestion.pdf>.
[16] Transportation Bureau of Local Government of Jakarta2007, Jakarta’s Macro Transportation Model.
[17] Transportation Planning of DKI Jakarta 2007, Pola Trans-portasi Makro DKI Jakarta.
[18] Venezia, E 2009, ’Determinants of the demand for urbantransport: results of a case study’, Working Papers SIET2009, 09_9, Società Italiana di Economia dei Trasporti edella Logistica - XI Riunione Scientifica –Trieste, 15–18giugno 2009, viewed 15 June 2010, <http://www.sietitalia.org/wpsiet/Venezia_paper_SIET.pdf>.
[19] Wilbur Smith Associates 2008, Traffic & Transportation Poli-cies and Strategies in Urban Areas in India, Ministry of Ur-ban Development, viewed 15 June 2010, <www.urbanindia.nic.in:http://urbanindia.nic.in/moud/programme/ut/>.
Economics and Finance in Indonesia Vol. 62 No. 3, December 2016