


Bahasa
Halaman
Hukum

Xmrk, Kras and Myc Transgenic Zebrafish Liver CancerModels Share Molecular Signatures with Subsets ofHuman Hepatocellular CarcinomaWeiling Zheng1, Zhen Li1, Anh Tuan Nguyen1, Caixia Li1, Alexander Emelyanov2, Zhiyuan Gong1*
1 Department of Biological Sciences, National University of Singapore, Singapore, Singapore, 2 Institute of Cell and Molecular Biology, Singapore, Singapore
Abstract
Previously three oncogene transgenic zebrafish lines with inducible expression of xmrk, kras or Myc in the liver have beengenerated and these transgenic lines develop oncogene-addicted liver tumors upon chemical induction. In the currentstudy, comparative transcriptomic approaches were used to examine the correlation of the three induced transgenic livercancers with human liver cancers. RNA profiles from the three zebrafish tumors indicated relatively small overlaps ofsignificantly deregulated genes and biological pathways. Nevertheless, the three transgenic tumor signatures all showedsignificant correlation with advanced or very advanced human hepatocellular carcinoma (HCC). Interestingly, molecularsignature from each oncogene-induced zebrafish liver tumor correlated with only a small subset of human HCC samples(24–29%) and there were conserved up-regulated pathways between the zebrafish and correlated human HCC subgroup.The three zebrafish liver cancer models together represented nearly half (47.2%) of human HCCs while some human HCCsshowed significant correlation with more than one signature defined from the three oncogene-addicted zebrafish tumors.In contrast, commonly deregulated genes (21 up and 16 down) in the three zebrafish tumor models generally showedaccordant deregulation in the majority of human HCCs, suggesting that these genes might be more consistentlyderegulated in a broad range of human HCCs with different molecular mechanisms and thus serve as common diagnosismarkers and therapeutic targets. Thus, these transgenic zebrafish models with well-defined oncogene-induced tumors arevaluable tools for molecular classification of human HCCs and for understanding of molecular drivers in hepatocarcin-ogenesis in each human HCC subgroup.
Citation: Zheng W, Li Z, Nguyen AT, Li C, Emelyanov A, et al. (2014) Xmrk, Kras and Myc Transgenic Zebrafish Liver Cancer Models Share Molecular Signatureswith Subsets of Human Hepatocellular Carcinoma. PLoS ONE 9(3): e91179. doi:10.1371/journal.pone.0091179
Editor: Xiaolei Xu, Mayo Clinic, United States of America
Received October 2, 2013; Accepted February 9, 2014; Published March 14, 2014
Copyright: � 2014 Zheng et al. This is an open-access article distributed under the terms of the Creative Commons Attribution License, which permitsunrestricted use, distribution, and reproduction in any medium, provided the original author and source are credited.
Funding: This work was supported by a grant from National Medical Research Council of Singapore. The funders had no role in study design, data collection andanalysis, decision to publish, or preparation of the manuscript.
Competing Interests: Zhiyuan Gong is currently an academic editor of PLoS ONE; this does not alter the authors’ adherence to all the PLOS ONE policies onsharing data and materials.
* E-mail: [email protected]
Introduction
Human hepatocellular carcinoma (HCC) is known to be a very
heterogeneous disease, especially at intermediate and advanced
stages [1]. Due to the diverse and complex etiologies contributing
to HCC incidence, different genetic mutations or altered
molecular pathways could be responsible for hepatocarcinogene-
sis. So far, several carcinogenic pathways have been identified to
be involved in the development and progression of HCC,
including the VEGFR, EGFR, and mTOR pathways [2]. In
effort to decipher the role of different oncogenic pathways, a
number of transgenic mouse models have been established [3,4]
and comparative transcriptomic analyses have been used to
identify the best transgenic mouse models for human HCCs [4].
The zebrafish has been increasingly recognized as a valuable
experimental model for human diseases, particularly for cancers
[5] including liver cancers [6–11]. It has been shown that the
zebrafish tumors had striking similarities with human cancer
histologically [12,13]. Transcriptomic and epigenetic analyses
have also indicated conserved features of carcinogen-induced
zebrafish HCC with human HCC [14–16].
Previously we have generated several liver tumor models by
transgenic expression of three different oncogenes (kras, xmrk or
Myc) specifically in the zebrafish liver and these transgenic
zebrafish usually produce liver tumors with variable degrees of
severity from hepatocellular adenoma (HCA) to HCC [6–9]. The
three oncogenes we used in the zebrafish have all been shown to
be involved in hepatocarcinogenesis. KRAS is mutated in ,7% of
liver cancers in human [17] but Ras signaling is ubiquitously
activated in HCC [18]. Xmrk is a naturally occurring variant of the
EGFR in fish of the genus Xiphophorus (platyfish and swordtails)
with constitutive autophosphorylation and activation of down-
stream signals [19]. Activation of EGFR signal is correlated with
poor prognosis of HCC patients [20]. MYC is commonly amplified
in many cancers including HCC and higher expression level of
MYC is associated with more advanced status of HCC [21]. We
have shown that overexpression of kras and xmrk in the zebrafish
liver could induce HCC [7–9], while overexpression of Myc
induced mostly HCA [6].
Comparative transcriptomic analyses of animal models and
human clinical samples provide a powerful tool for identification
of conserved molecular pathways and biomarker genes for
diagnosis and therapy [15,22]. Our existing oncogene transgenic
PLOS ONE | www.plosone.org 1 March 2014 | Volume 9 | Issue 3 | e91179
zebrafish models have well defined up-regulation of driver
oncogene and this may provide a valuable tool to identify the
molecular driving forces in human carcinogenesis by comparative
transcriptomic analyses. Thus, in this study, we employed RNA
sequencing technology to compare the transcriptomic profiles of
the three oncogene-induced liver tumors in transgenic zebrafish.
By comparative analyses with human liver transcriptomes from
cirrhotic livers to very advanced HCC, we found that they all
showed strong molecular correlation with advanced or very
advanced human HCCs. Nevertheless, there are quite distinct
deregulated biological pathways based on deregulated genes in the
three oncogene transgenic models. Interestingly, each zebrafish
liver tumor model correlated with a subset of human HCCs and
each subset has some distinct molecular features. We showed that
the transgenic zebrafish models with well-defined driver-gene
activity should be valuable for classification of human HCCs and
for understanding the molecular mechanisms behind each HCC
subtype.
Materials and Methods
Treatment and Induction of Liver Cancer in the ThreeZebrafish Transgenic Models
Zebrafish were maintained following the approved protocol by
Institutional Animal Care and Use Committee of National
University of Singapore (Protocol 079/07). The generation of
xmrk and Myc transgenic zebrafish was previously described and
they were termed as TO(xmrk) [9] and TO(Myc) [6] respectively in
the previous publications. The two transgenic lines were
constructed by using a tetracycline-inducible transgenic system
and the oncogene expression were induced by doxycycline. The
krasV12 transgenic line used in the present study was newly
generated by using a mifepristone-inducible system [7] in
combination with a Cre-loxP system (unpublished). For the xmrk
and Myc transgenic lines, transgenic fish and their non-transgenic
siblings were treated with 60 mg/ml doxycycline (Sigma, USA)
starting from 3.5 mpf (month post fertilization) for 6 weeks. All
xmrk fish developed HCC and all Myc fish developed HCA. In
total, for each transgenic line, one tumor sample (transgenic fish
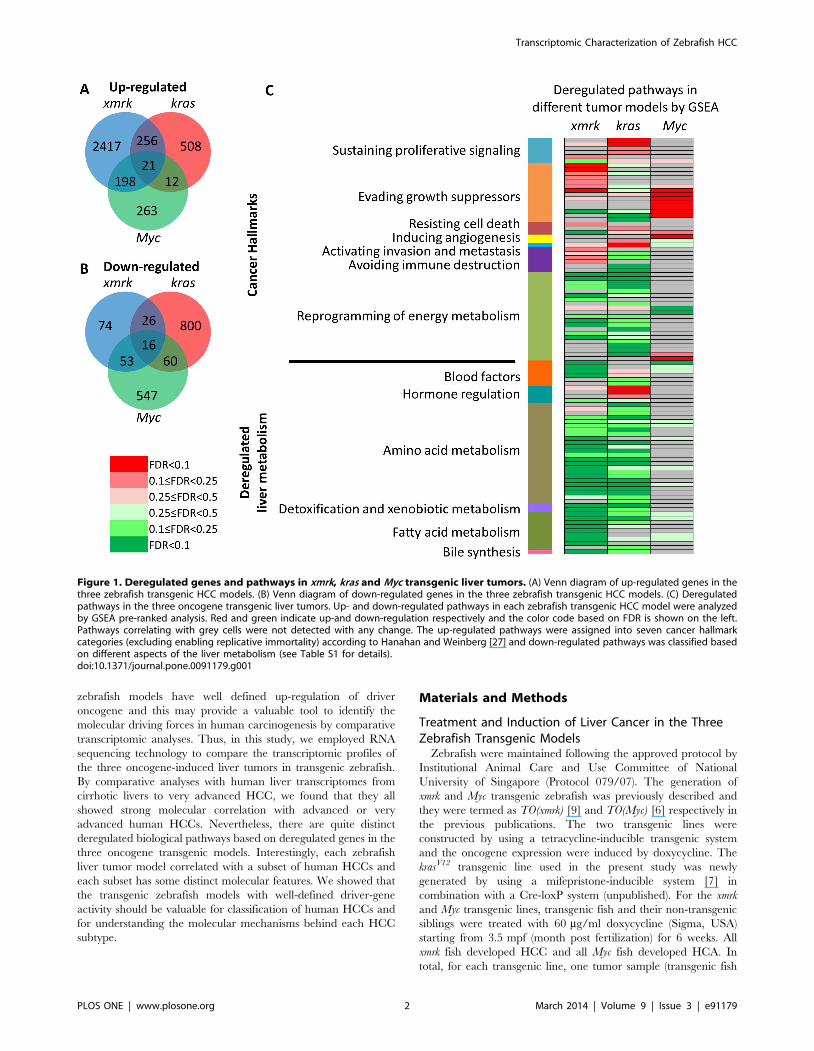
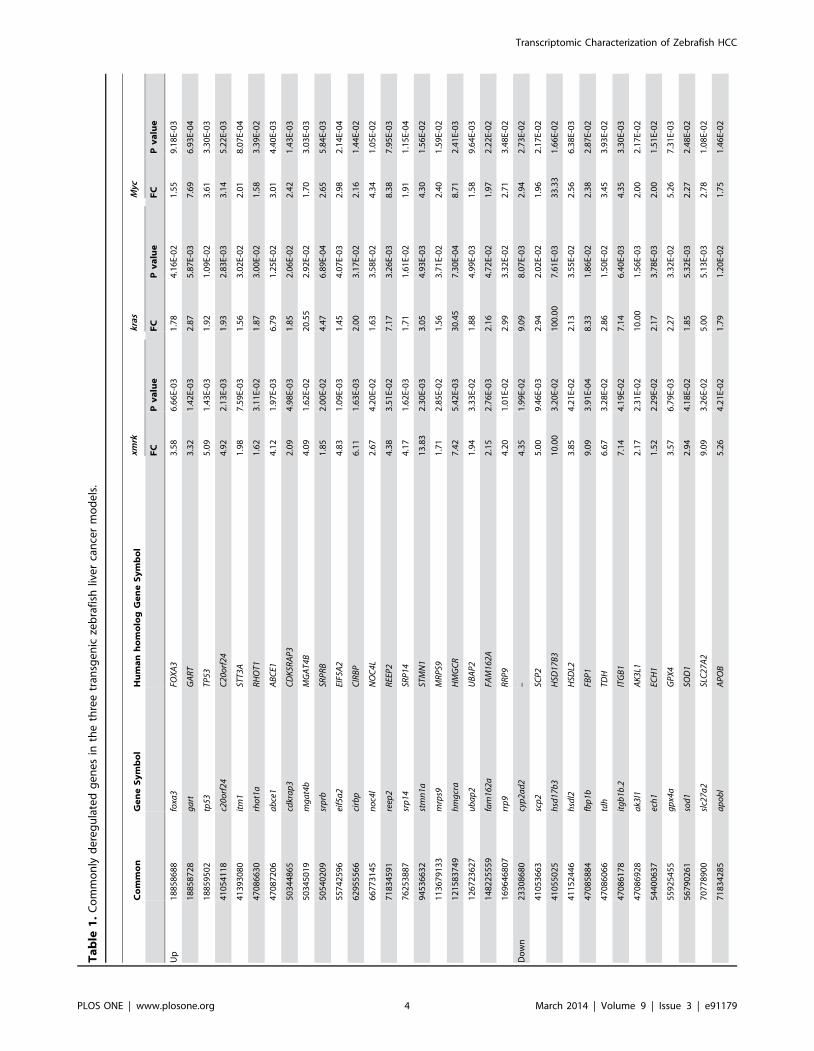
Figure 1. Deregulated genes and pathways in xmrk, kras and Myc transgenic liver tumors. (A) Venn diagram of up-regulated genes in thethree zebrafish transgenic HCC models. (B) Venn diagram of down-regulated genes in the three zebrafish transgenic HCC models. (C) Deregulatedpathways in the three oncogene transgenic liver tumors. Up- and down-regulated pathways in each zebrafish transgenic HCC model were analyzedby GSEA pre-ranked analysis. Red and green indicate up-and down-regulation respectively and the color code based on FDR is shown on the left.Pathways correlating with grey cells were not detected with any change. The up-regulated pathways were assigned into seven cancer hallmarkcategories (excluding enabling replicative immortality) according to Hanahan and Weinberg [27] and down-regulated pathways was classified basedon different aspects of the liver metabolism (see Table S1 for details).doi:10.1371/journal.pone.0091179.g001
Transcriptomic Characterization of Zebrafish HCC
PLOS ONE | www.plosone.org 2 March 2014 | Volume 9 | Issue 3 | e91179
treated with doxycycline) and three control samples (non-
transgenic siblings similarly treated with doxycycline, transgenic
siblings without doxycycline treatment, and non-transgenic
siblings without doxycycline treatment) were collected for RNA
sequencing. In all cases, liver samples used for RNA sequencing
were pooled from four to five male fish. For the krasV12 transgenic
fish, one-month-old transgenic fish were treated with 1 mM
mifepristone (Sigma, USA) for 36 hours to induce Cre-mediated
recombination for activation of krasV12 transgene expression in the
liver. The krasV12 activated transgenic fish were then allowed to
grow for six months to develop HCC and HCC samples were then
collected for RNA sequencing. Three liver tumors from induced
transgenic fish and three normal livers from uninduced transgenic
fish were pooled separately as tumor and control samples. All
samples used were from male fish and two sets of biological
replicates were used.
Identification of Signature Gene Lists in Each ZebrafishLiver Cancer Model
Total RNA was extracted using TRIzol Reagent (Invitrogen,
USA) and treated with DNase I to remove genomic DNA
contamination. 39 RNA-SAGE (serial analysis of gene expression)
sequencing was performed on ABI SOLiD platform by Mission
Biotech (Taiwan) according to manufacturer’s protocol and 10–23
million reads were generated from each sampler (Table S1).
Briefly, mRNA was purified using Dynabeads Oligo(dT) EcoP
(Invitrogen) and subjected to cDNA synthesis. Resultant cDNA
was digested by NlaIII and EcoP15I to result in a 27 nucleotides
cDNA tag between the two sequencing adapters. The tags were
mapped to the NCBI RefSeq (Reference Sequence) mRNA
database for zebrafish with a criterion of allowing maximum 2
nucleotide mismatches. All RNA-Seq data were submitted to
Gene Expression Omnibus database with the following access
numbers: GSE53342 for xmrk and Myc data and GSE53630 for
kras data. Tag counts for each transcript were normalized to TPM
(transcripts per million) to facilitate comparison among different
samples. The differentially regulated genes in the Myc- and xmrk-
induced liver cancers were identified using one sample t-test as
previously described [23], and the differentially expressed genes in
the kras-induced liver cancer was identified using two-tailed
Student’s t-test.
To facilitate functional implications of zebrafish transcriptome,
all zebrafish genes were mapped to annotated human genes in
order to use existing online software developed in human genes.
Thus, human homology mapping of zebrafish Unigene clusters
were retrieved from the Genome Institute of Singapore Zebrafish
Annotation Database (http://123.136.65.67/). For Unigene clus-
ters mapped by more than one transcript entries, the highest TPM
was used to represent the expression level of the Unigene cluster.
Some zebrafish Unigene clusters were mapped to more than one
human Unigene clusters, which usually came from the same gene
family. To remove redundancy and avoid causing bias in
functional analyses, only the first human Unigene cluster in the
list was selected to represent the zebrafish Unigene clusters. The
lists of significantly up-regulated zebrafish genes that were mapped
with human homologs and used for comparative analyese with
human HCC data are shown in Table S2.
Gene Set Enrichment Analysis (GSEA)GSEA was used to establish the relatedness between the
transgenic zebrafish models and human liver cancers [24]. GSEA
is a computational method that determines whether a priori defined
set of genes shows statistically significant, concordant differences
between two biological samples; it calculates an enrichment score
using a running-sum statistic through a ranked list of gene
expression data set. Human homologs of the significantly up-
regulated genes from the zebrafish tumor tissues were used as
cancer signatures for each transgenic zebrafish model for
transcriptomic comparison with human HCC data. Each chosen
phenotype of human HCCs (either one specific HCC stage or one
particular HCC sample) was compared to the rest of the samples
in the same dataset. All genes in the chosen phenotype were
ranked by t-test to determine expression differences among
different HCC stages or different HCC samples. The enrichment
score of the pre-defined transgenic zebrafish cancer signature was
calculated using a running-sum statistic through the ranked genes.
The statistical significance of the enrichment score was estimated
by using an empirical phenotype-based permutation test proce-
dure. An FDR (false discovery rate) value was provided by
introducing adjustment of multiple hypothesis testing. Human
liver cancer transcriptome data were retrieved from Gene
Expression Omnibus (GEO) database. The human dataset
including different stages of HCCs used in the comparison was
GSE6764 [25]. The ten human HCC datasets used for examining
the representation of zebrafish liver cancer gene signatures are
summarized in Table S3. Annotation information was retrieved
from SOURCE (http://smd.stanford.edu/cgi-bin/source/
sourceSearch). For multiple probes which can be mapped to one
Unigene cluster, the maximum signal intensity was selected to
represent the expression level of the Unigene cluster.
GSEA Pre-ranked AnalysisGSEA pre-ranked option was used to analyze the deregulated
pathways in each transgenic zebrafish model and subgroups of
human HCCs. Briefly, the entire transcriptome was ranked by
logarithm transformed p-value (base 10). The up-regulated genes
were given positive values, and the down-regulated genes negative
values. The curated canonical pathways from the MSigDB
(Molecular Signature Database) were used. The number of
permutation used was 1000.
RT-qPCR ValidationTotal RNA were reverse-transcribed using the SuperScript II
cDNA Synthesis Kit (Invitrogen). RT-qPCR was performed with
same sets of cDNAs used for SAGE sequencing using the
LightCycler 480 SYBR Green I Master system (Roche). Reactions
were conducted in triplicate for each cDNA sample and primer
sequences are shown in the Table S4. Gene expression levels in
each control or transgenic liver sample were normalized with the
level of b-actin mRNA as the internal control. The log2 fold
changes between tumor and control samples were calculated using
the CT method according to the formula: log2 fold changes = 2
DDCT = 2[(CT gene of interest–CT b-actin) transgenic sample–
(CT gene of interest–CT b-actin) control sample]. Two-tailed
heteroscedastic t test was performed using normalized CT values
(CT gene - CT b-actin) and changes with p,0.05 are considered
to be significant.
Results
Identification of Differentially Expressed Genes in theThree Transgenic Zebrafish Liver Cancer Models
The three oncogene transgenic lines (xmrk, Myc and krasV12) were
induced to develop liver tumors (Figure S1) and these tumor
samples were subjected to RNA-SAGE sequencing. By a selection
criteria of fold change.1.5, p value,0.05 and TPM.10 (in either
control or tumor samples), differentially expressed genes were
selected from the three tumor sets. There were 2,892, 797 and 494
Transcriptomic Characterization of Zebrafish HCC
PLOS ONE | www.plosone.org 3 March 2014 | Volume 9 | Issue 3 | e91179
Ta
ble
1.
Co
mm
on
lyd
ere
gu
late
dg
en
es
inth
eth
ree
tran
sge
nic
zeb
rafi
shliv
er
can
cer
mo
de
ls.
Co
mm
on
Ge
ne
Sy
mb
ol
Hu
ma
nh
om
olo
gG
en
eS
ym
bo
lxm
rkkr
asM
yc
FC
Pv
alu
eF
CP
va
lue
FC
Pv
alu
e
Up
18
85
86
88
foxa
3FO
XA
33
.58
6.6
6E-
03
1.7
84
.16
E-0
21
.55
9.1
8E-
03
18
85
87
28
ga
rtG
AR
T3
.32
1.4
2E-
03
2.8
75
.87
E-0
37
.69
6.9
3E-
04
18
85
95
02
tp53
TP53
5.0
91
.43
E-0
31
.92
1.0
9E-
02
3.6
13
.30
E-0
3
41
05
41
18
c20o
rf24
C20
orf
244
.92
2.1
3E-
03
1.9
32
.83
E-0
33
.14
5.2
2E-
03
41
39
30
80
itm
1ST
T3A
1.9
87
.59
E-0
31
.56
3.0
2E-
02
2.0
18
.07
E-0
4
47
08
66
30
rho
t1a
RH
OT1
1.6
23
.11
E-0
21
.87
3.0
0E-
02
1.5
83
.39
E-0
2
47
08
72
06
ab
ce1
AB
CE1
4.1
21
.97
E-0
36
.79
1.2
5E-
02
3.0
14
.40
E-0
3
50
34
48
65
cdkr
ap
3C
DK
5RA
P3
2.0
94
.98
E-0
31
.85
2.0
6E-
02
2.4
21
.43
E-0
3
50
34
50
19
mg
at4
bM
GA
T4B
4.0
91
.62
E-0
22
0.5
52
.92
E-0
21
.70
3.0
3E-
03
50
54
02
09
srp
rbSR
PR
B1
.85
2.0
0E-
02
4.4
76
.89
E-0
42
.65
5.8
4E-
03
55
74
25
96
eif5
a2
EIF5
A2
4.8
31
.09
E-0
31
.45
4.0
7E-
03
2.9
82
.14
E-0
4
62
95
55
66
cirb
pC
IRB
P6
.11
1.6
3E-
03
2.0
03
.17
E-0
22
.16
1.4
4E-
02
66
77
31
45
no
c4l
NO
C4L
2.6
74
.20
E-0
21
.63
3.5
8E-
02
4.3
41
.05
E-0
2
71
83
45
91
reep
2R
EEP
24
.38
3.5
1E-
02
7.1
73
.26
E-0
38
.38
7.9
5E-
03
76
25
38
87
srp
14SR
P14
4.1
71
.62
E-0
31
.71
1.6
1E-
02
1.9
11
.15
E-0
4
94
53
66
32
stm
n1a
STM
N1
13
.83
2.3
0E-
03
3.0
54
.93
E-0
34
.30
1.5
6E-
02
11
36
79
13
3m
rps9
MR
PS9
1.7
12
.85
E-0
21
.56
3.7
1E-
02
2.4
01
.59
E-0
2
12
15
83
74
9h
mg
cra
HM
GC
R7
.42
5.4
2E-
03
30
.45
7.3
0E-
04
8.7
12
.41
E-0
3
12
67
23
62
7u
ba
p2
UB
AP
21
.94
3.3
3E-
02
1.8
84
.99
E-0
31
.58
9.6
4E-
03
14
82
25
55
9fa
m16
2aFA
M16
2A2
.15
2.7
6E-
03
2.1
64
.72
E-0
21
.97
2.2
2E-
02
16
96
46
80
7rr
p9
RR
P9
4.2
01
.01
E-0
22
.99
3.3
2E-
02
2.7
13
.48
E-0
2
Do
wn
23
30
86
80
cyp
2ad
2–
4.3
51
.99
E-0
29
.09
8.0
7E-
03
2.9
42
.73
E-0
2
41
05
36
63
scp
2SC
P2
5.0
09
.46
E-0
32
.94
2.0
2E-
02
1.9
62
.17
E-0
2
41
05
50
25
hsd
17b
3H
SD17
B3
10
.00
3.2
0E-
02
10
0.0
07
.61
E-0
33
3.3
31
.66
E-0
2
41
15
24
46
hsd
l2H
SDL2
3.8
54
.21
E-0
22
.13
3.5
5E-
02
2.5
66
.38
E-0
3
47
08
58
84
fbp
1bFB
P1
9.0
93
.91
E-0
48
.33
1.8
6E-
02
2.3
82
.87
E-0
2
47
08
60
66
tdh
TDH
6.6
73
.28
E-0
22
.86
1.5
0E-
02
3.4
53
.93
E-0
2
47
08
61
78
itg
b1b
.2IT
GB
17
.14
4.1
9E-
02
7.1
46
.40
E-0
34
.35
3.3
0E-
03
47
08
69
28
ak3
l1A
K3L
12
.17
2.3
1E-
02
10
.00
1.5
6E-
03
2.0
02
.17
E-0
2
54
40
06
37
ech
1EC
H1
1.5
22
.29
E-0
22
.17
3.7
8E-
03
2.0
01
.51
E-0
2
55
92
54
55
gp
x4a
GP
X4
3.5
76
.79
E-0
32
.27
3.3
2E-
02
5.2
67
.31
E-0
3
56
79
02
61
sod
1SO
D1
2.9
44
.18
E-0
21
.85
5.3
2E-
03
2.2
72
.48
E-0
2
70
77
89
00
slc2
7a2
SLC
27A
29
.09
3.2
6E-
02
5.0
05
.13
E-0
32
.78
1.0
8E-
02
71
83
42
85
ap
ob
lA
PO
B5
.26
4.2
1E-
02
1.7
91
.20
E-0
21
.75
1.4
6E-
02
Transcriptomic Characterization of Zebrafish HCC
PLOS ONE | www.plosone.org 4 March 2014 | Volume 9 | Issue 3 | e91179
genes up-regulated and 169, 902 and 676 genes down-regulated in
the xmrk-, kras- and Myc- induced zebrafish liver cancer,
respectively (Figure 1A,B). Deregulated genes from the three
transgenic models showed relatively small overlaps, indicating that
the three oncogenes regulated quite distinct sets of genes. This is
consistent with the report that morphologically uniform cancer
type is frequently classified into different subgroups based on their
distinct gene expression patterns [26]. Interestingly, there were 21
up-regulated and 16 down-regulated genes commonly found in all
the three tumor models (Figure 1A, B, Table 1).
Distinct Pathways Regulated in the Three Zebrafish LiverTumor Models
Pathway analysis using GSEA showed that the three transgenic
liver cancer models have different pathways deregulated
(Figure 1C, Table S5). It has been widely accepted that there
are eight cancer hallmarks for multistep tumorigenesis and the
complexities of neoplasms [27,28]. We found that the GSEA-
identified pathways fallen into at least seven cancer hallmarks
(except for enabling replicative immortality). Xmrk mainly up-
regulated pathways involved in evading growth suppressors and
avoiding immune destruction, which included activating cell cycle,
promoting RNA transcription, up-regulating proteasome and
altering immune properties. Kras provided the tumor cells with
the ability of self-sustaining proliferative signals by up-regulating
EGFR, Raf-MEK-ERK, PI3K-AKT-mTOR and GSK3 signaling
pathways. Specifically, it also altered the focal adhesive characters
of tumor cells which could activate invasion and metastasis. Myc
mainly up-regulated translation and proteolysis to assist tumor
cells to evade growth suppressors, and it also up-regulated VEGF
pathway, thus potentially inducing angiogenesis. While there was
no single pathway significantly up-regulated in all three tumor
models, there were some pathways up-regulated in two models,
such as proteasome in the xmrk and Myc models, and IGF1
pathway, mTOR pathway, tRNA biosynthesis and focal adhesion
in the xmrk and kras models. In contrast, pathways in reprogram-
ming of energy metabolism were generally down-regulated in all
three models though the down-regulation in the Myc model was
less apparent than the other two models. Meanwhile, many other
pathways involved in normal liver function such as blood factors,
amino acid metabolism, detoxification and xenobiotic metabolism,
fatty acid metabolism, and bile synthesis were uniformly down-
regulated in all three tumor models. However, one exception was
hormone regulation that was apparently up-regulated in the kras
tumors.
Correlation of the Three Gene Signatures of ZebrafishLiver Tumors with Different Stages of Human HCCs
The up-regulated genes, 2,892, 797 and 494 from xmrk, kras and
Myc tumors respectively, were used as the signature genes for each
model. These up-regulated genes were converted to 1,362, 490,
and 146 human Unigenes respectively in order to compare with
available transcriptomic data from human studies. We then
compared the three signature gene sets with a set of human
transcriptomic data (GSE6764) from different stages of human
liver conditions: cirrhotic liver, low grade dysplastic nodules
(LGDN), high grade dysplastic nodules (HGDN), and very early,
early, advanced, and very advanced HCC (veHCC, eHCC,
aHCC and vaHCC), in which the pathological HCC stages have
been defined by tumor size, differentiation status and metastasis
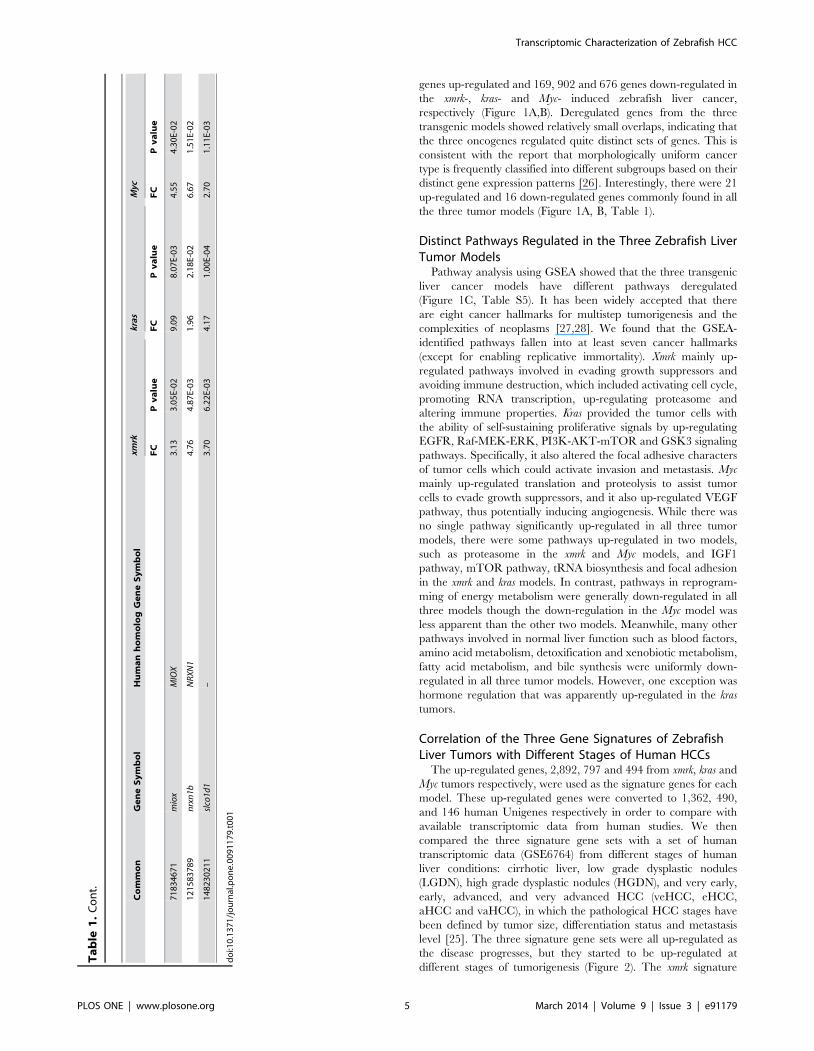
level [25]. The three signature gene sets were all up-regulated as
the disease progresses, but they started to be up-regulated at
different stages of tumorigenesis (Figure 2). The xmrk signature
Ta
ble
1.
Co
nt.
Co
mm
on
Ge
ne
Sy
mb
ol
Hu
ma
nh
om
olo
gG
en
eS
ym
bo
lxm
rkkr
asM
yc
FC
Pv
alu
eF
CP
va
lue
FC
Pv
alu
e
71
83
46
71
mio
xM
IOX
3.1
33
.05
E-0
29
.09
8.0
7E-
03
4.5
54
.30
E-0
2
12
15
83
78
9n
rxn
1bN
RX
N1
4.7
64
.87
E-0
31
.96
2.1
8E-
02
6.6
71
.51
E-0
2
14
82
30
21
1sl
co1d
1–
3.7
06
.22
E-0
34
.17
1.0
0E-
04
2.7
01
.11
E-0
3
do
i:10
.13
71
/jo
urn
al.p
on
e.0
09
11
79
.t0
01
Transcriptomic Characterization of Zebrafish HCC
PLOS ONE | www.plosone.org 5 March 2014 | Volume 9 | Issue 3 | e91179
showed positive correlation with HCCs starting from eHCC, and
it was significantly correlated with aHCC and vaHCC. The kras
signature positively correlated with aHCC and vaHCC, and it was
only significantly correlated with vaHCC. The Myc signature
showed significantly positive correlation with HCCs starting from
eHCC, similar with our previous result using an independent set of
RNA-seq data from the same transgenic line [6]. Interestingly, the
common 21 up-regulated genes in all three tumor models also
showed up-regulation even from the very early stage of HCC,
indicating these genes are correlated with the entire neoplastic
process.
Representation of the Three Gene Signatures of ZebrafishLiver Tumors in Human HCC Samples
Given the distinctive pathways altered in the three zebrafish
liver tumor models and the high level of heterogeneity in human
HCC patients, we sought to examine the degree of representation
of the three zebrafish liver cancer models in human HCC samples.
We examined ten sets of published clinical HCC microarray data,
each of which included at least 80 clinical samples. The ten
datasets contain a total of 1,272 samples covering different ethnic
groups and risk factors (Table S2). We found that the xmrk, kras
and Myc gene signatures were significantly correlated with 30.8%,
24.8% and 25.6% of all clinical samples, respectively. 47.2% of the
human HCC samples had significant correlation with at least one
of the three zebrafish gene signatures (Table 2, Figure S2). In
different human HCC datasets, the percentage ranges from 22.0%
to 60.4%. Moreover, some of the clinical samples were correlated
with two or even three zebrafish gene signatures. Co-correlation of
two gene signatures, namely xmrk/kras, kras/Myc and kras/Myc,
accounted for 17.5%, 13.5% and 12.4% of the human HCC
samples. 9.3% of the human samples showed co-correlation of all
the three gene signatures. Thus, it appears that the three
transgenic zebrafish liver tumor models represent molecular
mechanisms of hepatocarcinogenesis in almost half of the human
HCC cases and the other half of human HCC may be due to
different molecular mechanisms.
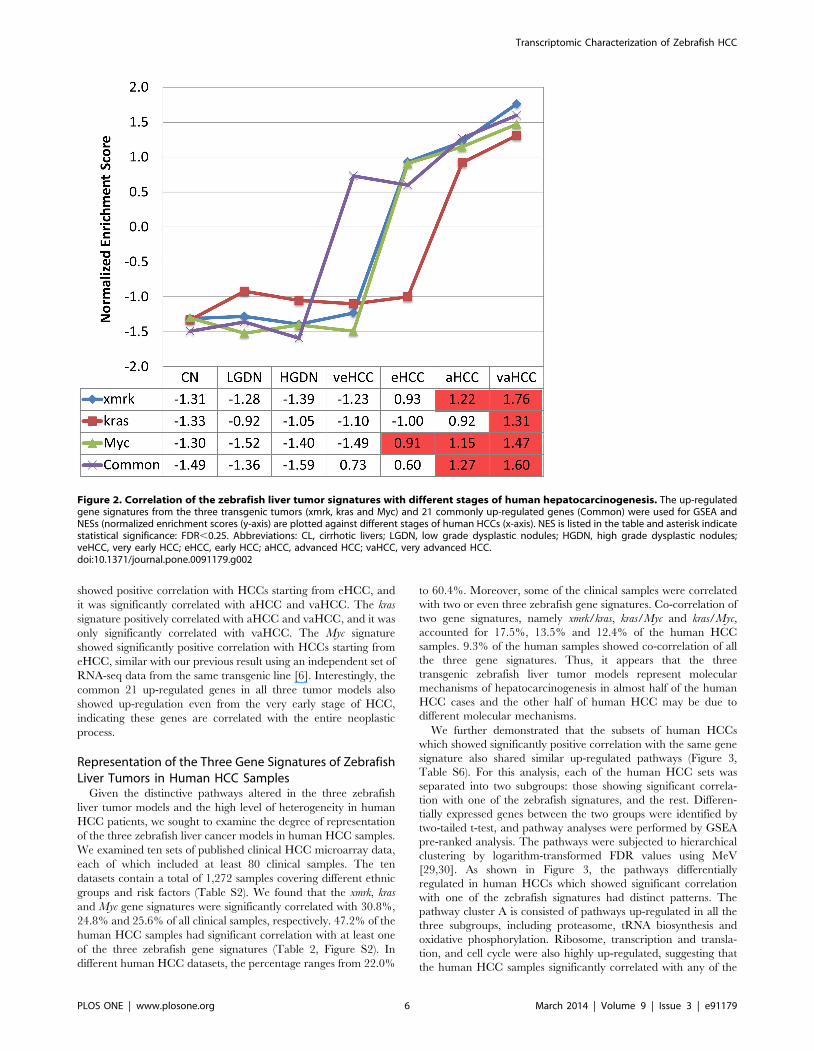
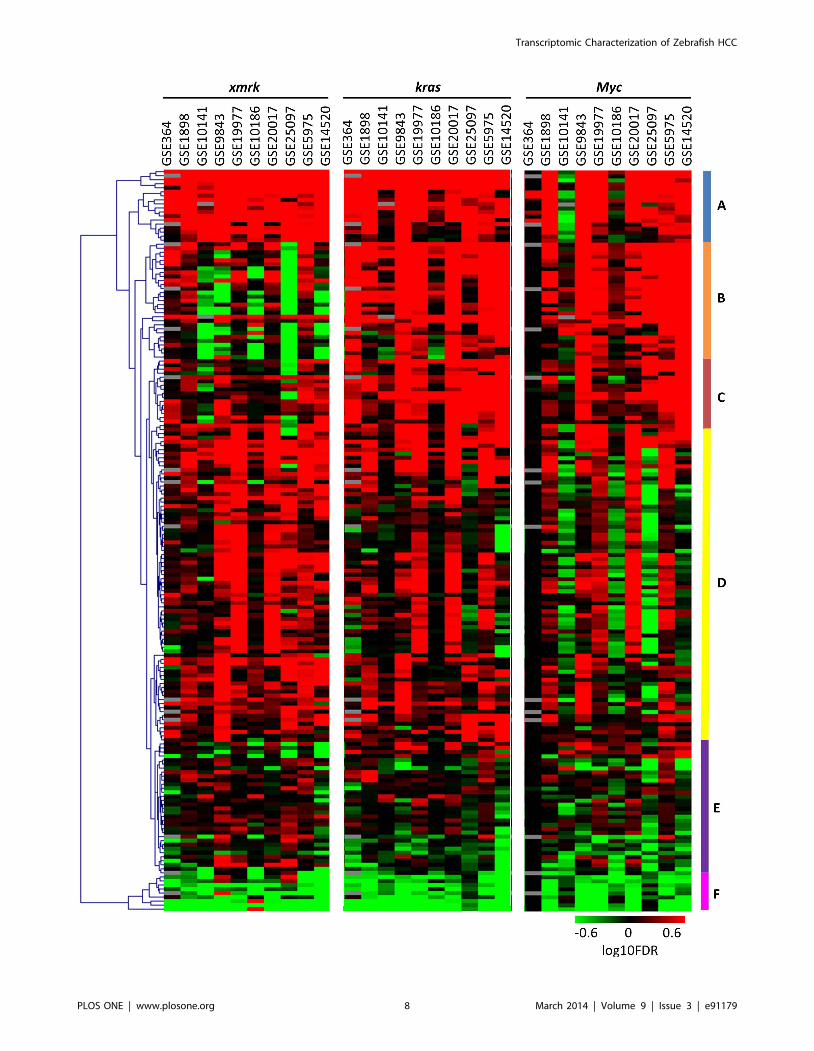
We further demonstrated that the subsets of human HCCs
which showed significantly positive correlation with the same gene
signature also shared similar up-regulated pathways (Figure 3,
Table S6). For this analysis, each of the human HCC sets was
separated into two subgroups: those showing significant correla-
tion with one of the zebrafish signatures, and the rest. Differen-
tially expressed genes between the two groups were identified by
two-tailed t-test, and pathway analyses were performed by GSEA
pre-ranked analysis. The pathways were subjected to hierarchical
clustering by logarithm-transformed FDR values using MeV
[29,30]. As shown in Figure 3, the pathways differentially
regulated in human HCCs which showed significant correlation
with one of the zebrafish signatures had distinct patterns. The
pathway cluster A is consisted of pathways up-regulated in all the
three subgroups, including proteasome, tRNA biosynthesis and
oxidative phosphorylation. Ribosome, transcription and transla-
tion, and cell cycle were also highly up-regulated, suggesting that
the human HCC samples significantly correlated with any of the
Figure 2. Correlation of the zebrafish liver tumor signatures with different stages of human hepatocarcinogenesis. The up-regulatedgene signatures from the three transgenic tumors (xmrk, kras and Myc) and 21 commonly up-regulated genes (Common) were used for GSEA andNESs (normalized enrichment scores (y-axis) are plotted against different stages of human HCCs (x-axis). NES is listed in the table and asterisk indicatestatistical significance: FDR,0.25. Abbreviations: CL, cirrhotic livers; LGDN, low grade dysplastic nodules; HGDN, high grade dysplastic nodules;veHCC, very early HCC; eHCC, early HCC; aHCC, advanced HCC; vaHCC, very advanced HCC.doi:10.1371/journal.pone.0091179.g002
Transcriptomic Characterization of Zebrafish HCC
PLOS ONE | www.plosone.org 6 March 2014 | Volume 9 | Issue 3 | e91179
zebrafish signatures were probably more proliferative than those
not significantly correlated. The pathway cluster B contains
pathways down-regulated in most of the subgroups associated with
xmrk but up-regulated in the subgroups associated with kras and
Myc. Interestingly, theses pathways were consistent with highly
down-regulated pathways in the xmrk-induced zebrafish HCC,
including energy metabolism, amino acid metabolism, fatty acid
metabolism, bile acid biosynthesis, complement pathway, biosyn-
thesis of steroid, and N-glycan biosynthesis. The pathway cluster C
is more up-regulated in the kras-associated HCC subgroups,
including glutamate metabolism and glycolysis. It has been
reported that Kras could increase the conversion of glucose to
glutamate, and this was essential for Kras-mediated tumorigenicity
[31]. The pathway cluster D was generally up-regulated in the
xmrk- and kras-correlated human HCCs, but showed a disparate
pattern in the Myc-correlated human HCCs. This cluster
contained many kinase pathways which were deregulated in the
xmrk- and kras-induced zebrafish liver cancer, but not significantly
changed in the Myc-induced zebrafish liver cancer. The pathway
cluster E was quite heterogeneous. The pathway cluster F was well
separated from all the others and it contained pathways which
were mostly down-regulated in all the human HCC subgroups
associated with zebrafish signatures, including hematopoietic cell
lineage, cytokine pathway, calcium signaling, and GPCR pathway.
Since most of these down-regulated pathways are involved in
inflammatory response, it is likely that the subgroups of human
HCCs not captured by the three zebrafish models have more
severe inflammatory status.
The Commonly Up- and Down-regulated Genes inZebrafish Liver Tumors are also Consistently Up- andDown-regulated in Human HCCs
While the three gene signatures represent up-regulation of
distinct pathways and correlate with different subgroups of human
HCCs, we sought to investigate whether the 21 commonly up-
regulated and 16 commonly down-regulated genes in all three
transgenic models would be similarly regulated in human HCCs.
Among the ten human HCC datasets we used, we were able to
examine two datasets which included both HCCs and their
corresponding non-tumor tissues (GSE14520 and GSE25097).
However, only GSE14520 could be compared with the zebrafish
data as most of the human genes homologous to the common
zebrafish genes could be identified from the microarray platform
used: 19 of the 21 up-regulated genes (except FOXA3 and MRPS9)
and 12 of the 16 down-regulated genes (except for cyp2ad2, slco1d1,
TDH and MIOX). GSE14520 dataset contains 229 primary HCCs
and the corresponding paired non-tumor hepatic tissues [32,33].
The xmrk, kras and Myc signatures were significantly correlated
with 30.5%, 20.0%, and 20.5% of the HCC samples, and in total
47.6% of the HCC samples showed significant up-regulation of at
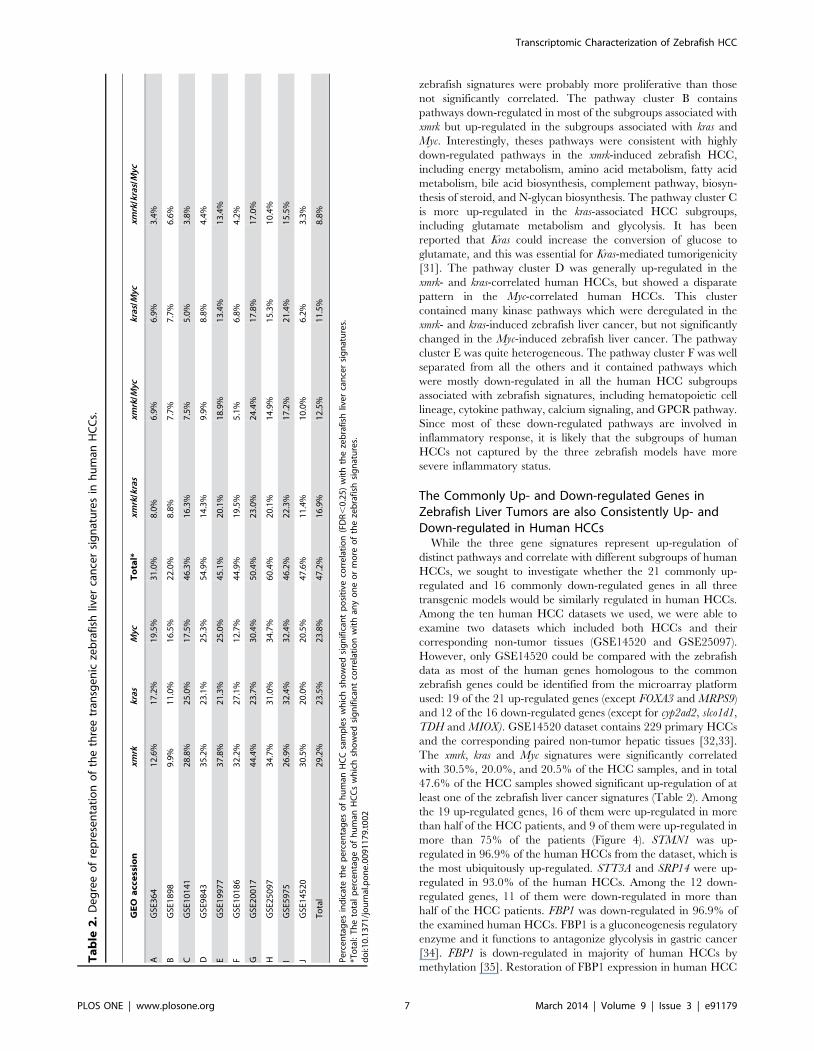
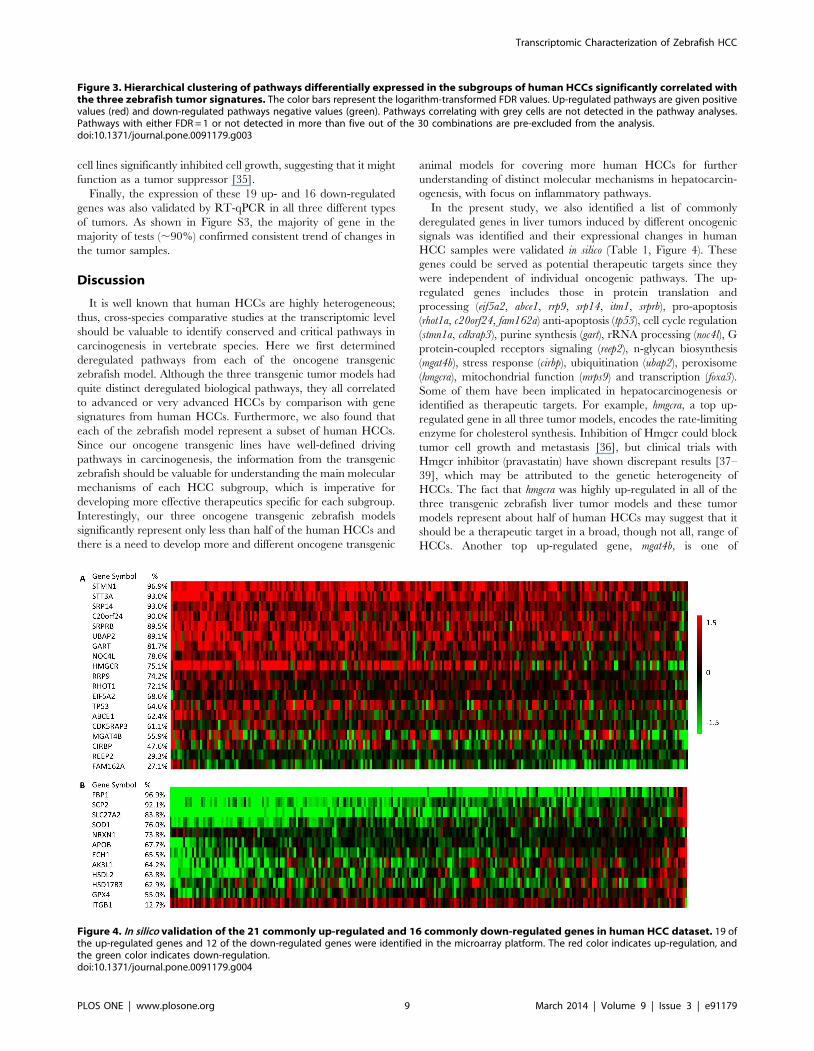
least one of the zebrafish liver cancer signatures (Table 2). Among
the 19 up-regulated genes, 16 of them were up-regulated in more
than half of the HCC patients, and 9 of them were up-regulated in
more than 75% of the patients (Figure 4). STMN1 was up-
regulated in 96.9% of the human HCCs from the dataset, which is
the most ubiquitously up-regulated. STT3A and SRP14 were up-
regulated in 93.0% of the human HCCs. Among the 12 down-
regulated genes, 11 of them were down-regulated in more than
half of the HCC patients. FBP1 was down-regulated in 96.9% of
the examined human HCCs. FBP1 is a gluconeogenesis regulatory
enzyme and it functions to antagonize glycolysis in gastric cancer
[34]. FBP1 is down-regulated in majority of human HCCs by
methylation [35]. Restoration of FBP1 expression in human HCC
Ta
ble
2.
De
gre
eo
fre
pre
sen
tati
on
of
the
thre
etr
ansg
en
icze
bra
fish
live
rca
nce
rsi
gn
atu
res
inh
um
anH
CC
s.
GE
Oa
cce
ssio
nxm
rkkr
asM
ycT
ota
l*xm
rk/k
ras
xmrk
/Myc
kras
/Myc
xmrk
/kra
s/M
yc
AG
SE3
64
12
.6%
17
.2%
19
.5%
31
.0%
8.0
%6
.9%
6.9
%3
.4%
BG
SE1
89
89
.9%
11
.0%
16
.5%
22
.0%
8.8
%7
.7%
7.7
%6
.6%
CG
SE1
01
41
28
.8%
25
.0%
17
.5%
46
.3%
16
.3%
7.5
%5
.0%
3.8
%
DG
SE9
84
33
5.2
%2
3.1
%2
5.3
%5
4.9
%1
4.3
%9
.9%
8.8
%4
.4%
EG
SE1
99
77
37
.8%
21
.3%
25
.0%
45
.1%
20
.1%
18
.9%
13
.4%
13
.4%
FG
SE1
01
86
32
.2%
27
.1%
12
.7%
44
.9%
19
.5%
5.1
%6
.8%
4.2
%
GG
SE2
00
17
44
.4%
23
.7%
30
.4%
50
.4%
23
.0%
24
.4%
17
.8%
17
.0%
HG
SE2
50
97
34
.7%
31
.0%
34
.7%
60
.4%
20
.1%
14
.9%
15
.3%
10
.4%
IG
SE5
97
52
6.9
%3
2.4
%3
2.4
%4
6.2
%2
2.3
%1
7.2
%2
1.4
%1
5.5
%
JG
SE1
45
20
30
.5%
20
.0%
20
.5%
47
.6%
11
.4%
10
.0%
6.2
%3
.3%
To
tal
29
.2%
23
.5%
23
.8%
47
.2%
16
.9%
12
.5%
11
.5%
8.8
%
Pe
rce
nta
ge
sin
dic
ate
the
pe
rce
nta
ge
so
fh
um
anH
CC
sam
ple
sw
hic
hsh
ow
ed
sig
nif
ican
tp
osi
tive
corr
ela
tio
n(F
DR
,0
.25
)w
ith
the
zeb
rafi
shliv
er
can
cer
sig
nat
ure
s.*T
ota
l:T
he
tota
lp
erc
en
tag
eo
fh
um
anH
CC
sw
hic
hsh
ow
ed
sig
nif
ican
tco
rre
lati
on
wit
han
yo
ne
or
mo
reo
fth
eze
bra
fish
sig
nat
ure
s.d
oi:1
0.1
37
1/j
ou
rnal
.po
ne
.00
91
17
9.t
00
2
Transcriptomic Characterization of Zebrafish HCC
PLOS ONE | www.plosone.org 7 March 2014 | Volume 9 | Issue 3 | e91179
Transcriptomic Characterization of Zebrafish HCC
PLOS ONE | www.plosone.org 8 March 2014 | Volume 9 | Issue 3 | e91179
cell lines significantly inhibited cell growth, suggesting that it might
function as a tumor suppressor [35].
Finally, the expression of these 19 up- and 16 down-regulated
genes was also validated by RT-qPCR in all three different types
of tumors. As shown in Figure S3, the majority of gene in the
majority of tests (,90%) confirmed consistent trend of changes in
the tumor samples.
Discussion
It is well known that human HCCs are highly heterogeneous;
thus, cross-species comparative studies at the transcriptomic level
should be valuable to identify conserved and critical pathways in
carcinogenesis in vertebrate species. Here we first determined
deregulated pathways from each of the oncogene transgenic
zebrafish model. Although the three transgenic tumor models had
quite distinct deregulated biological pathways, they all correlated
to advanced or very advanced HCCs by comparison with gene
signatures from human HCCs. Furthermore, we also found that
each of the zebrafish model represent a subset of human HCCs.
Since our oncogene transgenic lines have well-defined driving
pathways in carcinogenesis, the information from the transgenic
zebrafish should be valuable for understanding the main molecular
mechanisms of each HCC subgroup, which is imperative for
developing more effective therapeutics specific for each subgroup.
Interestingly, our three oncogene transgenic zebrafish models
significantly represent only less than half of the human HCCs and
there is a need to develop more and different oncogene transgenic
animal models for covering more human HCCs for further
understanding of distinct molecular mechanisms in hepatocarcin-
ogenesis, with focus on inflammatory pathways.
In the present study, we also identified a list of commonly
deregulated genes in liver tumors induced by different oncogenic
signals was identified and their expressional changes in human
HCC samples were validated in silico (Table 1, Figure 4). These
genes could be served as potential therapeutic targets since they
were independent of individual oncogenic pathways. The up-
regulated genes includes those in protein translation and
processing (eif5a2, abce1, rrp9, srp14, itm1, srprb), pro-apoptosis
(rhot1a, c20orf24, fam162a) anti-apoptosis (tp53), cell cycle regulation
(stmn1a, cdkrap3), purine synthesis (gart), rRNA processing (noc4l), G
protein-coupled receptors signaling (reep2), n-glycan biosynthesis
(mgat4b), stress response (cirbp), ubiquitination (ubap2), peroxisome
(hmgcra), mitochondrial function (mrps9) and transcription (foxa3).
Some of them have been implicated in hepatocarcinogenesis or
identified as therapeutic targets. For example, hmgcra, a top up-
regulated gene in all three tumor models, encodes the rate-limiting
enzyme for cholesterol synthesis. Inhibition of Hmgcr could block
tumor cell growth and metastasis [36], but clinical trials with
Hmgcr inhibitor (pravastatin) have shown discrepant results [37–
39], which may be attributed to the genetic heterogeneity of
HCCs. The fact that hmgcra was highly up-regulated in all of the
three transgenic zebrafish liver tumor models and these tumor
models represent about half of human HCCs may suggest that it
should be a therapeutic target in a broad, though not all, range of
HCCs. Another top up-regulated gene, mgat4b, is one of
Figure 3. Hierarchical clustering of pathways differentially expressed in the subgroups of human HCCs significantly correlated withthe three zebrafish tumor signatures. The color bars represent the logarithm-transformed FDR values. Up-regulated pathways are given positivevalues (red) and down-regulated pathways negative values (green). Pathways correlating with grey cells are not detected in the pathway analyses.Pathways with either FDR = 1 or not detected in more than five out of the 30 combinations are pre-excluded from the analysis.doi:10.1371/journal.pone.0091179.g003
Figure 4. In silico validation of the 21 commonly up-regulated and 16 commonly down-regulated genes in human HCC dataset. 19 ofthe up-regulated genes and 12 of the down-regulated genes were identified in the microarray platform. The red color indicates up-regulation, andthe green color indicates down-regulation.doi:10.1371/journal.pone.0091179.g004
Transcriptomic Characterization of Zebrafish HCC
PLOS ONE | www.plosone.org 9 March 2014 | Volume 9 | Issue 3 | e91179
the important enzymes in the biosynthetic pathway of N-glycans.
N-glycan is up-regulated in human HCC [40] and is associated
with drug resistance [41]. Another gene which was highly up-
regulated is stmn1a. The human homolog of stmn1a, STATHMIN1,
is over-expressed and is associated with polyploidy, metastasis,
early recurrence, and poor prognosis in hepatocarcinogenesis [42–
44]. It has also been identified as a major molecular target of an
anticancer drug [45].
Most of the 16 genes commonly down-regulated (Table 1) are
apparently involved in metabolism for normal liver function,
including fatty acid metabolism (cyp2ad2, hsdl2, ech1), intracellular
fatty acid and lipid transport (scp2, slc27a2, apobl), androgen
metabolism (hsd17b3), glucose metabolism (fbp1b), mitochondria
function (tdh, ak4), integrin complex (itgb1b.2), antioxidation (gpx4a,
sod1), inositol catabolism (miox), bile acid metabolism (slco1d1) and
neuron cell adhesion (nrxn1b). Several of them may have a direct
connection with hepatocarcinogenesis. For example, Sod1 deficient
mice showed extensive cellular oxidative damage and majority of
them developed HCC [46]. Moreover, SOD1 has also been
markedly down-regulated in human HCCs induced from different
etiological factors [47]. Gpx4 has also been reported to be
associated with multiple types of cancers, including breast cancer
[48], colorectal cancer [49], and aggressive prostate cancer [50];
however, no study has presented its correlation with HCC. Both
Sod1 and Gpx4 are important components of the cellular
antioxidant mechanisms. The down-regulation of these two genes
in the three transgenic zebrafish liver cancer models suggested
that oxidative damage is a common and conserved part of
hepatocarcinogenesis.
Supporting Information
Figure S1 Induction of liver tumors in the threezebrafish transgenic liver cancer models. (A–D) Gross
morphology of treated transgenic fish and the non-transgenic
siblings. The treated non-transgenic siblings have normal liver size
and gross morphology (A). The livers in the treated transgenic fish
were obviously enlarged (B–D) compared to the treated non-
transgenic siblings (A). (E–H) Histological examination of the
treated transgenic fish and non-transgenic siblings. Treated xmrk
fish developed HCC (F), treated Myc fish developed HCA (G), and
treated kras fish developed heterogeneous HCC (H). The liver was
circled out in white dotted lines. Scale bars: 25 mm for A–D,
50 mm for E–H.
(TIF)
Figure S2 Correlation of the three transgenic zebrafishliver cancer signatures with human HCC samples. The
heat maps showed the positive- and negative-correlation of the
three transgenic zebrafish liver cancer signatures with 9 sets of
human HCC samples, including GSE364 (A), GSE1898 (B),
GSE10141 (C), GSE9843 (D), GSE19977 (E), GSE10186 (F),
GSE20017 (G), GSE25097 (H) and GSE5975 (I). The color was
determined by normalized enrichment score (NES) of the GSEA
analysis. The red color indicates up-regulation or positive
correlation, and the green color indicates down-regulation or
negative correlation.
(TIF)
Figure S3 RT-qPCR validation of commonly up- anddown-regulated genes in three transgenic zebrafish livertumors. (A) Up-regulated genes. (B) Down-regulated genes. Gene
names are indicated at the top and transgenic lines are indicaed on
the left. RT-qPCR data are presented with red bars in comparison
with corresponding RNA-Seq data represented by blue bars. Y-
axes indicate fold changes on Log2 scale. Standard error bars are
included for the RT-qPCR data and asterisks indicate statistically
significance (P,0.05).
(TIF)
Table S1 Summary of RNA-SAGE data.(DOCX)
Table S2 Significantary up-regulated zebrafish geneswith mapped human homologs.(XLSX)
Table S3 Summary of human HCC datasets used in thepresent Study.(DOCX)
Table S4 Sequences of PCR primers used for RT-qPCRvalidation of commonly up- and down-regulated genes inzebrafish liver tumors.(DOCX)
Table S5 Details of pathways deregulated in the threetransgenic zebrafish liver cancer models as classifiedinto the seven cancer hallmarks and different aspects ofthe liver metabolisms.(DOCX)
Table S6 Details of pathways differentially expressed inthe subgroups of human HCCs which showed signifi-cantly correlation with the three zebrafish signatures.(DOCX)
Acknowledgments
We thank Dr. Serguei Parinov for helping in the works on generation of
kras transgenic zebrafish.
Author Contributions
Conceived and designed the experiments: ZL ATN AE ZG. Performed the
experiments: ZL ATN CL. Analyzed the data: WZ ZG. Contributed
reagents/materials/analysis tools: WZ ZL ATN AE. Wrote the paper: WZ
ZG.
References
1. Llovet JM, Bustamante J, Castells A, Vilana R, Ayuso Mdel C, et al. (1999)
Natural history of untreated nonsurgical hepatocellular carcinoma: rationale for
the design and evaluation of therapeutic trials. Hepatology 29: 62–67.
2. Siegel AB, Olsen SK, Magun A, Brown RS Jr (2010) Sorafenib: where do we go
from here? Hepatology 52: 360–369.
3. Leenders MW, Nijkamp MW, Borel Rinkes IH (2008) Mouse models in liver
cancer research: a review of current literature. World J Gastroenterol 14: 6915–
6923.
4. Lee JS, Chu IS, Mikaelyan A, Calvisi DF, Heo J, et al. (2004) Application of
comparative functional genomics to identify best-fit mouse models to study
human cancer. Nat Genet 36: 1306–1311.
5. Liu S, Leach SD (2011) Zebrafish models for cancer. Annu Rev Pathol 6: 71–93.
6. Li Z, Zheng W, Wang Z, Zeng Z, Zhan H, et al. (2012) An inducible Myc
zebrafish liver tumor model revealed conserved Myc signatures with mammalian
liver tumors. Dis Model Mech.
7. Nguyen AT, Emelyanov A, Koh CH, Spitsbergen JM, Parinov S, et al. (2012)
An inducible kras(V12) transgenic zebrafish model for liver tumorigenesis and
chemical drug screening. Dis Model Mech 5: 63–72.
8. Nguyen AT, Emelyanov A, Koh CH, Spitsbergen JM, Lam SH, et al. (2011) A
high level of liver-specific expression of oncogenic Kras(V12) drives robust liver
tumorigenesis in transgenic zebrafish. Dis Model Mech 4: 801–813.
9. Li Z, Huang X, Zhan H, Zeng Z, Li C, et al. (2011) Inducible and repressable
oncogene-addicted hepatocellular carcinoma in Tet-on xmrk transgenic
zebrafish. J Hepatol 56: 419–425.
Transcriptomic Characterization of Zebrafish HCC
PLOS ONE | www.plosone.org 10 March 2014 | Volume 9 | Issue 3 | e91179
10. Lu JW, Hsia Y, Tu HC, Hsiao YC, Yang WY, et al. (2011) Liver development
and cancer formation in zebrafish. Birth Defects Res C Embryo Today 93: 157–172.
11. Liu W, Chen JR, Hsu CH, Li YH, Chen YM, et al. (2012) A zebrafish model of
intrahepatic cholangiocarcinoma by dual expression of hepatitis B virus X andhepatitis C virus core protein in liver. Hepatology 56: 2268–2276.
12. Amatruda JF, Shepard JL, Stern HM, Zon LI (2002) Zebrafish as a cancermodel system. Cancer Cell 1: 229–231.
13. Spitsbergen JM, Tsai HW, Reddy A, Miller T, Arbogast D, et al. (2000)
Neoplasia in zebrafish (Danio rerio) treated with 7,12-dimethylbenz[a]anthra-cene by two exposure routes at different developmental stages. Toxicol Pathol
28: 705–715.14. Mirbahai L, Williams TD, Zhan H, Gong Z, Chipman JK (2011)
Comprehensive profiling of zebrafish hepatic proximal promoter CpG islandmethylation and its modification during chemical carcinogenesis. BMC
Genomics 12: 3.
15. Lam SH, Gong Z (2006) Modeling liver cancer using zebrafish: a comparativeoncogenomics approach. Cell Cycle 5: 573–577.
16. Lam SH, Wu YL, Vega VB, Miller LD, Spitsbergen J, et al. (2006) Conservationof gene expression signatures between zebrafish and human liver tumors and
tumor progression. Nat Biotechnol 24: 73–75.
17. Karnoub AE, Weinberg RA (2008) Ras oncogenes: split personalities. Nat RevMol Cell Biol 9: 517–531.
18. Calvisi DF, Ladu S, Gorden A, Farina M, Conner EA, et al. (2006) Ubiquitousactivation of Ras and Jak/Stat pathways in human HCC. Gastroenterology 130:
1117–1128.19. Gomez A, Wellbrock C, Gutbrod H, Dimitrijevic N, Schartl M (2001) Ligand-
independent dimerization and activation of the oncogenic Xmrk receptor by two
mutations in the extracellular domain. J Biol Chem 276: 3333–3340.20. Foster J, Black J, LeVea C, Khoury T, Kuvshinoff B, et al. (2007) COX-2
expression in hepatocellular carcinoma is an initiation event; while EGF receptorexpression with downstream pathway activation is a prognostic predictor of
survival. Ann Surg Oncol 14: 752–758.
21. Gan FY, Gesell MS, Alousi M, Luk GD (1993) Analysis of ODC and c-myc geneexpression in hepatocellular carcinoma by in situ hybridization and immuno-
histochemistry. J Histochem Cytochem 41: 1185–1196.22. Sweet-Cordero A, Mukherjee S, Subramanian A, You H, Roix JJ, et al. (2005)
An oncogenic KRAS2 expression signature identified by cross-species gene-expression analysis. Nat Genet 37: 48–55.
23. Zheng W, Wang Z, Collins JE, Andrews RM, Stemple D, et al. (2011)
Comparative transcriptome analyses indicate molecular homology of zebrafishswimbladder and mammalian lung. PLoS One 6: e24019.
24. Subramanian A, Tamayo P, Mootha VK, Mukherjee S, Ebert BL, et al. (2005)Gene set enrichment analysis: a knowledge-based approach for interpreting
genome-wide expression profiles. Proc Natl Acad Sci U S A 102: 15545–15550.
25. Wurmbach E, Chen YB, Khitrov G, Zhang W, Roayaie S, et al. (2007)Genome-wide molecular profiles of HCV-induced dysplasia and hepatocellular
carcinoma. Hepatology 45: 938–947.26. Lee JS, Grisham JW, Thorgeirsson SS (2005) Comparative functional genomics
for identifying models of human cancer. Carcinogenesis 26: 1013–1020.27. Hanahan D, Weinberg RA (2011) Hallmarks of cancer: the next generation. Cell
144: 646–674.
28. Hanahan D, Weinberg RA (2000) The hallmarks of cancer. Cell 100: 57–70.29. Saeed AI, Sharov V, White J, Li J, Liang W, et al. (2003) TM4: a free, open-
source system for microarray data management and analysis. Biotechniques 34:374–378.
30. Saeed AI, Bhagabati NK, Braisted JC, Liang W, Sharov V, et al. (2006) TM4
microarray software suite. Methods Enzymol 411: 134–193.31. Weinberg F, Hamanaka R, Wheaton WW, Weinberg S, Joseph J, et al. (2010)
Mitochondrial metabolism and ROS generation are essential for Kras-mediatedtumorigenicity. Proc Natl Acad Sci U S A 107: 8788–8793.
32. Roessler S, Long EL, Budhu A, Chen Y, Zhao X, et al. (2012) Integrative
genomic identification of genes on 8p associated with hepatocellular carcinoma
progression and patient survival. Gastroenterology 142: 957–966 e912.
33. Roessler S, Jia HL, Budhu A, Forgues M, Ye QH, et al. (2010) A unique
metastasis gene signature enables prediction of tumor relapse in early-stage
hepatocellular carcinoma patients. Cancer Res 70: 10202–10212.
34. Liu X, Wang X, Zhang J, Lam EK, Shin VY, et al. (2010) Warburg effect
revisited: an epigenetic link between glycolysis and gastric carcinogenesis.
Oncogene 29: 442–450.
35. Chen M, Zhang J, Li N, Qian Z, Zhu M, et al. (2011) Promoter
hypermethylation mediated downregulation of FBP1 in human hepatocellular
carcinoma and colon cancer. PLoS One 6: e25564.
36. Cao Z, Fan-Minogue H, Bellovin DI, Yevtodiyenko A, Arzeno J, et al. (2011)
MYC phosphorylation, activation, and tumorigenic potential in hepatocellular
carcinoma are regulated by HMG-CoA reductase. Cancer Res 71: 2286–2297.
37. Lersch C, Schmelz R, Erdmann J, Hollweck R, Schulte-Frohlinde E, et al.
(2004) Treatment of HCC with pravastatin, octreotide, or gemcitabine–a critical
evaluation. Hepatogastroenterology 51: 1099–1103.
38. Graf H, Jungst C, Straub G, Dogan S, Hoffmann RT, et al. (2008)
Chemoembolization combined with pravastatin improves survival in patients
with hepatocellular carcinoma. Digestion 78: 34–38.
39. Kawata S, Yamasaki E, Nagase T, Inui Y, Ito N, et al. (2001) Effect of
pravastatin on survival in patients with advanced hepatocellular carcinoma. A
randomized controlled trial. Br J Cancer 84: 886–891.
40. Goldman R, Ressom HW, Varghese RS, Goldman L, Bascug G, et al. (2009)
Detection of hepatocellular carcinoma using glycomic analysis. Clin Cancer Res
15: 1808–1813.
41. Kudo T, Nakagawa H, Takahashi M, Hamaguchi J, Kamiyama N, et al. (2007)
N-glycan alterations are associated with drug resistance in human hepatocellular
carcinoma. Mol Cancer 6: 32.
42. Hsieh SY, Huang SF, Yu MC, Yeh TS, Chen TC, et al. (2010) Stathmin1
overexpression associated with polyploidy, tumor-cell invasion, early recurrence,
and poor prognosis in human hepatoma. Mol Carcinog 49: 476–487.
43. Gan L, Guo K, Li Y, Kang X, Sun L, et al. (2010) Up-regulated expression of
stathmin may be associated with hepatocarcinogenesis. Oncol Rep 23: 1037–
1043.
44. Yuan RH, Jeng YM, Chen HL, Lai PL, Pan HW, et al. (2006) Stathmin
overexpression cooperates with p53 mutation and osteopontin overexpression,
and is associated with tumour progression, early recurrence, and poor prognosis
in hepatocellular carcinoma. J Pathol 209: 549–558.
45. Wang X, Chen Y, Han QB, Chan CY, Wang H, et al. (2009) Proteomic
identification of molecular targets of gambogic acid: role of stathmin in
hepatocellular carcinoma. Proteomics 9: 242–253.
46. Elchuri S, Oberley TD, Qi W, Eisenstein RS, Jackson Roberts L, et al. (2005)
CuZnSOD deficiency leads to persistent and widespread oxidative damage and
hepatocarcinogenesis later in life. Oncogene 24: 367–380.
47. Li Y, Wan D, Wei W, Su J, Cao J, et al. (2008) Candidate genes responsible for
human hepatocellular carcinoma identified from differentially expressed genes in
hepatocarcinogenesis of the tree shrew (Tupaia belangeri chinesis). Hepatol Res
38: 85–95.
48. Mavaddat N, Dunning AM, Ponder BA, Easton DF, Pharoah PD (2009)
Common genetic variation in candidate genes and susceptibility to subtypes of
breast cancer. Cancer Epidemiol Biomarkers Prev 18: 255–259.
49. Meplan C, Hughes DJ, Pardini B, Naccarati A, Soucek P, et al. (2010) Genetic
variants in selenoprotein genes increase risk of colorectal cancer. Carcinogenesis
31: 1074–1079.
50. Abe M, Xie W, Regan MM, King IB, Stampfer MJ, et al. (2011) Single-
nucleotide polymorphisms within the antioxidant defence system and associa-
tions with aggressive prostate cancer. BJU Int 107: 126–134.
Transcriptomic Characterization of Zebrafish HCC
PLOS ONE | www.plosone.org 11 March 2014 | Volume 9 | Issue 3 | e91179
Top Related

Copyright © 2022 FDOKUMEN

