


Bahasa
Halaman
Hukum

Validation of ground-based microwave radiometers at 22 GHz
for stratospheric and mesospheric water vapor
A. Haefele,1 E. De Wachter,1 K. Hocke,1,2 N. Kampfer,1,2 G. E. Nedoluha,3
R. M. Gomez,3 P. Eriksson,4 P. Forkman,4 A. Lambert,5 and M. J. Schwartz5
Received 3 March 2009; revised 22 July 2009; accepted 29 July 2009; published 8 December 2009.
[1] We present a detailed intercomparison of five ground-based 22 GHz microwaveradiometers for stratospheric and mesospheric water vapor. Four of these instruments aremembers of the Network for the Detection of Atmospheric Composition Change(NDACC). The global measurements of middle atmospheric water vapor of theMicrowave Limb Sounder (MLS) onboard the Aura satellite serve as reference and allowintercomparison of the ground-based systems that are located between 45�S and 57�N.The retrievals of water vapor profiles from the ground-based radiation measurements havebeen made consistent to a large extent: for the required temperature profiles, we used theglobal temperature measurements of MLS and we agreed on one common set ofspectroscopic parameters. The agreement with the reference measurements is better than±8% in the altitude range from 0.01 to 3 hPa. Strong correlation is found between theground-based and the reference data in the mesosphere with respect to seasonal cycle andplanetary waves. In the stratosphere the measurements are generally more noisy andbecome sensitive to instrumental instabilities toward lower levels (pressures greater than3 hPa). We further present a compilation of a NDACC data set based on the retrievalparameters described herein but using a temperature climatology derived from the MLSrecord. This makes the ground-based measurements independent of additional informationand allows extension of the data set for years in a homogeneous manner.
Citation: Haefele, A., E. De Wachter, K. Hocke, N. Kampfer, G. E. Nedoluha, R. M. Gomez, P. Eriksson, P. Forkman, A. Lambert,
and M. J. Schwartz (2009), Validation of ground-based microwave radiometers at 22 GHz for stratospheric and mesospheric water
vapor, J. Geophys. Res., 114, D23305, doi:10.1029/2009JD011997.
1. Introduction
[2] The main source of water vapor in the atmosphere isthe evaporation from the Earth’s surface. Water vapor entersthe stratosphere through the tropical tropopause, which actsas a cold trap and renders the stratosphere and mesospheretypically a thousand times dryer than the lower troposphere.Methane oxidation is the second important source of watervapor in the stratosphere and provides a link betweenstratospheric humidity and human activities [Forster et al.,2007]. As the dominant greenhouse gas, water vapor has astrong impact on the radiative budget of the atmosphere andhence on the Earth’s surface temperature. The long lifetimeof water vapor in the stratosphere makes it a good tracer and
gives valuable information about the atmospheric circulationand waves.[3] Water vapor in the upper stratosphere and mesosphere
is mainly observed by spaceborne and ground-based remotesensing instruments in passive modes. While single ground-based instruments cannot provide any information on thehorizontal distribution of water vapor, they are characterizedby long operational lifetimes. They are hence of majorimportance for water vapor monitoring and for the intercom-parison of consecutive satellite missions. The merging ofdata sets of consecutive satellite missions is an importanttask to generate global and homogeneous long-term data setsthat are essential for the climate community. A network ofground-based instruments allows to detect biases betweensatellite experiments as well as the geographical dependenceof these biases and plays a key role in the attempt to mergesatellite data sets. A good characterization of the uncer-tainties, long-term stability and consistency are key require-ments for a network in this respect. Consistency means thatmeasurements of the individual instruments of the networkare in agreement with each other in terms of absolute valuesand in terms of information content. This has been formulatedby Harris [1976] as follows: ‘‘It therefore seems imperativethat workers [..] should combine to compare their instru-mental sensitivities and errors so that some standardization
JOURNAL OF GEOPHYSICAL RESEARCH, VOL. 114, D23305, doi:10.1029/2009JD011997, 2009ClickHere
for
FullArticle
1Department of Microwave Physics, Institute of Applied Physics,University of Bern, Bern, Switzerland.
2Oeschger Center for Climate Change Research, University of Bern,Bern, Switzerland.
3Naval Research Laboratory, Washington, D. C., USA.4Department of Radio and Space Science, Chalmers University of
Technology, Gothenburg, Sweden.5Jet Propulsion Laboratory, California Institute of Technology,
Pasadena, California, USA.
Copyright 2009 by the American Geophysical Union.0148-0227/09/2009JD011997$09.00
D23305 1 of 11
of results may be achieved. Without such standardization,much information about the real nature and behavior ofstratospheric humidity is being lost.’’[4] At the time of writing several new ground-based
22 GHz radiometers for middle atmospheric water vaporare being developed [Motte et al., 2007; Straub et al., 2008]and the network of such instruments will increase in the nearfuture. There is thus a need for a standardization of the datareduction to increase the significance of data intercompar-isons and to retrieve the highest amount of information fromthe network.[5] In this paper we present an intercomparison of five
ground-based microwave radiometers for middle atmo-spheric water vapor that are members of the Network forthe Detection of Atmospheric Composition Change(NDACC). The global data set of middle atmospheric watervapor of the Earth Observing System (EOS) MicrowaveLimb Sounder (MLS) serves as reference and allows toperform an intercomparison of the ground-based instrumentsthat are located at different sites. The retrievals of theradiometer systems have been standardized to a large extent:Temperature information, that is required in the water vaporretrieval, is taken from the global temperature record ofMLS. Also, a common set of spectroscopic parameters hasbeen used.[6] The paper is organized as follows: The intercompar-
ison strategy is elucidated in section 2. In sections 3 and 4the ground-based instruments and the space-borne MLS,respectively, are introduced. Section 5 is dedicated to theretrieval of water vapor profiles from measured radiationspectra. In sections 6 and 7 we present and discuss theresults and implications of the intercomparison.
2. Intercomparison Strategy
[7] In order to compare measurements of ground-basedinstruments that are not located at the same place a referencemeasurement is needed that is available at each location.Under the assumption that the reference measurement doesnot have a location-dependent bias it is then possible toestimate differences between the instruments under consid-eration from the differences between the instruments and thereference according to the approach of the double differ-ences by Hocke et al. [2007]. As a traveling standard forground-based microwave radiometry is not yet available wehave chosen the Microwave Limb Sounder (MLS) on boardof the Aura satellite (see section 4) as the reference for thisstudy because its water vapor product has extensively beenvalidated [Lambert et al., 2007; Nedoluha et al., 2007;Vomel et al., 2007] and has proven to be of good quality.Furthermore the data set shows excellent continuity andcovers the latitudes up to 82� north and south.[8] The retrieval of a water vapor profile from a measured
spectrum requires a first guess of the H2O profile and itserror, i.e., the a priori profile and its covariance, auxiliaryinformation like pressure and temperature profiles and aforward model that does the radiative transfer calculationsand establishes a relation between an atmospheric state andthe measured intensity spectrum. These retrieval parametersare generally chosen in an attempt to optimize the retrievalsfrom a particular type of instrument, and the specific choice
can affect the retrieved water vapor values significantly. Allof the retrievals of this study use a common set of retrievalparameters to eliminate biases between the instruments thatsimply originate from differences in the spectroscopicparameters or in the temperature information, for instance.A detailed description of the applied inversion parametersand their values is given in section 5.
3. Instruments
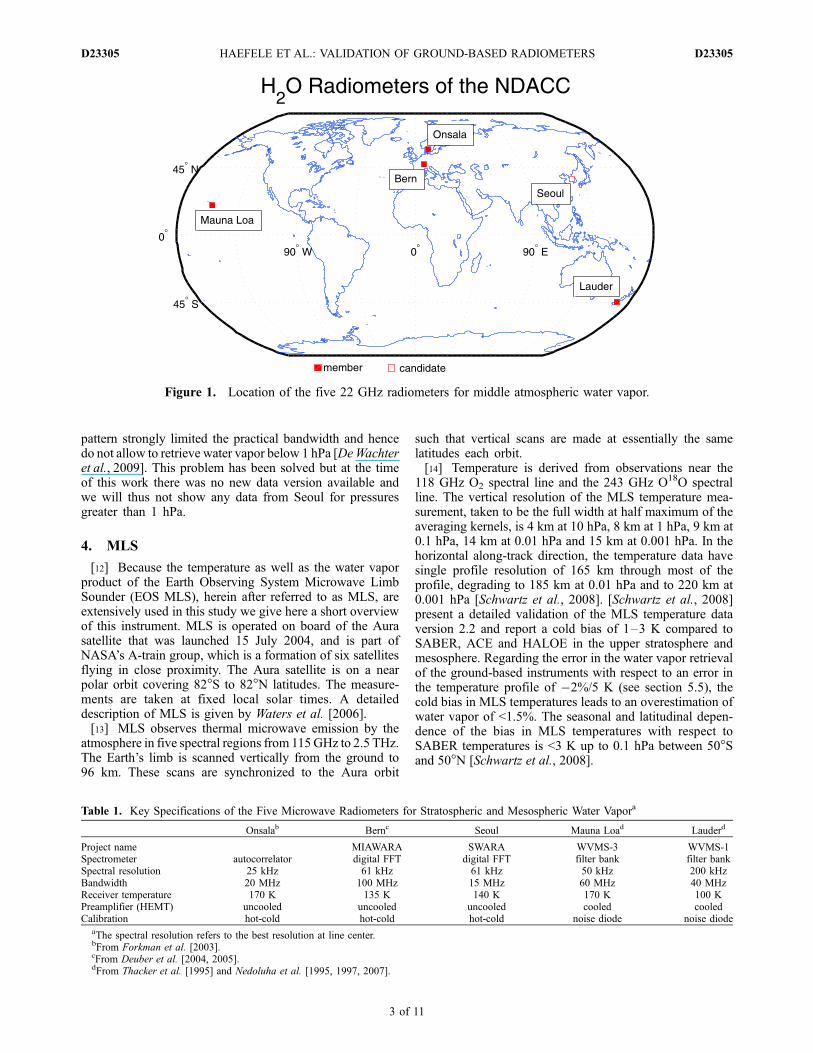
[9] The five microwave radiometers under considerationare operated at the four NDACC sites Onsala (57�N, 12�E,50 m amsl), Bern (47�N, 7�E, 900 m amsl), Mauna Loa(20�N, 156�W, 3500 m amsl) and Lauder (45�S, 170�E,200 m amsl), and at Seoul (37�N, 127�E, 50 m amsl), whichis not a NDACC site yet. The geographical distribution ofthe radiometers is shown in Figure 1. All systems measurethe rotational transition line of H2O at 22.235 GHz in abalancing mode including a line measurement at a lowelevation angle (20�–40�) and a reference measurement inzenith direction according to the method first introduced byParrish et al. [1988]. Small modifications, however, aremade and for details we refer to the instrument papersreferenced in Table 1. The receiver front ends consist of ahorizontally aligned horn antenna and a rotating mirror at45� inclination allowing the beam to be pointed at differentelevation angles. The optical components are followed by aheterodyne receiver which amplifies the incoming signal andconverts it to a lower frequency range to be analyzed by aspectrometer. Important specifications and references of thefive systems are given in Table 1.[10] In the hot-cold calibration mode, that is applied by
three of the five instruments (Onsala, Bern and Seoul), theatmospheric signal is compared to the signals from tworeference targets at known temperatures. The hot load, whichis a microwave absorber at ambient temperature, and thecold load, which is the sky itself. The temperature of the skyand the opacity of the atmosphere are derived on regularintervals of 30 min from a tipping curve measurement[Han and Westwater, 2000]. The tipping curve is a set ofatmospheric measurements taken at different elevationangles to which a model of the atmosphere is fitted with itsopacity as a free parameter revealing both t and the temper-ature of the sky. The noise diode calibration mode, applied atLauder and Mauna Loa, uses a noise diode as reference andits temperature is determined on a weekly basis by means of ahot-cold calibration using an ambient temperature and aliquid nitrogen calibration load. The atmospheric opacity isderived from tipping curve measurements as well.[11] The Water Vapor Millimeter wave Spectrometers
(WVMS) at Mauna Loa and Lauder have been in operationsince 1996 and 1992, respectively, and have undergoneextensive validation (see references in Table 1). The Onsalaand Bern systems started operation in 2002. The instrumentfrom Bern showed drifts in the properties of the previouslyused acousto-optical spectrometer before March 2007 andwe will present only data after the implementation of a newdigital FFT spectrometer in March 2007. The StratosphericWater vapor RAdiometer (SWARA) began with routinemeasurements in October 2006. Features in the spectra thatoriginated from a frequency dependence in the antenna
D23305 HAEFELE ET AL.: VALIDATION OF GROUND-BASED RADIOMETERS
2 of 11
D23305
pattern strongly limited the practical bandwidth and hencedo not allow to retrieve water vapor below 1 hPa [DeWachteret al., 2009]. This problem has been solved but at the timeof this work there was no new data version available andwe will thus not show any data from Seoul for pressuresgreater than 1 hPa.
4. MLS
[12] Because the temperature as well as the water vaporproduct of the Earth Observing System Microwave LimbSounder (EOS MLS), herein after referred to as MLS, areextensively used in this study we give here a short overviewof this instrument. MLS is operated on board of the Aurasatellite that was launched 15 July 2004, and is part ofNASA’s A-train group, which is a formation of six satellitesflying in close proximity. The Aura satellite is on a nearpolar orbit covering 82�S to 82�N latitudes. The measure-ments are taken at fixed local solar times. A detaileddescription of MLS is given by Waters et al. [2006].[13] MLS observes thermal microwave emission by the
atmosphere in five spectral regions from 115GHz to 2.5 THz.The Earth’s limb is scanned vertically from the ground to96 km. These scans are synchronized to the Aura orbit
such that vertical scans are made at essentially the samelatitudes each orbit.[14] Temperature is derived from observations near the
118 GHz O2 spectral line and the 243 GHz O18O spectralline. The vertical resolution of the MLS temperature mea-surement, taken to be the full width at half maximum of theaveraging kernels, is 4 km at 10 hPa, 8 km at 1 hPa, 9 km at0.1 hPa, 14 km at 0.01 hPa and 15 km at 0.001 hPa. In thehorizontal along-track direction, the temperature data havesingle profile resolution of 165 km through most of theprofile, degrading to 185 km at 0.01 hPa and to 220 km at0.001 hPa [Schwartz et al., 2008]. [Schwartz et al., 2008]present a detailed validation of the MLS temperature dataversion 2.2 and report a cold bias of 1–3 K compared toSABER, ACE and HALOE in the upper stratosphere andmesosphere. Regarding the error in the water vapor retrievalof the ground-based instruments with respect to an error inthe temperature profile of �2%/5 K (see section 5.5), thecold bias in MLS temperatures leads to an overestimation ofwater vapor of <1.5%. The seasonal and latitudinal depen-dence of the bias in MLS temperatures with respect toSABER temperatures is <3 K up to 0.1 hPa between 50�Sand 50�N [Schwartz et al., 2008].
Figure 1. Location of the five 22 GHz radiometers for middle atmospheric water vapor.
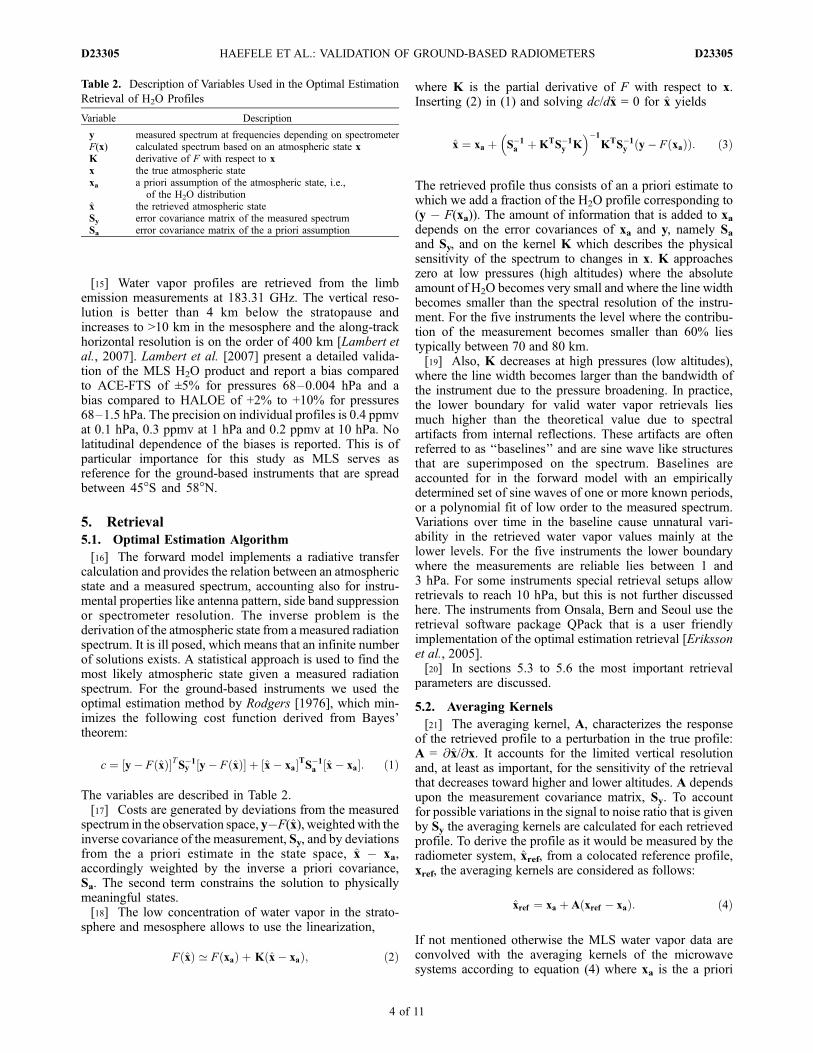
Table 1. Key Specifications of the Five Microwave Radiometers for Stratospheric and Mesospheric Water Vapora
Onsalab Bernc Seoul Mauna Load Lauderd
Project name MIAWARA SWARA WVMS-3 WVMS-1Spectrometer autocorrelator digital FFT digital FFT filter bank filter bankSpectral resolution 25 kHz 61 kHz 61 kHz 50 kHz 200 kHzBandwidth 20 MHz 100 MHz 15 MHz 60 MHz 40 MHzReceiver temperature 170 K 135 K 140 K 170 K 100 KPreamplifier (HEMT) uncooled uncooled uncooled cooled cooledCalibration hot-cold hot-cold hot-cold noise diode noise diode
aThe spectral resolution refers to the best resolution at line center.bFrom Forkman et al. [2003].cFrom Deuber et al. [2004, 2005].dFrom Thacker et al. [1995] and Nedoluha et al. [1995, 1997, 2007].
D23305 HAEFELE ET AL.: VALIDATION OF GROUND-BASED RADIOMETERS
3 of 11
D23305
[15] Water vapor profiles are retrieved from the limbemission measurements at 183.31 GHz. The vertical reso-lution is better than 4 km below the stratopause andincreases to >10 km in the mesosphere and the along-trackhorizontal resolution is on the order of 400 km [Lambert etal., 2007]. Lambert et al. [2007] present a detailed valida-tion of the MLS H2O product and report a bias comparedto ACE-FTS of ±5% for pressures 68–0.004 hPa and abias compared to HALOE of +2% to +10% for pressures68–1.5 hPa. The precision on individual profiles is 0.4 ppmvat 0.1 hPa, 0.3 ppmv at 1 hPa and 0.2 ppmv at 10 hPa. Nolatitudinal dependence of the biases is reported. This is ofparticular importance for this study as MLS serves asreference for the ground-based instruments that are spreadbetween 45�S and 58�N.
5. Retrieval
5.1. Optimal Estimation Algorithm
[16] The forward model implements a radiative transfercalculation and provides the relation between an atmosphericstate and a measured spectrum, accounting also for instru-mental properties like antenna pattern, side band suppressionor spectrometer resolution. The inverse problem is thederivation of the atmospheric state from ameasured radiationspectrum. It is ill posed, which means that an infinite numberof solutions exists. A statistical approach is used to find themost likely atmospheric state given a measured radiationspectrum. For the ground-based instruments we used theoptimal estimation method by Rodgers [1976], which min-imizes the following cost function derived from Bayes’theorem:
c ¼ y� F xð Þ½ �TSy�1 y� F xð Þ½ � þ x� xa½ �TS�1a x� xa½ �: ð1Þ
The variables are described in Table 2.[17] Costs are generated by deviations from the measured
spectrum in the observation space, y�F(x), weightedwith theinverse covariance of the measurement, Sy, and by deviationsfrom the a priori estimate in the state space, x � xa,accordingly weighted by the inverse a priori covariance,Sa. The second term constrains the solution to physicallymeaningful states.[18] The low concentration of water vapor in the strato-
sphere and mesosphere allows to use the linearization,
F xð Þ ’ F xað Þ þ K x� xað Þ; ð2Þ
where K is the partial derivative of F with respect to x.Inserting (2) in (1) and solving dc/dx = 0 for x yields
x ¼ xa þ S�1a þKTS�1y K� ��1
KTS�1y y� F xað Þð Þ: ð3Þ
The retrieved profile thus consists of an a priori estimate towhich we add a fraction of the H2O profile corresponding to(y � F(xa)). The amount of information that is added to xadepends on the error covariances of xa and y, namely Saand Sy, and on the kernel K which describes the physicalsensitivity of the spectrum to changes in x. K approacheszero at low pressures (high altitudes) where the absoluteamount of H2O becomes very small and where the line widthbecomes smaller than the spectral resolution of the instru-ment. For the five instruments the level where the contribu-tion of the measurement becomes smaller than 60% liestypically between 70 and 80 km.[19] Also, K decreases at high pressures (low altitudes),
where the line width becomes larger than the bandwidth ofthe instrument due to the pressure broadening. In practice,the lower boundary for valid water vapor retrievals liesmuch higher than the theoretical value due to spectralartifacts from internal reflections. These artifacts are oftenreferred to as ‘‘baselines’’ and are sine wave like structuresthat are superimposed on the spectrum. Baselines areaccounted for in the forward model with an empiricallydetermined set of sine waves of one or more known periods,or a polynomial fit of low order to the measured spectrum.Variations over time in the baseline cause unnatural vari-ability in the retrieved water vapor values mainly at thelower levels. For the five instruments the lower boundarywhere the measurements are reliable lies between 1 and3 hPa. For some instruments special retrieval setups allowretrievals to reach 10 hPa, but this is not further discussedhere. The instruments from Onsala, Bern and Seoul use theretrieval software package QPack that is a user friendlyimplementation of the optimal estimation retrieval [Erikssonet al., 2005].[20] In sections 5.3 to 5.6 the most important retrieval
parameters are discussed.
5.2. Averaging Kernels
[21] The averaging kernel, A, characterizes the responseof the retrieved profile to a perturbation in the true profile:A = @x/@x. It accounts for the limited vertical resolutionand, at least as important, for the sensitivity of the retrievalthat decreases toward higher and lower altitudes. A dependsupon the measurement covariance matrix, Sy. To accountfor possible variations in the signal to noise ratio that is givenby Sy the averaging kernels are calculated for each retrievedprofile. To derive the profile as it would be measured by theradiometer system, xref, from a colocated reference profile,xref, the averaging kernels are considered as follows:
xref ¼ xa þ A xref � xað Þ: ð4Þ
If not mentioned otherwise the MLS water vapor data areconvolved with the averaging kernels of the microwavesystems according to equation (4) where xa is the a priori
Table 2. Description of Variables Used in the Optimal Estimation
Retrieval of H2O Profiles
Variable Description
y measured spectrum at frequencies depending on spectrometerF(x) calculated spectrum based on an atmospheric state xK derivative of F with respect to xx the true atmospheric statexa a priori assumption of the atmospheric state, i.e.,
of the H2O distributionx the retrieved atmospheric stateSy error covariance matrix of the measured spectrumSa error covariance matrix of the a priori assumption
D23305 HAEFELE ET AL.: VALIDATION OF GROUND-BASED RADIOMETERS
4 of 11
D23305
profile of the ground-based instrument. The vertical resolu-tion of MLS at 0.10 hPa is better by a factor of 2 than thatof the ground-based instruments and is being neglected.
5.3. A Priori Information on H2O
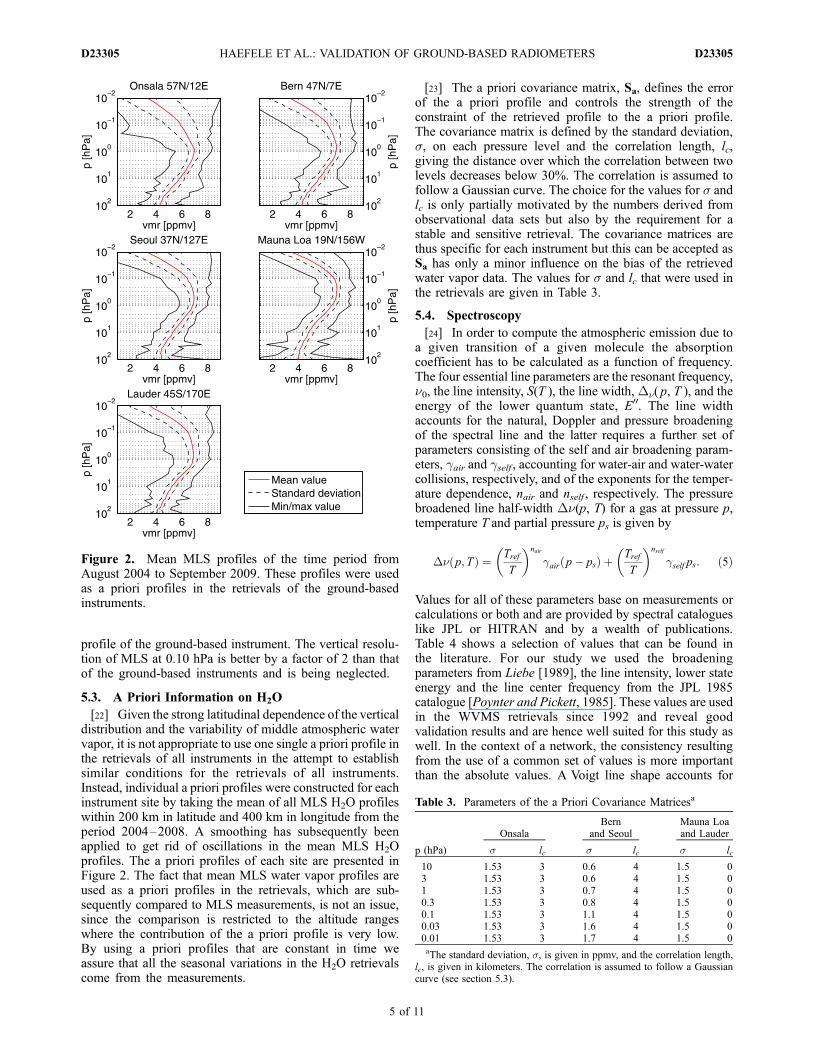
[22] Given the strong latitudinal dependence of the verticaldistribution and the variability of middle atmospheric watervapor, it is not appropriate to use one single a priori profile inthe retrievals of all instruments in the attempt to establishsimilar conditions for the retrievals of all instruments.Instead, individual a priori profiles were constructed for eachinstrument site by taking the mean of all MLS H2O profileswithin 200 km in latitude and 400 km in longitude from theperiod 2004–2008. A smoothing has subsequently beenapplied to get rid of oscillations in the mean MLS H2Oprofiles. The a priori profiles of each site are presented inFigure 2. The fact that mean MLS water vapor profiles areused as a priori profiles in the retrievals, which are sub-sequently compared to MLS measurements, is not an issue,since the comparison is restricted to the altitude rangeswhere the contribution of the a priori profile is very low.By using a priori profiles that are constant in time weassure that all the seasonal variations in the H2O retrievalscome from the measurements.
[23] The a priori covariance matrix, Sa, defines the errorof the a priori profile and controls the strength of theconstraint of the retrieved profile to the a priori profile.The covariance matrix is defined by the standard deviation,s, on each pressure level and the correlation length, lc,giving the distance over which the correlation between twolevels decreases below 30%. The correlation is assumed tofollow a Gaussian curve. The choice for the values for s andlc is only partially motivated by the numbers derived fromobservational data sets but also by the requirement for astable and sensitive retrieval. The covariance matrices arethus specific for each instrument but this can be accepted asSa has only a minor influence on the bias of the retrievedwater vapor data. The values for s and lc that were used inthe retrievals are given in Table 3.
5.4. Spectroscopy
[24] In order to compute the atmospheric emission due toa given transition of a given molecule the absorptioncoefficient has to be calculated as a function of frequency.The four essential line parameters are the resonant frequency,n0, the line intensity, S(T ), the line width, Dn(p, T ), and theenergy of the lower quantum state, E00. The line widthaccounts for the natural, Doppler and pressure broadeningof the spectral line and the latter requires a further set ofparameters consisting of the self and air broadening param-eters, gair and gself , accounting for water-air and water-watercollisions, respectively, and of the exponents for the temper-ature dependence, nair and nself , respectively. The pressurebroadened line half-width Dn(p, T) for a gas at pressure p,temperature T and partial pressure ps is given by
Dn p;Tð Þ ¼ Tref
T
� �nair
gair p� psð Þ þ Tref
T
� �nself
gself ps: ð5Þ
Values for all of these parameters base on measurements orcalculations or both and are provided by spectral catalogueslike JPL or HITRAN and by a wealth of publications.Table 4 shows a selection of values that can be found inthe literature. For our study we used the broadeningparameters from Liebe [1989], the line intensity, lower stateenergy and the line center frequency from the JPL 1985catalogue [Poynter and Pickett, 1985]. These values are usedin the WVMS retrievals since 1992 and reveal goodvalidation results and are hence well suited for this study aswell. In the context of a network, the consistency resultingfrom the use of a common set of values is more importantthan the absolute values. A Voigt line shape accounts for
Figure 2. Mean MLS profiles of the time period fromAugust 2004 to September 2009. These profiles were usedas a priori profiles in the retrievals of the ground-basedinstruments.
Table 3. Parameters of the a Priori Covariance Matricesa
p (hPa)
OnsalaBern
and SeoulMauna Loaand Lauder
s lc s lc s lc
10 1.53 3 0.6 4 1.5 03 1.53 3 0.6 4 1.5 01 1.53 3 0.7 4 1.5 00.3 1.53 3 0.8 4 1.5 00.1 1.53 3 1.1 4 1.5 00.03 1.53 3 1.6 4 1.5 00.01 1.53 3 1.7 4 1.5 0aThe standard deviation, s, is given in ppmv, and the correlation length,
lc, is given in kilometers. The correlation is assumed to follow a Gaussiancurve (see section 5.3).
D23305 HAEFELE ET AL.: VALIDATION OF GROUND-BASED RADIOMETERS
5 of 11
D23305
pressure and Doppler broadening. For the Mauna Loa andLauder systems an adapted version of the radiative transfermodel by Liebe [1989] is used while the AtmosphericRadiative Transfer Simulator (ARTS) [Buehler et al., 2005]is used for the other systems.
5.5. Temperature Information
[25] The emission of the atmosphere depends on theactual temperature profile. Underestimating the temperatureat a particular level will cause the retrieval to overestimatethe water vapor amount required to emit the observed signal.The relative error in H2O mixing ratio depends on altitudeand is on the order of �2%/5 K. For the retrievals of theground-based microwave systems the temperature profilesare routinely taken from different analyses as provided byNCEP, ECMWF or from models or climatologies likeWACCM or MSISE90. But upper stratospheric and meso-spheric temperature data provided by analyses or models arepurely modeled and afflicted with considerable uncertainties.Observations as provided by SABER orMLS for an extendedaltitude range are assumed to be a better data source.Nedoluha et al. [2007] investigated the performance ofMLS temperature observations in the WVMS retrievals,and reported an improvement in the reanalyzed water vaporretrievals mainly with respect to interannual variations. Inthis study the MLS temperature observations at the specificlocations were used in the retrievals for all microwavesystems and hence the validation is free of effects that arerelated to the use of different temperature data sources.[26] As a consequence of the Sun-synchronous orbit, the
MLS measurements are taken at constant local solar times,with daytime measurements on the ascending branch.Because of the coincidence criterion (see section 6) and dataavailability there are not always both day and nighttimemeasurements available at one site for a 24 h interval. Thiscan introduce biases in daily mean profiles as differencesbetween day and nighttime measurements are on the orderof 5 K at 0.10 hPa. To create data sets of daily temperatureprofiles that are more representative for 24 h we thus cal-culated 3 day running means where day and nighttime mea-surements were equally weighted, for example, the meanof the mean daytime and the mean nighttime profile of a72 h interval.
5.6. Measurement Integration Time
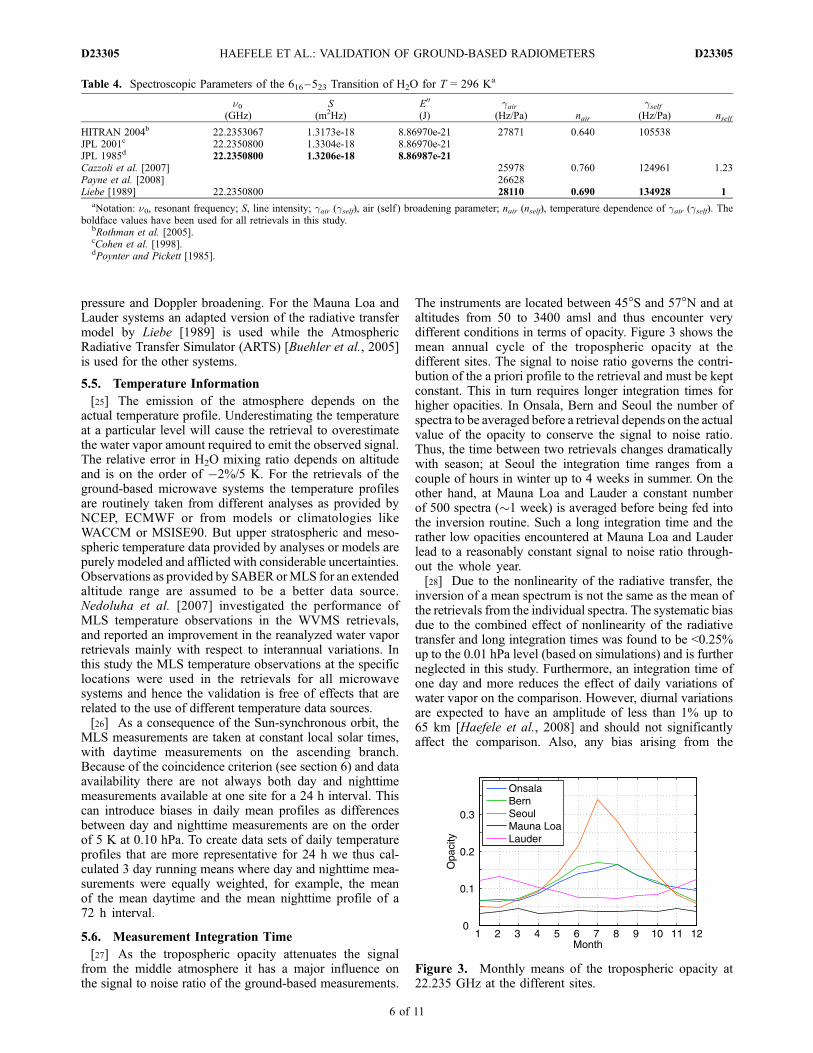
[27] As the tropospheric opacity attenuates the signalfrom the middle atmosphere it has a major influence onthe signal to noise ratio of the ground-based measurements.
The instruments are located between 45�S and 57�N and ataltitudes from 50 to 3400 amsl and thus encounter verydifferent conditions in terms of opacity. Figure 3 shows themean annual cycle of the tropospheric opacity at thedifferent sites. The signal to noise ratio governs the contri-bution of the a priori profile to the retrieval and must be keptconstant. This in turn requires longer integration times forhigher opacities. In Onsala, Bern and Seoul the number ofspectra to be averaged before a retrieval depends on the actualvalue of the opacity to conserve the signal to noise ratio.Thus, the time between two retrievals changes dramaticallywith season; at Seoul the integration time ranges from acouple of hours in winter up to 4 weeks in summer. On theother hand, at Mauna Loa and Lauder a constant numberof 500 spectra (�1 week) is averaged before being fed intothe inversion routine. Such a long integration time and therather low opacities encountered at Mauna Loa and Lauderlead to a reasonably constant signal to noise ratio through-out the whole year.[28] Due to the nonlinearity of the radiative transfer, the
inversion of a mean spectrum is not the same as the mean ofthe retrievals from the individual spectra. The systematic biasdue to the combined effect of nonlinearity of the radiativetransfer and long integration times was found to be <0.25%up to the 0.01 hPa level (based on simulations) and is furtherneglected in this study. Furthermore, an integration time ofone day and more reduces the effect of daily variations ofwater vapor on the comparison. However, diurnal variationsare expected to have an amplitude of less than 1% up to65 km [Haefele et al., 2008] and should not significantlyaffect the comparison. Also, any bias arising from the
Table 4. Spectroscopic Parameters of the 616–523 Transition of H2O for T = 296 Ka
n0(GHz)
S(m2Hz)
E00
(J)gair
(Hz/Pa) nair
gself(Hz/Pa) nself
HITRAN 2004b 22.2353067 1.3173e-18 8.86970e-21 27871 0.640 105538JPL 2001c 22.2350800 1.3304e-18 8.86970e-21JPL 1985d 22.2350800 1.3206e-18 8.86987e-21Cazzoli et al. [2007] 25978 0.760 124961 1.23Payne et al. [2008] 26628Liebe [1989] 22.2350800 28110 0.690 134928 1
aNotation: n0, resonant frequency; S, line intensity; gair (gself), air (self ) broadening parameter; nair (nself), temperature dependence of gair (gself). Theboldface values have been used for all retrievals in this study.
bRothman et al. [2005].cCohen et al. [1998].dPoynter and Pickett [1985].
Figure 3. Monthly means of the tropospheric opacity at22.235 GHz at the different sites.
D23305 HAEFELE ET AL.: VALIDATION OF GROUND-BASED RADIOMETERS
6 of 11
D23305
MLS sampling at fixed local solar times is hence expectedto be of minor importance.[29] While statistical errors like noise can be reduced by
longer integration times, this does no apply for systematicerrors. But systematic spectral errors are much smaller thanthe standard deviation of the target noise for all instrumentsand are not further discussed here. One exception, however,are baselines, which are features in the measured spectrumthat originate from internal reflections. The structure ofbaselines is usually well known and they are thus not treatedas spectral errors but included in the forward model (seesection 5.1). However, if the baseline is not well known orif it changes over time, baselines may affect the retrievalsand can lead to unrealistic fluctuations (see section 6).
6. Intercomparison of the Ground-BasedMeasurements
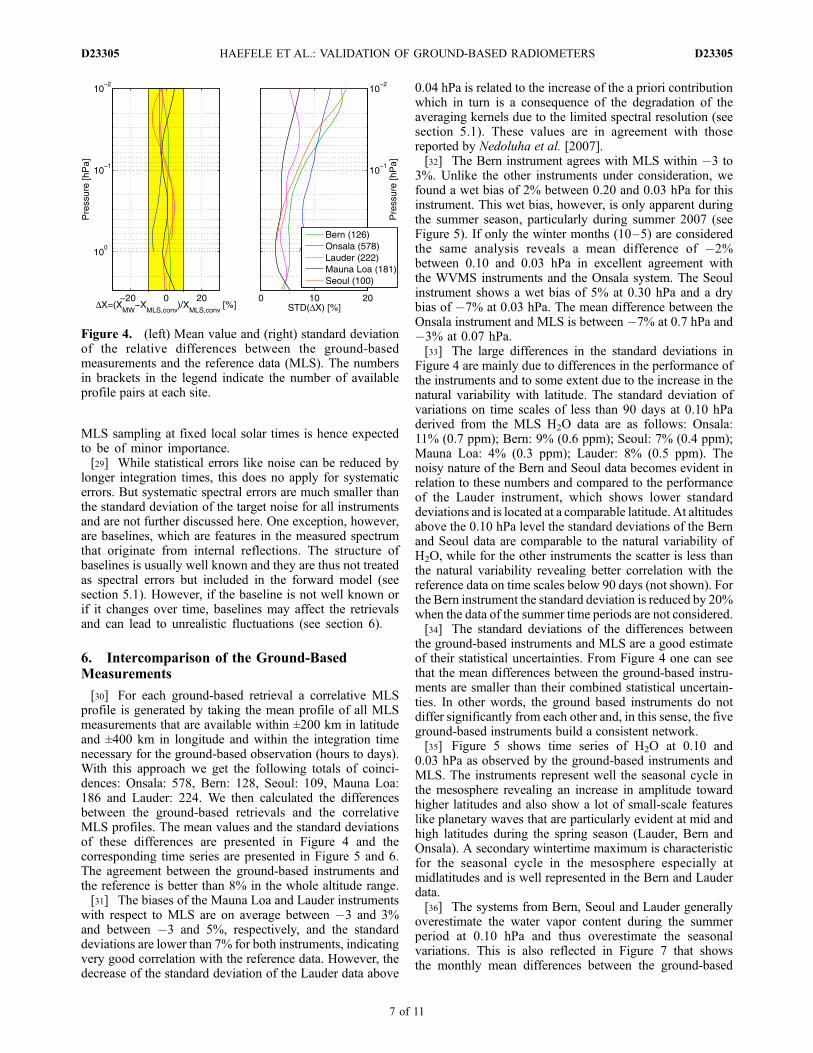
[30] For each ground-based retrieval a correlative MLSprofile is generated by taking the mean profile of all MLSmeasurements that are available within ±200 km in latitudeand ±400 km in longitude and within the integration timenecessary for the ground-based observation (hours to days).With this approach we get the following totals of coinci-dences: Onsala: 578, Bern: 128, Seoul: 109, Mauna Loa:186 and Lauder: 224. We then calculated the differencesbetween the ground-based retrievals and the correlativeMLS profiles. The mean values and the standard deviationsof these differences are presented in Figure 4 and thecorresponding time series are presented in Figure 5 and 6.The agreement between the ground-based instruments andthe reference is better than 8% in the whole altitude range.[31] The biases of the Mauna Loa and Lauder instruments
with respect to MLS are on average between �3 and 3%and between �3 and 5%, respectively, and the standarddeviations are lower than 7% for both instruments, indicatingvery good correlation with the reference data. However, thedecrease of the standard deviation of the Lauder data above
0.04 hPa is related to the increase of the a priori contributionwhich in turn is a consequence of the degradation of theaveraging kernels due to the limited spectral resolution (seesection 5.1). These values are in agreement with thosereported by Nedoluha et al. [2007].[32] The Bern instrument agrees with MLS within �3 to
3%. Unlike the other instruments under consideration, wefound a wet bias of 2% between 0.20 and 0.03 hPa for thisinstrument. This wet bias, however, is only apparent duringthe summer season, particularly during summer 2007 (seeFigure 5). If only the winter months (10–5) are consideredthe same analysis reveals a mean difference of �2%between 0.10 and 0.03 hPa in excellent agreement withthe WVMS instruments and the Onsala system. The Seoulinstrument shows a wet bias of 5% at 0.30 hPa and a drybias of �7% at 0.03 hPa. The mean difference between theOnsala instrument and MLS is between �7% at 0.7 hPa and�3% at 0.07 hPa.[33] The large differences in the standard deviations in
Figure 4 are mainly due to differences in the performance ofthe instruments and to some extent due to the increase in thenatural variability with latitude. The standard deviation ofvariations on time scales of less than 90 days at 0.10 hPaderived from the MLS H2O data are as follows: Onsala:11% (0.7 ppm); Bern: 9% (0.6 ppm); Seoul: 7% (0.4 ppm);Mauna Loa: 4% (0.3 ppm); Lauder: 8% (0.5 ppm). Thenoisy nature of the Bern and Seoul data becomes evident inrelation to these numbers and compared to the performanceof the Lauder instrument, which shows lower standarddeviations and is located at a comparable latitude. At altitudesabove the 0.10 hPa level the standard deviations of the Bernand Seoul data are comparable to the natural variability ofH2O, while for the other instruments the scatter is less thanthe natural variability revealing better correlation with thereference data on time scales below 90 days (not shown). Forthe Bern instrument the standard deviation is reduced by 20%when the data of the summer time periods are not considered.[34] The standard deviations of the differences between
the ground-based instruments and MLS are a good estimateof their statistical uncertainties. From Figure 4 one can seethat the mean differences between the ground-based instru-ments are smaller than their combined statistical uncertain-ties. In other words, the ground based instruments do notdiffer significantly from each other and, in this sense, the fiveground-based instruments build a consistent network.[35] Figure 5 shows time series of H2O at 0.10 and
0.03 hPa as observed by the ground-based instruments andMLS. The instruments represent well the seasonal cycle inthe mesosphere revealing an increase in amplitude towardhigher latitudes and also show a lot of small-scale featureslike planetary waves that are particularly evident at mid andhigh latitudes during the spring season (Lauder, Bern andOnsala). A secondary wintertime maximum is characteristicfor the seasonal cycle in the mesosphere especially atmidlatitudes and is well represented in the Bern and Lauderdata.[36] The systems from Bern, Seoul and Lauder generally
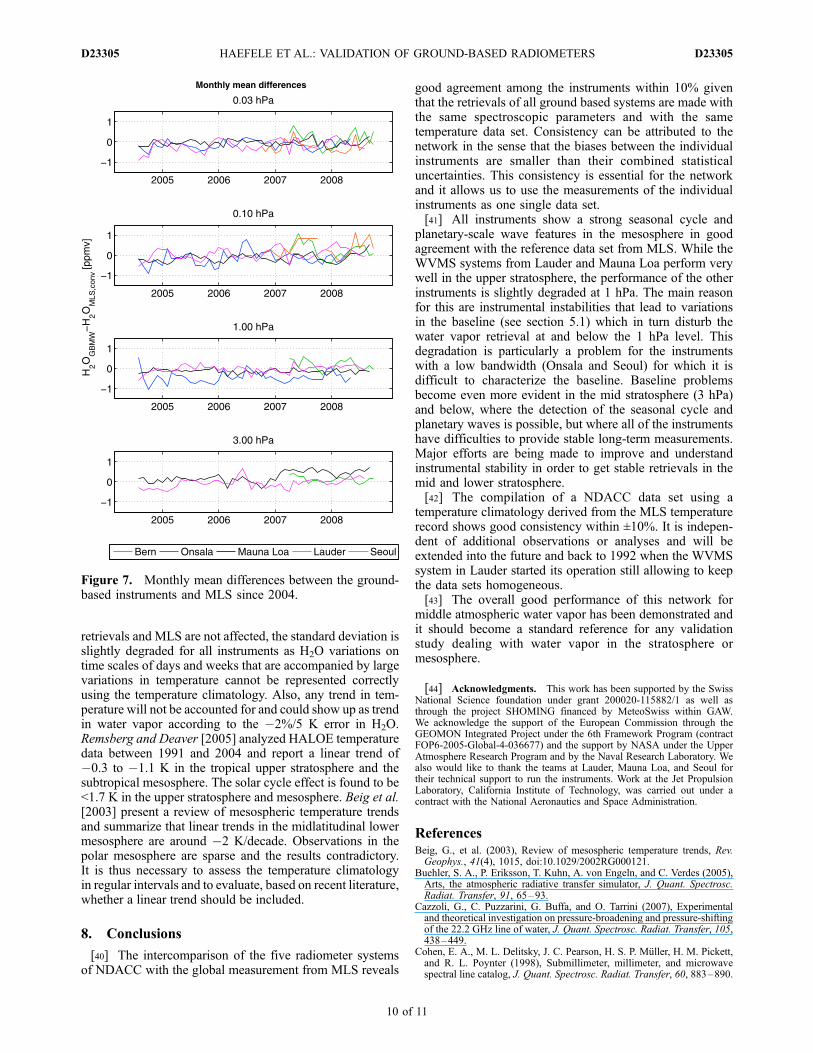
overestimate the water vapor content during the summerperiod at 0.10 hPa and thus overestimate the seasonalvariations. This is also reflected in Figure 7 that showsthe monthly mean differences between the ground-based
Figure 4. (left) Mean value and (right) standard deviationof the relative differences between the ground-basedmeasurements and the reference data (MLS). The numbersin brackets in the legend indicate the number of availableprofile pairs at each site.
D23305 HAEFELE ET AL.: VALIDATION OF GROUND-BASED RADIOMETERS
7 of 11
D23305
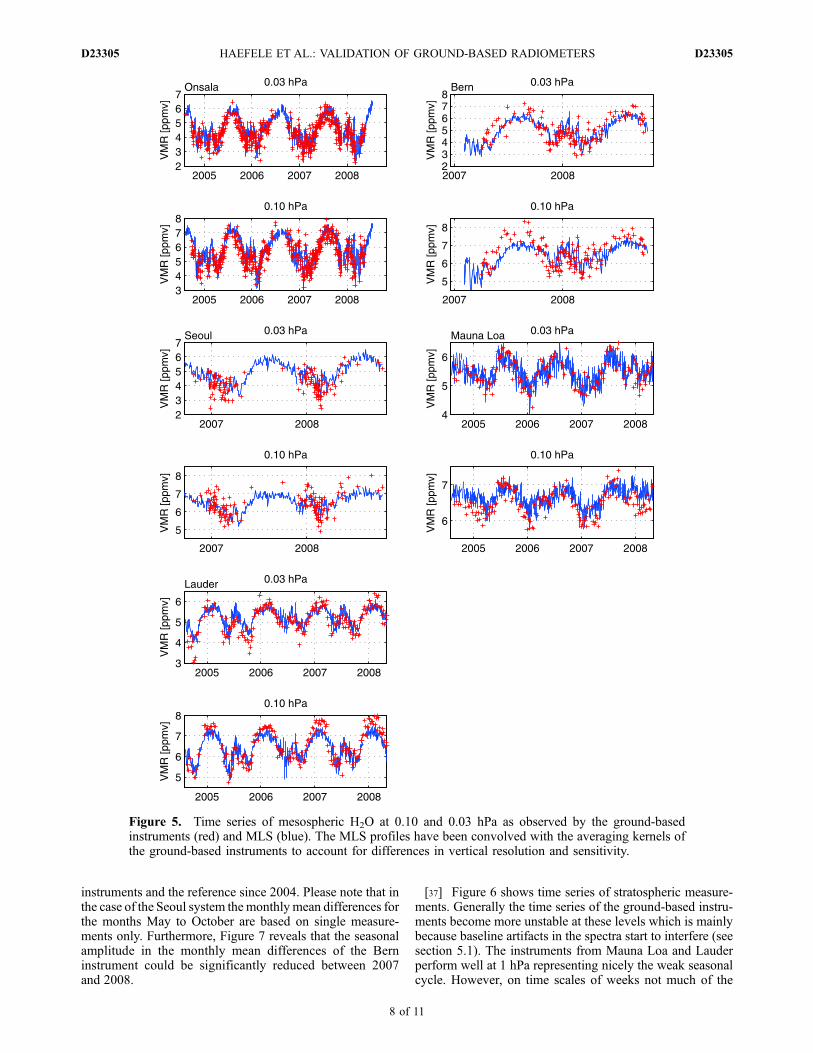
instruments and the reference since 2004. Please note that inthe case of the Seoul system themonthly mean differences forthe months May to October are based on single measure-ments only. Furthermore, Figure 7 reveals that the seasonalamplitude in the monthly mean differences of the Berninstrument could be significantly reduced between 2007and 2008.
[37] Figure 6 shows time series of stratospheric measure-ments. Generally the time series of the ground-based instru-ments become more unstable at these levels which is mainlybecause baseline artifacts in the spectra start to interfere (seesection 5.1). The instruments from Mauna Loa and Lauderperform well at 1 hPa representing nicely the weak seasonalcycle. However, on time scales of weeks not much of the
Figure 5. Time series of mesospheric H2O at 0.10 and 0.03 hPa as observed by the ground-basedinstruments (red) and MLS (blue). The MLS profiles have been convolved with the averaging kernels ofthe ground-based instruments to account for differences in vertical resolution and sensitivity.
D23305 HAEFELE ET AL.: VALIDATION OF GROUND-BASED RADIOMETERS
8 of 11
D23305
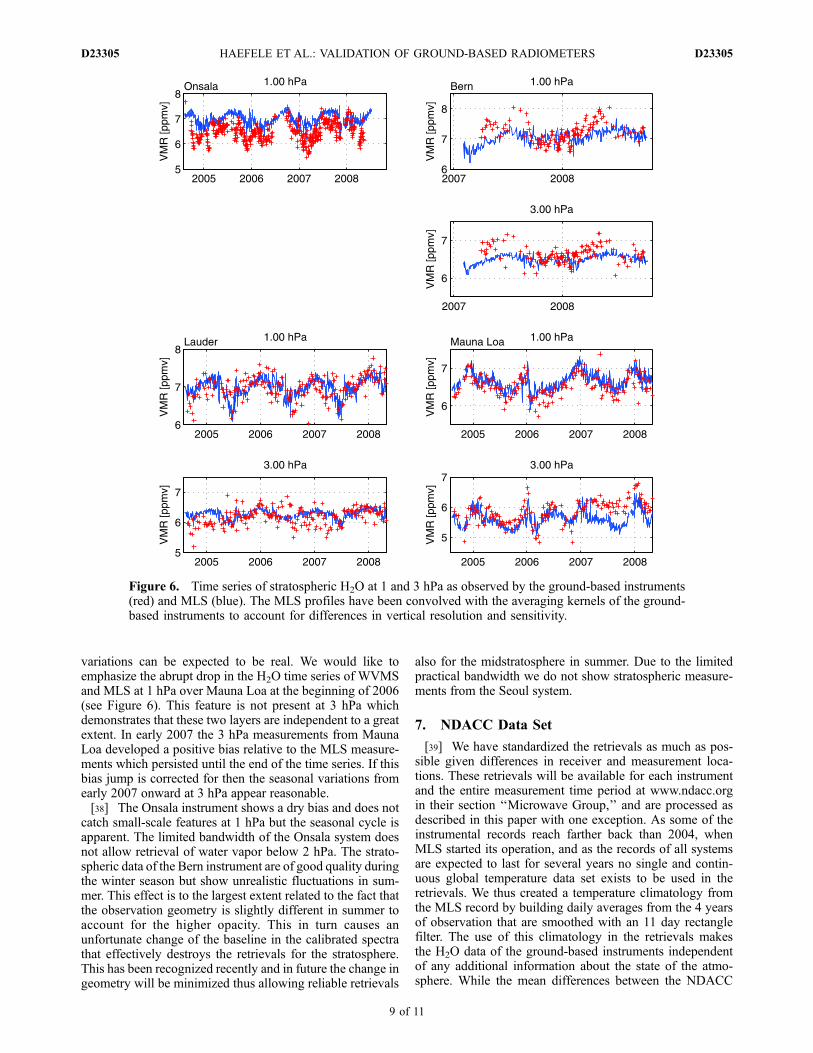
variations can be expected to be real. We would like toemphasize the abrupt drop in the H2O time series of WVMSand MLS at 1 hPa over Mauna Loa at the beginning of 2006(see Figure 6). This feature is not present at 3 hPa whichdemonstrates that these two layers are independent to a greatextent. In early 2007 the 3 hPa measurements from MaunaLoa developed a positive bias relative to the MLS measure-ments which persisted until the end of the time series. If thisbias jump is corrected for then the seasonal variations fromearly 2007 onward at 3 hPa appear reasonable.[38] The Onsala instrument shows a dry bias and does not
catch small-scale features at 1 hPa but the seasonal cycle isapparent. The limited bandwidth of the Onsala system doesnot allow retrieval of water vapor below 2 hPa. The strato-spheric data of the Bern instrument are of good quality duringthe winter season but show unrealistic fluctuations in sum-mer. This effect is to the largest extent related to the fact thatthe observation geometry is slightly different in summer toaccount for the higher opacity. This in turn causes anunfortunate change of the baseline in the calibrated spectrathat effectively destroys the retrievals for the stratosphere.This has been recognized recently and in future the change ingeometry will be minimized thus allowing reliable retrievals
also for the midstratosphere in summer. Due to the limitedpractical bandwidth we do not show stratospheric measure-ments from the Seoul system.
7. NDACC Data Set
[39] We have standardized the retrievals as much as pos-sible given differences in receiver and measurement loca-tions. These retrievals will be available for each instrumentand the entire measurement time period at www.ndacc.orgin their section ‘‘Microwave Group,’’ and are processed asdescribed in this paper with one exception. As some of theinstrumental records reach farther back than 2004, whenMLS started its operation, and as the records of all systemsare expected to last for several years no single and contin-uous global temperature data set exists to be used in theretrievals. We thus created a temperature climatology fromthe MLS record by building daily averages from the 4 yearsof observation that are smoothed with an 11 day rectanglefilter. The use of this climatology in the retrievals makesthe H2O data of the ground-based instruments independentof any additional information about the state of the atmo-sphere. While the mean differences between the NDACC
Figure 6. Time series of stratospheric H2O at 1 and 3 hPa as observed by the ground-based instruments(red) and MLS (blue). The MLS profiles have been convolved with the averaging kernels of the ground-based instruments to account for differences in vertical resolution and sensitivity.
D23305 HAEFELE ET AL.: VALIDATION OF GROUND-BASED RADIOMETERS
9 of 11
D23305
retrievals and MLS are not affected, the standard deviation isslightly degraded for all instruments as H2O variations ontime scales of days and weeks that are accompanied by largevariations in temperature cannot be represented correctlyusing the temperature climatology. Also, any trend in tem-perature will not be accounted for and could show up as trendin water vapor according to the �2%/5 K error in H2O.Remsberg and Deaver [2005] analyzed HALOE temperaturedata between 1991 and 2004 and report a linear trend of�0.3 to �1.1 K in the tropical upper stratosphere and thesubtropical mesosphere. The solar cycle effect is found to be<1.7 K in the upper stratosphere and mesosphere. Beig et al.[2003] present a review of mesospheric temperature trendsand summarize that linear trends in the midlatitudinal lowermesosphere are around �2 K/decade. Observations in thepolar mesosphere are sparse and the results contradictory.It is thus necessary to assess the temperature climatologyin regular intervals and to evaluate, based on recent literature,whether a linear trend should be included.
8. Conclusions
[40] The intercomparison of the five radiometer systemsof NDACC with the global measurement from MLS reveals
good agreement among the instruments within 10% giventhat the retrievals of all ground based systems are made withthe same spectroscopic parameters and with the sametemperature data set. Consistency can be attributed to thenetwork in the sense that the biases between the individualinstruments are smaller than their combined statisticaluncertainties. This consistency is essential for the networkand it allows us to use the measurements of the individualinstruments as one single data set.[41] All instruments show a strong seasonal cycle and
planetary-scale wave features in the mesosphere in goodagreement with the reference data set from MLS. While theWVMS systems from Lauder and Mauna Loa perform verywell in the upper stratosphere, the performance of the otherinstruments is slightly degraded at 1 hPa. The main reasonfor this are instrumental instabilities that lead to variationsin the baseline (see section 5.1) which in turn disturb thewater vapor retrieval at and below the 1 hPa level. Thisdegradation is particularly a problem for the instrumentswith a low bandwidth (Onsala and Seoul) for which it isdifficult to characterize the baseline. Baseline problemsbecome even more evident in the mid stratosphere (3 hPa)and below, where the detection of the seasonal cycle andplanetary waves is possible, but where all of the instrumentshave difficulties to provide stable long-term measurements.Major efforts are being made to improve and understandinstrumental stability in order to get stable retrievals in themid and lower stratosphere.[42] The compilation of a NDACC data set using a
temperature climatology derived from the MLS temperaturerecord shows good consistency within ±10%. It is indepen-dent of additional observations or analyses and will beextended into the future and back to 1992 when the WVMSsystem in Lauder started its operation still allowing to keepthe data sets homogeneous.[43] The overall good performance of this network for
middle atmospheric water vapor has been demonstrated andit should become a standard reference for any validationstudy dealing with water vapor in the stratosphere ormesosphere.
[44] Acknowledgments. This work has been supported by the SwissNational Science foundation under grant 200020-115882/1 as well asthrough the project SHOMING financed by MeteoSwiss within GAW.We acknowledge the support of the European Commission through theGEOMON Integrated Project under the 6th Framework Program (contractFOP6-2005-Global-4-036677) and the support by NASA under the UpperAtmosphere Research Program and by the Naval Research Laboratory. Wealso would like to thank the teams at Lauder, Mauna Loa, and Seoul fortheir technical support to run the instruments. Work at the Jet PropulsionLaboratory, California Institute of Technology, was carried out under acontract with the National Aeronautics and Space Administration.
ReferencesBeig, G., et al. (2003), Review of mesospheric temperature trends, Rev.Geophys., 41(4), 1015, doi:10.1029/2002RG000121.
Buehler, S. A., P. Eriksson, T. Kuhn, A. von Engeln, and C. Verdes (2005),Arts, the atmospheric radiative transfer simulator, J. Quant. Spectrosc.Radiat. Transfer, 91, 65–93.
Cazzoli, G., C. Puzzarini, G. Buffa, and O. Tarrini (2007), Experimentaland theoretical investigation on pressure-broadening and pressure-shiftingof the 22.2 GHz line of water, J. Quant. Spectrosc. Radiat. Transfer, 105,438–449.
Cohen, E. A., M. L. Delitsky, J. C. Pearson, H. S. P. Muller, H. M. Pickett,and R. L. Poynter (1998), Submillimeter, millimeter, and microwavespectral line catalog, J. Quant. Spectrosc. Radiat. Transfer, 60, 883–890.
Figure 7. Monthly mean differences between the ground-based instruments and MLS since 2004.
D23305 HAEFELE ET AL.: VALIDATION OF GROUND-BASED RADIOMETERS
10 of 11
D23305
Deuber, B., N. Kampfer, and D. G. Feist (2004), A new 22-GHz radiometerfor middle atmospheric water vapour profile measurements, IEEE Trans.Geosci. Remote Sens., 42(5), 974–984.
Deuber, B., A. Haefele, D. G. Feist, L. Martin, N. Kampfer, G. E.Nedoluha, V. Yushkov, S. Khaykin, R. Kivi, and H. Vomel (2005),Middle Atmospheric Water Vapour Radiometer—MIAWARA: Validationand first results of the LAUTLOS/WAVVAP campaign, J. Geophys. Res.,110, D13306, doi:10.1029/2004JD005543.
De Wachter, E., A. Murk, C. Straub, A. Haefele, S. Ka, J. J. Oh, andN. Kampfer (2009), Effects of resonances in corrugated horn antennasfor a 22 GHz balancing radiometer, IEEE Geosci. Remote Sens. Lett., 6,3–7, doi:10.1109/LGRS.2008.2005851.
Eriksson, P., C. Jimenez, and S. A. Buehler (2005), Qpack, a general toolfor instrument simulation and retrieval work, J. Quant. Spectrosc. Radiat.Transfer, 91, 47–64.
Forkman, P., P. Eriksson, and A. Winnberg (2003), The 22 GHz radio-aeronomy reciver at Onsala Space Observatory, J. Quant. Spectrosc.Radiat. Transfer, 77, 23–42.
Forster, P., et al. (2007), Changes in atmospheric constituents and in radia-tive forcing, in Climate Change 2007: The Physical Science Basis. Con-tribution of Working Group I to the Fourth Assessment Report of theIntergovernmental Panel on Climate Change, pp. 131–234, CambridgeUniv. Press, Cambridge, U. K.
Haefele, A., K. Hocke, N. Kampfer, P. Keckhut, M. Marchand, S. Bekki,B. Morel, T. Egorova, and E. Rozanov (2008), Diurnal changes inmiddle atmospheric H2O and O3: Observations in the Alpine regionand climate models, J. Geophys. Res., 113, D17303, doi:10.1029/2008JD009892.
Han, Y., and E. R. Westwater (2000), Analysis and improvement of tippingcalibration for ground-based microwave radiometers, IEEE Trans. Geosci.Remote Sens., 38, 1260–1276.
Harris, J. E. (1976), The Distribution of water vapor in the stratosphere,Rev. Geophysics, 14, 565–575.
Hocke, K., et al. (2007), Comparison and synergy of stratospheric ozonemeasurements by satellite limb sounders and the ground-based micro-wave radiometer SOMORA, Atmos. Chem. Phys., 7, 4117–4131.
Lambert, A., et al. (2007), Validation of the Aura Microwave Limb Soundermiddle atmosphere water vapor and nitrous oxide measurements, J. Geo-phys. Res., 112, D24S36, doi:10.1029/2007JD008724.
Liebe, H. J. (1989), MPM—A atmospheric millimeter-wave propagationmodel, Int. J. Infrared Millimeter Waves, 10, 631–650.
Motte, E., P. Ricaud, M. Niclas, B. Gabard, and F. Gangneron (2007), A22 GHz mobile microwave radiometer for the study of stratosphericwater vapor, paper presented at IGARSS 2007, Inst. of Electr. andElectron. Eng., New York.
Nedoluha, G. E., R. M. Bevilacqua, R. M. Gomez, D. L. Thacker, W. B.Waltman, and T. A. Pauls (1995), Ground-based measurements of watervapor in the middle atmosphere, J. Geophys. Res., 100(D2), 2927–2939.
Nedoluha, G. E., R. Bevilacqua, R. Gomez, W. Waltman, B. Hicks,D. Thacker, J. Russell III, M. Abrams, H. Pumphrey, and B. Connor(1997), A comparative study of mesospheric water vapor measurementsfrom the ground-based water vapor millimeter-wave spectrometer andspace-based instruments, J. Geophys. Res., 102(D14), 16,647–16,661.
Nedoluha, G. E., R. M. Gomez, B. C. Hicks, R. M. Bevilacqua, J. M.Russell III, B. J. Connor, and A. Lambert (2007), A comparison ofmiddle atmospheric water vapor as measured by WVMS, EOS-MLS,and HALOE, J. Geophys. Res. , 112 , D24S39, doi:10.1029/2007JD008757.
Parrish, A., R. L. deZafra, P. M. Solomon, and J. W. Barret (1988), Aground–based technique for millimeter wave spectroscopic observationsof stratospheric trace constituents, Radio Sci., 23, 106–118.
Payne, V. H., J. S. Delamere, K. E. Cady-Pereira, R. R. Gamache,L. J-Moncet, S. Mlawer, and A. Clough (2008), Air-broadened half-widthsof the 22- and 183-GHz water-vapor lines, IEEE Trans. Geosci. RemoteSens., 46, 3601–3617.
Poynter, R. L., and H. M. Pickett (1985), Submillimeter, millimeter, andmicrowave spectral-line catalog, Appl. Opt., 24, 2235–2240.
Remsberg, E. E., and L. E. Deaver (2005), Interannual, solar cycle, andtrend terms in middle atmospheric temperature time series from HALOE,J. Geophys. Res., 110, D06106, doi:10.1029/2004JD004905.
Rodgers, C. D. (1976), Retrieval of atmospheric temperature and composi-tion from remote measurements of thermal radiation, Rev. Geophys., 14,609–624.
Rothman, L. S., et al. (2005), The HITRAN 2004 molecular spectroscopicdatabase, J. Quant. Spectrosc. Radiat. Transfer, 96, 139–204.
Schwartz, M. J., et al. (2008), Validation of the Aura Microwave LimbSounder temperature and geopotential height measurements, J. Geophys.Res., 113, D15S11, doi:10.1029/2007JD008783.
Straub, C., A. Murk, N. Kampfer, D. Zardet, and B. Stuber (2008), Devel-opment of a 22 GHz correlating radiometer for the observation of strato-spheric water vapor, paper presented at 2008 Microwave Radiometry andRemote Sensing of the Environment (MICRORAD2008), IEEEGeosci. andRemote Sens. Soc., New York.
Thacker, D. L., R. M. Bevilacqua, W. B. Waltman, T. A. Pauls, R. M.Gomez, G. E. Nedoluha, and P. R. Schwartz (1995), Ground-based sensingof water-vapor in the stratosphere and mesosphere, IEEE Trans. Instrum.Meas., 44(2), 355–359.
Vomel, H., et al. (2007), Validation of Aura MLS water vapor by balloon-borne Cryogenic Frost point Hygrometer measurements, J. Geophys.Res., 112, D24S37, doi:10.1029/2007JD008698.
Waters, J. W., et al. (2006), The Eartch Observing System Microwave LimbSounder (EOS MLS)on the Aura satellite, IEEE Trans. Geosci. RemoteSens., 44, 1075–1092.
�����������������������E. De Wachter, A. Haefele, K. Hocke, and N. Kampfer, Department
of Microwave Physics, Institute of Applied Physics, University of Bern,Sidlerstrasse 5, Bern CH-3012, Switzerland. ([email protected])P. Eriksson and P. Forkman, Department of Radio and Space Science,
Chalmers University of Technology, Gothenburg S-41296, Sweden.R. M. Gomez and G. E. Nedoluha, Naval Research Laboratory, 4555
Overlook Ave., SW, Washington, DC 20375, USA.A. Lambert and M. J. Schwartz, Jet Propulsion Laboratory, California
Institute of Technology, Pasadena, CA 91109, USA.
D23305 HAEFELE ET AL.: VALIDATION OF GROUND-BASED RADIOMETERS
11 of 11
D23305
Top Related
Copyright © 2022 FDOKUMEN

