


Bahasa
Halaman
Hukum

i n t e r n a t i o n a l j o u r n a l o f h y d r o g e n e n e r g y 3 5 ( 2 0 1 0 ) 4 1 1 1 – 4 1 2 2
Avai lab le a t www.sc iencedi rec t .com
j ourna l homepage : www.e lsev ier . com/ loca te /he
Transformation of light paraffins in a microwave-inducedplasma-based reactor at reduced pressure
Manuel Mora a, Marıa del Carmen Garcıa b,*, Cesar Jimenez-Sanchidrian a,Francisco Jose Romero-Salguero a,**a Department of Organic Chemistry, Faculty of Sciences, University of Cordoba, Campus de Rabanales, Marie Curie Building, Ctra. Nnal. IV,
km 396, 14071 Cordoba, Spainb Department of Applied Physics, Polytechnic School, University of Cordoba, Campus de Rabanales, Albert Einstein Building, Ctra. Nnal. IV,
km 396, 14071 Cordoba, Spain
a r t i c l e i n f o
Article history:
Received 30 December 2009
Received in revised form
29 January 2010
Accepted 31 January 2010
Available online 26 February 2010
Keywords:
Surface-wave discharge
Microwave plasma
Light paraffins
Hydrogen
Ethylene
Amorphous hydrogenated
carbon films
* Corresponding author. Tel.: þ34 957212633;** Corresponding author. Tel.: þ34 957212065;
E-mail addresses: [email protected] (M.0360-3199/$ – see front matter ª 2010 Profesdoi:10.1016/j.ijhydene.2010.01.149
a b s t r a c t
In this work, the effects of the plasma chemistry of an argon microwave (2.45 GHz)
discharge at reduced pressure on the conversion of three different alkanes (n-pentane,
n-hexane and n-heptane) have been studied. Optical emission spectroscopy has been used
for identifying the species generated in the plasma and for estimating its gas temperature.
Gas chromatography, mass spectrometry, X-ray diffraction and FTIR spectroscopy have
been employed for identifying and analyzing all the compounds present as reaction
products. Microwave power and hydrocarbon flow rate have been found critically to affect
both conversion and selectivity. The main gas products have been hydrogen and ethylene.
At low powers (100–150 W) the conversion to hydrogen has been quite selective. However,
at high powers (>300 W) or slow hydrocarbon flow rate ethylene has resulted to be the
major product. In most cases, an important fraction of a carbon deposit has been obtained
which has been characterized as an amorphous hydrogenated carbon film. Some plausible
mechanisms explaining the formation of the main reaction products have been discussed.
ª 2010 Professor T. Nejat Veziroglu. Published by Elsevier Ltd. All rights reserved.
1. Introduction commonly selected as the hydrogen source by steam reforming
Hydrogen is nowadays widely used in the chemical industry as
a raw material (i.e., ammonia synthesis, refining, etc.) and is
becoming more and more popular due to its application in fuel
cells. Concerning hydrogen production, it should be clearly
distinguished between mobile and stationary applications
since one of the main drawbacks of hydrogen is its difficult
storage. Hydrogen can be produced from hydrocarbons by
a variety of processes, such as partial oxidation with air, steam
reforming, CO2 reforming, and pyrolysis [1–4]. Methane is
fax: þ34 957212068.fax: þ34 957212066.
del Carmen Garcıa), qo2rsor T. Nejat Veziroglu. Pu
on nickel catalysts.
Pyrolysis, often also called thermolysis or direct decar-
bonization, consists in the dissociation of the hydrocarbon to
hydrogen and carbon in the absence of an oxidizer (air, water,
etc.), thus avoiding the emission of CO and CO2 [5]. These by-
products would impose additional purification steps for
hydrogen in order to fulfill some of its end-use applications [6].
In particular, for its application in fuel cell, hydrogen must be
of a high purity. Additionally, it would reduce the amount of
CO2 emitted from fossil fuels, so decreasing the needs for its
[email protected] (F.J. Romero-Salguero).blished by Elsevier Ltd. All rights reserved.
i n t e r n a t i o n a l j o u r n a l o f h y d r o g e n e n e r g y 3 5 ( 2 0 1 0 ) 4 1 1 1 – 4 1 2 24112
capture or sequestration. Moreover, the carbon produced
would be free of sulfur and ash and could be used in a variety
of applications or stored in an environmentally safer manner
than CO2. The hydrocarbon decomposition processes can be
catalytic or non-catalytic [7,8]. Among the catalysts, nickel is
the most common because it provides the highest activity.
In the last years, the use of plasmas in hydrocarbon
reforming applications for different purposes (such as growth
of carbon nanotubes, deposition of diamond-like carbon films,
conversion of methane into more valuable hydrocarbons, or
hydrogen production) has northerly increased. Plasma offers
an interesting means for producing active species (electrons,
ions, free radicals, metastable species or photons) that allows
synthesizing chemicals with high activation energy. Thus, the
employ of plasma reactors for the production of H2 is very
attractive, even for on-board applications [9–13]. They have
several important advantages, such as their high conversion
efficiencies and their possibilities to operate with a broad
range of fuels, including higher hydrocarbons [14–18], alcohols
[19], ethers [20,21] or biomass [22].
Different types of plasmas have been used for the trans-
formation of hydrocarbons. Glow discharges at atmospheric
pressures were successfully used by Nozaki et al. in the growth
of carbon nanotubes [23]. Dielectric-barrier discharges have
been employed in deposition of amorphous hydrogenated-
carbon thin films [24], conversion of methane into more
useful chemicals including synthesis gas, gaseous and liquid
hydrocarbons and oxygenates [25–28], and in conversion of
natural gas to C2 hydrocarbons [29]. A maximum hydrogen
yield of 4 mol of hydrogen per mol of hydrocarbon has been
reported in the auto-thermal reforming of isooctane by
combining a dielectric barrier discharge on the surface of
bimetallic catalysts [16]. Pulsed corona plasmas were used by
Zhu et al. [30] to study methane conversion and Sobacchi et al.
[31] used them (followed by a catalytic system) for the partial
oxidation based reforming of isooctane at atmospheric pres-
sure. Corona discharges have been also resulted to be effective
to produce synthesis gas from methane and air together with C2
hydrocarbons and carbon oxides [32] as well as C2 hydrocar-
bons by oxidative coupling of methane [33]. Kaning et al. [34]
and Ioffe et al. [35] have studied the dissociation of methane
in capacitively coupled RF plasmas, and Chiang and Hon have
utilized positive direct current (DC) plasmas of methane-
hydrogen for diamond deposition [36]. A hydrogen-rich gas
can be produced by using a non-thermal gliding arc reactor to
convert gasoline under auto-thermal or steam reforming
conditions for automotive applications [18]. A periodic pulsed
spark discharge has been used for direct conversion of methane
to acetylene or syngas by Kado et al. [37]. Finally, both DC arc
and low current plasmatron fuel converters have been used to
convert natural gas, gasoline and diesel fuel into a hydrogen-
rich gas under partial oxidation conditions [10,11,14]. The
application of the plasma catalysis technique, which integrates
plasma and thermal catalysis, in hydrocarbon reforming for
hydrogen production has been recently reviewed [38].
Microwave induced plasmas (MIPs) have been also
employed with similar purposes. Suib and Zerger [39] have
study the conversion of methane to higher hydrocarbons by
using MIPs. Heintze and Magureanu have investigated the
conversion of methane to aromatic hydrocarbons [40] as well as
to acetylene [41,42] in a pulsed microwave plasma at atmo-
spheric pressure. Hatano et al. [43] have also claimed the
selective conversion of methane to acetylene. Ioffle et al. [44]
and Kovacs and Deam [45] used MIPs for decomposing
methane over carbon. Several authors have employed micro-
wave plasma reactors for hydrogen production by steam
reforming [46] or by dry reforming without additives [47,48].
Microwave discharges have been used for the steam reforming
of hexane to produce syngas [49]. However, this process
requires the subsequent transformation of CO into CO2 with
H2O with the simultaneous production of H2 by means of
a water–gas shift reaction.
Against other plasmas, in microwave discharges the plasma
is not in direct contact with the electrodes which prevents their
erosion and the subsequent plasma contamination. Surface
Wave Sustained Discharges (SWDs) generated in dielectric
tubes are a special kind of MIPs with numerous and interesting
features [50]: they can be generated under a broad range of
frequency, using different support gases (argon, helium, xenon,
nitrogen,.), at different pressure conditions (from few mtorr to
several atmospheres), and employing tubes of different shapes
(cylindrical or flat) and sizes. The electromagnetic field that
sustains a SWD column is provided by a travelling surface wave
linked to the plasma-dielectric interface. This surface wave
gradually transmits energy as it propagates throughout the
discharge (energy that is partially employed to excite, to ionize
and/or to dissociate the different species and molecules exist-
ing in the support gas) what provokes a progressively decay of
the electron density and temperature (and so of the number of
active species) along the plasma column. This feature could be
very useful because allows to adapt the design of plasma
reactor in order to optimize the results of the application
needed, capability that does not have other kind of MIPs, such
as those generated at resonant cavities or microwave plasma
torches, in which the microwave power is absorbed more
uniformly within the whole plasma volume [51].
Often, a surplus of naphtha in the refineries exceeding the
needs for its incorporation to the gasoline blend is used for the
production of certain hydrocarbons, particularly ethylene, as
well as hydrogen. Ethylene is a very useful bulk chemical. It is
the organic compound of higher production by virtue of its use
as a raw material for the synthesis of very important chemicals,
such as polyethylene, ethylene glycol, ethanol or styrene. In
fact, more than 70% of the ethylene is currently produced from
naphtha. Hydrogen is widely used in refinery for numerous
processes (hydrodesulfurization, hydrocracking, hydrogena-
tion, etc.) and is produced in two steps from naphtha, the first
one involving its prereforming to hydrogen and methane, and
the second consisting in methane to hydrogen conversion via
steam reforming. Herein, the transformation of several paraf-
fins in a microwave SWD plasma reactor is reported. In the
present work, n-pentane, n-hexane and n-heptane have been
chosen as model hydrocarbons of light naphtha. Optical
Emission Spectroscopy (OES) techniques have been used in
order to gain into the knowledge of the hydrocarbon cleavage
process inside the plasma. In the last years, the employ of
optical emission spectroscopy in the plasma process control
technology is getting more and more concern. OES is a non-
invasive technique (does not affect the plasma) that offers the
possibility of observing the plasma in real-time, and whose
i n t e r n a t i o n a l j o u r n a l o f h y d r o g e n e n e r g y 3 5 ( 2 0 1 0 ) 4 1 1 1 – 4 1 2 2 4113
implementation in the experimental set-up is very simple,
since only requires a diagnostic port providing a line-of-sight
through the plasma. On the other hand, the combination of
OES techniques with GC and mass spectrometry has permitted
to get a better understanding of the chemical processes that
take place in the post-discharge leading to the production of
hydrogen and other hydrocarbons as well as to the deposition
of carbon films.
2. Experimental set-up
2.1. Plasma reactor design
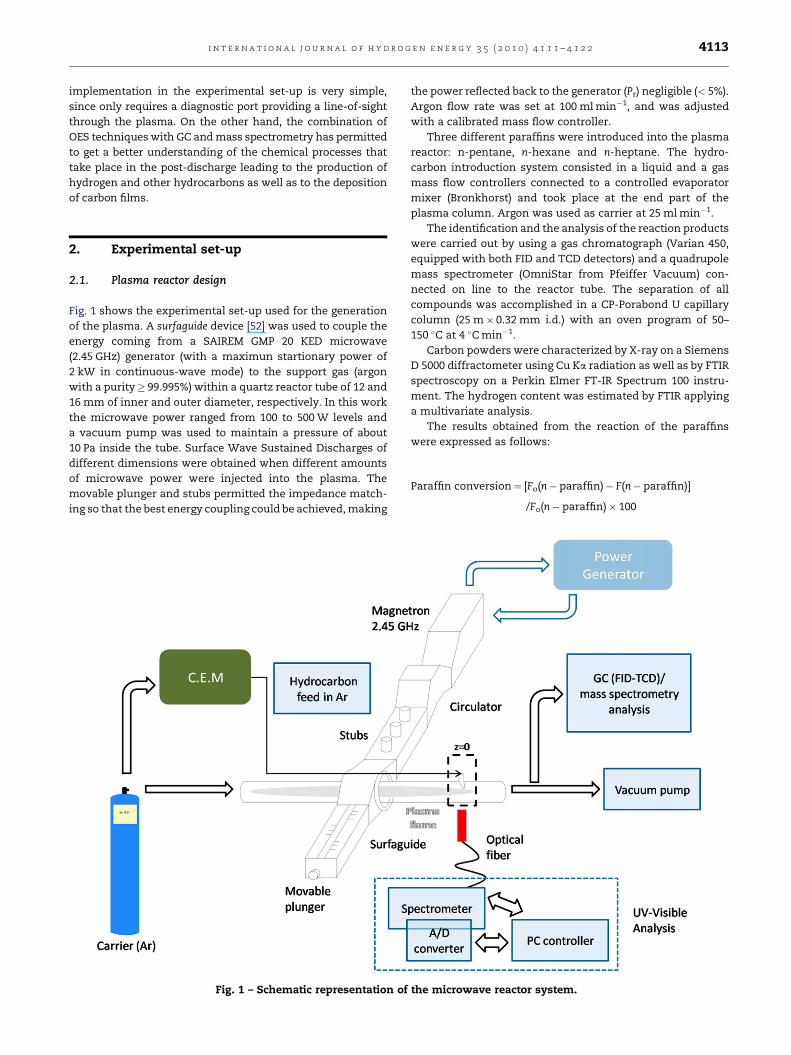
Fig. 1 shows the experimental set-up used for the generation
of the plasma. A surfaguide device [52] was used to couple the
energy coming from a SAIREM GMP 20 KED microwave
(2.45 GHz) generator (with a maximun startionary power of
2 kW in continuous-wave mode) to the support gas (argon
with a purity� 99.995%) within a quartz reactor tube of 12 and
16 mm of inner and outer diameter, respectively. In this work
the microwave power ranged from 100 to 500 W levels and
a vacuum pump was used to maintain a pressure of about
10 Pa inside the tube. Surface Wave Sustained Discharges of
different dimensions were obtained when different amounts
of microwave power were injected into the plasma. The
movable plunger and stubs permitted the impedance match-
ing so that the best energy coupling could be achieved, making
Fig. 1 – Schematic representation of
the power reflected back to the generator (Pr) negligible (< 5%).
Argon flow rate was set at 100 ml min�1, and was adjusted
with a calibrated mass flow controller.
Three different paraffins were introduced into the plasma
reactor: n-pentane, n-hexane and n-heptane. The hydro-
carbon introduction system consisted in a liquid and a gas
mass flow controllers connected to a controlled evaporator
mixer (Bronkhorst) and took place at the end part of the
plasma column. Argon was used as carrier at 25 ml min�1.
The identification and the analysis of the reaction products
were carried out by using a gas chromatograph (Varian 450,
equipped with both FID and TCD detectors) and a quadrupole
mass spectrometer (OmniStar from Pfeiffer Vacuum) con-
nected on line to the reactor tube. The separation of all
compounds was accomplished in a CP-Porabond U capillary
column (25 m� 0.32 mm i.d.) with an oven program of 50–
150 �C at 4 �C min�1.
Carbon powders were characterized by X-ray on a Siemens
D 5000 diffractometer using Cu Ka radiation as well as by FTIR
spectroscopy on a Perkin Elmer FT-IR Spectrum 100 instru-
ment. The hydrogen content was estimated by FTIR applying
a multivariate analysis.
The results obtained from the reaction of the paraffins
were expressed as follows:
Paraffin conversion¼ [Fo(n� paraffin)� F(n� paraffin)]
/Fo(n� paraffin)� 100
the microwave reactor system.
i n t e r n a t i o n a l j o u r n a l o f h y d r o g e n e n e r g y 3 5 ( 2 0 1 0 ) 4 1 1 1 – 4 1 2 24114
where Fo(n� paraffin) and F(n� paraffin), both in mol h�1,
denote the flow rates of the paraffin in the feed and the
product gas, respectively, and
Production rate¼ F(product)
where F(product) indicates the flow rate of each compound
in the product gas (in mol h�1 but g h�1 for carbon). Finally, the
selectivities to products were defined as follows:
Product selectivity¼ F(product)/[Fo(n� paraffin)
� F(n� paraffin)]� 100
2.2. Optical measurements
Light emission from the plasma was analyzed by employing an
AvaSpec Multichannel Fiber Optic Spectrometer, configured
with three 75 mm focal length spectrometer (Czerny–Turner
type) channels, all consisting of 2048 pixel CCD detectors,
holographic diffraction gratings of 1200 grooves/mm, and
10 mm slit widths (spectral resolution in 0.1–0.2 nm range). The
wavelength ranges for every channel were 300–450 nm, 450–
670 nm and 670–850 nm, respectively. Emission from the
plasma was side-on collected at different axial position of the
plasma column through three optical fibers every one con-
nected to their corresponding spectrometer channel.
Spectra recorded permitted us both to gain knowledge into
the different species existing in the plasma and to estimate
the plasma gas temperature from the theoretical simulations
of CH (4300 A system) and CN (violet system at 388 nm)
spectra and their comparisons to the experimental ones
[53,54]. For this purpose, LIFBASE software developed by
Luque and Crosley [55] was employed.
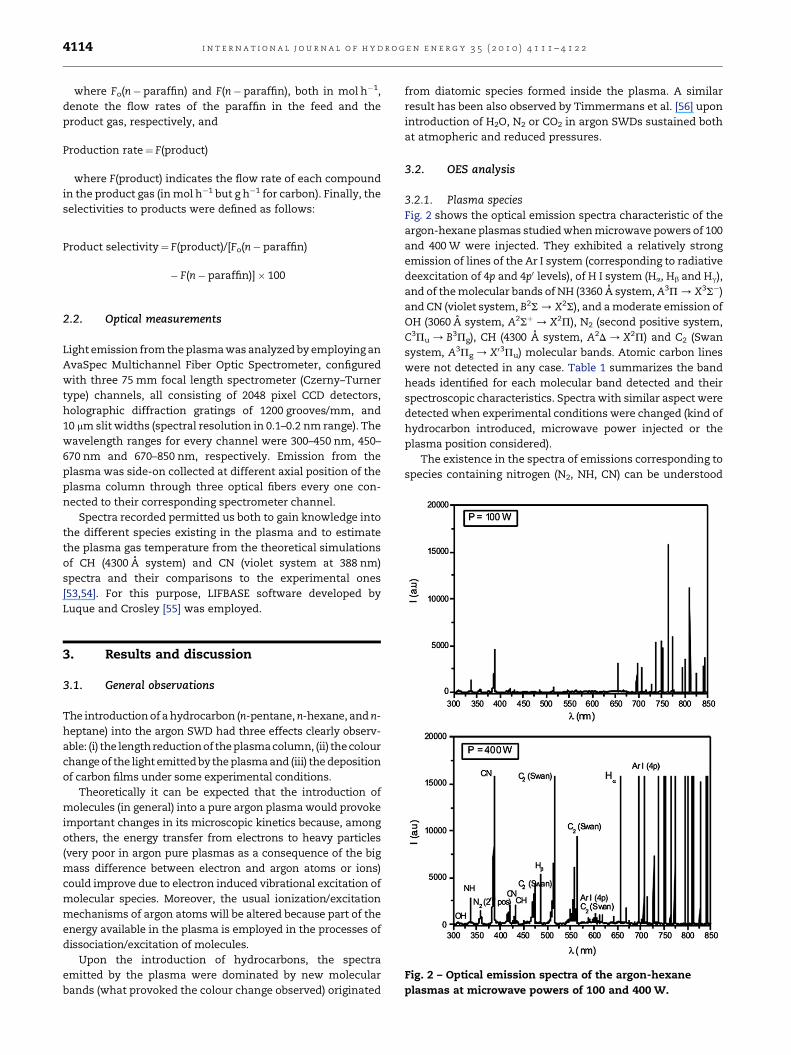
Fig. 2 – Optical emission spectra of the argon-hexane
plasmas at microwave powers of 100 and 400 W.
3. Results and discussion
3.1. General observations
The introduction of a hydrocarbon (n-pentane, n-hexane, and n-
heptane) into the argon SWD had three effects clearly observ-
able: (i) the length reduction of the plasmacolumn, (ii) the colour
change of the light emitted by the plasma and (iii) the deposition
of carbon films under some experimental conditions.
Theoretically it can be expected that the introduction of
molecules (in general) into a pure argon plasma would provoke
important changes in its microscopic kinetics because, among
others, the energy transfer from electrons to heavy particles
(very poor in argon pure plasmas as a consequence of the big
mass difference between electron and argon atoms or ions)
could improve due to electron induced vibrational excitation of
molecular species. Moreover, the usual ionization/excitation
mechanisms of argon atoms will be altered because part of the
energy available in the plasma is employed in the processes of
dissociation/excitation of molecules.
Upon the introduction of hydrocarbons, the spectra
emitted by the plasma were dominated by new molecular
bands (what provoked the colour change observed) originated
from diatomic species formed inside the plasma. A similar
result has been also observed by Timmermans et al. [56] upon
introduction of H2O, N2 or CO2 in argon SWDs sustained both
at atmopheric and reduced pressures.
3.2. OES analysis
3.2.1. Plasma speciesFig. 2 shows the optical emission spectra characteristic of the
argon-hexane plasmas studied when microwave powers of 100
and 400 W were injected. They exhibited a relatively strong
emission of lines of the Ar I system (corresponding to radiative
deexcitation of 4p and 4p0 levels), of H I system (Ha, Hb and Hg),
and of the molecular bands of NH (3360 A system, A3P / X3S�)
and CN (violet system, B2S / X2S), and a moderate emission of
OH (3060 A system, A2Sþ/ X2P), N2 (second positive system,
C3Pu / B3Pg), CH (4300 A system, A2D / X2P) and C2 (Swan
system, A3Pg / X03Pu) molecular bands. Atomic carbon lines
were not detected in any case. Table 1 summarizes the band
heads identified for each molecular band detected and their
spectroscopic characteristics. Spectra with similar aspect were
detected when experimental conditions were changed (kind of
hydrocarbon introduced, microwave power injected or the
plasma position considered).
The existence in the spectra of emissions corresponding to
species containing nitrogen (N2, NH, CN) can be understood
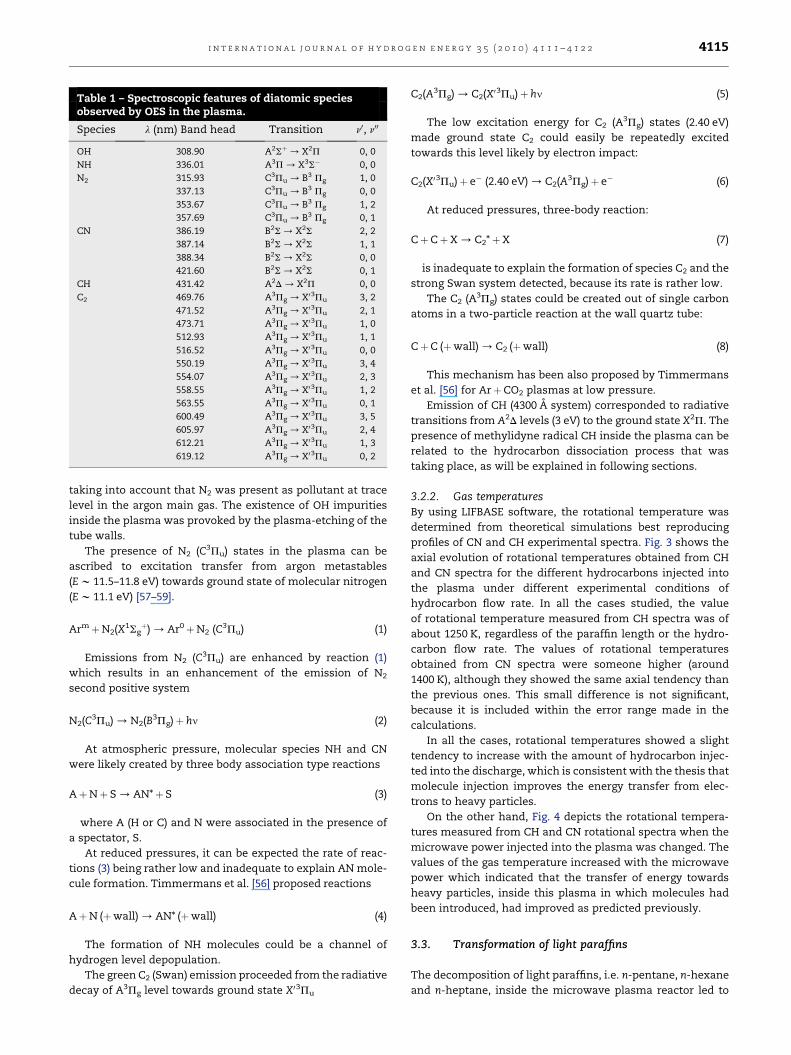
Table 1 – Spectroscopic features of diatomic speciesobserved by OES in the plasma.
Species l (nm) Band head Transition n0, n00
OH 308.90 A2Sþ/ X2P 0, 0
NH 336.01 A3P / X3S� 0, 0
N2 315.93 C3Pu / B3 Pg 1, 0
337.13 C3Pu / B3 Pg 0, 0
353.67 C3Pu / B3 Pg 1, 2
357.69 C3Pu / B3 Pg 0, 1
CN 386.19 B2S / X2S 2, 2
387.14 B2S / X2S 1, 1
388.34 B2S / X2S 0, 0
421.60 B2S / X2S 0, 1
CH 431.42 A2D / X2P 0, 0
C2 469.76 A3Pg / X03Pu 3, 2
471.52 A3Pg / X03Pu 2, 1
473.71 A3Pg / X03Pu 1, 0
512.93 A3Pg / X03Pu 1, 1
516.52 A3Pg / X03Pu 0, 0
550.19 A3Pg / X03Pu 3, 4
554.07 A3Pg / X03Pu 2, 3
558.55 A3Pg / X03Pu 1, 2
563.55 A3Pg / X03Pu 0, 1
600.49 A3Pg / X03Pu 3, 5
605.97 A3Pg / X03Pu 2, 4
612.21 A3Pg / X03Pu 1, 3
619.12 A3Pg / X03Pu 0, 2
i n t e r n a t i o n a l j o u r n a l o f h y d r o g e n e n e r g y 3 5 ( 2 0 1 0 ) 4 1 1 1 – 4 1 2 2 4115
taking into account that N2 was present as pollutant at trace
level in the argon main gas. The existence of OH impurities
inside the plasma was provoked by the plasma-etching of the
tube walls.
The presence of N2 (C3Pu) states in the plasma can be
ascribed to excitation transfer from argon metastables
(E w 11.5–11.8 eV) towards ground state of molecular nitrogen
(E w 11.1 eV) [57–59].
ArmþN2(X1Sgþ) / Ar0þN2 (C3Pu) (1)
Emissions from N2 (C3Pu) are enhanced by reaction (1)
which results in an enhancement of the emission of N2
second positive system
N2(C3Pu) / N2(B3Pg)þ hn (2)
At atmospheric pressure, molecular species NH and CN
were likely created by three body association type reactions
AþNþ S / AN*þ S (3)
where A (H or C) and N were associated in the presence of
a spectator, S.
At reduced pressures, it can be expected the rate of reac-
tions (3) being rather low and inadequate to explain AN mole-
cule formation. Timmermans et al. [56] proposed reactions
AþN (þwall) / AN* (þwall) (4)
The formation of NH molecules could be a channel of
hydrogen level depopulation.
The green C2 (Swan) emission proceeded from the radiative
decay of A3Pg level towards ground state X03Pu
C2(A3Pg) / C2(X03Pu)þ hn (5)
The low excitation energy for C2 (A3Pg) states (2.40 eV)
made ground state C2 could easily be repeatedly excited
towards this level likely by electron impact:
C2(X03Pu)þ e� (2.40 eV) / C2(A3Pg)þ e� (6)
At reduced pressures, three-body reaction:
CþCþX / C2*þX (7)
is inadequate to explain the formation of species C2 and the
strong Swan system detected, because its rate is rather low.
The C2 (A3Pg) states could be created out of single carbon
atoms in a two-particle reaction at the wall quartz tube:
CþC (þwall) / C2 (þwall) (8)
This mechanism has been also proposed by Timmermans
et al. [56] for ArþCO2 plasmas at low pressure.
Emission of CH (4300 A system) corresponded to radiative
transitions from A2D levels (3 eV) to the ground state X2P. The
presence of methylidyne radical CH inside the plasma can be
related to the hydrocarbon dissociation process that was
taking place, as will be explained in following sections.
3.2.2. Gas temperaturesBy using LIFBASE software, the rotational temperature was
determined from theoretical simulations best reproducing
profiles of CN and CH experimental spectra. Fig. 3 shows the
axial evolution of rotational temperatures obtained from CH
and CN spectra for the different hydrocarbons injected into
the plasma under different experimental conditions of
hydrocarbon flow rate. In all the cases studied, the value
of rotational temperature measured from CH spectra was of
about 1250 K, regardless of the paraffin length or the hydro-
carbon flow rate. The values of rotational temperatures
obtained from CN spectra were someone higher (around
1400 K), although they showed the same axial tendency than
the previous ones. This small difference is not significant,
because it is included within the error range made in the
calculations.
In all the cases, rotational temperatures showed a slight
tendency to increase with the amount of hydrocarbon injec-
ted into the discharge, which is consistent with the thesis that
molecule injection improves the energy transfer from elec-
trons to heavy particles.
On the other hand, Fig. 4 depicts the rotational tempera-
tures measured from CH and CN rotational spectra when the
microwave power injected into the plasma was changed. The
values of the gas temperature increased with the microwave
power which indicated that the transfer of energy towards
heavy particles, inside this plasma in which molecules had
been introduced, had improved as predicted previously.
3.3. Transformation of light paraffins
The decomposition of light paraffins, i.e. n-pentane, n-hexane
and n-heptane, inside the microwave plasma reactor led to

Fig. 4 – Rotational temperatures obtained from theoretical
simulations with LIFBASE of CH and CN spectra for
n-hexane fed into the plasma (2.35 3 10L2 mol hL1 in
position 0) at different microwave powers.
Fig. 3 – Rotational temperatures obtained from theoretical
simulations with LIFBASE of CH and CN spectra for the
different hydrocarbons fed into the plasma (in position 0)
at different flow rates.
i n t e r n a t i o n a l j o u r n a l o f h y d r o g e n e n e r g y 3 5 ( 2 0 1 0 ) 4 1 1 1 – 4 1 2 24116
lower hydrocarbons, from C1 to C4, hydrogen and a carbon
deposit as a result of pyrolysis reactions. In general, the main
hydrocarbon products were methane and particularly a C2
fraction consisting of ethylene and acetylene as well as C3 and
C4 hydrocarbons, most of them unsaturated (Fig. 5).
The conversion of n-pentane at applied microwave powers
from 100 to 450 W is depicted in Fig. 6. As can be observed, the
conversion increased with the power, being practically
constant (ca. 60–65%) above 300 W. At low discharge powers
(100–200 W), n-pentane was predominantly transformed into
hydrogen and carbon, whereas above 250 W the main product
was ethylene (Fig. 7). Due to the importance of ethylene in the
current petrochemical industry, these results might represent
a promising alternative process to produce it since SWDs are
relatively easy to scale-up [51,60]. In general, the yields to other
compounds followed the order: H2> acetylene>C4>
C3>methane. Nevertheless, the amount of hydrogen
obtained at any power was comparable and in fact at 150 W it
could be produced from n-pentane at moderate conversion (ca.
35%) with a high selectivity. Acetylene was not a major product
in contrast to the results obtained by other authors in the study
of the microwave plasma methane conversion to higher
hydrocarbons [39].
Similarly, n-hexane and n-heptane were also transformed in
the plasma reactor giving rise to conversions close to 80% at the
higher powers (Fig. 6). Powers above200 W producedethylene as
the mainreaction product (Fig.7). In these cases, the distribution
of products followed the order: H2>C4> acetylene>
C3>methane. The amounts of hydrogen obtained were
comparable for all hydrocarbons probably because of the anal-
ogous H/C ratio of the three paraffins. Prieto et al. [15] obtained
hydrogen and ethylene as the major compounds in the non-
continuous reforming of heavy oils by using a plate-plate
plasma reactor which generated a spark discharge. They
found that the selectivity towards both compounds decreased
with increasing input power, whereas that to methane and C3þ
hydrocarbons increased.
At a slower hydrocarbon flow rate, n-hexane was also
converted to the same compounds as shown in Fig. 7.
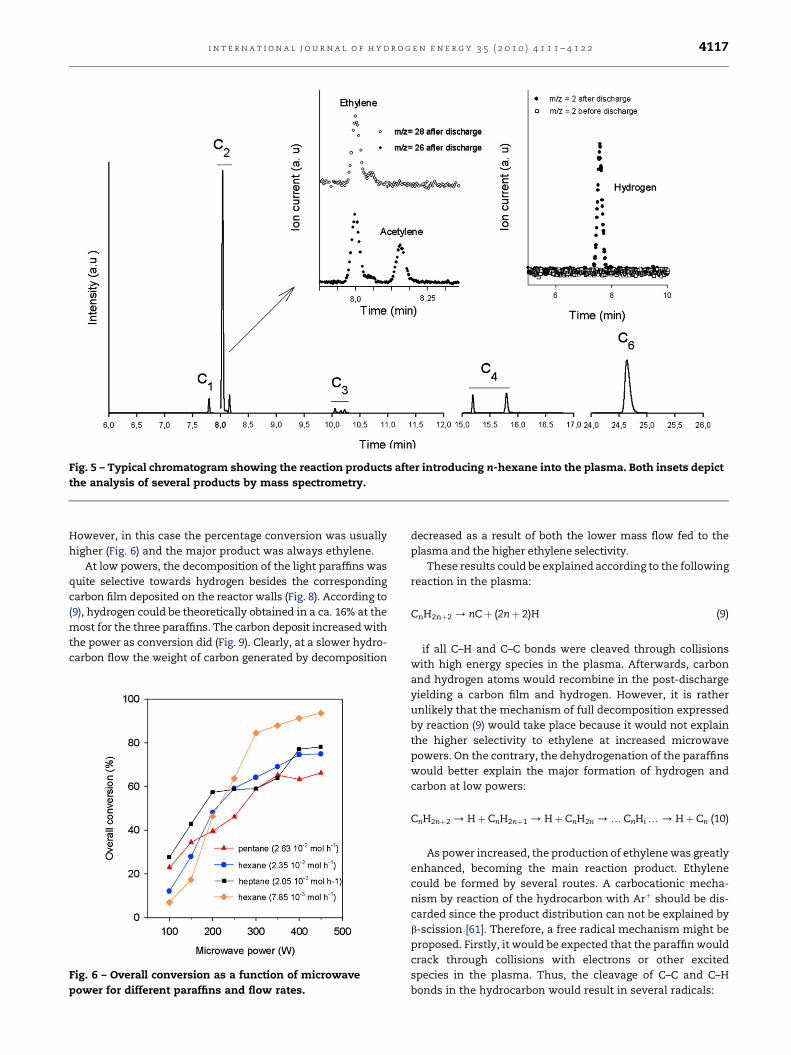
Fig. 5 – Typical chromatogram showing the reaction products after introducing n-hexane into the plasma. Both insets depict
the analysis of several products by mass spectrometry.
i n t e r n a t i o n a l j o u r n a l o f h y d r o g e n e n e r g y 3 5 ( 2 0 1 0 ) 4 1 1 1 – 4 1 2 2 4117
However, in this case the percentage conversion was usually
higher (Fig. 6) and the major product was always ethylene.
At low powers, the decomposition of the light paraffins was
quite selective towards hydrogen besides the corresponding
carbon film deposited on the reactor walls (Fig. 8). According to
(9), hydrogen could be theoretically obtained in a ca. 16% at the
most for the three paraffins. The carbon deposit increased with
the power as conversion did (Fig. 9). Clearly, at a slower hydro-
carbon flow the weight of carbon generated by decomposition
Fig. 6 – Overall conversion as a function of microwave
power for different paraffins and flow rates.
decreased as a result of both the lower mass flow fed to the
plasma and the higher ethylene selectivity.
These results could be explained according to the following
reaction in the plasma:
CnH2nþ2 / nCþ (2nþ 2)H (9)
if all C–H and C–C bonds were cleaved through collisions
with high energy species in the plasma. Afterwards, carbon
and hydrogen atoms would recombine in the post-discharge
yielding a carbon film and hydrogen. However, it is rather
unlikely that the mechanism of full decomposition expressed
by reaction (9) would take place because it would not explain
the higher selectivity to ethylene at increased microwave
powers. On the contrary, the dehydrogenation of the paraffins
would better explain the major formation of hydrogen and
carbon at low powers:
CnH2nþ2 / HþCnH2nþ1 / HþCnH2n / . CnHi . / HþCn (10)
As power increased, the production of ethylene was greatly
enhanced, becoming the main reaction product. Ethylene
could be formed by several routes. A carbocationic mecha-
nism by reaction of the hydrocarbon with Arþ should be dis-
carded since the product distribution can not be explained by
b-scission [61]. Therefore, a free radical mechanism might be
proposed. Firstly, it would be expected that the paraffin would
crack through collisions with electrons or other excited
species in the plasma. Thus, the cleavage of C–C and C–H
bonds in the hydrocarbon would result in several radicals:
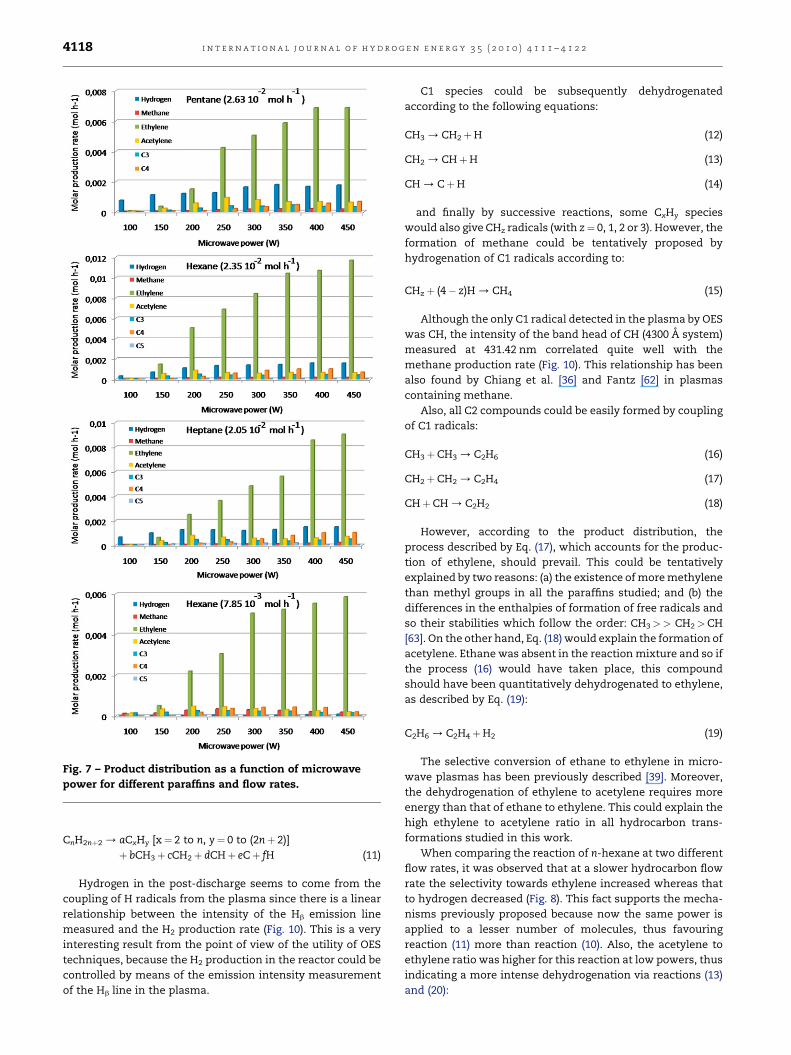
Fig. 7 – Product distribution as a function of microwave
power for different paraffins and flow rates.
i n t e r n a t i o n a l j o u r n a l o f h y d r o g e n e n e r g y 3 5 ( 2 0 1 0 ) 4 1 1 1 – 4 1 2 24118
CnH2nþ2 / aCxHy [x¼ 2 to n, y¼ 0 to (2nþ 2)]
þ bCH3þ cCH2þ dCHþ eCþ fH (11)
Hydrogen in the post-discharge seems to come from the
coupling of H radicals from the plasma since there is a linear
relationship between the intensity of the Hb emission line
measured and the H2 production rate (Fig. 10). This is a very
interesting result from the point of view of the utility of OES
techniques, because the H2 production in the reactor could be
controlled by means of the emission intensity measurement
of the Hb line in the plasma.
C1 species could be subsequently dehydrogenated
according to the following equations:
CH3 / CH2þH (12)
CH2 / CHþH (13)
CH / CþH (14)
and finally by successive reactions, some CxHy species
would also give CHz radicals (with z¼ 0, 1, 2 or 3). However, the
formation of methane could be tentatively proposed by
hydrogenation of C1 radicals according to:
CHzþ (4� z)H / CH4 (15)
Although the only C1 radical detected in the plasma by OES
was CH, the intensity of the band head of CH (4300 A system)
measured at 431.42 nm correlated quite well with the
methane production rate (Fig. 10). This relationship has been
also found by Chiang et al. [36] and Fantz [62] in plasmas
containing methane.
Also, all C2 compounds could be easily formed by coupling
of C1 radicals:
CH3þCH3 / C2H6 (16)
CH2þCH2 / C2H4 (17)
CHþCH / C2H2 (18)
However, according to the product distribution, the
process described by Eq. (17), which accounts for the produc-
tion of ethylene, should prevail. This could be tentatively
explained by two reasons: (a) the existence of more methylene
than methyl groups in all the paraffins studied; and (b) the
differences in the enthalpies of formation of free radicals and
so their stabilities which follow the order: CH3>> CH2>CH
[63]. On the other hand, Eq. (18) would explain the formation of
acetylene. Ethane was absent in the reaction mixture and so if
the process (16) would have taken place, this compound
should have been quantitatively dehydrogenated to ethylene,
as described by Eq. (19):
C2H6 / C2H4þH2 (19)
The selective conversion of ethane to ethylene in micro-
wave plasmas has been previously described [39]. Moreover,
the dehydrogenation of ethylene to acetylene requires more
energy than that of ethane to ethylene. This could explain the
high ethylene to acetylene ratio in all hydrocarbon trans-
formations studied in this work.
When comparing the reaction of n-hexane at two different
flow rates, it was observed that at a slower hydrocarbon flow
rate the selectivity towards ethylene increased whereas that
to hydrogen decreased (Fig. 8). This fact supports the mecha-
nisms previously proposed because now the same power is
applied to a lesser number of molecules, thus favouring
reaction (11) more than reaction (10). Also, the acetylene to
ethylene ratio was higher for this reaction at low powers, thus
indicating a more intense dehydrogenation via reactions (13)
and (20):
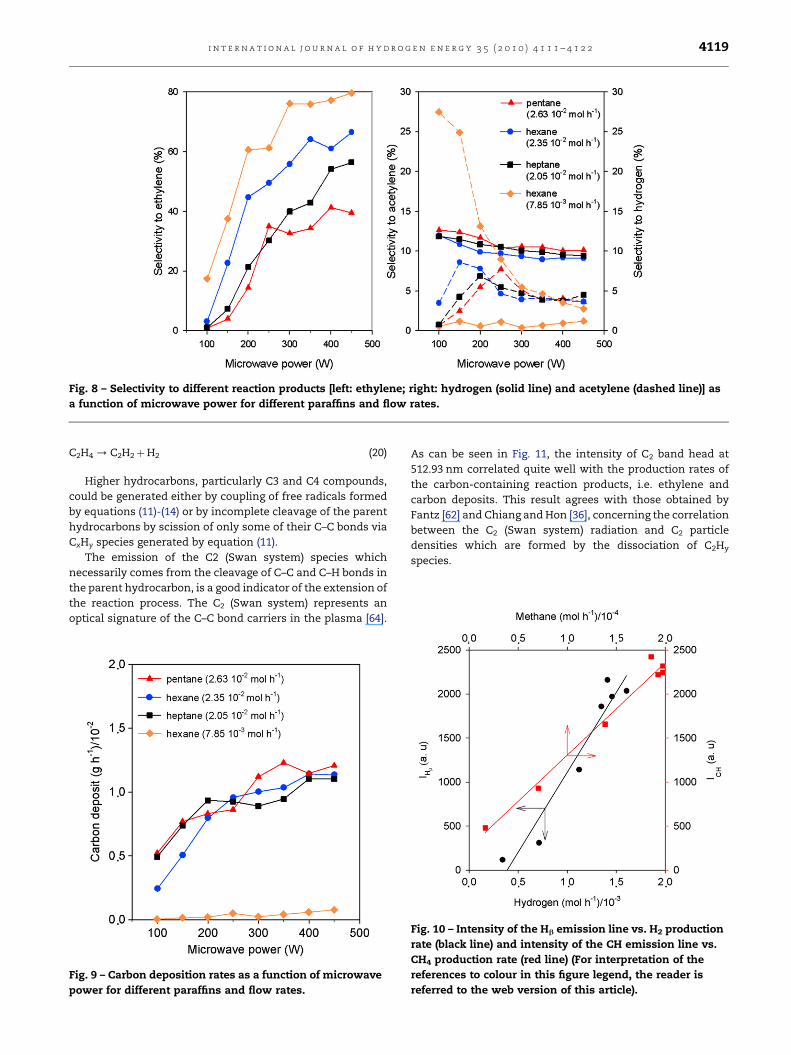
Fig. 8 – Selectivity to different reaction products [left: ethylene; right: hydrogen (solid line) and acetylene (dashed line)] as
a function of microwave power for different paraffins and flow rates.
i n t e r n a t i o n a l j o u r n a l o f h y d r o g e n e n e r g y 3 5 ( 2 0 1 0 ) 4 1 1 1 – 4 1 2 2 4119
C2H4 / C2H2þH2 (20)
Higher hydrocarbons, particularly C3 and C4 compounds,
could be generated either by coupling of free radicals formed
by equations (11)-(14) or by incomplete cleavage of the parent
hydrocarbons by scission of only some of their C–C bonds via
CxHy species generated by equation (11).
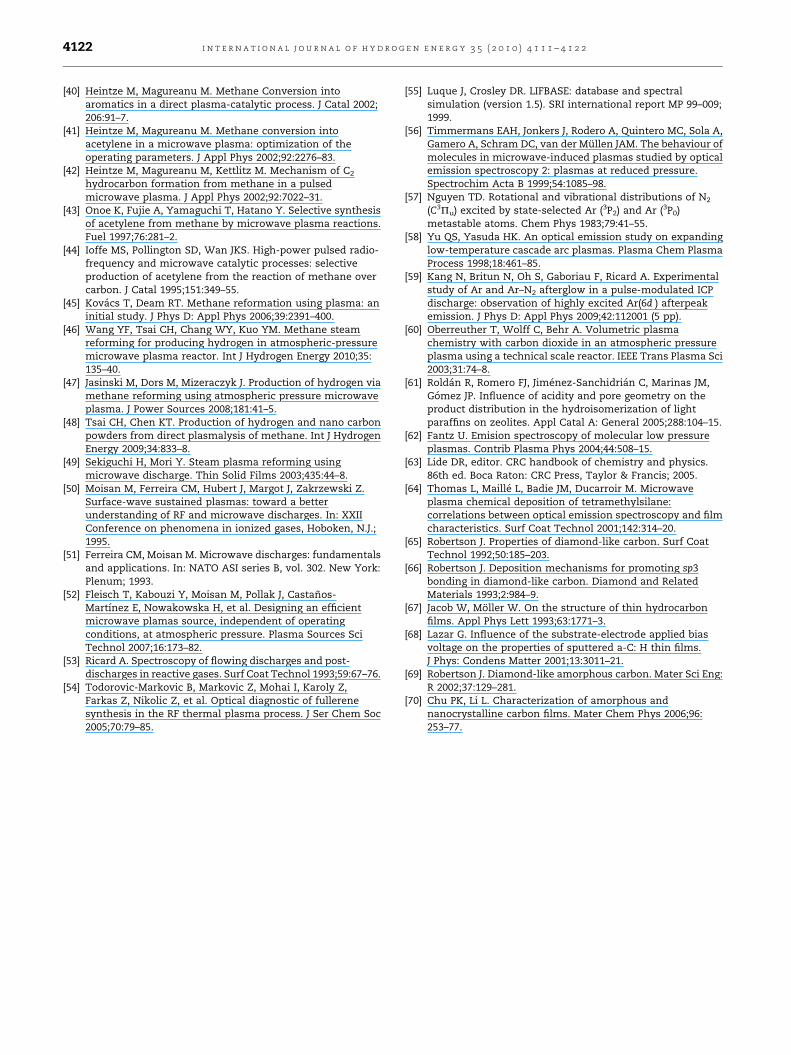
The emission of the C2 (Swan system) species which
necessarily comes from the cleavage of C–C and C–H bonds in
the parent hydrocarbon, is a good indicator of the extension of
the reaction process. The C2 (Swan system) represents an
optical signature of the C–C bond carriers in the plasma [64].
Fig. 9 – Carbon deposition rates as a function of microwave
power for different paraffins and flow rates.
As can be seen in Fig. 11, the intensity of C2 band head at
512.93 nm correlated quite well with the production rates of
the carbon-containing reaction products, i.e. ethylene and
carbon deposits. This result agrees with those obtained by
Fantz [62] and Chiang and Hon [36], concerning the correlation
between the C2 (Swan system) radiation and C2 particle
densities which are formed by the dissociation of C2Hy
species.
Fig. 10 – Intensity of the Hb emission line vs. H2 production
rate (black line) and intensity of the CH emission line vs.
CH4 production rate (red line) (For interpretation of the
references to colour in this figure legend, the reader is
referred to the web version of this article).
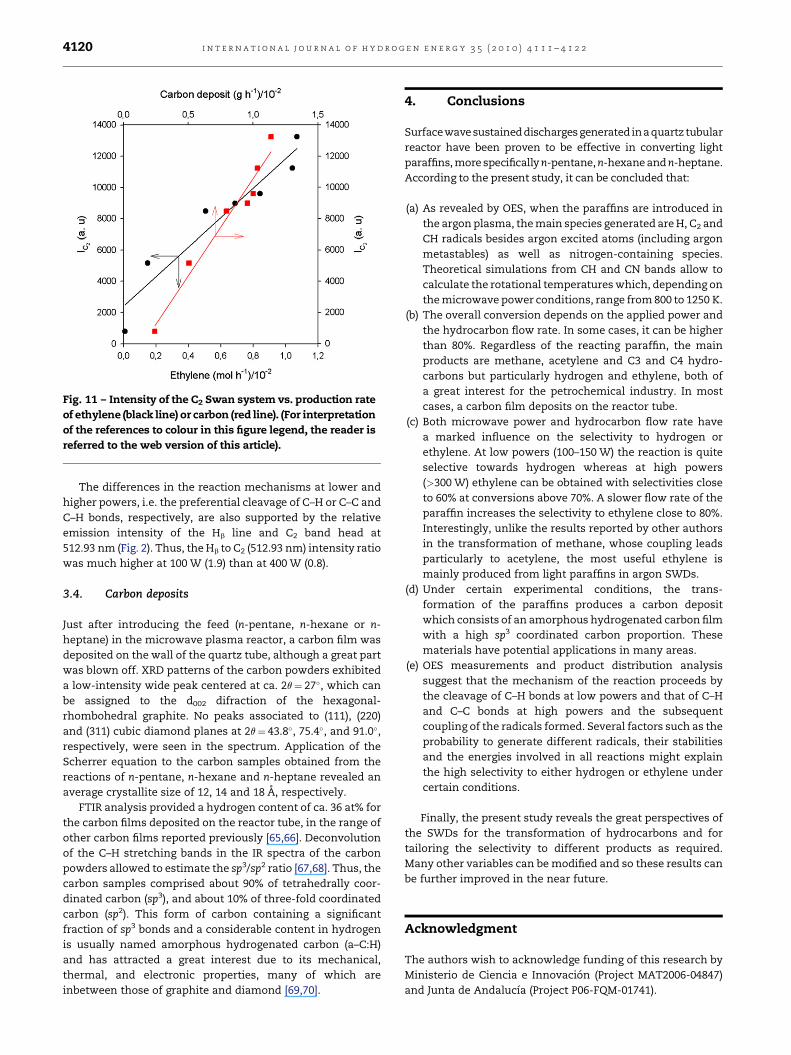
Fig. 11 – Intensity of the C2 Swan system vs. production rate
of ethylene (black line) or carbon (red line). (For interpretation
of the references to colour in this figure legend, the reader is
referred to the web version of this article).
i n t e r n a t i o n a l j o u r n a l o f h y d r o g e n e n e r g y 3 5 ( 2 0 1 0 ) 4 1 1 1 – 4 1 2 24120
The differences in the reaction mechanisms at lower and
higher powers, i.e. the preferential cleavage of C–H or C–C and
C–H bonds, respectively, are also supported by the relative
emission intensity of the Hb line and C2 band head at
512.93 nm (Fig. 2). Thus, the Hb to C2 (512.93 nm) intensity ratio
was much higher at 100 W (1.9) than at 400 W (0.8).
3.4. Carbon deposits
Just after introducing the feed (n-pentane, n-hexane or n-
heptane) in the microwave plasma reactor, a carbon film was
deposited on the wall of the quartz tube, although a great part
was blown off. XRD patterns of the carbon powders exhibited
a low-intensity wide peak centered at ca. 2q¼ 27�, which can
be assigned to the d002 difraction of the hexagonal-
rhombohedral graphite. No peaks associated to (111), (220)
and (311) cubic diamond planes at 2q¼ 43.8�, 75.4�, and 91.0�,
respectively, were seen in the spectrum. Application of the
Scherrer equation to the carbon samples obtained from the
reactions of n-pentane, n-hexane and n-heptane revealed an
average crystallite size of 12, 14 and 18 A, respectively.
FTIR analysis provided a hydrogen content of ca. 36 at% for
the carbon films deposited on the reactor tube, in the range of
other carbon films reported previously [65,66]. Deconvolution
of the C–H stretching bands in the IR spectra of the carbon
powders allowed to estimate the sp3/sp2 ratio [67,68]. Thus, the
carbon samples comprised about 90% of tetrahedrally coor-
dinated carbon (sp3), and about 10% of three-fold coordinated
carbon (sp2). This form of carbon containing a significant
fraction of sp3 bonds and a considerable content in hydrogen
is usually named amorphous hydrogenated carbon (a–C:H)
and has attracted a great interest due to its mechanical,
thermal, and electronic properties, many of which are
inbetween those of graphite and diamond [69,70].
4. Conclusions
Surfacewave sustaineddischargesgenerated inaquartz tubular
reactor have been proven to be effective in converting light
paraffins, more specifically n-pentane, n-hexane and n-heptane.
According to the present study, it can be concluded that:
(a) As revealed by OES, when the paraffins are introduced in
the argon plasma, the main species generated are H, C2 and
CH radicals besides argon excited atoms (including argon
metastables) as well as nitrogen-containing species.
Theoretical simulations from CH and CN bands allow to
calculate the rotational temperatures which, depending on
the microwave power conditions, range from 800 to 1250 K.
(b) The overall conversion depends on the applied power and
the hydrocarbon flow rate. In some cases, it can be higher
than 80%. Regardless of the reacting paraffin, the main
products are methane, acetylene and C3 and C4 hydro-
carbons but particularly hydrogen and ethylene, both of
a great interest for the petrochemical industry. In most
cases, a carbon film deposits on the reactor tube.
(c) Both microwave power and hydrocarbon flow rate have
a marked influence on the selectivity to hydrogen or
ethylene. At low powers (100–150 W) the reaction is quite
selective towards hydrogen whereas at high powers
(>300 W) ethylene can be obtained with selectivities close
to 60% at conversions above 70%. A slower flow rate of the
paraffin increases the selectivity to ethylene close to 80%.
Interestingly, unlike the results reported by other authors
in the transformation of methane, whose coupling leads
particularly to acetylene, the most useful ethylene is
mainly produced from light paraffins in argon SWDs.
(d) Under certain experimental conditions, the trans-
formation of the paraffins produces a carbon deposit
which consists of an amorphous hydrogenated carbon film
with a high sp3 coordinated carbon proportion. These
materials have potential applications in many areas.
(e) OES measurements and product distribution analysis
suggest that the mechanism of the reaction proceeds by
the cleavage of C–H bonds at low powers and that of C–H
and C–C bonds at high powers and the subsequent
coupling of the radicals formed. Several factors such as the
probability to generate different radicals, their stabilities
and the energies involved in all reactions might explain
the high selectivity to either hydrogen or ethylene under
certain conditions.
Finally, the present study reveals the great perspectives of
the SWDs for the transformation of hydrocarbons and for
tailoring the selectivity to different products as required.
Many other variables can be modified and so these results can
be further improved in the near future.
Acknowledgment
The authors wish to acknowledge funding of this research by
Ministerio de Ciencia e Innovacion (Project MAT2006-04847)
and Junta de Andalucıa (Project P06-FQM-01741).

i n t e r n a t i o n a l j o u r n a l o f h y d r o g e n e n e r g y 3 5 ( 2 0 1 0 ) 4 1 1 1 – 4 1 2 2 4121
r e f e r e n c e s
[1] Holladay JD, Hu J, King DL, Wang Y. An overview of hydrogenproduction technologies. Catal Today 2009;139:244–60.
[2] Salazar-Villalpando MD, Reyes B. Hydrogen production overNi/ceria-supported catalysts by partial oxidation of methane.Int J Hydrogen Energy 2009;34:9723–9.
[3] Al-Hamamre Z, Voß S, Trimis D. Hydrogen production bythermal partial oxidation of hydrocarbon fuels in porousmedia based reformer. Int J Hydrogen Energy 2009;34:827–32.
[4] Roh HS, Lee DK, Koo KY, Jung UH, Yoon WL. Natural gassteam reforming for hydrogen production over metalmonolith catalyst with efficient heat-transfer. Int J HydrogenEnergy 2010;35:1613–9.
[5] Muradov NZ, Veziroglu TN. ‘‘Green’’ path from fossil-basedto hydrogen economy: an overview of carbon-neutraltechnologies. Int J Hydrogen Energy 2008;33:6804–39.
[6] Besancon BM, Hasanov V, Imbault-Lastapis R, Benesch R,Barrio M, Molnvik MJ. Hydrogen quality from decarbonizedfossil fuels to fuel cells. Int J Hydrogen Energy 2009;34:2350–60.
[7] Ahmed S, Aitani A, Rahman F, Al-Dawood A, Al-Muhaish F.Decomposition of hydrocarbons to hydrogen and carbon.Appl Catal A: General 2009;359:1–24.
[8] Abbas HF, Wan Daud WMA. Hydrogen production bymethane decomposition: a review. Int J Hydrogen Energy2010;35:1160–90.
[9] Bromberg L, Cohn DR, Rabinovich A. Plasma reformer-fuelcell system for decentralized power applications. Int JHydrogen Energy 1997;22:83–94.
[10] Conh DR, Rabinovich A, Titus CH, Bromberg L. Near-termpossibilities for extremely low emission vehicles usingonboard plasmatron generation of hydrogen. Int J HydrogenEnergy 1997;22:715–23.
[11] Bromberg L, Cohn DR, Rabinovich A, Surma JE, Virden J.Compact plasmatron-boosted hydrogen generationtechnology for vehicular applications. Int J Hydrogen Energy1999;24:341–50.
[12] da Silva CF, Ishikawa T, Santos S, Alves C, Martinelli AE.Production of hydrogen from methane using pulsed plasmaand simultaneous storage in titanium sheet. Int J HydrogenEnergy 2006;31:49–54.
[13] Petitpas G, Rollier J-D, Darmon A, Gonzalez-Aguilar J,Metkemeijer R, Fulcheri L. A comparative study of non-thermal plasma assisted reforming technologies. Int JHydrogen Energy 2007;32:2848–67.
[14] Bromberg L, Cohn DR, Rabinovich A, Heywood J. Emissionsreductions using hydrogen from plasmatron fuel converters.Int J Hydrogen Energy 2001;26:1115–21.
[15] Prieto G, Okumoto M, Shimano K, Takashima K, Katsura S,Mizuno A. Reforming of heavy oil using nonthermal plasma.IEEE Trans Ind Applicat 2001;37:1464–7.
[16] Biniwale RB, Mizuno A, Ichikawa M. Hydrogen production byreforming of iso-octane using spray-pulsed injection andeffect of non-thermal plasma. Appl Catal A: General 2004;276:169–77.
[17] Matsui Y, Kawakami S, Takashima K, Katsura S, Mizuno A.Liquid-phase fuel reforming at room temperature usingnonthermal plasma. Energy Fuels 2005;19:1561–5.
[18] Paulmier T, Fulcheri L. Use of non-thermal plasma forhydrocarbon reforming. Chem. Eng. J 2005;106:59–71.
[19] Sarmiento B, Brey JJ, Viera IG, Gonzalez-Elipe AR, Cotrino J,Rico VJ. Hydrogen production by reforming of hydrocarbonsand alcohols in a dielectric barrier discharge. J Power Sources2007;169:140–3.
[20] Song L, Li X, Zheng T. Onboard hydrogen production frompartial oxidation of dimethyl ether by spark dischargeplasma reforming. Int J Hydrogen Energy 2008;33:5060–5.
[21] Zou JJ, Zhang YP, Liu CJ. Hydrogen production from partialoxidation of dimethyl ether using corona discharge plasma.Int J Hydrogen Energy 2007;32:958–64.
[22] Van Oost G, Hrabovsky M, Kopecky V, Konrad M, Hlina M.Pyrolysis/gasification of biomass for synthetic fuelproduction using a hybrid gas-water stabilized plasma torch.Vacuum 2009;83:209–12.
[23] Nozaki T, Kimura Y, Okazaki K. Carbon nanotubesdeposition in glow barrier discharge enhanced catalytic CVD.J Phys D: Appl Phys 2002;35:2779–84.
[24] Liu DP, Yu SJ, Ma TC, Song ZM, Yang XF. Diamond-likecarbon films deposited in the plasma of dielectric barrierdischarge at atmospheric pressure. Jpn J Appl Phys Part 12000;39:3359–60.
[25] Jiang T, Li Y, Liu CJ, Xu GH, Eliasson B, Xue B. Plasmamethane conversion using dielectric-barrier discharges withzeolite. Catal Today 2002;2002(72):229–35.
[26] Zou JJ, Zhang YP, Liu CJ, Li Y, Eliasson B. Starch-enhancedsynthesis of oxigenates from methane and carbon dioxideusing dielectric-barrier discharges. Plasma Chem PlasmaProcess 2003;23:69–82.
[27] Liu C, Eliasson B, Xue B, Li Y, Wang Y. Zeolite-enhancedplasma methane conversion directly to higher hydrocarbonsusing dielectric-barrier-discharges. React Kinet Catal Lett2001;74:71.
[28] Thayachotpaiboon K, Chavadej S, Caldwell TA, Lobban LL,Mallinson RG. Conversion of methane to higher hydrocarbonsin AC nonequilibrium plasmas. AIChE 1998;44:2252–7.
[29] Wang WB, Xu GH. Conversion of methane to C2
hydrocarbons via cold plasma reaction. J Natural Gas Chem2003;12:178–82.
[30] Zhu A, Gong W, Zhang X, Zhang B. Coupling of methaneunder pulse corona plasma. Sci China (Ser B) 2000;43:208–14.
[31] Sobacchi MG, Saveliev AV, Fridman AA, Kennedy LA,Ahmed S, Krause T. Experimental assessment of a comninedplasma/catalytic system for hydrogen production via partialoxidation of hydrocarbons fuels. Int J Hydrogen Energy 2002;27:635–42.
[32] Supat K, Kruapong A, Chavadej S, Lobban LL, Mallinson RG.Synthesis gas production from partial oxidation of methanewith air in ac electric gas discharge. Energy Fuels 2003;17:474–81.
[33] Liu C, Marafee A, Hill B, Xu G, Mallinson R, Lobban L.Oxidative coupling of methane with AC and DC coronadischarges. Ind Eng Chem Res 1996;35:3295–301.
[34] Kaning M, Ropcke J, Lukas C, Kawetzki T, Shultz-von derGathen V. Dobele HF, Diagnostic Studies of a CapacitivelyCoupled RF Plasma containing CH4–H2–Ar Part II: On CH4Dissociation and Hydrocarbon Plasma Chemistry. Frontiersin Low Temperature Plasma Diagnostics III; 1999.Switzerland.
[35] Ioffe MS, Pollington SD, WanHigh-Power Pulsed Radio-Frequency JKS, Catalytic Microwave. Processes: selectiveproduction of acetylene from the reaction of methane overcarbon. J Catal 1995;151:349–55.
[36] Chiang MJ, Hon MH. Optical emission spectroscopy study ofpositive direct current bias enhanced diamond nucleation.Thin Solid Films 2008;516:4765–70.
[37] Kado S, Urasaki K, Sekine Y, Fujimoto K. Direct conversion ofmethane to acetylene or syngas at room temperature usingnon-equilibrium pulsed discharge. Fuel 2003;82:1377–85.
[38] Chen HL, Lee HM, Chen SH, Chao Y, Chang MB. Review ofplasma catalysis on hydrocarbon reforming for hydrogenproductiondinteraction, integration, and prospects. ApplCatal B: Environmental 2008;85:1–9.
[39] Suib SL, Zerger RP. A direct, continuous, low-power catalyticconversion of methane to higher hydrocarbons viamicrowave plasma. J Catal 1993;139:383–91.
i n t e r n a t i o n a l j o u r n a l o f h y d r o g e n e n e r g y 3 5 ( 2 0 1 0 ) 4 1 1 1 – 4 1 2 24122
[40] Heintze M, Magureanu M. Methane Conversion intoaromatics in a direct plasma-catalytic process. J Catal 2002;206:91–7.
[41] Heintze M, Magureanu M. Methane conversion intoacetylene in a microwave plasma: optimization of theoperating parameters. J Appl Phys 2002;92:2276–83.
[42] Heintze M, Magureanu M, Kettlitz M. Mechanism of C2
hydrocarbon formation from methane in a pulsedmicrowave plasma. J Appl Phys 2002;92:7022–31.
[43] Onoe K, Fujie A, Yamaguchi T, Hatano Y. Selective synthesisof acetylene from methane by microwave plasma reactions.Fuel 1997;76:281–2.
[44] Ioffe MS, Pollington SD, Wan JKS. High-power pulsed radio-frequency and microwave catalytic processes: selectiveproduction of acetylene from the reaction of methane overcarbon. J Catal 1995;151:349–55.
[45] Kovacs T, Deam RT. Methane reformation using plasma: aninitial study. J Phys D: Appl Phys 2006;39:2391–400.
[46] Wang YF, Tsai CH, Chang WY, Kuo YM. Methane steamreforming for producing hydrogen in atmospheric-pressuremicrowave plasma reactor. Int J Hydrogen Energy 2010;35:135–40.
[47] Jasinski M, Dors M, Mizeraczyk J. Production of hydrogen viamethane reforming using atmospheric pressure microwaveplasma. J Power Sources 2008;181:41–5.
[48] Tsai CH, Chen KT. Production of hydrogen and nano carbonpowders from direct plasmalysis of methane. Int J HydrogenEnergy 2009;34:833–8.
[49] Sekiguchi H, Mori Y. Steam plasma reforming usingmicrowave discharge. Thin Solid Films 2003;435:44–8.
[50] Moisan M, Ferreira CM, Hubert J, Margot J, Zakrzewski Z.Surface-wave sustained plasmas: toward a betterunderstanding of RF and microwave discharges. In: XXIIConference on phenomena in ionized gases, Hoboken, N.J.;1995.
[51] Ferreira CM, Moisan M. Microwave discharges: fundamentalsand applications. In: NATO ASI series B, vol. 302. New York:Plenum; 1993.
[52] Fleisch T, Kabouzi Y, Moisan M, Pollak J, Castanos-Martınez E, Nowakowska H, et al. Designing an efficientmicrowave plamas source, independent of operatingconditions, at atmospheric pressure. Plasma Sources SciTechnol 2007;16:173–82.
[53] Ricard A. Spectroscopy of flowing discharges and post-discharges in reactive gases. Surf Coat Technol 1993;59:67–76.
[54] Todorovic-Markovic B, Markovic Z, Mohai I, Karoly Z,Farkas Z, Nikolic Z, et al. Optical diagnostic of fullerenesynthesis in the RF thermal plasma process. J Ser Chem Soc2005;70:79–85.
[55] Luque J, Crosley DR. LIFBASE: database and spectralsimulation (version 1.5). SRI international report MP 99–009;1999.
[56] Timmermans EAH, Jonkers J, Rodero A, Quintero MC, Sola A,Gamero A, Schram DC, van der Mullen JAM. The behaviour ofmolecules in microwave-induced plasmas studied by opticalemission spectroscopy 2: plasmas at reduced pressure.Spectrochim Acta B 1999;54:1085–98.
[57] Nguyen TD. Rotational and vibrational distributions of N2
(C3Pu) excited by state-selected Ar (3P2) and Ar (3P0)metastable atoms. Chem Phys 1983;79:41–55.
[58] Yu QS, Yasuda HK. An optical emission study on expandinglow-temperature cascade arc plasmas. Plasma Chem PlasmaProcess 1998;18:461–85.
[59] Kang N, Britun N, Oh S, Gaboriau F, Ricard A. Experimentalstudy of Ar and Ar–N2 afterglow in a pulse-modulated ICPdischarge: observation of highly excited Ar(6d ) afterpeakemission. J Phys D: Appl Phys 2009;42:112001 (5 pp).
[60] Oberreuther T, Wolff C, Behr A. Volumetric plasmachemistry with carbon dioxide in an atmospheric pressureplasma using a technical scale reactor. IEEE Trans Plasma Sci2003;31:74–8.
[61] Roldan R, Romero FJ, Jimenez-Sanchidrian C, Marinas JM,Gomez JP. Influence of acidity and pore geometry on theproduct distribution in the hydroisomerization of lightparaffins on zeolites. Appl Catal A: General 2005;288:104–15.
[62] Fantz U. Emision spectroscopy of molecular low pressureplasmas. Contrib Plasma Phys 2004;44:508–15.
[63] Lide DR, editor. CRC handbook of chemistry and physics.86th ed. Boca Raton: CRC Press, Taylor & Francis; 2005.
[64] Thomas L, Maille L, Badie JM, Ducarroir M. Microwaveplasma chemical deposition of tetramethylsilane:correlations between optical emission spectroscopy and filmcharacteristics. Surf Coat Technol 2001;142:314–20.
[65] Robertson J. Properties of diamond-like carbon. Surf CoatTechnol 1992;50:185–203.
[66] Robertson J. Deposition mechanisms for promoting sp3bonding in diamond-like carbon. Diamond and RelatedMaterials 1993;2:984–9.
[67] Jacob W, Moller W. On the structure of thin hydrocarbonfilms. Appl Phys Lett 1993;63:1771–3.
[68] Lazar G. Influence of the substrate-electrode applied biasvoltage on the properties of sputtered a-C: H thin films.J Phys: Condens Matter 2001;13:3011–21.
[69] Robertson J. Diamond-like amorphous carbon. Mater Sci Eng:R 2002;37:129–281.
[70] Chu PK, Li L. Characterization of amorphous andnanocrystalline carbon films. Mater Chem Phys 2006;96:253–77.
Top Related
Copyright © 2022 FDOKUMEN

