


Bahasa
Halaman
Hukum

Int. J. Environ. Res. Public Health 2014, 11, 1-12; doi:10.3390/ijerph110100001
International Journal of
Environmental Research and Public Health
ISSN 1660-4601 www.mdpi.com/journal/ijerph
Article
Time Trends of Italian Former Smokers 1980–2009 and 2010–2030 Projections Using a Bayesian Age Period Cohort Model
Giulia Carreras * and Giuseppe Gorini
Cancer Prevention and Research Institute, via delle Oblate 2, Florence 50139, Italy;
E-Mail: [email protected]
* Author to whom correspondence should be addressed; E-Mail: [email protected];
Tel.: +39-055-7972563; Fax: +39-055-7972522.
Received: 9 October 2013; in revised form: 25 November 2013 / Accepted: 26 November 2013 /
Published: 19 December 2013
Abstract: This study aimed to describe past time trends of the prevalence of former
smokers in Italy and to estimate prevalence projections using a Bayesian approach.
An age-period-cohort (APC) analysis has been carried out in order to investigate the effect
of the age, period and birth cohort on the prevalence of former smokers during 1980–2009.
A Bayesian APC model with an autoregressive structure for the age, period and cohort
parameters has been used to estimate future trends. Results showed that awareness of harm
from smoking occurred at younger ages with each advancing cohort, and that women were
more likely to attempt to stop smoking during pregnancies and breastfeeding, whereas men
attempted to quit only when smoking-related diseases became evident. Projections of
future trend recorded a further increase in the number of former smokers in future decades,
showing an estimate of the “end of smoking” around years 2060 and 2055 in men and
women, respectively. The application of the APC analysis to study the prevalence of
former smokers turned out to be a useful method for the evaluation of past smoking trends,
reflecting the effects of tobacco control policies on time and generations, and to make
projections of future trend.
Keywords: smoking prevalence; former smokers; APC model; Bayesian analysis; Italy
OPEN ACCESS
Int. J. Environ. Res. Public Health 2014, 11 2
1. Introduction
Smoking is a major risk factor for many tumours and other chronic diseases, and reduces length and
quality of life [1]. The implementation of tobacco control policies (TCP) recommended by the World
Health Organization–Framework Convention on Tobacco Control (WHO-FCTC) is considered the
leading primary prevention strategy to reduce smoking prevalence [2].
In Italy, several policies have been already implemented since the 1970s. A smoking ban in
hospitals, schools, cinemas, and public transportations was introduced in 1975, followed by a smoking
ban in front-offices of public administrations in 1995, and finally by a comprehensive smoking ban in
all workplaces and in the hospitality sector in 2005 [3]. Tobacco advertising and promotion were
almost totally banned in Italy since 1991, as in most European countries [4]. Moreover, the real price
of cigarettes in 1990–2000 increased at an annual 3% rate [5]. In addition, several smoking cessation
services were established since the end of the 1990s [3].
In response to all these efforts, smoking rates in Italy have progressively declined. Male smoking
prevalence declined from 41.6% in 1986 to 29.5% in 2009, an average annual drop of 1.2%.
Meanwhile, female smoking prevalence declined from 19.2% in 1986 to 17.0% in 1993, and stalled at
that level [6]. At the same time, the prevalence of former smokers in men almost doubled from 15.2%
in 1986 to 29.8% in 2009, whereas in women increased more than four times (from 3.4% to 15.8%).
Prevalence of former smokers is a cumulated measure of smoking cessation, which accounts for those
who stopped smoking in previous years. The proportion of annually quitters, however, was estimated
to be very low in Italy: it was higher than 5% only in elderly persons and in women aged < 30 years,
while in adults aged 30–49 and 50–59 cessations were about 2% and 3–5%, respectively. In addition,
most of quit probabilities stalled from 1986 to 2009 [7].
The effect of smoking cessation policies may be highlighted by studying the prevalence of former
smokers. Variations in prevalence of former smokers over time may be due to age, to a period effect,
which is a reflection of changes in pro-tobacco efforts and smoking cessation policies in time, as well
as to a cohort effect that may reflect different cumulative exposures to pro- and anti-tobacco
efforts [8]. The age-period-cohort (APC) model is a descriptive tool for observations from a Lexis
diagram that describes rates as a product of an age, a period, and a cohort effect in order to give an
overview of the magnitude of the rates, the variation by age and time trends in the rates [9]. Such
model is typically used in investigating vital rates with data from cancer registries or other disease
registers. Two studies used the APC method to analyze smoking trends by applying the APC models to
the prevalence of adolescent never smokers, and showing the effect of anti-tobacco programs to
prevent adolescents from starting to smoke, primarily through a cohort effect [8,10].
This study investigated the effects of age, time period, and birth cohort on trends of Italian former
smokers as a reflection of smoking cessation policies, by using the APC models on the trends
of prevalence of former smokers. In addition, we predicted future trends of the prevalence of
former smokers in Italy using a Bayesian APC approach, which incorporates prior information about
smoothness on each time scale to reduce random variation and improve the precision of the
projections [11].
The purpose is to use methods typically used in other contexts in order to advance our
understanding of the trends of tobacco smoking and to provide data supporting evidence-based
Int. J. Environ. Res. Public Health 2014, 11 3
planning for more effective tobacco control. In addition, an estimate of the end of tobacco smoking
may be given using this approach.
2. Methods
Data on smoking prevalence by gender and age were available from the Italian National Institute of
Statistics (ISTAT) Multipurpose Surveys “Health conditions and access to health services” and
“Aspects of daily living”. The two surveys are a surveillance system carried out almost every year
between 1980 and 2009, and were based on similar scientific design providing comparable data on
smoking habits over the years [12]. Sampling methods and data collection were already described
elsewhere [6] and are briefly summarized herein. Surveys used a two-step sampling method: in the
first step, about 900 municipalities were chosen, using different stratification criteria (demographic,
geographic, and economic), and in the second step, a systematic sample of the families was selected
within the municipality on the basis of demographic registries. Surveys were carried out on
representative samples of the Italian population, and each survey was administered on average to
24,000 families and 54,000 persons distributed in about 850 Italian municipalities of different
population sizes. Information was collected through questionnaires administered by professional
interviewers. Smoking status was based on participant self-report as never, former, or current
smoker [12]. Former smokers were those who reported smoking during their lifetimes but currently did
not smoke. Prevalence of each smoking status in each survey was computed with sampling weight
adjustment. Only former smokers over 25 years of age were considered, since the relative risks of
death for smoking-related diseases are not discernable for those who quit smoking before that age [13].
Time trends of the prevalence of former smokers were evaluated through an APC analysis. Data
were arranged in six 5-year periods (1980–1984, 1985–1989, 1990–1994, 1995–1999, 2000–2004, and
2005–2009) and twelve 5-year age groups (25–29 to 80–84 years). These age groups and calendar
periods involved 17 overlapping 5-year cohorts identified by central year of birth, and defined using
the relationship cohort = period − age [14,15] starting with 1900 and finishing with the cohort 1980.
It should be noted that there are fewer observations for the earliest and most recent cohorts which may
lead to less precision in the estimates of these cohorts.
We assessed the age, period, and cohort effects by means of generalized linear models assuming
that the number of former smokers follows a Binomial distribution [14,15], since the more common
Poisson distribution assumption of rare events is not appropriate for the prevalence of former smokers.
Three models were used: the full APC model, age-period, and age-cohort (AC). In the APC analysis,
there is the non-identifiable problem as age, period and cohort are linearly related [14,15]. In order to
avoid the non-identifiability problem, we estimated the parameters of the full APC model using a
two-step procedure [9]. In the first step, we fitted an AC model, using 1930 as the reference cohort in
men and 1950 in women. The reference cohorts were chosen because they were the most exposed to
cigarette smoking in Italy among men and women, respectively [12]. In the second step, we fitted a
period effect to the residuals of the AC model by means of a Binomial model for the number of former
smokers with the log of the fitted values from the AC model as offset. By this procedure, the standard
deviations of the estimated values of the effects can be obtained assuming that the secular trend is
related with the cohort effect [9]. Comparison between the nested models was evaluated by the
Int. J. Environ. Res. Public Health 2014, 11 4
changes in deviance (Δ-Dev) [9]. The Akaike Information Criterion (AIC) was also considered to
identify the best-fitting model considering the best model the one with the lower AIC value [16].
Bayesian APC methods are often considered more appropriate for long-term projections due to the
problem of random variation in classical parameter estimates of APC models [17] and consequently
projections based on these estimates, particularly of the most recent cohort effects, are sensitive to this
instability [11,18]. A Bayesian APC model smoothing the age, period and cohort effects and
estimating the age-specific rates from their posterior distribution by Markov chain Monte Carlo
(MCMC) techniques was used (see appendix) [11,18–20]. Constraints on first-order differences were
set for the age, period and cohort effects (see appendix) [11,18–20]. For the analyses presented,
posterior inferences were based on 1,000,000 iterations of the Gibbs sampler after a burn-in of 500,000
iterations was discarded. Convergence was assessed by using the Geweke statistic [21]. We carried out
a sensitivity analysis on the prior distributions to evaluate the robustness of the results (appendix).
In order to evaluate the goodness of fit the observed prevalence of former smokers cumulated by age
was plotted together to the fitted one. The statistical software used for the analyses was R [22] and
JAGS [23].
3. Results and Discussion
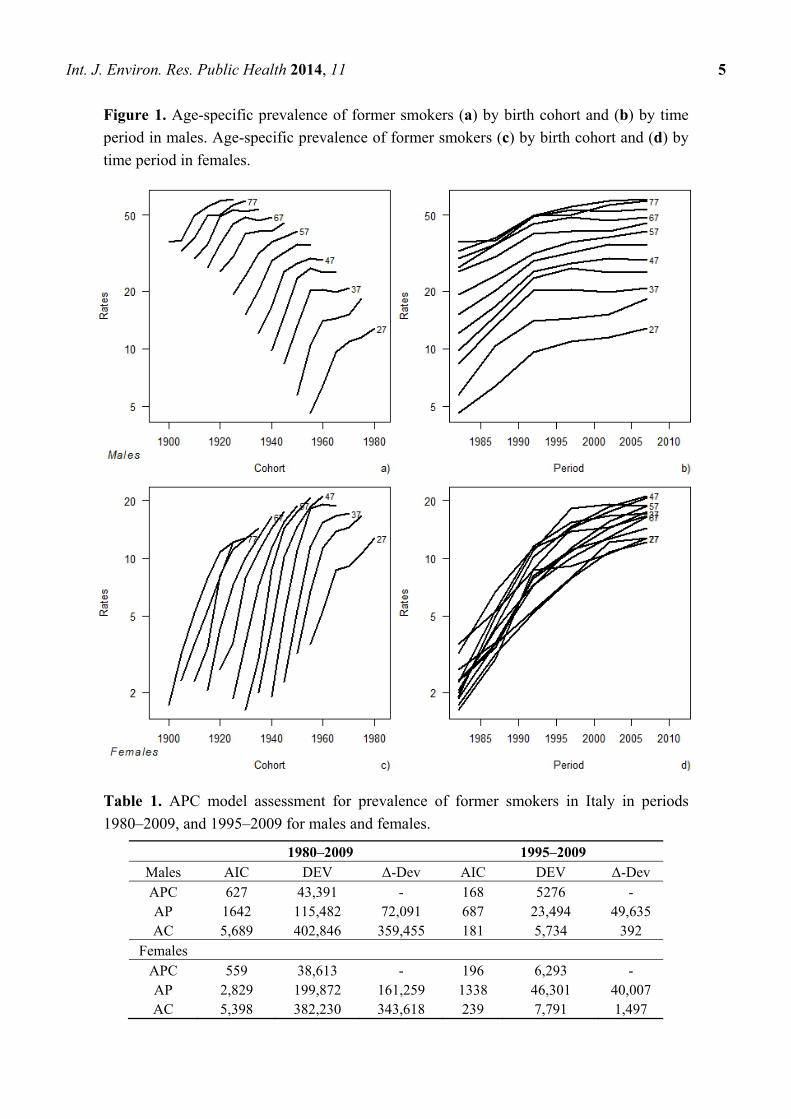
Figure 1 shows the patterns of age-specific rates by birth cohort and time period for both genders.
Younger cohorts have higher prevalence rates for all ages both in males and in females (Figure 1a,c).
In fact, as an example, men former smokers aged 47 years are 12.0% and 29.2% in the 1982 and 2007
birth cohorts, respectively. The rates appear to increase steadily with age with no evidence of downturn
in males (Figure 1a,b). This was not true for females among whom the proportion of former smokers is
similar for all age groups, with prevalence values smaller than that recorded in males (Figure 1c,d).
An increasing trend for all age groups was observed mainly up to 1992 in males, whereas in females
the rates showed an increased trend in the whole time period.
In the APC analysis we obtained similar results for both genders (Table 1). The APC model showed
the lowest AIC value, thus both cohort and period effects should be taken into account. The Δ-Dev was
higher for the AC model than for the AP one. Thus, the period effect was more important than the
cohort effect in describing prevalence of former smokers. An APC analysis restricted to the period
1995–2009 showed however for both genders an AIC value for the AC model comparable to the APC
one, revealing that cohort effect was the most important factor to explain the variability in the
prevalence of former smokers during that period.
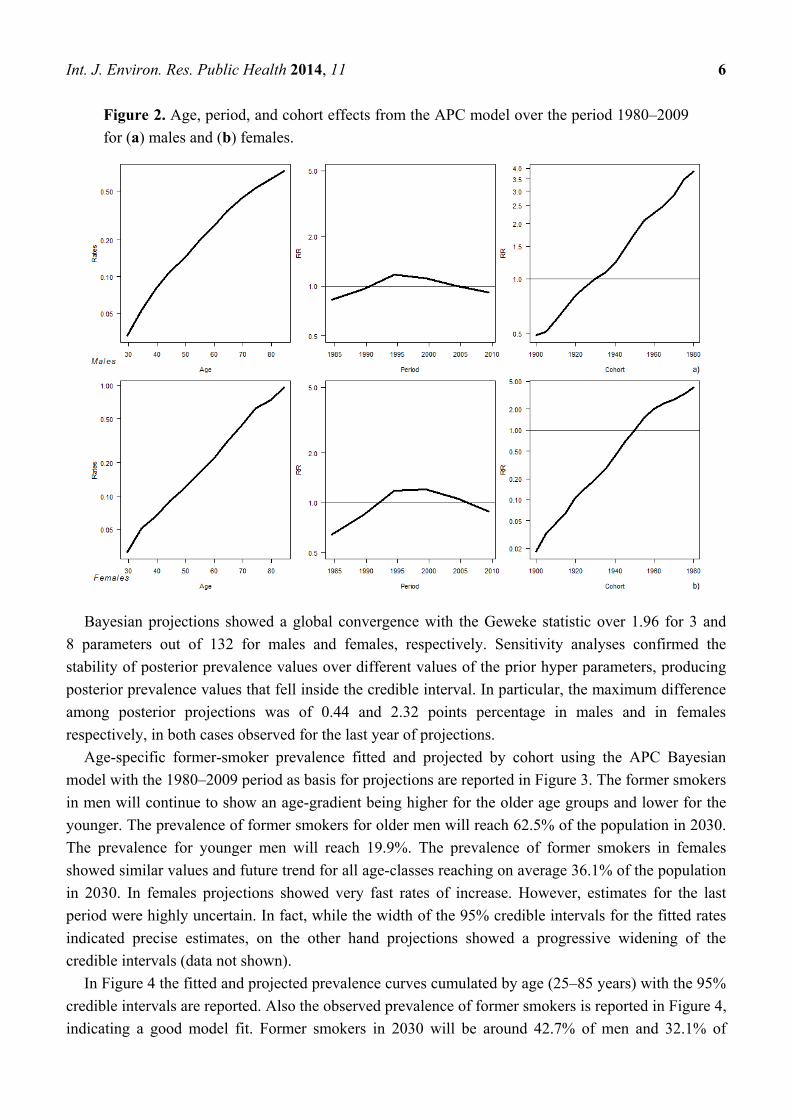
In Figure 2 the age, period, and cohort effects from the APC model over the period 1980–2009 for
males and females are reported. For both genders the age effect grew with the increasing of age,
the period effect was almost negligible reaching a peak in 1992–2002, and the cohort effect showed an
increasing trend in the whole period. For both males and females confidence intervals of the estimated
effects resulted very narrow.
Int. J. Environ. Res. Public Health 2014, 11 5
Figure 1. Age-specific prevalence of former smokers (a) by birth cohort and (b) by time
period in males. Age-specific prevalence of former smokers (c) by birth cohort and (d) by
time period in females.
Table 1. APC model assessment for prevalence of former smokers in Italy in periods
1980–2009, and 1995–2009 for males and females.
1980–2009 1995–2009 Males AIC DEV Δ-Dev AIC DEV Δ-Dev APC 627 43,391 - 168 5276 - AP 1642 115,482 72,091 687 23,494 49,635 AC 5,689 402,846 359,455 181 5,734 392
Females APC 559 38,613 - 196 6,293 - AP 2,829 199,872 161,259 1338 46,301 40,007 AC 5,398 382,230 343,618 239 7,791 1,497
Int. J. Environ. Res. Public Health 2014, 11 6
Figure 2. Age, period, and cohort effects from the APC model over the period 1980–2009
for (a) males and (b) females.
Bayesian projections showed a global convergence with the Geweke statistic over 1.96 for 3 and
8 parameters out of 132 for males and females, respectively. Sensitivity analyses confirmed the
stability of posterior prevalence values over different values of the prior hyper parameters, producing
posterior prevalence values that fell inside the credible interval. In particular, the maximum difference
among posterior projections was of 0.44 and 2.32 points percentage in males and in females
respectively, in both cases observed for the last year of projections.
Age-specific former-smoker prevalence fitted and projected by cohort using the APC Bayesian
model with the 1980–2009 period as basis for projections are reported in Figure 3. The former smokers
in men will continue to show an age-gradient being higher for the older age groups and lower for the
younger. The prevalence of former smokers for older men will reach 62.5% of the population in 2030.
The prevalence for younger men will reach 19.9%. The prevalence of former smokers in females
showed similar values and future trend for all age-classes reaching on average 36.1% of the population
in 2030. In females projections showed very fast rates of increase. However, estimates for the last
period were highly uncertain. In fact, while the width of the 95% credible intervals for the fitted rates
indicated precise estimates, on the other hand projections showed a progressive widening of the
credible intervals (data not shown).
In Figure 4 the fitted and projected prevalence curves cumulated by age (25–85 years) with the 95%
credible intervals are reported. Also the observed prevalence of former smokers is reported in Figure 4,
indicating a good model fit. Former smokers in 2030 will be around 42.7% of men and 32.1% of
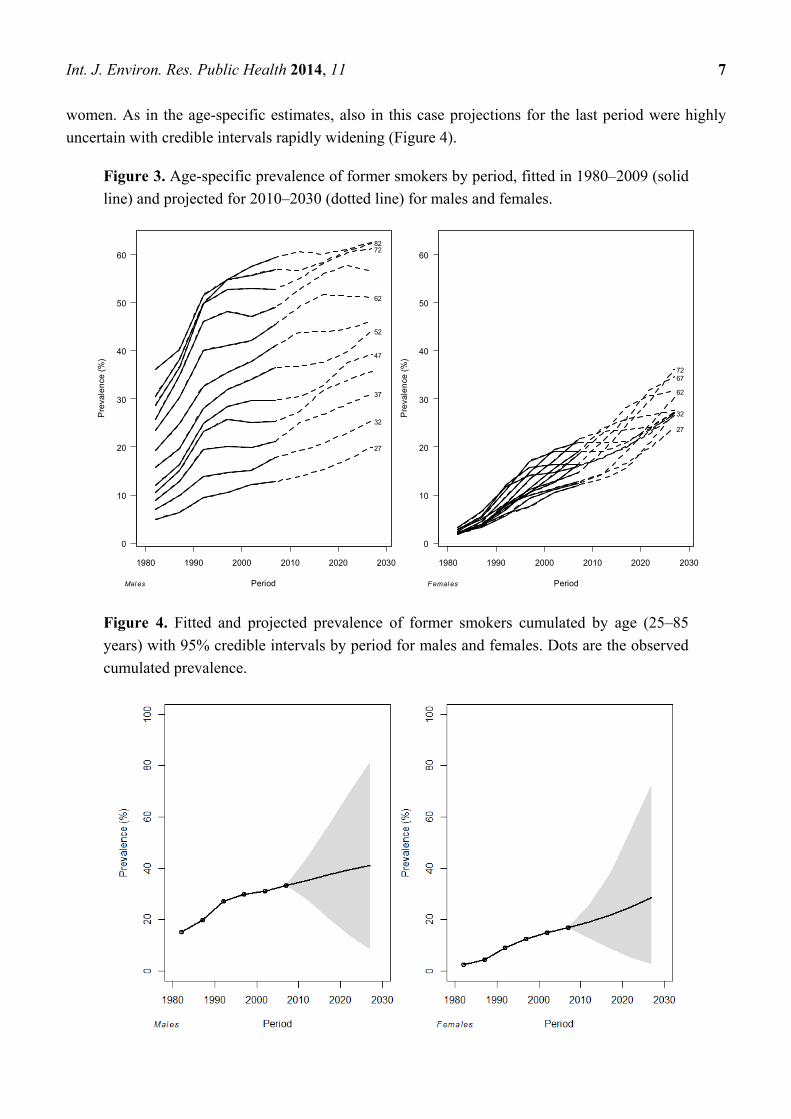
Int. J. Environ. Res. Public Health 2014, 11 7
women. As in the age-specific estimates, also in this case projections for the last period were highly
uncertain with credible intervals rapidly widening (Figure 4).
Figure 3. Age-specific prevalence of former smokers by period, fitted in 1980–2009 (solid
line) and projected for 2010–2030 (dotted line) for males and females.
Figure 4. Fitted and projected prevalence of former smokers cumulated by age (25–85
years) with 95% credible intervals by period for males and females. Dots are the observed
cumulated prevalence.
1980 1990 2000 2010 2020 2030
0
10
20
30
40
50
60
Period
Pre
vale
nce
(%
)
27
32
37
47
52
62
72 82
Mal es
1980 1990 2000 2010 2020 2030
0
10
20
30
40
50
60
Period
Pre
vale
nce
(%
)
27
32
62
67 72
Femal es
Int. J. Environ. Res. Public Health 2014, 11 8
We described time trends of the prevalence of former smokers and projected trends for the next
decades in Italy. In 1980–2009 younger cohorts showed higher prevalence values for all ages in both
genders. Rise in prevalence occurred earlier in life, as for more recent cohorts. This is likely to reflect
awareness of harm from smoking that occurred at younger ages in each advancing cohort [24]. The
prevalence increased with age in males, and was similar for all age-groups in females. This is probably
due to the fact that women were more likely to attempt to stop smoking at younger age during
pregnancies and breastfeeding. On the contrary, men attempted to quit only when smoking-related
diseases became evident [7].
The APC analyses showed that the period effect reached its maximum in 1992–2002, as an effect of
the laws implemented in that period, such as smoking ban on TV advertisement (1991), smoking ban
on public administrations (1995), and rise in cigarettes taxes (from 1990). At the same time, the cohort
effect showed a progressive continuous increase since the first generation, suggesting that awareness
of harm from smoking progressively became stronger. The analysis restricted to the time period
1995–2010 revealed an increasing importance of the cohort.
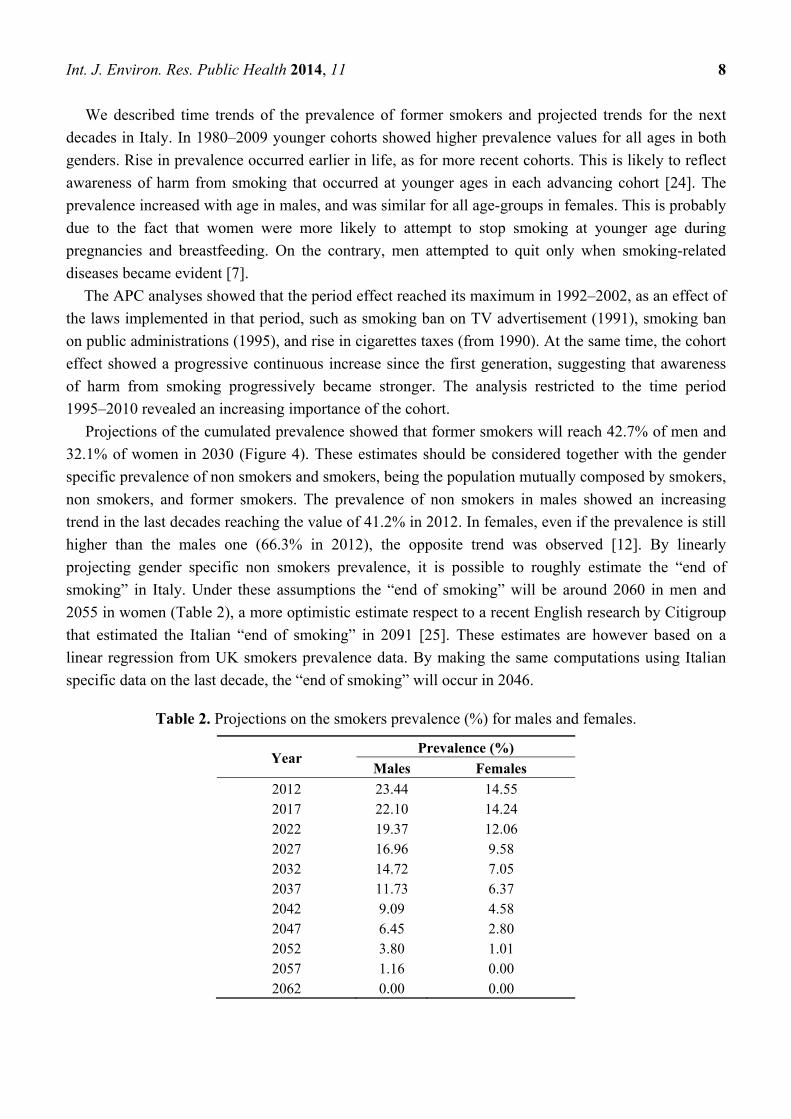
Projections of the cumulated prevalence showed that former smokers will reach 42.7% of men and
32.1% of women in 2030 (Figure 4). These estimates should be considered together with the gender
specific prevalence of non smokers and smokers, being the population mutually composed by smokers,
non smokers, and former smokers. The prevalence of non smokers in males showed an increasing
trend in the last decades reaching the value of 41.2% in 2012. In females, even if the prevalence is still
higher than the males one (66.3% in 2012), the opposite trend was observed [12]. By linearly
projecting gender specific non smokers prevalence, it is possible to roughly estimate the “end of
smoking” in Italy. Under these assumptions the “end of smoking” will be around 2060 in men and
2055 in women (Table 2), a more optimistic estimate respect to a recent English research by Citigroup
that estimated the Italian “end of smoking” in 2091 [25]. These estimates are however based on a
linear regression from UK smokers prevalence data. By making the same computations using Italian
specific data on the last decade, the “end of smoking” will occur in 2046.
Table 2. Projections on the smokers prevalence (%) for males and females.
Year Prevalence (%)
Males Females
2012 23.44 14.55 2017 22.10 14.24 2022 19.37 12.06 2027 16.96 9.58 2032 14.72 7.05 2037 11.73 6.37 2042 9.09 4.58 2047 6.45 2.80 2052 3.80 1.01 2057 1.16 0.00 2062 0.00 0.00
Int. J. Environ. Res. Public Health 2014, 11 9
The novelty of this work is the use of APC methods, which are usually used for the study of trends
in deaths rates, to study trends in the prevalence of former smoker, and to make projections in a
Bayesian perspective.
This study has some limitations. First, prevalence projections resulted highly uncertain. The credible
intervals encompass both uncertainty associated with the choice of the model and uncertainty associated
with projecting beyond the range of the data. This is necessarily reflected by the rapidly increasing width
of the intervals as the length of the projection increases [18]. Second, the use of MCMC algorithms in the
field of latent Gaussian models, as regression models for longitudinal data, has been criticized in terms of
both computational time and mixing due to strong dependencies of parameters in the posterior
distribution, and of weak identifiability. Several alternatives were proposed to overcome these problems,
as integrated nested Laplace approximations [26]. However our application did not exhibit convergence
problems with the use of MCMC, even if computational times were rather long. A third limitation is that
further measures to improve cessation rates, such as, a further increase in cigarette taxes and promoting
smoking cessation strategies (reimbursement of cessation treatments, setting up an active quit line for
smokers, and promoting widespread use of cessation counselling among health professionals) could be
implemented in the period for which we made projections [27].
4. Conclusions
In conclusion, this study showed a constant increase in prevalence of former smokers in Italy since
1980s, and regarding all generations and age-groups. Projections of future trend recorded a further
increase in the number of former smokers in future decades, showing an estimate of the “end of
smoking” around years 2060 and 2055 in men and women, respectively.
Acknowledgements
This work was published with the contribution of Istituto Toscano Tumori (ITT), grant proposal 2008.
Conflicts of Interest
The authors declare no conflict of interest.
Appendix—Autoregressive APC Model for Projections of the Prevalence of Former Smokers
Following Breslow and Clayton [19], Berzuini and Clayton [20] and Bray [11,18] we specify a
Gaussian autoregressive prior model in the forward direction to smooth effects on each timescale and
to extrapolate period and cohort effects.
According to this model each point (except the first two on each scale) is predicted by linear
extrapolation from its two immediate predecessors, plus a random error from a normal distribution
with mean 0. The first two parameters for age, period and cohort effects are given non-informative
priors. The distributions for the α1,…, αA age, β1,…, βP period, and γ1,…, γC cohort effects, can be
defined as follows:
Int. J. Environ. Res. Public Health 2014, 11 10
3),1
,1000000-N(2~,,
)1
0N(0,100000~),1
0N(0,100000~
3),1
,1000000-N(2~,,
)1
0N(0,100000~),1
0N(0,100000~
3),1
,1000000-N(2~,,
)1
0N(0,100000~),1
0N(0,100000~
2-c1-c11
121
2-p1-p11
121
2-a1-a11
121
c
p
a
pa
pa
aa
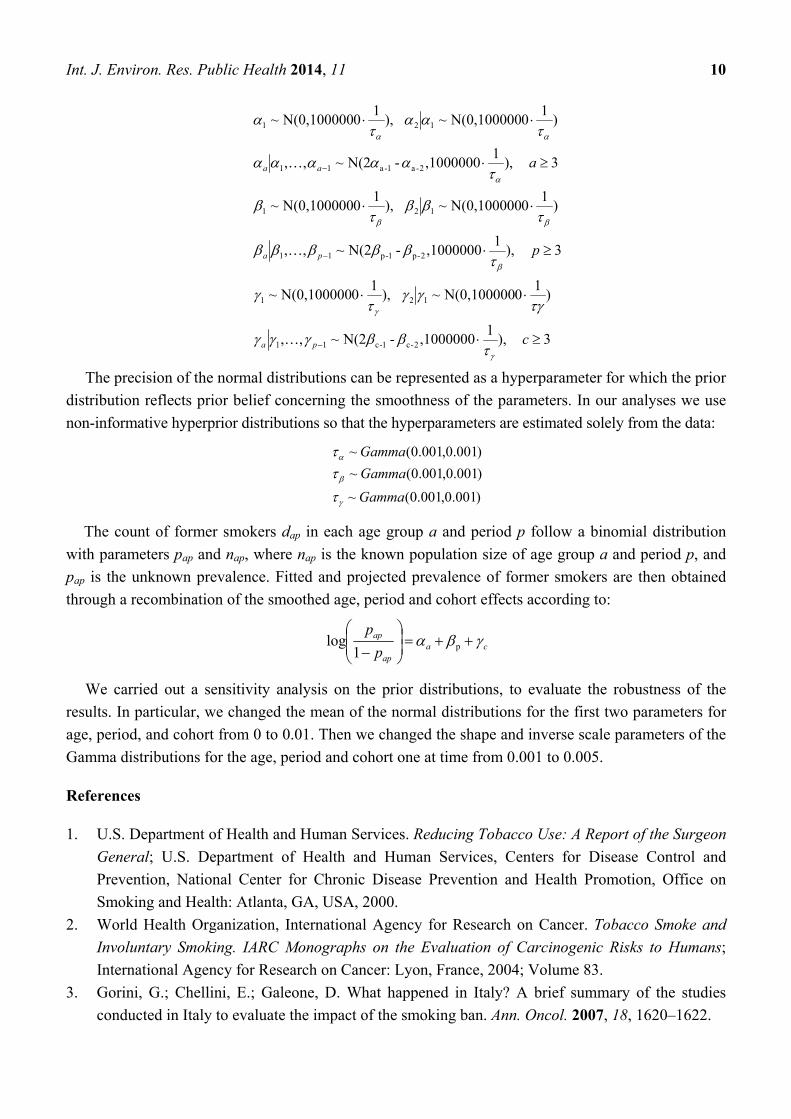
The precision of the normal distributions can be represented as a hyperparameter for which the prior
distribution reflects prior belief concerning the smoothness of the parameters. In our analyses we use
non-informative hyperprior distributions so that the hyperparameters are estimated solely from the data:
)001.0,001.0(~
)001.0,001.0(~
)001.0,001.0(~
Gamma
Gamma
Gamma
The count of former smokers dap in each age group a and period p follow a binomial distribution
with parameters pap and nap, where nap is the known population size of age group a and period p, and
pap is the unknown prevalence. Fitted and projected prevalence of former smokers are then obtained
through a recombination of the smoothed age, period and cohort effects according to:
caap
ap
p
p
p1log
We carried out a sensitivity analysis on the prior distributions, to evaluate the robustness of the
results. In particular, we changed the mean of the normal distributions for the first two parameters for
age, period, and cohort from 0 to 0.01. Then we changed the shape and inverse scale parameters of the
Gamma distributions for the age, period and cohort one at time from 0.001 to 0.005.
References
1. U.S. Department of Health and Human Services. Reducing Tobacco Use: A Report of the Surgeon
General; U.S. Department of Health and Human Services, Centers for Disease Control and
Prevention, National Center for Chronic Disease Prevention and Health Promotion, Office on
Smoking and Health: Atlanta, GA, USA, 2000.
2. World Health Organization, International Agency for Research on Cancer. Tobacco Smoke and
Involuntary Smoking. IARC Monographs on the Evaluation of Carcinogenic Risks to Humans;
International Agency for Research on Cancer: Lyon, France, 2004; Volume 83.
3. Gorini, G.; Chellini, E.; Galeone, D. What happened in Italy? A brief summary of the studies
conducted in Italy to evaluate the impact of the smoking ban. Ann. Oncol. 2007, 18, 1620–1622.
Int. J. Environ. Res. Public Health 2014, 11 11
4. Joossens, L.; Raw, M. The tobacco control scale: A new scale to measure country activity.
Tob. Control 2006, 15, 247–253.
5. Gallus, S. Price and consumption of tobacco in Italy over the last three decades. Eur. J. Cancer Prev.
2003, 12, 333–337.
6. Gorini, G.; Carreras, G.; Allara, E.; Faggiano, F. Decennial trends of social differences in
smoking habits in Italy: A 30-year update. Canc. Caus. Contr. 2013, 24, 1385–1391.
7. Carreras, G.; Gallus, S.; Iannucci, L.; Gorini, G. Estimating the probabilities of making a smoking
quit attempt in Italy: Stall in smoking cessation levels, 1986–2009. BMC Public Health 2012, 12,
doi:10.1186/1471-2458-12-183.
8. Chen, X.; Lin, F.; Stanton, B.; Zhan, X. APC-modeling of smoking prevalence among US
adolescents and yong adults. Am. J. Health Behav. 2011, 35, 416–427.
9. Carstensen, B. Age-period-cohort models for the lexis diagram. Stat. Med. 2007, 26, 3018–3045.
10. Chen, X.; Li, G.; Unger, J.B.; Liu, X.; Johnson, C.A. Secular trends in adolescent never smoking
from 1990 to 1999 in California: An age-period-cohort analysis. Am. J. Public Health 2003, 93,
2099–2104.
11. Bray, I.; Brennan, P.; Boffetta, P. Recent trends and future projections of lymphoid neoplasms—
A Bayesian age-period-cohort analysis. Cancer Causes Control 2001, 12, 813–820.
12. Italian Institute of Statistics (ISTAT). Multipurpose Surveys 1980–2009; ISTAT: Rome, Italy,
2010.
13. U.S. Department of Health and Human Services. The Health Benefits of Smoking Cessation:
A Report of the Surgeon General; U.S. Department of Health and Human Services, Centers for
Disease Control and Prevention, Center for Chronic Disease Prevention and Health Promotion,
Office on Smoking and Health: Atlanta, GA, USA, 1990.
14. Clayton, D.; Schifflers, E. Models for temporal variation in cancer rates. I: Age-period and
age-cohort models. Stat. Med. 1987, 6, 449–467.
15. Clayton, D.; Schifflers, E. Models for temporal variation in cancer rates. II: Age-period-cohort
models. Stat. Med. 1987, 6, 469–481.
16. Akaike, H. A new look at the statistical model identification. IEEE Trans. Autom. Control 1974,
19, 716–723.
17. La Vecchia, C.; Negri, E.; Levi, F.; Decarli, A.; Boyle, P. Cancer mortality in Europe: Effects of
age, cohort of birth and period of death. Eur. J. Cancer 1998, 34, 118–141.
18. Bray, I. Application of Markov chain Monte Carlo methods to projecting cancer incidence and
mortality. Appl. Stat. 2002, 51, 151–164.
19. Breslow NE, Clayton DG. Approximate inference in generalized linear mixed models. J. Am. Stat.
Assoc. 1993, 88, 9–25.
20. Berzuini, C, Clayton D. Bayesian analysis of survival on multiple time scales. Stat. Med. 1994,
13, 823–838.
21. Geweke, J. Evaluating the Accuracy of Sampling-Based Approaches to the Calculation of
Posterior Moments; Oxford University Press: Oxford, UK, 1992; pp. 169–193.
22. R Core Team. R: A Language and Environment for Statistical Computing; R Foundation for
Statistical Computing: Vienna, Austria, 2013.
Int. J. Environ. Res. Public Health 2014, 11 12
23. Plummer, M. JAGS: A Program for Analysis of Bayesian Graphical Models Using Gibbs
Sampling. In Proceedings of the 3rd International Workshop on Distributed Statistical Computing
(DSC 2003), Vienna, Austria, 20–22 March 2003.
24. Holford, T.R.; Clark, L. Chapter 4: Development of the counterfactual smoking histories used to
assess the effects of tobacco control. Risk Anal. 2012, 32, S39–S50.
25. Citigroup. CITI Investment Research and Analysis Based on OECD, National Data, TMA and JT
Data; Citigroup: New York, NY, USA, 2011.
26. Rue, H, Martino, S, Copia, N. Approximate Bayesian inference for latent Gaussian models using
integrated nested Laplace approximations (with discussion). J. Roy. Stat. Soc. 2009, 71, 319–392.
27. Carreras, G.; Gorini, G.; Gallus, S.; Iannucci, L.; Levy, D.T. Predicting the future prevalence of
cigarette smoking in Italy over the next three decades. Eur. J. Public Health 2012, 22, 699–704.
© 2013 by the authors; licensee MDPI, Basel, Switzerland. This article is an open access article
distributed under the terms and conditions of the Creative Commons Attribution license
(http://creativecommons.org/licenses/by/3.0/).
Top Related
Copyright © 2022 FDOKUMEN

