


Bahasa
Halaman
Hukum

RESEARCH ARTICLE – Pharmaceutics, Drug Delivery and Pharmaceutical Technology
The Development of Self-Emulsifying Oil-in-Water EmulsionAdjuvant and an Evaluation of the Impact of Droplet Sizeon Performance
RUCHI R. SHAH,1 STEPHANIE DODD,2 MARY SCHAEFER,3 MILDRED UGOZZOLI,3 MANMOHAN SINGH,4 GILLIS R. OTTEN,3
MANSOOR M. AMIJI,1 DEREK T. O’HAGAN,3 LUIS A. BRITO3
1Department of Pharmaceutical Sciences, Northeastern University, Boston, Massachusetts 021152Novartis Institute of Biomedical Research, Cambridge, Massachusetts3Novartis Vaccines, Cambridge, Massachusetts 021394Novartis Vaccines, Holly Springs, North Carolina
Received 29 August 2014; revised 27 October 2014; accepted 8 December 2014
Published online in Wiley Online Library (wileyonlinelibrary.com). DOI 10.1002/jps.24337
ABSTRACT: Microfluidization is an established technique for preparing emulsion adjuvant formulations for use in vaccines. Althoughthis technique reproducibly yields high-quality stable emulsions, it is complex, expensive, and requires proprietary equipment. For thisstudy, we developed a novel and simple low shear process to prepare stable reproducible emulsions without the use of any proprietaryequipment. We found this process can produce a wide range of differently sized emulsions based on the modification of ratios of oil andsurfactants. Using this process, we prepared a novel 20-nm-sized emulsion that was stable, reproducible, and showed adjuvant effects.During evaluation of this emulsion, we studied a range of emulsions with the same composition all sized below 200; 20, 90, and 160 nmin vivo and established a correlation between adjuvant size and immune responses. Our studies indicate that 160-nm-sized emulsionsgenerate the strongest immune responses. C© 2015 Wiley Periodicals, Inc. and the American Pharmacists Association J Pharm SciKeywords: vaccines; vaccine adjuvants; squalene; emulsion; particle size; formulation; self-emulsifying; physical characterization
INTRODUCTION
Vaccine adjuvants are components added to subunit or recombi-nant vaccines to raise the overall immunogenicity of poorly im-munogenic antigens. In addition to enhancing and sustainingimmune responses, adjuvants help in reducing the antigen doseper vaccine, reduce the frequency of vaccination, enhance thebreadth of immune responses, and improve the immunologicalmemory associated with the vaccine.1 Adjuvants are composedof a large class of compounds ranging from inorganic aluminumsalts to semisynthetic lipid-based systems such as emulsions,to naturally derived compounds like monophosphoryl lipid A.Despite the extensive discovery effort and inclusion of adju-vants in a number of marketed vaccines, the exact mechanismof action of many adjuvants is still under investigation. Amongthe adjuvants added in commercial vaccines, the oil-in-water(o/w) emulsion MF59 (Novartis Vaccines) was the first lipidparticulate adjuvant to be successfully included in a commer-cial influenza vaccine. MF59 is produced by microfluidization,which is a well-established technique routinely used in phar-maceutical manufacturing.2
Although microfluidization has successfully produced o/wemulsion adjuvants such as MF59 and AS03 (GlaxoSmithK-line), both at droplet size around 160 nm size, this techniquehas a limitation in droplet size reduction. Sizes less than 45 nmare difficult to produce by such conventional techniques, asthe energy required to reduce the droplets that small is veryhigh. Hence, using the established methods, the sizes that could
Correspondence to: Luis A. Brito (Telephone: +617-871-8123; Fax: +617-373-8886; E-mail: [email protected])
Journal of Pharmaceutical SciencesC© 2015 Wiley Periodicals, Inc. and the American Pharmacists Association
be prepared are between 45 and 200 nm. Techniques such asmicrofluidization and homogenization are expensive, complex,and require proprietary equipment that is difficult to maintain.To generate stable small-sized emulsions less than 30 nm, wefelt the need to develop a novel process that could address twoissues: (1) can a single process resolve issues related to conven-tional techniques in terms of expense, high shear, complexity,and maintenance and (2) can this process generate emulsionsless than 30 nm in size?
While exploring for low shear processes to produce stable o/wemulsions, we identified the approach of self-emulsifying drugdelivery systems (SEDDs) routinely used in pharma for oraldelivery of lipophilic drugs (e.g., Neoral R© for cyclosporine de-livery). SEDDs are isotropic mixtures of oil and surfactant thatform fine o/w emulsions when diluted with an aqueous phaseunder conditions of gentle agitation.3 They are specific to thenature of oil and surfactant, ratio of oil and surfactant, and thetemperature needed for emulsification.4 SEDDs are most com-monly used for oral drug delivery and allow the emulsificationto occur in the gut, minimizing the amount of shear needed toproduce these fine oil droplets. Neoral is a microemulsion pre-concentrate that emulsifies in the body to produce fine emul-sion droplets below 100 nm in size.5 The higher hydrophilielipophile balance value of surfactants and the higher concen-tration of hydrophilic surfactants in the system make Neo-ral a type IIIb lipid formulation and help in generating self-emulsifying smaller-sized droplets.6,7 Applying this concept, wedesigned a novel process for formulation of fine o/w emulsionswithout shear, where we mixed the oil and the surfactants andthen introduced them in an aqueous phase with mild heatingand stirring. This simple process utilizes minimal shear, is in-expensive, requires no proprietary equipment, and generated a
Shah et al., JOURNAL OF PHARMACEUTICAL SCIENCES 1
2 RESEARCH ARTICLE – Pharmaceutics, Drug Delivery and Pharmaceutical Technology
range of emulsions that had different sizes based on the modi-fication of ratios of oil and surfactants.
Although there is a lack of literature focusing on the ef-fect of droplet size of emulsion adjuvants on overall vaccineresponses, certain key features during the development of theo/w emulsion adjuvant MF59 (Novartis Vaccines) explains therationale for the size of the final formulation. The size of MF59(160 nm) was found to be important during its developmentwhere nanosized emulsions elicited better immune responsesthan micron-sized emulsions. Additionally, the nanosize en-abled sterile filtration of the emulsion with a 0.22-:m filter,making terminal sterilization a key attribute of parenteralformulations feasible.8 Because of the limitations of particlesize reduction by microfluidization, no thorough investigationto find the optimal size to generate the most potent responseexists. As adjuvant development comprises a number of de-livery systems similar to pharma (emulsion, polymeric par-ticles, and liposomes), there is a tendency to extrapolate theresults of drug delivery to vaccines. Although majority of size-related studies for vaccine adjuvants have been performed forpolymeric particles, there are few studies that have been per-formed for other classes of adjuvants as well. A study by Liet al.9 showed that smaller-size aluminum nanoparticles ex-hibited improved immune responses and tolerance in compar-ison to larger micron-sized particles. In case of liposomes, theparticle size controls quality and type of response rather thancontrolling the magnitude of responses, for example, Th1 versusTh2 differentiation.10,11 For polymeric particles, it is difficult tomake a correlation between size and responses; depending ondesired outcome, type of polymer, and antigen used, the resultscan be different.12 Thus, based on the published reports, it isclear that each class adjuvant may have an ideal size that isdifferent than another.
In this study, we describe a novel process to develop20-nm-sized emulsions. Using the composition of the 20-nm-sized emulsion, emulsions with 90 and 160 nm size were pre-pared by conventional techniques (homogenization and mi-crofluidization). These emulsions were subsequently evaluatedin vivo to establish their potency and to compare the effect ofdroplet size on immune responses with a model antigen oval-bumin and with flu vaccine.
MATERIALS AND METHODS
Materials
Squalene oil, sorbitan trioleate (Span 85), and phosphate-buffered saline (PBS) were obtained from Sigma–Aldrich (St.Louis, MO), and polysorbate 80 (Tween 80) was obtained fromAcros Organic (Geel, Belgium). Millipore MilliQ deionized wa-ter was used for formulation and assay procedures and 100 mMcitrate buffer was acquired from Teknova (Hollister, CA).Reagents for the gel clot assay to test the endotoxin level of theformulations were procured from Associates of Cape Cod (EastFalmouth, MA). Goat antimouse OVA HRP (horseradish perox-idase) conjugate secondary antibody for ELISA (enzyme-linkedimmunosorbent assay) was obtained from Sigma–Aldrich andTMB substrate was procured from KPL (Gaithersburg, MD).Antibodies, dyes, and compensation beads for T-cell analy-sis were obtained from BD Biosciences (Franklyn Lakes, NJ).Reagents for sodium dodecyl sulfate-polyacrylamide gel elec-
trophoresis (SDS-PAGE) were obtained from Invitrogen (Carls-bad, CA).
Antigens for Immunizations
To establish proof of concept, ovalbumin (OVA) procured fromWorthington (Lakewood, NJ) was used as a model antigen inthe initial couple of studies. For the next study, equal amountsof trivalent-inactivated influenza vaccine (TIV) antigens wereused: H1N1 A/California/7/09, H3N2 A/Texas/50/2012, andB/Massachusetts/2/2012 at 0.1 :g dose each. The trivalent vac-cine contains purified subunit antigens and is standardizedfor hemagglutinin content by single radial immunodiffusion asrecommended by regulatory authorities.
Screening of Squalene, Span 85, and Tween 80 Ratios forSelf-Emulsification
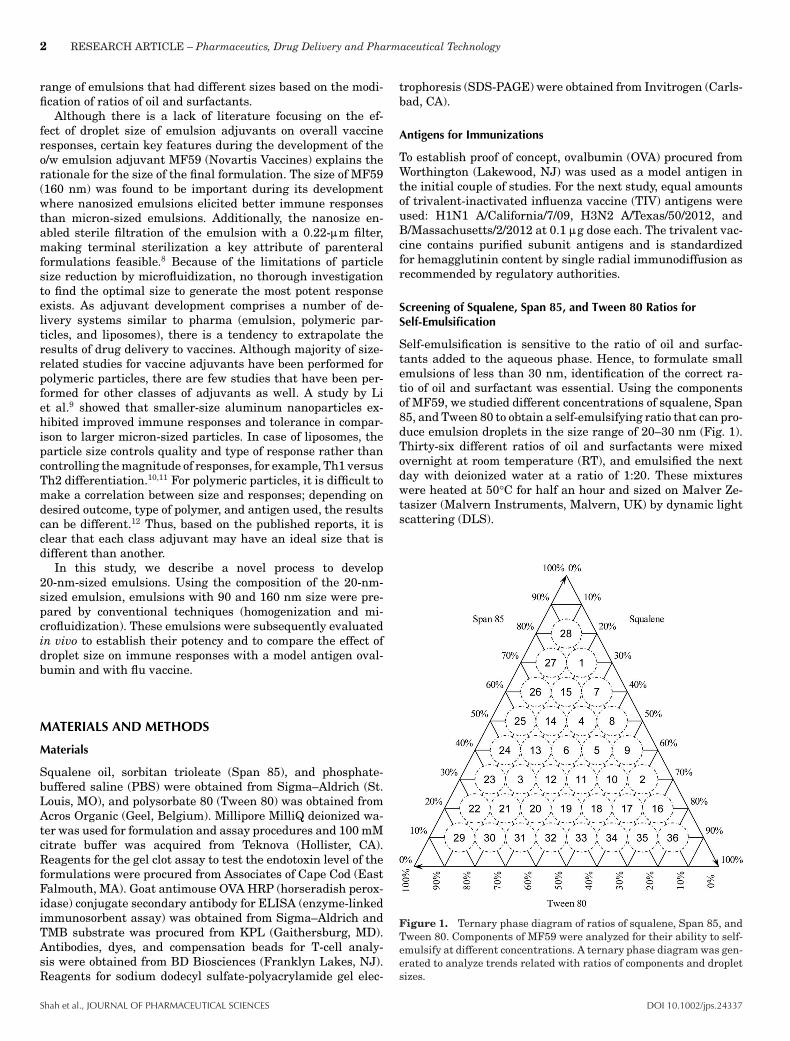
Self-emulsification is sensitive to the ratio of oil and surfac-tants added to the aqueous phase. Hence, to formulate smallemulsions of less than 30 nm, identification of the correct ra-tio of oil and surfactant was essential. Using the componentsof MF59, we studied different concentrations of squalene, Span85, and Tween 80 to obtain a self-emulsifying ratio that can pro-duce emulsion droplets in the size range of 20–30 nm (Fig. 1).Thirty-six different ratios of oil and surfactants were mixedovernight at room temperature (RT), and emulsified the nextday with deionized water at a ratio of 1:20. These mixtureswere heated at 50°C for half an hour and sized on Malver Ze-tasizer (Malvern Instruments, Malvern, UK) by dynamic lightscattering (DLS).
Figure 1. Ternary phase diagram of ratios of squalene, Span 85, andTween 80. Components of MF59 were analyzed for their ability to self-emulsify at different concentrations. A ternary phase diagram was gen-erated to analyze trends related with ratios of components and dropletsizes.
Shah et al., JOURNAL OF PHARMACEUTICAL SCIENCES DOI 10.1002/jps.24337
RESEARCH ARTICLE – Pharmaceutics, Drug Delivery and Pharmaceutical Technology 3
Optimization of 30 nm Squalene o/w Emulsion
We selected the ratio of oil and surfactants that generated thesmallest droplet size, and optimized it further to get a dropletsize of less than 30 nm with high stability and low polydis-persity. The final ratio of the emulsion that produced stable20 nm-sized emulsions was 63.63 parts Tween 80, 9.09 partsSpan 85, and 27.27 parts squalene oil. This “oil phase” wasmixed overnight at RT. The next day, 1.1 mL of this oil phasewas diluted with 19 mL of 10 mM citrate buffer at pH 6.5. Thismixture was manually agitated and then heated at 40°C for1 h to produce self-emulsifying adjuvant 20 (SEA20). Althoughthe initial screen used deionized water as aqueous phase, theoptimized SEA20 had 10 mM citrate buffer at pH 6.5 (similarto MF59). This aqueous phase improved the uniformity of theemulsion and also reduced the droplet size to 20 nm. Addition-ally, the heating phase in the screen was carried out at 50°C,whereas the optimized formulation was heated at 40°C. Tem-perature was lowered to eliminate concerns regarding squalenestability at 50°C.
Preparation of Control Emulsions of Similar Compositions
Using the same composition as SEA20, two emulsions were pre-pared by microfludization in the size range of 90–160 nm; thesewere named as microfluidized adjuvants 90 and 160, respec-tively (MFA90 and MFA160). For both MFA90 and MFA160,aqueous phase consisted of Tween 80 dissolved in 10 mM cit-rate buffer, whereas oil phase consisted of squalene oil andSpan 85. Aqueous phase was added to the oil phase and thesemixtures were then passed through a T25 homogenizer (IKA,Wilmington, North Carolina) at 24,000 rpm. MFA90 mixturewas passed for 2 min, whereas MFA160 was passed for 30 son the homogenizer. This gave us a primary emulsion that wasthen passed through a M-110P Microfluidizer (Microfluidics,Newton, Massachusetts). Thirty cycles of microfluidizer wererun at different pressures for both emulsions; for MFA90, pres-sure was 20,000 PSI, whereas for MFA160, pressure was keptat 5000 PSI.
Physical Characterization of SEA20, MFA90, and MFA160
All emulsions were filtered through 0.22-:m membrane filterprior to characterization. Droplet sizes and zeta potential ofthese emulsions were measured on Zetasizer Nano ZS. pH mea-surements were performed using an Orion 3 star pH meter fromThermo Scientific and osmolality was measured on Vapro Va-por Pressure Osmometer from Wesco (Salt Lake City, Utah).Additionally, all three novel adjuvants were analyzed on JEOL100X transmission electron microscope (TEM) (Peabody, Mas-sachusetts) to confirm the size as measured by DLS; 1% uranylacetate was used for negative staining. To assess the endotoxinlevels of these emulsions, gel clot assay was performed where0.1 mL of limulus amoebocyte lysate (LAL reagent) was addedto 0.1 mL of serially diluted test samples in depyrogenated flintglass tubes. The reaction solution was mixed and incubated at37°C. Results were expressed as Endotoxin Units per milliliter(EU/mL) if a gel had formed and remained intact when the tubewas inverted 90°. Squalene content of the formulations was as-sessed using high-performance liquid chromatography (HPLC),where the squalene peak was detected using photodiode arraydetector (PDA).13
Accelerated Short-Term Stability Study of AdjuvantsWithout Antigen
Each of the three emulsion adjuvants were studied for stabilityat RT, 4°C and 37°C. These samples were analyzed for squalenecontent by liquid chromatography up to 20 weeks postformula-tion and droplet size on Zetasizer by DLS was assessed up to11 weeks.
Proof of Concept In Vitro Assessment of Stability of Antigen withEmulsion Adjuvants
We analyzed the stability of model antigen OVA postmixingwith adjuvants using SDS-PAGE analysis. As our adjuvantscontain less squalene in comparison to MF59, we added an ad-ditional group of diluted MF59 to match the concentration ofsqualene in novel adjuvants. Briefly, OVA in PBS was mixedwith the adjuvants and centrifuged at 17,000g for 20 min.The subnatant was collected and mixed with 4× sample buffercontaining dithiothreitol and bromophenol blue. These sampleswere boiled at 95°C and centrifuged at 12,000 g for 5 min. Sam-ples containing 10 :g of ovalbumin were loaded on to 4%–12%Bis–Tris gel with one well-containing Novex Sharp Pre-StainedProtein Standard obtained from Invitrogen. The gel was run at200 V for 35–45 min and then placed in the colloidal blue stainovernight at RT. The next day the gel was destained with deion-ized water for 3–4 h to remove the nonspecific staining and wasscanned with a GS-800 Calibrated Densitometer from Bio-Radand analyzed using the Quantity One software (Hercules, CA).
Immunogenicity Studies in Mice with Model Antigen Ovalbuminto Establish Potency of Novel Adjuvants
For initial proof of concept studies, model antigen OVA was usedfor immunization in two different strains of mice—Balb/c andC57Bl/6. Animals were handled and cared in accordance withthe Northeastern Division of Laboratory Animal Medicine andthe animal study protocol was approved by Institutional Ani-mal Care and Use Committee (IACUC) of Northeastern Uni-versity. Animals were immunized twice (3 weeks apart) andbled prior to immunization (day 0), 3 weeks after 1st immu-nization (3wp1), and a terminal bleed at the end of the study(2 weeks post 2nd immunization–2wp2). For one study, a totalof 35 6–8-weeks-old female Balb/c mice were used (n = 5) andfor the next, 6–8-weeks-old female C57BL/6 mice were used (n= 3, total 21). Groups used for immunization for both stud-ies were: negative control group receiving PBS, nonadjuvantedOVA, OVA + SEA20, OVA + MFA90, OVA + MFA160, andOVA + 4times diluted MF59. OVA and adjuvants were mixed1:1 such that the final dose of the 100 :L vaccine had 10 :g ofOVA. These mixtures were allowed to sit on ice for 1 h and thenadministered intramuscularly in two thighs (50 :L bilaterallyinto two thighs).
Immunogenicity Study in Balb/c Mice to Test Potency ofAdjuvants with TIV Antigens
The novel emulsion adjuvants were next tested with TIV anti-gens at Novartis Vaccines in Siena, Italy (study 3). Six-to-eight-weeks-old female Balb/c mice (n = 10, total 70) were used inagreement with institutional and European guidelines. Time-line for the study was similar to study 1 and 2; two immuniza-tions 3-weeks apart and three bleeds—day0, 3wp1, and 2wp2.TIV at 0.1 :g was used for immunization. Vaccine groups weresimilar to previous studies: negative control group receiving no
DOI 10.1002/jps.24337 Shah et al., JOURNAL OF PHARMACEUTICAL SCIENCES
4 RESEARCH ARTICLE – Pharmaceutics, Drug Delivery and Pharmaceutical Technology
vaccine, TIV, TIV + SEA20, TIV + MFA90, TIV + MFA160,and TIV + 4times diluted MF59. Antigen and adjuvants weremixed in a 1:1 ratio and injected intramuscularly in two thighs(50 :L bilaterally).
Assessment of Humoral Responses
For studies performed with ovalbumin, plasma samples wereanalyzed for OVA-specific total immunoglobulin using ELISA.ELISA was performed as previously described.14 Briefly, plateswere coated with 1 :g OVA and incubated overnight at 4°C.Plates were blocked with 0.3% Tween 20 + 5% goat serum+ 1× PBS the next day. Sera samples were serially dilutedwith the blocking agent and added to the wells. 0.5% Tween20 in 1× PBS was used as washing buffer. Secondary antibodyat 1:2000 dilution (in blocking agent) was added to the platesand TMB was added as a substrate. 2 N hydrochloric acid wasused as a stopping solution and plates were read at 450 nmwavelength on VERSAmax Microplate Reader from MolecularDevices (Sunnyvale, CA). Titer values represent the reciprocalof the highest dilution of the sample at optical density of 0.5.
Assessment of Cellular Responses
To analyze cellular responses generated in response to adju-vant inclusion, in the end of the study performed in C57Bl/6mice, spleens were harvested and pooled by individual vac-cine groups. Spleens were homogenized and erythrocyte-freesingle cell suspension was prepared. Duplicate cultures wereprepared with each well receiving 2 million cells for stimu-lation with CD4+ epitope 323–339 and CD8+ epitope 257–264. Additionally, nonstimulated cultures were also used foreach vaccine group as negative control. Anti-CD28 was addedas a source of costimulation, and Brefeldin A was added toprevent cytokine secretion. Cultures were incubated overnightat 4°C and prepared for flow cytometry the next day. Af-ter overnight incubation, cells were stained for CD4 (PacificBlue) and CD8 (AlexaFluor700) population, permeabilized withCytofix/Cytoperm, and then stained for intracellular cytokines.To stain intracellular cytokines peridinin-chlorophyll protein(PerCP) Cy5.5 (eBioscience, San Diego, CA) was used for inter-feron gamma (IFN-(), allophycocyanin (APC) for interleukin-2(IL-2), R-Phycoerythrin (PE) for interleukin-5 (IL-5), and Alex-aFluor488 for tumor necrosis factor alpha (TNF-") were used.These cells were then analyzed on BD LSRII using appropri-ate voltage controls and compensation controls generated bymixing BDCompBeads and the above-mentioned 6 dyes.
Hemagglutinin Inhibition Titers
Hemagglutinin inhibition (HI) titers were calculated for indi-vidual sera taken at 3wp1 and 2wp2 immunizations. To in-activate nonspecific inhibitors in serum samples, aliquots ofeach serum were separately treated with receptor-destroyingenzyme prior to being tested with a final serum dilution of 1:10(starting dilution for the assays). Samples were serially dilutedtwofold into V-bottom 96 well microtiter plates. Briefly, 25 :Lof twofold serially diluted samples were incubated with 25 :Lof H1N1 A/California/7/09 (whole virus, containing four hemag-glutinating units) for 60 min at RT. A 0.5% (v/v) suspension ofred blood cells obtained from adult turkeys was added and themixture was incubated for another 60 min. As a negative con-trol, to determine the background values of the assay serumsamples of mice immunized with buffer were tested in paral-
Table 1. Size Measured by DLS of Self-Emulsifying Formulations
SEA Squalene Span 85 Tween 80 Size (nm) PDI
1 20 70 10 231 0.4282 60 30 10 260.4 0.9783 20 30 50 229.4 0.5164 30 50 20 2655 0.3815 40 40 20 240.2 0.5036 30 40 30 191.3 0.4137 30 60 10 257.5 0.5298 40 50 10 148.3 0.4239 50 40 10 273.1 0.41610 50 30 20 221.4 0.37611 40 30 30 162.9 0.22712 30 30 40 167.1 0.29313 20 40 40 192.2 0.52214 20 50 30 486 0.69915 20 60 20 1686 0.87816 70 20 10 176.8 0.47417 60 20 20 191.8 0.39118 50 20 30 121.1 0.20119 40 20 40 97.72 0.23420 30 20 50 54.49 0.30621 20 20 60 56.89 0.44822 10 20 70 35.61 0.72723 10 30 60 195.3 0.46424 10 40 50 171.4 0.33925 10 50 40 314.9 0.48826 10 60 30 877.7 0.69727 10 70 20 1535 0.9328 10 80 10 603.1 0.50229 10 10 80 18.3 0.30430 20 10 70 19.14 0.13631 30 10 60 113.5 0.56832 40 10 50 184.1 0.48433 50 10 40 242.1 0.27934 60 10 30 677.1 0.58535 70 10 20 661.8 0.56436 80 10 10 342.4 0.539
Thirty-six ratios (Fig. 1) of squalene, Span 85, and Tween 80 were mixed andemulsified with deionized water at a dilution of 1:20 and then sized on DLS toidentify the best self-emulsifying ratio producing smaller droplets.
lel. Serum response to vaccine antigens was considered posi-tive if a rise in antibody titers greater than fourfold comparedwith background was detectable. All sera were run in duplicate.The HI titer is defined as the greatest serum dilution at whichcomplete agglutination inhibition is observed. Geometric meantiters (GMTs) of 10 mice per group are shown for 2wp2 sera forSEA20 and MFA160 groups.
RESULTS
Screen of Squalene Self-Emulsifying Systems
All the 36 ratios of Figure 1 were emulsified with deionizedwater at a 1:20 dilution and analyzed on DLS for particle sizeand polydispersity index (PDI). These results are presented inTable 1. Different ratios exhibited differential stability anddroplet sizes and for stable formulations we observed an in-crease in droplet size with an increase in squalene concen-tration. As the oil content and the ratio of oil–surfactant in-creased from emulsion #22 to emulsion #16 (descending order),the droplet size increased. Similar trend was observed from
Shah et al., JOURNAL OF PHARMACEUTICAL SCIENCES DOI 10.1002/jps.24337
RESEARCH ARTICLE – Pharmaceutics, Drug Delivery and Pharmaceutical Technology 5
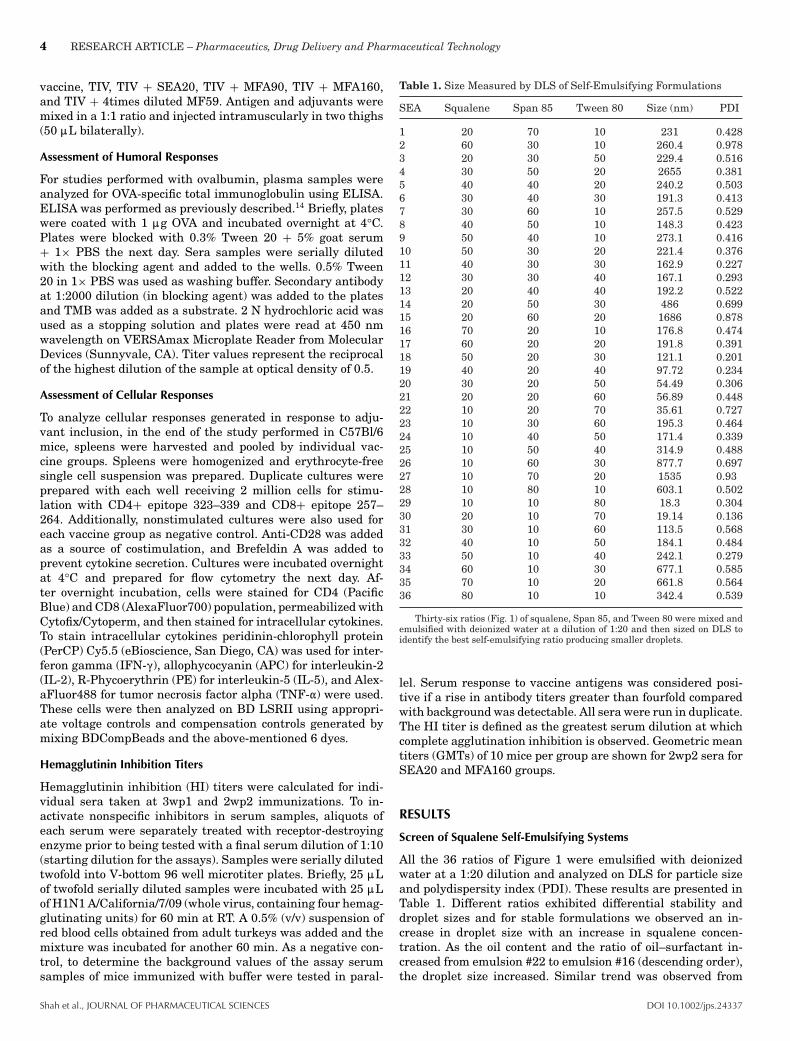
Table 2. Biophysical Characterization of Novel Adjuvants
Formulation Size (nm)Particle Size
Distribution (PDI)Zeta Potential
(mV) pHOsmolality(mmol/kg)
Endotoxin Level ofAdjuvants (EU/Dose)
Squalene Content(mg/mL)
SEA20 20.86 ± 2.18 0.08 ± 0.01 −1.95 ± 0.66 6.93 ± 0.03 66.66 ± 2.31 �0.1125 13.26 ± 0.3MFA 90 84.95 ± 5.13 0.17 ± 0.02 −9.08 ± 1.13 6.98 ± 0.06 59.66 ± 1.53 �0.1125 12.03 ± 0.2MFA 160 145.53 ± 3.05 0.14 ± 0.02 −17.5 ± 0.62 6.94 ± 0.04 62.33 ± 3.51 �0.1125 11.95 ± 0.04
Each adjuvant after filtering through a 0.22-:m membrane filter was analyzed for droplet size, zeta potential, pH, osmolality, endotoxin levels, and squalenecontent. Size and zeta potential were measured on DLS with different dilutions for each adjuvant: no dilution for SEA20, 1:1 dilution for MFA90, and 1:100 dilutionfor SEA160. pH and osmolality were measured without diluting the adjuvants. Endotoxin levels were analyzed by gel clot assay using LAL reagent, and squalenecontent was determined by chromatographic techniques. Values are expressed as average ± standard deviation, n = 3.
emulsions #30 to #34. The purpose of this screen was to iden-tify a ratio that generates extremely small-sized droplets withminimum shear; emulsion #22 and #30 were selected for furtheroptimization. Selection was based on particle size generated byDLS, visual observation, and stability of emulsions (absence ofcreaming or phase separation). The final emulsion obtained byself-emulsification had a ratio of oil to surfactants close to bothemulsion #22 and #30.
Characterization of SEA20, MFA90, and MFA160
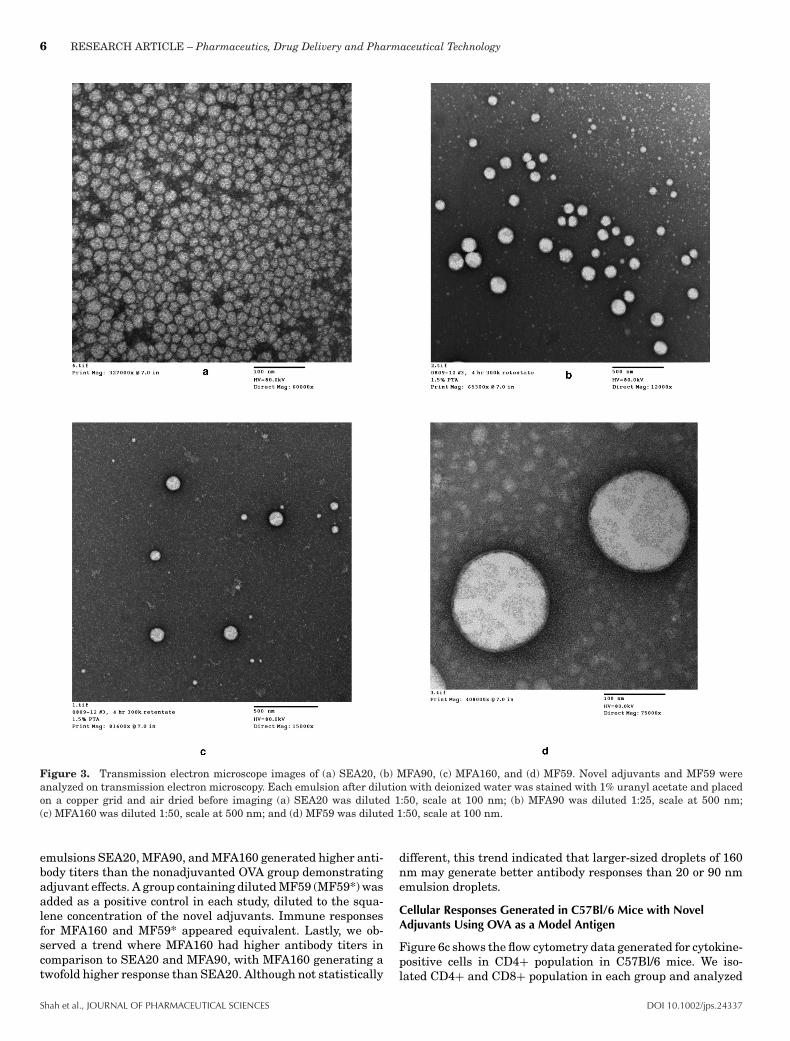
Characterization results for the emulsions are shown inTable 2, where n = 3 and results are represented as average± standard deviation. The results indicated that the sizes andzeta potential of the three emulsions were distinct and repro-ducible; with a PDI of less than 0.2, indicating uniform sizes.pH (�6.9) and osmolality (�60 mmol/kg) for all three emulsionswere also similar (Table 2). Additionally, squalene concentra-tion, calculated off a standard curve generated with squaleneoil in isopropyl alcohol, was found to be relatively similar amongall three novel emulsions. Reported concentration of squalenein MF59 is 39 ± 3 mg/mL.15 Results generated from the stan-dard curve showed that the squalene oil concentration of allthree emulsions was relatively low in comparison to MF59. Asall three emulsions are different in size, they have differentlevels of turbidity with SEA20 being the least turbid (Fig. 2).As the droplet size increases, we observed an increase in tur-bidity, with MFA160 having a milk-like appearance similar toMF59. DLS measures hydrodynamic diameter; to confirm theDLS measurements, we analyzed each novel emulsion using
Figure 2. Relative turbidity of the adjuvants is dependent on theirdroplet size. Images were taken for the novel adjuvants after filteringthrough 0.22-:m membrane filter. SEA20 (20 nm) is the least turbid,whereas MFA160 (160 nm) is the most and appears milky similar toMF59 (160 nm). MFA90 (90 nm) has intermediate turbidity comparedwith the other adjuvants prepared.
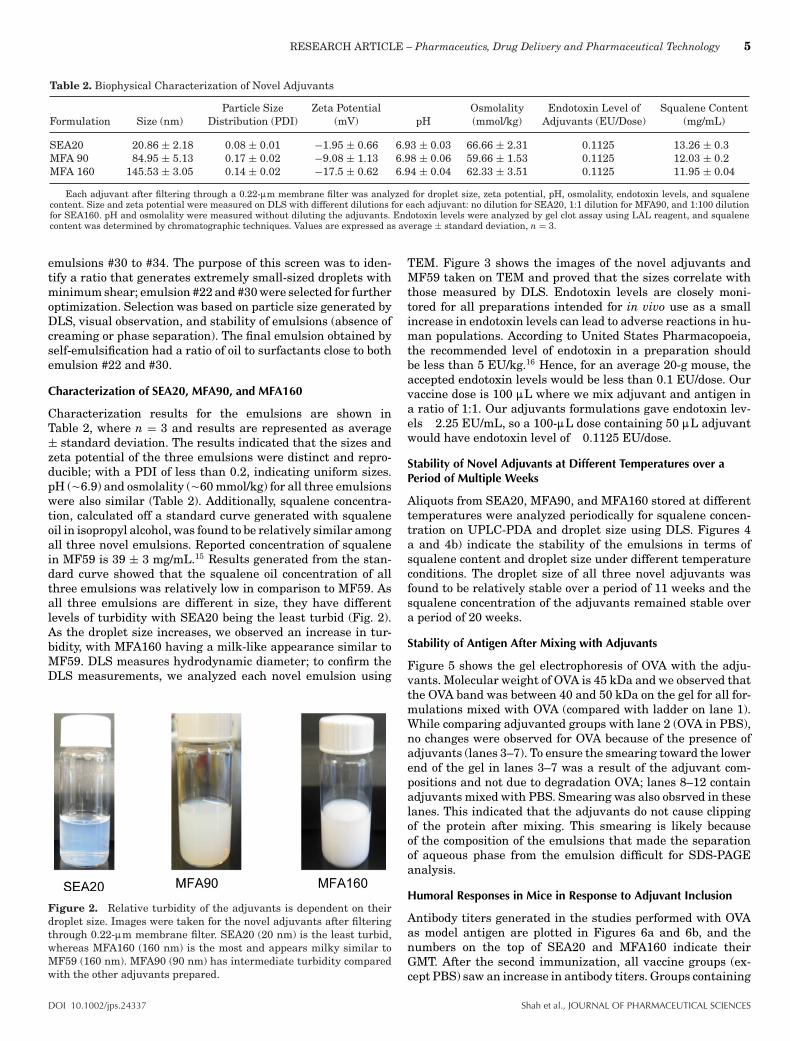
TEM. Figure 3 shows the images of the novel adjuvants andMF59 taken on TEM and proved that the sizes correlate withthose measured by DLS. Endotoxin levels are closely moni-tored for all preparations intended for in vivo use as a smallincrease in endotoxin levels can lead to adverse reactions in hu-man populations. According to United States Pharmacopoeia,the recommended level of endotoxin in a preparation shouldbe less than 5 EU/kg.16 Hence, for an average 20-g mouse, theaccepted endotoxin levels would be less than 0.1 EU/dose. Ourvaccine dose is 100 :L where we mix adjuvant and antigen ina ratio of 1:1. Our adjuvants formulations gave endotoxin lev-els �2.25 EU/mL, so a 100-:L dose containing 50 :L adjuvantwould have endotoxin level of �0.1125 EU/dose.
Stability of Novel Adjuvants at Different Temperatures over aPeriod of Multiple Weeks
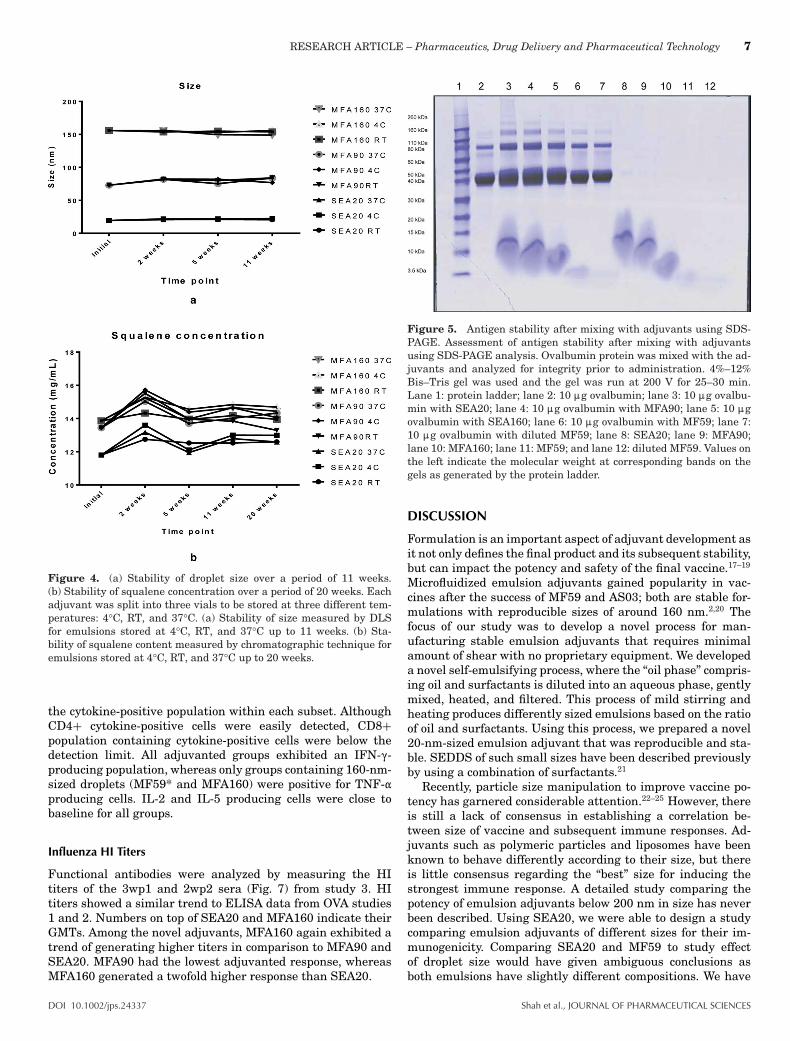
Aliquots from SEA20, MFA90, and MFA160 stored at differenttemperatures were analyzed periodically for squalene concen-tration on UPLC-PDA and droplet size using DLS. Figures 4a and 4b) indicate the stability of the emulsions in terms ofsqualene content and droplet size under different temperatureconditions. The droplet size of all three novel adjuvants wasfound to be relatively stable over a period of 11 weeks and thesqualene concentration of the adjuvants remained stable overa period of 20 weeks.
Stability of Antigen After Mixing with Adjuvants
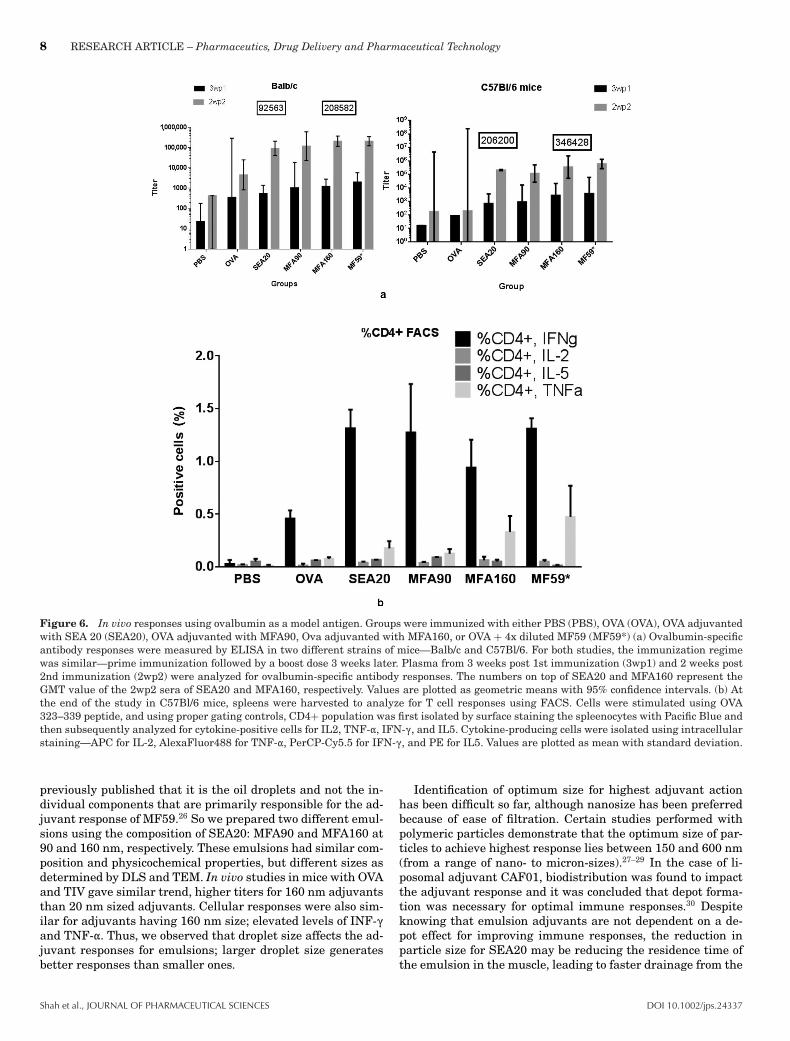
Figure 5 shows the gel electrophoresis of OVA with the adju-vants. Molecular weight of OVA is 45 kDa and we observed thatthe OVA band was between 40 and 50 kDa on the gel for all for-mulations mixed with OVA (compared with ladder on lane 1).While comparing adjuvanted groups with lane 2 (OVA in PBS),no changes were observed for OVA because of the presence ofadjuvants (lanes 3–7). To ensure the smearing toward the lowerend of the gel in lanes 3–7 was a result of the adjuvant com-positions and not due to degradation OVA; lanes 8–12 containadjuvants mixed with PBS. Smearing was also obsrved in theselanes. This indicated that the adjuvants do not cause clippingof the protein after mixing. This smearing is likely becauseof the composition of the emulsions that made the separationof aqueous phase from the emulsion difficult for SDS-PAGEanalysis.
Humoral Responses in Mice in Response to Adjuvant Inclusion
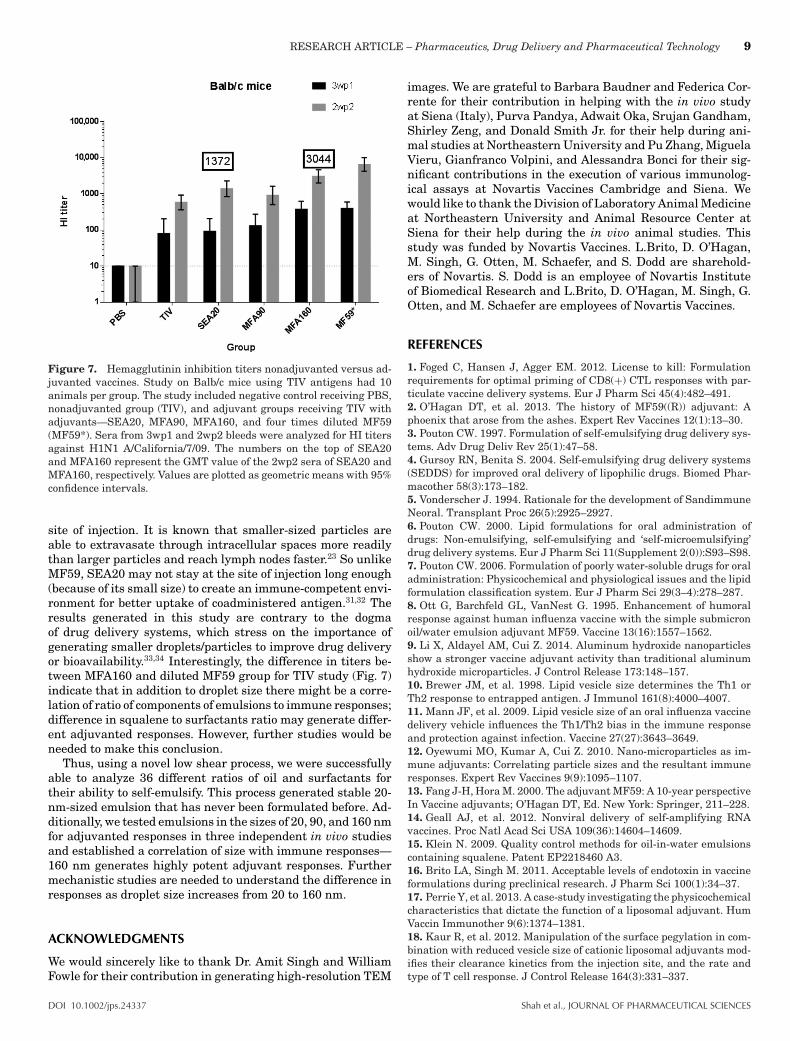
Antibody titers generated in the studies performed with OVAas model antigen are plotted in Figures 6a and 6b, and thenumbers on the top of SEA20 and MFA160 indicate theirGMT. After the second immunization, all vaccine groups (ex-cept PBS) saw an increase in antibody titers. Groups containing
DOI 10.1002/jps.24337 Shah et al., JOURNAL OF PHARMACEUTICAL SCIENCES
6 RESEARCH ARTICLE – Pharmaceutics, Drug Delivery and Pharmaceutical Technology
Figure 3. Transmission electron microscope images of (a) SEA20, (b) MFA90, (c) MFA160, and (d) MF59. Novel adjuvants and MF59 wereanalyzed on transmission electron microscopy. Each emulsion after dilution with deionized water was stained with 1% uranyl acetate and placedon a copper grid and air dried before imaging (a) SEA20 was diluted 1:50, scale at 100 nm; (b) MFA90 was diluted 1:25, scale at 500 nm;(c) MFA160 was diluted 1:50, scale at 500 nm; and (d) MF59 was diluted 1:50, scale at 100 nm.
emulsions SEA20, MFA90, and MFA160 generated higher anti-body titers than the nonadjuvanted OVA group demonstratingadjuvant effects. A group containing diluted MF59 (MF59*) wasadded as a positive control in each study, diluted to the squa-lene concentration of the novel adjuvants. Immune responsesfor MFA160 and MF59* appeared equivalent. Lastly, we ob-served a trend where MFA160 had higher antibody titers incomparison to SEA20 and MFA90, with MFA160 generating atwofold higher response than SEA20. Although not statistically
different, this trend indicated that larger-sized droplets of 160nm may generate better antibody responses than 20 or 90 nmemulsion droplets.
Cellular Responses Generated in C57Bl/6 Mice with NovelAdjuvants Using OVA as a Model Antigen
Figure 6c shows the flow cytometry data generated for cytokine-positive cells in CD4+ population in C57Bl/6 mice. We iso-lated CD4+ and CD8+ population in each group and analyzed
Shah et al., JOURNAL OF PHARMACEUTICAL SCIENCES DOI 10.1002/jps.24337
RESEARCH ARTICLE – Pharmaceutics, Drug Delivery and Pharmaceutical Technology 7
Figure 4. (a) Stability of droplet size over a period of 11 weeks.(b) Stability of squalene concentration over a period of 20 weeks. Eachadjuvant was split into three vials to be stored at three different tem-peratures: 4°C, RT, and 37°C. (a) Stability of size measured by DLSfor emulsions stored at 4°C, RT, and 37°C up to 11 weeks. (b) Sta-bility of squalene content measured by chromatographic technique foremulsions stored at 4°C, RT, and 37°C up to 20 weeks.
the cytokine-positive population within each subset. AlthoughCD4+ cytokine-positive cells were easily detected, CD8+population containing cytokine-positive cells were below thedetection limit. All adjuvanted groups exhibited an IFN-(-producing population, whereas only groups containing 160-nm-sized droplets (MF59* and MFA160) were positive for TNF-"producing cells. IL-2 and IL-5 producing cells were close tobaseline for all groups.
Influenza HI Titers
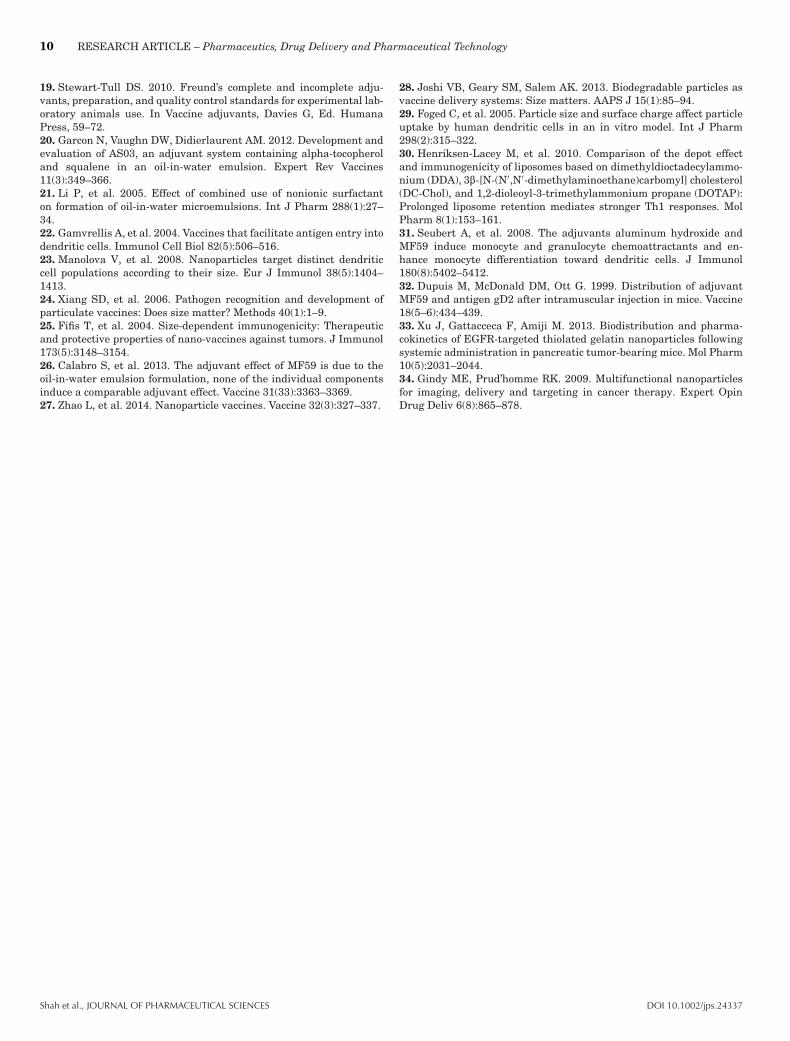
Functional antibodies were analyzed by measuring the HItiters of the 3wp1 and 2wp2 sera (Fig. 7) from study 3. HItiters showed a similar trend to ELISA data from OVA studies1 and 2. Numbers on top of SEA20 and MFA160 indicate theirGMTs. Among the novel adjuvants, MFA160 again exhibited atrend of generating higher titers in comparison to MFA90 andSEA20. MFA90 had the lowest adjuvanted response, whereasMFA160 generated a twofold higher response than SEA20.
Figure 5. Antigen stability after mixing with adjuvants using SDS-PAGE. Assessment of antigen stability after mixing with adjuvantsusing SDS-PAGE analysis. Ovalbumin protein was mixed with the ad-juvants and analyzed for integrity prior to administration. 4%–12%Bis–Tris gel was used and the gel was run at 200 V for 25–30 min.Lane 1: protein ladder; lane 2: 10 :g ovalbumin; lane 3: 10 :g ovalbu-min with SEA20; lane 4: 10 :g ovalbumin with MFA90; lane 5: 10 :govalbumin with SEA160; lane 6: 10 :g ovalbumin with MF59; lane 7:10 :g ovalbumin with diluted MF59; lane 8: SEA20; lane 9: MFA90;lane 10: MFA160; lane 11: MF59; and lane 12: diluted MF59. Values onthe left indicate the molecular weight at corresponding bands on thegels as generated by the protein ladder.
DISCUSSION
Formulation is an important aspect of adjuvant development asit not only defines the final product and its subsequent stability,but can impact the potency and safety of the final vaccine.17–19
Microfluidized emulsion adjuvants gained popularity in vac-cines after the success of MF59 and AS03; both are stable for-mulations with reproducible sizes of around 160 nm.2,20 Thefocus of our study was to develop a novel process for man-ufacturing stable emulsion adjuvants that requires minimalamount of shear with no proprietary equipment. We developeda novel self-emulsifying process, where the “oil phase” compris-ing oil and surfactants is diluted into an aqueous phase, gentlymixed, heated, and filtered. This process of mild stirring andheating produces differently sized emulsions based on the ratioof oil and surfactants. Using this process, we prepared a novel20-nm-sized emulsion adjuvant that was reproducible and sta-ble. SEDDS of such small sizes have been described previouslyby using a combination of surfactants.21
Recently, particle size manipulation to improve vaccine po-tency has garnered considerable attention.22–25 However, thereis still a lack of consensus in establishing a correlation be-tween size of vaccine and subsequent immune responses. Ad-juvants such as polymeric particles and liposomes have beenknown to behave differently according to their size, but thereis little consensus regarding the “best” size for inducing thestrongest immune response. A detailed study comparing thepotency of emulsion adjuvants below 200 nm in size has neverbeen described. Using SEA20, we were able to design a studycomparing emulsion adjuvants of different sizes for their im-munogenicity. Comparing SEA20 and MF59 to study effectof droplet size would have given ambiguous conclusions asboth emulsions have slightly different compositions. We have
DOI 10.1002/jps.24337 Shah et al., JOURNAL OF PHARMACEUTICAL SCIENCES
8 RESEARCH ARTICLE – Pharmaceutics, Drug Delivery and Pharmaceutical Technology
Figure 6. In vivo responses using ovalbumin as a model antigen. Groups were immunized with either PBS (PBS), OVA (OVA), OVA adjuvantedwith SEA 20 (SEA20), OVA adjuvanted with MFA90, Ova adjuvanted with MFA160, or OVA + 4x diluted MF59 (MF59*) (a) Ovalbumin-specificantibody responses were measured by ELISA in two different strains of mice—Balb/c and C57Bl/6. For both studies, the immunization regimewas similar—prime immunization followed by a boost dose 3 weeks later. Plasma from 3 weeks post 1st immunization (3wp1) and 2 weeks post2nd immunization (2wp2) were analyzed for ovalbumin-specific antibody responses. The numbers on top of SEA20 and MFA160 represent theGMT value of the 2wp2 sera of SEA20 and MFA160, respectively. Values are plotted as geometric means with 95% confidence intervals. (b) Atthe end of the study in C57Bl/6 mice, spleens were harvested to analyze for T cell responses using FACS. Cells were stimulated using OVA323–339 peptide, and using proper gating controls, CD4+ population was first isolated by surface staining the spleenocytes with Pacific Blue andthen subsequently analyzed for cytokine-positive cells for IL2, TNF-", IFN-(, and IL5. Cytokine-producing cells were isolated using intracellularstaining—APC for IL-2, AlexaFluor488 for TNF-", PerCP-Cy5.5 for IFN-(, and PE for IL5. Values are plotted as mean with standard deviation.
previously published that it is the oil droplets and not the in-dividual components that are primarily responsible for the ad-juvant response of MF59.26 So we prepared two different emul-sions using the composition of SEA20: MFA90 and MFA160 at90 and 160 nm, respectively. These emulsions had similar com-position and physicochemical properties, but different sizes asdetermined by DLS and TEM. In vivo studies in mice with OVAand TIV gave similar trend, higher titers for 160 nm adjuvantsthan 20 nm sized adjuvants. Cellular responses were also sim-ilar for adjuvants having 160 nm size; elevated levels of INF-(and TNF-". Thus, we observed that droplet size affects the ad-juvant responses for emulsions; larger droplet size generatesbetter responses than smaller ones.
Identification of optimum size for highest adjuvant actionhas been difficult so far, although nanosize has been preferredbecause of ease of filtration. Certain studies performed withpolymeric particles demonstrate that the optimum size of par-ticles to achieve highest response lies between 150 and 600 nm(from a range of nano- to micron-sizes).27–29 In the case of li-posomal adjuvant CAF01, biodistribution was found to impactthe adjuvant response and it was concluded that depot forma-tion was necessary for optimal immune responses.30 Despiteknowing that emulsion adjuvants are not dependent on a de-pot effect for improving immune responses, the reduction inparticle size for SEA20 may be reducing the residence time ofthe emulsion in the muscle, leading to faster drainage from the
Shah et al., JOURNAL OF PHARMACEUTICAL SCIENCES DOI 10.1002/jps.24337
RESEARCH ARTICLE – Pharmaceutics, Drug Delivery and Pharmaceutical Technology 9
Figure 7. Hemagglutinin inhibition titers nonadjuvanted versus ad-juvanted vaccines. Study on Balb/c mice using TIV antigens had 10animals per group. The study included negative control receiving PBS,nonadjuvanted group (TIV), and adjuvant groups receiving TIV withadjuvants—SEA20, MFA90, MFA160, and four times diluted MF59(MF59*). Sera from 3wp1 and 2wp2 bleeds were analyzed for HI titersagainst H1N1 A/California/7/09. The numbers on the top of SEA20and MFA160 represent the GMT value of the 2wp2 sera of SEA20 andMFA160, respectively. Values are plotted as geometric means with 95%confidence intervals.
site of injection. It is known that smaller-sized particles areable to extravasate through intracellular spaces more readilythan larger particles and reach lymph nodes faster.23 So unlikeMF59, SEA20 may not stay at the site of injection long enough(because of its small size) to create an immune-competent envi-ronment for better uptake of coadministered antigen.31,32 Theresults generated in this study are contrary to the dogmaof drug delivery systems, which stress on the importance ofgenerating smaller droplets/particles to improve drug deliveryor bioavailability.33,34 Interestingly, the difference in titers be-tween MFA160 and diluted MF59 group for TIV study (Fig. 7)indicate that in addition to droplet size there might be a corre-lation of ratio of components of emulsions to immune responses;difference in squalene to surfactants ratio may generate differ-ent adjuvanted responses. However, further studies would beneeded to make this conclusion.
Thus, using a novel low shear process, we were successfullyable to analyze 36 different ratios of oil and surfactants fortheir ability to self-emulsify. This process generated stable 20-nm-sized emulsion that has never been formulated before. Ad-ditionally, we tested emulsions in the sizes of 20, 90, and 160 nmfor adjuvanted responses in three independent in vivo studiesand established a correlation of size with immune responses—160 nm generates highly potent adjuvant responses. Furthermechanistic studies are needed to understand the difference inresponses as droplet size increases from 20 to 160 nm.
ACKNOWLEDGMENTS
We would sincerely like to thank Dr. Amit Singh and WilliamFowle for their contribution in generating high-resolution TEM
images. We are grateful to Barbara Baudner and Federica Cor-rente for their contribution in helping with the in vivo studyat Siena (Italy), Purva Pandya, Adwait Oka, Srujan Gandham,Shirley Zeng, and Donald Smith Jr. for their help during ani-mal studies at Northeastern University and Pu Zhang, MiguelaVieru, Gianfranco Volpini, and Alessandra Bonci for their sig-nificant contributions in the execution of various immunolog-ical assays at Novartis Vaccines Cambridge and Siena. Wewould like to thank the Division of Laboratory Animal Medicineat Northeastern University and Animal Resource Center atSiena for their help during the in vivo animal studies. Thisstudy was funded by Novartis Vaccines. L.Brito, D. O’Hagan,M. Singh, G. Otten, M. Schaefer, and S. Dodd are sharehold-ers of Novartis. S. Dodd is an employee of Novartis Instituteof Biomedical Research and L.Brito, D. O’Hagan, M. Singh, G.Otten, and M. Schaefer are employees of Novartis Vaccines.
REFERENCES
1. Foged C, Hansen J, Agger EM. 2012. License to kill: Formulationrequirements for optimal priming of CD8(+) CTL responses with par-ticulate vaccine delivery systems. Eur J Pharm Sci 45(4):482–491.2. O’Hagan DT, et al. 2013. The history of MF59((R)) adjuvant: Aphoenix that arose from the ashes. Expert Rev Vaccines 12(1):13–30.3. Pouton CW. 1997. Formulation of self-emulsifying drug delivery sys-tems. Adv Drug Deliv Rev 25(1):47–58.4. Gursoy RN, Benita S. 2004. Self-emulsifying drug delivery systems(SEDDS) for improved oral delivery of lipophilic drugs. Biomed Phar-macother 58(3):173–182.5. Vonderscher J. 1994. Rationale for the development of SandimmuneNeoral. Transplant Proc 26(5):2925–2927.6. Pouton CW. 2000. Lipid formulations for oral administration ofdrugs: Non-emulsifying, self-emulsifying and ‘self-microemulsifying’drug delivery systems. Eur J Pharm Sci 11(Supplement 2(0)):S93–S98.7. Pouton CW. 2006. Formulation of poorly water-soluble drugs for oraladministration: Physicochemical and physiological issues and the lipidformulation classification system. Eur J Pharm Sci 29(3–4):278–287.8. Ott G, Barchfeld GL, VanNest G. 1995. Enhancement of humoralresponse against human influenza vaccine with the simple submicronoil/water emulsion adjuvant MF59. Vaccine 13(16):1557–1562.9. Li X, Aldayel AM, Cui Z. 2014. Aluminum hydroxide nanoparticlesshow a stronger vaccine adjuvant activity than traditional aluminumhydroxide microparticles. J Control Release 173:148–157.10. Brewer JM, et al. 1998. Lipid vesicle size determines the Th1 orTh2 response to entrapped antigen. J Immunol 161(8):4000–4007.11. Mann JF, et al. 2009. Lipid vesicle size of an oral influenza vaccinedelivery vehicle influences the Th1/Th2 bias in the immune responseand protection against infection. Vaccine 27(27):3643–3649.12. Oyewumi MO, Kumar A, Cui Z. 2010. Nano-microparticles as im-mune adjuvants: Correlating particle sizes and the resultant immuneresponses. Expert Rev Vaccines 9(9):1095–1107.13. Fang J-H, Hora M. 2000. The adjuvant MF59: A 10-year perspectiveIn Vaccine adjuvants; O’Hagan DT, Ed. New York: Springer, 211–228.14. Geall AJ, et al. 2012. Nonviral delivery of self-amplifying RNAvaccines. Proc Natl Acad Sci USA 109(36):14604–14609.15. Klein N. 2009. Quality control methods for oil-in-water emulsionscontaining squalene. Patent EP2218460 A3.16. Brito LA, Singh M. 2011. Acceptable levels of endotoxin in vaccineformulations during preclinical research. J Pharm Sci 100(1):34–37.17. Perrie Y, et al. 2013. A case-study investigating the physicochemicalcharacteristics that dictate the function of a liposomal adjuvant. HumVaccin Immunother 9(6):1374–1381.18. Kaur R, et al. 2012. Manipulation of the surface pegylation in com-bination with reduced vesicle size of cationic liposomal adjuvants mod-ifies their clearance kinetics from the injection site, and the rate andtype of T cell response. J Control Release 164(3):331–337.
DOI 10.1002/jps.24337 Shah et al., JOURNAL OF PHARMACEUTICAL SCIENCES
10 RESEARCH ARTICLE – Pharmaceutics, Drug Delivery and Pharmaceutical Technology
19. Stewart-Tull DS. 2010. Freund’s complete and incomplete adju-vants, preparation, and quality control standards for experimental lab-oratory animals use. In Vaccine adjuvants, Davies G, Ed. HumanaPress, 59–72.20. Garcon N, Vaughn DW, Didierlaurent AM. 2012. Development andevaluation of AS03, an adjuvant system containing alpha-tocopheroland squalene in an oil-in-water emulsion. Expert Rev Vaccines11(3):349–366.21. Li P, et al. 2005. Effect of combined use of nonionic surfactanton formation of oil-in-water microemulsions. Int J Pharm 288(1):27–34.22. Gamvrellis A, et al. 2004. Vaccines that facilitate antigen entry intodendritic cells. Immunol Cell Biol 82(5):506–516.23. Manolova V, et al. 2008. Nanoparticles target distinct dendriticcell populations according to their size. Eur J Immunol 38(5):1404–1413.24. Xiang SD, et al. 2006. Pathogen recognition and development ofparticulate vaccines: Does size matter? Methods 40(1):1–9.25. Fifis T, et al. 2004. Size-dependent immunogenicity: Therapeuticand protective properties of nano-vaccines against tumors. J Immunol173(5):3148–3154.26. Calabro S, et al. 2013. The adjuvant effect of MF59 is due to theoil-in-water emulsion formulation, none of the individual componentsinduce a comparable adjuvant effect. Vaccine 31(33):3363–3369.27. Zhao L, et al. 2014. Nanoparticle vaccines. Vaccine 32(3):327–337.
28. Joshi VB, Geary SM, Salem AK. 2013. Biodegradable particles asvaccine delivery systems: Size matters. AAPS J 15(1):85–94.29. Foged C, et al. 2005. Particle size and surface charge affect particleuptake by human dendritic cells in an in vitro model. Int J Pharm298(2):315–322.30. Henriksen-Lacey M, et al. 2010. Comparison of the depot effectand immunogenicity of liposomes based on dimethyldioctadecylammo-nium (DDA), 3$-[N-(N′,N′-dimethylaminoethane)carbomyl] cholesterol(DC-Chol), and 1,2-dioleoyl-3-trimethylammonium propane (DOTAP):Prolonged liposome retention mediates stronger Th1 responses. MolPharm 8(1):153–161.31. Seubert A, et al. 2008. The adjuvants aluminum hydroxide andMF59 induce monocyte and granulocyte chemoattractants and en-hance monocyte differentiation toward dendritic cells. J Immunol180(8):5402–5412.32. Dupuis M, McDonald DM, Ott G. 1999. Distribution of adjuvantMF59 and antigen gD2 after intramuscular injection in mice. Vaccine18(5–6):434–439.33. Xu J, Gattacceca F, Amiji M. 2013. Biodistribution and pharma-cokinetics of EGFR-targeted thiolated gelatin nanoparticles followingsystemic administration in pancreatic tumor-bearing mice. Mol Pharm10(5):2031–2044.34. Gindy ME, Prud’homme RK. 2009. Multifunctional nanoparticlesfor imaging, delivery and targeting in cancer therapy. Expert OpinDrug Deliv 6(8):865–878.
Shah et al., JOURNAL OF PHARMACEUTICAL SCIENCES DOI 10.1002/jps.24337
Top Related
Copyright © 2022 FDOKUMEN

