


Bahasa
Halaman
Hukum

Spatial organization of the extracellular matrixregulates cell–cell junction positioningQingzong Tsenga, Eve Duchemin-Pelletierb, Alexandre Deshiereb, Martial Ballandc, Hervé Guilloud,e, Odile Filholb,and Manuel Thérya,1
aLaboratoire de Physiologie Cellulaire et Végétale, Unité Mixte de Recherche (UMR) 5168, Institut de Recherches en Technologies et Sciences pour le Vivant(iRTSV), Commissariat à l’Energie Atomiques et aux Energies Alternatives (CEA), Centre National de la Recherche Scientifique (CNRS), Institut National de laRecherche Agronomique, Université Joseph Fourier (UJF), 38054 Grenoble, France; bLaboratoire de Biologie du Cancer et de l’Infection, Unité 1036, iRTSV,Institut National de la Santé et de la Recherche Médicale, CEA, UJF, 38054 Grenoble, France; cLaboratoire Interdisciplinaire de Physique, UMR 5588, UJF, CNRS,38402 Saint Martin d’Heres, France; dUnité Mixte International 2820, Laboratory for Integrated Micro Mechatronic Systems, CNRS, Institute of IndustrialScience, University of Tokyo, Meguro-ku, Tokyo 153-8505, Japan; and eLaboratoire de Thermodynamique des Petits Systémes, Institut Néel, CNRS, UJF, BP166,38042 Grenoble, France
Edited by Alexander D. Bershadsky, Weizmann Institute of Science, Rehovot, Israel, and accepted by the Editorial Board November 22, 2011 (received forreview April 21, 2011)
The organization of cells into epithelium depends on cell in-teraction with both the extracellular matrix (ECM) and adjacentcells. The role of cell–cell adhesion in the regulation of epithelialtopology is well-described. ECM is better known to promote cellmigration and provide a structural scaffold for cell anchoring, butits contribution to multicellular morphogenesis is less well-under-stood. We developed a minimal model system to investigate howECM affects the spatial organization of intercellular junctions. Fi-bronectin micropatterns were used to constrain the location ofcell–ECM adhesion. We found that ECM affects the degree of sta-bility of intercellular junction positioning and the magnitude ofintra- and intercellular forces. Intercellular junctions were perma-nently displaced, and experienced large perpendicular tensionalforces as long as they were positioned close to ECM. They remainedstable solely in regions deprived of ECM, where they were submit-ted to lower tensional forces. The heterogeneity of the spatial or-ganization of ECM induced anisotropic distribution of mechanicalconstraints in cells, which seemed to adapt their position to mini-mize both intra- and intercellular forces. These results uncovera morphogenetic role for ECM in the mechanical regulation of cellsand intercellular junction positioning.
tissue architecture | cytoskeleton | actin | traction force | integrin cadherincrosstalk
Epithelial sheets lie on a layer of extracellular matrix (ECM),the so-called basement membrane. In such epithelia, cells
establish integrin-based adhesions on the basal part of the cell incontact with ECM, and cadherin-based intercellular adhesionson the apical part of contacting lateral domains, away fromcontact with ECM. The two adhesion systems display non-overlapping spatial distributions. Both cell–cell and cell–ECMadhesions are required to establish proper epithelium morphol-ogy (1). They both participate in mechano-transduction of ex-ternal physical cues into intracellular signaling (2). The biochemicalnature of adhesion molecules engaged in intercellular adhesion,the energy of the interaction, as well as the mechanical tensiondeveloped along intercellular junctions have been shown togovern epithelial cell shape and orient intercellular junctionsin various systems (3–6). However, whereas the contribution ofcell–cell adhesion to epithelial topology has been the focus of manystudies, much less attention has been paid to the role of ECM.ECM is a dynamic scaffold that is actively remodeled duringmorphogenesis, where it plays major roles in stimulating andguiding cell migration as well as orienting stem cell fate (7, 8).ECM is also known to impart morphoregulatory signals to epi-thelia, and thereby regulates tissue morphogenesis (8, 9). How-ever, the mechanism by which ECM guides cell positioning at thesingle-cell scale is still not known. ECM geometry has beenshown to regulate intracellular architecture (10) and provide
spatial information for cell polarization (1, 11, 12), but how itregulates cell positioning and thereby spatially organizes multi-cellular architectures remained to be investigated.
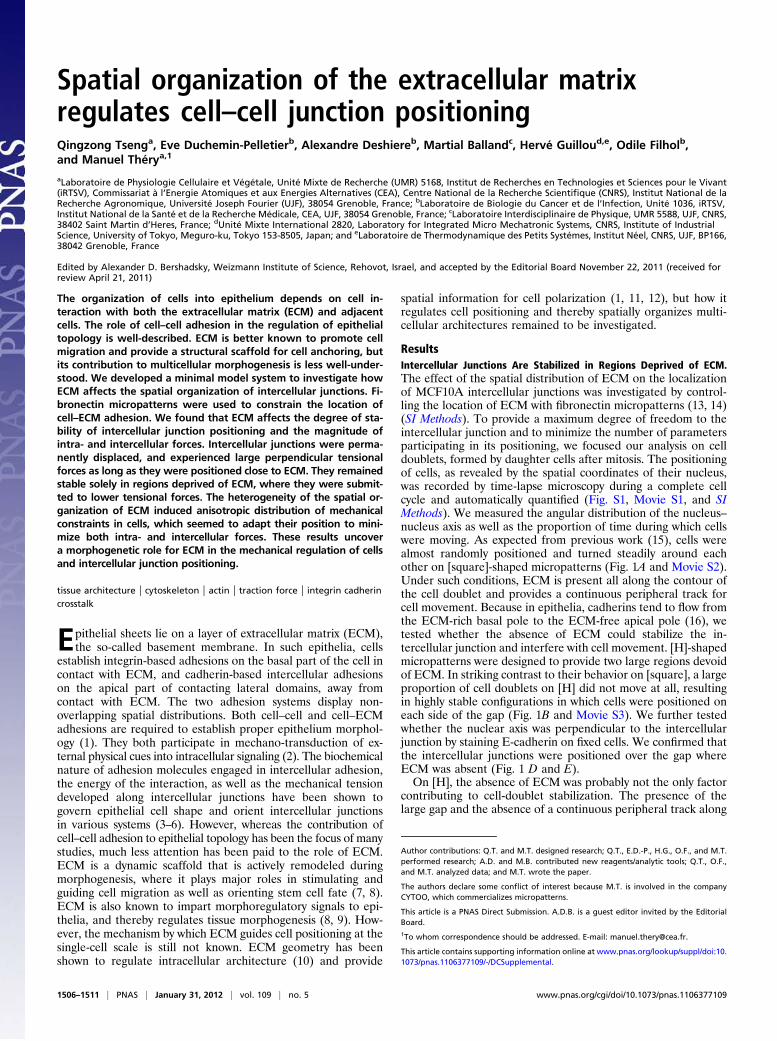
ResultsIntercellular Junctions Are Stabilized in Regions Deprived of ECM.The effect of the spatial distribution of ECM on the localizationof MCF10A intercellular junctions was investigated by control-ling the location of ECM with fibronectin micropatterns (13, 14)(SI Methods). To provide a maximum degree of freedom to theintercellular junction and to minimize the number of parametersparticipating in its positioning, we focused our analysis on celldoublets, formed by daughter cells after mitosis. The positioningof cells, as revealed by the spatial coordinates of their nucleus,was recorded by time-lapse microscopy during a complete cellcycle and automatically quantified (Fig. S1, Movie S1, and SIMethods). We measured the angular distribution of the nucleus–nucleus axis as well as the proportion of time during which cellswere moving. As expected from previous work (15), cells werealmost randomly positioned and turned steadily around eachother on [square]-shaped micropatterns (Fig. 1A and Movie S2).Under such conditions, ECM is present all along the contour ofthe cell doublet and provides a continuous peripheral track forcell movement. Because in epithelia, cadherins tend to flow fromthe ECM-rich basal pole to the ECM-free apical pole (16), wetested whether the absence of ECM could stabilize the in-tercellular junction and interfere with cell movement. [H]-shapedmicropatterns were designed to provide two large regions devoidof ECM. In striking contrast to their behavior on [square], a largeproportion of cell doublets on [H] did not move at all, resultingin highly stable configurations in which cells were positioned oneach side of the gap (Fig. 1B and Movie S3). We further testedwhether the nuclear axis was perpendicular to the intercellularjunction by staining E-cadherin on fixed cells. We confirmed thatthe intercellular junctions were positioned over the gap whereECM was absent (Fig. 1 D and E).On [H], the absence of ECM was probably not the only factor
contributing to cell-doublet stabilization. The presence of thelarge gap and the absence of a continuous peripheral track along
Author contributions: Q.T. and M.T. designed research; Q.T., E.D.-P., H.G., O.F., and M.T.performed research; A.D. and M.B. contributed new reagents/analytic tools; Q.T., O.F.,and M.T. analyzed data; and M.T. wrote the paper.
The authors declare some conflict of interest because M.T. is involved in the companyCYTOO, which commercializes micropatterns.
This article is a PNAS Direct Submission. A.D.B. is a guest editor invited by the EditorialBoard.1To whom correspondence should be addressed. E-mail: [email protected].
This article contains supporting information online at www.pnas.org/lookup/suppl/doi:10.1073/pnas.1106377109/-/DCSupplemental.
1506–1511 | PNAS | January 31, 2012 | vol. 109 | no. 5 www.pnas.org/cgi/doi/10.1073/pnas.1106377109
the cell-doublet contour may also have physically separated cellsand prevented cell movement. [Hourglass]-shaped micropatternswere designed to provide both a continuous peripheral track forcell movement and two regions along the cell-doublet contour inwhich ECM was absent (Fig. 1C). Thereby we could test thespecific effect of ECM on intercellular junction positioning un-der conditions where migration was not impaired. Analysis ofboth nucleus position and junction position confirmed that celldoublets tend to stabilize their positions in configurations wheretheir intercellular junction lies above regions deprived of ECM(Fig. 1 C and F). Under these conditions, the central part of thejunction lies above ECM. However, cadherins tend to concen-trate at the extremity of the junction (17), where most of theintercellular force is applied (18), and we could show that it isindeed the absence of ECM at the extremity and not in thecentral part of the junction that stabilizes junction displacements(Fig. S2). Notably, these orientations of cell doublets did notmerely result from the orientation of the mother cell division butinstead implied an active repositioning mechanism of the in-tercellular junction in response to ECM geometry (Fig. S3).
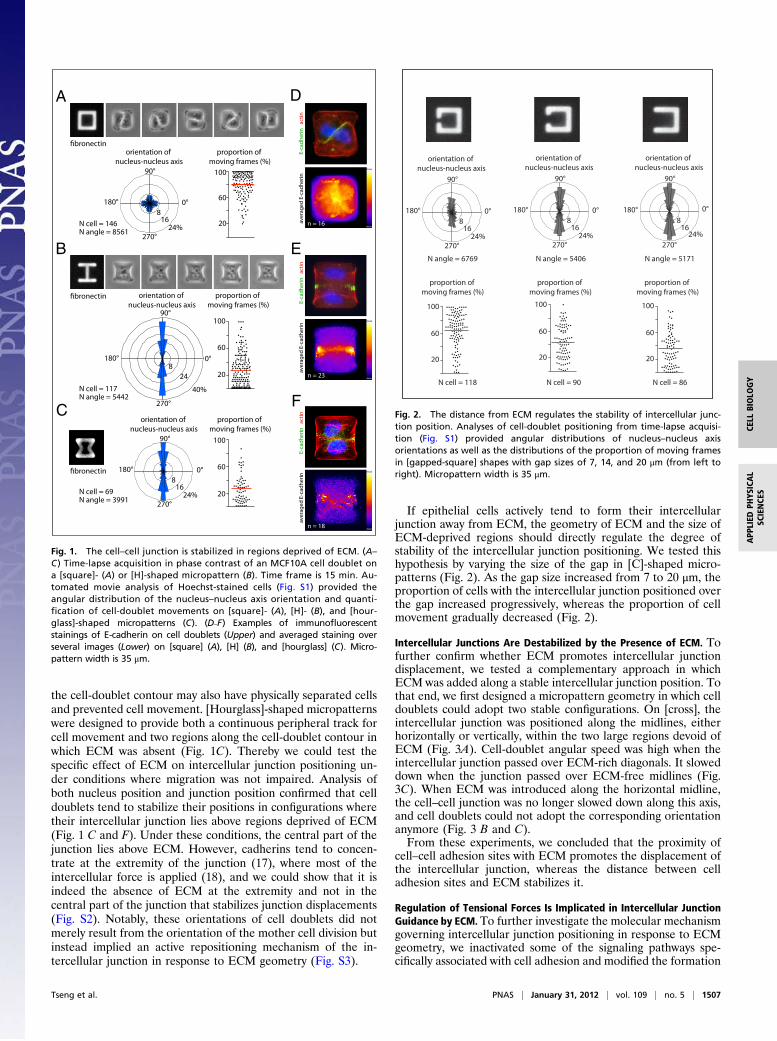
If epithelial cells actively tend to form their intercellularjunction away from ECM, the geometry of ECM and the size ofECM-deprived regions should directly regulate the degree ofstability of the intercellular junction positioning. We tested thishypothesis by varying the size of the gap in [C]-shaped micro-patterns (Fig. 2). As the gap size increased from 7 to 20 μm, theproportion of cells with the intercellular junction positioned overthe gap increased progressively, whereas the proportion of cellmovement gradually decreased (Fig. 2).
Intercellular Junctions Are Destabilized by the Presence of ECM. Tofurther confirm whether ECM promotes intercellular junctiondisplacement, we tested a complementary approach in whichECM was added along a stable intercellular junction position. Tothat end, we first designed a micropattern geometry in which celldoublets could adopt two stable configurations. On [cross], theintercellular junction was positioned along the midlines, eitherhorizontally or vertically, within the two large regions devoid ofECM (Fig. 3A). Cell-doublet angular speed was high when theintercellular junction passed over ECM-rich diagonals. It sloweddown when the junction passed over ECM-free midlines (Fig.3C). When ECM was introduced along the horizontal midline,the cell–cell junction was no longer slowed down along this axis,and cell doublets could not adopt the corresponding orientationanymore (Fig. 3 B and C).From these experiments, we concluded that the proximity of
cell–cell adhesion sites with ECM promotes the displacement ofthe intercellular junction, whereas the distance between celladhesion sites and ECM stabilizes it.
Regulation of Tensional Forces Is Implicated in Intercellular JunctionGuidance by ECM.To further investigate the molecular mechanismgoverning intercellular junction positioning in response to ECMgeometry, we inactivated some of the signaling pathways spe-cifically associated with cell adhesion and modified the formation
816
24%
90°
180°
270°
orientation of nucleus-nucleus axis
N cell = 146N angle = 8561
100
60
20
proportion of moving frames (%)
824
90°
180°
270°
40%
100
60
20
B
C
E-ca
dher
inac
tinav
erag
ed E
-cad
herin
n = 23
max
min
n = 16
max
min
100
60
20
n = 18
max
min
A
E
F
D
E-ca
dher
inac
tinav
erag
ed E
-cad
herin
E-ca
dher
inac
tinav
erag
ed E
-cad
herin
0°
816
24%
90°
180°
270°
orientation of nucleus-nucleus axis
proportion of moving frames (%)
0°
N cell = 117N angle = 5442
0°
orientation of nucleus-nucleus axis
proportion of moving frames (%)
N cell = 69N angle = 3991
Fig. 1. The cell–cell junction is stabilized in regions deprived of ECM. (A–C) Time-lapse acquisition in phase contrast of an MCF10A cell doublet ona [square]- (A) or [H]-shaped micropattern (B). Time frame is 15 min. Au-tomated movie analysis of Hoechst-stained cells (Fig. S1) provided theangular distribution of the nucleus–nucleus axis orientation and quanti-fication of cell-doublet movements on [square]- (A), [H]- (B), and [hour-glass]-shaped micropatterns (C). (D–F) Examples of immunofluorescentstainings of E-cadherin on cell doublets (Upper) and averaged staining overseveral images (Lower) on [square] (A), [H] (B), and [hourglass] (C). Micro-pattern width is 35 μm.
816
24%
90°
180°
270°
orientation of nucleus-nucleus axis
N cell = 86
N angle = 5171
100
60
20
proportion of moving frames (%)
0°
816
24%
90°
180°
270°
orientation of nucleus-nucleus axis
N cell = 118
N angle = 6769
100
60
20
proportion of moving frames (%)
0°8
1624%
90°
180°
270°
orientation of nucleus-nucleus axis
N cell = 90
N angle = 5406
100
60
20
proportion of moving frames (%)
0°
Fig. 2. The distance from ECM regulates the stability of intercellular junc-tion position. Analyses of cell-doublet positioning from time-lapse acquisi-tion (Fig. S1) provided angular distributions of nucleus–nucleus axisorientations as well as the distributions of the proportion of moving framesin [gapped-square] shapes with gap sizes of 7, 14, and 20 μm (from left toright). Micropattern width is 35 μm.
Tseng et al. PNAS | January 31, 2012 | vol. 109 | no. 5 | 1507
CELL
BIOLO
GY
APP
LIED
PHYS
ICAL
SCIENCE
S
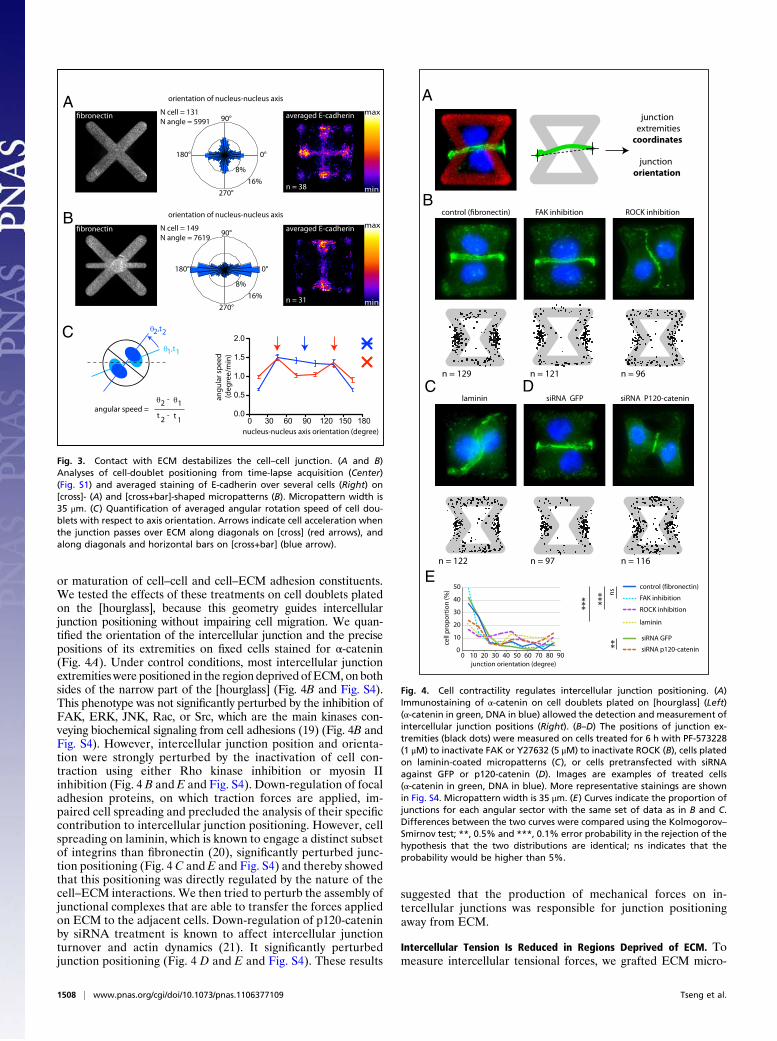
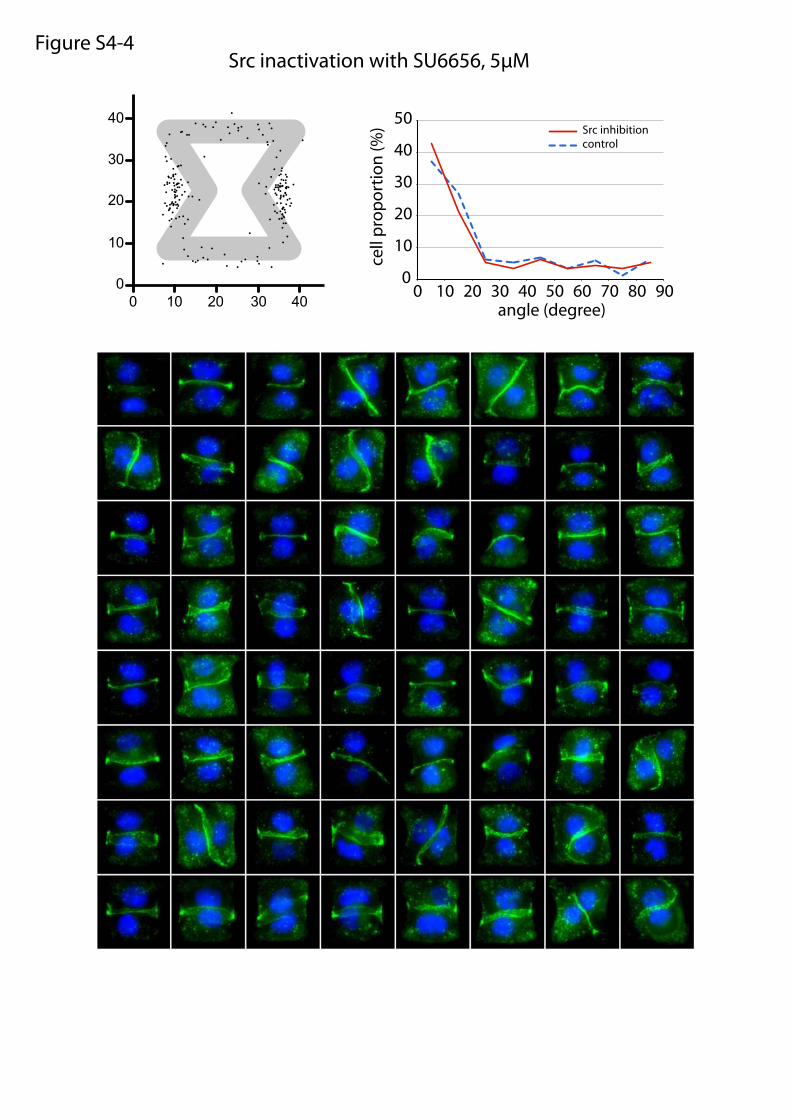
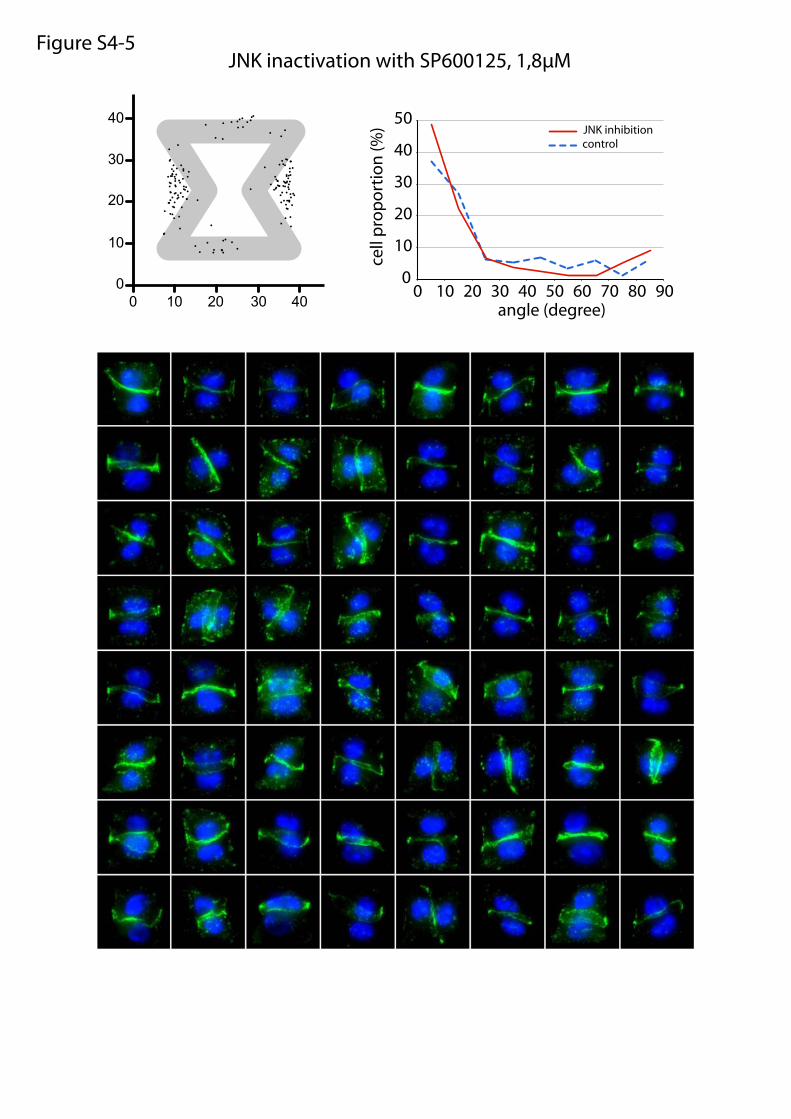
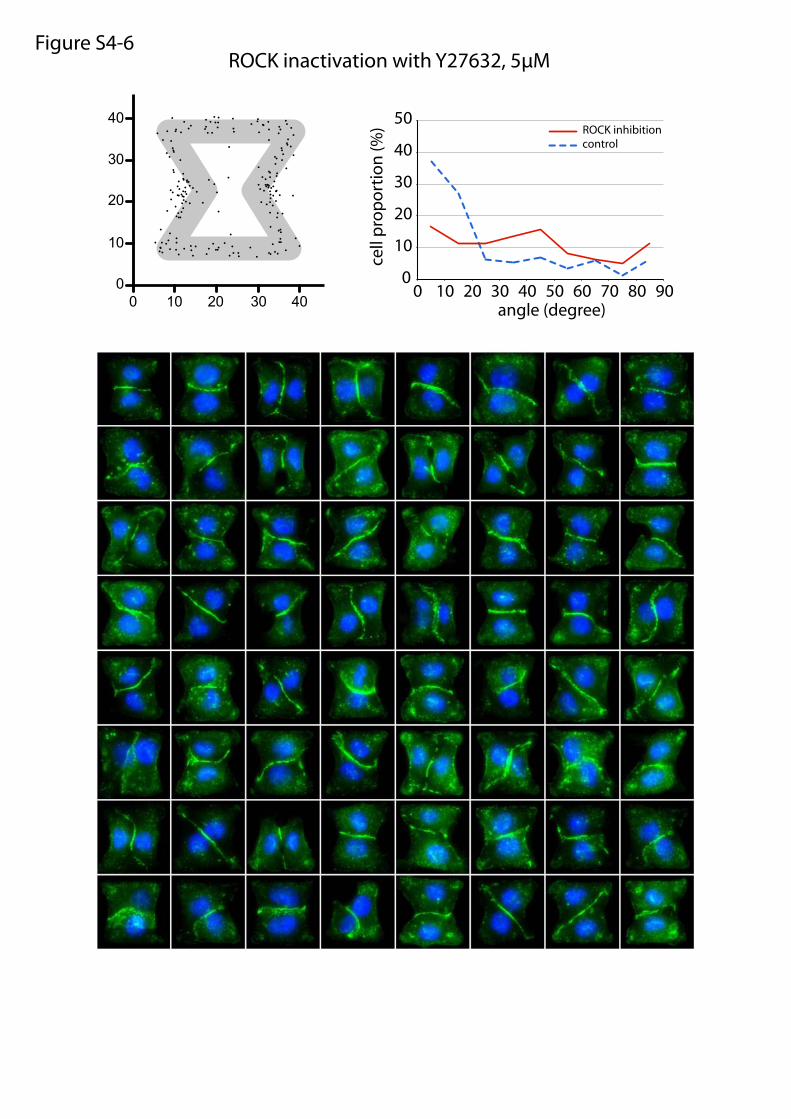
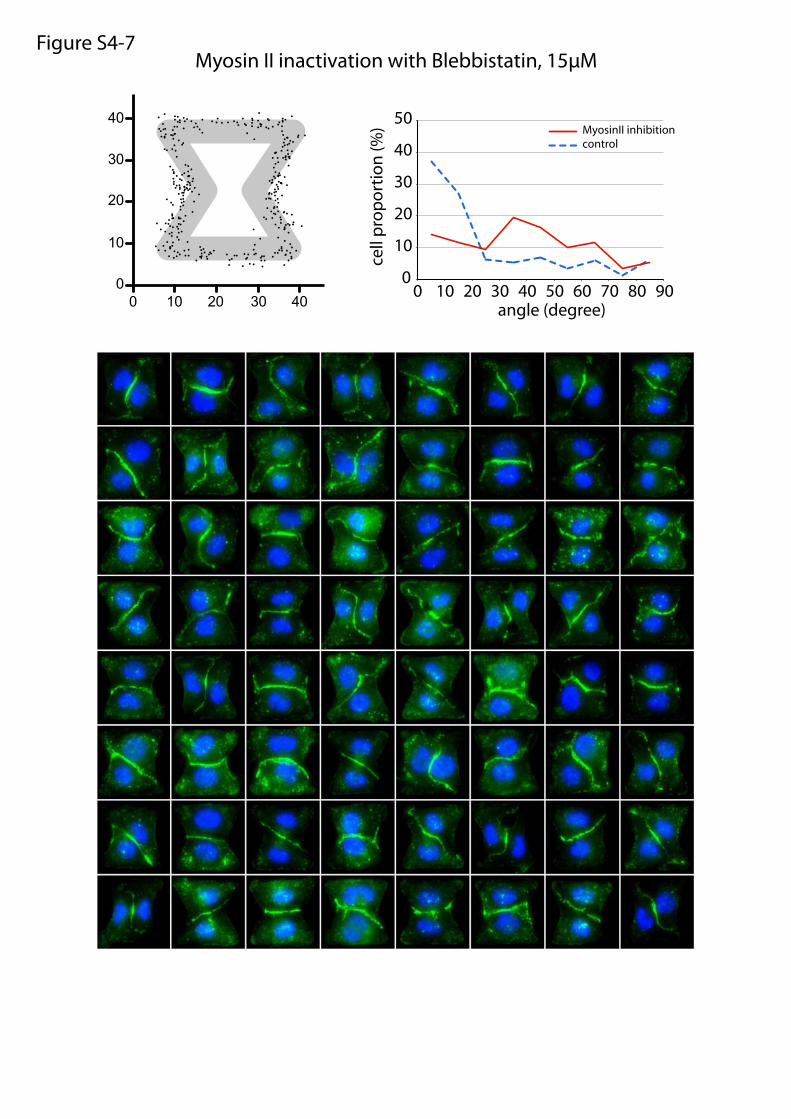
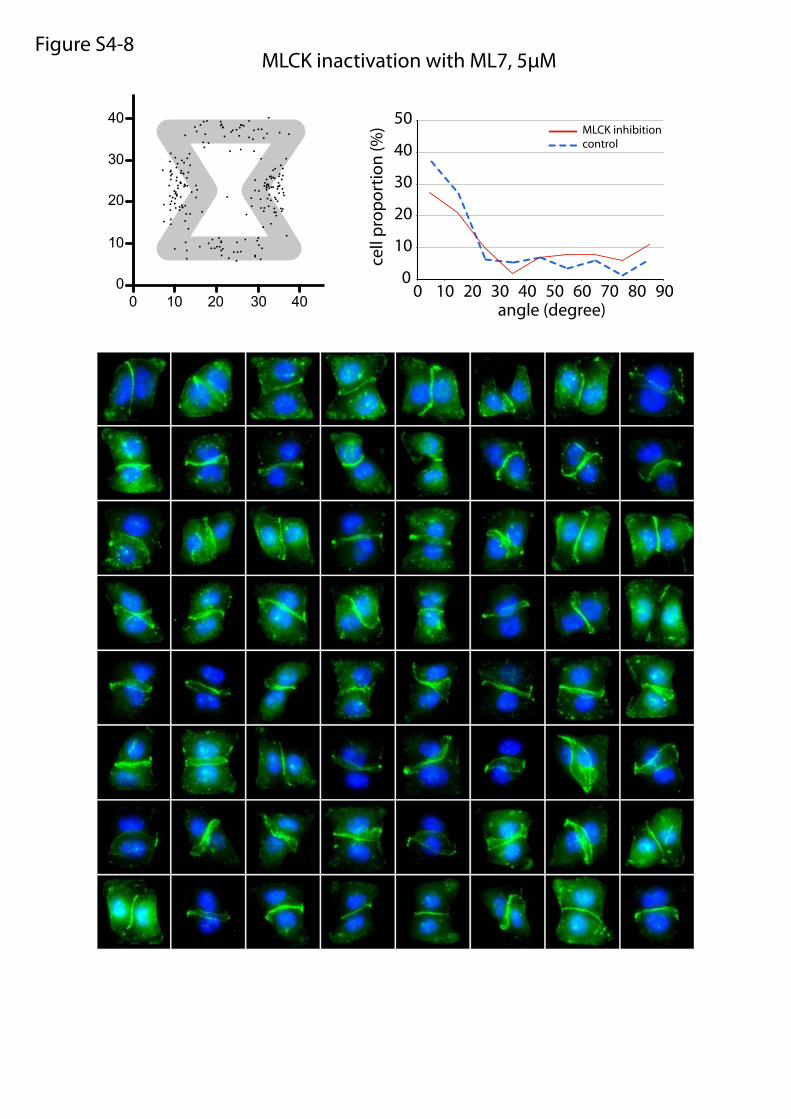
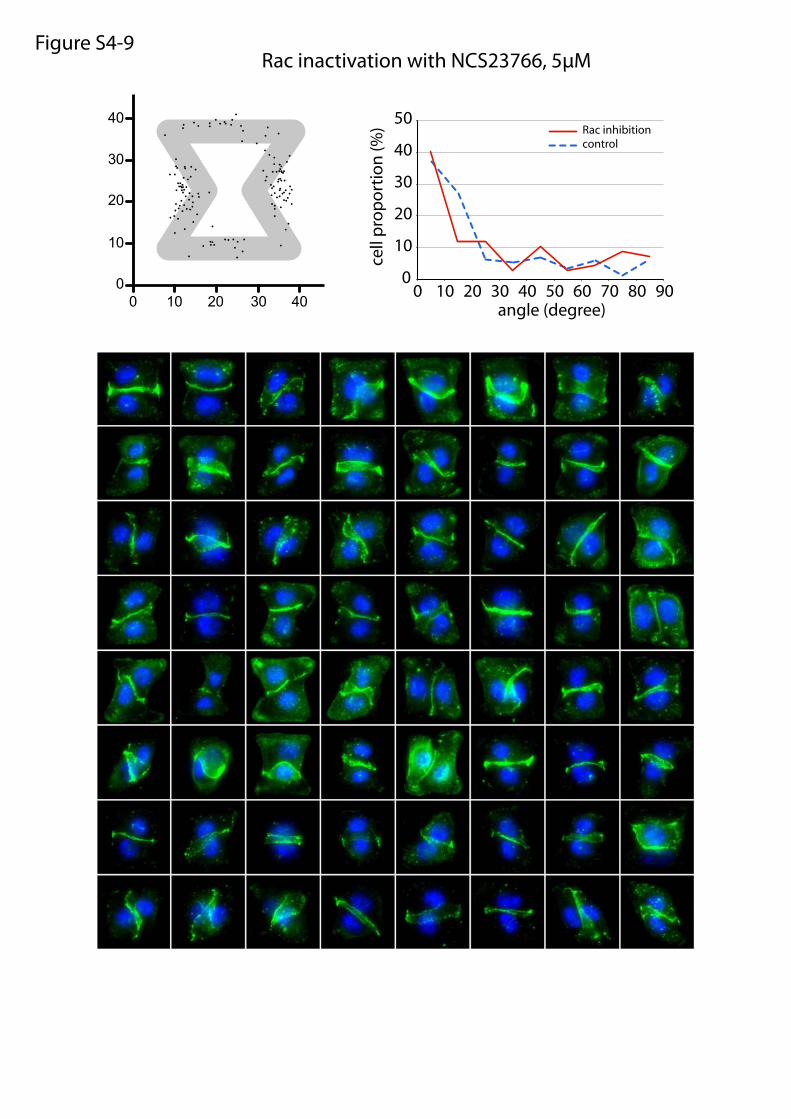
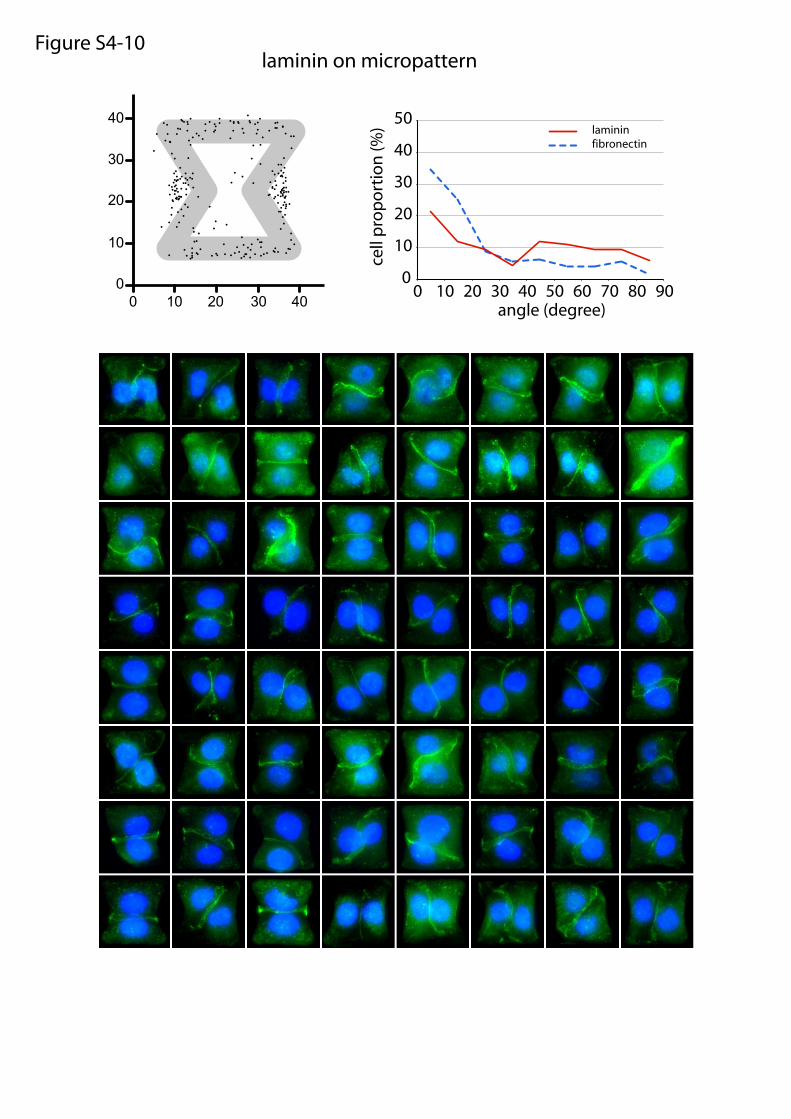
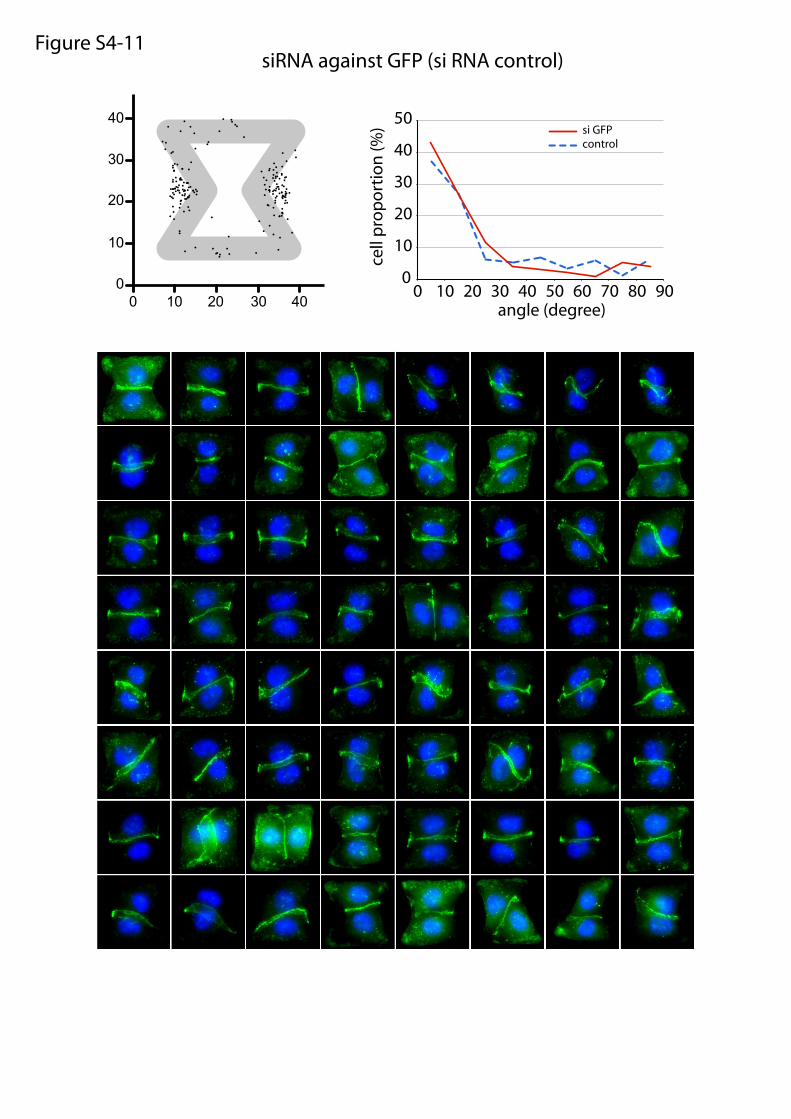
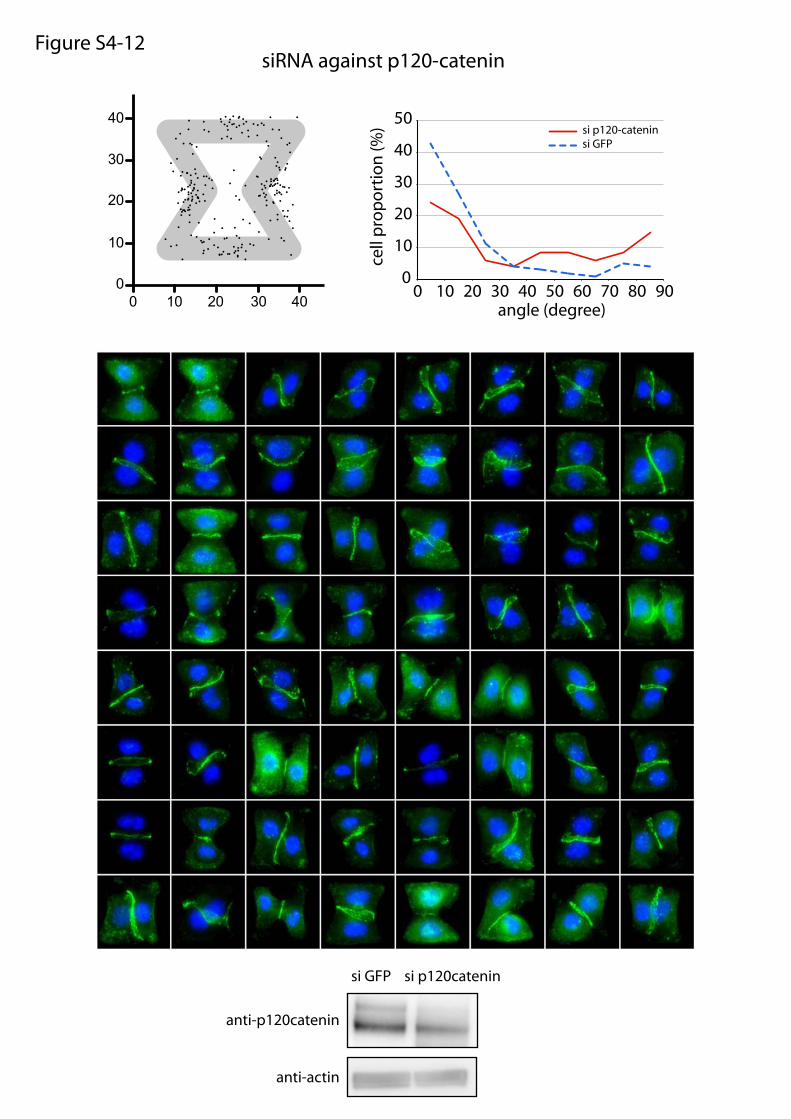
or maturation of cell–cell and cell–ECM adhesion constituents.We tested the effects of these treatments on cell doublets platedon the [hourglass], because this geometry guides intercellularjunction positioning without impairing cell migration. We quan-tified the orientation of the intercellular junction and the precisepositions of its extremities on fixed cells stained for α-catenin(Fig. 4A). Under control conditions, most intercellular junctionextremities were positioned in the region deprived ofECM, on bothsides of the narrow part of the [hourglass] (Fig. 4B and Fig. S4).This phenotype was not significantly perturbed by the inhibition ofFAK, ERK, JNK, Rac, or Src, which are the main kinases con-veying biochemical signaling from cell adhesions (19) (Fig. 4B andFig. S4). However, intercellular junction position and orienta-tion were strongly perturbed by the inactivation of cell con-traction using either Rho kinase inhibition or myosin IIinhibition (Fig. 4 B and E and Fig. S4). Down-regulation of focaladhesion proteins, on which traction forces are applied, im-paired cell spreading and precluded the analysis of their specificcontribution to intercellular junction positioning. However, cellspreading on laminin, which is known to engage a distinct subsetof integrins than fibronectin (20), significantly perturbed junc-tion positioning (Fig. 4 C and E and Fig. S4) and thereby showedthat this positioning was directly regulated by the nature of thecell–ECM interactions. We then tried to perturb the assembly ofjunctional complexes that are able to transfer the forces appliedon ECM to the adjacent cells. Down-regulation of p120-cateninby siRNA treatment is known to affect intercellular junctionturnover and actin dynamics (21). It significantly perturbedjunction positioning (Fig. 4 D and E and Fig. S4). These results
suggested that the production of mechanical forces on in-tercellular junctions was responsible for junction positioningaway from ECM.
Intercellular Tension Is Reduced in Regions Deprived of ECM. Tomeasure intercellular tensional forces, we grafted ECM micro-
orientation of nucleus-nucleus axis
orientation of nucleus-nucleus axis
8%16%
90°
180°
270°
0°
8%16%
90°
180°
270°
0°
A
B
averaged E-cadherin
n = 38
averaged E-cadherin
n = 31
angu
lar s
peed
(d
egre
e/m
in)
0 30 60 90 120 150 1800.0
0.5
1.0
1.5
2.0
nucleus-nucleus axis orientation (degree)
C
max
min
max
min
angular speed =
,t2θ2
,t1θ1
θ2 θ1-
t 2 t 1-
N cell = 131N angle = 5991
N cell = 149N angle = 7619
Fig. 3. Contact with ECM destabilizes the cell–cell junction. (A and B)Analyses of cell-doublet positioning from time-lapse acquisition (Center)(Fig. S1) and averaged staining of E-cadherin over several cells (Right) on[cross]- (A) and [cross+bar]-shaped micropatterns (B). Micropattern width is35 μm. (C) Quantification of averaged angular rotation speed of cell dou-blets with respect to axis orientation. Arrows indicate cell acceleration whenthe junction passes over ECM along diagonals on [cross] (red arrows), andalong diagonals and horizontal bars on [cross+bar] (blue arrow).
siRNA GFP siRNA P120-catenin
junction orientation
junction extremitiescoordinates
laminin
ROCK inhibitionFAK inhibition
A
B
C
E
10 20 30 40 50 60 70 80 900
10
20
30
40
50
0
control (fibronectin)
FAK inhibition
ROCK inhibition
siRNA GFP
laminin
siRNA p120-catenin
junction orientation (degree)
cell
pro
po
rtio
n (%
) ns
***
**
n = 129 n = 121 n = 96
n = 97n = 122 n = 116
D
***
Fig. 4. Cell contractility regulates intercellular junction positioning. (A)Immunostaining of α-catenin on cell doublets plated on [hourglass] (Left)(α-catenin in green, DNA in blue) allowed the detection and measurement ofintercellular junction positions (Right). (B–D) The positions of junction ex-tremities (black dots) were measured on cells treated for 6 h with PF-573228(1 μM) to inactivate FAK or Y27632 (5 μM) to inactivate ROCK (B), cells platedon laminin-coated micropatterns (C), or cells pretransfected with siRNAagainst GFP or p120-catenin (D). Images are examples of treated cells(α-catenin in green, DNA in blue). More representative stainings are shownin Fig. S4. Micropattern width is 35 μm. (E) Curves indicate the proportion ofjunctions for each angular sector with the same set of data as in B and C.Differences between the two curves were compared using the Kolmogorov–Smirnov test; **, 0.5% and ***, 0.1% error probability in the rejection of thehypothesis that the two distributions are identical; ns indicates that theprobability would be higher than 5%.
1508 | www.pnas.org/cgi/doi/10.1073/pnas.1106377109 Tseng et al.
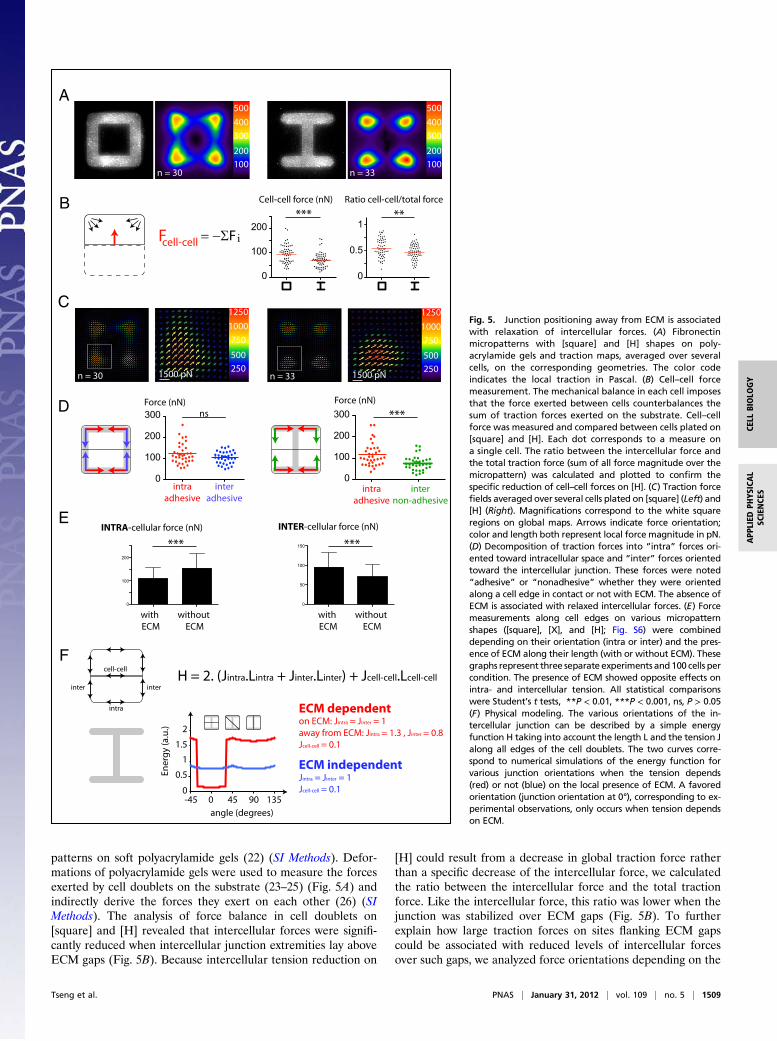
patterns on soft polyacrylamide gels (22) (SI Methods). Defor-mations of polyacrylamide gels were used to measure the forcesexerted by cell doublets on the substrate (23–25) (Fig. 5A) andindirectly derive the forces they exert on each other (26) (SIMethods). The analysis of force balance in cell doublets on[square] and [H] revealed that intercellular forces were signifi-cantly reduced when intercellular junction extremities lay aboveECM gaps (Fig. 5B). Because intercellular tension reduction on
[H] could result from a decrease in global traction force ratherthan a specific decrease of the intercellular force, we calculatedthe ratio between the intercellular force and the total tractionforce. Like the intercellular force, this ratio was lower when thejunction was stabilized over ECM gaps (Fig. 5B). To furtherexplain how large traction forces on sites flanking ECM gapscould be associated with reduced levels of intercellular forcesover such gaps, we analyzed force orientations depending on the
0
100
200
300
0
100
200
300
0
100
200
0
0.5
1
A
B
C
intraadhesive
interadhesive
intraadhesive
internon-adhesive
Force (nN) Force (nN)D
Cell-cell force (nN) Ratio cell-cell/total force
*** **
ns ***
= −ΣF iFcell-cell
100200
300400500
100200
300400500
n = 30 n = 33
n = 30 n = 331500 pN 250500
75010001250
ECM independentJintra = Jinter = 1Jcell-cell = 0.1
E
F
inter
intra
inter
cell-cellH = 2. (Jintra.Lintra + Jinter.Linter) + Jcell-cell.Lcell-cell
-45 0 45 90 135
ECM dependenton ECM: Jintra = Jinter = 1away from ECM: Jintra = 1.3 , Jinter = 0.8Jcell-cell = 0.1
angle (degrees)
Ener
gy (a
.u.)
0
0.5
1
1.5
2
1500 pN250500
75010001250
INTRA-cellular force (nN) INTER-cellular force (nN)
0
100
200
0
50
100
150 ******
with ECM
without ECM
with ECM
without ECM
Fig. 5. Junction positioning away from ECM is associatedwith relaxation of intercellular forces. (A) Fibronectinmicropatterns with [square] and [H] shapes on poly-acrylamide gels and traction maps, averaged over severalcells, on the corresponding geometries. The color codeindicates the local traction in Pascal. (B) Cell–cell forcemeasurement. The mechanical balance in each cell imposesthat the force exerted between cells counterbalances thesum of traction forces exerted on the substrate. Cell–cellforce was measured and compared between cells plated on[square] and [H]. Each dot corresponds to a measure ona single cell. The ratio between the intercellular force andthe total traction force (sum of all force magnitude over themicropattern) was calculated and plotted to confirm thespecific reduction of cell–cell forces on [H]. (C) Traction forcefields averaged over several cells plated on [square] (Left) and[H] (Right). Magnifications correspond to the white squareregions on global maps. Arrows indicate force orientation;color and length both represent local force magnitude in pN.(D) Decomposition of traction forces into “intra” forces ori-ented toward intracellular space and “inter” forces orientedtoward the intercellular junction. These forces were noted“adhesive” or “nonadhesive” whether they were orientedalong a cell edge in contact or not with ECM. The absence ofECM is associated with relaxed intercellular forces. (E) Forcemeasurements along cell edges on various micropatternshapes ([square], [X], and [H]; Fig. S6) were combineddepending on their orientation (intra or inter) and the pres-ence of ECM along their length (with or without ECM). Thesegraphs represent three separate experiments and100 cells percondition. The presence of ECM showed opposite effects onintra- and intercellular tension. All statistical comparisonswere Student’s t tests, **P < 0.01, ***P < 0.001, ns, P > 0.05(F) Physical modeling. The various orientations of the in-tercellular junction can be described by a simple energyfunction H taking into account the length L and the tension Jalong all edges of the cell doublets. The two curves corre-spond to numerical simulations of the energy function forvarious junction orientations when the tension depends(red) or not (blue) on the local presence of ECM. A favoredorientation (junction orientation at 0°), corresponding to ex-perimental observations, only occurs when tension dependson ECM.
Tseng et al. PNAS | January 31, 2012 | vol. 109 | no. 5 | 1509
CELL
BIOLO
GY
APP
LIED
PHYS
ICAL
SCIENCE
S
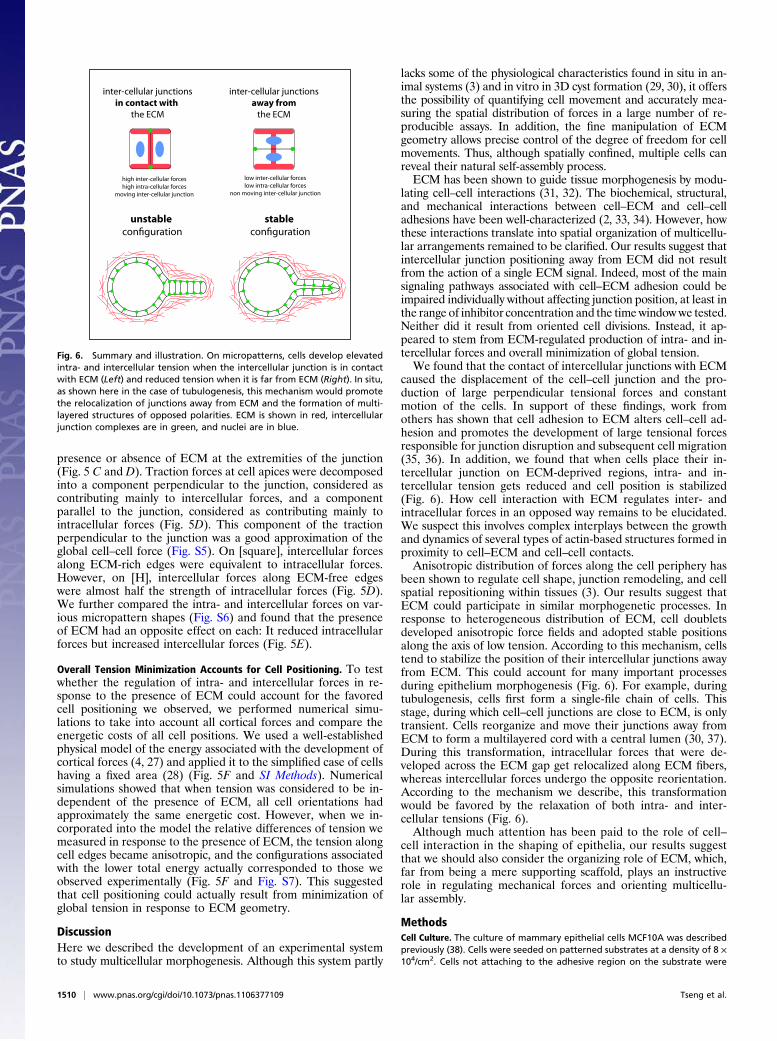
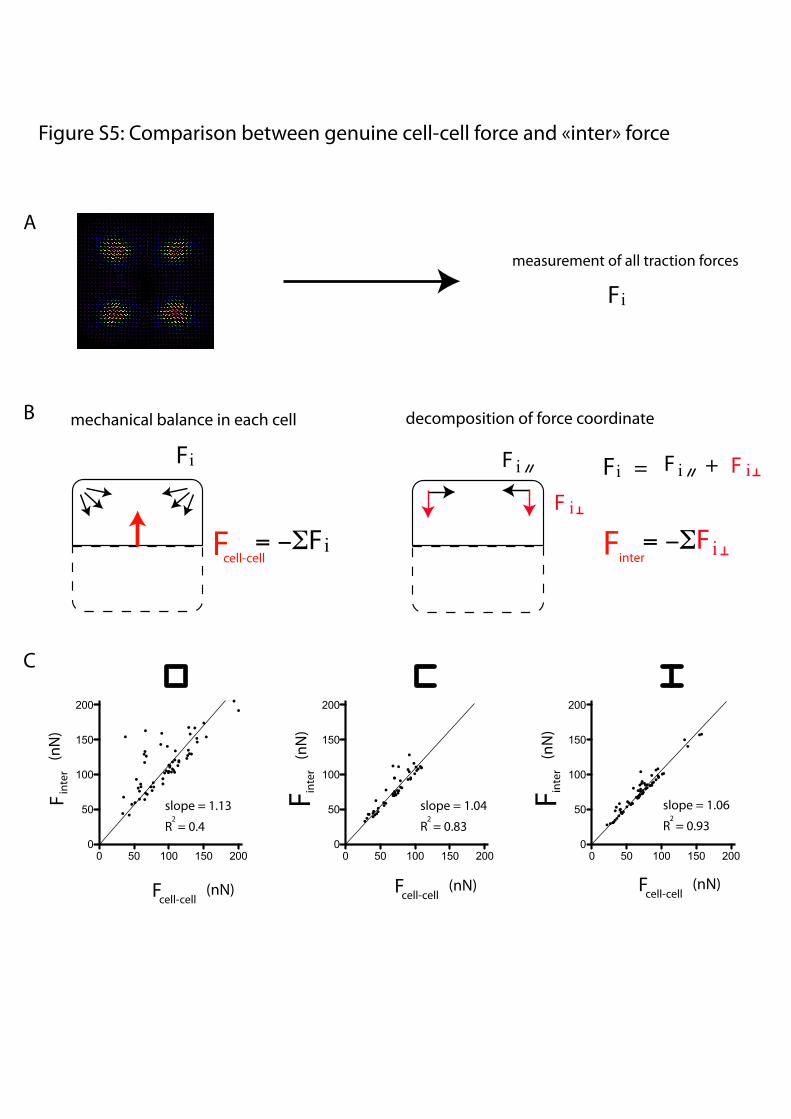
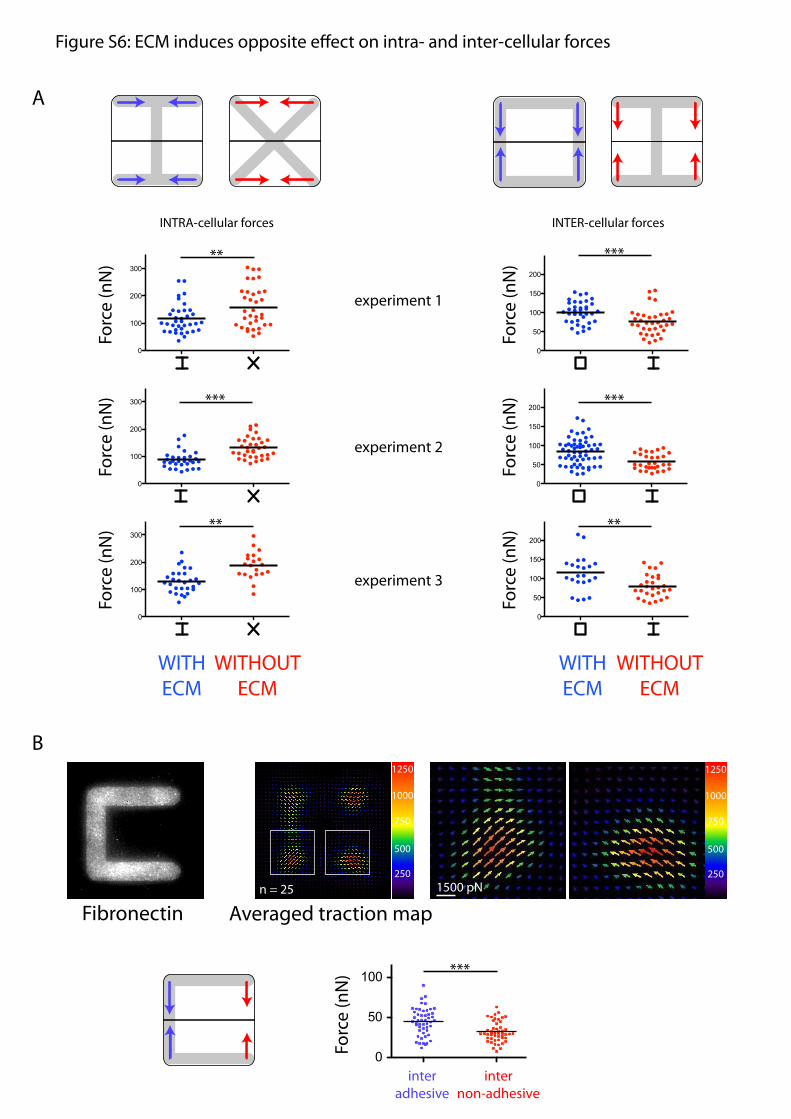
presence or absence of ECM at the extremities of the junction(Fig. 5 C and D). Traction forces at cell apices were decomposedinto a component perpendicular to the junction, considered ascontributing mainly to intercellular forces, and a componentparallel to the junction, considered as contributing mainly tointracellular forces (Fig. 5D). This component of the tractionperpendicular to the junction was a good approximation of theglobal cell–cell force (Fig. S5). On [square], intercellular forcesalong ECM-rich edges were equivalent to intracellular forces.However, on [H], intercellular forces along ECM-free edgeswere almost half the strength of intracellular forces (Fig. 5D).We further compared the intra- and intercellular forces on var-ious micropattern shapes (Fig. S6) and found that the presenceof ECM had an opposite effect on each: It reduced intracellularforces but increased intercellular forces (Fig. 5E).
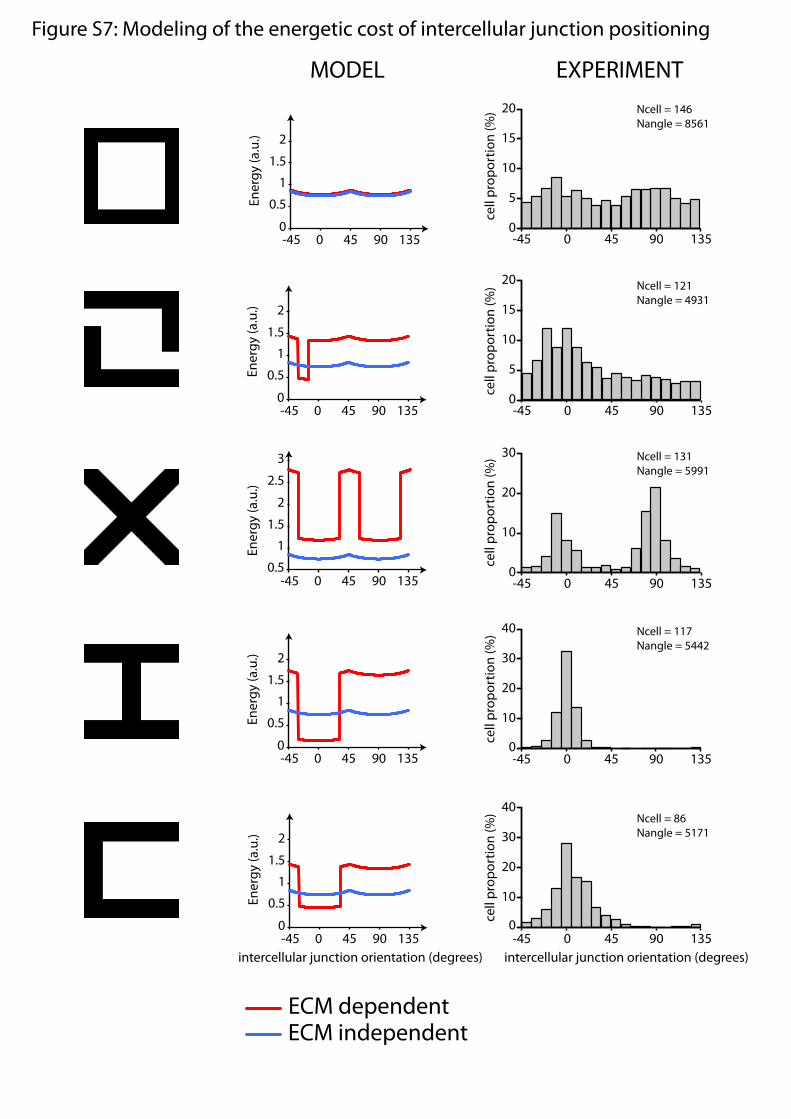
Overall Tension Minimization Accounts for Cell Positioning. To testwhether the regulation of intra- and intercellular forces in re-sponse to the presence of ECM could account for the favoredcell positioning we observed, we performed numerical simu-lations to take into account all cortical forces and compare theenergetic costs of all cell positions. We used a well-establishedphysical model of the energy associated with the development ofcortical forces (4, 27) and applied it to the simplified case of cellshaving a fixed area (28) (Fig. 5F and SI Methods). Numericalsimulations showed that when tension was considered to be in-dependent of the presence of ECM, all cell orientations hadapproximately the same energetic cost. However, when we in-corporated into the model the relative differences of tension wemeasured in response to the presence of ECM, the tension alongcell edges became anisotropic, and the configurations associatedwith the lower total energy actually corresponded to those weobserved experimentally (Fig. 5F and Fig. S7). This suggestedthat cell positioning could actually result from minimization ofglobal tension in response to ECM geometry.
DiscussionHere we described the development of an experimental systemto study multicellular morphogenesis. Although this system partly
lacks some of the physiological characteristics found in situ in an-imal systems (3) and in vitro in 3D cyst formation (29, 30), it offersthe possibility of quantifying cell movement and accurately mea-suring the spatial distribution of forces in a large number of re-producible assays. In addition, the fine manipulation of ECMgeometry allows precise control of the degree of freedom for cellmovements. Thus, although spatially confined, multiple cells canreveal their natural self-assembly process.ECM has been shown to guide tissue morphogenesis by modu-
lating cell–cell interactions (31, 32). The biochemical, structural,and mechanical interactions between cell–ECM and cell–celladhesions have been well-characterized (2, 33, 34). However, howthese interactions translate into spatial organization of multicellu-lar arrangements remained to be clarified. Our results suggest thatintercellular junction positioning away from ECM did not resultfrom the action of a single ECM signal. Indeed, most of the mainsignaling pathways associated with cell–ECM adhesion could beimpaired individually without affecting junction position, at least inthe range of inhibitor concentration and the timewindowwe tested.Neither did it result from oriented cell divisions. Instead, it ap-peared to stem from ECM-regulated production of intra- and in-tercellular forces and overall minimization of global tension.We found that the contact of intercellular junctions with ECM
caused the displacement of the cell–cell junction and the pro-duction of large perpendicular tensional forces and constantmotion of the cells. In support of these findings, work fromothers has shown that cell adhesion to ECM alters cell–cell ad-hesion and promotes the development of large tensional forcesresponsible for junction disruption and subsequent cell migration(35, 36). In addition, we found that when cells place their in-tercellular junction on ECM-deprived regions, intra- and in-tercellular tension gets reduced and cell position is stabilized(Fig. 6). How cell interaction with ECM regulates inter- andintracellular forces in an opposed way remains to be elucidated.We suspect this involves complex interplays between the growthand dynamics of several types of actin-based structures formed inproximity to cell–ECM and cell–cell contacts.Anisotropic distribution of forces along the cell periphery has
been shown to regulate cell shape, junction remodeling, and cellspatial repositioning within tissues (3). Our results suggest thatECM could participate in similar morphogenetic processes. Inresponse to heterogeneous distribution of ECM, cell doubletsdeveloped anisotropic force fields and adopted stable positionsalong the axis of low tension. According to this mechanism, cellstend to stabilize the position of their intercellular junctions awayfrom ECM. This could account for many important processesduring epithelium morphogenesis (Fig. 6). For example, duringtubulogenesis, cells first form a single-file chain of cells. Thisstage, during which cell–cell junctions are close to ECM, is onlytransient. Cells reorganize and move their junctions away fromECM to form a multilayered cord with a central lumen (30, 37).During this transformation, intracellular forces that were de-veloped across the ECM gap get relocalized along ECM fibers,whereas intercellular forces undergo the opposite reorientation.According to the mechanism we describe, this transformationwould be favored by the relaxation of both intra- and inter-cellular tensions (Fig. 6).Although much attention has been paid to the role of cell–
cell interaction in the shaping of epithelia, our results suggestthat we should also consider the organizing role of ECM, which,far from being a mere supporting scaffold, plays an instructiverole in regulating mechanical forces and orienting multicellu-lar assembly.
MethodsCell Culture. The culture of mammary epithelial cells MCF10A was describedpreviously (38). Cells were seeded on patterned substrates at a density of 8 ×10⁴/cm2. Cells not attaching to the adhesive region on the substrate were
unstable
high inter-cellular forceshigh intra-cellular forces
moving inter-cellular junction
low inter-cellular forceslow intra-cellular forces
non moving inter-cellular junction
stable
inter-cellular junctionsin contact with
the ECM
inter-cellular junctionsaway from
the ECM
Fig. 6. Summary and illustration. On micropatterns, cells develop elevatedintra- and intercellular tension when the intercellular junction is in contactwith ECM (Left) and reduced tension when it is far from ECM (Right). In situ,as shown here in the case of tubulogenesis, this mechanism would promotethe relocalization of junctions away from ECM and the formation of multi-layered structures of opposed polarities. ECM is shown in red, intercellularjunction complexes are in green, and nuclei are in blue.
1510 | www.pnas.org/cgi/doi/10.1073/pnas.1106377109 Tseng et al.
washed away 1 h after seeding. After cell spreading on micropatterns,Hoechst 33342 was added at 5 ng/mL to label the nucleus during time-lapse acquisition.
Chemical Inhibitors. Chemical inhibitors were added 24 h after cell plating onmicropatterns at the following concentrations: PF573228, 1 μM (FAK in-hibition); PD98059, 2 μM (ERK1 inhibition); SP600125, 1.8 μM (JNK in-hibition); SU6656, 5 μM (Src inhibition); NCS23766, 5 μM (Rac inhibition);Y27632, 5 μM (ROCK inhibition); blebbistatin, 15 μM (myosin II inactivation);ML7, 5 μM (MLCK inhibition). Cells were fixed 6 h later.
Micropatterning. Glass coverslip micropatterning has been described else-where (14). Micropatterned polyacrylamide gels were made as previouslydescribed (22) (SI Methods).
Immunofluorescent Staining. Thirty hours after plating cells on a micro-patterned coverslip, cells were either extracted in cytoskeleton buffercontaining 0.5% Triton X-100 and fixed in 4% paraformaldehyde or fixed inmethanol at −20 °C. Fixed cells were incubated with a 1:200 dilution of anti-α-catenin (B52975; Calbiochem) or a 1:50 dilution of anti-E-cadherin(sc8426; Santa Cruz Biotechnology) for 1 h, and then incubated with cor-responding secondary antibodies and FITC-phalloidin (Invitrogen) at 1 μg/mLfor 30 min.
Traction Force Microscopy. Images of fluorescent beads with and without celldoublets were first aligned to correct experimental drift using the ImageJplugin “align slices in stack.” The displacement field was subsequentlycalculated by a custom-written particle image velocimetry (PIV) programimplemented as an ImageJ (http://rsb.info.nih.gov/ij) plugin. The PIV wasperformed through an iterative scheme. In each iteration, the displacement
was calculated by the normalized correlation coefficient algorithm, so thatan individual interrogation window was compared with a larger searchingwindow. The next iteration takes into account the displacement field mea-sured previously, so that a false correlation peak due to insufficient imagefeatures is avoided. The normalized cross-correlation also allowed us todefine an arbitrary threshold to filter out low correlation values due to in-sufficient beads presented in the window. The resulting final grid size forthe displacement field was 1.63 × 1.63 μm, with six beads per interrogationwindow on average. The erroneous displacement vectors due to insufficientbeads present in the window were filtered out by their low correlation valueand replaced by the median value from the neighboring vectors.
With the displacement field obtained from the PIV analysis, the tractionforce field was reconstructed by the Fourier transform traction cytometry(FTTC) method with regularized scheme (25) on the same grid (1.63 ×1.63 μm) without further interpolation or remapping. The regularizationparameter was set at 9 × 10⁻¹⁰ for all traction force reconstructions. TheFTTC code was also written in Java as an ImageJ plugin, so that the wholetraction force microscopy procedure from PIV to force calculation could beperformed with ImageJ. The entire package of traction force microscopysoftware is available at https://sites.google.com/site/qingzongtseng/tfm.
ACKNOWLEDGMENTS. We thank Laurent Blanchoin and Thomas Lecuit forinteresting discussions about this work, Benedikt Sabass for help on the JavaFTTC code, as well as Matthieu Piel, Alexandra Fuchs, and Susana Godinho forcritical reading of the manuscript. Kevin Berton, Philippe Huber, and JulienVerove kindly provided reagents. This work was supported by Agence Nationalpour la Recherche Grants ANR-PCV08-322457 (to H.G., O.F., and M.T.) andANR-08-JC-0103 (to M.T.), the Ligue Nationale contre le Cancer (O.F.), anda PhD fellowship from the Irtelis Program of the Commissariat à l’EnergieAtomique et aux Energies Alternatives (to Q.T.).
1. Yu W, et al. (2005) β1-integrin orients epithelial polarity via Rac1 and laminin. MolBiol Cell 16:433–445.
2. Papusheva E, Heisenberg CP (2010) Spatial organization of adhesion: Force-de-pendent regulation and function in tissue morphogenesis. EMBO J 29:2753–2768.
3. Rauzi M, Verant P, Lecuit T, Lenne PF (2008) Nature and anisotropy of cortical forcesorienting Drosophila tissue morphogenesis. Nat Cell Biol 10:1401–1410.
4. Käfer J, Hayashi T, Marée AF, Carthew RW, Graner F (2007) Cell adhesion and cortexcontractility determine cell patterning in the Drosophila retina. Proc Natl Acad SciUSA 104:18549–18554.
5. Krieg M, et al. (2008) Tensile forces govern germ-layer organization in zebrafish. NatCell Biol 10:429–436.
6. Foty RA, Steinberg MS (2005) The differential adhesion hypothesis: A direct evalua-tion. Dev Biol 278:255–263.
7. Guilak F, et al. (2009) Control of stem cell fate by physical interactions with the ex-tracellular matrix. Cell Stem Cell 5(1):17–26.
8. Rozario T, DeSimone DW (2010) The extracellular matrix in development and mor-phogenesis: A dynamic view. Dev Biol 341(1):126–140.
9. Fata JE,WerbZ, BissellMJ (2004) Regulationofmammaryglandbranchingmorphogenesisby the extracellular matrix and its remodeling enzymes. Breast Cancer Res 6(1):1–11.
10. Théry M, Pépin A, Dressaire E, Chen Y, Bornens M (2006) Cell distribution of stressfibres in response to the geometry of the adhesive environment. Cell Motil Cyto-skeleton 63:341–355.
11. Wang AZ, Ojakian GK, Nelson WJ (1990) Steps in the morphogenesis of a polarizedepithelium. I. Uncoupling the roles of cell-cell and cell-substratum contact in estab-lishing plasma membrane polarity in multicellular epithelial (MDCK) cysts. J Cell Sci95(Pt 1):137–151.
12. Théry M, et al. (2006) Anisotropy of cell adhesive microenvironment governs cell in-ternal organization and orientation of polarity. Proc Natl Acad Sci USA 103:19771–19776.
13. Théry M (2010) Micropatterning as a tool to decipher cell morphogenesis and func-tions. J Cell Sci 123:4201–4213.
14. Azioune A, Carpi N, Tseng Q, Théry M, Piel M (2010) Protein micropatterns: A directprinting protocol using deep UVs. Methods Cell Biol 97:133–146.
15. Huang S, Brangwynne CP, Parker KK, Ingber DE (2005) Symmetry-breaking in mam-malian cell cohort migration during tissue pattern formation: Role of random-walkpersistence. Cell Motil Cytoskeleton 61:201–213.
16. Kametani Y, Takeichi M (2007) Basal-to-apical cadherin flow at cell junctions. Nat CellBiol 9(1):92–98.
17. Yamada S, Nelson WJ (2007) Localized zones of Rho and Rac activities drive initiationand expansion of epithelial cell-cell adhesion. J Cell Biol 178:517–527.
18. Maruthamuthu V, Sabass B, Schwarz US, Gardel ML (2011) Cell-ECM traction force mod-ulates endogenous tension at cell-cell contacts. Proc Natl Acad Sci USA 108:4708–4713.
19. Playford MP, Schaller MD (2004) The interplay between Src and integrins in normaland tumor biology. Oncogene 23:7928–7946.
20. Hynes RO, Naba A (2011) Overview of the matrisome—An inventory of extracellularmatrix constituents and functions. Cold Spring Harb Perspect Biol, 10.1101/cshperspect.a004903.
21. Reynolds AB, Roczniak-Ferguson A (2004) Emerging roles for p120-catenin in celladhesion and cancer. Oncogene 23:7947–7956.
22. Tseng Q, et al. (2011) A new micropatterning method of soft substrates reveals thatdifferent tumorigenic signals can promote or reduce cell contraction levels. Lab Chip11:2231–2240.
23. Butler JP, Toli�c-Nųrrelykke IM, Fabry B, Fredberg JJ (2002) Traction fields, moments, andstrainenergy that cells exert on their surroundings.AmJPhysiol Cell Physiol282:C595–C605.
24. Dembo M, Wang YL (1999) Stresses at the cell-to-substrate interface during loco-motion of fibroblasts. Biophys J 76:2307–2316.
25. Sabass B, Gardel ML, Waterman CM, Schwarz US (2008) High resolution traction forcemicroscopy based on experimental and computational advances.Biophys J 94:207–220.
26. Liu Z, et al. (2010) Mechanical tugging force regulates the size of cell-cell junctions.Proc Natl Acad Sci USA 107:9944–9949.
27. Farhadifar R, Röper JC,AigouyB, Eaton S, Jülicher F (2007) The influenceof cellmechanics,cell-cell interactions, and proliferation on epithelial packing. Curr Biol 17:2095–2104.
28. Vianay B, et al. (2010) Single cells spreading on a protein lattice adopt an energyminimizing shape. Phys Rev Lett 105:128101.
29. Debnath J, Brugge JS (2005) Modelling glandular epithelial cancers in three-di-mensional cultures. Nat Rev Cancer 5:675–688.
30. O’Brien LE, Zegers MMP, Mostov KE (2002) Building epithelial architecture: Insightsfrom three-dimensional culture models. Nat Rev Mol Cell Biol 3:531–537.
31. Sakai T, Larsen M, Yamada KM (2003) Fibronectin requirement in branching mor-phogenesis. Nature 423:876–881.
32. Kurpios NA, et al. (2008) The direction of gut looping is established by changes in theextracellular matrix and in cell:cell adhesion. Proc Natl Acad Sci USA 105:8499–8506.
33. Weber GF, Bjerke MA, DeSimone DW (2011) Integrins and cadherins join forces toform adhesive networks. J Cell Sci 124:1183–1193.
34. Borghi N, Lowndes M, Maruthamuthu V, Gardel ML, Nelson WJ (2010) Regulation ofcell motile behavior by crosstalk between cadherin- and integrin-mediated adhesions.Proc Natl Acad Sci USA 107:13324–13329.
35. de Rooij J, Kerstens A, Danuser G, Schwartz MA, Waterman-Storer CM (2005) Integrin-dependent actomyosin contraction regulates epithelial cell scattering. J Cell Biol 171(1):153–164.
36. Marsden M, DeSimone DW (2003) Integrin-ECM interactions regulate cadherin-de-pendent cell adhesion and are required for convergent extension in Xenopus. CurrBiol 13:1182–1191.
37. Pollack AL, Runyan RB, Mostov KE (1998) Morphogenetic mechanisms of epithelialtubulogenesis: MDCK cell polarity is transiently rearranged without loss of cell-cellcontact during scatter factor/hepatocyte growth factor-induced tubulogenesis. DevBiol 204(1):64–79.
38. Deshière A, Theis-Febvre N, Martel V, Cochet C, Filhol O (2008) Protein kinase CK2 andcell polarity. Mol Cell Biochem 316(1-2):107–113.
Tseng et al. PNAS | January 31, 2012 | vol. 109 | no. 5 | 1511
CELL
BIOLO
GY
APP
LIED
PHYS
ICAL
SCIENCE
S
Supporting InformationTseng et al. 10.1073/pnas.1106377109SI MethodssiRNA Treatments. Transient silencing was performed using 15 nMsiRNA P120-catenin: 5′-AACGAGGUUAUCGCUGAGAAC-3′; GFP: 5′-GACGUAAACGGCCACAAGUUC-3′) and retro-transfection with Lipofectamine 2000 according to the manufac-turer’s instructions (Invitrogen). Lysates of cells were preparedin RIPA lysis buffer [10 mM Tris·HCl (pH 7.4), 150 mM NaCl,1% (vol/vol) Triton X-100, 0.1% (vol/vol) SDS, 0.5% (vol/vol)sodium deoxycholate, and 1 mM EDTA] containing a proteaseand phosphatase inhibitor mixtures (P8340, P2850, P5726; Sigma-Aldrich). Equivalent amounts of protein were processed by SDS/PAGE and transferred to PVDF membrane (Hybond-P; Amer-sham Biosciences). Immunoblotting was performed using thefollowing primary antibodies: Integrin-β1 and P120-catenin (BDBiosciences) and β-actin (Abcam).
Video Microscopy and Image Acquisition. Time-lapse acquisitionsweretakenwithaninvertedmicroscope(Axiovert200M;CarlZeiss).Temperature, CO2, and humidity control was performed usinga Box and Brick System (Life Imaging Services). Multiple positionswere recorded using anXYmotorized stage (Marzhauser). Nucleusmovements were followed with a 15-min time frame and a 10× dryphase-contrast objective over 48 h.Fluorescent image acquisitions of fixed cells were taken using
an upright microscope (BX61; Olympus) with 100× (N.A. 1.4) oil-immersion objectives mounted on a piezo motor (Physics In-struments). Both microscopes were controlled with MetaMorphsoftware (MDS Analytical Technologies).Averaged images were obtained by aligning multiple images
taken on distinct cells and projecting them onto a single image bycalculating the average fluorescence intensity of each pixel.
Automated Nucleus Tracking. Micropattern images (taken witha 10× objective) from each stage position were first segmented to36 subregions corresponding to a 6 × 6 array of micropatterns.Subregions were screened for the existence of a nucleus bystandard deviation of pixel intensities. Nucleus images were thenconvolved by a 9 × 9 “Mexican hat” kernel. Binarized nucleusimages were obtained by automatic thresholding and a medianfilter to remove isolated noise pixels. After “watershed” seg-mentation, the number of nuclei was determined consideringtheir size and shape factor as well. Only subregions containingonly one nucleus at the beginning were selected for subsequentmitosis detection. Based on the nucleus shape factor, intensityvariation, and the number of nuclei detected, division from onecell to two cells could be detected. At these positions only, ori-entations of the nucleus–nucleus axis were recorded after celldivision. The measurements continued until the end of the time-lapse series or the detection of the second mitosis event.
Glass Slide Micropatterning. Glass coverslip micropatterning hasbeen described elsewhere (1). Coverslips were first spin-coatedwith adhesion promoter Ti Prime (MicroChemicals) and thenwith 0.5% polystyrene in toluene at 3,000 rpm. Polystyrene-coated coverslips were oxidized through oxygen plasma (FEM-TO; Diener Electronic) for 10 s at 30 W before incubation with0.1 mg/mL poly-L-lysine(20)-g[3.5]-poly-ethyleneglycol (PLL-PEG) (Surface Solutions) in 10 mM Hepes (pH 7.4) for 15 min.After drying, coverslips were exposed to deep UV (UVOcleaner; Jelight) through a photomask (Toppan) for 2 min. Rightafter UV activation, coverslips were incubated with 20 μg/mLfibronectin (Sigma), another selected ECM protein when spe-
cifically mentioned (type 1 collagen from rat tail; Sigma), orlaminin (Sigma), and 10 μg/mL of fluorescent fibrinogen conju-gate (Invitrogen) solution in PBS for 30 min. Coverslips werewashed three times with sterile PBS before plating cells.
Polyacrylamide Micropatterning. Micropatterned polyacrylamidegels were made as previously described (2). Briefly, fluorescentbeads (dark red 200 nm; F-8807; Invitrogen) were first passiv-ated by PLL-PEG (2) (Surface Solutions). Acrylamide (6.67%)and bis-acrylamide (0.167%) solution, containing the passivatedbeads, was polymerized between the photomask (Toppan) andacryl-silanized coverslips. The resulting polyacrylamide gel had athickness of 70 μm and rigidity of 7 kPa. After deep UV activationthrough the photomask, the gel was incubated with the cross-linker N-hydroxysuccinimide (Fluka) and 1-ethyl-3-(3-dimethyla-minopropyl)carbodiimide hydrochloride (Pierce) before coatingwith fibronectin (Sigma) and fluorescent conjugated fibrinogen(Invitrogen).
Physical Modeling and Numerical Simulations.When cells spread ona patterned substrate, they optimize their shape by minimizingenergy. This simple argument has been demonstrated in the caseof single cells and a lattice of adhesive proteins. The extension ofthis argument to the case of two cells is the purpose of thismaterial.We suppose that the energy of the cell doublet can be separated
into three parts as in the equation
H ¼ H1 þH2 þH12;
where H1 and H2 are the self-energy, respectively, of cell 1 and ofcell 2 within the doublet. The coupling term H12 accounts for theinteraction energy between cell 1 and cell 2. In our model, cellsare considered as 2D homogeneous material. The self-energyterms include (i) an adhesion term, corresponding to the energygain upon binding of integrins with ECM, (ii) a line energy termmimicking the energy cost of the tension generated by the ac-tomyosin contractility, and (iii) a compressibility term that fixesthe mean cell area and allocates an energy cost to variations ofcell area. These terms have been thoroughly discussed in theframework of the cellular Potts model in refs. 3–6. To furthersimplify the analysis, we suppose that first, cell shapes adopt theconvex envelope of the micropattern, second, cells have equalareas in the doublet, third, the interfaces are straight, and fourth,this interface passes through the center of the pattern. Withthese simplifications, terms (i) and (iii) in the self-energy of cellscan be dropped.The interaction energy H12 is written as
H12 ¼ Jcell�cell:Lcell�cell;
where Jcell-cell measures the strength of the cadherin–cadherininteraction and Lcell-cell is the length of the interface between cell1 and cell 2. Dropping all of the constant terms, the self-energyof cell i = 1,2 is expressed as
Hi ¼X
k
JK :Lk;
where k is the interface type, Lk is the interface length, and Jk isthe line tension of the interface. According to the experimentalmeasurements of the forces (Fig. 5 and Fig. S7), the interfaceshave been classified into four types:
Tseng et al. www.pnas.org/cgi/content/short/1106377109 1 of 4
k = intra-noECM; corresponds to the type of interface linkingintegrins to integrins and standing above nonadhesive regions;k = inter-noECM; corresponds to the type of interface linkingintegrins and cadherin above nonadhesive regions;k = intra-ECM; corresponds to the type of interface linkingintegrins to integrins and standing above adhesive regions;k = inter-ECM; corresponds to the type of interface linkingintegrins and cadherin above adhesive regions.
The total energy of the doublet depends then on a set ofparameters describing the cell states and on a single variable thatdefines the orientation of the interface. Our computation willconsider various ECM patterns, and we will identify the energyminima as a function of the doublet configuration described bya unique variable. We compare the computations on variouspatterns with experimental observations. At first we ignore therole of ECM and set all of the cortical line energy equal, that is,
Jintra�noECM ¼ Jintra�ECM ¼ Jinter�noECM ¼ Jinter�ECM ¼ 1:
We also set a value for the cadherin–cadherin interface lineenergy. Because this interface fluctuates more than the others,the line energy must be smaller and we arbitrarily fixed it to 10%of Jintra-ECM. The energy was plotted as a function of the doublet
orientation for various types of patterns. Because the corticalline energies are all equal, the self-energy is a constant and isproportional to the perimeter of the doublet. Thus, the variationof the doublet energy is determined only by the changes in inter-cellular junction length. The energy profile is also independentof the pattern, because they have by construction all of the sameperimeters. Considering isotropic line tension is not sufficient tofind all of the equilibrium positions of the doublets on the pat-terns, except in the case of the [square]-shaped micropattern(Fig. S7). Next, we consider anisotropic cortical energy in re-sponse to the presence of ECM and fix the values of the lineenergies in the same ratio as the force measurements:
Jintra�noECM ¼ 1:3; Jinter�noECM ¼ 0:8; and Jintra�ECM ¼ Jinter�ECM
¼ 1:
We kept Jcell-cell = 0.1. The energy plots are represented inFig. S7. For clarity, all of the profiles have been shifted bya constant value. In the case of anisotropic cortical tensions,the positions of the energy minima vary from pattern to pat-tern and systematically correspond to the orientations ob-served experimentally.
1. Azioune A, Carpi N, Tseng Q, Théry M, Piel M (2010) Protein micropatterns: A directprinting protocol using deep UVs. Methods Cell Biol 97:133e146.
2. Tseng Q, et al. (2011) A new micropatterning method of soft substrates reveals thatdifferent tumorigenic signals can promote or reduce cell contraction levels. Lab Chip11:2231e2240.
3. Käfer J, Hayashi T, Marée AF, Carthew RW, Graner F (2007) Cell adhesion and cortexcontractility determine cell patterning in the Drosophila retina. Proc Natl Acad Sci USA104:18549e18554.
4. Vianay B, et al. (2010) Single cells spreading on a protein lattice adopt an energyminimizing shape. Phys Rev Lett 105:128101.
5. Farhadifar R, Röper JC, Aigouy B, Eaton S, Jülicher F (2007) The influence of cellmechanics, cell-cell interactions, and proliferation on epithelial packing. Curr Biol 17:2095e2104.
6. Rauzi M, Verant P, Lecuit T, Lenne PF (2008) Nature and anisotropy of corticalforces orienting Drosophila tissue morphogenesis. Nat Cell Biol 10:1401e1410.
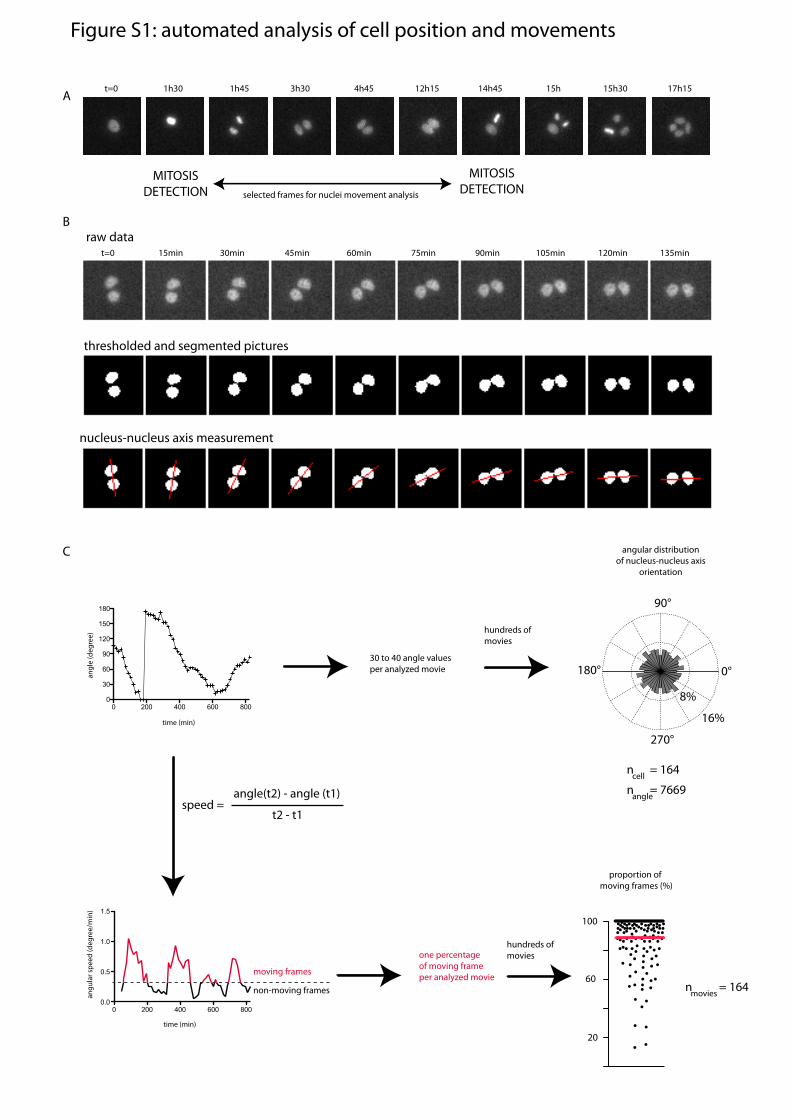
Fig. S1. Automated analysis of cell positions and movements. (A) Automated detection of mitosis events from fluorescent images of nucleus staining withHoechst in 10× video-microscopy acquisition and a 15-min time frame. Fluorescence intensity increase during metaphase and object separation during ana-phase were both used to detect mitosis. Detections of first and subsequent mitosis were then used to determine the part of the movie in which daughter cellpositions could be analyzed. (B) Example of image thresholding and segmentation to detect nucleus positions and automatically record nucleus–nucleusorientation. (C) The measured angles of nucleus–nucleus axis orientation over time (Upper Left) from all movies were pooled and plotted together in a circularhistogram showing the angular distribution of cell doublets (Upper Right). The histogram has been made circular for clarity but is identical modulo 180°. Inaddition, for each movie, the instantaneous angular speed was calculated at every time point (Lower Left). Comparison between measured value and personalvisual appreciation of movement led to the determination of an arbitrary threshold of 0.3°/min above which cells were considered as moving. For each movie,this threshold was used to calculate the proportion of moving versus nonmoving frames. All these percentages (one per movie) are graphically represented ina scatterplot graphic (Lower Right).
Fig. S1
Fig. S2. Intercellular junctions are stabilized by the absence of ECM at their extremities. Cell positions and movement analysis (Fig. S1) of cells on five differentgeometries of fibronectin-coated micropatterns (images). The presence of anisotropic adhesive or nonadhesive regions in the central part of the geometry hadno effect on junction orientation (first to third rows). The absence of ECM at the extremities of the junction stabilizes the junction (fourth and fifth rows).
Fig. S2
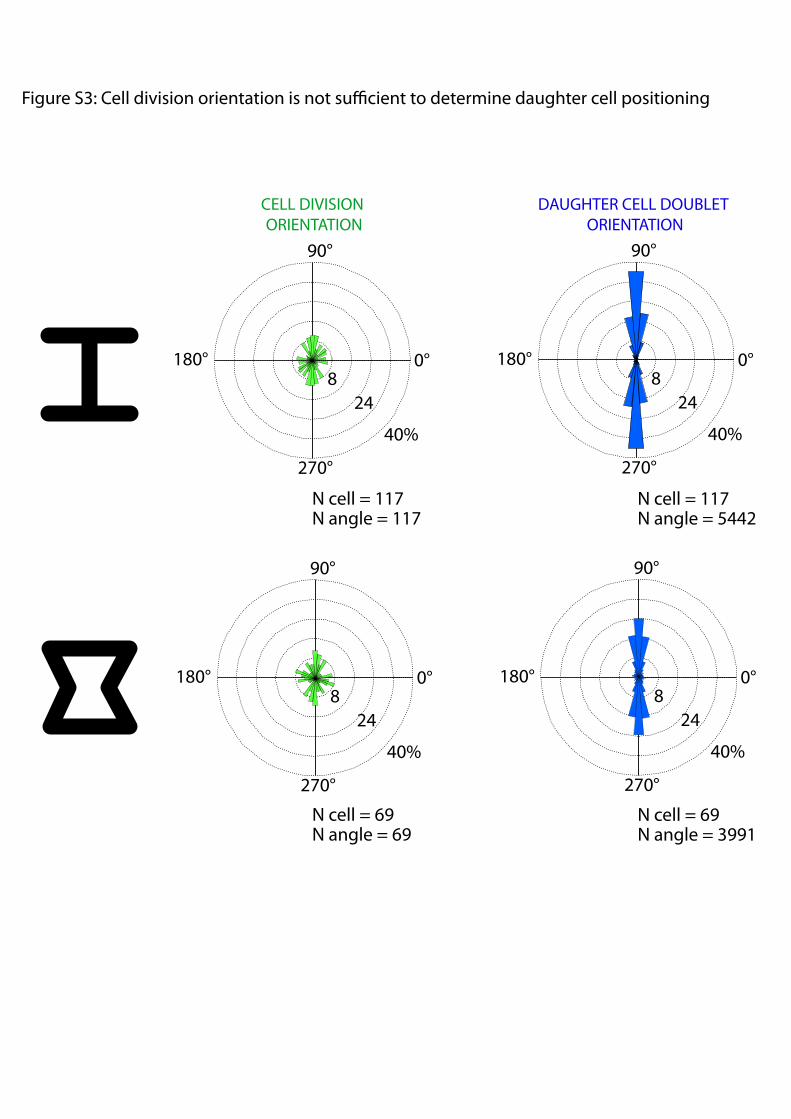
Fig. S3. Cell division orientation is not sufficient to determine daughter cell positioning. The automated detection of mitosis (Fig. S1A) was used to measurecell division orientation (nucleus–nucleus orientation during anaphase) on [H] (Upper) and [hourglass] (Lower). Angular distributions of cell division orientationwere only slightly biased by ECM geometry (Left) because micropattern size was not adapted to single cells that were moving on the micropatterns (Movie S3).Daughter cells refine their positioning after cell division and finally adopted much more biased orientations (Right). These data were duplicated from Fig. 1 tobe easily compared with cell division orientation. Cell-doublet orientation appeared to result from an active positioning process of daughter cells rather thanoriented cell division.
Fig. S3
Tseng et al. www.pnas.org/cgi/content/short/1106377109 2 of 4
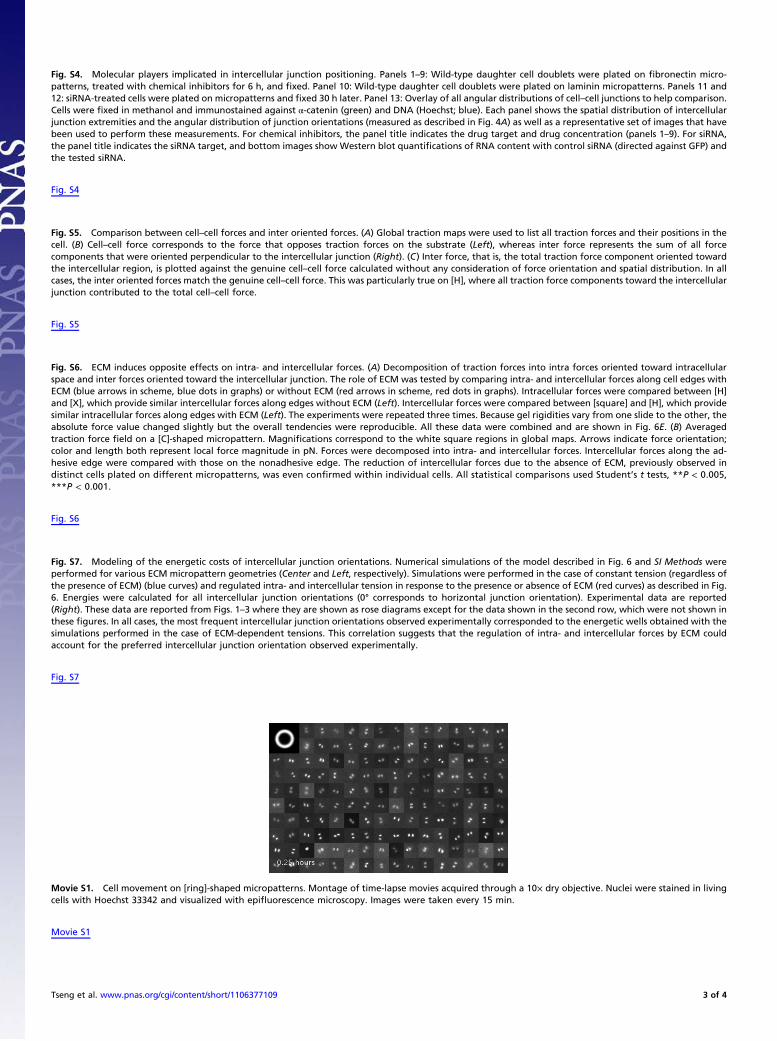
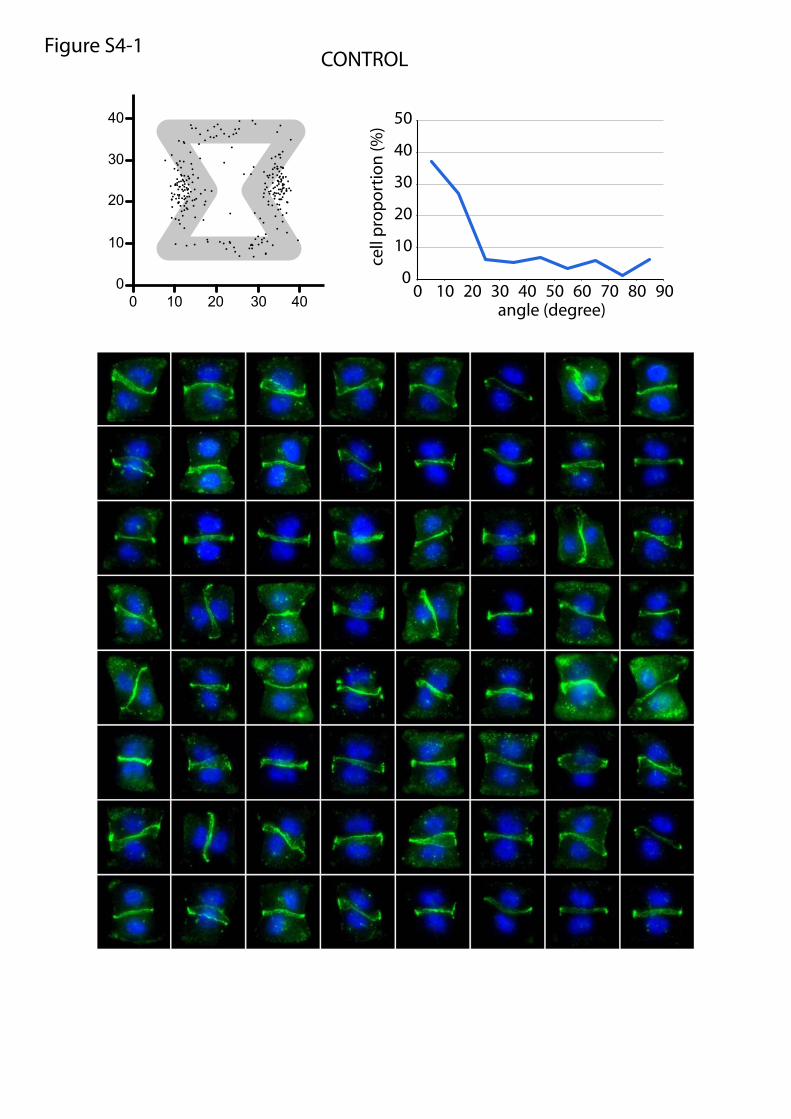
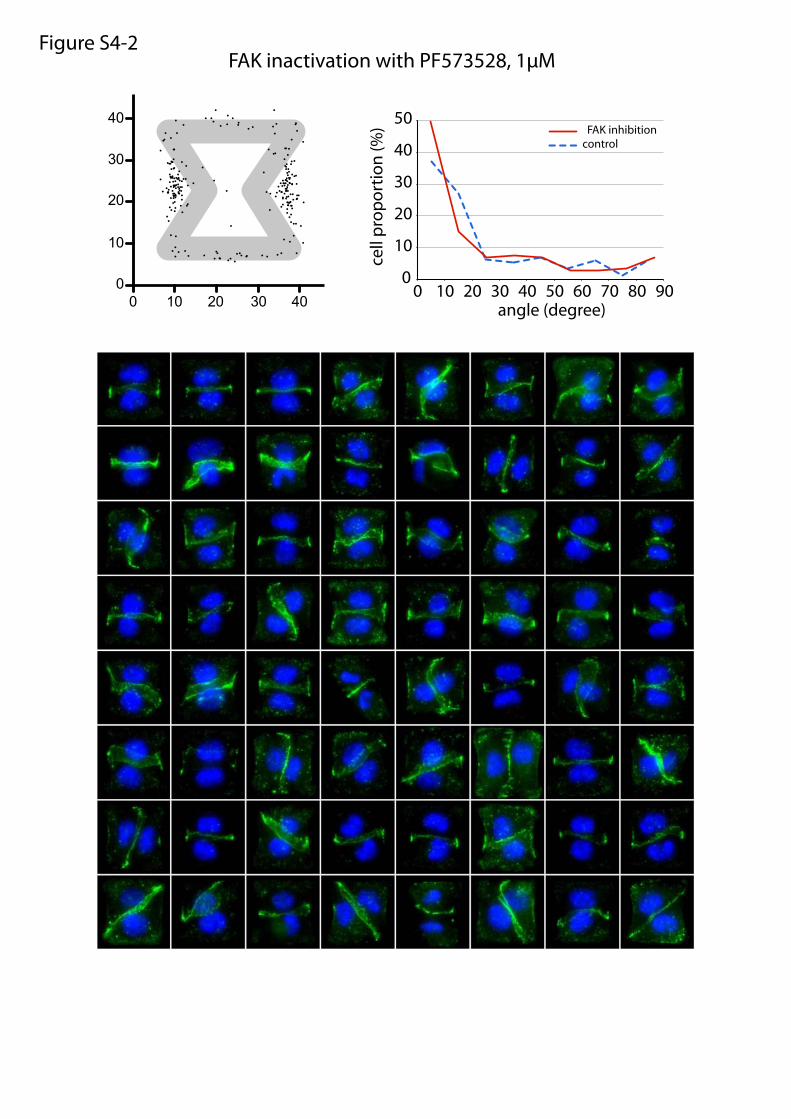
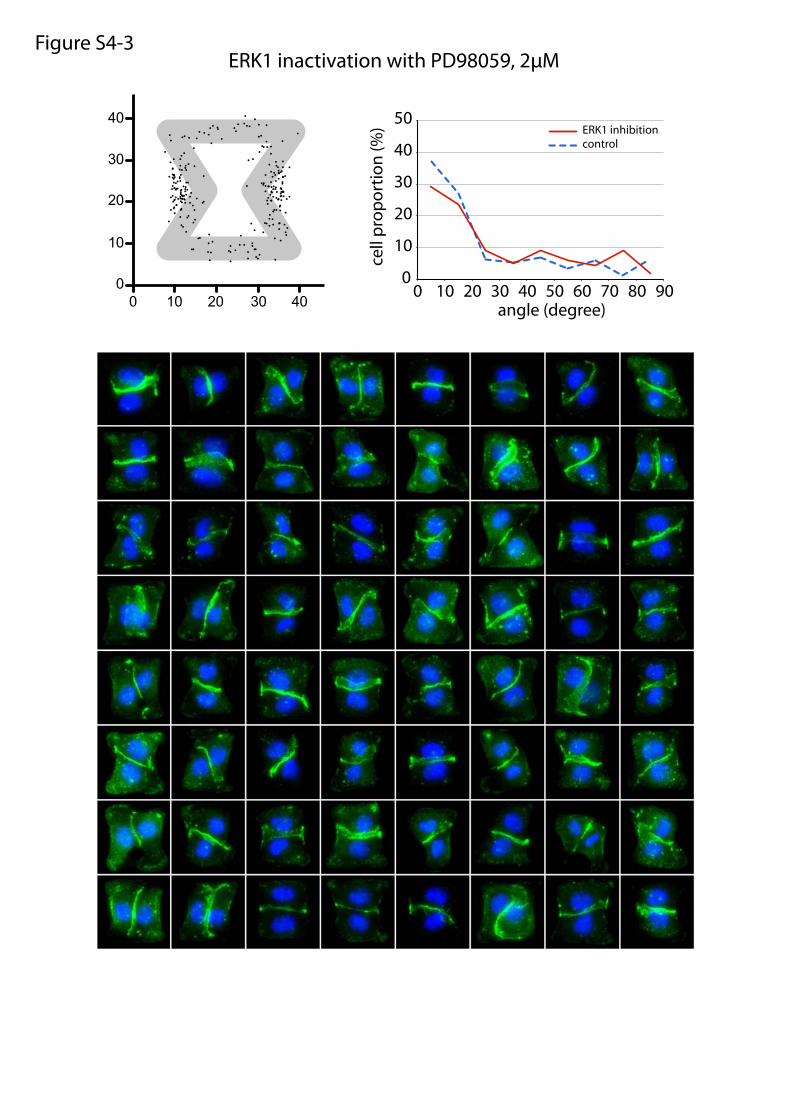
Fig. S4. Molecular players implicated in intercellular junction positioning. Panels 1–9: Wild-type daughter cell doublets were plated on fibronectin micro-patterns, treated with chemical inhibitors for 6 h, and fixed. Panel 10: Wild-type daughter cell doublets were plated on laminin micropatterns. Panels 11 and12: siRNA-treated cells were plated on micropatterns and fixed 30 h later. Panel 13: Overlay of all angular distributions of cell–cell junctions to help comparison.Cells were fixed in methanol and immunostained against α-catenin (green) and DNA (Hoechst; blue). Each panel shows the spatial distribution of intercellularjunction extremities and the angular distribution of junction orientations (measured as described in Fig. 4A) as well as a representative set of images that havebeen used to perform these measurements. For chemical inhibitors, the panel title indicates the drug target and drug concentration (panels 1–9). For siRNA,the panel title indicates the siRNA target, and bottom images show Western blot quantifications of RNA content with control siRNA (directed against GFP) andthe tested siRNA.
Fig. S4
Fig. S5. Comparison between cell–cell forces and inter oriented forces. (A) Global traction maps were used to list all traction forces and their positions in thecell. (B) Cell–cell force corresponds to the force that opposes traction forces on the substrate (Left), whereas inter force represents the sum of all forcecomponents that were oriented perpendicular to the intercellular junction (Right). (C) Inter force, that is, the total traction force component oriented towardthe intercellular region, is plotted against the genuine cell–cell force calculated without any consideration of force orientation and spatial distribution. In allcases, the inter oriented forces match the genuine cell–cell force. This was particularly true on [H], where all traction force components toward the intercellularjunction contributed to the total cell–cell force.
Fig. S5
Fig. S6. ECM induces opposite effects on intra- and intercellular forces. (A) Decomposition of traction forces into intra forces oriented toward intracellularspace and inter forces oriented toward the intercellular junction. The role of ECM was tested by comparing intra- and intercellular forces along cell edges withECM (blue arrows in scheme, blue dots in graphs) or without ECM (red arrows in scheme, red dots in graphs). Intracellular forces were compared between [H]and [X], which provide similar intercellular forces along edges without ECM (Left). Intercellular forces were compared between [square] and [H], which providesimilar intracellular forces along edges with ECM (Left). The experiments were repeated three times. Because gel rigidities vary from one slide to the other, theabsolute force value changed slightly but the overall tendencies were reproducible. All these data were combined and are shown in Fig. 6E. (B) Averagedtraction force field on a [C]-shaped micropattern. Magnifications correspond to the white square regions in global maps. Arrows indicate force orientation;color and length both represent local force magnitude in pN. Forces were decomposed into intra- and intercellular forces. Intercellular forces along the ad-hesive edge were compared with those on the nonadhesive edge. The reduction of intercellular forces due to the absence of ECM, previously observed indistinct cells plated on different micropatterns, was even confirmed within individual cells. All statistical comparisons used Student’s t tests, **P < 0.005,***P < 0.001.
Fig. S6
Fig. S7. Modeling of the energetic costs of intercellular junction orientations. Numerical simulations of the model described in Fig. 6 and SI Methods wereperformed for various ECM micropattern geometries (Center and Left, respectively). Simulations were performed in the case of constant tension (regardless ofthe presence of ECM) (blue curves) and regulated intra- and intercellular tension in response to the presence or absence of ECM (red curves) as described in Fig.6. Energies were calculated for all intercellular junction orientations (0° corresponds to horizontal junction orientation). Experimental data are reported(Right). These data are reported from Figs. 1–3 where they are shown as rose diagrams except for the data shown in the second row, which were not shown inthese figures. In all cases, the most frequent intercellular junction orientations observed experimentally corresponded to the energetic wells obtained with thesimulations performed in the case of ECM-dependent tensions. This correlation suggests that the regulation of intra- and intercellular forces by ECM couldaccount for the preferred intercellular junction orientation observed experimentally.
Fig. S7
Movie S1. Cell movement on [ring]-shaped micropatterns. Montage of time-lapse movies acquired through a 10× dry objective. Nuclei were stained in livingcells with Hoechst 33342 and visualized with epifluorescence microscopy. Images were taken every 15 min.
Movie S1
Tseng et al. www.pnas.org/cgi/content/short/1106377109 3 of 4
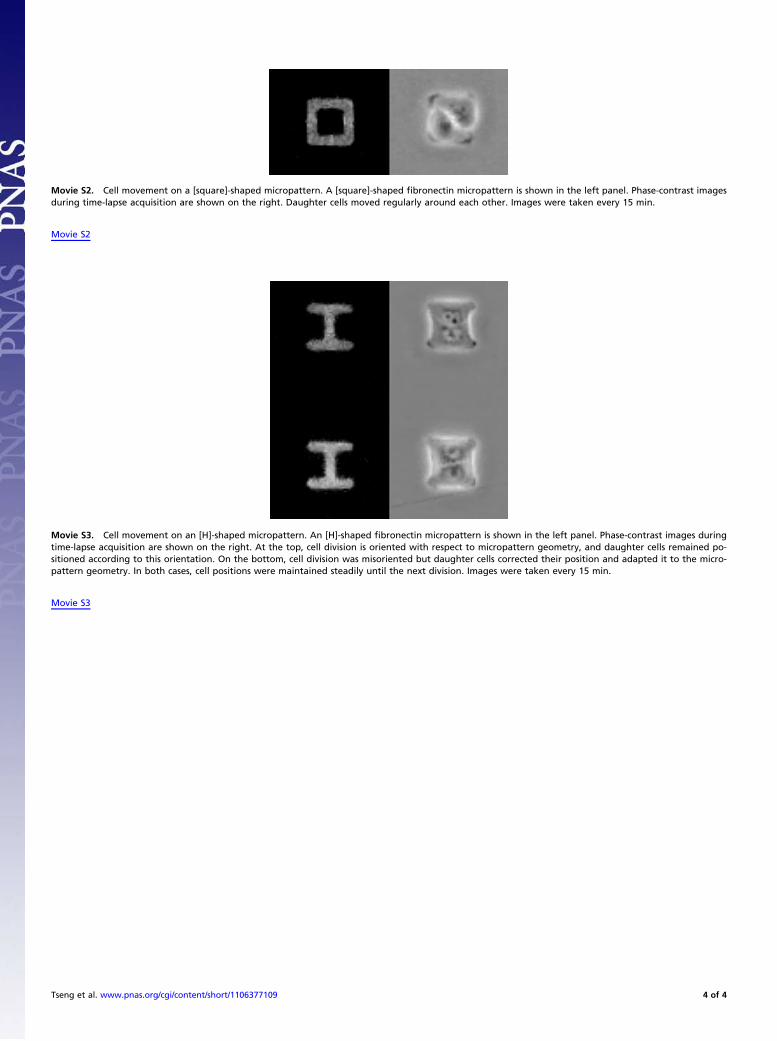
Movie S2. Cell movement on a [square]-shaped micropattern. A [square]-shaped fibronectin micropattern is shown in the left panel. Phase-contrast imagesduring time-lapse acquisition are shown on the right. Daughter cells moved regularly around each other. Images were taken every 15 min.
Movie S2
Movie S3. Cell movement on an [H]-shaped micropattern. An [H]-shaped fibronectin micropattern is shown in the left panel. Phase-contrast images duringtime-lapse acquisition are shown on the right. At the top, cell division is oriented with respect to micropattern geometry, and daughter cells remained po-sitioned according to this orientation. On the bottom, cell division was misoriented but daughter cells corrected their position and adapted it to the micro-pattern geometry. In both cases, cell positions were maintained steadily until the next division. Images were taken every 15 min.
Movie S3
Tseng et al. www.pnas.org/cgi/content/short/1106377109 4 of 4
raw data
thresholded and segmented pictures
nucleus-nucleus axis measurement
30 to 40 angle valuesper analyzed movie
one percentage of moving frame per analyzed movie
0 200 400 600 8000.0
0.5
1.0
1.5
angu
lar s
peed
(deg
ree/
min
)
time (min)
0 200 400 600 8000
30
60
90
120
150
180
angl
e (d
egre
e)
time (min)
t=0 15min 30min 45min 60min 75min 90min 105min 120min 135min
100
60
20
proportion of moving frames (%)
angular distributionof nucleus-nucleus axis
orientation
n = 164cell
n = 7669angle
8%
16%
90°
180°
270°
0°
hundreds ofmovies
hundreds ofmovies
n = 164movies
speed = angle(t2) - angle (t1)
t2 - t1
t=0 1h30 1h45 3h30 4h45 12h15 14h45 15h 15h30 17h15
MITOSISDETECTION
MITOSISDETECTIONselected frames for nuclei movement analysis
Figure S1: automated analysis of cell position and movements
A
B
C
moving frames
non-moving frames
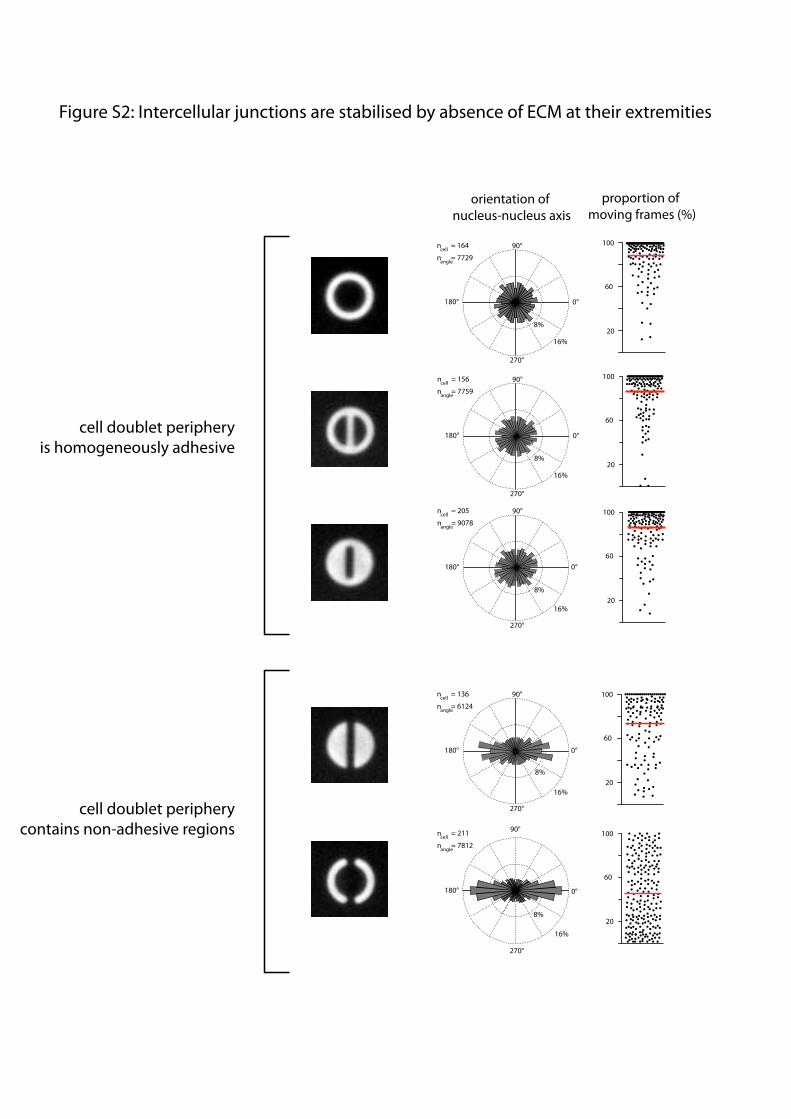
Figure S2: Intercellular junctions are stabilised by absence of ECM at their extremities
8%
16%
90°
180°
270°
100
60
20
n = 156cell
n = 7759angle
0°
100
60
208%
16%
90°
180°
270°
n = 205cell
n = 9078angle
0°
100
60
208%
16%
90°
180°
270°
n = 136cell
n = 6124angle
0°
100
60
208%
16%
90°
180°
270°
0°
n = 211cell
n = 7812angle
8%
16%
90°
180°
270°
100
60
20
proportion of moving frames (%)
orientation of nucleus-nucleus axis
n = 164cell
n = 7729angle
0°
cell doublet peripheryis homogeneously adhesive
cell doublet peripherycontains non-adhesive regions
824
90°
180°
270°
40%
N cell = 117N angle = 5442
0°
N cell = 69N angle = 3991
824
90°
180°
270°
40%
0°
824
90°
180°
270°
40%
0°8
24
90°
180°
270°
40%
0°
CELL DIVISION ORIENTATION
DAUGHTER CELL DOUBLET ORIENTATION
N cell = 117N angle = 117
N cell = 69N angle = 69
Figure S3: Cell division orientation is not su�cient to determine daughter cell positioning
0 10 20 40300
10
20
40
30
10 20 30 40 50 60 70 80 900
10
20
30
40
50
0
angle (degree)
cell
pro
po
rtio
n (%
)
CONTROLFigure S4-1
0 10 20 40300
10
20
40
30
10 20 30 40 50 60 70 80 900
10
20
30
40
50
0
angle (degree)
cell
pro
po
rtio
n (%
)
controlFAK inhibition
FAK inactivation with PF573528, 1µMFigure S4-2
0 10 20 40300
10
20
40
30
10 20 30 40 50 60 70 80 900
10
20
30
40
50
0
angle (degree)
cell
pro
po
rtio
n (%
)
controlERK1 inhibition
ERK1 inactivation with PD98059, 2µMFigure S4-3
0 10 20 40300
10
20
40
30
10 20 30 40 50 60 70 80 900
10
20
30
40
50
0
angle (degree)
cell
pro
po
rtio
n (%
)
controlSrc inhibition
Src inactivation with SU6656, 5µMFigure S4-4
0 10 20 40300
10
20
40
30
10 20 30 40 50 60 70 80 900
10
20
30
40
50
0
angle (degree)
cell
pro
po
rtio
n (%
)
controlJNK inhibition
JNK inactivation with SP600125, 1,8µMFigure S4-5
0 10 20 40300
10
20
40
30
10 20 30 40 50 60 70 80 900
10
20
30
40
50
0
angle (degree)
cell
pro
po
rtio
n (%
)
controlROCK inhibition
ROCK inactivation with Y27632, 5µMFigure S4-6
0 10 20 40300
10
20
40
30
10 20 30 40 50 60 70 80 900
10
20
30
40
50
0
angle (degree)
cell
pro
po
rtio
n (%
)
controlMyosinII inhibition
Myosin II inactivation with Blebbistatin, 15µMFigure S4-7
0 10 20 40300
10
20
40
30
10 20 30 40 50 60 70 80 900
10
20
30
40
50
0
angle (degree)
cell
pro
po
rtio
n (%
)
controlMLCK inhibition
MLCK inactivation with ML7, 5µMFigure S4-8
0 10 20 40300
10
20
40
30
10 20 30 40 50 60 70 80 900
10
20
30
40
50
0
angle (degree)
cell
pro
po
rtio
n (%
)
controlRac inhibition
Rac inactivation with NCS23766, 5µMFigure S4-9
0 10 20 40300
10
20
40
30
10 20 30 40 50 60 70 80 900
10
20
30
40
50
0
angle (degree)
cell
pro
po
rtio
n (%
)
fibronectinlaminin
laminin on micropatternFigure S4-10
0 10 20 40300
10
20
40
30
10 20 30 40 50 60 70 80 900
10
20
30
40
50
0
angle (degree)
cell
pro
po
rtio
n (%
)
controlsi GFP
siRNA against GFP (si RNA control)Figure S4-11
0 10 20 40300
10
20
40
30
10 20 30 40 50 60 70 80 900
10
20
30
40
50
0
angle (degree)
cell
pro
po
rtio
n (%
)
si GFPsi p120-catenin
siRNA against p120-catenin
anti-p120catenin
anti-actin
si GFP si p120catenin
Figure S4-12
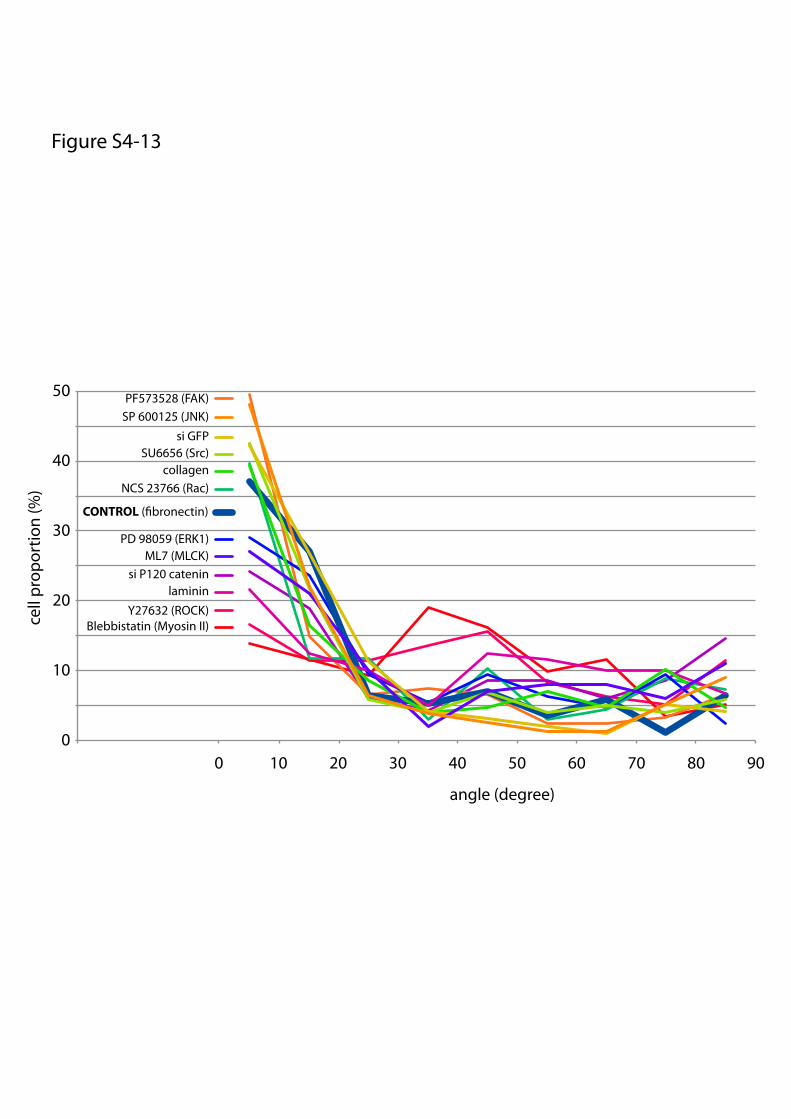
Y27632 (ROCK)Blebbistatin (Myosin II)
si P120 catenin
PF573528 (FAK)
NCS 23766 (Rac)
PD 98059 (ERK1)
CONTROL (�bronectin)
laminin
collagenSU6656 (Src)
si GFP
ML7 (MLCK)
SP 600125 (JNK)
10
20
30
40
50
0
cell
pro
po
rtio
n (%
)
10 20 30 40 50 60 70 80 900
angle (degree)
Figure S4-13
= −ΣFiFcell-cell
Fi Fi
= −ΣFFinter
= F + F
i
i iF i
F i
0 50 100 150 2000
50
100
150
200
0 50 100 150 2000
50
100
150
200
0 50 100 150 2000
50
100
150
200
Fcell-cell
F int
er
(nN)
(nN
)
mechanical balance in each cell decomposition of force coordinate
F inte
r(n
N)
F inte
r(n
N)
Fcell-cell(nN) Fcell-cell
(nN)
Fi
measurement of all traction forces
A
B
C
Figure S5: Comparison between genuine cell-cell force and «inter» force
slope = 1.13
R = 0.42
slope = 1.04
R = 0.83 2
slope = 1.06
R = 0.932
experiment 1
experiment 2
experiment 3
0
50
100
interadhesive
internon-adhesive
Forc
e (n
N) ***
1500 pNn = 25250
500
750
1000
1250
250
500
750
1000
1250
Figure S6: ECM induces opposite e�ect on intra- and inter-cellular forces
A
B
WITHECM
WITHOUTECM
WITHECM
WITHOUTECM
Fibronectin Averaged traction map
0
100
200
300
0
100
200
300
0
100
200
300
0
50
100
150
200
0
50
100
150
200
0
50
100
150
200
** ***
******
** **
INTRA-cellular forces INTER-cellular forces
Forc
e (n
N)
Forc
e (n
N)
Forc
e (n
N)
Forc
e (n
N)
Forc
e (n
N)
Forc
e (n
N)
-45 0 45 90 135
Ener
gy (a
.u.)
0
0.5
1
1.5
2
-45 0 45 90 135intercellular junction orientation (degrees)
Ener
gy (a
.u.)
0
0.5
1
1.5
2
-45 0 45 90 135
Ener
gy (a
.u.)
0.5
1
1.5
2
2.5
3
-45 0 45 90 135En
ergy
(a.u
.)
0
0.5
1
1.5
2
-45 0 45 90 135
Ener
gy (a
.u.)
0
0.5
1
1.5
2
0
10
20
30
40
-45 0 45 90 135
10
20
30
40
-45 0 45 90 135
0
10
20
30
-45 0 45 90 135
0
5
10
15
20
-45 0 45 90 135
0
5
10
15
20
-45 0 45 90 135
MODEL EXPERIMENT
ECM dependentECM independent
cell
prop
ortio
n (%
)ce
ll pr
opor
tion
(%)
cell
prop
ortio
n (%
)ce
ll pr
opor
tion
(%)
0
cell
prop
ortio
n (%
)
Ncell = 146Nangle = 8561
Ncell = 121Nangle = 4931
Ncell = 131Nangle = 5991
Ncell = 117Nangle = 5442
Ncell = 86 Nangle = 5171
intercellular junction orientation (degrees)
Figure S7: Modeling of the energetic cost of intercellular junction positioning
Top Related
Copyright © 2022 FDOKUMEN

