


Bahasa
Halaman
Hukum


Atmospheric Environment 36 (2002) 2707–2719
Snow-pile and chamber experiments during the Polar SunriseExperiment ‘Alert 2000’: exploration of nitrogen chemistry
Harald J. Beinea,b,*, Florent Domin!ec, William Simpsond, Richard E. Honratha,Roberto Sparapanib, Xianliang Zhoue, Martin Kingd,f
aMichigan Technological University, Houghton, MI, USAbC.N.R.-Istituto sull’Inquinamento Atmosferico, Rome, Italy
cCNRS-Laboratoire de Glaciologie et G!eophysique de l’Environnement, St. Martin d’H"eres, FrancedGeophysical Institute and University of Alaska, Fairbanks, AK, USA
eWadsworth Center, U. Albany, NY, USAfDepartment of Chemistry, King’s College London Strand, UK
Received 4 June 2001; received in revised form 8 October 2001; accepted 1 November 2001
Abstract
Snow chamber and snow-pile experiments performed during the ‘Alert 2000’ campaign show significant release of
NO, NO2, and HONO in steady ratios under the influence of irradiation. Both light and a minimal degree of heating are
required to produce this effect. We suggest diffusion and re-distribution of NO3� in the form of HNO3 as an important
step in the mechanism of active nitrogen release from the snowpack. r 2002 Elsevier Science Ltd. All rights reserved.
Keywords: Nitrogen oxides; Arctic; Snow; Photochemical release; Diffusion of HNO3
1. Introduction
In addition to the measurements of many ambient
trace species and parameters during the Polar Sunrise
Experiment 2000 at Alert, Nunavut, several different
snow experiments were carried out. These were mainly
of two kinds; snow-piles and chambers. The experiments
were made during both the dark and the light intensive
and used either lamps or shading to effect rapid changes
in the light conditions. This paper concerns specifically
the nitrogen chemistry in snow and exchange processes
in and above dark and sunlit snow surfaces. Snow
chamber studies were developed recently to study in a
defined ‘reactor’ the recycling of nitrate, and emissions
of NOx and HONO (Honrath et al., 2000; Zhou et al.,
2001; Dibb et al., 2002) and organic species (Sumner
et al., 2002). The snow-pile studies described here are a
new approach to investigate a confined amount of snow
without the complication of wall effects inside a
chamber. Also for the first time, the snow used in all
experiments was characterized both for physical proper-
ties and chemical ion content. The aim of this study is (a)
to give an overview of a number of snow experiments to
which many researchers contributed with their measure-
ments, and (b) to specifically explore nitrogen chemistry.
We are interested in which species are released, which
are the factors that lead to the release, and what is the
relationship between the intake, reservoir and release of
nitrogen in the snow.
As discussed by Honrath et al. (2000) NO3� photolysis
in an aqueous surface phase of the snow layer may
produce both NO2 and NO2 (aq)� . The latter would
continue to react towards NO and HONO. A first aim
of the snow experiments was to quantify release rates of
these species, and their timing, to be able to test the
mechanism. Recent laboratory experiments on sub-mm
spray frozen aqueous nitrate solutions confirmed the
*Corresponding author. C.N.R.-Istituto sull’Inquinamento
Atmosferico, Via Salaria Km 29.3 CP10, 00016 Monterotondo
Scalo, Rome, Italy.
E-mail address: [email protected] (H.J. Beine).
1352-2310/02/$ - see front matter r 2002 Elsevier Science Ltd. All rights reserved.
PII: S 1 3 5 2 - 2 3 1 0 ( 0 2 ) 0 0 1 2 0 - 6

production of both NO2 and NO2 (aq)� (Dubowski et al.,
2001). In these experiments NO2 was directly released
only from a o50mm surface layer, while in deeper layers
secondary reactions occurred.
The photochemical reactions of NO3� in snow so far
have been discussed in terms of chemistry. We present
evidence in this work for transport processes that occur
in the snow, and identify gas-phase HNO3 as important
link for re-distributing NO3� in the snowpack.
Although the species that contribute to the NO3�
signal in the snow are not known with certainty, there
are clear indications what these may (Bergin et al., 1995)
or may not (Dibb et al., 1998) be. In order to identify the
importance of a possible in situ source of NO3� onto the
snowpack (Ianniello et al., manuscript in preparation),
we attempt a mass balance and nitrogen balance for the
snow used in our experiments.
Finally, there are several reasons why manipulated
snow in such experiments may give different results than
natural snow in a pristine surrounding. In particular, the
experimental conditions in the snow piles turned out to
be rather extreme. The discussion of the mechanisms in
this study is an attempt to extract information about the
natural behavior without over interpreting our indivi-
dual results.
2. Experimental
The experimental methods and ambient data from the
various measurements used here are described in detail
in companion papers (Beine et al., 2002; Domin!e et al.,
2002; Simpson et al., 2002). Some of the results
pertaining to HONO were recently published separately
(Zhou et al., 2001). Briefly, NO was measured with the
Michigan Tech. University (MTU) chemiluminescence
instrument. NO2 was detected as NO following UV-
broadband photolysis (Peterson and Honrath, 1999).
For the NOx measurements in the chamber, the upper
inlet was replaced with a connection to the snow
chamber or pile. The length of the inlet tubing was kept
equal for both inlets. Thus, ambient air NOx measure-
ments were available at 0.5m inlet height, and allowed
us to monitor changes in the experiments with respect to
ambient conditions. HONO was measured following
DNPH derivatization using HPLC analysis (Zhou et al.,
1999). In addition to the chamber measurements,
ambient air was drawn for reference from 10 cm above
the snow surface. Snow sampling for both physical and
chemical properties was performed by F. Domin!e
following a strict sampling protocol (Cabanes et al.,
2002; Domin!e et al., 2002). Specific surface areas (SSA)
of snow were determined by methane absorption at 77K
(Hanot and Domin!e, 1999). Analysis of inorganic ions
from denuder and filter measurements (Ianniello et al.,
manuscript in preparation) and discrete snow samples
(Domin!e et al., 2002) was performed using the ion
chromatographic system (IC) of the Italian National
Research Council (C.N.R.-IIA). The IC analyses have a
precision better than 5% (Beine et al., 2001, and
references therein). In all cases the snow for these
experiments was handled only with special clean
equipment, and the person handling the snow wore
special protective clean-room clothing and gloves. The
individual experiments described in this work are
identified with either P (pile) in Table 1 or Q (quartz-
chamber) in Fig. 5. This is not a complete list of all snow
experiments performed during the PSE 2000. The stated
flowrates are in all cases total flow through the snow. In
the pile experiments this is the sum of all inlet flows of
the connected instruments; in the chamber experiments
an additional pump was used to hold this flow constant.
2.1. Snow-piles
During the dark intensive several experiments with
snow-piles were performed. A total of three snow-piles
were built at the Special Studies Trailer near Alert (SST;
82127.290N, 62131.860E). These snow-piles were homo-
geneous. They were built using one layer of snow only,
which was characterized beforehand. Both snow chem-
istry and physics were characterized before and after the
experiments for the first two piles. Two similar piles were
built near a second measurement site (FTX) with similar
snow. Here only their snow characteristics, but not the
actual experiments, are discussed.
Snow-piles were made with snow that fell on 3
February, while moderate winds were blowing. This
snow was therefore wind-accumulated in wind-sheltered
spots, where its thickness was 3–8 cm. It was overlain by
a homogeneous layer, about 5–10mm thick, fallen under
calm conditions on 7 February (see Domin!e et al., 2002,
for details). The 7 February layer was removed and only
the 3 February layer was used. This layer consisted of
sub-millimeter size columns and bullet combinations
(Domin!e et al., 2002). It was essentially uncohesive,
although a few fragile chunks were noticed during
sampling, and a few others may have formed during the
formation of the pile. Numerous IC analyses of 3
February snow samples taken from both the SST and
the FTX area showed the homogeneity of the NO3�
content of the snow within 10% (Domin!e et al., 2002).
The base of an even area of 40� 40 cm was cleaned from
hoar and 7 February snow. A Teflon filter pack without
any filter (to create some dead air space and prevent
clogging) was set in the middle of the base connected to
1/400 tubing, and covered evenly with the snow. After the
experiments the piles were taken apart to sample snow at
a number of locations and to confirm the uniformity of
the pile. For the very first pile a thermocouple was added
after experiments were already in progress. In the later
piles thermocouples were buried a few cm above the
H.J. Beine et al. / Atmospheric Environment 36 (2002) 2707–27192708

filter pack. The dimensions of the piles were radius
E30 cm, and height E35–40 cm. Thus the maximum
volume, weight, and snow surface area were 65 l, 11 kg,
and 600m2, respectively, for 3 February snow. At the
SST several instruments sampled from the same inlet
inside the snow-pile: NOx, HCHO, O3, PAN, HONO,
VOC, and Hg. The total flow rate was up to 9 slm.
Typically, air was sampled for several hours in darkness,
then a lamp was used to irradiate the pile from about
40 cm above the top.
Table 1 summarizes the times of the snow-pile
experiments. After sampling from the pile for ca. 12 h
under ambient dark conditions, a 150W Xe-arc lamp
(ILC-Cermax) with a Pyrex beaker was used to irradiate
the pile. The Pyrex beaker was added to eliminate UV-C
and attenuate some short wavelength UV-B. The
spectrum for the lamp used in these experiments with
the Pyrex beaker is compared to downwelling solar
irradiance in Fig. 1. The unfiltered lamp spectrum (not
shown) contained UV down to 250 nm and thus
resembled solar irradiance at the top of the atmosphere,
i.e. with 0 D.U. ozone. In all pile experiments a Pyrex
beaker was used in front of the lamp to filter the UV-C
part below 290 nm. We did detect significant amounts of
radiation o300 nm, which is essentially absent (o0.1%
of 400 nm radiation) in skylight at Alert. Therefore, the
pile experiments could have been influenced by photo-
chemical pathways that are not active in Alert skylight.
With the light beam hitting the pile center, the Eppley
irradiance was estimated as about one order of
magnitude brighter than noon-time sun at Alert (for
DOY 113). This very high intensity spot was then
rapidly diffused within the snowpack. Since the e-folding
depth of UV radiation in snow is only a weak function
of wavelength, the pile was illuminated with a spectrum
similar to the one shown in Fig. 1.
The sampling cycleFambient darkness, UV irradia-
tionFwas repeated once. The flow through the pile was
then turned off completely over night, and then
sampling was resumed for 1 day under ambient
conditions.
The experiences with the first pile determined much of
the strategy for the following experiments. After the
experiment 1P2Xe it was found that the top part of the pile
had melted and produced an ice/slush cone that reached
in the center of the pile. The temperature at the base was
elevated, also. To identify heat effects on the snow, the
second pile 2P was irradiated with an IR heat lamp only.
After a short period of ambient sampling the pile was
irradiated at 25% and the 100% intensity over night.
Table 1
Three piles at the SST
Codea Experiment Start times, EST (DOY)
1P Constructed from 3 Feb. snow1P1
A Ambient air 18 Feb., 15:20 (49.643)1P2
Xe Irradiation with 150W Xe-arc lampb 19 Feb., 3:05 (50.131)1P3
A Ambient air 19 Feb., 14:40 (50.610)1P4
Xe Irradiation with 150W Xe-arc lampb 20 Feb., 15:35 (51.653)1P5
A Ambient air 21 Feb., 10:11 (52.428)1P6
OFF All off. No flow 21 Feb., 20:35 (52.857)1P7
A Ambient air 22 Feb., 9:10 (53.385) end: 22 Feb., 11:15 (53.465)2P Built after some strong wind. The 3 Feb. layer was
windblown, harder and denser, and may have
contained other snow2P8
A Ambient air 22 Feb., 13:45 (53.576)2P9
H25 Heat lamp 25% 22 Feb., 15:50 (53.661)2P10
H100 Heat lamp 100% 22 Feb., 19:30 (53.818)2P11
A Ambient air 23 Feb., 10:16 (54.420) end: 24 Feb., 13:48
(55.575)3P Constructed from top 2 cm of a layer of fresh
snow3P12
A Ambient air 9 Mar., 18:18 (69.762)3P13
Cold-UV Xe-arc lampb: cold UVc 9 Mar., 23:13 (69.967)3P14
A Ambient air 10 Mar., 10:17 (70.428) end: 11 Mar., 17:55
(71.747)
aThe experiments are identified by this code; number of snow-pilelocation Pnumber of experiment
experiment ; where P stands for pile. The experiments discussed
here were mostly carried out at the SST, this location is not again specified for each experiment.bA glass beaker was set in front of the Xe-arc lamp in all experiments to filter out part of the ‘hard’ UV spectrum; See Fig. 1 for a
spectrum of the lamp.cA pyrex beaker with 300ml H2O was set in front of the Xe-arc lamp to filter out the IR part of the spectrum.
H.J. Beine et al. / Atmospheric Environment 36 (2002) 2707–2719 2709

Sampling of that pile was concluded with one day of
ambient dark conditions.
During the third pile experiment snow was irradiated
with a ‘cold’ UV lamp: a beaker filled with water was
placed before the Xe lamp. The IR part of the lamp
spectrum was filtered. Thus, a distinction between UV
and IR effects was possible from these three experi-
ments. Little attenuation from water in the ‘cold’ UV
experiments is seen in the UV. Again, the irradiation
period was preceded and followed by sampling under
ambient dark conditions.
2.2. Snow chamber experiments
During the light intensive, experiments were per-
formed using the MTU snow chamber. This quartz
chamber was 1m long, and had an inner diameter of
17.8 cm. It was filled to 94.5 cm length. The volume of
snow was about 23.5 l. This equaled about 4.7 kg H2O,
with a surface area of 234m2. Air was drawn only
through the inlet, a 1/200 Teflon port.
Similar to the snow-piles, the snow chamber was filled
with one layer of snow only, and then set vertically on
one end over night, so that the snow had a chance to
anneal, and to reduce wall-effects. The chamber was
used for four experiments with NOx: two with snow, and
two blanks with the empty chamber. The flowrates were
kept constant using an additional pump and a mass flow
controller downstream of the chamber. This was
adjusted in the range 6.2–12.75 slm, as discontinuous
samples such as for VOCs were taken, and some
instruments were not used in all experiments.
2.3. Residence times in the snow chamber
Air flow through the chamber was characterized by
the addition of NO calibration gas using a step function
standard addition. These results indicate that the snow-
filled chamber behaved only somewhat like an ideal plug
flow reactor. Little or no channeling was observed, but a
long tail in the response to the added NO was observed,
indicating the presence of ‘dead volume’: regions of the
interior of the chamber that exchanged more slowly with
the main flow. Thus, no NO reached the outlet before
80% of the chamber residence time (which was 67 s), but
it took approximately two residence times for the exit
concentration to reach its steady-state value. In contrast,
the empty snow chamber exhibited a significant amount
of mixing in the longitudinal direction: NO was detected
at the outlet after only 27% of the residence time (which
was 128 s), and it took 2.3–3.5 residence times for the
outlet concentration to reach its steady-state value.
2.4. Blank experiments with the snow chamber
In experiments in which the snow is enclosed by a
chamber, it is possible that the surfaces of the chamber
walls influence the observations (Honrath et al., 2000).
To quantify such effects, a blank experiment was
performed during the light intensive with the MTU
chamber on two days, 22 and 24 April. During the
second day, Alert plume air was sampled shortly after
the chamber was connected, and the blank test was
aborted. Maximum blank values for HONO, NO and
NO2 of ca. 6, 10 and 22 pmol/mol, respectively, were
observed. These values are significantly smaller than the
production in the snow filled chamber. The cause of this
artifact is not known, but it may be emission from the
snow surface around, or contamination of the chamber,
which may have been not fully dry during the experi-
ments.
3. Results
Results were obtained for the physical and chemical
characteristics of the snow used in the experiments and
for the air pulled through the chambers/piles from a
number of instruments. In this work we describe the
results from the snow characterization and for active
nitrogen in the gas phase.
The ‘production’ of species in the chamber/piles refers
to the difference between the measured mixing ratio
from the chamber/pile and the ambient mixing ratio
measured at the same time through the inlet at 0.5m
above the ground (10 cm for HONO). Note that
0.001
0.01
0.1
1
Rel
ativ
e ir
radi
ance
/ ar
bita
ry u
nits
(N
orm
aliz
ed a
t 400
nm)
420400380360340320300
Wavelength / nm
Fig. 1. Normalized spectrum (at 400 nm) of the 150W Xe-arc
lamp with Pyrex beaker (dashed line) that was used for the
snow-pile experiments during the dark intensive. The solid line
shows the solar spectrum at Alert, the dotted line shows the
spectrum of the lamp attenuated by water. In this setup at Alert
the Pyrex beaker was used to filter out the UV part of the
spectrum.
H.J. Beine et al. / Atmospheric Environment 36 (2002) 2707–27192710

gradients of NO, NO2, or HONO may influence this
result, especially during the light intensive (Beine et al.,
2002; Zhou et al., 2001). The inlet for the chamber was
8 cm above the snow surface level.
ProductionðNOxÞ ¼Mixing ratio at pile=chamberðNOxÞ
�Ambient mixing ratioðNOxÞ: ð1Þ
3.1. Snow-pile results
Fig. 2 shows an overview over all snow-pile experi-
ments that were performed at the SST. It is immediately
obvious that significant amounts of NO, HONO, or
NO2 were only produced in the illumination experiments
with the Xe-arc lamp. Neither NO nor HONO showed
any significant release during the heat or the ‘cold-UV’
experiment. NO2 showed small and variable production
of 20–50 pmol/mol during all heat and cold-UV experi-
ments, whether the light was turned on or not. There
was no statistically significant difference induced by the
change in light conditions. The sampling site was
impacted by local pollution during the experiments with
the heat lamp. The ambient airmasses showed variable
NO2 mixing ratios of up to 400 pmol/mol; this would
mask a possible production. However, no such ambient
influence was detected during the illumination with the
cold-UV lamp. This result indicates that in the pile
experiments both light and heat are necessary for the
release of these chemicals. This finding was not expected
in light of previous measurements of NO2 release in
snow chamber experiments. During the SNOW99 study
Honrath et al. (2000) found significant release of NO2 in
diffuse sunlight. However, heating of the snowpack due
to absorbed sunlight was not explicitly ruled out. The
temperature in the midlatitude snow that was used in
SNOW99 was up to �21C, which in our experiments
would only be found in the center of the melt zone of the
pile. Thus, a certain minimum temperature may be
necessary for the release of NOx.
Fig. 3 shows the timeseries of NO, NO2, and HONO
during the Xe-arc lamp experiments. All three species
rise in a similar, exponential fashion. NO drops
immediately to the background level as the Xe-arc lamp
is turned off, while both NO2 and HONO levels decay
more slowly. HONO and NO2 drop exponentially with a
lifetime of ca. 30min and 75–130min, respectively. All
three species show some memory effect; when the light is
turned on the second time, an initial higher mixing ratio
is immediately reached. NO2 is known to be adsorbed to
ice surfaces, while NO is not (Ammann et al., 2000). The
adsorbed NO2, however, may facilitate the production
of HONO or NO.
The relative ratios of the released nitrogen species
changed over the time of the irradiation significantly
(Fig. 4). When the pile was first exposed to UV light
only NO2 was released. Over the next 5 h the NO2
2 4 6 8 10 12 14
0
50
100
150
200
250
300
NO
pro
duced in p
ile [p
mol/m
ol]
2 4 6 8 10 12 14
0
100
200
300
400
500
NO
2 p
rod
uce
d in
pile
[p
mo
l/m
ol]
2 4 6 8 10 12 14
0
20
40
60
80
100
120
HO
NO
pro
duce
d in
pile
[p
mol/m
ol]
1 A
2 X
e3
A
4 X
e5
A6
Off
7 A
8 A
9 H
25
1
0 H
10
0
11
A
12
A1
3 c
old
-UV
14
A
1P 2P 3P
Name of Experiment
1 A
2 X
e3
A4
Xe
5 A
6 O
ff7
A8
A9
H2
5
10
H1
00
1
1 A
12
A1
3 c
old
-UV
14
A
1P 2P 3P
Name of Experiment
1 A
2 X
e3
A4
Xe
5 A
6 O
ff7
A8
A9
H2
5
10
H1
00
1
1 A
12
A1
3 c
old
-UV
14
A
1P 2P 3P
Name of Experiment
Fig. 2. (a) NO, (b) NO2, and (c) HONO produced in the snow-pile experiments. The figures show box-and-whisker plots for all snow-
pile experiments (see Table 1 for ‘name of experiment’). For all 3 species significant release from the piles occurred only during
irradiation with the Xe-arc lamp. In the box plot the center vertical line marks the median of the sample. The length of each box shows
the range within which the central 50% of the values fall, with the box edges (hinges) at the first and third quartile. The whiskers show
the range of values that fall within the inner fences. Values between the inner and outer fences are plotted with asterisks. Values outside
the outer fence are plotted with circles (Systat 9, 1999).
H.J. Beine et al. / Atmospheric Environment 36 (2002) 2707–2719 2711

fraction dropped to 50%. HONO, with some delay,
jumped to ca. 30% and increased slowly, while NO
increased steadily during that time. A minimum NO2
fraction was seen in both experiments; this minimum
was used to scale the x-axis (time) in Fig. 4. In the
second pile experiment time =0 is the starting point and
reflects the memory effect of NO2 in the pile. A steady
ratio of 3:6:2 for NO:NO2:HONO was reached after a
further 6 h. The initial release of NO2 only may reflect
the primary process in the snow, while secondary
processes; heating, transport and further photolysis lead
to the increasing production of the other species. This
was recently discussed quantitatively in laboratory
experiments on thin spray frozen aqueous nitrate
solutions (Dubowski et al., 2001): NO3 (aq)� was found
to uniformly photolyze in a liquidlike surface layer to a
depth of 400 mm to NO2 and NO2 (aq)� . Only NO2 formed
in the uppermost 50mm was able to escape, while the
remainder reacted to NO and HONO. In these experi-
ments the production of NO2 was found to increase
significantly with temperature.
In a noon-time solar spectrum for Alert (DOY 108),
the ratio of J(HNO3)/J(NO3 (aq)� ) at 243K was about 2.9.
Wavelengths below 315 nm favor HNO3 photolysis,
while longer wavelengths favor the photolysis of NO3�.
NO3 (aq)� is typically present in concentrations orders of
magnitudes larger than HNO3 in the interstitial air, so
that a small fraction of NO3 (aq)� is necessary at the
surface for this to represent a much more important
precursor for NO2 than HNO3 (Abbatt, 1997). Using
the Xe-arc lamp, however, the J(HNO3)/J(NO3 (aq)� )
ratio increased up to 15. Together with the higher lamp
intensity, this may have favored the photochemistry of
gaseous HNO3 in the interstitial air, compared to
natural sunlight. The time delay to reach stable ratios
in Fig. 4 was thus an indication of the occurrence of a
probably small fraction of gaseous HNO3 in the snow-
pile, which diffused out from the snow crystals. This
50 51 52 53
Day of Year 2000
0
100
200
300
400
500
NO
2 p
roduce
d [p
mol/m
ol]
50 51 52 53
Day of Year 2000
0
20
40
60
80
100
120
HO
NO
pro
duced [p
mol/m
ol]
Xe-arc lampambient
50 51 52 53
Day of Year 2000
0
50
100
150
200
250
300
NO
pro
duce
d [p
mol/m
ol]
Fig. 3. NO, NO2 and HONO produced during illumination with the Xe-arc lamp.
-5 0 5 10 15Time of the Experiment [hours]
20
40
60
80
100
% o
f to
tal N
rel
ease
HONONO2NO
released N species
Fig. 4. Ratio of the released N species (%) during the two UV irradiation experiments (combined dataset). The x-axis shows time (h).
For 1P2Xe time was set =0 at DOY 50.302 after an initial period of large changes that lasted ca. 5 h. For 1P4
Xe no such initial period was
observed, and the start of the illumination at DOY 51.677 was set as time =0.
H.J. Beine et al. / Atmospheric Environment 36 (2002) 2707–27192712

HNO3 was important for transport and redistribution
within the pile.
With a flowrate of about 7.5–9 lmin�1 through the
pile, the median hourly sum of released nitrogen from
these three species is 43.1 and 193.6 ngNh�1, for the two
experiments, respectively. The total amount of nitrogen
released as NOx or HONO from pile 1P in these two
experiments was 0.47 and 3.57mgN. The temperature in
the snow was measured during the second irradiation,
when a melt hole had already been drilled by the lamp.
While the surface snowpack temperature was –371C, the
temperature measured about 1 cm away from the melt
hole was –91C to –101C. Temperatures near the side of
the pile were –301C, to –341C. For comparison, the
temperature during the cold-UV experiment did not
increase over –301C in the pile. After those measure-
ments, the wind started to pick up and blew away most
of the pile over the following night. The pumping inlet
remained safely covered, and the snow remaining
around it was definitely the snow that was originally
placed on it. That snow was sampled for anions only
(Table 2).
3.2. Mass and nitrogen balance in snow during the pile
experiments
Tables 2 and 3 summarize the changes in the snow
chemistry during the pile and chamber experiments,
respectively. In the snow-piles close to the air inlet, Cl�,
NO3�, and SO4
2� were increased significantly. The gain of
Cl� together with a loss of Na+ excludes an enrichment
of sea-salt aerosols due to flow through the pile. An
enrichment of crustal material (CaSO4) is possible.
At the SST pile 1P, a decrease in cations is observed,
which has not been observed in snow in this way, and is
unexpected, since mineral particles do not dissolve. It is
conceivable that particles could be removed from
homogeneous snow through sublimation. A sub-micro
size particle is thus set free and could be carried in the
airflow through snow particles, which are on the order
of 0.2mm in size. It was for example shown that depth
hoar is less enriched in ions than other snow layers
because it undergoes strong sublimation and re-crystal-
lization (Domin!e et al., 2002). In this way aerosols fall
out and the snow can lose particles.
For the nitrogen balance of the snow-piles we would
expect the release of NOx and HONO to be consistent
with the uptake of NO3� from particles and the total
concentration of NO3� in the pile. Table 2 shows that
during the irradiation experiment the concentration of
NO3� increased in the pile. This result seems somewhat
counter-intuitive, as a decrease is expected due to the
release of NOx and HONO. The increase over the entire
experiment in snow-NO3� was on the order of 80 ng/g. If
no water/snow from the pile were lost, this would
translate into an increase of ca. 220 mgN. This apparent
Table 2
Snow characteristics during the dark intensive pile experiments. All mixing ratios in ppbw (ng/g)
Date Sample Density
(g cm�3)
SSA
(m2g�1)
Cl� NO2� Br� NO3
� SO42� Na+ NH4
+ K+ Mg2+ Ca2+
9 Feb. 3 Feb. snowa 0.16 0.069b 494.3 8.8 13.2 278.3 271.2
10 Feb. 3 Feb. snow 0.16 0.067 549.3 7.9 159.3 142.7 150.7 12.9 18.5 55.0 137.5
15 Feb. 3 Feb. snow 0.16 0.057 636.9 0.0 2.5 43.0 188.3 197.3 5.4 11.6 41.5 89.5
20 Feb. 3 Feb. snow 0.16 0.046 468.8 61.8 232.4 210.5 9.0 14.2 47.6 123.7
18 Feb. Before FTX1 PA
1 c,d 459.6 6.5 9.0 114.4 228.9 162.3 9.0 12.8 46.4 129.9
19 Feb. After FTX1 PA
1 , inlet 511.6 7.8 12.8 215.4 348.1 157.8 15.1 17.9 55.0 180.6
19 Feb. After FTX1 PA
1 , side 429.0 10.2 188.6 257.0 139.6 10.5 10.7 43.5 129.1
22 Feb. After 1P7A 0.043 525.7 9.1 157.5 306.0
Difference FTX1 PA
1 inlet 52.1 1.2 3.8 101.0 119.2 �4.5 6.1 5.1 8.6 50.7
Difference FTX1 PA
1 side �30.6 �6.5 1.2 74.2 28.1 �22.7 1.4 �2.1 �2.8 �0.8
Difference 1P7A
e 66.1 �6.5 0.1 43.1 77.1 �162.3 �9.0 �12.8 �46.4 �129.9
Difference 1P7A
f �0.004g 56.9 9.1 95.7 73.7 �210.5 �9.0 �14.2 �47.6 �123.7
aFrom ‘Site A’ (Domin!e et al., this issue).bThis SSA declined linearly with time in undisturbed snow. From 8 samples measured until 20 Feb. a linear regression of
SSA=0.1523–0.00207�DOY (R2 ¼ 0:81; p ¼ 0:0022) emerged.cSome of the experiments shown in Table 1 were duplicated near the FTX with similar snow, flow rates and other experimental
conditions. The samples shown here were taken from these piles at the FTX. Domin!e et al. (2002) have shown the spatial uniformity of
the snow around the sampling sites.dTriplicate samples were taken in the middle of the pile near the inlet and from the side of the pile. Before airflow or irradiation was
started, these measurements gave identical results.eComparing to before FTX
1 PA1 data.
fComparing to 3 Feb. snow at ‘site A’ sampled on 20 Feb.gThis is identical to the expected value for ‘aging’ of undisturbed snow; see (b) above.
H.J. Beine et al. / Atmospheric Environment 36 (2002) 2707–2719 2713

‘enrichment’ is 2 orders of magnitude larger than the N
loss to the atmosphere.
A possible loss path for water is sublimation into the
airflow. The flowrate through the pile during the first
experiment 1P varied between 7.5 and 9 slm. The total
flow through this pile was 37.5m3. The maximum
amount of sublimation can be estimated using the
saturation vapor pressure of water over ice (e.g. Marti
and Mauersberger, 1993) and assuming that the incom-
ing air flow is dry. Even if we assume that all the air
flows through the melt-zone at the maximum tempera-
ture of 01C, the total amount of water lost from the pile
is only on the order of 180 g. This amounts only to 1.5%
of the total mass of the pile and is thus negligible for the
enrichment in NO3�.
Total NO3� concentrations in atmospheric particles
showed a median value of 90.5 ng/m3 during the dark
intensive, and 135.5 ng/m3 during the light intensive
(Ianniello et al., in preparation). The maximum total
source of NO3� from particles into the snow-pile during
the dark campaign can thus be estimated as 0.76 mgN.
This gain of N through particulate NO3� is about 1/5 of
the loss due to emission as NOx and HONO during the
snow-pile experiments. The gains through NO3� deposi-
tion as well as the losses through the release of NOx and
HONO are three orders of magnitude smaller than the
total amount of nitrogen present in the snow-pile. In a
11 kg snow-pile the total amount of nitrogen was 0.15–
0.7mgN. The NO3� ‘enrichment’ in the pile was thus the
largest contribution to the N-balance.
3.3. Mobility of NO3�
An almost two-fold increase in NO3� was observed
after the irradiation experiments. We demonstrated that
atmospheric exchange cannot explain this increase, and
are therefore led to the conclusion that redistribution
and migration of nitrate took place. We suggest here
that the strong thermal gradient induced in the pile by
heating released NO3� from the snow in the form of
HNO3. Adjacent snow that has remained cold took up
this released HNO3. The ionic balance of the snow
shows that it was acidic. Thus, the main cation
interacting with NO3� is H+. Under those conditions,
NO3� will diffuse fast in ice (Thibert and Domin!e, 1998).
At –351C and around 01C the diffusion coefficient of
NO3� in ice with H+ as the counter cation is about
10�11 cm2 s�1, and 3� 10�10 cm2 s�1, respectively. The
snow crystals used in the snow-piles were found to be
hollow columns and bullets (Domin!e et al., 2002) with
walls 30–50 mm thick.
The time for diffusion out from the snow crystals,
t ¼ x2=D; is a maximum of 7 days at –351C, and 6 h at
01C. Clearly, NO3� had the time to diffuse out of heated
snow crystals and some of the HNO3 released may have
diffused into unheated crystals. HNO3 is about seven
times more soluble in ice (where it dissolves as H+ and
NO3�) at –351C than at 01C (Thibert and Domin!e, 1998),
so that most of the NO3� present in the snow may have
been released by heating. We cannot at this point
evaluate quantitatively the exchanges of NO3� between
different parts of the snow-pile, but the data presented
here show that our hypothesis of exchange of NO3�
between heated and unheated snow is consistent with the
known behavior of HNO3 in ice. The pile 1P was mostly
eroded by the wind after the experiments, and the
samples shown in Table 2 were taken from the zone
immediately surrounding the inlet. This would be the
cooler zone where ions dissolve. This zone would be
expected to show higher concentrations of NO3�.
The high mobility of NO3� may also give a hint to the
possible mechanism that releases NOx and HONO. With
the diffusion distance x ¼ ðDtÞ1=2 of NO3� on the same
order of magnitude as the wall thickness of the hollow
column ice crystals, NO3� can thus diffuse out of the
snow crystals within the initial 5 h (Fig. 4) (xE25mm at
01C within 5 h) and would be likely present in the form
of HNO3 in the gas phase. The high HNO3 photolysis of
the lamp, compared to natural sunlight, thus made this
process visible.
As NO3� photolyzes in the ice phase, the product NO2
may diffuse out of the ice, as observed by Dubowski
Table 3
Snow characteristics during the light intensive chamber experiments. All mixing ratios in ppbw (ng/g)
Date Sample Cl� NO2� Br� NO3
� SO42� Na+ NH4
+ K+ Mg2+ Ca2+
14 April Before 1Q1 195.3 9.1 11.0 242.3 414.9 64.8 12.2 7.7 31.6 37.6
17 April After 1Q1 475.2 8.9 10.3 267.9 484.7 163.6 17.4 19.3 56.7 110.3
Difference 279.8 �0.2 �0.8 25.6 69.8 98.7 5.3 11.6 25.1 72.7
17 April Before 2Q2; outleta top 488.9 9.8 7.2 325.8 455.6 154.1 16.8 14.7 60.9 255.8
21 April After 2Q2; outlet top 448.3 9.1 8.7 327.3 471.0
21 April After 2Q2; mid-outlet 482.5 9.3 8.1 341.7 484.7
Difference outlet top �40.6 �0.7 1.5 1.5 15.4
Difference outlet middle �6.4 �0.5 0.9 15.8 29.0
aThe outlet of the snow chamber is where the sampling inlets of the instruments are connected.
H.J. Beine et al. / Atmospheric Environment 36 (2002) 2707–27192714

et al. (2000). In their laboratory experiment, films of
KNO3 solutions at pH 6 were used. With K+ as counter
cation, the diffusion rate of NO3� would be too slow to
allow it to diffuse out from the ice crystals. In the case of
natural acidic snow, the high mobility of NO3�, and its
release to the gas phase as HNO3, allows photolysis in
the gas phase, or possibly on the ice surface. Considering
the extensive remobilization evidence here, gas phase
photolysis is indeed a strong possibility. The process
that we propose could not have been observed by
Dubowski et al. (2000) whose experimental conditions
were different.
3.4. Snow chamber results
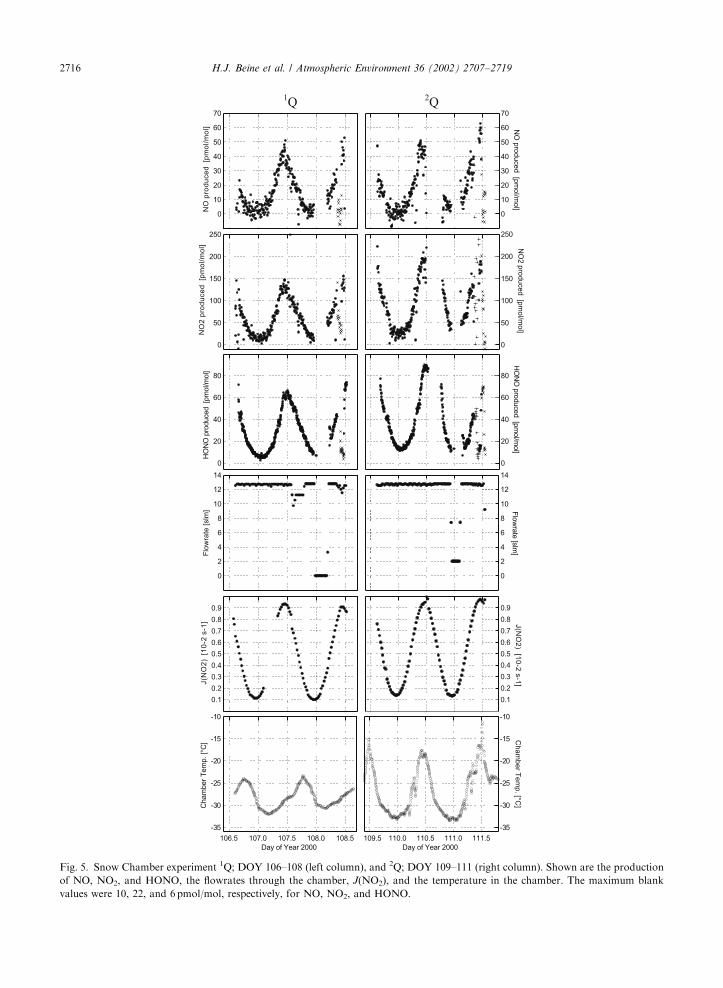
Fig. 5 shows results of the chamber experiments 1Q
and 2Q. Zhou et al. (2001) already showed the HONO
timeseries. Interruptions in the timeseries may be due to
any of three reasons: (a) The sampling flow was
interrupted from the chamber once in both experiments.
These times can be seen from row 4, which shows the
flow through the chamber. (b) During the experiment,2Q local pollution with high NO and NOy mixing ratios
was sampled during three short episodes. These data
were removed from the figures. (c) Sunlight was shaded
either with Al foil (indicated in the timeseries with +) or
black plastic foil (indicated with � ). The shading
experiment with Al foil during 2Q coincided with a
local pollution event; the data are inconclusive. Shading
of the snow chamber stopped the NO production
immediately. The production of NO2 and HONO
declined more slowly, similar to the snow-pile results.
Shading with the black foil increased the temperature in
the chamber (last row), while shading with Al foil
decreased it.
Up to 50 pmol/mol NO were produced in both
experiments. On noon on DOY 111 the NO production
is higher, following contamination of the chamber by a
local pollution event. NO2 and HONO production were
higher during the second experiment 2Q, due possibly to
either higher J-rates or higher NO3� concentrations in
the snow used (Table 3). The NO2 production reached
noon-time maxima of 150 and 200 pmol/mol, and the
HONO production reached 60 and 90 pmol/mol, respec-
tively. The measured temperatures in the chamber
behaved significantly different during the two experi-
ments, most likely this is due to the placement of the
sensor. During 1Q the sensor was placed towards the
middle of the snow volume, while during 2Q it was
placed close to the walls of the chamber. The
temperature profile shows that the snow pack is heated
by solar irradiation.
The ratio of NOx:HONO in the produced flux is
invariant throughout the experiments, the partitioning
of NO:NO2 correlates with J(NO2). The NOx:HONO
ratio was 3:1 in the chamber experiments. The NOx
fraction is lower than in the pile experiments, where the
ratio was 4.5:1.
3.5. Mass and nitrogen balance in the chamber
Much smaller enrichment of NO3� and SO4
2� was
found during the chamber experiments during the light
intensive (Table 3) compared to the pile experiments.
The initial concentrations were higher than in the dark,
and the changes an order of magnitude smaller. These
differences can be related to heating effects; the
chambers stayed close to ambient temperatures, and
were not exposed to significant heating in the same way
the piles were.
During experiments 1Q and 2Q a total flow of 31.0 and
33.8m3, respectively, was pumped through the chamber.
Using both the measured temperature in the chamber
and the ambient temperature to calculate the saturation
vapor pressure of H2O over ice, the maximum total
sublimation into the dry air stream was estimated as 6.3–
6.9 g for 1Q and 7.7–8.4 g for 2Q. This, as in the case of
the snow-piles, is three orders of magnitude smaller than
the total weight of snow in the chamber, and is too small
to have a significant effect.
During 1Q a significant enrichment in Cl�, and sea-
salt and crustal cations took place (Table 3). After 2Q
cations were not measured, the observed anion differ-
ences may not be significant. Airflow, irradiation and
heating effects are much more uniform in the snow
chambers than in the piles. Extreme enrichment and
diffusion effects as with the piles were therefore not
expected in the chamber experiments. In addition, only a
few places within the snow volume were sampled. The
redistribution of dissolved trace species may have led to
some spatial variability within the snow volume, the
samples shown in Table 3 may not be sufficient to
discuss these effects in detail.
The median total NO3� concentration in aerosol
particles during the light campaign was 135.5 ng/m3,
HNO3 showed a median value of 26 ng/m3 (Ianniello
et al., manuscript in preparation). The possible intake
into the snow chambers is thus on the order of 1.2 mgNfrom this particle NO3
�. During the snow chamber
experiments 1Q and 2Q the release of nitrogen as NOx or
HONO amounted to 5.29 and 5.22 mgN, respectively.
Similar to the snow-piles, the NO3� gain amounts to ca.
1/4 of this loss.
In summary neither the pile nor the chamber
experiments show a balance of N present before and
after the experiments with the incoming NO3� and the
out-flowing NOx and HONO. In the case of the snow-
piles a redistribution of NO3� is believed to have taken
place, due to heating and diffusion effects in the pile.
Sublimation in either the piles or the chambers was
estimated as being too small to have a significant effect
on the mass balance. The nitrogen influx from particle
H.J. Beine et al. / Atmospheric Environment 36 (2002) 2707–2719 2715
1Q
2Q
0
10
20
30
40
50
60
70
NO
pro
du
ce
d [p
mo
l/m
ol]
0
10
20
30
40
50
60
70
NO
pro
duced [p
mol/m
ol]
0
50
100
150
200
250
NO
2 p
rod
uce
d
[pm
ol/
mo
l]
0
50
100
150
200
250
NO
2 p
roduced [p
mol/m
ol]
0
20
40
60
80
HO
NO
pro
duced [p
mol/m
ol]
0
20
40
60
80
HO
NO
pro
duced [p
mol/m
ol]
0
2
4
6
8
10
12
14
Flo
wra
te [
slm
]
0
2
4
6
8
10
12
14
0.1
0.2
0.3
0.4
0.5
0.6
0.7
0.8
0.9
J(N
O2
) [
10
-2 s
-1]
0.1
0.2
0.3
0.4
0.5
0.6
0.7
0.8
0.9
J(N
O2
) [10
-2 s
-1]
106.5 107.0 107.5 108.0 108.5
Day of Year 2000
-35
-30
-25
-20
-15
-10
Cham
ber
Tem
p. [°
C]
109.5 110.0 110.5 111.0 111.5
Day of Year 2000
-35
-30
-25
-20
-15
-10
Ch
am
be
r Te
mp
. [°C]
Flo
wra
te [s
lm]
Fig. 5. Snow Chamber experiment 1Q; DOY 106–108 (left column), and 2Q; DOY 109–111 (right column). Shown are the production
of NO, NO2, and HONO, the flowrates through the chamber, J(NO2), and the temperature in the chamber. The maximum blank
values were 10, 22, and 6 pmol/mol, respectively, for NO, NO2, and HONO.
H.J. Beine et al. / Atmospheric Environment 36 (2002) 2707–27192716

NO3� amounted in all experiments to roughly 1/5�1/4 of
the emitted nitrogen (as NOx and HONO).
4. Nitrogen chemistry in the snow
Neither the pile nor the chamber experiments
produced the NOx:HONO flux ratios of E1:1 that were
observed in ambient air at Alert (Beine et al., 2002).
Since the ambient snow/air system operates on different
time scales, and secondary reactions may change the
original ratios, this was not expected. While it is still
unclear what the sources or possible forms of NO3� in
the snow are, there seems to be agreement that this NO3�
is the origin of the release of the various active nitrogen
species (Dibb et al., 1998; Honrath et al., 2000).
However, in addition to the discussion by Honrath
et al. (2000), we see evidence that this NO3� may occur in
the form of mobile interstitial gas-phase HNO3.
Changes in NO3� concentrations will be caused by
transport of HNO3, but the fraction of NO3� that will be
in the form of HNO3 is negligible.
The pile experiments show clearly that light alone is
not sufficient to produce significant amounts of any of
the three observed nitrogen species; some heating of the
snow is necessary. The term ‘heating’, however, may
lead to misunderstandings: We hypothesize that the
snowpack must have a minimum temperature that
allows NO3� to diffuse out of the snow crystals within
a certain time. This minimum temperature is a function
foremost of the snow type (Table 4). In the case of the
snow chamber experiments heating of the surface snow
by solar insolation was apparently sufficient.
Hence we postulate that NO3� is set free by diffusion.
We cannot estimate the amount of surface NO3� versus
that in the snow bulk. Abbatt (1997) discussed the
possibility that most of the NO3� is adsorbed on the
surface, however, he was investigating a simple ice-
HNO3 system whereas the presence of both cations such
as Ca2+, Na+, or Mg2+, and acids such as SO42� and
Cl� may decrease the affinity of NO3� for the surface.
This point certainly may require additional research.
Consistent with previous studies on this subject we see a
photochemical process. The adsorbed NO3� can be
directly photolyzed, as described by Honrath et al.
(2000). The photolysis will result in a surface depletion
of NO3� and will lead to diffusion of nitrate from the
bulk of the snow volume to the surface at a rate
determined by D. As shown above, gas-phase HNO3 is
the most likely form of nitrate for this transport.
Heating will speed up diffusion and facilitate the
replenishment to the surface. Additionally, HNO3 may
photolyze directly.
Honrath et al. (2000) and Dubowski et al. (2001) have
identified the primary emitted species as NO2, our
results are consistent with this finding. The results from
the first 5 h of the snow-pile experiments show that NO2
is emitted first. The production of NO and HONO may
thus proceed in a secondary step through NO2�. We
observed additionally photolysis of NO2, but little
HONO photolysis on the time scales present in our
experiments.
The snow characteristics and, incidentally, the weight
of 1m2 active surface snow at Alert (4.7 kg) (Beine et al.,
2002) was equal to the filling of the snow chamber. The
noon-time production of NOx and HONO from the
chamber was 0.18mgN in a flow of around 600 l/h. This
compares to the production of ca. 1mgN/h from a
similar amount of similar snow in a natural environment
without the forced flow through a chamber. The ratio of
NOx:HONO in the chamber effluent was X3:1, in
natural snow 1:1. These findings indicate that the
residence time of the chemicals in the interstitial air in
the snow is important, more so for HONO than for
NOx. In the snow chamber experiments air spent only
ca. 2min in contact with snow. Thus, the system cannot
reach for example the NO2 (aq)� –HONO equilibrium (Li,
1994). Furthermore, incoming atmospheric NO3� does
not immediately come in contact with the reactive
surface zone in the snow chambers, unlike deposition to
a natural snow surface (Beine et al., 2002). In this case
especially transport, diffusion and equilibrium processes
seem to be important in maximizing the production of
active nitrogen species from NO3� in the snow.
Table 4
Threshold temperature for HNO3 diffusion within t ¼ 3 days
Snow type Diffusion length (mm)
(=smallest dimension/2)
D value needed
(¼ x2=t)
T for D value (1C)
Fresh columns and bullets 25 2.4� 10�11 �31
Aged columns and bullets 50 9.6� 10�11 �17
Rimed dendrites 15 8.7� 10�12 �40
Depth hoar 100 3.9� 10�10 0
Hard windpacked 120 5.6� 10�10 Impossiblea
Soft windpacked 250 2.4� 10�09 Impossiblea
aThe temperature for this diffusion coefficient would be >01C.
H.J. Beine et al. / Atmospheric Environment 36 (2002) 2707–2719 2717

The results obtained here may also be useful to
understand the NO3� signal in ice cores. This signal is
known to decrease with time (Legrand and Delmas,
1986), as surface snow is always more concentrated than
deeper snow. For the moment, only physical processes
such as degassing and release during metamorphism
have been invoked to explain this process. We suggest
here that photolysis of NO3� may be an additional
process that could contribute to the observed decrease.
5. Conclusion
In this work we have presented evidence that NO3� in
acidic snow is mobilized and re-distributed in the form
of HNO3 by diffusion above a certain threshold
temperature. In the snow-pile experiments a direct
photolysis of gas-phase HNO3 was observable; this
process may contribute to nitrate photolysis in natural
snow as well. Transport in the form of HNO3 will re-
distribute NO3� to the snow surface, where it can be
more efficiently photolyzed. Because of shortened
residence times in the snow, the photolysis products in
the pile and chamber effluents showed higher NOx:
HONO ratios than in natural snow.
This mechanism may be important for the interpreta-
tion of processes in ice cores or Antarctic snow: at
temperatures below the threshold photolysis will not be
effective to reactivate NO3� as NOx. Likewise, the
formation of HNO3 will not take place in alkaline
snow. Ice core records (Thibert and Domin!e, 1998, and
references therein) show that during glacial ages, when
the ice was alkaline and NO3� tied up with heavy cations,
the seasonality in the NO3� signal was preserved,
suggesting that photolysis did not take place. On the
contrary, NO3� disappeared from acidic ice in inter-
glacials, suggesting that diffusion was necessary for the
redistribution of NO3�, so that photolysis of either
HNO3 or surface NO3� could take place.
Understanding the mechanism of NO3� redistribution
and reactivation makes it possible to parameterize this
process in models. Diffusion coefficients are known,
snow temperatures and crystal sizes need to be
measured. The remaining problem for such calculations
would be the location of NO3�; the distribution between
bulk and surface.
Acknowledgements
We would like to thank the participants of the ‘Alert
2000’ experiment for initial discussions on the idea of
snow-piles, and their support; especially P. ‘SnowBla-
ster’ Shepson, for carrying out the irradiation experi-
ments at the piles using his lamps. Funding for this
project was received from the National Science Founda-
tion, Office of Polar Programs and the European
Commission (EVK2-1999-00029 ‘NICE’).
References
Abbatt, J.P.D., 1997. Interaction of HNO3 with water-ice
surfaces at temperatures of the free troposphere. Geophy-
sical Research Letters 24, 1479–1482.
Ammann, M., Bartels, T., Wachsmuth, M., Gaeggeler, H.,
2000. Adsorption of nitrogen oxides on ice. EOS Transac-
tions AGU, 81(48), Fall Meeting Supplement, Abstract
A21A-09.
Beine, H.J., Allegrini, I., Sparapani, R., Ianniello, A., Valentini,
F., 2001. Three years of springtime trace gas and particle
measurement at Ny- (Alesund, Svalbard. Atmospheric En-
vironment 35 (21), 3645–3658.
Beine, H.J., Honrath, R.E., Domin!e, F., Simpson, W., Fuentes,
J.D., 2002. NOx during background and ozone depletion
periods at Alert: Fluxes above the snow surface, Atmo-
spheric Environment, submitted for publication.
Bergin, M.H., Jaffrezo, J.-L., Davidson, C.I., Dibb, J.E.,
Pandis, S.N., Hillamo, R., Maenhaut, W., Kuhns, H.D.,
Makela, T., 1995. The contributions of snow, fog and dry
deposition to the summer flux of anions and cations at
Summit, Greenland. Journal of Geophysical Research 100
(16), 275–288.
Cabanes, A., Legagneux, L., Domin!e, F., 2002. Evolution of
the specific surface area and of crystal morphology of fresh
snow near Alert during Polar Sunrise Experiment 2000.
Atmospheric Environment 36, 2767–2777.
Dibb, J.E., Talbot, R.W., Munger, J.W., Jacob, D.J., Fan, S.-
M., 1998. Air-snow exchange of HNO3 and NOy at
Summit, Greenland. Journal of Geophysical Research 103,
3475–3486.
Dibb, J.E., Arsenault, M., Peterson, M.C., Honrath, R.E.,
2002. Fast nitrogen oxide photochemistry in Summit,
Greenland snow. Atmospheric Environment 36, 2501–2511.
Domin!e, F., Cabanes, A., Legagneux, L., 2002. Structure,
microphysics, and surface area of the Arctic snowpack near
Alert during Polar Sunrise Experiment 2000. Atmospheric
Environment 36, 2753–2765.
Dubowski, Y., Colussi, A.J., Hoffmann, M.R., 2001. Nitrogen
dioxide release in the 302 nm band photolysis of spray-
frozen aqueous nitrate solutions. Atmospheric Implications.
Journal of Physical Chemistry A 105, 4928–4932.
Hanot, L., Domin!e, F., 1999. Evolution of the surface area of a
snow layer. Environmental Science and Technology 33,
4250–4255.
Honrath, R.E., Peterson, M.C., Dziobak, M.P., Dibb, J.E.,
Arsenault, M.A., Gen, S.A., 2000. Release of NOx from
sunlight-irradiated midlatitude snow. Geophysical Research
Letters 27, 2237–2240.
Ianniello, A., Sparapani, R., Di Bari, F., Allegrini, I., Beine,
H.J. Denuder measurements of gas and aerosol species
above Arctic snow surfaces at Alert 2000. Manuscript in
preparation.
Legrand, M., Delmas, R., 1986. Relative contributions of
tropospheric and stratospheric sources to nitrate in Antarc-
tic snow. Tellus 38, 236–249.
H.J. Beine et al. / Atmospheric Environment 36 (2002) 2707–27192718
Li, S.-M., 1994. Equilibrium of particle nitrite with gas-phase
HONO: Tropospheric measurements in the high Arctic
during polar sunrise. Journal of Geophysical Research 99
(25), 469–478.
Marti, J., Mauersberger, K., 1993. A survey and new
measurements of ice vapor pressure at temperature between
170 and 250K. Geophysical Research Letters 20, 363–366.
Peterson, M.C., Honrath, R.E., 1999. NOx and NOy over the
Northwestern North Atlantic: Measurements and measure-
ment accuracy. Journal of Geophysical Research 104 (11),
695–707.
Simpson, W.R., King, M.D., Beine, H.J., Honrath, R.E., 2002.
Atmospheric photolysis rates during the Polar Sunrise
Experiment Alert 2000 field campaign. Atmospheric En-
vironment 36, 2471–2480.
Sumner, A.L., Shepson, P.B., Grannas, A.M., Bottenheim,
J.W., Anlauf, K.G., Worthy, D., Schroeder, W.H., Steffen,
A., Domin!e, F., Perrier, S., Houdier, S., 2002. Atmospheric
chemistry of formaldehyde in the Arctic troposphere at
Polar Sunrise, and the influence of the snowpack. Atmo-
spheric Environment 36, 2553–2562.
Thibert, E., Domin!e, F., 1998. Thermodynamics and kinetics of
the solid solution of HNO3 in ice. Journal of Physical
Chemistry B. 102, 4432–4439.
Zhou, X., Qiao, H., Deng, G., Civerolo, K., 1999. A method for
the measurement of atmospheric HONO based on DNPH
derivatization and HPLC analysis. Environmental Science
and Technology 33, 3672–3679.
Zhou, X., Beine, H.J., Honrath, R.E., Fuentes, J.D., Simpson,
W., Shepson, P.B., Bottenheim, J., 2001. Snowpack photo-
chemical production as a source for HONO in the Arctic
boundary layer in spring time. Geophysical Research
Letters 28 (21), 4087–4090.
H.J. Beine et al. / Atmospheric Environment 36 (2002) 2707–2719 2719
Copyright © 2022 FDOKUMEN

