


Bahasa
Halaman
Hukum

Presented at the Seminar in Environmental Science and Technology: Evaluation of Alternative Water TreatmentSystems for Obtaining Safe Water. Organized by the University of Salerno with support of NATO Science Programme.September 27, 2004, Fisciano (SA), Italy.
0011-9164/05/$– See front matter © 2005 Elsevier B.V. All rights reserved
Desalination 176 (2005) 127–141
Seasonal variations of trihalomethanes (THMs) in waterdistribution networks of Istanbul City
I. Toroz, V. Uyak*
Department of Environmental Engineering, Faculty of Civil Engineering, Istanbul Technical University,34469 Maslak–Istanbul, Turkey
Tel. +90 (212) 285-6548; Fax: +90 (212) 285-3781; email: [email protected] / [email protected]
Received 26 October 2004; accepted 5 November 2004
Abstract
Seasonal variations of trihalomethane (THM) concentrations were investigated within distribution systems of theBuyukcekmece water treatment plant in Istanbul City (Turkey). The investigation was based on an intensive 30-weeksampling program, undertaken during the spring, summer and fall of the year 2003. THMs and other water quality andoperational parameters were monitored at points along the distribution system between the treatment plant and thesystem’s extremity. The results showed that THM concentrations vary significantly between finished waters and waterat the distribution network. When water temperature exceeds 24°C in summer, the THM levels are 1.2–1.8 times higherthan finished water, while when water temperature is below 15°C in the spring and fall, the measured THMconcentrations at the system’s extremity were very rarely higher than 100 µg/L. Finally, THM levels were measuredat sampling points representing progressively greater travel times from the plant to the extremity of the distributionsystem. Multiple regression analysis was also conducted in order to estimate THMs from total organic carbon,temperature, and chlorine dose parameters. The regression model resulted in a R2 value of 0.827.
Keywords: Trihalomethanes; Chlorination; Distribution systems; Regression analysis
1. Introduction
The disinfection of water using chlorine is acommon practice in Turkey. Chlorine is used to
*Corresponding author.
treat water in order to destroy microorganismsand/or to ensure residual concentrations in dis-tribution systems, thus protecting water frommicroorganism regrowth [1]. Chlorine is a widelyused disinfectant because it is extremely efficient
I. Toroz, V. Uyak / Desalination 176 (2005) 127–141128
and relatively inexpensive [2]. Although chlori-nation worked well, it was discovered in the1970s that the use of chlorine as an oxidant ordisinfectant posed potential health risks due to theformation of disinfection by-products (DBPs) indrinking water [2,3]. Chlorine reacts with thenatural organic matters contained in water togenerate DBPs. The focus on the formation ofDBPs in drinking water distribution systems hasincreased in recent years [1]. Among DBPs foundin chlorinated water, special attention has beenpaid to the concentration of trihalomethanes[THMs: chloroform (CHCl3), bromodichloro-methane (CHCl2Br), chlorodibromomethane(CHBr2Cl) and bromoform (CHBr3)] because oftheir potential carcinogenic effects [4]. TheGovernment of Turkey recently has recently beenpreparing to establish a maximum contami-nantlevel (MCL) of THMs of 100 µg/L to complywith European Union criteria.
It was stated in the literature that THMoccurrence in chlorinated water may vary signifi-cantly based on season and geographical locationin the distribution system [5–9]. These variationsare due to changes in raw and treated waterquality as well as in operational parametersrelated to chlorination [10]. The operationalparameters that influence THM occurrence in thedistribution systems are chlorine dose, watertemperature, pH and travel time of water withinthe system. It has been concluded that, in terms ofwater quality, the fulvic and humic fraction oforganic matter constitute important precursors forTHMs [11]. Besides, total organic carbon (TOC)and ultraviolet absorbance at 254 nm (UV254)have been used as indicators for the presence oforganic matter in drinking water [12]. Severallaboratory and field research studies have shownthat the higher the values for these parameters,the higher the concentrations of THMs formed[1,6,13–15].
On the other hand, at this time there is a lackof information concerning THM occurrence inIstanbul water distribution systems, as well as
about the capacity of the Istanbul city watertreatment utilities for compliance with 100 µg/Lof the EU and 80 µg/L of US EnvironmentalProtection Agency (EPA) THM standards [16,17]. Because the EU and EPA standards forTHMS take into account the seasonal averages ofTHM concentrations in representative locationsof the distribution systems instead of singlevalues of the finished water, there is an increasinginterest in investigating locational and temporalvariations of these chlorination by-products indistributed water [1].
Recently, several researchers have investi-gated and modeled the occurrence of THMs indistribution systems, based on single-samplesurveys [1]. The aim of this paper is to study theseasonal variations of THMs in the treated waterof the Buyukcekmece water treatment plant inIstanbul. This plant receives raw water fromBuyukcekmece Lake (BL). The study also tries toinvestigate the effects of water quality and opera-tional parameters on THM occurrence in distri-bution systems. Multiple regression analysis wascarried out in order to estimate THMs from a setof parameters.
2. Materials and methods
2.1. Description of treatment plantsThe water utility taken as a case study is the
Buyukcekmece water treatment plant (BWTP).The plant takes water from BL; its capacity is400,000 m3/d and serves nearly 2 million peopleliving on the European side of Istanbul City(Fig. 1). A conventional treatment scheme isapplied in the plant and consists of aeration,prechlorination, coagulation, flocculation–sedi-mentation, filtration, and postchlorination. Pre-chlorination is adapted at the coagulation stagewith an average chlorine dose of 2 mg/L; alum isused as the coagulant at a typical dose of30 mg/L. The coagulated water is filtered in con-ventional rapid-sand filters, and chlorine is used
I. Toroz, V. Uyak / Desalination 176 (2005) 127–141 129
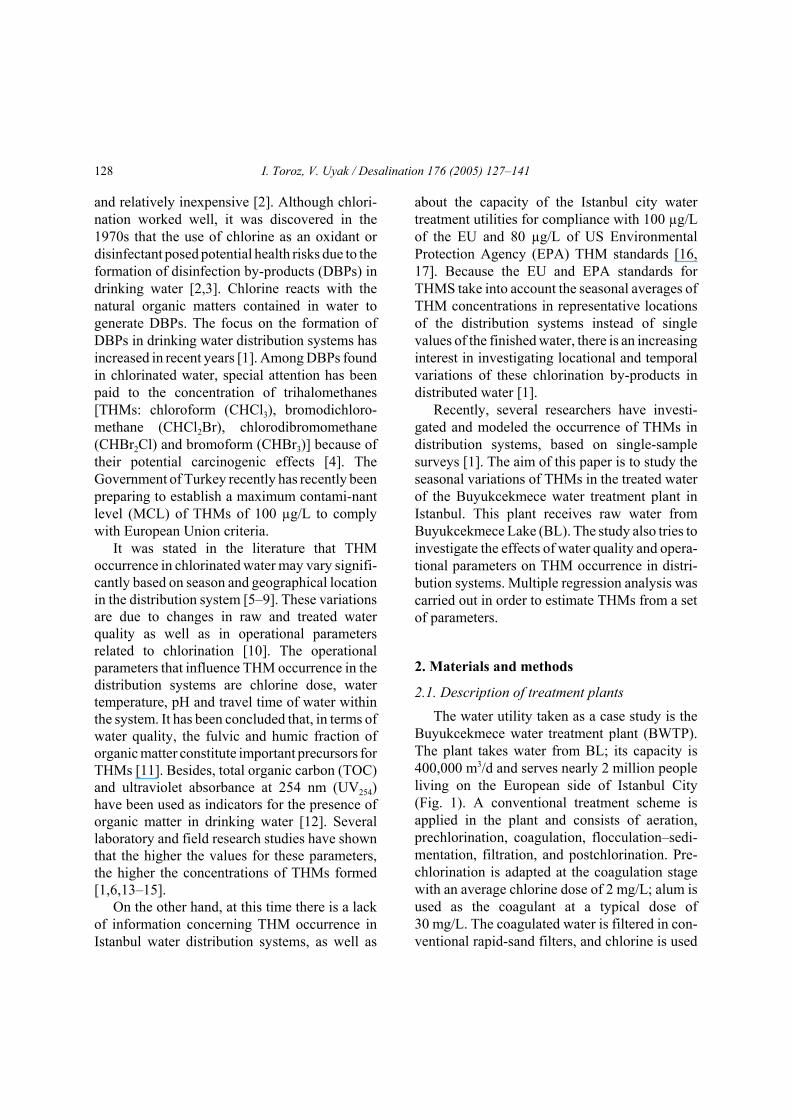
Fig. 1. Map of Istanbul City and BWTP distribution system area.
as the final disinfectant with a typical dose of2 mg/L before the treated water is transferred tothe city. The total applied chlorine dose (pre- pluspostchlorination) varies between 3.0 to 7.5 mg/L.
2.2. Sampling strategy
To investigate the occurrence of THMs withinthe water distribution systems of BWTP, anintensive 30-week sampling program was under-
I. Toroz, V. Uyak / Desalination 176 (2005) 127–141130
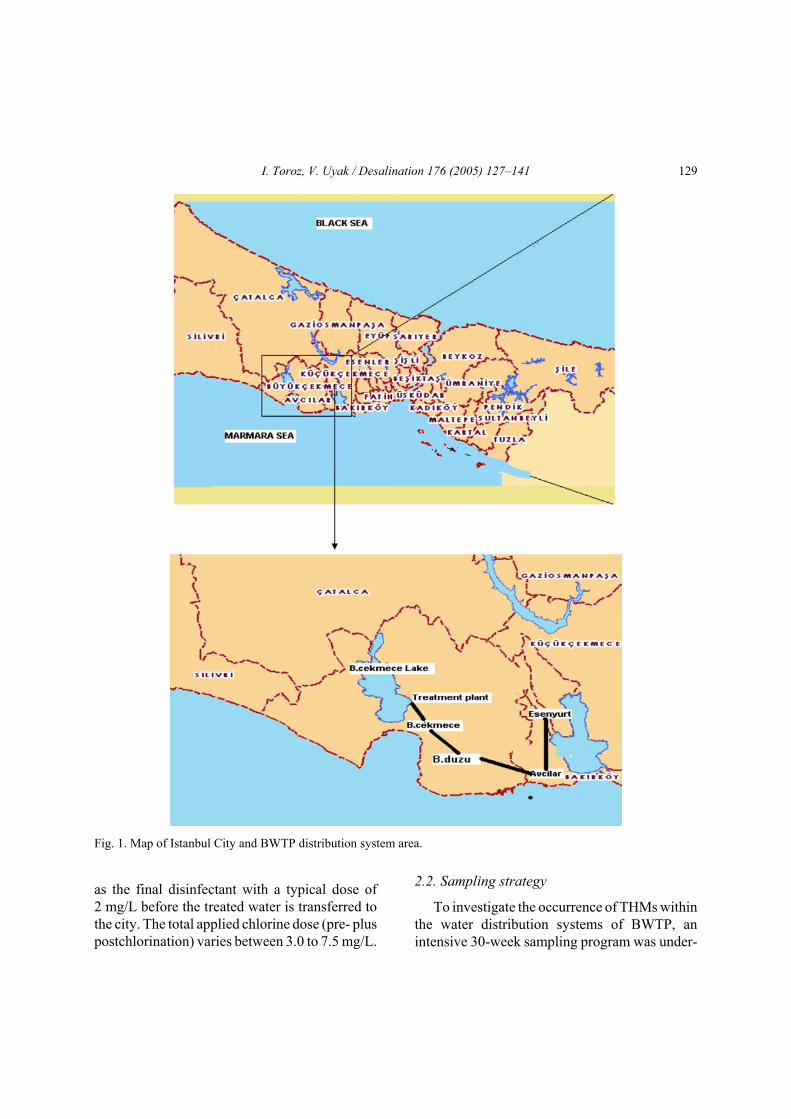
Table 1Monitoring parameters and their measurement frequency at the sampling points of BWTP
Sampling point TOC UV254 Temperature pH Free residualchlorine
THM Distance(km)a
Raw water T(34)
T(32)
T(36)
T(36)
Before post chlorination T(32)
T(30)
T(36)
T(36)
T(36)
T(32)
Finished water T(32)
T(32)
T(36)
T(36)
T(36)
T(32)
B.cekmece T(36)
T(30)
4
B.duzu T(36)
T(30)
11
Avcilar T(36)
T(30)
18
Esenyurt T(36)
T(30)
26
Note: Numbers in parentheses are the number of measurements at each point.a Distance from the plant to the sampling point.
taken during the spring (March–May), summer(June–August) and fall (September–October) of2003. Sampling locations were selected to ensurethat the variation of water quality from the rawwater source to the distribution system could beadequately described. Samples were collectedweekly at representative points for the utility —from raw water to the end points of the distri-bution systems (Table 1). Water samples weretaken at the treatment plant before and after finalchlorination (finished water) and at samplingpoints of the Buyukcekmece, Beylikduzu, Av-cilar, and Esenyurt districts. In this study, theEsenyurt sampling point represents the system’sextremity. As shown in Fig. 1, the selection ofsampling points was made by the distance fromthe plant to sampling point. It was ensured that allpoints were accessible for sampling the same dayof the week.
2.3. Collection of samples
Table 1 shows monitoring parameters andtheir measurement frequency at the sampling
points of BWTP. Sampling in the distributionsystem was done in residential and commercialbuildings using the faucet of washrooms nearestthe street. Before collecting samples, the faucetwas opened for about 2–3 min to ensure that thewater was coming directly from the distributionsystem instead of the plumbing system of thebuilding. For THM samples, water samples at thespecified locations were collected in 250-mLglass bottles. The bottles were filled just to over-flowing without passing air bubbles through thesample. They were previously washed withphosphate-free detergent and rinsed with tapwater, deionized water and ultra-pure water, andplaced in an oven at 400°C for 30 min. Beforesampling, an ammonium chloride solution(40 mg/mL) was added to bottles to eliminate anyremaining residual chlorine and to stop furtherTHM formation. Samples for TOC and UV254measurements were collected in 125-mL plasticbottles. Once collected, samples were stored inthe dark at 4°C and carried to the laboratory foranalytical procedures. On the other hand, pH, freeresidual chlorine, and temperature were moni-
I. Toroz, V. Uyak / Desalination 176 (2005) 127–141 131
tored at the time the THM samples were col-lected. For bromide analysis raw water sampleswere collected only during the summer months ofJune, July, and August, 2003.
2.4. Determination of chlorine
Free residual chlorine was measured in thefield at the same points of sample collection forTHMs. Measurements were conducted using theDPD titrimetric method of 4500-Cl-F [18] with afield DR-700 colorimeter (Hach). This methodinvolves the addition of an indicator solution ofdiethylphenyldiamine (DPD) to the sample afteraddition of a phosphate buffer. The DPD turnsred when oxidized by the chlorine. The sample isthen titrated with ferrous ammonium sulfate(FAS), which reduces the DPD. The chlorineconcentration is determined from the volume ofFAS titrant required to return the DPD to color-less form. Once collected, samples were stored inthe dark at 4°C and carried to the laboratory foranalytical procedures.
2.5. Determination of THMs
THM concentrations were determined by gaschromatography with an electron capture detec-tor (ECD) using the EPA Method 551 [19].Samples (35 mL) were placed head-space free in40-mL vials. Vials were capped with TFE facedsepta; then they were extracted into 3 mL ofpentane. The vials were then shaken vigorouslyfor 1 min and allowed to stand for 3 min tofacilitate phase separation. The pentane phasewas removed and placed in 2-mL autosamplervials. Calibration standards were prepared fromprimary stock solutions of the analytes in metha-nol obtained from a commercial source (Supelco,Bellefonte, PA). Sets of six to eight (including ablank) were prepared for each batch of samples.After that, 2-µL extract was analyzed by gaschromatography (GC) (Hewlett Packard 6890Series II) with an ECD and capillary column. The
system was operated by HP Chemstation soft-ware. The carrier gas was helium and the make-up gas was nitrogen. The column used for theGC–ECD analysis was fused silica DB-5, 30 m ×0.32 mm ID ×0.30 µm film thicknesses. Theinjection technique was split/splitless and thecarrier gas flow was 1.6 mL/min. The minimumreporting levels obtained with this method were0.1 µ/gL!1. This procedure allowed for the identi-fication of 17 different volatile organic com-pounds. For the purposes of this study, interestwill be focused strictly on the four THMs.
2.6. Determination of TOC
TOC measurements were conducted with aShimadzu TOC-5000 analyzer equipped with a Ptcatalyst on quartz wool (Shimadzu, Kyoto, Japan)and an auto-sampler according to the combustion-infrared method as described in the StandardMethods of 3510 B [18]. At least three measure-ments were made for each sample to obtainrepetitive results. Two calibration curves withpotassium hydrogen phthalate at two differentranges were obtained by processing the peakareas.
2.7. Determination of bromide
Bromide concentrations were measured usingsuppressed ion chromatography (Dionex DX-5000) fitted with an AS9-HC column and aneluent composition of 9.0 mM Na2CO3/1.0 mMNaHCO3. Injection loop volume was 25 µL.Following electrolytic suppression of the sodiumcarbonate eluent, bromide ions were quantified byconductivity. Standard calibration curves wereroutinely run with standard concentrations of 10,25, 75, 200, and 500 µg/L. The method detectionlimit was 1.4 µg/L.
3. Results and discussion
The sampling and analytical strategy contains
I. Toroz, V. Uyak / Desalination 176 (2005) 127–141132
Table 2Average values of physicochemical and operational parameters at raw and finished water
Raw water Finished water Operational parameters
pH TOC,mg/L
UV254
1/cmTemp.,°C
Br!,µg/L
pH TOC,mg/L
UV254,1/cm
Pre-chlorinedose, mg/L
Post-chlorinedose, mg/L
Spring 7.85 4.86 0.154 15.30 145 7.20 3.05 0.081 1.50 1.75(0.51) (0.36) (0.01) (4.13) (35) (0.28) (0.12) (0.01) (0.22) (0.27)
Summer 8.40 5.75 0.182 24.80 255 7.40 3.41 0.095 3.50 2.70
(0.10) (0.36) (0.02) (1.96) (64) (0.16) (0.15) (0.01) (0.38) (0.35)
Fall 7.93 4.75 0.146 19.20 180 7.10 2.98 0.072 1.60 1.60
(0.14) (0.33) (0.02) (3.38) (27) (0.17) (0.11) (0.01) (0.29) (0.24)
Note: Numbers in parentheses are the standard deviations.
Table 3Average seasonal THM values (µg/L) from the BWTP study area
CHCl3 CHCl2Br CHBr2Cl CHBr3 TTHM
Spring 25 20 23 7 75Summer 29 36 40 12 117Fall 18 28 34 10 89Averages 24 28 32 10 94
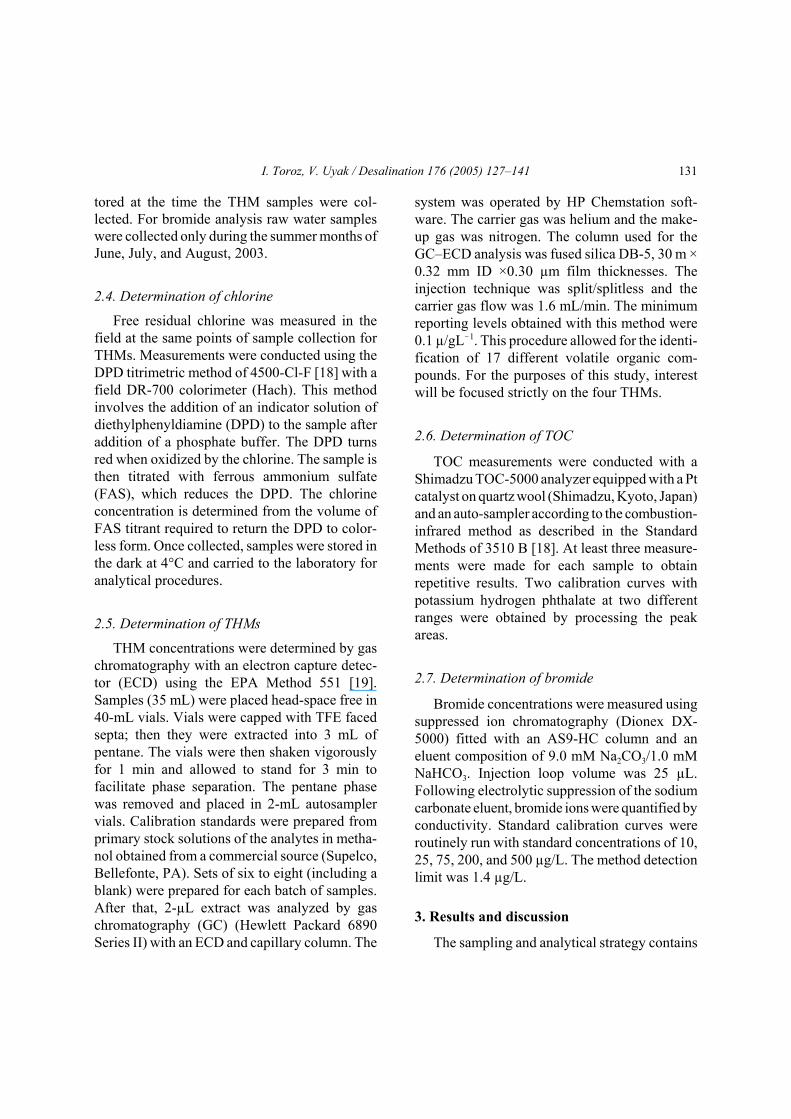
seasonal variations of THMs in finished waterand the distribution system. Raw and finishedwater quality parameters of BL water are reportedin Table 2. The lake exhibits medium rangeorganic carbon content since it receives agricul-tural drainage. Average seasonal totals andspecific THM levels are shown in Table 3. THMlevels vary significantly among areas. The Avci-lar and Esenyurt area exhibits the highest levelsof THMs (107 and 117 µg/L, respectively), whilethe Buyukcekmece and Beylikduzu regionsexhibit moderate levels of THMs (86 and94 µg/L), respectively (Fig. 2). Thus, total THMlevels increase with distance. The THM samplesmainly contain four species of THM: chloroform,bromodichloromethane, dibromochloromethane,and bromoform. The distribution of these fourTHMs species at sampling point is shown in
Fig. 2. The current drinking water regulations inTurkey do not include any THM levels [20].However, the recent Turkish Government appli-cation to the European Union requires upgradingthis water regulation. EU member countries allowtotal THM levels of 100 µg/L in their drinkingwater [16]. Therefore, there will be a THM limitof 100 µg/L in Turkey drinking water regulationsin the near future. On the other hand, the THMregulations of the EU and EPA only considermaximum acceptable levels for total THMs.However, results of recent toxicological studiessuggest further consideration should be paid tothe occurrence of brominated compounds, especi-ally bromodichloromethane [21]. The occurrenceof THM-brominated compounds is particularlyimportant in drinking water treatment plantslocated in coastal zones where raw waters can be
I. Toroz, V. Uyak / Desalination 176 (2005) 127–141 133
Fig. 2. Distribution of four THM species during study at sampling points of BWTP.
affected by saline intrusion [22]. As illustrated inFigs. 2 and 3, brominated THM species are thepredominant THM compound in BWTP samplingpoints. Especially in the summer and fall, bromi-nated THM species levels were higher thanchloroform, while in the spring chloroform hasthe highest concentration in treated water. Sincethe BL raw water source is next to the MarmaraSea, there is seawater intrusion to the lake(Fig. 1). In a recent sampling program carried outin the summer of 2003, the average concen-trations of bromide in BL water were found to be255 µg/L (Table 2). Because of medium levels ofbromide in BL water, the future Turkish waterregulation should be centered on the occurrenceof THM species rather than total THM in coastalcity zones where there will be salt intrusion tosource waters.
3.1. Correlations of THMs with other parametersTable 4 presents the correlation matrix for
some important water quality and operationalparameters. Using the Pearson correlation test, amoderate relationship (r = 0.520) was obtainedbetween THM formation and TOC for BWTP.The recent studies showed that THM formationrose with increasing soluble organic matters insurface water [23,24], and a higher concentrationof available TOC will provide more THMs ifenough residual chlorine is available. On theother hand, Pearson regression tests indicated astrong correlation between temperature and THMformation with a correlation coefficient of 0.927.Most researchers stated that temperature can havea significant effect on THM formation, and sea-sonal variations in temperature can affect reactionrates [23,24]. In this study the water temperature
I. Toroz, V. Uyak / Desalination 176 (2005) 127–141134
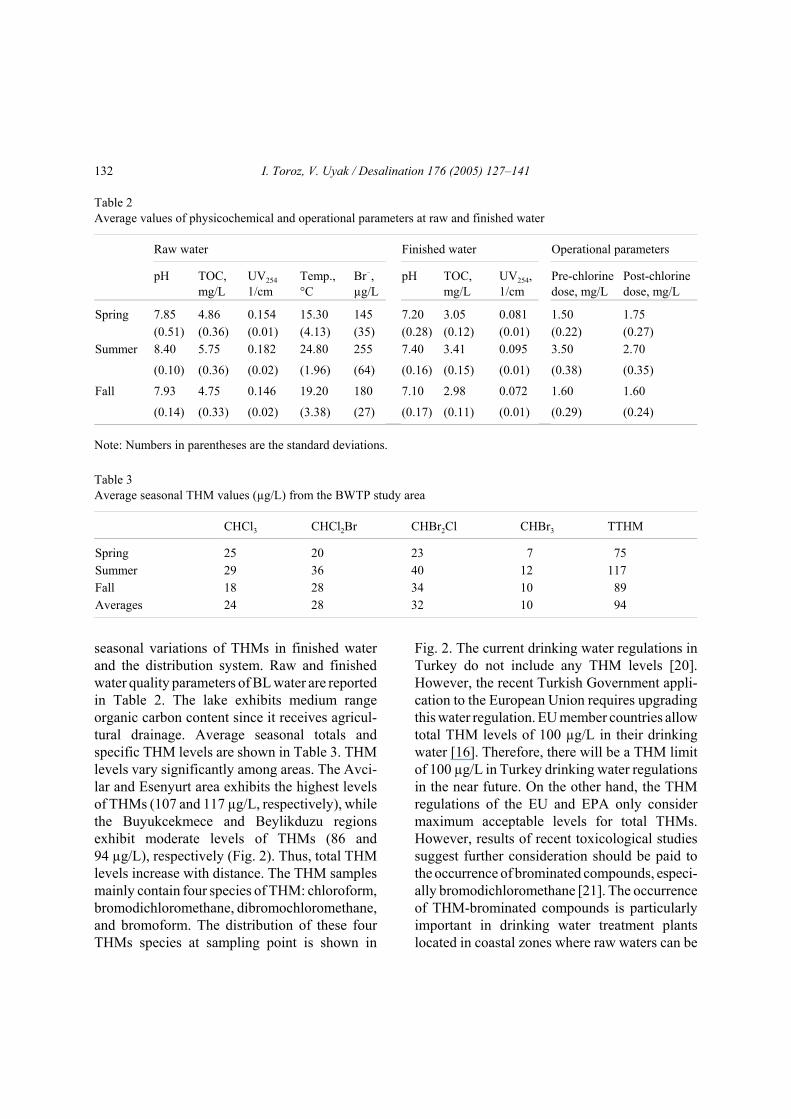
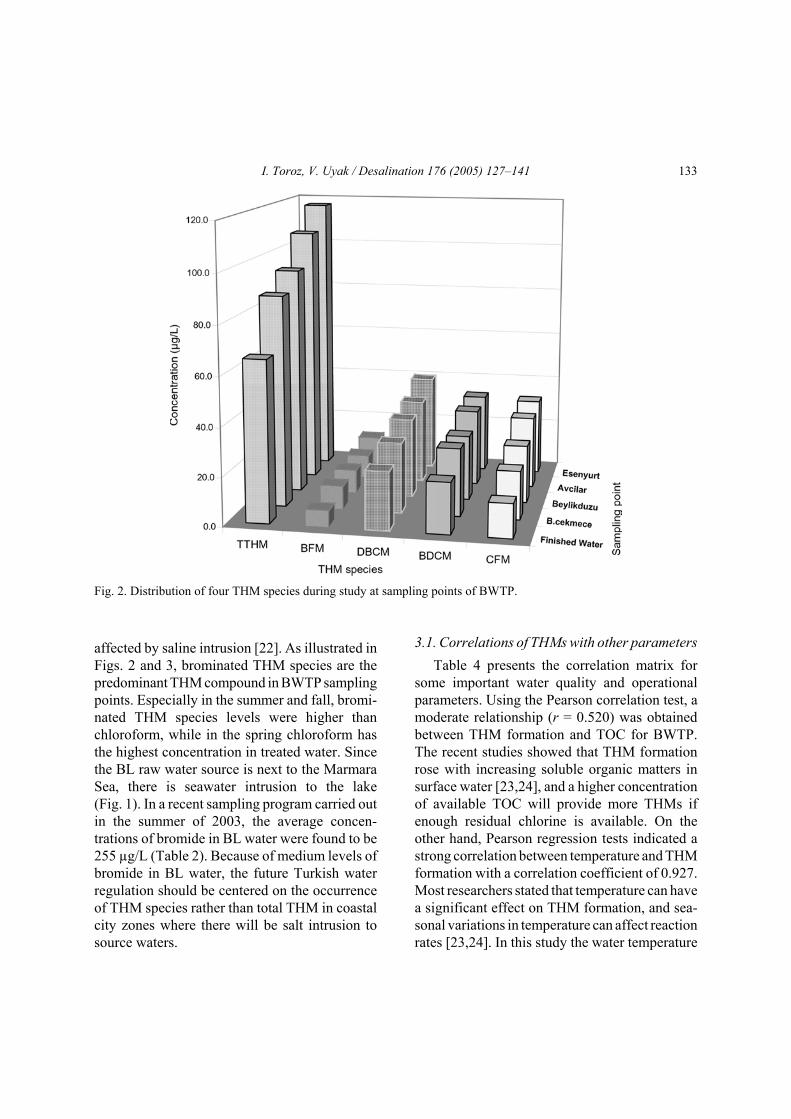
Fig. 3. Average seasonal variationsof THMs at sampling points ofBWTP.
value ranged from 11.07°C to 26.74°C, whichwas associated to the formation of THM averagevalues in a wide range: 60 µg/L to 140 µg/L. Astudy by Knocke et al. [25] indicated that the rateof THM formation at 2°C was normally 60–70%less than it was observed at 22°C [25]. Thus, thedata in Table 4 indicate that temperature has asignificant effect on THM formation at finishedwater within the area studied of the BWTP dis-tribution system, while attempts were made todetermine the effect of chlorine dose on the pro-duction of THMs. Using the Pearson correlationmethod, a strong definite relationship (r = 0.968)was obtained between THM production andchlorine dose for the study. As reported previ-ously, the addition of chlorine to water leads to
the formation of HOCl and hypochloride ions(OCl!) [26]. The formation of these two speciesdepends on the pH. In acidic solutions, formationof HOCl dominates, whereas in alkaline solutionsOCl! is dominant. In our study the pH value ofthe raw water ranged from 7.34 to 8.50, and inthis range OCl is the more prevalent chlorinespecies, which is responsible for the formation ofTHMs; when THM concentration increases, theconcentration of OCl decreases, which in thiscase is also the residual chlorine [26]. Our find-ings are in accordance with other modelingstudies.
As mentioned above, it is known that TOC,temperature, and chlorine dose are all importantparameters influencing THM formation. Results
I. Toroz, V. Uyak / Desalination 176 (2005) 127–141 135
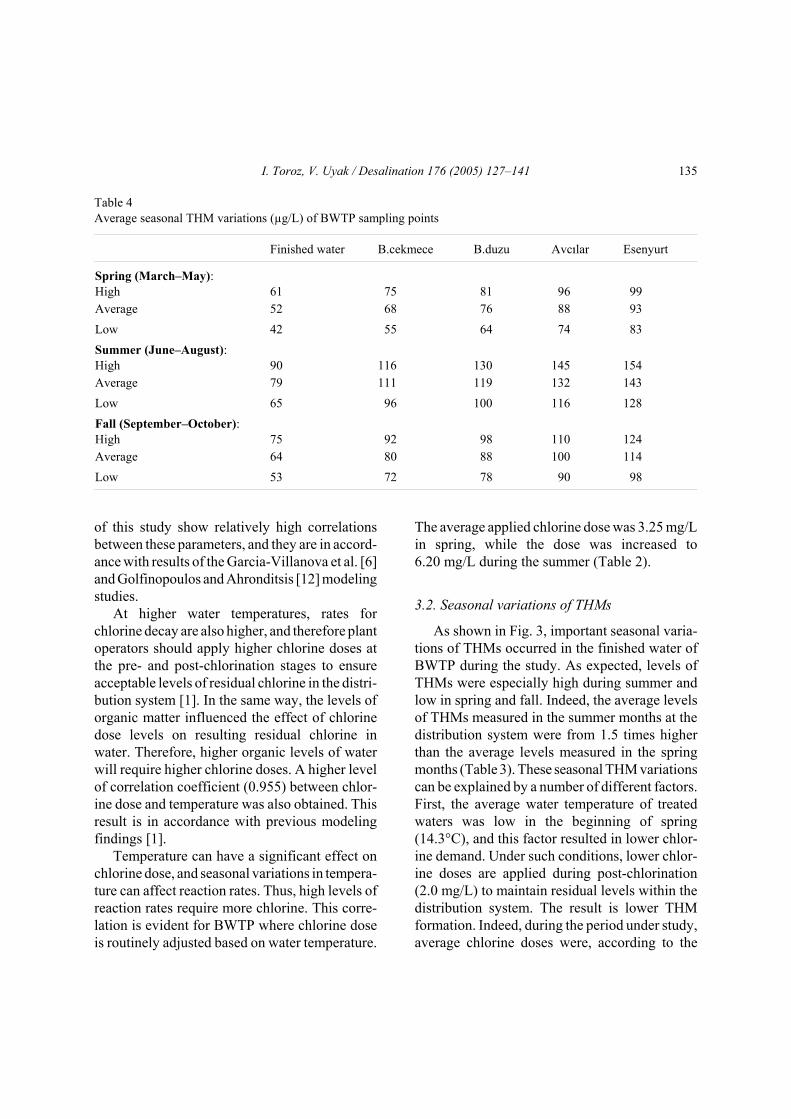
Table 4Average seasonal THM variations (µg/L) of BWTP sampling points
Finished water B.cekmece B.duzu Avc2lar Esenyurt
Spring (March–May):High 61 75 81 96 99Average 52 68 76 88 93Low 42 55 64 74 83Summer (June–August):High 90 116 130 145 154Average 79 111 119 132 143Low 65 96 100 116 128Fall (September–October):High 75 92 98 110 124Average 64 80 88 100 114Low 53 72 78 90 98
of this study show relatively high correlationsbetween these parameters, and they are in accord-ance with results of the Garcia-Villanova et al. [6]and Golfinopoulos and Ahronditsis [12] modelingstudies.
At higher water temperatures, rates forchlorine decay are also higher, and therefore plantoperators should apply higher chlorine doses atthe pre- and post-chlorination stages to ensureacceptable levels of residual chlorine in the distri-bution system [1]. In the same way, the levels oforganic matter influenced the effect of chlorinedose levels on resulting residual chlorine inwater. Therefore, higher organic levels of waterwill require higher chlorine doses. A higher levelof correlation coefficient (0.955) between chlor-ine dose and temperature was also obtained. Thisresult is in accordance with previous modelingfindings [1].
Temperature can have a significant effect onchlorine dose, and seasonal variations in tempera-ture can affect reaction rates. Thus, high levels ofreaction rates require more chlorine. This corre-lation is evident for BWTP where chlorine doseis routinely adjusted based on water temperature.
The average applied chlorine dose was 3.25 mg/Lin spring, while the dose was increased to6.20 mg/L during the summer (Table 2).
3.2. Seasonal variations of THMs
As shown in Fig. 3, important seasonal varia-tions of THMs occurred in the finished water ofBWTP during the study. As expected, levels ofTHMs were especially high during summer andlow in spring and fall. Indeed, the average levelsof THMs measured in the summer months at thedistribution system were from 1.5 times higherthan the average levels measured in the springmonths (Table 3). These seasonal THM variationscan be explained by a number of different factors.First, the average water temperature of treatedwaters was low in the beginning of spring(14.3°C), and this factor resulted in lower chlor-ine demand. Under such conditions, lower chlor-ine doses are applied during post-chlorination(2.0 mg/L) to maintain residual levels within thedistribution system. The result is lower THMformation. Indeed, during the period under study,average chlorine doses were, according to the
I. Toroz, V. Uyak / Desalination 176 (2005) 127–141136
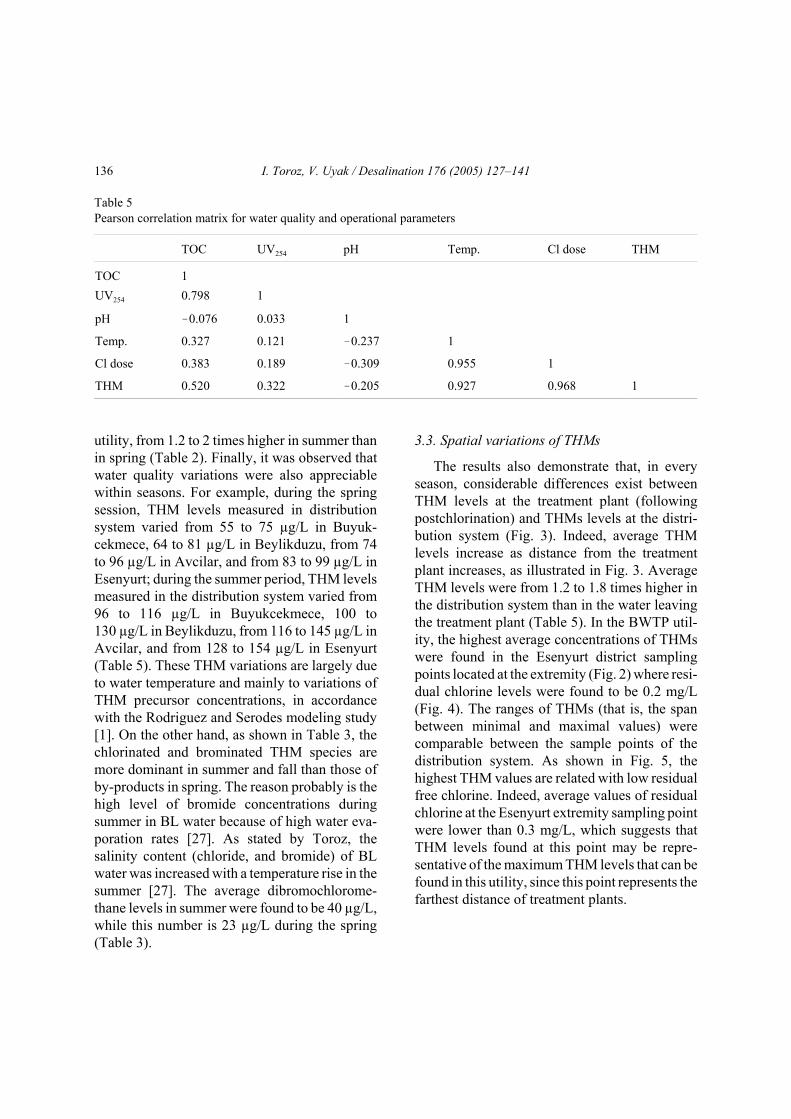
Table 5Pearson correlation matrix for water quality and operational parameters
TOC UV254 pH Temp. Cl dose THM
TOC 1UV254 0.798 1
pH !0.076 0.033 1
Temp. 0.327 0.121 !0.237 1
Cl dose 0.383 0.189 !0.309 0.955 1
THM 0.520 0.322 !0.205 0.927 0.968 1
utility, from 1.2 to 2 times higher in summer thanin spring (Table 2). Finally, it was observed thatwater quality variations were also appreciablewithin seasons. For example, during the springsession, THM levels measured in distributionsystem varied from 55 to 75 µg/L in Buyuk-cekmece, 64 to 81 µg/L in Beylikduzu, from 74to 96 µg/L in Avcilar, and from 83 to 99 µg/L inEsenyurt; during the summer period, THM levelsmeasured in the distribution system varied from96 to 116 µg/L in Buyukcekmece, 100 to130 µg/L in Beylikduzu, from 116 to 145 µg/L inAvcilar, and from 128 to 154 µg/L in Esenyurt(Table 5). These THM variations are largely dueto water temperature and mainly to variations ofTHM precursor concentrations, in accordancewith the Rodriguez and Serodes modeling study[1]. On the other hand, as shown in Table 3, thechlorinated and brominated THM species aremore dominant in summer and fall than those ofby-products in spring. The reason probably is thehigh level of bromide concentrations duringsummer in BL water because of high water eva-poration rates [27]. As stated by Toroz, thesalinity content (chloride, and bromide) of BLwater was increased with a temperature rise in thesummer [27]. The average dibromochlorome-thane levels in summer were found to be 40 µg/L,while this number is 23 µg/L during the spring(Table 3).
3.3. Spatial variations of THMs
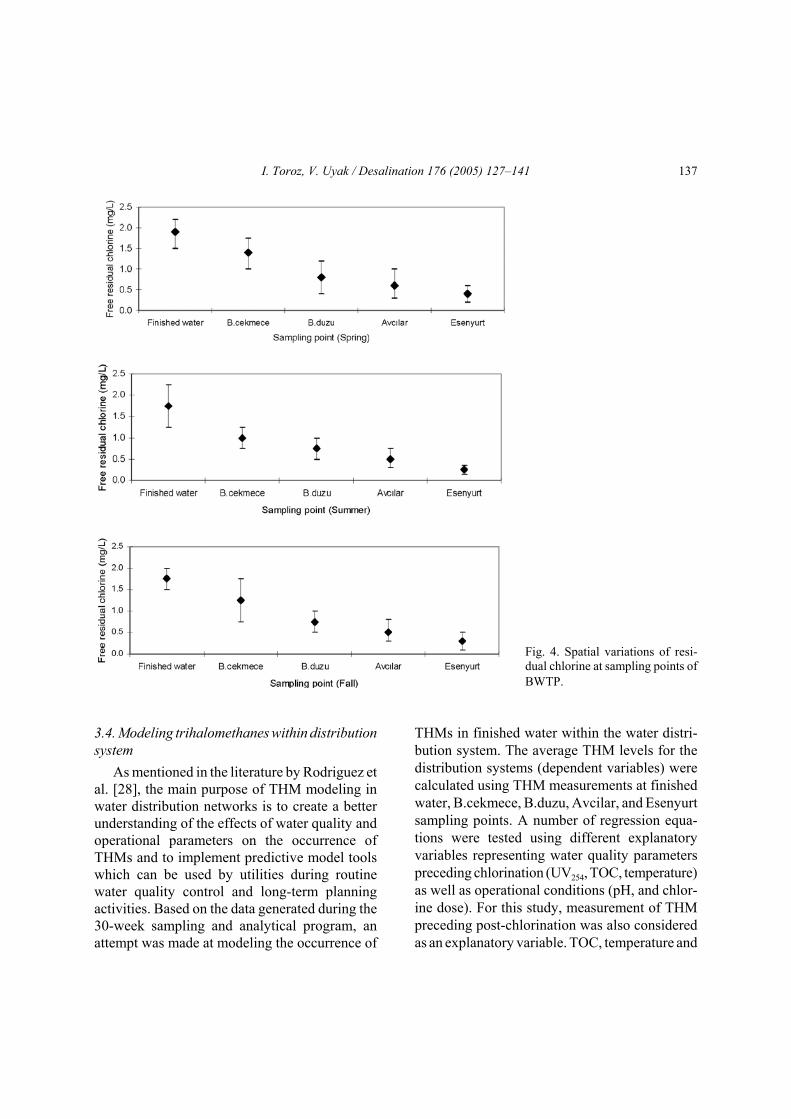
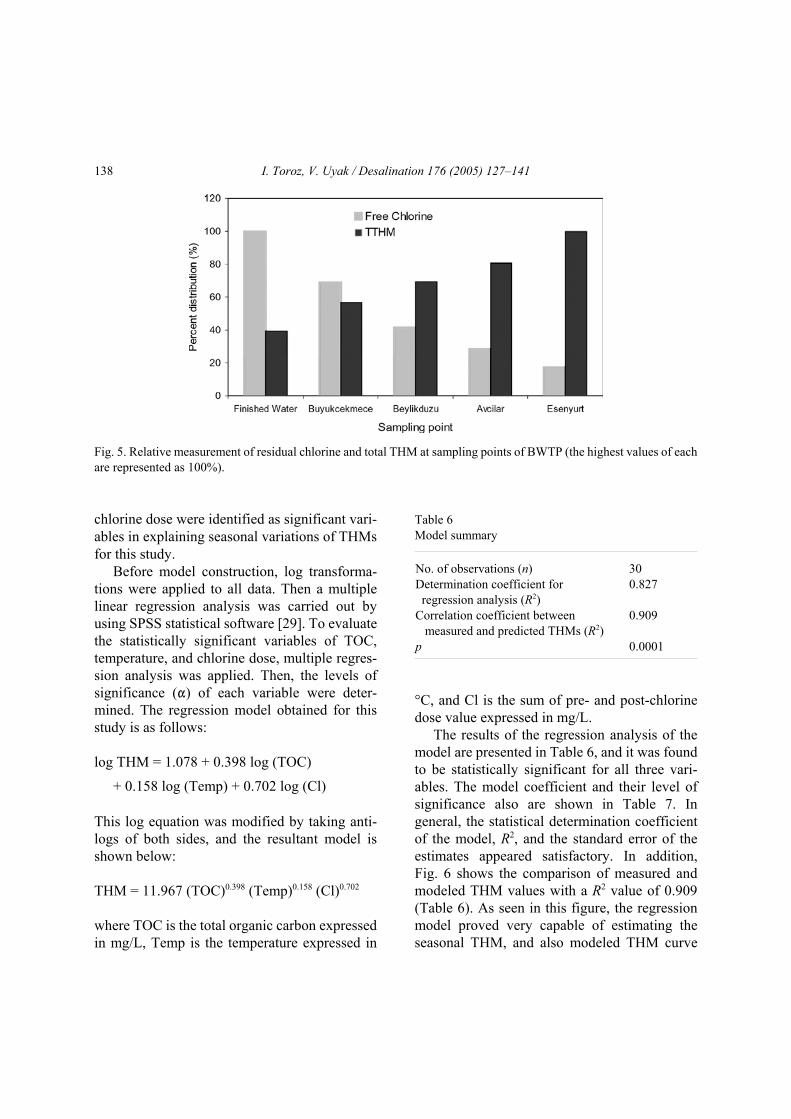
The results also demonstrate that, in everyseason, considerable differences exist betweenTHM levels at the treatment plant (followingpostchlorination) and THMs levels at the distri-bution system (Fig. 3). Indeed, average THMlevels increase as distance from the treatmentplant increases, as illustrated in Fig. 3. AverageTHM levels were from 1.2 to 1.8 times higher inthe distribution system than in the water leavingthe treatment plant (Table 5). In the BWTP util-ity, the highest average concentrations of THMswere found in the Esenyurt district samplingpoints located at the extremity (Fig. 2) where resi-dual chlorine levels were found to be 0.2 mg/L(Fig. 4). The ranges of THMs (that is, the spanbetween minimal and maximal values) werecomparable between the sample points of thedistribution system. As shown in Fig. 5, thehighest THM values are related with low residualfree chlorine. Indeed, average values of residualchlorine at the Esenyurt extremity sampling pointwere lower than 0.3 mg/L, which suggests thatTHM levels found at this point may be repre-sentative of the maximum THM levels that can befound in this utility, since this point represents thefarthest distance of treatment plants.
I. Toroz, V. Uyak / Desalination 176 (2005) 127–141 137
Fig. 4. Spatial variations of resi-dual chlorine at sampling points ofBWTP.
3.4. Modeling trihalomethanes within distributionsystem
As mentioned in the literature by Rodriguez etal. [28], the main purpose of THM modeling inwater distribution networks is to create a betterunderstanding of the effects of water quality andoperational parameters on the occurrence ofTHMs and to implement predictive model toolswhich can be used by utilities during routinewater quality control and long-term planningactivities. Based on the data generated during the30-week sampling and analytical program, anattempt was made at modeling the occurrence of
THMs in finished water within the water distri-bution system. The average THM levels for thedistribution systems (dependent variables) werecalculated using THM measurements at finishedwater, B.cekmece, B.duzu, Avcilar, and Esenyurtsampling points. A number of regression equa-tions were tested using different explanatoryvariables representing water quality parameterspreceding chlorination (UV254, TOC, temperature)as well as operational conditions (pH, and chlor-ine dose). For this study, measurement of THMpreceding post-chlorination was also consideredas an explanatory variable. TOC, temperature and
I. Toroz, V. Uyak / Desalination 176 (2005) 127–141138
Fig. 5. Relative measurement of residual chlorine and total THM at sampling points of BWTP (the highest values of eachare represented as 100%).
chlorine dose were identified as significant vari-ables in explaining seasonal variations of THMsfor this study.
Before model construction, log transforma-tions were applied to all data. Then a multiplelinear regression analysis was carried out byusing SPSS statistical software [29]. To evaluatethe statistically significant variables of TOC,temperature, and chlorine dose, multiple regres-sion analysis was applied. Then, the levels ofsignificance (") of each variable were deter-mined. The regression model obtained for thisstudy is as follows:
log THM = 1.078 + 0.398 log (TOC)
+ 0.158 log (Temp) + 0.702 log (Cl)
This log equation was modified by taking anti-logs of both sides, and the resultant model isshown below:
THM = 11.967 (TOC)0.398 (Temp)0.158 (Cl)0.702
where TOC is the total organic carbon expressedin mg/L, Temp is the temperature expressed in
Table 6Model summary
No. of observations (n)Determination coefficient for regression analysis (R2)Correlation coefficient between measured and predicted THMs (R2)p
300.827
0.909
0.0001
°C, and Cl is the sum of pre- and post-chlorinedose value expressed in mg/L.
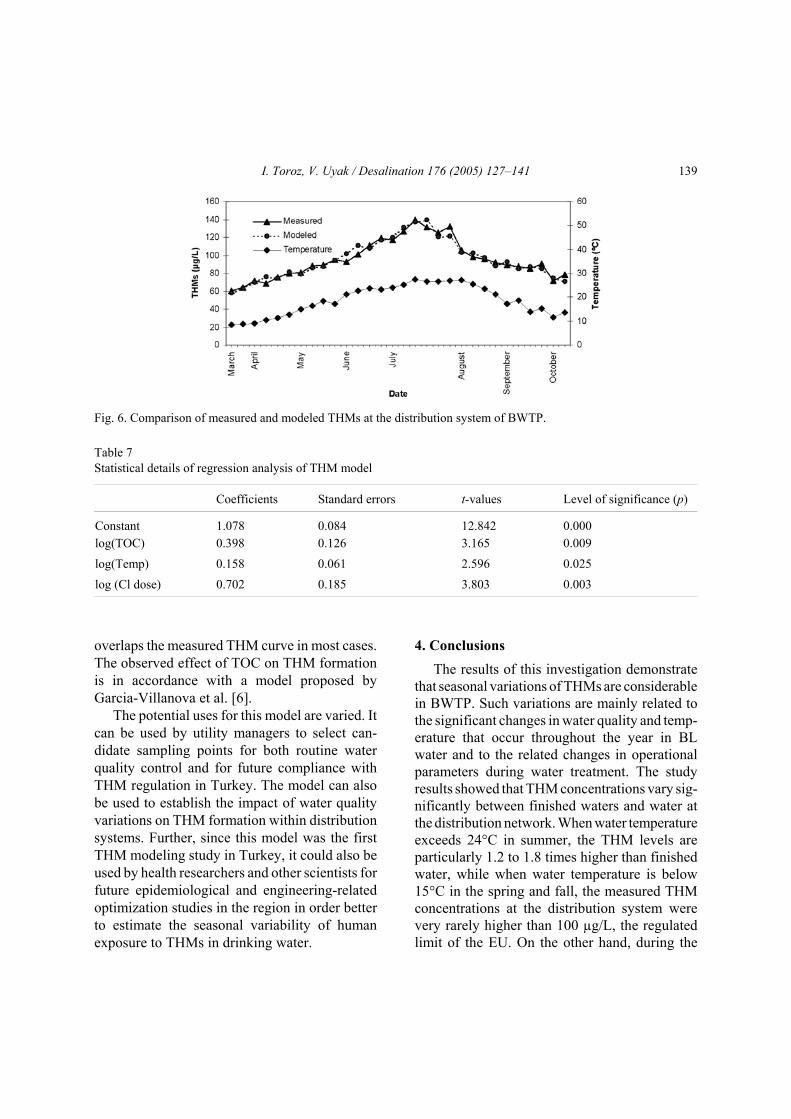
The results of the regression analysis of themodel are presented in Table 6, and it was foundto be statistically significant for all three vari-ables. The model coefficient and their level ofsignificance also are shown in Table 7. Ingeneral, the statistical determination coefficientof the model, R2, and the standard error of theestimates appeared satisfactory. In addition,Fig. 6 shows the comparison of measured andmodeled THM values with a R2 value of 0.909(Table 6). As seen in this figure, the regressionmodel proved very capable of estimating theseasonal THM, and also modeled THM curve
I. Toroz, V. Uyak / Desalination 176 (2005) 127–141 139
Fig. 6. Comparison of measured and modeled THMs at the distribution system of BWTP.
Table 7Statistical details of regression analysis of THM model
Coefficients Standard errors t-values Level of significance (p)
Constant 1.078 0.084 12.842 0.000log(TOC) 0.398 0.126 3.165 0.009log(Temp) 0.158 0.061 2.596 0.025log (Cl dose) 0.702 0.185 3.803 0.003
overlaps the measured THM curve in most cases.The observed effect of TOC on THM formationis in accordance with a model proposed byGarcia-Villanova et al. [6].
The potential uses for this model are varied. Itcan be used by utility managers to select can-didate sampling points for both routine waterquality control and for future compliance withTHM regulation in Turkey. The model can alsobe used to establish the impact of water qualityvariations on THM formation within distributionsystems. Further, since this model was the firstTHM modeling study in Turkey, it could also beused by health researchers and other scientists forfuture epidemiological and engineering-relatedoptimization studies in the region in order betterto estimate the seasonal variability of humanexposure to THMs in drinking water.
4. ConclusionsThe results of this investigation demonstrate
that seasonal variations of THMs are considerablein BWTP. Such variations are mainly related tothe significant changes in water quality and temp-erature that occur throughout the year in BLwater and to the related changes in operationalparameters during water treatment. The studyresults showed that THM concentrations vary sig-nificantly between finished waters and water atthe distribution network. When water temperatureexceeds 24°C in summer, the THM levels areparticularly 1.2 to 1.8 times higher than finishedwater, while when water temperature is below15°C in the spring and fall, the measured THMconcentrations at the distribution system werevery rarely higher than 100 µg/L, the regulatedlimit of the EU. On the other hand, during the
I. Toroz, V. Uyak / Desalination 176 (2005) 127–141140
study, the highest average concentrations ofTHMs (143 µg/L) were found in the Esenyurtsample where residual chlorine levels were foundto be 0.2 mg/L. The highest THM values arerelated to low residual-free chlorine. In addition,important differences in THM occurrence werealso noted among three seasons.
The model for seasonal variation of THMswas also developed from data generated duringthe sampling program using regression analysis.Modeling results show that, with the use of thismodel, it is possible to estimate THM levels insampling points of the distribution system. How-ever, it must be noted that the complexity ofTHM formation reactions makes it difficult todevelop universally applicable models.
Future research in this area must be directed tothe study of spatial and temporal variations ofhaloacetic acids (HAAs) which are also not cur-rently regulated in Turkey, and also residencetime based modeling studies contribute morebenefits to THM modeling efforts in Istanbul.
Acknowledgements
The authors would like to thank SahinOzaydin, Water Quality Laboratory Manager, ofthe Istanbul Water and Sewerage Works Admin-istration for his collaboration for sampling andtransportation. The valuable contribution ofManuel Rodriguez and Syros Golfinopoulos toimprove this manuscript is appreciated.
References
[1] M.J. Rodriguez and J.B. Serodes, Water Res., 35(2001) 1572–1586.
[2] J.J. Rook, Water Treat. Exam., 23 (1974) 234–243.[3] J.M. Symons, T.A. Bellar and J.K. Carswell, J.
AWWA, 67 (1975) 634–647.[4] P.C. Singer, Formation and characterization of dis-
infection by-products, in: Safety of Water Disin-fection: Balancing Chemical and Microbial Risk,G.F. Craun, ed., ILSI Press, Washington, 1993.
[5] D.T. Williams, G.L. Lebel and F.M. Benoit, Chemo-sphere, 34(2) (1997) 299–316.
[6] R.J. Garcia-Villanova, C. Garcia, J.A. Gomez, M.P.Garcia and R. Ardanuy, Water Res., 31 (1997) 1299–1308.
[7] A. Arora, M.W. LeChevallier and K.L. Dixon, J.AWWA, 89(6) (1997) 60–68.
[8] P.C. Singer, A. Obolensky and A. Greiner, J.AWWA, 87(10) (1995) 83–92.
[9] R.M. Clark, J. Water Supply Res. Technol–Aquat,43(3) (1994) 133–143.
[10] M.A. Abdullah, C.H. Yew and M.S. Ramli, WaterRes., 37 (2003) 4637–4644.
[11] R.F. Christman, L. Kronkerg, R. Sing, L. Ball andJ.D. Johnson, Identification and mutagenic by pro-ducts from aquatic humic chlorination. AWWARF,and AWWA, Denver, 1990.
[12] S.K. Golfinopoulos and G.B. Arhonditsis, Chemo-sphere, 47 (2002) 1007–1018.
[13] M.J. Rodriguez, J.B. Serodes and M. Morin, J. WaterSupply Res. Technol–Aqua., 49(2) (2000) 57–73.
[14] S.K. Golfinopoulos, N.K. Xilourgidis, M.N.Kpstopoulou and T.D. Lekkas, Water Res., 32(9)(1998) 2821–2829.
[15] M. Watson, Mathematical Modeling of the Forma-tion of THMs and HAAs in Chlorinated NaturalWaters. AWWA, Denver, 1993.
[16] EECD (European Economic Community Directive),Amended proposal for a Council Directive con-cerning the quality of water intended for humanconsumption—common position, Proc. Council ofthe European Union, Directive 80/778/EEC, Com(97) 228 final 95/0010 SYN, Brussels, 1997.
[17] US EPA, National Primary Drinking WaterRegulations: Disinfectants and Disinfection By-products, Final Rule, 40 CGR part 9. 141 and 142,1998.
[18] APHA–AWWA–WPCF, Standard Methods for theExamination of Water and Waste Water, 20th ed.,American Public Health Assoc., Washington, DC,1998.
[19] US EPA, Method 551, Determination of chlorinationdisinfection by-products and chlorinated solvents indrinking water by liquid-liquid extraction and gaschromatography with electron-capture detection,Environmental Monitoring Systems Laboratory, Of-fice of Research and Development, Cincinnati, 1990.
I. Toroz, V. Uyak / Desalination 176 (2005) 127–141 141
[20] Turkish Water Pollution Control Regulation(TS_266), 19919, Ankara, Turkey, 1988.
[21] S.W. Krasner, M.J. Sclimenti and E.G. Means,J. AWWA, 86(6) (1994) 34–47.
[22] K.L. Simpson and K.P. Hayes, Water Res., 32 (1998)1522–1528.
[23] J. Milot, M.J. Rodriguez and J.B. Serodes, J.Environ. Manag., 60 (2000) 155–171.
[24] J. Sohn, D. Gatel and G. Amy, Env. Monitor.Assess., 70 (2001) 211–222.
[25] W.R. Knocke, S. West and R.C. Hoehn, J. AWWA,78 (1986) 189–196.
[26] G.C. White, Handbook of Chlorination and Alter-native Disinfections, 3rd ed., Van Nostrand Rein-hold, New York, 1992.
[27] I. Toroz, H. Selcuk and E. Soyer, Determination ofbromide and bromate in Istanbul water suppliesproject, Department of Environmental Engineering,Istanbul Technical University, Maslak, Istanbul,Turkey, 2003.
[28] M.J. Rodriguez, Y. Vinette, J.B. Serodes andC. Bouchard, Env. Monitor. Assess., 89 (2003) 69–93.
[29] SPSS 11.5, Statistical Packages for Social Sciences(SPSS) for Windows, SPSS, 2002.
[30] V. Uyak. 5th PhD Term Activity Report, Institute ofScience, Istanbul Technical University, Maslak,Istanbul, Turkey, 2003.
Top Related
Copyright © 2022 FDOKUMEN

