


Bahasa
Halaman
Hukum


River of the Dammed: Longitudinal changes in fish assemblages in response to dams
This is the final submission copy of the following article: Freedman, J.A., B.D. Lorson, R.B. Taylor, R.F. Carline, & J.R. Stauffer Jr. 2014. River of the Dammed: Longitudinal changes in fish assemblages in response to dams. Hydrobiologia. 727: 19-33. DOI: 10.1007/s10750-013-1780-6.
Please contact Jonathan Freedman at [email protected] if you would like a PDF of the final published version.
1
River of the dammed: Longitudinal changes in fish assemblages in response to dams 1
2
Jonathan A. Freedman* 3
Pennsylvania Cooperative Fish and Wildlife Research Unit and School of Forest Resources, The 4
Pennsylvania State University, University Park, PA 16802 USA. 5
6
Benjamin D. Lorson. School of Forest Resources, The Pennsylvania State University, University 7
Park, PA 16802 USA. 8
9
Richard B. Taylor. School of Forest Resources, The Pennsylvania State University, University 10
Park, PA 16802 USA. 11
12
Robert F. Carline 13
Pennsylvania Cooperative Fish and Wildlife Research Unit, The Pennsylvania State University, 14
University Park, PA 16802 USA. 15
16
Jay R. Stauffer Jr. 17
School of Forest Resources, The Pennsylvania State University, University Park, PA 16802 18
USA. 19
20
* Correspondence to: J. A. Freedman, Department of Biology, Stetson University, 421 N. 21
Woodland Blvd., Unit 8264, DeLand, Florida 32723, USA. 22
E-mail: [email protected]
*ManuscriptClick here to download Manuscript: River of the Dammed_12_1_13_revision3.docx Click here to view linked References
2
Abstract 24
Although dams are a common feature on rivers throughout the world, their effects on diversity, 25
composition, and structure of fish assemblages are often unclear. We used electrified benthic 26
trawls and stable isotope analysis of δ13C and δ15
N to determine the complex relationships 27
between taxonomic diversity and food web structure of fish assemblages among sites in the free-28
flowing and impounded reaches of the Allegheny River, Pennsylvania, USA. We found higher 29
gamma and beta fish diversity in the free-flowing section, where Brillouin diversity increased in 30
a downstream direction; however, in the impounded section we found decreasing diversity 31
downstream. Analysis of similarity (ANOSIM) and non-metric multi-dimensional scaling 32
revealed longitudinal differences in Bray-Curtis similarity between assemblages from 33
impounded and those from free-flowing sites. Finally, using stable isotope analysis we showed 34
that fishes in the free-flowing section derived nutrients primarily from benthic sources while 35
fishes in the impounded section had a stronger reliance on pelagic nutrients. Our findings reveal 36
that dams can reduce fish taxonomic diversity, driven primarily by decreases in lotic taxa, while 37
shifting resource use from benthic towards pelagic nutrients. A multi-faceted approach to assess 38
the cumulative effects of dams on aquatic communities is therefore recommended. 39
40
Keywords Stable isotope analysis; Diversity partitioning; Community ecology; Food web; 41
Nutrient dynamics; impoundment.42
3
Introduction 43
The majority of large river systems throughout the world are affected by dams (Nilsson et 44
al. 2005) for purposes that include flood-control, hydroelectric power generation, and 45
facilitation of navigation or recreation. Irrespective of their purpose, the presence of dams alters 46
the natural flow of rivers (Graf 1999; Graf 2006; Poff and Hart 2002). Nutrient and sediment 47
dynamics are affected, as detritus and sediment accumulate behind dams, thus becoming 48
unavailable downstream (Graf 2006; Kondolf 1997; Vorosmarty et al. 2003). By altering flow, 49
dams decrease the natural heterogeneity of rivers (Kondolf 1997; Poff et al. 1997; Poff et al. 50
2007), as pool and lentic habitats predominate, and the only proxy for riffle habitats is usually 51
immediately downstream of dams where turbulence and oxygen content of the water can be 52
relatively high (Ward and Stanford 1983). Altered flow regimes, and the transformation from 53
lotic riffle-pool-run sequences to lentic habitats, also leads to subsequent changes in biotic 54
assemblages (Bunn and Arthington 2002; Miranda et al. 2008; Poff et al. 1997; Power et al. 55
1996). Species adapted to fast-flowing water are especially susceptible to such changes, while a 56
variety of trophic shifts may occur with the arrival and dominance of lentic species at multiple 57
trophic levels (Bunn and Arthington 2002; Lytle and Poff 2004; Poff et al. 1997). 58
In impounded reaches, aquatic vegetation and periphyton can be negatively affected by 59
higher turbidity and sedimentation rates, and the subsequent reductions in light penetration and 60
changes in substrate composition (Poff et al. 1997; Rivier and Seguier 1985). Fish species in 61
lithophilic reproductive guilds, such as many darters (Percidae: Etheostomatini), require rocky 62
and gravel habitats, in addition to well-oxygenated, flowing water, in which to spawn and care 63
for their eggs (Page 1983; Simon 1998). The loss of these habitats due to increased turbidity and 64
sedimentation can render such habitats unsuitable for reproduction even if adults are able to 65
4
survive (Berkman and Rabeni 1987). Sedimentation-induced changes to aquatic invertebrate 66
assemblages can also affect fish foraging behaviour and efficiency (Berkman and Rabeni 1987; 67
Harvey 1986; Milner and Piorkowski 2004). Assessing direct effects of these types of 68
disturbance on fish assemblages can be quite challenging, particularly in large river systems; 69
determining more subtle indirect effects and ecological shifts mediated by dams present a greater 70
challenge still. 71
Longitudinal patterns along stream river gradients have been described using theoretical 72
models such as the nutrient spiraling concept (Webster and Patten 1979), river continuum 73
concept (Vannote et al. 1980), process domains concept (Montgomery 1999), and flood pulse 74
concept (Thorp and Delong 1994); however, these models generally assume uninterrupted 75
continua and do not account for disruptions to water and nutrient flow caused by dams. The 76
serial discontinuity concept (Ward and Stanford 1983) showed how dams can not only create 77
lentic conditions above the dam, but below the dam can effectively “reset” environmental 78
conditions to states reflecting lower order streams. Paradoxically, dams can thus provide refugia 79
for lotic species in impounded rivers, with higher flow and oxygenated water immediately below 80
dams (Argent and Kimmel 2011; Freedman et al. 2009a). 81
Although longitudinal patterns in relative fish abundance and diversity along a river 82
continuum can thus be affected by the presence of dams (Miranda et al. 2008; Ward and Stanford 83
1983). However, most studies have focused on smaller rivers, or on large bodied fish taxa or 84
those that can be sampled in near shore habitats. Furthermore, while there are other studies that 85
separately examine the effects of dams on either taxonomic diversity or nutrient dynamics, the 86
complex relationships between these factors is not well understood. Our objectives were 87
therefore to use a novel sampling gear (electrified benthic trawl; Freedman et al. 2009b) in 88
5
conjunction with stable isotope analysis to examine the effects of dams on benthic fish 89
assemblages and food webs by sampling dam-impacted and free-flowing reaches of the 90
Allegheny River, Pennsylvania. The Allegheny River is important because it is the most 91
northeast extension of the rich Ohio River (and thus also of the Mississippi River watershed); its 92
diverse fauna was derived from the rich Teays/Mississippi valley via the developing Ohio River 93
and from glacial meltwaters of that formed the Great Lakes (Hocutt et al. 1986). We 94
hypothesized that fish diversity would be lower in the impounded section, with shifts from lotic 95
to lentic species dominating the community. As habitat would be less diverse (contiguous deep 96
pools in the impounded section; riffle-pool-run sequences in the free-flowing section), we also 97
expected to see higher biotic homogenization in the impounded section (Olden et al. 2004; Poff 98
et al. 2007). Furthermore, because our impounded sites were located downstream from our free-99
flowing sites, we expected that differences due to river distance between sites (measured in river 100
kilometers) between free-flowing and impounded sites would be greater than within these 101
categories. Regular interruptions in nutrient and water flow caused by navigation dams would 102
also be expected to increase homogeneity and disrupt any longitudinal patterns in diversity. We 103
used diversity partitioning to determine the relative contribution of alpha (within sample) and 104
beta (among sample) diversity to the overall (gamma) diversity of the river. Finally, we 105
examined how dams affect nutrient flow and food webs by using stable isotope analysis; with 106
greater mean depth and habitat homogenization, we expected that fishes at impounded sites 107
would derive fewer nutrients from benthic sources relative to those at free-flowing sites. 108
109
Materials and methods 110
Study area and sampling 111
6
The Allegheny River has a total length of 523 km and a watershed of approximately 112
30,000 km2, and is comprised of three main sections (Figure 1). From its headwaters in 113
Pennsylvania, the upper section of Allegheny River flows into New York State before reentering 114
Pennsylvania, and is unregulated above a hydroelectric and flood control dam that forms the 115
Kinzua Reservoir at River Kilometer 325. Below the Kinzua Dam, the middle section of the 116
river is free-flowing for 211 km. The lower section’s 113 km are regulated by a series of eight 117
navigation lock-and-dam systems until its confluence with the Monongahela River in Pittsburgh 118
forms the Ohio River. Glacial alluvial gravel and rocks comprise the dominant substrate in the 119
Allegheny River. Commercial gravel dredging has occurred throughout most of the nine 120
navigation pools on the Allegheny River (Freedman et al. 2013), but only at one site above the 121
navigation pool influence. Annual mean discharge of the Allegheny River is 189 m3s
-1 at our 122
uppermost site near Kinzua Dam (USGS Gauging Station 03012550; River Kilometer 316), 623 123
m3s
-1 at Parker, PA, located 20 km upstream of the navigation limit (USGS Gauging Station 124
03031500; River Kilometer 133), and 920 m3s
-1 at Lock & Dam 4 at Natrona, PA (USGS 125
Gauging Station 03049500; River Kilometer 39). While subject to some point- and non-point 126
source stressors such as sewage discharges and agriculture, 139 km of the middle section of the 127
Allegheny River is designated as a National Wild and Scenic River, and is yet relatively pristine. 128
We used electrified benthic trawls (Freedman et al. 2009b) to sample benthic fish 129
assemblages at 66 sites in the middle and lower sections of the Allegheny River (Figure 1). We 130
sampled 26 sites in the lower, impounded river, with three or four sites in each navigation pool 131
from 2-9; these included sites located above and below each dam, with one or two sites located 132
in the middle of the pool (Figure 2). We sampled 40 sites in the middle, free-flowing section of 133
the river, from below Kinzua dam to just above the upper navigation limit in navigation pool 9. 134
7
Three to eight (mean ± SD; 4.44 ± 1.63) two-minute timed trawls were conducted at each site 135
depending on the width of the river. All fishes were identified to species in the field when 136
possible; representative samples were retained and photo vouchers were taken for laboratory 137
verification. 138
139
Stable isotope sampling and preparation 140
Stable isotopes can be used to provide information about both realized trophic 141
scenopoetic (environmental conditions) and bionomic (interactions with other organisms) niche 142
dimensions (Newsome et al. 2007). In other words, we used them not only to determine what an 143
organism was eating, but also whether it was deriving nutrients from benthic or pelagic sources 144
(e.g., Newsome et al. 2007; Post 2002b; Vander Zanden and Vadeboncoeur 2002; Vander 145
Zanden et al. 2005). Stable carbon isotope signatures (δ13
C) vary across both primary producers 146
and in response to differences in environmental variables. For instance, periphyton and 147
phytoplankton differ in δ13
C signatures, as do producers from deep or shallow water (Post 2002b; 148
Vander Zanden and Rasmussen 1999). Variation in primary producer δ13
C in streams and rivers 149
is largely driven by CO2 availability: in shallow or turbulent water the boundary layer effect 150
increases the availability of “fresh” CO2, while in slow or deep water CO2 is less available and is 151
therefore “recycled” by primary producers (Finlay et al. 1999; Peterson and Fry 1987; Trudeau 152
and Rasmussen 2003). The heavier stable isotope of nitrogen (15
N) is conserved in organic 153
tissues, and passes to higher consumers via bioaccumulation. Thus, δ15
N is enriched at a 154
relatively constant rate (2-5‰, mean 3.4‰) across trophic levels, and therefore serves to 155
estimate trophic position within a food-web (Post 2002a; Vander Zanden and Rasmussen 1999; 156
Vander Zanden and Rasmussen 2001; Vanderklift and Ponsard 2003). While stable isotope 157
8
analysis has been used to gain insights into biotic changes that occur as a response to 158
anthropomorphic stress, such research has tended to focus on point- and non-point-source 159
additions to aquatic environments (Anderson and Cabana 2005; Costanzo et al. 2001; Gray et al. 160
2004; Grey et al. 2004; Vadeboncoeur et al. 2003; Vander Zanden et al. 2005) rather than 161
physical alterations to the environment. The ability of stable isotope analysis to differentiate 162
food sources and detect trophic positions thus makes it a powerful tool for examining the effects 163
of dams on riverine fish assemblages. 164
Two sites were sampled above the influence of navigation dams (free-flowing sites), and 165
three sites were sampled in the upper navigation pools of the Allegheny River (Pools 7-8) during 166
late summer, 2007. Adult fishes were collected using a combination of Missouri- and PSU-167
benthic trawls (Freedman et al. 2009b; Herzog et al. 2005). Fish samples were immediately 168
frozen until processed in the laboratory. All fishes were identified to species, with the exception 169
of shiners (Notropis spp.) which were not identified to species prior to stable isotope sampling, 170
and were therefore grouped together and analyzed as shiner spp. Several individuals of each fish 171
taxon (range 2-48 individuals per site) to compensate for inherent inter-individual variability, 172
and of different size-classes where relevant, were sampled for stable isotope analysis. White 173
muscle tissue was used if sufficient material could be obtained for fish samples as previous 174
studies have shown it to be less variable than other tissues, with a moderate stable isotope 175
turnover rate on the order of weeks to months (Hobson 1999); smaller fishes were eviscerated 176
and decapitated. To compensate for inherent differences among sites, samples were pooled by 177
taxon for both the two free-flowing and the three dam-impacted sites. 178
All samples were rinsed with deionized water, placed into a clean glass vial, and dried in 179
a drying oven at 60oC for 24-48 hours. Dried samples were homogenized to a fine powder using 180
9
mortar-and-pestle, or using a glass stirring rod within the vial. Samples were weighed into 0.2 181
mg (± 10 %) aliquots, placed into 5 mm x 3.5 mm tin capsules, and analyzed for 13
C and 15
N 182
using either a Thermo-Finnigan Delta Plus or Delta XP isotope-ratio mass spectrometer 183
interfaced with a Carlo Erba NC2500 Elemental Analyzer via the Conflo II or Conflo III at the 184
Stable Isotopes in Nature Laboratory at the University of New Brunswick, Canada. 185
From each sample, the ratios of 14
N to 15
N and of 12
C to 13
C were determined, and used to 186
calculate δ15
N and δ13
C using the formula: 187
188
δX = [(Rsample/Rstandard)-1] x 1000 189
190
where X refers to the rare, heavy isotope, and R is the ratio of the heavy isotope (15
N, 13
C) to the 191
light isotope (14
N, 12
C) in the sample and in a standard. The standard for nitrogen is atmospheric 192
nitrogen (AIR), and for carbon is carbon dioxide derived from calcium carbonate in the Pee Dee 193
Bee formation of South Carolina (PDB). As lipids are rich in carbon relative to tissues, variable 194
tissue-lipid contents among samples can increase overall variability of samples; we therefore 195
used a lipid correction factor to standardize across samples (Equation 3, Table 1 from Post et al. 196
2007). For isotopic standards, standard deviations were 0.15‰ for δ13
C and 0.24‰ for δ15
N, for 197
elemental standards standard deviations ranged from 0.13‰ to 0.15‰ for δ13
C and 0.14‰ to 198
0.25‰ for δ15
N, and for biological standards the standard deviations ranged from 0.11‰ to 199
0.14‰ for δ13
C and from 0.12‰ to 0.14‰ for δ15
N. Replicate fish tissue samples varied by an 200
average of 0.22‰ (SD 0.24‰) for δ13
C and 0.19‰ (SD 0.18‰) for δ15
N. 201
10
202
Statistical analysis 203
We calculated both observed site-to-site differences, and used three-site moving averages 204
to visualize longitudinal trends, in Brillouin diversity of fish assemblages along the river (Figure 205
2); however, all analyses were conducted on the observed data. We performed both non-metric 206
multidimensional scaling (nMDS) and analysis of similarity (ANOSIM) based on a Bray-Curtis 207
dissimilarity matrix of fish assemblages to examine differences among sites, using Primer 5.2.2 208
(Primer-E Ltd., Plymouth UK). River sections (free-flowing middle and impounded lower) were 209
used as factors. 210
To quantify the effects of dams in structuring diversity, we examined the relative 211
contributions of alpha (α, within sample) and beta (β, among sample) diversity to the gamma (γ, 212
total) diversity of the Allegheny River (sensu Crist et al. 2003). We performed complete 213
randomization of 10,000 iterations using additive partitioning (Partition 3.0; Veech and Crist 214
2009) wherein 215
γ(total diversity) = α1 (within site) + β1 (among site) + β2 (among section) 216
to test for the presence of patterns across these hierarchical levels in the Allegheny River. We 217
tested the null hypothesis that observed fish species richness at each hierarchical level was not 218
significantly different from a random distribution of these fish species among samples at each of 219
these levels. 220
We used circular statistics (Schmidt et al. 2007) to assess differences between fish stable 221
isotope signatures by assessing directional changes from free-flowing to impounded sites using 222
the software package Oriana 3.0 (Kovach Computing Services 2009). In circular statistics, the 223
stable isotope data are transformed into linear vectors for each fish species, with an origin that is 224
11
standardized as 0,0. δ13
C is plotted on the X-axis, with 13
C-depletion (indicative of pelagic 225
carbon sources) to the left (270°), and 13C-enrichment (benthic carbon sources) to the right 226
(90°). δ15
N is plotted on the Y-axis, with 15
N-enrichment (higher trophic level) at 0° and 15
N-227
depletion (lower trophic level) at 180°. We defined the origin as being the free-flowing site, 228
while the other end of the vector represents the impounded sites. The length of each vector 229
represents the magnitude of change of stable isotopic signatures for that species, while the angle 230
of the vector represents the directionality of that change. We used Rayleigh’s Test for Circular 231
Uniformity to test whether the distribution of vectors was random or uniform. Alpha levels of 232
0.05 were used to assess significance for all analyses. 233
234
Results 235
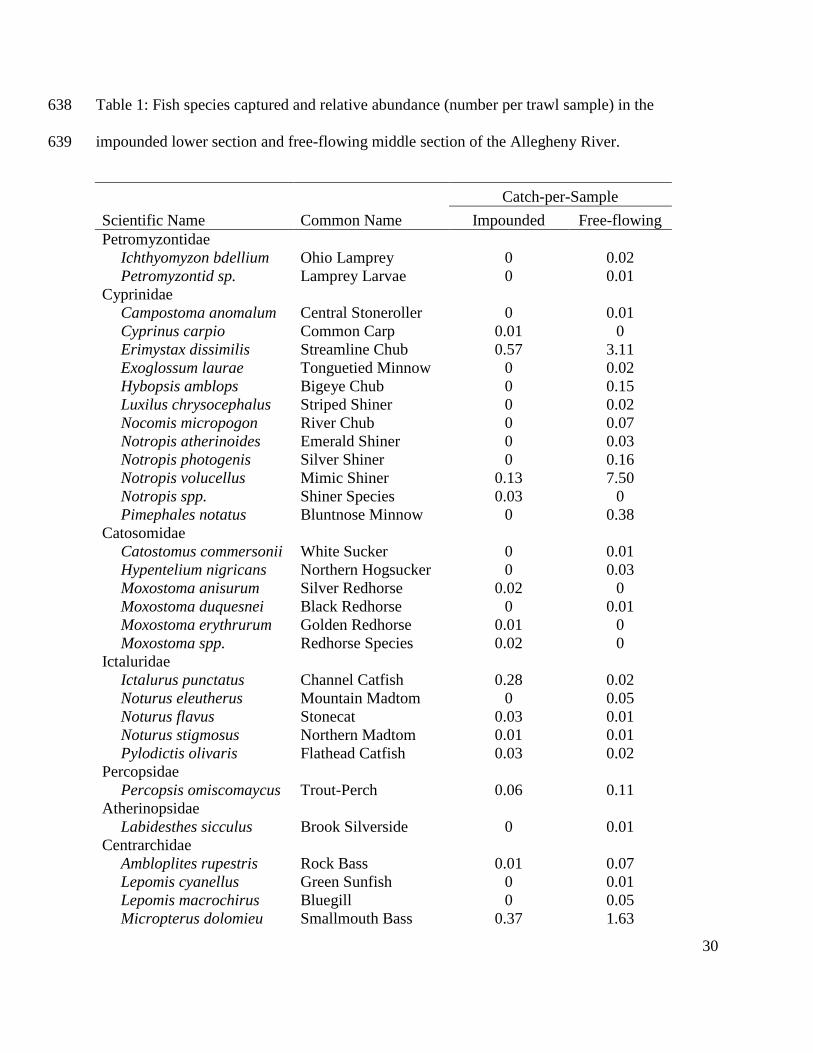
Fish Distribution, Abundance, and Diversity 236
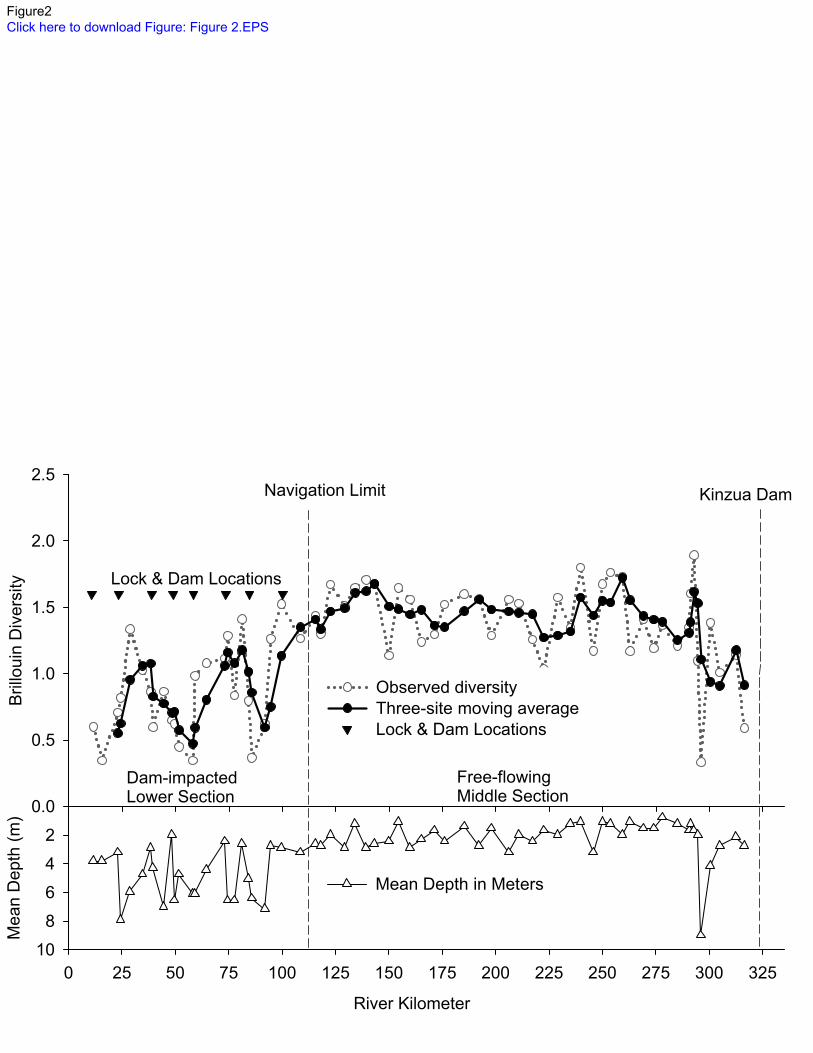
Diversity in the free-flowing middle section generally increased from the Kinzua dam 237
until the dam influence near 116 rkm and was variable in the dam-impacted lower section, but 238
generally declined downstream (Figure 2). We caught more fishes in the free-flowing section 239
(46.6 fish per trawl) than in the impounded section (18.8 fish per trawl), as well as higher 240
taxonomic richness with 44 taxa in the free-flowing section compared to 34 taxa in the 241
impounded section (Table 1). Mean diversity was lower in the impounded section (mean 242
Brillouin diversity 1.04 ± 0.34 SD) than in the free-flowing section (1.44 ± 0.35; t-test, d.f. = 64, 243
t-stat = -4.59, p<0.00002125; Figure 2). Mean depth of sites in the impounded section was 4.7 m 244
(range 0.3 – 14.9 m) and in the free flowing section was 2.2 m (range 0.3 – 10.0 m; Figure 2). 245
We caught a total of 10, 038 fishes comprising 54 taxa: 53 species and 1 hybrid (Table 246
1). Fishes from the family Percidae (primarily darters) comprised 90.5% of the total catch in the 247
12
impounded section, while catch from the free-flowing section comprised 62.4% percids and 248
24.6% cyprinids (minnow family). However, percids were more abundant in the free-flowing 249
section, with a catch rate of percids (29.1 per trawl) almost double that in the impounded section 250
(17.0 per trawl; Table 1). The most prevalent percids in the impounded section were tolerant 251
species such as Channel Darter (34.2% of total catch), Johnny Darter (17.9%), and Logperch 252
(13.0%). In the free-flowing section, the most prevalent percids were species with more lotic 253
requirements such as Rainbow Darter (14.7% of total catch), Banded Darter (11.1%), and 254
Greenside Darter (10.0%; Table 1). Overall, the most prevalent species in the free-flowing 255
section was Mimic Shiner (16.1% of total catch; Table 1), while Mottled Sculpin (8.6%) were 256
also prevalent, particularly in the upper reaches of the section. The free-flowing site with the 257
lowest diversity (0.33) was located at river km 296.1. This site was the deepest in the free-258
flowing section (9.0 m deep) and we captured just 22 fishes: 19 Trout-Perch and three Mottled 259
Sculpin. This site was also characterized by sandy substratum, which was also noted at the other 260
three sites in the impounded section where Trout-Perch were collected. 261
Twenty taxa (19 species and one hybrid) were found only in the free-flowing section, 262
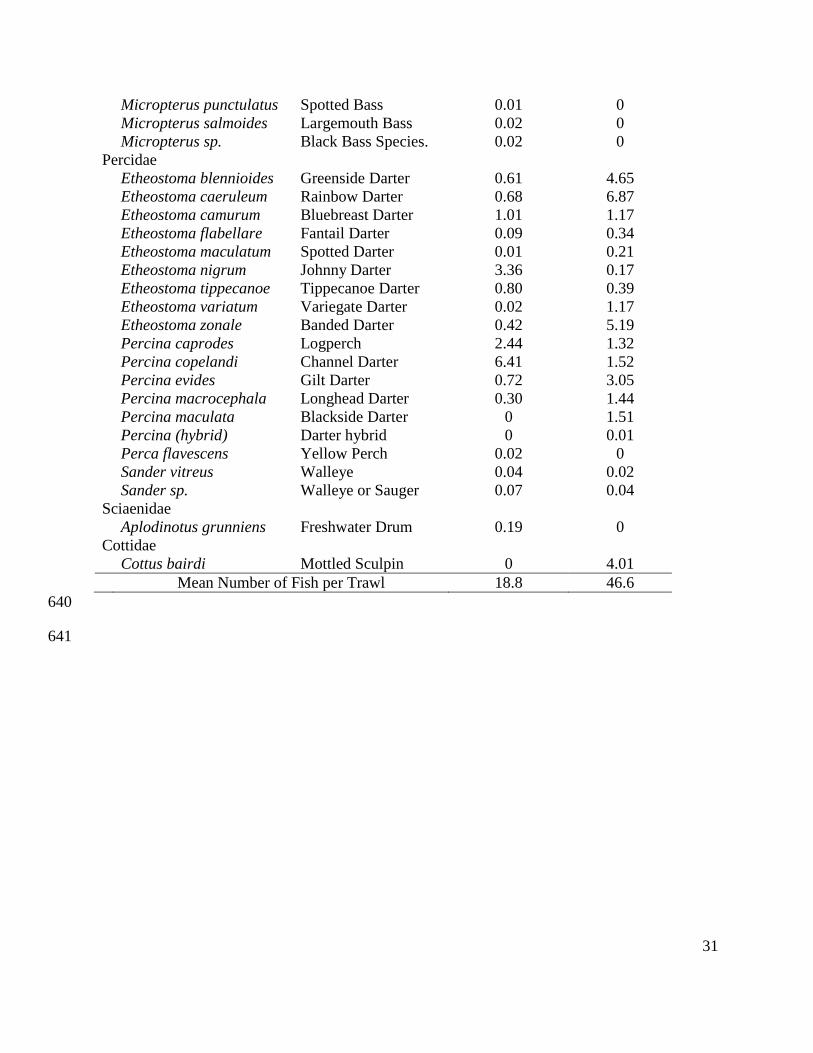
while 10 taxa were found only in the impounded section (Table 1). These contributed to a 263
section beta diversity (β2) of 14.5 which represented 26.9% of gamma species richness but was 264
not significantly different than expected using diversity partitioning (p>0.05; 10,000 iterations; 265
Table 2 & Figure 3). The mean numbers of species that were not shared among sites (β1) was 266
higher than expected from the 10,000 randomizations (72.3% of gamma diversity versus 56.7%; 267
p<0.001). The mean numbers of species shared among sites (α1) was lower than expected 268
(27.7% versus 43.3% expected; p<0.001; Table 2 & Figure 3). 269
13
There was differentiation between fish assemblages from the free-flowing and 270
impounded sections of the Allegheny River along Axis 1 of the nMDS, with all fish assemblages 271
from impounded sites having values of <0, while only one free-flowing site value of <0 along 272
this axis (nMDS, Stress 0.17; Figure 4). ANOSIM also revealed significant differences in site 273
similarity between free-flowing and impounded sites (Global R: 0.62, significance level 0.1). 274
Fish assemblages in the impounded section were equally dissimilar between 0-59 rkm 275
(navigation pools 2-5) and 59-115 rkm (navigation pools 6-9) subsections. Fish assemblages 276
from the free-flowing section were progressively more dissimilar from impounded section 277
assemblages with increasing distance upstream (Figure 4). Fish assemblages from sites located 278
below dams in both the 0-59 rkm and 59-116 rkm subsections were not more similar to free-279
flowing sites than sites located mid-pool or above dams. 280
281
Food Webs and Nutrient Dynamics 282
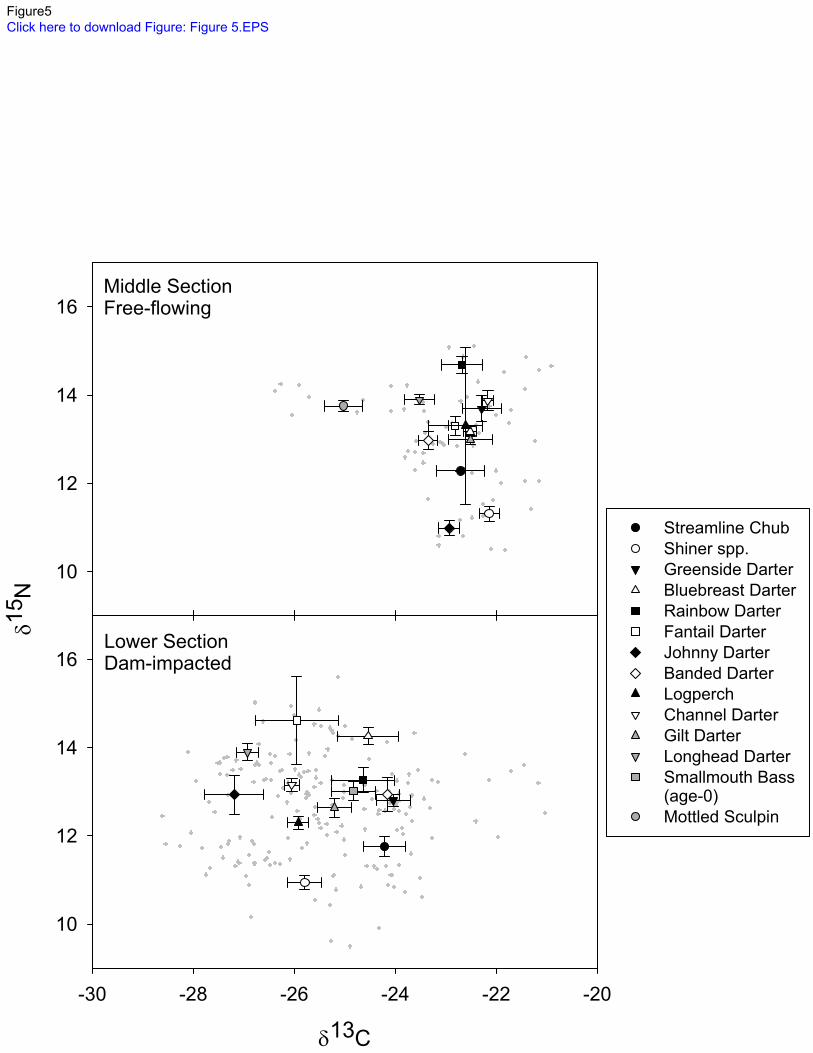
Small fishes from free-flowing sites were less depleted in 13
C, consistent with reliance on 283
benthic-derived nutrients (Figure 5). Fishes from impounded sites had 13
C depleted δ13
C 284
signatures, consistent with increased reliance on pelagic-derived nutrients rather than benthic-285
derived nutrients. Only Mottled Sculpin from free-flowing sites had δ13
C signatures more 286
negative than -24.00 ‰. 287
14
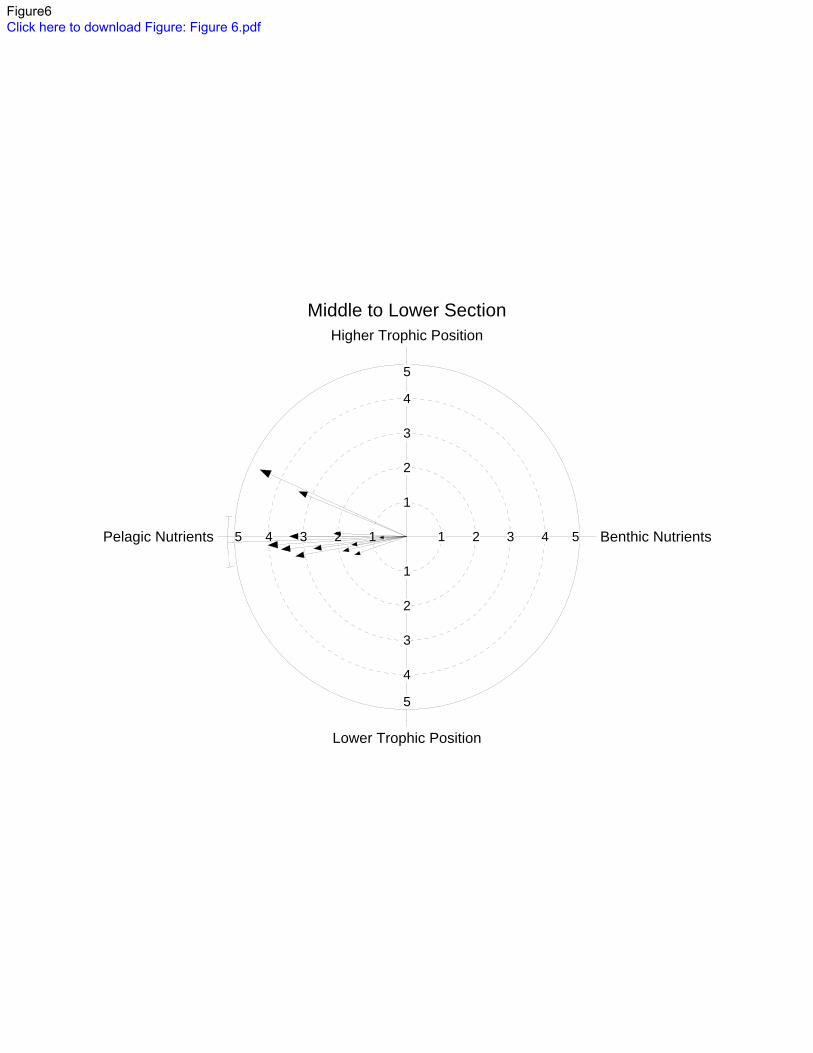
There was a directional shift in δ13
C from free-flowing to impounded sites. Circular 288
statistics revealed that fishes from the lower section (Rayleigh’s Test, Z=11.437, p=0.00000143; 289
Figure 6) shifted to increased reliance on pelagic-derived nutrients at impounded sites. There 290
was no significant effect of dam influence on the trophic position of fishes. Fantail Darter (from 291
mean δ15
N 13.30 ± 0.38 SD at free-flowing sites to 14.61 ± 1.41 at undredged sites) and Johnny 292
Darter (from δ15
N 10.99 ± 0.25 to 12.93 ± 1.00) appeared to be exceptions as they both increased 293
mean trophic position from free-flowing to undredged sites. 294
295
Discussion 296
Effects of Dams on Fish Distribution, Abundance, and Diversity 297
We detected significant differences between fish communities in the impounded lower 298
section and free-flowing middle sections of the Allegheny River. These were largely influenced 299
by higher fish abundance and taxonomic diversity at sites in the free-flowing section. Mottled 300
Sculpin were captured at 23 of the 24 uppermost sites; they were among the most abundant taxa 301
in the free-flowing section, but were not captured below river km 210. This may be due to 302
thermal limitations and habitat preference, as this species is generally associated with cool, clear, 303
flowing water (Scott and Crossman 1973; Trautman 1981). Lotic-adapted darters such as 304
Greenside, Rainbow, Banded, and Gilt darters were more abundant in the free-flowing section 305
than in the impounded section. Darter species that were more abundant in the lower section 306
included Johnny Darter, Channel Darter, and Logperch, all of which are better adapted to slower-307
moving and lentic conditions than most darters (Page 1983). Streamline Chub and Mimic 308
Shiners were also more prevalent in the free-flowing section although they have different habitat 309
preferences. Both species are found in streams and rivers, but while Mimic Shiners are more 310
15
tolerant of both silt and lotic conditions than Streamline Chub, neither species thrives in high-silt 311
environments that characterizes much of the impounded section (Trautman 1981). 312
Fish assemblages from below dams were dissimilar to above-dam sites. Contrary to our 313
expectations, however, below-dam sites were not more similar to free-flowing sites. Species that 314
are adapted to lotic conditions may find refugia below dams within rivers where turbulence is 315
greatest (Argent and Kimmel 2011; Freedman et al. 2009a). For instance, lotic fish species listed 316
as threatened by the state of Pennsylvania were found at higher abundances in dam tailwaters on 317
the Ohio River (Freedman et al. 2009a), and a similar trend was noted for dams in the Allegheny 318
River (Argent and Kimmel 2011). Despite providing refugia for lotic species, fish assemblages 319
from habitats immediately below dams were equally dissimilar to free-flowing sites as were 320
other dam-impacted sites. This indicates a fundamental impact of dams on these fish 321
assemblages. 322
This may be driven, in part, by the lower diversity in the impounded section than the free-323
flowing section. Additive partitioning revealed higher heterogeneity in fish assemblages 324
between impounded and free-flowing sites than expected. There was no evidence of increased 325
homogeneity per se among the impounded sites relative to free-flowing sites. At the same time, 326
despite generally lower diversity at lower river km in the impounded section, there was no 327
pattern of longitudinal changes in this section apparent in the MDS analysis. The free-flowing 328
section, however, showed a downstream pattern in increased diversity that was also apparent in 329
MDS analysis. Fish assemblages in the free-flowing section are thus generally consistent with 330
the river continuum concept (Vannote et al. 1980) in that there were increases in taxonomic 331
diversity and mixed assemblages of lotic and lentic species at downstream sites. The disruption 332
of this pattern, with generally lower taxonomic diversity and a sharp drop in lotic species, as well 333
16
as a lack of longitudinal changes in the dam-impacted section are consistent with the serial 334
discontinuity concept (Ward and Stanford 1983). 335
While the locks in navigation lock-and-dam systems provide access between pools, the 336
dams inhibit fish movement. For instance, river darter, Percina shumardi, has been captured to 337
the base of the second lock-and-dam of the Ohio River (DaShields lock-and-dam in the 338
Montgomery Pool; Freedman et al. 2009a). Extensive sampling has not collected this species 339
upstream of this dam in the Ohio River or in the Allegheny or Monongahela rivers (Argent and 340
Kimmel 2011; Freedman et al. 2009a; Freedman et al. 2009b; Stauffer Jr. et al. 2010), suggesting 341
that it is recolonizing the Pennsylvania section of the Ohio River from downstream refugia 342
rather than simply having been missed in prior surveys. The range of this species may expand 343
upstream into the Allegheny and Monongahela rivers, but this dispersal will likely be slowed by 344
the presence of navigation dams. The extirpation from the Ohio River of anadromous species 345
such as Lake Sturgeon, Acipenser fulvescens, can be at least partially explained by the presence 346
of dams (Pearson and Pearson 1989). The presence of locks may help to mediate this issue, as 347
juvenile paddlefish, Polyodon spathula, stocked in the Ohio River were confirmed to have 348
passed through locks in both upstream and downstream directions (Barry et al. 2007). The use of 349
navigation lock chambers by fishes can also be confirmed by lock chamber rotenone surveys on 350
The Ohio River in which almost 3 x 10⁶ fishes comprising 116 fish taxa were collected in 377 351
sampling events: an average of almost 8,000 fishes per collection (Thomas et al. 2005). 352
353
Effects of Dams on Food Webs and Nutrient Dynamics 354
Stable isotope analysis revealed a shift towards increased reliance on pelagic-derived 355
nutrients by fishes at impounded sites relative to the free-flowing sites above the navigation dam 356
17
influence. This shift is consistent with shifts from allochthonous to autochthonous and benthic to 357
pelagic nutrients from low-order streams to high-order rivers predicted and observed in other 358
studies (e.g. Finlay 2001; Vannote et al. 1980), and also with patterns of increased depth caused 359
by the downstream presence of dams at these sites. These results are also consistent with shifts 360
from benthic-driven primary production (e.g., periphyton) to pelagic-production (e.g., 361
phytoplankton) as a result of cultural eutrophication (Chandra et al. 2005; Vadeboncoeur et al. 362
2003; Vander Zanden et al. 2005). Such shifts are generally considered to be the result of 363
eutrophication increasing concentration and productivity of pelagic primary producers, thus 364
starving benthic producers of both nutrients for growth and sunlight for photosynthesis (Chandra 365
et al. 2005; Vadeboncoeur et al. 2003). Anthropogenically increased depth and turbidity may 366
have similar effects (Freedman et al. 2013). As average depth increases from headwater streams 367
to high-order rivers, relatively less light reaches the river floor, from near 100% of non-refracted 368
light in small clear streams to zero in turbid and deep water, thus decreasing benthic production. 369
Dams increased the mean depth from <3 m in pools in the free-flowing Allegheny River to a 370
constant minimum of 4-5 m (or more) in dam-impacted reaches, and can therefore decrease 371
benthic production without any influences from eutrophication or other increases in relative 372
turbidity. Since the free-flowing reach of the river includes runs and riffles as well as pools, 373
while the homogenous impounded reaches effectively consist only of long pools possibly with 374
minimal lotic habitat immediately downstream of dams, a loss of some benthic nutrient pathways 375
becomes even more likely. 376
Reliance on benthic-derived nutrients at free-flowing sites appears to be high while at 377
dam-impacted sites δ13
C signatures suggest a trend towards increasing reliance on pelagic-378
derived nutrients. While a full range of benthic and pelagic nutrients seem to be available, fishes 379

18
are relying more on pelagic nutrients; this is consistent with the theory that reliance on pelagic 380
nutrients (and decreased reliance on benthic nutrients) would increase with the increased depth 381
due to the navigation dams. Pelagic production is also lower in lower order rivers, with 382
zooplankton diversity and biomass consequently increasing downstream (e.g. Vannote et al. 383
1980; Ward and Stanford 1983). The relative reliance on pelagic nutrient sources in the free-384
flowing section may therefore be a combination of higher availability of benthic nutrients and 385
lower availability of pelagic nutrients. 386
Samuel Rafinesque (1820) referred to the Allegheny River as being “almost perfectly 387
clear,” while our Secchi depths ranged from 142-145cm downstream of an active dredging 388
operation and 157-198cm in other impounded areas of the river (JAF, unpublished data), thus 389
offering supporting evidence that this is no longer the case. We found Secchi depths in the range 390
of 330cm, however in a pool above the dam influence, so there does appear to be a negative 391
effect of dams on water clarity. Although other studies have found that dams can decrease 392
turbidity through retention of fine sediments (e.g., Kondolf 1997), the Allegheny River system 393
may differ due to the size of the dams (relatively small compared to dams constructed for 394
hydroelectric power generation, flood-prevention, and similar purposes) and locks, both of which 395
may allow for the passage and resuspension of fine sediments. Land use does not differ greatly 396
between the upper navigation pools and lower free-flowing section, consisting primarily of 397
forested land with some residential properties. The approximately 214 km of the Allegheny 398
River between the Kinzua Dam and the end of the navigation dam influence near East Brady PA, 399
likely experience full light penetration except during times of high discharge due to shallow 400
depths and lower turbidity. Despite the upstream presence of the Kinzua dam, free-flowing sites 401
19
likely represent similar reference states to the historical condition, and with similar fish 402
assemblages and food-web structure. 403
According to the river continuum concept, nutrient sources shift from allochthonous 404
inputs to autochthonous primary production along the longitudinal river gradient (Vannote et al. 405
1980). These gradients can be reset by dams, creating higher-flow downstream conditions that 406
mimic higher order streams. Conversely, deeper and slower flowing conditions above dams can 407
be more similar to lower order rivers. Plankton communities are sparse in higher order streams 408
and rivers relative to lower order rivers and impoundments. In the Allegheny River, therefore, 409
nutrient inputs in the free-flowing section would comprise primarily benthic sources, possibly 410
with increased allochthonous inputs. In the dam-impacted section, however, increased 411
phytoplankton production due to environmental conditions combined with lower benthic 412
production would lead to increased reliance on such pelagic producers. The Allegheny River 413
also has a long history of extractive gravel dredging. Dredged portions can exceed 20 m depth, 414
with no light penetration deeper than approximately 10 m. We focused our sampling on 415
undredged areas <7 m deep; however, in another study we found that dredged areas accumulate 416
terrestrial detritus, and to alter nutrient and sediment flow (Freedman et al. 2013). 417
418
Conclusions 419
We found significant differences among fish community compositions at sites in 420
impounded and free-flowing sections of the Allegheny River. Furthermore, the shift from 421
communities characterized by lotic-adapted species and those intolerant of silt, to those 422
dominated by generalist and tolerant large-river species was very abrupt. In particular, the 423
longitudinal gradient in fish community similarity and downstream trend toward increasing 424
20
taxonomic diversity was disrupted in the impounded section where we found decreasing 425
downstream diversity but no concurrent trend in similarity. These findings were consistent with 426
the stable isotope results, which showed shifts away from the benthic production that 427
characterized the free-flowing section towards increasing reliance on pelagic-derived nutrients in 428
the impounded section. These shifts were likely due to a decrease in benthic production due to 429
increased depth, turbidity, and siltation (Freedman et al. 2013), and would also be consistent with 430
a decline of lotic and intolerant species. By using an electrified benthic trawl, we were able to 431
sample small benthic fishes that are difficult to sample using traditional methods. However, 432
although we did also capture some non-benthic taxa, our sampling method was biased towards 433
the capture of benthic rather than pelagic or littoral fishes. Since benthic fishes may be 434
particularly impacted by habitat alterations due to increased depth (Freedman et al. 2013), our 435
findings cannot necessarily be extrapolated to the entire fish community. 436
While dams can provide economic benefits, it is necessary to understand the effects that 437
they can have on individual fish species, populations, and communities. While dam removal can 438
restore habitats, and subsequently invertebrate and fish populations (Maloney et al. 2008), many 439
factors need to be considered prior to restoration (Poff and Hart 2002). Stable isotope analysis of 440
δ13
C and δ15
N is an appropriate tool for assessing differences in fish assemblages between sites 441
with varying degrees of influence from dams, and should be considered for before-after-control-442
impact (BACI) study designs. It is therefore important for managers and policy makers to 443
consider not only the direct effects of habitat alterations on taxonomic diversity, but also indirect 444
effects on ecosystem functioning. Furthermore, alterations in water flow, prey availability, and 445
migration due to dams can even effect changes in fish ecomorphology and functional 446
morphology in certain species (Curry et al. 2004; Freedman 2010; Haas et al. 2010; Langerhans 447
21
2008; Palkovacs et al. 2007), further confounding these issues. Dams influence riverine fish in 448
many ways; a complete understanding of ecological processes is therefore necessary for 449
informed conservation and management decisions. 450
451
Acknowledgements 452
We thank A. Anderson, V. Cavener, D. Cooper, H. Goldstein, A. Henning, R. Lorson, R. Lorson, 453
T. Stecko, K. Taylor, T. Vasilopoulos, and R. Yoder for their invaluable field and laboratory 454
assistance. The Stable Isotopes in Nature Laboratory at the University of New Brunswick 455
performed the stable isotope analysis. An earlier draft of this manuscript was improved by 456
addressing comments and suggestions from two anonymous reviewers. This research received 457
funding and support from State Wildlife Grant T-42 administered by the Pennsylvania Fish and 458
Boat Commission; from the Pennsylvania Department of Conservation and Natural Resources 459
through Wild Resources Conservation Program Grants WRCP-06171 and WRCP-07269; and 460
from the United States Geological Survey, Pennsylvania Cooperative Fish and Wildlife Research 461
Unit. 462
463
References 464
Anderson, C. & G. Cabana, 2005. ð15
N in riverine food webs: effects of N inputs from 465
agricultural watersheds. Canadian Journal of Fisheries and Aquatic Sciences 62:333-340 466
doi:10.1139/f04-191. 467
Argent, D. G. & W. G. Kimmel, 2011. Influence of navigational lock and dam structures on 468
adjacent fish communities in a major river system. River Research and Applications 469
27(10):1325-1333 doi:10.1002/rra.1432. 470
22
Barry, P. M., R. F. Carline, D. G. Argent & W. G. Kimmel, 2007. Movement and Habitat Use of 471
Stocked Juvenile Paddlefish in the Ohio River System, Pennsylvania. North American 472
Journal of Fisheries Management 27:1316-1325 doi:10.1577/M06-232.1. 473
Berkman, H. E. & C. F. Rabeni, 1987. Effect of siltation on stream fish communities. 474
Environmental Biology of Fishes 18(4):285-294 doi:10.1007/BF00004881. 475
Bunn, S. E. & A. H. Arthington, 2002. Basic principles and ecological consequences of altered 476
flow regimes for aquatic biodiversity. Environmental Management 30(4):492-507 477
doi:10.1007/s00267-002-2737-0. 478
Chandra, S., M. J. Vander Zanden, A. C. Heyvaert, B. C. Richards, B. C. Allen & C. R. 479
Goldman, 2005. The effects of cultural eutrophication on the coupling between pelagic 480
primary producers and benthic consumers. Limnology and Oceanography 50(5):1368-481
1376 doi:10.4319/lo.2005.50.5.1368. 482
Costanzo, S. D., M. J. O'Donohue, W. C. Dennison, N. R. Loneragan & M. Thomas, 2001. A 483
new approach for detecting and mapping sewage impacts. Marine Pollution Bulletin 484
42(2):149-156 doi:10.1016/S0025-326X(00)00125-9. 485
Crist, T. O., J. A. Veech, J. C. Gering & K. S. Summerville, 2003. Partitioning species diversity 486
across landscapes and regions: a hierarchical analysis of diversity. The 487
American Naturalist 162(6):734-743 doi:10.1086/378901. 488
Curry, R. A., S. L. Currie, L. Bernatchez & R. Saint-Laurent, 2004. The rainbow smelt, Osmerus 489
mordax, complex of Lake Utopia: threatened or misunderstood? Environmental Biology 490
of Fishes 69(1-4):153-166 doi:10.1023/B:EBFI.0000022896.77922.22. 491
Finlay, J. C., 2001. Stable-carbon-isotope ratios of river biota: implications for energy flow in 492
lotic food webs. Ecology 82(4):1052-1064 doi:10.2307/2679902. 493
23
Finlay, J. C., M. E. Power & G. Cabana, 1999. Effects of water velocity on algal carbon isotope 494
ratios: Implications for river food web studies. Limnology and Oceanography 495
44(5):1198-1203 doi:10.4319/lo.1999.44.5.1198. 496
Freedman, J. A., 2010. Dams, Dredging, and Development: Effects of Anthropogenic 497
Disturbances on Fish Ecology. The Pennsylvania State University. 498
Freedman, J. A., R. F. Carline & J. R. Stauffer Jr., 2013. Gravel dredging alters diversity and 499
structure of riverine fish assemblages. Freshwater Biology 58:261-274 500
doi:10.1111/fwb.12056. 501
Freedman, J. A., T. D. Stecko, R. W. Criswell & J. R. Stauffer Jr., 2009a. Extensions of the 502
known ranges of Percina shumardi Girard and three species of Etheostoma (subgenus 503
Nothonotus) in Pennsylvania. Journal of the Pennsylvania Academy of Science 83(1):42-504
44. 505
Freedman, J. A., T. D. Stecko, B. D. Lorson & J. R. Stauffer Jr., 2009b. Development and 506
efficacy of an electrified benthic trawl for sampling large-river fish assemblages. North 507
American Journal of Fisheries Management 29:1001-1005 doi:10.1577/M08-219.1. 508
Graf, W. L., 1999. Dam nation: a geographic census of American dams and their large-scale 509
hydrologic impacts. Water Resources Research 35(4):1305 doi:10.1029/1999WR900016. 510
Graf, W. L., 2006. Downstream hydrologic and geomorphic effects of large dams on American 511
rivers. Geomorphology 79(3-4):336-360 doi:10.1016/j.geomorph.2006.06.022. 512
Gray, M. A., R. A. Cunjak & K. R. Munkittrick, 2004. Site fidelity of slimy sculpin (Cottus 513
cognatus): insights from stable carbon and nitrogen analysis. Canadian Journal of 514
Fisheries and Aquatic Sciences 61:1717-1722 doi:10.1139/f04-108. 515
24
Grey, J., S. Waldron & R. Hutchinson, 2004. The utility of carbon and nitrogen isotope analyses 516
to trace contributions from fish farms to the receiving communities of freshwater lakes: a 517
pilot study in Esthwaite Water, UK. Hydrobiologia 524(1):253-262 518
doi:10.1023/B:HYDR.0000036144.49795.dd. 519
Haas, T., M. Blum & D. Heins, 2010. Morphological responses of a stream fish to water 520
impoundment. Biology Letters 6:803-806 doi:10.1098/rsbi.2010.0401. 521
Harvey, B. C., 1986. Effects of suction gold dredging on fish and invertebrates in two California 522
USA streams. North American Journal of Fisheries Management 6(3):401-409. 523
Herzog, D. P., V. A. Barko, J. S. Scheibe, R. A. Hrabik & D. E. Ostendorf, 2005. Efficacy of a 524
benthic trawl for sampling small-bodied fishes in large river systems. North American 525
Journal of Fisheries Management 25:594-603. 526
Hobson, K. A., 1999. Tracing origins and migration of wildlife using stable isotopes: a review. 527
Oecologia 120(3):314-326. 528
Hocutt, C. H., R. E. Jenkins & J. R. Stauffer Jr., 1986. Zoogeography of the fishes of the Central 529
Appalachians and Central Atlantic Coastal Plain. In Hocutt, C. H. & E. O. Wiley (eds) 530
Zoogeography of North American Freshwater Fishes. J. Wiley. 531
Kondolf, G. M., 1997. Hungry water: Effects of dams and gravel mining on river channels. 532
Environmental Management 21(4):533-551. 533
Langerhans, R. B., 2008. Predictability of phenotypic differentiation across flow regimes in 534
fishes. Integr Comp Biol 48(6):750-768 doi:Doi 10.1093/Icb/Icn092. 535
Lytle, D. A. & N. L. Poff, 2004. Adaptation to natural flow regimes. Trends in Ecology & 536
Evolution 19(2):94-100. 537
25
Maloney, K. O., H. R. Dodd, S. E. Butler & D. H. Wahl, 2008. Changes in macroinvertebrate 538
and fish assemblages in a medium sized river following a breach of a low head dam. 539
Freshwater Biology 53(5):1055-1068. 540
Milner, A. M. & R. J. Piorkowski, 2004. Macroinvertebrate assemblages in streams of interior 541
Alaska following alluvial gold mining. River Research and Applications 20:719-731. 542
Miranda, L. E., M. D. Habrat & S. Miyazono, 2008. Longitudinal gradients along a reservoir 543
cascade. Transactions of the American Fisheries Society 137:1851-1865 544
doi:10.1577/T07-262.1. 545
Montgomery, D. R., 1999. Process Domains and the river continuum. JAWRA Journal of the 546
American Water Resources Association 35(2):397-410. 547
Newsome, S. D., C. Martinez del Rio, S. Bearhop & D. L. Phillips, 2007. A niche for isotopic 548
ecology. Frontiers in Ecology and the Environment 5(8):429-436. 549
Nilsson, C., C. A. Reidy, M. Dynesius & C. Revenga, 2005. Fragmentation and flow regulation 550
of the world's large river systems. Science 308(5720):405. 551
Olden, J. D., N. LeRoy Poff, M. R. Douglas, M. E. Douglas & K. D. Fausch, 2004. Ecological 552
and evolutionary consequences of biotic homogenization. Trends in Ecology & Evolution 553
19(1):18-24. 554
Page, L. M., 1983. Handbook of darters. TFH Publications, Neptune City, NJ. 555
Palkovacs, E. P., K. B. Dion, D. M. Post & A. Caccone, 2007. Independent evolutionary origins 556
of landlocked alewife populations and rapid parallel evolution of phenotypic traits. 557
Molecular Ecology 17(2):582-597 doi:10.1111/j.1365-294X.2007.03593.x. 558
Pearson, W. D. & B. J. Pearson, 1989. Fishes of the Ohio River. Ohio Journal of Science 559
89(5):181-187. 560
26
Peterson, B. J. & B. Fry, 1987. Stable isotopes in ecosystem studies. Annual Reviews in Ecology 561
and Systematics 18:293-320 doi:10.1146/annurev.es.18.110187.001453. 562
Poff, N. L. & D. D. Hart, 2002. How dams vary and why it matters for the emerging science of 563
dam removal. Bioscience 52(8):659-668. 564
Poff, N. L. R., J. D. Allan, M. B. Bain, J. R. Karr, K. L. Prestegaard, B. D. Richter, R. E. Sparks 565
& J. C. Stromberg, 1997. The natural flow regime. Bioscience 47(11):769-784. 566
Poff, N. L. R., J. D. Olden, D. M. Merritt & D. M. Pepin, 2007. Homogenization of regional 567
river dynamics by dams and global biodiversity implications. Proceedings of the National 568
Academy of Sciences 104(14):5732. 569
Post, D. M., 2002a. The long and short of food-chain length. Trends in Ecology & Evolution 570
17(6):269-277 doi:10.1016/S0169-5347(02)02455-2. 571
Post, D. M., 2002b. Using stable isotopes to estimate trophic position: models, methods, and 572
assumptions. Ecology 83(3):703-718 doi:10.2307/3071875. 573
Post, D. M., C. A. Layman, D. A. Arrington, G. Takimoto, J. Quattrochi & C. G. Montana, 2007. 574
Getting to the fat of the matter: models, methods and assumptions for dealing with lipids 575
in stable isotope analyses. Oecologia 152(1):179-189. 576
Power, M. E., W. E. Dietrich & J. C. Finlay, 1996. Dams and downstream aquatic biodiversity: 577
potential food web consequences of hydrologic and geomorphic change. Environmental 578
Management 20(6):887-895. 579
Rafinesque, C. S., 1820. Ichthyologia Ohiensis, or natural history of the fishes inhabiting the 580
river Ohio and its tributary streams, preceded by a physical description of the Ohio and 581
its branches, Lexington KY. 582
27
Rivier, B. & J. Seguier, 1985. Physical and biological effects of gravel extraction in river beds. 583
In Alabaster, J. S. (ed) Habitat modification and freshwater fisheries. U.N. Food and 584
Agriculture Organization, Rome, 131-146. 585
Schmidt, S. N., J. D. Olden, C. T. Solomon & M. J. Vander Zanden, 2007. Quantitative 586
approaches to the analysis of stable isotope food web data. Ecology 88(11):2793-2802 587
doi:10.1890/07-0121.1. 588
Scott, W. B. & E. J. Crossman, 1973. Freshwater fishes of Canada, 3 edn. Galt House 589
Publications Ltd., Oakville ON, Canada. 590
Simon, T. P., 1998. Assessment of Balon's Reproductive Guilds with Application to Midwestern 591
North American Freshwater Fishes. In Simon, T. P. (ed) Assessing the Sustainability and 592
Biological Integrity of Water Resources Using Fish Communities. CRC Press, New 593
York, 97-122. 594
Stauffer Jr., J. R., R. Taylor, R. Cleaver Yoder, B. D. Lorson, K. M. Taylor & B. Fost, 2010. 595
Larval fish survey of the navigational channels of the Ohio River system, PA. US Army 596
Corps of Engineers, 391. 597
Thomas, J. A., E. B. Emery & F. H. McCormick, 2005. Detection of temporal trends in Ohio 598
River fish assemblages based on lockchamber surveys (1957-2001). In Rinne, J. N., H. R. 599
Hughes & R. Calamusso (eds) Historical changes in large river fish assemblages of the 600
Americas. American Fisheries Society, Bethesda, MD, 431-450. 601
Thorp, J. H. & M. D. Delong, 1994. The riverine productivity model: an heuristic view of carbon 602
sources and organic processing in large river ecosystems. Oikos 70(2):305-308. 603
Trautman, M. B., 1981. The fishes of Ohio. Ohio State University Press, Columbus. 604
28
Trudeau, V. & J. B. Rasmussen, 2003. The effect of water velocity on stable carbon and nitrogen 605
isotope signatures of periphyton. Limnology and Oceanography 48(6):2194-2199. 606
Vadeboncoeur, Y., E. Jeppesen, M. J. Vander Zanden, H. H. Schierup, K. Christoffersen & D. 607
M. Lodge, 2003. From Greenland to green lakes: Cultural eutrophication and the loss of 608
benthic pathways in lakes. Limnology and Oceanography 48(4):1408-1418 609
doi:10.4319/lo.2003.48.4.1408. 610
Vander Zanden, M. J. & J. B. Rasmussen, 1999. Primary consumer delta C-13 and delta N-15 611
and the trophic position of aquatic consumers. Ecology 80(4):1395-1404 612
doi:10.1890/0012-9658(1999)080[1395:PCCANA]2.0.CO;2. 613
Vander Zanden, M. J. & J. B. Rasmussen, 2001. Variation in delta N-15 and delta C-13 trophic 614
fractionation: Implications for aquatic food web studies. Limnology and Oceanography 615
46(8):2061-2066. 616
Vander Zanden, M. J. & Y. Vadeboncoeur, 2002. Fishes as integrators of benthic and pelagic 617
food webs in lakes. Ecology 83(8):2152-2161 doi:10.2307/3072047. 618
Vander Zanden, M. J., Y. Vadeboncoeur, M. W. Diebel & E. Jeppesen, 2005. Primary consumer 619
stable nitrogen isotones as indicators of nutrient source. Environmental Science & 620
Technology 39(19):7509-7515. 621
Vanderklift, M. A. & S. Ponsard, 2003. Sources of variation in consumer-diet ð15
N enrichment: a 622
meta-analysis. Oecologia 136:169-182 doi:10.1007/s00442-003-1270-z. 623
Vannote, R. L., G. W. Minshall, K. W. Cummins, J. R. Sedell & C. E. Cushing, 1980. The river 624
continuum concept. Canadian Journal of Fisheries and Aquatic Sciences 37:130-137. 625
Veech, J. A. & T. O. Crist, 2009. PARTITION: software for hierarchical partitioning of species 626
diversity, version 3.0. http://www.users.muohio.edu/cristto/partition.htm. 627
29
Vorosmarty, C. J., M. Meybeck, B. Fekete, K. Sharma, P. Green & J. P. M. Syvitski, 2003. 628
Anthropogenic sediment retention: major global impact from registered river 629
impoundments. Global and Planetary Change 39(1-2):169-190. 630
Ward, J. V. & J. A. Stanford, 1983. The serial discontinuity concept of river ecosystems. In 631
Fontaine, T. D. & S. M. Bartell (eds) Dynamics of lotic ecosytems. Ann Arbor Science 632
Publishers, Ann Arbor MI, 29-42. 633
Webster, J. R. & B. C. Patten, 1979. Effects of watershed perturbation on stream potassium and 634
calcium dynamics. Ecological Monographs:51-72. 635
636
637
30
Table 1: Fish species captured and relative abundance (number per trawl sample) in the 638
impounded lower section and free-flowing middle section of the Allegheny River. 639
Scientific Name Common Name
Catch-per-Sample
Impounded Free-flowing
Petromyzontidae
Ichthyomyzon bdellium Ohio Lamprey 0 0.02
Petromyzontid sp. Lamprey Larvae 0 0.01
Cyprinidae
Campostoma anomalum Central Stoneroller 0 0.01
Cyprinus carpio Common Carp 0.01 0
Erimystax dissimilis Streamline Chub 0.57 3.11
Exoglossum laurae Tonguetied Minnow 0 0.02
Hybopsis amblops Bigeye Chub 0 0.15
Luxilus chrysocephalus Striped Shiner 0 0.02
Nocomis micropogon River Chub 0 0.07
Notropis atherinoides Emerald Shiner 0 0.03
Notropis photogenis Silver Shiner 0 0.16
Notropis volucellus Mimic Shiner 0.13 7.50
Notropis spp. Shiner Species 0.03 0
Pimephales notatus Bluntnose Minnow 0 0.38
Catosomidae
Catostomus commersonii White Sucker 0 0.01
Hypentelium nigricans Northern Hogsucker 0 0.03
Moxostoma anisurum Silver Redhorse 0.02 0
Moxostoma duquesnei Black Redhorse 0 0.01
Moxostoma erythrurum Golden Redhorse 0.01 0
Moxostoma spp. Redhorse Species 0.02 0
Ictaluridae
Ictalurus punctatus Channel Catfish 0.28 0.02
Noturus eleutherus Mountain Madtom 0 0.05
Noturus flavus Stonecat 0.03 0.01
Noturus stigmosus Northern Madtom 0.01 0.01
Pylodictis olivaris Flathead Catfish 0.03 0.02
Percopsidae
Percopsis omiscomaycus Trout-Perch 0.06 0.11
Atherinopsidae
Labidesthes sicculus Brook Silverside 0 0.01
Centrarchidae
Ambloplites rupestris Rock Bass 0.01 0.07
Lepomis cyanellus Green Sunfish 0 0.01
Lepomis macrochirus Bluegill 0 0.05
Micropterus dolomieu Smallmouth Bass 0.37 1.63
31
Micropterus punctulatus Spotted Bass 0.01 0
Micropterus salmoides Largemouth Bass 0.02 0
Micropterus sp. Black Bass Species. 0.02 0
Percidae
Etheostoma blennioides Greenside Darter 0.61 4.65
Etheostoma caeruleum Rainbow Darter 0.68 6.87
Etheostoma camurum Bluebreast Darter 1.01 1.17
Etheostoma flabellare Fantail Darter 0.09 0.34
Etheostoma maculatum Spotted Darter 0.01 0.21
Etheostoma nigrum Johnny Darter 3.36 0.17
Etheostoma tippecanoe Tippecanoe Darter 0.80 0.39
Etheostoma variatum Variegate Darter 0.02 1.17
Etheostoma zonale Banded Darter 0.42 5.19
Percina caprodes Logperch 2.44 1.32
Percina copelandi Channel Darter 6.41 1.52
Percina evides Gilt Darter 0.72 3.05
Percina macrocephala Longhead Darter 0.30 1.44
Percina maculata Blackside Darter 0 1.51
Percina (hybrid) Darter hybrid 0 0.01
Perca flavescens Yellow Perch 0.02 0
Sander vitreus Walleye 0.04 0.02
Sander sp. Walleye or Sauger 0.07 0.04
Sciaenidae
Aplodinotus grunniens Freshwater Drum 0.19 0
Cottidae
Cottus bairdi Mottled Sculpin 0 4.01
Mean Number of Fish per Trawl 18.8 46.6
640
641
32
Table 2: Additive partitioning results for fish communities among sites in impounded and free-642
flowing sections of the Allegheny River. 643
644
Spatial Scale Diversity
component
Observed
mean diversity
Expected
mean diversity
Contribution to
gamma diversity (%)
River γ 54
Section α2 39.5 39.5 73.1
β2 14.5 14.5 26.9
Site α1 10.94 17.11 27.7
β1 28.56 22.39 72.3
645
33
List of Figures 646
Fig.1 Map of Allegheny River watershed (shaded), showing the lower section impounded by 647
multiple navigation lock-and-dams, and the free-flowing middle section. For reference, the 648
upper free-flowing section above the Kinzua dam is also denoted. 649
Fig. 2 Fish diversity (upper panel) and mean depth (lower panel) of sites along a longitudinal 650
gradient in the Allegheny River. Open circles and dotted lines represent observed Brillouin 651
diversity, while solid circles and lines were calculated using a three-site moving average. 652
The navigation limit (dashed line) forms the break between the impounded lower section and 653
free-flowing middle section, while the Kinzua dam (dashed line) is the upstream limit of the 654
middle section of river. Navigation lock-and-dam structures are denoted by solid triangles, 655
and mean depths by open triangles. 656
Fig. 3: Diversity partitioning results (10 000 iterations) for the Allegheny River showing species 657
richness between the free-flowing middle and impounded lower sections (β2), among sites 658
(β1), and within sites (α1). The symbol ‘+’ indicates that observed diversity was greater than 659
expected, while ‘-‘ indicates that observed diversity was lower than expected. 660
Fig. 4 Non-metric multidimensional scaling plot of Bray-Curtis similarity among sites in the 661
Allegheny River. Downwards triangles represent impounded lower section sites, while 662
upwards triangles represent free-flowing middle section sites. Symbol shading represent 663
subsections defined by river kilometers (rkm). 664
Fig. 5 Bivariate plots of δ13
C and δ15
N for fish assemblages in the free-flowing middle section 665
(upper plot) and impounded lower section (lower plot) of the Allegheny River. Symbols 666
indicate mean stable isotope values (± s.e.) of individual species while light grey crosses 667
represent stable isotope values for individual fish. 668
34
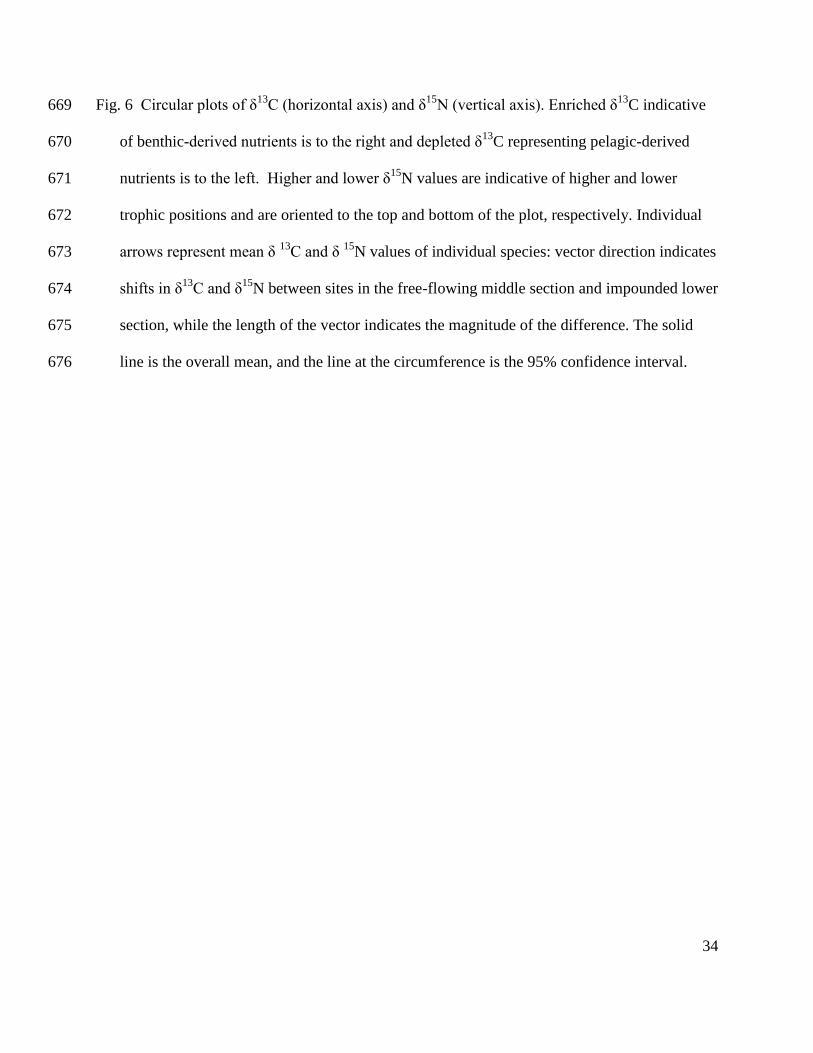
Fig. 6 Circular plots of δ13
C (horizontal axis) and δ15
N (vertical axis). Enriched δ13
C indicative 669
of benthic-derived nutrients is to the right and depleted δ13
C representing pelagic-derived 670
nutrients is to the left. Higher and lower δ15
N values are indicative of higher and lower 671
trophic positions and are oriented to the top and bottom of the plot, respectively. Individual 672
arrows represent mean δ 13
C and δ 15
N values of individual species: vector direction indicates 673
shifts in δ13
C and δ15
N between sites in the free-flowing middle section and impounded lower 674
section, while the length of the vector indicates the magnitude of the difference. The solid 675
line is the overall mean, and the line at the circumference is the 95% confidence interval. 676
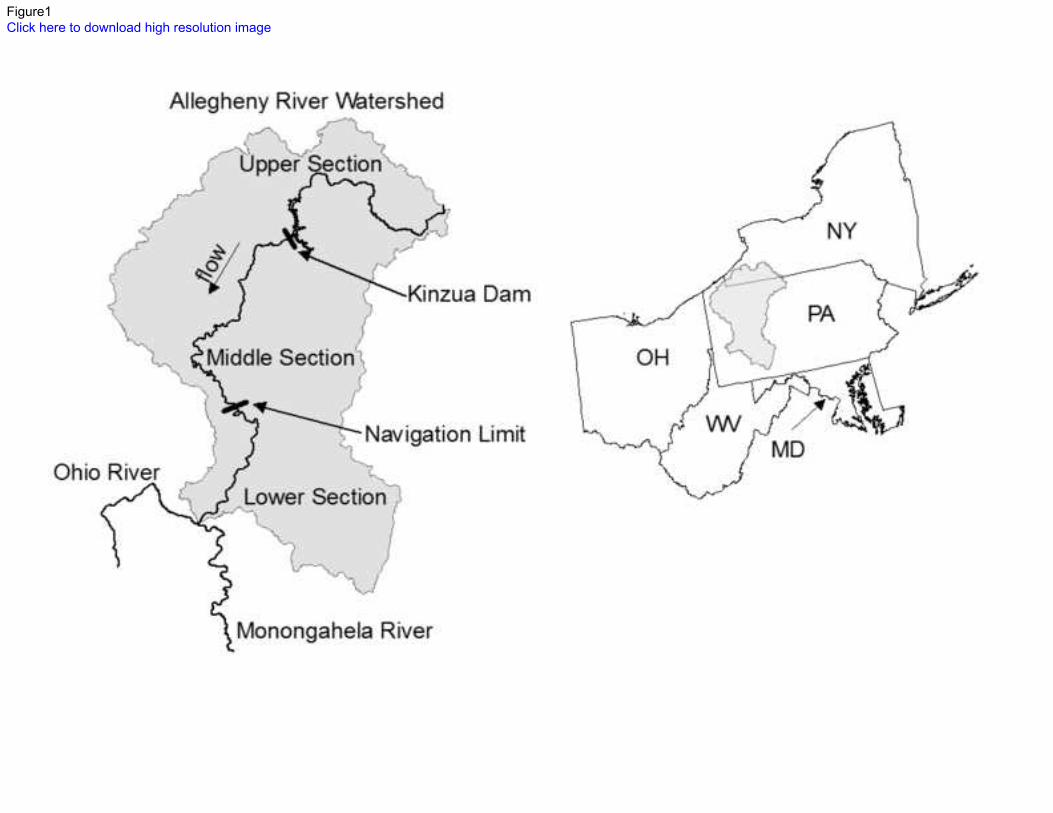
Figure1Click here to download high resolution image
!
!
!
!
!
!
"#$$
%&''
()*+()
,'( -
& )$(./)
0&1.'$$/)
()*+()
Figure2Click here to download Figure: Figure 2.EPS
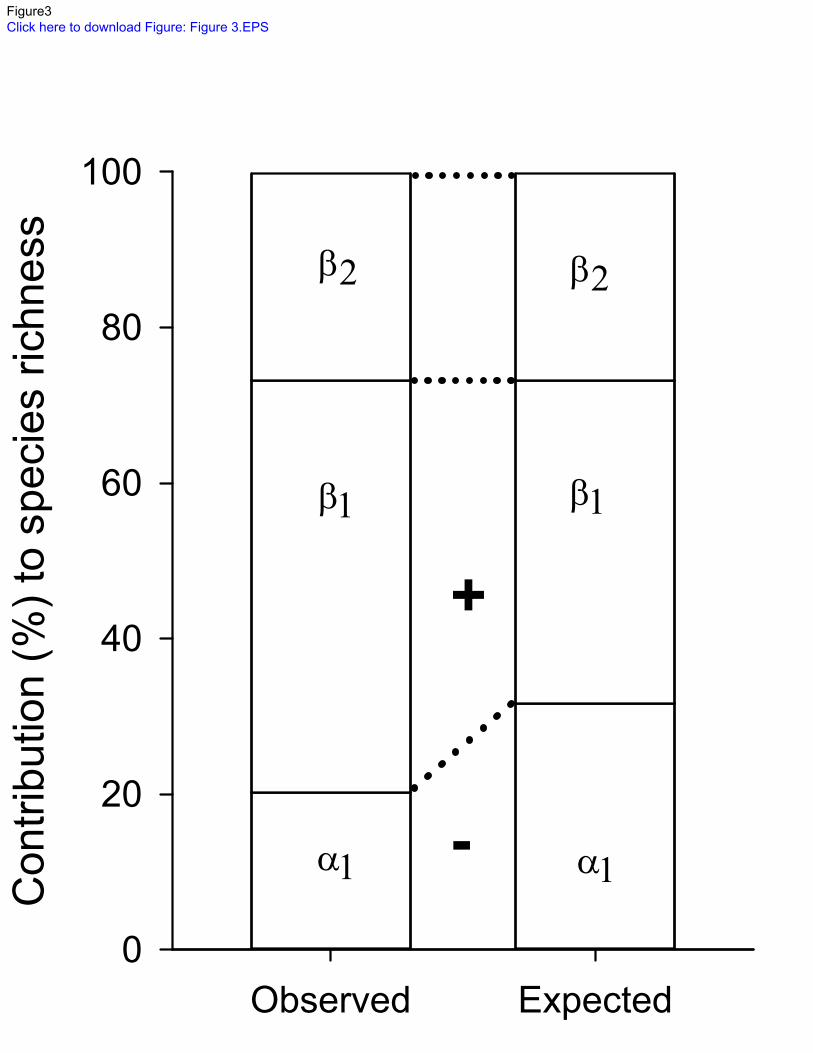
Figure3Click here to download Figure: Figure 3.EPS
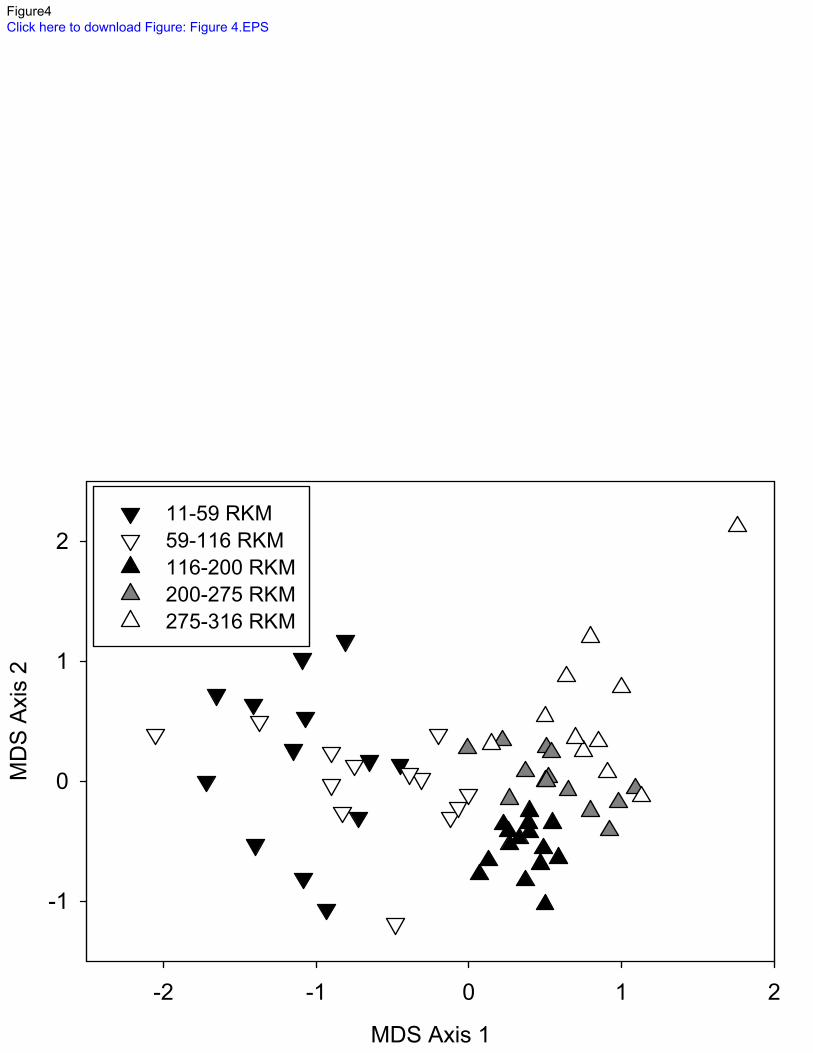
Figure4Click here to download Figure: Figure 4.EPS
!
" !
#!
!
$%!
"!
&
!
!
&!
"'(
& !
)
) *
+,
Figure5Click here to download Figure: Figure 5.EPS
Middle to Lower SectionHigher Trophic Position
Benthic Nutrients
Lower Trophic Position
Pelagic Nutrients 5 5
5
5
4 4
4
4
3 3
3
3
2 2
2
2
1 1
1
1
Figure6Click here to download Figure: Figure 6.pdf
Top Related
Copyright © 2022 FDOKUMEN

