


Bahasa
Halaman
Hukum


Response of plant species richness and primaryproductivity in shrublands along a north–south gradientin Europe to seven years of experimental warming anddrought: reductions in primary productivity in the heatand drought year of 2003
J O S E P P E N U E L A S *, PAT R I C I A P R I E T O *, C L A U S B E I E R w , C A R L A C E S A R A C C I O z, PA O L O
D E A N G E L I S § , G I O VA N B AT T I S T A D E D AT O § , B R I D G E T A . E M M E T T } , M A R C E S T I A R T E *,
J A N O S G A R A D N A I k, A N T O N I E G O R I S S E N **, E D I T K O VA C S L A N G k, G Y O R G Y K R O E L -
D U L AY k, L A U R A L L O R E N S *, G R A Z I A P E L L I Z Z A R O z, T O R B E N R I I S - N I E L S E N w w , I N G E R
K . S C H M I D T w w , C O S T A N T I N O S I R C A zz, A L W Y N S O W E R B Y } , D O N AT E L L A S PA N O zz and
A L B E R T T I E T E M A § §
*Unitat d’Ecofisiologia i Canvi Global CSIC-CEAB-CREAF, CREAF (Centre de Recerca Ecologica i Apicacions Forestals), Edifici C,
Universitat Autonoma de Barcelona, 08193 Bellaterra, Barcelona, Spain, wRISØ National Laboratory, PO Box 49, DK-4000
Roskilde, Denmark, zNational Research Council of Italy, Institute of Biometeorology (CNR-IBIMET), Via Funtana di lu Colbu 4/A,
07100-Sassari, Italy, §Department of Forest Environment and Resources (DISAFRI), University of Tuscia, Via San Camillo de Lellis,
I-01100 Viterbo, Italy, }Centre for Ecology and Hydrology-Bangor, Deiniol Rd, Bangor, Gwynedd LL572UP, UK, kInstitute of
Ecology and Botany, Hungarian Academy of Sciences, H-2163 Vacratot, Hungary, **Plant Research International, PO Box 16,
Bornsesteeg 65, NL-6700 AA Wageningen, The Netherlands, wwForest & Landscape, University of Copenhagen, H�rsholm Kongevej
11, DK-2970 H�rsholm, Denmark, zzDepartment of Economics and Tree Crops (DESA), Univeristy of Sassari, Via Enrico De Nicola
1, 07100 Sassari, Italy, §§Center for Geo-ecological Research (ICG), Institute for Biodiversity and Ecosystem Dynamics (IBED) –
Physical Geography, University of Amsterdam, Nieuwe Achtergracht 166, 1018 WVAmsterdam, The Netherlands
Abstract
We used a nonintrusive field experiment carried out at six sites – Wales (UK), Denmark
(DK), the Netherlands (NL), Hungary (HU), Sardinia (Italy – IT), and Catalonia (Spain –
SP) – along a climatic and latitudinal gradient to examine the response of plant species
richness and primary productivity to warming and drought in shrubland ecosystems.
The warming treatment raised the plot daily temperature by ca. 1 1C, while the drought
treatment led to a reduction in soil moisture at the peak of the growing season that
ranged from 26% at the SP site to 82% in the NL site. During the 7 years the experiment
lasted (1999–2005), we used the pin-point method to measure the species composition of
plant communities and plant biomass, litterfall, and shoot growth of the dominant plant
species at each site. A significantly lower increase in the number of species pin-pointed
per transect was found in the drought plots at the SP site, where the plant community
was still in a process of recovering from a forest fire in 1994. No changes in species
richness were found at the other sites, which were at a more mature and stable state of
succession and, thus less liable to recruitment of new species. The relationship between
annual biomass accumulation and temperature of the growing season was positive at the
coldest site and negative at the warmest site. The warming treatment tended to increase
the aboveground net primary productivity (ANPP) at the northern sites. The relationship
between annual biomass accumulation and soil moisture during the growing season was
not significant at the wettest sites, but was positive at the driest sites. The drought
treatment tended to reduce the ANPP in the NL, HU, IT, and SP sites. The responses to
warming were very strongly related to the Gaussen aridity index (stronger responses the
lower the aridity), whereas the responses to drought were not. Changes in the annual
Correspondence: Josep Penuelas, tel. 134 9358 12199, fax 134 9358
14151, e-mail: [email protected]
Global Change Biology (2007) 13, 2563–2581, doi: 10.1111/j.1365-2486.2007.01464.x
r 2007 The AuthorsJournal compilation r 2007 Blackwell Publishing Ltd 2563

aboveground biomass accumulation, litterfall, and, thus, the ANPP, mirrored the inter-
annual variation in climate conditions: the most outstanding change was a decrease in
biomass accumulation and an increase in litterfall at most sites during the abnormally
hot year of 2003. Species richness also tended to decrease in 2003 at all sites except the
cold and wet UK site. Species-specific responses to warming were found in shoot growth:
at the SP site, Globularia alypum was not affected, while the other dominant species,
Erica multiflora, grew 30% more; at the UK site, Calluna vulgaris tended to grow more in
the warming plots, while Empetrum nigrum tended to grow less. Drought treatment
decreased plant growth in several studied species, although there were some species
such as Pinus halepensis at the SP site or C. vulgaris at the UK site that were not affected.
The magnitude of responses to warming and drought thus depended greatly on the
differences between sites, years, and species and these multiple plant responses may be
expected to have consequences at ecosystem and community level. Decreases in biodi-
versity and the increase in E. multiflora growth at the SP site as a response to warming
challenge the assumption that sensitivity to warming may be less well developed at more
southerly latitudes; likewise, the fact that one of the studied shrublands presented
negative ANPP as a response to the 2003 heat wave also challenges the hypothesis that
future climate warming will lead to an enhancement of plant growth and carbon
sequestration in temperate ecosystems. Extreme events may thus change the general
trend of increased productivity in response to warming in the colder sites.
Keywords: biodiversity, climate change, drought, European gradient, forest-steppe, global warming,
heathland, heat wave, litterfall, net primary productivity, plant biomass, plant growth, shrubland,
species richness
Received 21 March 2007; revised version received 16 August 2007 and accepted 12 September 2007
Introduction
Global air temperatures have increased by 0.7 1C during
the 20th century and are predicted to increase by
between 1.1 and 6.4 1C during the 21st century, with
the greatest increases expected to occur at more north-
erly latitudes (IPCC, 2007). These increases will also be
accompanied by changes in precipitation patterns that
are much more difficult to forecast. However, many
models predict that summer droughts in some central
and southern European regions will become more pre-
valent (Penuelas et al., 2005; IPCC, 2007).
Over the last decade, the need for information re-
garding the physiological, ecological, and evolutive
response of organisms and ecosystems to climate
change has been addressed by a growing number
of observational and temperature- and precipitation-
manipulation experiments around the world. As a
result, a substantial body of data now exists that de-
monstrates the link between changes in regional climate
and alterations in biological processes in ecosystems.
Arft et al. (1999), Shaver et al. (2000), Penuelas & Filella
(2001), Rustad et al. (2001), Walther et al. (2002), Parme-
san & Yohe (2003), Root et al. (2003) and others have
reviewed many of these experiments. More recently, we
reported variable responses in plants and ecosystems
to experimental warming and drought along a
north–south gradient in European shrublands (Beier
et al., 2004; Emmett et al., 2004; Llorens et al., 2004;
Penuelas et al., 2004).
The responses of plant productivity and other eco-
system processes to climate change are quite variable
and increases, decreases, or no change at all have all
been reported (see references Rustad et al., 2001; Penue-
las et al., 2004). However, there seem to be some
regularities such as a greater positive response of
aboveground plant productivity to warming in colder
ecosystems (Rustad et al., 2001). Furthermore, Antle
et al. (2001) assembled a database of more than 2500
studies that address climate and related physical or
biological processes and found that 80% of the studied
species undergoing change were shifting in response to
warming in the direction expected on the basis of
known physiological constraints of species, while 20%
were changing in the opposite direction. There is also a
large body of observational, satellite, and atmospheric
data regarding plant species and ecosystems that shows
clear biological responses to warming such as extended
growing seasons and altitudinal and northward move-
ment of species’ distributions in both northern and
southern, cold-wet and warm-dry ecosystems (Myneni
et al., 1997; Penuelas & Filella, 2001; Penuelas et al., 2001,
2002; Walther et al., 2002; Parmesan & Yohe, 2003;
Penuelas & Boada, 2003; Root et al., 2003; Menzel
2564 J . P E N U E L A S et al.
r 2007 The AuthorsJournal compilation r 2007 Blackwell Publishing Ltd, Global Change Biology, 13, 2563–2581

et al., 2006). Ecosystem processes and biological species
may respond asymmetrically to climatic changes
(Walther et al., 2002) and the overall effect on ecosystem
functioning and species richness is, therefore, often
highly complex and determined by the relative sensi-
tivity of the different processes to climate change.
We conducted a nonintrusive field experiment (Beier
et al., 2004; Penuelas et al., 2004) for 7 years at six sites
from northern to southern Europe (United Kingdom,
Denmark, the Netherlands, Hungary, Italy, and Spain)
to examine the response of plant species richness and
aboveground primary productivity to warming and
drought along a climatic and latitudinal gradient of
shrubland ecosystems. The aim was to study the effects
of the climatic changes expected to occur over the
coming decades (Penuelas et al., 2005; IPCC, 2007)
and, additionally, we analyzed the effects of the 2003
heat wave. Our initial hypotheses were that plant
primary productivity responses to warming would be
greater in colder northern latitudes and the responses to
drought greater in drier southern latitudes, because
higher latitude ecosystems are typically limited by
temperature (Chapin et al., 1995) and lower latitude
Mediterranean and continental ecosystems by drought
(Mitrakos, 1980; Kovacs-Lang et al., 2000; Penuelas et al.,
2001; Terradas, 2001). We also hypothesized that effects
such as species-specific responses and the reduced
number of recruited seedlings in warming and, above
all, in drought plots found at some sites in a previous
study (Lloret et al., 2004) would, thus tend to lead to
decreased species richness, especially at those sites still
recovering their species-richness after a severe distur-
bance [e.g., the serious fire that occurred 5 years before
the start of the experiment at the Spanish (SP) site] by
progressively recruiting new species. The experimental
approach was specifically chosen to overcome some of
the main drawbacks found in previous studies such as
the overintrusiveness of some of the methodologies
used, the constant or diurnal rather than nocturnal
manipulation of warming, the predominance of studies
in cold and wet temperate and Arctic ecosystems, the
lack of across-the-board protocols, and temporal (our
results are the fruit of 7-year study instead of the 2 years
in our previous study) limitations (Beier et al., 2004;
Penuelas et al., 2004). To approach vegetation (and
ecosystem) response at larger spatial and temporal
scales, we examined local studies across a natural
climatic and environmental gradient along a transect
from northern to southern Europe. With this geo-
graphical approach, we aimed to take into account
long-term responses of vegetation to environmental
conditions (Chapin et al., 1995; Shaver et al., 2000;
Rustad et al., 2001). Long-term studies allow the natural
interannual variability as a result of temporal variability
in climatic conditions to be analyzed, thereby avoiding
the often initially stronger transient response to treat-
ments (Arft et al., 1999).
Material and methods
Sites and manipulations
Experimental manipulations were carried out in shrub-
lands at six European sites, in Wales (UK), in an atlantic
heathland, Denmark (DK), in an atlantic heathland/
grassland, the Netherlands (NL) in an atlantic heath-
land, Hungary (HU), in a continental forest-steppe,
Sardinia (Italy – IT), in a mediterranean shrubland
and in Catalonia (SP) also in a mediterranean shrub-
land, spanning both a temperature and precipitation
gradient, and an aridity gradient (Fig. 1) (Beier et al.,
20
40
60
80
UK NL DK HU IT SP
Gau
ssen
ind
ex o
f ar
idit
y
1200
1400
800
600
1000
9 10 11 12 13 14 15
Pre
cip
itat
ion
(m
m)
Air temperature (°C)
UK
NL
DK
HU
IT
SP
Fig. 1 Gaussen index of aridity (precipitation/2� temperature),
mean annual precipitation, and mean annual air temperature at
the studied shrubland study sites in Wales (UK), the Netherlands
(NL), Denmark (DK), Hungary (HU), Sardinia (Italy – IT), and
Catalonia (Spain – SP).
R E S P O N S E S O F S H R U B L A N D P L A N T S T O C L I M A T E C H A N G E 2565
r 2007 The AuthorsJournal compilation r 2007 Blackwell Publishing Ltd, Global Change Biology, 13, 2563–2581

2004). At each site, we imposed field-scale night-time
warming, drought and control treatments and the re-
sponse to the treatments was compared with control
plots. Plots were 4� 5 m2, allowing for a buffer strip of
0.5 m at the perimeter. Each type of manipulation was
replicated three times at each site. Pretreatment mea-
surements were conducted in order to identify varia-
bility between sites and plots.
Warming treatment
The warming treatment consisted of night-time warm-
ing provided by reflective curtains covering the vegeta-
tion at night (Beier et al., 2004). Solar energy is
accumulated in the ecosystem during the day and part
of this energy is reradiated back to the atmosphere at
night as long-wave infrared (IR) radiation. The covering
of the ecosystem with reflective aluminum foil curtains
(ILS ALU, AB Ludvig Svensson, Sweden) reduces the
loss of IR radiation. These curtains reflect 97% of the
direct and 96% of the diffuse radiation. The warming
plots are 20 m2 (5� 4 m2) and are framed by light
scaffolding that supports the reflective aluminum cur-
tain approximately 20 cm above the top of canopy. This
curtain is activated automatically by pre-established
light (o200 lx), rain, and wind (o10 m s�1) conditions
(Beier et al., 2004). The curtains reduced the heat loss
during night by 64%, from 33 to 12 W m�2, and in-
creased the temperature of the soil and plants by 0.5–
1.5 1C (DK), 0–2 1C (UK), 0–1 1C (NL), 1–2 1C (SP), 0.3–
1.3 (HU), and 0.2–0.6 1C (IT). These temperature in-
creases are in the range predicted by the next 20–30
years by Global Circulation Models (IPCC, 2007). The
magnitude of the warming effect depended on the site,
time of the year, and meteorological conditions (Beier
et al., 2004). These moderate increases in temperature
raised the average annual growth potential (growing
degree days – GDD) by 3–16% at the non-Mediterra-
nean sites. Overall at the six sites the number of days
with frost was reduced by 19–44% (Beier et al., 2004). In
order to avoid unwanted effects on the hydrological
cycle, rain sensors automatically trigger curtain re-
moval during rainfall. This warming treatment has been
applied since spring 1999 (since 2001 in HU and IT).
This method has the advantage that unintended edge
effects and artifacts are minimized. Measurements of
curtain movements, temperatures, precipitation, water
input into the plots, radiation balance during cam-
paigns, relative humidity, and wind speed showed that
the edge effects on the temperature increase, as well as
unintended effects on wind and moisture conditions,
were minimal. Because night-time warming implies
leaving the plots open during daytime, the effect on
light conditions was negligible (Beier et al., 2004).
Drought treatment
The drought treatment, which consisted of covering the
vegetation with transparent waterproof covers, was put
into practice for 2 months every year between 1999 and
2005 in the spring/summer growing seasons (in the SP
and IT sites an additional drought period was estab-
lished in the autumn growing season; Beier et al., 2004).
The drought plots are constructed in a similar way to
the warming plots except for the fact that the curtains
are made of transparent plastic and are only drawn in
case of rain and wind. During the drought period the
rain sensors activate the curtains whenever it rains and
remove them again once the rain stops. The curtains are
also removed automatically if the wind speed exceeds
10 m s�1. For the part of the year without the drought
treatment, the drought plots were managed in the same
way as the control plots. Decreases in soil moisture
during the drought treatment ranged from 82% in the
NL site to 26% in the SP site; air and soil temperatures
were not affected. For the rest of the year, the drought
treatment was not applied and so the received precipi-
tation was not directly affected (Beier et al., 2004).
Despite this soil moisture in the drought plots never
completely recovered to the control levels.
Untreated control
Three untreated plots with similar light scaffolding as in
the warming and drought plots but without curtains
were set up as controls.
Plant response
We conducted yearly monitoring of plant responses to
the above described climate manipulation treatments
and measured the following variables in all the experi-
mental plots: plant-community species richness, plant-
community cover and biomass, litterfall, aboveground
net primary productivity (ANPP), and individual plant
growth. The objective was to assess relative changes in
plant performance between treatment types for the
different sites, years, and species.
Species richness, plant cover and biomass (pin-pointmethod), litterfall, and ANPP
The pin-point method was used for measuring plant
frequency and for indirectly estimating plant cover and
biomass. Pin-point measurements were conducted an-
nually at each site in July–August, although in IT
measurements were taken at the end of the growing
season (September–May), at the beginning of June.
Vegetation response is assessed by noting species types
2566 J . P E N U E L A S et al.
r 2007 The AuthorsJournal compilation r 2007 Blackwell Publishing Ltd, Global Change Biology, 13, 2563–2581

and calculating plant contacts and heights at a large
number of points in each plot. This method enables,
moreover, the assessment of changes in species compo-
sition and species-specific growth to be recorded. A
sharpened pin was lowered through the vegetation
with a minimum of 300 measurement points for each
experimental plot. These points were arranged at 5 cm
intervals along replicated five 3 m long transect lines (in
SP and HU) or four 4 m long transect lines (in NL and
IT) or in 0.5� 0.5 m2 subplots (in the UK and DK). Each
plant hit with the pin was counted and the plant species
(or species group) recorded. At some of the sites the
height above the ground was also recorded for each hit
by means of 1 cm marks along the pin or along a vertical
rod held behind the pin in a way that did not disturb
the vegetation. We recorded the total number of hits for
each species (and for each plant part of each species, if
relevant) per transect and also the total number of hits
as a proportion of all pin hits per transect. We also
calibrated the pin-point measurements against absolute
biomass using destructive sampling outside the plots.
In each site biomass was regressed against hit numbers
(or proportions) or, if hit heights were recorded, against
heights.
In each plot, we placed litterfall collectors (between 5
and 30 – depending on the site and the traits of the
corresponding vegetation – small pots with small holes
allowing for drainage). These collectors ranged in dia-
meter from 15 to 4.4 cm and were randomly placed
under the plant canopy (or below Erica multiflora,
Globularia alypum, and Populus alba plants in the scat-
tered vegetation of SP and HU). We retrieved the litter
monthly (or every 2 or 6 months, depending on the site)
and then oven-dried it at 60 1C until constant weight.
Litterfall from grasses (DK) was estimated by harvest-
ing the standing dead biomass once a year from a 0.5 m2
plot since the litter is not shed from the grasses, which
were a dominant part of the vegetation.
ANPP was estimated as the sum of the change in total
aboveground biomass and litterfall. In DK, the ANPP is
equal to the litterfall as the aboveground biomass of
grasses and herbs senesce during the autumn.
Individual plant growth
The pin-point method does not provide a direct calcula-
tion of yearly plant growth at the species or individual
level (although the frequency of hits is affected by plant
growth and was also used to indirectly assess net
aboveground biomass change). Additional direct mea-
surement of individual plant growth was obtained in
the UK, HU, IT, and SP sites by marking shoots and
measuring them at intervals. A sample of 20–30 term-
inal shoots of the dominant site species were perma-
nently marked in each plot (in the HU site all shoots of
10 randomly selected shrubs per plot were measured).
The length of each shoot was measured and plant
growth estimated by using allometric relationships
between biomass and shoot lengths obtained from a
destructive sampling of plants from outside the plots.
Statistical analyses
We first conducted repeated measures ANOVAs and
Bonferroni post hoc comparison tests with each mea-
sured plant variable as a dependent variable and the
country and treatment as fixed factors. We used only the
mean value of each variable for each plot, so that n 5 3
per treatment, because we considered the roof/plot as
the smallest independent unit. We used as many sub-
plots/replicate samples as possible (usually three or
more with a maximum of 30, depending on the variable
being measured) to provide a good mean estimate for
each plot.
General regression models were built with plant
biomass, litterfall, and individual plant growth as de-
pendent variables, site, year, and species as fixed fac-
tors, and temperature, soil moisture, and precipitation
during the growing season (i.e. the final 3 months,
except in IT, where we took into account the whole
growing season from September to May) as indepen-
dent variables. Differences with a P-valueo0.05 were
considered as statistically different. Analyses were per-
formed with the STATVIEW software package (Abacus
Concepts Inc., Cary, NC, USA) and the STATISTICA soft-
ware package (StatSoft Inc., Tulsa, OK, USA).
Results
Species richness
The number of species pin-pointed per transect was
lower in the drought plots than in the control plots (it
was also lower in the warming plots than in the control
plots although the difference was statistically not sig-
nificant) at the SP site (Figs 2 and 3). At this site, the
plant community was recovering from a forest fire in
1994. During the 6-year study period between 1999 and
2004, drought plots recruited less than one new species
per transect and warming plots a little more than two
new species, whereas control plots recruited more than
three new species per transect (Figs 2 and 3). No
significant changes due to warming or drought were
found either at the other Mediterranean site (IT) or at
the continental and northern sites (Figs 2 and 3), which
were already in a more stable state of succession.
There was also a decrease in the number of species
detected in 2003 at all sites apart from the UK (Fig. 2),
R E S P O N S E S O F S H R U B L A N D P L A N T S T O C L I M A T E C H A N G E 2567
r 2007 The AuthorsJournal compilation r 2007 Blackwell Publishing Ltd, Global Change Biology, 13, 2563–2581

5.5
6
6.5
7
7.5
8
8.5 ControlWarming
7
8
9
10
11
12
ControlDrought
UK
Drought P=0.05
IT
1999 2001 2003 2005
5
6
7
8
9
10 Year P<0.0001
1999 2001 2003 2005
Drought P<0.02Year P<0.0001
SP
HU
8
10
12
14 Year P=0.01
DK
0.7
0.6
0.5
0.4
0.8
Pla
nt
spec
ies
rich
nes
s
2568 J . P E N U E L A S et al.
r 2007 The AuthorsJournal compilation r 2007 Blackwell Publishing Ltd, Global Change Biology, 13, 2563–2581

a consequence of the especially hot and dry weather
conditions of that year. A similar decrease was also
noted in another very dry year in SP, 2005 (Fig. 2).
Community plant biomass
Plant biomass calculated from allometric relationships
between pin-point measurements and biomass was
significantly greater at the UK site (3500 g m�2) than at
the NL site (ca. 1000 g m�2) and all the other sites (ca.
500 g m�2) (Fig. 4).
The ca. 1 1C experimental warming led to an increase of
69% in plant aboveground biomass accumulation during
the 5 years of experimentation at the UK site and of 72%
during the 3 years (2000–2002) with positive biomass
accumulation at the NL site (Fig. 5). The warming treat-
ment increased the total plant biomass at the northern sites,
UK and NL, and at the continental site, HU, but when the
responses during the unusually hot year of 2003 were
included, the global effect of warming was not significant
except slightly in HU (Fig. 5). The drought treatment
tended to reduce biomass accumulation at the NL, HU,
and SP sites, but again, if the whole study period is taken
into account, the overall reduction was only slightly sig-
nificant in HU (Fig. 5).
The annual aboveground biomass accumulation (Fig.
5) followed the interannual variation in climate condi-
tions and, moreover, presented a significant interaction
for site�year (F 5 3.89, Po0.01). However, the most
outstanding change was the decrease in biomass
accumulation at all sites except for the UK in the hot
year of 2003, with negative accumulation values at the
NL and HU sites. The UK site, on the other hand,
accumulated a greater amount of biomass than usual
(Fig. 7) as a likely result of increased nutrient avail-
ability as soil microbes are released from oxygen limita-
tion caused by excess of water.
−4
−2
0
2
4
ControlDroughtWarming
UK DK HU SP
a
b
aIn
crem
ent
of
the
spec
ies
nu
mb
era a
a
a
a
a
aaa
Fig. 3 Change in number of species per transect or subplot (see
Fig. 2 caption), in control, drought, and warming treatments at
the UK, DK, HU, and SP sites after 5–7 years of experiment in the
period 1998–2005. Bars indicate the standard errors of the mean
(n 5 3 plot means). UK, Wales; DK, Denmark; HU, Hungary; SP,
Catalonia (Spain).
500
1000
1500
2000
2500
3000
3500
Bio
mas
s (g
m−2
)
a
ccc
c
b
100
200
300
400
AN
PP
(g
m−2
yr−
1 )
UK NL DK HU IT SP
Fig. 4 Total aboveground plant biomass and annual above-
ground net primary productivity in the control plots at the UK,
NL, DK, SP, HU, and IT sites. Data are from control plots in 2002.
Bars indicate the standard errors of the mean (n 5 3 plots).
Different letters indicate significantly different means (Bonferro-
ni’s post-hoc test of the ANOVA). UK, Wales; NL, the Netherlands;
DK, Denmark; HU, Hungary; IT, Sardinia (Italy); SP, Catalonia
(Spain).
Fig. 2 Changes in plant species richness – number of species per 3 m transect (SP and HU), per m2 (IT), or per 0.5� 0.5 m2 subplot (UK
and DK) – in response to warming and drought treatments in the period between 1998 (before the experimental treatments were applied)
and the years of the experiment (1999–2005) in well-developed shrubland sites in UK, DK, HU, and IT, and in a typical shrubland
recovering from 1994 fire (SP). Whenever significant (repeated measures ANOVA), the effects of the studied factor or interaction are
depicted in the corresponding panel. An arrow signals the decreases in 2003 in all sites but the UK site. UK, Wales; DK, Denmark; HU,
Hungary; IT, Sardinia (Italy); SP, Catalonia (Spain).
R E S P O N S E S O F S H R U B L A N D P L A N T S T O C L I M A T E C H A N G E 2569
r 2007 The AuthorsJournal compilation r 2007 Blackwell Publishing Ltd, Global Change Biology, 13, 2563–2581

0
200
400
600
800UK
0
200
400NL
Drought P =0.09
50
60
70
80IT
0
50
100
150SP
1999 2001 2003 2005 1999 2001 2003 2005
Year P=0.02
Year P=0.07
Year P=0.008
Year P=0.001
Year P<0.0001
Year P<0.0001
Year P=0.03
−600
−400
−200
−400
−200
0
200DK
−20
−10
0
10
20
30HUWarming P = 0.06
An
nu
al a
bo
veg
rou
nd
bio
mas
s ac
cum
ula
tio
n (
g m
−2)
Control ControlWarming Drought
2570 J . P E N U E L A S et al.
r 2007 The AuthorsJournal compilation r 2007 Blackwell Publishing Ltd, Global Change Biology, 13, 2563–2581

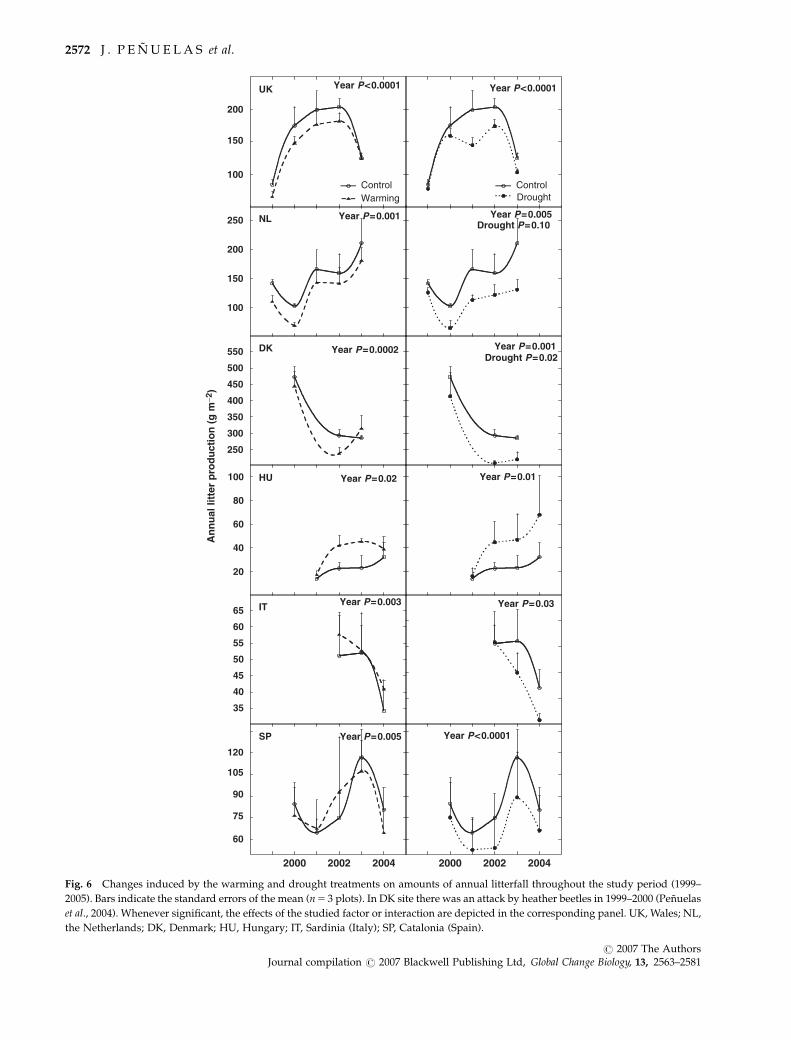
Litterfall
There was less plant litterfall at the southern sites (ca.
50 g m�2 at the IT site and ca. 100 g m�2 in the SP site)
than at the northern sites (ca. 150 g m�2 at the NL and
the UK sites) (Fig. 6), a logical consequence of their
smaller plant biomass (Fig. 4).
The warming treatment tended to decrease (ca. 15%) the
amount of litterfall at the northern sites, tended to increase
it at the HU site, and had no effect at the Mediterranean
sites (Fig. 6). The drought treatment tended to decrease
litterfall at all sites by ca. 25%, the only exception being the
HU site, where the drought treatment tended to increase
litterfall (Fig. 6). However, the HU litter data are not
comparable because of the deciduous character and the
special dynamics of the clonal poplar shrubs that grow
there: the amount of cover (and thus litterfall) of the
poplars changed at different rates in different plots, that
is, independently of the treatment type. In some plots
shrub cover spread, but died back in others.
In line with the plant accumulation response, there
was also an interannual variation in litterfall: an in-
crease in the litterfall amount was recorded in the hot
year of 2003 at the SP and the NL sites, whereas a
decrease was recorded at the UK site (Fig. 6).
NPP
In a typical year such as 2002 the ANPP, calculated as
the accumulated aboveground biomass plus litterfall,
ranged between 100 and 200 g m�2 at the southern and
continental sites and between 200 and 300 g m�2 at the
northern sites (Fig. 4).
The warming treatment increased the ANPP, especially
at the northern sites (the UK and the NL sites) and at the
HU site, but when the responses to the unusually hot
year of 2003 are included, the overall effect of warming
throughout the whole experiment was not significant in
the northern sites (see Figs 5–8). Drought treatment
reduced the ANPP at the NL, HU, IT, and SP sites, but
again, after taking the whole study period into account
using a repeated measures analysis including all years,
this reduction was nowhere significant (see Figs 5–8).
The ANPP followed the interannual variation in
climate conditions and the effect was different depend-
ing on the site as indicated by the significant interaction
found for site� year (F 5 7.28, Po0.001). However, the
most outstanding change was the decrease in ANPP in
2003 in all sites except for the UK site.
Individual plant growth
Plant growth measured as shoot length was not signifi-
cantly affected by the warming treatment in the studied
species at the HU (P. alba) and IT (Cistus monspeliensis)
sites, or in two of the three dominant species studied in
SP, G. alypum and Pinus halepensis. However, at the SP
site, the growth of the other dominant species, E. multi-
flora, was significantly enhanced (30%) by the warming
treatment (Fig. 8). There was also a contrasting response
to warming at the UK site: Calluna vulgaris tended to
respond positively to the warming treatment, while
Empetrum nigrum tended to respond negatively (Fig. 8).
The drought treatment decreased growth in G. alypum
(34%) and E. multiflora (25%) in SP and in C. monspe-
liensis (21%) in IT, but had no significant effect either on
P. alba at the HU site (Fig. 8) or on the two studied
species in the UK (C. vulgaris and E. nigrum) that,
however, also tended to grow less, especially E. nigrum
(Fig. 8). There were also contrasting responses among
the three studied species at the SP site, since the third
dominant species in SP, P. halepensis, was not signifi-
cantly affected by the drought treatment (data not
shown). Drought decreased plant growth in Deschampsia
flexuosa in DK, although in that country other more
rhizomatous grasses did tend to increase growth in
response to drought. Annual growth was significantly
dependent not only on species and treatment, but also
on the year and precipitation and soil moisture of the
year (Figs 7 and 8). Most studied plant species presented
significantly higher growth rates in wet years (2002 and
2004) than in dry years (2001 and 2003) (Figs 7 and 8).
Relationships between annual aboveground biomassaccumulation and site temperature and soil moisture
Biomass accumulation and litterfall responses to warm-
ing and drought followed a gradient from wet/cold to
dry/warm climatic environments. The responses to
warming were very strongly related to the Gaussen
aridity index with the maximum response occurring
in the least arid site and with the minimum response in
the most arid site (Fig. 9). The responses to the drought
treatment were not significantly related to this aridity
Fig. 5 Changes induced by the warming and drought treatments in the annual plant aboveground biomass accumulation throughout
the study period (1999–2005). Bars indicate the standard errors of the mean (n 5 3 plots). In DK site, there was a heather beetle attack in
1999–2000 (Penuelas et al., 2004). When significant, the effects of the studied factor or the interaction are depicted in the corresponding
panel. An arrow signals the decreases in 2003 in all sites but the UK site. UK, Wales; NL, the Netherlands; DK, Denmark; HU, Hungary;
IT, Sardinia (Italy); SP, Catalonia (Spain).
R E S P O N S E S O F S H R U B L A N D P L A N T S T O C L I M A T E C H A N G E 2571
r 2007 The AuthorsJournal compilation r 2007 Blackwell Publishing Ltd, Global Change Biology, 13, 2563–2581
UK
100
150
200
Year P<0.0001
NL
100
150
200
250 Year P=0.001
Year P=0.001
Year P=0.01
Year P=0.03Year P=0.003
Year P=0.005
Year P=0.02
Year P=0.0002
Year P=0.005
Year P<0.0001
IT
35
40
45
50
55
60
65
Drought P=0.02
2000 2002 2004
Year P<0.0001SP
60
75
90
105
120
2000 2002 2004
DK
250
300
350
400
450
500
550
Drought P=0.10
HU
20
40
60
80
100
An
nu
al li
tter
pro
du
ctio
n (
g m
−2)
Control ControlWarming Drought
Fig. 6 Changes induced by the warming and drought treatments on amounts of annual litterfall throughout the study period (1999–
2005). Bars indicate the standard errors of the mean (n 5 3 plots). In DK site there was an attack by heather beetles in 1999–2000 (Penuelas
et al., 2004). Whenever significant, the effects of the studied factor or interaction are depicted in the corresponding panel. UK, Wales; NL,
the Netherlands; DK, Denmark; HU, Hungary; IT, Sardinia (Italy); SP, Catalonia (Spain).
2572 J . P E N U E L A S et al.
r 2007 The AuthorsJournal compilation r 2007 Blackwell Publishing Ltd, Global Change Biology, 13, 2563–2581
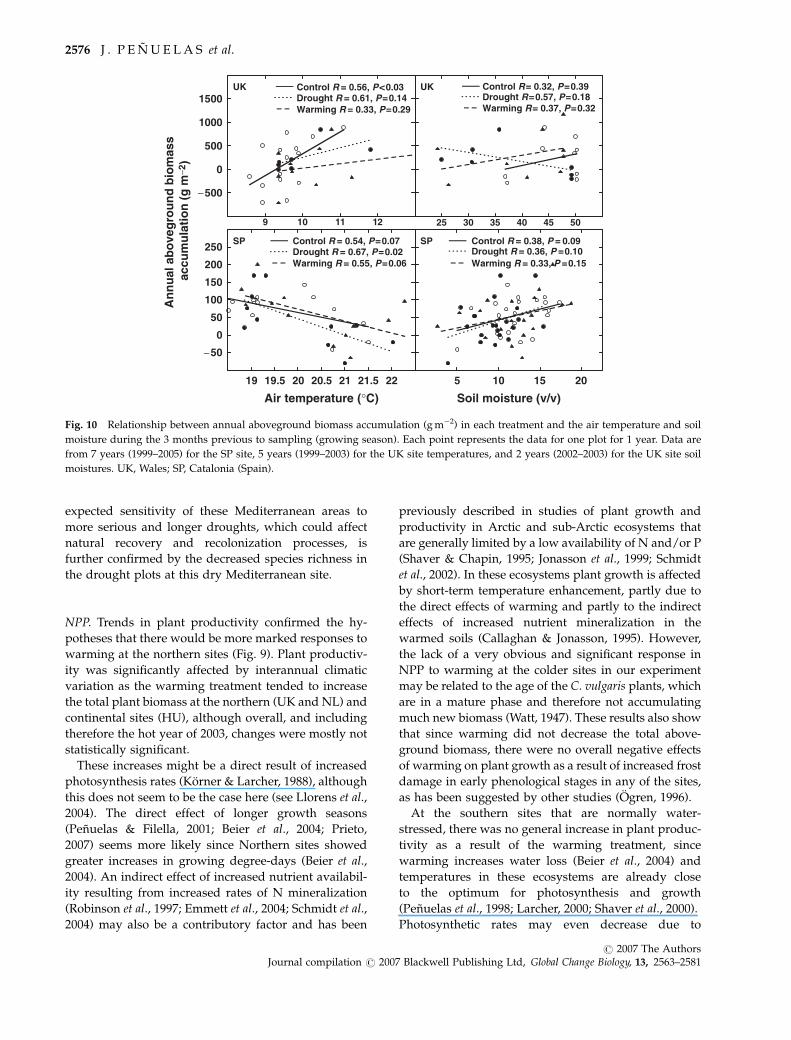
index (Fig. 9), Fig. 10 highlights this gradient by con-
trasting the annual aboveground biomass accumulation
with the temperature and soil moisture changes at the
wettest and coldest (least arid) site (the UK) with those
recorded at the driest and warmest (most arid) site (SP).
The relationship with temperature was positive for
annual biomass accumulation at the coldest site,
whereas this relationship was negative for annual bio-
mass accumulation at the warmest site (Fig. 10). The
correlation with soil moisture was not significant at the
wettest site, although annual biomass accumulation
was positively related to soil moisture changes at the
driest site (Fig. 10). The relationship between biomass
accumulation and soil moisture did not significantly
differ under the drought or warming treatments. Simi-
larly, there were no significant differences between
treatments in the response of biomass accumulation to
temperature, except for a slight trend toward lower
response of warming plots in the coldest site.
Discussion
The geographical gradient: responses in the wet/coldnorthern sites, but also in the dry/warm southern sites
Species richness. As a result of moderate warming (ca.
1 1C) and drought (on average ca. 19% lower soil
moisture) there was a lower increase in species
richness in the 7 years study in treated plots than in
control plots at the SP site, which had not reached a
UK
−100
0
100
200
300
400
500
600
700
NL
10
11UK P=0.01P=0.1
19
20
21
22SP
17
18
19
20 HU
10
20
30
40
50
60 HU
16
17
18 NL
130
140
150
160
170
180 SP
50
55
60
UK
11
12
13
14SP P=0.07
P=0.0005P<0.0001
P <0.0001
P<0.0001P<0.0001 P=0.02
P=0.05
3
4
5
6
7
8 HU
12
13
14
15
16NL
ANPP (g m−2 yr−1) Air temperature (°C) Soil moisture (v/v)
2002 2003 2002 2003 2002 2003
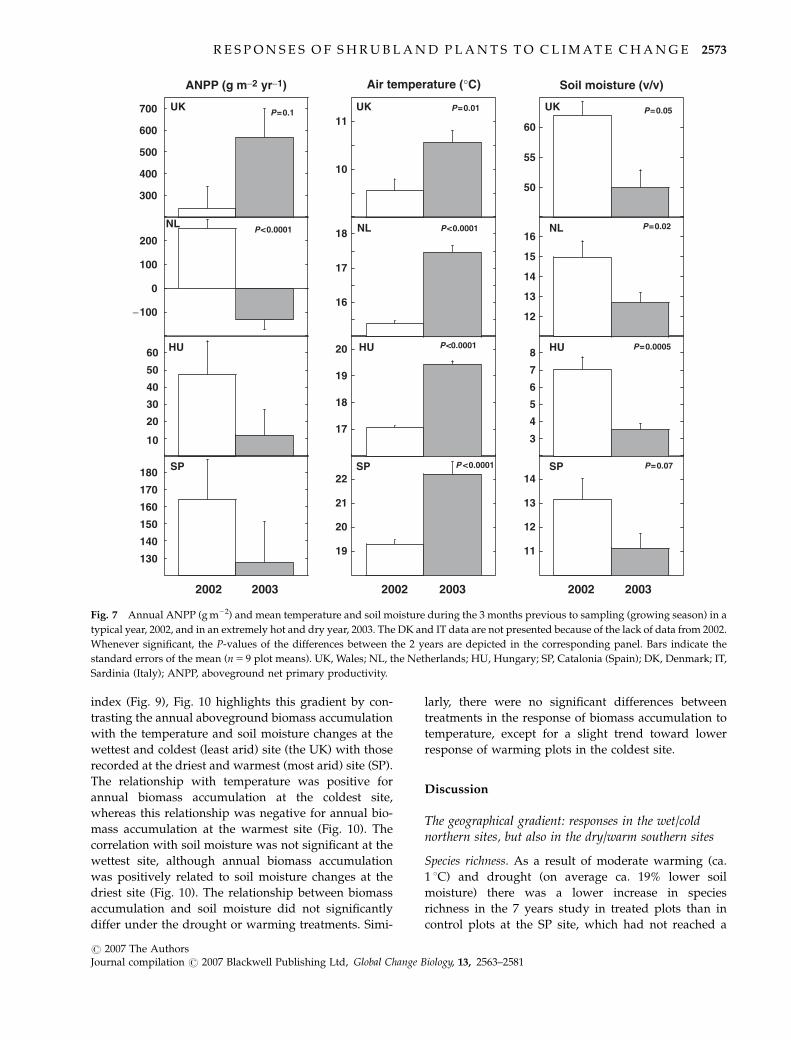
Fig. 7 Annual ANPP (g m�2) and mean temperature and soil moisture during the 3 months previous to sampling (growing season) in a
typical year, 2002, and in an extremely hot and dry year, 2003. The DK and IT data are not presented because of the lack of data from 2002.
Whenever significant, the P-values of the differences between the 2 years are depicted in the corresponding panel. Bars indicate the
standard errors of the mean (n 5 9 plot means). UK, Wales; NL, the Netherlands; HU, Hungary; SP, Catalonia (Spain); DK, Denmark; IT,
Sardinia (Italy); ANPP, aboveground net primary productivity.
R E S P O N S E S O F S H R U B L A N D P L A N T S T O C L I M A T E C H A N G E 2573
r 2007 The AuthorsJournal compilation r 2007 Blackwell Publishing Ltd, Global Change Biology, 13, 2563–2581

5
6
7
Cal
lun
a vu
lgar
is
UK
6
7
8
9
10
11E
mp
etru
m n
igru
mUK
1
2
3
Year P<0.0006Warming P =0.08
Eri
ca m
ult
iflo
ra
SP Year P<0.0001
Year P<0.0001 Year P<0.0001
Year P<0.0001
Year P<0.0001 Year P=0.0001
Year P<0.003
Drought P =0.11
Drought P =0.005
Year P =0.0005Year P =0.0005
Year P =0.0008 Year P =0.02
Drought P=0.06
4
6
8
10
2000 2002 2004 2000 2002 2004
Glo
bu
lari
a al
ypu
m SP
2
3
4
5
Po
pu
lus
alb
a
HU
Year * Drought P <0.04
6
7
8 IT
Cis
tus
mo
nsp
elie
nsi
s
An
nu
al e
lon
gat
ion
(cm
)
Control ControlWarming Drought
2574 J . P E N U E L A S et al.
r 2007 The AuthorsJournal compilation r 2007 Blackwell Publishing Ltd, Global Change Biology, 13, 2563–2581

mature successional stage after the 1994 forest fire (5
years before the experiments started). The resulting
decrease in species richness agrees with the decrease
in seedling recruitment and seedling diversity observed
at this SP site (Lloret et al., 2004). This decrease in
species richness shows that the climate change
predicted for the coming decades will have significant
implications for vegetation composition, biodiversity,
and structure, especially in plant communities that have
not reached a mature successional stage. Such decreases
in species richness may also play an important role in
controlling the response of the overall carbon balance in
these terrestrial ecosystems. In the other Mediterranean
site (IT), where the state of succession was more mature
and stable, no significant changes in the species richness
occurred as a result of the experimental treatments. In
the IT site, the previous major disturbance occurred 10
years before the beginning of the experiment and, as
reported by Calvo et al. (2002), Mediterranean
shrublands generally completely recover within 12
years of a disturbance.
Changes in species composition in response to
warming and altered water availabilty have also been
reported in colder ecosystems such as a Rocky
Mountain meadow (Harte & Shaw, 1995) and
temperate bogs and fens (Weltzin et al., 2003). The
results from our study extend species composition
findings into the warm and dry Mediterranean zone,
which like most warm areas is normally not considered
to be temperature sensitive. On the other hand, our
findings do agree with species and ecosystem changes
in species composition observed in SP over the past 50
years of progressive warming and aridification
(Penuelas et al., 2001; Hodar et al., 2003; Penuelas &
Boada, 2003; Sanz-Elorza et al., 2003; Jump & Penuelas,
2006).
No significant changes in response to the
experimental warming and drought were found in the
species richness of the other sites (Fig. 2). The DK and
NL sites had thick covers of grass and heather,
respectively, with no bare soil available for the
establishment of new species and other sites such as
those in the UK, HU, and IT were in more mature
successional stage as shrublands and, therefore, were
less prone to new species recruitment.
This slightly greater response in species richness to
warming at the SP site does not necessarily contradict
our hypothesis that responses to warming would be
greater at colder temperature-limited northern latitudes
(Chapin et al., 1995), because the SP site was at a
different successional stage and its sensitive com-
munities were still recovering from a major distur-
bance. However, the response of this warm site
highlights the need to re-examine the assumption that
sensitivity to warming will not be as great at southern
latitudes, in particular wherever successional processes
are still at work and where increased evapo-
transpiration associated to warming is significant. The
Fig. 8 Changes produced by the warming and drought treatments in the annual growth of dominant plant species measured as the
increases in shoot length at the HU (Populus alba), IT (Cistus monspeliensis), and SP (Erica multiflora and Globularia alypum) sites. Bars
indicate the standard errors of the mean (n 5 3 plot means). Whenever significant, the effects of the studied factor or interaction are
depicted in the corresponding panel. An arrow signals the decreases in 2003. In IT, the effects of the 2003 heat and drought were noticed
in the growth measured in June 2004, at the end of the 2003–2004 growth period. UK, Wales; HU, Hungary; IT, Sardinia (Italy); SP,
Catalonia (Spain).
0
400
300
200
100
R2= 0.997P=0.02
War
min
g
SPHU
NL
UK
−200
−150
−100
−50
0
20 30 40 50 60 70 80
Dro
ug
ht
SPHU
NL
UK
Tre
atm
ent
effe
ct o
n b
iom
ass
accu
mu
lati
on
(g
m−2
) (1
998
–20
03)
Gaussen index of aridity
Fig. 9 Relationship between the change of annual aboveground
biomass accumulation (g m�2) during the period 1998–2003 in
response to warming and drought treatments and the Gaussen
index of aridity (precipitation/2� temperature) of each site.
Data are from 5 years (1999–2003) for the UK, NL, and SP sites
and from 4 years (2001–2004) for the HU site. (DK site was not
considered here because there was a heather beetle attack in
1999–2000 (Penuelas et al., 2004); the IT site was not either
considered because we only had 1 year data available). UK,
Wales; NL, the Netherlands; DK, Denmark; HU, Hungary; IT,
Sardinia (Italy); SP, Catalonia (Spain).
R E S P O N S E S O F S H R U B L A N D P L A N T S T O C L I M A T E C H A N G E 2575
r 2007 The AuthorsJournal compilation r 2007 Blackwell Publishing Ltd, Global Change Biology, 13, 2563–2581
expected sensitivity of these Mediterranean areas to
more serious and longer droughts, which could affect
natural recovery and recolonization processes, is
further confirmed by the decreased species richness in
the drought plots at this dry Mediterranean site.
NPP. Trends in plant productivity confirmed the hy-
potheses that there would be more marked responses to
warming at the northern sites (Fig. 9). Plant productiv-
ity was significantly affected by interannual climatic
variation as the warming treatment tended to increase
the total plant biomass at the northern (UK and NL) and
continental sites (HU), although overall, and including
therefore the hot year of 2003, changes were mostly not
statistically significant.
These increases might be a direct result of increased
photosynthesis rates (Korner & Larcher, 1988), although
this does not seem to be the case here (see Llorens et al.,
2004). The direct effect of longer growth seasons
(Penuelas & Filella, 2001; Beier et al., 2004; Prieto,
2007) seems more likely since Northern sites showed
greater increases in growing degree-days (Beier et al.,
2004). An indirect effect of increased nutrient availabil-
ity resulting from increased rates of N mineralization
(Robinson et al., 1997; Emmett et al., 2004; Schmidt et al.,
2004) may also be a contributory factor and has been
previously described in studies of plant growth and
productivity in Arctic and sub-Arctic ecosystems that
are generally limited by a low availability of N and/or P
(Shaver & Chapin, 1995; Jonasson et al., 1999; Schmidt
et al., 2002). In these ecosystems plant growth is affected
by short-term temperature enhancement, partly due to
the direct effects of warming and partly to the indirect
effects of increased nutrient mineralization in the
warmed soils (Callaghan & Jonasson, 1995). However,
the lack of a very obvious and significant response in
NPP to warming at the colder sites in our experiment
may be related to the age of the C. vulgaris plants, which
are in a mature phase and therefore not accumulating
much new biomass (Watt, 1947). These results also show
that since warming did not decrease the total above-
ground biomass, there were no overall negative effects
of warming on plant growth as a result of increased frost
damage in early phenological stages in any of the sites,
as has been suggested by other studies (Ogren, 1996).
At the southern sites that are normally water-
stressed, there was no general increase in plant produc-
tivity as a result of the warming treatment, since
warming increases water loss (Beier et al., 2004) and
temperatures in these ecosystems are already close
to the optimum for photosynthesis and growth
(Penuelas et al., 1998; Larcher, 2000; Shaver et al., 2000).
Photosynthetic rates may even decrease due to
Drought R = 0.61, P=0.14
−50
0
50
100
150
200
250
19 19.5 20 20.5 21 21.5 22
SP
25 30 35 40 45 50
Control R= 0.32, P=0.39UK
Warming R = 0.33, P=0.29
9 10 11 12
−500
0
500
1000
1500Control R = 0.56, P<0.03
Drought R = 0.67, P=0.02Warming R = 0.55, P=0.06
Control R = 0.54, P=0.07
UKDrought R=0.57, P=0.18
An
nu
al a
bo
veg
rou
nd
bio
mas
s a
ccu
mu
lati
on
(g
m−2
)
Soil moisture (v/v)
Warming R= 0.37, P=0.32
5 10 15 20
Control R = 0.38, P = 0.09SP
Warming R = 0.33, P =0.15Drought R = 0.36, P =0.10
Air temperature (°C)
Fig. 10 Relationship between annual aboveground biomass accumulation (g m�2) in each treatment and the air temperature and soil
moisture during the 3 months previous to sampling (growing season). Each point represents the data for one plot for 1 year. Data are
from 7 years (1999–2005) for the SP site, 5 years (1999–2003) for the UK site temperatures, and 2 years (2002–2003) for the UK site soil
moistures. UK, Wales; SP, Catalonia (Spain).
2576 J . P E N U E L A S et al.
r 2007 The AuthorsJournal compilation r 2007 Blackwell Publishing Ltd, Global Change Biology, 13, 2563–2581

overheating in the warmest seasons or microenviron-
ments (Penuelas et al., 1998; Shaver et al., 2000; Penuelas
& Llusia, 2002; Llorens et al., 2003). Other reasons for the
lack of response or a negative plant response to increas-
ing temperature are the concomitant increases in eva-
potranspiration and decline in soil moisture often
associated with warming, and the decreased availability
of nutrient resources such as N and P (Rustad et al.,
2000; Sardans & Penuelas, 2004, 2005).
The drought treatment tended to reduce biomass
accumulation at the NL, HU, IT, and SP sites, although
after taking into consideration the whole study period,
this reduction was not significant. In fact, in most
southern semiarid areas drought already limits plant
productivity (Mitrakos, 1980; Larcher, 2000; Penuelas
et al., 2001; Terradas, 2001), as shown by the low 14C
recoveries (Gorissen et al., 2004), photosynthetic rates
(Llorens et al., 2004), and standing plant cover and
biomass in Mediterranean and continental shrublands
(Fig. 4). Both the direct effects due to decreased photo-
synthetic rates and the indirect effects due to decreased
nutrient availability of the drought treatment (Sardans
& Penuelas, 2004; Sardans & Penuelas, 2007) would
tend to lead in the same direction toward decreased
plant productivity.
The tendency of the warming treatment to decrease (ca.
15%) the amount of litterfall only at the northern sites
may be an effect of the longer leaf life-span found at the
temperature-limited northern sites (Prieto, 2007). The
drought treatment litterfall decrease, or tendency to
decrease, at all sites (ca. 25%) except for the HU site
(where the data originating from the dynamic character
of the poplar trees were not comparable) was unexpected
because drought often encourages leaf fall (Harley et al.,
1987; Oliveira & Penuelas, 2002; Ogaya & Penuelas, 2006).
These decreases might be related to lower precipitation
levels diminishing litter production (Simmons et al.,
1996). Further monitoring during the coming years is
needed to be able to draw reliable conclusions regarding
litterfall responses to warming and drought.
Biomass accumulation responses to warming and
drought lie along a gradient from wet/cold to dry/
warm environments that is highlighted in Figs 9 and 10.
Figure 9 shows how aridity limits the response to
warming. The response to the warming treatment in-
creased the lower the aridity of the site (it was stronger
in sites with high precipitation and cold temperatures).
Figure 10 shows the trend toward a positive relation-
ship between biomass accumulation and temperature at
the coldest site, a negative relationship between these
two factors at the warmest site, and a positive relation-
ship between biomass accumulation and soil moisture
in the driest site. Because the relationship between
biomass and soil moisture was the same under control,
drought, and warming, soil moisture alone will be a
good predictor of biomass accumulation as tempera-
tures increase due to climate change. Similarly, because
the relationship between biomass accumulation and
temperature was the same under all treatments, inter-
annual temperature variation can be used to predict
biomass accumulation response to warming. A slight
trend toward lower response of warming plots in the
coldest site can indicate a slight acclimation that de-
serves to be further studied.
Interannual differences. The 2003 heat wave and thedecreases in species recruitment and ANPP
Interannual changes in species richness, aboveground
plant biomass accumulation, and litterfall occurred at
all sites and mirrored interannual variation in climate
conditions. The lower number of species detected in
2003 at all sites except the UK site, in line with the
especially hot and dry weather conditions that year, was
especially notable. There was also a decrease in biomass
accumulation at all sites except the UK site in the
unusually hot year of 2003. Temperatures at the UK site
did not increase as much as at most other sites and this
site was the most positively sensitive to warming as was
to be expected from it being the coldest site. This
finding is also consistent with the fact that the UK site
is limited by excess water and, thus drought can have
neutral or positive effects (Fig. 7). There was also great
interannual variation, with a significant increase in the
amount of litterfall in 2003 at the SP and NL sites,
contrasting with a decrease at the UK site, in conso-
nance with their respective plant accumulations.
Since severe regional heat waves such as the one that
occurred in 2003 may become more frequent in a chan-
ging climate (Meehl & Tebaldi, 2004; Schar et al., 2004),
the expected future enhancement of plant growth and
carbon sequestration resulting from climate warming in
temperate ecosystems may not in fact occur, as has been
suggested by Ciais et al. (2005). In fact, our results show
an even stronger decrease in NPP than the 30% reduc-
tion in gross primary productivity throughout Europe
estimated by a recent study by Ciais et al. (2005),
measuring ecosystem carbon fluxes, the remotely
sensed radiation absorbed by plants, and crop yields
at country level. The shrublands at the NL site even
presented negative ANPP, contributing thus to positive
carbon flux as previously anticipated by models (Cox
et al., 2000; Dufresne et al., 2002).
Species-specific growth responses
Our results show different responses to warming and
drought not only between years and between sites, but
R E S P O N S E S O F S H R U B L A N D P L A N T S T O C L I M A T E C H A N G E 2577
r 2007 The AuthorsJournal compilation r 2007 Blackwell Publishing Ltd, Global Change Biology, 13, 2563–2581

also between species. Plant growth, measured as shoot
length, was not significantly affected by the warming
treatment in most studied species at the southern sites.
On the other hand, D. flexuosa in DK and C. vulgaris in
DK and UK tended to grow more in the warming plots.
At the UK site C. vulgaris tended to grow more in the
warming plots, whereas E. nigrum tended to grow less
as expected from its more northerly distribution. Plant
growth also increased in one of the dominant species at
the SP site, E. multiflora, but not in the other dominant
species, G. alypum. This result, apart from the previous
comments on possible effects resulting from different
competitive abilities, also provides further evidence of
the existence of a cold temperature limitation for plants
in the Mediterranean winter (Mitrakos, 1980; Oliveira &
Penuelas, 2001, 2002, 2004) and highlights again that
warm southern Mediterranean ecosystems may be
more sensitive to warming than expected.
The warming treatment had a significant impact on
extreme and seasonal climatic conditions and led to a
large reduction in the number of frost days and an
extended spring growing season (Beier et al., 2004). The
increased growth of some of these species may therefore
be a direct result of a small constant temperature
increase in annual mean values and/or the indirect
effects of warming such as an extended growing season
(Prieto, 2007).
The drought treatment, on the other hand, decreased
plant growth by 25–35% in the studied species at the SP
site and by 21% in C. monspeliensis at the IT site. Never-
theless, no decreased plant growth was recorded in the
drought resistant tree species P. halepensis at the SP site,
in P. alba at the HU site (as was to be expected, since
these poplar shrubs get water support from their
‘mother tree’ which has deep roots, and usually grows
outside the plots), or at the UK site, where plenty of
water was available usually in excess. In DK, the
dominant grass D. flexuosa decreased plant growth by
30–40%, as measured by the number of hits per pin. In
contrast, rhizomatous grass species at the same site
increased growth.
The species-specific responses to warming at the UK
and SP sites or to drought at the SP and IT sites suggest
that climate change may translate into changes in the
species composition of communities in the near future
as a consequence of different competitive abilities.
Ecosystem and community level responses andfinal remarks
If plant species composition in communities change in
response to climate change, ecosystem responses to
warming and drought will in turn be affected (Corne-
lissen et al., 1999), because species composition affects
ecosystem properties such as plant growth rates or litter
quantity and quality (and therefore microbial dynamics
and litter decomposition), frost hardiness, and drought
resistance. Most of these changes are expected to occur
over the coming years and decades, although our study
shows that they may occur in the space of just a few
years as a result of a moderate change in climate. This is
shown by the sensitive SP site, still recovering from a
fire and in an early stage of succession and recruitment
of new species.
This study is also a relatively long-term project, a fact
that has enabled us to disregard certain changes such as
the often measured increase in vegetative growth after
warming in the early years of most experiments (Arft
et al., 1999). As well, the length of the study period was
sufficient for the complex interactions between envir-
onmental factors that limit plant growth to become
apparent in the form of marked interannual variations.
During the study period severely hot and/or dry years
occurred and, given that severe regional heat waves
such as those in 2003 may become more frequent in a
changing climate (Meehl & Tebaldi, 2004; Schar et al.,
2004), the predicted enhancement of plant growth and
carbon sequestration in temperate ecosystems in the
future as a result of climate warming might in fact not
take place, as suggested by our results and by those
reported by Ciais et al. (2005). As commented above,
these shrubs may even turn into carbon sources, con-
tributing thus to positive carbon climate feeding.
On the other hand, the small overall differences in
plant productivity in response to warming and drought
treatments during the 6 years of study and the small
differences between site responses along the climatic
gradient suggests that the enhanced C fixation by plants
induced by warming during the first 2 years of the
experiment (Penuelas et al., 2004) will not be maintained
in the longer term. This lack of maintenance of en-
hanced carbon fixation may occur as a consequence of
extreme heat or drought events or due to progressive
nutrient limitation (Hungate et al., 2004; Luo et al., 2004),
as our results do not indicate any consistent increase in
net N mineralization that might provide the additional
inorganic-N required for continued enhanced plant
growth. Limitations in other nutrients such as phos-
phorus (P) may become progressively more important
mechanisms controlling acclimation in these areas
(Penuelas et al., 2004).
An additional interesting issue raised by this study is
the fact that some of the studied sites, such as those in
DK and SP, experienced other disturbances apart from
the experimental climate change. The attack by pests at
the NL site or the earlier forest fire at the SP site
represent common natural occurrences that will interact
with climate change, as is also the case for the P
2578 J . P E N U E L A S et al.
r 2007 The AuthorsJournal compilation r 2007 Blackwell Publishing Ltd, Global Change Biology, 13, 2563–2581

limitation at the NL site, where microbes are very
strong competitors for P and, thereby hamper any
serious response by plants (Van Meeteren, 2005).
In summary, the magnitude of the response to warm-
ing and drought was very dependent on differences
between sites, years, and plant species. The differences
reported here, those reported in the literature (Shaver
et al., 2000; Rustad et al., 2001), and the fact that plant
responses seem transient and changeable over time
(Arft et al., 1999), illustrate the multiple responses to
warming and drought and the complex interactions
with other environmental factors that condition plant
performance. The net response is still very difficult to
predict. The prediction of plant responses to climate
change must account for natural variability to avoid
overestimation of the importance of warming and un-
realistic projections of vegetation change. The prolonga-
tion of this study in the following years will help to
further clarify some of these interactions and their
longer-term effects. Although the overall period re-
sponses to warming were very strongly related to the
Gaussen aridity index of each site (stronger responses
the lower the aridity), the decreases in biodiversity
and the increased growth in E. multiflora in response
to warming at the SP site (the most arid one)
challenge the assumption that sensitivity to warming
may be lower at more southerly latitudes. Finally, more
frequent heat waves and droughts may further pre-
clude predicted increases in plant productivity in
response to warming and, instead, may even decrease
productivity.
Acknowledgements
We would like to thank all the people involved in the extensiveactivities of the CLIMOOR and VULCAN projects, which in-clude the running and maintaining of the various treatment plotsand recording data. The work was financially supported by theEU (Contracts ENV4-CT97-0694 and EVK2-CT-2000-00094) andthe participating research institutes. The CREAF group alsoreceived help from the Spanish Government (grants CGL2004-1402/BOS and CGL2006-04025/BOS), the Catalan Government(SGR2005-00312), the European project ALARM (Contract506675), and the Fundacion Banco Bilbao Vizcaya 2004 grant.The Hungarian team received help from the Hungarian Govern-ment (grants NKFP 3B-0008/2002) and the Hungarian ScientificResearch Fund OTKA (T34790).
References
Antle J, Apps M, Beamish R et al. (2001) Ecosystems and their
goods and services. In: Climate Change 2001: Impacts, Adapta-
tion, and Vulnerability (eds McCarthy JJ, Canziani OF, Leary
NA, Dokken DJ, White KS), pp. 235–342. Cambridge Univer-
sity Press, Cambridge.
Arft AM, Walker MD, Gurevitch J et al. (1999) Response patterns
of tundra plant species to experimental warming: a meta-
analysis of the International Tundra Experiment. Ecological
Monographs, 69, 491–511.
Beier C, Emmett B, Gundersen P et al. (2004) Novel approaches to
study climate change effects on terrestrial ecosystems at the
field scale – drought and passive night time warming. Ecosys-
tems, 7, 583–597.
Callaghan TV, Jonasson S (1995) Arctic terrestrial ecosystems and
environmental change. Philosophical Transactions of the Royal
Society of London, 352, 259–276.
Calvo L, Tarrega R, De Luis E (2002) The dynamics of mediter-
ranean shrub species over 12 years following perturbations.
Plant Ecology, 160, 25–42.
Chapin FS III, Shaver GR, Giblin AE, Nadelhoffer KJ, Laundre JA
(1995) Response of arctic tundra to experimental and observed
changes in climate. Ecology, 76, 694–711.
Ciais P, Reichstein M, Viovy N et al. (2005) Europe-wide reduc-
tion in primary productivity caused by the heat and drought
in 2003. Nature, 437, 529–533.
Cornelissen JHC, Perez-Harguindeguy N, Dıaz S et al. (1999)
Leaf structure and defense control litter decomposition rate
across species and life forms in regional floras on two con-
tinents. New Phytologist, 143, 191–200.
Cox PM, Betts RA, Jones C, Spall SA, Totterdell IJ (2000) Accel-
eration of global warming due to carbon-cycle feedbacks in a
coupled climate model. Nature, 408, 184–187.
Dufresne JL, Fairhead L, Le Treut H et al. (2002) On the magni-
tude of positive feedback between future climate change and
the carbon cycle. Geophysical Research Letters, 29, 1405.
Emmett B, Beier C, Estiarte M et al. (2004) The response of soil
processes to climate change: results from manipulation studies
across an environmental gradient. Ecosystems, 7, 625–637.
Gorissen A, Tietema A, Joosten N, Estiarte M, Penuelas J,
Emmett B, Beier C (2004) Climate change affects carbon
allocation to the soil in shrublands. Ecosystems, 7, 650–661.
Harley PC, Tenhunen JD, Beyschlag W, Lange OL (1987) Seaso-
nal changes in net photosynthesis rates and photosynthetic
capacity in leaves of Cistus salvifolius, a European Mediterra-
nean semi-deciduous shrub. Oecologia, 74, 380–388.
Harte J, Shaw R (1995) Shifting dominance within a montane
vegetation community – results of a climate-warming experi-
ment. Science, 267, 876–880.
Hodar JA, Castro J, Zamora R (2003) Pine processionary cater-
pillar Thaumetopoea pityocampa as a new threat for relict Med-
iterranean Scots pine forests under climatic warming.
Biological Conservation, 110, 123–129.
Hungate BA, Stiling PD, Dijkstra P et al. (2004) CO2 elicits long-
term decline in nitrogen fixation. Science, 304, 1291.
IPCC (2007) Climate change 2007: the physical science basis.
Contribution of Working Group I. In: Fourth Assessment Report
of the Intergovernmental Panel on Climate Change (eds Solomon S,
Qin D, Manning M, Chen Z, Marquis M, Averyt KB, Tignor M,
Miller HL), Cambridge University Press, Cambridge, 996 pp.
Jonasson S, Michelsen A, Schmidt IK (1999) Coupling of nutrient
cycling and carbon dynamics in the Arctic, integration of
soil microbial and plant processes. Applied Soil Ecology, 11,
135–146.
R E S P O N S E S O F S H R U B L A N D P L A N T S T O C L I M A T E C H A N G E 2579
r 2007 The AuthorsJournal compilation r 2007 Blackwell Publishing Ltd, Global Change Biology, 13, 2563–2581

Jump AS, Penuelas J (2006) Genetic effects of chronic habitat
fragmentation in a wind-pollinated tree. Proceedings National
Academy of Sciences USA, 103, 8096–8100.
Korner C, Larcher W (1988) Plant life in cold climates. In:
Symposium of the Society of Experimental Biology (eds The
Company of Biologists, Long SF, Woodward FI), pp. 25–57.
Cambridge, UK.
Kovacs-Lang E, Kroel-Dulay GY, Kertesz FM et al. (2000)
Changes in the composition of sand grasslands along a cli-
matic gradient in Hungary and implications for climate
change. Phytocoenologia, 30, 385–407.
Larcher W (2000) Temperature stress and survival ability of
Mediterranean sclerophyllous plants. Plant Biosystems, 134,
279–95.
Llorens L, Penuelas J, Beier C, Emmett B, Estiarte M, Tietema A
(2004) Effects of an experimental increase of temperature and
drought on the photosynthetic performance of two ericaceous
shrub species along a North–South European gradient. Eco-
systems, 7, 613–624.
Llorens L, Penuelas J, Estiarte M (2003) Ecophysiological re-
sponses of two Mediterranean shrubs, Erica multiflora and
Globularia alypum, to experimentally drier and warmer condi-
tions. Physiologia Plantarum, 119, 231–243.
Lloret F, Penuelas J, Estiarte M (2004) Experimental evidence of
reduced diversity of seedlings due to climate modification in a
Mediterranean-type community. Global Change Biology, 10,
248–258.
Luo Y, Su B, Currie WS et al. (2004) Progressive nitrogen limita-
tion of ecosystem responses to rising atmospheric carbon
dioxide. BioScience, 54, 731–739.
Meehl GA, Tebaldi C (2004) More intense, more frequent, and
longer lasting heat waves in the 21st century. Science, 305,
994–997.
Menzel A, Sparks TH, Estrella N et al. (2006) European pheno-
logical response to climate change matches the warming
pattern. Global Change Biology, 12, 1969–1976.
Mitrakos KA (1980) A theory for Mediterranean plant life. Acta
Oecologica, 1, 245–252.
Myneni RB, Keeling CD, Tucker CJ, Asrar G, Nemani RR (1997)
Increased plant growth in the northern high latitudes from
1981 to 1991. Nature, 386, 698–702.
Ogaya R, Penuelas J (2006) Contrasting drought responses of leaf
morphology, longevity, demography and number in the two
codominant woody species of a holm oak forest. Biologia
Plantarum, 50, 373–382.
Ogren E (1996) Premature dehardening in Vaccinium myrtillus
during a mild winter: a cause for winter dieback? Functional
Ecology, 10, 724–732.
Oliveira G, Penuelas J (2001) Allocation of absorbed light energy
into photochemistry and dissipation in a semi-deciduous and
an evergreen Mediterranean woody species during winter.
Functional Plant Biology, 28, 471–480.
Oliveira G, Penuelas J (2002) Comparative protective strategies
of Cistus albidus and Quercus ilex facing photoinhibitory
winter conditions. Environmental Experimental Botany, 47,
281–289.
Oliveira G, Penuelas J (2004) The effect of winter cold stress on
photosynthesis and photochemical efficiency of PSII of two
Mediterranean woody species – Cistus albidus and Quercus ilex.
Plant Ecology, 175, 179–191.
Parmesan C, Yohe G (2003) A globally coherent fingerprint of
climate change impacts across natural systems. Nature, 421,
37–42.
Penuelas J, Boada M (2003) A global distribution of bio-
diversity inferred from climatic constraints: results from a
process-based modelling study. Global Change Biology, 9,
131–140.
Penuelas J, Filella I (2001) Phenology: responses to a warming
world. Science, 294, 793–795.
Penuelas J, Filella I, Comas P (2002) Changed plant and animal
life cycles from 1952–2000 in the Mediterranean region. Global
Change Biology, 8, 531–544.
Penuelas J, Filella I, Llusia J, Siscart D, Pinol J (1998) Compara-
tive field study of spring and summer leaf gas exchange
and photobiology of the mediterranean trees Quercus
ilex and Phillyrea latifolia. Journal Experimental Botany, 49,
229–238.
Penuelas J, Filella I, Sabate S, Gracia C (2005) Natural systems:
terrestrial ecosystems. In: Climate Change Report in Catalonia
(ed. Llebot JE), pp. 517–553. Institut d’Estudis Catalans, Bar-
celona.
Penuelas J, Gordon C, Llorens L et al. (2004) Non-intrusive field
experiments show different plant responses to warming and
drought among sites, seasons and species in a North–South
European gradient. Ecosystems, 7, 598–612.
Penuelas J, Lloret F, Montoya R (2001) Drought effects on
mediterranean vegetation and taxa evolutionary history. Forest
Science, 47, 214–218.
Penuelas J, Llusia J (2002) Linking photorespiration, terpenes
and thermotolerance. New Phytologist, 155, 227–237.
Prieto P (2007) Phenology, biomass and community composition
changes in a Mediterranean shrubland submitted to experimental
warming and drought. PhD thesis, Universitat Autonoma de
Barcelona, Barcelona, Spain.
Robinson CH, Michelsen A, Lee JA, Whitehead SJ, Callaghan TV,
Press MC, Jonasson S (1997) Elevated atmospheric CO2
affects decomposition of Festuca vivipara (L.) Sm. litter and
roots in experiments simulating environmental change in two
contrasting arctic ecosystems. Global Change Biology, 3,
37–49.
Root TL, Price JT, Hall KR, Schneider SH, Rosenzweig C, Pounds
JA (2003) Fingerprints of global warming on wild animals and
plants. Nature, 421, 57–60.
Rustad LE, Campbell JL, Marion GM et al. (2001) A meta-analysis
of the response of soil respiration, net nitrogen mineralization,
and aboveground plant growth to experimental ecosystem
warming. Oecologia, 126, 543–562.
Rustad LE, Melillo JM, Mitchel MJ, Fernandez IJ, Steudler PA,
McHale PJ (2000) Effects of soil warming on C and N cycling in
northern US forest soils. In: Responses of Northern US Forests to
Environmental Change (eds Mickler R, Birdsey R, Hom J), pp.
357–381. Springer, New York.
Sanz-Elorza M, Dana ED, Gonzalez A, Sobrino E (2003) Changes
in the high-mountain vegetation of the central Iberian Penin-
sula as a probable sign of global warming. Annals of Botany, 92,
273–280.
2580 J . P E N U E L A S et al.
r 2007 The AuthorsJournal compilation r 2007 Blackwell Publishing Ltd, Global Change Biology, 13, 2563–2581

Sardans J, Penuelas J (2004) Increasing drought decreases phos-
horus availability in an evergreen Mediterranean forest. Plant
and Soil, 267, 367–377.
Sardans J, Penuelas J (2005) Drought decreases soil enzyme
activity in a Mediterranean Quercus ilex L. forest. Soil Biology
and Biochemistry, 37, 455–461.
Sardans J, Penuelas J (2007) Drought changes phosphorus and
potassium accumulation patterns in an evergreen Mediterra-
nean forest. Functional Ecology, 21, 191–201.
Schar C, Vidale PL, Luthi D, Frei C, Haberli C, Liniger MA,
Appenzeller C (2004) The role of increasing temperature
variability in European summer heatwaves. Nature, 427, 332–
335.
Schmidt IK, Jonasson S, Shaver GR, Michelsen A, Nordin A
(2002) Mineralization and allocation of nutrients by plants and
microbes in four tundra ecosystems-responses to warming.
Plant Soil, 242, 93–106.
Schmidt IK, Tietema A, Williams D, Gundersen P, Beier C,
Emmett B, Estiarte M (2004) Soil solution chemistry
and element fluxes in three European heathlands and
their responses to warming and drought. Ecosystems, 7, 638–
649.
Shaver GR, Canadell J, Chapin FS III et al. (2000) Global warming
and terrestrial ecosystems: a conceptual framework for analy-
sis. BioScience, 50, 871–882.
Shaver GR, Chapin FS III (1995) Long-term responses to factorial
NPK fertilizer treatment by Alaskan wet and moist tundra
sedge species. Ecography, 18, 259–275.
Simmons JA, Fernandez IJ, Briggs RD, Delaney MT (1996) Forest
floor carbon pools and fluxes along a regional climate gradient
in Maine, USA. Forest Ecology and Management, 84, 81–95.
Terradas J (2001) Vegetation Ecology. From Plant Ecophysiology to
Community and Landscape Dynamics. Omega, Barcelona (in
Spanish).
Van Meeteren MJM (2005) Heathland ecosystem functioning under
climate change. PhD thesis, University of Amsterdam, Amster-
dam, The Netherlands.
Walther G-R, Post EP, Convey P et al. (2002) Ecological responses
to recent climate change. Nature, 416, 389–395.
Watt AS (1947) Pattern and process in the plant community.
Journal of Ecology, 35, 1–22.
Weltzin JF, Bridgham SD, Pastor J, Chen JQ, Harth C (2003)
Potential effects of warming and drying on peatland plant
community composition. Global Change Biology, 9, 141–151.
R E S P O N S E S O F S H R U B L A N D P L A N T S T O C L I M A T E C H A N G E 2581
r 2007 The AuthorsJournal compilation r 2007 Blackwell Publishing Ltd, Global Change Biology, 13, 2563–2581
Top Related
Copyright © 2022 FDOKUMEN

