


Bahasa
Halaman
Hukum

JOURNAL OF GEOPHYSICAL RESEARCH, VOL. 103, NO. C7, PAGES 14,291-14,324, JUNE 29, 1998
Progress during TOGA in understanding and modeling global teleconnections associated with tropical sea surface temperatures
Kevin E. Trenberth, • Grant W. Branstator, • David Karoly, Ngar-Cheu•ng Lau, 4 and Chester Ropelewski •
e Arun Kumar, 3
Abstract. The primary focus of this review is tropical-extratropical interactions and especially the issues involved in determining the response of the extratropical atmosphere to tropical forcing associated with sea surface temperature (SST) anomalies. The review encompasses observations, empirical studies, theory and modeling of the extratropical teleconnections with a focus on developments over the Tropical Oceans-Global Atmosphere (TOGA) decade and the current state of understanding. In the tropical atmosphere, anomalous SSTs force anomalies in convection and large-scale overturning with subsidence in the descending branch of the local Hadley circulation. The resulting strong upper tropospheric divergence in the tropics and convergence in the subtropics act as a Rossby wave source. The climatological stationary planetary waves and associated jet streams, especially in the northern hemisphere, can make the total Rossby wave sources somewhat insensitive to the position of the tropical heating that induces them and thus can create preferred teleconnection response patterns, such as the Pacific-North American (PNA) pattern. However, a number of factors influence the dispersion and propagation of Rossby waves through the atmosphere, including zonal asymmetries in the climatological state, transients, and baroclinic and nonlinear effects. Internal midlatitude sources can amplify perturbations. Observations, modeling, and theory have clearly shown how storm tracks change in response to changes in quasi-stationary waves and how these changes generally feedback to maintain or strengthen the dominant perturbations through vorticity and momentum transports. The response of the extratropical atmosphere naturally induces changes in the underlying surface, so that there are changes in extratropical SSTs and changes in land surface hydrology and moisture availability that can feedback and influence the total response. Land surface processes are believed to be especially important in spring and summer. Anomalous SSTs and tropical forcing have tended to be strongest in the northern winter, and teleconnections in the southern hemisphere are weaker and more variable and thus more inclined to be masked by natural variability. Occasional strong forcing in seasons other than winter can produce strong and identifiable signals in the northern hemisphere and, because the noise of natural variability is less, the signal-to-noise ratio can be large. The relative importance of tropical versus extratropical SST forcings has been established through numerical experiments with atmospheric general circulation models (AGCMs). Predictability of anomalous circulation and associated surface temperature and precipitation in the extratropics is somewhat limited by the difficulty of finding a modest signal embedded in the high level of noise from natural variability in the extratropics, and the complexity and variety of the possible feedbacks. Accordingly, ensembles of AGCM runs and time averaging are needed to identify signals and make predictions. Strong anomalous tropical forcing provides opportunities for skillful forecasts, and the accuracy and usefulness of forecasts is expected to improve as the ability to forecast the anomalous SSTs improves, as models improve, and as the information available from the mean and the spread of ensemble forecasts is better utilized.
Copyright 1998 by the American Geophysical Union.
Paper number 97JC01444. 0148-0227/98/97JC-01444509.00
• National Cente• for Atmospheric Researchl Boulder, Col- orado
2CRC for Southern Hemisphere Meteorology, Monash University, Victoria, Australia.
14,291
14,292 TRENBERTH ET AL.: UNDERSTANDING ENSO TELECONNECTIONS:
aNational Centers for Environmental Prediction, Wash- ington D. C.
4Geophysical Fluid Dynamics Laboratory, Princeton, New Jersey.
1. Introduction
The Tropical Oceans-Global Atmosphere (TOGA) program focused on the coupling of the tropical oceans with the atmosphere; in particular, it focused r.egion- ally on the Pacific and the E1 Nifio-Southern Oscilla- tion (ENSO) phenomenon. The manifestations of the changes in atmospheric circulation in the tropics are felt throughout the global atmosphere via teleconnections and large-scale monsoonal overturning. In turn, the changes in extratropical atmospheric circulation can in- fluence the oceans and force an identifiable signal there which is much stronger than a connection through the ocean itself. The other review papers in this issue deal mainly with the tropical aspects of TOGA; this review will focus on the global atmosphere, especially the ex- tratropical circulation and the linkages with the tropics.
In the buildup to the TOGA program a number of studies had documented empirical connections between the tropics and the atmospheric circulation at higher latitudes (as reviewed in section 2), and theoretical breakthroughs (section 3) had provided a basis for be- ginning to understand these relationships. The result was that perturbations in the pattern of atmospheric heating over the equatorial Pacific were thought to clearly affect the planetary wave structure over much of the North Pacific Ocean, North America, and probably other parts of the globe [National Academy of Sciences, 1983]. Moreover, associated with the atmospheric cir- culation changes were seasonal changes in surface tem- peratures and precipitation, so there were prospects for seasonal forecasts that might have great utility.
Prior to TOGA, there had been a considerable debate about the relative role of extra-tropical sea surface tem- peratures (SSTs) and tropical SSTs in forcing telecon- nections in the atmosphere [Namias, 1963, 1969; Bjerk- nes, 1969]. However, the TOGA program focused on the tropics, and it was recognized that the way in which the tropical SST changes influenced the atmosphere was through surface fluxes of moisture, heat, and momen- tum and a readjustment of the tropical circulation in a thermally direct sense. Thus the distribution of deep convection is altered along with associated changes in heating, low level convergence, and upper level diver- gence, thereby altering the generation of the horizontal component of atmospheric vorticity and the forcing of large-scale atmospheric Rossby waves which could prop- agate into higher latitudes. In particular, the deepening of the Aleutian low-pressure system in the North Pacific in winter in association with E1 Nifio events was noted
by Bjerknes [1969]. This feature is now recognized to be one lobe of the Pacific-North American (PNA) tele- connection pattern. Moreover, it was also recognized that such a pattern was not always present during the warm phase of ENSO, and it was a topic for TOGA to understand why. In addition, the evolution of these pat-
terns and their interactions with transient phenomena such as storm tracks were identified as vital pieces of the puzzle not yet adequately described or understood.
Global atmospheric general circulation models (AGCMs) had been used to attempt to simulate the extratropical response to tropical SST anomalies (sec- tion 4) with some success but also with some puzzling results, which indicated that the extratropical response was not explainable by simple wave propagation but involved interactions with the extratropical stationary planetary waves and perhaps "modal" behavior. This excitation of possible preferred modes of the extratrop- ical circulation is one aspect that has been studied dur- ing TOGA.
The early promise of major breakthroughs in un- derstanding, modeling, and predicting extratropical re- sponses to tropical forcing has been slow in coming, and recent results have tempered future expectations with the realization that potentially predictable tropi- cal influences must compete with extratropical chaotic weather that is essentially unpredictable beyond 2 weeks or so.
Section 2 describes observed teleconnections and es-
pecially the linkages between the tropics and extratrop- ics and how these are manifested in terms of changes in storm tracks, temperatures, and precipitation. The 1986-1987 E1 Nifio case is used as a typical example of many aspects. The interactions between the tropics and the extratropics are discussed in detail in section 3 with a focus on theoretical understanding and plane- tary wave modeling, including recent advances in storm track modeling. Extratropical influences on the tropical atmosphere are also mentioned.
Section 4 describes the state of the art in AGCM
modeling as it pertains to the TOGA problem, with special attention given to model runs forced with ob- served SSTs, and the relative importance of SSTs in different parts of the world. It also addresses the use of models for predictions and how to deal with the ex- tratropical chaotic dynamics by making extensive use of ensemble averaging to distinguish predictable signals from the noise.
The extratropical oceans also have identifiable signals associated with both phases of ENSO, in part through direct propagation of Kelvin waves along eastern bound- aries of oceans such as the Americas in the Pacific but
also as a result of changes in the extratropical atmo- sphere and surface fluxes, and these aspects are dis- cussed in section 5 along with possible feedback effects over land. Unsolved problems and issues for the future are addressed in section 6.
2. Observed Relationships 2.1. Teleconnections
The term "teleconnections" does not appear in the glossary [Huschke, 1959] although it dates back to Angstroem [1935]. It has been in common use by op- erational long-range forecasters, at least those in the United States, since the 1950s. It has become common
TRENBERTH ET AL.: UNDERSTANDING ENSO TELECONNECTIONS: 14,293
for contemporary climate scientists to use correlation or teleconnection patterns to describe relationships in the variability of large-scale features of the atmospheric circulation as well as tropical and extratropical precip- itation and temperature relationships, especially those related to the ENSO. Implied in the term teleconnection is that there is a physical reason for the simultaneous variations, often of opposite sign, over distant parts of the globe, and it now appears that in the extratropics the primary reason is the presence of Rossby waves, whose theory is discussed in section 3. The TOGA era has seen an increase in the widespread use of the term teleconnections as well as the wide acceptance of correlation and composite analyses in attempts to un- derstand and document modes of interannual climate
variability. Interest in prediction of seasonal surface tempera-
ture and precipitation motivated the earliest telecon- nection studies [e.g., Walker, 1923, 1924], although not called by that name. Walker's studies were primarily focused on the Indian summer monsoon, and they pro- vided the first evidence of the significant global-scale ENSO-related relationships with temperature and pre- cipitation. After a long hiatus in teleconnection re- search these ENSO teleconnections patterns were later confirmed.
2.1.1. Circulation. Several studies in the early 1980s set the pre-TOGA stage for the use of teleconnec- tion patterns to describe northern hemisphere circula-
•tion features and their relationships to tropical anoma- lies. The North Pacific (NP) oscillation and North At- lantic Oscillation (NAO), which had a long history in the literature [e.g., Walker and Bliss, 1932], were exam- ined closely by van Loon and Rogers [1978] and Rogers and van Loon [1979]. Wallace and Gutzler [1981] re- viewed the teleconnection studies up to that time and extended them through analysis of 500 mbar and sea level pressure data for the northern hemisphere winter for timescales of a month and longer. They identified a number of major teleconnection patterns including a pattern they recognized as the now well-known PNA (see Figure 1). They noted for the sea level pressure teleconnections that the anomalies of opposite sign were predominantly between temperate and higher latitudes (e.g., the NP and NAO), while at 500 mbar the pat- terns were more regional in scale and more wavelike in appearance, and had equivalent barotropic vertical structure.
All these patterns were recognized as preferred modes of variability of the atmosphere, but only some have been clearly identified as also being associated with forcing from SSTs. Hotel and Wallace [1981] docu- mented the link between the equatorial SST anomalies and the PNA. Van Loon and Madden [1981] presented global relationships of the Southern Oscillation (SO) in the northern winter with sea level pressures and tem- peratures, while Trenberth and Paolino [1981] explored northern hemisphere modes of variability in sea level pressure and relationships with the SO in all four sea- sons using data beginning in 1899. Thus, by the be-
ginning of the TOGA era, much of the foundation had been laid for more detailed teleconnection studies.
TOGA diagnostic research has fostered the introduc- tion and growth of a number of analysis tools previ- ously not widely applied in the meteorological litera- ture. These include the large array of techniques that fall under the general heading of eigenvalue analysis and are generally identified in climate studies as prin- cipal component (PC), empirical orthogonal function (EOF), and singular value decomposition (SVD) anal- yses. Hotel [1981] expanded the concept of teleconnec- tion from that given by a simple contemporaneous cor- relation between a base point and values at every data point in the analysis domain to the use of rotated prin- cipal component analysis (RPCA) to identify principal height patterns. During the TOGA era, Barnston and Livezey [1987] exploited RPCA analysis to document the annual cycle of monthly 700 mbar height field pat- terns as well as'longer-term secular variability with a 35 year data set and provided the impetus for opera- tional monitoring (e.g., the National Oceanic and At- mospheric Administration 's (NOAA) Climate Diagnos- tics Bulletin) of principal circulation patterns [Bell and Halpert, 1995].
At least 13 distinct teleconnection patterns can be identified in the northern hemisphere extratrop- ics throughout the year, and many of these patterns have appeared previously in the meteorological liter- ature [Bell and Halpert, 1995]. Only some of these patterns and a portion of their variability arises from SST variability. The nomenclature of both Wallace and Gutzler [1981] and Barnston and Livezey [1987] is used. Six prominent patterns are found over the North Pacific-North American sector: the West Pacific pat- tern (WP), which exists in all months; the East Pacific pattern (EP), which exists in all months except Au- gust and September; the NP pattern, which exists from March to July; the PNA, which exists in all months ex- cept June and July; the Tropical/Northern Hemisphere pattern (TNH), which exists from November to Jan- uary; and the Pacific Transition pattern, which exists from May to August. This latter pattern is somewhat similar to another teleconnection pattern that is im- portant in the northern summer and variously known as the northern hemisphere summer pattern, Pacific- Japan (P J) pattern (or earlier, the south Japan pattern) [Gambo and Kudo, 1983; Nitta, 1986, 1987], and Asia- North America (ANA) pattern [Lau, 1992] that features a wave train sequence of at least four centers stretching from Japan along about 45øN to North America. The PJ pattern is especially important in the far-western Pacific primarily as a north-south dipole pattern.
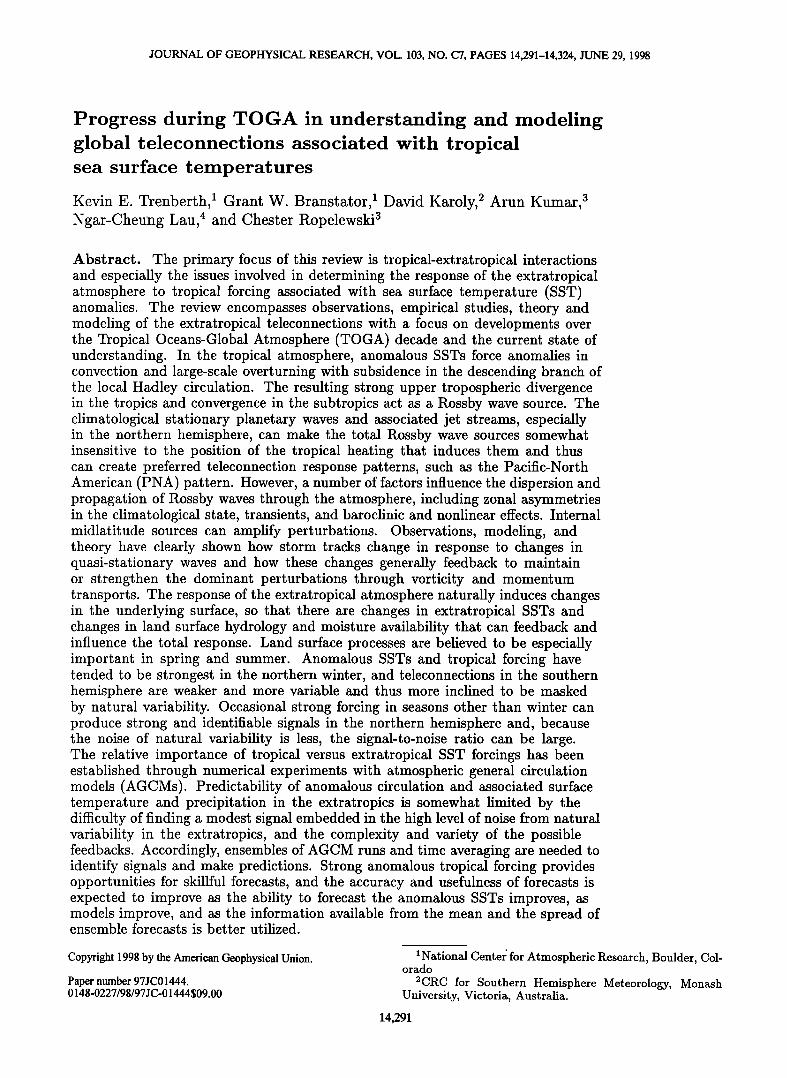
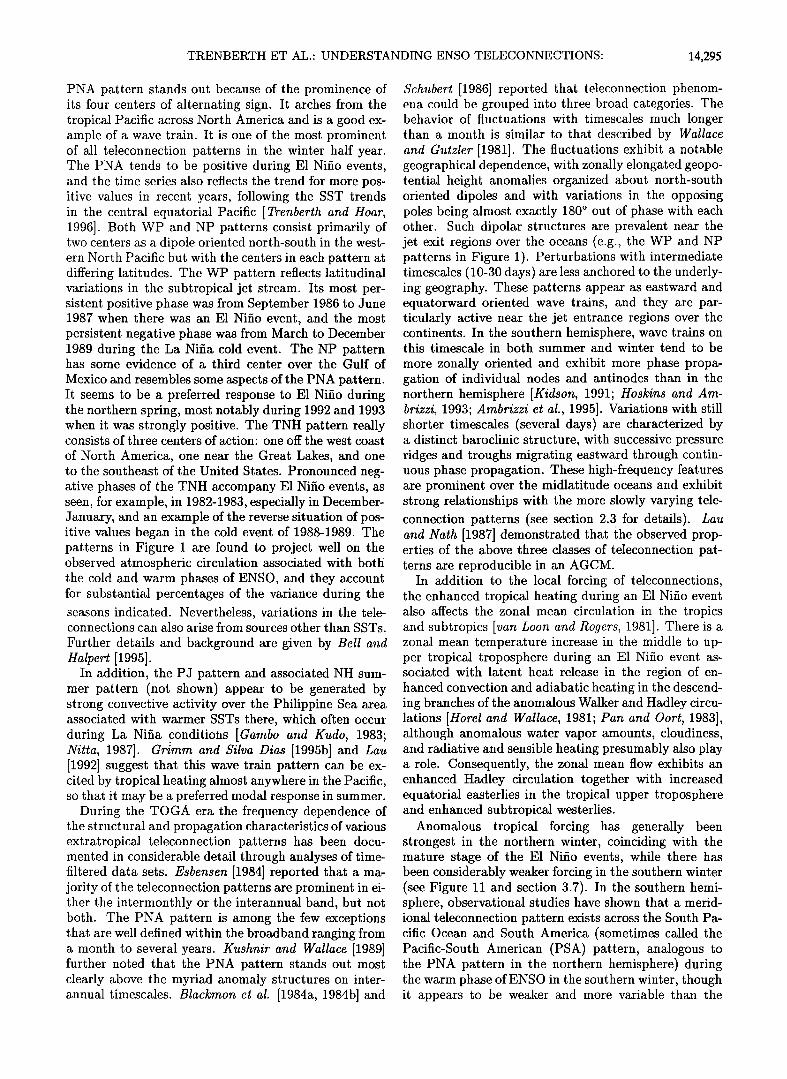
•Iost teleconnections patterns associated with changes in SSTs in the tropical Pacific over the northern hemisphere and associated times series for 1963 to 1995 are shown in Figure 1. On the basis of RPCA, shown are the PNA, WP, NP, and the TNH patterns as seen at 700 mbar. For PNA, WP, and TNH, the patterns and time series are for December-January, while NP applies to March-April-May [after Bell and Halpert, 1995]. The
14,294 TRENBERTH ET AL.' UNDERSTANDING ENSO TELECONNECTIONS:
3.0 3.0 3.0 3,0
2.0
1.O
0.0
-1.O
-2.0
ß i .... i .... i .... i .... i .... i ....
.
.
.i .... i .... ! .... i .... i .... i .... i
2.0 2.0
1 .o 1 .o
0.0 0.0
-1.0 -1.0
ß 1 .... i .... i .... i .... i .... l'-''l
ß
.
,
.i .... i .... i .... i .... i .... i .... i
2.0
-2.0 -2.0
-3.0 -3.0 90 95
1.O
0.0
-1.O
-2.0
-3.0 -3.0 65 70 75 80 85 65 70 75 80 85 90 95
NP
2.0
1.0
0.0
-1.0
-2.0
ß 2.0 2.0
I I . . . I 0.0 0.0 .1
I' "ll l'l _,.o -2.0 -2.0
ß i .... ! .... i .... i .... i .... i .... i
.
ß
,...,,,11...,.,111,' .' "I1' '1'i .
,,
ii .... i .... i .... i .... i .... i .... -3.0" .............................. 65 70 75 80 85 90
-3.0 -3.0 65 70 75 80 85 90 95
3.0
2.0
1.0
0.0
-1.0
-2.0
-3.0
Figure 1. Teleconnections patterns associated with changes in sea surface temeratures (SST) in the tropical Pacific over the northern hemisphere and associated times series for 1963 to 1995. On the basis of rotated principal component analysis (RPCA), shown are the Pacific- North American (PNA), Western Pacific (WP), North Pacific (NP), and the Tropical-Northern Hemisphere'(TNH) patterns as seen at 700 mbar. For PNA, WP and TNH, the patterns and time series are for December-January, while NP applies to March-April-May. Positive values are hatched, and negative values are stippled, with the contour interval of 25 m. All time series are standardized to have mean zero and standard deviation of 1. After Bell and Halpert [1995].
TRENBERTH ET AL.: UNDERSTANDING ENSO TELECONNECTIONS: 14,295
PNA pattern stands out because of the prominence of its four centers of alternating sign. It arches from the tropical Pacific across North America and is a good ex- alnple of a wave train. It is one of the most prominent of all teleconnection patterns in the winter half year. The PNA tends to be positive during E1 Nifio events, and the time series also reflects the trend for more pos- itive values in recent years, following the SST trends in the central equatorial Pacific [Trenberth and Hoar, 1996]. Both WP and NP patterns consist primarily of two centers as a dipole oriented north-south in the west- ern North Pacific but with the centers in each pattern at differing latitudes. The WP pattern reflects latitudinal variations in the subtropical jet stream. Its most per- sistent positive phase was from September 1986 to June 1987 when there was an E1 Nifio event, and the most persistent negative phase was from March to December 1989 during the La Nifia cold event. The NP pattern has some evidence of a third center over the Gulf of
Mexico and resembles some aspects of the PNA pattern. It seems to be a preferred response to E1 Nifio during the northern spring, most notably during 1992 and 1993 when it was strongly positive. The TNH pattern really consists of three centers of action: one off the west coast
of North America, one near the Great Lakes, and one to the southeast of the United States. Pronounced neg- ative phases of the TNH accompany E1 Nifio events, as seen, for example, in 1982-1983, especially in December- January, and an example of the reverse situation of pos- itive values began in the cold event of 1988-1989. The patterns in Figure I are found to project well on the observed atmospheric circulation associated with both' the cold and warm phases of ENSO, and they account for substantial percentages of the variance during the seasons indicated. Nevertheless, variations in the tele- connections can also arise from sources other than SSTs.
Further details and background are given by Bell and Halpert [1995].
In addition, the PJ pattern and associated NH sum- mer pattern (not shown) appear to be generated by strong convective activity over the Philippine Sea area associated with warmer SSTs there, which often occur during La Nifia conditions [Gambo and Kudo, 1983; Nitta, 1987]. Grimm and Silva Dias [1995b] and Lau [1992] suggest that this wave train pattern can be ex- cited by tropical heating almost anywhere in the Pacific, so that it may be a preferred modal response in summer.
During the TOGA era the frequency dependence of the structural and propagation characteristics of various extratropical teleconnection patterns has been docu- mented in considerable detail through analyses of time- filtered data sets. Esbensen [1984] reported that a ma- jority of the teleconnection patterns are prominent in ei- ther the intermonthly or the interannual band, but not both. The PNA pattern is among the few exceptions that are well defined within the broadband ranging from a month to several years. Kushnir and Wallace [1989] further noted that the PNA pattern stands out most clearly above the myriad anomaly structures on inter- annual timescales. Blackmon et al. [1984a, 1984b] and
Schubert [1986] reported that teleconnection phenom- ena could be grouped into three broad categories. The behavior of fluctuations with timescales much longer than a month is similar to that described by Wallace and Gutzler [1981]. The fluctuations exhibit a notable geographical dependence, with zonally elongated geopo- tential height anomalies organized about north-south oriented dipoles and with variations in the opposing poles being almost exactly 180 ø out of phase with each other. Such dipolaf structures are prevalent near the jet exit regions over the oceans (e.g., the WP and NP patterns in Figure 1). Perturbations with intermediate timescales (10-30 days) are less anchored to the underly- ing geography. These patterns appear as eastward and equatorward oriented wave trains, and they are par- ticularly active near the jet entrance regions over the continents. In the southern hemisphere, wave trains on this timescale in both summer and winter tend to be
more zonally oriented and exhibit more phase propa- gation of individual nodes and antinodes than in the northern hemisphere [Kidson, 1991; Hoskins and Am- brizzi, 1993; Ambrizzi et al., 1995]. Variations with still shorter timescales (several days) are characterized by a distinct baroclinic structure, with successive pressure ridges and troughs migrating eastward through contin- uous phase propagation. These high-frequency features are prominent over the midlatitude oceans and exhibit strong relationships with the more slowly varying tele- connection patterns (see section 2.3 for details). Lau and Nath [1987] demonstrated that the observed prop- erties of the above three classes of teleconnection pat- terns are reproducible in an AGCM.
In addition to the local forcing of teleconnections, the enhanced tropical heating during an E1 Nifio event also affects the zonal mean circulation in the tropics and subtropics [van Loon and Rogers, 1981]. There is a zonal mean temperature increase in the middle to up- per tropical troposphere during an E1 Nifio event as- sociated with latent heat release in the region of en- hanced convection and adiabatic heating in the descend- ing branches of the anomalous Walker and Hadley circu- lations [Hotel and Wallace, 1981; Pan and Oort, 1983], although anomalous water vapor amounts, cloudiness, and radiative and sensible heating presumably also play a role. Consequently, the zonal mean flow exhibits an enhanced Hadley circulation together with increased equatorial easterlies in the tropical upper troposphere and enhanced subtropical westerlies.
Anomalous tropical forcing has generally been strongest in the northern winter, coinciding with the mature stage of the E1 Nifio events, while there has been considerably weaker forcing in the southern winter (see Figure 11 and section 3.7). In the southern hemi- sphere, observational studies have shown that a merid- ional teleconnection pattern exists across the South Pa- cific Ocean and South America (sometimes called the Pacific-South American (PSA) pattern• analogous to the PNA pattern in the northern hemisphere) during the warm phase of ENSO in the southern winter, though it appears to be weaker and more variable than the
14,296 TRENBERTH ET AL.' UNDERSTANDING ENSO TELECONNECTIONS:
northern hemisphere (NH) teleconnections [van Loon and Shea, 1985, 1987; Karoly, 1989]. The weaker and more variable response in southern winter is consistent with the relatively weaker tropical forcing, as well as the weaker zonal gradients in the mean flow providing less of a geographical focus for the midlatitude telecon- nections (see section 3.3).
2.1.2. Temperature and precipitation. The TOGA era witnessed a significant increase in documen- tation and understanding of ENSO-precipitation rela- tionships. Consistent warm phase ENSO-precipitation teleconnections were documented by $toeckenius [1981] Ropelewski and Halpert [1986, 1987], and Lau and Sheu [1988], and later expanded to include precipitation re-
70N
60N
50N
40N
30N
20N
1ON
EQ
lOS
20S
30S
40S
& WARM
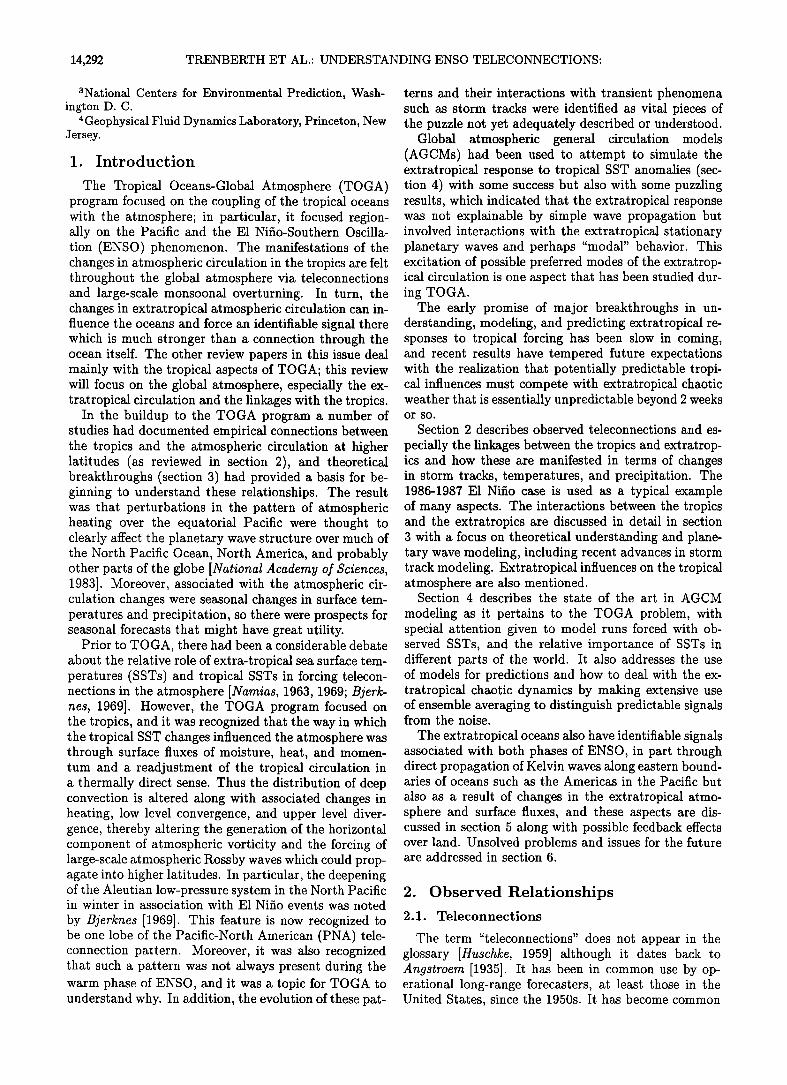
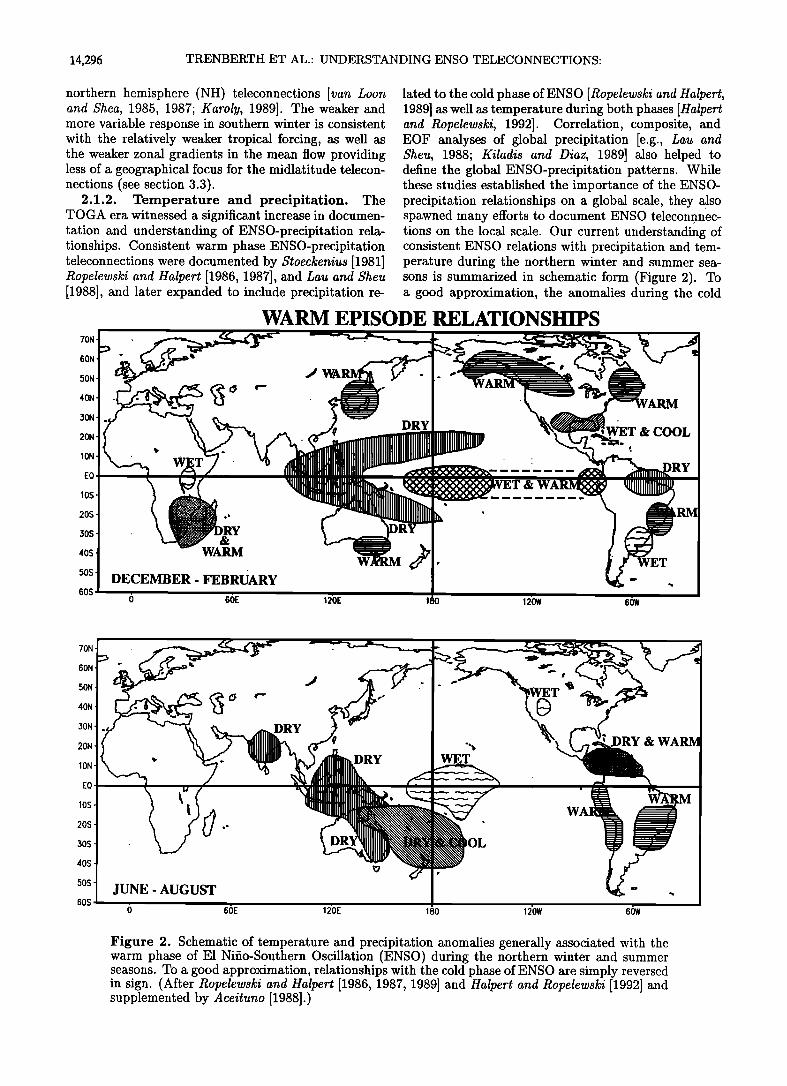
lated to the cold phase of ENSO [Ropelewski and Halpert, 1989] as well as temperature during both phases [Halpert and Ropelewski, 1992]. Correlation, composite, and EOF analyses of global precipitation [e.g., Lau and Sheu, 1988; Kiladis and Diaz, 1989] also helped to define the global ENSO-precipitation patterns. While these studies established the importance of the ENSO- precipitation relationships on a global scale, they also spawned many efforts to document ENSO teleconnnec- tions on the local scale. Our current understanding of consistent ENSO relations with precipitation and tem- perature during the northern winter and summer sea- sons is summarized in schematic form (Figure 2). To a good approximation, the anomalies during the cold
WARM EPISODE RELATIONSHIPS
DRY ß .
WET & COOL
5os DECEMBER- FEBRUARY 605 6 66E 120E 180
50N "• ' *'
os
•OS L 6 •6E •2•E •80 •2•W •6W
Figure 2. Schematic of temperature and precipitation anomalies generally associated with the warm phase of E1 Nifio-Southern Oscillation (ENSO) during the northern winter and summer seasons. To a good approximation, relationships with the cold phase of ENSO are simply reversed in sign. (After Ropelewski and Halpert [1986, 1987, 1989] and Halpert and Ropelewski [1992] and supplemented by Aceituno [1988].)
TRENBERTH ET AL.: UNDERSTANDING ENSO TELECONNECTIONS: 14,297
phase of ENSO are the reverse of those in Figure 2. This figure is based upon surface measurements and is incomplete over the oceans.
Many of the ENSO-precipitation studies have been limited by the irregular spatial coverage of gauge pre- cipitation data. This limitation motivated the use of satellite observations for the estimation of precipitation especially over the oceans. During the TOGA era, out- going longwave radiation (OLR), measured by opera- tional NOAA satellites since 1974 [Chelliah and Arkin, 1992], has become the most widely used satellite-based indicator of convective precipitation. OLR measures the outgoing radiation from the Earth and tends 'to be dominated either by the radiation from the surface, where there are no clouds, or from cloud tops, so that it serves as a proxy index of the amount of convection in the tropics. The relatively long period of record, at least for satellite measurements, has made OLR a mainstay for a multitude of research studies. The con- tinued operation of the weather satellites has also made them a major observational tool for monitoring current climate (e.g., the Climate Diagnostics Bulletins issued by NOAA's Climate Prediction Center). While OLR has proven invaluable for several TOGA-related stud- ies, its limitations have also spurred efforts to provide precipitation estimates with higher spatial and tempo- ral coverage as well as to provide better estimates for nonconvective precipitation. Many of these activities are taking place under the World Climate Research Pro- gram's Global Precipitation Climatology Project [Arkin and Xie, 1994].
The above satellite observations reveal that in the
Pacific the Intertropical Convergence Zone (ITCZ) is typically stronger and located closer to the equator in E1 Nifio years, while the South Pacific Convergence Zone (SPCZ) shifts north and east of normal. Dur- ing the ENSO warm phase in the northern winter for December-January-February (DJF), Figure 2 re- veals the warm and wet conditions that typically oc- cur throughout the tropical central and eastern Pa- cific and along the Pacific coast of South America. Dry conditions, corresponding to higher sea level pres- sures, exist in a characteristic boomerang-shaped pat- tern over the western Pacific and extend to southern
Africa and across the Atlantic to northeast Brazil and
Columbia. Cool and wet conditions in the southeast- ern United States are linked via a teleconnection to the warm conditions over western Canada and Alaska.
Warmth in Uruguay expands in area in southern winter in June-July-August (JJA). Dryness in parts of South- east Asia, Indonesia, Central America, Australia, and New Zealand in JJA contrasts with wet conditions in
the tropical central Pacific. 2.1.3. An example: The E1 Nifio of 1986-
1987. To illustrate the changes in circulation in the extratropics and the links with the tropics, the exam- ple of the 1986-1987 E1 Nifio event is used. This was a modest event by most standards, and the warmest water near the equator was displaced eastward to near 170øW. Even though the SST anomalies there were only
1øC or so, it was sufficient to produce ensuing strong convection in that area[Trenberth, 1996] (see Figure 3). We use the National Centers for Environmental Predic-
tion (NCEP, formerly National Meteorological Center (NMC)) NCAR reanalyses for 1985 to 1993 (9 years) to define a base period to determine circulation anomalies for this event, and the same base period is used for OLR and SST.
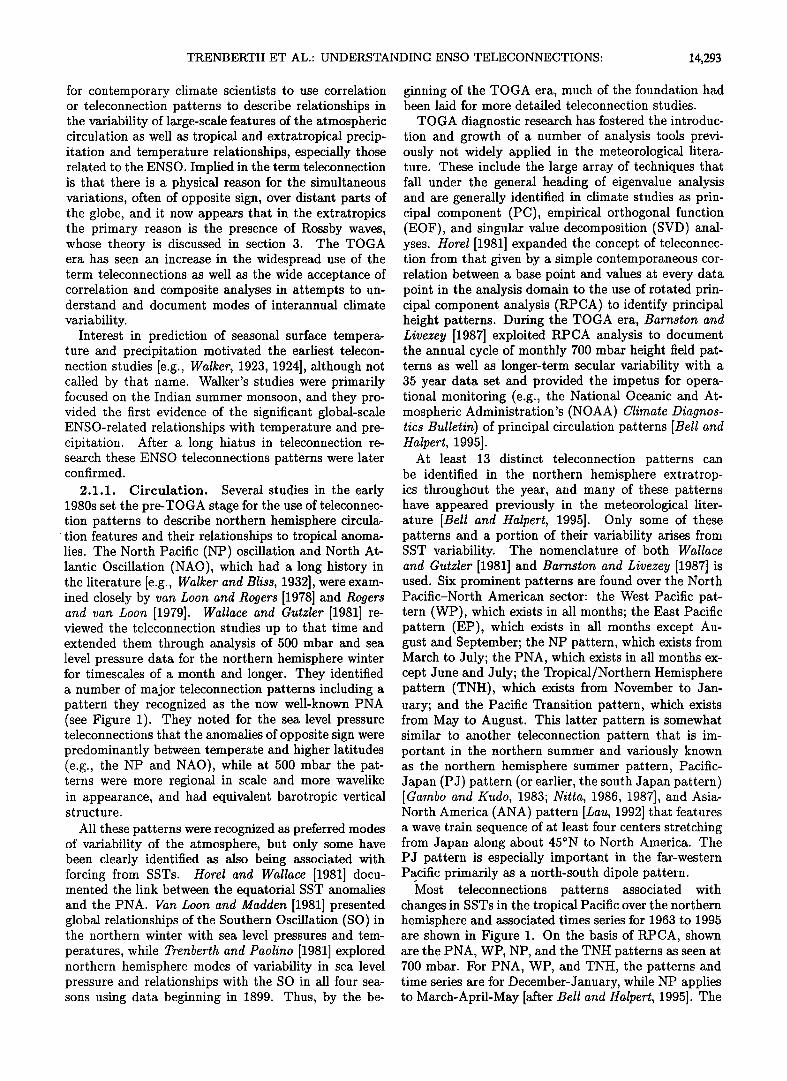
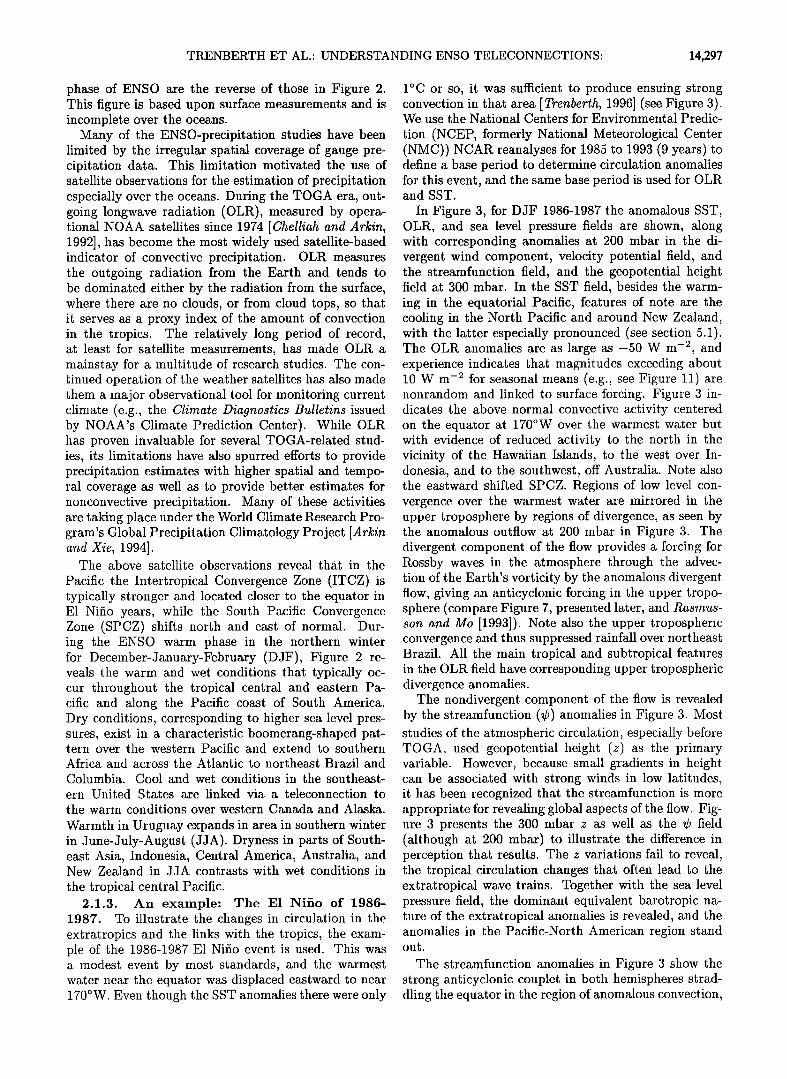
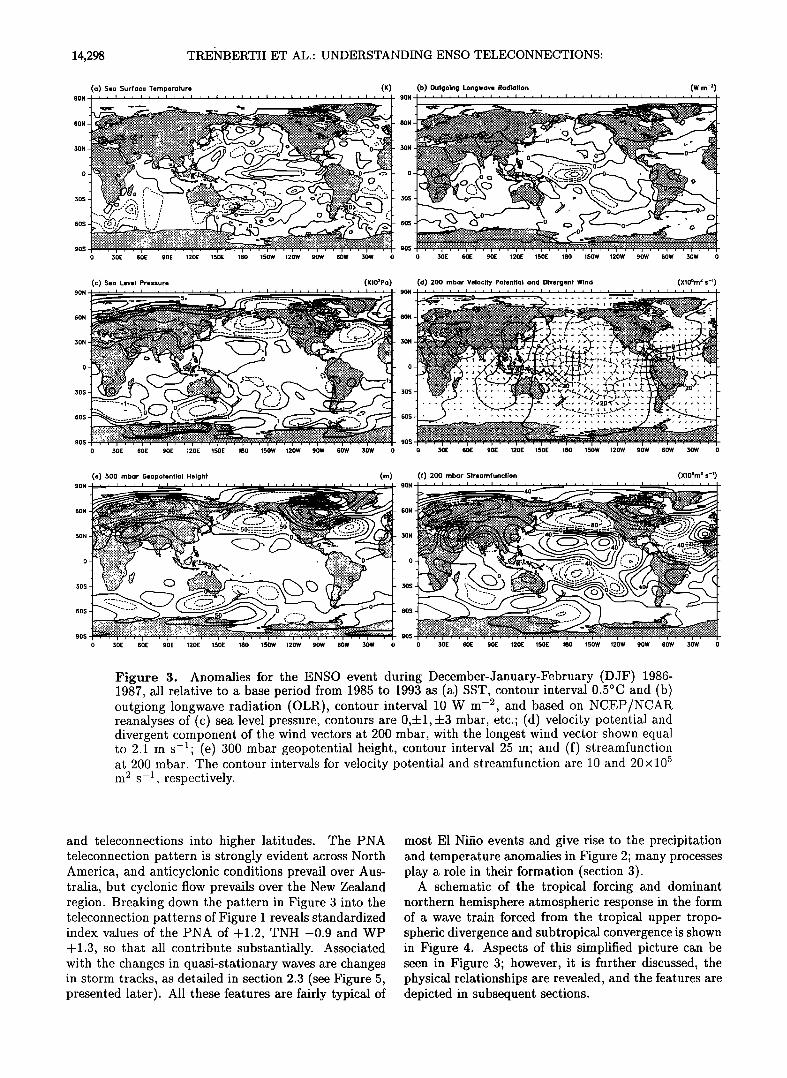
In Figure 3, for DJF 1986-1987 the anomalous SST, OLR, and sea level pressure fields are shown, along with corresponding anomalies at 200 mbar in the di- vergent wind component, velocity potential field, and the streamfunction field, and the geopotential height field at 300 mbar. In the $ST field, besides the warm- ing in the equatorial Pacific, features of note are the cooling in the North Pacific and around New Zealand, with the latter especially pronounced (see section 5.1). The OLR anomalies are as large as -50 W m -2, and experience indicates that magnitudes exceeding about 10 W m -2 for seasonal means (e.g., see Figure 11) are nonrandom and linked to surface forcing. Figure 3 in- dicates the above normal convective activity centered on the equator at 170øW over the warmest water but with evidence of reduced activity to the north in the vicinity of the Hawaiian Islands, to the west over In- donesia, and to the southwest, off Australia. Note also the eastward shifted $PCZ. Regions of low level con- vergence over the warmest water are mirrored in the upper troposphere by regions of divergence, as seen by the anomalous outflow at 200 mbar in Figure 3. The divergent component of the flow provides a forcing for Rossby waves in the atmosphere through the advec- tion of the Earth's vorticity by the anomalous divergent flow, giving an anticyclonic forcing in the upper tropo- sphere (compare Figure 7, presented later, and Rasmus- son and Mo [1993]). Note also the upper tropospheric convergence and thus suppressed rainfall over northeast Brazil. All the main tropical and subtropical features in the OLR field have corresponding upper tropospheric divergence anomalies.
The nondivergent component of the flow is revealed by the streamfunction (•p) anomalies in Figure 3. Most studies of the atmospheric circulation, especially before TOGA, used geopotential height (z) as the primary variable. However, because small gradients in height can be associated with strong winds in low latitudes, it has been recognized that the streamfunction is more appropriate for revealing global aspects of the flow. Fig- ure 3 presents the 300 mbar z as well as the •p field (although at 200 mbar) to illustrate the difference in perception that results. The z variations fail to reveal, the tropical circulation changes that often lead to the extratropical wave trains. Together with the sea level pressure field, the dominant equivalent barotropic na- ture of the extratropical anomalies is revealed, and the anomalies in the Pacific-North American region stand out.
The streamfunction anomalies in Figure 3 show the strong anticyclonic couplet in both hemispheres strad- dling the equator in the region of anomalous convection,
14,298 TRENBERTH ET AL.' UNDERSTANDING ENSO TELECONNECTIONS:
60N
Sea Surface Temperature , i , , , , i , , i , ,
.::.=.:.'"'"':':'• ,";-:', ! / ,.--=.. ,. 50E 60E 90E 120E lSOE 180 150W 120W 90W 60W 50W 0
(b) Outgoing Longwave Radiation (W.m -z) 90N ' ' ' • ' ' • ' ' • ' ' ' ' ' • ' ' • ' ' • ' ' • ' ' ' ' ' • • • i • •
60N
30N
'• I' '-::::--=;-. 0 o • :' :"'?{•:•'),,'.,-' o ,
30S
60S
90S
0 30E 60E 90E 120E 150E 180 150W 120W 90W 60W 30W 0
Sea Level Pressure (X102Pa) (d) 200 mbar Velocity Potential and Divergent Wind (X105mZ.s -•)
0 30E 60E 90E 120E 150E 180 150W 120W 90W 60W .lOW 0 0 30E 60E 90E 120E 150E 180 150W 120W 90W 60W 30W 0
(e) 500 mbar Geopotenfial Height (m) (f) 200 mbar Streamfunction (X10'•m•.s -•) 90H I i i I i i I i i I i i i , , i , , I , , I , , I , , I , , I , , I , , I 90N I , , • , , I , , I , , I , , ! , , i , , I , , I , , I , , I , , I , , I
L. 40 •..-------'•__ 0 ..............
60N 60N '"
.'.'.'.:-.'::•-_-';.:.:_:::.-•o_•...; 30N 30N 40 '•0 ...... ===========:-
0 0
30S 30S
60S 60S
905 I I I 90S ......................................... •""':•;",:, , , , • , , , .... '"";";:;:;1 0 30E 60E 90E 120E 150E 180 150W 120W 90W 60W 30W 0 0 30E 60E 90E 120E 150E 180 150W 120W 90W 60W .lOW 0
Figure 3. Anomalies for the ENSO event during December-January-February (DJF) 1986- 1987• all relative to a base period from 1985 to 1993 as (a) SST, contour interval 0.5øC and (b) outgiong longwave radiation (OLR), contour interval 10 W m -s, and based on NCEP/NCAR reanalyses of (c) sea level pressure, contours are 0,+1, +3 mbar, etc.; (d) velocity potential and divergent component of the wind vectors at 200 mbar, with the longest wind vector shown equal to 2.1 m s-1; (e) 300 mbar geopotential height, contour interval 25 m; and (f) streamfunction at 200 mbar. The contour intervals for velocity potential and streamfunction are 10 and 20x 10 • m • s -1, respectively.
and teleconnections into higher latitudes. The PNA teleconnection pattern is strongly evident across North America, and anticyclonic conditions prevail over Aus- tralia, but cyclonic flow prevails over the New Zealand region. Breaking down the pattern in Figure 3 into the teleconnection patterns of Figure I reveals standardized index values of the PNA of +1.2, TNH -0.9 and WP +1.3, so that all contribute substantially. Associated with the changes in quasi-stationary waves are changes in storm tracks, as detailed in section 2.3 (see Figure 5, presented later). All these features are fairly typical of
most E1 Nifio events and give rise to the precipitation and temperature anomalies in Figure 2; many processes play a role in their formation (section 3).
A schematic of the tropical forcing and dominant northern hemisphere atmospheric response in the form of a wave train forced from the tropical upper tropo- spheric divergence and subtropical convergence is shown in Figure 4. Aspects of this simplified picture can be seen in Figure 3; however, it is further discussed, the physical relationships are revealed, and the features are depicted in subsequent sections.
TRENBERTH ET AL.: UNDERSTANDING ENSO TELECONNECTIONS: 14,299
North ::::.: ..........
Storm Track Changes
DIVERGENCE • Equator
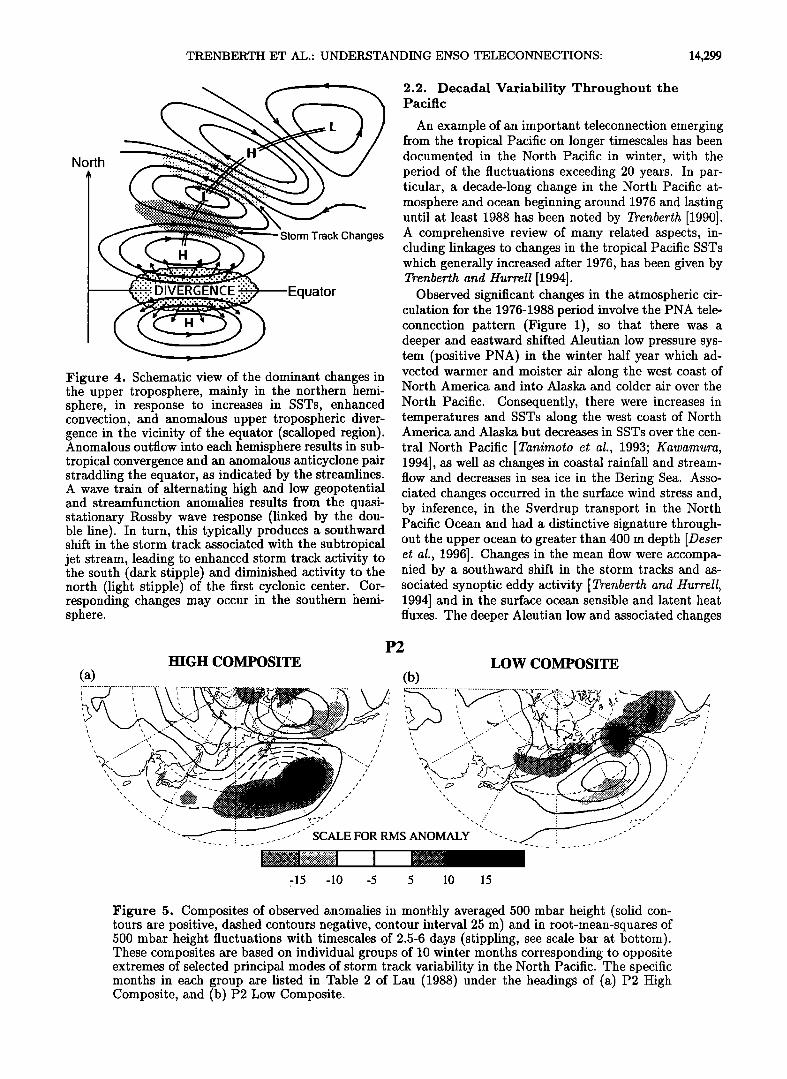
Figure 4. Schematic view of the dominant changes in the upper troposphere, mainly in the northern hemi- sphere, in response to increases in SSTs, enhanced convection, and anomalous upper tropospheric diver- gence in the vicinity of the equator (scalloped region). Anomalous outflow into each hemisphere results in sub- tropical convergence and an anomalous anticyclone pair straddling the equator, as indicated by the streamlines. A wave train of alternating high and low geopotential and streamfunction anomalies results from the quasi- stationary Rossby wave response (linked by the dou- ble line). In turn, this typically produces a southward shift in the storm track associated with the subtropical jet stream, leading to enhanced storm track activity to the south (dark stipple) and diminished activity to the north (light stipple) of the first cyclonic center. Cor- responding changes may occur in the southern hemi- sphere.
2.2. Decadal Variability Throughout the Pacific
An example of an important teleconnection emerging from the tropical Pacific on longer timescales has been documented in the North Pacific in winter, with the period of the fluctuations exceeding 20 years. In par- ticular, a decade-long change in the North Pacific at- mosphere and ocean beginning around 1976 and lasting until at least 1988 has been noted by Trenberth [1990]. A comprehensive review of many related aspects, in- cluding linkages to changes in the tropical Pacific SSTs which generally increased after 1976, has been given by Trenberth and Hurrell [1994].
Observed significant changes in the atmospheric cir- culation for the 1976-1988 period involve the PNA tele- connection pattern (Figure 1), so that there was a deeper and eastward shifted Aleutian low pressure sys- tem (positive PNA) in the winter half year which ad- vected warmer and moister air along the west' coast of North America and into Alaska and colder air over the
North Pacific. Consequently, there were increases in temperatures and SSTs along the west coast of North America and Alaska but decreases in SSTs over the cen-
tral North Pacific [Tanimoto et al., 1993; Kawamura, 1994], as well as changes in coastal rainfall and stream- flow and decreases in sea ice in the Bering Sea. Asso- ciated changes occurred in the surface wind stress and, by inference, in the Sverdrup transport in the North Pacific Ocean and had a distinctive signature through- out the upper ocean to greater than 400 m depth [Deser et al., 1996]. Changes in the mean flow were accompa- nied by a southward shift in the storm tracks and as- sociated synoptic eddy activity [Trenberth and Hurrell, 1994] and in the surface ocean sensible and latent heat fluxes. The deeper Aleutian low and associated changes
P2 HIGH COMPOSITE LOW COMPOSITE
(a) (b)
...................... ' ................. .......... .... ......... .................. , .............................. ........ , .... .......... ', ...•<'" ::•:: :• ' ,.•. •/,,,,/' ',, .........-'<•, .• "• .... '•= '• ,,,
. ..¾, ', ........ ............
' _ ...... - - ANOMALY -. ........ ', _ ' SCALE FOR RMS '
-15 -10 -5 5 10 15
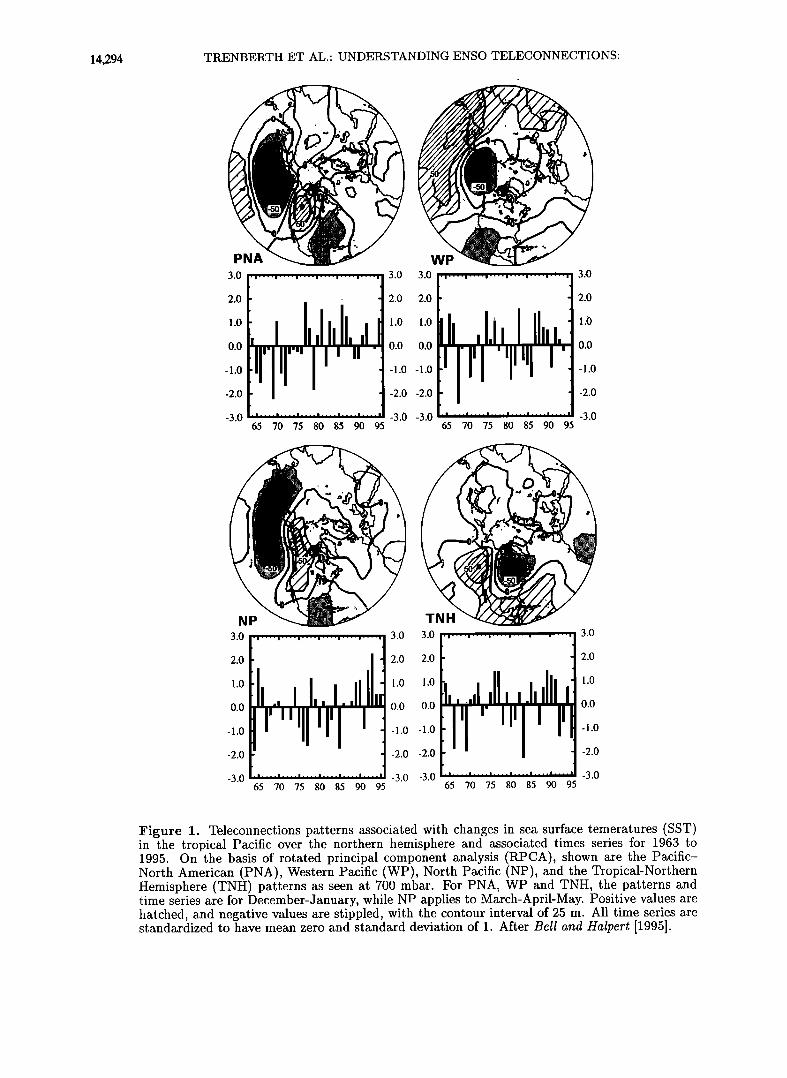
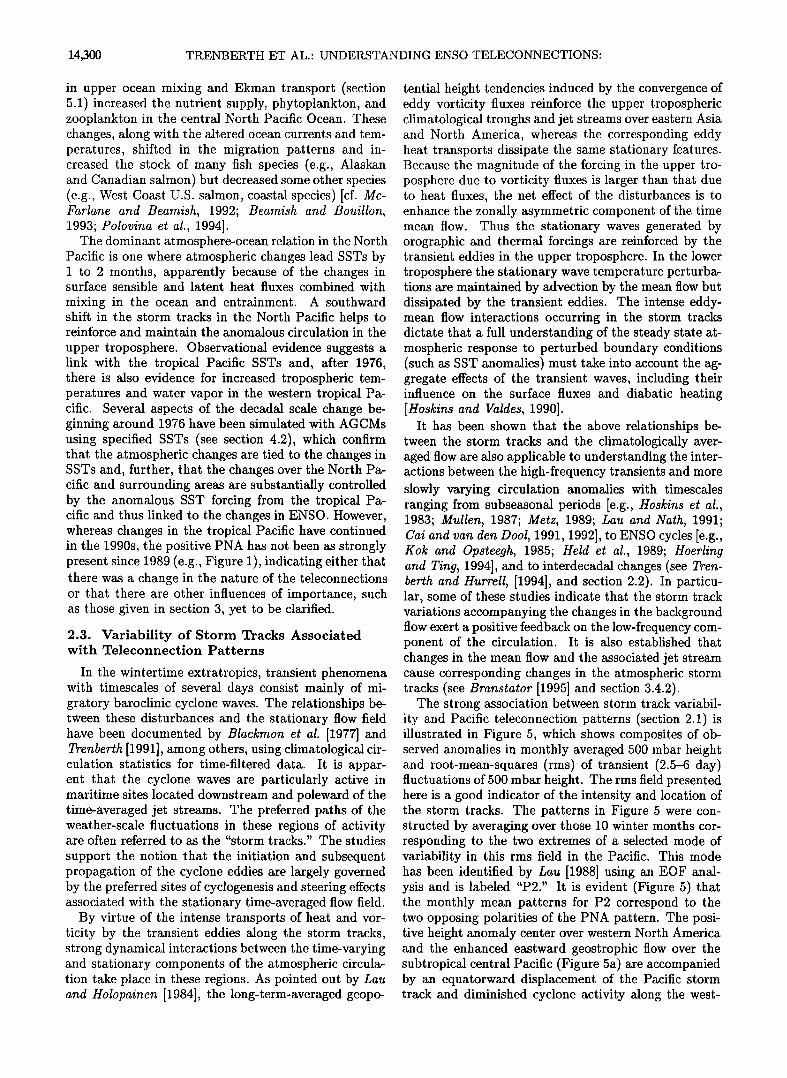
Figure 5. Composites of observed anomalies in monthly averaged 500 mbar height (solid con- tours are positive, dashed contours negative, contour interval 25 m) and in root-mean-squares of 500 mbar height fluctuations with timescales of 2.5-6 days (stippling, see scale bar at bottom). These composites are based on individual groups of 10 winter months corresponding to opposite extremes of selected principal modes of storm track variability in the North Pacific. The specific months in each group are listed in Table 2 of Lau (1988) under the headings of (a) P2 High Composite, and (b) P2 Low Composite.
14,300 TRENBERTH ET AL.: UNDERSTANDING ENSO TELECONNECTIONS:
in upper ocean mixing and Ekman transport (section 5.1) increased the nutrient supply, phytoplankton, and zooplankton in the central North Pacific Ocean. These changes, along with the altered ocean currents and te•n- peratures, shifted in the migration patterns and in- creased the stock of many fish species (e.g., Alaskan and Canadian salmon) but decreased sonhe other species (e.g., West Coast U.S. salmon, coastal species) [cf. Mc- Farlane and Bcamish, 1992; Bcamish and Bouillon, 1993; Polovina ctal., 1994].
The dominant atmosphere-ocean relation in the North Pacific is one where atmospheric changes lead SSTs by I to 2 months, apparently because of the changes in surface sensible and latent heat fluxes combined with
mixing in the ocean and entrainment. A southward shift in the storm tracks in the North Pacific helps to reinforce and maintain the anomalous circulation in the
upper troposphere. Observational evidence suggests a link with the tropical Pacific SSTs and, after 1976, there is also evidence for increased tropospheric tem- peratures and water vapor in the western tropical Pa- cific. Several aspects of the decadal scale change be- ginning around 1976 have been simulated with AGCMs using specified SSTs (see section 4.2), which confirm that the atmospheric changes are tied to the changes in SSTs and, further, that the changes over the North Pa- cific and surrounding areas are substantially controlled by the anomalous SST forcing from the tropical Pa- cific and thus linked to the changes in ENSO. However, whereas changes in the tropical Pacific have continued in the 1990s, the positive PNA has not been as strongly present since 1989 (e.g., Figure 1), indicating either that there was a change in the nature of the teleconnections or that there are other influences of importance, such as those given in section 3, yet to be clarified.
2.3. Variability of Storm Tracks Associated with Teleconnection Patterns
In the wintertime extratropics, transient phenomena with timescales of several days consist mainly of mi- gratory baroclinic cyclone waves. The relationships be- tween these disturbances and the stationary flow field have been documented by Blackmon et al. [1977] and Trenberth [1991], among others, using climatological cir- culation statistics for time-filtered data. It is appar- ent that the cyclone waves are particularly active in maritime sites located downstream and poleward of the time-averaged jet streams. The preferred paths of the weather-scale fluctuations in these regions of activity are often referred to as the "storm tracks." The studies
support the notion that the initiation and subsequent propagation of the cyclone eddies are largely governed by the preferred sites of cyclogenesis and steering effects associated with the stationary time-averaged flow field.
By virtue of the intense transports of heat and vor- ticity by the transient eddies along the storm tracks, strong dynamical interactions between the time-varying and stationary components of the atmospheric circula- tion take place in these regions. As pointed out by Lau and Holopainen [1984], the long-term-averaged geopo-
tential height tendencies induced by the convergence of eddy vorticity fluxes reinforce the upper tropospheric climatological troughs and jet streams over eastern Asia and North America, whereas the corresponding eddy heat transports dissipate the sanhe stationary features. Because the magnitude of the forcing in the upper tro- posphere due to vorticity fluxes is larger than that due to heat fluxes, the net effect of the disturbances is to enhance the zonally asymmetric component of the time mean flow. Thus the stationary waves generated by orographic and thermal forcings are reinforced by the transient eddies in the upper troposphere. In the lower troposphere the stationary wave temperature perturba- tions are maintained by advection by the mean flow but dissipated by the transient eddies. The intense eddy- mean flow interactions occurring in the storm tracks dictate that a full understanding of the steady state at- mospheric response to perturbed boundary conditions (such as SST anomalies) must take into account the ag- gregate effects of the transient waves, including their influence on the surface fluxes and diabatic heating [Hoskins and Valdes, 1990].
It has been shown that the above relationships be- tween the storm tracks and the climatologically aver- aged flow are also applicable to understanding the inter- actions between the high-frequency transients and more slowly varying circulation anomalies with timescales ranging from subseasonal periods [e.g., Hoskins et al., 1983; Mullen, 1987; Metz, 1989; Lau and Nath, 1991; Cai and van den Dool, 1991, 1992], to ENSO cycles [e.g., Kok and Opsteegh, 1985; Held et al., 1989; Hoerling and Ting, 1994], and to interdecadal changes (see Tren- berth and Hurrell, [1994], and section 2.2). In particu- lar, some of these studies indicate that the storm track variations accompanying the changes in the background flow exert a positive feedback on the low-frequency com- ponent of the circulation. It is also established that changes in the mean flow and the associated jet stream cause corresponding changes in the atmospheric storm tracks (see Branstator [1995] and section 3.4.2).
The strong association between storm track variabil- ity and Pacific teleconnection patterns (section 2.1) is illustrated in Figure 5, which shows composites of ob- served anomalies in monthly averaged 500 mbar height and root-mean-squares (rms) of transient (2.5-6 day) fluctuations of 500 mbar height. The rms field presented here is a good indicator of the intensity and location of the storm tracks. The patterns in Figure 5 were con- structed by averaging over those 10 winter months cor- responding to the two extremes of a selected mode of variability in this rms field in the Pacific. This mode has been identified by Lau [1988] using an EOF anal- ysis and is labeled "P2." It is evident (Figure 5) that the monthly mean patterns for P2 correspond to the two opposing polarities of the PNA pattern. The posi- tive height anomaly center over western North America and the enhanced eastward geostrophic flow over the subtropical central Pacific (Figure 5a) are accompanied by an equatorward displacement of the Pacific storm track and diminished cyclone activity along the west-
TRENBERTH ET AL.' UNDERSTANDING ENSO TELECONNECTIONS: 14,301
ern seaboard of North America. Reversal of the polar- ity in the monthly mean pattern (Figure 5b) occurs in conjunction with a poleward storm track displacement and enhanced activity off the west coast of North Amer- ica. These relationships are depicted schematically in Figure 4.
In the southern hemisphere, larger interannual vari- ations are found in the zonal mean flow than in the
wavelike teleconnections, but there also exists a pro- found influence of the low-frequency circulation on the storm tracks with similar feedbacks coming into play. The dominant mode is one of switching from a single to a double jet structure [Trenberth and Christy, 1985]. Kidson [1988b] detected variations in the westerlies sev- eral days after the occurrence of barotropic forcing due to the convergence of eddy westerly momentum trans- ports. Karoly [1990] noted that the storm track dis- placements are accompanied by changes in the transient eddy poleward heat flux and thus in the Eliassen-Palm flux. Randel [1989] traced the evolution of the zonal mean flow in response to life cycle dynamics of baro- clinic waves. However, Trenberth [1984], Kidson [1988a, 1988b], Karoly [1990], $hiotani [1990], and Cuff and Cai [1995] emphasize that the low-frequency variations in zonal mean flow are primarily equivalent barotropic and dominated by changes in the transient momentum (or equivalently vorticity) fluxes, with the heat flux playing a much smaller role. Both the southern hemisphere jet stream and storm tracks vary considerably from year to year in models without external forcing [Zwiers, 1987; Yu and Hartmann, 1993; Hartmann, 1995], so the ef- fects of eddy-mean flow interactions contribute signifi- cantly to internal atmospheric variability, which could mask any influences of tropical SST forcing.
3. Theory and Diagnostics of Interactions of the Tropics with the Extratropics 3.1. Introduction
We now focus on the theoretical basis for the linkages between the anomalous tropical circulation associated with ENSO and changes in the extratropical circulation. Prior to TOGA, the modeling studies of Hoskins et al. [1977], Hoskins and Karoly [1981], and Webster [1981] had shown that the extratropical response to large-scale tropical forcing could be understood in terms of anoma- lous planetary wave propagation from regions of tropical upper tropospheric divergence (Figure 4). The mod- eled teleconnections from tropical heating were shown by Hoskins and Karoly [1981] and Webster [1981] to be remarkably similar to some of the observed telecon- nections described in section 2. We shall refer to this
pre-TOGA conceptual model as the "protomodel" of the extratropical response to tropical forcing.
There have been many refinements to the theoreti- cal understanding of these linkages during the TOGA decade, and these are outlined in the remainder of this section. A number of factors are important in deter-
mining the extratropical circulation during an E1 Nifio event, including the location and intensity of the trop- ical circulation anomalies, the effects of the mean flow on planetary wave propagation and forcing, interactions with midlatitude storm tracks, and interference from the internal chaotic variability of the midlatitude circu- lation. However, Rossby wave propagation still provides the underpinning for all theories of how the tropics in- fluence midlatitudes. Hence we start with a description of the protomodel, including a brief review of the theory of Rossby wave forcing and propagation as it stood at the start of the TOGA period, then continue with the more recent refinements.
The vorticity equation in pressure coordinates is given by
0t + v. V(½ + f) +C0•pp - -(½ + f)V.v (1) 0v
+k. (•pp x V•)- F where ( is the vertical component of relative vorticity, v - (u, v) is horizontal velocity, • is vertical velocity, f - 2•sin• is the planetary vorticity, and F is due to friction. When applied to the time-averaged flow in the upper troposphere, the vorticity equation can be written (using an overbar to represent time-averaged quantities)
_
- - - • +V. V(• + f) - -(• + I)V.V- V. (v'•') - r (2) neglecting terms involving • since the vertical velocity is small near the tropopause. This is the equivalent barotropic vorticity equation for the mean vorticity ( with forcing by the mean stretching of absolute vorticity ((+f)V.V or by trapslent eddy convergence of vorticity -v. (v'(').
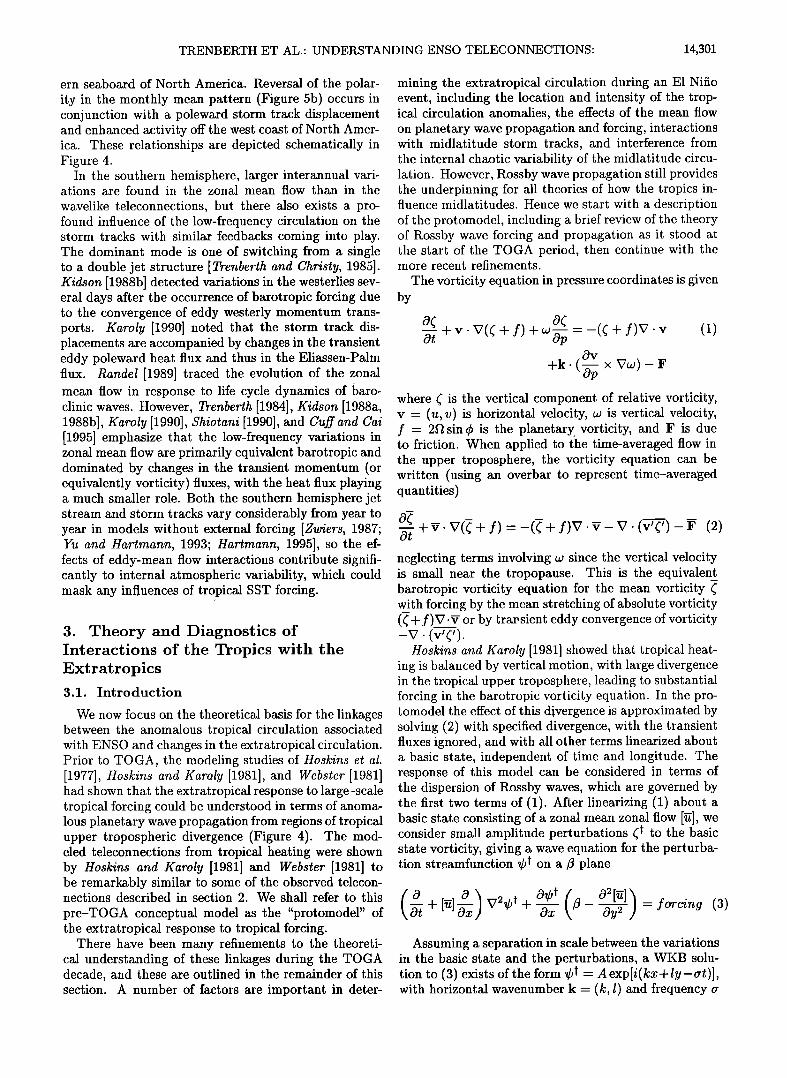
Hoskins and Karoly [1981] showed that tropical heat- ing is balanced by vertical motion, with large divergence in the tropical upper troposphere, leading to substantial forcing in the barotropic vorticity equation. In the pro- tomodel the effect of this divergence is approximated by solving (2) with specified divergence, with the transient fluxes ignored, and with all other terms linearized about a basic state, independent of time and longitude. The response of this model can be considered in terms of the dispersion of Rossby waves, which are governed by the first two terms of (1). After linearizing (1) about a basic state consisting of a zonal mean zonal flow [•], we consider smM1 amplitude perturbations (• to the basic state vorticity, giving a wave equation for the perturba- tion streamfunction • on a • plane
(0 0) 0•pt ( 02[•])-forcing (3) + v+t + -5-'X-x Oy Assuming a separation in scale between the variations
in the basic state and the perturbations, a WKB solu- tion to (3) exists of the form •b t - A exp[i(kx+ly-ert)], with horizontal wavenumber k - (k, l) and frequency er
14,302 TRENBERTH ET AL.- UNDERSTANDING ENSO TELECONNECTIONS:
which satisfies the dispersion equation cr- [•]k- (fi- [W].vv)/,:/IC 2, with IC -Ikl . The dispersion of wave en- ergy froin the forcing is in the direction of the group velocity
C 9 -- (O'/]C q- 2(/•- ['•,]yy)]C2/I•4•2(•- [•]yy)]•l/I•4). (4)
For stationary waves on the sphere in a climatological mean zonal flow, as considered by Hoskins and Karoly [1981], wavelike solutions are possible for low-latitude forcing in a westerly mean flow, and wave energy dis- perses poleward and eastward from the forcing region before arcing back toward low-latitudes and being ab- sorbed (according to linear theory) at the low latitude "critical line" where the mean flow is equal to the phase speed of the waves (zero) (compare Figure 4).
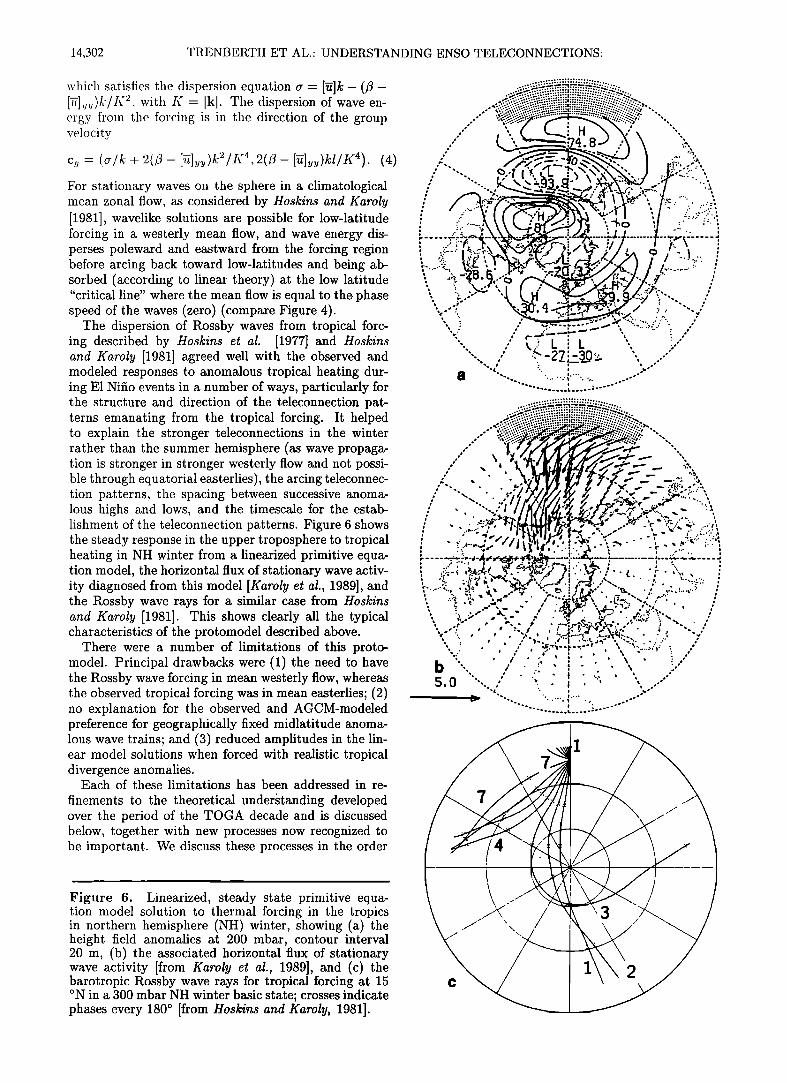
The dispersion of Rossby waves from tropical forc- ing described by Hoskins et al. [1977] and Hoskins and Karoly [1981] agreed well with the observed and modeled responses to anomalous tropical heating dur- ing E1 Nifio events in a number of ways, particularly for the structure and direction of the teleconnection pat- terns emanating from the tropical forcing. It helped to explain the stronger teleconnections in the winter rather than the summer hemisphere (as wave propaga- tion is stronger in stronger westerly flow and not possi- ble through equatorial easterlies), the arcing teleconnec- tion patterns, the spacing between successive anoma- lous highs and lows, and the timescale for the estab- lishment of the teteconnection patterns. Figure 6 shows the steady response in the upper troposphere to tropical heating in NH winter from a linearized primitive equa- tion model, the horizontal flux of stationary wave activ- ity diagnosed from this model [Karoly et al., 1989], and the Rossby wave rays for a similar case from Hoskins and Karoly [1981]. This shows clearly all the typical characteristics of the protomodel described above.
There were a number of limitations of this proto- model. Principal drawbacks were (1) the need to have the Rossby wave forcing in mean westerly flow, whereas the observed tropical forcing was in mean easterlies; (2) no explanation for the observed and AGCM-modeled preference for geographically fixed midlatitude anoma- lous wave trains; and (3) reduced amplitudes in the lin- ear model solutions when forced with realistic tropical divergence anomalies.
Each of these limitations has been addressed in re-
finements to the theoretical underktanding developed over the period of the TOGA decade and is discussed below, together with new processes now recognized to be important. We discuss these processes in the order
Figure 6. Linearized, steady state primitive equa- tion model solution to thermal forcing in the tropics in northern hemisphere (NH) winter, showing (a) the height field anomalies at 200 mbar, contour interval 20 m, (b) the associated horizontal flux of stationary wave activity [from Karoly et al., 1989], and (c) the barotropic Rossby wave rays for tropical forcing at 15 øN in a 300 mbar NH winter basic state; crosses indicate phases every 180 ø [from Hoskins and Karoly, 1981].
' ,'.):.2<..'.:\?.>:..'..:!.:•v.:.:::':..:
/ ' , '-.,• I •,, ' ""' :t / - ,:.",. ','
: :. ,.."---•,,, , :.. :. .... • -•.,,.,.,i,,,,,,<•,.,,• t , ..... : ; .: , ," - ,•
, ...' : •, / •:•.F •...,_• i•....•,,•. '.- . :.: .... .; ,•...•,.::•. • x. ß:: i ß ' .' ', ':' ..:o'> •, i"•% '- .• i :.,•. ,. v: , •..• ...•,.. . ... ',: ......... .-.. ' '.:'.'. k' ,.:"-•'" ,;2 • ".. -' ', ';','> .",-' i ß '-•r ß
N .-) ,' ,""::/"- ,' '½ ' ". ß • , 'ß ' "M'• .... '•' ', '. ' , ; '1'.. ' .;•' "1 '
ß .- ' • .1' T
b"' ' / ';' ' i ß ",.. ,
TRENBERTH ET AL.' UNDERSTANDING ENSO TELECONNECTIONS: 14,303
in which they occur in nature, starting with the tropical forcing, then continuing with propagation into midlati- tudes, and internal midlatitude forcing and other issues.
3.2. Tropical Forcing
The focus of the ENSO phenomenon is the trop- ical Pacific, and the observed global influence arises from atmospheric teleconnections from the regions of anomalous tropical heating. Small changes in SST and SST gradients can lead to shifts in the location of the large-scale organized convection in the tropics and also to changes in the intensity of the convec- tion. These result in large anomalies in atmospheric heating, mainly through latent heat release in precip- itation, and upper tropospheric divergence (Figure 3). The tropical response to this anomalous heating can be explained in terms of equatorially trapped Kelvin and mixed Rossby-gravity waves with a first internal mode vertical structure in the troposphere [Gill, 1980]. In the vicinity of the tropical heating the response in the up- per troposphere takes the form of a pair of anomalous anticyclones which straddle the equator (compare Fig- ures 3 and 4). In addition to the anomalous divergence over the tropical heating, there is usually an anoma- lous circulation involving an east-west Walker circula- tion linking a region of anomalous convergence over the Indonesian region to the anomalous divergence (see also section 2.1.3).
Hence one factor which directly influences the tropi- cal forcing during ENSO events is the differences of SST anomaly patterns between events. These lead to differ- ences in the location of the tropical heating anomalies, apparent in the anomalous tropical rainfall and asso- ciated OLR fields observed during different events. It is not clear how much the changes in the location and magnitude of the tropical heating anomalies account for some of the variations of the extratropical circulation between ENSO events.
The forcing of extratropical Rossby waves by the anomalous tropical heating can be best understood by partitioning the horizontal flow v into nondiver- gent v• and irrotational vx components, such that v = vg, +vx = k x K7•+VX, with streamfunction • and velocity potential ,. Then (2) can be rewritten as
+ v,. v(½ + f) - -(• + f)v.% ot
-%. + f)- v.
-v. The left-hand side retains all terms necessary to support Rossby wave propagation, while the right-hand side in- volves an additional term compared with (2) involving the advection of vorticity by the divergent flow. This form of the barotropic vorticity equation was discussed by $ardeshmukh and Hoskins [1988], who described the first three terms on the right-hand side as the Rossby wave source, S - -V. vx((+ f), which is the forc- ing associated with the divergent flow. The anomalous
Rossby wave source term, which contributes to the forc- ing of seasonal anomalies, can be written as
-$• = f Da + •vx,• + (•D,• + (,•D• + (,•D,• (6) +vx•.V(•+vx• V(•+vx•.
+(v ß
where the overbar represents a single season mean, the primes indicate the daily departures from the single sea- son mean, subscript represents the climatological mean value, and subscript represents the departure of the sin- gle season mean from the climatological value, and D is the divergence.
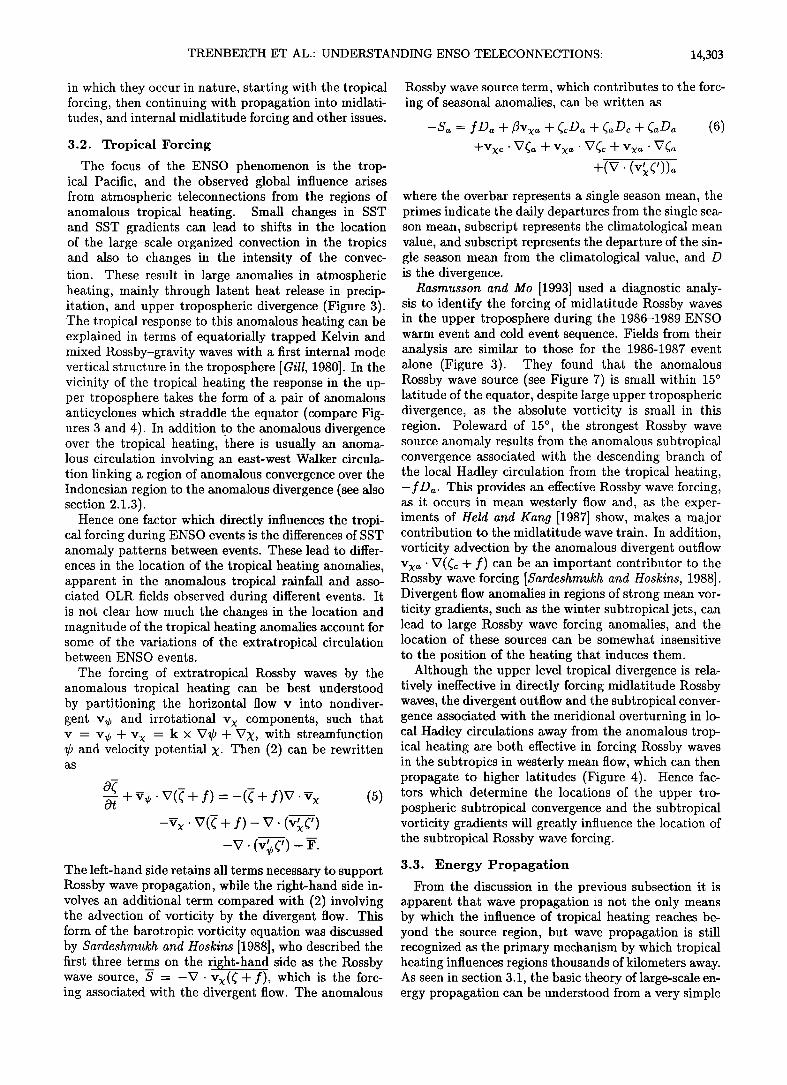
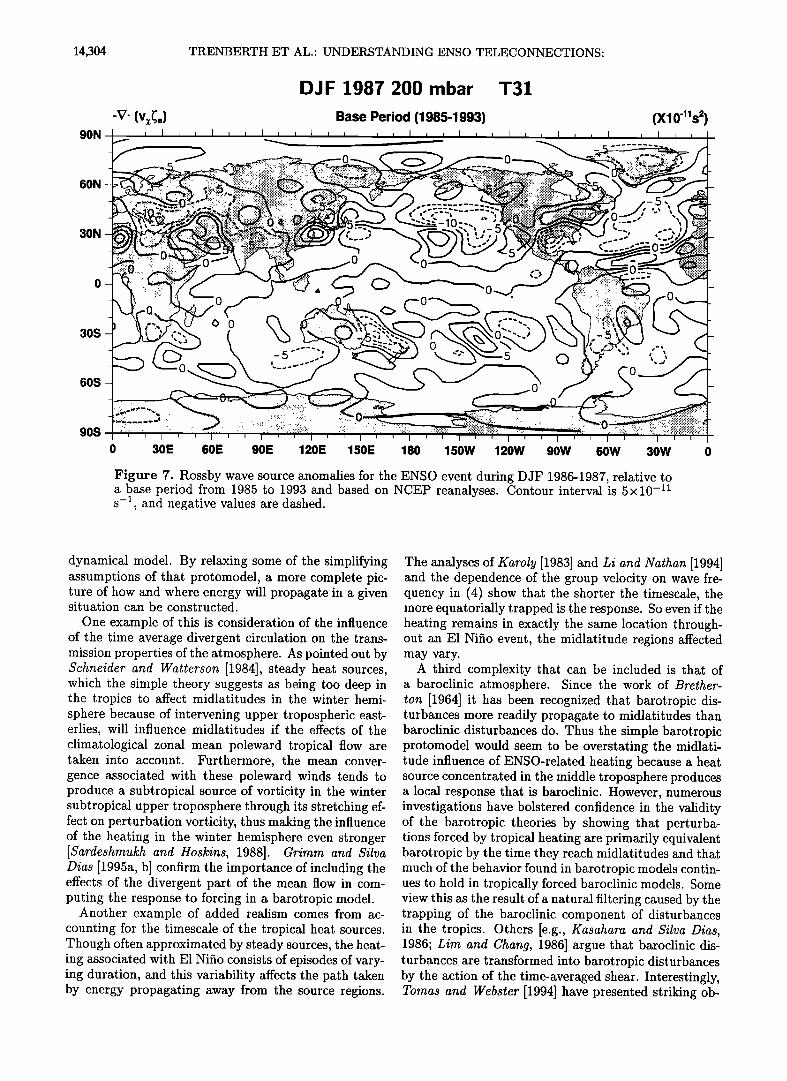
Rasmusson and Mo [1993] used a diagnostic analy- sis to identify the forcing of midlatitude Rossby waves in the upper troposphere during the 1986-1989 ENSO warm event and cold event sequence. Fields from their analysis are similar to those for the 1986-1987 event alone (Figure 3). They found that the anomalous Rossby wave source (see Figure 7) is small within 15 ø latitude of the equator, despite large upper tropospheric divergence, as the absolute vorticity is small in this region. Poleward of 15 ø, the strongest Rossby wave source anomaly results from the anomalous subtropical convergence associated with the descending branch of the local Hadley circulation from the tropical heating, -fD•. This provides an effective Rossby wave forcing, as it occurs in mean westerly flow and, as the exper- iments of Held and Kang [1987] show, makes a major contribution to the midlatitude wave train. In addition, vorticity advection by the anomalous divergent outflow vx•. V((• + f) can be an important contributor to the Rossby wave forcing [Sardeshmukh and Hoskins, 1988]. Divergent flow anomalies in regions of strong mean vor- ticity gradients, such as the winter subtropical jets, can lead to large Rossby wave forcing anomalies, and the location of these sources can be somewhat insensitive
to the position of the heating that induces them. Although the upper level tropical divergence is rela-
tively ineffective in directly forcing midlatitude Rossby waves, the divergent outflow and the subtropical conver- gence associated with the meridional overturning in lo- cal Hadley circulations away from the anomalous trop- ical heating are both effective in forcing Rossby waves in the subtropics in westerly mean flow, which can then propagate to higher latitudes (Figure 4). Hence fac- tors which determine the locations of the upper tro- pospheric subtropical convergence and the subtropical vorticity gradients will greatly influence the location of the subtropical Rossby wave forcing.
3.3. Energy Propagation
From the discussion in the previous subsection it is apparent that wave propagation is not the only means by which the influence of tropical heating reaches be- yond the source region, but wave propagation is still recognized as the primary mechanism by which tropical heating influences regions thousands of kilometers away. As seen in section 3.1, the basic theory of large-scale en- ergy propagation can be understood from a very simple
14,304 TRENBERTH ET AL.' UNDERSTANDING ENSO TELECONNECTIONS.
90N
60N
30N
30S
60S
90S
-v.
DJF 1987 200 mbar T31
Base Period (1985-1993)
• o
(X10'11S2)
, CD o
•
0 30E 60E 90E 120E 150E 180 150W 120W 90W 60W 30W
Figure 7. Rossby wave source anomalies for the ENSO event during DJF 1986-1987, relative to a base period from 1985 to 1993 and based on NCEP reanalyses. Contour interval is 5x10 -• s -• and negative values are dashed • ß
dynamical model. By relaxing some of the simplifying assumptions of that protomodel, a more complete pic- ture of how and where energy will propagate in a given situation can be constructed.
One example of this is consideration of the influence of the time average divergent circulation on the trans- mission properties of the atmosphere. As pointed out by Schneider and Wattorson [1984], steady heat sources, which the simple theory suggests as being too deep in the tropics to affect midlatitudes in the winter hemi- sphere because of intervening upper tropospheric east- erlies, will influence midlatitudes if the effects of the climatological zonal mean poleward tropical flow are taken into account. Furthermore, the mean conver- gence associated with these poleward winds tends to produce a subtropical source of vorticity in the winter subtropical upper troposphere through its stretching ef- fect on perturbation vorticity, thus making the influence of the heating in the winter hemisphere even stronger [Sardeshmukh and Hoskins, 1988]. Grimm and Silva Dias [1995a, b] confirm the importance of including the effects of the divergent part of the mean flow in com- puting the response to forcing in a barotropic model.
Another example of added realism comes from ac- counting for the timescale of the tropical heat sources. Though often approximated by steady sources, the heat- ing associated with E1 Nifio consists of episodes of vary- ing duration, and this variability affects the path taken by energy propagating away from the source regions.
The analyses of Karoly [1983] and Li and Nathan [1994] and the dependence of the group velocity on wave fre- quency in (4) show that the shorter the timescale, the more equatorially trapped is the response. So even if the heating remains in exactly the same location through- out an E1 Nifio event, the midlatitude regions affected may vary.
A third complexity that can be included is that of a baroclinic atmosphere. Since the work of Brether- ton [1964] it has been recognized that barotropic dis- turbances more readily propagate to midlatitudes than baroclinic disturbances do. Thus the simple barotropic protomodel would seem to be overstating the midlati- tude influence of ENSO-related heating because a heat source concentrated in the middle troposphere produces a local response that is baroclinic. However, numerous investigations have bolstered confidence in the validity of the barotropic theories by showing that perturba- tions forced by tropical heating are primarily equivalent barotropic by the time they reach midlatitudes and that much of the behavior found in barotropic models contin- ues to hold in tropically forced baroclinic models. Some view this as the result of a natural filtering caused by the trapping of the baroclinic component of disturbances in the tropics. Others [e.g., Kasahara and Silva Dias, 1986; Lim and Chang, 1986] argue that baroclinic dis- turbances are transformed into barotropic disturbances by the action of the time-averaged shear. Interestingly, Tomas and Webster [1994] have presented striking ob-
TRENBERTH ET AL.: UNDERSTANDING ENSO TELECONNECTIONS: 14,305
servational evidence of analogous behavior for pertur- bations entering the tropics; the vertical structure of such disturbances changes from equivalent barotropic to baroclinic as they encounter the region of low-level easterlies.
Given the prominent equivalent barotropic structure of midlatitude anomalies, it is quite common to exam- ine extratropical responses to tropical forcings by using a barotropic model forced by tropical divergence. How- ever, results are quite sensitive to the level chosen to represent the atmosphere owing to considerable sensi- tivity to the strength of the zonal mean wind and its effect on Rossby wave dispersion. Best results (in the sense that the midlatitude response to tropical heating agree with a full baroclinic model) occur for a barotropic model applied at the 350 mbar level [Ting, 1996]. This roughly agrees with the results of the Held et al. [1985] study of the appropriate level for use of the barotropic vorticity equation in the study of the forced response of the external mode. Further, as Ting and $ardesh- mulch [1993] have demonstrated, the vertical distribu- tion of tropical heating can influence the amplitude of the resulting midlatitude anomalies because meridional propagation is influenced by the vertical structure of a disturbance, as explained above. Because barotropic models cannot represent the spatially varying vertical structure of tropically forced perturbations, baroclinic models are required for accurate representation of their propagation. Therefore, although barotropic dynam- ics are able to capture the essence of the tropical- extratropical character during ENSO, baroclinic models are needed for quantitative understanding.
A complementary view of the links between tropical forcing and the extratropical response can be obtained using "potential vorticity (PV) thinking" [Hoskins et al., 1985]. Rossby waves propagate along isentropic sur- faces on potential vorticity gradients, so the large PV gradients at the tropopause provide preferred channels for wave propagation. Anomalous tropical heating and the associated vertical motion lead to disturbances of
the isentropic surfaces in the upper troposphere in the tropics and subtropics. These disturbances can radiate Rossby waves along the PV gradients into midlatitudes, leading to the teleconnections described earlier.
A fourth elaboration arises from recognizing that per- turbations stimulated from the tropics are influenced by a time-mean state that is a function of longitude as well as latitude. This means that the midlatitude response to tropical heating is very sensitive to the longitude of the heating as, for example, Simmons [1982] demon- strated. Investigations have found that because of the large scale of longitudinal variations in the mean state, WKB theory holds. This means that the general prop- erties of wave propagation developed in section 3.1 for a Tonally symmetric basic state can be applied to the local conditions in a Tonally varying mean state. This is true for propagation in both the tropics and in midlat- itudes. Applying this principle to the tropics, Webster and Holton [1982] showed that meridional propagation across the tropical belt is possible if it occurs through
a patch of local westerlies, while Webster and Chang [1988] and Hoskins and Jin [1991] suggested that longi- tudinal variations in the tropical background can affect the zonal propagation of tropical perturbations leading to an accumulation of perturbation energy to the east of a westerly maximum.
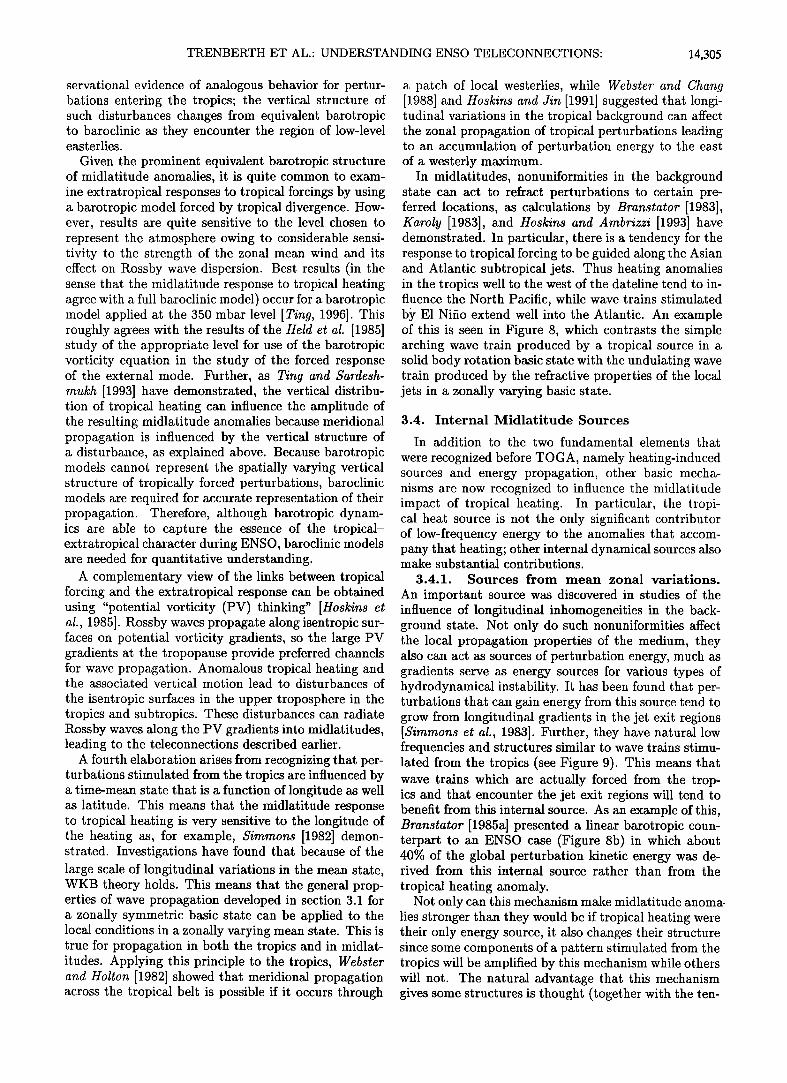
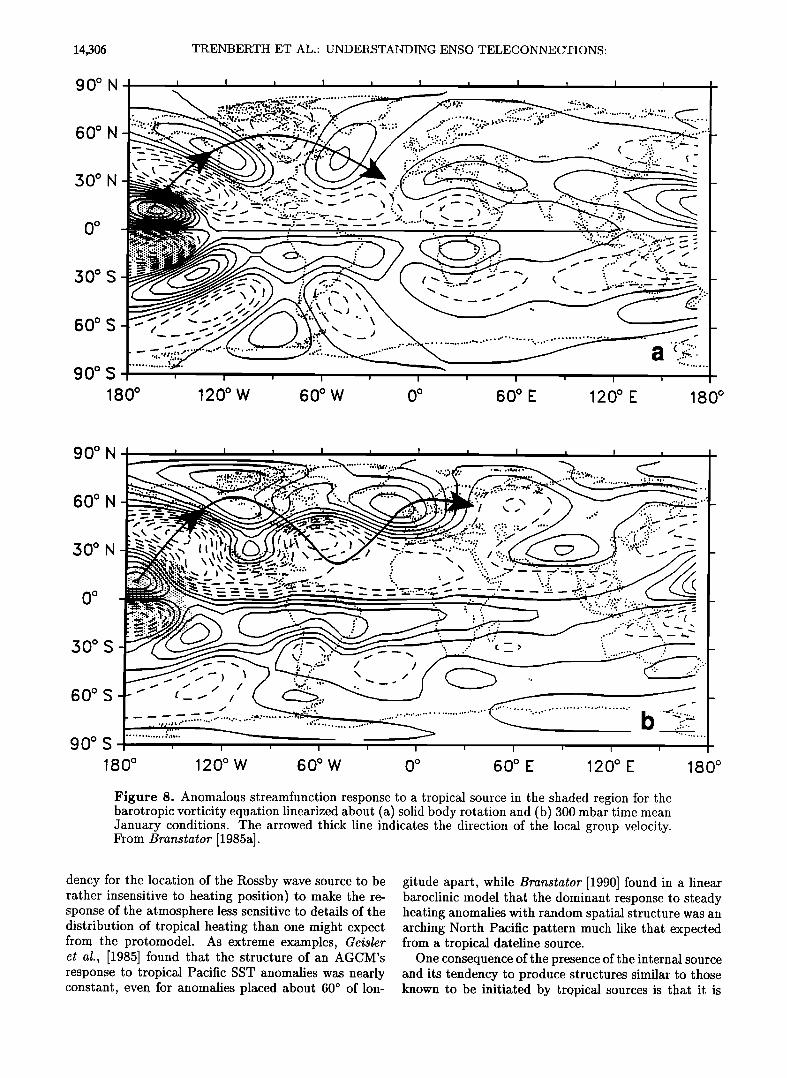
In midlatitudes, nonuniformities in the background state can act to refract perturbations to certain pre- ferred locations, as calculations by Branstator [1983], Karoly [1983], and Hoskins and Ambrizzi [1993] have demonstrated. In particular, there is a tendency for the response to tropical forcing to be guided along the Asian and Atlantic subtropical jets. Thus heating anomalies in the tropics well to the west of the dateline tend to in- fluence the North Pacific, while wave trains stimulated by E1 Nifio extend well into the Atlantic. An example of this is seen in Figure 8, which contrasts the simple arching wave train produced by a tropical source in a solid body rotation basic state with the undulating wave train produced by the refractive properties of the local jets in a zonally varying basic state.
3.4. Internal Midlatitude Sources
In addition to the two fundamental elements that
were recognized before TOGA, namely heating-induced sources and energy propagation, other basic mecha- nisms are now recognized to influence the midlatitude impact of tropical heating. In particular, the tropi- cal heat source is not the only significant contributor of low-frequency energy to the anomalies that accom- pany that heating; other internal dynamical sources also make substantial contributions.
3.4.1. Sources from mean zonal variations.
An important source was discovered in studies of the influence of longitudinal inhomogeneities in the back- ground state. Not only do such nonuniformities affect the local propagation properties of the medium, they also can act as sources of perturbation energy, much as gradients serve as energy sources for various types of hydrodynamical instability. It has been found that per- turbations that can gain energy from this source tend to grow from longitudinal gradients in the jet exit regions [Simmons et al., 1983]. Further, they have natural low frequencies and structures similar to wave trains stimu- lated from the tropics (see Figure 9). This means that wave trains which are actually forced from the trop- ics and that encounter the jet exit regions will tend to benefit from this internal source. As an example of this, Branstator [1985a] presented a linear barotropic coun- terpart to an ENSO case (Figure 8b) in which about 40% of the global perturbation kinetic energy was de- rived from this internal source rather than from the
tropical heating anomaly. Not only can this mechanism make midlatitude anoma-
lies stronger than they would be if tropical heating were their only energy source, it also changes their structure since some components of a pattern stimulated from the tropics will be amplified by this mechanism while others will not. The natural advantage that this mechanism gives some structures is thought (together with the ten-
14,306 TRENBERTH ET AL.' UNDERSTANDING ENSO TELECONNECTIONS:
90 ø N
60 ø N
30 ø N
o
30 ø S
60 ø S
90 ø $ 180 ø
.o.
120 ø W 60 ø W 0 ø 60 ø E 120 ø E 180 ø
90 ø N
60 ø N
30 ø N
o
30 ø S
60 ø S
90 ø S
180 ø 120 ø W 60 ø W 0 ø 60 ø E 120 ø E 180 ø
Figure 8. Anomalous streamfunction response to a tropical source in the shaded region for the barotropic vorticity equation linearized about (a) solid body rotation and (b) 300 mbar time mean January conditions. The arrowed thick line indicates the direction of the local group velocity. From Branstator [1985a].
dency for the location of the Rossby wave source to be rather insensitive to heating position) to make the re- sponse of the atmosphere less sensitive to details of the distribution of tropical heating than one might expect from the protomodel. As extreme examples, Geisler et al., [1985] found that the structure of an AGCM's response to tropical Pacific SST anomalies was nearly constant, even for anomalies placed about 60 ø of lon-
gitude apart, while Branstator [1990] found in a linear baroclinic model that the dominant response to steady heating anomalies with random spatial structure was an arching North Pacific pattern much like that expected from a tropical dateline source.
One consequence of the presence of the internal source and its tendency to produce structures similar to those known to be initiated by tropical sources is that it is
TRENBERTH ET AL.' UNDERSTANDING ENSO TELECONNECTIONSi 14,307
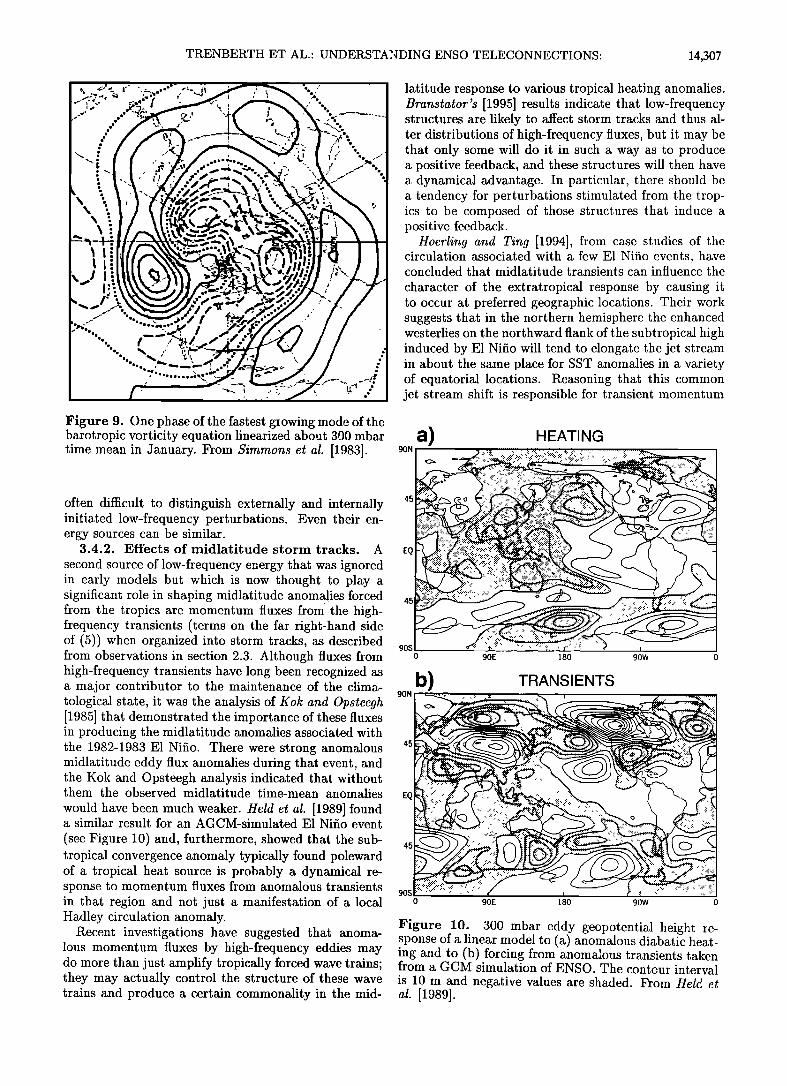
ii e
Figure 9. One phase of the fastest gzowing mode of the barotropic vorticity equation linearized about 300 mba,r time mean in January. From Simmons et al. []_983].
often difficult to distinguish externally and internally initiated low-frequency perturbations. Even their en- ergy sources can be similar.
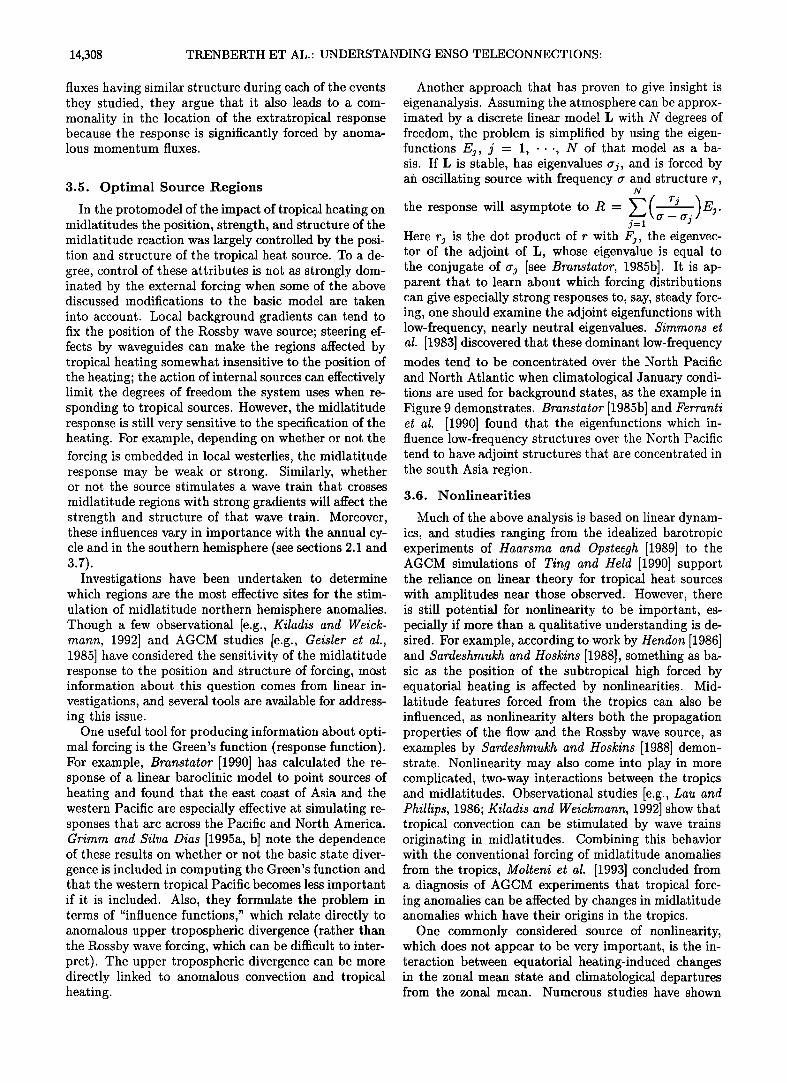
3.4.2. Effects of midlatitude storm tracks. A
second source of low-frequency energy that was ignored in early models but which is now thought to play a significant role in shaping midlatitude anomalies forced from the tropics are momentum fluxes from the high- frequency transients (terms on the far right-hand side of (5)) when organized into storm tracks, as described fi'om observations in section 2.3. Although fluxes from high-frequency transients have long been recognized as a major contributor to the maintenance of the clima- tological state, it was the analysis of Kok and Opsteegh [1985] that demonstrated the importance of these fluxes in producing the midlatitude anomalies associated with the 1982-1983 E1 Nifio. There were strong anomalous midlatitude eddy flux anomalies during that event, and the Kok and Opsteegh analysis indicated that without them the observed midlatitude time-mean anomalies
would have been much weaker. Held et al. [1989] found a similar result for an AGCM-simulated E1 Nifio event
(see Figure 10) and, furthermore, showed that the sub- tropical convergence anomaly typically found poleward of a tropical heat source is probably a dynamical re- sponse to momentum fluxes from anomalous transients in that region and not just a manifestation of a local Hadley circulation anomaly.
Recent investigations have suggested that anoma- lous momentum fluxes by high-frequency eddies may do more than just amplify tropically forced wave trains; they may actually control the structure of these wave trains and produce a certain commonality in the mid-
latitude response to various tropical heating anomalies. Branstator's [1995] results indicate that low-frequency structures are likely to affect storm tracks and thus al- ter distributions of high-frequency fluxes, but it may be that only some will do it in such a way as to produce a positive feedback, and these structures will then have a dynamical advantage. In particular, there should be a tendency for perturbations stimulated from the trop- ics to be composed of those structures that induce a positive feedback.
Hoerling and Ting [1994], from case studies of the circulation associated with a few E1 Nifio events, have concluded that midlatitude transients can influence the
character of the extratropical response by causing it to occur at preferred geographic locations. Their work suggests that in the northern hemisphere the enhanced westerlies on the northward flank of the subtropical high induced by E1 Nifio will tend to elongate the jet stream in about the same place for SST anomalies in a variety of equatorial locations. Reasoning that this common jet stream shift is responsible for transient momentum
a) HEATING 90N ............ • ............. :.,;:.,....;,; ................ :;.;.;.;.;- .................. • ................................
EQ ::':/'/' '"':••"....••••......•<:::::::::::• - 45 __ c2
90S • 0 90E 180 90W 0
b) TRANSIENTS
45
905 0 90E !80 90W 0
Figure 10. 300 mbar eddy geopotential height re- sponse of a linear model to (a) anomalous die•ba•ic heat- ing and to (b) forcing from anomalous transients taken from a GCM simulation of ENSO. The contcur interval is 10 m and negative values are shaded. From Held et al. [1989].
14,308 TRENBERTH ET AL.: UNDERSTANDING ENSO TELECONNECTIONS:
fluxes having similar structure during each of the events they studied, they argue that it also leads to a com- monality in the location of the extratropical response because the response is significantly forced by anoma- lous momentum fluxes.
3.5. Optimal Source Regions
In the protomodel of the impact of tropical heating on midlatitudes the position, strength, and structure of the midlatitude reaction was largely controlled by the posi- tion and structure of the tropical heat source. To a de- gree, control of these attributes is not as strongly dom- inated by the external forcing when some of the above discussed modifications to the basic model are taken
into account. Local background gradients can tend to fix the position of the Rossby wave source; steering ef- fects by waveguides can make the regions affected by tropical heating somewhat insensitive to the position of the heating; the action of internal sources can effectively limit the degrees of freedom the system uses when re- sponding to tropical sources. However, the midlatitude response is still very sensitive to the specification of the heating. For example, depending on whether or not the forcing is embedded in local westerlies, the midlatitude response may be weak or strong. Similarly, whether or not the source stimulates a wave train that crosses
midlatitude regions with strong gradients will affect the strength and structure of that wave train. Moreover, these influences vary in importance with the annual cy- cle and in the southern hemisphere (see sections 2.1 and 3.7).
]nvestiõations have been undertaken to determine which regions are the most effective sites for the stim- ulation of midlatitude northern hemisphere anomalies. Though a few observational Ie.õ., Kiladis mann, 1992] and AGCM studies [e.g., Geisler e• al., 1955] have considered the sensitivity of the midlatitude response to the position and structure of forcing, most information about this question comes from linear in- vestiõations, and several tools are available for address- ing this issue.
One useful tool for producing information about opti- mal forcing is the Green's function (response function). For example, Branstator [1990] has calculated the re- sponse of a linear baroclinic model to point sources of heating and found that the east coast of Asia and the western Pacific are especially effective at simulating re- sponses that arc across the Pacific and North America. Grimm and Silva Dias [1995a, b] note the dependence of these results on whether or not the basic state diver-
gence is included in computing the Green's function and that the western tropical Pacific becomes less important if it is included. Also, they formulate the problem in terms of "influence functions," which relate directly to anomalous upper tropospheric divergence (rather than the Rossby wave forcing, which can be difficult to inter- pret). The upper tropospheric divergence can be more directly linked to anomalous convection and tropical heating.
Another approach that has proven to give insight is eigenanalysis. Assuming the atmosphere can be approx- imated by a discrete linear model L with N degrees of freedom, the problem is simplified by using the eigen- functions Ej, j = l, ..., N of that model as a ba- sis. If L is stable, has eigenvalues •j, and is forced by aft oscillating source with frequency • and structure r,
N
rspos sympo' 'o j--1 --O'j Here rj is the dot product of r with Fj, the eigenvec- tor of the adjoint of L, whose eigenvalue is equal to the conjugate of aj [see Branstator, 1985b]. It is ap- parent that to learn about which forcing distributions can give especially strong responses to, say, steady forc- ing, one should examine the adjoint eigenfunctions with low-frequency, nearly neutral eigenvalues. Simmons et al. [1983] discovered that these dominant low-frequency modes tend to be concentrated over the North Pacific
and North Atlantic when climatological January condi- tions are used for background states, as the example in Figure 9 demonstrates. Branstator [1985b] and Ferranti et al. [1990] found that the eigenfunctions which in- fluence low-frequency structures over the North Pacific tend to have adjoint structures that are concentrated in the south Asia region.
3.6. Nonlinearities
Much of the above analysis is based on linear dynam- ics, and studies ranging from the idealized barotropic experiments of Haarsma and Opsteegh [1989] to the AGCM simulations of Ting and Held [1990] support the reliance on linear theory for tropical heat sources with amplitudes near those observed. However, there is still potential for nonlinearity to be important, es- pecially if more than a qualitative understanding is de- sired. For example, according to work by Hendon [1986] and $ardeshmukh and Hoskins [1988], something as ba- sic as the position of the subtropical high forced by equatorial heating is affected by nonlinearities. Mid- latitude features forced from the tropics can also be influenced, as nonlinearity alters both the propagation properties of the flow and the Rossby wave source, as examples by $ardeshmukh and Hoskins [1988] demon- strate. Nonlinearity may also come into play in more complicated, two-way interactions between the tropics and midlatitudes. Observational studies [e.g., Lau and Phillips, 1986; Kiladis and Weickmann, 1992] show that tropical convection can be stimulated by wave trains originating in midlatitudes. Combining this behavior with the conventional forcing of midlatitude anomalies from the tropics, Molteni et al. [1993] concluded from a diagnosis of AGCM experiments that tropical forc- ing anomalies can be affected by changes in midlatitude anomalies which have their origins in the tropics.
One commonly considered source of nonlinearity, which does not appear to be very important, is the in- teraction between equatorial heating-induced changes in the zonal mean state and climatological departures from the zonal mean. Numerous studies have shown
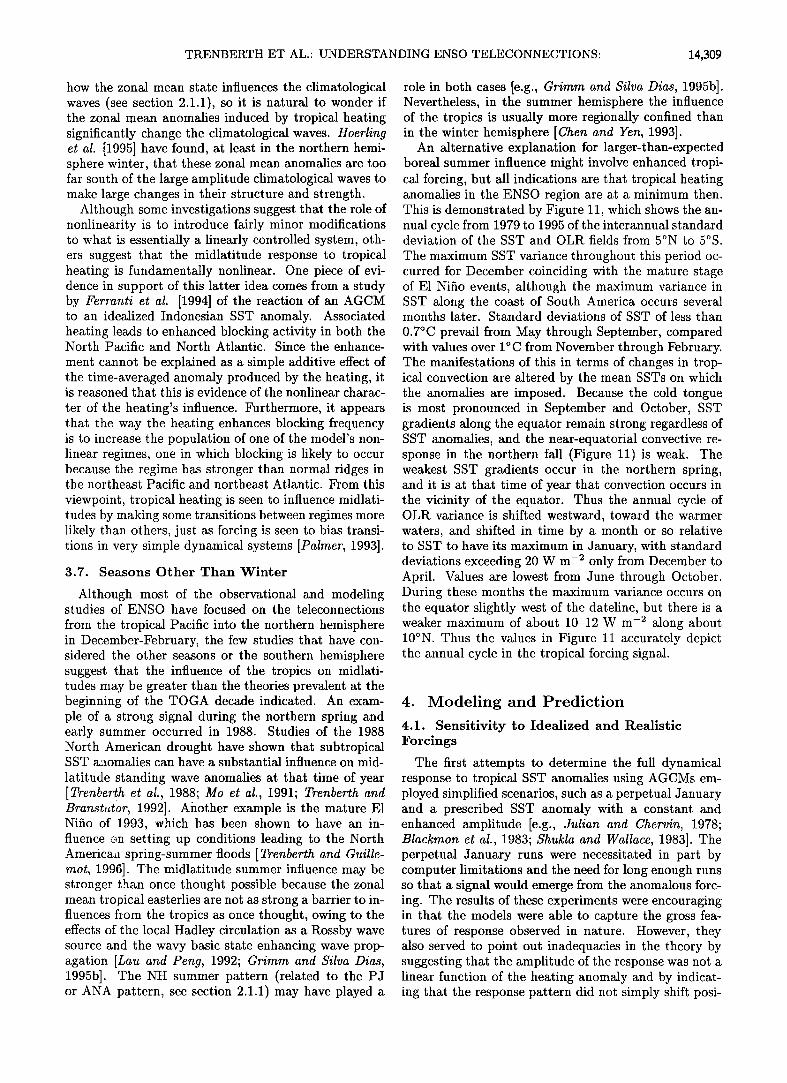
TRENBERTH ET AL.: UNDERSTANDING ENSO TELECONNECTIONS: 14,309
how the zonal mean state influences the climatological waves (see section 2.1.1), so it is natural to wonder if the zonal mean anomalies induced by tropical heating significantly change the climatological waves. Hoerling et al. [1995] have found, at least in the northern hemi- sphere winter, that these zonal mean anomalies are too far south of the large amplitude climatological waves to make large changes in their structure and strength.
Although some investigations suggest that the role of nonlinearity is to introduce fairly minor modifications to what is essentially a linearly controlled system, oth- ers suggest that the midlatitude response to tropical heating is fundamentally nonlinear. One piece of evi- dence in support of this latter idea comes from a study by Ferranti et al. [1994] of the reaction of an AGCM to an idealized Indonesian SST anomaly. Associated heating leads to enhanced blocking activity in both the North Pacific and North Atlantic. Since the enhance-
ment cannot be explained as a simple additive effect of the time-averaged anomaly produced by the heating, it is reasoned that this is evidence of the nonlinear charac-
ter of the heating's influence. Furthermore, it appears that the way the heating enhances blocking frequency is to increase the population of one of the model's non- linear regimes, one in which blocking is likely to occur because the regime has stronger than normal ridges in the northeast Pacific and northeast Atlantic. From this
viewpoint, tropical heating is seen to influence midlati- tudes by making some transitions between regimes more likely than others, just as forcing is seen to bias transi- tions in very simple dynamical systems [Palmer, 1993].
3.?. Seasons Other Than Winter
Although most of the observational and modeling studies of ENSO have focused on the teleconnections
from the tropical Pacific into the northern hemisphere in December-February, the few studies that have con- sidered the other seasons or the southern hemisphere suggest that the influence of the tropics on midlati- tudes may be greater than the theories prevalent at the beginning of the TOGA decade indicated. An exam- ple of a strong signal during the northern spring and early summer occurred in 1988. Studies of the 1988 North American drought have shown that subtropical SST a':•omalies can have a substantial influence on mid-
latitude standing wave anomalies at that time of year [Trenberth et al., 1988; Mo et al., 1991; Trenberth and Branst•.•t•r, 1992]. Another example is the mature E1 Nifio of 1993, Which has been shown to have an in- fluence •n setting up conditions leading to the North America•'• spring-summer floods [ Trenberth and Guille- mot, 1996]. The midlatitude summer influence may be stronger than once thought possible because the zonal mean tropical easterlies are not as strong a barrier to in- fluences f•om the tropics as once thought, owing to the effects of the local Hadley circulation as a Rossby wave source and the wavy basic state enhancing wave prop- agation [Lau and Peng, 1992; Grimm and Silva Dias, 1995b]. The NH summer pattern (related to the PJ or ANA pattern, see section 2.1.1) may have played a
role in both cases [e.g., Grimm and Silva Dias, 1995b]. Nevertheless, in the summer hemisphere the influence of the tropics is usually more regionally confined than in the winter hemisphere [Chen and Yen, 1993].
An alternative explanation for larger-than-expected boreal summer influence might involve enhanced tropi- cal forcing, but all indications are that tropical heating anomalies in the ENSO region are at a minimum then. This is demonstrated by Figure 11, which shows the an- nual cycle from 1979 to 1995 of the interannual standard deviation of the SST and OLR fields from 5øN to 5øS.
The maximum SST variance throughout this period oc- curred for December coinciding with the mature stage of E1 Nifio events, although the maximum variance in SST along the coast of South America occurs several months later. Standard deviations of SST of less than
0.7øC prevail from May through September, compared with values over 1øC from November through February. The manifestations of this in terms of changes in trop- ical convection are altered by the mean SSTs on which the anomalies are imposed. Because the cold tongue is most pronounced in September and October, SST gradients along the equator remain strong regardless of SST anomalies, and the near-equatorial convective re- sponse in the northern fall (Figure 11) is weak. The weakest SST gradients occur in the northern spring, and it is at that time of year that convection occurs in the vicinity of the equator. Thus the annual cycle of OLR variance is shifted westward, toward the warmer waters, and shifted in time by a month or so relative to SST to have its maximum in January, with standard deviations exceeding 20 W m -2 only from December to April. Values are lowest from June through October. During these months the maximum variance occurs on the equator slightly west of the dateline, but there is a weaker maximum of about 10-12 W m -2 along about 10øN. Thus the values in Figure ll accurately depict the annual cycle in the tropical forcing signal.
4. Modeling and Prediction
4.1. Sensitivity to Idealized and Realistic Forcings
The first attempts to determine the full dynamical response to tropical SST anomalies using AGCMs em- ployed simplified scenarios, such as a perpetual January and a prescribed SST anomaly with a constant and enhanced amplitude [e.g., Julian and Chervin, 1978; Blackmon et al., 1983; $hukla and Wallace, 1983]. The perpetual January runs were necessitated in part by computer limitations and the need for long enough runs so that a signal would emerge from the anomalous forc- ing. The results of these experiments were encouraging in that the models were able to capture the gross fea- tures of response observed in nature. However, they also served to point out inadequacies in the theory by suggesting that the amplitude of the response was not a linear function of the heating anomaly and by indicat- ing that the response pattern did not simply shift posi-
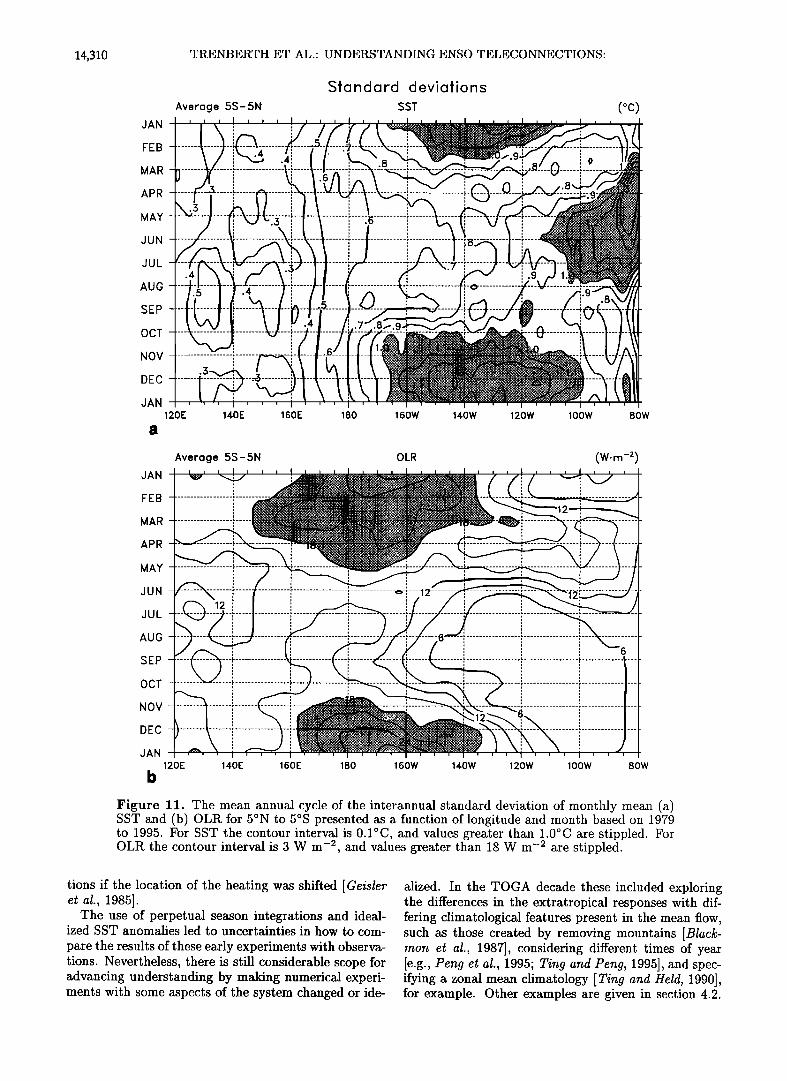
14,310 TRENBERTH ET AL.. UNDERSTANDING ENSO TELECONNECTIONS:
JAN
FEB
MAR
APR
MAY
JUN
JUL
AUG
SEP
OCT
NOV
DEC
JAN
Standard deviations
Average 5S- 5N SST
120E
' :.9
I
140E 160E 180 160W 140W 120W 1oow
(øC)
80W
JAN
FEB
MAR
APR
MAY
JUN
JUL
AUG
SEP
OCT
NOV
DEC
JAN
b
Average 5S-5N OLR (W.m -2)
120E 140E 160E 180 160W 140W 120W 100W 80W
Figure 11. The mean annual cycle of the interannual standard deviation of monthly mean (a) SST and (b) OLR for 5øN to 5øS presented as a function of longitude and month based on 1979 to 1995. For SST the contour interval is 0.1øC, and values greater than 1.0øC are stippled. For OLR the contour interval is 3 W m -2, and values greater than 18 W m -2 are stippled.
tions' if the location of the heating was shifted [Geisler et al., 1985].
The use of perpetual season integrations and ideal- ized SST anomalies led to uncertainties in how to com-
pare the results of these early experiments with observa- tions. Nevertheless, there is still considerable scope for advancing understanding by making numerical experi- ments with some aspects of the system changed or ide-
alized. In the TOGA decade these included exploring the differences in the extratropical responses with dif- fering climatological features present in the mean flow, such as those created by removing mountains [Black- monet al., 1987], considering different times of year [e.g., Peng et al., 1995; Ting and Peng, 1995], and spec- ifying a zonal mean climatology [Ting and Held, 1990], for example. Other examples are given in section 4.2.
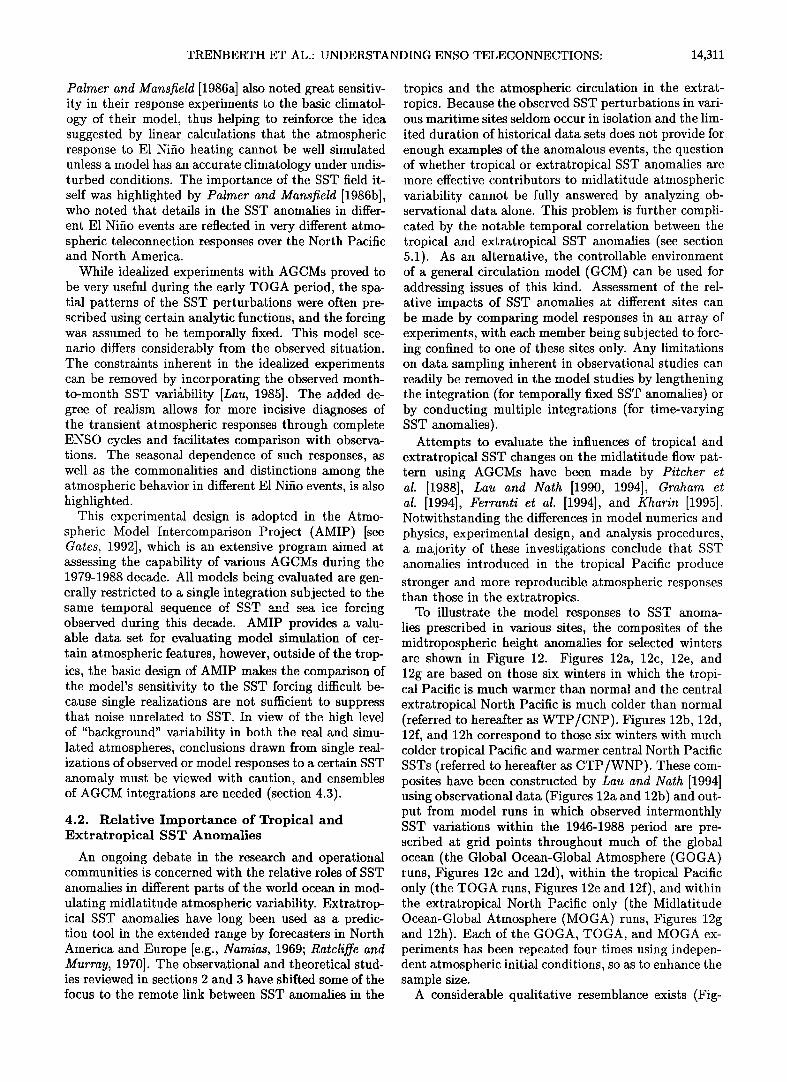
TRENBERTH ET AL.' UNDERSTANDING ENSO TELECONNECTIONS' 14,311
Palmer and Mansfield [1986a] also noted great sensitiv- ity in their response experiments to the basic climatol- ogy of their model, thus helping to reinforce the idea suggested by linear calculations that the atmospheric response to E1 Nifio heating cannot be well simulated unless a model has an accurate climatology under undis- turbed conditions. The importance of the SST field it- self was highlighted by Palmer and Mansfield [1986b], who noted that details in the SST anomalies in differ-
ent E1 Nifio events are reflected in very different atmo- spheric teleconnection responses over the North Pacific and North America.
While idealized experiments with AGCMs proved to be very useful during the early TOGA period, the spa- tial patterns of the SST perturbations were often pre- scribed using certain analytic functions, and the forcing was assumed to be temporally fixed. This model sce- nario differs considerably from the observed situation. The constraints inherent in the idealized experiments can be removed by incorporating the observed month- to-month SST variability [Lau, 1985]. The added de- gree of realism allows for more incisive diagnoses of the transient atmospheric responses through complete ENSO cycles and facilitates comparison with observa- tions. The seasonal dependence of such responses, as well as the commonalities and distinctions among the atmospheric behavior in different E1 Nifio events, is also highlighted.
This experimental design is adopted in the Atmo- spheric Model Intercomparison Project (AMIP) [see Gates, 1992], which is an extensive program aimed at assessing the capability of various AGCMs during the 1979-1988 decade. All models being evaluated are gen- erally restricted to a single integration subjected to the same temporal sequence of SST and sea ice forcing observed during this decade. AMIP provides a valu- able data set for evaluating model simulation of cer- tain atmospheric features, however, outside of the trop- ics, the basic design of AMIP makes the comparison of the model's sensitivity to the SST forcing difficult be- cause single realizations are not sufficient to suppress that noise unrelated to SST. In view of the high level of "background" variability in both the real and simu- lated atmospheres, conclusions drawn from single real- izations of observed or model responses to a certain SST anomaly must be viewed with caution, and ensembles of AGCM integrations are needed (section 4.3).
4.2. Relative Importance of Tropical and Ex•ra•ropical SST Anomalies
An ongoing debate in the research and operational communities is concerned with the relative roles of SST
anomalies in different parts of the world ocean in mod- ulating midlatitude atmospheric variability. Extratrop- ical SST anomalies have long been used as a predic- tion tool in the extended range by forecasters in North America and Europe [e.g., Namias, 1969; Ratcliffe and Murray, 1970]. The observational and theoretical stud- ies reviewed in sections 2 and 3 have shifted some of the focus to the remote link between SST anomalies in the
tropics and the atmospheric circulation in the extrat- ropics. Because the observed SST perturbations in vari- ous maritime sites seldom occur in isolation and the lim-
ited duration of historical data sets does not provide for enough examples of the anomalous events, the question of whether tropical or extratropical SST anomalies are more effective contributors to midlatitude atmospheric variability cannot be fully answered by •nalyzing ob- servational data alone. This problem is further compli- cated by the notable temporal correlation between the tropical and extratropical SST anomalies (see section 5.1). As an alternative, the controllable environment of a general circulation model (GCM) can be used for addressing issues of this kind. Assessment of the rel- ative impacts of SST anomalies at different sites can be made by comparing model responses in an array of experiments, with each member being subjected to forc- ing confined to one of these sites only. Any limitations on data sampling inherent in observational studies can readily be removed in the model studies by lengthening the integration (for temporally fixed SST anomalies) or by conducting multiple integrations (for time-varying SST anomalies).
Attempts to evaluate the influences of tropical and extratropical SST changes on the midlatitude flow pat- tern using AGCMs have been made by Pitcher et al. [1988], Lau and Nath [1990, 1994], Graham et al. [1994], Ferranti et al. [1994], and Kharin [1995]. Notwithstanding the differences in model numerics and physics, experimental design, and analysis procedures, a majority of these investigations conclude that SST anomalies introduced in the tropical Pacific produce
stronger and more reproducible atmospheric responses than those in the extratropics.
To illustrate the model responses to SST anoma- lies prescribed in various sites, the composites of the midtropospheric height anomalies for selected winters are shown in Figure 12. Figures 12a, 12c, 12e, and 12g are based on those six winters in which the tropi- cal Pacific is much warmer than normal and the central
extratropical North Pacific is much colder than normal (referred to hereafter as WTP/CNP). Figures 12b, 12d, 12f, and 12h correspond to those six winters with much colder tropical Pacific and warmer central North Pacific SSTs (referred to hereafter as CTP/WNP). These com- posites have been constructed by Lau and Nath [1994] using observational data (Figures 12a and 12b) and out- put from model runs in which observed intermonthly SST variations within the 1946-1988 period are pre- scribed at grid points throughout much of the global ocean (the Global Ocean-Global Atmosphere (GOGA) runs, Figures 12c and 12d), within the tropical Pacific only (the TOGA runs, Figures 12e and 12f), and within the extratropical North Pacific only (the Midlatitude Ocean-Global Atmosphere (MOGA) runs, Figures 12g and 12h). Each of the GOGA, TOGA, and MOGA ex- periments has been repeated four times using indepen- dent e•tmospheric initial conditions, so as to enhance the sample size.
A considerable qualitative resemblance exists (Fig-
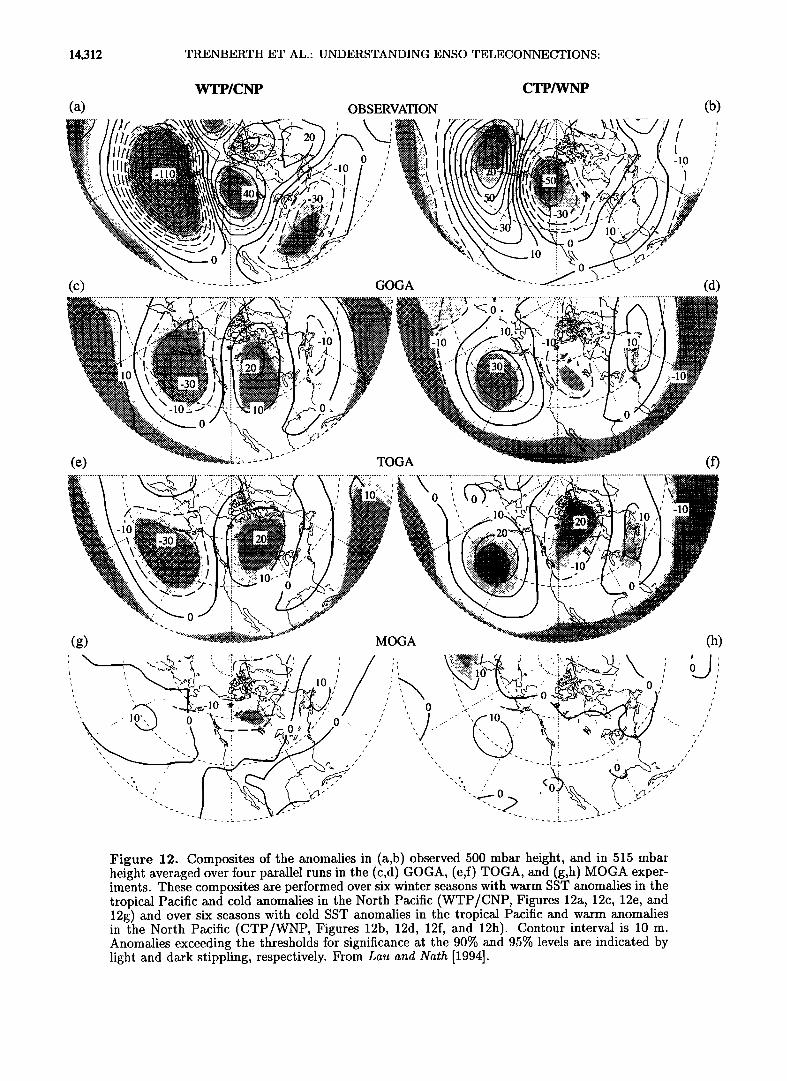
14,312 TRENBERTH ET AL.' UNDERSTANDING ENSO TELECONNECTIONS:
WTP/CNP CTP/WNP
(a) OBSERVATION (b)
\'•' •'•-- I ' ,,'i:i:i:i .... •'":":i•.•' , '-.. , '•,.:,!i,•,iii!•!i•. - ,:....:,:'•""•'.:.:• • '. -.. / •.,
...... ' ....... ,',,x •.:...i• •'.z .................... ,:,4 ........... ,:,::,::::,:,.: /.:::::•...'• •:;....::,.. ...,.::,. ....... . ..... ,:,:,:•...•:,:,:,:•,:,:,:// . .•:•,•, ....... \ .......... ,,.,..... ...... / ß •:,:..., .... "•.•• ....... ,:,:,:,:,:,:,..,:,..::,..:,:,:,:, , .,..,:,,,:,:,.. ..::../ ß .•,:..::, .... .,,,'• ..."•..'•,.: .. 7'.b,:,::•....:.•,,:,:,:,. . -•:•:•:•:. -3o. . .............. •q• ................................... / ........ .::. \ , / / ......
ß '•! '.::i:!•i:i ....... '•'.:.::::• ........ / .: :•:•:i.,.'.'.::.:.'.::: ...... :::::' ß .'•:i:; ..... :
(c) • - ...... :- .... -' GO,..:•• GA • - ..... :- ....... (d) •:•.;,..'..•::'..•..':.•:;:•{.: ......................... , .... ' ............ c ...... ::•,•,7:-[• ................ . ...................... •,.'•:•a•:•.:.:•..:.: •:r..•:•.•r•:..'-:r..•.:.• '.•..}:•:.•:'..•:•.:..:•.:..•:;:a •:;?-.::•.:•- .......... -• ......... •, ............ :•,•,::: .... -, ................ , ................... . ..... : .:':.•t...'•.•.,,'•{•:•,:•.,.•:!.::.:.:..'..•i• •!,.::..::!::::.:•,' .-' .• . • • .':•:5:!::½• 'gi.".-:'..:.::.'.::':: ;'•!..'.'!. ;!:•!:!:!:!:!:•:.>.5:i:!:•.!:::•.i:i:•:•:•:•:•:• :•:•:•:•:•:.•:•:•::::..•:.,,2 . ... ..• . . ..• ........ . , ::: .•:• •g•..:.
............................... \ ........................ I ............................................... i,\ ... • ....................... '•;•!ii::i::i•i}!ii ::ii?:::!•:. ',q*•::..•.• ......... i!•:j:•-•::i:::-•'? i •: L .:•::•::•i•i•i$*' '*i•i•i{•i•.:':.•,."•:::i':•.. ":•!•!•i•i•.•:.-:: / : ,•.•,•: •,.•,..,•:• .... - ..• ,, ,. ........... •,•,•,:.:.,,:• .... ......... : • :"::""":"•'.:.•.:•
...
(e) • TOGA • I1 i• I (f) ?ii•i ................ , ........ : ................ 7. ...... i-?•,.v .... •, ................. , .................... iil/:.•i:i',iii•ii.i:i .... ::i::?;i::i:- ................. ,, .................. ; ............. •!?.•;i'•:?• ........... ,' • ........ •:..
,,, .........
•::•::.. , ,, ....
, ]o o ................ • ............... •/' F /
!
!
/
Figure 12. Composites of the anomalies in (a,b) observed 500 mbar height, and in 515 mbar height averaged over four parallel runs in the (c,d) GOGA, (e,f) TOGA, and (g,h) MOGA exper- iments. These composites are performed over six winter seasons with warm SST anomalies in the tropical Pacific and cold anomalies in the North Pacific (WTP/CNP, Figures 12a, 12c, 12e, and 12g) and over six seasons with cold SST anomalies in the tropical Pacific and warm anomalies in the North Pacific (CTP/WNP, Figures 12b, 12d, 12f, and 12h). Contour interval is 10 m. Anomalies exceeding the thresholds for significance at the 90% and 95% levels are indicated by light and dark stippling, respectively. From Lau and Nath [1994].
TRENBERTH ET AL.: UNDERSTANDING ENSO TELECONNECTIONS: 14,313
ure 12) between the patterns based on observed, GOGA, and TOGA data, thus indicating that the model at- mosphere is capable of producing a realistic and sta- tistically significant response when subjected to SST changes in the global ocean and that much of this re- sponse may be attributed to forcing in the tropical Pa- cific only. The much weaker and less significant pat- terns for the MOGA experiment illustrate the relative inefficiency of midlatitude SST anolnalies in forcing the •nodel atmosphere.
The amplitude of the simulated height anomalies in all three model experiments shown in Figure 12 is no- tably lower than the observed date[. This discrepancy is likely related to the following factors. The low resolu- tion (rhomboidal truncation at 15 wavenumbers) used in this suite of integrations is not sufficient to fully re- produce the constructive effects of the storm tracks on the slowly varying background flow (see sections 2.3 and 3.4.2). The precipitation response (which in turn gov- erns the magnitude of the atmospheric forcing due to diabatic heat sources) to $ST changes in the particular AGCM used in this study is also known to be weaker than observed. The four separate realizations of the model response for a given $ST forcing exhibit consid- erable sampling fluctuations, so that the magnitude of the ensemble average presented in Figures 12c-12h is typically less than that of the individual samples.
Whereas most of the modeling studies have consider- able success in simulating the extratropical atmospheric response to tropical SST anomalies, the corresponding results for the in situ response to prescribed midlati- tude SST forcing are much more tenuous. Pitcher et al. [1988] and Kushnir and Lau [1992] have pointed out the nonlinear nature of the model response with respect to the polarity of the midlatitude SST anomaly (i.e., the response pattern does not undergo a straightfor- ward sign reversal when a warm anomaly is replaced by a cold anomaly). This behavior is in sharp contrast to the quasi-linear response to tropical $$T forcing (e.g., note the change in polarity of the spatial patterns simu- lated in the TOGA runs for warm and cold $ST anoma-
lies in the tropical Pacific in Figures 12e-12f). There also exist notable discrepancies among various AGCM experiments concerning the amplitude of atmospheric anomalies associated with extratropical $$T changes (e.g., contrast the strong signals reported by Latif and Barnett [1994] with the feeble response illustrated in Figures 12g-12h).
A partial explanation for the above puzzling findings has been offered by Trenberth and Hurrell [1994]. While the changes in eddy transports due to the altered syn- optic systems (section 2.3) constitute a major compli- cation, another potentially important factor is that the atmospheric heating effects may not be local in the ex- tratropics. The sensible heat exchanged between the ocean and atmosphere is realized locally, but the latent heat lost by the ocean through evaporation is realized only as an increase in moisture, and the actual atmo- spheric heating is not realized until precipitation oc- curs, often far downstream. The occurrence of conden-
sational heating hence depends on the prevailing syn- optic situation and varies geographically according to the ambient flow field. These nonlocal effects therefore
exhibit a strong regional dependence, and they add a large variable component to any forcing, thus compli- cating attempts to detect any systematic effects in both the real atmosphere and models. This issue may also contribute to discrepancies among the findings based on different model experiments, in which the prescribed SST anomalies vary in location and intensity, and the model climatologies vary. Placing "super SST anoma- lies" into a model will enhance the local effects so that
results are more likely to appear as significant, but they are also much more likely to be unrealistic and inappro- priate for the real atmosphere.
The extended integrations examined by Kitoh [1991], Lau and Nath [1994], Graham et al. [1994], Kumar et al. [1994], and Kawamura et al. [1995] demonstrate that the current AGCMs are not only capable of reproducing the essential features accompanying individual ENSO cycles on interannual timescales, but they also yield longer-term atmospheric signals in response to decadal changes in the SST conditions, such as those described in section 2.2. In particular, aspects of the decadal scale change beginning around 1976 have been simulated with atmospheric models using specified SSTs [see also Miller et al., 1994]. Further model experiments of this kind should shed new light on the mechanisms contributing to air-sea interaction on interdecadal timescales, as well as on the relationships between such slowly varying phe- nomena and the individual E1 Nifio events.
4.3. Predictability and Prediction of the Extratropical Atmospheric Circulation
Previous sections have shown that $$T variations in
the tropical Pacific can have considerable impact on the extratropical mean state. It is desirable to determine a "signal" of tropical $$T anomalies in the extratropi- cal atmosphere. However, any such signal will be em- bedded within the "noise" of natural variability associ- ated with midlatitude weather systems. The noise must be regarded as unpredictable while the signal might be potentially predictable given a very good model and a good forecast of the tropical SSTs. The signal-to-noise ratio then provides a measure of the predictability.
One estimate of the signal comes from observed fields composited with respect to the tropical SSTs. This method brings out the common features of each case but ignores differences in forcings coming from other parts of the tropics and elsewhere. It also ignores dif- ferences in details such as magnitudes and spatial pat- terns of SST anomalies in the region used for composit- ing [e.g., Tomita and Yasunari, 1993; Trenberth, 1996]. In principle, this could be overcome with a long enough observational record but in practice, the observational record is very short, and no two E1 Nifio events, for in- stance, are alike. Consequently, any such estimates of potential predictability from this technique will be very conservative.
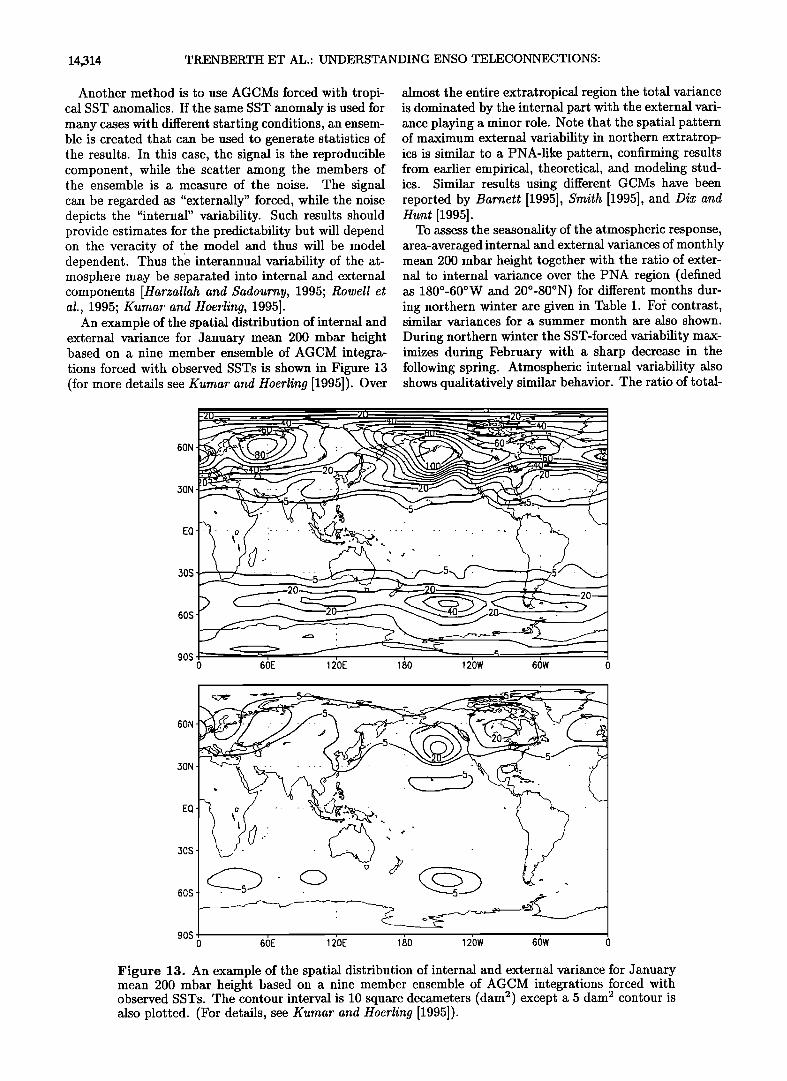
14,314 TRENBERTH ET AL.' UNDERSTANDING ENSO TELECONNECTIONS:
Another method is to use AGCMs forced with tropi- cal SST anomalies. If the same SST anomaly is used for many cases with different starting conditions, an ensem- ble is created that can be used to generate statistics of the results. In this case, the signal is the reproducible component, while the scatter among the members of the ensemble is a measure of the noise. The signal can be regarded as "externally" forced, while the noise depicts the "internal" variability. Such results should provide estimates for the predictability but will depend on the veracity of the model and thus will be model dependent. Thus the interannual variability of the at- mosphere may be separated into internal and external components [Harzallah and $adourny, 1995; Rowell et al., 1995; Kumar and Hoerling, 1995].
An example of the spatial distribution of internal and external variance for January mean 200 mbar height based on a nine member ensemble of AGCM integra- tions forced with observed SSTs is shown in Figure 13 (for more details see Kumar and Hoerling [1995]). Over
almost the entire extratropical region the total variance is dominated by the internal part with the external vari- ance playing a minor role. Note that the spatial pattern of maximum external variability in northern extratrop- ics is similar to a PNA-like pattern, confirming results from earlier empirical, theoretical, and modeling stud- ies. Similar results using different GCMs have been reported by Barnett [1995], Smith [1995], and Dix and Hunt [1995].
To assess the seasonality of the atmospheric response, area-averaged internal and external variances of monthly mean 200 mbar height together with the ratio of exter- nal to internal variance over the PNA region (defined as 180ø-60øW and 20ø-80øN) for different months dur- ing northern winter are given in Table 1. Fo• contrast, similar variances for a summer month are also shown.
During northern winter the SST-forced variability max- imizes during February with a sharp decrease in the following spring. Atmospheric internal variability also shows qualitatively similar behavior. The ratio of total-
60N
30N
EQ
30S
60S
90S 60E 12'0E 1•0 12'0W 66W
60N
30N
EQ
30S
60S
90S 0 6•)E 12'0E 1•0 12'0W 66W 0
Figure 13. An example of the spatial distribution of internal and external variance for January mean 200 mbar height based on a nine member ensemble of AGCM integrations forced with observed SSTs. The contour interval is 10 square decameters (dam 2) except a 5 dam 2 contour is also plotted. (For details, see Kumar and Hoerling [1995]).
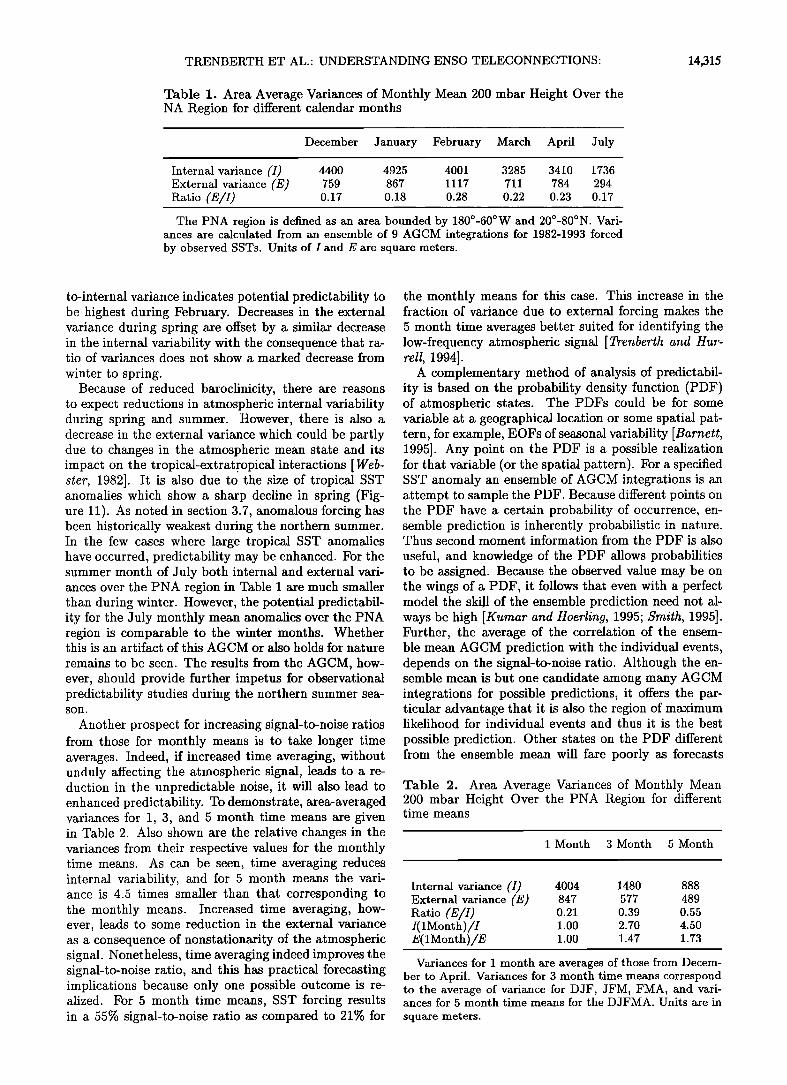
TRENBERTH ET AL:: UNDERSTANDING ENSO TELECONNECTIONS: 14,315
Table 1. Area Average Variances of Monthly Mean 200 mbar Height Over the NA Region for different calendar months
December January February March April July
Internal variance (I) 4400 4925 4001 3285 3410 1736 External variance (E) 759 867 1117 711 784 294 Ratio (E/I) 0.17 0.18 0.28 0.22 0.23 0.17
The PNA region is defined as an area bounded by 180ø-60øW and 20ø-80øN. Vari- ances are calculated from an ensemble of 9 AGCM integrations for 1982-1993 forced by observed SSTs. Units of I and E are square meters.
to-internal variance indicates potential predictability to be highest during February. Decreases in the external variance during spring are offset by a similar decrease in the internal variability with the consequence that ra- tio of variances does not show a marked decrease from
winter to spring. Because of reduced baroclinicity, there are reasons
to expect reductions in atmospheric internal variability during spring and summer. However, there is also a decrease in the external variance which could be partly due to changes in the atmospheric mean state and its impact on the tropical-extrat.ropical interactions [Web- ster, 1982]. It is also due to the size of tropical SST anomalies which show a sharp decline in spring (Fig- ure 11). As noted in section 3.7, anomalous forcing has been historically weakest during the northern summer. In the few cases where large tropical SST anomalies have occurred, predictability may be enhanced. For the summer month of July both internal and external vari- ances over the PNA region in Table 1 are much smaller than during winter. However, the potential predictabil- ity for the July monthly mean anomalies over the PNA region is comparable to the winter months. Whether this is an artifact of this AGCM or also holds for'nature
remains to be seen. The results from the AGCM, how- ever, should provide further impetus for observational predictability studies during the northern summer sea- son.
Another prospect for increasing signal-to-noise ratios from those for monthly means is to take longer time averages. Indeed, if increased time averaging, without unduly affecting the atmospheric signal, leads to a re- duction in the unpredictable noise, it will also lead to enhanced predictability. To demonstrate, area-averaged variances for 1, 3, and 5 month time means are given in Table 2. Also shown are the relative changes in the variances from their respective values for the monthly time means. As can be seen, time averaging reduces internal variability, and for 5 month means the vari- ance is 4.5 times smaller than that corresponding to the monthly means. Increased time averaging, how- ever, leads to some reduction in the external variance as a consequence of nonstationarity of the atmospheric signal. Nonetheless, time averaging indeed improves the signal-to-noise ratio, and this has practical forecasting implications because only one possible outcome is re- alized. For 5 month time means, SST forcing results in a 55% signal-to-noise ratio as compared to 21% for
the monthly means for this case. This increase in the fraction of variance due to external forcing makes the 5 month time averages better suited for identifying the low-frequency atmospheric signal [Trenberth and Hut- tell, 1994].
A complementary method of analysis of predictabil- ity is based on the probability density function (PDF) of atmospheric states. The PDFs could be for some variable at a geographical location or some spatial pat- tern, for example, EOFs of seasonal variability [Barnett, 1995]. Any point on the PDF is a possible realization for that variable (or the spatial pattern). For a specified $ST anomaly an ensemble of AGCM integrations is an attempt to sample the PDF. Because different points on the PDF have a certain probability of occurrence, en- semble prediction is inherently probabilistic in nature. Thus second moment information from the PDF is also
useful, and knowledge of the PDF allows probabilities to be assigned. Because the observed value may be on the wings of a PDF, it follows that even with a perfect model the skill of the ensemble prediction need not al- ways be high [Kumar and Hoerling, 1995; Smith, 1995]. Further, the average of the correlation of the ensem- ble mean AGCM prediction with the individual events, depends on the signal-to-noise ratio. Although the en- semble mean is but one candidate among many AGCM integrations for possible predictions, it offers the par- ticular advantage that it is also the region of maximum likelihood for individual events and thus it is the best
possible prediction. Other states on the PDF different from the ensemble mean will fare poorly as forecasts
Table 2. Area Average Variances of Monthly Mean 200 mbar Height Over the PNA Region for different time means
1 Month 3 Month 5 Month
Internal variance (I) 4004 1480 888 External variance (E) 847 577 489 Ratio (E/I) 0.21 0.39 0.55 I(1Month)/I 1.00 2.70 4.50 E(1Month)/E 1.00 1.47 1.73
Variances for 1 month are averages of those from Decem- ber to April. Variances for 3 month time means correspond to the average of variance for DJF, JFM, FMA, and vari- ances for 5 month time means for the DJFMA. Units are in
square meters.
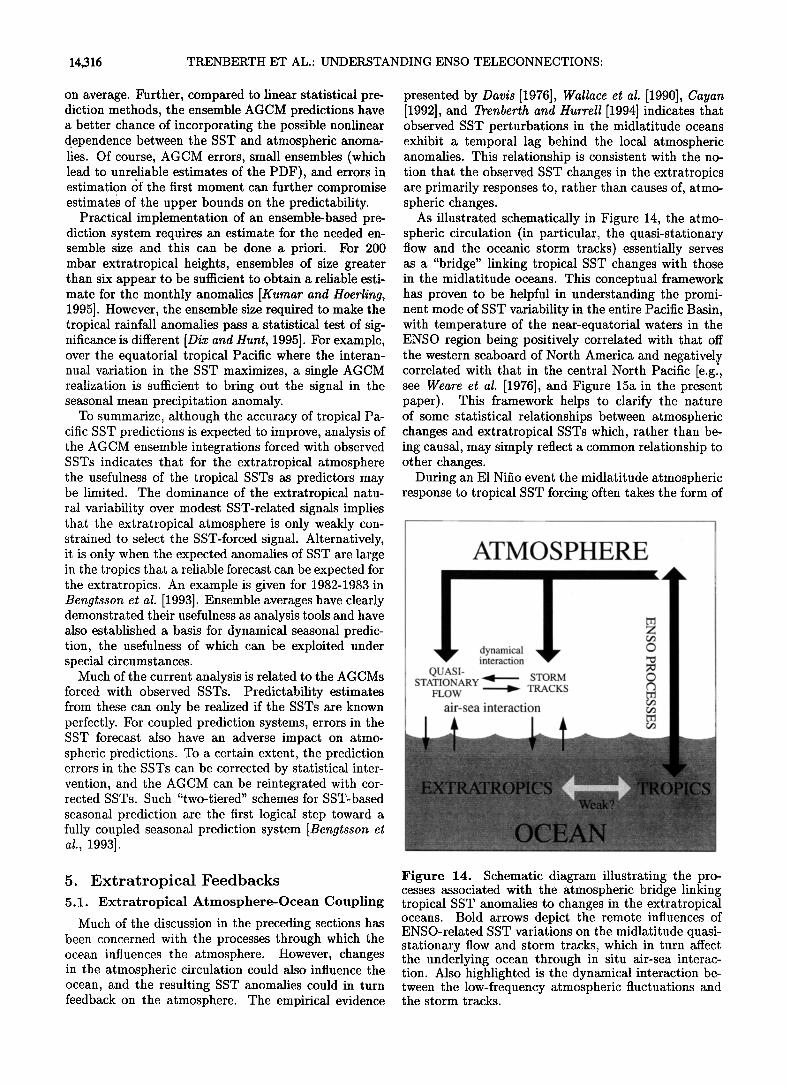
14,316 TRENBERTH ET AL.: UNDERSTANDING ENSO TELECONNECTIONS:
on average. Further, compared to linear statistical pre- diction methods, the ensemble AGCM predictions have a better chance of incorporating the possible nonlinear d. ependence between the SST and atmospheric anoma- lies. Of course, AGCM errors, small ensembles (which lead to unreliable estimates of the PDF), and errors in estimation (•f the first moment can further compromise estimate• of the upper bounds on the predictability.
Practical implementation of an ensemble-based pre- diction system requires an estimate for the needed en- semble size and this can be done a priori. For 200 mbar extratropical heights, ensembles of size greater than six appear to be sufficient to obtain a reliable esti- mate for the monthly anomalies [Kumar and Hoerling, 1995]. However, the ensemble size required to make the tropical rainfall anomalies pass a statistical test of sig- nificance is different [Dix and Hunt, 1995]. For example, over the equatorial tropical Pacific where the interan- nual variation in the SST maximizes, a single AGCM realization is sufficient to bring out the signal in the seasonal mean precipitation anomaly.
To summarize, although the accuracy of tropical Pa- cific SST predictions is expected to improve, analysis of the AGCM ensemble integrations forced with observed SSTs indicates that for the extratropical atmosphere the usefulness of the tropical SSTs as predictors may be limited. The dominance of the extratropical natu- ral variability over modest SST-related signals implies that the extratropical atmosphere is only weakly con- strained to select the SST-forced signal. Alternatively, it is only when the expected anomalies of SST are large in the tropics that a reliable forecast can be expected for the extratropics. An example is given for 1982-1983 in Bengtsson et al. [1993]. Ensemble averages have clearly demonstrated their usefulness as analysis tools and have also established a basis for dynamical seasonal predic- tion, the usefulness of which can be exploited under special circumstances.
Much of the current analysis is related to the AGCMs forced with observed SSTs. Predictability estimates from these can only be realized if the SSTs are known perfectly. For coupled prediction systems, errors in the SST forecast also have an adverse impact on atmo- spheric p•edictions. To a certain extent, the prediction errors in the SSTs can be corrected by statistical inter- vention, and the AGCM can be reintegrated with cor- rected SSTs. Such "two-tiered" schemes for SST-based
seasonal prediction are the first logical step toward a fully coupled seasonal prediction system [Bengtsson et al., 1993].
presented by Davis [19761, Wallace et al. [1990], Cayan [1992], and Trenberth and Hurtell [1994] indicates that observed SST perturbations in the midlatitude oceans exhibit a temporal lag behind the local atmospheric anomalies. This relationship is consistent with the no- tion that the observed SST changes in the extratropics are primarily responses to, rather than causes of, atmo- spheric changes.
As illustrated schematically in Figure 14, the atmo- spheric circulation (in particular, the quasi-stationary flow and the oceanic storm tracks) essentially serves as a "bridge" linking tropical SST changes with those in the midlatitude oceans. This conceptual framework has proven to be helpful in understanding the promi- nent mode of SST variability in the entire Pacific Basin, with temperature of the near-equatorial waters in the ENSO region being positively correlated with that off the western seaboard of North America and negatively correlated with that in the central North Pacific [e.g., see Weare et al. [1976], and Figure 15a in the present paper). This framework helps to clarify the nature of some statistical relationships between atmospheric changes and extratropical SSTs which, rather than be- ing causal, may simply reflect a common relationship to other changes.
During an E1 Nifio event the midlatitude atmospheric response to tropical SST forcing often takes the form of
ATMOSPHERE
dynamical interaction
QUASI- STATIONARY • STORM
FLOW • TRACKS air- sea interaction
.•.....% :: . ..... _..> ,•,, ::.•_.• .:•,*•, .• ;,½:....•.. ........ •,,.:> ?'i. 'fi;• ..... •.- .. .
5. Extratropical Feedbacks 5.1. Extratropical Atmosphere-Ocean Coupling
Much of the discussion in the preceding sections has been concerned with the processes through which the ocean influences the atmosphere. However, changes in the atmospheric circulation could also influence the ocean, and the resulting SST anomalies could in turn feedback on the atmosphere. The empirical evidence
Figure 14. Schematic diagram illustrating the pro- cesses associated with the atmospheric bridge linking tropical SST anomalies to changes in the extratropical oceans. Bold arrows depict the remote influences of ENSO-related SST variations on the midlatitude quasi- stationary flow and storm tracks, which in turn affect the underlying ocean through in situ air-sea interac- tion. Also highlighted is the dynamical interaction be- tween the low-frequency atmospheric fluctuations and the storm tracks.
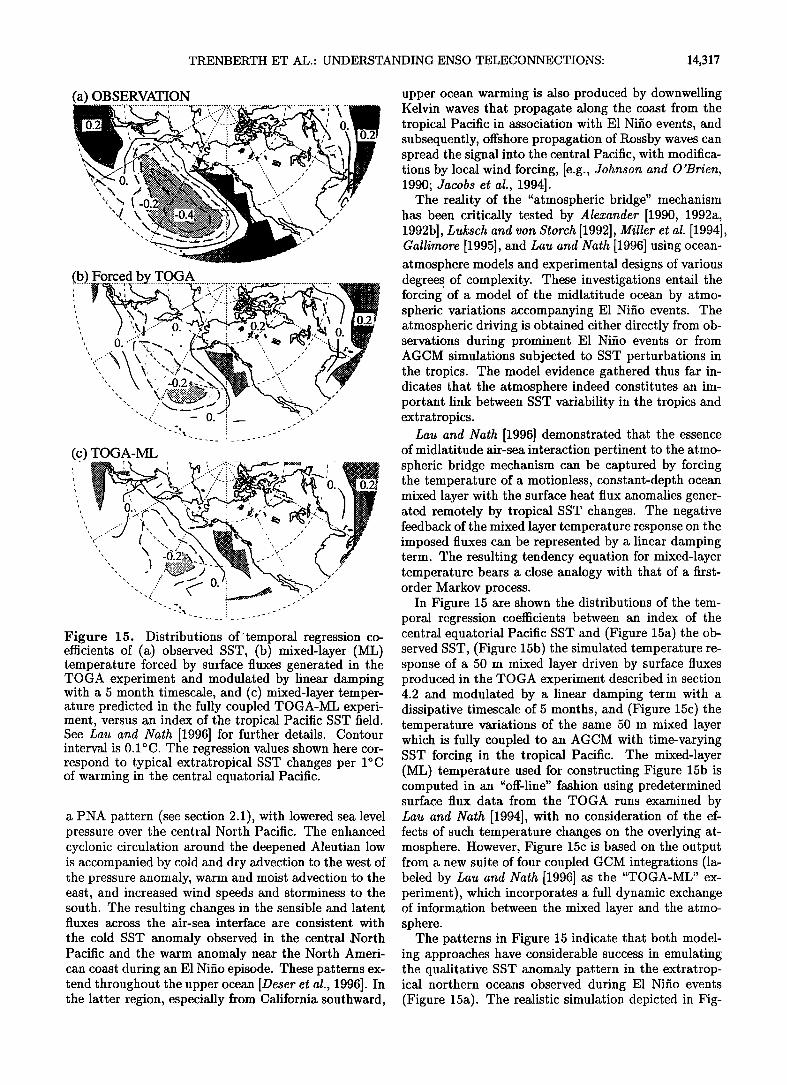
TRENBERTH ET AL.: UNDERSTANDING ENSO TELECONNECTIONS: 14,317
(a) OBSERVATION
(_b_.). F9r.c...e,..d._.b.y..T.Q_G...A_. ........................................................
........ "- .... 0 , ! .02 v-•'"'• .... i" '
.....--- ...
- ....
(c) TOGA-ML
' •i;•*:,'.' ' % * '",, ' i "*':' ' : m• ..... ... ,?._!
-.... ,,,,,,,":'::!:•iii!:•ii:::"•"• . ' '
Figure lB. Distributions oœ'temporal regression co- ef•cients oœ (a) observed temperature forced by surface fluxes generated in the TOGA experiment and modulated by linear damping with a 5 month timescale, and (c) mixed-layer temper- ature predicted in the fully coupled TOGA-ML experi- ment, versus an index of the tropical Pacific SST field. See Lau and Nath [1996] for further details. Contour interval is 0.1øC. The regression values shown here cor- respond to typical extratropical SST changes per 1øC of warming in the central equatorial Pacific.
a PNA pattern (see section 2.1), with lowered sea level pressure over the central North Pacific. The enhanced cyclonic circulation around the deepened Aleutian low is accompanied by cold and dry advection to the west of the pressure anomaly, warm and moist advection to the east, and increased wind speeds and storminess to the south. The resulting changes in the sensible and latent fluxes across the air-sea interface are consistent with
the cold SST anomaly observed in the central .North Pacific and the warm anomaly near the North Ameri- can coast during an E1 Nifio episode. These patterns ex- tend throughout the upper ocean [Deser et al., 1996]. In the latter region, especially from California southward,
upper ocean warming is also produced by downwelling Kelvin waves that propagate along the coast from the tropical Pacific in association with E1 Nifio events, and subsequently, offshore propagation of Rossby waves can spread the signal into the central Pacific, with modifica- tions by local wind forcing, [e.g., Johnson and O'Brien, 1990; Jacobs et al., 1994].
The reality of the "atmospheric bridge" mechanism has been critically tested by Alexander [1990, 1992a, 199261, Luksch and von $torch [19921, Miller et al. [19941, Gallimore [19915], and Lau and Nath [1996] using ocean- atmosphere models and experimental designs of various degrees. of complexity. These investigations entail the forcing of a model of the midlatitude ocean by atmo- spheric variations accompanying E1 Nifio events. The atmospheric driving is obtained either directly from ob- servations during prominent E1 Nifio events or from AGCM simulations subjected to SST perturbations in the tropics. The model evidence gathered thus far in- dicates that the atmosphere indeed constitutes an im- portant link between SST variability in the tropics and extratropics.
Lau and Nath [1996] demonstrated that the essence of midlatitude air-sea interaction pertinent to the atmo- spheric bridge mechanism can be captured by forcing the temperature of a motionless, constant-depth ocean mixed layer with the surface heat flux anomalies gener- ated remotely by tropical SST changes. The negative feedback of the mixed layer temperature response on the imposed fluxes can be represented by a linear damping term. The resulting tendency equation for mixed-layer temperature bears a close analogy with that of a first- order Markov process.
In Figure 115 are shown the distributions of the tem- poral regression coefficients between an index of the central equatorial Pacific SST and (Figure 15a) the ob- served SST, (Figure 15b) the simulated temperature re- sponse of a 150 m mixed layer driven by surface fluxes produced in the TOGA experiment described in section 4.2 and modulated by a linear damping term with a dissipative timescale of 15 months, and (Figure 15c) the temperature variations of the same 150 m mixed layer which is fully coupled to an AGCM with time-varying SST forcing in the tropical Pacific. The mixed-layer (ML) temperature used for constructing Figure 15b is computed in an "off-line" fashion using predetermined surface flux data from the TOGA runs examined by Lau and Nath [1994], with no consideration of the ef- fects of such temperature changes on the overlying at- mosphere. However, Figure 15c is based on the output from a new suite of four coupled GCM integrations (la- beled by Lau and Nath [1996] as the "TOGA-ML" ex- periment), which incorporates a full dynamic exchange of information between the mixed layer and the atmo- sphere.
The patterns in Figure 115 indicate that both model- ing approaches have considerable success in emulating the qualitative SST anomaly pattern in the extratrop- ical northern oceans observed during E1 Nifio events (Figure 15a). The realistic simulation depicted in Fig-
14,318 TRENBERTH ET AL.: UNDERSTANDING ENSO TELECONNECTIONS:
ure 15b confirms that this SST pattern can largely be attributed to the oceanic response to atmospheric driv- ing. Comparison between Figure 15b and 15c reveals that the incorporation of feedbacks from the ocean to the atmosphere in the TOGA-ML runs does not sig- nificantly alter the local SST response. The notably lower amplitudes of the simulated SST anomalies (Fig- ures 15b-15c) as compared to the observed values (Fig- ure 15a) are likely a consequence of the relatively weaker extratropical responses to tropical SST forcing in the model atmosphere, as pointed out in section 4.2 (see Figure 12).
Additional diagnosis [Lau and Nath, 1996] indicates that the presence of two-way air-sea coupling in the TOGA-ML experiment leads to a noticeable enhance- ment of the atmospheric signal. This finding suggests that the SST response to atmospheric driving in mid- latitudes could in turn affect the overlying atmosphere through positive feedback processes, as hypothesized by Trenberth and Hurrell [1994].
It is anticipated that further progress in understand- ing extratropical air-sea coupling can be made by im- proving the highly idealized mixed-layer treatment of the surface ocean. For instance, the incorporation of seasonal variations in the thermocline processes at the bottom of the mixed layer would link the near- surface changes to heat storage in the deeper ocean. For atmosphere-ocean changes on timescales of a decade
heat waves in ways that are likely to provide impor- tant feedbacks [Trenberth et al., 1988; Trenberth and Branstator, 1992; Atlas et al., 1993]. The North Amer- ican spring-summer floods in 1993 during mature E1 Nifio conditions is another case, this time of positive SST anomalies in the tropical Pacific. Trenberth and Guillemot [1996] show the influence of the tropics on changes in storm tracks, moisture sources, and transient eddy moisture transports that contributed to the North American floods which in turn altered the Bowen ratio
to be close to its potential value as the surface became saturated in the upper Mississippi Basin. The recycling of moisture diminishes the sensible heating at the ex- pense of increased evapotranspiration, and these effects combine with changes in atmospheric heating through altered latent heating and increased cloudiness to af- fect the atmospheric circulation and subsequent mois- ture transports. Preconditioning of the early spring soil moisture to dry conditions, as in 1988, or moist condi- tions, as in 1993, are important in the beginning stages [Dirmeyer and Shukla, 1993]. These considerations sug- gest the potential for significant feedback effects, most likely in the spring and summer, but their importance remains to be quantified.
6. The Future
The main thrust of this review has been on the im-
and longer, other low-frequency processes involving trans- proved understanding gained throughout TOGA of the ports by anomalous ocean currents might also need to be taken into consideration [Trenberth and Hurrell, 1994; Deser et al., 1996].
5.2. Interactions With Land
It is well established that ENSO events lead to changes in rainfall all over the globe (Figure 2), often producing droughts in some regions and floods in other regions. The regions most affected are in the tropics and sub- tropics. These changes in rainfall clearly influence the availability of surface water over land, and in particu- lar, the soil moisture and transpiration in vegetation is changed, providing a potentially powerful feedback on the atmospheric circulation.
The importance of surface hydrology in the low- frequency variability in the Asian monsoon has been postulated by Webster [1983]. The influence of snow cover and soil moisture on the Asian monsoon has been
ß
subject to considerable study and is one domain where effects seem to be important. Barnett et al. [1989] and Yasunari et al. [1991] showed with climate model ex- periments how anomalous snowfall over Asia could in- fluence the subsequent summer monsoon, with heavier snow causing a delay in continental heating. Moreover, there are indications that the subsequent changes in the surface winds over the Pacific could possibly trigger an E1 Nifio event.
Over North America the 1988 spring-summer drought has been linked to the strong La Nifia and related trop- ical SST anomalies at that time, but with dry soil conditions and low-moisture availability contributing to
extratropical response to tropical atmospheric forcing. Considerable progress has been made, but much of that progress consisted of unearthing the full complexity of the problem and the di•culties in capitalizing on the predictability that exists.
From realization of the complexity of the problem we now know that several issues must be addressed if the
midlatitude response to tropical forcing is to be success- fully represented and predicted. The first issue is one of obtaining the tropical atmospheric forcings, driven by anomalous SSTs. The second is one of determin- ing reliably the response of the atmosphere. The pro- cesses involved in transforming the thermally forced in- ternal mode in the tropics into an external, equivalent barotropic. mode in the extratropics are not fully ex- plained; neither are the mechanisms that produce ex- tratropical convergence anomalies associated with the Rossby wave source. The response also involves sort- ing out the signal from the high level of natural vari- ability that gives rise to noise and properly account- ing for many and varied feedbacks. The climatological mean planetary waves create an environment favorable for producing internal sources of the energy that can compete in magnitude with the original perturbation. Further research into the role of nonlinearity is needed. Changes in the planetary waves produce changes in jet streams and storm tracks, and the latter feedback to alter and often reinforce the initial response. But such a feedback only applies on average, and limited periods can behave quite differently according to the synoptic situation. A second major feedback arises from
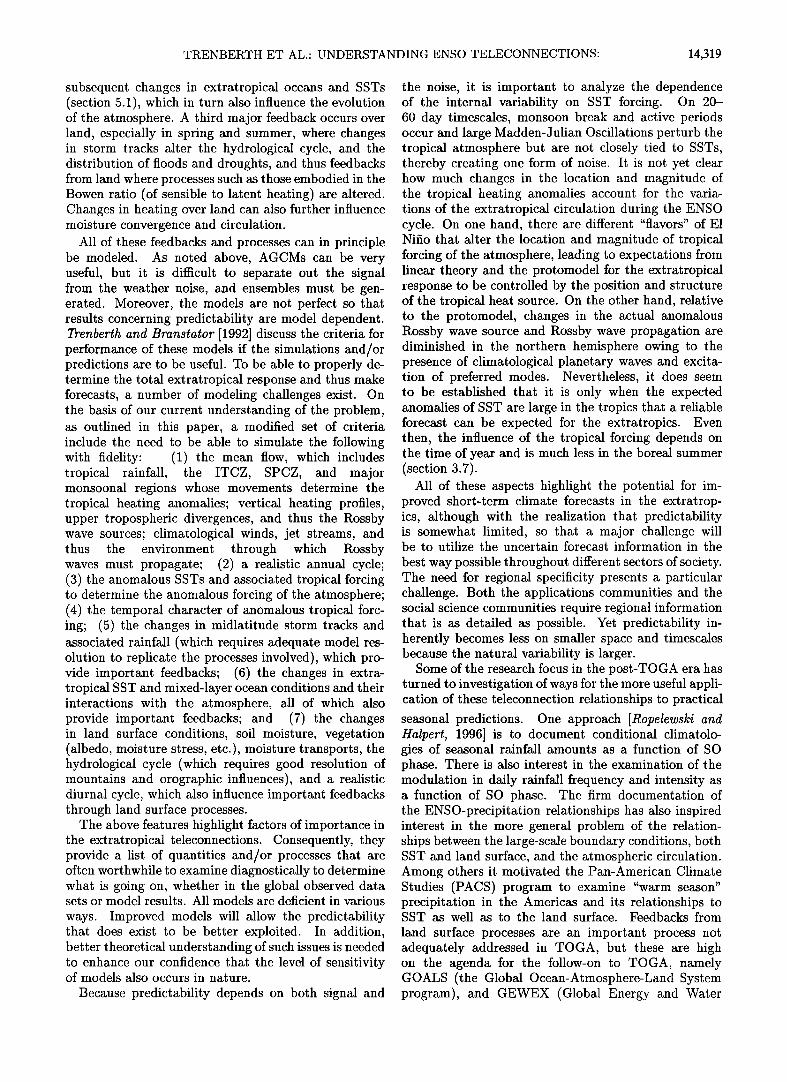
TRENBERTH ET AL.: UNDERSTANDING ENSO TELECONNECTIONS: 14,319
subsequent changes in extratropical oceans and SSTs (section 5.1), which in turn also influence the evolution of the atmosphere. A third major feedback occurs over land, especially in spring and summer, where changes in storm tracks alter the hydrological cycle, and the distribution of floods and droughts, and thus feedbacks from land where processes such as those embodied in the Bowen ratio (of sensible to latent heating) are altered. Changes in heating over land can also further influence moisture convergence and circulation.
All of these feedbacks and processes can in principle be modeled. As noted above, AGCMs can be very useful, but it is difficult to separate out the signal from the weather noise, and ensembles must be gen- erated. Moreover, the models are not perfect so that results concerning predictability are model dependent. Trenberth and Branstator [1992] discuss the criteria for performance of these models if the simulations and/or predictions are to be useful. To be able to properly de- termine the total extratropical response and thus make forecasts, a number of modeling challenges exist. On the basis of our current understanding of the problem, as outlined in this paper, a modified set of criteria include the need to be able to simulate the following with fidelity: (1) the mean flow, which includes tropical rainfall, the ITCZ, SPCZ, and major monsoonal regions whose movements determine the tropical heating anomalies; vertical heating profiles, upper tropospheric divergences, and thus the Rossby wave sources; climatological winds, jet streams, and thus the environment through which Rossby waves must propagate; (2) a realistic annual cycle; (3) the anomalous SSTs and associated tropical forcing to determine the anomalous forcing of the atmosphere; (4) the temporal character of anomalous tropical forc- ing; (5) the changes in midlatitude storm tracks and associated rainfall (which requires adequate model res- olution to replicate the processes involved), which pro- vide important feedbacks; (6) the changes in extra- tropical SST and mixed-layer ocean conditions and their interactions with the atmosphere, all of which also provide important feedbacks; and (7) the changes in land surface conditions, soil moisture, vegetation (albedo, moisture stress, etc.), moisture transports, the hydrological cycle (which requires good resolution of mountains and orographic influences), and a realistic diurnal cycle, which also influence important feedbacks through land surface processes.
The above features highlight factors of importance in the extratropical teleconnections. Consequently, they provide a list of quantities and/or processes that are often worthwhile to examine diagnostically to determine what is going on, whether in the global observed data sets or model results. All models are deficient in various
ways. Improved models will allow the predictability that does exist to be better exploited. In addition, better theoretical understanding of such issues is needed to enhance our confidence that the level of sensitivity of models also occurs in nature.
Because predictability depends on both signal and
the noise, it is important to analyze the dependence of the internal variability on SST forcing. On 20- 60 day timescales, monsoon break and active periods occur and large Madden-Julian Oscillations perturb the tropical atmosphere but are not closely tied to SSTs, thereby creating one form of noise. It is not yet clear how much changes in the location and magnitude of the tropical heating anomalies account for the varia- tions of the extratropical circulation during the ENSO cycle. On one hand, there are different "flavors" of E1 Nifio that alter the location and magnitude of tropical forcing of the atmosphere, leading to expectations from linear theory and the protomodel for the extratropical response to be controlled by the position and structure of the tropical heat source. On the other hand, relative to the protomodel, changes in the actual anomalous Rossby wave source and Rossby wave propagation are diminished in the northern hemisphere owing to the presence of climatological planetary waves and excita- tion of preferred modes. Nevertheless, it does seem to be established that it is only when the expected anomalies of SST are large in the tropics that a reliable forecast can be expected for the extratropics. Even then, the influence of the tropical forcing depends on the time of year and is much less in the boreal summer (section 3.7).
All of these aspects highlight the potential for im- proved short-term climate forecasts in the extratrop- ics, although with the realization that predictability is somewhat limited, so that a major challenge will be to utilize the uncertain forecast information in the
best way possible throughout different sectors of society. The need for regional specificity presents a particular challenge. Both the applications communities and the social science communities require regional information that is ag detailed as possible. Yet predictability in- herently becomes less on smaller space and timescales because the natural variability is larger.
Some of the research focus in the post-TOGA era has turned to investigation of ways for the more useful appli- cation of these teleconnection relationships to practical
seasonal predictions. One approach [Ropelewski and Halpert, 1996] is to document conditional climatolo- gies of seasonal rainfall amounts as a function of SO phase. There is also interest in the examination of the modulation in daily rainfall frequency and intensity as a function of SO phase. The firm documentation of the ENSO-precipitation relationships has also inspired interest in the more general problem of the relation- ships between the large-scale boundary conditions, both SST and land surface, and the atmospheric circulation. Among others it motivated the Pan-American Climate Studies (PACS) program to examine "warm season" precipitation in the Americas and its relationships to SST as well as to the land surface. Feedbacks from
land surface processes are an important process not adequately addressed in TOGA, but these are high on the agenda for the follow-on to TOGA, namely GOALS (the Global Ocean-Atmosphere-Land System program), and GEWEX (Global Energy and Water
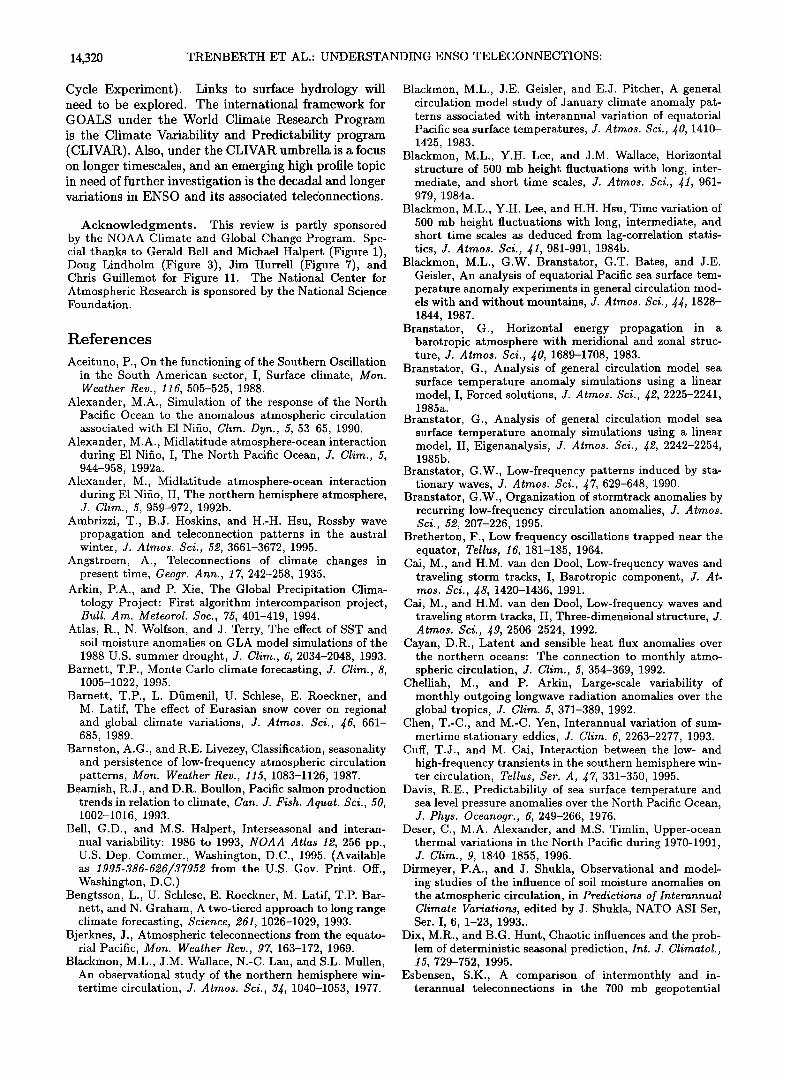
14,320 TRENBERTH ET AL.: UNDERSTANDING ENSO TELECONNECTIONS:
Cycle Experiment). Links to surface hydrology will need to be explored. The international framework for GOALS under the World Climate Research Program is the Climate Variability and Predictability program (CLIVAR). Also, under the CLIVAR umbrella is a focus on longer timescales, and an emerging high profile topic in need of further investigation is the decadal and longer variations in ENSO and its associated teledonnections.
Acknowledgments. This review is partly sponsored by the NOAA Climate and Global Change Program. Spe- cial thanks to Gerald Bell and Michael Halpert (Figure 1), Doug Lindholm (Figure 3), Jim Hurrell (Figure 7), and Chris Guillemot for Figure 11. The National Center for Atmospheric Research is sponsored by the National Science Foundation.
References
Aceituno, P., On the functioning of the Southern Oscillation in the South American sector, I, Surface climate, Mon. Weather Rev., 116, 505-525, 1988.
Alexander, M.A., Simulation of the response of the North Pacific Ocean to the anomalous atmospheric circulation associated with E1 Nifio, Clim. Dyn., 5, 53-65, 1990.
Alexander, M.A., Midlatitude atmosphere-ocean interaction during E1 Nifio, I, The North Pacific Ocean, J. Clim., 5, 944-958, 1992a.
Alexander, M., Midlatitude atmosphere-ocean interaction during E1 Nifio, II, The northern hemisphere atmosphere, J. Clim., 5, 959-972, 1992b.
Ambrizzi, T., B.J. Hoskins, and H.-H. Hsu, Rossby wave propagation and teleconnection patterns in the austral winter, J. Atmos. Sci., 52, 3661-3672, 1995.
Angstroem, A., Teleconnections of climate changes in present time, Geogr. Ann., 17, 242-258, 1935.
Arkin, P.A., and P. Xie, The Global Precipitation Clima- tology Project: First algorithm intercomparison project, Bull. Am. Meteorol. Soc., 75, 401-419, 1994.
Atlas, R., N. Wolfson, and J. Terry, The effect of SST and soil moisture anomalies on GLA model simulations of the
1988 U.S. summer drought, J. Clim., 6, 2034-2048, 1993. Barnett, T.P., Monte Carlo climate forecasting, J. Clim., 8,
1005-1022, 1995. Barnett, T.P., L. Dfimenil, U. Schlese, E. Roeckner, and
M. Latif, The effect of Eurasian snow cover on regional and global climate variations, J. Atmos. Sci., •6, 661- 685, 1989.
Barnston, A.G., and R.E. Livezey, Classification, seasonality and persistence of low-frequency atmospheric circulation patterns, Mon. Weather Rev., 115, 1083-1126, 1987.
Beamish, R.J., and D.R. Boullon, Pacific salmon production trends in relation to climate, Can. J. Fish. Aquat. Sci., 50, 1002-1016, 1993.
Bell, G.D., and M.S. Halpert, Interseasonal and interan- nual variability: 1986 to 1993, NOAA Atlas 12, 256 pp., U.S. Dep. Commer., Washington, D.C., 1995. (Available as 1995-386-626/37952 from the U.S. Gov. Print. Off., Washington, D.C.)
Bengtsson, L., U. Schlese, E. Roeckner, M. Latif, T.P. Bar- nett, and N. Graham, A two-tiered approach to long range climate forecasting, Science, 261, 1026-1029, 1993.
Bjerknes, J., Atmospheric teleconnections from the equato- rial Pacific, Mon. Weather Rev., 97, 163-172, 1969.
Blackmon, M.L., J.M. Wallace, N.-C. Lau, and S.L. Mullen, An observational study of the northern hemisphere win- tertime circulation, J. Atmos. Sci., 3•, 1040-1053, 1977.
Blackmon, M.L., J.E. Geisler, and E.J. Pitcher, A general circulation model study of January climate anomaly pat- terns associated with interannual variation of equatorial Pacific sea surface temperatures, J. Atmos. Sci., •0, 1410- 1425, 1983.
Blackmon, M.L., Y.H. Lee, and J.M. Wallace, Horizontal structure of 500 mb height fluctuations with long, inter- mediate, and short time scales, J. Atmos. Sci., •1, 961- 979, 1984a.
Blackmon, M.L., Y.H. Lee, and H.H. Hsu, Time variation of 500 mb height fluctuations with long, intermediate, and short time scales as deduced from lag-correlation statis- tics, J. Atmos. Sci., •1, 981-991, 1984b.
Blackmon, M.L., G.W. Branstator, G.T. Bates, and J.E. Geisler, An analysis of equatorial Pacific sea surface tem- perature anomaly experiments in general circulation mod- els with and without mountains, J. Atmos. Sci., JJ, 1828- 1844, 1987.
Branstator, G., Horizontal energy propagation in a barotropic atmosphere with meridional and zonal struc- ture, J. Atmos. Sci., •0, 1689-1708, 1983.
Branstator, G., Analysis of general circulation model sea surface temperature anomaly simulations using a linear model, I, Forced solutions, J. Atmos. Sci., •2, 2225-2241, 1985a.
Branstator, G., Analysis of general circulation model sea surface temperature anomaly simulations using a linear model, II, Eigenanalysis, J. Atmos. Sci., •2, 2242-2254, 1985b.
Branstator, G.W., Low-frequency patterns induced by sta- tionary waves, J. Atmos. Sci., •7, 629-648, 1990.
Branstator, G.W., Organization of stormtrack anomalies by recurring low-frequency circulation anomalies, J. A tmos. Sci., 52, 207-226, 1995.
Bretherton, F., Low frequency oscillations trapped near the equator, Tellus, 16, 181-185, 1964.
Cai, M., and H.M. van den Dool, Low-frequency waves and traveling storm tracks, I, Barotropic component, J. At- mos. Sci., •8, 1420-1436, 1991.
Cai, M., and H.M. van den Dool, Low-frequency waves and traveling storm tracks, II, Three-dimensional structure, J. Atmos. Sci., •9, 2506-2524, 1992.
Cayan, D.R., Latent and sensible heat flux anomalies over the northern oceans: The connection to monthly atmo- spheric circulation, J. Clim., 5, 354-369, 1992.
Chelliah, M., and P. Arkin, Large-scale variability of monthly outgoing longwave radiation anomalies over the global tropics, J. Clim. 5, 371-389, 1992.
Chen, T.-C., and M.-C. Yen, Interannual variation of sum- mertime stationary eddies, J. Clim. 6, 2263-2277, 1993.
Cuff, T.J., and M. Cai, Interaction between the low- and high-frequency transients in the southern hemisphere win- ter circulation, Tellus, Ser. A, •7, 331-350, 1995.
Davis, R.E., Predictability of sea surface temperature and sea level pressure anomalies over the North Pacific Ocean, J. Phys. ¸ceanogr., 6, 249-266, 1976.
Deser, C., M.A. Alexander, and M.S. Timlin, Upper-ocean thermal variations in the North Pacific during 1970-1991, J. Clim., 9, 1840-1855, 1996.
Dirmeyer, P.A., and J. Shukla, Observational and model- ing studies of the influence of soil moisture anomalies on the atmospheric circulation, in Predictions of Interannual Climate Variations, edited by J. Shukla, NATO ASI Ser, Set. I, 6, 1-23, 1993..
Dix, M.R., and B.G. Hunt, Chaotic influences and the prob- lem of deterministic seasonal prediction, Int. J. Climatol., 15, 729-752, 1995.
Esbensen, S.K., A comparison of intermonthly and in- terannual teleconnections in the 700 mb geopotential
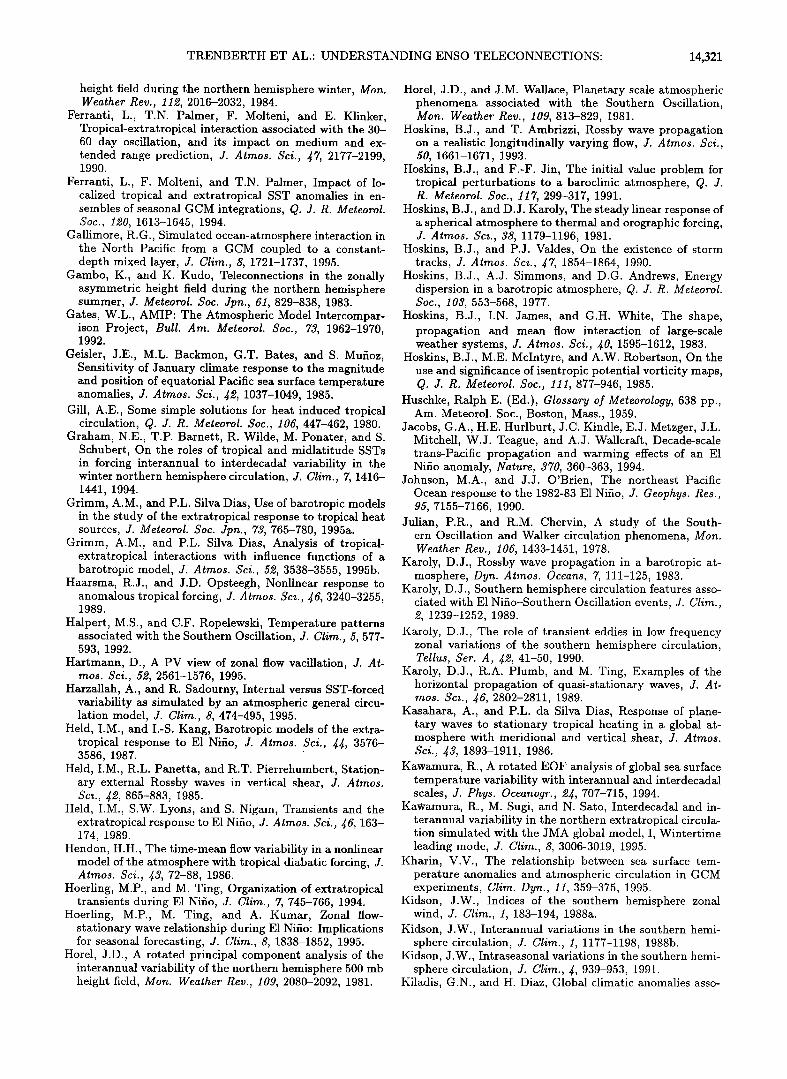
TRENBERTH ET AL.: UNDERSTANDING ENSO TELECONNECTIONS: 14,321
height field during the northern hemisphere winter, Mon. Weather Rev., 112, 2016-2032, 1984.
Ferranti, L., T.N. Palmer, F. Molteni, and E. Klinker, Tropical-extratropical interaction associated with the 30- 60 day oscillation, and its impact on medium and ex- tended range prediction, J. Atmos. $ci., J7, 2177-2199, 1990.
Ferranti, L., F. Molteni, and T.N. Palmer, Impact of lo- calized tropical and extratropical SST anomalies in en- sembles of seasonal GCM integrations, Q. J. R. Meteorol. $oc., 120, 1613-1645, 1994.
Gallimore, R.G., Simulated ocean-atmosphere interaction in the North Pacific from a GCM coupled to a constant- depth mixed layer, J. Clim., 8, 1721-1737, 1995.
Gambo, K., and K. Kudo, Teleconnections in the zonally asymmetric height field during the northern hemisphere summer, J. Meteorol. $oc. Jpn., 61, 829-838, 1983.
Gates, W.L., AMIP: The Atmospheric Model Intercompar- ison Project, Bull. Am. Meteorol. $oc., 73, 1962-1970, 1992.
Geisler, J.E., M.L. Backmon, G.T. Bates, and S. Mufioz, Sensitivity of January climate response to the magnitude and position of equatorial Pacific sea surface temperature anomalies, J. Atmos. $ci., J2, 1037-1049, 1985.
Gill, A.E., Some simple solutions for heat induced tropical circulation, Q. J. R. Meteorol. $oc., 106, 447-462, 1980.
Graham, N.E., T.P. Barnett, R. Wilde, M. Ponater, and S. Schubert, On the roles of tropical and midlatitude SSTs in forcing interannual to interdecadal variability in the winter northern hemisphere circulation, J. Clim., 7, 1416- 1441, 1994.
Grimm, A.M., and P.L. Silva Dias, Use of barotropic models in the study of the extratropical response to tropical heat sources, J. Meteorol. $oc. Jpn., 73, 765-780, 1995a.
Grimm, A.M., and P.L. Silva Dias, Analysis of tropical- extratropical interactions with influence functions of a barotropic model, J. Atmos. $ci., 52, 3538-3555, 1995b.
Haarsma, R.J., and J.D. Opsteegh, Nonlinear response to anomalous tropical forcing, J. Atmos. $ci., •6, 3240-3255, 1989.
Halpert, M.S., and C.F. Ropelewski, Temperature patterns associated with the Southern Oscillation, J. Clim., 5, 577- 593, 1992.
Hartmann, D., A PV view of zonal flow vacillation, J. At- mos. $ci., 52, 2561-1576, 1995.
Harzallah, A., and R. Sadourny, Internal versus SST-forced variability as simulated by an atmospheric general circu- lation model, J. Clim., 8, 474-495, 1995.
Held, I.M., and I.-S. Kang, Barotropic models of the extra- tropical response to E1 Nifio, J. Atmos. $ci., JJ, 3576- 3586, 1987.
Held, I.M., R.L. Panetta, and R.T. Pierrehumbert, Station- ary external Rossby waves in vertical shear, J. Atmos. $ci., J2, 865-883, 1985.
Held, I.M., S.W. Lyons, and S. Nigam, Transients and the extratropical response to E1Nifio, J. Atmos. $ci., •6, 163- 174, 1989.
Hendon, H.H., The time-mean flow variability in a nonlinear model of the atmosphere with tropical diabatic forcing, J. Atmos. $ci., •43, 72-88, 1986.
Hoerling, M.P., and M. Ting, Organization of extratropical transients during E1 Nifio, J. Clim., 7, 745-766, 1994.
Hoerling, M.P., M. Ting, and A. Kumar, Zonal flow- stationary wave relationship during E1 Nifio: Implications for seasonal forecasting, J. Clim., 8, 1838-1852, 1995.
Horel, J.D., A rotated principal component analysis of the interannual variability of the northern hemisphere 500 mb height field, Mon. Weather Rev., 109, 2080-2092, 1981.
Horel, J.D., and J.M. Wallace, Planetary scale atmospheric phenomena associated with the Southern Oscillation, Mon. Weather Rev., 109, 813-829, 1981.
Hoskins, B.J., and T. Ambrizzi, Rossby wave propagation on a realistic longitudinally varying flow, J. Atmos. $ci., 50, 1661-1671, 1993.
Hoskins, B.J., and F.-F. Jin, The initial value problem for tropical perturbations to a baroclinic atmosphere, Q. J. R. Meteorol. Soc., 117, 299-317, 1991.
Hoskins, B.J., and D.J. Karoly, The steady linear response of a spherical atmosphere to thermal and orographic forcing, J. Atmos. $ci., 38, 1179-1196, 1981.
Hoskins, B.J., and P.J. Valdes, On the existence of storm tracks, J. Atmos. $ci., J7, 1854-1864, 1990.
Hoskins, B.J., A.J. Simmons, and D.G. Andrews, Energy dispersion in a barotropic atmosphere, Q. J. R. Meteorol. Soc., 103, 553-568, 1977.
Hoskins, B.J., I.N. James, and G.H. White, The shape, propagation and mean flow interaction of large-scale weather systems, J. Atmos. $ci., •0, 1595-1612, 1983.
Hoskins, B.J., M.E. Mcintyre, and A.W. Robertson, On the use and significance of isentropic potential vorticity maps, Q. J. R. Meteorol. Soc., 111, 877-946, 1985.
Huschke, Ralph E. (Ed.), Glossary of Meteorology, 638 pp., Am. Meteorol. Soc., Boston, Mass., 1959.
Jacobs, G.A., H.E. Hurlhurt, J.C. Kindle, E.J. Metzger, J.L. Mitchell, W.J. Teague, and A.J. Wallcraft, Decade-scale trans-Pacific propagation and warming effects of an E1 Nifio anomaly, Nature, 370, 360-363, 1994.
Johnson, M.A., and J.J. O'Brien, The northeast Pacific Ocean response to the 1982-83 E1 Nifio, J. Geophys. Res., 95, 7155-7166, 1990.
Julian, P.R., and R.M. Chervin, A study of the South- ern Oscillation and Walker circulation phenomena, Mon. Weather Rev., 106, 1433-1451, 1978.
Karoly, D.J., Rossby wave propagation in a barotropic at- toosphere, Dyn. Atmos. Oceans, 7, 111-125, 1983.
Karoly, D.J., Southern hemisphere circulation features asso- ciated with E1 Nifio-Southern Oscillation events, J. Clim., 2, 1239-1252, 1989.
Karoly, D.J., The role of transient eddies in low frequency zonal variations of the southern hemisphere circulation, Tellus, Set. A, J2, 41-50, 1990.
Karoly, D.J., R.A. Plumb, and M. Ting, Examples of the horizontal propagation of quasi-stationary waves, J. At- mos. Sci., J6, 2802-2811, 1989.
Kasahara, A., and P.L. da Silva Dias, Response of plane- tary waves to stationary tropical heating in a global at- mosphere with meridional and vertical shear, J. Atmos. Sci., J3, 1893-1911, 1986.
Kawamura, R., A rotated EOF analysis of global sea surface temperature variability with interannual and interdecadal scales, J. Phys. Oceanogr., 2•4, 707-715, 1994.
Kawamura, R., M. Sugi, and N. Sato, Interdecadal and in- terannual variability in the northern extratropical circula- tion simulated with the JMA global model, I, Wintertime leading mode, J. Clim., 8, 3006-3019, 1995.
Kharin, V.V., The relationship between sea surface tem- perature anomalies and atmospheric circulation in GCM experiments, Clim. Dyn., 11,359-375, 1995.
Kidson, J.W., Indices of the southern hemisphere zonal wind, J. Clim., 1, 183-194, 1988a.
Kidson, J.W., Interannual variations in the southern hemi- sphere circulation, J. Clim., 1, 1177-1198, 1988b.
Kidson, J.W., Intraseasonal variations in the southern hemi- sphere circulation, J. Clim., J, 939-953, 1991.
Kiladis, G.N., and H. Diaz, Global climatic anomalies asso-
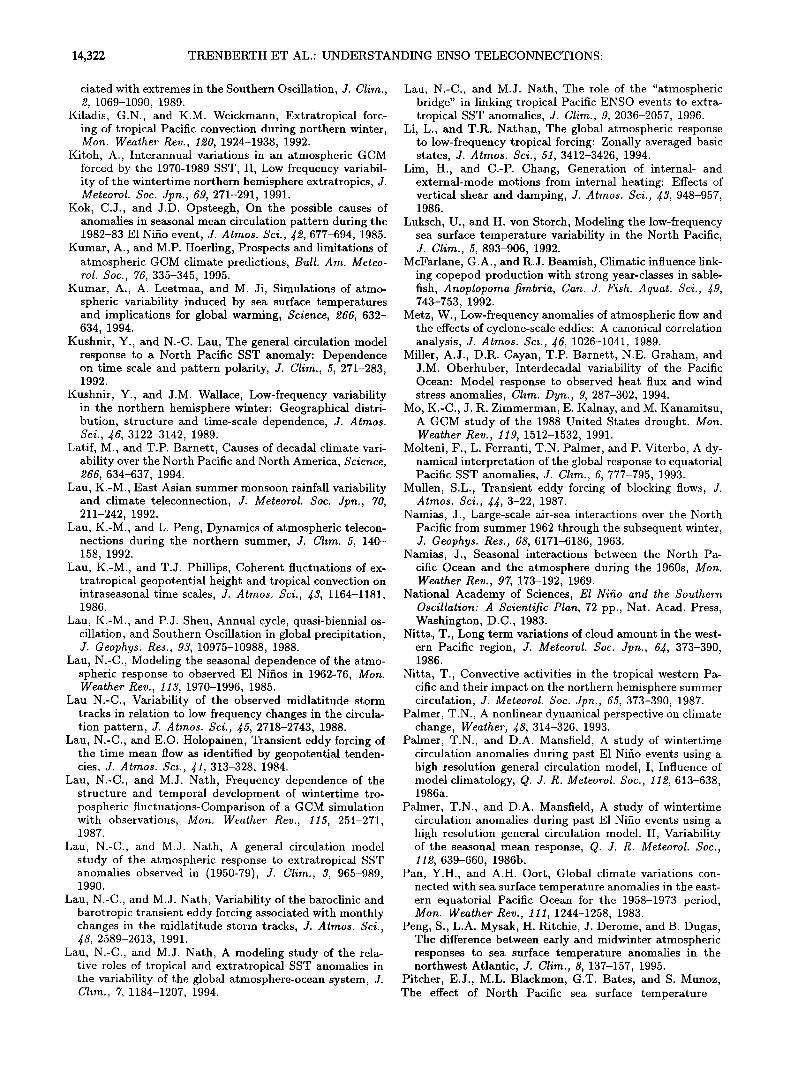
14,322 TRENBERTH ET AL.: UNDERSTANDING ENSO TELECONNECTIONS:
ciated with extremes in the Southern Oscillation, J. Clim., 2, 1069-1090, 1989.
Kiladis, G.N., and K.M. Weickmann, Extratropical forc- ing of tropical Pacific convection during northern winter, Mon. Weather Rev., 120, 1924-1938, 1992.
Kitoh, A., Interannual variations in an atmospheric GCM forced by the 1970-1989 SST, II, Low frequency variabil- ity of the wintertime northern hemisphere extratropics, J. Meteorol. Soc. Jpn., 69, 271-291, 1991.
Kok, C.J., and J.D. Opsteegh, On the possible causes of anomalies in seasonal mean circulation pattern during the 1982-83 E1 Nifio event, J. Atmos. Sci., •2, 677-694, 1985.
Kumar, A., and M.P. Hoerling, Prospects and limitations of atmospheric GCM climate predictions, Bull. Am. Meteo- rol. Soc., 76, 335-345, 1995.
Kumar, A., A. Leetmaa, and M. Ji, Simulations of atmo- spheric variability induced by sea surface temperatures and implications for global warming, Science, 266, 632- 634, 1994.
Kushnir, Y., and N.-C. Lau, The general circulation model response to a North Pacific SST anomaly: Dependence on time scale and pattern polarity, J. Clim., 5, 271-283, 1992.
Kushnir, Y., and J.M. Wallace, Low-frequency variability in the northern hemisphere winter: Geographical distri- bution, structure and time-scale dependence, J. A tmos. Sci., •6, 3122-3142, 1989.
Latif, M., and T.P. Barnett, Causes of decadal climate vari- ability over the North Pacific and North America, Science, 266, 634-637, 1994.
Lau, K.-M., East Asian summer monsoon rainfall variability and climate teleconnection, J. Meteorol. Soc. Jpn., 70, 211-242, 1992.
Lau, K.-M., and L. Peng, Dynamics of atmospheric telecon- nections during the northern summer, J. Clim. 5, 140- 158, 1992.
Lau, K.-M., and T.J. Phillips, Coherent fluctuations of ex- tratropical geopotential height and tropical convection on intraseasonal time scales, J. Atmos. Sci., •$, 1164-1181, 1986.
Lau, K.-M., and P.J. Sheu, Annual cycle, quasi-biennial os- cillation, and Southern Oscillation in global precipitation, J. Geophys. Res., 93, 10975-10988, 1988.
Lau, N.-C., Modeling the seasonal dependence of the atmo- spheric response to observed E1 Nifios in 1962-76, Mon. Weather Rev., 113, 1970-1996, 1985.
Lau N.-C., Variability of the observed midlatitude storm tracks in relation to low frequency changes in the circula- tion pattern, J. Atmos. Sci., •5, 2718-2743, 1988.
Lau, N.-C., and E.O. Holopainen, Transient eddy forcing of the time mean flow as identified by geopotential tenden- cies, J. Atmos. Sci., J1, 313-328, 1984.
Lau, N.-C., and M.J. Nath, Frequency dependence of the structure and temporal development of wintertime tro- pospheric fluctuations-Comparison of a GCM simulation with observations, Mon. Weather Rev., 115, 251-271, 1987.
Lau, N.-C., and M.J. Nath, A general circulation model study of the atmospheric response to extratropical SST anomalies observed in (1950-79), J. Clira., 3, 965-989, 1990.
Lau, N.-C., and M.J. Nath, Variability of the baroclinic and barotropic transient eddy forcing associated with monthly changes in the midlatitude storm tracks, J. Atraos. Sci., •8, 2589-2613, 1991.
Lau, N.-C., and M.J. Nath, A modeling study of the rela- tive roles of tropical and extratropical SST anomalies in the variability of the global atmosphere-ocean system, J. Clira., 7, 1184-1207, 1994.
Lau, N.-C., and M.J. Nath, The role of the "atmospheric bridge" in linking tropical Pacific ENSO events to extra- tropical SST anomalies, J. elire., 9, 2036-2057, 1996.
Li, L., and T.R. Nathan, The global atmospheric response to low-frequency tropical forcing: Zonally averaged basic states, J. Atraos. Sci., 51, 3412-3426, 1994.
Lira, H., and C.-P. Chang, Generation of internal- and external-mode motions from internal heating: Effects of vertical shear and damping, J. Atmos. Sci., •3, 948-957, 1986.
Luksch, U., and H. von Storch, Modeling the low-frequency sea surface temperature variability in the North Pacific, J. Clira., 5, 893-906, 1992.
McFarlane, G.A., and R.J. Beamish, Climatic influence link- ing copepod production with strong year-classes in sable- fish, Anoplopoma fimbria, Can. J. Fish. Aquat. Sci., •9, 743-753, 1992.
Metz, W., Low-frequency anomalies of atmospheric flow and the effects of cyclone-scale eddies: A canonical correlation analysis, J. Atmos. Sci., •6, 1026-1041, 1989.
Miller, A.J., D.R. Cayan, T.P. Barnett, N.E. Graham, and J.M. Oberhuber, Interdecadal variability of the Pacific Ocean: Model response to observed heat flux and wind stress anomalies, Clim. Dyn., 9, 287-302, 1994.
Mo, K.-C., J. R. Zimmerman, E. Kalnay, and M. Kanamitsu, A GCM study of the 1988 United States drought. Mon. Weather Rev., 119, 1512-1532, 1991.
Molteni, F., L. Ferranti, T.N. Palmer, and P. Viterbo, A dy- namical interpretation of the global response to equatorial Pacific SST anomalies, J. Clim., 6, 777-795, 1993.
Mullen, S.L., Transient eddy forcing of blocking flows, J. Atmos. Sci., jj, 3-22, 1987.
Namias, J., Large-scale air-sea interactions over the North Pacific from summer 1962 through the subsequent winter, J. Geophys. Res., 68, 6171-6186, 1963.
Namias, J., Seasonal interactions between the North Pa- cific Ocean and the atmosphere during the 1960s, Mon. Weather Rev., 97, 173-192, 1969.
National Academy of Sciences, El Nifo and the Southern Oscillation: A Scientific Plan, 72 pp., Nat. Acad. Press, Washington, D.C., 1983.
Nitta, T., Long term variations of cloud amount in the west- ern Pacific region, J. Meteorol. Soc. Jpn., 64, 373-390, 1986.
Nitta, T., Convective activities in the tropical western Pa- cific and their impact on the northern hemisphere summer circulation, J. Meteorol. Soc. Jpn., 65, 373-390, 1987.
Pahner, T.N., A nonlinear dynamical perspective on climate change, Weather, •8, 314-326, 1993.
Pahner, T.N., and D.A. Mansfield, A study of wintertime circulation anomalies during past E1 Nifio events using a high resolution general circulation model, I, Influence of model climatology, Q. J. R. Meteorol. Soc., 112, 613-638, 1986a.
Palmer, T.N., and D.A. Mansfield, A study of wintertime circulation anomalies during past E1 Nifio events using a high resolution general circulation model. II, Variability of the seasonal mean response, Q. J. R. Meteorol. Soc., 112, 639-660, 1986b.
Pan, Y.H., and A.H. Oort, Global climate variations con- nected with sea surface temperature anomalies in the east- ern equatorial Pacific Ocean for the 1958-1973 period, Mon. Weather Rev., 111, 1244-1258, 1983.
Peng, S., L.A. Mysak, H. Ritchie, J. Derome, and B. Dugas, The difference between early and midwinter atmospheric responses to sea surface temperature anomalies in the northwest Atlantic, J. Clim., 8, 137-157, 1995.
Pitcher, E.J., M.L. Blackmon, G.T. Bates, and S. Munoz, The effect of North Pacific sea surface temperature
TRENBERTH ET AL.: UNDERSTANDING ENSO TELECONNECTIONS: 14,323
anomalies on the January climate of a general circulation model, J. Atmos. Sci., •5, 173-188, 1988.
Polovina, J.J., G.T. Mitchum, N.E. Graham, M.P. Craig, E.E. DeMartini, and E.N. Flint, Physical and biological consequences of a climate event in the central North Pa- cific, Fish. Oceanogr., 3, 15-21, 1994.
Randel, W.J., Coherent wave-zonal mean flow interactions in the troposphere, J. Atmos. Sci., •7, 439-456, 1989.
Rasmusson, E., and K.-C. Mo, Linkages between 200-mb tropical and extratropical anomalies during the 1986-1989 ENSO cycle, J. Clim., 6, 595-616, 1993.
Ratcliffe, R.A.S., and R. Murray, New lag association be- tween North Atlantic sea temperature and European pres- sure applied to long-range weather forecasting, Q. J. R. Meteorol. Soc., 96, 226-246, 1970.
Rogers, J.C., and H. van Loon, The seesaw in winter tem- peratures between Greenland and northern Europe, II, Some atmospheric and oceanic effects in middle and high latitudes, Mon. Weather Rev., 107, 509-519, 1979.
Ropelewski, C.F., and M.S. Halpert, North American pre- cipitation and temperature associated with the E1 Nifio Southern Oscillation (ENSO), Mon. Weather Rev., 11•, 2352-2362, 1986.
Ropelewski, C.F., and M.S. Halpert, Global and re- gional scale precipitation patterns associated with the E1 Nifio/Southern Oscillation, Mon. Weather Rev., 115, 1606-1626, 1987.
Ropelewski, C.F., and M.S. Halpert, Precipitation patterns associated with the high index phase of the Southern Os- cillation, J. Clim., 2, 268-284, 1989.
Ropelewski, C.F., and M.S. Halpert, Quantifying Southern Oscillation-precipitation relationships, J. Clim., 9, 1043- 1059, 1996.
Rowell, D.P., C.K. Foiland, K. Maskell, and M.N. Ward, Variability of summer rainfall over tropical North Africa (1906-92): Observations and modelling, Q. J. R. Meteo- rol. Soc., 121, 669-704, 1995.
Sardeshmukh, P.D., and B.J. Hoskins, The generation of global rotational flow by steady idealized tropical diver- gence, J. Atmos. Sci., •5, 1228-1251, 1988.
Schneider, E.K., and I.G. Watterson, Stationary Rossby wave propagation through easterly layers, J. Atmos. Sci., •1, 2069-2083, 1984.
Schubert, S.D., The structure, energetics and evolution of the dominant frequency-dependent three-dimensional at- mospheric modes, J. Atmos. Sci., •$, 1210-1237, 1986.
Shiotani, M., Low-frequency variations of the zonal mean state of the southern hemisphere troposphere, J. Meteorol. Soc. Jpn., 68, 461-471, 1990.
Shukla, J., and J.M. Wallace, Numerical simulation of the atmospheric response to equatorial Pacific sea surface temperature anomalies, J. Atmos. Sci., J0, 1613-1630, 1983.
Simmons, A.J., The forcing of stationary wave motion by tropical diabatic heating, Q. J. R. Meteorol. Soc., 108, 503-534, 1982.
Simmons, A.J., J.M. Wallace, and G.W. Branstator, Barotropic wave propagation and instability, and atmo- spheric teleconnection patterns, J. A tmos. Sci., •0, 1363- 1392, 1983.
Smith, I.N., A GCM simulation of global climate interannual variability: 1950-1988 J. Clim., 8, 709-718, 1995.
Stoeckenius, T., Interanual variations of tropical precipita- tion patterns, Mon. Weather Rev., 109, 1233-1247, 1981.
Tanimoto, Y., N. Iwasaka, K. Hanawa, and Y. Toba, Char- acteristic variations of sea surface temperature with mul- tiple time scales in the North Pacific, J. Clim., 6, 1153- 1160, 1993.
Ting, M., Steady linear response to tropical heating in barotropic and baroclinic models, J. Atmos. Sci., 53, 1698-1709, 1996.
Ting, M., and I.M. Held, The stationary wave response to a tropical SST anomaly in an idealized GCM, J. A tmos. Sci., d7, 2546-2566, 1990.
Ting, M., and S. Peng, Dynamics of the early and middle winter atmospheric responses to the northwest Atlantic SST anomalies, J. Clim., 8, 2239-2254, 1995.
Ting, M., and P.D. Sardeshmukh, Factors determining the extratropical response to equatorial diabatic heating anomalies, J. Atmos. Sci., 50, 907-918, 1993.
Tomas, R.A., and P.J. Webster, Horizontal and vertical structure of cross-equatorial wave propagation, J. Atmos. Sci., 51, 1417-1430, 1994.
Tomita, T., and T. Yasunari, On two types of ENSO, J. Meteorol. Soc. Jpn., 71, 273-283, 1993.
Trenberth, K.E., Interannual variability of the southern hemisphere circulation: Representativeness of the year of the Global Weather Experiment, Mon. Weather Rev., 112, 108-123, 1984a.
Trenberth, K.E., Recent observed interdecadal climate changes in the northern hemisphere, Bull. Am. Meteorol. Soc., 71,988-993, 1990.
Trenberth, K.E., Storm tracks in the southern hemisphere, J. Atmos. Sci., d8, 2159-2178, 1991.
Trenberth, K.E., E1 Nifio-Southern Oscillation, Climate Change: Developing Southern Hemisphere Perspectives, edited by T. Giambelluca and A. Henderson-Sellers, chap. 6, pp. 145-173, John Wiley, New York, 1996.
Trenberth, K.E., and G.W. Branstator, Issues in establish- ing causes of the 1988 drought over North America, J. Clim., 5, 159-172, 1992.
Trenberth, K.E., and J.R. Christy, Global fluctuations in the distribution of atmospheric mass, J. Geophys. Res. 90, 8042-8052, 1985.
Trenberth, K.E., and C.J. Guillemot, Physical processes involved in the 1988 drought and 1993 floods in North America, J. Clim., 9, 1288-1298, 1996.
Trenberth, K.E., and T.J. Hoar, The 1990-1995 E1 Nifio- Southern Oscillation Event: Longest on record, Geophys. Res. Ltt., 23, 57-60, 1996.
Trenberth, K.E., and J.W. Hurrell, Decadal atmosphere- ocean variations in the Pacific, Clim. Dyn., 9, 303-319, 1994.
Trenberth, K.E., and D.A. Paolino, Characteristic patterns of variability of sea level pressure in the northern hemi- sphere, Mon. Weather Rev., 109, 1169-1189, 1981.
Trenberth, K.E., G. Branstator, and P.A. Arkin, Origins of the 1988 North American drought, Science, 242, 1640- 1645, 1988.
van Loon, H., and R.A. Madden, The Southern Oscilla- tion, I, Global associations with pressure and temperature in northern winter, Mon. Weather Rev., 109, 1150-1162, 1981.
van Loon, H., and J.C. Rogers, The seesaw in winter temper- atures between Greenland and northern Europe, I, Gen- eral description, Mon. Weather Rev., 106, 296-310, 1978.
van Loon, H., and J.C. Rogers, The Southern Oscillation, II, Associations with changes in the middle troposphere in the northern winter, Mon. Weather Rev., 109, 1163-1168, 1981.
van Loon, H. and D.J. Shea, The Southern Oscillation, IV, The precursors south of 15øS to the extremes of the oscil- lation, Mon. Weather Rev., 113, 2063-2074, 1985.
van Loon, H. and D.J. Shea, The Southern Oscillation, VI, Anomalies of sea level pressure on the southern hemi- sphere and of Pacific sea surface temperature during the
14,324 TRENBERTH ET AL.: UNDERSTANDING ENSO TELECONNECTIONS:
development of a warm event, Mon. Weather Rev., 115, 370-379, 1987.
Walker, G.T., Correlation in seasonal variations of weather, VIII, A preliminary study of world weather, Mere. Indian Meteorol. Dep., 2J(4), 75-131, 1923.
Walker, G.T., Correlation in seasonal variations of weather, IX, A further study of world weather, Mere. Indian Me- teorol. Dep., 2J(9), 275-332, 1924.
Walker, G.T., and E.W. Bliss, World weather V, Mere. R. Meteorol. $oc., J, 53-84, 1932.
Wallace, J.M., and D.S. Gutzler, Teleconnections in the geopotential height field during the northern hemisphere winter, Mon. Weather Rev., 109, 784-812, 1981.
Wallace J.M., C. Smith, and Q. Jiang, Spatial patterns of atmosphere-ocean interaction in the northern winter, J. Clim., 3, 990-998, 1990.
Weare, B.C., A. Navato, and R.E. Newell, Empirical orthog- onal analysis of Pacific Ocean sea surface temperatures, J. Phys. Oceanogr., 6, 671-678, 1976.
Webster, P.J., Mechanisms determining the atmospheric re- sponse to sea surface anomalies, J. Atmos. $ci., 38, 554- 571, 1981.
Webster, P.J., Seasonality in the local and remote atmo- spheric response to sea surface temperature anomalies, J. Atmos. Sci., 39, 41-52, 1982.
Webster, P.J., Mechanisms of monsoon low-frequency vari- ability: Surface hydrological effects, J. Atmos. $ci., 2110-2124, 1983.
Webster, P.J., and H.R. Chang, Dispersion of equatorial waves in a flow with longitudinal flow: implications to teleconnections theory, J. Atmos. $ci., •5, 803-829, 1988.
Webster, P.J., and J.R. Holton, Cross equatorial response to middle latitude forcing in a zonally varying basic state, J. Atmos. $ci., 39, 722-733, 1982.
Yasunari, T., A. Kitoh, and T. Tokioka, Local and remote responses to excessive snow mass over Eurasia appearing in the northern spring and summer climate A study with the MRI-GCM, J. Meteorol. $oc. Jpn., 69, 473-487, 1991.
Yu, J.-Y., and D.L. Hartmann, Zonal flow vacillation and eddy forcing in a simple GCM of the atmosphere, J. At- mos. $ci., 50, 571-585, 1993.
Zwiers, F.W., A potential predictability study conducted with an atmospheric general circulation model, IV•on. Weather Rev., 115, 2957-2974, 1987.
G. W. Branstator, K. E. Trenberth, National Center for Atmospheric Research, P.O. Box 3000, Boulder, CO 80307. (email: [email protected])
D. Karoly, CRC for Southern Hemisphere Meteorology, Monash University, Victoria, Australia.
A. Kumar, C. Ropelewski, National Centers for Enviorn- mental Prediction Washington DC.
N-C Lau, Geophysical Fluid Dynamics Laboratory, NOAA, Princeton, NJ.
(Received April 4, 1996; revised February 17, 1997; accepted May 15, 1997.)
Top Related
Copyright © 2022 FDOKUMEN

