


Bahasa
Halaman
Hukum


Volume 14 Number 12 1986 Nucleic Acids Research
Processing of mammalian tRNA transcripts in vitro: different pre-tRNAs are processed alongalternative pathways that contain a common rate-limiting step
Robert J.Rooney and John D.Harding*
922 Fairchild Center, Department of Biological Sciences, Columbia University, New York,NY 10027, USA
Received 24 March 1986; Revised and Accepted 19 May 1986
ABSTRACT
We have analyzed the pathways and kinetics of processing of mouse tRNA gene transcripts invitro. Different transcripts are processed along two alternative pathways. The 3' trailer sequence of
His Glthe tRNA primary transcript is excised before the 5' leader sequence. In contrast, for the tRNAGlYprimary transcript, the 5' leader sequence is excised before the 3' trailer sequence, as has been foundfor other monomeric eukaryotic tRNA gene transcripts.
Computerized analysis of the kinetics of processing indicates that tRNAAsP, tRNAGlY, tRNAGlUand tRNA lg transcripts are processed in a substrate concentration-dependent manner and also revealsthe existence of a common rate-limiting step, the rate constant of which is equivalent for three of thefour transcripts tested. The processing of one pre-tRNA transcript can be competitively inhibited byaddition of another pre-tRNA transcript to the processing reaction. The common rate-limiting step isassociated with the conversion of the primary transcript to an intermediate and is independent ofsequence and the particular processing pathway of the transcript.
INTRODUCTION
Primary transcripts of eukaryotic tRNA genes undergo a number of processing reactions prior to
the appearance of mature tRNA in the cytoplasm. These reactions include the removal of sequences
external to both the 5' and 3' ends of the mature tRNA, nucleotide modifications and addition of CCA
to the mature 3' terminus (1-5). In addition, a subset of tRNA gene transcripts requires the removal of
intervening sequences subsequent to terminal maturation (4-6). The 5' and 3' termini of tRNA
molecules appear to result from specific endonucleolytic cleavages of the primary transcript (7-1 1).
The excision of 5' leader sequences is catalyzed by RNase P, an endonuclease most extensively studied
in E. coli (reviewed in ref. 12), but also found in a variety of eukaryotes including HeLa cells (11-17).Enzymatic activities responsible for the maturation of 3' termini have been purified to varying degreesfrom several eukaryotic sources (see refs. 1,7,10,). The most extensively characterized of these activi-
ties, the 3' pre-tRNase from Xenopus laevis ovaries, displays a strict substrate requirement for tRNAprecursor molecules from which the 5' leader sequence has already been removed (10). Processingactivities present in Drosophila Kc cell and human KB cell extracts also exhibit this substrate
specificity (7,18). To our knowledge, all published analyses of monomeric eukaryotic tRNA precursor
processing, in which the pathway has been determined unambiguously, indicate that the 5' leader
sequence is excised before the 3' trailer sequence. Exceptions to this are seen for some, but not all
© I R L Press Limited, Oxford, England. 4849
Nucleic Acids Research
(6), multimeric tRNA transcripts (19,20) and for transcripts from a tRNA genie mutated in vitro inwhich sequence complementarity extends from the amino acid acceptor stem into the leader and trailersequences (21). A major question in regard to tRNA processing is thus whether the pathway in which
the 5' leader sequence is excised first is obligatory for wild type monomeric transcripts. In addition,there are relatively little data regarding the relative rates of processing of transcripts of differentsequence, although some of the sequence requirements for efficient processing have been analyzed for
genes mutated in vitro (21-27).In this paper we address issues relevant to an understanding of the mechanisms of tRNA biosyn-
thesis by analyzing in detail the pathways and kinetics of processing of four different mouse tRNA
gene transcripts. We show that some transcripts are processed via a pathway in which the 3' trailer
sequence is excised before the 5' leader sequence. In addition, a mathematical analysis of processingkinetics reveals the existence of a common rate-limiting step, the rate of which is independent of
sequence or pathway for three of the four transcripts tested.
MATERIALS AND METHODS
Preparation of Transcription Templates
A clones containing tRNA genes were isolated from a mouse recombinant DNA library. ThetRNA genes and flanking regions were subcloned into phage M13mp7 or M13mp9 vectors andsequenced as described (28,29). The M13 subclones used in this paper are as follows: mAsp has a
510 bp Sma I insert containing a tRNAAsp gene, mGly has a 141 bp Nar I insert containing a tRNAGlYgene, mGlu has a 1120 bp Alu I insert containing a tRNAGlu gene, mHis has a 296 bp Sau 3A insertcontaining a tRNAHis gene. Subclones mAsp, mGly and mGlu were derived from the mouse DNAinsert of the recombinant X phage Mt2 (28). Subclone mHis was derived from X phage Mtl (29).Supercoiled RF I DNA was isolated from a cleared lysate and further purified by CsCl density gradientcentrifugation (30).
Transcription and Processing Assays
HeLa cell S100 extracts were prepared by the method of Weil et. al. (31) as modified by Talking-ton et. al. (32). Freezing and thawing of the cell lysate prior to high speed centrifugation (32) substan-tially and reproducibly increased the processing activities in the S100 extract. Optimal transcriptionwas obtained for each clone at 0.8 jg DNA/ 25 reaction, containing 10 mM HEPES (pH 7.9), 60mM KCI, 1.5-2.0 mM MgCl2, 12% glycerol, 500 jM each ATP, CTP, UTP, 25 FiM GTP and 2.5 mM
creatine phosphate. Analytical transcription reactions were performed in a volume of 25 p.1 containing10 RCi of [a-32P]GTP at 30°C. Preparative scale transcriptions were performed in a volume of 75 p1
containing 100 jiCi of [a-32P]GTP. Non-radioactive tRNA transcripts were synthesized under prepara-
tive conditions with 500 jM GTP.
RNA transcripts were isolated by phenol extraction in the presence of 8M urea followed by
ethanol precipitation (33). The transcripts were resolved on 12% polyacrylamide gels (20x20x0.4 mm)
containing 7M urea and TBE buffer (34), visualized by autoradiography of the dried gel, excised and
4850

Nucleic Acids Research
quantitated by liquid scintillation counting. Equivalent areas above and below the bands were alsoexcised and counted to determine background.
In experiments in which purified tRNA gene transcripts were added exogenously to the S1O0extract, processing was performed using analytical scale transcription conditions (unless otherwisenoted) except that DNA template and [c32P]GTP were not present. RNA endogenous to the S100extract, used as controls in Fig. 6, was isolated from mock transcription reactions containing no DNA
template after incubation for 40 minutes at 30°C.RNA Isolation and Sequence Analysis
RNA transcripts run on polyacrylamide gels were isolated by the crush and soak method in 50mM Tris (pH 8.0), 300 mM NaCl, 1mM EDTA, 1% phenol followed by phenol extraction and ethanolprecipitation (7). Nonradioactive RNA transcripts were located by co-migration of radioactive markers.Further purification was performed by chromatography on Whatman CFI 1 cellulose (H. Robertson,personal communication).
RNA transcripts synthesized in vitro with [a-32P]-GTP were digested with RNase T1 and finger-printed according to the procedure of Volckaert and Fiers (35) but using Homomix C15 according toBarrell (36) in the second dimension. The identity of each oligonucleotide was inferred from its rela-tive position in the fingerprint (37) and the known DNA sequence and, in the case of mHis transcripts,by comparison with a published T1 fingerprint of tRNAHis (38). The presence or absence of large T1generated oligonucleotides specific to the 3' trailer sequences in mGlu and mHis transcripts wasconfirmed by electrophoresis in 20% polyacrylamide gels containing 8 M urea (39) or by one dimen-sional homochromatography on PEI-cellulose plates (35). Nucleoside 5'-triphosphate 3'-monophosphates were identified in transcripts digested with RNases A, T1 and T2 by TLC on PEI-
cellulose plates (Polygram CEL 300 PEI, Brinkmann Instruments Co.) developed in 0.75 M potassiumphosphate, pH 3.5 (7).
Mathematical Analysis of Processing Kinetics
As shown in Results and by others (e.g. refs. 6,7,18), the sequential maturation of tRNA terminioccurs via a pathway in which the primary transcript is processed through an intermediate form toyield a final tRNA-sized molecule. In its simplest form the processing pathway can be considered to
k, k2consist of two consecutive first-order reactions, represented by A -* B -e C , in which A is the pri-mary transcript, B, the intermediate and C, the fully processed transcript. The behavior of reactants
and products in this pathway can be described by the following rate equations:
d(A) =-k1(A) (1)
d(B) = k1(A)-k2(B) (2)
dt= k2(B) (3)
4851

Nucleic Acids Research
a b c d e fCfPe*@.IV:
9 h ii k I mA,EOW_or q p
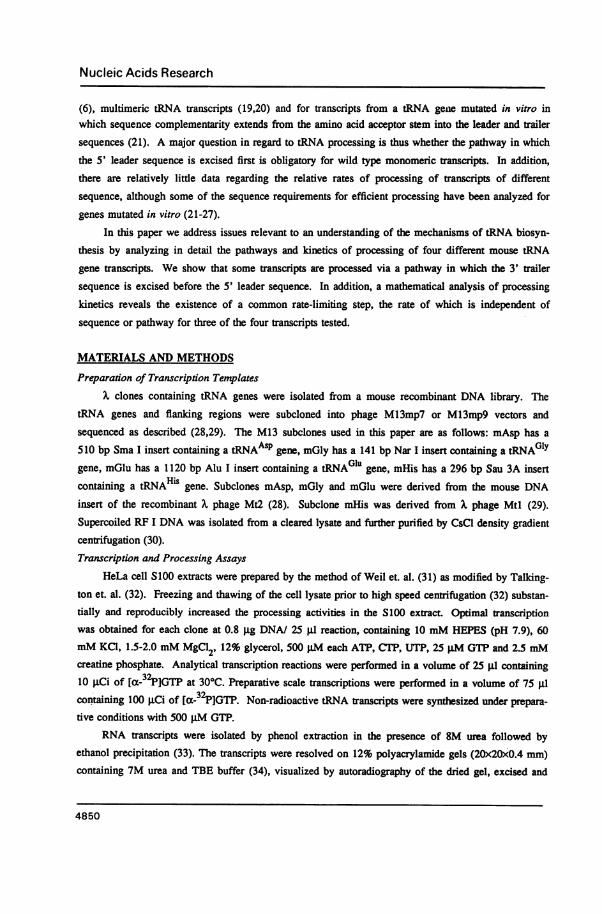
Figure 1. In vitro transcription products of four mouse tRNA genes.
Each tRNA gene was transcribed under analytical conditions for 60 minutes at 300C (see Materials and
Methods). Lanes: a, mAsp; b, mAsp + 5 jig/mi a-Amanitin; c, mAsp + 300 jig/mi a-Amanitin; d,
mOly; e, mOly + 5 jig/ml a-Amanitin; f, mOly + 300 jg/tml a-Amanitin; g, mGlu; h, mGlu + 5 jig/mla-Amanitin; i, mGlu + 300 jig/ml a-Amanitin; j, mHis; k, mHis + 5 jig/ml a-Amanitin; 1, niHis + 300
jig/mi oa-Amanitin; m, Ml3mp7 (vector DNA).
By solving each rate equation, the amount of A, B or C at any time (t) is expressed by:
(A) -(A)OeAIkl (4)
(B) =kl(A)0 1-ei-~-½2] (5)
i;---k2
(C) = (A)O[I (k2eeA-kke L)] (6)
where (A)o is the amount of (A) at t - 0. If reactant A is being synthesized at a constant rate such that
d(A)/dt = kT and simultaneously undergoing conversion to B, then in equations 4, 5 and 6, (A)O can
be replaced by (k7*) where kT is the rate of synthesis and t is the time of de novo synthesis. This
4852
Nucleic Acids Research
transforms equation 6 into:
(C) =k*[1? I ((ke7tll ke7t2)] (7)k1-k2
This equation is used to describe mature tRNA accumulation during transcription (see Results).
Computerized curve fitting and error analyses were performed using the COTFIT program (40,41)on a Vax-11/780 computer (Digital). Function 20 of COTFIT, used to evaluate the data, was gen-
erously written by Dr. Robert F. Murphy (Carnegie-Mellon University).
RESULTS
Transcription of Four Mouse tRNA Genes in Vitro
We have previously described the isolation and sequence analysis of mouse genes encodingAspGly Glu ~~~~~~HistRNAASP, tRNAGlY, tRNAGlU (28) and tRNA (29). The M13 subclones containing these genes are
designated mAsp, mGly, mGlu and mHis, respectively, as described in Materials and Methods. As
shown in Fig. 1, each clone yields a distinctive pattern of transcripts in a HeLa cell S100 extract. Tran-
scription is completely inhibited by 300 gg/ml a-Amanitin (Fig. 1, lanes c,f,i,l) but is relatively
unaffected by 5 jig/ml a-Amanitin (lanes b,e,h,k), indicating that the genes are transcribed by RNA
polymerase III (42). M13 vector DNA alone does not support the synthesis of any discernable tran-
scripts (lane m).
Each gene produces three different sized transcripts (or groups of transcripts), as indicated in Fig.
1. The size of the largest RNA species (RNA 1) from each gene is approximately 96 (mAsp), 93
(mGly), 148 (mGlu) and 110 (mHis) nucleotides, respectively, as judged by electrophoretic mobility in
comparison to a DNA sequencing ladder. All RNA 3 species are between 72 and 75 nucleotides in
length, as expected for fully processed tRNA transcripts. The intermediate sized transcripts labelledRNA 2 appear only after production of RNA 1 and remain in relatively low abundance during tran-
scription, suggesting that the RNA 2 molecules are processing intermediates (see also the sequence
analysis, below).In experiments in which the transcription of each gene was stopped after 30 minutes by addition
of a-Amanitin and processing allowed to continue during further incubation, RNA 1 of each gene
disappears and a transcient increase in the amount of each RNA 2 occurs. Incubation for 120 minutes
results in the loss of RNAs 1 and 2 and the concomitant accumulation of RNA 3. An exception to this
involves the long mGlu RNA 1 transcript. This transcript is processed at an intrinsically slower rate
than the others, requiring 5 hours to be fully chased into the RNA 3 band. RNA 3 does not chase into
a smaller band (data not shown). From these results, we conclude that each gene is transcribed to pro-duce RNA 1 which is processed through an intermediate form (RNA 2) to mature sized tRNA (RNA3).Sequence Analysis of in Vitro Transcripts
The RNA transcripts described above were synthesized in preparative scale reactions containing[cz-32P]GTP, isolated and characterized by RNA fingerprint analysis as described in Materials and
4853

Nucleic Acids Research
Ac.*
II $*t
fi..
A*
MWW*i
St&
4y t"
0im.._w
_q
'9a,
S ...
7 %,,,
_j"b
kl.AI; C; ; G 1.1A4; UAClCt ( ; I(; 1:(;13 1 2 - 4
111; (A ('AArCL'C ;( L ; AAt.W'(; AC L t'AlC Ci t'. V .1'I *f3 nu' 't; ;I 'f :'.U,,HC hft 6 1 4 3 17
Figure 2. Fingerprint analysis of mHis transcripts. 3mHis RNA 1 (panel A), RNA 2 (panel B) and RNA 3 (panel C), synthesized using [a- 2P]GTP, weredigested with RNase T1 and fingerprinted. The T1 products are aligned with the mHis RNA 1sequence in panel D. The residues in bold print correspond to the mHis tRNA coding region.
Methods. The fingerprints of mHis transcripts are shown in Fig. 2. The fingerprint of mHis RNA 1
(Fig. 2A), was compared with the pattern of T1 generated oligonucleotides predicted from the DNA
sequence of mHis. All of the oligonucleotides of RNA 1 can be identified and positioned unambigu-ously in and around the tRNAHi coding region. The primary structure of mHis RNA 1 is shown in
Fig. 2D. Examination of the fingerprint of RNA 1 reveals the presence of two T1 oligonucleotides, 8
and 17, which extend past the 5' and 3' ends of the tRNA coding region (Fig. 2A). Oligonucleotide 8has the sequence UCCG and is diagnostic for the presence of the 5' leader sequence. The G residue
of oligonucleotide 8 is the first residue of the tRNAHis coding region (see Fig. 2D). Oligonucleotide17 has the sequence CAUUAUCCUCUG and is diagnostic for the presence of the 3' trailer sequence.
4854
v. gL2Lr; s; tLI' L{;'(.'i; t'; Al ('C t,4. 4 .1 8 4
*1f t
MRMW
.2 alsolik.
600-

Nucleic Acids Research
The CA residues at the 5' end of oligonucleotide 17 are the last two residues of the tRNAHis coding
region. That initiation of transcription occurs with pppA at position -12 (relative to the start of the
tRNAHis coding region) was determined as follows. The relative molar yield of oligonucleotide 4 fromRNA 1 indicates the presence of several UG fragments in addition to those in the coding region.
These can only come from the 5' leader sequence at positions -6, -8, and -10 (in the DNA sequence),
placing the initiation point 5' to position -10. Upon digestion of [a-32P]GTP labelled RNA 1 to
mononucleotides, analysis of the mixture by PEI-TLC reveals radioactively labelled pppAp (data not
shown), indicating that the transcript starts with pppApGp. This sequence only occurs in the 5' flank-
ing region of the gene at position -12, fixing initiation at that point. Transcription termination appears
to occur in the stretch of 6 T residues beginning at position +88, a RNA polymerase III terminator
(43). The oligonucleotide UCACUUUUUUG, which would be generated by T1 digestion of a tran-
script continuing past this point, is absent in the fingerprints.
The fingerprint of the intermediate transcript, mHis RNA 2, is shown in Fig. 2B. Oligonucleo-
tide 8 (UCCG) is present, indicating that RNA 2 still retains the 5' leader sequence. This is corro-borated by the continued relative excess of oligonucleotide 4 (UG). In contrast, oligonucleotide 17
(CAUUAUCCUCUG) is absent, indicating the loss of the 3' trailer sequence.The fingerprint of mHis RNA 3 (Fig. 2C) lacks both oligonucleotides 8 and 17 and appears to be
identical to a published fingerprint of mammalian tRNAHis (38). We conclude from these results thatexcision of the 3' trailer from the primary transcript (RNA 1) generates an intermediate (RNA 2)
which, upon excision of the 5' leader, yields mature sized tRNA. Thus, during the maturation ofHistRNA , processing of the 3' end preceeds that of the 5' end.
The fingerprints of mGly transcripts are shown in Fig. 3. The T1 generated oligonucleotides
identified in the fingerprint of mGly RNA 1 (Fig. 3A), match those predicted from the DNA sequence
in and around the tRNAGlY coding region. The primary structure of mGly RNA 1 is shown in Fig.
3D. Oligonucleotide 5 (CAG) spans both the 5' and 3' termini of the coding sequence. The relative
molar yield of this fragment decreases incrementally from RNA 1 to RNA 2 to RNA 3 (compare the
difference in intensity between oligonucleotides 5 and 6 in Fig. 3, panels A, B and C), indicating the
structure of RNA 1 extends past both these points. This, and the absence of the oligonucleotide
UCCCAG, which is found between positions -8 and -13 in the 5' flanking region of the gene, indi-
cates transcription initiates between positions -2 and -13 from the 5' end of the coding region. TLC
analysis of [a-32P]GTP labelled RNA 1 digested to mononucleotides shows two initiating nucleotides,
pppAp and pppGp (data not shown). The use of two initiation sites explains the somewhat heterogene-
ous size of mGly RNA 1 apparent in Fig. 1. The only possible site of initiation with pppAp between
positions -2 and -13 is position -9. Initiation with pppGp could occur at positions -3 or -6 if we
impose the constraint that the initiating purine is preceeded by a pyrimidine, as is the case for other
tRNA transcripts (see ref. 44). The 3' end of RNA 1 terminates in a stretch of 4 T residues which
starts 12 bp downstream from the tRNA coding sequence at position +84. This is indicated by the
presence of oligonucleotide 12 (CCCACG), which is characteristic of the 3' trailer, and by the absence
4855

Nucleic Acids Research
A C 41
3B 4 D
10
4w '1 '
mGlyRNA1(panel A), RNA 2 (panel B) and RNA 3 (pneAC),GG sythesGizedC1 usACin (A-32P,]G6TP,wr
12~~~~~~~~13.
BL~~P1
digested with RNase T1 and fingerprinted. The T1 products are aligned with the mGly RNA 1sequence in panel D, (parentheses surround those nucleotides present only in the RNA 1 transcripts ini-tiating with pppA). The residues in bold print correspond to the mGly tRNA coding region.
of the oligonucleotide UUUUG, which would be encoded by the terminator sequence.The fingerprint of the intermediate transcript, mGly RNA 2, is shown in Fig. 3B. The decrease
in relative intensity of oligonucleotide 5 (CAG) indicates that at least one of the flankidng regions has
been removed. The presence of oligonucleotide 12 (CCCACG), which is well resolved from oligonu-cleotide 13 (CCAACG) in this fingerprint (4B3), demonstrates that RNA 2 still retains the 3' trailer
sequence. In contrast, TLC analysis reveals the absence of both initiating nucleotides, indicating theloss of the 5' leader sequence (data not shown). Therefore, RNA 2 is generated by excision of the 5'
leader sequence from the primary transcript. This means that the heterogeneous size of mGly RNA 2
(see Fig. 1, lane d) is not due to the two different initiation events. TLC analysis shows that neither
the larger nor smaller transcripts of RNA 2 contain the initiating mononucleotides. Also, T1 generatedoligonucleotides from either RNA 2 transcript produce the same fingerprint (data not shown). We
therefore assume that the size heterogeneity of mGly RNA 2 is due to a variable number of 3' terminal
uridylate residues and/or base modifications or alterative tertiary structures which affect the
transcript's electrophoretic mobility.
4856

Nucleic Acids Research
%.0
V-;3.0
a
C:
a:
o2.0.1
3.0
U #SU ICU IODUM INUTES
.............
Figure 4. Kinetics of synthesis and processing of mGly transcripts.The reaction contained 0.8 gLg mGly DNA in a total volume of 50 p1. Aliquots (5 p1) were taken atthe times indicated, run on 7 M urea gels and the precursor and tRNA bands quantitated as describedin Materials and Methods.A. Synthesis and accumuladon of mGly transcripts. Total transcripts, X ; precursor tanscripts, S;
tRNA sized transcripts,B. Semi-logarithmic plot of the accumulation of mature tRNAlly from the data in panel A. The curvethrough the points was generated by COTFIT as the best fit solution to Eq. 7 (see Results). Transcrip-tion rate - 40.0 cpm/min.
The fingerprint of mGly RNA 3 (Fig. 3C) shows that the 3' trailer sequence has been removed
(as indicated by the absence of oligonucleotide 12) as well as the 5' leader sequence (TLC analysis not
shown). From these results we conclude that excision of the 5' leader from the primary traScript
4857
B
Nucleic Acids Research
(RNA 1) generates an intermediate (RNA 2) from which the 3' trailer is excised to yield mature sized
tRNA (RNA 3). Thus, during the maturation of tRNAGlY, processing of the 5' end preceeds that of
the 3' end.
Analysis of Processing Kinetics
In its simplest form the synthesis and terminal maturation of a tRNA transcript can be
represented by:
kT k1 k2NTPs -+ A -e B -e C
where A is the primary transcript, B, an intermediate and C, the mature tRNA molecule. In this
expression, kT is the transcription rate constant and k1 and k2 are processing rate constants. As
described in Materials and Methods, rate equations describing the kinetics of this pathway can be
derived and their solution yields equations that allow the accumulation of A, B or C to be expressedas a function of time. Thus, the amount of mature tRNA species (C) at any time (t) during transcrip-
tion can be expressed by:
r I -k t ,-k2t1C = kTt* I k-(k2e -kle ) (7)
where t* is the time of de novo synthesis or transcription.An analysis of the in vitro kinetics of tRNAGlY processing is shown in Fig. 4. The accumulation
of mGly transcripts is plotted in Fig. 4A. Total transcripts accumulate in a linear fashion for approxi-mately 150 minutes, after which de novo synthesis stops. The rate of accumulation of mature sized
tRNA begins slowly but then increases with time, suggesting an exponential rate of appearance. Note
that after de novo synthesis stops (150-180 min.), the rate of accumulation decreases, suggestive of a
substrate concentration-dependent reaction.The kinetic behavior seen in Fig. 4A is consistant with the processing pathway depicted above,
which consists of a zero-order synthetic reaction followed by two consecutive first-order processingreactions. To determine whether the data of Fig. 4A are described accurately by Eq. 7, above, we
have analyzed the data using the COTFIT program (40,41). COTFIT uses a non-linear least squares,
iterative method to determine values for parameters of a function which enable the function to best fit
experimental data. In this case, the function is Eq. 7 (COTFIT function 20). The rate of transcriptionand the time of de novo synthesis (parameters kT and t, respectively) are set to experimentallydetermined values. The processing rate constants, k1 and k2, are calculated by the computer pro-
gram.
A description of the accumulation of mature tRNAGlY by Eq. 7 is shown in Fig. 4B. Using kT
and t derived from the data in 4A, COTFIT generated a curve that fits the measured accumulation ofmature sized tRNA. The overall RMS error of the fit is 6% (chi square value/Ymean-0.1063, 4
parameters, 9 degrees of freedom). Equation 7 provides a good fit to the data and, therefore, accuratelydescribes the kinetics of tRNA processing during in vitro transcription.
The processing kinetics of precursor transcripts from all four tRNA genes were analyzed by
4858

Nucleic Acids Research
Table I. Transcription and Processing Rate Constants
kTa k,b kb
mAsp 366 0.00811 0.959mGly 166 0.00613 0.909mGlu 83 0.00250 1.490mHis 66 0.00788 0.313
,Experimentally determined transcription rate (cpm/min).Processing rate constants (min ) calculated bythe COTFIT program.
COTFIT. In parallel reactions, transcripts of mAsp, mGly, mGlu and mHis were synthesized and pro-cessed. Using the transcription rates measured in each reaction, curves were generated from Eq. 7which best fit the data obtained from each reaction and values for the processing rate constants of each
transcript were generated (the 5 minute lag in synthesis normally seen in the beginning of transcriptionhas been taken into account). The computer-generated values for the processing rate constants ( k,and k2 ) are given in Table I. The smaller of the two rate constants ( k1 ) describes the rate-limitingstep of the pathway and is the critical parameter with regard to determining the shape and fit of thecurve.
The rate-limiting values of k, for mAsp, mGly and mHis transcripts are quite similar (0.00737± 0.00088). This suggests that the rates of processing of mAsp, mGly and mHis transcripts are
equivalent. Thus, any relative differences in the accumulation of mature sized tRNA from these threegenes in the in vitro system are due solely to differences in the concentrations of unprocessed tran-
scripts (as determined by transcription rates).
The rate-limiting value of k, for mGlu transcripts (0.0025) is significantly lower than those of
the other three tRNAs; mGlu transcripts exhibit an intrinsically slower rate of processing regardless ofthe concentration of unprocessed transcripts. This had also been noticed in a-Amanitin pulse-chaseexperiments (as discussed above).
It is important to note that for all four gene transcripts the rate-limiting processing step involvesk1 (and not k2 ). Although the k1 and k2 values for each tRNA transcript are interchangable in
Eqs. 6 and 7, they cannot be exchanged for each other in Eqs. 4 and 5 (see Materials and Methods).The rate-limiting value in each set of processing rate constants must be used as k1 in Eqs. 4 and 5 to
derive values for (A) and (B) which are non-negative and increase with time (calculations not shown).This point is corroborated by the fact that the slow rate of mGlu transcript processing is due to the per-
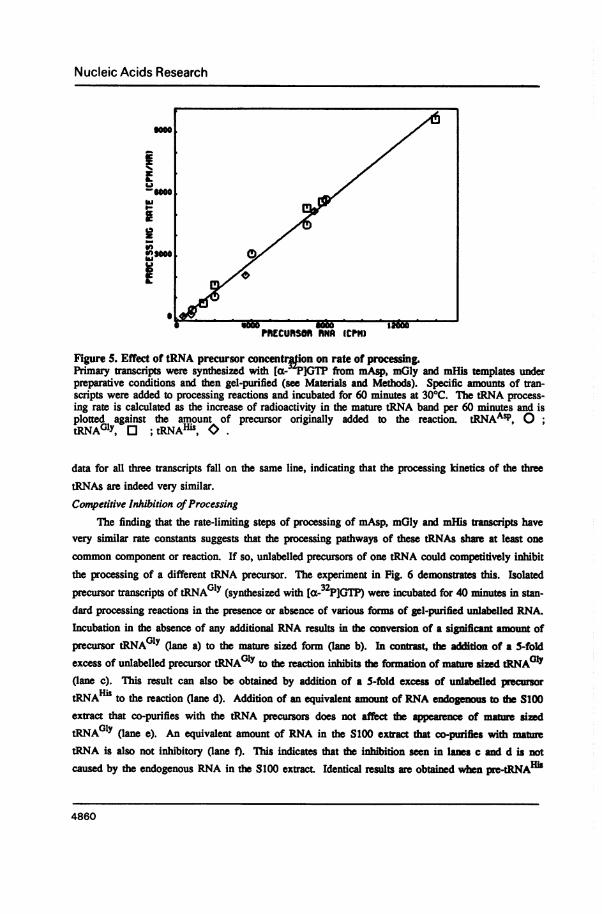
sistence of the primary transcript, mGlu RNA 1, not the intermediate transcript.The experimental data presented in Fig. 5 confirms the fact that processing is a substrate
concentration-dependent reaction. Precursor tRNAs were synthesized in vitro, purified, added back to
the S100 extract and the rate of processing determined as a function of the initial concentration of pre-cursor. The results show that the relationship between the processing rate and precursor concentration
is linear for mAsp, mGly and mHis transcripts, indicating a first-order rate-limiting step. Furthermore,
4859
Nucleic Acids Research
PRECURSOR R ICPNR
Figure S. Effect of tRNA precursor concentrflion on rate of processing.Primary transcripts were synthesized with [af-PiGTP from mAsp, mGly and mHils templates underpreparative conditions and then gel-purified (see Materials and Methods). Specific amounts of tran-scripts were added to processing reactions and incubated for 60 minutes at 30°C. The tRNA process-ing rate is calculated as the increase of radioacdvity in the mature tRNA band per 60 minutes and isplotted against the amount of precursor originally added to the reaction. tRNAASP, otRNAGlY, 0 ; tRNAHi, 0 .
data for all three transcripts fall on the same line, indicating that the processing kinetics of the threetRNAs are indeed very similar.
Competitive Inhibition ofProcessingThe finding that the rate-limiting steps of processing of mAsp, mGly and mHis aipts have
very similar rate constants suggests that the processing pathways of these tRNAs shae at least one
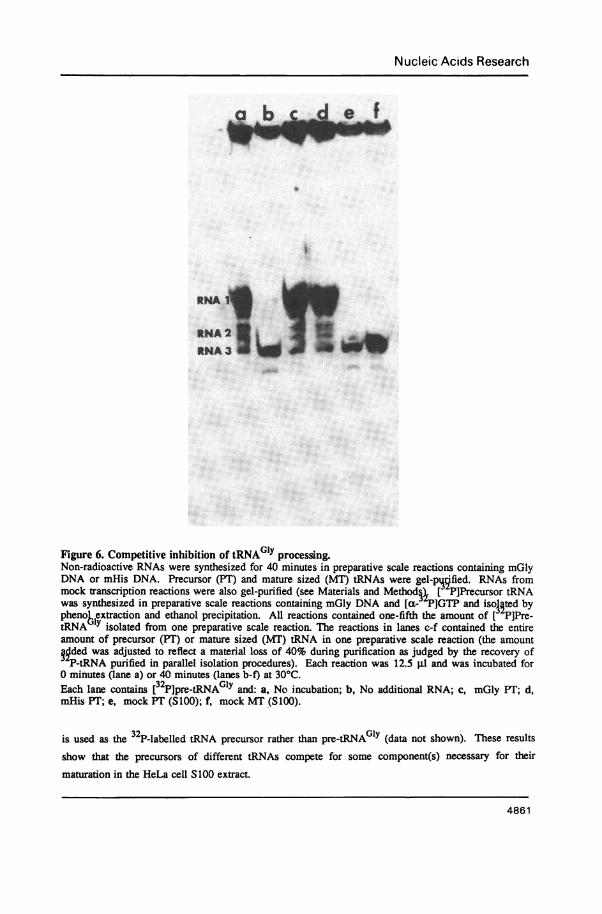
common component or reaction. If so, unlabelled precursors of one tRNA could competitively inhibitthe processing of a different tRNA precursor. The experiment in Fig. 6 demonstrates this. Isolatedprecursor transcripts of tRNAGlY (synthesized with Ia-32P]GTP) were incubated for 40 minutes in stan-dard processing reacdons in the presence or absence of various forms of gel-purified unlabelled RNA.Incubation in the absence of any additional RNA results in the conversion of a significant amount ofprecursor tRNAG0y (lane a) to the mature sized form (lane b). In contrast, the addition of a 5-foldexcess of unlabelled precursor tRNAGlY to the reaction inhibits the formation of mature sized tRNAOly(lane c). This result can also be obtained by addition of a 5-fold excess of unlabelled pecursortRNAH" to the reaction (lane d). Additon of an equivalent amout of RNA endogenous to the S100extract that co-purifies with the tRNA precursors does not affect the apearence of mature sizedtRNA01Y (lane e). An equivalent amount of RNA in the S100 ext dat co-purifies with matetRNA is also not inhibitory (lane f). This indicates that the inhibition seen in lanes c and d is notcaused by the endogenous RNA in the 8100 extract Identical results are obtained when pre-tRNAHi
4860
Nucleic Acids Research
RNA
RNA 21RNA3
Figure 6. Competitive inhibition of tRNAGy processing.Non-radioactive RNAs were synthesized for 40 minutes in preparative scale reactions containing mGlyDNA or mHis DNA. Precursor (PT) and mature sized (MT) tRNAs were gel-pified. RNAs frommock transcription reactions were also gel-purified (see Materials and Methodj, [ PIPrecursor tRNAwas synthesized in preparative scale reactions containing mGly DNA and [a- -P]GTP and isol ted byphenob extraction and ethanol precipitation. All reactions contained one-fifth the amount of [1PiPre-tRNA Y isolated from one preparative scale reaction. The reactions in lanes c-f contained the entireamount of precursor (PT) or mature sized (MT) tRNA in one preparative scale reaction (the amountSded was adjusted to reflect a material loss of 40% during purification as judged by the recovery ofP-tRNA purified in parallel isolation procedures). Each reaction was 12.5 g1 and was incubated for
0 minutes (lane a) or 40 minutes (lanes b-f) at 30°C.Each lane contains [32P]pre-tRNAGlY and: a, No incubation; b, No additional RNA; c, mGly PT; d,mHis PT; e, mock PT (S100); f, mock MT (S 100).
is used as the 32P-labelled tRNA precursor rather than pre-tRNAGlY (data not shown). These results
show that the precursors of different tRNAs compete for some component(s) necessary for their
maturation in the HeLa cell SIO0 extract.
4861
e f

Nucleic Acids Research
DISCUSSION
Processing PathwaysThe data reported here for tRNAHi provide the first unambiguous evidence to our knowledge
that the 3' trailer sequences of some monomeric eukaryotic tRNA gene transcripts are excised beforethe 5' leader sequences. Preliminary fingerprinting data indicate that this pathway is also followed bytRNAGlu transcripts (data not shown). Thus this pathway is not unique to tRNAHs. Other studies(7,11,18) which have examined the processing of monomeric human, Drosophila and Bombyx modtRNAs in homologous and heterologous extracts revealed only the pathway in which the 5' leadersequence is removed first (as is also shown here for mouse tRNAGlY transcripts). The only reporeddeviations from this order of processing involve multimeric tRNA transcripts (19,20) or mutant tran-
scripts with abnormal secondary structures (21). From inspection of the pre-tRNAOs and pre-tRNA!3usequences, we cannot identify any particular motifs that could influence the order of processing in any
obvious way. Studies utilizing point mutants of the tRNA gemes may identify sequences that influencethe choice of processing pathways, although such studies to date have only identified mutants which
abolish processing or diminish its rate (18,23,25-27).Castaho et al. have recently isolated an endonuclease from Xenopus ovaries that excises the 3'
trailer sequences from human tRNA. and Bombyx mori tRNAA"' transcripts (10). The substrate for
this enzyme is a tRNA transcript from which the 5' leader sequence has already been removed; the
enzyme does not excise the 3' trailer sequence from primary tanscripts of either gene. Activities with
similar characteristics have been reported in extracts of human KB cells (18) and Drosophila Kc cells(7). These findings suggest that the order of 5' and 3' terminal maturation could be detrmined by thesubstrate specificity of the 3' processing nuclease. However, since the tRNA primary tanscripts usedin the studies by Castafno et al. only undergo processing of the 5' end prior to the 3' end (8,18), it will
be of interest to determine whether this nuclease can also participate in the processing of tRNAThs andtRNAGlU primary transcripts in which the 3' trailer sequence is removed first. If it is not active on
these transcripts, then another type of 3' processing nuclease must be present in HeLa cell extracts.
Kinetics ofProcessingWe show here that the kinetics of synthesis and processing of tRNA gene tacipts can be
described quite accurately by an equation that describes a pathway consisting of a zeo-order synthticreaction followed by two consecutive first-order processing reactions. Using this pifld c,our data suggest that the processing pathway contains a rate-limitng step which has a similar re con-stant for three of the four transcripts. In addition, the equation predicts, and the data of Pig. 5 confim,that for tRNAASP, tRNA01y and tRNAThS, the rate of processing depends on the concentation of tRNAprecursor and is relatively independent of the sequence of the turancits.
That there can be some effect of sequence on the processing rate is indicated by the fact thattRNA01b transcripts are processed more slowly than those of the other genes. Inhibitowy residues couldbe present in the tRNAGlU sequence itself. One possible candidate is the U residue at position 61 inthe T stem of tRNAOlU (28). A C-T transition at the analogous position in human tRNAMt reduces
4862

Nucleic Acids Research
processing by approximately 50% (27). Alternatively, the mGlu primary transcript may be processed
slowly because it contains an unusually long 3' trailer sequence. The transcription termination site of
mGlu is 62 bp downstream from the 3' end of the coding region. A survey of 69 eucaryotic tRNA
genes shows that termination sites are, on average, 9 bp from the 3' end of the coding region. We
have found that long transcripts derived from several tRNA genes from which the normal terminationsites have been deleted are processed more slowly in vitro than are their normal counterparts (R. Roo-
ney and J. Harding, unpublished). Point mutagenesis at position 61 and deletion mutagenesis of the 3'
trailer sequence should resolve this issue.The similarity of the constant for the rate-limiting processing step for tRNAASP, tRNAGlY and
tRNA transcripts implies that the processing pathways contain at least one common event or com-
ponent. The ability of precursor tRNAHis transcripts to inhibit the processing of tRNAGlY primarytranscripts (Fig. 9) supports this contention. However, the experiments do not prove that pre-tRNAHiS
is actually inhibiting the rate-limiting step revealed by the mathematical analysis of the processing
kinetics.Our analysis suggests that the rate-limiting step is associated with some aspect of conversion of
the primary transcript to an intermediate rather than conversion of the intermediate to the mature
tRNA. This assertion follows from the mathematical analysis of the processing kinetics (see Materials
and Methods and Results) and is exemplified by the refractory nature of mGlu primary transcripts to
precursor processing (see Results). A major issue is the identity of this step. In addition, the existenceof the rate-limiting step must be reconciled with the fact that different transcripts are processed alongdifferent pathways (in regard to the order of 5' and 3' cleavages), as discussed above. One attractivehypothesis which would explain our data is that the rate-limiting step occurs prior to the first endonu-
cleolytic cleavage of the primary transcript. Possibly, the transcript must associate with an additionalfactor (e.g. the La protein which binds to the 3' oligouridylate residues of the primary transcript, refs.45,46) or undergo a particular base modification before a processing nuclease can recognize or interact
with it. Alternatively, the 5' and 3' processing enzymes may be present in a complex (although the
enzymes clearly can be separated from each other and remain active in vitro, refs. 14,18). Once thetranscript has bound to the complex (the rate-limiting step) 5' and 3' cuts can perhaps occur rapidly
with the particular pathway dictated by the sequence of the transcript.
ACKNOWLEDGEMENTSThis work was funded by National Foundation, March of Dimes Grant 1-802 and NIH Grant
GM26884 to J.D.H.. R.J.R. was supported by NIH Training Grant GM07216. We wish to thank Dr.Robert F. Murphy for helping with data analysis using the COTFIT program.
*To whom correspondence should be addressed
REFERENCES1. Deutscher, M. P. (1984) Crit. Rev. Biochem. 17, 45-71.2. Altman, S. (1978) In Altman, S. (ed), Transfer RNA, M.I.T. Press, Cambridge, Mass., pp. 48-77.3 Mazzara, G. P. and McClain, W. H. (1980) In Sll, D. and Abelson, J. (eds), Transfer RNA: Bio-
logical Aspects, Cold Spring Harbor Laboratory, New York, pp. 3-27.4. Melton, D. A., DeRobertis, E. M. and Cortese, R. (1980) Nature 284, 143-148.
4863
Nucleic Acids Research
5. Abelson, J. (1979) Ann. Rev. Biochem. 48, 1035-1069.6 Mao, J., Schmidt, D. and S5ll, D. (1980) Cell 21, 509-516.7 Frendeway, D., Dingermann, T. and S5ll, D. (1985) J. Biol. Chem. 260, 1217-1229.8. Hagenblichle, O., Larson, D., Hall, G.I. and Sprague, K.U. (1979) Cell 18, 1217-1229.9. Garber, R. L. and Gage, L. P. (1979) Cell 18, 817-828.10. Castano, J. G., Tobian, J. A. and Zasloff, M. (1985) J. Biol. Chem. 260, 9002-9008.11. Garber, R. L. and Altman, S. (1979) Cell 17, 389-397.12. Altman, S., Guerrier-Takada, C., Frankfort, H. and Robertson, H. D. (1982) In Linn, S. M. and
Roberts, R. J. (eds), Nucleases, Cold Spring Harbor Laboratory, New York, pp. 243-274.13. Stark, B. C., Kole, R., Bowman, E. J. and Altman, S. (1978) Proc. Natl. Acad. Sci. USA 75,
3717-3721.14. Kline, L., Nishikawa, S. and S5ll, D. (1981) J. Biol. Chem. 256, 5058-5063.15. Akaboshi, E., Guerrier-Takada, C. and Altman, S. (1980) Biochem. Biophys. Res. Comm. 96,
831-837.16. Koski, R.A., Bothwell, A.L.M. and Altman, S. (1976) Cell 9, 101-116.17. Gold, H. A. and Altman, S. (1986) Cell 44, 243-249.18. Zasloff, M., Santos, T., Romeo, P. and Rosenberg, M. (1982) J. Biol. Chem. 257, 7857-7863.19. Gruissen, W., Prescott, D.M., Greenberg, B.M. and Hallick, R.B. (1982) Cell 30, 81-92.20. Engelke, D. R., Gegenheimer, P. and Abelson, J. (1985) J. Biol. Chem. 260, 1271-1279.21. Castagnoli, L., Ciliberto, G. and Cortese, R. (1982) Nucleic Acid Res. 10, 4135-4145.22. Mattoccia, E., Baldi, M.I., Pande, G., Ogden, R. and Tocchini-Valentini, G.P. (1983) Cell 32,
67-76.23. Traboni, C., Ciliberto, G. and Cortese, R.C. (1984) Cell 36, 179-187.24. Baldi, M.I., Mattoccia, E. and Tocchini-Valentini, G.P. (1983) Cell 35, 109-115.25. Folk, W.R. and Hofstetter, H. (1983) Cell 33, 585-593.26. Nishikura, K., Kurjan, J., Hall, B.D. and DeRobertis, E.M. (1982) EMBO J. 1, 263-268.27. Tobian, J. A., Drinkard, L. and Zasloff, M. (1985) Cell 43, 415-422.28. Looney, J.E. and Harding, J.D. (1983) Nucleic Acids Res. 11, 8761-8775.29. Han, J.H. and Harding, J.D. (1982) Nucleic Acids Res. 10, 4891-4900.30. Messing, J. (1983) In Wu, R., Grossman, L. and Moldave, K. (eds), Methods in Enzymology,
Academic Press, New York, Vol. 101, pp. 20-77.31. Weil, P.A., Segall, J., Harris, B., Ng, S-Y. and Roeder, R.G. (1979) J. Biol. Chem. 254, 6163-
6173.32. Talkington, C., Nishioka, Y. and Leder, P. (1980) Proc. Natl. Acad. Sci. USA 77, 7132-7136.33. Manley, J.L., Fire, A., Samuels, M. and Sharp, P.A. (1983) In Wu, R. Grossman, L. amd Mol-
dave, K. (eds), Methods in Enzymology, Academic Press, New York, Vol. 101, pp. 568-581.34. Sanger, F. and Coulson, A.R. (1978) FEBS Letts. 87, 107-110.35. Volckaert, G., Min Jou, W. and Fiers, W. (1978) Analytical Biochemstry 72, 433-446.36. Barrel, B. G. (1972) In Cantoni, G. L. and Davies, D. R. (eds), Procedures in Nucleic Acid
Research, Harper and Row, New York, Vol. II, pp. 751-779.37. Squires, C., Lee, F., Bertrand, K., Squires, C., Bronson, M. J. and Yanofsky, C. (1977) J. Mol.
Bio. 103, 351-381.38. Rosa, M., Hendrick, J.P., Lerner, M.R. and Steitz, J.A. (1983) Nucleic Acids Res. 11, 853-882.39. Maxam, A. and Gilbert, W. (1977) Proc. Natl. Acad. Sci. USA 74, 560-564.40. Murphy, R.F., Pearson, W.R. and Bonner, J. (1979) Nucleic Acids Res. 5, 3911-3921.41. Pearson, W.R., Davidson, E.H. and Britten, R.J. (1977) Nucleic Acids Res. 4, 1727-1737.42. Schwartz, L.B., Sklar, V.E.F., Jaehning, J.A., Weinmann, R. and Roeder, R.G. (1974) J. Biol.
Chem. 249, 5889-5897.43. Cozzarelli, N.R., Gerrard, S.P., Schlissel, M., Brown, D. and Bogenhagen, D.F. (1983) Cell 34,
829-835.44. Koski, R.A. and Clarkson, S.G. (1982) J. Biol. Chem. 257, 7857-7863.45. Stefano, J.E. (1984) Cell 36, 145-154.46. Rinke, J. and Steitz, J.A. (1982) Cell 29, 149-159.
4864
Top Related
Copyright © 2022 FDOKUMEN

