


Bahasa
Halaman
Hukum

Submitted 18 September 2014Accepted 10 December 2014Published 23 December 2014
Corresponding authorLuis P. Lamas, [email protected]
Academic editorScott Edwards
Additional Information andDeclarations can be found onpage 25
DOI 10.7717/peerj.716
Copyright2014 Lamas et al.
Distributed underCreative Commons CC-BY 4.0
OPEN ACCESS
Ontogenetic scaling patterns andfunctional anatomy of the pelvic limbmusculature in emus (Dromaiusnovaehollandiae)Luis P. Lamas1, Russell P. Main2 and John R. Hutchinson1
1 Structure and Motion Laboratory, Department of Comparative Biomedical Sciences, The RoyalVeterinary College, Hatfield, United Kingdom
2 Department of Basic Medical Sciences, College of Veterinary Medicine, Purdue University, WestLafayette, IN, USA
ABSTRACTEmus (Dromaius novaehollandiae) are exclusively terrestrial, bipedal and cursorialratites with some similar biomechanical characteristics to humans. Their growthrates are impressive, as their body mass increases eighty-fold from hatching toadulthood whilst maintaining the same mode of locomotion throughout life. Theseontogenetic characteristics stimulate biomechanical questions about the strategiesthat allow emus to cope with their rapid growth and locomotion, which can bepartly addressed via scaling (allometric) analysis of morphology. In this study wehave collected pelvic limb anatomical data (muscle architecture, tendon length,tendon mass and bone lengths) and calculated muscle physiological cross sectionalarea (PCSA) and average tendon cross sectional area from emus across three on-togenetic stages (n = 17, body masses from 3.6 to 42 kg). The data were analysedby reduced major axis regression to determine how these biomechanically relevantaspects of morphology scaled with body mass. Muscle mass and PCSA showed amarked trend towards positive allometry (26 and 27 out of 34 muscles respectively)and fascicle length showed a more mixed scaling pattern. The long tendons of themain digital flexors scaled with positive allometry for all characteristics whilst othertendons demonstrated a less clear scaling pattern. Finally, the two longer bones of thelimb (tibiotarsus and tarsometatarsus) also exhibited positive allometry for length,and two others (femur and first phalanx of digit III) had trends towards isometry.These results indicate that emus experience a relative increase in their muscle force-generating capacities, as well as potentially increasing the force-sustaining capacitiesof their tendons, as they grow. Furthermore, we have clarified anatomical descrip-tions and provided illustrations of the pelvic limb muscle–tendon units in emus.
Subjects Bioengineering, Developmental Biology, Evolutionary Studies, Paleontology,Anatomy and PhysiologyKeywords Tendon, Ratite, Bone, Scaling, Palaeognathae, Emu, Biomechanics, Locomotion,Muscle
How to cite this article Lamas et al. (2014), Ontogenetic scaling patterns and functional anatomy of the pelvic limb musculature in emus(Dromaius novaehollandiae). PeerJ 2:e716; DOI 10.7717/peerj.716
INTRODUCTIONScaling studies (relating animal body mass to other biological parameters) have broadly
elucidated locomotor adaptations across a wide range of body sizes. These studies have
also described important size-related biomechanical (Alexander et al., 1979; Bertram
& Biewener, 1990; Biewener, 1982; Gatesy & Biewener, 1991; LaBarbera, 1989; Maloiy
et al., 1979; McMahon, 1975) and metabolic (Gillooly et al., 2001; Hemmingsen, 1960;
Hokkanen, 1986; Kleiber, 1932; Schmidt-Nielsen, 1984; Taylor et al., 1981) constraints
across species. Intraspecific scaling studies are less common (Allen et al., 2010; Allen et
al., 2014; Carrier & Leon, 1990; Carrier, 1983; Dial & Jackson, 2011; Main & Biewener, 2007;
Miller et al., 2008; Picasso, 2012; Smith & Wilson, 2013; Young, 2009; Picasso, 2014). These
ontogenetic approaches yield valuable insights into musculoskeletal adaptations to growth
and potentially to identify size-related constraints on mechanical function within a species.
Furthermore, studies of species where the mode of locomotion and basic anatomy remains
similar during development contribute to the understanding of strategies and trade-offs
that occur during growth. Such information can, for example, be used to comprehend
developmental abnormalities and study intervention strategies to manage them.
Ratites are large flightless birds with cursorial morphology (e.g., Smith, Jespers &
Wilson, 2010; Smith & Wilson, 2013) that makes them attractive subjects for studies of
terrestrial locomotion and bipedalism (Abourachid, 2000). Certain characteristics make
emus (Dromaius novaehollandiae) particularly useful: they have some anatomical and
functional similarities to other bipedal animals, including purportedly humans (Goetz
et al., 2008). Compared to ostriches, they are generally easier to handle and train in
experimental settings due to their smaller size and calmer temperament. Finally, their
growth rate is impressive, as they multiply their body weight ∼80 times in the first
18 months of life (Minnaar & Minnaar, 1997) whilst maintaining the same cursorial
mode of locomotion. Despite this interest, there are still some discrepancies in published
anatomical descriptions and depictions of the pelvic limb musculature of emus (Haughton,
1867; Patak & Baldwin, 1998; Vanden Berge & Zweers, 1993), and clear visual anatomical
aids are lacking in the literature.
Some of the biomechanical changes in the hindlimb occurring during the growth in
emus have been described. Main & Biewener (2007) measured the skeletal strain patterns
on the surfaces of the femur and the tibiotarsus (TBT) in running emus, demonstrating a
significant increase in the magnitude of cranial and caudal femoral and caudal tibiotarsal
strains during ontogeny, despite the enlargement and strengthening of those bones via
positive allometric scaling of the second moment of area. Muscles have been shown to
influence the strain patterns of bones (Yoshikawa et al., 1994), and although other factors
are likely to be involved in the changes in peak bone strains reported across ontogeny
(Main & Biewener, 2007), allometric scaling of the musculature could also play a role in
these differences in bone tissue loading. The strains induced by muscle contraction will
be proportional to the muscle forces acting on the bone; therefore by estimating muscle
forces (e.g., maximal force capacity based upon anatomy), associations between these two
findings would be possible.
Lamas et al. (2014), PeerJ, DOI 10.7717/peerj.716 2/29
In order to build on already available biomechanical data for emus (Goetz et al., 2008;
Main & Biewener, 2007), we aim here to quantify the ontogenetic scaling patterns of four
pelvic limb bones, pelvic limb muscles and their tendons and in the process describe and
compare the functional and descriptive anatomy of the pelvic limb musculature of emus.
We use regression analysis to determine the relationship of muscle architectural properties
with body mass in an ontogenetic series of emus, and then examine the implications
of these findings for the locomotor ontogeny of emus, other ratites, as well as extinct
theropod dinosaurs.
MATERIALS AND METHODSAnimal subjects and care: UK groupWe dissected 17 emus for this study, obtained from our ongoing research examining emu
ontogenetic biomechanics (conducted with ethical approval under a UK Home Office
license). The emus were divided in three groups of animals according to their age: Group
1: Five individuals at 4–6 weeks old; Group 2: Six 24–28 weeks (6 months) old individuals;
and Group 3: Six 64–68 weeks (16 months) old individuals. All birds had been used as
experimental animals and kept in a small pen (7 × 7 m) for the first six weeks of life, after
which they were moved to an outdoor larger enclosure with grass footing (40 m× 15 m)
until they were six months old; after this they were moved to a large (1.6 hectares) grass
field (maximal animal density at one time was 8 birds/ha). The birds were all born in
three consecutive yearly breeding seasons. Only the birds in Group 3 were from the same
breeding season but not necessarily the same progenitors; birds from the other two Groups
were from two different seasons.
All animals were hatched at a commercial breeding farm in the UK and raised from four
weeks of age at the Royal Veterinary College. They were fed a commercial ostrich pelleted
diet supplemented with grass, and from six weeks of age were kept with free access to
commercial food and grass. At 24 weeks, their diet changed from an ostrich grower diet to
adult ostrich pelleted food (Dodson and Horrel Ltd., Kettering, Northamptonshire, UK).
There were no restrictions or enforcements on the animals’ regular exercise regime, and all
animals were allowed the same area and conditions to exercise during their development.
All animals were euthanized after other experimental procedures were completed, by lethal
intravenous injection of a barbiturate following induction of deep terminal general anaes-
thesia by intramuscular injection of ketamine and xylazine. Carcasses were kept frozen in a
−20 ◦C freezer for up to 2 years before dissection. Thawing was allowed at variable ambient
temperatures and for variable amounts of time depending on the size of the animal, and
dissection started no longer than 4 days after removal from the freezer. All dissections were
performed within a six week period and led by the same individual (L.P.L.).
USA group of emusUnpublished raw data of muscle masses from a different group of 29 emus (0.74–51.7 kg
body mass) used for similar purposes as those described for the UK group were also
included in this study. This group was bred and reared in the USA (Concord Field Station,
Lamas et al. (2014), PeerJ, DOI 10.7717/peerj.716 3/29
Harvard University) under the care of another investigator (R.P.M.) who led all dissections
for this group. The size and age composition for this group was more heterogeneous, and
only body masses and muscle masses were available for analysis. Because the purpose of the
dissections in the group was not a systematic ontogenetic musculoskeletal scaling study, the
number of muscles dissected per animal varied.
Bone measurementsMaximal interarticular lengths of the femur, tibiotarsus (TBT), tarsometatarsus (TMT)
and first phalanx of the middle (third) digit were measured using an ordinary flexible
measuring tape (±1 mm) once they were cleared of all soft tissues.
Myology and muscle architectureWe identified muscles of emus using four separate literature sources (Haughton, 1867;
Patak & Baldwin, 1998; Smith et al., 2007; Vanden Berge & Zweers, 1993); when our
observations differed from these, we described the anatomical landmarks and attachments
in detail according to our observations. General main actions of the muscle were defined
based on these publications and confirmed by identifying the muscle attachments and
paths and then mimicking the muscle action by applying tension on the muscle during dis-
section. We used additional reference to a biomechanical model of an ostrich (Hutchinson
et al., 2014) to refine the three-dimensional actions of the hip muscles, as those actions are
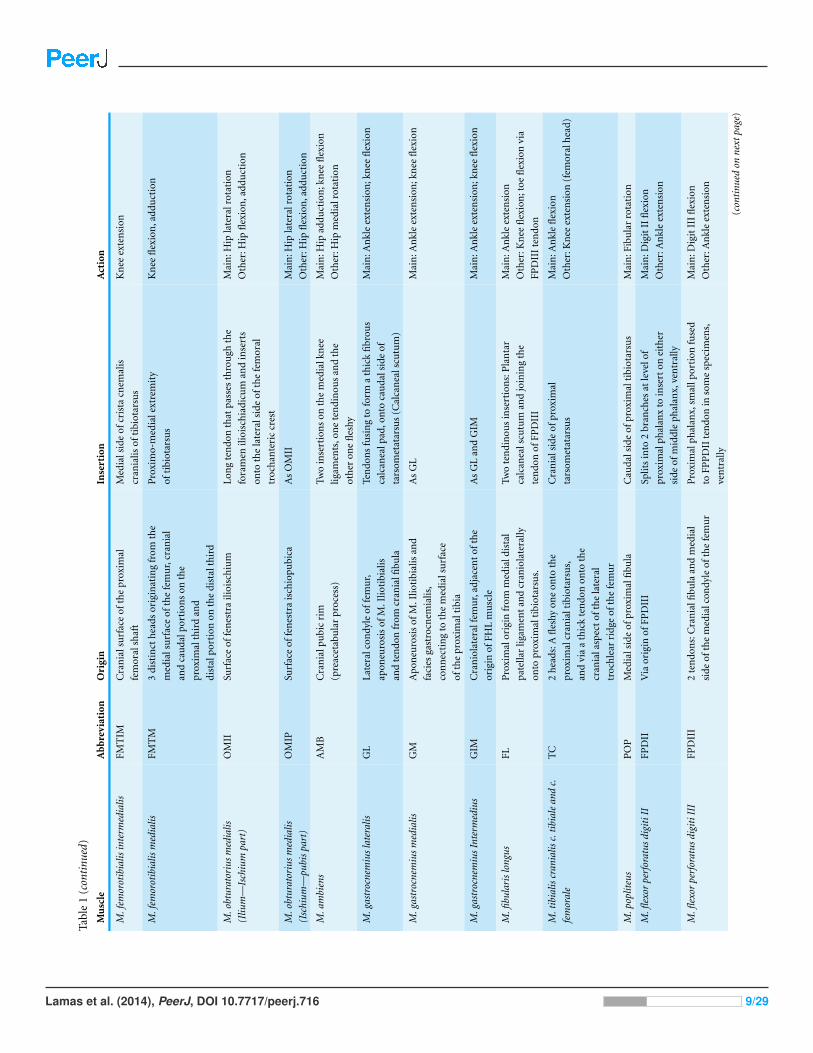
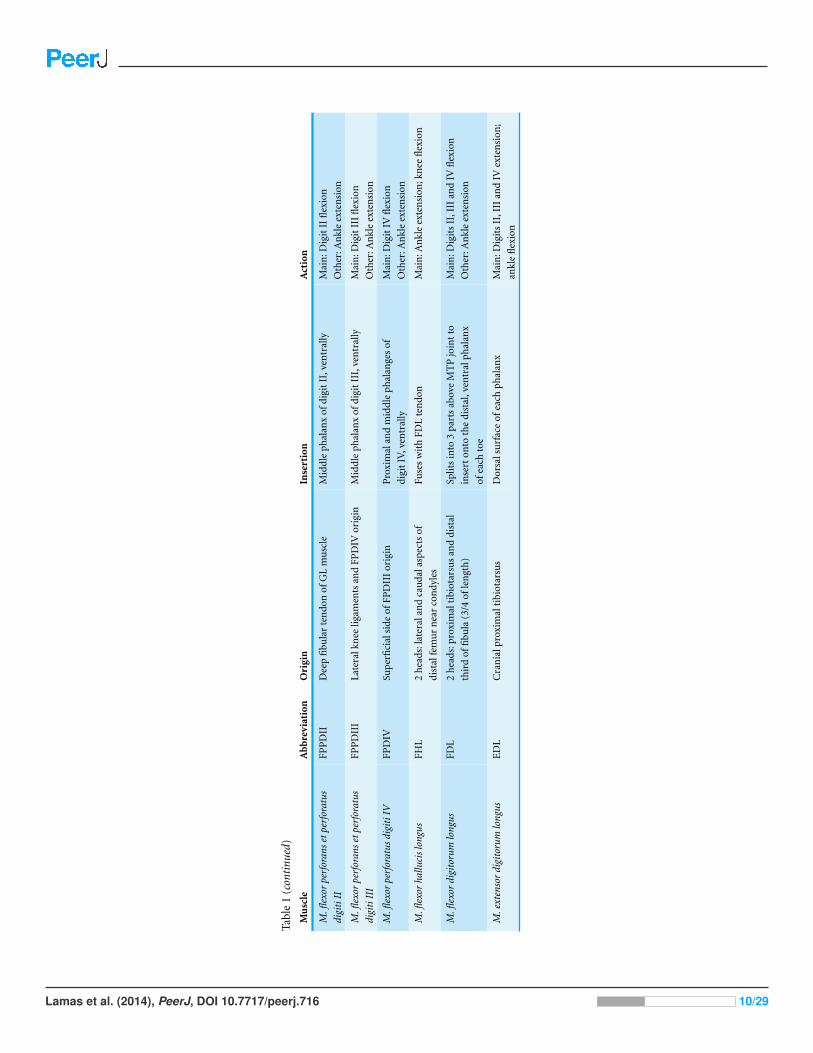
difficult to accurately ascertain from visual inspection and manipulation. Table 1 shows
our simplified description of the anatomy, abbreviations used throughout this study, and
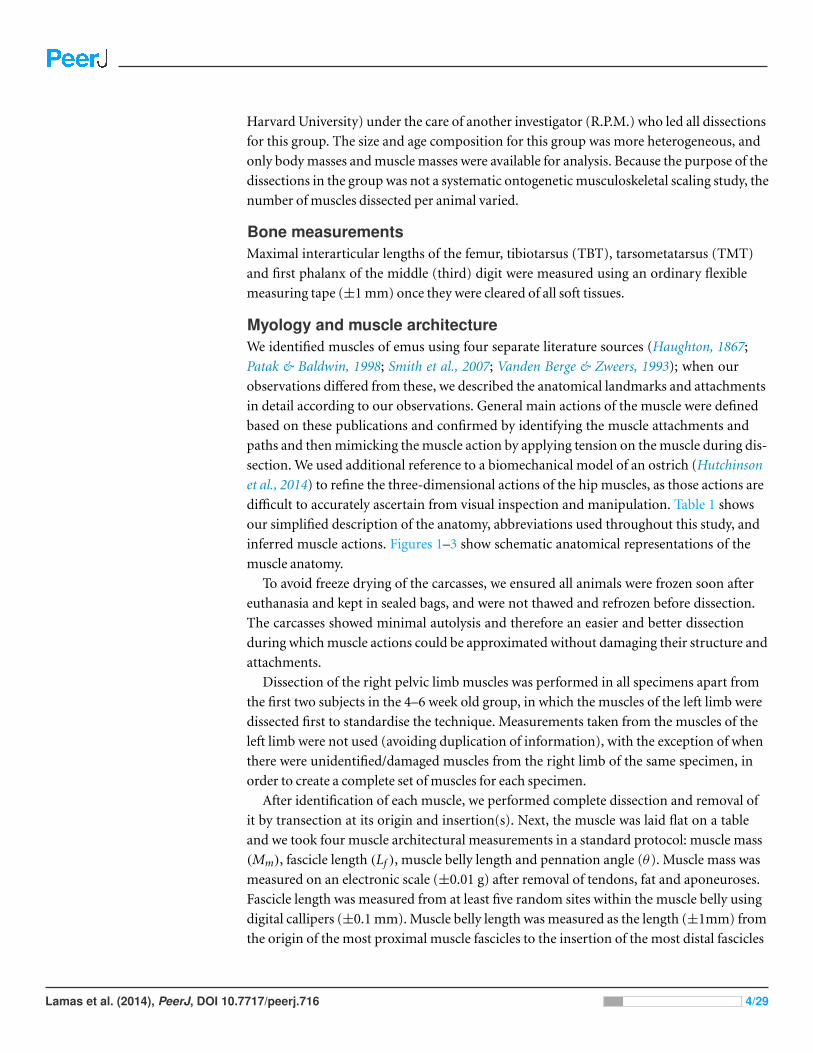
inferred muscle actions. Figures 1–3 show schematic anatomical representations of the
muscle anatomy.
To avoid freeze drying of the carcasses, we ensured all animals were frozen soon after
euthanasia and kept in sealed bags, and were not thawed and refrozen before dissection.
The carcasses showed minimal autolysis and therefore an easier and better dissection
during which muscle actions could be approximated without damaging their structure and
attachments.
Dissection of the right pelvic limb muscles was performed in all specimens apart from
the first two subjects in the 4–6 week old group, in which the muscles of the left limb were
dissected first to standardise the technique. Measurements taken from the muscles of the
left limb were not used (avoiding duplication of information), with the exception of when
there were unidentified/damaged muscles from the right limb of the same specimen, in
order to create a complete set of muscles for each specimen.
After identification of each muscle, we performed complete dissection and removal of
it by transection at its origin and insertion(s). Next, the muscle was laid flat on a table
and we took four muscle architectural measurements in a standard protocol: muscle mass
(Mm), fascicle length (Lf ), muscle belly length and pennation angle (θ). Muscle mass was
measured on an electronic scale (±0.01 g) after removal of tendons, fat and aponeuroses.
Fascicle length was measured from at least five random sites within the muscle belly using
digital callipers (±0.1 mm). Muscle belly length was measured as the length (±1mm) from
the origin of the most proximal muscle fascicles to the insertion of the most distal fascicles
Lamas et al. (2014), PeerJ, DOI 10.7717/peerj.716 4/29
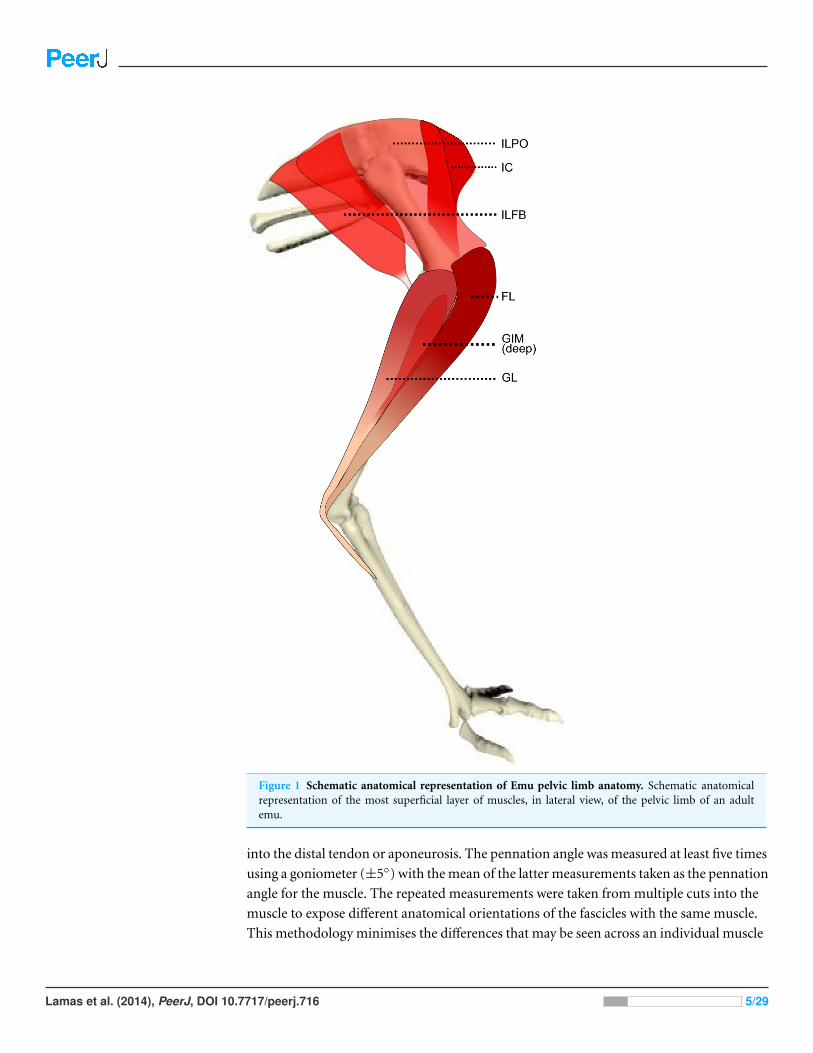
Figure 1 Schematic anatomical representation of Emu pelvic limb anatomy. Schematic anatomicalrepresentation of the most superficial layer of muscles, in lateral view, of the pelvic limb of an adultemu.
into the distal tendon or aponeurosis. The pennation angle was measured at least five times
using a goniometer (±5◦) with the mean of the latter measurements taken as the pennation
angle for the muscle. The repeated measurements were taken from multiple cuts into the
muscle to expose different anatomical orientations of the fascicles with the same muscle.
This methodology minimises the differences that may be seen across an individual muscle
Lamas et al. (2014), PeerJ, DOI 10.7717/peerj.716 5/29
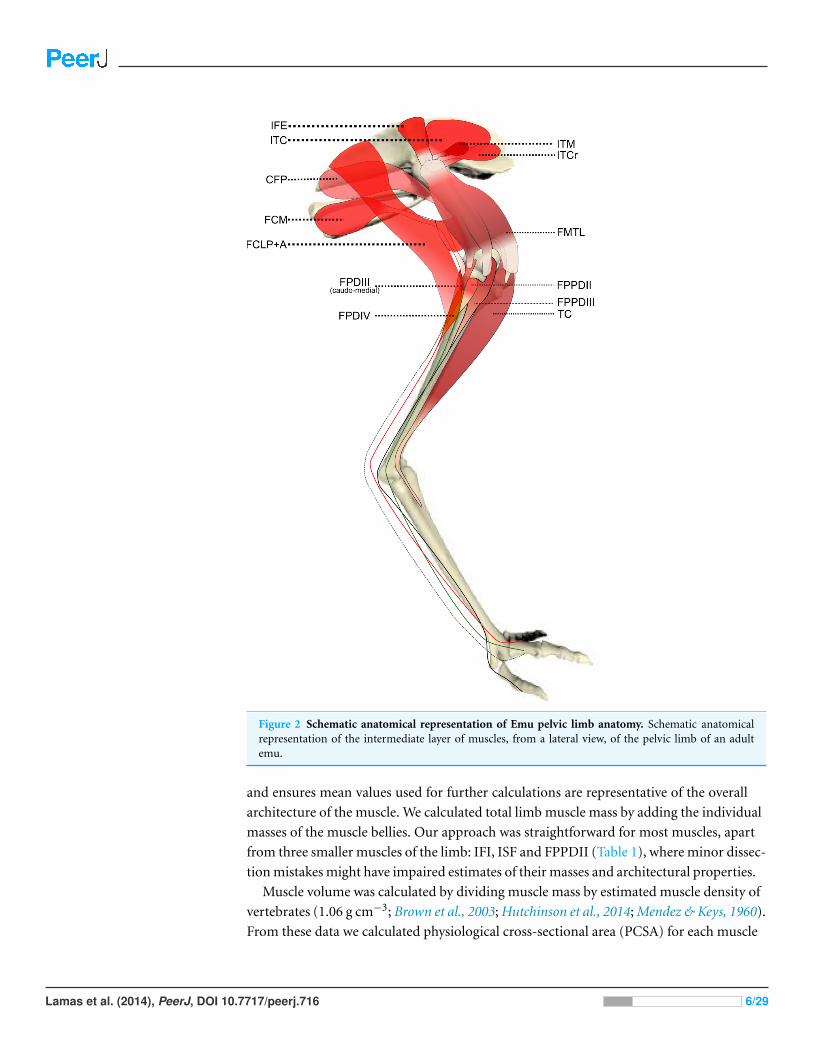
Figure 2 Schematic anatomical representation of Emu pelvic limb anatomy. Schematic anatomicalrepresentation of the intermediate layer of muscles, from a lateral view, of the pelvic limb of an adultemu.
and ensures mean values used for further calculations are representative of the overall
architecture of the muscle. We calculated total limb muscle mass by adding the individual
masses of the muscle bellies. Our approach was straightforward for most muscles, apart
from three smaller muscles of the limb: IFI, ISF and FPPDII (Table 1), where minor dissec-
tion mistakes might have impaired estimates of their masses and architectural properties.
Muscle volume was calculated by dividing muscle mass by estimated muscle density of
vertebrates (1.06 g cm−3; Brown et al., 2003; Hutchinson et al., 2014; Mendez & Keys, 1960).
From these data we calculated physiological cross-sectional area (PCSA) for each muscle
Lamas et al. (2014), PeerJ, DOI 10.7717/peerj.716 6/29
Figure 3 Schematic anatomical representation of Emu pelvic limb anatomy. Schematic anatomicalrepresentation of the deeper layer of muscles, from a lateral view, of the pelvic limb of an adult emu.
via the standard formula (Powell et al., 1984; Sacks & Roy, 1982):
PCSA =
Vmusc
Lfasc
cosθ. (1)
When a tendon was present it was dissected down to its insertion onto the bone together
with the muscle. The tendon was then transected at the musculotendinous junction when
Lamas et al. (2014), PeerJ, DOI 10.7717/peerj.716 7/29

Tabl
e1
Pel
vic
lim
bm
usc
les
ofem
us
and
thei
rap
par
enta
ctio
ns.
Mu
scle
Abb
revi
atio
nO
rigi
nIn
sert
ion
Act
ion
M.i
lioti
bial
iscr
ania
lisIC
Dor
sale
dge
of
prea
ceta
bula
rili
um
Inse
rtio
non
the
med
iala
spec
tof
the
prox
imal
tibi
otar
sus
Mai
n:H
ipfl
exio
n;k
nee
exte
nsi
on/fl
exio
n
Oth
er:H
ipm
edia
lrot
atio
n,
addu
ctio
n
M.i
lioti
bial
isla
tera
lis
(cra
nial
and
caud
alpo
rtio
ns)
ILP
OLa
tera
ledg
eof
acet
abu
lar
ala
Cra
nio
late
ralp
roxi
mal
tibi
otar
sus
(cra
nia
lan
dla
tera
lcri
stae
cnem
iale
s)
via
apon
euro
sis
(com
bin
edw
ith
FMT
L)
Mai
n:H
ipex
ten
sion
,ab-
duct
ion
;kn
eeex
ten
sion
Oth
er:H
ipm
edia
l/la
tera
lrot
atio
n
M.i
liotr
ocha
nter
icus
cran
ialis
ITC
rC
ran
ials
urf
ace
of
prea
ceta
bula
rili
um
Late
rala
spec
tof
the
fem
oral
troc
han
teri
ccr
est
(dis
talt
oIF
Ein
sert
ion
)
Mai
n:H
ipfl
exio
n,m
edia
lrot
atio
n
Oth
er:H
ipab
duct
ion
/add
uct
ion
M.i
liotr
ocha
nter
icus
med
ialis
ITM
Cra
nio
dors
alsu
rfac
eof
prea
ceta
bula
rili
um
Late
rala
spec
tof
the
fem
oral
troc
han
teri
ccr
est
(pro
xim
alto
IFE
inse
rtio
n)
Mai
n:H
ipfl
exio
n,m
edia
lrot
atio
n
Oth
er:H
ipab
duct
ion
/add
uct
ion
M.i
liotr
ocha
nter
icus
caud
alis
ITC
Ala
prea
ceta
bula
ris
ilii:
foss
aili
aca
dors
alis
Late
rala
spec
tof
the
fem
oral
troc
han
teri
ccr
est
Mai
n:H
ipfl
exio
n,m
edia
lrot
atio
n
Oth
er:H
ipab
duct
ion
/add
uct
ion
M.i
liofib
ular
isIL
FBA
lapo
stac
etab
ula
ris
ilii:
faci
esla
tera
lis
Pro
xim
alth
ird
ofth
e
corp
us
fibu
lae
Mai
n:K
nee
flex
ion
;hip
exte
nsi
on
Oth
er:H
ipab
duct
ion
M.i
liofe
mor
alis
exte
rnus
IFE
Cri
sta
iliac
ado
rsal
is,
dors
alto
fora
men
acet
abu
lum
Late
rals
ide
offe
mor
al
troc
han
teri
ccr
est
(bet
wee
nIT
Can
dIT
Min
sert
ion
s)
Mai
n:H
ipfl
exio
n,a
bdu
ctio
n
Oth
er:H
ipm
edia
l/la
tera
lrot
atio
n
M.i
liofe
mor
alis
inte
rnus
IFI
Ven
tral
prea
ceta
bula
rili
um
Med
ials
ide
ofpr
oxim
al
fem
oral
shaf
t;tu
berc
le
Mai
n:H
ipfl
exio
n,a
ddu
ctio
n
Oth
er:H
ipm
edia
l/la
tera
lrot
atio
n
M.i
schi
ofem
oral
isIS
FC
ran
ialm
argi
nof
the
fora
men
ilioi
sch
iadi
cum
Pro
xim
alca
uda
lfem
ur
un
der
orig
inof
FMT
L
Mai
n:H
ipab
duct
ion
,lat
eral
rota
tion
Oth
er:H
ipfl
exio
n/e
xten
sion
M.c
audo
fem
oral
is
p.pe
lvic
a
CFP
Cau
dola
tera
liliu
m
and
isch
ium
Pro
xim
alca
udo
med
ial
fem
ur
Mai
n:H
ipex
ten
sion
Oth
er:H
ipla
tera
lrot
atio
n,a
bdu
ctio
n
M.fl
exor
crur
is
late
ralis
pars
pelv
ica
FCL
PC
audo
late
ralc
orn
er
ofp
elvi
s
Pro
xim
alcr
anio
med
ial
tibi
otar
sus
Mai
n:H
ipex
ten
sion
,abd
uct
ion
Oth
er:M
edia
lrot
atio
nof
hip
and
knee
;kn
eefl
exio
n
M.fl
exor
crur
is
late
ralis
pars
acce
ssor
ia
FCLA
By
ara
phe
from
the
dist
al
thir
dof
the
FCLP
Cau
dom
edia
lfem
oral
shaf
tM
ain
:Hip
exte
nsi
on,a
bdu
ctio
n
Oth
er:H
ipm
edia
lrot
atio
n
M.fl
exor
crur
ism
edia
lisFC
MC
audo
late
rale
xtre
mes
of
isch
ium
and
pubi
s
Via
split
cran
iala
pon
euro
sis:
onth
eca
uda
lfem
oral
shaf
t,
and
onth
eca
udo
prox
imal
tibi
otar
sus,
cau
dodi
stal
lyto
the
inse
rtio
nof
the
FCLP
.
Mai
n:H
ipex
ten
sion
,abd
uct
ion
;
knee
flex
ion
Oth
er:H
ipm
edia
lrot
atio
n
M.p
uboi
schi
ofem
oral
is
p.la
tera
lisan
dp.
med
ialis
PIF
LMA
lon
gth
ele
ngt
hof
the
late
rali
sch
ium
Via
thin
ten
din
ous
inse
rtio
non
toth
e
cau
dala
spec
tof
the
fem
oral
shaf
t
Mai
n:H
ipex
ten
sion
,abd
uct
ion
Oth
er:H
ipla
tera
lrot
atio
n
M.f
emor
otib
ialis
late
ralis
(Cra
nial
,int
erm
edia
tean
d
caud
alpo
rtio
ns)
FMT
LC
audo
late
rals
urf
ace
offe
mor
al
shaf
t.W
ith
3fu
sed
part
s:
cran
ial,
inte
rmed
iate
and
cau
dal
Cri
sta
cnem
alis
ofti
biot
arsu
svi
aa
thic
kpa
tella
rte
ndo
n
(no
ossi
fied
pate
lla)
wit
hIL
PO
Kn
eeex
ten
sion
(con
tinu
edon
next
page
)
Lamas et al. (2014), PeerJ, DOI 10.7717/peerj.716 8/29
Tabl
e1
(con
tinu
ed)
Mu
scle
Abb
revi
atio
nO
rigi
nIn
sert
ion
Act
ion
M.f
emor
otib
ialis
inte
rmed
ialis
FMT
IMC
ran
ials
urf
ace
ofth
epr
oxim
al
fem
oral
shaf
t
Med
ials
ide
ofcr
ista
cnem
alis
cran
ialis
ofti
biot
arsu
s
Kn
eeex
ten
sion
M.f
emor
otib
ialis
med
ialis
FMT
M3
dist
inct
hea
dsor
igin
atin
gfr
omth
e
med
ials
urf
ace
ofth
efe
mu
r,cr
ania
l
and
cau
dalp
orti
ons
onth
e
prox
imal
thir
dan
d
dist
alpo
rtio
non
the
dist
alth
ird
Pro
xim
o-m
edia
lext
rem
ity
ofti
biot
arsu
s
Kn
eefl
exio
n,a
ddu
ctio
n
M.o
btur
ator
ius
med
ialis
(Iliu
m—
Isch
ium
part
)
OM
IISu
rfac
eof
fen
estr
aili
oisc
hiu
mLo
ng
ten
don
that
pass
esth
rou
ghth
e
fora
men
ilioi
sch
iadi
cum
and
inse
rts
onto
the
late
rals
ide
ofth
efe
mor
al
troc
han
teri
ccr
est
Mai
n:H
ipla
tera
lrot
atio
n
Oth
er:H
ipfl
exio
n,a
ddu
ctio
n
M.o
btur
ator
ius
med
ialis
(Isc
hium
—pu
bis
part
)
OM
IPSu
rfac
eof
fen
estr
ais
chio
pubi
caA
sO
MII
Mai
n:H
ipla
tera
lrot
atio
n
Oth
er:H
ipfl
exio
n,a
ddu
ctio
n
M.a
mbi
ens
AM
BC
ran
ialp
ubi
cri
m
(pre
acet
abu
lar
proc
ess)
Two
inse
rtio
ns
onth
em
edia
lkn
ee
ligam
ents
,on
ete
ndi
nou
san
dth
e
oth
eron
efl
eshy
Mai
n:H
ipad
duct
ion
;kn
eefl
exio
n
Oth
er:H
ipm
edia
lrot
atio
n
M.g
astr
ocne
miu
sla
tera
lisG
LLa
tera
lcon
dyle
offe
mu
r,
apon
euro
sis
ofM
.Ilio
tibi
alis
and
ten
don
from
cran
ialfi
bula
Ten
don
sfu
sin
gto
form
ath
ick
fibr
ous
calc
anea
lpad
,on
toca
uda
lsid
eof
tars
omet
atar
sus
(Cal
can
eals
cutu
m)
Mai
n:A
nkl
eex
ten
sion
;kn
eefl
exio
n
M.g
astr
ocne
miu
sm
edia
lisG
MA
pon
euro
sis
ofM
.Ilio
tibi
alis
and
faci
esga
stro
cnem
ialis
,
con
nec
tin
gto
the
med
ials
urf
ace
ofth
epr
oxim
alti
bia
As
GL
Mai
n:A
nkl
eex
ten
sion
;kn
eefl
exio
n
M.g
astr
ocne
miu
sIn
term
ediu
sG
IMC
ran
iola
tera
lfem
ur,
adja
cen
tof
the
orig
inof
FHL
mu
scle
As
GL
and
GIM
Mai
n:A
nkl
eex
ten
sion
;kn
eefl
exio
n
M.fi
bula
ris
long
usFL
Pro
xim
alor
igin
from
med
iald
ista
l
pate
llar
ligam
ent
and
cran
iola
tera
lly
onto
prox
imal
tibi
otar
sus.
Two
ten
din
ous
inse
rtio
ns:
Pla
nta
r
calc
anea
lscu
tum
and
join
ing
the
ten
don
ofFP
DII
I
Mai
n:A
nkl
eex
ten
sion
Oth
er:K
nee
flex
ion
;toe
flex
ion
via
FPD
III
ten
don
M.t
ibia
liscr
ania
lisc.
tibi
ale
and
c.
fem
oral
e
TC
2h
eads
:Afl
eshy
one
onto
the
prox
imal
cran
ialt
ibio
tars
us,
and
via
ath
ick
ten
don
onto
the
cran
iala
spec
tof
the
late
ral
troc
hle
arri
dge
ofth
efe
mu
r
Cra
nia
lsid
eof
prox
imal
tars
omet
atar
sus
Mai
n:A
nkl
efl
exio
n
Oth
er:K
nee
exte
nsi
on(f
emor
alh
ead)
M.p
oplit
eus
PO
PM
edia
lsid
eof
prox
imal
fibu
laC
auda
lsid
eof
prox
imal
tibi
otar
sus
Mai
n:F
ibu
lar
rota
tion
M.fl
exor
perf
orat
usdi
giti
IIFP
DII
Via
orig
inof
FPD
III
Split
sin
to2
bran
ches
atle
velo
f
prox
imal
phal
anx
toin
sert
onei
ther
side
ofm
idd
leph
alan
x,ve
ntr
ally
Mai
n:D
igit
IIfl
exio
n
Oth
er:A
nkl
eex
ten
sion
M.fl
exor
perf
orat
usdi
giti
III
FPD
III
2te
ndo
ns:
Cra
nia
lfibu
laan
dm
edia
l
side
ofth
em
edia
lcon
dyle
ofth
efe
mu
r
Pro
xim
alph
alan
x,sm
allp
orti
onfu
sed
toFP
PD
IIte
ndo
nin
som
esp
ecim
ens,
ven
tral
ly
Mai
n:D
igit
III
flex
ion
Oth
er:A
nkl
eex
ten
sion
(con
tinu
edon
next
page
)
Lamas et al. (2014), PeerJ, DOI 10.7717/peerj.716 9/29
Tabl
e1
(con
tinu
ed)
Mu
scle
Abb
revi
atio
nO
rigi
nIn
sert
ion
Act
ion
M.fl
exor
perf
oran
set
perf
orat
us
digi
tiII
FPP
DII
Dee
pfi
bula
rte
ndo
nof
GL
mu
scle
Mid
dle
phal
anx
ofdi
git
II,v
entr
ally
Mai
n:D
igit
IIfl
exio
n
Oth
er:A
nkl
eex
ten
sion
M.fl
exor
perf
oran
set
perf
orat
us
digi
tiII
I
FPP
DII
ILa
tera
lkn
eelig
amen
tsan
dFP
DIV
orig
inM
idd
leph
alan
xof
digi
tII
I,ve
ntr
ally
Mai
n:D
igit
III
flex
ion
Oth
er:A
nkl
eex
ten
sion
M.fl
exor
perf
orat
usdi
giti
IVFP
DIV
Sup
erfi
cial
side
ofFP
DII
Ior
igin
Pro
xim
alan
dm
idd
leph
alan
ges
of
digi
tIV
,ven
tral
ly
Mai
n:D
igit
IVfl
exio
n
Oth
er:A
nkl
eex
ten
sion
M.fl
exor
hallu
cis
long
usFH
L2
hea
ds:l
ater
alan
dca
uda
lasp
ects
of
dist
alfe
mu
rn
ear
con
dyle
s
Fuse
sw
ith
FDL
ten
don
Mai
n:A
nkl
eex
ten
sion
;kn
eefl
exio
n
M.fl
exor
digi
toru
mlo
ngus
FDL
2h
eads
:pro
xim
alti
biot
arsu
san
ddi
stal
thir
dof
fibu
la(3
/4of
len
gth
)
Split
sin
to3
part
sab
ove
MT
Pjo
int
to
inse
rton
toth
edi
stal
,ven
tral
phal
anx
ofea
chto
e
Mai
n:D
igit
sII
,III
and
IVfl
exio
n
Oth
er:A
nkl
eex
ten
sion
M.e
xten
sor
digi
toru
mlo
ngus
ED
LC
ran
ialp
roxi
mal
tibi
otar
sus
Dor
sals
urf
ace
ofea
chph
alan
xM
ain
:Dig
its
II,I
IIan
dIV
exte
nsi
on;
ankl
efl
exio
n
Lamas et al. (2014), PeerJ, DOI 10.7717/peerj.716 10/29
a clear separation became apparent and stretched on a flat surface. We then measured
lengths with a standard ruler or flexible measuring tape (±1 mm), and tendon mass was
also measured using the same instrumentation as for the muscles.
Tendon cross-sectional area (TCSA) was calculated using tendon length (Lten); from
muscle origin to bony insertion; and tendon mass (Mten) as follows:
TCSA =Mten
1120 Lten(2)
where 1,120 kg m−3 is assumed as the density of tendon (Hutchinson et al., 2014; Ker, 1981).
Statistical analysisOntogenetic scaling relationships of (non-normalized) muscle properties were analysed
using reduced major axis (“Model II”) regression for log10 of each property vs log10
body mass using custom-designed R software code (R Development Core Team, 2010).
A Shapiro–Wilk test was performed to assess normality of distribution of the residuals,
and the p value for significance was set to <0.05. The inclusion criteria for data presented
were: Datasets first had to have a p value <0.05 in the above described Shapiro–Wilk test.
If this p was >0.05, the data were then tested for the presence of outliers (which were set
at ±2 standard deviations [SD] from the mean) and outliers removed. The RMA linear
regression was performed again using this dataset; and again, data were only presented
if the p value for distribution of residuals was <0.05. Once the datasets were defined, R2
correlation values and upper and lower bounds of the 95% confidence interval (CI) were
calculated to assess the spread of data points around each regression line.
We used body mass (BM) as our independent variable and the target architectural
parameter as our dependant variable. Overall, we followed a similar approach as that
described by Allen et al. (2010) and Allen et al. (2014).
Briefly, for two objects to be considered geometrically similar (and thus for an isometric
scaling pattern to be inferred), areas should scale to the square product of lengths and
volumes to the cube of lengths. Because mass is a volumetric property, the dependant
variable is considered to scale isometrically if the mass of the structure scales with BM1,
areal properties (PCSA, TCSA) scale to BM0.67 and lengths scale to BM0.33, whereas angles
and other non-dimensional variables should scale as BM0. In order to obtain relative values
to compare results from individuals of different size, muscle mass, PCSA and Flength were
normalized to body mass (BM) by dividing each value by the subject’s BM, BM0.67 and
BM0.33 respectively.
RESULTSWe obtained 6,524 measurements of seven different muscle–tendon architectural
parameters from 34 pelvic limb muscles and four pelvic limb bones in 17 emus from
3.6 to 42 kg of body mass. We found strong evidence for positive allometric scaling for
many of these architectural parameters, as described below. To aid interpretation of our
results, we have divided the muscles of the limb into proximal (those acting mostly on the
Lamas et al. (2014), PeerJ, DOI 10.7717/peerj.716 11/29
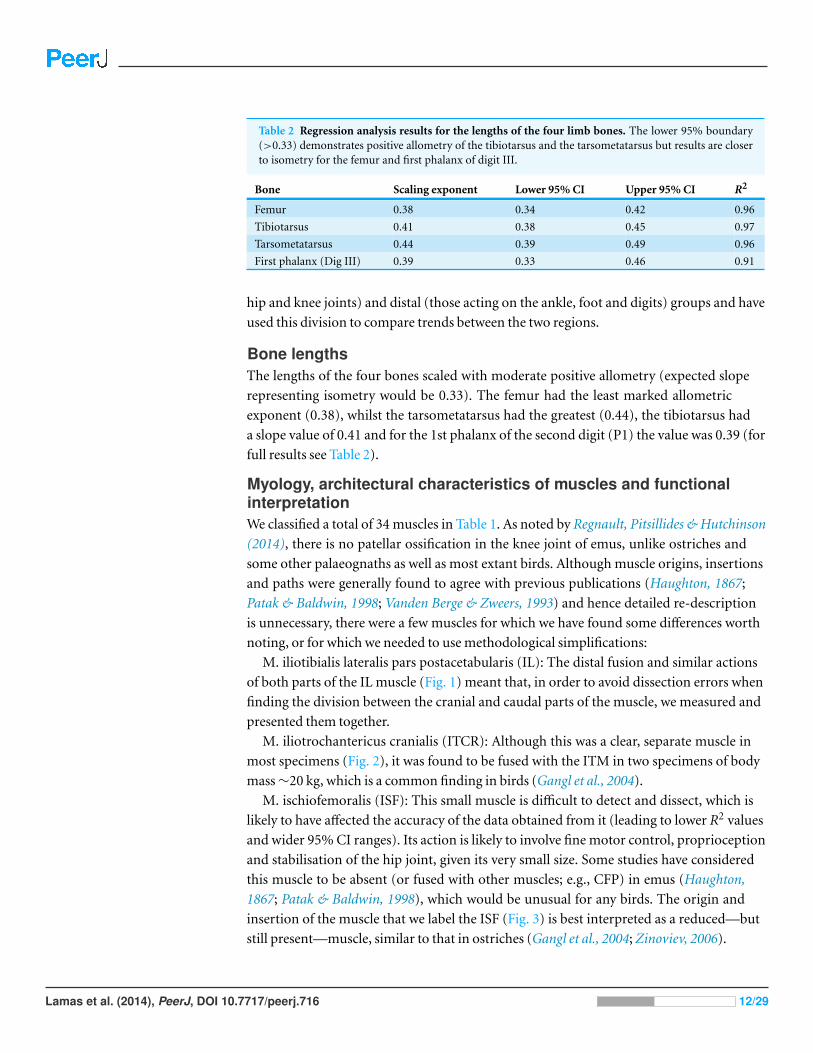
Table 2 Regression analysis results for the lengths of the four limb bones. The lower 95% boundary(>0.33) demonstrates positive allometry of the tibiotarsus and the tarsometatarsus but results are closerto isometry for the femur and first phalanx of digit III.
Bone Scaling exponent Lower 95% CI Upper 95% CI R2
Femur 0.38 0.34 0.42 0.96
Tibiotarsus 0.41 0.38 0.45 0.97
Tarsometatarsus 0.44 0.39 0.49 0.96
First phalanx (Dig III) 0.39 0.33 0.46 0.91
hip and knee joints) and distal (those acting on the ankle, foot and digits) groups and have
used this division to compare trends between the two regions.
Bone lengthsThe lengths of the four bones scaled with moderate positive allometry (expected slope
representing isometry would be 0.33). The femur had the least marked allometric
exponent (0.38), whilst the tarsometatarsus had the greatest (0.44), the tibiotarsus had
a slope value of 0.41 and for the 1st phalanx of the second digit (P1) the value was 0.39 (for
full results see Table 2).
Myology, architectural characteristics of muscles and functionalinterpretationWe classified a total of 34 muscles in Table 1. As noted by Regnault, Pitsillides & Hutchinson
(2014), there is no patellar ossification in the knee joint of emus, unlike ostriches and
some other palaeognaths as well as most extant birds. Although muscle origins, insertions
and paths were generally found to agree with previous publications (Haughton, 1867;
Patak & Baldwin, 1998; Vanden Berge & Zweers, 1993) and hence detailed re-description
is unnecessary, there were a few muscles for which we have found some differences worth
noting, or for which we needed to use methodological simplifications:
M. iliotibialis lateralis pars postacetabularis (IL): The distal fusion and similar actions
of both parts of the IL muscle (Fig. 1) meant that, in order to avoid dissection errors when
finding the division between the cranial and caudal parts of the muscle, we measured and
presented them together.
M. iliotrochantericus cranialis (ITCR): Although this was a clear, separate muscle in
most specimens (Fig. 2), it was found to be fused with the ITM in two specimens of body
mass ∼20 kg, which is a common finding in birds (Gangl et al., 2004).
M. ischiofemoralis (ISF): This small muscle is difficult to detect and dissect, which is
likely to have affected the accuracy of the data obtained from it (leading to lower R2 values
and wider 95% CI ranges). Its action is likely to involve fine motor control, proprioception
and stabilisation of the hip joint, given its very small size. Some studies have considered
this muscle to be absent (or fused with other muscles; e.g., CFP) in emus (Haughton,
1867; Patak & Baldwin, 1998), which would be unusual for any birds. The origin and
insertion of the muscle that we label the ISF (Fig. 3) is best interpreted as a reduced—but
still present—muscle, similar to that in ostriches (Gangl et al., 2004; Zinoviev, 2006).
Lamas et al. (2014), PeerJ, DOI 10.7717/peerj.716 12/29
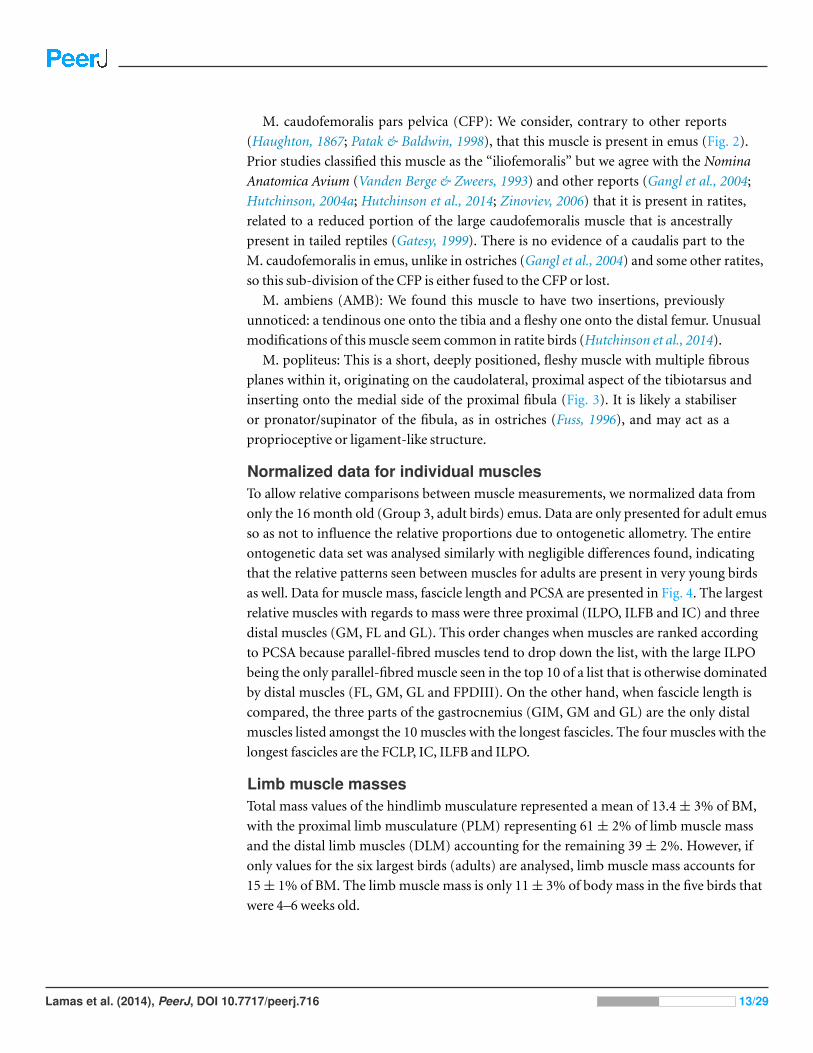
M. caudofemoralis pars pelvica (CFP): We consider, contrary to other reports
(Haughton, 1867; Patak & Baldwin, 1998), that this muscle is present in emus (Fig. 2).
Prior studies classified this muscle as the “iliofemoralis” but we agree with the Nomina
Anatomica Avium (Vanden Berge & Zweers, 1993) and other reports (Gangl et al., 2004;
Hutchinson, 2004a; Hutchinson et al., 2014; Zinoviev, 2006) that it is present in ratites,
related to a reduced portion of the large caudofemoralis muscle that is ancestrally
present in tailed reptiles (Gatesy, 1999). There is no evidence of a caudalis part to the
M. caudofemoralis in emus, unlike in ostriches (Gangl et al., 2004) and some other ratites,
so this sub-division of the CFP is either fused to the CFP or lost.
M. ambiens (AMB): We found this muscle to have two insertions, previously
unnoticed: a tendinous one onto the tibia and a fleshy one onto the distal femur. Unusual
modifications of this muscle seem common in ratite birds (Hutchinson et al., 2014).
M. popliteus: This is a short, deeply positioned, fleshy muscle with multiple fibrous
planes within it, originating on the caudolateral, proximal aspect of the tibiotarsus and
inserting onto the medial side of the proximal fibula (Fig. 3). It is likely a stabiliser
or pronator/supinator of the fibula, as in ostriches (Fuss, 1996), and may act as a
proprioceptive or ligament-like structure.
Normalized data for individual musclesTo allow relative comparisons between muscle measurements, we normalized data from
only the 16 month old (Group 3, adult birds) emus. Data are only presented for adult emus
so as not to influence the relative proportions due to ontogenetic allometry. The entire
ontogenetic data set was analysed similarly with negligible differences found, indicating
that the relative patterns seen between muscles for adults are present in very young birds
as well. Data for muscle mass, fascicle length and PCSA are presented in Fig. 4. The largest
relative muscles with regards to mass were three proximal (ILPO, ILFB and IC) and three
distal muscles (GM, FL and GL). This order changes when muscles are ranked according
to PCSA because parallel-fibred muscles tend to drop down the list, with the large ILPO
being the only parallel-fibred muscle seen in the top 10 of a list that is otherwise dominated
by distal muscles (FL, GM, GL and FPDIII). On the other hand, when fascicle length is
compared, the three parts of the gastrocnemius (GIM, GM and GL) are the only distal
muscles listed amongst the 10 muscles with the longest fascicles. The four muscles with the
longest fascicles are the FCLP, IC, ILFB and ILPO.
Limb muscle massesTotal mass values of the hindlimb musculature represented a mean of 13.4 ± 3% of BM,
with the proximal limb musculature (PLM) representing 61 ± 2% of limb muscle mass
and the distal limb muscles (DLM) accounting for the remaining 39 ± 2%. However, if
only values for the six largest birds (adults) are analysed, limb muscle mass accounts for
15 ± 1% of BM. The limb muscle mass is only 11 ± 3% of body mass in the five birds that
were 4–6 weeks old.
Lamas et al. (2014), PeerJ, DOI 10.7717/peerj.716 13/29
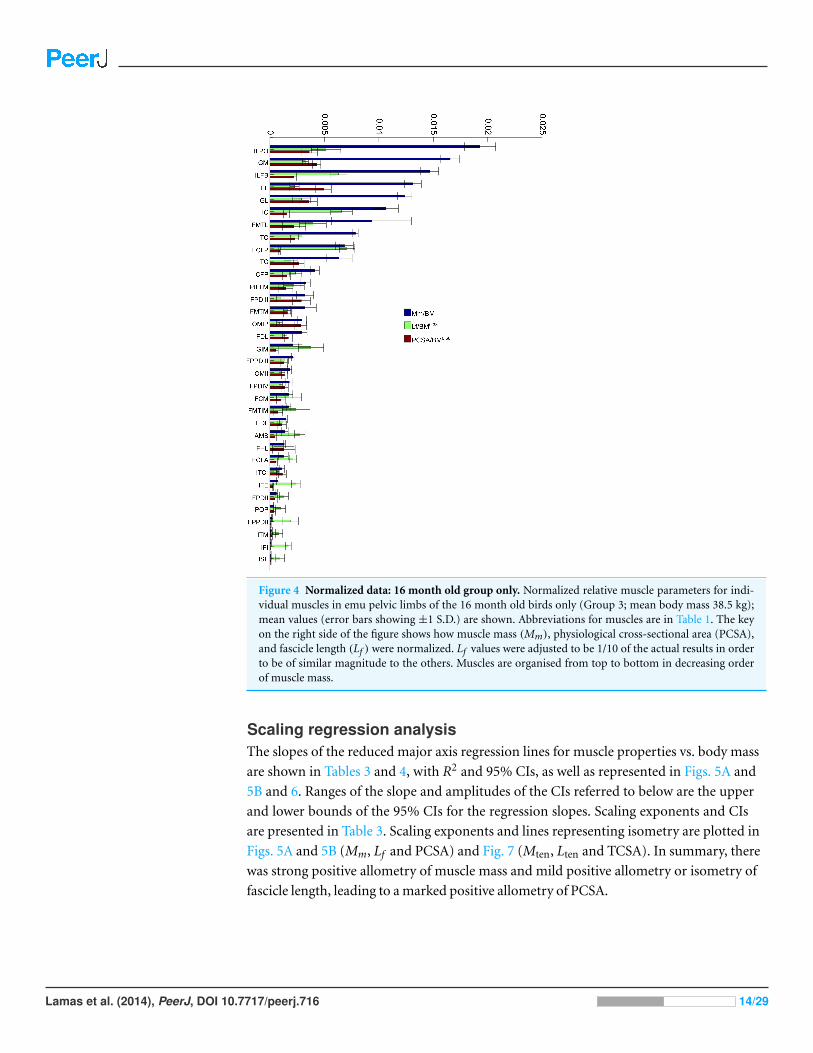
Figure 4 Normalized data: 16 month old group only. Normalized relative muscle parameters for indi-vidual muscles in emu pelvic limbs of the 16 month old birds only (Group 3; mean body mass 38.5 kg);mean values (error bars showing ±1 S.D.) are shown. Abbreviations for muscles are in Table 1. The keyon the right side of the figure shows how muscle mass (Mm), physiological cross-sectional area (PCSA),and fascicle length (Lf ) were normalized. Lf values were adjusted to be 1/10 of the actual results in orderto be of similar magnitude to the others. Muscles are organised from top to bottom in decreasing orderof muscle mass.
Scaling regression analysisThe slopes of the reduced major axis regression lines for muscle properties vs. body mass
are shown in Tables 3 and 4, with R2 and 95% CIs, as well as represented in Figs. 5A and
5B and 6. Ranges of the slope and amplitudes of the CIs referred to below are the upper
and lower bounds of the 95% CIs for the regression slopes. Scaling exponents and CIs
are presented in Table 3. Scaling exponents and lines representing isometry are plotted in
Figs. 5A and 5B (Mm, Lf and PCSA) and Fig. 7 (Mten, Lten and TCSA). In summary, there
was strong positive allometry of muscle mass and mild positive allometry or isometry of
fascicle length, leading to a marked positive allometry of PCSA.
Lamas et al. (2014), PeerJ, DOI 10.7717/peerj.716 14/29
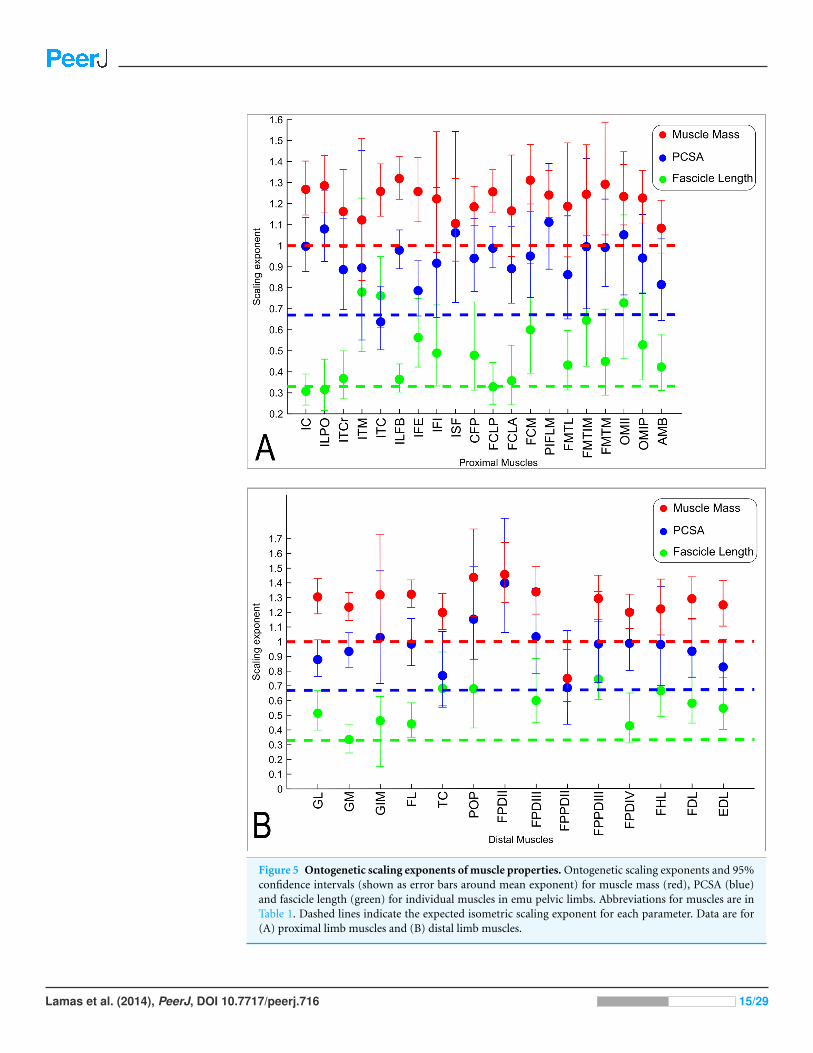
Figure 5 Ontogenetic scaling exponents of muscle properties. Ontogenetic scaling exponents and 95%confidence intervals (shown as error bars around mean exponent) for muscle mass (red), PCSA (blue)and fascicle length (green) for individual muscles in emu pelvic limbs. Abbreviations for muscles are inTable 1. Dashed lines indicate the expected isometric scaling exponent for each parameter. Data are for(A) proximal limb muscles and (B) distal limb muscles.
Lamas et al. (2014), PeerJ, DOI 10.7717/peerj.716 15/29
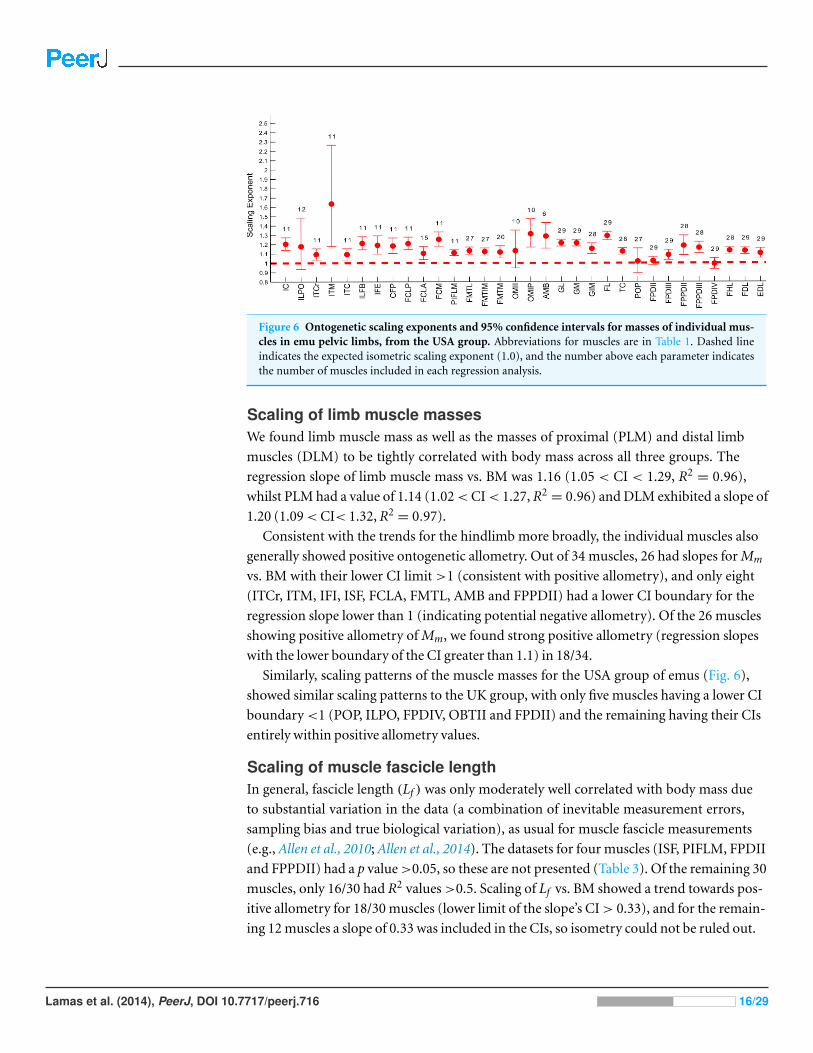
Figure 6 Ontogenetic scaling exponents and 95% confidence intervals for masses of individual mus-cles in emu pelvic limbs, from the USA group. Abbreviations for muscles are in Table 1. Dashed lineindicates the expected isometric scaling exponent (1.0), and the number above each parameter indicatesthe number of muscles included in each regression analysis.
Scaling of limb muscle massesWe found limb muscle mass as well as the masses of proximal (PLM) and distal limb
muscles (DLM) to be tightly correlated with body mass across all three groups. The
regression slope of limb muscle mass vs. BM was 1.16 (1.05 < CI < 1.29, R2= 0.96),
whilst PLM had a value of 1.14 (1.02 < CI < 1.27, R2= 0.96) and DLM exhibited a slope of
1.20 (1.09 < CI< 1.32, R2= 0.97).
Consistent with the trends for the hindlimb more broadly, the individual muscles also
generally showed positive ontogenetic allometry. Out of 34 muscles, 26 had slopes for Mm
vs. BM with their lower CI limit >1 (consistent with positive allometry), and only eight
(ITCr, ITM, IFI, ISF, FCLA, FMTL, AMB and FPPDII) had a lower CI boundary for the
regression slope lower than 1 (indicating potential negative allometry). Of the 26 muscles
showing positive allometry of Mm, we found strong positive allometry (regression slopes
with the lower boundary of the CI greater than 1.1) in 18/34.
Similarly, scaling patterns of the muscle masses for the USA group of emus (Fig. 6),
showed similar scaling patterns to the UK group, with only five muscles having a lower CI
boundary <1 (POP, ILPO, FPDIV, OBTII and FPDII) and the remaining having their CIs
entirely within positive allometry values.
Scaling of muscle fascicle lengthIn general, fascicle length (Lf ) was only moderately well correlated with body mass due
to substantial variation in the data (a combination of inevitable measurement errors,
sampling bias and true biological variation), as usual for muscle fascicle measurements
(e.g., Allen et al., 2010; Allen et al., 2014). The datasets for four muscles (ISF, PIFLM, FPDII
and FPPDII) had a p value >0.05, so these are not presented (Table 3). Of the remaining 30
muscles, only 16/30 had R2 values >0.5. Scaling of Lf vs. BM showed a trend towards pos-
itive allometry for 18/30 muscles (lower limit of the slope’s CI > 0.33), and for the remain-
ing 12 muscles a slope of 0.33 was included in the CIs, so isometry could not be ruled out.
Lamas et al. (2014), PeerJ, DOI 10.7717/peerj.716 16/29
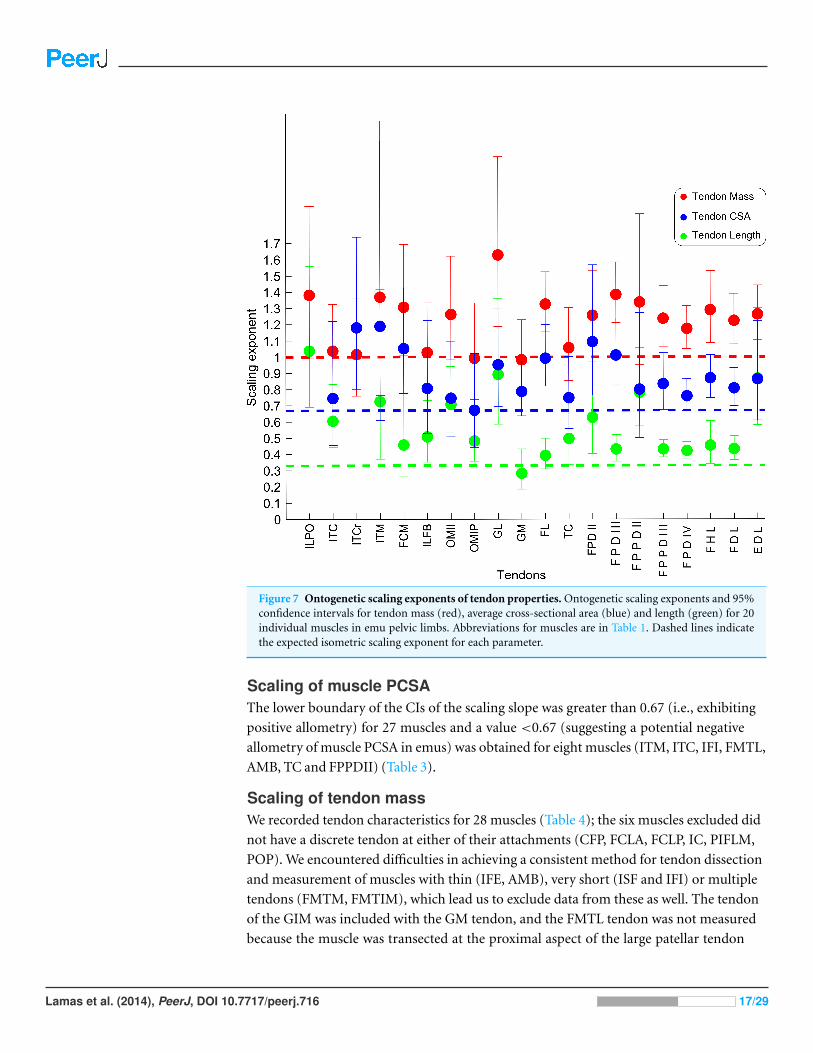
Figure 7 Ontogenetic scaling exponents of tendon properties. Ontogenetic scaling exponents and 95%confidence intervals for tendon mass (red), average cross-sectional area (blue) and length (green) for 20individual muscles in emu pelvic limbs. Abbreviations for muscles are in Table 1. Dashed lines indicatethe expected isometric scaling exponent for each parameter.
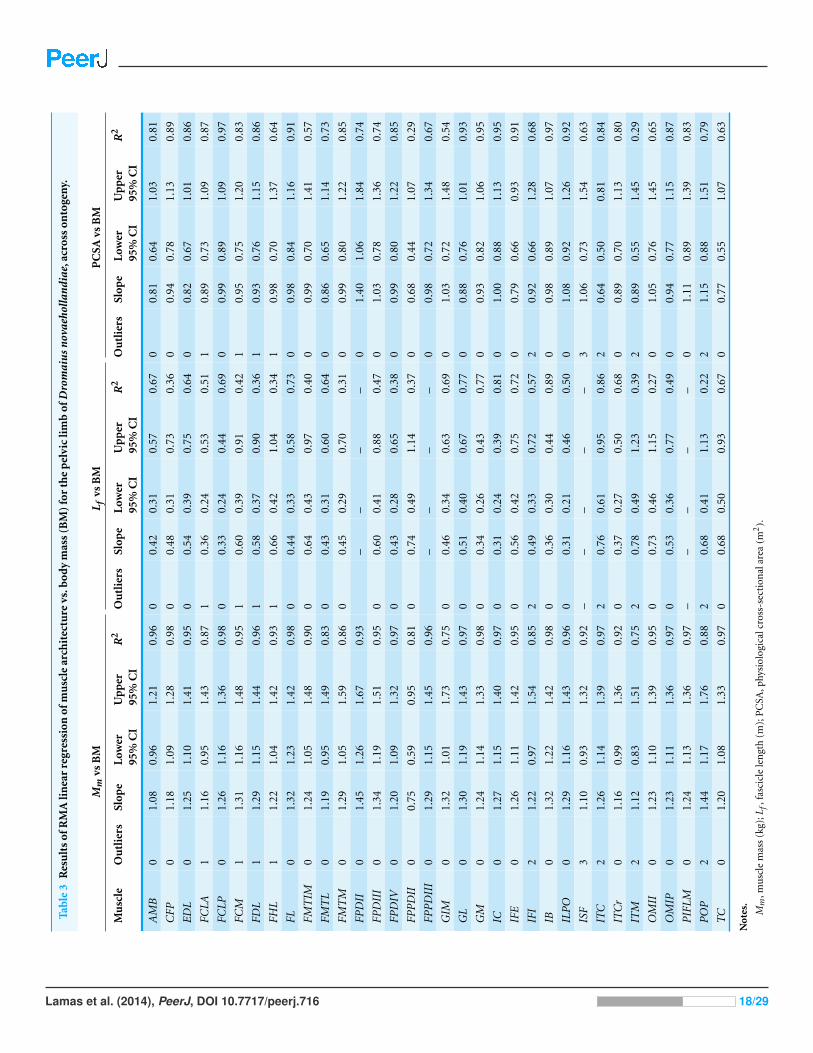
Scaling of muscle PCSAThe lower boundary of the CIs of the scaling slope was greater than 0.67 (i.e., exhibiting
positive allometry) for 27 muscles and a value <0.67 (suggesting a potential negative
allometry of muscle PCSA in emus) was obtained for eight muscles (ITM, ITC, IFI, FMTL,
AMB, TC and FPPDII) (Table 3).
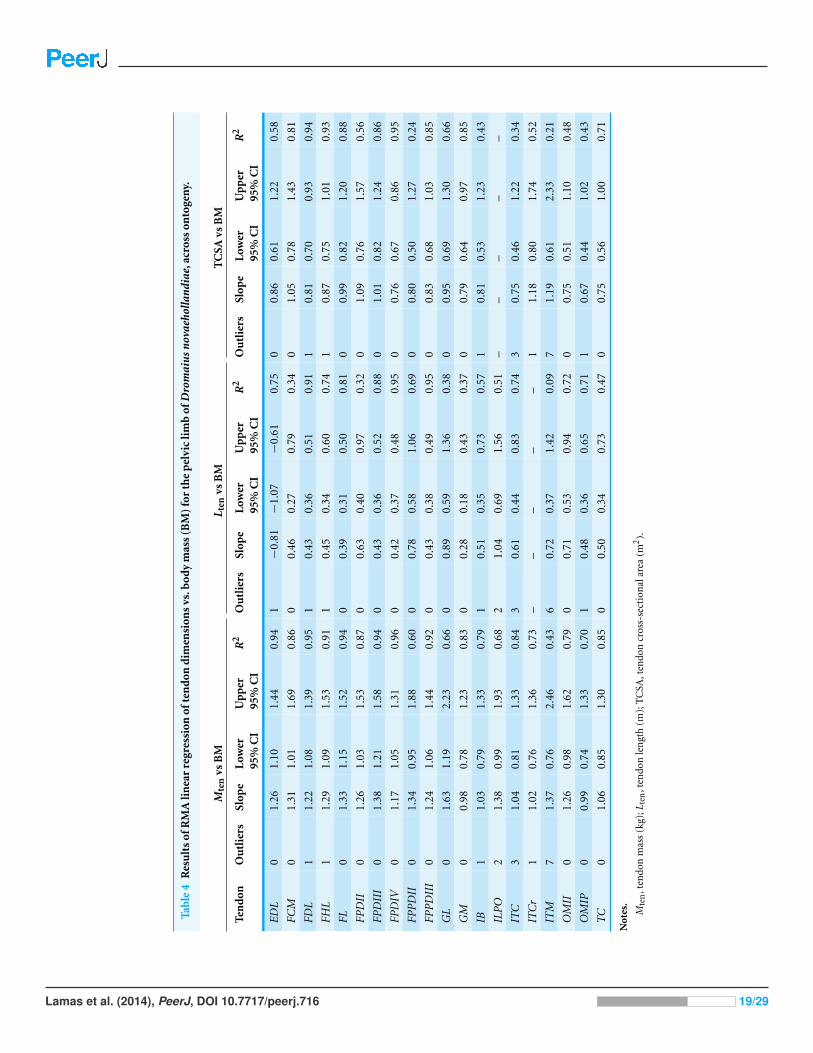
Scaling of tendon massWe recorded tendon characteristics for 28 muscles (Table 4); the six muscles excluded did
not have a discrete tendon at either of their attachments (CFP, FCLA, FCLP, IC, PIFLM,
POP). We encountered difficulties in achieving a consistent method for tendon dissection
and measurement of muscles with thin (IFE, AMB), very short (ISF and IFI) or multiple
tendons (FMTM, FMTIM), which lead us to exclude data from these as well. The tendon
of the GIM was included with the GM tendon, and the FMTL tendon was not measured
because the muscle was transected at the proximal aspect of the large patellar tendon
Lamas et al. (2014), PeerJ, DOI 10.7717/peerj.716 17/29
Tabl
e3
Res
ult
sof
RM
Ali
nea
rre
gres
sion
ofm
usc
lear
chit
ectu
revs
.bod
ym
ass
(BM
)fo
rth
ep
elvi
cli
mb
ofD
rom
aiu
sn
ovae
holl
andi
ae,a
cros
son
toge
ny.
Mm
vsB
ML f
vsB
MP
CSA
vsB
M
Mu
scle
Ou
tlie
rsSl
ope
Low
er95
%C
IU
pper
95%
CI
R2
Ou
tlie
rsSl
ope
Low
er95
%C
IU
pper
95%
CI
R2
Ou
tlie
rsSl
ope
Low
er95
%C
IU
pper
95%
CI
R2
AM
B0
1.08
0.96
1.21
0.96
00.
420.
310.
570.
670
0.81
0.64
1.03
0.81
CFP
01.
181.
091.
280.
980
0.48
0.31
0.73
0.36
00.
940.
781.
130.
89
ED
L0
1.25
1.10
1.41
0.95
00.
540.
390.
750.
640
0.82
0.67
1.01
0.86
FCLA
11.
160.
951.
430.
871
0.36
0.24
0.53
0.51
10.
890.
731.
090.
87
FCLP
01.
261.
161.
360.
980
0.33
0.24
0.44
0.69
00.
990.
891.
090.
97
FCM
11.
311.
161.
480.
951
0.60
0.39
0.91
0.42
10.
950.
751.
200.
83
FDL
11.
291.
151.
440.
961
0.58
0.37
0.90
0.36
10.
930.
761.
150.
86
FHL
11.
221.
041.
420.
931
0.66
0.42
1.04
0.34
10.
980.
701.
370.
64
FL0
1.32
1.23
1.42
0.98
00.
440.
330.
580.
730
0.98
0.84
1.16
0.91
FMT
IM0
1.24
1.05
1.48
0.90
00.
640.
430.
970.
400
0.99
0.70
1.41
0.57
FMT
L0
1.19
0.95
1.49
0.83
00.
430.
310.
600.
640
0.86
0.65
1.14
0.73
FMT
M0
1.29
1.05
1.59
0.86
00.
450.
290.
700.
310
0.99
0.80
1.22
0.85
FPD
II0
1.45
1.26
1.67
0.93
––
––
01.
401.
061.
840.
74
FPD
III
01.
341.
191.
510.
950
0.60
0.41
0.88
0.47
01.
030.
781.
360.
74
FPD
IV0
1.20
1.09
1.32
0.97
00.
430.
280.
650.
380
0.99
0.80
1.22
0.85
FPP
DII
00.
750.
590.
950.
810
0.74
0.49
1.14
0.37
00.
680.
441.
070.
29
FPP
DII
I0
1.29
1.15
1.45
0.96
––
––
00.
980.
721.
340.
67
GIM
01.
321.
011.
730.
750
0.46
0.34
0.63
0.69
01.
030.
721.
480.
54
GL
01.
301.
191.
430.
970
0.51
0.40
0.67
0.77
00.
880.
761.
010.
93
GM
01.
241.
141.
330.
980
0.34
0.26
0.43
0.77
00.
930.
821.
060.
95
IC0
1.27
1.15
1.40
0.97
00.
310.
240.
390.
810
1.00
0.88
1.13
0.95
IFE
01.
261.
111.
420.
950
0.56
0.42
0.75
0.72
00.
790.
660.
930.
91
IFI
21.
220.
971.
540.
852
0.49
0.33
0.72
0.57
20.
920.
661.
280.
68
IB0
1.32
1.22
1.42
0.98
00.
360.
300.
440.
890
0.98
0.89
1.07
0.97
ILP
O0
1.29
1.16
1.43
0.96
00.
310.
210.
460.
500
1.08
0.92
1.26
0.92
ISF
31.
100.
931.
320.
92–
––
––
31.
060.
731.
540.
63
ITC
21.
261.
141.
390.
972
0.76
0.61
0.95
0.86
20.
640.
500.
810.
84
ITC
r0
1.16
0.99
1.36
0.92
00.
370.
270.
500.
680
0.89
0.70
1.13
0.80
ITM
21.
120.
831.
510.
752
0.78
0.49
1.23
0.39
20.
890.
551.
450.
29
OM
II0
1.23
1.10
1.39
0.95
00.
730.
461.
150.
270
1.05
0.76
1.45
0.65
OM
IP0
1.23
1.11
1.36
0.97
00.
530.
360.
770.
490
0.94
0.77
1.15
0.87
PIF
LM0
1.24
1.13
1.36
0.97
––
––
–0
1.11
0.89
1.39
0.83
PO
P2
1.44
1.17
1.76
0.88
20.
680.
411.
130.
222
1.15
0.88
1.51
0.79
TC
01.
201.
081.
330.
970
0.68
0.50
0.93
0.67
00.
770.
551.
070.
63
Not
es.
Mm
,mu
scle
mas
s(k
g);L
f,fa
scic
lele
ngt
h(m
);P
CSA
,phy
siol
ogic
alcr
oss-
sect
ion
alar
ea(m
2).
Lamas et al. (2014), PeerJ, DOI 10.7717/peerj.716 18/29
Tabl
e4
Res
ult
sof
RM
Ali
nea
rre
gres
sion
ofte
nd
ond
imen
sion
svs
.bod
ym
ass
(BM
)fo
rth
ep
elvi
cli
mb
ofD
rom
aiu
sn
ovae
holl
andi
ae,a
cros
son
toge
ny.
Mte
nvs
BM
L ten
vsB
MT
CSA
vsB
M
Ten
don
Ou
tlie
rsSl
ope
Low
er95
%C
IU
pper
95%
CI
R2
Ou
tlie
rsSl
ope
Low
er95
%C
IU
pper
95%
CI
R2
Ou
tlie
rsSl
ope
Low
er95
%C
IU
pper
95%
CI
R2
ED
L0
1.26
1.10
1.44
0.94
1−
0.81
−1.
07−
0.61
0.75
00.
860.
611.
220.
58
FCM
01.
311.
011.
690.
860
0.46
0.27
0.79
0.34
01.
050.
781.
430.
81
FDL
11.
221.
081.
390.
951
0.43
0.36
0.51
0.91
10.
810.
700.
930.
94
FHL
11.
291.
091.
530.
911
0.45
0.34
0.60
0.74
10.
870.
751.
010.
93
FL0
1.33
1.15
1.52
0.94
00.
390.
310.
500.
810
0.99
0.82
1.20
0.88
FPD
II0
1.26
1.03
1.53
0.87
00.
630.
400.
970.
320
1.09
0.76
1.57
0.56
FPD
III
01.
381.
211.
580.
940
0.43
0.36
0.52
0.88
01.
010.
821.
240.
86
FPD
IV0
1.17
1.05
1.31
0.96
00.
420.
370.
480.
950
0.76
0.67
0.86
0.95
FPP
DII
01.
340.
951.
880.
600
0.78
0.58
1.06
0.69
00.
800.
501.
270.
24
FPP
DII
I0
1.24
1.06
1.44
0.92
00.
430.
380.
490.
950
0.83
0.68
1.03
0.85
GL
01.
631.
192.
230.
660
0.89
0.59
1.36
0.38
00.
950.
691.
300.
66
GM
00.
980.
781.
230.
830
0.28
0.18
0.43
0.37
00.
790.
640.
970.
85
IB1
1.03
0.79
1.33
0.79
10.
510.
350.
730.
571
0.81
0.53
1.23
0.43
ILP
O2
1.38
0.99
1.93
0.68
21.
040.
691.
560.
51–
––
––
ITC
31.
040.
811.
330.
843
0.61
0.44
0.83
0.74
30.
750.
461.
220.
34
ITC
r1
1.02
0.76
1.36
0.73
––
––
–1
1.18
0.80
1.74
0.52
ITM
71.
370.
762.
460.
436
0.72
0.37
1.42
0.09
71.
190.
612.
330.
21
OM
II0
1.26
0.98
1.62
0.79
00.
710.
530.
940.
720
0.75
0.51
1.10
0.48
OM
IP0
0.99
0.74
1.33
0.70
10.
480.
360.
650.
711
0.67
0.44
1.02
0.43
TC
01.
060.
851.
300.
850
0.50
0.34
0.73
0.47
00.
750.
561.
000.
71
Not
es.
Mte
n,t
endo
nm
ass
(kg)
;Lte
n,t
endo
nle
ngt
h(m
);T
CSA
,ten
don
cros
s-se
ctio
nal
area
(m2).
Lamas et al. (2014), PeerJ, DOI 10.7717/peerj.716 19/29
for studies of patellar tendon morphology by Regnault, Pitsillides & Hutchinson (2014).
Thus data are presented for the tendons of 20 muscles. The major gastrocnemius tendon
resulting from the fusion of the tendons of the three gastrocnemius muscles was dissected
by transecting the tendon of the GL at the site of fusion onto the common tendon;
therefore the GM remained with the extensive common portion of the tendon, which
distally was transected at its insertion onto the fibrous scutum at the level of the ankle joint.
The scaling slopes for tendon mass indicate positive allometry in 10 out of 20 tendons
(lower CI boundary >1) across emu ontogeny. The masses for the remaining ten tendons
scaled with isometry (lower CI < 1.0, upper CI > 1.2).
Scaling of tendon lengthWe measured Lten for the same 20 muscles for which we obtained tendon masses (Table 4),
from the end of the muscle belly to the insertion. Statistical analysis of one muscle (ITCr)
led to exclusion of this muscle because the p value was >0.05. For the other 19 tendons,
the general scaling trend was towards strong positive allometry, with 16 muscles having
the lower limit of the CI >0.33. In three muscles (FCM, GM, FL), the lower CI for tendon
length was <0.33, indicating isometry for length in these tendons. Given these patterns, we
infer a general trend for positive allometry of tendon length in growing emus.
Scaling of tendon cross-sectional areaAverage TCSA was calculated for the same 20 tendons as above (Table 4). The dataset for
ILPO had a p value >0.05 and was excluded. Of the 19 remaining tendons, 10 showed a
lower CI limit of the slope consistent with positive allometry (>0.67). The remaining nine
tendons showed ontogenetic isometry for TCSA.
DISCUSSIONEmus, like other ratites and other precocial birds, must have locomotor independence
from hatching and develop into large, running adult birds within 16–18 months (Davies
& Bamford, 2002). Taking into consideration their initial development within the egg,
their ontogeny poses interesting questions about their locomotor development, related to
our study’s aims, such as: How do muscle structure and anatomy change to accommodate
precocial development in emus? What are the strategies that growing emus use to maintain
tissue mechanical safety factors during rapid development of cursorial morphology and
high-speed locomotor abilities? Our data suggest some answers to these questions, as
follows.
Scaling patterns across ontogenyWe found positive allometry of emu pelvic limb muscle masses, indicating that most
muscles get become significantly more powerful (in relative and absolute terms) as the
animals grow. However, the functional relevance of this observation is slightly mitigated by
a less marked positive allometry of PCSA (and therefore maximal muscle force), driven by
a trend for fascicle length that is closer to isometry (i.e., preserving geometric similarity).
Lamas et al. (2014), PeerJ, DOI 10.7717/peerj.716 20/29
In the proximal part of the pelvic limb of emus, the developmental and functional
mechanics appear to rely on the arrangement of large and metabolically expensive muscles
(ILPO, ILFB, IC, FCLP and FMTL) to provide the wide range of motion of the knee joint
(and hip, during faster running) in combination with a relatively short femur that scales
close to isometry. This arrangement also leads to a proximal to distal gradient of muscle
mass, which has been previously reported for other birds (Paxton et al., 2010; Smith et al.,
2006) and has long been thought to favour energy-savings by keeping the distal end of the
limb light and its muscles dependent on springy tendons. The proximal-distal gradient
also concentrates large, power-generating muscles in the proximal limb (Alexander,
1974; Alexander, 1991) with large moment arms (Hutchinson et al., 2014; Smith et al., 2007)
and thus the ability to produce the considerable joint moments needed for high-speed
running (Hutchinson, 2004a; Hutchinson, 2004b).
The distal limb, on the other hand, is heavily dependent on the triad of M. gastrocne-
mius (GL, GIM and GM) along with: M. fibularis longus (FL); both ankle extensors; as
well as M. tibialis cranialis (TC); M. extensor digitorum longus (EDL); and both ankle
flexors. Combined, these muscles constitute 80% of the muscle mass and 60% of the
force-generating capacity (PCSA) of this portion of the limb. The unusual proportion of
body mass taken up by the ankle extensors has been noted before (Hutchinson, 2004a)
and is likely an ancestral characteristic of birds (e.g., Paxton et al., 2010) but is taken to an
extreme in large ratites (e.g., Smith et al., 2006).
Further distally, the long and slender tarsometatarsus bone lends itself well as a support
for the long tendons of the digital flexor muscles which in turn provide essential springs
used in support and propulsion of the limbs and body. The relatively small muscles
and long tendons of the digital flexors make them likely to operate mainly as energy
storage devices at faster speeds, as seen in other species like horses and smaller running
birds (Biewener, 1998; Daley & Biewener, 2011). The positive allometry of many tendon
properties in emus is in line with this increase in force-generating capacity seen during
ontogeny. As in most other birds, the tendons running along the tarsometatarsus are
almost exclusively on the cranial and caudal (dorsal/plantar) side. It would also be
interesting to know the effect on bone strains from this “bow and arrow” anatomical
arrangement between the tarsometatarsus and the dorsal/plantar tendons to see if it
influences the predominantly torsional loads experienced by the two proximal pelvic
limb bones (Main & Biewener, 2007).
For these spring-like tendons, a trade-off between muscle force and tendon elasticity
does not seem to occur in emus. This lack of a trade-off is indicated by the similar scaling
patterns of the cross-sectional areas of the digital flexor muscles and tendons, both of
which trend towards positive allometry across emu ontogeny. As seen in other species (Ker,
Alexander & Bennet, 1988), the relative increases in the cross-sectional areas of tendons
might maintain tendon safety factors (maximal stresses before failure vs. in vivo maximal
stress) as emus increase in size. However, tendons might also change their biomechanical
properties (Young’s modulus) with age, as seen in other species (Shadwick, 1990; Thorpe et
al., 2014), therefore influencing biomechanical interpretations of the data presented here.
Lamas et al. (2014), PeerJ, DOI 10.7717/peerj.716 21/29
Without measuring tendon elastic modulus with age, it is difficult to interpret how tendon
stiffness and safety factor might change with age in emus.
To complement data from a prior study showing the scaling patterns of the cross-
sectional areas of the femur and tibiotarsus of emus to be close to isometry (Main &
Biewener, 2007), here we analysed the scaling patterns of the lengths of the three longest
limb bones and the first phalanx of the third toe. Our data indicate positive allometry of
the two longer bones, the tibiotarsus (lower CI limit = 0.37) and tarsometatarsus (lower
CI limit = 0.39), but a less marked positively allometric scaling trend for the femur (lower
limit of CI = 0.34) and for the first phalanx of digit III (lower CI limit = 0.33). These
results differ from those reported for another ratite, the greater rhea (Rhea americana), in
which only the tarsometarsus showed positive allometry (Picasso, 2012) but interestingly
are in line with general interspecific scaling exponents found for pelvic limb bone lengths
across different species of palaeognaths (Cubo & Casinos, 1996). Considering our results, if
similar cross-sectional geometry is assumed along the length of the bone shafts, this would
lead to an increase in strains (at least in bending, due to larger moments) at the mid-shaft
with increasing body mass. However, changes in cross-sectional areal geometry have been
shown to lead to slight positive allometry of the cross-sectional geometry of avian limb
bones across species (Doube et al., 2012) and ontogenetically (Main & Biewener, 2007). As
these geometrical changes might not suffice to explain the increases in strain magnitudes
seen during ontogeny, they leave unexplained the role of internal forces (soft tissues) on
bone mechanics and consequently their influence on bone morphology during growth.
Although there are very limited data on the ontogeny of skeletal muscle physiology,
experiments in mice and cats (Close, 1964; Close & Hoh, 1967) demonstrate that although
muscle force: velocity parameters change from newborns to adults, these changes appear
to occur in a relatively short period and therefore newborn muscle, after the first few
days of life, becomes similar to that of adults. However, mice and cats, like many other
mammals, are born with neuromotor immaturity (Muir, 2000), in contrast to emus. It is
therefore reasonable to speculate that, like other birds (Gaunt & Gans, 1990), emus are
unlikely to have appreciable changes in muscle physiology during growth. Thus changes in
functional (e.g., maximal force-generating capacity) and biomechanical parameters should
be detectable by anatomical studies such as ours.
Few studies have quantified the ontogenetic scaling patterns of limb musculature in
birds (Carrier & Leon, 1990; Dial & Carrier, 2012; Paxton et al., 2014; Picasso et al., 2012;
Picasso, 2014), but positive allometry predominates in the muscle masses involved in the
major adult mode of locomotion (flying vs. cursorial). In the Californian gull, the M.
gastrocnemius scaled isometrically but the M. pectoralis had strong positive allometry
with an inflection point when the fledglings started exercising their wings (Carrier &
Leon, 1990). Paxton et al. (2014) and Paxton et al. (2010) both recently reported the
ontogenetic scaling patterns of the musculature of a highly modified galliform, the broiler
chicken. These birds, unsurprisingly due to their selective breeding, were found to have
positive allometry of muscle masses of the main pelvic limb muscles but isometry of the
fascicle lengths (Paxton et al., 2014), a pattern that is nonetheless similar to our findings.
Lamas et al. (2014), PeerJ, DOI 10.7717/peerj.716 22/29
Picasso et al. (2012) found quite similar scaling patterns across rhea ontogeny: an average
64-fold increase in pelvic limb muscle mass from 1 month of age to adulthood whilst only
a 34-fold increase in body mass. In a later study, where scaling exponents were calculated,
a more generalised positively allometric scaling was found in these South American ratites
compared to emus: with all muscle masses but two (where isometry was evident) scaling
with positive allometry (slopes ∼1.3). Total limb muscle mass of rheas scaled with an
exponent of 1.18 (Picasso, 2014), which is similar to our value of 1.16. Together, these data
suggest that positive allometry prevails across ontogeny for leg muscles in extant birds
with precocial development; potentially a homologous feature of their development that is
quite unlike the isometry prevailing in their closest extant relatives, Crocodylia (Allen et al.,
2010; Allen et al., 2014).
Dial & Carrier (2012) suggested that birds must optimise their energy consumption to
achieve their ultimate functional gait whilst channelling resources to their precocial gait
(Dial & Carrier, 2012) (running vs. swimming or flying). Ratites are unusual for birds in
that they solely have terrestrial gaits throughout their life and, in the case of emus, their
wings have atrophied to such an extent that they should not present much metabolic
competition to hindlimb development. Considering the approximately isometric overall
scaling of kinematic parameters (e.g., stride lengths, stride frequencies, duty factors) seen
in ratites (Main & Biewener, 2007; Smith, Jespers & Wilson, 2010), it is likely that this
increase in muscle masses will lead to a limb that is adapted for power production and
perhaps (considering our less allometric tendon results) elastic energy storage/return. The
former is also supported by metabolic studies which found a predominance of fast fibres
in the M. gastrocnemius of adult emus (Patak, 1993), although more studies of muscle
physiology in emus and other ratites would be valuable.
The need for locomotor independence and high performance in vulnerable, young,
precocial and cursorial birds might favour allometry of muscle architecture (Carrier, 1996).
If so, could adult muscle phenotypes be a reflection of the locomotor needs during early
development and therefore be overdesigned for their demands? Alternatively, negative
allometric scaling in the musculoskeletal system may occur as seen in goats (Main &
Biewener, 2004) and jackrabbits (Carrier, 1983). It is hard to draw an inference from our
data, because the overall positive allometry seen in the pelvic limb musculature could
indicate a necessity to grow faster and stronger to adulthood to compensate for a juvenile
disadvantage, or could reflect selective pressures on the locomotor ontogeny of emus
in which muscles congenitally primed for fast growth during adolescence could lead
to continued growth past an optimum in adulthood. Although direct measurements
of maximal performance of complex locomotor systems is problematic, a modelling
approach using the data presented here could be a valid approach to answer this question.
How well are farmed emus representative of the species overall?Although emu farming is relatively common, its goal is to extract meat, oil and skin and
therefore these birds are not bred in captivity for their locomotor behaviour, nor do they
suffer strong predatory pressures on it. The diet of captive bred birds as well as their relative
Lamas et al. (2014), PeerJ, DOI 10.7717/peerj.716 23/29
sedentary regime when compared to wild animals is likely to influence tissue development
and distribution. However, as farming of these birds is a recent activity and it is not a
highly specialised or intense process as with other domesticated species (Goonewardene et
al., 2003), it is unlikely that heritable traits of the emu musculoskeletal system have been
significantly altered. Therefore, we expect the muscle distribution and scaling patterns of
our emus to be similar to wild emus.
By presenting muscle mass data from two distinct groups of birds (UK and USA
groups), we established that these groups at least have similar scaling patterns, ruling
out any potential bias imposed by different breeding regimes. With regards to diet, it was
apparent that our birds were carrying a significant amount of subcutaneous and peritoneal
fat; likely encouraged by their ad libitum access to a commercial pelleted diet. The influence
of body fat on our scaling results is hard to test with the available data, but Hutchinson
et al. (2014) noted a possible reduction in relative muscle masses in wild vs. captive bred
ostriches, which could also apply to emus. Regardless, it is less certain that the scaling pat-
terns for muscle/tendon architecture observed here would differ in wild vs. captive emus.
CONCLUSIONSWe have provided a new dataset on the ontogenetic scaling of pelvic limb anatomy and
muscle architectural properties of a cursorial bird (the first complete architectural dataset
of its kind), and we have done this using a group of 17 emus across a tenfold increase
in body mass. A marked trend of positive allometry of muscle masses and PCSAs is
accompanied by less marked positive allometry of fascicle lengths. Tendons, especially
the long digital flexors, also demonstrate positive allometry of their lengths, as do the two
longer limb bones (tibiotarsus and tarsometatarsus). We have illuminated the ontogenetic
adaptation of the musculoskeletal system in an extreme example of size variation during
rapid growth. Our dissections refined the myology of the pelvic limb in emus (Table 1
and Figs. 1–3) and found some anatomical aspects that were previously misunderstood.
This is important as functional studies depending on inaccurate anatomical accounts of
the myology could obtain unrealistic results from biomechanical models using such data
(Goetz et al., 2008; Hutchinson et al., 2014). This work should be a valuable resource for
future functional, comparative and evolutionary studies of emus, other birds and extinct
related animals.
ACKNOWLEDGEMENTSWe thank Jack Machale, Emily Sparkes, Kyle Chadwick, Charlotte Cullingford, Sophie
Regnault and Chris Basu who helped with the dissections. Craig McGowan provided
assistance with muscle dissections in the USA emu sample. A special thank you goes
to Vivian Allen for providing the custom designed R code that we used to perform the
regression analysis, as well as valuable intellectual discussions. We also thank Ashley Heers
and Diego Sustaita as well as an anonymous reviewer and reviewer Trevor Worthy for their
helpful comments on an earlier draft of this manuscript.
Lamas et al. (2014), PeerJ, DOI 10.7717/peerj.716 24/29
ADDITIONAL INFORMATION AND DECLARATIONS
FundingOur funding bodies are the Fundacao para a Ciencia e Tecnologia-FCT (Portuguese
Government-Foundation for Science and Technology) for PhD studentship funding for
LPL (Grant Code SFRH/BD/74439/2010), the Royal Veterinary College, and grant number
BB/I02204X/1 from the British Biotechnology and Biological Sciences Research Council.
The funders had no role in study design, data collection and analysis, decision to publish,
or preparation of the manuscript.
Grant DisclosuresThe following grant information was disclosed by the authors:
Fundacao para a Ciencia e Tecnologia-FCT (Portuguese Government-Foundation for
Science and Technology).
LPL: SFRH/BD/74439/2010.
Royal Veterinary College: BB/I02204X/1.
British Biotechnology and Biological Sciences Research Council.
Competing InterestsJohn R. Hutchinson is an Academic Editor for PeerJ.
Author Contributions• Luis P. Lamas, Russell P. Main and John R. Hutchinson conceived and designed
the experiments, performed the experiments, analyzed the data, contributed
reagents/materials/analysis tools, wrote the paper, prepared figures and/or tables,
reviewed drafts of the paper.
Animal EthicsThe following information was supplied relating to ethical approvals (i.e., approving body
and any reference numbers):
Birds were obtained from our ongoing research examining emu ontogenetic biome-
chanics (conducted with ethical approval under a UK Home Office license: PPL 70 7122).
Supplemental InformationSupplemental information for this article can be found online at http://dx.doi.org/
10.7717/peerj.716#supplemental-information.
REFERENCESAbourachid A. 2000. Bipedal locomotion in ratites (Paleognatiform): examples of cursorial birds.
Ibis 142:538–549 DOI 10.1111/j.1474-919X.2000.tb04455.x.
Alexander R. 1974. Mechanics of jumping by a dog Canis familiaris. Journal of Zoology173:549–573 DOI 10.1111/j.1469-7998.1974.tb04134.x.
Lamas et al. (2014), PeerJ, DOI 10.7717/peerj.716 25/29
Alexander R. 1991. Energy saving mechanisms in walking and running. Journal of ExperimentalBiology 160:55–69.
Alexander R, Jayes A, Maloiy GM, Wathuda E. 1979. Allometry of the limb bones ofmammals from shrews (Sorex) to elephant (Loxodonta). Journal of Zoology 189:305–314DOI 10.1111/j.1469-7998.1979.tb03964.x.
Allen V, Elsey RM, Jones N, Wright J, Hutchinson JR. 2010. Functional specialization andontogenetic scaling of limb anatomy in Alligator mississippiensis. Journal of Anatomy216:423–445 DOI 10.1111/j.1469-7580.2009.01202.x.
Allen V, Molnar J, Parker W, Pollard A, Nolan G, Hutchinson JR. 2014. Comparativearchitectural properties of limb muscles in Crocodylidae and Alligatoridae and their relevanceto divergent use of asymmetrical gaits in extant Crocodylia. Journal of Anatomy 225:569–582DOI 10.1111/joa.12245.
Bertram JE, Biewener A. 1990. Differential scaling of the long bones in the terrestrial Carnivoraand other mammals. Journal of Morphology 204:157–169 DOI 10.1002/jmor.1052040205.
Biewener A. 1982. Bone strength in small mammals and bipedal birds: do safety factors changewith body size? Journal of Experimental Biology 98:289–301.
Biewener A. 1998. Muscle-tendon stresses and elastic energy storage during locomotion in thehorse. Comparative Biochemistry and Physiology B 120:73–87DOI 10.1016/S0305-0491(98)00024-8.
Brown NT, Pandy MG, Kawcak CE, McIlwraith CW. 2003. Force- and moment-generatingcapacities of muscles in the distal forelimb of the horse. Journal of Anatomy 203:101–113DOI 10.1046/j.1469-7580.2003.00206.x.
Carrier R. 1983. Postnatal ontogeny of the musculo-skeletal system in the black-tailed jackrabbit(Lepus californicus). Journal of Zoology 201:27–55 DOI 10.1111/j.1469-7998.1983.tb04259.x.
Carrier DR. 1996. Ontogenetic limits on locomotor performance. Physiological Zoology69:467–488.
Carrier D, Leon L. 1990. Skeletal growth and function in the California gull (Larus californicus).Journal of Zoology 222:375–389 DOI 10.1111/j.1469-7998.1990.tb04039.x.
Close B. 1964. Dynamic properties of fast and slow skeletal muscles of the rat during development.Journal of Physiology 173:74–95 DOI 10.1113/jphysiol.1964.sp007444.
Close B, Hoh J. 1967. Force:velocity properties of kitten muscles. Journal of Physiology192:815–822 DOI 10.1113/jphysiol.1967.sp008333.
Cubo J, Casinos A. 1996. Flightlessness and long bone allometry in Palaeognathiformes andSphenisciformes. Netherlands Journal of Zoology 47:209–226 DOI 10.1163/156854297X00175.
Daley MA, Biewener AA. 2011. Leg muscles that mediate stability: mechanics andcontrol of two distal extensor muscles during obstacle negotiation in the guinea fowl.Philosophical Transactions of the Royal Society of London B: Biological Sciences 366:1580–1591DOI 10.1098/rstb.2010.0338.
Davies SF, Bamford M. 2002. Ratites and tinamous: tinamidae, rheidae, dromaiidae, casuariidae,apterygidae, struthionidae. New York: Oxford University Press.
Dial TR, Carrier DR. 2012. Precocial hindlimbs and altricial forelimbs: partitioning ontogeneticstrategies in mallards (Anas platyrhynchos). Journal of Experimental Biology 215:3703–3710DOI 10.1242/jeb.057380.
Dial KP, Jackson BE. 2011. When hatchlings outperform adults: locomotor development inAustralian brush turkeys (Alectura lathami, Galliformes). Proceedings of the Royal Society B:Biological Sciences 278:1610–1616 DOI 10.1098/rspb.2010.1984.
Lamas et al. (2014), PeerJ, DOI 10.7717/peerj.716 26/29
Doube M, Yen SC, Klosowski MM, Farke AA, Hutchinson JR, Shefelbine SJ. 2012. Whole-bonescaling of the avian pelvic limb. Journal of Anatomy 221:21–29DOI 10.1111/j.1469-7580.2012.01514.x.
Fuss FK. 1996. Tibiofibular junction of the South African ostrich (Struthio camelus australis).Journal of Morphology 227:213–226 DOI 10.1002/(SICI)1097-4687(199602)227:2<213::AID-JMOR7>3.0.CO;2-9.
Gangl D, Weissengruber GE, Egerbacher M, Forstenpointner G. 2004. Anatomical descriptionof the muscles of the pelvic limb in the ostrich (Struthio camelus). Anatomia HistologiaEmbryologia 33:100–114 DOI 10.1111/j.1439-0264.2003.00522.x.
Gatesy SM. 1999. Guineafowl hind limb function. II: electromyographic analysis andmotor pattern evolution. Journal of Morphology 240:127–142 DOI 10.1002/(SICI)1097-4687(199905)240:2<127::AID-JMOR4>3.0.CO;2-Q.
Gatesy SM, Biewener AA. 1991. Bipedal locomotion: effects of speed, size and limb posture inbirds and humans. Journal of Zoology 224:127–147 DOI 10.1111/j.1469-7998.1991.tb04794.x.
Gaunt A, Gans C. 1990. Architecture of chicken muscles: short-fibre patterns and theirontogeny. Proceedings of the Royal Society of London B: Biological Sciences 240:351–362DOI 10.1098/rspb.1990.0041.
Gillooly JF, Brown JH, West GB, Savage VM, Charnov EL. 2001. Effects of size and temperatureon metabolic rate. Science 293:2248–2251 DOI 10.1126/science.1061967.
Goetz JE, Derrick TR, Pedersen DR, Robinson DA, Conzemius MG, Baer TE, Brown TD. 2008.Hip joint contact force in the emu (Dromaius novaehollandiae) during normal level walking.Journal of Biomechanics 41:770–778 DOI 10.1016/j.jbiomech.2007.11.022.
Goonewardene LA, Wang Z, Okine E, Zuidhof MJ, Dunk E, Onderka D. 2003. Comparativegrowth characteristics of emus (Dromaius novaehollandiae). Journal of Applied Poultry Research12:27–31 DOI 10.1093/japr/12.1.27.
Haughton S. 1867. The muscular anatomy of the emu (Dromaius novaehollandiae). Proceedings ofthe Royal Irish Academy 9:487–497.
Hemmingsen AM. 1960. Energy metabolism as related to body size and respiratory surfaces, andits evolution. Steno Memorial Hospital and Nordinsk Insulin Laboratorium 9:6–110.
Hokkanen JE. 1986. The size of the largest land animal. Journal of Theoretical Biology 118:491–499DOI 10.1016/S0022-5193(86)80167-9.
Hutchinson JR. 2004a. Biomechanical modeling and sensitivity analysis of bipedal running ability.I. Extant taxa. Journal of Morphology 262:421–440 DOI 10.1002/jmor.10241.
Hutchinson JR. 2004b. Biomechanical modeling and sensitivity analysis of bipedal running ability.II. Extinct taxa. Journal of Morphology 262:441–461 DOI 10.1002/jmor.10240.
Hutchinson JR, Rankin J, Rubenson J, Rosenbluth K, Siston R, Delp S. 2014. Musculoskeletalmodeling of an ostrich (Struthio camelus) pelvic limb: influence of limb orientation on muscularcapacity during locomotion. PeerJ PrePrints 2:e513v1http://dx.doi.org/10.7287/peerj.preprints.513v1.
Ker R. 1981. Dynamic tensile properties of the plantaris tendon of sheep (Ovis aries). Journal ofExperimental Biology 93:283–302.
Ker RF, Alexander R, Bennet M. 1988. Why are mammalian tendons so thick? Journal of Zoology216:309–324 DOI 10.1111/j.1469-7998.1988.tb02432.x.
Kleiber M. 1932. Body size and metabolism. Hilgardia 6:311–353 DOI 10.3733/hilg.v06n11p315.
LaBarbera M. 1989. Analyzing body size as a factor in ecology and evolution. Annual Review ofEcology and Systematics 20:97–117 DOI 10.1146/annurev.es.20.110189.000525.
Lamas et al. (2014), PeerJ, DOI 10.7717/peerj.716 27/29
Main RP, Biewener AA. 2004. Ontogenetic patterns of limb loading, in vivo bonestrains and growth in the goat radius. Journal of Experimental Biology 207:2577–2588DOI 10.1242/jeb.01065.
Main RP, Biewener AA. 2007. Skeletal strain patterns and growth in the emu hindlimb duringontogeny. Journal of Experimental Biology 210:2676–2690 DOI 10.1242/jeb.004580.
Maloiy GM, Alexander RM, Njau R, Jayes AS. 1979. Allometry of the legs of running birds.Journal of Zoology 187:161–167 DOI 10.1111/j.1469-7998.1979.tb03940.x.
McMahon T. 1975. Allometry and biomechanics: limb bones in adult ungulates. AmericanNaturalist 109:547–563 DOI 10.1086/283026.
Mendez J, Keys A. 1960. Density and composition of mammalian muscle. Metabolism-Clinical andExperimental 9:184–188.
Miller CE, Basu C, Fritsch G, Hildebrandt T, Hutchinson JR. 2008. Ontogenetic scaling offoot musculoskeletal anatomy in elephants. Journal of the Royal Society, Interface 5:465–475DOI 10.1098/rsif.2007.1220.
Minnaar P, Minnaar M. 1997. The emu farmer’s handbook. Grovetown, TX: Nyoni Publishing.
Muir GD. 2000. Early ontogeny of locomotor behaviour: a comparison between altricial andprecocial animals. Brain Research Bulletin 53:719–726 DOI 10.1016/S0361-9230(00)00404-4.
Patak A. 1993. Structural and metabolic characterization of the muscles used to power runningin the emu (Dromaius novaehollandiae), a giant flightless bird. Journal of Experimental Biology249:233–249.
Patak A, Baldwin J. 1998. Pelvic limb musculature in the emu Dromaius novaehollandiae (Aves:Struthioniformes: Dromaiidae): adaptations to high-speed running. Journal of Morphology238:23–37 DOI 10.1002/(SICI)1097-4687(199810)238:1<23::AID-JMOR2>3.0.CO;2-O.
Paxton H, Anthony NB, Corr SA, Hutchinson JR. 2010. The effects of selective breedingon the architectural properties of the pelvic limb in broiler chickens: a comparativestudy across modern and ancestral populations. Journal of Anatomy 217:153–166DOI 10.1111/j.1469-7580.2010.01251.x.
Paxton H, Tickle P, Rankin J, Codd J, Hutchinson J. 2014. Anatomical and biomechanical traitsof broiler chickens across ontogeny. Part II. Body segment inertial properties and musclearchitecture of the pelvic limb. PeerJ 2:e473 DOI 10.7717/peerj.473.
Picasso MBJ. 2012. Postnatal ontogeny of the locomotor skeleton of a cursorial bird: greater rhea.Journal of Zoology 286:303–311 DOI 10.1111/j.1469-7998.2011.00880.x.
Picasso MBJ. 2014. Ontogenetic scaling of the hindlimb muscles of the greater Rhea (Rheaamericana). Anatomia, Histologia, Embryologia 1–8 DOI 10.1111/ahe.12158.
Picasso MBJ, Tambussi CP, Mosto MC, Degrange FJ. 2012. Crescimiento de la masa musculardel miembro posterior del Nandu Grande (Rhea americana) durante la vida postnatal. RevistaBrasileira de Ornintologia 20:1–7.
Powell PL, Roy RR, Kanim P, Bello MA, Edgerton VR. 1984. Predictability of skeletal muscletension from architectural determinations in guinea pig hindlimbs. Journal of Applied Physiology57:1715–1721.
R Development Core Team. 2010. R: a language and environment for statistical computing. Vienna:R Foundation for Statistical computing.
Regnault S, Pitsillides AA, Hutchinson JR. 2014. Structure, ontogeny and evolution of thepatellar tendon in emus (Dromaius novaehollandiae) and other palaeognath birds. PeerJ 2:e711DOI 10.7717/peerj.711.
Lamas et al. (2014), PeerJ, DOI 10.7717/peerj.716 28/29
Sacks RD, Roy RR. 1982. Architecture of the hind limb muscles of cats: functional significance.Journal of Morphology 173:185–195 DOI 10.1002/jmor.1051730206.
Schmidt-Nielsen K. 1984. Scaling: why is animal size so important? Cambridge: CambridgeUniversity Press.
Shadwick RE. 1990. Elastic energy storage in tendons: mechanical differences related to functionand age. Journal of Applied Physiology 68:1033–1040 DOI 10.1063/1.346741.
Smith NC, Jespers KJ, Wilson A. 2010. Ontogenetic scaling of locomotor kinetics andkinematics of the ostrich (Struthio camelus). Journal of Experimental Biology 213:1347–1355DOI 10.1242/jeb.020271.
Smith NC, Payne RC, Jespers KJ, Wilson AM. 2007. Muscle moment arms of pelviclimb muscles of the ostrich (Struthio camelus). Journal of Anatomy 211:313–324DOI 10.1111/j.1469-7580.2007.00762.x.
Smith NC, Wilson AM. 2013. Mechanical and energetic scaling relationships of runninggait through ontogeny in the ostrich (Struthio camelus). Journal of Experimental Biology216:841–849 DOI 10.1242/jeb.064691.
Smith N, Wilson A, Jespers K, Payne R. 2006. Muscle architecture and functional anatomyof the pelvic limb of the ostrich (Struthio camelus). Journal of Anatomy 209:765–779DOI 10.1111/j.1469-7580.2006.00658.x.
Taylor RC, Maloiy GMO, Weibel ER, Langman VA, Kamau JMZ, Seeherman HJ, Heglund NC.1981. Design of the mammalian respiratory system. III. Scaling maximum aerobiccapacity to body mass: wild and domestic mammals. Respiration Physiology 44:25–37DOI 10.1016/0034-5687(81)90075-X.
Thorpe CT, Riley GP, Birch HL, Clegg PD, Screen HR. 2014. Fascicles from energy-storingtendons show an age-specific response to cyclic fatigue loading. Journal of the Royal SocietyInterface 11 DOI 10.1098/rsif.2013.1058.
Vanden Berge J, Zweers G. 1993. Myologia. In: Baumel J, King A, Breazile J, Evans H, VandenBerge J, eds. Handbook of avian anatomy: nomina anatomica avium. Cambridge, MA: NuttallOrnithological Club, 189–247.
Yoshikawa T, Mori S, Santiesteban AJ, Sun TC, Hafstad E, Chen J, Burr DB. 1994. The effects ofmuscle fatigue on bone strain. Journal of Experimental Biology 188:217–233.
Young JW. 2009. Ontogeny of joint mechanics in squirrel monkeys (Saimiri boliviensis): functionalimplications for mammalian limb growth and locomotor development. Journal of ExperimentalBiology 212:1576–1591 DOI 10.1242/jeb.025460.
Zinoviev A. 2006. Notes on the hind limb myology of the Ostrich (Struthio camelus). Ornithologia33:53–62.
Lamas et al. (2014), PeerJ, DOI 10.7717/peerj.716 29/29
Top Related
Copyright © 2022 FDOKUMEN

